0000770540natixis:NATIXISINDEXMSCIWorldIndexNet18048AdditionalIndexMember2023-07-310000770540natixis:NATIXISINDEXRussell1000Index18007AdditionalIndexMember2016-04-300000770540natixis:NATIXISINDEXRussell2000ValueIndex17969AdditionalIndexMember2018-07-31
UNITED STATES
SECURITIES AND EXCHANGE COMMISSION
Washington, D.C. 20549
FORM N-CSR
CERTIFIED SHAREHOLDER REPORT OF REGISTERED
MANAGEMENT INVESTMENT COMPANIES
Investment Company Act file number: 811-04323
Natixis Funds Trust I
(Exact name of Registrant as specified in charter)
888 Boylston Street, Suite 800, Boston, Massachusetts 02199-8197
(Address of principal executive offices) (Zip code)
Susan McWhan Tobin, Esq.
Natixis Distribution, LLC
888 Boylston Street, Suite 800
Boston, Massachusetts 02199-8197
(Name and address of agent for service)
Registrant’s telephone number, including area code: (617) 449-2139
Date of fiscal year end: December 31
Date of reporting period: December 31, 2024
Item 1. Reports to Stockholders.
| (a) | The Registrant’s annual report transmitted to shareholders pursuant to Rule 30e-1 under the Investment Company Act of 1940 is as follows: |
Mirova Global Green Bond Fund
Annual Shareholder Report - December 31, 2024
This annual shareholder report contains important information about Mirova Global Green Bond Fund for the period of January 1, 2024 to December 31, 2024. You can find additional information (including tax information) about the Fund at im.natixis.com/funddocuments. You can also request the information by contacting us at (800) 225-5478 or by contacting your financial intermediary directly.
What were the fund costs for the last year? (based on a hypothetical $10,000 investment)
| Class Name | Costs of a $10,000 investment | Costs paid as a percentage of a $10,000 investmentFootnote Reference† |
|---|
| Class A | $91 | 0.90% |
|---|
| Footnote | Description |
Footnote† | Annualized for periods less than one year (if applicable). |
How did the fund perform last year and what affected its performance?
Explanation of Fund Performance
In 2024, the Mirova Global Green Bond Fund lagged in overall performance which can be attributed to movements on the yield curve.
Top Contributors to Performance
•Allocation had a positive impact on the Fund during the year due to its long position on credit, while US and Euro credit spreads compressed.
•Issue selection during the year was also positive. The largest contributors to this outperformance were among the corporate holdings, namely Altarea, Johnson Controls, and EIB.
Top Detractors from Performance
•The Fund's duration and curve strategy during the year incurred a cost, negatively impacting performance.
•Yield curve positioning on the CAD zone, Euro zone and USD zone were negative throughout the year.
•Among the worst detractors were Philips, Vestas, and Credit Mutuelle Arkea.
The Fund’s benchmarks are unmanaged indices used as a general measure of market performance. Calculations assume dividends and capital gains are reinvested. The tables do not reflect taxes shareholders might owe on any fund distributions or when they redeem their shares. You cannot invest directly in an index.
Total Return Based on a Hypothetical $10,000 Investment
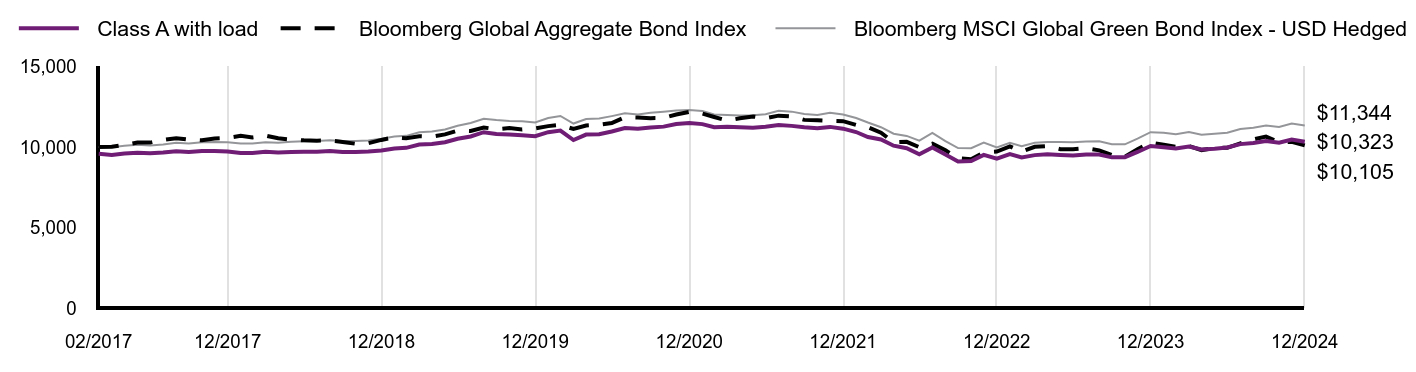
| Class A with load | Bloomberg Global Aggregate Bond Index | Bloomberg MSCI Global Green Bond Index - USD Hedged |
|---|
| 02/2017 | $9,579 | $10,000 | $10,000 |
|---|
| 03/2017 | $9,502 | $10,015 | $9,984 |
|---|
| 04/2017 | $9,598 | $10,128 | $10,076 |
|---|
| 05/2017 | $9,646 | $10,285 | $10,149 |
|---|
| 06/2017 | $9,607 | $10,276 | $10,103 |
|---|
| 07/2017 | $9,655 | $10,449 | $10,153 |
|---|
| 08/2017 | $9,741 | $10,552 | $10,266 |
|---|
| 09/2017 | $9,689 | $10,457 | $10,216 |
|---|
| 10/2017 | $9,747 | $10,418 | $10,295 |
|---|
| 11/2017 | $9,756 | $10,533 | $10,316 |
|---|
| 12/2017 | $9,719 | $10,570 | $10,302 |
|---|
| 01/2018 | $9,631 | $10,696 | $10,217 |
|---|
| 02/2018 | $9,631 | $10,601 | $10,217 |
|---|
| 03/2018 | $9,701 | $10,714 | $10,293 |
|---|
| 04/2018 | $9,662 | $10,542 | $10,271 |
|---|
| 05/2018 | $9,691 | $10,462 | $10,322 |
|---|
| 06/2018 | $9,713 | $10,416 | $10,362 |
|---|
| 07/2018 | $9,713 | $10,398 | $10,368 |
|---|
| 08/2018 | $9,752 | $10,409 | $10,422 |
|---|
| 09/2018 | $9,697 | $10,319 | $10,372 |
|---|
| 10/2018 | $9,697 | $10,204 | $10,372 |
|---|
| 11/2018 | $9,717 | $10,236 | $10,404 |
|---|
| 12/2018 | $9,781 | $10,443 | $10,515 |
|---|
| 01/2019 | $9,912 | $10,602 | $10,648 |
|---|
| 02/2019 | $9,952 | $10,541 | $10,694 |
|---|
| 03/2019 | $10,156 | $10,673 | $10,923 |
|---|
| 04/2019 | $10,186 | $10,641 | $10,961 |
|---|
| 05/2019 | $10,298 | $10,785 | $11,095 |
|---|
| 06/2019 | $10,517 | $11,025 | $11,327 |
|---|
| 07/2019 | $10,659 | $10,994 | $11,494 |
|---|
| 08/2019 | $10,922 | $11,217 | $11,757 |
|---|
| 09/2019 | $10,814 | $11,103 | $11,675 |
|---|
| 10/2019 | $10,773 | $11,177 | $11,613 |
|---|
| 11/2019 | $10,732 | $11,093 | $11,596 |
|---|
| 12/2019 | $10,676 | $11,157 | $11,529 |
|---|
| 01/2020 | $10,924 | $11,300 | $11,801 |
|---|
| 02/2020 | $11,027 | $11,376 | $11,929 |
|---|
| 03/2020 | $10,434 | $11,121 | $11,460 |
|---|
| 04/2020 | $10,774 | $11,339 | $11,743 |
|---|
| 05/2020 | $10,795 | $11,389 | $11,771 |
|---|
| 06/2020 | $10,969 | $11,490 | $11,922 |
|---|
| 07/2020 | $11,186 | $11,857 | $12,093 |
|---|
| 08/2020 | $11,134 | $11,838 | $12,027 |
|---|
| 09/2020 | $11,216 | $11,796 | $12,125 |
|---|
| 10/2020 | $11,268 | $11,807 | $12,192 |
|---|
| 11/2020 | $11,434 | $12,022 | $12,265 |
|---|
| 12/2020 | $11,489 | $12,183 | $12,298 |
|---|
| 01/2021 | $11,425 | $12,076 | $12,244 |
|---|
| 02/2021 | $11,233 | $11,868 | $12,021 |
|---|
| 03/2021 | $11,267 | $11,640 | $11,990 |
|---|
| 04/2021 | $11,234 | $11,787 | $11,967 |
|---|
| 05/2021 | $11,202 | $11,898 | $11,972 |
|---|
| 06/2021 | $11,261 | $11,793 | $12,037 |
|---|
| 07/2021 | $11,369 | $11,950 | $12,248 |
|---|
| 08/2021 | $11,315 | $11,900 | $12,200 |
|---|
| 09/2021 | $11,230 | $11,688 | $12,055 |
|---|
| 10/2021 | $11,165 | $11,660 | $11,991 |
|---|
| 11/2021 | $11,252 | $11,626 | $12,132 |
|---|
| 12/2021 | $11,142 | $11,610 | $12,016 |
|---|
| 01/2022 | $10,933 | $11,372 | $11,806 |
|---|
| 02/2022 | $10,625 | $11,237 | $11,524 |
|---|
| 03/2022 | $10,473 | $10,895 | $11,233 |
|---|
| 04/2022 | $10,083 | $10,298 | $10,828 |
|---|
| 05/2022 | $9,927 | $10,326 | $10,691 |
|---|
| 06/2022 | $9,548 | $9,994 | $10,398 |
|---|
| 07/2022 | $9,971 | $10,207 | $10,872 |
|---|
| 08/2022 | $9,536 | $9,804 | $10,366 |
|---|
| 09/2022 | $9,101 | $9,300 | $9,935 |
|---|
| 10/2022 | $9,135 | $9,236 | $9,925 |
|---|
| 11/2022 | $9,514 | $9,671 | $10,278 |
|---|
| 12/2022 | $9,277 | $9,723 | $9,972 |
|---|
| 01/2023 | $9,568 | $10,043 | $10,263 |
|---|
| 02/2023 | $9,359 | $9,709 | $10,054 |
|---|
| 03/2023 | $9,498 | $10,016 | $10,267 |
|---|
| 04/2023 | $9,545 | $10,060 | $10,312 |
|---|
| 05/2023 | $9,510 | $9,863 | $10,308 |
|---|
| 06/2023 | $9,475 | $9,863 | $10,299 |
|---|
| 07/2023 | $9,533 | $9,931 | $10,341 |
|---|
| 08/2023 | $9,533 | $9,795 | $10,359 |
|---|
| 09/2023 | $9,359 | $9,509 | $10,170 |
|---|
| 10/2023 | $9,370 | $9,395 | $10,171 |
|---|
| 11/2023 | $9,695 | $9,869 | $10,520 |
|---|
| 12/2023 | $10,064 | $10,279 | $10,925 |
|---|
| 01/2024 | $9,993 | $10,137 | $10,887 |
|---|
| 02/2024 | $9,910 | $10,010 | $10,788 |
|---|
| 03/2024 | $10,028 | $10,065 | $10,928 |
|---|
| 04/2024 | $9,851 | $9,811 | $10,770 |
|---|
| 05/2024 | $9,898 | $9,940 | $10,826 |
|---|
| 06/2024 | $9,969 | $9,954 | $10,886 |
|---|
| 07/2024 | $10,182 | $10,229 | $11,123 |
|---|
| 08/2024 | $10,253 | $10,471 | $11,204 |
|---|
| 09/2024 | $10,372 | $10,649 | $11,344 |
|---|
| 10/2024 | $10,265 | $10,292 | $11,249 |
|---|
| 11/2024 | $10,466 | $10,327 | $11,458 |
|---|
| 12/2024 | $10,323 | $10,105 | $11,344 |
|---|
Performance data shown represents past performance and is no guarantee of, and is not necessarily indicative of, future results. Total return and value will vary, and you may have a gain or loss when shares are sold. Current performance may be lower or higher than quoted. For the most recent month-end performance, visit im.natixis.com/en-us/products/mutual-funds/price-and-performance.
Average Annual Total Returns (%)
| AATR | 1 Year | 5 Years | Since Inception 2/28/17 |
|---|
| Class A at NAV | 2.57% | (0.67%) | 0.96% |
|---|
Class A with 4.25% MSCFootnote Reference1 | (1.82%) | (1.53%) | 0.41% |
|---|
| Bloomberg Global Aggregate Bond Index | (1.69%) | (1.96%) | 0.13% |
|---|
| Bloomberg MSCI Global Green Bond Index - USD Hedged | 3.83% | (0.32%) | 1.62% |
|---|
| Footnote | Description |
Footnote1 | Maximum sales charge |
Effective May 1, 2024, in accordance with new regulations, the Fund’s primary broad-based index changed to the Bloomberg Global Aggregate Bond Index - USD Hedged. The Fund will retain the Bloomberg MSCI Global Green Bond Index - USD Hedged as an additional benchmark for performance comparison.
| Total Net Assets | $38,096,678 |
|---|
| # of Portfolio Holdings (including overnight repurchase agreements and derivatives) | 82 |
|---|
| Portfolio Turnover Rate | 10% |
|---|
| Total Advisory Fees Paid (after waiver/reimbursement, if applicable) | $17,744 |
|---|
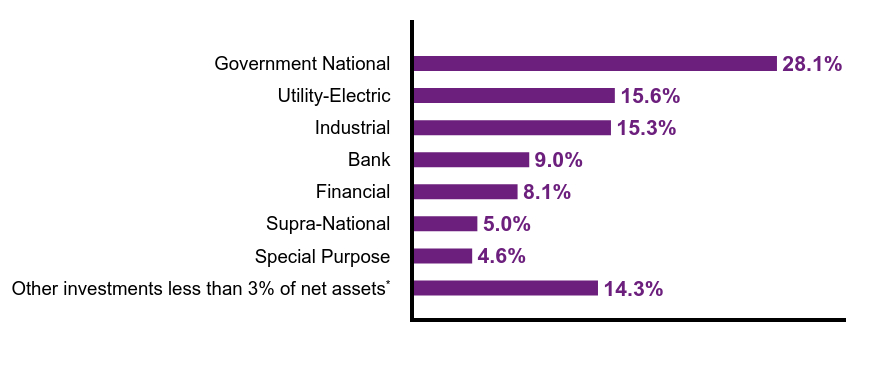
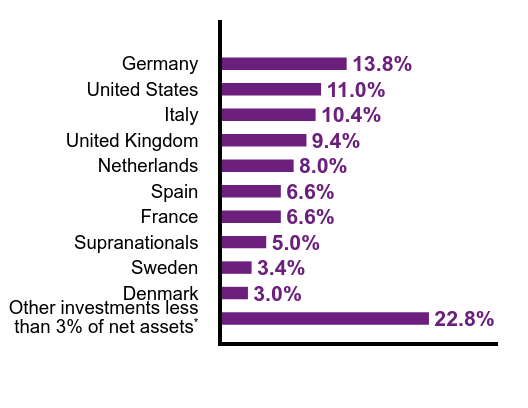
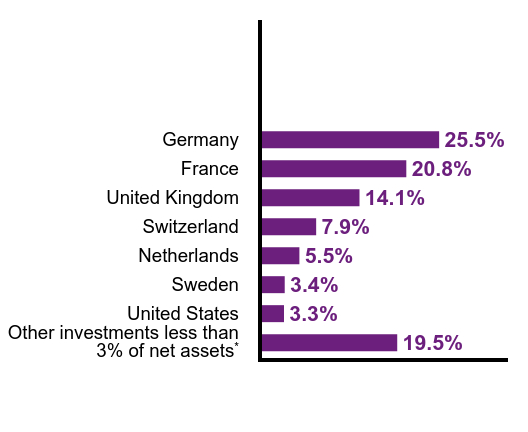
What did the Fund invest in? (% of Net Assets)
| Value | Value |
|---|
Other investments less than 3% of net assetsFootnote Reference* | 14.3% |
| Special Purpose | 4.6% |
| Supra-National | 5.0% |
| Financial | 8.1% |
| Bank | 9.0% |
| Industrial | 15.3% |
| Utility-Electric | 15.6% |
| Government National | 28.1% |
| Footnote | Description |
Footnote* | Net of other assets less liabilities (including futures contracts) |
| Value | Value |
|---|
Other investments less than 3% of net assetsFootnote Reference* | 22.8% |
| Denmark | 3.0% |
| Sweden | 3.4% |
| Supranationals | 5.0% |
| France | 6.6% |
| Spain | 6.6% |
| Netherlands | 8.0% |
| United Kingdom | 9.4% |
| Italy | 10.4% |
| United States | 11.0% |
| Germany | 13.8% |
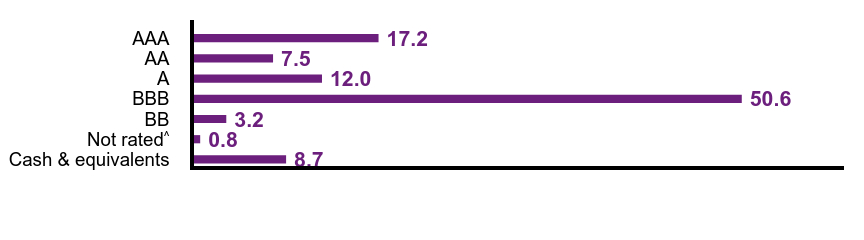
Credit QualityFootnote Reference†
| Value | Value |
|---|
| Cash & equivalents | 8.7 |
Not ratedFootnote Reference^ | 0.8 |
| BB | 3.2 |
| BBB | 50.6 |
| A | 12.0 |
| AA | 7.5 |
| AAA | 17.2 |
| Footnote | Description |
Footnote† | Credit ratings are by S&P Global Ratings. A credit rating is an assessment provided by a nationally recognized statistical rating organization (NRSRO) of the creditworthiness of an issuer with respect to debt obligations except for those debt obligations that are only privately rated. Ratings are measured on a scale that generally ranges from AAA (highest) to D (lowest). The credit ratings shown relate to the creditworthiness of the issuers of the underlying securities in the Fund, and not to the Fund or its shares. Credit ratings are subject to change. |
Footnote^ | Not Rated category represents only those securities not rated by S&P Global Ratings. Such securities may be rated by other NRSROs not shown here. |
There were no material fund changes during the period.
There were no changes in or disagreements with Accountants during the period.
For additional information about the Fund; including its prospectus, financial information, holdings and proxy information, scan the QR code or visit im.natixis.com/funddocuments.
Mirova Global Green Bond Fund
Annual Shareholder Report
December 31, 2024
Mirova Global Green Bond Fund
Annual Shareholder Report - December 31, 2024
This annual shareholder report contains important information about Mirova Global Green Bond Fund for the period of January 1, 2024 to December 31, 2024. You can find additional information (including tax information) about the Fund at im.natixis.com/funddocuments. You can also request the information by contacting us at (800) 225-5478 or by contacting your financial intermediary directly.
What were the fund costs for the last year? (based on a hypothetical $10,000 investment)
| Class Name | Costs of a $10,000 investment | Costs paid as a percentage of a $10,000 investmentFootnote Reference† |
|---|
| Class N | $61 | 0.60% |
|---|
| Footnote | Description |
Footnote† | Annualized for periods less than one year (if applicable). |
How did the fund perform last year and what affected its performance?
Explanation of Fund Performance
In 2024, the Mirova Global Green Bond Fund lagged in overall performance which can be attributed to movements on the yield curve.
Top Contributors to Performance
•Allocation had a positive impact on the Fund during the year due to its long position on credit, while US and Euro credit spreads compressed.
•Issue selection during the year was also positive. The largest contributors to this outperformance were among the corporate holdings, namely Altarea, Johnson Controls, and EIB.
Top Detractors from Performance
•The Fund's duration and curve strategy during the year incurred a cost, negatively impacting performance.
•Yield curve positioning on the CAD zone, Euro zone and USD zone were negative throughout the year.
•Among the worst detractors were Philips, Vestas, and Credit Mutuelle Arkea.
The Fund’s benchmarks are unmanaged indices used as a general measure of market performance. Calculations assume dividends and capital gains are reinvested. The tables do not reflect taxes shareholders might owe on any fund distributions or when they redeem their shares. You cannot invest directly in an index.
Total Return Based on a Hypothetical $10,000 Investment
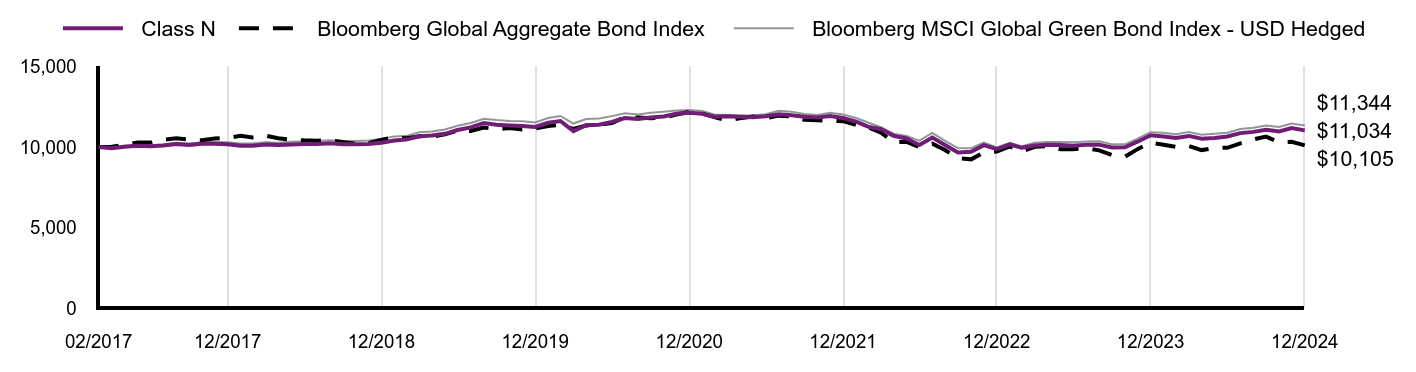
| Class N | Bloomberg Global Aggregate Bond Index | Bloomberg MSCI Global Green Bond Index - USD Hedged |
|---|
| 02/2017 | $10,000 | $10,000 | $10,000 |
|---|
| 03/2017 | $9,930 | $10,015 | $9,984 |
|---|
| 04/2017 | $10,020 | $10,128 | $10,076 |
|---|
| 05/2017 | $10,080 | $10,285 | $10,149 |
|---|
| 06/2017 | $10,050 | $10,276 | $10,103 |
|---|
| 07/2017 | $10,100 | $10,449 | $10,153 |
|---|
| 08/2017 | $10,190 | $10,552 | $10,266 |
|---|
| 09/2017 | $10,131 | $10,457 | $10,216 |
|---|
| 10/2017 | $10,201 | $10,418 | $10,295 |
|---|
| 11/2017 | $10,211 | $10,533 | $10,316 |
|---|
| 12/2017 | $10,177 | $10,570 | $10,302 |
|---|
| 01/2018 | $10,086 | $10,696 | $10,217 |
|---|
| 02/2018 | $10,086 | $10,601 | $10,217 |
|---|
| 03/2018 | $10,165 | $10,714 | $10,293 |
|---|
| 04/2018 | $10,123 | $10,542 | $10,271 |
|---|
| 05/2018 | $10,165 | $10,462 | $10,322 |
|---|
| 06/2018 | $10,184 | $10,416 | $10,362 |
|---|
| 07/2018 | $10,194 | $10,398 | $10,368 |
|---|
| 08/2018 | $10,236 | $10,409 | $10,422 |
|---|
| 09/2018 | $10,176 | $10,319 | $10,372 |
|---|
| 10/2018 | $10,176 | $10,204 | $10,372 |
|---|
| 11/2018 | $10,196 | $10,236 | $10,404 |
|---|
| 12/2018 | $10,272 | $10,443 | $10,515 |
|---|
| 01/2019 | $10,409 | $10,602 | $10,648 |
|---|
| 02/2019 | $10,462 | $10,541 | $10,694 |
|---|
| 03/2019 | $10,672 | $10,673 | $10,923 |
|---|
| 04/2019 | $10,714 | $10,641 | $10,961 |
|---|
| 05/2019 | $10,820 | $10,785 | $11,095 |
|---|
| 06/2019 | $11,059 | $11,025 | $11,327 |
|---|
| 07/2019 | $11,219 | $10,994 | $11,494 |
|---|
| 08/2019 | $11,495 | $11,217 | $11,757 |
|---|
| 09/2019 | $11,385 | $11,103 | $11,675 |
|---|
| 10/2019 | $11,343 | $11,177 | $11,613 |
|---|
| 11/2019 | $11,311 | $11,093 | $11,596 |
|---|
| 12/2019 | $11,249 | $11,157 | $11,529 |
|---|
| 01/2020 | $11,509 | $11,300 | $11,801 |
|---|
| 02/2020 | $11,617 | $11,376 | $11,929 |
|---|
| 03/2020 | $10,991 | $11,121 | $11,460 |
|---|
| 04/2020 | $11,361 | $11,339 | $11,743 |
|---|
| 05/2020 | $11,382 | $11,389 | $11,771 |
|---|
| 06/2020 | $11,562 | $11,490 | $11,922 |
|---|
| 07/2020 | $11,801 | $11,857 | $12,093 |
|---|
| 08/2020 | $11,747 | $11,838 | $12,027 |
|---|
| 09/2020 | $11,840 | $11,796 | $12,125 |
|---|
| 10/2020 | $11,895 | $11,807 | $12,192 |
|---|
| 11/2020 | $12,070 | $12,022 | $12,265 |
|---|
| 12/2020 | $12,137 | $12,183 | $12,298 |
|---|
| 01/2021 | $12,069 | $12,076 | $12,244 |
|---|
| 02/2021 | $11,878 | $11,868 | $12,021 |
|---|
| 03/2021 | $11,910 | $11,640 | $11,990 |
|---|
| 04/2021 | $11,876 | $11,787 | $11,967 |
|---|
| 05/2021 | $11,853 | $11,898 | $11,972 |
|---|
| 06/2021 | $11,913 | $11,793 | $12,037 |
|---|
| 07/2021 | $12,038 | $11,950 | $12,248 |
|---|
| 08/2021 | $11,981 | $11,900 | $12,200 |
|---|
| 09/2021 | $11,889 | $11,688 | $12,055 |
|---|
| 10/2021 | $11,832 | $11,660 | $11,991 |
|---|
| 11/2021 | $11,923 | $11,626 | $12,132 |
|---|
| 12/2021 | $11,805 | $11,610 | $12,016 |
|---|
| 01/2022 | $11,584 | $11,372 | $11,806 |
|---|
| 02/2022 | $11,271 | $11,237 | $11,524 |
|---|
| 03/2022 | $11,107 | $10,895 | $11,233 |
|---|
| 04/2022 | $10,694 | $10,298 | $10,828 |
|---|
| 05/2022 | $10,529 | $10,326 | $10,691 |
|---|
| 06/2022 | $10,128 | $9,994 | $10,398 |
|---|
| 07/2022 | $10,588 | $10,207 | $10,872 |
|---|
| 08/2022 | $10,116 | $9,804 | $10,366 |
|---|
| 09/2022 | $9,668 | $9,300 | $9,935 |
|---|
| 10/2022 | $9,704 | $9,236 | $9,925 |
|---|
| 11/2022 | $10,116 | $9,671 | $10,278 |
|---|
| 12/2022 | $9,867 | $9,723 | $9,972 |
|---|
| 01/2023 | $10,161 | $10,043 | $10,263 |
|---|
| 02/2023 | $9,953 | $9,709 | $10,054 |
|---|
| 03/2023 | $10,100 | $10,016 | $10,267 |
|---|
| 04/2023 | $10,149 | $10,060 | $10,312 |
|---|
| 05/2023 | $10,124 | $9,863 | $10,308 |
|---|
| 06/2023 | $10,087 | $9,863 | $10,299 |
|---|
| 07/2023 | $10,149 | $9,931 | $10,341 |
|---|
| 08/2023 | $10,149 | $9,795 | $10,359 |
|---|
| 09/2023 | $9,977 | $9,509 | $10,170 |
|---|
| 10/2023 | $9,989 | $9,395 | $10,171 |
|---|
| 11/2023 | $10,333 | $9,869 | $10,520 |
|---|
| 12/2023 | $10,728 | $10,279 | $10,925 |
|---|
| 01/2024 | $10,653 | $10,137 | $10,887 |
|---|
| 02/2024 | $10,565 | $10,010 | $10,788 |
|---|
| 03/2024 | $10,691 | $10,065 | $10,928 |
|---|
| 04/2024 | $10,515 | $9,811 | $10,770 |
|---|
| 05/2024 | $10,565 | $9,940 | $10,826 |
|---|
| 06/2024 | $10,653 | $9,954 | $10,886 |
|---|
| 07/2024 | $10,866 | $10,229 | $11,123 |
|---|
| 08/2024 | $10,942 | $10,471 | $11,204 |
|---|
| 09/2024 | $11,080 | $10,649 | $11,344 |
|---|
| 10/2024 | $10,967 | $10,292 | $11,249 |
|---|
| 11/2024 | $11,180 | $10,327 | $11,458 |
|---|
| 12/2024 | $11,034 | $10,105 | $11,344 |
|---|
Performance data shown represents past performance and is no guarantee of, and is not necessarily indicative of, future results. Total return and value will vary, and you may have a gain or loss when shares are sold. Current performance may be lower or higher than quoted. For the most recent month-end performance, visit im.natixis.com/en-us/products/mutual-funds/price-and-performance.
Average Annual Total Returns (%)
| AATR | 1 Year | 5 Years | Since Inception 2/28/17 |
|---|
| Class N | 2.85% | (0.39%) | 1.26% |
|---|
| Bloomberg Global Aggregate Bond Index | (1.69%) | (1.96%) | 0.13% |
|---|
| Bloomberg MSCI Global Green Bond Index - USD Hedged | 3.83% | (0.32%) | 1.62% |
|---|
Effective May 1, 2024, in accordance with new regulations, the Fund’s primary broad-based index changed to the Bloomberg Global Aggregate Bond Index - USD Hedged. The Fund will retain the Bloomberg MSCI Global Green Bond Index - USD Hedged as an additional benchmark for performance comparison.
| Total Net Assets | $38,096,678 |
|---|
| # of Portfolio Holdings (including overnight repurchase agreements and derivatives) | 82 |
|---|
| Portfolio Turnover Rate | 10% |
|---|
| Total Advisory Fees Paid (after waiver/reimbursement, if applicable) | $17,744 |
|---|
What did the Fund invest in? (% of Net Assets)
| Value | Value |
|---|
Other investments less than 3% of net assetsFootnote Reference* | 14.3% |
| Special Purpose | 4.6% |
| Supra-National | 5.0% |
| Financial | 8.1% |
| Bank | 9.0% |
| Industrial | 15.3% |
| Utility-Electric | 15.6% |
| Government National | 28.1% |
| Footnote | Description |
Footnote* | Net of other assets less liabilities (including futures contracts) |
| Value | Value |
|---|
Other investments less than 3% of net assetsFootnote Reference* | 22.8% |
| Denmark | 3.0% |
| Sweden | 3.4% |
| Supranationals | 5.0% |
| France | 6.6% |
| Spain | 6.6% |
| Netherlands | 8.0% |
| United Kingdom | 9.4% |
| Italy | 10.4% |
| United States | 11.0% |
| Germany | 13.8% |
Credit QualityFootnote Reference†
| Value | Value |
|---|
| Cash & equivalents | 8.7 |
Not ratedFootnote Reference^ | 0.8 |
| BB | 3.2 |
| BBB | 50.6 |
| A | 12.0 |
| AA | 7.5 |
| AAA | 17.2 |
| Footnote | Description |
Footnote† | Credit ratings are by S&P Global Ratings. A credit rating is an assessment provided by a nationally recognized statistical rating organization (NRSRO) of the creditworthiness of an issuer with respect to debt obligations except for those debt obligations that are only privately rated. Ratings are measured on a scale that generally ranges from AAA (highest) to D (lowest). The credit ratings shown relate to the creditworthiness of the issuers of the underlying securities in the Fund, and not to the Fund or its shares. Credit ratings are subject to change. |
Footnote^ | Not Rated category represents only those securities not rated by S&P Global Ratings. Such securities may be rated by other NRSROs not shown here. |
There were no material fund changes during the period.
There were no changes in or disagreements with Accountants during the period.
For additional information about the Fund; including its prospectus, financial information, holdings and proxy information, scan the QR code or visit im.natixis.com/funddocuments.
Mirova Global Green Bond Fund
Annual Shareholder Report
December 31, 2024
Mirova Global Green Bond Fund
Annual Shareholder Report - December 31, 2024
This annual shareholder report contains important information about Mirova Global Green Bond Fund for the period of January 1, 2024 to December 31, 2024. You can find additional information (including tax information) about the Fund at im.natixis.com/funddocuments. You can also request the information by contacting us at (800) 225-5478 or by contacting your financial intermediary directly.
What were the fund costs for the last year? (based on a hypothetical $10,000 investment)
| Class Name | Costs of a $10,000 investment | Costs paid as a percentage of a $10,000 investmentFootnote Reference† |
|---|
| Class Y | $66 | 0.65% |
|---|
| Footnote | Description |
Footnote† | Annualized for periods less than one year (if applicable). |
How did the fund perform last year and what affected its performance?
Explanation of Fund Performance
In 2024, the Mirova Global Green Bond Fund lagged in overall performance which can be attributed to movements on the yield curve.
Top Contributors to Performance
•Allocation had a positive impact on the Fund during the year due to its long position on credit, while US and Euro credit spreads compressed.
•Issue selection during the year was also positive. The largest contributors to this outperformance were among the corporate holdings, namely Altarea, Johnson Controls, and EIB.
Top Detractors from Performance
•The Fund's duration and curve strategy during the year incurred a cost, negatively impacting performance.
•Yield curve positioning on the CAD zone, Euro zone and USD zone were negative throughout the year.
•Among the worst detractors were Philips, Vestas, and Credit Mutuelle Arkea.
The Fund’s benchmarks are unmanaged indices used as a general measure of market performance. Calculations assume dividends and capital gains are reinvested. The tables do not reflect taxes shareholders might owe on any fund distributions or when they redeem their shares. You cannot invest directly in an index.
Total Return Based on a Hypothetical $10,000 Investment
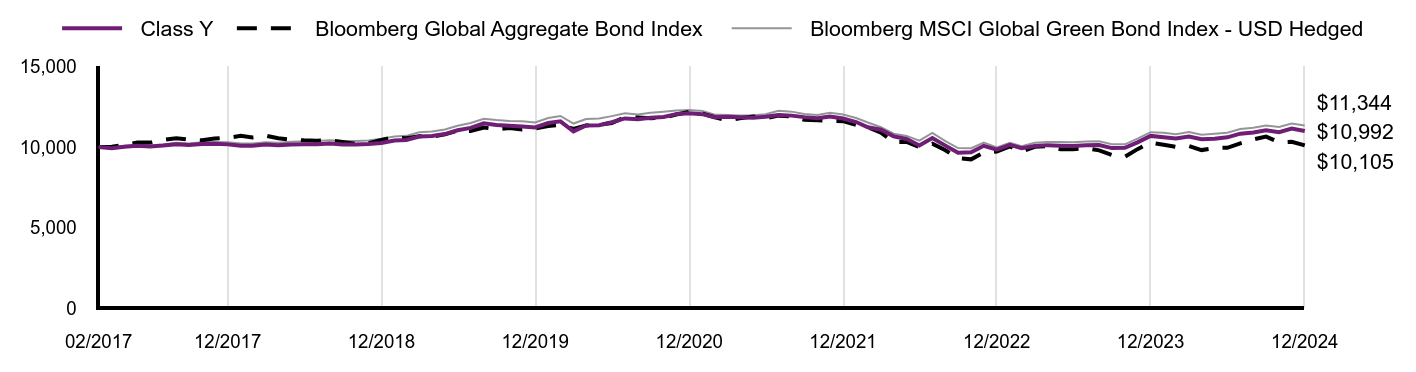
| Class Y | Bloomberg Global Aggregate Bond Index | Bloomberg MSCI Global Green Bond Index - USD Hedged |
|---|
| 02/2017 | $10,000 | $10,000 | $10,000 |
|---|
| 03/2017 | $9,920 | $10,015 | $9,984 |
|---|
| 04/2017 | $10,020 | $10,128 | $10,076 |
|---|
| 05/2017 | $10,080 | $10,285 | $10,149 |
|---|
| 06/2017 | $10,040 | $10,276 | $10,103 |
|---|
| 07/2017 | $10,090 | $10,449 | $10,153 |
|---|
| 08/2017 | $10,180 | $10,552 | $10,266 |
|---|
| 09/2017 | $10,130 | $10,457 | $10,216 |
|---|
| 10/2017 | $10,191 | $10,418 | $10,295 |
|---|
| 11/2017 | $10,201 | $10,533 | $10,316 |
|---|
| 12/2017 | $10,166 | $10,570 | $10,302 |
|---|
| 01/2018 | $10,075 | $10,696 | $10,217 |
|---|
| 02/2018 | $10,075 | $10,601 | $10,217 |
|---|
| 03/2018 | $10,153 | $10,714 | $10,293 |
|---|
| 04/2018 | $10,112 | $10,542 | $10,271 |
|---|
| 05/2018 | $10,153 | $10,462 | $10,322 |
|---|
| 06/2018 | $10,171 | $10,416 | $10,362 |
|---|
| 07/2018 | $10,171 | $10,398 | $10,368 |
|---|
| 08/2018 | $10,213 | $10,409 | $10,422 |
|---|
| 09/2018 | $10,162 | $10,319 | $10,372 |
|---|
| 10/2018 | $10,162 | $10,204 | $10,372 |
|---|
| 11/2018 | $10,183 | $10,236 | $10,404 |
|---|
| 12/2018 | $10,257 | $10,443 | $10,515 |
|---|
| 01/2019 | $10,405 | $10,602 | $10,648 |
|---|
| 02/2019 | $10,436 | $10,541 | $10,694 |
|---|
| 03/2019 | $10,656 | $10,673 | $10,923 |
|---|
| 04/2019 | $10,688 | $10,641 | $10,961 |
|---|
| 05/2019 | $10,804 | $10,785 | $11,095 |
|---|
| 06/2019 | $11,042 | $11,025 | $11,327 |
|---|
| 07/2019 | $11,190 | $10,994 | $11,494 |
|---|
| 08/2019 | $11,477 | $11,217 | $11,757 |
|---|
| 09/2019 | $11,367 | $11,103 | $11,675 |
|---|
| 10/2019 | $11,324 | $11,177 | $11,613 |
|---|
| 11/2019 | $11,282 | $11,093 | $11,596 |
|---|
| 12/2019 | $11,218 | $11,157 | $11,529 |
|---|
| 01/2020 | $11,489 | $11,300 | $11,801 |
|---|
| 02/2020 | $11,597 | $11,376 | $11,929 |
|---|
| 03/2020 | $10,970 | $11,121 | $11,460 |
|---|
| 04/2020 | $11,339 | $11,339 | $11,743 |
|---|
| 05/2020 | $11,361 | $11,389 | $11,771 |
|---|
| 06/2020 | $11,539 | $11,490 | $11,922 |
|---|
| 07/2020 | $11,778 | $11,857 | $12,093 |
|---|
| 08/2020 | $11,724 | $11,838 | $12,027 |
|---|
| 09/2020 | $11,816 | $11,796 | $12,125 |
|---|
| 10/2020 | $11,871 | $11,807 | $12,192 |
|---|
| 11/2020 | $12,045 | $12,022 | $12,265 |
|---|
| 12/2020 | $12,099 | $12,183 | $12,298 |
|---|
| 01/2021 | $12,043 | $12,076 | $12,244 |
|---|
| 02/2021 | $11,852 | $11,868 | $12,021 |
|---|
| 03/2021 | $11,883 | $11,640 | $11,990 |
|---|
| 04/2021 | $11,849 | $11,787 | $11,967 |
|---|
| 05/2021 | $11,826 | $11,898 | $11,972 |
|---|
| 06/2021 | $11,884 | $11,793 | $12,037 |
|---|
| 07/2021 | $11,997 | $11,950 | $12,248 |
|---|
| 08/2021 | $11,952 | $11,900 | $12,200 |
|---|
| 09/2021 | $11,859 | $11,688 | $12,055 |
|---|
| 10/2021 | $11,791 | $11,660 | $11,991 |
|---|
| 11/2021 | $11,893 | $11,626 | $12,132 |
|---|
| 12/2021 | $11,774 | $11,610 | $12,016 |
|---|
| 01/2022 | $11,554 | $11,372 | $11,806 |
|---|
| 02/2022 | $11,229 | $11,237 | $11,524 |
|---|
| 03/2022 | $11,076 | $10,895 | $11,233 |
|---|
| 04/2022 | $10,664 | $10,298 | $10,828 |
|---|
| 05/2022 | $10,499 | $10,326 | $10,691 |
|---|
| 06/2022 | $10,099 | $9,994 | $10,398 |
|---|
| 07/2022 | $10,558 | $10,207 | $10,872 |
|---|
| 08/2022 | $10,087 | $9,804 | $10,366 |
|---|
| 09/2022 | $9,640 | $9,300 | $9,935 |
|---|
| 10/2022 | $9,675 | $9,236 | $9,925 |
|---|
| 11/2022 | $10,075 | $9,671 | $10,278 |
|---|
| 12/2022 | $9,838 | $9,723 | $9,972 |
|---|
| 01/2023 | $10,132 | $10,043 | $10,263 |
|---|
| 02/2023 | $9,923 | $9,709 | $10,054 |
|---|
| 03/2023 | $10,070 | $10,016 | $10,267 |
|---|
| 04/2023 | $10,119 | $10,060 | $10,312 |
|---|
| 05/2023 | $10,083 | $9,863 | $10,308 |
|---|
| 06/2023 | $10,058 | $9,863 | $10,299 |
|---|
| 07/2023 | $10,107 | $9,931 | $10,341 |
|---|
| 08/2023 | $10,119 | $9,795 | $10,359 |
|---|
| 09/2023 | $9,936 | $9,509 | $10,170 |
|---|
| 10/2023 | $9,948 | $9,395 | $10,171 |
|---|
| 11/2023 | $10,291 | $9,869 | $10,520 |
|---|
| 12/2023 | $10,693 | $10,279 | $10,925 |
|---|
| 01/2024 | $10,605 | $10,137 | $10,887 |
|---|
| 02/2024 | $10,530 | $10,010 | $10,788 |
|---|
| 03/2024 | $10,655 | $10,065 | $10,928 |
|---|
| 04/2024 | $10,480 | $9,811 | $10,770 |
|---|
| 05/2024 | $10,518 | $9,940 | $10,826 |
|---|
| 06/2024 | $10,605 | $9,954 | $10,886 |
|---|
| 07/2024 | $10,831 | $10,229 | $11,123 |
|---|
| 08/2024 | $10,906 | $10,471 | $11,204 |
|---|
| 09/2024 | $11,044 | $10,649 | $11,344 |
|---|
| 10/2024 | $10,918 | $10,292 | $11,249 |
|---|
| 11/2024 | $11,144 | $10,327 | $11,458 |
|---|
| 12/2024 | $10,992 | $10,105 | $11,344 |
|---|
Performance data shown represents past performance and is no guarantee of, and is not necessarily indicative of, future results. Total return and value will vary, and you may have a gain or loss when shares are sold. Current performance may be lower or higher than quoted. For the most recent month-end performance, visit im.natixis.com/en-us/products/mutual-funds/price-and-performance.
Average Annual Total Returns (%)
| AATR | 1 Year | 5 Years | Since Inception 2/28/17 |
|---|
| Class Y | 2.80% | (0.41%) | 1.21% |
|---|
| Bloomberg Global Aggregate Bond Index | (1.69%) | (1.96%) | 0.13% |
|---|
| Bloomberg MSCI Global Green Bond Index - USD Hedged | 3.83% | (0.32%) | 1.62% |
|---|
Effective May 1, 2024, in accordance with new regulations, the Fund’s primary broad-based index changed to the Bloomberg Global Aggregate Bond Index - USD Hedged. The Fund will retain the Bloomberg MSCI Global Green Bond Index - USD Hedged as an additional benchmark for performance comparison.
| Total Net Assets | $38,096,678 |
|---|
| # of Portfolio Holdings (including overnight repurchase agreements and derivatives) | 82 |
|---|
| Portfolio Turnover Rate | 10% |
|---|
| Total Advisory Fees Paid (after waiver/reimbursement, if applicable) | $17,744 |
|---|
What did the Fund invest in? (% of Net Assets)
| Value | Value |
|---|
Other investments less than 3% of net assetsFootnote Reference* | 14.3% |
| Special Purpose | 4.6% |
| Supra-National | 5.0% |
| Financial | 8.1% |
| Bank | 9.0% |
| Industrial | 15.3% |
| Utility-Electric | 15.6% |
| Government National | 28.1% |
| Footnote | Description |
Footnote* | Net of other assets less liabilities (including futures contracts) |
| Value | Value |
|---|
Other investments less than 3% of net assetsFootnote Reference* | 22.8% |
| Denmark | 3.0% |
| Sweden | 3.4% |
| Supranationals | 5.0% |
| France | 6.6% |
| Spain | 6.6% |
| Netherlands | 8.0% |
| United Kingdom | 9.4% |
| Italy | 10.4% |
| United States | 11.0% |
| Germany | 13.8% |
Credit QualityFootnote Reference†
| Value | Value |
|---|
| Cash & equivalents | 8.7 |
Not ratedFootnote Reference^ | 0.8 |
| BB | 3.2 |
| BBB | 50.6 |
| A | 12.0 |
| AA | 7.5 |
| AAA | 17.2 |
| Footnote | Description |
Footnote† | Credit ratings are by S&P Global Ratings. A credit rating is an assessment provided by a nationally recognized statistical rating organization (NRSRO) of the creditworthiness of an issuer with respect to debt obligations except for those debt obligations that are only privately rated. Ratings are measured on a scale that generally ranges from AAA (highest) to D (lowest). The credit ratings shown relate to the creditworthiness of the issuers of the underlying securities in the Fund, and not to the Fund or its shares. Credit ratings are subject to change. |
Footnote^ | Not Rated category represents only those securities not rated by S&P Global Ratings. Such securities may be rated by other NRSROs not shown here. |
There were no material fund changes during the period.
There were no changes in or disagreements with Accountants during the period.
For additional information about the Fund; including its prospectus, financial information, holdings and proxy information, scan the QR code or visit im.natixis.com/funddocuments.
Mirova Global Green Bond Fund
Annual Shareholder Report
December 31, 2024
Mirova Global Sustainable Equity Fund
Annual Shareholder Report - December 31, 2024
This annual shareholder report contains important information about Mirova Global Sustainable Equity Fund for the period of January 1, 2024 to December 31, 2024. You can find additional information (including tax information) about the Fund at im.natixis.com/funddocuments. You can also request the information by contacting us at (800) 225-5478 or by contacting your financial intermediary directly.
What were the fund costs for the last year? (based on a hypothetical $10,000 investment)
| Class Name | Costs of a $10,000 investment | Costs paid as a percentage of a $10,000 investmentFootnote Reference† |
|---|
| Class A | $128 | 1.20% |
|---|
| Footnote | Description |
Footnote† | Annualized for periods less than one year (if applicable). |
How did the fund perform last year and what affected its performance?
Explanation of Fund Performance
While the Fund delivered strong absolute returns for the full year, it lagged in overall performance mainly due to fourth quarter results as the Fund was underexposed to some of the areas expected to benefit under a Trump presidency. This included U.S. stocks, bank and energy stocks, and lower quality and procyclical areas. Certain companies also faced industry-wide or company-specific challenges.
Top Contributors to Performance
• Lack of exposure to the Energy and Real Estate sectors and an underweight to Consumer Staples contributed to performance.
• Stock selection in Health Care (Eli Lilly and Intuitive Surgical) and Materials (Smurfit Westrock and not owning mining companies) contributed.
•Nvidia, Taiwan Semi and eBay were the largest contributors to performance.
Top Detractors from Performance
•An overweight to Health Care and Materials, and underweight to Communication Services, which was led by Magnificent 7 stocks the Fund does not own (Meta, Alphabet), detracted.
•As U.S. equities outperformed, driven in part by the Magnificent 7, the Fund’s U.S. underweight and Europe overweight detracted.
•Stock picks in Industrials (Vestas Wind Systems and AGCO Corp) and Financials (AIA Group and Legal & General) detracted from relative performance.
•Vestas Wind Systems, Aptiv and Adobe were the largest detractors overall.
The Fund continued to invest for the long term, in high-quality companies likely to benefit from the demographic, technological, environmental and governance related transitions expected to transform the world’s economies during the next decade.
The Fund’s benchmarks are unmanaged indices used as a general measure of market performance. Calculations assume dividends and capital gains are reinvested. The tables do not reflect taxes shareholders might owe on any fund distributions or when they redeem their shares. You cannot invest directly in an index.
Total Return Based on a Hypothetical $10,000 Investment
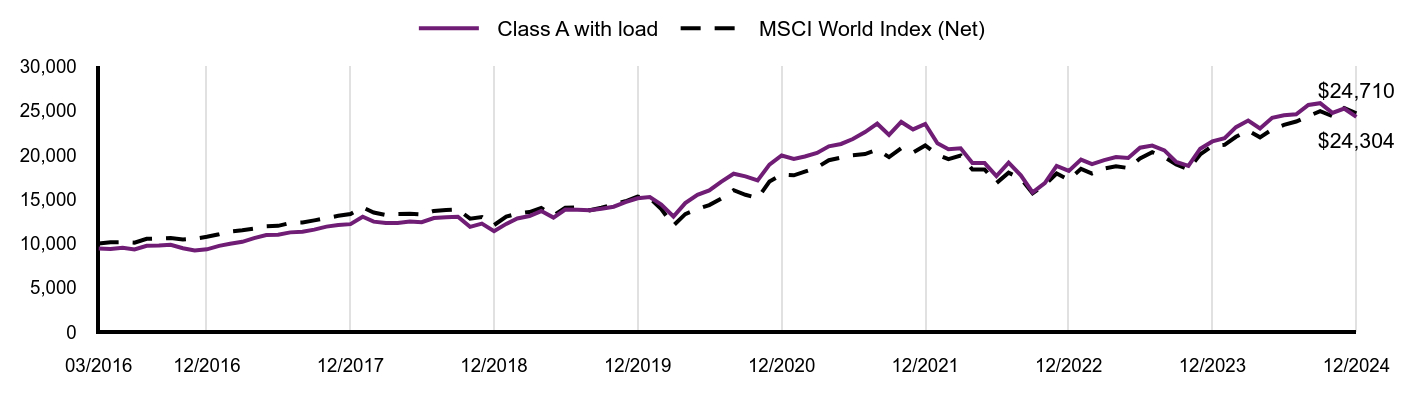
| Class A with load | MSCI World Index (Net) |
|---|
| 03/2016 | $9,425 | $10,000 |
|---|
| 04/2016 | $9,369 | $10,148 |
|---|
| 05/2016 | $9,529 | $10,160 |
|---|
| 06/2016 | $9,331 | $10,099 |
|---|
| 07/2016 | $9,746 | $10,534 |
|---|
| 08/2016 | $9,764 | $10,570 |
|---|
| 09/2016 | $9,859 | $10,634 |
|---|
| 10/2016 | $9,463 | $10,454 |
|---|
| 11/2016 | $9,208 | $10,533 |
|---|
| 12/2016 | $9,345 | $10,761 |
|---|
| 01/2017 | $9,732 | $11,055 |
|---|
| 02/2017 | $9,967 | $11,365 |
|---|
| 03/2017 | $10,194 | $11,504 |
|---|
| 04/2017 | $10,609 | $11,683 |
|---|
| 05/2017 | $10,968 | $11,941 |
|---|
| 06/2017 | $10,987 | $11,996 |
|---|
| 07/2017 | $11,261 | $12,331 |
|---|
| 08/2017 | $11,336 | $12,378 |
|---|
| 09/2017 | $11,572 | $12,617 |
|---|
| 10/2017 | $11,912 | $12,879 |
|---|
| 11/2017 | $12,101 | $13,129 |
|---|
| 12/2017 | $12,189 | $13,340 |
|---|
| 01/2018 | $13,029 | $14,093 |
|---|
| 02/2018 | $12,476 | $13,501 |
|---|
| 03/2018 | $12,333 | $13,212 |
|---|
| 04/2018 | $12,322 | $13,338 |
|---|
| 05/2018 | $12,475 | $13,355 |
|---|
| 06/2018 | $12,418 | $13,283 |
|---|
| 07/2018 | $12,879 | $13,683 |
|---|
| 08/2018 | $12,975 | $13,791 |
|---|
| 09/2018 | $13,023 | $13,851 |
|---|
| 10/2018 | $11,880 | $12,813 |
|---|
| 11/2018 | $12,245 | $13,000 |
|---|
| 12/2018 | $11,392 | $12,084 |
|---|
| 01/2019 | $12,218 | $13,039 |
|---|
| 02/2019 | $12,834 | $13,387 |
|---|
| 03/2019 | $13,103 | $13,556 |
|---|
| 04/2019 | $13,667 | $14,013 |
|---|
| 05/2019 | $12,935 | $13,182 |
|---|
| 06/2019 | $13,838 | $14,045 |
|---|
| 07/2019 | $13,808 | $14,087 |
|---|
| 08/2019 | $13,757 | $13,752 |
|---|
| 09/2019 | $13,938 | $14,042 |
|---|
| 10/2019 | $14,159 | $14,426 |
|---|
| 11/2019 | $14,681 | $14,778 |
|---|
| 12/2019 | $15,109 | $15,299 |
|---|
| 01/2020 | $15,261 | $15,130 |
|---|
| 02/2020 | $14,400 | $13,908 |
|---|
| 03/2020 | $13,053 | $12,030 |
|---|
| 04/2020 | $14,573 | $13,319 |
|---|
| 05/2020 | $15,510 | $13,898 |
|---|
| 06/2020 | $16,008 | $14,342 |
|---|
| 07/2020 | $16,995 | $15,101 |
|---|
| 08/2020 | $17,891 | $16,025 |
|---|
| 09/2020 | $17,596 | $15,508 |
|---|
| 10/2020 | $17,128 | $15,131 |
|---|
| 11/2020 | $18,919 | $16,996 |
|---|
| 12/2020 | $19,954 | $17,785 |
|---|
| 01/2021 | $19,566 | $17,705 |
|---|
| 02/2021 | $19,842 | $18,115 |
|---|
| 03/2021 | $20,239 | $18,598 |
|---|
| 04/2021 | $20,983 | $19,412 |
|---|
| 05/2021 | $21,252 | $19,714 |
|---|
| 06/2021 | $21,810 | $19,973 |
|---|
| 07/2021 | $22,595 | $20,111 |
|---|
| 08/2021 | $23,545 | $20,614 |
|---|
| 09/2021 | $22,274 | $19,763 |
|---|
| 10/2021 | $23,741 | $20,772 |
|---|
| 11/2021 | $22,894 | $20,271 |
|---|
| 12/2021 | $23,509 | $21,082 |
|---|
| 01/2022 | $21,333 | $20,047 |
|---|
| 02/2022 | $20,657 | $19,529 |
|---|
| 03/2022 | $20,772 | $19,952 |
|---|
| 04/2022 | $19,088 | $18,355 |
|---|
| 05/2022 | $19,088 | $18,377 |
|---|
| 06/2022 | $17,624 | $16,828 |
|---|
| 07/2022 | $19,148 | $18,003 |
|---|
| 08/2022 | $17,707 | $17,340 |
|---|
| 09/2022 | $15,790 | $15,680 |
|---|
| 10/2022 | $16,838 | $16,626 |
|---|
| 11/2022 | $18,767 | $17,916 |
|---|
| 12/2022 | $18,206 | $17,211 |
|---|
| 01/2023 | $19,486 | $18,444 |
|---|
| 02/2023 | $18,983 | $17,916 |
|---|
| 03/2023 | $19,426 | $18,468 |
|---|
| 04/2023 | $19,785 | $18,734 |
|---|
| 05/2023 | $19,666 | $18,533 |
|---|
| 06/2023 | $20,827 | $19,609 |
|---|
| 07/2023 | $21,066 | $20,327 |
|---|
| 08/2023 | $20,527 | $19,759 |
|---|
| 09/2023 | $19,223 | $18,942 |
|---|
| 10/2023 | $18,780 | $18,372 |
|---|
| 11/2023 | $20,719 | $20,068 |
|---|
| 12/2023 | $21,541 | $21,032 |
|---|
| 01/2024 | $21,913 | $21,155 |
|---|
| 02/2024 | $23,150 | $22,063 |
|---|
| 03/2024 | $23,906 | $22,756 |
|---|
| 04/2024 | $23,000 | $22,005 |
|---|
| 05/2024 | $24,213 | $22,899 |
|---|
| 06/2024 | $24,489 | $23,409 |
|---|
| 07/2024 | $24,598 | $23,786 |
|---|
| 08/2024 | $25,667 | $24,390 |
|---|
| 09/2024 | $25,859 | $24,957 |
|---|
| 10/2024 | $24,766 | $24,397 |
|---|
| 11/2024 | $25,258 | $25,309 |
|---|
| 12/2024 | $24,304 | $24,710 |
|---|
Performance data shown represents past performance and is no guarantee of, and is not necessarily indicative of, future results. Total return and value will vary, and you may have a gain or loss when shares are sold. Current performance may be lower or higher than quoted. For the most recent month-end performance, visit im.natixis.com/en-us/products/mutual-funds/price-and-performance.
Average Annual Total Returns (%)
| AATR | 1 Year | 5 Years | Since Inception 3/31/16 |
|---|
| Class A at NAV | 12.83% | 9.97% | 11.43% |
|---|
Class A with 5.75% MSCFootnote Reference1 | 6.37% | 8.68% | 10.68% |
|---|
| MSCI World Index (Net) | 17.49% | 10.06% | 10.85% |
|---|
| Footnote | Description |
Footnote1 | Maximum sales charge |
| Total Net Assets | $974,101,733 |
|---|
| # of Portfolio Holdings (including overnight repurchase agreements) | 51 |
|---|
| Portfolio Turnover Rate | 18% |
|---|
| Total Advisory Fees Paid (after waiver/reimbursement, if applicable) | $8,602,808 |
|---|
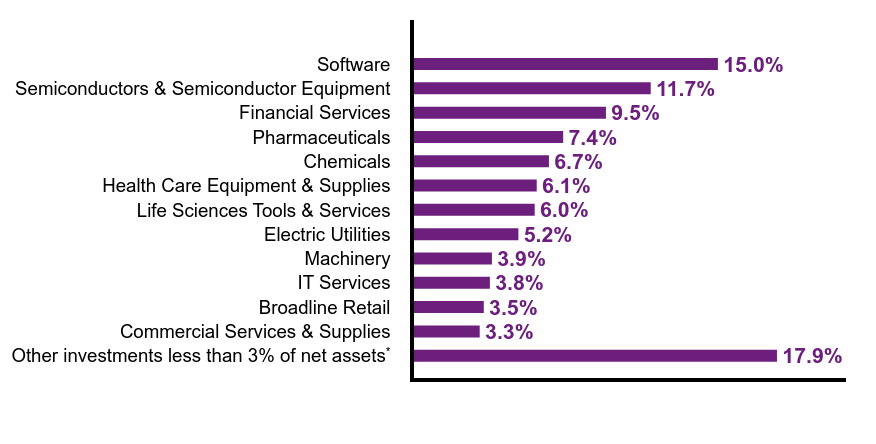
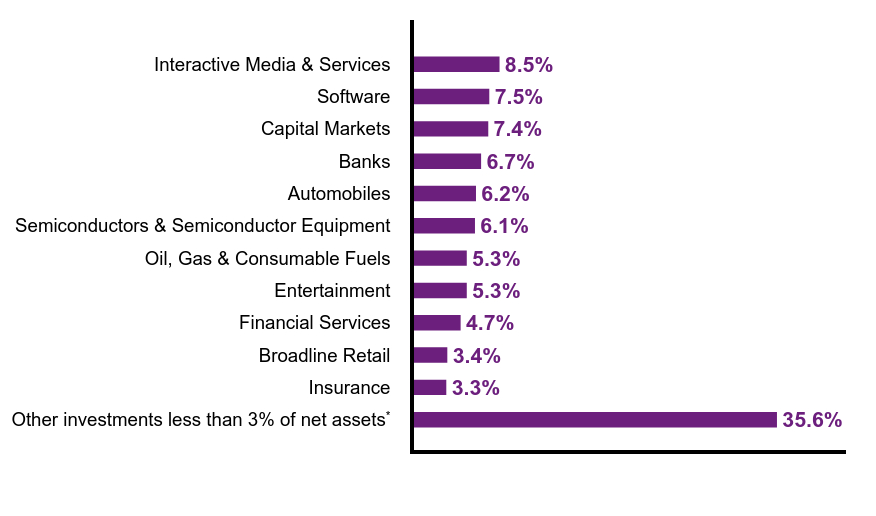
What did the Fund invest in? (% of Net Assets)
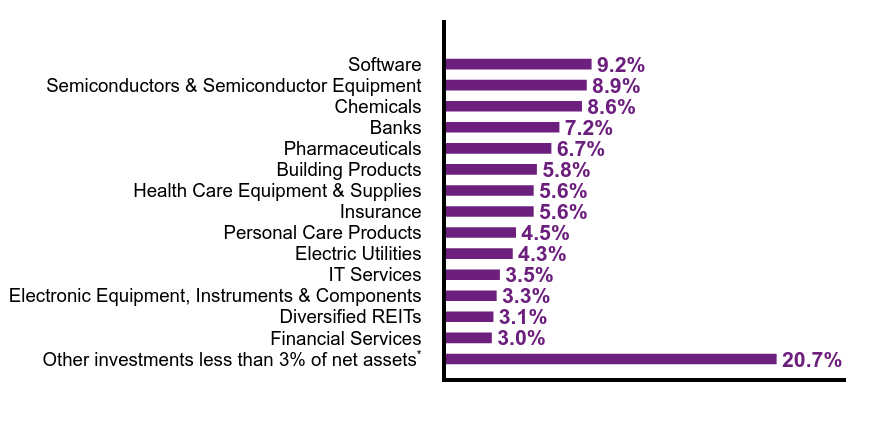
| Value | Value |
|---|
Other investments less than 3% of net assetsFootnote Reference* | 17.9% |
| Commercial Services & Supplies | 3.3% |
| Broadline Retail | 3.5% |
| IT Services | 3.8% |
| Machinery | 3.9% |
| Electric Utilities | 5.2% |
| Life Sciences Tools & Services | 6.0% |
| Health Care Equipment & Supplies | 6.1% |
| Chemicals | 6.7% |
| Pharmaceuticals | 7.4% |
| Financial Services | 9.5% |
| Semiconductors & Semiconductor Equipment | 11.7% |
| Software | 15.0% |
| Footnote | Description |
Footnote* | Net of other assets less liabilities |
| NVIDIA Corp. | 5.9% |
| Microsoft Corp. | 5.5% |
| Mastercard, Inc., Class A | 5.2% |
| Eli Lilly & Co. | 3.8% |
| Ecolab, Inc. | 3.7% |
| eBay, Inc. | 3.5% |
| Thermo Fisher Scientific, Inc. | 3.4% |
| Taiwan Semiconductor Manufacturing Co. Ltd., ADR | 3.2% |
| Roper Technologies, Inc. | 3.0% |
| Iberdrola SA | 2.9% |
There were no material fund changes during the period.
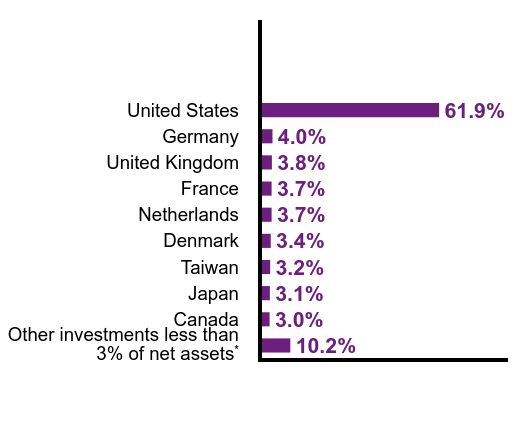
| Value | Value |
|---|
Other investments less than 3% of net assetsFootnote Reference* | 10.2% |
| Canada | 3.0% |
| Japan | 3.1% |
| Taiwan | 3.2% |
| Denmark | 3.4% |
| Netherlands | 3.7% |
| France | 3.7% |
| United Kingdom | 3.8% |
| Germany | 4.0% |
| United States | 61.9% |
| Footnote | Description |
Footnote* | Net of other assets less liabilities |
There were no changes in or disagreements with Accountants during the period.
For additional information about the Fund; including its prospectus, financial information, holdings and proxy information, scan the QR code or visit im.natixis.com/funddocuments.
Mirova Global Sustainable Equity Fund
Annual Shareholder Report
December 31, 2024
Mirova Global Sustainable Equity Fund
Annual Shareholder Report - December 31, 2024
This annual shareholder report contains important information about Mirova Global Sustainable Equity Fund for the period of January 1, 2024 to December 31, 2024. You can find additional information (including tax information) about the Fund at im.natixis.com/funddocuments. You can also request the information by contacting us at (800) 225-5478 or by contacting your financial intermediary directly.
What were the fund costs for the last year? (based on a hypothetical $10,000 investment)
| Class Name | Costs of a $10,000 investment | Costs paid as a percentage of a $10,000 investmentFootnote Reference† |
|---|
| Class C | $207 | 1.95% |
|---|
| Footnote | Description |
Footnote† | Annualized for periods less than one year (if applicable). |
How did the fund perform last year and what affected its performance?
Explanation of Fund Performance
While the Fund delivered strong absolute returns for the full year, it lagged in overall performance mainly due to fourth quarter results as the Fund was underexposed to some of the areas expected to benefit under a Trump presidency. This included U.S. stocks, bank and energy stocks, and lower quality and procyclical areas. Certain companies also faced industry-wide or company-specific challenges.
Top Contributors to Performance
• Lack of exposure to the Energy and Real Estate sectors and an underweight to Consumer Staples contributed to performance.
• Stock selection in Health Care (Eli Lilly and Intuitive Surgical) and Materials (Smurfit Westrock and not owning mining companies) contributed.
•Nvidia, Taiwan Semi and eBay were the largest contributors to performance.
Top Detractors from Performance
•An overweight to Health Care and Materials, and underweight to Communication Services, which was led by Magnificent 7 stocks the Fund does not own (Meta, Alphabet), detracted.
•As U.S. equities outperformed, driven in part by the Magnificent 7, the Fund’s U.S. underweight and Europe overweight detracted.
•Stock picks in Industrials (Vestas Wind Systems and AGCO Corp) and Financials (AIA Group and Legal & General) detracted from relative performance.
•Vestas Wind Systems, Aptiv and Adobe were the largest detractors overall.
The Fund continued to invest for the long term, in high-quality companies likely to benefit from the demographic, technological, environmental and governance related transitions expected to transform the world’s economies during the next decade.
The Fund’s benchmarks are unmanaged indices used as a general measure of market performance. Calculations assume dividends and capital gains are reinvested. The tables do not reflect taxes shareholders might owe on any fund distributions or when they redeem their shares. You cannot invest directly in an index.
Total Return Based on a Hypothetical $10,000 Investment
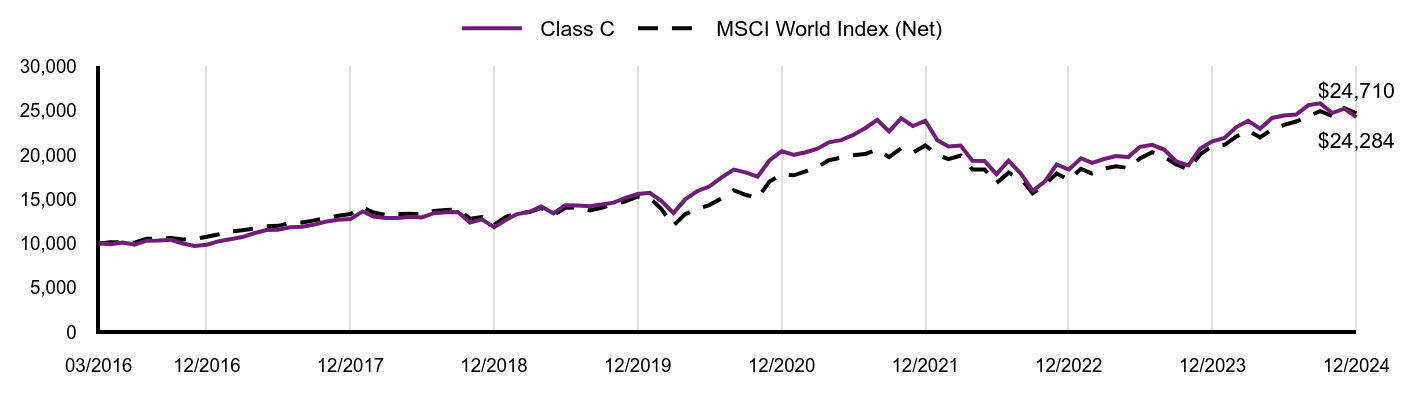
| Class C | MSCI World Index (Net) |
|---|
| 03/2016 | $10,000 | $10,000 |
|---|
| 04/2016 | $9,930 | $10,148 |
|---|
| 05/2016 | $10,100 | $10,160 |
|---|
| 06/2016 | $9,880 | $10,099 |
|---|
| 07/2016 | $10,320 | $10,534 |
|---|
| 08/2016 | $10,330 | $10,570 |
|---|
| 09/2016 | $10,420 | $10,634 |
|---|
| 10/2016 | $10,000 | $10,454 |
|---|
| 11/2016 | $9,720 | $10,533 |
|---|
| 12/2016 | $9,861 | $10,761 |
|---|
| 01/2017 | $10,262 | $11,055 |
|---|
| 02/2017 | $10,492 | $11,365 |
|---|
| 03/2017 | $10,732 | $11,504 |
|---|
| 04/2017 | $11,163 | $11,683 |
|---|
| 05/2017 | $11,533 | $11,941 |
|---|
| 06/2017 | $11,553 | $11,996 |
|---|
| 07/2017 | $11,833 | $12,331 |
|---|
| 08/2017 | $11,894 | $12,378 |
|---|
| 09/2017 | $12,134 | $12,617 |
|---|
| 10/2017 | $12,484 | $12,879 |
|---|
| 11/2017 | $12,684 | $13,129 |
|---|
| 12/2017 | $12,761 | $13,340 |
|---|
| 01/2018 | $13,630 | $14,093 |
|---|
| 02/2018 | $13,054 | $13,501 |
|---|
| 03/2018 | $12,892 | $13,212 |
|---|
| 04/2018 | $12,871 | $13,338 |
|---|
| 05/2018 | $13,023 | $13,355 |
|---|
| 06/2018 | $12,952 | $13,283 |
|---|
| 07/2018 | $13,430 | $13,683 |
|---|
| 08/2018 | $13,521 | $13,791 |
|---|
| 09/2018 | $13,562 | $13,851 |
|---|
| 10/2018 | $12,362 | $12,813 |
|---|
| 11/2018 | $12,728 | $13,000 |
|---|
| 12/2018 | $11,841 | $12,084 |
|---|
| 01/2019 | $12,695 | $13,039 |
|---|
| 02/2019 | $13,327 | $13,387 |
|---|
| 03/2019 | $13,590 | $13,556 |
|---|
| 04/2019 | $14,177 | $14,013 |
|---|
| 05/2019 | $13,401 | $13,182 |
|---|
| 06/2019 | $14,326 | $14,045 |
|---|
| 07/2019 | $14,294 | $14,087 |
|---|
| 08/2019 | $14,219 | $13,752 |
|---|
| 09/2019 | $14,400 | $14,042 |
|---|
| 10/2019 | $14,623 | $14,426 |
|---|
| 11/2019 | $15,155 | $14,778 |
|---|
| 12/2019 | $15,590 | $15,299 |
|---|
| 01/2020 | $15,729 | $15,130 |
|---|
| 02/2020 | $14,830 | $13,908 |
|---|
| 03/2020 | $13,438 | $12,030 |
|---|
| 04/2020 | $14,991 | $13,319 |
|---|
| 05/2020 | $15,938 | $13,898 |
|---|
| 06/2020 | $16,444 | $14,342 |
|---|
| 07/2020 | $17,456 | $15,101 |
|---|
| 08/2020 | $18,360 | $16,025 |
|---|
| 09/2020 | $18,048 | $15,508 |
|---|
| 10/2020 | $17,553 | $15,131 |
|---|
| 11/2020 | $19,382 | $16,996 |
|---|
| 12/2020 | $20,434 | $17,785 |
|---|
| 01/2021 | $20,024 | $17,705 |
|---|
| 02/2021 | $20,283 | $18,115 |
|---|
| 03/2021 | $20,682 | $18,598 |
|---|
| 04/2021 | $21,436 | $19,412 |
|---|
| 05/2021 | $21,687 | $19,714 |
|---|
| 06/2021 | $22,245 | $19,973 |
|---|
| 07/2021 | $23,032 | $20,111 |
|---|
| 08/2021 | $23,983 | $20,614 |
|---|
| 09/2021 | $22,671 | $19,763 |
|---|
| 10/2021 | $24,147 | $20,772 |
|---|
| 11/2021 | $23,272 | $20,271 |
|---|
| 12/2021 | $23,878 | $21,082 |
|---|
| 01/2022 | $21,663 | $20,047 |
|---|
| 02/2022 | $20,969 | $19,529 |
|---|
| 03/2022 | $21,066 | $19,952 |
|---|
| 04/2022 | $19,350 | $18,355 |
|---|
| 05/2022 | $19,337 | $18,377 |
|---|
| 06/2022 | $17,841 | $16,828 |
|---|
| 07/2022 | $19,362 | $18,003 |
|---|
| 08/2022 | $17,904 | $17,340 |
|---|
| 09/2022 | $15,964 | $15,680 |
|---|
| 10/2022 | $17,004 | $16,626 |
|---|
| 11/2022 | $18,944 | $17,916 |
|---|
| 12/2022 | $18,361 | $17,211 |
|---|
| 01/2023 | $19,641 | $18,444 |
|---|
| 02/2023 | $19,121 | $17,916 |
|---|
| 03/2023 | $19,553 | $18,468 |
|---|
| 04/2023 | $19,895 | $18,734 |
|---|
| 05/2023 | $19,768 | $18,533 |
|---|
| 06/2023 | $20,923 | $19,609 |
|---|
| 07/2023 | $21,152 | $20,327 |
|---|
| 08/2023 | $20,593 | $19,759 |
|---|
| 09/2023 | $19,274 | $18,942 |
|---|
| 10/2023 | $18,830 | $18,372 |
|---|
| 11/2023 | $20,745 | $20,068 |
|---|
| 12/2023 | $21,558 | $21,032 |
|---|
| 01/2024 | $21,926 | $21,155 |
|---|
| 02/2024 | $23,131 | $22,063 |
|---|
| 03/2024 | $23,880 | $22,756 |
|---|
| 04/2024 | $22,981 | $22,005 |
|---|
| 05/2024 | $24,193 | $22,899 |
|---|
| 06/2024 | $24,469 | $23,409 |
|---|
| 07/2024 | $24,577 | $23,786 |
|---|
| 08/2024 | $25,646 | $24,390 |
|---|
| 09/2024 | $25,838 | $24,957 |
|---|
| 10/2024 | $24,745 | $24,397 |
|---|
| 11/2024 | $25,237 | $25,309 |
|---|
| 12/2024 | $24,284 | $24,710 |
|---|
Performance data shown represents past performance and is no guarantee of, and is not necessarily indicative of, future results. Total return and value will vary, and you may have a gain or loss when shares are sold. Current performance may be lower or higher than quoted. For the most recent month-end performance, visit im.natixis.com/en-us/products/mutual-funds/price-and-performance.
Average Annual Total Returns (%)
| AATR | 1 Year | 5 Years | Since Inception 3/31/16 |
|---|
| Class C at NAV | 11.99% | 9.14% | 10.67% |
|---|
Class C with 1.00% CDSCFootnote Reference1 | 10.99% | 9.14% | 10.67% |
|---|
| MSCI World Index (Net) | 17.49% | 10.06% | 10.85% |
|---|
| Footnote | Description |
Footnote1 | Contingent deferred sales charge |
| Total Net Assets | $974,101,733 |
|---|
| # of Portfolio Holdings (including overnight repurchase agreements) | 51 |
|---|
| Portfolio Turnover Rate | 18% |
|---|
| Total Advisory Fees Paid (after waiver/reimbursement, if applicable) | $8,602,808 |
|---|
What did the Fund invest in? (% of Net Assets)
| Value | Value |
|---|
Other investments less than 3% of net assetsFootnote Reference* | 17.9% |
| Commercial Services & Supplies | 3.3% |
| Broadline Retail | 3.5% |
| IT Services | 3.8% |
| Machinery | 3.9% |
| Electric Utilities | 5.2% |
| Life Sciences Tools & Services | 6.0% |
| Health Care Equipment & Supplies | 6.1% |
| Chemicals | 6.7% |
| Pharmaceuticals | 7.4% |
| Financial Services | 9.5% |
| Semiconductors & Semiconductor Equipment | 11.7% |
| Software | 15.0% |
| Footnote | Description |
Footnote* | Net of other assets less liabilities |
| NVIDIA Corp. | 5.9% |
| Microsoft Corp. | 5.5% |
| Mastercard, Inc., Class A | 5.2% |
| Eli Lilly & Co. | 3.8% |
| Ecolab, Inc. | 3.7% |
| eBay, Inc. | 3.5% |
| Thermo Fisher Scientific, Inc. | 3.4% |
| Taiwan Semiconductor Manufacturing Co. Ltd., ADR | 3.2% |
| Roper Technologies, Inc. | 3.0% |
| Iberdrola SA | 2.9% |
There were no material fund changes during the period.
| Value | Value |
|---|
Other investments less than 3% of net assetsFootnote Reference* | 10.2% |
| Canada | 3.0% |
| Japan | 3.1% |
| Taiwan | 3.2% |
| Denmark | 3.4% |
| Netherlands | 3.7% |
| France | 3.7% |
| United Kingdom | 3.8% |
| Germany | 4.0% |
| United States | 61.9% |
| Footnote | Description |
Footnote* | Net of other assets less liabilities |
There were no changes in or disagreements with Accountants during the period.
For additional information about the Fund; including its prospectus, financial information, holdings and proxy information, scan the QR code or visit im.natixis.com/funddocuments.
Mirova Global Sustainable Equity Fund
Annual Shareholder Report
December 31, 2024
Mirova Global Sustainable Equity Fund
Annual Shareholder Report - December 31, 2024
This annual shareholder report contains important information about Mirova Global Sustainable Equity Fund for the period of January 1, 2024 to December 31, 2024. You can find additional information (including tax information) about the Fund at im.natixis.com/funddocuments. You can also request the information by contacting us at (800) 225-5478 or by contacting your financial intermediary directly.
What were the fund costs for the last year? (based on a hypothetical $10,000 investment)
| Class Name | Costs of a $10,000 investment | Costs paid as a percentage of a $10,000 investmentFootnote Reference† |
|---|
| Class N | $95 | 0.89% |
|---|
| Footnote | Description |
Footnote† | Annualized for periods less than one year (if applicable). |
How did the fund perform last year and what affected its performance?
Explanation of Fund Performance
While the Fund delivered strong absolute returns for the full year, it lagged in overall performance mainly due to fourth quarter results as the Fund was underexposed to some of the areas expected to benefit under a Trump presidency. This included U.S. stocks, bank and energy stocks, and lower quality and procyclical areas. Certain companies also faced industry-wide or company-specific challenges.
Top Contributors to Performance
• Lack of exposure to the Energy and Real Estate sectors and an underweight to Consumer Staples contributed to performance.
• Stock selection in Health Care (Eli Lilly and Intuitive Surgical) and Materials (Smurfit Westrock and not owning mining companies) contributed.
•Nvidia, Taiwan Semi and eBay were the largest contributors to performance.
Top Detractors from Performance
•An overweight to Health Care and Materials, and underweight to Communication Services, which was led by Magnificent 7 stocks the Fund does not own (Meta, Alphabet), detracted.
•As U.S. equities outperformed, driven in part by the Magnificent 7, the Fund’s U.S. underweight and Europe overweight detracted.
•Stock picks in Industrials (Vestas Wind Systems and AGCO Corp) and Financials (AIA Group and Legal & General) detracted from relative performance.
•Vestas Wind Systems, Aptiv and Adobe were the largest detractors overall.
The Fund continued to invest for the long term, in high-quality companies likely to benefit from the demographic, technological, environmental and governance related transitions expected to transform the world’s economies during the next decade.
The Fund’s benchmarks are unmanaged indices used as a general measure of market performance. Calculations assume dividends and capital gains are reinvested. The tables do not reflect taxes shareholders might owe on any fund distributions or when they redeem their shares. You cannot invest directly in an index.
Total Return Based on a Hypothetical $10,000 Investment
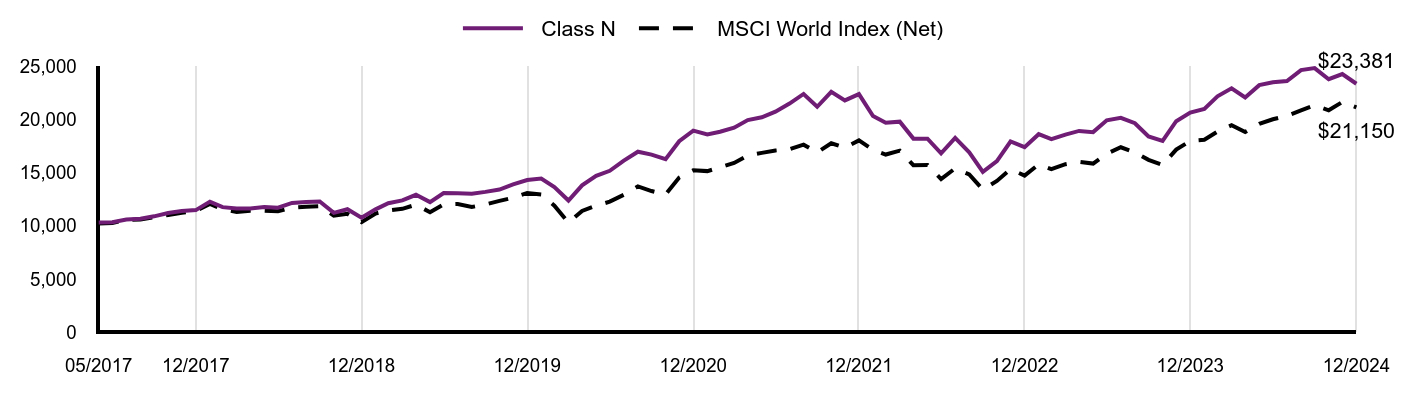
| Class N | MSCI World Index (Net) |
|---|
| 05/2017 | $10,319 | $10,221 |
|---|
| 06/2017 | $10,337 | $10,267 |
|---|
| 07/2017 | $10,593 | $10,554 |
|---|
| 08/2017 | $10,673 | $10,595 |
|---|
| 09/2017 | $10,895 | $10,799 |
|---|
| 10/2017 | $11,213 | $11,024 |
|---|
| 11/2017 | $11,399 | $11,237 |
|---|
| 12/2017 | $11,481 | $11,418 |
|---|
| 01/2018 | $12,278 | $12,062 |
|---|
| 02/2018 | $11,759 | $11,556 |
|---|
| 03/2018 | $11,624 | $11,308 |
|---|
| 04/2018 | $11,623 | $11,416 |
|---|
| 05/2018 | $11,767 | $11,431 |
|---|
| 06/2018 | $11,713 | $11,369 |
|---|
| 07/2018 | $12,155 | $11,712 |
|---|
| 08/2018 | $12,245 | $11,804 |
|---|
| 09/2018 | $12,299 | $11,855 |
|---|
| 10/2018 | $11,217 | $10,967 |
|---|
| 11/2018 | $11,560 | $11,127 |
|---|
| 12/2018 | $10,762 | $10,343 |
|---|
| 01/2019 | $11,549 | $11,160 |
|---|
| 02/2019 | $12,129 | $11,458 |
|---|
| 03/2019 | $12,392 | $11,603 |
|---|
| 04/2019 | $12,923 | $11,994 |
|---|
| 05/2019 | $12,233 | $11,283 |
|---|
| 06/2019 | $13,093 | $12,022 |
|---|
| 07/2019 | $13,064 | $12,057 |
|---|
| 08/2019 | $13,017 | $11,771 |
|---|
| 09/2019 | $13,197 | $12,018 |
|---|
| 10/2019 | $13,414 | $12,347 |
|---|
| 11/2019 | $13,905 | $12,649 |
|---|
| 12/2019 | $14,319 | $13,094 |
|---|
| 01/2020 | $14,452 | $12,950 |
|---|
| 02/2020 | $13,650 | $11,904 |
|---|
| 03/2020 | $12,380 | $10,297 |
|---|
| 04/2020 | $13,813 | $11,400 |
|---|
| 05/2020 | $14,706 | $11,895 |
|---|
| 06/2020 | $15,186 | $12,276 |
|---|
| 07/2020 | $16,137 | $12,925 |
|---|
| 08/2020 | $16,981 | $13,716 |
|---|
| 09/2020 | $16,703 | $13,274 |
|---|
| 10/2020 | $16,271 | $12,951 |
|---|
| 11/2020 | $17,970 | $14,547 |
|---|
| 12/2020 | $18,964 | $15,223 |
|---|
| 01/2021 | $18,598 | $15,153 |
|---|
| 02/2021 | $18,858 | $15,504 |
|---|
| 03/2021 | $19,243 | $15,919 |
|---|
| 04/2021 | $19,964 | $16,615 |
|---|
| 05/2021 | $20,218 | $16,873 |
|---|
| 06/2021 | $20,754 | $17,096 |
|---|
| 07/2021 | $21,514 | $17,213 |
|---|
| 08/2021 | $22,421 | $17,644 |
|---|
| 09/2021 | $21,212 | $16,915 |
|---|
| 10/2021 | $22,616 | $17,779 |
|---|
| 11/2021 | $21,816 | $17,351 |
|---|
| 12/2021 | $22,409 | $18,045 |
|---|
| 01/2022 | $20,343 | $17,158 |
|---|
| 02/2022 | $19,705 | $16,715 |
|---|
| 03/2022 | $19,813 | $17,077 |
|---|
| 04/2022 | $18,213 | $15,710 |
|---|
| 05/2022 | $18,213 | $15,729 |
|---|
| 06/2022 | $16,830 | $14,403 |
|---|
| 07/2022 | $18,280 | $15,409 |
|---|
| 08/2022 | $16,920 | $14,841 |
|---|
| 09/2022 | $15,087 | $13,421 |
|---|
| 10/2022 | $16,099 | $14,231 |
|---|
| 11/2022 | $17,943 | $15,334 |
|---|
| 12/2022 | $17,408 | $14,731 |
|---|
| 01/2023 | $18,632 | $15,787 |
|---|
| 02/2023 | $18,156 | $15,334 |
|---|
| 03/2023 | $18,587 | $15,807 |
|---|
| 04/2023 | $18,939 | $16,034 |
|---|
| 05/2023 | $18,825 | $15,863 |
|---|
| 06/2023 | $19,937 | $16,784 |
|---|
| 07/2023 | $20,175 | $17,398 |
|---|
| 08/2023 | $19,664 | $16,912 |
|---|
| 09/2023 | $18,417 | $16,212 |
|---|
| 10/2023 | $18,009 | $15,725 |
|---|
| 11/2023 | $19,857 | $17,176 |
|---|
| 12/2023 | $20,664 | $18,001 |
|---|
| 01/2024 | $21,018 | $18,107 |
|---|
| 02/2024 | $22,204 | $18,884 |
|---|
| 03/2024 | $22,946 | $19,477 |
|---|
| 04/2024 | $22,085 | $18,834 |
|---|
| 05/2024 | $23,249 | $19,599 |
|---|
| 06/2024 | $23,523 | $20,036 |
|---|
| 07/2024 | $23,637 | $20,359 |
|---|
| 08/2024 | $24,664 | $20,876 |
|---|
| 09/2024 | $24,858 | $21,361 |
|---|
| 10/2024 | $23,808 | $20,881 |
|---|
| 11/2024 | $24,299 | $21,662 |
|---|
| 12/2024 | $23,381 | $21,150 |
|---|
Performance data shown represents past performance and is no guarantee of, and is not necessarily indicative of, future results. Total return and value will vary, and you may have a gain or loss when shares are sold. Current performance may be lower or higher than quoted. For the most recent month-end performance, visit im.natixis.com/en-us/products/mutual-funds/price-and-performance.
Average Annual Total Returns (%)
| AATR | 1 Year | 5 Years | Since Inception 5/1/17 |
|---|
| Class N | 13.15% | 10.30% | 11.71% |
|---|
| MSCI World Index (Net) | 17.49% | 10.06% | 10.19% |
|---|
| Total Net Assets | $974,101,733 |
|---|
| # of Portfolio Holdings (including overnight repurchase agreements) | 51 |
|---|
| Portfolio Turnover Rate | 18% |
|---|
| Total Advisory Fees Paid (after waiver/reimbursement, if applicable) | $8,602,808 |
|---|
What did the Fund invest in? (% of Net Assets)
| Value | Value |
|---|
Other investments less than 3% of net assetsFootnote Reference* | 17.9% |
| Commercial Services & Supplies | 3.3% |
| Broadline Retail | 3.5% |
| IT Services | 3.8% |
| Machinery | 3.9% |
| Electric Utilities | 5.2% |
| Life Sciences Tools & Services | 6.0% |
| Health Care Equipment & Supplies | 6.1% |
| Chemicals | 6.7% |
| Pharmaceuticals | 7.4% |
| Financial Services | 9.5% |
| Semiconductors & Semiconductor Equipment | 11.7% |
| Software | 15.0% |
| Footnote | Description |
Footnote* | Net of other assets less liabilities |
| NVIDIA Corp. | 5.9% |
| Microsoft Corp. | 5.5% |
| Mastercard, Inc., Class A | 5.2% |
| Eli Lilly & Co. | 3.8% |
| Ecolab, Inc. | 3.7% |
| eBay, Inc. | 3.5% |
| Thermo Fisher Scientific, Inc. | 3.4% |
| Taiwan Semiconductor Manufacturing Co. Ltd., ADR | 3.2% |
| Roper Technologies, Inc. | 3.0% |
| Iberdrola SA | 2.9% |
There were no material fund changes during the period.
| Value | Value |
|---|
Other investments less than 3% of net assetsFootnote Reference* | 10.2% |
| Canada | 3.0% |
| Japan | 3.1% |
| Taiwan | 3.2% |
| Denmark | 3.4% |
| Netherlands | 3.7% |
| France | 3.7% |
| United Kingdom | 3.8% |
| Germany | 4.0% |
| United States | 61.9% |
| Footnote | Description |
Footnote* | Net of other assets less liabilities |
There were no changes in or disagreements with Accountants during the period.
For additional information about the Fund; including its prospectus, financial information, holdings and proxy information, scan the QR code or visit im.natixis.com/funddocuments.
Mirova Global Sustainable Equity Fund
Annual Shareholder Report
December 31, 2024
Mirova Global Sustainable Equity Fund
Annual Shareholder Report - December 31, 2024
This annual shareholder report contains important information about Mirova Global Sustainable Equity Fund for the period of January 1, 2024 to December 31, 2024. You can find additional information (including tax information) about the Fund at im.natixis.com/funddocuments. You can also request the information by contacting us at (800) 225-5478 or by contacting your financial intermediary directly.
What were the fund costs for the last year? (based on a hypothetical $10,000 investment)
| Class Name | Costs of a $10,000 investment | Costs paid as a percentage of a $10,000 investmentFootnote Reference† |
|---|
| Class Y | $101 | 0.95% |
|---|
| Footnote | Description |
Footnote† | Annualized for periods less than one year (if applicable). |
How did the fund perform last year and what affected its performance?
Explanation of Fund Performance
While the Fund delivered strong absolute returns for the full year, it lagged in overall performance mainly due to fourth quarter results as the Fund was underexposed to some of the areas expected to benefit under a Trump presidency. This included U.S. stocks, bank and energy stocks, and lower quality and procyclical areas. Certain companies also faced industry-wide or company-specific challenges.
Top Contributors to Performance
• Lack of exposure to the Energy and Real Estate sectors and an underweight to Consumer Staples contributed to performance.
• Stock selection in Health Care (Eli Lilly and Intuitive Surgical) and Materials (Smurfit Westrock and not owning mining companies) contributed.
•Nvidia, Taiwan Semi and eBay were the largest contributors to performance.
Top Detractors from Performance
•An overweight to Health Care and Materials, and underweight to Communication Services, which was led by Magnificent 7 stocks the Fund does not own (Meta, Alphabet), detracted.
•As U.S. equities outperformed, driven in part by the Magnificent 7, the Fund’s U.S. underweight and Europe overweight detracted.
•Stock picks in Industrials (Vestas Wind Systems and AGCO Corp) and Financials (AIA Group and Legal & General) detracted from relative performance.
•Vestas Wind Systems, Aptiv and Adobe were the largest detractors overall.
The Fund continued to invest for the long term, in high-quality companies likely to benefit from the demographic, technological, environmental and governance related transitions expected to transform the world’s economies during the next decade.
The Fund’s benchmarks are unmanaged indices used as a general measure of market performance. Calculations assume dividends and capital gains are reinvested. The tables do not reflect taxes shareholders might owe on any fund distributions or when they redeem their shares. You cannot invest directly in an index.
Total Return Based on a Hypothetical $10,000 Investment
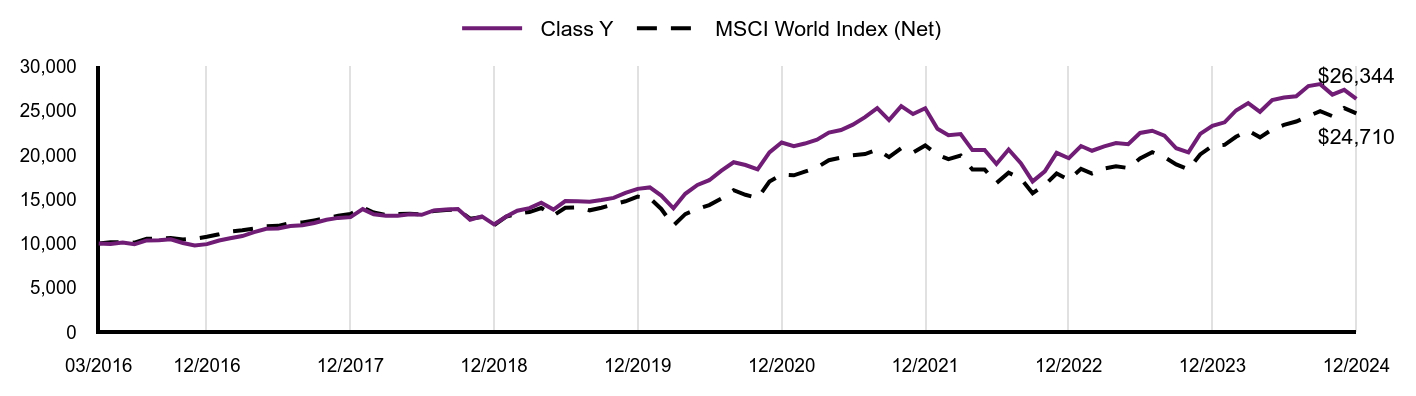
| Class Y | MSCI World Index (Net) |
|---|
| 03/2016 | $10,000 | $10,000 |
|---|
| 04/2016 | $9,940 | $10,148 |
|---|
| 05/2016 | $10,120 | $10,160 |
|---|
| 06/2016 | $9,910 | $10,099 |
|---|
| 07/2016 | $10,350 | $10,534 |
|---|
| 08/2016 | $10,370 | $10,570 |
|---|
| 09/2016 | $10,470 | $10,634 |
|---|
| 10/2016 | $10,060 | $10,454 |
|---|
| 11/2016 | $9,790 | $10,533 |
|---|
| 12/2016 | $9,930 | $10,761 |
|---|
| 01/2017 | $10,341 | $11,055 |
|---|
| 02/2017 | $10,591 | $11,365 |
|---|
| 03/2017 | $10,842 | $11,504 |
|---|
| 04/2017 | $11,283 | $11,683 |
|---|
| 05/2017 | $11,673 | $11,941 |
|---|
| 06/2017 | $11,693 | $11,996 |
|---|
| 07/2017 | $11,984 | $12,331 |
|---|
| 08/2017 | $12,064 | $12,378 |
|---|
| 09/2017 | $12,325 | $12,617 |
|---|
| 10/2017 | $12,685 | $12,879 |
|---|
| 11/2017 | $12,896 | $13,129 |
|---|
| 12/2017 | $12,983 | $13,340 |
|---|
| 01/2018 | $13,885 | $14,093 |
|---|
| 02/2018 | $13,297 | $13,501 |
|---|
| 03/2018 | $13,145 | $13,212 |
|---|
| 04/2018 | $13,144 | $13,338 |
|---|
| 05/2018 | $13,307 | $13,355 |
|---|
| 06/2018 | $13,246 | $13,283 |
|---|
| 07/2018 | $13,745 | $13,683 |
|---|
| 08/2018 | $13,847 | $13,791 |
|---|
| 09/2018 | $13,909 | $13,851 |
|---|
| 10/2018 | $12,675 | $12,813 |
|---|
| 11/2018 | $13,072 | $13,000 |
|---|
| 12/2018 | $12,163 | $12,084 |
|---|
| 01/2019 | $13,052 | $13,039 |
|---|
| 02/2019 | $13,708 | $13,387 |
|---|
| 03/2019 | $14,005 | $13,556 |
|---|
| 04/2019 | $14,616 | $14,013 |
|---|
| 05/2019 | $13,836 | $13,182 |
|---|
| 06/2019 | $14,797 | $14,045 |
|---|
| 07/2019 | $14,776 | $14,087 |
|---|
| 08/2019 | $14,712 | $13,752 |
|---|
| 09/2019 | $14,915 | $14,042 |
|---|
| 10/2019 | $15,160 | $14,426 |
|---|
| 11/2019 | $15,715 | $14,778 |
|---|
| 12/2019 | $16,176 | $15,299 |
|---|
| 01/2020 | $16,338 | $15,130 |
|---|
| 02/2020 | $15,421 | $13,908 |
|---|
| 03/2020 | $13,985 | $12,030 |
|---|
| 04/2020 | $15,616 | $13,319 |
|---|
| 05/2020 | $16,614 | $13,898 |
|---|
| 06/2020 | $17,156 | $14,342 |
|---|
| 07/2020 | $18,230 | $15,101 |
|---|
| 08/2020 | $19,184 | $16,025 |
|---|
| 09/2020 | $18,870 | $15,508 |
|---|
| 10/2020 | $18,371 | $15,131 |
|---|
| 11/2020 | $20,301 | $16,996 |
|---|
| 12/2020 | $21,420 | $17,785 |
|---|
| 01/2021 | $21,007 | $17,705 |
|---|
| 02/2021 | $21,300 | $18,115 |
|---|
| 03/2021 | $21,735 | $18,598 |
|---|
| 04/2021 | $22,539 | $19,412 |
|---|
| 05/2021 | $22,825 | $19,714 |
|---|
| 06/2021 | $23,430 | $19,973 |
|---|
| 07/2021 | $24,289 | $20,111 |
|---|
| 08/2021 | $25,313 | $20,614 |
|---|
| 09/2021 | $23,948 | $19,763 |
|---|
| 10/2021 | $25,534 | $20,772 |
|---|
| 11/2021 | $24,631 | $20,271 |
|---|
| 12/2021 | $25,288 | $21,082 |
|---|
| 01/2022 | $22,968 | $20,047 |
|---|
| 02/2022 | $22,235 | $19,529 |
|---|
| 03/2022 | $22,369 | $19,952 |
|---|
| 04/2022 | $20,562 | $18,355 |
|---|
| 05/2022 | $20,562 | $18,377 |
|---|
| 06/2022 | $18,989 | $16,828 |
|---|
| 07/2022 | $20,626 | $18,003 |
|---|
| 08/2022 | $19,090 | $17,340 |
|---|
| 09/2022 | $17,021 | $15,680 |
|---|
| 10/2022 | $18,163 | $16,626 |
|---|
| 11/2022 | $20,245 | $17,916 |
|---|
| 12/2022 | $19,641 | $17,211 |
|---|
| 01/2023 | $21,022 | $18,444 |
|---|
| 02/2023 | $20,485 | $17,916 |
|---|
| 03/2023 | $20,971 | $18,468 |
|---|
| 04/2023 | $21,355 | $18,734 |
|---|
| 05/2023 | $21,227 | $18,533 |
|---|
| 06/2023 | $22,494 | $19,609 |
|---|
| 07/2023 | $22,750 | $20,327 |
|---|
| 08/2023 | $22,187 | $19,759 |
|---|
| 09/2023 | $20,766 | $18,942 |
|---|
| 10/2023 | $20,306 | $18,372 |
|---|
| 11/2023 | $22,391 | $20,068 |
|---|
| 12/2023 | $23,300 | $21,032 |
|---|
| 01/2024 | $23,699 | $21,155 |
|---|
| 02/2024 | $25,037 | $22,063 |
|---|
| 03/2024 | $25,873 | $22,756 |
|---|
| 04/2024 | $24,890 | $22,005 |
|---|
| 05/2024 | $26,215 | $22,899 |
|---|
| 06/2024 | $26,511 | $23,409 |
|---|
| 07/2024 | $26,640 | $23,786 |
|---|
| 08/2024 | $27,798 | $24,390 |
|---|
| 09/2024 | $28,017 | $24,957 |
|---|
| 10/2024 | $26,833 | $24,397 |
|---|
| 11/2024 | $27,373 | $25,309 |
|---|
| 12/2024 | $26,344 | $24,710 |
|---|
Performance data shown represents past performance and is no guarantee of, and is not necessarily indicative of, future results. Total return and value will vary, and you may have a gain or loss when shares are sold. Current performance may be lower or higher than quoted. For the most recent month-end performance, visit im.natixis.com/en-us/products/mutual-funds/price-and-performance.
Average Annual Total Returns (%)
| AATR | 1 Year | 5 Years | Since Inception 3/31/16 |
|---|
| Class Y | 13.06% | 10.25% | 11.70% |
|---|
| MSCI World Index (Net) | 17.49% | 10.06% | 10.85% |
|---|
| Total Net Assets | $974,101,733 |
|---|
| # of Portfolio Holdings (including overnight repurchase agreements) | 51 |
|---|
| Portfolio Turnover Rate | 18% |
|---|
| Total Advisory Fees Paid (after waiver/reimbursement, if applicable) | $8,602,808 |
|---|
What did the Fund invest in? (% of Net Assets)
| Value | Value |
|---|
Other investments less than 3% of net assetsFootnote Reference* | 17.9% |
| Commercial Services & Supplies | 3.3% |
| Broadline Retail | 3.5% |
| IT Services | 3.8% |
| Machinery | 3.9% |
| Electric Utilities | 5.2% |
| Life Sciences Tools & Services | 6.0% |
| Health Care Equipment & Supplies | 6.1% |
| Chemicals | 6.7% |
| Pharmaceuticals | 7.4% |
| Financial Services | 9.5% |
| Semiconductors & Semiconductor Equipment | 11.7% |
| Software | 15.0% |
| Footnote | Description |
Footnote* | Net of other assets less liabilities |
| NVIDIA Corp. | 5.9% |
| Microsoft Corp. | 5.5% |
| Mastercard, Inc., Class A | 5.2% |
| Eli Lilly & Co. | 3.8% |
| Ecolab, Inc. | 3.7% |
| eBay, Inc. | 3.5% |
| Thermo Fisher Scientific, Inc. | 3.4% |
| Taiwan Semiconductor Manufacturing Co. Ltd., ADR | 3.2% |
| Roper Technologies, Inc. | 3.0% |
| Iberdrola SA | 2.9% |
There were no material fund changes during the period.
| Value | Value |
|---|
Other investments less than 3% of net assetsFootnote Reference* | 10.2% |
| Canada | 3.0% |
| Japan | 3.1% |
| Taiwan | 3.2% |
| Denmark | 3.4% |
| Netherlands | 3.7% |
| France | 3.7% |
| United Kingdom | 3.8% |
| Germany | 4.0% |
| United States | 61.9% |
| Footnote | Description |
Footnote* | Net of other assets less liabilities |
There were no changes in or disagreements with Accountants during the period.
For additional information about the Fund; including its prospectus, financial information, holdings and proxy information, scan the QR code or visit im.natixis.com/funddocuments.
Mirova Global Sustainable Equity Fund
Annual Shareholder Report
December 31, 2024
Mirova International Sustainable Equity Fund
Annual Shareholder Report - December 31, 2024
This annual shareholder report contains important information about Mirova International Sustainable Equity Fund for the period of January 1, 2024 to December 31, 2024. You can find additional information (including tax information) about the Fund at im.natixis.com/funddocuments. You can also request the information by contacting us at (800) 225-5478 or by contacting your financial intermediary directly.
What were the fund costs for the last year? (based on a hypothetical $10,000 investment)
| Class Name | Costs of a $10,000 investment | Costs paid as a percentage of a $10,000 investmentFootnote Reference† |
|---|
| Class A | $121 | 1.20% |
|---|
| Footnote | Description |
Footnote† | Annualized for periods less than one year (if applicable). |
How did the fund perform last year and what affected its performance?
Explanation of Fund Performance
While the Fund delivered strong absolute returns for the full year, it lagged in overall performance mainly due to fourth quarter results as the Fund was underexposed to some of the areas expected to benefit under a Trump presidency. This included bank and energy stocks, and lower quality and procyclical areas. Certain companies also faced industry-wide or company-specific challenges.
Top Contributors to Performance
•Lack of exposure to the Energy sector, underweight to Consumer Staples and overweight to IT contributed to relative performance.
•Stock selection in IT (Taiwan Semi, SAP and Shopify), Materials (Smurfit Westrock and not owning mining companies) and Utilities (Iberdrola) contributed.
•Taiwan Semi, SAP and KBC Group were the largest contributors to performance.
Top Detractors from Performance
•An underweight position in Financials and overweight in Materials detracted from relative performance.
•Stock picks in Industrials (Vestas Wind Systems, Kubota and Kingspan) and Financials (AIA Group) detracted from relative performance.
•Vestas Wind Systems, L’Oreal and Dassault Systemes were the largest detractors from performance.
The Fund continued to invest for the long term, in high-quality companies likely to benefit from the demographic, technological, environmental and governance related transitions expected to transform the world’s economies during the next decade.
The Fund’s benchmarks are unmanaged indices used as a general measure of market performance. Calculations assume dividends and capital gains are reinvested. The tables do not reflect taxes shareholders might owe on any fund distributions or when they redeem their shares. You cannot invest directly in an index.
Total Return Based on a Hypothetical $10,000 Investment
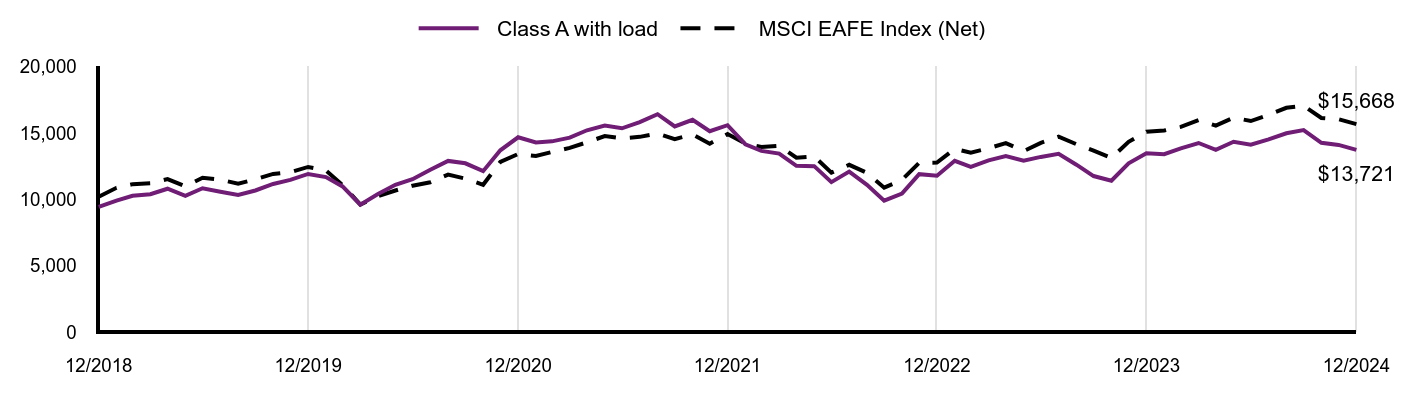
| Class A with load | MSCI EAFE Index (Net) |
|---|
| 12/2018 | $9,434 | $10,193 |
|---|
| 01/2019 | $9,906 | $10,863 |
|---|
| 02/2019 | $10,264 | $11,140 |
|---|
| 03/2019 | $10,386 | $11,210 |
|---|
| 04/2019 | $10,795 | $11,525 |
|---|
| 05/2019 | $10,257 | $10,971 |
|---|
| 06/2019 | $10,833 | $11,622 |
|---|
| 07/2019 | $10,569 | $11,475 |
|---|
| 08/2019 | $10,333 | $11,178 |
|---|
| 09/2019 | $10,663 | $11,498 |
|---|
| 10/2019 | $11,154 | $11,911 |
|---|
| 11/2019 | $11,465 | $12,045 |
|---|
| 12/2019 | $11,909 | $12,437 |
|---|
| 01/2020 | $11,671 | $12,177 |
|---|
| 02/2020 | $10,966 | $11,076 |
|---|
| 03/2020 | $9,595 | $9,598 |
|---|
| 04/2020 | $10,372 | $10,218 |
|---|
| 05/2020 | $11,097 | $10,663 |
|---|
| 06/2020 | $11,517 | $11,026 |
|---|
| 07/2020 | $12,232 | $11,283 |
|---|
| 08/2020 | $12,891 | $11,863 |
|---|
| 09/2020 | $12,710 | $11,555 |
|---|
| 10/2020 | $12,118 | $11,093 |
|---|
| 11/2020 | $13,692 | $12,813 |
|---|
| 12/2020 | $14,669 | $13,409 |
|---|
| 01/2021 | $14,280 | $13,266 |
|---|
| 02/2021 | $14,364 | $13,563 |
|---|
| 03/2021 | $14,648 | $13,875 |
|---|
| 04/2021 | $15,199 | $14,293 |
|---|
| 05/2021 | $15,550 | $14,759 |
|---|
| 06/2021 | $15,348 | $14,593 |
|---|
| 07/2021 | $15,816 | $14,703 |
|---|
| 08/2021 | $16,411 | $14,962 |
|---|
| 09/2021 | $15,486 | $14,528 |
|---|
| 10/2021 | $15,986 | $14,885 |
|---|
| 11/2021 | $15,125 | $14,192 |
|---|
| 12/2021 | $15,581 | $14,919 |
|---|
| 01/2022 | $14,148 | $14,198 |
|---|
| 02/2022 | $13,649 | $13,947 |
|---|
| 03/2022 | $13,442 | $14,037 |
|---|
| 04/2022 | $12,519 | $13,129 |
|---|
| 05/2022 | $12,498 | $13,227 |
|---|
| 06/2022 | $11,292 | $12,000 |
|---|
| 07/2022 | $12,085 | $12,598 |
|---|
| 08/2022 | $11,086 | $11,999 |
|---|
| 09/2022 | $9,892 | $10,877 |
|---|
| 10/2022 | $10,424 | $11,462 |
|---|
| 11/2022 | $11,890 | $12,753 |
|---|
| 12/2022 | $11,776 | $12,763 |
|---|
| 01/2023 | $12,901 | $13,796 |
|---|
| 02/2023 | $12,440 | $13,509 |
|---|
| 03/2023 | $12,935 | $13,843 |
|---|
| 04/2023 | $13,260 | $14,234 |
|---|
| 05/2023 | $12,910 | $13,632 |
|---|
| 06/2023 | $13,192 | $14,252 |
|---|
| 07/2023 | $13,429 | $14,713 |
|---|
| 08/2023 | $12,606 | $14,150 |
|---|
| 09/2023 | $11,750 | $13,666 |
|---|
| 10/2023 | $11,401 | $13,112 |
|---|
| 11/2023 | $12,708 | $14,329 |
|---|
| 12/2023 | $13,468 | $15,091 |
|---|
| 01/2024 | $13,400 | $15,177 |
|---|
| 02/2024 | $13,832 | $15,455 |
|---|
| 03/2024 | $14,241 | $15,964 |
|---|
| 04/2024 | $13,722 | $15,555 |
|---|
| 05/2024 | $14,336 | $16,157 |
|---|
| 06/2024 | $14,109 | $15,896 |
|---|
| 07/2024 | $14,518 | $16,363 |
|---|
| 08/2024 | $14,973 | $16,895 |
|---|
| 09/2024 | $15,212 | $17,051 |
|---|
| 10/2024 | $14,257 | $16,124 |
|---|
| 11/2024 | $14,098 | $16,032 |
|---|
| 12/2024 | $13,721 | $15,668 |
|---|
Performance data shown represents past performance and is no guarantee of, and is not necessarily indicative of, future results. Total return and value will vary, and you may have a gain or loss when shares are sold. Current performance may be lower or higher than quoted. For the most recent month-end performance, visit im.natixis.com/en-us/products/mutual-funds/price-and-performance.
Average Annual Total Returns (%)
| AATR | 1 Year | 5 Years | Since Inception 12/28/18 |
|---|
| Class A at NAV | 1.88% | 2.87% | 6.45% |
|---|
Class A with 5.75% MSCFootnote Reference1 | (3.96%) | 1.67% | 5.41% |
|---|
| MSCI EAFE Index (Net) | 3.82% | 4.73% | 7.47% |
|---|
| Footnote | Description |
Footnote1 | Maximum sales charge |
| Total Net Assets | $16,353,903 |
|---|
| # of Portfolio Holdings (including overnight repurchase agreements) | 37 |
|---|
| Portfolio Turnover Rate | 33% |
|---|
| Total Advisory Fees Paid (after waiver/reimbursement, if applicable) | $0 |
|---|
What did the Fund invest in? (% of Net Assets)
| Value | Value |
|---|
Other investments less than 3% of net assetsFootnote Reference* | 20.7% |
| Financial Services | 3.0% |
| Diversified REITs | 3.1% |
| Electronic Equipment, Instruments & Components | 3.3% |
| IT Services | 3.5% |
| Electric Utilities | 4.3% |
| Personal Care Products | 4.5% |
| Insurance | 5.6% |
| Health Care Equipment & Supplies | 5.6% |
| Building Products | 5.8% |
| Pharmaceuticals | 6.7% |
| Banks | 7.2% |
| Chemicals | 8.6% |
| Semiconductors & Semiconductor Equipment | 8.9% |
| Software | 9.2% |
| Footnote | Description |
Footnote* | Net of other assets less liabilities |
| SAP SE | 6.6% |
| Taiwan Semiconductor Manufacturing Co. Ltd., ADR | 5.0% |
| KBC Group NV | 5.0% |
| Iberdrola SA | 4.3% |
| ASML Holding NV | 3.9% |
| Air Liquide SA | 3.6% |
| Novo Nordisk AS, Class B | 3.5% |
| Shopify, Inc., Class A | 3.5% |
| Legal & General Group PLC | 3.4% |
| Halma PLC | 3.3% |
There were no material fund changes during the period.
| Value | Value |
|---|
Other investments less than 3% of net assetsFootnote Reference* | 6.5% |
| Ireland | 3.1% |
| United States | 3.5% |
| Spain | 4.3% |
| Switzerland | 4.5% |
| Belgium | 5.0% |
| Taiwan | 5.0% |
| Canada | 5.3% |
| Denmark | 5.3% |
| Netherlands | 6.9% |
| Japan | 10.6% |
| Germany | 12.4% |
| France | 13.0% |
| United Kingdom | 14.6% |
| Footnote | Description |
Footnote* | Net of other assets less liabilities |
There were no changes in or disagreements with Accountants during the period.
For additional information about the Fund; including its prospectus, financial information, holdings and proxy information, scan the QR code or visit im.natixis.com/funddocuments.
Mirova International Sustainable Equity Fund
Annual Shareholder Report
December 31, 2024
Mirova International Sustainable Equity Fund
Annual Shareholder Report - December 31, 2024
This annual shareholder report contains important information about Mirova International Sustainable Equity Fund for the period of January 1, 2024 to December 31, 2024. You can find additional information (including tax information) about the Fund at im.natixis.com/funddocuments. You can also request the information by contacting us at (800) 225-5478 or by contacting your financial intermediary directly.
What were the fund costs for the last year? (based on a hypothetical $10,000 investment)
| Class Name | Costs of a $10,000 investment | Costs paid as a percentage of a $10,000 investmentFootnote Reference† |
|---|
| Class N | $91 | 0.90% |
|---|
| Footnote | Description |
Footnote† | Annualized for periods less than one year (if applicable). |
How did the fund perform last year and what affected its performance?
Explanation of Fund Performance
While the Fund delivered strong absolute returns for the full year, it lagged in overall performance mainly due to fourth quarter results as the Fund was underexposed to some of the areas expected to benefit under a Trump presidency. This included bank and energy stocks, and lower quality and procyclical areas. Certain companies also faced industry-wide or company-specific challenges.
Top Contributors to Performance
•Lack of exposure to the Energy sector, underweight to Consumer Staples and overweight to IT contributed to relative performance.
•Stock selection in IT (Taiwan Semi, SAP and Shopify), Materials (Smurfit Westrock and not owning mining companies) and Utilities (Iberdrola) contributed.
•Taiwan Semi, SAP and KBC Group were the largest contributors to performance.
Top Detractors from Performance
•An underweight position in Financials and overweight in Materials detracted from relative performance.
•Stock picks in Industrials (Vestas Wind Systems, Kubota and Kingspan) and Financials (AIA Group) detracted from relative performance.
•Vestas Wind Systems, L’Oreal and Dassault Systemes were the largest detractors from performance.
The Fund continued to invest for the long term, in high-quality companies likely to benefit from the demographic, technological, environmental and governance related transitions expected to transform the world’s economies during the next decade.
The Fund’s benchmarks are unmanaged indices used as a general measure of market performance. Calculations assume dividends and capital gains are reinvested. The tables do not reflect taxes shareholders might owe on any fund distributions or when they redeem their shares. You cannot invest directly in an index.
Total Return Based on a Hypothetical $10,000 Investment

| Class N | MSCI EAFE Index (Net) |
|---|
| 12/2018 | $10,010 | $10,193 |
|---|
| 01/2019 | $10,510 | $10,863 |
|---|
| 02/2019 | $10,900 | $11,140 |
|---|
| 03/2019 | $11,030 | $11,210 |
|---|
| 04/2019 | $11,464 | $11,525 |
|---|
| 05/2019 | $10,893 | $10,971 |
|---|
| 06/2019 | $11,514 | $11,622 |
|---|
| 07/2019 | $11,234 | $11,475 |
|---|
| 08/2019 | $10,983 | $11,178 |
|---|
| 09/2019 | $11,344 | $11,498 |
|---|
| 10/2019 | $11,864 | $11,911 |
|---|
| 11/2019 | $12,205 | $12,045 |
|---|
| 12/2019 | $12,669 | $12,437 |
|---|
| 01/2020 | $12,426 | $12,177 |
|---|
| 02/2020 | $11,677 | $11,076 |
|---|
| 03/2020 | $10,229 | $9,598 |
|---|
| 04/2020 | $11,055 | $10,218 |
|---|
| 05/2020 | $11,826 | $10,663 |
|---|
| 06/2020 | $12,283 | $11,026 |
|---|
| 07/2020 | $13,044 | $11,283 |
|---|
| 08/2020 | $13,755 | $11,863 |
|---|
| 09/2020 | $13,562 | $11,555 |
|---|
| 10/2020 | $12,933 | $11,093 |
|---|
| 11/2020 | $14,618 | $12,813 |
|---|
| 12/2020 | $15,660 | $13,409 |
|---|
| 01/2021 | $15,246 | $13,266 |
|---|
| 02/2021 | $15,346 | $13,563 |
|---|
| 03/2021 | $15,649 | $13,875 |
|---|
| 04/2021 | $16,235 | $14,293 |
|---|
| 05/2021 | $16,620 | $14,759 |
|---|
| 06/2021 | $16,405 | $14,593 |
|---|
| 07/2021 | $16,914 | $14,703 |
|---|
| 08/2021 | $17,559 | $14,962 |
|---|
| 09/2021 | $16,563 | $14,528 |
|---|
| 10/2021 | $17,106 | $14,885 |
|---|
| 11/2021 | $16,190 | $14,192 |
|---|
| 12/2021 | $16,674 | $14,919 |
|---|
| 01/2022 | $15,145 | $14,198 |
|---|
| 02/2022 | $14,613 | $13,947 |
|---|
| 03/2022 | $14,393 | $14,037 |
|---|
| 04/2022 | $13,420 | $13,129 |
|---|
| 05/2022 | $13,397 | $13,227 |
|---|
| 06/2022 | $12,100 | $12,000 |
|---|
| 07/2022 | $12,957 | $12,598 |
|---|
| 08/2022 | $11,892 | $11,999 |
|---|
| 09/2022 | $10,618 | $10,877 |
|---|
| 10/2022 | $11,174 | $11,462 |
|---|
| 11/2022 | $12,760 | $12,753 |
|---|
| 12/2022 | $12,644 | $12,763 |
|---|
| 01/2023 | $13,846 | $13,796 |
|---|
| 02/2023 | $13,353 | $13,509 |
|---|
| 03/2023 | $13,894 | $13,843 |
|---|
| 04/2023 | $14,241 | $14,234 |
|---|
| 05/2023 | $13,880 | $13,632 |
|---|
| 06/2023 | $14,181 | $14,252 |
|---|
| 07/2023 | $14,446 | $14,713 |
|---|
| 08/2023 | $13,567 | $14,150 |
|---|
| 09/2023 | $12,640 | $13,666 |
|---|
| 10/2023 | $12,267 | $13,112 |
|---|
| 11/2023 | $13,675 | $14,329 |
|---|
| 12/2023 | $14,497 | $15,091 |
|---|
| 01/2024 | $14,436 | $15,177 |
|---|
| 02/2024 | $14,899 | $15,455 |
|---|
| 03/2024 | $15,350 | $15,964 |
|---|
| 04/2024 | $14,782 | $15,555 |
|---|
| 05/2024 | $15,464 | $16,157 |
|---|
| 06/2024 | $15,220 | $15,896 |
|---|
| 07/2024 | $15,671 | $16,363 |
|---|
| 08/2024 | $16,147 | $16,895 |
|---|
| 09/2024 | $16,427 | $17,051 |
|---|
| 10/2024 | $15,391 | $16,124 |
|---|
| 11/2024 | $15,220 | $16,032 |
|---|
| 12/2024 | $14,821 | $15,668 |
|---|
Performance data shown represents past performance and is no guarantee of, and is not necessarily indicative of, future results. Total return and value will vary, and you may have a gain or loss when shares are sold. Current performance may be lower or higher than quoted. For the most recent month-end performance, visit im.natixis.com/en-us/products/mutual-funds/price-and-performance.
Average Annual Total Returns (%)
| AATR | 1 Year | 5 Years | Since Inception 12/28/18 |
|---|
| Class N | 2.23% | 3.19% | 6.77% |
|---|
| MSCI EAFE Index (Net) | 3.82% | 4.73% | 7.47% |
|---|
| Total Net Assets | $16,353,903 |
|---|
| # of Portfolio Holdings (including overnight repurchase agreements) | 37 |
|---|
| Portfolio Turnover Rate | 33% |
|---|
| Total Advisory Fees Paid (after waiver/reimbursement, if applicable) | $0 |
|---|
What did the Fund invest in? (% of Net Assets)
| Value | Value |
|---|
Other investments less than 3% of net assetsFootnote Reference* | 20.7% |
| Financial Services | 3.0% |
| Diversified REITs | 3.1% |
| Electronic Equipment, Instruments & Components | 3.3% |
| IT Services | 3.5% |
| Electric Utilities | 4.3% |
| Personal Care Products | 4.5% |
| Insurance | 5.6% |
| Health Care Equipment & Supplies | 5.6% |
| Building Products | 5.8% |
| Pharmaceuticals | 6.7% |
| Banks | 7.2% |
| Chemicals | 8.6% |
| Semiconductors & Semiconductor Equipment | 8.9% |
| Software | 9.2% |
| Footnote | Description |
Footnote* | Net of other assets less liabilities |
| SAP SE | 6.6% |
| Taiwan Semiconductor Manufacturing Co. Ltd., ADR | 5.0% |
| KBC Group NV | 5.0% |
| Iberdrola SA | 4.3% |
| ASML Holding NV | 3.9% |
| Air Liquide SA | 3.6% |
| Novo Nordisk AS, Class B | 3.5% |
| Shopify, Inc., Class A | 3.5% |
| Legal & General Group PLC | 3.4% |
| Halma PLC | 3.3% |
There were no material fund changes during the period.
| Value | Value |
|---|
Other investments less than 3% of net assetsFootnote Reference* | 6.5% |
| Ireland | 3.1% |
| United States | 3.5% |
| Spain | 4.3% |
| Switzerland | 4.5% |
| Belgium | 5.0% |
| Taiwan | 5.0% |
| Canada | 5.3% |
| Denmark | 5.3% |
| Netherlands | 6.9% |
| Japan | 10.6% |
| Germany | 12.4% |
| France | 13.0% |
| United Kingdom | 14.6% |
| Footnote | Description |
Footnote* | Net of other assets less liabilities |
There were no changes in or disagreements with Accountants during the period.
For additional information about the Fund; including its prospectus, financial information, holdings and proxy information, scan the QR code or visit im.natixis.com/funddocuments.
Mirova International Sustainable Equity Fund
Annual Shareholder Report
December 31, 2024
Mirova International Sustainable Equity Fund
Annual Shareholder Report - December 31, 2024
This annual shareholder report contains important information about Mirova International Sustainable Equity Fund for the period of January 1, 2024 to December 31, 2024. You can find additional information (including tax information) about the Fund at im.natixis.com/funddocuments. You can also request the information by contacting us at (800) 225-5478 or by contacting your financial intermediary directly.
What were the fund costs for the last year? (based on a hypothetical $10,000 investment)
| Class Name | Costs of a $10,000 investment | Costs paid as a percentage of a $10,000 investmentFootnote Reference† |
|---|
| Class Y | $96 | 0.95% |
|---|
| Footnote | Description |
Footnote† | Annualized for periods less than one year (if applicable). |
How did the fund perform last year and what affected its performance?
Explanation of Fund Performance
While the Fund delivered strong absolute returns for the full year, it lagged in overall performance mainly due to fourth quarter results as the Fund was underexposed to some of the areas expected to benefit under a Trump presidency. This included bank and energy stocks, and lower quality and procyclical areas. Certain companies also faced industry-wide or company-specific challenges.
Top Contributors to Performance
•Lack of exposure to the Energy sector, underweight to Consumer Staples and overweight to IT contributed to relative performance.
•Stock selection in IT (Taiwan Semi, SAP and Shopify), Materials (Smurfit Westrock and not owning mining companies) and Utilities (Iberdrola) contributed.
•Taiwan Semi, SAP and KBC Group were the largest contributors to performance.
Top Detractors from Performance
•An underweight position in Financials and overweight in Materials detracted from relative performance.
•Stock picks in Industrials (Vestas Wind Systems, Kubota and Kingspan) and Financials (AIA Group) detracted from relative performance.
•Vestas Wind Systems, L’Oreal and Dassault Systemes were the largest detractors from performance.
The Fund continued to invest for the long term, in high-quality companies likely to benefit from the demographic, technological, environmental and governance related transitions expected to transform the world’s economies during the next decade.
The Fund’s benchmarks are unmanaged indices used as a general measure of market performance. Calculations assume dividends and capital gains are reinvested. The tables do not reflect taxes shareholders might owe on any fund distributions or when they redeem their shares. You cannot invest directly in an index.
Total Return Based on a Hypothetical $10,000 Investment
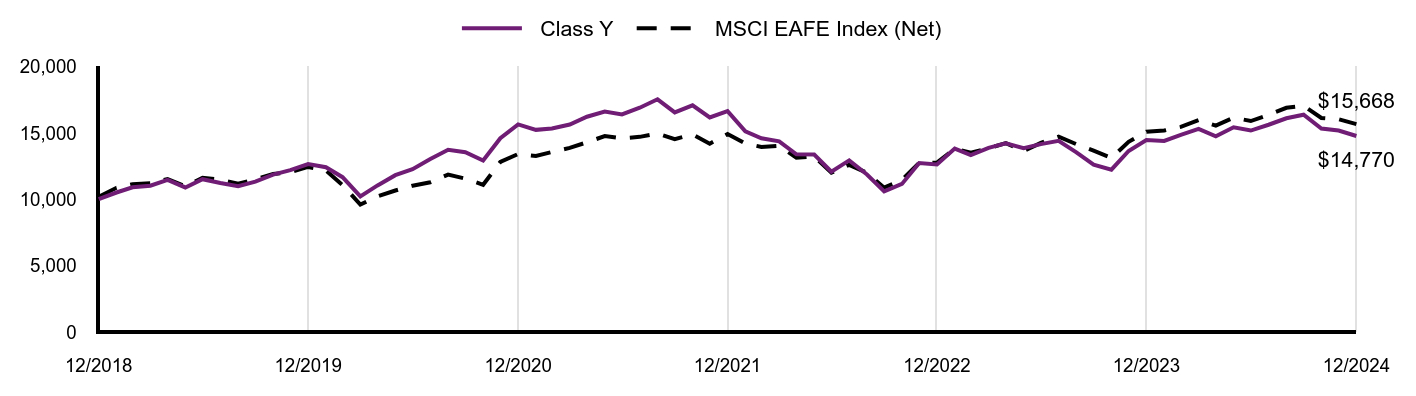
| Class Y | MSCI EAFE Index (Net) |
|---|
| 12/2018 | $10,010 | $10,193 |
|---|
| 01/2019 | $10,510 | $10,863 |
|---|
| 02/2019 | $10,900 | $11,140 |
|---|
| 03/2019 | $11,020 | $11,210 |
|---|
| 04/2019 | $11,464 | $11,525 |
|---|
| 05/2019 | $10,893 | $10,971 |
|---|
| 06/2019 | $11,514 | $11,622 |
|---|
| 07/2019 | $11,224 | $11,475 |
|---|
| 08/2019 | $10,983 | $11,178 |
|---|
| 09/2019 | $11,334 | $11,498 |
|---|
| 10/2019 | $11,854 | $11,911 |
|---|
| 11/2019 | $12,195 | $12,045 |
|---|
| 12/2019 | $12,658 | $12,437 |
|---|
| 01/2020 | $12,415 | $12,177 |
|---|
| 02/2020 | $11,666 | $11,076 |
|---|
| 03/2020 | $10,218 | $9,598 |
|---|
| 04/2020 | $11,044 | $10,218 |
|---|
| 05/2020 | $11,815 | $10,663 |
|---|
| 06/2020 | $12,272 | $11,026 |
|---|
| 07/2020 | $13,033 | $11,283 |
|---|
| 08/2020 | $13,734 | $11,863 |
|---|
| 09/2020 | $13,551 | $11,555 |
|---|
| 10/2020 | $12,922 | $11,093 |
|---|
| 11/2020 | $14,597 | $12,813 |
|---|
| 12/2020 | $15,646 | $13,409 |
|---|
| 01/2021 | $15,231 | $13,266 |
|---|
| 02/2021 | $15,332 | $13,563 |
|---|
| 03/2021 | $15,634 | $13,875 |
|---|
| 04/2021 | $16,221 | $14,293 |
|---|
| 05/2021 | $16,606 | $14,759 |
|---|
| 06/2021 | $16,391 | $14,593 |
|---|
| 07/2021 | $16,900 | $14,703 |
|---|
| 08/2021 | $17,533 | $14,962 |
|---|
| 09/2021 | $16,549 | $14,528 |
|---|
| 10/2021 | $17,081 | $14,885 |
|---|
| 11/2021 | $16,164 | $14,192 |
|---|
| 12/2021 | $16,646 | $14,919 |
|---|
| 01/2022 | $15,118 | $14,198 |
|---|
| 02/2022 | $14,597 | $13,947 |
|---|
| 03/2022 | $14,365 | $14,037 |
|---|
| 04/2022 | $13,393 | $13,129 |
|---|
| 05/2022 | $13,370 | $13,227 |
|---|
| 06/2022 | $12,085 | $12,000 |
|---|
| 07/2022 | $12,930 | $12,598 |
|---|
| 08/2022 | $11,865 | $11,999 |
|---|
| 09/2022 | $10,592 | $10,877 |
|---|
| 10/2022 | $11,159 | $11,462 |
|---|
| 11/2022 | $12,733 | $12,753 |
|---|
| 12/2022 | $12,620 | $12,763 |
|---|
| 01/2023 | $13,821 | $13,796 |
|---|
| 02/2023 | $13,329 | $13,509 |
|---|
| 03/2023 | $13,869 | $13,843 |
|---|
| 04/2023 | $14,216 | $14,234 |
|---|
| 05/2023 | $13,843 | $13,632 |
|---|
| 06/2023 | $14,156 | $14,252 |
|---|
| 07/2023 | $14,408 | $14,713 |
|---|
| 08/2023 | $13,530 | $14,150 |
|---|
| 09/2023 | $12,604 | $13,666 |
|---|
| 10/2023 | $12,231 | $13,112 |
|---|
| 11/2023 | $13,638 | $14,329 |
|---|
| 12/2023 | $14,468 | $15,091 |
|---|
| 01/2024 | $14,395 | $15,177 |
|---|
| 02/2024 | $14,857 | $15,455 |
|---|
| 03/2024 | $15,307 | $15,964 |
|---|
| 04/2024 | $14,740 | $15,555 |
|---|
| 05/2024 | $15,421 | $16,157 |
|---|
| 06/2024 | $15,178 | $15,896 |
|---|
| 07/2024 | $15,616 | $16,363 |
|---|
| 08/2024 | $16,103 | $16,895 |
|---|
| 09/2024 | $16,371 | $17,051 |
|---|
| 10/2024 | $15,336 | $16,124 |
|---|
| 11/2024 | $15,178 | $16,032 |
|---|
| 12/2024 | $14,770 | $15,668 |
|---|
Performance data shown represents past performance and is no guarantee of, and is not necessarily indicative of, future results. Total return and value will vary, and you may have a gain or loss when shares are sold. Current performance may be lower or higher than quoted. For the most recent month-end performance, visit im.natixis.com/en-us/products/mutual-funds/price-and-performance.
Average Annual Total Returns (%)
| AATR | 1 Year | 5 Years | Since Inception 12/28/18 |
|---|
| Class Y | 2.09% | 3.13% | 6.71% |
|---|
| MSCI EAFE Index (Net) | 3.82% | 4.73% | 7.47% |
|---|
| Total Net Assets | $16,353,903 |
|---|
| # of Portfolio Holdings (including overnight repurchase agreements) | 37 |
|---|
| Portfolio Turnover Rate | 33% |
|---|
| Total Advisory Fees Paid (after waiver/reimbursement, if applicable) | $0 |
|---|
What did the Fund invest in? (% of Net Assets)
| Value | Value |
|---|
Other investments less than 3% of net assetsFootnote Reference* | 20.7% |
| Financial Services | 3.0% |
| Diversified REITs | 3.1% |
| Electronic Equipment, Instruments & Components | 3.3% |
| IT Services | 3.5% |
| Electric Utilities | 4.3% |
| Personal Care Products | 4.5% |
| Insurance | 5.6% |
| Health Care Equipment & Supplies | 5.6% |
| Building Products | 5.8% |
| Pharmaceuticals | 6.7% |
| Banks | 7.2% |
| Chemicals | 8.6% |
| Semiconductors & Semiconductor Equipment | 8.9% |
| Software | 9.2% |
| Footnote | Description |
Footnote* | Net of other assets less liabilities |
| SAP SE | 6.6% |
| Taiwan Semiconductor Manufacturing Co. Ltd., ADR | 5.0% |
| KBC Group NV | 5.0% |
| Iberdrola SA | 4.3% |
| ASML Holding NV | 3.9% |
| Air Liquide SA | 3.6% |
| Novo Nordisk AS, Class B | 3.5% |
| Shopify, Inc., Class A | 3.5% |
| Legal & General Group PLC | 3.4% |
| Halma PLC | 3.3% |
There were no material fund changes during the period.
| Value | Value |
|---|
Other investments less than 3% of net assetsFootnote Reference* | 6.5% |
| Ireland | 3.1% |
| United States | 3.5% |
| Spain | 4.3% |
| Switzerland | 4.5% |
| Belgium | 5.0% |
| Taiwan | 5.0% |
| Canada | 5.3% |
| Denmark | 5.3% |
| Netherlands | 6.9% |
| Japan | 10.6% |
| Germany | 12.4% |
| France | 13.0% |
| United Kingdom | 14.6% |
| Footnote | Description |
Footnote* | Net of other assets less liabilities |
There were no changes in or disagreements with Accountants during the period.
For additional information about the Fund; including its prospectus, financial information, holdings and proxy information, scan the QR code or visit im.natixis.com/funddocuments.
Mirova International Sustainable Equity Fund
Annual Shareholder Report
December 31, 2024
Natixis Oakmark International Fund
Annual Shareholder Report - December 31, 2024
This annual shareholder report contains important information about Natixis Oakmark International Fund for the period of January 1, 2024 to December 31, 2024. You can find additional information (including tax information) about the Fund at im.natixis.com/funddocuments. You can also request the information by contacting us at (800) 225-5478 or by contacting your financial intermediary directly.
What were the fund costs for the last year? (based on a hypothetical $10,000 investment)
| Class Name | Costs of a $10,000 investment | Costs paid as a percentage of a $10,000 investmentFootnote Reference† |
|---|
| Class A | $112 | 1.15% |
|---|
| Footnote | Description |
Footnote† | Annualized for periods less than one year (if applicable). |
How did the fund perform last year and what affected its performance?
Explanation of Fund Performance
On an absolute-return basis, the industrials and communication services sectors were the only sectors that contributed to the Fund’s return. Health care and consumer discretionary detracted the most to the Fund’s absolute return for the year. Geographically, Italy and Japan had the largest contribution to absolute performance of the Fund, while France and Germany were the largest detractors.
Top Contributors to Performance
•Intesa Sanpaolo was a contributor during the 1-year period. The company started the year strong after posting results that benefited from increased fees and commissions. Solid performance continued throughout the year with the company’s net interest income being a highlight. During the year, Intesa launched management changes, which we believe could be pivotal in the continued growth of total fee income and commission over the coming years.
•Prosus was another contributor during the 1-year period. The Netherlands-headquartered broadline retail company, which, in our view, is a discounted way to invest in Tencent, saw its stock price rise on improved sentiment toward Chinese stocks after the announcement of a multipronged stimulus package by the Chinese government. During the year, we met with the new CEO, who emphasized focus on balancing steady growth and increasing profitability to unlock further value.
Top Detractors from Performance
•Bayer was a detractor during the 1-year period. The Germany-headquartered pharmaceuticals company’s stock price declined following its third-quarter earnings release. While pharma revenues exceeded consensus expectations, crop market weakness weighed on performance and drove a downgrade in 2025 guidance.
•Kering was another detractor during the 1-year period. The France-headquartered luxury holdings company’s stock price declined initially following the release of first-quarter results with underperformance mainly concentrated around Gucci globally, but most severely in China. The company’s stock price continued to slip after reporting challenging third-quarter earnings and portfolio brands, including Gucci and Yves Saint Laurent, struggled during the period.
The Fund’s benchmarks are unmanaged indices used as a general measure of market performance. Calculations assume dividends and capital gains are reinvested. The tables do not reflect taxes shareholders might owe on any fund distributions or when they redeem their shares. You cannot invest directly in an index.
Total Return Based on a Hypothetical $10,000 Investment
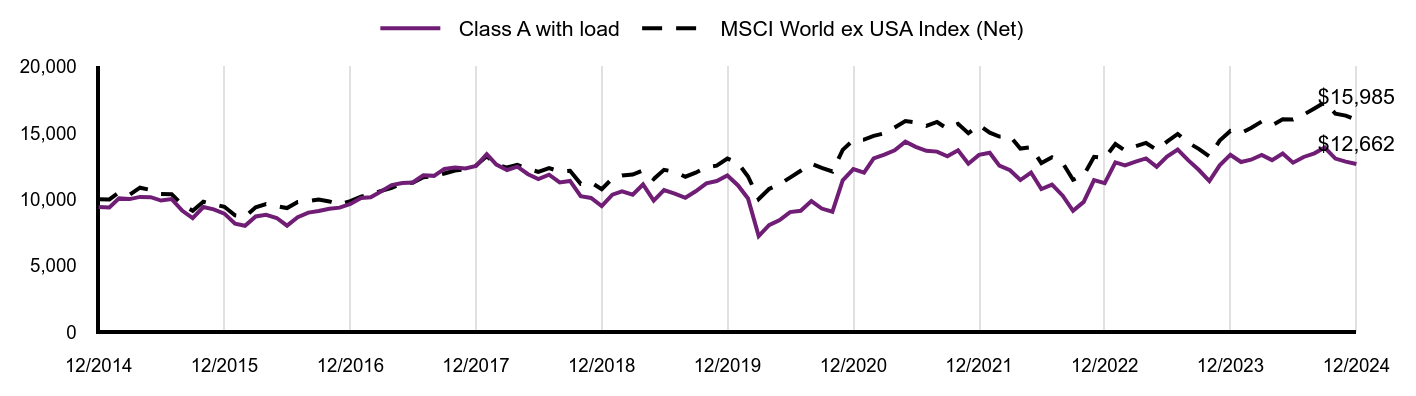
| Class A with load | MSCI World ex USA Index (Net) |
|---|
| 12/2014 | $9,424 | $10,000 |
|---|
| 01/2015 | $9,379 | $9,985 |
|---|
| 02/2015 | $10,068 | $10,519 |
|---|
| 03/2015 | $10,015 | $10,349 |
|---|
| 04/2015 | $10,179 | $10,872 |
|---|
| 05/2015 | $10,156 | $10,702 |
|---|
| 06/2015 | $9,905 | $10,403 |
|---|
| 07/2015 | $10,019 | $10,375 |
|---|
| 08/2015 | $9,135 | $9,582 |
|---|
| 09/2015 | $8,587 | $9,137 |
|---|
| 10/2015 | $9,417 | $9,818 |
|---|
| 11/2015 | $9,242 | $9,615 |
|---|
| 12/2015 | $8,920 | $9,434 |
|---|
| 01/2016 | $8,166 | $8,792 |
|---|
| 02/2016 | $8,003 | $8,692 |
|---|
| 03/2016 | $8,703 | $9,398 |
|---|
| 04/2016 | $8,825 | $9,646 |
|---|
| 05/2016 | $8,591 | $9,483 |
|---|
| 06/2016 | $8,013 | $9,338 |
|---|
| 07/2016 | $8,646 | $9,800 |
|---|
| 08/2016 | $8,997 | $9,862 |
|---|
| 09/2016 | $9,114 | $9,983 |
|---|
| 10/2016 | $9,286 | $9,840 |
|---|
| 11/2016 | $9,372 | $9,612 |
|---|
| 12/2016 | $9,651 | $9,858 |
|---|
| 01/2017 | $10,104 | $10,207 |
|---|
| 02/2017 | $10,159 | $10,370 |
|---|
| 03/2017 | $10,604 | $10,633 |
|---|
| 04/2017 | $11,073 | $10,860 |
|---|
| 05/2017 | $11,223 | $11,213 |
|---|
| 06/2017 | $11,263 | $11,248 |
|---|
| 07/2017 | $11,803 | $11,662 |
|---|
| 08/2017 | $11,764 | $11,723 |
|---|
| 09/2017 | $12,288 | $11,941 |
|---|
| 10/2017 | $12,399 | $12,165 |
|---|
| 11/2017 | $12,328 | $12,264 |
|---|
| 12/2017 | $12,504 | $12,538 |
|---|
| 01/2018 | $13,395 | $13,237 |
|---|
| 02/2018 | $12,616 | $12,613 |
|---|
| 03/2018 | $12,207 | $12,390 |
|---|
| 04/2018 | $12,456 | $12,588 |
|---|
| 05/2018 | $11,886 | $12,297 |
|---|
| 06/2018 | $11,525 | $12,066 |
|---|
| 07/2018 | $11,854 | $12,355 |
|---|
| 08/2018 | $11,268 | $12,096 |
|---|
| 09/2018 | $11,380 | $12,151 |
|---|
| 10/2018 | $10,233 | $11,163 |
|---|
| 11/2018 | $10,096 | $11,269 |
|---|
| 12/2018 | $9,484 | $10,758 |
|---|
| 01/2019 | $10,349 | $11,571 |
|---|
| 02/2019 | $10,593 | $11,797 |
|---|
| 03/2019 | $10,349 | $11,868 |
|---|
| 04/2019 | $11,114 | $12,181 |
|---|
| 05/2019 | $9,904 | $11,527 |
|---|
| 06/2019 | $10,694 | $12,222 |
|---|
| 07/2019 | $10,433 | $12,074 |
|---|
| 08/2019 | $10,114 | $11,701 |
|---|
| 09/2019 | $10,601 | $12,002 |
|---|
| 10/2019 | $11,198 | $12,421 |
|---|
| 11/2019 | $11,374 | $12,530 |
|---|
| 12/2019 | $11,794 | $13,073 |
|---|
| 01/2020 | $11,041 | $12,722 |
|---|
| 02/2020 | $10,063 | $11,716 |
|---|
| 03/2020 | $7,225 | $10,020 |
|---|
| 04/2020 | $8,047 | $10,779 |
|---|
| 05/2020 | $8,436 | $11,132 |
|---|
| 06/2020 | $9,033 | $11,635 |
|---|
| 07/2020 | $9,137 | $12,153 |
|---|
| 08/2020 | $9,864 | $12,674 |
|---|
| 09/2020 | $9,302 | $12,362 |
|---|
| 10/2020 | $9,059 | $12,096 |
|---|
| 11/2020 | $11,430 | $13,724 |
|---|
| 12/2020 | $12,272 | $14,465 |
|---|
| 01/2021 | $12,012 | $14,497 |
|---|
| 02/2021 | $13,079 | $14,784 |
|---|
| 03/2021 | $13,365 | $14,971 |
|---|
| 04/2021 | $13,695 | $15,411 |
|---|
| 05/2021 | $14,337 | $15,893 |
|---|
| 06/2021 | $13,947 | $15,790 |
|---|
| 07/2021 | $13,651 | $15,530 |
|---|
| 08/2021 | $13,591 | $15,825 |
|---|
| 09/2021 | $13,235 | $15,319 |
|---|
| 10/2021 | $13,695 | $15,684 |
|---|
| 11/2021 | $12,679 | $14,978 |
|---|
| 12/2021 | $13,344 | $15,597 |
|---|
| 01/2022 | $13,511 | $15,022 |
|---|
| 02/2022 | $12,533 | $14,725 |
|---|
| 03/2022 | $12,190 | $14,748 |
|---|
| 04/2022 | $11,450 | $13,822 |
|---|
| 05/2022 | $12,014 | $13,922 |
|---|
| 06/2022 | $10,772 | $12,724 |
|---|
| 07/2022 | $11,106 | $13,160 |
|---|
| 08/2022 | $10,270 | $12,736 |
|---|
| 09/2022 | $9,133 | $11,464 |
|---|
| 10/2022 | $9,803 | $11,806 |
|---|
| 11/2022 | $11,450 | $13,200 |
|---|
| 12/2022 | $11,221 | $13,101 |
|---|
| 01/2023 | $12,780 | $14,164 |
|---|
| 02/2023 | $12,556 | $13,666 |
|---|
| 03/2023 | $12,843 | $14,001 |
|---|
| 04/2023 | $13,076 | $14,244 |
|---|
| 05/2023 | $12,449 | $13,726 |
|---|
| 06/2023 | $13,211 | $14,342 |
|---|
| 07/2023 | $13,749 | $14,925 |
|---|
| 08/2023 | $12,933 | $14,251 |
|---|
| 09/2023 | $12,225 | $13,801 |
|---|
| 10/2023 | $11,374 | $13,231 |
|---|
| 11/2023 | $12,557 | $14,422 |
|---|
| 12/2023 | $13,346 | $15,147 |
|---|
| 01/2024 | $12,809 | $14,996 |
|---|
| 02/2024 | $12,982 | $15,376 |
|---|
| 03/2024 | $13,346 | $15,857 |
|---|
| 04/2024 | $12,951 | $15,572 |
|---|
| 05/2024 | $13,452 | $16,024 |
|---|
| 06/2024 | $12,759 | $16,009 |
|---|
| 07/2024 | $13,188 | $16,379 |
|---|
| 08/2024 | $13,462 | $16,846 |
|---|
| 09/2024 | $13,900 | $17,300 |
|---|
| 10/2024 | $13,069 | $16,451 |
|---|
| 11/2024 | $12,841 | $16,302 |
|---|
| 12/2024 | $12,662 | $15,985 |
|---|
Performance data shown represents past performance and is no guarantee of, and is not necessarily indicative of, future results. Total return and value will vary, and you may have a gain or loss when shares are sold. Current performance may be lower or higher than quoted. For the most recent month-end performance, visit im.natixis.com/en-us/products/mutual-funds/price-and-performance.
Average Annual Total Returns (%)
| AATR | 1 Year | 5 Years | 10 Years |
|---|
| Class A at NAV | (5.13%) | 1.43% | 3.00% |
|---|
Class A with 5.75% MSCFootnote Reference1 | (10.57%) | 0.24% | 2.39% |
|---|
| MSCI World ex USA Index (Net) | 5.49% | 4.09% | 4.79% |
|---|
| Footnote | Description |
Footnote1 | Maximum sales charge |
| Total Net Assets | $269,010,643 |
|---|
| # of Portfolio Holdings (including overnight repurchase agreements) | 69 |
|---|
| Portfolio Turnover Rate | 35% |
|---|
| Total Advisory Fees Paid (after waiver/reimbursement, if applicable) | $2,037,075 |
|---|
What did the Fund invest in? (% of Net Assets)
| Value | Value |
|---|
Other investments less than 3% of net assetsFootnote Reference* | 42.3% |
| Automobile Components | 3.2% |
| Beverages | 3.4% |
| Insurance | 3.5% |
| Health Care Providers & Services | 4.6% |
| Automobiles | 5.1% |
| Financial Services | 5.3% |
| Pharmaceuticals | 5.7% |
| Textiles, Apparel & Luxury Goods | 7.4% |
| Banks | 9.1% |
| Machinery | 10.4% |
| Footnote | Description |
Footnote* | Net of other assets less liabilities |
| BNP Paribas SA | 3.7% |
| Kering SA | 3.3% |
| CNH Industrial NV | 3.2% |
| Continental AG | 3.2% |
| Bayer AG | 3.2% |
| Edenred SE | 2.8% |
| Bayerische Motoren Werke AG | 2.8% |
| Fresenius Medical Care AG | 2.5% |
| Mercedes-Benz Group AG, (Registered) | 2.3% |
| Airbus SE | 2.2% |
There were no material fund changes during the period.
| Value | Value |
|---|
Other investments less than 3% of net assetsFootnote Reference* | 19.5% |
| United States | 3.3% |
| Sweden | 3.4% |
| Netherlands | 5.5% |
| Switzerland | 7.9% |
| United Kingdom | 14.1% |
| France | 20.8% |
| Germany | 25.5% |
| Footnote | Description |
Footnote* | Net of other assets less liabilities |
There were no changes in or disagreements with Accountants during the period.
For additional information about the Fund; including its prospectus, financial information, holdings and proxy information, scan the QR code or visit im.natixis.com/funddocuments.
Natixis Oakmark International Fund
Annual Shareholder Report
December 31, 2024
Natixis Oakmark International Fund
Annual Shareholder Report - December 31, 2024
This annual shareholder report contains important information about Natixis Oakmark International Fund for the period of January 1, 2024 to December 31, 2024. You can find additional information (including tax information) about the Fund at im.natixis.com/funddocuments. You can also request the information by contacting us at (800) 225-5478 or by contacting your financial intermediary directly.
What were the fund costs for the last year? (based on a hypothetical $10,000 investment)
| Class Name | Costs of a $10,000 investment | Costs paid as a percentage of a $10,000 investmentFootnote Reference† |
|---|
| Class C | $184 | 1.90% |
|---|
| Footnote | Description |
Footnote† | Annualized for periods less than one year (if applicable). |
How did the fund perform last year and what affected its performance?
Explanation of Fund Performance
On an absolute-return basis, the industrials and communication services sectors were the only sectors that contributed to the Fund’s return. Health care and consumer discretionary detracted the most to the Fund’s absolute return for the year. Geographically, Italy and Japan had the largest contribution to absolute performance of the Fund, while France and Germany were the largest detractors.
Top Contributors to Performance
•Intesa Sanpaolo was a contributor during the 1-year period. The company started the year strong after posting results that benefited from increased fees and commissions. Solid performance continued throughout the year with the company’s net interest income being a highlight. During the year, Intesa launched management changes, which we believe could be pivotal in the continued growth of total fee income and commission over the coming years.
•Prosus was another contributor during the 1-year period. The Netherlands-headquartered broadline retail company, which, in our view, is a discounted way to invest in Tencent, saw its stock price rise on improved sentiment toward Chinese stocks after the announcement of a multipronged stimulus package by the Chinese government. During the year, we met with the new CEO, who emphasized focus on balancing steady growth and increasing profitability to unlock further value.
Top Detractors from Performance
•Bayer was a detractor during the 1-year period. The Germany-headquartered pharmaceuticals company’s stock price declined following its third-quarter earnings release. While pharma revenues exceeded consensus expectations, crop market weakness weighed on performance and drove a downgrade in 2025 guidance.
•Kering was another detractor during the 1-year period. The France-headquartered luxury holdings company’s stock price declined initially following the release of first-quarter results with underperformance mainly concentrated around Gucci globally, but most severely in China. The company’s stock price continued to slip after reporting challenging third-quarter earnings and portfolio brands, including Gucci and Yves Saint Laurent, struggled during the period.
The Fund’s benchmarks are unmanaged indices used as a general measure of market performance. Calculations assume dividends and capital gains are reinvested. The tables do not reflect taxes shareholders might owe on any fund distributions or when they redeem their shares. You cannot invest directly in an index.
Total Return Based on a Hypothetical $10,000 Investment
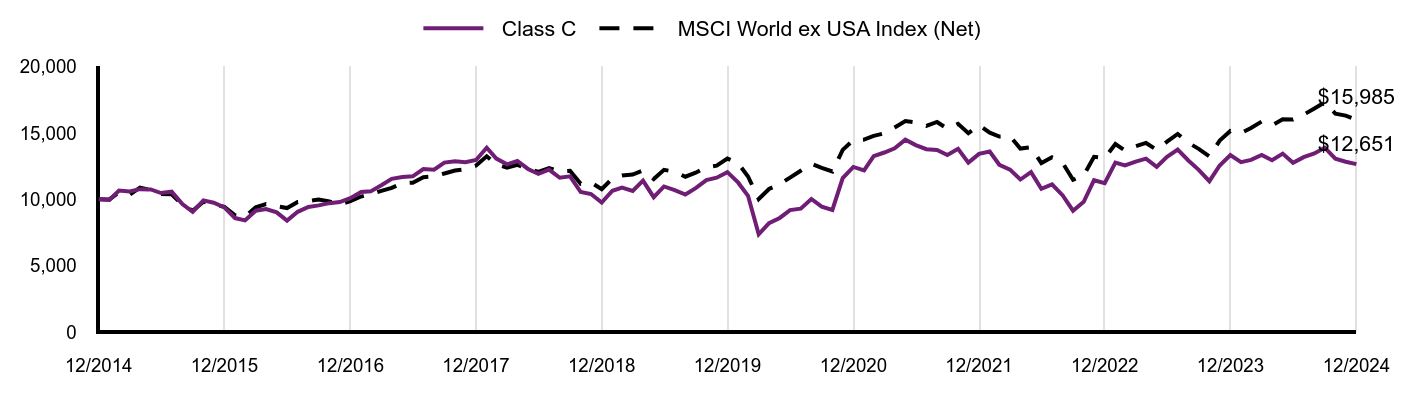
| Class C | MSCI World ex USA Index (Net) |
|---|
| 12/2014 | $10,000 | $10,000 |
|---|
| 01/2015 | $9,943 | $9,985 |
|---|
| 02/2015 | $10,661 | $10,519 |
|---|
| 03/2015 | $10,596 | $10,349 |
|---|
| 04/2015 | $10,764 | $10,872 |
|---|
| 05/2015 | $10,740 | $10,702 |
|---|
| 06/2015 | $10,469 | $10,403 |
|---|
| 07/2015 | $10,575 | $10,375 |
|---|
| 08/2015 | $9,639 | $9,582 |
|---|
| 09/2015 | $9,056 | $9,137 |
|---|
| 10/2015 | $9,919 | $9,818 |
|---|
| 11/2015 | $9,738 | $9,615 |
|---|
| 12/2015 | $9,392 | $9,434 |
|---|
| 01/2016 | $8,585 | $8,792 |
|---|
| 02/2016 | $8,410 | $8,692 |
|---|
| 03/2016 | $9,142 | $9,398 |
|---|
| 04/2016 | $9,265 | $9,646 |
|---|
| 05/2016 | $9,014 | $9,483 |
|---|
| 06/2016 | $8,396 | $9,338 |
|---|
| 07/2016 | $9,056 | $9,800 |
|---|
| 08/2016 | $9,424 | $9,862 |
|---|
| 09/2016 | $9,541 | $9,983 |
|---|
| 10/2016 | $9,708 | $9,840 |
|---|
| 11/2016 | $9,791 | $9,612 |
|---|
| 12/2016 | $10,083 | $9,858 |
|---|
| 01/2017 | $10,547 | $10,207 |
|---|
| 02/2017 | $10,597 | $10,370 |
|---|
| 03/2017 | $11,061 | $10,633 |
|---|
| 04/2017 | $11,541 | $10,860 |
|---|
| 05/2017 | $11,685 | $11,213 |
|---|
| 06/2017 | $11,727 | $11,248 |
|---|
| 07/2017 | $12,283 | $11,662 |
|---|
| 08/2017 | $12,224 | $11,723 |
|---|
| 09/2017 | $12,764 | $11,941 |
|---|
| 10/2017 | $12,873 | $12,165 |
|---|
| 11/2017 | $12,789 | $12,264 |
|---|
| 12/2017 | $12,962 | $12,538 |
|---|
| 01/2018 | $13,885 | $13,237 |
|---|
| 02/2018 | $13,063 | $12,613 |
|---|
| 03/2018 | $12,631 | $12,390 |
|---|
| 04/2018 | $12,886 | $12,588 |
|---|
| 05/2018 | $12,284 | $12,297 |
|---|
| 06/2018 | $11,911 | $12,066 |
|---|
| 07/2018 | $12,233 | $12,355 |
|---|
| 08/2018 | $11,623 | $12,096 |
|---|
| 09/2018 | $11,733 | $12,151 |
|---|
| 10/2018 | $10,547 | $11,163 |
|---|
| 11/2018 | $10,395 | $11,269 |
|---|
| 12/2018 | $9,755 | $10,758 |
|---|
| 01/2019 | $10,642 | $11,571 |
|---|
| 02/2019 | $10,888 | $11,797 |
|---|
| 03/2019 | $10,633 | $11,868 |
|---|
| 04/2019 | $11,406 | $12,181 |
|---|
| 05/2019 | $10,159 | $11,527 |
|---|
| 06/2019 | $10,967 | $12,222 |
|---|
| 07/2019 | $10,686 | $12,074 |
|---|
| 08/2019 | $10,361 | $11,701 |
|---|
| 09/2019 | $10,844 | $12,002 |
|---|
| 10/2019 | $11,450 | $12,421 |
|---|
| 11/2019 | $11,625 | $12,530 |
|---|
| 12/2019 | $12,042 | $13,073 |
|---|
| 01/2020 | $11,270 | $12,722 |
|---|
| 02/2020 | $10,264 | $11,716 |
|---|
| 03/2020 | $7,364 | $10,020 |
|---|
| 04/2020 | $8,199 | $10,779 |
|---|
| 05/2020 | $8,594 | $11,132 |
|---|
| 06/2020 | $9,187 | $11,635 |
|---|
| 07/2020 | $9,294 | $12,153 |
|---|
| 08/2020 | $10,022 | $12,674 |
|---|
| 09/2020 | $9,447 | $12,362 |
|---|
| 10/2020 | $9,196 | $12,096 |
|---|
| 11/2020 | $11,593 | $13,724 |
|---|
| 12/2020 | $12,437 | $14,465 |
|---|
| 01/2021 | $12,177 | $14,497 |
|---|
| 02/2021 | $13,245 | $14,784 |
|---|
| 03/2021 | $13,524 | $14,971 |
|---|
| 04/2021 | $13,847 | $15,411 |
|---|
| 05/2021 | $14,494 | $15,893 |
|---|
| 06/2021 | $14,081 | $15,790 |
|---|
| 07/2021 | $13,776 | $15,530 |
|---|
| 08/2021 | $13,713 | $15,825 |
|---|
| 09/2021 | $13,335 | $15,319 |
|---|
| 10/2021 | $13,803 | $15,684 |
|---|
| 11/2021 | $12,760 | $14,978 |
|---|
| 12/2021 | $13,422 | $15,597 |
|---|
| 01/2022 | $13,594 | $15,022 |
|---|
| 02/2022 | $12,600 | $14,725 |
|---|
| 03/2022 | $12,239 | $14,748 |
|---|
| 04/2022 | $11,489 | $13,822 |
|---|
| 05/2022 | $12,049 | $13,922 |
|---|
| 06/2022 | $10,794 | $12,724 |
|---|
| 07/2022 | $11,128 | $13,160 |
|---|
| 08/2022 | $10,288 | $12,736 |
|---|
| 09/2022 | $9,141 | $11,464 |
|---|
| 10/2022 | $9,809 | $11,806 |
|---|
| 11/2022 | $11,435 | $13,200 |
|---|
| 12/2022 | $11,208 | $13,101 |
|---|
| 01/2023 | $12,769 | $14,164 |
|---|
| 02/2023 | $12,545 | $13,666 |
|---|
| 03/2023 | $12,832 | $14,001 |
|---|
| 04/2023 | $13,065 | $14,244 |
|---|
| 05/2023 | $12,439 | $13,726 |
|---|
| 06/2023 | $13,200 | $14,342 |
|---|
| 07/2023 | $13,737 | $14,925 |
|---|
| 08/2023 | $12,922 | $14,251 |
|---|
| 09/2023 | $12,215 | $13,801 |
|---|
| 10/2023 | $11,364 | $13,231 |
|---|
| 11/2023 | $12,546 | $14,422 |
|---|
| 12/2023 | $13,335 | $15,147 |
|---|
| 01/2024 | $12,798 | $14,996 |
|---|
| 02/2024 | $12,971 | $15,376 |
|---|
| 03/2024 | $13,335 | $15,857 |
|---|
| 04/2024 | $12,940 | $15,572 |
|---|
| 05/2024 | $13,441 | $16,024 |
|---|
| 06/2024 | $12,748 | $16,009 |
|---|
| 07/2024 | $13,177 | $16,379 |
|---|
| 08/2024 | $13,450 | $16,846 |
|---|
| 09/2024 | $13,888 | $17,300 |
|---|
| 10/2024 | $13,058 | $16,451 |
|---|
| 11/2024 | $12,830 | $16,302 |
|---|
| 12/2024 | $12,651 | $15,985 |
|---|
Performance data shown represents past performance and is no guarantee of, and is not necessarily indicative of, future results. Total return and value will vary, and you may have a gain or loss when shares are sold. Current performance may be lower or higher than quoted. For the most recent month-end performance, visit im.natixis.com/en-us/products/mutual-funds/price-and-performance.
Average Annual Total Returns (%)
| AATR | 1 Year | 5 Years | 10 Years |
|---|
| Class C at NAV | (5.88%) | 0.67% | 2.38% |
|---|
Class C with 1.00% CDSCFootnote Reference1 | (6.81%) | 0.67% | 2.38% |
|---|
| MSCI World ex USA Index (Net) | 5.49% | 4.09% | 4.79% |
|---|
| Footnote | Description |
Footnote1 | Contingent deferred sales charge |
| Total Net Assets | $269,010,643 |
|---|
| # of Portfolio Holdings (including overnight repurchase agreements) | 69 |
|---|
| Portfolio Turnover Rate | 35% |
|---|
| Total Advisory Fees Paid (after waiver/reimbursement, if applicable) | $2,037,075 |
|---|
What did the Fund invest in? (% of Net Assets)
| Value | Value |
|---|
Other investments less than 3% of net assetsFootnote Reference* | 42.3% |
| Automobile Components | 3.2% |
| Beverages | 3.4% |
| Insurance | 3.5% |
| Health Care Providers & Services | 4.6% |
| Automobiles | 5.1% |
| Financial Services | 5.3% |
| Pharmaceuticals | 5.7% |
| Textiles, Apparel & Luxury Goods | 7.4% |
| Banks | 9.1% |
| Machinery | 10.4% |
| Footnote | Description |
Footnote* | Net of other assets less liabilities |
| BNP Paribas SA | 3.7% |
| Kering SA | 3.3% |
| CNH Industrial NV | 3.2% |
| Continental AG | 3.2% |
| Bayer AG | 3.2% |
| Edenred SE | 2.8% |
| Bayerische Motoren Werke AG | 2.8% |
| Fresenius Medical Care AG | 2.5% |
| Mercedes-Benz Group AG, (Registered) | 2.3% |
| Airbus SE | 2.2% |
There were no material fund changes during the period.
| Value | Value |
|---|
Other investments less than 3% of net assetsFootnote Reference* | 19.5% |
| United States | 3.3% |
| Sweden | 3.4% |
| Netherlands | 5.5% |
| Switzerland | 7.9% |
| United Kingdom | 14.1% |
| France | 20.8% |
| Germany | 25.5% |
| Footnote | Description |
Footnote* | Net of other assets less liabilities |
There were no changes in or disagreements with Accountants during the period.
For additional information about the Fund; including its prospectus, financial information, holdings and proxy information, scan the QR code or visit im.natixis.com/funddocuments.
Natixis Oakmark International Fund
Annual Shareholder Report
December 31, 2024
Natixis Oakmark International Fund
Annual Shareholder Report - December 31, 2024
This annual shareholder report contains important information about Natixis Oakmark International Fund for the period of January 1, 2024 to December 31, 2024. You can find additional information (including tax information) about the Fund at im.natixis.com/funddocuments. You can also request the information by contacting us at (800) 225-5478 or by contacting your financial intermediary directly.
What were the fund costs for the last year? (based on a hypothetical $10,000 investment)
| Class Name | Costs of a $10,000 investment | Costs paid as a percentage of a $10,000 investmentFootnote Reference† |
|---|
| Class N | $83 | 0.85% |
|---|
| Footnote | Description |
Footnote† | Annualized for periods less than one year (if applicable). |
How did the fund perform last year and what affected its performance?
Explanation of Fund Performance
On an absolute-return basis, the industrials and communication services sectors were the only sectors that contributed to the Fund’s return. Health care and consumer discretionary detracted the most to the Fund’s absolute return for the year. Geographically, Italy and Japan had the largest contribution to absolute performance of the Fund, while France and Germany were the largest detractors.
Top Contributors to Performance
•Intesa Sanpaolo was a contributor during the 1-year period. The company started the year strong after posting results that benefited from increased fees and commissions. Solid performance continued throughout the year with the company’s net interest income being a highlight. During the year, Intesa launched management changes, which we believe could be pivotal in the continued growth of total fee income and commission over the coming years.
•Prosus was another contributor during the 1-year period. The Netherlands-headquartered broadline retail company, which, in our view, is a discounted way to invest in Tencent, saw its stock price rise on improved sentiment toward Chinese stocks after the announcement of a multipronged stimulus package by the Chinese government. During the year, we met with the new CEO, who emphasized focus on balancing steady growth and increasing profitability to unlock further value.
Top Detractors from Performance
•Bayer was a detractor during the 1-year period. The Germany-headquartered pharmaceuticals company’s stock price declined following its third-quarter earnings release. While pharma revenues exceeded consensus expectations, crop market weakness weighed on performance and drove a downgrade in 2025 guidance.
•Kering was another detractor during the 1-year period. The France-headquartered luxury holdings company’s stock price declined initially following the release of first-quarter results with underperformance mainly concentrated around Gucci globally, but most severely in China. The company’s stock price continued to slip after reporting challenging third-quarter earnings and portfolio brands, including Gucci and Yves Saint Laurent, struggled during the period.
The Fund’s benchmarks are unmanaged indices used as a general measure of market performance. Calculations assume dividends and capital gains are reinvested. The tables do not reflect taxes shareholders might owe on any fund distributions or when they redeem their shares. You cannot invest directly in an index.
Total Return Based on a Hypothetical $10,000 Investment
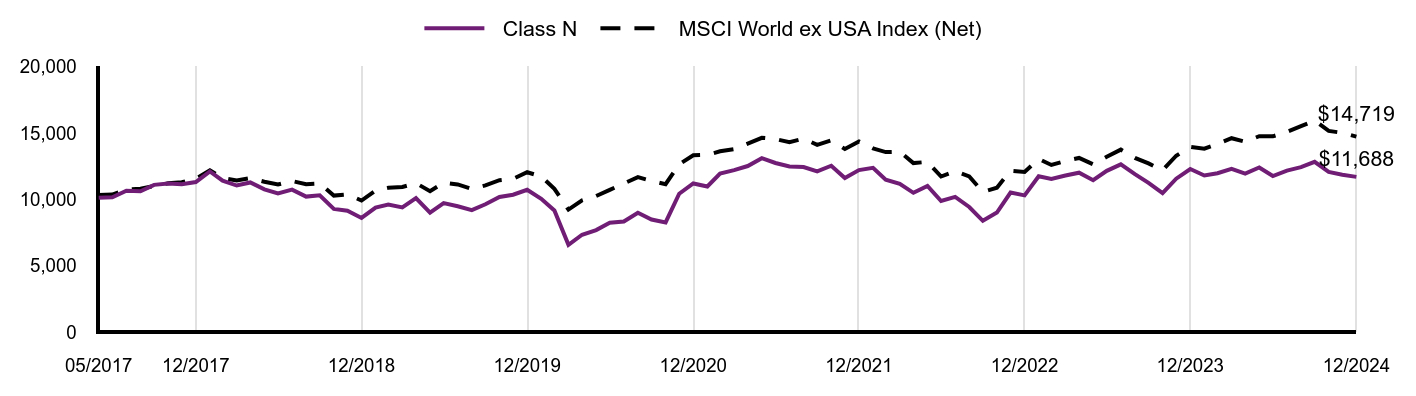
| Class N | MSCI World ex USA Index (Net) |
|---|
| 05/2017 | $10,114 | $10,324 |
|---|
| 06/2017 | $10,150 | $10,357 |
|---|
| 07/2017 | $10,644 | $10,738 |
|---|
| 08/2017 | $10,608 | $10,794 |
|---|
| 09/2017 | $11,087 | $10,995 |
|---|
| 10/2017 | $11,187 | $11,202 |
|---|
| 11/2017 | $11,130 | $11,293 |
|---|
| 12/2017 | $11,296 | $11,545 |
|---|
| 01/2018 | $12,101 | $12,188 |
|---|
| 02/2018 | $11,405 | $11,613 |
|---|
| 03/2018 | $11,035 | $11,409 |
|---|
| 04/2018 | $11,267 | $11,591 |
|---|
| 05/2018 | $10,753 | $11,323 |
|---|
| 06/2018 | $10,434 | $11,110 |
|---|
| 07/2018 | $10,724 | $11,376 |
|---|
| 08/2018 | $10,202 | $11,138 |
|---|
| 09/2018 | $10,303 | $11,189 |
|---|
| 10/2018 | $9,273 | $10,279 |
|---|
| 11/2018 | $9,143 | $10,376 |
|---|
| 12/2018 | $8,592 | $9,906 |
|---|
| 01/2019 | $9,378 | $10,655 |
|---|
| 02/2019 | $9,607 | $10,863 |
|---|
| 03/2019 | $9,386 | $10,928 |
|---|
| 04/2019 | $10,081 | $11,216 |
|---|
| 05/2019 | $8,989 | $10,614 |
|---|
| 06/2019 | $9,707 | $11,253 |
|---|
| 07/2019 | $9,470 | $11,117 |
|---|
| 08/2019 | $9,187 | $10,774 |
|---|
| 09/2019 | $9,623 | $11,051 |
|---|
| 10/2019 | $10,173 | $11,437 |
|---|
| 11/2019 | $10,341 | $11,538 |
|---|
| 12/2019 | $10,718 | $12,037 |
|---|
| 01/2020 | $10,038 | $11,714 |
|---|
| 02/2020 | $9,153 | $10,788 |
|---|
| 03/2020 | $6,568 | $9,226 |
|---|
| 04/2020 | $7,327 | $9,925 |
|---|
| 05/2020 | $7,683 | $10,250 |
|---|
| 06/2020 | $8,228 | $10,713 |
|---|
| 07/2020 | $8,323 | $11,191 |
|---|
| 08/2020 | $8,987 | $11,670 |
|---|
| 09/2020 | $8,473 | $11,383 |
|---|
| 10/2020 | $8,260 | $11,138 |
|---|
| 11/2020 | $10,417 | $12,636 |
|---|
| 12/2020 | $11,194 | $13,319 |
|---|
| 01/2021 | $10,964 | $13,348 |
|---|
| 02/2021 | $11,941 | $13,613 |
|---|
| 03/2021 | $12,195 | $13,785 |
|---|
| 04/2021 | $12,505 | $14,190 |
|---|
| 05/2021 | $13,093 | $14,634 |
|---|
| 06/2021 | $12,736 | $14,540 |
|---|
| 07/2021 | $12,473 | $14,300 |
|---|
| 08/2021 | $12,426 | $14,572 |
|---|
| 09/2021 | $12,100 | $14,105 |
|---|
| 10/2021 | $12,529 | $14,442 |
|---|
| 11/2021 | $11,599 | $13,792 |
|---|
| 12/2021 | $12,203 | $14,362 |
|---|
| 01/2022 | $12,373 | $13,832 |
|---|
| 02/2022 | $11,475 | $13,558 |
|---|
| 03/2022 | $11,159 | $13,580 |
|---|
| 04/2022 | $10,487 | $12,727 |
|---|
| 05/2022 | $11,005 | $12,819 |
|---|
| 06/2022 | $9,872 | $11,716 |
|---|
| 07/2022 | $10,180 | $12,117 |
|---|
| 08/2022 | $9,419 | $11,727 |
|---|
| 09/2022 | $8,375 | $10,555 |
|---|
| 10/2022 | $8,998 | $10,871 |
|---|
| 11/2022 | $10,504 | $12,154 |
|---|
| 12/2022 | $10,293 | $12,063 |
|---|
| 01/2023 | $11,731 | $13,042 |
|---|
| 02/2023 | $11,532 | $12,584 |
|---|
| 03/2023 | $11,788 | $12,891 |
|---|
| 04/2023 | $12,004 | $13,115 |
|---|
| 05/2023 | $11,434 | $12,639 |
|---|
| 06/2023 | $12,144 | $13,206 |
|---|
| 07/2023 | $12,631 | $13,743 |
|---|
| 08/2023 | $11,896 | $13,122 |
|---|
| 09/2023 | $11,235 | $12,707 |
|---|
| 10/2023 | $10,459 | $12,183 |
|---|
| 11/2023 | $11,549 | $13,280 |
|---|
| 12/2023 | $12,280 | $13,947 |
|---|
| 01/2024 | $11,791 | $13,808 |
|---|
| 02/2024 | $11,959 | $14,158 |
|---|
| 03/2024 | $12,288 | $14,601 |
|---|
| 04/2024 | $11,930 | $14,338 |
|---|
| 05/2024 | $12,394 | $14,755 |
|---|
| 06/2024 | $11,753 | $14,741 |
|---|
| 07/2024 | $12,158 | $15,082 |
|---|
| 08/2024 | $12,420 | $15,511 |
|---|
| 09/2024 | $12,825 | $15,929 |
|---|
| 10/2024 | $12,057 | $15,148 |
|---|
| 11/2024 | $11,846 | $15,010 |
|---|
| 12/2024 | $11,688 | $14,719 |
|---|
Performance data shown represents past performance and is no guarantee of, and is not necessarily indicative of, future results. Total return and value will vary, and you may have a gain or loss when shares are sold. Current performance may be lower or higher than quoted. For the most recent month-end performance, visit im.natixis.com/en-us/products/mutual-funds/price-and-performance.
Average Annual Total Returns (%)
| AATR | 1 Year | 5 Years | Since Inception 5/1/17 |
|---|
| Class N | (4.82%) | 1.75% | 2.05% |
|---|
| MSCI World ex USA Index (Net) | 5.49% | 4.09% | 5.12% |
|---|
| Total Net Assets | $269,010,643 |
|---|
| # of Portfolio Holdings (including overnight repurchase agreements) | 69 |
|---|
| Portfolio Turnover Rate | 35% |
|---|
| Total Advisory Fees Paid (after waiver/reimbursement, if applicable) | $2,037,075 |
|---|
What did the Fund invest in? (% of Net Assets)
| Value | Value |
|---|
Other investments less than 3% of net assetsFootnote Reference* | 42.3% |
| Automobile Components | 3.2% |
| Beverages | 3.4% |
| Insurance | 3.5% |
| Health Care Providers & Services | 4.6% |
| Automobiles | 5.1% |
| Financial Services | 5.3% |
| Pharmaceuticals | 5.7% |
| Textiles, Apparel & Luxury Goods | 7.4% |
| Banks | 9.1% |
| Machinery | 10.4% |
| Footnote | Description |
Footnote* | Net of other assets less liabilities |
| BNP Paribas SA | 3.7% |
| Kering SA | 3.3% |
| CNH Industrial NV | 3.2% |
| Continental AG | 3.2% |
| Bayer AG | 3.2% |
| Edenred SE | 2.8% |
| Bayerische Motoren Werke AG | 2.8% |
| Fresenius Medical Care AG | 2.5% |
| Mercedes-Benz Group AG, (Registered) | 2.3% |
| Airbus SE | 2.2% |
There were no material fund changes during the period.
| Value | Value |
|---|
Other investments less than 3% of net assetsFootnote Reference* | 19.5% |
| United States | 3.3% |
| Sweden | 3.4% |
| Netherlands | 5.5% |
| Switzerland | 7.9% |
| United Kingdom | 14.1% |
| France | 20.8% |
| Germany | 25.5% |
| Footnote | Description |
Footnote* | Net of other assets less liabilities |
There were no changes in or disagreements with Accountants during the period.
For additional information about the Fund; including its prospectus, financial information, holdings and proxy information, scan the QR code or visit im.natixis.com/funddocuments.
Natixis Oakmark International Fund
Annual Shareholder Report
December 31, 2024
Natixis Oakmark International Fund
Annual Shareholder Report - December 31, 2024
This annual shareholder report contains important information about Natixis Oakmark International Fund for the period of January 1, 2024 to December 31, 2024. You can find additional information (including tax information) about the Fund at im.natixis.com/funddocuments. You can also request the information by contacting us at (800) 225-5478 or by contacting your financial intermediary directly.
What were the fund costs for the last year? (based on a hypothetical $10,000 investment)
| Class Name | Costs of a $10,000 investment | Costs paid as a percentage of a $10,000 investmentFootnote Reference† |
|---|
| Class Y | $88 | 0.90% |
|---|
| Footnote | Description |
Footnote† | Annualized for periods less than one year (if applicable). |
How did the fund perform last year and what affected its performance?
Explanation of Fund Performance
On an absolute-return basis, the industrials and communication services sectors were the only sectors that contributed to the Fund’s return. Health care and consumer discretionary detracted the most to the Fund’s absolute return for the year. Geographically, Italy and Japan had the largest contribution to absolute performance of the Fund, while France and Germany were the largest detractors.
Top Contributors to Performance
•Intesa Sanpaolo was a contributor during the 1-year period. The company started the year strong after posting results that benefited from increased fees and commissions. Solid performance continued throughout the year with the company’s net interest income being a highlight. During the year, Intesa launched management changes, which we believe could be pivotal in the continued growth of total fee income and commission over the coming years.
•Prosus was another contributor during the 1-year period. The Netherlands-headquartered broadline retail company, which, in our view, is a discounted way to invest in Tencent, saw its stock price rise on improved sentiment toward Chinese stocks after the announcement of a multipronged stimulus package by the Chinese government. During the year, we met with the new CEO, who emphasized focus on balancing steady growth and increasing profitability to unlock further value.
Top Detractors from Performance
•Bayer was a detractor during the 1-year period. The Germany-headquartered pharmaceuticals company’s stock price declined following its third-quarter earnings release. While pharma revenues exceeded consensus expectations, crop market weakness weighed on performance and drove a downgrade in 2025 guidance.
•Kering was another detractor during the 1-year period. The France-headquartered luxury holdings company’s stock price declined initially following the release of first-quarter results with underperformance mainly concentrated around Gucci globally, but most severely in China. The company’s stock price continued to slip after reporting challenging third-quarter earnings and portfolio brands, including Gucci and Yves Saint Laurent, struggled during the period.
The Fund’s benchmarks are unmanaged indices used as a general measure of market performance. Calculations assume dividends and capital gains are reinvested. The tables do not reflect taxes shareholders might owe on any fund distributions or when they redeem their shares. You cannot invest directly in an index.
Total Return Based on a Hypothetical $10,000 Investment
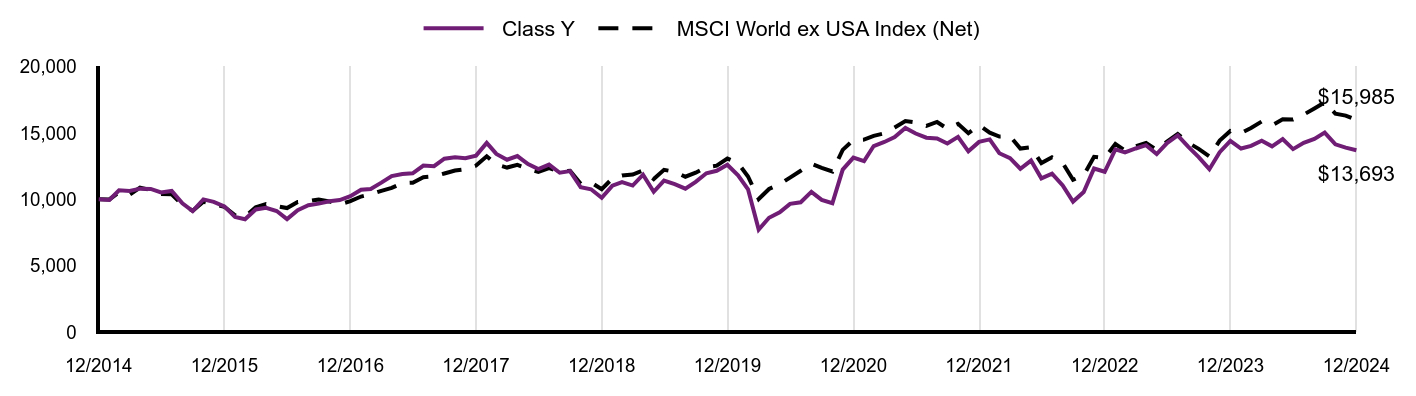
| Class Y | MSCI World ex USA Index (Net) |
|---|
| 12/2014 | $10,000 | $10,000 |
|---|
| 01/2015 | $9,952 | $9,985 |
|---|
| 02/2015 | $10,683 | $10,519 |
|---|
| 03/2015 | $10,627 | $10,349 |
|---|
| 04/2015 | $10,801 | $10,872 |
|---|
| 05/2015 | $10,777 | $10,702 |
|---|
| 06/2015 | $10,510 | $10,403 |
|---|
| 07/2015 | $10,631 | $10,375 |
|---|
| 08/2015 | $9,693 | $9,582 |
|---|
| 09/2015 | $9,111 | $9,137 |
|---|
| 10/2015 | $9,992 | $9,818 |
|---|
| 11/2015 | $9,807 | $9,615 |
|---|
| 12/2015 | $9,465 | $9,434 |
|---|
| 01/2016 | $8,665 | $8,792 |
|---|
| 02/2016 | $8,492 | $8,692 |
|---|
| 03/2016 | $9,234 | $9,398 |
|---|
| 04/2016 | $9,364 | $9,646 |
|---|
| 05/2016 | $9,116 | $9,483 |
|---|
| 06/2016 | $8,503 | $9,338 |
|---|
| 07/2016 | $9,174 | $9,800 |
|---|
| 08/2016 | $9,547 | $9,862 |
|---|
| 09/2016 | $9,671 | $9,983 |
|---|
| 10/2016 | $9,853 | $9,840 |
|---|
| 11/2016 | $9,944 | $9,612 |
|---|
| 12/2016 | $10,240 | $9,858 |
|---|
| 01/2017 | $10,721 | $10,207 |
|---|
| 02/2017 | $10,780 | $10,370 |
|---|
| 03/2017 | $11,252 | $10,633 |
|---|
| 04/2017 | $11,749 | $10,860 |
|---|
| 05/2017 | $11,909 | $11,213 |
|---|
| 06/2017 | $11,960 | $11,248 |
|---|
| 07/2017 | $12,541 | $11,662 |
|---|
| 08/2017 | $12,491 | $11,723 |
|---|
| 09/2017 | $13,055 | $11,941 |
|---|
| 10/2017 | $13,173 | $12,165 |
|---|
| 11/2017 | $13,098 | $12,264 |
|---|
| 12/2017 | $13,290 | $12,538 |
|---|
| 01/2018 | $14,246 | $13,237 |
|---|
| 02/2018 | $13,418 | $12,613 |
|---|
| 03/2018 | $12,982 | $12,390 |
|---|
| 04/2018 | $13,255 | $12,588 |
|---|
| 05/2018 | $12,649 | $12,297 |
|---|
| 06/2018 | $12,273 | $12,066 |
|---|
| 07/2018 | $12,615 | $12,355 |
|---|
| 08/2018 | $12,000 | $12,096 |
|---|
| 09/2018 | $12,120 | $12,151 |
|---|
| 10/2018 | $10,907 | $11,163 |
|---|
| 11/2018 | $10,753 | $11,269 |
|---|
| 12/2018 | $10,110 | $10,758 |
|---|
| 01/2019 | $11,026 | $11,571 |
|---|
| 02/2019 | $11,296 | $11,797 |
|---|
| 03/2019 | $11,035 | $11,868 |
|---|
| 04/2019 | $11,853 | $12,181 |
|---|
| 05/2019 | $10,568 | $11,527 |
|---|
| 06/2019 | $11,413 | $12,222 |
|---|
| 07/2019 | $11,134 | $12,074 |
|---|
| 08/2019 | $10,801 | $11,701 |
|---|
| 09/2019 | $11,314 | $12,002 |
|---|
| 10/2019 | $11,961 | $12,421 |
|---|
| 11/2019 | $12,149 | $12,530 |
|---|
| 12/2019 | $12,600 | $13,073 |
|---|
| 01/2020 | $11,801 | $12,722 |
|---|
| 02/2020 | $10,751 | $11,716 |
|---|
| 03/2020 | $7,722 | $10,020 |
|---|
| 04/2020 | $8,605 | $10,779 |
|---|
| 05/2020 | $9,023 | $11,132 |
|---|
| 06/2020 | $9,655 | $11,635 |
|---|
| 07/2020 | $9,775 | $12,153 |
|---|
| 08/2020 | $10,556 | $12,674 |
|---|
| 09/2020 | $9,952 | $12,362 |
|---|
| 10/2020 | $9,701 | $12,096 |
|---|
| 11/2020 | $12,238 | $13,724 |
|---|
| 12/2020 | $13,144 | $14,465 |
|---|
| 01/2021 | $12,873 | $14,497 |
|---|
| 02/2021 | $14,012 | $14,784 |
|---|
| 03/2021 | $14,320 | $14,971 |
|---|
| 04/2021 | $14,685 | $15,411 |
|---|
| 05/2021 | $15,376 | $15,893 |
|---|
| 06/2021 | $14,956 | $15,790 |
|---|
| 07/2021 | $14,638 | $15,530 |
|---|
| 08/2021 | $14,582 | $15,825 |
|---|
| 09/2021 | $14,199 | $15,319 |
|---|
| 10/2021 | $14,704 | $15,684 |
|---|
| 11/2021 | $13,611 | $14,978 |
|---|
| 12/2021 | $14,323 | $15,597 |
|---|
| 01/2022 | $14,513 | $15,022 |
|---|
| 02/2022 | $13,468 | $14,725 |
|---|
| 03/2022 | $13,097 | $14,748 |
|---|
| 04/2022 | $12,299 | $13,822 |
|---|
| 05/2022 | $12,916 | $13,922 |
|---|
| 06/2022 | $11,576 | $12,724 |
|---|
| 07/2022 | $11,937 | $13,160 |
|---|
| 08/2022 | $11,044 | $12,736 |
|---|
| 09/2022 | $9,827 | $11,464 |
|---|
| 10/2022 | $10,550 | $11,806 |
|---|
| 11/2022 | $12,318 | $13,200 |
|---|
| 12/2022 | $12,073 | $13,101 |
|---|
| 01/2023 | $13,760 | $14,164 |
|---|
| 02/2023 | $13,527 | $13,666 |
|---|
| 03/2023 | $13,828 | $14,001 |
|---|
| 04/2023 | $14,081 | $14,244 |
|---|
| 05/2023 | $13,412 | $13,726 |
|---|
| 06/2023 | $14,236 | $14,342 |
|---|
| 07/2023 | $14,818 | $14,925 |
|---|
| 08/2023 | $13,945 | $14,251 |
|---|
| 09/2023 | $13,179 | $13,801 |
|---|
| 10/2023 | $12,267 | $13,231 |
|---|
| 11/2023 | $13,547 | $14,422 |
|---|
| 12/2023 | $14,398 | $15,147 |
|---|
| 01/2024 | $13,824 | $14,996 |
|---|
| 02/2024 | $14,022 | $15,376 |
|---|
| 03/2024 | $14,408 | $15,857 |
|---|
| 04/2024 | $13,988 | $15,572 |
|---|
| 05/2024 | $14,533 | $16,024 |
|---|
| 06/2024 | $13,780 | $16,009 |
|---|
| 07/2024 | $14,255 | $16,379 |
|---|
| 08/2024 | $14,552 | $16,846 |
|---|
| 09/2024 | $15,027 | $17,300 |
|---|
| 10/2024 | $14,137 | $16,451 |
|---|
| 11/2024 | $13,889 | $16,302 |
|---|
| 12/2024 | $13,693 | $15,985 |
|---|
Performance data shown represents past performance and is no guarantee of, and is not necessarily indicative of, future results. Total return and value will vary, and you may have a gain or loss when shares are sold. Current performance may be lower or higher than quoted. For the most recent month-end performance, visit im.natixis.com/en-us/products/mutual-funds/price-and-performance.
Average Annual Total Returns (%)
| AATR | 1 Year | 5 Years | 10 Years |
|---|
| Class Y | (4.89%) | 1.68% | 3.19%Footnote Reference* |
|---|
| MSCI World ex USA Index (Net) | 5.49% | 4.09% | 4.79% |
|---|
| Footnote | Description |
Footnote* | Prior to the inception of Class Y shares (5/1/2017), performance is that of Class A shares and reflects the higher net expenses of that share class. |
| Total Net Assets | $269,010,643 |
|---|
| # of Portfolio Holdings (including overnight repurchase agreements) | 69 |
|---|
| Portfolio Turnover Rate | 35% |
|---|
| Total Advisory Fees Paid (after waiver/reimbursement, if applicable) | $2,037,075 |
|---|
What did the Fund invest in? (% of Net Assets)
| Value | Value |
|---|
Other investments less than 3% of net assetsFootnote Reference* | 42.3% |
| Automobile Components | 3.2% |
| Beverages | 3.4% |
| Insurance | 3.5% |
| Health Care Providers & Services | 4.6% |
| Automobiles | 5.1% |
| Financial Services | 5.3% |
| Pharmaceuticals | 5.7% |
| Textiles, Apparel & Luxury Goods | 7.4% |
| Banks | 9.1% |
| Machinery | 10.4% |
| Footnote | Description |
Footnote* | Net of other assets less liabilities |
| BNP Paribas SA | 3.7% |
| Kering SA | 3.3% |
| CNH Industrial NV | 3.2% |
| Continental AG | 3.2% |
| Bayer AG | 3.2% |
| Edenred SE | 2.8% |
| Bayerische Motoren Werke AG | 2.8% |
| Fresenius Medical Care AG | 2.5% |
| Mercedes-Benz Group AG, (Registered) | 2.3% |
| Airbus SE | 2.2% |
There were no material fund changes during the period.
| Value | Value |
|---|
Other investments less than 3% of net assetsFootnote Reference* | 19.5% |
| United States | 3.3% |
| Sweden | 3.4% |
| Netherlands | 5.5% |
| Switzerland | 7.9% |
| United Kingdom | 14.1% |
| France | 20.8% |
| Germany | 25.5% |
| Footnote | Description |
Footnote* | Net of other assets less liabilities |
There were no changes in or disagreements with Accountants during the period.
For additional information about the Fund; including its prospectus, financial information, holdings and proxy information, scan the QR code or visit im.natixis.com/funddocuments.
Natixis Oakmark International Fund
Annual Shareholder Report
December 31, 2024
Natixis U.S. Equity Opportunities Fund
Annual Shareholder Report - December 31, 2024
This annual shareholder report contains important information about Natixis U.S. Equity Opportunities Fund for the period of January 1, 2024 to December 31, 2024. You can find additional information (including tax information) about the Fund at im.natixis.com/funddocuments. You can also request the information by contacting us at (800) 225-5478 or by contacting your financial intermediary directly. This report describes changes to the Fund that occurred during the reporting period.
What were the fund costs for the last year? (based on a hypothetical $10,000 investment)
| Class Name | Costs of a $10,000 investment | Costs paid as a percentage of a $10,000 investmentFootnote Reference† |
|---|
| Class A | $120 | 1.07% |
|---|
| Footnote | Description |
Footnote† | Annualized for periods less than one year (if applicable). |
How did the fund perform last year and what affected its performance?
Explanation of Fund Performance
The Natixis U.S. Equity Opportunities Fund is composed of two separately managed portfolio sleeves, combining the value expertise of Harris Associates, L.P. ("Harris Associates") with the growth expertise of Loomis, Sayles & Company, L.P. ("Loomis Sayles").
Harris Associates Large Cap Value Sleeve
On an absolute-return basis, the financials sector contributed the most to the return of the Fund, while health care and energy had the only negative contributions.
Top Contributors to Performance
Fiserv and Alphabet were top contributors during the 1-year period. Fiserv's stock price rose due to solid second-quarter results, improved free-cash-flow conversion, and significant share repurchases. Alphabet's stock price increased after strong first-quarter results, driven by revenue growth across Search, YouTube, and Cloud. Despite ongoing antitrust litigation, we still see attractive upside.
Top Detractors from Performance
Centene and APA Corporation were top detractors during the 1-year period. Centene's stock price declined due to investor concerns about legislative changes. APA Corporation's stock price fell due to issues with a liquified natural gas export contract and new U.K. emissions regulations.
Loomis Sayles All Cap Growth Sleeve
We are an active manager with a long-term, private equity approach to investing. Through our proprietary bottom-up research framework, we look to invest in those few high-quality businesses with sustainable competitive advantages and profitable growth when they trade at a significant discount to intrinsic value.
Top Contributors to Performance
Nvidia, Meta Platforms, and Tesla contributed the most to performance. Stock selection in the information technology, communication services, consumer discretionary, and healthcare sectors, and allocations in the communication services, consumer discretionary, and industrials sectors, contributed positively to relative performance.
Top Detractors from Performance
Boeing, Mobileye Global, and Monster Beverage detracted the most from performance. Stock selection in the industrials, consumer staples, and financials sectors, and allocations in the healthcare, information technology, and financials sectors, detracted from relative performance.
The Fund’s benchmarks are unmanaged indices used as a general measure of market performance. Calculations assume dividends and capital gains are reinvested. The tables do not reflect taxes shareholders might owe on any fund distributions or when they redeem their shares. You cannot invest directly in an index.
Total Return Based on a Hypothetical $10,000 Investment
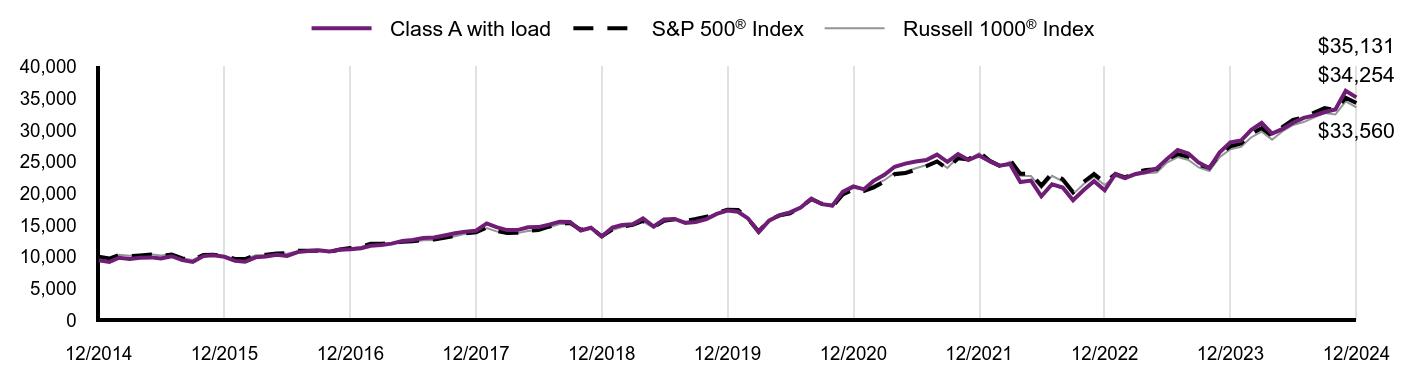
| Class A with load | S&P 500® Index | Russell 1000® Index |
|---|
| 12/2014 | $9,426 | $10,000 | $10,000 |
|---|
| 01/2015 | $9,154 | $9,700 | $9,725 |
|---|
| 02/2015 | $9,828 | $10,257 | $10,287 |
|---|
| 03/2015 | $9,646 | $10,095 | $10,159 |
|---|
| 04/2015 | $9,828 | $10,192 | $10,231 |
|---|
| 05/2015 | $9,883 | $10,323 | $10,365 |
|---|
| 06/2015 | $9,699 | $10,123 | $10,171 |
|---|
| 07/2015 | $10,068 | $10,335 | $10,367 |
|---|
| 08/2015 | $9,445 | $9,712 | $9,743 |
|---|
| 09/2015 | $9,170 | $9,471 | $9,476 |
|---|
| 10/2015 | $10,085 | $10,270 | $10,243 |
|---|
| 11/2015 | $10,204 | $10,301 | $10,277 |
|---|
| 12/2015 | $9,978 | $10,138 | $10,092 |
|---|
| 01/2016 | $9,327 | $9,635 | $9,549 |
|---|
| 02/2016 | $9,193 | $9,622 | $9,545 |
|---|
| 03/2016 | $9,891 | $10,275 | $10,210 |
|---|
| 04/2016 | $10,034 | $10,315 | $10,266 |
|---|
| 05/2016 | $10,297 | $10,500 | $10,446 |
|---|
| 06/2016 | $10,107 | $10,527 | $10,469 |
|---|
| 07/2016 | $10,713 | $10,915 | $10,868 |
|---|
| 08/2016 | $10,873 | $10,931 | $10,882 |
|---|
| 09/2016 | $11,019 | $10,933 | $10,891 |
|---|
| 10/2016 | $10,815 | $10,733 | $10,679 |
|---|
| 11/2016 | $11,085 | $11,131 | $11,100 |
|---|
| 12/2016 | $11,161 | $11,351 | $11,308 |
|---|
| 01/2017 | $11,338 | $11,566 | $11,536 |
|---|
| 02/2017 | $11,718 | $12,025 | $11,982 |
|---|
| 03/2017 | $11,832 | $12,039 | $11,990 |
|---|
| 04/2017 | $12,057 | $12,163 | $12,116 |
|---|
| 05/2017 | $12,457 | $12,334 | $12,271 |
|---|
| 06/2017 | $12,627 | $12,411 | $12,357 |
|---|
| 07/2017 | $12,953 | $12,666 | $12,601 |
|---|
| 08/2017 | $13,019 | $12,705 | $12,641 |
|---|
| 09/2017 | $13,334 | $12,967 | $12,910 |
|---|
| 10/2017 | $13,682 | $13,270 | $13,206 |
|---|
| 11/2017 | $13,948 | $13,677 | $13,609 |
|---|
| 12/2017 | $14,095 | $13,829 | $13,761 |
|---|
| 01/2018 | $15,237 | $14,621 | $14,516 |
|---|
| 02/2018 | $14,648 | $14,082 | $13,983 |
|---|
| 03/2018 | $14,190 | $13,724 | $13,666 |
|---|
| 04/2018 | $14,186 | $13,777 | $13,712 |
|---|
| 05/2018 | $14,638 | $14,108 | $14,062 |
|---|
| 06/2018 | $14,662 | $14,195 | $14,153 |
|---|
| 07/2018 | $15,048 | $14,724 | $14,642 |
|---|
| 08/2018 | $15,520 | $15,203 | $15,146 |
|---|
| 09/2018 | $15,454 | $15,290 | $15,204 |
|---|
| 10/2018 | $14,131 | $14,245 | $14,128 |
|---|
| 11/2018 | $14,564 | $14,535 | $14,415 |
|---|
| 12/2018 | $13,182 | $13,223 | $13,102 |
|---|
| 01/2019 | $14,590 | $14,282 | $14,200 |
|---|
| 02/2019 | $15,002 | $14,741 | $14,681 |
|---|
| 03/2019 | $15,113 | $15,027 | $14,937 |
|---|
| 04/2019 | $16,023 | $15,636 | $15,540 |
|---|
| 05/2019 | $14,754 | $14,642 | $14,550 |
|---|
| 06/2019 | $15,861 | $15,674 | $15,571 |
|---|
| 07/2019 | $15,957 | $15,899 | $15,813 |
|---|
| 08/2019 | $15,323 | $15,648 | $15,523 |
|---|
| 09/2019 | $15,476 | $15,940 | $15,792 |
|---|
| 10/2019 | $15,926 | $16,286 | $16,127 |
|---|
| 11/2019 | $16,736 | $16,877 | $16,737 |
|---|
| 12/2019 | $17,272 | $17,386 | $17,220 |
|---|
| 01/2020 | $17,088 | $17,379 | $17,238 |
|---|
| 02/2020 | $16,038 | $15,949 | $15,830 |
|---|
| 03/2020 | $13,859 | $13,979 | $13,738 |
|---|
| 04/2020 | $15,678 | $15,771 | $15,553 |
|---|
| 05/2020 | $16,568 | $16,522 | $16,374 |
|---|
| 06/2020 | $16,982 | $16,850 | $16,736 |
|---|
| 07/2020 | $17,765 | $17,801 | $17,716 |
|---|
| 08/2020 | $19,141 | $19,080 | $19,016 |
|---|
| 09/2020 | $18,280 | $18,355 | $18,321 |
|---|
| 10/2020 | $18,056 | $17,867 | $17,879 |
|---|
| 11/2020 | $20,220 | $19,823 | $19,985 |
|---|
| 12/2020 | $21,087 | $20,585 | $20,830 |
|---|
| 01/2021 | $20,623 | $20,377 | $20,658 |
|---|
| 02/2021 | $21,973 | $20,939 | $21,257 |
|---|
| 03/2021 | $22,924 | $21,856 | $22,061 |
|---|
| 04/2021 | $24,186 | $23,022 | $23,249 |
|---|
| 05/2021 | $24,679 | $23,183 | $23,359 |
|---|
| 06/2021 | $25,010 | $23,724 | $23,944 |
|---|
| 07/2021 | $25,245 | $24,288 | $24,442 |
|---|
| 08/2021 | $26,097 | $25,026 | $25,149 |
|---|
| 09/2021 | $24,971 | $23,863 | $23,994 |
|---|
| 10/2021 | $26,181 | $25,534 | $25,659 |
|---|
| 11/2021 | $25,256 | $25,357 | $25,315 |
|---|
| 12/2021 | $25,967 | $26,494 | $26,340 |
|---|
| 01/2022 | $25,057 | $25,123 | $24,855 |
|---|
| 02/2022 | $24,353 | $24,371 | $24,173 |
|---|
| 03/2022 | $24,630 | $25,276 | $24,989 |
|---|
| 04/2022 | $21,777 | $23,071 | $22,761 |
|---|
| 05/2022 | $22,009 | $23,114 | $22,727 |
|---|
| 06/2022 | $19,534 | $21,206 | $20,823 |
|---|
| 07/2022 | $21,420 | $23,161 | $22,763 |
|---|
| 08/2022 | $20,919 | $22,217 | $21,889 |
|---|
| 09/2022 | $18,901 | $20,170 | $19,863 |
|---|
| 10/2022 | $20,518 | $21,804 | $21,456 |
|---|
| 11/2022 | $21,909 | $23,022 | $22,617 |
|---|
| 12/2022 | $20,476 | $21,696 | $21,302 |
|---|
| 01/2023 | $23,059 | $23,059 | $22,730 |
|---|
| 02/2023 | $22,417 | $22,496 | $22,189 |
|---|
| 03/2023 | $23,045 | $23,322 | $22,891 |
|---|
| 04/2023 | $23,358 | $23,686 | $23,175 |
|---|
| 05/2023 | $23,924 | $23,789 | $23,283 |
|---|
| 06/2023 | $25,409 | $25,361 | $24,855 |
|---|
| 07/2023 | $26,837 | $26,176 | $25,710 |
|---|
| 08/2023 | $26,286 | $25,759 | $25,260 |
|---|
| 09/2023 | $24,836 | $24,531 | $24,073 |
|---|
| 10/2023 | $23,959 | $24,015 | $23,491 |
|---|
| 11/2023 | $26,469 | $26,208 | $25,685 |
|---|
| 12/2023 | $28,053 | $27,399 | $26,953 |
|---|
| 01/2024 | $28,328 | $27,859 | $27,329 |
|---|
| 02/2024 | $29,970 | $29,347 | $28,805 |
|---|
| 03/2024 | $31,108 | $30,291 | $29,728 |
|---|
| 04/2024 | $29,425 | $29,054 | $28,463 |
|---|
| 05/2024 | $30,159 | $30,494 | $29,804 |
|---|
| 06/2024 | $31,144 | $31,589 | $30,790 |
|---|
| 07/2024 | $31,908 | $31,973 | $31,238 |
|---|
| 08/2024 | $32,290 | $32,749 | $31,979 |
|---|
| 09/2024 | $32,825 | $33,448 | $32,663 |
|---|
| 10/2024 | $33,230 | $33,145 | $32,434 |
|---|
| 11/2024 | $36,171 | $35,090 | $34,522 |
|---|
| 12/2024 | $35,131 | $34,254 | $33,560 |
|---|
Performance data shown represents past performance and is no guarantee of, and is not necessarily indicative of, future results. Total return and value will vary, and you may have a gain or loss when shares are sold. Current performance may be lower or higher than quoted. For the most recent month-end performance, visit im.natixis.com/en-us/products/mutual-funds/price-and-performance.
Average Annual Total Returns (%)
| AATR | 1 Year | 5 Years | 10 Years |
|---|
| Class A at NAV | 25.23% | 15.26% | 14.06% |
|---|
Class A with 5.75% MSCFootnote Reference1 | 18.03% | 13.90% | 13.39% |
|---|
S&P 500® Index | 25.02% | 14.53% | 13.10% |
|---|
Russell 1000® Index | 24.51% | 14.28% | 12.87% |
|---|
| Footnote | Description |
Footnote1 | Maximum sales charge |
| Total Net Assets | $1,128,654,333 |
|---|
| # of Portfolio Holdings (including overnight repurchase agreements) | 75 |
|---|
| Portfolio Turnover Rate | 33% |
|---|
| Total Advisory Fees Paid (after waiver/reimbursement, if applicable) | $7,057,328 |
|---|
What did the Fund invest in? (% of Net Assets)
| Value | Value |
|---|
Other investments less than 3% of net assetsFootnote Reference* | 35.6% |
| Insurance | 3.3% |
| Broadline Retail | 3.4% |
| Financial Services | 4.7% |
| Entertainment | 5.3% |
| Oil, Gas & Consumable Fuels | 5.3% |
| Semiconductors & Semiconductor Equipment | 6.1% |
| Automobiles | 6.2% |
| Banks | 6.7% |
| Capital Markets | 7.4% |
| Software | 7.5% |
| Interactive Media & Services | 8.5% |
| Footnote | Description |
Footnote* | Net of other assets less liabilities |
| Alphabet, Inc., Class A | 4.6% |
| NVIDIA Corp. | 4.5% |
| Tesla, Inc. | 4.0% |
| Meta Platforms, Inc., Class A | 3.6% |
| Amazon.com, Inc. | 3.1% |
| Netflix, Inc. | 3.0% |
| Deere & Co. | 2.3% |
| Citigroup, Inc. | 2.3% |
| Oracle Corp. | 2.2% |
| Charles Schwab Corp. | 2.2% |
Effective July 1, 2024, the Fund had the following material changes, which were reported in a supplement to the Fund's prospectus. For more information, you may review the Fund's prospectus at im.natixis.com/funddocuments or upon request at (800) 225-5478 or through your financial intermediary.
Expenses: The expense limit as a percentage of average daily net assets was reduced to 1.08% from 1.12%.
There were no changes in or disagreements with Accountants during the period.
For additional information about the Fund; including its prospectus, financial information, holdings and proxy information, scan the QR code or visit im.natixis.com/funddocuments.
Natixis U.S. Equity Opportunities Fund
Annual Shareholder Report
December 31, 2024
Natixis U.S. Equity Opportunities Fund
Annual Shareholder Report - December 31, 2024
This annual shareholder report contains important information about Natixis U.S. Equity Opportunities Fund for the period of January 1, 2024 to December 31, 2024. You can find additional information (including tax information) about the Fund at im.natixis.com/funddocuments. You can also request the information by contacting us at (800) 225-5478 or by contacting your financial intermediary directly. This report describes changes to the Fund that occurred during the reporting period.
What were the fund costs for the last year? (based on a hypothetical $10,000 investment)
| Class Name | Costs of a $10,000 investment | Costs paid as a percentage of a $10,000 investmentFootnote Reference† |
|---|
| Class C | $204 | 1.82% |
|---|
| Footnote | Description |
Footnote† | Annualized for periods less than one year (if applicable). |
How did the fund perform last year and what affected its performance?
Explanation of Fund Performance
The Natixis U.S. Equity Opportunities Fund is composed of two separately managed portfolio sleeves, combining the value expertise of Harris Associates, L.P. ("Harris Associates") with the growth expertise of Loomis, Sayles & Company, L.P. ("Loomis Sayles").
Harris Associates Large Cap Value Sleeve
On an absolute-return basis, the financials sector contributed the most to the return of the Fund, while health care and energy had the only negative contributions.
Top Contributors to Performance
Fiserv and Alphabet were top contributors during the 1-year period. Fiserv's stock price rose due to solid second-quarter results, improved free-cash-flow conversion, and significant share repurchases. Alphabet's stock price increased after strong first-quarter results, driven by revenue growth across Search, YouTube, and Cloud. Despite ongoing antitrust litigation, we still see attractive upside.
Top Detractors from Performance
Centene and APA Corporation were top detractors during the 1-year period. Centene's stock price declined due to investor concerns about legislative changes. APA Corporation's stock price fell due to issues with a liquified natural gas export contract and new U.K. emissions regulations.
Loomis Sayles All Cap Growth Sleeve
We are an active manager with a long-term, private equity approach to investing. Through our proprietary bottom-up research framework, we look to invest in those few high-quality businesses with sustainable competitive advantages and profitable growth when they trade at a significant discount to intrinsic value.
Top Contributors to Performance
Nvidia, Meta Platforms, and Tesla contributed the most to performance. Stock selection in the information technology, communication services, consumer discretionary, and healthcare sectors, and allocations in the communication services, consumer discretionary, and industrials sectors, contributed positively to relative performance.
Top Detractors from Performance
Boeing, Mobileye Global, and Monster Beverage detracted the most from performance. Stock selection in the industrials, consumer staples, and financials sectors, and allocations in the healthcare, information technology, and financials sectors, detracted from relative performance.
The Fund’s benchmarks are unmanaged indices used as a general measure of market performance. Calculations assume dividends and capital gains are reinvested. The tables do not reflect taxes shareholders might owe on any fund distributions or when they redeem their shares. You cannot invest directly in an index.
Total Return Based on a Hypothetical $10,000 Investment
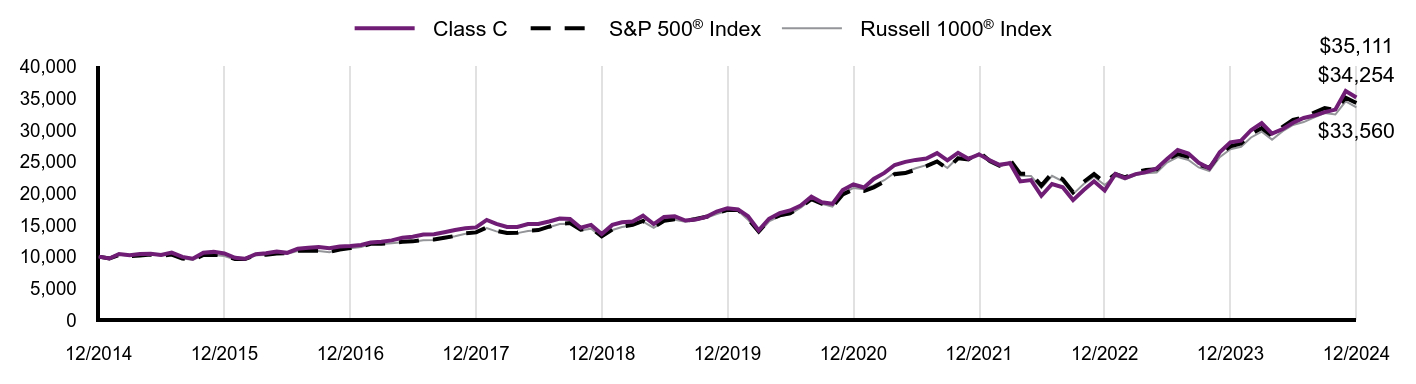
| Class C | S&P 500® Index | Russell 1000® Index |
|---|
| 12/2014 | $10,000 | $10,000 | $10,000 |
|---|
| 01/2015 | $9,704 | $9,700 | $9,725 |
|---|
| 02/2015 | $10,415 | $10,257 | $10,287 |
|---|
| 03/2015 | $10,212 | $10,095 | $10,159 |
|---|
| 04/2015 | $10,400 | $10,192 | $10,231 |
|---|
| 05/2015 | $10,450 | $10,323 | $10,365 |
|---|
| 06/2015 | $10,249 | $10,123 | $10,171 |
|---|
| 07/2015 | $10,636 | $10,335 | $10,367 |
|---|
| 08/2015 | $9,968 | $9,712 | $9,743 |
|---|
| 09/2015 | $9,672 | $9,471 | $9,476 |
|---|
| 10/2015 | $10,631 | $10,270 | $10,243 |
|---|
| 11/2015 | $10,751 | $10,301 | $10,277 |
|---|
| 12/2015 | $10,506 | $10,138 | $10,092 |
|---|
| 01/2016 | $9,813 | $9,635 | $9,549 |
|---|
| 02/2016 | $9,670 | $9,622 | $9,545 |
|---|
| 03/2016 | $10,395 | $10,275 | $10,210 |
|---|
| 04/2016 | $10,540 | $10,315 | $10,266 |
|---|
| 05/2016 | $10,808 | $10,500 | $10,446 |
|---|
| 06/2016 | $10,599 | $10,527 | $10,469 |
|---|
| 07/2016 | $11,232 | $10,915 | $10,868 |
|---|
| 08/2016 | $11,392 | $10,931 | $10,882 |
|---|
| 09/2016 | $11,537 | $10,933 | $10,891 |
|---|
| 10/2016 | $11,317 | $10,733 | $10,679 |
|---|
| 11/2016 | $11,591 | $11,131 | $11,100 |
|---|
| 12/2016 | $11,664 | $11,351 | $11,308 |
|---|
| 01/2017 | $11,842 | $11,566 | $11,536 |
|---|
| 02/2017 | $12,232 | $12,025 | $11,982 |
|---|
| 03/2017 | $12,340 | $12,039 | $11,990 |
|---|
| 04/2017 | $12,568 | $12,163 | $12,116 |
|---|
| 05/2017 | $12,976 | $12,334 | $12,271 |
|---|
| 06/2017 | $13,145 | $12,411 | $12,357 |
|---|
| 07/2017 | $13,477 | $12,666 | $12,601 |
|---|
| 08/2017 | $13,537 | $12,705 | $12,641 |
|---|
| 09/2017 | $13,858 | $12,967 | $12,910 |
|---|
| 10/2017 | $14,211 | $13,270 | $13,206 |
|---|
| 11/2017 | $14,478 | $13,677 | $13,609 |
|---|
| 12/2017 | $14,620 | $13,829 | $13,761 |
|---|
| 01/2018 | $15,797 | $14,621 | $14,516 |
|---|
| 02/2018 | $15,172 | $14,082 | $13,983 |
|---|
| 03/2018 | $14,689 | $13,724 | $13,666 |
|---|
| 04/2018 | $14,682 | $13,777 | $13,712 |
|---|
| 05/2018 | $15,139 | $14,108 | $14,062 |
|---|
| 06/2018 | $15,151 | $14,195 | $14,153 |
|---|
| 07/2018 | $15,543 | $14,724 | $14,642 |
|---|
| 08/2018 | $16,018 | $15,203 | $15,146 |
|---|
| 09/2018 | $15,936 | $15,290 | $15,204 |
|---|
| 10/2018 | $14,565 | $14,245 | $14,128 |
|---|
| 11/2018 | $15,004 | $14,535 | $14,415 |
|---|
| 12/2018 | $13,571 | $13,223 | $13,102 |
|---|
| 01/2019 | $15,014 | $14,282 | $14,200 |
|---|
| 02/2019 | $15,426 | $14,741 | $14,681 |
|---|
| 03/2019 | $15,532 | $15,027 | $14,937 |
|---|
| 04/2019 | $16,454 | $15,636 | $15,540 |
|---|
| 05/2019 | $15,143 | $14,642 | $14,550 |
|---|
| 06/2019 | $16,267 | $15,674 | $15,571 |
|---|
| 07/2019 | $16,357 | $15,899 | $15,813 |
|---|
| 08/2019 | $15,698 | $15,648 | $15,523 |
|---|
| 09/2019 | $15,844 | $15,940 | $15,792 |
|---|
| 10/2019 | $16,295 | $16,286 | $16,127 |
|---|
| 11/2019 | $17,113 | $16,877 | $16,737 |
|---|
| 12/2019 | $17,651 | $17,386 | $17,220 |
|---|
| 01/2020 | $17,449 | $17,379 | $17,238 |
|---|
| 02/2020 | $16,373 | $15,949 | $15,830 |
|---|
| 03/2020 | $14,137 | $13,979 | $13,738 |
|---|
| 04/2020 | $15,982 | $15,771 | $15,553 |
|---|
| 05/2020 | $16,871 | $16,522 | $16,374 |
|---|
| 06/2020 | $17,287 | $16,850 | $16,736 |
|---|
| 07/2020 | $18,079 | $17,801 | $17,716 |
|---|
| 08/2020 | $19,466 | $19,080 | $19,016 |
|---|
| 09/2020 | $18,576 | $18,355 | $18,321 |
|---|
| 10/2020 | $18,332 | $17,867 | $17,879 |
|---|
| 11/2020 | $20,518 | $19,823 | $19,985 |
|---|
| 12/2020 | $21,384 | $20,585 | $20,830 |
|---|
| 01/2021 | $20,905 | $20,377 | $20,658 |
|---|
| 02/2021 | $22,263 | $20,939 | $21,257 |
|---|
| 03/2021 | $23,211 | $21,856 | $22,061 |
|---|
| 04/2021 | $24,467 | $23,022 | $23,249 |
|---|
| 05/2021 | $24,957 | $23,183 | $23,359 |
|---|
| 06/2021 | $25,270 | $23,724 | $23,944 |
|---|
| 07/2021 | $25,489 | $24,288 | $24,442 |
|---|
| 08/2021 | $26,335 | $25,026 | $25,149 |
|---|
| 09/2021 | $25,187 | $23,863 | $23,994 |
|---|
| 10/2021 | $26,387 | $25,534 | $25,659 |
|---|
| 11/2021 | $25,437 | $25,357 | $25,315 |
|---|
| 12/2021 | $26,145 | $26,494 | $26,340 |
|---|
| 01/2022 | $25,211 | $25,123 | $24,855 |
|---|
| 02/2022 | $24,492 | $24,371 | $24,173 |
|---|
| 03/2022 | $24,743 | $25,276 | $24,989 |
|---|
| 04/2022 | $21,870 | $23,071 | $22,761 |
|---|
| 05/2022 | $22,091 | $23,114 | $22,727 |
|---|
| 06/2022 | $19,599 | $21,206 | $20,823 |
|---|
| 07/2022 | $21,468 | $23,161 | $22,763 |
|---|
| 08/2022 | $20,948 | $22,217 | $21,889 |
|---|
| 09/2022 | $18,924 | $20,170 | $19,863 |
|---|
| 10/2022 | $20,520 | $21,804 | $21,456 |
|---|
| 11/2022 | $21,896 | $23,022 | $22,617 |
|---|
| 12/2022 | $20,453 | $21,696 | $21,302 |
|---|
| 01/2023 | $23,045 | $23,059 | $22,730 |
|---|
| 02/2023 | $22,404 | $22,496 | $22,189 |
|---|
| 03/2023 | $23,031 | $23,322 | $22,891 |
|---|
| 04/2023 | $23,344 | $23,686 | $23,175 |
|---|
| 05/2023 | $23,910 | $23,789 | $23,283 |
|---|
| 06/2023 | $25,394 | $25,361 | $24,855 |
|---|
| 07/2023 | $26,821 | $26,176 | $25,710 |
|---|
| 08/2023 | $26,270 | $25,759 | $25,260 |
|---|
| 09/2023 | $24,821 | $24,531 | $24,073 |
|---|
| 10/2023 | $23,945 | $24,015 | $23,491 |
|---|
| 11/2023 | $26,454 | $26,208 | $25,685 |
|---|
| 12/2023 | $28,037 | $27,399 | $26,953 |
|---|
| 01/2024 | $28,311 | $27,859 | $27,329 |
|---|
| 02/2024 | $29,952 | $29,347 | $28,805 |
|---|
| 03/2024 | $31,090 | $30,291 | $29,728 |
|---|
| 04/2024 | $29,408 | $29,054 | $28,463 |
|---|
| 05/2024 | $30,141 | $30,494 | $29,804 |
|---|
| 06/2024 | $31,126 | $31,589 | $30,790 |
|---|
| 07/2024 | $31,889 | $31,973 | $31,238 |
|---|
| 08/2024 | $32,271 | $32,749 | $31,979 |
|---|
| 09/2024 | $32,805 | $33,448 | $32,663 |
|---|
| 10/2024 | $33,210 | $33,145 | $32,434 |
|---|
| 11/2024 | $36,149 | $35,090 | $34,522 |
|---|
| 12/2024 | $35,111 | $34,254 | $33,560 |
|---|
Performance data shown represents past performance and is no guarantee of, and is not necessarily indicative of, future results. Total return and value will vary, and you may have a gain or loss when shares are sold. Current performance may be lower or higher than quoted. For the most recent month-end performance, visit im.natixis.com/en-us/products/mutual-funds/price-and-performance.
Average Annual Total Returns (%)
| AATR | 1 Year | 5 Years | 10 Years |
|---|
| Class C at NAV | 24.32% | 14.39% | 13.38% |
|---|
Class C with 1.00% CDSCFootnote Reference1 | 23.32% | 14.39% | 13.38% |
|---|
S&P 500® Index | 25.02% | 14.53% | 13.10% |
|---|
Russell 1000® Index | 24.51% | 14.28% | 12.87% |
|---|
| Footnote | Description |
Footnote1 | Contingent deferred sales charge |
| Total Net Assets | $1,128,654,333 |
|---|
| # of Portfolio Holdings (including overnight repurchase agreements) | 75 |
|---|
| Portfolio Turnover Rate | 33% |
|---|
| Total Advisory Fees Paid (after waiver/reimbursement, if applicable) | $7,057,328 |
|---|
What did the Fund invest in? (% of Net Assets)
| Value | Value |
|---|
Other investments less than 3% of net assetsFootnote Reference* | 35.6% |
| Insurance | 3.3% |
| Broadline Retail | 3.4% |
| Financial Services | 4.7% |
| Entertainment | 5.3% |
| Oil, Gas & Consumable Fuels | 5.3% |
| Semiconductors & Semiconductor Equipment | 6.1% |
| Automobiles | 6.2% |
| Banks | 6.7% |
| Capital Markets | 7.4% |
| Software | 7.5% |
| Interactive Media & Services | 8.5% |
| Footnote | Description |
Footnote* | Net of other assets less liabilities |
| Alphabet, Inc., Class A | 4.6% |
| NVIDIA Corp. | 4.5% |
| Tesla, Inc. | 4.0% |
| Meta Platforms, Inc., Class A | 3.6% |
| Amazon.com, Inc. | 3.1% |
| Netflix, Inc. | 3.0% |
| Deere & Co. | 2.3% |
| Citigroup, Inc. | 2.3% |
| Oracle Corp. | 2.2% |
| Charles Schwab Corp. | 2.2% |
Effective July 1, 2024, the Fund had the following material changes, which were reported in a supplement to the Fund's prospectus. For more information, you may review the Fund's prospectus at im.natixis.com/funddocuments or upon request at (800) 225-5478 or through your financial intermediary.
Expenses: The expense limit as a percentage of average daily net assets was reduced to 1.83% from 1.87%.
There were no changes in or disagreements with Accountants during the period.
For additional information about the Fund; including its prospectus, financial information, holdings and proxy information, scan the QR code or visit im.natixis.com/funddocuments.
Natixis U.S. Equity Opportunities Fund
Annual Shareholder Report
December 31, 2024
Natixis U.S. Equity Opportunities Fund
Annual Shareholder Report - December 31, 2024
This annual shareholder report contains important information about Natixis U.S. Equity Opportunities Fund for the period of January 1, 2024 to December 31, 2024. You can find additional information (including tax information) about the Fund at im.natixis.com/funddocuments. You can also request the information by contacting us at (800) 225-5478 or by contacting your financial intermediary directly. This report describes changes to the Fund that occurred during the reporting period.
What were the fund costs for the last year? (based on a hypothetical $10,000 investment)
| Class Name | Costs of a $10,000 investment | Costs paid as a percentage of a $10,000 investmentFootnote Reference† |
|---|
| Class N | $86 | 0.76% |
|---|
| Footnote | Description |
Footnote† | Annualized for periods less than one year (if applicable). |
How did the fund perform last year and what affected its performance?
Explanation of Fund Performance
The Natixis U.S. Equity Opportunities Fund is composed of two separately managed portfolio sleeves, combining the value expertise of Harris Associates, L.P. ("Harris Associates") with the growth expertise of Loomis, Sayles & Company, L.P. ("Loomis Sayles").
Harris Associates Large Cap Value Sleeve
On an absolute-return basis, the financials sector contributed the most to the return of the Fund, while health care and energy had the only negative contributions.
Top Contributors to Performance
Fiserv and Alphabet were top contributors during the 1-year period. Fiserv's stock price rose due to solid second-quarter results, improved free-cash-flow conversion, and significant share repurchases. Alphabet's stock price increased after strong first-quarter results, driven by revenue growth across Search, YouTube, and Cloud. Despite ongoing antitrust litigation, we still see attractive upside.
Top Detractors from Performance
Centene and APA Corporation were top detractors during the 1-year period. Centene's stock price declined due to investor concerns about legislative changes. APA Corporation's stock price fell due to issues with a liquified natural gas export contract and new U.K. emissions regulations.
Loomis Sayles All Cap Growth Sleeve
We are an active manager with a long-term, private equity approach to investing. Through our proprietary bottom-up research framework, we look to invest in those few high-quality businesses with sustainable competitive advantages and profitable growth when they trade at a significant discount to intrinsic value.
Top Contributors to Performance
Nvidia, Meta Platforms, and Tesla contributed the most to performance. Stock selection in the information technology, communication services, consumer discretionary, and healthcare sectors, and allocations in the communication services, consumer discretionary, and industrials sectors, contributed positively to relative performance.
Top Detractors from Performance
Boeing, Mobileye Global, and Monster Beverage detracted the most from performance. Stock selection in the industrials, consumer staples, and financials sectors, and allocations in the healthcare, information technology, and financials sectors, detracted from relative performance.
The Fund’s benchmarks are unmanaged indices used as a general measure of market performance. Calculations assume dividends and capital gains are reinvested. The tables do not reflect taxes shareholders might owe on any fund distributions or when they redeem their shares. You cannot invest directly in an index.
Total Return Based on a Hypothetical $10,000 Investment
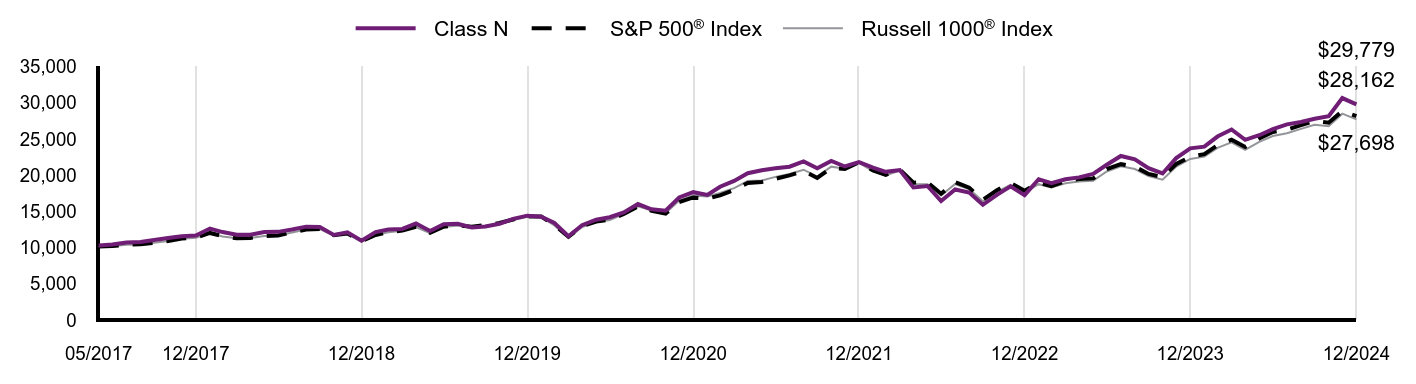
| Class N | S&P 500® Index | Russell 1000® Index |
|---|
| 05/2017 | $10,298 | $10,141 | $10,128 |
|---|
| 06/2017 | $10,439 | $10,204 | $10,198 |
|---|
| 07/2017 | $10,712 | $10,414 | $10,400 |
|---|
| 08/2017 | $10,774 | $10,446 | $10,433 |
|---|
| 09/2017 | $11,037 | $10,661 | $10,655 |
|---|
| 10/2017 | $11,329 | $10,910 | $10,899 |
|---|
| 11/2017 | $11,552 | $11,245 | $11,232 |
|---|
| 12/2017 | $11,678 | $11,370 | $11,357 |
|---|
| 01/2018 | $12,629 | $12,021 | $11,980 |
|---|
| 02/2018 | $12,144 | $11,578 | $11,541 |
|---|
| 03/2018 | $11,766 | $11,283 | $11,279 |
|---|
| 04/2018 | $11,771 | $11,327 | $11,317 |
|---|
| 05/2018 | $12,150 | $11,599 | $11,606 |
|---|
| 06/2018 | $12,173 | $11,671 | $11,681 |
|---|
| 07/2018 | $12,496 | $12,105 | $12,084 |
|---|
| 08/2018 | $12,890 | $12,500 | $12,500 |
|---|
| 09/2018 | $12,840 | $12,571 | $12,548 |
|---|
| 10/2018 | $11,746 | $11,711 | $11,660 |
|---|
| 11/2018 | $12,109 | $11,950 | $11,897 |
|---|
| 12/2018 | $10,965 | $10,871 | $10,814 |
|---|
| 01/2019 | $12,137 | $11,742 | $11,720 |
|---|
| 02/2019 | $12,484 | $12,119 | $12,117 |
|---|
| 03/2019 | $12,581 | $12,355 | $12,328 |
|---|
| 04/2019 | $13,340 | $12,855 | $12,825 |
|---|
| 05/2019 | $12,290 | $12,038 | $12,008 |
|---|
| 06/2019 | $13,216 | $12,887 | $12,851 |
|---|
| 07/2019 | $13,297 | $13,072 | $13,051 |
|---|
| 08/2019 | $12,772 | $12,865 | $12,812 |
|---|
| 09/2019 | $12,905 | $13,105 | $13,034 |
|---|
| 10/2019 | $13,281 | $13,389 | $13,310 |
|---|
| 11/2019 | $13,963 | $13,875 | $13,813 |
|---|
| 12/2019 | $14,412 | $14,294 | $14,212 |
|---|
| 01/2020 | $14,263 | $14,288 | $14,227 |
|---|
| 02/2020 | $13,391 | $13,112 | $13,065 |
|---|
| 03/2020 | $11,573 | $11,493 | $11,338 |
|---|
| 04/2020 | $13,099 | $12,966 | $12,836 |
|---|
| 05/2020 | $13,844 | $13,584 | $13,514 |
|---|
| 06/2020 | $14,196 | $13,854 | $13,813 |
|---|
| 07/2020 | $14,856 | $14,635 | $14,621 |
|---|
| 08/2020 | $16,009 | $15,687 | $15,695 |
|---|
| 09/2020 | $15,292 | $15,091 | $15,121 |
|---|
| 10/2020 | $15,106 | $14,689 | $14,756 |
|---|
| 11/2020 | $16,923 | $16,297 | $16,494 |
|---|
| 12/2020 | $17,652 | $16,924 | $17,191 |
|---|
| 01/2021 | $17,268 | $16,753 | $17,050 |
|---|
| 02/2021 | $18,404 | $17,215 | $17,544 |
|---|
| 03/2021 | $19,209 | $17,969 | $18,208 |
|---|
| 04/2021 | $20,266 | $18,928 | $19,188 |
|---|
| 05/2021 | $20,688 | $19,060 | $19,279 |
|---|
| 06/2021 | $20,970 | $19,505 | $19,762 |
|---|
| 07/2021 | $21,175 | $19,969 | $20,173 |
|---|
| 08/2021 | $21,893 | $20,576 | $20,756 |
|---|
| 09/2021 | $20,954 | $19,619 | $19,803 |
|---|
| 10/2021 | $21,973 | $20,993 | $21,177 |
|---|
| 11/2021 | $21,201 | $20,848 | $20,893 |
|---|
| 12/2021 | $21,805 | $21,782 | $21,739 |
|---|
| 01/2022 | $21,048 | $20,655 | $20,514 |
|---|
| 02/2022 | $20,460 | $20,036 | $19,951 |
|---|
| 03/2022 | $20,698 | $20,780 | $20,624 |
|---|
| 04/2022 | $18,306 | $18,968 | $18,785 |
|---|
| 05/2022 | $18,506 | $19,003 | $18,757 |
|---|
| 06/2022 | $16,432 | $17,435 | $17,186 |
|---|
| 07/2022 | $18,020 | $19,042 | $18,787 |
|---|
| 08/2022 | $17,600 | $18,266 | $18,065 |
|---|
| 09/2022 | $15,909 | $16,583 | $16,394 |
|---|
| 10/2022 | $17,276 | $17,926 | $17,709 |
|---|
| 11/2022 | $18,448 | $18,928 | $18,667 |
|---|
| 12/2022 | $17,251 | $17,837 | $17,581 |
|---|
| 01/2023 | $19,433 | $18,958 | $18,760 |
|---|
| 02/2023 | $18,893 | $18,495 | $18,313 |
|---|
| 03/2023 | $19,428 | $19,174 | $18,893 |
|---|
| 04/2023 | $19,695 | $19,474 | $19,127 |
|---|
| 05/2023 | $20,181 | $19,558 | $19,216 |
|---|
| 06/2023 | $21,436 | $20,851 | $20,514 |
|---|
| 07/2023 | $22,654 | $21,521 | $21,219 |
|---|
| 08/2023 | $22,191 | $21,178 | $20,848 |
|---|
| 09/2023 | $20,973 | $20,168 | $19,868 |
|---|
| 10/2023 | $20,236 | $19,744 | $19,388 |
|---|
| 11/2023 | $22,361 | $21,547 | $21,199 |
|---|
| 12/2023 | $23,710 | $22,526 | $22,245 |
|---|
| 01/2024 | $23,944 | $22,905 | $22,556 |
|---|
| 02/2024 | $25,336 | $24,128 | $23,774 |
|---|
| 03/2024 | $26,310 | $24,904 | $24,536 |
|---|
| 04/2024 | $24,887 | $23,887 | $23,492 |
|---|
| 05/2024 | $25,515 | $25,071 | $24,598 |
|---|
| 06/2024 | $26,362 | $25,971 | $25,412 |
|---|
| 07/2024 | $27,014 | $26,287 | $25,782 |
|---|
| 08/2024 | $27,345 | $26,925 | $26,393 |
|---|
| 09/2024 | $27,798 | $27,500 | $26,957 |
|---|
| 10/2024 | $28,149 | $27,250 | $26,769 |
|---|
| 11/2024 | $30,651 | $28,850 | $28,492 |
|---|
| 12/2024 | $29,779 | $28,162 | $27,698 |
|---|
Performance data shown represents past performance and is no guarantee of, and is not necessarily indicative of, future results. Total return and value will vary, and you may have a gain or loss when shares are sold. Current performance may be lower or higher than quoted. For the most recent month-end performance, visit im.natixis.com/en-us/products/mutual-funds/price-and-performance.
Average Annual Total Returns (%)
| AATR | 1 Year | 5 Years | Since Inception 5/1/17 |
|---|
| Class N | 25.60% | 15.62% | 15.29% |
|---|
S&P 500® Index | 25.02% | 14.53% | 14.37% |
|---|
Russell 1000® Index | 24.51% | 14.28% | 14.12% |
|---|
| Total Net Assets | $1,128,654,333 |
|---|
| # of Portfolio Holdings (including overnight repurchase agreements) | 75 |
|---|
| Portfolio Turnover Rate | 33% |
|---|
| Total Advisory Fees Paid (after waiver/reimbursement, if applicable) | $7,057,328 |
|---|
What did the Fund invest in? (% of Net Assets)
| Value | Value |
|---|
Other investments less than 3% of net assetsFootnote Reference* | 35.6% |
| Insurance | 3.3% |
| Broadline Retail | 3.4% |
| Financial Services | 4.7% |
| Entertainment | 5.3% |
| Oil, Gas & Consumable Fuels | 5.3% |
| Semiconductors & Semiconductor Equipment | 6.1% |
| Automobiles | 6.2% |
| Banks | 6.7% |
| Capital Markets | 7.4% |
| Software | 7.5% |
| Interactive Media & Services | 8.5% |
| Footnote | Description |
Footnote* | Net of other assets less liabilities |
| Alphabet, Inc., Class A | 4.6% |
| NVIDIA Corp. | 4.5% |
| Tesla, Inc. | 4.0% |
| Meta Platforms, Inc., Class A | 3.6% |
| Amazon.com, Inc. | 3.1% |
| Netflix, Inc. | 3.0% |
| Deere & Co. | 2.3% |
| Citigroup, Inc. | 2.3% |
| Oracle Corp. | 2.2% |
| Charles Schwab Corp. | 2.2% |
Effective July 1, 2024, the Fund had the following material changes, which were reported in a supplement to the Fund's prospectus. For more information, you may review the Fund's prospectus at im.natixis.com/funddocuments or upon request at (800) 225-5478 or through your financial intermediary.
Expenses: The expense limit as a percentage of average daily net assets was reduced to 0.78% from 0.82%.
There were no changes in or disagreements with Accountants during the period.
For additional information about the Fund; including its prospectus, financial information, holdings and proxy information, scan the QR code or visit im.natixis.com/funddocuments.
Natixis U.S. Equity Opportunities Fund
Annual Shareholder Report
December 31, 2024
Natixis U.S. Equity Opportunities Fund
Annual Shareholder Report - December 31, 2024
This annual shareholder report contains important information about Natixis U.S. Equity Opportunities Fund for the period of January 1, 2024 to December 31, 2024. You can find additional information (including tax information) about the Fund at im.natixis.com/funddocuments. You can also request the information by contacting us at (800) 225-5478 or by contacting your financial intermediary directly. This report describes changes to the Fund that occurred during the reporting period.
What were the fund costs for the last year? (based on a hypothetical $10,000 investment)
| Class Name | Costs of a $10,000 investment | Costs paid as a percentage of a $10,000 investmentFootnote Reference† |
|---|
| Class Y | $92 | 0.82% |
|---|
| Footnote | Description |
Footnote† | Annualized for periods less than one year (if applicable). |
How did the fund perform last year and what affected its performance?
Explanation of Fund Performance
The Natixis U.S. Equity Opportunities Fund is composed of two separately managed portfolio sleeves, combining the value expertise of Harris Associates, L.P. ("Harris Associates") with the growth expertise of Loomis, Sayles & Company, L.P. ("Loomis Sayles").
Harris Associates Large Cap Value Sleeve
On an absolute-return basis, the financials sector contributed the most to the return of the Fund, while health care and energy had the only negative contributions.
Top Contributors to Performance
Fiserv and Alphabet were top contributors during the 1-year period. Fiserv's stock price rose due to solid second-quarter results, improved free-cash-flow conversion, and significant share repurchases. Alphabet's stock price increased after strong first-quarter results, driven by revenue growth across Search, YouTube, and Cloud. Despite ongoing antitrust litigation, we still see attractive upside.
Top Detractors from Performance
Centene and APA Corporation were top detractors during the 1-year period. Centene's stock price declined due to investor concerns about legislative changes. APA Corporation's stock price fell due to issues with a liquified natural gas export contract and new U.K. emissions regulations.
Loomis Sayles All Cap Growth Sleeve
We are an active manager with a long-term, private equity approach to investing. Through our proprietary bottom-up research framework, we look to invest in those few high-quality businesses with sustainable competitive advantages and profitable growth when they trade at a significant discount to intrinsic value.
Top Contributors to Performance
Nvidia, Meta Platforms, and Tesla contributed the most to performance. Stock selection in the information technology, communication services, consumer discretionary, and healthcare sectors, and allocations in the communication services, consumer discretionary, and industrials sectors, contributed positively to relative performance.
Top Detractors from Performance
Boeing, Mobileye Global, and Monster Beverage detracted the most from performance. Stock selection in the industrials, consumer staples, and financials sectors, and allocations in the healthcare, information technology, and financials sectors, detracted from relative performance.
The Fund’s benchmarks are unmanaged indices used as a general measure of market performance. Calculations assume dividends and capital gains are reinvested. The tables do not reflect taxes shareholders might owe on any fund distributions or when they redeem their shares. You cannot invest directly in an index.
Total Return Based on a Hypothetical $10,000 Investment
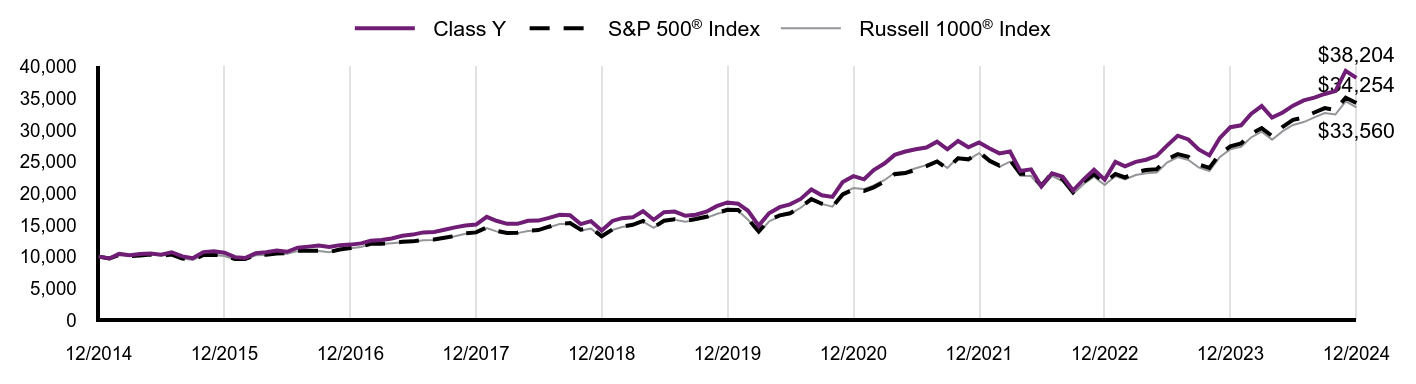
| Class Y | S&P 500® Index | Russell 1000® Index |
|---|
| 12/2014 | $10,000 | $10,000 | $10,000 |
|---|
| 01/2015 | $9,711 | $9,700 | $9,725 |
|---|
| 02/2015 | $10,430 | $10,257 | $10,287 |
|---|
| 03/2015 | $10,237 | $10,095 | $10,159 |
|---|
| 04/2015 | $10,433 | $10,192 | $10,231 |
|---|
| 05/2015 | $10,494 | $10,323 | $10,365 |
|---|
| 06/2015 | $10,300 | $10,123 | $10,171 |
|---|
| 07/2015 | $10,695 | $10,335 | $10,367 |
|---|
| 08/2015 | $10,034 | $9,712 | $9,743 |
|---|
| 09/2015 | $9,746 | $9,471 | $9,476 |
|---|
| 10/2015 | $10,718 | $10,270 | $10,243 |
|---|
| 11/2015 | $10,848 | $10,301 | $10,277 |
|---|
| 12/2015 | $10,611 | $10,138 | $10,092 |
|---|
| 01/2016 | $9,922 | $9,635 | $9,549 |
|---|
| 02/2016 | $9,781 | $9,622 | $9,545 |
|---|
| 03/2016 | $10,527 | $10,275 | $10,210 |
|---|
| 04/2016 | $10,679 | $10,315 | $10,266 |
|---|
| 05/2016 | $10,963 | $10,500 | $10,446 |
|---|
| 06/2016 | $10,760 | $10,527 | $10,469 |
|---|
| 07/2016 | $11,410 | $10,915 | $10,868 |
|---|
| 08/2016 | $11,580 | $10,931 | $10,882 |
|---|
| 09/2016 | $11,739 | $10,933 | $10,891 |
|---|
| 10/2016 | $11,525 | $10,733 | $10,679 |
|---|
| 11/2016 | $11,813 | $11,131 | $11,100 |
|---|
| 12/2016 | $11,897 | $11,351 | $11,308 |
|---|
| 01/2017 | $12,092 | $11,566 | $11,536 |
|---|
| 02/2017 | $12,496 | $12,025 | $11,982 |
|---|
| 03/2017 | $12,623 | $12,039 | $11,990 |
|---|
| 04/2017 | $12,862 | $12,163 | $12,116 |
|---|
| 05/2017 | $13,291 | $12,334 | $12,271 |
|---|
| 06/2017 | $13,477 | $12,411 | $12,357 |
|---|
| 07/2017 | $13,827 | $12,666 | $12,601 |
|---|
| 08/2017 | $13,902 | $12,705 | $12,641 |
|---|
| 09/2017 | $14,242 | $12,967 | $12,910 |
|---|
| 10/2017 | $14,616 | $13,270 | $13,206 |
|---|
| 11/2017 | $14,901 | $13,677 | $13,609 |
|---|
| 12/2017 | $15,063 | $13,829 | $13,761 |
|---|
| 01/2018 | $16,290 | $14,621 | $14,516 |
|---|
| 02/2018 | $15,660 | $14,082 | $13,983 |
|---|
| 03/2018 | $15,172 | $13,724 | $13,666 |
|---|
| 04/2018 | $15,175 | $13,777 | $13,712 |
|---|
| 05/2018 | $15,662 | $14,108 | $14,062 |
|---|
| 06/2018 | $15,687 | $14,195 | $14,153 |
|---|
| 07/2018 | $16,108 | $14,724 | $14,642 |
|---|
| 08/2018 | $16,612 | $15,203 | $15,146 |
|---|
| 09/2018 | $16,544 | $15,290 | $15,204 |
|---|
| 10/2018 | $15,132 | $14,245 | $14,128 |
|---|
| 11/2018 | $15,600 | $14,535 | $14,415 |
|---|
| 12/2018 | $14,122 | $13,223 | $13,102 |
|---|
| 01/2019 | $15,635 | $14,282 | $14,200 |
|---|
| 02/2019 | $16,078 | $14,741 | $14,681 |
|---|
| 03/2019 | $16,202 | $15,027 | $14,937 |
|---|
| 04/2019 | $17,177 | $15,636 | $15,540 |
|---|
| 05/2019 | $15,824 | $14,642 | $14,550 |
|---|
| 06/2019 | $17,014 | $15,674 | $15,571 |
|---|
| 07/2019 | $17,121 | $15,899 | $15,813 |
|---|
| 08/2019 | $16,445 | $15,648 | $15,523 |
|---|
| 09/2019 | $16,612 | $15,940 | $15,792 |
|---|
| 10/2019 | $17,097 | $16,286 | $16,127 |
|---|
| 11/2019 | $17,973 | $16,877 | $16,737 |
|---|
| 12/2019 | $18,551 | $17,386 | $17,220 |
|---|
| 01/2020 | $18,356 | $17,379 | $17,238 |
|---|
| 02/2020 | $17,235 | $15,949 | $15,830 |
|---|
| 03/2020 | $14,893 | $13,979 | $13,738 |
|---|
| 04/2020 | $16,852 | $15,771 | $15,553 |
|---|
| 05/2020 | $17,811 | $16,522 | $16,374 |
|---|
| 06/2020 | $18,260 | $16,850 | $16,736 |
|---|
| 07/2020 | $19,110 | $17,801 | $17,716 |
|---|
| 08/2020 | $20,593 | $19,080 | $19,016 |
|---|
| 09/2020 | $19,673 | $18,355 | $18,321 |
|---|
| 10/2020 | $19,433 | $17,867 | $17,879 |
|---|
| 11/2020 | $21,765 | $19,823 | $19,985 |
|---|
| 12/2020 | $22,699 | $20,585 | $20,830 |
|---|
| 01/2021 | $22,205 | $20,377 | $20,658 |
|---|
| 02/2021 | $23,669 | $20,939 | $21,257 |
|---|
| 03/2021 | $24,701 | $21,856 | $22,061 |
|---|
| 04/2021 | $26,059 | $23,022 | $23,249 |
|---|
| 05/2021 | $26,598 | $23,183 | $23,359 |
|---|
| 06/2021 | $26,961 | $23,724 | $23,944 |
|---|
| 07/2021 | $27,220 | $24,288 | $24,442 |
|---|
| 08/2021 | $28,146 | $25,026 | $25,149 |
|---|
| 09/2021 | $26,936 | $23,863 | $23,994 |
|---|
| 10/2021 | $28,249 | $25,534 | $25,659 |
|---|
| 11/2021 | $27,255 | $25,357 | $25,315 |
|---|
| 12/2021 | $28,028 | $26,494 | $26,340 |
|---|
| 01/2022 | $27,052 | $25,123 | $24,855 |
|---|
| 02/2022 | $26,299 | $24,371 | $24,173 |
|---|
| 03/2022 | $26,600 | $25,276 | $24,989 |
|---|
| 04/2022 | $23,523 | $23,071 | $22,761 |
|---|
| 05/2022 | $23,780 | $23,114 | $22,727 |
|---|
| 06/2022 | $21,112 | $21,206 | $20,823 |
|---|
| 07/2022 | $23,148 | $23,161 | $22,763 |
|---|
| 08/2022 | $22,612 | $22,217 | $21,889 |
|---|
| 09/2022 | $20,437 | $20,170 | $19,863 |
|---|
| 10/2022 | $22,195 | $21,804 | $21,456 |
|---|
| 11/2022 | $23,700 | $23,022 | $22,617 |
|---|
| 12/2022 | $22,156 | $21,696 | $21,302 |
|---|
| 01/2023 | $24,961 | $23,059 | $22,730 |
|---|
| 02/2023 | $24,265 | $22,496 | $22,189 |
|---|
| 03/2023 | $24,955 | $23,322 | $22,891 |
|---|
| 04/2023 | $25,293 | $23,686 | $23,175 |
|---|
| 05/2023 | $25,912 | $23,789 | $23,283 |
|---|
| 06/2023 | $27,523 | $25,361 | $24,855 |
|---|
| 07/2023 | $29,087 | $26,176 | $25,710 |
|---|
| 08/2023 | $28,491 | $25,759 | $25,260 |
|---|
| 09/2023 | $26,927 | $24,531 | $24,073 |
|---|
| 10/2023 | $25,977 | $24,015 | $23,491 |
|---|
| 11/2023 | $28,704 | $26,208 | $25,685 |
|---|
| 12/2023 | $30,432 | $27,399 | $26,953 |
|---|
| 01/2024 | $30,733 | $27,859 | $27,329 |
|---|
| 02/2024 | $32,520 | $29,347 | $28,805 |
|---|
| 03/2024 | $33,767 | $30,291 | $29,728 |
|---|
| 04/2024 | $31,941 | $29,054 | $28,463 |
|---|
| 05/2024 | $32,750 | $30,494 | $29,804 |
|---|
| 06/2024 | $33,828 | $31,589 | $30,790 |
|---|
| 07/2024 | $34,662 | $31,973 | $31,238 |
|---|
| 08/2024 | $35,089 | $32,749 | $31,979 |
|---|
| 09/2024 | $35,672 | $33,448 | $32,663 |
|---|
| 10/2024 | $36,117 | $33,145 | $32,434 |
|---|
| 11/2024 | $39,321 | $35,090 | $34,522 |
|---|
| 12/2024 | $38,204 | $34,254 | $33,560 |
|---|
Performance data shown represents past performance and is no guarantee of, and is not necessarily indicative of, future results. Total return and value will vary, and you may have a gain or loss when shares are sold. Current performance may be lower or higher than quoted. For the most recent month-end performance, visit im.natixis.com/en-us/products/mutual-funds/price-and-performance.
Average Annual Total Returns (%)
| AATR | 1 Year | 5 Years | 10 Years | Since Inception 1/1/00 |
|---|
| Class Y | 25.54% | 15.54% | 14.34% | -% |
|---|
S&P 500® Index | 25.02% | 14.53% | 13.10% | 23.30% |
|---|
Russell 1000® Index | 24.51% | 14.28% | 12.87% | 14.12% |
|---|
| Total Net Assets | $1,128,654,333 |
|---|
| # of Portfolio Holdings (including overnight repurchase agreements) | 75 |
|---|
| Portfolio Turnover Rate | 33% |
|---|
| Total Advisory Fees Paid (after waiver/reimbursement, if applicable) | $7,057,328 |
|---|
What did the Fund invest in? (% of Net Assets)
| Value | Value |
|---|
Other investments less than 3% of net assetsFootnote Reference* | 35.6% |
| Insurance | 3.3% |
| Broadline Retail | 3.4% |
| Financial Services | 4.7% |
| Entertainment | 5.3% |
| Oil, Gas & Consumable Fuels | 5.3% |
| Semiconductors & Semiconductor Equipment | 6.1% |
| Automobiles | 6.2% |
| Banks | 6.7% |
| Capital Markets | 7.4% |
| Software | 7.5% |
| Interactive Media & Services | 8.5% |
| Footnote | Description |
Footnote* | Net of other assets less liabilities |
| Alphabet, Inc., Class A | 4.6% |
| NVIDIA Corp. | 4.5% |
| Tesla, Inc. | 4.0% |
| Meta Platforms, Inc., Class A | 3.6% |
| Amazon.com, Inc. | 3.1% |
| Netflix, Inc. | 3.0% |
| Deere & Co. | 2.3% |
| Citigroup, Inc. | 2.3% |
| Oracle Corp. | 2.2% |
| Charles Schwab Corp. | 2.2% |
Effective July 1, 2024, the Fund had the following material changes, which were reported in a supplement to the Fund's prospectus. For more information, you may review the Fund's prospectus at im.natixis.com/funddocuments or upon request at (800) 225-5478 or through your financial intermediary.
Expenses: The expense limit as a percentage of average daily net assets was reduced to 0.83% from 0.87%.
There were no changes in or disagreements with Accountants during the period.
For additional information about the Fund; including its prospectus, financial information, holdings and proxy information, scan the QR code or visit im.natixis.com/funddocuments.
Natixis U.S. Equity Opportunities Fund
Annual Shareholder Report
December 31, 2024
Vaughan Nelson Small Cap Value Fund
Annual Shareholder Report - December 31, 2024
This annual shareholder report contains important information about Vaughan Nelson Small Cap Value Fund for the period of January 1, 2024 to December 31, 2024. You can find additional information (including tax information) about the Fund at im.natixis.com/funddocuments. You can also request the information by contacting us at (800) 225-5478 or by contacting your financial intermediary directly.
What were the fund costs for the last year? (based on a hypothetical $10,000 investment)
| Class Name | Costs of a $10,000 investment | Costs paid as a percentage of a $10,000 investmentFootnote Reference† |
|---|
| Class A | $128 | 1.25% |
|---|
| Footnote | Description |
Footnote† | Annualized for periods less than one year (if applicable). |
How did the fund perform last year and what affected its performance?
Top Contributors to Performance
•The largest contributor to the fund’s 2024 performance was the portfolio's overweight position and selection in Information Technology led by Celestica Inc.
•Selection and an underweight position within Energy also contributed to performance with Antero Resources Corporation leading.
•Selection within Consumer Staples positively impacted performance thanks to strong returns from Coca-Cola Consolidated, Inc.
Top Detractors from Performance
•The largest detractor from the fund’s 2024 performance was the portfolio’s overweight position and security selection within Materials with Chemours Co. as the weakest name.
•Security selection within Health Care negatively impacted performance. AMN Healthcare Services, Inc. hindered the sector the most.
•The portfolio’s underweight position and selection within Financials detracted from performance with Selective Insurance Group, Inc. being the weakest name.
Investment Activity
As a result of buys and sells and market action, the portfolio is overweight Industrials, Information Technology, Materials, and Consumer Staples while underweight Real Estate, Utilities, Communication Services, Health Care, Financials, Energy, and Consumer Discretionary.
We continued to sell positions that we believe to be fully valued or that could face increased earnings pressure as we move into the late stages of this economic recovery and added to existing positions or established new positions that met our investment criteria.
We continue to position the portfolio into companies that have lower earnings variability, higher profitability, and stronger balance sheets than the broader investment universe, and where we can get these characteristics at similar valuation levels to the benchmark index. We still do not favor any single industry or sector and continue to look for the characteristics noted above across all industries.
The Fund’s benchmarks are unmanaged indices used as a general measure of market performance. Calculations assume dividends and capital gains are reinvested. The tables do not reflect taxes shareholders might owe on any fund distributions or when they redeem their shares. You cannot invest directly in an index.
Total Return Based on a Hypothetical $10,000 Investment
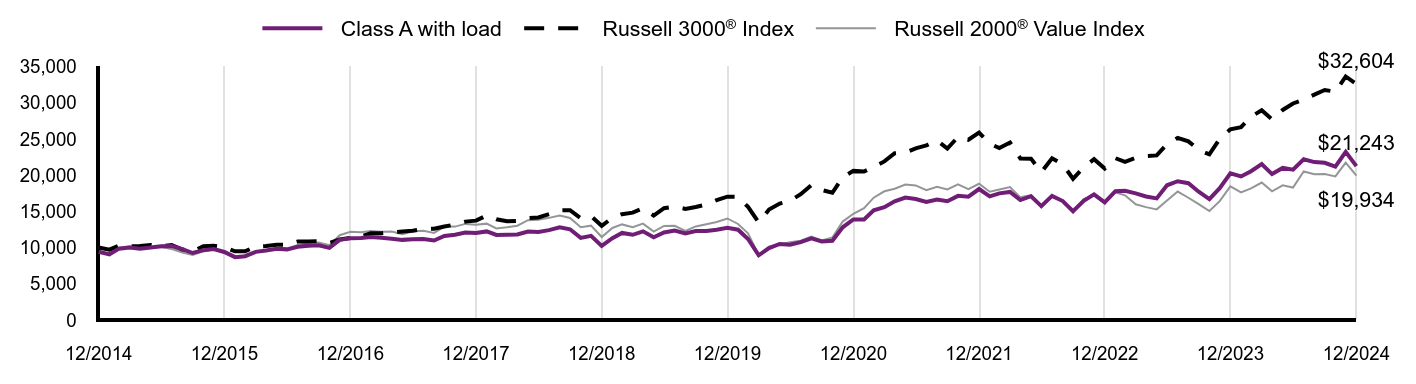
| Class A with load | Russell 3000® Index | Russell 2000® Value Index |
|---|
| 12/2014 | $9,425 | $10,000 | $10,000 |
|---|
| 01/2015 | $9,055 | $9,722 | $9,584 |
|---|
| 02/2015 | $9,854 | $10,285 | $10,029 |
|---|
| 03/2015 | $10,005 | $10,180 | $10,198 |
|---|
| 04/2015 | $9,828 | $10,226 | $9,980 |
|---|
| 05/2015 | $10,027 | $10,368 | $10,063 |
|---|
| 06/2015 | $10,194 | $10,194 | $10,076 |
|---|
| 07/2015 | $10,212 | $10,365 | $9,798 |
|---|
| 08/2015 | $9,791 | $9,739 | $9,317 |
|---|
| 09/2015 | $9,250 | $9,455 | $8,994 |
|---|
| 10/2015 | $9,648 | $10,202 | $9,498 |
|---|
| 11/2015 | $9,800 | $10,258 | $9,768 |
|---|
| 12/2015 | $9,398 | $10,048 | $9,253 |
|---|
| 01/2016 | $8,683 | $9,481 | $8,632 |
|---|
| 02/2016 | $8,810 | $9,478 | $8,690 |
|---|
| 03/2016 | $9,414 | $10,145 | $9,411 |
|---|
| 04/2016 | $9,599 | $10,208 | $9,610 |
|---|
| 05/2016 | $9,852 | $10,391 | $9,786 |
|---|
| 06/2016 | $9,755 | $10,412 | $9,816 |
|---|
| 07/2016 | $10,112 | $10,825 | $10,346 |
|---|
| 08/2016 | $10,258 | $10,853 | $10,603 |
|---|
| 09/2016 | $10,322 | $10,870 | $10,686 |
|---|
| 10/2016 | $9,966 | $10,635 | $10,335 |
|---|
| 11/2016 | $11,073 | $11,111 | $11,707 |
|---|
| 12/2016 | $11,300 | $11,327 | $12,190 |
|---|
| 01/2017 | $11,317 | $11,541 | $12,103 |
|---|
| 02/2017 | $11,471 | $11,970 | $12,278 |
|---|
| 03/2017 | $11,352 | $11,978 | $12,174 |
|---|
| 04/2017 | $11,220 | $12,105 | $12,222 |
|---|
| 05/2017 | $11,066 | $12,229 | $11,842 |
|---|
| 06/2017 | $11,143 | $12,339 | $12,256 |
|---|
| 07/2017 | $11,173 | $12,572 | $12,333 |
|---|
| 08/2017 | $10,983 | $12,596 | $12,030 |
|---|
| 09/2017 | $11,611 | $12,903 | $12,882 |
|---|
| 10/2017 | $11,783 | $13,185 | $12,899 |
|---|
| 11/2017 | $12,079 | $13,585 | $13,272 |
|---|
| 12/2017 | $12,010 | $13,721 | $13,146 |
|---|
| 01/2018 | $12,234 | $14,444 | $13,308 |
|---|
| 02/2018 | $11,740 | $13,912 | $12,642 |
|---|
| 03/2018 | $11,759 | $13,633 | $12,799 |
|---|
| 04/2018 | $11,804 | $13,684 | $13,020 |
|---|
| 05/2018 | $12,227 | $14,071 | $13,778 |
|---|
| 06/2018 | $12,161 | $14,163 | $13,861 |
|---|
| 07/2018 | $12,406 | $14,633 | $14,106 |
|---|
| 08/2018 | $12,809 | $15,147 | $14,442 |
|---|
| 09/2018 | $12,525 | $15,172 | $14,084 |
|---|
| 10/2018 | $11,341 | $14,055 | $12,823 |
|---|
| 11/2018 | $11,625 | $14,336 | $13,029 |
|---|
| 12/2018 | $10,227 | $13,002 | $11,455 |
|---|
| 01/2019 | $11,301 | $14,118 | $12,707 |
|---|
| 02/2019 | $12,022 | $14,614 | $13,201 |
|---|
| 03/2019 | $11,768 | $14,828 | $12,821 |
|---|
| 04/2019 | $12,245 | $15,420 | $13,306 |
|---|
| 05/2019 | $11,433 | $14,422 | $12,219 |
|---|
| 06/2019 | $12,097 | $15,435 | $12,997 |
|---|
| 07/2019 | $12,351 | $15,664 | $13,018 |
|---|
| 08/2019 | $11,966 | $15,345 | $12,291 |
|---|
| 09/2019 | $12,294 | $15,614 | $12,923 |
|---|
| 10/2019 | $12,302 | $15,950 | $13,236 |
|---|
| 11/2019 | $12,474 | $16,557 | $13,545 |
|---|
| 12/2019 | $12,749 | $17,035 | $14,020 |
|---|
| 01/2020 | $12,469 | $17,016 | $13,263 |
|---|
| 02/2020 | $11,190 | $15,623 | $11,975 |
|---|
| 03/2020 | $8,937 | $13,475 | $9,020 |
|---|
| 04/2020 | $9,924 | $15,259 | $10,133 |
|---|
| 05/2020 | $10,498 | $16,075 | $10,424 |
|---|
| 06/2020 | $10,390 | $16,443 | $10,726 |
|---|
| 07/2020 | $10,756 | $17,376 | $10,947 |
|---|
| 08/2020 | $11,272 | $18,635 | $11,536 |
|---|
| 09/2020 | $10,856 | $17,957 | $11,000 |
|---|
| 10/2020 | $10,939 | $17,569 | $11,393 |
|---|
| 11/2020 | $12,802 | $19,707 | $13,593 |
|---|
| 12/2020 | $13,885 | $20,593 | $14,669 |
|---|
| 01/2021 | $13,877 | $20,501 | $15,441 |
|---|
| 02/2021 | $15,158 | $21,142 | $16,892 |
|---|
| 03/2021 | $15,574 | $21,900 | $17,775 |
|---|
| 04/2021 | $16,389 | $23,029 | $18,134 |
|---|
| 05/2021 | $16,913 | $23,134 | $18,698 |
|---|
| 06/2021 | $16,714 | $23,705 | $18,585 |
|---|
| 07/2021 | $16,298 | $24,105 | $17,920 |
|---|
| 08/2021 | $16,630 | $24,793 | $18,400 |
|---|
| 09/2021 | $16,406 | $23,681 | $18,031 |
|---|
| 10/2021 | $17,146 | $25,282 | $18,719 |
|---|
| 11/2021 | $17,030 | $24,897 | $18,079 |
|---|
| 12/2021 | $18,084 | $25,877 | $18,816 |
|---|
| 01/2022 | $17,082 | $24,355 | $17,719 |
|---|
| 02/2022 | $17,487 | $23,741 | $18,013 |
|---|
| 03/2022 | $17,689 | $24,512 | $18,365 |
|---|
| 04/2022 | $16,570 | $22,312 | $16,940 |
|---|
| 05/2022 | $17,098 | $22,282 | $17,265 |
|---|
| 06/2022 | $15,733 | $20,418 | $15,559 |
|---|
| 07/2022 | $17,139 | $22,333 | $17,066 |
|---|
| 08/2022 | $16,426 | $21,500 | $16,526 |
|---|
| 09/2022 | $15,040 | $19,506 | $14,842 |
|---|
| 10/2022 | $16,467 | $21,106 | $16,711 |
|---|
| 11/2022 | $17,356 | $22,208 | $17,221 |
|---|
| 12/2022 | $16,240 | $20,907 | $16,091 |
|---|
| 01/2023 | $17,793 | $22,347 | $17,627 |
|---|
| 02/2023 | $17,836 | $21,825 | $17,220 |
|---|
| 03/2023 | $17,482 | $22,408 | $15,986 |
|---|
| 04/2023 | $17,054 | $22,647 | $15,587 |
|---|
| 05/2023 | $16,797 | $22,735 | $15,280 |
|---|
| 06/2023 | $18,606 | $24,288 | $16,494 |
|---|
| 07/2023 | $19,163 | $25,158 | $17,739 |
|---|
| 08/2023 | $18,895 | $24,673 | $16,885 |
|---|
| 09/2023 | $17,718 | $23,497 | $16,006 |
|---|
| 10/2023 | $16,701 | $22,875 | $15,051 |
|---|
| 11/2023 | $18,210 | $25,008 | $16,406 |
|---|
| 12/2023 | $20,271 | $26,334 | $18,448 |
|---|
| 01/2024 | $19,830 | $26,626 | $17,610 |
|---|
| 02/2024 | $20,550 | $28,067 | $18,186 |
|---|
| 03/2024 | $21,527 | $28,973 | $18,983 |
|---|
| 04/2024 | $20,153 | $27,698 | $17,774 |
|---|
| 05/2024 | $21,001 | $29,006 | $18,605 |
|---|
| 06/2024 | $20,754 | $29,904 | $18,291 |
|---|
| 07/2024 | $22,193 | $30,460 | $20,520 |
|---|
| 08/2024 | $21,806 | $31,123 | $20,135 |
|---|
| 09/2024 | $21,709 | $31,767 | $20,148 |
|---|
| 10/2024 | $21,173 | $31,534 | $19,833 |
|---|
| 11/2024 | $23,223 | $33,632 | $21,746 |
|---|
| 12/2024 | $21,243 | $32,604 | $19,934 |
|---|
Performance data shown represents past performance and is no guarantee of, and is not necessarily indicative of, future results. Total return and value will vary, and you may have a gain or loss when shares are sold. Current performance may be lower or higher than quoted. For the most recent month-end performance, visit im.natixis.com/en-us/products/mutual-funds/price-and-performance.
Average Annual Total Returns (%)
| AATR | 1 Year | 5 Years | 10 Years |
|---|
| Class A at NAV | 4.80% | 10.75% | 8.47% |
|---|
Class A with 5.75% MSCFootnote Reference1 | (1.22%) | 9.45% | 7.83% |
|---|
Russell 3000® Index | 23.81% | 13.86% | 12.55% |
|---|
Russell 2000® Value Index | 8.05% | 7.29% | 7.14% |
|---|
| Footnote | Description |
Footnote1 | Maximum sales charge |
Effective May 1, 2024, in accordance with new regulations, the Fund’s primary broad-based index changed to the Russell 3000® Index. The Fund will retain Russell 2000® Value Index as an additional benchmark for performance comparison.
| Total Net Assets | $1,220,283,826 |
|---|
| # of Portfolio Holdings (including overnight repurchase agreements) | 61 |
|---|
| Portfolio Turnover Rate | 80% |
|---|
| Total Advisory Fees Paid (after waiver/reimbursement, if applicable) | $8,955,710 |
|---|
What did the Fund invest in? (% of Net Assets)
| Value | Value |
|---|
Other investments less than 3% of net assetsFootnote Reference* | 34.8% |
| Short-Term Investments | 5.7% |
| Textiles, Apparel & Luxury Goods | 3.0% |
| Mortgage Real Estate Investment Trusts (REITs) | 3.1% |
| Specialty Retail | 3.1% |
| Health Care Providers & Services | 3.2% |
| Chemicals | 4.2% |
| Insurance | 4.5% |
| Machinery | 4.9% |
| Electronic Equipment, Instruments & Components | 4.9% |
| Oil, Gas & Consumable Fuels | 5.9% |
| Trading Companies & Distributors | 6.3% |
| Banks | 16.4% |
| Footnote | Description |
Footnote* | Net of other assets less liabilities |
| Element Solutions, Inc. | 3.4% |
| Comerica, Inc. | 3.0% |
| Western Alliance Bancorp | 3.0% |
| Zions Bancorp NA | 2.7% |
| Beacon Roofing Supply, Inc. | 2.7% |
| First American Financial Corp. | 2.5% |
| Cushman & Wakefield PLC | 2.5% |
| Celestica, Inc. | 2.4% |
| Cullen/Frost Bankers, Inc. | 2.2% |
| Cadence Bank | 2.1% |
There were no material fund changes during the period.
There were no changes in or disagreements with Accountants during the period.
For additional information about the Fund; including its prospectus, financial information, holdings and proxy information, scan the QR code or visit im.natixis.com/funddocuments.
Vaughan Nelson Small Cap Value Fund
Annual Shareholder Report
December 31, 2024
Vaughan Nelson Small Cap Value Fund
Annual Shareholder Report - December 31, 2024
This annual shareholder report contains important information about Vaughan Nelson Small Cap Value Fund for the period of January 1, 2024 to December 31, 2024. You can find additional information (including tax information) about the Fund at im.natixis.com/funddocuments. You can also request the information by contacting us at (800) 225-5478 or by contacting your financial intermediary directly.
What were the fund costs for the last year? (based on a hypothetical $10,000 investment)
| Class Name | Costs of a $10,000 investment | Costs paid as a percentage of a $10,000 investmentFootnote Reference† |
|---|
| Class C | $204 | 2.00% |
|---|
| Footnote | Description |
Footnote† | Annualized for periods less than one year (if applicable). |
How did the fund perform last year and what affected its performance?
Top Contributors to Performance
•The largest contributor to the fund’s 2024 performance was the portfolio's overweight position and selection in Information Technology led by Celestica Inc.
•Selection and an underweight position within Energy also contributed to performance with Antero Resources Corporation leading.
•Selection within Consumer Staples positively impacted performance thanks to strong returns from Coca-Cola Consolidated, Inc.
Top Detractors from Performance
•The largest detractor from the fund’s 2024 performance was the portfolio’s overweight position and security selection within Materials with Chemours Co. as the weakest name.
•Security selection within Health Care negatively impacted performance. AMN Healthcare Services, Inc. hindered the sector the most.
•The portfolio’s underweight position and selection within Financials detracted from performance with Selective Insurance Group, Inc. being the weakest name.
Investment Activity
As a result of buys and sells and market action, the portfolio is overweight Industrials, Information Technology, Materials, and Consumer Staples while underweight Real Estate, Utilities, Communication Services, Health Care, Financials, Energy, and Consumer Discretionary.
We continued to sell positions that we believe to be fully valued or that could face increased earnings pressure as we move into the late stages of this economic recovery and added to existing positions or established new positions that met our investment criteria.
We continue to position the portfolio into companies that have lower earnings variability, higher profitability, and stronger balance sheets than the broader investment universe, and where we can get these characteristics at similar valuation levels to the benchmark index. We still do not favor any single industry or sector and continue to look for the characteristics noted above across all industries.
The Fund’s benchmarks are unmanaged indices used as a general measure of market performance. Calculations assume dividends and capital gains are reinvested. The tables do not reflect taxes shareholders might owe on any fund distributions or when they redeem their shares. You cannot invest directly in an index.
Total Return Based on a Hypothetical $10,000 Investment
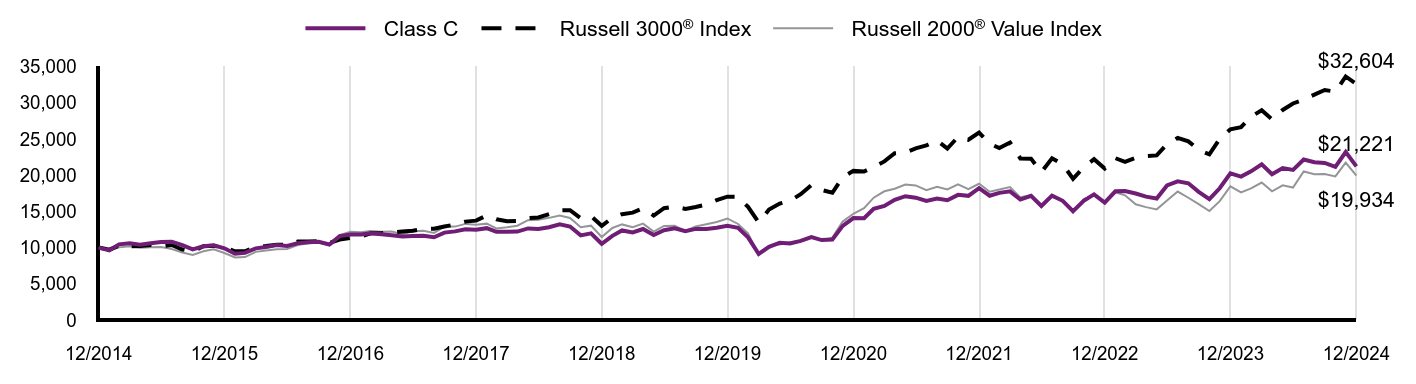
| Class C | Russell 3000® Index | Russell 2000® Value Index |
|---|
| 12/2014 | $10,000 | $10,000 | $10,000 |
|---|
| 01/2015 | $9,603 | $9,722 | $9,584 |
|---|
| 02/2015 | $10,443 | $10,285 | $10,029 |
|---|
| 03/2015 | $10,599 | $10,180 | $10,198 |
|---|
| 04/2015 | $10,406 | $10,226 | $9,980 |
|---|
| 05/2015 | $10,605 | $10,368 | $10,063 |
|---|
| 06/2015 | $10,778 | $10,194 | $10,076 |
|---|
| 07/2015 | $10,791 | $10,365 | $9,798 |
|---|
| 08/2015 | $10,333 | $9,739 | $9,317 |
|---|
| 09/2015 | $9,756 | $9,455 | $8,994 |
|---|
| 10/2015 | $10,174 | $10,202 | $9,498 |
|---|
| 11/2015 | $10,326 | $10,258 | $9,768 |
|---|
| 12/2015 | $9,898 | $10,048 | $9,253 |
|---|
| 01/2016 | $9,139 | $9,481 | $8,632 |
|---|
| 02/2016 | $9,267 | $9,478 | $8,690 |
|---|
| 03/2016 | $9,898 | $10,145 | $9,411 |
|---|
| 04/2016 | $10,080 | $10,208 | $9,610 |
|---|
| 05/2016 | $10,343 | $10,391 | $9,786 |
|---|
| 06/2016 | $10,236 | $10,412 | $9,816 |
|---|
| 07/2016 | $10,606 | $10,825 | $10,346 |
|---|
| 08/2016 | $10,746 | $10,853 | $10,603 |
|---|
| 09/2016 | $10,811 | $10,870 | $10,686 |
|---|
| 10/2016 | $10,425 | $10,635 | $10,335 |
|---|
| 11/2016 | $11,584 | $11,111 | $11,707 |
|---|
| 12/2016 | $11,810 | $11,327 | $12,190 |
|---|
| 01/2017 | $11,819 | $11,541 | $12,103 |
|---|
| 02/2017 | $11,980 | $11,970 | $12,278 |
|---|
| 03/2017 | $11,846 | $11,978 | $12,174 |
|---|
| 04/2017 | $11,704 | $12,105 | $12,222 |
|---|
| 05/2017 | $11,525 | $12,229 | $11,842 |
|---|
| 06/2017 | $11,610 | $12,339 | $12,256 |
|---|
| 07/2017 | $11,628 | $12,572 | $12,333 |
|---|
| 08/2017 | $11,421 | $12,596 | $12,030 |
|---|
| 09/2017 | $12,071 | $12,903 | $12,882 |
|---|
| 10/2017 | $12,241 | $13,185 | $12,899 |
|---|
| 11/2017 | $12,542 | $13,585 | $13,272 |
|---|
| 12/2017 | $12,459 | $13,721 | $13,146 |
|---|
| 01/2018 | $12,684 | $14,444 | $13,308 |
|---|
| 02/2018 | $12,171 | $13,912 | $12,642 |
|---|
| 03/2018 | $12,171 | $13,633 | $12,799 |
|---|
| 04/2018 | $12,213 | $13,684 | $13,020 |
|---|
| 05/2018 | $12,650 | $14,071 | $13,778 |
|---|
| 06/2018 | $12,572 | $14,163 | $13,861 |
|---|
| 07/2018 | $12,807 | $14,633 | $14,106 |
|---|
| 08/2018 | $13,222 | $15,147 | $14,442 |
|---|
| 09/2018 | $12,908 | $15,172 | $14,084 |
|---|
| 10/2018 | $11,687 | $14,055 | $12,823 |
|---|
| 11/2018 | $11,967 | $14,336 | $13,029 |
|---|
| 12/2018 | $10,527 | $13,002 | $11,455 |
|---|
| 01/2019 | $11,627 | $14,118 | $12,707 |
|---|
| 02/2019 | $12,366 | $14,614 | $13,201 |
|---|
| 03/2019 | $12,087 | $14,828 | $12,821 |
|---|
| 04/2019 | $12,566 | $15,420 | $13,306 |
|---|
| 05/2019 | $11,727 | $14,422 | $12,219 |
|---|
| 06/2019 | $12,401 | $15,435 | $12,997 |
|---|
| 07/2019 | $12,665 | $15,664 | $13,018 |
|---|
| 08/2019 | $12,253 | $15,345 | $12,291 |
|---|
| 09/2019 | $12,582 | $15,614 | $12,923 |
|---|
| 10/2019 | $12,582 | $15,950 | $13,236 |
|---|
| 11/2019 | $12,747 | $16,557 | $13,545 |
|---|
| 12/2019 | $13,020 | $17,035 | $14,020 |
|---|
| 01/2020 | $12,738 | $17,016 | $13,263 |
|---|
| 02/2020 | $11,409 | $15,623 | $11,975 |
|---|
| 03/2020 | $9,117 | $13,475 | $9,020 |
|---|
| 04/2020 | $10,107 | $15,259 | $10,133 |
|---|
| 05/2020 | $10,681 | $16,075 | $10,424 |
|---|
| 06/2020 | $10,580 | $16,443 | $10,726 |
|---|
| 07/2020 | $10,934 | $17,376 | $10,947 |
|---|
| 08/2020 | $11,457 | $18,635 | $11,536 |
|---|
| 09/2020 | $11,035 | $17,957 | $11,000 |
|---|
| 10/2020 | $11,103 | $17,569 | $11,393 |
|---|
| 11/2020 | $12,993 | $19,707 | $13,593 |
|---|
| 12/2020 | $14,073 | $20,593 | $14,669 |
|---|
| 01/2021 | $14,056 | $20,501 | $15,441 |
|---|
| 02/2021 | $15,355 | $21,142 | $16,892 |
|---|
| 03/2021 | $15,760 | $21,900 | $17,775 |
|---|
| 04/2021 | $16,587 | $23,029 | $18,134 |
|---|
| 05/2021 | $17,093 | $23,134 | $18,698 |
|---|
| 06/2021 | $16,890 | $23,705 | $18,585 |
|---|
| 07/2021 | $16,452 | $24,105 | $17,920 |
|---|
| 08/2021 | $16,772 | $24,793 | $18,400 |
|---|
| 09/2021 | $16,536 | $23,681 | $18,031 |
|---|
| 10/2021 | $17,279 | $25,282 | $18,719 |
|---|
| 11/2021 | $17,144 | $24,897 | $18,079 |
|---|
| 12/2021 | $18,217 | $25,877 | $18,816 |
|---|
| 01/2022 | $17,167 | $24,355 | $17,719 |
|---|
| 02/2022 | $17,561 | $23,741 | $18,013 |
|---|
| 03/2022 | $17,771 | $24,512 | $18,365 |
|---|
| 04/2022 | $16,626 | $22,312 | $16,940 |
|---|
| 05/2022 | $17,154 | $22,282 | $17,265 |
|---|
| 06/2022 | $15,764 | $20,418 | $15,559 |
|---|
| 07/2022 | $17,182 | $22,333 | $17,066 |
|---|
| 08/2022 | $16,459 | $21,500 | $16,526 |
|---|
| 09/2022 | $15,041 | $19,506 | $14,842 |
|---|
| 10/2022 | $16,459 | $21,106 | $16,711 |
|---|
| 11/2022 | $17,349 | $22,208 | $17,221 |
|---|
| 12/2022 | $16,211 | $20,907 | $16,091 |
|---|
| 01/2023 | $17,774 | $22,347 | $17,627 |
|---|
| 02/2023 | $17,817 | $21,825 | $17,220 |
|---|
| 03/2023 | $17,464 | $22,408 | $15,986 |
|---|
| 04/2023 | $17,036 | $22,647 | $15,587 |
|---|
| 05/2023 | $16,779 | $22,735 | $15,280 |
|---|
| 06/2023 | $18,587 | $24,288 | $16,494 |
|---|
| 07/2023 | $19,143 | $25,158 | $17,739 |
|---|
| 08/2023 | $18,875 | $24,673 | $16,885 |
|---|
| 09/2023 | $17,699 | $23,497 | $16,006 |
|---|
| 10/2023 | $16,683 | $22,875 | $15,051 |
|---|
| 11/2023 | $18,191 | $25,008 | $16,406 |
|---|
| 12/2023 | $20,249 | $26,334 | $18,448 |
|---|
| 01/2024 | $19,809 | $26,626 | $17,610 |
|---|
| 02/2024 | $20,528 | $28,067 | $18,186 |
|---|
| 03/2024 | $21,504 | $28,973 | $18,983 |
|---|
| 04/2024 | $20,131 | $27,698 | $17,774 |
|---|
| 05/2024 | $20,978 | $29,006 | $18,605 |
|---|
| 06/2024 | $20,732 | $29,904 | $18,291 |
|---|
| 07/2024 | $22,169 | $30,460 | $20,520 |
|---|
| 08/2024 | $21,783 | $31,123 | $20,135 |
|---|
| 09/2024 | $21,686 | $31,767 | $20,148 |
|---|
| 10/2024 | $21,150 | $31,534 | $19,833 |
|---|
| 11/2024 | $23,198 | $33,632 | $21,746 |
|---|
| 12/2024 | $21,221 | $32,604 | $19,934 |
|---|
Performance data shown represents past performance and is no guarantee of, and is not necessarily indicative of, future results. Total return and value will vary, and you may have a gain or loss when shares are sold. Current performance may be lower or higher than quoted. For the most recent month-end performance, visit im.natixis.com/en-us/products/mutual-funds/price-and-performance.
Average Annual Total Returns (%)
| AATR | 1 Year | 5 Years | 10 Years |
|---|
| Class C at NAV | 4.00% | 9.92% | 7.81% |
|---|
Class C with 1.00% CDSCFootnote Reference1 | 3.00% | 9.92% | 7.81% |
|---|
Russell 3000® Index | 23.81% | 13.86% | 12.55% |
|---|
Russell 2000® Value Index | 8.05% | 7.29% | 7.14% |
|---|
| Footnote | Description |
Footnote1 | Contingent deferred sales charge |
Effective May 1, 2024, in accordance with new regulations, the Fund’s primary broad-based index changed to the Russell 3000® Index. The Fund will retain Russell 2000® Value Index as an additional benchmark for performance comparison.
| Total Net Assets | $1,220,283,826 |
|---|
| # of Portfolio Holdings (including overnight repurchase agreements) | 61 |
|---|
| Portfolio Turnover Rate | 80% |
|---|
| Total Advisory Fees Paid (after waiver/reimbursement, if applicable) | $8,955,710 |
|---|
What did the Fund invest in? (% of Net Assets)
| Value | Value |
|---|
Other investments less than 3% of net assetsFootnote Reference* | 34.8% |
| Short-Term Investments | 5.7% |
| Textiles, Apparel & Luxury Goods | 3.0% |
| Mortgage Real Estate Investment Trusts (REITs) | 3.1% |
| Specialty Retail | 3.1% |
| Health Care Providers & Services | 3.2% |
| Chemicals | 4.2% |
| Insurance | 4.5% |
| Machinery | 4.9% |
| Electronic Equipment, Instruments & Components | 4.9% |
| Oil, Gas & Consumable Fuels | 5.9% |
| Trading Companies & Distributors | 6.3% |
| Banks | 16.4% |
| Footnote | Description |
Footnote* | Net of other assets less liabilities |
| Element Solutions, Inc. | 3.4% |
| Comerica, Inc. | 3.0% |
| Western Alliance Bancorp | 3.0% |
| Zions Bancorp NA | 2.7% |
| Beacon Roofing Supply, Inc. | 2.7% |
| First American Financial Corp. | 2.5% |
| Cushman & Wakefield PLC | 2.5% |
| Celestica, Inc. | 2.4% |
| Cullen/Frost Bankers, Inc. | 2.2% |
| Cadence Bank | 2.1% |
There were no material fund changes during the period.
There were no changes in or disagreements with Accountants during the period.
For additional information about the Fund; including its prospectus, financial information, holdings and proxy information, scan the QR code or visit im.natixis.com/funddocuments.
Vaughan Nelson Small Cap Value Fund
Annual Shareholder Report
December 31, 2024
Vaughan Nelson Small Cap Value Fund
Annual Shareholder Report - December 31, 2024
This annual shareholder report contains important information about Vaughan Nelson Small Cap Value Fund for the period of January 1, 2024 to December 31, 2024. You can find additional information (including tax information) about the Fund at im.natixis.com/funddocuments. You can also request the information by contacting us at (800) 225-5478 or by contacting your financial intermediary directly.
What were the fund costs for the last year? (based on a hypothetical $10,000 investment)
| Class Name | Costs of a $10,000 investment | Costs paid as a percentage of a $10,000 investmentFootnote Reference† |
|---|
| Class N | $97 | 0.95% |
|---|
| Footnote | Description |
Footnote† | Annualized for periods less than one year (if applicable). |
How did the fund perform last year and what affected its performance?
Top Contributors to Performance
•The largest contributor to the fund’s 2024 performance was the portfolio's overweight position and selection in Information Technology led by Celestica Inc.
•Selection and an underweight position within Energy also contributed to performance with Antero Resources Corporation leading.
•Selection within Consumer Staples positively impacted performance thanks to strong returns from Coca-Cola Consolidated, Inc.
Top Detractors from Performance
•The largest detractor from the fund’s 2024 performance was the portfolio’s overweight position and security selection within Materials with Chemours Co. as the weakest name.
•Security selection within Health Care negatively impacted performance. AMN Healthcare Services, Inc. hindered the sector the most.
•The portfolio’s underweight position and selection within Financials detracted from performance with Selective Insurance Group, Inc. being the weakest name.
Investment Activity
As a result of buys and sells and market action, the portfolio is overweight Industrials, Information Technology, Materials, and Consumer Staples while underweight Real Estate, Utilities, Communication Services, Health Care, Financials, Energy, and Consumer Discretionary.
We continued to sell positions that we believe to be fully valued or that could face increased earnings pressure as we move into the late stages of this economic recovery and added to existing positions or established new positions that met our investment criteria.
We continue to position the portfolio into companies that have lower earnings variability, higher profitability, and stronger balance sheets than the broader investment universe, and where we can get these characteristics at similar valuation levels to the benchmark index. We still do not favor any single industry or sector and continue to look for the characteristics noted above across all industries.
The Fund’s benchmarks are unmanaged indices used as a general measure of market performance. Calculations assume dividends and capital gains are reinvested. The tables do not reflect taxes shareholders might owe on any fund distributions or when they redeem their shares. You cannot invest directly in an index.
Total Return Based on a Hypothetical $10,000 Investment
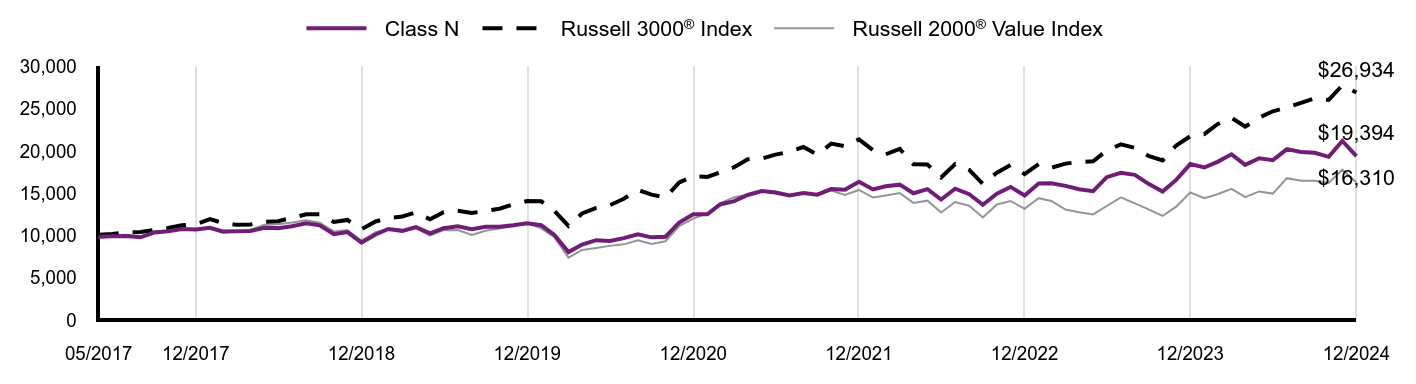
| Class N | Russell 3000® Index | Russell 2000® Value Index |
|---|
| 05/2017 | $9,852 | $10,102 | $9,689 |
|---|
| 06/2017 | $9,923 | $10,194 | $10,028 |
|---|
| 07/2017 | $9,954 | $10,386 | $10,091 |
|---|
| 08/2017 | $9,790 | $10,406 | $9,843 |
|---|
| 09/2017 | $10,353 | $10,659 | $10,540 |
|---|
| 10/2017 | $10,512 | $10,892 | $10,554 |
|---|
| 11/2017 | $10,777 | $11,223 | $10,859 |
|---|
| 12/2017 | $10,717 | $11,335 | $10,755 |
|---|
| 01/2018 | $10,922 | $11,932 | $10,888 |
|---|
| 02/2018 | $10,485 | $11,493 | $10,344 |
|---|
| 03/2018 | $10,501 | $11,262 | $10,472 |
|---|
| 04/2018 | $10,546 | $11,305 | $10,653 |
|---|
| 05/2018 | $10,927 | $11,624 | $11,273 |
|---|
| 06/2018 | $10,876 | $11,700 | $11,341 |
|---|
| 07/2018 | $11,092 | $12,088 | $11,541 |
|---|
| 08/2018 | $11,457 | $12,513 | $11,816 |
|---|
| 09/2018 | $11,206 | $12,533 | $11,523 |
|---|
| 10/2018 | $10,153 | $11,611 | $10,491 |
|---|
| 11/2018 | $10,409 | $11,843 | $10,660 |
|---|
| 12/2018 | $9,166 | $10,741 | $9,372 |
|---|
| 01/2019 | $10,126 | $11,663 | $10,397 |
|---|
| 02/2019 | $10,778 | $12,073 | $10,801 |
|---|
| 03/2019 | $10,553 | $12,249 | $10,490 |
|---|
| 04/2019 | $10,989 | $12,738 | $10,886 |
|---|
| 05/2019 | $10,260 | $11,914 | $9,997 |
|---|
| 06/2019 | $10,863 | $12,751 | $10,634 |
|---|
| 07/2019 | $11,094 | $12,940 | $10,651 |
|---|
| 08/2019 | $10,744 | $12,677 | $10,057 |
|---|
| 09/2019 | $11,045 | $12,899 | $10,573 |
|---|
| 10/2019 | $11,052 | $13,177 | $10,829 |
|---|
| 11/2019 | $11,213 | $13,678 | $11,083 |
|---|
| 12/2019 | $11,464 | $14,073 | $11,471 |
|---|
| 01/2020 | $11,217 | $14,057 | $10,852 |
|---|
| 02/2020 | $10,063 | $12,906 | $9,797 |
|---|
| 03/2020 | $8,039 | $11,131 | $7,380 |
|---|
| 04/2020 | $8,928 | $12,606 | $8,291 |
|---|
| 05/2020 | $9,449 | $13,280 | $8,528 |
|---|
| 06/2020 | $9,356 | $13,583 | $8,775 |
|---|
| 07/2020 | $9,691 | $14,355 | $8,956 |
|---|
| 08/2020 | $10,155 | $15,395 | $9,439 |
|---|
| 09/2020 | $9,784 | $14,834 | $9,000 |
|---|
| 10/2020 | $9,855 | $14,514 | $9,322 |
|---|
| 11/2020 | $11,545 | $16,280 | $11,121 |
|---|
| 12/2020 | $12,527 | $17,012 | $12,002 |
|---|
| 01/2021 | $12,520 | $16,936 | $12,634 |
|---|
| 02/2021 | $13,678 | $17,466 | $13,821 |
|---|
| 03/2021 | $14,064 | $18,092 | $14,543 |
|---|
| 04/2021 | $14,800 | $19,024 | $14,837 |
|---|
| 05/2021 | $15,272 | $19,111 | $15,299 |
|---|
| 06/2021 | $15,101 | $19,582 | $15,206 |
|---|
| 07/2021 | $14,729 | $19,914 | $14,662 |
|---|
| 08/2021 | $15,029 | $20,482 | $15,054 |
|---|
| 09/2021 | $14,836 | $19,563 | $14,753 |
|---|
| 10/2021 | $15,508 | $20,885 | $15,315 |
|---|
| 11/2021 | $15,408 | $20,568 | $14,792 |
|---|
| 12/2021 | $16,365 | $21,377 | $15,395 |
|---|
| 01/2022 | $15,459 | $20,120 | $14,498 |
|---|
| 02/2022 | $15,830 | $19,613 | $14,738 |
|---|
| 03/2022 | $16,020 | $20,249 | $15,026 |
|---|
| 04/2022 | $15,005 | $18,432 | $13,860 |
|---|
| 05/2022 | $15,490 | $18,407 | $14,126 |
|---|
| 06/2022 | $14,256 | $16,867 | $12,730 |
|---|
| 07/2022 | $15,543 | $18,450 | $13,963 |
|---|
| 08/2022 | $14,891 | $17,761 | $13,521 |
|---|
| 09/2022 | $13,639 | $16,114 | $12,144 |
|---|
| 10/2022 | $14,943 | $17,436 | $13,672 |
|---|
| 11/2022 | $15,754 | $18,346 | $14,090 |
|---|
| 12/2022 | $14,737 | $17,272 | $13,166 |
|---|
| 01/2023 | $16,160 | $18,461 | $14,422 |
|---|
| 02/2023 | $16,187 | $18,030 | $14,089 |
|---|
| 03/2023 | $15,877 | $18,512 | $13,079 |
|---|
| 04/2023 | $15,485 | $18,709 | $12,753 |
|---|
| 05/2023 | $15,257 | $18,782 | $12,502 |
|---|
| 06/2023 | $16,908 | $20,064 | $13,495 |
|---|
| 07/2023 | $17,418 | $20,783 | $14,514 |
|---|
| 08/2023 | $17,181 | $20,382 | $13,815 |
|---|
| 09/2023 | $16,114 | $19,411 | $13,096 |
|---|
| 10/2023 | $15,202 | $18,897 | $12,315 |
|---|
| 11/2023 | $16,579 | $20,659 | $13,423 |
|---|
| 12/2023 | $18,456 | $21,755 | $15,094 |
|---|
| 01/2024 | $18,053 | $21,996 | $14,408 |
|---|
| 02/2024 | $18,722 | $23,186 | $14,880 |
|---|
| 03/2024 | $19,611 | $23,934 | $15,532 |
|---|
| 04/2024 | $18,364 | $22,881 | $14,542 |
|---|
| 05/2024 | $19,143 | $23,962 | $15,222 |
|---|
| 06/2024 | $18,923 | $24,704 | $14,966 |
|---|
| 07/2024 | $20,234 | $25,163 | $16,789 |
|---|
| 08/2024 | $19,895 | $25,711 | $16,474 |
|---|
| 09/2024 | $19,803 | $26,243 | $16,485 |
|---|
| 10/2024 | $19,318 | $26,050 | $16,227 |
|---|
| 11/2024 | $21,196 | $27,783 | $17,792 |
|---|
| 12/2024 | $19,394 | $26,934 | $16,310 |
|---|
Performance data shown represents past performance and is no guarantee of, and is not necessarily indicative of, future results. Total return and value will vary, and you may have a gain or loss when shares are sold. Current performance may be lower or higher than quoted. For the most recent month-end performance, visit im.natixis.com/en-us/products/mutual-funds/price-and-performance.
Average Annual Total Returns (%)
| AATR | 1 Year | 5 Years | Since Inception 5/1/17 |
|---|
| Class N | 5.08% | 11.09% | 9.02% |
|---|
Russell 3000® Index | 23.81% | 13.86% | 13.71% |
|---|
Russell 2000® Value Index | 8.05% | 7.29% | 6.50% |
|---|
Effective May 1, 2024, in accordance with new regulations, the Fund’s primary broad-based index changed to the Russell 3000® Index. The Fund will retain Russell 2000® Value Index as an additional benchmark for performance comparison.
| Total Net Assets | $1,220,283,826 |
|---|
| # of Portfolio Holdings (including overnight repurchase agreements) | 61 |
|---|
| Portfolio Turnover Rate | 80% |
|---|
| Total Advisory Fees Paid (after waiver/reimbursement, if applicable) | $8,955,710 |
|---|
What did the Fund invest in? (% of Net Assets)
| Value | Value |
|---|
Other investments less than 3% of net assetsFootnote Reference* | 34.8% |
| Short-Term Investments | 5.7% |
| Textiles, Apparel & Luxury Goods | 3.0% |
| Mortgage Real Estate Investment Trusts (REITs) | 3.1% |
| Specialty Retail | 3.1% |
| Health Care Providers & Services | 3.2% |
| Chemicals | 4.2% |
| Insurance | 4.5% |
| Machinery | 4.9% |
| Electronic Equipment, Instruments & Components | 4.9% |
| Oil, Gas & Consumable Fuels | 5.9% |
| Trading Companies & Distributors | 6.3% |
| Banks | 16.4% |
| Footnote | Description |
Footnote* | Net of other assets less liabilities |
| Element Solutions, Inc. | 3.4% |
| Comerica, Inc. | 3.0% |
| Western Alliance Bancorp | 3.0% |
| Zions Bancorp NA | 2.7% |
| Beacon Roofing Supply, Inc. | 2.7% |
| First American Financial Corp. | 2.5% |
| Cushman & Wakefield PLC | 2.5% |
| Celestica, Inc. | 2.4% |
| Cullen/Frost Bankers, Inc. | 2.2% |
| Cadence Bank | 2.1% |
There were no material fund changes during the period.
There were no changes in or disagreements with Accountants during the period.
For additional information about the Fund; including its prospectus, financial information, holdings and proxy information, scan the QR code or visit im.natixis.com/funddocuments.
Vaughan Nelson Small Cap Value Fund
Annual Shareholder Report
December 31, 2024
Vaughan Nelson Small Cap Value Fund
Annual Shareholder Report - December 31, 2024
This annual shareholder report contains important information about Vaughan Nelson Small Cap Value Fund for the period of January 1, 2024 to December 31, 2024. You can find additional information (including tax information) about the Fund at im.natixis.com/funddocuments. You can also request the information by contacting us at (800) 225-5478 or by contacting your financial intermediary directly.
What were the fund costs for the last year? (based on a hypothetical $10,000 investment)
| Class Name | Costs of a $10,000 investment | Costs paid as a percentage of a $10,000 investmentFootnote Reference† |
|---|
| Class Y | $103 | 1.00% |
|---|
| Footnote | Description |
Footnote† | Annualized for periods less than one year (if applicable). |
How did the fund perform last year and what affected its performance?
Top Contributors to Performance
•The largest contributor to the fund’s 2024 performance was the portfolio's overweight position and selection in Information Technology led by Celestica Inc.
•Selection and an underweight position within Energy also contributed to performance with Antero Resources Corporation leading.
•Selection within Consumer Staples positively impacted performance thanks to strong returns from Coca-Cola Consolidated, Inc.
Top Detractors from Performance
•The largest detractor from the fund’s 2024 performance was the portfolio’s overweight position and security selection within Materials with Chemours Co. as the weakest name.
•Security selection within Health Care negatively impacted performance. AMN Healthcare Services, Inc. hindered the sector the most.
•The portfolio’s underweight position and selection within Financials detracted from performance with Selective Insurance Group, Inc. being the weakest name.
Investment Activity
As a result of buys and sells and market action, the portfolio is overweight Industrials, Information Technology, Materials, and Consumer Staples while underweight Real Estate, Utilities, Communication Services, Health Care, Financials, Energy, and Consumer Discretionary.
We continued to sell positions that we believe to be fully valued or that could face increased earnings pressure as we move into the late stages of this economic recovery and added to existing positions or established new positions that met our investment criteria.
We continue to position the portfolio into companies that have lower earnings variability, higher profitability, and stronger balance sheets than the broader investment universe, and where we can get these characteristics at similar valuation levels to the benchmark index. We still do not favor any single industry or sector and continue to look for the characteristics noted above across all industries.
The Fund’s benchmarks are unmanaged indices used as a general measure of market performance. Calculations assume dividends and capital gains are reinvested. The tables do not reflect taxes shareholders might owe on any fund distributions or when they redeem their shares. You cannot invest directly in an index.
Total Return Based on a Hypothetical $10,000 Investment
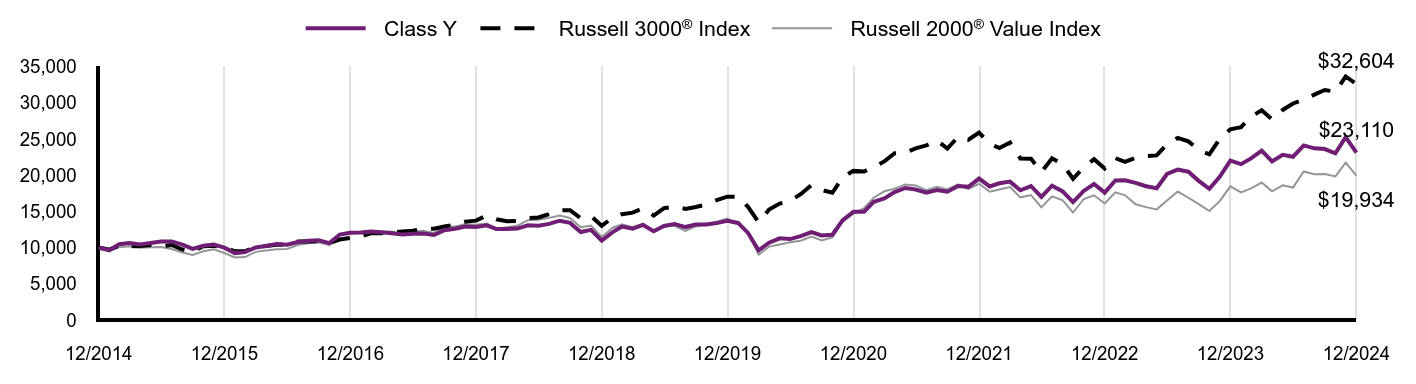
| Class Y | Russell 3000® Index | Russell 2000® Value Index |
|---|
| 12/2014 | $10,000 | $10,000 | $10,000 |
|---|
| 01/2015 | $9,612 | $9,722 | $9,584 |
|---|
| 02/2015 | $10,459 | $10,285 | $10,029 |
|---|
| 03/2015 | $10,625 | $10,180 | $10,198 |
|---|
| 04/2015 | $10,437 | $10,226 | $9,980 |
|---|
| 05/2015 | $10,648 | $10,368 | $10,063 |
|---|
| 06/2015 | $10,831 | $10,194 | $10,076 |
|---|
| 07/2015 | $10,855 | $10,365 | $9,798 |
|---|
| 08/2015 | $10,404 | $9,739 | $9,317 |
|---|
| 09/2015 | $9,832 | $9,455 | $8,994 |
|---|
| 10/2015 | $10,260 | $10,202 | $9,498 |
|---|
| 11/2015 | $10,423 | $10,258 | $9,768 |
|---|
| 12/2015 | $9,995 | $10,048 | $9,253 |
|---|
| 01/2016 | $9,237 | $9,481 | $8,632 |
|---|
| 02/2016 | $9,374 | $9,478 | $8,690 |
|---|
| 03/2016 | $10,022 | $10,145 | $9,411 |
|---|
| 04/2016 | $10,219 | $10,208 | $9,610 |
|---|
| 05/2016 | $10,493 | $10,391 | $9,786 |
|---|
| 06/2016 | $10,392 | $10,412 | $9,816 |
|---|
| 07/2016 | $10,773 | $10,825 | $10,346 |
|---|
| 08/2016 | $10,929 | $10,853 | $10,603 |
|---|
| 09/2016 | $11,002 | $10,870 | $10,686 |
|---|
| 10/2016 | $10,622 | $10,635 | $10,335 |
|---|
| 11/2016 | $11,802 | $11,111 | $11,707 |
|---|
| 12/2016 | $12,047 | $11,327 | $12,190 |
|---|
| 01/2017 | $12,070 | $11,541 | $12,103 |
|---|
| 02/2017 | $12,236 | $11,970 | $12,278 |
|---|
| 03/2017 | $12,112 | $11,978 | $12,174 |
|---|
| 04/2017 | $11,976 | $12,105 | $12,222 |
|---|
| 05/2017 | $11,810 | $12,229 | $11,842 |
|---|
| 06/2017 | $11,902 | $12,339 | $12,256 |
|---|
| 07/2017 | $11,933 | $12,572 | $12,333 |
|---|
| 08/2017 | $11,731 | $12,596 | $12,030 |
|---|
| 09/2017 | $12,405 | $12,903 | $12,882 |
|---|
| 10/2017 | $12,595 | $13,185 | $12,899 |
|---|
| 11/2017 | $12,908 | $13,585 | $13,272 |
|---|
| 12/2017 | $12,842 | $13,721 | $13,146 |
|---|
| 01/2018 | $13,080 | $14,444 | $13,308 |
|---|
| 02/2018 | $12,557 | $13,912 | $12,642 |
|---|
| 03/2018 | $12,576 | $13,633 | $12,799 |
|---|
| 04/2018 | $12,629 | $13,684 | $13,020 |
|---|
| 05/2018 | $13,086 | $14,071 | $13,778 |
|---|
| 06/2018 | $13,018 | $14,163 | $13,861 |
|---|
| 07/2018 | $13,278 | $14,633 | $14,106 |
|---|
| 08/2018 | $13,714 | $15,147 | $14,442 |
|---|
| 09/2018 | $13,414 | $15,172 | $14,084 |
|---|
| 10/2018 | $12,152 | $14,055 | $12,823 |
|---|
| 11/2018 | $12,452 | $14,336 | $13,029 |
|---|
| 12/2018 | $10,965 | $13,002 | $11,455 |
|---|
| 01/2019 | $12,105 | $14,118 | $12,707 |
|---|
| 02/2019 | $12,893 | $14,614 | $13,201 |
|---|
| 03/2019 | $12,616 | $14,828 | $12,821 |
|---|
| 04/2019 | $13,129 | $15,420 | $13,306 |
|---|
| 05/2019 | $12,265 | $14,422 | $12,219 |
|---|
| 06/2019 | $12,978 | $15,435 | $12,997 |
|---|
| 07/2019 | $13,255 | $15,664 | $13,018 |
|---|
| 08/2019 | $12,836 | $15,345 | $12,291 |
|---|
| 09/2019 | $13,196 | $15,614 | $12,923 |
|---|
| 10/2019 | $13,205 | $15,950 | $13,236 |
|---|
| 11/2019 | $13,398 | $16,557 | $13,545 |
|---|
| 12/2019 | $13,693 | $17,035 | $14,020 |
|---|
| 01/2020 | $13,406 | $17,016 | $13,263 |
|---|
| 02/2020 | $12,027 | $15,623 | $11,975 |
|---|
| 03/2020 | $9,608 | $13,475 | $9,020 |
|---|
| 04/2020 | $10,670 | $15,259 | $10,133 |
|---|
| 05/2020 | $11,284 | $16,075 | $10,424 |
|---|
| 06/2020 | $11,173 | $16,443 | $10,726 |
|---|
| 07/2020 | $11,574 | $17,376 | $10,947 |
|---|
| 08/2020 | $12,128 | $18,635 | $11,536 |
|---|
| 09/2020 | $11,685 | $17,957 | $11,000 |
|---|
| 10/2020 | $11,770 | $17,569 | $11,393 |
|---|
| 11/2020 | $13,790 | $19,707 | $13,593 |
|---|
| 12/2020 | $14,957 | $20,593 | $14,669 |
|---|
| 01/2021 | $14,948 | $20,501 | $15,441 |
|---|
| 02/2021 | $16,332 | $21,142 | $16,892 |
|---|
| 03/2021 | $16,785 | $21,900 | $17,775 |
|---|
| 04/2021 | $17,673 | $23,029 | $18,134 |
|---|
| 05/2021 | $18,237 | $23,134 | $18,698 |
|---|
| 06/2021 | $18,023 | $23,705 | $18,585 |
|---|
| 07/2021 | $17,579 | $24,105 | $17,920 |
|---|
| 08/2021 | $17,938 | $24,793 | $18,400 |
|---|
| 09/2021 | $17,707 | $23,681 | $18,031 |
|---|
| 10/2021 | $18,510 | $25,282 | $18,719 |
|---|
| 11/2021 | $18,391 | $24,897 | $18,079 |
|---|
| 12/2021 | $19,535 | $25,877 | $18,816 |
|---|
| 01/2022 | $18,442 | $24,355 | $17,719 |
|---|
| 02/2022 | $18,886 | $23,741 | $18,013 |
|---|
| 03/2022 | $19,112 | $24,512 | $18,365 |
|---|
| 04/2022 | $17,911 | $22,312 | $16,940 |
|---|
| 05/2022 | $18,479 | $22,282 | $17,265 |
|---|
| 06/2022 | $17,017 | $20,418 | $15,559 |
|---|
| 07/2022 | $18,543 | $22,333 | $17,066 |
|---|
| 08/2022 | $17,764 | $21,500 | $16,526 |
|---|
| 09/2022 | $16,270 | $19,506 | $14,842 |
|---|
| 10/2022 | $17,827 | $21,106 | $16,711 |
|---|
| 11/2022 | $18,785 | $22,208 | $17,221 |
|---|
| 12/2022 | $17,586 | $20,907 | $16,091 |
|---|
| 01/2023 | $19,273 | $22,347 | $17,627 |
|---|
| 02/2023 | $19,306 | $21,825 | $17,220 |
|---|
| 03/2023 | $18,936 | $22,408 | $15,986 |
|---|
| 04/2023 | $18,468 | $22,647 | $15,587 |
|---|
| 05/2023 | $18,195 | $22,735 | $15,280 |
|---|
| 06/2023 | $20,166 | $24,288 | $16,494 |
|---|
| 07/2023 | $20,776 | $25,158 | $17,739 |
|---|
| 08/2023 | $20,482 | $24,673 | $16,885 |
|---|
| 09/2023 | $19,219 | $23,497 | $16,006 |
|---|
| 10/2023 | $18,119 | $22,875 | $15,051 |
|---|
| 11/2023 | $19,763 | $25,008 | $16,406 |
|---|
| 12/2023 | $21,999 | $26,334 | $18,448 |
|---|
| 01/2024 | $21,518 | $26,626 | $17,610 |
|---|
| 02/2024 | $22,316 | $28,067 | $18,186 |
|---|
| 03/2024 | $23,377 | $28,973 | $18,983 |
|---|
| 04/2024 | $21,890 | $27,698 | $17,774 |
|---|
| 05/2024 | $22,809 | $29,006 | $18,605 |
|---|
| 06/2024 | $22,546 | $29,904 | $18,291 |
|---|
| 07/2024 | $24,110 | $30,460 | $20,520 |
|---|
| 08/2024 | $23,706 | $31,123 | $20,135 |
|---|
| 09/2024 | $23,607 | $31,767 | $20,148 |
|---|
| 10/2024 | $23,016 | $31,534 | $19,833 |
|---|
| 11/2024 | $25,259 | $33,632 | $21,746 |
|---|
| 12/2024 | $23,110 | $32,604 | $19,934 |
|---|
Performance data shown represents past performance and is no guarantee of, and is not necessarily indicative of, future results. Total return and value will vary, and you may have a gain or loss when shares are sold. Current performance may be lower or higher than quoted. For the most recent month-end performance, visit im.natixis.com/en-us/products/mutual-funds/price-and-performance.
Average Annual Total Returns (%)
| AATR | 1 Year | 5 Years | 10 Years |
|---|
| Class Y | 5.05% | 11.04% | 8.74% |
|---|
Russell 3000® Index | 23.81% | 13.86% | 12.55% |
|---|
Russell 2000® Value Index | 8.05% | 7.29% | 7.14% |
|---|
Effective May 1, 2024, in accordance with new regulations, the Fund’s primary broad-based index changed to the Russell 3000® Index. The Fund will retain Russell 2000® Value Index as an additional benchmark for performance comparison.
| Total Net Assets | $1,220,283,826 |
|---|
| # of Portfolio Holdings (including overnight repurchase agreements) | 61 |
|---|
| Portfolio Turnover Rate | 80% |
|---|
| Total Advisory Fees Paid (after waiver/reimbursement, if applicable) | $8,955,710 |
|---|
What did the Fund invest in? (% of Net Assets)
| Value | Value |
|---|
Other investments less than 3% of net assetsFootnote Reference* | 34.8% |
| Short-Term Investments | 5.7% |
| Textiles, Apparel & Luxury Goods | 3.0% |
| Mortgage Real Estate Investment Trusts (REITs) | 3.1% |
| Specialty Retail | 3.1% |
| Health Care Providers & Services | 3.2% |
| Chemicals | 4.2% |
| Insurance | 4.5% |
| Machinery | 4.9% |
| Electronic Equipment, Instruments & Components | 4.9% |
| Oil, Gas & Consumable Fuels | 5.9% |
| Trading Companies & Distributors | 6.3% |
| Banks | 16.4% |
| Footnote | Description |
Footnote* | Net of other assets less liabilities |
| Element Solutions, Inc. | 3.4% |
| Comerica, Inc. | 3.0% |
| Western Alliance Bancorp | 3.0% |
| Zions Bancorp NA | 2.7% |
| Beacon Roofing Supply, Inc. | 2.7% |
| First American Financial Corp. | 2.5% |
| Cushman & Wakefield PLC | 2.5% |
| Celestica, Inc. | 2.4% |
| Cullen/Frost Bankers, Inc. | 2.2% |
| Cadence Bank | 2.1% |
There were no material fund changes during the period.
There were no changes in or disagreements with Accountants during the period.
For additional information about the Fund; including its prospectus, financial information, holdings and proxy information, scan the QR code or visit im.natixis.com/funddocuments.
Vaughan Nelson Small Cap Value Fund
Annual Shareholder Report
December 31, 2024
Item 2. Code of Ethics.
The Registrant has adopted a code of ethics that applies to the Registrant’s principal executive officer, principal financial officer and persons performing similar functions. There have been no amendments or waivers of the Registrant’s code of ethics during the period.
Item 3. Audit Committee Financial Expert.
The Board of Trustees of the Registrant has established an audit committee. Mr. Richard A. Goglia, Mr. James P. Palermo, Mr. Kirk A. Sykes and Ms. Cynthia L. Walker are members of the audit committee and have been designated as “audit committee financial experts” by the Board of Trustees. Each of these individuals is also an Independent Trustee of the Registrant.
Item 4. Principal Accountant Fees and Services.
Fees billed by the Principal Accountant for services rendered to the Registrant.
The table below sets forth fees billed by the principal accountant, PricewaterhouseCoopers LLP, for the past two fiscal years for professional services rendered in connection with a) the audit of the Registrant’s annual financial statements and services provided in connection with regulatory filings; b) audit-related services (including services that are reasonably related to the performance of the audit of the Registrant’s financial statements but not reported under “Audit Fees”); c) tax compliance, tax advice and tax planning and d) all other fees billed for professional services rendered by the principal accountant to the Registrant, other than the services reported as a part of (a) through (c) of this Item.
| | | | | | | | | | | | | | | | | | | | | | | | | | | | | | | | |
| | | Audit fees | | | Audit-related fees1 | | | Tax fees2 | | | All other fees | |
| | | 1/1/23-
12/31/23 | | | 1/1/24-
12/31/24 | | | 1/1/23-
12/31/23 | | | 1/1/24-
12/31/24 | | | 1/1/23-
12/31/23 | | | 1/1/24-
12/31/24 | | | 1/1/23-
12/31/23 | | | 1/1/24-
12/31/24 | |
Natixis Funds Trust I (except Loomis Sayles Core Plus Bond Fund) | | $ | 223,970 | | | $ | 230,689 | | | $ | 557 | | | $ | 765 | | | $ | 61,080 | | | $ | 61,924 | | | $ | — | | | $ | — | |
| 1. | Audit-related fees consist of: |
2023 & 2024 – performance of agreed-upon procedures related to the Registrant’s deferred compensation plan.
2023 & 2024 – review of the Registrant’s tax returns (2023 & 2024), filings to reclaim withholding taxes paid on EU dividends (2023), and consulting services (2024).
Aggregate fees billed to the Registrant for non-audit services during 2023 and 2024 were $61,637 and $62,689, respectively.
(e)(1) Audit Committee Pre-Approval Policies.
Annually, the Registrant’s Audit Committee reviews the audit, audit-related, tax and other non-audit services together with the projected fees, for services proposed to be rendered to the Registrant and/or other entities for which pre-approval is required during the upcoming year. Any subsequent revisions to already pre-approved services or fees (including fee increases) and requests for pre-approval of new services would be presented for consideration quarterly as needed.
If, in the opinion of management, a proposed engagement by the Registrant’s independent accountants needs to commence before the next regularly scheduled Audit Committee meeting, any member of the Audit Committee who is an Independent Trustee of the Registrant is authorized to pre-approve the engagement, but only for engagements to provide audit, audit related and tax services. This approval is subject to review by the full Audit Committee at its next quarterly meeting. All other engagements require the approval of all the members of the Audit Committee.
(e)(2) None of the services described in each of Items 4 (b) through (d) were approved pursuant to de minimis exception in paragraph (c)(7)(i)(C) of Rule 2-01 of Regulation S-X.
(f) Not applicable.
(g) Fees billed by the Principal Accountant for services rendered to the Adviser and Control Affiliates.
The following table sets forth the fees billed by the Registrant’s principal accountant for non-audit services rendered to Natixis Advisors, LLC (“Natixis Advisors”), Mirova US LLC (“Mirova”) and entities controlling, controlled by or under common control with Natixis Advisors and Mirova (“Control Affiliates”) that provide ongoing services to the Registrant, for engagements that related directly to the operations and financial reporting of the Registrant for the last two fiscal years.
| | | | | | | | | | | | | | | | | | | | | | | | |
| | | Audit-related fees | | | Tax fees | | | All other fees | |
| | | 1/1/23-12/31/23 | | | 1/1/24-12/31/24 | | | 1/1/23-12/31/23 | | | 1/1/24-12/31/24 | | | 1/1/23-12/31/23 | | | 1/1/24-12/31/24 | |
Control Affiliates | | $ | — | | | $ | — | | | $ | 17,898 | | | $ | 45,373 | | | $ | — | | | $ | — | |
The following table sets forth the aggregate fees billed by the Registrant’s principal accountant for non-audit services rendered to Mirova, Natixis Advisors and Control Affiliates that provide ongoing services to the Registrant, for the last two fiscal years, including the fees disclosed in the table above.
| | | | | | | | |
| | | Aggregate Non-Audit Fees | |
| | | 1/1/23-12/31/23 | | | 1/1/24-12/31/24 | |
Control Affiliates | | $ | 289,793 | | | $ | 110,563 | |
(h) The audit committee has considered and determined that the provisions of non-audit services that were rendered to the Registrant’s investment adviser, and any entity controlling, controlled by, or under common control with the investment adviser that provides ongoing services to the Registrant that were not pre-approved pursuant to paragraph (c)(7)(i)(C) of Rule 2-01 of Regulation S-X is compatible with maintaining the principal accountant’s independence.
(i) Not applicable.
(j) Not applicable.
Item 5. Audit Committee of Listed Registrants.
Not applicable.
Item 6. Schedule of Investments.
The Schedule of Investments are incorporated by reference as part of the Financial Statements and Other Important Information for Open-End Management Investment Companies filed as Item 7 herewith.
Item 7. Financial Statements and Financial Highlights for Open-End Management Investment Companies.
(a) The Registrant’s Financial Statements are attached herewith.
(b) The Registrant’s Financial Highlights are attached herewith.
Annual Financial Statements and Other Important Information
Loomis Sayles International Growth Fund |
|
Natixis Oakmark International Fund |
Natixis U.S. Equity Opportunities Fund |
Vaughan Nelson Mid Cap Fund |
Vaughan Nelson Small Cap Value Fund |
Portfolio of Investments – as of December 31, 2024Loomis Sayles International Growth Fund
| | |
Common Stocks — 98.4% of Net Assets |
| |
| | |
| |
| | |
| |
| | |
| | |
| | |
| |
| Shopify, Inc., Class A(a) | |
| |
| Alibaba Group Holding Ltd., ADR(b) | |
| | |
| Budweiser Brewing Co. APAC Ltd. | |
| Kweichow Moutai Co. Ltd., Class A | |
| | |
| | |
| Trip.com Group Ltd., ADR(a)(b) | |
| Vipshop Holdings Ltd., ADR(b) | |
| Yum China Holdings, Inc.(b) | |
| | |
| |
| | |
| |
| | |
| LVMH Moet Hennessy Louis Vuitton SE | |
| | |
| | |
| |
| | |
| |
| | |
| | |
| | |
| |
| Galaxy Entertainment Group Ltd. | |
| |
| | |
| |
| CRISPR Therapeutics AG(a) | |
| Novartis AG, (Registered) | |
| | |
| |
| | |
| Reckitt Benckiser Group PLC | |
| | |
| | |
| |
| | |
| | |
| Doximity, Inc., Class A(a) | |
| | |
| | |
| | |
| United States — continued |
| | |
| | |
| | |
| Total Common Stocks
(Identified Cost $24,660,999) | |
| | |
Short-Term Investments — 4.7% |
| Tri-Party Repurchase Agreement with Fixed Income Clearing Corporation, dated 12/31/2024 at 2.500% to be repurchased at $1,365,409 on 1/02/2025 collateralized by $1,375,300 U.S. Treasury Note, 4.125% due 2/15/2027 valued at $1,392,566 including accrued interest (Note 2 of Notes to Financial Statements)
(Identified Cost $1,365,220) | |
| Total Investments — 103.1%
(Identified Cost $26,026,219) | |
| Other assets less liabilities — (3.1)% | |
| | |
| See Note 2 of Notes to Financial Statements. |
| Non-income producing security. |
| Security invests in variable interest entities based in China. See Note 9 of Notes to Financial Statements. |
| An American Depositary Receipt is a certificate issued by a custodian bank representing the right to receive securities of the foreign issuer described. The values of ADRs may be significantly influenced by trading on exchanges not located in the United States. |
Industry Summary at December 31, 2024
| |
| |
Hotels, Restaurants & Leisure | |
| |
| |
| |
Semiconductors & Semiconductor Equipment | |
| |
Interactive Media & Services | |
| |
| |
| |
Textiles, Apparel & Luxury Goods | |
| |
| |
Health Care Equipment & Supplies | |
Other Investments, less than 2% each | |
| |
| |
Other assets less liabilities | |
| |
See accompanying notes to financial statements.
Portfolio of Investments – as of December 31, 2024Loomis Sayles International Growth Fund (continued) Currency Exposure Summary at December 31, 2024
| |
| |
| |
| |
| |
| |
| |
| |
| |
| |
Other assets less liabilities | |
| |
See accompanying notes to financial statements.
Portfolio of Investments – as of December 31, 2024Natixis Oakmark Fund
| | |
Common Stocks — 95.2% of Net Assets |
| Automobile Components — 1.9% |
| | |
| Magna International, Inc. | |
| | |
| |
| | |
| |
| | |
| | |
| First Citizens BancShares, Inc., Class A | |
| | |
| | |
| |
| | |
| |
| Fortune Brands Innovations, Inc. | |
| | |
| | |
| |
| Bank of New York Mellon Corp. | |
| | |
| | |
| | |
| Intercontinental Exchange, Inc. | |
| | |
| | |
| | |
| |
| | |
| | |
| | |
| |
| | |
| Capital One Financial Corp. | |
| | |
| Consumer Staples Distribution & Retail — 2.5% |
| | |
| |
| | |
| Electronic Equipment, Instruments & Components — 1.2% |
| | |
| |
| Warner Bros. Discovery, Inc.(a) | |
| Financial Services — 5.7% |
| Corebridge Financial, Inc. | |
| | |
| | |
| | |
| Health Care Equipment & Supplies — 1.3% |
| Baxter International, Inc. | |
| GE HealthCare Technologies, Inc. | |
| | |
| Health Care Providers & Services — 4.1% |
| | |
| | |
| Health Care Providers & Services — continued |
| | |
| | |
| | |
| Hotels, Restaurants & Leisure — 0.8% |
| | |
| |
| American International Group, Inc. | |
| Reinsurance Group of America, Inc. | |
| | |
| | |
| Interactive Media & Services — 3.6% |
| | |
| Life Sciences Tools & Services — 2.3% |
| | |
| |
| | |
| |
| Charter Communications, Inc., Class A(a) | |
| | |
| Liberty Broadband Corp., Class C(a) | |
| | |
| Oil, Gas & Consumable Fuels — 9.0% |
| | |
| | |
| | |
| | |
| | |
| Passenger Airlines — 1.7% |
| | |
| Personal Care Products — 1.9% |
| | |
| |
| | |
| Professional Services — 1.6% |
| | |
| Real Estate Management & Development — 2.3% |
| CBRE Group, Inc., Class A(a) | |
| Total Common Stocks
(Identified Cost $692,765,798) | |
See accompanying notes to financial statements.
Portfolio of Investments – as of December 31, 2024Natixis Oakmark Fund (continued)
| | |
Short-Term Investments — 4.6% |
| Tri-Party Repurchase Agreement with Fixed Income Clearing Corporation, dated 12/31/2024 at 2.500% to be repurchased at $39,772,191 on 1/02/2025 collateralized by $40,059,700 U.S. Treasury Note, 4.125% due 2/15/2027 valued at $40,562,021 including accrued interest (Note 2 of Notes to Financial Statements)
(Identified Cost $39,766,668) | |
| Total Investments — 99.8%
(Identified Cost $732,532,466) | |
| Other assets less liabilities — 0.2% | |
| | |
| See Note 2 of Notes to Financial Statements. |
| Non-income producing security. |
Industry Summary at December 31, 2024
| |
| |
Oil, Gas & Consumable Fuels | |
| |
| |
| |
| |
Health Care Providers & Services | |
Interactive Media & Services | |
| |
| |
| |
| |
Consumer Staples Distribution & Retail | |
Real Estate Management & Development | |
Life Sciences Tools & Services | |
Other Investments, less than 2% each | |
| |
| |
Other assets less liabilities | |
| |
See accompanying notes to financial statements.
Portfolio of Investments – as of December 31, 2024Natixis Oakmark International Fund
| | |
Common Stocks — 94.8% of Net Assets |
| |
| | |
| |
| | |
| |
| | |
| |
| Alibaba Group Holding Ltd. | |
| |
| | |
| |
| | |
| | |
| | |
| | |
| | |
| | |
| | |
| | |
| | |
| | |
| | |
| | |
| |
| | |
| | |
| | |
| Bayerische Motoren Werke AG | |
| | |
| | |
| | |
| Fresenius Medical Care AG | |
| Fresenius SE & Co. KGaA(a) | |
| | |
| Mercedes-Benz Group AG, (Registered) | |
| | |
| | |
| | |
| |
| | |
| |
| Bank Mandiri Persero Tbk. PT | |
| |
| Ryanair Holdings PLC, ADR | |
| |
| | |
| |
| | |
| | |
| | |
| |
| | |
| | |
| | |
| |
| | |
| | |
| | |
| |
| Koninklijke Ahold Delhaize NV | |
| | |
| | |
| |
| | |
| |
| | |
| | |
| | |
| | |
| |
| Cie Financiere Richemont SA, Class A | |
| | |
| | |
| Novartis AG, (Registered) | |
| | |
| | |
| | |
| | |
| |
| | |
| | |
| | |
| | |
| Liberty Global Ltd., Class A(a) | |
| | |
| | |
| Reckitt Benckiser Group PLC | |
| | |
| | |
| | |
| | |
| | |
| |
| | |
| | |
| | |
| Total Common Stocks
(Identified Cost $258,419,309) | |
|
|
|
| | |
| Samsung Electronics Co. Ltd., 3.269%, (KRW)
(Identified Cost $6,594,377) | |
|
|
Participatory Notes — 0.2% |
| | |
| Ryanair Holdings PLC, 12/12/2025(a)(b)
(Identified Cost $664,862) | |
See accompanying notes to financial statements.
Portfolio of Investments – as of December 31, 2024Natixis Oakmark International Fund (continued)
| | |
Short-Term Investments — 2.1% |
| Tri-Party Repurchase Agreement with Fixed Income Clearing Corporation, dated 12/31/2024 at 2.500% to be repurchased at $5,461,497 on 1/02/2025 collateralized by $5,501,000 U.S. Treasury Note, 4.125% due 2/15/2027 valued at $5,570,002 including accrued interest (Note 2 of Notes to Financial Statements)
(Identified Cost $5,460,738) | |
| Total Investments — 98.5%
(Identified Cost $271,139,286) | |
| Other assets less liabilities — 1.5% | |
| | |
| See Note 2 of Notes to Financial Statements. |
| Non-income producing security. |
| Securities subject to restriction on resale. At December 31, 2024, the restricted securities held by the Fund are as follows: |
| An American Depositary Receipt is a certificate issued by a custodian bank representing the right to receive securities of the foreign issuer described. The values of ADRs may be significantly influenced by trading on exchanges not located in the United States. |
Industry Summary at December 31, 2024
| |
| |
Textiles, Apparel & Luxury Goods | |
| |
| |
| |
Health Care Providers & Services | |
| |
| |
| |
Hotels, Restaurants & Leisure | |
| |
| |
| |
Trading Companies & Distributors | |
| |
| |
| |
| |
| |
Other Investments, less than 2% each | |
| |
| |
Other assets less liabilities | |
| |
Currency Exposure Summary at December 31, 2024
| |
| |
| |
| |
| |
| |
| |
| |
| |
Other assets less liabilities | |
| |
See accompanying notes to financial statements.
Portfolio of Investments – as of December 31, 2024Natixis U.S. Equity Opportunities Fund
| | |
Common Stocks — 98.1% of Net Assets |
| Aerospace & Defense — 1.9% |
| | |
| Air Freight & Logistics — 0.4% |
| Expeditors International of Washington, Inc. | |
| Automobile Components — 0.5% |
| Mobileye Global, Inc., Class A(a) | |
| |
| | |
| | |
| | |
| |
| | |
| | |
| First Citizens BancShares, Inc., Class A | |
| | |
| | |
| |
| Boston Beer Co., Inc., Class A(a) | |
| | |
| Monster Beverage Corp.(a) | |
| | |
| |
| Alnylam Pharmaceuticals, Inc.(a) | |
| CRISPR Therapeutics AG(a) | |
| Regeneron Pharmaceuticals, Inc.(a) | |
| | |
| |
| Alibaba Group Holding Ltd., ADR | |
| | |
| | |
| |
| | |
| |
| Bank of New York Mellon Corp. | |
| | |
| FactSet Research Systems, Inc. | |
| Intercontinental Exchange, Inc. | |
| | |
| | |
| | |
| |
| | |
| |
| | |
| Capital One Financial Corp. | |
| | |
| Consumer Staples Distribution & Retail — 1.7% |
| | |
| Electronic Equipment, Instruments & Components — 0.8% |
| | |
| |
| | |
| | |
| Warner Bros. Discovery, Inc.(a) | |
| | |
| | |
| Financial Services — 4.7% |
| | |
| | |
| | |
| | |
| | |
| Health Care Equipment & Supplies — 0.6% |
| Intuitive Surgical, Inc.(a) | |
| Health Care Providers & Services — 1.6% |
| | |
| | |
| | |
| Health Care Technology — 1.7% |
| Doximity, Inc., Class A(a) | |
| Veeva Systems, Inc., Class A(a) | |
| | |
| Hotels, Restaurants & Leisure — 1.4% |
| | |
| | |
| | |
| | |
| |
| American International Group, Inc. | |
| | |
| | |
| Interactive Media & Services — 8.5% |
| | |
| | |
| Meta Platforms, Inc., Class A | |
| | |
| |
| Shopify, Inc., Class A(a) | |
| Life Sciences Tools & Services — 2.1% |
| | |
| | |
| | |
| |
| | |
| |
| Charter Communications, Inc., Class A(a) | |
| Oil, Gas & Consumable Fuels — 5.3% |
| | |
| | |
| | |
| | |
| | |
| Passenger Airlines — 1.6% |
| | |
| Personal Care Products — 0.6% |
| | |
| |
| | |
| | |
| | |
| | |
See accompanying notes to financial statements.
Portfolio of Investments – as of December 31, 2024Natixis U.S. Equity Opportunities Fund (continued) | | |
| Professional Services — 0.6% |
| | |
| Real Estate Management & Development — 1.6% |
| CBRE Group, Inc., Class A(a) | |
| Semiconductors & Semiconductor Equipment — 6.1% |
| | |
| | |
| | |
| | |
| |
| | |
| | |
| | |
| | |
| Workday, Inc., Class A(a) | |
| | |
| Textiles, Apparel & Luxury Goods — 0.2% |
| Under Armour, Inc., Class A(a) | |
| Total Common Stocks
(Identified Cost $667,439,175) | |
| | |
Short-Term Investments — 2.0% |
| Tri-Party Repurchase Agreement with Fixed Income Clearing Corporation, dated 12/31/2024 at 2.500% to be repurchased at $22,170,948 on 1/02/2025 collateralized by $22,331,300 U.S. Treasury Note, 4.125% due 2/15/2027 valued at $22,611,400 including accrued interest (Note 2 of Notes to Financial Statements)
(Identified Cost $22,167,869) | |
| Total Investments — 100.1%
(Identified Cost $689,607,044) | |
| Other assets less liabilities — (0.1)% | |
| | |
| See Note 2 of Notes to Financial Statements. |
| Non-income producing security. |
| An American Depositary Receipt is a certificate issued by a custodian bank representing the right to receive securities of the foreign issuer described. The values of ADRs may be significantly influenced by trading on exchanges not located in the United States. |
Industry Summary at December 31, 2024
Interactive Media & Services | |
| |
| |
| |
| |
Semiconductors & Semiconductor Equipment | |
Oil, Gas & Consumable Fuels | |
| |
| |
| |
| |
| |
| |
| |
| |
Life Sciences Tools & Services | |
| |
Other Investments, less than 2% each | |
| |
| |
Other assets less liabilities | |
| |
See accompanying notes to financial statements.
Portfolio of Investments – as of December 31, 2024Vaughan Nelson Mid Cap Fund
| | |
Common Stocks — 99.0% of Net Assets |
| Aerospace & Defense — 4.9% |
| | |
| | |
| | |
| |
| | |
| | |
| | |
| | |
| |
| | |
| | |
| | |
| Builders FirstSource, Inc.(a) | |
| | |
| |
| ARES Management Corp., Class A | |
| | |
| | |
| | |
| | |
| Communications Equipment — 1.1% |
| | |
| Construction Materials — 3.0% |
| | |
| Consumer Staples Distribution & Retail — 2.1% |
| Performance Food Group Co.(a) | |
| Electrical Equipment — 4.9% |
| | |
| | |
| | |
| | |
| Vertiv Holdings Co., Class A | |
| | |
| Electronic Equipment, Instruments & Components — 2.4% |
| | |
| | |
| | |
| | |
| Energy Equipment & Services — 2.8% |
| | |
| Financial Services — 2.1% |
| Apollo Global Management, Inc. | |
| Ground Transportation — 3.6% |
| | |
| | |
| | |
| Hotels, Restaurants & Leisure — 11.6% |
| | |
| | |
| DoorDash, Inc., Class A(a) | |
| Royal Caribbean Cruises Ltd. | |
| | |
| | |
| Household Durables — 2.7% |
| | |
| | |
| | |
| Independent Power & Renewable Electricity Producers — 1.9% |
| | |
| |
| EastGroup Properties, Inc. | |
| |
| | |
| | |
| Reinsurance Group of America, Inc. | |
| | |
| |
| | |
| Life Sciences Tools & Services — 3.2% |
| Agilent Technologies, Inc. | |
| | |
| | |
| | |
| |
| | |
| | |
| Helios Technologies, Inc. | |
| Lincoln Electric Holdings, Inc. | |
| | |
| Oil, Gas & Consumable Fuels — 1.9% |
| | |
| | |
| | |
| Professional Services — 1.1% |
| CACI International, Inc., Class A(a) | |
| Real Estate Management & Development — 3.0% |
| Cushman & Wakefield PLC(a) | |
| Semiconductors & Semiconductor Equipment — 6.2% |
| | |
| Monolithic Power Systems, Inc. | |
| | |
| |
| Tyler Technologies, Inc.(a) | |
| |
| Extra Space Storage, Inc. | |
| |
| | |
| | |
| Dick's Sporting Goods, Inc. | |
| | |
| Textiles, Apparel & Luxury Goods — 2.0% |
| Skechers USA, Inc., Class A(a) | |
| Trading Companies & Distributors — 2.4% |
| | |
| SiteOne Landscape Supply, Inc.(a) | |
| | |
| Total Common Stocks
(Identified Cost $181,852,021) | |
See accompanying notes to financial statements.
Portfolio of Investments – as of December 31, 2024Vaughan Nelson Mid Cap Fund (continued)
| | |
Short-Term Investments — 0.8% |
| Tri-Party Repurchase Agreement with Fixed Income Clearing Corporation, dated 12/31/2024 at 2.500% to be repurchased at $1,997,613 on 1/02/2025 collateralized by $2,012,100 U.S. Treasury Note, 4.125% due 2/15/2027 valued at $2,037,378 including accrued interest (Note 2 of Notes to Financial Statements)
(Identified Cost $1,997,335) | |
| Total Investments — 99.8%
(Identified Cost $183,849,356) | |
| Other assets less liabilities — 0.2% | |
| | |
| See Note 2 of Notes to Financial Statements. |
| Non-income producing security. |
| An American Depositary Receipt is a certificate issued by a custodian bank representing the right to receive securities of the foreign issuer described. The values of ADRs may be significantly influenced by trading on exchanges not located in the United States. |
| Real Estate Investment Trusts |
Industry Summary at December 31, 2024
Hotels, Restaurants & Leisure | |
| |
| |
Semiconductors & Semiconductor Equipment | |
| |
| |
| |
| |
| |
| |
Life Sciences Tools & Services | |
| |
Real Estate Management & Development | |
| |
| |
Energy Equipment & Services | |
| |
| |
Electronic Equipment, Instruments & Components | |
Trading Companies & Distributors | |
Consumer Staples Distribution & Retail | |
| |
Textiles, Apparel & Luxury Goods | |
Other Investments, less than 2% each | |
| |
| |
Other assets less liabilities | |
| |
See accompanying notes to financial statements.
Portfolio of Investments – as of December 31, 2024Vaughan Nelson Small Cap Value Fund
| | |
Common Stocks — 94.3% of Net Assets |
| Aerospace & Defense — 2.6% |
| | |
| Huntington Ingalls Industries, Inc. | |
| | |
| Air Freight & Logistics — 1.3% |
| | |
| |
| | |
| | |
| Cullen/Frost Bankers, Inc. | |
| Prosperity Bancshares, Inc. | |
| | |
| | |
| | |
| | |
| |
| | |
| |
| Artisan Partners Asset Management, Inc., Class A | |
| |
| | |
| | |
| | |
| Communications Equipment — 1.8% |
| | |
| Construction & Engineering — 1.5% |
| | |
| |
| | |
| Electric Utilities — 1.5% |
| Portland General Electric Co. | |
| Electronic Equipment, Instruments & Components — 4.9% |
| | |
| | |
| Insight Enterprises, Inc.(a) | |
| | |
| Ground Transportation — 1.5% |
| | |
| Health Care Equipment & Supplies — 2.0% |
| Globus Medical, Inc., Class A(a) | |
| TransMedics Group, Inc.(a) | |
| | |
| Health Care Providers & Services — 3.2% |
| Acadia Healthcare Co., Inc.(a) | |
| | |
| | |
| Hotels, Restaurants & Leisure — 1.7% |
| Red Rock Resorts, Inc., Class A | |
| Household Durables — 2.8% |
| | |
| Installed Building Products, Inc. | |
| | |
| |
| | |
| | |
| |
| First American Financial Corp. | |
| Selective Insurance Group, Inc. | |
| | |
| Life Sciences Tools & Services — 1.3% |
| | |
| |
| | |
| | |
| John Bean Technologies Corp. | |
| Lincoln Electric Holdings, Inc. | |
| | |
| | |
| Marine Transportation — 0.8% |
| | |
| |
| | |
| Mortgage Real Estate Investment Trusts (REITs) — 3.1% |
| | |
| | |
| | |
| Oil, Gas & Consumable Fuels — 5.9% |
| Antero Resources Corp.(a) | |
| | |
| | |
| | |
| | |
| Personal Care Products — 1.1% |
| | |
| Professional Services — 0.9% |
| | |
| Real Estate Management & Development — 2.5% |
| Cushman & Wakefield PLC(a) | |
| |
| | |
| Semiconductors & Semiconductor Equipment — 1.6% |
| | |
| | |
| | |
| |
| | |
| Warby Parker, Inc., Class A(a) | |
| | |
| Textiles, Apparel & Luxury Goods — 3.0% |
| | |
| | |
| | |
| Trading Companies & Distributors — 6.3% |
| Beacon Roofing Supply, Inc.(a) | |
| | |
| H&E Equipment Services, Inc. | |
| Rush Enterprises, Inc., Class A | |
| | |
| Total Common Stocks
(Identified Cost $1,020,560,625) | |
See accompanying notes to financial statements.
Portfolio of Investments – as of December 31, 2024Vaughan Nelson Small Cap Value Fund (continued)
| | |
Short-Term Investments — 5.7% |
| Tri-Party Repurchase Agreement with Fixed Income Clearing Corporation, dated 12/31/2024 at 2.500% to be repurchased at $69,576,314 on 1/02/2025 collateralized by $70,079,300 U.S. Treasury Note, 4.125% due 2/15/2027 valued at $70,958,073 including accrued interest (Note 2 of Notes to Financial Statements)
(Identified Cost $69,566,652) | |
| Total Investments — 100.0%
(Identified Cost $1,090,127,277) | |
| Other assets less liabilities — (0.0)% | |
| | |
| See Note 2 of Notes to Financial Statements. |
| Non-income producing security. |
| Real Estate Investment Trusts |
Industry Summary at December 31, 2024
| |
Trading Companies & Distributors | |
Oil, Gas & Consumable Fuels | |
Electronic Equipment, Instruments & Components | |
| |
| |
| |
Health Care Providers & Services | |
| |
Mortgage Real Estate Investment Trusts (REITs) | |
Textiles, Apparel & Luxury Goods | |
| |
| |
Real Estate Management & Development | |
Health Care Equipment & Supplies | |
Other Investments, less than 2% each | |
| |
| |
Other assets less liabilities | |
| |
See accompanying notes to financial statements.
Statements of Assets and Liabilities
| Loomis
Sayles
International
Growth Fund | | Natixis
Oakmark
International
Fund | Natixis
U.S.
Equity
Opportunities
Fund |
| | | | |
| | | | |
Net unrealized appreciation (depreciation) | | | | |
| | | | |
| | | | |
Foreign currency at value (identified cost $29,013, $0, $677 and $0, respectively) | | | | |
Receivable for Fund shares sold | | | | |
Receivable for securities sold | | | | |
Dividends and interest receivable | | | | |
| | | | |
| | | | |
| | | | |
| | | | |
Payable for securities purchased | | | | |
Payable for Fund shares redeemed | | | | |
Foreign taxes payable (Note 2) | | | | |
Management fees payable (Note 5) | | | | |
Deferred Trustees’ fees (Note 5) | | | | |
Administrative fees payable (Note 5) | | | | |
Payable to distributor (Note 5d) | | | | |
Audit and tax services fees payable | | | | |
Other accounts payable and accrued expenses | | | | |
| | | | |
COMMITMENTS AND CONTINGENCIES(a) | | | | |
| | | | |
| | | | |
| | | | |
Accumulated earnings (loss) | | | | |
| | | | |
See accompanying notes to financial statements.
Statements of Assets and Liabilities (continued)
| Loomis Sayles International Growth Fund | | Natixis Oakmark International Fund | Natixis U.S. Equity Opportunities Fund |
COMPUTATION OF NET ASSET VALUE AND OFFERING PRICE: | | | | |
| | | | |
| | | | |
Shares of beneficial interest | | | | |
Net asset value and redemption price per share | | | | |
Offering price per share (100/94.25 of net asset value) (Note 1) | | | | |
Class C shares: (redemption price per share is equal to net asset value less any applicable contingent deferred sales charge) (Note 1) | | | | |
| | | | |
Shares of beneficial interest | | | | |
Net asset value and offering price per share | | | | |
| | | | |
| | | | |
Shares of beneficial interest | | | | |
Net asset value, offering and redemption price per share | | | | |
| | | | |
| | | | |
Shares of beneficial interest | | | | |
Net asset value, offering and redemption price per share | | | | |
| Net asset value calculations have been determined utilizing fractional share and penny amounts. |
| As disclosed in the Notes to Financial Statements, if applicable. |
See accompanying notes to financial statements.
Statements of Assets and Liabilities (continued)
| | Vaughan
Nelson
Small Cap
Value Fund |
| | |
| | |
Net unrealized appreciation | | |
| | |
| | |
Receivable for Fund shares sold | | |
Receivable for securities sold | | |
Dividends and interest receivable | | |
| | |
| | |
| | |
Payable for securities purchased | | |
Payable for Fund shares redeemed | | |
Management fees payable (Note 5) | | |
Deferred Trustees’ fees (Note 5) | | |
Administrative fees payable (Note 5) | | |
Payable to distributor (Note 5d) | | |
Audit and tax services fees payable | | |
Other accounts payable and accrued expenses | | |
| | |
COMMITMENTS AND CONTINGENCIES(a) | | |
| | |
| | |
| | |
| | |
| | |
COMPUTATION OF NET ASSET VALUE AND OFFERING PRICE: | | |
| | |
| | |
Shares of beneficial interest | | |
Net asset value and redemption price per share | | |
Offering price per share (100/94.25 of net asset value) (Note 1) | | |
Class C shares: (redemption price per share is equal to net asset value less any applicable contingent deferred sales charge) (Note 1) | | |
| | |
Shares of beneficial interest | | |
Net asset value and offering price per share | | |
| | |
| | |
Shares of beneficial interest | | |
Net asset value, offering and redemption price per share | | |
| | |
| | |
Shares of beneficial interest | | |
Net asset value, offering and redemption price per share | | |
| As disclosed in the Notes to Financial Statements, if applicable. |
See accompanying notes to financial statements.
For the Year Ended December 31, 2024
| Loomis
Sayles
International
Growth Fund | | Natixis
Oakmark
International
Fund | Natixis
U.S.
Equity
Opportunities
Fund |
| | | | |
| | | | |
| | | | |
Less net foreign taxes withheld | | | | |
| | | | |
| | | | |
| | | | |
Service and distribution fees (Note 5) | | | | |
Administrative fees (Note 5) | | | | |
Trustees' fees and expenses (Note 5) | | | | |
Transfer agent fees and expenses (Notes 5, 6 and 7) | | | | |
Audit and tax services fees | | | | |
Custodian fees and expenses | | | | |
Interest expense (Note 11) | | | | |
| | | | |
| | | | |
Shareholder reporting expenses | | | | |
| | | | |
| | | | |
Less waiver and/or expense reimbursement (Note 5) | | | | |
Less expense offset (Note 7) | | | | |
| | | | |
| | | | |
Net realized and unrealized gain (loss) on Investments and Foreign currency transactions | | | | |
Net realized gain (loss) on: | | | | |
| | | | |
Foreign currency transactions (Note 2c) | | | | |
Net change in unrealized appreciation (depreciation) on: | | | | |
| | | | |
Foreign currency translations (Note 2c) | | | | |
Net realized and unrealized gain (loss) on Investments and Foreign currency transactions | | | | |
NET INCREASE (DECREASE) IN NET ASSETS RESULTING FROM OPERATIONS | | | | |
| Includes a non-recurring dividend of $68,876. |
See accompanying notes to financial statements.
Statements of Operations (continued)
For the Year Ended December 31, 2024
| | Vaughan
Nelson
Small Cap
Value Fund |
| | |
| | |
| | |
Less net foreign taxes withheld | | |
| | |
| | |
| | |
Service and distribution fees (Note 5) | | |
Administrative fees (Note 5) | | |
Trustees' fees and expenses (Note 5) | | |
Transfer agent fees and expenses (Notes 5, 6 and 7) | | |
Audit and tax services fees | | |
Custodian fees and expenses | | |
| | |
| | |
Shareholder reporting expenses | | |
| | |
| | |
Expense recovery (Note 5) | | |
Less waiver and/or expense reimbursement (Note 5) | | |
Less expense offset (Note 7) | | |
| | |
| | |
Net realized and unrealized gain (loss) on Investments | | |
| | |
| | |
Net change in unrealized appreciation (depreciation) on: | | |
| | |
Net realized and unrealized gain on Investments | | |
NET INCREASE IN NET ASSETS RESULTING FROM OPERATIONS | | |
See accompanying notes to financial statements.
Statements of Changes in Net Assets
| Loomis Sayles
International Growth Fund | |
| Year Ended
December 31,2024 | Year Ended
December 31,2023 | Year Ended
December 31,2024 | Year Ended
December 31,2023 |
| | | | |
| | | | |
Net realized gain on investments and foreign currency transactions | | | | |
Net change in unrealized appreciation on investments and foreign currency translations | | | | |
Net increase in net assets resulting from operations | | | | |
FROM DISTRIBUTIONS TO SHAREHOLDERS: | | | | |
| | | | |
| | | | |
| | | | |
| | | | |
| | | | |
NET INCREASE (DECREASE) IN NET ASSETS
FROM CAPITAL SHARES TRANSACTIONS
(Note 12) | | | | |
Net increase (decrease) in net assets | | | | |
| | | | |
| | | | |
| | | | |
See accompanying notes to financial statements.
Statements of Changes in Net Assets (continued)
| Natixis Oakmark International Fund | Natixis U.S. Equity Opportunities Fund |
| Year Ended
December 31,2024 | Year Ended
December 31,2023 | Year Ended
December 31,2024 | Year Ended
December 31,2023 |
| | | | |
| | | | |
Net realized gain (loss) on investments and foreign currency transactions | | | | |
Net change in unrealized appreciation (depreciation) on investments and foreign currency translations | | | | |
Net increase (decrease) in net assets resulting from operations | | | | |
FROM DISTRIBUTIONS TO SHAREHOLDERS: | | | | |
| | | | |
| | | | |
| | | | |
| | | | |
| | | | |
NET INCREASE (DECREASE) IN NET ASSETS
FROM CAPITAL SHARES TRANSACTIONS
(Note 12) | | | | |
Net increase (decrease) in net assets | | | | |
| | | | |
| | | | |
| | | | |
See accompanying notes to financial statements.
Statements of Changes in Net Assets (continued)
| Vaughan Nelson Mid Cap Fund | Vaughan Nelson Small Cap Value Fund |
| Year Ended
December 31,2024 | Year Ended
December 31,2023 | Year Ended
December 31,2024 | Year Ended
December 31,2023 |
| | | | |
| | | | |
Net realized gain (loss) on investments | | | | |
Net change in unrealized appreciation on investments | | | | |
Net increase in net assets resulting from operations | | | | |
FROM DISTRIBUTIONS TO SHAREHOLDERS: | | | | |
| | | | |
| | | | |
| | | | |
| | | | |
| | | | |
NET INCREASE (DECREASE) IN NET ASSETS
FROM CAPITAL SHARES TRANSACTIONS
(Note 12) | | | | |
Net increase (decrease) in net assets | | | | |
| | | | |
| | | | |
| | | | |
See accompanying notes to financial statements.
For a share outstanding throughout each period.
| Loomis Sayles International Growth Fund—Class A |
| Year Ended
December 31,
2024 | Year Ended
December 31,
2023 | Year Ended
December 31,
2022 | Year Ended
December 31,
2021 | |
Net asset value, beginning of the period | | | | | |
INCOME (LOSS) FROM INVESTMENT OPERATIONS: | | | | | |
Net investment income (loss)(a) | | | | | |
Net realized and unrealized gain (loss) | | | | | |
Total from Investment Operations | | | | | |
| | | | | |
| | | | | |
Net realized capital gains | | | | | |
| | | | | |
Net asset value, end of the period | | | | | |
| | | | | |
RATIOS TO AVERAGE NET ASSETS: | | | | | |
Net assets, end of the period (000's) | | | | | |
| | | | | |
| | | | | |
Net investment income (loss) | | | | | |
| | | | | |
| From commencement of operations on December 15, 2020 through December 31, 2020. |
| Per share net investment income (loss) has been calculated using the average shares outstanding during the period. |
| Includes a non-recurring dividend. Without this dividend, net investment income per share would have been $0.01, total return would have been 12.98% and the ratio of net investment income to average net assets would have been 0.12%. |
| A sales charge for Class A shares is not reflected in total return calculations. |
| Had certain expenses not been waived/reimbursed during the period, total returns would have been lower. |
| Periods less than one year are not annualized. |
| The investment adviser agreed to waive its fees and/or reimburse a portion of the Fund’s expenses during the period. Without this waiver/reimbursement, expenses would have been higher. |
| Includes interest expense. Without this expense the ratio of net expenses would have been 1.20% and the ratio of gross expenses would have been 1.74%. |
| Computed on an annualized basis for periods less than one year. |
See accompanying notes to financial statements.
Financial Highlights (continued)
For a share outstanding throughout each period.
| Loomis Sayles International Growth Fund—Class C |
| Year Ended
December 31,
2024 | Year Ended
December 31,
2023 | Year Ended
December 31,
2022 | Year Ended
December 31,
2021 | |
Net asset value, beginning of the period | | | | | |
INCOME (LOSS) FROM INVESTMENT OPERATIONS: | | | | | |
Net investment income (loss)(a) | | | | | |
Net realized and unrealized gain (loss) | | | | | |
Total from Investment Operations | | | | | |
| | | | | |
| | | | | |
Net realized capital gains | | | | | |
| | | | | |
Net asset value, end of the period | | | | | |
| | | | | |
RATIOS TO AVERAGE NET ASSETS: | | | | | |
Net assets, end of the period (000's) | | | | | |
| | | | | |
| | | | | |
Net investment income (loss) | | | | | |
| | | | | |
| From commencement of operations on December 15, 2020 through December 31, 2020. |
| Per share net investment income (loss) has been calculated using the average shares outstanding during the period. |
| Includes a non-recurring dividend. Without this dividend, net investment loss per share would have been $(0.07), total return would have been 12.08% and the ratio of net investment loss to average net assets would have been (0.75)%. |
| Amount rounds to less than $0.01 per share. |
| A contingent deferred sales charge for Class C shares is not reflected in total return calculations. |
| Had certain expenses not been waived/reimbursed during the period, total returns would have been lower. |
| Periods less than one year are not annualized. |
| The investment adviser agreed to waive its fees and/or reimburse a portion of the Fund’s expenses during the period. Without this waiver/reimbursement, expenses would have been higher. |
| Includes interest expense of less than 0.01%. |
| Computed on an annualized basis for periods less than one year. |
See accompanying notes to financial statements.
Financial Highlights (continued)
For a share outstanding throughout each period.
| Loomis Sayles International Growth Fund—Class N |
| Year Ended
December 31,
2024 | Year Ended
December 31,
2023 | Year Ended
December 31,
2022 | Year Ended
December 31,
2021 | |
Net asset value, beginning of the period | | | | | |
INCOME (LOSS) FROM INVESTMENT OPERATIONS: | | | | | |
| | | | | |
Net realized and unrealized gain (loss) | | | | | |
Total from Investment Operations | | | | | |
| | | | | |
| | | | | |
Net realized capital gains | | | | | |
| | | | | |
Net asset value, end of the period | | | | | |
| | | | | |
RATIOS TO AVERAGE NET ASSETS: | | | | | |
Net assets, end of the period (000's) | | | | | |
| | | | | |
| | | | | |
| | | | | |
| | | | | |
| From commencement of operations on December 15, 2020 through December 31, 2020. |
| Per share net investment income has been calculated using the average shares outstanding during the period. |
| Includes a non-recurring dividend. Without this dividend, net investment income per share would have been $0.03, total return would have been 13.26% and the ratio of net investment income to average net assets would have been 0.29%. |
| Had certain expenses not been waived/reimbursed during the period, total returns would have been lower. |
| Periods less than one year are not annualized. |
| The investment adviser agreed to waive its fees and/or reimburse a portion of the Fund’s expenses during the period. Without this waiver/reimbursement, expenses would have been higher. |
| Includes interest expense of less than 0.01%. |
| Computed on an annualized basis for periods less than one year. |
See accompanying notes to financial statements.
Financial Highlights (continued)
For a share outstanding throughout each period.
| Loomis Sayles International Growth Fund—Class Y |
| Year Ended
December 31,
2024 | Year Ended
December 31,
2023 | Year Ended
December 31,
2022 | Year Ended
December 31,
2021 | |
Net asset value, beginning of the period | | | | | |
INCOME (LOSS) FROM INVESTMENT OPERATIONS: | | | | | |
| | | | | |
Net realized and unrealized gain (loss) | | | | | |
Total from Investment Operations | | | | | |
| | | | | |
| | | | | |
Net realized capital gains | | | | | |
| | | | | |
Net asset value, end of the period | | | | | |
| | | | | |
RATIOS TO AVERAGE NET ASSETS: | | | | | |
Net assets, end of the period (000's) | | | | | |
| | | | | |
| | | | | |
| | | | | |
| | | | | |
| From commencement of operations on December 15, 2020 through December 31, 2020. |
| Per share net investment income has been calculated using the average shares outstanding during the period. |
| Includes a non-recurring dividend. Without this dividend, net investment income per share would have been $0.04, total return would have been 13.23% and the ratio of net investment income to average net assets would have been 0.34%. |
| Had certain expenses not been waived/reimbursed during the period, total returns would have been lower. |
| Periods less than one year are not annualized. |
| The investment adviser agreed to waive its fees and/or reimburse a portion of the Fund’s expenses during the period. Without this waiver/reimbursement, expenses would have been higher. |
| Includes interest expense. Without this expense the ratio of net expenses would have been 0.95% and the ratio of gross expenses would have been 1.49%. |
| Computed on an annualized basis for periods less than one year. |
See accompanying notes to financial statements.
Financial Highlights (continued)
For a share outstanding throughout each period.
| Natixis Oakmark Fund—Class A |
| Year Ended
December 31,
2024 | Year Ended
December 31,
2023 | Year Ended
December 31,
2022 | Year Ended
December 31,
2021 | Year Ended
December 31,
2020 |
Net asset value, beginning of the period | | | | | |
INCOME (LOSS) FROM INVESTMENT OPERATIONS: | | | | | |
| | | | | |
Net realized and unrealized gain (loss) | | | | | |
Total from Investment Operations | | | | | |
| | | | | |
| | | | | |
Net realized capital gains | | | | | |
| | | | | |
Net asset value, end of the period | | | | | |
| | | | | |
RATIOS TO AVERAGE NET ASSETS: | | | | | |
Net assets, end of the period (000's) | | | | | |
| | | | | |
| | | | | |
| | | | | |
| | | | | |
| Per share net investment income has been calculated using the average shares outstanding during the period. |
| Includes a non-recurring dividend. Without this dividend, net investment income per share would have been $0.05, total return would have been 12.72% and the ratio of net investment income to average net assets would have been 0.27%. |
| A sales charge for Class A shares is not reflected in total return calculations. |
| Had certain expenses not been waived/reimbursed during the period, total returns would have been lower. |
| The investment adviser agreed to waive its fees and/or reimburse a portion of the Fund’s expenses during the period. Without this waiver/reimbursement, expenses would have been higher. |
| Effective July 1, 2024, the expense limit decreased from 1.05% to 1.03%. See Note 5 of Notes to Financial Statements. |
| Effective July 1, 2021, the expense limit decreased from 1.30% to 1.05%. |
| Includes refund of prior year service fee of 0.01%. |
See accompanying notes to financial statements.
Financial Highlights (continued)
For a share outstanding throughout each period.
| Natixis Oakmark Fund—Class C |
| Year Ended
December 31,
2024 | Year Ended
December 31,
2023 | Year Ended
December 31,
2022 | Year Ended
December 31,
2021 | Year Ended
December 31,
2020 |
Net asset value, beginning of the period | | | | | |
INCOME (LOSS) FROM INVESTMENT OPERATIONS: | | | | | |
Net investment income (loss)(a) | | | | | |
Net realized and unrealized gain (loss) | | | | | |
Total from Investment Operations | | | | | |
| | | | | |
| | | | | |
Net realized capital gains | | | | | |
| | | | | |
Net asset value, end of the period | | | | | |
| | | | | |
RATIOS TO AVERAGE NET ASSETS: | | | | | |
Net assets, end of the period (000's) | | | | | |
| | | | | |
| | | | | |
Net investment income (loss) | | | | | |
| | | | | |
| Per share net investment income (loss) has been calculated using the average shares outstanding during the period. |
| Includes a non-recurring dividend. Without this dividend, net investment loss per share would have been $(0.08), total return would have been 11.85% and the ratio of net investment loss to average net assets would have been (0.46)%. |
| Amount rounds to less than $0.01 per share. |
| A contingent deferred sales charge for Class C shares is not reflected in total return calculations. |
| Had certain expenses not been waived/reimbursed during the period, total returns would have been lower. |
| The investment adviser agreed to waive its fees and/or reimburse a portion of the Fund’s expenses during the period. Without this waiver/reimbursement, expenses would have been higher. |
| Effective July 1, 2024, the expense limit decreased from 1.80% to 1.78%. See Note 5 of Notes to Financial Statements. |
| Effective July 1, 2021, the expense limit decreased from 2.05% to 1.80%. |
See accompanying notes to financial statements.
Financial Highlights (continued)
For a share outstanding throughout each period.
| Natixis Oakmark Fund—Class N |
| Year Ended
December 31,
2024 | Year Ended
December 31,
2023 | Year Ended
December 31,
2022 | Year Ended
December 31,
2021 | Year Ended
December 31,
2020 |
Net asset value, beginning of the period | | | | | |
INCOME (LOSS) FROM INVESTMENT OPERATIONS: | | | | | |
| | | | | |
Net realized and unrealized gain (loss) | | | | | |
Total from Investment Operations | | | | | |
| | | | | |
| | | | | |
Net realized capital gains | | | | | |
| | | | | |
Net asset value, end of the period | | | | | |
| | | | | |
RATIOS TO AVERAGE NET ASSETS: | | | | | |
Net assets, end of the period (000's) | | | | | |
| | | | | |
| | | | | |
| | | | | |
| | | | | |
| Per share net investment income has been calculated using the average shares outstanding during the period. |
| Includes a non-recurring dividend. Without this dividend, net investment income per share would have been $0.14, total return would have been 13.13% and the ratio of net investment income to average net assets would have been 0.67%. |
| Had certain expenses not been waived/reimbursed during the period, total returns would have been lower. |
| The investment adviser agreed to waive its fees and/or reimburse a portion of the Fund’s expenses during the period. Without this waiver/reimbursement, expenses would have been higher. |
| Effective July 1, 2024, the expense limit decreased from 0.75% to 0.73%. See Note 5 of Notes to Financial Statements. |
| Effective July 1, 2021, the expense limit decreased from 1.00% to 0.75%. |
| Includes transfer agent fees and expenses before expense offset. Without these expenses the ratio of gross expenses would have been 0.87%. See Note 7 of Notes to Financial Statements. |
See accompanying notes to financial statements.
Financial Highlights (continued)
For a share outstanding throughout each period.
| Natixis Oakmark Fund—Class Y |
| Year Ended
December 31,
2024 | Year Ended
December 31,
2023 | Year Ended
December 31,
2022 | Year Ended
December 31,
2021 | Year Ended
December 31,
2020 |
Net asset value, beginning of the period | | | | | |
INCOME (LOSS) FROM INVESTMENT OPERATIONS: | | | | | |
| | | | | |
Net realized and unrealized gain (loss) | | | | | |
Total from Investment Operations | | | | | |
| | | | | |
| | | | | |
Net realized capital gains | | | | | |
| | | | | |
Net asset value, end of the period | | | | | |
| | | | | |
RATIOS TO AVERAGE NET ASSETS: | | | | | |
Net assets, end of the period (000's) | | | | | |
| | | | | |
| | | | | |
| | | | | |
| | | | | |
| Per share net investment income has been calculated using the average shares outstanding during the period. |
| Includes a non-recurring dividend. Without this dividend, net investment income per share would have been $0.12, total return would have been 13.00% and the ratio of net investment income to average net assets would have been 0.55%. |
| Had certain expenses not been waived/reimbursed during the period, total returns would have been lower. |
| The investment adviser agreed to waive its fees and/or reimburse a portion of the Fund’s expenses during the period. Without this waiver/reimbursement, expenses would have been higher. |
| Effective July 1, 2024, the expense limit decreased from 0.80% to 0.78%. See Note 5 of Notes to Financial Statements. |
| Effective July 1, 2021, the expense limit decreased from 1.05% to 0.80%. |
See accompanying notes to financial statements.
Financial Highlights (continued)
For a share outstanding throughout each period.
| Natixis Oakmark International Fund—Class A |
| Year Ended
December 31,
2024 | Year Ended
December 31,
2023 | Year Ended
December 31,
2022 | Year Ended
December 31,
2021 | Year Ended
December 31,
2020 |
Net asset value, beginning of the period | | | | | |
INCOME (LOSS) FROM INVESTMENT OPERATIONS: | | | | | |
Net investment income (loss)(a) | | | | | |
Net realized and unrealized gain (loss) | | | | | |
Total from Investment Operations | | | | | |
| | | | | |
| | | | | |
Net asset value, end of the period | | | | | |
| | | | | |
RATIOS TO AVERAGE NET ASSETS: | | | | | |
Net assets, end of the period (000's) | | | | | |
| | | | | |
| | | | | |
Net investment income (loss) | | | | | |
| | | | | |
| Per share net investment income (loss) has been calculated using the average shares outstanding during the period. |
| Includes tax reclaims. Without these, net investment income per share would have been $0.25, total return would have been 18.78% and the ratio of net investment income to average net assets would have been 1.74%. |
| Includes a non-recurring dividend and tax reclaims. Without these, net investment income per share would have been $0.13, total return would have been 7.74% and the ratio of net investment income to average net assets would have been 0.84%. |
| Amount rounds to less than $0.01 per share. |
| The amount shown for a share outstanding does not correspond with the aggregate realized and unrealized gain (loss) on investments for the period due to the timing of sales and redemptions of fund shares in relation to fluctuating market values of investments of the Fund. |
| A sales charge for Class A shares is not reflected in total return calculations. |
| Had certain expenses not been waived/reimbursed during the period, total returns would have been lower. |
| The investment adviser agreed to waive its fees and/or reimburse a portion of the Fund’s expenses during the period. Without this waiver/reimbursement, expenses would have been higher. |
| Effective July 1, 2021, the expense limit decreased from 1.20% to 1.15%. |
| Effective July 1, 2020, the expense limit decreased from 1.37% to 1.20%. |
See accompanying notes to financial statements.
Financial Highlights (continued)
For a share outstanding throughout each period.
| Natixis Oakmark International Fund—Class C |
| Year Ended
December 31,
2024 | Year Ended
December 31,
2023 | Year Ended
December 31,
2022 | Year Ended
December 31,
2021 | Year Ended
December 31,
2020 |
Net asset value, beginning of the period | | | | | |
INCOME (LOSS) FROM INVESTMENT OPERATIONS: | | | | | |
Net investment income (loss)(a) | | | | | |
Net realized and unrealized gain (loss) | | | | | |
Total from Investment Operations | | | | | |
| | | | | |
| | | | | |
Net asset value, end of the period | | | | | |
| | | | | |
RATIOS TO AVERAGE NET ASSETS: | | | | | |
Net assets, end of the period (000's) | | | | | |
| | | | | |
| | | | | |
Net investment income (loss) | | | | | |
| | | | | |
| Per share net investment income (loss) has been calculated using the average shares outstanding during the period. |
| Includes tax reclaims. Without these, net investment income per share would have been $0.15, total return would have been 17.85% and the ratio of net investment income to average net assets would have been 1.10%. |
| Includes a non-recurring dividend and tax reclaims. Without these, net investment income per share would have been $0.02, total return would have been 6.98% and the ratio of net investment income to average net assets would have been 0.13%. |
| The amount shown for a share outstanding does not correspond with the aggregate realized and unrealized gain (loss) on investments for the period due to the timing of sales and redemptions of fund shares in relation to fluctuating market values of investments of the Fund. |
| A contingent deferred sales charge for Class C shares is not reflected in total return calculations. |
| Had certain expenses not been waived/reimbursed during the period, total returns would have been lower. |
| The investment adviser agreed to waive its fees and/or reimburse a portion of the Fund’s expenses during the period. Without this waiver/reimbursement, expenses would have been higher. |
| Effective July 1, 2021, the expense limit decreased from 1.95% to 1.90%. |
| Effective July 1, 2020, the expense limit decreased from 2.12% to 1.95%. |
See accompanying notes to financial statements.
Financial Highlights (continued)
For a share outstanding throughout each period.
| Natixis Oakmark International Fund—Class N |
| Year Ended
December 31,
2024 | Year Ended
December 31,
2023 | Year Ended
December 31,
2022 | Year Ended
December 31,
2021 | Year Ended
December 31,
2020 |
Net asset value, beginning of the period | | | | | |
INCOME (LOSS) FROM INVESTMENT OPERATIONS: | | | | | |
| | | | | |
Net realized and unrealized gain (loss) | | | | | |
Total from Investment Operations | | | | | |
| | | | | |
| | | | | |
Net asset value, end of the period | | | | | |
| | | | | |
RATIOS TO AVERAGE NET ASSETS: | | | | | |
Net assets, end of the period (000's) | | | | | |
| | | | | |
| | | | | |
| | | | | |
| | | | | |
| Per share net investment income has been calculated using the average shares outstanding during the period. |
| Includes tax reclaims. Without these, net investment income per share would have been $0.27, total return would have been 19.14% and the ratio of net investment income to average net assets would have been 1.95%. |
| Includes a non-recurring dividend and tax reclaims. Without these, net investment income per share would have been $0.11, total return would have been 8.09% and the ratio of net investment income to average net assets would have been 0.70%. |
| The amount shown for a share outstanding does not correspond with the aggregate realized and unrealized gain (loss) on investments for the period due to the timing of sales and redemptions of fund shares in relation to fluctuating market values of investments of the Fund. |
| Had certain expenses not been waived/reimbursed during the period, total returns would have been lower. |
| The investment adviser agreed to waive its fees and/or reimburse a portion of the Fund’s expenses during the period. Without this waiver/reimbursement, expenses would have been higher. |
| Effective July 1, 2021, the expense limit decreased from 0.90% to 0.85%. |
| Effective July 1, 2020, the expense limit decreased from 1.07% to 0.90%. |
| Includes transfer agent fees and expenses before expense offset. Without these expenses the ratio of gross expenses would have been 1.19%. See Note 7 of Notes to Financial Statements. |
See accompanying notes to financial statements.
Financial Highlights (continued)
For a share outstanding throughout each period.
| Natixis Oakmark International Fund—Class Y |
| Year Ended
December 31,
2024 | Year Ended
December 31,
2023 | Year Ended
December 31,
2022 | Year Ended
December 31,
2021 | Year Ended
December 31,
2020 |
Net asset value, beginning of the period | | | | | |
INCOME (LOSS) FROM INVESTMENT OPERATIONS: | | | | | |
| | | | | |
Net realized and unrealized gain (loss) | | | | | |
Total from Investment Operations | | | | | |
| | | | | |
| | | | | |
Net asset value, end of the period | | | | | |
| | | | | |
RATIOS TO AVERAGE NET ASSETS: | | | | | |
Net assets, end of the period (000's) | | | | | |
| | | | | |
| | | | | |
| | | | | |
| | | | | |
| Per share net investment income has been calculated using the average shares outstanding during the period. |
| Includes tax reclaims. Without these, net investment income per share would have been $0.28, total return would have been 19.18% and the ratio of net investment income to average net assets would have been 1.98%. |
| Includes a non-recurring dividend and tax reclaims. Without these, net investment income per share would have been $0.17, total return would have been 8.04% and the ratio of net investment income to average net assets would have been 1.07%. |
| The amount shown for a share outstanding does not correspond with the aggregate realized and unrealized gain (loss) on investments for the period due to the timing of sales and redemptions of fund shares in relation to fluctuating market values of investments of the Fund. |
| Had certain expenses not been waived/reimbursed during the period, total returns would have been lower. |
| The investment adviser agreed to waive its fees and/or reimburse a portion of the Fund’s expenses during the period. Without this waiver/reimbursement, expenses would have been higher. |
| Effective July 1, 2021, the expense limit decreased from 0.95% to 0.90%. |
| Effective July 1, 2020, the expense limit decreased from 1.12% to 0.95%. |
See accompanying notes to financial statements.
Financial Highlights (continued)
For a share outstanding throughout each period.
| Natixis U.S. Equity Opportunities Fund—Class A |
| Year Ended
December 31,
2024 | Year Ended
December 31,
2023 | Year Ended
December 31,
2022 | Year Ended
December 31,
2021 | Year Ended
December 31,
2020 |
Net asset value, beginning of the period | | | | | |
INCOME (LOSS) FROM INVESTMENT OPERATIONS: | | | | | |
Net investment income (loss)(a) | | | | | |
Net realized and unrealized gain (loss) | | | | | |
Total from Investment Operations | | | | | |
| | | | | |
| | | | | |
Net realized capital gains | | | | | |
| | | | | |
Net asset value, end of the period | | | | | |
| | | | | |
RATIOS TO AVERAGE NET ASSETS: | | | | | |
Net assets, end of the period (000's) | | | | | |
| | | | | |
| | | | | |
Net investment income (loss) | | | | | |
| | | | | |
| Per share net investment income (loss) has been calculated using the average shares outstanding during the period. |
| A sales charge for Class A shares is not reflected in total return calculations. |
See accompanying notes to financial statements.
Financial Highlights (continued)
For a share outstanding throughout each period.
| Natixis U.S. Equity Opportunities Fund—Class C |
| Year Ended
December 31,
2024 | Year Ended
December 31,
2023 | Year Ended
December 31,
2022 | Year Ended
December 31,
2021 | Year Ended
December 31,
2020 |
Net asset value, beginning of the period | | | | | |
INCOME (LOSS) FROM INVESTMENT OPERATIONS: | | | | | |
| | | | | |
Net realized and unrealized gain (loss) | | | | | |
Total from Investment Operations | | | | | |
| | | | | |
| | | | | |
Net realized capital gains | | | | | |
| | | | | |
Net asset value, end of the period | | | | | |
| | | | | |
RATIOS TO AVERAGE NET ASSETS: | | | | | |
Net assets, end of the period (000's) | | | | | |
| | | | | |
| | | | | |
| | | | | |
| | | | | |
| Per share net investment loss has been calculated using the average shares outstanding during the period. |
| A contingent deferred sales charge for Class C shares is not reflected in total return calculations. |
See accompanying notes to financial statements.
Financial Highlights (continued)
For a share outstanding throughout each period.
| Natixis U.S. Equity Opportunities Fund—Class N |
| Year Ended
December 31,
2024 | Year Ended
December 31,
2023 | Year Ended
December 31,
2022 | Year Ended
December 31,
2021 | Year Ended
December 31,
2020 |
Net asset value, beginning of the period | | | | | |
INCOME (LOSS) FROM INVESTMENT OPERATIONS: | | | | | |
| | | | | |
Net realized and unrealized gain (loss) | | | | | |
Total from Investment Operations | | | | | |
| | | | | |
| | | | | |
Net realized capital gains | | | | | |
| | | | | |
Net asset value, end of the period | | | | | |
| | | | | |
RATIOS TO AVERAGE NET ASSETS: | | | | | |
Net assets, end of the period (000's) | | | | | |
| | | | | |
| | | | | |
| | | | | |
| | | | | |
| Per share net investment income has been calculated using the average shares outstanding during the period. |
| Had certain expenses not been waived/reimbursed during the period, total returns would have been lower. |
| The investment adviser agreed to waive its fees and/or reimburse a portion of the Fund’s expenses during the period. Without this waiver/reimbursement, expenses would have been higher. |
See accompanying notes to financial statements.
Financial Highlights (continued)
For a share outstanding throughout each period.
| Natixis U.S. Equity Opportunities Fund—Class Y |
| Year Ended
December 31,
2024 | Year Ended
December 31,
2023 | Year Ended
December 31,
2022 | Year Ended
December 31,
2021 | Year Ended
December 31,
2020 |
Net asset value, beginning of the period | | | | | |
INCOME (LOSS) FROM INVESTMENT OPERATIONS: | | | | | |
| | | | | |
Net realized and unrealized gain (loss) | | | | | |
Total from Investment Operations | | | | | |
| | | | | |
| | | | | |
Net realized capital gains | | | | | |
| | | | | |
Net asset value, end of the period | | | | | |
| | | | | |
RATIOS TO AVERAGE NET ASSETS: | | | | | |
Net assets, end of the period (000's) | | | | | |
| | | | | |
| | | | | |
| | | | | |
| | | | | |
| Per share net investment income has been calculated using the average shares outstanding during the period. |
| Amount rounds to less than $0.01 per share. |
| Amount rounds to less than 0.01%. |
See accompanying notes to financial statements.
Financial Highlights (continued)
For a share outstanding throughout each period.
| Vaughan Nelson Mid Cap Fund—Class A |
| Year Ended
December 31,
2024 | Year Ended
December 31,
2023 | Year Ended
December 31,
2022 | Year Ended
December 31,
2021 | Year Ended
December 31,
2020 |
Net asset value, beginning of the period | | | | | |
INCOME (LOSS) FROM INVESTMENT OPERATIONS: | | | | | |
Net investment income (loss)(a) | | | | | |
Net realized and unrealized gain (loss) | | | | | |
Total from Investment Operations | | | | | |
| | | | | |
| | | | | |
Net realized capital gains | | | | | |
| | | | | |
Net asset value, end of the period | | | | | |
| | | | | |
RATIOS TO AVERAGE NET ASSETS: | | | | | |
Net assets, end of the period (000's) | | | | | |
| | | | | |
| | | | | |
Net investment income (loss) | | | | | |
| | | | | |
| Per share net investment income (loss) has been calculated using the average shares outstanding during the period. |
| Amount rounds to less than $0.01 per share. |
| A sales charge for Class A shares is not reflected in total return calculations. |
| Had certain expenses not been waived/reimbursed during the period, total returns would have been lower. |
| The investment adviser agreed to waive its fees and/or reimburse a portion of the Fund’s expenses during the period. Without this waiver/reimbursement, expenses would have been higher. |
| Effective July 1, 2021, the expense limit decreased from 1.20% to 1.15%. |
See accompanying notes to financial statements.
Financial Highlights (continued)
For a share outstanding throughout each period.
| Vaughan Nelson Mid Cap Fund—Class C |
| Year Ended
December 31,
2024 | Year Ended
December 31,
2023 | Year Ended
December 31,
2022 | Year Ended
December 31,
2021 | Year Ended
December 31,
2020 |
Net asset value, beginning of the period | | | | | |
INCOME (LOSS) FROM INVESTMENT OPERATIONS: | | | | | |
| | | | | |
Net realized and unrealized gain (loss) | | | | | |
Total from Investment Operations | | | | | |
| | | | | |
| | | | | |
Net realized capital gains | | | | | |
| | | | | |
Net asset value, end of the period | | | | | |
| | | | | |
RATIOS TO AVERAGE NET ASSETS: | | | | | |
Net assets, end of the period (000's) | | | | | |
| | | | | |
| | | | | |
| | | | | |
| | | | | |
| Per share net investment loss has been calculated using the average shares outstanding during the period. |
| Amount rounds to less than $0.01 per share. |
| A contingent deferred sales charge for Class C shares is not reflected in total return calculations. |
| Had certain expenses not been waived/reimbursed during the period, total returns would have been lower. |
| The investment adviser agreed to waive its fees and/or reimburse a portion of the Fund’s expenses during the period. Without this waiver/reimbursement, expenses would have been higher. |
| Effective July 1, 2021, the expense limit decreased from 1.95% to 1.90%. |
See accompanying notes to financial statements.
Financial Highlights (continued)
For a share outstanding throughout each period.
| Vaughan Nelson Mid Cap Fund—Class N |
| Year Ended
December 31,
2024 | Year Ended
December 31,
2023 | Year Ended
December 31,
2022 | Year Ended
December 31,
2021 | Year Ended
December 31,
2020 |
Net asset value, beginning of the period | | | | | |
INCOME (LOSS) FROM INVESTMENT OPERATIONS: | | | | | |
| | | | | |
Net realized and unrealized gain (loss) | | | | | |
Total from Investment Operations | | | | | |
| | | | | |
| | | | | |
Net realized capital gains | | | | | |
| | | | | |
Net asset value, end of the period | | | | | |
| | | | | |
RATIOS TO AVERAGE NET ASSETS: | | | | | |
Net assets, end of the period (000's) | | | | | |
| | | | | |
| | | | | |
| | | | | |
| | | | | |
| Per share net investment income has been calculated using the average shares outstanding during the period. |
| Amount rounds to less than $0.01 per share. |
| Had certain expenses not been waived/reimbursed during the period, total returns would have been lower. |
| The investment adviser agreed to waive its fees and/or reimburse a portion of the Fund’s expenses during the period. Without this waiver/reimbursement, expenses would have been higher. |
| Effective July 1, 2021, the expense limit decreased from 0.90% to 0.85%. |
See accompanying notes to financial statements.
Financial Highlights (continued)
For a share outstanding throughout each period.
| Vaughan Nelson Mid Cap Fund—Class Y |
| Year Ended
December 31,
2024 | Year Ended
December 31,
2023 | Year Ended
December 31,
2022 | Year Ended
December 31,
2021 | Year Ended
December 31,
2020 |
Net asset value, beginning of the period | | | | | |
INCOME (LOSS) FROM INVESTMENT OPERATIONS: | | | | | |
| | | | | |
Net realized and unrealized gain (loss) | | | | | |
Total from Investment Operations | | | | | |
| | | | | |
| | | | | |
Net realized capital gains | | | | | |
| | | | | |
Net asset value, end of the period | | | | | |
| | | | | |
RATIOS TO AVERAGE NET ASSETS: | | | | | |
Net assets, end of the period (000's) | | | | | |
| | | | | |
| | | | | |
| | | | | |
| | | | | |
| Per share net investment income has been calculated using the average shares outstanding during the period. |
| Amount rounds to less than $0.01 per share. |
| Had certain expenses not been waived/reimbursed during the period, total returns would have been lower. |
| The investment adviser agreed to waive its fees and/or reimburse a portion of the Fund’s expenses during the period. Without this waiver/reimbursement, expenses would have been higher. |
| Effective July 1, 2021, the expense limit decreased from 0.95% to 0.90%. |
See accompanying notes to financial statements.
Financial Highlights (continued)
For a share outstanding throughout each period.
| Vaughan Nelson Small Cap Value Fund—Class A |
| Year Ended
December 31,
2024 | Year Ended
December 31,
2023 | Year Ended
December 31,
2022 | Year Ended
December 31,
2021 | Year Ended
December 31,
2020 |
Net asset value, beginning of the period | | | | | |
INCOME (LOSS) FROM INVESTMENT OPERATIONS: | | | | | |
Net investment income (loss)(a) | | | | | |
Net realized and unrealized gain (loss) | | | | | |
Total from Investment Operations | | | | | |
| | | | | |
| | | | | |
Net realized capital gains | | | | | |
| | | | | |
Net asset value, end of the period | | | | | |
| | | | | |
RATIOS TO AVERAGE NET ASSETS: | | | | | |
Net assets, end of the period (000's) | | | | | |
| | | | | |
| | | | | |
Net investment income (loss) | | | | | |
| | | | | |
| Per share net investment income (loss) has been calculated using the average shares outstanding during the period. |
| Amount rounds to less than $0.01 per share. |
| Includes a non-recurring dividend. Without this dividend, net investment loss per share would have been $(0.05), total return would have been 29.95% and the ratio of net investment loss to average net assets would have been (0.25)%. |
| A sales charge for Class A shares is not reflected in total return calculations. |
| Had certain expenses not been waived/reimbursed during the period, total returns would have been lower. |
| The investment adviser agreed to waive its fees and/or reimburse a portion of the Fund’s expenses during the period. Without this waiver/reimbursement, expenses would have been higher. |
| Effective July 1, 2021, the expense limit decreased from 1.30% to 1.25%. |
| Effective July 1, 2020, the expense limit decreased from 1.34% to 1.30%. |
See accompanying notes to financial statements.
Financial Highlights (continued)
For a share outstanding throughout each period.
| Vaughan Nelson Small Cap Value Fund—Class C |
| Year Ended
December 31,
2024 | Year Ended
December 31,
2023 | Year Ended
December 31,
2022 | Year Ended
December 31,
2021 | Year Ended
December 31,
2020 |
Net asset value, beginning of the period | | | | | |
INCOME (LOSS) FROM INVESTMENT OPERATIONS: | | | | | |
Net investment income (loss)(a) | | | | | |
Net realized and unrealized gain (loss) | | | | | |
Total from Investment Operations | | | | | |
| | | | | |
| | | | | |
Net realized capital gains | | | | | |
| | | | | |
Net asset value, end of the period | | | | | |
| | | | | |
RATIOS TO AVERAGE NET ASSETS: | | | | | |
Net assets, end of the period (000's) | | | | | |
| | | | | |
| | | | | |
Net investment income (loss) | | | | | |
| | | | | |
| Per share net investment income (loss) has been calculated using the average shares outstanding during the period. |
| Amount rounds to less than $0.01 per share. |
| Includes a non-recurring dividend. Without this dividend, net investment loss per share would have been $(0.10), total return would have been 29.09% and the ratio of net investment loss to average net assets would have been (0.99)%. |
| A contingent deferred sales charge for Class C shares is not reflected in total return calculations. |
| Had certain expenses not been waived/reimbursed during the period, total returns would have been lower. |
| The investment adviser agreed to waive its fees and/or reimburse a portion of the Fund’s expenses during the period. Without this waiver/reimbursement, expenses would have been higher. |
| Effective July 1, 2021, the expense limit decreased from 2.05% to 2.00%. |
| Effective July 1, 2020, the expense limit decreased from 2.09% to 2.05%. |
See accompanying notes to financial statements.
Financial Highlights (continued)
For a share outstanding throughout each period.
| Vaughan Nelson Small Cap Value Fund—Class N |
| Year Ended
December 31,
2024 | Year Ended
December 31,
2023 | Year Ended
December 31,
2022 | Year Ended
December 31,
2021 | Year Ended
December 31,
2020 |
Net asset value, beginning of the period | | | | | |
INCOME (LOSS) FROM INVESTMENT OPERATIONS: | | | | | |
| | | | | |
Net realized and unrealized gain (loss) | | | | | |
Total from Investment Operations | | | | | |
| | | | | |
| | | | | |
Net realized capital gains | | | | | |
| | | | | |
Net asset value, end of the period | | | | | |
| | | | | |
RATIOS TO AVERAGE NET ASSETS: | | | | | |
Net assets, end of the period (000's) | | | | | |
| | | | | |
| | | | | |
| | | | | |
| | | | | |
| Per share net investment income has been calculated using the average shares outstanding during the period. |
| Includes a non-recurring dividend. Without this dividend, net investment income per share would have been $0.01, total return would have been 30.37% and the ratio of net investment income to average net assets would have been 0.03%. |
| Had certain expenses not been waived/reimbursed during the period, total returns would have been lower. |
| The investment adviser agreed to waive its fees and/or reimburse a portion of the Fund’s expenses during the period. Without this waiver/reimbursement, expenses would have been higher. |
| Effective July 1, 2021, the expense limit decreased from 1.00% to 0.95%. |
| Effective July 1, 2020, the expense limit decreased from 1.04% to 1.00%. |
See accompanying notes to financial statements.
Financial Highlights (continued)
For a share outstanding throughout each period.
| Vaughan Nelson Small Cap Value Fund—Class Y |
| Year Ended
December 31,
2024 | Year Ended
December 31,
2023 | Year Ended
December 31,
2022 | Year Ended
December 31,
2021 | Year Ended
December 31,
2020 |
Net asset value, beginning of the period | | | | | |
INCOME (LOSS) FROM INVESTMENT OPERATIONS: | | | | | |
| | | | | |
Net realized and unrealized gain (loss) | | | | | |
Total from Investment Operations | | | | | |
| | | | | |
| | | | | |
Net realized capital gains | | | | | |
| | | | | |
Net asset value, end of the period | | | | | |
| | | | | |
RATIOS TO AVERAGE NET ASSETS: | | | | | |
Net assets, end of the period (000's) | | | | | |
| | | | | |
| | | | | |
| | | | | |
| | | | | |
| Per share net investment income has been calculated using the average shares outstanding during the period. |
| Includes a non-recurring dividend. Without this dividend, net investment income per share would have been $0.00, total return would have been 30.26% and the ratio of net investment income to average net assets would have been 0.01%. |
| Had certain expenses not been waived/reimbursed during the period, total returns would have been lower. |
| The investment adviser agreed to waive its fees and/or reimburse a portion of the Fund’s expenses during the period. Without this waiver/reimbursement, expenses would have been higher. |
| Effective July 1, 2021, the expense limit decreased from 1.05% to 1.00%. |
| Effective July 1, 2020, the expense limit decreased from 1.09% to 1.05%. |
See accompanying notes to financial statements.
Notes to Financial Statements
1.Organization. Loomis Sayles Funds II, Natixis Funds Trust I and Natixis Funds Trust II (the “Trusts” and each a “Trust”) are each organized as a Massachusetts business trust. Each Trust is registered under the Investment Company Act of 1940, as amended (the “1940 Act”), as an open-end management investment company. Each Declaration of Trust permits the Board of Trustees to authorize the issuance of an unlimited number of shares of the Trust in multiple series. The financial statements for certain funds of the Trusts are presented in separate reports. The following funds (individually, a “Fund” and collectively, the “Funds”) are included in this report:
Loomis Sayles Funds II:
Loomis Sayles International Growth Fund (“International Growth Fund”)
Natixis Funds Trust I:
Natixis Oakmark International Fund
Natixis U.S. Equity Opportunities Fund (“U.S. Equity Opportunities Fund”)
Vaughan Nelson Small Cap Value Fund (“Small Cap Value Fund”)
Natixis Funds Trust II:
Natixis Oakmark Fund
Vaughan Nelson Mid Cap Fund (“Mid Cap Fund”)
Each Fund is a diversified investment company, except for International Growth Fund, which is a non-diversified investment company.
Each Fund offers Class A, Class C, Class N and Class Y shares.
Class A shares are sold with a maximum front-end sales charge of 5.75%. Class C shares do not pay a front-end sales charge, pay higher Rule 12b-1 fees than Class A shares for eight years (at which point they automatically convert to Class A shares) (prior to May 1, 2021, Class C shares automatically converted to Class A shares after ten years) and may be subject to a contingent deferred sales charge (“CDSC”) of 1.00% if those shares are redeemed within one year of acquisition, except for reinvested distributions. Class N and Class Y shares do not pay a front-end sales charge, a CDSC or Rule 12b-1 fees. Class N shares are offered with an initial minimum investment of $1,000,000. Class Y shares are offered with an initial minimum investment of $100,000. Certain categories of investors are exempted from the minimum investment amounts for Class N and Class Y as outlined in the relevant Funds’ prospectus.
Most expenses can be directly attributed to a Fund. Expenses which cannot be directly attributed to a Fund are generally apportioned based on the relative net assets of each of the Funds in Natixis Funds Trust I, Natixis Funds Trust II, Natixis Funds Trust IV and Gateway Trust (“Natixis Funds Trusts”), Loomis Sayles Funds I and Loomis Sayles Funds II (“Loomis Sayles Funds Trusts”) and Natixis ETF Trust and Natixis ETF Trust II (“Natixis ETF Trusts”). Expenses of a Fund are borne pro rata by the holders of each class of shares, except that each class bears expenses unique to that class (such as the Rule 12b-1 fees applicable to Class A and Class C), and transfer agent fees are borne collectively for Class A, Class C and Class Y, and individually for Class N. In addition, each class votes as a class only with respect to its own Rule 12b-1 Plan. Shares of each class would receive their pro rata share of the net assets of the Fund if the Fund were liquidated. The Trustees approve separate distributions from net investment income on each class of shares.
2.Significant Accounting Policies. The following is a summary of significant accounting policies consistently followed by each Fund in the preparation of its financial statements. The Funds' financial statements follow the accounting and reporting guidelines provided for investment companies and are prepared in accordance with accounting principles generally accepted in the United States of America which require the use of management estimates that affect the reported amounts and disclosures in the financial statements. Actual results could differ from those estimates. Each Fund operates as a single segment entity, focusing on investments in a portfolio of securities. Each Fund's named investment adviser acts as chief operating decision maker ("CODM") regarding allocation of resources and performance assessment. Financial information including, but not limited to, portfolio composition, net asset changes and total returns, is used by the CODM to assess performance and to make resource allocation decisions and is consistent with that presented within the financial statements. Management has evaluated the events and transactions subsequent to year-end through the date the financial statements were issued and has determined that there were no material events that would require disclosure in the Funds' financial statements.
a. Valuation. Registered investment companies are required to value portfolio investments using an unadjusted, readily available market quotation. Each Fund obtains readily available market quotations from independent pricing services. Fund investments for which readily available market quotations are not available are priced at fair value pursuant to the Funds’ Valuation Procedures. The Board of Trustees has approved a valuation designee who is subject to the Board’s oversight.
Unadjusted readily available market quotations that are utilized for exchange traded equity securities (including shares of closed-end investment companies and exchange-traded funds) include the last sale price quoted on the exchange where the security is traded most extensively. Shares of open-end investment companies are valued at net asset value (“NAV”) per share.
Notes to Financial Statements (continued)
Exchange traded equity securities for which there is no reported sale during the day are fair valued at the closing bid quotation as reported by an independent pricing service. Unlisted equity securities (except unlisted preferred equity securities) are fair valued at the last sale price quoted in the market where they are traded most extensively or, if there is no reported sale during the day, the closing bid quotation as reported by an independent pricing service. If there is no last sale price or closing bid quotation available, unlisted equity securities will be fair valued using evaluated bids furnished by an independent pricing service, if available.
Debt securities and unlisted preferred equity securities are fair valued based on evaluated bids furnished to the Funds by an independent pricing service or bid prices obtained from broker-dealers. Broker-dealer bid prices may be used to fair value debt and unlisted equities where an independent pricing service is unable to price an investment or where an independent pricing service does not provide a reliable price for the investment. Forward foreign currency contracts are fair valued utilizing interpolated rates determined based on information provided by an independent pricing service.
The Funds may also fair value investments in other circumstances such as when extraordinary events occur after the close of a foreign market, but prior to the close of the New York Stock Exchange. This may include situations relating to a single issuer (such as a declaration of bankruptcy or a delisting of the issuer’s security from the primary market on which it has traded) as well as events affecting the securities markets in general (such as market disruptions or closings and significant fluctuations in U.S. and/or foreign markets). When fair valuing a Fund’s investments, the valuation designee may, among other things, use modeling tools or other processes that may take into account factors such as issuer specific information, or other related market activity and/or information that occurred after the close of the foreign market but before the time the Fund’s NAV is calculated. Fair valuation by the Fund(s) valuation designee may require subjective determinations about the value of the investment, and fair values used to determine a Fund’s NAV may differ from quoted or published prices, or from prices that are used by others, for the same investments. In addition, the use of fair value pricing may not always result in adjustments to the prices of investments held by a Fund.
b. Investment Transactions and Related Investment Income. Investment transactions are accounted for on a trade date plus one day basis for daily NAV calculation. However, for financial reporting purposes, investment transactions are reported on trade date. Dividend income (including income reinvested) and foreign withholding tax, if applicable, is recorded on the ex-dividend date, or in the case of certain foreign securities, as soon as a Fund is notified, and interest income is recorded on an accrual basis. Dividends reinvested and stock dividends are reflected as non-cash dividends on the Statements of Operations. Interest income is increased by the accretion of discount and decreased by the amortization of premium, if applicable. Distributions received from investments in securities that represent a return of capital or capital gain are recorded as a reduction of cost of investments or as a realized gain, respectively. The calendar year-end amounts of ordinary income, capital gains and return of capital included in distributions received from the Funds’ investments in real estate investment trusts (“REITs”) are reported to the Funds after the end of the fiscal year; accordingly, the Funds estimate these amounts for accounting purposes until the characterization of REIT distributions is reported to the Funds after the end of the fiscal year. Estimates are based on the most recent REIT distribution information available. In determining net gain or loss on securities sold, the cost of securities has been determined on an identified cost basis. Investment income, non-class specific expenses and realized and unrealized gains and losses are allocated on a pro rata basis to each class based on the relative net assets of each class to the total net assets of the Fund.
c. Foreign Currency Translation. The books and records of the Funds are maintained in U.S. dollars. The values of securities, currencies and other assets and liabilities denominated in currencies other than U.S. dollars, if any, are translated into U.S. dollars based upon foreign exchange rates prevailing at the end of the period. Purchases and sales of investment securities, income and expenses are translated into U.S. dollars on the respective dates of such transactions.
Net realized foreign exchange gains or losses arise from sales of foreign currency, changes in exchange rates between the trade and settlement dates on securities transactions and the difference between the amounts of dividends, interest and foreign withholding taxes recorded in the Funds’ books and records and the U.S. dollar equivalent of the amounts actually received or paid. Net unrealized foreign exchange gains or losses arise from changes in the value of assets and liabilities, other than investment securities, as of the end of the fiscal period, resulting from changes in exchange rates. Net realized foreign exchange gains or losses and the net change in unrealized foreign exchange gains or losses are disclosed in the Statements of Operations. For federal income tax purposes, net realized foreign exchange gains or losses are characterized as ordinary income, and may, if the Funds have net losses, reduce the amount of income available to be distributed by the Funds.
The values of investment securities are presented at the foreign exchange rates prevailing at the end of the period for financial reporting purposes. Net realized and unrealized gains or losses on investments reported in the Statements of Operations reflect gains or losses resulting from changes in exchange rates and fluctuations which arise due to changes in market prices of investment securities. For federal income tax purposes, a portion of the net realized gain or loss on investments arising from changes in exchange rates, which is reflected in the Statements of Operations, may be characterized as ordinary income and may, if the Funds have net losses, reduce the amount of income available to be distributed by the Funds.
Notes to Financial Statements (continued)
The Funds may use foreign currency exchange contracts to facilitate transactions in foreign-denominated investments. Losses may arise from changes in the value of the foreign currency or if the counterparties do not perform under the contracts’ terms.
d. Forward Foreign Currency Contracts. A Fund may enter into forward foreign currency contracts, including forward foreign cross currency contracts, to acquire exposure to foreign currencies or to hedge the Funds’ investments against currency fluctuation. A contract can also be used to offset a previous contract. These contracts involve market risk in excess of the unrealized appreciation (depreciation) reflected in the Funds’ Statements of Assets and Liabilities. The U.S. dollar value of the currencies a Fund has committed to buy or sell represents the aggregate exposure to each currency a Fund has acquired or hedged through currency contracts outstanding at period end. Gains or losses are recorded for financial statement purposes as unrealized until settlement date. Contracts are traded over-the-counter directly with a counterparty. Risks may arise upon entering into these contracts from the potential inability of counterparties to meet the terms of their contracts and from unanticipated movements in the value of a foreign currency relative to the U.S. dollar. Certain contracts may require the movement of cash and/or securities as collateral for the Funds’ or counterparty’s net obligations under the contracts. Forward foreign currency contracts outstanding at the end of the period, if any, are listed in each applicable Fund's Portfolio of Investments.
e. Federal and Foreign Income Taxes. The Trusts treat each Fund as a separate entity for federal income tax purposes. Each Fund intends to meet the requirements of the Internal Revenue Code of 1986, as amended, applicable to regulated investment companies, and to distribute to its shareholders substantially all of its net investment income and any net realized capital gains at least annually. Management has performed an analysis of each Fund’s tax positions for the open tax years as of December 31, 2024 and has concluded that no provisions for income tax are required. The Funds’ federal tax returns for the prior three fiscal years remain subject to examination by the Internal Revenue Service. Management is not aware of any events that are reasonably possible to occur in the next twelve months that would result in the amounts of any unrecognized tax benefits significantly increasing or decreasing for the Funds. However, management’s conclusions regarding tax positions taken may be subject to review and adjustment at a later date based on factors including, but not limited to, new tax laws and accounting regulations and interpretations thereof.
A Fund may be subject to foreign withholding taxes on investment income and taxes on capital gains on investments that are accrued and paid based upon the Fund’s understanding of the tax rules and regulations that exist in the countries in which the Fund invests. Foreign withholding taxes on dividend and interest income are reflected on the Statements of Operations as a reduction of investment income, net of amounts that have been or are expected to be reclaimed and paid. Dividends and interest receivable on the Statements of Assets and Liabilities are net of foreign withholding taxes. Foreign withholding taxes where reclaims have been or are expected to be filed and paid are reflected on the Statements of Assets and Liabilities as tax reclaims receivable. Capital gains taxes paid are included in net realized gain (loss) on investments in the Statements of Operations. Accrued but unpaid capital gains taxes are reflected as foreign taxes payable on the Statements of Assets and Liabilities, if applicable, and reduce unrealized gains on investments. In the event that realized gains on investments are subsequently offset by realized losses, taxes paid on realized gains may be returned to a Fund. Such amounts, if applicable, are reflected as foreign tax rebates receivable on the Statements of Assets and Liabilities and are recorded as a realized gain when received.
Certain Funds have filed tax reclaims for previously withheld taxes on dividends earned in certain European Union countries (“EU reclaims”) and may continue to make such filings when it is determined to be in the best interest of the Funds and their shareholders. These filings are subject to various administrative proceedings by the local jurisdictions’ tax authorities within the European Union, as well as a number of related judicial proceedings. EU reclaims are recognized by a Fund when deemed more likely than not to be collected, and are reflected as a reduction of foreign taxes withheld in the Statements of Operations. Any related receivable is reflected as tax reclaims receivable in the Statements of Assets and Liabilities. Under certain circumstances, EU reclaims may be subject to closing agreements with the Internal Revenue Service ("IRS"), which may materially reduce the reclaim amounts realized by the Funds. Fees and expenses associated with closing agreements will be reflected in the Statements of Operations when it is determined that a closing agreement with the IRS is required.
f. Dividends and Distributions to Shareholders. Dividends and distributions are recorded on the ex-dividend date. The timing and characterization of certain income and capital gain distributions are determined in accordance with federal tax regulations, which may differ from accounting principles generally accepted in the United States of America. Permanent differences are primarily due to differing treatments for book and tax purposes of items such as capital gains taxes, deferred Trustees’ fees, forward foreign currency contract mark-to-market, distributions in excess of income and/or capital gain, distribution re-designations, foreign currency gains and losses, corporate actions, passive foreign investment company adjustments, return of capital distributions received and capital gain distribution received. Permanent book and tax basis differences relating to shareholder distributions, net investment income and net realized gains will result in reclassifications to capital accounts reported on the Statements of Assets and Liabilities. Temporary differences between book and tax distributable earnings are primarily due to capital gains taxes, wash sales, forward foreign currency contract mark-to-market, return of capital distributions received, corporate actions, deferred Trustees’ fees, deferral of EU reclaims,
Notes to Financial Statements (continued)
capital gain distribution received and passive foreign investment company adjustments. Amounts of income and capital gain available to be distributed on a tax basis are determined annually, and at other times during the Funds’ fiscal year as may be necessary to avoid knowingly declaring and paying a return of capital distribution. Distributions from net investment income and short-term capital gains are considered to be distributed from ordinary income for tax purposes.
The tax characterization of distributions is determined on an annual basis. The tax character of distributions paid to shareholders during the years ended December 31, 2024 and 2023 was as follows:
| | |
| | | | | | |
International Growth Fund | | | | | | |
| | | | | | |
Natixis Oakmark International Fund | | | | | | |
U.S. Equity Opportunities Fund | | | | | | |
| | | | | | |
| | | | | | |
Distributions paid to shareholders from net investment income and net realized capital gains, based on accounting principles generally accepted in the United States of America, are consolidated and reported on the Statements of Changes in Net Assets as Distributions to Shareholders. Distributions paid to shareholders from net investment income and net realized capital gains expressed in per-share amounts, based on accounting principles generally accepted in the United States of America, are separately stated and reported within the Financial Highlights.
As of December 31, 2024, the components of distributable earnings on a tax basis were as follows:
| | | Natixis
Oakmark
International
Fund | U.S.
Equity
Opportunities
Fund |
Undistributed ordinary income | | | | |
Undistributed long-term capital gains | | | | |
Total undistributed earnings | | | | |
Capital loss carryforward: | | | | |
| | | | |
| | | | |
| | | | |
| | | | |
Total capital loss carryforward | | | | |
Late-year ordinary and post-October
| | | | |
Unrealized appreciation (depreciation) | | | | |
Total accumulated earnings (losses) | | | | |
Notes to Financial Statements (continued)
| | |
Undistributed ordinary income | | |
Undistributed long-term capital gains | | |
Total undistributed earnings | | |
Capital loss carryforward: | | |
| | |
| | |
Late-year ordinary and post-October
| | |
| | |
Total accumulated earnings | | |
| Under current tax law, capital losses, foreign currency losses, and losses on passive foreign investment companies and contingent payment debt instruments after October 31 or December 31, as applicable, may be deferred and treated as occurring on the first day of the following taxable year. International Growth Fund and Natixis Oakmark International Fund are deferring foreign currency losses and Small Cap Value Fund is deferring capital losses. |
As of December 31, 2024, the tax cost of investments (including derivatives, if applicable) and unrealized appreciation (depreciation) on a federal tax basis were as follows:
| | | Natixis
Oakmark
International
Fund | U.S.
Equity
Opportunities
Fund | | |
| | | | | | |
| | | | | | |
| | | | | | |
Net tax appreciation (depreciation) | | | | | | |
The difference between these amounts and those reported in the components of distributable earnings, if any, are primarily attributable to foreign currency mark-to-market and foreign capital gains taxes.
g. Repurchase Agreements. Each Fund may enter into repurchase agreements, under the terms of a Master Repurchase Agreement, under which each Fund acquires securities as collateral and agrees to resell the securities at an agreed upon time and at an agreed upon price. It is each Fund’s policy that the market value of the collateral for repurchase agreements be at least equal to 102% of the repurchase price, including interest. Certain repurchase agreements are tri-party arrangements whereby the collateral is held in a segregated account for the benefit of the Fund and on behalf of the counterparty. Repurchase agreements could involve certain risks in the event of default or insolvency of the counterparty, including possible delays or restrictions upon a Fund’s ability to dispose of the underlying securities. As of December 31, 2024, each Fund, as applicable, had investments in repurchase agreements for which the value of the related collateral exceeded the value of the repurchase agreement. The gross value of repurchase agreements is included in the Statements of Assets and Liabilities for financial reporting purposes.
h. Indemnifications. Under the Trusts’ organizational documents, their officers and Trustees are indemnified against certain liabilities arising out of the performance of their duties to the Funds. Additionally, in the normal course of business, the Funds enter into contracts with service providers that contain general indemnification clauses. The Funds' maximum exposure under these arrangements is unknown as this would involve future claims that may be made against the Funds that have not yet occurred. However, based on experience, the Funds expect the risk of loss to be remote.
3.Fair Value Measurements. In accordance with accounting standards related to fair value measurements and disclosures, the Funds have categorized the inputs utilized in determining the value of each Fund’s assets or liabilities. These inputs are summarized in the three broad levels listed below:
• Level 1 — quoted prices in active markets for identical assets or liabilities;
• Level 2 — prices determined using other significant inputs that are observable either directly, or indirectly through corroboration
Notes to Financial Statements (continued)
with observable market data (which could include quoted prices for similar assets or liabilities, interest rates, credit risk, etc.); and
• Level 3 — prices determined using significant unobservable inputs when quoted prices or observable inputs are unavailable such as when there is little or no market activity for an asset or liability (unobservable inputs reflect each Fund’s own assumptions in determining the fair value of assets or liabilities and would be based on the best information available).
The inputs or methodology used for valuing securities are not necessarily an indication of the risk associated with investing in those securities.
The Funds' pricing policies have been approved by the Board of Trustees. Investments for which market quotations are readily available are categorized in Level 1. Other investments for which an independent pricing service is utilized are categorized in Level 2. Broker-dealer bid prices for which the Funds have knowledge of the inputs used by the broker-dealer are categorized in Level 2. All other investments, including broker-dealer bid prices for which the Funds do not have knowledge of the inputs used by the broker-dealer, as well as investments fair valued by the valuation designee, are categorized in Level 3. All Level 2 and 3 securities are defined as being fair valued.
Under certain conditions and based upon specific facts and circumstances, the Fund’s valuation designee may determine that a fair valuation should be made for portfolio investment(s). These valuation designee fair valuations will be based upon a significant amount of Level 3 inputs.
The following is a summary of the inputs used to value the Funds' investments as of December 31, 2024, at value:
International Growth Fund |
|
| | | | |
| | | | |
| | | | |
| | | | |
| | | | |
| | | | |
| | | | |
| | | | |
| | | | |
| | | | |
| | | | |
| | | | |
| | | | |
| | | | |
All Other Common Stocks(a) | | | | |
| | | | |
| | | | |
| | | | |
| Details of the major categories of the Fund’s investments are reflected within the Portfolio of Investments. |
| Details of the major categories of the Fund’s investments are reflected within the Portfolio of Investments. |
Notes to Financial Statements (continued)
Natixis Oakmark International Fund |
|
| | | | |
| | | | |
| | | | |
| | | | |
| | | | |
| | | | |
| | | | |
| | | | |
| | | | |
| | | | |
| | | | |
| | | | |
| | | | |
| | | | |
| | | | |
| | | | |
| | | | |
| | | | |
All Other Common Stocks(a) | | | | |
| | | | |
| | | | |
| | | | |
| | | | |
| | | | |
| Details of the major categories of the Fund’s investments are reflected within the Portfolio of Investments. |
U.S. Equity Opportunities Fund |
|
| | | | |
| | | | |
| | | | |
| | | | |
| Details of the major categories of the Fund’s investments are reflected within the Portfolio of Investments. |
| Details of the major categories of the Fund’s investments are reflected within the Portfolio of Investments. |
Notes to Financial Statements (continued)
| Details of the major categories of the Fund’s investments are reflected within the Portfolio of Investments. |
4.Purchases and Sales of Securities. For the year ended December 31, 2024, purchases and sales of securities (excluding short-term investments) were as follows:
| | |
International Growth Fund | | |
| | |
Natixis Oakmark International Fund | | |
U.S. Equity Opportunities Fund | | |
| | |
| | |
5.Management Fees and Other Transactions with Affiliates.
a. Management Fees. Loomis, Sayles & Company, L.P. (“Loomis Sayles”) serves as investment adviser to International Growth Fund. Loomis Sayles is a limited partnership whose sole general partner, Loomis, Sayles & Company, Inc., is indirectly owned by Natixis Investment Managers, LLC, which is part of Natixis Investment Managers, an international asset management group based in Paris, France.
Under the terms of the management agreement, International Growth Fund pays a management fee at the annual rate of 0.75%, calculated daily and payable monthly, based on the Fund’s average daily net assets.
Natixis Advisors, LLC (“Natixis Advisors”) serves as investment adviser to Natixis Oakmark Fund, Natixis Oakmark International Fund, U.S. Equity Opportunities Fund, Mid Cap Fund and Small Cap Value Fund. Under the terms of the management agreements, each Fund pays a management fee at the following annual rates, calculated daily and payable monthly, based on each Fund’s average daily net assets:
| Percentage of Average Daily Net Assets |
| | | | | | |
| | | | | | |
Natixis Oakmark International Fund | | | | | | |
U.S. Equity Opportunities Fund | | | | | | |
| | | | | | |
| | | | | | |
Natixis Advisors has entered into subadvisory agreements for each Fund as listed below.
| |
| Harris Associates L.P. (“Harris”) |
Natixis Oakmark International Fund | |
U.S. Equity Opportunities Fund | |
| Vaughan Nelson Investment Management, L.P. (“Vaughan Nelson”) |
| |
Natixis Advisors, Harris and Vaughan Nelson are subsidiaries of Natixis Investment Managers, LLC.
Notes to Financial Statements (continued)
Under the terms of the subadvisory agreements, each Fund has agreed to pay its respective subadviser a subadvisory fee at the following annual rates, calculated daily and payable monthly, based on each Fund’s average daily net assets:
| | Percentage of Average
Daily Net Assets |
| | | | | | |
| | | | | | |
Natixis Oakmark International Fund | | | | | | |
U.S. Equity Opportunities Fund | | | | | | |
| | | | | | |
| | | | | | |
| | | | | | |
| | | | | | |
Loomis Sayles and Natixis Advisors have given binding undertakings to the Funds to waive management fees and/or reimburse certain expenses to limit the Funds’ operating expenses, exclusive of acquired fund fees and expenses, brokerage expenses, interest expense, substitute dividend expenses on securities sold short, taxes, organizational and extraordinary expenses such as litigation and indemnification expenses. These undertakings are in effect until April 30, 2025, except for U.S. Equity Opportunities Fund which is in effect until April 30, 2026, may be terminated before then only with the consent of the Funds’ Board of Trustees, and are reevaluated on an annual basis. Management fees payable, as reflected on the Statements of Assets and Liabilities, is net of waivers and/or expense reimbursements, if any, pursuant to these undertakings. Waivers/reimbursements that exceed management fees payable are reflected on the Statements of Assets and Liabilities as receivable from investment adviser.
For the year ended December 31, 2024, the expense limits as a percentage of average daily net assets under the expense limitation agreements were as follows:
| Expense Limit as a Percentage of
Average Daily Net Assets |
| | | | |
International Growth Fund | | | | |
| | | | |
Natixis Oakmark International Fund | | | | |
U.S. Equity Opportunities Fund | | | | |
| | | | |
| | | | |
Prior to July 1, 2024, the expense limits as a percentage of average daily net assets under the expense limitation agreements for Natixis Oakmark Fund and U.S. Equity Opportunities Fund were as follows:
| Expense Limit as a Percentage of
Average Daily Net Assets |
| | | | |
| | | | |
U.S. Equity Opportunities Fund | | | | |
Loomis Sayles and Natixis Advisors shall be permitted to recover expenses borne under the expense limitation agreements (whether through waiver of management fee or otherwise) on a class by class basis in later periods to the extent the annual operating expenses of a class fall below both (1) a class’ expense limitation ratio in place at the time such amounts were waived/reimbursed and (2) a class’ current applicable expense limitation ratio, provided, however, that a class is not obligated to pay such waived/reimbursed fees or expenses more than one year after the end of the fiscal year in which the fees or expenses were waived/reimbursed.
Notes to Financial Statements (continued)
For the year ended December 31, 2024, the management fees and waiver of management fees for each Fund were as follows:
| | Contractual
Waivers of
Management
| | Percentage of
Average
Daily Net Assets |
| | |
International Growth Fund | | | | | |
| | | | | |
Natixis Oakmark International Fund | | | | | |
U.S. Equity Opportunities Fund | | | | | |
| | | | | |
| | | | | |
| Management fee waivers are subject to possible recovery until December 31, 2025. |
For the year ended December 31, 2024, class-specific expenses have been reimbursed as follows:
| Management fee waivers are subject to possible recovery until December 31, 2025. |
For the year ended December 31, 2024, expense reimbursements related to the prior fiscal year were recovered as follows:
b. Service and Distribution Fees. Natixis Distribution, LLC (“Natixis Distribution"), which is a wholly-owned subsidiary of Natixis Investment Managers, LLC, has entered into a distribution agreement with the Trusts. Pursuant to this agreement, Natixis Distribution serves as principal underwriter of the Funds of the Trusts.
Pursuant to Rule 12b-1 under the 1940 Act, the Trusts have adopted a Service Plan relating to each Fund’s Class A shares (the “Class A Plans”), a Distribution and Service Plan relating to each Fund’s Class C shares (the “Class C Plans”).
Under the Class A Plans, each Fund pays Natixis Distribution a monthly service fee at an annual rate not to exceed 0.25% of the average daily net assets attributable to the Funds’ Class A shares, as reimbursement for expenses incurred by Natixis Distribution in providing personal services to investors in Class A shares and/or the maintenance of shareholder accounts.
Under the Class C Plans, each Fund pays Natixis Distribution a monthly service fee at an annual rate not to exceed 0.25% of the average daily net assets attributable to the Funds’ Class C shares, as compensation for services provided by Natixis Distribution in providing personal services to investors in Class C shares and/or the maintenance of shareholder accounts.
Also under the Class C Plans, each Fund pays Natixis Distribution a monthly distribution fee at an annual rate of 0.75% of the average daily net assets attributable to the Funds’ Class C shares, as compensation for services provided by Natixis Distribution in connection with the marketing or sale of Class C shares.
For the year ended December 31, 2024, the service and distribution fees for each Fund were as follows:
| | | |
| | | | |
International Growth Fund | | | | |
| | | | |
Natixis Oakmark International Fund | | | | |
U.S. Equity Opportunities Fund | | | | |
| | | | |
| | | | |
Notes to Financial Statements (continued)
c. Administrative Fees. Natixis Advisors provides certain administrative services for the Funds and contracts with State Street Bank and Trust Company (“State Street Bank”) to serve as sub-administrator. Pursuant to an agreement among Natixis Funds Trusts, Loomis Sayles Funds Trusts, Natixis ETF Trusts and Natixis Advisors, each Fund pays Natixis Advisors monthly its pro rata portion of fees equal to an annual rate of 0.0540% of the first $15 billion of the average daily net assets of the Natixis Funds Trusts, Loomis Sayles Funds Trusts and Natixis ETF Trusts, 0.0500% of the next $15 billion, 0.0400% of the next $30 billion, 0.0275% of the next $30 billion and 0.0225% of such assets in excess of $90 billion, subject to an annual aggregate minimum fee for the Natixis Funds Trusts, Loomis Sayles Funds Trusts and Natixis ETF Trusts of $10 million, which is reevaluated on an annual basis.
For the year ended December 31, 2024, the administrative fees for each Fund were as follows:
| |
International Growth Fund | |
| |
Natixis Oakmark International Fund | |
U.S. Equity Opportunities Fund | |
| |
| |
d. Sub-Transfer Agent Fees. Natixis Distribution has entered into agreements, which include servicing agreements, with financial intermediaries that provide recordkeeping, processing, shareholder communications and other services to customers of the intermediaries that hold positions in the Funds and has agreed to compensate the intermediaries for providing those services. Intermediaries transact with the Funds primarily through the use of omnibus accounts on behalf of their customers who hold positions in the Funds. These services would have been provided by the Funds’ transfer agent and other service providers if the shareholders’ accounts were maintained directly at the Funds’ transfer agent. Accordingly, the Funds have agreed to reimburse Natixis Distribution for all or a portion of the servicing fees paid to these intermediaries. The reimbursement amounts (sub-transfer agent fees) paid to Natixis Distribution are subject to a current equivalent fee limit approved by the Funds’ Board of Trustees, which is based on fees for similar services paid to the Funds’ transfer agent and other service providers. Class N shares do not bear such expenses.
For the year ended December 31, 2024, the sub-transfer agent fees (which are reflected in transfer agent fees and expenses in the Statements of Operations) for each Fund were as follows:
| |
International Growth Fund | |
| |
Natixis Oakmark International Fund | |
U.S. Equity Opportunities Fund | |
| |
| |
As of December 31, 2024, the Funds owe Natixis Distribution the following reimbursements for sub-transfer agent fees (which are reflected in the Statements of Assets and Liabilities as payable to distributor):
| Reimbursements
of Sub-Transfer
Agent Fees |
International Growth Fund | |
| |
Natixis Oakmark International Fund | |
U.S. Equity Opportunities Fund | |
| |
| |
Sub-transfer agent fees attributable to Class A, Class C and Class Y are allocated on a pro rata basis to each class based on the relative net assets of each class to the total net assets of those classes.
Notes to Financial Statements (continued)
e. Commissions. Commissions (including CDSCs) on Fund shares retained by Natixis Distribution during the year ended December 31, 2024 were as follows:
| |
| |
Natixis Oakmark International Fund | |
U.S. Equity Opportunities Fund | |
| |
| |
f. Trustees Fees and Expenses. The Trusts do not pay any compensation directly to their officers or Trustees who are directors, officers or employees of Natixis Advisors, Natixis Distribution, Natixis Investment Managers, LLC or their affiliates. The Chairperson of the Board of Trustees receives a retainer fee at the annual rate of $400,000. The Chairperson does not receive any meeting attendance fees for Board of Trustees meetings or committee meetings that he attends. Each Independent Trustee (other than the Chairperson) receives, in the aggregate, a retainer fee at the annual rate of $225,000. Each Independent Trustee also receives a meeting attendance fee of $10,000 for each meeting of the Board of Trustees that he or she attends in person and $5,000 for each meeting of the Board of Trustees that he or she attends telephonically. In addition, the Chairperson of the Contract Review Committee and the Chairperson of the Audit Committee each receive an additional retainer fee at the annual rate of $25,000. The Chairperson of the Governance Committee receives an additional retainer fee at the annual rate of $20,000. Each Contract Review Committee member is compensated $6,000 for each Committee meeting that he or she attends in person and $3,000 for each meeting that he or she attends telephonically. Each Audit Committee member is compensated $6,000 for each Committee meeting that he or she attends in person and $3,000 for each meeting that he or she attends telephonically. Each Governance Committee member is compensated $2,500 for each Committee meeting that he or she attends. These fees are allocated among the funds in the Natixis Funds Trusts, Loomis Sayles Funds Trusts and Natixis ETF Trusts based on a formula that takes into account, among other factors, the relative net assets of each fund. Trustees are reimbursed for travel expenses in connection with attendance at meetings.
Effective January 1, 2025, the Chairperson of the Board of Trustees will receive a retainer fee at the annual rate of $410,000 and each Independent Trustee (other than the Chairperson) will receive, in the aggregate, a retainer fee at the annual rate of $235,000. The Chairperson of the Contract Review Committee and the Chairperson of the Audit Committee each will receive an additional retainer fee at the annual rate of $30,000. All other Trustees fees will remain unchanged.
A deferred compensation plan (the “Plan”) is available to the Trustees on a voluntary basis. The value of a participating Trustee’s deferral account is based on theoretical investments of deferred amounts, on the normal payment dates, in certain funds of the Natixis Funds Trusts, Loomis Sayles Funds Trusts and Natixis ETF Trusts as designated by the participating Trustees. Changes in the value of participants’ deferral accounts are allocated pro rata among the funds in the Natixis Funds Trusts, Loomis Sayles Funds Trusts and Natixis ETF Trusts and are normally reflected as Trustees’ fees and expenses in the Statements of Operations. Deferred amounts remain in the funds until distributed in accordance with the provisions of the Plan. The portions of the accrued obligations allocated to the Funds under the Plan are reflected as Deferred Trustees’ fees in the Statements of Assets and Liabilities.
Certain officers and employees of Natixis Advisors, Loomis Sayles and affiliates are also officers and/or Trustees of the Trusts.
g. Affiliated Ownership. As of December 31, 2024, Natixis and affiliates held shares of International Growth Fund representing 71.97% of the Fund's net assets.
Investment activities of affiliated shareholders could have material impacts on the Fund.
h. Reimbursement of Transfer Agent Fees and Expenses. Natixis Advisors has given a binding contractual undertaking to the Funds to reimburse any and all transfer agency expenses for the Funds’ Class N shares. This undertaking is in effect through April 30, 2025 and is not subject to recovery under the expense limitation agreement described above.
Notes to Financial Statements (continued)
For the year ended December 31, 2024, Natixis Advisors reimbursed the Funds for transfer agency expenses as follows:
| Reimbursement of
Transfer Agency
Expenses |
| |
International Growth Fund | |
| |
Natixis Oakmark International Fund | |
U.S. Equity Opportunities Fund | |
| |
| |
i. Interfund Transactions. A Fund may purchase securities from, or sell securities to, an affiliated fund provided the affiliation is due solely to having a common investment adviser, common officers, or common Trustees. For the year ended December 31, 2024, Natixis Oakmark International Fund engaged in purchase transactions of $82,259 with an affiliate of Natixis in compliance with Rule 17a-7 of the 1940 Act pursuant to procedures adopted by the Board of Trustees.
6.Class-Specific Transfer Agent Fees and Expenses. Transfer agent fees and expenses attributable to Class A, Class C and Class Y are allocated on a pro rata basis to each class based on the relative net assets of each class to the total net assets of those classes. Transfer agent fees and expenses attributable to Class N are allocated to Class N.
For the year ended December 31, 2024, the Funds incurred the following class-specific transfer agent fees and expenses (net of expense offsets and including sub-transfer agent fees, where applicable):
| Transfer Agent Fees and Expenses |
| | | | |
International Growth Fund | | | | |
| | | | |
Natixis Oakmark International Fund | | | | |
U.S. Equity Opportunities Fund | | | | |
| | | | |
| | | | |
7.Expense Offset Arrangements. The Funds have entered into an agreement with the transfer agent whereby certain transfer agent fees and expenses may be paid indirectly by credits earned on the Funds' cash balances. Transfer agent fees and expenses are presented in the Statements of Operations gross of such credits, and the credits are presented as offsets to expenses.
8.Line of Credit. Each Fund, together with certain other funds of Natixis Funds Trusts, Loomis Sayles Funds Trusts and Natixis ETF Trusts, entered into a syndicated, revolving, committed, unsecured line of credit with State Street Bank as administrative agent. The aggregate revolving commitment amount is $575,000,000. Any one Fund may borrow up to $402,500,000 under the line of credit agreement (as long as all borrowings by all Funds in the aggregate do not exceed the $575,000,000 limit at any time), subject to each Fund’s investment restrictions and its contractual obligations under the line of credit. Interest is charged to the Funds based upon the terms set forth in the agreement. In addition, a commitment fee of 0.15% per annum, payable at the end of each calendar quarter, is accrued and apportioned among the participating funds based on their average daily unused portion of the line of credit.
For the year ended December 31, 2024, none of the Funds had borrowings under this agreement.
9.Risk. The Funds’ investments in foreign securities may be subject to greater political, economic, environmental, credit/counterparty and information risks. The Fund's investments in foreign securities also are subject to foreign currency fluctuations and other foreign currency-related risks. Foreign securities may be subject to higher volatility than U.S. securities, varying degrees of regulation and limited liquidity.
International Growth Fund may invest to a significant extent in variable interest entity (“VIE”) structures. VIE structures can vary, but generally consist of a U.S.-listed company with contractual arrangements, through one or more wholly-owned special purpose vehicles, with a Chinese company that ultimately provides the U.S.-listed company with contractual rights to obtain economic benefits from the Chinese company. The VIE structure enables foreign investors, such as the Fund, to obtain investment exposure similar to that of an equity owner in a Chinese company in situations in which the Chinese government has restricted or prohibited the ownership of such company by foreign investors. The Fund’s exposure to VIE structures may pose additional risks because the VIE structure is not
Notes to Financial Statements (continued)
formally recognized under Chinese law. The Chinese government may cease to tolerate VIE structures at any time or impose new restrictions. In addition, Chinese companies using the VIE structure, and listed on stock exchanges in the U.S., could also face delisting or other ramifications for failure to meet the expectations and/or requirements of the U.S. Securities and Exchange Commission, the Public Company Accounting Oversight Board, or other U.S. regulators. Any of these risks could reduce the liquidity and value of these investments or render them valueless.
International Growth Fund is non-diversified, which means that it is not limited under the 1940 Act to a percentage of assets that it may invest in any one issuer. Because the Fund may invest in the securities of a limited number of issuers, an investment in the Fund may involve a higher degree of risk than would be present in a diversified portfolio.
Geopolitical events (such as trading halts, sanctions or wars) could increase volatility and uncertainty in the financial markets and adversely affect regional and global economies. These, and other related events, could significantly impact a Fund's performance and the value of an investment in the Fund, even if the Fund does not have direct exposure to issuers in the country or countries involved.
10.Concentration of Ownership. From time to time, a Fund may have a concentration of one or more accounts constituting a significant percentage of shares outstanding. Investment activities by holders of such accounts could have material impacts on the Funds. As of December 31, 2024, based on management’s evaluation of the shareholder account base, the Funds had accounts representing controlling ownership of more than 5% of the Funds’ total outstanding shares. The number of such accounts, based on accounts that represent more than 5% of an individual class of shares, and the aggregate percentage of net assets represented by such holdings were as follows:
| Number of 5%
Non-Affiliated
Account Holders | Percentage of
Non-Affiliated
Ownership | Percentage of
Affiliated
Ownership
(Note 5g) | Total
Percentage of
Ownership |
International Growth Fund | | | | |
Natixis Oakmark International Fund | | | | |
U.S. Equity Opportunities Fund | | | | |
| | | | |
| | | | |
Omnibus shareholder accounts for which Natixis Advisors understands that the intermediary has discretion over the underlying shareholder accounts or investment models where a shareholder account may be invested for a non-discretionary customer are included in the table above. For other omnibus accounts, the Funds do not have information on the individual shareholder accounts underlying the omnibus accounts; therefore, there could be other 5% shareholders in addition to those disclosed in the table above.
11.Interest Expense. The Funds incur interest expense on cash (including foreign currency) overdrafts at the custodian bank and, for International Growth Fund, foreign currency debit balances at brokers. Interest expense incurred for the year ended December 31, 2024 is reflected on the Statements of Operations.
Notes to Financial Statements (continued)
12.Capital Shares. Each Fund may issue an unlimited number of shares of beneficial interest, without par value. Transactions in capital shares were as follows:
|
| Year Ended
December 31, 2024 | Year Ended
December 31, 2023 |
International Growth Fund | | | | |
| | | | |
Issued from the sale of shares | | | | |
Issued in connection with the reinvestment of distributions | | | | |
| | | | |
| | | | |
| | | | |
Issued from the sale of shares | | | | |
Issued in connection with the reinvestment of distributions | | | | |
| | | | |
| | | | |
| | | | |
Issued from the sale of shares | | | | |
Issued in connection with the reinvestment of distributions | | | | |
| | | | |
| | | | |
Increase (decrease) from capital share transactions | | | | |
|
| Year Ended
December 31, 2024 | Year Ended
December 31, 2023 |
| | | | |
| | | | |
Issued from the sale of shares | | | | |
Issued in connection with the reinvestment of distributions | | | | |
| | | | |
| | | | |
| | | | |
Issued from the sale of shares | | | | |
Issued in connection with the reinvestment of distributions | | | | |
| | | | |
| | | | |
| | | | |
Issued from the sale of shares | | | | |
Issued in connection with the reinvestment of distributions | | | | |
| | | | |
| | | | |
| | | | |
Issued from the sale of shares | | | | |
Issued in connection with the reinvestment of distributions | | | | |
| | | | |
| | | | |
Increase from capital share transactions | | | | |
Notes to Financial Statements (continued)
12.Capital Shares (continued).
|
| Year Ended
December 31, 2024 | Year Ended
December 31, 2023 |
Natixis Oakmark International Fund | | | | |
| | | | |
Issued from the sale of shares | | | | |
Issued in connection with the reinvestment of distributions | | | | |
| | | | |
| | | | |
| | | | |
Issued from the sale of shares | | | | |
Issued in connection with the reinvestment of distributions | | | | |
| | | | |
| | | | |
| | | | |
Issued from the sale of shares | | | | |
Issued in connection with the reinvestment of distributions | | | | |
| | | | |
| | | | |
| | | | |
Issued from the sale of shares | | | | |
Issued in connection with the reinvestment of distributions | | | | |
| | | | |
| | | | |
Decrease from capital share transactions | | | | |
Notes to Financial Statements (continued)
12.Capital Shares (continued).
|
| Year Ended
December 31, 2024 | Year Ended
December 31, 2023 |
U.S. Equity Opportunities Fund | | | | |
| | | | |
Issued from the sale of shares | | | | |
Issued in connection with the reinvestment of distributions | | | | |
| | | | |
| | | | |
| | | | |
Issued from the sale of shares | | | | |
Issued in connection with the reinvestment of distributions | | | | |
| | | | |
| | | | |
| | | | |
Issued from the sale of shares | | | | |
Issued in connection with the reinvestment of distributions | | | | |
| | | | |
| | | | |
| | | | |
Issued from the sale of shares | | | | |
Issued in connection with the reinvestment of distributions | | | | |
| | | | |
| | | | |
Increase (decrease) from capital share transactions | | | | |
Notes to Financial Statements (continued)
12.Capital Shares (continued).
|
| Year Ended
December 31, 2024 | Year Ended
December 31, 2023 |
| | | | |
| | | | |
Issued from the sale of shares | | | | |
Issued in connection with the reinvestment of distributions | | | | |
| | | | |
| | | | |
| | | | |
Issued from the sale of shares | | | | |
Issued in connection with the reinvestment of distributions | | | | |
| | | | |
| | | | |
| | | | |
Issued from the sale of shares | | | | |
Issued in connection with the reinvestment of distributions | | | | |
| | | | |
| | | | |
| | | | |
Issued from the sale of shares | | | | |
Issued in connection with the reinvestment of distributions | | | | |
| | | | |
| | | | |
Decrease from capital share transactions | | | | |
Notes to Financial Statements (continued)
12.Capital Shares (continued).
|
| Year Ended
December 31, 2024 | Year Ended
December 31, 2023 |
| | | | |
| | | | |
Issued from the sale of shares | | | | |
Issued in connection with the reinvestment of distributions | | | | |
| | | | |
| | | | |
| | | | |
Issued from the sale of shares | | | | |
Issued in connection with the reinvestment of distributions | | | | |
| | | | |
| | | | |
| | | | |
Issued from the sale of shares | | | | |
Issued in connection with the reinvestment of distributions | | | | |
| | | | |
| | | | |
| | | | |
Issued from the sale of shares | | | | |
Issued in connection with the reinvestment of distributions | | | | |
| | | | |
| | | | |
Increase from capital share transactions | | | | |
Report of Independent Registered Public Accounting Firm
To the Boards of Trustees of Loomis Sayles Funds II, Natixis Funds Trust I, and Natixis Funds Trust II and Shareholders of Loomis Sayles International Growth Fund, Natixis Oakmark International Fund, Natixis U.S. Equity Opportunities Fund, Vaughan Nelson Small Cap Value Fund, Natixis Oakmark Fund, and Vaughan Nelson Mid Cap Fund
Opinions on the Financial Statements
We have audited the accompanying statements of assets and liabilities, including the portfolios of investments, of Loomis Sayles International Growth Fund (one of the funds constituting Loomis Sayles Funds II), Natixis Oakmark International Fund, Natixis U.S. Equity Opportunities Fund, and Vaughan Nelson Small Cap Value Fund (three of the funds constituting Natixis Funds Trust I), and Natixis Oakmark Fund and Vaughan Nelson Mid Cap Fund (two of the funds constituting Natixis Funds Trust II) (hereafter collectively referred to as the "Funds") as of December 31, 2024, the related statements of operations for the year ended December 31, 2024, the statements of changes in net assets for each of the two years in the period ended December 31, 2024, including the related notes, and the financial highlights for each of the periods indicated therein (collectively referred to as the “financial statements”). In our opinion, the financial statements present fairly, in all material respects, the financial position of each of the Funds as of December 31, 2024, the results of each of their operations for the year then ended, the changes in each of their net assets for each of the two years in the period ended December 31, 2024 and each of the financial highlights for each of the periods indicated therein, in conformity with accounting principles generally accepted in the United States of America.
These financial statements are the responsibility of the Funds’ management. Our responsibility is to express an opinion on the Funds’ financial statements based on our audits. We are a public accounting firm registered with the Public Company Accounting Oversight Board (United States) (PCAOB) and are required to be independent with respect to the Funds in accordance with the U.S. federal securities laws and the applicable rules and regulations of the Securities and Exchange Commission and the PCAOB.
We conducted our audits of these financial statements in accordance with the standards of the PCAOB. Those standards require that we plan and perform the audit to obtain reasonable assurance about whether the financial statements are free of material misstatement, whether due to error or fraud.
Our audits included performing procedures to assess the risks of material misstatement of the financial statements, whether due to error or fraud, and performing procedures that respond to those risks. Such procedures included examining, on a test basis, evidence regarding the amounts and disclosures in the financial statements. Our audits also included evaluating the accounting principles used and significant estimates made by management, as well as evaluating the overall presentation of the financial statements. Our procedures included confirmation of securities owned as of December 31, 2024 by correspondence with the custodian and brokers; when replies were not received from brokers, we performed other auditing procedures. We believe that our audits provide a reasonable basis for our opinions.
/s/PricewaterhouseCoopers LLP
Boston, Massachusetts
February 24, 2025
We have served as the auditor of one or more investment companies in Natixis Investment Company Complex since at least 1995. We have not been able to determine the specific year we began serving as auditor.
2024 U.S. Tax Distribution Information to Shareholders (Unaudited)
Corporate Dividends Received Deduction. For the fiscal year ended December 31, 2024, a percentage of dividends distributed by the Funds listed below qualify for the dividends received deduction for corporate shareholders. These percentages are as follows:
| |
International Growth Fund | |
| |
U.S. Equity Opportunities Fund | |
| |
| |
Qualified Dividend Income. For the fiscal year ended December 31, 2024, a percentage of the ordinary income dividends paid by the Funds are considered qualified dividend income eligible for reduced tax rates. These lower rates range from 0% to 20% depending on an individual’s tax bracket. If the Funds paid a distribution during calendar year 2024, complete information will be reported in conjunction with Form 1099-DIV. These percentages are noted below:
| |
International Growth Fund | |
| |
Natixis Oakmark International Fund | |
U.S. Equity Opportunities Fund | |
| |
| |
Capital Gains Distributions. Pursuant to Internal Revenue Section 852(b), the following Funds paid distributions, which have been designated as capital gains distributions for the fiscal year ended December 31, 2024.
| |
| |
U.S. Equity Opportunities Fund | |
| |
| |
Foreign Tax Credit. For the year ended December 31, 2024, the Fund intends to pass through foreign tax credits and have derived gross income from sources within foreign countries amounting to:
| Foreign-Tax
Credit Pass-Through | |
International Growth Fund | | |
Natixis Oakmark International Fund | | |
This Page Intentionally Left Blank
˃To learn more about Natixis Funds products and services:
Visit: im.natixis.com Call: 800-225-5478
Before investing, consider the fund’s investment objectives, risks, charges, and expenses. Visit im.natixis.com or call 800-225-5478 for a prospectus or summary prospectus containing this and other information.
Contact us by mail:
If you wish to communicate with the funds’ Board of Trustees, you may do so by writing to:
Secretary of the Funds
Natixis Advisors, LLC
888 Boylston Street, Suite 800
Boston, MA 02199-8197
The correspondence must (a) be signed by the shareholder; (b) include the shareholder’s name and address; and (c) identify the fund(s), account number, share class, and number of shares held in that fund, as of a recent date.
Or by e-mail:
secretaryofthefunds@natixis.com (Communications regarding recommendations for Trustee candidates may not be submitted by e-mail.)
Please note: Unlike written correspondence, e-mail is not secure. Please do NOT include your account number, Social Security number, PIN, or any other non-public personal information in an e-mail communication because this information may be viewed by others.
 Exp. 3/31/2026EF58A-1224
This page is not part of the financial statements and other important information
Annual Financial Statements and Other Important Information
|
Gateway Equity Call Premium Fund |
Mirova Global Green Bond Fund |
Mirova Global Sustainable Equity Fund |
Mirova International Sustainable Equity Fund |
Portfolio of Investments – as of December 31, 2024Gateway Fund
| | |
Common Stocks — 97.9% of Net Assets |
| Aerospace & Defense — 1.5% |
| | |
| | |
| | |
| | |
| | |
| Air Freight & Logistics — 0.4% |
| United Parcel Service, Inc., Class B(a) | |
| Automobile Components — 0.0% |
| | |
| |
| | |
| | |
| | |
| | |
| |
| | |
| | |
| | |
| | |
| |
| Celsius Holdings, Inc.(b) | |
| Monster Beverage Corp.(a)(b) | |
| | |
| | |
| |
| | |
| Alnylam Pharmaceuticals, Inc.(a)(b) | |
| | |
| | |
| Vertex Pharmaceuticals, Inc.(a)(b) | |
| | |
| |
| | |
| | |
| | |
| |
| | |
| Lennox International, Inc.(a) | |
| | |
| |
| | |
| | |
| FactSet Research Systems, Inc.(a) | |
| Intercontinental Exchange, Inc.(a) | |
| | |
| | |
| | |
| |
| | |
| | |
| | |
| | |
| LyondellBasell Industries NV, Class A(a) | |
| | |
| |
| | |
| RPM International, Inc.(a) | |
| | |
| Commercial Services & Supplies — 1.0% |
| | |
| Waste Connections, Inc.(a) | |
| Waste Management, Inc.(a) | |
| | |
| Communications Equipment — 1.0% |
| | |
| | |
| Telefonaktiebolaget LM Ericsson, ADR(a) | |
| | |
| Construction Materials — 0.3% |
| Martin Marietta Materials, Inc.(a) | |
| |
| | |
| Discover Financial Services(a) | |
| | |
| | |
| Consumer Staples Distribution & Retail — 2.1% |
| Casey's General Stores, Inc.(a) | |
| Costco Wholesale Corp.(a) | |
| | |
| U.S. Foods Holding Corp.(a)(b) | |
| | |
| | |
| Containers & Packaging — 0.3% |
| | |
| | |
| | |
| | |
| |
| | |
| Diversified Consumer Services — 0.1% |
| Service Corp. International(a) | |
| |
| | |
| Diversified Telecommunication Services — 0.6% |
| | |
| Electric Utilities — 0.8% |
| | |
| American Electric Power Co., Inc.(a) | |
| | |
| | |
| Electrical Equipment — 0.8% |
| | |
| | |
| | |
| Electronic Equipment, Instruments & Components — 0.7% |
| | |
| | |
| | |
See accompanying notes to financial statements.
Portfolio of Investments – as of December 31, 2024Gateway Fund (continued) | | |
| Electronic Equipment, Instruments & Components — continued |
| | |
| Zebra Technologies Corp., Class A(a)(b) | |
| | |
| Energy Equipment & Services — 0.1% |
| | |
| |
| Live Nation Entertainment, Inc.(a)(b) | |
| | |
| Spotify Technology SA(a)(b) | |
| | |
| | |
| Financial Services — 4.2% |
| Berkshire Hathaway, Inc., Class B(a)(b) | |
| PayPal Holdings, Inc.(a)(b) | |
| Shift4 Payments, Inc., Class A(a)(b) | |
| | |
| | |
| | |
| |
| | |
| Mondelez International, Inc., Class A(a) | |
| | |
| Ground Transportation — 0.7% |
| Canadian Pacific Kansas City Ltd.(a) | |
| | |
| Old Dominion Freight Line, Inc.(a) | |
| | |
| | |
| Health Care Equipment & Supplies — 2.3% |
| | |
| Boston Scientific Corp.(a)(b) | |
| Intuitive Surgical, Inc.(a)(b) | |
| | |
| | |
| Health Care Providers & Services — 2.3% |
| | |
| | |
| | |
| Molina Healthcare, Inc.(a)(b) | |
| UnitedHealth Group, Inc.(a) | |
| Universal Health Services, Inc., Class B(a) | |
| | |
| Health Care Technology — 0.1% |
| Veeva Systems, Inc., Class A(a)(b) | |
| Hotels, Restaurants & Leisure — 1.7% |
| Booking Holdings, Inc.(a) | |
| DoorDash, Inc., Class A(a)(b) | |
| Hilton Worldwide Holdings, Inc.(a) | |
| | |
| Restaurant Brands International, Inc.(a) | |
| | |
| Household Durables — 0.4% |
| | |
| | |
| | |
| | |
| Household Products — 1.0% |
| | |
| Industrial Conglomerates — 0.7% |
| Honeywell International, Inc.(a) | |
| |
| | |
| |
| | |
| American Financial Group, Inc.(a) | |
| | |
| Arthur J Gallagher & Co.(a) | |
| Fidelity National Financial, Inc.(a) | |
| | |
| | |
| | |
| Interactive Media & Services — 6.8% |
| Alphabet, Inc., Class A(a) | |
| Alphabet, Inc., Class C(a) | |
| Meta Platforms, Inc., Class A(a) | |
| | |
| |
| Accenture PLC, Class A(a) | |
| Shopify, Inc., Class A(a)(b) | |
| Twilio, Inc., Class A(a)(b) | |
| | |
| | |
| Life Sciences Tools & Services — 0.8% |
| Agilent Technologies, Inc.(a) | |
| | |
| | |
| | |
| Thermo Fisher Scientific, Inc.(a) | |
| | |
| |
| | |
| | |
| | |
| | |
| | |
| | |
| |
| Comcast Corp., Class A(a) | |
| |
| | |
| | |
| | |
| | |
| |
| | |
| Consolidated Edison, Inc.(a) | |
| WEC Energy Group, Inc.(a) | |
| | |
| Oil, Gas & Consumable Fuels — 3.1% |
| | |
| | |
| | |
| | |
| Occidental Petroleum Corp.(a) | |
See accompanying notes to financial statements.
Portfolio of Investments – as of December 31, 2024Gateway Fund (continued) | | |
| Oil, Gas & Consumable Fuels — continued |
| | |
| | |
| | |
| Passenger Airlines — 0.1% |
| American Airlines Group, Inc.(b) | |
| |
| | |
| | |
| | |
| | |
| | |
| Professional Services — 1.0% |
| Automatic Data Processing, Inc.(a) | |
| Booz Allen Hamilton Holding Corp.(a) | |
| | |
| | |
| | |
| Real Estate Management & Development — 0.1% |
| Zillow Group, Inc., Class C(a)(b) | |
| |
| American Homes 4 Rent, Class A(a) | |
| Semiconductors & Semiconductor Equipment — 11.3% |
| Advanced Micro Devices, Inc.(a)(b) | |
| | |
| | |
| | |
| Marvell Technology, Inc.(a) | |
| | |
| | |
| | |
| Texas Instruments, Inc.(a) | |
| | |
| |
| | |
| | |
| Cadence Design Systems, Inc.(a)(b) | |
| CrowdStrike Holdings, Inc., Class A(a)(b) | |
| | |
| | |
| | |
| Palo Alto Networks, Inc.(a)(b) | |
| | |
| | |
| Workday, Inc., Class A(a)(b) | |
| | |
| | |
| |
| | |
| Extra Space Storage, Inc.(a) | |
| SBA Communications Corp.(a) | |
| | |
| |
| Abercrombie & Fitch Co., Class A(b) | |
| Dick's Sporting Goods, Inc.(a) | |
| | |
| | |
| | |
| | |
| | |
| | |
| Technology Hardware, Storage & Peripherals — 7.6% |
| | |
| Dell Technologies, Inc., Class C(a) | |
| Pure Storage, Inc., Class A(b) | |
| | |
| Textiles, Apparel & Luxury Goods — 0.2% |
| Lululemon Athletica, Inc.(a)(b) | |
| |
| British American Tobacco PLC, ADR(a) | |
| Total Common Stocks
(Identified Cost $1,590,902,053) | |
| Total Purchased Options — 1.0%
(Identified Cost $63,048,457) (see details below) | |
| | |
Short-Term Investments — 1.5% |
| Tri-Party Repurchase Agreement with Fixed Income Clearing Corporation, dated 12/31/2024 at 2.500% to be repurchased at $102,018,596 on 1/02/2025 collateralized by $102,756,100 U.S. Treasury Note, 4.125% due 2/15/2027 valued at $104,044,613 including accrued interest (Note 2 of Notes to Financial Statements)
(Identified Cost $102,004,428) | |
| Total Investments — 100.4%
(Identified Cost $1,755,954,938) | |
| Other assets less liabilities — (0.4)% | |
| | |
See accompanying notes to financial statements.
Portfolio of Investments – as of December 31, 2024Gateway Fund (continued)
| See Note 2 of Notes to Financial Statements. |
| Security (or a portion thereof) has been pledged as collateral for open derivative contracts. |
| Non-income producing security. |
| An American Depositary Receipt is a certificate issued by a custodian bank representing the right to receive securities of the foreign issuer described. The values of ADRs may be significantly influenced by trading on exchanges not located in the United States. |
| Real Estate Investment Trusts |
Industry Summary at December 31, 2024
Semiconductors & Semiconductor Equipment | |
| |
Technology Hardware, Storage & Peripherals | |
Interactive Media & Services | |
| |
| |
| |
| |
Oil, Gas & Consumable Fuels | |
| |
Health Care Equipment & Supplies | |
Health Care Providers & Services | |
| |
| |
Consumer Staples Distribution & Retail | |
| |
| |
Other Investments, less than 2% each | |
| |
| |
Other assets less liabilities (including open written options) | |
| |
See accompanying notes to financial statements.
Portfolio of Investments – as of December 31, 2024Gateway Equity Call Premium Fund
| | |
Common Stocks — 98.4% of Net Assets |
| Aerospace & Defense — 1.9% |
| | |
| | |
| | |
| | |
| | |
| | |
| Air Freight & Logistics — 0.2% |
| Expeditors International of Washington, Inc.(a) | |
| GXO Logistics, Inc.(a)(b) | |
| | |
| Automobile Components — 0.1% |
| | |
| |
| | |
| | |
| | |
| |
| | |
| East West Bancorp, Inc.(a) | |
| | |
| | |
| | |
| | |
| | |
| | |
| |
| Coca-Cola Europacific Partners PLC(a) | |
| | |
| | |
| |
| | |
| Alnylam Pharmaceuticals, Inc.(a)(b) | |
| | |
| BioMarin Pharmaceutical, Inc.(a)(b) | |
| Exact Sciences Corp.(a)(b) | |
| United Therapeutics Corp.(a)(b) | |
| Vertex Pharmaceuticals, Inc.(a)(b) | |
| | |
| |
| Alibaba Group Holding Ltd., ADR | |
| | |
| | |
| | |
| | |
| |
| Fortune Brands Innovations, Inc.(a) | |
| Lennox International, Inc.(a) | |
| | |
| |
| Bank of New York Mellon Corp.(a) | |
| | |
| | |
| Brookfield Asset Management Ltd., Class A(a) | |
| | |
| | |
| LPL Financial Holdings, Inc.(a) | |
| | |
| Capital Markets — continued |
| | |
| | |
| Raymond James Financial, Inc.(a) | |
| | |
| |
| Air Products & Chemicals, Inc.(a) | |
| | |
| | |
| | |
| RPM International, Inc.(a) | |
| | |
| Commercial Services & Supplies — 0.6% |
| Waste Connections, Inc.(a) | |
| Waste Management, Inc.(a) | |
| | |
| Communications Equipment — 0.9% |
| | |
| | |
| Telefonaktiebolaget LM Ericsson, ADR(a) | |
| | |
| Construction Materials — 0.3% |
| Martin Marietta Materials, Inc.(a) | |
| |
| | |
| | |
| | |
| Consumer Staples Distribution & Retail — 2.2% |
| Costco Wholesale Corp.(a) | |
| | |
| | |
| | |
| Containers & Packaging — 0.1% |
| | |
| Diversified Consumer Services — 0.1% |
| Service Corp. International(a) | |
| Diversified Telecommunication Services — 0.7% |
| | |
| Electric Utilities — 1.3% |
| | |
| American Electric Power Co., Inc.(a) | |
| Constellation Energy Corp.(a) | |
| | |
| | |
| Electrical Equipment — 0.9% |
| | |
| | |
| | |
| NEXTracker, Inc., Class A(a)(b) | |
| Sensata Technologies Holding PLC(a) | |
| | |
| Electronic Equipment, Instruments & Components — 0.4% |
| Arrow Electronics, Inc.(a)(b) | |
| | |
| | |
| | |
See accompanying notes to financial statements.
Portfolio of Investments – as of December 31, 2024Gateway Equity Call Premium Fund (continued) | | |
| Energy Equipment & Services — 0.0% |
| | |
| |
| Liberty Media Corp.-Liberty Formula One, Class C(a)(b) | |
| | |
| TKO Group Holdings, Inc.(b) | |
| | |
| | |
| Financial Services — 4.5% |
| Berkshire Hathaway, Inc., Class B(a)(b) | |
| | |
| Mastercard, Inc., Class A(a) | |
| | |
| | |
| |
| | |
| | |
| Post Holdings, Inc.(a)(b) | |
| | |
| Ground Transportation — 0.7% |
| Canadian National Railway Co.(a) | |
| Canadian Pacific Kansas City Ltd.(a) | |
| J.B. Hunt Transport Services, Inc.(a) | |
| Uber Technologies, Inc.(a)(b) | |
| | |
| | |
| Health Care Equipment & Supplies — 1.9% |
| | |
| | |
| Edwards Lifesciences Corp.(a)(b) | |
| IDEXX Laboratories, Inc.(a)(b) | |
| | |
| | |
| | |
| Zimmer Biomet Holdings, Inc.(a) | |
| | |
| Health Care Providers & Services — 1.7% |
| | |
| | |
| Labcorp Holdings, Inc.(a) | |
| UnitedHealth Group, Inc.(a) | |
| | |
| Health Care Technology — 0.1% |
| Veeva Systems, Inc., Class A(a)(b) | |
| Hotels, Restaurants & Leisure — 2.0% |
| Booking Holdings, Inc.(a) | |
| Hilton Worldwide Holdings, Inc.(a) | |
| | |
| Restaurant Brands International, Inc.(a) | |
| | |
| Trip.com Group Ltd., ADR(a)(b) | |
| | |
| | |
| Household Durables — 0.5% |
| | |
| | |
| | |
| | |
| Household Products — 1.3% |
| | |
| | |
| | |
| |
| | |
| |
| Arch Capital Group Ltd.(a) | |
| Cincinnati Financial Corp.(a) | |
| Hartford Financial Services Group, Inc.(a) | |
| Manulife Financial Corp.(a) | |
| | |
| Prudential Financial, Inc.(a) | |
| RenaissanceRe Holdings Ltd.(a) | |
| | |
| Willis Towers Watson PLC(a) | |
| | |
| Interactive Media & Services — 6.8% |
| Alphabet, Inc., Class A(a) | |
| Alphabet, Inc., Class C(a) | |
| | |
| Meta Platforms, Inc., Class A(a) | |
| | |
| |
| Accenture PLC, Class A(a) | |
| | |
| Shopify, Inc., Class A(a)(b) | |
| Twilio, Inc., Class A(a)(b) | |
| | |
| |
| | |
| | |
| | |
| Life Sciences Tools & Services — 1.1% |
| | |
| Bio-Rad Laboratories, Inc., Class A(a)(b) | |
| | |
| Thermo Fisher Scientific, Inc.(a) | |
| | |
| | |
| |
| | |
| | |
| | |
| | |
| | |
| | |
| |
| Interpublic Group of Cos., Inc.(a) | |
| Liberty Broadband Corp., Class C(a)(b) | |
| | |
| |
| | |
| | |
| | |
| | |
See accompanying notes to financial statements.
Portfolio of Investments – as of December 31, 2024Gateway Equity Call Premium Fund (continued) | | |
| Metals & Mining — continued |
| | |
| | |
| | |
| |
| | |
| | |
| | |
| Oil, Gas & Consumable Fuels — 3.0% |
| Canadian Natural Resources Ltd.(a) | |
| | |
| | |
| | |
| | |
| | |
| | |
| | |
| | |
| | |
| | |
| | |
| | |
| | |
| Passenger Airlines — 0.2% |
| | |
| Personal Care Products — 0.1% |
| BellRing Brands, Inc.(a)(b) | |
| |
| | |
| | |
| Jazz Pharmaceuticals PLC(a)(b) | |
| | |
| | |
| | |
| Teva Pharmaceutical Industries Ltd., ADR(a)(b) | |
| | |
| Professional Services — 0.7% |
| Booz Allen Hamilton Holding Corp.(a) | |
| | |
| SS&C Technologies Holdings, Inc.(a) | |
| | |
| Verisk Analytics, Inc.(a) | |
| | |
| Real Estate Management & Development — 0.1% |
| Jones Lang LaSalle, Inc.(a)(b) | |
| |
| Invitation Homes, Inc.(a) | |
| |
| | |
| | |
| | |
| Semiconductors & Semiconductor Equipment — 11.3% |
| Advanced Micro Devices, Inc.(a)(b) | |
| Applied Materials, Inc.(a) | |
| | |
| | |
| Marvell Technology, Inc.(a) | |
| Micron Technology, Inc.(a) | |
| | |
| Semiconductors & Semiconductor Equipment — continued |
| | |
| | |
| Taiwan Semiconductor Manufacturing Co. Ltd., ADR(a) | |
| Texas Instruments, Inc.(a) | |
| | |
| |
| | |
| Check Point Software Technologies Ltd.(a)(b) | |
| | |
| | |
| | |
| | |
| Palantir Technologies, Inc., Class A(a)(b) | |
| Palo Alto Networks, Inc.(a)(b) | |
| | |
| | |
| | |
| Workday, Inc., Class A(a)(b) | |
| Zoom Communications, Inc.(a)(b) | |
| | |
| |
| | |
| Gaming & Leisure Properties, Inc.(a) | |
| SBA Communications Corp.(a) | |
| | |
| |
| Burlington Stores, Inc.(a)(b) | |
| Dick's Sporting Goods, Inc.(a) | |
| | |
| | |
| | |
| | |
| | |
| Technology Hardware, Storage & Peripherals — 7.8% |
| | |
| Dell Technologies, Inc., Class C(a) | |
| | |
| Textiles, Apparel & Luxury Goods — 0.4% |
| | |
| Skechers USA, Inc., Class A(a)(b) | |
| | |
| |
| British American Tobacco PLC, ADR(a) | |
| Philip Morris International, Inc.(a) | |
| | |
| Trading Companies & Distributors — 0.2% |
| Ferguson Enterprises, Inc.(a) | |
| | |
| | |
| Wireless Telecommunication Services — 0.2% |
| America Movil SAB de CV, ADR(a) | |
| Vodafone Group PLC, ADR(a) | |
| | |
| Total Common Stocks
(Identified Cost $126,221,285) | |
See accompanying notes to financial statements.
Portfolio of Investments – as of December 31, 2024Gateway Equity Call Premium Fund (continued)
| | |
Short-Term Investments — 1.8% |
| Tri-Party Repurchase Agreement with Fixed Income Clearing Corporation, dated 12/31/2024 at 2.500% to be repurchased at $4,567,259 on 1/02/2025 collateralized by $4,600,300 U.S. Treasury Note, 4.125% due 2/15/2027 valued at $4,658,010 including accrued interest (Note 2 of Notes to Financial Statements)
(Identified Cost $4,566,625) | |
| Total Investments — 100.2%
(Identified Cost $130,787,910) | |
| Other assets less liabilities — (0.2)% | |
| | |
| See Note 2 of Notes to Financial Statements. |
| Security (or a portion thereof) has been pledged as collateral for open derivative contracts. |
| Non-income producing security. |
| An American Depositary Receipt is a certificate issued by a custodian bank representing the right to receive securities of the foreign issuer described. The values of ADRs may be significantly influenced by trading on exchanges not located in the United States. |
| Real Estate Investment Trusts |
Industry Summary at December 31, 2024
Semiconductors & Semiconductor Equipment | |
| |
Technology Hardware, Storage & Peripherals | |
Interactive Media & Services | |
| |
| |
| |
| |
Oil, Gas & Consumable Fuels | |
| |
| |
| |
Consumer Staples Distribution & Retail | |
Hotels, Restaurants & Leisure | |
Other Investments, less than 2% each | |
| |
| |
Other assets less liabilities (including open written options) | |
| |
See accompanying notes to financial statements.
Portfolio of Investments – as of December 31, 2024Mirova Global Green Bond Fund
| | |
Bonds and Notes — 91.9% of Net Assets |
| |
| Province of Quebec, 2.600%, 7/06/2025, (CAD) | |
| |
| Chile Government International Bonds, 1.250%, 1/29/2040, (EUR) | |
| Chile Government International Bonds, 3.500%, 1/25/2050 | |
| | |
| |
| Orsted AS, 1.500%, 11/26/2029, (EUR) | |
| Orsted AS, (fixed rate to 9/09/2027, variable rate thereafter), 1.750%, 12/31/2099, (EUR) | |
| Vestas Wind Systems Finance BV, EMTN, 1.500%, 6/15/2029, (EUR) | |
| | |
| |
| VR-Yhtymae OYJ, 2.375%, 5/30/2029, (EUR) | |
| |
| Altarea SCA, 1.750%, 1/16/2030, (EUR) | |
| Banque Stellantis France SACA, EMTN, 3.875%, 1/19/2026, (EUR) | |
| Cie de Saint-Gobain SA, EMTN, 2.125%, 6/10/2028, (EUR) | |
| Covivio SA, 1.125%, 9/17/2031, (EUR) | |
| Credit Mutuel Arkea SA, EMTN, 4.250%, 12/01/2032, (EUR) | |
| ICADE, 1.500%, 9/13/2027, (EUR) | |
| Societe Des Grands Projets EPIC, EMTN, 1.700%, 5/25/2050, (EUR) | |
| | |
| |
| Bundesrepublik Deutschland Bundesanleihe, Zero Coupon, 2.296%–2.788%, 8/15/2030, (EUR)(a) | |
| Bundesrepublik Deutschland Bundesanleihe, Zero Coupon, 1.719%–3.065%, 8/15/2050, (EUR)(a) | |
| EnBW Energie Baden-Wuerttemberg AG, (fixed rate to 3/30/2026, variable rate thereafter), 1.875%, 6/29/2080, (EUR) | |
| | |
| |
| Hungary Government International Bonds, 1.750%, 6/05/2035, (EUR) | |
| |
| ESB Finance DAC, EMTN, 1.000%, 7/19/2034, (EUR) | |
| |
| A2A SpA, EMTN, 1.000%, 7/16/2029, (EUR) | |
| Cassa Depositi e Prestiti SpA, 3.875%, 2/13/2029, (EUR) | |
| ERG SpA, EMTN, 0.500%, 9/11/2027, (EUR) | |
| Generali, EMTN, 2.124%, 10/01/2030, (EUR) | |
| Hera SpA, EMTN, 2.500%, 5/25/2029, (EUR) | |
| Italy Buoni Poliennali Del Tesoro, 1.500%, 4/30/2045, (EUR) | |
| Italy Buoni Poliennali Del Tesoro, 4.000%, 10/30/2031, (EUR) | |
| Terna - Rete Elettrica Nazionale, EMTN, 3.875%, 7/24/2033, (EUR) | |
| | |
| | |
| |
| Denso Corp., 1.239%, 9/16/2026 | |
| Mizuho Financial Group, Inc., EMTN, 3.490%, 9/05/2027, (EUR) | |
| | |
| |
| Kookmin Bank, GMTN, 4.500%, 2/01/2029 | |
| Korea International Bonds, Zero Coupon, 0.000%, 10/15/2026, (EUR)(b) | |
| | |
| |
| Mexico Government International Bonds, 1.350%, 9/18/2027, (EUR) | |
| |
| Alliander NV, EMTN, 2.625%, 9/09/2027, (EUR) | |
| CTP NV, EMTN, 2.125%, 10/01/2025, (EUR) | |
| de Volksbank NV, EMTN, 0.375%, 3/03/2028, (EUR) | |
| de Volksbank NV, EMTN, (fixed rate to 7/22/2025, variable rate thereafter), 1.750%, 10/22/2030, (EUR) | |
| Enexis Holding NV, EMTN, 3.625%, 6/12/2034, (EUR) | |
| Koninklijke Philips NV, EMTN, 2.125%, 11/05/2029, (EUR) | |
| Stedin Holding NV, EMTN, 2.375%, 6/03/2030, (EUR) | |
| TenneT Holding BV, EMTN, 1.250%, 10/24/2033, (EUR) | |
| TenneT Holding BV, EMTN, 1.875%, 6/13/2036, (EUR) | |
| | |
| |
| Statkraft AS, EMTN, 2.875%, 9/13/2029, (EUR) | |
| |
| EDP Finance BV, EMTN, 3.875%, 3/11/2030, (EUR) | |
| Ren Finance BV, EMTN, 0.500%, 4/16/2029, (EUR) | |
| | |
| |
| Vena Energy Capital Pte. Ltd., EMTN, 3.133%, 2/26/2025 | |
| |
| Banco Bilbao Vizcaya Argentaria SA, 1.000%, 6/21/2026, (EUR) | |
| Banco Bilbao Vizcaya Argentaria SA, GMTN, 4.375%, 10/14/2029, (EUR) | |
| Bankinter SA, 0.625%, 10/06/2027, (EUR) | |
| Iberdrola Finanzas SA, EMTN, 1.375%, 3/11/2032, (EUR) | |
| Spain Government Bonds, 1.000%, 7/30/2042, (EUR) | |
| Telefonica Europe BV, (fixed rate to 2/05/2027, variable rate thereafter), 2.502%, (EUR)(c) | |
| | |
| |
| European Investment Bank, 2.375%, 5/24/2027 | |
| |
| SKF AB, 3.125%, 9/14/2028, (EUR) | |
| Vattenfall AB, EMTN, 0.125%, 2/12/2029, (EUR) | |
| Volvo Car AB, EMTN, 2.500%, 10/07/2027, (EUR) | |
| | |
| |
| Anglian Water Services Financing PLC, EMTN, 1.625%, 8/10/2025, (GBP) | |
| DS Smith PLC, EMTN, 4.375%, 7/27/2027, (EUR) | |
See accompanying notes to financial statements.
Portfolio of Investments – as of December 31, 2024Mirova Global Green Bond Fund (continued) | | |
| United Kingdom — continued |
| Severn Trent Utilities Finance PLC, EMTN, 5.250%, 4/04/2036, (GBP) | |
| SSE PLC, EMTN, 1.375%, 9/04/2027, (EUR) | |
| SSE PLC, EMTN, 2.875%, 8/01/2029, (EUR) | |
| U.K. Gilts, 0.875%, 7/31/2033, (GBP) | |
| U.K. Gilts, 1.500%, 7/31/2053, (GBP) | |
| | |
| |
| Digital Dutch Finco BV, 1.500%, 3/15/2030, (EUR) | |
| Digital Intrepid Holding BV, 0.625%, 7/15/2031, (EUR) | |
| DTE Electric Co., 3.950%, 3/01/2049 | |
| Ford Motor Co., 3.250%, 2/12/2032 | |
| General Motors Co., 5.400%, 10/15/2029 | |
| Johnson Controls International PLC, 4.250%, 5/23/2035, (EUR) | |
| Southern Power Co., 4.150%, 12/01/2025 | |
| Stellantis NV, EMTN, 4.375%, 3/14/2030, (EUR) | |
| Thermo Fisher Scientific, Inc., 4.100%, 8/15/2047 | |
| Verizon Communications, Inc., 3.875%, 2/08/2029 | |
| Wabtec Transportation Netherlands BV, 1.250%, 12/03/2027, (EUR) | |
| | |
| Total Bonds and Notes
(Identified Cost $38,727,405) | |
|
|
Short-Term Investments — 0.4% |
| Tri-Party Repurchase Agreement with Fixed Income Clearing Corporation, dated 12/31/2024 at 2.500% to be repurchased at $137,780 on 1/02/2025 collateralized by $138,800 U.S. Treasury Note, 4.125% due 2/15/2027 valued at $140,565 including accrued interest (Note 2 of Notes to Financial Statements)
(Identified Cost $137,761) | |
| Total Investments — 92.3%
(Identified Cost $38,865,166) | |
| Other assets less liabilities — 7.7% | |
| | |
| See Note 2 of Notes to Financial Statements. |
| Principal Amount stated in U.S. dollars unless otherwise noted. |
| Interest rate represents annualized yield at time of purchase; not a coupon rate. The Fund’s investment in this security is comprised of various lots with differing annualized yields. |
| Interest rate represents annualized yield at time of purchase; not a coupon rate. |
| Perpetual bond with no specified maturity date. |
At December 31, 2024, the Fund had the following open long futures contracts:
| | | | | Unrealized
Appreciation
(Depreciation) |
CBOT 10 Year U.S. Treasury Notes Futures | | | | | |
Eurex 10 Year Euro BUND Futures | | | | | |
Eurex 30 Year Euro BUXL Futures | | | | | |
Eurex 5 Year Euro BOBL Futures | | | | | |
Montreal Exchange 10 Year Canadian Bond Futures | | | | | |
| | | | | |
At December 31, 2024, the Fund had the following open short futures contracts:
| | | | | Unrealized
Appreciation
(Depreciation) |
CME British Pound Currency Futures | | | | | |
See accompanying notes to financial statements.
Portfolio of Investments – as of December 31, 2024Mirova Global Green Bond Fund (continued) | | | | | Unrealized Appreciation (Depreciation) |
CME Canadian Dollar Currency Futures | | | | | |
CME Euro Foreign Exchange Currency Futures | | | | | |
| | | | | |
Investment Summary at December 31, 2024
| |
| |
| |
| |
| |
| |
| |
| |
Other Investments, less than 2% each | |
| |
| |
Other assets less liabilities (including futures contracts) | |
| |
Currency Exposure Summary at December 31, 2024
| |
| |
| |
| |
| |
Other assets less liabilities (including futures contracts) | |
| |
See accompanying notes to financial statements.
Portfolio of Investments – as of December 31, 2024Mirova Global Sustainable Equity Fund
| | |
Common Stocks — 98.1% of Net Assets |
| |
| | |
| |
| Canadian Pacific Kansas City Ltd. | |
| Shopify, Inc., Class A(a) | |
| | |
| |
| | |
| Vestas Wind Systems AS(a) | |
| | |
| |
| | |
| | |
| | |
| | |
| |
| | |
| | |
| | |
| |
| | |
| |
| | |
| |
| | |
| | |
| | |
| |
| | |
| |
| | |
| | |
| | |
| |
| | |
| |
| Taiwan Semiconductor Manufacturing Co. Ltd., ADR | |
| |
| | |
| Legal & General Group PLC | |
| | |
| | |
| | |
| |
| Advanced Drainage Systems, Inc. | |
| | |
| American Water Works Co., Inc. | |
| | |
| | |
| | |
| | |
| Edwards Lifesciences Corp.(a) | |
| | |
| | |
| | |
| | |
| United States — continued |
| Intuitive Surgical, Inc.(a) | |
| Mastercard, Inc., Class A | |
| | |
| | |
| | |
| Palo Alto Networks, Inc.(a) | |
| | |
| | |
| | |
| Thermo Fisher Scientific, Inc. | |
| | |
| | |
| | |
| | |
| Watts Water Technologies, Inc., Class A | |
| | |
| | |
| Total Common Stocks
(Identified Cost $806,215,212) | |
| | |
Short-Term Investments — 0.9% |
| Tri-Party Repurchase Agreement with Fixed Income Clearing Corporation, dated 12/31/2024 at 2.500% to be repurchased at $9,039,866 on 1/02/2025 collateralized by $9,105,300 U.S. Treasury Note, 4.125% due 2/15/2027 valued at $9,219,561 including accrued interest (Note 2 of Notes to Financial Statements)
(Identified Cost $9,038,611) | |
| Total Investments — 99.0%
(Identified Cost $815,253,823) | |
| Other assets less liabilities — 1.0% | |
| | |
| See Note 2 of Notes to Financial Statements. |
| Non-income producing security. |
| An American Depositary Receipt is a certificate issued by a custodian bank representing the right to receive securities of the foreign issuer described. The values of ADRs may be significantly influenced by trading on exchanges not located in the United States. |
See accompanying notes to financial statements.
Portfolio of Investments – as of December 31, 2024Mirova Global Sustainable Equity Fund (continued) Industry Summary at December 31, 2024
| |
Semiconductors & Semiconductor Equipment | |
| |
| |
| |
Health Care Equipment & Supplies | |
Life Sciences Tools & Services | |
| |
| |
| |
| |
Commercial Services & Supplies | |
| |
| |
Other Investments, less than 2% each | |
| |
| |
Other assets less liabilities | |
| |
Currency Exposure Summary at December 31, 2024
| |
| |
| |
| |
| |
| |
| |
Other assets less liabilities | |
| |
See accompanying notes to financial statements.
Portfolio of Investments – as of December 31, 2024Mirova International Sustainable Equity Fund
| | |
Common Stocks — 96.9% of Net Assets |
| |
| | |
| |
| | |
| |
| Canadian Pacific Kansas City Ltd. | |
| Shopify, Inc., Class A(a) | |
| | |
| |
| | |
| Vestas Wind Systems AS(a) | |
| | |
| |
| | |
| | |
| | |
| | |
| | |
| | |
| |
| | |
| | |
| | |
| | |
| |
| | |
| |
| | |
| |
| | |
| | |
| | |
| | |
| | |
| | |
| | |
| |
| | |
| | |
| | |
| |
| | |
| |
| | |
| | |
| | |
| |
| Taiwan Semiconductor Manufacturing Co. Ltd., ADR | |
| |
| | |
| | |
| Land Securities Group PLC | |
| Legal & General Group PLC | |
| | |
| | |
| | |
| | |
| |
| | |
| | |
| | |
| Total Common Stocks
(Identified Cost $15,696,242) | |
| | |
Short-Term Investments — 1.9% |
| Tri-Party Repurchase Agreement with Fixed Income Clearing Corporation, dated 12/31/2024 at 2.500% to be repurchased at $319,214 on 1/02/2025 collateralized by $321,600 U.S. Treasury Note, 4.125% due 2/15/2027 valued at $325,712 including accrued interest (Note 2 of Notes to Financial Statements)
(Identified Cost $319,170) | |
| Total Investments — 98.8%
(Identified Cost $16,015,412) | |
| Other assets less liabilities — 1.2% | |
| | |
| See Note 2 of Notes to Financial Statements. |
| Non-income producing security. |
| An American Depositary Receipt is a certificate issued by a custodian bank representing the right to receive securities of the foreign issuer described. The values of ADRs may be significantly influenced by trading on exchanges not located in the United States. |
Industry Summary at December 31, 2024
| |
Semiconductors & Semiconductor Equipment | |
| |
| |
| |
| |
Health Care Equipment & Supplies | |
| |
| |
| |
| |
Electronic Equipment, Instruments & Components | |
| |
| |
Diversified Telecommunication Services | |
| |
| |
| |
| |
| |
Other Investments, less than 2% each | |
| |
| |
Other assets less liabilities | |
| |
See accompanying notes to financial statements.
Portfolio of Investments – as of December 31, 2024Mirova International Sustainable Equity Fund (continued) Currency Exposure Summary at December 31, 2024
| |
| |
| |
| |
| |
| |
| |
| |
| |
Other assets less liabilities | |
| |
See accompanying notes to financial statements.
Statements of Assets and Liabilities
| | Gateway Equity
Call Premium
Fund | Mirova Global
Green Bond
Fund |
| | | |
| | | |
Net unrealized appreciation (depreciation) | | | |
| | | |
| | | |
Due from brokers (including variation margin on futures contracts) (Note 2) | | | |
Foreign currency at value (identified cost $0, $0 and $2,060,306, respectively) | | | |
Receivable for Fund shares sold | | | |
Receivable from investment adviser (Note 6) | | | |
Receivable for securities sold | | | |
Dividends and interest receivable | | | |
Unrealized appreciation on futures contracts (Note 2) | | | |
| | | |
| | | |
| | | |
| | | |
Options written, at value (premiums received $68,422,584, $2,800,212 and $0, respectively) (Note 2) | | | |
Payable for securities purchased | | | |
Payable for Fund shares redeemed | | | |
Unrealized depreciation on futures contracts (Note 2) | | | |
Management fees payable (Note 6) | | | |
Deferred Trustees’ fees (Note 6) | | | |
Administrative fees payable (Note 6) | | | |
Payable to distributor (Note 6d) | | | |
Audit and tax services fees payable | | | |
Other accounts payable and accrued expenses | | | |
| | | |
COMMITMENTS AND CONTINGENCIES(a) | | | |
| | | |
| | | |
| | | |
Accumulated earnings (loss) | | | |
| | | |
See accompanying notes to financial statements.
Statements of Assets and Liabilities (continued)
| | Gateway Equity Call Premium Fund | Mirova Global Green Bond Fund |
COMPUTATION OF NET ASSET VALUE AND OFFERING PRICE: | | | |
| | | |
| | | |
Shares of beneficial interest | | | |
Net asset value and redemption price per share | | | |
Offering price per share (100/[100-maximum sales charge] of net asset value) (Note 1) | | | |
Class C shares: (redemption price per share is equal to net asset value less any applicable contingent deferred sales charge) (Note 1) | | | |
| | | |
Shares of beneficial interest | | | |
Net asset value and offering price per share | | | |
| | | |
| | | |
Shares of beneficial interest | | | |
Net asset value, offering and redemption price per share | | | |
| | | |
| | | |
Shares of beneficial interest | | | |
Net asset value, offering and redemption price per share | | | |
| As disclosed in the Notes to Financial Statements, if applicable. |
See accompanying notes to financial statements.
Statements of Assets and Liabilities (continued)
| Mirova Global
Sustainable
Equity Fund | Mirova
International
Sustainable
Equity Fund |
| | |
| | |
Net unrealized appreciation (depreciation) | | |
| | |
Foreign currency at value (identified cost $8,291,465 and $196,016, respectively) | | |
Receivable for Fund shares sold | | |
Dividends and interest receivable | | |
| | |
| | |
| | |
| | |
Payable for Fund shares redeemed | | |
Management fees payable (Note 6) | | |
Deferred Trustees’ fees (Note 6) | | |
Administrative fees payable (Note 6) | | |
Payable to distributor (Note 6d) | | |
Audit and tax services fees payable | | |
Other accounts payable and accrued expenses | | |
| | |
COMMITMENTS AND CONTINGENCIES(a) | | |
| | |
| | |
| | |
Accumulated earnings (loss) | | |
| | |
COMPUTATION OF NET ASSET VALUE AND OFFERING PRICE: | | |
| | |
| | |
Shares of beneficial interest | | |
Net asset value and redemption price per share | | |
Offering price per share (100/94.25 of net asset value) (Note 1) | | |
Class C shares: (redemption price per share is equal to net asset value less any applicable contingent deferred sales charge) (Note 1) | | |
| | |
Shares of beneficial interest | | |
Net asset value and offering price per share | | |
| | |
| | |
Shares of beneficial interest | | |
Net asset value, offering and redemption price per share | | |
| | |
| | |
Shares of beneficial interest | | |
Net asset value, offering and redemption price per share | | |
| As disclosed in the Notes to Financial Statements, if applicable. |
See accompanying notes to financial statements.
For the Year Ended December 31, 2024
| | Gateway Equity
Call Premium
Fund | Mirova Global
Green Bond
Fund |
| | | |
| | | |
| | | |
Less net foreign taxes withheld | | | |
| | | |
| | | |
| | | |
Service and distribution fees (Note 6) | | | |
Administrative fees (Note 6) | | | |
Trustees' fees and expenses (Note 6) | | | |
Transfer agent fees and expenses (Notes 6, 7 and 8) | | | |
Audit and tax services fees | | | |
Custodian fees and expenses | | | |
Excise tax expenses (Note 11) | | | |
| | | |
| | | |
| | | |
Shareholder reporting expenses | | | |
| | | |
| | | |
Less waiver and/or expense reimbursement (Notes 6 and 11) | | | |
Less expense offset (Note 8) | | | |
| | | |
| | | |
Net realized and unrealized gain (loss) on Investments, Futures contracts, Options written and Foreign currency transactions | | | |
Net realized gain (loss) on: | | | |
| | | |
| | | |
| | | |
Foreign currency transactions (Note 2c) | | | |
Net change in unrealized appreciation (depreciation) on: | | | |
| | | |
| | | |
| | | |
Foreign currency translations (Note 2c) | | | |
Net realized and unrealized gain on Investments, Futures contracts, Options written and Foreign currency transactions | | | |
NET INCREASE IN NET ASSETS RESULTING FROM OPERATIONS | | | |
See accompanying notes to financial statements.
Statements of Operations (continued)
For the Year Ended December 31, 2024
| Mirova Global
Sustainable
Equity Fund | Mirova
International
Sustainable
Equity Fund |
| | |
| | |
Non-cash dividends (Note 2b) | | |
| | |
Less net foreign taxes withheld | | |
| | |
| | |
| | |
Service and distribution fees (Note 6) | | |
Administrative fees (Note 6) | | |
Trustees' fees and expenses (Note 6) | | |
Transfer agent fees and expenses (Notes 6, 7 and 8) | | |
Audit and tax services fees | | |
Custodian fees and expenses | | |
| | |
| | |
| | |
Shareholder reporting expenses | | |
| | |
| | |
Less waiver and/or expense reimbursement (Notes 6 and 11) | | |
Less expense offset (Note 8) | | |
| | |
| | |
Net realized and unrealized gain (loss) on Investments and Foreign currency transactions | | |
Net realized gain (loss) on: | | |
| | |
Foreign currency transactions (Note 2c) | | |
Net change in unrealized appreciation (depreciation) on: | | |
| | |
Foreign currency translations (Note 2c) | | |
Net realized and unrealized gain (loss) on Investments and Foreign currency transactions | | |
NET INCREASE IN NET ASSETS RESULTING FROM OPERATIONS | | |
See accompanying notes to financial statements.
Statements of Changes in Net Assets
| | Gateway Equity Call
Premium Fund |
| Year Ended
December 31,2024 | Year Ended
December 31,2023 | Year Ended
December 31,2024 | Year Ended
December 31,2023 |
| | | | |
| | | | |
Net realized gain (loss) on investments, written options and foreign currency transactions | | | | |
Net change in unrealized appreciation on investments, written options and foreign currency translations | | | | |
Net increase in net assets resulting from operations | | | | |
FROM DISTRIBUTIONS TO SHAREHOLDERS: | | | | |
| | | | |
| | | | |
| | | | |
| | | | |
| | | | |
NET INCREASE (DECREASE) IN NET ASSETS
FROM CAPITAL SHARES TRANSACTIONS
(Note 13) | | | | |
Net increase (decrease) in net assets | | | | |
| | | | |
| | | | |
| | | | |
See accompanying notes to financial statements.
Statements of Changes in Net Assets (continued)
| Mirova Global
Green Bond Fund | Mirova Global Sustainable
Equity Fund |
| Year Ended
December 31,2024 | Year Ended
December 31,2023 | Year Ended
December 31,2024 | Year Ended
December 31,2023 |
| | | | |
| | | | |
Net realized gain (loss) on investments, futures contracts and foreign currency transactions | | | | |
Net change in unrealized appreciation (depreciation) on investments, futures contracts and foreign currency translations | | | | |
Net increase in net assets resulting from operations | | | | |
FROM DISTRIBUTIONS TO SHAREHOLDERS: | | | | |
| | | | |
| | | | |
| | | | |
| | | | |
| | | | |
NET INCREASE (DECREASE) IN NET ASSETS
FROM CAPITAL SHARES TRANSACTIONS
(Note 13) | | | | |
Net increase (decrease) in net assets | | | | |
| | | | |
| | | | |
| | | | |
See accompanying notes to financial statements.
Statements of Changes in Net Assets (continued)
| Mirova International
Sustainable Equity Fund |
| Year Ended
December 31,2024 | Year Ended
December 31,2023 |
| | |
| | |
Net realized loss on investments and foreign currency transactions | | |
Net change in unrealized appreciation on investments and foreign currency translations | | |
Net increase in net assets resulting from operations | | |
FROM DISTRIBUTIONS TO SHAREHOLDERS: | | |
| | |
| | |
| | |
| | |
NET INCREASE IN NET ASSETS
FROM CAPITAL SHARES TRANSACTIONS
(Note 13) | | |
Net increase in net assets | | |
| | |
| | |
| | |
See accompanying notes to financial statements.
For a share outstanding throughout each period.
| |
| Year Ended
December 31,
2024 | Year Ended
December 31,
2023 | Year Ended
December 31,
2022 | Year Ended
December 31,
2021 | Year Ended
December 31,
2020 |
Net asset value, beginning of the period | | | | | |
INCOME (LOSS) FROM INVESTMENT OPERATIONS: | | | | | |
| | | | | |
Net realized and unrealized gain (loss) | | | | | |
Total from Investment Operations | | | | | |
| | | | | |
| | | | | |
Net asset value, end of the period | | | | | |
| | | | | |
RATIOS TO AVERAGE NET ASSETS: | | | | | |
Net assets, end of the period (000's) | | | | | |
| | | | | |
| | | | | |
| | | | | |
| | | | | |
| Per share net investment income has been calculated using the average shares outstanding during the period. |
| A sales charge for Class A shares is not reflected in total return calculations. |
| Had certain expenses not been waived/reimbursed during the period, total returns would have been lower. |
| The investment adviser agreed to waive its fees and/or reimburse a portion of the Fund’s expenses during the period. Without this waiver/reimbursement, expenses would have been higher. |
| Includes refund of prior year service fee of less than 0.01%. See Note 6b of Notes to Financial Statements. |
| Includes refund of prior year service fee of less than 0.01%. |
| Includes refund of prior year service fee of 0.01%. |
See accompanying notes to financial statements.
Financial Highlights (continued)
For a share outstanding throughout each period.
| |
| Year Ended
December 31,
2024 | Year Ended
December 31,
2023 | Year Ended
December 31,
2022 | Year Ended
December 31,
2021 | Year Ended
December 31,
2020 |
Net asset value, beginning of the period | | | | | |
INCOME (LOSS) FROM INVESTMENT OPERATIONS: | | | | | |
Net investment income (loss)(a) | | | | | |
Net realized and unrealized gain (loss) | | | | | |
Total from Investment Operations | | | | | |
| | | | | |
| | | | | |
Net asset value, end of the period | | | | | |
| | | | | |
RATIOS TO AVERAGE NET ASSETS: | | | | | |
Net assets, end of the period (000's) | | | | | |
| | | | | |
| | | | | |
Net investment income (loss) | | | | | |
| | | | | |
| Per share net investment income (loss) has been calculated using the average shares outstanding during the period. |
| A contingent deferred sales charge for Class C shares is not reflected in total return calculations. |
| Had certain expenses not been waived/reimbursed during the period, total returns would have been lower. |
| The investment adviser agreed to waive its fees and/or reimburse a portion of the Fund’s expenses during the period. Without this waiver/reimbursement, expenses would have been higher. |
See accompanying notes to financial statements.
Financial Highlights (continued)
For a share outstanding throughout each period.
| |
| Year Ended
December 31,
2024 | Year Ended
December 31,
2023 | Year Ended
December 31,
2022 | Year Ended
December 31,
2021 | Year Ended
December 31,
2020 |
Net asset value, beginning of the period | | | | | |
INCOME (LOSS) FROM INVESTMENT OPERATIONS: | | | | | |
| | | | | |
Net realized and unrealized gain (loss) | | | | | |
Total from Investment Operations | | | | | |
| | | | | |
| | | | | |
Net asset value, end of the period | | | | | |
| | | | | |
RATIOS TO AVERAGE NET ASSETS: | | | | | |
Net assets, end of the period (000's) | | | | | |
| | | | | |
| | | | | |
| | | | | |
| | | | | |
| Per share net investment income has been calculated using the average shares outstanding during the period. |
| Had certain expenses not been waived/reimbursed during the period, total returns would have been lower. |
| The investment adviser agreed to waive its fees and/or reimburse a portion of the Fund’s expenses during the period. Without this waiver/reimbursement, expenses would have been higher. |
See accompanying notes to financial statements.
Financial Highlights (continued)
For a share outstanding throughout each period.
| Gateway Equity Call Premium Fund—Class A |
| Year Ended
December 31,
2024 | Year Ended
December 31,
2023 | Year Ended
December 31,
2022 | Year Ended
December 31,
2021 | Year Ended
December 31,
2020 |
Net asset value, beginning of the period | | | | | |
INCOME (LOSS) FROM INVESTMENT OPERATIONS: | | | | | |
| | | | | |
Net realized and unrealized gain (loss) | | | | | |
Total from Investment Operations | | | | | |
| | | | | |
| | | | | |
Net asset value, end of the period | | | | | |
| | | | | |
RATIOS TO AVERAGE NET ASSETS: | | | | | |
Net assets, end of the period (000's) | | | | | |
| | | | | |
| | | | | |
| | | | | |
| | | | | |
| Per share net investment income has been calculated using the average shares outstanding during the period. |
| A sales charge for Class A shares is not reflected in total return calculations. |
| Had certain expenses not been waived/reimbursed during the period, total returns would have been lower. |
| The investment adviser agreed to waive its fees and/or reimburse a portion of the Fund’s expenses during the period. Without this waiver/reimbursement, expenses would have been higher. |
| Effective July 1, 2021, the expense limit decreased from 1.20% to 0.93%. |
| Includes additional voluntary waiver of advisory fee of 0.02%. |
See accompanying notes to financial statements.
Financial Highlights (continued)
For a share outstanding throughout each period.
| Gateway Equity Call Premium Fund—Class C |
| Year Ended
December 31,
2024 | Year Ended
December 31,
2023 | Year Ended
December 31,
2022 | Year Ended
December 31,
2021 | Year Ended
December 31,
2020 |
Net asset value, beginning of the period | | | | | |
INCOME (LOSS) FROM INVESTMENT OPERATIONS: | | | | | |
Net investment income (loss)(a) | | | | | |
Net realized and unrealized gain (loss) | | | | | |
Total from Investment Operations | | | | | |
| | | | | |
| | | | | |
Net asset value, end of the period | | | | | |
| | | | | |
RATIOS TO AVERAGE NET ASSETS: | | | | | |
Net assets, end of the period (000's) | | | | | |
| | | | | |
| | | | | |
Net investment income (loss) | | | | | |
| | | | | |
| Per share net investment income (loss) has been calculated using the average shares outstanding during the period. |
| Amount rounds to less than $0.01 per share. |
| A contingent deferred sales charge for Class C shares is not reflected in total return calculations. |
| Had certain expenses not been waived/reimbursed during the period, total returns would have been lower. |
| The investment adviser agreed to waive its fees and/or reimburse a portion of the Fund’s expenses during the period. Without this waiver/reimbursement, expenses would have been higher. |
| Effective July 1, 2021, the expense limit decreased from 1.95% to 1.68%. |
| Includes additional voluntary waiver of advisory fee of 0.02%. |
See accompanying notes to financial statements.
Financial Highlights (continued)
For a share outstanding throughout each period.
| Gateway Equity Call Premium Fund—Class N |
| Year Ended
December 31,
2024 | Year Ended
December 31,
2023 | Year Ended
December 31,
2022 | Year Ended
December 31,
2021 | Year Ended
December 31,
2020 |
Net asset value, beginning of the period | | | | | |
INCOME (LOSS) FROM INVESTMENT OPERATIONS: | | | | | |
| | | | | |
Net realized and unrealized gain (loss) | | | | | |
Total from Investment Operations | | | | | |
| | | | | |
| | | | | |
Net asset value, end of the period | | | | | |
| | | | | |
RATIOS TO AVERAGE NET ASSETS: | | | | | |
Net assets, end of the period (000's) | | | | | |
| | | | | |
| | | | | |
| | | | | |
| | | | | |
| Per share net investment income has been calculated using the average shares outstanding during the period. |
| Had certain expenses not been waived/reimbursed during the period, total returns would have been lower. |
| The investment adviser agreed to waive its fees and/or reimburse a portion of the Fund’s expenses during the period. Without this waiver/reimbursement, expenses would have been higher. |
| Effective July 1, 2021, the expense limit decreased from 0.90% to 0.63%. |
See accompanying notes to financial statements.
Financial Highlights (continued)
For a share outstanding throughout each period.
| Gateway Equity Call Premium Fund—Class Y |
| Year Ended
December 31,
2024 | Year Ended
December 31,
2023 | Year Ended
December 31,
2022 | Year Ended
December 31,
2021 | Year Ended
December 31,
2020 |
Net asset value, beginning of the period | | | | | |
INCOME (LOSS) FROM INVESTMENT OPERATIONS: | | | | | |
| | | | | |
Net realized and unrealized gain (loss) | | | | | |
Total from Investment Operations | | | | | |
| | | | | |
| | | | | |
Net asset value, end of the period | | | | | |
| | | | | |
RATIOS TO AVERAGE NET ASSETS: | | | | | |
Net assets, end of the period (000's) | | | | | |
| | | | | |
| | | | | |
| | | | | |
| | | | | |
| Per share net investment income has been calculated using the average shares outstanding during the period. |
| Had certain expenses not been waived/reimbursed during the period, total returns would have been lower. |
| The investment adviser agreed to waive its fees and/or reimburse a portion of the Fund’s expenses during the period. Without this waiver/reimbursement, expenses would have been higher. |
| Effective July 1, 2021, the expense limit decreased from 0.95% to 0.68%. |
| Includes additional voluntary waiver of advisory fee of 0.02%. |
See accompanying notes to financial statements.
Financial Highlights (continued)
For a share outstanding throughout each period.
| Mirova Global Green Bond Fund—Class A |
| Year Ended
December 31,
2024 | Year Ended
December 31,
2023 | Year Ended
December 31,
2022 | Year Ended
December 31,
2021 | Year Ended
December 31,
2020 |
Net asset value, beginning of the period | | | | | |
INCOME (LOSS) FROM INVESTMENT OPERATIONS: | | | | | |
| | | | | |
Net realized and unrealized gain (loss) | | | | | |
Total from Investment Operations | | | | | |
| | | | | |
| | | | | |
Net realized capital gains | | | | | |
| | | | | |
Net asset value, end of the period | | | | | |
| | | | | |
RATIOS TO AVERAGE NET ASSETS: | | | | | |
Net assets, end of the period (000's) | | | | | |
| | | | | |
| | | | | |
| | | | | |
| | | | | |
| Per share net investment income has been calculated using the average shares outstanding during the period. |
| A sales charge for Class A shares is not reflected in total return calculations. |
| Had certain expenses not been waived/reimbursed during the period, total returns would have been lower. |
| The investment adviser agreed to waive its fees and/or reimburse a portion of the Fund’s expenses during the period. Without this waiver/reimbursement, expenses would have been higher. |
| Includes interest expense. Without this expense the ratio of net expenses would have been 0.90% and the ratio of gross expenses would have been 1.38%. |
| Includes interest expense. Without this expense the ratio of net expenses would have been 0.90% and the ratio of gross expenses would have been 1.33%. |
| Effective July 1, 2021, the expense limit decreased from 0.95% to 0.90%. |
| Includes interest expense. Without this expense the ratio of net expenses would have been 0.92% and the ratio of gross expenses would have been 1.37%. |
| Includes interest expense. Without this expense the ratio of net expenses would have been 0.95% and the ratio of gross expenses would have been 1.41%. |
See accompanying notes to financial statements.
Financial Highlights (continued)
For a share outstanding throughout each period.
| Mirova Global Green Bond Fund—Class N |
| Year Ended
December 31,
2024 | Year Ended
December 31,
2023 | Year Ended
December 31,
2022 | Year Ended
December 31,
2021 | Year Ended
December 31,
2020 |
Net asset value, beginning of the period | | | | | |
INCOME (LOSS) FROM INVESTMENT OPERATIONS: | | | | | |
| | | | | |
Net realized and unrealized gain (loss) | | | | | |
Total from Investment Operations | | | | | |
| | | | | |
| | | | | |
Net realized capital gains | | | | | |
| | | | | |
Net asset value, end of the period | | | | | |
| | | | | |
RATIOS TO AVERAGE NET ASSETS: | | | | | |
Net assets, end of the period (000's) | | | | | |
| | | | | |
| | | | | |
| | | | | |
| | | | | |
| Per share net investment income has been calculated using the average shares outstanding during the period. |
| Had certain expenses not been waived/reimbursed during the period, total returns would have been lower. |
| The investment adviser agreed to waive its fees and/or reimburse a portion of the Fund’s expenses during the period. Without this waiver/reimbursement, expenses would have been higher. |
| Includes interest expense. Without this expense the ratio of net expenses would have been 0.60% and the ratio of gross expenses would have been 1.06%. |
| Includes interest expense. Without this expense the ratio of net expenses would have been 0.60% and the ratio of gross expenses would have been 0.98%. |
| Effective July 1, 2021, the expense limit decreased from 0.65% to 0.60%. |
| Includes interest expense. Without this expense the ratio of net expenses would have been 0.63% and the ratio of gross expenses would have been 1.02%. |
| Includes interest expense. Without this expense the ratio of net expenses would have been 0.65% and the ratio of gross expenses would have been 1.05%. |
See accompanying notes to financial statements.
Financial Highlights (continued)
For a share outstanding throughout each period.
| Mirova Global Green Bond Fund—Class Y |
| Year Ended
December 31,
2024 | Year Ended
December 31,
2023 | Year Ended
December 31,
2022 | Year Ended
December 31,
2021 | Year Ended
December 31,
2020 |
Net asset value, beginning of the period | | | | | |
INCOME (LOSS) FROM INVESTMENT OPERATIONS: | | | | | |
| | | | | |
Net realized and unrealized gain (loss) | | | | | |
Total from Investment Operations | | | | | |
| | | | | |
| | | | | |
Net realized capital gains | | | | | |
| | | | | |
Net asset value, end of the period | | | | | |
| | | | | |
RATIOS TO AVERAGE NET ASSETS: | | | | | |
Net assets, end of the period (000's) | | | | | |
| | | | | |
| | | | | |
| | | | | |
| | | | | |
| Per share net investment income has been calculated using the average shares outstanding during the period. |
| Had certain expenses not been waived/reimbursed during the period, total returns would have been lower. |
| The investment adviser agreed to waive its fees and/or reimburse a portion of the Fund’s expenses during the period. Without this waiver/reimbursement, expenses would have been higher. |
| Includes interest expense. Without this expense the ratio of net expenses would have been 0.65% and the ratio of gross expenses would have been 1.13%. |
| Includes interest expense. Without this expense the ratio of net expenses would have been 0.65% and the ratio of gross expenses would have been 1.08%. |
| Effective July 1, 2021, the expense limit decreased from 0.70% to 0.65%. |
| Includes interest expense. Without this expense the ratio of net expenses would have been 0.67% and the ratio of gross expenses would have been 1.13%. |
| Includes interest expense. Without this expense the ratio of net expenses would have been 0.70% and the ratio of gross expenses would have been 1.16%. |
See accompanying notes to financial statements.
Financial Highlights (continued)
For a share outstanding throughout each period.
| Mirova Global Sustainable Equity Fund—Class A |
| Year Ended
December 31,
2024 | Year Ended
December 31,
2023 | Year Ended
December 31,
2022 | Year Ended
December 31,
2021 | Year Ended
December 31,
2020 |
Net asset value, beginning of the period | | | | | |
INCOME (LOSS) FROM INVESTMENT OPERATIONS: | | | | | |
Net investment income (loss)(a) | | | | | |
Net realized and unrealized gain (loss) | | | | | |
Total from Investment Operations | | | | | |
| | | | | |
| | | | | |
Net realized capital gains | | | | | |
| | | | | |
Net asset value, end of the period | | | | | |
| | | | | |
RATIOS TO AVERAGE NET ASSETS: | | | | | |
Net assets, end of the period (000's) | | | | | |
| | | | | |
| | | | | |
Net investment income (loss) | | | | | |
| | | | | |
| Per share net investment income (loss) has been calculated using the average shares outstanding during the period. |
| Amount rounds to less than $0.01 per share. |
| A sales charge for Class A shares is not reflected in total return calculations. |
| Had certain expenses not been waived/reimbursed during the period, total returns would have been lower. |
| The investment adviser agreed to waive its fees and/or reimburse a portion of the Fund’s expenses during the period. Without this waiver/reimbursement, expenses would have been higher. |
| Includes interest expense. Without this expense the ratio of net expenses would have been 1.20% and the ratio of gross expenses would have been 1.25%. |
| Includes interest expense. Without this expense the ratio of net expenses would have been 1.20% and the ratio of gross expenses would have been 1.24%. |
| The variation in the Fund’s turnover rate from 2020 to 2021 was primarily due to an increase in shareholder activity. |
See accompanying notes to financial statements.
Financial Highlights (continued)
For a share outstanding throughout each period.
| Mirova Global Sustainable Equity Fund—Class C |
| Year Ended
December 31,
2024 | Year Ended
December 31,
2023 | Year Ended
December 31,
2022 | Year Ended
December 31,
2021 | Year Ended
December 31,
2020 |
Net asset value, beginning of the period | | | | | |
INCOME (LOSS) FROM INVESTMENT OPERATIONS: | | | | | |
| | | | | |
Net realized and unrealized gain (loss) | | | | | |
Total from Investment Operations | | | | | |
| | | | | |
| | | | | |
Net realized capital gains | | | | | |
| | | | | |
Net asset value, end of the period | | | | | |
| | | | | |
RATIOS TO AVERAGE NET ASSETS: | | | | | |
Net assets, end of the period (000's) | | | | | |
| | | | | |
| | | | | |
| | | | | |
| | | | | |
| Per share net investment loss has been calculated using the average shares outstanding during the period. |
| Amount rounds to less than $0.01 per share. |
| A contingent deferred sales charge for Class C shares is not reflected in total return calculations. |
| Had certain expenses not been waived/reimbursed during the period, total returns would have been lower. |
| The investment adviser agreed to waive its fees and/or reimburse a portion of the Fund’s expenses during the period. Without this waiver/reimbursement, expenses would have been higher. |
| Includes interest expense. Without this expense the ratio of net expenses would have been 1.95% and the ratio of gross expenses would have been 2.00%. |
| Includes interest expense. Without this expense the ratio of net expenses would have been 1.95% and the ratio of gross expenses would have been 1.99%. |
| The variation in the Fund’s turnover rate from 2020 to 2021 was primarily due to an increase in shareholder activity. |
See accompanying notes to financial statements.
Financial Highlights (continued)
For a share outstanding throughout each period.
| Mirova Global Sustainable Equity Fund—Class N |
| Year Ended
December 31,
2024 | Year Ended
December 31,
2023 | Year Ended
December 31,
2022 | Year Ended
December 31,
2021 | Year Ended
December 31,
2020 |
Net asset value, beginning of the period | | | | | |
INCOME (LOSS) FROM INVESTMENT OPERATIONS: | | | | | |
| | | | | |
Net realized and unrealized gain (loss) | | | | | |
Total from Investment Operations | | | | | |
| | | | | |
| | | | | |
Net realized capital gains | | | | | |
| | | | | |
Net asset value, end of the period | | | | | |
| | | | | |
RATIOS TO AVERAGE NET ASSETS: | | | | | |
Net assets, end of the period (000's) | | | | | |
| | | | | |
| | | | | |
| | | | | |
| | | | | |
| Per share net investment income has been calculated using the average shares outstanding during the period. |
| Had certain expenses not been waived/reimbursed during the period, total returns would have been lower. |
| Includes interest expense. Without this expense the ratio of net expenses would have been 0.89% and the ratio of gross expenses would have been 0.89%. |
| Includes interest expense. Without this expense the ratio of net expenses would have been 0.90% and the ratio of gross expenses would have been 0.90%. |
| Includes fee/expense recovery of 0.01%. |
| The investment adviser agreed to waive its fees and/or reimburse a portion of the Fund’s expenses during the period. Without this waiver/reimbursement, expenses would have been higher. |
| The variation in the Fund’s turnover rate from 2020 to 2021 was primarily due to an increase in shareholder activity. |
See accompanying notes to financial statements.
Financial Highlights (continued)
For a share outstanding throughout each period.
| Mirova Global Sustainable Equity Fund—Class Y |
| Year Ended
December 31,
2024 | Year Ended
December 31,
2023 | Year Ended
December 31,
2022 | Year Ended
December 31,
2021 | Year Ended
December 31,
2020 |
Net asset value, beginning of the period | | | | | |
INCOME (LOSS) FROM INVESTMENT OPERATIONS: | | | | | |
| | | | | |
Net realized and unrealized gain (loss) | | | | | |
Total from Investment Operations | | | | | |
| | | | | |
| | | | | |
Net realized capital gains | | | | | |
| | | | | |
Net asset value, end of the period | | | | | |
| | | | | |
RATIOS TO AVERAGE NET ASSETS: | | | | | |
Net assets, end of the period (000's) | | | | | |
| | | | | |
| | | | | |
| | | | | |
| | | | | |
| Per share net investment income has been calculated using the average shares outstanding during the period. |
| Amount rounds to less than $0.01 per share. |
| Had certain expenses not been waived/reimbursed during the period, total returns would have been lower. |
| The investment adviser agreed to waive its fees and/or reimburse a portion of the Fund’s expenses during the period. Without this waiver/reimbursement, expenses would have been higher. |
| Includes interest expense. Without this expense the ratio of net expenses would have been 0.95% and the ratio of gross expenses would have been 1.00%. |
| Includes interest expense. Without this expense the ratio of net expenses would have been 0.95% and the ratio of gross expenses would have been 0.99%. |
| The variation in the Fund’s turnover rate from 2020 to 2021 was primarily due to an increase in shareholder activity. |
See accompanying notes to financial statements.
Financial Highlights (continued)
For a share outstanding throughout each period.
| Mirova International Sustainable Equity Fund—Class A |
| Year Ended
December 31,
2024 | Year Ended
December 31,
2023 | Year Ended
December 31,
2022 | Year Ended
December 31,
2021 | Year Ended
December 31,
2020 |
Net asset value, beginning of the period | | | | | |
INCOME (LOSS) FROM INVESTMENT OPERATIONS: | | | | | |
Net investment income (loss)(a) | | | | | |
Net realized and unrealized gain (loss) | | | | | |
Total from Investment Operations | | | | | |
| | | | | |
| | | | | |
Net realized capital gains | | | | | |
| | | | | |
Net asset value, end of the period | | | | | |
| | | | | |
RATIOS TO AVERAGE NET ASSETS: | | | | | |
Net assets, end of the period (000's) | | | | | |
| | | | | |
| | | | | |
Net investment income (loss) | | | | | |
| | | | | |
| Per share net investment income (loss) has been calculated using the average shares outstanding during the period. |
| The amount shown for a share outstanding does not correspond with the aggregate realized and unrealized gain (loss) on investments for the period due to the timing of sales and redemptions of fund shares in relation to fluctuating market values of investments of the Fund. |
| A sales charge for Class A shares is not reflected in total return calculations. |
| Had certain expenses not been waived/reimbursed during the period, total returns would have been lower. |
| The investment adviser agreed to waive its fees and/or reimburse a portion of the Fund’s expenses during the period. Without this waiver/reimbursement, expenses would have been higher. |
| Includes interest expense. Without this expense the ratio of net expenses would have been 1.20% and the ratio of gross expenses would have been 2.29%. |
| Includes interest expense. Without this expense the ratio of net expenses would have been 1.20% and the ratio of gross expenses would have been 2.07%. |
| Includes interest expense. Without this expense the ratio of net expenses would have been 1.20% and the ratio of gross expenses would have been 5.64%. |
See accompanying notes to financial statements.
Financial Highlights (continued)
For a share outstanding throughout each period.
| Mirova International Sustainable Equity Fund—Class N |
| Year Ended
December 31,
2024 | Year Ended
December 31,
2023 | Year Ended
December 31,
2022 | Year Ended
December 31,
2021 | Year Ended
December 31,
2020 |
Net asset value, beginning of the period | | | | | |
INCOME (LOSS) FROM INVESTMENT OPERATIONS: | | | | | |
| | | | | |
Net realized and unrealized gain (loss) | | | | | |
Total from Investment Operations | | | | | |
| | | | | |
| | | | | |
Net realized capital gains | | | | | |
| | | | | |
Net asset value, end of the period | | | | | |
| | | | | |
RATIOS TO AVERAGE NET ASSETS: | | | | | |
Net assets, end of the period (000's) | | | | | |
| | | | | |
| | | | | |
| | | | | |
| | | | | |
| Per share investment income has been calculated using the average shares outstanding during the period. |
| The amount shown for a share outstanding does not correspond with the aggregate realized and unrealized gain (loss) on investments for the period due to the timing of sales and redemptions of fund shares in relation to fluctuating market values of investments of the Fund. |
| Had certain expenses not been waived/reimbursed during the period, total returns would have been lower. |
| The investment adviser agreed to waive its fees and/or reimburse a portion of the Fund’s expenses during the period. Without this waiver/reimbursement, expenses would have been higher. |
| Includes interest expense. Without this expense the ratio of net expenses would have been 0.90% and the ratio of gross expenses would have been 1.79%. |
| Includes interest expense. Without this expense the ratio of net expenses would have been 0.90% and the ratio of gross expenses would have been 1.43%. |
| Includes interest expense. Without this expense the ratio of net expenses would have been 0.90% and the ratio of gross expenses would have been 1.80%. |
See accompanying notes to financial statements.
Financial Highlights (continued)
For a share outstanding throughout each period.
| Mirova International Sustainable Equity Fund—Class Y |
| Year Ended
December 31,
2024 | Year Ended
December 31,
2023 | Year Ended
December 31,
2022 | Year Ended
December 31,
2021 | Year Ended
December 31,
2020 |
Net asset value, beginning of the period | | | | | |
INCOME (LOSS) FROM INVESTMENT OPERATIONS: | | | | | |
| | | | | |
Net realized and unrealized gain (loss) | | | | | |
Total from Investment Operations | | | | | |
| | | | | |
| | | | | |
Net realized capital gains | | | | | |
| | | | | |
Net asset value, end of the period | | | | | |
| | | | | |
RATIOS TO AVERAGE NET ASSETS: | | | | | |
Net assets, end of the period (000's) | | | | | |
| | | | | |
| | | | | |
| | | | | |
| | | | | |
| Per share investment income has been calculated using the average shares outstanding during the period. |
| The amount shown for a share outstanding does not correspond with the aggregate realized and unrealized gain (loss) on investments for the period due to the timing of sales and redemptions of fund shares in relation to fluctuating market values of investments of the Fund. |
| Had certain expenses not been waived/reimbursed during the period, total returns would have been lower. |
| The investment adviser agreed to waive its fees and/or reimburse a portion of the Fund’s expenses during the period. Without this waiver/reimbursement, expenses would have been higher. |
| Includes interest expense. Without this expense the ratio of net expenses would have been 0.95% and the ratio of gross expenses would have been 2.04%. |
| Includes interest expense. Without this expense the ratio of net expenses would have been 0.95% and the ratio of gross expenses would have been 1.82%. |
| Includes interest expense. Without this expense the ratio of net expenses would have been 0.95% and the ratio of gross expenses would have been 6.46%. |
See accompanying notes to financial statements.
Notes to Financial Statements
1.Organization. Gateway Trust and Natixis Funds Trust I (the “Trusts” and each a “Trust”) are each organized as a Massachusetts business trust. Each Trust is registered under the Investment Company Act of 1940, as amended (the “1940 Act”), as an open-end management investment company. Each Declaration of Trust permits the Board of Trustees to authorize the issuance of an unlimited number of shares of the Trust in multiple series. The financial statements for certain funds of the Trusts are presented in separate reports. The following funds (individually, a “Fund” and collectively, the “Funds”) are included in this report:
Gateway Fund
Gateway Equity Call Premium Fund
Mirova Global Green Bond Fund (“Global Green Bond Fund”)
Mirova Global Sustainable Equity Fund (“Global Sustainable Equity Fund”)
Mirova International Sustainable Equity Fund (“International Sustainable Equity Fund”)
Each Fund is a diversified investment company.
Each Fund offers Class A, Class C, Class N and Class Y shares, except for Global Green Bond Fund and International Sustainable Equity Fund, which do not offer Class C shares.
Class A shares are sold with a maximum front-end sales charge of 5.75% for all Funds except for Global Green Bond Fund which are sold with a maximum front-end sales charge of 4.25%. Class C shares do not pay a front-end sales charge, pay higher Rule 12b-1 fees than Class A shares for eight years (at which point they automatically convert to Class A shares) (prior to May 1, 2021, Class C shares automatically converted to Class A shares after ten years) and may be subject to a contingent deferred sales charge (“CDSC”) of 1.00% if those shares are redeemed within one year of acquisition, except for reinvested distributions. Class N and Class Y shares do not pay a front-end sales charge, a CDSC or Rule 12b-1 fees. Class N shares are offered with an initial minimum investment of $1,000,000. Class Y shares are offered with an initial minimum investment of $100,000. Certain categories of investors are exempted from the minimum investment amounts for Class N and Class Y as outlined in the relevant Funds’ prospectus.
Most expenses can be directly attributed to a Fund. Expenses which cannot be directly attributed to a Fund are generally apportioned based on the relative net assets of each of the Funds in Natixis Funds Trust I, Natixis Funds Trust II, Natixis Funds Trust IV and Gateway Trust (“Natixis Funds Trusts”), Loomis Sayles Funds I and Loomis Sayles Funds II (“Loomis Sayles Funds Trusts”) and Natixis ETF Trust and Natixis ETF Trust II (“Natixis ETF Trusts”). Expenses of a Fund are borne pro rata by the holders of each class of shares, except that each class bears expenses unique to that class (such as the Rule 12b-1 fees applicable to Class A and Class C), and transfer agent fees are borne collectively for Class A, Class C and Class Y, and individually for Class N. In addition, each class votes as a class only with respect to its own Rule 12b-1 Plan. Shares of each class would receive their pro rata share of the net assets of the Fund if the Fund were liquidated. The Trustees approve separate distributions from net investment income on each class of shares.
2.Significant Accounting Policies. The following is a summary of significant accounting policies consistently followed by each Fund in the preparation of its financial statements. The Funds' financial statements follow the accounting and reporting guidelines provided for investment companies and are prepared in accordance with accounting principles generally accepted in the United States of America which require the use of management estimates that affect the reported amounts and disclosures in the financial statements. Actual results could differ from those estimates. Each Fund operates as a single segment entity, focusing on investments in a portfolio of securities. Each Fund's named investment adviser acts as chief operating decision maker ("CODM") regarding allocation of resources and performance assessment. Financial information including, but not limited to, portfolio composition, net asset changes and total returns, is used by the CODM to assess performance and to make resource allocation decisions and is consistent with that presented within the financial statements. Management has evaluated the events and transactions subsequent to year-end through the date the financial statements were issued and has determined that there were no material events that would require disclosure in the Funds' financial statements.
a. Valuation. Registered investment companies are required to value portfolio investments using an unadjusted, readily available market quotation. Each Fund obtains readily available market quotations from independent pricing services. Fund investments for which readily available market quotations are not available are priced at fair value pursuant to the Funds’ Valuation Procedures. The Board of Trustees has approved a valuation designee who is subject to the Board’s oversight.
Unadjusted readily available market quotations that are utilized for exchange traded equity securities (including shares of closed-end investment companies and exchange-traded funds) include the last sale price quoted on the exchange where the security is traded most extensively. Futures contracts are valued at the closing settlement price on the exchange on which the valuation designee believes that, over time, they are traded most extensively. Domestic, exchange-traded index and single name equity option contracts (including options on exchange-traded funds) are valued at the mean of the National Best Bid and Offer quotations as determined by the Options Price Reporting Authority. Shares of open-end investment companies are valued at net asset value (“NAV”) per share.
Notes to Financial Statements (continued)
Exchange traded equity securities for which there is no reported sale during the day are fair valued at the closing bid quotation as reported by an independent pricing service. Unlisted equity securities (except unlisted preferred equity securities) are fair valued at the last sale price quoted in the market where they are traded most extensively or, if there is no reported sale during the day, the closing bid quotation as reported by an independent pricing service. If there is no last sale price or closing bid quotation available, unlisted equity securities will be fair valued using evaluated bids furnished by an independent pricing service, if available.
Debt securities and unlisted preferred equity securities are fair valued based on evaluated bids furnished to the Funds by an independent pricing service or bid prices obtained from broker-dealers. Broker-dealer bid prices may be used to fair value debt and unlisted equities where an independent pricing service is unable to price an investment or where an independent pricing service does not provide a reliable price for the investment.
The Funds may also fair value investments in other circumstances such as when extraordinary events occur after the close of a foreign market, but prior to the close of the New York Stock Exchange. This may include situations relating to a single issuer (such as a declaration of bankruptcy or a delisting of the issuer’s security from the primary market on which it has traded) as well as events affecting the securities markets in general (such as market disruptions or closings and significant fluctuations in U.S. and/or foreign markets). When fair valuing a Fund’s investments, the valuation designee may, among other things, use modeling tools or other processes that may take into account factors such as issuer specific information, or other related market activity and/or information that occurred after the close of the foreign market but before the time the Fund’s NAV is calculated. Fair valuation by the Fund(s) valuation designee may require subjective determinations about the value of the investment, and fair values used to determine a Fund’s NAV may differ from quoted or published prices, or from prices that are used by others, for the same investments. In addition, the use of fair value pricing may not always result in adjustments to the prices of investments held by a Fund.
b. Investment Transactions and Related Investment Income. Investment transactions are accounted for on a trade date plus one day basis for daily NAV calculation. However, for financial reporting purposes, investment transactions are reported on trade date. Dividend income (including income reinvested) and foreign withholding tax, if applicable, are recorded on the ex-dividend date, or in the case of certain foreign securities, as soon as a Fund is notified, and interest income is recorded on an accrual basis. Dividends reinvested and stock dividends are reflected as non-cash dividends on the Statements of Operations. Interest income is increased by the accretion of discount and decreased by the amortization of premium, if applicable. For securities with paydown provisions, principal payments received are treated as a proportionate reduction to the cost basis of the securities, and excess or shortfall amounts are recorded as income. Distributions received from investments in securities that represent a return of capital or capital gain are recorded as a reduction of cost of investments or as a realized gain, respectively. The calendar year-end amounts of ordinary income, capital gains, and return of capital included in distributions received from the Funds’ investments in real estate investment trusts (“REITs”) are reported to the Funds after the end of the fiscal year; accordingly, the Funds estimate these amounts for accounting purposes until the characterization of REIT distributions is reported to the Funds after the end of the fiscal year. Estimates are based on the most recent REIT distribution information available. In determining net gain or loss on securities sold, the cost of securities has been determined on an identified cost basis. Investment income, non-class specific expenses and realized and unrealized gains and losses are allocated on a pro rata basis to each class based on the relative net assets of each class to the total net assets of the Fund.
c. Foreign Currency Translation. The books and records of the Funds are maintained in U.S. dollars. The values of securities, currencies and other assets and liabilities denominated in currencies other than U.S. dollars, if any, are translated into U.S. dollars based upon foreign exchange rates prevailing at the end of the period. Purchases and sales of investment securities, income and expenses are translated into U.S. dollars on the respective dates of such transactions.
Net realized foreign exchange gains or losses arise from sales of foreign currency, changes in exchange rates between the trade and settlement dates on securities transactions and the difference between the amounts of dividends, interest and foreign withholding taxes recorded in the Funds’ books and records and the U.S. dollar equivalent of the amounts actually received or paid. Net unrealized foreign exchange gains or losses arise from changes in the value of assets and liabilities, other than investment securities, as of the end of the fiscal period, resulting from changes in exchange rates. Net realized foreign exchange gains or losses and the net change in unrealized foreign exchange gains or losses are disclosed in the Statements of Operations. For federal income tax purposes, net realized foreign exchange gains or losses are characterized as ordinary income and may, if the Funds have net losses, reduce the amount of income available to be distributed by the Funds.
The values of investment securities are presented at the foreign exchange rates prevailing at the end of the period for financial reporting purposes. Net realized and unrealized gains or losses on investments reported in the Statements of Operations reflect gains or losses resulting from changes in exchange rates and fluctuations which arise due to changes in market prices of investment securities. For federal income tax purposes, a portion of the net realized gain or loss on investments arising from changes in exchange rates, which is reflected in the Statements of Operations, may be characterized as ordinary income and may, if the Funds have net losses, reduce the amount of income available to be distributed by the Funds.
The Funds may use foreign currency exchange contracts to facilitate transactions in foreign-denominated investments. Losses may arise from changes in the value of the foreign currency or if the counterparties do not perform under the contracts’ terms.
Notes to Financial Statements (continued)
d. Futures Contracts. A Fund may enter into futures contracts. Futures contracts are agreements between two parties to buy and sell a particular instrument or index for a specified price on a specified future date.
When a Fund enters into a futures contract, it is required to deposit with (or for the benefit of) its broker an amount of cash or short-term high-quality securities as “initial margin.” As the value of the contract changes, the value of the futures contract position increases or declines. Subsequent payments, known as “variation margin,” are made or received by a Fund, depending on the price fluctuations in the fair value of the contract and the value of cash or securities on deposit with the broker. Gross unrealized appreciation (depreciation) on futures contracts is recorded in the Statements of Assets and Liabilities as an asset (liability). The aggregate principal amounts of the contracts are not recorded in the financial statements. Fluctuations in the value of the contracts are recorded in the Statements of Operations as unrealized appreciation (depreciation) until the contracts are closed, when they are recorded as realized gains (losses). Realized gain or loss on a futures position is equal to the difference between the value of the contract at the time it was opened and the value at the time it was closed, minus brokerage commissions. When a Fund enters into a futures contract certain risks may arise, such as illiquidity in the futures market, which may limit a Fund’s ability to close out a futures contract prior to settlement date, and unanticipated movements in the value of securities or interest rates. Futures contracts outstanding at the end of the period, if any, are listed in each applicable Fund's Portfolio of Investments.
Futures contracts are exchange-traded. Exchange-traded futures contracts are standardized and are settled through a clearing house with fulfillment supported by the credit of the exchange. Therefore, counterparty credit risks to the Funds are reduced; however, in the event that a counterparty enters into bankruptcy, a Fund’s claim against initial/variation margin on deposit with the counterparty may be subject to terms of a final settlement in bankruptcy court.
e. Option Contracts. Gateway Fund and Gateway Equity Call Premium Fund’s investment strategies make use of exchange-traded options. Exchange-traded options are standardized contracts and are settled through a clearing house with fulfillment supported by the credit of the exchange. Therefore, counterparty credit risks to a Fund are reduced.
When a Fund writes an index call option, an amount equal to the net premium received (the premium less commission) is recorded as a liability and is subsequently adjusted to the current value until the option expires or a Fund enters into a closing purchase transaction. When an index call option expires or a Fund enters into a closing purchase transaction, the difference between the net premium received and any amount paid at expiration or on effecting a closing purchase transaction, including commission, is treated as a realized gain or, if the net premium received is less than the amount paid, as a realized loss. A Fund, as writer of an index call option, bears the risk of an unfavorable change in the market value of the index underlying the written option.
When a Fund purchases an index put option, it pays a premium and the index put option is subsequently marked-to-market to reflect current value until the option expires or a Fund enters into a closing sale transaction. Premiums paid for purchasing index put options which expire are treated as realized losses. When a Fund enters into a closing sale transaction, the difference between the premium paid and the proceeds of the closing sale transaction is treated as a realized gain or loss. The risk associated with purchasing index put options is limited to the premium paid. Option contracts outstanding at the end of the period, if any, are listed in each applicable Fund’s Portfolio of Investments.
f. Due from Brokers. Transactions and positions in certain futures contracts are maintained and cleared by registered U.S. broker/dealers pursuant to customer agreements between a Fund and the various broker/dealers. The due from brokers balance in the Statements of Assets and Liabilities for Global Green Bond Fund represents cash pledged as collateral for futures contracts (including variation margin, as applicable). In certain circumstances the Fund’s use of cash held at brokers is restricted by regulation or broker mandated limits.
g. Federal and Foreign Income Taxes. The Trusts treat each Fund as a separate entity for federal income tax purposes. Each Fund intends to meet the requirements of the Internal Revenue Code of 1986, as amended, applicable to regulated investment companies, and to distribute to its shareholders substantially all of its net investment income and any net realized capital gains at least annually. Management has performed an analysis of each Fund’s tax positions for the open tax years as of December 31, 2024 and has concluded that no provisions for income tax are required. The Funds’ federal tax returns for the prior three fiscal years remain subject to examination by the Internal Revenue Service. Management is not aware of any events that are reasonably possible to occur in the next twelve months that would result in the amounts of any unrecognized tax benefits significantly increasing or decreasing for the Funds. However, management’s conclusions regarding tax positions taken may be subject to review and adjustment at a later date based on factors including, but not limited to, new tax laws and accounting regulations and interpretations thereof.
A Fund may be subject to foreign withholding taxes on investment income and taxes on capital gains on investments that are accrued and paid based upon the Fund’s understanding of the tax rules and regulations that exist in the countries in which the Fund invests. Foreign withholding taxes on dividend and interest income are reflected on the Statements of Operations as a reduction of investment income, net of amounts that have been or are expected to be reclaimed and paid. Dividends and interest receivable on the Statements of Assets and Liabilities are net of foreign withholding taxes. Foreign withholding taxes where reclaims have been or are expected to be filed and paid are reflected on the Statements of Assets and Liabilities as tax reclaims receivable. Capital gains taxes paid are included in net realized gain (loss) on investments in the Statements of Operations. Accrued but unpaid capital gains taxes are
Notes to Financial Statements (continued)
reflected as foreign taxes payable on the Statements of Assets and Liabilities, if applicable, and reduce unrealized gains on investments. In the event that realized gains on investments are subsequently offset by realized losses, taxes paid on realized gains may be returned to a Fund. Such amounts, if applicable, are reflected as foreign tax rebates receivable on the Statements of Assets and Liabilities and are recorded as a realized gain when received.
Certain Funds have filed tax reclaims for previously withheld taxes on dividends earned in certain European Union countries ("EU reclaims") and may continue to make such filings when it is determined to be in the best interest of the Funds and their shareholders. These filings are subject to various administrative proceedings by the local jurisdictions’ tax authorities within the European Union, as well as a number of related judicial proceedings. EU reclaims are recognized by a Fund when deemed more likely than not to be collected, and are reflected as a reduction of foreign taxes withheld in the Statements of Operations. Any related receivable is reflected as tax reclaims receivable in the Statements of Assets and Liabilities. Under certain circumstances, EU reclaims may be subject to closing agreements with the Internal Revenue Service ("IRS"), which may materially reduce the reclaim amounts realized by the Funds. Fees and expenses associated with closing agreements will be reflected in the Statements of Operations when it is determined that a closing agreement with the IRS is required.
h. Dividends and Distributions to Shareholders. Dividends and distributions are recorded on the ex-dividend date. The timing and characterization of certain income and capital gain distributions are determined in accordance with federal tax regulations, which may differ from accounting principles generally accepted in the United States of America. Permanent differences are primarily due to differing treatments for book and tax purposes of items such as premium amortization, deferred Trustees' fees, distribution re-designations, capital gain distribution received, return of capital distributions received, corporate actions, distributions in excess of income and/or capital gain and foreign currency gains and losses. Permanent book and tax basis differences relating to shareholder distributions, net investment income and net realized gains will result in reclassifications to capital accounts reported on the Statements of Assets and Liabilities. Temporary differences between book and tax distributable earnings are primarily due to wash sales, deferred Trustees’ fees, premium amortization, futures contract mark-to-market, capital gain distribution received, corporate actions, options contract mark-to-market, deferral of EU reclaim and return of capital distributions received. Amounts of income and capital gain available to be distributed on a tax basis are determined annually, and at other times during the Funds’ fiscal year as may be necessary to avoid knowingly declaring and paying a return of capital distribution. Distributions from net investment income and short-term capital gains are considered to be distributed from ordinary income for tax purposes.
The tax characterization of distributions is determined on an annual basis. The tax character of distributions paid to shareholders during the years ended December 31, 2024 and 2023 was as follows:
| | |
| | | | | | |
| | | | | | |
Gateway Equity Call Premium Fund | | | | | | |
| | | | | | |
Global Sustainable Equity Fund | | | | | | |
International Sustainable Equity Fund | | | | | | |
Distributions paid to shareholders from net investment income and net realized capital gains, based on accounting principles generally accepted in the United States of America, are consolidated and reported on the Statements of Changes in Net Assets as Distributions to Shareholders. Distributions paid to shareholders from net investment income and net realized capital gains expressed in per-share amounts, based on accounting principles generally accepted in the United States of America, are separately stated and reported within the Financial Highlights.
Notes to Financial Statements (continued)
As of December 31, 2024, the components of distributable earnings on a tax basis were as follows:
| | Gateway
Equity Call
Premium Fund | | Global
Sustainable
Equity Fund | International
Sustainable
Equity Fund |
Undistributed ordinary income | | | | | |
Undistributed long-term capital gains | | | | | |
Total undistributed earnings | | | | | |
Capital loss carryforward: | | | | | |
| | | | | |
| | | | | |
| | | | | |
| | | | | |
Total capital loss carryforward* | | | | | |
Late-year ordinary and post-October
| | | | | |
Unrealized appreciation (depreciation) | | | | | |
Total accumulated earnings (losses) | | | | | |
| Under Section 382 of the Internal Revenue Service Code, a portion of the capital loss carryforward for the International Sustainable Equity Fund is subject to certain limitations upon availability, to offset future capital gains, if any. |
| Under current tax law, capital losses, foreign currency losses, and losses on passive foreign investment companies and contingent payment debt instruments after October 31 or December 31, as applicable, may be deferred and treated as occurring on the first day of the following taxable year. Global Green Bond Fund, Global Sustainable Equity Fund and International Sustainable Equity Fund are deferring foreign currency losses. |
As of December 31, 2024, the tax cost of investments (including derivatives, if applicable) and unrealized appreciation (depreciation) on a federal tax basis were as follows:
| | Gateway
Equity Call
Premium Fund | | Global
Sustainable
Equity Fund | International
Sustainable
Equity Fund |
| | | | | |
| | | | | |
| | | | | |
Net tax appreciation (depreciation) | | | | | |
The difference between these amounts and those reported in the components of distributable earnings, if any, are primarily attributable to foreign currency mark-to-market.
i. Repurchase Agreements. Each Fund may enter into repurchase agreements, under the terms of a Master Repurchase Agreement, under which each Fund acquires securities as collateral and agrees to resell the securities at an agreed upon time and at an agreed upon price. It is each Fund’s policy that the market value of the collateral for repurchase agreements be at least equal to 102% of the repurchase price, including interest. Certain repurchase agreements are tri-party arrangements whereby the collateral is held in a segregated account for the benefit of the Fund and on behalf of the counterparty. Repurchase agreements could involve certain risks in the event of default or insolvency of the counterparty, including possible delays or restrictions upon a Fund’s ability to dispose of the underlying securities. As of December 31, 2024, each Fund, as applicable, had investments in repurchase agreements for which the value of the related collateral exceeded the value of the repurchase agreement. The gross value of repurchase agreements is included in the Statements of Assets and Liabilities for financial reporting purposes.
j. Indemnifications. Under the Trusts’ organizational documents, their officers and Trustees are indemnified against certain liabilities arising out of the performance of their duties to the Funds. Additionally, in the normal course of business, the Funds enter into contracts with service providers that contain general indemnification clauses. The Funds' maximum exposure under these arrangements is unknown as this would involve future claims that may be made against the Funds that have not yet occurred. However, based on experience, the Funds expect the risk of loss to be remote.
Notes to Financial Statements (continued)
3.Fair Value Measurements. In accordance with accounting standards related to fair value measurements and disclosures, the Funds have categorized the inputs utilized in determining the value of each Fund’s assets or liabilities. These inputs are summarized in the three broad levels listed below:
• Level 1 — quoted prices in active markets for identical assets or liabilities;
• Level 2 — prices determined using other significant inputs that are observable either directly, or indirectly through corroboration with observable market data (which could include quoted prices for similar assets or liabilities, interest rates, credit risk, etc.); and
• Level 3 — prices determined using significant unobservable inputs when quoted prices or observable inputs are unavailable such as when there is little or no market activity for an asset or liability (unobservable inputs reflect each Fund’s own assumptions in determining the fair value of assets or liabilities and would be based on the best information available).
The inputs or methodology used for valuing securities are not necessarily an indication of the risk associated with investing in those securities.
The Funds' pricing policies have been approved by the Board of Trustees. Investments for which market quotations are readily available are categorized in Level 1. Other investments for which an independent pricing service is utilized are categorized in Level 2. Broker-dealer bid prices for which the Funds have knowledge of the inputs used by the broker-dealer are categorized in Level 2. All other investments, including broker-dealer bid prices for which the Funds do not have knowledge of the inputs used by the broker-dealer, as well as investments fair valued by the valuation designee, are categorized in Level 3. All Level 2 and 3 securities are defined as being fair valued.
Under certain conditions and based upon specific facts and circumstances, the Fund’s valuation designee may determine that a fair valuation should be made for portfolio investment(s). These valuation designee fair valuations will be based upon a significant amount of Level 3 inputs.
The following is a summary of the inputs used to value the Funds' investments as of December 31, 2024, at value:
|
Liability Valuation Inputs |
| | | | |
| | | | |
| Details of the major categories of the Fund’s investments are reflected within the Portfolio of Investments. |
Notes to Financial Statements (continued)
Gateway Equity Call Premium Fund |
|
| | | | |
| | | | |
| | | | |
| | | | |
|
Liability Valuation Inputs |
| | | | |
| | | | |
| Details of the major categories of the Fund’s investments are reflected within the Portfolio of Investments. |
|
|
| | | | |
| | | | |
| | | | |
| | | | |
Futures Contracts (unrealized appreciation) | | | | |
| | | | |
|
Liability Valuation Inputs |
| | | | |
Futures Contracts (unrealized depreciation) | | | | |
| Details of the major categories of the Fund’s investments are reflected within the Portfolio of Investments. |
Global Sustainable Equity Fund |
|
| | | | |
| | | | |
| | | | |
| | | | |
| | | | |
| | | | |
| | | | |
| | | | |
| | | | |
| | | | |
| | | | |
| | | | |
All Other Common Stocks(a) | | | | |
| | | | |
| | | | |
| | | | |
| Details of the major categories of the Fund’s investments are reflected within the Portfolio of Investments. |
Notes to Financial Statements (continued)
International Sustainable Equity Fund |
|
| | | | |
| | | | |
| | | | |
| | | | |
| | | | |
| | | | |
| | | | |
| | | | |
| | | | |
| | | | |
| | | | |
| | | | |
| | | | |
| | | | |
| | | | |
All Other Common Stocks(a) | | | | |
| | | | |
| | | | |
| | | | |
| Details of the major categories of the Fund’s investments are reflected within the Portfolio of Investments. |
4.Derivatives. Derivative instruments are defined as financial instruments whose value and performance are based on the value and performance of an underlying asset, reference rate or index. Derivative instruments the Funds used during the period include written index call options, purchased index put options and futures contracts.
Through the use of index options, Gateway Fund and Gateway Equity Call Premium Fund intends that its risk management strategy will reduce the volatility inherent in equity investments while also allowing for more participation in equity returns than hybrid investments. Each Fund seeks to provide an efficient trade-off between risk and reward, where risk is characterized by volatility or fluctuations in value over time. To meet this objective, the Funds invest in a broadly diversified portfolio of common stocks, while also writing index call options and, for Gateway Fund, purchasing index put options. Writing index call options can reduce a Fund's volatility, provide a steady cash flow and be an important source of a Fund's return, although it also may reduce a Fund's ability to profit from increases in the value of its equity portfolio. Buying index put options, can protect a Fund from a significant market decline that may occur over a short period of time. The value of an index put option generally increases as the prices of stocks constituting the index decrease and decreases as those stocks increase in price. For Gateway Fund, the combination of the diversified stock portfolio, the steady cash flow from writing of index call options and the downside protection from purchased index put options is intended to provide the Fund with the majority of the returns associated with equity market investments while exposing investors to less risk than other equity investments. For Gateway Equity Call Premium Fund, the combination of the diversified stock portfolio and the steady cash flow from writing of index call options is intended to moderate the volatility of returns relative to an all-equity portfolio. During the year ended December 31, 2024, Gateway Fund used written index call options and purchased index put options and Gateway Equity Call Premium Fund used written index call options in accordance with these strategies.
Global Green Bond Fund seeks to provide total return, through a combination of capital appreciation and current income, by investing in green bonds. The Fund pursues its objective by primarily investing in fixed-income securities. In connection with its principal investment strategies, the Fund may also invest in various types of futures contracts for investment purposes. During the year ended December 31, 2024, Global Green Bond Fund used U.S. and foreign government bond futures to gain yield curve exposure.
Global Green Bond Fund is subject to the risk that changes in interest rates will affect the value of the Fund’s investments in fixed income securities. The Fund will be subject to increased interest rate risk to the extent that it invests in fixed-income securities with longer maturities or durations, as compared to investing in fixed-income securities with shorter maturities or durations. The Fund may use futures contracts to hedge against changes in interest rates and to manage duration without having to buy or sell portfolio securities. During the year ended December 31, 2024, Global Green Bond Fund used U.S. and foreign government bond futures to manage duration.
Notes to Financial Statements (continued)
Global Green Bond Fund is also subject to the risk that changes in foreign currency exchange rates will have an unfavorable effect on the value of Fund assets denominated in foreign currencies. The Fund may use futures contracts for hedging purposes to protect the value of the Fund’s holdings of foreign securities. During the year ended December 31, 2024, Global Green Bond Fund used currency futures for hedging purposes.
The following is a summary of derivative instruments for Gateway Fund as of December 31, 2024, as reflected within the Statements of Assets and Liabilities:
| |
Exchange-traded asset derivatives | |
| |
| |
Exchange-traded liability derivatives | |
| |
| Represents purchased options, at value. |
Transactions in derivative instruments for Gateway Fund during the year ended December 31, 2024, as reflected within the Statements of Operations were as follows:
Net Realized Gain (Loss) on: | | |
| | |
Net Change in Unrealized
Appreciation (Depreciation) on: | | |
| | |
| Represents realized loss and change in unrealized appreciation (depreciation), respectively, for purchased options during the period. |
The following is a summary of derivative instruments for Gateway Equity Call Premium Fund as of December 31, 2024, as reflected within the Statements of Assets and Liabilities:
| |
Exchange-traded liability derivatives | |
| |
Transactions in derivative instruments for Gateway Equity Call Premium Fund during the year ended December 31, 2024, as reflected within the Statements of Operations were as follows:
Net Realized Gain (Loss) on: | |
| |
Net Change in Unrealized
Appreciation (Depreciation) on: | |
| |
Notes to Financial Statements (continued)
The following is a summary of derivative instruments for Global Green Bond Fund as of December 31, 2024, as reflected within the Statements of Assets and Liabilities:
| Unrealized
appreciation
on futures
contracts |
Exchange-traded asset derivatives | |
Foreign exchange contracts | |
| |
Total exchange-traded asset derivatives | |
| Unrealized
depreciation
on futures
contracts |
Exchange-traded liability derivatives | |
| |
Transactions in derivative instruments for Global Green Bond Fund during the year ended December 31, 2024, as reflected within the Statements of Operations were as follows:
Net Realized Gain (Loss) on: | |
| |
Foreign exchange contracts | |
| |
Net Change in Unrealized
Appreciation (Depreciation) on: | |
| |
Foreign exchange contracts | |
| |
As the Funds value their derivatives at fair value and recognize changes in fair value through the Statements of Operations, they do not qualify for hedge accounting under authoritative guidance for derivative instruments. The Funds’ investments in derivatives may represent an economic hedge; however, they are considered to be non-hedge transactions for the purpose of these disclosures.
The volume of option contract activity as a percentage of investments in common stocks for Gateway Fund based on month-end notional amounts outstanding during the period, at absolute value, was as follows for the year ended December 31, 2024:
| | |
Average Notional Amount Outstanding | | |
Highest Notional Amount Outstanding | | |
Lowest Notional Amount Outstanding | | |
Notional Amount Outstanding as of December 31, 2024 | | |
| Notional amounts outstanding are determined by multiplying option contracts by the contract multiplier by the price of the option’s underlying index, the S&P 500 ® Index. |
Notes to Financial Statements (continued)
The volume of option contract activity as a percentage of investments in common stocks for Gateway Equity Call Premium Fund based on month-end notional amounts outstanding during the period, at absolute value, was as follows for the year ended December 31, 2024:
Gateway Equity Call Premium Fund | |
Average Notional Amount Outstanding | |
Highest Notional Amount Outstanding | |
Lowest Notional Amount Outstanding | |
Notional Amount Outstanding as of December 31, 2024 | |
| Notional amounts outstanding are determined by multiplying option contracts by the contract multiplier by the price of the option’s underlying index, the S&P 500 ® Index. |
The volume of futures contract activity as a percentage of net assets for Global Green Bond Fund, based on month-end notional amounts outstanding during the period, at absolute value, was as follows for the year ended December 31, 2024:
| |
Average Notional Amount Outstanding | |
Highest Notional Amount Outstanding | |
Lowest Notional Amount Outstanding | |
Notional Amount Outstanding as of December 31, 2024 | |
Notional amounts outstanding at the end of the prior period are included in the average notional amount outstanding.
Unrealized gain and/or loss on open futures is recorded in the Statements of Assets and Liabilities. The aggregate notional values of futures contracts are not recorded in the Statements of Assets and Liabilities, and therefore are not included in the Funds’ net assets.
Counterparty risk is managed based on policies and procedures established by the Fund’s adviser. Such policies and procedures may include, but are not limited to, minimum counterparty credit rating requirements, monitoring of counterparty credit default swap spreads and posting of collateral. With exchange-traded derivatives, there is minimal counterparty credit risk to the Fund because the exchange’s clearing house, as counterparty to these instruments, stands between the buyer and the seller of the contract. Credit risk still exists in exchange-traded derivatives with respect to initial and variation margin that is held in a broker’s customer accounts. While brokers typically are required to segregate customer margin for exchange-traded derivatives from their own assets, in the event that a broker becomes insolvent or goes into bankruptcy and at that time there is a shortfall in the aggregate amount of margin held by the broker for all its customers, U.S. bankruptcy laws will typically allocate that shortfall on a pro rata basis across all of the broker’s customers, potentially resulting in losses to the Fund.
5.Purchases and Sales of Securities. For the year ended December 31, 2024, purchases and sales of securities (excluding short-term investments, option contracts and including paydowns) were as follows:
| | |
| | |
Gateway Equity Call Premium Fund | | |
| | |
Global Sustainable Equity Fund | | |
International Sustainable Equity Fund | | |
6.Management Fees and Other Transactions with Affiliates.
a. Management Fees. Gateway Investment Advisers, LLC (“Gateway Advisers”) serves as investment adviser to Gateway Fund and Gateway Equity Call Premium Fund. Gateway Advisers is a subsidiary of Natixis Investment Managers, LLC, which is part of Natixis Investment Managers, an international asset management group based in Paris, France. Under the terms of the management agreements, each Fund pays a management fee at the following annual rates, calculated daily and payable monthly, based on each Fund’s average daily net assets:
| Percentage of Average Daily Net Assets |
| | | |
| | | |
Gateway Equity Call Premium Fund | | | |
Notes to Financial Statements (continued)
Mirova US LLC ("Mirova US") serves as investment adviser to Global Green Bond Fund, Global Sustainable Equity Fund and International Sustainable Equity Fund. Mirova US is a wholly-owned subsidiary of Mirova, which is in turn a subsidiary of Natixis Investment Managers. Under the terms of the management agreements, each Fund pays a management fee at the following annual rates, calculated daily and payable monthly, based on each Fund’s average daily net assets:
| Percentage of
Average Daily
Net Assets |
| |
Global Sustainable Equity Fund | |
International Sustainable Equity Fund | |
Gateway Advisers and Mirova US have given binding undertakings to the Funds to waive management fees and/or reimburse certain expenses to limit the Funds’ operating expenses, exclusive of acquired fund fees and expenses, brokerage expenses, interest expense, substitute dividend expenses on securities sold short, taxes, organizational and extraordinary expenses such as litigation and indemnification expenses. These undertakings are in effect until April 30, 2025, may be terminated before then only with the consent of the Funds' Board of Trustees, and are reevaluated on an annual basis. Management fees payable, as reflected on the Statements of Assets and Liabilities, is net of waivers and/or expense reimbursements, if any, pursuant to these undertakings. Waivers/reimbursements that exceed management fees payable are reflected on the Statements of Assets and Liabilities as receivable from investment adviser.
For the year ended December 31, 2024, the expense limits as a percentage of average daily net assets under the expense limitation agreements were as follows:
| Expense Limit as a Percentage of
Average Daily Net Assets |
| | | | |
| | | | |
Gateway Equity Call Premium Fund | | | | |
| | | | |
Global Sustainable Equity Fund | | | | |
International Sustainable Equity Fund | | | | |
Gateway Advisers and Mirova US shall be permitted to recover expenses borne under the expense limitation agreements (whether through waiver of management fee or otherwise) on a class by class basis in later periods to the extent the annual operating expenses of a class fall below (1) a class' expense limitation ratio in place at the time such amounts were waived/reimbursed and (2) a class' current applicable expense limitation ratio, provided, however, that a class is not obligated to pay such waived/reimbursed fees or expenses more than one year after the end of the fiscal year in which the fees or expenses were waived/reimbursed.
For the year ended December 31, 2024, the management fees and waiver of management fees for each Fund were as follows:
| | Contractual
Waivers of
Management
| | Percentage of
Average
Daily Net Assets |
| | |
| | | | | |
Gateway Equity Call Premium Fund | | | | | |
| | | | | |
Global Sustainable Equity Fund | | | | | |
International Sustainable Equity Fund | | | | | |
| Management fee waivers are subject to possible recovery until December 31, 2025. |
For the year ended December 31, 2024, class-specific expenses have been reimbursed as follows:
| |
| | | | | |
| | | | | |
Global Sustainable Equity Fund | | | | | |
| Management fee waivers are subject to possible recovery until December 31, 2025. |
Notes to Financial Statements (continued)
In addition, Mirova US reimbursed non-class-specific expenses of International Sustainable Equity Fund in the amount of $32,309, for the year ended December 31, 2024, which is subject to possible recovery until December 31, 2025.
b. Service and Distribution Fees. Natixis Distribution, LLC (“Natixis Distribution"), which is a wholly-owned subsidiary of Natixis Investment Managers, LLC, has entered into a distribution agreement with the Trusts. Pursuant to this agreement, Natixis Distribution serves as principal underwriter of the Funds of the Trusts.
Pursuant to Rule 12b-1 under the 1940 Act, the Trusts have adopted a Service Plan relating to each Fund’s Class A shares (the “Class A Plans”), a Distribution and Service Plan relating to each Fund’s Class C shares (the “Class C Plans”).
Under the Class A Plans, each Fund pays Natixis Distribution a monthly service fee at an annual rate not to exceed 0.25% of the average daily net assets attributable to the Funds’ Class A shares, as reimbursement for expenses incurred by Natixis Distribution in providing personal services to investors in Class A shares and/or the maintenance of shareholder accounts.
Under the Class C Plans, each Fund pays Natixis Distribution a monthly service fee at an annual rate not to exceed 0.25% of the average daily net assets attributable to the Funds’ Class C shares, as compensation for services provided by Natixis Distribution in providing personal services to investors in Class C shares and/or the maintenance of shareholder accounts.
Also under the Class C Plans, each Fund pays Natixis Distribution a monthly distribution fee at an annual rate of 0.75% of the average daily net assets attributable to the Funds’ Class C shares, as compensation for services provided by Natixis Distribution in connection with the marketing or sale of Class C shares.
For the year ended December 31, 2024, the service and distribution fees for each Fund were as follows:
| | | |
| | | | |
| | | | |
Gateway Equity Call Premium Fund | | | | |
| | | | |
Global Sustainable Equity Fund | | | | |
International Sustainable Equity Fund | | | | |
For the year ended December 31, 2024, Natixis Distribution refunded Gateway Fund $17,671 of prior year Class A service fees paid to Natixis Distribution in excess of amounts subsequently paid to securities dealers or financial intermediaries. Service and distribution fees on the Statements of Operations have been reduced by these amounts.
c. Administrative Fees. Natixis Advisors, LLC ("Natixis Advisors") provides certain administrative services for the Funds and contracts with State Street Bank and Trust Company ("State Street Bank") to serve as sub-administrator. Natixis Advisors is a wholly-owned subsidiary of Natixis Investment Managers, LLC. Pursuant to an agreement among Natixis Funds Trusts, Loomis Sayles Funds Trusts, Natixis ETF Trusts and Natixis Advisors, each Fund pays Natixis Advisors monthly its pro rata portion of fees equal to an annual rate of 0.0540% of the first $15 billion of the average daily net assets of the Natixis Funds Trusts, Loomis Sayles Funds Trusts and Natixis ETF Trusts, 0.0500% of the next $15 billion, 0.0400% of the next $30 billion, 0.0275% of the next $30 billion and 0.0225% of such assets in excess of $90 billion, subject to an annual aggregate minimum fee for the Natixis Funds Trusts, Loomis Sayles Funds Trusts and Natixis ETF Trusts of $10 million, which is reevaluated on an annual basis.
For the year ended December 31, 2024, the administrative fees for each Fund were as follows:
| |
| |
Gateway Equity Call Premium Fund | |
| |
Global Sustainable Equity Fund | |
International Sustainable Equity Fund | |
d. Sub-Transfer Agent Fees. Natixis Distribution has entered into agreements, which include servicing agreements, with financial intermediaries that provide recordkeeping, processing, shareholder communications and other services to customers of the intermediaries that hold positions in the Funds and has agreed to compensate the intermediaries for providing those services. Intermediaries transact with the Funds primarily through the use of omnibus accounts on behalf of their customers who hold positions in the Funds. These services would have been provided by the Funds’ transfer agent and other service providers if the shareholders’ accounts were maintained directly at the Funds’ transfer agent. Accordingly, the Funds have agreed to reimburse Natixis Distribution for all or a portion of the servicing fees paid to these intermediaries. The reimbursement amounts (sub-transfer agent fees) paid to Natixis Distribution are subject to a current equivalent fee limit approved by the Funds’ Board of Trustees, which is based on fees for similar services paid to the Funds’ transfer agent and other service providers. Class N shares do not bear such expenses.
Notes to Financial Statements (continued)
For the year ended December 31, 2024, the sub-transfer agent fees (which are reflected in transfer agent fees and expenses in the Statements of Operations) for each Fund were as follows:
| |
| |
Gateway Equity Call Premium Fund | |
| |
Global Sustainable Equity Fund | |
International Sustainable Equity Fund | |
As of December 31, 2024, the Funds owe Natixis Distribution the following reimbursements for sub-transfer agent fees (which are reflected in the Statements of Assets and Liabilities as payable to distributor):
| Reimbursements
of Sub-Transfer
Agent Fees |
| |
Gateway Equity Call Premium Fund | |
| |
Global Sustainable Equity Fund | |
International Sustainable Equity Fund | |
Sub-transfer agent fees attributable to Class A, Class C and Class Y are allocated on a pro rata basis to each class based on the relative net assets of each class to the total net assets of those classes.
e. Commissions. Commissions (including CDSCs) on Fund shares retained by Natixis Distribution during the year ended December 31, 2024 were as follows:
| |
| |
Gateway Equity Call Premium Fund | |
Global Sustainable Equity Fund | |
f. Trustees Fees and Expenses. The Trusts do not pay any compensation directly to their officers or Trustees who are directors, officers or employees of Natixis Advisors, Natixis Distribution, Natixis Investment Managers, LLC or their affiliates. The Chairperson of the Board of Trustees receives a retainer fee at the annual rate of $400,000. The Chairperson does not receive any meeting attendance fees for Board of Trustees meetings or committee meetings that he attends. Each Independent Trustee (other than the Chairperson) receives, in the aggregate, a retainer fee at the annual rate of $225,000. Each Independent Trustee also receives a meeting attendance fee of $10,000 for each meeting of the Board of Trustees that he or she attends in person and $5,000 for each meeting of the Board of Trustees that he or she attends telephonically. In addition, the Chairperson of the Contract Review Committee and the Chairperson of the Audit Committee each receive an additional retainer fee at the annual rate of $25,000. The Chairperson of the Governance Committee receives an additional retainer fee at the annual rate of $20,000. Each Contract Review Committee member is compensated $6,000 for each Committee meeting that he or she attends in person and $3,000 for each meeting that he or she attends telephonically. Each Audit Committee member is compensated $6,000 for each Committee meeting that he or she attends in person and $3,000 for each meeting that he or she attends telephonically. Each Governance Committee member is compensated $2,500 for each Committee meeting that he or she attends. These fees are allocated among the funds in the Natixis Funds Trusts, Loomis Sayles Funds Trusts and Natixis ETF Trusts based on a formula that takes into account, among other factors, the relative net assets of each fund. Trustees are reimbursed for travel expenses in connection with attendance at meetings.
Effective January 1, 2025, the Chairperson of the Board of Trustees will receive a retainer fee at the annual rate of $410,000 and each Independent Trustee (other than the Chairperson) will receive, in the aggregate, a retainer fee at the annual rate of $235,000. The Chairperson of the Contract Review Committee and the Chairperson of the Audit Committee each will receive an additional retainer fee at the annual rate of $30,000. All other Trustees fees will remain unchanged.
A deferred compensation plan (the “Plan”) is available to the Trustees on a voluntary basis. The value of a participating Trustee’s deferral account is based on theoretical investments of deferred amounts, on the normal payment dates, in certain funds of the Natixis Funds Trusts, Loomis Sayles Funds Trusts and Natixis ETF Trusts as designated by the participating Trustees. Changes in the value of participants’ deferral accounts are allocated pro rata among the funds in the Natixis Funds Trusts, Loomis Sayles Funds Trusts and Natixis ETF Trusts and are normally reflected as Trustees’ fees and expenses in the Statements of Operations. Deferred amounts remain in the funds until distributed in accordance with the provisions of the Plan. The portions of the accrued obligations allocated to the Funds under the Plan are reflected as Deferred Trustees’ fees in the Statements of Assets and Liabilities.
Notes to Financial Statements (continued)
Certain officers and employees of Natixis Advisors and affiliates are also officers and/or Trustees of the Trusts.
g. Affiliated Ownership. As of December 31, 2024, the percentage of each Fund’s net assets owned by Natixis and affiliates is as follows:
| |
| |
Natixis Target Retirement 2015 Fund | |
Natixis Target Retirement 2020 Fund | |
Natixis Target Retirement 2025 Fund | |
Natixis Target Retirement 2030 Fund | |
Natixis Target Retirement 2035 Fund | |
Natixis Target Retirement 2040 Fund | |
Natixis Target Retirement 2045 Fund | |
Natixis Target Retirement 2050 Fund | |
Natixis Target Retirement 2055 Fund | |
Natixis Target Retirement 2060 Fund | |
Natixis Target Retirement 2065 Fund | |
| |
International Sustainable Equity Fund | |
Natixis Target Retirement 2015 Fund | |
Natixis Target Retirement 2020 Fund | |
Natixis Target Retirement 2025 Fund | |
Natixis Target Retirement 2030 Fund | |
Natixis Target Retirement 2035 Fund | |
Natixis Target Retirement 2040 Fund | |
Natixis Target Retirement 2045 Fund | |
Natixis Target Retirement 2050 Fund | |
Natixis Target Retirement 2055 Fund | |
Natixis Target Retirement 2060 Fund | |
Natixis Target Retirement 2065 Fund | |
| |
Investment activities of affiliated shareholders could have material impacts on the Funds.
h. Reimbursement of Transfer Agent Fees and Expenses. Natixis Advisors has given a binding contractual undertaking to Gateway Equity Call Premium Fund, Global Green Bond Fund, Global Sustainable Equity Fund and International Sustainable Equity Fund to reimburse any and all transfer agency expenses for the Funds’ Class N shares. This undertaking is in effect through April 30, 2025, and is not subject to recovery under the expense limitation agreement described above.
For the year ended December 31, 2024, Natixis Advisors reimbursed the Funds for transfer agency expenses as follows:
| Reimbursement of
Transfer Agency
Expenses |
| |
Gateway Equity Call Premium Fund | |
| |
Global Sustainable Equity Fund | |
International Sustainable Equity Fund | |
7.Class-Specific Transfer Agent Fees and Expenses. Transfer agent fees and expenses attributable to Class A, Class C and Class Y are allocated on a pro rata basis to each class based on the relative net assets of each class to the total net assets of those classes. Transfer agent fees and expenses attributable to Class N are allocated to Class N.
Notes to Financial Statements (continued)
For the year ended December 31, 2024, the Funds incurred the following class-specific transfer agent fees and expenses (net of expense offsets and including sub-transfer agent fees, where applicable):
| Transfer Agent Fees and Expenses |
| | | | |
| | | | |
Gateway Equity Call Premium Fund | | | | |
| | | | |
Global Sustainable Equity Fund | | | | |
International Sustainable Equity Fund | | | | |
8.Expense Offset Arrangements. The Funds have entered into an agreement with the transfer agent whereby certain transfer agent fees and expenses may be paid indirectly by credits earned on the Funds' cash balances. Transfer agent fees and expenses are presented in the Statements of Operations gross of such credits, and the credits are presented as offsets to expenses.
9. Line of Credit. Each Fund, together with certain other funds of Natixis Funds Trusts, Loomis Sayles Funds Trusts and Natixis ETF Trusts, entered into a syndicated, revolving, committed, unsecured line of credit with State Street Bank as administrative agent. The aggregate revolving commitment amount is $575,000,000. Any one Fund may borrow up to $402,500,000 under the line of credit agreement (as long as all borrowings by all Funds in the aggregate do not exceed the $575,000,000 limit at any time), subject to each Fund’s investment restrictions and its contractual obligations under the line of credit. Interest is charged to the Funds based upon the terms set forth in the agreement. In addition, a commitment fee of 0.15% per annum, payable at the end of each calendar quarter, is accrued and apportioned among the participating funds based on their average daily unused portion of the line of credit.
For the year ended December 31, 2024, International Sustainable Equity Fund had an average daily balance on the line of credit (for those days on which there were borrowings) of $1,500,000 at a weighted average interest rate of 6.43%. Interest expense incurred on the line of credit was $536.
10.Risk. The Funds’ investments in foreign securities may be subject to greater political, economic, environmental, credit/counterparty and information risks. The Fund's investments in foreign securities also are subject to foreign currency fluctuations and other foreign currency-related risks. Foreign securities may be subject to higher volatility than U.S. securities, varying degrees of regulation and limited liquidity.
Geopolitical events (such as trading halts, sanctions or wars) could increase volatility and uncertainty in the financial markets and adversely affect regional and global economies. These, and other related events, could significantly impact a Fund's performance and the value of an investment in the Fund, even if the Fund does not have direct exposure to issuers in the country or countries involved.
11.Excise Tax Expense. During the year ended December 31, 2024, Global Green Bond Fund paid excise tax on undistributed income under IRC Section 4982 in the amount of $1,413. The custodian bank and Natixis Advisors have each reimbursed the Fund equally for the entire amount of the tax due. There is no impact to net expenses.
12.Concentration of Ownership. From time to time, a Fund may have a concentration of one or more accounts constituting a significant percentage of shares outstanding. Investment activities by holders of such accounts could have material impacts on the Funds. As of December 31, 2024, based on management’s evaluation of the shareholder account base, the Funds had accounts representing controlling ownership of more than 5% of the Funds’ total outstanding shares. The number of such accounts, based on accounts that represent more than 5% of an individual class of shares, and the aggregate percentage of net assets represented by such holdings were as follows:
| Number of 5%
Non-Affiliated
Account Holders | Percentage of
Non-Affiliated
Ownership | Percentage of
Affiliated
Ownership
(Note 6g) | Total
Percentage of
Ownership |
Gateway Equity Call Premium Fund | | | | |
| | | | |
Global Sustainable Equity Fund | | | | |
International Sustainable Equity Fund | | | | |
Omnibus shareholder accounts for which Natixis Advisors understands that the intermediary has discretion over the underlying shareholder accounts or investment models where a shareholder account may be invested for a non-discretionary customer are included in the table above. For other omnibus accounts, the Funds do not have information on the individual shareholder accounts underlying the omnibus accounts; therefore, there could be other 5% shareholders in addition to those disclosed in the table above.
Notes to Financial Statements (continued)
13.Capital Shares. Each Fund may issue an unlimited number of shares of beneficial interest, without par value. Transactions in capital shares were as follows:
|
| Year Ended
December 31, 2024 | Year Ended
December 31, 2023 |
| | | | |
| | | | |
Issued from the sale of shares | | | | |
Issued in connection with the reinvestment of distributions | | | | |
| | | | |
| | | | |
| | | | |
Issued from the sale of shares | | | | |
Issued in connection with the reinvestment of distributions | | | | |
| | | | |
| | | | |
| | | | |
Issued from the sale of shares | | | | |
Issued in connection with the reinvestment of distributions | | | | |
| | | | |
| | | | |
| | | | |
Issued from the sale of shares | | | | |
Issued in connection with the reinvestment of distributions | | | | |
| | | | |
| | | | |
Decrease from capital share transactions | | | | |
Notes to Financial Statements (continued)
13.Capital Shares (continued).
|
| Year Ended
December 31, 2024 | Year Ended
December 31, 2023 |
Gateway Equity Call Premium Fund | | | | |
| | | | |
Issued from the sale of shares | | | | |
Issued in connection with the reinvestment of distributions | | | | |
| | | | |
| | | | |
| | | | |
Issued from the sale of shares | | | | |
Issued in connection with the reinvestment of distributions | | | | |
| | | | |
| | | | |
| | | | |
Issued from the sale of shares | | | | |
Issued in connection with the reinvestment of distributions | | | | |
| | | | |
| | | | |
| | | | |
Issued from the sale of shares | | | | |
Issued in connection with the reinvestment of distributions | | | | |
| | | | |
| | | | |
Increase (decrease) from capital share transactions | | | | |
|
| Year Ended
December 31, 2024 | Year Ended
December 31, 2023 |
| | | | |
| | | | |
Issued from the sale of shares | | | | |
Issued in connection with the reinvestment of distributions | | | | |
| | | | |
| | | | |
| | | | |
Issued from the sale of shares | | | | |
Issued in connection with the reinvestment of distributions | | | | |
| | | | |
| | | | |
| | | | |
Issued from the sale of shares | | | | |
Issued in connection with the reinvestment of distributions | | | | |
| | | | |
| | | | |
Increase (decrease) from capital share transactions | | | | |
Notes to Financial Statements (continued)
13.Capital Shares (continued).
|
| Year Ended
December 31, 2024 | Year Ended
December 31, 2023 |
Global Sustainable Equity Fund | | | | |
| | | | |
Issued from the sale of shares | | | | |
Issued in connection with the reinvestment of distributions | | | | |
| | | | |
| | | | |
| | | | |
Issued from the sale of shares | | | | |
Issued in connection with the reinvestment of distributions | | | | |
| | | | |
| | | | |
| | | | |
Issued from the sale of shares | | | | |
Issued in connection with the reinvestment of distributions | | | | |
| | | | |
| | | | |
| | | | |
Issued from the sale of shares | | | | |
Issued in connection with the reinvestment of distributions | | | | |
| | | | |
| | | | |
Increase (decrease) from capital share transactions | | | | |
|
| Year Ended
December 31, 2024 | Year Ended
December 31, 2023 |
International Sustainable Equity Fund | | | | |
| | | | |
Issued from the sale of shares | | | | |
Issued in connection with the reinvestment of distributions | | | | |
| | | | |
| | | | |
| | | | |
Issued from the sale of shares | | | | |
Issued in connection with the reinvestment of distributions | | | | |
| | | | |
| | | | |
| | | | |
Issued from the sale of shares | | | | |
Issued in connection with the reinvestment of distributions | | | | |
| | | | |
| | | | |
Increase from capital share transactions | | | | |
Report of Independent Registered Public Accounting Firm
To the Boards of Trustees of Gateway Trust and Natixis Funds Trust I and Shareholders of Gateway Fund, Gateway Equity Call Premium Fund, Mirova Global Green Bond Fund, Mirova Global Sustainable Equity Fund, and Mirova International Sustainable Equity Fund
Opinions on the Financial Statements
We have audited the accompanying statements of assets and liabilities, including the portfolios of investments, of Gateway Fund and Gateway Equity Call Premium Fund (constituting Gateway Trust), Mirova Global Green Bond Fund, Mirova Global Sustainable Equity Fund, and Mirova International Sustainable Equity Fund (three of the funds constituting Natixis Funds Trust I) (hereafter collectively referred to as the "Funds") as of December 31, 2024, the related statements of operations for the year ended December 31, 2024, the statements of changes in net assets for each of the two years in the period ended December 31, 2024, including the related notes, and the financial highlights for each of the five years in the period ended December 31, 2024 (collectively referred to as the “financial statements”). In our opinion, the financial statements present fairly, in all material respects, the financial position of each of the Funds as of December 31, 2024, the results of each of their operations for the year then ended, the changes in each of their net assets for each of the two years in the period ended December 31, 2024 and each of the financial highlights for each of the five years in the period ended December 31, 2024 in conformity with accounting principles generally accepted in the United States of America.
These financial statements are the responsibility of the Funds’ management. Our responsibility is to express an opinion on the Funds’ financial statements based on our audits. We are a public accounting firm registered with the Public Company Accounting Oversight Board (United States) (PCAOB) and are required to be independent with respect to the Funds in accordance with the U.S. federal securities laws and the applicable rules and regulations of the Securities and Exchange Commission and the PCAOB.
We conducted our audits of these financial statements in accordance with the standards of the PCAOB. Those standards require that we plan and perform the audit to obtain reasonable assurance about whether the financial statements are free of material misstatement, whether due to error or fraud.
Our audits included performing procedures to assess the risks of material misstatement of the financial statements, whether due to error or fraud, and performing procedures that respond to those risks. Such procedures included examining, on a test basis, evidence regarding the amounts and disclosures in the financial statements. Our audits also included evaluating the accounting principles used and significant estimates made by management, as well as evaluating the overall presentation of the financial statements. Our procedures included confirmation of securities owned as of December 31, 2024 by correspondence with the custodian and brokers; when replies were not received from brokers, we performed other auditing procedures. We believe that our audits provide a reasonable basis for our opinions.
/s/PricewaterhouseCoopers LLP
Boston, Massachusetts
February 24, 2025
We have served as the auditor of one or more investment companies in Natixis Investment Company Complex since at least 1995. We have not been able to determine the specific year we began serving as auditor.
2024 U.S. Tax Distribution Information to Shareholders (Unaudited)
Corporate Dividends Received Deduction. For the fiscal year ended December 31, 2024, a percentage of dividends distributed by the Funds listed below qualify for the dividends received deduction for corporate shareholders. These percentages are as follows:
| |
| |
Gateway Equity Call Premium Fund | |
Global Sustainable Equity Fund | |
Qualified Dividend Income. For the fiscal year ended December 31, 2024, a percentage of the ordinary income dividends paid by the Funds are considered qualified dividend income eligible for reduced tax rates. These lower rates range from 0% to 20% depending on an individual’s tax bracket. If the Funds paid a distribution during calendar year 2024, complete information will be reported in conjunction with Form 1099-DIV. These percentages are noted below:
| |
| |
Gateway Equity Call Premium Fund | |
Global Sustainable Equity Fund | |
International Sustainable Equity Fund | |
Capital Gains Distributions. Pursuant to Internal Revenue Section 852(b), the following Funds paid distributions, which have been designated as capital gains distributions for the fiscal year ended December 31, 2024.
| |
Global Sustainable Equity Fund | |
Foreign Tax Credit. For the year ended December 31, 2024, the Fund intends to pass through foreign tax credits and have derived gross income from sources within foreign countries amounting to:
| Foreign-Tax
Credit Pass-Through | |
International Sustainable Equity Fund | | |
˃To learn more about Natixis Funds products and services:
Visit: im.natixis.com Call: 800-225-5478
Before investing, consider the fund’s investment objectives, risks, charges, and expenses. Visit im.natixis.com or call 800-225-5478 for a prospectus or summary prospectus containing this and other information.
Contact us by mail:
If you wish to communicate with the funds’ Board of Trustees, you may do so by writing to:
Secretary of the Funds
Natixis Advisors, LLC
888 Boylston Street, Suite 800
Boston, MA 02199-8197
The correspondence must (a) be signed by the shareholder; (b) include the shareholder’s name and address; and (c) identify the fund(s), account number, share class, and number of shares held in that fund, as of a recent date.
Or by e-mail:
secretaryofthefunds@natixis.com (Communications regarding recommendations for Trustee candidates may not be submitted by e-mail.)
Please note: Unlike written correspondence, e-mail is not secure. Please do NOT include your account number, Social Security number, PIN, or any other non-public personal information in an e-mail communication because this information may be viewed by others.
 Exp. 3/31/2026LSAF58A-1224
This page is not part of the financial statements and other important information
Item 8. Changes in and Disagreements with Accountants for Open-End Management Investment Companies
Not applicable.
Item 9. Proxy Disclosures for Open-End Management Investment Companies.
Not applicable.
Item 10. Remuneration Paid to Directors, Officers, and Others of Open-End Management Investment Companies.
The remuneration paid to Directors and Officers are incorporated by reference as part of the Financial Statements and Other Important Information for Open-End Management Investment Companies filed as Item 7 herewith.
Item 11. Statement Regarding Basis for Approval of Investment Advisory Contract.
The statements regarding basis for approval of investment advisory contracts are incorporated by reference as part of the Financial Statements and Other Important Information for Open-End Management Investment Companies filed as Item 7 herewith.
Item 12. Disclosure of Proxy Voting Policies and Procedures for Closed-End Management Investment Companies.
Not applicable.
Item 13. Portfolio Managers of Closed-End Management Investment Companies.
Not applicable.
Item 14. Purchases of Equity Securities by Closed-End Management Investment Companies and Affiliated Purchasers.
Not applicable.
Item 15. Submission of Matters to a Vote of Securities Holders.
There were no material changes to the procedures by which shareholders may recommend nominees to the Registrant’s Board of Trustees.
Item 16. Controls and Procedures.
(a) The Registrant’s principal executive officer and principal financial officer have concluded that the Registrant’s disclosure controls and procedures are sufficient to ensure that information required to be disclosed by the Registrant in this Form N-CSR was recorded, processed, summarized and reported within the time periods specified in the Securities and Exchange Commission’s rules and forms, based upon such officers’ evaluation of these controls and procedures as of a date within 90 days of the filing date of the report.
(b) There were no changes in the Registrant’s internal control over financial reporting that occurred during the period covered by the report that have materially affected, or is reasonably likely to materially affect, the Registrant’s internal control over financial reporting.
Item 17. Disclosure of Securities Lending Activities for Closed-End Management Investment Companies.
Not applicable.
Item 18. Recovery of Erroneously Awarded Compensation.
Not applicable.
Item 19. Exhibits.
SIGNATURES
Pursuant to the requirements of the Securities Exchange Act of 1934 and the Investment Company Act of 1940, the Registrant has duly caused this report to be signed on its behalf by the undersigned, thereunto duly authorized.
| | |
| Natixis Funds Trust I |
| |
| By: | | /s/ David L. Giunta |
| Name: | | David L. Giunta |
| Title: | | President and Chief Executive Officer |
| Date: | | February 24, 2025 |
Pursuant to the requirements of the Securities Exchange Act of 1934 and the Investment Company Act of 1940, this report has been signed by the following persons on behalf of the Registrant and in the capacities and on the dates indicated.
| | |
| By: | | /s/ David L. Giunta |
| Name: | | David L. Giunta |
| Title: | | President and Chief Executive Officer |
| Date: | | February 24, 2025 |
| |
| By: | | /s/ Matthew J. Block |
| Name: | | Matthew J. Block |
| Title: | | Treasurer and Principal Financial and |
| | Accounting Officer |
| Date: | | February 24, 2025 |