UNITED STATES
SECURITIES AND EXCHANGE COMMISSION
Washington, D.C. 20549
FORM N-CSR
CERTIFIED SHAREHOLDER REPORT OF REGISTERED
MANAGEMENT INVESTMENT COMPANIES
Investment Company Act file number: 811-04323
Natixis Funds Trust I
(Exact name of Registrant as specified in charter)
888 Boylston Street, Suite 800, Boston, Massachusetts 02199-8197
(Address of principal executive offices) (Zip code)
Susan McWhan Tobin, Esq.
Natixis Distribution, LLC
888 Boylston Street, Suite 800
Boston, Massachusetts 02199-8197
(Name and address of agent for service)
Registrant’s telephone number, including area code: (617) 449-2139
Date of fiscal year end: December 31
Date of reporting period: December 31, 2023
Item 1. Reports to Stockholders.
| (a) | The Registrant’s annual report transmitted to shareholders pursuant to Rule 30e-1 under the Investment Company Act of 1940 is as follows: |
Annual Report
December 31, 2023
Loomis Sayles International Growth Fund |
|
Natixis Oakmark International Fund |
Natixis U.S. Equity Opportunities Fund |
Vaughan Nelson Mid Cap Fund |
Vaughan Nelson Small Cap Value Fund |
IMPORTANT NOTICE TO SHAREHOLDERS
The Securities and Exchange Commission (SEC) has adopted new regulations that will result in changes to the design and delivery of annual and semiannual shareholder reports. Beginning in July 2024, Funds will be required by the SEC to send shareholders a paper copy of a new tailored shareholder report in place of the full shareholder report that is currently being provided. If you would like to receive shareholder reports and other communications from the Funds electronically, instead of by mail, you may make that request at www.icsdelivery.com/natixisfunds. If you have already elected to receive shareholder reports electronically, you will not be affected by this change, and you need not take any action.
Loomis Sayles International Growth Fund
|
Aziz V. Hamzaogullari, CFA® |
Loomis, Sayles & Company, L.P.
|
Investment GoalThe Fund's investment goal is long-term growth of capital.
Market Conditions
International equities delivered strong, double-digit total returns in 2023, with much of the gain occurring in November and December. The asset class generally performed well in the first half of the year, with stocks trending higher in choppy trade amid expectations that central banks’ interest-rate increases were largely nearing their conclusion. Sentiment shifted in the third quarter, however, as worries mounted that central banks would need to keep interest rates “higher for longer.” The international equity markets experienced a protracted decline in the August-October time frame as a result, bringing the major international indexes back near the levels where they began the year. The outlook changed yet again in November, when a series of weaker-than-expected inflation reports and comments from U.S. Federal Reserve officials indicated that not only were interest-rate increases largely concluded, but also that rate cuts were likely to begin as soon as the first half of 2024. Stocks rose in response, helping the key indexes finish December near their highs for the year.
The European markets were a key driver of performance for the broader asset class. Economic growth in the region exceeded the depressed expectations that existed coming into 2023, when concerns about the effects of the war in Ukraine remained at the forefront. Italy and Spain were top performers in Europe, as were the larger markets of Germany and France. The Asian markets, while posting gains, lagged somewhat due to the more proximate impact of China’s sub-par growth.
Performance Results
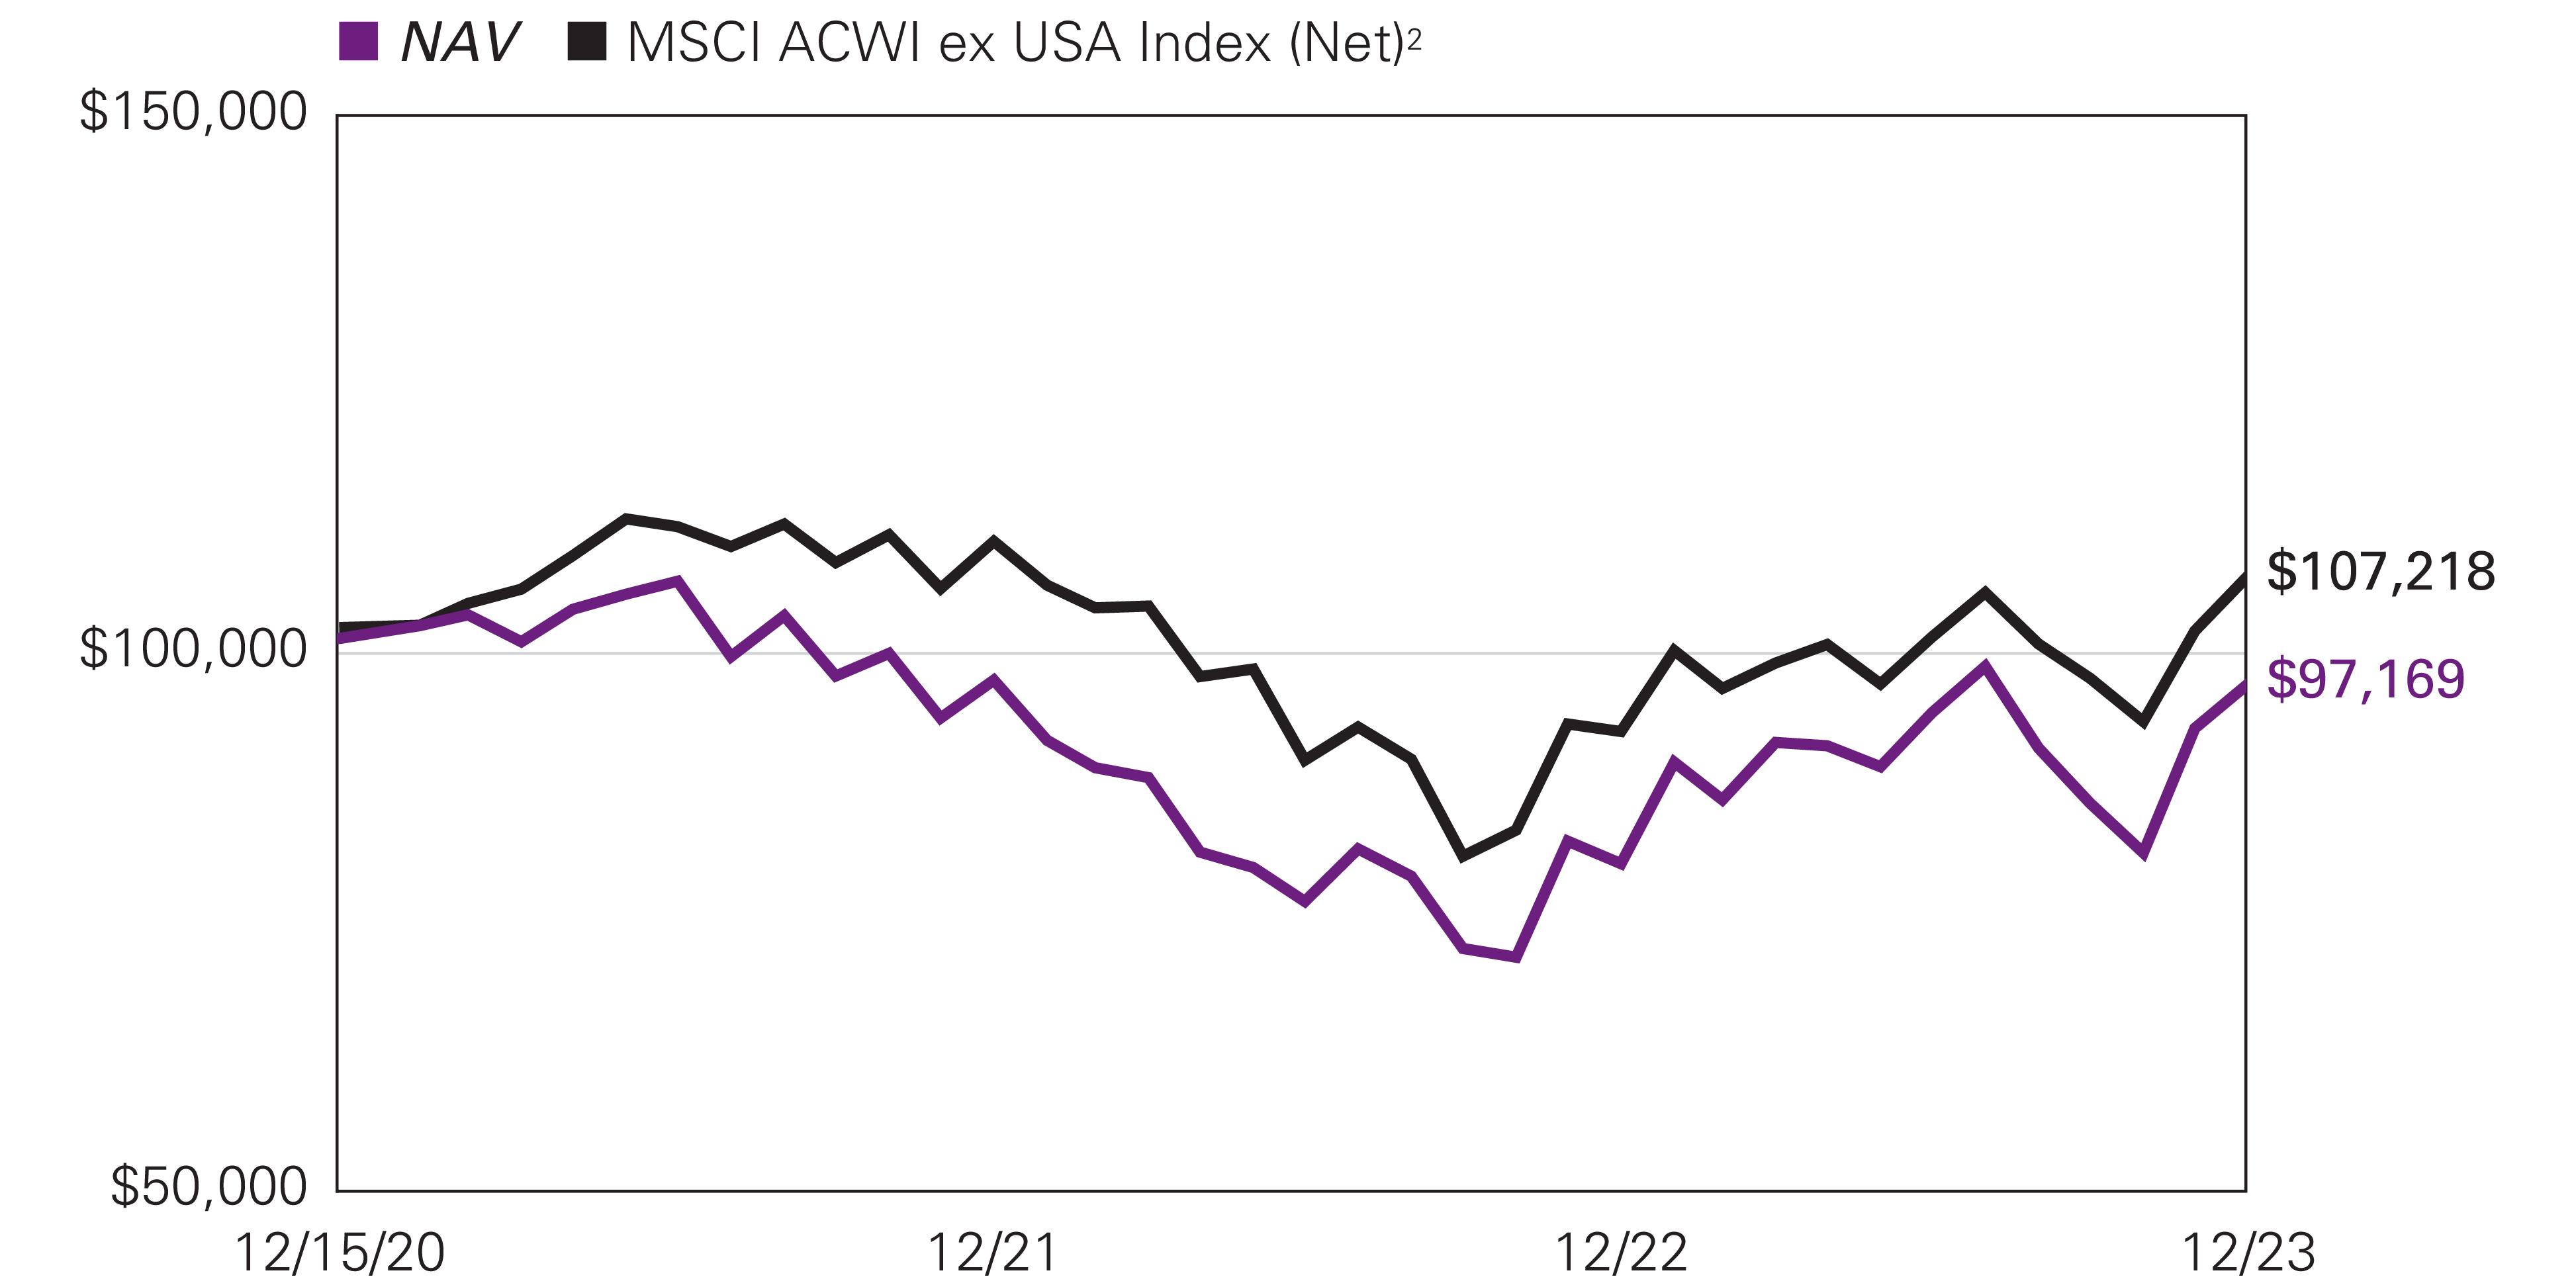
For the 12 months ended December 31, 2023, Class Y shares of the Loomis Sayles International Growth Fund returned 20.81% at net asset value. The Fund outperformed its benchmark, the MSCI All Country World Index ex USA Index (Net), which returned 15.62%.
Explanation of Fund Performance
We are an active manager with a long-term, private equity approach to investing. Through our proprietary bottom-up research framework, we look to invest in those few high-quality businesses with sustainable competitive advantages and profitable growth when they trade at a significant discount to intrinsic value. Given the rare confluence of quality, growth, and valuation, we may study dozens of companies but may only invest in a select few businesses each year. We believe identifying those few businesses with such characteristics is an art, not a science. As a result of this rigorous approach, ours is a selective, high-conviction portfolio of typically 30–45 names.
The Fund’s positions in MercadoLibre, Novo Nordisk, and WiseTech Global contributed the most to performance. Stock selection in the consumer discretionary, information technology, and healthcare sectors, along with our allocations in the information technology sector, contributed positively to relative performance.
MercadoLibre is the largest online commerce platform in Latin America. The company offers its users an ecosystem of six integrated e-commerce services that include its marketplace, payment and fintech solutions, shipping and logistics, advertising, classified listings, and merchant web services. The company operates in 18 countries representing the vast majority of Latin American GDP, and its 148 million active users in 2022 represented approximately 30% of the region’s estimated 480 million internet users. We believe MercadoLibre benefits from strong and sustainable competitive advantages that include its network and ecosystem, brand, and understanding of local markets that collectively contribute to its leadership position in each market it serves. A Fund holding since inception, the company delivered strong revenue growth that was consistently above consensus expectations, driven by growth in gross merchandise volume and payments, and continued market share gains in both e-commerce and payments. MercadoLibre remains in an elevated investment cycle to build out a more powerful ecosystem focused on greater product selection, easier payment options, wider credit availability, and lower cost and faster speed of delivery. The company also expects to increase its investments in several areas, including first-party sales, an improved loyalty program, and advertising technology. While these investments impact near-term profitability, operating margins still expanded substantially and exceeded expectations throughout the period, and we believe the investments have contributed to market share gains in e-commerce and payments and a stronger competitive position. We believe management remains focused on balancing the investments needed to further improve user experience and extend the company’s
Loomis Sayles International Growth Fund
leadership in e-commerce and payments, while maintaining a sustainable and profitable financial model. With continued growth in internet access, increasing availability of credit, and the company’s continuing investments to improve the ease and convenience of transacting online, we believe MercadoLibre remains well positioned for sustained growth over the next decade, driven by the secular growth of e-commerce across Latin America. Over our forecast period, we believe the penetration of e-commerce can more than double, which would bring the penetration rate into the mid-20% level. We believe the current market price embeds expectations for key revenue and cash flow growth drivers that are well below our long-term assumptions. As a result, we believe the shares trade at a significant discount to our estimate of intrinsic value and offer a compelling long-term reward-to-risk opportunity.
Headquartered in Denmark, Novo Nordisk is a global healthcare company with 100 years of innovation and leadership in diabetes care. Over this time, Novo has amassed unparalleled experience in the biology of diabetes, expertise in protein science, and developed significant competitive advantages as a result. Its diabetes products have captured approximately one-third of the global branded diabetes care market, which along with its first-mover position in related obesity therapies account for over 90% of the company’s annual revenues. We believe Novo’s strong and sustainable advantages include its deep experience in diabetes care and therapeutic proteins, strong infrastructure that took decades to build, efficient manufacturing techniques, robust pipeline, and economies of scale. A Fund holding since inception, shares have been up strongly since early August when the company released results from a five-year cardiovascular outcomes trial for Wegovy, the company’s newest GLP-1 treatment for obesity. Among non-type 2 diabetes obese patients with established cardiovascular (CV) disease, the therapy resulted in a 20% decrease in CV events such as CV death, heart attack, and stroke, versus the placebo. The 17,500-person trial represents the first study evaluating the longer-term benefits that GLP-1 therapies can provide to an obese population. The company’s financial results also reflected strong execution as year-to-date sales rose 33% year over year, driven by strong uptake in GLP-1 therapies across both its diabetes and obesity-care franchises, and operating profit grew 37%. The GLP-1 class of therapies are a quickly growing class of medications that while first documented in 1987, were first approved for type-2 diabetes in 2005 and later for obesity in 2014. The therapies are currently being tested in a range of comorbidities including heart failure, sleep apnea, NASH (nonalcoholic steatohepatitis), and kidney disease. In the diabetes indication, GLP-1 sales grew 49% year over year, contributing to the company’s nearly 55% total GLP-1 market share. In addition to targeting diabetes with its GLP-1s, in 2021, Novo received approval for semaglutide (the same molecule behind its leading diabetes therapies, Ozempic and Rybelsus) in the obesity setting under the brand name Wegovy. While operational challenges limited the initial production of Wegovy, the company is seeing robust early demand which contributed to 174% year-to-date sales growth in its nascent obesity care franchise. Diabetes is a global epidemic with an estimated population of 530 million. The market has been growing annually in the low double digits over the last ten years, driven by aging of the global population and increasing obesity. Further, there are estimated to be almost 500 million non-diabetic obese people globally who may benefit from Novo’s therapies. We believe Novo’s deep experience in diabetes care and leadership in the nascent obesity market, differentiated product suite, and leading innovation should enable the company to grow revenues and free cash flow in the low double digits over our long-term investment horizon. We believe the company’s shares continue to sell at a meaningful discount to our estimate of intrinsic value and offer an attractive reward-to-risk opportunity.
Wisetech Global is the leading software solutions provider to the global logistics industry. Founded in 1994 to provide freight-forwarding and customs software to the Australian logistics industry, Wisetech solutions are used in whole or in part by over 85% of the world’s 50 largest third-party logistics providers (3PLs) and almost all of the 25 largest freight forwarders, led by the company’s primary SAAS (software-as-a-service) platform, CargoWise One. From a single unified platform, the company offers function-specific and enterprise-wide modules that support the complex international movement of goods and create substantial efficiencies for its logistics clients. The company’s vision is to become the world’s operating system for global logistics. A holding since Fund inception, Wisetech reported financial results for its 2023 fiscal year ended June 2023 that reflected continued strong penetration of its end markets and organic revenue growth in excess of 20%. After having substantially slowed its pace of acquisition activity in recent quarters, the company announced two sizeable acquisitions in landside logistics earlier in the year, which continued to expand the company’s capabilities outside of forwarding to execute on its strategy of building a universal operating system for global logistics. However, shares pulled back midyear after the company disclosed that it expects the acquisitions to depress its operating margins for the next few years. We do not believe the decline in margins is structural, and in our view, the company continues to execute well on its long-term strategic vision. Outside of its acquisition activity, the company showed continued growth among its existing client base, with every calendar-year cohort of new clients going back to 2006 showing growth over the prior year, continuing a multi-year trend. We believe Wisetech benefits from strong and sustainable competitive advantages that include an installed client base with high switching costs, its freight-forwarding industry expertise, significant investments in research and development, its brand, and network. We believe Wisetech will benefit from secular growth in logistics software and services as companies increasingly move towards outsourcing and away from less effective in-house solutions. With virtually no comparable off-the-shelf competition to its unified global platform, Wisetech is the dominant market share leader in its legacy freight-forwarding market. We estimate the company now captures over 20% share of its addressable freight forwarding market, up from the mid-single digits five years ago, with gains coming at the expense of proprietary solutions or competitor offerings that addressed only limited industry functions or geographies. Through underlying industry growth, continued market share gains in its legacy freight-forwarding market, and ongoing penetration of other
Loomis Sayles International Growth Fund
parts of the logistics industry performed by 3PLs, including warehouse management, land transportation, and cargo handling, we believe the company can generate compounded annual revenue growth of approximately 20% over our long-term investment horizon, with faster growth in operating profits and free cash flow as the company benefits from scale and operating leverage. Prior to the share price drop that followed the company’s lowered margin guidance, we meaningfully trimmed our position in the company, which had been our largest position at the time. We continue to believe the expectations embedded in Wisetech’s share price underestimate the company’s superior positioning and the sustainability of its growth. As a result, we believe the shares trade at a discount to our estimate of intrinsic value and represent an attractive reward-to-risk opportunity.
The Fund’s positions in Yum China, Budweiser Brewing APAC, and Doximity detracted the most from performance. Stock selection in the consumer staples, industrials, and communication services sectors, as well as our allocations in the consumer staples, healthcare, industrials, consumer discretionary, financials, and communication services sectors, detracted from relative performance.
Yum China is the largest restaurant company in China, operating over 14,000 restaurants primarily under the KFC and Pizza Hut brands. A Fund holding since inception, Yum China reported financial and operating results throughout the period that we believe reflected the company’s success in navigating a challenging China consumer spending environment that was still impacted by Covid-19 and related restrictions in the early part of the year. Shares responded negatively to the company’s most recent quarterly financial results that were below consensus expectations, despite including record revenues, operating profits, and net new store openings. The company observed a noticeable slowdown in consumer traffic in September 2023 that continued into the fourth quarter as macroeconomic weakness persists and more local competitors have returned to the market as China continues to normalize post Covid. This near-term economic weakness does not affect our structural investment thesis for the company, which continues to expand into lower-tier cities while consistently innovating to sustain consumer purchases – especially among its over 460 million loyalty members. We also believe the company has the products and scale to offer increasingly value-conscious consumers attractive food options at all price points. We believe Yum China’s strong and sustainable competitive advantages include its exclusive license to operate and franchise two of the most prominent restaurant brands in China, the scale of its distribution and supply chain infrastructure, a first-mover advantage in real estate procurement, which allows the company to identify the best locations with respect to traffic flow and thereby offer the most convenient service, and decades of experience in restaurant operations. The Chinese economy is transitioning to a consumption-driven economy, following a path similar to that of other developing economies. We believe this will fuel future consumption spending, including expenditures in restaurants, as food options such as Pizza Hut and KFC become increasingly affordable to an emerging middle class with rising levels of disposable income. With its iconic brands, large and complex supply chain infrastructure, and real estate procurement expertise, we believe Yum China remains well positioned to benefit from the secular growth of consumer spending on restaurants in China. We believe the current market price embeds expectations for free cash flow growth that are well below our long-term estimates. As a result, we believe the company is selling at a significant discount to our estimate of intrinsic value, and offers a compelling reward-to-risk opportunity.
Budweiser Brewing Company APAC Ltd (Bud APAC) is the Asia-Pacific division of Anheuser-Busch InBev (AB InBev), the world’s largest beer brewer and distributor. The company became a publicly traded entity following its September 2019 initial public offering (IPO) and remains 87% owned by AB InBev. Bud APAC is the market share leader in its two largest markets, China and South Korea, which account for over 90% of revenues. The company sells over 50 brands across all segments of the beer market, but is focused on the premium segments where it is the regional leader. We believe Bud APAC’s strong and sustainable competitive advantages include its portfolio of leading local and global beer brands, difficult-to-replicate global and local scale in manufacturing, and strong distribution capabilities, which contribute to leading regional market share. On a standalone basis, Bud APAC is one of the largest brewers in the world and over our long-term investment horizon, we believe it is among the best-positioned companies in the entire value chain. A Fund holding since inception, over the past year, Bud APAC demonstrated continued recovery from the impact of the pandemic on alcohol consumption in on-premise consumption channels – particularly in its largest country, China. However, the market reacted negatively to the company’s performance in South Korea, its second largest country, which accounts for approximately 20% of its EBITDA (earnings before interest, taxes, depreciation and amortization), and where it is the leader in a duopoly structure. The South Korea beer industry is facing material near-term headwinds as consumer spending has softened. This has resulted in industry growth slowing to what we believe is below the long-term structural growth rate. Coupled with high cost inflation, which the company is slowly recovering through both pricing and premiumization, Bud APAC has also experienced a decrease in profit margins. Over the long-term, we believe the beer industry will benefit from structural drivers that include growth in per capita consumption and premiumization. Today, premium beer represents only 25% of total volume in South Korea. We believe premium beer can approach 40% as in other developed markets and that margins will improve as the company continues to recoup inflation costs through price increases. We believe the secular growth opportunity for Bud APAC is long-term growth in Asia-Pacific emerging market spending on beer, in particular, China and India. Today, the Asia-Pacific beer markets in which Bud APAC is primarily focused, namely China, South Korea and India, represent an estimated $120 billion in annual retail spending, which has grown at a mid-single-digit percentage over the past decade. As a function of its numerous competitive advantages, over our long-term investment horizon, we believe the company can generate mid-single-digit growth in revenue, driven by mid-to-high single-digit
Loomis Sayles International Growth Fund
growth in China and India, and low single-digit growth in South Korea. With respect to profitability, we believe Bud APAC will benefit in all of its markets from premiumization, which improves the gross margin, greater efficiency within its sales and marketing expenditures, which are high when compared with AB InBev’s other regions, and operating leverage. Combining these drivers, we believe operating margins will expand and operating profits will thereby grow faster than revenue. In addition, as revenue growth outpaces stable capital expenditures and working capital efficiency further improves, we expect free cash flow will grow faster than revenues and profits. Over our investment time horizon, we believe free cash flow will grow at a mid-to-high single-digit compounded annual rate. We believe the share price embeds expectations that underestimate the long-term secular growth drivers and the company’s superior competitive position. As a result, we believe the shares are selling at a significant discount to our estimate of intrinsic value, representing a compelling reward-to-risk opportunity.
Doximity is a leading cloud-based platform specifically built for US medical professionals (“MPs”). The company was founded in 2010 and has grown to over 2 million members, including approximately 800,000 physicians representing every medical specialty. Doximity provides a single place for MPs to access productivity tools that enable collaboration with colleagues, secure coordination of patient care, virtual patient visits, customized medical news and research, and career management. Doximity is free to healthcare providers and monetizes its platform primarily by providing targeted marketing access to customers that are largely pharmaceutical manufacturers and healthcare systems, which accounted for over 90% of revenue in its most recent fiscal year. A portfolio holding since the first quarter of 2022, shares responded negatively to the company’s fiscal first quarter financial report in August. The company reported quarterly financial results that were fundamentally solid and in line with consensus expectations. However, management significantly lowered its full-year revenue guidance, implying 10% year-over-year growth versus a previous estimate of 20%. Doximity typically enters its fiscal year with approximately 60%-65% of subscription-based revenue already under contract, with a further 30%-35% generated through renewing and upselling existing customers – typically in the summer months. In 2023, the company experienced substantially lower upsell rates, which it attributed to slowing industry spending and the company’s “white-glove” approach to client sales that is more time-intensive than the programmatic banner advertising that captured share during the summer. We believe Doximity’s strong and sustainable competitive advantages include the power of its network, its “physicians first” focus, and its trusted reputation and brand. The company has firmly established itself as the de facto digital network for healthcare professionals, including over 80% of US physicians (up from 25% in 2013) and over 90% of graduating US medical students. Members average over 50 connections with Doximity colleagues, which drives utility through referrals, care coordination, knowledge exchange, and career management. A powerful network effect occurs as the number and engagement of members has increased; Doximity has more data to create engaging and useful products that are specifically tailored to physician workflows, which in turn drives higher membership and greater stickiness among users. Shares partially rebounded following the most recent earnings release in November 2023, which exceeded management’s guidance for revenue and operating profit, leading the company to modestly raise its full-year outlook. The company also reported that active workflow users reached record levels, as did the number of quarterly, monthly, weekly, and daily active users – suggesting continued strong levels of engagement among its physician user base. Notably, daily users grew the most, underscoring the integral role Doximity now plays in day-to-day patient care. Further, net revenue retention among the company’s 20 largest customers was 119%, versus 114% overall – indicating that its most sophisticated and engaged clients continue to be the company’s fastest growing customer cohort. We believe Doximity’s primary growth driver is the secular shift from traditional marketing channels to digital channels, specifically in healthcare, where digital spending has lagged due in part to a historic reliance on pharmaceutical sales representatives. Today, market intelligence firm IDC estimates less than 30% of healthcare advertising spending is via digital channels, versus 46% on an industry-wide basis and greater than 80% in industries such as computing, appliances, and media and entertainment. Given the superior return on investment (ROI) for digital advertising as opposed to traditional advertising, coupled with growing restrictions on the ability to gain access to key healthcare decision makers through traditional, in-person methods, we estimate that digital marketing expenditures will grow substantially over our long-term investment horizon to approach 50% of total healthcare advertising spending. As a physicians-first company, Doximity has historically allocated approximately 90% of its R&D (research and development) spending towards physician-facing products. The company intends to allocate a higher level of R&D spending to build client-facing technologies that enable advertising clients to more-seamlessly direct incremental advertising dollars akin to other successful ad platforms and which likely benefited less-advantaged banner advertising during the quarter. The company is currently beta testing a new self-service client portal that it expects to be ready in advance of the 2024 upsell season. With its commanding penetration among healthcare decision makers and superior ROIs for advertisers, we believe Doximity can grow its capture of the digital opportunity from approximately 5% today to exceed 25%. Over our long-term investment horizon, we believe the company can generate approximately 20% compounded annual growth in overall revenues. As the company further penetrates its existing market and gains scale, we believe it will benefit from operating leverage, and that operating profits and free cash flow will grow faster than revenue. We believe Doximity’s share price embeds expectations for key revenue and cash flow growth drivers that are well below our long-term assumptions. As a result, we believe the company is selling at a significant discount to our estimate of its intrinsic value and offers a compelling reward-to-risk opportunity. We added to our holdings in the company during the year.
All aspects of our quality-growth-valuation investment thesis must be present simultaneously for us to make an investment. Often our research is completed well in advance of the opportunity to invest. We are patient investors and maintain coverage of high-quality
Loomis Sayles International Growth Fund
businesses in order to take advantage of meaningful price dislocations if and when they occur. During the period we initiated a new position in Arm Holdings plc. We added to our existing holdings in Adyen, Block, and Doximity. We trimmed our existing positions in Novartis and WiseTech Global.
Outlook
Our investment process is characterized by bottom-up fundamental research and a long-term investment time horizon. The nature of the process leads to a lower-turnover portfolio in which sector positioning is the result of stock selection. The Fund ended the year with overweight positions in the consumer discretionary, consumer staples, healthcare, information technology, and communication services sectors and was underweight in the financials and industrials sectors. We had no exposure to stocks in the materials, energy, utilities, or real estate sectors. From a geographic standpoint we were overweight in emerging markets and Europe and underweight in developed Asia and North America.
Top Ten Holdings as of December 31, 2023 |
| |
1 Novo Nordisk AS, Class B | |
| |
| |
| |
| |
| |
| |
| |
| |
10 Shopify, Inc., Class A | |
The portfolio is actively managed and holdings are subject to change. There is no guarantee the Fund continues to invest in the securities referenced. The holdings listed exclude any temporary cash investments, are presented on an individual security basis and do not represent holdings of the issuer. |
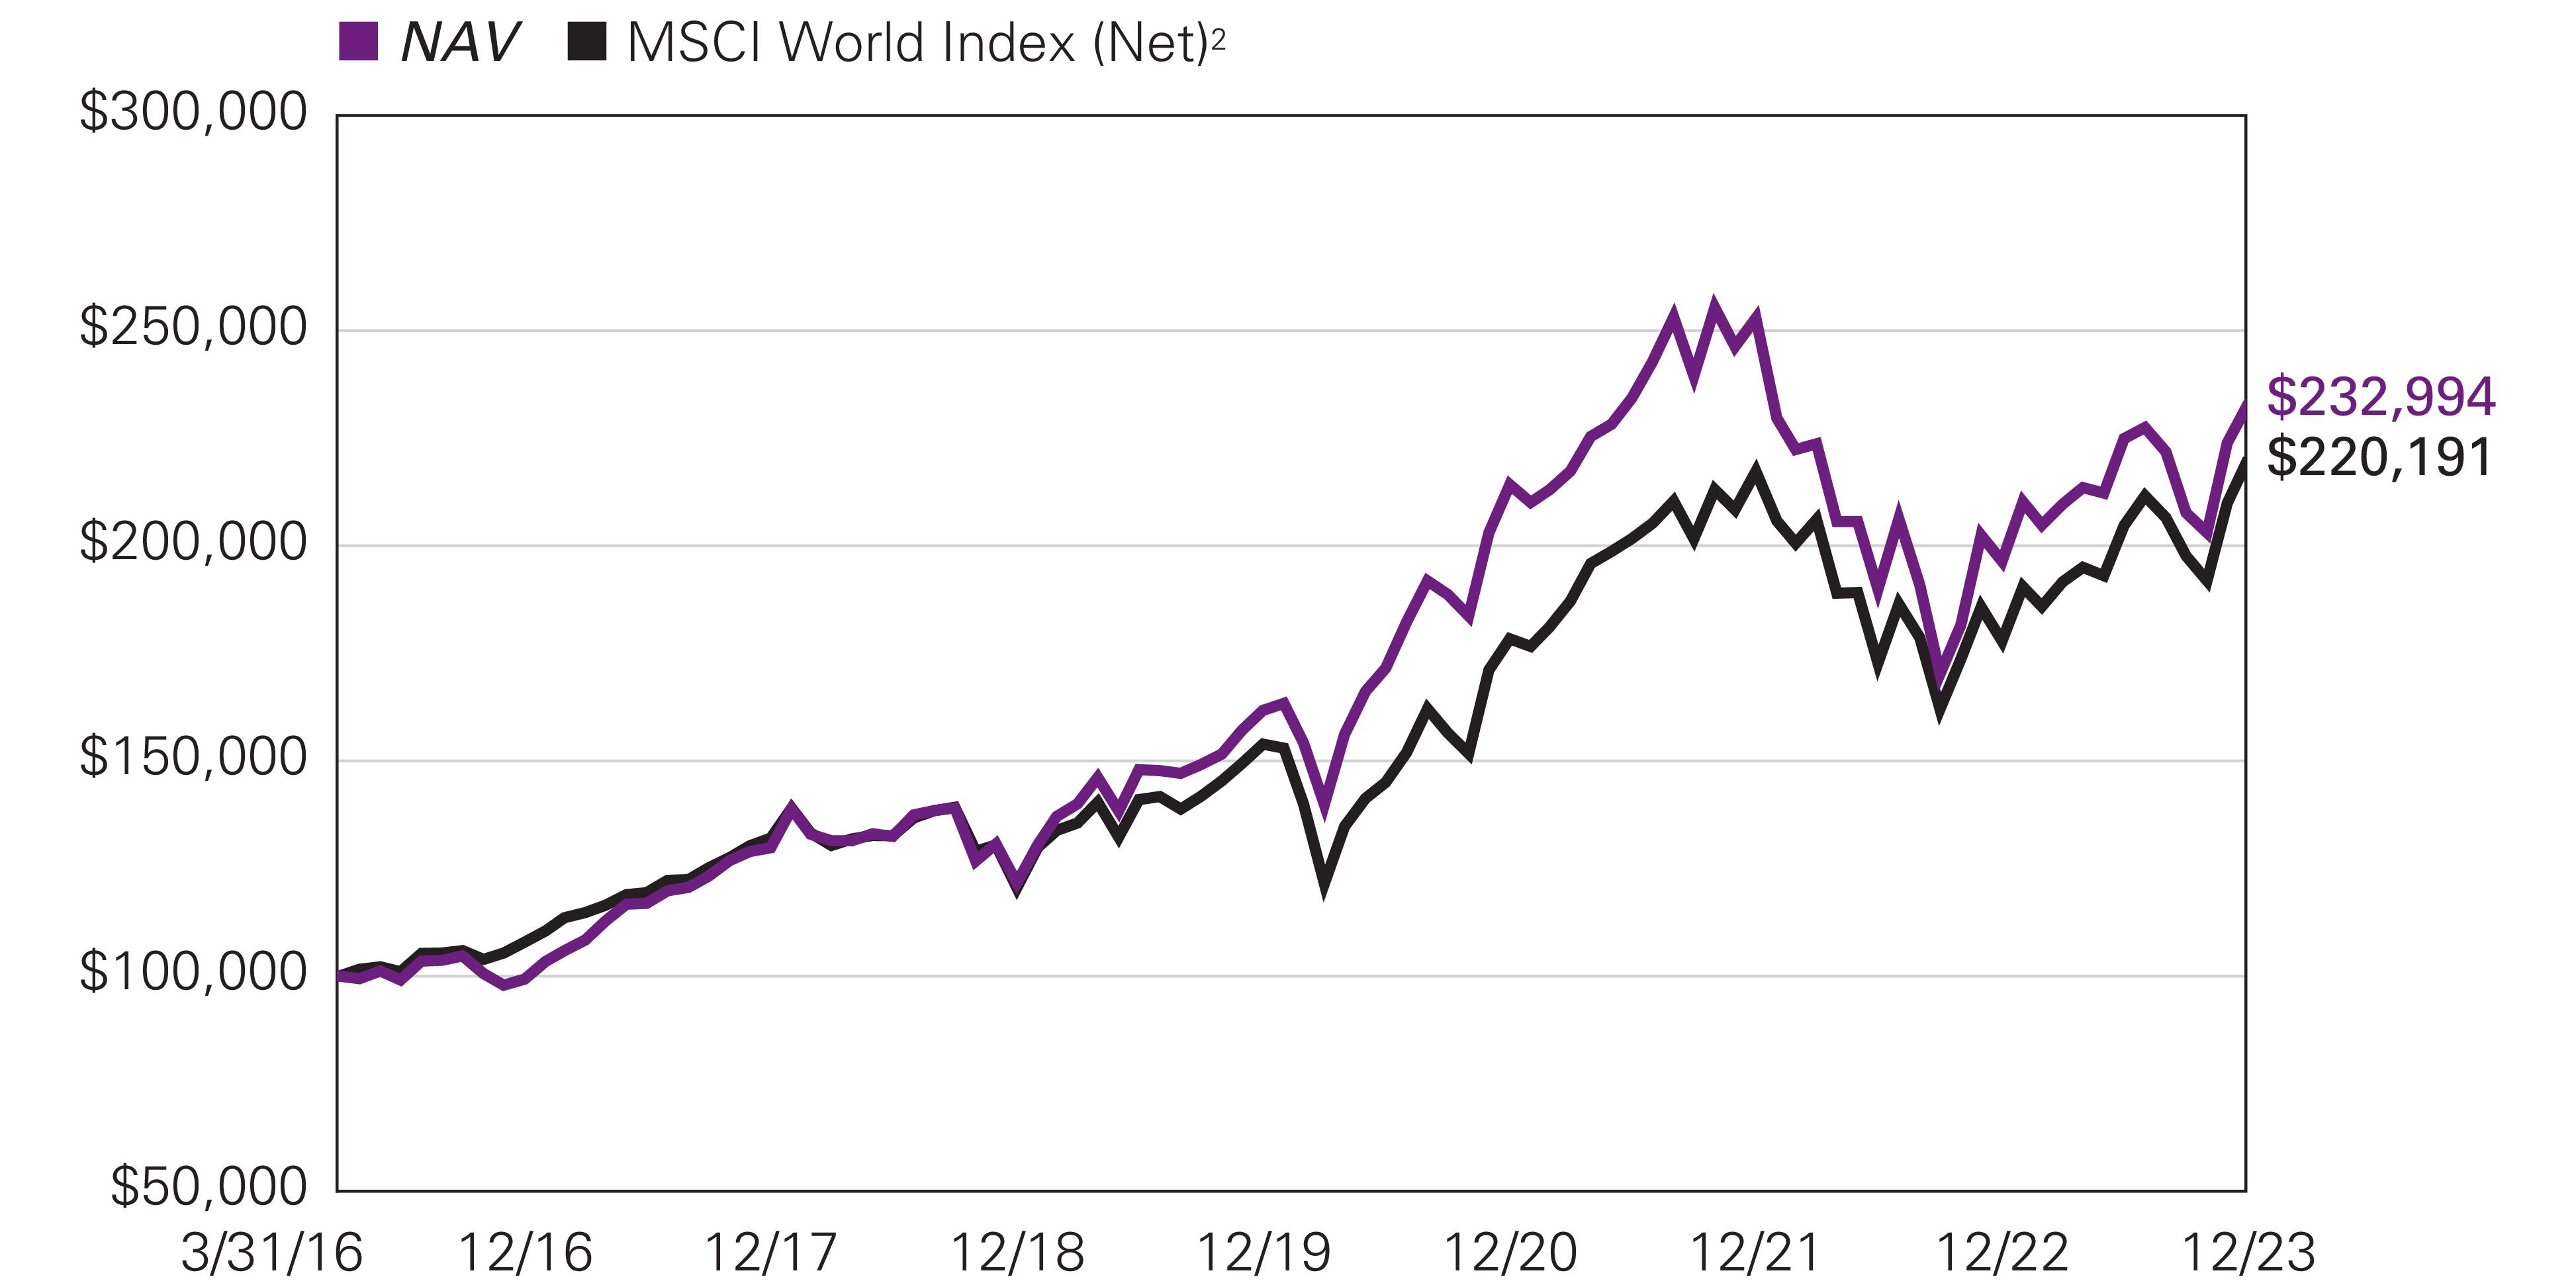
Hypothetical Growth of $100,000 Investment in Class Y Shares1 |
December 15, 2020 (inception) through December 31, 2023 |
Loomis Sayles International Growth Fund
Average Annual Total Returns —December 31, 20231 |
| | | |
| | |
Class Y (Inception 12/15/20) | | | | |
| | | | |
Class A (Inception 12/15/20) | | | | |
| | | | |
With 5.75% Maximum Sales Charge | | | | |
Class C (Inception 12/15/20) | | | | |
| | | | |
| | | | |
Class N (Inception 12/15/20) | | | | |
| | | | |
| | | | |
MSCI ACWI ex USA Index (Net)2 | | | | |
Performance data shown represents past performance and is no guarantee of, and not necessarily indicative of, future results. Total return and value will vary, and you may have a gain or loss when shares are sold. Current performance may be lower or higher than quoted. For most recent month-end performance, visit im.natixis.com/performance. Performance for other share classes will be greater or less than shown based on differences in fees and sales charges. You may not invest directly in an index. Performance for periods less than one year is cumulative, not annualized. Returns reflect changes in share price and reinvestment of dividends and capital gains, if any. The table(s) do not reflect taxes shareholders might owe on any fund distributions or when they redeem their shares.
| Fund performance has been increased by fee waivers and/or expense reimbursements, if any, without which performance would have been lower. |
| The MSCI ACWI ex USA Index captures large and mid cap representation across 22 of 23 Developed Markets (DM) countries (excluding the US) and 24 Emerging Markets (EM) countries. With 2,311 constituents, the index covers approximately 85% of the global equity opportunity set outside the US. |
| Expense ratios are as shown in the Fund’s prospectus in effect as of the date of this report. The expense ratios for the current reporting period can be found in the Financial Highlights section of this report under Ratios to Average Net Assets. Net expenses reflect contractual expense limitations set to expire on 4/30/24. When a Fund’s expenses are below the limitation, gross and net expense ratios will be the same. See Note 5 of the Notes to Financial Statements for more information about the Fund’s expense limitations. |
| Performance for Class C shares assumes a 1.00% contingent deferred sales charge (“CDSC”) applied when you sell shares within one year of purchase. |
Investment GoalThe Fund seeks long-term capital appreciation.
Market Conditions
U.S. equity markets showed strength in 2023 following a challenging 2022, aided by better-than-expected economic data. The calendar year included heightened volatility, highlighted by turmoil in the banking sector in March and pressure in October when Hamas, an Islamist political and military organization, orchestrated an attack against Israel, shaking the geopolitical landscape and markets. The U.S. 10-Year yield rose as high as 5% before declining and ending the period around 3.86% as investors continued to digest economic data and expectations on interest rates. In the fourth quarter, the U.S. reported its strongest gross domestic product growth in nearly two years at 4.3% annualized.
Markets were shaken in March as worry about the health of the banking system spread, ignited by the collapse of Silicon Valley Bank and Signature Bank and furthered by UBS’s purchase of Credit Suisse at a discounted valuation. Major banking institutions and government agencies around the globe stepped in to help assure depositors their money was safe, which helped avoid contagion across the system. Central banks throughout the world continued to tighten monetary policy to combat elevated inflation. The U.S. Federal Reserve increased its benchmark interest rate by a total of 100 basis points to reach 5.50%. Inflation in the U.S. decelerated throughout the year, and the Federal Reserve paused its interest rate increases toward the end of the year while assessing economic data.
Performance Results
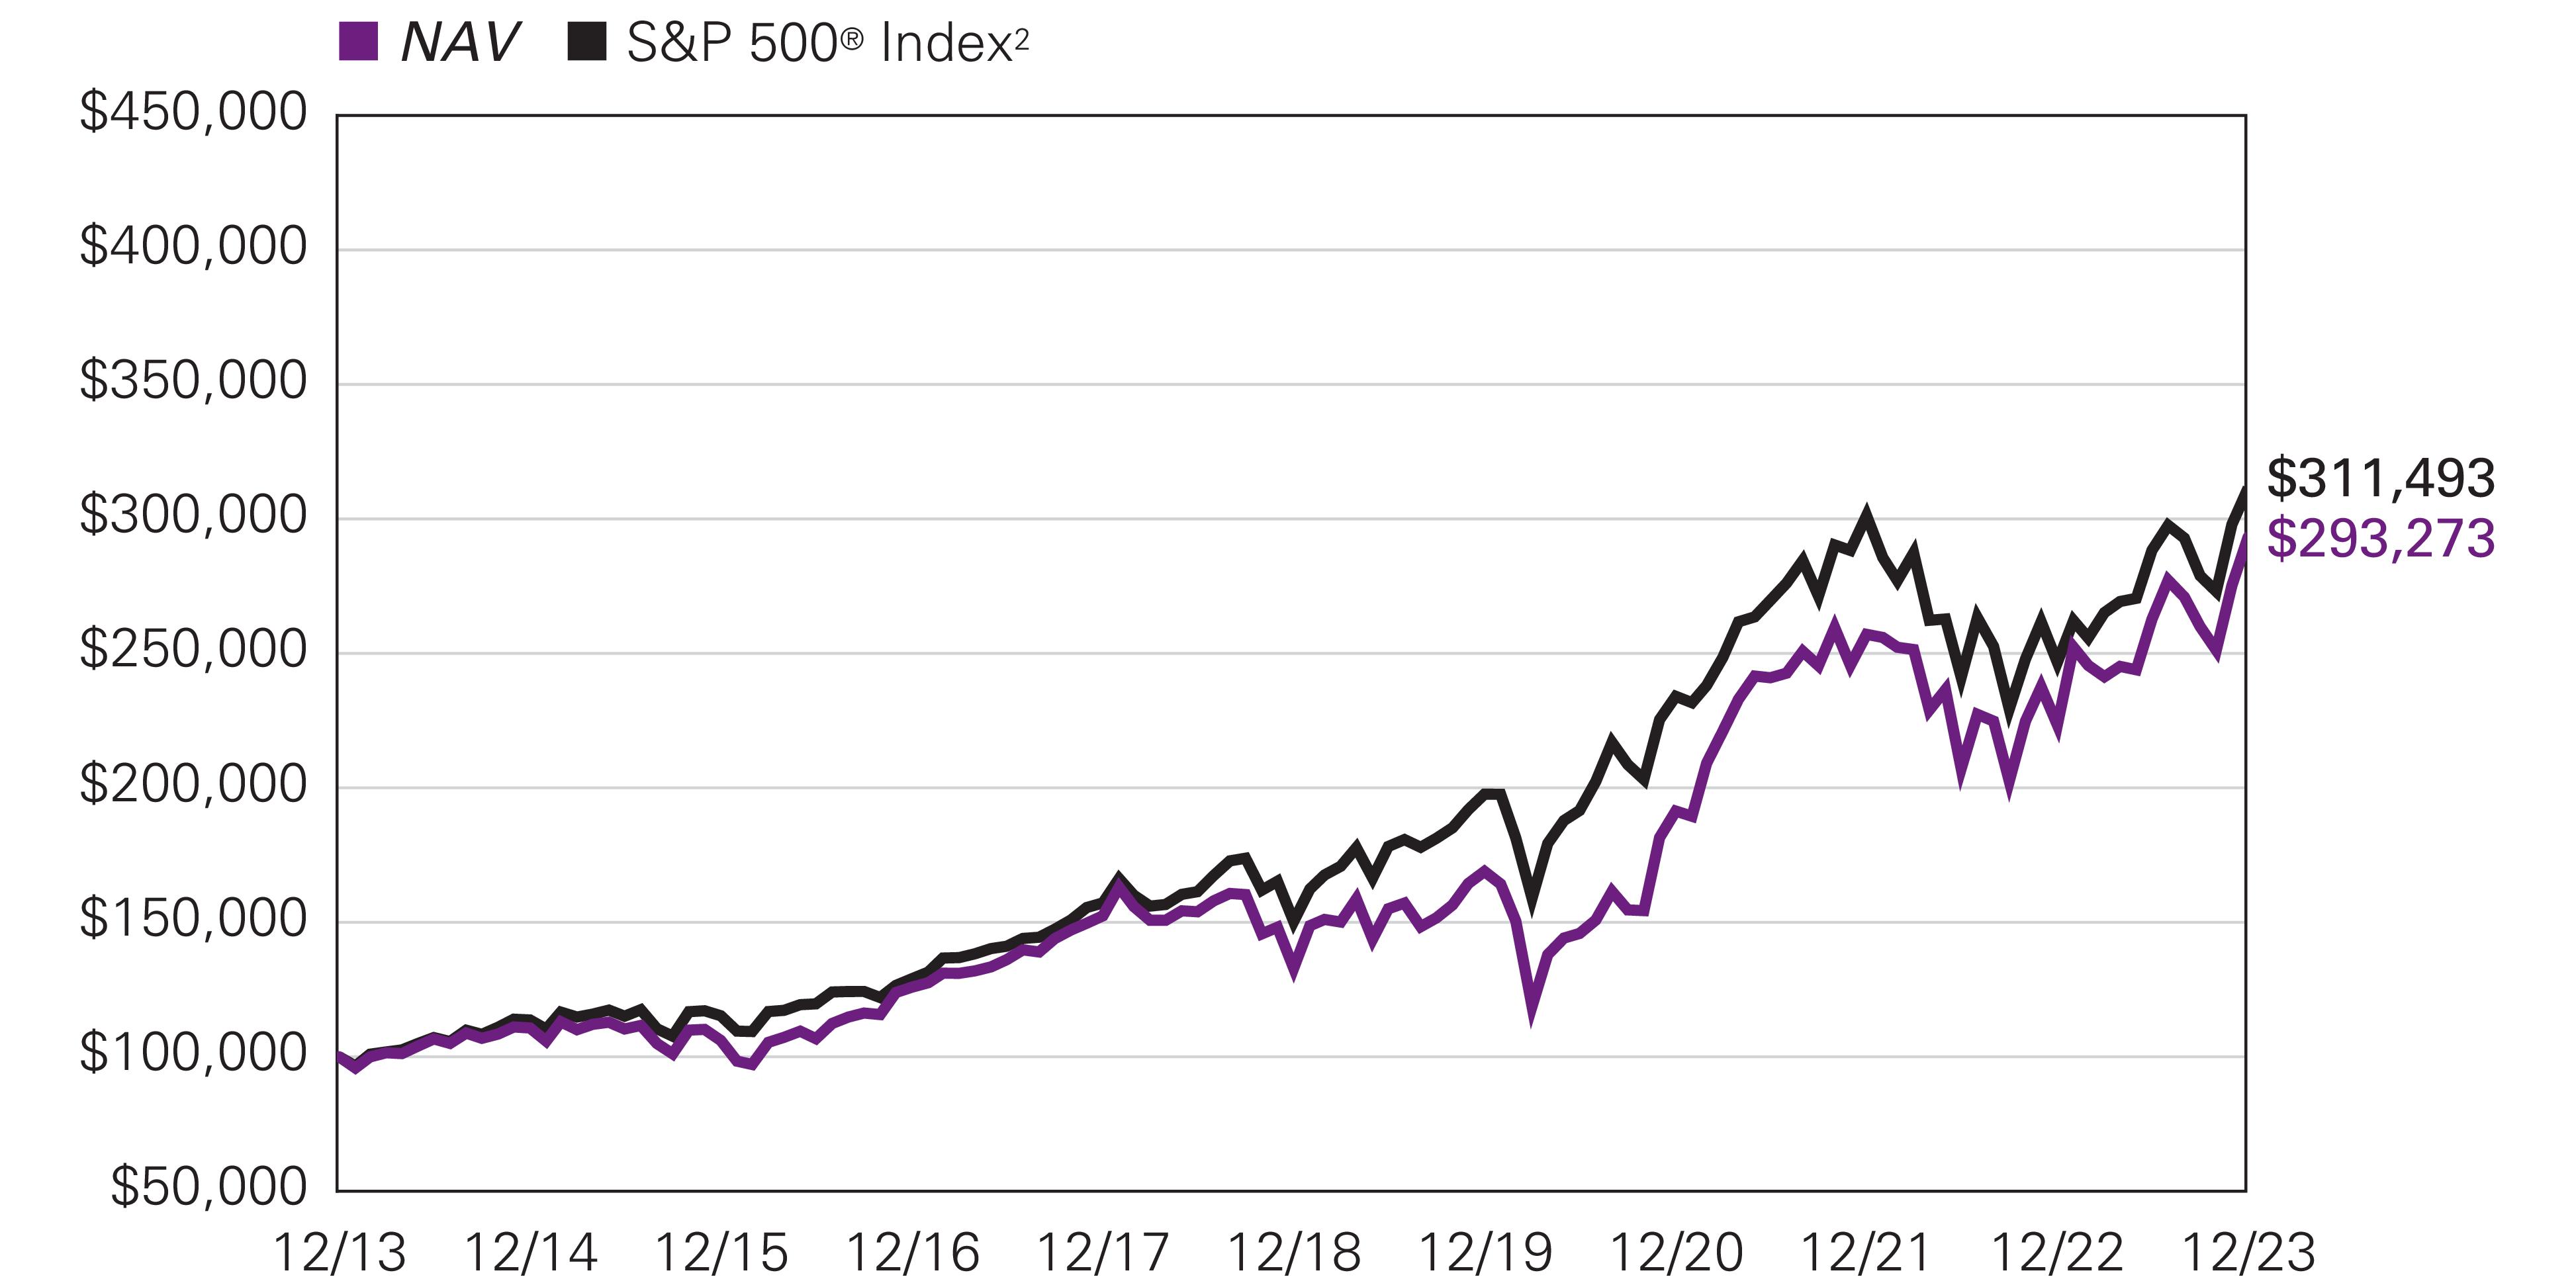
For the 12 months ended December 31, 2023, Class Y shares of the Natixis Oakmark Fund returned 31.28% at net asset value. The Fund outperformed its benchmark, the S&P 500® Index, which returned 26.29%.
Explanation of Fund Performance
On an absolute-return basis, the financials sector contributed the most to the return of the Fund, while consumer staples was the largest detractor to total performance.
Meta was a top contributor for the year. The underlying health of the U.S. social media company’s platforms remained strong, in our view, as daily active users reached new all-time highs. CEO Mark Zuckerberg said since the launch of Reels, time spent on Instagram has increased 24% and monetization is improving rapidly. Furthermore, the company’s technical enhancements around targeting seem to be gaining steam with advertisers, and management remains bullish on the continued growth of messaging across their platforms. We appreciate Meta’s keen focus on operating efficiency and believe its major investments in AI infrastructure over the past couple years have positioned it well.
KKR was also a top contributor for the year. In August, the New York-headquartered investment company reported second-quarter results that were modestly ahead of consensus estimates, largely due to increased transactional activity as capital markets activity accelerated. Management has highlighted that more than 30 strategies will come to market in the next 12 to 18 months and noted this number is likely to increase during the third quarter. Separately, KKR launched its retail-oriented private equity and infrastructure funds mid-year. Management said initial fundraising performance was ahead of expectations and it remains bullish on the 5- to 10-year opportunity in this largely untapped market, citing KKR’s brand, track record, and significantly expanded marketing and distribution teams. Finally, in November, KKR announced its acquisition of the remaining 37% of Global Atlantic (GA) for $2.7 billion. GA has a strong retail distribution network for its annuity business, which KKR can leverage as it continues to establish its own retail funds.
APA Corp. was a top detractor for the year. Despite reporting solid business fundamentals, the oil and natural gas explorer traded lower alongside increased volatility in commodity markets. We continue to believe APA has a long runway of underappreciated inventory in the form of untapped energy assets in the ground, which results in less capital required to replace assets and grow the
business over time. We also appreciate that at our estimate of normalized oil prices, APA generates a double-digit free cash flow yield, and management is returning cash to shareholders via sustainable buybacks and dividends.
Liberty Broadband was also a top detractor for the year despite reporting solid results. The U.S. communication services company owns GCI, the primary cable provider in Alaska, and has a notable stake in Charter Communications. We believe Liberty Broadband is trading at a material discount to its net asset value and that our ownership provides access to Charter Communications at a discount. Liberty Broadband’s management team is taking advantage of this discount by repurchasing shares. We would not be surprised to see the price-value gap reduced or eliminated through a transaction with Charter Communications.
Outlook
We believe our intensive research process and focus on the long term help us find opportunities despite the pervasive themes of the time. When the market does not separate the macro from the micro, this creates an exploitable opportunity for long-term investors. We use times of uncertainty and volatility to strategically position our portfolios for long-term success and believe this approach best positions us for achieving the protection and appreciation of our investors’ capital over the long term.
Top Ten Holdings as of December 31, 2023 |
| |
1 Alphabet, Inc., Class A | |
2 Capital One Financial Corp. | |
3 Intercontinental Exchange, Inc. | |
| |
| |
| |
| |
| |
9 American International Group, Inc. | |
| |
The portfolio is actively managed and holdings are subject to change. There is no guarantee the Fund continues to invest in the securities referenced. The holdings listed exclude any temporary cash investments, are presented on an individual security basis and do not represent holdings of the issuer. |
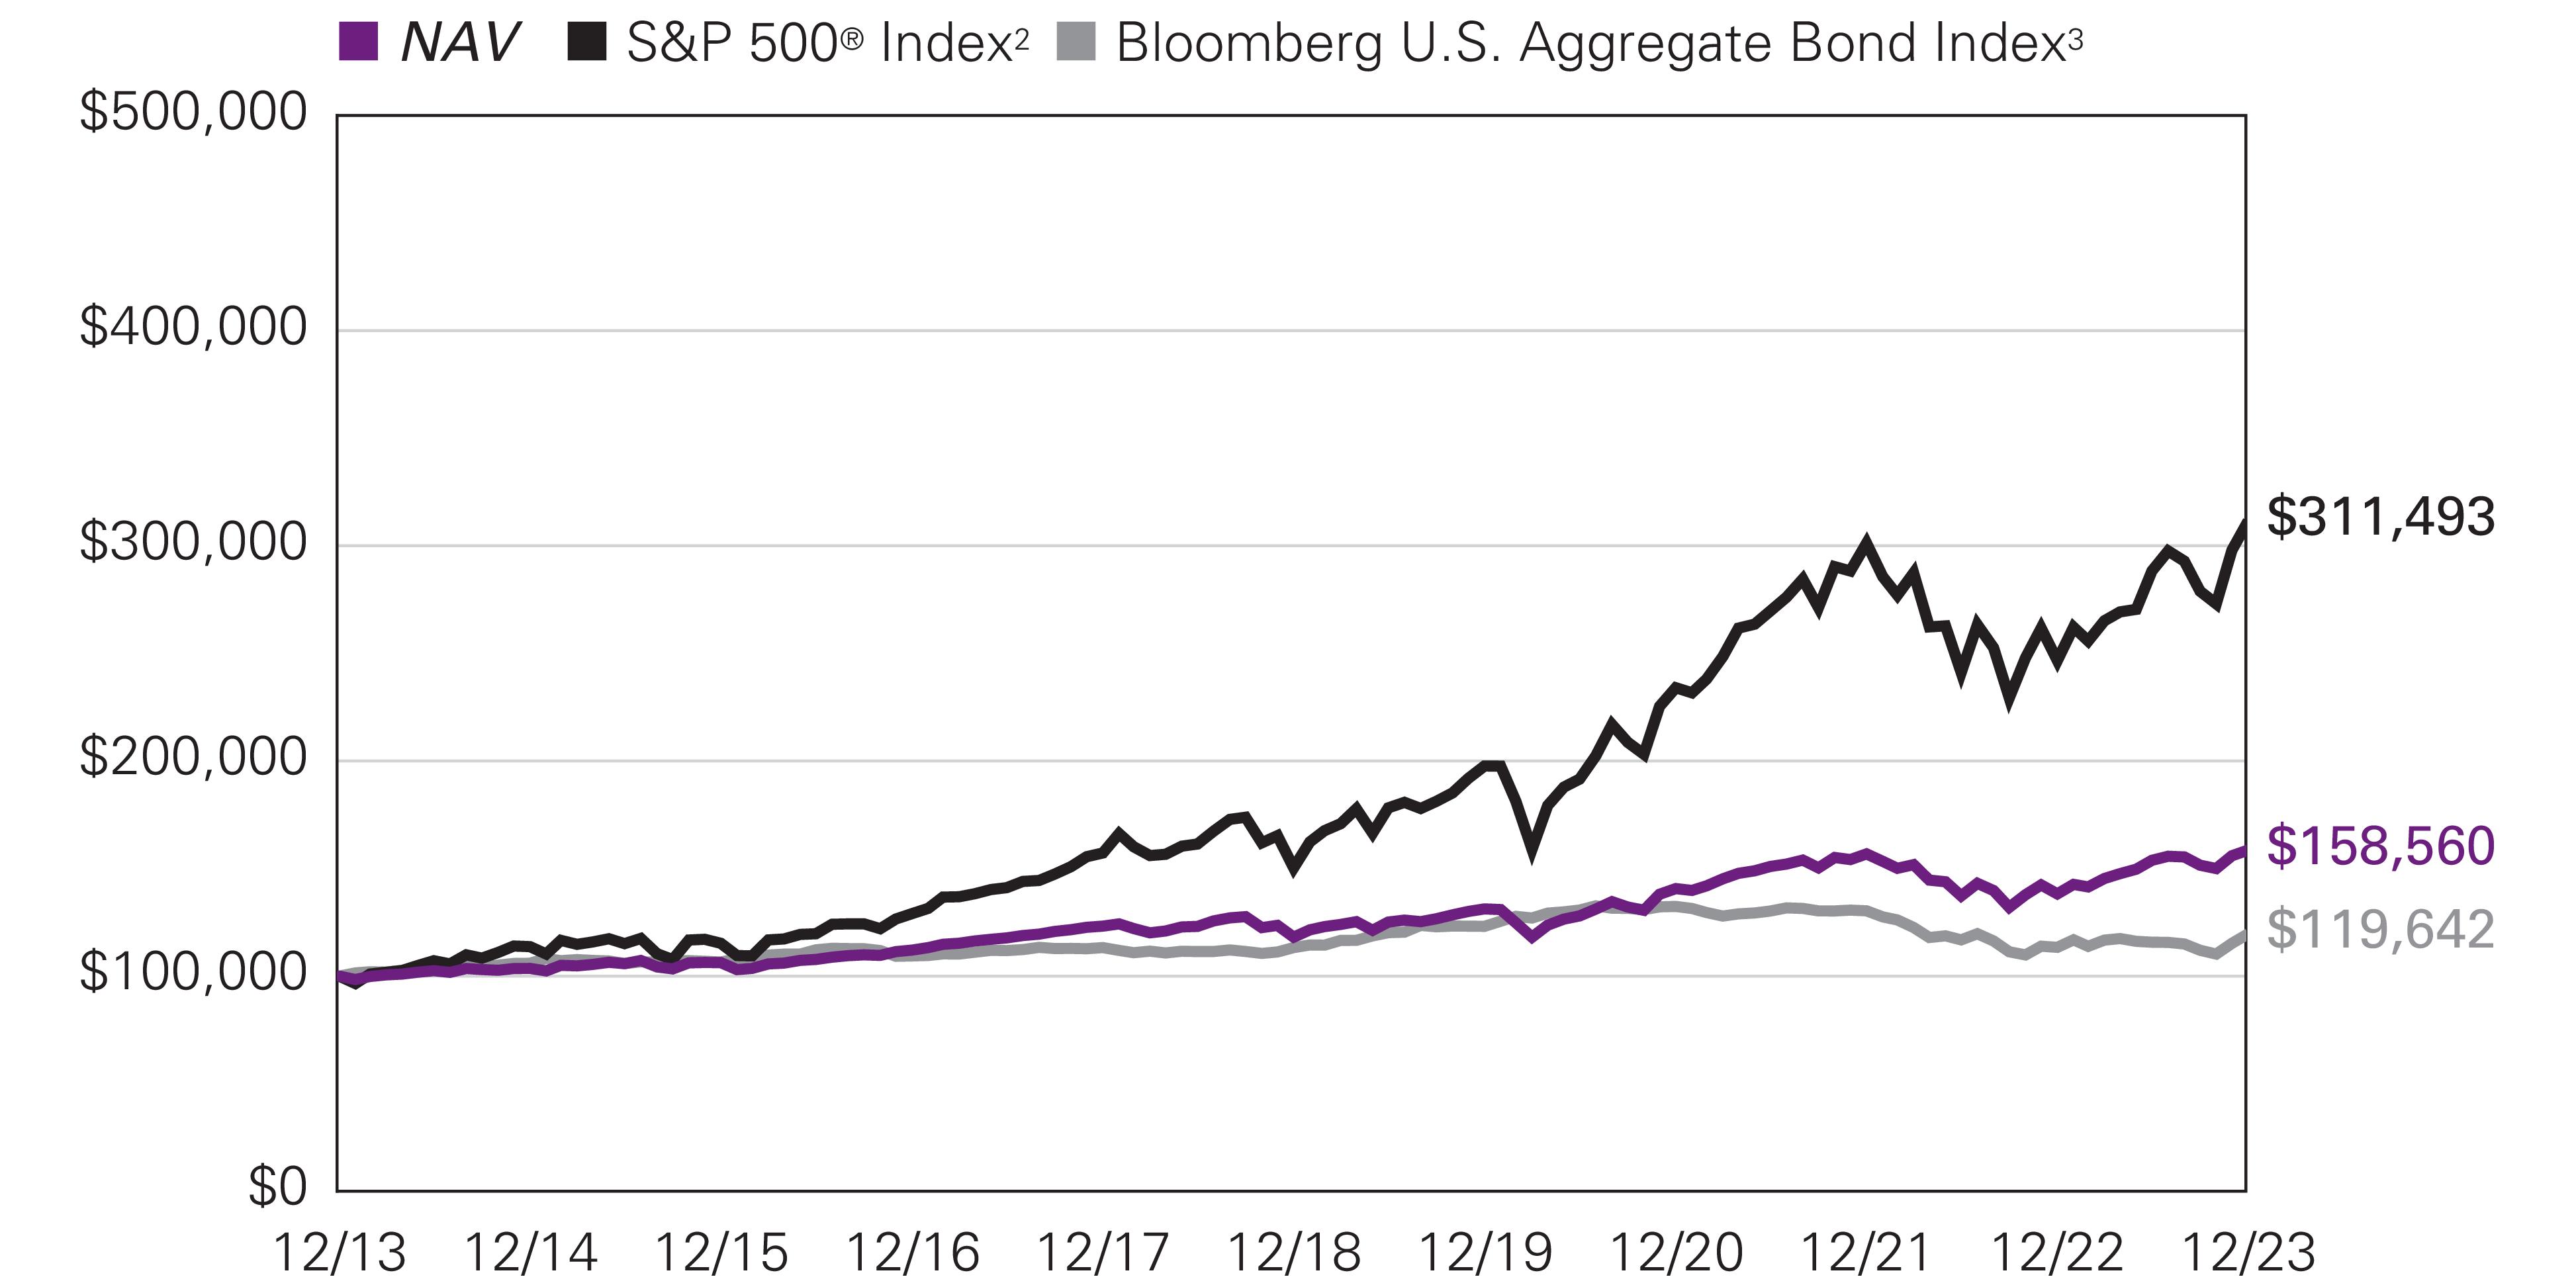
Hypothetical Growth of $100,000 Investment in Class Y Shares1 |
December 31, 2013 through December 31, 2023 |
Average Annual Total Returns —December 31, 20231 |
| | | | | |
| | |
| | | | | | |
| | | | | | |
| | | | | | |
| | | | | | |
With 5.75% Maximum Sales Charge | | | | | | |
| | | | | | |
| | | | | | |
| | | | | | |
Class N (Inception 5/1/17) | | | | | | |
| | | | | | |
| | | | | | |
| | | | | | |
Performance data shown represents past performance and is no guarantee of, and not necessarily indicative of, future results. Total return and value will vary, and you may have a gain or loss when shares are sold. Current performance may be lower or higher than quoted. For most recent month-end performance, visit im.natixis.com/performance. Performance for other share classes will be greater or less than shown based on differences in fees and sales charges. You may not invest directly in an index. Performance for periods less than one year is cumulative, not annualized. Returns reflect changes in share price and reinvestment of dividends and capital gains, if any. The table(s) do not reflect taxes shareholders might owe on any fund distributions or when they redeem their shares.
| Fund performance has been increased by fee waivers and/or expense reimbursements, if any, without which performance would have been lower. |
| S&P 500® Index is a widely recognized measure of U.S. stock market performance. It is an unmanaged index of 500 common stocks chosen for market size, liquidity, and industry group representation, among other factors. It also measures the performance of the large cap segment of the U.S. equities market. |
| Expense ratios are as shown in the Fund’s prospectus in effect as of the date of this report. The expense ratios for the current reporting period can be found in the Financial Highlights section of this report under Ratios to Average Net Assets. Net expenses reflect contractual expense limitations set to expire on 4/30/24. When a Fund’s expenses are below the limitation, gross and net expense ratios will be the same. See Note 5 of the Notes to Financial Statements for more information about the Fund’s expense limitations. |
| Performance for Class C shares assumes a 1.00% contingent deferred sales charge (“CDSC”) applied when you sell shares within one year of purchase, and includes automatic conversion to Class A shares after eight years. |
Natixis Oakmark International Fund
| Effective August 31, 2023, Eric Liu serves as portfolio manager of the Fund. |
Investment GoalThe Fund seeks long-term capital appreciation.
Market Conditions
Major global markets generally showed strength in 2023 following a challenging 2022. The calendar year included heightened volatility, highlighted by turmoil in the banking sector in March and pressure in October when Hamas, an Islamist political and military organization, orchestrated an attack against Israel, shaking the geopolitical landscape and markets. While the U.S. and European equity markets showed strength on the back of better-than-expected economic data, Asian markets were mixed with Chinese equities experiencing pressure and Japanese equities reaching 30-year highs during the period. The U.S.10-Year yield rose as high as 5% before declining and ending the period around 4% as investors continued to digest economic data and expectations on interest rates.
Central banks throughout the world continued to tighten monetary policy to combat elevated inflation. The U.S. Federal Reserve increased its benchmark interest rate by a total of 100 basis points to reach 5.50%, the European Central Bank opted for 200 basis points to reach 4.50%, and the Bank of England chose 175 basis points to reach 5.25%. Inflation in the U.S. and eurozone decelerated throughout the year, with most central banks pausing their interest rate increases toward the end of the year while assessing economic data. The Bank of Japan continued its accommodative monetary policy stance although it took a step toward reversing the policy when it announced that the 1% cap on its 10-year government bonds would be considered a reference rate going forward. In the fourth quarter, the yen reversed its trend and gained value, ending the period at approximately 141 USD/JPY.
Performance Results
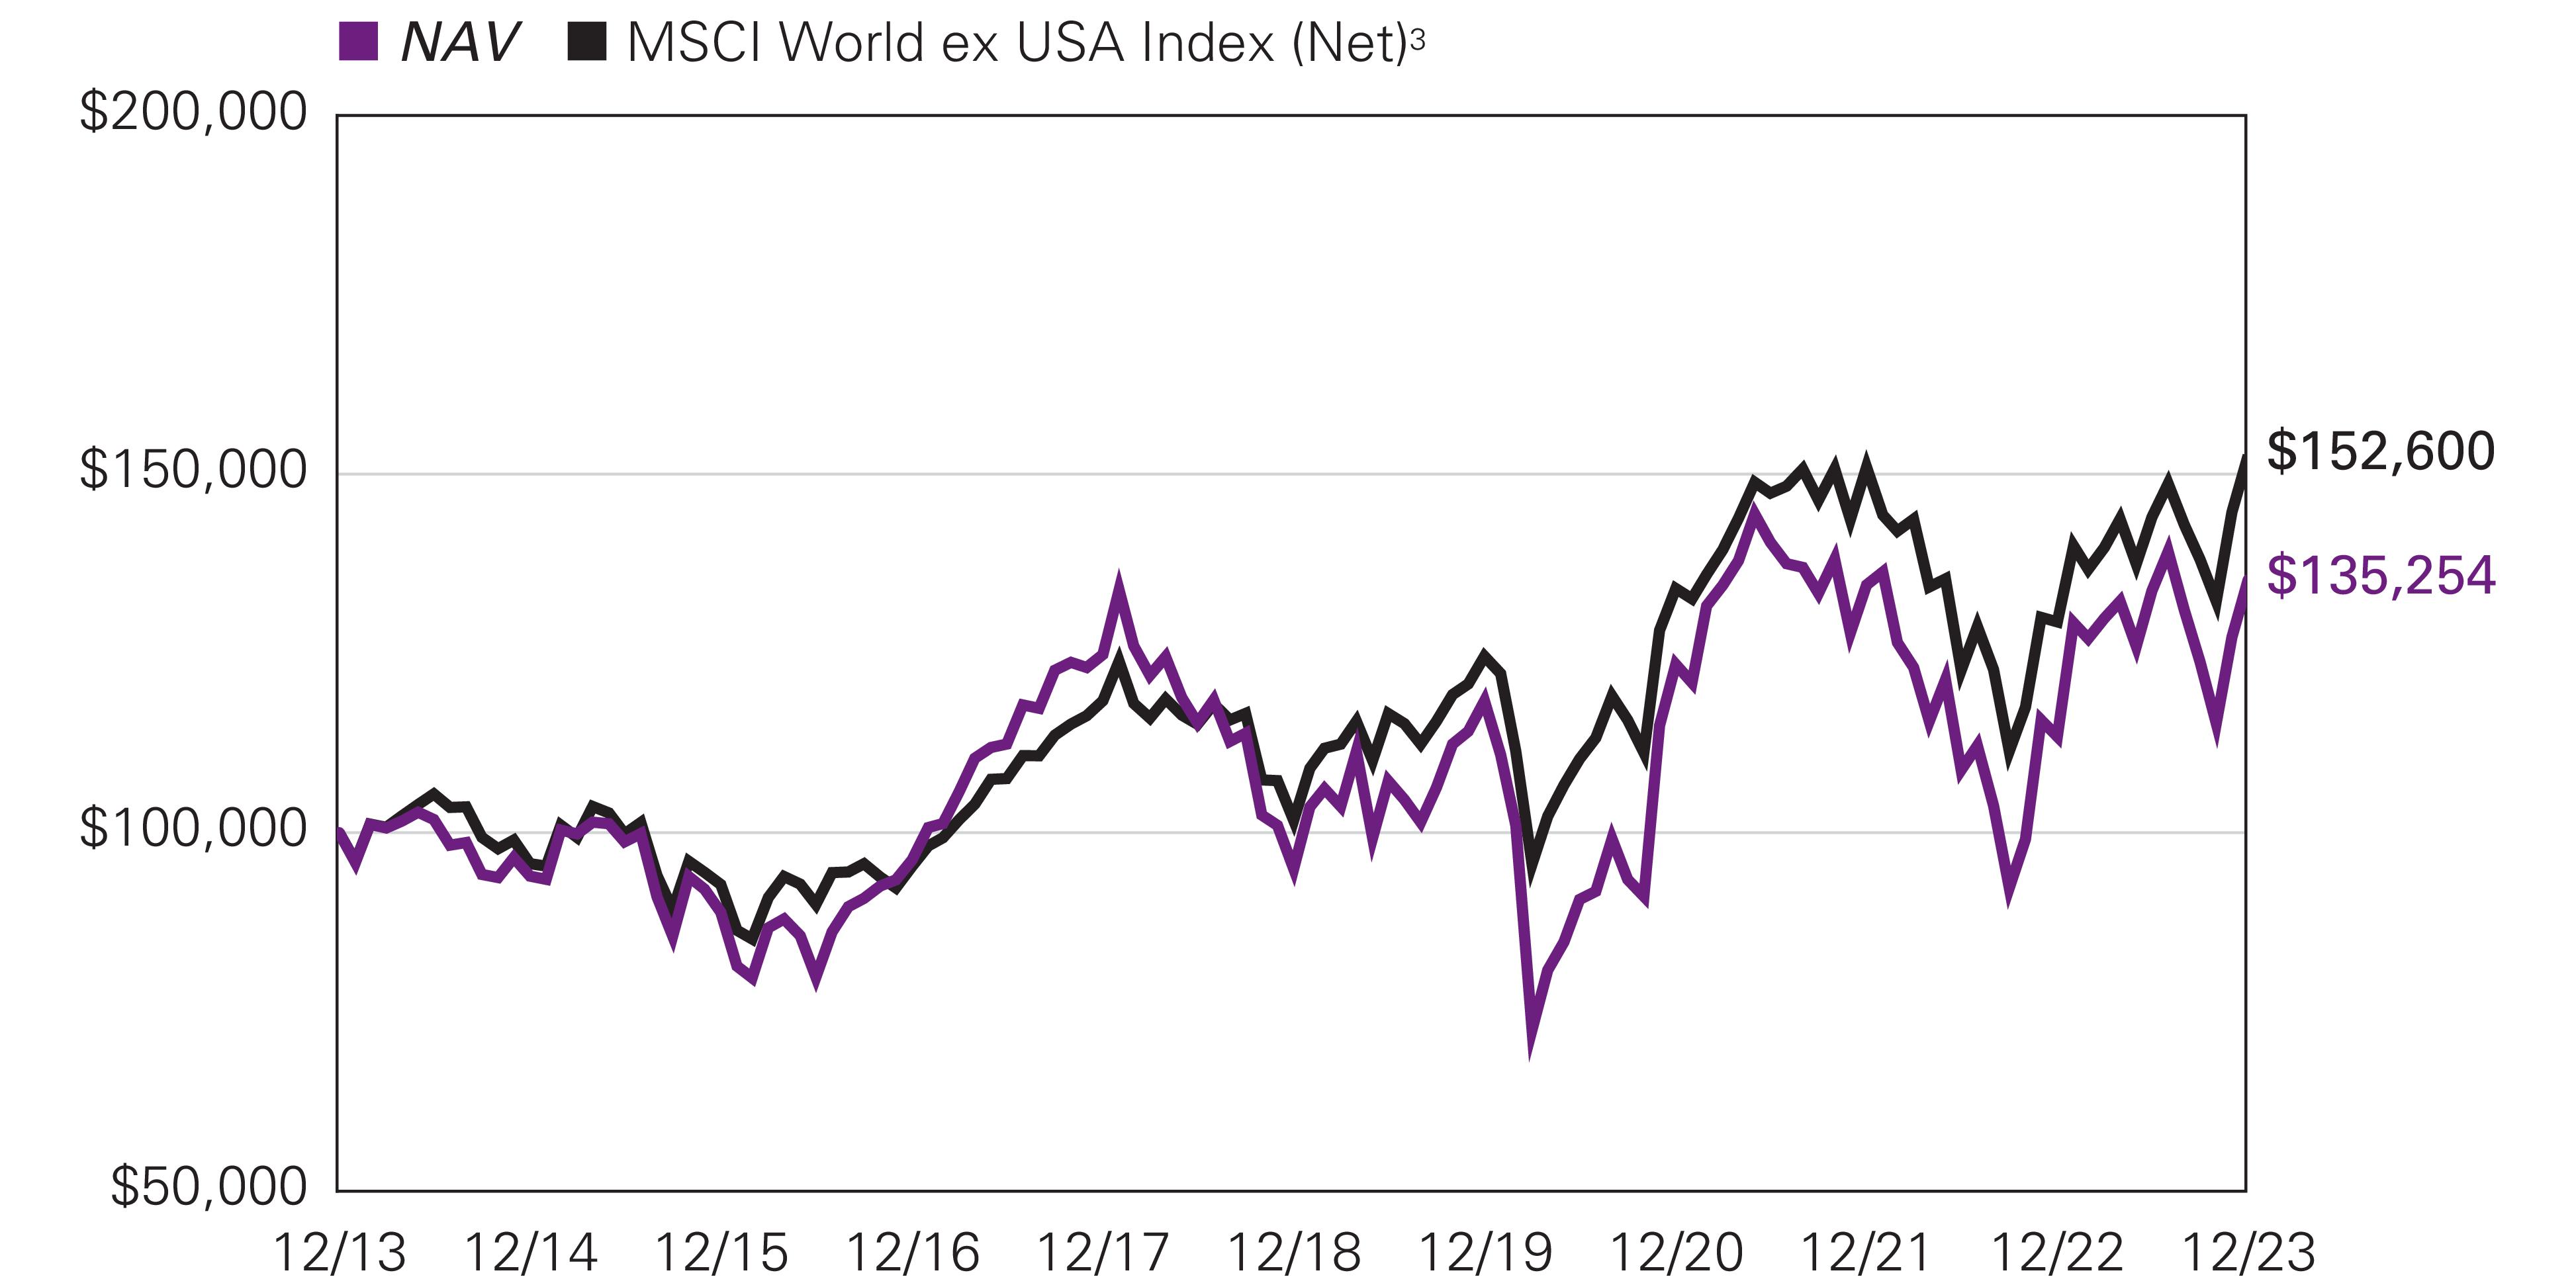
For the 12 months ended December 31, 2023, Class Y shares of the Natixis Oakmark International Fund returned 19.26% at net asset value. The Fund outperformed its benchmark, the MSCI World ex USA Index (Net), which returned 17.94%.
Explanation of Fund Performance
The industrials sector contributed most to the Fund’s return and no sectors impacted Fund performance negatively.
Ryanair was a top contributor for the year. The Irish airline benefitted from strong travel demand within Europe as well as a pickup in foreign visitors to the region. During our mid-year conversations with management, CEO Michael O’Leary was optimistic about Ryanair’s future due to increased bookings industry-wide, expectations for higher oil prices and elevated cost structures of peers driving higher pricing. We appreciate that Ryanair continues to reduce unit costs and widen the gap between itself and more capacity-constrained European competitors. In the fourth quarter, Ryanair reported additional revenue growth and strong free cash flow levels, which allowed the company to reinstate a EUR 400 million dividend and announce an incremental EUR 1.5 billion return to shareholders starting in 2025.
Intesa Sanpaolo, the largest bank in Italy, was a top contributor for the year. Intesa has generated substantial net profit increases in recent periods thanks to a significant rise in net interest income. This was consistent with our view that Intesa would dramatically benefit from rising rates. In addition, Intesa’s non-performing loan formation has continued to decline, reflecting its low-risk business model and strong underwriting practices. Management has also been able to keep operating costs well-controlled thanks to efficiency measures that have largely offset inflationary impacts. With one of the highest dividend payout ratios in Europe, Intesa has been returning capital to shareholders via buybacks while maintaining a robust balance sheet.
Worldline was a top detractor for the year. In October, the French multinational payment and transactional services company delivered a weaker than expected set of results and the stock fell significantly on the news. Management reduced growth estimates citing two factors: (1) a negative mix shift in Germany as German consumers shifted from discretionary to non-discretionary purchases and (2) merchant terminations, driven by Worldline voluntarily and proactively cutting ties with certain online merchants at risk of
Natixis Oakmark International Fund
violating new regulatory standards. We spoke with management after the results and confirmed both factors are transitory. We continue to believe the payments industry is a structurally attractive GDP+ growth market, and Worldline, as the European payments leader, has a very long growth runway given lower European cashless penetration and higher levels of bank payment in-sourcing versus the U.S.
Bayer was also a top detractor for the year. In November, shares of the German health care company fell after it announced negative news on two known unknowns: (1) Bayer stopped its phase III OCEANIC-AF trial for anti-clotting drug asundexian early due to lack of efficacy and (2) the company received an adverse RoundUp verdict for $1.5 billion over three plaintiffs. We spoke with CEO Bill Anderson after the announcement and he articulated a very strategic, thoughtful framework for managing the situation. Although we reduced our estimate of intrinsic value, we continue to view Bayer’s position across the crop sciences ecosystem as unrivaled and believe the company can take portfolio actions to unlock value.
Outlook
We believe our intensive research process and focus on the long term help us find opportunities despite the pervasive themes of the time. When the market does not separate the macro from the micro, this creates an exploitable opportunity for long-term investors. We use times of uncertainty and volatility to strategically position our portfolios for long-term success and believe this approach best positions us for achieving the protection and appreciation of our investors’ capital over the long term.
Top Ten Holdings as of December 31, 2023 |
| |
| |
2 Lloyds Banking Group PLC | |
| |
| |
| |
| |
| |
| |
9 Fresenius Medical Care AG | |
| |
The portfolio is actively managed and holdings are subject to change. There is no guarantee the Fund continues to invest in the securities referenced. The holdings listed exclude any temporary cash investments, are presented on an individual security basis and do not represent holdings of the issuer. |
Natixis Oakmark International Fund
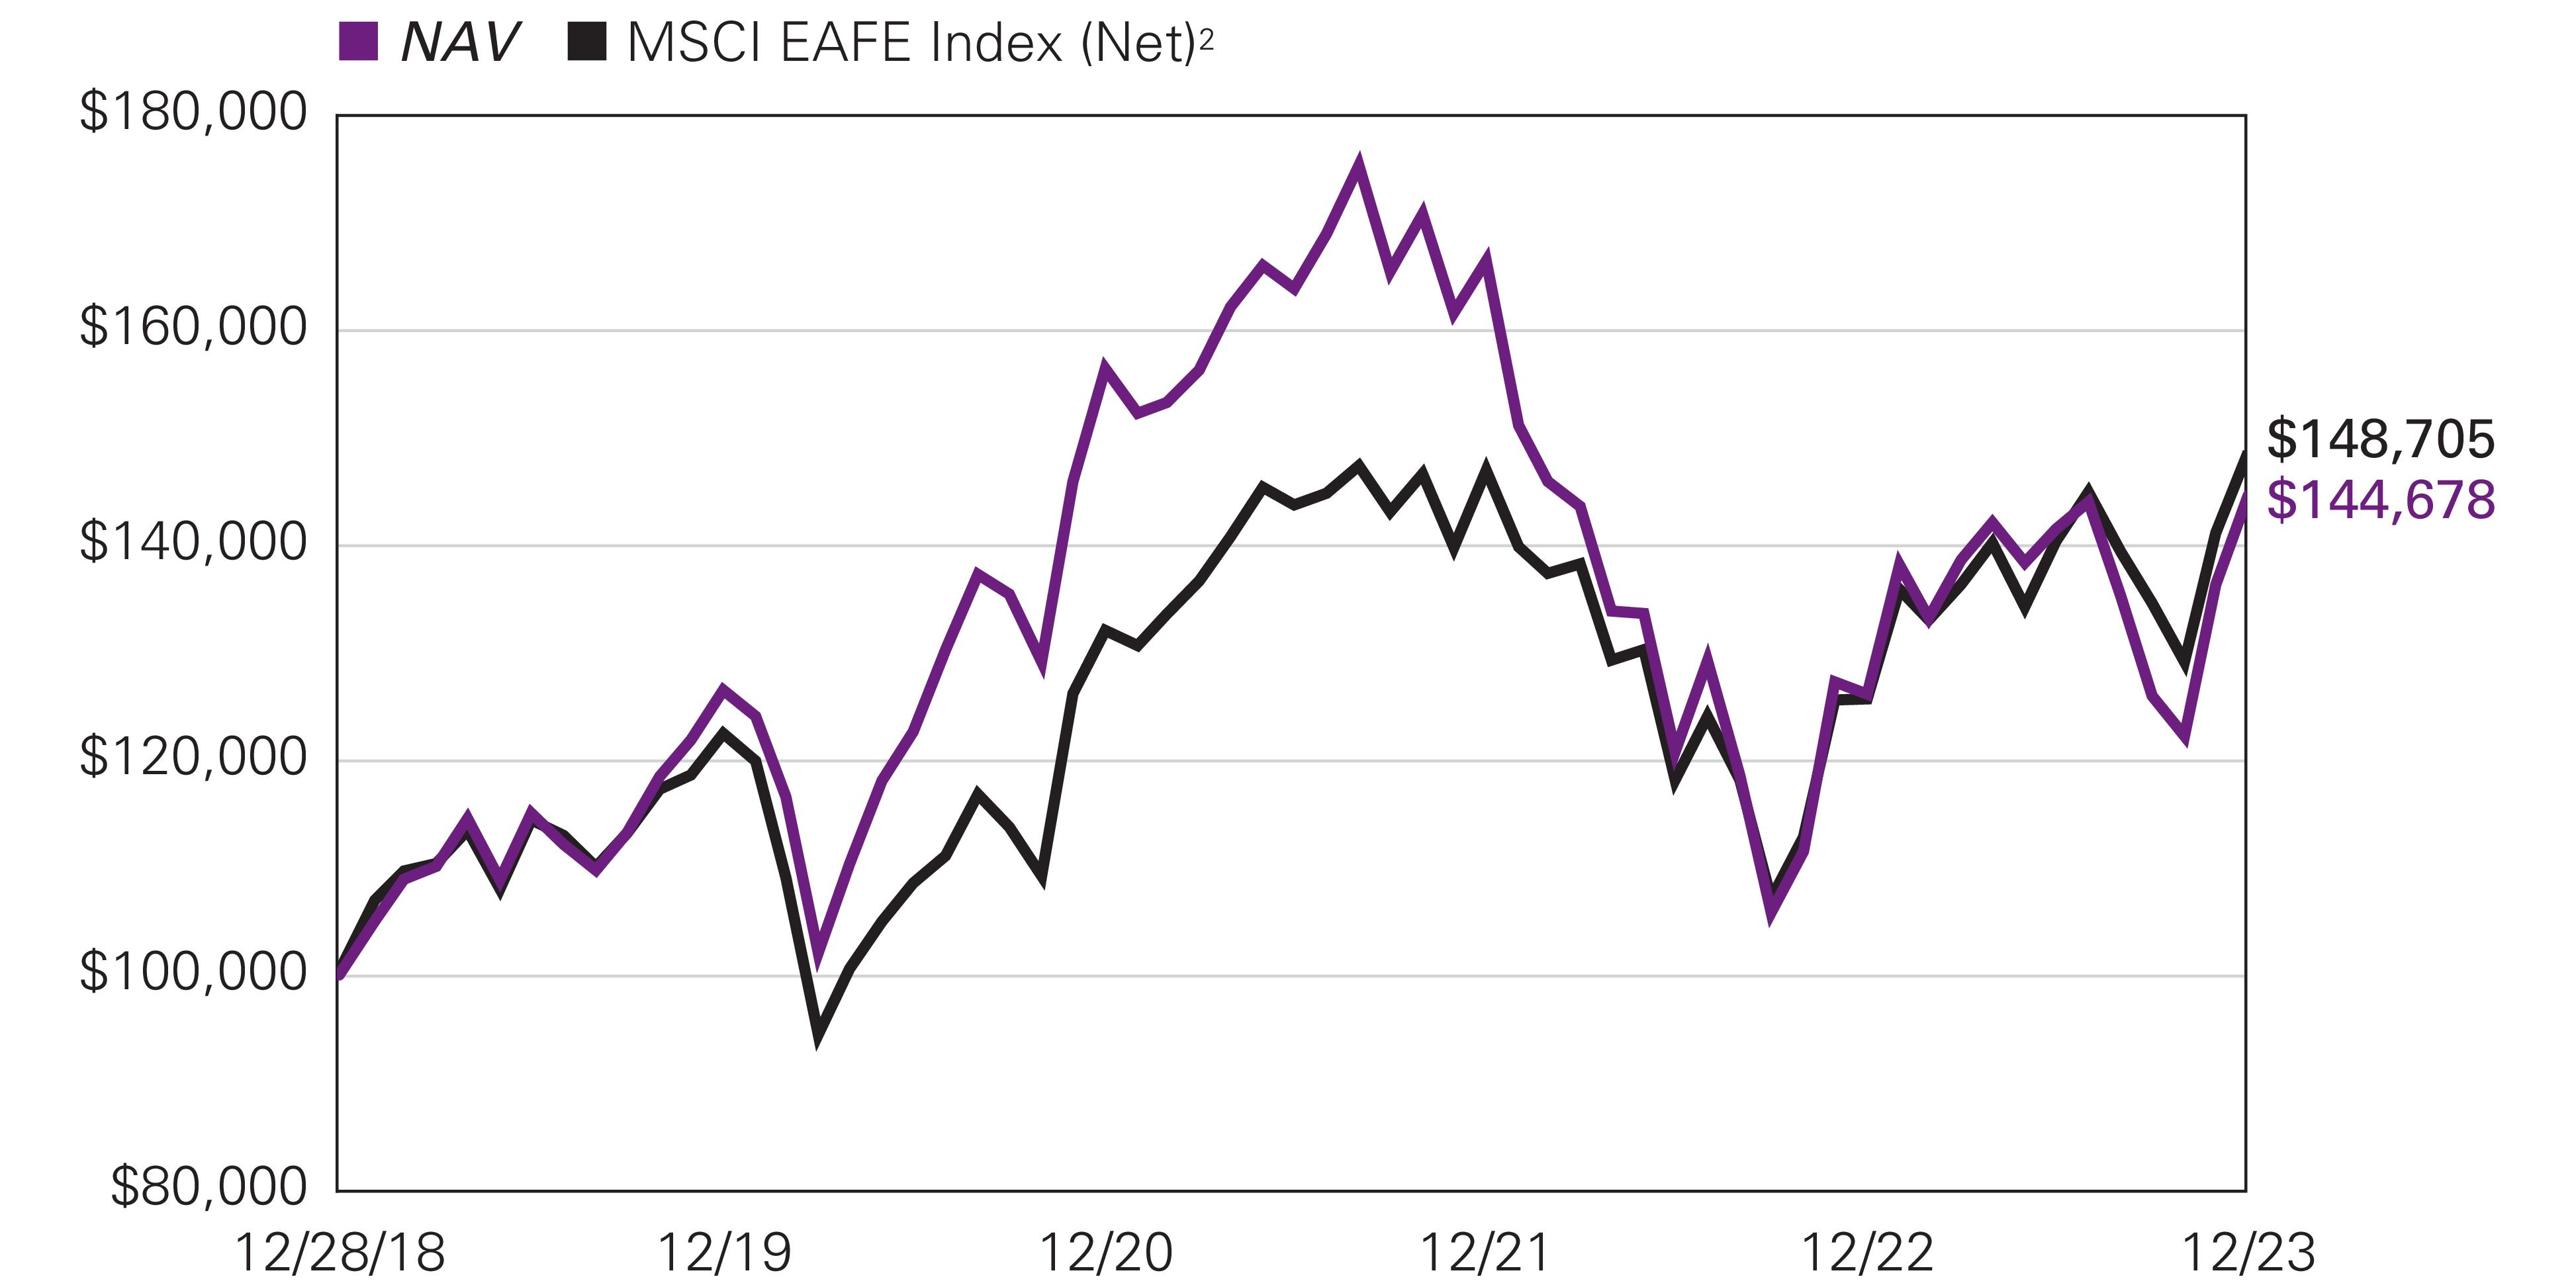
Hypothetical Growth of $100,000 Investment in Class Y Shares1, 2 |
December 31, 2013 through December 31, 2023 |
Natixis Oakmark International Fund
Average Annual Total Returns —December 31, 20231 |
| | | | | |
| | |
Class Y (Inception 5/1/17) | | | | | | |
| | | | | | |
| | | | | | |
| | | | | | |
With 5.75% Maximum Sales Charge | | | | | | |
| | | | | | |
| | | | | | |
| | | | | | |
Class N (Inception 5/1/17) | | | | | | |
| | | | | | |
| | | | | | |
MSCI World ex USA Index (Net)3 | | | | | | |
Performance data shown represents past performance and is no guarantee of, and not necessarily indicative of, future results. Total return and value will vary, and you may have a gain or loss when shares are sold. Current performance may be lower or higher than quoted. For most recent month-end performance, visit im.natixis.com/performance. Performance for other share classes will be greater or less than shown based on differences in fees and sales charges. You may not invest directly in an index. Performance for periods less than one year is cumulative, not annualized. Returns reflect changes in share price and reinvestment of dividends and capital gains, if any. The table(s) do not reflect taxes shareholders might owe on any fund distributions or when they redeem their shares.
| Fund performance has been increased by fee waivers and/or expense reimbursements, if any, without which performance would have been lower. |
| Prior to the inception of Class Y shares (5/1/2017), performance is that of Class A shares and reflects the higher net expenses of that share class. |
| MSCI World ex USA Index (Net) is an unmanaged index that is designed to measure the equity market performance of developed markets, excluding the United States. |
| Expense ratios are as shown in the Fund’s prospectus in effect as of the date of this report. The expense ratios for the current reporting period can be found in the Financial Highlights section of this report under Ratios to Average Net Assets. Net expenses reflect contractual expense limitations set to expire on 4/30/24. When a Fund’s expenses are below the limitation, gross and net expense ratios will be the same. See Note 5 of the Notes to Financial Statements for more information about the Fund’s expense limitations. |
| Performance for Class C shares assumes a 1.00% contingent deferred sales charge (“CDSC”) applied when you sell shares within one year of purchase, and includes automatic conversion to Class A shares after eight years. |
Natixis U.S. Equity Opportunities Fund
|
|
Michael J. Mangan, CFA®, CPA |
|
|
|
Aziz V. Hamzaogullari, CFA® |
Loomis, Sayles & Company, L.P.
|
Investment GoalThe Fund seeks long-term growth of capital.
Market Conditions
The Natixis U.S. Equity Opportunities Fund is composed of two separate segments, combining the value expertise of Harris Associates with the growth expertise of Loomis Sayles. The two segments have common investment philosophies and a rigorous long-term, bottom-up research process focused on high-quality businesses trading at a significant discount to intrinsic value.
Despite the economic pessimism that prevailed at the beginning of 2023, the economy continued to turn in strong results while the S&P 500® posted a 26.4% return including dividends. This came in the wake of 2022, when the U.S. Federal Reserve (Fed) began an aggressive campaign to raise interest rates, the S&P 500® posted a 19.44% loss, and many economists predicted a recession. By the end of 2023, after seven Fed rate increases, inflation as measured by the Consumer Price Index fell by more than half from 6.4% in January to 3.1%. Late in the year, the Fed announced an end to its series of rate increases and is expected to cut rates three times in 2024 as inflation continues to moderate.
Despite declining inflation during 2023, mortgage rates remained high by recent standards, hitting a 20-year high of 8% in October. When the Fed reported that the rate hiking cycle had ended, mortgage rates began to fall, settling below 7% in December. Despite this fact, mortgage rates are still twice as high as they were in January 2021. Housing prices continued to increase, with median home prices rising above $400,000 in the third quarter as inventory fell to new lows, making it difficult for new buyers to enter the market. With many employees on hybrid schedules, commercial real estate took a beating that is expected to continue into 2024. This sector lost $590 billion in value in 2023 and is expected to hemorrhage a further $480 billion in 2024.
Contributing to the Fed’s anticipated rate cuts in 2024 were moderating job gains. While unemployment rates stayed low—below 4%—for all of 2023, job growth cooled. Wages rose robustly at 0.8% annually through November for all wages and 1.1% for non-supervisory and production workers, who make up 80% of the workforce. Consumers continued to prop up the economy in 2023, spending more than expected, even as savings from the Covid-19 pandemic dwindled.
On the technology front, generative artificial intelligence (AI) took the economy and markets by storm. Worldwide generative AI spending neared $20 billion in 2023, as organizations sought to monetize this productivity-enhancing technology. The seven largest technology stocks by market capitalization led the market in 2023, contributing nearly half the overall stock market gain. Overall, technology stocks turned in their best performance since 2009, rallying by 59.1%. The tech-heavy Nasdaq rose by 43%. Small-cap stocks, as captured by the Russell 2000® Index, notched a 15.1% gain, as the Dow Jones Industrial Average rose by 13%.
The bond market bounced back in 2023 following its worst year on record in 2022. The 10-Year Treasury Bond yield ended 2023 at 3.84%, while the 2-Year Treasury Bill yield was 4.26%. The effective Federal Funds rate was 5.33%. The Morningstar U.S. Core Bond index rose by 5.32%, buoyed by a strong fourth quarter. Savers benefitted from higher rates, as rates on CDs, high-yield savings and newly issued bonds increased. With Fed rate cuts on the horizon in 2024, these rates are expected to decline, although they are likely to remain higher than in the recent past.
Natixis U.S. Equity Opportunities Fund
While the economy continued to hum along, turbulence continued on the geopolitical front as war broke out between Israel and Hamas and the conflict between Russia and Ukraine dragged into the second year. Despite these conflicts, gas prices fell during 2023, contributing to the overall decline in inflation. Global stock markets overall tracked U.S. markets, with the MSCI Global Index notching a 22% gain in 2023.
Performance Results
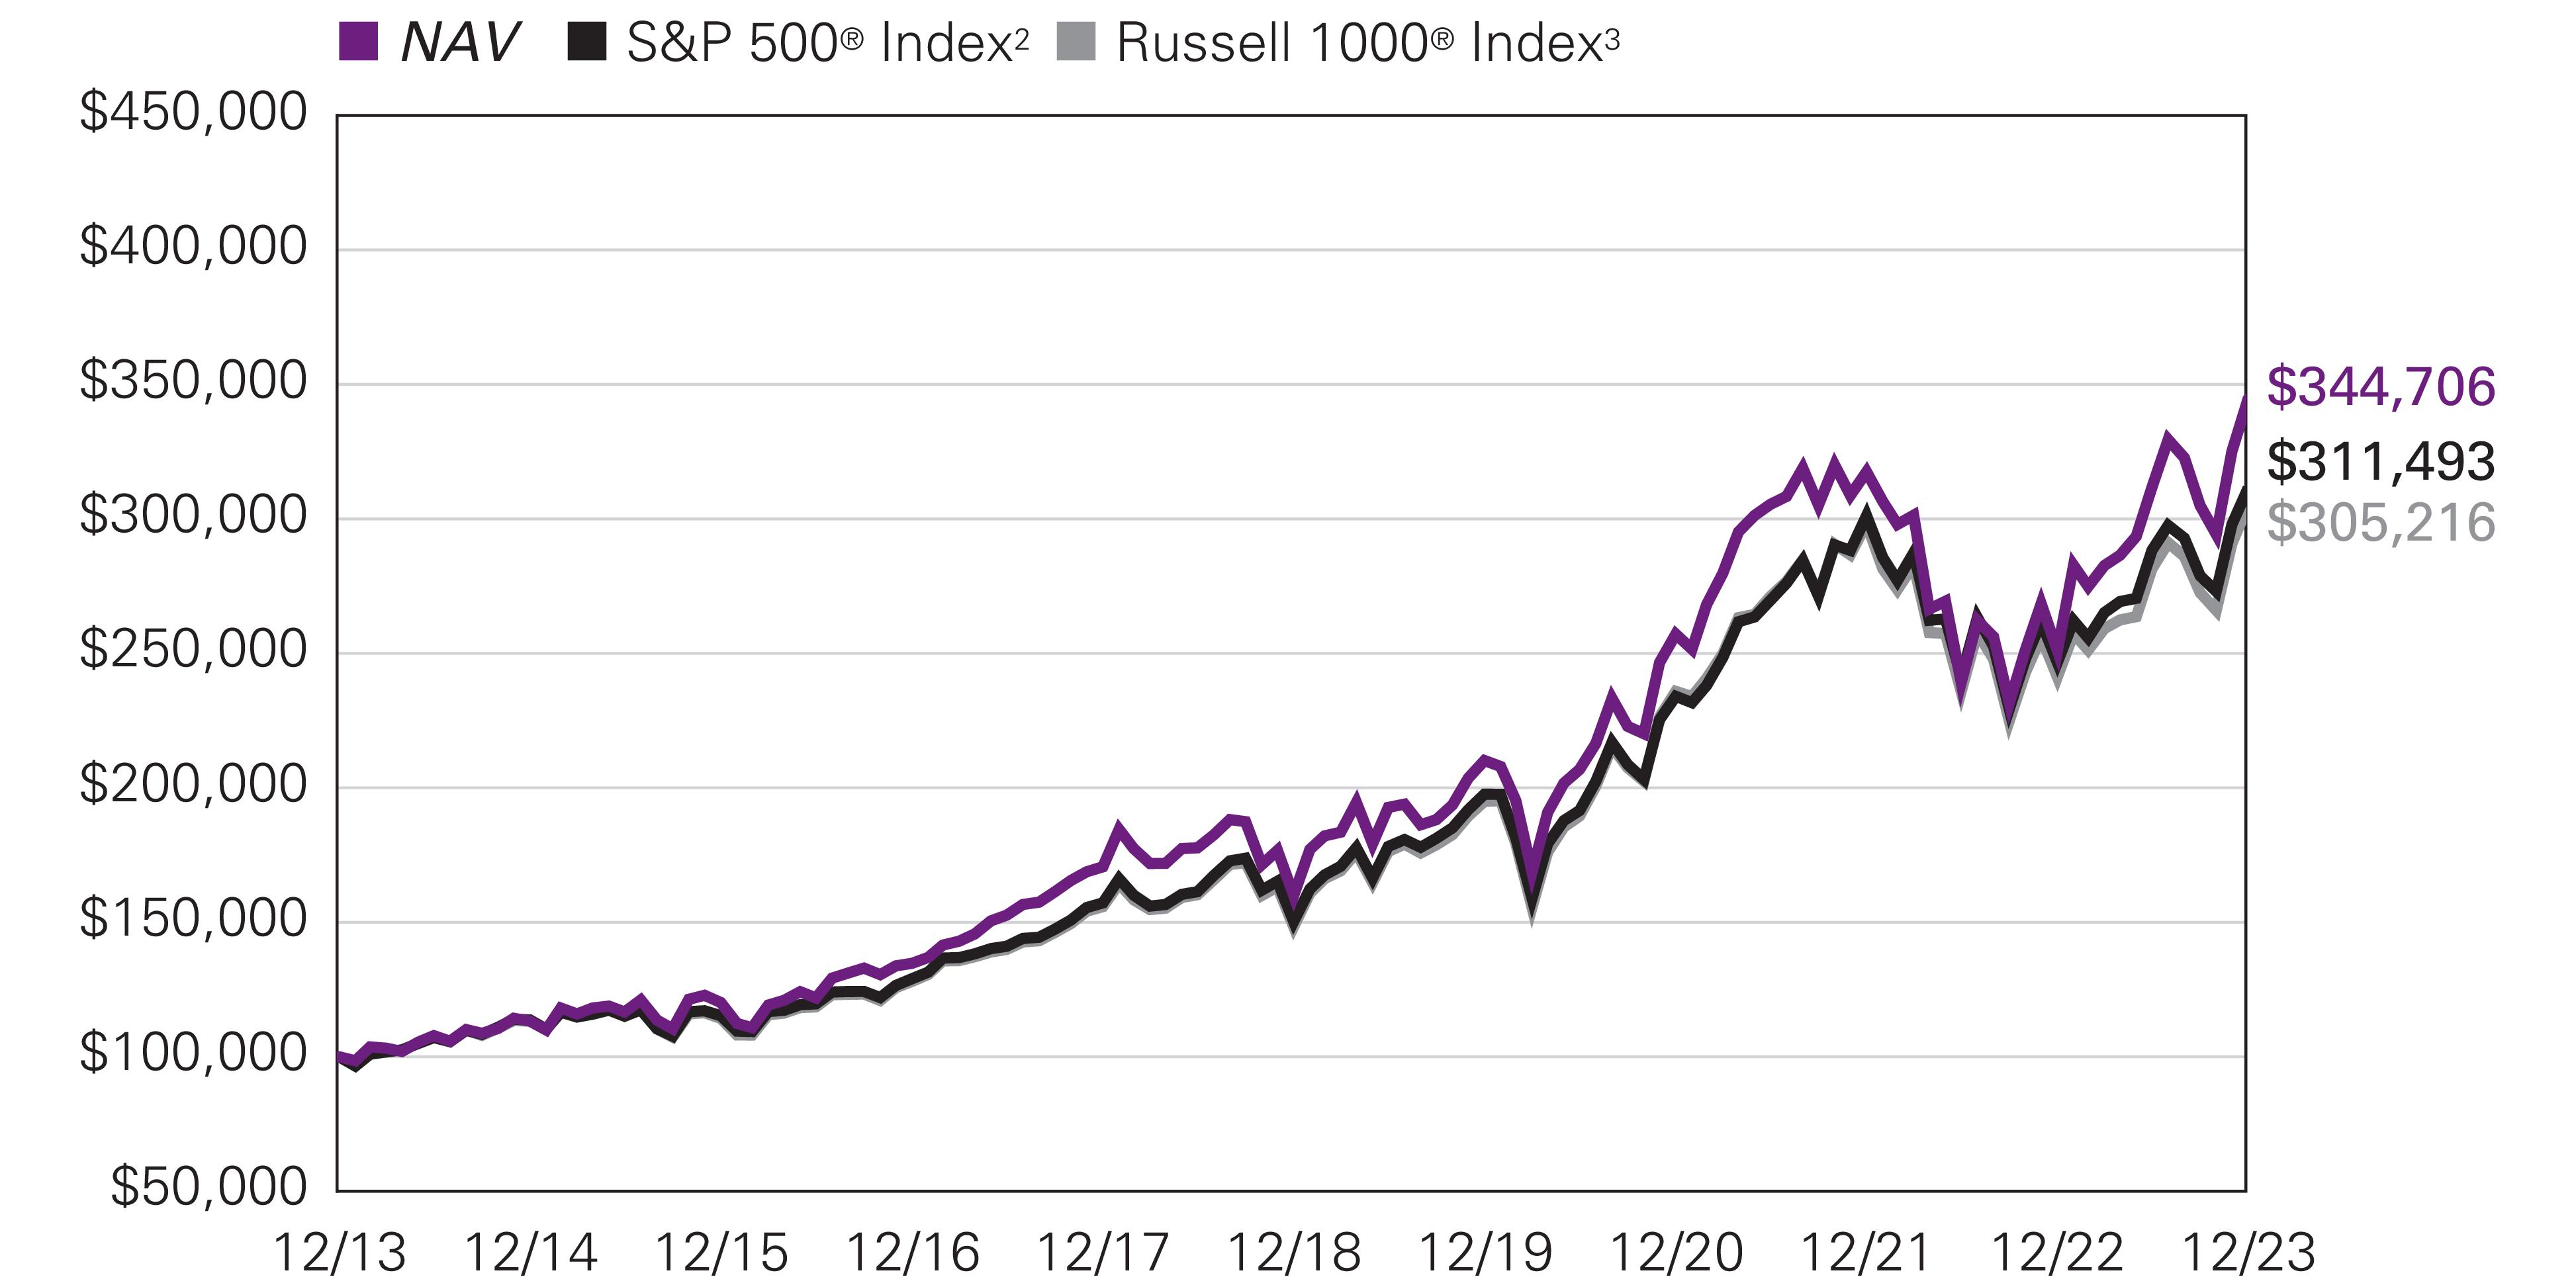
For the 12 months ended December 31, 2023, Class Y shares of the Natixis U.S. Equity Opportunities Fund returned 37.35% at net asset value. The Fund outperformed its primary benchmark, the S&P 500® Index, which returned 26.29%, and also outperformed its secondary benchmark, the Russell 1000® Index, which returned 26.53%.
Explanation of Fund Performance
Each of the portfolio’s segments uses a distinct investment style, providing shareholders with exposure to a variety of different stocks:
• The Harris Associates Large Cap Value segment invests primarily in the common stocks of larger-capitalization companies that Harris Associates L.P. (“Harris Associates”) believes are trading at a substantial discount to the company’s “true business value.”
• The Loomis Sayles All Cap Growth segment invests primarily in equity securities and may invest in companies of any size. The segment employs a growth style of equity management that emphasizes companies with sustainable competitive advantages versus others, long-term structural growth drivers that will lead to above-average future cash flow growth, attractive cash flow returns on invested capital, and management teams focused on creating long-term value for shareholders. The segment aims to invest in companies when they trade at a significant discount to the estimate of intrinsic value.
Both segments contributed positively to the Fund’s performance.
Harris Associates Large Cap Value Segment
On an absolute-return basis, the financials sector contributed the most to the return of the segment, while the consumer staples sector was the only sector with a negative contribution to the total return.
Meta was a top contributor for the year. The underlying health of the U.S. social media company’s platforms remained strong, in our view, as daily active users reached new all-time highs. CEO Mark Zuckerberg said since the launch of Reels, time spent on Instagram has increased 24% and monetization is improving rapidly. Furthermore, the company’s technical enhancements around targeting seem to be gaining steam with advertisers, and management remains bullish on the continued growth of messaging across their platforms. We appreciate Meta’s keen focus on operating efficiency and believe its major investments in AI infrastructure over the past couple years have positioned it well.
KKR was also a top contributor for the year. In August, the New York-headquartered investment company reported second-quarter results that were modestly ahead of consensus estimates, largely due to increased transactional activity as capital markets activity accelerated. Management has highlighted that more than 30 strategies will come to market in the next 12 to 18 months and noted this number is likely to increase during the third quarter. Separately, KKR launched its retail-oriented private equity and infrastructure funds mid-year. Management said initial fundraising performance was ahead of expectations and it remains bullish on the 5- to 10-year opportunity in this largely untapped market, citing KKR’s brand, track record, and significantly expanded marketing and distribution teams. Finally, in November, KKR announced its acquisition of the remaining 37% of Global Atlantic (GA) for $2.7 billion. GA has a strong retail distribution network for its annuity business, which KKR can leverage as it continues to establish its own retail funds.
APA Corp. was a top detractor for the year. Despite reporting solid business fundamentals, the oil and natural gas explorer traded lower alongside increased volatility in commodity markets. We continue to believe APA has a long runway of underappreciated inventory in the form of untapped energy assets in the ground, which results in less capital required to replace assets and grow the business over time. We also appreciate that at our estimate of normalized oil prices, APA generates a double-digit free cash flow yield, and management is returning cash to shareholders via sustainable buybacks and dividends.
General Motors (GM) was also a top detractor for the year. In April, the U.S. auto company reported a drop in profits and the discontinuation of its top-selling electric vehicle, the Chevrolet Volt. In August, shares fell again on news that production of GM’s electric vehicle lineup was being slowed by issues in assembling updated battery modules. Finally, members of the United Auto Workers union (UAW) went on strike following the expiration of its labor contract in September. The strike targeted the GM
Natixis U.S. Equity Opportunities Fund
Wentzville assembly plant, which accounts for around 7% of the company’s North American production. UAW was able to reach a deal with GM in mid-November, ending the six-week labor disruption.
Loomis Sayles All Cap Growth Segment
We are an active manager with a long-term, private equity approach to investing. Through our proprietary bottom-up research framework, we look to invest in those few high-quality businesses with sustainable competitive advantages and profitable growth when they trade at a significant discount to intrinsic value. For the period, the All Cap Growth segment posted a positive absolute return. Our holdings in each of the information technology, communication services, consumer discretionary, industrials, financials, consumer staples, and healthcare sectors contributed positively to the segment’s performance.
Nvidia and Meta Platforms were the largest contributors to performance during the period. Nvidia is the world leader in artificial intelligence (AI) computing, which enables computers to mimic human-like intelligence for problem solving and decision-making capabilities. We believe the company’s competitive advantages include its intellectual property, brands, and a large and growing ecosystem of developers and applications utilizing its GPU (graphic processing unit) technology. A portfolio holding since January 2019, after shares were under pressure throughout most of 2022 given a weak market backdrop, shares rebounded substantially over the past 12 months, with gains accelerating following the company’s first quarter earnings report in May. Nvidia reported record financial results that were well above consensus expectations, as AI applications, including generative AI, are driving strong demand for GPUs by companies looking to leverage these capabilities and drive competitive differentiation. The company also provided revenue guidance that was substantially higher than consensus expectations, resulting in a material increase in expectations for revenue, profits, and free cash flow for its full fiscal year. Revenue in the company’s gaming segment had been depressed, which we believe reflected global demand for PCs returning to pre-pandemic levels after a period of excess and the impact of Covid restrictions on China consumer spending. However, we believe the company has worked expeditiously in clearing existing inventory in its retail channels, which contributed to the gaming business returning to growth in the past two quarters. In the company’s data center business, we believe the company’s decades of focused investment, cumulative know-how, and robust software platform and architecture that has attracted millions of developers, position the company to benefit from several secular long-term growth drivers, including continued growth in use cases for artificial intelligence. To further drive adoption by enterprises, Nvidia is also partnering with cloud service providers including Oracle, Microsoft, and Google to offer AI services via the cloud. We believe Nvidia remains strongly positioned to benefit from secular growth in PC gaming and is still in the early stages of growth in its data center business, which has the potential to be much larger. We believe Nvidia’s strong growth prospects are not currently reflected in its share price. As a result, we believe the company’s shares are trading at a significant discount to our estimate of intrinsic value, offering a compelling reward-to-risk opportunity. We trimmed our position on multiple occasions during the year as the company reached our maximum allowable position size of eight percent due to market appreciation.
Meta Platforms operates online social networking platforms that allow people to connect, share, and interact with friends and communities. With 3.9 billion monthly users, 200 million businesses, and 10 million advertisers worldwide using its family of apps – Facebook, Messenger, WhatsApp, and Instagram – we believe the scale and reach of Meta’s network is unrivaled. A strategy holding since its initial public offering in 2012, Meta’s shares rebounded substantially in 2023 after being under pressure throughout most of 2022 due to a perceived lack of discipline in the company’s capital expenditures – especially with respect to the metaverse – that coincided with what we believed was temporary fundamental weakness arising from the company’s transition to a new advertising format and maneuvering around privacy changes imposed by Apple in 2021. Our analysis suggested that Meta was being priced as if a high-quality, high-returning, growth company – whose returns on capital were many times larger than its cost of capital – would become a low-quality business that both ceased to grow and would also see its margins and returns on invested capital deteriorate. We took advantage of price weakness in 2022 to add to our holdings on multiple occasions during that year, most recently in November 2022. Despite ongoing macroeconomic pressure on advertising spending, Meta has since posted four consecutive quarters of better-than-expected financial results, including accelerating revenue growth in the last three quarters as it made further progress in navigating Apple’s privacy changes and saw improved monetization of its newest Reels video format. Following this period of temporary weakness and elevated investment spending, Meta announced a set of efficiency measures that have already led to significant improvements in margins and lower capital expenditure plans, and shares responded positively to the company’s increased focus on productivity and cost management. We believe founder and CEO Mark Zuckerberg has always managed the company with a long-term focus and strong strategic vision. Over the past ten years, Meta has spent over $125 billion on research and development and $110 billion on capital expenditures – a level of investment that few firms can match, and which creates high barriers to entry for competitors that are further buttressed by the growth of cumulative knowledge over time. The successful development of a metaverse is not an explicit part of our investment thesis for Meta. However, given the potential size of the opportunity, which we estimate could impact over $1 trillion of spending over the long term, and Meta’s positioning with billions of users and hundreds of millions of businesses, we believe Meta’s current balanced approach to its forward-looking investments make sense. We expect that corporations will continue to allocate an increasing proportion of their advertising spending online, and Meta remains one of very few platforms where advertisers can reach consumers at such scale in such a targeted and effective fashion. We believe Meta’s brands, network, and
Natixis U.S. Equity Opportunities Fund
targeting advantage position the company to take increasing share of the industry’s profit pool and grow its market share from approximately 6% currently to approximately 10% of the total global advertising market over our investment time horizon. On the basis of its core business alone, we believe the company is substantially undervalued and trades at a significant discount to our estimate of intrinsic value. We trimmed our position on multiple occasions during the year because it reached our maximum allowable position size of eight percent due to market appreciation.
Alnylam Pharmaceuticals and Illumina were the largest detractors during the period. Alnylam Pharmaceuticals is a leader in gene therapies based on its pioneering small-interfering RNA (siRNA) approach to disease treatment. Founded in 2002, Alnylam was one of the first companies to develop and commercialize therapies based on RNA interference (RNAi), a breakthrough discovery in understanding how genes are naturally regulated within cells that was recognized with the 2006 Nobel Prize in Medicine. RNAi therapies exploit a naturally occurring biological pathway within cells that regulates the expression of specific genes. In particular, siRNA has proven to be one of the most effective approaches to RNAi therapy, and Alnylam remains the first and only company to successfully commercialize siRNA-based therapies. We believe Alnylam’s strong and sustainable competitive advantages include its deep, cumulative and compounding knowledge in the science of RNAi therapeutics, in particular its creation and advancement of unique siRNA-based therapies, and the multiple partnerships it has entered on the basis of its technology which provide both external funding and established commercialization avenues. Currently, the company’s technology is the basis for five approved therapies, ten therapies currently in clinical trials, and a robust pipeline of potential treatments that we expect to enter the clinic in the coming years, with a focus on genetic diseases, cardiometabolic diseases, infectious diseases, and central nervous system and ocular diseases. A strategy holding since the second quarter of 2021, shares responded negatively to the dimming prospects for patisiran, Alnylam’s approved therapy for hATTR amyloidosis, to receive regulatory approval in the larger, related indication of ATTR with cardiomyopathy (ATTR-CM). In October, the company decided to discontinue its bid to attain approval in favor of its more robust and longer trial for vutrisiran. Vutrisiran is also approved for hATTR amyloidosis, but the therapy is delivered via subcutaneous injection every three months, while patisiran requires intravenous administration every three weeks. While the outcomes for patisiran were positive and statistically significant, the FDA was likely to require further study, and the easier administration of vutrisiran, which was developed after patisiran, makes the therapy more commercially attractive. Vutrisiran is currently in Phase III clinical trials for ATTR-CM, with results expected in the first half of 2024. We believe the uniqueness of Alnylam’s pioneering scientific expertise and technology is evident from both its existing products, which provide meaningful value to previously underserved patient populations, as well as the numerous partnerships in which world-class global pharmaceutical companies and specialty competitors alike have sought to access its proprietary technology. With its approved therapies and substantial pipeline of significant late-stage clinical programs, we believe the company has now reached the point at which its existing therapies will continue to contribute positively and its subsequent innovations will shift its financial profile from that of an early-stage biotech company to a profitable business with normalized margins that is able to internally fund its ongoing growth needs. Over our long-term investment horizon, we believe the company can generate substantial revenue growth, while turning profitable and generating substantial cumulative free cash flow. We believe Alnylam’s market price continues to substantially undervalue the potential contribution from the company’s clinical-stage assets – which we believe is unsupported by the company’s established track record for producing genetically validated therapeutics. Further, while embedded expectations reflect some success for its currently marketed products, we believe the market is focused on short-term profitability while ignoring the platform the company has built, that we believe will serve as the basis for ongoing innovation over our long-term investment horizon and beyond. As a result, we believe the company is selling at a substantial discount to our estimate of its intrinsic value and offers a compelling reward to risk opportunity.
Founded in 1998, Illumina is the industry leader in the fast-growing field of sequencing for genetic and genomic analysis, supporting research, clinical, and consumer genetics applications. A strategy holding since March 2020, Illumina’s shares have been under pressure due to lower-than-expected results in its core business, uncertainty regarding its acquisition of GRAIL, and near-term management uncertainty following an activist investor campaign that succeeded in ousting the Chairman of the Board in May and later prompted the resignation of CEO Francis deSouza in June. While orders for its newest sequencing platform, NovaSeq X, had been solid, they slowed in the company’s most recently reported quarter as the company observed a lengthening sales cycle among customers facing macroeconomic pressure – which has similarly impacted peers as well. Still, the company’s recent results and guidance are below our long-term expectations as we believe the GRAIL acquisition has detracted from near-term focus and returns. Illumina acquired GRAIL in August 2021, but closed the transaction prior to receiving approval from the EU, which has since ordered that the business be divested. In December 2023, Illumina announced it will divest GRAIL and aims to have the terms finalized by the end of second quarter 2024. GRAIL is an early leader in asymptomatic cancer screening through liquid biopsies that use Illumina’s sequencing technology to detect tumor DNA in the bloodstream before it could otherwise be sampled via a traditional biopsy. While we believed that there was potential upside in GRAIL, our structural investment thesis for Illumina was not premised on a successful completion of the acquisition, and GRAIL will remain an important customer for the company. We believe the core Illumina business remains highly attractive on a reward-to-risk basis and remains substantially discounted relative to intrinsic value. Illumina is in the early stages of a major platform launch while simultaneously facing more competition than in recent years. Over the last two years, Illumina’s share of industry revenue has dropped from an estimated 80% to 77%. These share losses have been most pronounced in China and in the
Natixis U.S. Equity Opportunities Fund
lower-value, mid- and low- throughput portions of the sequencing market. We anticipate Illumina will retain its dominant share in the high-value, high-throughput ends of the market on the strength of its product ecosystem and continue to capture approximately 75% of the sequencing market. In September, the company named Jacob Thaysen, Ph.D. as its new CEO. Thaysen previously served as President of the Life Sciences and Applied Markets Group at Agilent, and brings a background in research and development (R&D) as well as experience operating in genetics and clinical end markets. We met with Thaysen and our interactions have been positive as we believe he has the requisite skills and vision to reinvigorate the core Illumina franchise. We are encouraged that new management seems committed to redoubling its focus on the significant opportunity in Illumina’s core markets and reinvigorating operational execution – which appeared to have diminished over the last several quarters under deSouza. In addition to the activist-sponsored candidate, Illumina also added two new board members with significant experience at innovative, market-expanding healthcare businesses that we believe should contribute positively to Illumina’s return to growth. Despite the near-term uncertainty, we believe Illumina remains advantageously positioned in a high-quality industry benefiting from long-term, secular growth. We believe Illumina is at the forefront of a multi-decade transformation that will see genetic analysis incorporated into multiple facets of our lives. While demand today is still predominantly from large life sciences research facilities, over the next decade we believe democratization of gene sequencing technology and greater practical application will result in the equipment becoming ubiquitous in clinical settings as well, with oncology offering the largest market opportunity. We believe Illumina is a dominant competitor whose sequencing technology represents the critical enabling technology that ideally positions it to capitalize on an approximately $100 billion market opportunity. We believe Illumina’s shares embed expectations for key revenue and cash flow growth drivers that are well below our long-term assumptions. As a result, we believe the company is selling at a significant discount to our estimate of its intrinsic value and offers a compelling reward-to-risk opportunity. We added to our position on multiple occasions this year, most recently in late September.
Top Ten Holdings as of December 31, 2023 |
| |
1 Alphabet, Inc., Class A | |
| |
3 Meta Platforms, Inc., Class A | |
| |
5 Capital One Financial Corp. | |
| |
| |
| |
| |
| |
The portfolio is actively managed and holdings are subject to change. There is no guarantee the Fund continues to invest in the securities referenced. The holdings listed exclude any temporary cash investments, are presented on an individual security basis and do not represent holdings of the issuer. |
Natixis U.S. Equity Opportunities Fund
Hypothetical Growth of $100,000 Investment in Class Y Shares1 |
December 31, 2013 through December 31, 2023 |
See notes to chart on page 21.
Natixis U.S. Equity Opportunities Fund
Average Annual Total Returns —December 31, 20231 |
| | | | | |
| | |
| | | | | | |
| | | | | | |
| | | | | | |
| | | | | | |
With 5.75% Maximum Sales Charge | | | | | | |
| | | | | | |
| | | | | | |
| | | | | | |
Class N (Inception 5/1/17) | | | | | | |
| | | | | | |
| | | | | | |
| | | | | | |
| | | | | | |
Performance data shown represents past performance and is no guarantee of, and not necessarily indicative of, future results. Total return and value will vary, and you may have a gain or loss when shares are sold. Current performance may be lower or higher than quoted. For most recent month-end performance, visit im.natixis.com/performance. Performance for other share classes will be greater or less than shown based on differences in fees and sales charges. You may not invest directly in an index. Performance for periods less than one year is cumulative, not annualized. Returns reflect changes in share price and reinvestment of dividends and capital gains, if any. The table(s) do not reflect taxes shareholders might owe on any fund distributions or when they redeem their shares.
| Fund performance has been increased by fee waivers and/or expense reimbursements, if any, without which performance would have been lower. |
| S&P 500® Index is a widely recognized measure of U.S. stock market performance. It is an unmanaged index of 500 common stocks chosen for market size, liquidity, and industry group representation, among other factors. It also measures the performance of the large cap segment of the U.S. equities market. |
| Russell 1000® Index measures the performance of the large-cap segment of the U.S. equity universe. It is a subset of the Russell 3000® Index and includes approximately 1000 of the largest securities based on a combination of their market cap and current index membership. The Russell 1000® Index represents approximately 92% of the U.S. market and is constructed to provide a comprehensive and unbiased barometer for the large-cap segment and is completely reconstituted annually to ensure new and growing equities are reflected. |
| Expense ratios are as shown in the Fund’s prospectus in effect as of the date of this report. The expense ratios for the current reporting period can be found in the Financial Highlights section of this report under Ratios to Average Net Assets. Net expenses reflect contractual expense limitations set to expire on 4/30/25. When a Fund’s expenses are below the limitation, gross and net expense ratios will be the same. See Note 5 of the Notes to Financial Statements for more information about the Fund’s expense limitations. |
| Performance for Class C shares assumes a 1.00% contingent deferred sales charge (“CDSC”) applied when you sell shares within one year of purchase, and includes automatic conversion to Class A shares after eight years. |
Vaughan Nelson Mid Cap Fund
|
|
|
|
Vaughan Nelson Investment Management, L.P.
|
Investment GoalThe Fund seeks long-term capital appreciation.
Market Conditions
During the fiscal year ending December 31, 2023, the market began with sequential growth slowing in both the first and second quarters. Typically, banking stress develops once we are well into a recession as the ability for borrowers to service debt becomes impaired. Given the rapid increase in interest rates, regional banks fell under tremendous pressure.
As we moved through the summer months, global growth continued to deteriorate as the impact of aggressive rate increases affected economic fundamentals. In the U.S., the manufacturing and transportation sectors recessed, and the service sector slowed further. Offsetting the deteriorating economic environment were continued liquidity injections by the major non-U.S. central banks and the U.S. Federal Reserve’s (Fed) reverse repo facility, which became the primary source of liquidity for rebuilding the U.S. Treasury’s general account. This flood of liquidity boosted equity markets and dampened fixed income volatility, compressing fixed income spreads (the difference in yield between bonds with similar maturity but different credit quality).
Inflation peaked in the fourth quarter of 2022 and economic growth bottomed, which set the stage for the move higher in U.S. equity markets during the first seven months of 2023. The reacceleration in growth coupled with declining inflation allowed the market to begin pricing in a “soft landing” for the U.S. economy despite aggressive monetary policy tightening, the emergence of a banking crisis, and rising U.S. Treasury yields as the U.S. Treasury struggled to fund rising deficit spending. The Fed added fuel to the rally by aggressively pumping liquidity into the banking system to offset the material losses on bank balance sheets.
During the fourth quarter, improving supply chains, rising employment participation rates, and the lagging influence of stabilized home prices and rental inflation continued to promote disinflationary conditions. Declining inflationary pressures, combined with stable economic growth, produced a material improvement in financial conditions as the market discounted future Fed rate cuts without any corresponding decrease in earnings expectations or economic weakness. The resulting decline in interest rates led to a powerful fourth quarter rally in equity and fixed income markets.
Performance Results
For the 12 months ended December 31, 2023, Class Y shares of the Vaughan Nelson Mid Cap Fund returned 16.52% at net asset value. The Fund outperformed its benchmark, the Russell Mid Cap Value® Index, which returned 12.71%.
Explanation of Fund Performance
The Fund outperformed on a relative basis during the period.
Health care was the top performing sector with Cencora, Inc. leading the way. Cencora benefited from both multiple expansion and positive earnings revisions. The company’s consistent top-line and bottom-line growth combined with strong cash flow generation and return of capital were rewarded.
Materials outperformed, driven by stock selection. Constellium SE Class A outperformed on a cycle of positive earnings revisions, as demand remained robust, and the company spoke to the end of destocking in packaging.
Overweight and selection within information technology aided performance. The strongest name was Motorola Solutions, Inc. Motorola’s public end markets continued to prove strong and consistent, as the company was able to beat and raise earnings expectations throughout the year.
Financials outperformed via selection with Comerica Incorporated leading the way. Comerica benefited with the rest of the regional banks as valuations had gotten too punitive for what may turn out to be a shallow recession.
Consumer staples’ outperformance was led by Church & Dwight Co., Inc. After a year of disappointing investors in 2022, Church & Dwight regained its credibility in 2023 by putting an end to the downward revision cycle, while recent acquisitions performed better
Vaughan Nelson Mid Cap Fund
than expectations. Additionally, with GLP1 headlines hurting packaged food and beverage stocks, Church & Dwight benefited on a relative basis as it is not impacted by GLP1s.
Further assisting in outperformance was Extra Space Storage Inc. within real estate. REITs outperformed in the fourth quarter as interest rates peaked, and Extra Space Storage outperformed REITs on solid fundamentals.
Selection within utilities assisted performance with Vistra Corp. as the top name. Vistra continued to show a strong recovery in earnings power as the company benefited from pricing during a very hot summer in Texas. The company outperformed regulated utilities which were dealing with ROE (return on equity) pressures.
An underweight to energy, an underperforming sector, added to relative performance.
Selection within consumer discretionary positively impacted performance. Floor & Decor Holdings, Inc. Class A outperformed as strong numbers and a desirable long-term algorithm led to the stock rising with other highly shorted names in the fourth quarter.
Selection within communication services hurt performance on a relative basis. Nexstar Media Group, Inc. detracted the most as softness in advertising markets coupled with worries about distribution held down the stock.
The Fund also experienced negative attribution within industrials with WillScot Mobile Mini Holdings Corp. Class A being the largest drag. WillScot lagged due to slowing volumes coupled with an uncertain macro environment, especially in non-residential end markets.
Outlook
As we enter 2024, we expect modest economic weakness in the first half of the year followed by economic stability and an improvement in growth heading into the 2024 election cycle. Inflation will likely remain above the Fed’s 2% target, and with the recent dramatic easing in financial conditions, inflation may begin to increase in the fourth quarter of 2024. Should inflation expectations begin firming, we would expect some modest downward pressure on equity valuations.
Top Ten Holdings as of December 31, 2023 |
| |
1 Extra Space Storage, Inc. | |
2 EastGroup Properties, Inc. | |
3 Monolithic Power Systems, Inc. | |
| |
| |
6 Diamondback Energy, Inc. | |
| |
8 Marvell Technology, Inc. | |
9 Skechers USA, Inc., Class A | |
| |
The portfolio is actively managed and holdings are subject to change. There is no guarantee the Fund continues to invest in the securities referenced. The holdings listed exclude any temporary cash investments, are presented on an individual security basis and do not represent holdings of the issuer. |
Vaughan Nelson Mid Cap Fund
Hypothetical Growth of $100,000 Investment in Class Y Shares1 |
December 31, 2013 through December 31, 2023 |
See notes to chart on page 25.
Vaughan Nelson Mid Cap Fund
Average Annual Total Returns —December 31, 20231 |
| | | | |
| | |
| | | | | |
| | | | | |
| | | | | |
| | | | | |
With 5.75% Maximum Sales Charge | | | | | |
| | | | | |
| | | | | |
| | | | | |
| | | | | |
| | | | | |
| | | | | |
Russell Midcap® Value Index2 | | | | | |
Performance data shown represents past performance and is no guarantee of, and not necessarily indicative of, future results. Total return and value will vary, and you may have a gain or loss when shares are sold. Current performance may be lower or higher than quoted. For most recent month-end performance, visit im.natixis.com/performance. Performance for other share classes will be greater or less than shown based on differences in fees and sales charges. You may not invest directly in an index. Performance for periods less than one year is cumulative, not annualized. Returns reflect changes in share price and reinvestment of dividends and capital gains, if any. The table(s) do not reflect taxes shareholders might owe on any fund distributions or when they redeem their shares.
| Fund performance has been increased by fee waivers and/or expense reimbursements, if any, without which performance would have been lower. |
| Russell Midcap® Value Index is an unmanaged index that measures the performance of the mid-cap value segment of the U.S. equity universe. It includes those Russell Midcap® Index companies with lower price-to-book ratios and lower forecasted growth values. |
| Expense ratios are as shown in the Fund’s prospectus in effect as of the date of this report. The expense ratios for the current reporting period can be found in the Financial Highlights section of this report under Ratios to Average Net Assets. Net expenses reflect contractual expense limitations set to expire on 4/30/24. When a Fund’s expenses are below the limitation, gross and net expense ratios will be the same. See Note 5 of the Notes to Financial Statements for more information about the Fund’s expense limitations. |
| Performance for Class C shares assumes a 1.00% contingent deferred sales charge (“CDSC”) applied when you sell shares within one year of purchase, and includes automatic conversion to Class A shares after eight years. |
Vaughan Nelson Small Cap Value Fund
|
|
|
Vaughan Nelson Investment Management, L.P.
|
Investment GoalThe Fund seeks capital appreciation.
Market Conditions
During the fiscal year ending December 31, 2023, the market began with sequential growth slowing in both the first and second quarters. Typically, banking stress develops once we are well into a recession as the ability for borrowers to service debt becomes impaired. Given the rapid increase in interest rates, regional banks fell under tremendous pressure.
As we moved through the summer months, global growth continued to deteriorate as the impact of aggressive rate increases affected economic fundamentals. In the U.S., the manufacturing and transportation sectors recessed, and the service sector slowed further. Offsetting the deteriorating economic environment were continued liquidity injections by the major non-U.S. central banks and the U.S. Federal Reserve’s (Fed) reverse repo facility, which became the primary source of liquidity for rebuilding the U.S. Treasury’s general account. This flood of liquidity boosted equity markets and dampened fixed income volatility, compressing fixed income spreads (the difference in yield between bonds with similar maturity but different credit quality).
Inflation peaked in the fourth quarter of 2022 and economic growth bottomed, which set the stage for the move higher in U.S. equity markets during the first seven months of 2023. The reacceleration in growth coupled with declining inflation allowed the market to begin pricing in a “soft landing” for the U.S. economy despite aggressive monetary policy tightening, the emergence of a banking crisis, and rising U.S. Treasury yields as the U.S. Treasury struggled to fund rising deficit spending. The Fed added fuel to the rally by aggressively pumping liquidity into the banking system to offset the material losses on bank balance sheets.
During the fourth quarter, improving supply chains, rising employment participation rates, and the lagging influence of stabilized home prices and rental inflation continued to promote disinflationary conditions. Declining inflationary pressures, combined with stable economic growth, produced a material improvement in financial conditions as the market discounted future Fed rate cuts without any corresponding decrease in earnings expectations or economic weakness. The resulting decline in interest rates led to a powerful fourth quarter rally in equity and fixed income markets.
Performance Results
For the 12 months ended December 31, 2023, Class Y shares of the Vaughan Nelson Small Cap Value Fund returned 25.10% at net asset value. The Fund outperformed its benchmark, the Russell 2000 Value® Index, which returned 14.65%.
Explanation of Fund Performance
The Fund outperformed on a relative basis during the period.
An underweight to financials, an underperforming sector, and selection within it resulted in the top performing sector. Cboe Global Markets Inc. was the top name due to strength in zero-day option offerings to the market which experienced material growth combined with increased penetration of their data and analytics business.
The Fund experienced positive attribution within industrials, with Core & Main, Inc. Class A leading the way. Core & Main outperformed due to continued pricing power maintaining high gross margins, strong and accretive merger & acquisition activity and the exit a of private equity controlling shareholder increasing market liquidity.
Overweight and selection within information technology aided performance. The strongest name was Insight Enterprises, Inc. due to the continued positive margin mix shift into services business from hardware business generating a higher return on assets and a higher multiple for the company.
An underweight to health care, an underperforming sector, aided relative performance.
Selection within utilities assisted performance. Univar Solutions Inc. was the top name due to its acquisition by private equity.
Consumer staples’ outperformance was led by Coca-Cola Consolidated, Inc., which outperformed due to debt paydown and the announcement of a 500% increase in an annual special dividend signaling to the market future material capital returns to shareholders.
Vaughan Nelson Small Cap Value Fund
Materials outperformed, driven by selection. Element Solutions Inc demonstrated strong cost discipline due to variable cost structure and started taking chemicals market share from competitors.
Last, further assisting in outperformance was STAG Industrial, Inc., within real estate, due to strong re-lease rental growth of over 30% on new long-term contracts due to the value of their industrial properties to their tenants.
The largest detractor was in energy, driven by an underweight position and security selection. Patterson-UTI Energy, Inc. was the most challenged name. The stock underperformed due to concerns about softening activity levels (rigs/fracs) in light of weakening near-term oil and natural gas fundamentals.
Selection within consumer discretionary negatively impacted performance. Bally's Corporation was the largest laggard due to high leverage and continued increased capital commitments in non-core business activities.
Selection within communication services hurt on a relative basis. Gray Television, Inc. detracted the most due to high leverage and concerns over coming contract negotiations with major networks (mainly NBC).
Outlook
As we enter 2024, we expect modest economic weakness in the first half of the year followed by economic stability and an improvement in growth heading into the 2024 election cycle. Inflation will likely remain above the Federal Reserve’s 2% target, and with the recent dramatic easing in financial conditions, inflation may begin to increase in the fourth quarter of 2024. Should inflation expectations begin firming, we would expect some modest downward pressure on equity valuations.
Top Ten Holdings as of December 31, 2023 |
| |
1 Insight Enterprises, Inc. | |
2 Element Solutions, Inc. | |
3 First American Financial Corp. | |
4 Western Alliance Bancorp | |
5 Core & Main, Inc., Class A | |
6 Installed Building Products, Inc. | |
| |
| |
9 Beacon Roofing Supply, Inc. | |
| |
The portfolio is actively managed and holdings are subject to change. There is no guarantee the Fund continues to invest in the securities referenced. The holdings listed exclude any temporary cash investments, are presented on an individual security basis and do not represent holdings of the issuer. |
Vaughan Nelson Small Cap Value Fund
Hypothetical Growth of $100,000 Investment in Class Y Shares1 |
December 31, 2013 through December 31, 2023 |
See notes to chart on page 29.
Vaughan Nelson Small Cap Value Fund
Average Annual Total Returns —December 31, 20231 |
| | | | | |
| | |
| | | | | | |
| | | | | | |
| | | | | | |
| | | | | | |
With 5.75% Maximum Sales Charge | | | | | | |
| | | | | | |
| | | | | | |
| | | | | | |
Class N (Inception 5/1/17) | | | | | | |
| | | | | | |
| | | | | | |
Russell 2000® Value Index2 | | | | | | |
Performance data shown represents past performance and is no guarantee of, and not necessarily indicative of, future results. Total return and value will vary, and you may have a gain or loss when shares are sold. Current performance may be lower or higher than quoted. For most recent month-end performance, visit im.natixis.com/performance. Performance for other share classes will be greater or less than shown based on differences in fees and sales charges. You may not invest directly in an index. Performance for periods less than one year is cumulative, not annualized. Returns reflect changes in share price and reinvestment of dividends and capital gains, if any. The table(s) do not reflect taxes shareholders might owe on any fund distributions or when they redeem their shares.
| Fund performance has been increased by fee waivers and/or expense reimbursements, if any, without which performance would have been lower. |
| Russell 2000® Value Index is an unmanaged index that measures the performance of the small-cap value segment of the U.S. equity universe. It includes those Russell 2000® companies with lower price-to-book ratios and lower forecasted growth values. |
| Expense ratios are as shown in the Fund’s prospectus in effect as of the date of this report. The expense ratios for the current reporting period can be found in the Financial Highlights section of this report under Ratios to Average Net Assets. Net expenses reflect contractual expense limitations set to expire on 4/30/24. When a Fund’s expenses are below the limitation, gross and net expense ratios will be the same. See Note 5 of the Notes to Financial Statements for more information about the Fund’s expense limitations. |
| Performance for Class C shares assumes a 1.00% contingent deferred sales charge (“CDSC”) applied when you sell shares within one year of purchase, and includes automatic conversion to Class A shares after eight years. |
ADDITIONAL INFORMATION
The views expressed in this report reflect those of the portfolio managers as of the dates indicated. The managers’ views are subject to change at any time without notice based on changes in market or other conditions. References to specific securities or industries should not be regarded as investment advice. Because the Funds are actively managed, there is no assurance that they will continue to invest in the securities or industries mentioned.
All investing involves risk, including the risk of loss. There is no assurance that any investment will meet its performance objectives or that losses will be avoided.
ADDITIONAL INDEX INFORMATION
This document may contain references to third party copyrights, indexes, and trademarks, each of which is the property of its respective owner. Such owner is not affiliated with Natixis Investment Managers or any of its related or affiliated companies (collectively “Natixis Affiliates”) and does not sponsor, endorse or participate in the provision of any Natixis Affiliates services, funds or other financial products.
The index information contained herein is derived from third parties and is provided on an “as is” basis. The user of this information assumes the entire risk of use of this information. Each of the third party entities involved in compiling, computing or creating index information disclaims all warranties (including, without limitation, any warranties of originality, accuracy, completeness, timeliness, non-infringement, merchantability and fitness for a particular purpose) with respect to such information.
PROXY VOTING INFORMATION
A description of the Natixis Funds' proxy voting policies and procedures is available without charge, upon request, by calling Natixis Funds at 800-225-5478; on the Natixis Funds’ website at im.natixis.com, and on the Securities and Exchange Commission (“SEC”) website at www.sec.gov. Information about how the Natixis Funds voted proxies relating to portfolio securities during the most recent 12-month period ended June 30 is available through the Natixis Funds’ website and the SEC website.
QUARTERLY PORTFOLIO SCHEDULES
The Natixis Funds file a complete schedule of portfolio holdings with the SEC for the first and third quarters of each fiscal year as an exhibit to its reports on Form N-PORT. The Funds’ Form N-PORT reports are available on the SEC website at www.sec.gov. First and third quarter schedules of portfolio holdings are also available at im.natixis.com/funddocuments. A hard copy may be requested from the Fund at no charge by calling 800-225-5478.
TAILORED SHAREHOLDER REPORTS FOR MUTUAL FUNDS AND EXCHANGE-TRADED FUNDS
In October 2022, the SEC adopted rule and form amendments requiring mutual funds and exchange-traded funds to transmit concise and visually engaging streamlined annual and semiannual reports that highlight key information to shareholders. Other information, including financial statements, will no longer appear in the funds’ shareholder reports but will be available online, delivered free of charge upon request, and filed with the SEC on a semiannual basis on Form N-CSR. The rule and form amendments have a compliance date of July 24, 2024.
CFA® and Chartered Financial Analyst® are registered trademarks owned by the CFA Institute.
Understanding Fund Expenses
As a mutual fund shareholder, you incur different costs: transaction costs, including sales charges (loads) on purchases and contingent deferred sales charges on redemptions, and ongoing costs, including management fees, distribution and/or service fees ("12b-1 fees"), and other fund expenses. Certain exemptions may apply. These costs are described in more detail in the Funds’ prospectus. The following examples are intended to help you understand the ongoing costs of investing in the Funds and help you compare these with the ongoing costs of investing in other mutual funds.
The first line in the table of each class of Fund shares shows the actual account values and actual Fund expenses you would have paid on a $1,000 investment in the Fund from July 1, 2023 through December 31, 2023. To estimate the expenses you paid over the period, simply divide your account value by $1,000 (for example $8,600 account value divided by $1,000 = 8.60) and multiply the result by the number in the Expenses Paid During Period column as shown for your class.
The second line in the table for each class of fund shares provides information about hypothetical account values and hypothetical expenses based on the Fund’s actual expense ratios and an assumed rate of return of 5% per year before expenses, which is not the Fund’s actual return. The hypothetical account values and expenses may not be used to estimate the actual ending account balance or expenses you paid on your investment for the period. You may use this information to compare the ongoing costs of investing in the Fund and other funds. To do so, compare this 5% hypothetical example with the 5% hypothetical examples that appear in the shareholder reports of the other funds.
Please note that the expenses shown reflect ongoing costs only, and do not include any transaction costs, such as sales charges. Therefore, the second line in the table of each fund is useful in comparing ongoing costs only, and will not help you determine the relative costs of owning funds. If transaction costs were included, total costs would be higher.
Loomis Sayles International Growth Fund | Beginning
Account Value
7/1/2023 | Ending
Account Value
12/31/2023 | Expenses Paid
7/1/2023 – 12/31/2023 |
| | | |
| | | |
Hypothetical (5% return before expenses) | | | |
| | | |
| | | |
Hypothetical (5% return before expenses) | | | |
| | | |
| | | |
Hypothetical (5% return before expenses) | | | |
| | | |
| | | |
Hypothetical (5% return before expenses) | | | |
| Expenses are equal to the Fund’s annualized expense ratio (after waiver/reimbursement): 1.20%, 1.95%, 0.90% and 0.95% for Class A, C, N and Y, respectively, multiplied by the average account value over the period, multiplied by the number of days in the most recent fiscal half-year (184), divided by 365 (to reflect the half-year period). |
| Beginning
Account Value
7/1/2023 | Ending
Account Value
12/31/2023 | Expenses Paid
7/1/2023 – 12/31/2023 |
| | | |
| | | |
Hypothetical (5% return before expenses) | | | |
| | | |
| | | |
Hypothetical (5% return before expenses) | | | |
| | | |
| | | |
Hypothetical (5% return before expenses) | | | |
| | | |
| | | |
Hypothetical (5% return before expenses) | | | |
| Expenses are equal to the Fund’s annualized expense ratio (after waiver/reimbursement): 1.05%, 1.80%, 0.75% and 0.80% for Class A, C, N and Y, respectively, multiplied by the average account value over the period, multiplied by the number of days in the most recent fiscal half-year (184), divided by 365 (to reflect the half-year period). |
Natixis Oakmark International Fund | Beginning
Account Value
7/1/2023 | Ending
Account Value
12/31/2023 | Expenses Paid
7/1/2023 – 12/31/2023 |
| | | |
| | | |
Hypothetical (5% return before expenses) | | | |
| | | |
| | | |
Hypothetical (5% return before expenses) | | | |
| | | |
| | | |
Hypothetical (5% return before expenses) | | | |
| | | |
| | | |
Hypothetical (5% return before expenses) | | | |
| Expenses are equal to the Fund’s annualized expense ratio (after waiver/reimbursement): 1.15%, 1.90%, 0.85% and 0.90% for Class A, C, N and Y, respectively, multiplied by the average account value over the period, multiplied by the number of days in the most recent fiscal half-year (184), divided by 365 (to reflect the half-year period). |
Natixis U.S. Equity Opportunities Fund | Beginning
Account Value
7/1/2023 | Ending
Account Value
12/31/2023 | Expenses Paid
7/1/2023 – 12/31/2023 |
| | | |
| | | |
Hypothetical (5% return before expenses) | | | |
| | | |
| | | |
Hypothetical (5% return before expenses) | | | |
| | | |
| | | |
Hypothetical (5% return before expenses) | | | |
| | | |
| | | |
Hypothetical (5% return before expenses) | | | |
| Expenses are equal to the Fund’s annualized expense ratio (after waiver/reimbursement): 1.07%, 1.82%, 0.76% and 0.82% for Class A, C, N and Y, respectively, multiplied by the average account value over the period, multiplied by the number of days in the most recent fiscal half-year (184), divided by 365 (to reflect the half-year period). |
Vaughan Nelson Mid Cap Fund | Beginning
Account Value
7/1/2023 | Ending
Account Value
12/31/2023 | Expenses Paid
7/1/2023 – 12/31/2023 |
| | | |
| | | |
Hypothetical (5% return before expenses) | | | |
| | | |
| | | |
Hypothetical (5% return before expenses) | | | |
| | | |
| | | |
Hypothetical (5% return before expenses) | | | |
| | | |
| | | |
Hypothetical (5% return before expenses) | | | |
| Expenses are equal to the Fund’s annualized expense ratio (after waiver/reimbursement): 1.15%, 1.90%, 0.85% and 0.90% for Class A, C, N and Y, respectively, multiplied by the average account value over the period, multiplied by the number of days in the most recent fiscal half-year (184), divided by 365 (to reflect the half-year period). |
Vaughan Nelson Small Cap Value Fund | Beginning
Account Value
7/1/2023 | Ending
Account Value
12/31/2023 | Expenses Paid
7/1/2023 – 12/31/2023 |
| | | |
| | | |
Hypothetical (5% return before expenses) | | | |
| | | |
| | | |
Hypothetical (5% return before expenses) | | | |
| | | |
| | | |
Hypothetical (5% return before expenses) | | | |
| | | |
| | | |
Hypothetical (5% return before expenses) | | | |
| Expenses are equal to the Fund’s annualized expense ratio (after waiver/reimbursement): 1.25%, 2.00%, 0.95% and 1.00% for Class A, C, N and Y, respectively, multiplied by the average account value over the period, multiplied by the number of days in the most recent fiscal half-year (184), divided by 365 (to reflect the half-year period). |
Portfolio of Investments – as of December 31, 2023Loomis Sayles International Growth Fund
| | |
Common Stocks — 97.5% of Net Assets |
| |
| | |
| |
| | |
| |
| | |
| | |
| | |
| |
| Shopify, Inc., Class A(a) | |
| |
| Alibaba Group Holding Ltd., ADR(b) | |
| | |
| Budweiser Brewing Co. APAC Ltd. | |
| Kweichow Moutai Co. Ltd., Class A | |
| | |
| | |
| Trip.com Group Ltd., ADR(a)(b) | |
| Vipshop Holdings Ltd., ADR(a)(b) | |
| | |
| | |
| |
| | |
| |
| | |
| | |
| | |
| |
| | |
| |
| | |
| | |
| | |
| |
| Galaxy Entertainment Group Ltd. | |
| |
| | |
| |
| CRISPR Therapeutics AG(a) | |
| Novartis AG, (Registered) | |
| | |
| | |
| |
| | |
| Reckitt Benckiser Group PLC | |
| | |
| | |
| |
| | |
| | |
| Doximity, Inc., Class A(a) | |
| | |
| | |
| | |
| United States — continued |
| | |
| | |
| | |
| Total Common Stocks
(Identified Cost $30,378,194) | |
| | |
Short-Term Investments — 1.6% |
| Tri-Party Repurchase Agreement with Fixed Income Clearing Corporation, dated 12/29/2023 at 2.500% to be repurchased at $483,707 on 1/02/2024 collateralized by $512,200 U.S. Treasury Note, 2.500% due 3/31/2027 valued at $493,280 including accrued interest (Note 2 of Notes to Financial Statements)
(Identified Cost $483,572) | |
| Total Investments — 99.1%
(Identified Cost $30,861,766) | |
| Other assets less liabilities — 0.9% | |
| | |
| See Note 2 of Notes to Financial Statements. |
| Non-income producing security. |
| Security invests in variable interest entities based in China. See Note 8 of Notes to Financial Statements. |
| An American Depositary Receipt is a certificate issued by a custodian bank representing the right to receive securities of the foreign issuer described. The values of ADRs may be significantly influenced by trading on exchanges not located in the United States. |
Industry Summary at December 31, 2023
| |
| |
| |
Hotels, Restaurants & Leisure | |
| |
| |
Semiconductors & Semiconductor Equipment | |
Interactive Media & Services | |
| |
| |
| |
| |
| |
| |
Health Care Equipment & Supplies | |
Other Investments, less than 2% each | |
| |
| |
Other assets less liabilities | |
| |
See accompanying notes to financial statements.
Portfolio of Investments – as of December 31, 2023Loomis Sayles International Growth Fund (continued) Currency Exposure Summary at December 31, 2023
| |
| |
| |
| |
| |
| |
| |
| |
| |
| |
Other assets less liabilities | |
| |
See accompanying notes to financial statements.
Portfolio of Investments – as of December 31, 2023Natixis Oakmark Fund
| | |
Common Stocks — 94.7% of Net Assets |
| Automobile Components — 2.8% |
| | |
| Magna International, Inc. | |
| | |
| | |
| |
| | |
| |
| | |
| | |
| First Citizens BancShares, Inc., Class A | |
| | |
| | |
| | |
| |
| | |
| | |
| | |
| |
| Fortune Brands Innovations, Inc. | |
| | |
| | |
| |
| Bank of New York Mellon Corp. | |
| | |
| | |
| Goldman Sachs Group, Inc. | |
| Intercontinental Exchange, Inc. | |
| | |
| | |
| | |
| | |
| |
| | |
| | |
| | |
| Communications Equipment — 0.9% |
| | |
| |
| | |
| | |
| Capital One Financial Corp. | |
| | |
| Consumer Staples Distribution & Retail — 2.1% |
| | |
| Electronic Equipment, Instruments & Components — 0.9% |
| | |
| |
| | |
| Warner Bros Discovery, Inc.(a) | |
| | |
| Financial Services — 3.7% |
| | |
| | |
| | |
| | |
| Health Care Equipment & Supplies — 1.0% |
| Baxter International, Inc. | |
| Health Care Providers & Services — 4.0% |
| | |
| | |
| | |
| | |
| Hotels, Restaurants & Leisure — 0.9% |
| Hilton Worldwide Holdings, Inc. | |
| |
| American International Group, Inc. | |
| Reinsurance Group of America, Inc. | |
| | |
| | |
| Interactive Media & Services — 4.5% |
| Alphabet, Inc., Class A(a) | |
| Meta Platforms, Inc., Class A(a) | |
| | |
| Life Sciences Tools & Services — 3.3% |
| | |
| | |
| | |
| |
| Charter Communications, Inc., Class A(a) | |
| | |
| Liberty Broadband Corp., Class C(a) | |
| | |
| Oil, Gas & Consumable Fuels — 8.6% |
| | |
| | |
| | |
| | |
| | |
| Professional Services — 1.1% |
| | |
| Real Estate Management & Development — 2.3% |
| CBRE Group, Inc., Class A(a) | |
| |
| | |
| | |
| | |
| |
| | |
| Total Common Stocks
(Identified Cost $520,726,283) | |
See accompanying notes to financial statements.
Portfolio of Investments – as of December 31, 2023Natixis Oakmark Fund (continued)
| | |
Short-Term Investments — 5.0% |
| Tri-Party Repurchase Agreement with Fixed Income Clearing Corporation, dated 12/29/2023 at 2.500% to be repurchased at $32,125,528 on 1/02/2024 collateralized by $36,628,200 U.S. Treasury Note, 0.500% due 4/30/2027 valued at $32,758,985 including accrued interest (Note 2 of Notes to Financial Statements)
(Identified Cost $32,116,607) | |
| Total Investments — 99.7%
(Identified Cost $552,842,890) | |
| Other assets less liabilities — 0.3% | |
| | |
| See Note 2 of Notes to Financial Statements. |
| Non-income producing security. |
Industry Summary at December 31, 2023
| |
| |
Oil, Gas & Consumable Fuels | |
| |
| |
| |
Interactive Media & Services | |
Health Care Providers & Services | |
| |
Life Sciences Tools & Services | |
| |
| |
| |
| |
Real Estate Management & Development | |
| |
| |
| |
Consumer Staples Distribution & Retail | |
Other Investments, less than 2% each | |
| |
| |
Other assets less liabilities | |
| |
See accompanying notes to financial statements.
Portfolio of Investments – as of December 31, 2023Natixis Oakmark International Fund
| | |
Common Stocks — 94.5% of Net Assets |
| |
| | |
| |
| | |
| |
| Alibaba Group Holding Ltd. | |
| |
| | |
| |
| | |
| | |
| | |
| | |
| | |
| | |
| | |
| | |
| | |
| | |
| | |
| |
| | |
| | |
| | |
| Bayerische Motoren Werke AG | |
| | |
| | |
| | |
| Fresenius Medical Care AG | |
| | |
| | |
| Mercedes-Benz Group AG, (Registered) | |
| | |
| | |
| | |
| | |
| |
| | |
| |
| Bank Mandiri Persero Tbk. PT | |
| |
| Ryanair Holdings PLC, ADR(a) | |
| |
| | |
| |
| | |
| | |
| Recruit Holdings Co. Ltd. | |
| | |
| |
| | |
| |
| | |
| | |
| | |
| | |
| | |
| |
| | |
| |
| | |
| | |
| | |
| | |
| |
| Cie Financiere Richemont SA, Class A | |
| | |
| | |
| Novartis AG, (Registered) | |
| | |
| | |
| | |
| | |
| |
| | |
| | |
| | |
| | |
| | |
| Liberty Global Ltd., Class A(a) | |
| | |
| | |
| Reckitt Benckiser Group PLC | |
| | |
| | |
| | |
| | |
| Total Common Stocks
(Identified Cost $335,101,987) | |
|
|
|
| | |
| Samsung Electronics Co. Ltd., 2.319%, (KRW)
(Identified Cost $7,538,747) | |
| | |
Short-Term Investments — 2.5% |
| Tri-Party Repurchase Agreement with Fixed Income Clearing Corporation, dated 12/29/2023 at 2.500% to be repurchased at $9,627,025 on 1/02/2024 collateralized by $10,976,400 U.S. Treasury Note, 0.500% due 4/30/2027 valued at $9,816,909 including accrued interest (Note 2 of Notes to Financial Statements)
(Identified Cost $9,624,351) | |
| Total Investments — 98.7%
(Identified Cost $352,265,085) | |
| Other assets less liabilities — 1.3% | |
| | |
| See Note 2 of Notes to Financial Statements. |
| Non-income producing security. |
See accompanying notes to financial statements.
Portfolio of Investments – as of December 31, 2023Natixis Oakmark International Fund (continued) | An American Depositary Receipt is a certificate issued by a custodian bank representing the right to receive securities of the foreign issuer described. The values of ADRs may be significantly influenced by trading on exchanges not located in the United States. |
Industry Summary at December 31, 2023
| |
| |
Textiles, Apparel & Luxury Goods | |
| |
| |
Health Care Providers & Services | |
| |
| |
Hotels, Restaurants & Leisure | |
| |
| |
| |
| |
| |
Trading Companies & Distributors | |
| |
| |
| |
Other Investments, less than 2% each | |
| |
| |
Other assets less liabilities | |
| |
Currency Exposure Summary at December 31, 2023
| |
| |
| |
| |
| |
| |
| |
| |
| |
Other assets less liabilities | |
| |
See accompanying notes to financial statements.
Portfolio of Investments – as of December 31, 2023Natixis U.S. Equity Opportunities Fund
| | |
Common Stocks — 97.6% of Net Assets |
| Aerospace & Defense — 2.4% |
| | |
| Air Freight & Logistics — 0.6% |
| Expeditors International of Washington, Inc. | |
| Automobile Components — 1.9% |
| | |
| Mobileye Global, Inc., Class A(a) | |
| | |
| |
| | |
| | |
| | |
| |
| | |
| | |
| | |
| | |
| |
| Boston Beer Co., Inc., Class A(a) | |
| Monster Beverage Corp.(a) | |
| | |
| |
| Alnylam Pharmaceuticals, Inc.(a) | |
| CRISPR Therapeutics AG(a) | |
| Regeneron Pharmaceuticals, Inc.(a) | |
| | |
| |
| Alibaba Group Holding Ltd., ADR | |
| | |
| | |
| |
| | |
| |
| Bank of New York Mellon Corp. | |
| | |
| FactSet Research Systems, Inc. | |
| Goldman Sachs Group, Inc. | |
| Intercontinental Exchange, Inc. | |
| | |
| | |
| | |
| | |
| |
| | |
| | |
| Capital One Financial Corp. | |
| | |
| Consumer Staples Distribution & Retail — 1.6% |
| | |
| |
| | |
| | |
| Warner Bros Discovery, Inc.(a) | |
| | |
| | |
| Financial Services — 4.5% |
| | |
| | |
| | |
| | |
| | |
| Health Care Equipment & Supplies — 1.2% |
| Baxter International, Inc. | |
| Intuitive Surgical, Inc.(a) | |
| | |
| Health Care Providers & Services — 0.8% |
| | |
| Health Care Technology — 1.4% |
| Doximity, Inc., Class A(a) | |
| Veeva Systems, Inc., Class A(a) | |
| | |
| Hotels, Restaurants & Leisure — 1.6% |
| | |
| | |
| | |
| | |
| |
| | |
| Interactive Media & Services — 8.6% |
| Alphabet, Inc., Class A(a) | |
| Alphabet, Inc., Class C(a) | |
| Meta Platforms, Inc., Class A(a) | |
| | |
| |
| Shopify, Inc., Class A(a) | |
| Life Sciences Tools & Services — 2.5% |
| | |
| | |
| | |
| |
| | |
| |
| Charter Communications, Inc., Class A(a) | |
| | |
| | |
| Oil, Gas & Consumable Fuels — 5.0% |
| | |
| | |
| | |
| | |
| |
| | |
| | |
| | |
| | |
| | |
| Real Estate Management & Development — 1.9% |
| CBRE Group, Inc., Class A(a) | |
| Semiconductors & Semiconductor Equipment — 4.9% |
| | |
See accompanying notes to financial statements.
Portfolio of Investments – as of December 31, 2023Natixis U.S. Equity Opportunities Fund (continued) | | |
| Semiconductors & Semiconductor Equipment — continued |
| | |
| | |
| | |
| |
| | |
| | |
| | |
| | |
| Workday, Inc., Class A(a) | |
| | |
| Textiles, Apparel & Luxury Goods — 0.3% |
| Under Armour, Inc., Class A(a) | |
| |
| | |
| Total Common Stocks
(Identified Cost $627,240,002) | |
| | |
Short-Term Investments — 2.3% |
| Tri-Party Repurchase Agreement with Fixed Income Clearing Corporation, dated 12/29/2023 at 2.500% to be repurchased at $22,293,432 on 1/02/2024 collateralized by $19,483,300 U.S. Treasury Note, 0.500% due 4/30/2027 valued at $17,425,184; $5,213,500 U.S. Treasury Note, 4.125% due 9/30/2027 valued at $5,307,928 including accrued interest (Note 2 of Notes to Financial Statements)
(Identified Cost $22,287,241) | |
| Total Investments — 99.9%
(Identified Cost $649,527,243) | |
| Other assets less liabilities — 0.1% | |
| | |
| See Note 2 of Notes to Financial Statements. |
| Non-income producing security. |
| An American Depositary Receipt is a certificate issued by a custodian bank representing the right to receive securities of the foreign issuer described. The values of ADRs may be significantly influenced by trading on exchanges not located in the United States. |
Industry Summary at December 31, 2023
| |
| |
Interactive Media & Services | |
| |
Oil, Gas & Consumable Fuels | |
Semiconductors & Semiconductor Equipment | |
| |
| |
| |
| |
| |
Life Sciences Tools & Services | |
| |
| |
| |
Other Investments, less than 2% each | |
| |
| |
Other assets less liabilities | |
| |
See accompanying notes to financial statements.
Portfolio of Investments – as of December 31, 2023Vaughan Nelson Mid Cap Fund
| | |
Common Stocks — 98.7% of Net Assets |
| Aerospace & Defense — 1.4% |
| | |
| |
| Bank of NT Butterfield & Son Ltd. | |
| | |
| | |
| | |
| | |
| |
| | |
| | |
| | |
| |
| Ares Management Corp., Class A | |
| | |
| | |
| Raymond James Financial, Inc. | |
| | |
| |
| Axalta Coating Systems Ltd.(a) | |
| Commercial Services & Supplies — 0.5% |
| | |
| Communications Equipment — 0.9% |
| | |
| Construction & Engineering — 2.3% |
| WillScot Mobile Mini Holdings Corp.(a) | |
| Construction Materials — 2.4% |
| | |
| Consumer Staples Distribution & Retail — 1.0% |
| Performance Food Group Co.(a) | |
| Containers & Packaging — 2.2% |
| | |
| | |
| | |
| Electrical Equipment — 5.1% |
| | |
| | |
| | |
| | |
| | |
| Electronic Equipment, Instruments & Components — 2.4% |
| | |
| | |
| | |
| Energy Equipment & Services — 2.0% |
| | |
| Financial Services — 0.9% |
| Apollo Global Management, Inc. | |
| Ground Transportation — 1.0% |
| | |
| Health Care Providers & Services — 1.5% |
| | |
| Laboratory Corp. of America Holdings | |
| | |
| | |
| Independent Power & Renewable Electricity Producers — 1.9% |
| | |
| |
| EastGroup Properties, Inc. | |
| |
| | |
| | |
| First American Financial Corp. | |
| Reinsurance Group of America, Inc. | |
| | |
| |
| | |
| Life Sciences Tools & Services — 6.5% |
| Agilent Technologies, Inc. | |
| | |
| | |
| | |
| | |
| |
| | |
| | |
| | |
| |
| Nexstar Media Group, Inc. | |
| |
| | |
| Mortgage Real Estate Investment Trusts (REITs) — 1.7% |
| | |
| Oil, Gas & Consumable Fuels — 4.0% |
| | |
| | |
| | |
| Professional Services — 5.3% |
| CACI International, Inc., Class A(a) | |
| | |
| | |
| | |
| Semiconductors & Semiconductor Equipment — 7.9% |
| | |
| Monolithic Power Systems, Inc. | |
| ON Semiconductor Corp.(a) | |
| | |
| |
| Tyler Technologies, Inc.(a) | |
| |
| Extra Space Storage, Inc. | |
| |
| | |
| Floor & Decor Holdings, Inc., Class A(a) | |
| | |
| | |
| Textiles, Apparel & Luxury Goods — 2.4% |
| Skechers USA, Inc., Class A(a) | |
See accompanying notes to financial statements.
Portfolio of Investments – as of December 31, 2023Vaughan Nelson Mid Cap Fund (continued) | | |
| Trading Companies & Distributors — 2.2% |
| SiteOne Landscape Supply, Inc.(a) | |
| Total Common Stocks
(Identified Cost $194,166,623) | |
| | |
Short-Term Investments — 0.7% |
| Tri-Party Repurchase Agreement with Fixed Income Clearing Corporation, dated 12/29/2023 at 2.500% to be repurchased at $1,752,359 on 1/02/2024 collateralized by $1,998,000 U.S. Treasury Note, 0.500% due 4/30/2027 valued at $1,786,942 including accrued interest (Note 2 of Notes to Financial Statements)
(Identified Cost $1,751,872) | |
| Total Investments — 99.4%
(Identified Cost $195,918,495) | |
| Other assets less liabilities — 0.6% | |
| | |
| See Note 2 of Notes to Financial Statements. |
| Non-income producing security. |
| Real Estate Investment Trusts |
Industry Summary at December 31, 2023
Semiconductors & Semiconductor Equipment | |
| |
Life Sciences Tools & Services | |
| |
| |
| |
| |
| |
| |
Oil, Gas & Consumable Fuels | |
| |
| |
Textiles, Apparel & Luxury Goods | |
| |
| |
Electronic Equipment, Instruments & Components | |
| |
Construction & Engineering | |
| |
Trading Companies & Distributors | |
| |
Energy Equipment & Services | |
Other Investments, less than 2% each | |
| |
| |
Other assets less liabilities | |
| |
See accompanying notes to financial statements.
Portfolio of Investments – as of December 31, 2023Vaughan Nelson Small Cap Value Fund
| | |
Common Stocks — 96.1% of Net Assets |
| |
| | |
| | |
| | |
| Prosperity Bancshares, Inc. | |
| | |
| | |
| | |
| | |
| |
| Coca-Cola Consolidated, Inc. | |
| |
| | |
| Advanced Drainage Systems, Inc. | |
| Janus International Group, Inc.(a) | |
| | |
| |
| Artisan Partners Asset Management, Inc., Class A | |
| | |
| | |
| |
| Axalta Coating Systems Ltd.(a) | |
| | |
| | |
| | |
| | |
| Construction & Engineering — 0.7% |
| | |
| Electronic Equipment, Instruments & Components — 7.1% |
| Advanced Energy Industries, Inc. | |
| | |
| Insight Enterprises, Inc.(a) | |
| | |
| Energy Equipment & Services — 0.9% |
| Patterson-UTI Energy, Inc. | |
| |
| | |
| Ground Transportation — 3.1% |
| | |
| | |
| | |
| Health Care Equipment & Supplies — 1.3% |
| Globus Medical, Inc., Class A(a) | |
| Health Care Providers & Services — 1.7% |
| Acadia Healthcare Co., Inc.(a) | |
| | |
| | |
| Hotels, Restaurants & Leisure — 2.6% |
| International Game Technology PLC | |
| Red Rock Resorts, Inc., Class A | |
| | |
| Household Durables — 3.8% |
| Installed Building Products, Inc. | |
| Skyline Champion Corp.(a) | |
| | |
| | |
| |
| | |
| |
| First American Financial Corp. | |
| Selective Insurance Group, Inc. | |
| | |
| Life Sciences Tools & Services — 1.0% |
| | |
| |
| | |
| | |
| Franklin Electric Co., Inc. | |
| Watts Water Technologies, Inc., Class A | |
| | |
| Marine Transportation — 1.9% |
| | |
| |
| | |
| Mortgage Real Estate Investment Trusts (REITs) — 3.1% |
| | |
| | |
| PennyMac Mortgage Investment Trust | |
| | |
| |
| | |
| Oil, Gas & Consumable Fuels — 5.9% |
| Antero Resources Corp.(a) | |
| | |
| | |
| | |
| | |
| | |
| | |
| Personal Care Products — 0.7% |
| | |
| Professional Services — 2.9% |
| | |
| | |
| | |
| Real Estate Management & Development — 0.3% |
| Cushman & Wakefield PLC(a) | |
| |
| | |
| Semiconductors & Semiconductor Equipment — 2.4% |
| | |
| Ultra Clean Holdings, Inc.(a) | |
| | |
| |
| National Storage Affiliates Trust | |
| |
| Academy Sports & Outdoors, Inc. | |
| | |
| Restoration Hardware, Inc.(a) | |
| | |
| | |
| | |
See accompanying notes to financial statements.
Portfolio of Investments – as of December 31, 2023Vaughan Nelson Small Cap Value Fund (continued) | | |
| Textiles, Apparel & Luxury Goods — 1.1% |
| | |
| Trading Companies & Distributors — 7.9% |
| Beacon Roofing Supply, Inc.(a) | |
| Core & Main, Inc., Class A(a) | |
| | |
| | |
| Rush Enterprises, Inc., Class A | |
| | |
| Total Common Stocks
(Identified Cost $524,545,604) | |
| | |
Short-Term Investments — 3.4% |
| Tri-Party Repurchase Agreement with Fixed Income Clearing Corporation, dated 12/29/2023 at 2.500% to be repurchased at $22,599,905 on 1/02/2024 collateralized by $22,635,600 U.S. Treasury Note, 4.125% due 9/30/2027 valued at $23,045,580 including accrued interest (Note 2 of Notes to Financial Statements)
(Identified Cost $22,593,629) | |
| Total Investments — 99.5%
(Identified Cost $547,139,233) | |
| Other assets less liabilities — 0.5% | |
| | |
| See Note 2 of Notes to Financial Statements. |
| Non-income producing security. |
| Real Estate Investment Trusts |
Industry Summary at December 31, 2023
| |
Trading Companies & Distributors | |
Electronic Equipment, Instruments & Components | |
| |
Oil, Gas & Consumable Fuels | |
| |
| |
| |
| |
| |
| |
Mortgage Real Estate Investment Trusts (REITs) | |
| |
| |
Hotels, Restaurants & Leisure | |
Semiconductors & Semiconductor Equipment | |
Other Investments, less than 2% each | |
| |
| |
Other assets less liabilities | |
| |
See accompanying notes to financial statements.
Statements of Assets and Liabilities
| Loomis
Sayles
International
Growth Fund | | Natixis
Oakmark
International
Fund | Natixis
U.S.
Equity
Opportunities
Fund |
| | | | |
| | | | |
Net unrealized appreciation (depreciation) | | | | |
| | | | |
| | | | |
Foreign currency at value (identified cost $45,561, $0, $836,111 and $51,248, respectively) | | | | |
Receivable for Fund shares sold | | | | |
Receivable for securities sold | | | | |
Dividends and interest receivable | | | | |
| | | | |
Prepaid expenses (Note 7) | | | | |
| | | | |
| | | | |
Payable for securities purchased | | | | |
Payable for Fund shares redeemed | | | | |
Foreign taxes payable (Note 2) | | | | |
Management fees payable (Note 5) | | | | |
Deferred Trustees’ fees (Note 5) | | | | |
Administrative fees payable (Note 5) | | | | |
Payable to distributor (Note 5d) | | | | |
Audit and tax services fees payable | | | | |
Other accounts payable and accrued expenses | | | | |
| | | | |
COMMITMENTS AND CONTINGENCIES(a) | | | | |
| | | | |
| | | | |
| | | | |
Accumulated earnings (loss) | | | | |
| | | | |
See accompanying notes to financial statements.
Statements of Assets and Liabilities (continued)
| Loomis Sayles International Growth Fund | | Natixis Oakmark International Fund | Natixis U.S. Equity Opportunities Fund |
COMPUTATION OF NET ASSET VALUE AND OFFERING PRICE: | | | | |
| | | | |
| | | | |
Shares of beneficial interest | | | | |
Net asset value and redemption price per share | | | | |
Offering price per share (100/94.25 of net asset value) (Note 1) | | | | |
Class C shares: (redemption price per share is equal to net asset value less any applicable contingent deferred sales charge) (Note 1) | | | | |
| | | | |
Shares of beneficial interest | | | | |
Net asset value and offering price per share | | | | |
| | | | |
| | | | |
Shares of beneficial interest | | | | |
Net asset value, offering and redemption price per share | | | | |
| | | | |
| | | | |
Shares of beneficial interest | | | | |
Net asset value, offering and redemption price per share | | | | |
| Net asset value calculations have been determined utilizing fractional share and penny amounts. |
| As disclosed in the Notes to Financial Statements, if applicable. |
See accompanying notes to financial statements.
Statements of Assets and Liabilities (continued)
| | Vaughan
Nelson
Small Cap
Value Fund |
| | |
| | |
Net unrealized appreciation | | |
| | |
| | |
Receivable for Fund shares sold | | |
Receivable for securities sold | | |
Dividends and interest receivable | | |
Prepaid expenses (Note 7) | | |
| | |
| | |
Payable for securities purchased | | |
Payable for Fund shares redeemed | | |
Management fees payable (Note 5) | | |
Deferred Trustees’ fees (Note 5) | | |
Administrative fees payable (Note 5) | | |
Payable to distributor (Note 5d) | | |
Audit and tax services fees payable | | |
Other accounts payable and accrued expenses | | |
| | |
COMMITMENTS AND CONTINGENCIES(a) | | |
| | |
| | |
| | |
| | |
| | |
COMPUTATION OF NET ASSET VALUE AND OFFERING PRICE: | | |
| | |
| | |
Shares of beneficial interest | | |
Net asset value and redemption price per share | | |
Offering price per share (100/94.25 of net asset value) (Note 1) | | |
Class C shares: (redemption price per share is equal to net asset value less any applicable contingent deferred sales charge) (Note 1) | | |
| | |
Shares of beneficial interest | | |
Net asset value and offering price per share | | |
| | |
| | |
Shares of beneficial interest | | |
Net asset value, offering and redemption price per share | | |
| | |
| | |
Shares of beneficial interest | | |
Net asset value, offering and redemption price per share | | |
| As disclosed in the Notes to Financial Statements, if applicable. |
See accompanying notes to financial statements.
For the Year Ended December 31, 2023
| Loomis
Sayles
International
Growth Fund | | Natixis
Oakmark
International
Fund | Natixis
U.S.
Equity
Opportunities
Fund |
| | | | |
| | | | |
| | | | |
| | | | |
Less net foreign taxes withheld | | | | |
| | | | |
| | | | |
| | | | |
Service and distribution fees (Note 5) | | | | |
Administrative fees (Note 5) | | | | |
Trustees' fees and expenses (Note 5) | | | | |
Transfer agent fees and expenses (Notes 5 and 6) | | | | |
Audit and tax services fees | | | | |
Custodian fees and expenses | | | | |
| | | | |
| | | | |
Shareholder reporting expenses | | | | |
Tax reclaim professional fees (Note 2e) | | | | |
| | | | |
| | | | |
Less waiver and/or expense reimbursement (Note 5) | | | | |
| | | | |
| | | | |
Net realized and unrealized gain (loss) on Investments and Foreign currency transactions | | | | |
Net realized gain (loss) on: | | | | |
| | | | |
Foreign currency transactions (Note 2c) | | | | |
Net change in unrealized appreciation (depreciation) on: | | | | |
| | | | |
Foreign currency translations (Note 2c) | | | | |
Net realized and unrealized gain on Investments and Foreign currency transactions | | | | |
NET INCREASE IN NET ASSETS RESULTING FROM OPERATIONS | | | | |
See accompanying notes to financial statements.
Statements of Operations (continued)
For the Year Ended December 31, 2023
| | Vaughan
Nelson
Small Cap
Value Fund |
| | |
| | |
| | |
| | |
| | |
| | |
Service and distribution fees (Note 5) | | |
Administrative fees (Note 5) | | |
Trustees' fees and expenses (Note 5) | | |
Transfer agent fees and expenses (Notes 5 and 6) | | |
Audit and tax services fees | | |
Custodian fees and expenses | | |
| | |
| | |
Shareholder reporting expenses | | |
| | |
| | |
Less waiver and/or expense reimbursement (Note 5) | | |
| | |
| | |
Net realized and unrealized gain (loss) on Investments | | |
Net realized gain (loss) on: | | |
| | |
Net change in unrealized appreciation (depreciation) on: | | |
| | |
Net realized and unrealized gain on Investments | | |
NET INCREASE IN NET ASSETS RESULTING FROM OPERATIONS | | |
See accompanying notes to financial statements.
Statements of Changes in Net Assets
| Loomis Sayles
International Growth Fund | |
| Year Ended
December 31,2023 | Year Ended
December 31,2022 | Year Ended
December 31,2023 | Year Ended
December 31,2022 |
| | | | |
| | | | |
Net realized gain (loss) on investments and foreign currency transactions | | | | |
Net change in unrealized appreciation (depreciation) on investments and foreign currency translations | | | | |
Net increase (decrease) in net assets resulting from operations | | | | |
FROM DISTRIBUTIONS TO SHAREHOLDERS: | | | | |
| | | | |
| | | | |
| | | | |
| | | | |
| | | | |
NET INCREASE IN NET ASSETS FROM CAPITAL
SHARES TRANSACTIONS (Note 10) | | | | |
Net increase (decrease) in net assets | | | | |
| | | | |
| | | | |
| | | | |
See accompanying notes to financial statements.
Statements of Changes in Net Assets (continued)
| Natixis Oakmark International Fund | Natixis U.S. Equity Opportunities Fund |
| Year Ended
December 31,2023 | Year Ended
December 31,2022 | Year Ended
December 31,2023 | Year Ended
December 31,2022 |
| | | | |
| | | | |
Net realized gain (loss) on investments, forward foreign currency contracts and foreign currency transactions | | | | |
Net change in unrealized appreciation (depreciation) on investments, forward foreign currency contracts and foreign currency translations | | | | |
Net increase (decrease) in net assets resulting from operations | | | | |
FROM DISTRIBUTIONS TO SHAREHOLDERS: | | | | |
| | | | |
| | | | |
| | | | |
| | | | |
| | | | |
NET INCREASE (DECREASE) IN NET ASSETS FROM CAPITAL
SHARES TRANSACTIONS (Note 10) | | | | |
Net increase (decrease) in net assets | | | | |
| | | | |
| | | | |
| | | | |
See accompanying notes to financial statements.
Statements of Changes in Net Assets (continued)
| Vaughan Nelson Mid Cap Fund | Vaughan Nelson Small Cap Value Fund |
| Year Ended
December 31,2023 | Year Ended
December 31,2022 | Year Ended
December 31,2023 | Year Ended
December 31,2022 |
| | | | |
| | | | |
Net realized gain (loss) on investments | | | | |
Net change in unrealized appreciation (depreciation) on investments | | | | |
Net increase (decrease) in net assets resulting from operations | | | | |
FROM DISTRIBUTIONS TO SHAREHOLDERS: | | | | |
| | | | |
| | | | |
| | | | |
| | | | |
| | | | |
NET INCREASE (DECREASE) IN NET ASSETS FROM CAPITAL
SHARES TRANSACTIONS (Note 10) | | | | |
Net increase (decrease) in net assets | | | | |
| | | | |
| | | | |
| | | | |
See accompanying notes to financial statements.
For a share outstanding throughout each period.
| Loomis Sayles International Growth Fund—Class A |
| Year Ended
December 31,
2023 | Year Ended
December 31,
2022 | Year Ended
December 31,
2021 | |
Net asset value, beginning of the period | | | | |
INCOME (LOSS) FROM INVESTMENT OPERATIONS: | | | | |
Net investment income (loss)(a) | | | | |
Net realized and unrealized gain (loss) | | | | |
Total from Investment Operations | | | | |
| | | | |
| | | | |
Net realized capital gains | | | | |
| | | | |
Net asset value, end of the period | | | | |
| | | | |
RATIOS TO AVERAGE NET ASSETS: | | | | |
Net assets, end of the period (000's) | | | | |
| | | | |
| | | | |
Net investment income (loss) | | | | |
| | | | |
| From commencement of operations on December 15, 2020 through December 31, 2020. |
| Per share net investment income (loss) has been calculated using the average shares outstanding during the period. |
| A sales charge for Class A shares is not reflected in total return calculations. |
| Had certain expenses not been waived/reimbursed during the period, total returns would have been lower. |
| Periods less than one year are not annualized. |
| The investment adviser agreed to waive its fees and/or reimburse a portion of the Fund’s expenses during the period. Without this waiver/reimbursement, expenses would have been higher. |
| Computed on an annualized basis for periods less than one year. |
See accompanying notes to financial statements.
Financial Highlights (continued)
For a share outstanding throughout each period.
| Loomis Sayles International Growth Fund—Class C |
| Year Ended
December 31,
2023 | Year Ended
December 31,
2022 | Year Ended
December 31,
2021 | |
Net asset value, beginning of the period | | | | |
INCOME (LOSS) FROM INVESTMENT OPERATIONS: | | | | |
Net investment income (loss)(a) | | | | |
Net realized and unrealized gain (loss) | | | | |
Total from Investment Operations | | | | |
| | | | |
| | | | |
Net realized capital gains | | | | |
| | | | |
Net asset value, end of the period | | | | |
| | | | |
RATIOS TO AVERAGE NET ASSETS: | | | | |
Net assets, end of the period (000's) | | | | |
| | | | |
| | | | |
Net investment income (loss) | | | | |
| | | | |
| From commencement of operations on December 15, 2020 through December 31, 2020. |
| Per share net investment income (loss) has been calculated using the average shares outstanding during the period. |
| Amount rounds to less than $0.01 per share. |
| A contingent deferred sales charge for Class C shares is not reflected in total return calculations. |
| Had certain expenses not been waived/reimbursed during the period, total returns would have been lower. |
| Periods less than one year are not annualized. |
| The investment adviser agreed to waive its fees and/or reimburse a portion of the Fund’s expenses during the period. Without this waiver/reimbursement, expenses would have been higher. |
| Computed on an annualized basis for periods less than one year. |
See accompanying notes to financial statements.
Financial Highlights (continued)
For a share outstanding throughout each period.
| Loomis Sayles International Growth Fund—Class N |
| Year Ended
December 31,
2023 | Year Ended
December 31,
2022 | Year Ended
December 31,
2021 | |
Net asset value, beginning of the period | | | | |
INCOME (LOSS) FROM INVESTMENT OPERATIONS: | | | | |
| | | | |
Net realized and unrealized gain (loss) | | | | |
Total from Investment Operations | | | | |
| | | | |
| | | | |
Net realized capital gains | | | | |
| | | | |
Net asset value, end of the period | | | | |
| | | | |
RATIOS TO AVERAGE NET ASSETS: | | | | |
Net assets, end of the period (000's) | | | | |
| | | | |
| | | | |
| | | | |
| | | | |
| From commencement of operations on December 15, 2020 through December 31, 2020. |
| Per share net investment income has been calculated using the average shares outstanding during the period. |
| Had certain expenses not been waived/reimbursed during the period, total returns would have been lower. |
| Periods less than one year are not annualized. |
| The investment adviser agreed to waive its fees and/or reimburse a portion of the Fund’s expenses during the period. Without this waiver/reimbursement, expenses would have been higher. |
| Computed on an annualized basis for periods less than one year. |
See accompanying notes to financial statements.
Financial Highlights (continued)
For a share outstanding throughout each period.
| Loomis Sayles International Growth Fund—Class Y |
| Year Ended
December 31,
2023 | Year Ended
December 31,
2022 | Year Ended
December 31,
2021 | |
Net asset value, beginning of the period | | | | |
INCOME (LOSS) FROM INVESTMENT OPERATIONS: | | | | |
| | | | |
Net realized and unrealized gain (loss) | | | | |
Total from Investment Operations | | | | |
| | | | |
| | | | |
Net realized capital gains | | | | |
| | | | |
Net asset value, end of the period | | | | |
| | | | |
RATIOS TO AVERAGE NET ASSETS: | | | | |
Net assets, end of the period (000's) | | | | |
| | | | |
| | | | |
| | | | |
| | | | |
| From commencement of operations on December 15, 2020 through December 31, 2020. |
| Per share net investment income has been calculated using the average shares outstanding during the period. |
| Had certain expenses not been waived/reimbursed during the period, total returns would have been lower. |
| Periods less than one year are not annualized. |
| The investment adviser agreed to waive its fees and/or reimburse a portion of the Fund’s expenses during the period. Without this waiver/reimbursement, expenses would have been higher. |
| Computed on an annualized basis for periods less than one year. |
See accompanying notes to financial statements.
Financial Highlights (continued)
For a share outstanding throughout each period.
| Natixis Oakmark Fund—Class A |
| Year Ended
December 31,
2023 | Year Ended
December 31,
2022 | Year Ended
December 31,
2021 | Year Ended
December 31,
2020 | Year Ended
December 31,
2019 |
Net asset value, beginning of the period | | | | | |
INCOME (LOSS) FROM INVESTMENT OPERATIONS: | | | | | |
| | | | | |
Net realized and unrealized gain (loss) | | | | | |
Total from Investment Operations | | | | | |
| | | | | |
| | | | | |
Net realized capital gains | | | | | |
| | | | | |
Net asset value, end of the period | | | | | |
| | | | | |
RATIOS TO AVERAGE NET ASSETS: | | | | | |
Net assets, end of the period (000's) | | | | | |
| | | | | |
| | | | | |
| | | | | |
| | | | | |
| Per share net investment income has been calculated using the average shares outstanding during the period. |
| Includes a non-recurring dividend. Without this dividend, net investment income per share would have been $0.05, total return would have been 12.72% and the ratio of net investment income to average net assets would have been 0.27%. |
| Includes a non-recurring dividend. Without this dividend, net investment income per share would have been $0.13, total return would have been 26.50% and the ratio of net investment income to average net assets would have been 0.62%. |
| A sales charge for Class A shares is not reflected in total return calculations. |
| Had certain expenses not been waived/reimbursed during the period, total returns would have been lower. |
| The investment adviser agreed to waive its fees and/or reimburse a portion of the Fund’s expenses during the period. Without this waiver/reimbursement, expenses would have been higher. |
| Effective July 1, 2021, the expense limit decreased from 1.30% to 1.05%. |
| Includes refund of prior year service fee of 0.01%. |
See accompanying notes to financial statements.
Financial Highlights (continued)
For a share outstanding throughout each period.
| Natixis Oakmark Fund—Class C |
| Year Ended
December 31,
2023 | Year Ended
December 31,
2022 | Year Ended
December 31,
2021 | Year Ended
December 31,
2020 | Year Ended
December 31,
2019 |
Net asset value, beginning of the period | | | | | |
INCOME (LOSS) FROM INVESTMENT OPERATIONS: | | | | | |
Net investment income (loss)(a) | | | | | |
Net realized and unrealized gain (loss) | | | | | |
Total from Investment Operations | | | | | |
| | | | | |
| | | | | |
Net realized capital gains | | | | | |
| | | | | |
Net asset value, end of the period | | | | | |
| | | | | |
RATIOS TO AVERAGE NET ASSETS: | | | | | |
Net assets, end of the period (000's) | | | | | |
| | | | | |
| | | | | |
Net investment income (loss) | | | | | |
| | | | | |
| Per share net investment income (loss) has been calculated using the average shares outstanding during the period. |
| Includes a non-recurring dividend. Without this dividend, net investment loss per share would have been $(0.08), total return would have been 11.85% and the ratio of net investment loss to average net assets would have been (0.46)%. |
| Includes a non-recurring dividend. Without this dividend, net investment loss per share would have been $(0.02), total return would have been 25.50% and the ratio of net investment loss to average net assets would have been (0.12)%. |
| Amount rounds to less than $0.01 per share. |
| A contingent deferred sales charge for Class C shares is not reflected in total return calculations. |
| Had certain expenses not been waived/reimbursed during the period, total returns would have been lower. |
| The investment adviser agreed to waive its fees and/or reimburse a portion of the Fund’s expenses during the period. Without this waiver/reimbursement, expenses would have been higher. |
| Effective July 1, 2021, the expense limit decreased from 2.05% to 1.80%. |
See accompanying notes to financial statements.
Financial Highlights (continued)
For a share outstanding throughout each period.
| Natixis Oakmark Fund—Class N |
| Year Ended
December 31,
2023 | Year Ended
December 31,
2022 | Year Ended
December 31,
2021 | Year Ended
December 31,
2020 | Year Ended
December 31,
2019 |
Net asset value, beginning of the period | | | | | |
INCOME (LOSS) FROM INVESTMENT OPERATIONS: | | | | | |
| | | | | |
Net realized and unrealized gain (loss) | | | | | |
Total from Investment Operations | | | | | |
| | | | | |
| | | | | |
Net realized capital gains | | | | | |
| | | | | |
Net asset value, end of the period | | | | | |
| | | | | |
RATIOS TO AVERAGE NET ASSETS: | | | | | |
Net assets, end of the period (000's) | | | | | |
| | | | | |
| | | | | |
| | | | | |
| | | | | |
| Per share net investment income has been calculated using the average shares outstanding during the period. |
| Includes a non-recurring dividend. Without this dividend, net investment income per share would have been $0.14, total return would have been 13.13% and the ratio of net investment income to average net assets would have been 0.67%. |
| Includes a non-recurring dividend. Without this dividend, net investment income per share would have been $0.22, total return would have been 26.90% and the ratio of net investment income to average net assets would have been 0.92%. |
| Had certain expenses not been waived/reimbursed during the period, total returns would have been lower. |
| The investment adviser agreed to waive its fees and/or reimburse a portion of the Fund’s expenses during the period. Without this waiver/reimbursement, expenses would have been higher. |
| Effective July 1, 2021, the expense limit decreased from 1.00% to 0.75%. |
See accompanying notes to financial statements.
Financial Highlights (continued)
For a share outstanding throughout each period.
| Natixis Oakmark Fund—Class Y |
| Year Ended
December 31,
2023 | Year Ended
December 31,
2022 | Year Ended
December 31,
2021 | Year Ended
December 31,
2020 | Year Ended
December 31,
2019 |
Net asset value, beginning of the period | | | | | |
INCOME (LOSS) FROM INVESTMENT OPERATIONS: | | | | | |
| | | | | |
Net realized and unrealized gain (loss) | | | | | |
Total from Investment Operations | | | | | |
| | | | | |
| | | | | |
Net realized capital gains | | | | | |
| | | | | |
Net asset value, end of the period | | | | | |
| | | | | |
RATIOS TO AVERAGE NET ASSETS: | | | | | |
Net assets, end of the period (000's) | | | | | |
| | | | | |
| | | | | |
| | | | | |
| | | | | |
| Per share net investment income has been calculated using the average shares outstanding during the period. |
| Includes a non-recurring dividend. Without this dividend, net investment income per share would have been $0.12, total return would have been 13.00% and the ratio of net investment income to average net assets would have been 0.55%. |
| Includes a non-recurring dividend. Without this dividend, net investment income per share would have been $0.20, total return would have been 26.80% and the ratio of net investment income to average net assets would have been 0.90%. |
| Had certain expenses not been waived/reimbursed during the period, total returns would have been lower. |
| The investment adviser agreed to waive its fees and/or reimburse a portion of the Fund’s expenses during the period. Without this waiver/reimbursement, expenses would have been higher. |
| Effective July 1, 2021, the expense limit decreased from 1.05% to 0.80%. |
See accompanying notes to financial statements.
Financial Highlights (continued)
For a share outstanding throughout each period.
| Natixis Oakmark International Fund—Class A |
| Year Ended
December 31,
2023 | Year Ended
December 31,
2022 | Year Ended
December 31,
2021 | Year Ended
December 31,
2020 | Year Ended
December 31,
2019 |
Net asset value, beginning of the period | | | | | |
INCOME (LOSS) FROM INVESTMENT OPERATIONS: | | | | | |
Net investment income (loss)(a) | | | | | |
Net realized and unrealized gain (loss) | | | | | |
Total from Investment Operations | | | | | |
| | | | | |
| | | | | |
Net asset value, end of the period | | | | | |
| | | | | |
RATIOS TO AVERAGE NET ASSETS: | | | | | |
Net assets, end of the period (000's) | | | | | |
| | | | | |
| | | | | |
Net investment income (loss) | | | | | |
| | | | | |
| Per share net investment income (loss) has been calculated using the average shares outstanding during the period. |
| Includes tax reclaims. Without these, net investment income per share would have been $0.25, total return would have been 18.78% and the ratio of net investment income to average net assets would have been 1.74%. |
| Includes a non-recurring dividend and tax reclaims. Without these, net investment income per share would have been $0.13, total return would have been 7.74% and the ratio of net investment income to average net assets would have been 0.84%. |
| Amount rounds to less than $0.01 per share. |
| Includes non-recurring dividends. Without this dividend, net investment income per share would have been $0.29, total return would have been 23.55% and the ratio of net investment income to average net assets would have been 2.26%. |
| The amount shown for a share outstanding does not correspond with the aggregate realized and unrealized gain (loss) on investments for the period due to the timing of sales and redemptions of fund shares in relation to fluctuating market values of investments of the Fund. |
| A sales charge for Class A shares is not reflected in total return calculations. |
| Had certain expenses not been waived/reimbursed during the period, total returns would have been lower. |
| The investment adviser agreed to waive its fees and/or reimburse a portion of the Fund’s expenses during the period. Without this waiver/reimbursement, expenses would have been higher. |
| Effective July 1, 2021, the expense limit decreased from 1.20% to 1.15%. |
| Effective July 1, 2020, the expense limit decreased from 1.37% to 1.20%. |
See accompanying notes to financial statements.
Financial Highlights (continued)
For a share outstanding throughout each period.
| Natixis Oakmark International Fund—Class C |
| Year Ended
December 31,
2023 | Year Ended
December 31,
2022 | Year Ended
December 31,
2021 | Year Ended
December 31,
2020 | Year Ended
December 31,
2019 |
Net asset value, beginning of the period | | | | | |
INCOME (LOSS) FROM INVESTMENT OPERATIONS: | | | | | |
Net investment income (loss)(a) | | | | | |
Net realized and unrealized gain (loss) | | | | | |
Total from Investment Operations | | | | | |
| | | | | |
| | | | | |
Net asset value, end of the period | | | | | |
| | | | | |
RATIOS TO AVERAGE NET ASSETS: | | | | | |
Net assets, end of the period (000's) | | | | | |
| | | | | |
| | | | | |
Net investment income (loss) | | | | | |
| | | | | |
| Per share net investment income (loss) has been calculated using the average shares outstanding during the period. |
| Includes tax reclaims. Without these, net investment income per share would have been $0.15, total return would have been 17.85% and the ratio of net investment income to average net assets would have been 1.10%. |
| Includes a non-recurring dividend and tax reclaims. Without these, net investment income per share would have been $0.02, total return would have been 6.98% and the ratio of net investment income to average net assets would have been 0.13%. |
| Includes non-recurring dividends. Without this dividend, net investment income per share would have been $0.18, total return would have been 22.63% and the ratio of net investment income to average net assets would have been 1.43%. |
| The amount shown for a share outstanding does not correspond with the aggregate realized and unrealized gain (loss) on investments for the period due to the timing of sales and redemptions of fund shares in relation to fluctuating market values of investments of the Fund. |
| A contingent deferred sales charge for Class C shares is not reflected in total return calculations. |
| Had certain expenses not been waived/reimbursed during the period, total returns would have been lower. |
| The investment adviser agreed to waive its fees and/or reimburse a portion of the Fund’s expenses during the period. Without this waiver/reimbursement, expenses would have been higher. |
| Effective July 1, 2021, the expense limit decreased from 1.95% to 1.90%. |
| Effective July 1, 2020, the expense limit decreased from 2.12% to 1.95%. |
See accompanying notes to financial statements.
Financial Highlights (continued)
For a share outstanding throughout each period.
| Natixis Oakmark International Fund—Class N |
| Year Ended
December 31,
2023 | Year Ended
December 31,
2022 | Year Ended
December 31,
2021 | Year Ended
December 31,
2020 | Year Ended
December 31,
2019 |
Net asset value, beginning of the period | | | | | |
INCOME (LOSS) FROM INVESTMENT OPERATIONS: | | | | | |
| | | | | |
Net realized and unrealized gain (loss) | | | | | |
Total from Investment Operations | | | | | |
| | | | | |
| | | | | |
Net asset value, end of the period | | | | | |
| | | | | |
RATIOS TO AVERAGE NET ASSETS: | | | | | |
Net assets, end of the period (000's) | | | | | |
| | | | | |
| | | | | |
| | | | | |
| | | | | |
| Per share net investment income has been calculated using the average shares outstanding during the period. |
| Includes tax reclaims. Without these, net investment income per share would have been $0.27, total return would have been 19.14% and the ratio of net investment income to average net assets would have been 1.95%. |
| Includes a non-recurring dividend and tax reclaims. Without these, net investment income per share would have been $0.11, total return would have been 8.09% and the ratio of net investment income to average net assets would have been 0.70%. |
| Includes non-recurring dividends. Without this dividend, net investment income per share would have been $0.27, total return would have been 23.94% and the ratio of net investment income to average net assets would have been 2.15%. |
| The amount shown for a share outstanding does not correspond with the aggregate realized and unrealized gain (loss) on investments for the period due to the timing of sales and redemptions of fund shares in relation to fluctuating market values of investments of the Fund. |
| Had certain expenses not been waived/reimbursed during the period, total returns would have been lower. |
| The investment adviser agreed to waive its fees and/or reimburse a portion of the Fund’s expenses during the period. Without this waiver/reimbursement, expenses would have been higher. |
| Effective July 1, 2021, the expense limit decreased from 0.90% to 0.85%. |
| Effective July 1, 2020, the expense limit decreased from 1.07% to 0.90%. |
See accompanying notes to financial statements.
Financial Highlights (continued)
For a share outstanding throughout each period.
| Natixis Oakmark International Fund—Class Y |
| Year Ended
December 31,
2023 | Year Ended
December 31,
2022 | Year Ended
December 31,
2021 | Year Ended
December 31,
2020 | Year Ended
December 31,
2019 |
Net asset value, beginning of the period | | | | | |
INCOME (LOSS) FROM INVESTMENT OPERATIONS: | | | | | |
| | | | | |
Net realized and unrealized gain (loss) | | | | | |
Total from Investment Operations | | | | | |
| | | | | |
| | | | | |
Net asset value, end of the period | | | | | |
| | | | | |
RATIOS TO AVERAGE NET ASSETS: | | | | | |
Net assets, end of the period (000's) | | | | | |
| | | | | |
| | | | | |
| | | | | |
| | | | | |
| Per share net investment income has been calculated using the average shares outstanding during the period. |
| Includes tax reclaims. Without these, net investment income per share would have been $0.28, total return would have been 19.18% and the ratio of net investment income to average net assets would have been 1.98%. |
| Includes a non-recurring dividend and tax reclaims. Without these, net investment income per share would have been $0.17, total return would have been 8.04% and the ratio of net investment income to average net assets would have been 1.07%. |
| Includes non-recurring dividends. Without this dividend, net investment income per share would have been $0.29, total return would have been 23.84% and the ratio of net investment income to average net assets would have been 2.29%. |
| The amount shown for a share outstanding does not correspond with the aggregate realized and unrealized gain (loss) on investments for the period due to the timing of sales and redemptions of fund shares in relation to fluctuating market values of investments of the Fund. |
| Had certain expenses not been waived/reimbursed during the period, total returns would have been lower. |
| The investment adviser agreed to waive its fees and/or reimburse a portion of the Fund’s expenses during the period. Without this waiver/reimbursement, expenses would have been higher. |
| Effective July 1, 2021, the expense limit decreased from 0.95% to 0.90%. |
| Effective July 1, 2020, the expense limit decreased from 1.12% to 0.95%. |
See accompanying notes to financial statements.
Financial Highlights (continued)
For a share outstanding throughout each period.
| Natixis U.S. Equity Opportunities Fund—Class A |
| Year Ended
December 31,
2023 | Year Ended
December 31,
2022 | Year Ended
December 31,
2021 | Year Ended
December 31,
2020 | Year Ended
December 31,
2019 |
Net asset value, beginning of the period | | | | | |
INCOME (LOSS) FROM INVESTMENT OPERATIONS: | | | | | |
Net investment income (loss)(a) | | | | | |
Net realized and unrealized gain (loss) | | | | | |
Total from Investment Operations | | | | | |
| | | | | |
| | | | | |
Net realized capital gains | | | | | |
| | | | | |
Net asset value, end of the period | | | | | |
| | | | | |
RATIOS TO AVERAGE NET ASSETS: | | | | | |
Net assets, end of the period (000's) | | | | | |
| | | | | |
| | | | | |
Net investment income (loss) | | | | | |
| | | | | |
| Per share net investment income (loss) has been calculated using the average shares outstanding during the period. |
| Includes non-recurring dividends. Without this dividend, net investment income per share would have been $0.09, total return would have been 30.87% and the ratio of net investment income to average net assets would have been 0.26%. |
| A sales charge for Class A shares is not reflected in total return calculations. |
See accompanying notes to financial statements.
Financial Highlights (continued)
For a share outstanding throughout each period.
| Natixis U.S. Equity Opportunities Fund—Class C |
| Year Ended
December 31,
2023 | Year Ended
December 31,
2022 | Year Ended
December 31,
2021 | Year Ended
December 31,
2020 | Year Ended
December 31,
2019 |
Net asset value, beginning of the period | | | | | |
INCOME (LOSS) FROM INVESTMENT OPERATIONS: | | | | | |
| | | | | |
Net realized and unrealized gain (loss) | | | | | |
Total from Investment Operations | | | | | |
| | | | | |
| | | | | |
Net realized capital gains | | | | | |
| | | | | |
Net asset value, end of the period | | | | | |
| | | | | |
RATIOS TO AVERAGE NET ASSETS: | | | | | |
Net assets, end of the period (000's) | | | | | |
| | | | | |
| | | | | |
| | | | | |
| | | | | |
| Per share net investment loss has been calculated using the average shares outstanding during the period. |
| Includes non-recurring dividends. Without this dividend, net investment loss per share would have been $(0.11), total return would have been 29.85% and the ratio of net investment loss to average net assets would have been (0.48)%. |
| A contingent deferred sales charge for Class C shares is not reflected in total return calculations. |
See accompanying notes to financial statements.
Financial Highlights (continued)
For a share outstanding throughout each period.
| Natixis U.S. Equity Opportunities Fund—Class N |
| Year Ended
December 31,
2023 | Year Ended
December 31,
2022 | Year Ended
December 31,
2021 | Year Ended
December 31,
2020 | Year Ended
December 31,
2019 |
Net asset value, beginning of the period | | | | | |
INCOME (LOSS) FROM INVESTMENT OPERATIONS: | | | | | |
| | | | | |
Net realized and unrealized gain (loss) | | | | | |
Total from Investment Operations | | | | | |
| | | | | |
| | | | | |
Net realized capital gains | | | | | |
| | | | | |
Net asset value, end of the period | | | | | |
| | | | | |
RATIOS TO AVERAGE NET ASSETS: | | | | | |
Net assets, end of the period (000's) | | | | | |
| | | | | |
| | | | | |
| | | | | |
| | | | | |
| Per share net investment income has been calculated using the average shares outstanding during the period. |
| Includes non-recurring dividends. Without this dividend, net investment income per share would have been $0.19, total return would have been 31.27% and the ratio of net investment income to average net assets would have been 0.44%. |
| Had certain expenses not been waived/reimbursed during the period, total returns would have been lower. |
| The investment adviser agreed to waive its fees and/or reimburse a portion of the Fund’s expenses during the period. Without this waiver/reimbursement, expenses would have been higher. |
See accompanying notes to financial statements.
Financial Highlights (continued)
For a share outstanding throughout each period.
| Natixis U.S. Equity Opportunities Fund—Class Y |
| Year Ended
December 31,
2023 | Year Ended
December 31,
2022 | Year Ended
December 31,
2021 | Year Ended
December 31,
2020 | Year Ended
December 31,
2019 |
Net asset value, beginning of the period | | | | | |
INCOME (LOSS) FROM INVESTMENT OPERATIONS: | | | | | |
| | | | | |
Net realized and unrealized gain (loss) | | | | | |
Total from Investment Operations | | | | | |
| | | | | |
| | | | | |
Net realized capital gains | | | | | |
| | | | | |
Net asset value, end of the period | | | | | |
| | | | | |
RATIOS TO AVERAGE NET ASSETS: | | | | | |
Net assets, end of the period (000's) | | | | | |
| | | | | |
| | | | | |
| | | | | |
| | | | | |
| Per share net investment income has been calculated using the average shares outstanding during the period. |
| Amount rounds to less than $0.01 per share. |
| Includes non-recurring dividends. Without this dividend, net investment income per share would have been $0.22, total return would have been 31.16% and the ratio of net investment income to average net assets would have been 0.53%. |
| Had certain expenses not been waived/reimbursed during the period, total returns would have been lower. |
| The administrator agreed to waive its fees and/or reimburse a portion of the Fund’s expenses during the period. Without this waiver/reimbursement, expenses would have been higher. |
| Amount rounds to less than 0.01%. |
See accompanying notes to financial statements.
Financial Highlights (continued)
For a share outstanding throughout each period.
| Vaughan Nelson Mid Cap Fund—Class A |
| Year Ended
December 31,
2023 | Year Ended
December 31,
2022 | Year Ended
December 31,
2021 | Year Ended
December 31,
2020 | Year Ended
December 31,
2019 |
Net asset value, beginning of the period | | | | | |
INCOME (LOSS) FROM INVESTMENT OPERATIONS: | | | | | |
| | | | | |
Net realized and unrealized gain (loss) | | | | | |
Total from Investment Operations | | | | | |
| | | | | |
| | | | | |
Net realized capital gains | | | | | |
| | | | | |
Net asset value, end of the period | | | | | |
| | | | | |
RATIOS TO AVERAGE NET ASSETS: | | | | | |
Net assets, end of the period (000's) | | | | | |
| | | | | |
| | | | | |
| | | | | |
| | | | | |
| Per share net investment income has been calculated using the average shares outstanding during the period. |
| A sales charge for Class A shares is not reflected in total return calculations. |
| Had certain expenses not been waived/reimbursed during the period, total returns would have been lower. |
| The investment adviser agreed to waive its fees and/or reimburse a portion of the Fund’s expenses during the period. Without this waiver/reimbursement, expenses would have been higher. |
| Effective July 1, 2021, the expense limit decreased from 1.20% to 1.15%. |
| Effective July 1, 2019, the expense limit decreased from 1.40% to 1.20%. |
| Includes interest expense. Without this expense the ratio of net expenses would have been 1.23% and the ratio of gross expenses would have been 1.26%. |
See accompanying notes to financial statements.
Financial Highlights (continued)
For a share outstanding throughout each period.
| Vaughan Nelson Mid Cap Fund—Class C |
| Year Ended
December 31,
2023 | Year Ended
December 31,
2022 | Year Ended
December 31,
2021 | Year Ended
December 31,
2020 | Year Ended
December 31,
2019 |
Net asset value, beginning of the period | | | | | |
INCOME (LOSS) FROM INVESTMENT OPERATIONS: | | | | | |
| | | | | |
Net realized and unrealized gain (loss) | | | | | |
Total from Investment Operations | | | | | |
| | | | | |
| | | | | |
Net realized capital gains | | | | | |
| | | | | |
Net asset value, end of the period | | | | | |
| | | | | |
RATIOS TO AVERAGE NET ASSETS: | | | | | |
Net assets, end of the period (000's) | | | | | |
| | | | | |
| | | | | |
| | | | | |
| | | | | |
| Per share net investment loss has been calculated using the average shares outstanding during the period. |
| Amount rounds to less than $0.01 per share. |
| A contingent deferred sales charge for Class C shares is not reflected in total return calculations. |
| Had certain expenses not been waived/reimbursed during the period, total returns would have been lower. |
| The investment adviser agreed to waive its fees and/or reimburse a portion of the Fund’s expenses during the period. Without this waiver/reimbursement, expenses would have been higher. |
| Effective July 1, 2021, the expense limit decreased from 1.95% to 1.90%. |
| Effective July 1, 2019, the expense limit decreased from 2.15% to 1.95%. |
| Includes interest expense. Without this expense the ratio of net expenses would have been 1.98% and the ratio of gross expenses would have been 2.01%. |
See accompanying notes to financial statements.
Financial Highlights (continued)
For a share outstanding throughout each period.
| Vaughan Nelson Mid Cap Fund—Class N |
| Year Ended
December 31,
2023 | Year Ended
December 31,
2022 | Year Ended
December 31,
2021 | Year Ended
December 31,
2020 | Year Ended
December 31,
2019 |
Net asset value, beginning of the period | | | | | |
INCOME (LOSS) FROM INVESTMENT OPERATIONS: | | | | | |
| | | | | |
Net realized and unrealized gain (loss) | | | | | |
Total from Investment Operations | | | | | |
| | | | | |
| | | | | |
Net realized capital gains | | | | | |
| | | | | |
Net asset value, end of the period | | | | | |
| | | | | |
RATIOS TO AVERAGE NET ASSETS: | | | | | |
Net assets, end of the period (000's) | | | | | |
| | | | | |
| | | | | |
| | | | | |
| | | | | |
| Per share net investment income has been calculated using the average shares outstanding during the period. |
| Had certain expenses not been waived/reimbursed during the period, total returns would have been lower. |
| The investment adviser agreed to waive its fees and/or reimburse a portion of the Fund’s expenses during the period. Without this waiver/reimbursement, expenses would have been higher. |
| Effective July 1, 2021, the expense limit decreased from 0.90% to 0.85%. |
| Effective July 1, 2019, the expense limit decreased from 1.10% to 0.90%. |
| Includes interest expense. Without this expense the ratio of net expenses would have been 0.91% and the ratio of gross expenses would have been 0.91%. |
See accompanying notes to financial statements.
Financial Highlights (continued)
For a share outstanding throughout each period.
| Vaughan Nelson Mid Cap Fund—Class Y |
| Year Ended
December 31,
2023 | Year Ended
December 31,
2022 | Year Ended
December 31,
2021 | Year Ended
December 31,
2020 | Year Ended
December 31,
2019 |
Net asset value, beginning of the period | | | | | |
INCOME (LOSS) FROM INVESTMENT OPERATIONS: | | | | | |
| | | | | |
Net realized and unrealized gain (loss) | | | | | |
Total from Investment Operations | | | | | |
| | | | | |
| | | | | |
Net realized capital gains | | | | | |
| | | | | |
Net asset value, end of the period | | | | | |
| | | | | |
RATIOS TO AVERAGE NET ASSETS: | | | | | |
Net assets, end of the period (000's) | | | | | |
| | | | | |
| | | | | |
| | | | | |
| | | | | |
| Per share net investment income has been calculated using the average shares outstanding during the period. |
| Had certain expenses not been waived/reimbursed during the period, total returns would have been lower. |
| The investment adviser agreed to waive its fees and/or reimburse a portion of the Fund’s expenses during the period. Without this waiver/reimbursement, expenses would have been higher. |
| Effective July 1, 2021, the expense limit decreased from 0.95% to 0.90%. |
| Effective July 1, 2019, the expense limit decreased from 1.15% to 0.95%. |
| Includes interest expense. Without this expense the ratio of net expenses would have been 0.98% and the ratio of gross expenses would have been 1.01%. |
See accompanying notes to financial statements.
Financial Highlights (continued)
For a share outstanding throughout each period.
| Vaughan Nelson Small Cap Value Fund—Class A |
| Year Ended
December 31,
2023 | Year Ended
December 31,
2022 | Year Ended
December 31,
2021 | Year Ended
December 31,
2020 | Year Ended
December 31,
2019 |
Net asset value, beginning of the period | | | | | |
INCOME (LOSS) FROM INVESTMENT OPERATIONS: | | | | | |
Net investment income (loss)(a) | | | | | |
Net realized and unrealized gain (loss) | | | | | |
Total from Investment Operations | | | | | |
| | | | | |
| | | | | |
Net realized capital gains | | | | | |
| | | | | |
Net asset value, end of the period | | | | | |
| | | | | |
RATIOS TO AVERAGE NET ASSETS: | | | | | |
Net assets, end of the period (000's) | | | | | |
| | | | | |
| | | | | |
Net investment income (loss) | | | | | |
| | | | | |
| Per share net investment income (loss) has been calculated using the average shares outstanding during the period. |
| Amount rounds to less than $0.01 per share. |
| Includes a non-recurring dividend. Without this dividend, net investment loss per share would have been $(0.05), total return would have been 29.95% and the ratio of net investment loss to average net assets would have been (0.25)%. |
| A sales charge for Class A shares is not reflected in total return calculations. |
| Had certain expenses not been waived/reimbursed during the period, total returns would have been lower. |
| The investment adviser agreed to waive its fees and/or reimburse a portion of the Fund’s expenses during the period. Without this waiver/reimbursement, expenses would have been higher. |
| Effective July 1, 2021, the expense limit decreased from 1.30% to 1.25%. |
| Effective July 1, 2020, the expense limit decreased from 1.34% to 1.30%. |
| Effective July 1, 2019, the expense limit decreased from 1.45% to 1.34%. |
See accompanying notes to financial statements.
Financial Highlights (continued)
For a share outstanding throughout each period.
| Vaughan Nelson Small Cap Value Fund—Class C |
| Year Ended
December 31,
2023 | Year Ended
December 31,
2022 | Year Ended
December 31,
2021 | Year Ended
December 31,
2020 | Year Ended
December 31,
2019 |
Net asset value, beginning of the period | | | | | |
INCOME (LOSS) FROM INVESTMENT OPERATIONS: | | | | | |
| | | | | |
Net realized and unrealized gain (loss) | | | | | |
Total from Investment Operations | | | | | |
| | | | | |
| | | | | |
Net realized capital gains | | | | | |
| | | | | |
Net asset value, end of the period | | | | | |
| | | | | |
RATIOS TO AVERAGE NET ASSETS: | | | | | |
Net assets, end of the period (000's) | | | | | |
| | | | | |
| | | | | |
| | | | | |
| | | | | |
| Per share net investment loss has been calculated using the average shares outstanding during the period. |
| Includes a non-recurring dividend. Without this dividend, net investment loss per share would have been $(0.10), total return would have been 29.09% and the ratio of net investment loss to average net assets would have been (0.99)%. |
| Amount rounds to less than $0.01 per share. |
| A contingent deferred sales charge for Class C shares is not reflected in total return calculations. |
| Had certain expenses not been waived/reimbursed during the period, total returns would have been lower. |
| The investment adviser agreed to waive its fees and/or reimburse a portion of the Fund’s expenses during the period. Without this waiver/reimbursement, expenses would have been higher. |
| Effective July 1, 2021, the expense limit decreased from 2.05% to 2.00%. |
| Effective July 1, 2020, the expense limit decreased from 2.09% to 2.05%. |
| Effective July 1, 2019, the expense limit decreased from 2.20% to 2.09%. |
See accompanying notes to financial statements.
Financial Highlights (continued)
For a share outstanding throughout each period.
| Vaughan Nelson Small Cap Value Fund—Class N |
| Year Ended
December 31,
2023 | Year Ended
December 31,
2022 | Year Ended
December 31,
2021 | Year Ended
December 31,
2020 | Year Ended
December 31,
2019 |
Net asset value, beginning of the period | | | | | |
INCOME (LOSS) FROM INVESTMENT OPERATIONS: | | | | | |
| | | | | |
Net realized and unrealized gain (loss) | | | | | |
Total from Investment Operations | | | | | |
| | | | | |
| | | | | |
Net realized capital gains | | | | | |
| | | | | |
Net asset value, end of the period | | | | | |
| | | | | |
RATIOS TO AVERAGE NET ASSETS: | | | | | |
Net assets, end of the period (000's) | | | | | |
| | | | | |
| | | | | |
| | | | | |
| | | | | |
| Per share net investment income has been calculated using the average shares outstanding during the period. |
| Includes a non-recurring dividend. Without this dividend, net investment income per share would have been $0.01, total return would have been 30.37% and the ratio of net investment income to average net assets would have been 0.03%. |
| Had certain expenses not been waived/reimbursed during the period, total returns would have been lower. |
| The investment adviser agreed to waive its fees and/or reimburse a portion of the Fund’s expenses during the period. Without this waiver/reimbursement, expenses would have been higher. |
| Effective July 1, 2021, the expense limit decreased from 1.00% to 0.95%. |
| Effective July 1, 2020, the expense limit decreased from 1.04% to 1.00%. |
| Effective July 1, 2019, the expense limit decreased from 1.15% to 1.04%. |
See accompanying notes to financial statements.
Financial Highlights (continued)
For a share outstanding throughout each period.
| Vaughan Nelson Small Cap Value Fund—Class Y |
| Year Ended
December 31,
2023 | Year Ended
December 31,
2022 | Year Ended
December 31,
2021 | Year Ended
December 31,
2020 | Year Ended
December 31,
2019 |
Net asset value, beginning of the period | | | | | |
INCOME (LOSS) FROM INVESTMENT OPERATIONS: | | | | | |
| | | | | |
Net realized and unrealized gain (loss) | | | | | |
Total from Investment Operations | | | | | |
| | | | | |
| | | | | |
Net realized capital gains | | | | | |
| | | | | |
Net asset value, end of the period | | | | | |
| | | | | |
RATIOS TO AVERAGE NET ASSETS: | | | | | |
Net assets, end of the period (000's) | | | | | |
| | | | | |
| | | | | |
| | | | | |
| | | | | |
| Per share net investment income has been calculated using the average shares outstanding during the period. |
| Includes a non-recurring dividend. Without this dividend, net investment income per share would have been $0.00, total return would have been 30.26% and the ratio of net investment income to average net assets would have been 0.01%. |
| Had certain expenses not been waived/reimbursed during the period, total returns would have been lower. |
| The investment adviser agreed to waive its fees and/or reimburse a portion of the Fund’s expenses during the period. Without this waiver/reimbursement, expenses would have been higher. |
| Effective July 1, 2021, the expense limit decreased from 1.05% to 1.00%. |
| Effective July 1, 2020, the expense limit decreased from 1.09% to 1.05%. |
| Effective July 1, 2019, the expense limit decreased from 1.20% to 1.09%. |
See accompanying notes to financial statements.
Notes to Financial Statements
1.Organization. Loomis Sayles Funds II, Natixis Funds Trust I and Natixis Funds Trust II (the “Trusts” and each a “Trust”) are each organized as a Massachusetts business trust. Each Trust is registered under the Investment Company Act of 1940, as amended (the “1940 Act”), as an open-end management investment company. Each Declaration of Trust permits the Board of Trustees to authorize the issuance of an unlimited number of shares of the Trust in multiple series. The financial statements for certain funds of the Trusts are presented in separate reports. The following funds (individually, a “Fund” and collectively, the “Funds”) are included in this report:
Loomis Sayles Funds II:
Loomis Sayles International Growth Fund (“International Growth Fund”)
Natixis Funds Trust I:
Natixis Oakmark International Fund
Natixis U.S. Equity Opportunities Fund (“U.S. Equity Opportunities Fund”)
Vaughan Nelson Small Cap Value Fund (“Small Cap Value Fund”)
Natixis Funds Trust II:
Natixis Oakmark Fund
Vaughan Nelson Mid Cap Fund (“Mid Cap Fund”)
Each Fund is a diversified investment company, except for International Growth Fund, which is a non-diversified investment company.
Each Fund offers Class A, Class C, Class N and Class Y shares.
Class A shares are sold with a maximum front-end sales charge of 5.75%. Class C shares do not pay a front-end sales charge, pay higher Rule 12b-1 fees than Class A shares for eight years (at which point they automatically convert to Class A shares) (prior to May 1, 2021, Class C shares automatically converted to Class A shares after ten years) and may be subject to a contingent deferred sales charge (“CDSC”) of 1.00% if those shares are redeemed within one year of acquisition, except for reinvested distributions. Class N and Class Y shares do not pay a front-end sales charge, a CDSC or Rule 12b-1 fees. Class N shares are offered with an initial minimum investment of $1,000,000. Class Y shares are offered with an initial minimum investment of $100,000. Certain categories of investors are exempted from the minimum investment amounts for Class N and Class Y as outlined in the relevant Funds’ prospectus.
Most expenses can be directly attributed to a Fund. Expenses which cannot be directly attributed to a Fund are generally apportioned based on the relative net assets of each of the Funds in Natixis Funds Trust I, Natixis Funds Trust II, Natixis Funds Trust IV and Gateway Trust (“Natixis Funds Trusts”), Loomis Sayles Funds I and Loomis Sayles Funds II (“Loomis Sayles Funds Trusts”) and Natixis ETF Trust and Natixis ETF Trust II (“Natixis ETF Trusts”). Expenses of a Fund are borne pro rata by the holders of each class of shares, except that each class bears expenses unique to that class (such as the Rule 12b-1 fees applicable to Class A and Class C), and transfer agent fees are borne collectively for Class A, Class C and Class Y, and individually for Class N. In addition, each class votes as a class only with respect to its own Rule 12b-1 Plan. Shares of each class would receive their pro rata share of the net assets of the Fund if the Fund were liquidated. The Trustees approve separate distributions from net investment income on each class of shares.
2.Significant Accounting Policies. The following is a summary of significant accounting policies consistently followed by each Fund in the preparation of its financial statements. The Funds' financial statements follow the accounting and reporting guidelines provided for investment companies and are prepared in accordance with accounting principles generally accepted in the United States of America which require the use of management estimates that affect the reported amounts and disclosures in the financial statements. Actual results could differ from those estimates. Management has evaluated the events and transactions subsequent to year-end through the date the financial statements were issued and has determined that there were no material events that would require disclosure in the Funds' financial statements.
a. Valuation. Registered investment companies are required to value portfolio investments using an unadjusted, readily available market quotation. Each Fund obtains readily available market quotations from independent pricing services. Fund investments for which readily available market quotations are not available are priced at fair value pursuant to the Funds’ Valuation Procedures. The Board of Trustees has approved a valuation designee who is subject to the Board’s oversight.
Unadjusted readily available market quotations that are utilized for exchange traded equity securities (including shares of closed-end investment companies and exchange-traded funds) include the last sale price quoted on the exchange where the security is traded most extensively. Shares of open-end investment companies are valued at net asset value (“NAV”) per share.
Exchange traded equity securities for which there is no reported sale during the day are fair valued at the closing bid quotation as reported by an independent pricing service. Unlisted equity securities (except unlisted preferred equity securities) are fair valued at the last sale price quoted in the market where they are traded most extensively or, if there is no reported sale during the day, the closing
Notes to Financial Statements (continued)
bid quotation as reported by an independent pricing service. If there is no last sale price or closing bid quotation available, unlisted equity securities will be fair valued using evaluated bids furnished by an independent pricing service, if available.
Debt securities and unlisted preferred equity securities are fair valued based on evaluated bids furnished to the Funds by an independent pricing service or bid prices obtained from broker-dealers. Broker-dealer bid prices may be used to fair value debt and unlisted equities where an independent pricing service is unable to price an investment or where an independent pricing service does not provide a reliable price for the investment. Forward foreign currency contracts are fair valued utilizing interpolated rates determined based on information provided by an independent pricing service.
The Funds may also fair value investments in other circumstances such as when extraordinary events occur after the close of a foreign market, but prior to the close of the New York Stock Exchange. This may include situations relating to a single issuer (such as a declaration of bankruptcy or a delisting of the issuer’s security from the primary market on which it has traded) as well as events affecting the securities markets in general (such as market disruptions or closings and significant fluctuations in U.S. and/or foreign markets). When fair valuing a Fund’s investments, the valuation designee may, among other things, use modeling tools or other processes that may take into account factors such as issuer specific information, or other related market activity and/or information that occurred after the close of the foreign market but before the time the Fund’s NAV is calculated. Fair valuation by the Fund(s) valuation designee may require subjective determinations about the value of the investment, and fair values used to determine a Fund’s NAV may differ from quoted or published prices, or from prices that are used by others, for the same investments. In addition, the use of fair value pricing may not always result in adjustments to the prices of investments held by a Fund.
b. Investment Transactions and Related Investment Income. Investment transactions are accounted for on a trade date plus one day basis for daily NAV calculation. However, for financial reporting purposes, investment transactions are reported on trade date. Dividend income (including income reinvested) and foreign withholding tax, if applicable, is recorded on the ex-dividend date, or in the case of certain foreign securities, as soon as a Fund is notified, and interest income is recorded on an accrual basis. Dividends reinvested and stock dividends are reflected as non-cash dividends on the Statements of Operations. Interest income is increased by the accretion of discount and decreased by the amortization of premium, if applicable. Distributions received from investments in securities that represent a return of capital or capital gain are recorded as a reduction of cost of investments or as a realized gain, respectively. The calendar year-end amounts of ordinary income, capital gains and return of capital included in distributions received from the Funds’ investments in real estate investment trusts (“REITs”) are reported to the Funds after the end of the fiscal year; accordingly, the Funds estimate these amounts for accounting purposes until the characterization of REIT distributions is reported to the Funds after the end of the fiscal year. Estimates are based on the most recent REIT distribution information available. In determining net gain or loss on securities sold, the cost of securities has been determined on an identified cost basis. Investment income, non-class specific expenses and realized and unrealized gains and losses are allocated on a pro rata basis to each class based on the relative net assets of each class to the total net assets of the Fund.
c. Foreign Currency Translation. The books and records of the Funds are maintained in U.S. dollars. The values of securities, currencies and other assets and liabilities denominated in currencies other than U.S. dollars, if any, are translated into U.S. dollars based upon foreign exchange rates prevailing at the end of the period. Purchases and sales of investment securities, income and expenses are translated into U.S. dollars on the respective dates of such transactions.
Net realized foreign exchange gains or losses arise from sales of foreign currency, changes in exchange rates between the trade and settlement dates on securities transactions and the difference between the amounts of dividends, interest and foreign withholding taxes recorded in the Funds’ books and records and the U.S. dollar equivalent of the amounts actually received or paid. Net unrealized foreign exchange gains or losses arise from changes in the value of assets and liabilities, other than investment securities, as of the end of the fiscal period, resulting from changes in exchange rates. Net realized foreign exchange gains or losses and the net change in unrealized foreign exchange gains or losses are disclosed in the Statements of Operations. For federal income tax purposes, net realized foreign exchange gains or losses are characterized as ordinary income, and may, if the Funds have net losses, reduce the amount of income available to be distributed by the Funds.
The values of investment securities are presented at the foreign exchange rates prevailing at the end of the period for financial reporting purposes. Net realized and unrealized gains or losses on investments reported in the Statements of Operations reflect gains or losses resulting from changes in exchange rates and fluctuations which arise due to changes in market prices of investment securities. For federal income tax purposes, a portion of the net realized gain or loss on investments arising from changes in exchange rates, which is reflected in the Statements of Operations, may be characterized as ordinary income and may, if the Funds have net losses, reduce the amount of income available to be distributed by the Funds.
The Funds may use foreign currency exchange contracts to facilitate transactions in foreign-denominated investments. Losses may arise from changes in the value of the foreign currency or if the counterparties do not perform under the contracts’ terms.
Notes to Financial Statements (continued)
d. Forward Foreign Currency Contracts. A Fund may enter into forward foreign currency contracts, including forward foreign cross currency contracts, to acquire exposure to foreign currencies or to hedge the Funds’ investments against currency fluctuation. A contract can also be used to offset a previous contract. These contracts involve market risk in excess of the unrealized appreciation (depreciation) reflected in the Funds’ Statements of Assets and Liabilities. The U.S. dollar value of the currencies a Fund has committed to buy or sell represents the aggregate exposure to each currency a Fund has acquired or hedged through currency contracts outstanding at period end. Gains or losses are recorded for financial statement purposes as unrealized until settlement date. Contracts are traded over-the-counter directly with a counterparty. Risks may arise upon entering into these contracts from the potential inability of counterparties to meet the terms of their contracts and from unanticipated movements in the value of a foreign currency relative to the U.S. dollar. Certain contracts may require the movement of cash and/or securities as collateral for the Funds’ or counterparty’s net obligations under the contracts. Forward foreign currency contracts outstanding at the end of the period, if any, are listed in each applicable Fund's Portfolio of Investments.
e. Federal and Foreign Income Taxes. The Trusts treat each Fund as a separate entity for federal income tax purposes. Each Fund intends to meet the requirements of the Internal Revenue Code of 1986, as amended, applicable to regulated investment companies, and to distribute to its shareholders substantially all of its net investment income and any net realized capital gains at least annually. Management has performed an analysis of each Fund’s tax positions for the open tax years as of December 31, 2023 and has concluded that no provisions for income tax are required. The Funds’ federal tax returns for the prior three fiscal years remain subject to examination by the Internal Revenue Service. Management is not aware of any events that are reasonably possible to occur in the next twelve months that would result in the amounts of any unrecognized tax benefits significantly increasing or decreasing for the Funds. However, management’s conclusions regarding tax positions taken may be subject to review and adjustment at a later date based on factors including, but not limited to, new tax laws and accounting regulations and interpretations thereof.
A Fund may be subject to foreign withholding taxes on investment income and taxes on capital gains on investments that are accrued and paid based upon the Fund’s understanding of the tax rules and regulations that exist in the countries in which the Fund invests. Foreign withholding taxes on dividend and interest income are reflected on the Statements of Operations as a reduction of investment income, net of amounts that have been or are expected to be reclaimed and paid. Dividends and interest receivable on the Statements of Assets and Liabilities are net of foreign withholding taxes. Foreign withholding taxes where reclaims have been or are expected to be filed and paid are reflected on the Statements of Assets and Liabilities as tax reclaims receivable. Capital gains taxes paid are included in net realized gain (loss) on investments in the Statements of Operations. Accrued but unpaid capital gains taxes are reflected as foreign taxes payable on the Statements of Assets and Liabilities, if applicable, and reduce unrealized gains on investments. In the event that realized gains on investments are subsequently offset by realized losses, taxes paid on realized gains may be returned to a Fund. Such amounts, if applicable, are reflected as foreign tax rebates receivable on the Statements of Assets and Liabilities and are recorded as a realized gain when received.
Certain Funds have filed tax reclaims for previously withheld taxes on dividends earned in certain European Union countries (“EU reclaims”) and may continue to make such filings when it is determined to be in the best interest of the Funds and their shareholders. These filings are subject to various administrative proceedings by the local jurisdictions’ tax authorities within the European Union, as well as a number of related judicial proceedings. EU reclaims are recognized by a Fund when deemed more likely than not to be collected, and are reflected as a reduction of foreign taxes withheld in the Statements of Operations. Any related receivable is reflected as tax reclaims receivable in the Statements of Assets and Liabilities. Under certain circumstances, EU reclaims may be subject to closing agreements with the Internal Revenue Service ("IRS"), which may materially reduce the reclaim amounts realized by the Funds. Fees and expenses associated with closing agreements will be reflected in the Statements of Operations when it is determined that a closing agreement with the IRS is required.
f. Dividends and Distributions to Shareholders. Dividends and distributions are recorded on the ex-dividend date. The timing and characterization of certain income and capital gain distributions are determined in accordance with federal tax regulations, which may differ from accounting principles generally accepted in the United States of America. Permanent differences are primarily due to differing treatments for book and tax purposes of items such as capital gains taxes, deferred Trustees’ fees, forward foreign currency contract mark-to-market, tax equalization, distribution re-designations, foreign currency gains and losses, corporate actions, passive foreign investment company adjustments, return of capital distributions received and capital gain distribution received. Permanent book and tax basis differences relating to shareholder distributions, net investment income and net realized gains will result in reclassifications to capital accounts reported on the Statements of Assets and Liabilities. Temporary differences between book and tax distributable earnings are primarily due to capital gains taxes, wash sales, forward foreign currency contract mark-to-market, return of capital distributions received, corporate actions, deferred Trustees’ fees, deferral of EU reclaims, capital gain distribution received and passive foreign investment company adjustments. Amounts of income and capital gain available to be distributed on a tax basis are
Notes to Financial Statements (continued)
determined annually, and at other times during the Funds’ fiscal year as may be necessary to avoid knowingly declaring and paying a return of capital distribution. Distributions from net investment income and short-term capital gains are considered to be distributed from ordinary income for tax purposes.
The tax characterization of distributions is determined on an annual basis. The tax character of distributions paid to shareholders during the years ended December 31, 2023 and 2022 was as follows:
| | |
| | | | | | |
International Growth Fund | | | | | | |
| | | | | | |
Natixis Oakmark International Fund | | | | | | |
U.S. Equity Opportunities Fund | | | | | | |
| | | | | | |
| | | | | | |
Distributions paid to shareholders from net investment income and net realized capital gains, based on accounting principles generally accepted in the United States of America, are consolidated and reported on the Statements of Changes in Net Assets as Distributions to Shareholders. Distributions paid to shareholders from net investment income and net realized capital gains expressed in per-share amounts, based on accounting principles generally accepted in the United States of America, are separately stated and reported within the Financial Highlights.
As of December 31, 2023, the components of distributable earnings on a tax basis were as follows:
| | | Natixis
Oakmark
International
Fund | U.S.
Equity
Opportunities
Fund |
Undistributed ordinary income | | | | |
Undistributed long-term capital gains | | | | |
Total undistributed earnings | | | | |
Capital loss carryforward: | | | | |
| | | | |
| | | | |
| | | | |
| | | | |
Total capital loss carryforward | | | | |
Late-year ordinary and post-October
| | | | |
Unrealized appreciation (depreciation) | | | | |
Total accumulated earnings (losses) | | | | |
Notes to Financial Statements (continued)
| | |
Undistributed ordinary income | | |
Capital loss carryforward: | | |
| | |
| | |
| | |
| | |
Total capital loss carryforward | | |
| | |
Total accumulated earnings | | |
| Under current tax law, net operating losses, capital losses, foreign currency losses, and losses on passive foreign investment companies and contingent payment debt instruments after October 31 or December 31, as applicable, may be deferred and treated as occurring on the first day of the following taxable year. U.S. Equity Opportunities Fund is deferring capital losses. |
As of December 31, 2023, the tax cost of investments (including derivatives, if applicable) and unrealized appreciation (depreciation) on a federal tax basis were as follows:
| | | Natixis
Oakmark
International
Fund | U.S.
Equity
Opportunities
Fund | | |
| | | | | | |
| | | | | | |
| | | | | | |
Net tax appreciation (depreciation) | | | | | | |
The difference between these amounts and those reported in the components of distributable earnings, if any, are primarily attributable to foreign currency mark-to-market and foreign capital gains taxes.
g. Repurchase Agreements. Each Fund may enter into repurchase agreements, under the terms of a Master Repurchase Agreement, under which each Fund acquires securities as collateral and agrees to resell the securities at an agreed upon time and at an agreed upon price. It is each Fund’s policy that the market value of the collateral for repurchase agreements be at least equal to 102% of the repurchase price, including interest. Certain repurchase agreements are tri-party arrangements whereby the collateral is held in a segregated account for the benefit of the Fund and on behalf of the counterparty. Repurchase agreements could involve certain risks in the event of default or insolvency of the counterparty, including possible delays or restrictions upon a Fund’s ability to dispose of the underlying securities. As of December 31, 2023, each Fund, as applicable, had investments in repurchase agreements for which the value of the related collateral exceeded the value of the repurchase agreement. The gross value of repurchase agreements is included in the Statements of Assets and Liabilities for financial reporting purposes.
h. Indemnifications. Under the Trusts’ organizational documents, their officers and Trustees are indemnified against certain liabilities arising out of the performance of their duties to the Funds. Additionally, in the normal course of business, the Funds enter into contracts with service providers that contain general indemnification clauses. The Funds' maximum exposure under these arrangements is unknown as this would involve future claims that may be made against the Funds that have not yet occurred. However, based on experience, the Funds expect the risk of loss to be remote.
i. Regulatory Update. Effective January 24, 2023, the SEC adopted a release (the “Release”) containing rule and form amendments to require mutual funds and ETFs to transmit concise and visually engaging streamlined annual and semiannual reports to shareholders that highlight key information deemed important for retail investors to assess and monitor their fund investments. Other information, including financial statements, will no longer appear in the new tailored shareholder reports but will be available online, delivered free of charge upon request, and filed with the SEC on a semiannual basis on Form N-CSR. In addition to the removal of financial statements from the new tailored shareholder reports, the Release requires mandatory mailing of the reports, unless a shareholder specifically opts out and chooses electronic delivery. The Release also requires that the new tailored shareholder reports be no longer than 2-4 pages, include only a single share class of a single fund, and use a broad-based securities market index for performance comparison
Notes to Financial Statements (continued)
purposes. Management is evaluating the impact of the Release on the content of the current shareholder report and newly created tailored shareholder reports and expects to meet the required compliance date of July 24, 2024.
3.Fair Value Measurements. In accordance with accounting standards related to fair value measurements and disclosures, the Funds have categorized the inputs utilized in determining the value of each Fund’s assets or liabilities. These inputs are summarized in the three broad levels listed below:
• Level 1 — quoted prices in active markets for identical assets or liabilities;
• Level 2 — prices determined using other significant inputs that are observable either directly, or indirectly through corroboration with observable market data (which could include quoted prices for similar assets or liabilities, interest rates, credit risk, etc.); and
• Level 3 — prices determined using significant unobservable inputs when quoted prices or observable inputs are unavailable such as when there is little or no market activity for an asset or liability (unobservable inputs reflect each Fund’s own assumptions in determining the fair value of assets or liabilities and would be based on the best information available).
The inputs or methodology used for valuing securities are not necessarily an indication of the risk associated with investing in those securities.
The Funds' pricing policies have been approved by the Board of Trustees. Investments for which market quotations are readily available are categorized in Level 1. Other investments for which an independent pricing service is utilized are categorized in Level 2. Broker-dealer bid prices for which the Funds have knowledge of the inputs used by the broker-dealer are categorized in Level 2. All other investments, including broker-dealer bid prices for which the Funds do not have knowledge of the inputs used by the broker-dealer, as well as investments fair valued by the valuation designee, are categorized in Level 3. All Level 2 and 3 securities are defined as being fair valued.
Under certain conditions and based upon specific facts and circumstances, the Fund’s valuation designee may determine that a fair valuation should be made for portfolio investment(s). These valuation designee fair valuations will be based upon a significant amount of Level 3 inputs.
The following is a summary of the inputs used to value the Funds' investments as of December 31, 2023, at value:
International Growth Fund |
|
| | | | |
| | | | |
| | | | |
| | | | |
| | | | |
| | | | |
| | | | |
| | | | |
| | | | |
| | | | |
| | | | |
| | | | |
| | | | |
| | | | |
All Other Common Stocks(a) | | | | |
| | | | |
| | | | |
| | | | |
| Details of the major categories of the Fund’s investments are reflected within the Portfolio of Investments. |
Notes to Financial Statements (continued)
| Details of the major categories of the Fund’s investments are reflected within the Portfolio of Investments. |
Natixis Oakmark International Fund |
|
| | | | |
| | | | |
| | | | |
| | | | |
| | | | |
| | | | |
| | | | |
| | | | |
| | | | |
| | | | |
| | | | |
| | | | |
| | | | |
| | | | |
| | | | |
| | | | |
| | | | |
All Other Common Stocks(a) | | | | |
| | | | |
| | | | |
| | | | |
| | | | |
| Details of the major categories of the Fund’s investments are reflected within the Portfolio of Investments. |
U.S. Equity Opportunities Fund |
|
| | | | |
| | | | |
| | | | |
| | | | |
| Details of the major categories of the Fund’s investments are reflected within the Portfolio of Investments. |
Notes to Financial Statements (continued)
| Details of the major categories of the Fund’s investments are reflected within the Portfolio of Investments. |
| Details of the major categories of the Fund’s investments are reflected within the Portfolio of Investments. |
4.Purchases and Sales of Securities. For the year ended December 31, 2023, purchases and sales of securities (excluding short-term investments) were as follows:
| | |
International Growth Fund | | |
| | |
Natixis Oakmark International Fund | | |
U.S. Equity Opportunities Fund | | |
| | |
| | |
5.Management Fees and Other Transactions with Affiliates.
a. Management Fees. Loomis, Sayles & Company, L.P. (“Loomis Sayles”) serves as investment adviser to International Growth Fund. Loomis Sayles is a limited partnership whose sole general partner, Loomis, Sayles & Company, Inc., is indirectly owned by Natixis Investment Managers, LLC, which is part of Natixis Investment Managers, an international asset management group based in Paris, France.
Under the terms of the management agreement, International Growth Fund pays a management fee at the annual rate of 0.75%, calculated daily and payable monthly, based on the Fund’s average daily net assets.
Natixis Advisors, LLC (“Natixis Advisors”) serves as investment adviser to Natixis Oakmark Fund, Natixis Oakmark International Fund, U.S. Equity Opportunities Fund, Mid Cap Fund and Small Cap Value Fund. Under the terms of the management agreements, each Fund pays a management fee at the following annual rates, calculated daily and payable monthly, based on each Fund’s average daily net assets:
| Percentage of Average Daily Net Assets |
| | | | | | |
| | | | | | |
Natixis Oakmark International Fund | | | | | | |
U.S. Equity Opportunities Fund | | | | | | |
| | | | | | |
| | | | | | |
Notes to Financial Statements (continued)
Prior to July 1, 2023, U.S. Equity Opportunities Fund paid a management fee at the annual rate of 0.70% of the Fund’s average daily net assets, calculated daily and payable monthly.
Natixis Advisors has entered into subadvisory agreements for each Fund as listed below.
| |
| Harris Associates L.P. (“Harris”) |
Natixis Oakmark International Fund | |
U.S. Equity Opportunities Fund | |
| Vaughan Nelson Investment Management, L.P. (“Vaughan Nelson”) |
| |
Natixis Advisors, Harris and Vaughan Nelson are subsidiaries of Natixis Investment Managers, LLC.
Under the terms of the subadvisory agreements, each Fund has agreed to pay its respective subadviser a subadvisory fee at the following annual rates, calculated daily and payable monthly, based on each Fund’s average daily net assets:
| | Percentage of Average
Daily Net Assets |
| | | | | | |
| | | | | | |
Natixis Oakmark International Fund | | | | | | |
U.S. Equity Opportunities Fund | | | | | | |
| | | | | | |
| | | | | | |
| | | | | | |
| | | | | | |
Prior to July 1, 2023, U.S. Equity Opportunities Fund Large Cap Value Segment had paid its respective subadviser a subadvisory fee at the following annual rates, calculated daily and payable monthly, based on the Fund’s average daily net assets:
| | Percentage of Average
Daily Net Assets |
| | | | | | |
U.S. Equity Opportunities Fund | | | | | | |
| | | | | | |
Loomis Sayles and Natixis Advisors have given binding undertakings to the Funds to waive management fees and/or reimburse certain expenses to limit the Funds’ operating expenses, exclusive of acquired fund fees and expenses, brokerage expenses, interest expense, substitute dividend expenses on securities sold short, taxes, organizational and extraordinary expenses such as litigation and indemnification expenses. These undertakings are in effect until April 30, 2024, except for U.S. Equity Opportunities Fund which is in effect until April 30, 2025, may be terminated before then only with the consent of the Funds’ Board of Trustees, and are reevaluated on an annual basis. Management fees payable, as reflected on the Statements of Assets and Liabilities, is net of waivers and/or expense reimbursements, if any, pursuant to these undertakings. Waivers/reimbursements that exceed management fees payable are reflected on the Statements of Assets and Liabilities as receivable from investment adviser.
Notes to Financial Statements (continued)
For the year ended December 31, 2023, the expense limits as a percentage of average daily net assets under the expense limitation agreements were as follows:
| Expense Limit as a Percentage of
Average Daily Net Assets |
| | | | |
International Growth Fund | | | | |
| | | | |
Natixis Oakmark International Fund | | | | |
U.S. Equity Opportunities Fund | | | | |
| | | | |
| | | | |
Prior to July 1, 2023, the expense limits as a percentage of average daily net assets under the expense limitation agreements for U.S. Equity Opportunities Fund were as follows:
| Expense Limit as a Percentage of
Average Daily Net Assets |
| | | | |
U.S. Equity Opportunities Fund | | | | |
Loomis Sayles and Natixis Advisors shall be permitted to recover expenses borne under the expense limitation agreements (whether through waiver of management fee or otherwise) on a class by class basis in later periods to the extent the annual operating expenses of a class fall below both (1) a class’ expense limitation ratio in place at the time such amounts were waived/reimbursed and (2) a class’ current applicable expense limitation ratio, provided, however, that a class is not obligated to pay such waived/reimbursed fees or expenses more than one year after the end of the fiscal year in which the fees or expenses were waived/reimbursed.
For the year ended December 31, 2023, the management fees and waiver of management fees for each Fund were as follows:
| | Contractual
Waivers of
Management
| | Percentage of
Average
Daily Net Assets |
| | |
International Growth Fund | | | | | |
| | | | | |
Natixis Oakmark International Fund | | | | | |
U.S. Equity Opportunities Fund | | | | | |
| | | | | |
| | | | | |
| Management fee waivers are subject to possible recovery until December 31, 2024. |
No expenses were recovered for any of the Funds during the year ended December 31, 2023 under the terms of the expense limitation agreements.
b. Service and Distribution Fees. Natixis Distribution, LLC (“Natixis Distribution"), which is a wholly-owned subsidiary of Natixis Investment Managers, LLC, has entered into a distribution agreement with the Trusts. Pursuant to this agreement, Natixis Distribution serves as principal underwriter of the Funds of the Trusts.
Pursuant to Rule 12b-1 under the 1940 Act, the Trusts have adopted a Service Plan relating to each Fund’s Class A shares (the “Class A Plans”), a Distribution and Service Plan relating to each Fund’s Class C shares (the “Class C Plans”).
Under the Class A Plans, each Fund pays Natixis Distribution a monthly service fee at an annual rate not to exceed 0.25% of the average daily net assets attributable to the Funds’ Class A shares, as reimbursement for expenses incurred by Natixis Distribution in providing personal services to investors in Class A shares and/or the maintenance of shareholder accounts.
Under the Class C Plans, each Fund pays Natixis Distribution a monthly service fee at an annual rate not to exceed 0.25% of the average daily net assets attributable to the Funds’ Class C shares, as compensation for services provided by Natixis Distribution in providing personal services to investors in Class C shares and/or the maintenance of shareholder accounts.
Notes to Financial Statements (continued)
Also under the Class C Plans, each Fund pays Natixis Distribution a monthly distribution fee at an annual rate of 0.75% of the average daily net assets attributable to the Funds’ Class C shares, as compensation for services provided by Natixis Distribution in connection with the marketing or sale of Class C shares.
For the year ended December 31, 2023, the service and distribution fees for each Fund were as follows:
| | | |
| | | | |
International Growth Fund | | | | |
| | | | |
Natixis Oakmark International Fund | | | | |
U.S. Equity Opportunities Fund | | | | |
| | | | |
| | | | |
c. Administrative Fees. Natixis Advisors provides certain administrative services for the Funds and contracts with State Street Bank and Trust Company (“State Street Bank”) to serve as sub-administrator. Pursuant to an agreement among Natixis Funds Trusts, Loomis Sayles Funds Trusts, Natixis ETF Trusts and Natixis Advisors, each Fund pays Natixis Advisors monthly its pro rata portion of fees equal to an annual rate of 0.0540% of the first $15 billion of the average daily net assets of the Natixis Funds Trusts, Loomis Sayles Funds Trusts and Natixis ETF Trusts, 0.0500% of the next $15 billion, 0.0400% of the next $30 billion, 0.0275% of the next $30 billion and 0.0225% of such assets in excess of $90 billion, subject to an annual aggregate minimum fee for the Natixis Funds Trusts, Loomis Sayles Funds Trusts and Natixis ETF Trusts of $10 million, which is reevaluated on an annual basis.
For the year ended December 31, 2023, the administrative fees for each Fund were as follows:
| |
International Growth Fund | |
| |
Natixis Oakmark International Fund | |
U.S. Equity Opportunities Fund | |
| |
| |
d. Sub-Transfer Agent Fees. Natixis Distribution has entered into agreements, which include servicing agreements, with financial intermediaries that provide recordkeeping, processing, shareholder communications and other services to customers of the intermediaries that hold positions in the Funds and has agreed to compensate the intermediaries for providing those services. Intermediaries transact with the Funds primarily through the use of omnibus accounts on behalf of their customers who hold positions in the Funds. These services would have been provided by the Funds’ transfer agent and other service providers if the shareholders’ accounts were maintained directly at the Funds’ transfer agent. Accordingly, the Funds have agreed to reimburse Natixis Distribution for all or a portion of the servicing fees paid to these intermediaries. The reimbursement amounts (sub-transfer agent fees) paid to Natixis Distribution are subject to a current per-account equivalent fee limit approved by the Funds’ Board of Trustees, which is based on fees for similar services paid to the Funds’ transfer agent and other service providers. Class N shares do not bear such expenses.
For the year ended December 31, 2023, the sub-transfer agent fees (which are reflected in transfer agent fees and expenses in the Statements of Operations) for each Fund were as follows:
| |
International Growth Fund | |
| |
Natixis Oakmark International Fund | |
U.S. Equity Opportunities Fund | |
| |
| |
Notes to Financial Statements (continued)
As of December 31, 2023, the Funds owe Natixis Distribution the following reimbursements for sub-transfer agent fees (which are reflected in the Statements of Assets and Liabilities as payable to distributor):
| Reimbursements
of Sub-Transfer
Agent Fees |
International Growth Fund | |
| |
Natixis Oakmark International Fund | |
U.S. Equity Opportunities Fund | |
| |
| |
Sub-transfer agent fees attributable to Class A, Class C and Class Y are allocated on a pro rata basis to each class based on the relative net assets of each class to the total net assets of those classes.
e. Commissions. Commissions (including CDSCs) on Fund shares retained by Natixis Distribution during the year ended December 31, 2023 were as follows:
| |
| |
Natixis Oakmark International Fund | |
U.S. Equity Opportunities Fund | |
| |
| |
f. Trustees Fees and Expenses. The Trusts do not pay any compensation directly to their officers or Trustees who are directors, officers or employees of Natixis Advisors, Natixis Distribution, Natixis Investment Managers, LLC or their affiliates. The Chairperson of the Board of Trustees receives a retainer fee at the annual rate of $369,000. The Chairperson does not receive any meeting attendance fees for Board of Trustees meetings or committee meetings that he attends. Each Independent Trustee (other than the Chairperson) receives, in the aggregate, a retainer fee at the annual rate of $210,000. Each Independent Trustee also receives a meeting attendance fee of $10,000 for each meeting of the Board of Trustees that he or she attends in person and $5,000 for each meeting of the Board of Trustees that he or she attends telephonically. In addition, the chairperson of the Contract Review Committee, the chairperson of the Audit Committee and the chairperson of the Governance Committee each receive an additional retainer fee at the annual rate of $20,000. Each Contract Review Committee member is compensated $6,000 for each Committee meeting that he or she attends in person and $3,000 for each meeting that he or she attends telephonically. Each Audit Committee member is compensated $6,000 for each Committee meeting that he or she attends in person and $3,000 for each meeting that he or she attends telephonically. Each Governance Committee member is compensated $2,500 for each Committee meeting that he or she attends either in person or telephonically. These fees are allocated among the funds in the Natixis Funds Trusts, Loomis Sayles Funds Trusts and Natixis ETF Trusts based on a formula that takes into account, among other factors, the relative net assets of each fund. Trustees are reimbursed for travel expenses in connection with attendance at meetings.
Effective January 1, 2024, the Chairperson of the Board of Trustees will receive a retainer fee at the annual rate of $385,000 and each Independent Trustee (other than the Chairperson) will receive, in the aggregate, a retainer fee at the annual rate of $225,000. Each Independent Trustee will receive a meeting attendance fee of $10,000 for each meeting of the Board of Trustees that he or she attends in person. The chairperson of the Contract Review Committee and the chairperson of the Audit Committee each will receive an additional retainer fee at the annual rate of $25,000. All other Trustees fees will remain unchanged.
A deferred compensation plan (the “Plan”) is available to the Trustees on a voluntary basis. The value of a participating Trustee’s deferral account is based on theoretical investments of deferred amounts, on the normal payment dates, in certain funds of the Natixis Funds Trusts, Loomis Sayles Funds Trusts and Natixis ETF Trusts as designated by the participating Trustees. Changes in the value of participants’ deferral accounts are allocated pro rata among the funds in the Natixis Funds Trusts, Loomis Sayles Funds Trusts and Natixis ETF Trusts and are normally reflected as Trustees’ fees and expenses in the Statements of Operations. Deferred amounts remain in the funds until distributed in accordance with the provisions of the Plan. The portions of the accrued obligations allocated to the Funds under the Plan are reflected as Deferred Trustees’ fees in the Statements of Assets and Liabilities.
Certain officers and employees of Natixis Advisors, Loomis Sayles and affiliates are also officers and/or Trustees of the Trusts.
Notes to Financial Statements (continued)
g. Affiliated Ownership. As of December 31, 2023, Natixis and affiliates held shares of International Growth Fund representing 99.39% of the Fund's net assets.
Investment activities of affiliated shareholders could have material impacts on the Fund.
h. Reimbursement of Transfer Agent Fees and Expenses. Natixis Advisors has given a binding contractual undertaking to the Funds to reimburse any and all transfer agency expenses for the Funds’ Class N shares. This undertaking is in effect through April 30, 2024 and is not subject to recovery under the expense limitation agreement described above.
For the year ended December 31, 2023, Natixis Advisors reimbursed the Funds for transfer agency expenses as follows:
| Reimbursement of
Transfer Agency
Expenses |
| |
International Growth Fund | |
| |
Natixis Oakmark International Fund | |
U.S. Equity Opportunities Fund | |
| |
| |
6.Class-Specific Transfer Agent Fees and Expenses. Transfer agent fees and expenses attributable to Class A, Class C and Class Y are allocated on a pro rata basis to each class based on the relative net assets of each class to the total net assets of those classes. Transfer agent fees and expenses attributable to Class N are allocated to Class N.
For the year ended December 31, 2023, the Funds incurred the following class-specific transfer agent fees and expenses (including sub-transfer agent fees, where applicable):
| Transfer Agent Fees and Expenses |
| | | | |
International Growth Fund | | | | |
| | | | |
Natixis Oakmark International Fund | | | | |
U.S. Equity Opportunities Fund | | | | |
| | | | |
| | | | |
7.Line of Credit. Each Fund, together with certain other funds of Natixis Funds Trusts, Loomis Sayles Funds Trusts and Natixis ETF Trusts, entered into a syndicated, revolving, committed, unsecured line of credit with State Street Bank as administrative agent. The aggregate revolving commitment amount is $575,000,000. Any one Fund may borrow up to $402,500,000 under the line of credit agreement (as long as all borrowings by all Funds in the aggregate do not exceed the $575,000,000 limit at any time), subject to each Fund’s investment restrictions and its contractual obligations under the line of credit. Interest is charged to the Funds based upon the terms set forth in the agreement. In addition, a commitment fee of 0.15% per annum, payable at the end of each calendar quarter, is accrued and apportioned among the participating funds based on their average daily unused portion of the line of credit. The Funds paid certain legal fees in connection with the line of credit agreement, which are being amortized over a period of 364 days and are reflected in legal fees on the Statements of Operations. The unamortized balance is reflected as prepaid expenses on the Statements of Assets and Liabilities.
Prior to April 6, 2023, each Fund, together with certain other funds of Natixis Funds Trusts and Loomis Sayles Funds Trusts and Natixis ETF Trusts, entered into a $500,000,000 committed unsecured line of credit provided by State Street Bank. Any one Fund was able to borrow up to $350,000,000 under the line of credit agreement (as long as all borrowings by all Funds in the aggregate did not exceed the $500,000,000 limit at any time), subject to each Fund’s investment restrictions and its contractual obligations under the line of credit. Interest was charged to the Funds based upon the terms set forth in the agreement. In addition, a commitment fee of 0.15% per annum, payable at the end of each calendar quarter, was accrued and apportioned among the participating funds based on their average daily unused portion of the line of credit.
Notes to Financial Statements (continued)
For the year ended December 31, 2023, U.S. Equity Opportunities Fund had an average daily balance on the line of credit (for those days on which there were borrowings) of $2,850,000 at a weighted average interest rate of 5.43%. Interest expense incurred on the line of credit was $1,720.
8.Risk. The Funds’ investments in foreign securities may be subject to greater political, economic, environmental, credit/counterparty and information risks. The Fund's investments in foreign securities also are subject to foreign currency fluctuations and other foreign currency-related risks. Foreign securities may be subject to higher volatility than U.S. securities, varying degrees of regulation and limited liquidity.
International Growth Fund may invest to a significant extent in variable interest entity (“VIE”) structures. VIE structures can vary, but generally consist of a U.S.-listed company with contractual arrangements, through one or more wholly-owned special purpose vehicles, with a Chinese company that ultimately provides the U.S.-listed company with contractual rights to obtain economic benefits from the Chinese company. The VIE structure enables foreign investors, such as the Fund, to obtain investment exposure similar to that of an equity owner in a Chinese company in situations in which the Chinese government has restricted or prohibited the ownership of such company by foreign investors. The Fund’s exposure to VIE structures may pose additional risks because the VIE structure is not formally recognized under Chinese law. The Chinese government may cease to tolerate VIE structures at any time or impose new restrictions. In addition, Chinese companies using the VIE structure, and listed on stock exchanges in the U.S., could also face delisting or other ramifications for failure to meet the expectations and/or requirements of the U.S. Securities and Exchange Commission, the Public Company Accounting Oversight Board, or other U.S. regulators. Any of these risks could reduce the liquidity and value of these investments or render them valueless.
International Growth Fund is non-diversified, which means that it is not limited under the 1940 Act to a percentage of assets that it may invest in any one issuer. Because the Fund may invest in the securities of a limited number of issuers, an investment in the Fund may involve a higher degree of risk than would be present in a diversified portfolio.
Geopolitical events (such as trading halts, sanctions or wars) could increase volatility and uncertainty in the financial markets and adversely affect regional and global economies. These, and other related events, could significantly impact a Fund's performance and the value of an investment in the Fund, even if the Fund does not have direct exposure to issuers in the country or countries involved.
9.Concentration of Ownership. From time to time, a Fund may have a concentration of one or more accounts constituting a significant percentage of shares outstanding. Investment activities by holders of such accounts could have material impacts on the Funds. As of December 31, 2023, based on management’s evaluation of the shareholder account base, the Funds had accounts representing controlling ownership of more than 5% of the Funds’ total outstanding shares. The number of such accounts, based on accounts that represent more than 5% of an individual class of shares, and the aggregate percentage of net assets represented by such holdings were as follows:
| Number of 5%
Account Holders | |
| | |
Natixis Oakmark International Fund | | |
U.S. Equity Opportunities Fund | | |
| | |
Omnibus shareholder accounts for which Natixis Advisors understands that the intermediary has discretion over the underlying shareholder accounts or investment models where a shareholder account may be invested for a non-discretionary customer are included in the table above. For other omnibus accounts, the Funds do not have information on the individual shareholder accounts underlying the omnibus accounts; therefore, there could be other 5% shareholders in addition to those disclosed in the table above.
Notes to Financial Statements (continued)
10.Capital Shares. Each Fund may issue an unlimited number of shares of beneficial interest, without par value. Transactions in capital shares were as follows:
|
| Year Ended
December 31, 2023 | Year Ended
December 31, 2022 |
International Growth Fund | | | | |
| | | | |
Issued from the sale of shares | | | | |
Issued in connection with the reinvestment of distributions | | | | |
| | | | |
| | | | |
| | | | |
| | | | |
| | | | |
| | | | |
Issued from the sale of shares | | | | |
Issued in connection with the reinvestment of distributions | | | | |
| | | | |
| | | | |
Issued from the sale of shares | | | | |
Issued in connection with the reinvestment of distributions | | | | |
| | | | |
| | | | |
Increase from capital share transactions | | | | |
Notes to Financial Statements (continued)
10.Capital Shares (continued).
|
| Year Ended
December 31, 2023 | Year Ended
December 31, 2022 |
| | | | |
| | | | |
Issued from the sale of shares | | | | |
Issued in connection with the reinvestment of distributions | | | | |
| | | | |
| | | | |
| | | | |
Issued from the sale of shares | | | | |
Issued in connection with the reinvestment of distributions | | | | |
| | | | |
| | | | |
| | | | |
Issued from the sale of shares | | | | |
Issued in connection with the reinvestment of distributions | | | | |
| | | | |
| | | | |
| | | | |
Issued from the sale of shares | | | | |
Issued in connection with the reinvestment of distributions | | | | |
| | | | |
| | | | |
Increase from capital share transactions | | | | |
Notes to Financial Statements (continued)
10.Capital Shares (continued).
|
| Year Ended
December 31, 2023 | Year Ended
December 31, 2022 |
Natixis Oakmark International Fund | | | | |
| | | | |
Issued from the sale of shares | | | | |
Issued in connection with the reinvestment of distributions | | | | |
| | | | |
| | | | |
| | | | |
Issued from the sale of shares | | | | |
Issued in connection with the reinvestment of distributions | | | | |
| | | | |
| | | | |
| | | | |
Issued from the sale of shares | | | | |
Issued in connection with the reinvestment of distributions | | | | |
| | | | |
| | | | |
| | | | |
Issued from the sale of shares | | | | |
Issued in connection with the reinvestment of distributions | | | | |
| | | | |
| | | | |
Decrease from capital share transactions | | | | |
Notes to Financial Statements (continued)
10.Capital Shares (continued).
|
| Year Ended
December 31, 2023 | Year Ended
December 31, 2022 |
U.S. Equity Opportunities Fund | | | | |
| | | | |
Issued from the sale of shares | | | | |
Issued in connection with the reinvestment of distributions | | | | |
| | | | |
| | | | |
| | | | |
Issued from the sale of shares | | | | |
Issued in connection with the reinvestment of distributions | | | | |
| | | | |
| | | | |
| | | | |
Issued from the sale of shares | | | | |
Issued in connection with the reinvestment of distributions | | | | |
| | | | |
| | | | |
| | | | |
Issued from the sale of shares | | | | |
Issued in connection with the reinvestment of distributions | | | | |
| | | | |
| | | | |
Increase from capital share transactions | | | | |
Notes to Financial Statements (continued)
10.Capital Shares (continued).
|
| Year Ended
December 31, 2023 | Year Ended
December 31, 2022 |
| | | | |
| | | | |
Issued from the sale of shares | | | | |
Issued in connection with the reinvestment of distributions | | | | |
| | | | |
| | | | |
| | | | |
Issued from the sale of shares | | | | |
Issued in connection with the reinvestment of distributions | | | | |
| | | | |
| | | | |
| | | | |
Issued from the sale of shares | | | | |
Issued in connection with the reinvestment of distributions | | | | |
| | | | |
| | | | |
| | | | |
Issued from the sale of shares | | | | |
Issued in connection with the reinvestment of distributions | | | | |
| | | | |
| | | | |
Decrease from capital share transactions | | | | |
Notes to Financial Statements (continued)
10.Capital Shares (continued).
|
| Year Ended
December 31, 2023 | Year Ended
December 31, 2022 |
| | | | |
| | | | |
Issued from the sale of shares | | | | |
Issued in connection with the reinvestment of distributions | | | | |
| | | | |
| | | | |
| | | | |
Issued from the sale of shares | | | | |
Issued in connection with the reinvestment of distributions | | | | |
| | | | |
| | | | |
| | | | |
Issued from the sale of shares | | | | |
Issued in connection with the reinvestment of distributions | | | | |
| | | | |
| | | | |
| | | | |
Issued from the sale of shares | | | | |
Issued in connection with the reinvestment of distributions | | | | |
| | | | |
| | | | |
Increase from capital share transactions | | | | |
Report of Independent Registered Public Accounting Firm
To the Boards of Trustees of Loomis Sayles Funds II, Natixis Funds Trust I and Natixis Funds Trust II and Shareholders of Loomis Sayles International Growth Fund, Natixis Oakmark International Fund, Natixis U.S. Equity Opportunities Fund, Vaughan Nelson Small Cap Value Fund, Natixis Oakmark Fund and Vaughan Nelson Mid Cap Fund
Opinions on the Financial Statements
We have audited the accompanying statements of assets and liabilities, including the portfolios of investments, of Loomis Sayles International Growth Fund (one of the funds constituting Loomis Sayles Funds II), Natixis Oakmark International Fund, Natixis U.S. Equity Opportunities Fund and Vaughan Nelson Small Cap Value Fund (three of the funds constituting Natixis Funds Trust I), and Natixis Oakmark Fund and Vaughan Nelson Mid Cap Fund (two of the funds constituting Natixis Funds Trust II) (hereafter collectively referred to as the "Funds") as of December 31, 2023, the related statements of operations for the year ended December 31, 2023, the statements of changes in net assets for each of the two years in the period ended December 31, 2023, including the related notes, and the financial highlights for each of the periods indicated therein (collectively referred to as the “financial statements”). In our opinion, the financial statements present fairly, in all material respects, the financial position of each of the Funds as of December 31, 2023, the results of each of their operations for the year then ended, the changes in each of their net assets for each of the two years in the period ended December 31, 2023 and each of the financial highlights for each of the periods indicated therein, in conformity with accounting principles generally accepted in the United States of America.
Basis for Opinions
These financial statements are the responsibility of the Funds’ management. Our responsibility is to express an opinion on the Funds’ financial statements based on our audits. We are a public accounting firm registered with the Public Company Accounting Oversight Board (United States) (PCAOB) and are required to be independent with respect to the Funds in accordance with the U.S. federal securities laws and the applicable rules and regulations of the Securities and Exchange Commission and the PCAOB.
We conducted our audits of these financial statements in accordance with the standards of the PCAOB. Those standards require that we plan and perform the audit to obtain reasonable assurance about whether the financial statements are free of material misstatement, whether due to error or fraud.
Our audits included performing procedures to assess the risks of material misstatement of the financial statements, whether due to error or fraud, and performing procedures that respond to those risks. Such procedures included examining, on a test basis, evidence regarding the amounts and disclosures in the financial statements. Our audits also included evaluating the accounting principles used and significant estimates made by management, as well as evaluating the overall presentation of the financial statements. Our procedures included confirmation of securities owned as of December 31, 2023 by correspondence with the custodian and brokers; when replies were not received from brokers, we performed other auditing procedures. We believe that our audits provide a reasonable basis for our opinions.
/s/PricewaterhouseCoopers LLP
Boston, Massachusetts
February 22, 2024
We have served as the auditor of one or more investment companies in Natixis Investment Company Complex since at least 1995. We have not been able to determine the specific year we began serving as auditor.
2023 U.S. Tax Distribution Information to Shareholders (Unaudited)
Corporate Dividends Received Deduction. For the fiscal year ended December 31, 2023, a percentage of dividends distributed by the
Funds listed below qualify for the dividends received deduction for corporate shareholders. These percentages are as follows:
| |
International Growth Fund | |
| |
U.S. Equity Opportunities Fund | |
| |
| |
Qualified Dividend Income. For the fiscal year ended December 31, 2023, a percentage of the ordinary income dividends paid by the Funds are considered qualified dividend income eligible for reduced tax rates. These lower rates range from 0% to 20% depending on an individual’s tax bracket. If the Funds paid a distribution during calendar year 2023, complete information will be reported in conjunction with Form 1099-DIV. These percentages are noted below:
| |
International Growth Fund | |
| |
Natixis Oakmark International Fund | |
U.S. Equity Opportunities Fund | |
| |
| |
Capital Gains Distributions. Pursuant to Internal Revenue Section 852(b), the following Funds paid distributions, which have been designated as capital gains distributions for the fiscal year ended December 31, 2023.
| |
| |
U.S. Equity Opportunities Fund | |
Foreign Tax Credit. For the year ended December 31, 2023, the Fund intends to pass through foreign tax credits and have derived gross income from sources within foreign countries amounting to:
| Foreign-Tax
Credit Pass-Through | |
International Growth Fund | | |
Natixis Oakmark International Fund | | |
Trustee and Officer Information
The tables below provide certain information regarding the Trustees and officers of Natixis Funds Trust I, Natixis Funds Trust II, and Loomis Sayles Funds II (the “Trusts”). Unless otherwise indicated, the address of all persons below is 888 Boylston Street, Suite 800, Boston, MA 02199-8197. The Funds' Statements of Additional Information include additional information about the Trustees of the Trusts and are available by calling Natixis Funds at 800-225-5478.
| Position(s) Held with
the Trusts, Length
of Time Served and
| Principal
Occupation(s)
During Past 5 Years | Number of Portfolios
in Fund Complex
Overseen2and Other
Directorships Held
During Past 5 Years | Experience,
Qualifications,
Attributes, Skills for
Board Membership |
| | | | |
| Trustee since 2013
Contract Review
Committee Member | Executive Chairman of Bob’s Discount Furniture (retail) | 51
Director, Burlington Stores, Inc. (retail); Director, Rue La La
(e-commerce retail) | Significant experience on the Board and on the boards of other business organizations (including retail companies and a bank); executive experience (including at a retail company) |
| Trustee since 2015
Chairperson of the
Audit Committee | | 51
Formerly, Director of Triumph Group (aerospace industry) | Significant experience on the Board and executive experience (including his role as Vice President and treasurer of a defense company and experience at a financial services company) |
| Trustee since 2012
Chairperson of the
Governance Committee
and
Contract Review
Committee Member | President, University of Massachusetts | | Significant experience on the Board and on the boards of other business organizations; experience as President of the University of Massachusetts; government experience (including as a member of the U.S. House of Representatives); academic experience |
Maureen B. Mitchell
(1951) | Trustee since 2017
Chairperson of the
Contract Review
Committee | | 51
Director, Sterling Bancorp (bank) | Significant experience on the Board; financial services industry and executive experience (including role as President of global sales and marketing at a financial services company) |
Trustee and Officer Information
| Position(s) Held with the Trusts, Length of Time Served and Term of Office1 | Principal Occupation(s) During Past 5 Years | Number of Portfolios in Fund Complex Overseen2and Other Directorships Held During Past 5 Years | Experience, Qualifications, Attributes, Skills for Board Membership |
Independent Trustees − continued |
| Trustee since 2016
Audit Committee
Member and
Governance
Committee
Member | Founding Partner, Breton Capital Management, LLC (private equity); formerly, Partner, STEP Partners, LLC (private equity) | 51
Director, Candidly (chemicals and biofuels) | Significant experience on the Board; financial services industry and executive experience (including roles as Chief Executive Officer of client management and asset servicing for a banking and financial services company) |
| Chairperson of the Board
of Trustees since 2021
Trustee since 2009
Ex Officio Member of the
Audit Committee,
Contract Review
Committee and
Governance Committee | Retired; formerly, Professor of Finance at Babson College | | Significant experience on the Board; experience as Director of the Division of Trading and Markets at the Securities and Exchange Commission; academic experience; training as an economist |
| Trustee since 2009
Contract Review
Committee
Member | | | Significant experience on the Board; mutual fund industry and executive experience (including roles as President and Chief Executive Officer for an investment adviser) |
Trustee and Officer Information
| Position(s) Held with the Trusts, Length of Time Served and Term of Office1 | Principal Occupation(s) During Past 5 Years | Number of Portfolios in Fund Complex Overseen2and Other Directorships Held During Past 5 Years | Experience, Qualifications, Attributes, Skills for Board Membership |
Independent Trustees − continued |
| Trustee since 2019
Audit Committee
Member and Governance
Committee Member | Managing Director of Accordia Partners, LLC (real estate development); President of Primary Corporation (real estate development); Managing Principal of Merrick Capital Partners (infrastructure finance) | 51
Advisor/Risk Management Committee, Eastern Bank (bank); Director, Apartment Investment and Management Company (real estate investment trust); formerly, Director, Ares Commercial Real Estate Corporation (real estate investment trust) | Experience on the Board and significant experience on the boards of other business organizations (including real estate companies and banks) |
| Trustee since 2005
Audit Committee
and Governance
Committee Member | Retired; formerly, Deputy Dean for Finance and Administration, Yale University School of Medicine | | Significant experience on the Board; executive experience in a variety of academic organizations (including roles as dean for finance and administration) |
| | | | |
(1965)
One Financial Center
Boston, MA 02111 | | President, Chief Executive Officer and Chairman of the Board of Directors, Loomis, Sayles & Company, L.P. | | Significant experience on the Board; continuing service as President, Chief Executive Officer and Chairman of the Board of Directors of Loomis, Sayles & Company, L.P. |
Trustee and Officer Information
| Position(s) Held with the Trusts, Length of Time Served and Term of Office1 | Principal Occupation(s) During Past 5 Years | Number of Portfolios in Fund Complex Overseen2and Other Directorships Held During Past 5 Years | Experience, Qualifications, Attributes, Skills for Board Membership |
Interested Trustees − continued |
| Trustee since 2011
President and Chief
Executive Officer of
Natixis Funds Trust I and
Natixis Funds Trust II
since 2008; President of
Loomis Sayles Funds II
since 2008; Chief
Executive Officer of
Loomis Sayles Funds II
since 2015 | President and Chief Executive Officer, Natixis Advisors, LLC and Natixis Distribution, LLC | | Significant experience on the Board; experience as President and Chief Executive Officer of Natixis Advisors, LLC and Natixis Distribution, LLC |
| Each Trustee serves until retirement, resignation or removal from the Board. The current retirement age is 75. The position of Chairperson of the Board is appointed for a three-year term. |
| The Trustees of the Trusts serve as Trustees of a fund complex that includes all series of the Natixis Funds Trust I, Natixis Funds Trust II, Natixis Funds Trust IV, Gateway Trust, Loomis Sayles Funds I, Loomis Sayles Funds II, Natixis ETF Trust and Natixis ETF Trust II (collectively, the “Fund Complex”). |
| Mr. Charleston is deemed an “interested person” of the Trusts because he holds the following positions with an affiliated person of the Trusts: President, Chief Executive Officer and Chairman of the Board of Directors of Loomis, Sayles & Company, L.P. |
| Mr. Giunta is deemed an “interested person” of the Trusts because he holds the following positions with an affiliated person of the Trusts: President and Chief Executive Officer, Natixis Advisors, LLC and Natixis Distribution, LLC. |
Trustee and Officer Information
| Position(s) Held
with the Trusts | | |
| | | |
| Treasurer, Principal
Financial and
Accounting Officer | | Senior Vice President, Natixis Advisors, LLC and Natixis Distribution, LLC; formerly, Vice President, Natixis Advisors, LLC and Natixis Distribution, LLC; Assistant Treasurer of the Fund Complex |
| Secretary and Chief
Legal Officer | | Executive Vice President, General Counsel and Secretary, Natixis Advisors, LLC and Natixis Distribution, LLC; formerly, Executive Vice President and Chief Compliance Officer of Natixis Investment Managers (March 2019 – May 2022) and Senior Vice President and Head of Compliance, U.S. for Natixis Investment Managers (July 2011 – March 2019) |
| Chief Compliance
Officer, Assistant
Secretary and
Anti-Money
Laundering Officer | | Senior Vice President, Natixis Advisors, LLC and Natixis Distribution, LLC; formerly, Vice President, Head of Corporate Compliance, Global Atlantic Financial Group |
| Each officer of the Trusts serves for an indefinite term in accordance with the Trusts' current by-laws until the date his or her successor is elected and qualified, or until he or she sooner dies, retires, is removed or becomes disqualified. |
| Each person listed above, except as noted, holds the same position(s) with the Fund Complex. Previous positions during the past five years with Natixis Distribution, LLC, Natixis Advisors, LLC or Loomis, Sayles & Company, L.P. are omitted, if not materially different from an officer’s current position with such entity. |
This Page Intentionally Left Blank
˃To learn more about Natixis Funds products and services:
Visit: im.natixis.com Call: 800-225-5478
Before investing, consider the fund’s investment objectives, risks, charges, and expenses. Visit im.natixis.com or call 800-225-5478 for a prospectus or summary prospectus containing this and other information.
Contact us by mail:
If you wish to communicate with the funds’ Board of Trustees, you may do so by writing to:
Secretary of the Funds
Natixis Advisors, LLC
888 Boylston Street, Suite 800
Boston, MA 02199-8197
The correspondence must (a) be signed by the shareholder; (b) include the shareholder’s name and address; and (c) identify the fund(s), account number, share class, and number of shares held in that fund, as of a recent date.
Or by e-mail:
secretaryofthefunds@natixis.com (Communications regarding recommendations for Trustee candidates may not be submitted by e-mail.)
Please note: Unlike written correspondence, e-mail is not secure. Please do NOT include your account number, Social Security number, PIN, or any other non-public personal information in an e-mail communication because this information may be viewed by others.
 Exp. 3/1/20256255481.1.1EF58A-1223
This page not part of shareholder report
Annual Report
December 31, 2023
|
Gateway Equity Call Premium Fund |
Mirova Global Green Bond Fund |
Mirova Global Sustainable Equity Fund |
Mirova International Sustainable Equity Fund |
IMPORTANT NOTICE TO SHAREHOLDERS
The Securities and Exchange Commission (SEC) has adopted new regulations that will result in changes to the design and delivery of annual and semiannual shareholder reports. Beginning in July 2024, Funds will be required by the SEC to send shareholders a paper copy of a new tailored shareholder report in place of the full shareholder report that is currently being provided. If you would like to receive shareholder reports and other communications from the Funds electronically, instead of by mail, you may make that request at www.icsdelivery.com/natixisfunds. If you have already elected to receive shareholder reports electronically, you will not be affected by this change, and you need not take any action.
|
|
|
|
|
Gateway Investment Advisers, LLC |
Investment GoalThe Fund seeks to capture the majority of returns associated with equity market investments, while exposing investors to less risk than other equity investments.
Market Conditions
The S&P 500® Index returned 7.50%, 8.74%, -3.27%, and 11.69% in the first, second, third, and fourth quarters of 2023, respectively. Despite significant turmoil and growing global conflict, the year was all about the US Federal Reserve (Fed) and expectations surrounding the path of monetary policy. Investors attempted to predict the direction of Fed decisions and, most importantly, the level and pace of interest rate increases. After record inflation and negative equity markets in 2022, signs of softening inflation in January 2023 helped the S&P 500® Index climb 8.98% from January 1 to February 2, 2023. Sudden tumult from a regional bank crisis contributed to a 7.53% decline in the S&P 500® Index from February 2 to March 13. As confidence in the financial system showed signs of deterioration, the Fed enacted emergency measures which relieved investor concerns and fueled a 19.72% rally in the S&P 500® Index from March 13 to July 31. Last-minute US debt ceiling negotiations triggered a surprise credit downgrade by Fitch Ratings and a second wave of regional bank downgrades. The burst of uncertainty contributed to a 9.94% equity market decline from the end of July to October 27. As inflation continued to ease, a less-hawkish tone from the Fed kicked off a 16.23% market advance from October 27 through year-end.
With a significant equity market advance during 2023, implied volatility drifted lower, as expected. Implied volatility, as measured by the Cboe® Volatility Index (the VIX®), ended 2022 at 21.67 and averaged 16.85 during 2023. Consistent with its typical relationship, average implied volatility exceeded realized volatility, as measured by the standard deviation of daily returns for the S&P 500® Index, which was 13.10% for the year. The Volatility Risk Premium, or the difference between the two volatility measures, was positive throughout the year and averaged 4.19% in 2023, above its average of 4.08% since 1990. The VIX® spent most of 2023 ranging from the mid-teens to the mid-20s, closing above its long-term average of 19.58 for more than 20% of the year. The VIX® reached an intra-year high of 26.52 on March 13 at the height of the banking crisis before settling into a quiet summer supported by a rapid equity market advance and growing investor optimism surrounding the direction of monetary policy. The selloff from July 31 through October 27 drove the measure above summer lows, reaching a fourth quarter high of 21.71 on October 20. Implied volatility through the end of 2023 was stifled as hopes grew for an extended pause, or even a cut, in interest rates. The VIX® reached an intra-year low of 12.07 on December 12 and ended 2023 at 12.45.
Performance Results
For the 12 months ended December 31, 2023, Class Y shares of the Gateway Fund returned 14.70% at net asset value. The Fund underperformed its primary benchmark, the S&P 500® Index, which returned 26.29%, while the Fund outperformed its secondary benchmark, the Bloomberg U.S. Aggregate Bond Index, which returned 5.53%.
Explanation of Fund Performance
The Fund invests in a broadly diversified portfolio of common stocks that is designed to track the performance of the S&P 500® Index, while also selling index call options and purchasing index put options. The Fund seeks to generate returns by creating cash flow through writing at- and near-the-money index call options against the full value of its underlying equity portfolio. The steady cash flow from call option writing is intended to be an important source of the Fund’s return, although it reduces the Fund’s ability to profit from increases in the value of its equity portfolio. The Fund uses some of the cash flow from index call option writing to purchase out-of-the-money index put options to mitigate sudden and severe price declines in the equity portfolio. An index call option is considered near-the-money when the price of the underlying index is close to the option’s strike price. Additionally, an index put option is deemed out-of-the money when its strike price is below the price of the underlying index. It is the net premium-to-earn from selling index call options less the price of protective index put options that is a significant factor in determining how much participation the Fund will have in a rising market and how much downside mitigation is delivered in a declining market. In the long term, the combination of the
diversified stock portfolio, steady cash flow from the sale of index call options and downside mitigation from index put options is intended to provide the Fund with a majority of the returns associated with equity market investments while exposing investors to less risk.
The Fund underperformed its primary benchmark for the year while achieving the risk component of its objective by exhibiting significantly less risk than the equity market, as measured by the standard deviation of daily returns. Net gains from the Fund’s two-part index option strategy provided loss mitigation during market declines, while net losses on options resulted in lagging performance during market rallies. On a quarterly basis, the Fund had smaller losses than the S&P 500® Index in the third quarter with robust quarterly participation in the first, second, and final quarters of the year. Notably, from February 2 to March 13, the Fund returned -2.68% relative to the S&P 500® Index’s return of -7.53%, providing 485 basis points of loss mitigation. From March 13 to July 31, the Fund returned 11.26% relative to the 19.72% return of the S&P 500® Index.
The Fund’s equity portfolio returned 28.11% in 2023, a performance differential of positive 1.82% versus the S&P 500® Index. Consistent with its investment objective, the measured risk of the Fund was low relative to the US equity market, as its standard deviation of daily returns for 2023 was 6.41% versus 13.10% for the S&P 500® Index.
The Fund started and ended 2023 with full index put option coverage. While much of the year exhibited strong upward price movement for the S&P 500® Index, periods of market weakness provided the investment team with opportunities to actively monetize increased levels of volatility being priced into index put option contracts, to preserve index put gains in the event of a sudden and sharp market recovery, and to position the Fund for attractive outcomes in a wider range of market scenarios. During the first quarter, as concerns grew about the impact of higher interest rates on regional bank balance sheets, the investment team made several changes to put coverage in an effort to monetize higher implied volatility and preserve index put option gains. These adjustments were made while keeping the Fund’s market exposure relatively consistent with its historical risk profile. The investment team reduced put coverage to an intra-quarter low range of 50% to 60% before incrementally adding index put options and restoring full put coverage by early April. As the market rebounded through July, the team focused on maintaining the Fund’s typical risk profile and managing the cost of downside protection, while making adjustments to maintain consistent market exposure. Market weakness from August through October once again provided opportunities to monetize higher volatility and preserve gains in the event of a sudden and sharp market recovery. During October, the investment team reduced put coverage to an intra-quarter low range of 80% to 95% before restoring full put coverage in the first week of November as the cost of protection declined. During the remainder of the year, adjustments to the index put option portfolio focused on gradually increasing the weighted-average strike price and managing weighted-average time to expiration. Adjustments were aimed at managing the cost of downside protection while maintaining the Fund’s typical level of market exposure and risk profile.
The Fund maintained a portfolio of written index call options on the full value of its equity holdings over the course of the year, while making active adjustments to positions in response to deteriorating market conditions and opportunistically taking advantage of the higher implied volatility that was priced into longer-dated contracts to enhance cash flow potential. The term structure of volatility pricing was highly dynamic over the year and the investment team generally extended weighted-average time to expiration when term structure was steep, as it was for most of 2023, and shortened when term structure was inverted or flat such as it was during periods of market stress.
Outlook
The Federal Funds Effective Rate (Fed Funds Rate) was increased seven times during 2022, ratcheting from 0.07% to 4.33%. With a significant departure from the quantitative easing approach of the prior decade or more, the consensus was that the Fed had been too aggressive and risked pushing the US economy into recession. Amidst progress against inflation paired with an impressively resilient economy and labor market, the Fed’s tone turned less hawkish as the year progressed and led to a pause in the rate hiking cycle. Ultimately, the Fed Funds Rate climbed to 5.33% in July 2023 and was held steady through year-end. Bond yields are higher than prior to the Global Financial Crisis but only time will tell if current yields will be overwhelmed by lower-but-persistent inflation or be sufficient compensation for the potential loss of principle if the Fed’s tightening cycle resumes.
There are growing expectations of interest rate cuts in 2024 and some market participants may view such a reversal as a potentially bullish development. The historical record is not so sanguine as the effects of monetary policy tend to lag policy action and create significant uncertainty. On average, the equity market advanced 5.1% in the one-year period following an interest rate cut, although investors had to withstand significant drawdowns and increased volatility along the way.
While it’s impossible to predict market performance in 2024, a review of the last 25 years shows that the equity market has climbed more than 20% in eight of those years. In the year following those advances, average returns were just 3.8%. Positive, but hardly as exciting as 2023’s results. With ample drivers of volatility on the horizon – such as the US presidential election, geopolitical uncertainty, and ongoing wars – risk management may be prudent.
If current levels of volatility and interest rates persist, or move higher, option writing premiums may continue to be an effective source of risk-reduced return potential, as well as downside protection. Whether the Fed resumes rate hikes, holds steady, or even cuts rates, investment strategies that combine equity market exposure with cash flow from writing index options, like the Fund, may benefit from relatively higher levels of interest rates and implied volatility. Elevated cash flow provides strong return potential during market advances and attractive downside protection potential in declining markets.
Top Ten Holdings as of December 31, 2023 |
| |
| |
| |
| |
| |
5 Alphabet, Inc., Class C | |
6 Berkshire Hathaway, Inc., Class B | |
7 Meta Platforms, Inc., Class A | |
| |
| |
10 UnitedHealth Group, Inc. | |
The portfolio is actively managed and holdings are subject to change. There is no guarantee the Fund continues to invest in the securities referenced. The holdings listed exclude any temporary cash investments, are presented on an individual security basis and do not represent holdings of the issuer. |
Hypothetical Growth of $100,000 Investment in Class Y Shares1 |
December 31, 2013 through December 31, 2023 |
Average Annual Total Returns —December 31, 20231 |
| | | | | |
| | |
| | | | | | |
| | | | | | |
| | | | | | |
| | | | | | |
With 5.75% Maximum Sales Charge | | | | | | |
| | | | | | |
| | | | | | |
| | | | | | |
Class N (Inception 5/1/17) | | | | | | |
| | | | | | |
| | | | | | |
| | | | | | |
Bloomberg U.S. Aggregate Bond Index3 | | | | | | |
Performance data shown represents past performance and is no guarantee of, and not necessarily indicative of, future results. Total return and value will vary, and you may have a gain or loss when shares are sold. Current performance may be lower or higher than quoted. For most recent month-end performance, visit im.natixis.com/performance. Performance for other share classes will be greater or less than shown based on differences in fees and sales charges. You may not invest directly in an index. Performance for periods less than one year is cumulative, not annualized. Returns reflect changes in share price and reinvestment of dividends and capital gains, if any. The table(s) do not reflect taxes shareholders might owe on any fund distributions or when they redeem their shares.
| Fund performance has been increased by fee waivers and/or expense reimbursements, if any, without which performance would have been lower. |
| S&P 500® Index is a widely recognized measure of U.S. stock market performance. It is an unmanaged index of 500 common stocks chosen for market size, liquidity, and industry group representation, among other factors. It also measures the performance of the large cap segment of the U.S. equities market. |
| Bloomberg U.S. Aggregate Bond Index is a broad-based index that covers the U.S. dollar-denominated, investment-grade, fixed-rate, taxable bond market of SEC- registered securities. The index includes bonds from the Treasury, government-related, corporate, mortgage-backed securities, asset-backed securities, and collateralized mortgage-backed securities sectors. |
| Expense ratios are as shown in the Fund’s prospectus in effect as of the date of this report. The expense ratios for the current reporting period can be found in the Financial Highlights section of this report under Ratios to Average Net Assets. Net expenses reflect contractual expense limitations set to expire on 4/30/24. When a Fund’s expenses are below the limitation, gross and net expense ratios will be the same. See Note 6 of the Notes to Financial Statements for more information about the Fund’s expense limitations. |
| Performance for Class C shares assumes a 1.00% contingent deferred sales charge (“CDSC”) applied when you sell shares within one year of purchase, and includes automatic conversion to Class A shares after eight years. |
Gateway Equity Call Premium Fund
|
|
|
|
|
Gateway Investment Advisers, LLC |
Investment GoalThe Fund seeks total return with less risk than U.S. equity markets.
Market Conditions
The S&P 500® Index returned 7.50%, 8.74%, -3.27%, and 11.69% in the first, second, third, and fourth quarters of 2023, respectively. Despite significant turmoil and growing global conflict, the year was all about the US Federal Reserve (Fed) and expectations surrounding the path of monetary policy. Investors attempted to predict the direction of Fed decisions and, most importantly, the level and pace of interest rate increases. After record inflation and negative equity markets in 2022, signs of softening inflation in January 2023 helped the S&P 500® Index climb 8.98% from January 1 to February 2, 2023. Sudden tumult from a regional bank crisis contributed to a 7.53% decline in the S&P 500® Index from February 2 to March 13. As confidence in the financial system showed signs of deterioration, the Fed enacted emergency measures which relieved investor concerns and fueled a 19.72% rally in the S&P 500® Index from March 13 to July 31. Last-minute US debt ceiling negotiations triggered a surprise credit downgrade by Fitch Ratings and a second wave of regional bank downgrades. The burst of uncertainty contributed to a 9.94% equity market decline from the end of July to October 27. As inflation continued to ease, a less-hawkish tone from the Fed kicked off a 16.23% market advance from October 27 through year-end.
With a significant equity market advance during 2023, implied volatility drifted lower, as expected. Implied volatility, as measured by the Cboe® Volatility Index (the VIX®), ended 2022 at 21.67 and averaged 16.85 during 2023. Consistent with its typical relationship, average implied volatility exceeded realized volatility, as measured by the standard deviation of daily returns for the S&P 500® Index, which was 13.10% for the year. The Volatility Risk Premium, or the difference between the two volatility measures, was positive throughout the year and averaged 4.19% in 2023, above its average of 4.08% since 1990. The VIX® spent most of 2023 ranging from the mid-teens to the mid-20s, closing above its long-term average of 19.58 for more than 20% of the year. The VIX® reached an intra-year high of 26.52 on March 13 at the height of the banking crisis before settling into a quiet summer supported by a rapid equity market advance and growing investor optimism surrounding the direction of monetary policy. The selloff from July 31 through October 27 drove the measure above summer lows, reaching a fourth quarter high of 21.71 on October 20. Implied volatility through the end of 2023 was stifled as hopes grew for an extended pause, or even a cut, in interest rates. The VIX® reached an intra-year low of 12.07 on December 12 and ended 2023 at 12.45.
Performance Results
For the 12 months ended December 31, 2023, Class Y shares of the Gateway Equity Call Premium Fund returned 17.59% at net asset value. The Fund outperformed its primary benchmark, the Cboe® S&P 500 BuyWriteSM Index (BXMSM), which returned 11.82%. The Fund underperformed its secondary benchmark, the S&P 500® Index, which returned 26.29%.
Explanation of Fund Performance
The Fund invests in a broadly diversified portfolio of common stocks that is designed to track the performance of the S&P 500® Index and support its index option-based risk management strategy as efficiently as possible while seeking to enhance the Fund’s after-tax total return. The Fund seeks to generate returns by writing at- and near-the-money index call options against the full value of its underlying equity portfolio. The steady cash flow from call option writing is intended to be an important source of the Fund’s return, although it reduces the Fund’s ability to profit from increases in the value of its equity portfolio. The index call options written by the Fund often have similar characteristics to the single index call option present in the BXMSM at any given time. However, unlike the BXMSM, the Fund employs an active strategy that gives its management team discretion to diversify expiration dates and strike prices across a portfolio of index call options and to pursue attractive call premiums while maintaining a relatively consistent risk profile.
The Fund outperformed its primary benchmark for the period, slightly trailing in the first quarter and posting better quarterly results than the BXMSM in each of the last three quarters of the year, while achieving the risk component of its objective by exhibiting less risk than the equity market. A majority of the Fund’s outperformance occurred during the rapid market advance from March 13 to July 31, in which the S&P 500® Index returned 19.72%, while the BXMSM and the Fund returned 10.17% and 13.17%, respectively.
Gateway Equity Call Premium Fund
The Fund’s active and diversified approach resulted in a typical amount of market exposure over the course of the advance while the rules-based timing of the BXMSM’s replacement of its single written index call option contract resulted in the BXMSM having less exposure to the market advance than usual. During the equity market’s year-end advance from October 27 to December 31, the Fund returned 8.91% while the BXMSM and the S&P 500® Index returned 6.50% and 16.23%, respectively.
The Fund’s equity portfolio returned 26.28% for the year, a performance differential of negative 0.01% versus the S&P 500® Index. The measured risk of the Fund was lower than that of the US equity market and similar to the BXMSM, as its standard deviation of daily returns for 2023 was 7.90%, versus 13.10% and 7.52% for the S&P 500® Index and the BXMSM, respectively.
The Fund’s diversified and active index call option writing approach generated risk-reducing cash flow throughout 2023 while delivering loss mitigation during market declines and strong participation during periods of equity market rebound. Specifically, with quarterly returns of 5.90%, 6.22%, -1.31% and 5.93%, the Fund had smaller losses than the S&P 500® Index in the third quarter, while underperforming in the first, second, and fourth quarters, which is expected when the market advances at an above-average rate.
The Fund’s active approach was beneficial during periods of market decline where it was able to outperform the S&P 500® Index. The Fund’s active and diversified approach results in a typical amount of market exposure during periods of decline, whereas the passive approach of the Fund’s primary benchmark resulted in lower and varying levels of exposure. As a result, during the equity market’s decline from February 2 to March 13, the Fund returned -3.41% compared to the -2.78% return of the BXMSM. During the equity market’s decline from July 31 to October 27, however, the Fund held up better with a return of-5.63% relative to the -6.30% return of the BXMSM.
Outlook
The Federal Funds Effective Rate (Fed Funds Rate) was increased seven times during 2022, ratcheting from 0.07% to 4.33%. With a significant departure from the quantitative easing approach of the prior decade or more, the consensus was that the Fed had been too aggressive and risked pushing the US economy into recession. Amidst progress against inflation paired with an impressively resilient economy and labor market, the Fed’s tone turned less hawkish as the year progressed and led to a pause in the rate hiking cycle. Ultimately, the Fed Funds Rate climbed to 5.33% in July 2023 and was held steady through year-end. Bond yields are higher than prior to the Global Financial Crisis but only time will tell if current yields will be overwhelmed by lower-but-persistent inflation or be sufficient compensation for the potential loss of principle if the Fed’s tightening cycle resumes.
There are growing expectations of interest rate cuts in 2024 and some market participants may view such a reversal as a potentially bullish development. The historical record is not so sanguine as the effects of monetary policy tend to lag policy action and create significant uncertainty. On average, the equity market advanced 5.1% in the one-year period following an interest rate cut, although investors had to withstand significant drawdowns and increased volatility along the way.
While it’s impossible to predict market performance in 2024, a review of the last 25 years shows that the equity market has climbed more than 20% in eight of those years. In the year following those advances, average returns were just 3.8%. Positive, but hardly as exciting as 2023’s results. With ample drivers of volatility on the horizon – such as the US presidential election, geopolitical uncertainty, and ongoing wars – risk management may be prudent.
If current levels of volatility and interest rates persist, or move higher, option writing premiums may continue to be an effective source of risk-reduced return potential, as well as downside protection. Whether the Fed resumes rate hikes, holds steady, or even cuts rates, investment strategies that combine equity market exposure with cash flow from writing index options, like the Fund, may benefit from relatively higher levels of interest rates and implied volatility. Elevated cash flow provides strong return potential during market advances and attractive downside protection potential in declining markets.
Gateway Equity Call Premium Fund
Top Ten Holdings as of December 31, 2023 |
| |
| |
| |
| |
| |
5 Alphabet, Inc., Class C | |
6 Meta Platforms, Inc., Class A | |
7 Berkshire Hathaway, Inc., Class B | |
| |
| |
10 UnitedHealth Group, Inc. | |
The portfolio is actively managed and holdings are subject to change. There is no guarantee the Fund continues to invest in the securities referenced. The holdings listed exclude any temporary cash investments, are presented on an individual security basis and do not represent holdings of the issuer. |
Hypothetical Growth of $100,000 Investment in Class Y Shares1 |
September 30, 2014 (inception) through December 31, 2023 |
Gateway Equity Call Premium Fund
Average Annual Total Returns —December 31, 20231 |
| | | | |
| | | | |
Class Y (Inception 9/30/14) | | | | | | |
| | | | | | |
Class A (Inception 9/30/14) | | | | | | |
| | | | | | |
With 5.75% Maximum Sales Charge | | | | | | |
Class C (Inception 9/30/14) | | | | | | |
| | | | | | |
| | | | | | |
Class N (Inception 5/1/17) | | | | | | |
| | | | | | |
| | | | | | |
Cboe® S&P 500 BuyWriteSM Index (BXMSM)2 | | | | | | |
| | | | | | |
Performance data shown represents past performance and is no guarantee of, and not necessarily indicative of, future results. Total return and value will vary, and you may have a gain or loss when shares are sold. Current performance may be lower or higher than quoted. For most recent month-end performance, visit im.natixis.com/performance. Performance for other share classes will be greater or less than shown based on differences in fees and sales charges. You may not invest directly in an index. Performance for periods less than one year is cumulative, not annualized. Returns reflect changes in share price and reinvestment of dividends and capital gains, if any. The table(s) do not reflect taxes shareholders might owe on any fund distributions or when they redeem their shares.
| Fund performance has been increased by fee waivers and/or expense reimbursements, if any, without which performance would have been lower. |
| Cboe® S&P 500 BuyWriteSM Index (BXMSM) is a benchmark index designed to track the performance of a hypothetical buy-write strategy on the S&P® 500 Index. The BXM is a passive total return index based on (1) buying an S&P 500 stock index portfolio, and (2) "writing" (or selling) the near-term S&P 500® Index (SPXSM) "covered" call option, generally on the third Friday of each month. The SPX call written will have about one month remaining to expiration, with an exercise price just above the prevailing index level (i.e., slightly out of the money). The SPX call is held until expiration and cash settled, at which time a new one-month, near-the-money call is written. |
| S&P 500® Index is a widely recognized measure of U.S. stock market performance. It is an unmanaged index of 500 common stocks chosen for market size, liquidity, and industry group representation, among other factors. It also measures the performance of the large cap segment of the U.S. equities market. |
| Expense ratios are as shown in the Fund’s prospectus in effect as of the date of this report. The expense ratios for the current reporting period can be found in the Financial Highlights section of this report under Ratios to Average Net Assets. Net expenses reflect contractual expense limitations set to expire on 4/30/24. When a Fund’s expenses are below the limitation, gross and net expense ratios will be the same. See Note 6 of the Notes to Financial Statements for more information about the Fund’s expense limitations. |
| Performance for Class C shares assumes a 1.00% contingent deferred sales charge (“CDSC”) applied when you sell shares within one year of purchase, and includes automatic conversion to Class A shares after eight years. |
Mirova Global Green Bond Fund
Investment GoalThe Fund seeks to provide total return, through a combination of capital appreciation and current income, by investing in green bonds.
Market Conditions
2023 was expected to be the year of the bond markets, fueled by the already perceptible deceleration of inflation within the main economies, and consequently by the anticipation of the end of the rate increase cycle. However, it was only at the very end of the year that this optimistic scenario gained momentum.
The year began fairly optimistically before March marked a clear break due to a sudden surge in risk aversion. Following the difficulties encountered by several American regional banks and then by Crédit Suisse, fears about global financial stability dominated the markets. Subsequently, while economic indicators surprised on the upside, central banks continued their monetary tightening, and were still determined to fight inflation.
Finally, in mid-October the market became risk-on, as major central banks began to soften their tone, pushing for the continuation of monetary tightening but at a lower amplitude even if that meant maintaining higher rates for longer than initially anticipated.
The Australian and Norwegian central banks probably gave a dovish signal by raising rates only 25 bps. This triggered a search for yield and investors turned risk-on. Strong performance across risk assets in the two last months of the year created an atmosphere of euphoria in the financial markets. Despite an upward trend with strong volatility, rates declined from October through the end of December, ending the year roughly at the same level as December 2022. Given the deceleration of inflation, the yield curve steepened in the second half, meaning that the short end of the yield curve declined more rapidly than the long end.
The credit market gained from both the resilience of the economy and the search for yield before it falls: this asset class logically showed good performance. The investment grade Euro credit spread thus fueled by the contraction in swap spreads.
Performance Results
For the 12 months ending December 31, 2023, Class Y shares of the Mirova Global Green Bond Fund returned 8.69% at net asset value. The Fund underperformed its benchmark, the Bloomberg MSCI Global Green Bond Index - USD Hedged, which returned 9.55%.
Explanation of Fund Performance
The underperformance of the Fund during the year was attributable in large part to the moves in the yield curve.
During the year, allocation had a positive impact on relative performance due to the overweight position in credit (57% of the portfolio by weight versus 38% for the index) as US and Euro credit spreads compressed.
Issue selection was a positive contributor overall. The largest individual contributors were corporate holdings CTP, Faurecia and Telefonica. The worst detractors were Covivio, Thames Water and Altarea.
Our duration and curve strategy detracted from relative performance. At the end of the second quarter, we increased duration in the US currency zone as the US 10-Year Treasury yield rose back to the top of its range (3.8%). The portfolio’s overweight exposure to the US yield curve detracted from relative performance in the third quarter. However, the yield curve positioning in the Euro and GBP zone was positive.
Outlook
Mirova maintains the optimistic outlook we described in early 2023 – a soft landing in the US combined with lower inflation levels across the West, admittedly with greater resilience in North America than in Europe. We believe global GDP will reach 2.5% in 2024, as we anticipate: 1) 1.5% GDP growth in the US, where the investment-driven rejuvenation of industrial capacities and AI are fueling productivity gains not seen for 20 years and preserving growth without boosting inflation, 2) a minimum 0.5% GDP growth in the EU, where a few industrialized economies might record recession periods and be less able to fend off any inflationary pressures;
Mirova Global Green Bond Fund
however, the area has the potential to positively surprise thanks to households’ savings (still at record highs), the availability of the EU NextGeneration plan’s resources, and inventory build-up, and 3) 5% GDP growth in China, where the authorities have more means than market observers think to mitigate structurally unfavorable demographic drivers.
Such a slowdown, albeit not prompting any recession, would cause most central banks to pivot. This pivot would nonetheless not reach a large extent as the need for a decent term premium would resurface to factor in Western countries’ heavy debt loads, at a time when US federal deficits exceed 6% of GDP. Economic resilience and rate cuts together bode well for risky assets, even more so as they could benefit from a redeployment of the large amounts invested in money markets last year. The late-2023 rally in many markets has only consumed a portion of the upside potential.
Within equity markets, US leadership should now expand beyond technology. In Europe, small and mid-caps could end up generating outperformance this year. Also, cyclicals valuations incorporate a prolonged "stagflation" scenario, which is now less likely than three years ago. In fixed income, yield curve steepening remains the key area of focus: disinflation will lower short-term rates and resilience makes a free-fall in long-term rates unlikely. The key risk to our scenario is any pickup in inflation, preventing central banks from pivoting and consumers from spending. Mounting geopolitical tensions, particularly in the Middle East, represent the main driver of such risk.
Hypothetical Growth of $100,000 Investment in Class Y Shares1 |
February 28, 2017 (inception) through December 31, 2023 |
See notes to chart on page 11.
Mirova Global Green Bond Fund
Average Annual Total Returns —December 31, 20231 |
| | | | |
| | |
Class Y (Inception 2/28/17) | | | | | |
| | | | | |
Class A (Inception 2/28/17) | | | | | |
| | | | | |
With 4.25% Maximum Sales Charge | | | | | |
Class N (Inception 2/28/17) | | | | | |
| | | | | |
| | | | | |
Bloomberg MSCI Global Green Bond Index - USD Hedged2 | | | | | |
Performance data shown represents past performance and is no guarantee of, and not necessarily indicative of, future results. Total return and value will vary, and you may have a gain or loss when shares are sold. Current performance may be lower or higher than quoted. For most recent month-end performance, visit im.natixis.com/performance. Performance for other share classes will be greater or less than shown based on differences in fees and sales charges. You may not invest directly in an index. Performance for periods less than one year is cumulative, not annualized. Returns reflect changes in share price and reinvestment of dividends and capital gains, if any. The table(s) do not reflect taxes shareholders might owe on any fund distributions or when they redeem their shares.
| Fund performance has been increased by fee waivers and/or expense reimbursements, if any, without which performance would have been lower. |
| Bloomberg MSCI Green Bond Index - USD Hedged provides a broad-based measure of global fixed-income securities issued to fund projects with direct environmental benefits according to MSCI ESG Research’s green bond criteria. The green bonds are primarily investment-grade, or may be classified by other sources when bond ratings are not available. The Index may include green bonds from the corporate, securitized, Treasury, or government-related sectors. |
| Expense ratios are as shown in the Fund’s prospectus in effect as of the date of this report. The expense ratios for the current reporting period can be found in the Financial Highlights section of this report under Ratios to Average Net Assets. Net expenses reflect contractual expense limitations set to expire on 4/30/24. When a Fund’s expenses are below the limitation, gross and net expense ratios will be the same. See Note 6 of the Notes to Financial Statements for more information about the Fund’s expense limitations. |
Mirova Global Sustainable Equity Fund
Investment GoalThe Fund seeks long-term capital appreciation.
Market Conditions
Global equity markets posted a strong 2023 with the developed markets MSCI World Index returning nearly 24% in U.S. dollar terms. However, that strong return masks much of the volatility that equity market investors faced in different periods throughout the year. The year was marked by the continuation, and possibly the peak, of the most aggressive monetary policy tightening cycle in decades as central banks around the world sought to dampen inflation. It appears the Federal Reserve (Fed) and other central banks globally may have engineered the soft landing (when central banks raise interest rates just enough to stop an economy from overheating and experiencing high inflation, without causing a severe downturn) investors were hoping for. The European economy showed resilience to the energy crisis and avoided recession, though inflation and restrictive monetary policy increased concerns about potential recession during the year. An uneven reopening in China after the government ended its zero-Covid policy and issues in the Chinese property sector renewed concerns around slowing China growth. In early March, we saw the collapse of Silicon Valley Bank and other U.S. regional banks, though the volatility was generally contained to the banking sector. Investors refocused on the excitement around generative AI with OpenAI’s launch of GPT-4, which was reinforced by NVIDIA’s very strong financial results and forward guidance that was significantly ahead of expectations amid the interest in generative AI applications. The AI excitement supported the outperformance of the ‘Magnificent 7’ stocks, which had rallied since the end of 2022 on expectations of a slowdown in Fed rate hikes. In fact, the Magnificent 7 stocks, which accounted for roughly 19% of the MSCI World Index by weight at the end of 2023, narrowly led the stock market return for most of the year, contributing 63% of the MSCI World Index’s 11.10% total net return in USD through the first three quarters of the year. As the year progressed, the rally began to broaden beyond the Magnificent 7, with these stocks contributing less than 25% of the index’s 11.42% return for the fourth quarter. Elsewhere, excitement around the potential applications for GLP-1s not only in treating diabetes and obesity but also potentially in cardiovascular and kidney disease, supported companies active in these treatments. While the potential long-term business opportunities related to generative AI and GLP-1s are very promising for investors, we also spent a lot of time assessing the potential financial and sustainability risks, and engaging with portfolio companies involved in these activities.
Given the increasing prospects of a global soft landing, more defensive sectors, such as utilities, consumer staples and health care, underperformed the broad market as they tend to perform better on a relative basis during recessionary environments. The traditional energy sector also underperformed to finish the year as oil prices fell from their 2023 highs of around $90/barrel (WTI crude oil) at the end of September to around $70/barrel in December. The renewable energy space underperformed during the year as the sector faced near-term headwinds including cost inflation and supply chain delays as well as rising rates and regulatory uncertainty, impacting companies within the renewables value chain to varying degrees. Some of these issues eased in late 2023 and we saw the start of a reversal in certain names. The best-performing sectors for the year were those that are dominated by the Magnificent 7 and other companies that benefitted from the AI hype and from the possibility of falling interest rates – information technology, communication services and consumer discretionary.
Performance Results
For the 12 months ending December 31, 2023, Class Y shares of the Mirova Global Sustainable Equity Fund returned 18.63% at net asset value. The Fund underperformed its benchmark, the MSCI World Index (Net), which returned 23.79%.
Explanation of Fund Performance
The main drivers of underperformance relative to the MSCI World Index were our 1) exposure to the renewable energy sector, 2) exposure to the life sciences industry within the health care sector, 3) picks within the financials sector, and 4) lack of exposure to five of the “Magnificent 7”. On the other hand, we have seen strong performance contributions from some of our largest holdings within the information technology sector and elsewhere within the health care sector. Additionally, not owning the traditional energy sector (oil and gas) contributed to performance relative to the benchmark as the sector underperformed the broad market.
Mirova Global Sustainable Equity Fund
The renewable energy sector faced near-term headwinds during the year, including cost inflation and supply chain delays as well as rising rates and regulatory uncertainty, and companies within the renewables value chain were affected to varying degrees. The main detractors within renewables were Orsted and NextEra Energy. In late August, offshore wind utility Orsted announced a set of impairments related to its U.S. offshore and onshore portfolios. Three projects were negatively impacted by supply chain delays, which could delay revenue generation and future profitability. In addition, the company’s previous assumptions about levels of investment tax credit (ITC) qualifications for two of these projects could prove to be too optimistic, leading to an additional impairment if efforts with regulators were unsuccessful. Finally, the increase in long-term US interest rates could also lead to impairments. This announcement led to a substantial decline in Orsted’s share price. While the issues of supply chain and cost inflation, regulatory uncertainty and higher interest rates were facing the whole sector, companies have been impacted to varying degrees based on their exposure and their own practices around these issues. In the case of Orsted, the timing and the amount of the impairments were a surprise to the market as the company had just held its quarterly earnings call and previously hosted a capital markets day in June to communicate longer-term financial targets and strategy in which the management team was quite confident. The timing of this news soon after these events and the potential impairment amount (more than $2 billion) shook investor confidence in the quality of management and the business. After several conversations with the management team, industry experts and competitors, and updating our analysis on Orsted, we decided to exit the position due to deterioration in our confidence in the management team and overall business quality.
Within our renewable energy exposure, U.S. power utility NextEra Energy also underperformed, though our analysis on NextEra Energy led to a different decision than we took on Orsted. NextEra Energy underperformed mainly after its subsidiary NextEra Energy Partners, LP announced in September that it was lowering the limited partner distribution per unit growth rate versus previous guidance. This cut was mainly driven by tight financial conditions that pressure the growth prospects of NextEra Energy Partners. However, the direct financial impact from NextEra Energy Partners to NextEra Energy is marginal because NextEra Energy owns 54% of NextEra Energy Partners and it is a small part of the overall business. As for its indirect implication on NextEra Energy’s financing pressure to support its growth of renewable energy, historically, the asset sale proceeds to NextEra Energy Partners accounted for less than 10% of its overall financing and we believe NextEra Energy has the flexibility and balance sheet capacity to offset potentially lower asset sale proceeds to NextEra Energy Partners. NextEra Energy continues to be very well positioned to pursue growth opportunities in both the unregulated renewable energy and regulated utility business in Florida and has a strong track record of execution over more than a decade and a solid balance sheet. In late October, the company reported solid third quarter financial results with strong earnings growth in the context of a challenging market environment and the company reaffirmed its long-term earnings growth guidance. Importantly, the management team listened to investors’ concerns and provided details on its financing plan through 2026. These were encouraging updates although the overall macro and sector backdrop are still challenging, and the company needs to execute well, which we continue to monitor. As we maintain strong conviction in the long-term business opportunities for renewables and in our investment case for NextEra Energy, we viewed this as an excellent opportunity to add to our position in a high-quality company in the space with very favorable upside potential/downside risk.
While some of the challenges facing the renewables sector may continue in the near term and we can’t predict what the next two to three years will look like, we believe many of these issues may ease, which we already started to see towards the end of 2023. We continue to focus on individual company fundamentals and did a lot of work to update our analyses throughout the year. Through this work we made several portfolio decisions within the renewable energy sector. Due to lower conviction on two names, U.S. residential solar company Sunrun and Orsted, we exited these positions in July and October, respectively. On the other hand, we continue to have high conviction in the remaining renewables exposure in the portfolio and added slightly to our positions in wind turbine manufacturer Vestas Wind Systems and NextEra Energy at what we viewed as very attractive valuations. While we continue to have high conviction in the trends toward a low-carbon economy and energy independence and see significant long-term opportunities for high-quality companies in this space, given the near-term challenges and potential volatility, we did not increase our overall exposure to the sector.
In terms of life sciences exposure, long-term holdings Thermo Fisher and Danaher underperformed due to short-term issues, in our opinion. From 2020 to 2022, these companies benefited significantly from Covid, because they have not only diagnostic tools, but also the business model for Covid vaccine development. Now that this is completely behind us, we will see the headwind of the post-Covid normalization process decrease significantly. Another issue is that the organic growth for life sciences is currently slightly lower than the long-term average. For these two reasons, Thermo Fisher and Danaher, along with other life sciences companies, have underperformed. This does not change our long-term view on life sciences businesses, however. Both companies are life sciences “picks and shovels” market leaders that we believe will continue to benefit from secular trends such as aging population and structurally higher investment and spending in health care globally. The long-term business opportunity for these companies remains untouched. Given the recent underperformance, we believe the valuation has become very attractive for Thermo Fisher and Danaher.
Our financials exposure was another primary relative detractor, driven mainly by our exposure to SVB Financial. AIA Group also underperformed. SVB was taken over by the regulator and its shares were halted for trading on March 10, 2023, following the prior
Mirova Global Sustainable Equity Fund
day’s deposit run on the bank and a decline of 60% in the share price, as investors and depositors became concerned about the solvency of the bank. SVB’s shares were subsequently delisted from Nasdaq. Trading in SVB ultimately resumed on the off-exchange platform operated by OTC Markets Group on March 28 following the transaction with First Citizens. At this point, we took the opportunity to exit SVB Financial. There were lessons learned from the SVB situation, which we have already taken concrete action on, and will continue to analyze as we move forward. Hong Kong-based life and health insurance provider AIA Group underperformed on the weakness in the bancassurance channel and overall concern on China, which has been driven by issues in the Chinese property sector and a weak economic recovery and has been a growing market for AIA.
Regarding the Magnificent 7, while we held NVIDIA and Microsoft, which were both strong contributors to relative performance, not holding Apple, Amazon, Alphabet, Meta and Tesla was a drag on relative performance. We don’t own these five names for various financial and sustainability reasons, which are very much inextricably linked and include, but are not limited to, social and governance controversies, poor governance overall, unconvincing or uneven sustainability risk management practices, lack of transparency and willingness to engage in dialogue with us, difficult to justify valuations, and/or lack of clear next business drivers, and as we look to maintain diversification across long-term secular growth drivers. Overall, we have much more confidence in the companies that we do own – NVIDIA and Microsoft – and other high-quality names that we expect to benefit from long-term technological trends but that the market has yet to fully recognize.
The main positive contributors to relative performance were stocks within the health care and information technology sectors. Our underweight to the defensive consumer staples sector and our lack of exposure to the traditional energy sector (oil & gas) also aided relative results as these sectors underperformed the broader market. Within health care, Novo Nordisk and Eli Lilly performed well on strong financial results, alongside the excitement over obesity treatments, with the long-term fight against obesity in the very early stages. In Novo Nordisk trials, GLP-1 class of drugs also showed promising trial results in treating cardiovascular and kidney disease. These positive outcomes could support broader payer adoption and are important for launches and reimbursement of the drug outside the U.S., could increase the penetration of obesity treatment, and could expand Medicare coverage (in the US, Medicare doesn’t currently reimburse weight loss medications). Investors also reacted positively to Eli Lilly’s positive data out of its phase 3 studies for donanemab in treating Alzheimer’s disease.
Within information technology, NVIDIA was the strongest contributor. Performance was driven by continued excitement around the business opportunities related to AI applications and very strong financial results and forward guidance from the company, led by growing demand for generative AI and large language models using GPUs based on NVIDIA Hopper and Ampere architectures. We trimmed our position in NVIDIA several times throughout the year, taking profit in the position following the incredibly strong performance – the stock price more than quadrupled since its 2022 low in mid-October (we had increased the position by 100 bps around that time). Despite the strong run-up in its share price, its price-to-earnings multiple actually decreased due to better fundamentals. With solid fundamentals and promising long-term business opportunities on enterprise AI and autonomous driving in particular that are not fully priced in today, we continue to have high conviction in the position. Within IT, Adobe stock also performed strongly following solid financial results, particularly given the challenging macro environment. Moreover, its AI strategy is exciting and credible and is expected to be differentiated against peers, expand its addressable market, and has multiple layers to drive growth going forward. Even though it is still in the early stages of its AI strategy, we are encouraged to see Adobe’s gradual pricing increases driven by its AI functionalities and products launches and expect incremental revenue contribution going forward.
Outlook
During the year, we made several adjustments to the portfolio, which we believe holds high-quality companies that are well positioned to address long-term secular trends and are trading at very attractive valuations. During the year, we exited positions in SVB Financial, Bright Horizons Family Solutions, Sunrun, Orsted and telecom company Verizon. We initiated positions in Air Liquide, Enphase Energy, WM (formerly Waste Management), AstraZeneca and Palo Alto Networks. Throughout the year we also made several adjustments to existing positions. Overall, we aim to maintain diversification across and within long-term secular growth drivers and our portfolio continues to deliver that today.
We generally do not base our decision-making on macro forecasts; while an important input, we focus more on the impact to individual company fundamentals to ensure our long-term thesis remains intact. Looking forward, while equity markets were stronger than expected for most of the year, we believe we may experience continued volatility in equity markets. While economic data overall has still been supportive, albeit mixed, geopolitical tension continues to exist and is unpredictable in nature. In fact, we saw the continuation of the Russia-Ukraine conflict and the emergence of the Israel-Hamas conflict, which we expect to continue into 2024. While not our base case scenario, an escalation of either of those two conflicts involving other countries could be particularly negative for European markets. For now, we prefer the lower valuations of European markets over U.S. equities but would likely need to review this position in such a scenario. Last year, we highlighted the tensions between China and Taiwan turning into a military conflict as a major risk. Given the weaker-than-expected economic situation in China, our view is that the likelihood of a short-term escalation of this conflict has decreased. Our analysts recently visiting China have come back incrementally more negative about the internal
Mirova Global Sustainable Equity Fund
economy, increasing our conviction that China’s economic problems are more structural than cyclical. We are lowering our expectations for companies exposed to the Chinese consumer and to the Chinese economy in general. This year is also a historic election year globally with elections in more than 40 countries, representing 41% of the world's population and 42% of its GDP (Bloomberg Economics). In a more polarized world politicians take more extreme positions, which makes it more difficult to forecast the longevity of policies. This in turn makes it more difficult to make reliable forecasts based on those policies, adding to the expected volatility in equity markets.
Additionally, while inflation in many regions may have peaked, and it is expected that we have reached the end of monetary tightening, we continue to work under the assumption of higher inflation, and therefore rates, for longer. We may see slowing global growth and there is a risk, specifically in the U.S., of slowing consumer spending and potential for a small recession in the second half of the year. While we remain cautious in our overall positioning as a result, we do not necessarily believe that this is a bad setup for equities in 2024. However, selectivity will continue to be key, and we continue to focus on individual company fundamentals to ensure that the fundamentals or the long-term theses on the companies have not changed.
With this backdrop in mind, we have maintained our overweight to Europe in our global portfolios as we see more valuation opportunities compared to the U.S. and we continue to have a more balanced portfolio that we believe may do well in many different environments. On one hand, we have strong exposure to more defensive areas like utilities and health care, food production, and companies within technology with strong recurring revenue streams that are resilient in difficult economic environments. However, we also have exposure to companies that are well-positioned for a more benign economic situation or a recovery in the economy such as renewable energy and auto and auto component manufacturers that focus on more efficient and electric mobility, for example. In general, we like high-quality companies and, especially when interest rates are high, know that companies with larger amounts of debt on their balance sheets and those that may need to refinance that debt will find it more difficult to generate strong earnings growth. Therefore, we continue to focus the portfolio on high-quality companies with strong balance sheets.
Focusing on specific areas of opportunity for 2024, we believe we may see a reversal or at least an easing of near-term headwinds for some sectors. In particular, certain renewable energy, health care and technology companies may be well positioned in 2024.
While we have seen underperformance from renewable energy companies over the last three years, many of the challenges related to supply chains, pricing and inflation may be behind us, specifically for important wind turbine manufacturers in the space, and we expect certain companies may be set up to perform well in 2024. We believe these companies will be supported as we continue to see strong demand for renewable energy driven by 1) global governments having strong commitments to low carbon sources of energy, 2) the geopolitical tensions reinforcing the strategic importance of energy security and independence, requiring renewables to play a larger role, and 3) significantly declining renewable energy costs over the decades, becoming more cost competitive against traditional energy. This, combined with more attractive valuations in many of these stocks today, especially compared to the end of 2020/early 2021, potentially sets the sector up more positively going forward. As the global energy transition represents a multi-decade investment opportunity, our investment approach favors exposure to structural growth tailwinds from renewable energy rather than focusing on short-term, cyclical swings from traditional energy. In fact, we saw oil prices fall about 27% from the 2023 highs reached in late September to mid-December on the back of growing concerns about slowing global demand and higher inventories in the US. While we are more optimistic and continue to have high conviction in the secular trends toward a low-carbon economy and energy independence, we may continue to see some near-term volatility in renewables, and we have not increased our overall exposure to sector.
Regarding opportunities in health care being driven by secular demographic shifts, we have seen strong performance from companies involved in the treatment of diabetes and obesity and we expect that to continue. We have also seen a lot of research and development spending in areas like oncology and age-related diseases such as Alzheimer's disease and we expect to see more of these products come to market and drive performance for these companies over the next couple of years. Additionally, we have seen underperformance in the life sciences industry in 2023 due to transitory issues. From 2020 to 2022, certain life sciences companies that offered diagnostic tools and Covid vaccine development solutions benefited significantly from Covid and have recently been going through a normalization process. Going forward, we believe we will see the headwind of post-Covid normalization decrease significantly. Another headwind has been that the organic growth for life sciences is currently slightly lower than the long-term average. For these two reasons, the life sciences industry has underperformed. However, our long-term view on life sciences businesses is unchanged and we believe this space will continue to benefit from secular trends such as aging population and structurally higher investment and spending in health care globally. We believe the long-term business opportunity for high-quality life sciences businesses remains untouched and given the recent underperformance, we believe valuations have become much more attractive.
Within technology, we expect AI to continue to grow, not only through the solutions providers but also through the introduction of AI in normal business operations for companies across industries. For example, in the agriculture industry, we see growing adoption of AI-driven precision agriculture, which involves data collection, data analysis and treatments using precise systems to better target the crops and weeds and includes GPS, planting, spraying, chemical application and combine optimization, leading to reduced biodiversity
Mirova Global Sustainable Equity Fund
impacts and improved crop yield and overall economics for farmers. We expect this to be a more important theme going forward, unlocking significant incremental economic value over the long term. We may see increased regulation around AI globally in 2024, which may impact AI-related opportunities in the near term but may favor the large, high-quality companies that lead in the space. Within technology, many of the AI-related names have done very well since the end of 2022, but we see opportunity in other high-quality names that the market has yet to fully recognize, both in terms of fundamentals and sustainability.
Potential downside risks include increasing geopolitical tensions, inflation risk and slower-than-expected economic growth and a deeper and/or broader recession than the market is currently expecting. The potential for a resurgence in inflation, declining consumer spending and/or central banks keeping policy at restrictive levels longer than expected may create downside risk. Additionally, although the risks of a severe recession in Europe triggered by an energy crisis have greatly decreased compared to the situation before the outbreak of war in Ukraine, a possible exacerbation of geopolitical tensions in Europe or the Middle East could still cause huge fluctuations in oil prices, natural gas and other raw materials, and would likely end the ongoing disinflationary process with major impacts on our growth outlook, in addition to the prospects for inflation and rates. Lastly, the political, geopolitical and regulatory landscape is set for an uncertain year, and we will watch developments closely to see how it may affect our portfolio companies and portfolio positioning more broadly.
Overall, we believe maintaining patience, a long-term perspective and a focus on fundamentals is key in any environment. If we look beyond the short term, very little has changed regarding the long-term demographic, environmental, technological and governance trends shifting the economy we focus on, such as aging population, climate change and digitalization. These trends are secular in nature. We continue to focus on identifying opportunities well positioned in the context of a transitioning world. While our portfolios may face volatility in the short term, we believe they are well positioned with high-quality companies addressing long-term thematic (secular) growth trends. We believe that the underlying fundamentals remain strong, and we continue to take advantage of disconnects between current stock prices and the long-term value of companies.
Top Ten Holdings as of December 31, 2023 |
| |
1 Mastercard, Inc., Class A | |
| |
| |
| |
5 Novo Nordisk AS, Class B | |
6 Thermo Fisher Scientific, Inc. | |
| |
| |
9 Roper Technologies, Inc. | |
| |
The portfolio is actively managed and holdings are subject to change. There is no guarantee the Fund continues to invest in the securities referenced. The holdings listed exclude any temporary cash investments, are presented on an individual security basis and do not represent holdings of the issuer. |
Mirova Global Sustainable Equity Fund
Hypothetical Growth of $100,000 Investment in Class Y Shares1 |
March 31, 2016 (inception) through December 31, 2023 |
Mirova Global Sustainable Equity Fund
Average Annual Total Returns —December 31, 20231 |
| | | | |
| | | | |
Class Y (Inception 3/31/16) | | | | | | |
| | | | | | |
Class A (Inception 3/31/16) | | | | | | |
| | | | | | |
With 5.75% Maximum Sales Charge | | | | | | |
Class C (Inception 3/31/16) | | | | | | |
| | | | | | |
| | | | | | |
Class N (Inception 5/1/17) | | | | | | |
| | | | | | |
| | | | | | |
| | | | | | |
Performance data shown represents past performance and is no guarantee of, and not necessarily indicative of, future results. Total return and value will vary, and you may have a gain or loss when shares are sold. Current performance may be lower or higher than quoted. For most recent month-end performance, visit im.natixis.com/performance. Performance for other share classes will be greater or less than shown based on differences in fees and sales charges. You may not invest directly in an index. Performance for periods less than one year is cumulative, not annualized. Returns reflect changes in share price and reinvestment of dividends and capital gains, if any. The table(s) do not reflect taxes shareholders might owe on any fund distributions or when they redeem their shares.
| Fund performance has been increased by fee waivers and/or expense reimbursements, if any, without which performance would have been lower. |
| MSCI World Index (Net) is an unmanaged index that is designed to measure the equity market performance of developed markets. It is comprised of common stocks of companies representative of the market structure of developed market countries in North America, Europe, and the Asia/Pacific Region. The index is calculated without dividends, with net or with gross dividends reinvested, in both U.S. dollars and local currencies. |
| Expense ratios are as shown in the Fund’s prospectus in effect as of the date of this report. The expense ratios for the current reporting period can be found in the Financial Highlights section of this report under Ratios to Average Net Assets. Net expenses reflect contractual expense limitations set to expire on 4/30/24. When a Fund’s expenses are below the limitation, gross and net expense ratios will be the same. See Note 6 of the Notes to Financial Statements for more information about the Fund’s expense limitations. |
| Performance for Class C shares assumes a 1.00% contingent deferred sales charge (“CDSC”) applied when you sell shares within one year of purchase. |
Mirova International Sustainable Equity Fund
Investment GoalThe Fund seeks long-term capital appreciation.
Market Conditions
Global equity markets posted a strong 2023 with the developed markets MSCI World Index returning nearly 24% in U.S. dollar terms. Both U.S. and non-U.S. developed equities were up strongly during the year with the MSCI USA Index returning 26.49% vs. the MSCI EAFE Index’s 18.24% in USD. However, the strong overall returns mask much of the underlying volatility that equity market investors faced in different periods throughout the year. The year was marked by the continuation, and possibly the peak, of the most aggressive monetary policy tightening cycle in decades as central banks around the world sought to dampen inflation. It appears the Federal Reserve (Fed) and other central banks globally may have engineered the soft-landing (when central banks raise interest rates just enough to stop an economy from overheating and experiencing high inflation, without causing a severe downturn) investors were hoping for. The European economy showed resilience to the energy crisis and avoided recession, though inflation and restrictive monetary policy increased concerns about potential recession during the year. An uneven reopening in China after the government ended its zero-Covid policy and issues in the Chinese property sector renewed concerns around slowing China growth. In early March, we saw the collapse of Silicon Valley Bank and other U.S. regional banks, though the volatility was generally contained to the banking sector and investors refocused on the excitement around generative AI with OpenAI’s launch of GPT-4, which was reinforced by NVIDIA’s very strong financial results and forward guidance that was significantly ahead of expectations amid the interest in generative AI applications. The AI excitement supported the outperformance of the ‘Magnificent 7’ stocks, which had rallied since the end of 2022 on expectations of a slowdown in Fed rate hikes. In fact, the Magnificent 7 stocks, which accounted for roughly 19% of the MSCI World Index by weight at the end of 2023, narrowly led the stock market return for most of the year, contributing 63% of the MSCI World Index’s 11.10% total net return in USD through the first three quarters of the year. As the year progressed, the rally began to broaden beyond the Magnificent 7, with these stocks contributing less than 25% of the index’s 11.42% return for the fourth quarter. Elsewhere, excitement around the potential applications for GLP-1s not only in treating diabetes and obesity but also potentially in cardiovascular and kidney disease, supported companies active in these treatments. While the potential long-term business opportunities related to generative AI and GLP-1s are very promising for investors, we also spent a lot of time assessing the potential financial and sustainability risks, and engaging with portfolio companies involved in these activities.
Globally, given the increasing prospects of a global soft-landing, more defensive sectors, such as utilities, consumer staples and health care, underperformed the broad market as they tend to perform better on a relative basis during recessionary environments. The traditional energy sector also underperformed to finish the year as oil prices fell from their 2023 highs of around $90/barrel (WTI crude oil) at the end of September to around $70/barrel in December. The renewable energy space underperformed during the year as the sector faced near-term headwinds including cost inflation and supply chain delays as well as rising rates and regulatory uncertainty, impacting companies within the renewables value chain to varying degrees. Some of these issues eased in late 2023 and we saw the start of a reversal in certain names. The best-performing sectors for the year were those that are dominated by the Magnificent 7 and other companies that benefitted from the AI hype and from the possibility of falling interest rates – information technology and consumer discretionary.
Performance Results
For the 12 months ending December 31, 2023, Class Y shares of the Mirova International Sustainable Equity Fund returned 14.64% at net asset value. The Fund underperformed its benchmark, the MSCI EAFE Index (Net), which returned 18.24%.
Explanation of Fund Performance
The main drivers of underperformance relative to the MSCI EAFE Index were our exposure to the renewable energy sector and stock picking within the financials and materials sectors. On the other hand, we saw strong performance contribution from our overall sector positioning due to our overweight to the information technology sector, our underweight to consumer staples and having no exposure to the traditional energy sector (oil and gas). Stock picking within the health care sector was also a main contributor to relative performance, as were names within information technology.
Mirova International Sustainable Equity Fund
The renewable energy sector faced near-term headwinds during the year, including cost inflation and supply chain delays as well as rising rates and regulatory uncertainty, and companies within the renewables value chain were affected to varying degrees. The main detractor within renewables was Orsted. In late August, offshore wind utility Orsted announced a set of impairments related to its U.S. offshore and onshore portfolios. Three projects were negatively impacted by supply chain delays, which could delay revenue generation and future profitability. In addition, the company’s previous assumptions about levels of investment tax credit (ITC) qualifications for two of these projects could prove to be too optimistic, leading to an additional impairment if efforts with regulators were unsuccessful. Finally, the increase in long-term US interest rates could also lead to impairments. This announcement led to a substantial decline in Orsted’s share price. While the issues of supply chain and cost inflation, regulatory uncertainty and higher interest rates were facing the whole sector, companies have been impacted to varying degrees based on their exposure and their own practices around these issues. In the case of Orsted, the timing and the amount of the impairments were a surprise to the market as the company had just held its quarterly earnings call and previously hosted a capital markets day in June to communicate longer-term financial targets and strategy in which the management team was quite confident. The timing of this news soon after these events and the potential impairment amount (more than $2billion) shook investor confidence in the quality of management and the business. After several conversations with the management team, industry experts and competitors, and updating our analysis on Orsted, we decided to exit the position due to deterioration in our confidence in the management team and overall business quality.
While some of the challenges facing the renewables sector may continue in the near-term and we can’t predict what the next two to three years will look like, we believe many of these issues may ease, which we already started to see towards the end of 2023. We continue to focus on individual company fundamentals and did a lot of work to update our analyses throughout the year. Through this work we made portfolio decisions within the renewable energy sector. Due to lower conviction on Orsted, we exited the position in October. On the other hand, we continue to have high conviction in the remaining renewables exposure in the portfolio in high-quality names that are trading at very attractive valuations. While we continue to have high conviction in the trends toward a low-carbon economy and energy independence and see significant long-term opportunities for high-quality companies in this space, given the near-term challenges and potential volatility, we did not increase our overall exposure to the sector.
Our financials exposure was another primary relative detractor, driven mainly by our exposure to AIA Group and Worldline. Hong Kong-based life and health insurance provider AIA Group underperformed on the weakness in the bancassurance channel and overall concern on China, which has been driven by issues in the Chinese property sector and a weak economic recovery and has been a growing market for AIA. Digital payments company Worldline also underperformed after issuing a profit warning for 2023 and 2024 following six decent quarters. Management cited in part deteriorating macro, primarily a shift in German consumer behavior accelerating the move to non-discretionary spending, impacting growth and profitability. Apparently management underestimated the impact of two years of inflation at 6-8% on the type of consumption in their regions. In this context, and given their greater exposure to merchants’ activities, the impact on margins was more significant than expected. Management also cited increasing compliance standards and the closing of some customer accounts based on analysis done with the German financial authority. Management also announced that the group has decided to move to a new phase faster than expected, with investments that were planned for 2025-2027 being made now even if it further resets guidance. In its previous phase, Worldline built itself as a consolidator of the European market, which they have done for years, including three transformative acquisitions. However, this phase was accomplished with strong tailwinds, such as the transition from cash to electronic payment taking off and ever higher volumes in an economic context of low inflation and very low interest rates. This phase, although very beneficial for the group’s growth, has also led to restructuring costs, and integration is still underway. There is a real need for rationalization and simplification. After additional analysis we have concerns about the overall fundamental quality and credibility of the management team as well as the long-term plan. As a result of lower conviction, we decided to exit the position in Worldline.
Within the materials sector, specialty chemicals and ingredients company Croda International was the largest detractor. Over the last couple of years, the ingredients sector overall has been challenged by ongoing stocking and destocking issues driven by rising inflation, supply chain constraints and disappointing volumes and, while this is a temporary headwind and customer (e.g., food and home and personal care companies) inventories have likely peaked, the normalization process has taken longer than expected. Croda has been hit hard and the stock was down on the year on weaker-than-expected financial performance as a result. The management team issued a profit warning mid-year, lowering full-year guidance as its customers in consumer care, crop and industrial end markets continued destocking. Customer inventory normalization, originally expected to come to an end in the first half of the year, continued into the second half, and sales volumes were also lower than expected given a weaker demand environment.
Stock picking within the health care sector contributed positively to relative results. Within health care, Novo Nordisk performed well on strong financial results, alongside the excitement over obesity treatments, with the long-term fight against obesity in the very early stages. In Novo Nordisk trials, GLP-1 class of drugs also showed promising trial results in treating cardiovascular and kidney disease. These positive outcomes could support broader payer adoption and are important for launches and reimbursement of the drug outside the U.S., could increase the penetration of obesity treatment, and could expand Medicare coverage (in the US, Medicare doesn’t currently reimburse weight loss medications). Our picks within the information technology sector, including semiconductor names
Mirova International Sustainable Equity Fund
Taiwan Semiconductor and ASML, and enterprise software company SAP, contributed positively to relative performance due in part to support from the excitement around opportunities related to generative AI.
Outlook
During the year, we made several adjustments to the portfolio, which we believe holds high-quality companies that are well positioned to address long-term secular trends and are trading at very attractive valuations. During the year, we exited positions in Mercado Libre, Spirax-Sarco Engineering, Prudential, Orsted and Worldline. We initiated a position in AstraZeneca. Throughout the year we also made several adjustments to existing positions. Overall, we aim to maintain diversification across and within long-term secular growth drivers and our portfolio continues to deliver that today.
We generally do not base our decision-making on macro forecasts; while an important input, we focus more on the impact to individual company fundamentals to ensure our long-term thesis remains intact. Looking forward, while equity markets were stronger than expected for most of the year, we believe we may experience continued volatility in equity markets. While economic data overall has still been supportive, albeit mixed, geopolitical tension continues to exist and is unpredictable in nature. In fact, we saw the continuation of the Russia-Ukraine conflict and the emergence of the Israel-Hamas conflict, which we expect to continue into 2024. While not our base case scenario, an escalation of either of those two conflicts involving other countries could be particularly negative for European markets. For now, we continue to see lower valuations in European equities compared to but would likely need to adjust this view in such a scenario. Last year, we highlighted the tensions between China and Taiwan turning into a military conflict as a major risk. Given the weaker-than-expected economic situation in China, the likelihood of a short-term escalation of this conflict has decreased. Our analysts recently visiting China have come back incrementally more negative about the internal economy, increasing our conviction that China’s economic problems are more structural than cyclical. We are lowering our expectations for companies exposed to the Chinese consumer and to the Chinese economy in general. This year is also a historic election year globally with elections in more than 40 countries, representing 41% of the world's population and 42% of its GDP (Bloomberg Economics). In a more polarized world politicians take more extreme positions, which makes it more difficult to forecast the longevity of policies. This in turn makes it more difficult to make reliable forecasts based on those policies, adding to the expected volatility in equity markets.
Additionally, while inflation in many regions may have peaked, and it is expected that we have reached the end of monetary tightening, we continue to work under the assumption of higher inflation, and therefore rates, for longer. We may see slowing global growth and there is a risk, specifically in the U.S., of slowing consumer spending and potential for a small recession in the second half of the year. While we remain cautious in our overall positioning as a result, we don’t necessarily believe that this is a bad setup for equities in 2024. However, selectivity will continue to be key, and we continue to focus on individual company fundamentals to ensure that the fundamentals or the long-term theses on the companies have not changed.
With this backdrop in mind, we continue to have a more balanced portfolio that we believe may do well in many different environments. On one hand, we have strong exposure to more defensive areas like utilities and health care, food production, and companies within technology with strong recurring revenue streams that are resilient in difficult economic environments. However, we also have exposure to companies that are well-positioned for a more benign economic situation or a recovery in the economy such as renewable energy and auto and auto component manufacturers that focus on more efficient and electric mobility, for example. In general, we like high-quality companies and, especially when interest rates are high, know that companies with larger amounts of debt on their balance sheets and those that may need to refinance that debt will find it more difficult to generate strong earnings growth. Therefore, we continue to focus the portfolio on high-quality companies with strong balance sheets.
Focusing on specific areas of opportunity for 2024, we believe we may see a reversal or at least an easing of near-term headwinds for some sectors. In particular, certain renewable energy, health care and technology companies may be well positioned in 2024.
While we have seen underperformance from renewable energy companies over the last three years, many of the challenges related to supply chains, pricing and inflation may be behind us, specifically for important wind turbine manufacturers in the space, and we expect certain companies may be set up to perform well in 2024. We believe these companies will be supported as we continue to see strong demand for renewable energy driven by 1) global governments having strong commitments to low carbon sources of energy, 2) the geopolitical tensions reinforcing the strategic importance of energy security and independence, requiring renewables to play a larger role, and 3) significantly declining renewable energy costs over the decades, becoming more cost competitive against traditional energy. This, combined with more attractive valuations in many of these stocks today, especially compared to the end of 2020/early 2021, potentially sets the sector up more positively going forward. As the global energy transition represents a multi-decade investment opportunity, our investment approach favors exposure to structural growth tailwinds from renewable energy rather than focusing on short-term, cyclical swings from traditional energy. In fact, we saw oil prices fall about 27% from the 2023 highs reached in late September to mid-December on the back of growing concerns about slowing global demand and higher inventories in the US.
Mirova International Sustainable Equity Fund
While we are more optimistic and continue to have high conviction in the secular trends toward a low-carbon economy and energy independence, we may continue to see some near-term volatility in renewables, and we have not increased our overall exposure to sector.
Regarding opportunities in health care being driven by secular demographic shifts, we have seen strong performance from companies involved in the treatment of diabetes and obesity and we expect that to continue. We have also seen a lot of research and development spending in areas like oncology and age-related diseases such as Alzheimer's disease and we expect to see more of these products come to market and drive performance for these companies over the next couple of years. Additionally, we have seen underperformance in the life sciences industry in 2023 due to transitory issues. From 2020 to 2022, certain life sciences companies that offered diagnostic tools and Covid vaccine development solutions benefited significantly from Covid and have recently been going through a normalization process. Going forward, we believe we will see the headwind of post-Covid normalization decrease significantly. Another headwind has been that the organic growth for life sciences is currently slightly lower than the long-term average. For these two reasons, the life sciences industry has underperformed. However, our long-term view on life sciences businesses is unchanged and we believe this space will continue to benefit from secular trends such as aging population and structurally higher investment and spending in health care globally. We believe the long-term business opportunity for high-quality life sciences businesses remains untouched and given the recent underperformance, we believe valuations have become much more attractive.
Within technology, we expect AI to continue to grow, not only through the solutions providers but also through the introduction of AI in normal business operations for companies across industries. For example, in the health care sector, we see growing adoption of AI-driven solutions in areas like pharma and medical products where AI could deliver significant value in product research and development and software engineering, as well as customer operations and documentation, marketing and sales, and legal and other workflows. We expect this to be a more important theme going forward, unlocking significant incremental economic value. We may see increased regulation around AI globally in 2024, which may impact AI-related opportunities in the near term but may favor the large, high-quality companies that lead in the space. Within technology, many of the AI-related names have done very well since the end of 2022, but we see opportunity in other high-quality names that the market has yet to fully recognize, both in terms of fundamentals and sustainability.
Potential downside risks include increasing geopolitical tensions, inflation risk and slower-than-expected economic growth and a deeper and/or broader recession than the market is currently expecting. The potential for a resurgence in inflation, declining consumer spending and/or central banks keeping policy at restrictive levels longer than expected may create downside risk. Additionally, although the risks of a severe recession in Europe triggered by an energy crisis have greatly decreased compared to the situation before the outbreak of war in Ukraine, a possible exacerbation of geopolitical tensions in Europe or the Middle East could still cause huge fluctuations in oil prices, natural gas and other raw materials, and would likely end the ongoing disinflationary process with major impacts on our growth outlook, in addition to the prospects for inflation and rates. Lastly, the political, geopolitical and regulatory landscape is set for an uncertain year, and we will watch developments closely to see how it may affect our portfolio companies and portfolio positioning more broadly.
Overall, we believe maintaining patience, a long-term perspective and a focus on fundamentals is key in any environment. If we look beyond the short term, nothing has changed regarding the long-term demographic, environmental, technological and governance trends shifting the economy we focus on, such as aging population, climate change and digitalization. These trends are secular in nature. We continue to focus on identifying opportunities well positioned in the context of a transitioning world. While our portfolios may face volatility in the short term, we believe they are well positioned with high-quality companies addressing long-term thematic (secular) growth trends We believe that the underlying fundamentals remain strong, and we continue to take advantage of disconnects between current stock prices and the long-term value of companies.
Mirova International Sustainable Equity Fund
Top Ten Holdings as of December 31, 2023 |
| |
| |
2 Taiwan Semiconductor Manufacturing Co. Ltd. | |
3 Novo Nordisk AS, Class B | |
| |
| |
| |
| |
| |
| |
10 Legal & General Group PLC | |
The portfolio is actively managed and holdings are subject to change. There is no guarantee the Fund continues to invest in the securities referenced. The holdings listed exclude any temporary cash investments, are presented on an individual security basis and do not represent holdings of the issuer. |
Hypothetical Growth of $100,000 Investment in Class Y Shares1 |
December 28, 2018 (inception) through December 31, 2023 |
Mirova International Sustainable Equity Fund
Average Annual Total Returns —December 31, 20231 |
| | | | |
| | |
Class Y (Inception 12/28/18) | | | | | |
| | | | | |
Class A (Inception 12/28/18) | | | | | |
| | | | | |
With 5.75% Maximum Sales Charge | | | | | |
Class N (Inception 12/28/18) | | | | | |
| | | | | |
| | | | | |
| | | | | |
Performance data shown represents past performance and is no guarantee of, and not necessarily indicative of, future results. Total return and value will vary, and you may have a gain or loss when shares are sold. Current performance may be lower or higher than quoted. For most recent month-end performance, visit im.natixis.com/performance. Performance for other share classes will be greater or less than shown based on differences in fees and sales charges. You may not invest directly in an index. Performance for periods less than one year is cumulative, not annualized. Returns reflect changes in share price and reinvestment of dividends and capital gains, if any. The table(s) do not reflect taxes shareholders might owe on any fund distributions or when they redeem their shares.
| Fund performance has been increased by fee waivers and/or expense reimbursements, if any, without which performance would have been lower. |
| MSCI EAFE Index (Net) is a free float-adjusted market capitalization index designed to measure large and mid-cap equity performance in developed markets, excluding the U.S. and Canada. The Index includes countries in Europe, Australasia, and the Far East. |
| Expense ratios are as shown in the Fund’s prospectus in effect as of the date of this report. The expense ratios for the current reporting period can be found in the Financial Highlights section of this report under Ratios to Average Net Assets. Net expenses reflect contractual expense limitations set to expire on 4/30/24. When a Fund’s expenses are below the limitation, gross and net expense ratios will be the same. See Note 6 of the Notes to Financial Statements for more information about the Fund’s expense limitations. |
ADDITIONAL INFORMATION
The views expressed in this report reflect those of the portfolio managers as of the dates indicated. The managers’ views are subject to change at any time without notice based on changes in market or other conditions. References to specific securities or industries should not be regarded as investment advice. Because the Funds are actively managed, there is no assurance that they will continue to invest in the securities or industries mentioned.
All investing involves risk, including the risk of loss. There is no assurance that any investment will meet its performance objectives or that losses will be avoided.
ADDITIONAL INDEX INFORMATION
This document may contain references to third party copyrights, indexes, and trademarks, each of which is the property of its respective owner. Such owner is not affiliated with Natixis Investment Managers or any of its related or affiliated companies (collectively “Natixis Affiliates”) and does not sponsor, endorse or participate in the provision of any Natixis Affiliates services, funds or other financial products.
The index information contained herein is derived from third parties and is provided on an “as is” basis. The user of this information assumes the entire risk of use of this information. Each of the third party entities involved in compiling, computing or creating index information disclaims all warranties (including, without limitation, any warranties of originality, accuracy, completeness, timeliness, non-infringement, merchantability and fitness for a particular purpose) with respect to such information.
PROXY VOTING INFORMATION
A description of the Natixis Funds' proxy voting policies and procedures is available without charge, upon request, by calling Natixis Funds at 800-225-5478; on the Natixis Funds’ website at im.natixis.com, and on the Securities and Exchange Commission (“SEC”) website at www.sec.gov. Information about how the Natixis Funds voted proxies relating to portfolio securities during the most recent 12-month period ended June 30 is available through the Natixis Funds’ website and the SEC website.
QUARTERLY PORTFOLIO SCHEDULES
The Natixis Funds file a complete schedule of portfolio holdings with the SEC for the first and third quarters of each fiscal year as an exhibit to its reports on Form N-PORT. The Funds’ Form N-PORT reports are available on the SEC website at www.sec.gov. First and third quarter schedules of portfolio holdings are also available at im.natixis.com/funddocuments. A hard copy may be requested from the Fund at no charge by calling 800-225-5478.
TAILORED SHAREHOLDER REPORTS FOR MUTUAL FUNDS AND EXCHANGE-TRADED FUNDS
In October 2022, the SEC adopted rule and form amendments requiring mutual funds and exchange-traded funds to transmit concise and visually engaging streamlined annual and semiannual reports that highlight key information to shareholders. Other information, including financial statements, will no longer appear in the funds’ shareholder reports but will be available online, delivered free of charge upon request, and filed with the SEC on a semiannual basis on Form N-CSR. The rule and form amendments have a compliance date of July 24, 2024.
CFA® and Chartered Financial Analyst® are registered trademarks owned by the CFA Institute.
Understanding Fund Expenses
As a mutual fund shareholder, you incur different costs: transaction costs, including sales charges (loads) on purchases and contingent deferred sales charges on redemptions, and ongoing costs, including management fees, distribution and/or service fees ("12b-1 fees"), and other fund expenses. Certain exemptions may apply. These costs are described in more detail in the Funds’ prospectus. The following examples are intended to help you understand the ongoing costs of investing in the Funds and help you compare these with the ongoing costs of investing in other mutual funds.
The first line in the table of each class of Fund shares shows the actual account values and actual Fund expenses you would have paid on a $1,000 investment in the Fund from July 1, 2023 through December 31, 2023. To estimate the expenses you paid over the period, simply divide your account value by $1,000 (for example $8,600 account value divided by $1,000 = 8.60) and multiply the result by the number in the Expenses Paid During Period column as shown for your class.
The second line in the table for each class of fund shares provides information about hypothetical account values and hypothetical expenses based on the Fund’s actual expense ratios and an assumed rate of return of 5% per year before expenses, which is not the Fund’s actual return. The hypothetical account values and expenses may not be used to estimate the actual ending account balance or expenses you paid on your investment for the period. You may use this information to compare the ongoing costs of investing in the Fund and other funds. To do so, compare this 5% hypothetical example with the 5% hypothetical examples that appear in the shareholder reports of the other funds.
Please note that the expenses shown reflect ongoing costs only, and do not include any transaction costs, such as sales charges. Therefore, the second line in the table of each fund is useful in comparing ongoing costs only, and will not help you determine the relative costs of owning funds. If transaction costs were included, total costs would be higher.
| Beginning
Account Value
7/1/2023 | Ending
Account Value
12/31/2023 | Expenses Paid
7/1/2023 – 12/31/2023 |
| | | |
| | | |
Hypothetical (5% return before expenses) | | | |
| | | |
| | | |
Hypothetical (5% return before expenses) | | | |
| | | |
| | | |
Hypothetical (5% return before expenses) | | | |
| | | |
| | | |
Hypothetical (5% return before expenses) | | | |
| Expenses are equal to the Fund's annualized expense ratio (after waiver/reimbursement): 0.94%, 1.70%, 0.65% and 0.70% for Class A, C, N and Y, respectively, multiplied by the average account value over the period, multiplied by the number of days in the most recent fiscal half–year (184), divided by 365 (to reflect the half–year period). |
Gateway Equity Call Premium Fund | Beginning
Account Value
7/1/2023 | Ending
Account Value
12/31/2023 | Expenses Paid
7/1/2023 – 12/31/2023 |
| | | |
| | | |
Hypothetical (5% return before expenses) | | | |
| | | |
| | | |
Hypothetical (5% return before expenses) | | | |
| | | |
| | | |
Hypothetical (5% return before expenses) | | | |
| | | |
| | | |
Hypothetical (5% return before expenses) | | | |
| Expenses are equal to the Fund's annualized expense ratio (after waiver/reimbursement): 0.93%, 1.68%, 0.63% and 0.68% for Class A, C, N and Y, respectively, multiplied by the average account value over the period, multiplied by the number of days in the most recent fiscal half–year (184), divided by 365 (to reflect the half–year period). |
Mirova Global Green Bond Fund | Beginning
Account Value
7/1/2023 | Ending
Account Value
12/31/2023 | Expenses Paid
7/1/2023 – 12/31/2023 |
| | | |
| | | |
Hypothetical (5% return before expenses) | | | |
| | | |
| | | |
Hypothetical (5% return before expenses) | | | |
| | | |
| | | |
Hypothetical (5% return before expenses) | | | |
| Expenses are equal to the Fund's annualized expense ratio (after waiver/reimbursement): 0.86%, 0.56% and 0.61% for Class A, N and Y, respectively, multiplied by the average account value over the period, multiplied by the number of days in the most recent fiscal half–year (184), divided by 365 (to reflect the half–year period). |
Mirova Global Sustainable Equity Fund | Beginning
Account Value
7/1/2023 | Ending
Account Value
12/31/2023 | Expenses Paid
7/1/2023 – 12/31/2023 |
| | | |
| | | |
Hypothetical (5% return before expenses) | | | |
| | | |
| | | |
Hypothetical (5% return before expenses) | | | |
| | | |
| | | |
Hypothetical (5% return before expenses) | | | |
| | | |
| | | |
Hypothetical (5% return before expenses) | | | |
| Expenses are equal to the Fund's annualized expense ratio (after waiver/reimbursement): 1.20%, 1.95%, 0.88% and 0.95% for Class A, C, N and Y, respectively, multiplied by the average account value over the period, multiplied by the number of days in the most recent fiscal half–year (184), divided by 365 (to reflect the half–year period). |
Mirova International Sustainable Equity Fund | Beginning
Account Value
7/1/2023 | Ending
Account Value
12/31/2023 | Expenses Paid
7/1/2023 – 12/31/2023 |
| | | |
| | | |
Hypothetical (5% return before expenses) | | | |
| | | |
| | | |
Hypothetical (5% return before expenses) | | | |
| | | |
| | | |
Hypothetical (5% return before expenses) | | | |
| Expenses are equal to the Fund's annualized expense ratio (after waiver/reimbursement): 1.19%, 0.90% and 0.95% for Class A, N and Y, respectively, multiplied by the average account value over the period, multiplied by the number of days in the most recent fiscal half–year (184), divided by 365 (to reflect the half–year period). |
Portfolio of Investments – as of December 31, 2023Gateway Fund
| | |
Common Stocks — 99.8% of Net Assets |
| Aerospace & Defense — 1.3% |
| | |
| | |
| | |
| | |
| Air Freight & Logistics — 0.5% |
| United Parcel Service, Inc., Class B(a) | |
| Automobile Components — 0.1% |
| | |
| |
| | |
| | |
| | |
| | |
| |
| | |
| | |
| | |
| | |
| | |
| |
| Monster Beverage Corp.(a)(b) | |
| | |
| | |
| |
| | |
| Alnylam Pharmaceuticals, Inc.(b) | |
| | |
| | |
| | |
| Vertex Pharmaceuticals, Inc.(a)(b) | |
| | |
| |
| | |
| | |
| | |
| | |
| |
| | |
| Lennox International, Inc.(a) | |
| | |
| |
| Brookfield Corp., Class A | |
| | |
| FactSet Research Systems, Inc.(a) | |
| Intercontinental Exchange, Inc.(a) | |
| | |
| | |
| | |
| | |
| | |
| |
| | |
| | |
| | |
| | |
| | |
| |
| | |
| LyondellBasell Industries NV, Class A(a) | |
| | |
| | |
| | |
| RPM International, Inc.(a) | |
| | |
| Commercial Services & Supplies — 1.0% |
| | |
| Waste Connections, Inc.(a) | |
| Waste Management, Inc.(a) | |
| | |
| Communications Equipment — 0.8% |
| | |
| Construction Materials — 0.3% |
| Martin Marietta Materials, Inc.(a) | |
| |
| | |
| Discover Financial Services(a) | |
| | |
| | |
| Consumer Staples Distribution & Retail — 1.9% |
| Casey's General Stores, Inc.(a) | |
| Costco Wholesale Corp.(a) | |
| | |
| U.S. Foods Holding Corp.(a)(b) | |
| | |
| | |
| Containers & Packaging — 0.4% |
| | |
| | |
| | |
| | |
| |
| | |
| Diversified Consumer Services — 0.1% |
| Service Corp. International(a) | |
| Diversified Telecommunication Services — 0.9% |
| | |
| Verizon Communications, Inc.(a) | |
| | |
| Electric Utilities — 1.3% |
| | |
| American Electric Power Co., Inc.(a) | |
| | |
| | |
| | |
| | |
| Electrical Equipment — 0.6% |
| | |
| | |
| | |
| Electronic Equipment, Instruments & Components — 0.8% |
| | |
| | |
See accompanying notes to financial statements.
Portfolio of Investments – as of December 31, 2023Gateway Fund (continued) | | |
| Electronic Equipment, Instruments & Components — continued |
| Teledyne Technologies, Inc.(a)(b) | |
| Zebra Technologies Corp., Class A(a)(b) | |
| | |
| Energy Equipment & Services — 0.3% |
| | |
| |
| Live Nation Entertainment, Inc.(a)(b) | |
| | |
| | |
| | |
| Financial Services — 4.6% |
| Berkshire Hathaway, Inc., Class B(a)(b) | |
| Mastercard, Inc., Class A(a) | |
| PayPal Holdings, Inc.(a)(b) | |
| | |
| | |
| | |
| |
| | |
| Lamb Weston Holdings, Inc.(a) | |
| Mondelez International, Inc., Class A(a) | |
| | |
| Ground Transportation — 1.0% |
| Canadian National Railway Co. | |
| Canadian Pacific Kansas City Ltd.(a) | |
| | |
| J.B. Hunt Transport Services, Inc.(a) | |
| Old Dominion Freight Line, Inc.(a) | |
| Uber Technologies, Inc.(a)(b) | |
| | |
| Health Care Equipment & Supplies — 2.3% |
| | |
| Baxter International, Inc.(a) | |
| Boston Scientific Corp.(a)(b) | |
| Edwards Lifesciences Corp.(a)(b) | |
| Intuitive Surgical, Inc.(a)(b) | |
| | |
| | |
| Health Care Providers & Services — 3.1% |
| | |
| | |
| | |
| Molina Healthcare, Inc.(a)(b) | |
| UnitedHealth Group, Inc.(a) | |
| Universal Health Services, Inc., Class B(a) | |
| | |
| Health Care Technology — 0.1% |
| Veeva Systems, Inc., Class A(a)(b) | |
| Hotels, Restaurants & Leisure — 2.2% |
| Airbnb, Inc., Class A(a)(b) | |
| Booking Holdings, Inc.(a)(b) | |
| Hilton Worldwide Holdings, Inc.(a) | |
| | |
| Restaurant Brands International, Inc.(a) | |
| | |
| | |
| | |
| Household Durables — 0.4% |
| | |
| | |
| | |
| Household Products — 1.2% |
| | |
| Industrial Conglomerates — 0.9% |
| | |
| Honeywell International, Inc.(a) | |
| | |
| |
| | |
| |
| | |
| American Financial Group, Inc.(a) | |
| | |
| Arthur J Gallagher & Co.(a) | |
| Fidelity National Financial, Inc.(a) | |
| | |
| | |
| | |
| Interactive Media & Services — 6.0% |
| Alphabet, Inc., Class A(a)(b) | |
| Alphabet, Inc., Class C(a)(b) | |
| | |
| Meta Platforms, Inc., Class A(a)(b) | |
| | |
| |
| | |
| | |
| Shopify, Inc., Class A(a)(b) | |
| | |
| | |
| Life Sciences Tools & Services — 1.2% |
| Agilent Technologies, Inc.(a) | |
| | |
| Thermo Fisher Scientific, Inc.(a) | |
| | |
| |
| | |
| | |
| | |
| | |
| | |
| | |
| |
| Comcast Corp., Class A(a) | |
| |
| | |
| | |
| | |
| | |
| | |
| | |
| | |
| |
| | |
See accompanying notes to financial statements.
Portfolio of Investments – as of December 31, 2023Gateway Fund (continued) | | |
| Multi-Utilities — continued |
| Consolidated Edison, Inc.(a) | |
| WEC Energy Group, Inc.(a) | |
| | |
| Oil, Gas & Consumable Fuels — 3.6% |
| Canadian Natural Resources Ltd. | |
| | |
| | |
| | |
| | |
| | |
| | |
| | |
| Occidental Petroleum Corp.(a) | |
| | |
| | |
| | |
| | |
| | |
| Passenger Airlines — 0.2% |
| Alaska Air Group, Inc.(a)(b) | |
| United Airlines Holdings, Inc.(a)(b) | |
| | |
| Personal Care Products — 0.3% |
| Estee Lauder Cos., Inc., Class A(a) | |
| |
| | |
| Bristol-Myers Squibb Co.(a) | |
| | |
| | |
| | |
| | |
| | |
| Professional Services — 0.8% |
| Automatic Data Processing, Inc.(a) | |
| Booz Allen Hamilton Holding Corp. | |
| | |
| SS&C Technologies Holdings, Inc. | |
| | |
| Real Estate Management & Development — 0.0% |
| Zillow Group, Inc., Class C(b) | |
| |
| American Homes 4 Rent, Class A(a) | |
| | |
| Equity LifeStyle Properties, Inc.(a) | |
| Invitation Homes, Inc.(a) | |
| | |
| | |
| | |
| Semiconductors & Semiconductor Equipment — 7.9% |
| Advanced Micro Devices, Inc.(a)(b) | |
| | |
| | |
| | |
| | |
| | |
| Marvell Technology, Inc.(a) | |
| | |
| | |
| | |
| Semiconductors & Semiconductor Equipment — continued |
| Taiwan Semiconductor Manufacturing Co. Ltd., ADR(a) | |
| | |
| Texas Instruments, Inc.(a) | |
| | |
| |
| | |
| Atlassian Corp., Class A(a)(b) | |
| Cadence Design Systems, Inc.(a)(b) | |
| | |
| | |
| | |
| Palo Alto Networks, Inc.(a)(b) | |
| | |
| | |
| | |
| Workday, Inc., Class A(a)(b) | |
| | |
| |
| | |
| | |
| | |
| |
| Dick's Sporting Goods, Inc.(a) | |
| | |
| | |
| O'Reilly Automotive, Inc.(a)(b) | |
| | |
| | |
| Technology Hardware, Storage & Peripherals — 7.3% |
| | |
| Dell Technologies, Inc., Class C(a) | |
| | |
| Textiles, Apparel & Luxury Goods — 0.3% |
| Lululemon Athletica, Inc.(a)(b) | |
| |
| | |
| British American Tobacco PLC, ADR(a) | |
| | |
| Trading Companies & Distributors — 0.1% |
| | |
| Total Common Stocks
(Identified Cost $2,018,204,535) | |
| Total Purchased Options — 0.5%
(Identified Cost $47,446,549) (see details below) | |
See accompanying notes to financial statements.
Portfolio of Investments – as of December 31, 2023Gateway Fund (continued)
| | |
Short-Term Investments — 1.6% |
| Tri-Party Repurchase Agreement with Fixed Income Clearing Corporation, dated 12/29/2023 at 2.500% to be repurchased at $103,499,797 on 1/02/2024 collateralized by $113,653,400 U.S. Treasury Note, 0.375% due 11/30/2025 valued at $105,540,529 including accrued interest (Note 2 of Notes to Financial Statements)
(Identified Cost $103,471,055) | |
| Total Investments — 101.9%
(Identified Cost $2,169,122,139) | |
| Other assets less liabilities — (1.9)% | |
| | |
Purchased Options — 0.5%
Written Options — (2.1%)
| See Note 2 of Notes to Financial Statements. |
| Security (or a portion thereof) has been pledged as collateral for open derivative contracts. |
| Non-income producing security. |
| An American Depositary Receipt is a certificate issued by a custodian bank representing the right to receive securities of the foreign issuer described. The values of ADRs may be significantly influenced by trading on exchanges not located in the United States. |
| Real Estate Investment Trusts |
See accompanying notes to financial statements.
Portfolio of Investments – as of December 31, 2023Gateway Fund (continued) Industry Summary at December 31, 2023
| |
Semiconductors & Semiconductor Equipment | |
Technology Hardware, Storage & Peripherals | |
Interactive Media & Services | |
| |
| |
| |
Oil, Gas & Consumable Fuels | |
| |
Health Care Providers & Services | |
| |
Health Care Equipment & Supplies | |
Hotels, Restaurants & Leisure | |
| |
| |
| |
Other Investments, less than 2% each | |
| |
| |
Other assets less liabilities (including open written options) | |
| |
See accompanying notes to financial statements.
Portfolio of Investments – as of December 31, 2023Gateway Equity Call Premium Fund
| | |
Common Stocks — 99.5% of Net Assets |
| Aerospace & Defense — 1.5% |
| | |
| | |
| | |
| | |
| Air Freight & Logistics — 0.4% |
| C.H. Robinson Worldwide, Inc.(a) | |
| Expeditors International of Washington, Inc.(a) | |
| GXO Logistics, Inc.(a)(b) | |
| | |
| Automobile Components — 0.1% |
| | |
| | |
| Magna International, Inc.(a) | |
| | |
| |
| | |
| | |
| | |
| |
| | |
| | |
| East West Bancorp, Inc.(a) | |
| | |
| | |
| | |
| | |
| | |
| | |
| |
| Brown-Forman Corp., Class B(a) | |
| Coca-Cola Europacific Partners PLC(a) | |
| Keurig Dr Pepper, Inc.(a) | |
| | |
| | |
| |
| | |
| Alnylam Pharmaceuticals, Inc.(a)(b) | |
| | |
| BioMarin Pharmaceutical, Inc.(a)(b) | |
| Vertex Pharmaceuticals, Inc.(a)(b) | |
| | |
| |
| | |
| | |
| | |
| |
| Fortune Brands Innovations, Inc.(a) | |
| Lennox International, Inc.(a) | |
| | |
| |
| Bank of New York Mellon Corp.(a) | |
| | |
| | |
| Brookfield Corp., Class A | |
| FactSet Research Systems, Inc.(a) | |
| | |
| Capital Markets — continued |
| | |
| LPL Financial Holdings, Inc.(a) | |
| | |
| | |
| Raymond James Financial, Inc.(a) | |
| | |
| |
| Air Products & Chemicals, Inc.(a) | |
| | |
| | |
| | |
| RPM International, Inc.(a) | |
| | |
| Commercial Services & Supplies — 0.7% |
| Waste Connections, Inc.(a) | |
| Waste Management, Inc.(a) | |
| | |
| Communications Equipment — 0.8% |
| | |
| | |
| | |
| Construction Materials — 0.3% |
| Martin Marietta Materials, Inc.(a) | |
| |
| | |
| | |
| | |
| Consumer Staples Distribution & Retail — 2.0% |
| Costco Wholesale Corp.(a) | |
| | |
| | |
| | |
| | |
| Containers & Packaging — 0.2% |
| | |
| |
| | |
| Diversified Consumer Services — 0.1% |
| Service Corp. International(a) | |
| |
| | |
| Diversified Telecommunication Services — 0.6% |
| | |
| Electric Utilities — 1.5% |
| | |
| American Electric Power Co., Inc.(a) | |
| | |
| | |
| | |
| Electrical Equipment — 0.7% |
| | |
| | |
| | |
| Sensata Technologies Holding PLC(a) | |
| | |
See accompanying notes to financial statements.
Portfolio of Investments – as of December 31, 2023Gateway Equity Call Premium Fund (continued) | | |
| Electronic Equipment, Instruments & Components — 0.5% |
| Arrow Electronics, Inc.(a)(b) | |
| | |
| | |
| | |
| Energy Equipment & Services — 0.3% |
| | |
| | |
| | |
| |
| | |
| | |
| | |
| Financial Services — 4.3% |
| Berkshire Hathaway, Inc., Class B(a)(b) | |
| Mastercard, Inc., Class A(a) | |
| | |
| | |
| |
| | |
| | |
| | |
| Post Holdings, Inc.(a)(b) | |
| | |
| Ground Transportation — 1.2% |
| Canadian National Railway Co.(a) | |
| Canadian Pacific Kansas City Ltd.(a) | |
| Uber Technologies, Inc.(a)(b) | |
| | |
| | |
| | |
| Health Care Equipment & Supplies — 2.4% |
| | |
| | |
| Align Technology, Inc.(a)(b) | |
| | |
| IDEXX Laboratories, Inc.(a)(b) | |
| | |
| | |
| | |
| | |
| Health Care Providers & Services — 2.7% |
| | |
| | |
| | |
| | |
| Laboratory Corp. of America Holdings(a) | |
| Molina Healthcare, Inc.(a)(b) | |
| UnitedHealth Group, Inc.(a) | |
| | |
| Health Care Technology — 0.1% |
| Veeva Systems, Inc., Class A(a)(b) | |
| Hotels, Restaurants & Leisure — 2.1% |
| Booking Holdings, Inc.(a)(b) | |
| Hilton Worldwide Holdings, Inc.(a) | |
| | |
| MGM Resorts International(a)(b) | |
| Restaurant Brands International, Inc.(a) | |
| | |
| Hotels, Restaurants & Leisure — continued |
| | |
| Trip.com Group Ltd., ADR(a)(b) | |
| | |
| Yum China Holdings, Inc.(a) | |
| | |
| Household Durables — 0.4% |
| | |
| | |
| | |
| Household Products — 1.3% |
| | |
| | |
| | |
| Industrial Conglomerates — 1.0% |
| | |
| | |
| | |
| |
| | |
| |
| Arch Capital Group Ltd.(a)(b) | |
| Cincinnati Financial Corp.(a) | |
| Hartford Financial Services Group, Inc.(a) | |
| Manulife Financial Corp.(a) | |
| | |
| Prudential Financial, Inc.(a) | |
| RenaissanceRe Holdings Ltd.(a) | |
| | |
| Willis Towers Watson PLC(a) | |
| | |
| Interactive Media & Services — 5.9% |
| Alphabet, Inc., Class A(a)(b) | |
| Alphabet, Inc., Class C(a)(b) | |
| Meta Platforms, Inc., Class A(a)(b) | |
| | |
| |
| Accenture PLC, Class A(a) | |
| | |
| Shopify, Inc., Class A(a)(b) | |
| | |
| | |
| |
| | |
| | |
| | |
| Life Sciences Tools & Services — 1.4% |
| | |
| Bio-Rad Laboratories, Inc., Class A(a)(b) | |
| | |
| | |
| Thermo Fisher Scientific, Inc.(a) | |
| | |
| | |
| |
| | |
| | |
See accompanying notes to financial statements.
Portfolio of Investments – as of December 31, 2023Gateway Equity Call Premium Fund (continued) | | |
| |
| | |
| | |
| | |
| | |
| | |
| |
| Comcast Corp., Class A(a) | |
| Liberty Broadband Corp., Class C(a)(b) | |
| | |
| |
| | |
| | |
| | |
| | |
| | |
| | |
| | |
| Mortgage Real Estate Investment Trusts (REITs) — 0.1% |
| Annaly Capital Management, Inc.(a) | |
| |
| | |
| | |
| | |
| Oil, Gas & Consumable Fuels — 3.5% |
| Canadian Natural Resources Ltd.(a) | |
| | |
| | |
| | |
| | |
| | |
| | |
| | |
| | |
| Occidental Petroleum Corp.(a) | |
| | |
| Pioneer Natural Resources Co.(a) | |
| | |
| | |
| | |
| | |
| Passenger Airlines — 0.3% |
| | |
| Personal Care Products — 0.0% |
| BellRing Brands, Inc.(a)(b) | |
| |
| | |
| | |
| Jazz Pharmaceuticals PLC(a)(b) | |
| | |
| | |
| | |
| Teva Pharmaceutical Industries Ltd., ADR(a)(b) | |
| | |
| Professional Services — 0.6% |
| Booz Allen Hamilton Holding Corp.(a) | |
| | |
| | |
| Professional Services — continued |
| | |
| Verisk Analytics, Inc.(a) | |
| | |
| Real Estate Management & Development — 0.0% |
| Jones Lang LaSalle, Inc.(a)(b) | |
| |
| American Homes 4 Rent, Class A(a) | |
| Essex Property Trust, Inc.(a) | |
| Invitation Homes, Inc.(a) | |
| Mid-America Apartment Communities, Inc.(a) | |
| | |
| | |
| |
| | |
| | |
| | |
| Semiconductors & Semiconductor Equipment — 8.0% |
| Advanced Micro Devices, Inc.(a)(b) | |
| | |
| Applied Materials, Inc.(a) | |
| | |
| | |
| Enphase Energy, Inc.(a)(b) | |
| Marvell Technology, Inc.(a) | |
| | |
| ON Semiconductor Corp.(a)(b) | |
| | |
| | |
| Texas Instruments, Inc.(a) | |
| | |
| |
| | |
| | |
| Atlassian Corp., Class A(a)(b) | |
| Check Point Software Technologies Ltd.(a)(b) | |
| | |
| | |
| | |
| | |
| Palo Alto Networks, Inc.(a)(b) | |
| | |
| | |
| | |
| Workday, Inc., Class A(a)(b) | |
| Zoom Video Communications, Inc., Class A(a)(b) | |
| | |
| |
| Gaming & Leisure Properties, Inc.(a) | |
| SBA Communications Corp.(a) | |
| | |
| | |
| |
| Burlington Stores, Inc.(a)(b) | |
| Dick's Sporting Goods, Inc.(a) | |
| | |
| | |
| | |
See accompanying notes to financial statements.
Portfolio of Investments – as of December 31, 2023Gateway Equity Call Premium Fund (continued) | | |
| Specialty Retail — continued |
| | |
| | |
| | |
| Technology Hardware, Storage & Peripherals — 7.2% |
| | |
| Dell Technologies, Inc., Class C(a) | |
| | |
| Textiles, Apparel & Luxury Goods — 0.7% |
| Lululemon Athletica, Inc.(a)(b) | |
| | |
| Skechers USA, Inc., Class A(a)(b) | |
| | |
| |
| British American Tobacco PLC, ADR(a) | |
| Philip Morris International, Inc.(a) | |
| | |
| Trading Companies & Distributors — 0.2% |
| | |
| Wireless Telecommunication Services — 0.1% |
| America Movil SAB de CV, ADR(a) | |
| Vodafone Group PLC, ADR(a) | |
| | |
| Total Common Stocks
(Identified Cost $195,254,416) | |
| | |
Short-Term Investments — 2.4% |
| Tri-Party Repurchase Agreement with Fixed Income Clearing Corporation, dated 12/29/2023 at 2.500% to be repurchased at $6,524,637 on 1/02/2024 collateralized by $7,164,800 U.S. Treasury Note, 0.375% due 11/30/2025 valued at $6,653,358 including accrued interest (Note 2 of Notes to Financial Statements)
(Identified Cost $6,522,825) | |
| Total Investments — 101.9%
(Identified Cost $201,777,241) | |
| Other assets less liabilities — (1.9)% | |
| | |
| See Note 2 of Notes to Financial Statements. |
| Security (or a portion thereof) has been pledged as collateral for open derivative contracts. |
| Non-income producing security. |
| An American Depositary Receipt is a certificate issued by a custodian bank representing the right to receive securities of the foreign issuer described. The values of ADRs may be significantly influenced by trading on exchanges not located in the United States. |
| Real Estate Investment Trusts |
See accompanying notes to financial statements.
Portfolio of Investments – as of December 31, 2023Gateway Equity Call Premium Fund (continued) Industry Summary at December 31, 2023
| |
Semiconductors & Semiconductor Equipment | |
Technology Hardware, Storage & Peripherals | |
Interactive Media & Services | |
| |
| |
| |
Oil, Gas & Consumable Fuels | |
| |
| |
Health Care Providers & Services | |
Health Care Equipment & Supplies | |
Hotels, Restaurants & Leisure | |
| |
| |
| |
Consumer Staples Distribution & Retail | |
Other Investments, less than 2% each | |
| |
| |
Other assets less liabilities (including open written options) | |
| |
See accompanying notes to financial statements.
Portfolio of Investments – as of December 31, 2023Mirova Global Green Bond Fund
| | |
Bonds and Notes — 91.8% of Net Assets |
| |
| Province of Quebec, 2.600%, 7/06/2025, (CAD) | |
| |
| Chile Government International Bonds, 1.250%, 1/29/2040, (EUR) | |
| Chile Government International Bonds, 3.500%, 1/25/2050 | |
| | |
| |
| Orsted AS, 1.500%, 11/26/2029, (EUR) | |
| Orsted AS, (fixed rate to 9/09/2027, variable rate thereafter), 1.750%, 12/09/3019, (EUR) | |
| Vestas Wind Systems Finance BV, EMTN, 1.500%, 6/15/2029, (EUR) | |
| | |
| |
| VR-Yhtyma OYJ, 2.375%, 5/30/2029, (EUR) | |
| |
| Altarea SCA, 1.750%, 1/16/2030, (EUR) | |
| Banque Stellantis France SACA, EMTN, 3.875%, 1/19/2026, (EUR) | |
| Cie de Saint-Gobain SA, EMTN, 2.125%, 6/10/2028, (EUR) | |
| Covivio SA, 1.125%, 9/17/2031, (EUR) | |
| Credit Mutuel Arkea SA, EMTN, 4.250%, 12/01/2032, (EUR) | |
| Derichebourg SA, 2.250%, 7/15/2028, (EUR) | |
| Forvia SE, 2.375%, 6/15/2029, (EUR) | |
| Getlink SE, 3.500%, 10/30/2025, (EUR) | |
| ICADE, 1.500%, 9/13/2027, (EUR) | |
| Societe Du Grand Paris EPIC, EMTN, 1.700%, 5/25/2050, (EUR) | |
| | |
| |
| Bundesrepublik Deutschland Bundesanleihe, Series G, Zero Coupon, 0.000%–2.788%, 8/15/2030, (EUR)(a) | |
| Bundesrepublik Deutschland Bundesanleihe, Series G, Zero Coupon, 1.719%–3.065%, 8/15/2050, (EUR)(a) | |
| EnBW Energie Baden-Wuerttemberg AG, (fixed rate to 3/30/2026, variable rate thereafter), 1.875%, 6/29/2080, (EUR) | |
| | |
| |
| Hungary Government International Bonds, 1.750%, 6/05/2035, (EUR) | |
| |
| Perusahaan Penerbit SBSN Indonesia III, 3.900%, 8/20/2024 | |
| |
| ESB Finance DAC, EMTN, 1.000%, 7/19/2034, (EUR) | |
| |
| A2A SpA, EMTN, 1.000%, 7/16/2029, (EUR) | |
| Assicurazioni Generali SpA, EMTN, 2.124%, 10/01/2030, (EUR) | |
| Cassa Depositi e Prestiti SpA, 3.875%, 2/13/2029, (EUR) | |
| | |
| |
| ERG SpA, EMTN, 0.500%, 9/11/2027, (EUR) | |
| Hera SpA, EMTN, 2.500%, 5/25/2029, (EUR) | |
| Italy Buoni Poliennali Del Tesoro, Series 34Y, 1.500%, 4/30/2045, (EUR)(b) | |
| Terna - Rete Elettrica Nazionale, EMTN, 3.875%, 7/24/2033, (EUR) | |
| | |
| |
| Denso Corp., 1.239%, 9/16/2026 | |
| Mizuho Financial Group, Inc., EMTN, 3.490%, 9/05/2027, (EUR) | |
| | |
| |
| Kookmin Bank, GMTN, 4.500%, 2/01/2029 | |
| Korea International Bonds, Zero Coupon, 0.000%, 10/15/2026, (EUR)(c) | |
| | |
| |
| Ignitis Grupe AB, EMTN, 1.875%, 7/10/2028, (EUR) | |
| Ignitis Grupe AB, EMTN, 2.000%, 7/14/2027, (EUR) | |
| | |
| |
| Mexico Government International Bonds, 1.350%, 9/18/2027, (EUR) | |
| |
| Alliander NV, EMTN, 2.625%, 9/09/2027, (EUR) | |
| CTP NV, EMTN, 2.125%, 10/01/2025, (EUR) | |
| de Volksbank NV, EMTN, 0.375%, 3/03/2028, (EUR) | |
| de Volksbank NV, EMTN, (fixed rate to 10/22/2025, variable rate thereafter), 1.750%, 10/22/2030, (EUR) | |
| Enexis Holding NV, EMTN, 3.625%, 6/12/2034, (EUR) | |
| Koninklijke Philips NV, EMTN, 2.125%, 11/05/2029, (EUR) | |
| Stedin Holding NV, EMTN, 2.375%, 6/03/2030, (EUR) | |
| TenneT Holding BV, EMTN, 1.250%, 10/24/2033, (EUR) | |
| TenneT Holding BV, EMTN, 1.875%, 6/13/2036, (EUR) | |
| | |
| |
| Statkraft AS, EMTN, 2.875%, 9/13/2029, (EUR) | |
| |
| EDP Finance BV, EMTN, 3.875%, 3/11/2030, (EUR) | |
| Ren Finance BV, EMTN, 0.500%, 4/16/2029, (EUR) | |
| | |
| |
| Vena Energy Capital Pte. Ltd., EMTN, 3.133%, 2/26/2025 | |
| |
| Banco Bilbao Vizcaya Argentaria SA, 1.000%, 6/21/2026, (EUR) | |
| Banco Bilbao Vizcaya Argentaria SA, GMTN, 4.375%, 10/14/2029, (EUR) | |
| Bankinter SA, 0.625%, 10/06/2027, (EUR) | |
| Iberdrola Finanzas SA, EMTN, 1.375%, 3/11/2032, (EUR) | |
See accompanying notes to financial statements.
Portfolio of Investments – as of December 31, 2023Mirova Global Green Bond Fund (continued) | | |
| |
| Spain Government Bonds, 1.000%, 7/30/2042, (EUR)(b) | |
| Telefonica Europe BV, (fixed rate to 2/05/2027, variable rate thereafter), 2.502%, (EUR)(d) | |
| | |
| |
| European Investment Bank, 2.375%, 5/24/2027 | |
| |
| SKF AB, 3.125%, 9/14/2028, (EUR) | |
| Vattenfall AB, EMTN, 0.125%, 2/12/2029, (EUR) | |
| Volvo Car AB, EMTN, 2.500%, 10/07/2027, (EUR) | |
| | |
| |
| ABB Finance BV, ETMN, Zero Coupon, 0.000%–0.282%, 1/19/2030, (EUR)(a) | |
| |
| Anglian Water Services Financing PLC, EMTN, 1.625%, 8/10/2025, (GBP) | |
| DS Smith PLC, EMTN, 4.375%, 7/27/2027, (EUR) | |
| Severn Trent Utilities Finance PLC, EMTN, 5.250%, 4/04/2036, (GBP) | |
| SSE PLC, EMTN, 1.375%, 9/04/2027, (EUR) | |
| SSE PLC, EMTN, 2.875%, 8/01/2029, (EUR) | |
| U.K. Gilts, 0.875%, 7/31/2033, (GBP) | |
| U.K. Gilts, 1.500%, 7/31/2053, (GBP) | |
| | |
| |
| Digital Dutch Finco BV, 1.500%, 3/15/2030, (EUR) | |
| Digital Intrepid Holding BV, 0.625%, 7/15/2031, (EUR) | |
| DTE Electric Co., 3.950%, 3/01/2049 | |
| Equinix, Inc., 0.250%, 3/15/2027, (EUR) | |
| Ford Motor Co., 3.250%, 2/12/2032 | |
| General Motors Co., 5.400%, 10/15/2029 | |
| Johnson Controls International PLC, 4.250%, 5/23/2035, (EUR) | |
| Southern Power Co., 4.150%, 12/01/2025 | |
| Stellantis NV, EMTN, 4.375%, 3/14/2030, (EUR) | |
| Thermo Fisher Scientific, Inc., 4.100%, 8/15/2047 | |
| Verizon Communications, Inc., 3.875%, 2/08/2029 | |
| Wabtec Transportation Netherlands BV, 1.250%, 12/03/2027, (EUR) | |
| | |
| Total Bonds and Notes
(Identified Cost $38,551,416) | |
|
|
| | |
|
Short-Term Investments — 1.0% |
| Tri-Party Repurchase Agreement with Fixed Income Clearing Corporation, dated 12/29/2023 at 2.500% to be repurchased at $386,983 on 1/02/2024 collateralized by $441,300 U.S. Treasury Note, 0.500% due 4/30/2027 valued at $394,683 including accrued interest (Note 2 of Notes to Financial Statements)
(Identified Cost $386,876) | |
| Total Investments — 92.8%
(Identified Cost $38,938,292) | |
| Other assets less liabilities — 7.2% | |
| | |
| See Note 2 of Notes to Financial Statements. |
| Principal Amount stated in U.S. dollars unless otherwise noted. |
| Interest rate represents annualized yield at time of purchase; not a coupon rate. The Fund’s investment in this security is comprised of various lots with differing annualized yields. |
| All or a portion of these securities are exempt from registration under Rule 144A of the Securities Act of 1933. These securities may be resold in transactions exempt from registration, normally to qualified institutional buyers. At December 31, 2023, the value of Rule 144A holdings amounted to $1,223,834 or 3.1% of net assets. |
| Interest rate represents annualized yield at time of purchase; not a coupon rate. |
| Perpetual bond with no specified maturity date. |
At December 31, 2023, open long futures contracts were as follows:
| | | | | Unrealized
Appreciation
(Depreciation) |
Eurex 10 Year Euro BUND Futures | | | | | |
Eurex 30 Year Euro BUXL Futures | | | | | |
Eurex 5 Year Euro BOBL Futures | | | | | |
Montreal Exchange 10 Year Canadian Bond Futures | | | | | |
| | | | | |
See accompanying notes to financial statements.
Portfolio of Investments – as of December 31, 2023Mirova Global Green Bond Fund (continued) At December 31, 2023, open short futures contracts were as follows:
| | | | | Unrealized
Appreciation
(Depreciation) |
CME British Pound Currency Futures | | | | | |
CME Canadian Dollar Currency Futures | | | | | |
CME Euro Foreign Exchange Currency Futures | | | | | |
| | | | | |
Investment Summary at December 31, 2023
| |
| |
| |
| |
| |
| |
| |
| |
Other Investments, less than 2% each | |
| |
| |
Other assets less liabilities (including futures contracts) | |
| |
Currency Exposure Summary at December 31, 2023
| |
| |
| |
| |
| |
Other assets less liabilities (including futures contracts) | |
| |
See accompanying notes to financial statements.
Portfolio of Investments – as of December 31, 2023Mirova Global Sustainable Equity Fund
| | |
Common Stocks — 97.5% of Net Assets |
| |
| | |
| |
| | |
| Vestas Wind Systems AS(a) | |
| | |
| |
| | |
| | |
| | |
| | |
| |
| Mercedes-Benz Group AG, (Registered) | |
| | |
| | |
| | |
| |
| | |
| |
| | |
| Takeda Pharmaceutical Co. Ltd. | |
| | |
| | |
| |
| | |
| | |
| | |
| |
| | |
| |
| Taiwan Semiconductor Manufacturing Co. Ltd., ADR | |
| |
| | |
| Legal & General Group PLC | |
| | |
| | |
| |
| | |
| | |
| American Water Works Co., Inc. | |
| | |
| | |
| | |
| | |
| | |
| Edwards Lifesciences Corp.(a) | |
| | |
| | |
| Estee Lauder Cos., Inc., Class A | |
| Intuitive Surgical, Inc.(a) | |
| Mastercard, Inc., Class A | |
| | |
| | |
| | |
| Palo Alto Networks, Inc.(a) | |
| | |
| | |
| United States — continued |
| Thermo Fisher Scientific, Inc. | |
| | |
| | |
| | |
| Watts Water Technologies, Inc., Class A | |
| | |
| | |
| Total Common Stocks
(Identified Cost $926,206,078) | |
| | |
Short-Term Investments — 2.0% |
| Tri-Party Repurchase Agreement with Fixed Income Clearing Corporation, dated 12/29/2023 at 2.500% to be repurchased at $20,744,757 on 1/02/2024 collateralized by $6,016,800 U.S. Treasury Note, 0.500% due 4/30/2027 valued at $5,381,216; $15,492,000 U.S. Treasury Note, 4.125% due 9/30/2027 valued at $15,772,594 including accrued interest (Note 2 of Notes to Financial Statements)
(Identified Cost $20,738,996) | |
| Total Investments — 99.5%
(Identified Cost $946,945,074) | |
| Other assets less liabilities — 0.5% | |
| | |
| See Note 2 of Notes to Financial Statements. |
| Non-income producing security. |
| An American Depositary Receipt is a certificate issued by a custodian bank representing the right to receive securities of the foreign issuer described. The values of ADRs may be significantly influenced by trading on exchanges not located in the United States. |
Industry Summary at December 31, 2023
| |
| |
| |
Semiconductors & Semiconductor Equipment | |
| |
Life Sciences Tools & Services | |
| |
Health Care Equipment & Supplies | |
| |
| |
| |
| |
| |
Other Investments, less than 2% each | |
| |
| |
Other assets less liabilities | |
| |
See accompanying notes to financial statements.
Portfolio of Investments – as of December 31, 2023Mirova Global Sustainable Equity Fund (continued) Currency Exposure Summary at December 31, 2023
| |
| |
| |
| |
| |
| |
| |
Other assets less liabilities | |
| |
See accompanying notes to financial statements.
Portfolio of Investments – as of December 31, 2023Mirova International Sustainable Equity Fund
| | |
Common Stocks — 93.5% of Net Assets |
| |
| | |
| |
| | |
| | |
| | |
| |
| | |
| Vestas Wind Systems AS(a) | |
| | |
| |
| | |
| | |
| | |
| | |
| | |
| | |
| |
| Mercedes-Benz Group AG, (Registered) | |
| | |
| | |
| | |
| |
| | |
| |
| | |
| | |
| | |
| |
| | |
| | |
| | |
| | |
| Takeda Pharmaceutical Co. Ltd. | |
| | |
| | |
| | |
| |
| | |
| | |
| | |
| |
| | |
| |
| | |
| |
| | |
| |
| Taiwan Semiconductor Manufacturing Co. Ltd., ADR | |
| |
| | |
| | |
| | |
| | |
| Land Securities Group PLC | |
| | |
| United Kingdom — continued |
| Legal & General Group PLC | |
| | |
| | |
| |
| | |
| Total Common Stocks
(Identified Cost $15,496,092) | |
| | |
Short-Term Investments — 4.0% |
| Tri-Party Repurchase Agreement with Fixed Income Clearing Corporation, dated 12/29/2023 at 2.500% to be repurchased at $650,255 on 1/02/2024 collateralized by $651,300 U.S. Treasury Note, 4.125% due 9/30/2027 valued at $663,096 including accrued interest (Note 2 of Notes to Financial Statements)
(Identified Cost $650,074) | |
| Total Investments — 97.5%
(Identified Cost $16,146,166) | |
| Other assets less liabilities — 2.5% | |
| | |
| See Note 2 of Notes to Financial Statements. |
| Non-income producing security. |
| An American Depositary Receipt is a certificate issued by a custodian bank representing the right to receive securities of the foreign issuer described. The values of ADRs may be significantly influenced by trading on exchanges not located in the United States. |
Industry Summary at December 31, 2023
| |
Semiconductors & Semiconductor Equipment | |
| |
| |
| |
| |
| |
| |
Health Care Equipment & Supplies | |
| |
| |
| |
| |
Electronic Equipment, Instruments & Components | |
| |
| |
| |
Other Investments, less than 2% each | |
| |
| |
Other assets less liabilities | |
| |
See accompanying notes to financial statements.
Portfolio of Investments – as of December 31, 2023Mirova International Sustainable Equity Fund (continued) Currency Exposure Summary at December 31, 2023
| |
| |
| |
| |
| |
| |
| |
| |
| |
Other assets less liabilities | |
| |
See accompanying notes to financial statements.
Statements of Assets and Liabilities
| | Gateway Equity
Call Premium
Fund | Mirova Global
Green Bond
Fund |
| | | |
| | | |
Net unrealized appreciation (depreciation) | | | |
| | | |
| | | |
Due from brokers (including variation margin on futures contracts) (Note 2) | | | |
Foreign currency at value (identified cost $0, $0 and $1,614,508, respectively) | | | |
Receivable for Fund shares sold | | | |
Receivable from investment adviser (Note 6) | | | |
Receivable for securities sold | | | |
Dividends and interest receivable | | | |
Unrealized appreciation on futures contracts (Note 2) | | | |
| | | |
Prepaid expenses (Note 8) | | | |
| | | |
| | | |
Options written, at value (premiums received $80,730,872, $3,377,436 and $0, respectively) (Note 2) | | | |
Payable for Fund shares redeemed | | | |
Unrealized depreciation on futures contracts (Note 2) | | | |
Management fees payable (Note 6) | | | |
Deferred Trustees’ fees (Note 6) | | | |
Administrative fees payable (Note 6) | | | |
Payable to distributor (Note 6d) | | | |
Audit and tax services fees payable | | | |
Other accounts payable and accrued expenses | | | |
| | | |
COMMITMENTS AND CONTINGENCIES(a) | | | |
| | | |
| | | |
| | | |
Accumulated earnings (loss) | | | |
| | | |
See accompanying notes to financial statements.
Statements of Assets and Liabilities (continued)
| | Gateway Equity Call Premium Fund | Mirova Global Green Bond Fund |
COMPUTATION OF NET ASSET VALUE AND OFFERING PRICE: | | | |
| | | |
| | | |
Shares of beneficial interest | | | |
Net asset value and redemption price per share | | | |
Offering price per share (100/[100-maximum sales charge] of net asset value) (Note 1) | | | |
Class C shares: (redemption price per share is equal to net asset value less any applicable contingent deferred sales charge) (Note 1) | | | |
| | | |
Shares of beneficial interest | | | |
Net asset value and offering price per share | | | |
| | | |
| | | |
Shares of beneficial interest | | | |
Net asset value, offering and redemption price per share | | | |
| | | |
| | | |
Shares of beneficial interest | | | |
Net asset value, offering and redemption price per share | | | |
| As disclosed in the Notes to Financial Statements, if applicable. |
See accompanying notes to financial statements.
Statements of Assets and Liabilities (continued)
| Mirova Global
Sustainable
Equity Fund | Mirova
International
Sustainable
Equity Fund |
| | |
| | |
Net unrealized appreciation (depreciation) | | |
| | |
Foreign currency at value (identified cost $4,556,011 and $385,650, respectively) | | |
Receivable for Fund shares sold | | |
Receivable from investment adviser (Note 6) | | |
Dividends and interest receivable | | |
| | |
Prepaid expenses (Note 8) | | |
| | |
| | |
Payable for Fund shares redeemed | | |
Management fees payable (Note 6) | | |
Deferred Trustees’ fees (Note 6) | | |
Administrative fees payable (Note 6) | | |
Payable to distributor (Note 6d) | | |
Audit and tax services fees payable | | |
Other accounts payable and accrued expenses | | |
| | |
COMMITMENTS AND CONTINGENCIES(a) | | |
| | |
| | |
| | |
Accumulated earnings (loss) | | |
| | |
COMPUTATION OF NET ASSET VALUE AND OFFERING PRICE: | | |
| | |
| | |
Shares of beneficial interest | | |
Net asset value and redemption price per share | | |
Offering price per share (100/94.25 of net asset value) (Note 1) | | |
Class C shares: (redemption price per share is equal to net asset value less any applicable contingent deferred sales charge) (Note 1) | | |
| | |
Shares of beneficial interest | | |
Net asset value and offering price per share | | |
| | |
| | |
Shares of beneficial interest | | |
Net asset value, offering and redemption price per share | | |
| | |
| | |
Shares of beneficial interest | | |
Net asset value, offering and redemption price per share | | |
| As disclosed in the Notes to Financial Statements, if applicable. |
See accompanying notes to financial statements.
For the Year Ended December 31, 2023
| | Gateway Equity
Call Premium
Fund | Mirova Global
Green Bond
Fund |
| | | |
| | | |
| | | |
Less net foreign taxes withheld | | | |
| | | |
| | | |
| | | |
Service and distribution fees (Note 6) | | | |
Administrative fees (Note 6) | | | |
Trustees' fees and expenses (Note 6) | | | |
Transfer agent fees and expenses (Notes 6 and 7) | | | |
Audit and tax services fees | | | |
Custodian fees and expenses | | | |
Interest expense (Note 10) | | | |
| | | |
| | | |
| | | |
Shareholder reporting expenses | | | |
| | | |
| | | |
Less waiver and/or expense reimbursement (Note 6) | | | |
| | | |
| | | |
Net realized and unrealized gain (loss) on Investments, Futures contracts, Options written and Foreign currency transactions | | | |
Net realized gain (loss) on: | | | |
| | | |
| | | |
| | | |
Foreign currency transactions (Note 2c) | | | |
Net change in unrealized appreciation (depreciation) on: | | | |
| | | |
| | | |
| | | |
Foreign currency translations (Note 2c) | | | |
Net realized and unrealized gain on Investments, Futures contracts, Options written and Foreign currency transactions | | | |
NET INCREASE IN NET ASSETS RESULTING FROM OPERATIONS | | | |
See accompanying notes to financial statements.
Statements of Operations (continued)
For the Year Ended December 31, 2023
| Mirova Global
Sustainable
Equity Fund | Mirova
International
Sustainable
Equity Fund |
| | |
| | |
Non-cash dividends (Note 2b) | | |
| | |
Less net foreign taxes withheld | | |
| | |
| | |
| | |
Service and distribution fees (Note 6) | | |
Administrative fees (Note 6) | | |
Trustees' fees and expenses (Note 6) | | |
Transfer agent fees and expenses (Notes 6 and 7) | | |
Audit and tax services fees | | |
Custodian fees and expenses | | |
Interest expense (Note 10) | | |
| | |
| | |
| | |
Shareholder reporting expenses | | |
| | |
| | |
Less waiver and/or expense reimbursement (Note 6) | | |
| | |
| | |
Net realized and unrealized gain (loss) on Investments and Foreign currency transactions | | |
Net realized gain (loss) on: | | |
| | |
Foreign currency transactions (Note 2c) | | |
Net change in unrealized appreciation (depreciation) on: | | |
| | |
Foreign currency translations (Note 2c) | | |
Net realized and unrealized gain on investments and foreign currency transactions | | |
NET INCREASE IN NET ASSETS RESULTING FROM OPERATIONS | | |
See accompanying notes to financial statements.
Statements of Changes in Net Assets
| | Gateway Equity Call
Premium Fund |
| Year Ended
December 31,2023 | Year Ended
December 31,2022 | Year Ended
December 31,2023 | Year Ended
December 31,2022 |
| | | | |
| | | | |
Net realized gain (loss) on investments, written options and foreign currency transactions | | | | |
Net change in unrealized appreciation (depreciation) on investments, written options and foreign currency translations | | | | |
Net increase (decrease) in net assets resulting from operations | | | | |
FROM DISTRIBUTIONS TO SHAREHOLDERS: | | | | |
| | | | |
| | | | |
| | | | |
| | | | |
| | | | |
NET INCREASE (DECREASE) IN NET ASSETS FROM CAPITAL
SHARES TRANSACTIONS (Note 12) | | | | |
Net increase (decrease) in net assets | | | | |
| | | | |
| | | | |
| | | | |
See accompanying notes to financial statements.
Statements of Changes in Net Assets (continued)
| Mirova Global
Green Bond Fund | Mirova Global Sustainable
Equity Fund |
| Year Ended
December 31,2023 | Year Ended
December 31,2022 | Year Ended
December 31,2023 | Year Ended
December 31,2022 |
| | | | |
| | | | |
Net realized loss on investments, futures contracts and foreign currency transactions | | | | |
Net change in unrealized appreciation (depreciation) on investments, futures contracts and foreign currency translations | | | | |
Net increase (decrease) in net assets resulting from operations | | | | |
FROM DISTRIBUTIONS TO SHAREHOLDERS: | | | | |
| | | | |
| | | | |
| | | | |
| | | | |
| | | | |
NET INCREASE (DECREASE) IN NET ASSETS FROM CAPITAL
SHARES TRANSACTIONS (Note 12) | | | | |
Net increase (decrease) in net assets | | | | |
| | | | |
| | | | |
| | | | |
See accompanying notes to financial statements.
Statements of Changes in Net Assets (continued)
| Mirova International
Sustainable Equity Fund |
| Year Ended
December 31,2023 | Year Ended
December 31,2022 |
| | |
| | |
Net realized loss on investments and foreign currency transactions | | |
Net change in unrealized appreciation (depreciation) on investments and foreign currency translations | | |
Net increase (decrease) in net assets resulting from operations | | |
FROM DISTRIBUTIONS TO SHAREHOLDERS: | | |
| | |
| | |
| | |
| | |
NET INCREASE (DECREASE) IN NET ASSETS FROM CAPITAL
SHARES TRANSACTIONS (Note 12) | | |
Net increase (decrease) in net assets | | |
| | |
| | |
| | |
See accompanying notes to financial statements.
For a share outstanding throughout each period.
| |
| Year Ended
December 31,
2023 | Year Ended
December 31,
2022 | Year Ended
December 31,
2021 | Year Ended
December 31,
2020 | Year Ended
December 31,
2019 |
Net asset value, beginning of the period | | | | | |
INCOME (LOSS) FROM INVESTMENT OPERATIONS: | | | | | |
| | | | | |
Net realized and unrealized gain (loss) | | | | | |
Total from Investment Operations | | | | | |
| | | | | |
| | | | | |
Net asset value, end of the period | | | | | |
| | | | | |
RATIOS TO AVERAGE NET ASSETS: | | | | | |
Net assets, end of the period (000's) | | | | | |
| | | | | |
| | | | | |
| | | | | |
| | | | | |
| Per share net investment income has been calculated using the average shares outstanding during the period. |
| A sales charge for Class A shares is not reflected in total return calculations. |
| Had certain expenses not been waived/reimbursed during the period, total returns would have been lower. |
| The investment adviser agreed to waive its fees and/or reimburse a portion of the Fund’s expenses during the period. Without this waiver/reimbursement, expenses would have been higher. |
| Includes refund of prior year service fee of less than 0.01%. See Note 6b of Notes to Financial Statements. |
| Includes refund of prior year service fee of 0.01%. |
See accompanying notes to financial statements.
Financial Highlights (continued)
For a share outstanding throughout each period.
| |
| Year Ended
December 31,
2023 | Year Ended
December 31,
2022 | Year Ended
December 31,
2021 | Year Ended
December 31,
2020 | Year Ended
December 31,
2019 |
Net asset value, beginning of the period | | | | | |
INCOME (LOSS) FROM INVESTMENT OPERATIONS: | | | | | |
Net investment income (loss)(a) | | | | | |
Net realized and unrealized gain (loss) | | | | | |
Total from Investment Operations | | | | | |
| | | | | |
| | | | | |
Net asset value, end of the period | | | | | |
| | | | | |
RATIOS TO AVERAGE NET ASSETS: | | | | | |
Net assets, end of the period (000's) | | | | | |
| | | | | |
| | | | | |
Net investment income (loss) | | | | | |
| | | | | |
| Per share net investment income (loss) has been calculated using the average shares outstanding during the period. |
| A contingent deferred sales charge for Class C shares is not reflected in total return calculations. |
| Had certain expenses not been waived/reimbursed during the period, total returns would have been lower. |
| The investment adviser agreed to waive its fees and/or reimburse a portion of the Fund’s expenses during the period. Without this waiver/reimbursement, expenses would have been higher. |
See accompanying notes to financial statements.
Financial Highlights (continued)
For a share outstanding throughout each period.
| |
| Year Ended
December 31,
2023 | Year Ended
December 31,
2022 | Year Ended
December 31,
2021 | Year Ended
December 31,
2020 | Year Ended
December 31,
2019 |
Net asset value, beginning of the period | | | | | |
INCOME (LOSS) FROM INVESTMENT OPERATIONS: | | | | | |
| | | | | |
Net realized and unrealized gain (loss) | | | | | |
Total from Investment Operations | | | | | |
| | | | | |
| | | | | |
Net asset value, end of the period | | | | | |
| | | | | |
RATIOS TO AVERAGE NET ASSETS: | | | | | |
Net assets, end of the period (000's) | | | | | |
| | | | | |
| | | | | |
| | | | | |
| | | | | |
| Per share net investment income has been calculated using the average shares outstanding during the period. |
| Had certain expenses not been waived/reimbursed during the period, total returns would have been lower. |
| The investment adviser agreed to waive its fees and/or reimburse a portion of the Fund’s expenses during the period. Without this waiver/reimbursement, expenses would have been higher. |
See accompanying notes to financial statements.
Financial Highlights (continued)
For a share outstanding throughout each period.
| Gateway Equity Call Premium Fund—Class A |
| Year Ended
December 31,
2023 | Year Ended
December 31,
2022 | Year Ended
December 31,
2021 | Year Ended
December 31,
2020 | Year Ended
December 31,
2019 |
Net asset value, beginning of the period | | | | | |
INCOME (LOSS) FROM INVESTMENT OPERATIONS: | | | | | |
| | | | | |
Net realized and unrealized gain (loss) | | | | | |
Total from Investment Operations | | | | | |
| | | | | |
| | | | | |
Net asset value, end of the period | | | | | |
| | | | | |
RATIOS TO AVERAGE NET ASSETS: | | | | | |
Net assets, end of the period (000's) | | | | | |
| | | | | |
| | | | | |
| | | | | |
| | | | | |
| Per share net investment income has been calculated using the average shares outstanding during the period. |
| A sales charge for Class A shares is not reflected in total return calculations. |
| Had certain expenses not been waived/reimbursed during the period, total returns would have been lower. |
| The investment adviser agreed to waive its fees and/or reimburse a portion of the Fund’s expenses during the period. Without this waiver/reimbursement, expenses would have been higher. |
| Effective July 1, 2021, the expense limit decreased from 1.20% to 0.93%. |
| Includes additional voluntary waiver of advisory fee of 0.02%. |
See accompanying notes to financial statements.
Financial Highlights (continued)
For a share outstanding throughout each period.
| Gateway Equity Call Premium Fund—Class C |
| Year Ended
December 31,
2023 | Year Ended
December 31,
2022 | Year Ended
December 31,
2021 | Year Ended
December 31,
2020 | Year Ended
December 31,
2019 |
Net asset value, beginning of the period | | | | | |
INCOME (LOSS) FROM INVESTMENT OPERATIONS: | | | | | |
Net investment income (loss)(a) | | | | | |
Net realized and unrealized gain (loss) | | | | | |
Total from Investment Operations | | | | | |
| | | | | |
| | | | | |
Net asset value, end of the period | | | | | |
| | | | | |
RATIOS TO AVERAGE NET ASSETS: | | | | | |
Net assets, end of the period (000's) | | | | | |
| | | | | |
| | | | | |
Net investment income (loss) | | | | | |
| | | | | |
| Per share net investment income (loss) has been calculated using the average shares outstanding during the period. |
| Amount rounds to less than $0.01 per share. |
| A contingent deferred sales charge for Class C shares is not reflected in total return calculations. |
| Had certain expenses not been waived/reimbursed during the period, total returns would have been lower. |
| The investment adviser agreed to waive its fees and/or reimburse a portion of the Fund’s expenses during the period. Without this waiver/reimbursement, expenses would have been higher. |
| Effective July 1, 2021, the expense limit decreased from 1.95% to 1.68%. |
| Includes additional voluntary waiver of advisory fee of 0.02%. |
See accompanying notes to financial statements.
Financial Highlights (continued)
For a share outstanding throughout each period.
| Gateway Equity Call Premium Fund—Class N |
| Year Ended
December 31,
2023 | Year Ended
December 31,
2022 | Year Ended
December 31,
2021 | Year Ended
December 31,
2020 | Year Ended
December 31,
2019 |
Net asset value, beginning of the period | | | | | |
INCOME (LOSS) FROM INVESTMENT OPERATIONS: | | | | | |
| | | | | |
Net realized and unrealized gain (loss) | | | | | |
Total from Investment Operations | | | | | |
| | | | | |
| | | | | |
Net asset value, end of the period | | | | | |
| | | | | |
RATIOS TO AVERAGE NET ASSETS: | | | | | |
Net assets, end of the period (000's) | | | | | |
| | | | | |
| | | | | |
| | | | | |
| | | | | |
| Per share net investment income has been calculated using the average shares outstanding during the period. |
| Had certain expenses not been waived/reimbursed during the period, total returns would have been lower. |
| The investment adviser agreed to waive its fees and/or reimburse a portion of the Fund’s expenses during the period. Without this waiver/reimbursement, expenses would have been higher. |
| Effective July 1, 2021, the expense limit decreased from 0.90% to 0.63%. |
See accompanying notes to financial statements.
Financial Highlights (continued)
For a share outstanding throughout each period.
| Gateway Equity Call Premium Fund—Class Y |
| Year Ended
December 31,
2023 | Year Ended
December 31,
2022 | Year Ended
December 31,
2021 | Year Ended
December 31,
2020 | Year Ended
December 31,
2019 |
Net asset value, beginning of the period | | | | | |
INCOME (LOSS) FROM INVESTMENT OPERATIONS: | | | | | |
| | | | | |
Net realized and unrealized gain (loss) | | | | | |
Total from Investment Operations | | | | | |
| | | | | |
| | | | | |
Net asset value, end of the period | | | | | |
| | | | | |
RATIOS TO AVERAGE NET ASSETS: | | | | | |
Net assets, end of the period (000's) | | | | | |
| | | | | |
| | | | | |
| | | | | |
| | | | | |
| Per share net investment income has been calculated using the average shares outstanding during the period. |
| Had certain expenses not been waived/reimbursed during the period, total returns would have been lower. |
| The investment adviser agreed to waive its fees and/or reimburse a portion of the Fund’s expenses during the period. Without this waiver/reimbursement, expenses would have been higher. |
| Effective July 1, 2021, the expense limit decreased from 0.95% to 0.68%. |
| Includes additional voluntary waiver of advisory fee of 0.02%. |
See accompanying notes to financial statements.
Financial Highlights (continued)
For a share outstanding throughout each period.
| Mirova Global Green Bond Fund—Class A |
| Year Ended
December 31,
2023 | Year Ended
December 31,
2022 | Year Ended
December 31,
2021 | Year Ended
December 31,
2020 | Year Ended
December 31,
2019 |
Net asset value, beginning of the period | | | | | |
INCOME (LOSS) FROM INVESTMENT OPERATIONS: | | | | | |
| | | | | |
Net realized and unrealized gain (loss) | | | | | |
Total from Investment Operations | | | | | |
| | | | | |
| | | | | |
Net realized capital gains | | | | | |
| | | | | |
Net asset value, end of the period | | | | | |
| | | | | |
RATIOS TO AVERAGE NET ASSETS: | | | | | |
Net assets, end of the period (000's) | | | | | |
| | | | | |
| | | | | |
| | | | | |
| | | | | |
| Per share net investment income has been calculated using the average shares outstanding during the period. |
| A sales charge for Class A shares is not reflected in total return calculations. |
| Had certain expenses not been waived/reimbursed during the period, total returns would have been lower. |
| The investment adviser agreed to waive its fees and/or reimburse a portion of the Fund’s expenses during the period. Without this waiver/reimbursement, expenses would have been higher. |
| Includes interest expense. Without this expense the ratio of net expenses would have been 0.90% and the ratio of gross expenses would have been 1.38%. |
| Includes interest expense. Without this expense the ratio of net expenses would have been 0.90% and the ratio of gross expenses would have been 1.33%. |
| Effective July 1, 2021, the expense limit decreased from 0.95% to 0.90%. |
| Includes interest expense. Without this expense the ratio of net expenses would have been 0.92% and the ratio of gross expenses would have been 1.37%. |
| Includes interest expense. Without this expense the ratio of net expenses would have been 0.95% and the ratio of gross expenses would have been 1.41%. |
| Includes interest expense. Without this expense the ratio of net expenses would have been 0.95% and the ratio of gross expenses would have been 1.55%. |
See accompanying notes to financial statements.
Financial Highlights (continued)
For a share outstanding throughout each period.
| Mirova Global Green Bond Fund—Class N |
| Year Ended
December 31,
2023 | Year Ended
December 31,
2022 | Year Ended
December 31,
2021 | Year Ended
December 31,
2020 | Year Ended
December 31,
2019 |
Net asset value, beginning of the period | | | | | |
INCOME (LOSS) FROM INVESTMENT OPERATIONS: | | | | | |
| | | | | |
Net realized and unrealized gain (loss) | | | | | |
Total from Investment Operations | | | | | |
| | | | | |
| | | | | |
Net realized capital gains | | | | | |
| | | | | |
Net asset value, end of the period | | | | | |
| | | | | |
RATIOS TO AVERAGE NET ASSETS: | | | | | |
Net assets, end of the period (000's) | | | | | |
| | | | | |
| | | | | |
| | | | | |
| | | | | |
| Per share net investment income has been calculated using the average shares outstanding during the period. |
| Had certain expenses not been waived/reimbursed during the period, total returns would have been lower. |
| The investment adviser agreed to waive its fees and/or reimburse a portion of the Fund’s expenses during the period. Without this waiver/reimbursement, expenses would have been higher. |
| Includes interest expense. Without this expense the ratio of net expenses would have been 0.60% and the ratio of gross expenses would have been 1.06%. |
| Includes interest expense. Without this expense the ratio of net expenses would have been 0.60% and the ratio of gross expenses would have been 0.98%. |
| Effective July 1, 2021, the expense limit decreased from 0.65% to 0.60%. |
| Includes interest expense. Without this expense the ratio of net expenses would have been 0.63% and the ratio of gross expenses would have been 1.02%. |
| Includes interest expense. Without this expense the ratio of net expenses would have been 0.65% and the ratio of gross expenses would have been 1.05%. |
| Includes interest expense. Without this expense the ratio of net expenses would have been 0.65% and the ratio of gross expenses would have been 1.07%. |
See accompanying notes to financial statements.
Financial Highlights (continued)
For a share outstanding throughout each period.
| Mirova Global Green Bond Fund—Class Y |
| Year Ended
December 31,
2023 | Year Ended
December 31,
2022 | Year Ended
December 31,
2021 | Year Ended
December 31,
2020 | Year Ended
December 31,
2019 |
Net asset value, beginning of the period | | | | | |
INCOME (LOSS) FROM INVESTMENT OPERATIONS: | | | | | |
| | | | | |
Net realized and unrealized gain (loss) | | | | | |
Total from Investment Operations | | | | | |
| | | | | |
| | | | | |
Net realized capital gains | | | | | |
| | | | | |
Net asset value, end of the period | | | | | |
| | | | | |
RATIOS TO AVERAGE NET ASSETS: | | | | | |
Net assets, end of the period (000's) | | | | | |
| | | | | |
| | | | | |
| | | | | |
| | | | | |
| Per share net investment income has been calculated using the average shares outstanding during the period. |
| Had certain expenses not been waived/reimbursed during the period, total returns would have been lower. |
| The investment adviser agreed to waive its fees and/or reimburse a portion of the Fund’s expenses during the period. Without this waiver/reimbursement, expenses would have been higher. |
| Includes interest expense. Without this expense the ratio of net expenses would have been 0.65% and the ratio of gross expenses would have been 1.13%. |
| Includes interest expense. Without this expense the ratio of net expenses would have been 0.65% and the ratio of gross expenses would have been 1.08%. |
| Effective July 1, 2021, the expense limit decreased from 0.70% to 0.65%. |
| Includes interest expense. Without this expense the ratio of net expenses would have been 0.67% and the ratio of gross expenses would have been 1.13%. |
| Includes interest expense. Without this expense the ratio of net expenses would have been 0.70% and the ratio of gross expenses would have been 1.16%. |
| Includes interest expense. Without this expense the ratio of net expenses would have been 0.70% and the ratio of gross expenses would have been 1.27%. |
See accompanying notes to financial statements.
Financial Highlights (continued)
For a share outstanding throughout each period.
| Mirova Global Sustainable Equity Fund—Class A |
| Year Ended
December 31,
2023 | Year Ended
December 31,
2022 | Year Ended
December 31,
2021 | Year Ended
December 31,
2020 | Year Ended
December 31,
2019 |
Net asset value, beginning of the period | | | | | |
INCOME (LOSS) FROM INVESTMENT OPERATIONS: | | | | | |
Net investment income (loss)(a) | | | | | |
Net realized and unrealized gain (loss) | | | | | |
Total from Investment Operations | | | | | |
| | | | | |
| | | | | |
Net realized capital gains | | | | | |
| | | | | |
Net asset value, end of the period | | | | | |
| | | | | |
RATIOS TO AVERAGE NET ASSETS: | | | | | |
Net assets, end of the period (000's) | | | | | |
| | | | | |
| | | | | |
Net investment income (loss) | | | | | |
| | | | | |
| Per share net investment income (loss) has been calculated using the average shares outstanding during the period. |
| Amount rounds to less than $0.01 per share. |
| A sales charge for Class A shares is not reflected in total return calculations. |
| Had certain expenses not been waived/reimbursed during the period, total returns would have been lower. |
| The investment adviser agreed to waive its fees and/or reimburse a portion of the Fund’s expenses during the period. Without this waiver/reimbursement, expenses would have been higher. |
| Includes interest expense. Without this expense the ratio of net expenses would have been 1.20% and the ratio of gross expenses would have been 1.25%. |
| Includes interest expense. Without this expense the ratio of net expenses would have been 1.20% and the ratio of gross expenses would have been 1.24%. |
| Includes interest expense. Without this expense the ratio of net expenses would have been 1.20% and the ratio of gross expenses would have been 1.38%. |
| The variation in the Fund’s turnover rate from 2020 to 2021 was primarily due to an increase in shareholder activity. |
See accompanying notes to financial statements.
Financial Highlights (continued)
For a share outstanding throughout each period.
| Mirova Global Sustainable Equity Fund—Class C |
| Year Ended
December 31,
2023 | Year Ended
December 31,
2022 | Year Ended
December 31,
2021 | Year Ended
December 31,
2020 | Year Ended
December 31,
2019 |
Net asset value, beginning of the period | | | | | |
INCOME (LOSS) FROM INVESTMENT OPERATIONS: | | | | | |
| | | | | |
Net realized and unrealized gain (loss) | | | | | |
Total from Investment Operations | | | | | |
| | | | | |
| | | | | |
Net realized capital gains | | | | | |
| | | | | |
Net asset value, end of the period | | | | | |
| | | | | |
RATIOS TO AVERAGE NET ASSETS: | | | | | |
Net assets, end of the period (000's) | | | | | |
| | | | | |
| | | | | |
| | | | | |
| | | | | |
| Per share net investment loss has been calculated using the average shares outstanding during the period. |
| Amount rounds to less than $0.01 per share. |
| A contingent deferred sales charge for Class C shares is not reflected in total return calculations. |
| Had certain expenses not been waived/reimbursed during the period, total returns would have been lower. |
| The investment adviser agreed to waive its fees and/or reimburse a portion of the Fund’s expenses during the period. Without this waiver/reimbursement, expenses would have been higher. |
| Includes interest expense. Without this expense the ratio of net expenses would have been 1.95% and the ratio of gross expenses would have been 2.00%. |
| Includes interest expense. Without this expense the ratio of net expenses would have been 1.95% and the ratio of gross expenses would have been 1.99%. |
| Includes interest expense. Without this expense the ratio of net expenses would have been 1.95% and the ratio of gross expenses would have been 2.13%. |
| The variation in the Fund’s turnover rate from 2020 to 2021 was primarily due to an increase in shareholder activity. |
See accompanying notes to financial statements.
Financial Highlights (continued)
For a share outstanding throughout each period.
| Mirova Global Sustainable Equity Fund—Class N |
| Year Ended
December 31,
2023 | Year Ended
December 31,
2022 | Year Ended
December 31,
2021 | Year Ended
December 31,
2020 | Year Ended
December 31,
2019 |
Net asset value, beginning of the period | | | | | |
INCOME (LOSS) FROM INVESTMENT OPERATIONS: | | | | | |
| | | | | |
Net realized and unrealized gain (loss) | | | | | |
Total from Investment Operations | | | | | |
| | | | | |
| | | | | |
Net realized capital gains | | | | | |
| | | | | |
Net asset value, end of the period | | | | | |
| | | | | |
RATIOS TO AVERAGE NET ASSETS: | | | | | |
Net assets, end of the period (000's) | | | | | |
| | | | | |
| | | | | |
| | | | | |
| | | | | |
| Per share net investment income has been calculated using the average shares outstanding during the period. |
| Had certain expenses not been waived/reimbursed during the period, total returns would have been lower. |
| Includes interest expense. Without this expense the ratio of net expenses would have been 0.89% and the ratio of gross expenses would have been 0.89%. |
| Includes interest expense. Without this expense the ratio of net expenses would have been 0.90% and the ratio of gross expenses would have been 0.90%. |
| Includes fee/expense recovery of 0.01%. |
| The investment adviser agreed to waive its fees and/or reimburse a portion of the Fund’s expenses during the period. Without this waiver/reimbursement, expenses would have been higher. |
| Includes interest expense of less than 0.01%. |
| The variation in the Fund’s turnover rate from 2020 to 2021 was primarily due to an increase in shareholder activity. |
See accompanying notes to financial statements.
Financial Highlights (continued)
For a share outstanding throughout each period.
| Mirova Global Sustainable Equity Fund—Class Y |
| Year Ended
December 31,
2023 | Year Ended
December 31,
2022 | Year Ended
December 31,
2021 | Year Ended
December 31,
2020 | Year Ended
December 31,
2019 |
Net asset value, beginning of the period | | | | | |
INCOME (LOSS) FROM INVESTMENT OPERATIONS: | | | | | |
| | | | | |
Net realized and unrealized gain (loss) | | | | | |
Total from Investment Operations | | | | | |
| | | | | |
| | | | | |
Net realized capital gains | | | | | |
| | | | | |
Net asset value, end of the period | | | | | |
| | | | | |
RATIOS TO AVERAGE NET ASSETS: | | | | | |
Net assets, end of the period (000's) | | | | | |
| | | | | |
| | | | | |
| | | | | |
| | | | | |
| Per share net investment income has been calculated using the average shares outstanding during the period. |
| Amount rounds to less than $0.01 per share. |
| Had certain expenses not been waived/reimbursed during the period, total returns would have been lower. |
| The investment adviser agreed to waive its fees and/or reimburse a portion of the Fund’s expenses during the period. Without this waiver/reimbursement, expenses would have been higher. |
| Includes interest expense. Without this expense the ratio of net expenses would have been 0.95% and the ratio of gross expenses would have been 1.00%. |
| Includes interest expense. Without this expense the ratio of net expenses would have been 0.95% and the ratio of gross expenses would have been 0.99%. |
| Includes interest expense. Without this expense the ratio of net expenses would have been 0.95% and the ratio of gross expenses would have been 1.13%. |
| The variation in the Fund’s turnover rate from 2020 to 2021 was primarily due to an increase in shareholder activity. |
See accompanying notes to financial statements.
Financial Highlights (continued)
For a share outstanding throughout each period.
| Mirova International Sustainable Equity Fund—Class A |
| Year Ended
December 31,
2023 | Year Ended
December 31,
2022 | Year Ended
December 31,
2021 | Year Ended
December 31,
2020 | Year Ended
December 31,
2019 |
Net asset value, beginning of the period | | | | | |
INCOME (LOSS) FROM INVESTMENT OPERATIONS: | | | | | |
Net investment income (loss)(a) | | | | | |
Net realized and unrealized gain (loss) | | | | | |
Total from Investment Operations | | | | | |
| | | | | |
| | | | | |
Net realized capital gains | | | | | |
| | | | | |
Net asset value, end of the period | | | | | |
| | | | | |
RATIOS TO AVERAGE NET ASSETS: | | | | | |
Net assets, end of the period (000's) | | | | | |
| | | | | |
| | | | | |
Net investment income (loss) | | | | | |
| | | | | |
| Per share net investment income (loss) has been calculated using the average shares outstanding during the period. |
| A sales charge for Class A shares is not reflected in total return calculations. |
| Had certain expenses not been waived/reimbursed during the period, total returns would have been lower. |
| The investment adviser agreed to waive its fees and/or reimburse a portion of the Fund’s expenses during the period. Without this waiver/reimbursement, expenses would have been higher. |
| Includes interest expense. Without this expense the ratio of net expenses would have been 1.20% and the ratio of gross expenses would have been 2.29%. |
| Includes interest expense. Without this expense the ratio of net expenses would have been 1.20% and the ratio of gross expenses would have been 2.07%. |
| Includes interest expense. Without this expense the ratio of net expenses would have been 1.20% and the ratio of gross expenses would have been 5.64%. |
| Includes interest expense. Without this expense the ratio of net expenses would have been 1.20% and the ratio of gross expenses would have been 107.90%. |
See accompanying notes to financial statements.
Financial Highlights (continued)
For a share outstanding throughout each period.
| Mirova International Sustainable Equity Fund—Class N |
| Year Ended
December 31,
2023 | Year Ended
December 31,
2022 | Year Ended
December 31,
2021 | Year Ended
December 31,
2020 | Year Ended
December 31,
2019 |
Net asset value, beginning of the period | | | | | |
INCOME (LOSS) FROM INVESTMENT OPERATIONS: | | | | | |
| | | | | |
Net realized and unrealized gain (loss) | | | | | |
Total from Investment Operations | | | | | |
| | | | | |
| | | | | |
Net realized capital gains | | | | | |
| | | | | |
Net asset value, end of the period | | | | | |
| | | | | |
RATIOS TO AVERAGE NET ASSETS: | | | | | |
Net assets, end of the period (000's) | | | | | |
| | | | | |
| | | | | |
| | | | | |
| | | | | |
| Per share investment income has been calculated using the average shares outstanding during the period. |
| Had certain expenses not been waived/reimbursed during the period, total returns would have been lower. |
| The investment adviser agreed to waive its fees and/or reimburse a portion of the Fund’s expenses during the period. Without this waiver/reimbursement, expenses would have been higher. |
| Includes interest expense. Without this expense the ratio of net expenses would have been 0.90% and the ratio of gross expenses would have been 1.79%. |
| Includes interest expense. Without this expense the ratio of net expenses would have been 0.90% and the ratio of gross expenses would have been 1.43%. |
| Includes interest expense. Without this expense the ratio of net expenses would have been 0.90% and the ratio of gross expenses would have been 1.80%. |
| Includes interest expense. Without this expense the ratio of net expenses would have been 0.75% and the ratio of gross expenses would have been 1.22%. |
See accompanying notes to financial statements.
Financial Highlights (continued)
For a share outstanding throughout each period.
| Mirova International Sustainable Equity Fund—Class Y |
| Year Ended
December 31,
2023 | Year Ended
December 31,
2022 | Year Ended
December 31,
2021 | Year Ended
December 31,
2020 | Year Ended
December 31,
2019 |
Net asset value, beginning of the period | | | | | |
INCOME (LOSS) FROM INVESTMENT OPERATIONS: | | | | | |
| | | | | |
Net realized and unrealized gain (loss) | | | | | |
Total from Investment Operations | | | | | |
| | | | | |
| | | | | |
Net realized capital gains | | | | | |
| | | | | |
Net asset value, end of the period | | | | | |
| | | | | |
RATIOS TO AVERAGE NET ASSETS: | | | | | |
Net assets, end of the period (000's) | | | | | |
| | | | | |
| | | | | |
| | | | | |
| | | | | |
| Per share investment income has been calculated using the average shares outstanding during the period. |
| Had certain expenses not been waived/reimbursed during the period, total returns would have been lower. |
| The investment adviser agreed to waive its fees and/or reimburse a portion of the Fund’s expenses during the period. Without this waiver/reimbursement, expenses would have been higher. |
| Includes interest expense. Without this expense the ratio of net expenses would have been 0.95% and the ratio of gross expenses would have been 2.04%. |
| Includes interest expense. Without this expense the ratio of net expenses would have been 0.95% and the ratio of gross expenses would have been 1.82%. |
| Includes interest expense. Without this expense the ratio of net expenses would have been 0.95% and the ratio of gross expenses would have been 6.46%. |
| Includes interest expense. Without this expense the ratio of net expenses would have been 0.95% and the ratio of gross expenses would have been 94.12%. |
See accompanying notes to financial statements.
Notes to Financial Statements
1.Organization. Gateway Trust and Natixis Funds Trust I (the “Trusts” and each a “Trust”) are each organized as a Massachusetts business trust. Each Trust is registered under the Investment Company Act of 1940, as amended (the “1940 Act”), as an open-end management investment company. Each Declaration of Trust permits the Board of Trustees to authorize the issuance of an unlimited number of shares of the Trust in multiple series. The financial statements for certain funds of the Trusts are presented in separate reports. The following funds (individually, a “Fund” and collectively, the “Funds”) are included in this report:
Gateway Trust:
Gateway Fund
Gateway Equity Call Premium Fund
Natixis Funds Trust I:
Mirova Global Green Bond Fund (“Global Green Bond Fund”)
Mirova Global Sustainable Equity Fund (“Global Sustainable Equity Fund”)
Mirova International Sustainable Equity Fund (“International Sustainable Equity Fund”)
Each Fund is a diversified investment company.
Each Fund offers Class A, Class C, Class N and Class Y shares, except for Global Green Bond Fund and International Sustainable Equity Fund, which do not offer Class C shares.
Class A shares are sold with a maximum front-end sales charge of 5.75% for all Funds except for Global Green Bond Fund which are sold with a maximum front-end sales charge of 4.25%. Class C shares do not pay a front-end sales charge, pay higher Rule 12b-1 fees than Class A shares for eight years (at which point they automatically convert to Class A shares) (prior to May 1, 2021, Class C shares automatically converted to Class A shares after ten years) and may be subject to a contingent deferred sales charge (“CDSC”) of 1.00% if those shares are redeemed within one year of acquisition, except for reinvested distributions. Class N and Class Y shares do not pay a front-end sales charge, a CDSC or Rule 12b-1 fees. Class N shares are offered with an initial minimum investment of $1,000,000. Class Y shares are offered with an initial minimum investment of $100,000. Certain categories of investors are exempted from the minimum investment amounts for Class N and Class Y as outlined in the relevant Funds’ prospectus.
Most expenses can be directly attributed to a Fund. Expenses which cannot be directly attributed to a Fund are generally apportioned based on the relative net assets of each of the Funds in Natixis Funds Trust I, Natixis Funds Trust II, Natixis Funds Trust IV and Gateway Trust (“Natixis Funds Trusts”), Loomis Sayles Funds I and Loomis Sayles Funds II (“Loomis Sayles Funds Trusts”) and Natixis ETF Trust and Natixis ETF Trust II (“Natixis ETF Trusts”). Expenses of a Fund are borne pro rata by the holders of each class of shares, except that each class bears expenses unique to that class (such as the Rule 12b-1 fees applicable to Class A and Class C), and transfer agent fees are borne collectively for Class A, Class C and Class Y, and individually for Class N. In addition, each class votes as a class only with respect to its own Rule 12b-1 Plan. Shares of each class would receive their pro rata share of the net assets of the Fund if the Fund were liquidated. The Trustees approve separate distributions from net investment income on each class of shares.
2.Significant Accounting Policies. The following is a summary of significant accounting policies consistently followed by each Fund in the preparation of its financial statements. The Funds' financial statements follow the accounting and reporting guidelines provided for investment companies and are prepared in accordance with accounting principles generally accepted in the United States of America which require the use of management estimates that affect the reported amounts and disclosures in the financial statements. Actual results could differ from those estimates. Management has evaluated the events and transactions subsequent to year-end through the date the financial statements were issued and has determined that there were no material events that would require disclosure in the Funds' financial statements.
a. Valuation. Registered investment companies are required to value portfolio investments using an unadjusted, readily available market quotation. Each Fund obtains readily available market quotations from independent pricing services. Fund investments for which readily available market quotations are not available are priced at fair value pursuant to the Funds’ Valuation Procedures. The Board of Trustees has approved a valuation designee who is subject to the Board’s oversight.
Unadjusted readily available market quotations that are utilized for exchange traded equity securities (including shares of closed-end investment companies and exchange-traded funds) include the last sale price quoted on the exchange where the security is traded most extensively. Futures contracts are valued at the closing settlement price on the exchange on which the valuation designee believes that, over time, they are traded most extensively. Domestic, exchange-traded index and single name equity option contracts (including options on exchange-traded funds) are valued at the mean of the National Best Bid and Offer quotations as determined by the Options Price Reporting Authority. Shares of open-end investment companies are valued at net asset value (“NAV”) per share.
Exchange traded equity securities for which there is no reported sale during the day are fair valued at the closing bid quotation as reported by an independent pricing service. Unlisted equity securities (except unlisted preferred equity securities) are fair valued at the last sale price quoted in the market where they are traded most extensively or, if there is no reported sale during the day, the closing bid quotation as reported by an independent pricing service. If there is no last sale price or closing bid quotation available, unlisted equity securities will be fair valued using evaluated bids furnished by an independent pricing service, if available.
Notes to Financial Statements (continued)
Debt securities and unlisted preferred equity securities are fair valued based on evaluated bids furnished to the Funds by an independent pricing service or bid prices obtained from broker-dealers. Broker-dealer bid prices may be used to fair value debt and unlisted equities where an independent pricing service is unable to price an investment or where an independent pricing service does not provide a reliable price for the investment.
The Funds may also fair value investments in other circumstances such as when extraordinary events occur after the close of a foreign market, but prior to the close of the New York Stock Exchange. This may include situations relating to a single issuer (such as a declaration of bankruptcy or a delisting of the issuer’s security from the primary market on which it has traded) as well as events affecting the securities markets in general (such as market disruptions or closings and significant fluctuations in U.S. and/or foreign markets). When fair valuing a Fund’s investments, the valuation designee may, among other things, use modeling tools or other processes that may take into account factors such as issuer specific information, or other related market activity and/or information that occurred after the close of the foreign market but before the time the Fund’s NAV is calculated. Fair valuation by the Fund(s) valuation designee may require subjective determinations about the value of the investment, and fair values used to determine a Fund’s NAV may differ from quoted or published prices, or from prices that are used by others, for the same investments. In addition, the use of fair value pricing may not always result in adjustments to the prices of investments held by a Fund.
b. Investment Transactions and Related Investment Income. Investment transactions are accounted for on a trade date plus one day basis for daily NAV calculation. However, for financial reporting purposes, investment transactions are reported on trade date. Dividend income (including income reinvested) and foreign withholding tax, if applicable, are recorded on the ex-dividend date, or in the case of certain foreign securities, as soon as a Fund is notified, and interest income is recorded on an accrual basis. Dividends reinvested and stock dividends are reflected as non-cash dividends on the Statements of Operations. Interest income is increased by the accretion of discount and decreased by the amortization of premium, if applicable. For securities with paydown provisions, principal payments received are treated as a proportionate reduction to the cost basis of the securities, and excess or shortfall amounts are recorded as income. Distributions received from investments in securities that represent a return of capital or capital gain are recorded as a reduction of cost of investments or as a realized gain, respectively. The calendar year-end amounts of ordinary income, capital gains, and return of capital included in distributions received from the Funds’ investments in real estate investment trusts (“REITs”) are reported to the Funds after the end of the fiscal year; accordingly, the Funds estimate these amounts for accounting purposes until the characterization of REIT distributions is reported to the Funds after the end of the fiscal year. Estimates are based on the most recent REIT distribution information available. In determining net gain or loss on securities sold, the cost of securities has been determined on an identified cost basis. Investment income, non-class specific expenses and realized and unrealized gains and losses are allocated on a pro rata basis to each class based on the relative net assets of each class to the total net assets of the Fund.
c. Foreign Currency Translation. The books and records of the Funds are maintained in U.S. dollars. The values of securities, currencies and other assets and liabilities denominated in currencies other than U.S. dollars, if any, are translated into U.S. dollars based upon foreign exchange rates prevailing at the end of the period. Purchases and sales of investment securities, income and expenses are translated into U.S. dollars on the respective dates of such transactions.
Net realized foreign exchange gains or losses arise from sales of foreign currency, changes in exchange rates between the trade and settlement dates on securities transactions and the difference between the amounts of dividends, interest and foreign withholding taxes recorded in the Funds’ books and records and the U.S. dollar equivalent of the amounts actually received or paid. Net unrealized foreign exchange gains or losses arise from changes in the value of assets and liabilities, other than investment securities, as of the end of the fiscal period, resulting from changes in exchange rates. Net realized foreign exchange gains or losses and the net change in unrealized foreign exchange gains or losses are disclosed in the Statements of Operations. For federal income tax purposes, net realized foreign exchange gains or losses are characterized as ordinary income and may, if the Funds have net losses, reduce the amount of income available to be distributed by the Funds.
The values of investment securities are presented at the foreign exchange rates prevailing at the end of the period for financial reporting purposes. Net realized and unrealized gains or losses on investments reported in the Statements of Operations reflect gains or losses resulting from changes in exchange rates and fluctuations which arise due to changes in market prices of investment securities. For federal income tax purposes, a portion of the net realized gain or loss on investments arising from changes in exchange rates, which is reflected in the Statements of Operations, may be characterized as ordinary income and may, if the Funds have net losses, reduce the amount of income available to be distributed by the Funds.
The Funds may use foreign currency exchange contracts to facilitate transactions in foreign-denominated investments. Losses may arise from changes in the value of the foreign currency or if the counterparties do not perform under the contracts’ terms.
d. Futures Contracts. A Fund may enter into futures contracts. Futures contracts are agreements between two parties to buy and sell a particular instrument or index for a specified price on a specified future date.
When a Fund enters into a futures contract, it is required to deposit with (or for the benefit of) its broker an amount of cash or short-term high-quality securities as “initial margin.” As the value of the contract changes, the value of the futures contract position increases or declines. Subsequent payments, known as “variation margin,” are made or received by a Fund, depending on the price
Notes to Financial Statements (continued)
fluctuations in the fair value of the contract and the value of cash or securities on deposit with the broker. Gross unrealized appreciation (depreciation) on futures contracts is recorded in the Statements of Assets and Liabilities as an asset (liability). The aggregate principal amounts of the contracts are not recorded in the financial statements. Fluctuations in the value of the contracts are recorded in the Statements of Operations as unrealized appreciation (depreciation) until the contracts are closed, when they are recorded as realized gains (losses). Realized gain or loss on a futures position is equal to the difference between the value of the contract at the time it was opened and the value at the time it was closed, minus brokerage commissions. When a Fund enters into a futures contract certain risks may arise, such as illiquidity in the futures market, which may limit a Fund’s ability to close out a futures contract prior to settlement date, and unanticipated movements in the value of securities or interest rates. Futures contracts outstanding at the end of the period, if any, are listed in each applicable Fund's Portfolio of Investments.
Futures contracts are exchange-traded. Exchange-traded futures contracts are standardized and are settled through a clearing house with fulfillment supported by the credit of the exchange. Therefore, counterparty credit risks to the Funds are reduced; however, in the event that a counterparty enters into bankruptcy, a Fund’s claim against initial/variation margin on deposit with the counterparty may be subject to terms of a final settlement in bankruptcy court.
e. Option Contracts. Gateway Fund and Gateway Equity Call Premium Fund’s investment strategies make use of exchange-traded options. Exchange-traded options are standardized contracts and are settled through a clearing house with fulfillment supported by the credit of the exchange. Therefore, counterparty credit risks to a Fund are reduced.
When a Fund writes an index call option, an amount equal to the net premium received (the premium less commission) is recorded as a liability and is subsequently adjusted to the current value until the option expires or a Fund enters into a closing purchase transaction. When an index call option expires or a Fund enters into a closing purchase transaction, the difference between the net premium received and any amount paid at expiration or on effecting a closing purchase transaction, including commission, is treated as a realized gain or, if the net premium received is less than the amount paid, as a realized loss. A Fund, as writer of an index call option, bears the risk of an unfavorable change in the market value of the index underlying the written option.
When a Fund purchases an index put option, it pays a premium and the index put option is subsequently marked-to-market to reflect current value until the option expires or a Fund enters into a closing sale transaction. Premiums paid for purchasing index put options which expire are treated as realized losses. When a Fund enters into a closing sale transaction, the difference between the premium paid and the proceeds of the closing sale transaction is treated as a realized gain or loss. The risk associated with purchasing index put options is limited to the premium paid. Option contracts outstanding at the end of the period, if any, are listed in each applicable Fund’s Portfolio of Investments.
f. Due from Brokers. Transactions and positions in certain futures contracts are maintained and cleared by registered U.S. broker/dealers pursuant to customer agreements between a Fund and the various broker/dealers. The due from brokers balance in the Statements of Assets and Liabilities for Global Green Bond Fund represents cash pledged as collateral for futures contracts (including variation margin, as applicable). In certain circumstances the Fund’s use of cash held at brokers is restricted by regulation or broker mandated limits.
g. Federal and Foreign Income Taxes. The Trusts treat each Fund as a separate entity for federal income tax purposes. Each Fund intends to meet the requirements of the Internal Revenue Code of 1986, as amended, applicable to regulated investment companies, and to distribute to its shareholders substantially all of its net investment income and any net realized capital gains at least annually. Management has performed an analysis of each Fund’s tax positions for the open tax years as of December 31, 2023 and has concluded that no provisions for income tax are required. The Funds’ federal tax returns for the prior three fiscal years remain subject to examination by the Internal Revenue Service. Management is not aware of any events that are reasonably possible to occur in the next twelve months that would result in the amounts of any unrecognized tax benefits significantly increasing or decreasing for the Funds. However, management’s conclusions regarding tax positions taken may be subject to review and adjustment at a later date based on factors including, but not limited to, new tax laws and accounting regulations and interpretations thereof.
A Fund may be subject to foreign withholding taxes on investment income and taxes on capital gains on investments that are accrued and paid based upon the Fund’s understanding of the tax rules and regulations that exist in the countries in which the Fund invests. Foreign withholding taxes on dividend and interest income are reflected on the Statements of Operations as a reduction of investment income, net of amounts that have been or are expected to be reclaimed and paid. Dividends and interest receivable on the Statements of Assets and Liabilities are net of foreign withholding taxes. Foreign withholding taxes where reclaims have been or are expected to be filed and paid are reflected on the Statements of Assets and Liabilities as tax reclaims receivable. Capital gains taxes paid are included in net realized gain (loss) on investments in the Statements of Operations. Accrued but unpaid capital gains taxes are reflected as foreign taxes payable on the Statements of Assets and Liabilities, if applicable, and reduce unrealized gains on investments. In the event that realized gains on investments are subsequently offset by realized losses, taxes paid on realized gains may be returned to a Fund. Such amounts, if applicable, are reflected as foreign tax rebates receivable on the Statements of Assets and Liabilities and are recorded as a realized gain when received.
Notes to Financial Statements (continued)
Certain Funds have filed tax reclaims for previously withheld taxes on dividends earned in certain European Union countries ("EU reclaims") and may continue to make such filings when it is determined to be in the best interest of the Funds and their shareholders. These filings are subject to various administrative proceedings by the local jurisdictions’ tax authorities within the European Union, as well as a number of related judicial proceedings. EU reclaims are recognized by a Fund when deemed more likely than not to be collected, and are reflected as a reduction of foreign taxes withheld in the Statements of Operations. Any related receivable is reflected as tax reclaims receivable in the Statements of Assets and Liabilities. Under certain circumstances, EU reclaims may be subject to closing agreements with the Internal Revenue Service ("IRS"), which may materially reduce the reclaim amounts realized by the Funds. Fees and expenses associated with closing agreements will be reflected in the Statements of Operations when it is determined that a closing agreement with the IRS is required.
h. Dividends and Distributions to Shareholders. Dividends and distributions are recorded on the ex-dividend date. The timing and characterization of certain income and capital gain distributions are determined in accordance with federal tax regulations, which may differ from accounting principles generally accepted in the United States of America. Permanent differences are primarily due to differing treatments for book and tax purposes of items such as premium amortization, futures contract mark-to-market, capital gain distribution received, return of capital distributions received, corporate actions, options contract mark-to-market, distributions in excess of income and/or capital gain and foreign currency gains and losses. Permanent book and tax basis differences relating to shareholder distributions, net investment income and net realized gains will result in reclassifications to capital accounts reported on the Statements of Assets and Liabilities. Temporary differences between book and tax distributable earnings are primarily due to wash sales, deferred Trustees’ fees, premium amortization, futures contract mark-to-market, capital gain distribution received, corporate actions, options contract mark-to-market, deferral of EU reclaim and return of capital distributions received. Amounts of income and capital gain available to be distributed on a tax basis are determined annually, and at other times during the Funds’ fiscal year as may be necessary to avoid knowingly declaring and paying a return of capital distribution. Distributions from net investment income and short-term capital gains are considered to be distributed from ordinary income for tax purposes.
The tax characterization of distributions is determined on an annual basis. The tax character of distributions paid to shareholders during the years ended December 31, 2023 and 2022 was as follows:
| | |
| | | | | | |
| | | | | | |
Gateway Equity Call Premium Fund | | | | | | |
| | | | | | |
Global Sustainable Equity Fund | | | | | | |
International Sustainable Equity Fund | | | | | | |
Distributions paid to shareholders from net investment income and net realized capital gains, based on accounting principles generally accepted in the United States of America, are consolidated and reported on the Statements of Changes in Net Assets as Distributions to Shareholders. Distributions paid to shareholders from net investment income and net realized capital gains expressed in per-share amounts, based on accounting principles generally accepted in the United States of America, are separately stated and reported within the Financial Highlights.
Notes to Financial Statements (continued)
As of December 31, 2023, the components of distributable earnings on a tax basis were as follows:
| | Gateway
Equity Call
Premium Fund | | Global
Sustainable
Equity Fund | International
Sustainable
Equity Fund |
Undistributed ordinary income | | | | | |
Capital loss carryforward: | | | | | |
| | | | | |
| | | | | |
| | | | | |
| | | | | |
Total capital loss carryforward* | | | | | |
Late-year ordinary and post-October
| | | | | |
Unrealized appreciation (depreciation) | | | | | |
Total accumulated earnings (losses) | | | | | |
| Under Section 382 of the Internal Revenue Service Code, a portion of the capital loss carryforward for the International Sustainable Equity Fund is subject to certain limitations upon availability, to offset future capital gains, if any. |
| Under current tax law, capital losses, foreign currency losses, and losses on passive foreign investment companies and contingent payment debt instruments after October 31 or December 31, as applicable, may be deferred and treated as occurring on the first day of the following taxable year. Global Green Bond Fund is deferring foreign currency losses. |
As of December 31, 2023, the tax cost of investments (including derivatives, if applicable) and unrealized appreciation (depreciation) on a federal tax basis were as follows:
| | Gateway
Equity Call
Premium Fund | | Global
Sustainable
Equity Fund | International
Sustainable
Equity Fund |
| | | | | |
| | | | | |
| | | | | |
Net tax appreciation (depreciation) | | | | | |
The difference between these amounts and those reported in the components of distributable earnings, if any, are primarily attributable to foreign currency mark-to-market.
i. Repurchase Agreements. Each Fund may enter into repurchase agreements, under the terms of a Master Repurchase Agreement, under which each Fund acquires securities as collateral and agrees to resell the securities at an agreed upon time and at an agreed upon price. It is each Fund’s policy that the market value of the collateral for repurchase agreements be at least equal to 102% of the repurchase price, including interest. Certain repurchase agreements are tri-party arrangements whereby the collateral is held in a segregated account for the benefit of the Fund and on behalf of the counterparty. Repurchase agreements could involve certain risks in the event of default or insolvency of the counterparty, including possible delays or restrictions upon a Fund’s ability to dispose of the underlying securities. As of December 31, 2023, each Fund, as applicable, had investments in repurchase agreements for which the value of the related collateral exceeded the value of the repurchase agreement. The gross value of repurchase agreements is included in the Statements of Assets and Liabilities for financial reporting purposes.
j. Indemnifications. Under the Trusts’ organizational documents, their officers and Trustees are indemnified against certain liabilities arising out of the performance of their duties to the Funds. Additionally, in the normal course of business, the Funds enter into contracts with service providers that contain general indemnification clauses. The Funds' maximum exposure under these arrangements is unknown as this would involve future claims that may be made against the Funds that have not yet occurred. However, based on experience, the Funds expect the risk of loss to be remote.
k. Regulatory Update. Effective January 24, 2023, the SEC adopted a release (the “Release”) containing rule and form amendments to require mutual funds and ETFs to transmit concise and visually engaging streamlined annual and semiannual reports to shareholders that highlight key information deemed important for retail investors to assess and monitor their fund investments. Other information, including financial statements, will no longer appear in the new tailored shareholder reports but will be available online, delivered free of charge upon request, and filed with the SEC on a semiannual basis on Form N-CSR. In addition to the removal of financial statements from the new tailored shareholder reports, the Release requires mandatory mailing of the reports, unless a shareholder specifically opts out and chooses electronic delivery. The Release also requires that the new tailored shareholder reports be no longer than 2-4
Notes to Financial Statements (continued)
pages, include only a single share class of a single fund, and use a broad-based securities market index for performance comparison purposes. Management is evaluating the impact of the Release on the content of the current shareholder report and newly created tailored shareholder reports and expects to meet the required compliance date of July 24, 2024.
3.Fair Value Measurements. In accordance with accounting standards related to fair value measurements and disclosures, the Funds have categorized the inputs utilized in determining the value of each Fund’s assets or liabilities. These inputs are summarized in the three broad levels listed below:
• Level 1 — quoted prices in active markets for identical assets or liabilities;
• Level 2 — prices determined using other significant inputs that are observable either directly, or indirectly through corroboration with observable market data (which could include quoted prices for similar assets or liabilities, interest rates, credit risk, etc.); and
• Level 3 — prices determined using significant unobservable inputs when quoted prices or observable inputs are unavailable such as when there is little or no market activity for an asset or liability (unobservable inputs reflect each Fund’s own assumptions in determining the fair value of assets or liabilities and would be based on the best information available).
The inputs or methodology used for valuing securities are not necessarily an indication of the risk associated with investing in those securities.
The Funds' pricing policies have been approved by the Board of Trustees. Investments for which market quotations are readily available are categorized in Level 1. Other investments for which an independent pricing service is utilized are categorized in Level 2. Broker-dealer bid prices for which the Funds have knowledge of the inputs used by the broker-dealer are categorized in Level 2. All other investments, including broker-dealer bid prices for which the Funds do not have knowledge of the inputs used by the broker-dealer, as well as investments fair valued by the valuation designee, are categorized in Level 3. All Level 2 and 3 securities are defined as being fair valued.
Under certain conditions and based upon specific facts and circumstances, the Fund’s valuation designee may determine that a fair valuation should be made for portfolio investment(s). These valuation designee fair valuations will be based upon a significant amount of Level 3 inputs.
The following is a summary of the inputs used to value the Funds' investments as of December 31, 2023, at value:
|
Liability Valuation Inputs |
| | | | |
| | | | |
| Details of the major categories of the Fund’s investments are reflected within the Portfolio of Investments. |
Notes to Financial Statements (continued)
Gateway Equity Call Premium Fund |
|
| | | | |
| | | | |
| | | | |
| | | | |
|
Liability Valuation Inputs |
| | | | |
| | | | |
| Details of the major categories of the Fund’s investments are reflected within the Portfolio of Investments. |
|
|
| | | | |
| | | | |
| | | | |
| | | | |
Futures Contracts (unrealized appreciation) | | | | |
| | | | |
|
Liability Valuation Inputs |
| | | | |
Futures Contracts (unrealized depreciation) | | | | |
| Details of the major categories of the Fund’s investments are reflected within the Portfolio of Investments. |
Global Sustainable Equity Fund |
|
| | | | |
| | | | |
| | | | |
| | | | |
| | | | |
| | | | |
| | | | |
| | | | |
| | | | |
| | | | |
| | | | |
All Other Common Stocks(a) | | | | |
| | | | |
| | | | |
| | | | |
| Details of the major categories of the Fund’s investments are reflected within the Portfolio of Investments. |
Notes to Financial Statements (continued)
International Sustainable Equity Fund |
|
| | | | |
| | | | |
| | | | |
| | | | |
| | | | |
| | | | |
| | | | |
| | | | |
| | | | |
| | | | |
| | | | |
| | | | |
| | | | |
| | | | |
| | | | |
| | | | |
| | | | |
| | | | |
| | | | |
| | | | |
4.Derivatives. Derivative instruments are defined as financial instruments whose value and performance are based on the value and performance of an underlying asset, reference rate or index. Derivative instruments the Funds used during the period include written index call options, purchased index put options and futures contracts.
Through the use of index options, Gateway Fund and Gateway Equity Call Premium Fund intends that its risk management strategy will reduce the volatility inherent in equity investments while also allowing for more participation in equity returns than hybrid investments. Each Fund seeks to provide an efficient trade-off between risk and reward, where risk is characterized by volatility or fluctuations in value over time. To meet this objective, the Funds invest in a broadly diversified portfolio of common stocks, while also writing index call options and, for Gateway Fund, purchasing index put options. Writing index call options can reduce a Fund's volatility, provide a steady cash flow and be an important source of a Fund's return, although it also may reduce a Fund's ability to profit from increases in the value of its equity portfolio. Buying index put options, can protect a Fund from a significant market decline that may occur over a short period of time. The value of an index put option generally increases as the prices of stocks constituting the index decrease and decreases as those stocks increase in price. For Gateway Fund, the combination of the diversified stock portfolio, the steady cash flow from writing of index call options and the downside protection from purchased index put options is intended to provide the Fund with the majority of the returns associated with equity market investments while exposing investors to less risk than other equity investments. For Gateway Equity Call Premium Fund, the combination of the diversified stock portfolio and the steady cash flow from writing of index call options is intended to moderate the volatility of returns relative to an all-equity portfolio. During the year ended December 31, 2023, Gateway Fund used written index call options and purchased index put options and Gateway Equity Call Premium Fund used written index call options in accordance with these strategies.
Global Green Bond Fund seeks to provide total return, through a combination of capital appreciation and current income, by investing in green bonds. The Fund pursues its objective by primarily investing in fixed-income securities. In connection with its principal investment strategies, the Fund may also invest in various types of futures contracts for investment purposes. During the year ended December 31, 2023, Global Green Bond Fund used U.S. and foreign government bond futures to gain yield curve exposure.
Global Green Bond Fund is subject to the risk that changes in interest rates will affect the value of the Fund’s investments in fixed income securities. The Fund will be subject to increased interest rate risk to the extent that it invests in fixed-income securities with longer maturities or durations, as compared to investing in fixed-income securities with shorter maturities or durations. The Fund may use futures contracts to hedge against changes in interest rates and to manage duration without having to buy or sell portfolio securities. During the year ended December 31, 2023, Global Green Bond Fund used U.S. and foreign government bond futures to manage duration.
Global Green Bond Fund is also subject to the risk that changes in foreign currency exchange rates will have an unfavorable effect on the value of Fund assets denominated in foreign currencies. The Fund may use futures contracts for hedging purposes to protect the value of the Fund’s holdings of foreign securities. During the year ended December 31, 2023, Global Green Bond Fund used currency futures for hedging purposes.
Notes to Financial Statements (continued)
The following is a summary of derivative instruments for Gateway Fund as of December 31, 2023, as reflected within the Statements of Assets and Liabilities:
| |
Exchange-traded asset derivatives | |
| |
| |
Exchange-traded liability derivatives | |
| |
| Represents purchased options, at value. |
Transactions in derivative instruments for Gateway Fund during the year ended December 31, 2023, as reflected within the Statements of Operations were as follows:
Net Realized Gain (Loss) on: | | |
| | |
Net Change in Unrealized
Appreciation (Depreciation) on: | | |
| | |
| Represents realized loss and change in unrealized appreciation (depreciation), respectively, for purchased options during the period. |
The following is a summary of derivative instruments for Gateway Equity Call Premium Fund as of December 31, 2023, as reflected within the Statements of Assets and Liabilities:
| |
Exchange-traded liability derivatives | |
| |
Transactions in derivative instruments for Gateway Equity Call Premium Fund during the year ended December 31, 2023, as reflected within the Statements of Operations were as follows:
Net Realized Gain (Loss) on: | |
| |
Net Change in Unrealized
Appreciation (Depreciation) on: | |
| |
The following is a summary of derivative instruments for Global Green Bond Fund as of December 31, 2023, as reflected within the Statements of Assets and Liabilities:
| Unrealized
appreciation
on futures
contracts |
Exchange-traded asset derivatives | |
| |
Notes to Financial Statements (continued)
| Unrealized
depreciation
on futures
contracts |
Exchange-traded liability derivatives | |
Foreign exchange contracts | |
Transactions in derivative instruments for Global Green Bond Fund during the year ended December 31, 2023, as reflected within the Statements of Operations were as follows:
Net Realized Gain (Loss) on: | |
| |
Foreign exchange contracts | |
| |
Net Change in Unrealized
Appreciation (Depreciation) on: | |
| |
Foreign exchange contracts | |
| |
As the Funds value their derivatives at fair value and recognize changes in fair value through the Statements of Operations, they do not qualify for hedge accounting under authoritative guidance for derivative instruments. The Funds’ investments in derivatives may represent an economic hedge; however, they are considered to be non-hedge transactions for the purpose of these disclosures.
The volume of option contract activity as a percentage of investments in common stocks for Gateway Fund based on month-end notional amounts outstanding during the period, at absolute value, was as follows for the year ended December 31, 2023:
| | |
Average Notional Amount Outstanding | | |
Highest Notional Amount Outstanding | | |
Lowest Notional Amount Outstanding | | |
Notional Amount Outstanding as of December 31, 2023 | | |
| Notional amounts outstanding are determined by multiplying option contracts by the contract multiplier by the price of the option’s underlying index, the S&P 500 ® Index. |
The volume of option contract activity as a percentage of investments in common stocks for Gateway Equity Call Premium Fund based on month-end notional amounts outstanding during the period, at absolute value, was as follows for the year ended December 31, 2023:
Gateway Equity Call Premium Fund | |
Average Notional Amount Outstanding | |
Highest Notional Amount Outstanding | |
Lowest Notional Amount Outstanding | |
Notional Amount Outstanding as of December 31, 2023 | |
| Notional amounts outstanding are determined by multiplying option contracts by the contract multiplier by the price of the option’s underlying index, the S&P 500 ® Index. |
Notes to Financial Statements (continued)
The volume of futures contract activity as a percentage of net assets for Global Green Bond Fund, based on month-end notional amounts outstanding during the period, at absolute value, was as follows for the year ended December 31, 2023:
| |
Average Notional Amount Outstanding | |
Highest Notional Amount Outstanding | |
Lowest Notional Amount Outstanding | |
Notional Amount Outstanding as of December 31, 2023 | |
Notional amounts outstanding at the end of the prior period are included in the average notional amount outstanding.
Unrealized gain and/or loss on open futures is recorded in the Statements of Assets and Liabilities. The aggregate notional values of futures contracts are not recorded in the Statements of Assets and Liabilities, and therefore are not included in the Funds’ net assets.
Counterparty risk is managed based on policies and procedures established by the Fund’s adviser. Such policies and procedures may include, but are not limited to, minimum counterparty credit rating requirements, monitoring of counterparty credit default swap spreads and posting of collateral. With exchange-traded derivatives, there is minimal counterparty credit risk to the Fund because the exchange’s clearing house, as counterparty to these instruments, stands between the buyer and the seller of the contract. Credit risk still exists in exchange-traded derivatives with respect to initial and variation margin that is held in a broker’s customer accounts. While brokers typically are required to segregate customer margin for exchange-traded derivatives from their own assets, in the event that a broker becomes insolvent or goes into bankruptcy and at that time there is a shortfall in the aggregate amount of margin held by the broker for all its customers, U.S. bankruptcy laws will typically allocate that shortfall on a pro rata basis across all of the broker’s customers, potentially resulting in losses to the Fund.
5.Purchases and Sales of Securities. For the year ended December 31, 2023, purchases and sales of securities (excluding short-term investments, option contracts and including paydowns) were as follows:
| | |
| | |
Gateway Equity Call Premium Fund | | |
| | |
Global Sustainable Equity Fund | | |
International Sustainable Equity Fund | | |
6.Management Fees and Other Transactions with Affiliates.
a. Management Fees. Gateway Investment Advisers, LLC (“Gateway Advisers”) serves as investment adviser to Gateway Fund and Gateway Equity Call Premium Fund. Gateway Advisers is a subsidiary of Natixis Investment Managers, LLC, which is part of Natixis Investment Managers, an international asset management group based in Paris, France. Under the terms of the management agreements, each Fund pays a management fee at the following annual rates, calculated daily and payable monthly, based on each Fund’s average daily net assets:
| Percentage of Average Daily Net Assets |
| | | |
| | | |
Gateway Equity Call Premium Fund | | | |
Mirova US LLC ("Mirova US") serves as investment adviser to Global Green Bond Fund, Global Sustainable Equity Fund and International Sustainable Equity Fund. Mirova US is a wholly-owned subsidiary of Mirova, which is in turn a subsidiary of Natixis Investment Managers. Under the terms of the management agreements, each Fund pays a management fee at the following annual rates, calculated daily and payable monthly, based on each Fund’s average daily net assets:
| Percentage of
Average Daily
Net Assets |
| |
Global Sustainable Equity Fund | |
International Sustainable Equity Fund | |
Gateway Advisers and Mirova US have given binding undertakings to the Funds to waive management fees and/or reimburse certain expenses to limit the Funds’ operating expenses, exclusive of acquired fund fees and expenses, brokerage expenses, interest expense, substitute dividend expenses on securities sold short, taxes, organizational and extraordinary expenses such as litigation and
Notes to Financial Statements (continued)
indemnification expenses. These undertakings are in effect until April 30, 2024, may be terminated before then only with the consent of the Funds' Board of Trustees, and are reevaluated on an annual basis. Management fees payable, as reflected on the Statements of Assets and Liabilities, is net of waivers and/or expense reimbursements, if any, pursuant to these undertakings. Waivers/reimbursements that exceed management fees payable are reflected on the Statements of Assets and Liabilities as receivable from investment adviser.
For the year ended December 31, 2023, the expense limits as a percentage of average daily net assets under the expense limitation agreements were as follows:
| Expense Limit as a Percentage of
Average Daily Net Assets |
| | | | |
| | | | |
Gateway Equity Call Premium Fund | | | | |
| | | | |
Global Sustainable Equity Fund | | | | |
International Sustainable Equity Fund | | | | |
Gateway Advisers and Mirova US shall be permitted to recover expenses borne under the expense limitation agreements (whether through waiver of management fee or otherwise) on a class by class basis in later periods to the extent the annual operating expenses of a class fall below (1) a class' expense limitation ratio in place at the time such amounts were waived/reimbursed and (2) a class' current applicable expense limitation ratio, provided, however, that a class is not obligated to pay such waived/reimbursed fees or expenses more than one year after the end of the fiscal year in which the fees or expenses were waived/reimbursed.
For the year ended December 31, 2023, the management fees and waiver of management fees for each Fund were as follows:
| | Contractual
Waivers of
Management
| | Percentage of
Average
Daily Net Assets |
| | |
| | | | | |
Gateway Equity Call Premium Fund | | | | | |
| | | | | |
Global Sustainable Equity Fund | | | | | |
International Sustainable Equity Fund | | | | | |
| Waiver/expense reimbursements are subject to possible recovery until December 31, 2024. |
For the year ended December 31, 2023, class-specific expenses have been reimbursed as follows:
| |
| | | | | |
| | | | | |
Global Sustainable Equity Fund | | | | | |
| Waiver/expense reimbursements are subject to possible recovery until December 31, 2024. |
In addition, Mirova US reimbursed non-class-specific expenses of International Sustainable Equity Fund in the amount of $71,652, for the year ended December 31, 2023, which is subject to possible recovery until December 31, 2024.
b. Service and Distribution Fees. Natixis Distribution, LLC (“Natixis Distribution"), which is a wholly-owned subsidiary of Natixis Investment Managers, LLC, has entered into a distribution agreement with the Trusts. Pursuant to this agreement, Natixis Distribution serves as principal underwriter of the Funds of the Trusts.
Pursuant to Rule 12b-1 under the 1940 Act, the Trusts have adopted a Service Plan relating to each Fund’s Class A shares (the “Class A Plans”), a Distribution and Service Plan relating to each Fund’s Class C shares (the “Class C Plans”).
Under the Class A Plans, each Fund pays Natixis Distribution a monthly service fee at an annual rate not to exceed 0.25% of the average daily net assets attributable to the Funds’ Class A shares, as reimbursement for expenses incurred by Natixis Distribution in providing personal services to investors in Class A shares and/or the maintenance of shareholder accounts.
Under the Class C Plans, each Fund pays Natixis Distribution a monthly service fee at an annual rate not to exceed 0.25% of the average daily net assets attributable to the Funds’ Class C shares, as compensation for services provided by Natixis Distribution in providing personal services to investors in Class C shares and/or the maintenance of shareholder accounts.
Notes to Financial Statements (continued)
Also under the Class C Plans, each Fund pays Natixis Distribution a monthly distribution fee at an annual rate of 0.75% of the average daily net assets attributable to the Funds’ Class C shares, as compensation for services provided by Natixis Distribution in connection with the marketing or sale of Class C shares.
For the year ended December 31, 2023, the service and distribution fees for each Fund were as follows:
| | | |
| | | | |
| | | | |
Gateway Equity Call Premium Fund | | | | |
| | | | |
Global Sustainable Equity Fund | | | | |
International Sustainable Equity Fund | | | | |
For the year ended December 31, 2023, Natixis Distribution refunded Gateway Fund $17,210 of prior year Class A service fees paid to Natixis Distribution in excess of amounts subsequently paid to securities dealers or financial intermediaries. Service and distribution fees on the Statements of Operations have been reduced by these amounts.
c. Administrative Fees. Natixis Advisors, LLC ("Natixis Advisors") provides certain administrative services for the Funds and contracts with State Street Bank and Trust Company ("State Street Bank") to serve as sub-administrator. Natixis Advisors is a wholly-owned subsidiary of Natixis Investment Managers, LLC. Pursuant to an agreement among Natixis Funds Trusts, Loomis Sayles Funds Trusts, Natixis ETF Trusts and Natixis Advisors, each Fund pays Natixis Advisors monthly its pro rata portion of fees equal to an annual rate of 0.0540% of the first $15 billion of the average daily net assets of the Natixis Funds Trusts, Loomis Sayles Funds Trusts and Natixis ETF Trusts, 0.0500% of the next $15 billion, 0.0400% of the next $30 billion, 0.0275% of the next $30 billion and 0.0225% of such assets in excess of $90 billion, subject to an annual aggregate minimum fee for the Natixis Funds Trusts, Loomis Sayles Funds Trusts and Natixis ETF Trusts of $10 million, which is reevaluated on an annual basis.
For the year ended December 31, 2023, the administrative fees for each Fund were as follows:
| |
| |
Gateway Equity Call Premium Fund | |
| |
Global Sustainable Equity Fund | |
International Sustainable Equity Fund | |
d. Sub-Transfer Agent Fees. Natixis Distribution has entered into agreements, which include servicing agreements, with financial intermediaries that provide recordkeeping, processing, shareholder communications and other services to customers of the intermediaries that hold positions in the Funds and has agreed to compensate the intermediaries for providing those services. Intermediaries transact with the Funds primarily through the use of omnibus accounts on behalf of their customers who hold positions in the Funds. These services would have been provided by the Funds’ transfer agent and other service providers if the shareholders’ accounts were maintained directly at the Funds’ transfer agent. Accordingly, the Funds have agreed to reimburse Natixis Distribution for all or a portion of the servicing fees paid to these intermediaries. The reimbursement amounts (sub-transfer agent fees) paid to Natixis Distribution are subject to a current per-account equivalent fee limit approved by the Funds’ Board of Trustees, which is based on fees for similar services paid to the Funds’ transfer agent and other service providers. Class N shares do not bear such expenses.
For the year ended December 31, 2023, the sub-transfer agent fees (which are reflected in transfer agent fees and expenses in the Statements of Operations) for each Fund were as follows:
| |
| |
Gateway Equity Call Premium Fund | |
| |
Global Sustainable Equity Fund | |
International Sustainable Equity Fund | |
Notes to Financial Statements (continued)
As of December 31, 2023, the Funds owe Natixis Distribution the following reimbursements for sub-transfer agent fees (which are reflected in the Statements of Assets and Liabilities as payable to distributor):
| Reimbursements
of Sub-Transfer
Agent Fees |
| |
Gateway Equity Call Premium Fund | |
| |
Global Sustainable Equity Fund | |
International Sustainable Equity Fund | |
Sub-transfer agent fees attributable to Class A, Class C and Class Y are allocated on a pro rata basis to each class based on the relative net assets of each class to the total net assets of those classes.
e. Commissions. Commissions (including CDSCs) on Fund shares retained by Natixis Distribution during the year ended December 31, 2023 were as follows:
| |
| |
Gateway Equity Call Premium Fund | |
Global Sustainable Equity Fund | |
f. Trustees Fees and Expenses. The Trusts do not pay any compensation directly to their officers or Trustees who are directors, officers or employees of Natixis Advisors, Natixis Distribution, Natixis Investment Managers, LLC or their affiliates. The Chairperson of the Board of Trustees receives a retainer fee at the annual rate of $369,000. The Chairperson does not receive any meeting attendance fees for Board of Trustees meetings or committee meetings that he attends. Each Independent Trustee (other than the Chairperson) receives, in the aggregate, a retainer fee at the annual rate of $210,000. Each Independent Trustee also receives a meeting attendance fee of $10,000 for each meeting of the Board of Trustees that he or she attends in person and $5,000 for each meeting of the Board of Trustees that he or she attends telephonically. In addition, the chairperson of the Contract Review Committee, the chairperson of the Audit Committee and the chairperson of the Governance Committee each receive an additional retainer fee at the annual rate of $20,000. Each Contract Review Committee member is compensated $6,000 for each Committee meeting that he or she attends in person and $3,000 for each meeting that he or she attends telephonically. Each Audit Committee member is compensated $6,000 for each Committee meeting that he or she attends in person and $3,000 for each meeting that he or she attends telephonically. Each Governance Committee member is compensated $2,500 for each Committee meeting that he or she attends either in person or telephonically. These fees are allocated among the funds in the Natixis Funds Trusts, Loomis Sayles Funds Trusts and Natixis ETF Trusts based on a formula that takes into account, among other factors, the relative net assets of each fund. Trustees are reimbursed for travel expenses in connection with attendance at meetings.
Effective January 1, 2024, the Chairperson of the Board of Trustees will receive a retainer fee at the annual rate of $385,000 and each Independent Trustee (other than the Chairperson) will receive, in the aggregate, a retainer fee at the annual rate of $225,000. Each Independent Trustee will receive a meeting attendance fee of $10,000 for each meeting of the Board of Trustees that he or she attends in person. The chairperson of the Contract Review Committee and the chairperson of the Audit Committee each will receive an additional retainer fee at the annual rate of $25,000. All other Trustees fees will remain unchanged.
A deferred compensation plan (the “Plan”) is available to the Trustees on a voluntary basis. The value of a participating Trustee’s deferral account is based on theoretical investments of deferred amounts, on the normal payment dates, in certain funds of the Natixis Funds Trusts, Loomis Sayles Funds Trusts and Natixis ETF Trusts as designated by the participating Trustees. Changes in the value of participants’ deferral accounts are allocated pro rata among the funds in the Natixis Funds Trusts, Loomis Sayles Funds Trusts and Natixis ETF Trusts and are normally reflected as Trustees’ fees and expenses in the Statements of Operations. Deferred amounts remain in the funds until distributed in accordance with the provisions of the Plan. The portions of the accrued obligations allocated to the Funds under the Plan are reflected as Deferred Trustees’ fees in the Statements of Assets and Liabilities.
Certain officers and employees of Natixis Advisors and affiliates are also officers and/or Trustees of the Trusts.
Notes to Financial Statements (continued)
g. Affiliated Ownership. As of December 31, 2023, the percentage of each Fund’s net assets owned by Natixis and affiliates is as follows:
| |
| |
Natixis Sustainable Future 2015 Fund | |
Natixis Sustainable Future 2020 Fund | |
Natixis Sustainable Future 2025 Fund | |
Natixis Sustainable Future 2030 Fund | |
Natixis Sustainable Future 2035 Fund | |
Natixis Sustainable Future 2040 Fund | |
Natixis Sustainable Future 2045 Fund | |
Natixis Sustainable Future 2050 Fund | |
Natixis Sustainable Future 2055 Fund | |
Natixis Sustainable Future 2060 Fund | |
Natixis Sustainable Future 2065 Fund | |
| |
International Sustainable Equity Fund | |
Natixis Sustainable Future 2015 Fund | |
Natixis Sustainable Future 2020 Fund | |
Natixis Sustainable Future 2025 Fund | |
Natixis Sustainable Future 2030 Fund | |
Natixis Sustainable Future 2035 Fund | |
Natixis Sustainable Future 2040 Fund | |
Natixis Sustainable Future 2045 Fund | |
Natixis Sustainable Future 2050 Fund | |
Natixis Sustainable Future 2055 Fund | |
Natixis Sustainable Future 2060 Fund | |
Natixis Sustainable Future 2065 Fund | |
| |
Investment activities of affiliated shareholders could have material impacts on the Fund.
h. Reimbursement of Transfer Agent Fees and Expenses. Natixis Advisors has given a binding contractual undertaking to Gateway Equity Call Premium Fund, Global Green Bond Fund, Global Sustainable Equity Fund and International Sustainable Equity Fund to reimburse any and all transfer agency expenses for the Funds’ Class N shares. This undertaking is in effect through April 30, 2024, and is not subject to recovery under the expense limitation agreement described above.
For the year ended December 31, 2023, Natixis Advisors reimbursed the Funds for transfer agency expenses as follows:
| Reimbursement of
Transfer Agency
Expenses |
| |
Gateway Equity Call Premium Fund | |
| |
Global Sustainable Equity Fund | |
International Sustainable Equity Fund | |
7.Class-Specific Transfer Agent Fees and Expenses. Transfer agent fees and expenses attributable to Class A, Class C and Class Y are allocated on a pro rata basis to each class based on the relative net assets of each class to the total net assets of those classes. Transfer agent fees and expenses attributable to Class N are allocated to Class N.
Notes to Financial Statements (continued)
For the year ended December 31, 2023, the Funds incurred the following class-specific transfer agent fees and expenses (including sub-transfer agent fees, where applicable):
| Transfer Agent Fees and Expenses |
| | | | |
| | | | |
Gateway Equity Call Premium Fund | | | | |
| | | | |
Global Sustainable Equity Fund | | | | |
International Sustainable Equity Fund | | | | |
8. Line of Credit. Each Fund, together with certain other funds of Natixis Funds Trusts, Loomis Sayles Funds Trusts and Natixis ETF Trusts, entered into a syndicated, revolving, committed, unsecured line of credit with State Street Bank as administrative agent. The aggregate revolving commitment amount is $575,000,000. Any one Fund may borrow up to $402,500,000 under the line of credit agreement (as long as all borrowings by all Funds in the aggregate do not exceed the $575,000,000 limit at any time), subject to each Fund’s investment restrictions and its contractual obligations under the line of credit. Interest is charged to the Funds based upon the terms set forth in the agreement. In addition, a commitment fee of 0.15% per annum, payable at the end of each calendar quarter, is accrued and apportioned among the participating funds based on their average daily unused portion of the line of credit. The Funds paid certain legal fees in connection with the line of credit agreement, which are being amortized over a period of 364 days and are reflected in legal fees on the Statements of Operations. The unamortized balance is reflected as prepaid expenses on the Statements of Assets and Liabilities.
Prior to April 6, 2023, each Fund, together with certain other funds of Natixis Funds Trusts and Loomis Sayles Funds Trusts and Natixis ETF Trusts, entered into a $500,000,000 committed unsecured line of credit provided by State Street Bank. Any one Fund was able to borrow up to $350,000,000 under the line of credit agreement (as long as all borrowings by all Funds in the aggregate did not exceed the $500,000,000 limit at any time), subject to each Fund’s investment restrictions and its contractual obligations under the line of credit. Interest was charged to the Funds based upon the terms set forth in the agreement. In addition, a commitment fee of 0.15% per annum, payable at the end of each calendar quarter, was accrued and apportioned among the participating funds based on their average daily unused portion of the line of credit.
For the year ended December 31, 2023, Global Sustainable Equity Fund had an average daily balance on the line of credit (for those days on which there were borrowings) of $3,500,000 at a weighted average interest rate of 6.43%. Interest expense incurred on the line of credit was $625.
9.Risk. The Funds’ investments in foreign securities may be subject to greater political, economic, environmental, credit/counterparty and information risks. The Fund's investments in foreign securities also are subject to foreign currency fluctuations and other foreign currency-related risks. Foreign securities may be subject to higher volatility than U.S. securities, varying degrees of regulation and limited liquidity.
Geopolitical events (such as trading halts, sanctions or wars) could increase volatility and uncertainty in the financial markets and adversely affect regional and global economies. These, and other related events, could significantly impact a Fund's performance and the value of an investment in the Fund, even if the Fund does not have direct exposure to issuers in the country or countries involved.
10.Interest Expense. The Funds incur interest expense on cash (including foreign currency) overdrafts at the custodian bank, borrowings on the line of credit and, for Global Green Bond Fund, foreign currency debit balances at brokers. Interest expense incurred for the year ended December 31, 2023 is reflected on the Statements of Operations.
11.Concentration of Ownership. From time to time, a Fund may have a concentration of one or more accounts constituting a significant percentage of shares outstanding. Investment activities by holders of such accounts could have material impacts on the Funds. As of December 31, 2023, based on management’s evaluation of the shareholder account base, the Funds had accounts representing controlling ownership of more than 5% of the Funds’ total outstanding shares. The number of such accounts, based on accounts that represent more than 5% of an individual class of shares, and the aggregate percentage of net assets represented by such holdings were as follows:
| Number of 5%
Non-Affiliated
Account Holders | Percentage of
Non-Affiliated
Ownership | Percentage of
Affiliated
Ownership
(Note 6g) | Total
Percentage of
Ownership |
Gateway Equity Call Premium Fund | | | | |
| | | | |
Global Sustainable Equity Fund | | | | |
International Sustainable Equity Fund | | | | |
Notes to Financial Statements (continued)
Omnibus shareholder accounts for which Natixis Advisors understands that the intermediary has discretion over the underlying shareholder accounts or investment models where a shareholder account may be invested for a non-discretionary customer are included in the table above. For other omnibus accounts, the Funds do not have information on the individual shareholder accounts underlying the omnibus accounts; therefore, there could be other 5% shareholders in addition to those disclosed in the table above.
12.Capital Shares. Each Fund may issue an unlimited number of shares of beneficial interest, without par value. Transactions in capital shares were as follows:
|
| Year Ended
December 31, 2023 | Year Ended
December 31, 2022 |
| | | | |
| | | | |
Issued from the sale of shares | | | | |
Issued in connection with the reinvestment of distributions | | | | |
| | | | |
| | | | |
| | | | |
Issued from the sale of shares | | | | |
Issued in connection with the reinvestment of distributions | | | | |
| | | | |
| | | | |
| | | | |
Issued from the sale of shares | | | | |
Issued in connection with the reinvestment of distributions | | | | |
| | | | |
| | | | |
| | | | |
Issued from the sale of shares | | | | |
Issued in connection with the reinvestment of distributions | | | | |
| | | | |
| | | | |
Decrease from capital share transactions | | | | |
Notes to Financial Statements (continued)
12.Capital Shares (continued).
|
| Year Ended
December 31, 2023 | Year Ended
December 31, 2022 |
Gateway Equity Call Premium Fund | | | | |
| | | | |
Issued from the sale of shares | | | | |
Issued in connection with the reinvestment of distributions | | | | |
| | | | |
| | | | |
| | | | |
Issued from the sale of shares | | | | |
Issued in connection with the reinvestment of distributions | | | | |
| | | | |
| | | | |
| | | | |
Issued from the sale of shares | | | | |
Issued in connection with the reinvestment of distributions | | | | |
| | | | |
| | | | |
| | | | |
Issued from the sale of shares | | | | |
Issued in connection with the reinvestment of distributions | | | | |
| | | | |
| | | | |
Increase from capital share transactions | | | | |
|
| Year Ended
December 31, 2023 | Year Ended
December 31, 2022 |
| | | | |
| | | | |
Issued from the sale of shares | | | | |
Issued in connection with the reinvestment of distributions | | | | |
| | | | |
| | | | |
| | | | |
Issued from the sale of shares | | | | |
Issued in connection with the reinvestment of distributions | | | | |
| | | | |
| | | | |
| | | | |
Issued from the sale of shares | | | | |
Issued in connection with the reinvestment of distributions | | | | |
| | | | |
| | | | |
Increase (decrease) from capital share transactions | | | | |
Notes to Financial Statements (continued)
12.Capital Shares (continued).
|
| Year Ended
December 31, 2023 | Year Ended
December 31, 2022 |
Global Sustainable Equity Fund | | | | |
| | | | |
Issued from the sale of shares | | | | |
Issued in connection with the reinvestment of distributions | | | | |
| | | | |
| | | | |
| | | | |
Issued from the sale of shares | | | | |
Issued in connection with the reinvestment of distributions | | | | |
| | | | |
| | | | |
| | | | |
Issued from the sale of shares | | | | |
Issued in connection with the reinvestment of distributions | | | | |
| | | | |
| | | | |
| | | | |
Issued from the sale of shares | | | | |
Issued in connection with the reinvestment of distributions | | | | |
| | | | |
| | | | |
Increase from capital share transactions | | | | |
|
| Year Ended
December 31, 2023 | Year Ended
December 31, 2022 |
International Sustainable Equity Fund | | | | |
| | | | |
Issued from the sale of shares | | | | |
Issued in connection with the reinvestment of distributions | | | | |
| | | | |
| | | | |
| | | | |
Issued from the sale of shares | | | | |
Issued in connection with the reinvestment of distributions | | | | |
| | | | |
| | | | |
| | | | |
Issued from the sale of shares | | | | |
Issued in connection with the reinvestment of distributions | | | | |
| | | | |
| | | | |
Increase (decrease) from capital share transactions | | | | |
Report of Independent Registered Public Accounting Firm
To the Boards of Trustees of Gateway Trust and Natixis Funds Trust I and Shareholders of Gateway Fund, Gateway Equity Call Premium Fund, Mirova Global Green Bond Fund, Mirova Global Sustainable Equity Fund and Mirova International Sustainable Equity Fund
Opinions on the Financial Statements
We have audited the accompanying statements of assets and liabilities, including the portfolios of investments, of Gateway Fund and Gateway Equity Call Premium Fund (constituting Gateway Trust), Mirova Global Green Bond Fund, Mirova Global Sustainable Equity Fund and Mirova International Sustainable Equity Fund (three of the funds constituting Natixis Funds Trust I) (hereafter collectively referred to as the "Funds") as of December 31, 2023, the related statements of operations for the year ended December 31, 2023, the statements of changes in net assets for each of the two years in the period ended December 31, 2023, including the related notes, and the financial highlights for each of the five years in the period ended December 31, 2023 (collectively referred to as the “financial statements”). In our opinion, the financial statements present fairly, in all material respects, the financial position of each of the Funds as of December 31, 2023, the results of each of their operations for the year then ended, the changes in each of their net assets for each of the two years in the period ended December 31, 2023 and each of the financial highlights for each of the five years in the period ended December 31, 2023 in conformity with accounting principles generally accepted in the United States of America.
Basis for Opinions
These financial statements are the responsibility of the Funds’ management. Our responsibility is to express an opinion on the Funds’ financial statements based on our audits. We are a public accounting firm registered with the Public Company Accounting Oversight Board (United States) (PCAOB) and are required to be independent with respect to the Funds in accordance with the U.S. federal securities laws and the applicable rules and regulations of the Securities and Exchange Commission and the PCAOB.
We conducted our audits of these financial statements in accordance with the standards of the PCAOB. Those standards require that we plan and perform the audit to obtain reasonable assurance about whether the financial statements are free of material misstatement, whether due to error or fraud.
Our audits included performing procedures to assess the risks of material misstatement of the financial statements, whether due to error or fraud, and performing procedures that respond to those risks. Such procedures included examining, on a test basis, evidence regarding the amounts and disclosures in the financial statements. Our audits also included evaluating the accounting principles used and significant estimates made by management, as well as evaluating the overall presentation of the financial statements. Our procedures included confirmation of securities owned as of December 31, 2023 by correspondence with the custodian and brokers. We believe that our audits provide a reasonable basis for our opinions.
/s/PricewaterhouseCoopers LLP
Boston, Massachusetts
February 22, 2024
We have served as the auditor of one or more investment companies in Natixis Investment Company Complex since at least 1995. We have not been able to determine the specific year we began serving as auditor.
2023 U.S. Tax Distribution Information to Shareholders (Unaudited)
Corporate Dividends Received Deduction. For the fiscal year ended December 31, 2023, a percentage of dividends distributed by the Funds listed below qualify for the dividends received deduction for corporate shareholders. These percentage is as follows:
| |
| |
Gateway Equity Call Premium Fund | |
Global Sustainable Equity Fund | |
Qualified Dividend Income. For the fiscal year ended December 31, 2023, a percentage of the ordinary income dividends paid by the Funds are considered qualified dividend income eligible for reduced tax rates. These lower rates range from 0% to 20% depending on an individual’s tax bracket. If the Funds paid a distribution during calendar year 2023, complete information will be reported in conjunction with Form 1099-DIV. These percentages are noted below:
| |
| |
Gateway Equity Call Premium Fund | |
Global Sustainable Equity Fund | |
International Sustainable Equity Fund | |
Foreign Tax Credit. For the year ended December 31, 2023, the Fund intends to pass through foreign tax credits and have derived gross income from sources within foreign countries amounting to:
| Foreign-Tax
Credit Pass-Through | |
International Sustainable Equity Fund | | |
Trustee and Officer Information
The tables below provide certain information regarding the Trustees and officers of Natixis Fund Trust I and Gateway Trust (the "Trusts"). Unless otherwise indicated, the address of all persons below is 888 Boylston Street, Suite 800, Boston, MA 02199-8197. The Funds' Statements of Additional Information include additional information about the Trustees of the Trusts and are available by calling Natixis Funds at 800-225-5478.
| Position(s) Held with
the Trusts, Length
of Time Served and
| Principal
Occupation(s)
During Past 5 Years | Number of Portfolios
in Fund Complex
Overseen2and Other
Directorships Held
During Past 5 Years | Experience,
Qualifications,
Attributes, Skills for
Board Membership |
| | | | |
| Trustee since 2013
Contract Review
Committee Member | Executive Chairman of Bob’s Discount Furniture (retail) | 51
Director, Burlington Stores, Inc. (retail); Director, Rue La La
(e-commerce retail) | Significant experience on the Board and on the boards of other business organizations (including retail companies and a bank); executive experience (including at a retail company) |
| Trustee since 2015
Chairperson of the
Audit Committee | | 51
Formerly, Director of Triumph Group (aerospace industry) | Significant experience on the Board and executive experience (including his role as Vice President and treasurer of a defense company and experience at a financial services company) |
| Trustee since 2012
Chairperson of the
Governance Committee
and
Contract Review
Committee Member | President, University of Massachusetts | | Significant experience on the Board and on the boards of other business organizations; experience as President of the University of Massachusetts; government experience (including as a member of the U.S. House of Representatives); academic experience |
Maureen B. Mitchell
(1951) | Trustee since 2017
Chairperson of the
Contract Review
Committee | | 51
Director, Sterling Bancorp (bank) | Significant experience on the Board; financial services industry and executive experience (including role as President of global sales and marketing at a financial services company) |
Trustee and Officer Information
| Position(s) Held with the Trusts, Length of Time Served and Term of Office1 | Principal Occupation(s) During Past 5 Years | Number of Portfolios in Fund Complex Overseen2and Other Directorships Held During Past 5 Years | Experience, Qualifications, Attributes, Skills for Board Membership |
Independent Trustees − continued |
| Trustee since 2016
Audit Committee
Member and
Governance
Committee
Member | Founding Partner, Breton Capital Management, LLC (private equity); formerly, Partner, STEP Partners, LLC (private equity) | 51
Director, Candidly (chemicals and biofuels) | Significant experience on the Board; financial services industry and executive experience (including roles as Chief Executive Officer of client management and asset servicing for a banking and financial services company) |
| Chairperson of the Board
of Trustees since 2021
Trustee since 2009
Ex Officio Member of the
Audit Committee,
Contract Review
Committee and
Governance Committee | Retired; formerly, Professor of Finance at Babson College | | Significant experience on the Board; experience as Director of the Division of Trading and Markets at the Securities and Exchange Commission; academic experience; training as an economist |
| Trustee since 2009
Contract Review
Committee
Member | | | Significant experience on the Board; mutual fund industry and executive experience (including roles as President and Chief Executive Officer for an investment adviser) |
Trustee and Officer Information
| Position(s) Held with the Trusts, Length of Time Served and Term of Office1 | Principal Occupation(s) During Past 5 Years | Number of Portfolios in Fund Complex Overseen2and Other Directorships Held During Past 5 Years | Experience, Qualifications, Attributes, Skills for Board Membership |
Independent Trustees − continued |
| Trustee since 2019
Audit Committee
Member and Governance
Committee Member | Managing Director of Accordia Partners, LLC (real estate development); President of Primary Corporation (real estate development); Managing Principal of Merrick Capital Partners (infrastructure finance) | 51
Advisor/Risk Management Committee, Eastern Bank (bank); Director, Apartment Investment and Management Company (real estate investment trust); formerly, Director, Ares Commercial Real Estate Corporation (real estate investment trust) | Experience on the Board and significant experience on the boards of other business organizations (including real estate companies and banks) |
| Trustee since 2005
for Natixis Funds
Trust I and 2007
for Gateway Trust
Audit Committee
and Governance
Committee Member | Retired; formerly, Deputy Dean for Finance and Administration, Yale University School of Medicine | | Significant experience on the Board; executive experience in a variety of academic organizations (including roles as dean for finance and administration) |
| | | | |
(1965)
One Financial Center
Boston, MA 02111 | | President, Chief Executive Officer and Chairman of the Board of Directors, Loomis, Sayles & Company, L.P. | | Significant experience on the Board; continuing service as President, Chief Executive Officer and Chairman of the Board of Directors of Loomis, Sayles & Company, L.P. |
| Trustee since 2011
President and Chief
Executive Officer | President and Chief Executive Officer, Natixis Advisors, LLC and Natixis Distribution, LLC | | Significant experience on the Board; experience as President and Chief Executive Officer of Natixis Advisors, LLC and Natixis Distribution, LLC |
| Each Trustee serves until retirement, resignation or removal from the Board. The current retirement age is 75. The position of Chairperson of the Board is appointed for a three-year term. |
| The Trustees of the Trusts serve as Trustees of a fund complex that includes all series of the Natixis Funds Trust I, Natixis Funds Trust II, Natixis Funds Trust IV, Gateway Trust, Loomis Sayles Funds I, Loomis Sayles Funds II, Natixis ETF Trust and Natixis ETF Trust II (collectively, the “Fund Complex”). |
| Mr. Charleston is deemed an “interested person” of the Trusts because he holds the following positions with an affiliated person of the Trusts: President, Chief Executive Officer and Chairman of the Board of Directors of Loomis, Sayles & Company, L.P. |
| Mr. Giunta is deemed an “interested person” of the Trusts because he holds the following positions with an affiliated person of the Trusts: President and Chief Executive Officer, Natixis Advisors, LLC and Natixis Distribution, LLC. |
Trustee and Officer Information
| Position(s) Held
with the Trusts | | |
| | | |
| Treasurer, Principal
Financial and
Accounting Officer | | Senior Vice President, Natixis Advisors, LLC and Natixis Distribution, LLC; formerly, Vice President, Natixis Advisors, LLC and Natixis Distribution, LLC; Assistant Treasurer of the Fund Complex |
| Secretary and Chief
Legal Officer | | Executive Vice President, General Counsel and Secretary, Natixis Advisors, LLC and Natixis Distribution, LLC; formerly, Executive Vice President and Chief Compliance Officer of Natixis Investment Managers (March 2019 – May 2022) and Senior Vice President and Head of Compliance, U.S. for Natixis Investment Managers (July 2011 – March 2019) |
| Chief Compliance
Officer, Assistant
Secretary and
Anti-Money
Laundering Officer | | Senior Vice President, Natixis Advisors, LLC and Natixis Distribution, LLC; formerly, Vice President, Head of Corporate Compliance, Global Atlantic Financial Group |
| Each officer of the Trusts serves for an indefinite term in accordance with the Trusts' current by-laws until the date his or her successor is elected and qualified, or until he or she sooner dies, retires, is removed or becomes disqualified. |
| Each person listed above, except as noted, holds the same position(s) with the Fund Complex. Previous positions during the past five years with Natixis Distribution, LLC, Natixis Advisors, LLC or Loomis, Sayles & Company, L.P. are omitted, if not materially different from an officer’s current position with such entity. |
This Page Intentionally Left Blank
This Page Intentionally Left Blank
˃To learn more about Natixis Funds products and services:
Visit: im.natixis.com Call: 800-225-5478
Before investing, consider the fund’s investment objectives, risks, charges, and expenses. Visit im.natixis.com or call 800-225-5478 for a prospectus or summary prospectus containing this and other information.
Contact us by mail:
If you wish to communicate with the funds’ Board of Trustees, you may do so by writing to:
Secretary of the Funds
Natixis Advisors, LLC
888 Boylston Street, Suite 800
Boston, MA 02199-8197
The correspondence must (a) be signed by the shareholder; (b) include the shareholder’s name and address; and (c) identify the fund(s), account number, share class, and number of shares held in that fund, as of a recent date.
Or by e-mail:
secretaryofthefunds@natixis.com (Communications regarding recommendations for Trustee candidates may not be submitted by e-mail.)
Please note: Unlike written correspondence, e-mail is not secure. Please do NOT include your account number, Social Security number, PIN, or any other non-public personal information in an e-mail communication because this information may be viewed by others.
 Exp. 3/1/20256255527.1.1LSAF58A-1223
This page not part of shareholder report
(b) Not Applicable.
Item 2. Code of Ethics.
The Registrant has adopted a code of ethics that applies to the Registrant’s principal executive officer, principal financial officer and persons performing similar functions. There have been no amendments or waivers of the Registrant’s code of ethics during the period.
Item 3. Audit Committee Financial Expert.
The Board of Trustees of the Registrant has established an audit committee. Mr. Richard A. Goglia, Mr. James P. Palermo, Mr. Kirk A. Sykes and Ms. Cynthia L. Walker are members of the audit committee and have been designated as “audit committee financial experts” by the Board of Trustees. Each of these individuals is also an Independent Trustee of the Registrant.
Item 4. Principal Accountant Fees and Services.
Fees billed by the Principal Accountant for services rendered to the Registrant.
The table below sets forth fees billed by the principal accountant, PricewaterhouseCoopers LLP, for the past two fiscal years for professional services rendered in connection with a) the audit of the Registrant’s annual financial statements and services provided in connection with regulatory filings; b) audit-related services (including services that are reasonably related to the performance of the audit of the Registrant’s financial statements but not reported under “Audit Fees”); c) tax compliance, tax advice and tax planning and d) all other fees billed for professional services rendered by the principal accountant to the Registrant, other than the services reported as a part of (a) through (c) of this Item.
| | | | | | | | | | | | | | | | | | | | | | | | | | | | | | | | |
| | | Audit fees | | | Audit-related fees1 | | | Tax fees2 | | | All
other
fees | |
| | | 1/1/22-
12/31/22 | | | 1/1/23-
12/31/23 | | | 1/1/22-
12/31/22 | | | 1/1/23-
12/31/23 | | | 1/1/22-
12/31/22 | | | 1/1/23-
12/31/23 | | | 1/1/22-
12/31/22 | | | 1/1/23-
12/31/23 | |
Natixis Funds Trust I (except Loomis Sayles Core Plus Bond Fund) | | $ | 253,693 | | | $ | 223,970 | | | $ | 519 | | | $ | 557 | | | $ | 83,610 | | | $ | 61,080 | | | $ | — | | | $ | — | |
| | 1. | Audit-related fees consist of: |
2022 & 2023 – performance of agreed-upon procedures related to the Registrant’s deferred compensation plan.
2022 & 2023 – review of the Registrant’s tax returns (2022 & 2023), filings to reclaim withholding taxes paid on EU dividends (2022), and consulting services (2023).
Aggregate fees billed to the Registrant for non-audit services during 2022 and 2023 were $84,129 and $61,637, respectively.
Fees billed by the Principal Accountant for services rendered to the Adviser and Control Affiliates.
The following table sets forth the fees billed by the Registrant’s principal accountant for non-audit services rendered to Natixis Advisors, LLC (“Natixis Advisors”), Mirova US LLC (“Mirova”) and entities controlling, controlled by or under common control with Natixis Advisors and Mirova (“Control Affiliates”) that provide ongoing services to the Registrant, for engagements that related directly to the operations and financial reporting of the Registrant for the last two fiscal years.
| | | | | | | | | | | | | | | | | | | | | | | | |
| | | Audit-related fees | | | Tax fees | | | All other fees | |
| | | 1/1/22-12/31/22 | | | 1/1/23-12/31/23 | | | 1/1/22-12/31/22 | | | 1/1/23-12/31/23 | | | 1/1/22-12/31/22 | | | 1/1/23-12/31/23 | |
Control Affiliates | | $ | — | | | $ | — | | | $ | 28,621 | | | $ | 17,898 | | | $ | 50,000 | | | $ | — | |
The following table sets forth the aggregate fees billed by the Registrant’s principal accountant for non-audit services rendered to Mirova, Natixis Advisors and Control Affiliates that provide ongoing services to the Registrant, for the last two fiscal years, including the fees disclosed in the table above.
| | | | | | | | |
| | | Aggregate Non-Audit Fees | |
| | | 1/1/22-12/31/22 | | | 1/1/23-12/31/23 | |
Control Affiliates | | $ | 341,351 | | | $ | 289,793 | |
None of the services described above were approved pursuant to paragraph (c)(7)(i)(C) of Regulation S-X.
Audit Committee Pre-Approval Policies.
Annually, the Registrant’s Audit Committee reviews the audit, audit-related, tax and other non-audit services together with the projected fees, for services proposed to be rendered to the Registrant and/or other entities for which pre-approval is required during the upcoming year. Any subsequent revisions to already pre-approved services or fees (including fee increases) and requests for pre-approval of new services would be presented for consideration quarterly as needed.
If, in the opinion of management, a proposed engagement by the Registrant’s independent accountants needs to commence before the next regularly scheduled Audit Committee meeting, any member of the Audit Committee who is an independent Trustee of the Registrant is authorized to pre-approve the engagement, but only for engagements to provide audit, audit-related and tax services. This approval is subject to review by the full Audit Committee at its next quarterly meeting. All other engagements require the approval of all the members of the Audit Committee.
Item 5. Audit Committee of Listed Registrants.
Not applicable.
Item 6. Schedule of Investments.
Included as part of the Report to Shareholders filed as Item 1 herewith.
Item 7. Disclosure of Proxy Voting Policies and Procedures for Closed-End Management Investment Companies.
Not applicable.
Item 8. Portfolio Managers of Closed-End Management Investment Companies.
Not applicable.
Item 9. Purchases of Equity Securities by Closed-End Management Investment Companies and Affiliated Purchasers.
Not applicable.
Item 10. Submission of Matters to a Vote of Securities Holders.
There were no material changes to the procedures by which shareholders may recommend nominees to the Registrant’s Board of Trustees.
Item 11. Controls and Procedures.
The Registrant’s principal executive officer and principal financial officer have concluded that the Registrant’s disclosure controls and procedures are sufficient to ensure that information required to be disclosed by the Registrant in this Form N-CSR was recorded, processed, summarized and reported within the time periods specified in the Securities and Exchange Commission’s rules and forms, based upon such officers’ evaluation of these controls and procedures as of a date within 90 days of the filing date of the report.
There were no changes in the Registrant’s internal control over financial reporting that occurred during the period covered by the report that have materially affected, or are reasonably likely to materially affect, the Registrant’s internal control over financial reporting.
Item 12. Disclosure of Securities Lending Activities for Closed-End Management Investment Companies.
Not applicable.
Item 13. Recovery of Erroneously Awarded Compensation.
Not applicable.
Item 14. Exhibits.
SIGNATURES
Pursuant to the requirements of the Securities Exchange Act of 1934 and the Investment Company Act of 1940, the Registrant has duly caused this report to be signed on its behalf by the undersigned, thereunto duly authorized.
| | |
| Natixis Funds Trust I |
| |
| By: | | /s/ David L. Giunta |
| Name: | | David L. Giunta |
| Title: | | President and Chief Executive Officer |
| Date: | | February 22, 2024 |
Pursuant to the requirements of the Securities Exchange Act of 1934 and the Investment Company Act of 1940, this report has been signed by the following persons on behalf of the Registrant and in the capacities and on the dates indicated.
| | |
| By: | | /s/ David L. Giunta |
| Name: | | David L. Giunta |
| Title: | | President and Chief Executive Officer |
| Date: | | February 22, 2024 |
| |
| By: | | /s/ Matthew Block |
| Name: | | Matthew Block |
| Title: | | Treasurer and Principal Financial and Accounting Officer |
| Date: | | February 22, 2024 |