UNITED STATES
SECURITIES AND EXCHANGE COMMISSION
Washington, D.C. 20549
FORM N-CSR
CERTIFIED SHAREHOLDER REPORT OF REGISTERED
MANAGEMENT INVESTMENT COMPANIES
Investment Company Act file number: 811-04323
Natixis Funds Trust I
(Exact name of Registrant as specified in charter)
| | |
| 888 Boylston Street, Suite 800, Boston, Massachusetts | | 02199-8197 |
| (Address of principal executive offices) | | (Zip code) |
Susan McWhan Tobin, Esq.
Natixis Distribution, LLC
888 Boylston Street, Suite 800
Boston, Massachusetts 02199-8197
(Name and address of agent for service)
Registrant’s telephone number, including area code: (617) 449-2139
Date of fiscal year end: December 31
Date of reporting period: December 31, 2022
Item 1. Reports to Stockholders.
| (a) | The Registrant’s annual report transmitted to shareholders pursuant to Rule 30e-1 under the Investment Company Act of 1940 is as follows: |


Annual Report
December 31, 2022
Loomis Sayles International Growth Fund
Natixis Oakmark Fund
Natixis Oakmark International Fund
Natixis U.S. Equity Opportunities Fund
Vaughan Nelson Mid Cap Fund
Vaughan Nelson Small Cap Value Fund
Table of Contents

LOOMIS SAYLES INTERNATIONAL GROWTH FUND
| | | | |
| | |
| Manager | | Symbols | | |
| | |
| Aziz V. Hamzaogullari, CFA® | | Class A | | LIGGX |
| | |
| Loomis, Sayles & Company, L.P. | | Class C | | LIGCX |
| | |
| | Class N | | LIGNX |
| | |
| | Class Y | | LIGYX |
Investment Goal
The Fund’s investment goal is long-term growth of capital.
Market Conditions
The international markets experienced negative returns and high volatility in 2022. Persistently high inflation prompted the US Federal Reserve (Fed) and other major world central banks to raise interest rates aggressively throughout the year, fueling worries about the potential for a recession and a corresponding decline in corporate earnings in 2023.
Russia’s invasion of Ukraine may have weighed on stocks, as well. The conflict exacerbated supply chain disruptions, led to a spike in energy prices in the first half of the year, and dampened growth across Europe. These factors contributed to underperformance for the European markets versus the broader international equity indexes, but the Asia-Pacific region — which was more insulated from the effects of the invasion — outperformed.
Events in China were an additional source of concern. The government’s continued regulatory focus and zero-Covid policy hindered growth in the country, leading to a significant downturn in the nation’s market over the first ten months of the year. Since China is heavily represented in the major emerging market indexes, its weakness depressed the headline return of the broader asset class.
Currency translation was an additional headwind for US investors. Most developed and emerging market currencies declined sharply in the first ten months of the year, exacerbating the losses for equities. Stocks and foreign currencies both rallied in November and December, however, significantly reducing the extent of the losses for the full year.
Performance Results
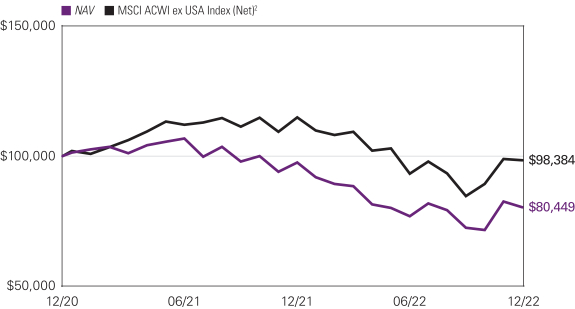
For the 12 months ended December 31, 2022, Class Y shares of the Loomis Sayles International Growth Fund returned -17.50% at net asset value. The Fund underperformed its benchmark, the MSCI All Country World Index ex USA Index (Net), which returned -16.00%.
Explanation of Fund Performance
We are an active manager with a long-term, private equity approach to investing. Through our proprietary bottom-up research framework, we look to invest in those few high-quality businesses with sustainable competitive advantages and profitable growth when they trade at a significant discount to intrinsic value. Given the rare confluence of quality, growth, and valuation, we may study dozens of companies but may only invest in a select few businesses each year. We believe identifying those few businesses with such characteristics is an art, not a science. As a result of this rigorous approach, ours is a selective, high-conviction portfolio of typically 30–45 names.
The Fund’s positions in Adyen, MercadoLibre, and Tencent detracted the most from performance. Stock selection in the information technology, industrials, and communication services sectors, as well as our allocations in the information technology, energy, consumer discretionary, and communication services sectors, detracted from relative performance.
Adyen is a global merchant acquisition and payment solutions provider based in Amsterdam. Adyen was founded in 2006 to serve as a next-generation, integrated provider of payment solutions to merchants, and today the company supports over 250 payment methods globally across online, mobile, and point-of-sale (POS) transactions for clients that include Facebook, McDonald’s, Microsoft, Netflix, and Uber. We believe Adyen’s strong and sustainable competitive advantages include its single, global platform and a high profile client base with which it has built lasting relationships. A Fund holding since inception, Adyen reported financial results during the year that reflected strong fundamentals, including continued market share gains and revenue growth that was well above our long-term assumptions for the company. However, the company’s most recent financial report for the first half of 2022 was below consensus expectations for revenues and profitability. We believe Adyen remains a high quality company with sustainable competitive advantages and secular growth opportunities that are not reflected in its current share price. Existing clients accounted for over 80% of Adyen’s strong double-digit sales growth in its most recent report — stemming from both organic growth at underlying clients and Adyen’s capture of increasing share — and client retention based on payment volumes remained above 99%. We believe the secular
1 |
shift to electronic-based payments from traditional paper-based systems represents the most significant growth driver for Adyen. While Adyen has been growing substantially faster than the leading global acquirers over the past few years, the company still captures only a small percentage of overall industry volumes estimated at approximately 1%. We believe a combination of industry- and company-specific factors will enable Adyen to continue to grow at more than twice the rate of growth in the overall payments industry over our long-term investment horizon. We also expect Adyen to benefit from the high incremental margins of its business, contributing to margin expansion and cash flow growth in excess of 20% over our forecast period. We believe Adyen’s strong growth prospects are not currently reflected in its share price. As a result, we believe the company’s shares are trading at a meaningful discount to our estimate of intrinsic value, offering an attractive reward-to-risk opportunity.
MercadoLibre is the largest online commerce platform in Latin America. The company offers its users an ecosystem of six integrated e-commerce services that include its marketplace, payment and fintech solutions, shipping and logistics, advertising, classified listings, and merchant web services. The company operates in 18 countries representing the vast majority of Latin American GDP, and its 140 million active users in 2021 represented over 30% of the region’s estimated 450 million internet users. We believe MercadoLibre benefits from strong and sustainable competitive advantages that include its network and ecosystem, brand, and understanding of local markets that collectively contribute to its leadership position in each market it serves. A Fund holding since inception, during the reporting period, the company delivered strong revenue growth that was generally above consensus expectations, driven by growth in gross merchandise volume and payments, and continued market share gains in both e-commerce and payments. Growth was notable because it follows strong pandemic-fueled growth in the prior year period and reflects the high value proposition to consumers. Despite strong fundamental performance, the company’s shares were volatile as a result of the weak market backdrop during the period. MercadoLibre remains in an elevated investment cycle to build out a more powerful ecosystem focused on greater product selection, easier payment options, wider credit availability, and lower cost and faster speed of delivery. While these investments have impacted near-term profitability, we believe they have contributed to market share gains in e-commerce and payments and a stronger competitive position, and operating income and margins were generally above expectations during the period. We believe management remains focused on balancing the investments needed to further improve user experience and extend the company’s leadership in e-commerce and payments, while maintaining a sustainable and profitable financial model. With continued growth in internet access, increasing availability of credit, and the company’s continuing investments to improve the ease and convenience of transacting online, we believe MercadoLibre remains well positioned for sustained growth over the next decade, driven by the secular growth of e-commerce across Latin America. Over our forecast period, we believe the penetration of e-commerce can more than double, which would bring the penetration rate into the mid-20% level. We believe the current market price embeds expectations for key revenue and cash flow growth drivers that are well below our long-term assumptions. As a result, we believe the shares trade at a significant discount to our estimate of intrinsic value and offer a compelling long-term reward-to-risk opportunity.
Tencent Holdings is one of the largest internet services companies in China and globally, offering a wide array of value-added services that span social networking and communication, gaming, media and entertainment, and e-commerce and local services. We believe Tencent’s strong and sustainable competitive advantages include its massive network and ecosystem, distribution, scale, and brand which collectively contribute to high barriers to entry for potential competitors. The company’s leading social and communication platforms, Weixin/WeChat and QQ, which attract approximately 1.3 billion and 550 million monthly active users, respectively, represent a significant portion of mobile internet users in China, as well as a significant amount of time spent in consumption of internet services. Through an open platform with services provided both by Tencent and by third-party providers, the company has created a one-stop “super app” that has become deeply embedded in the lives of its users – spanning communication, social media, gaming, media consumption, online and offline payments, and wealth management. As a result of its massive internet user base, Tencent has a distribution advantage in reaching consumers. The company has advantaged insights into how users are spending their time, which facilitates its ability to promote products and services to a targeted audience and lowers client acquisition costs relative to competitors. This distribution advantage would be difficult to replicate and is reflected in the company’s leading market positions in gaming, news, payments, music, and video. A Fund holding since inception, Tencent reported financial results during the year that were generally mixed-to-below consensus expectations and impacted by both cyclical and regulatory pressures. A combination of ongoing regulation, weakness in Chinese consumer spending, and the resurgence of Covid impacted a number of the company’s key businesses. While the company is operating in a challenging near-term environment, we believe Tencent’s leading digital enterprise and consumer platforms remain structurally well positioned for long-term growth and benefit from strong and sustainable competitive advantages that stem from Tencent’s network, distribution, brand and scale. We believe Tencent is one of the best-positioned companies in the China internet services industry. We believe the near-term uncertainty regarding the regulatory and economic environment does not change the long-term fundamentals; as a leading consumer platform provider, we believe the structural expansion of internet users in China will position Tencent to benefit from multiple secular growth drivers, including gaming, media, advertising, payments, and cloud-computing growth. We believe Tencent’s strong growth prospects are not currently reflected in its share price. As a result, we believe the company’s shares are trading at a significant discount to our estimate of intrinsic value, offering a compelling reward-to-risk opportunity. We took advantage of near-term price weakness to add to our position during the period.
| 2
LOOMIS SAYLES INTERNATIONAL GROWTH FUND
The Fund’s positions in Trip.com, Novo Nordisk, and Vipshop contributed the most to performance. Stock selection in the consumer discretionary, healthcare, energy, and consumer staples sectors, along with our allocations in the consumer staples, healthcare, and industrials sectors, contributed positively to relative performance.
China-based Trip.com (TCOM), formerly known as Ctrip, is the world’s largest global travel platform. Founded in 1999, the company offers a comprehensive, integrated platform on which travelers can make arrangements for lodging, transportation, packaged tours and other related services; they also provide corporate travel management services. The company provides its services in China through its Ctrip and Qunar platforms and serves non-Chinese customers primarily thorough Trip.com and Skyscanner. We believe Trip.com’s strong and sustainable competitive advantages include the power of its network and ecosystem, its scale, and leading brands. As an early mover in the fragmented China travel industry, the company has built the leading network of travelers and travel partners over the past twenty years. The company has over 400 million worldwide users that are attracted to its leading share of inventory in hotels, ticketing services, and vacation packages. As more travelers come to its sites, more travel providers wish to come and vice versa. The company’s scale serves to strengthen the power of its network and ecosystem. Trip.com is the clear leader in the China online travel agent (OTA) market with approximately 50% market share, which is greater than two times the next largest competitor, Meituan. Scale also enables the company to invest more in products, service, and brand than its smaller competitors. Collectively, we believe these competitive advantages would be very difficult for a competitor to replicate. A Fund holding since inception, Trip.com reported financial results over the past year that were above consensus expectations, despite being significantly impacted by Covid-19 and related restrictions that reduced Chinese travel, both domestically and abroad. Investors may have responded positively to the stronger-than-expected results, strong cost management during a period of cyclical weakness, and optimism regarding the Chinese government’s easing of Covid-related restrictions. While financial results have been pressured during this period, we believe that structural growth will resume in 2023 as China eases its controls and reopens its borders. As the leading global travel platform and largest in China, we believe Trip.com is well positioned to benefit from long-term growth in travel expenditures by consumers and business travelers in China. We believe that the impact of Covid-19 on travel is temporary, and that the structural drivers of growth remain intact. Apart from the near-term impact of Covid-19, the company has been reinvesting significantly in the business, depressing operating margins relative to history. As these investments moderate, we believe the company can generate structural operating margins in the low-20% range. We believe the company’s share price embeds expectations for key revenue and cash flow metrics that are substantially below our long-term assumptions. As a result, we believe the company’s shares are trading at a significant discount to our estimate of intrinsic value and offer a compelling reward-to-risk opportunity.
Headquartered in Denmark, Novo Nordisk is a global healthcare company with nearly 100 years of innovation and leadership in diabetes care. Over this time, Novo has amassed unparalleled experience in the biology of diabetes, along with expertise in protein science, and developed significant competitive advantages as a result. Its diabetes products have captured almost one-third of the global branded diabetes care market, which, along with its first-mover position in related obesity therapies, accounts for over 85% of the company’s annual revenues. In its rare disease (formerly biopharmaceutical) business segment, which represents almost 15% of annual revenues, Novo Nordisk has leading positions within hemophilia care, growth hormone therapy, and hormone replacement therapy. We believe Novo’s strong and sustainable advantages include its deep experience in diabetes care and therapeutic proteins, strong infrastructure that took decades to build, efficient manufacturing techniques, robust pipeline, and economies of scale. A Fund holding since inception, Novo reported solid operating results throughout the period that were generally ahead of consensus expectations and reflected a rebound in activity that was depressed in the prior-year period due to Covid-19. Due to strong results, the company raised its full-year 2022 revenue and operating profit guidance on multiple occasions, from an expectation of mid-to-high single-digit growth to low-teens growth. In particular, growth has been led by the company’s GLP-1 class of therapies — a quickly growing class of non-insulin anti-diabetic treatments that can postpone the need for insulin for two to four years. Novo’s class-leading Ozempic, a once-weekly therapy with comparable safety and superior efficacy to existing therapies, is capturing almost 40% of new-to-market patients and contributed to greater penetration of the GLP-1 market as well as share gains from its leading competitor. Sales of Rybelsus, an oral version of Ozempic and the company’s newest GLP-1 innovation launched in late 2019, grew 120% year over year in constant currency, contributing to the company’s greater than 50% total GLP-1 market share. In addition to targeting diabetes with its GLP-1s, in 2021, Novo received approval for semaglutide (the same molecule behind Ozempic and Rybelsus) in the obesity setting under the brand name Wegovy. While Novo is navigating operational challenges that have limited the initial production of Wegovy, the company is seeing robust early demand and expects supply constraints will begin to abate following a relaunch of the therapy in December 2022. Diabetes is a global epidemic with an estimated population of 530 million. The market has been growing annually in the low double digits over the last ten years, driven by aging of the global population and increasing obesity. We believe Novo’s deep experience in diabetes care, differentiated product suite, and leading innovation should enable the company to grow revenues in the mid-single digits over our long-term investment horizon, with faster growth in free cash flow. We believe the company’s shares continue to sell at a meaningful discount to our estimate of intrinsic value and offer an attractive reward-to-risk opportunity.
3 |
Vipshop is a specialty internet retailer focused on off-season, off-price apparel and fashion items which it sells via flash sales. Founded in 2008 with the vision of introducing high quality, branded fashion merchandise to the China market at value prices, the company is by far the largest flash retailer in China, and the largest player in the off-season, off-price category. In 2021, the company generated over $18 billion in net revenues across its core categories, and today the company is the 5th largest overall retailer in China. We believe that Vipshop creates a strong value proposition for end customers and vendors alike, which in turn creates a strong network effect that has been difficult to replicate even by the largest e-commerce companies in China. A Fund holding since inception, Vipshop reported better-than-expected profitability throughout the period, despite significant ongoing topline pressure as the Chinese market continued to be impacted by weak consumer demand amidst prolonged Covid-19 outbreaks, lockdowns, and restrictions. Despite this, the company appears to be maintaining market share in its core apparel-related business which accounts for approximately two-thirds of its revenues, even while experiencing greater competitive pressure in its non-core, general merchandise categories. We believe that Vipshop remains a high-quality business benefiting from competitive advantages of brand, scale, and a positive network effect that should enable it to expand its market share as the leading discount branded apparel retailer in China. While the Covid-19 outbreak and the associated travel restrictions and their impact on consumer confidence pressured sales over the past year, especially in the company’s smaller physical retail footprint, we believe the company’s competitive position in its core off-price apparel and accessories business remains intact, and that Vipshop will continue to benefit from structural growth in China consumption and e-commerce where it has a strong and defensible position in the off-season, off-price niche in which it competes. We believe the current market price embeds expectations for free cash flow growth that are well below our long-term assumptions. With its shares trading at a significant discount to our estimate of intrinsic value, we believe Vipshop offers a compelling reward-to-risk opportunity.
All aspects of our quality-growth-valuation investment thesis must be present simultaneously for us to make an investment. Often our research is completed well in advance of the opportunity to invest. We are patient investors and maintain coverage of high-quality businesses in order to take advantage of meaningful price dislocations if and when they occur. During the period we initiated new positions in Block, Doximity, Shopify, and Tesla. We added to our existing holdings in Fanuc and Tencent. We trimmed our existing positions in Novartis, Roche, Sodexo, and Unilever. We sold our positions in Core Laboratories and Schlumberger.
Outlook
Our investment process is characterized by bottom-up fundamental research and a long-term investment time horizon. The nature of the process leads to a lower-turnover portfolio in which sector positioning is the result of stock selection. The Fund ended the year with overweight positions in the consumer staples, consumer discretionary, healthcare, information technology, and communication services sectors and was underweight in the industrials sector. We had no exposure to stocks in the financials, materials, energy, utilities, or real estate sectors. From a geographic standpoint we were overweight in emerging markets and Europe and underweight in developed Asia and North America.
Top Ten Holdings as of December 31, 2022
| | | | | | | | |
| | | |
| | | | Security Name | | % of
Net Assets | |
| | 1 | | | WiseTech Global Ltd. | | | 5.59 | % |
| | 2 | | | Novo Nordisk A/S, Class B | | | 5.54 | |
| | 3 | | | Tencent Holdings Ltd. | | | 5.07 | |
| | 4 | | | MercadoLibre, Inc. | | | 4.41 | |
| | 5 | | | Novartis AG (Registered) | | | 4.29 | |
| | 6 | | | Roche Holding AG | | | 4.20 | |
| | 7 | | | Ambev S.A. ADR | | | 4.17 | |
| | 8 | | | Trip.com Group Ltd. ADR | | | 4.08 | |
| | 9 | | | Kweichow Moutai Co. Ltd., Class A | | | 3.94 | |
| | 10 | | | Nestle S.A. (Registered) | | | 3.90 | |
The portfolio is actively managed and holdings are subject to change. There is no guarantee the Fund continues to invest in the securities referenced. The holdings listed exclude any temporary cash investments, are presented on an individual security basis and do not represent holdings of the issuer.
| 4
LOOMIS SAYLES INTERNATIONAL GROWTH FUND
Hypothetical Growth of $100,000 Investment in Class Y Shares3
December 15, 2020 (inception) through December 31, 2022
Average Annual Total Returns — December 31, 20223
| | | | | | | | | | | | | | | | |
| | | | |
| | | 1 Year | | | Life of Fund | | | Expense Ratios4 | |
| | Gross | | | Net | |
| | | | | |
| Class Y (Inception 12/15/20) | | | | | | | | | | | | | | | | |
| NAV | | | -17.50 | % | | | -10.09 | % | | | 2.46 | % | | | 0.95 | % |
| | | | | |
| Class A (Inception 12/15/20) | | | | | | | | | | | | | | | | |
| NAV | | | -17.71 | | | | -10.33 | | | | 2.71 | | | | 1.20 | |
| With 5.75% Maximum Sales Charge | | | -22.41 | | | | -12.89 | | | | | | | | | |
| | | | | |
| Class C (Inception 12/15/20) | | | | | | | | | | | | | | | | |
| NAV | | | -18.30 | | | | -10.99 | | | | 3.46 | | | | 1.95 | |
| With CDSC1 | | | -19.11 | | | | -10.99 | | | | | | | | | |
| | | | | |
| Class N (Inception 12/15/20) | | | | | | | | | | | | | | | | |
| NAV | | | -17.47 | | | | -10.06 | | | | 1.58 | | | | 0.90 | |
| | | | | |
| Comparative Performance | | | | | | | | | | | | | | | | |
| MSCI ACWI ex USA Index (Net)2 | | | -16.00 | | | | -3.61 | | | | | | | | | |
Performance data shown represents past performance and is no guarantee of, and not necessarily indicative of, future results. Total return and value will vary, and you may have a gain or loss when shares are sold. Current performance may be lower or higher than quoted. For most recent month-end performance, visit im.natixis.com. Performance for other share classes will be greater or less than shown based on differences in fees and sales charges. You may not invest directly in an index. Performance for periods less than one year is cumulative, not annualized. Returns reflect changes in share price and reinvestment of dividends and capital gains, if any. The table(s) do not reflect taxes shareholders might owe on any fund distributions or when they redeem their shares.
| 1 | Performance for Class C shares assumes a 1% contingent deferred sales charge (“CDSC”) applied when you sell shares within one year of purchase and includes automatic conversion to Class A shares after eight years. |
| 2 | The MSCI ACWI ex USA Index (Net) captures large and mid cap representation across 22 of 23 Developed Markets (DM) countries (excluding the US) and 27 Emerging Markets (EM) countries. With 2,361 constituents, the index covers approximately 85% of the global equity opportunity set outside the US. |
| 3 | Fund performance has been increased by fee waivers and/or expense reimbursements, if any, without which performance would have been lower. |
| 4 | Expense ratios are as shown in the Fund’s prospectus in effect as of the date of this report. The expense ratios for the current reporting period can be found in the Financial Highlights section of this report under Ratios to Average Net Assets. Net expenses reflect contractual expense limitations set to expire on 4/30/23. When a Fund’s expenses are below the limitation, gross and net expense ratios will be the same. See Note 6 of the Notes to Financial Statements for more information about the Fund’s expense limitations. |
5 |
NATIXIS OAKMARK FUND
| | |
| |
| Managers | | Symbols |
| |
| William C. Nygren, CFA® | | Class A NEFOX |
| |
| Robert F. Bierig* | | Class C NECOX |
| |
| M. Colin Hudson, CFA®** | | Class N NOANX |
| |
| Michael J. Mangan, CFA®, CPA | | Class Y NEOYX |
| |
| Michael A. Nicolas, CFA® | | |
| |
| Harris Associates L.P. | | |
| * | Effective August 1, 2022, Robert F. Bierig serves as portfolio manager of the Fund. |
| ** | Effective August 1, 2022, M. Colin Hudson no longer serves as portfolio manager of the Fund. |
Investment Goal
The Fund seeks long-term capital appreciation.
Market Conditions
The fourth quarter saw a recovery in US equity markets with all three major indexes finishing higher following declines in the first three quarters of the year. Energy continued to outperform in the fourth quarter, along with industrials, materials and financials, while consumer discretionary and communication services were the two sectors to have negative absolute returns. Also in the fourth quarter, the US Dollar Index declined by over 7.5% after five consecutive quarters of gains. WTI crude ended the year near $80, which was around its level at the beginning of 2022 and prior to Russia’s invasion of Ukraine and the subsequent increase in energy prices.
Investors’ primary focus throughout the year appeared to be on the Federal Reserve and its efforts to tighten financial conditions, primarily through increases to the federal funds rate and quantitative tightening. The size of rate hikes slowed in December to 50 basis points, following a streak of 75 basis point increases in June, July, September and November. Some recent economic indicators have offered reason for optimism for those expecting the Fed to pivot, such as lower commodity prices and lower than expected inflation numbers. However, unemployment remains resilient at below 4% and the latest Consumer Price Index for November came in at 7.1% year-over-year, significantly above the Federal Reserve’s 2% target.
Performance Results
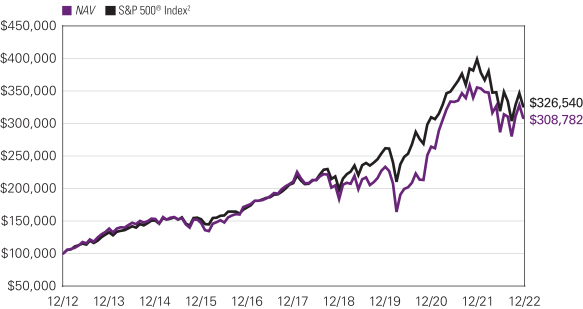
For the 12 months ended December 31, 2022, Class Y shares of the Natixis Oakmark Fund returned -13.10% at net asset value. The Fund outperformed its benchmark, the S&P 500® Index, which returned -18.11%.
Explanation of Fund Performance
As value investors with an emphasis on individual stock selection, our sector weights are a byproduct of our bottom-up process. On an absolute-return basis, the energy sector gained the most value, while holdings in the communications services sector lost the most value.
The largest contributors to Fund performance for the year were EOG Resources and APA Corporation. While energy price increases have helped companies across the sector this year, EOG Resources has also operated well on a fundamental basis, in our view. Second-quarter results showed that EOG is growing production without a disproportionate capital expense increase, which we see as evidence that management’s efficiency measures are working. Second-quarter production grew 11% from a year earlier and capital expenditures rose 14%; both metrics were better than market expectations. The company later reported a strong set of third-quarter results, in our view. Revenue of $7.59 billion surpassed consensus expectations of $6.26 billion, production grew 9% year-over-year, and capital expenditures were 6% below consensus expectations. Capital expenditures increased faster than production due to inflation, higher growth and additional exploration; however, full-year figures were within initial guidance. EOG also announced the discovery of a new opportunity in the Ohio Utica Basin by using learnings from decentralized teams across multiple basins to enter an overlooked opportunity. The company quietly amassed 395,000 acres for more than $500 million, acquired around 20 legacy wells for data, and drilled four initial wells to confirm their reservoir model. Management said the initial wells would qualify as double premium with longer laterals, and Utica wells could have the same oil recovery as the Delaware Basin, which we believe would be a great win. We continue to like the effectiveness of the company’s management team.
APA Corporation finished higher alongside rising energy prices early in the year, even though fourth-quarter results were generally below consensus estimates, which we attributed mainly to cost inflation weighing on free cash flow (FCF). Management guided to $6.5 billion of cumulative free cash flow over the next three years, each at strip prices with 5% annual growth. The company also announced a successful oil discovery at its new Krabdagu prospect. We believe if the well is of the same quality as the nearby Sapakara
| 6
NATIXIS OAKMARK FUND
well, it is likely to result in a fast-tracked final investment decision for a large development hub in the area. Later in the first quarter, APA announced it closed on two transactions totaling around $1 billion in net proceeds. More recently, third-quarter results from APA were good, in our assessment. Total revenue of $2.89 billion, adjusted earnings (EBITDAX)* of $1.69 billion and adjusted earnings per share of $1.97 all exceeded market expectations. More importantly, revenue rose 40% year-over-year and EBITDAX advanced 46%, while adjusted earnings per share doubled from a year earlier. We were pleased that drilling operations in both the Permian Basin and Egypt are accelerating, which eased concerns about sluggish second-quarter performance. Management expects $2.7 billion of total FCF in 2022 (a 19% FCF yield) and expects further growth in 2023 even at flat commodity prices. We found it impressive that over the last two years APA has reduced its net debt from $8.9 billion to $4.9 billion. Furthermore, during the most recent two-year period the company repurchased almost 20% of its share base and it continues with its buyback efforts. Management repurchased 10 million shares (3% of shares outstanding) in the third quarter and plans to repurchase another $520 million worth of shares (another 3%) in the fourth quarter. The company also announced the quarterly dividend would double to an annualized rate of $1.00 per share. We remain pleased with APA’s fundamental performance.
The largest detractors to Fund performance for the year were Meta Platforms and Ally Financial. The share price of Meta Platforms declined throughout the year as the company faced several challenges. Investors proved disappointed by Meta Platforms’ fourth-quarter earnings report and its share price fell over 20% following its release. Management pointed to new regulation in Europe and Apple iOS changes as a $10 billion headwind for personalized advertisements. The company also reported its first decline in daily active users for Facebook, which we believe was attributable to the size of the existing base and the number of users pulled forward during the Covid-19 pandemic. Management emphasized its focus on generating revenue from its fastest growing content format, Reels, a competitor to TikTok. The company believes the transition from stories to Reels will be similar to the transition from feed to stories in 2018 and expressed encouragement from early results. Late in April, Meta delivered a disappointing earnings report for the first quarter and guidance for the second quarter. The company reduced its expense guidance for the year, suggesting that much of the spend is highly discretionary, and daily active users on its platforms accelerated sequentially by 50 million in the second quarter versus 10 million in the first quarter. Meta reported a 1% decline in second-quarter revenue, in line with its guidance and consensus expectations. Core margins (ex-Reality Labs) came in at 39%, or 29% including the $2.8 billion loss from Reality Labs, which has lost $5.8 billion year to date. Cyclical weakness in advertising budgets, which worsened sequentially; the lingering impacts from Apple’s ad tracking changes; and higher engagement in Reels all weighed on results. Reels represented 20% of time spent on Instagram alone last quarter, and management said they saw a 30% increase in engagement on both Instagram and Facebook sequentially.
We spoke with Meta Platforms’ CFO Susan Li following the company’s third-quarter earnings report. After our discussion, we believe the core platform remains healthy, as evidenced by engagement and time spent remaining strong. While IDFA (identifier for advertisers) pressured growth this year, results show the company is lapping the impact from that headwind. Reels monetization is showing rapid growth, and we believe organic revenue trends look set to improve both next year and beyond. Expense management is becoming more disciplined, but we believe there remains work to be done. The company is finding more cost-cutting opportunities, and we were told CEO Mark Zuckerberg is increasingly focused on core profitability given the mounting pressure both external and internal. Despite this, the company is committed to ramping up capital spend for the time being. Li believes the increase in Artificial Intelligence spending is paying off, but it is still early in the process. She said the pace of spending will be governed by the returns it generates, and the company should benefit through improved ad effectiveness, engagement, and content editing and creation capabilities, among others. As for the Reality Labs segment, management sees this spend intrinsically tied to the success of the core platforms as they prepare for the potential next computing platform. In our view, the company has a very profitable core business paired with a large amount of growth capital spend and a bet on a potentially large new business opportunity that has an uncertain timeframe and probability of success. While the lack of expense discipline has lowered our estimate of intrinsic value, we continue to believe the company is undervalued at its current price.
First-quarter results from Ally Financial were impressive, in our view, as reported return on tangible common equity was nearly 24% and earning asset yields rose 11 basis points sequentially while funding costs declined 4 basis points, resulting in a near 4% net interest margin. Management believes it will generate a roughly 20% return on tangible common equity on a full-year basis and reiterated their 16%-18% target for 2023 and onward. We recognize that the inevitable normalization of credit, which continues to remain tame and below normal levels, combined with weakening used car prices and potential deposit rate pressure could eventually make the operating environment more challenging. CFO Jenn LaClair remains very optimistic and believes Ally will have some natural hedges in place to partially offset used car price declines. Second-quarter revenue was slightly better than market expectations, while earnings per share fell short of projections by about 4%. In terms of absolute earnings, the company’s results were again above trend with a reported return on tangible common equity of 23%. Earning asset yields rose by 25 basis points and repriced higher than funding sources in the second quarter, which drove the net interest margin to an impressive 4.06%, an increase of 49 basis points year-over-year. Following the earnings release, we met with CEO Jeff Brown and Jenn LaClair and discussed the company’s competitive advantage in auto
| * | EBITDAX stands for Earnings Before Interest, Taxes, Depreciation, Amortization, and Exploration Expense. It is an indicator of financial performance that is used when reporting earnings, specifically for oil and mineral exploration. |
7 |
lending. Loan receivables from retail auto borrowers grew faster than the industry in the second quarter, which management attributed to an expanded dealer count (+20% over the past few years) and higher application flow as well as from what they consider to be extremely attractive risk-adjusted returns.
The company reported third-quarter results with revenue and adjusted earnings per share that both undershot market expectations. Revenue rose about 2% from last year to $2.02 billion, while adjusted earnings per share fell by nearly half. Just prior to the earnings release, LaClair stepped down from her role as CFO and will now be a senior operating adviser. Bradley Brown, who had been the corporate treasurer since 2013, will serve as interim CFO. Upon review of the third-quarter earnings report, we observed that earning asset yields continue to improve and accelerated by 50 basis points quarter-over-quarter to 5.59%. However, funding costs increased 77 basis points from last year with deposit costs roughly doubling from 0.76% to 1.58%, which caused the net interest margin to contract by 23 basis points to 3.81%. In addition, auto loan originations were down 8% sequentially from last quarter and unchanged from last year. We spoke with Ally’s management team and discussed the company’s auto loan activity. While management expects lower current year retail auto loan balances than in pre-pandemic years, the company foresees a recovery upon the normalization of vehicle inventories. Also, Jeff Brown stated that Ally continues to be disciplined in its underwriting standards, which should protect against significant downside effects if the economy slows dramatically. Despite these near-term challenges, we find this company is poised to offer shareholder rewards moving forward.
Outlook
We believe our edge is our process for identifying undervalued businesses with growing values and good management teams and then positioning portfolios with conviction and discipline based on that process. We value companies as if they will have to weather macro-related bumps in the road without trying to be precise as to when this happens. This helps us divorce the investment decision from an attempt to time a business cycle. We believe this approach, paired with our longer time horizon and broad definition of value, enables us to uncover attractive investment opportunities during times of volatility.
Top Ten Holdings as of December 31, 2022
| | | | | | | | |
| | | |
| | | | Security Name | | % of
Net Assets | |
| | 1 | | | Alphabet, Inc., Class A | | | 3.44 | % |
| | 2 | | | KKR & Co., Inc. | | | 3.13 | |
| | 3 | | | Wells Fargo & Co. | | | 2.88 | |
| | 4 | | | Oracle Corp. | | | 2.70 | |
| | 5 | | | Citigroup, Inc. | | | 2.45 | |
| | 6 | | | EOG Resources, Inc. | | | 2.41 | |
| | 7 | | | Capital One Financial Corp. | | | 2.37 | |
| | 8 | | | Willis Towers Watson PLC | | | 2.36 | |
| | 9 | | | APA Corp. | | | 2.35 | |
| | 10 | | | CBRE Group, Inc., Class A | | | 2.33 | |
The portfolio is actively managed and holdings are subject to change. There is no guarantee the Fund continues to invest in the securities referenced. The holdings listed exclude any temporary cash investments, are presented on an individual security basis and do not represent holdings of the issuer.
| 8
NATIXIS OAKMARK FUND
Hypothetical Growth of $100,000 Investment in Class Y Shares3
December 31, 2012 through December 31, 2022
Average Annual Total Returns — December 31, 20223
| | | | | | | | | | | | | | | | | | | | | | | | |
| | | | | | |
| | | 1 Year | | | 5 Years | | | 10 Years | | | Life of
Class N | | | Expense Ratios4 | |
| | Gross | | | Net | |
| | | | | | | |
| Class Y | | | | | | | | | | | | | | | | | | | | | | | | |
| NAV | | | -13.10 | % | | | 7.95 | % | | | 11.93 | % | | | — | % | | | 0.89 | % | | | 0.80 | % |
| | | | | | | |
| Class A | | | | | | | | | | | | | | | | | | | | | | | | |
| NAV | | | -13.30 | | | | 7.68 | | | | 11.65 | | | | — | | | | 1.14 | | | | 1.05 | |
| With 5.75% Maximum Sales Charge | | | -18.28 | | | | 6.41 | | | | 10.99 | | | | — | | | | | | | | | |
| | | | | | | |
| Class C | | | | | | | | | | | | | | | | | | | | | | | | |
| NAV | | | -13.97 | | | | 6.87 | | | | 10.99 | | | | — | | | | 1.89 | | | | 1.80 | |
| With CDSC1 | | | -14.69 | | | | 6.87 | | | | 10.99 | | | | — | | | | | | | | | |
| | | | | | | |
| Class N (Inception 5/1/17) | | | | | | | | | | | | | | | | | | | | | | | | |
| NAV | | | -13.06 | | | | 8.07 | | | | — | | | | 9.84 | | | | 1.55 | | | | 0.75 | |
| | | | | | | |
| Comparative Performance | | | | | | | | | | | | | | | | | | | | | | | | |
| S&P 500® Index2 | | | -18.11 | | | | 9.42 | | | | 12.56 | | | | 10.67 | | | | | | | | | |
Performance data shown represents past performance and is no guarantee of, and not necessarily indicative of, future results. Total return and value will vary, and you may have a gain or loss when shares are sold. Current performance may be lower or higher than quoted. For most recent month-end performance, visit im.natixis.com/performance. Performance for other share classes will be greater or less than shown based on differences in fees and sales charges. You may not invest directly in an index. Performance for periods less than one year is cumulative, not annualized. Returns reflect changes in share price and reinvestment of dividends and capital gains, if any. The table(s) do not reflect taxes shareholders might owe on any fund distributions or when they redeem their shares.
| 1 | Performance for Class C shares assumes a 1.00% contingent deferred sales charge (“CDSC”) applied when you sell shares within one year of purchase and includes automatic conversion to Class A shares after eight years. |
| 2 | S&P 500® Index is a widely recognized measure of U.S. stock market performance. It is an unmanaged index of 500 common stocks chosen for market size, liquidity, and industry group representation, among other factors. It also measures the performance of the large cap segment of the U.S. equities market. |
| 3 | Fund performance has been increased by fee waivers and/or expense reimbursements, if any, without which performance would have been lower. |
| 4 | Expense ratios are as shown in the Fund’s prospectus in effect as of the date of this report. The expense ratios for the current reporting period can be found in the Financial Highlights section of this report under Ratios to Average Net Assets. Net expenses reflect contractual expense limitations set to expire on 4/30/23. When a Fund’s expenses are below the limitations, gross and net expense ratios will be the same. See Note 6 of the Notes to Financial Statements for more information about the Fund’s expense limitations. |
9 |
NATIXIS OAKMARK INTERNATIONAL FUND
| | |
| |
| Managers | | Symbols |
| |
| David G. Herro, CFA® | | Class A NOIAX |
| |
| Michael L. Manelli, CFA® | | Class C NOICX |
| |
| Harris Associates L.P. | | Class N NIONX |
| |
| | Class Y NOIYX |
Investment Goal
The Fund seeks long-term capital appreciation.
Market Conditions
Major global markets generally experienced relief in the fourth quarter after equity markets had declined meaningfully throughout the first three quarters of 2022. Conditions in markets turned more favorable as there were early signs that central bank increases in interest rates, improving supply chain conditions, and lower energy prices would lead to reductions in the level of inflation in many countries. International equities benefited from most international currencies strengthening relative to the dollar in the fourth quarter, though most major currencies still ended the year down 5%-15% versus the dollar.
The size of the US Federal Reserve’s hikes to its benchmark interest rate slowed in December to 50 basis points, following a streak of 75 basis point increases in June, July, September and November. Recently, the Bank of Canada increased its benchmark rate by 50 basis points in October and December, while the European Central Bank and Bank of England both hiked their respective rates by 75 basis points in November and 50 in December. The Bank of Japan continued its accommodative policy stance on interest rates through most of the year, but surprised markets by doubling its cap on 10-year yields from 0.25% to 0.50% late in December. The Japanese central bank said the reason was to enhance the sustainability of monetary easing, but many investors speculated it to be a sign of a potential exit from its decade-long stimulus policy. As a result, the yen appreciated against other currencies and Japanese government bonds fell. Late in the year, China backpedaled from its “Zero-Covid” policy and subsequently saw a sharp increase in the number of positive Covid-19 cases.
Performance Results
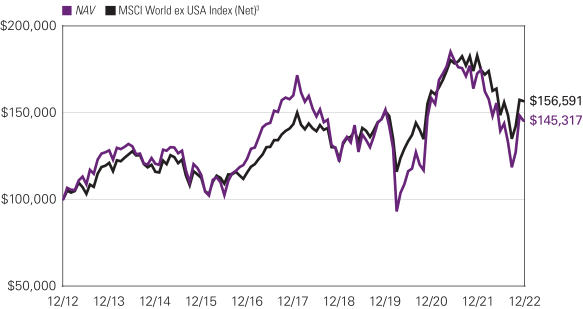
For the 12 months ended December 31, 2022, Class Y shares of the Natixis Oakmark International Fund returned -15.71% at net asset value. The Fund underperformed its benchmark, the MSCI World ex USA Index (Net), which returned -14.29%.
Explanation of Fund Performance
On an absolute-return basis, shares in the materials sector produced the largest positive collective return, while the information technology sector lost the most value.
Geographically, our average weightings for the year were 86% in Europe, 4% in China and 3% in South Korea. The remaining positions were in Canada, Australia, Japan, Mexico, India, Indonesia and South Africa.
The largest detractors from return were Credit Suisse Group and Continental. Credit Suisse Group faced several challenges in 2022 and its share price fell over the 12-month period. The company has suffered from a succession of negative internal and external events, which produced consistent quarterly net income losses during the year. Most recently, third-quarter results were impeded by a CHF 3.7 billion impairment of deferred tax assets (DTA). The DTA is attributed to the company’s securitized products segment, and the expected spinoff of this segment prompted the charge. Although the DTA impairment is a non-cash charge, it necessitated a larger than expected capital raise of CHF 4 billion to enable reaching its target ranges. However, Credit Suisse has instituted some restructuring initiatives to reinstate profitability. These efforts include de-risking operations, which drove management to conduct a strategic review on its investment bank to identify opportunities to transform it into a capital-light, advisory-led banking business with a reduced absolute cost base in the medium term. Another area of focus is digitizing the company’s processes that management anticipates will generate cost savings of CHF 650 million. While management acknowledged that these programs may elevate operating expenditures in the near term, these endeavors are aimed to save costs and boost efficiency moving forward. In addition, Credit Suisse saw the departure of some key executive team members in 2022, including CEO Thomas Gottstein, CFO David Mathers and General Counsel Romeo Cerutti. In our view, Credit Suisse’s new leadership team is a material upgrade and positions the company to better realize benefits from its restructuring plan that appears to be quite methodical and well contemplated. We believe these developments provide a path to a more successful 2023.
Continental revealed encouraging first-quarter earnings figures given the difficult backdrop. ContiTech and the tires business both met headwinds from raw material inflation and logistics issues. While these should normalize over time, adjustments in pricing and
| 10
NATIXIS OAKMARK INTERNATIONAL FUND
product mix aided the company’s results as it navigated the tough environment. In July, Continental warned that free cash flow for the quarter would come in below expectations due to a buildup of working capital related to supply chain issues, material cost inflation and higher receivables due to higher prices. The full release in August added more color for the tires segment, which had organic growth of 11.4%-16.7% of which came from price and product mix and a decline of 5.3%, which came from reduced replacement volumes across all regions. Management indicated that Chinese demand did not pick up as had been expected when lockdowns ended, and the company was unable to fully meet North American demand due to a lack of product availability. Though fiscal-year guidance was confirmed, margins in tires are expected to be under significantly more pressure in the second half due to weaker replacement demand as well as more severe raw material impacts. The company is responding with price increases, though they are not expected to fully offset the inflationary impact. The company’s automotive business reported an operating loss during the second quarter, though margins are expected to recover in the second half of the year due to improving light vehicle production and the benefits of price increases with OEMs. Encouragingly, the company has realized more than EUR 6 billion in order intake in the second quarter, which, when combined with the company’s ongoing restructuring program, supports its medium-term targets. Despite a difficult environment, we believe that Continental has undertaken significant action to improve results and that the company’s exposures across the automotive value chain along with its low valuation make it a compelling investment.
The top contributors to the yearly return were Glencore and Vipshop Holdings ADR. The share price of Glencore was volatile early in the year and rose mainly in the third and fourth quarters. In August, the company delivered a solid set of first-half earnings results, in our view, as marketing segment earnings increased over 100% year-over-year and profit of $3.7 billion handily surpassed the company’s long-term range of $2.2-$3.2 billion for the year. Furthermore, adjusted earnings in the coal segment reached $8.9 billion for the first half, which outpaced our full-year expectations of $15.4 billion. Management later participated in some corporate actions with the goal of enhancing the company’s value. The Australian Foreign Investment Review Board approved Metals Acquisition Corp’s purchase of CSA Copper Mine from Glencore. In addition, Glencore management announced plans to purchase all of Newmont’s stake in the MARA Project, an Argentina-based copper and gold mine, for $124.9 million along with other considerations. At its investor update event in December, Glencore issued its nine-month production report and lowered full-year output targets across most commodities as the company faced negative weather, labor and supply chain issues in certain geographies. Even so, management still expects fiscal second-half marketing segment earnings will exceed $1.6 billion, which would fall at the high end of the previously established long-term guidance range. The company also announced plans to close 12 coal mines by 2035 as it endeavors to achieve its climate priorities.
Vipshop Holdings delivered fiscal first-quarter results that met consensus estimates for both sales and profitability. A gross merchandise value decline of 8% aligned with the decline in active annual customers, which was attributable to weak consumer demand. However, gross profit margins improved 10 basis points year-over-year due to an improving business mix and management’s removal of lower quality brands. We appreciated management’s efforts to control costs. Despite the difficult backdrop in the second quarter, with much of the economy closed, Vipshop beat consensus estimates on revenue and earnings by 6% and 30%, respectively. The company made progress on cost controls, with gross profit margins improving 40 basis points to 20.5%. This figure was helped by multiple efficiency measures such as reduced coupons, cutting lower margin brands, and improving returns. Later, the company released third-quarter results that were generally better than consensus expectations. Revenue declined 14% and gross merchandise value declined almost 7%, held back by a weak macro environment and impacts from Covid-19. Despite the disappointing topline figures, we believe margins continued to show strength. Gross profit margins came in at 21.7%, 220 basis points higher than last year and 120 basis points higher than the second quarter. Management has been making an effort to improve mix and has also reduced discounts, which showed progress during the quarter as this is the highest gross profit margin reached in nearly two years. We appreciate that over the past twelve months before the release, Vipshop generated $1 billion in free cash flow on a $5.5 billion market cap. During the third-quarter management bought back $260 million in stock and had $560 million left in the current buyback program.
Outlook
While we recognize the challenge facing investors with the current state of financial markets, we believe that the lower and more widely dispersed valuations in the market today have allowed us to redeploy capital into increasingly attractive investments. We are optimistic that these decisions will sow the seeds of future outperformance. As always, we remain focused on building a high conviction portfolio of undervalued businesses that we believe will provide both a margin of safety and the potential for attractive risk-adjusted returns over the long term.
11 |
Top Ten Holdings as of December 31, 2022
| | | | | | | | |
| | | |
| | | | Security Name | | % of
Net Assets | |
| | 1 | | | BNP Paribas S.A. | | | 3.40 | % |
| | 2 | | | Intesa Sanpaolo SpA | | | 3.20 | |
| | 3 | | | Lloyds Banking Group PLC | | | 3.05 | |
| | 4 | | | Mercedes-Benz Group AG (Registered) | | | 2.97 | |
| | 5 | | | Prosus NV | | | 2.70 | |
| | 6 | | | Allianz SE (Registered) | | | 2.59 | |
| | 7 | | | Continental AG | | | 2.59 | |
| | 8 | | | Bayerische Motoren Werke AG | | | 2.58 | |
| | 9 | | | Fresenius SE & Co. KGaA | | | 2.49 | |
| | 10 | | | Adidas AG | | | 2.42 | |
The portfolio is actively managed and holdings are subject to change. There is no guarantee the Fund continues to invest in the securities referenced. The holdings listed exclude any temporary cash investments, are presented on an individual security basis and do not represent holdings of the issuer.
Hypothetical Growth of $100,000 Investment in Class Y Shares1,4
December 31, 2012 through December 31, 2022
See notes to chart on page 13.
| 12
NATIXIS OAKMARK INTERNATIONAL FUND
Average Annual Total Returns — December 31, 20224
| | | | | | | | | | | | | | | | | | | | | | | | |
| | | | | | |
| | | 1 Year | | | 5 Years | | | 10 Years | | | Life of
Class N | | | Expense Ratios5 | |
| | Gross | | | Net | |
| | | | | | | |
| Class Y (Inception 5/1/17) | | | | | | | | | | | | | | | | | | | | | | | | |
| NAV1 | | | -15.71 | % | | | -1.90 | % | | | 3.81 | % | | | — | % | | | 1.10 | % | | | 0.90 | % |
| | | | | | | |
| Class A | | | | | | | | | | | | | | | | | | | | | | | | |
| NAV | | | -15.91 | | | | -2.14 | | | | 3.66 | | | | — | | | | 1.35 | | | | 1.15 | |
| With 5.75% Maximum Sales Charge | | | -20.72 | | | | -3.29 | | | | 3.05 | | | | — | | | | | | | | | |
| | | | | | | |
| Class C | | | | | | | | | | | | | | | | | | | | | | | | |
| NAV | | | -16.50 | | | | -2.87 | | | | 3.04 | | | | — | | | | 2.10 | | | | 1.90 | |
| With CDSC2 | | | -17.32 | | | | -2.87 | | | | 3.04 | | | | — | | | | | | | | | |
| | | | | | | |
| Class N (Inception 5/1/17) | | | | | | | | | | | | | | | | | | | | | | | | |
| NAV | | | -15.65 | | | | -1.84 | | | | — | | | | 0.51 | | | | 1.25 | | | | 0.85 | |
| | | | | | | |
| Comparative Performance | | | | | | | | | | | | | | | | | | | | | | | | |
| MSCI World ex USA Index (Net)3 | | | -14.29 | | | | 1.79 | | | | 4.59 | | | | 3.87 | | | | | | | | | |
Performance data shown represents past performance and is no guarantee of, and not necessarily indicative of, future results. Total return and value will vary, and you may have a gain or loss when shares are sold. Current performance may be lower or higher than quoted. For most recent month-end performance, visit im.natixis.com/performance. Performance for other share classes will be greater or less than shown based on differences in fees and sales charges. You may not invest directly in an index. Performance for periods less than one year is cumulative, not annualized. Returns reflect changes in share price and reinvestment of dividends and capital gains, if any. The table(s) do not reflect taxes shareholders might owe on any fund distributions or when they redeem their shares.
| 1 | Prior to the inception of Class Y shares (5/1/2017), performance is that of Class A shares and reflects the higher net expenses of that share class. |
| 2 | Performance for Class C shares assumes a 1.00% contingent deferred sales charge (“CDSC”) applied when you sell shares within one year of purchase, and includes automatic conversion to Class A shares after eight years. |
| 3 | MSCI World ex USA Index (Net) is an unmanaged index that is designed to measure the equity market performance of developed markets, excluding the United States. |
| 4 | Fund performance has been increased by fee waivers and/or expense reimbursements, if any, without which performance would have been lower. |
| 5 | Expense ratios are as shown in the Fund’s prospectus in effect as of the date of this report. The expense ratios for the current reporting period can be found in the Financial Highlights section of this report under Ratios to Average Net Assets. Net expenses reflect contractual expense limitations set to expire on 4/30/23. When a Funds expenses are below the limitation, gross and net expense ratios will be the same. See Note 6 of the Notes to Financial Statements for more information about the Funds expense limitations. |
13 |
NATIXIS U.S. EQUITY OPPORTUNITIES FUND
| | | | |
| |
| Managers | | Symbols |
| | |
| William C. Nygren, CFA® | | Class A | | NEFSX |
| | |
| Robert F. Bierig* | | Class C | | NECCX |
| | |
| M. Colin Hudson, CFA®** | | Class N | | NESNX |
| | |
| Michael J. Mangan, CFA®, CPA | | Class Y | | NESYX |
| | |
| Michael A. Nicolas, CFA® | | | | |
| | |
| Harris Associates L.P. | | | | |
| |
| | |
| | |
| Aziz V. Hamzaogullari, CFA® | | | | |
| | |
| Loomis, Sayles & Company, L.P. | | | | |
| * | Effective August 1, 2022, Robert F. Bierig serves as portfolio manager of the Fund. |
| ** | Effective August 1, 2022, M. Colin Hudson no longer serves as portfolio manager of the Fund. |
Investment Goal
The Fund seeks long-term growth of capital.
Market Conditions
The 2022 market and economic environment demonstrates what can occur after a disruption of risk and infatuation with short-term trends. While US stocks hit record highs in January 2022 and economic growth looked poised to build on a strong Q42021, the specter of higher-than-expected inflation and Russia’s invasion of Ukraine slammed the brakes on the US economy, while heightening geopolitical risk.
The war immediately stoked inflation fears, disrupting commodities exports of wheat, oil, gas, and metals. US inflation climbed through the first half of 2022, peaking at 9.1% in June before leveling off to an annual increase of 6.5%. The US Federal Reserve (Fed) Board embarked on an inflation-fighting campaign, instituting seven interest rate hikes during 2022. Rates rose to their highest level since 2007 as the Fed indicated more moderate increases were ahead in 2023.
Technology stocks, fed by the pandemic and low interest rates, stumbled in a generally negative market environment: Amazon by 51%, Tesla by 68%, and Meta by 66%. As earnings fell back to earth, tech companies fired more than 200,000 workers in late 2022.
These were not the only companies to suffer as broad US markets withstood a dismal 2022. The Nasdaq Composite fell 33.1% while the S&P 500® declined by 18.1%, and the Russell 2000 was off by 21.6%.
Meanwhile, the Omicron variant of Covid-19 wreaked havoc across the country, with hospitalizations and deaths rising to new highs in the winter of 2022. Covid has negatively affected workforce participation and productivity, which experts estimate resulted in a billion days of lost work since 2020.
Performance Results
For the 12 months ended December 31, 2022, Class Y shares of the Natixis U.S. Equity Opportunities Fund returned -20.95% at net asset value. The Fund underperformed its primary benchmark, the S&P 500® Index, which returned -18.11%, and also underperformed its secondary benchmark, the Russell 1000® Index, which returned -19.13%.
Explanation of Fund Performance
Each of the portfolio’s segments uses a distinct investment style, providing shareholders with exposure to a variety of different stocks:
| | • | | The Harris Associates Large Cap Value segment invests primarily in the common stocks of larger-capitalization companies that Harris Associates L.P. (“Harris Associates”) believes are trading at a substantial discount to the company’s “true business value.” |
| | • | | The Loomis Sayles All Cap Growth segment invests primarily in equity securities and may invest in companies of any size. The segment employs a growth style of equity management that emphasizes companies with sustainable competitive advantages versus others, long-term structural growth drivers that will lead to above-average future cash flow growth, attractive cash flow returns on invested capital, and management teams focused on creating long-term value for shareholders. The segment aims to invest in companies when they trade at a significant discount to the estimate of intrinsic value. |
| 14
NATIXIS U.S. EQUITY OPPORTUNITIES FUND
Both segments contributed negatively to the Fund’s performance.
Harris Associates Large Cap Value Segment
As value investors with an emphasis on individual stock selection, our sector weights are a byproduct of our bottom-up process. On an absolute-return basis, the energy sector gained the most value, while holdings in the communication services sector lost the most value.
The largest contributors to segment performance for the year were EOG Resources and APA Corporation. While energy price increases have helped companies across the sector this year, EOG Resources has also operated well on a fundamental basis, in our view. Second-quarter results showed that EOG is growing production without a disproportionate capital expense increase, which we see as evidence that management’s efficiency measures are working. Second-quarter production grew 11% from a year earlier and capital expenditures rose 14%; both metrics were better than market expectations. The company later reported a strong set of third-quarter results, in our view. Revenue of $7.59 billion surpassed consensus expectations of $6.26 billion, production grew 9% year-over-year, and capital expenditures were 6% below consensus expectations. Capital expenditures increased faster than production due to inflation, higher growth and additional exploration; however, full-year figures were within initial guidance. EOG also announced the discovery of a new opportunity in the Ohio Utica Basin by using learnings from decentralized teams across multiple basins to enter an overlooked opportunity. The company quietly amassed 395,000 acres for more than $500 million, acquired around 20 legacy wells for data, and drilled four initial wells to confirm their reservoir model. Management said the initial wells would qualify as double premium with longer laterals, and Utica wells could have the same oil recovery as the Delaware Basin, which we believe would be a great win. We continue to like the effectiveness of the company’s management team.
APA Corporation finished higher alongside rising energy prices early in the year, even though fourth-quarter results were generally below consensus estimates, which we attributed mainly to cost inflation weighing on free cash flow (FCF). Management guided to $6.5 billion of cumulative free cash flow over the next three years, each at strip prices with 5% annual growth. The company also announced a successful oil discovery at its new Krabdagu prospect. We believe if the well flows as well as the nearby Sapakara well, it is likely to result in a fast-tracked final investment decision for a large development hub in the area. Later in the first quarter, APA announced it closed on two transactions totaling around $1 billion in net proceeds. More recently, third-quarter results from APA were good, in our assessment. Total revenue of $2.89 billion, adjusted earnings (EBITDAX)1 of $1.69 billion and adjusted earnings per share of $1.97 all exceeded market expectations. More importantly, revenue rose 40% year-over-year and EBITDAX advanced 46%, while adjusted earnings per share doubled from a year earlier. We were pleased that drilling operations in both the Permian Basin and Egypt are accelerating, which eased concerns about sluggish second-quarter performance. Management expects $2.7 billion of total FCF in 2022 (a 19% FCF yield) and expects further growth in 2023 even at flat commodity prices. We found it impressive that over the last two years APA has reduced its net debt from $8.9 billion to $4.9 billion. Furthermore, during the most recent two-year period the company repurchased almost 20% of its share base and it continues with its buyback efforts. Management repurchased 10 million shares (3% of shares outstanding) in the third quarter and plans to repurchase another $520 million worth of shares (another 3%) in the fourth quarter. The company also announced the quarterly dividend would double to an annualized rate of $1.00 per share. We remain pleased with APA’s fundamental performance.
The largest detractors to segment performance for the year were Meta Platforms and Ally Financial. The share price of Meta Platforms declined throughout the year as the company faced several challenges. Investors proved disappointed by Meta Platforms’ 2021 fourth-quarter earnings report and its share price fell over 20% following its release. Management pointed to new regulation in Europe and Apple iOS changes as a $10 billion headwind for personalized advertisements. The company also reported its first decline in daily active users for Facebook, which we believe was attributable to the size of the existing base and the amount of users pulled forward during the Covid-19 pandemic. Management emphasized its focus on generating revenue from its fastest growing content format, Reels, a competitor to TikTok. The company believes the transition from stories to reels will be similar to the transition from feed to stories in 2018 and expressed encouragement from early results. Late in April, Meta delivered a disappointing earnings report for the first quarter and guidance for the second quarter. The company reduced its expense guidance for the year, suggesting that much of the spend is highly discretionary, and daily active users on its platforms accelerated sequentially by 50 million in the second quarter versus 10 million in the first quarter. Meta reported a 1% decline in second-quarter revenue, in line with its guidance and consensus expectations. Core margins (ex-Reality Labs) came in at 39%, or 29% including the $2.8 billion loss from Reality Labs, which has lost $5.8 billion year to date. Cyclical weakness in advertising budgets, which worsened sequentially; the lingering impacts from Apple’s ad tracking changes; and higher engagement in Reels all weighed on results. Reels represented 20% of time spent on Instagram alone last quarter, and management said they saw a 30% increase in engagement on both Instagram and Facebook sequentially.
We spoke with Meta Platforms’ CFO Susan Li following the company’s third-quarter earnings report. After our discussion, we believe the core platform remains healthy, as evidenced by engagement and time spent remaining strong. While IDFA (identifier for
| 1 | EBITDAX stands for Earnings Before Interest, Taxes, Depreciation, Amortization, and Exploration Expense. It is an indicator of financial performance that is used when reporting earnings, specifically for oil and mineral exploration. |
15 |
advertisers) pressured growth this year, results show the company is lapping the impact from that headwind. Reels monetization is showing rapid growth, and we believe organic revenue trends look set to improve both next year and beyond. Expense management is becoming more disciplined, but we believe there remains work to be done. The company is finding more cost-cutting opportunities, and we were told CEO Mark Zuckerberg is increasingly focused on core profitability given the mounting pressure both external and internal. Despite this, the company is committed to ramping capital spend for the time being. Li believes the increase in Artificial Intelligence spending is paying off, but it is still early in the process. She said the pace of spending will be governed by the returns it generates, and the company should benefit through improved ad effectiveness, engagement, and content editing and creation capabilities, among others. As for the Reality Labs segment, management sees this spend intrinsically tied to the success of the core platforms as they prepare for the potential next computing platform. In our view, the company has a very profitable core business paired with a large amount of growth capital spend and a bet on a potentially large new business opportunity that has an uncertain timeframe and probability of success. While the lack of expense discipline has lowered our estimate of intrinsic value, we continue to believe the company is undervalued at its current price.
First-quarter results from Ally Financial were impressive, in our view, as reported return on tangible common equity was nearly 24% and earning asset yields rose 11 basis points sequentially while funding costs declined 4 basis points, resulting in a near 4% net interest margin. Management believes it will generate a roughly 20% return on tangible common equity on a full-year basis and reiterated their 16%-18% target for 2023 and onward. We recognize that the inevitable normalization of credit, which continues to remain tame and below normal levels, combined with weakening used car prices and potential deposit rate pressure could eventually make the operating environment more challenging. CFO Jenn LaClair remains very optimistic and believes Ally will have some natural hedges in place to partially offset used car price declines. Second-quarter revenue was slightly better than market expectations, while earnings per share fell short of projections by about 4%. In terms of absolute earnings, the company’s results were again above trend with a reported return on tangible common equity of 23%. Earning asset yields rose by 25 basis points and repriced higher than funding sources in the second quarter, which drove the net interest margin to an impressive 4.06%, an increase of 49 basis points year-over-year. Following the earnings release, we met with CEO Jeff Brown and Jenn LaClair and discussed the company’s competitive advantage in auto lending. Loan receivables from retail auto borrowers grew faster than the industry in the second quarter, which management attributed to an expanded dealer count (+20% over the past few years) and higher application flow as well as from what they consider to be extremely attractive risk-adjusted returns.
The company reported third-quarter results with revenue and adjusted earnings per share that both undershot market expectations. Revenue rose about 2% from last year to $2.02 billion, while adjusted earnings per share fell by nearly half. Just prior to the earnings release, LaClair stepped down from her role as CFO and will now be a senior operating adviser. Bradley Brown, who had been the corporate treasurer since 2013, will serve as interim CFO. Upon review of the third-quarter earnings report, we observed that earning asset yields continue to improve and accelerated by 50 basis points quarter-over-quarter to 5.59%. However, funding costs increased 77 basis points from last year with deposit costs roughly doubling from 0.76% to 1.58%, which caused the net interest margin to contract by 23 basis points to 3.81%. In addition, auto loan originations were down 8% sequentially from last quarter and unchanged from last year. We spoke with Ally’s management team and discussed the company’s auto loan activity. While management expects lower current year retail auto loan balances than in pre-pandemic years, the company foresees a recovery upon the normalization of vehicle inventories. Also, Jeff Brown stated that Ally continues to be disciplined in its underwriting standards, which should protect against significant downside effects if the economy slows dramatically. Despite these near-term challenges, we find this company is poised to offer shareholder rewards moving forward.
Loomis Sayles All Cap Growth Segment
We are an active manager with a long-term, private equity approach to investing. Through our proprietary bottom-up research framework, we look to invest in those few high-quality businesses with sustainable competitive advantages and profitable growth when they trade at a significant discount to intrinsic value. For the period, the All Cap Growth segment posted a negative absolute return. Our holdings in the consumer staples, energy and industrials sectors contributed positively to results. Our holdings in the information technology, communication services, consumer discretionary, healthcare, and financials sectors detracted from the segment’s performance.
Alnylam Pharmaceuticals and Monster Beverage were the largest contributors to performance during the period. Alnylam Pharmaceuticals is a leader in gene therapies based on its pioneering small-interfering RNA (siRNA) approach to disease treatment. Founded in 2002, Alnylam was one of the first companies to develop and commercialize therapies based on RNA interference (RNAi), a breakthrough discovery in understanding how genes are naturally regulated within cells that was recognized with the 2006 Nobel Prize in Medicine. We believe Alnylam’s strong and sustainable competitive advantages include its deep, cumulative and compounding knowledge in the science of RNAi therapeutics, in particular its creation and advancement of unique siRNA-based therapies, and the multiple partnerships it has entered on the basis of its technology, which provide both external funding and established commercialization avenues. Today, the company’s technology is the basis for five approved therapies, six therapies currently in clinical trials, and a robust pipeline of potential treatments that we expect to enter clinical trials in the coming years, with a
| 16
NATIXIS U.S. EQUITY OPPORTUNITIES FUND
focus on genetic diseases, cardiometabolic diseases, infectious diseases, and central nervous system and ocular diseases. A strategy holding since the second quarter of 2021, shares jumped almost 50% in August following news that Onpattro, the company’s approved therapy for hATTR amyloidosis, met its primary endpoint in the much larger indication of ATTR with cardiomyopathy, which is estimated to have a patient population approximately ten times as large. The results substantially increase the likelihood that the therapy will receive approval in the new indication, where it would be the first RNAi-based therapy. We believe the uniqueness of Alnylam’s pioneering scientific expertise and technology is evident from both its existing products, which provide meaningful value to previously underserved patient populations, and the numerous partnerships in which world-class global pharmaceutical companies and specialty competitors alike have sought to access its proprietary technology. With its approved therapies and substantial pipeline of significant late-stage clinical programs, we believe the company has now reached the point at which its existing therapies will continue to contribute positively, and its subsequent innovations will shift its financial profile from that of an early-stage biotech company to a profitable business with normalized margins that is able to internally fund its ongoing growth needs. Over our long-term investment horizon, we believe the company can generate substantial revenue growth, while turning profitable and generating substantial cumulative free cash flow. We believe Alnylam’s market price continues to substantially undervalue the potential contribution from the company’s clinical-stage assets – which we believe is unsupported by the company’s established track record for producing genetically validated therapeutics. Further, while embedded expectations reflect some success for its currently marketed products, we believe the market is focused on short-term profitability while ignoring the platform the company has built, which we believe will serve as the basis for ongoing innovation over our long-term investment horizon and beyond. As a result, we believe the company is selling at a substantial discount to our estimate of its intrinsic value and offers a compelling reward-to-risk opportunity.
Monster Beverage is a leading marketer and distributor of energy drinks in the US and internationally. We believe Monster’s strong and sustainable competitive advantages include its iconic brands, the benefits of scale, and its strong entrepreneurial culture. A holding in the strategy since 2013, Monster reported strong sales growth during the period, but faced pressure on profitability due to materials cost inflation, increased logistics costs, and can shortages that have led the company to import cans. After losing market share to Red Bull in the US over the past several quarters, as reflected in channels measured by Nielsen, the company more recently returned to share gains and market share leadership, despite increasing pricing by 6% in September. Throughout the period the company performed consistently well in channels not measured by Nielsen, such as e-commerce and sales through Home Depot. Outside of the US, Monster continued to take market share and demonstrated impressive sales growth. While cost inflation has impacted the consumer packaged goods industry broadly, Monster has been reducing promotions and trade spending and may take further price increases in the US and internationally. Despite the near-term pressure on margins, we believe the company will benefit from margin expansion over the long term as it achieves greater scale in international markets. The global energy drink industry is effectively a duopoly, creating strong competitive advantages for Monster and Red Bull, which command a combined share of approximately 80% of the US market, and an estimated 50% of the $50 billion global energy drink market. Patiently built using non-traditional, grassroots marketing, Monster’s iconic brand is a competitive advantage so difficult to replicate that even Pepsi and Coca-Cola were unable to make meaningful inroads in the profitable and growing energy drink market, despite over a decade of effort and investments. In 2014, Monster entered a partnership with Coca-Cola in which Coca-Cola purchased a 16.7% stake in the company, and Monster became its exclusive energy drink partner. The partnership gives Monster access to Coca-Cola’s unmatched global distribution system, accelerating its pace of international expansion, and extending its benefits of scale. We believe that energy drinks are here to stay and that continued increases in per-capita consumption in international markets will drive secular growth over our investment horizon. We estimate Monster can grow in the mid-teens in international markets and at a mid-to-high single-digit rate in the US market over our long-term investment horizon. As the company continues to scale its business in international markets, we expect it will be able to increase cash flow growth, expand margins, and improve its return on invested capital. We trimmed the position during the period following strong relative price performance but continue to believe the shares embed expectations for revenue and free cash flow that are below our long- term expectations. As a result, we believe the shares are trading at a discount to our estimate of intrinsic value and offer an attractive reward-to-risk opportunity.
Meta Platforms and Amazon were the largest detractors during the period. Meta Platforms operates online social networking platforms that allow people to connect, share, and interact with friends and communities. With over 3.7 billion monthly users, 200 million businesses, and 10 million advertisers worldwide using its family of apps — Facebook, Messenger, WhatsApp, and Instagram — the scale and reach of Meta’s network is unrivaled. A strategy holding since its IPO in 2012, Meta reported financial results during the period that were generally mixed with respect to consensus expectations. The company faced headwinds arising from privacy restrictions by Apple, the continuing impact of macro weakness on advertising spending, and a transition to a new product format — short-form video — where monetization is currently lower. Management previously addressed the changes by Apple, which it believes decreased the accuracy of Facebook’s ad targeting, increased the difficulty of measuring outcomes, and contributed to underreporting of successful conversions such as sales and app installs by approximately 15% in the third quarter of 2021. The company has already been investing in a number of solutions, including commerce tools to help businesses reach more customers and privacy-enhancing technologies, and believes it has closed a substantial portion of the measurement gap. Apple’s changes impact not just Meta, but the broader mobile advertising ecosystem. As a function of its competitive advantages, we believe Meta remains well
17 |
positioned relative to its peers, and there are no changes to our assessment of the company’s quality or secular growth opportunities. Another near-term headwind is the company’s capital investments in and transition to a new product format — the short-form video. During our ownership of Meta, Facebook has gone through several product transitions. Each such transition first requires capital expenditures followed by a gradual revenue ramp-up, creating pressures on topline, margins, and earnings. Over time, the required investment decreases and revenues increase. Of note, the Instagram “Reels” product, launched in August 2020, is now Meta’s fastest growing content format and largest contributor to engagement. We believe this is a necessary cycle for maintaining sustainable competitive advantages and long-term growth. Finally, the company continues to invest significantly in its early-stage Reality Labs segment, which includes augmented and virtual reality products that the company views as building its long-term vision for the metaverse. While the company has incurred year-to-date operating expenses of $10.9 billion in the Reality Labs segment, the investment represented only one-third of the operating profit generated by the company’s highly profitable core business. Mark Zuckerberg has always managed the company with a long-term focus and strong strategic vision. Over the past ten years, Meta has spent over $90 billion on research and development and $80 billion on capital expenditures — a level of investment which few firms can match and which creates high barriers to entry for competitors. And while the successful development of a metaverse is not an explicit part of our investment thesis for Meta, given the potential size of the opportunity, which we estimate could impact over $1 trillion of spending over the long term, and Meta’s positioning with billions of users and hundreds of millions of businesses, we believe Meta’s current balanced approach to its forward-looking investments makes sense. We expect that corporations will continue to allocate an increasing proportion of their advertising spending online, and Meta remains one of very few platforms where advertisers can reach consumers at such scale in such a targeted and effective fashion. We believe Meta’s brands, network, and targeting advantage position the company to take increasing share of the industry’s profit pool and grow its market share from 6% currently to approximately 10% of the total global advertising market over our investment time horizon. On the basis of its core business alone, we believe the company is substantially undervalued, even accounting for elevated levels of investment. We took advantage of near-term market weakness to add to our position on multiple occasions during the year.
Online retailer Amazon offers millions of products — sold by Amazon or by third parties — with the value proposition to consumers of selection, price, and convenience. Amazon’s enterprise IT business, Amazon Web Services (AWS), offers a suite of secure, on-demand cloud-computing services, with a value proposition to clients of speed, agility, and savings. In both of its core markets, we believe Amazon possesses strong and sustainable competitive advantages that would be difficult for competitors to replicate. A segment holding since inception, Amazon reported fundamentally solid operating results that were generally above management’s guidance during the period. However, Amazon is facing short-term cost inflation that has contributed to over $10 billion of incremental expense over the past few quarters. While a portion of the additional expense is outside of Amazon’s direct control, including higher shipping, fuel, and labor costs, approximately two-thirds stems from Amazon’s strategic decision to invest in labor to make up for Covid-related employee absences, as well as investments undertaken to ensure that its fulfillment and transportation network remained unconstrained during the pandemic. And while expense pressures are expected to persist for the foreseeable future, Amazon expects them to decline over the coming quarters. Over time, we expect that Amazon will take steps to mitigate external cost inflation, and that it will realize greater productivity and fixed cost leverage from its investments in labor, fulfillment, and distribution. Despite a deceleration of revenue growth in its online retail business from the pandemic-enhanced prior year, we continue to believe Amazon is well positioned for durable long-term growth. Further, the company has added over 50 million Prime members over the past two years and is seeing strong growth in other businesses including AWS and advertising. Earlier in the year, the company announced it was increasing the price of Prime membership for the first time since 2018, which we believe reflects its pricing power and ability to offset cost inflation. These near-term challenges do not impact our long-term view of Amazon’s quality, growth, or the attractiveness of its reward-to-risk proposition. We believe Amazon is one of the best-positioned companies in e-commerce and enterprise IT — in each case addressing large, underpenetrated markets experiencing secular growth that is still in its early stages. We believe the current share price shows a lack of appreciation for Amazon’s significant long-term growth opportunities and the sustainability of its business model. As a result, we believe the company is selling at a significant discount to our estimate of intrinsic value and offers a compelling reward-to-risk opportunity.
| 18
NATIXIS U.S. EQUITY OPPORTUNITIES FUND
Top Ten Holdings as of December 31, 2022
| | | | | | | | |
| | | |
| | | | Security Name | | % of
Net Assets | |
| | 1 | | | Alphabet, Inc., Class A | | | 4.75 | % |
| | 2 | | | Oracle Corp. | | | 4.15 | |
| | 3 | | | Amazon.com, Inc. | | | 3.85 | |
| | 4 | | | Netflix, Inc. | | | 3.56 | |
| | 5 | | | Wells Fargo & Co. | | | 2.82 | |
| | 6 | | | Salesforce, Inc. | | | 2.81 | |
| | 7 | | | Capital One Financial Corp. | | | 2.62 | |
| | 8 | | | KKR & Co., Inc. | | | 2.59 | |
| | 9 | | | Boeing Co. (The) | | | 2.42 | |
| | 10 | | | Workday, Inc., Class A | | | 2.31 | |
The portfolio is actively managed and holdings are subject to change. There is no guarantee the Fund continues to invest in the securities referenced. The holdings listed exclude any temporary cash investments, are presented on an individual security basis and do not represent holdings of the issuer.
Hypothetical Growth of $100,000 Investment in Class Y Shares4
December 31, 2012 through December 31, 2022
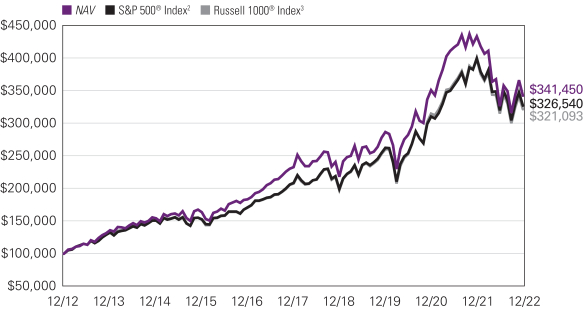
19 |
Average Annual Total Returns — December 31, 20224
| | | | | | | | | | | | | | | | | | | | | | | | |
| | | | | | |
| | | 1 Year | | | 5 Years | | | 10 Years | | | Life of
Class N | | | Expense Ratios5 | |
| | Gross | | | Net | |
| | | | | | | |
| Class Y | | | | | | | | | | | | | | | | | | | | | | | | |
| NAV | | | -20.95 | % | | | 8.02 | % | | | 13.06 | % | | | — | % | | | 0.84 | % | | | 0.84 | % |
| | | | | | | |
| Class A | | | | | | | | | | | | | | | | | | | | | | | | |
| NAV | | | -21.15 | | | | 7.75 | | | | 12.79 | | | | — | | | | 1.09 | | | | 1.09 | |
| With 5.75% Maximum Sales Charge | | | -25.68 | | | | 6.49 | | | | 12.12 | | | | — | | | | | | | | | |
| | | | | | | |
| Class C | | | | | | | | | | | | | | | | | | | | | | | | |
| NAV | | | -21.77 | | | | 6.94 | | | | 12.11 | | | | — | | | | 1.84 | | | | 1.84 | |
| With CDSC1 | | | -22.33 | | | | 6.94 | | | | 12.11 | | | | — | | | | | | | | | |
| | | | | | | |
| Class N (Inception 5/1/17) | | | | | | | | | | | | | | | | | | | | | | | | |
| NAV | | | -20.88 | | | | 8.12 | | | | — | | | | 10.10 | | | | 1.33 | | | | 0.78 | |
| | | | | | | |
| Comparative Performance | | | | | | | | | | | | | | | | | | | | | | | | |
| S&P 500® Index2 | | | -18.11 | | | | 9.42 | | | | 12.56 | | | | 10.67 | | | | | | | | | |
| Russell 1000® Index3 | | | -19.13 | | | | 9.13 | | | | 12.37 | | | | 10.39 | | | | | | | | | |
Performance data shown represents past performance and is no guarantee of, and not necessarily indicative of, future results. Total return and value will vary, and you may have a gain or loss when shares are sold. Current performance may be lower or higher than quoted. For most recent month-end performance, visit im.natixis.com/performance. Performance for other share classes will be greater or less than shown based on differences in fees and sales charges. You may not invest directly in an index. Performance for periods less than one year is cumulative, not annualized. Returns reflect changes in share price and reinvestment of dividends and capital gains, if any. The table(s) do not reflect taxes shareholders might owe on any fund distributions or when they redeem their shares.
| 1 | Performance for Class C shares assumes a 1.00% contingent deferred sales charge (“CDSC”) applied when you sell shares within one year of purchase and includes automatic conversion to Class A shares after eight years. |
| 2 | S&P 500® Index is a widely recognized measure of U.S. stock market performance. It is an unmanaged index of 500 common stocks chosen for market size, liquidity, and industry group representation, among other factors. It also measures the performance of the large cap segment of the US equities market. |
| 3 | Russell 1000® Index measures the performance of the large-cap segment of the U.S. equity universe. It is a subset of the Russell 3000® Index and includes approximately 1000 of the largest securities based on a combination of their market cap and current index membership. The Russell 1000® Index represents approximately 92% of the U.S. market and is constructed to provide a comprehensive and unbiased barometer for the large-cap segment and is completely reconstituted annually to ensure new and growing equities are reflected. |
| 4 | Fund performance has been increased by fee waivers and/or expense reimbursements, if any, without which performance would have been lower. |
| 5 | Expense ratios are as shown in the Fund’s prospectus in effect as of the date of this report. The expense ratios for the current reporting period can be found in the Financial Highlights section of this report under Ratios to Average Net Assets. Net expenses reflect contractual expense limitations set to expire on 4/30/24. When a Fund’s expenses are below the limitation, gross and net expense ratios will be the same. See Note 6 of the Notes to Financial Statements for more information about the Fund’s expense limitations. |
| 20
VAUGHAN NELSON MID CAP FUND
| | |
| |
| Managers | | Symbols |
| |
| Dennis G. Alff, CFA® | | Class A VNVAX |
| |
| Chad D. Fargason, PhD | | Class C VNVCX |
| |
| Chris D. Wallis, CFA®, CPA | | Class N VNVNX |
| |
| Vaughan Nelson Investment Management, L.P. | | Class Y VNVYX |
Investment Goal
The Fund seeks long-term capital appreciation.
Market Conditions
During the fiscal year ended December 31, 2022, equity market performance was initially defined by Russia’s invasion of Ukraine and NATO’s sharp response. These events further supported inflationary pressures and weighed on future economic growth.
The US Federal Reserve (Fed) raised the fed funds rate, kicking off the first Fed hiking cycle since 2018. The high inflation environment proved stickier than expected. With inflation elevated, the cost of capital rising, liquidity conditions deteriorating, and earnings estimates set for negative revisions, heightened equity market volatility led to further downside.
As we moved through the summer months, risk assets continued to be pressured by accelerating inflationary pressures, decelerating economic growth, and tightening financial conditions. Inflationary pressures in the US moved from goods to services and housing, in the form of owners’ equivalent rent – the amount a property owner would have to pay in rent to equal their cost of ownership. The yield curve flattened with the M2 money supply decelerating. M2 measures liquid assets such as savings, checking and money market accounts. The rapid slowdown in economic growth and tightening financial conditions are creating a recessionary environment in the US, Europe, and most export-led economies.
Exceptional US dollar strength drove markets as the Fed dramatically tightened financial conditions by increasing interest rates and aggressively shrinking its balance sheet. The strong US dollar accelerated the exportation of US inflation to the rest of the world, forcing nearly all global central banks to follow the Fed in raising interest rates. Tighter financial conditions forced global equity and fixed income markets to reduce investment positions and leverage, driving nearly all asset classes lower.
The fourth quarter recovery in equity markets was driven by peaking inflationary conditions and the rapid increase in non-US interest rates relative to US interest rates, which triggered a broad-based decline in the US dollar. The 2022 bear market in equities reflects the impact of higher interest rates increasing the cost of capital, and thereby decreasing equity valuations.
Performance Results
For the 12 months ended December 31, 2022, Class Y shares of the Vaughan Nelson Mid Cap Fund returned -10.58% at net asset value. The Fund outperformed its benchmark, the Russell Midcap® Value Index, which returned -12.03%.
Explanation of Fund Performance
The Fund outperformed on a relative basis during the period.
The largest contributor was industrials, driven by security selection. WillScot Mobile Mini Holdings Corp. Class A was the top name in the sector. WillScot beat and raised earnings throughout the year and benefited from its initiatives in value-added products. Selection within consumer services assisted, with performance led by Nexstar Media Group, Inc. Nexstar benefited due to its strong free cash flow generation in a market where investors sought value and cash flow.
The Fund was void of real estate companies throughout 2022. This benefited the portfolio, as real estate was an underperforming sector. Information Technology was an outperforming sector, with Motorola Solutions, Inc. the top name. Motorola continued its beat and raise cycle with defensible end markets and a margin expansion story.
Selection within consumer discretionary, specifically Aramark, bolstered the Fund. Aramark’s sales initiatives are beginning to bear fruit, and the market has become optimistic that margin expansion can follow. Financials contributed to the Fund’s outperformance, with Reinsurance Group of America, Incorporated (RGA) the top name. RGA outperformed as Covid headwinds are beginning to abate for the company. An overweight to utilities, an outperforming sector, added to relative performance.
The largest detracting sector was healthcare, with Aveanna Healthcare Holdings Inc the most impaired name. Aveanna continued to experience both sales and margin pressure due to labor constraints. Selection within materials hurt performance, with Crown Holdings, Inc. the worst relative performer. Crown suffered as sales struggled to surpass the surge resulting from Covid. Margins were
21 |
under pressure due to higher-cost inventory, foreign exchange and rising interest rates. Energy’s selection detracted with Southwestern Energy Company the weakest name. Southwestern underperformed as natural gas prices fell back down as fears of being undersupplied abated. A warmer start to winter was a contributor. An underweight to consumer staples, an outperforming sector, weighed on the Fund’s performance.
Outlook
With the current level of interest rates and expiring monetary and fiscal stimulus, we anticipate that by third quarter 2023, the trajectory of inflation will be on pace to meet the Fed’s inflation target. However, we anticipate the tighter financial conditions and expiring monetary and fiscal stimulus will lead to an earnings recession and likely an economic recession. Should weakening economic and financial conditions force policy makers to restimulate the economy, we could see inflationary pressures begin to reaccelerate.
Top Ten Holdings as of December 31, 2022
| | | | | | | | |
| | | |
| | | | Security Name | | % of
Net Assets | |
| | 1 | | | WillScot Mobile Mini Holdings Corp. | | | 3.93 | % |
| | 2 | | | Vistra Corp. | | | 3.35 | |
| | 3 | | | Motorola Solutions, Inc. | | | 3.21 | |
| | 4 | | | Nexstar Media Group, Inc., Class A | | | 3.08 | |
| | 5 | | | FactSet Research Systems, Inc. | | | 2.87 | |
| | 6 | | | AmerisourceBergen Corp. | | | 2.81 | |
| | 7 | | | Republic Services, Inc. | | | 2.68 | |
| | 8 | | | Allstate Corp. (The) | | | 2.62 | |
| | 9 | | | AMETEK, Inc. | | | 2.61 | |
| | 10 | | | Nasdaq, Inc. | | | 2.57 | |
The portfolio is actively managed and holdings are subject to change. There is no guarantee the Fund continues to invest in the securities referenced. The holdings listed exclude any temporary cash investments, are presented on an individual security basis and do not represent holdings of the issuer.
Hypothetical Growth of $100,000 Investment in Class Y Shares3
December 31, 2012 through December 31, 2022
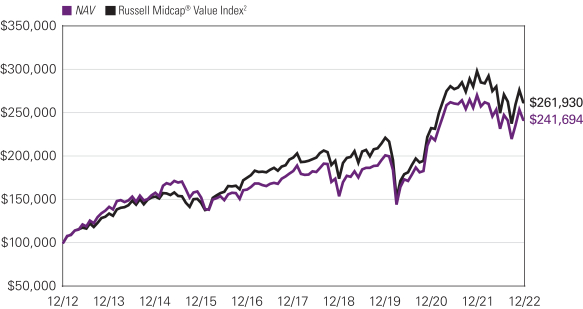
See notes to chart on page 23.
| 22
VAUGHAN NELSON MID CAP FUND
Average Annual Total Returns — December 31, 20223
| | | | | | | | | | | | | | | | | | | | | | | | |
| | | | | | |
| | | 1 Year | | | 5 Years | | | 10 Years | | | Life of
Class N | | | Expense Ratios4 | |
| | Gross | | | Net | |
| | | | | | | |
| Class Y | | | | | | | | | | | | | | | | | | | | | | | | |
| NAV | | | -10.58 | % | | | 5.76 | % | | | 9.22 | % | | | — | % | | | 0.96 | % | | | 0.90 | % |
| | | | | | | |
| Class A | | | | | | | | | | | | | | | | | | | | | | | | |
| NAV | | | -10.80 | | | | 5.48 | | | | 8.95 | | | | — | | | | 1.21 | | | | 1.15 | |
| With 5.75% Maximum Sales Charge | | | -15.91 | | | | 4.24 | | | | 8.30 | | | | — | | | | | | | | | |
| | | | | | | |
| Class C | | | | | | | | | | | | | | | | | | | | | | | | |
| NAV | | | -11.46 | | | | 4.70 | | | | 8.29 | | | | — | | | | 1.96 | | | | 1.90 | |
| With CDSC1 | | | -12.32 | | | | 4.70 | | | | 8.29 | | | | — | | | | | | | | | |
| | | | | | | |
| Class N (Inception 5/1/13) | | | | | | | | | | | | | | | | | | | | | | | | |
| NAV | | | -10.54 | | | | 5.83 | | | | — | | | | 8.20 | | | | 0.87 | | | | 0.85 | |
| | | | | | | |
| Comparative Performance | | | | | | | | | | | | | | | | | | | | | | | | |
| Russell Midcap® Value Index2 | | | -12.03 | | | | 5.72 | | | | 10.11 | | | | 8.95 | | | | | | | | | |
Performance data shown represents past performance and is no guarantee of, and not necessarily indicative of, future results. Total return and value will vary, and you may have a gain or loss when shares are sold. Current performance may be lower or higher than quoted. For most recent month-end performance, visit im.natixis.com/performance. Performance for other share classes will be greater or less than shown based on differences in fees and sales charges. You may not invest directly in an index. Performance for periods less than one year is cumulative, not annualized. Returns reflect changes in share price and reinvestment of dividends and capital gains, if any. The table(s) do not reflect taxes shareholders might owe on any fund distributions or when they redeem their shares.
| 1 | Performance for Class C shares assumes a 1.00% contingent deferred sales charge (“CDSC”) applied when you sell shares within one year of purchase and includes automatic conversion to Class A shares after eight years. |
| 2 | Russell Midcap® Value Index is an unmanaged index that measures the performance of the mid-cap value segment of the U.S. equity universe. It includes those Russell Midcap® Index companies with lower price-to-book ratios and lower forecasted growth values. |
| 3 | Fund performance has been increased by fee waivers and/or expense reimbursements, if any, without which performance would have been lower. |
| 4 | Expense ratios are as shown in the Fund’s prospectus in effect as of the date of this report. The expense ratios for the current reporting period can be found in the Financial Highlights section of this report under Ratios to Average Net Assets. Net expenses reflect contractual expense limitations set to expire on 4/30/23. When a Fund’s expenses are below the limitation, gross and net expense ratios will be the same. See Note 6 of the Notes to Financial Statements for more information about the Fund’s expense limitations. |
23 |
VAUGHAN NELSON SMALL CAP VALUE FUND
| | |
| |
| Managers | | Symbols |
| |
| Chris D. Wallis, CFA®, CPA | | Class A NEFJX |
| |
| Stephen A. Davis, CFA® | | Class C NEJCX |
| |
| James Eisenman, CFA®*, CPA | | Class N VSCNX |
| |
| Vaughan Nelson Investment Management, L.P. | | Class Y NEJYX |
| * | Effective May 1, 2022, James Eisenman serves as a co-portfolio manager on the Fund. |
Investment Goal
The Fund seeks capital appreciation.
Market Conditions
During the fiscal year ended December 31, 2022, equity market performance was initially defined by Russia’s invasion of Ukraine and NATO’s sharp response. These events further supported inflationary pressures and weighed on future economic growth.
The US Federal Reserve (Fed) raised the fed funds rate, kicking off the first Fed hiking cycle since 2018. The high inflation environment proved stickier than expected. With inflation elevated, the cost of capital rising, liquidity conditions deteriorating, and earnings estimates set for negative revisions, heightened equity market volatility led to further downside.
As we moved through the summer months, risk assets continued to be pressured by accelerating inflationary pressures, decelerating economic growth, and tightening financial conditions. Inflationary pressures in the US moved from goods to services and housing, in the form of owners’ equivalent rent. The yield curve flattened with the M2 money supply decelerating. M2 measures liquid assets such as savings, checking and money market accounts. The rapid slowdown in economic growth and tightening financial conditions are creating a recessionary environment in the US, Europe, and most export-led economies.
Exceptional US dollar strength drove markets as the Fed dramatically tightened financial conditions by increasing interest rates and aggressively shrinking its balance sheet. The strong US dollar accelerated the exportation of US inflation to the rest of the world, forcing nearly all global central banks to follow the Fed in raising interest rates. Tighter financial conditions forced global equity and fixed income markets to reduce investment positions and leverage, driving nearly all asset classes lower.
The fourth quarter recovery in equity markets was driven by peaking inflationary conditions and the rapid increase in non-US interest rates relative to US interest rates, which triggered a broad-based decline in the US dollar. The 2022 bear market in equities reflects the impact of higher interest rates increasing the cost of capital, and thereby decreasing equity valuations.
Performance Results
For the 12 months ended December 31, 2022, Class Y shares of the Vaughan Nelson Small Cap Value Fund returned -9.98% at net asset value. The Fund outperformed its benchmark, the Russell 2000® Value Index, which returned -14.48%.
Explanation of Fund Performance
The Fund outperformed on a relative basis during the period. The largest contributor was industrials, driven by security selection. Federal Signal Corporation was the top name in the sector due to strong book-to-bill ratios across the business for municipal commercial equipment combined with margin expansion due to improvements in the supply chain. Selection within communication services assisted, with the largest performance led by Tegna, Inc. which was acquired for a premium by Standard General. The Fund was underweight in real estate. This benefitted the portfolio, as real estate was an underperforming sector.
Information technology was an outperforming sector with EXL Service Holdings, Inc. the top name due to strong sequential revenue acceleration, long-term visibility due to the contract nature of its business, and margin improvement due to the higher revenue mix from its data analytics business. Selection within materials, specifically FMC Corporation, bolstered the Fund because of pricing actions regaining margin pressure from late 2021 combined with a higher percentage of revenues coming from new formulations that carry higher margins than legacy products. An underweight to health care, an underperforming sector, helped the Fund. Consumer staples contributed to the Fund’s outperformance with Performance Food Group Company the top name due to continued market share gains across the food distribution business, margin expansion due to increased company scale, and inventory gains because of materially higher inflation throughout the year.
An underweight to energy, an outperforming sector, was the largest relative detractor. Financials impaired the relative return, specifically Trean Insurance Group, Inc. which had concerns about underwriting performance on core insurance offerings and exiting certain markets due to poor profitability. Selection within consumer discretionary diminished relative performance, with Bally’s
| 24
VAUGHAN NELSON SMALL CAP VALUE FUND
Corporation the worst performer due to high balance sheet leverage, the beginning of a new cap-ex cycle to build a new casino in Chicago and a longer time horizon on planned cost reductions to improve profitability. An underweight to utilities, an outperforming sector, weighed on the Fund’s performance.
Outlook
With the current level of interest rates and expiring monetary and fiscal stimulus, we anticipate that by the third quarter 2023, the trajectory of inflation will be on pace to meet the Fed’s inflation target. However, we anticipate the tighter financial conditions and expiring monetary and fiscal stimulus will lead to an earnings recession and likely an economic recession. Should weakening economic and financial conditions force policy makers to restimulate the economy, we could see inflationary pressures begin to reaccelerate.
Top Ten Holdings as of December 31, 2022
| | | | | | | | |
| | | |
| | | | Security Name | | % of
Net Assets | |
| | 1 | | | Insight Enterprises, Inc. | | | 3.61 | % |
| | 2 | | | Element Solutions, Inc. | | | 3.36 | |
| | 3 | | | GATX Corp. | | | 2.58 | |
| | 4 | | | Rambus, Inc. | | | 2.53 | |
| | 5 | | | WNS Holdings Ltd. ADR | | | 2.44 | |
| | 6 | | | Fabrinet | | | 2.37 | |
| | 7 | | | ASGN, Inc. | | | 2.06 | |
| | 8 | | | Performance Food Group Co. | | | 1.93 | |
| | 9 | | | Franklin Electric Co., Inc. | | | 1.90 | |
| | 10 | | | Landstar System, Inc. | | | 1.87 | |
The portfolio is actively managed and holdings are subject to change. There is no guarantee the Fund continues to invest in the securities referenced. The holdings listed exclude any temporary cash investments, are presented on an individual security basis and do not represent holdings of the issuer.
Hypothetical Growth of $100,000 Investment in Class Y Shares3
December 31, 2012 through December 31, 2022
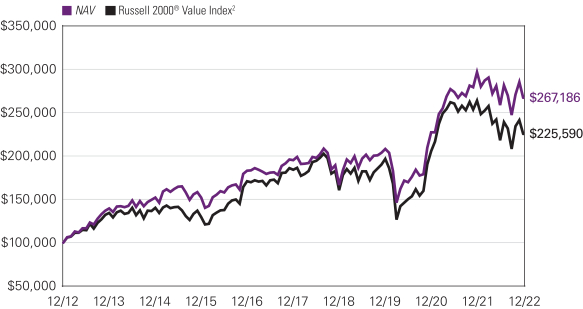
25 |
Average Annual Total Returns — December 31, 20223
| | | | | | | | | | | | | | | | | | | | | | | | |
| | | | | | |
| | | 1 Year | | | 5 Years | | | 10 Years | | | Life of
Class N | | | Expense Ratios4 | |
| | Gross | | | Net | |
| | | | | | | |
| Class Y | | | | | | | | | | | | | | | | | | | | | | | | |
| NAV | | | -9.98 | % | | | 6.49 | % | | | 10.33 | % | | | — | % | | | 1.16 | % | | | 1.00 | % |
| | | | | | | |
| Class A | | | | | | | | | | | | | | | | | | | | | | | | |
| NAV | | | -10.19 | | | | 6.22 | | | | 10.05 | | | | — | | | | 1.41 | | | | 1.25 | |
| With 5.75% Maximum Sales Charge | | | -15.36 | | | | 4.97 | | | | 9.40 | | | | — | | | | | | | | | |
| | | | | | |
| Class C | | | | | | | | | | | | | | | | | | | | | |
| NAV | | | -11.01 | | | | 5.41 | | | | 9.38 | | | | — | | | | 2.17 | | | | 2.00 | |
| With CDSC1 | | | -11.78 | | | | 5.41 | | | | 9.38 | | | | — | | | | | | | | | |
| | | | | | | |
| Class N (Inception 5/1/17) | | | | | | | | | | | | | | | | | | | | | | | | |
| NAV | | | -9.95 | | | | 6.58 | | | | — | | | | 7.08 | | | | 1.17 | | | | 0.95 | |
| | | | | | | |
| Comparative Performance | | | | | | | | | | | | | | | | | | | | | | | | |
| Russell 2000® Value Index2 | | | -14.48 | | | | 4.13 | | | | 8.48 | | | | 4.88 | | | | | | | | | |
Performance data shown represents past performance and is no guarantee of, and not necessarily indicative of, future results. Total return and value will vary, and you may have a gain or loss when shares are sold. Current performance may be lower or higher than quoted. For most recent month-end performance, visit im.natixis.com/performance. Performance for other share classes will be greater or less than shown based on differences in fees and sales charges. You may not invest directly in an index. Performance for periods less than one year is cumulative, not annualized. Returns reflect changes in share price and reinvestment of dividends and capital gains, if any. The table(s) do not reflect taxes shareholders might owe on any fund distributions or when they redeem their shares.
| 1 | Performance for Class C shares assumes a 1.00% contingent deferred sales charge (“CDSC”) applied when you sell shares within one year of purchase and includes automatic conversion to Class A shares after eight years. |
| 2 | Russell 2000® Value Index is an unmanaged index that measures the performance of the small-cap value segment of the U.S. equity universe. It includes those Russell 2000® companies with lower price-to-book ratios and lower forecasted growth values. |
| 3 | Fund performance has been increased by fee waivers and/or expense reimbursements, if any, without which performance would have been lower. |
| 4 | Expense ratios are as shown in the Fund’s prospectus in effect as of the date of this report. The expense ratios for the current reporting period can be found in the Financial Highlights section of this report under Ratios to Average Net Assets. Net expenses reflect contractual expense limitations set to expire on 4/30/23. When a Fund’s expenses are below the limitation, gross and net expense ratios will be the same. See Note 6 of the Notes to Financial Statements for more information about the Fund’s expense limitations. |
| 26
ADDITIONAL INFORMATION
The views expressed in this report reflect those of the portfolio managers as of the dates indicated. The managers’ views are subject to change at any time without notice based on changes in market or other conditions. References to specific securities or industries should not be regarded as investment advice. Because the Fund is actively managed, there is no assurance that they will continue to invest in the securities or industries mentioned.
All investing involves risk, including the risk of loss. There is no assurance that any investment will meet its performance objectives or that losses will be avoided.
ADDITIONAL INDEX INFORMATION
This document may contain references to third party copyrights, indexes, and trademarks, each of which is the property of its respective owner. Such owner is not affiliated with Natixis Investment Managers or any of its related or affiliated companies (collectively “Natixis Affiliates”) and does not sponsor, endorse or participate in the provision of any Natixis Affiliates services, funds or other financial products.
The index information contained herein is derived from third parties and is provided on an “as is” basis. The user of this information assumes the entire risk of use of this information. Each of the third party entities involved in compiling, computing or creating index information disclaims all warranties (including, without limitation, any warranties of originality, accuracy, completeness, timeliness, non-infringement, merchantability and fitness for a particular purpose) with respect to such information.
PROXY VOTING INFORMATION
A description of the Natixis Funds’ proxy voting policies and procedures is available without charge, upon request, by calling Natixis Funds at 800-225-5478; on the Natixis Funds’ website at im.natixis.com; and on the Securities and Exchange Commission’s (“SEC’s”) website at www.sec.gov. Information regarding how the Natixis Funds voted proxies relating to portfolio securities during the most recent 12-month period ended June 30 is available from the Natixis Funds’ website and the SEC’s website.
QUARTERLY PORTFOLIO SCHEDULES
The Natixis Funds file a complete schedule of portfolio holdings with the SEC for the first and third quarters of each fiscal year as an exhibit to its reports on Form N-PORT. The Funds’ Form N-PORT reports are available on the SEC’s website at www.sec.gov. First and third quarter schedules of portfolio holdings are also available at im.natixis.com/funddocuments. A hard copy may be requested from the Fund at no charge by calling 800-225-5478.
CFA® and Chartered Financial Analyst® are registered trademarks owned by the CFA Institute.
27 |
UNDERSTANDING FUND EXPENSES
As a mutual fund shareholder, you incur different costs: transaction costs, including sales charges (loads) on purchases and contingent deferred sales charges on redemptions, and ongoing costs, including management fees, distribution and/or service fees (12b-1 fees), and other fund expenses. Certain exemptions may apply. These costs are described in more detail in the Funds’ prospectus. The following examples are intended to help you understand the ongoing costs of investing in the Funds and help you compare these with the ongoing costs of investing in other mutual funds.
The first line in the table of each class of Fund shares shows the actual account values and actual Fund expenses you would have paid on a $1,000 investment in the Fund from July 1, 2022 through December 31, 2022. To estimate the expenses you paid over the period, simply divide your account value by $1,000 (for example $8,600 account value divided by $1,000 = 8.60) and multiply the result by the number in the Expenses Paid During Period column as shown for your class.
The second line in the table for each class of fund shares provides information about hypothetical account values and hypothetical expenses based on the Fund’s actual expense ratios and an assumed rate of return of 5% per year before expenses, which is not the Fund’s actual return. The hypothetical account values and expenses may not be used to estimate the actual ending account balance or expenses you paid on your investment for the period. You may use this information to compare the ongoing costs of investing in the Fund and other funds. To do so, compare this 5% hypothetical example with the 5% hypothetical examples that appear in the shareholder reports of the other funds.
Please note that the expenses shown reflect ongoing costs only, and do not include any transaction costs, such as sales charges. Therefore, the second line in the table of each fund is useful in comparing ongoing costs only, and will not help you determine the relative costs of owning funds. If transaction costs were included, total costs would be higher.
| | | | | | | | | | | | |
| LOOMIS SAYLES INTERNATIONAL GROWTH FUND | | BEGINNING
ACCOUNT VALUE
7/1/2022 | | | ENDING
ACCOUNT VALUE
12/31/2022 | | | EXPENSES PAID
DURING PERIOD*
7/1/2022 – 12/31/2022 | |
| Class A | | | | | | | | | | | | |
| Actual | | | $1,000.00 | | | | $1,043.10 | | | | $6.18 | |
| Hypothetical (5% return before expenses) | | | $1,000.00 | | | | $1,019.16 | | | | $6.11 | |
| Class C | | | | | | | | | | | | |
| Actual | | | $1,000.00 | | | | $1,040.20 | | | | $10.03 | |
| Hypothetical (5% return before expenses) | | | $1,000.00 | | | | $1,015.38 | | | | $9.91 | |
| Class N | | | | | | | | | | | | |
| Actual | | | $1,000.00 | | | | $1,045.90 | | | | $4.64 | |
| Hypothetical (5% return before expenses) | | | $1,000.00 | | | | $1,020.67 | | | | $4.58 | |
| Class Y | | | | | | | | | | | | |
| Actual | | | $1,000.00 | | | | $1,045.50 | | | | $4.90 | |
| Hypothetical (5% return before expenses) | | | $1,000.00 | | | | $1,020.42 | | | | $4.84 | |
| * | Expenses are equal to the Fund’s annualized expense ratio (after waiver/reimbursement): 1.20%, 1.95%, 0.90% and 0.95% for Class A, C, N and Y, respectively, multiplied by the average account value over the period, multiplied by the number of days in the most recent fiscal half-year (184), divided by 365 (to reflect the half-year period). |
| 28
| | | | | | | | | | | | |
| NATIXIS OAKMARK FUND | | BEGINNING ACCOUNT VALUE 7/1/2022 | | | ENDING ACCOUNT VALUE 12/31/2022 | | | EXPENSES PAID DURING PERIOD* 7/1/2022 – 12/31/2022 | |
| Class A | | | | | | | | | | | | |
| Actual | | | $1,000.00 | | | | $1,077.30 | | | | $5.50 | |
| Hypothetical (5% return before expenses) | | | $1,000.00 | | | | $1,019.91 | | | | $5.35 | |
| Class C | | | | | | | | | | | | |
| Actual | | | $1,000.00 | | | | $1,073.00 | | | | $9.41 | |
| Hypothetical (5% return before expenses) | | | $1,000.00 | | | | $1,016.13 | | | | $9.15 | |
| Class N | | | | | | | | | | | | |
| Actual | | | $1,000.00 | | | | $1,078.70 | | | | $3.93 | |
| Hypothetical (5% return before expenses) | | | $1,000.00 | | | | $1,021.43 | | | | $3.82 | |
| Class Y | | | | | | | | | | | | |
| Actual | | | $1,000.00 | | | | $1,078.50 | | | | $4.19 | |
| Hypothetical (5% return before expenses) | | | $1,000.00 | | | | $1,021.17 | | | | $4.08 | |
| * | Expenses are equal to the Fund’s annualized expense ratio (after waiver/reimbursement): 1.05%, 1.80%, 0.75% and 0.80% for Class A, C, N and Y, respectively, multiplied by the average account value over the period, multiplied by the number of days in the most recent fiscal half-year (184), divided by 365 (to reflect the half-year period). |
| | | | | | | | | | | | |
| NATIXIS OAKMARK INTERNATIONAL FUND | | BEGINNING ACCOUNT VALUE 7/1/2022 | | | ENDING ACCOUNT VALUE 12/31/2022 | | | EXPENSES PAID DURING PERIOD* 7/1/2022 – 12/31/2022 | |
| Class A | | | | | | | | | | | | |
| Actual | | | $1,000.00 | | | | $1,041.70 | | | | $5.92 | |
| Hypothetical (5% return before expenses) | | | $1,000.00 | | | | $1,019.41 | | | | $5.85 | |
| Class C | | | | | | | | | | | | |
| Actual | | | $1,000.00 | | | | $1,038.40 | | | | $9.76 | |
| Hypothetical (5% return before expenses) | | | $1,000.00 | | | | $1,015.63 | | | | $9.65 | |
| Class N | | | | | | | | | | | | |
| Actual | | | $1,000.00 | | | | $1,042.60 | | | | $4.38 | |
| Hypothetical (5% return before expenses) | | | $1,000.00 | | | | $1,020.92 | | | | $4.33 | |
| Class Y | | | | | | | | | | | | |
| Actual | | | $1,000.00 | | | | $1,042.90 | | | | $4.63 | |
| Hypothetical (5% return before expenses) | | | $1,000.00 | | | | $1,020.67 | | | | $4.58 | |
| * | Expenses are equal to the Fund’s annualized expense ratio (after waiver/reimbursement): 1.15%, 1.90%, 0.85% and 0.90% for Class A, C, N and Y, respectively, multiplied by the average account value over the period, multiplied by the number of days in the most recent fiscal half-year (184), divided by 365 (to reflect the half-year period). |
29 |
| | | | | | | | | | | | |
| NATIXIS U.S. EQUITY OPPORTUNITIES FUND | | BEGINNING ACCOUNT VALUE 7/1/2022 | | | ENDING ACCOUNT VALUE 12/31/2022 | | | EXPENSES PAID DURING PERIOD* 7/1/2022 – 12/31/2022 | |
| Class A | | | | | | | | | | | | |
| Actual | | | $1,000.00 | | | | $1,048.20 | | | | $5.68 | |
| Hypothetical (5% return before expenses) | | | $1,000.00 | | | | $1,019.66 | | | | $5.60 | |
| Class C | | | | | | | | | | | | |
| Actual | | | $1,000.00 | | | | $1,043.60 | | | | $9.53 | |
| Hypothetical (5% return before expenses) | | | $1,000.00 | | | | $1,015.88 | | | | $9.40 | |
| Class N | | | | | | | | | | | | |
| Actual | | | $1,000.00 | | | | $1,049.90 | | | | $4.08 | |
| Hypothetical (5% return before expenses) | | | $1,000.00 | | | | $1,021.22 | | | | $4.02 | |
| Class Y | | | | | | | | | | | | |
| Actual | | | $1,000.00 | | | | $1,049.40 | | | | $4.39 | |
| Hypothetical (5% return before expenses) | | | $1,000.00 | | | | $1,020.92 | | | | $4.33 | |
| * | Expenses are equal to the Fund’s annualized expense ratio (after waiver/reimbursement): 1.10%, 1.85%, 0.79% and 0.85% for Class A, C, N and Y, respectively, multiplied by the average account value over the period, multiplied by the number of days in the most recent fiscal half-year (184), divided by 365 (to reflect the half-year period). |
| | | | | | | | | | | | |
| VAUGHAN NELSON MID CAP FUND | | BEGINNING ACCOUNT VALUE 7/1/2022 | | | ENDING ACCOUNT VALUE 12/31/2022 | | | EXPENSES PAID DURING PERIOD* 7/1/2022 – 12/31/2022 | |
| Class A | | | | | | | | | | | | |
| Actual | | | $1,000.00 | | | | $1,042.90 | | | | $5.92 | |
| Hypothetical (5% return before expenses) | | | $1,000.00 | | | | $1,019.41 | | | | $5.85 | |
| Class C | | | | | | | | | | | | |
| Actual | | | $1,000.00 | | | | $1,039.20 | | | | $9.77 | |
| Hypothetical (5% return before expenses) | | | $1,000.00 | | | | $1,015.63 | | | | $9.65 | |
| Class N | | | | | | | | | | | | |
| Actual | | | $1,000.00 | | | | $1,044.80 | | | | $4.38 | |
| Hypothetical (5% return before expenses) | | | $1,000.00 | | | | $1,020.92 | | | | $4.33 | |
| Class Y | | | | | | | | | | | | |
| Actual | | | $1,000.00 | | | | $1,044.60 | | | | $4.64 | |
| Hypothetical (5% return before expenses) | | | $1,000.00 | | | | $1,020.67 | | | | $4.58 | |
| * | Expenses are equal to the Fund’s annualized expense ratio (after waiver/reimbursement): 1.15%, 1.90%, 0.85% and 0.90% for Class A, C, N and Y, respectively, multiplied by the average account value over the period, multiplied by the number of days in the most recent fiscal half-year (184), divided by 365 (to reflect the half-year period). |
| 30
| | | | | | | | | | | | |
| VAUGHAN NELSON SMALL CAP VALUE FUND | | BEGINNING ACCOUNT VALUE 7/1/2022 | | | ENDING ACCOUNT VALUE 12/31/2022 | | | EXPENSES PAID DURING PERIOD*
7/1/2022 – 12/31/2022 | |
| Class A | | | | | | | | | | | | |
| Actual | | | $1,000.00 | | | | $1,032.30 | | | | $6.40 | |
| Hypothetical (5% return before expenses) | | | $1,000.00 | | | | $1,018.90 | | | | $6.36 | |
| Class C | | | | | | | | | | | | |
| Actual | | | $1,000.00 | | | | $1,028.40 | | | | $10.23 | |
| Hypothetical (5% return before expenses) | | | $1,000.00 | | | | $1,015.12 | | | | $10.16 | |
| Class N | | | | | | | | | | | | |
| Actual | | | $1,000.00 | | | | $1,033.70 | | | | $4.87 | |
| Hypothetical (5% return before expenses) | | | $1,000.00 | | | | $1,020.42 | | | | $4.84 | |
| Class Y | | | | | | | | | | | | |
| Actual | | | $1,000.00 | | | | $1,033.40 | | | | $5.13 | |
| Hypothetical (5% return before expenses) | | | $1,000.00 | | | | $1,020.16 | | | | $5.09 | |
| * | Expenses are equal to the Fund’s annualized expense ratio (after waiver/reimbursement): 1.25%, 2.00%, 0.95% and 1.00% for Class A, C, N and Y, respectively, multiplied by the average account value over the period, multiplied by the number of days in the most recent fiscal half-year (184), divided by 365 (to reflect the half-year period). |
31 |
Portfolio of Investments – as of December 31, 2022
Loomis Sayles International Growth Fund
| | | | | | | | |
Shares | | | Description | | Value (†) | |
| | | | | | | | |
| | Common Stocks — 98.8% of Net Assets | |
| | | | Australia — 5.6% | |
| | 39,944 | | | WiseTech Global Ltd. | | $ | 1,373,771 | |
| | | | | | | | |
| | | | Belgium — 2.4% | |
| | 9,789 | | | Anheuser-Busch InBev S.A. | | | 589,601 | |
| | | | | | | | |
| | | | Brazil — 8.6% | |
| | 376,933 | | | Ambev S.A., ADR | | | 1,025,258 | |
| | 1,280 | | | MercadoLibre, Inc.(a) | | | 1,083,187 | |
| | | | | | | | |
| | | | | | | 2,108,445 | |
| | | | | | | | |
| | | | Canada — 1.8% | |
| | 13,047 | | | Shopify, Inc., Class A(a) | | | 452,861 | |
| | | | | | | | |
| | | | China — 27.6% | |
| | 4,121 | | | Alibaba Group Holding Ltd., Sponsored ADR(a)(b) | | | 363,019 | |
| | 5,038 | | | Baidu, Inc., Sponsored ADR(a)(b) | | | 576,246 | |
| | 70,700 | | | Budweiser Brewing Co. APAC Ltd., 144A | | | 221,008 | |
| | 553,500 | | | Dali Foods Group Co. Ltd., 144A | | | 251,813 | |
| | 3,900 | | | Kweichow Moutai Co. Ltd., Class A | | | 969,088 | |
| | 4,363 | | | NXP Semiconductors NV | | | 689,485 | |
| | 29,400 | | | Tencent Holdings Ltd.(b) | | | 1,246,571 | |
| | 29,164 | | | Trip.com Group Ltd., ADR(a)(b) | | | 1,003,242 | |
| | 48,974 | | | Vipshop Holdings Ltd., ADR(a)(b) | | | 668,005 | |
| | 14,779 | | | Yum China Holdings, Inc. | | | 807,672 | |
| | | | | | | | |
| | | | | | | 6,796,149 | |
| | | | | | | | |
| | | | Denmark — 5.5% | |
| | 10,021 | | | Novo Nordisk A/S, Class B | | | 1,361,008 | |
| | | | | | | | |
| | | | France — 5.2% | |
| | 3,017 | | | EssilorLuxottica S.A. | | | 545,875 | |
| | 7,683 | | | Sodexo S.A. | | | 735,097 | |
| | | | | | | | |
| | | | | | | 1,280,972 | |
| | | | | | | | |
| | | | Germany — 2.8% | |
| | 6,753 | | | SAP SE | | | 697,184 | |
| | | | | | | | |
| | | | Japan — 4.6% | |
| | 5,900 | | | FANUC Corp. | | | 882,914 | |
| | 6,200 | | | Unicharm Corp. | | | 237,375 | |
| | | | | | | | |
| | | | | | | 1,120,289 | |
| | | | | | | | |
| | | | Macau — 1.2% | |
| | 43,000 | | | Galaxy Entertainment Group Ltd. | | | 282,710 | |
| | | | | | | | |
| | | | Netherlands — 3.5% | |
| | 616 | | | Adyen NV, 144A(a) | | | 855,161 | |
| | | | | | | | |
| | | | Switzerland — 5.6% | |
| | 7,883 | | | CRISPR Therapeutics AG(a) | | | 320,444 | |
| | 11,652 | | | Novartis AG, (Registered) | | | 1,054,476 | |
| | | | | | | | |
| | | | | | | 1,374,920 | |
| | | | | | | | |
| | | | United Kingdom — 10.0% | |
| | 7,852 | | | Diageo PLC | | | 343,697 | |
| | 21,689 | | | Experian PLC | | | 734,570 | |
| | 11,545 | | | Reckitt Benckiser Group PLC | | | 800,257 | |
| | 11,782 | | | Unilever PLC | | | 591,182 | |
| | | | | | | | |
| | | | | | | 2,469,706 | |
| | | | | | | | |
| | | | United States — 14.4% | |
| | 7,585 | | | Block, Inc.(a) | | | 476,641 | |
| | 14,599 | | | Doximity, Inc., Class A(a) | | | 489,943 | |
| | 8,292 | | | Nestle S.A., (Registered) | | | 957,804 | |
| | 3,287 | | | Roche Holding AG | | | 1,032,898 | |
| | 4,645 | | | Tesla, Inc.(a) | | | 572,171 | |
| | | | | | | | |
| | | | | | | 3,529,457 | |
| | | | | | | | |
| | | | Total Common Stocks
(Identified Cost $29,668,972) | | | 24,292,234 | |
| | | | | | | | |
Principal
Amount | | | Description | | Value (†) | |
| | | | | | | | |
| | Short-Term Investments — 0.3% | |
| $ | 56,161 | | | Tri-Party Repurchase Agreement with Fixed Income Clearing Corporation, dated 12/30/2022 at 1.800% to be repurchased at $56,172 on 1/03/2023 collateralized by $65,500 U.S. Treasury Note, 1.250% due 3/31/2028 valued at $57,307 including accrued interest (Note 2 of Notes to Financial Statements)
(Identified Cost $56,161) | | $ | 56,161 | |
| | | | | | | | |
| | | | | | | | |
| | | | Total Investments — 99.1%
(Identified Cost $29,725,133) | | | 24,348,395 | |
| | | | Other assets less liabilities — 0.9% | | | 232,431 | |
| | | | | | | | |
| | | | Net Assets — 100.0% | | $ | 24,580,826 | |
| | | | | | | | |
| | | | | | | | |
| | (†) | | | See Note 2 of Notes to Financial Statements. | |
| | (a) | | | Non-income producing security. | |
| | (b) | | | Security invests in variable interest entities based in China. | |
| | | | | | | | |
| | 144A | | | All or a portion of these securities are exempt from registration under Rule 144A of the Securities Act of 1933. These securities may be resold in transactions exempt from registration, normally to qualified institutional buyers. At December 31, 2022, the value of Rule 144A holdings amounted to $1,327,982 or 5.4% of net assets. | |
| | ADR | | | An American Depositary Receipt is a certificate issued by a custodian bank representing the right to receive securities of the foreign issuer described. The values of ADRs may be significantly influenced by trading on exchanges not located in the United States. | |
Industry Summary at December 31, 2022
| | | | |
Pharmaceuticals | | | 14.0 | % |
Beverages | | | 12.8 | |
Hotels, Restaurants & Leisure | | | 11.6 | |
Internet & Direct Marketing Retail | | | 8.6 | |
Software | | | 8.4 | |
Interactive Media & Services | | | 7.4 | |
IT Services | | | 7.3 | |
Food Products | | | 4.9 | |
Household Products | | | 4.2 | |
Machinery | | | 3.6 | |
Professional Services | | | 3.0 | |
Semiconductors & Semiconductor Equipment | | | 2.8 | |
Personal Products | | | 2.4 | |
Automobiles | | | 2.3 | |
Health Care Equipment & Supplies | | | 2.2 | |
Health Care Technology | | | 2.0 | |
Biotechnology | | | 1.3 | |
Short-Term Investments | | | 0.3 | |
| | | | |
Total Investments | | | 99.1 | |
Other assets less liabilities | | | 0.9 | |
| | | | |
Net Assets | | | 100.0 | % |
| | | | |
Currency Exposure Summary at December 31, 2022
| | | | |
| |
United States Dollar | | | 35.0 | % |
Euro | | | 16.3 | |
Swiss Franc | | | 12.4 | |
Hong Kong Dollar | | | 8.2 | |
British Pound | | | 7.6 | |
Australian Dollar | | | 5.6 | |
Danish Krone | | | 5.5 | |
Japanese Yen | | | 4.6 | |
Yuan Renminbi | | | 3.9 | |
| | | | |
Total Investments | | | 99.1 | |
Other assets less liabilities | | | 0.9 | |
| | | | |
Net Assets | | | 100.0 | % |
| | | | |
See accompanying notes to financial statements.
| 32
Portfolio of Investments – as of December 31, 2022
Natixis Oakmark Fund
| | | | | | | | |
| Shares | | | Description | | Value (†) | |
| | Common Stocks — 96.7% of Net Assets | |
| | | | Auto Components — 2.8% | |
| | 158,667 | | | BorgWarner, Inc. | | $ | 6,386,347 | |
| | 61,000 | | | Magna International, Inc. | | | 3,426,980 | |
| | | | | | | | |
| | | | | | | 9,813,327 | |
| | | | | | | | |
| | | | Automobiles — 1.9% | |
| | 197,960 | | | General Motors Co. | | | 6,659,374 | |
| | | | | | | | |
| | | | Banks — 6.9% | |
| | 164,136 | | | Bank of America Corp. | | | 5,436,185 | |
| | 188,618 | | | Citigroup, Inc. | | | 8,531,192 | |
| | 243,104 | | | Wells Fargo��& Co. | | | 10,037,764 | |
| | | | | | | | |
| | | | | | | 24,005,141 | |
| | | | | | | | |
| | | | Building Products — 3.0% | |
| | 77,000 | | | Fortune Brands Innovations, Inc. | | | 4,397,470 | |
| | 111,700 | | | Masco Corp. | | | 5,213,039 | |
| | 128,800 | | | MasterBrand, Inc.(a) | | | 972,440 | |
| | | | | | | | |
| | | | | | | 10,582,949 | |
| | | | | | | | |
| | | | Capital Markets — 13.5% | |
| | 127,482 | | | Bank of New York Mellon Corp. (The) | | | 5,802,981 | |
| | 64,939 | | | Charles Schwab Corp. (The) | | | 5,406,821 | |
| | 23,298 | | | Goldman Sachs Group, Inc. (The) | | | 8,000,067 | |
| | 72,666 | | | Intercontinental Exchange, Inc. | | | 7,454,805 | |
| | 235,110 | | | KKR & Co., Inc. | | | 10,913,806 | |
| | 4,921 | | | Moody’s Corp. | | | 1,371,089 | |
| | 102,566 | | | State Street Corp. | | | 7,956,045 | |
| | | | | | | | |
| | | | | | | 46,905,614 | |
| | | | | | | | |
| | | | Consumer Finance — 6.0% | |
| | 326,054 | | | Ally Financial, Inc. | | | 7,972,020 | |
| | 32,373 | | | American Express Co. | | | 4,783,111 | |
| | 88,806 | | | Capital One Financial Corp. | | | 8,255,406 | |
| | | | | | | | |
| | | | | | | 21,010,537 | |
| | | | | | | | |
| | | | Electronic Equipment, Instruments & Components — 1.2% | |
| | 36,265 | | | TE Connectivity Ltd. | | | 4,163,222 | |
| | | | | | | | |
| | | | Entertainment — 5.6% | |
| | 23,526 | | | Netflix, Inc.(a) | | | 6,937,347 | |
| | 39,097 | | | Take-Two Interactive Software, Inc.(a) | | | 4,071,171 | |
| | 46,400 | | | Walt Disney Co. (The)(a) | | | 4,031,232 | |
| | 455,200 | | | Warner Bros. Discovery, Inc.(a) | | | 4,315,296 | |
| | | | | | | | |
| | | | | | | 19,355,046 | |
| | | | | | | | |
| | | | Health Care Providers & Services — 2.1% | |
| | 30,319 | | | HCA Healthcare, Inc. | | | 7,275,347 | |
| | | | | | | | |
| | | | Hotels, Restaurants & Leisure — 2.8% | |
| | 3,383 | | | Booking Holdings, Inc.(a) | | | 6,817,692 | |
| | 23,128 | | | Hilton Worldwide Holdings, Inc. | | | 2,922,454 | |
| | | | | | | | |
| | | | | | | 9,740,146 | |
| | | | | | | | |
| | | | Household Durables — 1.8% | |
| | 138,000 | | | PulteGroup, Inc. | | | 6,283,140 | |
| | | | | | | | |
| | | | Insurance — 4.9% | |
| | 77,935 | | | American International Group, Inc. | | | 4,928,609 | |
| | 27,637 | | | Reinsurance Group of America, Inc. | | | 3,926,941 | |
| | 33,663 | | | Willis Towers Watson PLC | | | 8,233,297 | |
| | | | | | | | |
| | | | | | | 17,088,847 | |
| | | | | | | | |
| | | | Interactive Media & Services — 7.3% | |
| | 135,820 | | | Alphabet, Inc., Class A(a) | | | 11,983,399 | |
| | 54,366 | | | Meta Platforms, Inc., Class A(a) | | | 6,542,404 | |
| | 287,100 | | | Pinterest, Inc., Class A(a) | | | 6,970,788 | |
| | | | | | | | |
| | | | | | | 25,496,591 | |
| | | | | | | | |
| | | | Internet & Direct Marketing Retail — 4.2% | |
| | 80,300 | | | Amazon.com, Inc.(a) | | $ | 6,745,200 | |
| | 113,565 | | | eBay, Inc. | | | 4,709,541 | |
| | 25,600 | | | Etsy, Inc.(a) | | | 3,066,368 | |
| | | | | | | | |
| | | | | | | 14,521,109 | |
| | | | | | | | |
| | | | IT Services — 4.0% | |
| | 75,069 | | | Fiserv, Inc.(a) | | | 7,587,224 | |
| | 7,966 | | | Gartner, Inc.(a) | | | 2,677,691 | |
| | 37,600 | | | Global Payments, Inc. | | | 3,734,432 | |
| | | | | | | | |
| | | | | | | 13,999,347 | |
| | | | | | | | |
| | | | Machinery — 3.5% | |
| | 5,371 | | | Cummins, Inc. | | | 1,301,340 | |
| | 43,966 | | | PACCAR, Inc. | | | 4,351,315 | |
| | 22,900 | | | Parker-Hannifin Corp. | | | 6,663,900 | |
| | | | | | | | |
| | | | | | | 12,316,555 | |
| | | | | | | | |
| | | | Media — 4.4% | |
| | 22,144 | | | Charter Communications, Inc., Class A(a) | | | 7,509,030 | |
| | 219,742 | | | Comcast Corp., Class A | | | 7,684,378 | |
| | | | | | | | |
| | | | | | | 15,193,408 | |
| | | | | | | | |
| | | | Oil, Gas & Consumable Fuels — 6.2% | |
| | 175,272 | | | APA Corp. | | | 8,181,697 | |
| | 42,277 | | | ConocoPhillips | | | 4,988,686 | |
| | 64,877 | | | EOG Resources, Inc. | | | 8,402,869 | |
| | | | | | | | |
| | | | | | | 21,573,252 | |
| | | | | | | | |
| | | | Professional Services — 1.6% | |
| | 28,600 | | | Equifax, Inc. | | | 5,558,696 | |
| | | | | | | | |
| | | | Real Estate Management & Development — 2.3% | |
| | 105,518 | | | CBRE Group, Inc., Class A(a) | | | 8,120,665 | |
| | | | | | | | |
| | | | Road & Rail — 0.9% | |
| | 123,600 | | | Uber Technologies, Inc.(a) | | | 3,056,628 | |
| | | | | | | | |
| | | | Software — 8.0% | |
| | 13,400 | | | Adobe, Inc.(a) | | | 4,509,502 | |
| | 114,900 | | | Oracle Corp. | | | 9,391,926 | |
| | 54,200 | | | Salesforce, Inc.(a) | | | 7,186,378 | |
| | 40,980 | | | Workday, Inc., Class A(a) | | | 6,857,183 | |
| | | | | | | | |
| | | | | | | 27,944,989 | |
| | | | | | | | |
| | | | Tobacco — 1.8% | |
| | 136,914 | | | Altria Group, Inc. | | | 6,258,339 | |
| | | | | | | | |
| | | | Total Common Stocks
(Identified Cost $343,773,300) | | | 336,922,269 | |
| | | | | | | | |
| | | | | | | | |
Principal
Amount | | | | |
| | Short-Term Investments — 2.7% | |
| $ | 9,517,756 | | | Tri-Party Repurchase Agreement with Fixed Income Clearing Corporation, dated 12/30/2022 at 1.800% to be repurchased at $9,519,660 on 1/03/2023 collateralized by $11,096,000 U.S. Treasury Note, 1.250% due 3/31/2028 valued at $9,708,135 including accrued interest (Note 2 of Notes to Financial Statements)
(Identified Cost $9,517,756) | | | 9,517,756 | |
| | | | | | | | |
| | | | | | | | |
| | | | Total Investments — 99.4%
(Identified Cost $353,291,056) | | | 346,440,025 | |
| | | | Other assets less liabilities — 0.6% | | | 2,027,532 | |
| | | | | | | | |
| | | | Net Assets — 100.0% | | $ | 348,467,557 | |
| | | | | | | | |
| | | | | | | | |
| | (†) | | | See Note 2 of Notes to Financial Statements. | | | | |
| | (a) | | | Non-income producing security. | | | | |
See accompanying notes to financial statements.
33 |
Portfolio of Investments – as of December 31, 2022
Natixis Oakmark Fund – (continued)
Industry Summary at December 31, 2022
| | | | |
Capital Markets | | | 13.5 | % |
Software | | | 8.0 | |
Interactive Media & Services | | | 7.3 | |
Banks | | | 6.9 | |
Oil, Gas & Consumable Fuels | | | 6.2 | |
Consumer Finance | | | 6.0 | |
Entertainment | | | 5.6 | |
Insurance | | | 4.9 | |
Media | | | 4.4 | |
Internet & Direct Marketing Retail | | | 4.2 | |
IT Services | | | 4.0 | |
Machinery | | | 3.5 | |
Building Products | | | 3.0 | |
Auto Components | | | 2.8 | |
Hotels, Restaurants & Leisure | | | 2.8 | |
Real Estate Management & Development | | | 2.3 | |
Health Care Providers & Services | | | 2.1 | |
Other Investments, less than 2% each | | | 9.2 | |
Short-Term Investments | | | 2.7 | |
| | | | |
Total Investments | | | 99.4 | |
Other assets less liabilities | | | 0.6 | |
| | | | |
Net Assets | | | 100.0 | % |
| | | | |
See accompanying notes to financial statements.
| 34
Portfolio of Investments – as of December 31, 2022
Natixis Oakmark International Fund
| | | | | | | | |
| Shares | | | Description | | Value (†) | |
| | Common Stocks — 95.4% of Net Assets | |
| | | | Australia — 0.7% | |
| | 254,020 | | | Orica Ltd. | | $ | 2,597,205 | |
| | | | | | | | |
| | | | Belgium — 2.0% | |
| | 119,900 | | | Anheuser-Busch InBev S.A. | | | 7,221,690 | |
| | | | | | | | |
| | | | Canada — 2.1% | |
| | 204,600 | | | Open Text Corp. | | | 6,062,446 | |
| | 23,899 | | | Restaurant Brands International, Inc. | | | 1,545,548 | |
| | | | | | | | |
| | | | | | | 7,607,994 | |
| | | | | | | | |
| | | | China — 5.8% | |
| | 712,300 | | | Alibaba Group Holding Ltd.(a) | | | 7,816,003 | |
| | 140,775 | | | Prosus NV | | | 9,719,583 | |
| | 256,096 | | | Vipshop Holdings Ltd., ADR(a) | | | 3,493,149 | |
| | | | | | | | |
| | | | | | | 21,028,735 | |
| | | | | | | | |
| | | | Denmark — 1.2% | |
| | 28,100 | | | DSV AS | | | 4,443,654 | |
| | | | | | | | |
| | | | France — 15.2% | |
| | 300,305 | | | Accor S.A.(a) | | | 7,491,875 | |
| | 215,191 | | | BNP Paribas S.A. | | | 12,252,789 | |
| | 28,200 | | | Capgemini SE | | | 4,714,363 | |
| | 73,100 | | | Danone S.A. | | | 3,852,783 | |
| | 50,063 | | | Edenred | | | 2,724,697 | |
| | 11,155 | | | Kering S.A. | | | 5,677,086 | |
| | 85,098 | | | Publicis Groupe S.A. | | | 5,436,255 | |
| | 300,598 | | | Valeo S.A. | | | 5,371,030 | |
| | 186,051 | | | Worldline S.A., 144A(a) | | | 7,286,213 | |
| | | | | | | | |
| | | | | | | 54,807,091 | |
| | | | | | | | |
| | | | Germany — 27.4% | |
| | 64,300 | | | Adidas AG | | | 8,714,341 | |
| | 43,710 | | | Allianz SE, (Registered) | | | 9,334,603 | |
| | 156,030 | | | Bayer AG, (Registered) | | | 8,030,872 | |
| | 104,700 | | | Bayerische Motoren Werke AG | | | 9,269,610 | |
| | 156,359 | | | Continental AG | | | 9,321,263 | |
| | 233,407 | | | Daimler Truck Holding AG(a) | | | 7,175,330 | |
| | 124,100 | | | Fresenius Medical Care AG & Co. KGaA | | | 4,053,418 | |
| | 320,500 | | | Fresenius SE & Co. KGaA | | | 8,952,168 | |
| | 80,400 | | | Henkel AG & Co. KGaA | | | 5,166,878 | |
| | 163,414 | | | Mercedes-Benz Group AG, (Registered) | | | 10,686,437 | |
| | 69,100 | | | SAP SE | | | 7,133,931 | |
| | 52,200 | | | Siemens AG, (Registered) | | | 7,195,833 | |
| | 581,663 | | | thyssenkrupp AG(a) | | | 3,532,170 | |
| | | | | | | | |
| | | | | | | 98,566,854 | |
| | | | | | | | |
| | | | Hong Kong — 2.1% | |
| | 563,200 | | | Prudential PLC | | | 7,679,394 | |
| | | | | | | | |
| | | | India — 0.4% | |
| | 141,675 | | | Axis Bank Ltd. | | | 1,594,358 | |
| | | | | | | | |
| | | | Ireland — 2.0% | |
| | 94,238 | | | Ryanair Holdings PLC, Sponsored ADR(a) | | | 7,045,233 | |
| | | | | | | | |
| | | | Italy — 3.2% | |
| | 5,205,700 | | | Intesa Sanpaolo SpA | | | 11,532,753 | |
| | | | | | | | |
| | | | Japan — 1.8% | |
| | 19,500 | | | Fujitsu Ltd. | | | 2,599,692 | |
| | 172,000 | | | Komatsu Ltd. | | | 3,717,627 | |
| | | | | | | | |
| | | | | | | 6,317,319 | |
| | | | | | | | |
| | | | Korea — 1.9% | |
| | 47,550 | | | NAVER Corp. | | | 6,762,606 | |
| | | | | | | | |
| | | | Mexico — 0.3% | |
| | 225,687 | | | Grupo Televisa SAB, Sponsored ADR | | | 1,029,133 | |
| | | | | | | | |
| | | | Netherlands — 3.4% | |
| | 34,400 | | | Akzo Nobel NV | | $ | 2,308,327 | |
| | 102,444 | | | EXOR NV(a) | | | 7,500,363 | |
| | 167,438 | | | Koninklijke Philips NV | | | 2,519,475 | |
| | | | | | | | |
| | | | | | | 12,328,165 | |
| | | | | | | | |
| | | | Spain — 1.4% | |
| | 94,630 | | | Amadeus IT Group S.A.(a) | | | 4,909,188 | |
| | | | | | | | |
| | | | Sweden — 3.1% | |
| | 74,400 | | | Sandvik AB | | | 1,344,526 | |
| | 342,403 | | | SKF AB, B Shares | | | 5,229,701 | |
| | 259,400 | | | Volvo AB, B Shares | | | 4,685,697 | |
| | | | | | | | |
| | | | | | | 11,259,924 | |
| | | | | | | | |
| | | | Switzerland — 7.1% | |
| | 12,400 | | | Cie Financiere Richemont S.A., Class A (Registered) | | | 1,607,783 | |
| | 571,021 | | | Credit Suisse Group AG, (Registered) | | | 1,704,754 | |
| | 914,080 | | | Glencore PLC | �� | | 6,095,674 | |
| | 129,721 | | | Holcim AG, (Registered) | | | 6,714,783 | |
| | 42,900 | | | Novartis AG, (Registered) | | | 3,882,339 | |
| | 12,800 | | | Schindler Holding AG | | | 2,407,453 | |
| | 10,499 | | | Swatch Group AG (The) | | | 2,984,032 | |
| | | | | | | | |
| | | | | | | 25,396,818 | |
| | | | | | | | |
| | | | United Kingdom — 13.7% | |
| | 68,800 | | | Ashtead Group PLC | | | 3,908,167 | |
| | 521,092 | | | CNH Industrial NV | | | 8,359,353 | |
| | 91,400 | | | Compass Group PLC | | | 2,110,611 | |
| | 414,477 | | | Informa PLC | | | 3,091,900 | |
| | 250,232 | | | Liberty Global PLC, Class A(a) | | | 4,736,892 | |
| | 20,113,500 | | | Lloyds Banking Group PLC | | | 10,976,195 | |
| | 25,000 | | | Reckitt Benckiser Group PLC | | | 1,732,908 | |
| | 1,136,500 | | | Rolls-Royce Holdings PLC(a) | | | 1,269,441 | |
| | 1,277,482 | | | Schroders PLC | | | 6,712,519 | |
| | 96,200 | | | Smiths Group PLC | | | 1,846,277 | |
| | 474,500 | | | WPP PLC | | | 4,688,052 | |
| | | | | | | | |
| | | | | | | 49,432,315 | |
| | | | | | | | |
| | | | United States — 0.6% | |
| | 6,290 | | | Roche Holding AG | | | 1,976,553 | |
| | | | | | | | |
| | | | Total Common Stocks
(Identified Cost $376,233,477) | | | 343,536,982 | |
| | | | | | | | |
| | | | | | | | |
| | Preferred Stocks — 1.5% | |
| | | | Korea — 1.5% | |
| | 130,400 | | | Samsung Electronics Co. Ltd.,
2.145%, (KRW)
(Identified Cost $7,333,977) | | | 5,225,566 | |
| | | | | | | | |
| | | | | | | | |
Principal
Amount | | | | | | |
| | Short-Term Investments — 1.8% | |
| $ | 6,501,999 | | | Tri-Party Repurchase Agreement with Fixed Income Clearing Corporation, dated 12/30/2022 at 1.800% to be repurchased at $6,503,299 on 1/03/2023 collateralized by $3,293,200 U.S. Treasury Inflation Indexed Bond, 3.625% due 4/15/2028 valued at $6,632,143 including accrued interest (Note 2 of Notes to Financial Statements)
(Identified Cost $6,501,999) | | | 6,501,999 | |
| | | | | | | | |
| | | | Total Investments — 98.7%
(Identified Cost $390,069,453) | | | 355,264,547 | |
| | | | Other assets less liabilities — 1.3% | | | 4,649,260 | |
| | | | | | | | |
| | | | Net Assets — 100.0% | | $ | 359,913,807 | |
| | | | | | | | |
See accompanying notes to financial statements.
35 |
Portfolio of Investments – as of December 31, 2022
Natixis Oakmark International Fund – (continued)
| | | | | | | | |
| | (†) | | | See Note 2 of Notes to Financial Statements. | |
| | (a) | | | Non-income producing security. | |
| | | | | | | | |
| | 144A | | | All or a portion of these securities are exempt from registration under Rule 144A of the Securities Act of 1933. These securities may be resold in transactions exempt from registration, normally to qualified institutional buyers. At December 31, 2022, the value of Rule 144A holdings amounted to $7,286,213 or 2.0% of net assets. | |
| | ADR | | | An American Depositary Receipt is a certificate issued by a custodian bank representing the right to receive securities of the foreign issuer described. The values of ADRs may be significantly influenced by trading on exchanges not located in the United States. | |
| | | | | |
| | KRW | | | South Korean Won | |
Industry Summary at December 31, 2022
| | | | |
Banks | | | 10.0 | % |
Machinery | | | 9.2 | |
IT Services | | | 6.1 | |
Internet & Direct Marketing Retail | | | 5.8 | |
Automobiles | | | 5.6 | |
Textiles, Apparel & Luxury Goods | | | 5.2 | |
Insurance | | | 4.7 | |
Auto Components | | | 4.1 | |
Media | | | 4.0 | |
Pharmaceuticals | | | 3.9 | |
Software | | | 3.7 | |
Health Care Providers & Services | | | 3.6 | |
Hotels, Restaurants & Leisure | | | 3.1 | |
Metals & Mining | | | 2.7 | |
Industrial Conglomerates | | | 2.5 | |
Capital Markets | | | 2.4 | |
Diversified Financial Services | | | 2.1 | |
Beverages | | | 2.0 | |
Airlines | | | 2.0 | |
Other Investments, less than 2% each | | | 14.2 | |
Short-Term Investments | | | 1.8 | |
| | | | |
Total Investments | | | 98.7 | |
Other assets less liabilities | | | 1.3 | |
| | | | |
Net Assets | | | 100.0 | % |
| | | | |
Currency Exposure Summary at December 31, 2022
| | | | |
Euro | | | 57.6 | % |
British Pound | | | 13.9 | |
United States Dollar | | | 6.7 | |
Swiss Franc | | | 6.0 | |
South Korean Won | | | 3.4 | |
Swedish Krona | | | 3.1 | |
Hong Kong Dollar | | | 2.2 | |
Other, less than 2% each | | | 5.8 | |
| | | | |
Total Investments | | | 98.7 | |
Other assets less liabilities | | | 1.3 | |
| | | | |
Net Assets | | | 100.0 | % |
| | | | |
See accompanying notes to financial statements.
| 36
Portfolio of Investments – as of December 31, 2022
Natixis U.S. Equity Opportunities Fund
| | | | | | | | |
| Shares | | | Description | | Value (†) | |
| | Common Stocks — 99.4% of Net Assets | |
| | | | Aerospace & Defense — 2.4% | |
| | 93,105 | | | Boeing Co. (The)(a) | | $ | 17,735,571 | |
| | | | | | | | |
| | | | Air Freight & Logistics — 0.7% | |
| | 47,986 | | | Expeditors International of Washington, Inc. | | | 4,986,705 | |
| | | | | | | | |
| | | | Auto Components — 0.1% | |
| | 18,900 | | | Mobileye Global, Inc., Class A(a) | | | 662,634 | |
| | | | | | | | |
| | | | Automobiles — 2.8% | |
| | 405,400 | | | General Motors Co. | | | 13,637,656 | |
| | 57,257 | | | Tesla, Inc.(a) | | | 7,052,917 | |
| | | | | | | | |
| | | | | | | 20,690,573 | |
| | | | | | | | |
| | | | Banks — 4.8% | |
| | 329,305 | | | Citigroup, Inc. | | | 14,894,465 | |
| | 500,900 | | | Wells Fargo & Co. | | | 20,682,161 | |
| | | | | | | | |
| | | | | | | 35,576,626 | |
| | | | | | | | |
| | | | Beverages — 2.7% | |
| | 11,851 | | | Boston Beer Co., Inc. (The), Class A(a) | | | 3,905,141 | |
| | 155,211 | | | Monster Beverage Corp.(a) | | | 15,758,573 | |
| | | | | | | | |
| | | | | | | 19,663,714 | |
| | | | | | | | |
| | | | Biotechnology — 3.7% | |
| | 54,809 | | | Alnylam Pharmaceuticals, Inc.(a) | | | 13,025,359 | |
| | 20,626 | | | BioMarin Pharmaceutical, Inc.(a) | | | 2,134,585 | |
| | 62,008 | | | CRISPR Therapeutics AG(a) | | | 2,520,625 | |
| | 12,680 | | | Regeneron Pharmaceuticals, Inc.(a) | | | 9,148,493 | |
| | | | | | | | |
| | | | | | | 26,829,062 | |
| | | | | | | | |
| | | | Building Products — 1.2% | |
| | 182,500 | | | Masco Corp. | | | 8,517,275 | |
| | | | | | | | |
| | | | Capital Markets — 11.9% | |
| | 112,845 | | | Charles Schwab Corp. (The) | | | 9,395,475 | |
| | 15,151 | | | FactSet Research Systems, Inc. | | | 6,078,733 | |
| | 40,700 | | | Goldman Sachs Group, Inc. (The) | | | 13,975,566 | |
| | 126,400 | | | Intercontinental Exchange, Inc. | | | 12,967,376 | |
| | 410,200 | | | KKR & Co., Inc. | | | 19,041,484 | |
| | 12,535 | | | MSCI, Inc. | | | 5,830,906 | |
| | 94,571 | | | SEI Investments Co. | | | 5,513,489 | |
| | 191,000 | | | State Street Corp. | | | 14,815,870 | |
| | | | | | | | |
| | | | | | | 87,618,899 | |
| | | | | | | | |
| | | | Consumer Finance — 3.4% | |
| | 224,200 | | | Ally Financial, Inc. | | | 5,481,690 | |
| | 207,185 | | | Capital One Financial Corp. | | | 19,259,918 | |
| | | | | | | | |
| | | | | | | 24,741,608 | |
| | | | | | | | |
| | | | Entertainment — 4.6% | |
| | 88,619 | | | Netflix, Inc.(a) | | | 26,131,971 | |
| | 88,963 | | | Walt Disney Co. (The)(a) | | | 7,729,105 | |
| | | | | | | | |
| | | | | | | 33,861,076 | |
| | | | | | | | |
| | | | Health Care Equipment & Supplies — 0.5% | |
| | 14,262 | | | Intuitive Surgical, Inc.(a) | | | 3,784,422 | |
| | | | | | | | |
| | | | Health Care Providers & Services — 1.7% | |
| | 52,900 | | | HCA Healthcare, Inc. | | | 12,693,884 | |
| | | | | | | | |
| | | | Health Care Technology — 1.7% | |
| | 201,593 | | | Doximity, Inc., Class A(a) | | | 6,765,461 | |
| | 35,085 | | | Veeva Systems, Inc., Class A(a) | | | 5,662,017 | |
| | | | | | | | |
| | | | | | | 12,427,478 | |
| | | | | | | | |
| | | | Hotels, Restaurants & Leisure — 4.0% | |
| | 5,920 | | | Booking Holdings, Inc.(a) | | | 11,930,458 | |
| | 81,052 | | | Starbucks Corp. | | | 8,040,358 | |
| | 102,126 | | | Yum China Holdings, Inc. | | | 5,581,186 | |
| | 32,228 | | | Yum! Brands, Inc. | | | 4,127,762 | |
| | | | | | | | |
| | | | | | | 29,679,764 | |
| | | | | | | | |
| | | | Insurance — 2.1% | |
| | 61,800 | | | Willis Towers Watson PLC | | $ | 15,115,044 | |
| | | | | | | | |
| | | | Interactive Media & Services — 9.0% | |
| | 395,382 | | | Alphabet, Inc., Class A(a) | | | 34,884,554 | |
| | 51,099 | | | Alphabet, Inc., Class C(a) | | | 4,534,014 | |
| | 111,956 | | | Meta Platforms, Inc., Class A(a) | | | 13,472,785 | |
| | 543,200 | | | Pinterest, Inc., Class A(a) | | | 13,188,896 | |
| | | | | | | | |
| | | | | | | 66,080,249 | |
| | | | | | | | |
| | | | Internet & Direct Marketing Retail — 4.4% | |
| | 49,745 | | | Alibaba Group Holding Ltd., Sponsored ADR(a) | | | 4,382,037 | |
| | 336,339 | | | Amazon.com, Inc.(a) | | | 28,252,476 | |
| | | | | | | | |
| | | | | | | 32,634,513 | |
| | | | | | | | |
| | | | IT Services — 5.6% | |
| | 63,576 | | | Block, Inc.(a) | | | 3,995,116 | |
| | 131,000 | | | Fiserv, Inc.(a) | | | 13,240,170 | |
| | 64,835 | | | PayPal Holdings, Inc.(a) | | | 4,617,548 | |
| | 99,880 | | | Shopify, Inc., Class A(a) | | | 3,466,835 | |
| | 74,271 | | | Visa, Inc., Class A | | | 15,430,543 | |
| | | | | | | | |
| | | | | | | 40,750,212 | |
| | | | | | | | |
| | | | Life Sciences Tools & Services — 0.8% | |
| | 28,868 | | | Illumina, Inc.(a) | | | 5,837,110 | |
| | | | | | | | |
| | | | Machinery — 2.0% | |
| | 7,883 | | | Deere & Co. | | | 3,379,915 | |
| | 40,000 | | | Parker-Hannifin Corp. | | | 11,640,000 | |
| | | | | | | | |
| | | | | | | 15,019,915 | |
| | | | | | | | |
| | | | Media — 3.6% | |
| | 19,310 | | | Charter Communications, Inc., Class A(a) | | | 6,548,021 | |
| | 382,880 | | | Comcast Corp., Class A | | | 13,389,314 | |
| | 84,200 | | | Liberty Broadband Corp., Class C(a) | | | 6,421,934 | |
| | | | | | | | |
| | | | | | | 26,359,269 | |
| | | | | | | | |
| | | | Oil, Gas & Consumable Fuels — 4.4% | |
| | 331,241 | | | APA Corp. | | | 15,462,330 | |
| | 128,338 | | | EOG Resources, Inc. | | | 16,622,338 | |
| | | | | | | | |
| | | | | | | 32,084,668 | |
| | | | | | | | |
| | | | Pharmaceuticals — 2.5% | |
| | 86,487 | | | Novartis AG, Sponsored ADR | | | 7,846,101 | |
| | 39,029 | | | Novo Nordisk A/S, Sponsored ADR | | | 5,282,185 | |
| | 140,503 | | | Roche Holding AG, Sponsored ADR | | | 5,500,692 | |
| | | | | | | | |
| | | | | | | 18,628,978 | |
| | | | | | | | |
| | | | Real Estate Management & Development — 1.9% | |
| | 177,700 | | | CBRE Group, Inc., Class A(a) | | | 13,675,792 | |
| | | | | | | | |
| | | | Semiconductors & Semiconductor Equipment — 2.8% | |
| | 95,994 | | | NVIDIA Corp. | | | 14,028,563 | |
| | 57,906 | | | QUALCOMM, Inc. | | | 6,366,186 | |
| | | | | | | | |
| | | | | | | 20,394,749 | |
| | | | | | | | |
| | | | Software — 12.1% | |
| | 59,455 | | | Autodesk, Inc.(a) | | | 11,110,356 | |
| | 39,616 | | | Microsoft Corp. | | | 9,500,709 | |
| | 372,438 | | | Oracle Corp. | | | 30,443,082 | |
| | 155,267 | | | Salesforce, Inc.(a) | | | 20,586,852 | |
| | 101,155 | | | Workday, Inc., Class A(a) | | | 16,926,266 | |
| | | | | | | | |
| | | | | | | 88,567,265 | |
| | | | | | | | |
| | | | Textiles, Apparel & Luxury Goods — 0.5% | |
| | 380,757 | | | Under Armour, Inc., Class A(a) | | | 3,868,491 | |
| | | | | | | | |
| | | | Tobacco — 1.5% | |
| | 239,000 | | | Altria Group, Inc. | | | 10,924,690 | |
| | | | | | | | |
| | | | Total Common Stocks
(Identified Cost $626,481,553) | | | 729,410,236 | |
| | | | | | | | |
See accompanying notes to financial statements.
37 |
Portfolio of Investments – as of December 31, 2022
Natixis U.S. Equity Opportunities Fund – (continued)
| | | | | | | | |
Principal
Amount | | | Description | | Value (†) | |
| | | | | | | | |
| | Short-Term Investments — 0.4% | |
| $ | 2,869,506 | | | Tri-Party Repurchase Agreement with Fixed Income Clearing Corporation, dated 12/30/2022 at 1.800% to be repurchased at $2,870,080 on 1/03/2023 collateralized by $3,345,400 U.S. Treasury Note, 1.250% due 3/31/2028 valued at $2,926,964 including accrued interest (Note 2 of Notes to Financial Statements) (Identified Cost $2,869,506) | | $ | 2,869,506 | |
| | | | | | | | |
| | | | | | | | |
| | | | Total Investments — 99.8%
(Identified Cost $629,351,059) | | | 732,279,742 | |
| | | | Other assets less liabilities — 0.2% | | | 1,546,749 | |
| | | | | | | | |
| | | | Net Assets — 100.0% | | $ | 733,826,491 | |
| | | | | | | | |
| | | | | | | | |
| | (†) | | | See Note 2 of Notes to Financial Statements. | |
| | (a) | | | Non-income producing security. | |
| | | | | | | | |
| | ADR | | | An American Depositary Receipt is a certificate issued by a custodian bank representing the right to receive securities of the foreign issuer described. The values of ADRs may be significantly influenced by trading on exchanges not located in the United States. | |
Industry Summary at December 31, 2022
| | | | |
Software | | | 12.1 | % |
Capital Markets | | | 11.9 | |
Interactive Media & Services | | | 9.0 | |
IT Services | | | 5.6 | |
Banks | | | 4.8 | |
Entertainment | | | 4.6 | |
Internet & Direct Marketing Retail | | | 4.4 | |
Oil, Gas & Consumable Fuels | | | 4.4 | |
Hotels, Restaurants & Leisure | | | 4.0 | |
Biotechnology | | | 3.7 | |
Media | | | 3.6 | |
Consumer Finance | | | 3.4 | |
Automobiles | | | 2.8 | |
Semiconductors & Semiconductor Equipment | | | 2.8 | |
Beverages | | | 2.7 | |
Pharmaceuticals | | | 2.5 | |
Aerospace & Defense | | | 2.4 | |
Insurance | | | 2.1 | |
Machinery | | | 2.0 | |
Other Investments, less than 2% each | | | 10.6 | |
Short-Term Investments | | | 0.4 | |
| | | | |
Total Investments | | | 99.8 | |
Other assets less liabilities | | | 0.2 | |
| | | | |
Net Assets | | | 100.0 | % |
| | | | |
See accompanying notes to financial statements.
| 38
Portfolio of Investments – as of December 31, 2022
Vaughan Nelson Mid Cap Fund
| | | | | | | | |
| Shares | | | Description | | Value (†) | |
| | Common Stocks — 98.0% of Net Assets | |
| | | | Aerospace & Defense — 1.3% | |
| | 21,210 | | | Axon Enterprise, Inc.(a) | | $ | 3,519,375 | |
| | | | | | | | |
| | | | Banks — 4.4% | |
| | 88,420 | | | Bank of N.T. Butterfield & Son Ltd. (The) | | | 2,635,800 | |
| | 41,680 | | | First Republic Bank | | | 5,080,375 | |
| | 127,681 | | | Huntington Bancshares, Inc. | | | 1,800,302 | |
| | 91,290 | | | PacWest Bancorp | | | 2,095,106 | |
| | | | | | | | |
| | | | | | | 11,611,583 | |
| | | | | | | | |
| | | | Building Products — 2.2% | |
| | 26,450 | | | Allegion PLC | | | 2,784,127 | |
| | 152,375 | | | AZEK Co., Inc. (The)(a) | | | 3,096,260 | |
| | | | | | | | |
| | | | | | | 5,880,387 | |
| | | | | | | | |
| | | | Capital Markets — 9.7% | |
| | 29,500 | | | Ares Management Corp., Class A | | | 2,018,980 | |
| | 174,912 | | | Brightsphere Investment Group, Inc. | | | 3,599,689 | |
| | 31,940 | | | Cboe Global Markets, Inc. | | | 4,007,512 | |
| | 18,735 | | | FactSet Research Systems, Inc. | | | 7,516,669 | |
| | 109,740 | | | Nasdaq, Inc. | | | 6,732,549 | |
| | 15,097 | | | Raymond James Financial, Inc. | | | 1,613,115 | |
| | | | | | | | |
| | | | | | | 25,488,514 | |
| | | | | | | | |
| | | | Chemicals — 4.2% | |
| | 140,300 | | | Axalta Coating Systems Ltd.(a) | | | 3,573,441 | |
| | 43,095 | | | FMC Corp. | | | 5,378,256 | |
| | 24,895 | | | LyondellBasell Industries NV, Class A | | | 2,067,032 | |
| | | | | | | | |
| | | | | | | 11,018,729 | |
| | | | | | | | |
| | | | Commercial Services & Supplies — 2.7% | |
| | 54,535 | | | Republic Services, Inc. | | | 7,034,470 | |
| | | | | | | | |
| | | | Communications Equipment — 3.2% | |
| | 32,615 | | | Motorola Solutions, Inc. | | | 8,405,212 | |
| | | | | | | | |
| | | | Construction & Engineering — 3.9% | |
| | 228,050 | | | WillScot Mobile Mini Holdings Corp.(a) | | | 10,301,018 | |
| | | | | | | | |
| | | | Construction Materials — 0.6% | |
| | 9,065 | | | Vulcan Materials Co. | | | 1,587,372 | |
| | | | | | | | |
| | | | Containers & Packaging — 1.8% | |
| | 8,815 | | | Avery Dennison Corp. | | | 1,595,515 | |
| | 37,890 | | | Crown Holdings, Inc. | | | 3,114,937 | |
| | | | | | | | |
| | | | | | | 4,710,452 | |
| | | | | | | | |
| | | | Diversified Consumer Services — 0.7% | |
| | 18,310 | | | Grand Canyon Education, Inc.(a) | | | 1,934,635 | |
| | | | | | | | |
| | | | Diversified Financial Services — 1.0% | |
| | 42,492 | | | Apollo Global Management, Inc. | | | 2,710,565 | |
| | | | | | | | |
| | | | Electric Utilities — 2.8% | |
| | 66,220 | | | Alliant Energy Corp. | | | 3,656,006 | |
| | 57,010 | | | Evergy, Inc. | | | 3,587,639 | |
| | | | | | | | |
| | | | | | | 7,243,645 | |
| | | | | | | | |
| | | | Electrical Equipment — 5.4% | |
| | 48,905 | | | AMETEK, Inc. | | | 6,833,007 | |
| | 8,075 | | | Hubbell, Inc. | | | 1,895,041 | |
| | 138,990 | | | nVent Electric PLC | | | 5,346,945 | |
| | | | | | | | |
| | | | | | | 14,074,993 | |
| | | | | | | | |
| | | | Electronic Equipment, Instruments & Components — 2.3% | |
| | 18,555 | | | CDW Corp. | | | 3,313,552 | |
| | 15,155 | | | Keysight Technologies, Inc.(a) | | | 2,592,566 | |
| | | | | | | | |
| | | | | | | 5,906,118 | |
| | | | | | | | |
| | | | Food & Staples Retailing — 1.9% | |
| | 83,535 | | | Performance Food Group Co.(a) | | | 4,877,609 | |
| | | | | | | | |
| | | | Health Care Equipment & Supplies — 2.6% | |
| | 10,555 | | | Cooper Cos., Inc. (The) | | $ | 3,490,222 | |
| | 45,045 | | | Hologic, Inc.(a) | | | 3,369,816 | |
| | | | | | | | |
| | | | | | | 6,860,038 | |
| | | | | | | | |
| | | | Health Care Providers & Services — 2.8% | |
| | 44,475 | | | AmerisourceBergen Corp. | | | 7,369,952 | |
| | | | | | | | |
| | | | Hotels, Restaurants & Leisure — 2.0% | |
| | 128,860 | | | Aramark | | | 5,327,072 | |
| | | | | | | | |
| | | | Household Products — 1.0% | |
| | 32,720 | | | Church & Dwight Co., Inc. | | | 2,637,559 | |
| | | | | | | | |
| | | | Independent Power & Renewable Electricity Producers — 3.4% | |
| | 378,120 | | | Vistra Corp. | | | 8,772,384 | |
| | | | | | | | |
| | | | Insurance — 6.4% | |
| | 50,675 | | | Allstate Corp. (The) | | | 6,871,530 | |
| | 30,455 | | | Arthur J. Gallagher & Co. | | | 5,741,986 | |
| | 28,470 | | | Reinsurance Group of America, Inc. | | | 4,045,302 | |
| | | | | | | | |
| | | | | | | 16,658,818 | |
| | | | | | | | |
| | | | IT Services — 4.7% | |
| | 86,050 | | | MAXIMUS, Inc. | | | 6,310,046 | |
| | 114,980 | | | SS&C Technologies Holdings, Inc. | | | 5,985,859 | |
| | | | | | | | |
| | | | | | | 12,295,905 | |
| | | | | | | | |
| | | | Life Sciences Tools & Services — 3.8% | |
| | 16,395 | | | Agilent Technologies, Inc. | | | 2,453,512 | |
| | 99,645 | | | Avantor, Inc.(a) | | | 2,101,513 | |
| | 25,807 | | | IQVIA Holdings, Inc.(a) | | | 5,287,596 | |
| | | | | | | | |
| | | | | | | 9,842,621 | |
| | | | | | | | |
| | | | Machinery — 3.7% | |
| | 50,140 | | | Crane Holdings Co. | | | 5,036,563 | |
| | 57,755 | | | Otis Worldwide Corp. | | | 4,522,794 | |
| | | | | | | | |
| | | | | | | 9,559,357 | |
| | | | | | | | |
| | | | Media — 3.1% | |
| | 46,140 | | | Nexstar Media Group, Inc., Class A | | | 8,075,884 | |
| | | | | | | | |
| | | | Metals & Mining — 1.7% | |
| | 375,960 | | | Constellium SE(a) | | | 4,447,607 | |
| | | | | | | | |
| | | | Multi-Utilities — 2.9% | |
| | 42,460 | | | Ameren Corp. | | | 3,775,543 | |
| | 60,835 | | | CMS Energy Corp. | | | 3,852,681 | |
| | | | | | | | |
| | | | | | | 7,628,224 | |
| | | | | | | | |
| | | | Oil, Gas & Consumable Fuels — 4.9% | |
| | 32,085 | | | Diamondback Energy, Inc. | | | 4,388,586 | |
| | 17,705 | | | Pioneer Natural Resources Co. | | | 4,043,645 | |
| | 756,665 | | | Southwestern Energy Co.(a) | | | 4,426,490 | |
| | | | | | | | |
| | | | | | | 12,858,721 | |
| | | | | | | | |
| | | | Pharmaceuticals — 0.4% | |
| | 94,830 | | | Elanco Animal Health, Inc.(a) | | | 1,158,823 | |
| | | | | | | | |
| | | | Professional Services — 3.0% | |
| | 19,230 | | | CACI International, Inc., Class A(a) | | | 5,780,346 | |
| | 10,625 | | | Equifax, Inc. | | | 2,065,075 | |
| | | | | | | | |
| | | | | | | 7,845,421 | |
| | | | | | | | |
| | | | REITs – Diversified — 1.5% | |
| | 495,830 | | | Rithm Capital Corp. | | | 4,050,931 | |
| | | | | | | | |
| | | | Semiconductors & Semiconductor Equipment — 1.0% | |
| | 8,145 | | | Analog Devices, Inc. | | | 1,336,025 | |
| | 19,580 | | | Entegris, Inc. | | | 1,284,252 | |
| | | | | | | | |
| | | | | | | 2,620,277 | |
| | | | | | | | |
See accompanying notes to financial statements.
39 |
Portfolio of Investments – as of December 31, 2022
Vaughan Nelson Mid Cap Fund – (continued)
| | | | | | | | |
| Shares | | | Description | | Value (†) | |
| | | | | | | | |
| | | | Software — 0.5% | |
| | 120,432 | | | N-Able, Inc.(a) | | $ | 1,238,041 | |
| | | | | | | | |
| | | | Textiles, Apparel & Luxury Goods — 0.5% | |
| | 32,010 | | | Skechers U.S.A., Inc., Class A(a) | | | 1,342,819 | |
| | | | | | | | |
| | | | Total Common Stocks
(Identified Cost $219,883,657) | | | 256,895,131 | |
| | | | | | | | |
| | | | | | | | |
Principal
Amount | | | | | | |
| | Short-Term Investments — 2.4% | |
| $ | 6,285,880 | | | Tri-Party Repurchase Agreement with Fixed Income Clearing Corporation, dated 12/30/2022 at 1.800% to be repurchased at $6,287,137 on 1/03/2023 collateralized by $3,183,700 U.S. Treasury Inflation Indexed Bond, 3.625% due 4/15/2028 valued at $6,411,622 including accrued interest (Note 2 of Notes to Financial Statements)
(Identified Cost $6,285,880) | | | 6,285,880 | |
| | | | | | | | |
| | | | | | | | |
| | | | Total Investments — 100.4%
(Identified Cost $226,169,537) | | | 263,181,011 | |
| | | | Other assets less liabilities — (0.4)% | | | (960,323 | ) |
| | | | | | | | |
| | | | Net Assets — 100.0% | | $ | 262,220,688 | |
| | | | | | | | |
| | | | | | | | |
| | (†) | | | See Note 2 of Notes to Financial Statements. | |
| | (a) | | | Non-income producing security. | |
| | | | | | | | |
| | REITs | | | Real Estate Investment Trusts | |
Industry Summary at December 31, 2022
| | | | |
Capital Markets | | | 9.7 | % |
Insurance | | | 6.4 | |
Electrical Equipment | | | 5.4 | |
Oil, Gas & Consumable Fuels | | | 4.9 | |
IT Services | | | 4.7 | |
Banks | | | 4.4 | |
Chemicals | | | 4.2 | |
Construction & Engineering | | | 3.9 | |
Life Sciences Tools & Services | | | 3.8 | |
Machinery | | | 3.7 | |
Independent Power & Renewable Electricity Producers | | | 3.4 | |
Communications Equipment | | | 3.2 | |
Media | | | 3.1 | |
Professional Services | | | 3.0 | |
Multi-Utilities | | | 2.9 | |
Health Care Providers & Services | | | 2.8 | |
Electric Utilities | | | 2.8 | |
Commercial Services & Supplies | | | 2.7 | |
Health Care Equipment & Supplies | | | 2.6 | |
Electronic Equipment, Instruments & Components | | | 2.3 | |
Building Products | | | 2.2 | |
Hotels, Restaurants & Leisure | | | 2.0 | |
Other Investments, less than 2% each | | | 13.9 | |
Short-Term Investments | | | 2.4 | |
| | | | |
Total Investments | | | 100.4 | |
Other assets less liabilities | | | (0.4 | ) |
| | | | |
Net Assets | | | 100.0 | % |
| | | | |
See accompanying notes to financial statements.
| 40
Portfolio of Investments – as of December 31, 2022
Vaughan Nelson Small Cap Value Fund
| | | | | | | | |
| Shares | | | Description | | Value (†) | |
| | Common Stocks — 92.3% of Net Assets | |
| | | | Banks — 5.5% | |
| | 96,235 | | | Cadence Bank | | $ | 2,373,155 | |
| | 137,475 | | | Old National Bancorp | | | 2,471,801 | |
| | 25,795 | | | SouthState Corp. | | | 1,969,706 | |
| | 47,270 | | | United Bankshares, Inc. | | | 1,913,962 | |
| | 54,585 | | | United Community Banks, Inc. | | | 1,844,973 | |
| | | | | | | | |
| | | | | | | 10,573,597 | |
| | | | | | | | |
| | | | Building Products — 0.9% | |
| | 20,720 | | | Advanced Drainage Systems, Inc. | | | 1,698,418 | |
| | | | | | | | |
| | | | Capital Markets — 5.0% | |
| | 59,180 | | | Artisan Partners Asset Management, Inc., Class A | | | 1,757,646 | |
| | 27,460 | | | Cboe Global Markets, Inc. | | | 3,445,406 | |
| | 50,705 | | | Moelis & Co., Class A | | | 1,945,551 | |
| | 113,860 | | | Virtu Financial, Inc., Class A | | | 2,323,883 | |
| | | | | | | | |
| | | | | | | 9,472,486 | |
| | | | | | | | |
| | | | Chemicals — 6.9% | |
| | 108,710 | | | Chemours Co. (The) | | | 3,328,700 | |
| | 351,430 | | | Element Solutions, Inc. | | | 6,392,512 | |
| | 27,450 | | | FMC Corp. | | | 3,425,760 | |
| | | | | | | | |
| | | | | | | 13,146,972 | |
| | | | | | | | |
| | | | Commercial Services & Supplies — 1.1% | |
| | 36,470 | | | Ritchie Bros. Auctioneers, Inc. | | | 2,109,060 | |
| | | | | | | | |
| | | | Electronic Equipment, Instruments & Components — 8.7% | |
| | 33,210 | | | Advanced Energy Industries, Inc. | | | 2,848,754 | |
| | 67,315 | | | Coherent Corp.(a) | | | 2,362,757 | |
| | 35,175 | | | Fabrinet(a) | | | 4,510,138 | |
| | 68,625 | | | Insight Enterprises, Inc.(a) | | | 6,881,029 | |
| | | | | | | | |
| | | | | | | 16,602,678 | |
| | | | | | | | |
| | | | Energy Equipment & Services — 1.0% | |
| | 114,255 | | | Patterson-UTI Energy, Inc. | | | 1,924,054 | |
| | | | | | | | |
| | | | Food & Staples Retailing — 1.9% | |
| | 62,965 | | | Performance Food Group Co.(a) | | | 3,676,526 | |
| | | | | | | | |
| | | | Gas Utilities — 3.2% | |
| | 44,335 | | | Southwest Gas Holdings, Inc. | | | 2,743,450 | |
| | 47,370 | | | Spire, Inc. | | | 3,261,898 | |
| | | | | | | | |
| | | | | | | 6,005,348 | |
| | | | | | | | |
| | | | Health Care Providers & Services — 0.9% | |
| | 36,645 | | | Tenet Healthcare Corp.(a) | | | 1,787,910 | |
| | | | | | | | |
| | | | Hotels, Restaurants & Leisure — 4.3% | |
| | 111,935 | | | Bally’s Corp.(a) | | | 2,169,300 | |
| | 177,275 | | | Everi Holdings, Inc.(a) | | | 2,543,896 | |
| | 156,779 | | | International Game Technology PLC | | | 3,555,748 | |
| | | | | | | | |
| | | | | | | 8,268,944 | |
| | | | | | | | |
| | | | Household Durables — 2.4% | |
| | 36,000 | | | Installed Building Products, Inc. | | | 3,081,600 | |
| | 15,405 | | | Meritage Homes Corp.(a) | | | 1,420,341 | |
| | | | | | | | |
| | | | | | | 4,501,941 | |
| | | | | | | | |
| | | | Insurance — 3.0% | |
| | 55,820 | | | First American Financial Corp. | | | 2,921,619 | |
| | 31,350 | | | Selective Insurance Group, Inc. | | | 2,777,923 | |
| | | | | | | | |
| | | | | | | 5,699,542 | |
| | | | | | | | |
| | | | IT Services — 3.8% | |
| | 15,715 | | | ExlService Holdings, Inc.(a) | | | 2,662,593 | |
| | 58,175 | | | WNS Holdings Ltd., ADR(a) | | | 4,653,418 | |
| | | | | | | | |
| | | | | | | 7,316,011 | |
| | | | | | | | |
| | | | Life Sciences Tools & Services — 2.3% | |
| | 134,495 | | | Avantor, Inc.(a) | | $ | 2,836,500 | |
| | 105,950 | | | Maravai LifeSciences Holdings, Inc., Class A(a) | | | 1,516,144 | |
| | | | | | | | |
| | | | | | | 4,352,644 | |
| | | | | | | | |
| | | | Machinery — 6.6% | |
| | 22,220 | | | Alamo Group, Inc. | | | 3,146,352 | |
| | 51,775 | | | Federal Signal Corp. | | | 2,405,984 | |
| | 45,280 | | | Franklin Electric Co., Inc. | | | 3,611,080 | |
| | 23,630 | | | Watts Water Technologies, Inc., Class A | | | 3,455,415 | |
| | | | | | | | |
| | | | | | | 12,618,831 | |
| | | | | | | | |
| | | | Marine — 1.6% | |
| | 46,475 | | | Kirby Corp.(a) | | | 2,990,666 | |
| | | | | | | | |
| | | | Media — 0.4% | |
| | 66,740 | | | Gray Television, Inc. | | | 746,821 | |
| | | | | | | | |
| | | | Oil, Gas & Consumable Fuels — 3.1% | |
| | 37,535 | | | Antero Resources Corp.(a) | | | 1,163,210 | |
| | 48,070 | | | Comstock Resources, Inc. | | | 659,040 | |
| | 25,070 | | | Ovintiv, Inc. | | | 1,271,300 | |
| | 28,630 | | | PDC Energy, Inc. | | | 1,817,432 | |
| | 184,045 | | | Southwestern Energy Co.(a) | | | 1,076,663 | |
| | | | | | | | |
| | | | | | | 5,987,645 | |
| | | | | | | | |
| | | | Personal Products — 0.5% | |
| | 110,570 | | | Coty, Inc., Class A(a) | | | 946,479 | |
| | | | | | | | |
| | | | Professional Services — 3.2% | |
| | 48,150 | | | ASGN, Inc.(a) | | | 3,923,262 | |
| | 38,830 | | | Kforce, Inc. | | | 2,129,049 | |
| | | | | | | | |
| | | | | | | 6,052,311 | |
| | | | | | | | |
| | | | REITs – Mortgage — 1.6% | |
| | 123,440 | | | MFA Financial, Inc. | | | 1,215,884 | |
| | 65,050 | | | PennyMac Mortgage Investment Trust | | | 805,970 | |
| | 59,850 | | | Two Harbors Investment Corp. | | | 943,834 | |
| | | | | | | | |
| | | | | | | 2,965,688 | |
| | | | | | | | |
| | | | REITs – Storage — 1.5% | |
| | 77,675 | | | National Storage Affiliates Trust | | | 2,805,621 | |
| | | | | | | | |
| | | | REITs – Warehouse/Industrials — 1.7% | |
| | 100,840 | | | STAG Industrial, Inc. | | | 3,258,140 | |
| | | | | | | | |
| | | | Road & Rail — 3.3% | |
| | 21,830 | | | Landstar System, Inc. | | | 3,556,107 | |
| | 13,280 | | | Saia, Inc.(a) | | | 2,784,550 | |
| | | | | | | | |
| | | | | | | 6,340,657 | |
| | | | | | | | |
| | | | Semiconductors & Semiconductor Equipment — 6.1% | |
| | 73,700 | | | Ichor Holdings Ltd.(a) | | | 1,976,634 | |
| | 31,955 | | | MKS Instruments, Inc. | | | 2,707,547 | |
| | 134,565 | | | Rambus, Inc.(a) | | | 4,820,118 | |
| | 63,510 | | | Ultra Clean Holdings, Inc.(a) | | | 2,105,357 | |
| | | | | | | | |
| | | | | | | 11,609,656 | |
| | | | | | | | |
| | | | Specialty Retail — 0.9% | |
| | 6,165 | | | RH(a) | | | 1,647,226 | |
| | | | | | | | |
| | | | Textiles, Apparel & Luxury Goods — 1.4% | |
| | 46,830 | | | Capri Holdings Ltd.(a) | | | 2,684,296 | |
| | | | | | | | |
| | | | Trading Companies & Distributors — 9.5% | |
| | 52,080 | | | Beacon Roofing Supply, Inc.(a) | | | 2,749,303 | |
| | 130,295 | | | Core & Main, Inc., Class A(a) | | | 2,515,997 | |
| | 46,220 | | | GATX Corp. | | | 4,915,035 | |
| | 36,155 | | | Rush Enterprises, Inc., Class A | | | 1,890,183 | |
| | 102,185 | | | Univar Solutions, Inc.(a) | | | 3,249,483 | |
| | 11,215 | | | Watsco, Inc. | | | 2,797,021 | |
| | | | | | | | |
| | | | | | | 18,117,022 | |
| | | | | | | | |
| | | | Total Common Stocks
(Identified Cost $170,680,218) | | | 175,907,190 | |
| | | | | | | | |
See accompanying notes to financial statements.
41 |
Portfolio of Investments – as of December 31, 2022
Vaughan Nelson Small Cap Value Fund – (continued)
| | | | | | | | |
Principal
Amount | | | Description | | Value (†) | |
| | | | | | | | |
| | Short-Term Investments — 5.9% | |
| $ | 11,203,500 | | | Tri-Party Repurchase Agreement with Fixed Income Clearing Corporation, dated 12/30/2022 at 1.800% to be repurchased at $11,205,740 on 1/03/2023 collateralized by $5,674,400 U.S. Treasury Inflation Indexed Bond, 3.625% due 4/15/2028 valued at $11,427,618 including accrued interest (Note 2 of Notes to Financial Statements)
(Identified Cost $11,203,500) | | $ | 11,203,500 | |
| | | | | | | | |
| | | | | | | | |
| | | | Total Investments — 98.2%
(Identified Cost $181,883,718) | | | 187,110,690 | |
| | | | Other assets less liabilities — 1.8% | | | 3,423,843 | |
| | | | | | | | |
| | | | Net Assets — 100.0% | | $ | 190,534,533 | |
| | | | | | | | |
| | | | | | | | |
| | (†) | | | See Note 2 of Notes to Financial Statements. | | | | |
| | (a) | | | Non-income producing security. | | | | |
| | | | | | | | |
| | ADR | | | An American Depositary Receipt is a certificate issued by a custodian bank representing the right to receive securities of the foreign issuer described. The values of ADRs may be significantly influenced by trading on exchanges not located in the United States. | |
| | | | | | | | |
| | REITs | | | Real Estate Investment Trusts | | | | |
Industry Summary at December 31, 2022
| | | | |
Trading Companies & Distributors | | | 9.5 | % |
Electronic Equipment, Instruments & Components | | | 8.7 | |
Chemicals | | | 6.9 | |
Machinery | | | 6.6 | |
Semiconductors & Semiconductor Equipment | | | 6.1 | |
Banks | | | 5.5 | |
Capital Markets | | | 5.0 | |
Hotels, Restaurants & Leisure | | | 4.3 | |
IT Services | | | 3.8 | |
Road & Rail | | | 3.3 | |
Professional Services | | | 3.2 | |
Gas Utilities | | | 3.2 | |
Oil, Gas & Consumable Fuels | | | 3.1 | |
Insurance | | | 3.0 | |
Household Durables | | | 2.4 | |
Life Sciences Tools & Services | | | 2.3 | |
Other Investments, less than 2% each | | | 15.4 | |
Short-Term Investments | | | 5.9 | |
| | | | |
Total Investments | | | 98.2 | |
Other assets less liabilities | | | 1.8 | |
| | | | |
Net Assets | | | 100.0 | % |
| | | | |
See accompanying notes to financial statements.
| 42
Statements of Assets and Liabilities
December 31, 2022
| | | | | | | | | | | | | | | | |
| | | International
Growth Fund | | | Natixis
Oakmark
Fund | | | Natixis
Oakmark
International
Fund | | | Natixis U.S.
Equity
Opportunities
Fund | |
ASSETS | |
Investments at cost | | $ | 29,725,133 | | | $ | 353,291,056 | | | $ | 390,069,453 | | | $ | 629,351,059 | |
Net unrealized appreciation (depreciation) | | | (5,376,738 | ) | | | (6,851,031 | ) | | | (34,804,906 | ) | | | 102,928,683 | |
| | | | | | | | | | | | | | | | |
Investments at value | | | 24,348,395 | | | | 346,440,025 | | | | 355,264,547 | | | | 732,279,742 | |
Cash | | | — | | | | 18 | | | | 11 | | | | — | |
Foreign currency at value (identified cost $42,380, $0, $103,550 and $0, respectively) | | | 43,103 | | | | — | | | | 103,596 | | | | — | |
Receivable for Fund shares sold | | | — | | | | 3,214,559 | | | | 1,059,829 | | | | 3,904,350 | |
Receivable for securities sold | | | 198,763 | | | | — | | | | 524,466 | | | | 3,339,180 | |
Dividends and interest receivable | | | 58,714 | | | | 423,072 | | | | 11,620 | | | | 447,824 | |
Tax reclaims receivable | | | 49,957 | | | | — | | | | 4,589,998 | | | | 455,920 | |
Prepaid expenses (Note 8) | | | 558 | | | | 597 | | | | 593 | | | | 633 | |
| | | | | | | | | | | | | | | | |
TOTAL ASSETS | | | 24,699,490 | | | | 350,078,271 | | | | 361,554,660 | | | | 740,427,649 | |
| | | | | | | | | | | | | | | | |
LIABILITIES | |
Payable for securities purchased | | | 49,986 | | | | — | | | | 508,653 | | | | 651,776 | |
Payable for Fund shares redeemed | | | — | | | | 707,405 | | | | 590,044 | | | | 3,575,528 | |
Foreign taxes payable (Note 2) | | | — | | | | — | | | | 65,132 | | | | — | |
Management fees payable (Note 6) | | | 2,120 | | | | 149,707 | | | | 176,831 | | | | 454,057 | |
Deferred Trustees’ fees (Note 6) | | | 5,779 | | | | 662,702 | | | | 126,450 | | | | 508,361 | |
Administrative fees payable (Note 6) | | | 990 | | | | 14,932 | | | | 14,681 | | | | 29,985 | |
Payable to distributor (Note 6d) | | | 2 | | | | 2,668 | | | | 6,200 | | | | 2,443 | |
Audit and tax services fees payable | | | 44,820 | | | | 43,526 | | | | 44,962 | | | | 44,627 | |
Other accounts payable and accrued expenses | | | 14,967 | | | | 29,774 | | | | 107,900 | | | | 1,334,381 | |
| | | | | | | | | | | | | | | | |
TOTAL LIABILITIES | | | 118,664 | �� | | | 1,610,714 | | | | 1,640,853 | | | | 6,601,158 | |
| | | | | | | | | | | | | | | | |
NET ASSETS | | $ | 24,580,826 | | | $ | 348,467,557 | | | $ | 359,913,807 | | | $ | 733,826,491 | |
| | | | | | | | | | | | | | | | |
NET ASSETS CONSIST OF: | |
Paid-in capital | | $ | 30,614,860 | | | $ | 366,340,856 | | | $ | 531,637,430 | | | $ | 637,349,787 | |
Accumulated earnings (loss) | | | (6,034,034 | ) | | | (17,873,299 | ) | | | (171,723,623 | ) | | | 96,476,704 | |
| | | | | | | | | | | | | | | | |
NET ASSETS | | $ | 24,580,826 | | | $ | 348,467,557 | | | $ | 359,913,807 | | | $ | 733,826,491 | |
| | | | | | | | | | | | | | | | |
COMPUTATION OF NET ASSET VALUE AND OFFERING PRICE: | |
Class A shares: | | | | | | | | | | | | | | | | |
Net assets | | $ | 125,085 | | | $ | 192,750,028 | | | $ | 120,315,724 | | | $ | 512,391,643 | |
| | | | | | | | | | | | | | | | |
Shares of beneficial interest | | | 15,953 | | | | 8,945,206 | | | | 9,610,821 | | | | 17,660,428 | |
| | | | | | | | | | | | | | | | |
Net asset value and redemption price per share | | $ | 7.84 | | | $ | 21.55 | | | $ | 12.52 | | | $ | 29.01 | |
| | | | | | | | | | | | | | | | |
Offering price per share (100/94.25 of net asset value) (Note 1) | | $ | 8.32 | | | $ | 22.86 | | | $ | 13.28 | | | $ | 30.78 | |
| | | | | | | | | | | | | | | | |
Class C shares: (redemption price per share is equal to net asset value less any applicable contingent deferred sales charge) (Note 1) | | | | | | | | | | | | | | | | |
Net assets | | $ | 788 | | | $ | 51,987,425 | | | $ | 39,201,565 | | | $ | 29,355,662 | |
| | | | | | | | | | | | | | | | |
Shares of beneficial interest | | | 101 | | | | 3,105,417 | | | | 3,185,678 | | | | 2,421,225 | |
| | | | | | | | | | | | | | | | |
Net asset value and offering price per share | | $ | 7.77 | * | | $ | 16.74 | | | $ | 12.31 | | | $ | 12.12 | |
| | | | | | | | | | | | | | | | |
Class N shares: | | | | | | | | | | | | | | | | |
Net assets | | $ | 21,330,920 | | | $ | 517,155 | | | $ | 221,614 | | | $ | 167,383 | |
| | | | | | | | | | | | | | | | |
Shares of beneficial interest | | | 2,717,489 | | | | 22,140 | | | | 17,784 | | | | 4,438 | |
| | | | | | | | | | | | | | | | |
Net asset value, offering and redemption price per share | | $ | 7.85 | | | $ | 23.36 | | | $ | 12.46 | | | $ | 37.72 | |
| | | | | | | | | | | | �� | | | | |
Class Y shares: | | | | | | | | | | | | | | | | |
Net assets | | $ | 3,124,033 | | | $ | 103,212,949 | | | $ | 200,174,904 | | | $ | 191,911,803 | |
| | | | | | | | | | | | | | | | |
Shares of beneficial interest | | | 397,996 | | | | 4,432,248 | | | | 16,072,947 | | | | 5,103,467 | |
| | | | | | | | | | | | | | | | |
Net asset value, offering and redemption price per share | | $ | 7.85 | | | $ | 23.29 | | | $ | 12.45 | | | $ | 37.60 | |
| | | | | | | | | | | | | | | | |
| * | Net asset value calculations have been determined utilizing fractional share and penny amounts. |
See accompanying notes to financial statements.
43 |
Statements of Assets and Liabilities (continued)
December 31, 2022
| | | | | | | | |
| | | Vaughan
Nelson Mid
Cap Fund | | | Vaughan
Nelson
Small Cap
Value Fund | |
ASSETS | |
Investments at cost | | $ | 226,169,537 | | | $ | 181,883,718 | |
Net unrealized appreciation | | | 37,011,474 | | | | 5,226,972 | |
| | | | | | | | |
Investments at value | | | 263,181,011 | | | | 187,110,690 | |
Cash | | | 10,995 | | | | — | |
Receivable for Fund shares sold | | | 99,520 | | | | 3,902,107 | |
Dividends and interest receivable | | | 282,314 | | | | 219,556 | |
Prepaid expenses (Note 8) | | | 582 | | | | 568 | |
| | | | | | | | |
TOTAL ASSETS | | | 263,574,422 | | | | 191,232,921 | |
| | | | | | | | |
LIABILITIES | |
Payable for securities purchased | | | 703,559 | | | | — | |
Payable for Fund shares redeemed | | | 218,144 | | | | 300,292 | |
Management fees payable (Note 6) | | | 143,942 | | | | 105,650 | |
Deferred Trustees’ fees (Note 6) | | | 197,539 | | | | 222,185 | |
Administrative fees payable (Note 6) | | | 10,668 | | | | 7,493 | |
Payable to distributor (Note 6d) | | | 2,113 | | | | 1,107 | |
Audit and tax services fees payable | | | 44,483 | | | | 43,556 | |
Other accounts payable and accrued expenses | | | 33,286 | | | | 18,105 | |
| | | | | | | | |
TOTAL LIABILITIES | | | 1,353,734 | | | | 698,388 | |
| | | | | | | | |
NET ASSETS | | $ | 262,220,688 | | | $ | 190,534,533 | |
| | | | | | | | |
NET ASSETS CONSIST OF: | |
Paid-in capital | | $ | 250,562,518 | | | $ | 188,067,956 | |
Accumulated earnings | | | 11,658,170 | | | | 2,466,577 | |
| | | | | | | | |
NET ASSETS | | $ | 262,220,688 | | | $ | 190,534,533 | |
| | | | | | | | |
COMPUTATION OF NET ASSET VALUE AND OFFERING PRICE: | |
Class A shares: | |
Net assets | | $ | 33,507,179 | | | $ | 66,338,608 | |
| | | | | | | | |
Shares of beneficial interest | | | 1,706,007 | | | | 4,372,373 | |
| | | | | | | | |
Net asset value and redemption price per share | | $ | 19.64 | | | $ | 15.17 | |
| | | | | | | | |
Offering price per share (100/94.25 of net asset value) (Note 1) | | $ | 20.84 | | | $ | 16.10 | |
| | | | | | | | |
Class C shares: (redemption price per share is equal to net asset value less any applicable contingent deferred sales
charge) (Note 1) | |
Net assets | | $ | 7,404,688 | | | $ | 2,118,173 | |
| | | | | | | | |
Shares of beneficial interest | | | 417,245 | | | | 399,337 | |
| | | | | | | | |
Net asset value and offering price per share | | $ | 17.75 | | | $ | 5.30 | |
| | | | | | | | |
Class N shares: | |
Net assets | | $ | 72,804,251 | | | $ | 1,492,979 | |
| | | | | | | | |
Shares of beneficial interest | | | 3,649,950 | | | | 92,360 | |
| | | | | | | | |
Net asset value, offering and redemption price per share | | $ | 19.95 | | | $ | 16.16 | |
| | | | | | | | |
Class Y shares: | |
Net assets | | $ | 148,504,570 | | | $ | 120,584,773 | |
| | | | | | | | |
Shares of beneficial interest | | | 7,430,185 | | | | 7,467,964 | |
| | | | | | | | |
Net asset value, offering and redemption price per share | | $ | 19.99 | | | $ | 16.15 | |
| | | | | | | | |
See accompanying notes to financial statements.
| 44
Statements of Operations
For the Year Ended December 31, 2022
| | | | | | | | | | | | | | | | |
| | | International
Growth Fund | | | Natixis
Oakmark
Fund | | | Natixis
Oakmark
International
Fund | | | Natixis
U.S. Equity
Opportunities
Fund | |
INVESTMENT INCOME | | | | | | | | | | | | | | | | |
Dividends | | $ | 361,963 | | | $ | 7,377,720 | | | $ | 12,087,259 | | | $ | 10,752,217 | |
Interest | | | 2,350 | | | | 92,619 | | | | 37,971 | | | | 89,389 | |
Less net foreign taxes withheld | | | (31,132 | ) | | | (400 | ) | | | (1,283,297 | ) | | | (121,515 | ) |
| | | | | | | | | | | | | | | | |
| | | 333,181 | | | | 7,469,939 | | | | 10,841,933 | | | | 10,720,091 | |
| | | | | | | | | | | | | | | | |
Expenses | | | | | | | | | | | | | | | | |
Management fees (Note 6) | | | 166,121 | | | | 2,959,141 | | | | 3,278,920 | | | | 6,413,195 | |
Service and distribution fees (Note 6) | | | 379 | | | | 1,080,718 | | | | 813,869 | | | | 1,906,756 | |
Administrative fees (Note 6) | | | 10,010 | | | | 198,579 | | | | 187,904 | | | | 397,716 | |
Trustees’ fees and expenses (Note 6) | | | 12,522 | | | | 25,691 | | | | 24,801 | | | | 38,626 | |
Trustees’ fees deferred compensation (Note 6) | | | 2,762 | | | | (95,019 | ) | | | (12,938 | ) | | | (69,538 | ) |
Transfer agent fees and expenses (Notes 6 and 7) | | | 4,349 | | | | 394,095 | | | | 719,310 | | | | 554,506 | |
Audit and tax services fees | | | 44,825 | | | | 43,569 | | | | 66,982 | | | | 46,437 | |
Custodian fees and expenses | | | 15,905 | | | | 19,708 | | | | 130,582 | | | | 39,195 | |
Legal fees (Note 8) | | | 761 | | | | 15,476 | | | | 14,014 | | | | 30,092 | |
Registration fees | | | 64,670 | | | | 110,190 | | | | 88,142 | | | | 87,708 | |
Shareholder reporting expenses | | | 11,698 | | | | 49,008 | | | | 104,608 | | | | 92,215 | |
Miscellaneous expenses | | | 39,711 | | | | 38,841 | | | | 101,519 | | | | 55,148 | |
| | | | | | | | | | | | | | | | |
Total expenses | | | 373,713 | | | | 4,839,997 | | | | 5,517,713 | | | | 9,592,056 | |
Less waiver and/or expense reimbursement (Note 6) | | | (172,690 | ) | | | (238,414 | ) | | | (948,938 | ) | | | (906 | ) |
| | | | | | | | | | | | | | | | |
Net expenses | | | 201,023 | | | | 4,601,583 | | | | 4,568,775 | | | | 9,591,150 | |
| | | | | | | | | | | | | | | | |
Net investment income | | | 132,158 | | | | 2,868,356 | | | | 6,273,158 | | | | 1,128,941 | |
| | | | | | | | | | | | | | | | |
NET REALIZED AND UNREALIZED GAIN (LOSS) ON INVESTMENTS, FORWARD FOREIGN CURRENCY CONTRACTS AND FOREIGN CURRENCY TRANSACTIONS | | | | | | | | | | | | | | | | |
Net realized gain (loss) on: | | | | | | | | | | | | | | | | |
Investments | | | (86,495 | ) | | | 42,131,981 | | | | (26,067,532 | ) | | | 79,629,441 | |
Forward foreign currency contracts (Note 2d) | | | — | | | | — | | | | 473,946 | | | | — | |
Foreign currency transactions (Note 2c) | | | (4,211 | ) | | | — | | | | (21,402 | ) | | | — | |
Net change in unrealized appreciation (depreciation) on: | | | | | | | | | | | | | | | | |
Investments | | | (4,318,729 | ) | | | (116,959,779 | ) | | | (63,246,155 | ) | | | (306,104,548 | ) |
Forward foreign currency contracts (Note 2d) | | | — | | | | — | | | | 94,327 | | | | — | |
Foreign currency translations (Note 2c) | | | 398 | | | | — | | | | (243,343 | ) | | | (5,545 | ) |
| | | | | | | | | | | | | | | | |
Net realized and unrealized loss on investments, forward foreign currency contracts and foreign currency transactions | | | (4,409,037 | ) | | | (74,827,798 | ) | | | (89,010,159 | ) | | | (226,480,652 | ) |
| | | | | | | | | | | | | | | | |
NET DECREASE IN NET ASSETS RESULTING FROM OPERATIONS | | $ | (4,276,879 | ) | | $ | (71,959,442 | ) | | $ | (82,737,001 | ) | | $ | (225,351,711 | ) |
| | | | | | | | | | | | | | | | |
See accompanying notes to financial statements.
45 |
Statements of Operations (continued)
For the Year Ended December 31, 2022
| | | | | | | | |
| | | Vaughan
Nelson Mid
Cap Fund | | | Vaughan
Nelson
Small Cap
Value Fund | |
INVESTMENT INCOME | |
Dividends | | $ | 5,095,697 | | | $ | 1,735,376 | |
Interest | | | 60,836 | | | | 71,194 | |
Less net foreign taxes withheld | | | — | | | | (5,211 | ) |
| | | | | | | | |
| | | 5,156,533 | | | | 1,801,359 | |
| | | | | | | | |
Expenses | |
Management fees (Note 6) | | | 2,292,180 | | | | 1,298,748 | |
Service and distribution fees (Note 6) | | | 176,160 | | | | 191,256 | |
Administrative fees (Note 6) | | | 137,881 | | | | 69,157 | |
Trustees’ fees and expenses (Note 6) | | | 21,253 | | | | 16,648 | |
Trustees’ fees deferred compensation (Note 6) | | | (24,416 | ) | | | (30,346 | ) |
Transfer agent fees and expenses (Notes 6 and 7) | | | 205,559 | | | | 151,516 | |
Audit and tax services fees | | | 44,492 | | | | 43,575 | |
Custodian fees and expenses | | | 14,946 | | | | 11,469 | |
Legal fees (Note 8) | | | 10,553 | | | | 4,784 | |
Registration fees | | | 78,393 | | | | 89,262 | |
Shareholder reporting expenses | | | 36,100 | | | | 28,121 | |
Miscellaneous expenses | | | 38,661 | | | | 31,982 | |
| | | | | | | | |
Total expenses | | | 3,031,762 | | | | 1,906,172 | |
Less waiver and/or expense reimbursement (Note 6) | | | (142,438 | ) | | | (187,632 | ) |
| | | | | | | | |
Net expenses | | | 2,889,324 | | | | 1,718,540 | |
| | | | | | | | |
Net investment income | | | 2,267,209 | | | | 82,819 | |
| | | | | | | | |
NET REALIZED AND UNREALIZED GAIN (LOSS) ON INVESTMENTS | |
Net realized gain (loss) on: | |
Investments | | | (21,324,989 | ) | | | 4,298,905 | |
Net change in unrealized appreciation (depreciation) on: | |
Investments | | | (18,052,025 | ) | | | (19,344,302 | ) |
| | | | | | | | |
Net realized and unrealized loss on investments | | | (39,377,014 | ) | | | (15,045,397 | ) |
| | | | | | | | |
NET DECREASE IN NET ASSETS RESULTING FROM OPERATIONS | | $ | (37,109,805 | ) | | $ | (14,962,578 | ) |
| | | | | | | | |
See accompanying notes to financial statements.
| 46
Statements of Changes in Net Assets
| | | | | | | | | | | | | | | | |
| | | International Growth Fund | | | Natixis Oakmark Fund | |
| | | Year Ended
December 31,
2022 | | | Year Ended
December 31,
2021 | | | Year Ended
December 31,
2022 | | | Year Ended
December 31,
2021 | |
FROM OPERATIONS: | |
Net investment income | | $ | 132,158 | | | $ | 68,456 | | | $ | 2,868,356 | | | $ | 633,264 | |
Net realized gain (loss) on investments and foreign currency transactions | | | (90,706 | ) | | | (203,613 | ) | | | 42,131,981 | | | | 28,561,069 | |
Net change in unrealized appreciation (depreciation) on investments and foreign currency translations | | | (4,318,331 | ) | | | (1,246,367 | ) | | | (116,959,779 | ) | | | 53,375,247 | |
| | | | | | | | | | | | | | | | |
Net increase (decrease) in net assets resulting from operations | | | (4,276,879 | ) | | | (1,381,524 | ) | | | (71,959,442 | ) | | | 82,569,580 | |
| | | | | | | | | | | | | | | | |
FROM DISTRIBUTIONS TO SHAREHOLDERS: | |
Class A | | | (565 | ) | | | (1,712 | ) | | | (28,746,130 | ) | | | (14,668,177 | ) |
Class C | | | — | | | | (540 | ) | | | (9,213,071 | ) | | | (3,860,638 | ) |
Class N | | | (155,851 | ) | | | (404,221 | ) | | | (73,284 | ) | | | (42,243 | ) |
Class Y | | | (21,469 | ) | | | (3,739 | ) | | | (15,943,567 | ) | | | (6,180,207 | ) |
| | | | | | | | | | | | | | | | |
Total distributions | | | (177,885 | ) | | | (410,212 | ) | | | (53,976,052 | ) | | | (24,751,265 | ) |
| | | | | | | | | | | | | | | | |
NET INCREASE IN NET ASSETS FROM CAPITAL SHARE TRANSACTIONS (NOTE 11) | | | 5,709,899 | | | | 9,897,595 | | | | 102,236,626 | | | | 69,746,167 | |
| | | | | | | | | | | | | | | | |
Net increase (decrease) in net assets | | | 1,255,135 | | | | 8,105,859 | | | | (23,698,868 | ) | | | 127,564,482 | |
NET ASSETS | |
Beginning of the year | | | 23,325,691 | | | | 15,219,832 | | | | 372,166,425 | | | | 244,601,943 | |
| | | | | | | | | | | | | | | | |
End of the year | | $ | 24,580,826 | | | $ | 23,325,691 | | | $ | 348,467,557 | | | $ | 372,166,425 | |
| | | | | | | | | | | | | | | | |
See accompanying notes to financial statements.
47 |
Statements of Changes in Net Assets (continued)
| | | | | | | | | | | | | | | | |
| | | Natixis Oakmark International Fund | | | Natixis U.S. Equity Opportunities Fund | |
| | | Year Ended
December 31,
2022 | | | Year Ended
December 31,
2021 | | | Year Ended
December 31,
2022 | | | Year Ended
December 31,
2021 | |
FROM OPERATIONS: | |
Net investment income (loss) | | $ | 6,273,158 | | | $ | 9,327,403 | | | $ | 1,128,941 | | | $ | (2,363,534 | ) |
Net realized gain (loss) on investments, forward foreign currency contracts and foreign currency transactions | | | (25,614,988 | ) | | | 37,081,829 | | | | 79,629,441 | | | | 116,863,738 | |
Net change in unrealized appreciation (depreciation) on investments, forward foreign currency contracts and foreign currency translations | | | (63,395,171 | ) | | | (4,477,434 | ) | | | (306,110,093 | ) | | | 97,061,972 | |
| | | | | | | | | | | | | | | | |
Net increase (decrease) in net assets resulting from operations | | | (82,737,001 | ) | | | 41,931,798 | | | | (225,351,711 | ) | | | 211,562,176 | |
| | | | | | | | | | | | | | | | |
FROM DISTRIBUTIONS TO SHAREHOLDERS: | |
Class A | | | (2,112,696 | ) | | | (2,330,358 | ) | | | (85,070,822 | ) | | | (76,697,366 | ) |
Class C | | | (316,972 | ) | | | (418,451 | ) | | | (10,955,220 | ) | | | (11,757,176 | ) |
Class N | | | (4,576 | ) | | | (12,581 | ) | | | (20,693 | ) | | | (15,616 | ) |
Class Y | | | (4,025,613 | ) | | | (5,540,267 | ) | | | (26,488,550 | ) | | | (23,677,132 | ) |
| | | | | | | | | | | | | | | | |
Total distributions | | | (6,459,857 | ) | | | (8,301,657 | ) | | | (122,535,285 | ) | | | (112,147,290 | ) |
| | | | | | | | | | | | | | | | |
NET INCREASE (DECREASE) IN NET ASSETS FROM CAPITAL SHARE TRANSACTIONS (NOTE 11) | | | (86,758,283 | ) | | | (1,920,547 | ) | | | 5,882,691 | | | | 20,061,764 | |
| | | | | | | | | | | | | | | | |
Net increase (decrease) in net assets | | | (175,955,141 | ) | | | 31,709,594 | | | | (342,004,305 | ) | | | 119,476,650 | |
NET ASSETS | |
Beginning of the year | | | 535,868,948 | | | | 504,159,354 | | | | 1,075,830,796 | | | | 956,354,146 | |
| | | | | | | | | | | | | | | | |
End of the year | | $ | 359,913,807 | | | $ | 535,868,948 | | | $ | 733,826,491 | | | $ | 1,075,830,796 | |
| | | | | | | | | | | | | | | | |
See accompanying notes to financial statements.
| 48
Statements of Changes in Net Assets (continued)
| | | | | | | | | | | | | | | | |
| | | Vaughan Nelson Mid Cap Fund | | | Vaughan Nelson Small Cap Value Fund | |
| | | Year Ended
December 31,
2022 | | | Year Ended
December 31,
2021 | | | Year Ended
December 31,
2022 | | | Year Ended
December 31,
2021 | |
FROM OPERATIONS: | |
Net investment income | | $ | 2,267,209 | | | $ | 1,331,082 | | | $ | 82,819 | | | $ | 174,435 | |
Net realized gain (loss) on investments | | | (21,324,989 | ) | | | 56,422,377 | | | | 4,298,905 | | | | 33,988,295 | |
Net change in unrealized appreciation (depreciation) on investments | | | (18,052,025 | ) | | | 4,168,218 | | | | (19,344,302 | ) | | | 828,120 | |
| | | | | | | | | | | | | | | | |
Net increase (decrease) in net assets resulting from operations | | | (37,109,805 | ) | | | 61,921,677 | | | | (14,962,578 | ) | | | 34,990,850 | |
| | | | | | | | | | | | | | | | |
FROM DISTRIBUTIONS TO SHAREHOLDERS: | |
Class A | | | (1,087,431 | ) | | | (5,329,869 | ) | | | (3,939,067 | ) | | | (14,352,433 | ) |
Class C | | | (262,976 | ) | | | (1,799,416 | ) | | | (240,247 | ) | | | (339,165 | ) |
Class N | | | (2,652,401 | ) | | | (12,164,843 | ) | | | (77,738 | ) | | | (233,321 | ) |
Class Y | | | (5,985,855 | ) | | | (33,148,269 | ) | | | (5,400,412 | ) | | | (11,433,578 | ) |
| | | | | | | | | | | | | | | | |
Total distributions | | | (9,988,663 | ) | | | (52,442,397 | ) | | | (9,657,464 | ) | | | (26,358,497 | ) |
| | | | | | | | | | | | | | | | |
NET INCREASE (DECREASE) IN NET ASSETS FROM CAPITAL SHARE TRANSACTIONS (NOTE 11) | | | (58,219,497 | ) | | | 68,004,051 | | | | 65,258,561 | | | | 29,370,496 | |
| | | | | | | | | | | | | | | | |
Net increase (decrease) in net assets | | | (105,317,965 | ) | | | 77,483,331 | | | | 40,638,519 | | | | 38,002,849 | |
NET ASSETS | |
Beginning of the year | | | 367,538,653 | | | | 290,055,322 | | | | 149,896,014 | | | | 111,893,165 | |
| | | | | | | | | | | | | | | | |
End of the year | | $ | 262,220,688 | | | $ | 367,538,653 | | | $ | 190,534,533 | | | $ | 149,896,014 | |
| | | | | | | | | | | | | | | | |
See accompanying notes to financial statements.
49 |
Financial Highlights
For a share outstanding throughout each period.
| | | | | | | | | | | | |
| | | International Growth Fund—Class A | |
| | | Year Ended
December 31,
2022
| | | Year Ended
December 31,
2021
| | | Period Ended
December 31,
2020*
| |
Net asset value, beginning of the period | | $ | 9.57 | | | $ | 10.13 | | | $ | 10.00 | |
| | | | | | | | | | | | |
INCOME (LOSS) FROM INVESTMENT OPERATIONS: | |
Net investment income (loss)(a) | | | 0.02 | | | | (0.01 | ) | | | 0.01 | |
Net realized and unrealized gain (loss) | | | (1.71 | ) | | | (0.41 | ) | | | 0.13 | |
| | | | | | | | | | | | |
Total from Investment Operations | | | (1.69 | ) | | | (0.42 | ) | | | 0.14 | |
| | | | | | | | | | | | |
LESS DISTRIBUTIONS FROM: | | | | | | | | | | | | |
Net investment income | | | (0.04 | ) | | | (0.01 | ) | | | (0.01 | ) |
Net realized capital gains | | | — | | | | (0.13 | ) | | | — | |
| | | | | | | | | | | | |
Total Distributions | | | (0.04 | ) | | | (0.14 | ) | | | (0.01 | ) |
| | | | | | | | | | | | |
Net asset value, end of the period | | $ | 7.84 | | | $ | 9.57 | | | $ | 10.13 | |
| | | | | | | | | | | | |
Total return(b)(c) | | | (17.71 | )% | | | (4.07 | )% | | | 1.37 | %(d) |
RATIOS TO AVERAGE NET ASSETS: | | | | | | | | | | | | |
Net assets, end of the period (000’s) | | $ | 125 | | | $ | 113 | | | $ | 1 | |
Net expenses(e) | | | 1.20 | % | | | 1.20 | % | | | 1.20 | %(f) |
Gross expenses | | | 2.05 | % | | | 2.71 | % | | | 13.05 | %(f) |
Net investment income (loss) | | | 0.26 | % | | | (0.07 | )% | | | 1.28 | %(f) |
Portfolio turnover rate | | | 11 | % | | | 9 | % | | | 1 | % |
| * | From commencement of operations on December 15, 2020 through December 31, 2020. |
| (a) | Per share net investment income (loss) has been calculated using the average shares outstanding during the period. |
| (b) | A sales charge for Class A shares is not reflected in total return calculations. |
| (c) | Had certain expenses not been waived/reimbursed during the period, total returns would have been lower. |
| (d) | Periods less than one year are not annualized. |
| (e) | The investment adviser agreed to waive its fees and/or reimburse a portion of the Fund’s expenses during the period. Without this waiver/reimbursement, expenses would have been higher. |
| (f) | Computed on an annualized basis for periods less than one year. |
See accompanying notes to financial statements.
| 50
Financial Highlights (continued)
For a share outstanding throughout each period.
| | | | | | | | | | | | |
| | | International Growth Fund—Class C | |
| | | Year Ended
December 31,
2022
| | | Year Ended
December 31,
2021
| | | Period Ended
December 31,
2020*
| |
Net asset value, beginning of the period | | $ | 9.51 | | | $ | 10.13 | | | $ | 10.00 | |
| | | | | | | | | | | | |
INCOME (LOSS) FROM INVESTMENT OPERATIONS: | | | | | | | | | | | | |
Net investment income (loss)(a) | | | 0.02 | | | | (0.09 | ) | | | 0.00 | (b) |
Net realized and unrealized gain (loss) | | | (1.76 | ) | | | (0.40 | ) | | | 0.13 | |
| | | | | | | | | | | | |
Total from Investment Operations | | | (1.74 | ) | | | (0.49 | ) | | | 0.13 | |
| | | | | | | | | | | | |
LESS DISTRIBUTIONS FROM: | | | | | | | | | | | | |
Net investment income | | | — | | | | (0.00 | )(b) | | | (0.00 | )(b) |
Net realized capital gains | | | — | | | | (0.13 | ) | | | — | |
| | | | | | | | | | | | |
Total Distributions | | | — | | | | (0.13 | ) | | | (0.00 | ) |
| | | | | | | | | | | | |
Net asset value, end of the period | | $ | 7.77 | | | $ | 9.51 | | | $ | 10.13 | |
| | | | | | | | | | | | |
Total return(c)(d) | | | (18.30 | )% | | | (4.79 | )% | | | 1.33 | %(e) |
RATIOS TO AVERAGE NET ASSETS: | | | | | | | | | | | | |
Net assets, end of the period (000’s) | | $ | 1 | | | $ | 38 | | | $ | 1 | |
Net expenses(f) | | | 1.95 | % | | | 1.95 | % | | | 1.95 | %(g) |
Gross expenses | | | 2.79 | % | | | 3.46 | % | | | 13.78 | %(g) |
Net investment income (loss) | | | 0.21 | % | | | (0.90 | )% | | | 0.55 | %(g) |
Portfolio turnover rate | | | 11 | % | | | 9 | % | | | 1 | % |
| * | From commencement of operations on December 15, 2020 through December 31, 2020. |
| (a) | Per share net investment income (loss) has been calculated using the average shares outstanding during the period. |
| (b) | Amount rounds to less than $0.01 per share. |
| (c) | A contingent deferred sales charge for Class C shares is not reflected in total return calculations. |
| (d) | Had certain expenses not been waived/reimbursed during the period, total returns would have been lower. |
| (e) | Periods less than one year are not annualized. |
| (f) | The investment adviser agreed to waive its fees and/or reimburse a portion of the Fund’s expenses during the period. Without this waiver/reimbursement, expenses would have been higher. |
| (g) | Computed on an annualized basis for periods less than one year. |
See accompanying notes to financial statements.
51 |
Financial Highlights (continued)
For a share outstanding throughout each period.
| | | | | | | | | | | | |
| | | International Growth Fund—Class N | |
| | | Year Ended
December 31,
2022
| | | Year Ended
December 31,
2021
| | | Period Ended
December 31,
2020*
| |
Net asset value, beginning of the period | | $ | 9.58 | | | $ | 10.13 | | | $ | 10.00 | |
| | | | | | | | | | | | |
INCOME (LOSS) FROM INVESTMENT OPERATIONS: | | | | | | | | | | | | |
Net investment income(a) | | | 0.05 | | | | 0.03 | | | | 0.01 | |
Net realized and unrealized gain (loss) | | | (1.72 | ) | | | (0.42 | ) | | | 0.13 | |
| | | | | | | | | | | | |
Total from Investment Operations | | | (1.67 | ) | | | (0.39 | ) | | | 0.14 | |
| | | | | | | | | | | | |
LESS DISTRIBUTIONS FROM: | | | | | | | | | | | | |
Net investment income | | | (0.06 | ) | | | (0.03 | ) | | | (0.01 | ) |
Net realized capital gains | | | — | | | | (0.13 | ) | | | — | |
| | | | | | | | | | | | |
Total Distributions | | | (0.06 | ) | | | (0.16 | ) | | | (0.01 | ) |
| | | | | | | | | | | | |
Net asset value, end of the period | | $ | 7.85 | | | $ | 9.58 | | | $ | 10.13 | |
| | | | | | | | | | | | |
Total return(b) | | | (17.47 | )% | | | (3.77 | )% | | | 1.38 | %(c) |
RATIOS TO AVERAGE NET ASSETS: | | | | | | | | | | | | |
Net assets, end of the period (000’s) | | $ | 21,331 | | | $ | 22,953 | | | $ | 15,206 | |
Net expenses(d) | | | 0.90 | % | | | 0.90 | % | | | 0.90 | %(e) |
Gross expenses | | | 1.67 | % | | | 1.58 | % | | | 6.48 | %(e) |
Net investment income | | | 0.62 | % | | | 0.29 | % | | | 1.43 | %(e) |
Portfolio turnover rate | | | 11 | % | | | 9 | % | | | 1 | % |
| * | From commencement of operations on December 15, 2020 through December 31, 2020. |
| (a) | Per share net investment income has been calculated using the average shares outstanding during the period. |
| (b) | Had certain expenses not been waived/reimbursed during the period, total returns would have been lower. |
| (c) | Periods less than one year are not annualized. |
| (d) | The investment adviser agreed to waive its fees and/or reimburse a portion of the Fund’s expenses during the period. Without this waiver/reimbursement, expenses would have been higher. |
| (e) | Computed on an annualized basis for periods less than one year. |
See accompanying notes to financial statements.
| 52
Financial Highlights (continued)
For a share outstanding throughout each period.
| | | | | | | | | | | | |
| | | International Growth Fund—Class Y | |
| | | Year Ended
December 31,
2022
| | | Year Ended
December 31,
2021
| | | Period Ended
December 31,
2020*
| |
Net asset value, beginning of the period | | $ | 9.58 | | | $ | 10.13 | | | $ | 10.00 | |
| | | | | | | | | | | | |
INCOME (LOSS) FROM INVESTMENT OPERATIONS: | | | | | | | | | | | | |
Net investment income(a) | | | 0.04 | | | | 0.02 | | | | 0.01 | |
Net realized and unrealized gain (loss) | | | (1.72 | ) | | | (0.41 | ) | | | 0.13 | |
| | | | | | | | | | | | |
Total from Investment Operations | | | (1.68 | ) | | | (0.39 | ) | | | 0.14 | |
| | | | | | | | | | | | |
LESS DISTRIBUTIONS FROM: | | | | | | | | | | | | |
Net investment income | | | (0.05 | ) | | | (0.03 | ) | | | (0.01 | ) |
Net realized capital gains | | | — | | | | (0.13 | ) | | | — | |
| | | | | | | | | | | | |
Total Distributions | | | (0.05 | ) | | | (0.16 | ) | | | (0.01 | ) |
| | | | | | | | | | | | |
Net asset value, end of the period | | $ | 7.85 | | | $ | 9.58 | | | $ | 10.13 | |
| | | | | | | | | | | | |
Total return(b) | | | (17.50 | )% | | | (3.81 | )% | | | 1.38 | %(c) |
RATIOS TO AVERAGE NET ASSETS: | | | | | | | | | | | | |
Net assets, end of the period (000’s) | | $ | 3,124 | | | $ | 222 | | | $ | 12 | |
Net expenses(d) | | | 0.95 | % | | | 0.95 | % | | | 0.95 | %(e) |
Gross expenses | | | 1.80 | % | | | 2.46 | % | | | 12.58 | %(e) |
Net investment income | | | 0.47 | % | | | 0.19 | % | | | 1.63 | %(e) |
Portfolio turnover rate | | | 11 | % | | | 9 | % | | | 1 | % |
| * | From commencement of operations on December 15, 2020 through December 31, 2020. |
| (a) | Per share net investment income has been calculated using the average shares outstanding during the period. |
| (b) | Had certain expenses not been waived/reimbursed during the period, total returns would have been lower. |
| (c) | Periods less than one year are not annualized. |
| (d) | The investment adviser agreed to waive its fees and/or reimburse a portion of the Fund’s expenses during the period. Without this waiver/reimbursement, expenses would have been higher. |
| (e) | Computed on an annualized basis for periods less than one year. |
See accompanying notes to financial statements.
53 |
Financial Highlights (continued)
For a share outstanding throughout each period.
| | | | | | | | | | | | | | | | | | | | |
| | | Natixis Oakmark Fund—Class A | |
| | | Year Ended
December 31,
2022
| | | Year Ended
December 31,
2021
| | | Year Ended
December 31,
2020
| | | Year Ended
December 31,
2019
| | | Year Ended
December 31,
2018
| |
Net asset value, beginning of the period | | $ | 29.04 | | | $ | 23.20 | | | $ | 22.45 | | | $ | 19.44 | | | $ | 24.72 | |
| | | | | | | | | | | | | | | | | | | | |
INCOME (LOSS) FROM INVESTMENT OPERATIONS: | | | | | | | | | | | | | | | | | | | | |
Net investment income(a) | | | 0.17 | | | | 0.07 | | | | 0.11 | (b) | | | 0.18 | (c) | | | 0.10 | |
Net realized and unrealized gain (loss) | | | (4.00 | ) | | | 7.81 | | | | 2.78 | | | | 4.93 | | | | (3.28 | ) |
| | | | | | | | | | | | | | | | | | | | |
Total from Investment Operations | | | (3.83 | ) | | | 7.88 | | | | 2.89 | | | | 5.11 | | | | (3.18 | ) |
| | | | | | | | | | | | | | | | | | | | |
LESS DISTRIBUTIONS FROM: | | | | | | | | | | | | | | | | | | | | |
Net investment income | | | (0.20 | ) | | | (0.05 | ) | | | (0.12 | ) | | | (0.21 | ) | | | (0.08 | ) |
Net realized capital gains | | | (3.46 | ) | | | (1.99 | ) | | | (2.02 | ) | | | (1.89 | ) | | | (2.02 | ) |
| | | | | | | | | | | | | | | | | | | | |
Total Distributions | | | (3.66 | ) | | | (2.04 | ) | | | (2.14 | ) | | | (2.10 | ) | | | (2.10 | ) |
| | | | | | | | | | | | | | | | | | | | |
Net asset value, end of the period | | $ | 21.55 | | | $ | 29.04 | | | $ | 23.20 | | | $ | 22.45 | | | $ | 19.44 | |
| | | | | | | | | | | | | | | | | | | | |
Total return(d) | | | (13.30 | )%(e) | | | 33.97 | %(e) | | | 13.01 | %(b) | | | 26.77 | %(c) | | | (13.01 | )% |
RATIOS TO AVERAGE NET ASSETS: | | | | | | | | | | | | | | | | | | | | |
Net assets, end of the period (000’s) | | $ | 192,750 | | | $ | 222,435 | | | $ | 170,702 | | | $ | 181,417 | | | $ | 164,748 | |
Net expenses | | | 1.05 | %(f) | | | 1.12 | %(f)(g) | | | 1.20 | %(h) | | | 1.17 | % | | | 1.13 | % |
Gross expenses | | | 1.10 | % | | | 1.14 | % | | | 1.20 | %(h) | | | 1.17 | % | | | 1.13 | % |
Net investment income | | | 0.65 | % | | | 0.25 | % | | | 0.53 | %(b) | | | 0.85 | %(c) | | | 0.41 | % |
Portfolio turnover rate | | | 69 | % | | | 23 | % | | | 22 | % | | | 15 | % | | | 39 | % |
| (a) | Per share net investment income has been calculated using the average shares outstanding during the period. |
| (b) | Includes a non-recurring dividend. Without this dividend, net investment income per share would have been $0.05, total return would have been 12.72% and the ratio of net investment income to average net assets would have been 0.27%. |
| (c) | Includes a non-recurring dividend. Without this dividend, net investment income per share would have been $0.13, total return would have been 26.50% and the ratio of net investment income to average net assets would have been 0.62%. |
| (d) | A sales charge for Class A shares is not reflected in total return calculations. |
| (e) | Had certain expenses not been waived/reimbursed during the period, total returns would have been lower. |
| (f) | The investment adviser agreed to waive its fees and/or reimburse a portion of the Fund’s expenses during the period. Without this waiver/reimbursement, expenses would have been higher. |
| (g) | Effective July 1, 2021, the expense limit decreased from 1.30% to 1.05%. |
| (h) | Includes refund of prior year service fee of 0.01%. |
See accompanying notes to financial statements.
| 54
Financial Highlights (continued)
For a share outstanding throughout each period.
| | | | | | | | | | | | | | | | | | | | |
| | | Natixis Oakmark Fund—Class C | |
| | | Year Ended
December 31,
2022 | | | Year Ended
December 31,
2021 | | | Year Ended
December 31,
2020 | | | Year Ended
December 31,
2019 | | | Year Ended
December 31,
2018 | |
Net asset value, beginning of the period | | $ | 23.50 | | | $ | 19.17 | | | $ | 18.92 | | | $ | 16.66 | | | $ | 21.58 | |
| | | | | | | | | | | | | | | | | | | | |
INCOME (LOSS) FROM INVESTMENT OPERATIONS: | | | | | | | | | | | | | | | | | | | | |
Net investment income (loss)(a) | | | (0.02 | ) | | | (0.12 | ) | | | (0.04 | )(b) | | | 0.02 | (c) | | | (0.07 | ) |
Net realized and unrealized gain (loss) | | | (3.23 | ) | | | 6.44 | | | | 2.31 | | | | 4.20 | | | | (2.83 | ) |
| | | | | | | | | | | | | | | | | | | | |
Total from Investment Operations | | | (3.25 | ) | | | 6.32 | | | | 2.27 | | | | 4.22 | | | | (2.90 | ) |
| | | | | | | | | | | | | | | | | | | | |
LESS DISTRIBUTIONS FROM: | | | | | | | | | | | | | | | | | | | | |
Net investment income | | | (0.05 | ) | | | (0.00 | )(d) | | | — | | | | (0.07 | ) | | | — | |
Net realized capital gains | | | (3.46 | ) | | | (1.99 | ) | | | (2.02 | ) | | | (1.89 | ) | | | (2.02 | ) |
| | | | | | | | | | | | | | | | | | | | |
Total Distributions | | | (3.51 | ) | | | (1.99 | ) | | | (2.02 | ) | | | (1.96 | ) | | | (2.02 | ) |
| | | | | | | | | | | | | | | | | | | | |
Net asset value, end of the period | | $ | 16.74 | | | $ | 23.50 | | | $ | 19.17 | | | $ | 18.92 | | | $ | 16.66 | |
| | | | | | | | | | | | | | | | | | | | |
Total return(e) | | | (13.97 | )%(f) | | | 32.99 | %(f) | | | 12.15 | %(b) | | | 25.82 | %(c) | | | (13.63 | )% |
RATIOS TO AVERAGE NET ASSETS: | | | | | | | | | | | | | | | | | | | | |
Net assets, end of the period (000’s) | | $ | 51,987 | | | $ | 50,042 | | | $ | 35,940 | | | $ | 54,384 | | | $ | 53,606 | |
Net expenses | | | 1.80 | %(g) | | | 1.87 | %(g)(h) | | | 1.95 | % | | | 1.92 | % | | | 1.88 | % |
Gross expenses | | | 1.85 | % | | | 1.89 | % | | | 1.95 | % | | | 1.92 | % | | | 1.88 | % |
Net investment income (loss) | | | (0.10 | )% | | | (0.49 | )% | | | (0.23 | )%(b) | | | 0.12 | %(c) | | | (0.33 | )% |
Portfolio turnover rate | | | 69 | % | | | 23 | % | | | 22 | % | | | 15 | % | | | 39 | % |
| (a) | Per share net investment income (loss) has been calculated using the average shares outstanding during the period. |
| (b) | Includes a non-recurring dividend. Without this dividend, net investment loss per share would have been $(0.08), total return would have been 11.85% and the ratio of net investment loss to average net assets would have been (0.46)%. |
| (c) | Includes a non-recurring dividend. Without this dividend, net investment loss per share would have been $(0.02), total return would have been 25.50% and the ratio of net investment loss to average net assets would have been (0.12)%. |
| (d) | Amount rounds to less than $0.01 per share. |
| (e) | A contingent deferred sales charge for Class C shares is not reflected in total return calculations. |
| (f) | Had certain expenses not been waived/reimbursed during the period, total returns would have been lower. |
| (g) | The investment adviser agreed to waive its fees and/or reimburse a portion of the Fund’s expenses during the period. Without this waiver/reimbursement, expenses would have been higher. |
| (h) | Effective July 1, 2021, the expense limit decreased from 2.05% to 1.80%. |
See accompanying notes to financial statements.
55 |
Financial Highlights (continued)
For a share outstanding throughout each period.
| | | | | | | | | | | | | | | | | | | | |
| | | Natixis Oakmark Fund—Class N | |
| | | Year Ended
December 31,
2022
| | | Year Ended
December 31,
2021
| | | Year Ended
December 31,
2020
| | | Year Ended
December 31,
2019
| | | Year Ended
December 31,
2018
| |
Net asset value, beginning of the period | | $ | 31.13 | | | $ | 24.72 | | | $ | 23.78 | | | $ | 20.49 | | | $ | 25.91 | |
| | | | | | | | | | | | | | | | | | | | |
INCOME (LOSS) FROM INVESTMENT OPERATIONS: | | | | | | | | | |
Net investment income(a) | | | 0.26 | | | | 0.23 | | | | 0.18 | (b) | | | 0.22 | (c) | | | 0.22 | |
Net realized and unrealized gain (loss) | | | (4.29 | ) | | | 8.31 | | | | 2.98 | | | | 5.25 | | | | (3.45 | ) |
| | | | | | | | | | | | | | | | | | | | |
Total from Investment Operations | | | (4.03 | ) | | | 8.54 | | | | 3.16 | | | | 5.47 | | | | (3.23 | ) |
| | | | | | | | | | | | | | | | | | | | |
LESS DISTRIBUTIONS FROM: | | | | | | | | | | | | | | | | | | | | |
Net investment income | | | (0.28 | ) | | | (0.14 | ) | | | (0.20 | ) | | | (0.29 | ) | | | (0.17 | ) |
Net realized capital gains | | | (3.46 | ) | | | (1.99 | ) | | | (2.02 | ) | | | (1.89 | ) | | | (2.02 | ) |
| | | | | | | | | | | | | | | | | | | | |
Total Distributions | | | (3.74 | ) | | | (2.13 | ) | | | (2.22 | ) | | | (2.18 | ) | | | (2.19 | ) |
| | | | | | | | | | | | | | | | | | | | |
Net asset value, end of the period | | $ | 23.36 | | | $ | 31.13 | | | $ | 24.72 | | | $ | 23.78 | | | $ | 20.49 | |
| | | | | | | | | | | | | | | | | | | | |
Total return(d) | | | (13.06 | )% | | | 34.54 | % | | | 13.41 | %(b) | | | 27.16 | %(c) | | | (12.60 | )% |
RATIOS TO AVERAGE NET ASSETS: | | | | | | | | | | | | | | | | | | | | |
Net assets, end of the period (000’s) | | $ | 517 | | | $ | 682 | | | $ | 364 | | | $ | 801 | | | $ | 10 | |
Net expenses(e) | | | 0.75 | % | | | 0.80 | %(f) | | | 0.86 | % | | | 0.83 | % | | | 0.75 | % |
Gross expenses | | | 0.93 | % | | | 1.55 | % | | | 1.05 | % | | | 1.25 | % | | | 3.79 | % |
Net investment income | | | 0.93 | % | | | 0.79 | % | | | 0.85 | %(b) | | | 0.93 | %(c) | | | 0.88 | % |
Portfolio turnover rate | | | 69 | % | | | 23 | % | | | 22 | % | | | 15 | % | | | 39 | % |
| (a) | Per share net investment income has been calculated using the average shares outstanding during the period. |
| (b) | Includes a non-recurring dividend. Without this dividend, net investment income per share would have been $0.14, total return would have been 13.13% and the ratio of net investment income to average net assets would have been 0.67%. |
| (c) | Includes a non-recurring dividend. Without this dividend, net investment income per share would have been $0.22, total return would have been 26.90% and the ratio of net investment income to average net assets would have been 0.92%. |
| (d) | Had certain expenses not been waived/reimbursed during the period, total returns would have been lower. |
| (e) | The investment adviser agreed to waive its fees and/or reimburse a portion of the Fund’s expenses during the period. Without this waiver/reimbursement, expenses would have been higher. |
| (f) | Effective July 1, 2021, the expense limit decreased from 1.00% to 0.75%. |
See accompanying notes to financial statements.
| 56
Financial Highlights (continued)
For a share outstanding throughout each period.
| | | | | | | | | | | | | | | | | | | | |
| | | Natixis Oakmark Fund—Class Y | |
| | | Year Ended
December 31,
2022 | | | Year Ended
December 31,
2021 | | | Year Ended
December 31,
2020 | | | Year Ended
December 31,
2019 | | | Year Ended
December 31,
2018 | |
Net asset value, beginning of the period | | $ | 31.04 | | | $ | 24.68 | | | $ | 23.75 | | | $ | 20.46 | | | $ | 25.90 | |
| | | | | | | | | | | | | | | | | | | | |
INCOME (LOSS) FROM INVESTMENT OPERATIONS: | | | | | | | | | |
Net investment income(a) | | | 0.25 | | | | 0.17 | | | | 0.17 | (b) | | | 0.27 | (c) | | | 0.17 | |
Net realized and unrealized gain (loss) | | | (4.28 | ) | | | 8.31 | | | | 2.95 | | | | 5.17 | | | | (3.44 | ) |
| | | | | | | | | | | | | | | | | | | | |
Total from Investment Operations | | | (4.03 | ) | | | 8.48 | | | | 3.12 | | | | 5.44 | | | | (3.27 | ) |
| | | | | | | | | | | | | | | | | | | | |
LESS DISTRIBUTIONS FROM: | | | | | | | | | |
Net investment income | | | (0.26 | ) | | | (0.13 | ) | | | (0.17 | ) | | | (0.26 | ) | | | (0.15 | ) |
Net realized capital gains | | | (3.46 | ) | | | (1.99 | ) | | | (2.02 | ) | | | (1.89 | ) | | | (2.02 | ) |
| | | | | | | | | | | | | | | | | | | | |
Total Distributions | | | (3.72 | ) | | | (2.12 | ) | | | (2.19 | ) | | | (2.15 | ) | | | (2.17 | ) |
| | | | | | | | | | | | | | | | | | | | |
Net asset value, end of the period | | $ | 23.29 | | | $ | 31.04 | | | $ | 24.68 | | | $ | 23.75 | | | $ | 20.46 | |
| | | | | | | | | | | | | | | | | | | | |
Total return | | | (13.10 | )%(d) | | | 34.35 | %(d) | | | 13.28 | %(b) | | | 27.06 | %(c)(d) | | | (12.76 | )% |
RATIOS TO AVERAGE NET ASSETS: | | | | | | | | | |
Net assets, end of the period (000’s) | | $ | 103,213 | | | $ | 99,008 | | | $ | 37,595 | | | $ | 46,836 | | | $ | 53,829 | |
Net expenses | | | 0.80 | %(e) | | | 0.86 | %(e)(f) | | | 0.95 | % | | | 0.91 | %(e) | | | 0.88 | % |
Gross expenses | | | 0.85 | % | | | 0.89 | % | | | 0.95 | % | | | 0.92 | % | | | 0.88 | % |
Net investment income | | | 0.89 | % | | | 0.56 | % | | | 0.79 | %(b) | | | 1.16 | %(c) | | | 0.68 | % |
Portfolio turnover rate | | | 69 | % | | | 23 | % | | | 22 | % | | | 15 | % | | | 39 | % |
| (a) | Per share net investment income has been calculated using the average shares outstanding during the period. |
| (b) | Includes a non-recurring dividend. Without this dividend, net investment income per share would have been $0.12, total return would have been 13.00% and the ratio of net investment income to average net assets would have been 0.55%. |
| (c) | Includes a non-recurring dividend. Without this dividend, net investment income per share would have been $0.20, total return would have been 26.80% and the ratio of net investment income to average net assets would have been 0.90%. |
| (d) | Had certain expenses not been waived/reimbursed during the period, total returns would have been lower. |
| (e) | The investment adviser agreed to waive its fees and/or reimburse a portion of the Fund’s expenses during the period. Without this waiver/reimbursement, expenses would have been higher. |
| (f) | Effective July 1, 2021, the expense limit decreased from 1.05% to 0.80%. |
See accompanying notes to financial statements.
57 |
Financial Highlights (continued)
For a share outstanding throughout each period.
| | | | | | | | | | | | | | | | | | | | |
| | | Natixis Oakmark International Fund—Class A | |
| | | Year Ended
December 31,
2022 | | | Year Ended
December 31,
2021 | | | Year Ended
December 31,
2020 | | | Year Ended
December 31,
2019 | | | Year Ended
December 31,
2018 | |
Net asset value, beginning of the period | | $ | 15.15 | | | $ | 14.15 | | | $ | 13.63 | | | $ | 11.29 | | | $ | 15.58 | |
| | | | | | | | | | | | | | | | | | | | |
INCOME (LOSS) FROM INVESTMENT OPERATIONS: | | | | | | | | | |
Net investment income (loss)(a) | | | 0.19 | | | | 0.27 | (b) | | | (0.00 | )(c) | | | 0.37 | (d) | | | 0.25 | |
Net realized and unrealized gain (loss) | | | (2.60 | ) | | | 0.96 | | | | 0.55 | (e) | | | 2.38 | | | | (4.02 | ) |
| | | | | | | | | | | | | | | | | | | | |
Total from Investment Operations | | | (2.41 | ) | | | 1.23 | | | | 0.55 | | | | 2.75 | | | | (3.77 | ) |
| | | | | | | | | | | | | | | | | | | | |
LESS DISTRIBUTIONS FROM: | | | | | | | | | |
Net investment income | | | (0.22 | ) | | | (0.23 | ) | | | (0.03 | ) | | | (0.41 | ) | | | (0.29 | ) |
Net realized capital gains | | | — | | | | — | | | | — | | | | — | | | | (0.23 | ) |
| | | | | | | | | | | | | | | | | | | | |
Total Distributions | | | (0.22 | ) | | | (0.23 | ) | | | (0.03 | ) | | | (0.41 | ) | | | (0.52 | ) |
| | | | | | | | | | | | | | | | | | | | |
Net asset value, end of the period | | $ | 12.52 | | | $ | 15.15 | | | $ | 14.15 | | | $ | 13.63 | | | $ | 11.29 | |
| | | | | | | | | | | | | | | | | | | | |
Total return(f) | | | (15.91 | )%(g) | | | 8.73 | %(b)(g) | | | 4.06 | %(g) | | | 24.35 | %(d) | | | (24.15 | )% |
RATIOS TO AVERAGE NET ASSETS: | | | | | | | | | |
Net assets, end of the period (000’s) | | $ | 120,316 | | | $ | 152,900 | | | $ | 131,630 | | | $ | 172,906 | | | $ | 257,551 | |
Net expenses | | | 1.15 | %(h) | | | 1.17 | %(h)(i) | | | 1.29 | %(h)(j) | | | 1.29 | % | | | 1.31 | % |
Gross expenses | | | 1.38 | % | | | 1.34 | % | | | 1.36 | % | | | 1.29 | % | | | 1.31 | % |
Net investment income (loss) | | | 1.48 | % | | | 1.73 | %(b) | | | (0.03 | )% | | | 2.91 | %(d) | | | 1.72 | % |
Portfolio turnover rate | | | 33 | % | | | 37 | % | | | 63 | % | | | 28 | % | | | 50 | % |
| (a) | Per share net investment income (loss) has been calculated using the average shares outstanding during the period. |
| (b) | Includes a non-recurring dividend and tax reclaims. Without these, net investment income per share would have been $0.13, total return would have been 7.74% and the ratio of net investment income to average net assets would have been 0.84%. |
| (c) | Amount rounds to less than $0.01 per share. |
| (d) | Includes non-recurring dividends. Without this dividend, net investment income per share would have been $0.29, total return would have been 23.55% and the ratio of net investment income to average net assets would have been 2.26%. |
| (e) | The amount shown for a share outstanding does not correspond with the aggregate realized and unrealized gain (loss) on investments for the period due to the timing of sales and redemptions of fund shares in relation to fluctuating market values of investments of the Fund. |
| (f) | A sales charge for Class A shares is not reflected in total return calculations. |
| (g) | Had certain expenses not been waived/reimbursed during the period, total returns would have been lower. |
| (h) | The investment adviser agreed to waive its fees and/or reimburse a portion of the Fund’s expenses during the period. Without this waiver/reimbursement, expenses would have been higher. |
| (i) | Effective July 1, 2021, the expense limit decreased from 1.20% to 1.15%. |
| (j) | Effective July 1, 2020, the expense limit decreased from 1.37% to 1.20%. |
See accompanying notes to financial statements.
| 58
Financial Highlights (continued)
For a share outstanding throughout each period.
| | | | | | | | | | | | | | | | | | | | |
| | | Natixis Oakmark International Fund—Class C | |
| | | Year Ended
December 31,
2022 | | | Year Ended
December 31,
2021 | | | Year Ended
December 31,
2020 | | | Year Ended
December 31,
2019 | | | Year Ended
December 31,
2018 | |
Net asset value, beginning of the period | | $ | 14.86 | | | $ | 13.85 | | | $ | 13.41 | | | $ | 11.11 | | | $ | 15.30 | |
| | | | | | | | | | | | | | | | | | | | |
INCOME (LOSS) FROM INVESTMENT OPERATIONS: | | | | | | | | | | | | | | | | | | | | |
Net investment income (loss)(a) | | | 0.10 | | | | 0.13 | (b) | | | (0.08 | ) | | | 0.26 | (c) | | | 0.13 | |
Net realized and unrealized gain (loss) | | | (2.55 | ) | | | 0.97 | | | | 0.52 | (d) | | | 2.34 | | | | (3.92 | ) |
| | | | | | | | | | | | | | | | | | | | |
Total from Investment Operations | | | (2.45 | ) | | | 1.10 | | | | 0.44 | | | | 2.60 | | | | (3.79 | ) |
| | | | | | | | | | | | | | | | | | | | |
LESS DISTRIBUTIONS FROM: | | | | | | | | | | | | | | | | | | | | |
Net investment income | | | (0.10 | ) | | | (0.09 | ) | | | — | | | | (0.30 | ) | | | (0.17 | ) |
Net realized capital gains | | | — | | | | — | | | | — | | | | — | | | | (0.23 | ) |
| | | | | | | | | | | | | | | | | | | | |
Total Distributions | | | (0.10 | ) | | | (0.09 | ) | | | — | | | | (0.30 | ) | | | (0.40 | ) |
| | | | | | | | | | | | | | | | | | | | |
Net asset value, end of the period | | $ | 12.31 | | | $ | 14.86 | | | $ | 13.85 | | | $ | 13.41 | | | $ | 11.11 | |
| | | | | | | | | | | | | | | | | | | | |
Total return(e) | | | (16.50 | )%(f) | | | 7.92 | %(b)(f) | | | 3.28 | %(f) | | | 23.44 | %(c) | | | (24.74 | )% |
RATIOS TO AVERAGE NET ASSETS: | | | | | | | | | | | | | | | | | | | | |
Net assets, end of the period (000’s) | | $ | 39,202 | | | $ | 69,335 | | | $ | 96,772 | | | $ | 179,533 | | | $ | 212,618 | |
Net expenses | | | 1.90 | %(g) | | | 1.93 | %(g)(h) | | | 2.05 | %(g)(i) | | | 2.04 | % | | | 2.07 | % |
Gross expenses | | | 2.13 | % | | | 2.09 | % | | | 2.11 | % | | | 2.04 | % | | | 2.07 | % |
Net investment income (loss) | | | 0.78 | % | | | 0.85 | %(b) | | | (0.76 | )% | | | 2.09 | %(c) | | | 0.94 | % |
Portfolio turnover rate | | | 33 | % | | | 37 | % | | | 63 | % | | | 28 | % | | | 50 | % |
| (a) | Per share net investment income (loss) has been calculated using the average shares outstanding during the period. |
| (b) | Includes a non-recurring dividend and tax reclaims. Without these, net investment income per share would have been $0.02, total return would have been 6.98% and the ratio of net investment income to average net assets would have been 0.13%. |
| (c) | Includes non-recurring dividends. Without this dividend, net investment income per share would have been $0.18, total return would have been 22.63% and the ratio of net investment income to average net assets would have been 1.43%. |
| (d) | The amount shown for a share outstanding does not correspond with the aggregate realized and unrealized gain (loss) on investments for the period due to the timing of sales and redemptions of fund shares in relation to fluctuating market values of investments of the Fund. |
| (e) | A contingent deferred sales charge for Class C shares is not reflected in total return calculations. |
| (f) | Had certain expenses not been waived/reimbursed during the period, total returns would have been lower. |
| (g) | The investment adviser agreed to waive its fees and/or reimburse a portion of the Fund’s expenses during the period. Without this waiver/reimbursement, expenses would have been higher. |
| (h) | Effective July 1, 2021, the expense limit decreased from 1.95% to 1.90%. |
| (i) | Effective July 1, 2020, the expense limit decreased from 2.12% to 1.95%. |
See accompanying notes to financial statements.
59 |
Financial Highlights (continued)
For a share outstanding throughout each period.
| | | | | | | | | | | | | | | | | | | | |
| | | Natixis Oakmark International Fund—Class N | |
| | | Year Ended
December 31,
2022 | | | Year Ended
December 31,
2021 | | | Year Ended
December 31,
2020 | | | Year Ended
December 31,
2019 | | | Year Ended
December 31,
2018
| |
Net asset value, beginning of the period | | $ | 15.08 | | | $ | 14.09 | | | $ | 13.56 | | | $ | 11.25 | | | $ | 15.58 | |
| | | | | | | | | | | | | | | | | | | | |
INCOME (LOSS) FROM INVESTMENT OPERATIONS: | | | | | | | | | |
Net investment income(a) | | | 0.32 | | | | 0.38 | (b) | | | 0.04 | | | | 0.33 | (c) | | | 0.28 | |
Net realized and unrealized gain (loss) | | | (2.68 | ) | | | 0.89 | | | | 0.56 | (d) | | | 2.45 | | | | (4.02 | ) |
| | | | | | | | | | | | | | | | | | | | |
Total from Investment Operations | | | (2.36 | ) | | | 1.27 | | | | 0.60 | | | | 2.78 | | | | (3.74 | ) |
| | | | | | | | | | | | | | | | | | | | |
LESS DISTRIBUTIONS FROM: | | | | | | | | | |
Net investment income | | | (0.26 | ) | | | (0.28 | ) | | | (0.07 | ) | | | (0.47 | ) | | | (0.36 | ) |
Net realized capital gains | | | — | | | | — | | | | — | | | | — | | | | (0.23 | ) |
| | | | | | | | | | | | | | | | | | | | |
Total Distributions | | | (0.26 | ) | | | (0.28 | ) | | | (0.07 | ) | | | (0.47 | ) | | | (0.59 | ) |
| | | | | | | | | | | | | | | | | | | | |
Net asset value, end of the period | | $ | 12.46 | | | $ | 15.08 | | | $ | 14.09 | | | $ | 13.56 | | | $ | 11.25 | |
| | | | | | | | | | | | | | | | | | | | |
Total return(e) | | | (15.65 | )% | | | 9.01 | %(b) | | | 4.44 | % | | | 24.75 | %(c) | | | (23.94 | )% |
RATIOS TO AVERAGE NET ASSETS: | | | | | | | | | |
Net assets, end of the period (000’s) | | $ | 222 | | | $ | 704 | | | $ | 290 | | | $ | 811 | | | $ | 758 | |
Net expenses(f) | | | 0.85 | % | | | 0.87 | %(g) | | | 0.92 | %(h) | | | 0.94 | % | | | 0.99 | % |
Gross expenses | | | 1.01 | % | | | 1.25 | % | | | 1.17 | % | | | 1.08 | % | | | 1.02 | % |
Net investment income | | | 2.56 | % | | | 2.49 | %(b) | | | 0.37 | % | | | 2.56 | %(c) | | | 2.04 | % |
Portfolio turnover rate | | | 33 | % | | | 37 | % | | | 63 | % | | | 28 | % | | | 50 | % |
| (a) | Per share net investment income has been calculated using the average shares outstanding during the period. |
| (b) | Includes a non-recurring dividend and tax reclaims. Without these, net investment income per share would have been $0.11, total return would have been 8.09% and the ratio of net investment income to average net assets would have been 0.70%. |
| (c) | Includes non-recurring dividends. Without this dividend, net investment income per share would have been $0.27, total return would have been 23.94% and the ratio of net investment income to average net assets would have been 2.15%. |
| (d) | The amount shown for a share outstanding does not correspond with the aggregate realized and unrealized gain (loss) on investments for the period due to the timing of sales and redemptions of fund shares in relation to fluctuating market values of investments of the Fund. |
| (e) | Had certain expenses not been waived/reimbursed during the period, total returns would have been lower. |
| (f) | The investment adviser agreed to waive its fees and/or reimburse a portion of the Fund’s expenses during the period. Without this waiver/reimbursement, expenses would have been higher. |
| (g) | Effective July 1, 2021, the expense limit decreased from 0.90% to 0.85%. |
| (h) | Effective July 1, 2020, the expense limit decreased from 1.07% to 0.90%. |
See accompanying notes to financial statements.
| 60
Financial Highlights (continued)
For a share outstanding throughout each period.
| | | | | | | | | | | | | | | | | | | | |
| | | Natixis Oakmark International Fund—Class Y | |
| | | Year Ended
December 31,
2022 | | | Year Ended
December 31,
2021 | | | Year Ended
December 31,
2020 | | | Year Ended
December 31,
2019 | | | Year Ended
December 31,
2018 | |
Net asset value, beginning of the period | | $ | 15.07 | | | $ | 14.08 | | | $ | 13.56 | | | $ | 11.25 | | | $ | 15.56 | |
| | | | | | | | | | | | | | | | | | | | |
INCOME (LOSS) FROM INVESTMENT OPERATIONS: | | | | | | | | | |
Net investment income(a) | | | 0.22 | | | | 0.30 | (b) | | | 0.04 | | | | 0.37 | (c) | | | 0.26 | |
Net realized and unrealized gain (loss) | | | (2.58 | ) | | | 0.96 | | | | 0.55 | (d) | | | 2.40 | | | | (3.99 | ) |
| | | | | | | | | | | | | | | | | | | | |
Total from Investment Operations | | | (2.36 | ) | | | 1.26 | | | | 0.59 | | | | 2.77 | | | | (3.73 | ) |
| | | | | | | | | | | | | | | | | | | | |
LESS DISTRIBUTIONS FROM: | | | | | | | | | |
Net investment income | | | (0.26 | ) | | | (0.27 | ) | | | (0.07 | ) | | | (0.46 | ) | | | (0.35 | ) |
Net realized capital gains | | | — | | | | — | | | | — | | | | — | | | | (0.23 | ) |
| | | | | | | | | | | | | | | | | | | | |
Total Distributions | | | (0.26 | ) | | | (0.27 | ) | | | (0.07 | ) | | | (0.46 | ) | | | (0.58 | ) |
| | | | | | | | | | | | | | | | | | | | |
Net asset value, end of the period | | $ | 12.45 | | | $ | 15.07 | | | $ | 14.08 | | | $ | 13.56 | | | $ | 11.25 | |
| | | | | | | | | | | | | | | | | | | | |
Total return | | | (15.71 | )%(e) | | | 8.97 | %(b)(e) | | | 4.32 | %(e) | | | 24.64 | %(c) | | | (23.93 | )% |
RATIOS TO AVERAGE NET ASSETS: | | | | | | | | | |
Net assets, end of the period (000’s) | | $ | 200,175 | | | $ | 312,930 | | | $ | 275,468 | | | $ | 244,586 | | | $ | 215,123 | |
Net expenses | | | 0.90 | %(f) | | | 0.92 | %(f)(g) | | | 1.03 | %(f)(h) | | | 1.04 | % | | | 1.07 | % |
Gross expenses | | | 1.13 | % | | | 1.09 | % | | | 1.11 | % | | | 1.04 | % | | | 1.07 | % |
Net investment income | | | 1.66 | % | | | 1.96 | %(b) | | | 0.41 | % | | | 2.91 | %(c) | | | 1.85 | % |
Portfolio turnover rate | | | 33 | % | | | 37 | % | | | 63 | % | | | 28 | % | | | 50 | % |
| (a) | Per share net investment income has been calculated using the average shares outstanding during the period. |
| (b) | Includes a non-recurring dividend and tax reclaims. Without these, net investment income per share would have been $0.17, total return would have been 8.04% and the ratio of net investment income to average net assets would have been 1.07%. |
| (c) | Includes non-recurring dividends. Without this dividend, net investment income per share would have been $0.29, total return would have been 23.84% and the ratio of net investment income to average net assets would have been 2.29%. |
| (d) | The amount shown for a share outstanding does not correspond with the aggregate realized and unrealized gain (loss) on investments for the period due to the timing of sales and redemptions of fund shares in relation to fluctuating market values of investments of the Fund. |
| (e) | Had certain expenses not been waived/reimbursed during the period, total returns would have been lower. |
| (f) | The investment adviser agreed to waive its fees and/or reimburse a portion of the Fund’s expenses during the period. Without this waiver/reimbursement, expenses would have been higher. |
| (g) | Effective July 1, 2021, the expense limit decreased from 0.95% to 0.90%. |
| (h) | Effective July 1, 2020, the expense limit decreased from 1.12% to 0.95%. |
See accompanying notes to financial statements.
61 |
Financial Highlights (continued)
For a share outstanding throughout each period.
| | | | | | | | | | | | | | | | | | | | |
| | | Natixis U.S. Equity Opportunities Fund—Class A | |
| | | Year Ended
December 31,
2022 | | | Year Ended
December 31,
2021 | | | Year Ended
December 31,
2020 | | | Year Ended
December 31,
2019 | | | Year Ended
December 31,
2018 | |
Net asset value, beginning of the period | | $ | 43.12 | | | $ | 39.04 | | | $ | 36.53 | | | $ | 31.00 | | | $ | 36.90 | |
| | | | | | | | | | | | | | | | | | | | |
INCOME (LOSS) FROM INVESTMENT OPERATIONS: | | | | | | | | | | | | | | | | | | | | |
Net investment income (loss)(a) | | | 0.03 | | | | (0.11 | ) | | | (0.05 | ) | | | 0.15 | (b) | | | 0.08 | |
Net realized and unrealized gain (loss) | | | (8.89 | ) | | | 8.99 | | | | 7.66 | | | | 9.34 | | | | (2.51 | ) |
| | | | | | | | | | | | | | | | | | | | |
Total from Investment Operations | | | (8.86 | ) | | | 8.88 | | | | 7.61 | | | | 9.49 | | | | (2.43 | ) |
| | | | | | | | | | | | | | | | | | | | |
LESS DISTRIBUTIONS FROM: | | | | | | | | | | | | | | | | | | | | |
Net investment income | | | (0.03 | ) | | | — | | | | — | | | | (0.17 | ) | | | (0.05 | ) |
Net realized capital gains | | | (5.22 | ) | | | (4.80 | ) | | | (5.10 | ) | | | (3.79 | ) | | | (3.42 | ) |
| | | | | | | | | | | | | | | | | | | | |
Total Distributions | | | (5.25 | ) | | | (4.80 | ) | | | (5.10 | ) | | | (3.96 | ) | | | (3.47 | ) |
| | | | | | | | | | | | | | | | | | | | |
Net asset value, end of the period | | $ | 29.01 | | | $ | 43.12 | | | $ | 39.04 | | | $ | 36.53 | | | $ | 31.00 | |
| | | | | | | | | | | | | | | | | | | | |
Total return(c) | | | (21.15 | )% | | | 23.14 | % | | | 22.09 | % | | | 31.03 | %(b) | | | (6.48 | )% |
RATIOS TO AVERAGE NET ASSETS: | | | | | | | | | | | | | | | | | | | | |
Net assets, end of the period (000’s) | | $ | 512,392 | | | $ | 733,423 | | | $ | 649,754 | | | $ | 616,922 | | | $ | 523,665 | |
Net expenses | | | 1.12 | % | | | 1.14 | % | | | 1.17 | % | | | 1.17 | % | | | 1.16 | % |
Gross expenses | | | 1.12 | % | | | 1.14 | % | | | 1.17 | % | | | 1.17 | % | | | 1.16 | % |
Net investment income (loss) | | | 0.09 | % | | | (0.25 | )% | | | (0.14 | )% | | | 0.42 | %(b) | | | 0.20 | % |
Portfolio turnover rate | | | 46 | % | | | 18 | % | | | 26 | % | | | 12 | % | | | 23 | % |
| (a) | Per share net investment income (loss) has been calculated using the average shares outstanding during the period. |
| (b) | Includes non-recurring dividends. Without this dividend, net investment income per share would have been $0.09, total return would have been 30.87% and the ratio of net investment income to average net assets would have been 0.26%. |
| (c) | A sales charge for Class A shares is not reflected in total return calculations. |
See accompanying notes to financial statements.
| 62
Financial Highlights (continued)
For a share outstanding throughout each period.
| | | | | | | | | | | | | | | | | | | | |
| | | Natixis U.S. Equity Opportunities Fund—Class C | |
| | | Year Ended
December 31,
2022 | | | Year Ended
December 31,
2021 | | | Year Ended
December 31,
2020 | | | Year Ended
December 31,
2019 | | | Year Ended
December 31,
2018 | |
Net asset value, beginning of the period | | $ | 21.82 | | | $ | 21.89 | | | $ | 22.65 | | | $ | 20.42 | | | $ | 25.73 | |
| | | | | | | | | | | | | | | | | | | | |
INCOME (LOSS) FROM INVESTMENT OPERATIONS: | | | | | | | | | | | | | | | | | | | | |
Net investment loss(a) | | | (0.12 | ) | | | (0.24 | ) | | | (0.19 | ) | | | (0.07 | )(b) | | | (0.14 | ) |
Net realized and unrealized gain (loss) | | | (4.36 | ) | | | 4.97 | | | | 4.53 | | | | 6.10 | | | | (1.75 | ) |
| | | | | | | | | | | | | | | | | | | | |
Total from Investment Operations | | | (4.48 | ) | | | 4.73 | | | | 4.34 | | | | 6.03 | | | | (1.89 | ) |
| | | | | | | | | | | | | | | | | | | | |
LESS DISTRIBUTIONS FROM: | |
Net investment income | | | — | | | | — | | | | — | | | | (0.01 | ) | | | — | |
Net realized capital gains | | | (5.22 | ) | | | (4.80 | ) | | | (5.10 | ) | | | (3.79 | ) | | | (3.42 | ) |
| | | | | | | | | | | | | | | | | | | | |
Total Distributions | | | (5.22 | ) | | | (4.80 | ) | | | (5.10 | ) | | | (3.80 | ) | | | (3.42 | ) |
| | | | | | | | | | | | | | | | | | | | |
Net asset value, end of the period | | $ | 12.12 | | | $ | 21.82 | | | $ | 21.89 | | | $ | 22.65 | | | $ | 20.42 | |
| | | | | | | | | | | | | | | | | | | | |
Total return(c) | | | (21.77 | )% | | | 22.27 | % | | | 21.15 | % | | | 30.06 | %(b) | | | (7.18 | )% |
RATIOS TO AVERAGE NET ASSETS: | |
Net assets, end of the period (000’s) | | $ | 29,356 | | | $ | 57,492 | | | $ | 63,126 | | | $ | 77,924 | | | $ | 78,783 | |
Net expenses | | | 1.87 | % | | | 1.89 | % | | | 1.92 | % | | | 1.92 | % | | | 1.91 | % |
Gross expenses | | | 1.87 | % | | | 1.89 | % | | | 1.92 | % | | | 1.92 | % | | | 1.91 | % |
Net investment loss | | | (0.66 | )% | | | (0.99 | )% | | | (0.87 | )% | | | (0.31 | )%(b) | | | (0.54 | )% |
Portfolio turnover rate | | | 46 | % | | | 18 | % | | | 26 | % | | | 12 | % | | | 23 | % |
| (a) | Per share net investment loss has been calculated using the average shares outstanding during the period. |
| (b) | Includes non-recurring dividends. Without this dividend, net investment loss per share would have been $(0.11), total return would have been 29.85% and the ratio of net investment loss to average net assets would have been (0.48)%. |
| (c) | A contingent deferred sales charge for Class C shares is not reflected in total return calculations. |
See accompanying notes to financial statements.
63 |
Financial Highlights (continued)
For a share outstanding throughout each period.
| | | | | | | | | | | | | | | | | | | | |
| | | Natixis U.S. Equity Opportunities Fund—Class N | |
| | | Year Ended
December 31,
2022 | | | Year Ended
December 31,
2021 | | | Year Ended
December 31,
2020 | | | Year Ended
December 31,
2019 | | | Year Ended
December 31,
2018 | |
Net asset value, beginning of the period | | $ | 54.14 | | | $ | 47.84 | | | $ | 43.61 | | | $ | 36.37 | | | $ | 42.63 | |
| | | | | | | | | | | | | | | | | | | | |
INCOME (LOSS) FROM INVESTMENT OPERATIONS: | | | | | | | | | | | | | | | | | | | | |
Net investment income(a) | | | 0.18 | | | | 0.03 | | | | 0.13 | | | | 0.19 | (b) | | | 0.25 | |
Net realized and unrealized gain (loss) | | | (11.23 | ) | | | 11.07 | | | | 9.20 | | | | 11.14 | | | | (2.91 | ) |
| | | | | | | | | | | | | | | | | | | | |
Total from Investment Operations | | | (11.05 | ) | | | 11.10 | | | | 9.33 | | | | 11.33 | | | | (2.66 | ) |
| | | | | | | | | | | | | | | | | | | | |
LESS DISTRIBUTIONS FROM: | | | | | | | | | | | | | | | | | | | | |
Net investment income | | | (0.15 | ) | | | — | | | | — | | | | (0.30 | ) | | | (0.18 | ) |
Net realized capital gains | | | (5.22 | ) | | | (4.80 | ) | | | (5.10 | ) | | | (3.79 | ) | | | (3.42 | ) |
| | | | | | | | | | | | | | | | | | | | |
Total Distributions | | | (5.37 | ) | | | (4.80 | ) | | | (5.10 | ) | | | (4.09 | ) | | | (3.60 | ) |
| | | | | | | | | | | | | | | | | | | | |
Net asset value, end of the period | | $ | 37.72 | | | $ | 54.14 | | | $ | 47.84 | | | $ | 43.61 | | | $ | 36.37 | |
| | | | | | | | | | | | | | | | | | | | |
Total return(c) | | | (20.88 | )% | | | 23.53 | % | | | 22.48 | % | | | 31.44 | %(b) | | | (6.11 | )% |
RATIOS TO AVERAGE NET ASSETS: | | | | | | | | | | | | | | | | | | | | |
Net assets, end of the period (000’s) | | $ | 167 | | | $ | 177 | | | $ | 172 | | | $ | 654 | | | $ | 1 | |
Net expenses(d) | | | 0.81 | % | | | 0.83 | % | | | 0.84 | % | | | 0.83 | % | | | 0.76 | % |
Gross expenses | | | 1.34 | % | | | 1.38 | % | | | 1.13 | % | | | 1.42 | % | | | 13.35 | % |
Net investment income | | | 0.41 | % | | | 0.06 | % | | | 0.31 | % | | | 0.44 | %(b) | | | 0.56 | % |
Portfolio turnover rate | | | 46 | % | | | 18 | % | | | 26 | % | | | 12 | % | | | 23 | % |
| (a) | Per share net investment income has been calculated using the average shares outstanding during the period. |
| (b) | Includes non-recurring dividends. Without this dividend, net investment income per share would have been $0.19, total return would have been 31.27% and the ratio of net investment income to average net assets would have been 0.44%. |
| (c) | Had certain expenses not been waived/reimbursed during the period, total returns would have been lower. |
| (d) | The investment adviser agreed to waive its fees and/or reimburse a portion of the Fund’s expenses during the period. Without this waiver/reimbursement, expenses would have been higher. |
See accompanying notes to financial statements.
| 64
Financial Highlights (continued)
For a share outstanding throughout each period.
| | | | | | | | | | | | | | | | | | | | |
| | | Natixis U.S. Equity Opportunities Fund—Class Y | |
| | | Year Ended
December 31,
2022 | | | Year Ended
December 31,
2021 | | | Year Ended
December 31,
2020 | | | Year Ended
December 31,
2019 | | | Year Ended
December 31,
2018 | |
Net asset value, beginning of the period | | $ | 53.99 | | | $ | 47.74 | | | $ | 43.56 | | | $ | 36.33 | | | $ | 42.61 | |
| | | | | | | | | | | | | | | | | | | | |
INCOME (LOSS) FROM INVESTMENT OPERATIONS: | | | | | | | | | | | | | | | | | | | | |
Net investment income(a) | | | 0.15 | | | | 0.00 | (b) | | | 0.05 | | | | 0.29 | (c) | | | 0.20 | |
Net realized and unrealized gain (loss) | | | (11.20 | ) | | | 11.05 | | | | 9.23 | | | | 10.99 | | | | (2.92 | ) |
| | | | | | | | | | | | | | | | | | | | |
Total from Investment Operations | | | (11.05 | ) | | | 11.05 | | | | 9.28 | | | | 11.28 | | | | (2.72 | ) |
| | | | | | | | | | | | | | | | | | | | |
LESS DISTRIBUTIONS FROM: | | | | | | | | | | | | | | | | | | | | |
Net investment income | | | (0.12 | ) | | | — | | | | — | | | | (0.26 | ) | | | (0.14 | ) |
Net realized capital gains | | | (5.22 | ) | | | (4.80 | ) | | | (5.10 | ) | | | (3.79 | ) | | | (3.42 | ) |
| | | | | | | | | | | | | | | | | | | | |
Total Distributions | | | (5.34 | ) | | | (4.80 | ) | | | (5.10 | ) | | | (4.05 | ) | | | (3.56 | ) |
| | | | | | | | | | | | | | | | | | | | |
Net asset value, end of the period | | $ | 37.60 | | | $ | 53.99 | | | $ | 47.74 | | | $ | 43.56 | | | $ | 36.33 | |
| | | | | | | | | | | | | | | | | | | | |
Total return | | | (20.95 | )% | | | 23.48 | % | | | 22.36 | % | | | 31.36 | %(c)(d) | | | (6.24 | )% |
RATIOS TO AVERAGE NET ASSETS: | | | | | | | | | | | | | | | | | | | | |
Net assets, end of the period (000’s) | | $ | 191,912 | | | $ | 284,738 | | | $ | 243,302 | | | $ | 283,864 | | | $ | 296,255 | |
Net expenses | | | 0.87 | % | | | 0.89 | % | | | 0.92 | % | | | 0.91 | %(e) | | | 0.91 | % |
Gross expenses | | | 0.87 | % | | | 0.89 | % | | | 0.92 | % | | | 0.92 | % | | | 0.91 | % |
Net investment income | | | 0.35 | % | | | 0.00 | %(f) | | | 0.13 | % | | | 0.69 | %(c) | | | 0.45 | % |
Portfolio turnover rate | | | 46 | % | | | 18 | % | | | 26 | % | | | 12 | % | | | 23 | % |
| (a) | Per share net investment income has been calculated using the average shares outstanding during the period. |
| (b) | Amount rounds to less than $0.01 per share. |
| (c) | Includes non-recurring dividends. Without this dividend, net investment income per share would have been $0.22, total return would have been 31.16% and the ratio of net investment income to average net assets would have been 0.53%. |
| (d) | Had certain expenses not been waived/reimbursed during the period, total returns would have been lower. |
| (e) | The administrator agreed to waive its fees and/or reimburse a portion of the Fund’s expenses during the period. Without this waiver/reimbursement, expenses would have been higher. |
| (f) | Amount rounds to less than 0.01%. |
See accompanying notes to financial statements.
65 |
Financial Highlights (continued)
For a share outstanding throughout each period.
| | | | | | | | | | | | | | | | | | | | |
| | | Vaughan Nelson Mid Cap Fund—Class A | |
| | | Year Ended
December 31,
2022
| | | Year Ended
December 31,
2021
| | | Year Ended
December 31,
2020
| | | Year Ended
December 31,
2019
| | | Year Ended
December 31,
2018
| |
Net asset value, beginning of the period | | $ | 22.70 | | | $ | 21.79 | | | $ | 22.42 | | | $ | 17.37 | | | $ | 22.65 | |
| | | | | | | | | | | | | | | | | | | | |
INCOME (LOSS) FROM INVESTMENT OPERATIONS: | | | | | | | | | | | | | | | | | | | | |
Net investment income(a) | | | 0.11 | | | | 0.05 | | | | 0.07 | | | | 0.03 | | | | 0.09 | |
Net realized and unrealized gain (loss) | | | (2.53 | ) | | | 4.52 | | | | 1.96 | | | | 5.21 | | | | (3.71 | ) |
| | | | | | | | | | | | | | | | | | | | |
Total from Investment Operations | | | (2.42 | ) | | | 4.57 | | | | 2.03 | | | | 5.24 | | | | (3.62 | ) |
| | | | | | | | | | | | | | | | | | | | |
LESS DISTRIBUTIONS FROM: | | | | | | | | | | | | | | | | | | | | |
Net investment income | | | (0.13 | ) | | | (0.04 | ) | | | (0.04 | ) | | | (0.02 | ) | | | (0.15 | ) |
Net realized capital gains | | | (0.51 | ) | | | (3.62 | ) | | | (2.62 | ) | | | (0.17 | ) | | | (1.51 | ) |
| | | | | | | | | | | | | | | | | | | | |
Total Distributions | | | (0.64 | ) | | | (3.66 | ) | | | (2.66 | ) | | | (0.19 | ) | | | (1.66 | ) |
| | | | | | | | | | | | | | | | | | | | |
Net asset value, end of the period | | $ | 19.64 | | | $ | 22.70 | | | $ | 21.79 | | | $ | 22.42 | | | $ | 17.37 | |
| | | | | | | | | | | | | | | | | | | | |
Total return(b) | | | (10.80 | )%(c) | | | 21.32 | %(c) | | | 10.46 | %(c) | | | 30.21 | %(c) | | | (16.10 | )% |
RATIOS TO AVERAGE NET ASSETS: | | | | | | | | | | | | | | | | | | | | |
Net assets, end of the period (000’s) | | $ | 33,507 | | | $ | 37,849 | | | $ | 30,567 | | | $ | 33,434 | | | $ | 43,769 | |
Net expenses | | | 1.15 | %(d) | | | 1.17 | %(d)(e) | | | 1.20 | %(d) | | | 1.25 | %(d)(f)(g) | | | 1.24 | % |
Gross expenses | | | 1.21 | % | | | 1.23 | % | | | 1.29 | % | | | 1.28 | %(f) | | | 1.24 | % |
Net investment income | | | 0.55 | % | | | 0.22 | % | | | 0.35 | % | | | 0.16 | % | | | 0.42 | % |
Portfolio turnover rate | | | 53 | % | | | 71 | % | | | 52 | % | | | 52 | % | | | 44 | % |
| (a) | Per share net investment income has been calculated using the average shares outstanding during the period. |
| (b) | A sales charge for Class A shares is not reflected in total return calculations. |
| (c) | Had certain expenses not been waived/reimbursed during the period, total returns would have been lower. |
| (d) | The investment adviser agreed to waive its fees and/or reimburse a portion of the Fund’s expenses during the period. Without this waiver/reimbursement, expenses would have been higher. |
| (e) | Effective July 1, 2021, the expense limit decreased from 1.20% to 1.15%. |
| (f) | Includes interest expense. Without this expense the ratio of net expenses would have been 1.23% and the ratio of gross expenses would have been 1.26%. |
| (g) | Effective July 1, 2019, the expense limit decreased from 1.40% to 1.20%. |
See accompanying notes to financial statements.
| 66
Financial Highlights (continued)
For a share outstanding throughout each period.
| | | | | | | | | | | | | | | | | | | | |
| | | Vaughan Nelson Mid Cap Fund—Class C | |
| | | Year Ended
December 31,
2022 | | | Year Ended
December 31,
2021 | | | Year Ended
December 31,
2020 | | | Year Ended
December 31,
2019 | | | Year Ended
December 31,
2018 | |
Net asset value, beginning of the period | | $ | 20.58 | | | $ | 20.15 | | | $ | 21.06 | | | $ | 16.43 | | | $ | 21.50 | |
| | | | | | | | | | | | | | | | | | | | |
INCOME (LOSS) FROM INVESTMENT OPERATIONS: | | | | | | | | | | | | | | | | | | | | |
Net investment loss(a) | | | (0.04 | ) | | | (0.13 | ) | | | (0.08 | ) | | | (0.10 | ) | | | (0.08 | ) |
Net realized and unrealized gain (loss) | | | (2.28 | ) | | | 4.18 | | | | 1.79 | | | | 4.90 | | | | (3.48 | ) |
| | | | | | | | | | | | | | | | | | | | |
Total from Investment Operations | | | (2.32 | ) | | | 4.05 | | | | 1.71 | | | | 4.80 | | | | (3.56 | ) |
| | | | | | | | | | | | | | | | | | | | |
LESS DISTRIBUTIONS FROM: | | | | | | | | | | | | | | | | | | | | |
Net investment income | | | — | | | | (0.00 | )(b) | | | — | | | | (0.00 | )(b) | | | — | |
Net realized capital gains | | | (0.51 | ) | | | (3.62 | ) | | | (2.62 | ) | | | (0.17 | ) | | | (1.51 | ) |
| | | | | | | | | | | | | | | | | | | | |
Total Distributions | | | (0.51 | ) | | | (3.62 | ) | | | (2.62 | ) | | | (0.17 | ) | | | (1.51 | ) |
| | | | | | | | | | | | | | | | | | | | |
Net asset value, end of the period | | $ | 17.75 | | | $ | 20.58 | | | $ | 20.15 | | | $ | 21.06 | | | $ | 16.43 | |
| | | | | | | | | | | | | | | | | | | | |
Total return(c) | | | (11.46 | )%(d) | | | 20.44 | %(d) | | | 9.60 | %(d) | | | 29.25 | %(d) | | | (16.71 | )% |
RATIOS TO AVERAGE NET ASSETS: | | | | | | | | | | | | | | | | | | | | |
Net assets, end of the period (000’s) | | $ | 7,405 | | | $ | 11,436 | | | $ | 14,023 | | | $ | 21,932 | | | $ | 23,967 | |
Net expenses | | | 1.90 | %(e) | | | 1.93 | %(e)(f) | | | 1.95 | %(e) | | | 1.99 | %(e)(g)(h) | | | 1.98 | % |
Gross expenses | | | 1.96 | % | | | 1.98 | % | | | 2.04 | % | | | 2.02 | %(g) | | | 1.98 | % |
Net investment loss | | | (0.22 | )% | | | (0.56 | )% | | | (0.42 | )% | | | (0.50 | )% | | | (0.36 | )% |
Portfolio turnover rate | | | 53 | % | | | 71 | % | | | 52 | % | | | 52 | % | | | 44 | % |
| (a) | Per share net investment loss has been calculated using the average shares outstanding during the period. |
| (b) | Amount rounds to less than $0.01 per share. |
| (c) | A contingent deferred sales charge for Class C shares is not reflected in total return calculations. |
| (d) | Had certain expenses not been waived/reimbursed during the period, total returns would have been lower. |
| (e) | The investment adviser agreed to waive its fees and/or reimburse a portion of the Fund’s expenses during the period. Without this waiver/reimbursement, expenses would have been higher. |
| (f) | Effective July 1, 2021, the expense limit decreased from 1.95% to 1.90%. |
| (g) | Includes interest expense. Without this expense the ratio of net expenses would have been 1.98% and the ratio of gross expenses would have been 2.01%. |
| (h) | Effective July 1, 2019, the expense limit decreased from 2.15% to 1.95%. |
See accompanying notes to financial statements.
67 |
Financial Highlights (continued)
For a share outstanding throughout each period.
| | | | | | | | | | | | | | | | | | | | |
| | | Vaughan Nelson Mid Cap Fund—Class N | |
| | | Year Ended
December 31,
2022 | | | Year Ended
December 31,
2021 | | | Year Ended
December 31,
2020 | | | Year Ended
December 31,
2019 | | | Year Ended
December 31,
2018 | |
Net asset value, beginning of the period | | $ | 23.05 | | | $ | 22.07 | | | $ | 22.66 | | | $ | 17.54 | | | $ | 22.87 | |
| | | | | | | | | | | | | | | | | | | | |
INCOME (LOSS) FROM INVESTMENT OPERATIONS: | | | | | | | | | | | | | | | | | | | | |
Net investment income(a) | | | 0.17 | | | | 0.14 | | | | 0.13 | | | | 0.11 | | | | 0.17 | |
Net realized and unrealized gain (loss) | | | (2.57 | ) | | | 4.58 | | | | 2.00 | | | | 5.27 | | | | (3.75 | ) |
| | | | | | | | | | | | | | | | | | | | |
Total from Investment Operations | | | (2.40 | ) | | | 4.72 | | | | 2.13 | | | | 5.38 | | | | (3.58 | ) |
| | | | | | | | | | | | | | | | | | | | |
LESS DISTRIBUTIONS FROM: | | | | | | | | | | | | | | | | | | | | |
Net investment income | | | (0.19 | ) | | | (0.12 | ) | | | (0.10 | ) | | | (0.09 | ) | | | (0.24 | ) |
Net realized capital gains | | | (0.51 | ) | | | (3.62 | ) | | | (2.62 | ) | | | (0.17 | ) | | | (1.51 | ) |
| | | | | | | | | | | | | | | | | | | | |
Total Distributions | | | (0.70 | ) | | | (3.74 | ) | | | (2.72 | ) | | | (0.26 | ) | | | (1.75 | ) |
| | | | | | | | | | | | | | | | | | | | |
Net asset value, end of the period | | $ | 19.95 | | | $ | 23.05 | | | $ | 22.07 | | | $ | 22.66 | | | $ | 17.54 | |
| | | | | | | | | | | | | | | | | | | | |
Total return | | | (10.54 | )%(b) | | | 21.70 | %(b) | | | 10.83 | %(b) | | | 30.67 | %(b) | | | (15.78 | )% |
RATIOS TO AVERAGE NET ASSETS: | | | | | | | | | | | | | | | | | | | | |
Net assets, end of the period (000’s) | | $ | 72,804 | | | $ | 91,416 | | | $ | 17,965 | | | $ | 18,262 | | | $ | 70,902 | |
Net expenses | | | 0.85 | %(c) | | | 0.86 | %(c)(d) | | | 0.90 | %(c) | | | 0.92 | %(c)(e)(f) | | | 0.88 | % |
Gross expenses | | | 0.87 | % | | | 0.89 | % | | | 0.94 | % | | | 0.93 | %(e) | | | 0.88 | % |
Net investment income | | | 0.84 | % | | | 0.55 | % | | | 0.65 | % | | | 0.51 | % | | | 0.76 | % |
Portfolio turnover rate | | | 53 | % | | | 71 | % | | | 52 | % | | | 52 | % | | | 44 | % |
| (a) | Per share net investment income has been calculated using the average shares outstanding during the period. |
| (b) | Had certain expenses not been waived/reimbursed during the period, total returns would have been lower. |
| (c) | The investment adviser agreed to waive its fees and/or reimburse a portion of the Fund’s expenses during the period. Without this waiver/reimbursement, expenses would have been higher. |
| (d) | Effective July 1, 2021, the expense limit decreased from 0.90% to 0.85%. |
| (e) | Includes interest expense. Without this expense the ratio of net expenses would have been 0.91% and the ratio of gross expenses would have been 0.91%. |
| (f) | Effective July 1, 2019, the expense limit decreased from 1.10% to 0.90%. |
See accompanying notes to financial statements.
| 68
Financial Highlights (continued)
For a share outstanding throughout each period.
| | | | | | | | | | | | | | | | | | | | |
| | | Vaughan Nelson Mid Cap Fund—Class Y | |
| | | Year Ended
December 31,
2022 | | | Year Ended
December 31,
2021 | | | Year Ended
December 31,
2020 | | | Year Ended
December 31,
2019 | | | Year Ended
December 31,
2018 | |
Net asset value, beginning of the period | | $ | 23.09 | | | $ | 22.10 | | | $ | 22.69 | | | $ | 17.57 | | | $ | 22.89 | |
| | | | | | | | | | | | | | | | | | | | |
INCOME (LOSS) FROM INVESTMENT OPERATIONS: | | | | | | | | | | | | | | | | | | | | |
Net investment income(a) | | | 0.16 | | | | 0.11 | | | | 0.12 | | | | 0.10 | | | | 0.15 | |
Net realized and unrealized gain (loss) | | | (2.57 | ) | | | 4.60 | | | | 2.00 | | | | 5.26 | | | | (3.75 | ) |
| | | | | | | | | | | | | | | | | | | | |
Total from Investment Operations | | | (2.41 | ) | | | 4.71 | | | | 2.12 | | | | 5.36 | | | | (3.60 | ) |
| | | | | | | | | | | | | | | | | | | | |
LESS DISTRIBUTIONS FROM: | | | | | | | | | | | | | | | | | | | | |
Net investment income | | | (0.18 | ) | | | (0.10 | ) | | | (0.09 | ) | | | (0.07 | ) | | | (0.21 | ) |
Net realized capital gains | | | (0.51 | ) | | | (3.62 | ) | | | (2.62 | ) | | | (0.17 | ) | | | (1.51 | ) |
| | | | | | | | | | | | | | | | | | | | |
Total Distributions | | | (0.69 | ) | | | (3.72 | ) | | | (2.71 | ) | | | (0.24 | ) | | | (1.72 | ) |
| | | | | | | | | | | | | | | | | | | | |
Net asset value, end of the period | | $ | 19.99 | | | $ | 23.09 | | | $ | 22.10 | | | $ | 22.69 | | | $ | 17.57 | |
| | | | | | | | | | | | | | | | | | | | |
Total return | | | (10.58 | )%(b) | | | 21.65 | %(b) | | | 10.76 | %(b) | | | 30.52 | %(b) | | | (15.85 | )% |
RATIOS TO AVERAGE NET ASSETS: | | | | | | | | | | | | | | | | | | | | |
Net assets, end of the period (000’s) | | $ | 148,505 | | | $ | 226,838 | | | $ | 227,501 | | | $ | 298,705 | | | $ | 453,085 | |
Net expenses | | | 0.90 | %(c) | | | 0.93 | %(c)(d) | | | 0.95 | %(c) | | | 1.00 | %(c)(e)(f) | | | 0.99 | % |
Gross expenses | | | 0.96 | % | | | 0.98 | % | | | 1.04 | % | | | 1.02 | %(e) | | | 0.99 | % |
Net investment income | | | 0.78 | % | | | 0.45 | % | | | 0.60 | % | | | 0.48 | % | | | 0.66 | % |
Portfolio turnover rate | | | 53 | % | | | 71 | % | | | 52 | % | | | 52 | % | | | 44 | % |
| (a) | Per share net investment income has been calculated using the average shares outstanding during the period. |
| (b) | Had certain expenses not been waived/reimbursed during the period, total returns would have been lower. |
| (c) | The investment adviser agreed to waive its fees and/or reimburse a portion of the Fund’s expenses during the period. Without this waiver/reimbursement, expenses would have been higher. |
| (d) | Effective July 1, 2021, the expense limit decreased from 0.95% to 0.90%. |
| (e) | Includes interest expense. Without this expense the ratio of net expenses would have been 0.98% and the ratio of gross expenses would have been 1.01%. |
| (f) | Effective July 1, 2019, the expense limit decreased from 1.15% to 0.95%. |
See accompanying notes to financial statements.
69 |
Financial Highlights (continued)
For a share outstanding throughout each period.
| | | | | | | | | | | | | | | | | | | | |
| | | Vaughan Nelson Small Cap Value Fund—Class A | |
| | | Year Ended
December 31,
2022 | | | Year Ended
December 31,
2021 | | | Year Ended
December 31,
2020 | | | Year Ended
December 31,
2019 | | | Year Ended
December 31,
2018 | |
Net asset value, beginning of the period | | $ | 17.87 | | | $ | 16.69 | | | $ | 15.45 | | | $ | 12.48 | | | $ | 18.71 | |
| | | | | | | | | | | | | | | | | | | | |
INCOME (LOSS) FROM INVESTMENT OPERATIONS: | | | | | | | | | | | | | | | | | | | | |
Net investment income (loss)(a) | | | (0.02 | ) | | | 0.00 | (b)(c) | | | 0.00 | (c) | | | 0.02 | | | | 0.01 | |
Net realized and unrealized gain (loss) | | | (1.78 | ) | | | 4.98 | | | | 1.33 | | | | 3.06 | | | | (2.76 | ) |
| | | | | | | | | | | | | | | | | | | | |
Total from Investment Operations | | | (1.80 | ) | | | 4.98 | | | | 1.33 | | | | 3.08 | | | | (2.75 | ) |
| | | | | | | | | | | | | | | | | | | | |
LESS DISTRIBUTIONS FROM: | | | | | | | | | | | | | | | | | | | | |
Net investment income | | | — | | | | (0.01 | ) | | | (0.00 | )(c) | | | (0.03 | ) | | | (0.00 | )(c) |
Net realized capital gains | | | (0.90 | ) | | | (3.79 | ) | | | (0.09 | ) | | | (0.08 | ) | | | (3.48 | ) |
| | | | | | | | | | | | | | | | | | | | |
Total Distributions | | | (0.90 | ) | | | (3.80 | ) | | | (0.09 | ) | | | (0.11 | ) | | | (3.48 | ) |
| | | | | | | | | | | | | | | | | | | | |
Net asset value, end of the period | | $ | 15.17 | | | $ | 17.87 | | | $ | 16.69 | | | $ | 15.45 | | | $ | 12.48 | |
| | | | | | | | | | | | | | | | | | | | |
Total return(d) | | | (10.19 | )%(e) | | | 30.24 | %(b)(e) | | | 8.91 | %(e) | | | 24.66 | %(e) | | | (14.84 | )% |
RATIOS TO AVERAGE NET ASSETS: | | | | | | | | | | | | | | | | | | | | |
Net assets, end of the period (000’s) | | $ | 66,339 | | | $ | 81,493 | | | $ | 61,571 | | | $ | 67,525 | | | $ | 66,376 | |
Net expenses | | | 1.25 | %(f) | | | 1.27 | %(f)(g) | | | 1.32 | %(f)(h) | | | 1.40 | %(f)(i) | | | 1.38 | % |
Gross expenses | | | 1.37 | % | | | 1.43 | % | | | 1.53 | % | | | 1.47 | % | | | 1.38 | % |
Net investment income (loss) | | | (0.12 | )% | | | 0.01 | %(b) | | | 0.02 | % | | | 0.12 | % | | | 0.03 | % |
Portfolio turnover rate | | | 63 | % | | | 92 | % | | | 105 | % | | | 61 | % | | | 70 | % |
| (a) | Per share net investment income (loss) has been calculated using the average shares outstanding during the period. |
| (b) | Includes a non-recurring dividend. Without this dividend, net investment loss per share would have been $(0.05), total return would have been 29.95% and the ratio of net investment loss to average net assets would have been (0.25)%. |
| (c) | Amount rounds to less than $0.01 per share. |
| (d) | A sales charge for Class A shares is not reflected in total return calculations. |
| (e) | Had certain expenses not been waived/reimbursed during the period, total returns would have been lower. |
| (f) | The investment adviser agreed to waive its fees and/or reimburse a portion of the Fund’s expenses during the period. Without this waiver/reimbursement, expenses would have been higher. |
| (g) | Effective July 1, 2021, the expense limit decreased from 1.30% to 1.25%. |
| (h) | Effective July 1, 2020, the expense limit decreased from 1.34% to 1.30%. |
| (i) | Effective July 1, 2019, the expense limit decreased from 1.45% to 1.34%. |
See accompanying notes to financial statements.
| 70
Financial Highlights (continued)
For a share outstanding throughout each period.
| | | | | | | | | | | | | | | | | | | | |
| | | Vaughan Nelson Small Cap Value Fund—Class C | |
| | | Year Ended
December 31,
2022 | | | Year Ended
December 31,
2021 | | | Year Ended
December 31,
2020 | | | Year Ended
December 31,
2019 | | | Year Ended
December 31,
2018 | |
Net asset value, beginning of the period | | $ | 6.94 | | | $ | 8.34 | | | $ | 7.84 | | | $ | 6.41 | | | $ | 11.67 | |
| | | | | | | | | | | | | | | | | | | | |
INCOME (LOSS) FROM INVESTMENT OPERATIONS: | | | | | | | | | | | | | | | | | | | | |
Net investment loss(a) | | | (0.04 | ) | | | (0.06 | )(b) | | | (0.05 | ) | | | (0.05 | ) | | | (0.09 | ) |
Net realized and unrealized gain (loss) | | | (0.70 | ) | | | 2.45 | | | | 0.64 | | | | 1.57 | | | | (1.69 | ) |
| | | | | | | | | | | | | | | | | | | | |
Total from Investment Operations | | | (0.74 | ) | | | 2.39 | | | | 0.59 | | | | 1.52 | | | | (1.78 | ) |
| | | | | | | | | | | | | | | | | | | | |
LESS DISTRIBUTIONS FROM: | | | | | | | | | | | | | | | | | | | | |
Net investment income | | | — | | | | — | | | | (0.00 | )(c) | | | (0.01 | ) | | | (0.00 | )(c) |
Net realized capital gains | | | (0.90 | ) | | | (3.79 | ) | | | (0.09 | ) | | | (0.08 | ) | | | (3.48 | ) |
| | | | | | | | | | | | | | | | | | | | |
Total Distributions | | | (0.90 | ) | | | (3.79 | ) | | | (0.09 | ) | | | (0.09 | ) | | | (3.48 | ) |
| | | | | | | | | | | | | | | | | | | | |
Net asset value, end of the period | | $ | 5.30 | | | $ | 6.94 | | | $ | 8.34 | | | $ | 7.84 | | | $ | 6.41 | |
| | | | | | | | | | | | | | | | | | | | |
Total return(d) | | | (11.01 | )%(e) | | | 29.45 | %(b)(e) | | | 8.08 | %(e) | | | 23.69 | %(e) | | | (15.51 | )% |
RATIOS TO AVERAGE NET ASSETS: | | | | | | | | | | | | | | | | | | | | |
Net assets, end of the period (000’s) | | $ | 2,118 | | | $ | 966 | | | $ | 983 | | | $ | 1,450 | | | $ | 3,480 | |
Net expenses | | | 2.00 | %(f) | | | 2.03 | %(f)(g) | | | 2.07 | %(f)(h) | | | 2.16 | %(f)(i) | | | 2.12 | % |
Gross expenses | | | 2.12 | % | | | 2.19 | % | | | 2.28 | % | | | 2.23 | % | | | 2.12 | % |
Net investment loss | | | (0.74 | )% | | | (0.67 | )%(b) | | | (0.71 | )% | | | (0.68 | )% | | | (0.83 | )% |
Portfolio turnover rate | | | 63 | % | | | 92 | % | | | 105 | % | | | 61 | % | | | 70 | % |
| (a) | Per share net investment loss has been calculated using the average shares outstanding during the period. |
| (b) | Includes a non-recurring dividend. Without this dividend, net investment loss per share would have been $(0.10), total return would have been 29.09% and the ratio of net investment loss to average net assets would have been (0.99)%. |
| (c) | Amount rounds to less than $0.01 per share. |
| (d) | A contingent deferred sales charge for Class C shares is not reflected in total return calculations. |
| (e) | Had certain expenses not been waived/reimbursed during the period, total returns would have been lower. |
| (f) | The investment adviser agreed to waive its fees and/or reimburse a portion of the Fund’s expenses during the period. Without this waiver/reimbursement, expenses would have been higher. |
| (g) | Effective July 1, 2021, the expense limit decreased from 2.05% to 2.00%. |
| (h) | Effective July 1, 2020, the expense limit decreased from 2.09% to 2.05%. |
| (i) | Effective July 1, 2019, the expense limit decreased from 2.20% to 2.09%. |
See accompanying notes to financial statements.
71 |
Financial Highlights (continued)
For a share outstanding throughout each period.
| | | | | | | | | | | | | | | | | | | | |
| | | Vaughan Nelson Small Cap Value Fund—Class N | |
| | | Year Ended
December 31,
2022 | | | Year Ended
December 31,
2021 | | | Year Ended
December 31,
2020 | | | Year Ended
December 31,
2019 | | | Year Ended
December 31,
2018 | |
Net asset value, beginning of the period | | $ | 18.96 | | | $ | 17.52 | | | $ | 16.20 | | | $ | 13.08 | | | $ | 19.37 | |
| | | | | | | | | | | | | | | | | | | | |
INCOME (LOSS) FROM INVESTMENT OPERATIONS: | | | | | | | | | | | | | | | | | | | | |
Net investment income(a) | | | 0.04 | | | | 0.01 | (b) | | | 0.04 | | | | 0.08 | | | | 0.08 | |
Net realized and unrealized gain (loss) | | | (1.91 | ) | | | 5.29 | | | | 1.42 | | | | 3.20 | | | | (2.86 | ) |
| | | | | | | | | | | | | | | | | | | | |
Total from Investment Operations | | | (1.87 | ) | | | 5.30 | | | | 1.46 | | | | 3.28 | | | | (2.78 | ) |
| | | | | | | | | | | | | | | | | | | | |
LESS DISTRIBUTIONS FROM: | | | | | | | | | | | | | | | | | | | | |
Net investment income | | | (0.03 | ) | | | (0.07 | ) | | | (0.05 | ) | | | (0.08 | ) | | | (0.03 | ) |
Net realized capital gains | | | (0.90 | ) | | | (3.79 | ) | | | (0.09 | ) | | | (0.08 | ) | | | (3.48 | ) |
| | | | | | | | | | | | | | | | | | | | |
Total Distributions | | | (0.93 | ) | | | (3.86 | ) | | | (0.14 | ) | | | (0.16 | ) | | | (3.51 | ) |
| | | | | | | | | | | | | | | | | | | | |
Net asset value, end of the period | | $ | 16.16 | | | $ | 18.96 | | | $ | 17.52 | | | $ | 16.20 | | | $ | 13.08 | |
| | | | | | | | | | | | | | | | | | | | |
Total return(c) | | | (9.95 | )% | | | 30.64 | %(b) | | | 9.27 | % | | | 25.08 | % | | | (14.48 | )% |
RATIOS TO AVERAGE NET ASSETS: | | | | | | | | | | | | | | | | | | | | |
Net assets, end of the period (000’s) | | $ | 1,493 | | | $ | 1,383 | | | $ | 23 | | | $ | 21 | | | $ | 1 | |
Net expenses(d) | | | 0.95 | % | | | 0.97 | %(e) | | | 1.02 | %(f) | | | 1.03 | %(g) | | | 0.96 | % |
Gross expenses | | | 1.10 | % | | | 1.19 | % | | | 6.54 | % | | | 11.80 | % | | | 15.17 | % |
Net investment income | | | 0.22 | % | | | 0.03 | %(b) | | | 0.31 | % | | | 0.52 | % | | | 0.43 | % |
Portfolio turnover rate | | | 63 | % | | | 92 | % | | | 105 | % | | | 61 | % | | | 70 | % |
| (a) | Per share net investment income has been calculated using the average shares outstanding during the period. |
| (b) | Includes a non-recurring dividend. Without this dividend, net investment income per share would have been $0.01, total return would have been 30.37% and the ratio of net investment income to average net assets would have been 0.03%. |
| (c) | Had certain expenses not been waived/reimbursed during the period, total returns would have been lower. |
| (d) | The investment adviser agreed to waive its fees and/or reimburse a portion of the Fund’s expenses during the period. Without this waiver/reimbursement, expenses would have been higher. |
| (e) | Effective July 1, 2021, the expense limit decreased from 1.00% to 0.95%. |
| (f) | Effective July 1, 2020, the expense limit decreased from 1.04% to 1.00%. |
| (g) | Effective July 1, 2019, the expense limit decreased from 1.15% to 1.04%. |
See accompanying notes to financial statements.
| 72
Financial Highlights (continued)
For a share outstanding throughout each period.
| | | | | | | | | | | | | | | | | | | | |
| | | Vaughan Nelson Small Cap Value Fund—Class Y | |
| | | Year Ended
December 31,
2022 | | | Year Ended
December 31,
2021 | | | Year Ended
December 31,
2020 | | | Year Ended
December 31,
2019 | | | Year Ended
December 31,
2018 | |
Net asset value, beginning of the period | | $ | 18.95 | | | $ | 17.51 | | | $ | 16.19 | | | $ | 13.08 | | | $ | 19.37 | |
| | | | | | | | | | | | | | | | | | | | |
INCOME (LOSS) FROM INVESTMENT OPERATIONS: | | | | | | | | | | | | | | | | | | | | |
Net investment income(a) | | | 0.04 | | | | 0.06 | (b) | | | 0.04 | | | | 0.05 | | | | 0.04 | |
Net realized and unrealized gain (loss) | | | (1.91 | ) | | | 5.23 | | | | 1.41 | | | | 3.21 | | | | (2.84 | ) |
| | | | | | | | | | | | | | | | | | | | |
Total from Investment Operations | | | (1.87 | ) | | | 5.29 | | | | 1.45 | | | | 3.26 | | | | (2.80 | ) |
| | | | | | | | | | | | | | | | | | | | |
LESS DISTRIBUTIONS FROM: | | | | | | | | | | | | | | | | | | | | |
Net investment income | | | (0.03 | ) | | | (0.06 | ) | | | (0.04 | ) | | | (0.07 | ) | | | (0.01 | ) |
Net realized capital gains | | | (0.90 | ) | | | (3.79 | ) | | | (0.09 | ) | | | (0.08 | ) | | | (3.48 | ) |
| | | | | | | | | | | | | | | | | | | | |
Total Distributions | | | (0.93 | ) | | | (3.85 | ) | | | (0.13 | ) | | | (0.15 | ) | | | (3.49 | ) |
| | | | | | | | | | | | | | | | | | | | |
Net asset value, end of the period | | $ | 16.15 | | | $ | 18.95 | | | $ | 17.51 | | | $ | 16.19 | | | $ | 13.08 | |
| | | | | | | | | | | | | | | | | | | | |
Total return | | | (9.98 | )%(c) | | | 30.61 | %(b)(c) | | | 9.23 | %(c) | | | 24.88 | %(c) | | | (14.61 | )% |
RATIOS TO AVERAGE NET ASSETS: | | | | | | | | | | | | | | | | | | | | |
Net assets, end of the period (000’s) | | $ | 120,585 | | | $ | 66,054 | | | $ | 49,315 | | | $ | 44,482 | | | $ | 58,538 | |
Net expenses | | | 1.00 | %(d) | | | 1.02 | %(d)(e) | | | 1.07 | %(d)(f) | | | 1.15 | %(d)(g) | | | 1.12 | % |
Gross expenses | | | 1.12 | % | | | 1.18 | % | | | 1.28 | % | | | 1.23 | % | | | 1.12 | % |
Net investment income | | | 0.22 | % | | | 0.28 | %(b) | | | 0.26 | % | | | 0.35 | % | | | 0.22 | % |
Portfolio turnover rate | | | 63 | % | | | 92 | % | | | 105 | % | | | 61 | % | | | 70 | % |
| (a) | Per share net investment income has been calculated using the average shares outstanding during the period. |
| (b) | Includes a non-recurring dividend. Without this dividend, net investment income per share would have been $0.00, total return would have been 30.26% and the ratio of net investment income to average net assets would have been 0.01%. |
| (c) | Had certain expenses not been waived/reimbursed during the period, total returns would have been lower. |
| (d) | The investment adviser agreed to waive its fees and/or reimburse a portion of the Fund’s expenses during the period. Without this waiver/reimbursement, expenses would have been higher. |
| (e) | Effective July 1, 2021, the expense limit decreased from 1.05% to 1.00%. |
| (f) | Effective July 1, 2020, the expense limit decreased from 1.09% to 1.05%. |
| (g) | Effective July 1, 2019, the expense limit decreased from 1.20% to 1.09%. |
See accompanying notes to financial statements.
73 |
Notes to Financial Statements
December 31, 2022
1. Organization. Loomis Sayles Funds II, Natixis Funds Trust I and Natixis Funds Trust II (the “Trusts” and each a “Trust”) are each organized as a Massachusetts business trust. Each Trust is registered under the Investment Company Act of 1940, as amended (the “1940 Act”), as an open-end management investment company. Each Declaration of Trust permits the Board of Trustees to authorize the issuance of an unlimited number of shares of the Trust in multiple series. The financial statements for certain funds of the Trusts are presented in separate reports. The following funds (individually, a “Fund” and collectively, the “Funds”) are included in this report:
Loomis Sayles Funds II:
Loomis Sayles International Growth Fund (the “International Growth Fund”)
Natixis Funds Trust I:
Natixis Oakmark International Fund
Natixis U.S. Equity Opportunities Fund (the “U.S. Equity Opportunities Fund”)
Vaughan Nelson Small Cap Value Fund (the “Small Cap Value Fund”)
Natixis Funds Trust II:
Natixis Oakmark Fund
Vaughan Nelson Mid Cap Fund (the “Mid Cap Fund”)
Each Fund is a diversified investment company, except for International Growth Fund, which is a non-diversified investment company.
Each Fund offers Class A, Class C, Class N and Class Y shares.
Class A shares are sold with a maximum front-end sales charge of 5.75%. Class C shares do not pay a front-end sales charge, pay higher Rule 12b-1 fees than Class A shares for eight years (at which point they automatically convert to Class A shares) (prior to May 1, 2021, Class C shares automatically converted to Class A shares after ten years) and may be subject to a contingent deferred sales charge (“CDSC”) of 1.00% if those shares are redeemed within one year of acquisition, except for reinvested distributions. Class N and Class Y shares do not pay a front-end sales charge, a CDSC or Rule 12b-1 fees. Class N shares are offered with an initial minimum investment of $1,000,000. Class Y shares are offered with an initial minimum investment of $100,000. Certain categories of investors are exempted from the minimum investment amounts for Class N and Class Y as outlined in the relevant Funds’ prospectus.
Most expenses can be directly attributed to a Fund. Expenses which cannot be directly attributed to a Fund are generally apportioned based on the relative net assets of each of the Funds in Natixis Funds Trust I, Natixis Funds Trust II, Natixis Funds Trust IV and Gateway Trust (“Natixis Funds Trusts”), Loomis Sayles Funds I and Loomis Sayles Funds II (“Loomis Sayles Funds Trusts”) and Natixis ETF Trust and Natixis ETF Trust II (“Natixis ETF Trusts”). Expenses of a Fund are borne pro rata by the holders of each class of shares, except that each class bears expenses unique to that class (such as the Rule 12b-1 fees applicable to Class A and Class C), and transfer agent fees are borne collectively for Class A, Class C and Class Y, and individually for Class N. In addition, each class votes as a class only with respect to its own Rule 12b-1 Plan. Shares of each class would receive their pro rata share of the net assets of the Fund if the Fund were liquidated. The Trustees approve separate distributions from net investment income on each class of shares.
2. Significant Accounting Policies. The following is a summary of significant accounting policies consistently followed by each Fund in the preparation of its financial statements. The Funds’ financial statements follow the accounting and reporting guidelines provided for investment companies and are prepared in accordance with accounting principles generally accepted in the United States of America which require the use of management estimates that affect the reported amounts and disclosures in the financial statements. Actual results could differ from those estimates. Management has evaluated the events and transactions subsequent to year-end through the date the financial statements were issued and has determined that there were no material events that would require disclosure in the Funds’ financial statements.
a. Valuation. Registered investment companies are required to value portfolio investments using an unadjusted, readily available market quotation. Each Fund obtains readily available market quotations from independent pricing services. Fund investments for which readily available market quotations are not available are priced at fair value pursuant to the Funds’ Valuation Procedures. The Board of Trustees has approved a valuation designee who is subject to the Board’s oversight.
Unadjusted readily available market quotations that are utilized for exchange traded equity securities (including shares of closed-end investment companies and exchange-traded funds) include the last sale price quoted on the exchange where the security is traded most extensively. Shares of open-end investment companies are valued at net asset value per share.
Exchange traded equity securities for which there is no reported sale during the day are fair valued at the closing bid quotation as reported by an independent pricing service. Unlisted equity securities (except unlisted preferred equity securities) are fair valued at the last sale price quoted in the market where they are traded most extensively or, if there is no reported sale during the day, the closing
| 74
Notes to Financial Statements (continued)
December 31, 2022
bid quotation as reported by an independent pricing service. If there is no last sale price or closing bid quotation available, unlisted equity securities will be fair valued using evaluated bids furnished by an independent pricing service, if available.
Debt securities and unlisted preferred equity securities are fair valued based on evaluated bids furnished to the Fund by an independent pricing service or bid prices obtained from broker-dealers. Broker-dealer bid prices may be used to fair value debt and unlisted equities where an independent pricing service is unable to price an investment or where an independent pricing service does not provide a reliable price for the investment. Forward foreign currency contracts are fair valued utilizing interpolated rates determined based on information provided by an independent pricing service.
The Funds may also fair value investments in other circumstances such as when extraordinary events occur after the close of a foreign market, but prior to the close of the New York Stock Exchange. This may include situations relating to a single issuer (such as a declaration of bankruptcy or a delisting of the issuer’s security from the primary market on which it has traded) as well as events affecting the securities markets in general (such as market disruptions or closings and significant fluctuations in U.S. and/or foreign markets). When fair valuing a Fund’s investments, the valuation designee may, among other things, use modeling tools or other processes that may take into account factors such as issuer specific information, or other related market activity and/or information that occurred after the close of the foreign market but before the time the Fund’s net asset value (“NAV”) is calculated. Fair valuation by the Fund(s) valuation designee may require subjective determinations about the value of the investment, and fair values used to determine a Fund’s NAV may differ from quoted or published prices, or from prices that are used by others, for the same investments. In addition, the use of fair value pricing may not always result in adjustments to the prices of investments held by a Fund.
b. Investment Transactions and Related Investment Income. Investment transactions are accounted for on a trade date plus one day basis for daily NAV calculation. However, for financial reporting purposes, investment transactions are reported on trade date. Dividend income (including income reinvested) and foreign withholding tax, if applicable, are recorded on the ex-dividend date, or in the case of certain foreign securities, as soon as a Fund is notified, and interest income is recorded on an accrual basis. Dividends reinvested and stock dividends are reflected as non-cash dividends on the Statements of Operations. Interest income is increased by the accretion of discount and decreased by the amortization of premium, if applicable. Distributions received from investments in securities that represent a return of capital or capital gain are recorded as a reduction of cost of investments or as a realized gain, respectively. The calendar year-end amounts of ordinary income, capital gains, and return of capital included in distributions received from the Funds’ investments in real estate investment trusts (“REITs”) are reported to the Funds after the end of the fiscal year; accordingly, the Funds estimate these amounts for accounting purposes until the characterization of REIT distributions is reported to the Funds after the end of the fiscal year. Estimates are based on the most recent REIT distribution information available. In determining net gain or loss on securities sold, the cost of securities has been determined on an identified cost basis. Investment income, non-class specific expenses and realized and unrealized gains and losses are allocated on a pro rata basis to each class based on the relative net assets of each class to the total net assets of the Fund.
c. Foreign Currency Translation. The books and records of the Funds are maintained in U.S. dollars. The values of securities, currencies and other assets and liabilities denominated in currencies other than U.S. dollars, if any, are translated into U.S. dollars based upon foreign exchange rates prevailing at the end of the period. Purchases and sales of investment securities, income and expenses are translated into U.S. dollars on the respective dates of such transactions.
Net realized foreign exchange gains or losses arise from sales of foreign currency, changes in exchange rates between the trade and settlement dates on securities transactions and the difference between the amounts of dividends, interest and foreign withholding taxes recorded in the Funds’ books and records and the U.S. dollar equivalent of the amounts actually received or paid. Net unrealized foreign exchange gains or losses arise from changes in the value of assets and liabilities, other than investment securities, as of the end of the fiscal period, resulting from changes in exchange rates. Net realized foreign exchange gains or losses and the net change in unrealized foreign exchange gains or losses are disclosed in the Statements of Operations. For federal income tax purposes, net realized foreign exchange gains or losses are characterized as ordinary income, and may, if the Funds have net losses, reduce the amount of income available to be distributed by the Funds.
The values of investment securities are presented at the foreign exchange rates prevailing at the end of the period for financial reporting purposes. Net realized and unrealized gains or losses on investments reported in the Statements of Operations reflect gains or losses resulting from changes in exchange rates and fluctuations which arise due to changes in market prices of investment securities. For federal income tax purposes, a portion of the net realized gain or loss on investments arising from changes in exchange rates, which is reflected in the Statements of Operations, may be characterized as ordinary income and may, if the Funds have net losses, reduce the amount of income available to be distributed by the Funds.
The Funds may use foreign currency exchange contracts to facilitate transactions in foreign-denominated investments. Losses may arise from changes in the value of the foreign currency or if the counterparties do not perform under the contracts’ terms.
75 |
Notes to Financial Statements (continued)
December 31, 2022
d. Forward Foreign Currency Contracts. A Fund may enter into forward foreign currency contracts, including forward foreign cross currency contracts, to acquire exposure to foreign currencies or to hedge the Fund’s investments against currency fluctuation. A contract can also be used to offset a previous contract. These contracts involve market risk in excess of the unrealized appreciation (depreciation) reflected in the Funds’ Statements of Assets and Liabilities. The U.S. dollar value of the currencies a Fund has committed to buy or sell represents the aggregate exposure to each currency a Fund has acquired or hedged through currency contracts outstanding at period end. Gains or losses are recorded for financial statement purposes as unrealized until settlement date. Contracts are traded over-the-counter directly with a counterparty. Risks may arise upon entering into these contracts from the potential inability of counterparties to meet the terms of their contracts and from unanticipated movements in the value of a foreign currency relative to the U.S. dollar. Certain contracts may require the movement of cash and/or securities as collateral for the Fund’s or counterparty’s net obligations under the contracts. Forward foreign currency contracts outstanding at the end of the period, if any, are listed in each applicable Fund’s Portfolio of Investments.
e. Federal and Foreign Income Taxes. The Trusts treat each Fund as a separate entity for federal income tax purposes. Each Fund intends to meet the requirements of the Internal Revenue Code of 1986, as amended, applicable to regulated investment companies, and to distribute to its shareholders substantially all of its net investment income and any net realized capital gains at least annually. Management has performed an analysis of each Fund’s tax positions for the open tax years as of December 31, 2022 and has concluded that no provisions for income tax are required. The Funds’ federal tax returns for the prior three fiscal years, where applicable, remain subject to examination by the Internal Revenue Service. Management is not aware of any events that are reasonably possible to occur in the next twelve months that would result in the amounts of any unrecognized tax benefits significantly increasing or decreasing for the Funds. However, management’s conclusions regarding tax positions taken may be subject to review and adjustment at a later date based on factors including, but not limited to, new tax laws and accounting regulations and interpretations thereof.
A Fund may be subject to foreign withholding taxes on investment income and taxes on capital gains on investments that are accrued and paid based upon the Fund’s understanding of the tax rules and regulations that exist in the countries in which the Fund invests. Foreign withholding taxes on dividend and interest income are reflected on the Statements of Operations as a reduction of investment income, net of amounts that have been or are expected to be reclaimed and paid. Dividends and interest receivable on the Statements of Assets and Liabilities are net of foreign withholding taxes. Foreign withholding taxes where reclaims have been or are expected to be filed and paid are reflected on the Statements of Assets and Liabilities as tax reclaims receivable. Capital gains taxes paid are included in net realized gain (loss) on investments in the Statements of Operations. Accrued but unpaid capital gains taxes are reflected as foreign taxes payable on the Statements of Assets and Liabilities, if applicable, and reduce unrealized gains on investments. In the event that realized gains on investments are subsequently offset by realized losses, taxes paid on realized gains may be returned to a Fund. Such amounts, if applicable, are reflected as foreign tax rebates receivable on the Statements of Assets and Liabilities and are recorded as a realized gain when received.
Certain Funds have filed tax reclaims for previously withheld taxes on dividends earned in certain European Union countries (EU reclaims) and may continue to make such filings when it is determined to be in the best interest of the Funds and their shareholders. These filings are subject to various administrative proceedings by the local jurisdictions’ tax authorities within the European Union, as well as a number of related judicial proceedings. EU reclaims are recognized by a Fund when deemed more likely than not to be collected, and are reflected as a reduction of foreign taxes withheld in the Statements of Operations. Any related receivable is reflected as tax reclaims receivable in the Statements of Assets and Liabilities. Under certain circumstances, EU reclaims may be subject to closing agreements with the Internal Revenue Service (IRS), which may materially reduce the reclaim amounts realized by the Funds. Fees and expenses associated with closing agreements will be reflected in the Statements of Operations when it is determined that a closing agreement with the IRS is required.
f. Dividends and Distributions to Shareholders. Dividends and distributions are recorded on the ex-dividend date. The timing and characterization of certain income and capital gain distributions are determined in accordance with federal tax regulations, which may differ from accounting principles generally accepted in the United States of America. Permanent differences are primarily due to differing treatments for book and tax purposes of items such as capital gains taxes, deferred Trustees’ fees, distributions in excess of income and/or capital gain, distribution re-designations, foreign currency gains and losses, corporate actions, passive foreign investment company adjustments, return of capital distributions received and capital gain distribution received. Permanent book and tax basis differences relating to shareholder distributions, net investment income and net realized gains will result in reclassifications to capital accounts reported on the Statements of Assets and Liabilities. Temporary differences between book and tax distributable earnings are primarily due to capital gains taxes, wash sales, return of capital distributions received, corporate actions, deferred Trustees’ fees, deferral of EU reclaims, capital gain distribution received and passive foreign investment company adjustments. Amounts of income and capital gain available to be distributed on a tax basis are determined annually, and at other times during the
| 76
Notes to Financial Statements (continued)
December 31, 2022
Funds’ fiscal year as may be necessary to avoid knowingly declaring and paying a return of capital distribution. Distributions from net investment income and short-term capital gains are considered to be distributed from ordinary income for tax purposes.
The tax characterization of distributions is determined on an annual basis. The tax character of distributions paid to shareholders during the years ended December 31, 2022 and 2021 was as follows:
| | | | | | | | | | | | | | | | | | | | | | | | |
| | | 2022 Distributions | | | 2021 Distributions | |
Fund | | Ordinary
Income | | | Long-Term
Capital
Gains | | | Total | | | Ordinary
Income | | | Long-Term
Capital
Gains | | | Total | |
International Growth Fund | | $ | 177,885 | | | $ | — | | | $ | 177,885 | | | $ | 410,212 | | | $ | — | | | $ | 410,212 | |
Natixis Oakmark Fund | | | 2,835,653 | | | | 51,140,399 | | | | 53,976,052 | | | | 1,954,068 | | | | 22,797,197 | | | | 24,751,265 | |
Natixis Oakmark International Fund | | | 6,459,857 | | | | — | | | | 6,459,857 | | | | 8,301,657 | | | | — | | | | 8,301,657 | |
U.S. Equity Opportunities Fund | | | 1,935,796 | | | | 120,599,489 | | | | 122,535,285 | | | | 7,131,636 | | | | 105,015,654 | | | | 112,147,290 | |
Mid Cap Fund | | | 2,282,950 | | | | 7,705,713 | | | | 9,988,663 | | | | 11,228,135 | | | | 41,214,262 | | | | 52,442,397 | |
Small Cap Value Fund | | | 2,901,818 | | | | 6,755,646 | | | | 9,657,464 | | | | 20,173,469 | | | | 6,185,028 | | | | 26,358,497 | |
Distributions paid to shareholders from net investment income and net realized capital gains, based on accounting principles generally accepted in the United States of America, are consolidated and reported on the Statements of Changes in Net Assets as Distributions to Shareholders. Distributions paid to shareholders from net investment income and net realized capital gains expressed in per-share amounts, based on accounting principles generally accepted in the United States of America, are separately stated and reported within the Financial Highlights.
As of December 31, 2022, the components of distributable earnings on a tax basis were as follows:
| | | | | | | | | | | | | | | | |
| | | International
Growth Fund | | | Natixis
Oakmark
Fund | | | Natixis
Oakmark
International
Fund | | | U.S. Equity
Opportunities
Fund | |
Undistributed ordinary income | | $ | — | | | $ | 2,372 | | | $ | 14,369 | | | $ | — | |
Undistributed long-term capital gains | | | — | | | | — | | | | — | | | | 1,466,467 | |
| | | | | | | | | | | | | | | | |
Total undistributed earnings | | | — | | | | 2,372 | | | | 14,369 | | | | 1,466,467 | |
| | | | | | | | | | | | | | | | |
Capital loss carryforward: | |
Short-term: | | | | | | | | | | | | | | | | |
No expiration date | | | (318,617 | ) | | | — | | | | (7,975,554 | ) | | | — | |
Long-term: | | | | | | | | | | | | | | | | |
No expiration date | | | — | | | | — | | | | (112,759,862 | ) | | | — | |
| | | | | | | | | | | | | | | | |
Total capital loss carryforward | | | (318,617 | ) | | | — | | | | (120,735,416 | ) | | | — | |
| | | | | | | | | | | | | | | | |
Late-year ordinary and post-October capital loss deferrals* | | | — | | | | (5,213,543 | ) | | | — | | | | — | |
| | | | | | | | | | | | | | | | |
Unrealized appreciation (depreciation) | | | (5,709,638 | ) | | | (11,999,426 | ) | | | (50,876,126 | ) | | | 95,518,598 | |
| | | | | | | | | | | | | | | | |
Total accumulated earnings (losses) | | $ | (6,028,255 | ) | | $ | (17,210,597 | ) | | $ | (171,597,173 | ) | | $ | 96,985,065 | |
| | | | | | | | | | | | | | | | |
77 |
Notes to Financial Statements (continued)
December 31, 2022
| | | | | | | | |
| | | Mid Cap Fund | | | Small Cap
Value Fund | |
Undistributed long-term capital gains | | $ | — | | | $ | — | |
| | | | | | | | |
Capital loss carryforward: | |
Short-term: | |
No expiration date | | | (16,690,689 | ) | | | — | |
Long-term: | |
No expiration date | | | (5,472,473 | ) | | | — | |
| | | | | | | | |
Total capital loss carryforward | | | (22,163,162 | ) | | | — | |
| | | | | | | | |
Late-year ordinary and post-October capital loss deferrals* | | | — | | | | (581,338 | ) |
| | | | | | | | |
Unrealized appreciation | | | 34,018,871 | | | | 3,270,100 | |
| | | | | | | | |
Total accumulated earnings | | $ | 11,855,709 | | | $ | 2,688,762 | |
| | | | | | | | |
| * | Under current tax law, capital losses, foreign currency losses, and losses on passive foreign investment companies and contingent payment debt instruments after October 31 or December 31, as applicable, may be deferred and treated as occurring on the first day of the following taxable year. Natixis Oakmark Fund and Small Cap Value Fund are deferring capital losses. |
As of December 31, 2022, the tax cost of investments (including derivatives, if applicable) and unrealized appreciation (depreciation) on a federal tax basis were as follows:
| | | | | | | | | | | | | | | | | | | | | | | | |
| | | International
Growth Fund | | | Natixis
Oakmark
Fund | | | Natixis
Oakmark
International
Fund | | | U.S. Equity
Opportunities
Fund | | | Mid Cap
Fund | | | Small Cap
Value Fund | |
Federal tax cost | | $ | 30,058,612 | | | $ | 358,439,451 | | | $ | 405,678,484 | | | $ | 636,754,009 | | | $ | 229,162,140 | | | $ | 183,840,590 | |
| | | | | | | | | | | | | | | | | | | | | | | | |
Gross tax appreciation | | $ | 1,098,009 | | | $ | 26,981,840 | | | $ | 32,573,017 | | | $ | 154,043,740 | | | $ | 41,968,636 | | | $ | 15,671,607 | |
Gross tax depreciation | | | (6,808,226 | ) | | | (38,981,266 | ) | | | (82,986,954 | ) | | | (58,518,007 | ) | | | (7,949,765 | ) | | | (12,401,507 | ) |
| | | | | | | | | | | | | | | | | | | | | | | | |
Net tax appreciation (depreciation) | | $ | (5,710,217 | ) | | $ | (11,999,426 | ) | | $ | (50,413,937 | ) | | $ | 95,525,733 | | | $ | 34,018,871 | | | $ | 3,270,100 | |
| | | | | | | | | | | | | | | | | | | | | | | | |
The difference between these amounts and those reported in the components of distributable earnings, if any, are primarily attributable to foreign currency mark-to-market and foreign capital gains taxes.
g. Repurchase Agreements. Each Fund may enter into repurchase agreements, under the terms of a Master Repurchase Agreement, under which each Fund acquires securities as collateral and agrees to resell the securities at an agreed upon time and at an agreed upon price. It is each Fund’s policy that the market value of the collateral for repurchase agreements be at least equal to 102% of the repurchase price, including interest. Certain repurchase agreements are tri-party arrangements whereby the collateral is held in a segregated account for the benefit of the Fund and on behalf of the counterparty. Repurchase agreements could involve certain risks in the event of default or insolvency of the counterparty, including possible delays or restrictions upon a Fund’s ability to dispose of the underlying securities. As of December 31, 2022, each Fund, as applicable, had investments in repurchase agreements for which the value of the related collateral exceeded the value of the repurchase agreement. The gross value of repurchase agreements is included in the Statements of Assets and Liabilities for financial reporting purposes.
h. Securities Lending. Certain Funds have entered into an agreement with State Street Bank and Trust Company (“State Street Bank”), as agent of the Funds, to lend securities to certain designated borrowers. The loans are collateralized with cash or securities in an amount equal to at least 105% or 102% of the market value (including accrued interest) of the loaned international or domestic securities, respectively, when the loan is initiated. Thereafter, the value of the collateral must remain at least 102% of the market value (including accrued interest) of loaned securities for U.S. equities and U.S. corporate debt; at least 105% of the market value (including accrued interest) of loaned securities for non-U.S. equities; and at least 100% of the market value (including accrued interest) of loaned securities for U.S. Government securities, sovereign debt issued by non-U.S. Governments and non-U.S. corporate debt. In the event that the market value of the collateral falls below the required percentages described above, the borrower will deliver additional collateral on the next business day. As with other extensions of credit, the Funds may bear the risk of loss with respect to the investment of the collateral. The Funds invest cash collateral in short-term investments, a portion of the income from which is remitted to the borrowers and the remainder allocated between the Funds and State Street Bank as lending agent.
For the year ended December 31, 2022, none of the Funds had loaned securities under this agreement.
| 78
Notes to Financial Statements (continued)
December 31, 2022
i. Indemnifications. Under the Trusts’ organizational documents, their officers and Trustees are indemnified against certain liabilities arising out of the performance of their duties to the Funds. Additionally, in the normal course of business, the Funds enter into contracts with service providers that contain general indemnification clauses. The Funds’ maximum exposure under these arrangements is unknown as this would involve future claims that may be made against the Funds that have not yet occurred. However, based on experience, the Funds expect the risk of loss to be remote.
j. New Accounting Pronouncement. In June 2022, the Financial Accounting Standards Board issued Accounting Standards Update 2022-03, “Fair Value Measurement of Equity Securities Subject to Contractual Sale Restrictions” (“ASU 2022-03”). ASU 2022-03 clarifies the guidance in ASC 820 related to the measurement of fair value of an equity security subject to contractual sale restrictions, eliminating the ability to apply a discount to the fair value of such securities, and introducing related disclosure requirements. The guidance is effective for fiscal years, and interim periods within those fiscal years, beginning after December 15, 2023, and allows for early adoption. Management is currently evaluating the impact of applying this update.
3. Fair Value Measurements. In accordance with accounting standards related to fair value measurements and disclosures, the Funds have categorized the inputs utilized in determining the value of each Fund’s assets or liabilities. These inputs are summarized in the three broad levels listed below:
| | • | | Level 1 – quoted prices in active markets for identical assets or liabilities; |
| | • | | Level 2 – prices determined using other significant inputs that are observable either directly, or indirectly through corroboration with observable market data (which could include quoted prices for similar assets or liabilities, interest rates, credit risk, etc.); and |
| | • | | Level 3 – prices determined using significant unobservable inputs when quoted prices or observable inputs are unavailable such as when there is little or no market activity for an asset or liability (unobservable inputs reflect each Fund’s own assumptions in determining the fair value of assets or liabilities and would be based on the best information available). |
The inputs or methodology used for valuing securities are not necessarily an indication of the risk associated with investing in those securities.
The Funds’ pricing policies have been approved by the Board of Trustees. Investments for which market quotations are readily available are categorized in Level 1. Other investments for which an independent pricing service is utilized are categorized in Level 2. Broker-dealer bid prices for which the Funds have knowledge of the inputs used by the broker-dealer are categorized in Level 2. All other investments, including broker-dealer bid prices for which the Funds do not have knowledge of the inputs used by the broker-dealer, as well as investments fair valued by the valuation designee, are categorized in Level 3. All Level 2 and 3 securities are defined as being fair valued.
Under certain conditions and based upon specific facts and circumstances, the Fund’s valuation designee may determine that a fair valuation should be made for portfolio investment(s). These valuation designee fair valuations will be based upon a significant amount of Level 3 inputs.
79 |
Notes to Financial Statements (continued)
December 31, 2022
The following is a summary of the inputs used to value the Funds’ investments as of December 31, 2022, at value:
International Growth Fund
| | | | | | | | | | | | | | | | |
| Asset Valuation Inputs | |
Description | | Level 1 | | | Level 2 | | | Level 3 | | | Total | |
Common Stocks | | | | | | | | | | | | | | | | |
Australia | | $ | — | | | $ | 1,373,771 | | | $ | — | | | $ | 1,373,771 | |
Belgium | | | — | | | | 589,601 | | | | — | | | | 589,601 | |
China | | | 4,107,669 | | | | 2,688,480 | | | | — | | | | 6,796,149 | |
Denmark | | | — | | | | 1,361,008 | | | | — | | | | 1,361,008 | |
France | | | — | | | | 1,280,972 | | | | — | | | | 1,280,972 | |
Germany | | | — | | | | 697,184 | | | | — | | | | 697,184 | |
Japan | | | — | | | | 1,120,289 | | | | — | | | | 1,120,289 | |
Macau | | | — | | | | 282,710 | | | | — | | | | 282,710 | |
Netherlands | | | — | | | | 855,161 | | | | — | | | | 855,161 | |
Switzerland | | | 320,444 | | | | 1,054,476 | | | | — | | | | 1,374,920 | |
United Kingdom | | | — | | | | 2,469,706 | | | | — | | | | 2,469,706 | |
United States | | | 1,538,755 | | | | 1,990,702 | | | | — | | | | 3,529,457 | |
All Other Common Stocks(a) | | | 2,561,306 | | | | — | | | | — | | | | 2,561,306 | |
| | | | | | | | | | | | | | | | |
Total Common Stocks | | $ | 8,528,174 | | | $ | 15,764,060 | | | $ | — | | | $ | 24,292,234 | |
| | | | | | | | | | | | | | | | |
Short-Term Investments | | | — | | | | 56,161 | | | | — | | | | 56,161 | |
| | | | | | | | | | | | | | | | |
Total | | $ | 8,528,174 | | | $ | 15,820,221 | | | $ | — | | | $ | 24,348,395 | |
| | | | | | | | | | | | | | | | |
| (a) | Details of the major categories of the Fund’s investments are reflected within the Portfolio of Investments. |
Natixis Oakmark Fund
| | | | | | | | | | | | | | | | |
| Asset Valuation Inputs | |
Description | | Level 1 | | | Level 2 | | | Level 3 | | | Total | |
Common Stocks(a) | | $ | 336,922,269 | | | $ | — | | | $ | — | | | $ | 336,922,269 | |
Short-Term Investments | | | — | | | | 9,517,756 | | | | — | | | | 9,517,756 | |
| | | | | | | | | | | | | | | | |
Total | | $ | 336,922,269 | | | $ | 9,517,756 | | | $ | — | | | $ | 346,440,025 | |
| | | | | | | | | | | | | | | | |
| (a) | Details of the major categories of the Fund’s investments are reflected within the Portfolio of Investments. |
| 80
Notes to Financial Statements (continued)
December 31, 2022
Natixis Oakmark International Fund
| | | | | | | | | | | | | | | | |
| Asset Valuation Inputs | |
| | | | |
Description | | Level 1 | | | Level 2 | | | Level 3 | | | Total | |
Common Stocks | | | | | | | | | | | | | | | | |
Australia | | $ | — | | | $ | 2,597,205 | | | $ | — | | | $ | 2,597,205 | |
Belgium | | | — | | | | 7,221,690 | | | | — | | | | 7,221,690 | |
China | | | 3,493,149 | | | | 17,535,586 | | | | — | | | | 21,028,735 | |
Denmark | | | — | | | | 4,443,654 | | | | — | | | | 4,443,654 | |
France | | | — | | | | 54,807,091 | | | | — | | | | 54,807,091 | |
Germany | | | — | | | | 98,566,854 | | | | — | | | | 98,566,854 | |
Hong Kong | | | — | | | | 7,679,394 | | | | — | | | | 7,679,394 | |
India | | | — | | | | 1,594,358 | | | | — | | | | 1,594,358 | |
Italy | | | — | | | | 11,532,753 | | | | — | | | | 11,532,753 | |
Japan | | | — | | | | 6,317,319 | | | | — | | | | 6,317,319 | |
Korea | | | — | | | | 6,762,606 | | | | — | | | | 6,762,606 | |
Netherlands | | | — | | | | 12,328,165 | | | | — | | | | 12,328,165 | |
Spain | | | — | | | | 4,909,188 | | | | — | | | | 4,909,188 | |
Sweden | | | — | | | | 11,259,924 | | | | — | | | | 11,259,924 | |
Switzerland | | | — | | | | 25,396,818 | | | | — | | | | 25,396,818 | |
United Kingdom | | | 4,736,892 | | | | 44,695,423 | | | | — | | | | 49,432,315 | |
United States | | | — | | | | 1,976,553 | | | | — | | | | 1,976,553 | |
All Other Common Stocks(a) | | | 15,682,360 | | | | — | | | | — | | | | 15,682,360 | |
| | | | | | | | | | | | | | | | |
Total Common Stocks | | | 23,912,401 | | | | 319,624,581 | | | | — | | | | 343,536,982 | |
| | | | | | | | | | | | | | | | |
Preferred Stocks(a) | | | — | | | | 5,225,566 | | | | — | | | | 5,225,566 | |
Short-Term Investments | | | — | | | | 6,501,999 | | | | — | | | | 6,501,999 | |
| | | | | | | | | | | | | | | | |
Total | | $ | 23,912,401 | | | $ | 331,352,146 | | | $ | — | | | $ | 355,264,547 | |
| | | | | | | | | | | | | | | | |
| (a) | Details of the major categories of the Fund’s investments are reflected within the Portfolio of Investments. |
U.S. Equity Opportunities Fund
| | | | | | | | | | | | | | | | |
| Asset Valuation Inputs | |
| | | | |
Description | | Level 1 | | | Level 2 | | | Level 3 | | | Total | |
Common Stocks(a) | | $ | 729,410,236 | | | $ | — | | | $ | — | | | $ | 729,410,236 | |
Short-Term Investments | | | — | | | | 2,869,506 | | | | — | | | | 2,869,506 | |
| | | | | | | | | | | | | | | | |
Total | | $ | 729,410,236 | | | $ | 2,869,506 | | | $ | — | | | $ | 732,279,742 | |
| | | | | | | | | | | | | | | | |
| (a) | Details of the major categories of the Fund’s investments are reflected within the Portfolio of Investments. |
Mid Cap Fund
| | | | | | | | | | | | | | | | |
| Asset Valuation Inputs | |
| | | | |
Description | | Level 1 | | | Level 2 | | | Level 3 | | | Total | |
Common Stocks(a) | | $ | 256,895,131 | | | $ | — | | | $ | — | | | $ | 256,895,131 | |
Short-Term Investments | | | — | | | | 6,285,880 | | | | — | | | | 6,285,880 | |
| | | | | | | | | | | | | | | | |
Total | | $ | 256,895,131 | | | $ | 6,285,880 | | | $ | — | | | $ | 263,181,011 | |
| | | | | | | | | | | | | | | | |
| (a) | Details of the major categories of the Fund’s investments are reflected within the Portfolio of Investments. |
Small Cap Value Fund
| | | | | | | | | | | | | | | | |
| Asset Valuation Inputs | |
| | | | |
Description | | Level 1 | | | Level 2 | | | Level 3 | | | Total | |
Common Stocks(a) | | $ | 175,907,190 | | | $ | — | | | $ | — | | | $ | 175,907,190 | |
Short-Term Investments | | | — | | | | 11,203,500 | | | | — | | | | 11,203,500 | |
| | | | | | | | | | | | | | | | |
Total | | $ | 175,907,190 | | | $ | 11,203,500 | | | $ | — | | | $ | 187,110,690 | |
| | | | | | | | | | | | | | | | |
| (a) | Details of the major categories of the Fund’s investments are reflected within the Portfolio of Investments. |
81 |
Notes to Financial Statements (continued)
December 31, 2022
4. Derivatives. Derivative instruments are defined as financial instruments whose value and performance are based on the value and performance of an underlying asset, reference rate or index. Derivative instruments that Natixis Oakmark International Fund used during the period include forward foreign currency contracts.
Natixis Oakmark International Fund is subject to the risk that changes in foreign currency exchange rates will have an unfavorable effect on the value of Fund assets denominated in foreign currencies. The Fund may enter into forward foreign currency contracts for hedging purposes to protect the value of the Fund’s holdings of foreign securities. During the year ended December 31, 2022, Natixis Oakmark International Fund engaged in forward foreign currency transactions for hedging purposes.
Transactions in derivative instruments for Natixis Oakmark International Fund during the year ended December 31, 2022, as reflected within the Statements of Operations were as follows:
| | | | |
Net Realized Gain (Loss) on: | | Forward foreign
currency
contracts | |
Foreign exchange contracts | | $ | 473,946 | |
| |
Net Change in Unrealized
Appreciation (Depreciation) on: | | Forward foreign
currency
contracts | |
Foreign exchange contracts | | $ | 94,327 | |
As the Fund values its derivatives at fair value and recognizes changes in fair value through the Statement of Operations, it does not qualify for hedge accounting under authoritative guidance for derivative instruments. The Fund’s investments in derivatives may represent an economic hedge; however, they are considered to be non-hedge transactions for the purpose of these disclosures.
The volume of forward foreign currency contract activity, as a percentage of net assets, for Natixis Oakmark International Fund, based on gross month-end notional amounts outstanding during the period, including long and short positions at absolute value, was as follows for the year ended December 31, 2022:
| | | | |
Natixis Oakmark International Fund | | Forwards | |
Average Notional Amount Outstanding | | | 0.90 | % |
Highest Notional Amount Outstanding | | | 2.03 | % |
Lowest Notional Amount Outstanding | | | 0.00 | % |
Notional Amount Outstanding as of December 31, 2022 | | | 0.00 | % |
Notional amounts outstanding at the end of the prior period are included in the average notional amount outstanding.
5. Purchases and Sales of Securities. For the year ended December 31, 2022, purchases and sales of securities (excluding short-term investments) were as follows:
| | | | | | | | |
Fund | | Purchases | | | Sales | |
International Growth Fund | | $ | 8,278,874 | | | $ | 2,327,113 | |
Natixis Oakmark Fund | | | 346,264,953 | | | | 284,004,614 | |
Natixis Oakmark International Fund | | | 133,972,224 | | | | 221,944,655 | |
U.S. Equity Opportunities Fund | | | 395,441,524 | | | | 475,722,271 | |
Mid Cap Fund | | | 154,302,046 | | | | 217,952,372 | |
Small Cap Value Fund | | | 134,482,918 | | | | 91,315,366 | |
6. Management Fees and Other Transactions with Affiliates.
a. Management Fees. Loomis, Sayles & Company, L.P. (“Loomis Sayles”) serves as investment adviser to International Growth Fund. Loomis Sayles is a limited partnership whose sole general partner, Loomis, Sayles & Company, Inc., is indirectly owned by Natixis Investment Managers, LLC, which is part of Natixis Investment Managers, an international asset management group based in Paris, France.
Under the terms of the management agreement, International Growth Fund pays a management fee at the annual rate of 0.75%, calculated daily and payable monthly, based on the Fund’s average daily net assets.
| 82
Notes to Financial Statements (continued)
December 31, 2022
Natixis Advisors, LLC (“Natixis Advisors”) serves as investment adviser to Natixis Oakmark Fund, Natixis Oakmark International Fund, U.S. Equity Opportunities Fund, Mid Cap Fund and Small Cap Value Fund. Under the terms of the management agreements, each Fund pays a management fee at the following annual rates, calculated daily and payable monthly, based on each Fund’s average daily net assets:
| | | | | | | | | | | | | | | | | | | | | | | | |
| | | Percentage of Average Daily Net Assets | |
Fund | | First
$150 million | | | Next
$50 million | | | Next
$300 million | | | Next
$500 million | | | Next
$500 million | | | Over
$1.5 billion | |
Natixis Oakmark Fund | | | 0.70 | % | | | 0.70 | % | | | 0.65 | % | | | 0.60 | % | | | 0.60 | % | | | 0.60 | % |
Natixis Oakmark International Fund | | | 0.85 | % | | | 0.75 | % | | | 0.75 | % | | | 0.75 | % | | | 0.70 | % | | | 0.70 | % |
U.S. Equity Opportunities Fund | | | 0.70 | % | | | 0.70 | % | | | 0.70 | % | | | 0.70 | % | | | 0.70 | % | | | 0.70 | % |
Mid Cap Fund | | | 0.75 | % | | | 0.75 | % | | | 0.75 | % | | | 0.75 | % | | | 0.75 | % | | | 0.70 | % |
Small Cap Value Fund | | | 0.85 | % | | | 0.85 | % | | | 0.85 | % | | | 0.85 | % | | | 0.85 | % | | | 0.85 | % |
Prior to July 1, 2022, U.S. Equity Opportunities Fund paid a management fee at the annual rate of 0.75% of the Fund’s average daily net assets, calculated daily and payable monthly.
Natixis Advisors has entered into subadvisory agreements for each Fund as listed below.
| | |
Natixis Oakmark Fund | | Harris Associates L.P. (“Harris”) |
Natixis Oakmark International Fund | | Harris |
U.S. Equity Opportunities Fund | | Harris Loomis Sayles |
Mid Cap Fund | | Vaughan Nelson Investment Management, L.P. (“Vaughan Nelson”) |
Small Cap Value Fund | | Vaughan Nelson |
Natixis Advisors, Harris and Vaughan Nelson are subsidiaries of Natixis Investment Managers, LLC.
Under the terms of the subadvisory agreements, each Fund has agreed to pay its respective subadviser a subadvisory fee at the following annual rates, calculated daily and payable monthly, based on each Fund’s average daily net assets:
| | | | | | | | | | | | | | | | | | | | | | | | |
| | | | | | Percentage of Average Daily Net Assets | |
Fund | | Subadviser | | | First
$150 million | | | Next
$50 million | | | Next
$800 million | | | Next
$500 million | | | Over
$1.5 billion | |
Natixis Oakmark Fund | | | Harris | | | | 0.52 | % | | | 0.52 | % | | | 0.50 | % | | | 0.50 | % | | | 0.50 | % |
Natixis Oakmark International Fund | | | Harris | | | | 0.60 | % | | | 0.50 | % | | | 0.50 | % | | | 0.45 | % | | | 0.45 | % |
U.S. Equity Opportunities Fund | | | | | | | | | | | | | | | | | | | | | | | | |
Large Cap Value Segment | | | Harris | | | | 0.52 | % | | | 0.52 | % | | | 0.52 | % | | | 0.52 | % | | | 0.52 | % |
All Cap Growth Segment | | | Loomis Sayles | | | | 0.35 | % | | | 0.35 | % | | | 0.35 | % | | | 0.35 | % | | | 0.35 | % |
Mid Cap Fund | | | Vaughan Nelson | | | | 0.47 | % | | | 0.47 | % | | | 0.47 | % | | | 0.47 | % | | | 0.44 | % |
Small Cap Value Fund | | | Vaughan Nelson | | | | 0.52 | % | | | 0.52 | % | | | 0.52 | % | | | 0.52 | % | | | 0.52 | % |
Payments to Natixis Advisors are reduced by the amounts of payments to the subadvisers, as calculated based on the table above.
Loomis Sayles and Natixis Advisors have given binding undertakings to the Funds to waive management fees and/or reimburse certain expenses to limit the Funds’ operating expenses, exclusive of acquired fund fees and expenses, brokerage expenses, interest expense, substitute dividend expenses on securities sold short, taxes, organizational and extraordinary expenses such as litigation and indemnification expenses. These undertakings are in effect until April 30, 2023, except for U.S. Equity Opportunities Fund, which is in effect until April 30, 2024, may be terminated before then only with the consent of the Funds’ Board of Trustees, and are reevaluated on an annual basis. Management fees payable, as reflected on the Statements of Assets and Liabilities, is net of waivers and/or expense reimbursements, if any, pursuant to these undertakings. Waivers/reimbursements that exceed management fees payable are reflected on the Statements of Assets and Liabilities as receivable from investment adviser.
83 |
Notes to Financial Statements (continued)
December 31, 2022
For the year ended December 31, 2022, the expense limits as a percentage of average daily net assets under the expense limitation agreements were as follows:
| | | | | | | | | | | | | | | | |
| | | Expense Limit as a Percentage of Average
Daily Net Assets | |
Fund | | Class A | | | Class C | | | Class N | | | Class Y | |
International Growth Fund | | | 1.20 | % | | | 1.95 | % | | | 0.90 | % | | | 0.95 | % |
Natixis Oakmark Fund | | | 1.05 | % | | | 1.80 | % | | | 0.75 | % | | | 0.80 | % |
Natixis Oakmark International Fund | | | 1.15 | % | | | 1.90 | % | | | 0.85 | % | | | 0.90 | % |
U.S. Equity Opportunities Fund | | | 1.15 | % | | | 1.90 | % | | | 0.85 | % | | | 0.90 | % |
Mid Cap Fund | | | 1.15 | % | | | 1.90 | % | | | 0.85 | % | | | 0.90 | % |
Small Cap Value Fund | | | 1.25 | % | | | 2.00 | % | | | 0.95 | % | | | 1.00 | % |
Prior to July 1, 2022, the expense limits as a percentage of average daily net assets under the expense limitation agreements for U.S. Equity Opportunities Fund were as follows:
| | | | | | | | | | | | | | | | |
| | | Expense Limit as a Percentage of Average
Daily Net Assets | |
Fund | | Class A | | | Class C | | | Class N | | | Class Y | |
U.S. Equity Opportunities Fund | | | 1.20 | % | | | 1.95 | % | | | 0.90 | % | | | 0.95 | % |
Loomis Sayles and Natixis Advisors shall be permitted to recover expenses borne under the expense limitation agreements (whether through waiver of management fee or otherwise) on a class by class basis in later periods to the extent the annual operating expenses of a class fall below both (1) a class’ expense limitation ratio in place at the time such amounts were waived/reimbursed and (2) a class’ current applicable expense limitation ratio, provided, however, that a class is not obligated to pay such waived/reimbursed fees or expenses more than one year after the end of the fiscal year in which the fees or expenses were waived/reimbursed.
For the year ended December 31, 2022, the management fees and waiver of management fees for each Fund were as follows:
| | | | | | | | | | | | | | | | | | | | |
Fund | | Gross
Management Fees | | | Contractual
Waivers of
Management Fees1 | | | Net
Management Fees | | | Percentage of
Average
Daily Net Assets | |
| | Gross | | | Net | |
International Growth Fund | | $ | 166,121 | | | $ | 166,121 | | | $ | — | | | | 0.75 | % | | | — | % |
Natixis Oakmark Fund | | | 2,959,141 | | | | 237,489 | | | | 2,721,652 | | | | 0.67 | % | | | 0.62 | % |
Natixis Oakmark International Fund | | | 3,278,920 | | | | 947,991 | | | | 2,330,929 | | | | 0.79 | % | | | 0.56 | % |
U.S. Equity Opportunities Fund | | | 6,413,195 | | | | — | | | | 6,413,195 | | | | 0.73 | % | | | 0.73 | % |
Mid Cap Fund | | | 2,292,180 | | | | 141,410 | | | | 2,150,770 | | | | 0.75 | % | | | 0.70 | % |
Small Cap Value Fund | | | 1,298,748 | | | | 186,690 | | | | 1,112,058 | | | | 0.85 | % | | | 0.73 | % |
| 1 | Management fee waivers are subject to possible recovery until December 31, 2023. |
In addition, Loomis Sayles reimbursed non-class specific expenses of International Growth Fund in the amount of $5,588. Expense reimbursements are subject to possible recovery until December 31, 2023.
No expenses were recovered for any of the Funds during the year ended December 31, 2022 under the terms of the expense limitation agreements.
b. Service and Distribution Fees. Natixis Distribution, LLC (“Natixis Distribution”), which is a wholly-owned subsidiary of Natixis Investment Managers, LLC, has entered into a distribution agreement with the Trusts. Pursuant to this agreement, Natixis Distribution serves as principal underwriter of the Funds of the Trusts.
Pursuant to Rule 12b-1 under the 1940 Act, the Trusts have adopted a Service Plan relating to each Fund’s Class A shares (the “Class A Plans”) and a Distribution and Service Plan relating to each Fund’s Class C shares (the “Class C Plans”).
Under the Class A Plans, each Fund pays Natixis Distribution a monthly service fee at an annual rate not to exceed 0.25% of the average daily net assets attributable to the Funds’ Class A shares, as reimbursement for expenses incurred by Natixis Distribution in providing personal services to investors in Class A shares and/or the maintenance of shareholder accounts.
Under the Class C Plans, each Fund pays Natixis Distribution a monthly service fee at an annual rate not to exceed 0.25% of the average daily net assets attributable to the Funds’ Class C shares, as compensation for services provided by Natixis Distribution in providing personal services to investors in Class C shares and/or the maintenance of shareholder accounts.
| 84
Notes to Financial Statements (continued)
December 31, 2022
Also under the Class C Plans, each Fund pays Natixis Distribution a monthly distribution fee at an annual rate of 0.75% of the average daily net assets attributable to the Funds’ Class C shares, as compensation for services provided by Natixis Distribution in connection with the marketing or sale of Class C shares.
For the year ended December 31, 2022, the service and distribution fees for each Fund were as follows:
| | | | | | | | | | | | |
| | | Service Fees | | | Distribution
Fees | |
Fund | | Class A | | | Class C | | | Class C | |
International Growth Fund | | $ | 288 | | | $ | 23 | | | $ | 68 | |
Natixis Oakmark Fund | | | 515,407 | | | | 141,328 | | | | 423,983 | |
Natixis Oakmark International Fund | | | 321,347 | | | | 123,131 | | | | 369,391 | |
U.S. Equity Opportunities Fund | | | 1,490,974 | | | | 103,946 | | | | 311,836 | |
Mid Cap Fund | | | 86,271 | | | | 22,472 | | | | 67,417 | |
Small Cap Value Fund | | | 179,777 | | | | 2,870 | | | | 8,609 | |
c. Administrative Fees. Natixis Advisors provides certain administrative services for the Funds and contracts with State Street Bank to serve as sub-administrator. Pursuant to an agreement among Natixis Funds Trusts, Loomis Sayles Funds Trusts, Natixis ETF Trusts and Natixis Advisors, each Fund pays Natixis Advisors monthly its pro rata portion of fees equal to an annual rate of 0.0540% of the first $15 billion of the average daily net assets of the Natixis Funds Trusts, Loomis Sayles Funds Trusts and Natixis ETF Trusts, 0.0500% of the next $15 billion, 0.0400% of the next $30 billion, 0.0275% of the next $30 billion and 0.0225% of such assets in excess of $90 billion, subject to an annual aggregate minimum fee for the Natixis Funds Trusts, Loomis Sayles Funds Trusts and Natixis ETF Trusts of $10 million, which is reevaluated on an annual basis.
For the year ended December 31, 2022, the administrative fees for each Fund were as follows:
| | | | |
Fund | | Administrative
Fees | |
International Growth Fund | | $ | 10,010 | |
Natixis Oakmark Fund | | | 198,579 | |
Natixis Oakmark International Fund | | | 187,904 | |
U.S. Equity Opportunities Fund | | | 397,716 | |
Mid Cap Fund | | | 137,881 | |
Small Cap Value Fund | | | 69,157 | |
d. Sub-Transfer Agent Fees. Natixis Distribution has entered into agreements, which include servicing agreements, with financial intermediaries that provide recordkeeping, processing, shareholder communications and other services to customers of the intermediaries that hold positions in the Funds and has agreed to compensate the intermediaries for providing those services. Intermediaries transact with the Funds primarily through the use of omnibus accounts on behalf of their customers who hold positions in the Funds. These services would have been provided by the Funds’ transfer agent and other service providers if the shareholders’ accounts were maintained directly at the Funds’ transfer agent. Accordingly, the Funds have agreed to reimburse Natixis Distribution for all or a portion of the servicing fees paid to these intermediaries. The reimbursement amounts (sub-transfer agent fees) paid to Natixis Distribution are subject to a current per-account equivalent fee limit approved by the Funds’ Board of Trustees, which is based on fees for similar services paid to the Funds’ transfer agent and other service providers. Class N shares do not bear such expenses.
For the year ended December 31, 2022, the sub-transfer agent fees (which are reflected in transfer agent fees and expenses in the Statements of Operations) for each Fund were as follows:
| | | | |
Fund | | Sub-Transfer
Agent Fees | |
International Growth Fund | | $ | 139 | |
Natixis Oakmark Fund | | | 256,839 | |
Natixis Oakmark International Fund | | | 684,893 | |
U.S. Equity Opportunities Fund | | | 266,729 | |
Mid Cap Fund | | | 185,201 | |
Small Cap Value Fund | | | 93,662 | |
85 |
Notes to Financial Statements (continued)
December 31, 2022
As of December 31, 2022, the Funds owe Natixis Distribution the following reimbursements for sub-transfer agent fees (which are reflected in the Statements of Assets and Liabilities as payable to distributor):
| | | | |
Fund | | Reimbursements
of Sub-Transfer
Agent Fees | |
International Growth Fund | | $ | 2 | |
Natixis Oakmark Fund | | | 2,668 | |
Natixis Oakmark International Fund | | | 6,200 | |
U.S. Equity Opportunities Fund | | | 2,443 | |
Mid Cap Fund | | | 2,113 | |
Small Cap Value Fund | | | 1,107 | |
Sub-transfer agent fees attributable to Class A, Class C and Class Y are allocated on a pro rata basis to each class based on the relative net assets of each class to the total net assets of those classes.
e. Commissions. Commissions (including CDSCs) on Fund shares retained by Natixis Distribution during the year ended December 31, 2022 was as follows:
| | | | |
Fund | | Commissions | |
Natixis Oakmark Fund | | $ | 59,461 | |
Natixis Oakmark International Fund | | | 17,871 | |
U.S. Equity Opportunities Fund | | | 18,802 | |
Mid Cap Fund | | | 529 | |
Small Cap Value Fund | | | 2,641 | |
f. Trustees Fees and Expenses. The Trusts do not pay any compensation directly to their officers or Trustees who are directors, officers or employees of Natixis Advisors, Natixis Distribution, Natixis Investment Managers, LLC or their affiliates. The Chairperson of the Board of Trustees receives a retainer fee at the annual rate of $369,000. The Chairperson does not receive any meeting attendance fees for Board of Trustees meetings or committee meetings that he attends. Each Independent Trustee (other than the Chairperson) receives, in the aggregate, a retainer fee at the annual rate of $210,000. Each Independent Trustee also receives a meeting attendance fee of $10,000 for each meeting of the Board of Trustees that he or she attends in person and $5,000 for each meeting of the Board of Trustees that he or she attends telephonically. In addition, the chairperson of the Contract Review Committee, the chairperson of the Audit Committee and the chairperson of the Governance Committee each receive an additional retainer fee at the annual rate of $20,000. Each Contract Review Committee member is compensated $6,000 for each Committee meeting that he or she attends in person and $3,000 for each meeting that he or she attends telephonically. Each Audit Committee member is compensated $6,000 for each Committee meeting that he or she attends in person and $3,000 for each meeting that he or she attends telephonically. These fees are allocated among the funds in the Natixis Funds Trusts, Loomis Sayles Funds Trusts and Natixis ETF Trusts based on a formula that takes into account, among other factors, the relative net assets of each fund. Trustees are reimbursed for travel expenses in connection with attendance at meetings.
Effective January 1, 2023, each Governance Committee member is compensated $2,500 for each Committee meeting that he or she attends either in person or telephonically.
A deferred compensation plan (the “Plan”) is available to the Trustees on a voluntary basis. The value of a participating Trustee’s deferral account is based on theoretical investments of deferred amounts, on the normal payment dates, in certain funds of the Natixis Funds Trusts, Loomis Sayles Funds Trusts and Natixis ETF Trusts as designated by the participating Trustees. Changes in the value of participants’ deferral accounts are allocated pro rata among the funds in the Natixis Funds Trusts, Loomis Sayles Funds Trusts and Natixis ETF Trusts and are normally reflected as Trustees’ fees and expenses in the Statements of Operations. Deferred amounts remain in the funds until distributed in accordance with the provisions of the Plan. The portions of the accrued obligations allocated to the Funds under the Plan are reflected as Deferred Trustees’ fees in the Statements of Assets and Liabilities.
| 86
Notes to Financial Statements (continued)
December 31, 2022
For the year ended December 31, 2022, net depreciation in the value of participants’ deferral accounts are reflected on the Statements of Operations as a reduction to expenses, as follows:
| | | | |
Fund | | Amount | |
Natixis Oakmark Fund | | $ | (95,019 | ) |
Natixis Oakmark International Fund | | | (12,938 | ) |
U.S. Equity Opportunities Fund | | | (69,538 | ) |
Mid Cap Fund | | | (24,416 | ) |
Small Cap Value Fund | | | (30,346 | ) |
Certain officers and employees of Natixis Advisors, Loomis Sayles and affiliates are also officers and/or Trustees of the Trusts.
g. Affiliated Ownership. As of December 31, 2022, Natixis and affiliates held shares of International Growth Fund representing 98.06% of the Fund’s net assets.
Investment activities of affiliated shareholders could have material impacts on the Fund.
h. Reimbursement of Transfer Agent Fees and Expenses. Natixis Advisors has given a binding contractual undertaking to the Funds to reimburse any and all transfer agency expenses for the Funds’ Class N shares. This undertaking is in effect through April 30, 2023 and is not subject to recovery under the expense limitation agreement described above.
For the year ended December 31, 2022, Natixis Advisors reimbursed the Funds for transfer agency expenses as follows:
| | | | |
| | | Reimbursement of
Transfer Agency
Expenses | |
Fund | | Class N | |
International Growth Fund | | $ | 981 | |
Natixis Oakmark Fund | | | 925 | |
Natixis Oakmark International Fund | | | 947 | |
U.S. Equity Opportunities Fund | | | 906 | |
Mid Cap Fund | | | 1,028 | |
Small Cap Value Fund | | | 942 | |
7. Class-Specific Transfer Agent Fees and Expenses. Transfer agent fees and expenses attributable to Class A, Class C and Class Y are allocated on a pro rata basis to each class based on the relative net assets of each class to the total net assets of those classes. Transfer agent fees and expenses attributable to Class N are allocated to Class N.
For the year ended December 31, 2022, the Funds incurred the following class-specific transfer agent fees and expenses (including sub-transfer agent fees, where applicable):
| | | | | | | | | | | | | | | | |
| | | Transfer Agent Fees and Expenses | |
Fund | | Class A | | | Class C | | | Class N | | | Class Y | |
International Growth Fund | | $ | 150 | | | $ | 12 | | | $ | 981 | | | $ | 3,206 | |
Natixis Oakmark Fund | | | 183,953 | | | | 50,467 | | | | 925 | | | | 158,750 | |
Natixis Oakmark International Fund | | | 222,034 | | | | 85,477 | | | | 947 | | | | 410,852 | |
U.S. Equity Opportunities Fund | | | 374,199 | | | | 25,951 | | | | 906 | | | | 153,450 | |
Mid Cap Fund | | | 31,036 | | | | 8,089 | | | | 1,028 | | | | 165,406 | |
Small Cap Value Fund | | | 72,051 | | | | 1,127 | | | | 942 | | | | 77,396 | |
8. Line of Credit. Each Fund, together with certain other funds of Natixis Funds Trusts, Loomis Sayles Funds Trusts and Natixis ETF Trusts, entered into a $500,000,000 committed unsecured line of credit provided by State Street Bank. Any one Fund may borrow up to $350,000,000 under the line of credit agreement (as long as all borrowings by all Funds in the aggregate do not exceed the $500,000,000 limit at any time), subject to each Fund’s investment restrictions and its contractual obligations under the line of credit. Interest is charged to the Funds based upon the terms set forth in the agreement. In addition, a commitment fee of 0.15% per annum, payable at the end of each calendar quarter, is accrued and apportioned among the participating funds based on their average daily unused portion of the line of credit. The Funds paid certain legal fees in connection with the line of credit agreement, which are being amortized over a period of 364 days and are reflected in legal fees on the Statements of Operations. The unamortized balance is reflected as prepaid expenses on the Statements of Assets and Liabilities.
87 |
Notes to Financial Statements (continued)
December 31, 2022
For the year ended December 31, 2022, Natixis Oakmark Fund had an average daily balance on the line of credit (for those days on which there were borrowings) of $4,025,000 at a weighted average interest rate of 4.93%. Interest expense incurred on the line of credit was $2,205.
For the year ended December 31, 2022, Mid Cap Fund had an average daily balance on the line of credit (for those days on which there were borrowings) of $5,500,000 at a weighted average interest rate of 4.93%. Interest expense incurred on the line of credit was $753.
9. Risk. The Funds’ investments in foreign securities may be subject to greater political, economic, environmental, credit/counterparty and information risks. The Fund’s investments in foreign securities also are subject to foreign currency fluctuations and other foreign currency-related risks. Foreign securities may be subject to higher volatility than U.S. securities, varying degrees of regulation and limited liquidity.
The International Growth Fund may invest to a significant extent in variable interest entity (“VIE”) structures. VIE structures can vary, but generally consist of a U.S.-listed company with contractual arrangements, through one or more wholly-owned special purpose vehicles, with a Chinese company that ultimately provides the U.S.-listed company with contractual rights to obtain economic benefits from the Chinese company. The VIE structure enables foreign investors, such as the Fund, to obtain investment exposure similar to that of an equity owner in a Chinese company in situations in which the Chinese government has restricted or prohibited the ownership of such company by foreign investors. The Fund’s exposure to VIE structures may pose additional risks because the VIE structure is not formally recognized under Chinese law. The Chinese government may cease to tolerate VIE structures at any time or impose new restrictions. In addition, Chinese companies using the VIE structure, and listed on stock exchanges in the U.S., could also face delisting or other ramifications for failure to meet the expectations and/or requirements of the U.S. Securities and Exchange Commission, the Public Company Accounting Oversight Board, or other U.S. regulators. Any of these risks could reduce the liquidity and value of these investments or render them valueless.
International Growth Fund is non-diversified, which means that it is not limited under the 1940 Act to a percentage of assets that it may invest in any one issuer. Because the Fund may invest in the securities of a limited number of issuers, an investment in the Fund may involve a higher degree of risk than would be present in a diversified portfolio.
Russia’s military invasion of Ukraine in February 2022, the resulting responses by the United States and other countries, and the potential for wider conflict could increase volatility and uncertainty in the financial markets and adversely affect regional and global economies. These and any related events could significantly impact a Fund’s performance and the value of an investment in the Fund, even if the Fund does not have direct exposure to Russian issuers or issuers in other countries affected by the invasion.
10. Concentration of Ownership. From time to time, a Fund may have a concentration of one or more accounts constituting a significant percentage of shares outstanding. Investment activities by holders of such accounts could have material impacts on the Funds. As of December 31, 2022, based on management’s evaluation of the shareholder account base, the Funds had accounts representing controlling ownership of more than 5% of the Funds’ total outstanding shares. The number of such accounts, based on accounts that represent more than 5% of an individual class of shares, and the aggregate percentage of net assets represented by such holdings were as follows:
| | | | | | | | |
| | | Number of 5%
Account Holders | | | Percentage of
Ownership | |
Fund | | | | | | |
Natixis Oakmark International Fund | | | 1 | | | | 25.13 | % |
U.S. Equity Opportunities Fund | | | 1 | | | | 5.09 | % |
Mid Cap Fund | | | 1 | | | | 29.14 | % |
Small Cap Value Fund | | | 2 | | | | 12.69 | % |
Omnibus shareholder accounts for which Natixis Advisors understands that the intermediary has discretion over the underlying shareholder accounts or investment models where a shareholder account may be invested for a non-discretionary customer are included in the table above. For other omnibus accounts, the Funds do not have information on the individual shareholder accounts underlying the omnibus accounts; therefore, there could be other 5% shareholders in addition to those disclosed in the table above.
| 88
Notes to Financial Statements (continued)
December 31, 2022
11. Capital Shares. Each Fund may issue an unlimited number of shares of beneficial interest, without par value. Transactions in capital shares were as follows:
| | | | | | | | | | | | | | | | |
| | | Year Ended
December 31, 2022 | | | Year Ended
December 31, 2021 | |
International Growth Fund | | Shares | | | Amount | | | Shares | | | Amount | |
| Class A | |
Issued from the sale of shares | | | 4,118 | | | $ | 33,249 | | | | 11,486 | | | $ | 119,493 | |
Issued in connection with the reinvestment of distributions | | | 71 | | | | 565 | | | | 178 | | | | 1,712 | |
| | | | | | | | | | | | | | | | |
Net change | | | 4,189 | | | $ | 33,814 | | | | 11,664 | | | $ | 121,205 | |
| | | | | | | | | | | | | | | | |
| Class C | |
Issued from the sale of shares | | | — | | | $ | — | | | | 5,141 | | | $ | 52,756 | |
Issued in connection with the reinvestment of distributions | | | — | | | | — | | | | 56 | | | | 540 | |
Redeemed | | | (3,928 | ) | | | (33,853 | ) | | | (1,268 | ) | | | (12,908 | ) |
| | | | | | | | | | | | | | | | |
Net change | | | (3,928 | ) | | $ | (33,853 | ) | | | 3,929 | | | $ | 40,388 | |
| | | | | | | | | | | | | | | | |
| Class N | |
Issued from the sale of shares | | | 319,693 | | | $ | 2,500,000 | | | | 940,733 | | | $ | 10,000,000 | |
Issued in connection with the reinvestment of distributions | | | 2,314 | | | | 18,351 | | | | 517 | | | | 5,372 | |
Redeemed | | | — | | | | — | | | | (46,992 | ) | | | (500,000 | ) |
| | | | | | | | | | | | | | | | |
Net change | | | 322,007 | | | $ | 2,518,351 | | | | 894,258 | | | $ | 9,505,372 | |
| | | | | | | | | | | | | | | | |
| Class Y | |
Issued from the sale of shares | | | 374,914 | | | $ | 3,190,418 | | | | 24,598 | | | $ | 256,782 | |
Issued in connection with the reinvestment of distributions | | | 2,707 | | | | 21,469 | | | | 388 | | | | 3,739 | |
Redeemed | | | (2,822 | ) | | | (20,300 | ) | | | (2,953 | ) | | | (29,891 | ) |
| | | | | | | | | | | | | | | | |
Net change | | | 374,799 | | | $ | 3,191,587 | | | | 22,033 | | | $ | 230,630 | |
| | | | | | | | | | | | | | | | |
Increase from capital share transactions | | | 697,067 | | | $ | 5,709,899 | | | | 931,884 | | | $ | 9,897,595 | |
| | | | | | | | | | | | | | | | |
| | | | | | | | | | | | | | | | |
| | | Year Ended
December 31, 2022 | | | Year Ended
December 31, 2021 | |
Natixis Oakmark Fund | | Shares | | | Amount | | | Shares | | | Amount | |
| Class A | |
Issued from the sale of shares | | | 1,251,455 | | | $ | 32,636,811 | | | | 691,558 | | | $ | 20,206,685 | |
Issued in connection with the reinvestment of distributions | | | 1,168,653 | | | | 25,751,399 | | | | 463,894 | | | | 13,477,187 | |
Redeemed | | | (1,134,294 | ) | | | (28,656,218 | ) | | | (855,457 | ) | | | (24,491,426 | ) |
| | | | | | | | | | | | | | | | |
Net change | | | 1,285,814 | | | $ | 29,731,992 | | | | 299,995 | | | $ | 9,192,446 | |
| | | | | | | | | | | | | | | | |
Class C | | | | | | | | | | | | | | | | |
Issued from the sale of shares | | | 1,217,488 | | | $ | 26,738,602 | | | | 546,929 | | | $ | 13,338,620 | |
Issued in connection with the reinvestment of distributions | | | 492,676 | | | | 8,476,261 | | | | 147,029 | | | | 3,458,822 | |
Redeemed | | | (734,433 | ) | | | (14,940,011 | ) | | | (439,521 | ) | | | (10,138,945 | ) |
| | | | | | | | | | | | | | | | |
Net change | | | 975,731 | | | $ | 20,274,852 | | | | 254,437 | | | $ | 6,658,497 | |
| | | | | | | | | | | | | | | | |
Class N | | | | | | | | | | | | | | | | |
Issued from the sale of shares | | | 58 | | | $ | 1,547 | | | | 20,230 | | | $ | 668,794 | |
Issued in connection with the reinvestment of distributions | | | 3,064 | | | | 73,284 | | | | 1,354 | | | | 42,243 | |
Redeemed | | | (2,888 | ) | | | (81,794 | ) | | | (14,413 | ) | | | (395,951 | ) |
| | | | | | | | | | | | | | | | |
Net change | | | 234 | | | $ | (6,963 | ) | | | 7,171 | | | $ | 315,086 | |
| | | | | | | | | | | | | | | | |
Class Y | | | | | | | | | | | | | | | | |
Issued from the sale of shares | | | 6,361,056 | | | $ | 191,465,914 | | | | 2,239,599 | | | $ | 69,629,845 | |
Issued in connection with the reinvestment of distributions | | | 638,488 | | | | 15,388,143 | | | | 194,941 | | | | 6,059,178 | |
Redeemed | | | (5,757,253 | ) | | | (154,617,312 | ) | | | (767,848 | ) | | | (22,108,885 | ) |
| | | | | | | | | | | | | | | | |
Net change | | | 1,242,291 | | | $ | 52,236,745 | | | | 1,666,692 | | | $ | 53,580,138 | |
| | | | | | | | | | | | | | | | |
Increase from capital share transactions | | | 3,504,070 | | | $ | 102,236,626 | | | | 2,228,295 | | | $ | 69,746,167 | |
| | | | | | | | | | | | | | | | |
89 |
Notes to Financial Statements (continued)
December 31, 2022
11. Capital Shares (continued).
| | | | | | | | | | | | | | | | |
| | | Year Ended
December 31, 2022 | | | Year Ended
December 31, 2021 | |
Natixis Oakmark International Fund | | Shares | | | Amount | | | Shares | | | Amount | |
| Class A | |
Issued from the sale of shares | | | 2,081,450 | | | $ | 27,188,627 | | | | 2,335,450 | | | $ | 36,472,444 | |
Issued in connection with the reinvestment of distributions | | | 108,247 | | | | 1,369,329 | | | | 105,442 | | | | 1,593,676 | |
Redeemed | | | (2,674,538 | ) | | | (34,233,303 | ) | | | (1,647,832 | ) | | | (25,699,049 | ) |
| | | | | | | | | | | | | | | | |
Net change | | | (484,841 | ) | | $ | (5,675,347 | ) | | | 793,060 | | | $ | 12,367,071 | |
| | | | | | | | | | | | | | | | |
Class C | | | | | | | | | | | | | | | | |
Issued from the sale of shares | | | 146,028 | | | $ | 1,872,215 | | | | 335,969 | | | $ | 5,138,230 | |
Issued in connection with the reinvestment of distributions | | | 23,961 | | | | 297,840 | | | | 25,276 | | | | 376,368 | |
Redeemed | | | (1,650,271 | ) | | | (21,038,433 | ) | | | (2,680,195 | ) | | | (40,587,344 | ) |
| | | | | | | | | | | | | | | | |
Net change | | | (1,480,282 | ) | | $ | (18,868,378 | ) | | | (2,318,950 | ) | | $ | (35,072,746 | ) |
| | | | | | | | | | | | | | | | |
Class N | | | | | | | | | | | | | | | | |
Issued from the sale of shares | | | 145,580 | | | $ | 2,017,090 | | | | 27,769 | | | $ | 415,638 | |
Issued in connection with the reinvestment of distributions | | | 363 | | | | 4,576 | | | | 837 | | | | 12,581 | |
Redeemed | | | (174,806 | ) | | | (2,201,343 | ) | | | (2,541 | ) | | | (37,341 | ) |
| | | | | | | | | | | | | | | | |
Net change | | | (28,863 | ) | | $ | (179,677 | ) | | | 26,065 | | | $ | 390,878 | |
| | | | | | | | | | | | | | | | |
Class Y | | | | | | | | | | | | | | | | |
Issued from the sale of shares | | | 7,667,504 | | | $ | 104,077,801 | | | | 5,468,533 | | | $ | 86,311,348 | |
Issued in connection with the reinvestment of distributions | | | 303,265 | | | | 3,815,073 | | | | 353,698 | | | | 5,316,490 | |
Redeemed | | | (12,663,967 | ) | | | (169,927,755 | ) | | | (4,621,536 | ) | | | (71,233,588 | ) |
| | | | | | | | | | | | | | | | |
Net change | | | (4,693,198 | ) | | $ | (62,034,881 | ) | | | 1,200,695 | | | $ | 20,394,250 | |
| | | | | | | | | | | | | | | | |
Decrease from capital share transactions | | | (6,687,184 | ) | | $ | (86,758,283 | ) | | | (299,130 | ) | | $ | (1,920,547 | ) |
| | | | | | | | | | | | | | | | |
| | | | | | | | | | | | | | | | |
| | | Year Ended
December 31, 2022 | | | Year Ended
December 31, 2021 | |
U.S. Equity Opportunities Fund | | Shares | | | Amount | | | Shares | | | Amount | |
| Class A | |
Issued from the sale of shares | | | 682,513 | | | $ | 23,765,153 | | | | 706,028 | | | $ | 30,893,730 | |
Issued in connection with the reinvestment of distributions | | | 2,458,392 | | | | 77,467,012 | | | | 1,609,947 | | | | 68,881,940 | |
Redeemed | | | (2,488,264 | ) | | | (85,464,740 | ) | | | (1,953,593 | ) | | | (84,776,070 | ) |
| | | | | | | | | | | | | | | | |
Net change | | | 652,641 | | | $ | 15,767,425 | | | | 362,382 | | | $ | 14,999,600 | |
| | | | | | | | | | | | | | | | |
Class C | | | | | | | | | | | | | | | | |
Issued from the sale of shares | | | 188,655 | | | $ | 3,147,013 | | | | 226,043 | | | $ | 5,356,200 | |
Issued in connection with the reinvestment of distributions | | | 731,774 | | | | 10,169,356 | | | | 475,273 | | | | 10,545,794 | |
Redeemed | | | (1,134,470 | ) | | | (19,010,339 | ) | | | (949,764 | ) | | | (22,561,088 | ) |
| | | | | | | | | | | | | | | | |
Net change | | | (214,041 | ) | | $ | (5,693,970 | ) | | | (248,448 | ) | | $ | (6,659,094 | ) |
| | | | | | | | | | | | | | | | |
Class N | | | | | | | | | | | | | | | | |
Issued from the sale of shares | | | 721 | | | $ | 30,208 | | | | — | | | $ | — | |
Issued in connection with the reinvestment of distributions | | | 516 | | | | 20,693 | | | | 293 | | | | 15,616 | |
Redeemed | | | (72 | ) | | | (2,729 | ) | | | (620 | ) | | | (35,725 | ) |
| | | | | | | | | | | | | | | | |
Net change | | | 1,165 | | | $ | 48,172 | | | | (327 | ) | | $ | (20,109 | ) |
| | | | | | | | | | | | | | | | |
Class Y | | | | | | | | | | | | | | | | |
Issued from the sale of shares | | | 1,826,215 | | | $ | 81,090,815 | | | | 1,490,330 | | | $ | 81,108,161 | |
Issued in connection with the reinvestment of distributions | | | 558,904 | | | | 22,817,734 | | | | 370,262 | | | | 19,743,173 | |
Redeemed | | | (2,555,340 | ) | | | (108,147,485 | ) | | | (1,682,880 | ) | | | (89,109,967 | ) |
| | | | | | | | | | | | | | | | |
Net change | | | (170,221 | ) | | $ | (4,238,936 | ) | | | 177,712 | | | $ | 11,741,367 | |
| | | | | | | | | | | | | | | | |
Increase from capital share transactions | | | 269,544 | | | $ | 5,882,691 | | | | 291,319 | | | $ | 20,061,764 | |
| | | | | | | | | | | | | | | | |
| 90
Notes to Financial Statements (continued)
December 31, 2022
11. Capital Shares (continued).
| | | | | | | | | | | | | | | | |
| | | Year Ended
December 31, 2022 | | | Year Ended
December 31, 2021 | |
Mid Cap Fund | | Shares | | | Amount | | | Shares | | | Amount | |
| Class A | |
Issued from the sale of shares | | | 254,188 | | | $ | 5,207,282 | | | | 261,646 | | | $ | 6,416,364 | |
Issued in connection with the reinvestment of distributions | | | 47,991 | | | | 1,002,920 | | | | 216,292 | | | | 4,872,528 | |
Redeemed | | | (263,346 | ) | | | (5,258,953 | ) | | | (213,572 | ) | | | (5,159,634 | ) |
| | | | | | | | | | | | | | | | |
Net change | | | 38,833 | | | $ | 951,249 | | | | 264,366 | | | $ | 6,129,258 | |
| | | | | | | | | | | | | | | | |
Class C | | | | | | | | | | | | | | | | |
Issued from the sale of shares | | | 41,957 | | | $ | 749,400 | | | | 16,158 | | | $ | 374,819 | |
Issued in connection with the reinvestment of distributions | | | 13,437 | | | | 257,591 | | | | 85,496 | | | | 1,752,803 | |
Redeemed | | | (193,780 | ) | | | (3,552,548 | ) | | | (241,770 | ) | | | (5,500,556 | ) |
| | | | | | | | | | | | | | | | |
Net change | | | (138,386 | ) | | $ | (2,545,557 | ) | | | (140,116 | ) | | $ | (3,372,934 | ) |
| | | | | | | | | | | | | | | | |
Class N | | | | | | | | | | | | | | | | |
Issued from the sale of shares | | | 157,734 | | | $ | 3,317,147 | | | | 2,826,157 | | | $ | 72,192,384 | |
Issued in connection with the reinvestment of distributions | | | 125,027 | | | | 2,643,594 | | | | 531,924 | | | | 12,118,098 | |
Redeemed | | | (599,530 | ) | | | (12,583,501 | ) | | | (205,461 | ) | | | (5,123,004 | ) |
| | | | | | | | | | | | | | | | |
Net change | | | (316,769 | ) | | $ | (6,622,760 | ) | | | 3,152,620 | | | $ | 79,187,478 | |
| | | | | | | | | | | | | | | | |
Class Y | | | | | | | | | | | | | | | | |
Issued from the sale of shares | | | 994,932 | | | $ | 20,936,431 | | | | 1,675,522 | | | $ | 41,044,197 | |
Issued in connection with the reinvestment of distributions | | | 271,832 | | | | 5,776,106 | | | | 1,387,574 | | | | 31,819,928 | |
Redeemed | | | (3,661,665 | ) | | | (76,714,966 | ) | | | (3,531,602 | ) | | | (86,803,876 | ) |
| | | | | | | | | | | | | | | | |
Net change | | | (2,394,901 | ) | | $ | (50,002,429 | ) | | | (468,506 | ) | | $ | (13,939,751 | ) |
| | | | | | | | | | | | | | | | |
Increase (decrease) from capital share transactions | | | (2,811,223 | ) | | $ | (58,219,497 | ) | | | 2,808,364 | | | $ | 68,004,051 | |
| | | | | | | | | | | | | | | | |
| | | | | | | | | | | | | | | | |
| | | Year Ended
December 31, 2022 | | | Year Ended
December 31, 2021 | |
Small Cap Value Fund | | Shares | | | Amount | | | Shares | | | Amount | |
| Class A | |
Issued from the sale of shares | | | 294,742 | | | $ | 4,937,363 | | | | 642,790 | | | $ | 12,042,869 | |
Issued in connection with the reinvestment of distributions | | | 238,814 | | | | 3,785,851 | | | | 782,913 | | | | 13,763,408 | |
Redeemed | | | (720,255 | ) | | | (11,602,583 | ) | | | (555,154 | ) | | | (10,594,338 | ) |
| | | | | | | | | | | | | | | | |
Net change | | | (186,699 | ) | | $ | (2,879,369 | ) | | | 870,549 | | | $ | 15,211,939 | |
| | | | | | | | | | | | | | | | |
Class C | | | | | | | | | | | | | | | | |
Issued from the sale of shares | | | 269,996 | | | $ | 1,616,908 | | | | 6,936 | | | $ | 66,135 | |
Issued in connection with the reinvestment of distributions | | | 43,643 | | | | 240,247 | | | | 49,731 | | | | 339,165 | |
Redeemed | | | (53,628 | ) | | | (323,660 | ) | | | (35,173 | ) | | | (333,625 | ) |
| | | | | | | | | | | | | | | | |
Net change | | | 260,011 | | | $ | 1,533,495 | | | | 21,494 | | | $ | 71,675 | |
| | | | | | | | | | | | | | | | |
Class N | | | | | | | | | | | | | | | | |
Issued from the sale of shares | | | 16,766 | | | $ | 293,058 | | | | 59,076 | | | $ | 1,134,239 | |
Issued in connection with the reinvestment of distributions | | | 4,642 | | | | 77,738 | | | | 12,510 | | | | 233,321 | |
Redeemed | | | (1,959 | ) | | | (31,168 | ) | | | (1 | ) | | | (27 | ) |
| | | | | | | | | | | | | | | | |
Net change | | | 19,449 | | | $ | 339,628 | | | | 71,585 | | | $ | 1,367,533 | |
| | | | | | | | | | | | | | | | |
Class Y | | | | | | | | | | | | | | | | |
Issued from the sale of shares | | | 5,751,752 | | | $ | 96,719,232 | | | | 793,405 | | | $ | 16,230,504 | |
Issued in connection with the reinvestment of distributions | | | 313,912 | | | | 5,212,202 | | | | 591,535 | | | | 11,020,292 | |
Redeemed | | | (2,083,989 | ) | | | (35,666,627 | ) | | | (714,903 | ) | | | (14,531,447 | ) |
| | | | | | | | | | | | | | | | |
Net change | | | 3,981,675 | | | $ | 66,264,807 | | | | 670,037 | | | $ | 12,719,349 | |
| | | | | | | | | | | | | | | | |
Increase from capital share transactions | | | 4,074,436 | | | $ | 65,258,561 | | | | 1,633,665 | | | $ | 29,370,496 | |
| | | | | | | | | | | | | | | | |
91 |
Report of Independent Registered Public Accounting Firm
To the Board of Trustees of Loomis Sayles Funds II, Natixis Funds Trust I and Natixis Funds Trust II and Shareholders of Loomis Sayles International Growth Fund, Natixis Oakmark International Fund, Natixis U.S. Equity Opportunities Fund, Vaughan Nelson Small Cap Value Fund, Natixis Oakmark Fund and Vaughan Nelson Mid Cap Fund
Opinions on the Financial Statements
We have audited the accompanying statements of assets and liabilities, including the portfolios of investments, of Loomis Sayles International Growth Fund (one of the funds constituting Loomis Sayles Funds II), Natixis Oakmark International Fund, Natixis U.S. Equity Opportunities Fund and Vaughan Nelson Small Cap Value Fund (three of the funds constituting Natixis Funds Trust I), and Natixis Oakmark Fund and Vaughan Nelson Mid Cap Fund (two of the funds constituting Natixis Funds Trust II) (hereafter collectively referred to as the “Funds”) as of December 31, 2022, the related statements of operations for the year ended December 31, 2022, the statements of changes in net assets for each of the two years in the period ended December 31, 2022, including the related notes, and the financial highlights for each of the periods indicated therein (collectively referred to as the “financial statements”). In our opinion, the financial statements present fairly, in all material respects, the financial position of each of the Funds as of December 31, 2022, the results of each of their operations for the year then ended, the changes in each of their net assets for each of the two years in the period ended December 31, 2022, and each of the financial highlights for each of the periods indicated therein, in conformity with accounting principles generally accepted in the United States of America.
Basis for Opinions
These financial statements are the responsibility of the Funds’ management. Our responsibility is to express an opinion on the Funds’ financial statements based on our audits. We are a public accounting firm registered with the Public Company Accounting Oversight Board (United States) (PCAOB) and are required to be independent with respect to the Funds in accordance with the U.S. federal securities laws and the applicable rules and regulations of the Securities and Exchange Commission and the PCAOB.
We conducted our audits of these financial statements in accordance with the standards of the PCAOB. Those standards require that we plan and perform the audit to obtain reasonable assurance about whether the financial statements are free of material misstatement, whether due to error or fraud.
Our audits included performing procedures to assess the risks of material misstatement of the financial statements, whether due to error or fraud, and performing procedures that respond to those risks. Such procedures included examining, on a test basis, evidence regarding the amounts and disclosures in the financial statements. Our audits also included evaluating the accounting principles used and significant estimates made by management, as well as evaluating the overall presentation of the financial statements. Our procedures included confirmation of securities owned as of December 31, 2022 by correspondence with the custodian and brokers; when replies were not received from brokers, we performed other auditing procedures. We believe that our audits provide a reasonable basis for our opinions.
/s/PricewaterhouseCoopers LLP
Boston, Massachusetts
February 22, 2023
We have served as the auditor of one or more of the investment companies in the Natixis Investment Company Complex since at least 1995. We have not been able to determine the specific year we began serving as auditor.
| 92
2022 U.S. Tax Distribution Information to Shareholders (Unaudited)
Corporate Dividends Received Deduction. For the fiscal year ended December 31, 2022, a percentage of dividends distributed by the Funds listed below qualify for the dividends received deduction for corporate shareholders. These percentages are as follows:
| | | | |
Fund | | Qualifying
Percentage | |
International Growth Fund | | | 3.25 | % |
Natixis Oakmark Fund | | | 100.00 | % |
U.S. Equity Opportunities Fund | | | 100.00 | % |
Mid Cap Fund | | | 100.00 | % |
Small Cap Value Fund | | | 59.03 | % |
Capital Gains Distributions. Pursuant to Internal Revenue Section 852(b), the following Funds paid distributions, which have been designated as capital gains distributions for the fiscal year ended December 31, 2022.
| | | | |
Fund | | Amount | |
Natixis Oakmark Fund | | $ | 51,140,399 | |
U.S. Equity Opportunities Fund | | | 120,599,489 | |
Mid Cap Fund | | | 7,705,713 | |
Small Cap Value Fund | | | 6,755,646 | |
Qualified Dividend Income. For the fiscal year ended December 31, 2022, a percentage of the ordinary income dividends paid by the Funds are considered qualified dividend income eligible for reduced tax rates. These lower rates range from 0% to 20% depending on an individual’s tax bracket. If the Funds paid a distribution during calendar year 2022, complete information will be reported in conjunction with Form 1099-DIV. These percentages are noted below:
| | | | |
Fund | | Qualifying
Percentage | |
International Growth Fund | | | 100.00 | % |
Natixis Oakmark Fund | | | 100.00 | % |
Natixis Oakmark International Fund | | | 100.00 | % |
U.S. Equity Opportunities Fund | | | 100.00 | % |
Mid Cap Fund | | | 100.00 | % |
Small Cap Value Fund | | | 58.93 | % |
Foreign Tax Credit. For the year ended December 31, 2022, the Fund intends to pass through foreign tax credits and have derived gross income from sources within foreign countries amounting to:
| | | | | | | | |
Fund | | Foreign Tax
Credit Pass-Through | | | Foreign Source
Income | |
International Growth Fund | | $ | 27,083 | | | $ | 392,802 | |
Natixis Oakmark International Fund | | | 1,109,096 | | | | 12,087,259 | |
93 |
Trustee and Officer Information
The tables below provide certain information regarding the Trustees and officers of Natixis Funds Trust I, Natixis Funds Trust II, and Loomis Sayles Funds II (the “Trusts”). Unless otherwise indicated, the address of all persons below is 888 Boylston Street, Suite 800, Boston, MA 02199-8197. The Funds’ Statements of Additional Information includes additional information about the Trustees of the Trusts and are available by calling Natixis Funds at 800-225-5478.
| | | | | | | | |
Name and Year of Birth | | Position(s) Held with
the Trusts, Length of
Time Served and Term of Office1 | | Principal Occupation(s)
During Past 5 Years | | Number of Portfolios in
Fund Complex Overseen2 and Other Directorships
Held During Past 5 Years | | Experience,
Qualifications,
Attributes, Skills for
Board Membership |
|
| INDEPENDENT TRUSTEES |
| | | | |
Edmond J. English
(1953) | | Trustee since 2013 Chairperson of the Governance Committee and Contract Review Committee Member | | Executive Chairman of Bob’s Discount Furniture (retail) | | 54 Director, Burlington Stores, Inc. (retail) and Director, Rue Gilt Groupe, Inc. (e-commerce retail) | | Significant experience on the Board and on the boards of other business organizations (including retail companies and a bank); executive experience (including at a retail company) |
| | | | |
Richard A. Goglia (1951) | | Trustee since 2015 Audit Committee Member and Governance Committee Member | | Retired | | 54 Formerly, Director of Triumph Group (aerospace industry) | | Significant experience on the Board and executive experience (including his role as vice president and treasurer of a defense company and experience at a financial services company) |
| | | | |
Wendell J. Knox (1948) | | Trustee since 2009 Chairperson of the Contract Review Committee | | Retired | | 54 Director, Abt Associates Inc. (research and consulting); Director, The Hanover Insurance Group (property and casualty insurance); Formerly, Director, Eastern Bank (bank) | | Significant experience on the Board and on the boards of other business organizations (including at a bank and at a property and casualty insurance firm); executive experience (including roles as president and chief executive officer of a research and consulting company) |
| | | | |
| Martin T. Meehan (1956) | | Trustee since 2012 Contract Review Committee Member and Governance Committee Member | | President, University of Massachusetts | | 54 None | | Significant experience on the Board and on the boards of other business organizations; experience as President of the University of Massachusetts; government experience (including as a member of the U.S. House of Representatives); academic experience |
| 94
Trustee and Officer Information
| | | | | | | | |
Name and Year of Birth | | Position(s) Held with
the Trusts, Length of
Time Served and Term of Office1 | | Principal Occupation(s)
During Past 5 Years | | Number of Portfolios in
Fund Complex Overseen2 and Other Directorships
Held During Past 5 Years | | Experience,
Qualifications,
Attributes, Skills for
Board Membership |
|
| INDEPENDENT TRUSTEES-continued |
| | | | |
Maureen B. Mitchell (1951) | | Trustee since 2017 Contract Review Committee Member and Governance Committee Member | | Retired | | 54 Director, Sterling Bancorp (bank) | | Significant experience on the Board; financial services industry and executive experience (including role as president of global sales and marketing at a financial services company) |
| | | | |
James P. Palermo (1955) | | Trustee since 2016 Audit Committee Member | | Founding Partner, Breton Capital Management, LLC (private equity); Partner, STEP Partners, LLC (private equity) | | 54 Director, FutureFuel.io (chemicals and biofuels) | | Significant experience on the Board; financial services industry and executive experience (including roles as chief executive officer of client management and asset servicing for a banking and financial services company) |
| | | | |
Erik R. Sirri (1958) | | Chairperson of the Board of Trustees since 2021 Trustee since 2009 Ex Officio member of the Audit Committee, Contract Review Committee and Governance Committee | | Professor of Finance at Babson College | | 54 None | | Significant experience on the Board; experience as Director of the Division of Trading and Markets at the Securities and Exchange Commission; academic experience; training as an economist |
| | | | |
Peter J. Smail (1952) | | Trustee since 2009 Audit Committee Member | | Retired | | 54 None | | Significant experience on the Board; mutual fund industry and executive experience (including roles as president and chief executive officer for an investment adviser) |
| | | | |
Kirk A. Sykes (1958) | | Trustee since 2019 Audit Committee Member and Governance Committee Member | | Managing Director of Accordia Partners, LLC (real estate development); President of Primary Corporation (real estate development); Managing Principal of Merrick Capital Partners (infrastructure finance) | | 54 Advisor Eastern Bank (bank); Director, Apartment Investment and Management Company (real estate investment trust); formerly Director, Ares Commercial Real Estate Corporation (real estate investment trust) | | Experience on the Board and significant experience on the boards of other business organizations (including real estate companies and banks) |
95 |
Trustee and Officer Information
| | | | | | | | |
Name and Year of Birth | | Position(s) Held with
the Trusts, Length of
Time Served and Term of Office1 | | Principal Occupation(s)
During Past 5 Years | | Number of Portfolios in
Fund Complex Overseen2 and Other Directorships
Held During Past 5 Years | | Experience,
Qualifications,
Attributes, Skills for
Board Membership |
|
| INDEPENDENT TRUSTEES-continued |
| | | | |
Cynthia L. Walker (1956) | | Trustee since 2005 Chairperson of the Audit Committee | | Retired; Formerly, Deputy Dean for Finance and Administration, Yale University School of Medicine | | 54 None | | Significant experience on the Board; executive experience in a variety of academic organizations (including roles as dean for finance and administration) |
|
| INDEPENDENT TRUSTEES |
| | | | |
Kevin P. Charleston3 (1965) One Financial Center Boston, MA 02111 | | Trustee since 2015 | | President, Chief Executive Officer and Chairman of the Board of Directors, Loomis, Sayles & Company, L.P. | | 54 None | | Significant experience on the Board; continuing service as President, Chief Executive Officer and Chairman of the Board of Directors of Loomis, Sayles & Company, L.P. |
| | | | |
David L. Giunta4
(1965) | | Trustee since 2011 President and Chief Executive Officer of Natixis Funds Trust I and Natixis Funds Trust II since 2008; President of Loomis Sayles Funds II since 2008; Chief Executive Officer of Loomis Sayles Funds II since 2015 | | President and Chief Executive Officer, Natixis Advisors, LLC and Natixis Distribution, LLC | | 54 None | | Significant experience on the Board; experience as President and Chief Executive Officer of Natixis Advisors, LLC and Natixis Distribution, LLC |
| 1 | Each Trustee serves until retirement, resignation or removal from the Board. The current retirement age is 75. The position of Chairperson of the Board is appointed for a three-year term. |
| 2 | The Trustees of the Trusts serve as Trustees of a fund complex that includes all series of the Natixis Funds Trust I, Natixis Funds Trust II, Natixis Funds Trust IV, Gateway Trust, Loomis Sayles Funds I, Loomis Sayles Funds II, Natixis ETF Trust and Natixis ETF Trust II (collectively, the “Fund Complex”). |
| 3 | Mr. Charleston is deemed an “interested person” of the Trusts because he holds the following positions with an affiliated person of the Trusts: President, Chief Executive Officer and Chairman of the Board of Directors of Loomis, Sayles & Company, L.P. |
| 4 | Mr. Giunta is deemed an “interested person” of the Trusts because he holds the following positions with an affiliated person of the Trusts: President and Chief Executive Officer, Natixis Advisors, LLC and Natixis Distribution, LLC. |
| 96
Trustee and Officer Information
| | | | | | |
Name and Year of Birth | | Position(s) Held with
the Trusts | | Term of Office1 and
Length of Time Served | | Principal
Occupation(s) During
Past 5 Years2 |
| | |
| OFFICERS OF THE TRUSTS | | | | |
| | | |
Matthew Block (1981) | | Treasurer, Principal Financial and Accounting Officer | | Since 2022 | | Senior Vice President, Natixis Advisors, LLC and Natixis Distribution, LLC; formerly, Vice President, Natixis Advisors, LLC and Natixis Distribution, LLC; Assistant Treasurer of the Fund Complex; Managing Director, State Street Bank and Trust Company |
| | | |
Susan McWhan Tobin (1963) | | Secretary and Chief Legal Officer | | Since 2022 | | Executive Vice President, General Counsel and Secretary, Natixis Advisors, LLC and Natixis Distribution, LLC; formerly, Executive Vice President and Chief Compliance Officer of Natixis Investment Managers (March 2019– May 2022) and Senior Vice President and Head of Compliance, US for Natixis Investment Managers (July 2011–March 2019) |
| | | |
Natalie R. Wagner (1979) | | Chief Compliance Officer, Assistant Secretary and Anti-Money Laundering Officer | | Since 2021 | | Senior Vice President, Natixis Advisors, LLC and Natixis Distribution, LLC; formerly, Vice President, Head of Corporate Compliance, Global Atlantic Financial Group |
| 1 | Each officer of the Trusts serves for an indefinite term in accordance with the Trusts’ current by-laws until the date his or her successor is elected and qualified, or until he or she sooner dies, retires, is removed or becomes disqualified. |
| 2 | Each person listed above, except as noted, holds the same position(s) with the Fund Complex. Previous positions during the past five years with Natixis Distribution, LLC, Natixis Advisors, LLC or Loomis, Sayles & Company, L.P. are omitted, if not materially different from an officer’s current position with such entity. |
97 |


Annual Report
December 31, 2022
Gateway Fund
Gateway Equity Call Premium Fund
Mirova Global Green Bond Fund
Mirova Global Sustainable Equity Fund
Mirova International Sustainable Equity Fund
Mirova U.S. Sustainable Equity Fund
Table of Contents

GATEWAY FUND
| | |
| |
| Managers | | Symbols |
| |
| Daniel M. Ashcraft, CFA® | | Class A GATEX |
| |
| Michael T. Buckius, CFA® | | Class C GTECX |
| |
| Paul R. Stewart, CFA®* | | Class N GTENX |
| |
| Kenneth H. Toft, CFA® | | Class Y GTEYX |
| |
| Mitchell J. Trotta, CFA® | | |
|
| Gateway Investment Advisers, LLC |
| * | Effective July 1, 2022, Mr. Stewart no longer serves as a portfolio manager of the Fund. |
Investment Goal
The Fund seeks to capture the majority of returns associated with equity market investments, while exposing investors to less risk than other equity investments.
Market Conditions
Inflation, war and rising interest rates all contributed to equity market losses in 2022. The year ranks as the fourth-worst return for the S&P 500® Index over the last 85 years. The S&P 500® Index posted three consecutive losing quarters and ended the year with a partial recovery. Quarterly returns of -4.60%, -16.10%, -4.88% and 7.56% suggest an incessant market slide followed by a fourth quarter rally; however, the equity market path was more roller coaster than avalanche. The first three quarters each featured double-digit drawdowns, including a 19.69% plunge from April 4 through June 16. The last two quarters featured double-digit rallies that resulted in only partial recoveries, including a 14.35% advance from October 12 through November 30. Concerns over the pace and extent of monetary tightening were a key driver of each market decline, while rallies were mostly ignited by investor hopes of a US Federal Reserve (Fed) policy pivot towards a less hawkish, if not dovish, approach to achieving lower inflation without tipping the economy into recession.
The year also ranked as one of the most volatile on record. Realized volatility for 2022, as measured by the standard deviation of daily returns for the S&P 500® Index, was 24.18%, the eighth highest reading in the past 85 years. Despite beginning the year at an intra-year closing value low of 16.60 on January 3, average implied volatility for the year, as measured by the Cboe® Volatility Index (the VIX®), was higher than realized volatility at 25.64 and ranked as the sixth highest annual average since its 1990 inception. The defining feature of implied volatility in 2022, however, was its persistently above-average readings and relatively muted responses to sharp drops in equity market value. Typically, the VIX® reaches its highest levels when the equity market is at or near its low for the year or during multi-percentage-point plunges. However, its intra-year closing high of 36.45 took place on March 7, well before the equity market reached its low for the year and in advance of the steepest portion of 2022’s bear market decline. The year featured multiple multi-percentage-point single-day declines, including nine that exceeded 3% and two that exceeded 4%, all of which occurred after the intra-year VIX® high on March 7.
Performance Results
For the 12 months ended December 31, 2022, Class Y shares of the Gateway Fund returned -11.85% at net asset value. The Fund outperformed its primary benchmark, the S&P 500® Index, which returned -18.11%, while its secondary benchmark, the Bloomberg U.S. Aggregate Bond Index, returned -13.01%.
Explanation of Fund Performance
The Fund invests in a broadly diversified portfolio of common stocks that is designed to track the performance of the S&P 500® Index, while also selling index call options and purchasing index put options. The Fund seeks to generate returns by creating cash flow through writing at-the-money index call options against the full value of its underlying equity portfolio. The written call options, premium levels of which have a high correlation to volatility, provide cash flow into the Fund, yet may limit upside participation in an equity market advance. The Fund uses some of the cash flow from index call option writing to purchase out-of-the-money index put options to mitigate sudden and severe price declines in the equity portfolio. An index call option is considered at-the-money when the price of the underlying index is the same as the option’s strike price. Additionally, an index put option is deemed out-of-the money when its strike price is below the price of the underlying index. It is the net premium-to-earn from selling index call options less the price of protective index put options that is a significant factor in determining how much participation the Fund will have in a rising market and how much downside mitigation is delivered in a declining market. In the long term, the combination of the diversified stock portfolio, steady cash flow from the sale of index call options, and downside mitigation from index put options is intended to provide the Fund with a majority of the returns associated with equity market investments while exposing investors to less risk.
1 |
The Fund held up better than its primary benchmark for the year while achieving the risk component of its objective by exhibiting significantly less risk than the equity market, as measured by the standard deviation of daily returns. Throughout 2022, the Fund’s two-part option strategy delivered equity market participation during the periods in which the equity market advanced and downside protection during market declines. Specifically, the Fund had smaller losses than the S&P 500® Index in the first three quarters and strong participation in the fourth quarter of 2022. Additionally, from April 4 through June 16, the Fund returned -12.11% relative to the S&P 500® Index return of -19.69%, providing 7.58% of loss mitigation. From October 12 through November 30, the Fund returned 7.50% relative to the 14.35% return of the S&P 500® Index. Net gains from the Fund’s two-part option strategy provided loss mitigation during market declines, while net losses on options resulted in lagging performance during market rallies.
The Fund’s equity portfolio returned -17.93% in 2022, a performance differential of positive 0.18% versus the S&P 500® Index. Consistent with its investment objective, the measured risk of the Fund was low relative to the US equity market, as its standard deviation of daily returns for 2022 was 12.69% versus 24.18% for the S&P 500® Index.
The Fund began the year with full index put option coverage. However, as the equity market began its decline early in 2022 and implied volatility climbed, the investment team began to identify opportunities to monetize higher volatility being priced into index put contracts, preserve index put gains in the event of a sudden and sharp market recovery, and position the Fund for attractive outcomes in a wider range of market scenarios. These adjustments were made while keeping the Fund’s market exposure relatively consistent with the Fund’s historical risk profile. During the first quarter, the investment team reduced put coverage to an intra-quarter low range of 65% to 80% before incrementally adding index put options and restoring full put coverage by the quarter-end. During the second quarter, active adjustments were aimed at preserving index put gains in the event of a sudden and sharp market recovery, while maintaining the Fund’s typical risk profile. Put coverage reached an intra-quarter low range of 65% to 80%, a range that was maintained from mid-May through the end of the second quarter. In the third quarter, adjustments to put coverage were executed in an effort to position the Fund for attractive outcomes in a wide range of market scenarios while keeping the Fund’s market exposure relatively consistent. Put coverage reached an intra-quarter high range of 80% to 95% before adjustments in September brought coverage into a range of 65% to 80%, a level maintained through the end of the third quarter. During the final quarter of the year, the investment team increased put coverage to a range of 80% to 95% on October 31 and restored full put coverage on November 8, which was maintained through year-end. The increases in put coverage were executed in combination with an adjustment to existing index put positions, and the changes improved the loss mitigation potential of the index put portfolio while lowering the overall potential annualized cost of puts. Index put option contracts were traded in advance of their expirations while keeping weighted-average time to expiration relatively extended.
The Fund maintained a portfolio of written index call options on the full value of its equity holdings over the course of the year while making active adjustments to positions in response to deteriorating market conditions and opportunistically taking advantage of the higher implied volatility that was priced into longer-dated contracts to enhance cash flow potential. The term structure of volatility pricing was highly dynamic over the year and the investment team generally extended weighted-average time to expiration when term structure was steep and shortened when term structure was inverted or flat.
Outlook
Fed Chair Powell announced seven rate increases during 2022, raising the target rate for fed funds to 4.5% at the Fed’s final meeting of the year while indicating the likelihood of more increases in 2023. Returning inflation to more historically normal levels is an admirable goal; however, achieving this without causing painful economic contraction is looking increasingly difficult, as real estate is starting to cool off, the employment picture looks more uncertain, and banks are starting to tighten lending standards.
Despite a challenging economic environment, long-term investors may take comfort from the equity market’s historical resilience and tendency to deliver well-above-average returns after drawdowns exceeding 20%.
Elevated equity market volatility and higher short-term interest rates increase index call option premiums like those written by the Fund. Higher index call option premiums potentially improve the net cash flow generated by the Fund’s two-part option strategy. If current levels of volatility and interest rates persist, or move higher, net cash flow may continue to be an attractive source of lower-risk participation in a potential equity market recovery as well as provide downside protection if there are additional losses between now and the ultimate recovery of the equity market.
| 2
GATEWAY FUND
Top Ten Holdings as of December 31, 2022
| | | | | | | | |
| | | |
| | | | Security Name | | % of Net Assets | |
| | 1 | | | Apple, Inc. | | | 6.18 | % |
| | 2 | | | Microsoft Corp. | | | 5.58 | |
| | 3 | | | Amazon.com, Inc. | | | 2.40 | |
| | 4 | | | Alphabet, Inc., Class C | | | 2.31 | |
| | 5 | | | Berkshire Hathaway, Inc., Class B | | | 2.11 | |
| | 6 | | | UnitedHealth Group, Inc. | | | 1.90 | |
| | 7 | | | JPMorgan Chase & Co. | | | 1.56 | |
| | 8 | | | Exxon Mobil Corp. | | | 1.55 | |
| | 9 | | | Procter & Gamble Co. (The) | | | 1.54 | |
| | 10 | | | Johnson & Johnson | | | 1.46 | |
The portfolio is actively managed and holdings are subject to change. There is no guarantee the Fund continues to invest in the securities referenced. The holdings listed exclude any temporary cash investments, are presented on an individual security basis and do not represent holdings of the issuer.
Hypothetical Growth of $100,000 Investment in Class Y Shares4
December 31, 2012 through December 31, 2022
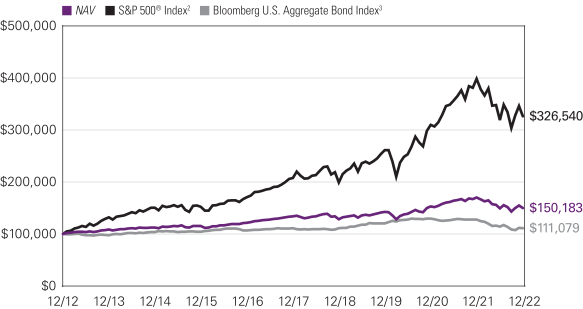
3 |
Average Annual Total Returns – December 31, 20224
| | | | | | | | | | | | | | | | | | | | | | | | |
| | | | | | |
| | | 1 Year | | | 5 Years | | | 10 Years | | | Life of Class N | | | Expense Ratios5 | |
| | Gross | | | Net | |
| | | | | | | |
| Class Y | | | | | | | | | | | | | | | | | | | | | | | | |
| NAV | | | -11.85 | % | | | 2.32 | % | | | 4.15 | % | | | — | % | | | 0.70 | % | | | 0.70 | % |
| | | | | | | |
| Class A | | | | | | | | | | | | | | | | | | | | | | | | |
| NAV | | | -12.06 | | | | 2.08 | | | | 3.90 | | | | — | | | | 0.95 | | | | 0.94 | |
| With 5.75% Maximum Sales Charge | | | -17.11 | | | | 0.88 | | | | 3.29 | | | | — | | | | | | | | | |
| | | | | | | |
| Class C | | | | | | | | | | | | | | | | | | | | | | | | |
| NAV | | | -12.74 | | | | 1.30 | | | | 3.27 | | | | — | | | | 1.70 | | | | 1.70 | |
| With CDSC1 | | | -13.62 | | | | 1.30 | | | | 3.27 | | | | — | | | | | | | | | |
| | | | | | | |
| Class N (Inception 5/1/17) | | | | | | | | | | | | | | | | | | | | | | | | |
| NAV | | | -11.80 | | | | 2.38 | | | | — | | | | 3.14 | | | | 0.64 | | | | 0.64 | |
| | | | | | | |
| Comparative Performance | | | | | | | | | | | | | | | | | | | | | | | | |
| S&P 500® Index2 | | | -18.11 | | | | 9.42 | | | | 12.56 | | | | 10.67 | | | | | | | | | |
| Bloomberg U.S. Aggregate Bond Index3 | | | -13.01 | | | | 0.02 | | | | 1.06 | | | | 0.39 | | | | | | | | | |
Performance data shown represents past performance and is no guarantee of, and not necessarily indicative of, future results. Total return and value will vary, and you may have a gain or loss when shares are sold. Current performance may be lower or higher than quoted. For more recent month-end performance, visit im.natixis.com/performance. Performance for other share classes will be greater or less than shown based on differences in fees and sales charges. You may not invest directly in an index. Performance for periods less than one year is cumulative, not annualized. Returns reflect changes in share price and reinvestment of dividends and capital gains, if any. The table(s) do not reflect taxes shareholders might owe on any fund distributions or when they redeem their shares.
| 1 | Performance for Class C shares assumes a 1% contingent deferred sales charge (“CDSC”) applied when you sell shares within one year of purchase, and includes automatic conversion to Class A shares after eight years. |
| 2 | S&P 500® Index is a widely recognized measure of U.S. stock market performance. It is an unmanaged index of 500 common stocks chosen for market size, liquidity, and industry group representation, among other factors. It also measures the performance of the large cap segment of the US equities market. |
| 3 | Bloomberg U.S. Aggregate Bond Index is a broad-based index that covers the U.S. dollar-denominated, investment-grade, fixed-rate, taxable bond market of SEC-registered securities. The index includes bonds from the Treasury, government-related, corporate, mortgage-backed securities, asset-backed securities, and collateralized mortgage-backed securities sectors. |
| 4 | Fund performance has been increased by fee waivers and/or expense reimbursements, if any, without which performance would have been lower. |
| 5 | Expense ratios are as shown in the Fund’s prospectus in effect as of the date of this report. The expense ratios for the current reporting period can be found in the Financial Highlights section of this report under Ratios to Average Net Assets. Net expenses reflect contractual expense limitations set to expire on 4/30/23. When a Fund’s expenses are below the limitation, gross and net expense ratios will be the same. See Note 6 of the Notes to Financial Statements for more information about the Fund’s expense limitations. |
| 4
GATEWAY EQUITY CALL PREMIUM FUND
| | |
| |
| Managers | | Symbols |
| |
| Daniel M. Ashcraft, CFA® | | Class A GCPAX |
| |
| Michael T. Buckius, CFA® | | Class C GCPCX |
| |
| Kenneth H. Toft, CFA® | | Class N GCPNX |
| |
| Mitchell J. Trotta, CFA® | | Class Y GCPYX |
| |
| Gateway Investment Advisers, LLC | | |
Investment Goal
The Fund seeks total return with less risk than U.S. equity markets.
Market Conditions
Inflation, war and rising interest rates all contributed to equity market losses in 2022. The year ranks as the fourth-worst return for the S&P 500® Index over the last 85 years. The S&P 500® Index posted three consecutive losing quarters and ended the year with a partial recovery. Quarterly returns of -4.60%, -16.10%, -4.88% and 7.56% suggest an incessant market slide followed by a fourth quarter rally; however, the equity market path was more roller coaster than avalanche. The first three quarters each featured double-digit drawdowns, including a 19.69% plunge from April 4 through June 16. The last two quarters featured double-digit rallies that resulted in only partial recoveries, including a 14.35% advance from October 12 through November 30. Concerns over the pace and extent of monetary tightening were a key driver of each market decline, while rallies were mostly ignited by investor hopes of a US Federal Reserve (Fed) policy pivot towards a less hawkish, if not dovish, approach to achieving lower inflation without tipping the economy into recession.
The year also ranked as one of the most volatile on record. Realized volatility for 2022, as measured by the standard deviation of daily returns for the S&P 500® Index, was 24.18%, the eighth highest reading in the past 85 years. Despite beginning the year at an intra-year closing value low of 16.60 on January 3, average implied volatility for the year, as measured by the Cboe® Volatility Index (the VIX®), was higher than realized volatility at 25.64 and ranked as the sixth highest annual average since its 1990 inception. The defining feature of implied volatility in 2022, however, was its persistently above-average readings and relatively muted responses to sharp drops in equity market value. Typically, the VIX® reaches its highest levels when the equity market is at or near its low for the year or during multi-percentage-point plunges. However, its intra-year closing high of 36.45 took place on March 7, well before the equity market reached its low for the year and in advance of the steepest portion of 2022’s bear market decline. The year featured multiple multi-percentage-point single-day declines, including nine that exceeded 3% and two that exceeded 4%, all of which occurred after the intra-year VIX® high on March 7.
Performance Results
For the 12 months ended December 31, 2022, Class Y shares of the Gateway Equity Call Premium Fund returned -11.48% at net asset value. The Fund underperformed its primary benchmark, the Cboe® S&P 500 BuyWriteSM Index (BXMSM), which returned -11.37%. The Fund outperformed its secondary benchmark, the S&P 500® Index, which returned -18.11%.
Explanation of Fund Performance
The Fund invests in a broadly diversified portfolio of common stocks that is designed to track the performance of the S&P 500® Index and support its index option-based risk management strategy as efficiently as possible while seeking to enhance the Fund’s after-tax total return. The Fund seeks to generate returns by writing at- and near-the-money index call options against the full value of its underlying equity portfolio. The steady cash flow from call option writing is intended to be an important source of the Fund’s return, although it reduces the Fund’s ability to profit from increases in the value of its equity portfolio. The index call options written by the Fund often have similar characteristics to the single index call option present in the BXMSM at any given time. However, unlike the BXMSM, the Fund employs an active strategy that gives its management team discretion to diversify expiration dates and strike prices across a portfolio of index call options and to opportunistically pursue attractive call premiums while maintaining a relatively consistent risk profile.
The Fund slightly underperformed its primary benchmark for the period, despite posting better quarterly results than the BXMSM in each of the last three quarters of the year, while achieving the risk component of its objective by exhibiting less risk than the equity market. Underperformance came during the equity market drawdown period of January 3 through March 8, in which the S&P 500® Index returned -12.82% while the BXMSM and the Fund returned -6.03% and -9.14%, respectively. The Fund’s active and diversified approach resulted in a typical amount of market exposure over the course of the drawdown while the rules-based timing of the BXMSM’s replacement of its single written index call option contract resulted in the BXMSM having less exposure to the market
5 |
decline than usual. From March 8 through December 31, the Fund returned -3.16% while the BXMSM and the S&P 500® Index returned -5.94% and -6.67%, respectively.
The Fund’s diversified and active index call option writing approach generated risk-reducing cash flow throughout 2022 while delivering loss mitigation during market declines and strong participation during periods of equity market rebound. Specifically, with quarterly returns of -3.49%, -10.40%, -4.99% and 7.74%, the Fund had smaller losses than the S&P 500® Index in the first two quarters, slightly underperformed in the third quarter and outperformed in the final quarter of the year.
The Fund’s active approach was beneficial during periods of market advance where it was able to outperform its primary benchmark. Specifically, during the equity market’s climb from June 16 through August 16, the Fund returned 11.02% compared to the BXMSM return of 6.57%. Active adjustments to the Fund’s index call option portfolio were also beneficial in generating outperformance relative to the BXMSM during the equity market advance from October 12 through November 30 during which time the Fund rose 10.43% compared to the 8.14% of the BXMSM.
The Fund’s equity portfolio returned -17.91% for the year, a performance differential of positive 0.20% versus the S&P 500® Index. The measured risk of the Fund was lower than that of the US equity market and similar to the BXMSM, as its standard deviation of daily returns for 2022 was 16.84%, versus 24.18% and 16.12% for the S&P 500® Index and the BXMSM, respectively.
Outlook
Fed Chair Powell announced seven rate increases during 2022, raising the target rate for fed funds to 4.5% at the Fed’s final meeting of the year while indicating the likelihood of more increases in 2023. Returning inflation to more historically normal levels is an admirable goal; however, achieving this without causing painful economic contraction is looking increasingly difficult, as real estate is starting to cool off, the employment picture looks more uncertain, and banks are starting to tighten lending standards.
Despite a challenging economic environment, long-term investors may take comfort from the equity market’s historical resilience and tendency to deliver well-above-average returns after drawdowns exceeding 20%.
Elevated equity market volatility and higher short-term interest rates increase index call option premiums like those written by the Fund. Higher index call option premiums potentially improve the net cash flow generated by the Fund’s option writing strategy. If current levels of volatility and interest rates persist, or move higher, net cash flow may continue to be an attractive source of lower-risk participation in a potential equity market recovery as well as provide downside protection if there are additional losses between now and the ultimate recovery of the equity market.
Top Ten Holdings as of December 31, 2022
| | | | | | | | |
| | | |
| | | | Security Name | | % of Net Assets | |
| | 1 | | | Apple, Inc. | | | 6.20 | % |
| | 2 | | | Microsoft Corp. | | | 5.80 | |
| | 3 | | | Amazon.com, Inc. | | | 2.37 | |
| | 4 | | | Alphabet, Inc., Class C | | | 2.27 | |
| | 5 | | | Berkshire Hathaway, Inc., Class B | | | 2.21 | |
| | 6 | | | UnitedHealth Group, Inc. | | | 1.73 | |
| | 7 | | | Exxon Mobil Corp. | | | 1.57 | |
| | 8 | | | Johnson & Johnson | | | 1.54 | |
| | 9 | | | Procter & Gamble Co. (The) | | | 1.48 | |
| | 10 | | | JPMorgan Chase & Co. | | | 1.35 | |
The portfolio is actively managed and holdings are subject to change. There is no guarantee the Fund continues to invest in the securities referenced. The holdings listed exclude any temporary cash investments, are presented on an individual security basis and do not represent holdings of the issuer.
| 6
GATEWAY EQUITY CALL PREMIUM FUND
Hypothetical Growth of $100,000 Investment in Class Y Shares4
September 30, 2014 (inception) through December 31, 2022
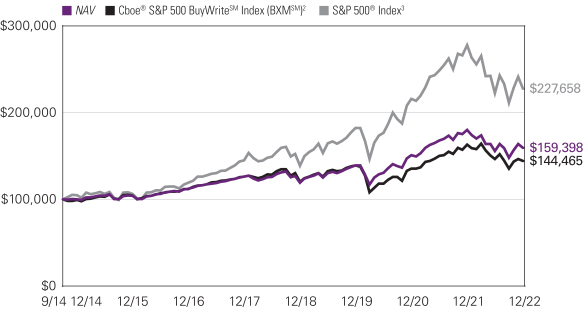
7 |
Average Annual Total Returns – December 31, 20224
| | | | | | | | | | | | | | | | | | | | | | | | |
| | | | | |
| | | 1 Year | | | 5 Years | | | | | | Expense Ratios5 | |
| | Life of Class | | | Gross | | | Net | |
| | | | | | | |
| Class Y (Inception 9/30/14) | | | | | | | | | | | Class Y/A/C | | | | Class N | | | | | | | | | |
| NAV | | | -11.48 | % | | | 4.81 | % | | | 5.82 | % | | | — | % | | | 0.92 | % | | | 0.68 | % |
| | | | | | | |
| Class A (Inception 9/30/14) | | | | | | | | | | | | | | | | | | | | | | | | |
| NAV | | | -11.77 | | | | 4.56 | | | | 5.55 | | | | — | | | | 1.17 | | | | 0.93 | |
| With 5.75% Maximum Sales Charge | | | -16.86 | | | | 3.32 | | | | 4.79 | | | | — | | | | | | | | | |
| | | | | | | |
| Class C (Inception 9/30/14) | | | | | | | | | | | | | | | | | | | | | | | | |
| NAV | | | -12.36 | | | | 3.78 | | | | 4.79 | | | | — | | | | 1.93 | | | | 1.68 | |
| With CDSC1 | | | -13.24 | | | | 3.78 | | | | 4.79 | | | | — | | | | | | | | | |
| | | | | | | |
| Class N (Inception 5/1/17) | | | | | | | | | | | | | | | | | | | | | | | | |
| NAV | | | -11.51 | | | | 4.84 | | | | — | | | | 5.59 | | | | 1.05 | | | | 0.63 | |
| | | | | | | |
| Comparative Performance | | | | | | | | | | | | | | | | | | | | | | | | |
| Cboe® S&P 500 BuyWriteSM Index (BXMSM)2 | | | -11.37 | | | | 2.73 | | | | 4.56 | | | | 3.73 | | | | | | | | | |
| S&P 500® Index3 | | | -18.11 | | | | 9.42 | | | | 10.44 | | | | 10.67 | | | | | | | | | |
Performance data shown represents past performance and is no guarantee of, and not necessarily indicative of, future results. Total return and value will vary, and you may have a gain or loss when shares are sold. Current performance may be lower or higher than quoted. For most recent month-end performance, visit im.natixis.com/performance. Performance for other share classes will be greater or less than shown based on differences in fees and sales charges. You may not invest directly in an index. Performance for periods less than one year is cumulative, not annualized. Returns reflect changes in share price and reinvestment of dividends and capital gains, if any. The table(s) do not reflect taxes shareholders might owe on any fund distributions or when they redeem their shares.
| 1 | Performance for Class C shares assumes a 1% contingent deferred sales charge (“CDSC”) applied when you sell shares within one year of purchase, and includes automatic conversion to Class A shares after eight years. |
| 2 | Cboe® S&P 500 BuyWriteSM Index (BXMSM) is a benchmark index designed to track the performance of a hypothetical buy-write strategy on the S&P 500® Index. The BXM is a passive total return index based on (1) buying an S&P 500 stock index portfolio, and (2) “writing” (or selling) the near-term S&P 500® Index (SPXSM) “covered” call option, generally on the third Friday of each month. The SPX call written will have about one month remaining to expiration, with an exercise price just above the prevailing index level (i.e., slightly out of the money). The SPX call is held until expiration and cash settled, at which time a new one-month, near-the-money call is written. |
| 3 | S&P 500® Index is a widely recognized measure of U.S. stock market performance. It is an unmanaged index of 500 common stocks chosen for market size, liquidity, and industry group representation, among other factors. It also measures the performance of the large cap segment of the US equities market. |
| 4 | Fund performance has been increased by fee waivers and/or expense reimbursements, if any, without which performance would have been lower. |
| 5 | Expense ratios are as shown in the Fund’s prospectus in effect as of the date of this report. The expense ratios for the current reporting period can be found in the Financial Highlights section of this report under Ratios to Average Net Assets. Net expenses reflect contractual expense limitations set to expire on 4/30/23. When a Fund’s expenses are below the limitation, gross and net expense ratios will be the same. See Note 6 of the Notes to Financial Statements for more information about the Fund’s expense limitations. |
| 8
MIROVA GLOBAL GREEN BOND FUND
| | |
| |
| Managers | | Symbols |
| |
| Marc Briand | | Class A MGGAX |
| |
| Charles Portier | | Class N MGGNX |
| |
| Bertrand Rocher | | Class Y MGGYX |
| |
| Mirova US LLC | | |
Investment Goal
The Fund seeks to provide total return, through a combination of capital appreciation and current income, by investing in green bonds.
Market Conditions
The year 2022 marked the collective realization that many factors could no longer be considered as established: This is the case with peace in Europe, and consequently, unlimited access to energy, and low inflation.
At the beginning of the year, central banks therefore changed their tone one after the other, suggesting monetary tightening earlier and stronger than initially expected. The conflict in Ukraine was initiated and then deepened, and discussions around an embargo on Russian oil in Europe reinforced the lasting nature of its impact on price increases, further reinforcing this need for monetary tightening, even if it meant eroding the potential for economic growth.
The zero-Covid strategy in China also penalized risky assets throughout the year. The lockdown slowed activity both in the country and internationally, aggravating fears of inflation peaks linked to a slowdown, if not a halt, in production chains.
The second half of the year was therefore quite logically that of rate hikes by central banks with magnitudes rarely seen in the last three decades in financial markets: 0.75% for the European Central Bank (ECB) and the US Federal Reserve (Fed), the Bank of Canada, the Swiss National Bank and even 1% from Sweden’s Riksbank.
At the end of the year, investors were looking for the “pivot” in monetary policy, but this did not seem to be on the agenda despite the first signs of slowing inflation. The fight against inflation will therefore continue, with undoubtedly less intensity, but over a longer period of time.
Performance Results
For the 12 months ending December 31, 2022, Class Y shares of the Mirova Global Green Bond Fund returned -16.45% at net asset value. The Fund outperformed its benchmark, the Bloomberg MSCI Global Green Bond Index – USD Hedged, which returned -17.01%.
Explanation of Fund Performance
During 2022, allocation had a positive impact on performance relative to the benchmark, due to an overweight position in corporates versus government-related and sovereigns. Credit spreads widened from January until October and offered opportunities to reinforce the credit exposure in the Fund; we increased exposure in the capital goods, utility, telecommunication and cyclical sub-sectors. Credit exposure increased from an 8% overweight versus the index at the end of 2021 to an overweight of 24% by the end of 2022.
Security selection detracted from relative performance, mainly within the corporate sector. The largest individual detractors were among the corporate holdings: Citycon, Faurecia, and Ford Motor Company. These are high-beta issuances, which underperformed in the context of a “risk-off” environment.
The duration and yield curve strategy of the Fund added value relative to the benchmark as the Fund had shorter duration positioning on both the US and euro zone.
Outlook
Since the first half of 2022, we believed the question was no longer so much about whether there would be a recession on both sides of the Atlantic and in China, but i) how deep and how long the recession would be, and ii) from when it would start curbing inflation. We also believed that the United States would be able to stabilize and then lower inflation without degrading economic growth potential too much, particularly thanks to the better responsiveness of the Fed. We now consider that North America may even avoid a recession, but the situation seems much more difficult for Europe. This is partly because of the ECB’s procrastination due to less room to maneuver, which requires it to find alternative tools such as the TPI (Transmission Protection Instrument) dedicated to supporting Italy and thus preserving the euro. We also long insisted that even if inflation was to stop accelerating, households would
9 |
probably find it hard to absorb it without slashing discretionary spending. We still believe this will weigh on economic prospects in the euro zone.
At the same time, the conflict in Ukraine continues with the markets appearing to not pay much attention to it: It was a neglect on their part because the very successful counteroffensive of the Ukrainian armed forces towards Kharkov was in our view opening a new phase, paradoxically far more dangerous, in particular due to the increased political pressure towards Vladimir Putin, forced to employ increased means to move towards a total war pattern, which the latest events have unfortunately confirmed. We still do not claim to know what the outcome will be, but we reiterate that the level of risk is rising significantly with potentially daunting consequences for Europe. In other words, the dichotomy we were already seeing settling between Europe and North America will become more intense. We have long argued rates would not necessarily fall there, however, as the ECB has to maintain the value of the euro to mitigate the effects of tension on commodity prices, especially given the Fed’s dedication to hike rates: We maintain this stance.
Hypothetical Growth of $100,000 Investment in Class Y Shares2
February 28, 2017 (inception) through December 31, 2022
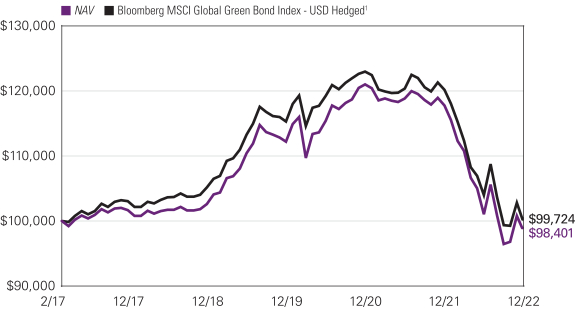
See notes to chart on page 11.
| 10
MIROVA GLOBAL GREEN BOND FUND
Average Annual Total Returns – December 31, 20222
| | | | | | | | | | | | | | | | | | | | |
| | | | | |
| | | 1 Year | | | 5 Year | | | Life of Fund | | | Expense Ratios3 | |
| | Gross | | | Net | |
| | | | | | |
| Class Y (Inception 2/28/17) | | | | | | | | | | | | | | | | | | | | |
| NAV | | | -16.45 | % | | | -0.66 | % | | | -0.28 | % | | | 1.14 | % | | | 0.69 | % |
| | | | | | |
| Class A (Inception 2/28/17) | | | | | | | | | | | | | | | | | | | | |
| NAV | | | -16.73 | | | | -0.92 | | | | -0.55 | | | | 1.39 | | | | 0.94 | |
| With 4.25% Maximum Sales Charge | | | -20.27 | | | | -1.78 | | | | -1.28 | | | | | | | | | |
| | | | | | |
| Class N (Inception 2/28/17) | | | | | | | | | | | | | | | | | | | | |
| NAV | | | -16.42 | | | | -0.62 | | | | -0.23 | | | | 1.03 | | | | 0.64 | |
| | | | | | |
| Comparative Performance | | | | | | | | | | | | | | | | | | | | |
| Bloomberg MSCI Global Green Bond Index – USD Hedged1 | | | -17.01 | | | | -0.65 | | | | -0.05 | | | | | | | | | |
Performance data shown represents past performance and is no guarantee of, and not necessarily indicative of, future results. Total return and value will vary, and you may have a gain or loss when shares are sold. Current performance may be lower or higher than quoted. For most recent month-end performance, visit im.natixis.com/performance. Performance for other share classes will be greater or less than shown based on differences in fees and sales charges. You may not invest directly in an index. Performance for periods less than one year is cumulative, not annualized. Returns reflect changes in share price and reinvestment of dividends and capital gains, if any. The table(s) do not reflect taxes shareholders might owe on any fund distributions or when they redeem their shares.
| 1 | Bloomberg MSCI Global Green Bond Index – USD Hedged provides a broad-based measure of global fixed-income securities issued to fund projects with direct environmental benefits according to MSCI ESG Research’s green bond criteria. The green bonds are primarily investment-grade, or may be classified by other sources when bond ratings are not available. The Index may include green bonds from the corporate, securitized, Treasury, or government-related sectors. |
| 2 | Fund performance has been increased by fee waivers and/or expense reimbursements, if any, without which performance would have been lower. |
| 3 | Expense ratios are as shown in the Fund’s prospectus in effect as of the date of this report. The expense ratios for the current reporting period can be found in the Financial Highlights section of this report under Ratios to Average Net Assets. Net expenses reflect contractual expense limitations set to expire on 4/30/23. When a Fund’s expenses are below the limitation, gross and net expense ratios will be the same. See Note 6 of the Notes to Financial Statements for more information about the Fund’s expense limitations. |
11 |
MIROVA GLOBAL SUSTAINABLE EQUITY FUND
| | |
| |
| Managers | | Symbols |
| |
| Jens Peers, CFA® | | Class A ESGMX |
| |
| Hua Cheng, PhD, CFA® | | Class C ESGCX |
| |
| Amber Fairbanks, CFA®* | | Class N ESGNX |
| |
| Soliane Varlet** | | Class Y ESGYX |
| |
| Mirova US LLC | | |
| * | Effective December 23, 2022, Ms. Fairbanks no longer serves as portfolio manager of the Fund. |
| ** | Effective December 27, 2022, Ms. Varlet serves as portfolio manager of the Fund. |
Investment Goal
The Fund seeks long-term capital appreciation.
Market Conditions
2022 proved to be a volatile year for global equity markets, with broad market indexes declining in each of the first three quarters of the year – the first time since the Great Financial Crisis global equities posted losses three quarters in a row. As inflation reached multi-decade highs, many central banks globally raised interest rates to fight inflation, global supply chains remained constrained, and geopolitical tensions remained high in Europe (Russia’s war) and Asia. While the consumer generally remained strong, recession fears became more in focus toward the end of the year, as it was clear that central bankers were willing to accept slowing economic growth and possible recession in order to curb inflation. The European economy was under increased pressure as the region grappled with surging energy and food prices as a result of the Russia/Ukraine conflict. While many European governments ordered the resumption of certain coal- and oil-based power utility operations in an effort to ensure energy supply security in the short term, the longer-term energy transition remains intact, and was likely strengthened as a result of the Russia/Ukraine conflict, as the need for Europe to move toward energy independence was reinforced and alternative energy will need to be a part of that. In the US, the Inflation Reduction Act (IRA) was signed into law in August, which includes historic climate legislation, setting aside ~$400bn for climate and clean energy-related initiatives. Global equity markets ended the year on a more positive, albeit still volatile, note as central bankers took on a more dovish tone, pressure was reduced on energy supplies due to Europe’s mild start to the winter, investors reacted to the potential easing of Covid restrictions in China, and global supply chain constraints eased somewhat.
As a result of high inflation and rising interest rates, longer-duration, growth-oriented stocks underperformed for the year as future cash flows are worth less in a higher rate environment. In terms of sector performance, traditional Energy outperformed strongly during the year, particularly following Russia’s invasion of Ukraine, driven by supply constraints and strong ongoing demand. Traditionally defensive sectors like Utilities, Health Care and Consumer Staples also held up better than the broad market amid growth and recession fears. The Communication Services, Consumer Discretionary and Information Technology sectors performed worst as longer-duration growth stocks underperformed on rising interest rates. By geography, developed markets generally outperformed emerging markets, while, in developed markets, European equities underperformed the US for most of the year given the difficult economic and geopolitical backdrop. European equities outperformed US markets to finish the year, as US markets were held back following weaker-than-expected third-quarter earnings and forward guidance for many of the widely held US large-cap tech and consumer names. European names saw some relief, supported by already depressed valuations, and as investors reacted to softer inflation data and a mild start to the European winter – a positive for energy supplies.
Performance Results
For the 12 months ending December 31, 2022, Class Y shares of the Mirova Global Sustainable Equity Fund returned -22.33% at net asset value. The Fund underperformed its benchmark, the MSCI World Index (Net), which returned -18.14%.
Explanation of Fund Performance
Underperformance relative to the benchmark during the period was driven mainly by security selection within the Materials and Financials sectors. More broadly, the portfolio’s lack of exposure to the traditional Energy sector was a relative detractor given the sector’s strong performance relative to the broad market. The strategy’s focus on long-term secular trends around the environment, technology, demographics, and governance often results in a growth bias to the portfolio, and many longer-duration stocks in the portfolio sold off during the year. The portfolio’s overweight to the Information Technology sector detracted as a result as well.
In terms of security selection, within the Materials sector, Ecolab was the largest relative detractor, with the majority of the stock’s year-to-date underperformance occurring during the first two months of the year after the company issued poor guidance indicating their end markets in hospitality had not fully recovered from Covid. Within Materials, the market also rotated into more cyclically exposed, lower quality companies that were expected to benefit from rising commodity prices, such as metals & mining where the portfolio has no
| 12
MIROVA GLOBAL SUSTAINABLE EQUITY FUND
exposure. Within Financials, Signature Bank was the largest relative detractor due in part to the macro backdrop and in part to digital asset volatility and investors’ reaction to this volatility. While the company is not involved in digital assets directly, a portion of its customers’ deposits is tied to the digital asset industry, and the company’s stock price came under pressure as a result of this reaction.
The worst performers overall for the period were Orpea and Signature Bank. French owner and operator of elderly care homes Orpea was a company that we had been actively engaging with following controversies that came to light in January 2022 including mistreatment of patients and misallocation of public funds. We proposed that it become a mission-driven company under French law to improve transparency and its HR policy, thus helping employees improve their care for the elderly. We had seen positive early signs from the new management team. From a portfolio management perspective, our initial rationale to invest in Orpea was its position as a global leader in elderly care and nursing home facilities – an incredibly important space with excellent long-term opportunities. Valuation was very attractive when the position was initiated, and we continued to see upside potential in the stock following the controversy coming to light based on updated valuation models. Even in our worst-case scenario, there was a slight upside. Financially, we still were motivated to maintain the position while we waited to see improvement as a result of our engagement efforts. Unfortunately, that changed when Orpea issued preliminary first-half results in September, which showed a decline in the company’s financial performance that was expected to continue for the second half of the year. At the same time, the company needed to confirm whether debt covenants could be met. While engagement with the company continued to be important from an ESG perspective, from a financial perspective we were not willing to hold the risk in the portfolio. As a result of low liquidity and higher risk, we ultimately decided to remove Orpea from the portfolio in September.
Contributors to relative results included the portfolio’s underweight to the Communications Services sector, the worst-performing sector in the index, as well as the overweight to the more defensive Health Care and Utilities sectors. Security selection in Information Technology was also additive. Within Information Technology, Mastercard and Visa were the top relative contributors as both stocks held up much better than the broader sector throughout the year.
The best performers overall for the period were global leaders on diabetes and obesity treatments Eli Lilly and Novo Nordisk. Eli Lilly performed well on continued optimism on the opportunity related to the company’s novel treatment for diabetes and obesity as well as positive results from Biogen’s late-stage studies on its Alzheimer’s disease treatment. Novo Nordisk performed well given its robust core business in diabetes and obesity with expected double-digit revenue growth and encouraging ongoing trials.
Finally, while the portfolio’s overweight to Europe and underweight to the US detracted from relative results during the earlier part of the period, underperformance of US equities in the last few months of the year led to a net positive impact overall for the full year.
We made several adjustments to the portfolio during the year, and broadly believe the portfolio is composed of high-quality companies that are well positioned to address long-term secular trends and are trading at very attractive valuations. During the year, we exited positions in Oracle, Geberit, Valeo, Allianz, Orpea, and Prudential plc., and initiated positions in Mercedes-Benz, Credit Agricole, Verizon, SVB Financial, Deere, and Edwards Lifesciences.
Outlook
Looking ahead to 2023, we expect continued volatility in equity markets, driven by many of the same issues markets faced in 2022. We expect a significant slowdown in economic activity in the first half of the year driven by central banks increasing interest rates to fight inflation. We continue to work under the assumption of higher inflation for longer, which is likely to lead to recession in both Europe and the US. The situation in Asia is a bit different, and the reopening of China’s economy may help ease global supply chain constraints and support economic growth, though this is likely to be fragile as reopening is likely to lead to pressure on the health care system. We think that many central banks will continue to raise interest rates to fight inflation at least in the beginning of the year, impacting short-term interest rates. The good news is we believe we may have already seen inflation peak in the US at the end of 2022 and may be nearing the peak in Europe and other regions, meaning the probability of higher long-term interest rates is quite low. That said, we believe that inflation will be higher than it has been historically and for longer, buoyed in part by shifting supply chain practices where companies and industries as a whole are rethinking global supply chains, as companies and regions seek to reduce dependence on countries with autocratic regimes as well as those with restrictive Covid policies. After decades of globalization and outsourcing production to low-cost countries and, less visibly, social and environmental problems, bringing this closer to home will be a costly and lengthy process. Shifting global supply chains will be an in-focus theme for us in 2023, leading to more opportunities related to industrial automation and optimization of industrial processes across industries.
Energy and energy security will continue to be a big theme in 2023. In the near term, the biggest risks to the downside, in our view, include an escalation in the Russia/Ukraine conflict and the potential for Russia to leverage its oil and gas supplies to apply political pressure as the impact on the European economy would be immense. While short-term solutions such as importing liquid natural gas from other countries will be used, renewable energy is the only solution for Europe’s energy security in the long term and can make the region truly energy independent. This should have a positive effect on wind, solar, and large-scale energy storage solutions such as hydrogen. It could take a few years, however, before this translates into higher earnings, but we will see much more research and
13 |
development in the space. High energy prices are also expected to have a positive impact on energy-efficient solutions for both the private and the corporate market. The passing of the IRA in the US to some extent reinforces our conviction in the environmental transition, as the path ahead for the US seems clearer for the time being. Our portfolios are already well positioned within this context.
The final big theme for 2023 that we are watching closely is on biodiversity and our food systems. We see the focus on these themes strengthening in 2023 and beyond, driven by the increasing impact of Gen Z and awareness of the impact our food systems and human activities more broadly have on climate and biodiversity. For example, we see more opportunities emerging in companies offering solutions for sustainable land management and food production, ingredients and bioscience, water technology and sustainable packaging.
While volatility may remain high and we may see a recession in Europe and in the US in the first half of the year, valuations have become much more attractive in many parts of the market and are already reflecting much of the near-term risk we see, and we believe we could see a recovery in the second half of the year. Our global portfolio is well positioned with this in mind given our overweight in European equities and underweight to the US, positioning which has been driven by our bottom-up valuation discipline where we have been able to identify attractive valuation opportunities outside the US. We believe the portfolios are well positioned for both a recession and subsequent recovery. Our approach to security selection has led to our portfolios being overweight areas like utilities, health care, and food and beverages, sectors that tend to be more defensive in recessionary environments. We also know that due to trends like population growth and generational shifts, these sectors tend to do well also in a normal economic environment. However, if we do get a recovery, we also believe that renewable energy and the digitalization of our economy will also lead to many investment opportunities, areas that we have strong exposure to in the portfolios.
Equity valuations have been impacted significantly in 2022 by rising interest rates, with that impact the highest on companies, sectors and themes with long-term visibility of cashflow generation. Because we expect that inflation will peak around end-of-2022 levels, we believe that those are the areas that are the most attractive from a valuation perspective now. We’re looking at companies within themes such as renewable energy and health care, but also at digitalization of our economy and may find opportunities to add names or add to existing holdings that have been hit hard already, but selectivity will continue to be key. In general, we like high-quality companies and, especially when interest rates are high, know that companies with larger amounts of debt on their balance sheets and those that may need to refinance that debt will find it more difficult to generate strong earnings growth. Therefore, we continue to focus the portfolio as a whole on high-quality companies with strong balance sheets.
Maintaining a long-term perspective and a focus on fundamentals is key in difficult environments. If we look beyond the short term, nothing has changed regarding the long-term demographic, environmental, technological and governance trends shifting the economy we focus on, such as aging population, climate change and digitalization. These trends are secular in nature. We continue to focus on individual company fundamentals to ensure that the fundamentals or the long-term theses on the companies have not changed. Overall, while our portfolios may have to endure a challenging environment in the short term, we believe that the portfolios are well positioned with high-quality companies addressing long-term thematic (secular) growth trends, believe that underlying fundamentals remain strong, and will continue to take advantage of disconnects between current stock prices and long-term value of companies.
Top Ten Holdings as of December 31, 2022
| | | | | | | | |
| | | |
| | | | Security Name | | % of Net Assets | |
| | 1 | | | Thermo Fisher Scientific, Inc. | | | 4.97 | % |
| | 2 | | | Mastercard, Inc., Class A | | | 4.75 | |
| | 3 | | | Novo Nordisk A/S, Class B | | | 4.73 | |
| | 4 | | | Microsoft Corp. | | | 4.42 | |
| | 5 | | | Roper Technologies, Inc. | | | 3.41 | |
| | 6 | | | Iberdrola S.A. | | | 3.41 | |
| | 7 | | | eBay, Inc. | | | 3.24 | |
| | 8 | | | Ecolab, Inc. | | | 3.20 | |
| | 9 | | | Visa, Inc., Class A | | | 2.89 | |
| | 10 | | | AIA Group Ltd. | | | 2.88 | |
The portfolio is actively managed and holdings are subject to change. There is no guarantee the Fund continues to invest in the securities referenced. The holdings listed exclude any temporary cash investments, are presented on an individual security basis and do not represent holdings of the issuer.
| 14
MIROVA GLOBAL SUSTAINABLE EQUITY FUND
Hypothetical Growth of $100,000 Investment in Class Y Shares3
March 31, 2016 (inception) through December 31, 2022
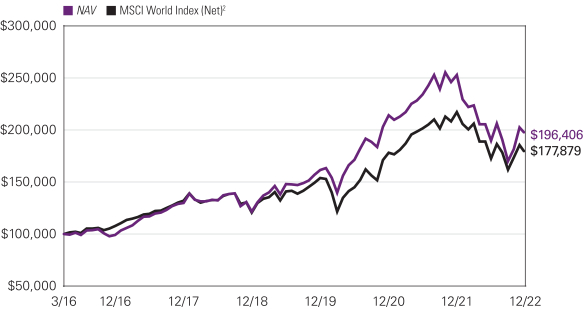
Average Annual Total Returns – December 31, 20223
| | | | | | | | | | | | | | | | | | | | | | | | |
| | | | | |
| | | 1 Year | | | 5 Years | | | Life of Class | | | Expense Ratios4 | |
| | Gross | | | Net | |
| | | | | | | |
| Class Y (Inception 3/31/16) | | | | | | | | | | | Class Y/A/C | | | | Class N | | | | | | | | | |
| NAV | | | -22.33 | % | | | 8.63 | % | | | 10.51 | % | | | — | % | | | 0.99 | % | | | 0.96 | % |
| | | | | | | |
| Class A (Inception 3/31/16) | | | | | | | | | | | | | | | | | | | | | | | | |
| NAV | | | -22.56 | | | | 8.35 | | | | 10.24 | | | | — | | | | 1.24 | | | | 1.21 | |
| With 5.75% Maximum Sales Charge | | | -27.00 | | | | 7.08 | | | | 9.28 | | | | — | | | | | | | | | |
| | | | | | | |
| Class C (Inception 3/31/16) | | | | | | | | | | | | | | | | | | | | | | | | |
| NAV | | | -23.11 | | | | 7.55 | | | | 9.41 | | | | — | | | | 1.99 | | | | 1.96 | |
| With CDSC1 | | | -23.84 | | | | 7.55 | | | | 9.41 | | | | — | | | | | | | | | |
| | | | | | | |
| Class N (Inception 5/1/17) | | | | | | | | | | | | | | | | | | | | | | | | |
| NAV | | | -22.32 | | | | 8.68 | | | | — | | | | 10.27 | | | | 0.91 | | | | 0.91 | |
| | | | | | | |
| Comparative Performance | | | | | | | | | | | | | | | | | | | | | | | | |
| MSCI World Index (Net)2 | | | -18.14 | | | | 6.14 | | | | 8.85 | | | | 7.69 | | | | | | | | | |
Performance data shown represents past performance and is no guarantee of, and not necessarily indicative of, future results. Total return and value will vary, and you may have a gain or loss when shares are sold. Current performance may be lower or higher than quoted. For most recent month-end performance, visit im.natixis.com/performance. Performance for other share classes will be greater or less than shown based on differences in fees and sales charges. You may not invest directly in an index. Performance for periods less than one year is cumulative, not annualized. Returns reflect changes in share price and reinvestment of dividends and capital gains, if any. The table(s) do not reflect taxes shareholders might owe on any fund distributions or when they redeem their shares.
| 1 | Performance for Class C shares assumes a 1.00% contingent deferred sales charge (“CDSC”) applied when you sell shares within one year of purchase, and includes automatic conversion to Class A shares after eight years. |
| 2 | MSCI World Index (Net) is an unmanaged index that is designed to measure the equity market performance of developed markets. It is composed of common stocks of companies representative of the market structure of developed market countries in North America, Europe, and the Asia/Pacific Region. The index is calculated without dividends, with net or with gross dividends reinvested, in both U.S. dollars and local currencies. |
| 3 | Fund performance has been increased by fee waivers and/or expense reimbursements, if any, without which performance would have been lower. |
| 4 | Expense ratios are as shown in the Fund’s prospectus in effect as of the date of this report. The expense ratios for the current reporting period can be found in the Financial Highlights section of this report under Ratios to Average Net Assets. Net expenses reflect contractual expense limitations set to expire on 4/30/23. When a Fund’s expenses are below the limitation, gross and net expense ratios will be the same. See Note 6 of the Notes to Financial Statements for more information about the Fund’s expense limitations. |
15 |
MIROVA INTERNATIONAL SUSTAINABLE EQUITY FUND
| | |
| |
| Managers | | Symbols |
| |
| Jens Peers, CFA® | | Class A MRVAX |
| |
| Hua Cheng, PhD, CFA® | | Class N MRVNX |
| |
| Amber Fairbanks, CFA® * | | Class Y MRVYX |
| |
| Soliane Varlet** | | |
|
| Mirova US LLC |
| * | Effective December 23, 2022, Ms. Fairbanks no longer serves as portfolio manager of the Fund. |
| ** | Effective December 27, 2022, Ms. Varlet serves as portfolio manager of the Fund. |
Investment Goal
The Fund seeks long-term capital appreciation.
Market Conditions
2022 proved to be a volatile year for global equity markets, with broad market indexes declining in each of the first three quarters of the year – the first time since the Great Financial Crisis global equities posted losses three quarters in a row. As inflation reached multi-decade highs, many central banks globally raised interest rates to fight inflation, global supply chains remained constrained, and geopolitical tensions remained high in Europe (Russia’s war) and Asia. While the consumer generally remained strong, recession fears became more in focus toward the end of the year, as it was clear that central bankers were willing to accept slowing economic growth and possible recession in order to curb inflation. The European economy was under increased pressure as the region grappled with surging energy and food prices as a result of the Russia/Ukraine conflict. While many European governments ordered the resumption of certain coal- and oil-based power utility operations in an effort to ensure energy supply security in the short term, the longer-term energy transition remains intact, and was likely strengthened as a result of the Russia/Ukraine conflict, as the need for Europe to move toward energy independence was reinforced and alternative energy will need to be a part of that. In the US, the Inflation Reduction Act (IRA) was signed into law in August, which includes historic climate legislation, setting aside ~$400bn for climate and clean energy-related initiatives. Global equity markets ended the year on a more positive, albeit still volatile, note as central bankers took on a more dovish tone, pressure was reduced on energy supplies due to Europe’s mild start to the winter, investors reacted to the potential easing of Covid restrictions in China, and global supply chain constraints eased somewhat.
As a result of high inflation and rising interest rates, longer-duration, growth-oriented stocks underperformed for the year as future cash flows are worth less in a higher rate environment. In terms of sector performance, traditional Energy outperformed strongly during the year, particularly following Russia’s invasion of Ukraine, driven by supply constraints and strong ongoing demand. Traditionally defensive sectors like Utilities, Health Care and Consumer Staples also held up better than the broad market amid growth and recession fears. The Communication Services, Consumer Discretionary and Information Technology sectors performed worst as longer-duration growth stocks underperformed on rising interest rates. By geography, developed markets generally outperformed emerging markets, while, in developed markets, European equities underperformed the US for most of the year given the difficult economic and geopolitical backdrop. European equities outperformed US markets to finish the year, as US markets were held back following weaker-than-expected third-quarter earnings and forward guidance for many of the widely held US large-cap tech and consumer names. European names saw some relief, supported by already depressed valuations, and as investors reacted to softer inflation data and a mild start to the European winter – a positive for energy supplies.
Performance Results
For the 12 months ending December 31, 2022, Class Y shares of the Mirova International Sustainable Equity Fund returned -24.18% at net asset value. The Fund underperformed its benchmark, the MSCI EAFE Index (Net), which returned -14.45%.
Explanation of Fund Performance
Underperformance relative to the benchmark during the period was driven mainly by security selection, particularly within the Industrials and Materials sectors. More broadly, the portfolio’s lack of exposure to the traditional Energy sector was a relative detractor given the sector’s strong performance relative to the broad market. The strategy’s focus on long-term secular trends around the environment, technology, demographics, and governance often results in a growth bias to the portfolio, and many longer-duration stocks in the portfolio sold off during the year. The portfolio’s overweight to the Information Technology sector was a main detractor as a result as well.
In terms of security selection, within the Industrials sector, high-performance insulation solutions company Kingspan Group was the largest relative detractor. Kingspan was impacted by a slowdown in construction markets and investors reacted negatively to management’s lack of visibility beyond a few months. Medium- and longer-term, we believe Kingspan is still attractive given its
| 16
MIROVA INTERNATIONAL SUSTAINABLE EQUITY FUND
strategic positioning and innovative products and the need for energy-efficiency solutions. Certain stocks within Materials underperformed (mainly during the first half of the year), particularly higher quality companies such as specialty chemicals company Croda, as the market rotated into more cyclically exposed, lower quality companies that were expected to benefit from rising commodity prices, such as metals & mining where the portfolio has no exposure.
The worst performers overall for the period were Orpea and Kingspan Group. French owner and operator of elderly care homes Orpea was a company that we had been actively engaging with following controversies that came to light in January 2022 including mistreatment of patients and misallocation of public funds. We proposed that it become a mission-driven company under French law to improve transparency and their HR policy, thus helping employees improve their care for the elderly. We had seen positive early signs from the new management team. From a portfolio management perspective, our initial rationale to invest in Orpea was its position as a global leader in elderly care and nursing home facilities – an incredibly important space with excellent long-term opportunities. Valuation was very attractive when the position was initiated, and we continued to see upside potential in the stock following the controversy coming to light based on updated valuation models. Even in our worst-case scenario, there was slight upside. Financially, we still were motivated to maintain the position while we waited to see improvement as a result of our engagement efforts. Unfortunately, that changed when Orpea issued preliminary first-half results in September, which showed a decline in the company’s financial performance that was expected to continue for the second half of the year. At the same time, the company needed to confirm whether debt covenants could be met. While engagement with the company continued to be important from an ESG perspective, from a financial perspective we were not willing to hold the risk in the portfolio. As a result of low liquidity and higher risk, we ultimately decided to remove Orpea from the portfolio in September.
Contributors to relative results included the portfolio’s underweight to the Consumer Discretionary sector and security selection in Health Care. Within Health Care, Novo Nordisk and Takeda Pharmaceutical were the largest relative contributors, and the best performers overall for the period. Global leader on diabetes and obesity treatments Novo Nordisk performed well given its robust core business on diabetes and obesity, with expected double-digit revenue growth and encouraging ongoing trials. Takeda performed well as the company delivered strong first-half 2022 financial results and reconfirmed management guidance for the full year alongside receipt of the first approval for its dengue vaccine and other pipeline milestones.
We made several adjustments to the portfolio during the year, and broadly believe the portfolio is composed of high-quality companies that are well positioned to address long-term secular trends and are trading at very attractive valuations. During the year, in addition to exiting Orpea, we exited positions in Valeo and Allianz, and initiated a position in Mercedes-Benz.
Outlook
Looking ahead to 2023, we expect continued volatility in equity markets, driven by many of the same issues markets faced in 2022. We expect a significant slowdown in economic activity in the first half of the year driven by central banks increasing interest rates to fight inflation. We continue to work under the assumption of higher inflation for longer, which is likely to lead to recession in both Europe and the US. The situation in Asia is a bit different, and the reopening of China’s economy may help ease global supply chain constraints and support economic growth, though this is likely to be fragile as reopening is likely to lead to pressure on the health care system. We think that many central banks will continue to raise interest rates to fight inflation at least in the beginning of the year, impacting short-term interest rates. The good news is we believe we may have already seen inflation peak in the US at the end of 2022 and may be nearing the peak in Europe and other regions, meaning the probability of higher long-term interest rates is quite low. That said, we believe that inflation will be higher than it has been historically and for longer, buoyed in part by shifting supply chain practices where companies and industries as a whole are rethinking global supply chains, as companies and regions seek to reduce dependence on countries with autocratic regimes as well as those with restrictive Covid policies. After decades of globalization and outsourcing production to low-cost countries and, less visibly, social and environmental problems, bringing this closer to home will be a costly and lengthy process. Shifting global supply chains will be an in-focus theme for us in 2023, leading to more opportunities related to industrial automation and optimization of industrial processes across industries.
Energy and energy security will continue to be a big theme in 2023. In the near term, the biggest risks to the downside, in our view, include an escalation in the Russia/Ukraine conflict and the potential for Russia to leverage its oil and gas supplies to apply political pressure as the impact on the European economy would be immense. While short-term solutions such as importing liquid natural gas from other countries will be used, renewable energy is the only solution for Europe’s energy security in the long term and can make the region truly energy independent. This should have a positive effect on wind, solar, and large-scale energy storage solutions such as hydrogen. It could take a few years, however, before this translates into higher earnings, but we will see much more research and development in the space. High energy prices are also expected to have a positive impact on energy-efficient solutions for both the private and the corporate market. The passing of the IRA in the US to some extent reinforces our conviction in the environmental transition, as the path ahead for the US seems clearer for the time being. Our portfolios are already well positioned within this context.
17 |
The final big theme for 2023 that we are watching closely is on biodiversity and our food systems. We see the focus on these themes strengthening in 2023 and beyond, driven by the increasing impact of Gen Z and awareness of the impact our food systems and human activities more broadly have on climate and biodiversity. For example, we see more opportunities emerging in companies offering solutions for sustainable land management and food production, ingredients and bioscience, water technology and sustainable packaging.
While volatility may remain high and we may see a recession in Europe and in the US in the first half of the year, valuations have become much more attractive in many parts of the market and are already reflecting much of the near-term risk we see, and we believe we could see a recovery in the second half of the year. We believe the portfolios are well positioned for both a recession and subsequent recovery. Our approach to security selection has led to our portfolios being overweight areas like utilities, health care, and food and beverages, sectors that tend to be more defensive in recessionary environments. We also know that due to trends like population growth and generational shifts, these sectors tend to do well also in a normal economic environment. However, if we do get a recovery, we also believe that renewable energy and the digitalization of our economy will also lead to many investment opportunities, areas that we have strong exposure to in the portfolios.
Equity valuations have been impacted significantly in 2022 by rising interest rates, with that impact the highest on companies, sectors and themes with long-term visibility of cashflow generation. Because we expect that inflation will peak around end-of-2022 levels, we believe that those are the areas that are the most attractive from a valuation perspective now. We’re looking at companies within themes such as renewable energy and health care, but also at digitalization of our economy and may find opportunities to add names or add to existing holdings that have been hit hard already, but selectivity will continue to be key. In general, we like high-quality companies and, especially when interest rates are high, know that companies with larger amounts of debt on their balance sheets and those that may need to refinance that debt will find it more difficult to generate strong earnings growth. Therefore, we continue to focus the portfolio as a whole on high-quality companies with strong balance sheets.
Maintaining a long-term perspective and a focus on fundamentals is key in difficult environments. If we look beyond the short term, nothing has changed regarding the long-term demographic, environmental, technological and governance trends shifting the economy we focus on, such as aging population, climate change and digitalization. These trends are secular in nature. We continue to focus on individual company fundamentals to ensure that the fundamentals or the long-term theses on the companies have not changed. Overall, while our portfolios may have to endure a challenging environment in the short term, we believe that the portfolios are well positioned with high-quality companies addressing long-term thematic (secular) growth trends, believe that underlying fundamentals remain strong, and will continue to take advantage of disconnects between current stock prices and long-term value of companies.
Top Ten Holdings as of December 31, 2022
| | | | | | | | |
| | | |
| | | | Security Name | | % of Net Assets | |
| | 1 | | | Novo Nordisk A/S, Class B | | | 5.25 | % |
| | 2 | | | AIA Group Ltd. | | | 5.24 | |
| | 3 | | | KBC Group NV | | | 4.78 | |
| | 4 | | | ASML Holding NV | | | 4.58 | |
| | 5 | | | Iberdrola S.A. | | | 4.18 | |
| | 6 | | | Taiwan Semiconductor Manufacturing Co. Ltd., Sponsored ADR | | | 4.13 | |
| | 7 | | | Legal & General Group PLC | | | 4.00 | |
| | 8 | | | Vestas Wind Systems A/S | | | 3.70 | |
| | 9 | | | Kubota Corp. | | | 3.37 | |
| | 10 | | | Prudential PLC | | | 3.33 | |
The portfolio is actively managed and holdings are subject to change. There is no guarantee the Fund continues to invest in the securities referenced. The holdings listed exclude any temporary cash investments, are presented on an individual security basis and do not represent holdings of the issuer.
| 18
MIROVA INTERNATIONAL SUSTAINABLE EQUITY FUND
Hypothetical Growth of $100,000 Investment in Class Y Shares2
December 28, 2018 (inception) through December 31, 2022
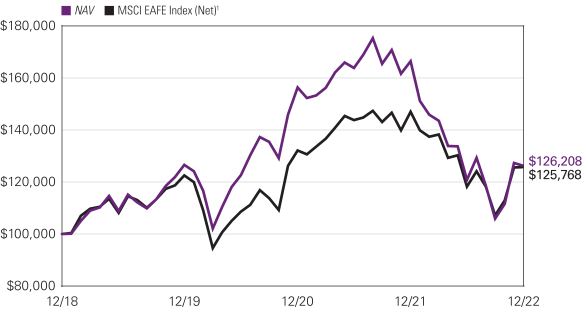
Average Annual Total Returns – December 31, 20222
| | | | | | | | | | | | | | | | |
| | | | |
| | | 1 Year | | | Life of Fund | | | Expense Ratios3 | |
| | Gross | | | Net | |
| | | | | |
| Class Y (Inception 12/28/18) | | | | | | | | | | | | | | | | |
| NAV | | | -24.18 | % | | | 5.98 | % | | | 1.83 | % | | | 0.96 | % |
| | | | | |
| Class A (Inception 12/28/18) | | | | | | | | | | | | | | | | |
| NAV | | | -24.42 | | | | 5.71 | | | | 2.08 | | | | 1.21 | |
| With 5.75% Maximum Sales Charge | | | -28.79 | | | | 4.16 | | | | | | | | | |
| | | | | |
| Class N (Inception 12/28/18) | | | | | | | | | | | | | | | | |
| NAV | | | -24.17 | | | | 6.03 | | | | 1.44 | | | | 0.91 | |
| | | | | |
| Comparative Performance | | | | | | | | | | | | | | | | |
| MSCI EAFE Index (Net)1 | | | -14.45 | | | | 5.87 | | | | | | | | | |
Performance data shown represents past performance and is no guarantee of, and not necessarily indicative of, future results. Total return and value will vary, and you may have a gain or loss when shares are sold. Current performance may be lower or higher than quoted. For most recent month-end performance, visit im.natixis.com/performance. Performance for other share classes will be greater or less than shown based on differences in fees and sales charges. You may not invest directly in an index. Performance for periods less than one year is cumulative, not annualized. Returns reflect changes in share price and reinvestment of dividends and capital gains, if any. The table(s) do not reflect taxes shareholders might owe on any fund distributions or when they redeem their shares.
| 1 | MSCI EAFE Index (Net) is a free float-adjusted market capitalization index designed to measure large and mid-cap equity performance in developed markets, excluding the U.S. and Canada. The Index includes countries in Europe, Australasia, and the Far East. |
| 2 | Fund performance has been increased by fee waivers and/or expense reimbursements, if any, without which performance would have been lower. |
| 3 | Expense ratios are as shown in the Fund’s prospectus in effect as of the date of this report. The expense ratios for the current reporting period can be found in the Financial Highlights section of this report under Ratios to Average Net Assets. Net expenses reflect contractual expense limitations set to expire on 4/30/23. When a Fund’s expenses are below the limitation, gross and net expense ratios will be the same. See Note 6 of the Notes to Financial Statements for more information about the Fund’s expense limitations. |
19 |
MIROVA U.S. SUSTAINABLE EQUITY FUND
| | |
| |
| Managers | | Symbols |
| |
| Jens Peers, CFA® | | Class A MUSAX |
| |
| Hua Cheng, PhD, CFA® | | Class C MUSCX |
| |
| Amber Fairbanks, CFA® * | | Class N MUSNX |
| |
| Soliane Varlet** | | Class Y MUSYX |
| |
| Mirova US LLC | | |
| * | Effective December 23, 2022, Ms. Fairbanks no longer serves as portfolio manager of the Fund. |
| ** | Effective December 27, 2022, Ms. Varlet serves as portfolio manager of the Fund. |
Investment Goal
The Fund seeks long-term capital appreciation.
Market Conditions
2022 proved to be a volatile year for global equity markets, with broad market indexes declining in each of the first three quarters of the year – the first time since the Great Financial Crisis global equities posted losses three quarters in a row. As inflation reached multi-decade highs, many central banks globally raised interest rates to fight inflation, global supply chains remained constrained, and geopolitical tensions remained high in Europe (Russia’s war) and Asia. While the consumer generally remained strong, recession fears became more in focus toward the end of the year, as it was clear that central bankers were willing to accept slowing economic growth and possible recession in order to curb inflation. The European economy was under increased pressure as the region grappled with surging energy and food prices as a result of the Russia/Ukraine conflict. While many European governments ordered the resumption of certain coal- and oil-based power utility operations in an effort to ensure energy supply security in the short term, the longer-term energy transition remains intact, and was likely strengthened as a result of the Russia/Ukraine conflict, as the need for Europe to move toward energy independence was reinforced and alternative energy will need to be a part of that. In the US, the Inflation Reduction Act (IRA) was signed into law in August, which includes historic climate legislation, setting aside ~$400bn for climate and clean energy-related initiatives. Global equity markets ended the year on a more positive, albeit still volatile, note as central bankers took on a more dovish tone, pressure was reduced on energy supplies due to Europe’s mild start to the winter, investors reacted to the potential easing of Covid restrictions in China, and global supply chain constraints eased somewhat.
As a result of high inflation and rising interest rates, longer-duration, growth-oriented stocks underperformed for the year as future cash flows are worth less in a higher rate environment. In terms of sector performance, traditional Energy outperformed strongly during the year, particularly following Russia’s invasion of Ukraine, driven by supply constraints and strong ongoing demand. Traditionally defensive sectors like Utilities, Health Care and Consumer Staples also held up better than the broad market amid growth and recession fears. The Communication Services, Consumer Discretionary and Information Technology sectors performed worst as longer-duration growth stocks underperformed on rising interest rates. By geography, developed markets generally outperformed emerging markets, while, in developed markets, European equities underperformed the US for most of the year given the difficult economic and geopolitical backdrop. European equities outperformed US markets to finish the year, as US markets were held back following weaker-than-expected third-quarter earnings and forward guidance for many of the widely held US large-cap tech and consumer names. European names saw some relief, supported by already depressed valuations, and as investors reacted to softer inflation data and a mild start to the European winter – a positive for energy supplies.
Performance Results
For the 12 months ending December 31, 2022, Class Y shares of the Mirova U.S. Sustainable Equity Fund returned -23.07% at net asset value. The Fund underperformed its benchmark, the S&P 500® Index, which returned -18.11%.
Explanation of Fund Performance
Underperformance relative to the benchmark during the period was driven mainly by security selection within the Financials, Materials, and Health Care sectors. More broadly, the portfolio’s lack of exposure to the traditional Energy sector was a relative detractor given the sector’s strong performance relative to the broad market. The strategy’s focus on long-term secular trends around the environment, technology, demographics, and governance often results in a growth bias to the portfolio, and many longer-duration stocks in the portfolio sold off during the year. The portfolio’s overweight to the Information Technology sector detracted as a result as well.
In terms of security selection, within Financials, Signature Bank was the largest relative detractor due in part to the macro backdrop and in part to digital asset volatility and investors’ reaction to this volatility. While the company is not involved in digital assets
| 20
MIROVA U.S. SUSTAINABLE EQUITY FUND
directly, a portion of its customers’ deposits are tied to the digital asset industry, and the company’s stock price came under pressure as a result of this reaction. Within the Materials sector, Ecolab was the largest relative detractor, with the majority of the stock’s year-to-date underperformance occurring during the first two months of the year after the company issued poor guidance indicating their end markets in hospitality had not fully recovered from Covid. Within Materials, the market also rotated into more cyclically exposed, lower quality companies that were expected to benefit from rising commodity prices, such as metals & mining where the portfolio has no exposure. Security selection within Health Care detracted overall mainly due to not owning certain names that are part of the benchmark and performed strongly during the year.
The worst performers overall for the period were Signature Bank and SVB Financial. SVB was lower due to deposit base pressure as its customers experienced reduced investment flow in a difficult market environment. We believe that SVB’s synergistic banking franchise in the innovation tech and health care sectors has strengthened in this challenging environment, and that its competitive advantages including deep sector expertise, unique relationship networks, and experience managing through volatile tech cycles position it well for renewed growth.
Contributors to relative results included the portfolio’s underweights to the Communications Services and Consumer Discretionary sectors, the worst-performing sectors in the index, as well as overweights to the more defensive Health Care and Utilities sectors. Security selection in Information Technology was also additive. Within Information Technology, First Solar performed strongly on the passing of the IRA in the US, and Mastercard held up much better than the broader sector throughout the year.
The best performers overall for the period were First Solar and global leaders on diabetes and obesity treatments Eli Lilly. Eli Lilly performed well on continued optimism on the opportunity related to the company’s novel treatment for diabetes and obesity as well as positive results from Biogen’s late-stage studies on its Alzheimer’s disease treatment.
We made several adjustments to the portfolio during the year and broadly believe the portfolio is composed of high-quality companies that are well positioned to address long-term secular trends and are trading at very attractive valuations. During the year, we exited positions in Oracle and Avalara, and initiated positions in SVB Financial, Deere, and Edwards Lifesciences.
Outlook
Looking ahead to 2023, we expect continued volatility in equity markets, driven by many of the same issues markets faced in 2022. We expect a significant slowdown in economic activity in the first half of the year driven by central banks increasing interest rates to fight inflation. We continue to work under the assumption of higher inflation for longer, which is likely to lead to recession in both Europe and the US. The situation in Asia is a bit different, and the reopening of China’s economy may help ease global supply chain constraints and support economic growth, though this is likely to be fragile as reopening is likely to lead to pressure on the health care system. We think that many central banks will continue to raise interest rates to fight inflation at least in the beginning of the year, impacting short-term interest rates. The good news is we believe we may have already seen inflation peak in the US at the end of 2022 and may be nearing the peak in Europe and other regions, meaning the probability of higher long-term interest rates is quite low. That said, we believe that inflation will be higher than it has been historically and for longer, buoyed in part by shifting supply chain practices where companies and industries as a whole are rethinking global supply chains, as companies and regions seek to reduce dependence on countries with autocratic regimes as well as those with restrictive Covid policies. After decades of globalization and outsourcing production to low-cost countries and, less visibly, social and environmental problems, bringing this closer to home will be a costly and lengthy process. Shifting global supply chains will be an in-focus theme for us in 2023, leading to more opportunities related to industrial automation and optimization of industrial processes across industries.
Energy and energy security will continue to be a big theme in 2023. In the near term, the biggest risks to the downside, in our view, include an escalation in the Russia/Ukraine conflict and the potential for Russia to leverage its oil and gas supplies to apply political pressure as the impact on the European economy would be immense. While short-term solutions such as importing liquid natural gas from other countries will be used, renewable energy is the only solution for Europe’s energy security in the long term and can make the region truly energy independent. This should have a positive effect on wind, solar, and large-scale energy storage solutions such as hydrogen. It could take a few years, however, before this translates into higher earnings, but we will see much more research and development in the space. High energy prices are also expected to have a positive impact on energy-efficient solutions for both the private and the corporate market. The passing of the IRA in the US to some extent reinforces our conviction in the environmental transition, as the path ahead for the US seems clearer for the time being. Our portfolios are already well positioned within this context.
The final big theme for 2023 that we are watching closely is on biodiversity and our food systems. We see the focus on these themes strengthening in 2023 and beyond, driven by the increasing impact of Gen Z and awareness of the impact our food systems and human activities more broadly have on climate and biodiversity. For example, we see more opportunities emerging in companies offering solutions for sustainable land management and food production, ingredients and bioscience, water technology and sustainable packaging.
21 |
While volatility may remain high and we may see a recession in Europe and in the US in the first half of the year, valuations have become much more attractive in many parts of the market and are already reflecting much of the near-term risk we see, and we believe we could see a recovery in the second half of the year. We believe the portfolios are well positioned for both a recession and subsequent recovery. Our approach to security selection has led to our portfolios being overweight areas like utilities, health care, and food and beverages, sectors that tend to be more defensive in recessionary environments. We also know that due to trends like population growth and generational shifts, these sectors tend to do well also in a normal economic environment. However, if we do get a recovery, we also believe that renewable energy and the digitalization of our economy will also lead to many investment opportunities, areas that we have strong exposure to in the portfolios.
Equity valuations have been impacted significantly in 2022 by rising interest rates, with that impact the highest on companies, sectors and themes with long-term visibility of cashflow generation. Because we expect that inflation will peak around end-of-2022 levels, we believe that those are the areas that are the most attractive from a valuation perspective now. We’re looking at companies within themes such as renewable energy and health care, but also at digitalization of our economy and may find opportunities to add names or add to existing holdings that have been hit hard already, but selectivity will continue to be key. In general, we like high-quality companies and, especially when interest rates are high, know that companies with larger amounts of debt on their balance sheets and those that may need to refinance that debt will find it more difficult to generate strong earnings growth. Therefore, we continue to focus the portfolio as a whole on high-quality companies with strong balance sheets.
Maintaining a long-term perspective and a focus on fundamentals is key in difficult environments. If we look beyond the short term, nothing has changed regarding the long-term demographic, environmental, technological and governance trends shifting the economy we focus on, such as aging population, climate change and digitalization. These trends are secular in nature. We continue to focus on individual company fundamentals to ensure that the fundamentals or the long-term theses on the companies have not changed. Overall, while our portfolios may have to endure a challenging environment in the short term, we believe that the portfolios are well positioned with high-quality companies addressing long-term thematic (secular) growth trends, believe that underlying fundamentals remain strong, and will continue to take advantage of disconnects between current stock prices and long-term value of companies.
Top Ten Holdings as of December 31, 2022
| | | | | | | | |
| | | |
| | | | Security Name | | % of Net Assets | |
| | 1 | | | Microsoft Corp. | | | 7.42 | % |
| | 2 | | | Thermo Fisher Scientific, Inc. | | | 6.64 | |
| | 3 | | | Mastercard, Inc., Class A | | | 5.76 | |
| | 4 | | | Roper Technologies, Inc. | | | 4.79 | |
| | 5 | | | Xylem, Inc. | | | 4.48 | |
| | 6 | | | NextEra Energy, Inc. | | | 4.42 | |
| | 7 | | | American Water Works Co., Inc. | | | 4.32 | |
| | 8 | | | Danaher Corp. | | | 4.26 | |
| | 9 | | | Waste Management, Inc. | | | 4.18 | |
| | 10 | | | NVIDIA Corp. | | | 4.01 | |
The portfolio is actively managed and holdings are subject to change. There is no guarantee the Fund continues to invest in the securities referenced. The holdings listed exclude any temporary cash investments, are presented on an individual security basis and do not represent holdings of the issuer.
| 22
MIROVA U.S. SUSTAINABLE EQUITY FUND
Hypothetical Growth of $100,000 Investment in Class Y Shares3
December 15, 2020 (inception) through December 31, 2022
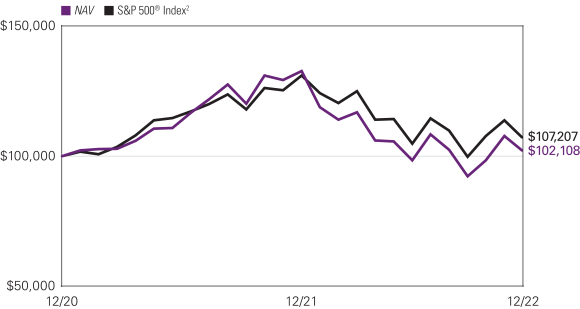
Average Annual Total Returns – December 31, 20223
| | | | | | | | | | | | | | | | |
| | | | |
| | | 1 Year | | | Life of Fund | | | Expense Ratios4 | |
| | Gross | | | Net | |
| | | | | |
| Class Y (Inception 12/15/20) | | | | | | | | | | | | | | | | |
| NAV | | | -23.07 | % | | | 1.01 | % | | | 8.79 | % | | | 0.80 | % |
| | | | | |
| Class A (Inception 12/15/20) | | | | | | | | | | | | | | | | |
| NAV | | | -23.21 | | | | 0.80 | | | | 8.99 | | | | 1.05 | |
| With 5.75% Maximum Sales Charge | | | -27.64 | | | | -2.07 | | | | | | | | | |
| | | | | |
| Class C (Inception 12/15/20) | | | | | | | | | | | | | | | | |
| NAV | | | -23.81 | | | | 0.02 | | | | 9.37 | | | | 1.80 | |
| With CDSC1 | | | -24.53 | | | | 0.02 | | | | | | | | | |
| | | | | |
| Class N (Inception 12/15/20) | | | | | | | | | | | | | | | | |
| NAV | | | -22.95 | | | | 1.10 | | | | 3.50 | | | | 0.75 | |
| | | | | |
| Comparative Performance | | | | | | | | | | | | | | | | |
| S&P 500® Index2 | | | -18.11 | | | | 3.45 | | | | | | | | | |
Performance data shown represents past performance and is no guarantee of, and not necessarily indicative of, future results. Total return and value will vary, and you may have a gain or loss when shares are sold. Current performance may be lower or higher than quoted. For most recent month-end performance, visit im.natixis.com/performance. Performance for other share classes will be greater or less than shown based on differences in fees and sales charges. You may not invest directly in an index. Performance for periods less than one year is cumulative, not annualized. Returns reflect changes in share price and reinvestment of dividends and capital gains, if any. The table(s) do not reflect taxes shareholders might owe on any fund distributions or when they redeem their shares.
| 1 | Performance for Class C shares assumes a 1.00% contingent deferred sales charge (“CDSC”) applied when you sell shares within one year of purchase, and includes automatic conversion to Class A shares after eight years. |
| 2 | S&P 500® Index is a widely recognized measure of U.S. stock market performance. It is an unmanaged index of 500 common stocks chosen for market size, liquidity, and industry group representation, among other factors. It also measures the performance of the large cap segment of the U.S. equities market. |
| 3 | Fund performance has been increased by fee waivers and/or expense reimbursements, if any, without which performance would have been lower. |
| 4 | Expense ratios are as shown in the Fund’s prospectus in effect as of the date of this report. The expense ratios for the current reporting period can be found in the Financial Highlights section of this report under Ratios to Average Net Assets. Net expenses reflect contractual expense limitations set to expire on 4/30/23. When a Fund’s expenses are below the limitation, gross and net expense ratios will be the same. See Note 6 of the Notes to Financial Statements for more information about the Fund’s expense limitations. |
23 |
ADDITIONAL INFORMATION
The views expressed in this report reflect those of the portfolio managers as of the dates indicated. The managers’ views are subject to change at any time without notice based on changes in market or other conditions. References to specific securities or industries should not be regarded as investment advice. Because the Fund is actively managed, there is no assurance that they will continue to invest in the securities or industries mentioned.
All investing involves risk, including the risk of loss. There is no assurance that any investment will meet its performance objectives or that losses will be avoided.
ADDITIONAL INDEX INFORMATION
This document may contain references to third party copyrights, indexes, and trademarks, each of which is the property of its respective owner. Such owner is not affiliated with Natixis Investment Managers or any of its related or affiliated companies (collectively “Natixis Affiliates”) and does not sponsor, endorse or participate in the provision of any Natixis Affiliates services, funds or other financial products.
The index information contained herein is derived from third parties and is provided on an “as is” basis. The user of this information assumes the entire risk of use of this information. Each of the third party entities involved in compiling, computing or creating index information disclaims all warranties (including, without limitation, any warranties of originality, accuracy, completeness, timeliness, non-infringement, merchantability and fitness for a particular purpose) with respect to such information.
PROXY VOTING INFORMATION
A description of the Natixis Funds’ proxy voting policies and procedures is available without charge, upon request, by calling Natixis Funds at 800-225-5478; on the Natixis Funds’ website at im.natixis.com; and on the Securities and Exchange Commission’s (“SEC’s”) website at www.sec.gov. Information regarding how the Natixis Funds voted proxies relating to portfolio securities during the most recent 12-month period ended June 30 is available from the Natixis Funds’ website and the SEC’s website.
QUARTERLY PORTFOLIO SCHEDULES
The Natixis Funds file a complete schedule of portfolio holdings with the SEC for the first and third quarters of each fiscal year as an exhibit to its reports on Form N-PORT. The Funds’ Form N-PORT reports are available on the SEC’s website at www.sec.gov. First and third quarter schedules of portfolio holdings are also available at im.natixis.com/funddocuments. A hard copy may be requested from the Fund at no charge by calling 800-225-5478.
CFA® and Chartered Financial Analyst® are registered trademarks owned by the CFA Institute.
| 24
UNDERSTANDING FUND EXPENSES
As a mutual fund shareholder, you incur different costs: transaction costs, including sales charges (loads) on purchases and contingent deferred sales charges on redemptions, and ongoing costs, including management fees, distribution and/or service fees (12b-1 fees), and other fund expenses. Certain exemptions may apply. These costs are described in more detail in the Funds’ prospectus. The following examples are intended to help you understand the ongoing costs of investing in the Funds and help you compare these with the ongoing costs of investing in other mutual funds.
The first line in the table of each class of Fund shares shows the actual account values and actual Fund expenses you would have paid on a $1,000 investment in the Fund from July 1, 2022 through December 31, 2022. To estimate the expenses you paid over the period, simply divide your account value by $1,000 (for example $8,600 account value divided by $1,000 = 8.60) and multiply the result by the number in the Expenses Paid During Period column as shown for your class.
The second line in the table for each class of fund shares provides information about hypothetical account values and hypothetical expenses based on the Fund’s actual expense ratios and an assumed rate of return of 5% per year before expenses, which is not the Fund’s actual return. The hypothetical account values and expenses may not be used to estimate the actual ending account balance or expenses you paid on your investment for the period. You may use this information to compare the ongoing costs of investing in the Fund and other funds. To do so, compare this 5% hypothetical example with the 5% hypothetical examples that appear in the shareholder reports of the other funds.
Please note that the expenses shown reflect ongoing costs only, and do not include any transaction costs, such as sales charges. Therefore, the second line in the table of each fund is useful in comparing ongoing costs only, and will not help you determine the relative costs of owning funds. If transaction costs were included, total costs would be higher.
| | | | | | | | | | | | |
| GATEWAY FUND | | BEGINNING
ACCOUNT VALUE
7/1/2022 | | | ENDING
ACCOUNT VALUE
12/31/2022 | | | EXPENSES PAID
DURING PERIOD*
7/1/2022 – 12/31/2022 | |
| Class A | | | | | | | | | | | | |
| Actual | | | $1,000.00 | | | | $1,005.60 | | | | $4.75 | |
| Hypothetical (5% return before expenses) | | | $1,000.00 | | | | $1,020.47 | | | | $4.79 | |
| Class C | | | | | | | | | | | | |
| Actual | | | $1,000.00 | | | | $1,002.00 | | | | $8.58 | |
| Hypothetical (5% return before expenses) | | | $1,000.00 | | | | $1,016.64 | | | | $8.64 | |
| Class N | | | | | | | | | | | | |
| Actual | | | $1,000.00 | | | | $1,007.20 | | | | $3.29 | |
| Hypothetical (5% return before expenses) | | | $1,000.00 | | | | $1,021.93 | | | | $3.31 | |
| Class Y | | | | | | | | | | | | |
| Actual | | | $1,000.00 | | | | $1,006.90 | | | | $3.54 | |
| Hypothetical (5% return before expenses) | | | $1,000.00 | | | | $1,021.68 | | | | $3.57 | |
| * | Expenses are equal to the Fund’s annualized expense ratio (after waiver/reimbursement): 0.94%, 1.70%, 0.65% and 0.70% for Class A, C, N and Y, respectively, multiplied by the average account value over the period, multiplied by the number of days in the most recent fiscal half-year (184), divided by 365 (to reflect the half-year period). |
25 |
| | | | | | | | | | | | |
| GATEWAY EQUITY CALL PREMIUM FUND | | BEGINNING
ACCOUNT VALUE
7/1/2022 | | | ENDING
ACCOUNT VALUE
12/31/2022 | | | EXPENSES PAID
DURING PERIOD*
7/1/2022 – 12/31/2022 | |
| Class A | | | | | | | | | | | | |
| Actual | | | $1,000.00 | | | | $1,022.10 | | | | $4.74 | |
| Hypothetical (5% return before expenses) | | | $1,000.00 | | | | $1,020.52 | | | | $4.74 | |
| Class C | | | | | | | | | | | | |
| Actual | | | $1,000.00 | | | | $1,019.00 | | | | $8.55 | |
| Hypothetical (5% return before expenses) | | | $1,000.00 | | | | $1,016.74 | | | | $8.54 | |
| Class N | | | | | | | | | | | | |
| Actual | | | $1,000.00 | | | | $1,023.90 | | | | $3.21 | |
| Hypothetical (5% return before expenses) | | | $1,000.00 | | | | $1,022.03 | | | | $3.21 | |
| Class Y | | | | | | | | | | | | |
| Actual | | | $1,000.00 | | | | $1,023.60 | | | | $3.47 | |
| Hypothetical (5% return before expenses) | | | $1,000.00 | | | | $1,021.78 | | | | $3.47 | |
| * | Expenses are equal to the Fund’s annualized expense ratio (after waiver/reimbursement): 0.93%, 1.68%, 0.63% and 0.68% for Class A, C, N and Y, respectively, multiplied by the average account value over the period, multiplied by the number of days in the most recent fiscal half-year (184), divided by 365 (to reflect the half-year period). |
| | | | | | | | | | | | |
| MIROVA GLOBAL GREEN BOND FUND | | BEGINNING
ACCOUNT VALUE
7/1/2022 | | | ENDING
ACCOUNT VALUE
12/31/2022 | | | EXPENSES PAID
DURING PERIOD*
7/1/2022 – 12/31/2022 | |
| Class A | | | | | | | | | | | | |
| Actual | | | $1,000.00 | | | | $971.70 | | | | $4.47 | |
| Hypothetical (5% return before expenses) | | | $1,000.00 | | | | $1,020.67 | | | | $4.58 | |
| Class N | | | | | | | | | | | | |
| Actual | | | $1,000.00 | | | | $974.20 | | | | $2.99 | |
| Hypothetical (5% return before expenses) | | | $1,000.00 | | | | $1,022.18 | | | | $3.06 | |
| Class Y | | | | | | | | | | | | |
| Actual | | | $1,000.00 | | | | $974.20 | | | | $3.23 | |
| Hypothetical (5% return before expenses) | | | $1,000.00 | | | | $1,021.93 | | | | $3.31 | |
| * | Expenses are equal to the Fund’s annualized expense ratio (after waiver/reimbursement): 0.90%, 0.60% and 0.65% for Class A, N and Y, respectively, multiplied by the average account value over the period, multiplied by the number of days in the most recent fiscal half-year (184), divided by 365 (to reflect the half-year period). |
| 26
| | | | | | | | | | | | |
| MIROVA GLOBAL SUSTAINABLE EQUITY FUND | | BEGINNING
ACCOUNT VALUE
7/1/2022 | | | ENDING
ACCOUNT VALUE
12/31/2022 | | | EXPENSES PAID
DURING PERIOD*
7/1/2022 – 12/31/2022 | |
| Class A | | | | | | | | | | | | |
| Actual | | | $1,000.00 | | | | $1,033.00 | | | | $6.15 | |
| Hypothetical (5% return before expenses) | | | $1,000.00 | | | | $1,019.16 | | | | $6.11 | |
| Class C | | | | | | | | | | | | |
| Actual | | | $1,000.00 | | | | $1,029.10 | | | | $9.97 | |
| Hypothetical (5% return before expenses) | | | $1,000.00 | | | | $1,015.38 | | | | $9.91 | |
| Class N | | | | | | | | | | | | |
| Actual | | | $1,000.00 | | | | $1,034.40 | | | | $4.56 | |
| Hypothetical (5% return before expenses) | | | $1,000.00 | | | | $1,020.72 | | | | $4.53 | |
| Class Y | | | | | | | | | | | | |
| Actual | | | $1,000.00 | | | | $1,034.40 | | | | $4.87 | |
| Hypothetical (5% return before expenses) | | | $1,000.00 | | | | $1,020.42 | | | | $4.84 | |
| * | Expenses are equal to the Fund’s annualized expense ratio (after waiver/reimbursement): 1.20%, 1.95%, 0.89% and 0.95% for Class A, C, N and Y, respectively, multiplied by the average account value over the period, multiplied by the number of days in the most recent fiscal half-year (184), divided by 365 (to reflect the half-year period). |
| | | | | | | | | | | | |
| MIROVA INTERNATIONAL SUSTAINABLE EQUITY FUND | | BEGINNING
ACCOUNT VALUE
7/1/2022 | | | ENDING
ACCOUNT VALUE
12/31/2022 | | | EXPENSES PAID
DURING PERIOD*
7/1/2022 – 12/31/2022 | |
| Class A | | | | | | | | | | | | |
| Actual | | | $1,000.00 | | | | $1,042.80 | | | | $6.23 | |
| Hypothetical (5% return before expenses) | | | $1,000.00 | | | | $1,019.11 | | | | $6.16 | |
| Class N | | | | | | | | | | | | |
| Actual | | | $1,000.00 | | | | $1,045.00 | | | | $4.69 | |
| Hypothetical (5% return before expenses) | | | $1,000.00 | | | | $1,020.62 | | | | $4.63 | |
| Class Y | | | | | | | | | | | | |
| Actual | | | $1,000.00 | | | | $1,044.30 | | | | $4.95 | |
| Hypothetical (5% return before expenses) | | | $1,000.00 | | | | $1,020.37 | | | | $4.89 | |
| * | Expenses are equal to the Fund’s annualized expense ratio (after waiver/reimbursement): 1.21%, 0.91% and 0.96% for Class A, N and Y, respectively, multiplied by the average account value over the period, multiplied by the number of days in the most recent fiscal half-year (184), divided by 365 (to reflect the half-year period). |
27 |
| | | | | | | | | | | | |
| MIROVA U.S. SUSTAINABLE EQUITY FUND | | BEGINNING
ACCOUNT VALUE
7/1/2022 | | | ENDING
ACCOUNT VALUE
12/31/2022 | | | EXPENSES PAID
DURING PERIOD*
7/1/2022 – 12/31/2022 | |
| Class A | | | | | | | | | | | | |
| Actual | | | $1,000.00 | | | | $1,037.50 | | | | $5.39 | |
| Hypothetical (5% return before expenses) | | | $1,000.00 | | | | $1,019.91 | | | | $5.35 | |
| Class C | | | | | | | | | | | | |
| Actual | | | $1,000.00 | | | | $1,033.50 | | | | $9.23 | |
| Hypothetical (5% return before expenses) | | | $1,000.00 | | | | $1,016.13 | | | | $9.15 | |
| Class N | | | | | | | | | | | | |
| Actual | | | $1,000.00 | | | | $1,039.20 | | | | $3.85 | |
| Hypothetical (5% return before expenses) | | | $1,000.00 | | | | $1,021.43 | | | | $3.82 | |
| Class Y | | | | | | | | | | | | |
| Actual | | | $1,000.00 | | | | $1,038.70 | | | | $4.11 | |
| Hypothetical (5% return before expenses) | | | $1,000.00 | | | | $1,021.17 | | | | $4.08 | |
| * | Expenses are equal to the Fund’s annualized expense ratio (after waiver/reimbursement): 1.05%, 1.80%, 0.75% and 0.80% for Class A, C, N and Y, respectively, multiplied by the average account value over the period, multiplied by the number of days in the most recent fiscal half-year (184), divided by 365 (to reflect the half-year period). |
| 28
Portfolio of Investments – as of December 31, 2022
Gateway Fund
| | | | | | | | |
| Shares | | | Description | | Value (†) | |
| | Common Stocks — 97.1% of Net Assets | |
| | | | Aerospace & Defense — 1.6% | |
| | 148,078 | | | Boeing Co. (The)(a)(b) | | $ | 28,207,378 | |
| | 41,278 | | | HEICO Corp.(b) | | | 6,341,952 | |
| | 57,338 | | | L3Harris Technologies, Inc.(b) | | | 11,938,345 | |
| | 552,963 | | | Raytheon Technologies Corp.(b) | | | 55,805,026 | |
| | | | | | | | |
| | | | | | | 102,292,701 | |
| | | | | | | | |
| | | | Air Freight & Logistics — 0.6% | |
| | 36,648 | | | GXO Logistics, Inc.(a) | | | 1,564,503 | |
| | 216,722 | | | United Parcel Service, Inc., Class B(b) | | | 37,674,953 | |
| | | | | | | | |
| | | | | | | 39,239,456 | |
| | | | | | | | |
| | | | Airlines — 0.2% | |
| | 153,012 | | | Alaska Air Group, Inc.(a)(b) | | | 6,570,335 | |
| | 144,851 | | | United Airlines Holdings, Inc.(a)(b) | | | 5,460,883 | |
| | | | | | | | |
| | | | | | | 12,031,218 | |
| | | | | | | | |
| | | | Auto Components — 0.0% | |
| | 36,852 | | | Autoliv, Inc.(b) | | | 2,822,126 | |
| | | | | | | | |
| | | | Automobiles — 1.2% | |
| | 1,177,145 | | | Ford Motor Co.(b) | | | 13,690,196 | |
| | 516,081 | | | Tesla, Inc.(a)(b) | | | 63,570,858 | |
| | | | | | | | |
| | | | | | | 77,261,054 | |
| | | | | | | | |
| | | | Banks — 3.4% | |
| | 193,834 | | | Associated Banc-Corp(b) | | | 4,475,627 | |
| | 2,043,446 | | | Bank of America Corp.(b) | | | 67,678,932 | |
| | 739,345 | | | JPMorgan Chase & Co.(b) | | | 99,146,164 | |
| | 16,401 | | | Signature Bank(b) | | | 1,889,723 | |
| | 980,841 | | | Wells Fargo & Co.(b) | | | 40,498,925 | |
| | | | | | | | |
| | | | | | | 213,689,371 | |
| | | | | | | | |
| | | | Beverages — 1.8% | |
| | 494,297 | | | Keurig Dr Pepper, Inc.(b) | | | 17,626,631 | |
| | 174,722 | | | Monster Beverage Corp.(a)(b) | | | 17,739,525 | |
| | 427,106 | | | PepsiCo, Inc.(b) | | | 77,160,970 | |
| | | | | | | | |
| | | | | | | 112,527,126 | |
| | | | | | | | |
| | | | Biotechnology — 2.3% | |
| | 368,852 | | | AbbVie, Inc.(b) | | | 59,610,172 | |
| | 8,614 | | | Alnylam Pharmaceuticals, Inc.(a)(b) | | | 2,047,117 | |
| | 127,391 | | | Amgen, Inc.(b) | | | 33,457,972 | |
| | 42,859 | | | Biogen, Inc.(a)(b) | | | 11,868,514 | |
| | 25,770 | | | BioMarin Pharmaceutical, Inc.(a)(b) | | | 2,666,937 | |
| | 16,697 | | | Exact Sciences Corp.(a)(b) | | | 826,669 | |
| | 3,171 | | | Horizon Therapeutics PLC(a)(b) | | | 360,860 | |
| | 49,266 | | | Ionis Pharmaceuticals, Inc.(a)(b) | | | 1,860,777 | |
| | 75,616 | | | Moderna, Inc.(a)(b) | | | 13,582,146 | |
| | 21,063 | | | Seagen, Inc.(a)(b) | | | 2,706,806 | |
| | 68,273 | | | Vertex Pharmaceuticals, Inc.(a)(b) | | | 19,715,877 | |
| | | | | | | | |
| | | | | | | 148,703,847 | |
| | | | | | | | |
| | | | Building Products — 0.4% | |
| | 15,104 | | | Carlisle Cos., Inc.(b) | | | 3,559,258 | |
| | 355,197 | | | Carrier Global Corp.(b) | | | 14,651,876 | |
| | 20,800 | | | Lennox International, Inc.(b) | | | 4,975,984 | |
| | | | | | | | |
| | | | | | | 23,187,118 | |
| | | | | | | | |
| | | | Capital Markets — 2.6% | |
| | 43,798 | | | Blackstone, Inc.(b) | | | 3,249,374 | |
| | 369,029 | | | Charles Schwab Corp. (The)(b) | | | 30,725,355 | |
| | 28,906 | | | FactSet Research Systems, Inc.(b) | | | 11,597,376 | |
| | 247,065 | | | Intercontinental Exchange, Inc.(b) | | | 25,346,398 | |
| | 86,329 | | | KKR & Co., Inc.(b) | | | 4,007,392 | |
| | 18,320 | | | LPL Financial Holdings, Inc.(b) | | | 3,960,234 | |
| | 474,198 | | | Morgan Stanley(b) | | | 40,316,314 | |
| | 41,804 | | | MSCI, Inc.(b) | | | 19,445,967 | |
| | | | Capital Markets — continued | |
| | 76,688 | | | S&P Global, Inc.(b) | | $ | 25,685,879 | |
| | | | | | | | |
| | | | | | | 164,334,289 | |
| | | | | | | | |
| | | | Chemicals — 1.6% | |
| | 83,434 | | | Ashland, Inc.(b) | | | 8,971,658 | |
| | 71,767 | | | Celanese Corp.(b) | | | 7,337,458 | |
| | 335,148 | | | Corteva, Inc.(b) | | | 19,699,999 | |
| | 295,277 | | | Dow, Inc.(b) | | | 14,879,008 | |
| | 125,392 | | | Eastman Chemical Co.(b) | | | 10,211,924 | |
| | 35,507 | | | Ingevity Corp.(a)(b) | | | 2,501,113 | |
| | 167,820 | | | LyondellBasell Industries NV, Class A(b) | | | 13,934,095 | |
| | 125,903 | | | Mosaic Co. (The)(b) | | | 5,523,365 | |
| | 8,638 | | | Nutrien Ltd.(b) | | | 630,833 | |
| | 66,451 | | | Olin Corp.(b) | | | 3,517,916 | |
| | 95,921 | | | RPM International, Inc.(b) | | | 9,347,501 | |
| | 195,010 | | | Valvoline, Inc.(b) | | | 6,367,077 | |
| | | | | | | | |
| | | | | | | 102,921,947 | |
| | | | | | | | |
| | | | Commercial Services & Supplies — 0.9% | |
| | 244,314 | | | Copart, Inc.(a)(b) | | | 14,876,279 | |
| | 69,341 | | | Waste Connections, Inc.(b) | | | 9,191,843 | |
| | 191,643 | | | Waste Management, Inc.(b) | | | 30,064,954 | |
| | | | | | | | |
| | | | | | | 54,133,076 | |
| | | | | | | | |
| | | | Communications Equipment — 0.9% | |
| | 1,243,711 | | | Cisco Systems, Inc.(b) | | | 59,250,392 | |
| | | | | | | | |
| | | | Construction Materials — 0.3% | |
| | 48,861 | | | Martin Marietta Materials, Inc.(b) | | | 16,513,552 | |
| | | | | | | | |
| | | | Consumer Finance — 0.6% | |
| | 121,623 | | | Ally Financial, Inc.(b) | | | 2,973,682 | |
| | 188,425 | | | Discover Financial Services(b) | | | 18,433,618 | |
| | 445,997 | | | Synchrony Financial(b) | | | 14,655,462 | |
| | | | | | | | |
| | | | | | | 36,062,762 | |
| | | | | | | | |
| | | | Containers & Packaging — 0.4% | |
| | 54,360 | | | Avery Dennison Corp.(b) | | | 9,839,160 | |
| | 60,185 | | | Crown Holdings, Inc.(b) | | | 4,947,809 | |
| | 40,058 | | | Sonoco Products Co.(b) | | | 2,431,921 | |
| | 141,364 | | | WestRock Co.(b) | | | 4,970,358 | |
| | | | | | | | |
| | | | | | | 22,189,248 | |
| | | | | | | | |
| | | | Distributors — 0.3% | |
| | 107,529 | | | Genuine Parts Co.(b) | | | 18,657,357 | |
| | | | | | | | |
| | | | Diversified Consumer Services — 0.1% | |
| | 67,454 | | | Service Corp. International(b) | | | 4,663,770 | |
| | | | | | | | |
| | | | Diversified Financial Services — 2.2% | |
| | 432,825 | | | Berkshire Hathaway, Inc., Class B(a)(b) | | | 133,699,643 | |
| | 133,431 | | | Voya Financial, Inc.(b) | | | 8,204,672 | |
| | | | | | | | |
| | | | | | | 141,904,315 | |
| | | | | | | | |
| | | | Diversified Telecommunication Services — 1.1% | |
| | 1,557,641 | | | AT&T, Inc.(b) | | | 28,676,171 | |
| | 119,721 | | | Liberty Global PLC, Class C(a)(b) | | | 2,326,179 | |
| | 196,472 | | | Lumen Technologies, Inc.(b) | | | 1,025,584 | |
| | 891,142 | | | Verizon Communications, Inc.(b) | | | 35,110,994 | |
| | | | | | | | |
| | | | | | | 67,138,928 | |
| | | | | | | | |
| | | | Electric Utilities — 2.0% | |
| | 323,243 | | | Alliant Energy Corp.(b) | | | 17,846,246 | |
| | 373,580 | | | American Electric Power Co., Inc.(b) | | | 35,471,421 | |
| | 138,237 | | | Evergy, Inc.(b) | | | 8,699,254 | |
| | 349,526 | | | FirstEnergy Corp.(b) | | | 14,659,120 | |
| | 429,980 | | | NextEra Energy, Inc.(b) | | | 35,946,328 | |
| | 153,399 | | | OGE Energy Corp.(b) | | | 6,066,931 | |
| | 501,471 | | | PG&E Corp.(a)(b) | | | 8,153,919 | |
| | | | | | | | |
| | | | | | | 126,843,219 | |
| | | | | | | | |
See accompanying notes to financial statements.
29 |
Portfolio of Investments – as of December 31, 2022
Gateway Fund – (continued)
| | | | | | | | |
| Shares | | | Description | | Value (†) | |
| | | | Electrical Equipment — 0.6% | |
| | 181,509 | | | Eaton Corp. PLC(b) | | $ | 28,487,838 | |
| | 31,715 | | | Hubbell, Inc.(b) | | | 7,442,876 | |
| | | | | | | | |
| | | | | | | 35,930,714 | |
| | | | | | | | |
| | | | Electronic Equipment, Instruments & Components — 0.8% | |
| | 97,069 | | | CDW Corp.(b) | | | 17,334,582 | |
| | 375,436 | | | Corning, Inc.(b) | | | 11,991,426 | |
| | 26,442 | | | Teledyne Technologies, Inc.(a)(b) | | | 10,574,420 | |
| | 33,350 | | | Zebra Technologies Corp., Class A(a)(b) | | | 8,551,274 | |
| | | | | | | | |
| | | | | | | 48,451,702 | |
| | | | | | | | |
| | | | Energy Equipment & Services — 0.5% | |
| | 645,484 | | | Halliburton Co.(b) | | | 25,399,795 | |
| | 102,771 | | | Helmerich & Payne, Inc.(b) | | | 5,094,359 | |
| | | | | | | | |
| | | | | | | 30,494,154 | |
| | | | | | | | |
| | | | Entertainment — 1.2% | |
| | 81,510 | | | Live Nation Entertainment, Inc.(a)(b) | | | 5,684,507 | |
| | 103,135 | | | Netflix, Inc.(a)(b) | | | 30,412,449 | |
| | 6,573 | | | Roku, Inc.(a)(b) | | | 267,521 | |
| | 439,708 | | | Walt Disney Co. (The)(a)(b) | | | 38,201,831 | |
| | | | | | | | |
| | | | | | | 74,566,308 | |
| | | | | | | | |
| | | | Food & Staples Retailing — 1.7% | |
| | 26,487 | | | Casey’s General Stores, Inc.(b) | | | 5,942,358 | |
| | 104,945 | | | Costco Wholesale Corp.(b) | | | 47,907,393 | |
| | 86,520 | | | Kroger Co. (The)(b) | | | 3,857,062 | |
| | 115,434 | | | U.S. Foods Holding Corp.(a)(b) | | | 3,927,065 | |
| | 338,093 | | | Walmart, Inc.(b) | | | 47,938,206 | |
| | | | | | | | |
| | | | | | | 109,572,084 | |
| | | | | | | | |
| | | | Food Products — 1.1% | |
| | 61,781 | | | Bunge Ltd.(b) | | | 6,163,890 | |
| | 127,011 | | | Hormel Foods Corp.(b) | | | 5,785,351 | |
| | 74,762 | | | Lamb Weston Holdings, Inc.(b) | | | 6,680,732 | |
| | 698,295 | | | Mondelez International, Inc., Class A(b) | | | 46,541,362 | |
| | 52,500 | | | Post Holdings, Inc.(a)(b) | | | 4,738,650 | |
| | | | | | | | |
| | | | | | | 69,909,985 | |
| | | | | | | | |
| | | | Gas Utilities — 0.0% | |
| | 76,973 | | | UGI Corp.(b) | | | 2,853,389 | |
| | | | | | | | |
| | | | Health Care Equipment & Supplies — 2.7% | |
| | 461,268 | | | Abbott Laboratories(b) | | | 50,642,614 | |
| | 161,683 | | | Baxter International, Inc.(b) | | | 8,240,982 | |
| | 554,460 | | | Boston Scientific Corp.(a)(b) | | | 25,654,864 | |
| | 75,712 | | | Dexcom, Inc.(a)(b) | | | 8,573,627 | |
| | 218,970 | | | Edwards Lifesciences Corp.(a)(b) | | | 16,337,352 | |
| | 3,008 | | | Insulet Corp.(a)(b) | | | 885,525 | |
| | 108,519 | | | Intuitive Surgical, Inc.(a)(b) | | | 28,795,517 | |
| | 237,716 | | | Medtronic PLC(b) | | | 18,475,287 | |
| | 55,109 | | | STERIS PLC(b) | | | 10,178,081 | |
| | 24,419 | | | Teleflex, Inc.(b) | | | 6,095,715 | |
| | | | | | | | |
| | | | | | | 173,879,564 | |
| | | | | | | | |
| | | | Health Care Providers & Services — 3.6% | |
| | 354,081 | | | CVS Health Corp.(b) | | | 32,996,808 | |
| | 83,702 | | | Elevance Health, Inc.(b) | | | 42,936,615 | |
| | 78,255 | | | HCA Healthcare, Inc.(b) | | | 18,778,070 | |
| | 16,707 | | | Molina Healthcare, Inc.(a)(b) | | | 5,516,986 | |
| | 227,229 | | | UnitedHealth Group, Inc.(b) | | | 120,472,271 | |
| | 65,316 | | | Universal Health Services, Inc., Class B(b) | | | 9,202,371 | |
| | | | | | | | |
| | | | | | | 229,903,121 | |
| | | | | | | | |
| | | | Health Care Technology — 0.1% | |
| | 35,189 | | | Veeva Systems, Inc., Class A(a)(b) | | | 5,678,801 | |
| | | | | | | | |
| | | | Hotels, Restaurants & Leisure — 2.0% | |
| | 10,914 | | | Booking Holdings, Inc.(a)(b) | | | 21,994,766 | |
| | | | Hotels, Restaurants & Leisure — continued | |
| | 71,898 | | | Hilton Grand Vacations, Inc.(a)(b) | | $ | 2,770,949 | |
| | 168,770 | | | Hilton Worldwide Holdings, Inc.(b) | | | 21,325,777 | |
| | 175,041 | | | McDonald’s Corp.(b) | | | 46,128,555 | |
| | 15,436 | | | Melco Resorts & Entertainment Ltd., Sponsored ADR(a)(b) | | | 177,514 | |
| | 105,955 | | | Restaurant Brands International, Inc.(b) | | | 6,852,110 | |
| | 207,725 | | | Starbucks Corp.(b) | | | 20,606,320 | |
| | 12,225 | | | Vail Resorts, Inc.(b) | | | 2,913,829 | |
| | 70,445 | | | Wendy’s Co. (The)(b) | | | 1,594,170 | |
| | | | | | | | |
| | | | | | | 124,363,990 | |
| | | | | | | | |
| | | | Household Durables — 0.3% | |
| | 2,420 | | | NVR, Inc.(a)(b) | | | 11,162,444 | |
| | 129,073 | | | Toll Brothers, Inc.(b) | | | 6,443,324 | |
| | | | | | | | |
| | | | | | | 17,605,768 | |
| | | | | | | | |
| | | | Household Products — 1.5% | |
| | 644,259 | | | Procter & Gamble Co. (The)(b) | | | 97,643,894 | |
| | | | | | | | |
| | | | Industrial Conglomerates — 1.4% | |
| | 205,207 | | | 3M Co.(b) | | | 24,608,423 | |
| | 217,269 | | | General Electric Co.(b) | | | 18,204,970 | |
| | 213,732 | | | Honeywell International, Inc.(b) | | | 45,802,768 | |
| | | | | | | | |
| | | | | | | 88,616,161 | |
| | | | | | | | |
| | | | Insurance — 2.4% | |
| | 577,052 | | | Aflac, Inc.(b) | | | 41,513,121 | |
| | 62,761 | | | American Financial Group, Inc.(b) | | | 8,615,830 | |
| | 91,119 | | | Aon PLC, Class A(b) | | | 27,348,457 | |
| | 240,576 | | | Arch Capital Group Ltd.(a)(b) | | | 15,103,361 | |
| | 187,556 | | | Arthur J. Gallagher & Co.(b) | | | 35,361,808 | |
| | 74,687 | | | Fidelity National Financial, Inc.(b) | | | 2,809,725 | |
| | 90,500 | | | Lincoln National Corp.(b) | | | 2,780,160 | |
| | 3,155 | | | Markel Corp.(a)(b) | | | 4,156,681 | |
| | 25,430 | | | RenaissanceRe Holdings Ltd.(b) | | | 4,684,969 | |
| | 245,220 | | | Unum Group(b) | | | 10,061,377 | |
| | | | | | | | |
| | | | | | | 152,435,489 | |
| | | | | | | | |
| | | | Interactive Media & Services — 4.0% | |
| | 561,560 | | | Alphabet, Inc., Class A(a)(b) | | | 49,546,439 | |
| | 1,651,577 | | | Alphabet, Inc., Class C(a)(b) | | | 146,544,427 | |
| | 488,450 | | | Meta Platforms, Inc., Class A(a)(b) | | | 58,780,073 | |
| | | | | | | | |
| | | | | | | 254,870,939 | |
| | | | | | | | |
| | | | Internet & Direct Marketing Retail — 2.5% | |
| | 1,813,960 | | | Amazon.com, Inc.(a)(b) | | | 152,372,640 | |
| | 3,379 | | | MercadoLibre, Inc.(a)(b) | | | 2,859,445 | |
| | | | | | | | |
| | | | | | | 155,232,085 | |
| | | | | | | | |
| | | | IT Services — 4.2% | |
| | 96,508 | | | Accenture PLC, Class A(b) | | | 25,752,195 | |
| | 141,064 | | | Automatic Data Processing, Inc.(b) | | | 33,694,547 | |
| | 40,838 | | | Block, Inc.(a)(b) | | | 2,566,260 | |
| | 114,609 | | | DXC Technology Co.(a)(b) | | | 3,037,139 | |
| | 16,340 | | | EPAM Systems, Inc.(a)(b) | | | 5,355,272 | |
| | 21,387 | | | Gartner, Inc.(a)(b) | | | 7,189,026 | |
| | 151,525 | | | Mastercard, Inc., Class A(b) | | | 52,689,788 | |
| | 160,547 | | | Paychex, Inc.(b) | | | 18,552,811 | |
| | 300,792 | | | PayPal Holdings, Inc.(a)(b) | | | 21,422,406 | |
| | 70,477 | | | Shopify, Inc., Class A(a)(b) | | | 2,446,257 | |
| | 21,371 | | | SS&C Technologies Holdings, Inc.(b) | | | 1,112,574 | |
| | 8,665 | | | Twilio, Inc., Class A(a)(b) | | | 424,238 | |
| | 72,450 | | | VeriSign, Inc.(a)(b) | | | 14,884,128 | |
| | 376,825 | | | Visa, Inc., Class A(b) | | | 78,289,162 | |
| | | | | | | | |
| | | | | | | 267,415,803 | |
| | | | | | | | |
See accompanying notes to financial statements.
| 30
Portfolio of Investments – as of December 31, 2022
Gateway Fund – (continued)
| | | | | | | | |
| Shares | | | Description | | Value (†) | |
| | | | Leisure Products — 0.0% | |
| | 19,460 | | | Polaris, Inc.(b) | | $ | 1,965,460 | |
| | | | | | | | |
| | | | Life Sciences Tools & Services — 1.5% | |
| | 151,550 | | | Avantor, Inc.(a)(b) | | | 3,196,189 | |
| | 113,133 | | | Danaher Corp.(b) | | | 30,027,761 | |
| | 17,245 | | | ICON PLC(a)(b) | | | 3,349,841 | |
| | 52,796 | | | Illumina, Inc.(a)(b) | | | 10,675,351 | |
| | 89,614 | | | Thermo Fisher Scientific, Inc.(b) | | | 49,349,534 | |
| | | | | | | | |
| | | | | | | 96,598,676 | |
| | | | | | | | |
| | | | Machinery — 2.0% | |
| | 142,239 | | | Caterpillar, Inc.(b) | | | 34,074,775 | |
| | 89,903 | | | Cummins, Inc.(b) | | | 21,782,598 | |
| | 72,565 | | | Deere & Co.(b) | | | 31,112,969 | |
| | 93,267 | | | Parker-Hannifin Corp.(b) | | | 27,140,697 | |
| | 121,067 | | | Pentair PLC(b) | | | 5,445,594 | |
| | 63,733 | | | Timken Co. (The)(b) | | | 4,504,011 | |
| | | | | | | | |
| | | | | | | 124,060,644 | |
| | | | | | | | |
| | | | Media — 0.7% | |
| | 1,121,178 | | | Comcast Corp., Class A(b) | | | 39,207,595 | |
| | 33,220 | | | Liberty Broadband Corp., Class C(a)(b) | | | 2,533,689 | |
| | 532,406 | | | Sirius XM Holdings, Inc.(b) | | | 3,109,251 | |
| | | | | | | | |
| | | | | | | 44,850,535 | |
| | | | | | | | |
| | | | Metals & Mining — 0.3% | |
| | 28,464 | | | Alcoa Corp.(b) | | | 1,294,258 | |
| | 184,756 | | | Newmont Corp.(b) | | | 8,720,483 | |
| | 116,378 | | | Southern Copper Corp.(b) | | | 7,028,067 | |
| | 47,801 | | | Steel Dynamics, Inc.(b) | | | 4,670,158 | |
| | | | | | | | |
| | | | | | | 21,712,966 | |
| | | | | | | | |
| | | | Multi-Utilities — 1.1% | |
| | 260,977 | | | Ameren Corp.(b) | | | 23,206,075 | |
| | 258,154 | | | Consolidated Edison, Inc.(b) | | | 24,604,658 | |
| | 227,581 | | | WEC Energy Group, Inc.(b) | | | 21,337,994 | |
| | | | | | | | |
| | | | | | | 69,148,727 | |
| | | | | | | | |
| | | | Multiline Retail — 0.4% | |
| | 152,451 | | | Target Corp.(b) | | | 22,721,297 | |
| | | | | | | | |
| | | | Oil, Gas & Consumable Fuels — 4.8% | |
| | 346,281 | | | Cenovus Energy, Inc.(b) | | | 6,721,314 | |
| | 50,447 | | | Cheniere Energy, Inc.(b) | | | 7,565,032 | |
| | 432,007 | | | Chevron Corp.(b) | | | 77,540,937 | |
| | 385,792 | | | ConocoPhillips(b) | | | 45,523,456 | |
| | 31,490 | | | Enbridge, Inc.(b) | | | 1,231,259 | |
| | 126,980 | | | EQT Corp.(b) | | | 4,295,733 | |
| | 891,239 | | | Exxon Mobil Corp.(b) | | | 98,303,662 | |
| | 61,365 | | | HF Sinclair Corp.(b) | | | 3,184,230 | |
| | 221,709 | | | Occidental Petroleum Corp.(b) | | | 13,965,450 | |
| | 254,599 | | | ONEOK, Inc.(b) | | | 16,727,154 | |
| | 117,666 | | | Suncor Energy, Inc.(b) | | | 3,733,542 | |
| | 115,966 | | | Targa Resources Corp.(b) | | | 8,523,501 | |
| | 107,375 | | | Valero Energy Corp.(b) | | | 13,621,593 | |
| | | | | | | | |
| | | | | | | 300,936,863 | |
| | | | | | | | |
| | | | Pharmaceuticals — 5.1% | |
| | 489,213 | | | Bristol-Myers Squibb Co.(b) | | | 35,198,875 | |
| | 179,752 | | | Eli Lilly & Co.(b) | | | 65,760,472 | |
| | 14,229 | | | Jazz Pharmaceuticals PLC(a)(b) | | | 2,266,822 | |
| | 523,591 | | | Johnson & Johnson(b) | | | 92,492,350 | |
| | 597,588 | | | Merck & Co., Inc.(b) | | | 66,302,388 | |
| | 1,174,553 | | | Pfizer, Inc.(b) | | | 60,184,096 | |
| | | | | | | | |
| | | | | | | 322,205,003 | |
| | | | | | | | |
| | | | Professional Services — 0.3% | |
| | 52,260 | | | Booz Allen Hamilton Holding Corp.(b) | | | 5,462,215 | |
| | 97,840 | | | CoStar Group, Inc.(a)(b) | | | 7,561,075 | |
| | | | Professional Services — continued | |
| | 40,427 | | | ManpowerGroup, Inc.(b) | | $ | 3,363,931 | |
| | 53,033 | | | TransUnion(b) | | | 3,009,623 | |
| | | | | | | | |
| | | | | | | 19,396,844 | |
| | | | | | | | |
| | | | Real Estate Management & Development — 0.0% | |
| | 56,375 | | | Zillow Group, Inc., Class C(a)(b) | | | 1,815,839 | |
| | | | | | | | |
| | | | REITs – Apartments — 0.6% | |
| | 252,006 | | | American Homes 4 Rent, Class A(b) | | | 7,595,461 | |
| | 85,332 | | | Camden Property Trust(b) | | | 9,546,944 | |
| | 409,105 | | | Invitation Homes, Inc.(b) | | | 12,125,872 | |
| | 265,036 | | | UDR, Inc.(b) | | | 10,264,844 | |
| | | | | | | | |
| | | | | | | 39,533,121 | |
| | | | | | | | |
| | | | REITs – Diversified — 0.5% | |
| | 107,323 | | | American Tower Corp.(b) | | | 22,737,451 | |
| | 100,874 | | | W.P. Carey, Inc.(b) | | | 7,883,303 | |
| | | | | | | | |
| | | | | | | 30,620,754 | |
| | | | | | | | |
| | | | REITs – Health Care — 0.2% | |
| | 260,504 | | | Healthcare Realty Trust, Inc.(b) | | | 5,019,912 | |
| | 453,565 | | | Medical Properties Trust, Inc.(b) | | | 5,052,714 | |
| | 295,291 | | | Sabra Health Care REIT, Inc.(b) | | | 3,670,467 | |
| | | | | | | | |
| | | | | | | 13,743,093 | |
| | | | | | | | |
| | | | REITs – Manufactured Homes — 0.3% | |
| | 143,552 | | | Equity LifeStyle Properties, Inc.(b) | | | 9,273,459 | |
| | 68,343 | | | Sun Communities, Inc.(b) | | | 9,773,049 | |
| | | | | | | | |
| | | | | | | 19,046,508 | |
| | | | | | | | |
| | | | REITs – Mortgage — 0.0% | |
| | 128,993 | | | Annaly Capital Management, Inc.(b) | | | 2,719,172 | |
| | | | | | | | |
| | | | REITs – Office Property — 0.0% | |
| | 3,663 | | | Kilroy Realty Corp.(b) | | | 141,648 | |
| | | | | | | | |
| | | | REITs – Single Tenant — 0.2% | |
| | 221,497 | | | National Retail Properties, Inc.(b) | | | 10,135,703 | |
| | | | | | | | |
| | | | REITs – Storage — 0.1% | |
| | 151,601 | | | CubeSmart(b) | | | 6,101,940 | |
| | | | | | | | |
| | | | REITs – Warehouse/Industrials — 0.3% | |
| | 171,517 | | | Prologis, Inc.(b) | | | 19,335,111 | |
| | | | | | | | |
| | | | Road & Rail — 0.9% | |
| | 115,540 | | | Canadian Pacific Railway Ltd.(b) | | | 8,618,128 | |
| | 836,813 | | | CSX Corp.(b) | | | 25,924,467 | |
| | 47,741 | | | J.B. Hunt Transport Services, Inc.(b) | | | 8,324,121 | |
| | 43,447 | | | Old Dominion Freight Line, Inc.(b) | | | 12,329,390 | |
| | 108,199 | | | Uber Technologies, Inc.(a)(b) | | | 2,675,761 | |
| | | | | | | | |
| | | | | | | 57,871,867 | |
| | | | | | | | |
| | | | Semiconductors & Semiconductor Equipment — 4.9% | |
| | 326,538 | | | Advanced Micro Devices, Inc.(a)(b) | | | 21,149,866 | |
| | 170,421 | | | Analog Devices, Inc.(b) | | | 27,954,157 | |
| | 100,260 | | | Broadcom, Inc.(b) | | | 56,058,374 | |
| | 16,102 | | | First Solar, Inc.(a)(b) | | | 2,411,919 | |
| | 960,537 | | | Intel Corp.(b) | | | 25,386,993 | |
| | 148,999 | | | Marvell Technology, Inc.(b) | | | 5,518,923 | |
| | 304,535 | | | Micron Technology, Inc.(b) | | | 15,220,659 | |
| | 527,202 | | | NVIDIA Corp.(b) | | | 77,045,300 | |
| | 268,158 | | | QUALCOMM, Inc.(b) | | | 29,481,290 | |
| | 106,600 | | | Teradyne, Inc.(b) | | | 9,311,510 | |
| | 258,807 | | | Texas Instruments, Inc.(b) | | | 42,760,093 | |
| | | | | | | | |
| | | | | | | 312,299,084 | |
| | | | | | | | |
| | | | Software — 8.2% | |
| | 121,776 | | | Adobe, Inc.(a)(b) | | | 40,981,277 | |
| | 33,266 | | | Black Knight, Inc.(a)(b) | | | 2,054,175 | |
| | 135,877 | | | Cadence Design Systems, Inc.(a)(b) | | | 21,827,281 | |
See accompanying notes to financial statements.
31 |
Portfolio of Investments – as of December 31, 2022
Gateway Fund – (continued)
| | | | | | | | |
| Shares | | | Description | | Value (†) | |
| | | | Software — continued | |
| | 22,762 | | | Ceridian HCM Holding, Inc.(a)(b) | | $ | 1,460,182 | |
| | 50,512 | | | Intuit, Inc.(b) | | | 19,660,281 | |
| | 1,475,957 | | | Microsoft Corp.(b) | | | 353,964,008 | |
| | 417,592 | | | Oracle Corp.(b) | | | 34,133,970 | |
| | 30,411 | | | Palo Alto Networks, Inc.(a)(b) | | | 4,243,551 | |
| | 122,267 | | | Salesforce, Inc.(a)(b) | | | 16,211,382 | |
| | 51,745 | | | ServiceNow, Inc.(a)(b) | | | 20,091,031 | |
| | 10,997 | | | VMware, Inc., Class A(a)(b) | | | 1,349,992 | |
| | 29,249 | | | Workday, Inc., Class A(a)(b) | | | 4,894,235 | |
| | | | | | | | |
| | | | | | | 520,871,365 | |
| | | | | | | | |
| | | | Specialty Retail — 2.3% | |
| | 17,696 | | | Burlington Stores, Inc.(a)(b) | | | 3,588,041 | |
| | 20,171 | | | Dick’s Sporting Goods, Inc.(b) | | | 2,426,370 | |
| | 256,279 | | | Home Depot, Inc. (The)(b) | | | 80,948,285 | |
| | 210,858 | | | Lowe’s Cos., Inc.(b) | | | 42,011,348 | |
| | 16,734 | | | O’Reilly Automotive, Inc.(a)(b) | | | 14,123,998 | |
| | 17,808 | | | Williams-Sonoma, Inc.(b) | | | 2,046,495 | |
| | | | | | | | |
| | | | | | | 145,144,537 | |
| | | | | | | | |
| | | | Technology Hardware, Storage & Peripherals — 6.2% | |
| | 3,012,758 | | | Apple, Inc.(b) | | | 391,447,647 | |
| | 63,335 | | | Dell Technologies, Inc., Class C(b) | | | 2,547,334 | |
| | | | | | | | |
| | | | | | | 393,994,981 | |
| | | | | | | | |
| | | | Textiles, Apparel & Luxury Goods — 0.6% | |
| | 16,507 | | | Lululemon Athletica, Inc.(a)(b) | | | 5,288,512 | |
| | 268,082 | | | NIKE, Inc., Class B(b) | | | 31,368,275 | |
| | | | | | | | |
| | | | | | | 36,656,787 | |
| | | | | | | | |
| | | | Tobacco — 0.5% | |
| | 671,905 | | | Altria Group, Inc.(b) | | | 30,712,778 | |
| | | | | | | | |
| | | | Trading Companies & Distributors — 0.0% | |
| | 18,040 | | | GATX Corp.(b) | | | 1,918,374 | |
| | | | | | | | |
| | | | Total Common Stocks
(Identified Cost $2,647,799,973) | | | 6,152,050,500 | |
| | | | | | | | |
| | | | | | | | |
| | | | Total Purchased Options — 1.0%
(Identified Cost $92,445,105) (see detail below) | | | 61,206,245 | |
| | | | | | | | |
| | | | | | | | |
Principal
Amount | | | | | | |
| | Short-Term Investments — 3.2% | | | | |
| $ | 206,114,180 | | | Tri-Party Repurchase Agreement with Fixed Income Clearing Corporation, dated 12/30/2022 at 1.800% to be repurchased at $206,155,403 on 1/03/2023 collateralized by $52,945,100 U.S. Treasury Inflation Indexed Bond, 3.625% due 4/15/2028 valued at $106,625,618; $4,404,700 U.S. Treasury Note, 2.875% due 5/15/2028 valued at $4,185,927; $114,000,000 U.S. Treasury Note, 1.250% due 4/30/2028 valued at $99,425,079 including accrued interest (Note 2 of Notes to Financial Statements)
(Identified Cost $206,114,180) | | | 206,114,180 | |
| | | | | | | | |
| | | | | | | | |
| | | | Total Investments — 101.3%
(Identified Cost $2,946,359,258) | | | 6,419,370,925 | |
| | | | Other assets less liabilities — (1.3)% | | | (81,331,419 | ) |
| | | | | | | | |
| | | | Net Assets — 100.0% | | $ | 6,338,039,506 | |
| | | | | | | | |
| | | | | | | | |
| | | | | | | | | | | | | | | | | | | | | | |
| Purchased Options — 1.0% | |
| | | | | | |
| Description | | Expiration
Date | | | Exercise
Price | | Contracts | | | Notional
Amount | | | Cost | | | Value (†) | |
| Index Options — 1.0% | |
| S&P 500® Index, Put(a) | | | 2/17/2023 | | | 3,425 | | | 2,284 | | | $ | 876,941,800 | | | $ | 11,471,390 | | | $ | 3,734,340 | |
| S&P 500® Index, Put(a) | | | 2/17/2023 | | | 3,500 | | | 2,302 | | | | 883,852,900 | | | | 11,511,151 | | | | 5,593,860 | |
| S&P 500® Index, Put(a) | | | 3/17/2023 | | | 3,400 | | | 2,172 | | | | 833,939,400 | | | | 17,012,190 | | | | 6,820,080 | |
| S&P 500® Index, Put(a) | | | 3/17/2023 | | | 3,425 | | | 2,249 | | | | 863,503,550 | | | | 17,671,360 | | | | 7,759,050 | |
| S&P 500® Index, Put(a) | | | 3/17/2023 | | | 3,500 | | | 2,283 | | | | 876,557,850 | | | | 12,715,169 | | | | 10,604,535 | |
| S&P 500® Index, Put(a) | | | 3/17/2023 | | | 3,550 | | | 2,283 | | | | 876,557,850 | | | | 11,485,499 | | | | 12,739,140 | |
| S&P 500® Index, Put(a) | | | 3/17/2023 | | | 3,575 | | | 2,284 | | | | 876,941,800 | | | | 10,578,346 | | | | 13,955,240 | |
| | | | | | | | | | | | | | | | | | | | | | |
| Total | | | | | | | | | | | | | | | | $ | 92,445,105 | | | $ | 61,206,245 | |
| | | | | | | | | | | | | | | | | | | | | | |
| | | | | | | | | | | | | | | | | | | | | | |
| Written Options — (1.8%) | |
| | | | | | |
| Description | | Expiration
Date | | | Exercise
Price | | Contracts | | | Notional
Amount | | | Premiums
(Received) | | | Value (†) | |
| Index Options — (1.8%) | |
| S&P 500® Index, Call | | | 1/20/2023 | | | 3,850 | | | (1,762 | ) | | $ | (676,519,900 | ) | | $ | (12,983,103 | ) | | $ | (12,659,970 | ) |
| S&P 500® Index, Call | | | 1/20/2023 | | | 4,075 | | | (1,762 | ) | | | (676,519,900 | ) | | | (19,813,708 | ) | | | (1,083,630 | ) |
| S&P 500® Index, Call | | | 1/20/2023 | | | 4,100 | | | (1,762 | ) | | | (676,519,900 | ) | | | (21,215,361 | ) | | | (757,660 | ) |
| S&P 500® Index, Call | | | 1/31/2023 | | | 3,925 | | | (1,762 | ) | | | (676,519,900 | ) | | | (10,488,305 | ) | | | (9,409,080 | ) |
| S&P 500® Index, Call | | | 2/17/2023 | | | 3,825 | | | (1,761 | ) | | | (676,135,950 | ) | | | (23,592,997 | ) | | | (23,799,915 | ) |
| S&P 500® Index, Call | | | 2/17/2023 | | | 3,900 | | | (1,762 | ) | | | (676,519,900 | ) | | | (21,731,363 | ) | | | (16,783,050 | ) |
| S&P 500® Index, Call | | | 2/17/2023 | | | 3,950 | | | (1,762 | ) | | | (676,519,900 | ) | | | (21,870,825 | ) | | | (12,844,980 | ) |
| S&P 500® Index, Call | | | 2/17/2023 | | | 3,975 | | | (1,762 | ) | | | (676,519,900 | ) | | | (31,962,380 | ) | | | (11,030,120 | ) |
| S&P 500® Index, Call | | | 3/17/2023 | | | 3,900 | | | (1,762 | ) | | | (676,519,900 | ) | | | (21,412,705 | ) | | | (23,205,540 | ) |
| | | | | | | | | | | | | | | | | | | | | | |
| Total | | | | | | | | | | | | | | | | $ | (185,070,747 | ) | | $ | (111,573,945 | ) |
| | | | | | | | | | | | | | | | | | | | | | |
| | | | | | | | |
| | | | | | | | | |
| | (†) | | | See Note 2 of Notes to Financial Statements. | |
| | (a) | | | Non-income producing security. | |
| | (b) | | | Security (or a portion thereof) has been pledged as collateral for open derivative contracts. | |
| | | | | |
| | ADR | | | An American Depositary Receipt is a certificate issued by a custodian bank representing the right to receive securities of the foreign issuer described. The values of ADRs may be significantly influenced by trading on exchanges not located in the United States. | |
| | REITs | | | Real Estate Investment Trusts | |
See accompanying notes to financial statements.
| 32
Portfolio of Investments – as of December 31, 2022
Gateway Fund – (continued)
Industry Summary at December 31, 2022
| | | | |
Software | | | 8.2 | % |
Technology Hardware, Storage & Peripherals | | | 6.2 | |
Pharmaceuticals | | | 5.1 | |
Semiconductors & Semiconductor Equipment | | | 4.9 | |
Oil, Gas & Consumable Fuels | | | 4.8 | |
IT Services | | | 4.2 | |
Interactive Media & Services | | | 4.0 | |
Health Care Providers & Services | | | 3.6 | |
Banks | | | 3.4 | |
Health Care Equipment & Supplies | | | 2.7 | |
Capital Markets | | | 2.6 | |
Internet & Direct Marketing Retail | | | 2.5 | |
Insurance | | | 2.4 | |
Biotechnology | | | 2.3 | |
Specialty Retail | | | 2.3 | |
Diversified Financial Services | | | 2.2 | |
Electric Utilities | | | 2.0 | |
Hotels, Restaurants & Leisure | | | 2.0 | |
Machinery | | | 2.0 | |
Other Investments, less than 2% each | | | 30.7 | |
Short-Term Investments | | | 3.2 | |
| | | | |
Total Investments | | | 101.3 | |
Other assets less liabilities (including open written options) | | | (1.3 | ) |
| | | | |
Net Assets | | | 100.0 | % |
| | | | |
See accompanying notes to financial statements.
33 |
Portfolio of Investments – as of December 31, 2022
Gateway Equity Call Premium Fund
| | | | | | | | |
| Shares | | | Description | | Value (†) | |
| | Common Stocks — 99.6% of Net Assets | |
| | | | Aerospace & Defense — 1.7% | |
| | 2,811 | | | Boeing Co. (The)(a)(b) | | $ | 535,467 | |
| | 1,505 | | | Lockheed Martin Corp.(b) | | | 732,167 | |
| | 11,106 | | | Raytheon Technologies Corp.(b) | | | 1,120,818 | |
| | | | | | | | |
| | | | | | | 2,388,452 | |
| | | | | | | | |
| | | | Air Freight & Logistics — 0.0% | |
| | 492 | | | GXO Logistics, Inc.(a)(b) | | | 21,004 | |
| | | | | | | | |
| | | | Airlines — 0.3% | |
| | 11,176 | | | Delta Air Lines, Inc.(a)(b) | | | 367,243 | |
| | 5,618 | | | JetBlue Airways Corp.(a)(b) | | | 36,405 | |
| | | | | | | | |
| | | | | | | 403,648 | |
| | | | | | | | |
| | | | Auto Components — 0.1% | |
| | 858 | | | Adient PLC(a)(b) | | | 29,764 | |
| | 1,374 | | | Gentex Corp.(b) | | | 37,469 | |
| | 343 | | | Lear Corp.(b) | | | 42,539 | |
| | 1,363 | | | Magna International, Inc.(b) | | | 76,573 | |
| | | | | | | | |
| | | | | | | 186,345 | |
| | | | | | | | |
| | | | Automobiles — 1.2% | |
| | 23,286 | | | Ford Motor Co.(b) | | | 270,816 | |
| | 11,733 | | | Tesla, Inc.(a)(b) | | | 1,445,271 | |
| | | | | | | | |
| | | | | | | 1,716,087 | |
| | | | | | | | |
| | | | Banks — 3.9% | |
| | 35,300 | | | Bank of America Corp.(b) | | | 1,169,136 | |
| | 10,229 | | | Citigroup, Inc.(b) | | | 462,658 | |
| | 2,043 | | | Comerica, Inc.(b) | | | 136,575 | |
| | 1,810 | | | East West Bancorp, Inc.(b) | | | 119,279 | |
| | 12,369 | | | Fifth Third Bancorp(b) | | | 405,827 | |
| | 3,780 | | | First Horizon Corp.(b) | | | 92,610 | |
| | 1,472 | | | First Republic Bank(b) | | | 179,422 | |
| | 14,077 | | | JPMorgan Chase & Co.(b) | | | 1,887,726 | |
| | 495 | | | SVB Financial Group(a)(b) | | | 113,919 | |
| | 19,570 | | | Wells Fargo & Co.(b) | | | 808,045 | |
| | | | | | | | |
| | | | | | | 5,375,197 | |
| | | | | | | | |
| | | | Beverages — 2.2% | |
| | 23,149 | | | Coca-Cola Co. (The)(b) | | | 1,472,508 | |
| | 8,468 | | | PepsiCo, Inc.(b) | | | 1,529,829 | |
| | | | | | | | |
| | | | | | | 3,002,337 | |
| | | | | | | | |
| | | | Biotechnology — 2.4% | |
| | 8,628 | | | AbbVie, Inc.(b) | | | 1,394,371 | |
| | 168 | | | Alnylam Pharmaceuticals, Inc.(a)(b) | | | 39,925 | |
| | 2,950 | | | Amgen, Inc.(b) | | | 774,788 | |
| | 1,006 | | | Biogen, Inc.(a)(b) | | | 278,581 | |
| | 1,134 | | | BioMarin Pharmaceutical, Inc.(a)(b) | | | 117,358 | |
| | 976 | | | Exact Sciences Corp.(a)(b) | | | 48,322 | |
| | 1,611 | | | Moderna, Inc.(a)(b) | | | 289,368 | |
| | 303 | | | Seagen, Inc.(a)(b) | | | 38,938 | |
| | 1,306 | | | Vertex Pharmaceuticals, Inc.(a)(b) | | | 377,147 | |
| | | | | | | | |
| | | | | | | 3,358,798 | |
| | | | | | | | |
| | | | Building Products — 0.8% | |
| | 1,115 | | | A.O. Smith Corp.(b) | | | 63,823 | |
| | 8,286 | | | Carrier Global Corp.(b) | | | 341,797 | |
| | 2,175 | | | Fortune Brands Innovations, Inc.(b) | | | 124,214 | |
| | 6,595 | | | Johnson Controls International PLC(b) | | | 422,080 | |
| | 368 | | | Lennox International, Inc.(b) | | | 88,037 | |
| | 2,175 | | | MasterBrand, Inc.(a) | | | 16,421 | |
| | | | | | | | |
| | | | | | | 1,056,372 | |
| | | | | | | | |
| | | | Capital Markets — 2.7% | |
| | 6,833 | | | Bank of New York Mellon Corp. (The)(b) | | | 311,038 | |
| | 1,304 | | | BlackRock, Inc.(b) | | | 924,053 | |
| | | | Capital Markets — continued | |
| | 8,586 | | | Charles Schwab Corp. (The)(b) | | $ | 714,870 | |
| | 394 | | | FactSet Research Systems, Inc.(b) | | | 158,077 | |
| | 1,688 | | | KKR & Co., Inc.(b) | | | 78,357 | |
| | 8,880 | | | Morgan Stanley(b) | | | 754,978 | |
| | 881 | | | MSCI, Inc.(b) | | | 409,815 | |
| | 3,883 | | | Raymond James Financial, Inc.(b) | | | 414,899 | |
| | | | | | | | |
| | | | | | | 3,766,087 | |
| | | | | | | | |
| | | | Chemicals — 1.7% | |
| | 849 | | | AdvanSix, Inc.(b) | | | 32,279 | |
| | 1,421 | | | Air Products & Chemicals, Inc.(b) | | | 438,037 | |
| | 1,655 | | | Ashland, Inc.(b) | | | 177,962 | |
| | 1,339 | | | CF Industries Holdings, Inc.(b) | | | 114,083 | |
| | 2,066 | | | Huntsman Corp.(b) | | | 56,774 | |
| | 3,129 | | | Linde PLC(b) | | | 1,020,617 | |
| | 512 | | | Nutrien Ltd.(b) | | | 37,391 | |
| | 2,459 | | | PPG Industries, Inc.(b) | | | 309,195 | |
| | 1,332 | | | RPM International, Inc.(b) | | | 129,803 | |
| | 3,498 | | | Valvoline, Inc.(b) | | | 114,210 | |
| | | | | | | | |
| | | | | | | 2,430,351 | |
| | | | | | | | |
| | | | Commercial Services & Supplies — 0.6% | |
| | 1,310 | | | Waste Connections, Inc.(b) | | | 173,654 | |
| | 3,875 | | | Waste Management, Inc.(b) | | | 607,910 | |
| | | | | | | | |
| | | | | | | 781,564 | |
| | | | | | | | |
| | | | Communications Equipment — 1.0% | |
| | 3,080 | | | Ciena Corp.(a)(b) | | | 157,019 | |
| | 25,097 | | | Cisco Systems, Inc.(b) | | | 1,195,621 | |
| | 9,010 | | | Telefonaktiebolaget LM Ericsson, Sponsored ADR(b) | | | 52,618 | |
| | | | | | | | |
| | | | | | | 1,405,258 | |
| | | | | | | | |
| | | | Construction Materials — 0.4% | |
| | 1,548 | | | Martin Marietta Materials, Inc.(b) | | | 523,178 | |
| | | | | | | | |
| | | | Consumer Finance — 0.2% | |
| | 4,484 | | | Ally Financial, Inc.(b) | | | 109,634 | |
| | 6,190 | | | Synchrony Financial(b) | | | 203,403 | |
| | | | | | | | |
| | | | | | | 313,037 | |
| | | | | | | | |
| | | | Containers & Packaging — 0.3% | |
| | 1,233 | | | Crown Holdings, Inc.(b) | | | 101,365 | |
| | 1,388 | | | Packaging Corp. of America(b) | | | 177,539 | |
| | 2,565 | | | WestRock Co.(b) | | | 90,185 | |
| | | | | | | | |
| | | | | | | 369,089 | |
| | | | | | | | |
| | | | Distributors — 0.5% | |
| | 3,868 | | | Genuine Parts Co.(b) | | | 671,137 | |
| | | | | | | | |
| | | | Diversified Consumer Services — 0.1% | |
| | 1,757 | | | Service Corp. International(b) | | | 121,479 | |
| | | | | | | | |
| | | | Diversified Financial Services — 2.2% | |
| | 9,974 | | | Berkshire Hathaway, Inc., Class B(a)(b) | | | 3,080,969 | |
| | | | | | | | |
| | | | Diversified Telecommunication Services — 0.8% | |
| | 27,588 | | | Verizon Communications, Inc.(b) | | | 1,086,967 | |
| | | | | | | | |
| | | | Electric Utilities — 1.8% | |
| | 7,254 | | | Alliant Energy Corp.(b) | | | 400,493 | |
| | 8,149 | | | American Electric Power Co., Inc.(b) | | | 773,747 | |
| | 2,101 | | | OGE Energy Corp.(b) | | | 83,095 | |
| | 18,458 | | | Southern Co. (The)(b) | | | 1,318,086 | |
| | | | | | | | |
| | | | | | | 2,575,421 | |
| | | | | | | | |
| | | | Electrical Equipment — 0.7% | |
| | 617 | | | Acuity Brands, Inc.(b) | | | 102,181 | |
| | 5,935 | | | Emerson Electric Co.(b) | | | 570,116 | |
| | 905 | | | Hubbell, Inc.(b) | | | 212,386 | |
| | 2,698 | | | Sensata Technologies Holding PLC(b) | | | 108,945 | |
| | | | | | | | |
| | | | | | | 993,628 | |
| | | | | �� | | | |
See accompanying notes to financial statements.
| 34
Portfolio of Investments – as of December 31, 2022
Gateway Equity Call Premium Fund – (continued)
| | | | | | | | |
| Shares | | | Description | | Value (†) | |
| | | | Electronic Equipment, Instruments & Components — 0.6% | |
| | 1,903 | | | Arrow Electronics, Inc.(a)(b) | | $ | 198,997 | |
| | 724 | | | Avnet, Inc.(b) | | | 30,104 | |
| | 2,406 | | | CDW Corp.(b) | | | 429,663 | |
| | 7,398 | | | Flex Ltd.(a)(b) | | | 158,761 | |
| | | | | | | | |
| | | | | | | 817,525 | |
| | | | | | | | |
| | | | Energy Equipment & Services — 0.4% | |
| | 10,927 | | | Halliburton Co.(b) | | | 429,978 | |
| | 6,142 | | | NOV, Inc.(b) | | | 128,306 | |
| | | | | | | | |
| | | | | | | 558,284 | |
| | | | | | | | |
| | | | Entertainment — 1.2% | |
| | 1,686 | | | Live Nation Entertainment, Inc.(a)(b) | | | 117,582 | |
| | 200 | | | Madison Square Garden Entertainment Corp.(a)(b) | | | 8,994 | |
| | 475 | | | Madison Square Garden Sports Corp.(b) | | | 87,082 | |
| | 1,975 | | | Netflix, Inc.(a)(b) | | | 582,388 | |
| | 206 | | | Roku, Inc.(a)(b) | | | 8,384 | |
| | 8,609 | | | Walt Disney Co. (The)(a)(b) | | | 747,950 | |
| | 8,992 | | | Warner Bros. Discovery, Inc.(a)(b) | | | 85,244 | |
| | | | | | | | |
| | | | | | | 1,637,624 | |
| | | | | | | | |
| | | | Food & Staples Retailing — 1.8% | |
| | 2,369 | | | Costco Wholesale Corp.(b) | | | 1,081,449 | |
| | 4,772 | | | Sysco Corp.(b) | | | 364,819 | |
| | 7,277 | | | Walmart, Inc.(b) | | | 1,031,806 | |
| | | | | | | | |
| | | | | | | 2,478,074 | |
| | | | | | | | |
| | | | Food Products — 0.7% | |
| | 570 | | | Bunge Ltd.(b) | | | 56,869 | |
| | 1,836 | | | Hain Celestial Group, Inc. (The)(a)(b) | | | 29,707 | |
| | 2,045 | | | Ingredion, Inc.(b) | | | 200,267 | |
| | 5,506 | | | Kellogg Co.(b) | | | 392,247 | |
| | 2,313 | | | Post Holdings, Inc.(a)(b) | | | 208,771 | |
| | 1,107 | | | TreeHouse Foods, Inc.(a)(b) | | | 54,664 | |
| | | | | | | | |
| | | | | | | 942,525 | |
| | | | | | | | |
| | | | Gas Utilities — 0.0% | |
| | 1,531 | | | UGI Corp.(b) | | | 56,754 | |
| | | | | | | | |
| | | | Health Care Equipment & Supplies — 2.4% | |
| | 10,188 | | | Abbott Laboratories(b) | | | 1,118,541 | |
| | 2,381 | | | Alcon, Inc.(b) | | | 163,218 | |
| | 588 | | | Align Technology, Inc.(a)(b) | | | 124,009 | |
| | 826 | | | Cooper Cos., Inc. (The)(b) | | | 273,133 | |
| | 753 | | | IDEXX Laboratories, Inc.(a)(b) | | | 307,194 | |
| | 247 | | | Insulet Corp.(a)(b) | | | 72,714 | |
| | 7,266 | | | Medtronic PLC(b) | | | 564,714 | |
| | 1,573 | | | ResMed, Inc.(b) | | | 327,388 | |
| | 1,116 | | | STERIS PLC(b) | | | 206,114 | |
| | 650 | | | Teleflex, Inc.(b) | | | 162,259 | |
| | | | | | | | |
| | | | | | | 3,319,284 | |
| | | | | | | | |
| | | | Health Care Providers & Services — 3.6% | |
| | 4,703 | | | Centene Corp.(a)(b) | | | 385,693 | |
| | 2,167 | | | Cigna Corp.(b) | | | 718,014 | |
| | 1,307 | | | DaVita, Inc.(a)(b) | | | 97,594 | |
| | 1,644 | | | Elevance Health, Inc.(b) | | | 843,323 | |
| | 1,079 | | | Laboratory Corp. of America Holdings(b) | | | 254,083 | |
| | 612 | | | Molina Healthcare, Inc.(a)(b) | | | 202,094 | |
| | 2,386 | | | Pediatrix Medical Group, Inc.(a)(b) | | | 35,456 | |
| | 4,562 | | | UnitedHealth Group, Inc.(b) | | | 2,418,681 | |
| | | | | | | | |
| | | | | | | 4,954,938 | |
| | | | | | | | |
| | | | Hotels, Restaurants & Leisure — 2.0% | |
| | 232 | | | Booking Holdings, Inc.(a)(b) | | | 467,545 | |
| | 7,208 | | | Carnival Corp.(a)(b) | | | 58,096 | |
| | 222 | | | Domino’s Pizza, Inc.(b) | | | 76,901 | |
| | 1,238 | | | Hilton Grand Vacations, Inc.(a)(b) | | | 47,712 | |
| | | | Hotels, Restaurants & Leisure — continued | |
| | 2,215 | | | Hilton Worldwide Holdings, Inc.(b) | | $ | 279,887 | |
| | 3,458 | | | McDonald’s Corp.(b) | | | 911,287 | |
| | 2,401 | | | MGM Resorts International(b) | | | 80,506 | |
| | 1,379 | | | Restaurant Brands International, Inc.(b) | | | 89,180 | |
| | 6,174 | | | Starbucks Corp.(b) | | | 612,461 | |
| | 905 | | | Trip.com Group Ltd., ADR(a)(b) | | | 31,132 | |
| | 479 | | | Vail Resorts, Inc.(b) | | | 114,170 | |
| | | | | | | | |
| | | | | | | 2,768,877 | |
| | | | | | | | |
| | | | Household Durables — 0.2% | |
| | 3,921 | | | PulteGroup, Inc.(b) | | | 178,523 | |
| | 3,091 | | | Toll Brothers, Inc.(b) | | | 154,303 | |
| | | | | | | | |
| | | | | | | 332,826 | |
| | | | | | | | |
| | | | Household Products — 1.7% | |
| | 2,118 | | | Clorox Co. (The)(b) | | | 297,219 | |
| | 13,588 | | | Procter & Gamble Co. (The)(b) | | | 2,059,397 | |
| | | | | | | | |
| | | | | | | 2,356,616 | |
| | | | | | | | |
| | | | Industrial Conglomerates — 1.1% | |
| | 3,889 | | | 3M Co.(b) | | | 466,369 | |
| | 4,774 | | | Honeywell International, Inc.(b) | | | 1,023,068 | |
| | | | | | | | |
| | | | | | | 1,489,437 | |
| | | | | | | | |
| | | | Insurance — 2.6% | |
| | 9,922 | | | Arch Capital Group Ltd.(a)(b) | | | 622,903 | |
| | 4,831 | | | Chubb Ltd.(b) | | | 1,065,719 | |
| | 2,762 | | | Cincinnati Financial Corp.(b) | | | 282,801 | |
| | 6,505 | | | Manulife Financial Corp.(b) | | | 116,049 | |
| | 216 | | | Markel Corp.(a)(b) | | | 284,578 | |
| | 5,821 | | | Prudential Financial, Inc.(b) | | | 578,957 | |
| | 911 | | | RenaissanceRe Holdings Ltd.(b) | | | 167,833 | |
| | 1,872 | | | Willis Towers Watson PLC(b) | | | 457,854 | |
| | | | | | | | |
| | | | | | | 3,576,694 | |
| | | | | | | | |
| | | | Interactive Media & Services — 4.2% | |
| | 16,000 | | | Alphabet, Inc., Class A(a)(b) | | | 1,411,680 | |
| | 35,648 | | | Alphabet, Inc., Class C(a)(b) | | | 3,163,047 | |
| | 1,416 | | | Match Group, Inc.(a)(b) | | | 58,750 | |
| | 9,875 | | | Meta Platforms, Inc., Class A(a)(b) | | | 1,188,357 | |
| | | | | | | | |
| | | | | | | 5,821,834 | |
| | | | | | | | |
| | | | Internet & Direct Marketing Retail — 2.4% | |
| | 39,292 | | | Amazon.com, Inc.(a)(b) | | | 3,300,528 | |
| | | | | | | | |
| | | | IT Services — 4.4% | |
| | 3,711 | | | Accenture PLC, Class A(b) | | | 990,243 | |
| | 439 | | | Block, Inc.(a)(b) | | | 27,587 | |
| | 277 | | | EPAM Systems, Inc.(a)(b) | | | 90,784 | |
| | 1,048 | | | FleetCor Technologies, Inc.(a)(b) | | | 192,497 | |
| | 2,488 | | | Global Payments, Inc.(b) | | | 247,108 | |
| | 4,509 | | | International Business Machines Corp.(b) | | | 635,273 | |
| | 600 | | | Kyndryl Holdings, Inc.(a)(b) | | | 6,672 | |
| | 4,301 | | | Mastercard, Inc., Class A(b) | | | 1,495,587 | |
| | 5,475 | | | PayPal Holdings, Inc.(a)(b) | | | 389,929 | |
| | 1,329 | | | Shopify, Inc., Class A(a)(b) | | | 46,130 | |
| | 2,955 | | | SS&C Technologies Holdings, Inc.(b) | | | 153,837 | |
| | 558 | | | Twilio, Inc., Class A(a)(b) | | | 27,320 | |
| | 991 | | | VeriSign, Inc.(a)(b) | | | 203,591 | |
| | 7,908 | | | Visa, Inc., Class A(b) | | | 1,642,966 | |
| | | | | | | | |
| | | | | | | 6,149,524 | |
| | | | | | | | |
| | | | Leisure Products — 0.1% | |
| | 590 | | | Brunswick Corp.(b) | | | 42,527 | |
| | 515 | | | Polaris, Inc.(b) | | | 52,015 | |
| | | | | | | | |
| | | | | | | 94,542 | |
| | | | | | | | |
See accompanying notes to financial statements.
35 |
Portfolio of Investments – as of December 31, 2022
Gateway Equity Call Premium Fund – (continued)
| | | | | | | | |
| Shares | | | Description | | Value (†) | |
| | | | Life Sciences Tools & Services — 1.8% | |
| | 7,763 | | | Avantor, Inc.(a)(b) | | $ | 163,722 | |
| | 159 | | | Bio-Rad Laboratories, Inc., Class A(a)(b) | | | 66,858 | |
| | 791 | | | ICON PLC(a)(b) | | | 153,652 | |
| | 1,123 | | | Illumina, Inc.(a)(b) | | | 227,070 | |
| | 2,542 | | | PerkinElmer, Inc.(b) | | | 356,439 | |
| | 2,331 | | | Thermo Fisher Scientific, Inc.(b) | | | 1,283,658 | |
| | 867 | | | Waters Corp.(a)(b) | | | 297,017 | |
| | | | | | | | |
| | | | | | | 2,548,416 | |
| | | | | | | | |
| | | | Machinery — 1.9% | |
| | 471 | | | AGCO Corp.(b) | | | 65,323 | |
| | 3,132 | | | Caterpillar, Inc.(b) | | | 750,302 | |
| | 1,517 | | | Cummins, Inc.(b) | | | 367,554 | |
| | 1,522 | | | Deere & Co.(b) | | | 652,572 | |
| | 1,533 | | | IDEX Corp.(b) | | | 350,030 | |
| | 6,154 | | | Otis Worldwide Corp.(b) | | | 481,920 | |
| | | | | | | | |
| | | | | | | 2,667,701 | |
| | | | | | | | |
| | | | Media — 0.8% | |
| | 21,855 | | | Comcast Corp., Class A(b) | | | 764,270 | |
| | 5,700 | | | Fox Corp., Class B(b) | | | 162,165 | |
| | 30 | | | Liberty Broadband Corp., Class C(a)(b) | | | 2,288 | |
| | 20,137 | | | Sirius XM Holdings, Inc.(b) | | | 117,600 | |
| | | | | | | | |
| | | | | | | 1,046,323 | |
| | | | | | | | |
| | | | Metals & Mining — 0.4% | |
| | 1,372 | | | Alcoa Corp.(b) | | | 62,385 | |
| | 4,852 | | | Barrick Gold Corp.(b) | | | 83,357 | |
| | 929 | | | Rio Tinto PLC, Sponsored ADR(b) | | | 66,145 | |
| | 2,052 | | | Southern Copper Corp.(b) | | | 123,920 | |
| | 1,435 | | | Steel Dynamics, Inc.(b) | | | 140,200 | |
| | 4,124 | | | Vale S.A., Sponsored ADR(b) | | | 69,984 | |
| | | | | | | | |
| | | | | | | 545,991 | |
| | | | | | | | |
| | | | Multi-Utilities — 1.1% | |
| | 9,368 | | | Ameren Corp.(b) | | | 833,003 | |
| | 10,972 | | | Public Service Enterprise Group, Inc.(b) | | | 672,254 | |
| | | | | | | | |
| | | | | | | 1,505,257 | |
| | | | | | | | |
| | | | Multiline Retail — 0.5% | |
| | 1,631 | | | Dollar Tree, Inc.(a)(b) | | | 230,689 | |
| | 3,827 | | | Nordstrom, Inc.(b) | | | 61,768 | |
| | 2,860 | | | Target Corp.(b) | | | 426,254 | |
| | | | | | | | |
| | | | | | | 718,711 | |
| | | | | | | | |
| | | | Oil, Gas & Consumable Fuels — 4.7% | |
| | 1,928 | | | Canadian Natural Resources Ltd.(b) | | | 107,062 | |
| | 8,056 | | | Cenovus Energy, Inc.(b) | | | 156,367 | |
| | 894 | | | Cheniere Energy, Inc.(b) | | | 134,064 | |
| | 8,951 | | | Chevron Corp.(b) | | | 1,606,615 | |
| | 7,143 | | | ConocoPhillips(b) | | | 842,874 | |
| | 4,720 | | | Devon Energy Corp.(b) | | | 290,327 | |
| | 1,122 | | | Enbridge, Inc.(b) | | | 43,870 | |
| | 3,283 | | | EQT Corp.(b) | | | 111,064 | |
| | 19,881 | | | Exxon Mobil Corp.(b) | | | 2,192,874 | |
| | 1,235 | | | HF Sinclair Corp.(b) | | | 64,084 | |
| | 4,296 | | | Occidental Petroleum Corp.(b) | | | 270,605 | |
| | 2,073 | | | Ovintiv, Inc.(b) | | | 105,122 | |
| | 1,422 | | | Pioneer Natural Resources Co.(b) | | | 324,771 | |
| | 3,117 | | | Suncor Energy, Inc.(b) | | | 98,903 | |
| | 1,936 | | | Targa Resources Corp.(b) | | | 142,296 | |
| | 1,014 | | | TC Energy Corp. | | | 40,418 | |
| | | | | | | | |
| | | | | | | 6,531,316 | |
| | | | | | | | |
| | | | Personal Products — 0.0% | |
| | 2,246 | | | BellRing Brands, Inc.(a)(b) | | | 57,587 | |
| | | | | | | | |
| | | | Pharmaceuticals — 5.1% | |
| | 9,892 | | | Bristol-Myers Squibb Co.(b) | | $ | 711,729 | |
| | 3,834 | | | Eli Lilly & Co.(b) | | | 1,402,631 | |
| | 331 | | | Jazz Pharmaceuticals PLC(a)(b) | | | 52,732 | |
| | 12,127 | | | Johnson & Johnson(b) | | | 2,142,234 | |
| | 12,675 | | | Merck & Co., Inc.(b) | | | 1,406,291 | |
| | 27,057 | | | Pfizer, Inc.(b) | | | 1,386,401 | |
| | 1,500 | | | Teva Pharmaceutical Industries Ltd., Sponsored ADR(a)(b) | | | 13,680 | |
| | | | | | | | |
| | | | | | | 7,115,698 | |
| | | | | | | | |
| | | | Professional Services — 0.7% | |
| | 588 | | | Booz Allen Hamilton Holding Corp.(b) | | | 61,458 | |
| | 3,601 | | | CoStar Group, Inc.(a)(b) | | | 278,285 | |
| | 1,850 | | | Leidos Holdings, Inc.(b) | | | 194,601 | |
| | 1,408 | | | ManpowerGroup, Inc.(b) | | | 117,160 | |
| | 597 | | | TransUnion(b) | | | 33,880 | |
| | 1,845 | | | Verisk Analytics, Inc.(b) | | | 325,495 | |
| | | | | | | | |
| | | | | | | 1,010,879 | |
| | | | | | | | |
| | | | Real Estate Management & Development — 0.0% | |
| | 176 | | | Jones Lang LaSalle, Inc.(a)(b) | | | 28,049 | |
| | | | | | | | |
| | | | REITs – Apartments — 0.8% | |
| | 3,564 | | | American Homes 4 Rent, Class A(b) | | | 107,419 | |
| | 1,564 | | | Essex Property Trust, Inc.(b) | | | 331,443 | |
| | 7,745 | | | Invitation Homes, Inc.(b) | | | 229,562 | |
| | 2,431 | | | Mid-America Apartment Communities, Inc.(b) | | | 381,642 | |
| | | | | | | | |
| | | | | | | 1,050,066 | |
| | | | | | | | |
| | | | REITs – Diversified — 1.0% | |
| | 3,388 | | | Crown Castle, Inc.(b) | | | 459,548 | |
| | 2,251 | | | Digital Realty Trust, Inc.(b) | | | 225,708 | |
| | 723 | | | Gaming & Leisure Properties, Inc.(b) | | | 37,661 | |
| | 698 | | | SBA Communications Corp.(b) | | | 195,657 | |
| | 11,638 | | | VICI Properties, Inc.(b) | | | 377,071 | |
| | 2,146 | | | W.P. Carey, Inc.(b) | | | 167,710 | |
| | | | | | | | |
| | | | | | | 1,463,355 | |
| | | | | | | | |
| | | | REITs – Health Care — 0.0% | |
| | 2,686 | | | Medical Properties Trust, Inc.(b) | | | 29,922 | |
| | | | | | | | |
| | | | REITs – Hotels — 0.0% | |
| | 2,742 | | | Park Hotels & Resorts, Inc.(b) | | | 32,328 | |
| | | | | | | | |
| | | | REITs – Manufactured Homes — 0.1% | |
| | 1,172 | | | Sun Communities, Inc.(b) | | | 167,596 | |
| | | | | | | | |
| | | | REITs – Mortgage — 0.0% | |
| | 1,078 | | | Annaly Capital Management, Inc.(b) | | | 22,724 | |
| | | | | | | | |
| | | | REITs – Office Property — 0.0% | |
| | 1,073 | | | Kilroy Realty Corp.(b) | | | 41,493 | |
| | 370 | | | Orion Office REIT, Inc.(b) | | | 3,160 | |
| | | | | | | | |
| | | | | | | 44,653 | |
| | | | | | | | |
| | | | REITs – Single Tenant — 0.4% | |
| | 4,368 | | | National Retail Properties, Inc.(b) | | | 199,880 | |
| | 6,468 | | | Realty Income Corp.(b) | | | 410,265 | |
| | | | | | | | |
| | | | | | | 610,145 | |
| | | | | | | | |
| | | | REITs – Storage — 0.1% | |
| | 1,277 | | | Extra Space Storage, Inc.(b) | | | 187,949 | |
| | | | | | | | |
| | | | REITs – Warehouse/Industrials — 0.4% | |
| | 5,292 | | | Prologis, Inc.(b) | | | 596,567 | |
| | | | | | | | |
| | | | Road & Rail — 1.2% | |
| | 2,291 | | | Canadian Pacific Railway Ltd.(b) | | | 170,886 | |
| | 1,509 | | | Norfolk Southern Corp.(b) | | | 371,848 | |
| | 1,047 | | | Old Dominion Freight Line, Inc.(b) | | | 297,117 | |
| | 492 | | | RXO, Inc.(a)(b) | | | 8,462 | |
See accompanying notes to financial statements.
| 36
Portfolio of Investments – as of December 31, 2022
Gateway Equity Call Premium Fund – (continued)
| | | | | | | | |
| Shares | | | Description | | Value (†) | |
| | | | Road & Rail — continued | |
| | 1,456 | | | Uber Technologies, Inc.(a)(b) | | $ | 36,007 | |
| | 4,069 | | | Union Pacific Corp.(b) | | | 842,568 | |
| | 492 | | | XPO, Inc.(a)(b) | | | 16,379 | |
| | | | | | | | |
| | | | | | | 1,743,267 | |
| | | | | | | | |
| | | | Semiconductors & Semiconductor Equipment — 5.0% | |
| | 7,809 | | | Advanced Micro Devices, Inc.(a)(b) | | | 505,789 | |
| | 5,292 | | | Analog Devices, Inc.(b) | | | 868,047 | |
| | 5,566 | | | Applied Materials, Inc.(b) | | | 542,017 | |
| | 713 | | | Enphase Energy, Inc.(a)(b) | | | 188,916 | |
| | 21,713 | | | Intel Corp.(b) | | | 573,875 | |
| | 5,092 | | | Marvell Technology, Inc.(b) | | | 188,608 | |
| | 11,609 | | | NVIDIA Corp.(b) | | | 1,696,539 | |
| | 1,873 | | | NXP Semiconductors NV(b) | | | 295,990 | |
| | 4,895 | | | ON Semiconductor Corp.(a)(b) | | | 305,301 | |
| | 5,968 | | | QUALCOMM, Inc.(b) | | | 656,122 | |
| | 2,721 | | | Teradyne, Inc.(b) | | | 237,679 | |
| | 5,685 | | | Texas Instruments, Inc.(b) | | | 939,276 | |
| | | | | | | | |
| | | | | | | 6,998,159 | |
| | | | | | | | |
| | | | Software — 8.6% | |
| | 2,336 | | | Adobe, Inc.(a)(b) | | | 786,134 | |
| | 1,380 | | | ANSYS, Inc.(a)(b) | | | 333,394 | |
| | 886 | | | Check Point Software Technologies Ltd.(a)(b) | | | 111,778 | |
| | 4,052 | | | Fortinet, Inc.(a)(b) | | | 198,102 | |
| | 33,729 | | | Microsoft Corp.(b) | | | 8,088,889 | |
| | 7,985 | | | Oracle Corp.(b) | | | 652,694 | |
| | 391 | | | Palo Alto Networks, Inc.(a)(b) | | | 54,560 | |
| | 5,025 | | | Salesforce, Inc.(a)(b) | | | 666,265 | |
| | 1,200 | | | ServiceNow, Inc.(a)(b) | | | 465,924 | |
| | 1,177 | | | Synopsys, Inc.(a)(b) | | | 375,804 | |
| | 656 | | | VMware, Inc., Class A(a)(b) | | | 80,531 | |
| | 446 | | | Workday, Inc., Class A(a)(b) | | | 74,629 | |
| | 922 | | | Zoom Video Communications, Inc., Class A(a)(b) | | | 62,456 | |
| | | | | | | | |
| | | | | | | 11,951,160 | |
| | | | | | | | |
| | | | Specialty Retail — 1.8% | |
| | 1,268 | | | Advance Auto Parts, Inc.(b) | | | 186,434 | |
| | 346 | | | Burlington Stores, Inc.(a)(b) | | | 70,155 | |
| | 933 | | | Dick’s Sporting Goods, Inc.(b) | | | 112,231 | |
| | 1,370 | | | Foot Locker, Inc.(b) | | | 51,772 | |
| | 5,211 | | | Gap, Inc. (The)(b) | | | 58,780 | |
| | 5,383 | | | Home Depot, Inc. (The)(b) | | | 1,700,274 | |
| | 478 | | | Ulta Beauty, Inc.(a)(b) | | | 224,216 | |
| | 749 | | | Williams-Sonoma, Inc.(b) | | | 86,075 | |
| | | | | | | | |
| | | | | | | 2,489,937 | |
| | | | | | | | |
| | | | Technology Hardware, Storage & Peripherals — 6.2% | |
| | 66,509 | | | Apple, Inc.(b) | | | 8,641,514 | |
| | 1,163 | | | Dell Technologies, Inc., Class C(b) | | | 46,776 | |
| | | | | | | | |
| | | | | | | 8,688,290 | |
| | | | | | | | |
| | | | Textiles, Apparel & Luxury Goods — 0.8% | |
| | 579 | | | Carter’s, Inc.(b) | | | 43,199 | |
| | 189 | | | Lululemon Athletica, Inc.(a)(b) | | | 60,552 | |
| | 7,268 | | | NIKE, Inc., Class B(b) | | | 850,429 | |
| | 2,457 | | | Skechers U.S.A., Inc., Class A(a)(b) | | | 103,071 | |
| | 2,600 | | | Under Armour, Inc., Class C(a)(b) | | | 23,192 | |
| | | | | | | | |
| | | | | | | 1,080,443 | |
| | | | | | | | |
| | | | Tobacco — 1.1% | |
| | 11,270 | | | Altria Group, Inc.(b) | | | 515,152 | |
| | 1,544 | | | British American Tobacco PLC, Sponsored ADR(b) | | | 61,729 | |
| | 8,950 | | | Philip Morris International, Inc.(b) | | | 905,829 | |
| | | | | | | | |
| | | | | | | 1,482,710 | |
| | | | | | | | |
| | | | Wireless Telecommunication Services — 0.1% | |
| | 6,515 | | | America Movil SAB de CV, Series L, Sponsored ADR(b) | | $ | 118,573 | |
| | 5,722 | | | Vodafone Group PLC, Sponsored ADR(b) | | | 57,907 | |
| | | | | | | | |
| | | | | | | 176,480 | |
| | | | | | | | |
| | | | Total Common Stocks
(Identified Cost $113,901,960) | | | 138,873,970 | |
| | | | | | | | |
| | | | | | | | |
Principal
Amount | | | | | | |
| | Short-Term Investments — 1.1% | | | | |
| $ | 1,540,484 | | | Tri-Party Repurchase Agreement with Fixed Income Clearing Corporation, dated 12/30/2022 at 1.800% to be repurchased at $1,540,792 on 1/03/2023 collateralized by $780,300 U.S. Treasury Note, 3.625% due 4/15/2028 valued at $1,571,439 including accrued interest (Note 2 of Notes to Financial Statements)
(Identified Cost $1,540,484) | | | 1,540,484 | |
| | | | | | | | |
| | | | | | | | |
| | | | Total Investments — 100.7%
(Identified Cost $115,442,444) | | | 140,414,454 | |
| | | | Other assets less liabilities — (0.7)% | | | (1,004,658 | ) |
| | | | | | | | |
| | | | Net Assets — 100.0% | | $ | 139,409,796 | |
| | | | | | | | |
| | | | | | | | | | | | | | | | | | | | | | |
| Written Options — (1.8%) | |
| | | | | | |
| Description | | Expiration
Date | | | Exercise
Price | | Contracts | | | Notional
Amount | | | Premiums
(Received) | | | Value (†) | |
| Index Options — (1.8%) | |
| S&P 500® Index, Call | | | 1/20/2023 | | | 3,850 | | | (40 | ) | | $ | (15,358,000 | ) | | $ | (294,736 | ) | | $ | (287,400 | ) |
| S&P 500® Index, Call | | | 1/20/2023 | | | 4,075 | | | (41 | ) | | | (15,741,950 | ) | | | (461,045 | ) | | | (25,215 | ) |
| S&P 500® Index, Call | | | 1/20/2023 | | | 4,100 | | | (40 | ) | | | (15,358,000 | ) | | | (481,620 | ) | | | (17,200 | ) |
| S&P 500® Index, Call | | | 1/31/2023 | | | 3,925 | | | (40 | ) | | | (15,358,000 | ) | | | (238,100 | ) | | | (213,600 | ) |
| S&P 500® Index, Call | | | 2/17/2023 | | | 3,825 | | | (40 | ) | | | (15,358,000 | ) | | | (535,900 | ) | | | (540,600 | ) |
| S&P 500® Index, Call | | | 2/17/2023 | | | 3,900 | | | (41 | ) | | | (15,741,950 | ) | | | (505,667 | ) | | | (390,525 | ) |
| S&P 500® Index, Call | | | 2/17/2023 | | | 3,950 | | | (38 | ) | | | (14,590,100 | ) | | | (471,675 | ) | | | (277,020 | ) |
| S&P 500® Index, Call | | | 2/17/2023 | | | 3,975 | | | (40 | ) | | | (15,358,000 | ) | | | (725,593 | ) | | | (250,400 | ) |
| S&P 500® Index, Call | | | 3/17/2023 | | | 3,900 | | | (39 | ) | | | (14,974,050 | ) | | | (473,948 | ) | | | (513,630 | ) |
| | | | | | | | | | | | | | | | | | | | | | |
| Total | | | | | | | | | | | | | | | | $ | (4,188,284 | ) | | $ | (2,515,590 | ) |
| | | | | | | | | | | | | | | | | | | | | | |
| | | | | | | | |
| | | | | | | | | |
| | (†) | | | See Note 2 of Notes to Financial Statements. | |
| | (a) | | | Non-income producing security. | |
| | (b) | | | Security (or a portion thereof) has been pledged as collateral for open derivative contracts. | |
| | | | | |
| | ADR | | | An American Depositary Receipt is a certificate issued by a custodian bank representing the right to receive securities of the foreign issuer described. The values of ADRs may be significantly influenced by trading on exchanges not located in the United States. | |
| | REITs | | | Real Estate Investment Trusts | |
See accompanying notes to financial statements.
37 |
Portfolio of Investments – as of December 31, 2022
Gateway Equity Call Premium Fund – (continued)
Industry Summary at December 31, 2022
| | | | |
Software | | | 8.6 | % |
Technology Hardware, Storage & Peripherals | | | 6.2 | |
Pharmaceuticals | | | 5.1 | |
Semiconductors & Semiconductor Equipment | | | 5.0 | |
Oil, Gas & Consumable Fuels | | | 4.7 | |
IT Services | | | 4.4 | |
Interactive Media & Services | | | 4.2 | |
Banks | | | 3.9 | |
Health Care Providers & Services | | | 3.6 | |
Capital Markets | | | 2.7 | |
Insurance | | | 2.6 | |
Biotechnology | | | 2.4 | |
Health Care Equipment & Supplies | | | 2.4 | |
Internet & Direct Marketing Retail | | | 2.4 | |
Diversified Financial Services | | | 2.2 | |
Beverages | | | 2.2 | |
Hotels, Restaurants & Leisure | | | 2.0 | |
Other Investments, less than 2% each | | | 35.0 | |
Short-Term Investments | | | 1.1 | |
| | | | |
Total Investments | | | 100.7 | |
Other assets less liabilities (including open written options) | | | (0.7 | ) |
| | | | |
Net Assets | | | 100.0 | % |
| | | | |
See accompanying notes to financial statements.
| 38
Portfolio of Investments – as of December 31, 2022
Mirova Global Green Bond Fund
| | | | | | | | |
Principal
Amount (‡) | | | Description | | Value (†) | |
| | Bonds and Notes — 98.7% of Net Assets | | | | |
| | | | Canada — 2.2% | | | | |
| | 1,000,000 | | | Province of Ontario Canada,
1.950%, 1/27/2023, (CAD) | | $ | 737,334 | |
| | 50,000 | | | Province of Quebec Canada,
2.600%, 7/06/2025, (CAD) | | | 35,648 | |
| | | | | | | | |
| | | | | | | 772,982 | |
| | | | | | | | |
| | | | Chile — 2.0% | | | | |
| | 500,000 | | | Chile Government International Bond,
1.250%, 1/29/2040, (EUR) | | | 348,329 | |
| | 500,000 | | | Chile Government International Bond,
3.500%, 1/25/2050 | | | 360,312 | |
| | | | | | | | |
| | | | | | | 708,641 | |
| | | | | | | | |
| | | | Denmark — 3.1% | | | | |
| | 500,000 | | | Orsted A/S, 1.500%, 11/26/2029, (EUR) | | | 463,852 | |
| | 200,000 | | | Orsted A/S, (fixed rate to 9/09/2027,
variable rate thereafter),
1.750%, 12/09/3019, (EUR) | | | 182,780 | |
| | 500,000 | | | Vestas Wind Systems Finance BV, EMTN,
1.500%, 6/15/2029, (EUR) | | | 468,654 | |
| | | | | | | | |
| | | | | | | 1,115,286 | |
| | | | | | | | |
| | | | Finland — 0.5% | | | | |
| | 200,000 | | | VR-Yhtyma OYJ, 2.375%, 5/30/2029, (EUR) | | | 190,811 | |
| | | | | | | | |
| | | | France — 7.7% | | | | |
| | 400,000 | | | Altarea SCA, 1.750%, 1/16/2030, (EUR) | | | 316,553 | |
| | 400,000 | | | Cie de Saint-Gobain, EMTN,
2.125%, 6/10/2028, (EUR) | | | 393,469 | |
| | 400,000 | | | Covivio, 1.125%, 9/17/2031, (EUR) | | | 342,861 | |
| | 200,000 | | | Derichebourg S.A., 2.250%, 7/15/2028, (EUR) | | | 182,957 | |
| | 200,000 | | | Faurecia SE, 2.375%, 6/15/2029, (EUR) | | | 161,370 | |
| | 100,000 | | | Getlink SE, 3.500%, 10/30/2025, (EUR) | | | 103,834 | |
| | 600,000 | | | ICADE, 1.500%, 9/13/2027, (EUR) | | | 556,071 | |
| | 300,000 | | | Seche Environnement S.A.,
2.250%, 11/15/2028, (EUR) | | | 275,367 | |
| | 600,000 | | | Societe du Grand Paris EPIC, EMTN,
1.700%, 5/25/2050, (EUR) | | | 422,828 | |
| | | | | | | | |
| | | | | | | 2,755,310 | |
| | | | | | | | |
| | | | Germany — 9.5% | | | | |
| | 700,000 | | | BayWa AG, EMTN, 3.125%, 6/26/2024, (EUR) | | | 747,007 | |
| | 2,300,000 | | | Bundesrepublik Deutschland Bundesanleihe, Series G, Zero Coupon,
1.719%-2.111%, 8/15/2050, (EUR)(a) | | | 1,288,013 | |
| | 500,000 | | | E.ON SE, EMTN,
0.350%, 2/28/2030, (EUR) | | | 419,019 | |
| | 500,000 | | | EnBW Energie Baden-Wuerttemberg AG, (fixed rate to 3/30/2026, variable rate thereafter),
1.875%, 6/29/2080, (EUR) | | | 458,934 | |
| | 500,000 | | | Landesbank Baden-Wuerttemberg, Series 809, MTN, 0.375%, 7/29/2026, (EUR) | | | 470,948 | |
| | | | | | | | |
| | | | | | | 3,383,921 | |
| | | | | | | | |
| | | | Hungary — 1.4% | | | | |
| | 700,000 | | | Hungary Government International Bond,
1.750%, 6/05/2035, (EUR) | | | 490,779 | |
| | | | | | | | |
| | | | Indonesia — 1.4% | | | | |
| | 500,000 | | | Perusahaan Penerbit SBSN Indonesia III, MTN,
3.900%, 8/20/2024 | | | 493,750 | |
| | | | | | | | |
| | | | Ireland — 0.7% | | | | |
| | 300,000 | | | ESB Finance DAC, EMTN,
1.000%, 7/19/2034, (EUR) | | | 232,435 | |
| | | | | | | | |
| | | | Italy — 6.5% | | | | |
| | 400,000 | | | A2A SpA, EMTN, 1.000%, 7/16/2029, (EUR) | | $ | 342,544 | |
| | 600,000 | | | Assicurazioni Generali SpA, EMTN,
2.124%, 10/01/2030, (EUR) | | | 527,573 | |
| | 300,000 | | | ERG SpA, EMTN, 0.500%, 9/11/2027, (EUR) | | | 271,530 | |
| | 400,000 | | | Hera SpA, EMTN, 2.500%, 5/25/2029, (EUR) | | | 387,844 | |
| | 1,300,000 | | | Italy Buoni Poliennali Del Tesoro,
1.500%, 4/30/2045, 144A, (EUR) | | | 786,842 | |
| | | | | | | | |
| | | | | | | 2,316,333 | |
| | | | | | | | |
| | | | Japan — 2.4% | | | | |
| | 500,000 | | | Denso Corp., 1.239%, 9/16/2026 | | | 434,423 | |
| | 400,000 | | | Mizuho Financial Group, Inc., EMTN,
3.490%, 9/05/2027, (EUR) | | | 416,645 | |
| | | | | | | | |
| | | | | | | 851,068 | |
| | | | | | | | |
| | | | Korea — 2.9% | | | | |
| | 400,000 | | | Kookmin Bank, GMTN, 4.500%, 2/01/2029 | | | 370,943 | |
| | 300,000 | | | Korea International Bond,
Zero Coupon, 0.000%, 10/15/2026, (EUR)(b) | | | 280,748 | |
| | 400,000 | | | Korea Water Resources Corp., EMTN,
3.875%, 5/15/2023 | | | 398,240 | |
| | | | | | | | |
| | | | | | | 1,049,931 | |
| | | | | | | | |
| | | | Lithuania — 2.3% | | | | |
| | 500,000 | | | AB Ignitis Grupe, EMTN, 1.875%, 7/10/2028, (EUR) | | | 448,834 | |
| | 400,000 | | | AB Ignitis Grupe, EMTN, 2.000%, 7/14/2027, (EUR) | | | 380,907 | |
| | | | | | | | |
| | | | | | | 829,741 | |
| | | | | | | | |
| | | | Mexico — 2.2% | |
| | 800,000 | | | Mexico Government International Bond,
1.350%, 9/18/2027, (EUR) | | | 767,754 | |
| | | | | | | | |
| | | | Netherlands — 9.0% | |
| | 200,000 | | | ABB Finance BV, EMTN, Zero Coupon,
0.282%, 1/19/2030, (EUR)(b) | | | 164,187 | |
| | 300,000 | | | Alliander NV, EMTN, 2.625%, 9/09/2027, (EUR) | | | 308,901 | |
| | 400,000 | | | CTP NV, EMTN, 2.125%, 10/01/2025, (EUR) | | | 367,510 | |
| | 400,000 | | | de Volksbank NV, EMTN,
0.375%, 3/03/2028, (EUR) | | | 345,462 | |
| | 500,000 | | | de Volksbank NV, (fixed rate to 12/15/2027, variable rate thereafter), 7.000%, (EUR)(c) | | | 478,973 | |
| | 600,000 | | | de Volksbank NV, EMTN, (fixed rate to 10/22/2025, variable rate thereafter), 1.750%, 10/22/2030, (EUR) | | | 581,639 | |
| | 500,000 | | | Koninklijke Philips NV, EMTN,
2.125%, 11/05/2029, (EUR) | | | 462,705 | |
| | 300,000 | | | Stedin Holding NV, EMTN, 2.375%, 6/03/2030, (EUR) | | | 290,963 | |
| | 150,000 | | | TenneT Holding BV, EMTN,
1.250%, 10/24/2033, (EUR) | | | 121,717 | |
| | 100,000 | | | TenneT Holding BV, EMTN, 1.875%, 6/13/2036, (EUR) | | | 84,055 | |
| | | | | | | | |
| | | | | | | 3,206,112 | |
| | | | | | | | |
| | | | Norway — 0.9% | |
| | 300,000 | | | Statkraft A/S, EMTN, 2.875%, 9/13/2029, (EUR) | | | 307,621 | |
| | | | | | | | |
| | | | Portugal — 1.0% | |
| | 400,000 | | | Ren Finance BV, EMTN, 0.500%, 4/16/2029, (EUR) | | | 342,283 | |
| | | | | | | | |
| | | | Singapore — 2.6% | |
| | 1,000,000 | | | Vena Energy Capital Pte Ltd., EMTN,
3.133%, 2/26/2025 | | | 918,658 | |
| | | | | | | | |
| | | | Spain — 9.5% | |
| | 400,000 | | | Banco Bilbao Vizcaya Argentaria S.A.,
1.000%, 6/21/2026, (EUR) | | | 390,780 | |
| | 300,000 | | | Banco Bilbao Vizcaya Argentaria S.A., GMTN,
4.375%, 10/14/2029, (EUR) | | | 325,204 | |
| | 500,000 | | | Bankinter S.A., 0.625%, 10/06/2027, (EUR) | | | 450,629 | |
See accompanying notes to financial statements.
39 |
Portfolio of Investments – as of December 31, 2022
Mirova Global Green Bond Fund – (continued)
| | | | | | | | |
Principal
Amount (‡) | | | Description | | Value (†) | |
| | | | Spain — continued | |
| | 400,000 | | | Iberdrola Finanzas S.A., EMTN,
1.375%, 3/11/2032, (EUR) | | $ | 353,980 | |
| | 500,000 | | | Iberdrola International BV, (fixed rate to 2/22/2023, variable rate thereafter), 1.875%, (EUR)(c) | | | 529,872 | |
| | 900,000 | | | Spain Government Bond,
1.000%, 7/30/2042, 144A, (EUR) | | | 587,773 | |
| | 500,000 | | | Telefonica Emisiones S.A., EMTN,
2.592%, 5/25/2031, (EUR) | | | 483,805 | |
| | 300,000 | | | Telefonica Europe BV, (fixed rate to
2/05/2027, variable rate thereafter),
2.502%, (EUR)(c) | | | 269,143 | |
| | | | | | | | |
| | | | | | | 3,391,186 | |
| | | | | | | | |
| | | | Supranationals — 5.7% | |
| | 2,200,000 | | | European Investment Bank, 2.375%, 5/24/2027 | | | 2,042,789 | |
| | | | | | | | |
| | | | Sweden — 3.4% | |
| | 400,000 | | | SKF AB, 3.125%, 9/14/2028, (EUR) | | | 406,771 | |
| | 500,000 | | | Vattenfall AB, EMTN, 0.125%, 2/12/2029, (EUR) | | | 427,694 | |
| | 400,000 | | | Volvo Car AB, EMTN, 2.500%, 10/07/2027, (EUR) | | | 376,453 | |
| | | | | | | | |
| | | | | | | 1,210,918 | |
| | | | | | | | |
| | | | United Kingdom — 9.2% | |
| | 500,000 | | | Anglian Water Services Financing PLC, EMTN,
1.625%, 8/10/2025, (GBP) | | | 555,359 | |
| | 500,000 | | | SSE PLC, EMTN, 1.375%, 9/04/2027, (EUR) | | | 482,190 | |
| | 300,000 | | | SSE PLC, EMTN, 2.875%, 8/01/2029, (EUR) | | | 300,050 | |
| | 400,000 | | | Thames Water Utilities Finance PLC,
0.875%, 1/31/2028, (EUR) | | | 364,185 | |
| | 1,600,000 | | | United Kingdom Gilt, 0.875%, 7/31/2033, (GBP) | | | 1,443,796 | |
| | 200,000 | | | United Kingdom Gilt, 1.500%, 7/31/2053, (GBP) | | | 138,309 | |
| | | | | | | | |
| | | | | | | 3,283,889 | |
| | | | | | | | |
| | | | United States — 12.6% | |
| | 600,000 | | | Digital Dutch Finco BV, 1.500%, 3/15/2030, (EUR) | | | 501,404 | |
| | 600,000 | | | Digital Euro Finco LLC, 2.500%, 1/16/2026, (EUR) | | | 594,489 | |
| | 300,000 | | | Digital Intrepid Holding BV, 0.625%, 7/15/2031, (EUR) | | | 219,607 | |
| | 200,000 | | | DTE Electric Co., 3.950%, 3/01/2049 | | | 163,888 | |
| �� | 500,000 | | | Equinix, Inc., 0.250%, 3/15/2027, (EUR) | | | 462,177 | |
| | 400,000 | | | Ford Motor Co., 3.250%, 2/12/2032 | | | 299,977 | |
| | | | United States — continued | |
| $ | 500,000 | | | General Motors Co., 5.400%, 10/15/2029 | | $ | 477,149 | |
| | 400,000 | | | Southern Power Co., 4.150%, 12/01/2025 | | | 392,030 | |
| | 200,000 | | | Thermo Fisher Scientific, Inc., 4.100%, 8/15/2047 | | | 173,957 | |
| | 700,000 | | | Verizon Communications, Inc., 3.875%, 2/08/2029 | | | 656,786 | |
| | 600,000 | | | Wabtec Transportation Netherlands BV, 1.250%, 12/03/2027, (EUR) | | | 543,970 | |
| | | | | | | | |
| | | | | | | 4,485,434 | |
| | | | | | | | |
| | | | Total Bonds and Notes
(Identified Cost $41,309,382) | | | 35,147,632 | |
| | | | | | | | |
| | | | | | | | |
| | | | Total Investments — 98.7%
(Identified Cost $41,309,382) | | | 35,147,632 | |
| | | | Other assets less liabilities — 1.3% | | | 467,662 | |
| | | | | | | | |
| | | | Net Assets — 100.0% | | $ | 35,615,294 | |
| | | | | | | | |
| | | | | | | | | |
| | (†) | | | See Note 2 of Notes to Financial Statements. | |
| | (‡) | | | Principal Amount stated in U.S. dollars unless otherwise noted. | |
| | (a) | | | Interest rate represents annualized yield at time of purchase; not a coupon rate. The Fund’s investment in this security is comprised of various lots with differing annualized yields. | |
| | (b) | | | Interest rate represents annualized yield at time of purchase; not a coupon rate. | |
| | (c) | | | Perpetual bond with no specified maturity date. | |
| | | | | | |
| | 144A | | | All or a portion of these securities are exempt from registration under Rule 144A of the Securities Act of 1933. These securities may be resold in transactions exempt from registration, normally to qualified institutional buyers. At December 31, 2022, the value of Rule 144A holdings amounted to $1,374,615 or 3.9% of net assets. | |
| | EMTN | | | Euro Medium Term Note | |
| | GMTN | | | Global Medium Term Note | |
| | MTN | | | Medium Term Note | |
| | | | | |
| | CAD | | | Canadian Dollar | |
| | EUR | | | Euro | |
| | GBP | | | British Pound | |
At December 31, 2022, open long futures contracts were as follows:
| | | | | | | | | | | | | | | | | | | | |
| Financial Futures | | Expiration
Date | | | Contracts | | | Notional
Amount | | | Value | | | Unrealized
Appreciation
(Depreciation) | |
2 Year U.S. Treasury Note | | | 3/31/2023 | | | | 10 | | | $ | 2,062,266 | | | $ | 2,050,782 | | | $ | (11,484 | ) |
5 Year U.S. Treasury Note | | | 3/31/2023 | | | | 11 | | | | 1,204,930 | | | | 1,187,226 | | | | (17,704 | ) |
10 Year Canada Government Bond | | | 3/22/2023 | | | | 2 | | | | 186,662 | | | | 181,019 | | | | (5,643 | ) |
Euro-Buxl® 30 Year Bond | | | 3/08/2023 | | | | 3 | | | | 517,347 | | | | 434,302 | | | | (83,045 | ) |
| | | | | | | | | | | | | | | | | | | | |
Total | | | | | | | | | | | | | | | | | | $ | (117,876 | ) |
| | | | | | | | | | | | | | | | | | | | |
At December 31, 2022, open short futures contracts were as follows:
| | | | | | | | | | | | | | | | | | | | |
| Financial and Currency Futures | | Expiration
Date | | | Contracts | | | Notional
Amount | | | Value | | | Unrealized
Appreciation
(Depreciation) | |
British Pound | | | 3/13/2023 | | | | 20 | | | $ | 1,514,209 | | | $ | 1,510,500 | | | $ | 3,709 | |
Canadian Dollar | | | 3/14/2023 | | | | 9 | | | | 673,920 | | | | 665,280 | | | | 8,640 | |
Euro | | | 3/13/2023 | | | | 190 | | | | 24,934,803 | | | | 25,540,750 | | | | (605,947 | ) |
German Euro BOBL | | | 3/08/2023 | | | | 25 | | | | 3,171,474 | | | | 3,097,613 | | | | 73,861 | |
Ultra Long U.S. Treasury Bond | | | 3/22/2023 | | | | 5 | | | | 720,000 | | | | 671,563 | | | | 48,437 | |
| | | | | | | | | | | | | | | | | | | | |
Total | | | | | | | | | | | | | | | | | | $ | (471,300 | ) |
| | | | | | | | | | | | | | | | | | | | |
See accompanying notes to financial statements.
| 40
Portfolio of Investments – as of December 31, 2022
Mirova Global Green Bond Fund – (continued)
Industry Summary at December 31, 2022
| | | | |
Utility-Electric | | | 18.9 | % |
Government National | | | 18.2 | |
Industrial | | | 16.3 | |
Special Purpose | | | 10.9 | |
Bank | | | 10.8 | |
Financial | | | 9.2 | |
Supra-National | | | 5.7 | |
Government Regional | | | 3.4 | |
Telephone | | | 2.6 | |
Government Agency | | | 1.1 | |
Utility-Gas | | | 0.8 | |
Transportation-Rail | | | 0.5 | |
Transportation-Non Rail | | | 0.3 | |
| | | | |
Total Investments | | | 98.7 | |
Other assets less liabilities (including futures contracts) | | | 1.3 | |
| | | | |
Net Assets | | | 100.0 | % |
| | | | |
Currency Exposure Summary at December 31, 2022
| | | | |
Euro | | | 70.4 | % |
United States Dollar | | | 20.1 | |
British Pound | | | 6.0 | |
Canadian Dollar | | | 2.2 | |
| | | | |
Total Investments | | | 98.7 | |
Other assets less liabilities (including futures contracts) | | | 1.3 | |
| | | | |
Net Assets | | | 100.0 | % |
| | | | |
See accompanying notes to financial statements.
41 |
Portfolio of Investments – as of December 31, 2022
Mirova Global Sustainable Equity Fund
| | | | | | | | |
| Shares | | | Description | | Value (†) | |
| | Common Stocks — 98.6% of Net Assets | |
| | | | Belgium — 1.1% | |
| | 151,183 | | | KBC Group NV | | $ | 9,733,960 | |
| | | | | | | | |
| | | | Brazil — 1.9% | |
| | 20,014 | | | MercadoLibre, Inc.(a) | | | 16,936,647 | |
| | | | | | | | |
| | | | Denmark — 9.3% | |
| | 302,260 | | | Novo Nordisk A/S, Class B | | | 41,051,612 | |
| | 251,826 | | | Orsted A/S, 144A | | | 22,766,489 | |
| | 591,167 | | | Vestas Wind Systems A/S | | | 17,244,723 | |
| | | | | | | | |
| | | | | | | 81,062,824 | |
| | | | | | | | |
| | | | France — 2.6% | |
| | 529,484 | | | Credit Agricole S.A. | | | 5,569,821 | |
| | 91,858 | | | EssilorLuxottica S.A. | | | 16,620,139 | |
| | | | | | | | |
| | | | | | | 22,189,960 | |
| | | | | | | | |
| | | | Germany — 5.5% | |
| | 218,629 | | | Mercedes-Benz Group AG, (Registered) | | | 14,297,215 | |
| | 107,744 | | | SAP SE | | | 11,123,563 | |
| | 206,565 | | | Symrise AG | | | 22,433,990 | |
| | | | | | | | |
| | | | | | | 47,854,768 | |
| | | | | | | | |
| | | | Hong Kong — 2.9% | |
| | 2,263,311 | | | AIA Group Ltd. | | | 24,994,607 | |
| | | | | | | | |
| | | | Japan — 5.4% | |
| | 841,800 | | | Sekisui House Ltd. | | | 14,924,316 | |
| | 607,130 | | | Takeda Pharmaceutical Co. Ltd. | | | 18,970,791 | |
| | 443,200 | | | Terumo Corp. | | | 12,564,975 | |
| | | | | | | | |
| | | | | | | 46,460,082 | |
| | | | | | | | |
| | | | Netherlands — 3.8% | |
| | 13,136 | | | Adyen NV, 144A(a) | | | 18,236,038 | |
| | 26,371 | | | ASML Holding NV | | | 14,378,831 | |
| | | | | | | | |
| | | | | | | 32,614,869 | |
| | | | | | | | |
| | | | Spain — 3.4% | |
| | 2,533,317 | | | Iberdrola S.A. | | | 29,572,646 | |
| | | | | | | | |
| | | | Taiwan — 2.2% | |
| | 260,502 | | | Taiwan Semiconductor Manufacturing Co. Ltd., Sponsored ADR | | | 19,404,794 | |
| | | | | | | | |
| | | | United Kingdom — 2.6% | |
| | 4,383,942 | | | Legal & General Group PLC | | | 13,143,638 | |
| | 192,268 | | | Unilever PLC | | | 9,647,380 | |
| | | | | | | | |
| | | | | | | 22,791,018 | |
| | | | | | | | |
| | | | United States — 57.9% | |
| | 70,960 | | | Adobe, Inc.(a) | | | 23,880,169 | |
| | 89,717 | | | American Water Works Co., Inc. | | | 13,674,665 | |
| | 220,003 | | | Aptiv PLC(a) | | | 20,488,879 | |
| | 190,484 | | | Ball Corp. | | | 9,741,352 | |
| | 73,553 | | | Bright Horizons Family Solutions, Inc.(a) | | | 4,641,194 | |
| | 86,494 | | | Danaher Corp. | | | 22,957,237 | |
| | 23,650 | | | Deere & Co. | | | 10,140,174 | |
| | 676,733 | | | eBay, Inc. | | | 28,064,118 | |
| | 190,714 | | | Ecolab, Inc. | | | 27,760,330 | |
| | 85,422 | | | Edwards Lifesciences Corp.(a) | | | 6,373,335 | |
| | 67,114 | | | Eli Lilly & Co. | | | 24,552,986 | |
| | 42,013 | | | Estee Lauder Cos., Inc. (The), Class A | | | 10,423,845 | |
| | 39,130 | | | Intuitive Surgical, Inc.(a) | | | 10,383,146 | |
| | 118,432 | | | Mastercard, Inc., Class A | | | 41,182,359 | |
| | 160,023 | | | Microsoft Corp. | | | 38,376,716 | |
| | 275,714 | | | NextEra Energy, Inc. | | | 23,049,690 | |
| | 168,559 | | | NVIDIA Corp. | | | 24,633,212 | |
| | 68,452 | | | Roper Technologies, Inc. | | | 29,577,425 | |
| | 70,522 | | | Signature Bank | | | 8,125,545 | |
| | 277,604 | | | Sunrun, Inc.(a) | | | 6,668,048 | |
| | | | United States — continued | |
| | 52,405 | | | SVB Financial Group(a) | | $ | 12,060,487 | |
| | 78,246 | | | Thermo Fisher Scientific, Inc. | | | 43,089,290 | |
| | 292,910 | | | Verizon Communications, Inc. | | | 11,540,654 | |
| | 120,475 | | | Visa, Inc., Class A | | | 25,029,886 | |
| | 69,244 | | | Watts Water Technologies, Inc., Class A | | | 10,125,550 | |
| | 139,203 | | | Xylem, Inc. | | | 15,391,676 | |
| | | | | | | | |
| | | | | | | 501,931,968 | |
| | | | | | | | |
| | | | Total Common Stocks
(Identified Cost $954,746,681) | | | 855,548,143 | |
| | | | | | | | |
| | | | | | | | |
| | | | Total Investments — 98.6%
(Identified Cost $954,746,681) | | | 855,548,143 | |
| | | | Other assets less liabilities — 1.4% | | | 11,884,265 | |
| | | | | | | | |
| | | | Net Assets — 100.0% | | $ | 867,432,408 | |
| | | | | | | | |
| | | | | | | | |
| | (†) | | | See Note 2 of Notes to Financial Statements. | |
| | (a) | | | Non-income producing security. | |
| | | | | |
| | 144A | | | All or a portion of these securities are exempt from registration under Rule 144A of the Securities Act of 1933. These securities may be resold in transactions exempt from registration, normally to qualified institutional buyers. At December 31, 2022, the value of Rule 144A holdings amounted to $41,002,527 or 4.7% of net assets. | |
| | ADR | | | An American Depositary Receipt is a certificate issued by a custodian bank representing the right to receive securities of the foreign issuer described. The values of ADRs may be significantly influenced by trading on exchanges not located in the United States. | |
Industry Summary at December 31, 2022
| | | | |
Software | | | 11.9 | % |
IT Services | | | 9.8 | |
Pharmaceuticals | | | 9.7 | |
Electric Utilities | | | 8.7 | |
Life Sciences Tools & Services | | | 7.6 | |
Semiconductors & Semiconductor Equipment | | | 6.7 | |
Chemicals | | | 5.8 | |
Health Care Equipment & Supplies | | | 5.3 | |
Internet & Direct Marketing Retail | | | 5.1 | |
Insurance | | | 4.4 | |
Machinery | | | 4.2 | |
Banks | | | 4.1 | |
Electrical Equipment | | | 2.8 | |
Auto Components | | | 2.4 | |
Personal Products | | | 2.3 | |
Other Investments, less than 2% each | | | 7.8 | |
| | | | |
Total Investments | | | 98.6 | |
Other assets less liabilities | | | 1.4 | |
| | | | |
Net Assets | | | 100.0 | % |
| | | | |
Currency Exposure Summary at December 31, 2022
| | | | |
United States Dollar | | | 62.0 | % |
Euro | | | 17.5 | |
Danish Krone | | | 9.3 | |
Japanese Yen | | | 5.4 | |
Hong Kong Dollar | | | 2.9 | |
British Pound | | | 1.5 | |
| | | | |
Total Investments | | | 98.6 | |
Other assets less liabilities | | | 1.4 | |
| | | | |
Net Assets | | | 100.0 | % |
| | | | |
See accompanying notes to financial statements.
| 42
Portfolio of Investments – as of December 31, 2022
Mirova International Sustainable Equity Fund
| | | | | | | | |
| Shares | | | Description | | Value (†) | |
| | Common Stocks — 99.9% of Net Assets | |
| | | | Australia — 1.2% | |
| | 42,192 | | | Stockland | | $ | 103,913 | |
| | | | | | | | |
| | | | Belgium — 5.9% | |
| | 6,653 | | | KBC Group NV | | | 428,355 | |
| | 2,805 | | | Umicore S.A. | | | 103,167 | |
| | | | | | | | |
| | | | | | | 531,522 | |
| | | | | | | | |
| | | | Brazil — 1.2% | |
| | 125 | | | MercadoLibre, Inc.(a) | | | 105,780 | |
| | | | | | | | |
| | | | Denmark — 12.1% | |
| | 3,464 | | | Novo Nordisk A/S, Class B | | | 470,465 | |
| | 3,158 | | | Orsted A/S, 144A | | | 285,501 | |
| | 11,352 | | | Vestas Wind Systems A/S | | | 331,145 | |
| | | | | | | | |
| | | | | | | 1,087,111 | |
| | | | | | | | |
| | | | France — 12.7% | |
| | 1,123 | | | Air Liquide S.A. | | | 159,393 | |
| | 16,194 | | | Credit Agricole S.A. | | | 170,350 | |
| | 4,823 | | | Dassault Systemes SE | | | 173,433 | |
| | 1,076 | | | EssilorLuxottica S.A. | | | 194,684 | |
| | 500 | | | L’Oreal S.A. | | | 179,049 | |
| | 1,420 | | | Sanofi | | | 136,926 | |
| | 3,151 | | | Worldline S.A., 144A(a) | | | 123,401 | |
| | | | | | | | |
| | | | | | | 1,137,236 | |
| | | | | | | | |
| | | | Germany — 6.9% | |
| | 2,533 | | | Mercedes-Benz Group AG, (Registered) | | | 165,645 | |
| | 2,765 | | | SAP SE | | | 285,461 | |
| | 1,504 | | | Symrise AG | | | 163,342 | |
| | | | | | | | |
| | | | | | | 614,448 | |
| | | | | | | | |
| | | | Hong Kong — 8.6% | |
| | 42,478 | | | AIA Group Ltd. | | | 469,101 | |
| | 21,857 | | | Prudential PLC | | | 298,026 | |
| | | | | | | | |
| | | | | | | 767,127 | |
| | | | | | | | |
| | | | Ireland — 3.9% | |
| | 3,596 | | | Kingspan Group PLC | | | 194,702 | |
| | 4,281 | | | Smurfit Kappa Group PLC | | | 158,655 | |
| | | | | | | | |
| | | | | | | 353,357 | |
| | | | | | | | |
| | | | Japan — 13.5% | |
| | 1,900 | | | Kao Corp. | | | 75,431 | |
| | 22,100 | | | Kubota Corp. | | | 301,918 | |
| | 10,100 | | | Sekisui House Ltd. | | | 179,063 | |
| | 800 | | | Shimano, Inc. | | | 126,415 | |
| | 8,138 | | | Takeda Pharmaceutical Co. Ltd. | | | 254,285 | |
| | 6,600 | | | Terumo Corp. | | | 187,114 | |
| | 2,000 | | | West Japan Railway Co. | | | 86,839 | |
| | | | | | | | |
| | | | | | | 1,211,065 | |
| | | | | | | | |
| | | | Netherlands — 7.7% | |
| | 204 | | | Adyen NV, 144A(a) | | | 283,203 | |
| | 753 | | | ASML Holding NV | | | 410,574 | |
| | | | | | | | |
| | | | | | | 693,777 | |
| | | | | | | | |
| | | | Norway — 0.4% | |
| | 3,921 | | | Telenor ASA | | | 36,634 | |
| | | | | | | | |
| | | | Spain — 4.2% | |
| | 32,051 | | | Iberdrola S.A. | | | 374,147 | |
| | | | | | | | |
| | | | Switzerland — 2.6% | |
| | 484 | | | Geberit AG, (Registered) | | | 228,487 | |
| | | | | | | | |
| | | | Taiwan — 4.1% | |
| | 4,962 | | | Taiwan Semiconductor Manufacturing Co. Ltd., Sponsored ADR | | | 369,619 | |
| | | | | | | | |
| | | | United Kingdom — 14.9% | |
| | 3,166 | | | Croda International PLC | | | 251,946 | |
| | | | United Kingdom — continued | |
| | 9,784 | | | Halma PLC | | $ | 233,005 | |
| | 3,187 | | | Johnson Matthey PLC | | | 81,451 | |
| | 14,707 | | | Land Securities Group PLC | | | 109,878 | |
| | 119,493 | | | Legal & General Group PLC | | | 358,256 | |
| | 964 | | | Spirax-Sarco Engineering PLC | | | 123,132 | |
| | 3,507 | | | Unilever PLC | | | 175,970 | |
| | | | | | | | |
| | | | | | | 1,333,638 | |
| | | | | | | | |
| | | | Total Common Stocks
(Identified Cost $11,539,092) | | | 8,947,861 | |
| | | | | | | | |
| | | | | | | | |
| | | | Total Investments — 99.9%
(Identified Cost $11,539,092) | | | 8,947,861 | |
| | | | Other assets less liabilities — 0.1% | | | 10,383 | |
| | | | | | | | |
| | | | Net Assets — 100.0% | | $ | 8,958,244 | |
| | | | | | | | |
| | | | | | | | |
| | (†) | | | See Note 2 of Notes to Financial Statements. | |
| | (a) | | | Non-income producing security. | |
| | | | | |
| | 144A | | | All or a portion of these securities are exempt from registration under Rule 144A of the Securities Act of 1933. These securities may be resold in transactions exempt from registration, normally to qualified institutional buyers. At December 31, 2022, the value of Rule 144A holdings amounted to $692,105 or 7.7% of net assets. | |
| | ADR | | | An American Depositary Receipt is a certificate issued by a custodian bank representing the right to receive securities of the foreign issuer described. The values of ADRs may be significantly influenced by trading on exchanges not located in the United States. | |
Industry Summary at December 31, 2022
| | | | |
Insurance | | | 12.6 | % |
Pharmaceuticals | | | 9.5 | |
Semiconductors & Semiconductor Equipment | | | 8.7 | |
Chemicals | | | 8.4 | |
Electric Utilities | | | 7.4 | |
Banks | | | 6.7 | |
Software | | | 5.1 | |
Personal Products | | | 4.8 | |
Machinery | | | 4.8 | |
Building Products | | | 4.8 | |
IT Services | | | 4.5 | |
Health Care Equipment & Supplies | | | 4.3 | |
Electrical Equipment | | | 3.7 | |
Electronic Equipment, Instruments & Components | | | 2.6 | |
REITs - Diversified | | | 2.4 | |
Household Durables | | | 2.0 | |
Other Investments, less than 2% each | | | 7.6 | |
| | | | |
Total Investments | | | 99.9 | |
Other assets less liabilities | | | 0.1 | |
| | | | |
Net Assets | | | 100.0 | % |
| | | | |
Currency Exposure Summary at December 31, 2022
| | | | |
Euro | | | 43.3 | % |
British Pound | | | 16.2 | |
Japanese Yen | | | 13.5 | |
Danish Krone | | | 12.1 | |
United States Dollar | | | 5.3 | |
Hong Kong Dollar | | | 5.3 | |
Swiss Franc | | | 2.6 | |
Other, less than 2% each | | | 1.6 | |
| | | | |
Total Investments | | | 99.9 | |
Other assets less liabilities | | | 0.1 | |
| | | | |
Net Assets | | | 100.0 | % |
| | | | |
See accompanying notes to financial statements.
43 |
Portfolio of Investments – as of December 31, 2022
Mirova U.S. Sustainable Equity Fund
| | | | | | | | |
| Shares | | | Description | | Value (†) | |
| | Common Stocks — 98.3% of Net Assets | | | | |
| | | | Auto Components — 2.1% | |
| | 832 | | | Aptiv PLC(a) | | $ | 77,484 | |
| | | | | | | | |
| | | | Banks — 2.1% | |
| | 509 | | | Signature Bank | | | 58,647 | |
| | 75 | | | SVB Financial Group(a) | | | 17,260 | |
| | | | | | | | |
| | | | | | | 75,907 | |
| | | | | | | | |
| | | | Chemicals — 3.2% | |
| | 811 | | | Ecolab, Inc. | | | 118,049 | |
| | | | | | | | |
| | | | Commercial Services & Supplies — 4.2% | |
| | 973 | | | Waste Management, Inc. | | | 152,644 | |
| | | | | | | | |
| | | | Communications Equipment — 1.1% | |
| | 815 | | | Cisco Systems, Inc. | | | 38,827 | |
| | | | | | | | |
| | | | | Containers & Packaging — 1.4% | |
| | 1,012 | | | Ball Corp. | | | 51,754 | |
| | | | | | | | |
| | | | Diversified Consumer Services — 0.9% | |
| | 504 | | | Bright Horizons Family Solutions, Inc.(a) | | | 31,802 | |
| | | | | | | | |
| | | | Diversified Telecommunication Services — 2.0% | |
| | 1,827 | | | Verizon Communications, Inc. | | | 71,984 | |
| | | | | | | | |
| | | | Electric Utilities — 4.4% | |
| | 1,933 | | | NextEra Energy, Inc. | | | 161,599 | |
| | | | | | | | |
| | | | Electrical Equipment — 0.9% | |
| | 1,347 | | | Sunrun, Inc.(a) | | | 32,355 | |
| | | | | | | | |
| | | | Electronic Equipment, Instruments & Components — 1.1% | |
| | 797 | | | Trimble, Inc.(a) | | | 40,296 | |
| | | | | | | | |
| | | | Health Care Equipment & Supplies — 4.0% | |
| | 353 | | | Edwards Lifesciences Corp.(a) | | | 26,337 | |
| | 447 | | | Intuitive Surgical, Inc.(a) | | | 118,612 | |
| | | | | | | | |
| | | | | | | 144,949 | |
| | | | | | | | |
| | | | Household Products — 1.5% | |
| | 718 | | | Colgate-Palmolive Co. | | | 56,571 | |
| | | | | | | | |
| | | | Internet & Direct Marketing Retail — 3.5% | |
| | 3,088 | | | eBay, Inc. | | | 128,059 | |
| | | | | | | | |
| | | | IT Services — 9.6% | |
| | 180 | | | Accenture PLC, Class A | | | 48,031 | |
| | 605 | | | Mastercard, Inc., Class A | | | 210,377 | |
| | 445 | | | Visa, Inc., Class A | | | 92,453 | |
| | | | | | | | |
| | | | | | | 350,861 | |
| | | | | | | | |
| | | | Life Sciences Tools & Services — 10.9% | |
| | 587 | | | Danaher Corp. | | | 155,802 | |
| | 441 | | | Thermo Fisher Scientific, Inc. | | | 242,854 | |
| | | | | | | | |
| | | | | | | 398,656 | |
| | | | | | | | |
| | | | Machinery — 8.4% | |
| | 103 | | | Deere & Co. | | | 44,162 | |
| | 684 | | | Watts Water Technologies, Inc., Class A | | | 100,021 | |
| | 1,482 | | | Xylem, Inc. | | | 163,865 | |
| | | | | | | | |
| | | | | | | 308,048 | |
| | | | | | | | |
| | | | Personal Products — 3.0% | |
| | 435 | | | Estee Lauder Cos., Inc. (The), Class A | | | 107,928 | |
| | | | | | | | |
| | | | Pharmaceuticals — 3.6% | |
| | 363 | | | Eli Lilly & Co. | | | 132,800 | |
| | | | | | | | |
| | | | Semiconductors & Semiconductor Equipment — 10.6% | |
| | 944 | | | First Solar, Inc.(a) | | | 141,402 | |
| | 1,004 | | | NVIDIA Corp. | | | 146,725 | |
| | 1,327 | | | Taiwan Semiconductor Manufacturing Co. Ltd., Sponsored ADR | | | 98,848 | |
| | | | | | | | |
| | | | | | | 386,975 | |
| | | | | | | | |
| | | | Software — 15.5% | |
| | 362 | | | Adobe, Inc.(a) | | $ | 121,824 | |
| | 1,131 | | | Microsoft Corp. | | | 271,236 | |
| | 405 | | | Roper Technologies, Inc. | | | 174,997 | |
| | | | | | | | |
| | | | | | | 568,057 | |
| | | | | | | | |
| | | | Water Utilities — 4.3% | |
| | 1,037 | | | American Water Works Co., Inc. | | | 158,060 | |
| | | | | | | | |
| | | | Total Common Stocks
(Identified Cost $3,704,689) | | | 3,593,665 | |
| | | | | | | | |
| | | | | | | | |
Principal
Amount | | | | | | |
| | Short-Term Investments — 2.7% | |
| $ | 100,052 | | | Tri-Party Repurchase Agreement with Fixed Income Clearing Corporation, dated 12/30/2022 at 1.800% to be repurchased at $100,072 on 1/03/2023 collateralized by $116,700 U.S. Treasury Note, 1.250% due 3/31/2028 valued at $102,103 including accrued interest (Note 2 of Notes to Financial Statements)
(Identified Cost $100,052) | | | 100,052 | |
| | | | | | | | |
| | | | Total Investments — 101.0%
(Identified Cost $3,804,741) | | | 3,693,717 | |
| | | | Other assets less liabilities — (1.0)% | | | (38,206 | ) |
| | | | | | | | |
| | | | Net Assets — 100.0% | | $ | 3,655,511 | |
| | | | | | | | |
| | | | | | | | |
| | (†) | | | See Note 2 of Notes to Financial Statements. | |
| | (a) | | | Non-income producing security. | |
| | | | | |
| | ADR | | | An American Depositary Receipt is a certificate issued by a custodian bank representing the right to receive securities of the foreign issuer described. The values of ADRs may be significantly influenced by trading on exchanges not located in the United States. | |
Industry Summary at December 31, 2022
| | | | |
Software | | | 15.5 | % |
Life Sciences Tools & Services | | | 10.9 | |
Semiconductors & Semiconductor Equipment | | | 10.6 | |
IT Services | | | 9.6 | |
Machinery | | | 8.4 | |
Electric Utilities | | | 4.4 | |
Water Utilities | | | 4.3 | |
Commercial Services & Supplies | | | 4.2 | |
Health Care Equipment & Supplies | | | 4.0 | |
Pharmaceuticals | | | 3.6 | |
Internet & Direct Marketing Retail | | | 3.5 | |
Chemicals | | | 3.2 | |
Personal Products | | | 3.0 | |
Auto Components | | | 2.1 | |
Banks | | | 2.1 | |
Diversified Telecommunication Services | | | 2.0 | |
Other Investments, less than 2% each | | | 6.9 | |
Short-Term Investments | | | 2.7 | |
| | | | |
Total Investments | | | 101.0 | |
Other assets less liabilities | | | (1.0 | ) |
| | | | |
Net Assets | | | 100.0 | % |
| | | | |
See accompanying notes to financial statements.
| 44
Statements of Assets and Liabilities
December 31, 2022
| | | | | | | | | | | | |
| | | Gateway
Fund | | | Gateway
Equity Call
Premium
Fund | | | Mirova
Global
Green
Bond Fund | |
ASSETS | |
Investments at cost | | $ | 2,946,359,258 | | | $ | 115,442,444 | | | $ | 41,309,382 | |
Net unrealized appreciation (depreciation) | | | 3,473,011,667 | | | | 24,972,010 | | | | (6,161,750 | ) |
| | | | | | | | | | | | |
Investments at value | | | 6,419,370,925 | | | | 140,414,454 | | | | 35,147,632 | |
Cash | | | 26,484 | | | | 2,454 | | | | — | |
Due from brokers (including variation margin on futures contracts) (Note 2) | | | — | | | | — | | | | 1,529,723 | |
Foreign currency at value (identified cost $0, $0 and $1,833,618, respectively) | | | — | | | | — | | | | 1,849,067 | |
Receivable for Fund shares sold | | | 9,711,231 | | | | 873,468 | | | | 208,406 | |
Receivable from investment adviser (Note 6) | | | — | | | | — | | | | 24,520 | |
Receivable for securities sold | | | 31,901,010 | | | | 712,048 | | | | — | |
Dividends and interest receivable | | | 4,142,643 | | | | 117,771 | | | | 294,825 | |
Unrealized appreciation on futures contracts (Note 2) | | | — | | | | — | | | | 134,647 | |
Prepaid expenses (Note 8) | | | 1,198 | | | | 566 | | | | 559 | |
| | | | | | | | | | | | |
TOTAL ASSETS | | | 6,465,153,491 | | | | 142,120,761 | | | | 39,189,379 | |
| | | | | | | | | | | | |
LIABILITIES | |
Options written, at value (premiums received $185,070,747, $4,188,284 and $0, respectively) (Note 2) | | | 111,573,945 | | | | 2,515,590 | | | | — | |
Payable for Fund shares redeemed | | | 10,682,824 | | | | 26,714 | | | | 700,620 | |
Payable to custodian bank (Note 9) | | | — | | | | — | | | | 2,071,038 | |
Unrealized depreciation on futures contracts (Note 2) | | | — | | | | — | | | | 723,823 | |
Management fees payable (Note 6) | | | 3,068,724 | | | | 34,780 | | | | — | |
Deferred Trustees’ fees (Note 6) | | | 1,143,854 | | | | 53,461 | | | | 20,777 | |
Administrative fees payable (Note 6) | | | 257,617 | | | | 5,669 | | | | 1,503 | |
Payable to distributor (Note 6d) | | | 41,301 | | | | 436 | | | | 344 | |
Audit and tax services fees payable | | | 54,782 | | | | 53,723 | | | | 45,285 | |
Other accounts payable and accrued expenses | | | 290,938 | | | | 20,592 | | | | 10,695 | |
| | | | | | | | | | | | |
TOTAL LIABILITIES | | | 127,113,985 | | | | 2,710,965 | | | | 3,574,085 | |
| | | | | | | | | | | | |
NET ASSETS | | $ | 6,338,039,506 | | | $ | 139,409,796 | | | $ | 35,615,294 | |
| | | | | | | | | | | | |
NET ASSETS CONSIST OF: | |
Paid-in capital | | $ | 3,848,120,513 | | | $ | 120,724,621 | | | $ | 45,587,908 | |
Accumulated earnings (loss) | | | 2,489,918,993 | | | | 18,685,175 | | | | (9,972,614 | ) |
| | | | | | | | | | | | |
NET ASSETS | | $ | 6,338,039,506 | | | $ | 139,409,796 | | | $ | 35,615,294 | |
| | | | | | | | | | | | |
COMPUTATION OF NET ASSET VALUE AND OFFERING PRICE: | |
Class A shares: | |
Net assets | | $ | 869,121,700 | | | $ | 1,617,348 | | | $ | 5,278,322 | |
| | | | | | | | | | | | |
Shares of beneficial interest | | | 24,432,413 | | | | 110,777 | | | | 660,314 | |
| | | | | | | | | | | | |
Net asset value and redemption price per share | | $ | 35.57 | | | $ | 14.60 | | | $ | 7.99 | |
| | | | | | | | | | | | |
Offering price per share (100/[100-maximum sales charge] of net asset value) (Note 1) | | $ | 37.74 | | | $ | 15.49 | | | $ | 8.34 | |
| | | | | | | | | | | | |
Class C shares: (redemption price per share is equal to net asset value less any applicable contingent deferred sales charge) (Note 1) | | | | | | | | | | | | |
Net assets | | $ | 77,354,918 | | | $ | 944,242 | | | $ | — | |
| | | | | | | | | | | | |
Shares of beneficial interest | | | 2,193,877 | | | | 65,314 | | | | — | |
| | | | | | | | | | | | |
Net asset value and offering price per share | | $ | 35.26 | | | $ | 14.46 | | | $ | — | |
| | | | | | | | | | | | |
Class N shares: | |
Net assets | | $ | 378,376,979 | | | $ | 218,791 | | | $ | 5,223,751 | |
| | | | | | | | | | | | |
Shares of beneficial interest | | | 10,644,572 | | | | 15,012 | | | | 649,942 | |
| | | | | | | | | | | | |
Net asset value, offering and redemption price per share | | $ | 35.55 | | | $ | 14.57 | | | $ | 8.04 | |
| | | | | | | | | | | | |
Class Y shares: | |
Net assets | | $ | 5,013,185,909 | | | $ | 136,629,415 | | | $ | 25,113,221 | |
| | | | | | | | | | | | |
Shares of beneficial interest | | | 141,050,267 | | | | 9,366,728 | | | | 3,128,962 | |
| | | | | | | | | | | | |
Net asset value, offering and redemption price per share | | $ | 35.54 | | | $ | 14.59 | | | $ | 8.03 | |
| | | | | | | | | | | | |
See accompanying notes to financial statements.
45 |
Statements of Assets and Liabilities (continued)
December 31, 2022
| | | | | | | | | | | | |
| | | Mirova
Global
Sustainable
Equity Fund | | | Mirova
International
Sustainable
Equity Fund | | | Mirova U.S.
Sustainable
Equity Fund | |
ASSETS | |
Investments at cost | | $ | 954,746,681 | | | $ | 11,539,092 | | | $ | 3,804,741 | |
Net unrealized depreciation | | | (99,198,538 | ) | | | (2,591,231 | ) | | | (111,024 | ) |
| | | | | | | | | | | | |
Investments at value | | | 855,548,143 | | | | 8,947,861 | | | | 3,693,717 | |
Foreign currency at value (identified cost $12,369,753, $91,334 and $0, respectively) | | | 12,537,049 | | | | 94,266 | | | | — | |
Receivable for Fund shares sold | | | 1,337,039 | | | | 18,198 | | | | 11,408 | |
Receivable from investment adviser (Note 6) | | | — | | | | 6,616 | | | | 5,653 | |
Dividends and interest receivable | | | 271,391 | | | | 11,634 | | | | 1,349 | |
Tax reclaims receivable | | | 682,248 | | | | 61,214 | | | | — | |
Prepaid expenses (Note 8) | | | 641 | | | | 558 | | | | 556 | |
| | | | | | | | | | | | |
TOTAL ASSETS | | | 870,376,511 | | | | 9,140,347 | | | | 3,712,683 | |
| | | | | | | | | | | | |
LIABILITIES | |
Payable for Fund shares redeemed | | | 1,973,761 | | | | 39,463 | | | | — | |
Management fees payable (Note 6) | | | 568,957 | | | | — | | | | — | |
Deferred Trustees’ fees (Note 6) | | | 43,462 | | | | 12,989 | | | | 5,549 | |
Administrative fees payable (Note 6) | | | 35,462 | | | | 362 | | | | 150 | |
Payable to distributor (Note 6d) | | | 7,793 | | | | 17 | | | | 2 | |
Audit and tax services fees payable | | | 44,996 | | | | 44,865 | | | | 44,448 | |
Other accounts payable and accrued expenses | | | 269,672 | | | | 84,407 | | | | 7,023 | |
| | | | | | | | | | | | |
TOTAL LIABILITIES | | | 2,944,103 | | | | 182,103 | | | | 57,172 | |
| | | | | | | | | | | | |
NET ASSETS | | $ | 867,432,408 | | | $ | 8,958,244 | | | $ | 3,655,511 | |
| | | | | | | | | | | | |
NET ASSETS CONSIST OF: | |
Paid-in capital | | $ | 980,681,195 | | | $ | 11,818,891 | | | $ | 3,777,005 | |
Accumulated loss | | | (113,248,787 | ) | | | (2,860,647 | ) | | | (121,494 | ) |
| | | | | | | | | | | | |
NET ASSETS | | $ | 867,432,408 | | | $ | 8,958,244 | | | $ | 3,655,511 | |
| | | | | | | | | | | | |
COMPUTATION OF NET ASSET VALUE AND OFFERING PRICE: | |
Class A shares: | |
Net assets | | $ | 29,013,123 | | | $ | 717,422 | | | $ | 2,667 | |
| | | | | | | | | | | | |
Shares of beneficial interest | | | 1,905,687 | | | | 68,504 | | | | 294 | |
| | | | | | | | | | | | |
Net asset value and redemption price per share | | $ | 15.22 | | | $ | 10.47 | | | $ | 9.07 | |
| | | | | | | | | | | | |
Offering price per share (100/94.25 of net asset value) (Note 1) | | $ | 16.15 | | | $ | 11.11 | | | $ | 9.62 | |
| | | | | | | | | | | | |
Class C shares: (redemption price per share is equal to net asset value less any applicable contingent deferred sales charge) (Note 1) | | | | | | | | | | | | |
Net assets | | $ | 11,440,846 | | | $ | — | | | $ | 77,144 | |
| | | | | | | | | | | | |
Shares of beneficial interest | | | 789,919 | | | | — | | | | 8,645 | |
| | | | | | | | | | | | |
Net asset value and offering price per share | | $ | 14.48 | | | $ | — | | | $ | 8.92 | |
| | | | | | | | | | | | |
Class N shares: | |
Net assets | | $ | 189,957,035 | | | $ | 7,433,250 | | | $ | 3,527,321 | |
| | | | | | | | | | | | |
Shares of beneficial interest | | | 12,364,452 | | | | 706,535 | | | | 388,535 | |
| | | | | | | | | | | | |
Net asset value, offering and redemption price per share | | $ | 15.36 | | | $ | 10.52 | | | $ | 9.08 | |
| | | | | | | | | | | | |
Class Y shares: | |
Net assets | | $ | 637,021,404 | | | $ | 807,572 | | | $ | 48,379 | |
| | | | | | | | | | | | |
Shares of beneficial interest | | | 41,466,978 | | | | 76,848 | | | | 5,333 | |
| | | | | | | | | | | | |
Net asset value, offering and redemption price per share | | $ | 15.36 | | | $ | 10.51 | | | $ | 9.07 | |
| | | | | | | | | | | | |
See accompanying notes to financial statements.
| 46
Statements of Operations
For the Year Ended December 31, 2022
| | | | | | | | | | | | |
| | | Gateway
Fund | | | Gateway
Equity Call
Premium
Fund | | | Mirova
Global
Green
Bond Fund | |
INVESTMENT INCOME | |
Dividends | | $ | 111,489,535 | | | $ | 2,105,185 | | | $ | — | |
Interest | | | 825,403 | | | | 23,781 | | | | 714,961 | |
Less net foreign taxes withheld | | | (131,554 | ) | | | (7,235 | ) | | | — | |
| | | | | | | | | | | | |
| | | 112,183,384 | | | | 2,121,731 | | | | 714,961 | |
| | | | | | | | | | | | |
Expenses | |
Management fees (Note 6) | | | 42,712,665 | | | | 754,139 | | | | 204,867 | |
Service and distribution fees (Note 6) | | | 3,277,842 | | | | 12,855 | | | | 15,597 | |
Administrative fees (Note 6) | | | 3,299,638 | | | | 58,881 | | | | 18,492 | |
Trustees’ fees and expenses (Note 6) | | | 232,940 | | | | 15,909 | | | | 13,089 | |
Trustees’ fees deferred compensation (Note 6) | | | (115,800 | ) | | | (3,826 | ) | | | 549 | |
Transfer agent fees and expenses (Notes 6 and 7) | | | 4,382,114 | | | | 67,138 | | | | 42,249 | |
Audit and tax services fees | | | 54,998 | | | | 53,742 | | | | 45,287 | |
Custodian fees and expenses | | | 277,348 | | | | 98,161 | | | | 11,800 | |
Interest expense (Note 11) | | | — | | | | 1,508 | | | | 4,380 | |
Legal fees (Note 8) | | | 248,230 | | | | 4,308 | | | | 1,374 | |
Registration fees | | | 181,419 | | | | 81,334 | | | | 51,342 | |
Regulatory filing fees | | | 13,000 | | | | 13,000 | | | | 13,000 | |
Shareholder reporting expenses | | | 331,628 | | | | 12,256 | | | | 13,771 | |
Miscellaneous expenses | | | 217,851 | | | | 22,791 | | | | 19,438 | |
| | | | | | | | | | | | |
Total expenses | | | 55,113,873 | | | | 1,192,196 | | | | 455,235 | |
Fee/expense recovery (Note 6) | | | 3,123 | | | | — | | | | — | |
Less waiver and/or expense reimbursement (Note 6) | | | (990,739 | ) | | | (293,801 | ) | | | (171,696 | ) |
| | | | | | | | | | | | |
Net expenses | | | 54,126,257 | | | | 898,395 | | | | 283,539 | |
| | | | | | | | | | | | |
Net investment income | | | 58,057,127 | | | | 1,223,336 | | | | 431,422 | |
| | | | | | | | | | | | |
NET REALIZED AND UNREALIZED GAIN (LOSS) ON INVESTMENTS, FUTURES CONTRACTS, OPTIONS WRITTEN AND FOREIGN CURRENCY TRANSACTIONS | | | | | | | | | | | | |
Net realized gain (loss) on: | |
Investments | | | 204,406,425 | | | | (626,895 | ) | | | (4,062,959 | ) |
Futures contracts | | | — | | | | — | | | | 1,911,303 | |
Options written | | | 448,762,179 | | | | 7,931,158 | | | | — | |
Foreign currency transactions (Note 2c) | | | (3,241 | ) | | | (155 | ) | | | (97,168 | ) |
Net change in unrealized appreciation (depreciation) on: | |
Investments | | | (1,779,813,042 | ) | | | (25,391,840 | ) | | | (5,644,636 | ) |
Futures contracts | | | — | | | | — | | | | (114,946 | ) |
Options written | | | 85,743,092 | | | | 1,830,792 | | | | — | |
Foreign currency translations (Note 2c) | | | (129 | ) | | | — | | | | 6,670 | |
| | | | | | | | | | | | |
Net realized and unrealized loss on investments, futures contracts, options written and foreign currency transactions | | | (1,040,904,716 | ) | | | (16,256,940 | ) | | | (8,001,736 | ) |
| | | | | | | | | | | | |
NET DECREASE IN NET ASSETS RESULTING FROM OPERATIONS | | $ | (982,847,589 | ) | | $ | (15,033,604 | ) | | $ | (7,570,314 | ) |
| | | | | | | | | | | | |
See accompanying notes to financial statements.
47 |
Statements of Operations (continued)
For the Year Ended December 31, 2022
| | | | | | | | | | | | |
| | | Mirova
Global
Sustainable
Equity Fund | | | Mirova
International
Sustainable
Equity Fund | | | Mirova U.S.
Sustainable
Equity Fund | |
INVESTMENT INCOME | |
Dividends | | $ | 16,679,217 | | | $ | 587,791 | | | $ | 38,939 | |
Non-cash dividends (Note 2b) | | | 1,225,552 | | | | 31,741 | | | | — | |
Interest | | | 35,148 | | | | 1,009 | | | | 654 | |
Less net foreign taxes withheld | | | (1,483,752 | ) | | | (67,280 | ) | | | (515 | ) |
| | | | | | | | | | | | |
| | | 16,456,165 | | | | 553,261 | | | | 39,078 | |
| | | | | | | | | | | | |
Expenses | |
Management fees (Note 6) | | | 7,695,354 | | | | 152,331 | | | | 25,740 | |
Service and distribution fees (Note 6) | | | 219,162 | | | | 1,370 | | | | 863 | |
Administrative fees (Note 6) | | | 434,036 | | | | 8,536 | | | | 1,786 | |
Trustees’ fees and expenses (Note 6) | | | 41,127 | | | | 12,386 | | | | 11,958 | |
Trustees’ fees deferred compensation (Note 6) | | | 4,776 | | | | 1,585 | | | | 2,645 | |
Transfer agent fees and expenses (Notes 6 and 7) | | | 843,739 | | | | 5,517 | | | | 3,892 | |
Audit and tax services fees | | | 45,838 | | | | 45,213 | | | | 44,449 | |
Custodian fees and expenses | | | 70,014 | | | | 24,633 | | | | 2,016 | |
Interest expense (Note 11) | | | 42,550 | | | | 2,412 | | | | — | |
Legal fees (Note 8) | | | 33,519 | | | | 761 | | | | 122 | |
Registration fees | | | 103,972 | | | | 52,520 | | | | 69,501 | |
Regulatory filing fees | | | 13,000 | | | | 13,000 | | | | 13,000 | |
Shareholder reporting expenses | | | 87,121 | | | | 9,177 | | | | 8,357 | |
Miscellaneous expenses | | | 58,821 | | | | 18,762 | | | | 13,529 | |
| | | | | | | | | | | | |
Total expenses | | | 9,693,029 | | | | 348,203 | | | | 197,858 | |
Less waiver and/or expense reimbursement (Note 6) | | | (410,053 | ) | | | (172,221 | ) | | | (167,224 | ) |
| | | | | | | | | | | | |
Net expenses | | | 9,282,976 | | | | 175,982 | | | | 30,634 | |
| | | | | | | | | | | | |
Net investment income | | | 7,173,189 | | | | 377,279 | | | | 8,444 | |
| | | | | | | | | | | | |
NET REALIZED AND UNREALIZED GAIN (LOSS) ON INVESTMENTS AND FOREIGN CURRENCY TRANSACTIONS | | | | | | | | | | | | |
Net realized gain (loss) on: | | | | | | | | | | | | |
Investments | | | (13,898,657 | ) | | | (43,865 | ) | | | 81,285 | |
Foreign currency transactions (Note 2c) | | | (231,031 | ) | | | (23,782 | ) | | | — | |
Net change in unrealized appreciation (depreciation) on: | | | | | | | | | | | | |
Investments | | | (261,769,491 | ) | | | (8,261,267 | ) | | | (1,240,668 | ) |
Foreign currency translations (Note 2c) | | | 178,325 | | | | (1,402 | ) | | | — | |
| | | | | | | | | | | | |
Net realized and unrealized loss on investments and foreign currency transactions | | | (275,720,854 | ) | | | (8,330,316 | ) | | | (1,159,383 | ) |
| | | | | | | | | | | | |
NET DECREASE IN NET ASSETS RESULTING FROM OPERATIONS | | $ | (268,547,665 | ) | | $ | (7,953,037 | ) | | $ | (1,150,939 | ) |
| | | | | | | | | | | | |
See accompanying notes to financial statements.
| 48
Statements of Changes in Net Assets
| | | | | | | | | | | | | | | | |
| | | Gateway Fund | | | Gateway Equity Call
Premium Fund | |
| | | Year Ended
December 31,
2022 | | | Year Ended
December 31,
2021 | | | Year Ended
December 31,
2022 | | | Year Ended
December 31,
2021 | |
FROM OPERATIONS: | | | | | | | | | | | | | | | | |
Net investment income | | $ | 58,057,127 | | | $ | 49,256,628 | | | $ | 1,223,336 | | | $ | 539,101 | |
Net realized gain (loss) on investments, options written and foreign currency transactions | | | 653,165,363 | | | | (549,706,836 | ) | | | 7,304,108 | | | | (5,401,601 | ) |
Net change in unrealized appreciation (depreciation) on investments, options written and foreign currency translations | | | (1,694,070,079 | ) | | | 1,314,249,613 | | | | (23,561,048 | ) | | | 19,067,765 | |
| | | | | | | | | | | | | | | | |
Net increase (decrease) in net assets resulting from operations | | | (982,847,589 | ) | | | 813,799,405 | | | | (15,033,604 | ) | | | 14,205,265 | |
| | | | | | | | | | | | | | | | |
FROM DISTRIBUTIONS TO SHAREHOLDERS: | |
Class A | | | (5,738,007 | ) | | | (4,616,139 | ) | | | (12,362 | ) | | | (7,926 | ) |
Class C | | | — | | | | — | | | | (601 | ) | | | (75 | ) |
Class N | | | (4,134,252 | ) | | | (3,190,505 | ) | | | (2,287 | ) | | | (4,105 | ) |
Class Y | | | (48,176,662 | ) | | | (41,377,637 | ) | | | (1,235,232 | ) | | | (532,807 | ) |
| | | | | | | | | | | | | | | | |
Total distributions | | | (58,048,921 | ) | | | (49,184,281 | ) | | | (1,250,482 | ) | | | (544,913 | ) |
| | | | | | | | | | | | | | | | |
NET INCREASE (DECREASE) IN NET ASSETS FROM CAPITAL SHARE TRANSACTIONS (NOTE 13) | | | (805,606,549 | ) | | | 294,964,158 | | | | 49,826,241 | | | | 32,303,743 | |
| | | | | | | | | | | | | | | | |
Net increase (decrease) in net assets | | | (1,846,503,059 | ) | | | 1,059,579,282 | | | | 33,542,155 | | | | 45,964,095 | |
NET ASSETS | | | | | | | | | | | | | | | | |
Beginning of the year | | | 8,184,542,565 | | | | 7,124,963,283 | | | | 105,867,641 | | | | 59,903,546 | |
| | | | | | | | | | | | | | | | |
End of the year | | $ | 6,338,039,506 | | | $ | 8,184,542,565 | | | $ | 139,409,796 | | | $ | 105,867,641 | |
| | | | | | | | | | | | | | | | |
See accompanying notes to financial statements.
49 |
Statements of Changes in Net Assets (continued)
| | | | | | | | | | | | | | | | |
| | | Mirova Global
Green Bond Fund | | | Mirova Global Sustainable
Equity Fund | |
| | | Year Ended
December 31,
2022 | | | Year Ended
December 31,
2021 | | | Year Ended
December 31,
2022 | | | Year Ended
December 31,
2021 | |
FROM OPERATIONS: | | | | | | | | | | | | | | | | |
Net investment income | | $ | 431,422 | | | $ | 261,984 | | | $ | 7,173,189 | | | $ | 2,101,557 | |
Net realized gain (loss) on investments, futures contracts and foreign currency transactions | | | (2,248,824 | ) | | | 2,318,906 | | | | (14,129,688 | ) | | | 150,307,939 | |
Net change in unrealized appreciation (depreciation) on investments, futures contracts and foreign currency translations | | | (5,752,912 | ) | | | (3,822,067 | ) | | | (261,591,166 | ) | | | 23,546,962 | |
| | | | | | | | | | | | | | | | |
Net increase (decrease) in net assets resulting from operations | | | (7,570,314 | ) | | | (1,241,177 | ) | | | (268,547,665 | ) | | | 175,956,458 | |
| | | | | | | | | | | | | | | | |
FROM DISTRIBUTIONS TO SHAREHOLDERS: | |
Class A | | | (308,314 | ) | | | (196,254 | ) | | | (1,656,969 | ) | | | (4,789,380 | ) |
Class C | | | — | | | | — | | | | (629,720 | ) | | | (1,953,531 | ) |
Class N | | | (298,746 | ) | | | (286,884 | ) | | | (10,372,579 | ) | | | (22,974,524 | ) |
Class Y | | | (1,496,052 | ) | | | (956,524 | ) | | | (35,564,616 | ) | | | (94,376,354 | ) |
| | | | | | | | | | | | | | | | |
Total distributions | | | (2,103,112 | ) | | | (1,439,662 | ) | | | (48,223,884 | ) | | | (124,093,789 | ) |
| | | | | | | | | | | | | | | | |
NET INCREASE (DECREASE) IN NET ASSETS FROM CAPITAL SHARE TRANSACTIONS (NOTE 13) | | | (1,836,354 | ) | | | 10,270,116 | | | | 63,521,966 | | | | 191,048,671 | |
| | | | | | | | | | | | | | | | |
Net increase (decrease) in net assets | | | (11,509,780 | ) | | | 7,589,277 | | | | (253,249,583 | ) | | | 242,911,340 | |
NET ASSETS | | | | | | | | | | | | | | | | |
Beginning of the year | | | 47,125,074 | | | | 39,535,797 | | | | 1,120,681,991 | | | | 877,770,651 | |
| | | | | | | | | | | | | | | | |
End of the year | | $ | 35,615,294 | | | $ | 47,125,074 | | | $ | 867,432,408 | | | $ | 1,120,681,991 | |
| | | | | | | | | | | | | | | | |
See accompanying notes to financial statements.
| 50
Statements of Changes in Net Assets (continued)
| | | | | | | | | | | | | | | | |
| | | Mirova International
Sustainable Equity Fund | | | Mirova U.S. Sustainable
Equity Fund | |
| | | Year Ended
December 31,
2022 | | | Year Ended
December 31,
2021 | | | Year Ended
December 31,
2022 | | | Year Ended
December 31,
2021 | |
FROM OPERATIONS: | | | | | | | | | | | | | | | | |
Net investment income | | $ | 377,279 | | | $ | 269,597 | | | $ | 8,444 | | | $ | 2,949 | |
Net realized gain (loss) on investments and foreign currency transactions | | | (67,647 | ) | | | 225,743 | | | | 81,285 | | | | 433,439 | |
Net change in unrealized appreciation (depreciation) on investments and foreign currency translations | | | (8,262,669 | ) | | | 1,042,311 | | | | (1,240,668 | ) | | | 1,023,001 | |
| | | | | | | | | | | | | | | | |
Net increase (decrease) in net assets resulting from operations | | | (7,953,037 | ) | | | 1,537,651 | | | | (1,150,939 | ) | | | 1,459,389 | |
| | | | | | | | | | | | | | | | |
FROM DISTRIBUTIONS TO SHAREHOLDERS: | |
Class A | | | (25,462 | ) | | | (8,864 | ) | | | (223 | ) | | | (623 | ) |
Class C | | | — | | | | — | | | | (5,225 | ) | | | (5,097 | ) |
Class N | | | (273,620 | ) | | | (929,817 | ) | | | (257,702 | ) | | | (264,825 | ) |
Class Y | | | (29,504 | ) | | | (41,940 | ) | | | (2,573 | ) | | | (2,393 | ) |
Tax return of capital | | | | | | | | | | | | | | | | |
Class N | | | — | | | | — | | | | (3,159 | ) | | | — | |
Class Y | | | — | | | | — | | | | (29 | ) | | | — | |
| | | | | | | | | | | | | | | | |
Total distributions | | | (328,586 | ) | | | (980,621 | ) | | | (268,911 | ) | | | (272,938 | ) |
| | | | | | | | | | | | | | | | |
NET INCREASE (DECREASE) IN NET ASSETS FROM CAPITAL SHARE TRANSACTIONS (NOTE 13) | | | (12,492,079 | ) | | | 12,545,607 | | | | 24,536 | | | | (1,244,405 | ) |
| | | | | | | | | | | | | | | | |
Net increase (decrease) in net assets | | | (20,773,702 | ) | | | 13,102,637 | | | | (1,395,314 | ) | | | (57,954 | ) |
NET ASSETS | | | | | | | | | | | | | | | | |
Beginning of the year | | | 29,731,946 | | | | 16,629,309 | | | | 5,050,825 | | | | 5,108,779 | |
| | | | | | | | | | | | | | | | |
End of the year | | $ | 8,958,244 | | | $ | 29,731,946 | | | $ | 3,655,511 | | | $ | 5,050,825 | |
| | | | | | | | | | | | | | | | |
See accompanying notes to financial statements.
51 |
Financial Highlights
For a share outstanding throughout each period.
| | | | | | | | | | | | | | | | | | | | |
| | | Gateway Fund—Class A | |
| | | Year Ended
December 31,
2022
| | | Year Ended
December 31,
2021
| | | Year Ended
December 31,
2020
| | | Year Ended
December 31,
2019
| | | Year Ended
December 31,
2018
| |
Net asset value, beginning of the period | | $ | 40.70 | | | $ | 36.76 | | | $ | 34.69 | | | $ | 31.65 | | | $ | 33.47 | |
| | | | | | | | | | | | | | | | | | | | |
INCOME (LOSS) FROM INVESTMENT OPERATIONS: | | | | | | | | | | | | | | | | | | | | |
Net investment income(a) | | | 0.22 | | | | 0.18 | | | | 0.30 | | | | 0.37 | | | | 0.34 | |
Net realized and unrealized gain (loss) | | | (5.13 | ) | | | 3.93 | | | | 2.08 | | | | 3.05 | | | | (1.80 | ) |
| | | | | | | | | | | | | | | | | | | | |
Total from Investment Operations | | | (4.91 | ) | | | 4.11 | | | | 2.38 | | | | 3.42 | | | | (1.46 | ) |
| | | | | | | | | | | | | | | | | | | | |
LESS DISTRIBUTIONS FROM: | |
Net investment income | | | (0.22 | ) | | | (0.17 | ) | | | (0.31 | ) | | | (0.38 | ) | | | (0.36 | ) |
| | | | | | | | | | | | | | | | | | | | |
Net asset value, end of the period | | $ | 35.57 | | | $ | 40.70 | | | $ | 36.76 | | | $ | 34.69 | | | $ | 31.65 | |
| | | | | | | | | | | | | | | | | | | | |
Total return(b)(c) | | | (12.06 | )% | | | 11.24 | % | | | 6.92 | % | | | 10.84 | % | | | (4.39 | )% |
RATIOS TO AVERAGE NET ASSETS: | | | | | | | | | | | | | | | | | | | | |
Net assets, end of the period (000’s) | | $ | 869,122 | | | $ | 1,073,713 | | | $ | 987,702 | | | $ | 1,125,464 | | | $ | 1,177,641 | |
Net expenses(d) | | | 0.93 | %(e) | | | 0.94 | %(f) | | | 0.94 | % | | | 0.94 | % | | | 0.94 | % |
Gross expenses | | | 0.96 | %(e) | | | 0.98 | %(f) | | | 1.02 | % | | | 1.01 | % | | | 1.01 | % |
Net investment income | | | 0.60 | % | | | 0.46 | % | | | 0.88 | % | | | 1.12 | % | | | 1.03 | % |
Portfolio turnover rate | | | 16 | % | | | 11 | % | | | 22 | % | | | 12 | % | | | 10 | % |
| (a) | Per share net investment income has been calculated using the average shares outstanding during the period. |
| (b) | Had certain expenses not been waived/reimbursed during the period, total returns would have been lower. |
| (c) | A sales charge for Class A shares is not reflected in total return calculations. |
| (d) | The investment adviser agreed to waive its fees and/or reimburse a portion of the Fund’s expenses during the period. Without this waiver/reimbursement, expenses would have been higher. |
| (e) | Includes refund of prior year service fee of 0.01%. See Note 6b of Notes to Financial Statements. |
| (f) | Includes refund of prior year service fee of 0.01% |
See accompanying notes to financial statements.
| 52
Financial Highlights (continued)
For a share outstanding throughout each period.
| | | | | | | | | | | | | | | | | | | | |
| | | Gateway Fund—Class C | |
| | | Year Ended
December 31,
2022
| | | Year Ended
December 31,
2021
| | | Year Ended
December 31,
2020
| | | Year Ended
December 31,
2019
| | | Year Ended
December 31,
2018
| |
Net asset value, beginning of the period | | $ | 40.41 | | | $ | 36.60 | | | $ | 34.54 | | | $ | 31.50 | | | $ | 33.32 | |
| | | | | | | | | | | | | | | | | | | | |
INCOME (LOSS) FROM INVESTMENT OPERATIONS: | | | | | | | | | | | | | | | | | | | | |
Net investment income (loss)(a) | | | (0.06 | ) | | | (0.11 | ) | | | 0.04 | | | | 0.12 | | | | 0.09 | |
Net realized and unrealized gain (loss) | | | (5.09 | ) | | | 3.92 | | | | 2.07 | | | | 3.03 | | | | (1.80 | ) |
| | | | | | | | | | | | | | | | | | | | |
Total from Investment Operations | | | (5.15 | ) | | | 3.81 | | | | 2.11 | | | | 3.15 | | | | (1.71 | ) |
| | | | | | | | | | | | | | | | | | | | |
LESS DISTRIBUTIONS FROM: | |
Net investment income | | | — | | | | — | | | | (0.05 | ) | | | (0.11 | ) | | | (0.11 | ) |
| | | | | | | | | | | | | | | | | | | | |
Net asset value, end of the period | | $ | 35.26 | | | $ | 40.41 | | | $ | 36.60 | | | $ | 34.54 | | | $ | 31.50 | |
| | | | | | | | | | | | | | | | | | | | |
Total return(b)(c) | | | (12.74 | )% | | | 10.41 | % | | | 6.13 | % | | | 10.02 | % | | | (5.15 | )% |
RATIOS TO AVERAGE NET ASSETS: | | | | | | | | | | | | | | | | | | | | |
Net assets, end of the period (000’s) | | $ | 77,355 | | | $ | 114,019 | | | $ | 142,623 | | | $ | 215,947 | | | $ | 272,904 | |
Net expenses(d) | | | 1.70 | % | | | 1.70 | % | | | 1.70 | % | | | 1.70 | % | | | 1.70 | % |
Gross expenses | | | 1.71 | % | | | 1.73 | % | | | 1.77 | % | | | 1.76 | % | | | 1.76 | % |
Net investment income (loss) | | | (0.17 | )% | | | (0.30 | )% | | | 0.12 | % | | | 0.37 | % | | | 0.27 | % |
Portfolio turnover rate | | | 16 | % | | | 11 | % | | | 22 | % | | | 12 | % | | | 10 | % |
| (a) | Per share net investment income (loss) has been calculated using the average shares outstanding during the period. |
| (b) | Had certain expenses not been waived/reimbursed during the period, total returns would have been lower. |
| (c) | A contingent deferred sales charge for Class C shares is not reflected in total return calculations. |
| (d) | The investment adviser agreed to waive its fees and/or reimburse a portion of the Fund’s expenses during the period. Without this waiver/reimbursement, expenses would have been higher. |
See accompanying notes to financial statements.
53 |
Financial Highlights (continued)
For a share outstanding throughout each period.
| | | | | | | | | | | | | | | | | | | | |
| | | Gateway Fund—Class N | |
| | | Year Ended
December 31,
2022
| | | Year Ended
December 31,
2021
| | | Year Ended
December 31,
2020
| | | Year Ended
December 31,
2019
| | | Year Ended
December 31,
2018
| |
Net asset value, beginning of the period | | $ | 40.68 | | | $ | 36.74 | | | $ | 34.68 | | | $ | 31.63 | | | $ | 33.46 | |
| | | | | | | | | | | | | | | | | | | | |
INCOME (LOSS) FROM INVESTMENT OPERATIONS: | | | | | | | | | | | | | | | | | | | | |
Net investment income(a) | | | 0.33 | | | | 0.29 | | | | 0.40 | | | | 0.47 | | | | 0.44 | |
Net realized and unrealized gain (loss) | | | (5.13 | ) | | | 3.94 | | | | 2.07 | | | | 3.06 | | | | (1.81 | ) |
| | | | | | | | | | | | | | | | | | | | |
Total from Investment Operations | | | (4.80 | ) | | | 4.23 | | | | 2.47 | | | | 3.53 | | | | (1.37 | ) |
| | | | | | | | | | | | | | | | | | | | |
LESS DISTRIBUTIONS FROM: | |
Net investment income | | | (0.33 | ) | | | (0.29 | ) | | | (0.41 | ) | | | (0.48 | ) | | | (0.46 | ) |
| | | | | | | | | | | | | | | | | | | | |
Net asset value, end of the period | | $ | 35.55 | | | $ | 40.68 | | | $ | 36.74 | | | $ | 34.68 | | | $ | 31.63 | |
| | | | | | | | | | | | | | | | | | | | |
Total return | | | (11.80 | )% | | | 11.57 | %(b) | | | 7.25 | %(b) | | | 11.17 | %(b) | | | (4.13 | )%(b) |
RATIOS TO AVERAGE NET ASSETS: | | | | | | | | | | | | | | | | | | | | |
Net assets, end of the period (000’s) | | $ | 378,377 | | | $ | 504,299 | | | $ | 369,829 | | | $ | 369,793 | | | $ | 179,727 | |
Net expenses | | | 0.65 | % | | | 0.65 | %(c) | | | 0.65 | %(c) | | | 0.65 | %(c) | | | 0.65 | %(c) |
Gross expenses | | | 0.65 | % | | | 0.67 | % | | | 0.70 | % | | | 0.69 | % | | | 0.70 | % |
Net investment income | | | 0.88 | % | | | 0.74 | % | | | 1.17 | % | | | 1.40 | % | | | 1.32 | % |
Portfolio turnover rate | | | 16 | % | | | 11 | % | | | 22 | % | | | 12 | % | | | 10 | % |
| (a) | Per share net investment income has been calculated using the average shares outstanding during the period. |
| (b) | Had certain expenses not been waived/reimbursed during the period, total returns would have been lower. |
| (c) | The investment adviser agreed to waive its fees and/or reimburse a portion of the Fund’s expenses during the period. Without this waiver/reimbursement, expenses would have been higher. |
See accompanying notes to financial statements.
| 54
Financial Highlights (continued)
For a share outstanding throughout each period.
| | | | | | | | | | | | | | | | | | | | |
| | | Gateway Fund—Class Y | |
| | | Year Ended
December 31,
2022
| | | Year Ended
December 31,
2021
| | | Year Ended
December 31,
2020
| | | Year Ended
December 31,
2019
| | | Year Ended
December 31,
2018
| |
Net asset value, beginning of the period | | $ | 40.67 | | | $ | 36.73 | | | $ | 34.67 | | | $ | 31.63 | | | $ | 33.46 | |
| | | | | | | | | | | | | | | | | | | | |
INCOME (LOSS) FROM INVESTMENT OPERATIONS: | | | | | | | | | | | | | | | | | | | | |
Net investment income(a) | | | 0.31 | | | | 0.27 | | | | 0.38 | | | | 0.46 | | | | 0.43 | |
Net realized and unrealized gain (loss) | | | (5.13 | ) | | | 3.94 | | | | 2.07 | | | | 3.04 | | | | (1.81 | ) |
| | | | | | | | | | | | | | | | | | | | |
Total from Investment Operations | | | (4.82 | ) | | | 4.21 | | | | 2.45 | | | | 3.50 | | | | (1.38 | ) |
| | | | | | | | | | | | | | | | | | | | |
LESS DISTRIBUTIONS FROM: | |
Net investment income | | | (0.31 | ) | | | (0.27 | ) | | | (0.39 | ) | | | (0.46 | ) | | | (0.45 | ) |
| | | | | | | | | | | | | | | | | | | | |
Net asset value, end of the period | | $ | 35.54 | | | $ | 40.67 | | | $ | 36.73 | | | $ | 34.67 | | | $ | 31.63 | |
| | | | | | | | | | | | | | | | | | | | |
Total return(b) | | | (11.85 | )% | | | 11.49 | % | | | 7.19 | % | | | 11.12 | % | | | (4.18 | )% |
RATIOS TO AVERAGE NET ASSETS: | | | | | | | | | | | | | | | | | �� | | | |
Net assets, end of the period (000’s) | | $ | 5,013,186 | | | $ | 6,492,511 | | | $ | 5,624,810 | | | $ | 6,446,007 | | | $ | 6,508,061 | |
Net expenses(c) | | | 0.70 | % | | | 0.70 | % | | | 0.70 | % | | | 0.70 | % | | | 0.70 | % |
Gross expenses | | | 0.71 | % | | | 0.73 | % | | | 0.77 | % | | | 0.76 | % | | | 0.76 | % |
Net investment income | | | 0.83 | % | | | 0.70 | % | | | 1.12 | % | | | 1.37 | % | | | 1.28 | % |
Portfolio turnover rate | | | 16 | % | | | 11 | % | | | 22 | % | | | 12 | % | | | 10 | % |
| (a) | Per share net investment income has been calculated using the average shares outstanding during the period. |
| (b) | Had certain expenses not been waived/reimbursed during the period, total returns would have been lower. |
| (c) | The investment adviser agreed to waive its fees and/or reimburse a portion of the Fund’s expenses during the period. Without this waiver/reimbursement, expenses would have been higher. |
See accompanying notes to financial statements.
55 |
Financial Highlights (continued)
For a share outstanding throughout each period.
| | | | | | | | | | | | | | | | | | | | |
| | | Gateway Equity Call Premium Fund—Class A | |
| | | Year Ended
December 31,
2022
| | | Year Ended
December 31,
2021
| | | Year Ended
December 31,
2020
| | | Year Ended
December 31,
2019
| | | Year Ended
December 31,
2018
| |
Net asset value, beginning of the period | | $ | 16.66 | | | $ | 14.03 | | | $ | 13.07 | | | $ | 11.32 | | | $ | 12.08 | |
| | | | | | | | | | | | | | | | | | | | |
INCOME (LOSS) FROM INVESTMENT OPERATIONS: | | | | | | | | | | | | | | | | | | | | |
Net investment income(a) | | | 0.10 | | | | 0.07 | | | | 0.09 | | | | 0.10 | | | | 0.09 | |
Net realized and unrealized gain (loss) | | | (2.06 | ) | | | 2.62 | | | | 0.95 | | | | 1.76 | | | | (0.76 | ) |
| | | | | | | | | | | | | | | | | | | | |
Total from Investment Operations | | | (1.96 | ) | | | 2.69 | | | | 1.04 | | | | 1.86 | | | | (0.67 | ) |
| | | | | | | | | | | | | | | | | | | | |
LESS DISTRIBUTIONS FROM: | |
Net investment income | | | (0.10 | ) | | | (0.06 | ) | | | (0.08 | ) | | | (0.11 | ) | | | (0.09 | ) |
| | | | | | | | | | | | | | | | | | | | |
Net asset value, end of the period | | $ | 14.60 | | | $ | 16.66 | | | $ | 14.03 | | | $ | 13.07 | | | $ | 11.32 | |
| | | | | | | | | | | | | | | | | | | | |
Total return(b)(c) | | | (11.77 | )% | | | 19.20 | % | | | 8.06 | % | | | 16.46 | % | | | (5.60 | )% |
RATIOS TO AVERAGE NET ASSETS: | | | | | | | | | | | | | | | | | | | | |
Net assets, end of the period (000’s) | | $ | 1,617 | | | $ | 2,613 | | | $ | 1,456 | | | $ | 2,363 | | | $ | 2,375 | |
Net expenses(d) | | | 0.93 | % | | | 1.03 | %(e)(f) | | | 1.20 | % | | | 1.20 | % | | | 1.20 | % |
Gross expenses | | | 1.16 | % | | | 1.20 | % | | | 1.43 | % | | | 1.42 | % | | | 1.44 | % |
Net investment income | | | 0.66 | % | | | 0.43 | % | | | 0.69 | % | | | 0.82 | % | | | 0.73 | % |
Portfolio turnover rate | | | 11 | % | | | 5 | % | | | 15 | % | | | 17 | % | | | 58 | % |
| (a) | Per share net investment income has been calculated using the average shares outstanding during the period. |
| (b) | A sales charge for Class A shares is not reflected in total return calculations. |
| (c) | Had certain expenses not been waived/reimbursed during the period, total returns would have been lower. |
| (d) | The investment adviser agreed to waive its fees and/or reimburse a portion of the Fund’s expenses during the period. Without this waiver/reimbursement, expenses would have been higher. |
| (e) | Effective July 1, 2021, the expense limit decreased from 1.20% to 0.93%. |
| (f) | Includes additional voluntary waiver of advisory fee of 0.02%. |
See accompanying notes to financial statements.
| 56
Financial Highlights (continued)
For a share outstanding throughout each period.
| | | | | | | | | | | | | | | | | | | | |
| | | Gateway Equity Call Premium Fund—Class C | |
| | | Year Ended
December 31,
2022
| | | Year Ended
December 31,
2021
| | | Year Ended
December 31,
2020
| | | Year Ended
December 31,
2019
| | | Year Ended
December 31,
2018
| |
Net asset value, beginning of the period | | $ | 16.52 | | | $ | 13.96 | | | $ | 13.03 | | | $ | 11.29 | | | $ | 12.05 | |
| | | | | | | | | | | | | | | | | | | | |
INCOME (LOSS) FROM INVESTMENT OPERATIONS: | | | | | | | | | | | | | | | | | | | | |
Net investment income (loss)(a) | | | (0.01 | ) | | | (0.05 | ) | | | (0.01 | ) | | | 0.01 | | | | 0.00 | (b) |
Net realized and unrealized gain (loss) | | | (2.04 | ) | | | 2.61 | | | | 0.95 | | | | 1.74 | | | | (0.75 | ) |
| | | | | | | | | | | | | | | | | | | | |
Total from Investment Operations | | | (2.05 | ) | | | 2.56 | | | | 0.94 | | | | 1.75 | | | | (0.75 | ) |
| | | | | | | | | | | | | | | | | | | | |
LESS DISTRIBUTIONS FROM: | |
Net investment income | | | (0.01 | ) | | | (0.00 | )(b) | | | (0.01 | ) | | | (0.01 | ) | | | (0.01 | ) |
| | | | | | | | | | | | | | | | | | | | |
Net asset value, end of the period | | $ | 14.46 | | | $ | 16.52 | | | $ | 13.96 | | | $ | 13.03 | | | $ | 11.29 | |
| | | | | | | | | | | | | | | | | | | | |
Total return(c)(d) | | | (12.36 | )% | | | 18.28 | % | | | 7.23 | % | | | 15.54 | % | | | (6.24 | )% |
RATIOS TO AVERAGE NET ASSETS: | | | | | | | | | | | | | | | | | | | | |
Net assets, end of the period (000’s) | | $ | 944 | | | $ | 814 | | | $ | 741 | | | $ | 727 | | | $ | 849 | |
Net expenses(e) | | | 1.68 | % | | | 1.79 | %(f)(g) | | | 1.95 | % | | | 1.95 | % | | | 1.95 | % |
Gross expenses | | | 1.91 | % | | | 1.96 | % | | | 2.17 | % | | | 2.17 | % | | | 2.19 | % |
Net investment income (loss) | | | (0.06 | )% | | | (0.33 | )% | | | (0.10 | )% | | | 0.07 | % | | | 0.02 | % |
Portfolio turnover rate | | | 11 | % | | | 5 | % | | | 15 | % | | | 17 | % | | | 58 | % |
| (a) | Per share net investment income (loss) has been calculated using the average shares outstanding during the period. |
| (b) | Amount rounds to less than $0.01 per share. |
| (c) | A contingent deferred sales charge for Class C shares is not reflected in total return calculations. |
| (d) | Had certain expenses not been waived/reimbursed during the period, total returns would have been lower. |
| (e) | The investment adviser agreed to waive its fees and/or reimburse a portion of the Fund’s expenses during the period. Without this waiver/reimbursement, expenses would have been higher. |
| (f) | Effective July 1, 2021, the expense limit decreased from 1.95% to 1.68%. |
| (g) | Includes additional voluntary waiver of advisory fee of 0.02%. |
See accompanying notes to financial statements.
57 |
Financial Highlights (continued)
For a share outstanding throughout each period.
| | | | | | | | | | | | | | | | | | | | |
| | | Gateway Equity Call Premium Fund—Class N | |
| | | Year Ended
December 31,
2022
| | | Year Ended
December 31,
2021
| | | Year Ended
December 31,
2020
| | | Year Ended
December 31,
2019
| | | Year Ended
December 31,
2018
| |
Net asset value, beginning of the period | | $ | 16.63 | | | $ | 14.01 | | | $ | 13.06 | | | $ | 11.32 | | | $ | 12.09 | |
| | | | | | | | | | | | | | | | | | | | |
INCOME (LOSS) FROM INVESTMENT OPERATIONS: | | | | | | | | | | | | | | | | | | | | |
Net investment income(a) | | | 0.14 | | | | 0.11 | | | | 0.12 | | | | 0.13 | | | | 0.13 | |
Net realized and unrealized gain (loss) | | | (2.05 | ) | | | 2.61 | | | | 0.95 | | | | 1.76 | | | | (0.77 | ) |
| | | | | | | | | | | | | | | | | | | | |
Total from Investment Operations | | | (1.91 | ) | | | 2.72 | | | | 1.07 | | | | 1.89 | | | | (0.64 | ) |
| | | | | | | | | | | | | | | | | | | | |
LESS DISTRIBUTIONS FROM: | |
Net investment income | | | (0.15 | ) | | | (0.10 | ) | | | (0.12 | ) | | | (0.15 | ) | | | (0.13 | ) |
| | | | | | | | | | | | | | | | | | | | |
Net asset value, end of the period | | $ | 14.57 | | | $ | 16.63 | | | $ | 14.01 | | | $ | 13.06 | | | $ | 11.32 | |
| | | | | | | | | | | | | | | | | | | | |
Total return(b) | | | (11.51 | )% | | | 19.49 | % | | | 8.36 | % | | | 16.73 | % | | | (5.32 | )% |
RATIOS TO AVERAGE NET ASSETS: | | | | | | | | | | | | | | | | | | | | |
Net assets, end of the period (000’s) | | $ | 219 | | | $ | 437 | | | $ | 728 | | | $ | 530 | | | $ | 1 | |
Net expenses(c) | | | 0.63 | % | | | 0.77 | %(d) | | | 0.90 | % | | | 0.90 | % | | | 0.90 | % |
Gross expenses | | | 1.23 | % | | | 1.08 | % | | | 1.29 | % | | | 1.63 | % | | | 15.41 | % |
Net investment income | | | 0.95 | % | | | 0.70 | % | | | 0.95 | % | | | 1.03 | % | | | 1.04 | % |
Portfolio turnover rate | | | 11 | % | | | 5 | % | | | 15 | % | | | 17 | % | | | 58 | % |
| (a) | Per share net investment income has been calculated using the average shares outstanding during the period. |
| (b) | Had certain expenses not been waived/reimbursed during the period, total returns would have been lower. |
| (c) | The investment adviser agreed to waive its fees and/or reimburse a portion of the Fund’s expenses during the period. Without this waiver/reimbursement, expenses would have been higher. |
| (d) | Effective July 1, 2021, the expense limit decreased from 0.90% to 0.63%. |
See accompanying notes to financial statements.
| 58
Financial Highlights (continued)
For a share outstanding throughout each period.
| | | | | | | | | | | | | | | | | | | | |
| | | Gateway Equity Call Premium Fund—Class Y | |
| | | Year Ended
December 31,
2022
| | | Year Ended
December 31,
2021
| | | Year Ended
December 31,
2020
| | | Year Ended
December 31,
2019
| | | Year Ended
December 31,
2018
| |
Net asset value, beginning of the period | | $ | 16.65 | | | $ | 14.02 | | | $ | 13.07 | | | $ | 11.32 | | | $ | 12.09 | |
| | | | | | | | | | | | | | | | | | | | |
INCOME (LOSS) FROM INVESTMENT OPERATIONS: | | | | | | | | | | | | | | | | | | | | |
Net investment income(a) | | | 0.14 | | | | 0.10 | | | | 0.11 | | | | 0.13 | | | | 0.12 | |
Net realized and unrealized gain (loss) | | | (2.06 | ) | | | 2.63 | | | | 0.96 | | | | 1.76 | | | | (0.76 | ) |
| | | | | | | | | | | | | | | | | | | | |
Total from Investment Operations | | | (1.92 | ) | | | 2.73 | | | | 1.07 | | | | 1.89 | | | | (0.64 | ) |
| | | | | | | | | | | | | | | | | | | | |
LESS DISTRIBUTIONS FROM: | |
Net investment income | | | (0.14 | ) | | | (0.10 | ) | | | (0.12 | ) | | | (0.14 | ) | | | (0.13 | ) |
| | | | | | | | | | | | | | | | | | | | |
Net asset value, end of the period | | $ | 14.59 | | | $ | 16.65 | | | $ | 14.02 | | | $ | 13.07 | | | $ | 11.32 | |
| | | | | | | | | | | | | | | | | | | | |
Total return(b) | | | (11.48 | )% | | | 19.43 | % | | | 8.38 | % | | | 16.67 | % | | | (5.37 | )% |
RATIOS TO AVERAGE NET ASSETS: | | | | | | | | | | | | | | | | | | | | |
Net assets, end of the period (000’s) | | $ | 136,629 | | | $ | 102,004 | | | $ | 56,979 | | | $ | 60,794 | | | $ | 67,125 | |
Net expenses(c) | | | 0.68 | % | | | 0.78 | %(d)(e) | | | 0.95 | % | | | 0.95 | % | | | 0.95 | % |
Gross expenses | | | 0.91 | % | | | 0.95 | % | | | 1.17 | % | | | 1.17 | % | | | 1.19 | % |
Net investment income | | | 0.95 | % | | | 0.67 | % | | | 0.90 | % | | | 1.06 | % | | | 1.01 | % |
Portfolio turnover rate | | | 11 | % | | | 5 | % | | | 15 | % | | | 17 | % | | | 58 | % |
| (a) | Per share net investment income has been calculated using the average shares outstanding during the period. |
| (b) | Had certain expenses not been waived/reimbursed during the period, total returns would have been lower. |
| (c) | The investment adviser agreed to waive its fees and/or reimburse a portion of the Fund’s expenses during the period. Without this waiver/reimbursement, expenses would have been higher. |
| (d) | Effective July 1, 2021, the expense limit decreased from 0.95% to 0.68%. |
| (e) | Includes additional voluntary waiver of advisory fee of 0.02%. |
See accompanying notes to financial statements.
59 |
Financial Highlights (continued)
For a share outstanding throughout each period.
| | | | | | | | | | | | | | | | | | | | |
| | | Mirova Global Green Bond—Class A | |
| | | Year Ended
December 31,
2022
| | | Year Ended
December 31,
2021
| | | Year Ended
December 31,
2020
| | | Year Ended
December 31,
2019
| | | Year Ended
December 31,
2018
| |
Net asset value, beginning of the period | | $ | 10.14 | | | $ | 10.77 | | | $ | 10.36 | | | $ | 9.71 | | | $ | 9.96 | |
| | | | | | | | | | | | | | | | | | | | |
INCOME (LOSS) FROM INVESTMENT OPERATIONS: | | | | | | | | | | | | | | | | | | | | |
Net investment income(a) | | | 0.07 | | | | 0.04 | | | | 0.07 | | | | 0.09 | | | | 0.08 | |
Net realized and unrealized gain (loss) | | | (1.75 | ) | | | (0.37 | ) | | | 0.71 | | | | 0.80 | | | | (0.02 | ) |
| | | | | | | | | | | | | | | | | | | | |
Total from Investment Operations | | | (1.68 | ) | | | (0.33 | ) | | | 0.78 | | | | 0.89 | | | | 0.06 | |
| | | | | | | | | | | | | | | | | | | | |
LESS DISTRIBUTIONS FROM: | |
Net investment income | | | (0.01 | ) | | | (0.14 | ) | | | (0.18 | ) | | | (0.10 | ) | | | (0.31 | ) |
Net realized capital gains | | | (0.46 | ) | | | (0.16 | ) | | | (0.19 | ) | | | (0.14 | ) | | | — | |
| | | | | | | | | | | | | | | | | | | | |
Total Distributions | | | (0.47 | ) | | | (0.30 | ) | | | (0.37 | ) | | | (0.24 | ) | | | (0.31 | ) |
| | | | | | | | | | | | | | | | | | | | |
Net asset value, end of the period | | $ | 7.99 | | | $ | 10.14 | | | $ | 10.77 | | | $ | 10.36 | | | $ | 9.71 | |
| | | | | | | | | | | | | | | | | | | | |
Total return(b)(c) | | | (16.73 | )% | | | (3.02 | )% | | | 7.61 | % | | | 9.16 | % | | | 0.64 | % |
RATIOS TO AVERAGE NET ASSETS: | | | | | | | | | | | | | | | | | | | | |
Net assets, end of the period (000’s) | | $ | 5,278 | | | $ | 6,798 | | | $ | 5,674 | | | $ | 2,549 | | | $ | 814 | |
Net expenses(d) | | | 0.91 | %(e) | | | 0.96 | %(f)(g) | | | 0.97 | %(h) | | | 0.96 | %(i) | | | 0.96 | %(j) |
Gross expenses | | | 1.34 | %(e) | | | 1.41 | %(g) | | | 1.43 | %(h) | | | 1.56 | %(i) | | | 1.75 | %(j) |
Net investment income | | | 0.83 | % | | | 0.39 | % | | | 0.69 | % | | | 0.86 | % | | | 0.85 | % |
Portfolio turnover rate | | | 60 | % | | | 37 | % | | | 53 | % | | | 25 | % | | | 46 | % |
| (a) | Per share net investment income has been calculated using the average shares outstanding during the period. |
| (b) | A sales charge for Class A shares is not reflected in total return calculations. |
| (c) | Had certain expenses not been waived/reimbursed during the period, total returns would have been lower. |
| (d) | The investment adviser agreed to waive its fees and/or reimburse a portion of the Fund’s expenses during the period. Without this waiver/reimbursement, expenses would have been higher. |
| (e) | Includes interest expense. Without this expense the ratio of net expenses would have been 0.90% and the ratio of gross expenses would have been 1.33%. |
| (f) | Effective July 1, 2021, the expense limit decreased from 0.95% to 0.90%. |
| (g) | Includes interest expense. Without this expense the ratio of net expenses would have been 0.92% and the ratio of gross expenses would have been 1.37%. |
| (h) | Includes interest expense. Without this expense the ratio of net expenses would have been 0.95% and the ratio of gross expenses would have been 1.41%. |
| (i) | Includes interest expense. Without this expense the ratio of net expenses would have been 0.95% and the ratio of gross expenses would have been 1.55%. |
| (j) | Includes interest expense. Without this expense the ratio of net expenses would have been 0.95% and the ratio of gross expenses would have been 1.74%. |
See accompanying notes to financial statements.
| 60
Financial Highlights (continued)
For a share outstanding throughout each period.
| | | | | | | | | | | | | | | | | | | | |
| | | Mirova Global Green Bond—Class N | |
| | | Year Ended
December 31,
2022
| | | Year Ended
December 31,
2021
| | | Year Ended
December 31,
2020
| | | Year Ended
December 31,
2019
| | | Year Ended
December 31,
2018
| |
Net asset value, beginning of the period | | $ | 10.17 | | | $ | 10.80 | | | $ | 10.39 | | | $ | 9.73 | | | $ | 9.98 | |
| | | | | | | | | | | | | | | | | | | | |
INCOME (LOSS) FROM INVESTMENT OPERATIONS: | | | | | | | | | | | | | | | | | | | | |
Net investment income(a) | | | 0.10 | | | | 0.07 | | | | 0.10 | | | | 0.12 | | | | 0.11 | |
Net realized and unrealized gain (loss) | | | (1.75 | ) | | | (0.36 | ) | | | 0.71 | | | | 0.80 | | | | (0.02 | ) |
| | | | | | | | | | | | | | | | | | | | |
Total from Investment Operations | | | (1.65 | ) | | | (0.29 | ) | | | 0.81 | | | | 0.92 | | | | 0.09 | |
| | | | | | | | | | | | | | | | | | | | |
LESS DISTRIBUTIONS FROM: | |
Net investment income | | | (0.02 | ) | | | (0.18 | ) | | | (0.21 | ) | | | (0.12 | ) | | | (0.34 | ) |
Net realized capital gains | | | (0.46 | ) | | | (0.16 | ) | | | (0.19 | ) | | | (0.14 | ) | | | — | |
| | | | | | | | | | | | | | | | | | | | |
Total Distributions | | | (0.48 | ) | | | (0.34 | ) | | | (0.40 | ) | | | (0.26 | ) | | | (0.34 | ) |
| | | | | | | | | | | | | | | | | | | | |
Net asset value, end of the period | | $ | 8.04 | | | $ | 10.17 | | | $ | 10.80 | | | $ | 10.39 | | | $ | 9.73 | |
| | | | | | | | | | | | | | | | | | | | |
Total return(b) | | | (16.42 | )% | | | (2.73 | )% | | | 7.89 | % | | | 9.52 | % | | | 0.93 | % |
RATIOS TO AVERAGE NET ASSETS: | | | | | | | | | | | | | | | | | | | | |
Net assets, end of the period (000’s) | | $ | 5,224 | | | $ | 8,110 | | | $ | 11,781 | | | $ | 27,322 | | | $ | 27,050 | |
Net expenses(c) | | | 0.61 | %(d) | | | 0.67 | %(e)(f) | | | 0.67 | %(g) | | | 0.66 | %(h) | | | 0.66 | %(i) |
Gross expenses | | | 0.99 | %(d) | | | 1.05 | %(f) | | | 1.07 | %(g) | | | 1.08 | %(h) | | | 1.12 | %(i) |
Net investment income | | | 1.11 | % | | | 0.69 | % | | | 0.96 | % | | | 1.17 | % | | | 1.13 | % |
Portfolio turnover rate | | | 60 | % | | | 37 | % | | | 53 | % | | | 25 | % | | | 46 | % |
| (a) | Per share net investment income has been calculated using the average shares outstanding during the period. |
| (b) | Had certain expenses not been waived/reimbursed during the period, total returns would have been lower. |
| (c) | The investment adviser agreed to waive its fees and/or reimburse a portion of the Fund’s expenses during the period. Without this waiver/reimbursement, expenses would have been higher. |
| (d) | Includes interest expense. Without this expense the ratio of net expenses would have been 0.60% and the ratio of gross expenses would have been 0.98%. |
| (e) | Effective July 1, 2021, the expense limit decreased from 0.65% to 0.60%. |
| (f) | Includes interest expense. Without this expense the ratio of net expenses would have been 0.63% and the ratio of gross expenses would have been 1.02%. |
| (g) | Includes interest expense. Without this expense the ratio of net expenses would have been 0.65% and the ratio of gross expenses would have been 1.05%. |
| (h) | Includes interest expense. Without this expense the ratio of net expenses would have been 0.65% and the ratio of gross expenses would have been 1.07%. |
| (i) | Includes interest expense. Without this expense the ratio of net expenses would have been 0.65% and the ratio of gross expenses would have been 1.11%. |
See accompanying notes to financial statements.
61 |
Financial Highlights (continued)
For a share outstanding throughout each period.
| | | | | | | | | | | | | | | | | | | | |
| | | Mirova Global Green Bond—Class Y | |
| | | Year Ended
December 31,
2022
| | | Year Ended
December 31,
2021
| | | Year Ended
December 31,
2020
| | | Year Ended
December 31,
2019
| | | Year Ended
December 31,
2018
| |
Net asset value, beginning of the period | | $ | 10.16 | | | $ | 10.79 | | | $ | 10.37 | | | $ | 9.72 | | | $ | 9.97 | |
| | | | | | | | | | | | | | | | | | | | |
INCOME (LOSS) FROM INVESTMENT OPERATIONS: | | | | | | | | | | | | | | | | | | | | |
Net investment income(a) | | | 0.10 | | | | 0.07 | | | | 0.10 | | | | 0.11 | | | | 0.12 | |
Net realized and unrealized gain (loss) | | | (1.76 | ) | | | (0.37 | ) | | | 0.72 | | | | 0.80 | | | | (0.03 | ) |
| | | | | | | | | | | | | | | | | | | | |
Total from Investment Operations | | | (1.66 | ) | | | (0.30 | ) | | | 0.82 | | | | 0.91 | | | | 0.09 | |
| | | | | | | | | | | | | | | | | | | | |
LESS DISTRIBUTIONS FROM: | |
Net investment income | | | (0.01 | ) | | | (0.17 | ) | | | (0.21 | ) | | | (0.12 | ) | | | (0.34 | ) |
Net realized capital gains | | | (0.46 | ) | | | (0.16 | ) | | | (0.19 | ) | | | (0.14 | ) | | | — | |
| | | | | | | | | | | | | | | | | | | | |
Total Distributions | | | (0.47 | ) | | | (0.33 | ) | | | (0.40 | ) | | | (0.26 | ) | | | (0.34 | ) |
| | | | | | | | | | | | | | | | | | | | |
Net asset value, end of the period | | $ | 8.03 | | | $ | 10.16 | | | $ | 10.79 | | | $ | 10.37 | | | $ | 9.72 | |
| | | | | | | | | | | | | | | | | | | | |
Total return(b) | | | (16.45 | )% | | | (2.69 | )% | | | 7.85 | % | | | 9.38 | % | | | 0.89 | % |
RATIOS TO AVERAGE NET ASSETS: | | | | | | | | | | | | | | | | | | | | |
Net assets, end of the period (000’s) | | $ | 25,113 | | | $ | 32,217 | | | $ | 22,081 | | | $ | 7,060 | | | $ | 1,205 | |
Net expenses(c) | | | 0.66 | %(d) | | | 0.71 | %(e)(f) | | | 0.72 | %(g) | | | 0.71 | %(h) | | | 0.71 | %(i) |
Gross expenses | | | 1.09 | %(d) | | | 1.16 | %(f) | | | 1.18 | %(g) | | | 1.28 | %(h) | | | 1.39 | %(i) |
Net investment income | | | 1.09 | % | | | 0.63 | % | | | 0.94 | % | | | 1.10 | % | | | 1.19 | % |
Portfolio turnover rate | | | 60 | % | | | 37 | % | | | 53 | % | | | 25 | % | | | 46 | % |
| (a) | Per share net investment income has been calculated using the average shares outstanding during the period. |
| (b) | Had certain expenses not been waived/reimbursed during the period, total returns would have been lower. |
| (c) | The investment adviser agreed to waive its fees and/or reimburse a portion of the Fund’s expenses during the period. Without this waiver/reimbursement, expenses would have been higher. |
| (d) | Includes interest expense. Without this expense the ratio of net expenses would have been 0.65% and the ratio of gross expenses would have been 1.08%. |
| (e) | Effective July 1, 2021, the expense limit decreased from 0.70% to 0.65%. |
| (f) | Includes interest expense. Without this expense the ratio of net expenses would have been 0.67% and the ratio of gross expenses would have been 1.13%. |
| (g) | Includes interest expense. Without this expense the ratio of net expenses would have been 0.70% and the ratio of gross expenses would have been 1.16%. |
| (h) | Includes interest expense. Without this expense the ratio of net expenses would have been 0.70% and the ratio of gross expenses would have been 1.27%. |
| (i) | Includes interest expense. Without this expense the ratio of net expenses would have been 0.70% and the ratio of gross expenses would have been 1.39%. |
See accompanying notes to financial statements.
| 62
Financial Highlights (continued)
For a share outstanding throughout each period.
| | | | | | | | | | | | | | | | | | | | |
| | | Mirova Global Sustainable Equity Fund—Class A | |
| | | Year Ended
December 31,
2022
| | | Year Ended
December 31,
2021
| | | Year Ended
December 31,
2020
| | | Year Ended
December 31,
2019
| | | Year Ended
December 31,
2018
| |
Net asset value, beginning of the period | | $ | 20.53 | | | $ | 19.57 | | | $ | 14.92 | | | $ | 11.45 | | | $ | 12.77 | |
| | | | | | | | | | | | | | | | | | | | |
INCOME (LOSS) FROM INVESTMENT OPERATIONS: | | | | | | | | | | | | | | | | | | | | |
Net investment income (loss)(a) | | | 0.08 | | | | (0.01 | ) | | | (0.02 | ) | | | 0.03 | | | | 0.00 | (b) |
Net realized and unrealized gain (loss) | | | (4.62 | ) | | | 3.45 | | | | 4.77 | | | | 3.69 | | | | (0.84 | ) |
| | | | | | | | | | | | | | | | | | | | |
Total from Investment Operations | | | (4.54 | ) | | | 3.44 | | | | 4.75 | | | | 3.72 | | | | (0.84 | ) |
| | | | | | | | | | | | | | | | | | | | |
LESS DISTRIBUTIONS FROM: | |
Net investment income | | | (0.07 | ) | | | (0.00 | )(b) | | | (0.00 | )(b) | | | (0.03 | ) | | | (0.00 | )(b) |
Net realized capital gains | | | (0.70 | ) | | | (2.48 | ) | | | (0.10 | ) | | | (0.22 | ) | | | (0.48 | ) |
| | | | | | | | | | | | | | | | | | | | |
Total Distributions | | | (0.77 | ) | | | (2.48 | ) | | | (0.10 | ) | | | (0.25 | ) | | | (0.48 | ) |
| | | | | | | | | | | | | | | | | | | | |
Net asset value, end of the period | | $ | 15.22 | | | $ | 20.53 | | | $ | 19.57 | | | $ | 14.92 | | | $ | 11.45 | |
| | | | | | | | | | | | | | | | | | | | |
Total return(c)(d) | | | (22.56 | )% | | | 17.82 | % | | | 32.07 | % | | | 32.63 | % | | | (6.54 | )% |
RATIOS TO AVERAGE NET ASSETS: | | | | | | | | | | | | | | | | | | | | |
Net assets, end of the period (000’s) | | $ | 29,013 | | | $ | 43,117 | | | $ | 33,625 | | | $ | 12,884 | | | $ | 6,360 | |
Net expenses(e) | | | 1.20 | %(f) | | | 1.21 | %(g) | | | 1.20 | % | | | 1.21 | %(h) | | | 1.30 | %(i)(j) |
Gross expenses | | | 1.26 | %(f) | | | 1.24 | %(g) | | | 1.24 | % | | | 1.39 | %(h) | | | 1.39 | %(i) |
Net investment income (loss) | | | 0.51 | % | | | (0.03 | )% | | | (0.14 | )% | | | 0.21 | % | | | 0.03 | % |
Portfolio turnover rate | | | 23 | % | | | 40 | %(k) | | | 11 | % | | | 23 | % | | | 19 | % |
| (a) | Per share net investment income (loss) has been calculated using the average shares outstanding during the period. |
| (b) | Amount rounds to less than $0.01 per share. |
| (c) | Had certain expenses not been waived/reimbursed during the period, total returns would have been lower. |
| (d) | A sales charge for Class A shares is not reflected in total return calculations. |
| (e) | The investment adviser agreed to waive its fees and/or reimburse a portion of the Fund’s expenses during the period. Without this waiver/reimbursement, expenses would have been higher. |
| (f) | Includes interest expense. Without this expense the ratio of net expenses would have been 1.20% and the ratio of gross expenses would have been 1.25%. |
| (g) | Includes interest expense. Without this expense the ratio of net expenses would have been 1.20% and the ratio of gross expenses would have been 1.24%. |
| (h) | Includes interest expense. Without this expense the ratio of net expenses would have been 1.20% and the ratio of gross expenses would have been 1.38%. |
| (i) | Includes interest expense of less than 0.01%. |
| (j) | Effective December 28, 2018, the expense limit decreased from 1.30% to 1.20%. |
| (k) | The variation in the Fund’s turnover rate from 2020 to 2021 was primarily due to an increase in shareholder activity. |
See accompanying notes to financial statements.
63 |
Financial Highlights (continued)
For a share outstanding throughout each period.
| | | | | | | | | | | | | | | | | | | | |
| | | Mirova Global Sustainable Equity Fund—Class C | |
| | | Year Ended
December 31,
2022
| | | Year Ended
December 31,
2021
| | | Year Ended
December 31,
2020
| | | Year Ended
December 31,
2019
| | | Year Ended
December 31,
2018
| |
Net asset value, beginning of the period | | $ | 19.62 | | | $ | 18.95 | | | $ | 14.56 | | | $ | 11.24 | | | $ | 12.63 | |
| | | | | | | | | | | | | | | | | | | | |
INCOME (LOSS) FROM INVESTMENT OPERATIONS: | | | | | | | | | | | | | | | | | | | | |
Net investment loss(a) | | | (0.04 | ) | | | (0.16 | ) | | | (0.13 | ) | | | (0.07 | ) | | | (0.09 | ) |
Net realized and unrealized gain (loss) | | | (4.40 | ) | | | 3.31 | | | | 4.62 | | | | 3.61 | | | | (0.82 | ) |
| | | | | | | | | | | | | | | | | | | | |
Total from Investment Operations | | | (4.44 | ) | | | 3.15 | | | | 4.49 | | | | 3.54 | | | | (0.91 | ) |
| | | | | | | | | | | | | | | | | | | | |
LESS DISTRIBUTIONS FROM: | |
Net investment income | | | — | | | | (0.00 | )(b) | | | (0.00 | )(b) | | | — | | | | — | |
Net realized capital gains | | | (0.70 | ) | | | (2.48 | ) | | | (0.10 | ) | | | (0.22 | ) | | | (0.48 | ) |
| | | | | | | | | | | | | | | | | | | | |
Total Distributions | | | (0.70 | ) | | | (2.48 | ) | | | (0.10 | ) | | | (0.22 | ) | | | (0.48 | ) |
| | | | | | | | | | | | | | | | | | | | |
Net asset value, end of the period | | $ | 14.48 | | | $ | 19.62 | | | $ | 18.95 | | | $ | 14.56 | | | $ | 11.24 | |
| | | | | | | | | | | | | | | | | | | | |
Total return(c)(d) | | | (23.11 | )% | | | 16.85 | % | | | 31.07 | % | | | 31.66 | % | | | (7.20 | )% |
RATIOS TO AVERAGE NET ASSETS: | | | | | | | | | | | | | | | | | | | | |
Net assets, end of the period (000’s) | | $ | 11,441 | | | $ | 17,248 | | | $ | 11,196 | | | $ | 5,406 | | | $ | 2,706 | |
Net expenses(e) | | | 1.95 | %(f) | | | 1.96 | %(g) | | | 1.95 | % | | | 1.96 | %(h) | | | 2.05 | %(i)(j) |
Gross expenses | | | 2.01 | %(f) | | | 1.99 | %(g) | | | 1.99 | % | | | 2.14 | %(h) | | | 2.14 | %(i) |
Net investment loss | | | (0.23 | )% | | | (0.79 | )% | | | (0.84 | )% | | | (0.52 | )% | | | (0.72 | )% |
Portfolio turnover rate | | | 23 | % | | | 40 | %(k) | | | 11 | % | | | 23 | % | | | 19 | % |
| (a) | Per share net investment loss has been calculated using the average shares outstanding during the period. |
| (b) | Amount rounds to less than $0.01 per share. |
| (c) | Had certain expenses not been waived/reimbursed during the period, total returns would have been lower. |
| (d) | A contingent deferred sales charge for Class C shares is not reflected in total return calculations. |
| (e) | The investment adviser agreed to waive its fees and/or reimburse a portion of the Fund’s expenses during the period. Without this waiver/reimbursement, expenses would have been higher. |
| (f) | Includes interest expense. Without this expense the ratio of net expenses would have been 1.95% and the ratio of gross expenses would have been 2.00%. |
| (g) | Includes interest expense. Without this expense the ratio of net expenses would have been 1.95% and the ratio of gross expenses would have been 1.99%. |
| (h) | Includes interest expense. Without this expense the ratio of net expenses would have been 1.95% and the ratio of gross expenses would have been 2.13%. |
| (i) | Includes interest expense of less than 0.01%. |
| (j) | Effective December 28, 2018, the expense limit decreased from 2.05% to 1.95%. |
| (k) | The variation in the Fund’s turnover rate from 2020 to 2021 was primarily due to an increase in shareholder activity. |
See accompanying notes to financial statements.
| 64
Financial Highlights (continued)
For a share outstanding throughout each period.
| | | | | | | | | | | | | | | | | | | | |
| | | Mirova Global Sustainable Equity Fund—Class N | |
| | | Year Ended
December 31,
2022
| | | Year Ended
December 31,
2021
| | | Year Ended
December 31,
2020
| | | Year Ended
December 31,
2019
| | | Year Ended
December 31,
2018
| |
Net asset value, beginning of the period | | $ | 20.72 | | | $ | 19.71 | | | $ | 14.99 | | | $ | 11.49 | | | $ | 12.81 | |
| | | | | | | | | | | | | | | | | | | | |
INCOME (LOSS) FROM INVESTMENT OPERATIONS: | | | | | | | | | | | | | | | | | | | | |
Net investment income (loss)(a) | | | 0.13 | | | | 0.05 | | | | 0.01 | | | | 0.06 | | | | (0.01 | ) |
Net realized and unrealized gain (loss) | | | (4.67 | ) | | | 3.49 | | | | 4.82 | | | | 3.72 | | | | (0.79 | ) |
| | | | | | | | | | | | | | | | | | | | |
Total from Investment Operations | | | (4.54 | ) | | | 3.54 | | | | 4.83 | | | | 3.78 | | | | (0.80 | ) |
| | | | | | | | | | | | | | | | | | | | |
LESS DISTRIBUTIONS FROM: | |
Net investment income | | | (0.12 | ) | | | (0.05 | ) | | | (0.01 | ) | | | (0.06 | ) | | | (0.04 | ) |
Net realized capital gains | | | (0.70 | ) | | | (2.48 | ) | | | (0.10 | ) | | | (0.22 | ) | | | (0.48 | ) |
| | | | | | | | | | | | | | | | | | | | |
Total Distributions | | | (0.82 | ) | | | (2.53 | ) | | | (0.11 | ) | | | (0.28 | ) | | | (0.52 | ) |
| | | | | | | | | | | | | | | | | | | | |
Net asset value, end of the period | | $ | 15.36 | | | $ | 20.72 | | | $ | 19.71 | | | $ | 14.99 | | | $ | 11.49 | |
| | | | | | | | | | | | | | | | | | | | |
Total return | | | (22.32 | )% | | | 18.17 | % | | | 32.44 | %(b) | | | 33.05 | %(b) | | | (6.26 | )%(b) |
RATIOS TO AVERAGE NET ASSETS: | | | | | | | | | | | | | | | | | | | | |
Net assets, end of the period (000’s) | | $ | 189,957 | | | $ | 219,679 | | | $ | 72,768 | | | $ | 11,000 | | | $ | 2,842 | |
Net expenses | | | 0.90 | %(c) | | | 0.91 | %(d)(e) | | | 0.90 | %(f) | | | 0.90 | %(f)(g) | | | 1.01 | %(f)(h)(i) |
Gross expenses | | | 0.90 | %(c) | | | 0.91 | %(d)(e) | | | 0.93 | % | | | 1.08 | %(g) | | | 1.08 | %(h) |
Net investment income (loss) | | | 0.81 | % | | | 0.24 | % | | | 0.08 | % | | | 0.46 | % | | | (0.08 | )% |
Portfolio turnover rate | | | 23 | % | | | 40 | %(j) | | | 11 | % | | | 23 | % | | | 19 | % |
| (a) | Per share net investment income (loss) has been calculated using the average shares outstanding during the period. |
| (b) | Had certain expenses not been waived/reimbursed during the period, total returns would have been lower. |
| (c) | Includes interest expense. Without this expense the ratio of net expenses would have been 0.89% and the ratio of gross expenses would have been 0.89%. |
| (d) | Includes interest expense. Without this expense the ratio of net expenses would have been 0.90% and the ratio of gross expenses would have been 0.90%. |
| (e) | Includes fee/expense recovery of 0.01%. |
| (f) | The investment adviser agreed to waive its fees and/or reimburse a portion of the Fund’s expenses during the period. Without this waiver/reimbursement, expenses would have been higher. |
| (g) | Includes interest expense of less than 0.01%. |
| (h) | Includes interest expense. Without this expense the ratio of net expenses would have been 0.99% and the ratio of gross expenses would have been 1.07%. |
| (i) | Effective December 28, 2018, the expense limit decreased from 1.00% to 0.90%. |
| (j) | The variation in the Fund’s turnover rate from 2020 to 2021 was primarily due to an increase in shareholder activity. |
See accompanying notes to financial statements.
65 |
Financial Highlights (continued)
For a share outstanding throughout each period.
| | | | | | | | | | | | | | | | | | | | |
| | | Mirova Global Sustainable Equity Fund—Class Y | |
| | | Year Ended
December 31,
2022
| | | Year Ended
December 31,
2021
| | | Year Ended
December 31,
2020
| | | Year Ended
December 31,
2019
| | | Year Ended
December 31,
2018
| |
Net asset value, beginning of the period | | $ | 20.71 | | | $ | 19.71 | | | $ | 14.99 | | | $ | 11.49 | | | $ | 12.81 | |
| | | | | | | | | | | | | | | | | | | | |
INCOME (LOSS) FROM INVESTMENT OPERATIONS: | | | | | | | | | | | | | | | | | | | | |
Net investment income(a) | | | 0.12 | | | | 0.05 | | | | 0.01 | | | | 0.07 | | | | 0.04 | |
Net realized and unrealized gain (loss) | | | (4.66 | ) | | | 3.46 | | | | 4.81 | | | | 3.70 | | | | (0.85 | ) |
| | | | | | | | | | | | | | | | | | | | |
Total from Investment Operations | | | (4.54 | ) | | | 3.51 | | | | 4.82 | | | | 3.77 | | | | (0.81 | ) |
| | | | | | | | | | | | | | | | | | | | |
LESS DISTRIBUTIONS FROM: | |
Net investment income | | | (0.11 | ) | | | (0.03 | ) | | | (0.00 | )(b) | | | (0.05 | ) | | | (0.03 | ) |
Net realized capital gains | | | (0.70 | ) | | | (2.48 | ) | | | (0.10 | ) | | | (0.22 | ) | | | (0.48 | ) |
| | | | | | | | | | | | | | | | | | | | |
Total Distributions | | | (0.81 | ) | | | (2.51 | ) | | | (0.10 | ) | | | (0.27 | ) | | | (0.51 | ) |
| | | | | | | | | | | | | | | | | | | | |
Net asset value, end of the period | | $ | 15.36 | | | $ | 20.71 | | | $ | 19.71 | | | $ | 14.99 | | | $ | 11.49 | |
| | | | | | | | | | | | | | | | | | | | |
Total return(c) | | | (22.33 | )% | | | 18.06 | % | | | 32.42 | % | | | 32.99 | % | | | (6.32 | )% |
RATIOS TO AVERAGE NET ASSETS: | | | | | | | | | | | | | | | | | | | | |
Net assets, end of the period (000’s) | | $ | 637,021 | | | $ | 840,638 | | | $ | 760,181 | | | $ | 118,032 | | | $ | 69,705 | |
Net expenses(d) | | | 0.95 | %(e) | | | 0.96 | %(f) | | | 0.95 | % | | | 0.96 | %(g) | | | 1.05 | %(h)(i) |
Gross expenses | | | 1.01 | %(e) | | | 0.99 | %(f) | | | 0.99 | % | | | 1.14 | %(g) | | | 1.15 | %(h) |
Net investment income | | | 0.76 | % | | | 0.22 | % | | | 0.06 | % | | | 0.50 | % | | | 0.29 | % |
Portfolio turnover rate | | | 23 | % | | | 40 | %(j) | | | 11 | % | | | 23 | % | | | 19 | % |
| (a) | Per share net investment income has been calculated using the average shares outstanding during the period. |
| (b) | Amount rounds to less than $0.01 per share. |
| (c) | Had certain expenses not been waived/reimbursed during the period, total returns would have been lower. |
| (d) | The investment adviser agreed to waive its fees and/or reimburse a portion of the Fund’s expenses during the period. Without this waiver/reimbursement, expenses would have been higher. |
| (e) | Includes interest expense. Without this expense the ratio of net expenses would have been 0.95% and the ratio of gross expenses would have been 1.00%. |
| (f) | Includes interest expense. Without this expense the ratio of net expenses would have been 0.95% and the ratio of gross expenses would have been 0.99%. |
| (g) | Includes interest expense. Without this expense the ratio of net expenses would have been 0.95% and the ratio of gross expenses would have been 1.13%. |
| (h) | Includes interest expense of less than 0.01%. |
| (i) | Effective December 28, 2018, the expense limit decreased from 1.05% to 0.95%. |
| (j) | The variation in the Fund’s turnover rate from 2020 to 2021 was primarily due to an increase in shareholder activity. |
See accompanying notes to financial statements.
| 66
Financial Highlights (continued)
For a share outstanding throughout each period.
| | | | | | | | | | | | | | | | | | | | |
| | | Mirova International Sustainable Equity Fund—Class A | |
| | | Year Ended
December 31,
2022
| | | Year Ended
December 31,
2021
| | | Year Ended
December 31,
2020
| | | Year Ended
December 31,
2019
| | | Period Ended
December 31,
2018*
| |
Net asset value, beginning of the period | | $ | 14.35 | | | $ | 13.95 | | | $ | 12.51 | | | $ | 10.03 | | | $ | 10.00 | |
| | | | | | | | | | | | | | | | | | | | |
INCOME (LOSS) FROM INVESTMENT OPERATIONS: | | | | | | | | | | | | | | | | | | | | |
Net investment income (loss)(a) | | | 0.11 | | | | 0.08 | | | | (0.01 | ) | | | 0.12 | | | | (0.00 | )(b) |
Net realized and unrealized gain (loss) | | | (3.62 | ) | | | 0.78 | | | | 2.87 | | | | 2.48 | | | | 0.03 | |
| | | | | | | | | | | | | | | | | | | | |
Total from Investment Operations | | | (3.51 | ) | | | 0.86 | | | | 2.86 | | | | 2.60 | | | | 0.03 | |
| | | | | | | | | | | | | | | | | | | | |
LESS DISTRIBUTIONS FROM: | |
Net investment income | | | (0.37 | ) | | | (0.09 | ) | | | (0.12 | ) | | | (0.12 | ) | | | — | |
Net realized capital gains | | | — | | | | (0.37 | ) | | | (1.30 | ) | | | — | | | | — | |
| | | | | | | | | | | | | | | | | | | | |
Total Distributions | | | (0.37 | ) | | | (0.46 | ) | | | (1.42 | ) | | | (0.12 | ) | | | — | |
| | | | | | | | | | | | | | | | | | | | |
Net asset value, end of the period | | $ | 10.47 | | | $ | 14.35 | | | $ | 13.95 | | | $ | 12.51 | | | $ | 10.03 | |
| | | | | | | | | | | | | | | | | | | | |
Total return(c)(d) | | | (24.42 | )% | | | 6.22 | % | | | 23.18 | % | | | 25.97 | % | | | 0.30 | %(e) |
RATIOS TO AVERAGE NET ASSETS: | | | | | | | | | | | | | | | | | | | | |
Net assets, end of the period (000’s) | | $ | 717 | | | $ | 380 | | | $ | 76 | | | $ | 4 | | | $ | 1 | |
Net expenses(f) | | | 1.21 | %(g) | | | 1.21 | %(h) | | | 1.26 | %(i) | | | 1.21 | %(j) | | | 1.20 | %(k) |
Gross expenses | | | 2.30 | %(g) | | | 2.08 | %(h) | | | 5.69 | %(i) | | | 107.91 | %(j) | | | 22.87 | %(k) |
Net investment income (loss) | | | 0.99 | % | | | 0.57 | % | | | (0.04 | )% | | | 1.09 | % | | | (1.20 | )%(k) |
Portfolio turnover rate | | | 8 | % | | | 8 | % | | | 11 | % | | | 8 | % | | | 0 | % |
| * | From commencement of operations on December 28, 2018 through December 31, 2018. |
| (a) | Per share net investment income (loss) has been calculated using the average shares outstanding during the period. |
| (b) | Amount rounds to less than $0.01 per share. |
| (c) | A sales charge for Class A shares is not reflected in total return calculations. |
| (d) | Had certain expenses not been waived/reimbursed during the period, total returns would have been lower. |
| (e) | Periods less than one year are not annualized. |
| (f) | The investment adviser agreed to waive its fees and/or reimburse a portion of the Fund’s expenses during the period. Without this waiver/reimbursement, expenses would have been higher. |
| (g) | Includes interest expense. Without this expense the ratio of net expenses would have been 1.20% and the ratio of gross expenses would have been 2.29%. |
| (h) | Includes interest expense. Without this expense the ratio of net expenses would have been 1.20% and the ratio of gross expenses would have been 2.07%. |
| (i) | Includes interest expense. Without this expense the ratio of net expenses would have been 1.20% and the ratio of gross expenses would have been 5.64%. |
| (j) | Includes interest expense. Without this expense the ratio of net expenses would have been 1.20% and the ratio of gross expenses would have been 107.90%. |
| (k) | Computed on an annualized basis for periods less than one year. |
See accompanying notes to financial statements.
67 |
Financial Highlights (continued)
For a share outstanding throughout each period.
| | | | | | | | | | | | | | | | | | | | |
| | | Mirova International Sustainable Equity Fund—Class N | |
| | | Year Ended
December 31,
2022
| | | Year Ended
December 31,
2021
| | | Year Ended
December 31,
2020
| | | Year Ended
December 31,
2019
| | | Period Ended
December 31,
2018*
| |
Net asset value, beginning of the period | | $ | 14.40 | | | $ | 13.99 | | | $ | 12.51 | | | $ | 10.03 | | | $ | 10.00 | |
| | | | | | | | | | | | | | | | | | | | |
INCOME (LOSS) FROM INVESTMENT OPERATIONS: | | | | | | | | | | | | | | | | | | | | |
Net investment income (loss)(a) | | | 0.23 | | | | 0.14 | | | | 0.07 | | | | 0.15 | | | | (0.00 | )(b) |
Net realized and unrealized gain (loss) | | | (3.71 | ) | | | 0.76 | | | | 2.84 | | | | 2.49 | | | | 0.03 | |
| | | | | | | | | | | | | | | | | | | | |
Total from Investment Operations | | | (3.48 | ) | | | 0.90 | | | | 2.91 | | | | 2.64 | | | | 0.03 | |
| | | | | | | | | | | | | | | | | | | | |
LESS DISTRIBUTIONS FROM: | |
Net investment income | | | (0.40 | ) | | | (0.12 | ) | | | (0.13 | ) | | | (0.16 | ) | | | — | |
Net realized capital gains | | | — | | | | (0.37 | ) | | | (1.30 | ) | | | — | | | | — | |
| | | | | | | | | | | | | | | | | | | | |
Total Distributions | | | (0.40 | ) | | | (0.49 | ) | | | (1.43 | ) | | | (0.16 | ) | | | — | |
| | | | | | | | | | | | | | | | | | | | |
Net asset value, end of the period | | $ | 10.52 | | | $ | 14.40 | | | $ | 13.99 | | | $ | 12.51 | | | $ | 10.03 | |
| | | | | | | | | | | | | | | | | | | | |
Total return(c) | | | (24.17 | )% | | | 6.47 | % | | | 23.60 | % | | | 26.31 | % | | | 0.30 | %(d) |
RATIOS TO AVERAGE NET ASSETS: | | | | | | | | | | | | | | | | | | | | |
Net assets, end of the period (000’s) | | $ | 7,433 | | | $ | 27,569 | | | $ | 16,478 | | | $ | 17,193 | | | $ | 10,035 | |
Net expenses(e) | | | 0.91 | %(f) | | | 0.91 | %(g) | | | 0.93 | %(h) | | | 0.92 | %(i) | | | 0.90 | %(j) |
Gross expenses | | | 1.80 | %(f) | | | 1.44 | %(g) | | | 1.83 | %(h) | | | 1.99 | %(i) | | | 22.55 | %(j) |
Net investment income (loss) | | | 2.01 | % | | | 0.94 | % | | | 0.58 | % | | | 1.36 | % | | | (0.90 | )%(j) |
Portfolio turnover rate | | | 8 | % | | | 8 | % | | | 11 | % | | | 8 | % | | | 0 | % |
| * | From commencement of operations on December 28, 2018 through December 31, 2018. |
| (a) | Per share net investment income (loss) has been calculated using the average shares outstanding during the period. |
| (b) | Amount rounds to less than $0.01 per share. |
| (c) | Had certain expenses not been waived/reimbursed during the period, total returns would have been lower. |
| (d) | Periods less than one year are not annualized. |
| (e) | The investment adviser agreed to waive its fees and/or reimburse a portion of the Fund’s expenses during the period. Without this waiver/reimbursement, expenses would have been higher. |
| (f) | Includes interest expense. Without this expense the ratio of net expenses would have been 0.90% and the ratio of gross expenses would have been 1.79%. |
| (g) | Includes interest expense. Without this expense the ratio of net expenses would have been 0.90% and the ratio of gross expenses would have been 1.43%. |
| (h) | Includes interest expense. Without this expense the ratio of net expenses would have been 0.90% and the ratio of gross expenses would have been 1.80%. |
| (i) | Includes interest expense. Without this expense the ratio of net expenses would have been 0.75% and the ratio of gross expenses would have been 1.22%. |
| (j) | Computed on an annualized basis for periods less than one year. |
See accompanying notes to financial statements.
| 68
Financial Highlights (continued)
For a share outstanding throughout each period.
| | | | | | | | | | | | | | | | | | | | |
| | | Mirova International Sustainable Equity Fund—Class Y | |
| | | Year Ended
December 31,
2022
| | | Year Ended
December 31,
2021
| | | Year Ended
December 31,
2020
| | | Year Ended
December 31,
2019
| | | Period Ended
December 31,
2018*
| |
Net asset value, beginning of the period | | $ | 14.38 | | | $ | 13.98 | | | $ | 12.50 | | | $ | 10.03 | | | $ | 10.00 | |
| | | | | | | | | | | | | | | | | | | | |
INCOME (LOSS) FROM INVESTMENT OPERATIONS: | | | | | | | | | | | | | | | | | | | | |
Net investment income (loss)(a) | | | 0.24 | | | | 0.08 | | | | 0.03 | | | | 0.15 | | | | (0.00 | )(b) |
Net realized and unrealized gain (loss) | | | (3.72 | ) | | | 0.80 | | | | 2.88 | | | | 2.48 | | | | 0.03 | |
| | | | | | | | | | | | | | | | | | | | |
Total from Investment Operations | | | (3.48 | ) | | | 0.88 | | | | 2.91 | | | | 2.63 | | | | 0.03 | |
| | | | | | | | | | | | | | | | | | | | |
LESS DISTRIBUTIONS FROM: | |
Net investment income | | | (0.39 | ) | | | (0.11 | ) | | | (0.13 | ) | | | (0.16 | ) | | | — | |
Net realized capital gains | | | — | | | | (0.37 | ) | | | (1.30 | ) | | | — | | | | — | |
| | | | | | | | | | | | | | | | | | | | |
Total Distributions | | | (0.39 | ) | | | (0.48 | ) | | | (1.43 | ) | | | (0.16 | ) | | | — | |
| | | | | | | | | | | | | | | | | | | | |
Net asset value, end of the period | | $ | 10.51 | | | $ | 14.38 | | | $ | 13.98 | | | $ | 12.50 | | | $ | 10.03 | |
| | | | | | | | | | | | | | | | | | | | |
Total return(c) | | | (24.18 | )% | | | 6.39 | % | | | 23.60 | % | | | 26.21 | % | | | 0.30 | %(d) |
RATIOS TO AVERAGE NET ASSETS: | | | | | | | | | | | | | | | | | | | | |
Net assets, end of the period (000’s) | | $ | 808 | | | $ | 1,783 | | | $ | 75 | | | $ | 9 | | | $ | 1 | |
Net expenses(e) | | | 0.96 | %(f) | | | 0.96 | %(g) | | | 1.00 | %(h) | | | 0.96 | %(i) | | | 0.95 | %(j) |
Gross expenses | | | 2.05 | %(f) | | | 1.83 | %(g) | | | 6.51 | %(h) | | | 94.13 | %(i) | | | 22.51 | %(j) |
Net investment income (loss) | | | 2.09 | % | | | 0.52 | % | | | 0.21 | % | | | 1.36 | % | | | (0.95 | )%(j) |
Portfolio turnover rate | | | 8 | % | | | 8 | % | | | 11 | % | | | 8 | % | | | 0 | % |
| * | From commencement of operations on December 28, 2018 through December 31, 2018. |
| (a) | Per share net investment income (loss) has been calculated using the average shares outstanding during the period. |
| (b) | Amount rounds to less than $0.01 per share. |
| (c) | Had certain expenses not been waived/reimbursed during the period, total returns would have been lower. |
| (d) | Periods less than one year are not annualized. |
| (e) | The investment adviser agreed to waive its fees and/or reimburse a portion of the Fund’s expenses during the period. Without this waiver/reimbursement, expenses would have been higher. |
| (f) | Includes interest expense. Without this expense the ratio of net expenses would have been 0.95% and the ratio of gross expenses would have been 2.04%. |
| (g) | Includes interest expense. Without this expense the ratio of net expenses would have been 0.95% and the ratio of gross expenses would have been 1.82%. |
| (h) | Includes interest expense. Without this expense the ratio of net expenses would have been 0.95% and the ratio of gross expenses would have been 6.46%. |
| (i) | Includes interest expense. Without this expense the ratio of net expenses would have been 0.95% and the ratio of gross expenses would have been 94.12%. |
| (j) | Computed on an annualized basis for periods less than one year. |
See accompanying notes to financial statements.
69 |
Financial Highlights (continued)
For a share outstanding throughout each period.
| | | | | | | | | | | | |
| | | Mirova U.S. Sustainable Equity Fund—Class A | |
| | | Year Ended
December 31,
2022
| | | Year Ended
December 31,
2021
| | | Period Ended
December 31,
2020*
| |
Net asset value, beginning of the period | | $ | 12.57 | | | $ | 10.21 | | | $ | 10.00 | |
| | | | | | | | | | | | |
INCOME (LOSS) FROM INVESTMENT OPERATIONS: | | | | | | | | | | | | |
Net investment income (loss)(a) | | | 0.00 | (b) | | | (0.04 | ) | | | (0.00 | )(b) |
Net realized and unrealized gain (loss) | | | (2.86 | ) | | | 3.06 | | | | 0.21 | |
| | | | | | | | | | | | |
Total from Investment Operations | | | (2.86 | ) | | | 3.02 | | | | 0.21 | |
| | | | | | | | | | | | |
LESS DISTRIBUTIONS FROM: | |
Net investment income | | | — | | | | (0.00 | )(b) | | | — | |
Net realized capital gains | | | (0.64 | ) | | | (0.66 | ) | | | — | |
| | | | | | | | | | | | |
Total Distributions | | | (0.64 | ) | | | (0.66 | ) | | | — | |
| | | | | | | | | | | | |
Net asset value, end of the period | | $ | 9.07 | | | $ | 12.57 | | | $ | 10.21 | |
| | | | | | | | | | | | |
Total return(c)(d) | | | (23.21 | )% | | | 29.65 | % | | | 2.10 | %(e) |
RATIOS TO AVERAGE NET ASSETS: | | | | | | | | | | | | |
Net assets, end of the period (000’s) | | $ | 3 | | | $ | 12 | | | $ | 1 | |
Net expenses(f) | | | 1.05 | % | | | 1.05 | % | | | 1.05 | %(g) |
Gross expenses | | | 7.15 | % | | | 8.99 | % | | | 23.61 | %(g) |
Net investment income (loss) | | | 0.01 | % | | | (0.31 | )% | | | (0.73 | )%(g) |
Portfolio turnover rate | | | 8 | % | | | 9 | % | | | 0 | % |
| * | From commencement of operations on December 15, 2020 through December 31, 2020. |
| (a) | Per share net investment income (loss) has been calculated using the average shares outstanding during the period. |
| (b) | Amount rounds to less than $0.01 per share. |
| (c) | Had certain expenses not been waived/reimbursed during the period, total returns would have been lower. |
| (d) | A sales charge for Class A shares is not reflected in total return calculations. |
| (e) | Periods less than one year are not annualized. |
| (f) | The investment adviser agreed to waive its fees and/or reimburse a portion of the Fund’s expenses during the period. Without this waiver/reimbursement, expenses would have been higher. |
| (g) | Computed on an annualized basis for periods less than one year. |
See accompanying notes to financial statements.
| 70
Financial Highlights (continued)
For a share outstanding throughout each period.
| | | | | | | | | | | | |
| | | Mirova U.S. Sustainable Equity Fund—Class C | |
| | | Year Ended
December 31,
2022
| | | Year Ended
December 31,
2021
| | | Period Ended
December 31,
2020*
| |
Net asset value, beginning of the period | | $ | 12.47 | | | $ | 10.21 | | | $ | 10.00 | |
| | | | | | | | | | | | |
INCOME (LOSS) FROM INVESTMENT OPERATIONS: | | | | | | | | | | | | |
Net investment loss(a) | | | (0.08 | ) | | | (0.12 | ) | | | (0.01 | ) |
Net realized and unrealized gain (loss) | | | (2.83 | ) | | | 3.04 | | | | 0.22 | |
| | | | | | | | | | | | |
Total from Investment Operations | | | (2.91 | ) | | | 2.92 | | | | 0.21 | |
| | | | | | | | | | | | |
LESS DISTRIBUTIONS FROM: | |
Net realized capital gains | | | (0.64 | ) | | | (0.66 | ) | | | — | |
| | | | | | | | | | | | |
Net asset value, end of the period | | $ | 8.92 | | | $ | 12.47 | | | $ | 10.21 | |
| | | | | | | | | | | | |
Total return(b)(c) | | | (23.81 | )% | | | 28.62 | % | | | 2.10 | %(d) |
RATIOS TO AVERAGE NET ASSETS: | | | | | | | | | | | | |
Net assets, end of the period (000’s) | | $ | 77 | | | $ | 101 | | | $ | 1 | |
Net expenses(e) | | | 1.80 | % | | | 1.80 | % | | | 1.80 | %(f) |
Gross expenses | | | 7.97 | % | | | 9.37 | % | | | 24.34 | %(f) |
Net investment loss | | | (0.81 | )% | | | (0.91 | )% | | | (1.45 | )%(f) |
Portfolio turnover rate | | | 8 | % | | | 9 | % | | | 0 | % |
| * | From commencement of operations on December 15, 2020 through December 31, 2020. |
| (a) | Per share net investment loss has been calculated using the average shares outstanding during the period. |
| (b) | Had certain expenses not been waived/reimbursed during the period, total returns would have been lower. |
| (c) | A contingent deferred sales charge for Class C shares is not reflected in total return calculations. |
| (d) | Periods less than one year are not annualized. |
| (e) | The investment adviser agreed to waive its fees and/or reimburse a portion of the Fund’s expenses during the period. Without this waiver/reimbursement, expenses would have been higher. |
| (f) | Computed on an annualized basis for periods less than one year. |
See accompanying notes to financial statements.
71 |
Financial Highlights (continued)
For a share outstanding throughout each period.
| | | | | | | | | | | | |
| | | Mirova U.S. Sustainable Equity Fund—Class N | |
| | | Year Ended
December 31,
2022
| | | Year Ended
December 31,
2021
| | | Period Ended
December 31,
2020*
| |
Net asset value, beginning of the period | | $ | 12.59 | | | $ | 10.21 | | | $ | 10.00 | |
| | | | | | | | | | | | |
INCOME (LOSS) FROM INVESTMENT OPERATIONS: | | | | | | | | | | | | |
Net investment income (loss)(a) | | | 0.02 | | | | 0.01 | | | | (0.00 | )(b) |
Net realized and unrealized gain (loss) | | | (2.85 | ) | | | 3.05 | | | | 0.21 | |
| | | | | | | | | | | | |
Total from Investment Operations | | | (2.83 | ) | | | 3.06 | | | | 0.21 | |
| | | | | | | | | | | | |
LESS DISTRIBUTIONS FROM: | |
Net investment income | | | (0.03 | ) | | | (0.02 | ) | | | — | |
Net realized capital gains | | | (0.64 | ) | | | (0.66 | ) | | | — | |
Tax return of capital | | | (0.01 | ) | | | — | | | | — | |
| | | | | | | | | | | | |
Total Distributions | | | (0.68 | ) | | | (0.68 | ) | | | — | |
| | | | | | | | | | | | |
Net asset value, end of the period | | $ | 9.08 | | | $ | 12.59 | | | $ | 10.21 | |
| | | | | | | | | | | | |
Total return(c) | | | (22.95 | )% | | | 29.99 | % | | | 2.10 | %(d) |
RATIOS TO AVERAGE NET ASSETS: | | | | | | | | | | | | |
Net assets, end of the period (000’s) | | $ | 3,527 | | | $ | 4,893 | | | $ | 5,106 | |
Net expenses(e) | | | 0.75 | % | | | 0.75 | % | | | 0.75 | %(f) |
Gross expenses | | | 4.90 | % | | | 3.50 | % | | | 17.07 | %(f) |
Net investment income (loss) | | | 0.24 | % | | | 0.06 | % | | | (0.39 | )%(f) |
Portfolio turnover rate | | | 8 | % | | | 9 | % | | | 0 | % |
| * | From commencement of operations on December 15, 2020 through December 31, 2020. |
| (a) | Per share net investment income (loss) has been calculated using the average shares outstanding during the period. |
| (b) | Amount rounds to less than $0.01 per share. |
| (c) | Had certain expenses not been waived/reimbursed during the period, total returns would have been lower. |
| (d) | Periods less than one year are not annualized. |
| (e) | The investment adviser agreed to waive its fees and/or reimburse a portion of the Fund’s expenses during the period. Without this waiver/reimbursement, expenses would have been higher. |
| (f) | Computed on an annualized basis for periods less than one year. |
See accompanying notes to financial statements.
| 72
Financial Highlights (continued)
For a share outstanding throughout each period.
| | | | | | | | | | | | |
| | | Mirova U.S. Sustainable Equity Fund—Class Y | |
| | | Year Ended
December 31,
2022
| | | Year Ended
December 31,
2021
| | | Period Ended
December 31,
2020*
| |
Net asset value, beginning of the period | | $ | 12.59 | | | $ | 10.21 | | | $ | 10.00 | |
| | | | | | | | | | | | |
INCOME (LOSS) FROM INVESTMENT OPERATIONS: | | | | | | | | | | | | |
Net investment income (loss)(a) | | | 0.02 | | | | (0.00 | )(b) | | | (0.00 | )(b) |
Net realized and unrealized gain (loss) | | | (2.87 | ) | | | 3.06 | | | | 0.21 | |
| | | | | | | | | | | | |
Total from Investment Operations | | | (2.85 | ) | | | 3.06 | | | | 0.21 | |
| | | | | | | | | | | | |
LESS DISTRIBUTIONS FROM: | |
Net investment income | | | (0.02 | ) | | | (0.02 | ) | | | — | |
Net realized capital gains | | | (0.64 | ) | | | (0.66 | ) | | | — | |
Tax return of capital | | | (0.01 | ) | | | — | | | | — | |
| | | | | | | | | | | | |
Total Distributions | | | (0.67 | ) | | | (0.68 | ) | | | — | |
| | | | | | | | | | | | |
Net asset value, end of the period | | $ | 9.07 | | | $ | 12.59 | | | $ | 10.21 | |
| | | | | | | | | | | | |
Total return(c) | | | (23.07 | )% | | | 29.97 | % | | | 2.10 | %(d) |
RATIOS TO AVERAGE NET ASSETS: | | | | | | | | | | | | |
Net assets, end of the period (000’s) | | $ | 48 | | | $ | 44 | | | $ | 1 | |
Net expenses(e) | | | 0.80 | % | | | 0.80 | % | | | 0.80 | %(f) |
Gross expenses | | | 6.96 | % | | | 8.79 | % | | | 23.24 | %(f) |
Net investment income (loss) | | | 0.19 | % | | | (0.01 | )% | | | (0.36 | )%(f) |
Portfolio turnover rate | | | 8 | % | | | 9 | % | | | 0 | % |
| * | From commencement of operations on December 15, 2020 through December 31, 2020. |
| (a) | Per share net investment income (loss) has been calculated using the average shares outstanding during the period. |
| (b) | Amount rounds to less than $0.01 per share. |
| (c) | Had certain expenses not been waived/reimbursed during the period, total returns would have been lower. |
| (d) | Periods less than one year are not annualized. |
| (e) | The investment adviser agreed to waive its fees and/or reimburse a portion of the Fund’s expenses during the period. Without this waiver/reimbursement, expenses would have been higher. |
| (f) | Computed on an annualized basis for periods less than one year. |
See accompanying notes to financial statements.
73 |
Notes to Financial Statements
December 31, 2022
1. Organization. Gateway Trust and Natixis Funds Trust I (the “Trusts” and each a “Trust”) are each organized as a Massachusetts business trust. Each Trust is registered under the Investment Company Act of 1940, as amended (the “1940 Act”), as an open-end management investment company. Each Declaration of Trust permits the Board of Trustees to authorize the issuance of an unlimited number of shares of the Trust in multiple series. The financial statements for certain funds of the Trusts are presented in separate reports. The following funds (individually, a “Fund” and collectively, the “Funds”) are included in this report:
Gateway Trust:
Gateway Fund
Gateway Equity Call Premium Fund
Natixis Funds Trust I:
Mirova Global Green Bond Fund (the “Global Green Bond Fund”)
Mirova Global Sustainable Equity Fund (the “Global Sustainable Equity Fund”)
Mirova International Sustainable Equity Fund (the “International Sustainable Equity Fund”)
Mirova U.S. Sustainable Equity Fund (the “U.S. Sustainable Equity Fund”)
Each Fund is a diversified investment company.
Each Fund offers Class A, Class C, Class N and Class Y shares, except for Global Green Bond Fund and International Sustainable Equity Fund, which do not offer Class C shares.
Class A shares are sold with a maximum front-end sales charge of 5.75% for all Funds except for Global Green Bond Fund which are sold with a maximum front-end sales charge of 4.25%. Class C shares do not pay a front-end sales charge, pay higher Rule 12b-1 fees than Class A shares for eight years (at which point they automatically convert to Class A shares) (prior to May 1, 2021, Class C shares automatically converted to Class A shares after ten years) and may be subject to a contingent deferred sales charge (“CDSC”) of 1.00% if those shares are redeemed within one year of acquisition, except for reinvested distributions. Class N and Class Y shares do not pay a front-end sales charge, a CDSC or Rule 12b-1 fees. Class N shares are offered with an initial minimum investment of $1,000,000. Class Y shares are offered with an initial minimum investment of $100,000. Certain categories of investors are exempted from the minimum investment amounts for Class N and Class Y as outlined in the relevant Funds’ prospectus.
Most expenses can be directly attributed to a Fund. Expenses which cannot be directly attributed to a Fund are generally apportioned based on the relative net assets of each of the Funds in Natixis Funds Trust I, Natixis Funds Trust II, Natixis Funds Trust IV and Gateway Trust (“Natixis Funds Trusts”), Loomis Sayles Funds I and Loomis Sayles Funds II (“Loomis Sayles Funds Trusts”) and Natixis ETF Trust and Natixis ETF Trust II (“Natixis ETF Trusts”). Expenses of a Fund are borne pro rata by the holders of each class of shares, except that each class bears expenses unique to that class (such as the Rule 12b-1 fees applicable to Class A and Class C), and transfer agent fees are borne collectively for Class A, Class C and Class Y, and individually for Class N. In addition, each class votes as a class only with respect to its own Rule 12b-1 Plan. Shares of each class would receive their pro rata share of the net assets of the Fund if the Fund were liquidated. The Trustees approve separate distributions from net investment income on each class of shares.
2. Significant Accounting Policies. The following is a summary of significant accounting policies consistently followed by each Fund in the preparation of its financial statements. The Funds’ financial statements follow the accounting and reporting guidelines provided for investment companies and are prepared in accordance with accounting principles generally accepted in the United States of America which require the use of management estimates that affect the reported amounts and disclosures in the financial statements. Actual results could differ from those estimates. Management has evaluated the events and transactions subsequent to year-end through the date the financial statements were issued and has determined that there were no material events that would require disclosure in the Funds’ financial statements.
a. Valuation. Registered investment companies are required to value portfolio investments using an unadjusted, readily available market quotation. Each Fund obtains readily available market quotations from independent pricing services. Fund investments for which readily available market quotations are not available are priced at fair value pursuant to the Funds’ Valuation Procedures. The Board of Trustees has approved a valuation designee who is subject to the Board’s oversight.
Unadjusted readily available market quotations that are utilized for exchange traded equity securities (including shares of closed-end investment companies and exchange-traded funds) include the last sale price quoted on the exchange where the security is traded most extensively. Futures contracts are valued at the closing settlement price on the exchange on which the valuation designee believes that, over time, they are traded most extensively. Domestic, exchange-traded index and single name equity option contracts (including options on exchange-traded funds) are valued at the mean of the National Best Bid and Offer quotations as determined by the Options Price Reporting Authority. Shares of open-end investment companies are valued at net asset value per share.
Exchange traded equity securities for which there is no reported sale during the day are fair valued at the closing bid quotation as reported by an independent pricing service. Unlisted equity securities (except unlisted preferred equity securities) are fair valued at the
| 74
Notes to Financial Statements (continued)
December 31, 2022
last sale price quoted in the market where they are traded most extensively or, if there is no reported sale during the day, the closing bid quotation as reported by an independent pricing service. If there is no last sale price or closing bid quotation available, unlisted equity securities will be fair valued using evaluated bids furnished by an independent pricing service, if available.
Debt securities and unlisted preferred equity securities are fair valued based on evaluated bids furnished to the Fund by an independent pricing service or bid prices obtained from broker-dealers. Broker-dealer bid prices may be used to fair value debt and unlisted equities where an independent pricing service is unable to price an investment or where an independent pricing service does not provide a reliable price for the investment.
The Funds may also fair value investments in other circumstances such as when extraordinary events occur after the close of a foreign market, but prior to the close of the New York Stock Exchange. This may include situations relating to a single issuer (such as a declaration of bankruptcy or a delisting of the issuer’s security from the primary market on which it has traded) as well as events affecting the securities markets in general (such as market disruptions or closings and significant fluctuations in U.S. and/or foreign markets). When fair valuing a Fund’s investments, the valuation designee may, among other things, use modeling tools or other processes that may take into account factors such as issuer specific information, or other related market activity and/or information that occurred after the close of the foreign market but before the time the Fund’s net asset value (“NAV”) is calculated. Fair valuation by the Fund(s) valuation designee may require subjective determinations about the value of the investment, and fair values used to determine a Fund’s NAV may differ from quoted or published prices, or from prices that are used by others, for the same investments. In addition, the use of fair value pricing may not always result in adjustments to the prices of investments held by a Fund.
b. Investment Transactions and Related Investment Income. Investment transactions are accounted for on a trade date plus one day basis for daily NAV calculation. However, for financial reporting purposes, investment transactions are reported on trade date. Dividend income (including income reinvested) and foreign withholding tax, if applicable, are recorded on the ex-dividend date, or in the case of certain foreign securities, as soon as a Fund is notified, and interest income is recorded on an accrual basis. Dividends reinvested and stock dividends are reflected as non-cash dividends on the Statements of Operations. Interest income is increased by the accretion of discount and decreased by the amortization of premium, if applicable. For securities with paydown provisions, principal payments received are treated as a proportionate reduction to the cost basis of the securities, and excess or shortfall amounts are recorded as income. Distributions received from investments in securities that represent a return of capital or capital gain are recorded as a reduction of cost of investments or as a realized gain, respectively. The calendar year-end amounts of ordinary income, capital gains, and return of capital included in distributions received from the Funds’ investments in real estate investment trusts (“REITs”) are reported to the Funds after the end of the fiscal year; accordingly, the Funds estimate these amounts for accounting purposes until the characterization of REIT distributions is reported to the Funds after the end of the fiscal year. Estimates are based on the most recent REIT distribution information available. In determining net gain or loss on securities sold, the cost of securities has been determined on an identified cost basis. Investment income, non-class specific expenses and realized and unrealized gains and losses are allocated on a pro rata basis to each class based on the relative net assets of each class to the total net assets of the Fund.
c. Foreign Currency Translation. The books and records of the Funds are maintained in U.S. dollars. The values of securities, currencies and other assets and liabilities denominated in currencies other than U.S. dollars, if any, are translated into U.S. dollars based upon foreign exchange rates prevailing at the end of the period. Purchases and sales of investment securities, income and expenses are translated into U.S. dollars on the respective dates of such transactions.
Net realized foreign exchange gains or losses arise from sales of foreign currency, changes in exchange rates between the trade and settlement dates on securities transactions and the difference between the amounts of dividends, interest and foreign withholding taxes recorded in the Funds’ books and records and the U.S. dollar equivalent of the amounts actually received or paid. Net unrealized foreign exchange gains or losses arise from changes in the value of assets and liabilities, other than investment securities, as of the end of the fiscal period, resulting from changes in exchange rates. Net realized foreign exchange gains or losses and the net change in unrealized foreign exchange gains or losses are disclosed in the Statements of Operations. For federal income tax purposes, net realized foreign exchange gains or losses are characterized as ordinary income, and may, if the Funds have net losses, reduce the amount of income available to be distributed by the Funds.
The values of investment securities are presented at the foreign exchange rates prevailing at the end of the period for financial reporting purposes. Net realized and unrealized gains or losses on investments reported in the Statements of Operations reflect gains or losses resulting from changes in exchange rates and fluctuations which arise due to changes in market prices of investment securities. For federal income tax purposes, a portion of the net realized gain or loss on investments arising from changes in exchange rates, which is reflected in the Statements of Operations, may be characterized as ordinary income and may, if the Funds have net losses, reduce the amount of income available to be distributed by the Funds.
75 |
Notes to Financial Statements (continued)
December 31, 2022
The Funds may use foreign currency exchange contracts to facilitate transactions in foreign-denominated investments. Losses may arise from changes in the value of the foreign currency or if the counterparties do not perform under the contracts’ terms.
d. Futures Contracts. A Fund may enter into futures contracts. Futures contracts are agreements between two parties to buy and sell a particular instrument or index for a specified price on a specified future date.
When a Fund enters into a futures contract, it is required to deposit with (or for the benefit of) its broker an amount of cash or short-term high-quality securities as “initial margin.” As the value of the contract changes, the value of the futures contract position increases or declines. Subsequent payments, known as “variation margin,” are made or received by a Fund, depending on the price fluctuations in the fair value of the contract and the value of cash or securities on deposit with the broker. Gross unrealized appreciation (depreciation) on futures contracts is recorded in the Statements of Assets and Liabilities as an asset (liability). The aggregate principal amounts of the contracts are not recorded in the financial statements. Fluctuations in the value of the contracts are recorded in the Statements of Operations as unrealized appreciation (depreciation) until the contracts are closed, when they are recorded as realized gains (losses). Realized gain or loss on a futures position is equal to the difference between the value of the contract at the time it was opened and the value at the time it was closed, minus brokerage commissions. When a Fund enters into a futures contract certain risks may arise, such as illiquidity in the futures market, which may limit a Fund’s ability to close out a futures contract prior to settlement date, and unanticipated movements in the value of securities or interest rates. Futures contracts outstanding at the end of the period, if any, are listed in each applicable Fund’s Portfolio of Investments.
Futures contracts are exchange-traded. Exchange-traded futures contracts are standardized and are settled through a clearing house with fulfillment supported by the credit of the exchange. Therefore, counterparty credit risks to the Funds are reduced; however, in the event that a counterparty enters into bankruptcy, a Fund’s claim against initial/variation margin on deposit with the counterparty may be subject to terms of a final settlement in bankruptcy court.
e. Option Contracts. Gateway Fund and Gateway Equity Call Premium Fund’s investment strategies make use of exchange-traded options. Exchange-traded options are standardized contracts and are settled through a clearing house with fulfillment supported by the credit of the exchange. Therefore, counterparty credit risks to a Fund are reduced.
When a Fund writes an index call option, an amount equal to the net premium received (the premium less commission) is recorded as a liability and is subsequently adjusted to the current value until the option expires or a Fund enters into a closing purchase transaction. When an index call option expires or a Fund enters into a closing purchase transaction, the difference between the net premium received and any amount paid at expiration or on effecting a closing purchase transaction, including commission, is treated as a realized gain or, if the net premium received is less than the amount paid, as a realized loss. A Fund, as writer of an index call option, bears the risk of an unfavorable change in the market value of the index underlying the written option.
When a Fund purchases an index put option, it pays a premium and the index put option is subsequently marked-to-market to reflect current value until the option expires or a Fund enters into a closing sale transaction. Premiums paid for purchasing index put options which expire are treated as realized losses. When a Fund enters into a closing sale transaction, the difference between the premium paid and the proceeds of the closing sale transaction is treated as a realized gain or loss. The risk associated with purchasing index put options is limited to the premium paid. Option contracts outstanding at the end of the period, if any, are listed in each applicable Fund’s Portfolio of Investments.
f. Due from Brokers. Transactions and positions in certain futures contracts are maintained and cleared by registered U.S. broker/dealers pursuant to customer agreements between a Fund and the various broker/dealers. The due from brokers balance in the Statements of Assets and Liabilities for Global Green Bond Fund represents cash pledged as collateral for futures contracts (including variation margin, as applicable). In certain circumstances the Fund’s use of cash held at brokers is restricted by regulation or broker mandated limits.
g. Federal and Foreign Income Taxes. The Trusts treat each Fund as a separate entity for federal income tax purposes. Each Fund intends to meet the requirements of the Internal Revenue Code of 1986, as amended, applicable to regulated investment companies, and to distribute to its shareholders substantially all of its net investment income and any net realized capital gains at least annually. Management has performed an analysis of each Fund’s tax positions for the open tax years as of December 31, 2022 and has concluded that no provisions for income tax are required. The Funds’ federal tax returns for the prior three fiscal years, where applicable, remain subject to examination by the Internal Revenue Service. Management is not aware of any events that are reasonably possible to occur in the next twelve months that would result in the amounts of any unrecognized tax benefits significantly increasing or decreasing for the Funds. However, management’s conclusions regarding tax positions taken may be subject to review and adjustment at a later date based on factors including, but not limited to, new tax laws and accounting regulations and interpretations thereof.
| 76
Notes to Financial Statements (continued)
December 31, 2022
A Fund may be subject to foreign withholding taxes on investment income and taxes on capital gains on investments that are accrued and paid based upon the Fund’s understanding of the tax rules and regulations that exist in the countries in which the Fund invests. Foreign withholding taxes on dividend and interest income are reflected on the Statements of Operations as a reduction of investment income, net of amounts that have been or are expected to be reclaimed and paid. Dividends and interest receivable on the Statements of Assets and Liabilities are net of foreign withholding taxes. Foreign withholding taxes where reclaims have been or are expected to be filed and paid are reflected on the Statements of Assets and Liabilities as tax reclaims receivable. Capital gains taxes paid are included in net realized gain (loss) on investments in the Statements of Operations. Accrued but unpaid capital gains taxes are reflected as foreign taxes payable on the Statements of Assets and Liabilities, if applicable, and reduce unrealized gains on investments. In the event that realized gains on investments are subsequently offset by realized losses, taxes paid on realized gains may be returned to a Fund. Such amounts, if applicable, are reflected as foreign tax rebates receivable on the Statements of Assets and Liabilities and are recorded as a realized gain when received.
Certain Funds have filed tax reclaims for previously withheld taxes on dividends earned in certain European Union countries (EU reclaims) and may continue to make such filings when it is determined to be in the best interest of the Funds and their shareholders. These filings are subject to various administrative proceedings by the local jurisdictions’ tax authorities within the European Union, as well as a number of related judicial proceedings. EU reclaims are recognized by a Fund when deemed more likely than not to be collected, and are reflected as a reduction of foreign taxes withheld in the Statements of Operations. Any related receivable is reflected as tax reclaims receivable in the Statements of Assets and Liabilities. Under certain circumstances, EU reclaims may be subject to closing agreements with the Internal Revenue Service (IRS), which may materially reduce the reclaim amounts realized by the Funds. Fees and expenses associated with closing agreements will be reflected in the Statements of Operations when it is determined that a closing agreement with the IRS is required.
h. Dividends and Distributions to Shareholders. Dividends and distributions are recorded on the ex-dividend date. The timing and characterization of certain income and capital gain distributions are determined in accordance with federal tax regulations, which may differ from accounting principles generally accepted in the United States of America. Permanent differences are primarily due to differing treatments for book and tax purposes of items such as premium amortization, futures contract mark-to-market, capital gain distribution received, return of capital distributions received, corporate actions, distributions in excess of income and/or capital gain and options contract mark-to-market. Permanent book and tax basis differences relating to shareholder distributions, net investment income and net realized gains will result in reclassifications to capital accounts reported on the Statements of Assets and Liabilities. Temporary differences between book and tax distributable earnings are primarily due to wash sales, deferred Trustees’ fees, premium amortization, futures contract mark-to-market, options contract mark-to-market, corporate actions, capital gain distribution received and return of capital distributions received. Amounts of income and capital gain available to be distributed on a tax basis are determined annually, and at other times during the Funds’ fiscal year as may be necessary to avoid knowingly declaring and paying a return of capital distribution. Distributions from net investment income and short-term capital gains are considered to be distributed from ordinary income for tax purposes.
The tax characterization of distributions is determined on an annual basis. The tax character of distributions paid to shareholders during the years ended December 31, 2022 and 2021 was as follows:
| | | | | | | | | | | | | | | | | | | | | | | | | | | | |
| | | 2022 Distributions | | | 2021 Distributions | |
Fund | | Ordinary
Income | | | Long-Term
Capital
Gains | | | Return of
Capital | | | Total | | | Ordinary
Income | | | Long-Term
Capital
Gains | | | Total | |
Gateway Fund | | $ | 58,048,921 | | | $ | — | | | $ | — | | | $ | 58,048,921 | | | $ | 49,184,281 | | | $ | — | | | $ | 49,184,281 | |
Gateway Equity Call Premium Fund | | | 1,250,482 | | | | — | | | | — | | | | 1,250,482 | | | | 544,913 | | | | — | | | | 544,913 | |
Global Green Bond Fund | | | 200,482 | | | | 1,902,630 | | | | — | | | | 2,103,112 | | | | 901,804 | | | | 537,858 | | | | 1,439,662 | |
Global Sustainable Equity Fund | | | 24,414,403 | | | | 23,809,481 | | | | — | | | | 48,223,884 | | | | 14,908,515 | | | | 109,185,274 | | | | 124,093,789 | |
International Sustainable Equity Fund | | | 328,586 | | | | — | | | | — | | | | 328,586 | | | | 409,826 | | | | 570,795 | | | | 980,621 | |
U.S. Sustainable Equity Fund | | | 165,527 | | | | 100,196 | | | | 3,188 | | | | 268,911 | | | | 272,938 | | | | — | | | | 272,938 | |
Distributions paid to shareholders from net investment income and net realized capital gains, based on accounting principles generally accepted in the United States of America, are consolidated and reported on the Statements of Changes in Net Assets as Distributions to Shareholders. Distributions paid to shareholders from net investment income and net realized capital gains expressed in per-share amounts, based on accounting principles generally accepted in the United States of America, are separately stated and reported within the Financial Highlights.
77 |
Notes to Financial Statements (continued)
December 31, 2022
As of December 31, 2022, the components of distributable earnings on a tax basis were as follows:
| | | | | | | | | | | | |
| | | Gateway
Fund | | | Gateway
Equity Call
Premium Fund | | | Global
Green
Bond Fund | |
Undistributed ordinary income | | $ | 1,154,074 | | | $ | — | | | $ | — | |
| | | | | | | | | | | | |
Capital loss carryforward: | |
Short-term: | |
No expiration date | | | (1,015,602,052 | ) | | | (5,417,327 | ) | | | — | |
Long-term: | |
No expiration date | | | — | | | | (808,973 | ) | | | — | |
| | | | | | | | | | | | |
Total capital loss carryforward | | | (1,015,602,052 | ) | | | (6,226,300 | ) | | | — | |
| | | | | | | | | | | | |
Late-year ordinary and post-October capital loss deferrals* | | | — | | | | — | | | | (2,907,874 | ) |
| | | | | | | | | | | | |
Unrealized appreciation (depreciation) | | | 3,505,510,825 | | | | 24,964,936 | | | | (7,043,963 | ) |
| | | | | | | | | | | | |
Total accumulated earnings (losses) | | $ | 2,491,062,847 | | | $ | 18,738,636 | | | $ | (9,951,837 | ) |
| | | | | | | | | | | | |
Capital loss carryforward utilized in the current year | | $ | 743,057,380 | | | $ | 9,129,634 | | | $ | — | |
| | | | | | | | | | | | |
| | | | | | | | | | | | |
| | | Global
Sustainable
Equity Fund | | | International
Sustainable
Equity Fund | | | U.S.
Sustainable
Equity Fund | |
Undistributed ordinary income | | $ | 580,522 | | | $ | 15,825 | | | $ | — | |
| | | | | | | | | | | | |
Capital loss carryforward: | |
Short-term: | |
No expiration date | | | (8,855,576 | ) | | | (212,150 | ) | | | — | |
Long-term: | |
No expiration date | | | (3,426,339 | ) | | | (67,885 | ) | | | — | |
| | | | | | | | | | | | |
Total capital loss carryforward** | | | (12,281,915 | ) | | | (280,035 | ) | | | — | |
| | | | | | | | | | | | |
Late-year ordinary and post-October capital loss deferrals* | | | — | | | | — | | | | (4,921 | ) |
| | | | | | | | | | | | |
Unrealized depreciation | | | (101,503,932 | ) | | | (2,583,448 | ) | | | (111,024 | ) |
| | | | | | | | | | | | |
Total accumulated losses | | $ | (113,205,325 | ) | | $ | (2,847,658 | ) | | $ | (115,945 | ) |
| | | | | | | | | | | | |
| * | Under current tax law, capital losses, foreign currency losses, and losses on passive foreign investment companies and contingent payment debt instruments after October 31 or December 31, as applicable, may be deferred and treated as occurring on the first day of the following taxable year. Global Green Bond Fund and U.S. Sustainable Equity Fund are deferring capital losses. |
| ** | Under Section 382 of the Internal Revenue Service Code, a portion of the capital loss carryforward for the International Sustainable Equity Fund is subject to certain limitations upon availability, to offset future capital gains, if any. |
As of December 31, 2022, the tax cost of investments (including derivatives, if applicable) and unrealized appreciation (depreciation) on a federal tax basis were as follows:
| | | | | | | | | | | | | | | | | | | | | | | | |
| | | Gateway
Fund | | | Gateway
Equity Call
Premium Fund | | | Global
Green
Bond Fund | | | Global
Sustainable
Equity Fund | | | International
Sustainable
Equity Fund | | | U.S.
Sustainable
Equity Fund | |
Federal tax cost | | $ | 2,852,653,866 | | | $ | 115,449,528 | | | $ | 42,189,386 | | | $ | 957,173,100 | | | $ | 11,531,264 | | | $ | 3,804,741 | |
| | | | | | | | | | | | | | | | | | | | | | | | |
Gross tax appreciation | | $ | 3,616,232,108 | | | $ | 30,824,950 | | | $ | 202,381 | | | $ | 39,804,706 | | | $ | 241,248 | | | $ | 315,140 | |
Gross tax depreciation | | | (110,721,295 | ) | | | (5,860,024 | ) | | | (7,249,778 | ) | | | (141,429,663 | ) | | | (2,824,651 | ) | | | (426,164 | ) |
| | | | | | | | | | | | | | | | | | | | | | | | |
Net tax appreciation (depreciation) | | $ | 3,505,510,813 | | | $ | 24,964,926 | | | $ | (7,047,397 | ) | | $ | (101,624,957 | ) | | $ | (2,583,403 | ) | | $ | (111,024 | ) |
| | | | | | | | | | | | | | | | | | | | | | | | |
The difference between these amounts and those reported in the components of distributable earnings, if any, are primarily attributable to foreign currency mark-to-market.
i. Repurchase Agreements. Each Fund may enter into repurchase agreements, under the terms of a Master Repurchase Agreement, under which each Fund acquires securities as collateral and agrees to resell the securities at an agreed upon time and at an agreed upon price. It is each Fund’s policy that the market value of the collateral for repurchase agreements be at least equal to 102% of the
| 78
Notes to Financial Statements (continued)
December 31, 2022
repurchase price, including interest. Certain repurchase agreements are tri-party arrangements whereby the collateral is held in a segregated account for the benefit of the Fund and on behalf of the counterparty. Repurchase agreements could involve certain risks in the event of default or insolvency of the counterparty, including possible delays or restrictions upon a Fund’s ability to dispose of the underlying securities. As of December 31, 2022, each Fund, as applicable, had investments in repurchase agreements for which the value of the related collateral exceeded the value of the repurchase agreement. The gross value of repurchase agreements is included in the Statements of Assets and Liabilities for financial reporting purposes.
j. Indemnifications. Under the Trusts’ organizational documents, their officers and Trustees are indemnified against certain liabilities arising out of the performance of their duties to the Funds. Additionally, in the normal course of business, the Funds enter into contracts with service providers that contain general indemnification clauses. The Funds’ maximum exposure under these arrangements is unknown as this would involve future claims that may be made against the Funds that have not yet occurred. However, based on experience, the Funds expect the risk of loss to be remote.
k. New Accounting Pronouncement. In June 2022, the Financial Accounting Standards Board issued Accounting Standards Update 2022-03, “Fair Value Measurement of Equity Securities Subject to Contractual Sale Restrictions” (“ASU 2022-03”). ASU 2022-03 clarifies the guidance in ASC 820 related to the measurement of fair value of an equity security subject to contractual sale restrictions, eliminating the ability to apply a discount to the fair value of such securities, and introducing related disclosure requirements. The guidance is effective for fiscal years, and interim periods within those fiscal years, beginning after December 15, 2023, and allows for early adoption. Management is currently evaluating the impact of applying this update.
3. Fair Value Measurements. In accordance with accounting standards related to fair value measurements and disclosures, the Funds have categorized the inputs utilized in determining the value of each Fund’s assets or liabilities. These inputs are summarized in the three broad levels listed below:
| | • | | Level 1 – quoted prices in active markets for identical assets or liabilities; |
| | • | | Level 2 – prices determined using other significant inputs that are observable either directly, or indirectly through corroboration with observable market data (which could include quoted prices for similar assets or liabilities, interest rates, credit risk, etc.); and |
| | • | | Level 3 – prices determined using significant unobservable inputs when quoted prices or observable inputs are unavailable such as when there is little or no market activity for an asset or liability (unobservable inputs reflect each Fund’s own assumptions in determining the fair value of assets or liabilities and would be based on the best information available). |
The inputs or methodology used for valuing securities are not necessarily an indication of the risk associated with investing in those securities.
The Funds’ pricing policies have been approved by the Board of Trustees. Investments for which market quotations are readily available are categorized in Level 1. Other investments for which an independent pricing service is utilized are categorized in Level 2. Broker-dealer bid prices for which the Funds have knowledge of the inputs used by the broker-dealer are categorized in Level 2. All other investments, including broker-dealer bid prices for which the Funds do not have knowledge of the inputs used by the broker-dealer, as well as investments fair valued by the valuation designee, are categorized in Level 3. All Level 2 and 3 securities are defined as being fair valued.
Under certain conditions and based upon specific facts and circumstances, the Fund’s valuation designee may determine that a fair valuation should be made for portfolio investment(s). These valuation designee fair valuations will be based upon a significant amount of Level 3 inputs.
The following is a summary of the inputs used to value the Funds’ investments as of December 31, 2022, at value:
Gateway Fund
Asset Valuation Inputs
| | | | | | | | | | | | | | | | |
Description | | Level 1 | | | Level 2 | | | Level 3 | | | Total | |
Common Stocks(a) | | $ | 6,152,050,500 | | | $ | — | | | $ | — | | | $ | 6,152,050,500 | |
Purchased Options(a) | | | 61,206,245 | | | | — | | | | — | | | | 61,206,245 | |
Short-Term Investments | | | — | | | | 206,114,180 | | | | — | | | | 206,114,180 | |
| | | | | | | | | | | | | | | | |
Total | | $ | 6,213,256,745 | | | $ | 206,114,180 | | | $ | — | | | $ | 6,419,370,925 | |
| | | | | | | | | | | | | | | | |
Liability Valuation Inputs
| | | | | | | | | | | | | | | | |
Description | | Level 1 | | | Level 2 | | | Level 3 | | | Total | |
Written Options(a) | | $ | (111,573,945 | ) | | $ | — | | | $ | — | | | $ | (111,573,945 | ) |
| | | | | | | | | | | | | | | | |
| (a) | Details of the major categories of the Fund’s investments are reflected within the Portfolio of Investments. |
79 |
Notes to Financial Statements (continued)
December 31, 2022
Gateway Equity Call Premium Fund
Asset Valuation Inputs
| | | | | | | | | | | | | | | | |
Description | | Level 1 | | | Level 2 | | | Level 3 | | | Total | |
Common Stocks(a) | | $ | 138,873,970 | | | $ | — | | | $ | — | | | $ | 138,873,970 | |
Short-Term Investments | | | — | | | | 1,540,484 | | | | — | | | | 1,540,484 | |
| | | | | | | | | | | | | | | | |
Total | | $ | 138,873,970 | | | $ | 1,540,484 | | | $ | — | | | $ | 140,414,454 | |
| | | | | | | | | | | | | | | | |
Liability Valuation Inputs
| | | | | | | | | | | | | | | | |
Description | | Level 1 | | | Level 2 | | | Level 3 | | | Total | |
Written Options(a) | | $ | (2,515,590) | | | $ | — | | | $ | — | | | $ | (2,515,590) | |
| | | | | | | | | | | | | | | | |
| (a) | Details of the major categories of the Fund’s investments are reflected within the Portfolio of Investments. |
Global Green Bond Fund
Asset Valuation Inputs
| | | | | | | | | | | | | | | | |
Description | | Level 1 | | | Level 2 | | | Level 3 | | | Total | |
Bonds and Notes(a) | | $ | — | | | $ | 35,147,632 | | | $ | — | | | $ | 35,147,632 | |
Futures Contracts (unrealized appreciation) | | | 134,647 | | | | — | | | | — | | | | 134,647 | |
| | | | | | | | | | | | | | | | |
Total | | $ | 134,647 | | | $ | 35,147,632 | | | $ | — | | | $ | 35,282,279 | |
| | | | | | | | | | | | | | | | |
Liability Valuation Inputs
| | | | | | | | | | | | | | | | |
Description | | Level 1 | | | Level 2 | | | Level 3 | | | Total | |
Futures Contracts (unrealized depreciation) | | $ | (723,823) | | | $ | — | | | $ | — | | | $ | (723,823) | |
| | | | | | | | | | | | | | | | |
| (a) | Details of the major categories of the Fund’s investments are reflected within the Portfolio of Investments. |
Global Sustainable Equity Fund
Asset Valuation Inputs
| | | | | | | | | | | | | | | | |
Description | | Level 1 | | | Level 2 | | | Level 3 | | | Total | |
Common Stocks | | | | | | | | | | | | | | | | |
Belgium | | $ | — | | | $ | 9,733,960 | | | $ | — | | | $ | 9,733,960 | |
Denmark | | | — | | | | 81,062,824 | | | | — | | | | 81,062,824 | |
France | | | — | | | | 22,189,960 | | | | — | | | | 22,189,960 | |
Germany | | | — | | | | 47,854,768 | | | | — | | | | 47,854,768 | |
Hong Kong | | | — | | | | 24,994,607 | | | | — | | | | 24,994,607 | |
Japan | | | — | | | | 46,460,082 | | | | — | | | | 46,460,082 | |
Netherlands | | | — | | | | 32,614,869 | | | | — | | | | 32,614,869 | |
Spain | | | — | | | | 29,572,646 | | | | — | | | | 29,572,646 | |
United Kingdom | | | — | | | | 22,791,018 | | | | — | | | | 22,791,018 | |
All Other Common Stocks(a) | | | 538,273,409 | | | | — | | | | — | | | | 538,273,409 | |
| | | | | | | | | | | | | | | | |
Total Common Stocks | | | 538,273,409 | | | | 317,274,734 | | | | — | | | | 855,548,143 | |
| | | | | | | | | | | | | | | | |
Total | | $ | 538,273,409 | | | $ | 317,274,734 | | | $ | — | | | $ | 855,548,143 | |
| | | | | | | | | | | | | | | | |
| (a) | Details of the major categories of the Fund’s investments are reflected within the Portfolio of Investments. |
| 80
Notes to Financial Statements (continued)
December 31, 2022
International Sustainable Equity Fund
Asset Valuation Inputs
| | | | | | | | | | | | | | | | |
Description | | Level 1 | | | Level 2 | | | Level 3 | | | Total | |
Common Stocks | | | | | | | | | | | | | | | | |
Australia | | $ | — | | | $ | 103,913 | | | $ | — | | | $ | 103,913 | |
Belgium | | | — | | | | 531,522 | | | | — | | | | 531,522 | |
Denmark | | | — | | | | 1,087,111 | | | | — | | | | 1,087,111 | |
France | | | — | | | | 1,137,236 | | | | — | | | | 1,137,236 | |
Germany | | | — | | | | 614,448 | | | | — | | | | 614,448 | |
Hong Kong | | | — | | | | 767,127 | | | | — | | | | 767,127 | |
Ireland | | | — | | | | 353,357 | | | | — | | | | 353,357 | |
Japan | | | — | | | | 1,211,065 | | | | — | | | | 1,211,065 | |
Netherlands | | | — | | | | 693,777 | | | | — | | | | 693,777 | |
Norway | | | — | | | | 36,634 | | | | — | | | | 36,634 | |
Spain | | | — | | | | 374,147 | | | | — | | | | 374,147 | |
Switzerland | | | — | | | | 228,487 | | | | — | | | | 228,487 | |
United Kingdom | | | — | | | | 1,333,638 | | | | — | | | | 1,333,638 | |
All Other Common Stocks(a) | | | 475,399 | | | | — | | | | — | | | | 475,399 | |
| | | | | | | | | | | | | | | | |
Total Common Stocks | | | 475,399 | | | | 8,472,462 | | | | — | | | | 8,947,861 | |
| | | | | | | | | | | | | | | | |
Total | | $ | 475,399 | | | $ | 8,472,462 | | | $ | — | | | $ | 8,947,861 | |
| | | | | | | | | | | | | | | | |
| (a) | Details of the major categories of the Fund’s investments are reflected within the Portfolio of Investments. |
U.S. Sustainable Equity Fund
Asset Valuation Inputs
| | | | | | | | | | | | | | | | |
Description | | Level 1 | | | Level 2 | | | Level 3 | | | Total | |
Common Stocks(a) | | $ | 3,593,665 | | | $ | — | | | $ | — | | | $ | 3,593,665 | |
Short-Term Investments | | | — | | | | 100,052 | | | | — | | | | 100,052 | |
| | | | | | | | | | | | | | | | |
Total | | $ | 3,593,665 | | | $ | 100,052 | | | $ | — | | | $ | 3,693,717 | |
| | | | | | | | | | | | | | | | |
| (a) | Details of the major categories of the Fund’s investments are reflected within the Portfolio of Investments. |
4. Derivatives. Derivative instruments are defined as financial instruments whose value and performance are based on the value and performance of an underlying asset, reference rate or index. Derivative instruments the Funds used during the period include written index call options, purchased index put options and futures contracts.
Through the use of index options, Gateway Fund and Gateway Equity Call Premium Fund intends that its risk management strategy will reduce the volatility inherent in equity investments while also allowing for more participation in equity returns than hybrid investments. Each Fund seeks to provide an efficient trade-off between risk and reward, where risk is characterized by volatility or fluctuations in value over time. To meet this objective, the Funds invest in a broadly diversified portfolio of common stocks, while also writing index call options and, for Gateway Fund, purchasing index put options. Writing index call options can reduce a Fund’s volatility, provide a steady cash flow and be an important source of a Fund’s return, although it also may reduce a Fund’s ability to profit from increases in the value of its equity portfolio. Buying index put options, can protect a Fund from a significant market decline that may occur over a short period of time. The value of an index put option generally increases as the prices of stocks constituting the index decrease and decreases as those stocks increase in price. For Gateway Fund, the combination of the diversified stock portfolio, the steady cash flow from writing of index call options and the downside protection from purchased index put options is intended to provide the Fund with the majority of the returns associated with equity market investments while exposing investors to less risk than other equity investments. For Gateway Equity Call Premium Fund, the combination of the diversified stock portfolio and the steady cash flow from writing of index call options is intended to moderate the volatility of returns relative to an all-equity portfolio. During the year ended December 31, 2022, Gateway Fund used written index call options and purchased index put options and Gateway Equity Call Premium Fund used written index call options in accordance with these strategies.
Global Green Bond Fund seeks to provide total return, through a combination of capital appreciation and current income, by investing in green bonds. The Fund pursues its objective by primarily investing in fixed-income securities. In connection with its principal
81 |
Notes to Financial Statements (continued)
December 31, 2022
investment strategies, the Fund may also invest in various types of futures contracts for investment purposes. During the year ended December 31, 2022, Global Green Bond Fund used U.S. and foreign government bond futures to gain yield curve exposure.
Global Green Bond Fund is subject to the risk that changes in interest rates will affect the value of the Fund’s investments in fixed income securities. The Fund will be subject to increased interest rate risk to the extent that it invests in fixed-income securities with longer maturities or durations, as compared to investing in fixed-income securities with shorter maturities or durations. The Fund may use futures contracts to hedge against changes in interest rates and to manage duration without having to buy or sell portfolio securities. During the year ended December 31, 2022, Global Green Bond Fund used U.S. and foreign government bond futures to manage duration.
Global Green Bond Fund is also subject to the risk that changes in foreign currency exchange rates will have an unfavorable effect on the value of Fund assets denominated in foreign currencies. The Fund may use futures contracts for hedging purposes to protect the value of the Fund’s holdings of foreign securities. During the year ended December 31, 2022, Global Green Bond Fund used currency futures for hedging purposes.
The following is a summary of derivative instruments for Gateway Fund as of December 31, 2022, as reflected within the Statements of Assets and Liabilities:
| | | | |
Assets | | Investments
at value1 | |
Exchange-traded asset derivatives | |
Equity contracts | | $ | 61,206,245 | |
| |
Liabilities | | Options written
at value | |
Exchange-traded liability derivatives | |
Equity contracts | | $ | (111,573,945 | ) |
| 1 | Represents purchased options, at value. |
Transactions in derivative instruments for Gateway Fund during the year ended December 31, 2022, as reflected within the Statements of Operations were as follows:
| | | | | | | | |
Net Realized Gain (Loss) on: | | Investments2 | | | Options written | |
Equity contracts | | $ | (7,523,800 | ) | | $ | 448,762,179 | |
| | |
Net Change in Unrealized
Appreciation (Depreciation) on: | | Investments2 | | | Options written | |
Equity contracts | | $ | 2,427,387 | | | $ | 85,743,092 | |
| 2 | Represents realized loss and change in unrealized appreciation (depreciation), respectively, for purchased options during the period. |
The following is a summary of derivative instruments for Gateway Equity Call Premium Fund as of December 31, 2022, as reflected within the Statements of Assets and Liabilities:
| | | | |
Liabilities | | Options written
at value | |
Exchange-traded liability derivatives | |
Equity contracts | | $ | (2,515,590 | ) |
Transactions in derivative instruments for Gateway Equity Call Premium Fund during the year ended December 31, 2022, as reflected within the Statements of Operations were as follows:
| | | | |
Net Realized Gain (Loss) on: | | Options written | |
Equity contracts | | $ | 7,931,158 | |
| |
Net Change in Unrealized
Appreciation (Depreciation) on: | | Options written | |
Equity contracts | | $ | 1,830,792 | |
| 82
Notes to Financial Statements (continued)
December 31, 2022
The following is a summary of derivative instruments for Global Green Bond Fund as of December 31, 2022, as reflected within the Statements of Assets and Liabilities:
| | | | |
Assets | | Unrealized
appreciation on
futures contracts | |
Exchange-traded asset derivatives | |
Interest rate contracts | | $ | 122,298 | |
Foreign exchange contracts | | | 12,349 | |
| | | | |
Total exchange-traded asset derivatives | | $ | 134,647 | |
| | | | |
| |
Liabilities | | Unrealized
depreciation on
futures contracts | |
Exchange-traded liability derivatives | |
Interest rate contracts | | $ | (117,876 | ) |
Foreign exchange contracts | | | (605,947 | ) |
| | | | |
Total exchange-traded liability derivatives | | $ | (723,823 | ) |
| | | | |
Transactions in derivative instruments for Global Green Bond Fund during the year ended December 31, 2022, as reflected within the Statements of Operations were as follows:
| | | | |
Net Realized Gain (Loss) on: | | Futures contracts | |
Interest rate contracts | | $ | (630,454 | ) |
Foreign exchange contracts | | | 2,541,757 | |
| | | | |
Total | | $ | 1,911,303 | |
| | | | |
| |
Net Change in Unrealized
Appreciation (Depreciation) on: | | Futures contracts | |
Interest rate contracts | | $ | 130,258 | |
Foreign exchange contracts | | | (245,204 | ) |
| | | | |
Total | | $ | (114,946 | ) |
| | | | |
As the Funds value their derivatives at fair value and recognize changes in fair value through the Statements of Operations, they do not qualify for hedge accounting under authoritative guidance for derivative instruments. The Funds’ investments in derivatives may represent an economic hedge; however, they are considered to be non-hedge transactions for the purpose of these disclosures.
The volume of option contract activity as a percentage of investments in common stocks for Gateway Fund based on month-end notional amounts outstanding during the period, at absolute value, was as follows for the year ended December 31, 2022:
| | | | | | | | |
Gateway Fund | | Call Options
Written* | | | Put Options
Purchased* | |
Average Notional Amount Outstanding | | | 99.02 | % | | | 81.23 | % |
Highest Notional Amount Outstanding | | | 99.15 | % | | | 99.03 | % |
Lowest Notional Amount Outstanding | | | 98.86 | % | | | 68.68 | % |
Notional Amount Outstanding as of December 31, 2022 | | | 98.96 | % | | | 98.96 | % |
The volume of option contract activity as a percentage of investments in common stocks for Gateway Equity Call Premium Fund, based on month-end notional amounts outstanding during the period, at absolute value, was as follows for the year ended December 31, 2022:
| | | | |
Gateway Equity Call Premium Fund | | Call Options Written* | |
Average Notional Amount Outstanding | | | 99.04 | % |
Highest Notional Amount Outstanding | | | 99.38 | % |
Lowest Notional Amount Outstanding | | | 98.74 | % |
Notional Amount Outstanding as of December 31, 2022 | | | 99.25 | % |
| * | Notional amounts outstanding are determined by multiplying option contracts by the contract multiplier by the price of the option’s underlying index, the S&P 500® Index. |
83 |
Notes to Financial Statements (continued)
December 31, 2022
The volume of futures contract activity as a percentage of net assets for Global Green Bond Fund, based on month-end notional amounts outstanding during the period, at absolute value, was as follows for the year ended December 31, 2022:
| | | | |
Global Green Bond Fund | | Futures | |
Average Notional Amount Outstanding | | | 84.77 | % |
Highest Notional Amount Outstanding | | | 99.22 | % |
Lowest Notional Amount Outstanding | | | 74.64 | % |
Notional Amount Outstanding as of December 31, 2022 | | | 99.22 | % |
Notional amounts outstanding at the end of the prior period are included in the average notional amount outstanding.
Unrealized gain and/or loss on open futures is recorded in the Statements of Assets and Liabilities. The aggregate notional values of futures contracts are not recorded in the Statements of Assets and Liabilities, and therefore are not included in the Funds’ net assets.
Counterparty risk is managed based on policies and procedures established by the Fund’s adviser. Such policies and procedures may include, but are not limited to, minimum counterparty credit rating requirements, monitoring of counterparty credit default swap spreads and posting of collateral. With exchange-traded derivatives, there is minimal counterparty credit risk to the Fund because the exchange’s clearing house, as counterparty to these instruments, stands between the buyer and the seller of the contract. Credit risk still exists in exchange-traded derivatives with respect to initial and variation margin that is held in a broker’s customer accounts. While brokers typically are required to segregate customer margin for exchange-traded derivatives from their own assets, in the event that a broker becomes insolvent or goes into bankruptcy and at that time there is a shortfall in the aggregate amount of margin held by the broker for all its customers, U.S. bankruptcy laws will typically allocate that shortfall on a pro rata basis across all of the broker’s customers, potentially resulting in losses to the Fund. The following table shows the maximum amount of loss due to credit risk that, based on the gross fair value of the financial instrument, the Fund would incur if parties to the relevant financial instruments failed completely to perform according to the terms of the contracts and the collateral or other security, if any, for the amount due proved to be of no value to the Fund, as of December 31, 2022:
| | | | | | | | |
Fund | | Maximum Amount
of Loss - Gross | | | Maximum Amount
of Loss - Net | |
Global Green Bond Fund | | $ | 2,200,821 | | | $ | 2,200,821 | |
5. Purchases and Sales of Securities. For the year ended December 31, 2022, purchases and sales of securities (excluding short-term investments, option contracts and including paydowns) were as follows:
| | | | | | | | |
Fund | | Purchases | | | Sales | |
Gateway Fund | | $ | 1,165,186,917 | | | $ | 1,612,134,351 | |
Gateway Equity Call Premium Fund | | | 75,807,561 | | | | 14,298,417 | |
Global Green Bond Fund | | | 25,239,355 | | | | 22,225,093 | |
Global Sustainable Equity Fund | | | 276,801,341 | | | | 216,043,949 | |
International Sustainable Equity Fund | | | 1,417,168 | | | | 12,953,023 | |
U.S. Sustainable Equity Fund | | | 319,412 | | | | 648,402 | |
6. Management Fees and Other Transactions with Affiliates.
a. Management Fees. Gateway Investment Advisers, LLC (“Gateway Advisers”) serves as investment adviser to Gateway Fund and Gateway Equity Call Premium Fund. Gateway Advisers is a subsidiary of Natixis Investment Managers, LLC, which is part of Natixis Investment Managers, an international asset management group based in Paris, France. Under the terms of the management agreements, each Fund pays a management fee at the following annual rates, calculated daily and payable monthly, based on each Fund’s average daily net assets:
| | | | | | | | | | | | |
| | | Percentage of Average Daily Net Assets | |
Fund | | First $5 billion | | | Next $5 billion | | | Over $10 billion | |
Gateway Fund | | | 0.60 | % | | | 0.55 | % | | | 0.53 | % |
Gateway Equity Call Premium Fund | | | 0.58 | % | | | 0.58 | % | | | 0.58 | % |
Mirova US LLC (“Mirova US”) serves as investment adviser to Global Green Bond Fund, Global Sustainable Equity Fund, International Sustainable Equity Fund and U.S. Sustainable Equity Fund. Mirova US is a wholly-owned subsidiary of Mirova, which is in turn a
| 84
Notes to Financial Statements (continued)
December 31, 2022
subsidiary of Natixis Investment Managers. Under the terms of the management agreements, each Fund pays a management fee at the following annual rates, calculated daily and payable monthly, based on each Fund’s average daily net assets:
| | | | |
Fund | | Percentage of
Average Daily
Net Assets | |
Global Green Bond Fund | | | 0.50 | % |
Global Sustainable Equity Fund | | | 0.80 | % |
International Sustainable Equity Fund | | | 0.80 | % |
U.S. Sustainable Equity Fund | | | 0.65 | % |
Gateway Advisers and Mirova US have given binding undertakings to the Funds to waive management fees and/or reimburse certain expenses to limit the Funds’ operating expenses, exclusive of acquired fund fees and expenses, brokerage expenses, interest expense, substitute dividend expenses on securities sold short, taxes, organizational and extraordinary expenses such as litigation and indemnification expenses. These undertakings are in effect until April 30, 2023, may be terminated before then only with the consent of the Funds’ Board of Trustees, and are reevaluated on an annual basis. Management fees payable, as reflected on the Statements of Assets and Liabilities, is net of waivers and/or expense reimbursements, if any, pursuant to these undertakings. Waivers/reimbursements that exceed management fees payable are reflected on the Statements of Assets and Liabilities as receivable from investment adviser.
For the year ended December 31, 2022, the expense limits as a percentage of average daily net assets under the expense limitation agreements were as follows:
| | | | | | | | | | | | | | | | |
| | | Expense Limit as a Percentage of
Average Daily Net Assets | |
Fund | | Class A | | | Class C | | | Class N | | | Class Y | |
Gateway Fund | | | 0.94 | % | | | 1.70 | % | | | 0.65 | % | | | 0.70 | % |
Gateway Equity Call Premium Fund | | | 0.93 | % | | | 1.68 | % | | | 0.63 | % | | | 0.68 | % |
Global Green Bond Fund | | | 0.90 | % | | | — | | | | 0.60 | % | | | 0.65 | % |
Global Sustainable Equity Fund | | | 1.20 | % | | | 1.95 | % | | | 0.90 | % | | | 0.95 | % |
International Sustainable Equity Fund | | | 1.20 | % | | | — | | | | 0.90 | % | | | 0.95 | % |
U.S. Sustainable Equity Fund | | | 1.05 | % | | | 1.80 | % | | | 0.75 | % | | | 0.80 | % |
Gateway Advisers and Mirova US shall be permitted to recover expenses borne under the expense limitation agreements (whether through waiver of management fee or otherwise) on a class by class basis in later periods to the extent the annual operating expenses of a class fall below (1) a class’ expense limitation ratio in place at the time such amounts were waived/reimbursed and (2) a class’ current applicable expense limitation ratio, provided, however, that a class is not obligated to pay such waived/reimbursed fees or expenses more than one year after the end of the fiscal year in which the fees or expenses were waived/reimbursed.
For the year ended December 31, 2022, the management fees and waiver of management fees for each Fund were as follows:
| | | | | | | | | | | | | | | | | | | | |
Fund | | Gross
Management Fees | | | Contractual
Waivers of
Management Fees1 | | | Net
Management Fees | | | Percentage
of Average
Daily Net Assets | |
| | Gross | | | Net | |
Gateway Fund | | $ | 42,712,665 | | | $ | — | | | $ | 42,712,665 | | | | 0.58 | % | | | 0.58 | % |
Gateway Equity Call Premium Fund | | | 754,139 | | | | 292,832 | | | | 461,307 | | | | 0.58 | % | | | 0.35 | % |
Global Green Bond Fund | | | 204,867 | | | | 170,565 | | | | 34,302 | | | | 0.50 | % | | | 0.08 | % |
Global Sustainable Equity Fund | | | 7,695,354 | | | | — | | | | 7,695,354 | | | | 0.80 | % | | | 0.80 | % |
International Sustainable Equity Fund | | | 152,331 | | | | 152,331 | | | | — | | | | 0.80 | % | | | — | % |
U.S. Sustainable Equity Fund | | | 25,740 | | | | 25,740 | | | | — | | | | 0.65 | % | | | — | % |
For the year ended December 31, 2022, class-specific expenses have been reimbursed as follows:
| | | | | | | | | | | | | | | | | | | | |
| | | Reimbursement1 | |
Fund | | Class A | | | Class C | | | Class N | | | Class Y | | | Total | |
Gateway Fund | | $ | 223,714 | | | $ | 11,772 | | | $ | — | | | $ | 755,253 | | | $ | 990,739 | |
Global Sustainable Equity Fund | | | 18,214 | | | | 7,230 | | | | — | | | | 382,905 | | | | 408,349 | |
| 1 | Waiver/expense reimbursements are subject to possible recovery until December 31, 2023. |
85 |
Notes to Financial Statements (continued)
December 31, 2022
In addition, Mirova US reimbursed non-class-specific expenses of International Sustainable Equity Fund and U.S. Sustainable Equity Fund in the amounts of $18,722 and $140,557, respectively, for the year ended December 31, 2022, which are subject to possible recovery until December 31, 2023.
For the year ended December 31, 2022, expense reimbursements related to the prior fiscal year were recovered as follows:
| | | | |
Fund | | Recovered
Expenses | |
Gateway Fund | | $ | 3,123 | |
b. Service and Distribution Fees. Natixis Distribution, LLC (“Natixis Distribution”), which is a wholly-owned subsidiary of Natixis Investment Managers, LLC, has entered into a distribution agreement with the Trusts. Pursuant to this agreement, Natixis Distribution serves as principal underwriter of the Funds of the Trusts.
Pursuant to Rule 12b-1 under the 1940 Act, the Trusts have adopted a Service Plan relating to each Fund’s Class A shares (the “Class A Plans”) and a Distribution and Service Plan relating to each Fund’s Class C shares (the “Class C Plans”).
Under the Class A Plans, each Fund pays Natixis Distribution a monthly service fee at an annual rate not to exceed 0.25% of the average daily net assets attributable to the Funds’ Class A shares, as reimbursement for expenses incurred by Natixis Distribution in providing personal services to investors in Class A shares and/or the maintenance of shareholder accounts.
Under the Class C Plans, each Fund pays Natixis Distribution a monthly service fee at an annual rate not to exceed 0.25% of the average daily net assets attributable to the Funds’ Class C shares, as compensation for services provided by Natixis Distribution in providing personal services to investors in Class C shares and/or the maintenance of shareholder accounts.
Also under the Class C Plans, each Fund pays Natixis Distribution a monthly distribution fee at an annual rate of 0.75% of the average daily net assets attributable to the Funds’ Class C shares, as compensation for services provided by Natixis Distribution in connection with the marketing or sale of Class C shares.
For the year ended December 31, 2022, the service and distribution fees for each Fund were as follows:
| | | | | | | | | | | | |
| | | Service Fees | | | Distribution Fees | |
Fund | | Class A | | | Class C | | | Class C | |
Gateway Fund | | $ | 2,340,771 | | | $ | 234,268 | | | $ | 702,803 | |
Gateway Equity Call Premium Fund | | | 4,959 | | | | 1,974 | | | | 5,922 | |
Global Green Bond Fund | | | 15,597 | | | | — | | | | — | |
Global Sustainable Equity Fund | | | 84,785 | | | | 33,594 | | | | 100,783 | |
International Sustainable Equity Fund | | | 1,370 | | | | — | | | �� | — | |
U.S. Sustainable Equity Fund | | | 56 | | | | 202 | | | | 605 | |
For the year ended December 31, 2022, Natixis Distribution refunded Gateway Fund $61,250 of prior year Class A service fees paid to Natixis Distribution in excess of amounts subsequently paid to securities dealers or financial intermediaries. Service and distribution fees on the Statements of Operations have been reduced by these amounts.
c. Administrative Fees. Natixis Advisors, LLC (“Natixis Advisors”) provides certain administrative services for the Funds and contracts with State Street Bank and Trust Company (“State Street Bank”) to serve as sub-administrator. Pursuant to an agreement among Natixis Funds Trusts, Loomis Sayles Funds Trusts, Natixis ETF Trusts and Natixis Advisors, each Fund pays Natixis Advisors monthly its pro rata portion of fees equal to an annual rate of 0.0540% of the first $15 billion of the average daily net assets of the Natixis Funds Trusts, Loomis Sayles Funds Trusts and Natixis ETF Trusts, 0.0500% of the next $15 billion, 0.0400% of the next $30 billion, 0.0275% of the next $30 billion and 0.0225% of such assets in excess of $90 billion, subject to an annual aggregate minimum fee for the Natixis Funds Trusts, Loomis Sayles Funds Trusts and Natixis ETF Trusts of $10 million, which is reevaluated on an annual basis.
For the year ended December 31, 2022, the administrative fees for each Fund were as follows:
| | | | |
Fund | | Administrative
Fees | |
Gateway Fund | | $ | 3,299,638 | |
Gateway Equity Call Premium Fund | | | 58,881 | |
Global Green Bond Fund | | | 18,492 | |
Global Sustainable Equity Fund | | | 434,036 | |
International Sustainable Equity Fund | | | 8,536 | |
U.S. Sustainable Equity Fund | | | 1,786 | |
| 86
Notes to Financial Statements (continued)
December 31, 2022
d. Sub-Transfer Agent Fees. Natixis Distribution has entered into agreements, which include servicing agreements, with financial intermediaries that provide recordkeeping, processing, shareholder communications and other services to customers of the intermediaries that hold positions in the Funds and has agreed to compensate the intermediaries for providing those services. Intermediaries transact with the Funds primarily through the use of omnibus accounts on behalf of their customers who hold positions in the Funds. These services would have been provided by the Funds’ transfer agent and other service providers if the shareholders’ accounts were maintained directly at the Funds’ transfer agent. Accordingly, the Funds have agreed to reimburse Natixis Distribution for all or a portion of the servicing fees paid to these intermediaries. The reimbursement amounts (sub-transfer agent fees) paid to Natixis Distribution are subject to a current per-account equivalent fee limit approved by the Funds’ Board of Trustees, which is based on fees for similar services paid to the Funds’ transfer agent and other service providers. Class N shares do not bear such expenses.
For the year ended December 31, 2022, the sub-transfer agent fees (which are reflected in transfer agent fees and expenses in the Statements of Operations) for each Fund were as follows:
| | | | |
Fund | | Sub-Transfer
Agent Fees | |
Gateway Fund | | $ | 3,851,759 | |
Gateway Equity Call Premium Fund | | | 45,305 | |
Global Green Bond Fund | | | 35,419 | |
Global Sustainable Equity Fund | | | 811,257 | |
International Sustainable Equity Fund | | | 2,235 | |
U.S. Sustainable Equity Fund | | | 47 | |
As of December 31, 2022, the Funds owe Natixis Distribution the following reimbursements for sub-transfer agent fees (which are reflected in the Statements of Assets and Liabilities as payable to distributor):
| | | | |
Fund | | Reimbursements
of Sub-Transfer
Agent Fees | |
Gateway Fund | | $ | 41,301 | |
Gateway Equity Call Premium Fund | | | 436 | |
Global Green Bond Fund | | | 344 | |
Global Sustainable Equity Fund | | | 7,793 | |
International Sustainable Equity Fund | | | 17 | |
U.S. Sustainable Equity Fund | | | 2 | |
Sub-transfer agent fees attributable to Class A, Class C and Class Y are allocated on a pro rata basis to each class based on the relative net assets of each class to the total net assets of those classes.
e. Commissions. Commissions (including CDSCs) on Fund shares retained by Natixis Distribution during the year ended December 31, 2022 was as follows:
| | | | |
Fund | | Commissions | |
Gateway Fund | | $ | 36,852 | |
Gateway Equity Call Premium Fund | | | 214 | |
Global Sustainable Equity Fund | | | 11,367 | |
International Sustainable Equity Fund | | | 19 | |
f. Trustees Fees and Expenses. The Trusts do not pay any compensation directly to their officers or Trustees who are directors, officers or employees of Natixis Advisors, Natixis Distribution, Natixis Investment Managers, LLC or their affiliates. The Chairperson of the Board of Trustees receives a retainer fee at the annual rate of $369,000. The Chairperson does not receive any meeting attendance fees for Board of Trustees meetings or committee meetings that he attends. Each Independent Trustee (other than the Chairperson) receives, in the aggregate, a retainer fee at the annual rate of $210,000. Each Independent Trustee also receives a meeting attendance fee of $10,000 for each meeting of the Board of Trustees that he or she attends in person and $5,000 for each meeting of the Board of Trustees that he or she attends telephonically. In addition, the chairperson of the Contract Review Committee, the chairperson of the Audit Committee and the chairperson of the Governance Committee each receive an additional retainer fee at the annual rate of $20,000. Each Contract Review Committee member is compensated $6,000 for each Committee meeting that he or she attends in person and $3,000 for each meeting that he or she attends telephonically. Each Audit Committee member is compensated $6,000 for each Committee meeting that he or she attends in person and $3,000 for each meeting that he or she attends telephonically. These fees are allocated among the funds in the Natixis Funds Trusts, Loomis Sayles Funds Trusts and Natixis ETF Trusts based on a formula that takes into account, among other factors, the relative net assets of each fund. Trustees are reimbursed for travel expenses in connection with attendance at meetings.
87 |
Notes to Financial Statements (continued)
December 31, 2022
Effective January 1, 2023, each Governance Committee member is compensated $2,500 for each Committee meeting that he or she attends either in person or telephonically.
A deferred compensation plan (the “Plan”) is available to the Trustees on a voluntary basis. The value of a participating Trustee’s deferral account is based on theoretical investments of deferred amounts, on the normal payment dates, in certain funds of the Natixis Funds Trusts, Loomis Sayles Funds Trusts and Natixis ETF Trusts as designated by the participating Trustees. Changes in the value of participants’ deferral accounts are allocated pro rata among the funds in the Natixis Funds Trusts, Loomis Sayles Funds Trusts and Natixis ETF Trusts and are normally reflected as Trustees’ fees and expenses in the Statements of Operations. Deferred amounts remain in the funds until distributed in accordance with the provisions of the Plan. The portions of the accrued obligations allocated to the Funds under the Plan are reflected as Deferred Trustees’ fees in the Statements of Assets and Liabilities.
For the year ended December 31, 2022, net depreciation in the value of participants’ deferral accounts are reflected on the Statements of Operations as a reduction to expenses, as follows:
| | | | |
Fund | | Amount | |
Gateway Fund | | $ | (115,800 | ) |
Gateway Equity Call Premium Fund | | | (3,826 | ) |
Certain officers and employees of Natixis Advisors and affiliates are also officers and/or Trustees of the Trusts.
g. Affiliated Ownership. As of December 31, 2022, the percentage of each Fund’s net assets owned by Natixis and affiliates is as follows:
| | | | |
Global Green Bond Fund | | Percentage of
Net Assets | |
Natixis Sustainable Future 2015 Fund | | | 1.56 | % |
Natixis Sustainable Future 2020 Fund | | | 1.11 | % |
Natixis Sustainable Future 2025 Fund | | | 1.96 | % |
Natixis Sustainable Future 2030 Fund | | | 3.39 | % |
Natixis Sustainable Future 2035 Fund | | | 2.21 | % |
Natixis Sustainable Future 2040 Fund | | | 1.55 | % |
Natixis Sustainable Future 2045 Fund | | | 1.22 | % |
Natixis Sustainable Future 2050 Fund | | | 0.48 | % |
Natixis Sustainable Future 2055 Fund | | | 0.41 | % |
Natixis Sustainable Future 2060 Fund | | | 0.29 | % |
Natixis Sustainable Future 2065 Fund | | | 0.11 | % |
| | | | |
| | | 14.29 | % |
| | | | |
International Sustainable Equity Fund | | Percentage of
Net Assets | |
Natixis Sustainable Future 2015 Fund | | | 1.91 | % |
Natixis Sustainable Future 2020 Fund | | | 1.85 | % |
Natixis Sustainable Future 2025 Fund | | | 4.38 | % |
Natixis Sustainable Future 2030 Fund | | | 9.68 | % |
Natixis Sustainable Future 2035 Fund | | | 11.27 | % |
Natixis Sustainable Future 2040 Fund | | | 10.86 | % |
Natixis Sustainable Future 2045 Fund | | | 12.02 | % |
Natixis Sustainable Future 2050 Fund | | | 11.43 | % |
Natixis Sustainable Future 2055 Fund | | | 10.00 | % |
Natixis Sustainable Future 2060 Fund | | | 6.90 | % |
Natixis Sustainable Future 2065 Fund | | | 2.57 | % |
| | | | |
| | | 82.87 | % |
| | | | |
| |
U.S. Sustainable Equity Fund | | Percentage of
Net Assets | |
Natixis and affiliates | | | 96.50 | % |
Investment activities of affiliated shareholders could have material impacts on the Fund.
| 88
Notes to Financial Statements (continued)
December 31, 2022
h. Reimbursement of Transfer Agent Fees and Expenses. Natixis Advisors has given a binding contractual undertaking to Gateway Equity Call Premium Fund, Global Green Bond Fund, Global Sustainable Equity Fund, International Sustainable Equity Fund and U.S. Sustainable Equity Fund to reimburse any and all transfer agency expenses for the Funds’ Class N shares. This undertaking is in effect through April 30, 2023, and is not subject to recovery under the expense limitation agreement described above.
For the year ended December 31, 2022, Natixis Advisors reimbursed the Funds for transfer agency expenses as follows:
| | | | |
| | | Reimbursement of
Transfer Agency
Expenses | |
Fund | | Class N | |
Gateway Equity Call Premium Fund | | $ | 969 | |
Global Green Bond Fund | | | 1,131 | |
Global Sustainable Equity Fund | | | 1,704 | |
International Sustainable Equity Fund | | | 1,168 | |
U.S. Sustainable Equity Fund | | | 927 | |
7. Class-Specific Transfer Agent Fees and Expenses. Transfer agent fees and expenses attributable to Class A, Class C and Class Y are allocated on a pro rata basis to each class based on the relative net assets of each class to the total net assets of those classes. Transfer agent fees and expenses attributable to Class N are allocated to Class N.
For the year ended December 31, 2022, the Funds incurred the following class-specific transfer agent fees and expenses (including sub-transfer agent fees, where applicable):
| | | | | | | | | | | | | | | | |
| | | Transfer Agent Fees and Expenses | |
Fund | | Class A | | | Class C | | | Class N | | | Class Y | |
Gateway Fund | | $ | 615,244 | | | $ | 59,937 | | | $ | 3,119 | | | $ | 3,703,814 | |
Gateway Equity Call Premium Fund | | | 1,026 | | | | 411 | | | | 969 | | | | 64,732 | |
Global Green Bond Fund | | | 7,239 | | | | — | | | | 1,131 | | | | 33,879 | |
Global Sustainable Equity Fund | | | 37,648 | | | | 14,916 | | | | 1,704 | | | | 789,471 | |
International Sustainable Equity Fund | | | 1,442 | | | | — | | | | 1,168 | | | | 2,907 | |
U.S. Sustainable Equity Fund | | | 462 | | | | 1,691 | | | | 927 | | | | 812 | |
8. Line of Credit. Each Fund, together with certain other funds of Natixis Funds Trusts, Loomis Sayles Funds Trusts and Natixis ETF Trusts, entered into a $500,000,000 committed unsecured line of credit provided by State Street Bank. Any one Fund may borrow up to $350,000,000 under the line of credit agreement (as long as all borrowings by all Funds in the aggregate do not exceed the $500,000,000 limit at any time), subject to each Fund’s investment restrictions and its contractual obligations under the line of credit. Interest is charged to the Funds based upon the terms set forth in the agreement. In addition, a commitment fee of 0.15% per annum, payable at the end of each calendar quarter, is accrued and apportioned among the participating funds based on their average daily unused portion of the line of credit. The Funds paid certain legal fees in connection with the line of credit agreement, which are being amortized over a period of 364 days and are reflected in legal fees on the Statements of Operations. The unamortized balance is reflected as prepaid expenses on the Statements of Assets and Liabilities.
For the year ended December 31, 2022, International Sustainable Equity Fund had an average daily balance on the line of credit (for those days on which there were borrowings) of $600,000 at a weighted average interest rate of 2.68%. Interest expense incurred on the line of credit was $268.
9. Payable to Custodian Bank. The Funds’ custodian bank, State Street Bank, provides overdraft protection to the Funds in the event of a cash shortfall. Cash overdrafts bear interest at a rate per annum equal to the Federal Funds rate plus a variable spread. At December 31, 2022, Global Green Bond Fund had a payable to the custodian bank of $2,071,038 for an overdraft.
10. Risk. The Funds’ investments in foreign securities may be subject to greater political, economic, environmental, credit/counterparty and information risks. The Fund’s investments in foreign securities also are subject to foreign currency fluctuations and other foreign currency-related risks. Foreign securities may be subject to higher volatility than U.S. securities, varying degrees of regulation and limited liquidity.
Russia’s military invasion of Ukraine in February 2022, the resulting responses by the United States and other countries, and the potential for wider conflict could increase volatility and uncertainty in the financial markets and adversely affect regional and global economies. These and any related events could significantly impact a Fund’s performance and the value of an investment in the Fund, even if the Fund does not have direct exposure to Russian issuers or issuers in other countries affected by the invasion.
89 |
Notes to Financial Statements (continued)
December 31, 2022
11. Interest Expense. The Funds incur interest expense on cash (including foreign currency) overdrafts at the custodian bank, borrowings on the line of credit and, for Global Green Bond Fund, foreign currency debit balances at brokers. Interest expense incurred for the year ended December 31, 2022 is reflected on the Statements of Operations.
12. Concentration of Ownership. From time to time, a Fund may have a concentration of one or more accounts constituting a significant percentage of shares outstanding. Investment activities by holders of such accounts could have material impacts on the Funds. As of December 31, 2022, based on management’s evaluation of the shareholder account base, the Funds had accounts representing controlling ownership of more than 5% of the Funds’ total outstanding shares. The number of such accounts, based on accounts that represent more than 5% of an individual class of shares, and the aggregate percentage of net assets represented by such holdings were as follows:
| | | | | | | | | | | | | | | | |
Fund | | Number of 5%
Non-Affiliated
Account Holders | | | Percentage of
Non-Affiliated
Ownership | | | Percentage
of Affiliated
Ownership
(Note 6g) | | | Total
Percentage of
Ownership | |
Gateway Equity Call Premium Fund | | | 2 | | | | 84.97 | % | | | — | | | | 84.97 | % |
Global Green Bond Fund | | | 3 | | | | 35.19 | % | | | 14.29 | % | | | 49.48 | % |
Global Sustainable Equity Fund | | | 1 | | | | 23.33 | % | | | — | | | | 23.33 | % |
International Sustainable Equity Fund | | | 2 | | | | 12.32 | % | | | 82.87 | % | | | 95.19 | % |
Omnibus shareholder accounts for which Natixis Advisors understands that the intermediary has discretion over the underlying shareholder accounts or investment models where a shareholder account may be invested for a non-discretionary customer are included in the table above. For other omnibus accounts, the Funds do not have information on the individual shareholder accounts underlying the omnibus accounts; therefore, there could be other 5% shareholders in addition to those disclosed in the table above.
13. Capital Shares. Each Fund may issue an unlimited number of shares of beneficial interest, without par value. Transactions in capital shares were as follows:
| | | | | | | | | | | | | | | | |
| | | Year Ended
December 31, 2022 | | | Year Ended
December 31, 2021 | |
| Gateway Fund | | Shares | | | Amount | | | Shares | | | Amount | |
| Class A | |
Issued from the sale of shares | | | 2,990,927 | | | $ | 111,688,911 | | | | 4,103,014 | | | $ | 159,384,742 | |
Issued in connection with the reinvestment of distributions | | | 132,916 | | | | 4,799,294 | | | | 100,047 | | | | 3,909,189 | |
Redeemed | | | (5,070,154 | ) | | | (186,569,866 | ) | | | (4,696,532 | ) | | | (182,041,657 | ) |
| | | | | | | | | | | | | | | | |
Net change | | | (1,946,311 | ) | | $ | (70,081,661 | ) | | | (493,471 | ) | | $ | (18,747,726 | ) |
| | | | | | | | | | | | | | | | |
| Class C | |
Issued from the sale of shares | | | 295,524 | | | $ | 11,043,487 | | | | 455,601 | | | $ | 17,700,327 | |
Redeemed | | | (923,521 | ) | | | (33,943,135 | ) | | | (1,530,271 | ) | | | (58,832,782 | ) |
| | | | | | | | | | | | | | | | |
Net change | | | (627,997 | ) | | $ | (22,899,648 | ) | | | (1,074,670 | ) | | $ | (41,132,455 | ) |
| | | | | | | | | | | | | | | | |
| Class N | |
Issued from the sale of shares | | | 4,827,293 | | | $ | 182,200,937 | | | | 5,482,060 | | | $ | 215,874,763 | |
Issued in connection with the reinvestment of distributions | | | 64,735 | | | | 2,340,801 | | | | 44,030 | | | | 1,726,281 | |
Redeemed | | | (6,643,828 | ) | | | (244,989,922 | ) | | | (3,197,125 | ) | | | (126,136,905 | ) |
| | | | | | | | | | | | | | | | |
Net change | | | (1,751,800 | ) | | $ | (60,448,184 | ) | | | 2,328,965 | | | $ | 91,464,139 | |
| | | | | | | | | | | | | | | | |
| Class Y | |
Issued from the sale of shares | | | 33,208,989 | | | $ | 1,246,241,832 | | | | 37,955,789 | | | $ | 1,477,701,403 | |
Issued in connection with the reinvestment of distributions | | | 1,096,216 | | | | 39,614,732 | | | | 867,558 | | | | 33,970,801 | |
Redeemed | | | (52,875,105 | ) | | | (1,938,033,620 | ) | | | (32,342,708 | ) | | | (1,248,292,004 | ) |
| | | | | | | | | | | | | | | | |
Net change | | | (18,569,900 | ) | | $ | (652,177,056 | ) | | | 6,480,639 | | | $ | 263,380,200 | |
| | | | | | | | | | | | | | | | |
Increase (decrease) from capital share transactions | | | (22,896,008 | ) | | $ | (805,606,549 | ) | | | 7,241,463 | | | $ | 294,964,158 | |
| | | | | | | | | | | | | | | | |
| 90
Notes to Financial Statements (continued)
December 31, 2022
13. Capital Shares (continued).
| | | | | | | | | | | | | | | | |
| | | Year Ended
December 31, 2022 | | | Year Ended
December 31, 2021 | |
| Gateway Equity Call Premium Fund | | Shares | | | Amount | | | Shares | | | Amount | |
| Class A | |
Issued from the sale of shares | | | 21,527 | | | $ | 334,499 | | | | 119,601 | | | $ | 1,838,974 | |
Issued in connection with the reinvestment of distributions | | | 807 | | | | 11,890 | | | | 486 | | | | 7,707 | |
Redeemed | | | (68,414 | ) | | | (1,058,963 | ) | | | (67,014 | ) | | | (1,010,211 | ) |
| | | | | | | | | | | | | | | | |
Net change | | | (46,080 | ) | | $ | (712,574 | ) | | | 53,073 | | | $ | 836,470 | |
| | | | | | | | | | | | | | | | |
| Class C | |
Issued from the sale of shares | | | 45,751 | | | $ | 665,059 | | | | 5,571 | | | $ | 83,540 | |
Issued in connection with the reinvestment of distributions | | | 41 | | | | 601 | | | | 5 | | | | 75 | |
Redeemed | | | (29,736 | ) | | | (422,608 | ) | | | (9,350 | ) | | | (135,497 | ) |
| | | | | | | | | | | | | | | | |
Net change | | | 16,056 | | | $ | 243,052 | | | | (3,774 | ) | | $ | (51,882 | ) |
| | | | | | | | | | | | | | | | |
| Class N | |
Issued from the sale of shares | | | 1,231 | | | $ | 18,762 | | | | 2,094 | | | $ | 31,390 | |
Issued in connection with the reinvestment of distributions | | | 156 | | | | 2,287 | | | | 263 | | | | 4,105 | |
Redeemed | | | (12,648 | ) | | | (196,525 | ) | | | (28,036 | ) | | | (439,160 | ) |
| | | | | | | | | | | | | | | | |
Net change | | | (11,261 | ) | | $ | (175,476 | ) | | | (25,679 | ) | | $ | (403,665 | ) |
| | | | | | | | | | | | | | | | |
| Class Y | |
Issued from the sale of shares | | | 6,302,053 | | | $ | 95,742,078 | | | | 2,374,121 | | | $ | 36,711,691 | |
Issued in connection with the reinvestment of distributions | | | 34,360 | | | | 498,728 | | | | 8,278 | | | | 130,618 | |
Redeemed | | | (3,097,465 | ) | | | (45,769,567 | ) | | | (318,518 | ) | | | (4,919,489 | ) |
| | | | | | | | | | | | | | | | |
Net change | | | 3,238,948 | | | $ | 50,471,239 | | | | 2,063,881 | | | $ | 31,922,820 | |
| | | | | | | | | | | | | | | | |
Increase from capital share transactions | | | 3,197,663 | | | $ | 49,826,241 | | | | 2,087,501 | | | $ | 32,303,743 | |
| | | | | | | | | | | | | | | | |
| | | | | | | | | | | | | | | | |
| | | Year Ended
December 31, 2022 | | | Year Ended
December 31, 2021 | |
| Global Green Bond Fund | | Shares | | | Amount | | | Shares | | | Amount | |
| Class A | |
Issued from the sale of shares | | | 224,455 | | | $ | 2,033,286 | | | | 330,121 | | | $ | 3,478,742 | |
Issued in connection with the reinvestment of distributions | | | 36,736 | | | | 308,268 | | | | 18,695 | | | | 191,969 | |
Redeemed | | | (271,498 | ) | | | (2,361,128 | ) | | | (205,158 | ) | | | (2,165,159 | ) |
| | | | | | | | | | | | | | | | |
Net change | | | (10,307 | ) | | $ | (19,574 | ) | | | 143,658 | | | $ | 1,505,552 | |
| | | | | | | | | | | | | | | | |
| Class N | |
Issued from the sale of shares | | | 325,512 | | | $ | 2,912,104 | | | | 402,160 | | | $ | 4,252,330 | |
Issued in connection with the reinvestment of distributions | | | 35,400 | | | | 298,746 | | | | 27,746 | | | | 286,884 | |
Redeemed | | | (508,558 | ) | | | (4,731,582 | ) | | | (723,427 | ) | | | (7,634,063 | ) |
| | | | | | | | | | | | | | | | |
Net change | | | (147,646 | ) | | $ | (1,520,732 | ) | | | (293,521 | ) | | $ | (3,094,849 | ) |
| | | | | | | | | | | | | | | | |
| Class Y | |
Issued from the sale of shares | | | 1,025,177 | | | $ | 9,141,286 | | | | 1,803,141 | | | $ | 19,007,559 | |
Issued in connection with the reinvestment of distributions | | | 162,421 | | | | 1,369,017 | | | | 84,947 | | | | 873,670 | |
Redeemed | | | (1,230,856 | ) | | | (10,806,351 | ) | | | (763,186 | ) | | | (8,021,816 | ) |
| | | | | | | | | | | | | | | | |
Net change | | | (43,258 | ) | | $ | (296,048 | ) | | | 1,124,902 | | | $ | 11,859,413 | |
| | | | | | | | | | | | | | | | |
Increase (decrease) from capital share transactions | | | (201,211 | ) | | $ | (1,836,354 | ) | | | 975,039 | | | $ | 10,270,116 | |
| | | | | | | | | | | | | | | | |
91 |
Notes to Financial Statements (continued)
December 31, 2022
13. Capital Shares (continued).
| | | | | | | | | | | | | | | | |
| | | Year Ended
December 31, 2022 | | | Year Ended
December 31, 2021 | |
| Global Sustainable Equity Fund | | Shares | | | Amount | | | Shares | | | Amount | |
| Class A | |
Issued from the sale of shares | | | 633,351 | | | $ | 10,228,563 | | | | 730,171 | | | $ | 15,268,213 | |
Issued in connection with the reinvestment of distributions | | | 54,978 | | | | 948,248 | | | | 137,134 | | | | 2,803,008 | |
Redeemed | | | (883,055 | ) | | | (13,688,073 | ) | | | (484,741 | ) | | | (10,404,320 | ) |
| | | | | | | | | | | | | | | | |
Net change | | | (194,726 | ) | | $ | (2,511,262 | ) | | | 382,564 | | | $ | 7,666,901 | |
| | | | | | | | | | | | | | | | |
| Class C | |
Issued from the sale of shares | | | 127,671 | | | $ | 2,080,308 | | | | 335,039 | | | $ | 6,688,657 | |
Issued in connection with the reinvestment of distributions | | | 13,506 | | | | 224,871 | | | | 35,331 | | | | 691,330 | |
Redeemed | | | (230,165 | ) | | | (3,378,088 | ) | | | (82,377 | ) | | | (1,707,925 | ) |
| | | | | | | | | | | | | | | | |
Net change | | | (88,988 | ) | | $ | (1,072,909 | ) | | | 287,993 | | | $ | 5,672,062 | |
| | | | | | | | | | | | | | | | |
| Class N | |
Issued from the sale of shares | | | 6,250,775 | | | $ | 105,399,673 | | | | 7,851,561 | | | $ | 166,251,848 | |
Issued in connection with the reinvestment of distributions | | | 581,695 | | | | 10,042,156 | | | | 1,098,456 | | | | 22,677,782 | |
Redeemed | | | (5,072,369 | ) | | | (79,685,344 | ) | | | (2,037,482 | ) | | | (42,874,998 | ) |
| | | | | | | | | | | | | | | | |
Net change | | | 1,760,101 | | | $ | 35,756,485 | | | | 6,912,535 | | | $ | 146,054,632 | |
| | | | | | | | | | | | | | | | |
| Class Y | |
Issued from the sale of shares | | | 17,246,094 | | | $ | 287,327,840 | | | | 23,278,352 | | | $ | 494,418,241 | |
Issued in connection with the reinvestment of distributions | | | 1,489,114 | | | | 25,731,128 | | | | 3,260,207 | | | | 67,203,764 | |
Redeemed | | | (17,853,965 | ) | | | (281,709,316 | ) | | | (24,519,480 | ) | | | (529,966,929 | ) |
| | | | | | | | | | | | | | | | |
Net change | | | 881,243 | | | $ | 31,349,652 | | | | 2,019,079 | | | $ | 31,655,076 | |
| | | | | | | | | | | | | | | | |
Increase from capital share transactions | | | 2,357,630 | | | $ | 63,521,966 | | | | 9,602,171 | | | $ | 191,048,671 | |
| | | | | | | | | | | | | | | | |
| | | | | | | | | | | | | | | | |
| | | Year Ended
December 31, 2022 | | | Year Ended
December 31, 2021 | |
| International Sustainable Equity Fund | | Shares | | | Amount | | | Shares | | | Amount | |
| Class A | |
Issued from the sale of shares | | | 68,704 | | | $ | 727,987 | | | | 20,848 | | | $ | 301,831 | |
Issued in connection with the reinvestment of distributions | | | 2,437 | | | | 25,462 | | | | 621 | | | | 8,864 | |
Redeemed | | | (29,117 | ) | | | (307,887 | ) | | | (427 | ) | | | (6,066 | ) |
| | | | | | | | | | | | | | | | |
Net change | | | 42,024 | | | $ | 445,562 | | | | 21,042 | | | $ | 304,629 | |
| | | | | | | | | | | | | | | | |
| Class N | |
Issued from the sale of shares | | | 309,325 | | | $ | 3,440,154 | | | | 1,061,665 | | | $ | 15,350,795 | |
Issued in connection with the reinvestment of distributions | | | 26,059 | | | | 273,620 | | | | 32,137 | | | | 457,863 | |
Redeemed | | | (1,543,327 | ) | | | (16,210,215 | ) | | | (356,899 | ) | | | (5,294,442 | ) |
| | | | | | | | | | | | | | | | |
Net change | | | (1,207,943 | ) | | $ | (12,496,441 | ) | | | 736,903 | | | $ | 10,514,216 | |
| | | | | | | | | | | | | | | | |
| Class Y | |
Issued from the sale of shares | | | 89,827 | | | $ | 983,179 | | | | 129,002 | | | $ | 1,885,986 | |
Issued in connection with the reinvestment of distributions | | | 2,813 | | | | 29,504 | | | | 2,927 | | | | 41,940 | |
Redeemed | | | (139,767 | ) | | | (1,453,883 | ) | | | (13,329 | ) | | | (201,164 | ) |
| | | | | | | | | | | | | | | | |
Net change | | | (47,127 | ) | | $ | (441,200 | ) | | | 118,600 | | | $ | 1,726,762 | |
| | | | | | | | | | | | | | | | |
Increase (decrease) from capital share transactions | | | (1,213,046 | ) | | $ | (12,492,079 | ) | | | 876,545 | | | $ | 12,545,607 | |
| | | | | | | | | | | | | | | | |
| 92
Notes to Financial Statements (continued)
December 31, 2022
13. Capital Shares (continued).
| | | | | | | | | | | | | | | | |
| | | Year Ended
December 31, 2022 | | | Year Ended
December 31, 2021 | |
| U.S. Sustainable Equity Fund | | Shares | | | Amount | | | Shares | | | Amount | |
| Class A | |
Issued from the sale of shares | | | 8,597 | | | $ | 88,519 | | | | 835 | | | $ | 10,270 | |
Issued in connection with the reinvestment of distributions | | | 22 | | | | 223 | | | | 50 | | | | 623 | |
Redeemed | | | (9,310 | ) | | | (86,739 | ) | | | — | | | | — | |
| | | | | | | | | | | | | | | | |
Net change | | | (691 | ) | | $ | 2,003 | | | | 885 | | | $ | 10,893 | |
| | | | | | | | | | | | | | | | |
| Class C | |
Issued from the sale of shares | | | — | | | $ | — | | | | 7,608 | | | $ | 99,355 | |
Issued in connection with the reinvestment of distributions | | | 528 | | | | 5,225 | | | | 409 | | | | 5,097 | |
| | | | | | | | | | | | | | | | |
Net change | | | 528 | | | $ | 5,225 | | | | 8,017 | | | $ | 104,452 | |
| | | | | | | | | | | | | | | | |
| Class N | |
Redeemed | | | — | | | | — | | | | (111,465 | ) | | | (1,400,000 | ) |
| | | | | | | | | | | | | | | | |
Net change | | | — | | | $ | — | | | | (111,465 | ) | | $ | (1,400,000 | ) |
| | | | | | | | | | | | | | | | |
| Class Y | |
Issued from the sale of shares | | | 1,793 | | | $ | 17,237 | | | | 16,848 | | | $ | 195,494 | |
Issued in connection with the reinvestment of distributions | | | 261 | | | | 2,602 | | | | 190 | | | | 2,393 | |
Redeemed | | | (254 | ) | | | (2,531 | ) | | | (13,605 | ) | | | (157,637 | ) |
| | | | | | | | | | | | | | | | |
Net change | | | 1,800 | | | $ | 17,308 | | | | 3,433 | | | $ | 40,250 | |
| | | | | | | | | | | | | | | | |
Increase (decrease) from capital share transactions | | | 1,637 | | | $ | 24,536 | | | | (99,130 | ) | | $ | (1,244,405 | ) |
| | | | | | | | | | | | | | | | |
93 |
Report of Independent Registered Public Accounting Firm
To the Board of Trustees of Gateway Trust and Natixis Funds Trust I and Shareholders of Gateway Fund, Gateway Equity Call Premium Fund, Mirova Global Green Bond Fund, Mirova Global Sustainable Equity Fund, Mirova International Sustainable Equity Fund and Mirova U.S. Sustainable Equity Fund
Opinions on the Financial Statements
We have audited the accompanying statements of assets and liabilities, including the portfolios of investments, of Gateway Fund and Gateway Equity Call Premium Fund (two of the funds constituting Gateway Trust), Mirova Global Green Bond Fund, Mirova Global Sustainable Equity Fund, Mirova International Sustainable Equity Fund and Mirova U.S. Sustainable Equity Fund (four of the funds constituting Natixis Funds Trust I) (hereafter collectively referred to as the “Funds”) as of December 31, 2022, the related statements of operations for the year ended December 31, 2022, the statements of changes in net assets for each of the two years in the period ended December 31, 2022, including the related notes, and the financial highlights for each of the periods indicated therein (collectively referred to as the “financial statements”). In our opinion, the financial statements present fairly, in all material respects, the financial position of each of the Funds as of December 31, 2022, the results of each of their operations for the year then ended, the changes in each of their net assets for each of the two years in the period ended December 31, 2022, and each of the financial highlights for each of the periods indicated therein, in conformity with accounting principles generally accepted in the United States of America.
Basis for Opinions
These financial statements are the responsibility of the Funds’ management. Our responsibility is to express an opinion on the Funds’ financial statements based on our audits. We are a public accounting firm registered with the Public Company Accounting Oversight Board (United States) (PCAOB) and are required to be independent with respect to the Funds in accordance with the U.S. federal securities laws and the applicable rules and regulations of the Securities and Exchange Commission and the PCAOB.
We conducted our audits of these financial statements in accordance with the standards of the PCAOB. Those standards require that we plan and perform the audit to obtain reasonable assurance about whether the financial statements are free of material misstatement, whether due to error or fraud.
Our audits included performing procedures to assess the risks of material misstatement of the financial statements, whether due to error or fraud, and performing procedures that respond to those risks. Such procedures included examining, on a test basis, evidence regarding the amounts and disclosures in the financial statements. Our audits also included evaluating the accounting principles used and significant estimates made by management, as well as evaluating the overall presentation of the financial statements. Our procedures included confirmation of securities owned as of December 31, 2022 by correspondence with the custodian and brokers; when replies were not received from brokers, we performed other auditing procedures. We believe that our audits provide a reasonable basis for our opinions.
/s/PricewaterhouseCoopers LLP
Boston, Massachusetts
February 22, 2023
We have served as the auditor of one or more of the investment companies in the Natixis Investment Company Complex since at least 1995. We have not been able to determine the specific year we began serving as auditor.
| 94
2022 U.S. Tax Distribution Information to Shareholders (Unaudited)
Corporate Dividends Received Deduction. For the fiscal year ended December 31, 2022, a percentage of dividends distributed by the Funds listed below qualify for the dividends received deduction for corporate shareholders. These percentages are as follows:
| | | | |
Fund | | Qualifying
Percentage | |
Gateway Fund | | | 100.00 | % |
Gateway Equity Call Premium Fund | | | 100.00 | % |
Global Sustainable Equity Fund | | | 92.12 | % |
U.S. Sustainable Equity Fund | | | 14.68 | % |
Capital Gains Distributions. Pursuant to Internal Revenue Section 852(b), the following Funds paid distributions, which have been designated as capital gains distributions for the fiscal year ended December 31, 2022.
| | | | |
Fund | | Amount | |
Global Green Bond Fund | | $ | 1,902,630 | |
Global Sustainable Equity Fund | | | 23,809,481 | |
U.S. Sustainable Equity Fund | | | 100,196 | |
Qualified Dividend Income. For the fiscal year ended December 31, 2022, a percentage of the ordinary income dividends paid by the Funds are considered qualified dividend income eligible for reduced tax rates. These lower rates range from 0% to 20% depending on an individual’s tax bracket. If the Funds paid a distribution during calendar year 2022, complete information will be reported in conjunction with Form 1099-DIV. These percentages are noted below:
| | | | |
Fund | | Qualifying
Percentage | |
Gateway Fund | | | 100.00 | % |
Gateway Equity Call Premium Fund | | | 100.00 | % |
Global Sustainable Equity Fund | | | 70.78 | % |
International Sustainable Equity Fund | | | 100.00 | % |
U.S. Sustainable Equity Fund | | | 23.08 | % |
Foreign Tax Credit. For the year ended December 31, 2022, the Fund intends to pass through foreign tax credits and have derived gross income from sources within foreign countries amounting to:
| | | | | | | | |
Fund | | Foreign Tax Credit Pass-Through | | | Foreign Source Income | |
International Sustainable Equity Fund | | $ | 51,801 | | | $ | 621,377 | |
95 |
Trustee and Officer Information
The tables below provide certain information regarding the Trustees and officers of Natixis Funds Trust I and Gateway Trust (the “Trusts”). Unless otherwise indicated, the address of all persons below is 888 Boylston Street, Suite 800, Boston, MA 02199-8197. The Funds’ Statement of Additional Information includes additional information about the Trustees of the Trusts and is available by calling Natixis Funds at 800-225-5478.
| | | | | | | | |
Name and Year of Birth | | Position(s) Held with
the Trusts, Length
of Time Served and Term of Office1 | | Principal
Occupation(s)
During Past 5 Years | | Number of Portfolios
in Fund Complex
Overseen2 and Other
Directorships Held
During Past 5 Years | | Experience,
Qualifications,
Attributes, Skills for
Board Membership |
| | | |
| INDEPENDENT TRUSTEES | | | | | | |
| | | | |
Edmond J. English
(1953) | | Trustee since 2013 Chairperson of the Governance Committee and Contract Review Committee Member | | Executive Chairman of Bob’s Discount Furniture (retail) | | 54 Director, Burlington Stores, Inc. (retail); Director, Rue Gilt Groupe, Inc. (e-commerce retail) | | Significant experience on the Board and on the boards of other business organizations (including retail companies and a bank); executive experience (including at a retail company) |
| | | | |
Richard A. Goglia
(1951) | | Trustee since 2015 Audit Committee Member and Governance Committee Member | | Retired | | 54 Formerly, Director, Triumph Group (aerospace industry) | | Significant experience on the Board and executive experience (including his role as vice president and treasurer of a defense company and experience at a financial services company) |
| | | | |
Wendell J. Knox
(1948) | | Trustee since 2009 Chairperson of the Contract Review Committee | | Retired | | 54 Director, Abt Associates Inc. (research and consulting); Director, The Hanover Insurance Group (property and casualty insurance); formerly, Director, Eastern Bank (bank) | | Significant experience on the Board and on the boards of other business organizations (including at a bank and at a property and casualty insurance firm); executive experience (including roles as president and chief executive officer of a research and consulting company) |
| | | | |
Martin T. Meehan
(1956) | | Trustee since 2012 Contract Review Committee Member and Governance Committee Member | | President, University of Massachusetts | | 54 None | | Significant experience on the Board and on the boards of other business organizations; experience as President of the University of Massachusetts; government experience (including as a member of the U.S. House of Representatives); academic experience |
| 96
Trustee and Officer Information
| | | | | | | | |
Name and Year of Birth | | Position(s) Held with
the Trusts, Length
of Time Served and Term of Office1 | | Principal
Occupation(s)
During Past 5 Years | | Number of Portfolios
in Fund Complex
Overseen2 and Other
Directorships Held
During Past 5 Years | | Experience,
Qualifications,
Attributes, Skills for
Board Membership |
| | | |
| INDEPENDENT TRUSTEES – continued | | | | | | |
| | | | |
Maureen B. Mitchell
(1951) | | Trustee since 2017 Contract Review Committee Member and Governance Committee Member | | Retired | | 54 Director, Sterling Bancorp (bank) | | Significant experience on the Board; financial services industry and executive experience (including role as president of global sales and marketing at a financial services company) |
| | | | |
James P. Palermo
(1955) | | Trustee since 2016 Audit Committee Member | | Founding Partner, Breton Capital Management, LLC (private equity); Partner, STEP Partners, LLC (private equity) | | 54 Director, FutureFuel.io (chemicals and biofuels) | | Significant experience on the Board; financial services industry and executive experience (including roles as chief executive officer of client management and asset servicing for a banking and financial services company) |
| | | | |
Erik R. Sirri
(1958) | | Chairperson of the Board of Trustees since 2021 Trustee since 2009 Ex Officio member of the Audit Committee, Contract Review Committee and Governance Committee | | Professor of Finance at Babson College | | 54 None | | Significant experience on the Board; experience as Director of the Division of Trading and Markets at the Securities and Exchange Commission; academic experience; training as an economist |
| | | | |
Peter J. Smail
(1952) | | Trustee since 2009 Audit Committee Member | | Retired | | 54 None | | Significant experience on the Board; mutual fund industry and executive experience (including roles as president and chief executive officer for an investment adviser) |
97 |
Trustee and Officer Information
| | | | | | | | |
Name and Year of Birth | | Position(s) Held with
the Trusts, Length
of Time Served and Term of Office1 | | Principal
Occupation(s)
During Past 5 Years | | Number of Portfolios
in Fund Complex
Overseen2 and Other
Directorships Held
During Past 5 Years | | Experience,
Qualifications,
Attributes, Skills for
Board Membership |
| | | |
| INDEPENDENT TRUSTEES – continued | | | | | | |
| | | | |
Kirk A. Sykes
(1958) | | Trustee since 2019 Audit Committee Member and Governance Committee Member | | Managing Director of Accordia Partners, LLC (real estate development); President of Primary Corporation (real estate development); Managing Principal of Merrick Capital Partners (infrastructure finance) | | 54 Advisor, Eastern Bank (bank); Director, Apartment Investment and Management Company (real estate investment trust); formerly, Director, Ares Commercial Real Estate Corporation (real estate investment trust) | | Experience on the Board and significant experience on the boards of other business organizations (including real estate companies and banks) |
| | | | |
Cynthia L. Walker
(1956) | | Trustee since 2005 Chairperson of the Audit Committee | | Retired; Formerly, Deputy Dean for Finance and Administration, Yale University School of Medicine | | 54 None | | Significant experience on the Board; executive experience in a variety of academic organizations (including roles as dean for finance and administration) |
| | | |
| INTERESTED TRUSTEES | | | | | | |
| | | | |
Kevin P. Charleston3
(1965) One Financial Center Boston, MA 02111 | | Trustee since 2015 | | President, Chief Executive Officer and Chairman of the Board of Directors, Loomis, Sayles & Company, L.P. | | 54 None | | Significant experience on the Board; continuing service as President, Chief Executive Officer and Chairman of the Board of Directors of Loomis, Sayles & Company, L.P. |
| | | | |
David L. Giunta4
(1965) | | Trustee since 2011 President and Chief Executive Officer | | President and Chief Executive Officer, Natixis Advisors, LLC and Natixis Distribution, LLC | | 54 None | | Significant experience on the Board; experience as President and Chief Executive Officer of Natixis Advisors, LLC and Natixis Distribution, LLC |
| 1 | Each Trustee serves until retirement, resignation or removal from the Board. The current retirement age is 75. The position of Chairperson of the Board is appointed for a three-year term. |
| 2 | The Trustees of the Trusts serve as Trustees of a fund complex that includes all series of the Natixis Funds Trust I, Natixis Funds Trust II, Natixis Funds Trust IV, Gateway Trust, Loomis Sayles Funds I, Loomis Sayles Funds II, Natixis ETF Trust and Natixis ETF Trust II (collectively, the “Fund Complex”). |
| 3 | Mr. Charleston is deemed an “interested person” of the Trusts because he holds the following positions with an affiliated person of the Trusts: President, Chief Executive Officer and Chairman of the Board of Directors of Loomis, Sayles & Company, L.P. |
| 4 | Mr. Giunta is deemed an “interested person” of the Trusts because he holds the following positions with an affiliated person of the Trusts: President and Chief Executive Officer, Natixis Advisors, LLC and Natixis Distribution, LLC. |
| 98
Trustee and Officer Information
| | | | | | |
Name and Year of Birth | | Position(s) Held
with the Trusts | | Term of Office1 and Length
of Time Served | | Principal Occupation(s)
During Past 5 Years2 |
| | |
| OFFICERS OF THE TRUSTS | | | | |
| | | |
Matthew Block
(1981) | | Treasurer, Principal Financial and Accounting Officer | | Since 2022 | | Senior Vice President, Natixis Advisors, LLC and Natixis Distribution, LLC; formerly, Vice President, Natixis Advisors, LLC and Natixis Distribution, LLC; Assistant Treasurer of the Fund Complex; Managing Director, State Street Bank and Trust Company |
| | | |
Susan McWhan Tobin
(1963) | | Secretary and Chief Legal Officer | | Since 2022 | | Executive Vice President, General Counsel and Secretary, Natixis Advisors, LLC and Natixis Distribution, LLC; formerly, Executive Vice President and Chief Compliance Officer of Natixis Investment Managers (March 2019– May 2022) and Senior Vice President and Head of Compliance, US for Natixis Investment Managers (July 2011–March 2019) |
| | | |
Natalie R. Wagner
(1979) | | Chief Compliance Officer, Assistant Secretary and Anti-Money Laundering Officer | | Since 2021 | | Senior Vice President, Natixis Advisors, LLC and Natixis Distribution, LLC; formerly, Vice President, Head of Corporate Compliance, Global Atlantic Financial Group |
| 1 | Each officer of the Trusts serves for an indefinite term in accordance with the Trusts’ current by-laws until the date his or her successor is elected and qualified, or until he or she sooner dies, retires, is removed or becomes disqualified. |
| 2 | Each person listed above, except as noted, holds the same position(s) with the Fund Complex. Previous positions during the past five years with Natixis Distribution, LLC, Natixis Advisors, LLC or Loomis, Sayles & Company, L.P. are omitted, if not materially different from an officer’s current position with such entity. |
99 |
(b) Not Applicable.
Item 2. Code of Ethics.
The Registrant has adopted a code of ethics that applies to the Registrant’s principal executive officer, principal financial officer and persons performing similar functions. There have been no amendments or waivers of the Registrant’s code of ethics during the period.
Item 3. Audit Committee Financial Expert.
The Board of Trustees of the Registrant has established an audit committee. Mr. Richard A. Goglia, Mr. James Palermo, Mr. Peter J. Smail, Mr. Kirk A. Sykes and Ms. Cynthia L. Walker are members of the audit committee and have been designated as “audit committee financial experts” by the Board of Trustees. Each of these individuals is also an Independent Trustee of the Registrant.
Item 4. Principal Accountant Fees and Services.
Fees billed by the Principal Accountant for services rendered to the Registrant.
The table below sets forth fees billed by the principal accountant, PricewaterhouseCoopers LLP, for the past two fiscal years for professional services rendered in connection with a) the audit of the Registrant’s annual financial statements and services provided in connection with regulatory filings; b) audit-related services (including services that are reasonably related to the performance of the audit of the Registrant’s financial statements but not reported under “Audit Fees”); c) tax compliance, tax advice and tax planning and d) all other fees billed for professional services rendered by the principal accountant to the Registrant, other than the services provided as reported as a part of (a) through (c) of this Item.
| | | | | | | | | | | | | | | | | | | | | | | | | | | | | | | | |
| | | Audit fees | | | Audit-related fees1 | | | Tax fees2 | | | All other fees | |
| | | | | | | | | | | | | | | | | | | | | | | | | |
| | | 1/1/21-12/31/21 | | | 1/1/22-12/31/22 | | | 1/1/21-12/31/21 | | | 1/1/22-12/31/22 | | | 1/1/21-12/31/21 | | | 1/1/22-12/31/22 | | | 1/1/21-12/31/21 | | | 1/1/22-12/31/22 | |
Natixis Funds Trust I (except Loomis Sayles Core Plus Bond Fund) | | $ | 239,331 | | | $ | 253,693 | | | $ | 480 | | | $ | 519 | | | $ | 93,292 | | | $ | 83,610 | | | $ | — | | | $ | — | |
| | 1. | Audit-related fees consist of: |
2021 & 2022 – performance of agreed-upon procedures related to the Registrant’s deferred compensation plan.
2021 & 2022 – review of the Registrant’s tax returns (2021 & 2022) and filings to reclaim withholding taxes paid on French dividends (2021 & 2022).
Aggregate fees billed to the Registrant for non-audit services during 2021 and 2022 were $93,772 and $84,129, respectively.
Fees billed by the Principal Accountant for services rendered to the Adviser and Control Affiliates.
The following table sets forth the fees billed by the Registrant’s principal accountant for non-audit services rendered to Natixis Advisors, LLC (“Natixis Advisors”), Mirova US LLC (“Mirova”) and entities controlling, controlled by or under common control with Natixis Advisors and Mirova (“Control Affiliates”) that provide ongoing services to the Registrant, for engagements that related directly to the operations and financial reporting of the Registrant for the last two fiscal years.
| | | | | | | | | | | | | | | | | | | | | | | | |
| | | Audit-related fees | | | Tax fees | | | All other fees | |
| | | 1/1/21-12/31/21 | | | 1/1/22- 12/31/22 | | | 1/1/21-12/31/21 | | | 1/1/22-12/31/22 | | | 1/1/21-12/31/21 | | | 1/1/22-12/31/22 | |
Control Affiliates | | $ | — | | | $ | — | | | $ | 31,137 | | | $ | 28,621 | | | $ | — | | | $ | 50,000 | |
The following table sets forth the aggregate fees billed by the Registrant’s principal accountant for non-audit services rendered to Mirova, Natixis Advisors and Control Affiliates that provide ongoing services to the Registrant, for the last two fiscal years, including the fees disclosed in the table above.
| | | | | | | | |
| | | Aggregate Non-Audit Fees | |
| | | 1/1/21-12/31/21 | | | 1/1/22-12/31/22 | |
Control Affiliates | | $ | 235,234 | | | $ | 341,351 | |
None of the services described above were approved pursuant to paragraph (c)(7)(i)(C) of Regulation S-X.
Audit Committee Pre-Approval Policies.
Annually, the Registrant’s Audit Committee reviews the audit, audit-related, tax and other non-audit services together with the projected fees, for services proposed to be rendered to the Registrant and/or other entities for which pre-approval is required during the upcoming year. Any subsequent revisions to already pre-approved services or fees (including fee increases) and requests for pre-approval of new services would be presented for consideration quarterly as needed.
If, in the opinion of management, a proposed engagement by the Registrant’s independent accountants needs to commence before the next regularly scheduled Audit Committee meeting, any member of the Audit Committee who is an independent Trustee of the Registrant is authorized to pre-approve the engagement, but only for engagements to provide audit, audit-related and tax services. This approval is subject to review by the full Audit Committee at its next quarterly meeting. All other engagements require the approval of all the members of the Audit Committee.
Item 5. Audit Committee of Listed Registrants.
Not applicable.
Item 6. Schedule of Investments.
Included as part of the Report to Shareholders filed as Item 1 herewith.
Item 7. Disclosure of Proxy Voting Policies and Procedures for Closed-End Management Investment Companies.
Not applicable.
Item 8. Portfolio Managers of Closed-End Management Investment Companies.
Not applicable.
Item 9. Purchases of Equity Securities by Closed-End Management Investment Companies and Affiliated Purchasers.
Not applicable.
Item 10. Submission of Matters to a Vote of Securities Holders.
There were no material changes to the procedures by which shareholders may recommend nominees to the Registrant’s Board of Trustees.
Item 11. Controls and Procedures.
The Registrant’s principal executive officer and principal financial officer have concluded that the Registrant’s disclosure controls and procedures are sufficient to ensure that information required to be disclosed by the Registrant in this Form N-CSR was recorded, processed, summarized and reported within the time periods specified in the Securities and Exchange Commission’s rules and forms, based upon such officers’ evaluation of these controls and procedures as of a date within 90 days of the filing date of the report.
There were no changes in the Registrant’s internal control over financial reporting that occurred during the period covered by the report that have materially affected, or is reasonably likely to materially affect, the Registrant’s internal control over financial reporting.
Item 12. Disclosure of Securities Lending Activities for Closed-End Management Investment Companies.
Not applicable.
Item 13. Exhibits.
SIGNATURES
Pursuant to the requirements of the Securities Exchange Act of 1934 and the Investment Company Act of 1940, the Registrant has duly caused this report to be signed on its behalf by the undersigned, thereunto duly authorized.
| | |
| Natixis Funds Trust I |
| |
| By: | | /s/ David L. Giunta |
| Name: | | David L. Giunta |
| Title: | | President and Chief Executive Officer |
| |
| Date: | | February 22, 2023 |
Pursuant to the requirements of the Securities Exchange Act of 1934 and the Investment Company Act of 1940, this report has been signed by the following persons on behalf of the Registrant and in the capacities and on the dates indicated.
| | |
| By: | | /s/ David L. Giunta |
| Name: | | David L. Giunta |
| Title: | | President and Chief Executive Officer |
| |
| Date: | | February 22, 2023 |
| |
| By: | | /s/ Matthew Block |
| Name: | | Matthew Block |
| Title: | | Treasurer and Principal Financial and |
| | Accounting Officer |
| |
| Date: | | February 22, 2023 |