UNITED STATES
SECURITIES AND EXCHANGE COMMISSION
Washington, D.C. 20549
FORM N-CSR
CERTIFIED SHAREHOLDER REPORT OF REGISTERED
MANAGEMENT INVESTMENT COMPANIES
Investment Company Act file number: 811-04323
Natixis Funds Trust I
(Exact name of Registrant as specified in charter)
888 Boylston Street, Suite 800, Boston, Massachusetts 02199-8197
(Address of principal executive offices) (Zip code)
Natalie Wagner, Esq.
Natixis Distribution, LLC
888 Boylston Street, Suite 800
Boston, Massachusetts 02199-8197
(Name and address of agent for service)
Registrant’s telephone number, including area code: (617) 449-2810
Date of fiscal year end: December 31
Date of reporting period: December 31, 2021
Item 1. Reports to Stockholders.
| (a) | The Registrant’s annual report transmitted to shareholders pursuant to Rule 30e-1 under the Investment Company Act of 1940 is as follows: |


Annual Report
December 31, 2021
Loomis Sayles International Growth Fund
Natixis Oakmark Fund
Natixis Oakmark International Fund
Natixis U.S. Equity Opportunities Fund
Vaughan Nelson Mid Cap Fund
Vaughan Nelson Small Cap Value Fund
Table of Contents

LOOMIS SAYLES INTERNATIONAL GROWTH FUND
| | | | |
| | |
| Manager | | Symbols | | |
| | |
| Aziz V. Hamzaogullari, CFA® | | Class A | | LIGGX |
| | |
| Loomis, Sayles & Company, L.P. | | Class C | | LIGCX |
| | |
| | Class N | | LIGNX |
| | |
| | Class Y | | LIGYX |
Investment Goal
The Fund’s investment goal is long-term growth of capital.
Market Conditions
International equities posted mixed results in 2021. The developed markets performed reasonably well, as investors reacted positively to rising vaccination rates and improving economic growth. In addition, world central banks maintained highly stimulative monetary policies for the majority of the year. Europe led the way, with notable strength for Switzerland, the UK and the oil-sensitive Nordic countries. Canada, which also has an above-average weighting in energy stocks, was another top performer for the year. However, Japan and other Asian markets lagged on a relative basis.
International equities trailed the US market for the fourth consecutive year, largely as a result of the lower representation of technology stocks outside of the US. The weakness in foreign currencies relative to the US dollar also took a sizable bite out of the developed markets’ returns for US-based investors in 2021.
Despite the positive showing for stocks elsewhere in the world, the emerging markets experienced a challenging year and finished with a loss. Improving global growth and higher commodity prices were tailwinds for the asset class, but these factors were outweighed by the prospect of rising US interest rates and strength in the US dollar. The slower vaccination rollout in many emerging countries was a further impediment to returns. China, which lagged considerably due to the combination of slowing growth, increased regulation and disruptions in the nation’s property market, was a key driver of the category’s underperformance.
Portfolio Results
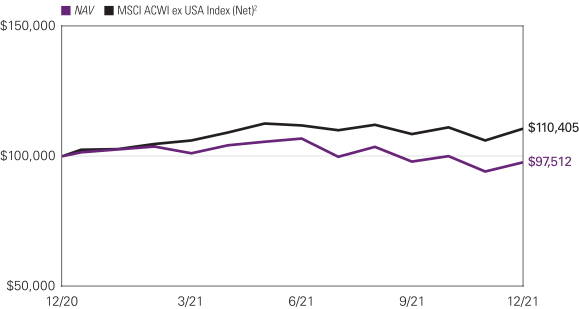
For the 12 months ended December 31, 2021, Class Y shares of the Loomis Sayles International Growth Fund returned -3.81% at net asset value. The Fund underperformed its benchmark, the MSCI All Country World Index ex USA Index (Net), which returned 7.82%.
Explanation of Fund Performance
We are an active manager with a long-term, private equity approach to investing. Through our proprietary bottom-up research framework, we look to invest in those few high-quality businesses with sustainable competitive advantages and profitable growth when they trade at a significant discount to intrinsic value. Given the rare confluence of quality, growth, and valuation, we may study dozens of companies but may only invest in a select few businesses each year. We believe identifying those few businesses with these characteristics is an art, not a science. As a result of this rigorous approach, ours is a selective, high-conviction portfolio of typically 30–45 names.
The Fund’s positions in Alibaba, Vipshop, and Tencent detracted the most from performance. Stock selection in the consumer discretionary, communication services, consumer staples, and energy sectors, as well as our allocations in the consumer discretionary, energy, communication services, consumer staples, industrials, and healthcare sectors detracted from relative performance.
A Fund holding since inception, Alibaba Group is a leading China e-commerce and consumer-engagement platform provider. With approximately 60% of China’s e-commerce transactions estimated to take place through its marketplaces, Alibaba is the world’s largest retail platform, and we believe Alibaba’s scale and interconnected sites create an unparalleled and difficult-to-replicate business ecosystem. Shares have been under pressure since late 2020 due to investor concern regarding increasing regulatory intervention by the Chinese government. In April, China’s State Administration for Market Regulation (SAMR) concluded that Alibaba’s practices had violated antitrust law. The company was fined approximately $2.8 billion and ordered to carry out “comprehensive” self-inspections to standardize business practices and ensure compliance with anti-monopoly laws. Alibaba cooperated fully with the investigation and has changed certain business practices. In August, China passed the Personal Information Protection Law (PIPL), which is focused on protecting personal information rights and interests by standardizing the handling and usage of personal information by businesses. We believe the focus of PIPL is similar to the General Data Protection Regulation (GDPR), which went into effect in the European Union in 2018. The GDPR impacted companies we own in other portfolios such as Alphabet and Facebook, which incurred increased compliance costs and other disruptions as they adjusted certain business practices to comply with the new regulations. However, both companies continued to generate strong growth in revenue and free cash flow due to their competitive advantages and strong value
1 |
propositions. While we expected that Alibaba would experience short-term disruptions as it modified its practices to fully comply with new regulatory changes, we did not believe the changes would ultimately impair the company’s difficult-to-replicate competitive advantages. More recently, we have observed increasing competitive pressure in two of the company’s smaller but faster-growing contributors: video streaming and penetration in lower-tier cities. Through the company’s Taobao Live, Alibaba offers a leading live-streaming social commercial platform, enabling merchants to interact with consumers. The relatively new medium has become a fast-growing vehicle for e-commerce sales, growing from less than 5% of China e-commerce two years earlier to almost 10% in 2020. While Alibaba continues to have a leadership position in live streaming and short video production, we have seen increased competition and market share gains from companies such as Douyin (China’s version of TikTok, owned by ByteDance) and Kuaishou. We expect this newer format will grow to represent approximately 25% of e-commerce sales over time. And while we expect Alibaba to remain a leader, we expect growing competition to take an increasing share of this fast-growing market over time. Growing competitive intensity has also impacted our assessment of Alibaba’s ongoing penetration of lower-tier cities. As internet access in lower-tier cities approaches that of higher-tier cities, we expect growth in e-commerce to be approximately twice that of overall China e-commerce growth. We believe Alibaba maintains leading market share in lower-tier cities, but is likely to face heightened competition from companies such as Pinduoduo, JD.com, and Meituan. We have long assumed that Alibaba’s disproportionate share of China e-commerce would decline, from over 80% at the time of our initial analysis in 2013, to a level closer to 50% of a still-growing market. While the company remains the dominant e-commerce platform in China, we estimate that a meaningful percentage of the company’s incremental growth in the most-recently reported quarter was from these markets where we are seeing signs of heightened competitive intensity. As a function of newer market entrants, faster growth from newer formats of e-commerce and lower-tier cities, and recent regulatory changes, we now expect the company’s market share to normalize at a lower level than we previously expected. While our ongoing analysis has lowered our assessment of intrinsic value for the company, it has not changed our assessment that Alibaba is a high-quality company that remains well positioned to benefit from secular growth in China e-commerce over our long-term investment horizon. We continue to believe that Alibaba trades at a discount to intrinsic value and offers asymmetric reward-to-risk. However, given our most recent analysis, it no longer justified the same degree of capital allocation relative to other opportunities, and we decreased our position size during the period.
Vipshop is a specialty internet retailer focused on off-season, off-price apparel and fashion items which it sells via flash sales. Founded in 2008 with the vision of introducing high-quality, branded fashion merchandise to the China market at value prices, the company is by far the largest flash retailer in China, and the largest player in the off-season, off-price category. In 2020, the company generated over $15 billion in net revenues across its core categories, and today the company is the 5th largest overall retailer in China. We believe that Vipshop creates a strong value proposition for both end customers and vendors alike, which in turn creates a strong network effect that has been difficult to replicate even by the largest e-commerce companies in China. A holding in the strategy since inception, Vipshop’s revenue growth decelerated throughout 2021, but still grew 27% year-over-year through the first three quarters, compared with an estimated 18.5% for total China e-commerce and 21% for the apparel and accessories category, indicating that the company continued to grow market share. The company provided guidance for lower-than-expected revenue growth in the fourth quarter, driven by a deterioration in China’s economic environment and weakening consumer sentiment. Shares have been under pressure throughout the year, first from the forced liquidation of Archegos Capital Management, which had Vipshop among its holdings, then from investor concern regarding increasing regulatory intervention by the Chinese government, and most recently from a slowdown in consumer demand in China. We believe that Vipshop remains a high-quality business benefiting from competitive advantages of brand, scale, and a positive network effect that should enable it to expand its market share as the leading discount branded apparel retailer in China. Further, management believes that the new regulatory restrictions on anti-competitive actions, such as merchant exclusivity provisions, will now enable merchants who were previously unable to sell through Vipshop to use its platform — further expanding its network. While the Covid-19 outbreak and resulting economic weakness have pressured growth over the past year, especially in the company’s smaller physical retail footprint, we believe the company’s reported growth rates reflect the resilience of the business, and that Vipshop will continue to benefit from structural growth in China e-commerce where it has a strong and defensible position in the off-season, off-price niche in which it competes. We believe the current market price embeds expectations for free cash flow growth that are well below our long-term assumptions. With its shares trading at a significant discount to our estimate of intrinsic value, we believe Vipshop offers a compelling reward-to-risk opportunity. We added to our position during the period.
Tencent Holdings is one of the largest internet services companies in China and globally, offering a wide array of value-added services that span social networking and communication, gaming, media and entertainment, and e-commerce and local services. The company also offers online advertising, cloud services, fintech solutions that include payment and wealth management offerings, and has investments in other related businesses. Founded in 1998, the company’s mission is to improve the quality of human life through internet services, and through its platform and ecosystem the company has become a leader in most segments of the internet industry in China. A Fund holding since inception, Tencent reported financial results during the period that were fundamentally solid but mixed with respect to consensus expectations, and growth decelerated due in part to macro and regulatory headwinds. Shares have been under pressure throughout the year due to investor concern regarding increased regulatory intervention by the Chinese government in a growing number of industries, including the internet, fintech, education, and gaming. In July, China’s SAMR fined
| 2
LOOMIS SAYLES INTERNATIONAL GROWTH FUND
the company $1.5 billion for practices within its streaming music business. The fine represented a small portion of the approximately $40 billion of cash on Tencent’s balance sheet. In fintech, we believe regulatory changes are likely to result in increased licensing requirements and guidelines around consumer and micro lending, information sharing, and disclosures, all of which are focused on reducing systematic risk and promoting healthy market development. We believe Tencent is generally compliant with most of the proposed changes, and we do not expect these developments to impact its competitive position. Most recently, China implemented restrictions on the amount of time minors can spend playing online games. Tencent management has embraced the new regulatory framework and highlighted the tools and restrictions it has introduced over the past several years to enable parents to manage minors’ gaming activity and limit both time spent and spending levels – in addition to announcing further restrictions. While gaming represents the company’s single largest source of revenue, approximately 40% of revenue in 2020, we believe the potential impact to the company is small as children under 16 accounted for less than 3% of the company’s gaming revenues. We do not believe that the fine or any of the proposed regulations materially impact Tencent’s strong and sustainable competitive advantages, which include its massive network and ecosystem, distribution, scale, and brand. We believe Tencent is one of the best-positioned companies in the China internet services industry. We believe the near-term uncertainty regarding the regulatory environment does not change the long-term fundamentals; as a leading consumer platform provider, we believe the structural expansion of internet users in China will position Tencent to benefit from multiple growth drivers including gaming, media, advertising, payments, and cloud-computing growth. We believe Tencent’s strong growth prospects are not currently reflected in its share price. As a result, we believe the company’s shares are trading at a significant discount to our estimate of intrinsic value, offering a compelling reward-to-risk opportunity.
The Fund’s positions in Wisetech Global, Novo Nordisk, and Roche contributed the most to performance. Stock selection in the information technology, healthcare, and industrials sectors, along with our allocation in the information technology sector, contributed positively to relative performance.
Wisetech Global is the leading software solutions provider to the global logistics industry. Founded in 1994 to provide freight-forwarding and customs software to the Australian logistics industry, Wisetech solutions are used in whole or in part by over 85% of the world’s 50 largest third-party logistics providers (3PLs) and all of the 25 largest freight forwarders, led by the company’s primary SAAS (software-as-a-service) platform, CargoWise One (CW1). From a single unified platform the company offers function-specific and enterprise-wide modules that support the complex international movement of goods and create substantial efficiencies for its logistics clients. The company’s vision is to become the world’s operating system for global logistics. A holding since Fund inception, Wisetech’s most-recently reported financial results, for its fiscal year ending June 2021, exceeded consensus expectations for revenue, EBITDA (earnings before interest, taxes, depreciation, and amortization), and EPS, and the company provided strong revenue and margin guidance for the current fiscal year. Total revenues increased 18% over the prior-year period and included 12% year-over-year revenue growth from the company’s existing customers, with every calendar-year cohort of new clients showing growth over the prior year, continuing a multi-year trend. The company also had a very successful year signing large new forwarders to its CW1 platform with six wins during the period, and now has 10 of the top 25 that have rolled out CW1 as their global platform or are in the process of doing so. We believe Wisetech benefits from strong and sustainable competitive advantages that include an installed client base with high switching costs, its freight-forwarding industry expertise, significant investments in research and development (R&D), its brand, and network. We believe Wisetech will benefit from secular growth in logistics software and services as companies increasingly move towards outsourcing and away from less effective in-house solutions. With virtually no comparable off-the-shelf competition to its unified global platform, Wisetech is the dominant market share leader in its legacy freight-forwarding market, which still represents only a mid-single-digit share of the overall global logistics and transportation market spending on supply chain management solutions. Through underlying industry growth, continued market share gains in its legacy freight-forwarding market, and ongoing penetration of other parts of the logistics industry performed by 3PLs, including warehouse management, land transportation, and cargo handling, we believe the company can generate compounded annual revenue growth in the high teens over our long-term investment horizon, with faster growth in operating profits and free cash flow as the company benefits from scale and operating leverage. We believe the expectations embedded in Wisetech’s share price continue to underestimate the company’s superior positioning and the sustainability of its growth. As a result, we believe the shares trade at a meaningful discount to our estimate of intrinsic value and represent an attractive reward-to-risk opportunity.
Headquartered in Denmark, Novo Nordisk is a global healthcare company with nearly 100 years of innovation and leadership in diabetes care. Over this time, Novo has amassed unparalleled experience in the biology of diabetes, expertise in protein science, and developed significant competitive advantages as a result. Its diabetes products have captured approximately one-third of the global branded diabetes care market and account for about 80% of the company’s annual revenues. In its biopharmaceutical business segment, which represents almost 15% of annual revenues, Novo Nordisk has leading positions within hemophilia care, growth hormone therapy, and hormone replacement therapy. We believe Novo’s strong and sustainable advantages include its deep experience in diabetes care and therapeutic proteins, strong infrastructure that took decades to build, efficient manufacturing techniques, a robust pipeline, and economies of scale. A Fund holding since inception, Novo reported solid operating results throughout the period that
3 |
were generally ahead of consensus expectations and reflected a rebound in activity that was depressed in the prior-year period due to Covid-19. In particular, growth was led by the company’s GLP-1 class of therapies — a quickly growing class of non-insulin, anti-diabetic treatments that can postpone the need for insulin for two to four years. Novo’s class-leading Ozempic, a once-weekly therapy with comparable safety and superior efficacy to existing therapies, has contributed to greater penetration of the GLP-1 market as well as share gains from its leading competitor, while Rybelsus, an oral version of Ozempic and the company’s newest GLP-1 innovation, has quickly captured almost 13% of all new prescriptions after its launch in late 2019. In addition to targeting diabetes with its GLP-1s, during the year, Novo received approval for semaglutide (the same molecule behind Ozempic and Rybelsus) in the obesity setting under the brand name Wegovy. While the company is navigating operational challenges that have limited the initial production of Wegovy, the company is seeing robust early demand. Diabetes is a global epidemic with an estimated population of 460 million. The market has been growing annually in the low double digits over the last ten years, driven by aging of the global population and increasing obesity. We believe Novo’s deep experience in diabetes care, differentiated product suite, and leading innovation should enable the company to grow revenues in the high single digits over our long-term investment horizon, with faster growth in free cash flow. We believe the company’s shares continue to sell at a meaningful discount to our estimate of intrinsic value and offer an attractive reward-to-risk opportunity.
Founded in Basel, Switzerland in 1896, Roche is a global biopharmaceutical and diagnostics company. An industry leader in the development and marketing of oncology products, Roche also has a broad product profile with industry-leading therapies and a robust development pipeline across major indications including immunology, infectious disease, ophthalmology, and neuroscience. We believe Roche has substantial and sustainable competitive advantages that include its expertise and reputation within oncology, an integrated diagnostics business, its biologics capability, and its commercialization experience which includes its regulatory experience and scale in manufacturing and distribution. A Fund holding since inception, Roche reported results during the period that were fundamentally solid and generally ahead of consensus expectations. The company benefited from faster growth in its smaller diagnostics division, where its success in rapid development and deployment of Covid-19 testing has highlighted its leadership position in the diagnostics market and has provided a valuable offset to the pandemic-related pressures in the pharmaceuticals division. While we expect pandemic-related demand to wane in the short-to-medium term, we believe the true long-term value of the diagnostics business will persist as it resides in its ability to support and differentiate the innovation within the company’s pharmaceuticals business. In pharmaceuticals, continued strength in the company’s more-recently launched growth products, including Ocrevus for multiple sclerosis and Hemlibra for hemophilia A, more than offset the ongoing decline in its mature oncology products. We believe Roche is successfully managing the inevitable decline for its leading off-patent oncology therapies, advancing its next-generation cancer therapy franchise through innovative follow-on and combination therapies as well as improved administration methods, and products launched since 2012 have collectively grown to reach 52% of sales as of the company’s most-recently reported financial results. In addition to its more-recently launched growth products, we believe Roche’s deep internally developed pipeline, which reflects over $100 billion invested in R&D over the past decade, combined with its ability to identify and capitalize on externally developed technologies such as its acquisition of Spark Therapeutics’ gene therapy platform, provides a significant platform for future growth. We believe Roche continues to execute well operationally, redeploying the cash flows from its mature core franchise to support product extensions and ongoing innovation. The company has a strong lineup of marketed biologic therapies, a growing suite of newly introduced products, and significant and robust pipeline assets that can drive significant long-term value for Roche. While the company now faces biosimilar competition in the US for its mature oncology franchise, we believe the current market price for Roche shares embeds expectations for key revenue and cash flow growth drivers that are well below our long-term assumptions. As a result, we believe the company is selling at a significant discount to our estimate of intrinsic value and offers a compelling reward-to-risk opportunity.
All aspects of our quality-growth-valuation investment thesis must be present simultaneously for us to make an investment. Often our research is completed well in advance of the opportunity to invest. We are patient investors and maintain coverage of high-quality businesses in order to take advantage of meaningful price dislocations if and when they occur. During the period we initiated a new position in CRISPR Therapeutics. We added to our existing holdings in Vipshop. We trimmed our existing positions in Alibaba, Kweichow Moutai, and Yum China. We also trimmed our position in MercadoLibre as it approached our maximum allowable position size. We sold our position in Kuehne + Nagel as it reached our view of intrinsic value.
Outlook
Our investment process is characterized by bottom-up fundamental research and a long-term investment time horizon. The nature of the process leads to a lower-turnover portfolio in which sector positioning is the result of stock selection. The Fund ended the year with overweight positions in the consumer staples, healthcare, consumer discretionary, information technology, and communication services sectors and was underweight in the industrials and energy sectors. We had no exposure to stocks in the financials, materials, utilities, or real estate sectors. From a geographic standpoint we were overweight in Europe and North America, underweight in developed Asia, and approximately equal weight in emerging markets.
| 4
LOOMIS SAYLES INTERNATIONAL GROWTH FUND
Hypothetical Growth of $100,000 Investment in Class Y Shares3
December 15, 2020 (inception) through December 31, 2021
Top Ten Holdings as of December 31, 2021
| | | | | | | | |
| | |
| Security Name | | % of
Net Assets | |
| | 1 | | | Roche Holding AG | | | 6.81 | % |
| | 2 | | | WiseTech Global Ltd. | | | 6.00 | % |
| | 3 | | | MercadoLibre, Inc. | | | 5.97 | % |
| | 4 | | | Adyen NV | | | 5.73 | % |
| | 5 | | | Tencent Holdings Ltd. | | | 5.50 | % |
| | 6 | | | Novartis AG, (Registered) | | | 4.79 | % |
| | 7 | | | Kweichow Moutai Co. Ltd., Class A | | | 4.28 | % |
| | 8 | | | Nestle S.A., (Registered) | | | 4.08 | % |
| | 9 | | | Novo Nordisk A/S, Class B | | | 3.97 | % |
| | 10 | | | Experian PLC | | | 3.76 | % |
The portfolio is actively managed and holdings are subject to change. There is no guarantee the Fund continues to invest in the securities referenced. The holdings listed exclude any temporary cash investments, are presented on an individual security basis and do not represent holdings of the issuer.
5 |
Average Annual Total Returns — December 31, 20213
| | | | | | | | | | | | | | | | |
| | | | |
| | | 1 Year | | | Life of Fund | | | Expense Ratios4 | |
| | Gross | | | Net | |
| | | | | |
| Class Y (Inception 12/15/20) | | | | | | | | | | | | | | | | |
| NAV | | | -3.81 | % | | | -2.38 | % | | | 1.35 | % | | | 0.95 | % |
| | | | | |
| Class A (Inception 12/15/20) | | | | | | | | | | | | | | | | |
| NAV | | | -4.07 | | | | -2.64 | | | | 1.60 | | | | 1.20 | |
| With 5.75% Maximum Sales Charge | | | -9.60 | | | | -8.01 | | | | | | | | | |
| | | | | |
| Class C (Inception 12/15/20) | | | | | | | | | | | | | | | | |
| NAV | | | -4.79 | | | | -3.37 | | | | 2.35 | | | | 1.95 | |
| With CDSC1 | | | -5.72 | | | | -3.37 | | | | | | | | | |
| | | | | |
| Class N (Inception 12/15/20) | | | | | | | | | | | | | | | | |
| NAV | | | -3.77 | | | | -2.34 | | | | 1.26 | | | | 0.90 | |
| | | | | |
| Comparative Performance | | | | | | | | | | | | | | | | |
| MSCI ACWI ex USA Index (Net)2 | | | 7.82 | | | | 9.89 | | | | | | | | | |
Performance data shown represents past performance and is no guarantee of, and not necessarily indicative of, future results. Total return and value will vary, and you may have a gain or loss when shares are sold. Current performance may be lower or higher than quoted. For most recent month-end performance, visit im.natixis.com. Performance for other share classes will be greater or less than shown based on differences in fees and sales charges. You may not invest directly in an index. Performance for periods less than one year is cumulative, not annualized. Returns reflect changes in share price and reinvestment of dividends and capital gains, if any. The table(s) do not reflect taxes shareholders might owe on any fund distributions or when they redeem their shares.
| 1 | Performance for Class C shares assumes a 1% contingent deferred sales charge (“CDSC”) applied when you sell shares within one year of purchase and includes automatic conversion to Class A shares after eight years. |
| 2 | The MSCI ACWI ex USA Index (Net) captures large and mid cap representation across 22 of 23 Developed Markets (DM) countries (excluding the US) and 27 Emerging Markets (EM) countries. With 2,361 constituents, the index covers approximately 85% of the global equity opportunity set outside the US. |
| 3 | Fund performance has been increased by fee waivers and/or expense reimbursements, if any, without which performance would have been lower. |
| 4 | Expense ratios are as shown in the Fund’s prospectus in effect as of the date of this report. The expense ratios for the current reporting period can be found in the Financial Highlights section of this report under Ratios to Average Net Assets. Net expenses reflect contractual expense limitations set to expire on 4/30/22. When a Fund’s expenses are below the limitation, gross and net expense ratios will be the same. See Note 6 of the Notes to Financial Statements for more information about the Fund’s expense limitations. |
| 6
NATIXIS OAKMARK FUND
| | |
| |
| Managers | | Symbols |
| |
| William C. Nygren, CFA® | | Class A NEFOX |
| |
| Kevin G. Grant, CFA®* | | Class C NECOX |
| |
| M. Colin Hudson, CFA® | | Class N NOANX |
| |
| Michael J. Mangan, CFA® | | Class Y NEOYX |
| |
| Michael A. Nicolas, CFA® | | |
| |
| Harris Associates L.P. | | |
| * | Effective January 1, 2022 Kevin G. Grant no longer serves as portfolio manager of the Fund. |
Investment Goal
The Fund seeks long-term capital appreciation.
Market Conditions
Global markets moved higher in the first quarter of 2021 as vaccines reached more and more people. In the United States, newly elected US President Joe Biden signed off on his economic stimulus plan in March. The $1.9 trillion relief package sent $1,400 payments to qualifying Americans and extended unemployment benefits. In response, the Dow Jones Industrial Average and S&P 500® Index soared to record highs. By the end of the second quarter, global cases surpassed 180 million and global deaths approached 4 million. However, more than 800 million people reached full vaccination, representing about 10% of the global population.
That said, a new wave of Covid-19 cases brought on by the Delta variant resulted in a slowdown in economic reopenings around the world as well as new economic restrictions in Asia and Australia. Simultaneously, the Chinese government implemented increased regulations on a range of businesses, including technology companies, prompting unease across global markets. Later, energy suppliers rushed to ramp up production to meet growing demand. However, a supply shortage and bottlenecks at major US ports sent US oil prices in excess of $85 per barrel for the first time since 2014. Natural gas prices also spiked around the world, forcing the suspension of operations at factories in Europe and China. A shortage of semiconductors, in particular, significantly impaired worldwide automobile production. Simultaneously, the new and highly contagious Omicron variant of Covid-19 spread in the fourth quarter as countries across Europe implemented restrictions once again to combat the spread of the disease.
As previously announced, the Federal Reserve slowed its pace of asset purchases in November. The tapering came as the rate of inflation in the US quickened to 6.8% versus the year-ago period. The Fed’s dot plot now calls for three rate hikes each in 2022 and 2023. The Bank of Japan and European Central Bank echoed similar sentiments as they also left interest rates unchanged, while the Bank of England raised its main interest rate from 0.1% to 0.25% following a surge in UK inflation to a 10-year high of 5.1% annual growth in November. All things considered, the International Monetary Fund (IMF) slightly lowered its expectations for global economic growth from 6.0% to 5.9%, with a 4.9% growth rate expected in 2022. The IMF also lowered its outlook for economic growth in the US, Japan and China by 1.0%, 0.4% and 0.1% in October, but raised its estimates for growth in the euro zone by 0.4%.
Performance Results
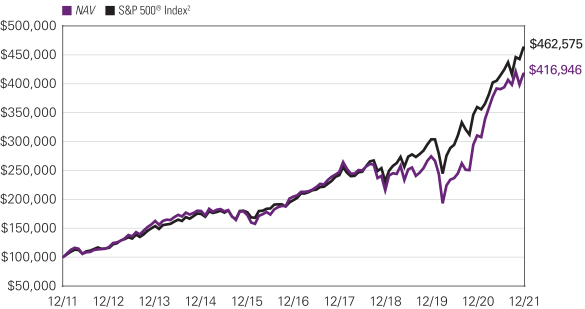
For the 12 months ended December 31, 2021, Class Y shares of the Natixis Oakmark Fund returned 34.35% at net asset value. The Fund outperformed its benchmark, the S&P 500® Index, which returned 28.71%.
Explanation of Fund Performance
As value investors with an emphasis on individual stock selection, our sector weights are a byproduct of our bottom-up process. On an absolute-return basis, the energy sector gained the most value, while holdings in the consumer staples sector delivered the smallest positive collective return.
The leading contributors to fund performance for the year were Alphabet and Gartner. Toward the beginning of 2021, Alphabet’s fourth-quarter results showed faster than expected revenue growth across the board. Total revenue grew 23% year-over-year and reached $56.9 billion, which led to earnings per share of $22.30, and both exceeded market expectations. Revenue in the key search segment grew 17%, owing to “broad-based re-engagement” among advertisers following the Covid-19-related pullback. Importantly, for the first time Alphabet disclosed cloud segment profitability and revealed that the company made massive upfront investments in its go-to-market strategy and engineering resources, implying that the remaining segments are even more profitable than most analysts expected. Later, Alphabet’s results continued to positively surprise the market as the company’s first-quarter total revenue, operating income and earnings per share outpaced expectations by 7%, 39% and 67%, respectively. By segment, search revenue grew 30%,
7 |
YouTube advertising revenue rose 49% and cloud revenue increased 46%. Furthermore, margin trends improved across all segments as underlying operational expenses appear progressively well controlled relative to history. In July, Alphabet’s second-quarter earnings report showed that revenue grew by 62%, again surpassing consensus expectations, and search revenue saw significant growth with a 67% increase year-over-year. Alphabet’s third-quarter earnings release resulted in the company’s share price moving higher into the end of the year. Reported revenue growth amounted to 41% and operating margins (ex-other bets) expanded 670 basis points. In addition, search and YouTube advertising revenue both grew over 40%. Management bought back $12.6 billion worth of stock in the third quarter, which puts the company on pace to meet our expectations for the full-year period. Although Alphabet’s share price declined on news that YouTube TV subscribers lost access to Disney-owned entertainment options, the issue resolved itself shortly thereafter. We believe Alphabet remains an attractive holding with upside potential despite its recent share price appreciation.
In February 2021, Gartner released positive fourth-quarter results, in our view. Revenue modestly surpassed consensus estimates; however, adjusted earnings of $245 million far exceeded expectations of $170 million. Significant margin improvement drove the company’s outperformance despite the disappearance of much of its conferences business, with underlying margins adjusted for conferences expanding by roughly 600 basis points. In May, Gartner reported first-quarter results that were solid, in our assessment. Reported revenue rose 8.4%, adjusted earnings advanced 50% and earnings per share grew nearly 67% from the prior year. We were most impressed that the earnings margin expanded to 29% in the quarter, a solid jump up from the previous typical level in the high teens. We also liked that revenue in both segments, global business sales and global technology sales, increased by 12% and 5%, respectively, despite reduced growth of investment spending and continued challenges from legacy product shutdowns in the global business sales segment. Later, following a strong second-quarter earnings report, Gartner’s share price advanced and finished the third quarter higher. Revenue ($1.17 billion versus $1.12 billion), adjusted earnings ($355 million versus $273.9 million) and earnings per share ($2.24 versus $1.73) all bested consensus estimates. Importantly, we appreciate that top line results are accelerating with improving sales force productivity driving growth. The company also increased its share repurchase authorization by $800 million in the second quarter. Prior to the report, we met with CEO Gene Hall and CFO Craig Safian. We came away impressed with the management team’s enthusiasm and conviction in their vision for the company’s future. We particularly like that Hall is a multi-faceted operator with a history of both consistently enhancing products to drive incremental customer demand and tightly managing the sales organization through significant growth. Strong performance continued toward the end of the year when Gartner released its third-quarter results that showed further organic growth as well as increased sales force productivity, which we believe has promising implications for underlying profitability. In addition, third quarter adjusted earnings of $305 million beat consensus expectations by $50 million. Even accounting for its recent price increase, we believe Gartner still offers a healthy amount of upside potential.
T-Mobile US and Fiserv were the largest detractors from Fund performance for the calendar year. T-Mobile US reported fourth-quarter revenue, adjusted earnings and earnings per share that were better than the market had expected. We were pleased that the company continued to outgrow its industry and achieved significant merger benefits faster than had been expected, realizing $1.3 billion of savings in 2020. We found it very important that the company continued to make headway in this buildout as we believe a large amount of T-Mobile’s growth potential rests on the expansion of its new network. We were further impressed that despite the company’s rapid network development, full-year 2020 free cash flow reached $3 billion, which far exceeded our estimates. In May, the company’s first-quarter earnings report showed above-consensus estimate numbers for customer additions and adjusted earnings, while also leading the industry across all customer metrics. We also appreciated the low brand churn the company boasted in comparison to competitors. Later in the year, T-Mobile’s second-quarter earnings report included results that aligned with our expectations. Post-paid net additions bested consensus estimates, service revenue growth of almost 6% led the industry and adjusted earnings exceeded analysts’ estimates. We thought the company’s third-quarter earnings results were impressive given that T-Mobile is at a peak point in its integration with Sprint and is operating in an elevated competitive environment. We appreciated that accounts grew 3.9% and organic service revenue grew 4.5%, both of which led the industry. In addition, management raised its guidance across the board, and the company’s adjusted earnings guidance now aligns with our estimates. We believe the valuation for T-Mobile remains attractive, offering a compelling reason to own.
Even though Fiserv’s first-quarter earnings disappointed investors, we saw the results as respectable considering the challenging operating environment. Importantly, organic revenue grew 4% from the prior year, earnings rose 15% and earnings per share advanced 18%. In merchant acquiring organic growth amounted to 8% and margins improved 650 basis points, while gross payment volume in Clover (Fiserv’s cloud-based point-of-sale product) grew 36%, ecommerce transactions grew 24% and the company won a record number of new customers during the period. In addition, we were pleased that Fiserv executed $612 million worth of share repurchases in the quarter (or about 0.8% of it share base). Later, Fiserv delivered strong second-quarter earnings results as exhibited by revenue, earnings and earnings per share that increased 18%, 41% and 47%, respectively. In addition, margins expanded 510 basis points to 33.9%. However, news that Amazon was reportedly developing a point-of-sale solution pressured Fiserv’s share price in September as investors feared increased competition. Fiserv’s third quarter earnings results were in line with market estimates, with organic revenue growth of 10%, operating margins increasing 130 basis points and adjusted earnings per share growing 23%. However, investors reacted poorly to the release, focusing on a client (speculated to be Stripe) that was part of a joint venture with Wells Fargo, which is serviced by Fiserv, deciding to leave. This likely stoked fears that other companies may decide to insource their payment
| 8
NATIXIS OAKMARK FUND
processing in the future. The departure is not expected to impact Fiserv’s financial results due to its minimal contribution and management anticipating the move. Despite the client loss, we appreciate that Fiserv still posted strong segment results and growth in customers, independent software vendors, and capabilities on its platform. We continue to believe the company is undervalued and find the investment attractive on a risk-to-reward basis.
Outlook
With seemingly constant uncertainty in politics, economics and market sentiment, we focus on finding undervalued and well-managed companies that will benefit from economic tailwinds while proving capable of weathering difficult environments. We believe this approach best services our goal of growing and protecting our investors’ capital over the long term.
Hypothetical Growth of $100,000 Investment in Class Y Shares3
December 31, 2011 through December 31, 2021
Top Ten Holdings as of December 31, 2021
| | | | | | | | |
| | |
| Security Name | | % of
Net Assets | |
| | 1 | | | Alphabet, Inc., Class A | | | 3.53 | % |
| | 2 | | | Ally Financial, Inc. | | | 3.33 | % |
| | 3 | | | EOG Resources, Inc. | | | 2.89 | % |
| | 4 | | | Capital One Financial Corp. | | | 2.86 | % |
| | 5 | | | Charles Schwab Corp. (The) | | | 2.80 | % |
| | 6 | | | Gartner, Inc. | | | 2.51 | % |
| | 7 | | | Meta Platforms, Inc., Class A | | | 2.45 | % |
| | 8 | | | Citigroup, Inc. | | | 2.43 | % |
| | 9 | | | Goldman Sachs Group, Inc. (The) | | | 2.32 | % |
| | 10 | | | Humana, Inc. | | | 2.29 | % |
The portfolio is actively managed and holdings are subject to change. There is no guarantee the Fund continues to invest in the securities referenced. The holdings listed exclude any temporary cash investments, are presented on an individual security basis and do not represent holdings of the issuer.
9 |
Average Annual Total Returns —December 31, 20213
| | | | | | | | | | | | | | | | | | | | | | | | |
| | | | | | |
| | | 1 Year | | | 5 Years | | | 10 Years | | | Life of
Class N | | | Expense Ratios4 | |
| | Gross | | | Net | |
| | | | | | | |
| Class Y | | | | | | | | | | | | | | | | | | | | | | | | |
| NAV | | | 34.35 | % | | | 15.35 | % | | | 15.35 | % | | | — | % | | | 0.95 | % | | | 0.80 | % |
| | | | | | | |
| Class A | | | | | | | | | | | | | | | | | | | | | | | | |
| NAV | | | 33.97 | | | | 15.05 | | | | 15.05 | | | | — | | | | 1.20 | | | | 1.05 | |
| With 5.75% Maximum Sales Charge | | | 26.25 | | | | 13.70 | | | | 14.37 | | | | — | | | | | | | | | |
| | | | | | | |
| Class C | | | | | | | | | | | | | | | | | | | | | | | | |
| NAV | | | 32.99 | | | | 14.20 | | | | 14.37 | | | | — | | | | 1.95 | | | | 1.80 | |
| With CDSC1 | | | 31.99 | | | | 14.20 | | | | 14.37 | | | | — | | | | | | | | | |
| | | | | | | |
| Class N (Inception 5/1/17) | | | | | | | | | | | | | | | | | | | | | | | | |
| NAV | | | 34.54 | | | | — | | | | — | | | | 15.48 | | | | 1.05 | | | | 0.75 | |
| | | | | | | |
| Comparative Performance | | | | | | | | | | | | | | | | | | | | | | | | |
| S&P 500® Index2 | | | 28.71 | | | | 18.47 | | | | 16.55 | | | | 18.02 | | | | | | | | | |
Performance data shown represents past performance and is no guarantee of, and not necessarily indicative of, future results. Total return and value will vary, and you may have a gain or loss when shares are sold. Current performance may be lower or higher than quoted. For most recent month-end performance, visit im.natixis.com/performance. Performance for other share classes will be greater or less than shown based on differences in fees and sales charges. You may not invest directly in an index. Performance for periods less than one year is cumulative, not annualized. Returns reflect changes in share price and reinvestment of dividends and capital gains, if any. The table(s) do not reflect taxes shareholders might owe on any fund distributions or when they redeem their shares.
| 1 | Performance for Class C shares assumes a 1.00% contingent deferred sales charge (“CDSC”) applied when you sell shares within one year of purchase and includes automatic conversion to Class A shares after eight years. |
| 2 | S&P 500® Index is a widely recognized measure of U.S. stock market performance. It is an unmanaged index of 500 common stocks chosen for market size, liquidity, and industry group representation, among other factors. It also measures the performance of the large cap segment of the U.S. equities market. |
| 3 | Fund performance has been increased by fee waivers and/or expense reimbursements, if any, without which performance would have been lower. |
| 4 | Expense ratios are as shown in the Fund’s prospectus in effect as of the date of this report. The expense ratios for the current reporting period can be found in the Financial Highlights section of this report under Ratios to Average Net Assets. Net expenses reflect contractual expense limitations set to expire on 4/30/23. When a Fund’s expenses are below the limitations, gross and net expense ratios will be the same. See Note 6 of the Notes to Financial Statements for more information about the Fund’s expense limitations. |
| 10
NATIXIS OAKMARK INTERNATIONAL FUND
| | |
| |
| Managers | | Symbols |
| |
| David G. Herro, CFA® | | Class A NOIAX |
| |
| Michael L. Manelli, CFA® | | Class C NOICX |
| |
| Harris Associates L.P. | | Class N NIONX |
| |
| | Class Y NOIYX |
Investment Goal
The Fund seeks long-term capital appreciation.
Market Conditions
Global markets moved higher in the first quarter of 2021 as vaccines reached more and more people. In the United States, newly elected US President Joe Biden signed off on his economic stimulus plan in March. The $1.9 trillion relief package sent $1,400 payments to qualifying Americans and extended unemployment benefits. In response, the Dow Jones Industrial Average and S&P 500® Index soared to record highs. By the end of the second quarter, global cases surpassed 180 million and global deaths approached 4 million. However, more than 800 million people reached full vaccination, representing about 10% of the global population.
That said, a new wave of Covid-19 cases brought on by the Delta variant resulted in a slowdown in economic reopenings around the world as well as new economic restrictions in Asia and Australia. Simultaneously, the Chinese government implemented increased regulations on a range of businesses, including technology companies, prompting unease across global markets. Later, energy suppliers rushed to ramp up production to meet growing demand. However, a supply shortage and bottlenecks at major US ports sent US oil prices in excess of $85 per barrel for the first time since 2014. Natural gas prices also spiked around the world, forcing the suspension of operations at factories in Europe and China. A shortage of semiconductors in particular significantly impaired worldwide automobile production. Simultaneously, the new and highly contagious Omicron variant of Covid-19 spread in the fourth quarter and countries across Europe implemented restrictions once again to combat the spread of the disease.
As previously announced, the Federal Reserve slowed its pace of asset purchases in November. The tapering came as the rate of inflation in the United States quickened to 6.8% versus the year-ago period. The Fed’s dot plot now calls for three rate hikes each in 2022 and 2023, and two in 2024. The Bank of Japan and European Central Bank echoed similar sentiments as they also left interest rates unchanged, while the Bank of England raised its main interest rate from 0.1% to 0.25% following a surge in UK inflation to a 10-year high of 5.1% annual growth in November. All things considered, the International Monetary Fund (IMF) slightly lowered its expectations for 2021 global economic growth from 6.0% to 5.9%, with a 4.9% growth rate expected in 2022. The IMF also lowered its outlook for 2021 economic growth in the United States, Japan and China by 1.0%, 0.4% and 0.1% respectively in October, but raised its estimates for growth in the euro zone by 0.4%.
Performance Results
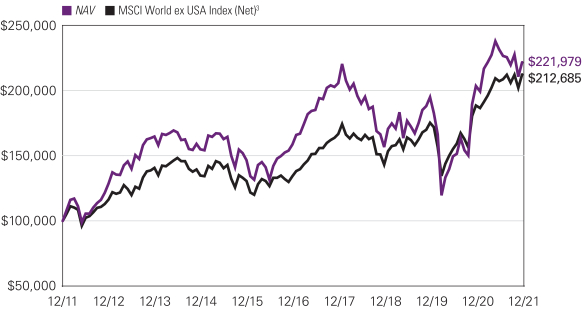
For the 12 months ended December 31, 2021, Class Y shares of the Natixis Oakmark International Fund returned 8.97% at net asset value. The Fund underperformed its benchmark, the MSCI World ex USA Index (Net), which returned 12.62%.
Explanation of Fund Performance
Geographically, the Fund’s average weightings for the year were 83% in Europe, 3% in Canada and 3% in Australia. The remaining positions were in Japan, China, South Africa, South Korea, India, Mexico and Indonesia.
On an absolute-return basis, shares in the energy sector produced the largest positive collective return, while the consumer staples sector lost the most value.
The top contributors to the yearly return were Glencore and Lloyds Banking Group. Early in the year, Glencore’s full-year results showed that adjusted earnings in both the industrials and marketing segments exceeded our expectations by 10% and 4%, respectively. Full-year total adjusted earnings of $11.56 billion were also better than market estimates of $10.69 billion. The industrials segment benefited from both a recovery in commodities prices from Covid-19 lows and higher production. Management also proposed a $0.12 per share dividend, which surpassed analysts’ estimates for $0.0625 per share. Later, Glencore’s share price increased after the company released its first-quarter production report late in April, which showed that copper production increased 2.7% year-over-year. Glencore continued to outperform expectations in the third quarter, benefiting from rising commodity prices and a disciplined cost program. Copper, the company’s most important commodity, is benefiting from rising production and lower costs. Glencore held its annual investor day in December, where the company reinforced its plan to emphasize low-cost, large-scale assets in future-facing commodities, while responsibly running down its coal business over time. We appreciate management’s focus on increasing
11 |
risk-adjusted returns by exiting assets that require a lot of management’s time, are in high-risk jurisdictions, have limited mine-life or face other constraints while not being material financial contributors. Prior to the company’s investor day, we spoke with Chairman Kalidas Madhavpeddi who possesses a solid background within the industry, in our view. He emphasized his appreciation for Glencore’s anti-bureaucratic culture, which leads to innovative ideas from younger talent, and the focus on financial returns in decision making. We are optimistic about Madhavpeddi’s abilities and the company’s future.
Lloyds Banking Group delivered strong fourth-quarter results largely driven by lower-than-expected impairment charges, which reached GBP 128 million compared with market forecasts for GBP 586 million. Profit before tax and net income both surpassed market projections by 5%, while pre-provision profit was 7% better than market estimates. In addition, the company’s common equity Tier 1 ratio grew to 16.2% and management announced plans to resume capital distributions. Later, Lloyds’ share price soared upon the release of solid first-quarter earnings, which were driven by a reserve release of GBP 459 million for credit losses that resulted in a GBP 323 million net impairment credit and pointed to management’s view of an improving economic outlook in the UK. Lloyds’ first-quarter revenues reached GBP 3.6 billion, and the company’s common equity Tier 1 ratio expanded by 54 basis points to 16.7%, despite funding half of its full-year pension contribution in the first quarter. In addition, Lloyds saw strong inflows of low-cost deposits, while higher-than-expected mortgage underwriting margins led to the company increasing its net interest margin target to more than 245 basis points, which exceeded our estimate of 240 basis points. Operating expenditure trends were also positive, in our view. Following a conversation with new CEO Charlie Nunn, our confidence in the company’s leadership was solidified as he emphasized a desire to grow the firm in both a profitable and responsible manner in order to create shareholder value. With a higher interest rate environment approaching, we believe financial services companies that are well managed and fundamentally sound, such as Lloyds Banking Group, are positioned to recognize upside potential.
The largest detractors from return were Alibaba Group and Credit Suisse Group. In February, Alibaba Group reported fiscal third-quarter revenue of CNY 221.08 billion and adjusted earnings of CNY 68.38 billion, both of which outpaced market forecasts by slightly more than 3%. Soon after, news outlets reported that officials in China asked Alibaba to dispose of its media assets over concern about the company’s influence over public opinion. In addition, China’s State Administration introduced new regulations for e-commerce platforms. Subsequently, internet companies in China removed Alibaba’s popular UC internet browser from its application stores. In the second quarter of 2021, China’s State Administration for Market Regulation fined Alibaba $2.8 billion, which was the largest antitrust penalty issued in the country’s history. The fine (which represents 4% of the company’s 2019 annual domestic revenue) was imposed because the regulatory body found that Alibaba’s practice of requiring merchants to remain exclusive on its platforms hindered competition. The company stated it does not expect a material impact on its business as a result of the new regulations. Later, the company’s share price plunged upon the release of fiscal full-year earnings, even though results were largely in line with our full-year estimates on an organic basis. Along with the earnings release, management announced it would reinvest all incremental profits in the next fiscal year, which disappointed investors. While this strategy will likely produce low or no near-term profit growth, management believes these investments will help grow its user base over the long term. Most recently, Alibaba’s second-quarter earnings report disappointed investors as growth meaningfully decelerated during the quarter and management lowered its full-year revenue growth guidance. Factors causing the slowdown in growth include a decrease in the retail spending environment in China, increased competition in e-commerce and Alibaba’s reinvestments into its merchant base, which coincided with recent increased regulation from the Chinese government. At the company’s investor day, we were impressed by Alibaba’s presentation on its growing cloud business, where the company believes its technology lead is at least two years ahead of its peers. Despite the current headwinds facing the company, we remain shareholders of Alibaba as we believe it is an important driver of innovation in China and several of its businesses have yet to fully scale.
The share price of Credit Suisse Group suffered upon revelations about the company’s exposure to Greensill Capital followed by its association with Archegos Capital Management. Investors sold shares over concerns that an investment fund run by its asset management division had exposure to the now-insolvent Greensill Capital, which specialized in supply chain finance. The lost market cap far surpassed Credit Suisse’s direct exposure to Greensill and ignored the fact that a large portion of its clients’ exposure was in cash, highly rated securities or insured investments. At the end of March, Credit Suisse’s share price dropped again as New York-based hedge fund client Archegos Capital defaulted on its margin calls to the company’s prime brokerage business. Credit Suisse announced it incurred a CHF 4.4 billion charge related to the Archegos Capital incident in the first quarter. While the amount exceeded both our initial expectations and consensus estimates, first quarter pre-tax profit of about CHF 3.6 billion, excluding the charge, exceeded analysts’ estimates for about CHF 1.2–1.5 billion in pre-tax profit driven by strong underlying performance across all three business segments. That being said, the company guided for an additional CHF 600 million charge in the second quarter to cover further Archegos-related losses. The company ultimately executed a small capital raise in an effort to boost its CET1 ratio to 13.0%. Credit Suisse’s third-quarter earnings results tracked ahead of our fiscal year estimates. Importantly, net new money inflected positively following second-quarter outflows related to the Archegos Capital and Greensill Capital incidents, suggesting that the potential reputational damage is less than feared. Following the company’s capital markets day and subsequent conversations with management, we learned that Credit Suisse planned to take additional capital from the lower return / higher risk investment bank and
| 12
NATIXIS OAKMARK INTERNATIONAL FUND
allocate capital toward the higher return / lower risk wealth management segment, a strategy we fully support. The company is also looking to generate CHF 1 billion — CHF 1.5 billion in savings from procurement initiatives, along with a new organizational structure that will serve to simplify the organization, reduce costs and enhance risk functions. Given the addition of David Wildermuth (formerly at Goldman Sachs with more than 30 years of banking experience) as chief risk officer in January and the arrival of new Chairman António Horta-Osório, the former CEO of Lloyds Banking Group, we expect better governance and risk management going forward.
Outlook
With seemingly constant uncertainty in politics, economics and market sentiment, we focus on finding undervalued and well-managed companies that will benefit from economic tailwinds while proving capable of weathering difficult environments. We believe this approach best services our goal of growing and protecting our investors’ capital over the long term.
Hypothetical Growth of $100,000 Investment in Class Y Shares1,4
December 31, 2011 through December 31, 2021
13 |
Top Ten Holdings as of December 31, 2021
| | | | | | | | |
| | |
| Security Name | | % of
Net Assets | |
| | 1 | | | Lloyds Banking Group PLC | | | 3.70 | % |
| | 2 | | | Bayer AG, (Registered) | | | 3.70 | % |
| | 3 | | | BNP Paribas S.A. | | | 3.48 | % |
| | 4 | | | Allianz SE, (Registered) | | | 3.38 | % |
| | 5 | | | Intesa Sanpaolo SpA | | | 3.21 | % |
| | 6 | | | Credit Suisse Group AG, (Registered) | | | 3.20 | % |
| | 7 | | | Bayerische Motoren Werke AG | | | 3.13 | % |
| | 8 | | | Glencore PLC | | | 2.92 | % |
| | 9 | | | Continental AG | | | 2.74 | % |
| | 10 | | | CNH Industrial NV | | | 2.58 | % |
The portfolio is actively managed and holdings are subject to change. There is no guarantee the Fund continues to invest in the securities referenced. The holdings listed exclude any temporary cash investments, are presented on an individual security basis and do not represent holdings of the issuer.
Average Annual Total Returns — December 31, 20214
| | | | | | | | | | | | | | | | | | | | | | | | |
| | | | | | |
| | | 1 Year | | | 5 Years | | | 10 Years | | | Life of
Class N | | | Expense Ratios5 | |
| | Gross | | | Net | |
| | | | | | | |
| Class Y (Inception 5/1/17) | | | | | | | | | | | | | | | | | | | | | | | | |
| NAV1 | | | 8.97 | % | | | 6.94 | % | | | 8.30 | % | | | — | % | | | 1.11 | % | | | 0.90 | % |
| | | | | | | |
| Class A | | | | | | | | | | | | | | | | | | | | | | | | |
| NAV | | | 8.73 | | | | 6.69 | | | | 8.18 | | | | — | | | | 1.36 | | | | 1.15 | |
| With 5.75% Maximum Sales Charge | | | 2.50 | | | | 5.44 | | | | 7.54 | | | | — | | | | | | | | | |
| | | | | | | |
| Class C | | | | | | | | | | | | | | | | | | | | | | | | |
| NAV | | | 7.92 | | | | 5.89 | | | | 7.54 | | | | — | | | | 2.11 | | | | 1.90 | |
| With CDSC2 | | | 6.92 | | | | 5.89 | | | | 7.54 | | | | — | | | | | | | | | |
| | | | | | | |
| Class N (Inception 5/1/17) | | | | | | | | | | | | | | | | | | | | | | | | |
| NAV | | | 9.01 | | | | — | | | | — | | | | 4.36 | | | | 1.17 | | | | 0.85 | |
| | | | | | | |
| Comparative Performance | | | | | | | | | | | | | | | | | | | | | | | | |
| MSCI World ex USA Index (Net)3 | | | 12.62 | | | | 9.63 | | | | 7.84 | | | | 8.22 | | | | | | | | | |
Performance data shown represents past performance and is no guarantee of, and not necessarily indicative of, future results. Total return and value will vary, and you may have a gain or loss when shares are sold. Current performance may be lower or higher than quoted. For most recent month-end performance, visit im.natixis.com/performance. Performance for other share classes will be greater or less than shown based on differences in fees and sales charges. You may not invest directly in an index. Performance for periods less than one year is cumulative, not annualized. Returns reflect changes in share price and reinvestment of dividends and capital gains, if any. The table(s) do not reflect taxes shareholders might owe on any fund distributions or when they redeem their shares.
| 1 | Prior to the inception of Class Y shares (5/1/2017), performance is that of Class A shares and reflects the higher net expenses of that share class. |
| 2 | Performance for Class C shares assumes a 1.00% contingent deferred sales charge (“CDSC”) applied when you sell shares within one year of purchase, and includes automatic conversion to Class A shares after eight years. |
| 3 | MSCI World ex USA Index (Net) is an unmanaged index that is designed to measure the equity market performance of developed markets, excluding the United States. |
| 4 | Fund performance has been increased by fee waivers and/or expense reimbursements, if any, without which performance would have been lower. |
| 5 | Expense ratios are as shown in the Fund’s prospectus in effect as of the date of this report. The expense ratios for the current reporting period can be found in the Financial Highlights section of this report under Ratios to Average Net Assets. Net expenses reflect contractual expense limitations set to expire on 4/30/23. When a Funds expenses are below the limitation, gross and net expense ratios will be the same. See Note 6 of the Notes to Financial Statements for more information about the Funds expense limitations. |
| 14
NATIXIS U.S. EQUITY OPPORTUNITIES FUND
| | | | |
| |
| Managers | | Symbols |
| | |
William C. Nygren, CFA® | | Class A | | NEFSX |
| | |
| Kevin G. Grant, CFA®* | | Class C | | NECCX |
| | |
M. Colin Hudson, CFA® | | Class N | | NESNX |
| | |
Michael J. Mangan, CFA®, CPA | | Class Y | | NESYX |
| | |
| Michael A. Nicolas, CFA® | | | | |
| | |
| Harris Associates L.P. | | | | |
| |
| | |
| | |
| Aziz V. Hamzaogullari, CFA® | | | | |
| | |
| Loomis, Sayles & Company, L.P. | | | | |
| * | Effective January 1, 2022 Kevin G. Grant no longer serves as portfolio manager of the Fund. |
Investment Goal
The Fund seeks long-term growth of capital.
Market Conditions
U.S. equities produced strong returns in 2021, marking the eighth year of the past ten in which the major large-cap indexes posted a double-digit gain. The gradual lifting of virus-related restrictions led to a substantial improvement in economic growth and corporate earnings compared to their levels of the previous year, contributing to the gains for stocks. While rising inflation prompted the Federal Reserve (Fed) to adopt a more hawkish tone in the fourth quarter, leading to increased market volatility, the major large-cap indexes closed the year at or near their all-time highs. In the continuation of a long-standing trend, mega-cap technology and communication services stocks were the key drivers of U.S. market performance in 2021.
Performance Results
For the 12 months ended December 31, 2021, Class Y shares of the Natixis U.S. Equity Opportunities Fund returned 23.48% at net asset value. The Fund underperformed its primary benchmark, the S&P 500® Index, which returned 28.71%, and also underperformed its secondary benchmark, the Russell 1000® Index, which returned 26.45%.
Explanation of Fund Performance
Each of the portfolio’s segments uses a distinct investment style, providing shareholders with exposure to a variety of different stocks:
| • | | The Harris Associates L.P. Large Cap Value segment invests primarily in the common stocks of larger-capitalization companies that Harris Associates L.P. (“Harris Associates”) believes are trading at a substantial discount to the company’s “true business value.” |
| • | | The Loomis, Sayles & Company, L.P. All Cap Growth segment invests primarily in equity securities and may invest in companies of any size. The segment employs a growth style of equity management that emphasizes companies with sustainable competitive advantages versus others, long-term structural growth drivers that will lead to above-average future cash flow growth, attractive cash flow returns on invested capital, and management teams focused on creating long-term value for shareholders. The segment aims to invest in companies when they trade at a significant discount to the estimate of intrinsic value. |
Both segments contributed positively to the Fund’s performance.
Harris Associates Large Cap Value Segment
As value investors with an emphasis on individual stock selection, our sector weights are a byproduct of our bottom-up process. On an absolute-return basis, the energy sector gained the most value, while holdings in the industrials sector delivered the smallest positive collective return.
The largest contributors to fund performance for the year were Alphabet and Capital One Financial. Toward the beginning of the year, Alphabet’s fourth-quarter results showed faster than expected revenue growth across the board. Total revenue grew 23% year-over-year and reached $56.9 billion, which led to earnings per share of $22.30, and both exceeded market expectations. Revenue in the key search segment grew 17%, owing to “broad-based re-engagement” among advertisers following the Covid-19-related pullback. Importantly, for the first time Alphabet disclosed cloud segment profitability and revealed that the company made massive upfront
15 |
investments in its go-to-market strategy and engineering resources, implying that the remaining segments are even more profitable than most analysts expected. Later, Alphabet’s results continued to positively surprise the market as the company’s first-quarter total revenue, operating income and earnings per share outpaced expectations by 7%, 39% and 67%, respectively. By segment, search revenue grew 30%, YouTube advertising revenue rose 49% and cloud revenue increased 46%. Furthermore, margin trends improved across all segments as underlying operational expenses appear progressively well controlled relative to history. In July, Alphabet’s second-quarter earnings report showed that revenue grew by 62%, again surpassing consensus expectations, and search revenue saw significant growth with a 67% increase year-over-year. Alphabet’s third-quarter earnings release resulted in the company’s share price moving higher into the end of the year. Reported revenue growth amounted to 41% and operating margins (ex-Other Bets) expanded 670 basis points. In addition, search and YouTube advertising revenue both grew over 40%. Management bought back $12.6 billion worth of stock in the third quarter, which puts the company on pace to meet our expectations for the full-year period. Although Alphabet’s share price declined on news that YouTube TV subscribers lost access to Disney-owned entertainment options, the issue resolved itself shortly thereafter. We believe Alphabet remains an attractive holding with upside potential despite its recent share price appreciation.
Capital One Financial issued first-quarter results that we saw as very good and that built on positive trends from prior quarters. Likewise, the company’s total net revenue and net interest margin exceeded market projections, while earnings per share were about 70% ahead of forecasts. We were pleased that credit quality remained strong, and charge-offs across lending categories fell once again from historically low levels. Credit card purchase volume grew 8% from last year, while deposits grew 15.1% and the average consumer deposit cost ratio reached an all-time low of 0.36%. Impressively, Capital One released loan loss reserves of $1.6 billion in the quarter, which was larger than the reserve release we had estimated for the full year. Capital One delivered another solid set of earnings results for its second quarter, in our view. A $1.7 billion loan reserve release led to earnings per share of $7.62, and the card charge-off rate fell 23 basis points versus the previous quarter’s already historically low rate to 2.29%. In October, investors responded unfavorably to CEO Richard Fairbank’s emphatic commentary surrounding elevated spending, the need to invest defensively in technology and the costliness of doing so given the competition for technology talent. That said, we think the company’s third-quarter earnings report highlighted strong results as charge-offs fell further from already all-time low levels, card purchase volume grew 28% year-over-year, ending loan balance improved 5% sequentially and net interest margins grew 46 basis points. In addition, Capital One executed $2.7 billion in third-quarter share repurchases (equivalent to 3.5% of its share base) and still ended the period with excess capital equal to 13% of its market cap. Our investment thesis for the company remains intact, and we believe it trades at a discount to our perception of its intrinsic value.
The largest detractors to fund performance for the year were Ally Financial and Fiserv. As management had predicted and we had expected, Ally Financial released good fourth-quarter results early in the year. Total net revenue rose 21% from a year earlier while earnings per share advanced 68% and both exceeded market forecasts. In addition, total deposits grew 13% and average total earning assets (including auto loans and mortgages) rose 3% year-over-year. Notably, the company’s provision for credit losses decreased materially from $998 million in the fourth quarter of 2020 to $102 million in the fourth quarter of 2021. Ally announced a new $1.60 billion share repurchase authorization in January following favorable results from the most recent Federal Reserve board stress test. In April, Ally’s first-quarter earnings report included earnings per share ($2.09 ex-items vs. $1.17) that beat analysts’ estimates as well as a reported return on tangible common equity of 24%. In fact, most metrics came in well above increasingly elevated expectations. Net interest margins expanded 26 basis points sequentially to 3.18%, retail deposits grew 21% year-over-year and deposit customers grew 14%. The company’s second-quarter earnings report in July continued to show strength as shown by return on tangible common equity of around 27%. New retail auto originations finished at the highest level in 15 years, while new originated yields maintained above 7%. In addition, net interest margins expanded to nearly 3.6%. In October, Ally reported a positive third-quarter earnings report, in our view. Return on average tangible common equity was assisted by a low credit loss environment and expanding net interest margins. Record retail application flow continued to show strength for a fourth straight year. However, the wholesale business continued to show weakness with loan balances at roughly half pre-pandemic levels. Later in the fourth quarter, Ally announced its decision to acquire digital credit card provider Fair Square Financial (FSF) for $750 million. FSF has been growing balances rapidly, and we believe the deal can add at least 150 basis points to core return on average tangible common equity over the medium term.
Even though Fiserv’s first-quarter earnings disappointed investors, we saw the results as respectable considering the challenging operating environment. Importantly, organic revenue grew 4% from the prior year, earnings rose 15% and earnings per share advanced 18%. In merchant acquiring, organic growth amounted to 8% and margins improved 650 basis points, while gross payment volume in Clover (Fiserv’s cloud-based point-of-sale product) grew 36%, e-commerce transactions grew 24% and the company won a record number of new customers during the period. In addition, we were pleased that Fiserv executed $612 million worth of share repurchases in the quarter (or about 0.8% of its share base). Later, Fiserv delivered strong second-quarter earnings results as exhibited by revenue, earnings and earnings per share that increased 18%, 41% and 47%, respectively. In addition, margins expanded 510 basis points to 33.9%. However, news that Amazon was reportedly developing a point-of-sale solution pressured Fiserv’s share price in
| 16
NATIXIS U.S. EQUITY OPPORTUNITIES FUND
September as investors feared increased competition. Fiserv’s third-quarter earnings results were in line with market estimates, with organic revenue growth of 10%, operating margins increasing 130 basis points and adjusted earnings per share growing 23%. However, investors reacted poorly to the release, focusing on a client (speculated to be Stripe) that was part of a joint venture with Wells Fargo, which is serviced by Fiserv, deciding to leave. This likely stoked fears that other companies may decide to insource their payment processing in the future. The departure is not expected to impact Fiserv’s financial results due to its minimal contribution and management anticipating the move. Despite the client loss, we appreciate that Fiserv still posted strong segment results and growth in customers, independent software vendors, and capabilities on its platform. We continue to believe the company is undervalued and find the investment attractive on a risk-to-reward basis.
Loomis, Sayles & Company All Cap Growth Segment
We are an active manager with a long-term, private equity approach to investing. Through our proprietary bottom-up research framework, we look to invest in those few high-quality businesses with sustainable competitive advantages and profitable growth when they trade at a significant discount to intrinsic value. For the period, the All Cap Growth segment posted a positive absolute return. Our holdings in the information technology, communication services, industrials, healthcare, financials, energy, and consumer staples sectors contributed positively to results. Our holdings in the consumer discretionary sector detracted from the segment’s performance.
Nvidia and Alphabet were the largest contributors to performance during the period. Nvidia is the world leader in graphic processing units (GPUs), which enable computers to produce and utilize highly realistic 3D graphic imagery and models. We believe the company’s competitive advantages include its intellectual property, brands, and a large and growing ecosystem of developers and applications utilizing GPU technology. A segment holding since January 2019, Nvidia reported financial results during the period that were better than consensus expectations, driven by broad-based strength that included quarterly revenue records in the company’s gaming, data center, and professional visualization segments in the second half of the year. In gaming, Nvidia is benefiting from record sales of PCs and gaming laptops and the rollout of Turing, its newest GPU architecture, which is becoming the industry norm for the latest blockbuster titles. Data center revenue benefited from a pickup in demand from hyperscale data center customers and rising demand from industry verticals such as industrials and enterprise clients that are adopting more artificial intelligence capabilities. The company saw strong traction for its latest architecture, Ampere, which for the first time enables clients to address both training and inferencing through a single architecture with performance that surpasses its already leading T4 inferencing and V100 training products. The company’s professional visualization segment addresses a more mature market, but Nvidia has been able to drive greater adoption of its products through ongoing innovation. Over our investment horizon, we believe Nvidia can sustain total annualized revenue growth of approximately 20%, driven by secular growth in spending on GPUs. As Nvidia’s business mix shifts increasingly towards its more profitable data center segment, we believe operating profits and free cash flow will grow faster than revenues. We believe Nvidia’s strong free cash flow growth prospects are not currently reflected in its share price. As a result, we believe the company’s shares trade at a significant discount to our estimate of intrinsic value and offer a compelling long-term reward-to-risk opportunity.
Alphabet is a holding company that owns a collection of businesses — the largest and most important of which by far is Google. Google is the global leader in online search and advertising, and also offers online cloud solutions to businesses and consumers globally. We believe Alphabet’s competitive advantages include its scale, brand strength, the power of its network and business ecosystem, as well as its innovative culture that is reinforced by its massive investments in research and development (R&D). A holding in the segment since inception, Alphabet reported financial results during the period that reflected a strong recovery in advertising spending, which had been depressed due to Covid-19, while revenue growth accelerated and adjusted operating margins expanded. Beginning in 2021, the company began presenting results in three segments. Google Services represents approximately 93% of total revenue and is driven by the secular shift of advertising to online and mobile platforms. The segment’s search and YouTube businesses both benefited from strong growth in direct response ads — particularly for YouTube, where in just three years direct response ads have grown from almost nothing to become one of the largest drivers. YouTube is also benefiting from strong demand from brand advertisers due to its reach and engagement with over 2 billion monthly users who recently spent over 1 billion hours daily on the platform. Google Cloud revenue represents approximately 7% of total revenue, and is driven by Google Cloud Platform, the company’s infrastructure- and platform-as-a-service offerings. Other Bets includes a number of early-stage and pre-revenue businesses and represents less than 1% of revenues. Google’s attractive financial model generates strong free cash flow and earns high returns on invested capital, enabling it to reinvest significantly in its business. Over the past five years, Google has invested over $100 billion in R&D, an amount very few companies could replicate. We believe the global secular shift from traditional advertising to online advertising is the biggest long-term growth driver for Google. Online advertising accounts for approximately $330 billion, or around 20% of the $1.5 trillion annual spending on global advertising and marketing. Over our investment horizon, we believe this penetration will increase to over 40%. We believe investors underestimate Alphabet’s growth opportunities and the intrinsic value of the business given its unique and difficult-to-replicate attributes and business model. We believe the company’s shares trade at a significant discount to our estimate of intrinsic value, and offer a compelling reward-to-risk opportunity.
17 |
Alibaba and CRISPR Therapeutics were the largest detractors during the period. A segment holding since its initial public offering in the third quarter of 2014, Alibaba Group is a leading China e-commerce and consumer-engagement platform provider. With approximately 60% of China’s e-commerce transactions estimated to take place through its marketplaces, Alibaba is the world’s largest retail platform, and we believe its scale and interconnected sites create an unparalleled and difficult-to-replicate business ecosystem. Shares have been under pressure since late 2020 due to investor concern regarding increasing regulatory intervention by the Chinese government. In April, China’s State Administration for Market Regulation concluded that Alibaba’s practices had violated antitrust law. The company was fined approximately $2.8 billion and ordered to carry out “comprehensive” self-inspections to standardize business practices and ensure compliance with anti-monopoly laws. Alibaba cooperated fully with the investigation and has changed certain business practices. In August, China passed the Personal Information Protection Law (PIPL), which is focused on protecting personal information rights and interests by standardizing the handling and usage of personal information by businesses. We believe the focus of PIPL is similar to the General Data Protection Regulation (GDPR), which went into effect in the European Union in 2018. The GDPR impacted other portfolio holdings such as Alphabet and Facebook, which incurred increased compliance costs and other disruptions as they adjusted certain business practices to comply with the new regulations. However, both companies continued to generate strong growth in revenue and free cash flow due to their competitive advantages and strong value propositions. While we expected that Alibaba would experience short-term disruptions as it modified its practices to fully comply with new regulatory changes, we did not believe the changes would ultimately impair the company’s difficult-to-replicate competitive advantages. More recently, we have observed increasing competitive pressure in two of the company’s smaller but faster-growing contributors: video streaming and penetration in lower-tier cities. Through the company’s Taobao Live, Alibaba offers a leading live-streaming social commercial platform, enabling merchants to interact with consumers. The relatively new medium has become a fast-growing vehicle for e-commerce sales, growing from less than 5% of China’s e-commerce two years earlier to almost 10% in 2020. While Alibaba continues to have a leadership position in live streaming and short video production, we have seen increased competition and market share gains from companies such as Douyin (China’s version of TikTok, owned by ByteDance), and Kuaishou. We expect this newer format will grow to represent approximately 25% of e-commerce sales over time. And while we expect Alibaba to remain a leader, we expect growing competition to take an increasing share of this fast-growing market over time. Growing competitive intensity has also impacted our assessment of Alibaba’s ongoing penetration of lower-tier cities. As internet access in lower-tier cities approaches that of higher-tier cities, we expect growth in e-commerce to be approximately twice that of overall China e-commerce growth. We believe Alibaba maintains leading market share in lower-tier cities, but is likely to face heightened competition from companies such as Pinduoduo, JD.com, and Meituan. We have long assumed that Alibaba’s disproportionate share of China e-commerce would decline, from over 80% at the time of our initial analysis in 2013, to a level closer to 50% of a still-growing market. While the company remains the dominant e-commerce platform in China, we estimate that a meaningful percentage of the company’s incremental growth in the most recent quarter was from these markets where we are seeing signs of heightened competitive intensity. As a function of newer market entrants, faster growth from newer formats of e-commerce and lower-tier cities, and recent regulatory changes, we now expect the company’s market share to normalize at a lower level than we previously expected. While our ongoing analysis has lowered our assessment of intrinsic value for the company, it has not changed our assessment that Alibaba is a high-quality company that remains well positioned to benefit from secular growth in China e-commerce over our long-term investment horizon. We continue to believe that Alibaba trades at a discount to intrinsic value and offers asymmetric reward-to-risk. However, given our most recent analysis, it no longer justified the same degree of capital allocation relative to other opportunities. We trimmed the position and allocated the proceeds to our existing holdings in Boeing, Disney, Illumina, and Salesforce.
Founded in 2013, CRISPR Therapeutics (“CRSP”) is a leading gene editing company, based in Switzerland. CRISPR, an acronym for “Clustered Regularly Interspaced Short Palindromic Repeats,” is a naturally occurring defense mechanism that protects bacteria against viral infections. Functioning as a “molecular scissors,” the process enables the bacteria to cut viral DNA, thereby disabling the virus. Dr. Emmanuelle Charpentier, a CRSP co-founder, elucidated the mechanism and developed a methodology to adapt and simplify its use for human gene therapy — for which she and a collaborator were awarded the 2020 Nobel Prize in Chemistry. The resulting gene editing technology enables precise alteration of DNA that can “silence” or correct undesirable sequences, potentially enabling a next generation of curative therapies for genetic diseases. Today, the company is focused on developing transformative gene-based medicines for serious diseases in areas including hemoglobinopathies (a group of inherited blood disorders including sickle cell disease), oncology, regenerative medicine, and rare diseases. A new purchase in the second quarter of 2021, CRSP reported financial results that demonstrated continued progress across its clinical and pre-clinical therapies, including the expectation for year-end 2022 regulatory filings for its CTX001 therapy for blood disorders including sickle cell disease. In October 2021, the company reported that its CTX110 CAR-T program, which uses the body’s own immune system to fight cancer, showed good Phase 1 safety results that were comparable to but less efficacious than competing autologous therapies. While the numbers appeared below peer results, they showed promise and potential for the company to improve the results by refining its dosing regimen. CRSP’s therapy also remains differentiated from autologous therapies which are patient-specific and can only be used to treat a single patient, while CRSP’s allogenic “off-the-shelf” CAR-T therapies can be derived from a single healthy donor and then used to treat many patients. While the results could impact the timing of potential approval and ultimate market share opportunity for its CAR-T therapies, they
| 18
NATIXIS U.S. EQUITY OPPORTUNITIES FUND
do not impact our assessment of the quality of CRSP’s platform, and we continue to expect the company to realize significant value from its CAR-T program. We took advantage of near-term price weakness to add to our holdings during the period. While CRSP has a number of therapies currently undergoing clinical trials, it has not yet commercialized any therapies and remains pre-revenue. However, at scale, we believe the company can attain the economics of a successful biotech company, including operating margins that could exceed 40% and cash flow returns on investment that substantially exceed its cost of capital. We believe the expectations embedded in CRSP’s market price substantially underestimate the potential of its curative therapies, its ability to rapidly innovate, and its structural advantages in the development process that should lift its probability of success compared to traditional biopharmaceutical therapies. We believe management is executing on a sound investment strategy that we expect will eventually generate meaningful free cash flow growth that is not reflected in current expectations. As a result, we believe the company is selling at a substantial discount to our estimate of its intrinsic value and offers a compelling reward-to-risk opportunity.
Outlook
The Natixis U.S. Equity Opportunities Fund is composed of two separate segments combining the value expertise of Harris Associates with the growth expertise of Loomis Sayles. The two segments have common investment philosophies and a rigorous long-term, bottom-up research process focused on high quality businesses trading at a significant discount to intrinsic value. Coming out of the pandemic-driven selloff in 2020, the market’s appetite for risk and infatuation with companies benefiting from the “work from home” environment has been most analogous to behavior observed in the dot-com era of the late 1990s and early 2000s and the financial crisis and energy bubble in 2008. The thesis for each investment, almost by definition, differs from consensus. The fund managers have maintained, and continue to maintain, temperament and discipline, and monitor any new information to constantly challenge those theses. The managers are patient investors and maintain coverage of high-quality businesses in order to take advantage of meaningful price dislocations if and when they occur.
Hypothetical Growth of $100,000 Investment in Class Y Shares4
December 31, 2011 through December 31, 2021
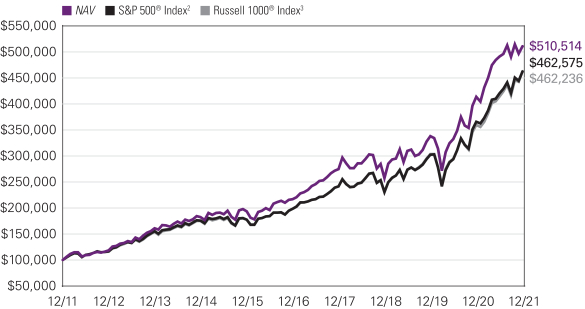
19 |
Top Ten Holdings as of December 31, 2021
| | | | | | | | |
| | |
| Security Name | | % of Net Assets | |
| | 1 | | | Meta Platforms, Inc., Class A | | | 4.48 | % |
| | 2 | | | Alphabet, Inc., Class A | | | 4.12 | % |
| | 3 | | | NVIDIA Corp. | | | 3.53 | % |
| | 4 | | | Amazon.com, Inc. | | | 3.13 | % |
| | 5 | | | Regeneron Pharmaceuticals, Inc. | | | 2.80 | % |
| | 6 | | | Ally Financial, Inc. | | | 2.43 | % |
| | 7 | | | EOG Resources, Inc. | | | 2.12 | % |
| | 8 | | | Capital One Financial Corp. | | | 2.10 | % |
| | 9 | | | Boeing Co. (The) | | | 2.06 | % |
| | 10 | | | Charles Schwab Corp. (The) | | | 2.06 | % |
The portfolio is actively managed and holdings are subject to change. There is no guarantee the Fund continues to invest in the securities referenced. The holdings listed exclude any temporary cash investments, are presented on an individual security basis and do not represent holdings of the issuer.
Average Annual Total Returns — December 31, 20214
| | | | | | | | | | | | | | | | | | | | | | | | |
| | | | | | |
| | | 1 Year | | | 5 Years | | | 10 Years | | | Life of
Class N | | | Expense Ratios5 | |
| | Gross | | | Net | |
| | | | | | | |
| Class Y | | | | | | | | | | | | | | | | | | | | | | | | |
| NAV | | | 23.48 | % | | | 18.69 | % | | | 17.70 | % | | | — | % | | | 0.92 | % | | | 0.92 | % |
| | | | | | | |
| Class A | | | | | | | | | | | | | | | | | | | | | | | | |
| NAV | | | 23.14 | | | | 18.40 | | | | 17.40 | | | | — | | | | 1.17 | | | | 1.17 | |
| With 5.75% Maximum Sales Charge | | | 16.07 | | | | 17.00 | | | | 16.71 | | | | — | | | | | | | | | |
| | | | | | | |
| Class C | | | | | | | | | | | | | | | | | | | | | | | | |
| NAV | | | 22.27 | | | | 17.52 | | | | 16.70 | | | | — | | | | 1.92 | | | | 1.92 | |
| With CDSC1 | | | 21.27 | | | | 17.52 | | | | 16.70 | | | | — | | | | | | | | | |
| | | | | | | |
| Class N (Inception 5/1/17) | | | | | | | | | | | | | | | | | | | | | | | | |
| NAV | | | 23.53 | | | | — | | | | — | | | | 18.17 | | | | 1.13 | | | | 0.84 | |
| | | | | | | |
| Comparative Performance | | | | | | | | | | | | | | | | | | | | | | | | |
| S&P 500® Index2 | | | 28.71 | | | | 18.47 | | | | 16.55 | | | | 18.02 | | | | | | | | | |
| Russell 1000® Index3 | | | 26.45 | | | | 18.43 | | | | 16.54 | | | | 17.96 | | | | | | | | | |
Performance data shown represents past performance and is no guarantee of, and not necessarily indicative of, future results. Total return and value will vary, and you may have a gain or loss when shares are sold. Current performance may be lower or higher than quoted. For most recent month-end performance, visit im.natixis.com/performance. Performance for other share classes will be greater or less than shown based on differences in fees and sales charges. You may not invest directly in an index. Performance for periods less than one year is cumulative, not annualized. Returns reflect changes in share price and reinvestment of dividends and capital gains, if any. The table(s) do not reflect taxes shareholders might owe on any fund distributions or when they redeem their shares.
| 1 | Performance for Class C shares assumes a 1.00% contingent deferred sales charge (“CDSC”) applied when you sell shares within one year of purchase and includes automatic conversion to Class A shares after eight years. |
| 2 | S&P 500® Index is a widely recognized measure of U.S. stock market performance. It is an unmanaged index of 500 common stocks chosen for market size, liquidity, and industry group representation, among other factors. It also measures the performance of the large cap segment of the US equities market. |
| 3 | Russell 1000® Index measures the performance of the large-cap segment of the U.S. equity universe. It is a subset of the Russell 3000® Index and includes approximately 1000 of the largest securities based on a combination of their market cap and current index membership. The Russell 1000® Index represents approximately 92% of the U.S. market and is constructed to provide a comprehensive and unbiased barometer for the large-cap segment and is completely reconstituted annually to ensure new and growing equities are reflected. |
| 4 | Fund performance has been increased by fee waivers and/or expense reimbursements, if any, without which performance would have been lower. |
| 5 | Expense ratios are as shown in the Fund’s prospectus in effect as of the date of this report. The expense ratios for the current reporting period can be found in the Financial Highlights section of this report under Ratios to Average Net Assets. Net expenses reflect contractual expense limitations set to expire on 4/30/22. When a Fund’s expenses are below the limitation, gross and net expense ratios will be the same. See Note 6 of the Notes to Financial Statements for more information about the Fund’s expense limitations. |
| 20
VAUGHAN NELSON MID CAP FUND
| | |
| |
| Managers | | Symbols |
| |
| Dennis G. Alff, CFA® | | Class A VNVAX |
| |
| Chad D. Fargason | | Class C VNVCX |
| |
| Chris D. Wallis, CFA® | | Class N VNVNX |
| |
| Vaughan Nelson Investment Management, L.P. | | Class Y VNVYX |
Investment Goal
The Fund seeks long-term capital appreciation.
Market Conditions
During the fiscal year ended December 31, 2021, the equity market continued to recover from the global pandemic. Buoyed by a new round of stimulus checks and an accelerated rollout of Covid-19 vaccines, cyclical sectors and securities with high beta and high short interest led the equity market to new all-time highs. As we moved through the fiscal year, growth stocks resumed their leadership over value. The leadership shift to larger cap equities with growth characteristics is consistent with the modest decline in Treasury yields and flattening yield curve. As we neared the fiscal year-end, returns were mixed as global equity markets grappled with slowing economic growth, rising energy prices, and material supply chain disruptions, offset by falling Covid cases and improving employment conditions. With rising inflationary pressures becoming a political issue, the US Federal Reserve began modestly reducing their Quantitative Easing purchases and provided forward guidance that interest rate increases are on the horizon. Inflationary pressures have peaked in the US and emerging markets but continue to rise in Europe. Although upward pressure on inflation is easing, inflation remains at elevated levels and may limit monetary policy support going forward.
Performance Results
For the 12 months ended December 31, 2021, Class Y shares of the Vaughan Nelson Mid Cap Fund returned 21.65% at net asset value. The Fund underperformed its benchmark, the Russell Midcap® Value Index, which returned 28.34%.
Explanation of Fund Performance
The largest contributor to underperformance was the Fund’s consumer discretionary names. Leslie’s, Inc. was a relative detractor. Leslie’s is a provider of pool supplies and chemicals in the US, with a network of nearly 1,000 stores. While earnings were strongly revised higher throughout the year, the stock suffered from private equity sponsor selling. With the December secondary offering, the company concurrently announced a share buyback to absorb more than half the offering. We believe this should begin to relieve the sponsor overhang in 2022.
Selection within materials, namely FMC Corporation, was a relative detractor. FMC is a leading agricultural sciences company making insecticides, herbicides, and fungicides for crops. The company experienced price/cost pressures during the year but exited the fourth quarter with positive momentum.
A significant underweight to real estate, an outperforming sector, meaningfully impacted relative returns.
Information technology was a negative contributor driven by an overweight position and stock selection. Alliance Data Systems Corporation (ADS) was the most challenged name. ADS is a provider of private label credit cards, promotional financings and savings products. The company underwent a spinoff of Loyalty Ventures to create value, but still lagged its peers as the market doubts its longer-term receivables growth targets and worries about the threat of alternatives such as buy-now-pay-later. The company is also classified in a different sector than its peers.
Health care underperformance was driven by security selection. Within the sector, Aveanna Healthcare Holdings Inc. is a provider of home health solutions, with a focus on pediatric patients. The stock underperformed as the sector was under pressure due to labor difficulties, and Aveanna is also a new issue.
Financials outperformed, with Athene Holding Ltd. Class A the strongest name. Athene was acquired by Apollo during the year and benefited from Apollo’s newly stated goal of $1 trillion in AUM by 2026, a doubling of its current asset base.
Security selection within industrials aided performance, with WillScot Mobile Mini Holdings Corp. Class A the strongest performer. The company provides modular space and portable storage products including temporary workspace, furniture rental, and facilities services. The company held an investor day with a bullish outlook, and a final sponsor stock sale allowed the stock to lift off.
21 |
Energy was a positive relative sector, primarily due to Pioneer Natural Resources Company. Pioneer is an oil & gas exploration and production company with a focus in the Permian basin. The company completed two big mergers, then benefited from a commitment to no more deals, capital return, and rising oil prices throughout the year.
Utilities was the final outperforming sector due in part to Evergy, Inc. Evergy is a regulated utility that provides electric services to Kansas and Missouri. The company has activist involvement and benefited from strong execution.
Outlook
Economic growth continues to slow, and we expect supporting data to become visible as we exit the first quarter and move through the second quarter of 2022. As monetary policy becomes incrementally more restrictive, it is important for inflationary pressures to ease faster than economic growth so that real growth can remain supportive of equity markets. Should economic growth slow more quickly than inflation, earnings estimates and equity valuations may come under pressure in the first half of 2022.
Hypothetical Growth of $100,000 Investment in Class Y Shares3
December 31, 2011 through December 31, 2021
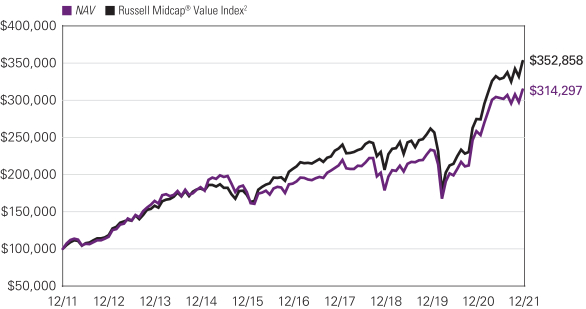
See notes to chart on page 23.
| 22
VAUGHAN NELSON MID CAP FUND
Top Ten Holdings as of December 31, 2021
| | | | | | | | |
| | |
| Security Name | | % of Net Assets | |
| | 1 | | | Motorola Solutions, Inc. | | | 4.82 | % |
| | 2 | | | Performance Food Group Co. | | | 3.70 | % |
| | 3 | | | Skechers U.S.A., Inc., Class A | | | 3.45 | % |
| | 4 | | | Elanco Animal Health, Inc. | | | 3.38 | % |
| | 5 | | | Avantor, Inc. | | | 2.93 | % |
| | 6 | | | Leslie's, Inc. | | | 2.78 | % |
| | 7 | | | Sotera Health Co. | | | 2.72 | % |
| | 8 | | | WillScot Mobile Mini Holdings Corp. | | | 2.67 | % |
| | 9 | | | Nexstar Media Group, Inc., Class A | | | 2.65 | % |
| | 10 | | | Crown Holdings, Inc. | | | 2.50 | % |
The portfolio is actively managed and holdings are subject to change. There is no guarantee the Fund continues to invest in the securities referenced. The holdings listed exclude any temporary cash investments, are presented on an individual security basis and do not represent holdings of the issuer.
Average Annual Total Returns — December 31, 20213
| | | | | | | | | | | | | | | | | | | | | | | | |
| | | | | | |
| | | 1 Year | | | 5 Years | | | 10 Years | | | Life of
Class N | | | Expense Ratios4 | |
| | Gross | | | Net | |
| | | | | | | |
| Class Y | | | | | | | | | | | | | | | | | | | | | | | | |
| NAV | | | 21.65 | % | | | 10.87 | % | | | 12.13 | % | | | — | % | | | 0.99 | % | | | 0.90 | % |
| | | | | | | |
| Class A | | | | | | | | | | | | | | | | | | | | | | | | |
| NAV | | | 21.32 | | | | 10.58 | | | | 11.84 | | | | — | | | | 1.24 | | | | 1.15 | |
| With 5.75% Maximum Sales Charge | | | 14.34 | | | | 9.28 | | | | 11.18 | | | | — | | | | | | | | | |
| | | | | | | |
| Class C | | | | | | | | | | | | | | | | | | | | | | | | |
| NAV | | | 20.44 | | | | 9.76 | | | | 11.18 | | | | — | | | | 1.99 | | | | 1.90 | |
| With CDSC1 | | | 19.44 | | | | 9.76 | | | | 11.18 | | | | — | | | | | | | | | |
| | | | | | | |
| Class N (Inception 5/1/13) | | | | | | | | | | | | | | | | | | | | | | | | |
| NAV | | | 21.70 | | | | 10.96 | | | | — | | | | 10.60 | | | | 0.89 | | | | 0.85 | |
| | | | | | | |
| Comparative Performance | | | | | | | | | | | | | | | | | | | | | | | | |
| Russell Midcap® Value Index2 | | | 28.34 | | | | 11.22 | | | | 13.44 | | | | 11.66 | | | | | | | | | |
Performance data shown represents past performance and is no guarantee of, and not necessarily indicative of, future results. Total return and value will vary, and you may have a gain or loss when shares are sold. Current performance may be lower or higher than quoted. For most recent month-end performance, visit im.natixis.com/performance. Performance for other share classes will be greater or less than shown based on differences in fees and sales charges. You may not invest directly in an index. Performance for periods less than one year is cumulative, not annualized. Returns reflect changes in share price and reinvestment of dividends and capital gains, if any. The table(s) do not reflect taxes shareholders might owe on any fund distributions or when they redeem their shares.
| 1 | Performance for Class C shares assumes a 1.00% contingent deferred sales charge (“CDSC”) applied when you sell shares within one year of purchase and includes automatic conversion to Class A shares after eight years. |
| 2 | Russell Midcap® Value Index is an unmanaged index that measures the performance of the mid-cap value segment of the U.S. equity universe. It includes those Russell Midcap® Index companies with lower price-to-book ratios and lower forecasted growth values. |
| 3 | Fund performance has been increased by fee waivers and/or expense reimbursements, if any, without which performance would have been lower. |
| 4 | Expense ratios are as shown in the Fund’s prospectus in effect as of the date of this report. The expense ratios for the current reporting period can be found in the Financial Highlights section of this report under Ratios to Average Net Assets. Net expenses reflect contractual expense limitations set to expire on 4/30/23. When a Fund’s expenses are below the limitation, gross and net expense ratios will be the same. See Note 6 of the Notes to Financial Statements for more information about the Fund’s expense limitations. |
23 |
VAUGHAN NELSON SMALL CAP VALUE FUND
| | |
| |
| Managers | | Symbols |
| |
| Chris D. Wallis, CFA® | | Class A NEFJX |
| |
| Stephen Davis, CFA® | | Class C NEJCX |
| |
| Vaughan Nelson Investment Management, L.P. | | Class N VSCNX |
| | Class Y NEJYX |
Investment Goal
The Fund seeks capital appreciation.
Market Conditions
During the fiscal year ended December 31, 2021, the equity market continued to recover from the global pandemic. Buoyed by a new round of stimulus checks and an accelerated rollout of Covid-19 vaccines, cyclical sectors and securities with high beta and high short interest led the equity market to new all-time highs. As we moved through the fiscal year, growth stocks resumed their leadership over value. The leadership shift to larger cap equities with growth characteristics is consistent with the modest decline in Treasury yields and flattening yield curve. As we neared the fiscal year-end, returns were mixed as global equity markets grappled with slowing economic growth, rising energy prices, and material supply chain disruptions offset by falling Covid cases and improving employment conditions. With rising inflationary pressures becoming a political issue, the US Federal Reserve began modestly reducing their Quantitative Easing purchases and provided forward guidance that interest rate increases are on the horizon. Inflationary pressures have peaked in the US and emerging markets but continue to rise in Europe. Although upward pressure on inflation is easing, inflation remains at elevated levels and may limit monetary policy support going forward.
Performance Results
For the 12 months ended December 31, 2021, Class Y shares of the Vaughan Nelson Small Cap Value Fund returned 30.61% at net asset value. The Fund outperformed its benchmark, the Russell 2000® Value Index, which returned 28.27%.
Explanation of Fund Performance
The largest contributor to outperformance was healthcare, driven by security selection. Within the sector, Syneos Health, Inc. Class A drove the outperformance due to continued strength in their backlog of core clinical contract outsourcing business combined with industry strength with respect to biotech funding levels.
Information technology (IT) was a significant contributor, driven by an overweight position and stock selection. ExlService Holdings, Inc. led the way, resulting from strong third quarter 2021 execution on booked business, strong (95%) revenue visibility into 2022 and the continued secular shift for enterprise clients to outsource core operations to the company to save money and gain operational efficiency.
The Fund’s consumer discretionary names outperformed the sector, with International Game Technology PLC the largest contributor due primarily to strength in i-Lottery and sports betting industry assets that drove a re-rating of the stock by the market. Higher cash flow generation by the company also led to a significant reduction in net leverage from previously high levels.
Financials outperformed, with LPL Financial Holdings Inc. the strongest name because of a rise in equity markets driving higher assets under management and the market anticipating higher interest rates, which would increase the spread earned by the company on their client’s cash balances.
Utilities was the final outperforming sector, due in part to the Fund’s underweight position.
The largest detractor from returns was a significant underweight to real estate, an outperforming benchmark sector.
Both an overweight to and security selection within industrials hampered performance, with Ritchie Bros. Auctioneers the worst performer
Ritchie Bros. Auctioneers underperformed due to supply chain constraints limiting the amount of auction inventory (industrial capital equipment) the company could aggregate as owners of equipment were holding on to older assets longer. This led to lower earnings growth than the market anticipated.
Energy was a negative relative sector, primarily due to TechnipFMC Plc, which underperformed due to a pullback in natural gas prices throughout the world and a milder winter in Europe. Further, oil retreated from its 2021 highs made in October 2021.
| 24
VAUGHAN NELSON SMALL CAP VALUE FUND
The communication services underperformance was driven by security selection. Sinclair Broadcast Group, Inc. Class A was the most challenged name. The Delta and Omicron virus waves led to changes in sports viewing schedules, which is one of the primary revenue sources for the company as it owns several regional sports networks.
Security selection within a disappointing consumer staples sector detracted from returns led by Performance Food Group Company. The stock underperformed due to inflation effects as the company lags price increases by 1–2 quarters, as well as a deal with CoreMark that the market is waiting to see demonstrable benefits from.
Lastly, selection within materials, namely Axalta Coating Systems Ltd., was a relative detractor due to lower auto production volumes resulting in decreased demand for Axalta paint, combined with margin pressure due to inflation which the company mitigates with price increases on a 1–2 quarter lag.
Outlook
Economic growth continues to slow, and we expect supporting data to become visible as we exit the first quarter and move through the second quarter of 2022. As monetary policy becomes incrementally more restrictive, it is important for inflationary pressures to ease faster than economic growth so that real growth can remain supportive of equity markets. Should economic growth slow more quickly than inflation, earnings estimates and equity valuations may come under pressure in the first half of 2022.
Hypothetical Growth of $100,000 Investment in Class Y Shares3
December 31, 2011 through December 31, 2021
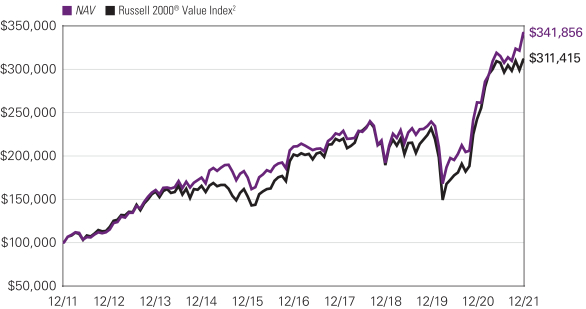
25 |
Top Ten Holdings as of December 31, 2021
| | | | | | | | |
| | |
| Security Name | | % of
Net Assets | |
| | 1 | | | Insight Enterprises, Inc. | | | 3.50 | % |
| | 2 | | | Element Solutions, Inc. | | | 3.41 | |
| | 3 | | | ExlService Holdings, Inc. | | | 2.98 | |
| | 4 | | | Syneos Health, Inc. | | | 2.86 | |
| | 5 | | | Molina Healthcare, Inc. | | | 2.77 | |
| | 6 | | | ASGN, Inc. | | | 2.58 | |
| | 7 | | | LPL Financial Holdings, Inc. | | | 2.45 | |
| | 8 | | | Performance Food Group Co. | | | 2.40 | |
| | 9 | | | Capri Holdings Ltd. | | | 2.35 | |
| | 10 | | | Chemours Co. (The) | | | 2.09 | |
The portfolio is actively managed and holdings are subject to change. There is no guarantee the Fund continues to invest in the securities referenced. The holdings listed exclude any temporary cash investments, are presented on an individual security basis and do not represent holdings of the issuer.
Average Annual Total Returns — December 31, 20213
| | | | | | | | | | | | | | | | | | | | | | | | |
| | | | | | |
| | | 1 Year | | | 5 Years | | | 10 Years | | | Life of
Class N | | | Expense Ratios4 | |
| | Gross | | | Net | |
| | | | | | | |
| Class Y | | | | | | | | | | | | | | | | | | | | | | | | |
| NAV | | | 30.61 | % | | | 10.15 | % | | | 13.09 | % | | | — | % | | | 1.23 | % | | | 1.00 | % |
| | | | | | | |
| Class A | | | | | | | | | | | | | | | | | | | | | | | | |
| NAV | | | 30.24 | | | | 9.86 | | | | 12.80 | | | | — | | | | 1.48 | | | | 1.25 | |
| With 5.75% Maximum Sales Charge | | | 22.74 | | | | 8.56 | | | | 12.13 | | | | — | | | | | | | | | |
| | | | | | |
| Class C | | | | | | | | | | | | | | | | | | | | | |
| NAV | | | 29.45 | | | | 9.05 | | | | 12.12 | | | | — | | | | 2.23 | | | | 2.00 | |
| With CDSC1 | | | 28.62 | | | | 9.05 | | | | 12.12 | | | | — | | | | | | | | | |
| | | | | | | |
| Class N (Inception 5/1/17) | | | | | | | | | | | | | | | | | | | | | | | | |
| NAV | | | 30.64 | | | | — | | | | — | | | | 11.13 | | | | 6.49 | | | | 0.95 | |
| | | | | | | |
| Comparative Performance | | | | | | | | | | | | | | | | | | | | | | | | |
| Russell 2000® Value Index2 | | | 28.27 | | | | 9.07 | | | | 12.03 | | | | 9.54 | | | | | | | | | |
Performance data shown represents past performance and is no guarantee of, and not necessarily indicative of, future results. Total return and value will vary, and you may have a gain or loss when shares are sold. Current performance may be lower or higher than quoted. For most recent month-end performance, visit im.natixis.com/performance. Performance for other share classes will be greater or less than shown based on differences in fees and sales charges. You may not invest directly in an index. Performance for periods less than one year is cumulative, not annualized. Returns reflect changes in share price and reinvestment of dividends and capital gains, if any. The table(s) do not reflect taxes shareholders might owe on any fund distributions or when they redeem their shares.
| 1 | Performance for Class C shares assumes a 1.00% contingent deferred sales charge (“CDSC”) applied when you sell shares within one year of purchase and includes automatic conversion to Class A shares after eight years. |
| 2 | Russell 2000® Value Index is an unmanaged index that measures the performance of the small-cap value segment of the U.S. equity universe. It includes those Russell 2000® companies with lower price-to-book ratios and lower forecasted growth values. |
| 3 | Fund performance has been increased by fee waivers and/or expense reimbursements, if any, without which performance would have been lower. |
| 4 | Expense ratios are as shown in the Fund’s prospectus in effect as of the date of this report. The expense ratios for the current reporting period can be found in the Financial Highlights section of this report under Ratios to Average Net Assets. Net expenses reflect contractual expense limitations set to expire on 4/30/23. When a Fund’s expenses are below the limitation, gross and net expense ratios will be the same. See Note 6 of the Notes to Financial Statements for more information about the Fund’s expense limitations. |
| 26
ADDITIONAL INFORMATION
All investing involves risk, including the risk of loss. There is no assurance that any investment will meet its performance objectives or that losses will be avoided.
The views expressed in this report reflect those of the portfolio managers as of the dates indicated. The managers’ views are subject to change at any time without notice based on changes in market or other conditions. References to specific securities or industries should not be regarded as investment advice. Because the Fund is actively managed, there is no assurance that they will continue to invest in the securities or industries mentioned.
ADDITIONAL INDEX INFORMATION
This document may contain references to third party copyrights, indexes, and trademarks, each of which is the property of its respective owner. Such owner is not affiliated with Natixis Investment Managers or any of its related or affiliated companies (collectively “Natixis Affiliates”) and does not sponsor, endorse or participate in the provision of any Natixis Affiliates services, funds or other financial products.
The index information contained herein is derived from third parties and is provided on an “as is” basis. The user of this information assumes the entire risk of use of this information. Each of the third party entities involved in compiling, computing or creating index information disclaims all warranties (including, without limitation, any warranties of originality, accuracy, completeness, timeliness, non-infringement, merchantability and fitness for a particular purpose) with respect to such information.
PROXY VOTING INFORMATION
A description of the Natixis Funds’ proxy voting policies and procedures is available without charge, upon request, by calling Natixis Funds at 800-225-5478; on the Natixis Funds’ website at im.natixis.com; and on the Securities and Exchange Commission’s (“SEC’s”) website at www.sec.gov. Information regarding how the Natixis Funds voted proxies relating to portfolio securities during the most recent 12-month period ended June 30 is available from the Natixis Funds’ website and the SEC’s website.
QUARTERLY PORTFOLIO SCHEDULES
The Natixis Funds file a complete schedule of portfolio holdings with the SEC for the first and third quarters of each fiscal year as an exhibit to its reports on Form N-PORT. The Funds’ Form N-PORT reports are available on the SEC’s website at www.sec.gov. First and third quarter schedules of portfolio holdings are also available at im.natixis.com/funddocuments. A hard copy may be requested from the Fund at no charge by calling 800-225-5478.
CFA® and Chartered Financial Analyst® are registered trademarks owned by the CFA Institute.
27 |
UNDERSTANDING FUND EXPENSES
As a mutual fund shareholder, you incur different costs: transaction costs, including sales charges (loads) on purchases and contingent deferred sales charges on redemptions, and ongoing costs, including management fees, distribution and/or service fees (12b-1 fees), and other fund expenses. Certain exemptions may apply. These costs are described in more detail in the Funds’ prospectus. The following examples are intended to help you understand the ongoing costs of investing in the Funds and help you compare these with the ongoing costs of investing in other mutual funds.
The first line in the table of each class of Fund shares shows the actual account values and actual Fund expenses you would have paid on a $1,000 investment in the Fund from July 1, 2021 through December 31, 2021. To estimate the expenses you paid over the period, simply divide your account value by $1,000 (for example $8,600 account value divided by $1,000 = 8.60) and multiply the result by the number in the Expenses Paid During Period column as shown for your class.
The second line in the table for each class of fund shares provides information about hypothetical account values and hypothetical expenses based on the Fund’s actual expense ratios and an assumed rate of return of 5% per year before expenses, which is not the Fund’s actual return. The hypothetical account values and expenses may not be used to estimate the actual ending account balance or expenses you paid on your investment for the period. You may use this information to compare the ongoing costs of investing in the Fund and other funds. To do so, compare this 5% hypothetical example with the 5% hypothetical examples that appear in the shareholder reports of the other funds.
Please note that the expenses shown reflect ongoing costs only, and do not include any transaction costs, such as sales charges. Therefore, the second line in the table of each fund is useful in comparing ongoing costs only, and will not help you determine the relative costs of owning funds. If transaction costs were included, total costs would be higher.
| | | | | | | | | | | | |
| LOOMIS SAYLES INTERNATIONAL GROWTH FUND | | BEGINNING
ACCOUNT VALUE
7/1/2021 | | | ENDING
ACCOUNT VALUE
12/31/2021 | | | EXPENSES PAID
DURING PERIOD
7/1/2021 – 12/31/2021* | |
| Class A | | | | | | | | | | | | |
| Actual | | | $1,000.00 | | | | $912.30 | | | | $5.78 | |
| Hypothetical (5% return before expenses) | | | $1,000.00 | | | | $1,019.16 | | | | $6.11 | |
| Class C | | | | | | | | | | | | |
| Actual | | | $1,000.00 | | | | $909.70 | | | | $9.39 | |
| Hypothetical (5% return before expenses) | | | $1,000.00 | | | | $1,015.38 | | | | $9.91 | |
| Class N | | | | | | | | | | | | |
| Actual | | | $1,000.00 | | | | $914.20 | | | | $4.34 | |
| Hypothetical (5% return before expenses) | | | $1,000.00 | | | | $1,020.67 | | | | $4.58 | |
| Class Y | | | | | | | | | | | | |
| Actual | | | $1,000.00 | | | | $913.90 | | | | $4.58 | |
| Hypothetical (5% return before expenses) | | | $1,000.00 | | | | $1,020.42 | | | | $4.84 | |
| * | Expenses are equal to the Fund’s annualized expense ratio (after waiver/reimbursement): 1.20%, 1.95%, 0.90% and 0.95% for Class A, C, N and Y, respectively, multiplied by the average account value over the period, multiplied by the number of days in the most recent fiscal half-year (184), divided by 365 (to reflect the half-year period). |
| 28
| | | | | | | | | | | | |
| NATIXIS OAKMARK FUND | | BEGINNING
ACCOUNT VALUE
7/1/2021 | | | ENDING
ACCOUNT VALUE
12/31/2021 | | | EXPENSES PAID
DURING PERIOD
7/1/2021 – 12/31/2021* | |
| Class A | | | | | | | | | | | | |
| Actual | | | $1,000.00 | | | | $1,065.30 | | | | $5.47 | |
| Hypothetical (5% return before expenses) | | | $1,000.00 | | | | $1,019.91 | | | | $5.35 | |
| Class C | | | | | | | | | | | | |
| Actual | | | $1,000.00 | | | | $1,061.50 | | | | $9.35 | |
| Hypothetical (5% return before expenses) | | | $1,000.00 | | | | $1,016.13 | | | | $9.15 | |
| Class N | | | | | | | | | | | | |
| Actual | | | $1,000.00 | | | | $1,067.10 | | | | $3.91 | |
| Hypothetical (5% return before expenses) | | | $1,000.00 | | | | $1,021.43 | | | | $3.82 | |
| Class Y | | | | | | | | | | | | |
| Actual | | | $1,000.00 | | | | $1,067.00 | | | | $4.17 | |
| Hypothetical (5% return before expenses) | | | $1,000.00 | | | | $1,021.17 | | | | $4.08 | |
| * | Expenses are equal to the Fund’s annualized expense ratio (after waiver/reimbursement): 1.05%, 1.80%, 0.75% and 0.80% for Class A, C, N and Y, respectively, multiplied by the average account value over the period, multiplied by the number of days in the most recent fiscal half-year (184), divided by 365 (to reflect the half-year period). |
| | | | | | | | | | | | |
| NATIXIS OAKMARK INTERNATIONAL FUND | | BEGINNING
ACCOUNT VALUE
7/1/2021 | | | ENDING
ACCOUNT VALUE
12/31/2021 | | | EXPENSES PAID
DURING PERIOD
7/1/2021 – 12/31/2021* | |
| Class A | | | | | | | | | | | | |
| Actual | | | $1,000.00 | | | | $956.80 | | | | $5.67 | |
| Hypothetical (5% return before expenses) | | | $1,000.00 | | | | $1,019.41 | | | | $5.85 | |
| Class C | | | | | | | | | | | | |
| Actual | | | $1,000.00 | | | | $953.20 | | | | $9.35 | |
| Hypothetical (5% return before expenses) | | | $1,000.00 | | | | $1,015.63 | | | | $9.65 | |
| Class N | | | | | | | | | | | | |
| Actual | | | $1,000.00 | | | | $958.20 | | | | $4.20 | |
| Hypothetical (5% return before expenses) | | | $1,000.00 | | | | $1,020.92 | | | | $4.33 | |
| Class Y | | | | | | | | | | | | |
| Actual | | | $1,000.00 | | | | $957.70 | | | | $4.44 | |
| Hypothetical (5% return before expenses) | | | $1,000.00 | | | | $1,020.67 | | | | $4.58 | |
| * | Expenses are equal to the Fund’s annualized expense ratio (after waiver/reimbursement): 1.15%, 1.90%, 0.85% and 0.90% for Class A, C, N and Y, respectively, multiplied by the average account value over the period, multiplied by the number of days in the most recent fiscal half-year (184), divided by 365 (to reflect the half-year period). |
29 |
| | | | | | | | | | | | |
| NATIXIS U.S. EQUITY OPPORTUNITIES FUND | | BEGINNING
ACCOUNT VALUE
7/1/2021 | | | ENDING
ACCOUNT VALUE
12/31/2021 | | | EXPENSES PAID
DURING PERIOD
7/1/2021 – 12/31/2021* | |
| Class A | | | | | | | | | | | | |
| Actual | | | $1,000.00 | | | | $1,038.20 | | | | $5.75 | |
| Hypothetical (5% return before expenses) | | | $1,000.00 | | | | $1,019.56 | | | | $5.70 | |
| Class C | | | | | | | | | | | | |
| Actual | | | $1,000.00 | | | | $1,034.60 | | | | $9.59 | |
| Hypothetical (5% return before expenses) | | | $1,000.00 | | | | $1,015.78 | | | | $9.50 | |
| Class N | | | | | | | | | | | | |
| Actual | | | $1,000.00 | | | | $1,039.80 | | | | $4.22 | |
| Hypothetical (5% return before expenses) | | | $1,000.00 | | | | $1,021.07 | | | | $4.18 | |
| Class Y | | | | | | | | | | | | |
| Actual | | | $1,000.00 | | | | $1,039.60 | | | | $4.47 | |
| Hypothetical (5% return before expenses) | | | $1,000.00 | | | | $1,020.82 | | | | $4.43 | |
| * | Expenses are equal to the Fund’s annualized expense ratio (after waiver/reimbursement): 1.12%, 1.87%, 0.82% and 0.87% for Class A, C, N and Y, respectively, multiplied by the average account value over the period, multiplied by the number of days in the most recent fiscal half-year (184), divided by 365 (to reflect the half-year period). |
| | | | | | | | | | | | |
| VAUGHAN NELSON MID CAP FUND | | BEGINNING
ACCOUNT VALUE
7/1/2021 | | | ENDING
ACCOUNT VALUE
12/31/2021 | | | EXPENSES PAID
DURING PERIOD
7/1/2021 – 12/31/2021* | |
| Class A | | | | | | | | | | | | |
| Actual | | | $1,000.00 | | | | $1,034.80 | | | | $5.90 | |
| Hypothetical (5% return before expenses) | | | $1,000.00 | | | | $1,019.41 | | | | $5.85 | |
| Class C | | | | | | | | | | | | |
| Actual | | | $1,000.00 | | | | $1,031.10 | | | | $9.73 | |
| Hypothetical (5% return before expenses) | | | $1,000.00 | | | | $1,015.63 | | | | $9.65 | |
| Class N | | | | | | | | | | | | |
| Actual | | | $1,000.00 | | | | $1,036.80 | | | | $4.36 | |
| Hypothetical (5% return before expenses) | | | $1,000.00 | | | | $1,020.92 | | | | $4.33 | |
| Class Y | | | | | | | | | | | | |
| Actual | | | $1,000.00 | | | | $1,036.60 | | | | $4.62 | |
| Hypothetical (5% return before expenses) | | | $1,000.00 | | | | $1,020.67 | | | | $4.58 | |
| * | Expenses are equal to the Fund’s annualized expense ratio (after waiver/reimbursement): 1.15%, 1.90%, 0.85% and 0.90% for Class A, C, N and Y, respectively, multiplied by the average account value over the period, multiplied by the number of days in the most recent fiscal half-year (184), divided by 365 (to reflect the half-year period). |
| 30
| | | | | | | | | | | | |
| VAUGHAN NELSON SMALL CAP VALUE FUND | | BEGINNING
ACCOUNT VALUE
7/1/2021 | | | ENDING
ACCOUNT VALUE
12/31/2021 | | | EXPENSES PAID
DURING PERIOD
7/1/2021 – 12/31/2021* | |
| Class A | | | | | | | | | | | | |
| Actual | | | $1,000.00 | | | | $1,082.00 | | | | $6.56 | |
| Hypothetical (5% return before expenses) | | | $1,000.00 | | | | $1,018.90 | | | | $6.36 | |
| Class C | | | | | | | | | | | | |
| Actual | | | $1,000.00 | | | | $1,078.50 | | | | $10.48 | |
| Hypothetical (5% return before expenses) | | | $1,000.00 | | | | $1,015.12 | | | | $10.16 | |
| Class N | | | | | | | | | | | | |
| Actual | | | $1,000.00 | | | | $1,083.70 | | | | $4.99 | |
| Hypothetical (5% return before expenses) | | | $1,000.00 | | | | $1,020.42 | | | | $4.84 | |
| Class Y | | | | | | | | | | | | |
| Actual | | | $1,000.00 | | | | $1,083.90 | | | | $5.25 | |
| Hypothetical (5% return before expenses) | | | $1,000.00 | | | | $1,020.16 | | | | $5.09 | |
| * | Expenses are equal to the Fund’s annualized expense ratio (after waiver/reimbursement): 1.25%, 2.00%, 0.95% and 1.00% for Class A, C, N and Y, respectively, multiplied by the average account value over the period, multiplied by the number of days in the most recent fiscal half-year (184), divided by 365 (to reflect the half-year period). |
31 |
Portfolio of Investments – as of December 31, 2021
Loomis Sayles International Growth Fund
| | | | | | | | |
| Shares | | | Description | |
Value (†) | |
| | Common Stocks — 97.7% of Net Assets | |
| | | | Argentina — 6.0% | |
| | 1,032 | | | MercadoLibre, Inc.(a) | | $ | 1,391,549 | |
| | | | | | | | |
| | | | Australia — 6.0% | |
| | 33,026 | | | WiseTech Global Ltd. | | | 1,400,680 | |
| | | | | | | | |
| | | | Belgium — 2.1% | |
| | 8,040 | | | Anheuser-Busch InBev S.A. | | | 484,731 | |
| | | | | | | | |
| | | | Brazil — 3.7% | |
| | 306,396 | | | Ambev S.A., ADR | | | 857,909 | |
| | | | | | | | |
| | | | China — 25.7% | |
| | 3,304 | | | Alibaba Group Holding Ltd., Sponsored ADR(a)(b) | | | 392,482 | |
| | 4,070 | | | Baidu, Inc., Sponsored ADR(a)(b) | | | 605,575 | |
| | 57,800 | | | Budweiser Brewing Co. APAC Ltd., 144A | | | 151,954 | |
| | 456,500 | | | Dali Foods Group Co. Ltd., 144A | | | 239,153 | |
| | 3,100 | | | Kweichow Moutai Co. Ltd., Class A | | | 998,693 | |
| | 3,517 | | | NXP Semiconductors NV | | | 801,102 | |
| | 22,000 | | | Tencent Holdings Ltd.(b) | | | 1,283,724 | |
| | 23,573 | | | Trip.com Group Ltd., ADR(a)(b) | | | 580,367 | |
| | 40,469 | | | Vipshop Holdings Ltd., ADR(a)(b) | | | 339,940 | |
| | 11,933 | | | Yum China Holdings, Inc. | | | 594,741 | |
| | | | | | | | |
| | | | | | | 5,987,731 | |
| | | | | | | | |
| | | | Denmark — 4.0% | |
| | 8,249 | | | Novo Nordisk A/S, Class B | | | 926,576 | |
| | | | | | | | |
| | | | France — 5.0% | |
| | 2,482 | | | EssilorLuxottica S.A. | | | 528,360 | |
| | 7,379 | | | Sodexo S.A. | | | 646,902 | |
| | | | | | | | |
| | | | | | | 1,175,262 | |
| | | | | | | | |
| | | | Germany — 3.3% | |
| | 5,548 | | | SAP SE | | | 780,823 | |
| | | | | | | | |
| | | | Japan — 4.7% | |
| | 4,100 | | | FANUC Corp. | | | 871,504 | |
| | 5,300 | | | Unicharm Corp. | | | 230,588 | |
| | | | | | | | |
| | | | | | | 1,102,092 | |
| | | | | | | | |
| | | | Macau — 0.9% | |
| | 39,000 | | | Galaxy Entertainment Group Ltd.(a) | | | 202,316 | |
| | | | | | | | |
| | | | Netherlands — 5.7% | |
| | 509 | | | Adyen NV, 144A(a) | | | 1,336,125 | |
| | | | | | | | |
| | | | Switzerland — 17.8% | |
| | 6,639 | | | CRISPR Therapeutics AG(a) | | | 503,103 | |
| | 6,811 | | | Nestle S.A., (Registered) | | | 950,933 | |
| | 12,727 | | | Novartis AG, (Registered) | | | 1,118,347 | |
| | 3,830 | | | Roche Holding AG | | | 1,588,918 | |
| | | | | | | | |
| | | | | | | 4,161,301 | |
| | | | | | | | |
| | | | United Kingdom — 11.1% | |
| | 6,459 | | | Diageo PLC | | | 353,152 | |
| | 17,805 | | | Experian PLC | | | 877,001 | |
| | 9,470 | | | Reckitt Benckiser Group PLC | | | 815,212 | |
| | 10,119 | | | Unilever PLC | | | 542,441 | |
| | | | | | | | |
| | | | | | | 2,587,806 | |
| | | | | | | | |
| | | | United States — 1.7% | |
| | 4,226 | | | Core Laboratories NV | | | 94,282 | |
| | 9,810 | | | Schlumberger NV | | | 293,809 | |
| | | | | | | | |
| | | | | | | 388,091 | |
| | | | | | | | |
| | | | Total Common Stocks
(Identified Cost $23,841,001) | | | 22,782,992 | |
| | | | | | | | |
| | | | | | | | |
Principal
Amount | | | Description | | Value (†) | |
| | Short-Term Investments — 1.6% | | | | |
| $ | 382,811 | | | Tri-Party Repurchase Agreement with Fixed Income Clearing Corporation, dated 12/31/2021 at 0.000% to be repurchased at $382,811 on 1/03/2022 collateralized by $323,400 U.S. Treasury Inflation Indexed Note, 0.125% due 07/15/2030 valued at $390,573 including accrued interest (Note 2 of Notes to Financial Statements)
(Identified Cost $382,811) | | $ | 382,811 | |
| | | | | | | | |
| | | | | | | | |
| | | | Total Investments — 99.3%
(Identified Cost $24,223,812) | | | 23,165,803 | |
| | | | Other assets less liabilities — 0.7% | | | 159,888 | |
| | | | | | | | |
| | | | Net Assets — 100.0% | | $ | 23,325,691 | |
| | | | | | | | |
| | | | | | | | |
| | (†) | | | See Note 2 of Notes to Financial Statements. | |
| | (a) | | | Non-income producing security. | |
| | (b) | | | Security invests in variable interest entities based in China. See Note 10 of Notes to Financial Statements. | |
| | | | | | | | |
| | 144A | | | All or a portion of these securities are exempt from registration under Rule 144A of the Securities Act of 1933. These securities may be resold in transactions exempt from registration, normally to qualified institutional buyers. At December 31, 2021, the value of Rule 144A holdings amounted to $1,727,232 or 7.4% of net assets. | |
| | ADR | | | An American Depositary Receipt is a certificate issued by a custodian bank representing the right to receive securities of the foreign issuer described. The values of ADRs may be significantly influenced by trading on exchanges not located in the United States. | |
Industry Summary at December 31, 2021
| | | | |
Pharmaceuticals | | | 15.6 | % |
Beverages | | | 12.3 | |
Software | | | 9.3 | |
Internet & Direct Marketing Retail | | | 9.2 | |
Hotels, Restaurants & Leisure | | | 8.7 | |
Interactive Media & Services | | | 8.1 | |
IT Services | | | 5.7 | |
Food Products | | | 5.1 | |
Household Products | | | 4.5 | |
Professional Services | | | 3.8 | |
Machinery | | | 3.7 | |
Semiconductors & Semiconductor Equipment | | | 3.4 | |
Personal Products | | | 2.3 | |
Textiles, Apparel & Luxury Goods | | | 2.2 | |
Biotechnology | | | 2.1 | |
Energy Equipment & Services | | | 1.7 | |
Short-Term Investments | | | 1.6 | |
| | | | |
Total Investments | | | 99.3 | |
Other assets less liabilities | | | 0.7 | |
| | | | |
Net Assets | | | 100.0 | % |
| | | | |
See accompanying notes to financial statements.
| 32
Portfolio of Investments – as of December 31, 2021
Loomis Sayles International Growth Fund – (continued)
Currency Exposure Summary at December 31, 2021
| | | | |
United States Dollar | | | 29.3 | % |
Euro | | | 18.4 | |
Swiss Franc | | | 15.7 | |
British Pound | | | 8.8 | |
Hong Kong Dollar | | | 8.1 | |
Australian Dollar | | | 6.0 | |
Japanese Yen | | | 4.7 | |
Yuan Renminbi | | | 4.3 | |
Danish Krone | | | 4.0 | |
| | | | |
Total Investments | | | 99.3 | |
Other assets less liabilities | | | 0.7 | |
| | | | |
Net Assets | | | 100.0 | % |
| | | | |
See accompanying notes to financial statements.
33 |
Portfolio of Investments – as of December 31, 2021
Natixis Oakmark Fund
| | | | | | | | |
| Shares | | | Description | | Value (†) | |
| | Common Stocks — 93.9% of Net Assets | |
| | | | Aerospace & Defense — 0.9% | |
| | 16,300 | | | General Dynamics Corp. | | $ | 3,398,061 | |
| | | | | | | | |
| | | | Auto Components — 1.0% | |
| | 81,700 | | | BorgWarner, Inc. | | | 3,682,219 | |
| | | | | | | | |
| | | | Automobiles — 1.6% | |
| | 103,400 | | | General Motors Co.(a) | | | 6,062,342 | |
| | | | | | | | |
| | | | Banks — 6.4% | |
| | 178,700 | | | Bank of America Corp. | | | 7,950,363 | |
| | 149,600 | | | Citigroup, Inc. | | | 9,034,344 | |
| | 143,045 | | | Wells Fargo & Co. | | | 6,863,299 | |
| | | | | | | | |
| | | | | | | 23,848,006 | |
| | | | | | | | |
| | | | Beverages — 3.9% | |
| | 30,300 | | | Constellation Brands, Inc., Class A | | | 7,604,391 | |
| | 183,404 | | | Keurig Dr Pepper, Inc. | | | 6,760,271 | |
| | | | | | | | |
| | | | | | | 14,364,662 | |
| | | | | | | | |
| | | | Biotechnology — 1.9% | |
| | 10,987 | | | Regeneron Pharmaceuticals, Inc.(a) | | | 6,938,510 | |
| | | | | | | | |
| | | | Capital Markets — 12.9% | |
| | 92,600 | | | Bank of New York Mellon Corp. (The) | | | 5,378,208 | |
| | 124,000 | | | Charles Schwab Corp. (The) | | | 10,428,400 | |
| | 22,575 | | | Goldman Sachs Group, Inc. (The) | | | 8,636,066 | |
| | 49,000 | | | Intercontinental Exchange, Inc. | | | 6,701,730 | |
| | 60,657 | | | KKR & Co., Inc. | | | 4,518,947 | |
| | 8,005 | | | Moody’s Corp. | | | 3,126,593 | |
| | 4,210 | | | S&P Global, Inc. | | | 1,986,825 | |
| | 76,943 | | | State Street Corp. | | | 7,155,699 | |
| | | | | | | | |
| | | | | | | 47,932,468 | |
| | | | | | | | |
| | | | Consumer Finance — 8.0% | |
| | 260,544 | | | Ally Financial, Inc. | | | 12,404,500 | |
| | 41,644 | | | American Express Co. | | | 6,812,958 | |
| | 73,305 | | | Capital One Financial Corp. | | | 10,635,823 | |
| | | | | | | | |
| | | | | | | 29,853,281 | |
| | | | | | | | |
| | | | Electronic Equipment, Instruments & Components — 1.5% | |
| | 35,747 | | | TE Connectivity Ltd. | | | 5,767,421 | |
| | | | | | | | |
| | | | Entertainment — 3.2% | |
| | 13,855 | | | Netflix, Inc.(a) | | | 8,346,806 | |
| | 20,400 | | | Take-Two Interactive Software, Inc.(a) | | | 3,625,488 | |
| | | | | | | | |
| | | | | | | 11,972,294 | |
| | | | | | | | |
| | | | Health Care Providers & Services — 6.3% | |
| | 62,866 | | | CVS Health Corp. | | | 6,485,257 | |
| | 32,407 | | | HCA Healthcare, Inc. | | | 8,326,006 | |
| | 18,345 | | | Humana, Inc. | | | 8,509,512 | |
| | | | | | | | |
| | | | | | | 23,320,775 | |
| | | | | | | | |
| | | | Hotels, Restaurants & Leisure — 4.3% | |
| | 3,405 | | | Booking Holdings, Inc.(a) | | | 8,169,378 | |
| | 50,545 | | | Hilton Worldwide Holdings, Inc.(a) | | | 7,884,515 | |
| | | | | | | | |
| | | | | | | 16,053,893 | |
| | | | | | | | |
| | | | Industrial Conglomerates — 1.3% | |
| | 51,625 | | | General Electric Co. | | | 4,877,014 | |
| | | | | | | | |
| | | | Insurance — 4.6% | |
| | 143,895 | | | American International Group, Inc. | | | 8,181,870 | |
| | 47,212 | | | Reinsurance Group of America, Inc. | | | 5,169,242 | |
| | 16,315 | | | Willis Towers Watson PLC | | | 3,874,649 | |
| | | | | | | | |
| | | | | | | 17,225,761 | |
| | | | | | | | |
| | | | Interactive Media & Services — 6.0% | |
| | 4,529 | | | Alphabet, Inc., Class A(a) | | | 13,120,694 | |
| | | | Interactive Media & Services — continued | | | | |
| | 27,155 | | | Meta Platforms, Inc., Class A(a) | | $ | 9,133,584 | |
| | | | | | | | |
| | | | | | | 22,254,278 | |
| | | | | | | | |
| | | | Internet & Direct Marketing Retail — 2.1% | |
| | 93,211 | | | eBay, Inc. | | | 6,198,531 | |
| | 196,930 | | | Qurate Retail, Inc., Class A | | | 1,496,668 | |
| | | | | | | | |
| | | | | | | 7,695,199 | |
| | | | | | | | |
| | | | IT Services — 8.8% | |
| | 19,320 | | | Automatic Data Processing, Inc. | | | 4,763,926 | |
| | 182,200 | | | DXC Technology Co.(a) | | | 5,865,018 | |
| | 77,600 | | | Fiserv, Inc.(a) | | | 8,054,104 | |
| | 27,959 | | | Gartner, Inc.(a) | | | 9,347,253 | |
| | 4,460 | | | MasterCard, Inc., Class A | | | 1,602,567 | |
| | 14,105 | | | Visa, Inc., Class A | | | 3,056,694 | |
| | | | | | | | |
| | | | | | | 32,689,562 | |
| | | | | | | | |
| | | | Machinery — 1.8% | |
| | 14,705 | | | Cummins, Inc. | | | 3,207,749 | |
| | 40,900 | | | PACCAR, Inc. | | | 3,609,834 | |
| | | | | | | | |
| | | | | | | 6,817,583 | |
| | | | | | | | |
| | | | Media — 3.7% | |
| | 11,409 | | | Charter Communications, Inc., Class A(a) | | | 7,438,326 | |
| | 127,700 | | | Comcast Corp., Class A | | | 6,427,141 | |
| | | | | | | | |
| | | | | | | 13,865,467 | |
| | | | | | | | |
| | | | Oil, Gas & Consumable Fuels — 8.2% | |
| | 261,517 | | | APA Corp. | | | 7,032,192 | |
| | 105,331 | | | ConocoPhillips | | | 7,602,791 | |
| | 48,248 | | | Diamondback Energy, Inc. | | | 5,203,547 | |
| | 120,924 | | | EOG Resources, Inc. | | | 10,741,679 | |
| | | | | | | | |
| | | | | | | 30,580,209 | |
| | | | | | | | |
| | | | Real Estate Management & Development — 1.1% | |
| | 38,200 | | | CBRE Group, Inc., Class A(a) | | | 4,145,082 | |
| | | | | | | | |
| | | | Software — 1.5% | |
| | 20,576 | | | Workday, Inc., Class A(a) | | | 5,620,952 | |
| | | | | | | | |
| | | | Tobacco — 1.6% | |
| | 122,469 | | | Altria Group, Inc. | | | 5,803,806 | |
| | | | | | | | |
| | | | Wireless Telecommunication Services — 1.3% | |
| | 40,870 | | | T-Mobile US, Inc.(a) | | | 4,740,103 | |
| | | | | | | | |
| | | | Total Common Stocks
(Identified Cost $239,400,200) | | | 349,508,948 | |
| | | | | | | | |
| | | | | | | | |
Principal
Amount | | | | | | |
| | Short-Term Investments — 5.4% | | | | |
| $ | 20,224,080 | | | Tri-Party Repurchase Agreement with Fixed Income Clearing Corporation, dated 12/31/2021 at 0.000% to be repurchased at $20,224,080 on 1/03/2022 collateralized by $14,758,200 U.S. Treasury Bond, 4.500% due 5/15/2038 valued at $20,628,613 including accrued interest (Note 2 of Notes to Financial Statements)
(Identified Cost $20,224,080) | | | 20,224,080 | |
| | | | | | | | |
| | | | | | | | |
| | | | Total Investments — 99.3%
(Identified Cost $259,624,280) | | | 369,733,028 | |
| | | | Other assets less liabilities — 0.7% | | | 2,433,397 | |
| | | | | | | | |
| | | | Net Assets — 100.0% | | $ | 372,166,425 | |
| | | | | | | | |
| | | | | | | | |
| | (†) | | | See Note 2 of Notes to Financial Statements. | |
| | (a) | �� | | Non-income producing security. | |
See accompanying notes to financial statements.
| 34
Portfolio of Investments – as of December 31, 2021
Natixis Oakmark Fund – (continued)
Industry Summary at December 31, 2021
| | | | |
Capital Markets | | | 12.9 | % |
IT Services | | | 8.8 | |
Oil, Gas & Consumable Fuels | | | 8.2 | |
Consumer Finance | | | 8.0 | |
Banks | | | 6.4 | |
Health Care Providers & Services | | | 6.3 | |
Interactive Media & Services | | | 6.0 | |
Insurance | | | 4.6 | |
Hotels, Restaurants & Leisure | | | 4.3 | |
Beverages | | | 3.9 | |
Media | | | 3.7 | |
Entertainment | | | 3.2 | |
Internet & Direct Marketing Retail | | | 2.1 | |
Other Investments, less than 2% each | | | 15.5 | |
Short-Term Investments | | | 5.4 | |
| | | | |
Total Investments | | | 99.3 | |
Other assets less liabilities | | | 0.7 | |
| | | | |
Net Assets | | | 100.0 | % |
| | | | |
See accompanying notes to financial statements.
35 |
Portfolio of Investments – as of December 31, 2021
Natixis Oakmark International Fund
| | | | | | | | |
| Shares | | | Description | | Value (†) | |
| | Common Stocks — 96.9% of Net Assets | |
| | | | Australia — 2.0% | |
| | 508,300 | | | Brambles Ltd. | | $ | 3,932,373 | |
| | 668,820 | | | Orica Ltd. | | | 6,669,647 | |
| | | | | | | | |
| | | | | | | 10,602,020 | |
| | | | | | | | |
| | | | Belgium — 2.0% | |
| | 175,700 | | | Anheuser-Busch InBev S.A. | | | 10,592,944 | |
| | | | | | | | |
| | | | Canada — 1.9% | |
| | 115,700 | | | Open Text Corp. | | | 5,491,623 | |
| | 80,199 | | | Restaurant Brands International, Inc. | | | 4,866,475 | |
| | | | | | | | |
| | | | | | | 10,358,098 | |
| | | | | | | | |
| | | | China — 5.0% | |
| | 729,300 | | | Alibaba Group Holding Ltd.(a) | | | 10,717,486 | |
| | 126,975 | | | Prosus NV | | | 10,516,705 | |
| | 45,646 | | | Trip.com Group Ltd.(a) | | | 1,119,539 | |
| | 543,696 | | | Vipshop Holdings Ltd., ADR(a) | | | 4,567,047 | |
| | | | | | | | |
| | | | | | | 26,920,777 | |
| | | | | | | | |
| | | | Finland — 0.7% | |
| | 102,500 | | | UPM-Kymmene OYJ | | | 3,899,981 | |
| | | | | | | | |
| | | | France — 12.5% | |
| | 326,305 | | | Accor S.A.(a) | | | 10,576,657 | |
| | 269,491 | | | BNP Paribas S.A.(b) | | | 18,632,884 | |
| | 14,600 | | | Capgemini SE | | | 3,578,175 | |
| | 111,600 | | | Danone S.A. | | | 6,936,995 | |
| | 130,198 | | | Publicis Groupe S.A. | | | 8,771,965 | |
| | 261,612 | | | Valeo S.A. | | | 7,889,269 | |
| | 190,400 | | | Worldline S.A., 144A(a) | | | 10,597,694 | |
| | | | | | | | |
| | | | | | | 66,983,639 | |
| | | | | | | | |
| | | | Germany — 24.4% | |
| | 76,810 | | | Allianz SE, (Registered) | | | 18,116,300 | |
| | 371,130 | | | Bayer AG, (Registered) | | | 19,819,931 | |
| | 167,900 | | | Bayerische Motoren Werke AG | | | 16,797,089 | |
| | 139,959 | | | Continental AG(a) | | | 14,704,852 | |
| | 172,114 | | | Daimler AG, (Registered) | | | 13,150,223 | |
| | 115,907 | | | Daimler Truck Holding AG(a) | | | 4,260,991 | |
| | 161,900 | | | Fresenius Medical Care AG & Co. KGaA | | | 10,495,685 | |
| | 198,500 | | | Fresenius SE & Co. KGaA | | | 7,978,387 | |
| | 81,900 | | | Henkel AG & Co. KGaA | | | 6,384,195 | |
| | 62,900 | | | SAP SE | | | 8,852,515 | |
| | 822,300 | | | thyssenkrupp AG(a) | | | 9,008,785 | |
| | 26,511 | | | Vitesco Technologies Group AG, Class A(a) | | | 1,300,124 | |
| | | | | | | | |
| | | | | | | 130,869,077 | |
| | | | | | | | |
| | | | India — 1.0% | |
| | 620,975 | | | Axis Bank Ltd.(a) | | | 5,642,961 | |
| | | | | | | | |
| | | | Indonesia — 0.7% | |
| | 7,495,500 | | | Bank Mandiri Persero Tbk PT | | | 3,701,122 | |
| | | | | | | | |
| | | | Ireland — 1.4% | |
| | 68,638 | | | Ryanair Holdings PLC, Sponsored ADR(a) | | | 7,023,727 | |
| | 24,200 | | | Ryanair Holdings PLC(a) | | | 419,054 | |
| | | | | | | | |
| | | | | | | 7,442,781 | |
| | | | | | | | |
| | | | Italy — 3.2% | |
| | 6,667,700 | | | Intesa Sanpaolo SpA | | | 17,222,157 | |
| | | | | | | | |
| | | | Japan — 1.9% | |
| | 145,200 | | | Komatsu Ltd. | | | 3,395,645 | |
| | 363,900 | | | Toyota Motor Corp. | | | 6,725,813 | |
| | | | | | | | |
| | | | | | | 10,121,458 | |
| | | | | | | | |
| | | | Korea — 1.2% | |
| | 19,750 | | | NAVER Corp.(a) | | | 6,269,071 | |
| | | | | | | | |
| | | | Mexico — 1.1% | |
| | 621,800 | | | Grupo Televisa SAB, Sponsored ADR | | $ | 5,826,266 | |
| | | | | | | | |
| | | | Netherlands — 2.2% | |
| | 129,544 | | | EXOR NV | | | 11,596,474 | |
| | | | | | | | |
| | | | South Africa — 0.7% | |
| | 25,788 | | | Naspers Ltd., N Shares | | | 4,002,582 | |
| | | | | | | | |
| | | | Spain — 1.6% | |
| | 123,630 | | | Amadeus IT Group S.A.(a) | | | 8,365,329 | |
| | | | | | | | |
| | | | Sweden — 4.7% | |
| | 516,655 | | | H & M Hennes & Mauritz AB, B Shares | | | 10,137,859 | |
| | 334,800 | | | SKF AB, B Shares | | | 7,917,925 | |
| | 298,300 | | | Volvo AB, B Shares | | | 6,898,631 | |
| | | | | | | | |
| | | | | | | 24,954,415 | |
| | | | | | | | |
| | | | Switzerland — 12.2% | |
| | 8,200 | | | Cie Financiere Richemont S.A., (Registered) | | | 1,225,366 | |
| | 1,767,639 | | | Credit Suisse Group AG, (Registered)(b) | | | 17,138,354 | |
| | 3,067,780 | | | Glencore PLC(b) | | | 15,631,191 | |
| | 214,521 | | | Holcim Ltd., (Registered) | | | 10,910,330 | |
| | 118,500 | | | Novartis AG, (Registered) | | | 10,412,829 | |
| | 12,900 | | | Roche Holding AG | | | 5,351,709 | |
| | 15,299 | | | Swatch Group AG (The) | | | 4,659,095 | |
| | | | | | | | |
| | | | | | | 65,328,874 | |
| | | | | | | | |
| | | | United Kingdom — 16.5% | |
| | 716,392 | | | CNH Industrial NV | | | 13,850,865 | |
| | 218,100 | | | Compass Group PLC(a) | | | 4,910,235 | |
| | 568,377 | | | Informa PLC(a) | | | 3,979,535 | |
| | 350,432 | | | Liberty Global PLC, Class A(a) | | | 9,720,984 | |
| | 30,524,500 | | | Lloyds Banking Group PLC | | | 19,822,345 | |
| | 2,182,200 | | | NatWest Group PLC | | | 6,682,583 | |
| | 325,700 | | | Prudential PLC | | | 5,632,279 | |
| | 52,800 | | | Reckitt Benckiser Group PLC | | | 4,545,215 | |
| | 1,165,300 | | | Rolls-Royce Holdings PLC(a) | | | 1,945,044 | |
| | 162,989 | | | Schroders PLC | | | 7,867,052 | |
| | 148,400 | | | Smiths Group PLC | | | 3,176,543 | |
| | 407,500 | | | WPP PLC | | | 6,205,298 | |
| | | | | | | | |
| | | | | | | 88,337,978 | |
| | | | | | | | |
| | | | Total Common Stocks
(Identified Cost $490,568,124) | | | 519,038,004 | |
| | | | | | | | |
| | | | | | | | |
| | Preferred Stocks — 1.3% | |
| | Non-Convertible Preferred Stocks — 1.3% | |
| | | | Korea — 1.3% | | | | |
| | 114,600 | | | Samsung Electronics Co. Ltd., 1.530%, (KRW)
(Identified Cost $6,734,682) | | | 6,851,437 | |
| | | | | | | | |
| | | | | | | | |
Principal
Amount | | | | | | |
| | Short-Term Investments – 1.0% | | | | |
| $ | 5,581,234 | | | Tri-Party Repurchase Agreement with Fixed Income Clearing Corporation, dated 12/31/2021 at 0.000% to be repurchased at $5,581,234 on 1/03/2022 collateralized by $4,090,300 U.S. Treasury Bond, 4.375% due 11/15/2039 valued at $5,692,867 including accrued interest (Note 2 of Notes to Financial Statements)
(Identified Cost $5,581,234) | | | 5,581,234 | |
| | | | | | | | |
| | | | | | | | |
| | | | Total Investments — 99.2%
(Identified Cost $502,884,040) | | | 531,470,675 | |
| | | | Other assets less liabilities — 0.8% | | | 4,398,273 | |
| | | | | | | | |
| | | | Net Assets — 100.0% | | $ | 535,868,948 | |
| | | | | | | | |
See accompanying notes to financial statements.
| 36
Portfolio of Investments – as of December 31, 2021
Natixis Oakmark International Fund – (continued)
| | | | | | | | |
| | (†) | | | See Note 2 of Notes to Financial Statements. | |
| | (a) | | | Non-income producing security. | |
| | (b) | | | Security (or a portion thereof) has been designated to cover the Fund’s obligations under open derivative contracts. | |
| | | | | | | | |
| | 144A | | | All or a portion of these securities are exempt from registration under Rule 144A of the Securities Act of 1933. These securities may be resold in transactions exempt from registration, normally to qualified institutional buyers. At December 31, 2021, the value of Rule 144A holdings amounted to $10,597,694 or 2.0% of net assets. | |
| | ADR | | | An American Depositary Receipt is a certificate issued by a custodian bank representing the right to receive securities of the foreign issuer described. The values of ADRs may be significantly influenced by trading on exchanges not located in the United States. | |
| | | | | | | | |
| | CHF | | | Swiss Franc | |
| | KRW | | | South Korean Won | |
At December 31, 2021, the Fund had the following open forward foreign currency contracts:
| | | | | | | | | | | | | | | | | | | | | | | | |
| Counterparty | | Delivery
Date | | | Currency
Bought/
Sold (B/S) | | | Units of Currency | | | In
Exchange for | | | Notional
Value | | | Unrealized
Appreciation
(Depreciation) | |
State Street Bank and Trust Company | | | 6/15/2022 | | | | CHF | | | $ | 6,786,000 | | | $ | 7,388,913 | | | $ | 7,483,240 | | | $ | (94,327 | ) |
| | | | | | | | | | | | | | | | | | | | | | | | |
Industry Summary at December 31, 2021
| | | | |
Banks | | | 13.3 | % |
Automobiles | | | 6.9 | |
Machinery | | | 6.8 | |
Pharmaceuticals | | | 6.7 | |
Internet & Direct Marketing Retail | | | 5.5 | |
Capital Markets | | | 4.7 | |
Media | | | 4.6 | |
Metals & Mining | | | 4.6 | |
Insurance | | | 4.5 | |
Auto Components | | | 4.4 | |
IT Services | | | 4.2 | |
Hotels, Restaurants & Leisure | | | 4.0 | |
Health Care Providers & Services | | | 3.5 | |
Software | | | 2.6 | |
Diversified Financial Services | | | 2.2 | |
Household Products | | | 2.0 | |
Construction Materials | | | 2.0 | |
Beverages | | | 2.0 | |
Other Investments, less than 2% each | | | 13.7 | |
Short-Term Investments | | | 1.0 | |
| | | | |
Total Investments | | | 99.2 | |
Other assets less liabilities (including forward foreign currency contracts) | | | 0.8 | |
| | | | |
Net Assets | | | 100.0 | % |
| | | | |
Currency Exposure Summary at December 31, 2021
| | | | |
Euro | | | 51.3 | % |
British Pound | | | 15.0 | |
Swiss Franc | | | 9.3 | |
United States Dollar | | | 6.9 | |
Swedish Krona | | | 4.7 | |
South Korean Won | | | 2.5 | |
Hong Kong Dollar | | | 2.2 | |
Australian Dollar | | | 2.0 | |
Other, less than 2% each | | | 5.3 | |
| | | | |
Total Investments | | | 99.2 | |
Other assets less liabilities (including forward foreign currency contracts) | | | 0.8 | |
| | | | |
Net Assets | | | 100.0 | % |
| | | | |
See accompanying notes to financial statements.
37 |
Portfolio of Investments – as of December 31, 2021
Natixis U.S. Equity Opportunities Fund
| | | | | | | | |
| Shares | | | Description | |
Value (†) | |
| | Common Stocks — 96.3% of Net Assets | |
| | | | Aerospace & Defense — 2.1% | |
| | 110,342 | | | Boeing Co. (The)(a) | | $ | 22,214,052 | |
| | | | | | | | |
| | | | Air Freight & Logistics — 0.8% | |
| | 66,796 | | | Expeditors International of Washington, Inc. | | | 8,970,035 | |
| | | | | | | | |
| | | | Automobiles — 1.2% | |
| | 220,000 | | | General Motors Co.(a) | | | 12,898,600 | |
| | | | | | | | |
| | | | Banks — 4.7% | |
| | 380,260 | | | Bank of America Corp. | | | 16,917,767 | |
| | 318,405 | | | Citigroup, Inc. | | | 19,228,478 | |
| | 304,400 | | | Wells Fargo & Co. | | | 14,605,112 | |
| | | | | | | | |
| | | | | | | 50,751,357 | |
| | | | | | | | |
| | | | Beverages — 4.8% | |
| | 64,591 | | | Constellation Brands, Inc., Class A | | | 16,210,403 | |
| | 390,500 | | | Keurig Dr Pepper, Inc. | | | 14,393,830 | |
| | 213,493 | | | Monster Beverage Corp.(a) | | | 20,503,868 | |
| | | | | | | | |
| | | | | | | 51,108,101 | |
| | | | | | | | |
| | | | Biotechnology — 4.9% | |
| | 74,446 | | | Alnylam Pharmaceuticals, Inc.(a) | | | 12,624,552 | |
| | 53,174 | | | BioMarin Pharmaceutical, Inc.(a) | | | 4,697,923 | |
| | 76,519 | | | CRISPR Therapeutics AG(a) | | | 5,798,610 | |
| | 47,623 | | | Regeneron Pharmaceuticals, Inc.(a) | | | 30,074,877 | |
| | | | | | | | |
| | | | | | | 53,195,962 | |
| | | | | | | | |
| | | | Capital Markets — 7.2% | |
| | 263,945 | | | Charles Schwab Corp. (The) | | | 22,197,775 | |
| | 18,574 | | �� | FactSet Research Systems, Inc. | | | 9,027,150 | |
| | 104,300 | | | Intercontinental Exchange, Inc. | | | 14,265,111 | |
| | 15,718 | | | MSCI, Inc. | | | 9,630,261 | |
| | 115,433 | | | SEI Investments Co. | | | 7,034,487 | |
| | 163,700 | | | State Street Corp. | | | 15,224,100 | |
| | | | | | | | |
| | | | | | | 77,378,884 | |
| | | | | | | | |
| | | | Communications Equipment — 0.8% | |
| | 133,363 | | | Cisco Systems, Inc. | | | 8,451,213 | |
| | | | | | | | |
| | | | Consumer Finance — 5.9% | |
| | 549,000 | | | Ally Financial, Inc. | | | 26,137,890 | |
| | 88,500 | | | American Express Co. | | | 14,478,600 | |
| | 155,885 | | | Capital One Financial Corp. | | | 22,617,355 | |
| | | | | | | | |
| | | | | | | 63,233,845 | |
| | | | | | | | |
| | | | Energy Equipment & Services — 0.7% | |
| | 255,577 | | | Schlumberger NV | | | 7,654,531 | |
| | | | | | | | |
| | | | Entertainment — 3.4% | |
| | 29,510 | | | Netflix, Inc.(a) | | | 17,778,004 | |
| | 118,039 | | | Walt Disney Co. (The)(a) | | | 18,283,061 | |
| | | | | | | | |
| | | | | | | 36,061,065 | |
| | | | | | | | |
| | | | Health Care Equipment & Supplies — 0.6% | |
| | 17,756 | | | Intuitive Surgical, Inc.(a) | | | 6,379,731 | |
| | | | | | | | |
| | | | Health Care Providers & Services — 3.3% | |
| | 68,700 | | | HCA Healthcare, Inc. | | | 17,650,404 | |
| | 39,120 | | | Humana, Inc. | | | 18,146,203 | |
| | | | | | | | |
| | | | | | | 35,796,607 | |
| | | | | | | | |
| | | | Hotels, Restaurants & Leisure — 5.5% | |
| | 7,245 | | | Booking Holdings, Inc.(a) | | | 17,382,421 | |
| | 107,400 | | | Hilton Worldwide Holdings, Inc.(a) | | | 16,753,326 | |
| | 113,726 | | | Starbucks Corp. | | | 13,302,530 | |
| | 113,077 | | | Yum China Holdings, Inc. | | | 5,635,758 | |
| | 40,738 | | | Yum! Brands, Inc. | | | 5,656,879 | |
| | | | | | | | |
| | | | | | | 58,730,914 | |
| | | | | | | | |
| | | | Household Products — 0.4% | |
| | 56,019 | | | Colgate-Palmolive Co. | | $ | 4,780,662 | |
| | | | | | | | |
| | | | Industrial Conglomerates — 1.0% | |
| | 109,793 | | | General Electric Co. | | | 10,372,145 | |
| | | | | | | | |
| | | | Insurance — 2.5% | |
| | 306,155 | | | American International Group, Inc. | | | 17,407,973 | |
| | 90,700 | | | Reinsurance Group of America, Inc. | | | 9,930,743 | |
| | | | | | | | |
| | | | | | | 27,338,716 | |
| | | | | | | | |
| | | | Interactive Media & Services — 10.1% | |
| | 15,295 | | | Alphabet, Inc., Class A(a) | | | 44,310,227 | |
| | 5,763 | | | Alphabet, Inc., Class C(a) | | | 16,675,759 | |
| | 143,138 | | | Meta Platforms, Inc., Class A(a) | | | 48,144,466 | |
| | | | | | | | |
| | | | | | | 109,130,452 | |
| | | | | | | | |
| | | | Internet & Direct Marketing Retail — 3.8% | |
| | 62,111 | | | Alibaba Group Holding Ltd., Sponsored ADR(a) | | | 7,378,166 | |
| | 10,109 | | | Amazon.com, Inc.(a) | | | 33,706,843 | |
| | | | | | | | |
| | | | | | | 41,085,009 | |
| | | | | | | | |
| | | | IT Services — 5.7% | |
| | 16,981 | | | Automatic Data Processing, Inc. | | | 4,187,175 | |
| | 165,200 | | | Fiserv, Inc.(a) | | | 17,146,108 | |
| | 59,000 | | | Gartner, Inc.(a) | | | 19,724,880 | |
| | 94,470 | | | Visa, Inc., Class A | | | 20,472,594 | |
| | | | | | | | |
| | | | | | | 61,530,757 | |
| | | | | | | | |
| | | | Life Sciences Tools & Services — 1.2% | |
| | 33,944 | | | Illumina, Inc.(a) | | | 12,913,655 | |
| | | | | | | | |
| | | | Machinery — 1.1% | |
| | 34,297 | | | Deere & Co. | | | 11,760,098 | |
| | | | | | | | |
| | | | Media — 2.8% | |
| | 24,385 | | | Charter Communications, Inc., Class A(a) | | | 15,898,289 | |
| | 271,880 | | | Comcast Corp., Class A | | | 13,683,720 | |
| | | | | | | | |
| | | | | | | 29,582,009 | |
| | | | | | | | |
| | | | Oil, Gas & Consumable Fuels — 5.0% | |
| | 554,341 | | | APA Corp. | | | 14,906,229 | |
| | 224,200 | | | ConocoPhillips | | | 16,182,756 | |
| | 257,238 | | | EOG Resources, Inc. | | | 22,850,452 | |
| | | | | | | | |
| | | | | | | 53,939,437 | |
| | | | | | | | |
| | | | Pharmaceuticals — 2.9% | |
| | 146,692 | | | Novartis AG, Sponsored ADR | | | 12,831,149 | |
| | 48,248 | | | Novo Nordisk A/S, Sponsored ADR | | | 5,403,776 | |
| | 247,251 | | | Roche Holding AG, Sponsored ADR | | | 12,780,404 | |
| | | | | | | | |
| | | | | | | 31,015,329 | |
| | | | | | | | |
| | | | Semiconductors & Semiconductor Equipment — 4.8% | |
| | 129,010 | | | NVIDIA Corp. | | | 37,943,131 | |
| | 72,233 | | | QUALCOMM, Inc. | | | 13,209,249 | |
| | | | | | | | |
| | | | | | | 51,152,380 | |
| | | | | | | | |
| | | | Software — 8.3% | |
| | 78,375 | | | Autodesk, Inc.(a) | | | 22,038,266 | |
| | 50,171 | | | Microsoft Corp. | | | 16,873,511 | |
| | 253,690 | | | Oracle Corp. | | | 22,124,305 | |
| | 56,864 | | | salesforce.com, Inc.(a) | | | 14,450,848 | |
| | 52,403 | | | Workday, Inc., Class A(a) | | | 14,315,452 | |
| | | | | | | | |
| | | | | | | 89,802,382 | |
| | | | | | | | |
| | | | Textiles, Apparel & Luxury Goods — 0.8% | |
| | 422,554 | | | Under Armour, Inc., Class A(a) | | | 8,953,919 | |
| | | | | | | | |
| | | | Total Common Stocks
(Identified Cost $627,148,616) | | | 1,036,181,847 | |
| | | | | | | | |
See accompanying notes to financial statements.
| 38
Portfolio of Investments – as of December 31, 2021
Natixis U.S. Equity Opportunities Fund – (continued)
| | | | | | | | |
Principal
Amount | | | Description | | Value (†) | |
| | Short-Term Investments — 1.6% | | | | |
| $ | 17,204,118 | | | Tri-Party Repurchase Agreement with Fixed Income Clearing Corporation, dated 12/31/2021 at 0.000% to be repurchased at $17,204,118 on 1/03/2022 collateralized by $7,134,500 U.S. Treasury Bond, 4.250% due 11/15/2040 valued at $9,838,918; $5,515,500 U.S. Treasury Bond, 4.500% due 5/15/2038 valued at $7,709,417 including accrued interest (Note 2 of Notes to Financial Statements)
(Identified Cost $17,204,118) | | $ | 17,204,118 | |
| | | | | | | | |
| | | | | | | | |
| | | | Total Investments — 97.9%
(Identified Cost $644,352,734) | | | 1,053,385,965 | |
| | | | Other assets less liabilities — 2.1% | | | 22,444,831 | |
| | | | | | | | |
| | | | Net Assets — 100.0% | | $ | 1,075,830,796 | |
| | | | | | | | |
| | | | | | | | |
| | (†) | | | See Note 2 of Notes to Financial Statements. | |
| | (a) | | | Non-income producing security. | |
| | | | | | | | |
| | ADR | | | An American Depositary Receipt is a certificate issued by a custodian bank representing the right to receive securities of the foreign issuer described. The values of ADRs may be significantly influenced by trading on exchanges not located in the United States. | |
Industry Summary at December 31, 2021
| | | | |
Interactive Media & Services | | | 10.1 | % |
Software | | | 8.3 | |
Capital Markets | | | 7.2 | |
Consumer Finance | | | 5.9 | |
IT Services | | | 5.7 | |
Hotels, Restaurants & Leisure | | | 5.5 | |
Oil, Gas & Consumable Fuels | | | 5.0 | |
Biotechnology | | | 4.9 | |
Semiconductors & Semiconductor Equipment | | | 4.8 | |
Beverages | | | 4.8 | |
Banks | | | 4.7 | |
Internet & Direct Marketing Retail | | | 3.8 | |
Entertainment | | | 3.4 | |
Health Care Providers & Services | | | 3.3 | |
Pharmaceuticals | | | 2.9 | |
Media | | | 2.8 | |
Insurance | | | 2.5 | |
Aerospace & Defense | | | 2.1 | |
Other Investments, less than 2% each | | | 8.6 | |
Short-Term Investments | | | 1.6 | |
| | | | |
Total Investments | | | 97.9 | |
Other assets less liabilities | | | 2.1 | |
| | | | |
Net Assets | | | 100.0 | % |
| | | | |
See accompanying notes to financial statements.
39 |
Portfolio of Investments – as of December 31, 2021
Vaughan Nelson Mid Cap Fund
| | | | | | | | |
| Shares | | | Description | |
Value (†) | |
| | Common Stocks — 98.1% of Net Assets | |
| | | | Banks — 3.2% | |
| | 91,990 | | | Bank of N.T. Butterfield & Son Ltd. (The) | | $ | 3,505,739 | |
| | 292,001 | | | Huntington Bancshares, Inc. | | | 4,502,655 | |
| | 86,270 | | | PacWest Bancorp | | | 3,896,816 | |
| | | | | | | | |
| | | | | | | 11,905,210 | |
| | | | | | | | |
| | | | Building Products — 1.0% | |
| | 27,885 | | | Allegion PLC | | | 3,693,089 | |
| | | | | | | | |
| | | | Capital Markets — 5.0% | |
| | 56,305 | | | Ares Management Corp., Class A | | | 4,575,908 | |
| | 129,117 | | | Brightsphere Investment Group, Inc. | | | 3,305,395 | |
| | 21,810 | | | Nasdaq, Inc. | | | 4,580,318 | |
| | 59,912 | | | Raymond James Financial, Inc. | | | 6,015,165 | |
| | | | | | | | |
| | | | | | | 18,476,786 | |
| | | | | | | | |
| | | | Chemicals — 4.2% | |
| | 169,660 | | | Axalta Coating Systems Ltd.(a) | | | 5,619,139 | |
| | 68,940 | | | FMC Corp. | | | 7,575,816 | |
| | 22,920 | | | LyondellBasell Industries NV, Class A | | | 2,113,912 | |
| | | | | | | | |
| | | | | | | 15,308,867 | |
| | | | | | | | |
| | | | Commercial Services & Supplies — 1.1% | |
| | 28,995 | | | Republic Services, Inc. | | | 4,043,353 | |
| | | | | | | | |
| | | | Communications Equipment — 4.8% | |
| | 65,215 | | | Motorola Solutions, Inc. | | | 17,718,916 | |
| | | | | | | | |
| | | | Construction & Engineering — 2.7% | |
| | 240,330 | | | WillScot Mobile Mini Holdings Corp.(a) | | | 9,815,077 | |
| | | | | | | | |
| | | | Consumer Finance — 1.6% | |
| | 129,140 | | | Synchrony Financial | | | 5,990,805 | |
| | | | | | | | |
| | | | Containers & Packaging — 3.5% | |
| | 16,845 | | | Avery Dennison Corp. | | | 3,648,122 | |
| | 83,080 | | | Crown Holdings, Inc. | | | 9,190,309 | |
| | | | | | | | |
| | | | | | | 12,838,431 | |
| | | | | | | | |
| | | | Diversified Consumer Services — 1.4% | |
| | 58,520 | | | Grand Canyon Education, Inc.(a) | | | 5,015,749 | |
| | | | | | | | |
| | | | Electric Utilities — 3.7% | |
| | 107,375 | | | Alliant Energy Corp. | | | 6,600,341 | |
| | 101,565 | | | Evergy, Inc. | | | 6,968,375 | |
| | | | | | | | |
| | | | | | | 13,568,716 | |
| | | | | | | | |
| | | | Electrical Equipment — 3.4% | |
| | 48,100 | | | AMETEK, Inc. | | | 7,072,624 | |
| | 17,335 | | | Hubbell, Inc. | | | 3,610,360 | |
| | 52,800 | | | nVent Electric PLC | | | 2,006,400 | |
| | | | | | | | |
| | | | | | | 12,689,384 | |
| | | | | | | | |
| | | | Electronic Equipment, Instruments & Components — 2.0% | |
| | 8,955 | | | CDW Corp. | | | 1,833,805 | |
| | 26,245 | | | Keysight Technologies, Inc.(a) | | | 5,419,855 | |
| | | | | | | | |
| | | | | | | 7,253,660 | |
| | | | | | | | |
| | | | Food & Staples Retailing — 3.7% | |
| | 296,055 | | | Performance Food Group Co.(a) | | | 13,585,964 | |
| | | | | | | | |
| | | | Health Care Equipment & Supplies — 2.7% | |
| | 13,210 | | | Cooper Cos., Inc. (The) | | | 5,534,198 | |
| | 56,390 | | | Hologic, Inc.(a) | | | 4,317,218 | |
| | | | | | | | |
| | | | | | | 9,851,416 | |
| | | | | | | | |
| | | | Health Care Providers & Services — 1.9% | |
| | 954,755 | | | Aveanna Healthcare Holdings, Inc.(a) | | | 7,065,187 | |
| | | | | | | | |
| | | | Hotels, Restaurants & Leisure — 1.0% | |
| | 96,600 | | | Aramark | | | 3,559,710 | |
| | | | | | | | |
| | | | Independent Power & Renewable Electricity Producers — 2.2% | |
| | 360,695 | | | Vistra Corp. | | $ | 8,213,025 | |
| | | | | | | | |
| | | | Insurance — 5.8% | |
| | 14,140 | | | Allstate Corp. (The) | | | 1,663,571 | |
| | 31,520 | | | Arthur J. Gallagher & Co. | | | 5,347,998 | |
| | 104,180 | | | Athene Holding Ltd., Class A(a) | | | 8,681,320 | |
| | 51,870 | | | Reinsurance Group of America, Inc. | | | 5,679,246 | |
| | | | | | | | |
| | | | | | | 21,372,135 | |
| | | | | | | | |
| | | | IT Services — 3.8% | |
| | 102,145 | | | Alliance Data Systems Corp. | | | 6,799,792 | |
| | 68,895 | | | MAXIMUS, Inc. | | | 5,488,865 | |
| | 121,030 | | | SolarWinds Corp. | | | 1,717,416 | |
| | | | | | | | |
| | | | | | | 14,006,073 | |
| | | | | | | | |
| | | | Life Sciences Tools & Services — 8.2% | |
| | 16,005 | | | Agilent Technologies, Inc. | | | 2,555,198 | |
| | 255,490 | | | Avantor, Inc.(a) | | | 10,766,349 | |
| | 24,347 | | | IQVIA Holdings, Inc.(a) | | | 6,869,262 | |
| | 424,620 | | | Sotera Health Co.(a) | | | 9,999,801 | |
| | | | | | | | |
| | | | | | | 30,190,610 | |
| | | | | | | | |
| | | | Machinery — 2.0% | |
| | 27,220 | | | Crane Co. | | | 2,769,091 | |
| | 54,485 | | | Otis Worldwide Corp. | | | 4,744,009 | |
| | | | | | | | |
| | | | | | | 7,513,100 | |
| | | | | | | | |
| | | | Media — 2.6% | |
| | 64,505 | | | Nexstar Media Group, Inc., Class A | | | 9,738,965 | |
| | | | | | | | |
| | | | Metals & Mining — 0.9% | |
| | 176,935 | | | Constellium SE(a) | | | 3,168,906 | |
| | | | | | | | |
| | | | Multi-Utilities — 3.7% | |
| | 73,770 | | | Ameren Corp. | | | 6,566,267 | |
| | 107,375 | | | CMS Energy Corp. | | | 6,984,744 | |
| | | | | | | | |
| | | | | | | 13,551,011 | |
| | | | | | | | |
| | | | Oil, Gas & Consumable Fuels — 3.9% | |
| | 47,660 | | | Diamondback Energy, Inc. | | | 5,140,131 | |
| | 50,230 | | | Pioneer Natural Resources Co. | | | 9,135,832 | |
| | | | | | | | |
| | | | | | | 14,275,963 | |
| | | | | | | | |
| | | | Pharmaceuticals — 3.4% | |
| | 438,230 | | | Elanco Animal Health, Inc.(a) | | | 12,436,967 | |
| | | | | | | | |
| | | | Professional Services — 1.8% | |
| | 24,075 | | | CACI International, Inc., Class A(a) | | | 6,481,231 | |
| | | | | | | | |
| | | | REITs – Diversified — 1.4% | |
| | 465,365 | | | New Residential Investment Corp. | | | 4,984,059 | |
| | | | | | | | |
| | | | Semiconductors & Semiconductor Equipment — 1.4% | |
| | 16,535 | | | Analog Devices, Inc. | | | 2,906,357 | |
| | 16,315 | | | Entegris, Inc. | | | 2,260,933 | |
| | | | | | | | |
| | | | | | | 5,167,290 | |
| | | | | | | | |
| | | | Software — 3.9% | |
| | 492,102 | | | N-Able, Inc.(a) | | | 5,462,332 | |
| | 107,330 | | | SS&C Technologies Holdings, Inc. | | | 8,798,914 | |
| | | | | | | | |
| | | | | | | 14,261,246 | |
| | | | | | | | |
| | | | Specialty Retail — 2.8% | |
| | 432,200 | | | Leslie’s, Inc.(a) | | | 10,225,852 | |
| | | | | | | | |
| | | | Textiles, Apparel & Luxury Goods — 3.4% | |
| | 292,330 | | | Skechers U.S.A., Inc., Class A(a) | | | 12,687,122 | |
| | | | | | | | |
| | | | Total Common Stocks
(Identified Cost $305,590,376) | | | 360,653,875 | |
| | | | | | | | |
See accompanying notes to financial statements.
| 40
Portfolio of Investments – as of December 31, 2021
Vaughan Nelson Mid Cap Fund – (continued)
| | | | | | | | |
Principal
Amount | | | Description | | Value (†) | |
| | Short-Term Investments — 2.0% | |
| $ | 7,086,204 | | | Tri-Party Repurchase Agreement with Fixed Income Clearing Corporation, dated 12/31/2021 at 0.000% to be repurchased at $7,086,204 on 1/03/2022 collateralized by $5,171,100 U.S. Treasury Bond, 4.500% due 5/15/2038 valued at $7,228,024 including accrued interest (Note 2 of Notes to Financial Statements)
(Identified Cost $7,086,204) | | $ | 7,086,204 | |
| | | | | | | | |
| | | | | | | | |
| | | | Total Investments — 100.1%
(Identified Cost $312,676,580) | | | 367,740,079 | |
| | | | Other assets less liabilities — (0.1)% | | | (201,426 | ) |
| | | | | | | | |
| | | | Net Assets — 100.0% | | $ | 367,538,653 | |
| | | | | | | | |
| | | | | | | | |
| | (†) | | | See Note 2 of Notes to Financial Statements. | |
| | (a) | | | Non-income producing security. | |
| | | | | | | | |
| | REITs | | | Real Estate Investment Trusts | |
Industry Summary at December 31, 2021
| | | | |
Life Sciences Tools & Services | | | 8.2 | % |
Insurance | | | 5.8 | |
Capital Markets | | | 5.0 | |
Communications Equipment | | | 4.8 | |
Chemicals | | | 4.2 | |
Oil, Gas & Consumable Fuels | | | 3.9 | |
Software | | | 3.9 | |
IT Services | | | 3.8 | |
Food & Staples Retailing | | | 3.7 | |
Electric Utilities | | | 3.7 | |
Multi-Utilities | | | 3.7 | |
Containers & Packaging | | | 3.5 | |
Electrical Equipment | | | 3.4 | |
Textiles, Apparel & Luxury Goods | | | 3.4 | |
Pharmaceuticals | | | 3.4 | |
Banks | | | 3.2 | |
Specialty Retail | | | 2.8 | |
Health Care Equipment & Supplies | | | 2.7 | |
Construction & Engineering | | | 2.7 | |
Media | | | 2.6 | |
Independent Power & Renewable Electricity Producers | | | 2.2 | |
Machinery | | | 2.0 | |
Electronic Equipment, Instruments & Components | | | 2.0 | |
Other Investments, less than 2% each | | | 13.5 | |
Short-Term Investments | | | 2.0 | |
| | | | |
Total Investments | | | 100.1 | |
Other assets less liabilities | | | (0.1 | ) |
| | | | |
Net Assets | | | 100.0 | % |
| | | | |
See accompanying notes to financial statements.
41 |
Portfolio of Investments – as of December 31, 2021
Vaughan Nelson Small Cap Value Fund
| | | | | | | | |
| Shares | | | Description | |
Value (†) | |
| | Common Stocks — 98.7% of Net Assets | |
| | | | Banks — 7.7% | |
| | 78,100 | | | Cadence Bank | | $ | 2,326,599 | |
| | 119,570 | | | Old National Bancorp | | | 2,166,608 | |
| | 51,980 | | | PacWest Bancorp | | | 2,347,936 | |
| | 19,815 | | | SouthState Corp. | | | 1,587,380 | |
| | 41,770 | | | United Bankshares, Inc. | | | 1,515,416 | |
| | 46,285 | | | United Community Banks, Inc. | | | 1,663,483 | |
| | | | | | | | |
| | | | | | | 11,607,422 | |
| | | | | | | | |
| | | | Biotechnology — 0.6% | |
| | 18,948 | | | Emergent BioSolutions, Inc.(a) | | | 823,670 | |
| | | | | | | | |
| | | | Building Products — 1.7% | |
| | 13,135 | | | Builders FirstSource, Inc.(a) | | | 1,125,801 | |
| | 21,340 | | | Gibraltar Industries, Inc.(a) | | | 1,422,951 | |
| | | | | | | | |
| | | | | | | 2,548,752 | |
| | | | | | | | |
| | | | Capital Markets — 4.0% | |
| | 17,985 | | | Artisan Partners Asset Management, Inc., Class A | | | 856,805 | |
| | 22,955 | | | LPL Financial Holdings, Inc. | | | 3,674,866 | |
| | 22,610 | | | Moelis & Co., Class A | | | 1,413,351 | |
| | | | | | | | |
| | | | | | | 5,945,022 | |
| | | | | | | | |
| | | | Chemicals — 7.5% | |
| | 93,345 | | | Chemours Co. (The) | | | 3,132,658 | |
| | 210,815 | | | Element Solutions, Inc. | | | 5,118,588 | |
| | 27,525 | | | FMC Corp. | | | 3,024,723 | |
| | | | | | | | |
| | | | | | | 11,275,969 | |
| | | | | | | | |
| | | | Commercial Services & Supplies — 2.2% | |
| | 35,040 | | | Ritchie Bros. Auctioneers, Inc. | | | 2,144,798 | |
| | 5,630 | | | UniFirst Corp. | | | 1,184,552 | |
| | | | | | | | |
| | | | | | | 3,329,350 | |
| | | | | | | | |
| | | | Electronic Equipment, Instruments & Components — 7.5% | |
| | 19,815 | | | Advanced Energy Industries, Inc. | | | 1,804,354 | |
| | 13,300 | | | Fabrinet(a) | | | 1,575,651 | |
| | 38,485 | | | II-VI, Inc.(a) | | | 2,629,680 | |
| | 49,160 | | | Insight Enterprises, Inc.(a) | | | 5,240,456 | |
| | | | | | | | |
| | | | | | | 11,250,141 | |
| | | | | | | | |
| | | | Energy Equipment & Services — 0.6% | |
| | 149,015 | | | TechnipFMC PLC(a) | | | 882,169 | |
| | | | | | | | |
| | | | Food & Staples Retailing — 2.4% | |
| | 78,265 | | | Performance Food Group Co.(a) | | | 3,591,581 | |
| | | | | | | | |
| | | | Food Products — 1.5% | |
| | 90,270 | | | Nomad Foods Ltd.(a) | | | 2,291,955 | |
| | | | | | | | |
| | | | Gas Utilities — 2.7% | |
| | 29,360 | | | Southwest Gas Holdings, Inc. | | | 2,056,668 | |
| | 30,430 | | | Spire, Inc. | | | 1,984,645 | |
| | | | | | | | |
| | | | | | | 4,041,313 | |
| | | | | | | | |
| | | | Health Care Equipment & Supplies — 1.3% | |
| | 26,310 | | | Hologic, Inc.(a) | | | 2,014,294 | |
| | | | | | | | |
| | | | Health Care Providers & Services — 2.8% | |
| | 13,050 | | | Molina Healthcare, Inc.(a) | | | 4,150,944 | |
| | | | | | | | |
| | | | Hotels, Restaurants & Leisure — 4.2% | |
| | 51,180 | | | Bally’s Corp.(a) | | | 1,947,911 | |
| | 73,330 | | | Everi Holdings, Inc.(a) | | | 1,565,596 | |
| | 97,529 | | | International Game Technology PLC | | | 2,819,563 | |
| | | | | | | | |
| | | | | | | 6,333,070 | |
| | | | | | | | |
| | | | Household Durables — 1.6% | |
| | 16,575 | | | Installed Building Products, Inc. | | | 2,315,859 | |
| | | | | | | | |
| | | | Insurance — 5.5% | |
| | 37,110 | | | Brown & Brown, Inc. | | | 2,608,091 | |
| | | | Insurance — continued | | | | |
| | 32,610 | | | First American Financial Corp. | | $ | 2,551,080 | |
| | 28,930 | | | Selective Insurance Group, Inc. | | | 2,370,524 | |
| | 85,380 | | | Trean Insurance Group, Inc.(a) | | | 760,736 | |
| | | | | | | | |
| | | | | | | 8,290,431 | |
| | | | | | | | |
| | | | IT Services — 4.4% | |
| | 30,880 | | | ExlService Holdings, Inc.(a) | | | 4,470,497 | |
| | 24,735 | | | WNS Holdings Ltd., ADR(a) | | | 2,182,122 | |
| | | | | | | | |
| | | | | | | 6,652,619 | |
| | | | | | | | |
| | | | Life Sciences Tools & Services — 3.9% | |
| | 37,695 | | | Avantor, Inc.(a) | | | 1,588,467 | |
| | 41,690 | | | Syneos Health, Inc.(a) | | | 4,280,729 | |
| | | | | | | | |
| | | | | | | 5,869,196 | |
| | | | | | | | |
| | | | Machinery — 4.6% | |
| | 13,880 | | | Alamo Group, Inc. | | | 2,042,858 | |
| | 69,455 | | | Federal Signal Corp. | | | 3,010,180 | |
| | 29,865 | | | SPX Corp.(a) | | | 1,782,343 | |
| | | | | | | | |
| | | | | | | 6,835,381 | |
| | | | | | | | |
| | | | Media — 2.8% | |
| | 76,130 | | | Sinclair Broadcast Group, Inc., Class A | | | 2,012,116 | |
| | 120,935 | | | TEGNA, Inc. | | | 2,244,554 | |
| | | | | | | | |
| | | | | | | 4,256,670 | |
| | | | | | | | |
| | | | Oil, Gas & Consumable Fuels — 3.5% | |
| | 48,135 | | | Antero Resources Corp.(a) | | | 842,363 | |
| | 86,460 | | | Comstock Resources, Inc.(a) | | | 699,461 | |
| | 52,920 | | | Ovintiv, Inc. | | | 1,783,404 | |
| | 20,860 | | | PDC Energy, Inc. | | | 1,017,551 | |
| | 185,370 | | | Southwestern Energy Co.(a) | | | 863,824 | |
| | | | | | | | |
| | | | | | | 5,206,603 | |
| | | | | | | | |
| | | | Personal Products — 1.7% | |
| | 239,870 | | | Coty, Inc., Class A(a) | | | 2,518,635 | |
| | | | | | | | |
| | | | Professional Services — 6.5% | |
| | 31,360 | | | ASGN, Inc.(a) | | | 3,869,824 | |
| | 11,425 | | | CACI International, Inc., Class A(a) | | | 3,075,724 | |
| | 18,240 | | | FTI Consulting, Inc.(a) | | | 2,798,381 | |
| | | | | | | | |
| | | | | | | 9,743,929 | |
| | | | | | | | |
| | | | Road & Rail — 2.6% | |
| | 11,985 | | | Landstar System, Inc. | | | 2,145,555 | |
| | 5,150 | | | Saia, Inc.(a) | | | 1,735,704 | |
| | | | | | | | |
| | | | | | | 3,881,259 | |
| | | | | | | | |
| | | | Semiconductors & Semiconductor Equipment — 5.4% | |
| | 11,600 | | | CMC Materials, Inc. | | | 2,223,604 | |
| | 31,415 | | | Ichor Holdings Ltd.(a) | | | 1,446,032 | |
| | 17,250 | | | MKS Instruments, Inc. | | | 3,004,433 | |
| | 24,135 | | | Ultra Clean Holdings, Inc.(a) | | | 1,384,384 | |
| | | | | | | | |
| | | | | | | 8,058,453 | |
| | | | | | | | |
| | | | Textiles, Apparel & Luxury Goods — 2.4% | |
| | 54,180 | | | Capri Holdings Ltd.(a) | | | 3,516,824 | |
| | | | | | | | |
| | | | Trading Companies & Distributors — 7.1% | |
| | 27,535 | | | Beacon Roofing Supply, Inc.(a) | | | 1,579,132 | |
| | 28,930 | | | GATX Corp. | | | 3,014,217 | |
| | 28,080 | | | Rush Enterprises, Inc., Class A | | | 1,562,371 | |
| | 103,585 | | | Univar Solutions, Inc.(a) | | | 2,936,635 | |
| | 5,080 | | | Watsco, Inc. | | | 1,589,430 | |
| | | | | | | | |
| | | | | | | 10,681,785 | |
| | | | | | | | |
| | | | Total Common Stocks
(Identified Cost $123,342,022) | | | 147,913,296 | |
| | | | | | | | |
| | | | | | | | |
See accompanying notes to financial statements.
| 42
Portfolio of Investments – as of December 31, 2021
Vaughan Nelson Small Cap Value Fund – (continued)
| | | | | | | | |
Principal
Amount | | | Description | | Value (†) | |
| | Short-Term Investments — 1.6% | | | | |
| $ | 2,415,684 | | | Tri-Party Repurchase Agreement with Fixed Income Clearing Corporation, dated 12/31/2021 at 0.000% to be repurchased at $2,415,684 on 1/03/2022 collateralized by $1,762,900 U.S. Treasury Bond, 4.500% due 5/15/2038 valued at $2,464,134 including accrued interest (Note 2 of Notes to Financial Statements)
(Identified Cost $2,415,684) | | $ | 2,415,684 | |
| | | | | | | | |
| | | | | | | | |
| | | | Total Investments — 100.3%
(Identified Cost $125,757,706) | | | 150,328,980 | |
| | | | Other assets less liabilities — (0.3)% | | | (432,966 | ) |
| | | | | | | | |
| | | | Net Assets — 100.0% | | $ | 149,896,014 | |
| | | | | | | | |
| | | | | | | | |
| | (†) | | | See Note 2 of Notes to Financial Statements. | |
| | (a) | | | Non-income producing security. | |
| | | | | | | | |
| | ADR | | | An American Depositary Receipt is a certificate issued by a custodian bank representing the right to receive securities of the foreign issuer described. The values of ADRs may be significantly influenced by trading on exchanges not located in the United States. | |
Industry Summary at December 31, 2021
| | | | |
Banks | | | 7.7 | % |
Chemicals | | | 7.5 | |
Electronic Equipment, Instruments & Components | | | 7.5 | |
Trading Companies & Distributors | | | 7.1 | |
Professional Services | | | 6.5 | |
Insurance | | | 5.5 | |
Semiconductors & Semiconductor Equipment | | | 5.4 | |
Machinery | | | 4.6 | |
IT Services | | | 4.4 | |
Hotels, Restaurants & Leisure | | | 4.2 | |
Capital Markets | | | 4.0 | |
Life Sciences Tools & Services | | | 3.9 | |
Oil, Gas & Consumable Fuels | | | 3.5 | |
Media | | | 2.8 | |
Health Care Providers & Services | | | 2.8 | |
Gas Utilities | | | 2.7 | |
Road & Rail | | | 2.6 | |
Food & Staples Retailing | | | 2.4 | |
Textiles, Apparel & Luxury Goods | | | 2.4 | |
Commercial Services & Supplies | | | 2.2 | |
Other Investments, less than 2% each | | | 9.0 | |
Short-Term Investments | | | 1.6 | |
| | | | |
Total Investments | | | 100.3 | |
Other assets less liabilities | | | (0.3 | ) |
| | | | |
Net Assets | | | 100.0 | % |
| | | | |
See accompanying notes to financial statements.
43 |
Statements of Assets and Liabilities
December 31, 2021
| | | | | | | | | | | | | | | | |
| | | International
Growth Fund | | | Natixis
Oakmark Fund | | |
Natixis
Oakmark
International
Fund | | | Natixis
U.S. Equity
Opportunities
Fund | |
ASSETS | |
Investments at cost | | $ | 24,223,812 | | | $ | 259,624,280 | | | $ | 502,884,040 | | | $ | 644,352,734 | |
Net unrealized appreciation (depreciation) | | | (1,058,009 | ) | | | 110,108,748 | | | | 28,586,635 | | | | 409,033,231 | |
| | | | | | | | | | | | | | | | |
Investments at value | | | 23,165,803 | | | | 369,733,028 | | | | 531,470,675 | | | | 1,053,385,965 | |
Cash | | | — | | | | 37,527 | | | | — | | | | 86,407 | |
Foreign currency at value (identified cost $27,044, $0, $11,947 and $0, respectively) | | | 27,091 | | | | — | | | | 11,949 | | | | — | |
Receivable for Fund shares sold | | | 474 | | | | 3,447,221 | | | | 1,084,997 | | | | 667,060 | |
Receivable for securities sold | | | 128,184 | | | | — | | | | 33,225 | | | | 44,608,842 | |
Dividends receivable | | | 33,310 | | | | 286,612 | | | | 70,767 | | | | 299,987 | |
Tax reclaims receivable | | | 25,754 | | | | 36,194 | | | | 4,349,440 | | | | 575,999 | |
Prepaid expenses (Note 9) | | | 1 | | | | 19 | | | | 33 | | | | 63 | |
| | | | | | | | | | | | | | | | |
TOTAL ASSETS | | | 23,380,617 | | | | 373,540,601 | | | | 537,021,086 | | | | 1,099,624,323 | |
| | | | | | | | | | | | | | | | |
LIABILITIES | |
Payable for securities purchased | | | — | | | | — | | | | 142,505 | | | | 22,242,085 | |
Payable for Fund shares redeemed | | | — | | | | 347,103 | | | | 173,558 | | | | 125,022 | |
Unrealized depreciation on forward foreign currency contracts (Note 2) | | | — | | | | — | | | | 94,327 | | | | — | |
Foreign taxes payable (Note 2) | | | — | | | | — | | | | 204,198 | | | | — | |
Management fees payable (Note 6) | | | 1,953 | | | | 208,207 | | | | 246,640 | | | | 677,734 | |
Deferred Trustees’ fees (Note 6) | | | 3,065 | | | | 742,483 | | | | 141,600 | | | | 587,074 | |
Administrative fees payable (Note 6) | | | 838 | | | | 13,081 | | | | 19,054 | | | | 38,359 | |
Payable to distributor (Note 6d) | | | 16 | | | | 1,267 | | | | 11,131 | | | | 3,103 | |
Audit and tax services fees payable | | | 42,287 | | | | 41,106 | | | | 42,412 | | | | 42,112 | |
Other accounts payable and accrued expenses | | | 6,767 | | | | 20,929 | | | | 76,713 | | | | 78,038 | |
| | | | | | | | | | | | | | | | |
TOTAL LIABILITIES | | | 54,926 | | | | 1,374,176 | | | | 1,152,138 | | | | 23,793,527 | |
| | | | | | | | | | | | | | | | |
NET ASSETS | | $ | 23,325,691 | | | $ | 372,166,425 | | | $ | 535,868,948 | | | $ | 1,075,830,796 | |
| | | | | | | | | | | | | | | | |
NET ASSETS CONSIST OF: | |
Paid-in capital | | $ | 24,915,060 | | | $ | 264,080,538 | | | $ | 618,395,713 | | | $ | 631,467,096 | |
Accumulated earnings (loss) | | | (1,589,369 | ) | | | 108,085,887 | | | | (82,526,765 | ) | | | 444,363,700 | |
| | | | | | | | | | | | | | | | |
NET ASSETS | | $ | 23,325,691 | | | $ | 372,166,425 | | | $ | 535,868,948 | | | $ | 1,075,830,796 | |
| | | | | | | | | | | | | | | | |
COMPUTATION OF NET ASSET VALUE AND OFFERING PRICE: | |
Class A shares: | |
Net assets | | $ | 112,615 | | | $ | 222,434,752 | | | $ | 152,899,962 | | | $ | 733,423,258 | |
| | | | | | | | | | | | | | | | |
Shares of beneficial interest | | | 11,764 | | | | 7,659,392 | | | | 10,095,662 | | | | 17,007,787 | |
| | | | | | | | | | | | | | | | |
Net asset value and redemption price per share | | $ | 9.57 | | | $ | 29.04 | | | $ | 15.15 | | | $ | 43.12 | |
| | | | | | | | | | | | | | | | |
Offering price per share (100/94.25 of net asset value) (Note 1) | | $ | 10.15 | | | $ | 30.81 | | | $ | 16.07 | | | $ | 45.75 | |
| | | | | | | | | | | | | | | | |
Class C shares: (redemption price per share is equal to net asset value less any applicable contingent deferred sales charge) (Note 1) | | | | | | | | | | | | | | | | |
Net assets | | $ | 38,321 | | | $ | 50,042,066 | | | $ | 69,334,988 | | | $ | 57,491,976 | |
| | | | | | | | | | | | | | | | |
Shares of beneficial interest | | | 4,029 | | | | 2,129,686 | | | | 4,665,960 | | | | 2,635,266 | |
| | | | | | | | | | | | | | | | |
Net asset value and offering price per share | | $ | 9.51 | | | $ | 23.50 | | | $ | 14.86 | | | $ | 21.82 | |
| | | | | | | | | | | | | | | | |
Class N shares: | |
Net assets | | $ | 22,952,510 | | | $ | 681,854 | | | $ | 703,657 | | | $ | 177,216 | |
| | | | | | | | | | | | | | | | |
Shares of beneficial interest | | | 2,395,482 | | | | 21,906 | | | | 46,647 | | | | 3,273 | |
| | | | | | | | | | | | | | | | |
Net asset value, offering and redemption price per share | | $ | 9.58 | | | $ | 31.13 | | | $ | 15.08 | | | $ | 54.14 | |
| | | | | | | | | | | | | | | | |
Class Y shares: | |
Net assets | | $ | 222,245 | | | $ | 99,007,753 | | | $ | 312,930,341 | | | $ | 284,738,346 | |
| | | | | | | | | | | | | | | | |
Shares of beneficial interest | | | 23,197 | | | | 3,189,957 | | | | 20,766,145 | | | | 5,273,688 | |
| | | | | | | | | | | | | | | | |
Net asset value, offering and redemption price per share | | $ | 9.58 | | | $ | 31.04 | | | $ | 15.07 | | | $ | 53.99 | |
| | | | | | | | | | | | | | | | |
See accompanying notes to financial statements.
| 44
Statements of Assets and Liabilities (continued)
December 31, 2021
| | | | | | | | |
| | | Vaughan
Nelson Mid
Cap Fund | | | Vaughan
Nelson
Small Cap
Value Fund | |
ASSETS | |
Investments at cost | | $ | 312,676,580 | | | $ | 125,757,706 | |
Net unrealized appreciation | | | 55,063,499 | | | | 24,571,274 | |
| | | | | | | | |
Investments at value | | | 367,740,079 | | | | 150,328,980 | |
Receivable for Fund shares sold | | | 54,565 | | | | 74,457 | |
Dividends receivable | | | 308,517 | | | | 95,374 | |
Prepaid expenses (Note 9) | | | 19 | | | | 8 | |
| | | | | | | | |
TOTAL ASSETS | | | 368,103,180 | | | | 150,498,819 | |
| | | | | | | | |
LIABILITIES | |
Payable for securities purchased | | | 165 | | | | 99,568 | |
Payable for Fund shares redeemed | | | 37,531 | | | | 83,109 | |
Management fees payable (Note 6) | | | 227,831 | | | | 93,313 | |
Deferred Trustees’ fees (Note 6) | | | 217,464 | | | | 256,541 | |
Administrative fees payable (Note 6) | | | 12,941 | | | | 5,216 | |
Payable to distributor (Note 6d) | | | 2,274 | | | | 705 | |
Audit and tax services fees payable | | | 41,978 | | | | 41,110 | |
Other accounts payable and accrued expenses | | | 24,343 | | | | 23,243 | |
| | | | | | | | |
TOTAL LIABILITIES | | | 564,527 | | | | 602,805 | |
| | | | | | | | |
NET ASSETS | | $ | 367,538,653 | | | $ | 149,896,014 | |
| | | | | | | | |
NET ASSETS CONSIST OF: | |
Paid-in capital | | $ | 308,797,941 | | | $ | 122,850,311 | |
Accumulated earnings | | | 58,740,712 | | | | 27,045,703 | |
| | | | | | | | |
NET ASSETS | | $ | 367,538,653 | | | $ | 149,896,014 | |
| | | | | | | | |
COMPUTATION OF NET ASSET VALUE AND OFFERING PRICE: | |
Class A shares: | |
Net assets | | $ | 37,849,294 | | | $ | 81,492,958 | |
| | | | | | | | |
Shares of beneficial interest | | | 1,667,174 | | | | 4,559,072 | |
| | | | | | | | |
Net asset value and redemption price per share | | $ | 22.70 | | | $ | 17.87 | |
| | | | | | | | |
Offering price per share (100/94.25 of net asset value) (Note 1) | | $ | 24.08 | | | $ | 18.96 | |
| | | | | | | | |
Class C shares: (redemption price per share is equal to net asset value less any applicable contingent deferred sales charge) (Note 1) | | | | | | | | |
Net assets | | $ | 11,435,679 | | | $ | 966,228 | |
| | | | | | | | |
Shares of beneficial interest | | | 555,631 | | | | 139,326 | |
| | | | | | | | |
Net asset value and offering price per share | | $ | 20.58 | | | $ | 6.94 | |
| | | | | | | | |
Class N shares: | |
Net assets | | $ | 91,415,740 | | | $ | 1,382,591 | |
| | | | | | | | |
Shares of beneficial interest | | | 3,966,719 | | | | 72,911 | |
| | | | | | | | |
Net asset value, offering and redemption price per share | | $ | 23.05 | | | $ | 18.96 | |
| | | | | | | | |
Class Y shares: | |
Net assets | | $ | 226,837,940 | | | $ | 66,054,237 | |
| | | | | | | | |
Shares of beneficial interest | | | 9,825,086 | | | | 3,486,289 | |
| | | | | | | | |
Net asset value, offering and redemption price per share | | $ | 23.09 | | | $ | 18.95 | |
| | | | | | | | |
See accompanying notes to financial statements.
45 |
Statements of Operations
For the Year Ended December 31, 2021
| | | | | | | | | | | | | | | | |
| | | International
Growth Fund | | | Natixis
Oakmark
Fund | | | Natixis
Oakmark
International
Fund | | | Natixis
U.S. Equity
Opportunities
Fund | |
INVESTMENT INCOME | |
Dividends | | $ | 318,789 | | | $ | 4,244,879 | | | $ | 11,560,245 | | | $ | 9,393,885 | |
Non-cash dividends (Note 2b) | | | — | | | | — | | | | 3,482,440 | (a) | | | — | |
Interest | | | — | | | | — | | | | 18,155 | | | | — | |
Tax reclaims (Note 2e) | | | — | | | | — | | | | 1,916,315 | | | | 94,347 | |
Less net foreign taxes withheld | | | (32,401 | ) | | | — | | | | (1,409,101 | ) | | | (133,479 | ) |
| | | | | | | | | | | | | | | | |
| | | 286,388 | | | | 4,244,879 | | | | 15,568,054 | | | | 9,354,753 | |
| | | | | | | | | | | | | | | | |
Expenses | |
Management fees (Note 6) | | | 181,065 | | | | 2,106,551 | | | | 4,216,094 | | | | 7,835,017 | |
Service and distribution fees (Note 6) | | | 509 | | | | 939,503 | | | | 1,226,414 | | | | 2,410,762 | |
Administrative fees (Note 6) | | | 10,285 | | | | 131,502 | | | | 231,005 | | | | 446,102 | |
Trustees’ fees and expenses (Note 6) | | | 13,379 | | | | 104,351 | | | | 44,753 | | | | 111,433 | |
Transfer agent fees and expenses (Notes 6 and 8) | | | 3,319 | | | | 214,269 | | | | 900,969 | | | | 599,597 | |
Audit and tax services fees | | | 42,263 | | | | 41,099 | | | | 42,321 | | | | 42,111 | |
Custodian fees and expenses (Note 7) | | | 16,515 | | | | 9,489 | | | | 196,517 | | | | 44,883 | |
Legal fees (Note 9) | | | 788 | | | | 9,817 | | | | 18,472 | | | | 35,355 | |
Registration fees | | | 73,966 | | | | 88,389 | | | | 88,575 | | | | 84,720 | |
Shareholder reporting expenses | | | 11,969 | | | | 21,325 | | | | 104,354 | | | | 53,586 | |
Tax reclaim professional fees (Note 2e) | | | — | | | | — | | | | 39,128 | | | | 2,711 | |
Miscellaneous expenses (Note 7) | | | 31,502 | | | | 33,689 | | | | 51,161 | | | | 53,058 | |
| | | | | | | | | | | | | | | | |
Total expenses | | | 385,560 | | | | 3,699,984 | | | | 7,159,763 | | | | 11,719,335 | |
Less waiver and/or expense reimbursement (Notes 6 and 7) | | | (167,628 | ) | | | (88,369 | ) | | | (919,112 | ) | | | (1,048 | ) |
| | | | | | | | | | | | | | | | |
Net expenses | | | 217,932 | | | | 3,611,615 | | | | 6,240,651 | | | | 11,718,287 | |
| | | | | | | | | | | | | | | | |
Net investment income (loss) | | | 68,456 | | | | 633,264 | | | | 9,327,403 | | | | (2,363,534 | ) |
| | | | | | | | | | | | | | | | |
NET REALIZED AND UNREALIZED GAIN (LOSS) ON INVESTMENTS, FORWARD FOREIGN CURRENCY CONTRACTS AND FOREIGN CURRENCY TRANSACTIONS | | | | | | | | | | | | | | | | |
Net realized gain (loss) on: | |
Investments | | | (202,920 | ) | | | 28,561,069 | | | | 36,749,218 | | | | 116,863,738 | |
Forward foreign currency contracts (Note 2d) | | | — | | | | — | | | | 386,242 | | | | — | |
Foreign currency transactions (Note 2c) | | | (693 | ) | | | — | | | | (53,631 | ) | | | — | |
Net change in unrealized appreciation (depreciation) on: | |
Investments | | | (1,246,544 | ) | | | 53,375,247 | | | | (4,068,384 | ) | | | 97,063,562 | |
Forward foreign currency contracts (Note 2d) | | | — | | | | — | | | | (85,208 | ) | | | — | |
Foreign currency translations (Note 2c) | | | 177 | | | | — | | | | (323,842 | ) | | | (1,590 | ) |
| | | | | | | | | | | | | | | | |
Net realized and unrealized gain (loss) on investments, forward foreign currency contracts and foreign currency transactions | | | (1,449,980 | ) | | | 81,936,316 | | | | 32,604,395 | | | | 213,925,710 | |
| | | | | | | | | | | | | | | | |
NET INCREASE (DECREASE) IN NET ASSETS RESULTING FROM OPERATIONS | | $ | (1,381,524 | ) | | $ | 82,569,580 | | | $ | 41,931,798 | | | $ | 211,562,176 | |
| | | | | | | | | | | | | | | | |
| (a) | Includes a non-recurring stock dividend of $2,738,911. |
See accompanying notes to financial statements.
| 46
Statements of Operations (continued)
For the Year Ended December 31, 2021
| | | | | | | | |
| | | Vaughan
Nelson Mid
Cap Fund | | | Vaughan
Nelson
Small Cap
Value Fund | |
INVESTMENT INCOME | |
Dividends | | $ | 4,588,817 | | | $ | 1,422,401 | |
Non-cash dividends (Note 2b) | | | — | | | | 363,704 | (a) |
Less net foreign taxes withheld | | | — | | | | (5,549 | ) |
| | | | | | | | |
| | | 4,588,817 | | | | 1,780,556 | |
| | | | | | | | |
Expenses | | | | | | | | |
Management fees (Note 6) | | | 2,560,977 | | | | 1,202,924 | |
Service and distribution fees (Note 6) | | | 220,531 | | | | 197,232 | |
Administrative fees (Note 6) | | | 141,096 | | | | 58,651 | |
Trustees’ fees and expenses (Note 6) | | | 46,745 | | | | 46,227 | |
Transfer agent fees and expenses (Notes 6 and 8) | | | 258,005 | | | | 128,931 | |
Audit and tax services fees | | | 41,875 | | | | 41,096 | |
Custodian fees and expenses (Note 7) | | | 13,570 | | | | 10,529 | |
Legal fees (Note 9) | | | 10,745 | | | | 4,563 | |
Registration fees | | | 70,168 | | | | 91,539 | |
Shareholder reporting expenses | | | 31,071 | | | | 16,310 | |
Miscellaneous expenses (Note 7) | | | 35,550 | | | | 30,208 | |
| | | | | | | | |
Total expenses | | | 3,430,333 | | | | 1,828,210 | |
Less waiver and/or expense reimbursement (Notes 6 and 7) | | | (172,598 | ) | | | (222,089 | ) |
| | | | | | | | |
Net expenses | | | 3,257,735 | | | | 1,606,121 | |
| | | | | | | | |
Net investment income | | | 1,331,082 | | | | 174,435 | |
| | | | | | | | |
NET REALIZED AND UNREALIZED GAIN ON INVESTMENTS | |
Net realized gain on: | | | | | | | | |
Investments | | | 56,422,377 | | | | 33,988,295 | |
Net change in unrealized appreciation (depreciation) on: | | | | | | | | |
Investments | | | 4,168,218 | | | | 828,120 | |
| | | | | | | | |
Net realized and unrealized gain on investments | | | 60,590,595 | | | | 34,816,415 | |
| | | | | | | | |
NET INCREASE IN NET ASSETS RESULTING FROM OPERATIONS | | $ | 61,921,677 | | | $ | 34,990,850 | |
| | | | | | | | |
| (a) | Represents a non-recurring stock dividend. |
See accompanying notes to financial statements.
47 |
Statements of Changes in Net Assets
| | | | | | | | | | | | | | | | |
| | | International Growth Fund | | | Natixis Oakmark Fund | |
| | | Year Ended
December 31,
2021 | | | Period Ended
December 31,
2020(a) | | | Year Ended
December 31,
2021 | | | Year Ended
December 31,
2020 | |
FROM OPERATIONS: | |
Net investment income | | $ | 68,456 | | | $ | 9,420 | | | $ | 633,264 | | | $ | 1,003,906 | |
Net realized gain (loss) on investments and foreign currency transactions | | | (203,613 | ) | | | 8,123 | | | | 28,561,069 | | | | 14,582,175 | |
Net change in unrealized appreciation (depreciation) on investments and foreign currency translations | | | (1,246,367 | ) | | | 188,539 | | | | 53,375,247 | | | | 5,121,754 | |
| | | | | | | | | | | | | | | | |
Net increase (decrease) in net assets resulting from operations | | | (1,381,524 | ) | | | 206,082 | | | | 82,569,580 | | | | 20,707,835 | |
| | | | | | | | | | | | | | | | |
FROM DISTRIBUTIONS TO SHAREHOLDERS: | |
Class A | | | (1,712 | ) | | | (1 | ) | | | (14,668,177 | ) | | | (14,572,150 | ) |
Class C | | | (540 | ) | | | — | (b) | | | (3,860,638 | ) | | | (3,470,297 | ) |
Class N | | | (404,221 | ) | | | (12,450 | ) | | | (42,243 | ) | | | (30,687 | ) |
Class Y | | | (3,739 | ) | | | (9 | ) | | | (6,180,207 | ) | | | (3,143,507 | ) |
| | | | | | | | | | | | | | | | |
Total distributions | | | (410,212 | ) | | | (12,460 | ) | | | (24,751,265 | ) | | | (21,216,641 | ) |
| | | | | | | | | | | | | | | | |
NET INCREASE (DECREASE) IN NET ASSETS FROM CAPITAL SHARE TRANSACTIONS (NOTE 12) | | | 9,897,595 | | | | 15,026,210 | | | | 69,746,167 | | | | (38,326,966 | ) |
| | | | | | | | | | | | | | | | |
Net increase (decrease) in net assets | | | 8,105,859 | | | | 15,219,832 | | | | 127,564,482 | | | | (38,835,772 | ) |
NET ASSETS | |
Beginning of the year | | | 15,219,832 | | | | — | | | | 244,601,943 | | | | 283,437,715 | |
| | | | | | | | | | | | | | | | |
End of the year | | $ | 23,325,691 | | | $ | 15,219,832 | | | $ | 372,166,425 | | | $ | 244,601,943 | |
| | | | | | | | | | | | | | | | |
| (a) | From commencement of operations on December 15, 2020 through December 31, 2020. |
| (b) | Amount rounds to less than $1.00. |
See accompanying notes to financial statements.
| 48
Statements of Changes in Net Assets (continued)
| | | | | | | | | | | | | | | | |
| | | Natixis Oakmark International Fund | | | Natixis U.S. Equity Opportunities Fund | |
| | | Year Ended
December 31,
2021 | | | Year Ended
December 31,
2020 | | | Year Ended
December 31,
2021 | | | Year Ended
December 31,
2020 | |
FROM OPERATIONS: | |
Net investment income (loss) | | $ | 9,327,403 | | | $ | 245,748 | | | $ | (2,363,534 | ) | | $ | (1,093,083 | ) |
Net realized gain (loss) on investments, forward foreign currency contracts and foreign currency transactions | | | 37,081,829 | | | | (97,769,005 | ) | | | 116,863,738 | | | | 130,277,857 | |
Net change in unrealized appreciation (depreciation) on investments, forward foreign currency contracts and foreign currency translations | | | (4,477,434 | ) | | | 79,782,696 | | | | 97,061,972 | | | | 34,019,289 | |
| | | | | | | | | | | | | | | | |
Net increase (decrease) in net assets resulting from operations | | | 41,931,798 | | | | (17,740,561 | ) | | | 211,562,176 | | | | 163,204,063 | |
| | | | | | | | | | | | | | | | |
FROM DISTRIBUTIONS TO SHAREHOLDERS: | |
Class A | | | (2,330,358 | ) | | | (310,049 | ) | | | (76,697,366 | ) | | | (78,012,779 | ) |
Class C | | | (418,451 | ) | | | — | | | | (11,757,176 | ) | | | (13,186,942 | ) |
Class N | | | (12,581 | ) | | | (1,852 | ) | | | (15,616 | ) | | | (21,295 | ) |
Class Y | | | (5,540,267 | ) | | | (1,281,600 | ) | | | (23,677,132 | ) | | | (24,792,696 | ) |
| | | | | | | | | | | | | | | | |
Total distributions | | | (8,301,657 | ) | | | (1,593,501 | ) | | | (112,147,290 | ) | | | (116,013,712 | ) |
| | | | | | | | | | | | | | | | |
NET INCREASE (DECREASE) IN NET ASSETS FROM CAPITAL SHARE TRANSACTIONS (NOTE 12) | | | (1,920,547 | ) | | | (74,342,754 | ) | | | 20,061,764 | | | | (70,200,600 | ) |
| | | | | | | | | | | | | | | | |
Net increase (decrease) in net assets | | | 31,709,594 | | | | (93,676,816 | ) | | | 119,476,650 | | | | (23,010,249 | ) |
NET ASSETS | |
Beginning of the year | | | 504,159,354 | | | | 597,836,170 | | | | 956,354,146 | | | | 979,364,395 | |
| | | | | | | | | | | | | | | | |
End of the year | | $ | 535,868,948 | | | $ | 504,159,354 | | | $ | 1,075,830,796 | | | $ | 956,354,146 | |
| | | | | | | | | | | | | | | | |
See accompanying notes to financial statements.
49 |
Statements of Changes in Net Assets (continued)
| | | | | | | | | | | | | | | | |
| | | Vaughan Nelson Mid Cap Fund | | | Vaughan Nelson Small Cap Value Fund | |
| | | Year Ended
December 31,
2021 | | | Year Ended
December 31,
2020 | | | Year Ended
December 31,
2021 | | | Year Ended
December 31,
2020 | |
FROM OPERATIONS: | |
Net investment income | | $ | 1,331,082 | | | $ | 1,455,275 | | | $ | 174,435 | | | $ | 101,981 | |
Net realized gain (loss) on investments | | | 56,422,377 | | | | 27,799,575 | | | | 33,988,295 | | | | (3,132,416 | ) |
Net change in unrealized appreciation (depreciation) on investments | | | 4,168,218 | | | | (16,338,813 | ) | | | 828,120 | | | | 10,854,499 | |
| | | | | | | | | | | | | | | | |
Net increase in net assets resulting from operations | | | 61,921,677 | | | | 12,916,037 | | | | 34,990,850 | | | | 7,824,064 | |
| | | | | | | | | | | | | | | | |
FROM DISTRIBUTIONS TO SHAREHOLDERS: | |
Class A | | | (5,329,869 | ) | | | (3,468,834 | ) | | | (14,352,433 | ) | | | (376,748 | ) |
Class C | | | (1,799,416 | ) | | | (1,857,110 | ) | | | (339,165 | ) | | | (14,118 | ) |
Class N | | | (12,164,843 | ) | | | (2,038,286 | ) | | | (233,321 | ) | | | (179 | ) |
Class Y | | | (33,148,269 | ) | | | (26,620,537 | ) | | | (11,433,578 | ) | | | (344,758 | ) |
| | | | | | | | | | | | | | | | |
Total distributions | | | (52,442,397 | ) | | | (33,984,767 | ) | | | (26,358,497 | ) | | | (735,803 | ) |
| | | | | | | | | | | | | | | | |
NET INCREASE (DECREASE) IN NET ASSETS FROM CAPITAL SHARE TRANSACTIONS (NOTE 12) | | | 68,004,051 | | | | (61,208,438 | ) | | | 29,370,496 | | | | (8,673,052 | ) |
| | | | | | | | | | | | | | | | |
Net increase (decrease) in net assets | | | 77,483,331 | | | | (82,277,168 | ) | | | 38,002,849 | | | | (1,584,791 | ) |
NET ASSETS | |
Beginning of the year | | | 290,055,322 | | | | 372,332,490 | | | | 111,893,165 | | | | 113,477,956 | |
| | | | | | | | | | | | | | | | |
End of the year | | $ | 367,538,653 | | | $ | 290,055,322 | | | $ | 149,896,014 | | | $ | 111,893,165 | |
| | | | | | | | | | | | | | | | |
See accompanying notes to financial statements.
| 50
Financial Highlights
For a share outstanding throughout each period.
| | | | | | | | |
| | | International Growth
Fund—Class A | |
| | | Year Ended
December 31,
2021
| | | Period Ended
December 31,
2020*
| |
Net asset value, beginning of the period | | $ | 10.13 | | | $ | 10.00 | |
| | | | | | | | |
INCOME (LOSS) FROM INVESTMENT OPERATIONS: | |
Net investment income (loss)(a) | | | (0.01 | ) | | | 0.01 | |
Net realized and unrealized gain (loss) | | | (0.41 | ) | | | 0.13 | |
| | | | | | | | |
Total from Investment Operations | | | (0.42 | ) | | | 0.14 | |
| | | | | | | | |
LESS DISTRIBUTIONS FROM: | |
Net investment income | | | (0.01 | ) | | | (0.01 | ) |
Net realized capital gains | | | (0.13 | ) | | | — | |
| | | | | | | | |
Total Distributions | | | (0.14 | ) | | | (0.01 | ) |
| | | | | | | | |
Net asset value, end of the period | | $ | 9.57 | | | $ | 10.13 | |
| | | | | | | | |
Total return(b)(c) | | | (4.07 | )% | | | 1.37 | %(d) |
RATIOS TO AVERAGE NET ASSETS: | |
Net assets, end of the period (000’s) | | $ | 113 | | | $ | 1 | |
Net expenses(e) | | | 1.20 | % | | | 1.20 | %(f) |
Gross expenses | | | 2.71 | % | | | 13.05 | %(f) |
Net investment income (loss) | | | (0.07 | )% | | | 1.28 | %(f) |
Portfolio turnover rate | | | 9 | % | | | 1 | % |
| * | From commencement of operations on December 15, 2020 through December 31, 2020. |
| (a) | Per share net investment income (loss) has been calculated using the average shares outstanding during the period. |
| (b) | A sales charge for Class A shares is not reflected in total return calculations. |
| (c) | Had certain expenses not been waived/reimbursed during the period, total returns would have been lower. |
| (d) | Periods less than one year are not annualized. |
| (e) | The investment adviser agreed to waive its fees and/or reimburse a portion of the Fund’s expenses during the period. Without this waiver/reimbursement, expenses would have been higher. |
| (f) | Computed on an annualized basis for periods less than one year. |
See accompanying notes to financial statements.
51 |
Financial Highlights (continued)
For a share outstanding throughout each period.
| | | | | | | | |
| | | International Growth
Fund—Class C | |
| | | Year Ended
December 31,
2021
| | | Period Ended
December 31,
2020*
| |
Net asset value, beginning of the period | | $ | 10.13 | | | $ | 10.00 | |
| | | | | | | | |
INCOME (LOSS) FROM INVESTMENT OPERATIONS: | |
Net investment income (loss)(a) | | | (0.09 | ) | | | 0.00 | (b) |
Net realized and unrealized gain (loss) | | | (0.40 | ) | | | 0.13 | |
| | | | | | | | |
Total from Investment Operations | | | (0.49 | ) | | | 0.13 | |
| | | | | | | | |
LESS DISTRIBUTIONS FROM: | |
Net investment income | | | (0.00 | )(b) | | | (0.00 | )(b) |
Net realized capital gains | | | (0.13 | ) | | | — | |
| | | | | | | | |
Total Distributions | | | (0.13 | ) | | | (0.00 | ) |
| | | | | | | | |
Net asset value, end of the period | | $ | 9.51 | | | $ | 10.13 | |
| | | | | | | | |
Total return(c)(d) | | | (4.79 | )% | | | 1.33 | %(e) |
RATIOS TO AVERAGE NET ASSETS: | |
Net assets, end of the period (000’s) | | $ | 38 | | | $ | 1 | |
Net expenses(f) | | | 1.95 | % | | | 1.95 | %(g) |
Gross expenses | | | 3.46 | % | | | 13.78 | %(g) |
Net investment income (loss) | | | (0.90 | )% | | | 0.55 | %(g) |
Portfolio turnover rate | | | 9 | % | | | 1 | % |
| * | From commencement of operations on December 15, 2020 through December 31, 2020. |
| (a) | Per share net investment income (loss) has been calculated using the average shares outstanding during the period. |
| (b) | Amount rounds to less than $0.01 per share. |
| (c) | A contingent deferred sales charge for Class C shares is not reflected in total return calculations. |
| (d) | Had certain expenses not been waived/reimbursed during the period, total returns would have been lower. |
| (e) | Periods less than one year are not annualized. |
| (f) | The investment adviser agreed to waive its fees and/or reimburse a portion of the Fund’s expenses during the period. Without this waiver/reimbursement, expenses would have been higher. |
| (g) | Computed on an annualized basis for periods less than one year. |
See accompanying notes to financial statements.
| 52
Financial Highlights (continued)
For a share outstanding throughout each period.
| | | | | | | | |
| | | International Growth
Fund—Class N | |
| | | Year Ended
December 31,
2021
| | | Period Ended
December 31,
2020*
| |
Net asset value, beginning of the period | | $ | 10.13 | | | $ | 10.00 | |
| | | | | | | | |
INCOME (LOSS) FROM INVESTMENT OPERATIONS: | |
Net investment income(a) | | | 0.03 | | | | 0.01 | |
Net realized and unrealized gain (loss) | | | (0.42 | ) | | | 0.13 | |
| | | | | | | | |
Total from Investment Operations | | | (0.39 | ) | | | 0.14 | |
| | | | | | | | |
LESS DISTRIBUTIONS FROM: | |
Net investment income | | | (0.03 | ) | | | (0.01 | ) |
Net realized capital gains | | | (0.13 | ) | | | — | |
| | | | | | | | |
Total Distributions | | | (0.16 | ) | | | (0.01 | ) |
| | | | | | | | |
Net asset value, end of the period | | $ | 9.58 | | | $ | 10.13 | |
| | | | | | | | |
Total return(b) | | | (3.77 | )% | | | 1.38 | %(c) |
RATIOS TO AVERAGE NET ASSETS: | |
Net assets, end of the period (000’s) | | $ | 22,953 | | | $ | 15,206 | |
Net expenses(d) | | | 0.90 | % | | | 0.90 | %(e) |
Gross expenses | | | 1.58 | % | | | 6.48 | %(e) |
Net investment income | | | 0.29 | % | | | 1.43 | %(e) |
Portfolio turnover rate | | | 9 | % | | | 1 | % |
| * | From commencement of operations on December 15, 2020 through December 31, 2020. |
| (a) | Per share net investment income has been calculated using the average shares outstanding during the period. |
| (b) | Had certain expenses not been waived/reimbursed during the period, total returns would have been lower. |
| (c) | Periods less than one year are not annualized. |
| (d) | The investment adviser agreed to waive its fees and/or reimburse a portion of the Fund’s expenses during the period. Without this waiver/reimbursement, expenses would have been higher. |
| (e) | Computed on an annualized basis for periods less than one year. |
See accompanying notes to financial statements.
53 |
Financial Highlights (continued)
For a share outstanding throughout each period.
| | | | | | | | |
| | | International Growth
Fund—Class Y | |
| | | Year Ended
December 31,
2021
| | | Period Ended
December 31,
2020*
| |
Net asset value, beginning of the period | | $ | 10.13 | | | $ | 10.00 | |
| | | | | | | | |
INCOME (LOSS) FROM INVESTMENT OPERATIONS: | |
Net investment income(a) | | | 0.02 | | | | 0.01 | |
Net realized and unrealized gain (loss) | | | (0.41 | ) | | | 0.13 | |
| | | | | | | | |
Total from Investment Operations | | | (0.39 | ) | | | 0.14 | |
| | | | | | | | |
LESS DISTRIBUTIONS FROM: | |
Net investment income | | | (0.03 | ) | | | (0.01 | ) |
Net realized capital gains | | | (0.13 | ) | | | — | |
| | | | | | | | |
Total Distributions | | | (0.16 | ) | | | (0.01 | ) |
| | | | | | | | |
Net asset value, end of the period | | $ | 9.58 | | | $ | 10.13 | |
| | | | | | | | |
Total return(b) | | | (3.81 | )% | | | 1.38 | %(c) |
RATIOS TO AVERAGE NET ASSETS: | |
Net assets, end of the period (000’s) | | $ | 222 | | | $ | 12 | |
Net expenses(d) | | | 0.95 | % | | | 0.95 | %(e) |
Gross expenses | | | 2.46 | % | | | 12.58 | %(e) |
Net investment income | | | 0.19 | % | | | 1.63 | %(e) |
Portfolio turnover rate | | | 9 | % | | | 1 | % |
| * | From commencement of operations on December 15, 2020 through December 31, 2020. |
| (a) | Per share net investment income has been calculated using the average shares outstanding during the period. |
| (b) | Had certain expenses not been waived/reimbursed during the period, total returns would have been lower. |
| (c) | Periods less than one year are not annualized. |
| (d) | The investment adviser agreed to waive its fees and/or reimburse a portion of the Fund’s expenses during the period. Without this waiver/reimbursement, expenses would have been higher. |
| (e) | Computed on an annualized basis for periods less than one year. |
See accompanying notes to financial statements.
| 54
Financial Highlights (continued)
For a share outstanding throughout each period.
| | | | | | | | | | | | | | | | | | | | |
| | | Natixis Oakmark Fund—Class A | |
| | | Year Ended
December 31,
2021
| | | Year Ended
December 31,
2020
| | | Year Ended
December 31,
2019
| | | Year Ended
December 31,
2018
| | | Year Ended
December 31,
2017
| |
Net asset value, beginning of the period | | $ | 23.20 | | | $ | 22.45 | | | $ | 19.44 | | | $ | 24.72 | | | $ | 21.37 | |
| | | | | | | | | | | | | | | | | | | | |
INCOME (LOSS) FROM INVESTMENT OPERATIONS: | |
Net investment income(a) | | | 0.07 | | | | 0.11 | (b) | | | 0.18 | (c) | | | 0.10 | | | | 0.11 | |
Net realized and unrealized gain (loss) | | | 7.81 | | | | 2.78 | | | | 4.93 | | | | (3.28 | ) | | | 4.28 | |
| | | | | | | | | | | | | | | | | | | | |
Total from Investment Operations | | | 7.88 | | | | 2.89 | | | | 5.11 | | | | (3.18 | ) | | | 4.39 | |
| | | | | | | | | | | | | | | | | | | | |
LESS DISTRIBUTIONS FROM: | |
Net investment income | | | (0.05 | ) | | | (0.12 | ) | | | (0.21 | ) | | | (0.08 | ) | | | (0.10 | ) |
Net realized capital gains | | | (1.99 | ) | | | (2.02 | ) | | | (1.89 | ) | | | (2.02 | ) | | | (0.94 | ) |
| | | | | | | | | | | | | | | | | | | | |
Total Distributions | | | (2.04 | ) | | | (2.14 | ) | | | (2.10 | ) | | | (2.10 | ) | | | (1.04 | ) |
| | | | | | | | | | | | | | | | | | | | |
Net asset value, end of the period | | $ | 29.04 | | | $ | 23.20 | | | $ | 22.45 | | | $ | 19.44 | | | $ | 24.72 | |
| | | | | | | | | | | | | | | | | | | | |
Total return(d) | | | 33.97 | %(e) | | | 13.01 | %(b) | | | 26.77 | %(c) | | | (13.01 | )% | | | 20.75 | % |
RATIOS TO AVERAGE NET ASSETS: | |
Net assets, end of the period (000’s) | | $ | 222,435 | | | $ | 170,702 | | | $ | 181,417 | | | $ | 164,748 | | | $ | 203,792 | |
Net expenses | | | 1.12 | %(f)(g) | | | 1.20 | %(h) | | | 1.17 | % | | | 1.13 | % | | | 1.18 | % |
Gross expenses | | | 1.14 | % | | | 1.20 | %(h) | | | 1.17 | % | | | 1.13 | % | | | 1.18 | % |
Net investment income | | | 0.25 | % | | | 0.53 | %(b) | | | 0.85 | %(c) | | | 0.41 | % | | | 0.48 | % |
Portfolio turnover rate | | | 23 | % | | | 22 | % | | | 15 | % | | | 39 | % | | | 16 | % |
| (a) | Per share net investment income has been calculated using the average shares outstanding during the period. |
| (b) | Includes a non-recurring dividend. Without this dividend, net investment income per share would have been $0.05, total return would have been 12.72% and the ratio of net investment income to average net assets would have been 0.27%. |
| (c) | Includes a non-recurring dividend. Without this dividend, net investment income per share would have been $0.13, total return would have been 26.50% and the ratio of net investment income to average net assets would have been 0.62%. |
| (d) | A sales charge for Class A shares is not reflected in total return calculations. |
| (e) | Had certain expenses not been waived/reimbursed during the period, total returns would have been lower. |
| (f) | The investment adviser agreed to waive its fees and/or reimburse a portion of the Fund’s expenses during the period. Without this waiver/reimbursement, expenses would have been higher. |
| (g) | Effective July 1, 2021, the expense limit decreased from 1.30% to 1.05%. |
| (h) | Includes refund of prior year service fee of 0.01%. |
See accompanying notes to financial statements.
55 |
Financial Highlights (continued)
For a share outstanding throughout each period.
| | | | | | | | | | | | | | | | | | | | |
| | | Natixis Oakmark Fund—Class C | |
| | | Year Ended
December 31,
2021
| | | Year Ended
December 31,
2020
| | | Year Ended
December 31,
2019
| | | Year Ended
December 31,
2018
| | | Year Ended
December 31,
2017
| |
Net asset value, beginning of the period | | $ | 19.17 | | | $ | 18.92 | | | $ | 16.66 | | | $ | 21.58 | | | $ | 18.83 | |
| | | | | | | | | | | | | | | | | | | | |
INCOME (LOSS) FROM INVESTMENT OPERATIONS: | |
Net investment income (loss)(a) | | | (0.12 | ) | | | (0.04 | )(b) | | | 0.02 | (c) | | | (0.07 | ) | | | (0.05 | ) |
Net realized and unrealized gain (loss) | | | 6.44 | | | | 2.31 | | | | 4.20 | | | | (2.83 | ) | | | 3.74 | |
| | | | | | | | | | | | | | | | | | | | |
Total from Investment Operations | | | 6.32 | | | | 2.27 | | | | 4.22 | | | | (2.90 | ) | | | 3.69 | |
| | | | | | | | | | | | | | | | | | | | |
LESS DISTRIBUTIONS FROM: | |
Net investment income | | | (0.00 | )(d) | | | — | | | | (0.07 | ) | | | — | | | | (0.00 | )(d) |
Net realized capital gains | | | (1.99 | ) | | | (2.02 | ) | | | (1.89 | ) | | | (2.02 | ) | | | (0.94 | ) |
| | | | | | | | | | | | | | | | | | | | |
Total Distributions | | | (1.99 | ) | | | (2.02 | ) | | | (1.96 | ) | | | (2.02 | ) | | | (0.94 | ) |
| | | | | | | | | | | | | | | | | | | | |
Net asset value, end of the period | | $ | 23.50 | | | $ | 19.17 | | | $ | 18.92 | | | $ | 16.66 | | | $ | 21.58 | |
| | | | | | | | | | | | | | | | | | | | |
Total return(e) | | | 32.99 | %(f) | | | 12.15 | %(b) | | | 25.82 | %(c) | | | (13.63 | )% | | | 19.85 | % |
RATIOS TO AVERAGE NET ASSETS: | |
Net assets, end of the period (000’s) | | $ | 50,042 | | | $ | 35,940 | | | $ | 54,384 | | | $ | 53,606 | | | $ | 62,272 | |
Net expenses | | | 1.87 | %(g)(h) | | | 1.95 | % | | | 1.92 | % | | | 1.88 | % | | | 1.93 | % |
Gross expenses | | | 1.89 | % | | | 1.95 | % | | | 1.92 | % | | | 1.88 | % | | | 1.93 | % |
Net investment income (loss) | | | (0.49 | )% | | | (0.23 | )%(b) | | | 0.12 | %(c) | | | (0.33 | )% | | | (0.27 | )% |
Portfolio turnover rate | | | 23 | % | | | 22 | % | | | 15 | % | | | 39 | % | | | 16 | % |
| (a) | Per share net investment income (loss) has been calculated using the average shares outstanding during the period. |
| (b) | Includes a non-recurring dividend. Without this dividend, net investment loss per share would have been $(0.08), total return would have been 11.85% and the ratio of net investment loss to average net assets would have been (0.46%). |
| (c) | Includes a non-recurring dividend. Without this dividend, net investment loss per share would have been $(0.02), total return would have been 25.50% and the ratio of net investment loss to average net assets would have been (0.12)%. |
| (d) | Amount rounds to less than $0.01 per share. |
| (e) | A contingent deferred sales charge for Class C shares is not reflected in total return calculations. |
| (f) | Had certain expenses not been waived/reimbursed during the period, total returns would have been lower. |
| (g) | The investment adviser agreed to waive its fees and/or reimburse a portion of the Fund’s expenses during the period. Without this waiver/reimbursement, expenses would have been higher. |
| (h) | Effective July 1, 2021, the expense limit decreased from 2.05% to 1.80%. |
See accompanying notes to financial statements.
| 56
Financial Highlights (continued)
For a share outstanding throughout each period.
| | | | | | | | | | | | | | | | | | | | |
| | | Natixis Oakmark Fund—Class N | |
| | | Year Ended
December 31,
2021
| | | Year Ended
December 31,
2020
| | | Year Ended
December 31,
2019
| | | Year Ended
December 31,
2018
| | | Period Ended
December 31,
2017*
| |
Net asset value, beginning of the period | | $ | 24.72 | | | $ | 23.78 | | | $ | 20.49 | | | $ | 25.91 | | | $ | 23.13 | |
| | | | | | | | | | | | | | | | | | | | |
INCOME (LOSS) FROM INVESTMENT OPERATIONS: | |
Net investment income(a) | | | 0.23 | | | | 0.18 | (b) | | | 0.22 | (c) | | | 0.22 | | | | 0.14 | |
Net realized and unrealized gain (loss) | | | 8.31 | | | | 2.98 | | | | 5.25 | | | | (3.45 | ) | | | 3.44 | |
| | | | | | | | | | | | | | | | | | | | |
Total from Investment Operations | | | 8.54 | | | | 3.16 | | | | 5.47 | | | | (3.23 | ) | | | 3.58 | |
| | | | | | | | | | | | | | | | | | | | |
LESS DISTRIBUTIONS FROM: | |
Net investment income | | | (0.14 | ) | | | (0.20 | ) | | | (0.29 | ) | | | (0.17 | ) | | | (0.17 | ) |
Net realized capital gains | | | (1.99 | ) | | | (2.02 | ) | | | (1.89 | ) | | | (2.02 | ) | | | (0.63 | ) |
| | | | | | | | | | | | | | | | | | | | |
Total Distributions | | | (2.13 | ) | | | (2.22 | ) | | | (2.18 | ) | | | (2.19 | ) | | | (0.80 | ) |
| | | | | | | | | | | | | | | | | | | | |
Net asset value, end of the period | | $ | 31.13 | | | $ | 24.72 | | | $ | 23.78 | | | $ | 20.49 | | | $ | 25.91 | |
| | | | | | | | | | | | | | | | | | | | |
Total return(d) | | | 34.54 | % | | | 13.41 | %(b) | | | 27.16 | %(c) | | | (12.60 | )% | | | 15.46 | %(e) |
RATIOS TO AVERAGE NET ASSETS: | |
Net assets, end of the period (000’s) | | $ | 682 | | | $ | 364 | | | $ | 801 | | | $ | 10 | | | $ | 1 | |
Net expenses(f) | | | 0.80 | %(g) | | | 0.86 | % | | | 0.83 | % | | | 0.75 | % | | | 0.75 | %(h) |
Gross expenses | | | 1.55 | % | | | 1.05 | % | | | 1.25 | % | | | 3.79 | % | | | 13.79 | %(h) |
Net investment income | | | 0.79 | % | | | 0.85 | %(b) | | | 0.93 | %(c) | | | 0.88 | % | | | 0.84 | %(h) |
Portfolio turnover rate | | | 23 | % | | | 22 | % | | | 15 | % | | | 39 | % | | | 16 | %(i) |
| * | From commencement of Class operations on May 1, 2017 through December 31, 2017. |
| (a) | Per share net investment income has been calculated using the average shares outstanding during the period. |
| (b) | Includes a non-recurring dividend. Without this dividend, net investment income per share would have been $0.14, total return would have been 13.13% and the ratio of net investment income to average net assets would have been 0.67%. |
| (c) | Includes a non-recurring dividend. Without this dividend, net investment income per share would have been $0.22, total return would have been 26.90% and the ratio of net investment income to average net assets would have been 0.92%. |
| (d) | Had certain expenses not been waived/reimbursed during the period, total returns would have been lower. |
| (e) | Periods less than one year are not annualized. |
| (f) | The investment adviser agreed to waive its fees and/or reimburse a portion of the Fund’s expenses during the period. Without this waiver/reimbursement, expenses would have been higher. |
| (g) | Effective July 1, 2021, the expense limit decreased from 1.00% to 0.75%. |
| (h) | Computed on an annualized basis for periods less than one year. |
| (i) | Represents the Fund’s portfolio turnover rate for the year ended December 31, 2017. |
See accompanying notes to financial statements.
57 |
Financial Highlights (continued)
For a share outstanding throughout each period.
| | | | | | | | | | | | | | | | | | | | |
| | | Natixis Oakmark Fund—Class Y | |
| | | Year Ended
December 31,
2021
| | | Year Ended
December 31,
2020
| | | Year Ended
December 31,
2019
| | | Year Ended
December 31,
2018
| | | Year Ended
December 31,
2017
| |
Net asset value, beginning of the period | | $ | 24.68 | | | $ | 23.75 | | | $ | 20.46 | | | $ | 25.90 | | | $ | 22.34 | |
| | | | | | | | | | | | | | | | | | | | |
INCOME (LOSS) FROM INVESTMENT OPERATIONS: | |
Net investment income(a) | | | 0.17 | | | | 0.17 | (b) | | | 0.27 | (c) | | | 0.17 | | | | 0.17 | |
Net realized and unrealized gain (loss) | | | 8.31 | | | | 2.95 | | | | 5.17 | | | | (3.44 | ) | | | 4.48 | |
| | | | | | | | | | | | | | | | | | | | |
Total from Investment Operations | | | 8.48 | | | | 3.12 | | | | 5.44 | | | | (3.27 | ) | | | 4.65 | |
| | | | | | | | | | | | | | | | | | | | |
LESS DISTRIBUTIONS FROM: | |
Net investment income | | | (0.13 | ) | | | (0.17 | ) | | | (0.26 | ) | | | (0.15 | ) | | | (0.15 | ) |
Net realized capital gains | | | (1.99 | ) | | | (2.02 | ) | | | (1.89 | ) | | | (2.02 | ) | | | (0.94 | ) |
| | | | | | | | | | | | | | | | | | | | |
Total Distributions | | | (2.12 | ) | | | (2.19 | ) | | | (2.15 | ) | | | (2.17 | ) | | | (1.09 | ) |
| | | | | | | | | | | | | | | | | | | | |
Net asset value, end of the period | | $ | 31.04 | | | $ | 24.68 | | | $ | 23.75 | | | $ | 20.46 | | | $ | 25.90 | |
| | | | | | | | | | | | | | | | | | | | |
Total return | | | 34.35 | %(d) | | | 13.28 | %(b) | | | 27.06 | %(c)(d) | | | (12.76 | )% | | | 21.05 | % |
RATIOS TO AVERAGE NET ASSETS: | |
Net assets, end of the period (000’s) | | $ | 99,008 | | | $ | 37,595 | | | $ | 46,836 | | | $ | 53,829 | | | $ | 49,955 | |
Net expenses | | | 0.86 | %(e)(f) | | | 0.95 | % | | | 0.91 | %(e) | | | 0.88 | % | | | 0.93 | % |
Gross expenses | | | 0.89 | % | | | 0.95 | % | | | 0.92 | % | | | 0.88 | % | | | 0.93 | % |
Net investment income | | | 0.56 | % | | | 0.79 | %(b) | | | 1.16 | %(c) | | | 0.68 | % | | | 0.71 | % |
Portfolio turnover rate | | | 23 | % | | | 22 | % | | | 15 | % | | | 39 | % | | | 16 | % |
| (a) | Per share net investment income has been calculated using the average shares outstanding during the period. |
| (b) | Includes a non-recurring dividend. Without this dividend, net investment income per share would have been $0.12, total return would have been 13.00% and the ratio of net investment income to average net assets would have been 0.55%. |
| (c) | Includes a non-recurring dividend. Without this dividend, net investment income per share would have been $0.20, total return would have been 26.80% and the ratio of net investment income to average net assets would have been 0.90%. |
| (d) | Had certain expenses not been waived/reimbursed during the period, total returns would have been lower. |
| (e) | The investment adviser agreed to waive its fees and/or reimburse a portion of the Fund’s expenses during the period. Without this waiver/reimbursement, expenses would have been higher. |
| (f) | Effective July 1, 2021, the expense limit decreased from 1.05% to 0.80%. |
See accompanying notes to financial statements.
| 58
Financial Highlights (continued)
For a share outstanding throughout each period.
| | | | | | | | | | | | | | | | | | | | |
| | | Natixis Oakmark International Fund—Class A | |
| | | Year Ended
December 31,
2021
| | | Year Ended
December 31,
2020
| | | Year Ended
December 31,
2019
| | | Year Ended
December 31,
2018
| | | Year Ended
December 31,
2017
| |
Net asset value, beginning of the period | | $ | 14.15 | | | $ | 13.63 | | | $ | 11.29 | | | $ | 15.58 | | | $ | 12.15 | |
| | | | | | | | | | | | | | | | | | | | |
INCOME (LOSS) FROM INVESTMENT OPERATIONS: | |
Net investment income (loss)(a) | | | 0.27 | (b) | | | (0.00 | )(c) | | | 0.37 | (d) | | | 0.25 | | | | 0.18 | |
Net realized and unrealized gain (loss) | | | 0.96 | | | | 0.55 | (e) | | | 2.38 | | | | (4.02 | ) | | | 3.41 | |
| | | | | | | | | | | | | | | | | | | | |
Total from Investment Operations | | | 1.23 | | | | 0.55 | | | | 2.75 | | | | (3.77 | ) | | | 3.59 | |
| | | | | | | | | | | | | | | | | | | | |
LESS DISTRIBUTIONS FROM: | |
Net investment income | | | (0.23 | ) | | | (0.03 | ) | | | (0.41 | ) | | | (0.29 | ) | | | (0.16 | ) |
Net realized capital gains | | | — | | | | — | | | | — | | | | (0.23 | ) | | | — | |
| | | | | | | | | | | | | | | | | | | | |
Total Distributions | | | (0.23 | ) | | | (0.03 | ) | | | (0.41 | ) | | | (0.52 | ) | | | (0.16 | ) |
| | | | | | | | | | | | | | | | | | | | |
Net asset value, end of the period | | $ | 15.15 | | | $ | 14.15 | | | $ | 13.63 | | | $ | 11.29 | | | $ | 15.58 | |
| | | | | | | | | | | | | | | | | | | | |
Total return(f) | | | 8.73 | %(b)(g) | | | 4.06 | %(g) | | | 24.35 | %(d) | | | (24.15 | )% | | | 29.56 | % |
RATIOS TO AVERAGE NET ASSETS: | |
Net assets, end of the period (000’s) | | $ | 152,900 | | | $ | 131,630 | | | $ | 172,906 | | | $ | 257,551 | | | $ | 603,988 | |
Net expenses | | | 1.17 | %(h)(i) | | | 1.29 | %(h)(j) | | | 1.29 | % | | | 1.31 | % | | | 1.32 | % |
Gross expenses | | | 1.34 | % | | | 1.36 | % | | | 1.29 | % | | | 1.31 | % | | | 1.32 | % |
Net investment income (loss) | | | 1.73 | %(b) | | | (0.03 | )% | | | 2.91 | %(d) | | | 1.72 | % | | | 1.28 | % |
Portfolio turnover rate | | | 37 | % | | | 63 | % | | | 28 | % | | | 50 | % | | | 40 | % |
| (a) | Per share net investment income (loss) has been calculated using the average shares outstanding during the period. |
| (b) | Includes a non-recurring dividend and tax reclaims. Without these, net investment income per share would have been $0.13, total return would have been 7.74% and the ratio of net investment income to average net assets would have been 0.84%. |
| (c) | Amount rounds to less than $0.01 per share. |
| (d) | Includes non-recurring dividends. Without this dividend, net investment income per share would have been $0.29, total return would have been 23.55% and the ratio of net investment income to average net assets would have been 2.26%. |
| (e) | The amount shown for a share outstanding does not correspond with the aggregate realized and unrealized gain (loss) on investments for the period due to the timing of sales and redemptions of fund shares in relation to fluctuating market values of investments of the Fund. |
| (f) | A sales charge for Class A shares is not reflected in total return calculations. |
| (g) | Had certain expenses not been waived/reimbursed during the period, total returns would have been lower. |
| (h) | The investment adviser agreed to waive its fees and/or reimburse a portion of the Fund’s expenses during the period. Without this waiver/reimbursement, expenses would have been higher. |
| (i) | Effective July 1, 2021, the expense limit decreased from 1.20% to 1.15%. |
| (j) | Effective July 1, 2020, the expense limit decreased from 1.37% to 1.20%. |
See accompanying notes to financial statements.
59 |
Financial Highlights (continued)
For a share outstanding throughout each period.
| | | | | | | | | | | | | | | | | | | | |
| | | Natixis Oakmark International Fund—Class C | |
| | | Year Ended
December 31,
2021
| | | Year Ended
December 31,
2020
| | | Year Ended
December 31,
2019
| | | Year Ended
December 31,
2018
| | | Year Ended
December 31,
2017
| |
Net asset value, beginning of the period | | $ | 13.85 | | | $ | 13.41 | | | $ | 11.11 | | | $ | 15.30 | | | $ | 11.96 | |
| | | | | | | | | | | | | | | | | | | | |
INCOME (LOSS) FROM INVESTMENT OPERATIONS: | |
Net investment income (loss)(a) | | | 0.13 | (b) | | | (0.08 | ) | | | 0.26 | (c) | | | 0.13 | | | | 0.06 | |
Net realized and unrealized gain (loss) | | | 0.97 | | | | 0.52 | (d) | | | 2.34 | | | | (3.92 | ) | | | 3.35 | |
| | | | | | | | | | | | | | | | | | | | |
Total from Investment Operations | | | 1.10 | | | | 0.44 | | | | 2.60 | | | | (3.79 | ) | | | 3.41 | |
| | | | | | | | | | | | | | | | | | | | |
LESS DISTRIBUTIONS FROM: | |
Net investment income | | | (0.09 | ) | | | — | | | | (0.30 | ) | | | (0.17 | ) | | | (0.07 | ) |
Net realized capital gains | | | — | | | | — | | | | — | | | | (0.23 | ) | | | — | |
| | | | | | | | | | | | | | | | | | | | |
Total Distributions | | | (0.09 | ) | | | — | | | | (0.30 | ) | | | (0.40 | ) | | | (0.07 | ) |
| | | | | | | | | | | | | | | | | | | | |
Net asset value, end of the period | | $ | 14.86 | | | $ | 13.85 | | | $ | 13.41 | | | $ | 11.11 | | | $ | 15.30 | |
| | | | | | | | | | | | | | | | | | | | |
Total return(e) | | | 7.92 | %(b)(f) | | | 3.28 | %(f) | | | 23.44 | %(c) | | | (24.74 | )% | | | 28.55 | % |
RATIOS TO AVERAGE NET ASSETS: | |
Net assets, end of the period (000’s) | | $ | 69,335 | | | $ | 96,772 | | | $ | 179,533 | | | $ | 212,618 | | | $ | 363,018 | |
Net expenses | | | 1.93 | %(g)(h) | | | 2.05 | %(g)(i) | | | 2.04 | % | | | 2.07 | % | | | 2.07 | % |
Gross expenses | | | 2.09 | % | | | 2.11 | % | | | 2.04 | % | | | 2.07 | % | | | 2.07 | % |
Net investment income (loss) | | | 0.85 | %(b) | | | (0.76 | )% | | | 2.09 | %(c) | | | 0.94 | % | | | 0.42 | % |
Portfolio turnover rate | | | 37 | % | | | 63 | % | | | 28 | % | | | 50 | % | | | 40 | % |
| (a) | Per share net investment income (loss) has been calculated using the average shares outstanding during the period. |
| (b) | Includes a non-recurring dividend and tax reclaims. Without these, net investment income per share would have been $0.02, total return would have been 6.98% and the ratio of net investment income to average net assets would have been 0.13%. |
| (c) | Includes non-recurring dividends. Without this dividend, net investment income per share would have been $0.18, total return would have been 22.63% and the ratio of net investment income to average net assets would have been 1.43%. |
| (d) | The amount shown for a share outstanding does not correspond with the aggregate realized and unrealized gain (loss) on investments for the period due to the timing of sales and redemptions of fund shares in relation to fluctuating market values of investments of the Fund. |
| (e) | A contingent deferred sales charge for Class C shares is not reflected in total return calculations. |
| (f) | Had certain expenses not been waived/reimbursed during the period, total returns would have been lower. |
| (g) | The investment adviser agreed to waive its fees and/or reimburse a portion of the Fund’s expenses during the period. Without this waiver/reimbursement, expenses would have been higher. |
| (h) | Effective July 1, 2021, the expense limit decreased from 1.95% to 1.90%. |
| (i) | Effective July 1, 2020, the expense limit decreased from 2.12% to 1.95%. |
See accompanying notes to financial statements.
| 60
Financial Highlights (continued)
For a share outstanding throughout each period.
| | | | | | | | | | | | | | | | | | | | |
| | | Natixis Oakmark International Fund—Class N | |
| | | Year Ended
December 31,
2021
| | | Year Ended
December 31,
2020
| | | Year Ended
December 31,
2019
| | | Year Ended
December 31,
2018
| | | Period Ended
December 31,
2017*
| |
Net asset value, beginning of the period | | $ | 14.09 | | | $ | 13.56 | | | $ | 11.25 | | | $ | 15.58 | | | $ | 13.98 | |
| | | | | | | | | | | | | | | | | | | | |
INCOME (LOSS) FROM INVESTMENT OPERATIONS: | |
Net investment income(a) | | | 0.38 | (b) | | | 0.04 | | | | 0.33 | (c) | | | 0.28 | | | | 0.15 | |
Net realized and unrealized gain (loss) | | | 0.89 | | | | 0.56 | (d) | | | 2.45 | | | | (4.02 | ) | | | 1.66 | |
| | | | | | | | | | | | | | | | | | | | |
Total from Investment Operations | | | 1.27 | | | | 0.60 | | | | 2.78 | | | | (3.74 | ) | | | 1.81 | |
| | | | | | | | | | | | | | | | | | | | |
LESS DISTRIBUTIONS FROM: | |
Net investment income | | | (0.28 | ) | | | (0.07 | ) | | | (0.47 | ) | | | (0.36 | ) | | | (0.21 | ) |
Net realized capital gains | | | — | | | | — | | | | — | | | | (0.23 | ) | | | — | |
| | | | | | | | | | | | | | | | | | | | |
Total Distributions | | | (0.28 | ) | | | (0.07 | ) | | | (0.47 | ) | | | (0.59 | ) | | | (0.21 | ) |
| | | | | | | | | | | | | | | | | | | | |
Net asset value, end of the period | | $ | 15.08 | | | $ | 14.09 | | | $ | 13.56 | | | $ | 11.25 | | | $ | 15.58 | |
| | | | | | | | | | | | | | | | | | | | |
Total return(e) | | | 9.01 | %(b) | | | 4.44 | % | | | 24.75 | %(c) | | | (23.94 | )% | | | 12.96 | %(f) |
RATIOS TO AVERAGE NET ASSETS: | |
Net assets, end of the period (000’s) | | $ | 704 | | | $ | 290 | | | $ | 811 | | | $ | 758 | | | $ | 1 | |
Net expenses(g) | | | 0.87 | %(h) | | | 0.92 | %(i) | | | 0.94 | % | | | 0.99 | % | | | 0.92 | %(j) |
Gross expenses | | | 1.25 | % | | | 1.17 | % | | | 1.08 | % | | | 1.02 | % | | | 25.21 | %(j) |
Net investment income | | | 2.49 | %(b) | | | 0.37 | % | | | 2.56 | %(c) | | | 2.04 | % | | | 1.54 | %(j) |
Portfolio turnover rate | | | 37 | % | | | 63 | % | | | 28 | % | | | 50 | % | | | 40 | %(k) |
| * | From commencement of Class operations on May 1, 2017 through December 31, 2017. |
| (a) | Per share net investment income has been calculated using the average shares outstanding during the period. |
| (b) | Includes a non-recurring dividend and tax reclaims. Without these, net investment income per share would have been $0.11, total return would have been 8.09% and the ratio of net investment income to average net assets would have been 0.70%. |
| (c) | Includes non-recurring dividends. Without this dividend, net investment income per share would have been $0.27, total return would have been 23.94% and the ratio of net investment income to average net assets would have been 2.15%. |
| (d) | The amount shown for a share outstanding does not correspond with the aggregate realized and unrealized gain (loss) on investments for the period due to the timing of sales and redemptions of fund shares in relation to fluctuating market values of investments of the Fund. |
| (e) | Had certain expenses not been waived/reimbursed during the period, total returns would have been lower. |
| (f) | Periods less than one year are not annualized. |
| (g) | The investment adviser agreed to waive its fees and/or reimburse a portion of the Fund’s expenses during the period. Without this waiver/reimbursement, expenses would have been higher. |
| (h) | Effective July 1, 2021, the expense limit decreased from 0.90% to 0.85%. |
| (i) | Effective July 1, 2020, the expense limit decreased from 1.07% to 0.90%. |
| (j) | Computed on an annualized basis for periods less than one year. |
| (k) | Represents the Fund’s portfolio turnover rate for the year ended December 31, 2017. |
See accompanying notes to financial statements.
61 |
Financial Highlights (continued)
For a share outstanding throughout each period.
| | | | | | | | | | | | | | | | | | | | |
| | | Natixis Oakmark International Fund—Class Y | |
| | | Year Ended
December 31,
2021
| | | Year Ended
December 31,
2020
| | | Year Ended
December 31,
2019
| | | Year Ended
December 31,
2018
| | | Period Ended
December 31,
2017*
| |
Net asset value, beginning of the period | | $ | 14.08 | | | $ | 13.56 | | | $ | 11.25 | | | $ | 15.56 | | | $ | 13.98 | |
| | | | | | | | | | | | | | | | | | | | |
INCOME (LOSS) FROM INVESTMENT OPERATIONS: | |
Net investment income(a) | | | 0.30 | (b) | | | 0.04 | | | | 0.37 | (c) | | | 0.26 | | | | 0.00 | (d) |
Net realized and unrealized gain (loss) | | | 0.96 | | | | 0.55 | (e) | | | 2.40 | | | | (3.99 | ) | | | 1.79 | |
| | | | | | | | | | | | | | | | | | | | |
Total from Investment Operations | | | 1.26 | | | | 0.59 | | | | 2.77 | | | | (3.73 | ) | | | 1.79 | |
| | | | | | | | | | | | | | | | | | | | |
LESS DISTRIBUTIONS FROM: | |
Net investment income | | | (0.27 | ) | | | (0.07 | ) | | | (0.46 | ) | | | (0.35 | ) | | | (0.21 | ) |
Net realized capital gains | | | — | | | | — | | | | — | | | | (0.23 | ) | | | — | |
| | | | | | | | | | | | | | | | | | | | |
Total Distributions | | | (0.27 | ) | | | (0.07 | ) | | | (0.46 | ) | | | (0.58 | ) | | | (0.21 | ) |
| | | | | | | | | | | | | | | | | | | | |
Net asset value, end of the period | | $ | 15.07 | | | $ | 14.08 | | | $ | 13.56 | | | $ | 11.25 | | | $ | 15.56 | |
| | | | | | | | | | | | | | | | | | | | |
Total return | | | 8.97 | %(b)(f) | | | 4.32 | %(f) | | | 24.64 | %(c) | | | (23.93 | )% | | | 12.79 | %(g) |
RATIOS TO AVERAGE NET ASSETS: | |
Net assets, end of the period (000’s) | | $ | 312,930 | | | $ | 275,468 | | | $ | 244,586 | | | $ | 215,123 | | | $ | 172,978 | |
Net expenses | | | 0.92 | %(h)(i) | | | 1.03 | %(h)(j) | | | 1.04 | % | | | 1.07 | % | | | 1.07 | %(k) |
Gross expenses | | | 1.09 | % | | | 1.11 | % | | | 1.04 | % | | | 1.07 | % | | | 1.07 | %(k) |
Net investment income | | | 1.96 | %(b) | | | 0.41 | % | | | 2.91 | %(c) | | | 1.85 | % | | | 0.03 | %(k) |
Portfolio turnover rate | | | 37 | % | | | 63 | % | | | 28 | % | | | 50 | % | | | 40 | %(l) |
| * | From commencement of Class operations on May 1, 2017 through December 31, 2017. |
| (a) | Per share net investment income has been calculated using the average shares outstanding during the period. |
| (b) | Includes a non-recurring dividend and tax reclaims. Without these, net investment income per share would have been $0.17, total return would have been 8.04% and the ratio of net investment income to average net assets would have been 1.07%. |
| (c) | Includes non-recurring dividends. Without this dividend, net investment income per share would have been $0.29, total return would have been 23.84% and the ratio of net investment income to average net assets would have been 2.29%. |
| (d) | Amount rounds to less than $0.01 per share. |
| (e) | The amount shown for a share outstanding does not correspond with the aggregate realized and unrealized gain (loss) on investments for the period due to the timing of sales and redemptions of fund shares in relation to fluctuating market values of investments of the Fund. |
| (f) | Had certain expenses not been waived/reimbursed during the period, total returns would have been lower. |
| (g) | Periods less than one year are not annualized. |
| (h) | The investment adviser agreed to waive its fees and/or reimburse a portion of the Fund’s expenses during the period. Without this waiver/reimbursement, expenses would have been higher. |
| (i) | Effective July 1, 2021, the expense limit decreased from 0.95% to 0.90%. |
| (j) | Effective July 1, 2020, the expense limit decreased from 1.12% to 0.95%. |
| (k) | Computed on an annualized basis for periods less than one year. |
| (l) | Represents the Fund’s portfolio turnover rate for the year ended December 31, 2017. |
See accompanying notes to financial statements.
| 62
Financial Highlights (continued)
For a share outstanding throughout each period.
| | | | | | | | | | | | | | | | | | | | |
| | | Natixis U.S. Equity Opportunities Fund—Class A | |
| | | Year Ended
December 31,
2021
| | | Year Ended
December 31,
2020
| | | Year Ended
December 31,
2019
| | | Year Ended
December 31,
2018
| | | Year Ended
December 31,
2017
| |
Net asset value, beginning of the period | | $ | 39.04 | | | $ | 36.53 | | | $ | 31.00 | | | $ | 36.90 | | | $ | 30.27 | |
| | | | | | | | | | | | | | | | | | | | |
INCOME (LOSS) FROM INVESTMENT OPERATIONS: | |
Net investment income (loss)(a) | | | (0.11 | ) | | | (0.05 | ) | | | 0.15 | (b) | | | 0.08 | | | | 0.06 | |
Net realized and unrealized gain (loss) | | | 8.99 | | | | 7.66 | | | | 9.34 | | | | (2.51 | ) | | | 7.88 | |
| | | | | | | | | | | | | | | | | | | | |
Total from Investment Operations | | | 8.88 | | | | 7.61 | | | | 9.49 | | | | (2.43 | ) | | | 7.94 | |
| | | | | | | | | | | | | | | | | | | | |
LESS DISTRIBUTIONS FROM: | |
Net investment income | | | — | | | | — | | | | (0.17 | ) | | | (0.05 | ) | | | (0.06 | ) |
Net realized capital gains | | | (4.80 | ) | | | (5.10 | ) | | | (3.79 | ) | | | (3.42 | ) | | | (1.25 | ) |
| | | | | | | | | | | | | | | | | | | | |
Total Distributions | | | (4.80 | ) | | | (5.10 | ) | | | (3.96 | ) | | | (3.47 | ) | | | (1.31 | ) |
| | | | | | | | | | | | | | | | | | | | |
Net asset value, end of the period | | $ | 43.12 | | | $ | 39.04 | | | $ | 36.53 | | | $ | 31.00 | | | $ | 36.90 | |
| | | | | | | | | | | | | | | | | | | | |
Total return(c) | | | 23.14 | % | | | 22.09 | % | | | 31.03 | %(b) | | | (6.48 | )% | | | 26.28 | % |
RATIOS TO AVERAGE NET ASSETS: | |
Net assets, end of the period (000’s) | | $ | 733,423 | | | $ | 649,754 | | | $ | 616,922 | | | $ | 523,665 | | | $ | 604,330 | |
Net expenses | | | 1.14 | % | | | 1.17 | % | | | 1.17 | % | | | 1.16 | % | | | 1.21 | %(d) |
Gross expenses | | | 1.14 | % | | | 1.17 | % | | | 1.17 | % | | | 1.16 | % | | | 1.21 | % |
Net investment income (loss) | | | (0.25 | )% | | | (0.14 | )% | | | 0.42 | %(b) | | | 0.20 | % | | | 0.16 | % |
Portfolio turnover rate | | | 18 | % | | | 26 | % | | | 12 | % | | | 23 | % | | | 17 | % |
| (a) | Per share net investment income (loss) has been calculated using the average shares outstanding during the period. |
| (b) | Includes non-recurring dividends. Without this dividend, net investment income per share would have been $0.09, total return would have been 30.87% and the ratio of net investment income to average net assets would have been 0.26%. |
| (c) | A sales charge for Class A shares is not reflected in total return calculations. |
| (d) | Effective July 1, 2017, the expense limit decreased from 1.25% to 1.20%. |
See accompanying notes to financial statements.
63 |
Financial Highlights (continued)
For a share outstanding throughout each period.
| | | | | | | | | | | | | | | | | | | | |
| | | Natixis U.S. Equity Opportunities Fund—Class C | |
| | | Year Ended
December 31,
2021
| | | Year Ended
December 31,
2020
| | | Year Ended
December 31,
2019
| | | Year Ended
December 31,
2018
| | | Year Ended
December 31,
2017
| |
Net asset value, beginning of the period | | $ | 21.89 | | | $ | 22.65 | | | $ | 20.42 | | | $ | 25.73 | | | $ | 21.54 | |
| | | | | | | | | | | | | | | | | | | | |
INCOME (LOSS) FROM INVESTMENT OPERATIONS: | |
Net investment loss(a) | | | (0.24 | ) | | | (0.19 | ) | | | (0.07 | )(b) | | | (0.14 | ) | | | (0.14 | ) |
Net realized and unrealized gain (loss) | | | 4.97 | | | | 4.53 | | | | 6.10 | | | | (1.75 | ) | | | 5.58 | |
| | | | | | | | | | | | | | | | | | | | |
Total from Investment Operations | | | 4.73 | | | | 4.34 | | | | 6.03 | | | | (1.89 | ) | | | 5.44 | |
| | | | | | | | | | | | | | | | | | | | |
LESS DISTRIBUTIONS FROM: | |
Net investment income | | | — | | | | — | | | | (0.01 | ) | | | — | | | | (0.00 | )(c) |
Net realized capital gains | | | (4.80 | ) | | | (5.10 | ) | | | (3.79 | ) | | | (3.42 | ) | | | (1.25 | ) |
| | | | | | | | | | | | | | | | | | | | |
Total Distributions | | | (4.80 | ) | | | (5.10 | ) | | | (3.80 | ) | | | (3.42 | ) | | | (1.25 | ) |
| | | | | | | | | | | | | | | | | | | | |
Net asset value, end of the period | | $ | 21.82 | | | $ | 21.89 | | | $ | 22.65 | | | $ | 20.42 | | | $ | 25.73 | |
| | | | | | | | | | | | | | | | | | | | |
Total return(d) | | | 22.27 | % | | | 21.15 | % | | | 30.06 | %(b) | | | (7.18 | )% | | | 25.35 | % |
RATIOS TO AVERAGE NET ASSETS: | |
Net assets, end of the period (000’s) | | $ | 57,492 | | | $ | 63,126 | | | $ | 77,924 | | | $ | 78,783 | | | $ | 112,615 | |
Net expenses | | | 1.89 | % | | | 1.92 | % | | | 1.92 | % | | | 1.91 | % | | | 1.96 | %(e) |
Gross expenses | | | 1.89 | % | | | 1.92 | % | | | 1.92 | % | | | 1.91 | % | | | 1.96 | % |
Net investment loss | | | (0.99 | )% | | | (0.87 | )% | | | (0.31 | )%(b) | | | (0.54 | )% | | | (0.59 | )% |
Portfolio turnover rate | | | 18 | % | | | 26 | % | | | 12 | % | | | 23 | % | | | 17 | % |
| (a) | Per share net investment loss has been calculated using the average shares outstanding during the period. |
| (b) | Includes non-recurring dividends. Without this dividend, net investment loss per share would have been $(0.11), total return would have been 29.85% and the ratio of net investment loss to average net assets would have been (0.48)%. |
| (c) | Amount rounds to less than $0.01 per share. |
| (d) | A contingent deferred sales charge for Class C shares is not reflected in total return calculations. |
| (e) | Effective July 1, 2017, the expense limit decreased from 2.00% to 1.95%. |
See accompanying notes to financial statements.
| 64
Financial Highlights (continued)
For a share outstanding throughout each period.
| | | | | | | | | | | | | | | | | | | | |
| | | Natixis U.S. Equity Opportunities Fund—Class N | |
| | | Year Ended
December 31,
2021
| | | Year Ended
December 31,
2020
| | | Year Ended
December 31,
2019
| | | Year Ended
December 31,
2018
| | | Period Ended
December 31,
2017*
| |
Net asset value, beginning of the period | | $ | 47.84 | | | $ | 43.61 | | | $ | 36.37 | | | $ | 42.63 | | | $ | 37.62 | |
| | | | | | | | | | | | | | | | | | | | |
INCOME (LOSS) FROM INVESTMENT OPERATIONS: | |
Net investment income(a) | | | 0.03 | | | | 0.13 | | | | 0.19 | (b) | | | 0.25 | | | | 0.12 | |
Net realized and unrealized gain (loss) | | | 11.07 | | | | 9.20 | | | | 11.14 | | | | (2.91 | ) | | | 6.20 | |
| | | | | | | | | | | | | | | | | | | | |
Total from Investment Operations | | | 11.10 | | | | 9.33 | | | | 11.33 | | | | (2.66 | ) | | | 6.32 | |
| | | | | | | | | | | | | | | | | | | | |
LESS DISTRIBUTIONS FROM: | |
Net investment income | | | — | | | | — | | | | (0.30 | ) | | | (0.18 | ) | | | (0.16 | ) |
Net realized capital gains | | | (4.80 | ) | | | (5.10 | ) | | | (3.79 | ) | | | (3.42 | ) | | | (1.15 | ) |
| | | | | | | | | | | | | | | | | | | | |
Total Distributions | | | (4.80 | ) | | | (5.10 | ) | | | (4.09 | ) | | | (3.60 | ) | | | (1.31 | ) |
| | | | | | | | | | | | | | | | | | | | |
Net asset value, end of the period | | $ | 54.14 | | | $ | 47.84 | | | $ | 43.61 | | | $ | 36.37 | | | $ | 42.63 | |
| | | | | | | | | | | | | | | | | | | | |
Total return(c) | | | 23.53 | % | | | 22.48 | % | | | 31.44 | %(b) | | | (6.11 | )% | | | 16.78 | %(d) |
RATIOS TO AVERAGE NET ASSETS: | |
Net assets, end of the period (000’s) | | $ | 177 | | | $ | 172 | | | $ | 654 | | | $ | 1 | | | $ | 1 | |
Net expenses(e) | | | 0.83 | % | | | 0.84 | % | | | 0.83 | % | | | 0.76 | % | | | 0.78 | %(f)(g) |
Gross expenses | | | 1.38 | % | | | 1.13 | % | | | 1.42 | % | | | 13.35 | % | | | 13.41 | %(f) |
Net investment income | | | 0.06 | % | | | 0.31 | % | | | 0.44 | %(b) | | | 0.56 | % | | | 0.44 | %(f) |
Portfolio turnover rate | | | 18 | % | | | 26 | % | | | 12 | % | | | 23 | % | | | 17 | %(h) |
| * | From commencement of Class operations on May 1, 2017 through December 31, 2017. |
| (a) | Per share net investment income has been calculated using the average shares outstanding during the period. |
| (b) | Includes non-recurring dividends. Without this dividend, net investment income per share would have been $0.19, total return would have been 31.27% and the ratio of net investment income to average net assets would have been 0.44%. |
| (c) | Had certain expenses not been waived/reimbursed during the period, total returns would have been lower. |
| (d) | Periods less than one year are not annualized. |
| (e) | The investment adviser agreed to waive its fees and/or reimburse a portion of the Fund’s expenses during the period. Without this waiver/reimbursement, expenses would have been higher. |
| (f) | Computed on an annualized basis for periods less than one year. |
| (g) | Effective July 1, 2017, the expense limit decreased from 0.95% to 0.90%. |
| (h) | Represents the Fund’s portfolio turnover rate for the year ended December 31, 2017. |
See accompanying notes to financial statements.
65 |
Financial Highlights (continued)
For a share outstanding throughout each period.
| | | | | | | | | | | | | | | | | | | | |
| | | Natixis U.S. Equity Opportunities Fund—Class Y | |
| | | Year Ended
December 31,
2021
| | | Year Ended
December 31,
2020
| | | Year Ended
December 31,
2019
| | | Year Ended
December 31,
2018
| | | Year Ended
December 31,
2017
| |
Net asset value, beginning of the period | | $ | 47.74 | | | $ | 43.56 | | | $ | 36.33 | | | $ | 42.61 | | | $ | 34.77 | |
| | | | | | | | | | | | | | | | | | | | |
INCOME (LOSS) FROM INVESTMENT OPERATIONS: | |
Net investment income(a) | | | 0.00 | (b) | | | 0.05 | | | | 0.29 | (c) | | | 0.20 | | | | 0.16 | |
Net realized and unrealized gain (loss) | | | 11.05 | | | | 9.23 | | | | 10.99 | | | | (2.92 | ) | | | 9.07 | |
| | | | | | | | | | | | | | | | | | | | |
Total from Investment Operations | | | 11.05 | | | | 9.28 | | | | 11.28 | | | | (2.72 | ) | | | 9.23 | |
| | | | | | | | | | | | | | | | | | | | |
LESS DISTRIBUTIONS FROM: | |
Net investment income | | | — | | | | — | | | | (0.26 | ) | | | (0.14 | ) | | | (0.14 | ) |
Net realized capital gains | | | (4.80 | ) | | | (5.10 | ) | | | (3.79 | ) | | | (3.42 | ) | | | (1.25 | ) |
| | | | | | | | | | | | | | | | | | | | |
Total Distributions | | | (4.80 | ) | | | (5.10 | ) | | | (4.05 | ) | | | (3.56 | ) | | | (1.39 | ) |
| | | | | | | | | | | | | | | | | | | | |
Net asset value, end of the period | | $ | 53.99 | | | $ | 47.74 | | | $ | 43.56 | | | $ | 36.33 | | | $ | 42.61 | |
| | | | | | | | | | | | | | | | | | | | |
Total return | | | 23.48 | % | | | 22.36 | % | | | 31.36 | %(c)(d) | | | (6.24 | )% | | | 26.60 | % |
RATIOS TO AVERAGE NET ASSETS: | |
Net assets, end of the period (000’s) | | $ | 284,738 | | | $ | 243,302 | | | $ | 283,864 | | | $ | 296,255 | | | $ | 285,008 | |
Net expenses | | | 0.89 | % | | | 0.92 | % | | | 0.91 | %(e) | | | 0.91 | % | | | 0.95 | %(f) |
Gross expenses | | | 0.89 | % | | | 0.92 | % | | | 0.92 | % | | | 0.91 | % | | | 0.95 | % |
Net investment income | | | 0.00 | %(g) | | | 0.13 | % | | | 0.69 | %(c) | | | 0.45 | % | | | 0.40 | % |
Portfolio turnover rate | | | 18 | % | | | 26 | % | | | 12 | % | | | 23 | % | | | 17 | % |
| (a) | Per share net investment income has been calculated using the average shares outstanding during the period. |
| (b) | Amount rounds to less than $0.01 per share. |
| (c) | Includes non-recurring dividends. Without this dividend, net investment income per share would have been $0.22, total return would have been 31.16% and the ratio of net investment income to average net assets would have been 0.53%. |
| (d) | Had certain expenses not been waived/reimbursed during the period, total returns would have been lower. |
| (e) | The administrator agreed to waive its fees and/or reimburse a portion of the Fund’s expenses during the period. Without this waiver/reimbursement, expenses would have been higher. |
| (f) | Effective July 1, 2017, the expense limit decreased from 1.00% to 0.95%. |
| (g) | Amount rounds to less than 0.01%. |
See accompanying notes to financial statements.
| 66
Financial Highlights (continued)
For a share outstanding throughout each period.
| | | | | | | | | | | | | | | | | | | | |
| | | Vaughan Nelson Mid Cap Fund—Class A | |
| | | Year Ended
December 31,
2021
| | | Year Ended
December 31,
2020
| | | Year Ended
December 31,
2019
| | | Year Ended
December 31,
2018
| | | Year Ended
December 31,
2017
| |
Net asset value, beginning of the period | | $ | 21.79 | | | $ | 22.42 | | | $ | 17.37 | | | $ | 22.65 | | | $ | 20.55 | |
| | | | | | | | | | | | | | | | | | | | |
INCOME (LOSS) FROM INVESTMENT OPERATIONS: | |
Net investment income(a) | | | 0.05 | | | | 0.07 | | | | 0.03 | | | | 0.09 | | | | 0.17 | (b) |
Net realized and unrealized gain (loss) | | | 4.52 | | | | 1.96 | | | | 5.21 | | | | (3.71 | ) | | | 2.48 | |
| | | | | | | | | | | | | | | | | | | | |
Total from Investment Operations | | | 4.57 | | | | 2.03 | | | | 5.24 | | | | (3.62 | ) | | | 2.65 | |
| | | | | | | | | | | | | | | | | | | | |
LESS DISTRIBUTIONS FROM: | |
Net investment income | | | (0.04 | ) | | | (0.04 | ) | | | (0.02 | ) | | | (0.15 | ) | | | (0.18 | ) |
Net realized capital gains | | | (3.62 | ) | | | (2.62 | ) | | | (0.17 | ) | | | (1.51 | ) | | | (0.37 | ) |
| | | | | | | | | | | | | | | | | | | | |
Total Distributions | | | (3.66 | ) | | | (2.66 | ) | | | (0.19 | ) | | | (1.66 | ) | | | (0.55 | ) |
| | | | | | | | | | | | | | | | | | | | |
Net asset value, end of the period | | $ | 22.70 | | | $ | 21.79 | | | $ | 22.42 | | | $ | 17.37 | | | $ | 22.65 | |
| | | | | | | | | | | | | | | | | | | | |
Total return(c) | | | 21.32 | %(d) | | | 10.46 | %(d) | | | 30.21 | %(d) | | | (16.10 | )% | | | 12.93 | %(b) |
RATIOS TO AVERAGE NET ASSETS: | |
Net assets, end of the period (000’s) | | $ | 37,849 | | | $ | 30,567 | | | $ | 33,434 | | | $ | 43,769 | | | $ | 67,186 | |
Net expenses | | | 1.17 | %(e)(f) | | | 1.20 | %(e) | | | 1.25 | %(e)(g)(h) | | | 1.24 | % | | | 1.22 | % |
Gross expenses | | | 1.23 | % | | | 1.29 | % | | | 1.28 | %(g) | | | 1.24 | % | | | 1.22 | % |
Net investment income | | | 0.22 | % | | | 0.35 | % | | | 0.16 | % | | | 0.42 | % | | | 0.77 | %(b) |
Portfolio turnover rate | | | 71 | % | | | 52 | % | | | 52 | % | | | 44 | % | | | 42 | % |
| (a) | Per share net investment income has been calculated using the average shares outstanding during the period. |
| (b) | Includes a non-recurring dividend. Without this dividend, net investment income per share would have been $0.09, total return would have been 12.53% and the ratio of net investment income to average net assets would have been 0.41%. |
| (c) | A sales charge for Class A shares is not reflected in total return calculations. |
| (d) | Had certain expenses not been waived/reimbursed during the period, total returns would have been lower. |
| (e) | The investment adviser agreed to waive its fees and/or reimburse a portion of the Fund’s expenses during the period. Without this waiver/reimbursement, expenses would have been higher. |
| (f) | Effective July 1, 2021, the expense limit decreased from 1.20% to 1.15%. |
| (g) | Includes interest expense. Without this expense the ratio of net expenses would have been 1.23% and the ratio of gross expenses would have been 1.26%. |
| (h) | Effective July 1, 2019, the expense limit decreased from 1.40% to 1.20%. |
See accompanying notes to financial statements.
67 |
Financial Highlights (continued)
For a share outstanding throughout each period.
| | | | | | | | | | | | | | | | | | | | |
| | | Vaughan Nelson Mid Cap Fund—Class C | |
| | | Year Ended
December 31,
2021
| | | Year Ended
December 31,
2020
| | | Year Ended
December 31,
2019
| | | Year Ended
December 31,
2018
| | | Year Ended
December 31,
2017
| |
Net asset value, beginning of the period | | $ | 20.15 | | | $ | 21.06 | | | $ | 16.43 | | | $ | 21.50 | | | $ | 19.51 | |
| | | | | | | | | | | | | | | | | | | | |
INCOME (LOSS) FROM INVESTMENT OPERATIONS: | |
Net investment income (loss)(a) | | | (0.13 | ) | | | (0.08 | ) | | | (0.10 | ) | | | (0.08 | ) | | | 0.00 | (b)(c) |
Net realized and unrealized gain (loss) | | | 4.18 | | | | 1.79 | | | | 4.90 | | | | (3.48 | ) | | | 2.36 | |
| | | | | | | | | | | | | | | | | | | | |
Total from Investment Operations | | | 4.05 | | | | 1.71 | | | | 4.80 | | | | (3.56 | ) | | | 2.36 | |
| | | | | | | | | | | | | | | | | | | | |
LESS DISTRIBUTIONS FROM: | |
Net investment income | | | (0.00 | )(b) | | | — | | | | (0.00 | )(b) | | | — | | | | — | |
Net realized capital gains | | | (3.62 | ) | | | (2.62 | ) | | | (0.17 | ) | | | (1.51 | ) | | | (0.37 | ) |
| | | | | | | | | | | | | | | | | | | | |
Total Distributions | | | (3.62 | ) | | | (2.62 | ) | | | (0.17 | ) | | | (1.51 | ) | | | (0.37 | ) |
| | | | | | | | | | | | | | | | | | | | |
Net asset value, end of the period | | $ | 20.58 | | | $ | 20.15 | | | $ | 21.06 | | | $ | 16.43 | | | $ | 21.50 | |
| | | | | | | | | | | | | | | | | | | | |
Total return(d) | | | 20.44 | %(e) | | | 9.60 | %(e) | | | 29.25 | %(e) | | | (16.71 | )% | | | 12.11 | %(c) |
RATIOS TO AVERAGE NET ASSETS: | |
Net assets, end of the period (000’s) | | $ | 11,436 | | | $ | 14,023 | | | $ | 21,932 | | | $ | 23,967 | | | $ | 47,559 | |
Net expenses | | | 1.93 | %(f)(g) | | | 1.95 | %(f) | | | 1.99 | %(f)(h)(i) | | | 1.98 | % | | | 1.97 | % |
Gross expenses | | | 1.98 | % | | | 2.04 | % | | | 2.02 | %(h) | | | 1.98 | % | | | 1.97 | % |
Net investment income (loss) | | | (0.56 | )% | | | (0.42 | )% | | | (0.50 | )% | | | (0.36 | )% | | | 0.00 | %(c)(j) |
Portfolio turnover rate | | | 71 | % | | | 52 | % | | | 52 | % | | | 44 | % | | | 42 | % |
| (a) | Per share net investment income (loss) has been calculated using the average shares outstanding during the period. |
| (b) | Amount rounds to less than $0.01 per share. |
| (c) | Includes a non-recurring dividend. Without this dividend, net investment loss per share would have been $(0.07), total return would have been 11.70% and the ratio of net investment loss to average net assets would have been (0.35)%. |
| (d) | A contingent deferred sales charge for Class C shares is not reflected in total return calculations. |
| (e) | Had certain expenses not been waived/reimbursed during the period, total returns would have been lower. |
| (f) | The investment adviser agreed to waive its fees and/or reimburse a portion of the Fund’s expenses during the period. Without this waiver/reimbursement, expenses would have been higher. |
| (g) | Effective July 1, 2021, the expense limit decreased from 1.95% to 1.90%. |
| (h) | Includes interest expense. Without this expense the ratio of net expenses would have been 1.98% and the ratio of gross expenses would have been 2.01%. |
| (i) | Effective July 1, 2019, the expense limit decreased from 2.15% to 1.95%. |
| (j) | Amount rounds to less than 0.01%. |
See accompanying notes to financial statements.
| 68
Financial Highlights (continued)
For a share outstanding throughout each period.
| | | | | | | | | | | | | | | | | | | | |
| | | Vaughan Nelson Mid Cap Fund—Class N | |
| | | Year Ended
December 31,
2021
| | | Year Ended
December 31,
2020
| | | Year Ended
December 31,
2019
| | | Year Ended
December 31,
2018
| | | Year Ended
December 31,
2017
| |
Net asset value, beginning of the period | | $ | 22.07 | | | $ | 22.66 | | | $ | 17.54 | | | $ | 22.87 | | | $ | 20.75 | |
| | | | | | | | | | | | | | | | | | | | |
INCOME (LOSS) FROM INVESTMENT OPERATIONS: | |
Net investment income(a) | | | 0.14 | | | | 0.13 | | | | 0.11 | | | | 0.17 | | | | 0.25 | (b) |
Net realized and unrealized gain (loss) | | | 4.58 | | | | 2.00 | | | | 5.27 | | | | (3.75 | ) | | | 2.51 | |
| | | | | | | | | | | | | | | | | | | | |
Total from Investment Operations | | | 4.72 | | | | 2.13 | | | | 5.38 | | | | (3.58 | ) | | | 2.76 | |
| | | | | | | | | | | | | | | | | | | | |
LESS DISTRIBUTIONS FROM: | |
Net investment income | | | (0.12 | ) | | | (0.10 | ) | | | (0.09 | ) | | | (0.24 | ) | | | (0.27 | ) |
Net realized capital gains | | | (3.62 | ) | | | (2.62 | ) | | | (0.17 | ) | | | (1.51 | ) | | | (0.37 | ) |
| | | | | | | | | | | | | | | | | | | | |
Total Distributions | | | (3.74 | ) | | | (2.72 | ) | | | (0.26 | ) | | | (1.75 | ) | | | (0.64 | ) |
| | | | | | | | | | | | | | | | | | | | |
Net asset value, end of the period | | $ | 23.05 | | | $ | 22.07 | | | $ | 22.66 | | | $ | 17.54 | | | $ | 22.87 | |
| | | | | | | | | | | | | | | | | | | | |
Total return | | | 21.70 | %(c) | | | 10.83 | %(c) | | | 30.67 | %(c) | | | (15.78 | )% | | | 13.31 | %(b) |
RATIOS TO AVERAGE NET ASSETS: | |
Net assets, end of the period (000’s) | | $ | 91,416 | | | $ | 17,965 | | | $ | 18,262 | | | $ | 70,902 | | | $ | 134,205 | |
Net expenses | | | 0.86 | %(d)(e) | | | 0.90 | %(d) | | | 0.92 | %(d)(f)(g) | | | 0.88 | % | | | 0.88 | % |
Gross expenses | | | 0.89 | % | | | 0.94 | % | | | 0.93 | %(f) | | | 0.88 | % | | | 0.88 | % |
Net investment income | | | 0.55 | % | | | 0.65 | % | | | 0.51 | % | | | 0.76 | % | | | 1.16 | %(b) |
Portfolio turnover rate | | | 71 | % | | | 52 | % | | | 52 | % | | | 44 | % | | | 42 | % |
| (a) | Per share net investment income has been calculated using the average shares outstanding during the period. |
| (b) | Includes a non-recurring dividend. Without this dividend, net investment income per share would have been $0.17, total return would have been 12.92% and the ratio of net investment income to average net assets would have been 0.76%. |
| (c) | Had certain expenses not been waived/reimbursed during the period, total returns would have been lower. |
| (d) | The investment adviser agreed to waive its fees and/or reimburse a portion of the Fund’s expenses during the period. Without this waiver/reimbursement, expenses would have been higher. |
| (e) | Effective July 1, 2021, the expense limit decreased from 0.90% to 0.85%. |
| (f) | Includes interest expense. Without this expense the ratio of net expenses would have been 0.91% and the ratio of gross expenses would have been 0.91%. |
| (g) | Effective July 1, 2019, the expense limit decreased from 1.10% to 0.90%. |
See accompanying notes to financial statements.
69 |
Financial Highlights (continued)
For a share outstanding throughout each period.
| | | | | | | | | | | | | | | | | | | | |
| | | Vaughan Nelson Mid Cap Fund—Class Y | |
| | | Year Ended
December 31,
2021
| | | Year Ended
December 31,
2020
| | | Year Ended
December 31,
2019
| | | Year Ended
December 31,
2018
| | | Year Ended
December 31,
2017
| |
Net asset value, beginning of the period | | $ | 22.10 | | | $ | 22.69 | | | $ | 17.57 | | | $ | 22.89 | | | $ | 20.77 | |
| | | | | | | | | | | | | | | | | | | | |
INCOME (LOSS) FROM INVESTMENT OPERATIONS: | |
Net investment income(a) | | | 0.11 | | | | 0.12 | | | | 0.10 | | | | 0.15 | | | | 0.23 | (b) |
Net realized and unrealized gain (loss) | | | 4.60 | | | | 2.00 | | | | 5.26 | | | | (3.75 | ) | | | 2.51 | |
| | | | | | | | | | | | | | | | | | | | |
Total from Investment Operations | | | 4.71 | | | | 2.12 | | | | 5.36 | | | | (3.60 | ) | | | 2.74 | |
| | | | | | | | | | | | | | | | | | | | |
LESS DISTRIBUTIONS FROM: | |
Net investment income | | | (0.10 | ) | | | (0.09 | ) | | | (0.07 | ) | | | (0.21 | ) | | | (0.25 | ) |
Net realized capital gains | | | (3.62 | ) | | | (2.62 | ) | | | (0.17 | ) | | | (1.51 | ) | | | (0.37 | ) |
| | | | | | | | | | | | | | | | | | | | |
Total Distributions | | | (3.72 | ) | | | (2.71 | ) | | | (0.24 | ) | | | (1.72 | ) | | | (0.62 | ) |
| | | | | | | | | | | | | | | | | | | | |
Net asset value, end of the period | | $ | 23.09 | | | $ | 22.10 | | | $ | 22.69 | | | $ | 17.57 | | | $ | 22.89 | |
| | | | | | | | | | | | | | | | | | | | |
Total return | | | 21.65 | %(c) | | | 10.76 | %(c) | | | 30.52 | %(c) | | | (15.85 | )% | | | 13.19 | %(b) |
RATIOS TO AVERAGE NET ASSETS: | |
Net assets, end of the period (000’s) | | $ | 226,838 | | | $ | 227,501 | | | $ | 298,705 | | | $ | 453,085 | | | $ | 774,304 | |
Net expenses | | | 0.93 | %(d)(e) | | | 0.95 | %(d) | | | 1.00 | %(d)(f)(g) | | | 0.99 | % | | | 0.97 | % |
Gross expenses | | | 0.98 | % | | | 1.04 | % | | | 1.02 | %(f) | | | 0.99 | % | | | 0.97 | % |
Net investment income | | | 0.45 | % | | | 0.60 | % | | | 0.48 | % | | | 0.66 | % | | | 1.04 | %(b) |
Portfolio turnover rate | | | 71 | % | | | 52 | % | | | 52 | % | | | 44 | % | | | 42 | % |
| (a) | Per share net investment income has been calculated using the average shares outstanding during the period. |
| (b) | Includes a non-recurring dividend. Without this dividend, net investment income per share would have been $0.15, total return would have been 12.80% and the ratio of net investment income to average net assets would have been 0.67%. |
| (c) | Had certain expenses not been waived/reimbursed during the period, total returns would have been lower. |
| (d) | The investment adviser agreed to waive its fees and/or reimburse a portion of the Fund’s expenses during the period. Without this waiver/reimbursement, expenses would have been higher. |
| (e) | Effective July 1, 2021, the expense limit decreased from 0.95% to 0.90%. |
| (f) | Includes interest expense. Without this expense the ratio of net expenses would have been 0.98% and the ratio of gross expenses would have been 1.01%. |
| (g) | Effective July 1, 2019, the expense limit decreased from 1.15% to 0.95%. |
See accompanying notes to financial statements.
| 70
Financial Highlights (continued)
For a share outstanding throughout each period.
| | | | | | | | | | | | | | | | | | | | |
| | | Vaughan Nelson Small Cap Value Fund—Class A | |
| | | Year Ended
December 31,
2021
| | | Year Ended
December 31,
2020
| | | Year Ended
December 31,
2019
| | | Year Ended
December 31,
2018
| | | Year Ended
December 31,
2017
| |
Net asset value, beginning of the period | | $ | 16.69 | | | $ | 15.45 | | | $ | 12.48 | | | $ | 18.71 | | | $ | 19.79 | |
| | | | | | | | | | | | | | | | | | | | |
INCOME (LOSS) FROM INVESTMENT OPERATIONS: | |
Net investment income (loss)(a) | | | 0.00 | (b)(c) | | | 0.00 | (c) | | | 0.02 | | | | 0.01 | | | | (0.01 | ) |
Net realized and unrealized gain (loss) | | | 4.98 | | | | 1.33 | | | | 3.06 | | | | (2.76 | ) | | | 1.21 | |
| | | | | | | | | | | | | | | | | | | | |
Total from Investment Operations | | | 4.98 | | | | 1.33 | | | | 3.08 | | | | (2.75 | ) | | | 1.20 | |
| | | | | | | | | | | | | | | | | | | | |
LESS DISTRIBUTIONS FROM: | |
Net investment income | | | (0.01 | ) | | | (0.00 | )(c) | | | (0.03 | ) | | | (0.00 | )(c) | | | (0.00 | )(c) |
Net realized capital gains | | | (3.79 | ) | | | (0.09 | ) | | | (0.08 | ) | | | (3.48 | ) | | | (2.28 | ) |
| | | | | | | | | | | | | | | | | | | | |
Total Distributions | | | (3.80 | ) | | | (0.09 | ) | | | (0.11 | ) | | | (3.48 | ) | | | (2.28 | ) |
| | | | | | | | | | | | | | | | | | | | |
Net asset value, end of the period | | $ | 17.87 | | | $ | 16.69 | | | $ | 15.45 | | | $ | 12.48 | | | $ | 18.71 | |
| | | | | | | | | | | | | | | | | | | | |
Total return(d) | | | 30.24 | %(b)(e) | | | 8.91 | %(e) | | | 24.66 | %(e) | | | (14.84 | )% | | | 6.28 | % |
RATIOS TO AVERAGE NET ASSETS: | |
Net assets, end of the period (000’s) | | $ | 81,493 | | | $ | 61,571 | | | $ | 67,525 | | | $ | 66,376 | | | $ | 93,751 | |
Net expenses | | | 1.27 | %(f)(g) | | | 1.32 | %(f)(h) | | | 1.40 | %(f)(i) | | | 1.38 | % | | | 1.36 | % |
Gross expenses | | | 1.43 | % | | | 1.53 | % | | | 1.47 | % | | | 1.38 | % | | | 1.36 | % |
Net investment income (loss) | | | 0.01 | %(b) | | | 0.02 | % | | | 0.12 | % | | | 0.03 | % | | | (0.03 | )% |
Portfolio turnover rate | | | 92 | % | | | 105 | % | | | 61 | % | | | 70 | % | | | 92 | % |
| (a) | Per share net investment income (loss) has been calculated using the average shares outstanding during the period. |
| (b) | Includes a non-recurring dividend. Without this dividend, net investment loss per share would have been $(0.05), total return would have been 29.95% and the ratio of net investment loss to average net assets would have been (0.25%). |
| (c) | Amount rounds to less than $0.01 per share. |
| (d) | A sales charge for Class A shares is not reflected in total return calculations. |
| (e) | Had certain expenses not been waived/reimbursed during the period, total returns would have been lower. |
| (f) | The investment adviser agreed to waive its fees and/or reimburse a portion of the Fund’s expenses during the period. Without this waiver/reimbursement, expenses would have been higher. |
| (g) | Effective July 1, 2021, the expense limit decreased from 1.30% to 1.25%. |
| (h) | Effective July 1, 2020, the expense limit decreased from 1.34% to 1.30%. |
| (i) | Effective July 1, 2019, the expense limit decreased from 1.45% to 1.34%. |
See accompanying notes to financial statements.
71 |
Financial Highlights (continued)
For a share outstanding throughout each period.
| | | | | | | | | | | | | | | | | | | | |
| | | Vaughan Nelson Small Cap Value Fund—Class C | |
| | | Year Ended
December 31,
2021
| | | Year Ended
December 31,
2020
| | | Year Ended
December 31,
2019
| | | Year Ended
December 31,
2018
| | | Year Ended
December 31,
2017
| |
Net asset value, beginning of the period | | $ | 8.34 | | | $ | 7.84 | | | $ | 6.41 | | | $ | 11.67 | | | $ | 13.26 | |
| | | | | | | | | | | | | | | | | | | | |
INCOME (LOSS) FROM INVESTMENT OPERATIONS: | |
Net investment loss(a) | | | (0.06 | )(b) | | | (0.05 | ) | | | (0.05 | ) | | | (0.09 | ) | | | (0.10 | ) |
Net realized and unrealized gain (loss) | | | 2.45 | | | | 0.64 | | | | 1.57 | | | | (1.69 | ) | | | 0.79 | |
| | | | | | | | | | | | | | | | | | | | |
Total from Investment Operations | | | 2.39 | | | | 0.59 | | | | 1.52 | | | | (1.78 | ) | | | 0.69 | |
| | | | | | | | | | | | | | | | | | | | |
LESS DISTRIBUTIONS FROM: | |
Net investment income | | | — | | | | (0.00 | )(c) | | | (0.01 | ) | | | (0.00 | )(c) | | | (0.00 | )(c) |
Net realized capital gains | | | (3.79 | ) | | | (0.09 | ) | | | (0.08 | ) | | | (3.48 | ) | | | (2.28 | ) |
| | | | | | | | | | | | | | | | | | | | |
Total Distributions | | | (3.79 | ) | | | (0.09 | ) | | | (0.09 | ) | | | (3.48 | ) | | | (2.28 | ) |
| | | | | | | | | | | | | | | | | | | | |
Net asset value, end of the period | | $ | 6.94 | | | $ | 8.34 | | | $ | 7.84 | | | $ | 6.41 | | | $ | 11.67 | |
| | | | | | | | | | | | | | | | | | | | |
Total return(d) | | | 29.45 | %(b)(e) | | | 8.08 | %(e) | | | 23.69 | %(e) | | | (15.51 | )% | | | 5.50 | % |
RATIOS TO AVERAGE NET ASSETS: | |
Net assets, end of the period (000’s) | | $ | 966 | | | $ | 983 | | | $ | 1,450 | | | $ | 3,480 | | | $ | 15,756 | |
Net expenses | | | 2.03 | %(f)(g) | | | 2.07 | %(f)(h) | | | 2.16 | %(f)(i) | | | 2.12 | % | | | 2.11 | % |
Gross expenses | | | 2.19 | % | | | 2.28 | % | | | 2.23 | % | | | 2.12 | % | | | 2.11 | % |
Net investment loss | | | (0.67 | )%(b) | | | (0.71 | )% | | | (0.68 | )% | | | (0.83 | )% | | | (0.79 | )% |
Portfolio turnover rate | | | 92 | % | | | 105 | % | | | 61 | % | | | 70 | % | | | 92 | % |
| (a) | Per share net investment loss has been calculated using the average shares outstanding during the period. |
| (b) | Includes a non-recurring dividend. Without this dividend, net investment loss per share would have been $(0.10), total return would have been 29.09% and the ratio of net investment loss to average net assets would have been (0.99%). |
| (c) | Amount rounds to less than $0.01 per share. |
| (d) | A contingent deferred sales charge for Class C shares is not reflected in total return calculations. |
| (e) | Had certain expenses not been waived/reimbursed during the period, total returns would have been lower. |
| (f) | The investment adviser agreed to waive its fees and/or reimburse a portion of the Fund’s expenses during the period. Without this waiver/reimbursement, expenses would have been higher. |
| (g) | Effective July 1, 2021, the expense limit decreased from 2.05% to 2.00%. |
| (h) | Effective July 1, 2020, the expense limit decreased from 2.09% to 2.05%. |
| (i) | Effective July 1, 2019, the expense limit decreased from 2.20% to 2.09%. |
See accompanying notes to financial statements.
| 72
Financial Highlights (continued)
For a share outstanding throughout each period.
| | | | | | | | | | | | | | | | | | | | |
| | | Vaughan Nelson Small Cap Value Fund—Class N | |
| | | Year Ended
December 31,
2021
| | | Year Ended
December 31,
2020
| | | Year Ended
December 31,
2019
| | | Year Ended
December 31,
2018
| | | Period Ended
December 31,
2017*
| |
Net asset value, beginning of the period | | $ | 17.52 | | | $ | 16.20 | | | $ | 13.08 | | | $ | 19.37 | | | $ | 19.55 | |
| | | | | | | | | | | | | | | | | | | | |
INCOME (LOSS) FROM INVESTMENT OPERATIONS: | |
Net investment income(a) | | | 0.01 | (b) | | | 0.04 | | | | 0.08 | | | | 0.08 | | | | 0.07 | |
Net realized and unrealized gain (loss) | | | 5.29 | | | | 1.42 | | | | 3.20 | | | | (2.86 | ) | | | 1.35 | |
| | | | | | | | | | | | | | | | | | | | |
Total from Investment Operations | | | 5.30 | | | | 1.46 | | | | 3.28 | | | | (2.78 | ) | | | 1.42 | |
| | | | | | | | | | | | | | | | | | | | |
LESS DISTRIBUTIONS FROM: | |
Net investment income | | | (0.07 | ) | | | (0.05 | ) | | | (0.08 | ) | | | (0.03 | ) | | | (0.02 | ) |
Net realized capital gains | | | (3.79 | ) | | | (0.09 | ) | | | (0.08 | ) | | | (3.48 | ) | | | (1.58 | ) |
| | | | | | | | | | | | | | | | | | | | |
Total Distributions | | | (3.86 | ) | | | (0.14 | ) | | | (0.16 | ) | | | (3.51 | ) | | | (1.60 | ) |
| | | | | | | | | | | | | | | | | | | | |
Net asset value, end of the period | | $ | 18.96 | | | $ | 17.52 | | | $ | 16.20 | | | $ | 13.08 | | | $ | 19.37 | |
| | | | | | | | | | | | | | | | | | | | |
Total return(c) | | | 30.64 | %(b) | | | 9.27 | % | | | 25.08 | % | | | (14.48 | )% | | | 7.17 | %(d) |
RATIOS TO AVERAGE NET ASSETS: | |
Net assets, end of the period (000’s) | | $ | 1,383 | | | $ | 23 | | | $ | 21 | | | $ | 1 | | | $ | 1 | |
Net expenses(e) | | | 0.97 | %(f) | | | 1.02 | %(g) | | | 1.03 | %(h) | | | 0.96 | % | | | 0.96 | %(i) |
Gross expenses | | | 1.19 | % | | | 6.54 | % | | | 11.80 | % | | | 15.17 | % | | | 14.68 | %(i) |
Net investment income | | | 0.03 | %(b) | | | 0.31 | % | | | 0.52 | % | | | 0.43 | % | | | 0.56 | %(i) |
Portfolio turnover rate | | | 92 | % | | | 105 | % | | | 61 | % | | | 70 | % | | | 92 | %(j) |
| * | From commencement of Class operations on May 1, 2017 through December 31, 2017. |
| (a) | Per share net investment income has been calculated using the average shares outstanding during the period. |
| (b) | Includes a non-recurring dividend. Without this dividend, net investment income per share would have been $0.01, total return would have been 30.37% and the ratio of net investment income to average net assets would have been 0.03%. |
| (c) | Had certain expenses not been waived/reimbursed during the period, total returns would have been lower. |
| (d) | Periods less than one year are not annualized. |
| (e) | The investment adviser agreed to waive its fees and/or reimburse a portion of the Fund’s expenses during the period. Without this waiver/reimbursement, expenses would have been higher. |
| (f) | Effective July 1, 2021, the expense limit decreased from 1.00% to 0.95%. |
| (g) | Effective July 1, 2020, the expense limit decreased from 1.04% to 1.00%. |
| (h) | Effective July 1, 2019, the expense limit decreased from 1.15% to 1.04%. |
| (i) | Computed on an annualized basis for periods less than one year. |
| (j) | Represents the Fund’s portfolio turnover rate for the year ended December 31, 2017. |
See accompanying notes to financial statements.
73 |
Financial Highlights (continued)
For a share outstanding throughout each period.
| | | | | | | | | | | | | | | | | | | | |
| | | Vaughan Nelson Small Cap Value Fund—Class Y | |
| | | Year Ended
December 31,
2021
| | | Year Ended
December 31,
2020
| | | Year Ended
December 31,
2019
| | | Year Ended
December 31,
2018
| | | Year Ended
December 31,
2017
| |
Net asset value, beginning of the period | | $ | 17.51 | | | $ | 16.19 | | | $ | 13.08 | | | $ | 19.37 | | | $ | 20.36 | |
| | | | | | | | | | | | | | | | | | | | |
INCOME (LOSS) FROM INVESTMENT OPERATIONS: | |
Net investment income(a) | | | 0.06 | (b) | | | 0.04 | | | | 0.05 | | | | 0.04 | | | | 0.05 | |
Net realized and unrealized gain (loss) | | | 5.23 | | | | 1.41 | | | | 3.21 | | | | (2.84 | ) | | | 1.25 | |
| | | | | | | | | | | | | | | | | | | | |
Total from Investment Operations | | | 5.29 | | | | 1.45 | | | | 3.26 | | | | (2.80 | ) | | | 1.30 | |
| | | | | | | | | | | | | | | | | | | | |
LESS DISTRIBUTIONS FROM: | |
Net investment income | | | (0.06 | ) | | | (0.04 | ) | | | (0.07 | ) | | | (0.01 | ) | | | (0.01 | ) |
Net realized capital gains | | | (3.79 | ) | | | (0.09 | ) | | | (0.08 | ) | | | (3.48 | ) | | | (2.28 | ) |
| | | | | | | | | | | | | | | | | | | | |
Total Distributions | | | (3.85 | ) | | | (0.13 | ) | | | (0.15 | ) | | | (3.49 | ) | | | (2.29 | ) |
| | | | | | | | | | | | | | | | | | | | |
Net asset value, end of the period | | $ | 18.95 | | | $ | 17.51 | | | $ | 16.19 | | | $ | 13.08 | | | $ | 19.37 | |
| | | | | | | | | | | | | | | | | | | | |
Total return | | | 30.61 | %(b)(c) | | | 9.23 | %(c) | | | 24.88 | %(c) | | | (14.61 | )% | | | 6.60 | % |
RATIOS TO AVERAGE NET ASSETS: | |
Net assets, end of the period (000’s) | | $ | 66,054 | | | $ | 49,315 | | | $ | 44,482 | | | $ | 58,538 | | | $ | 176,940 | |
Net expenses | | | 1.02 | %(d)(e) | | | 1.07 | %(d)(f) | | | 1.15 | %(d)(g) | | | 1.12 | % | | | 1.11 | % |
Gross expenses | | | 1.18 | % | | | 1.28 | % | | | 1.23 | % | | | 1.12 | % | | | 1.11 | % |
Net investment income | | | 0.28 | %(b) | | | 0.26 | % | | | 0.35 | % | | | 0.22 | % | | | 0.23 | % |
Portfolio turnover rate | | | 92 | % | | | 105 | % | | | 61 | % | | | 70 | % | | | 92 | % |
| (a) | Per share net investment income has been calculated using the average shares outstanding during the period. |
| (b) | Includes a non-recurring dividend. Without this dividend, net investment income per share would have been $0.00, total return would have been 30.26% and the ratio of net investment income to average net assets would have been 0.01%. |
| (c) | Had certain expenses not been waived/reimbursed during the period, total returns would have been lower. |
| (d) | The investment adviser agreed to waive its fees and/or reimburse a portion of the Fund’s expenses during the period. Without this waiver/reimbursement, expenses would have been higher. |
| (e) | Effective July 1, 2021, the expense limit decreased from 1.05% to 1.00%. |
| (f) | Effective July 1, 2020, the expense limit decreased from 1.09% to 1.05%. |
| (g) | Effective July 1, 2019, the expense limit decreased from 1.20% to 1.09%. |
See accompanying notes to financial statements.
| 74
Notes to Financial Statements
December 31, 2021
1. Organization. Loomis Sayles Funds II, Natixis Funds Trust I and Natixis Funds Trust II (the “Trusts” and each a “Trust”) are each organized as a Massachusetts business trust. Each Trust is registered under the Investment Company Act of 1940, as amended (the “1940 Act”), as an open-end management investment company. Each Declaration of Trust permits the Board of Trustees to authorize the issuance of an unlimited number of shares of the Trust in multiple series. The financial statements for certain funds of the Trusts are presented in separate reports. The following funds (individually, a “Fund” and collectively, the “Funds”) are included in this report:
Loomis Sayles Funds II:
Loomis Sayles International Growth Fund (the “International Growth Fund”)
Natixis Funds Trust I:
Natixis Oakmark International Fund
Natixis U.S. Equity Opportunities Fund (the “U.S. Equity Opportunities Fund”)
Vaughan Nelson Small Cap Value Fund (the “Small Cap Value Fund”)
Natixis Funds Trust II:
Natixis Oakmark Fund
Vaughan Nelson Mid Cap Fund (the “Mid Cap Fund”)
Each Fund is a diversified investment company, except for International Growth Fund, which is a non-diversified investment company.
Each Fund offers Class A, Class C, Class N and Class Y shares.
Class A shares are sold with a maximum front-end sales charge of 5.75%. Class C shares do not pay a front-end sales charge, pay higher Rule 12b-1 fees than Class A shares for eight years (at which point they automatically convert to Class A shares) (prior to May 1, 2021, Class C shares automatically converted to Class A shares after ten years) and may be subject to a contingent deferred sales charge (“CDSC”) of 1.00% if those shares are redeemed within one year of acquisition, except for reinvested distributions. Class N and Class Y shares do not pay a front-end sales charge, a CDSC or Rule 12b-1 fees. Class N shares are offered with an initial minimum investment of $1,000,000. Class Y shares are offered with an initial minimum investment of $100,000. Certain categories of investors are exempted from the minimum investment amounts for Class N and Class Y as outlined in the relevant Funds’ prospectus.
Most expenses can be directly attributed to a Fund. Expenses which cannot be directly attributed to a Fund are generally apportioned based on the relative net assets of each of the Funds in Natixis Funds Trust I, Natixis Funds Trust II, Natixis Funds Trust IV and Gateway Trust (“Natixis Funds Trusts”), Loomis Sayles Funds I and Loomis Sayles Funds II (“Loomis Sayles Funds Trusts”) and Natixis ETF Trust and Natixis ETF Trust II (“Natixis ETF Trusts”). Expenses of a Fund are borne pro rata by the holders of each class of shares, except that each class bears expenses unique to that class (such as the Rule 12b-1 fees applicable to Class A and Class C), and transfer agent fees are borne collectively for Class A, Class C and Class Y, and individually for Class N. In addition, each class votes as a class only with respect to its own Rule 12b-1 Plan. Shares of each class would receive their pro rata share of the net assets of the Fund if the Fund were liquidated. The Trustees approve separate distributions from net investment income on each class of shares.
2. Significant Accounting Policies. The following is a summary of significant accounting policies consistently followed by each Fund in the preparation of its financial statements. The Funds’ financial statements follow the accounting and reporting guidelines provided for investment companies and are prepared in accordance with accounting principles generally accepted in the United States of America which require the use of management estimates that affect the reported amounts and disclosures in the financial statements. Actual results could differ from those estimates. Management has evaluated the events and transactions subsequent to year-end through the date the financial statements were issued and has determined that there were no material events that would require disclosure in the Funds’ financial statements.
a. Valuation. Fund securities and other investments are valued at market value based on market quotations obtained or determined by independent pricing services recommended by the adviser or sub-adviser and approved by the Board of Trustees. Fund securities and other investments for which market quotations are not readily available are valued at fair value as determined in good faith by the adviser or sub-adviser pursuant to procedures approved by the Board of Trustees, as described below. Market value is determined as follows:
Listed equity securities (including shares of closed-end investment companies and exchange-traded funds) are valued at the last sale price quoted on the exchange where they are traded most extensively or, if there is no reported sale during the day, the closing bid quotation as reported by an independent pricing service. Securities traded on the NASDAQ Global Select Market, NASDAQ Global Market and NASDAQ Capital Market are valued at the NASDAQ Official Closing Price (“NOCP”), or if lacking an NOCP, at the most recent bid quotations on the applicable NASDAQ Market. Unlisted equity securities (except unlisted preferred equity securities) are valued at the last sale price quoted in the market where they are traded most extensively or, if there is no reported sale during the day, the closing bid quotation as reported by an independent pricing service. If there is no last sale price or closing bid quotation available,
75 |
Notes to Financial Statements (continued)
December 31, 2021
unlisted equity securities will be valued using evaluated bids furnished by an independent pricing service, if available. In some foreign markets, an official close price and a last sale price may be available from the foreign exchange or market. In those cases, the official close price is used. Debt securities and unlisted preferred equity securities are valued based on evaluated bids furnished to the Funds by an independent pricing service or bid prices obtained from broker-dealers. Broker-dealer bid prices may be used to value debt and unlisted equity securities where an independent pricing service is unable to price a security or where an independent pricing service does not provide a reliable price for the security. Forward foreign currency contracts are valued utilizing interpolated rates determined based on information provided by an independent pricing service.
Fund securities and other investments for which market quotations are not readily available are valued at fair value as determined in good faith by the adviser pursuant to procedures approved by the Board of Trustees. The Funds may also value securities and other investments at fair value in other circumstances such as when extraordinary events occur after the close of a foreign market but prior to the close of the New York Stock Exchange. This may include situations relating to a single issuer (such as a declaration of bankruptcy or a delisting of the issuer’s security from the primary market on which it has traded) as well as events affecting the securities markets in general (such as market disruptions or closings and significant fluctuations in U.S. and/or foreign markets). When fair valuing its securities or other investments, the Funds may, among other things, use modeling tools or other processes that may take into account factors such as securities or other market activity and/or significant events that occur after the close of the foreign market and before the time the Fund’s net asset value (“NAV”) is calculated. Fair value pricing may require subjective determinations about the value of a security, and fair values used to determine a Fund’s NAV may differ from quoted or published prices, or from prices that are used by others, for the same securities. In addition, the use of fair value pricing may not always result in adjustments to the prices of securities held by a Fund.
As of December 31, 2021, securities held by the Funds were fair valued as follows:
| | | | | | | | |
Fund | | Equity securities1 | | | Percentage of
Net Assets | |
International Growth Fund | | $ | 16,328,133 | | | | 70.0 | % |
Natixis Oakmark International Fund | | | 484,132,328 | | | | 90.3 | % |
| 1 | Certain foreign equity securities were fair valued pursuant to procedures approved by the Board of Trustees as events occurring after the close of the foreign market were believed to materially affect the value of those securities. |
b. Investment Transactions and Related Investment Income. Investment transactions are accounted for on a trade date plus one day basis for daily NAV calculation. However, for financial reporting purposes, investment transactions are reported on trade date. Dividend income (including income reinvested) and foreign withholding tax, if applicable, are recorded on the ex-dividend date, or in the case of certain foreign securities, as soon as a Fund is notified, and interest income is recorded on an accrual basis. Dividends reinvested and stock dividends are reflected as non-cash dividends on the Statements of Operations. Interest income is increased by the accretion of discount and decreased by the amortization of premium, if applicable. Distributions received from investments in securities that represent a return of capital or capital gain are recorded as a reduction of cost of investments or as a realized gain, respectively. The calendar year-end amounts of ordinary income, capital gains, and return of capital included in distributions received from the Funds’ investments in real estate investment trusts (“REITs”) are reported to the Funds after the end of the fiscal year; accordingly, the Funds estimate these amounts for accounting purposes until the characterization of REIT distributions is reported to the Funds after the end of the fiscal year. Estimates are based on the most recent REIT distribution information available. In determining net gain or loss on securities sold, the cost of securities has been determined on an identified cost basis. Investment income, non-class specific expenses and realized and unrealized gains and losses are allocated on a pro rata basis to each class based on the relative net assets of each class to the total net assets of the Fund.
c. Foreign Currency Translation. The books and records of the Funds are maintained in U.S. dollars. The values of securities, currencies and other assets and liabilities denominated in currencies other than U.S. dollars, if any, are translated into U.S. dollars based upon foreign exchange rates prevailing at the end of the period. Purchases and sales of investment securities, income and expenses are translated into U.S. dollars on the respective dates of such transactions.
Net realized foreign exchange gains or losses arise from sales of foreign currency, changes in exchange rates between the trade and settlement dates on securities transactions and the difference between the amounts of dividends, interest and foreign withholding taxes recorded on the Funds’ books and the U.S. dollar equivalent of the amounts actually received or paid. Net unrealized foreign exchange gains or losses arise from changes in the value of assets and liabilities, other than investment securities, as of the end of the fiscal period, resulting from changes in exchange rates. Net realized foreign exchange gains or losses and the net change in unrealized foreign exchange gains or losses are disclosed in the Statements of Operations. For federal income tax purposes, net realized foreign exchange gains or losses are characterized as ordinary income, and may, if the Funds have net losses, reduce the amount of income available to be distributed by the Funds.
| 76
Notes to Financial Statements (continued)
December 31, 2021
The values of investment securities are presented at the foreign exchange rates prevailing at the end of the period for financial reporting purposes. Net realized and unrealized gains or losses on investments reported in the Statements of Operations reflect gains or losses resulting from changes in exchange rates and fluctuations which arise due to changes in market prices of investment securities. For federal income tax purposes, a portion of the net realized gain or loss on investments arising from changes in exchange rates, which is reflected in the Statements of Operations, may be characterized as ordinary income and may, if the Funds have net losses, reduce the amount of income available to be distributed by the Funds.
The Funds may use foreign currency exchange contracts to facilitate transactions in foreign-denominated investments. Losses may arise from changes in the value of the foreign currency or if the counterparties do not perform under the contracts’ terms.
d. Forward Foreign Currency Contracts. A Fund may enter into forward foreign currency contracts, including forward foreign cross currency contracts, to acquire exposure to foreign currencies or to hedge the Fund’s investments against currency fluctuation. A contract can also be used to offset a previous contract. These contracts involve market risk in excess of the unrealized appreciation (depreciation) reflected in the Funds’ Statements of Assets and Liabilities. The U.S. dollar value of the currencies a Fund has committed to buy or sell represents the aggregate exposure to each currency a Fund has acquired or hedged through currency contracts outstanding at period end. Gains or losses are recorded for financial statement purposes as unrealized until settlement date. Contracts are traded over-the-counter directly with a counterparty. Risks may arise upon entering into these contracts from the potential inability of counterparties to meet the terms of their contracts and from unanticipated movements in the value of a foreign currency relative to the U.S. dollar. Certain contracts may require the movement of cash and/or securities as collateral for the Fund’s or counterparty’s net obligations under the contracts. Forward foreign currency contracts outstanding at the end of the period, if any, are listed in each applicable Fund’s Portfolio of Investments.
e. Federal and Foreign Income Taxes. The Trusts treat each Fund as a separate entity for federal income tax purposes. Each Fund intends to meet the requirements of the Internal Revenue Code of 1986, as amended, applicable to regulated investment companies, and to distribute to its shareholders substantially all of its net investment income and any net realized capital gains at least annually. Management has performed an analysis of each Fund’s tax positions for the open tax years as of December 31, 2021 and has concluded that no provisions for income tax are required. The Funds’ federal tax returns for the prior three fiscal years, where applicable, remain subject to examination by the Internal Revenue Service. Management is not aware of any events that are reasonably possible to occur in the next twelve months that would result in the amounts of any unrecognized tax benefits significantly increasing or decreasing for the Funds. However, management’s conclusions regarding tax positions taken may be subject to review and adjustment at a later date based on factors including, but not limited to, new tax laws and accounting regulations and interpretations thereof.
A Fund may be subject to foreign withholding taxes on investment income and taxes on capital gains on investments that are accrued and paid based upon the Fund’s understanding of the tax rules and regulations that exist in the countries in which the Fund invests. Foreign withholding taxes on dividend and interest income are reflected on the Statements of Operations as a reduction of investment income, net of amounts that have been or are expected to be reclaimed and paid. Dividends and interest receivable on the Statements of Assets and Liabilities are net of foreign withholding taxes. Foreign withholding taxes where reclaims have been or are expected to be filed and paid are reflected on the Statements of Assets and Liabilities as tax reclaims receivable. Capital gains taxes paid are included in net realized gain (loss) on investments in the Statements of Operations. Accrued but unpaid capital gains taxes are reflected as foreign taxes payable on the Statements of Assets and Liabilities, if applicable, and reduce unrealized gains on investments. In the event that realized gains on investments are subsequently offset by realized losses, taxes paid on realized gains may be returned to a Fund. Such amounts, if applicable, are reflected as foreign tax rebates receivable on the Statements of Assets and Liabilities and are recorded as a realized gain when received.
Certain Funds have filed tax reclaims for previously withheld taxes on dividends earned in certain European Union countries (EU reclaims) and may continue to make such filings when it is determined to be in the best interest of the Funds and their shareholders. These filings are subject to various administrative proceedings by the local jurisdictions’ tax authorities within the European Union, as well as a number of related judicial proceedings. EU reclaims are recognized by a Fund when deemed more likely than not to be collected, and are reflected as tax reclaims in the Statements of Operations. Any related receivable is reflected as tax reclaims receivable in the Statements of Assets and Liabilities. Amounts paid to service providers for filing tax reclaims on the Funds’ behalf are reflected on the Statements of Operations as tax reclaim professional fees. Under certain circumstances, EU reclaims may be subject to closing agreements with the Internal Revenue Service (IRS), which may materially reduce the reclaim amounts realized by the Funds. Fees and expenses associated with closing agreements will be reflected in the Statements of Operations when it is determined that a closing agreement with the IRS is required.
77 |
Notes to Financial Statements (continued)
December 31, 2021
f. Dividends and Distributions to Shareholders. Dividends and distributions are recorded on the ex-dividend date. The timing and characterization of certain income and capital gain distributions are determined in accordance with federal tax regulations, which may differ from accounting principles generally accepted in the United States of America. Permanent differences are primarily due to differing treatments for book and tax purposes of items such as deferred Trustees’ fees, distributions in excess of income and/or capital gain, forward foreign currency contract mark-to-market, distribution re-designations, foreign currency gains and losses, non-deductible expenses, net operating losses, passive foreign investment company adjustments, return of capital distributions received and deferral of EU reclaims. Permanent book and tax basis differences relating to shareholder distributions, net investment income and net realized gains will result in reclassifications to capital accounts reported on the Statements of Assets and Liabilities. Temporary differences between book and tax distributable earnings are primarily due to wash sales, foreign currency gains and losses, forward foreign currency contract mark-to-market, return of capital distributions received, net operating losses, deferral of EU reclaims, deferred Trustees’ fees and passive foreign investment company adjustments. Amounts of income and capital gain available to be distributed on a tax basis are determined annually, and at other times during the Funds’ fiscal year as may be necessary to avoid knowingly declaring and paying a return of capital distribution. Distributions from net investment income and short-term capital gains are considered to be distributed from ordinary income for tax purposes.
The tax characterization of distributions is determined on an annual basis. The tax character of distributions paid to shareholders during the years ended December 31, 2021 and 2020 was as follows:
| | | | | | | | | | | | | | | | | | | | | | | | |
| | | 2021 Distributions | | | 2020 Distributions | |
Fund | | Ordinary
Income | | | Long-Term
Capital
Gains | | | Total | | | Ordinary
Income | | | Long-Term
Capital
Gains | | | Total | |
International Growth Fund | | $ | 410,212 | | | $ | — | | | $ | 410,212 | | | $ | 12,460 | | | $ | — | | | $ | 12,460 | |
Natixis Oakmark Fund | | | 1,954,068 | | | | 22,797,197 | | | | 24,751,265 | | | | 3,185,140 | | | | 18,031,501 | | | | 21,216,641 | |
Natixis Oakmark International Fund | | | 8,301,657 | | | | — | | | | 8,301,657 | | | | 1,593,501 | | | | — | | | | 1,593,501 | |
U.S. Equity Opportunities Fund | | | 7,131,636 | | | | 105,015,654 | | | | 112,147,290 | | | | 297,964 | | | | 115,715,748 | | | | 116,013,712 | |
Mid Cap Fund | | | 11,228,135 | | | | 41,214,262 | | | | 52,442,397 | | | | 965,830 | | | | 33,018,937 | | | | 33,984,767 | |
Small Cap Value Fund | | | 20,173,469 | | | | 6,185,028 | | | | 26,358,497 | | | | 118,830 | | | | 616,973 | | | | 735,803 | |
Distributions paid to shareholders from net investment income and net realized capital gains, based on accounting principles generally accepted in the United States of America, are consolidated and reported on the Statements of Changes in Net Assets as Distributions to Shareholders. Distributions paid to shareholders from net investment income and net realized capital gains expressed in per-share amounts, based on accounting principles generally accepted in the United States of America, are separately stated and reported within the Financial Highlights.
As of December 31, 2021, the components of distributable earnings on a tax basis were as follows:
| | | | | | | | | | | | | | | | |
| | | International
Growth Fund | | | Natixis
Oakmark
Fund | | | Natixis
Oakmark
International
Fund | | | U.S. Equity
Opportunities
Fund | |
Undistributed ordinary income | | $ | — | | | $ | 73,142 | | | $ | — | | | $ | 885,380 | |
Undistributed long-term capital gains | | | — | | | | 6,353,070 | | | | — | | | | 38,289,306 | |
| | | | | | | | | | | | | | | | |
Total undistributed earnings | | | — | | | | 6,426,212 | | | | — | | | | 39,174,686 | |
| | | | | | | | | | | | | | | | |
Capital loss carryforward: | | | | | | | | | | | | | | | | |
Long-term: | | | | | | | | | | | | | | | | |
No expiration date | | | — | | | | — | | | | (88,513,660 | ) | | | — | |
| | | | | | | | | | | | | | | | |
Late-year ordinary and post-October capital loss deferrals* | | | (462,102 | ) | | | — | | | | (37,409 | ) | | | — | |
| | | | | | | | | | | | | | | | |
Unrealized appreciation (depreciation) | | | (1,124,202 | ) | | | 102,402,158 | | | | 6,165,904 | | | | 405,776,088 | |
| | | | | | | | | | | | | | | | |
Total accumulated earnings (losses) | | $ | (1,586,304 | ) | | $ | 108,828,370 | | | $ | (82,385,165 | ) | | $ | 444,950,774 | |
| | | | | | | | | | | | | | | | |
Capital loss carryforward utilized in the current year | | $ | — | | | $ | — | | | $ | 21,965,851 | | | $ | — | |
| | | | | | | | | | | | | | | | |
| 78
Notes to Financial Statements (continued)
December 31, 2021
| | | | | | | | |
| | | Mid Cap
Fund | | | Small Cap
Value Fund | |
Undistributed ordinary income | | $ | 4,016 | | | $ | 1,191,709 | |
Undistributed long-term capital gains | | | 7,716,860 | | | | 2,043,203 | |
| | | | | | | | |
Total undistributed earnings | | | 7,720,876 | | | | 3,234,912 | |
| | | | | | | | |
Late-year ordinary and post-October capital loss deferrals* | | | (747,693 | ) | | | — | |
| | | | | | | | |
Unrealized appreciation | | | 51,984,993 | | | | 24,067,332 | |
| | | | | | | | |
Total accumulated earnings | | $ | 58,958,176 | | | $ | 27,302,244 | |
| | | | | | | | |
Capital loss carryforward utilized in the current year | | $ | — | | | $ | 4,096,025 | |
| | | | | | | | |
| * | Under current tax law, capital losses, foreign currency losses, and losses on passive foreign investment companies and contingent payment debt instruments after October 31 or December 31, as applicable, may be deferred and treated as occurring on the first day of the following taxable year. Loomis Sayles International Growth Fund, Natixis Oakmark International Fund and Mid Cap Fund are deferring capital and foreign currency losses. |
As of December 31, 2021, the tax cost of investments (including derivatives, if applicable) and unrealized appreciation (depreciation) on a federal tax basis were as follows:
| | | | | | | | | | | | | | | | | | | | | | | | |
| | | International
Growth Fund | | | Natixis
Oakmark
Fund | | | Natixis
Oakmark
International
Fund | | | U.S. Equity
Opportunities
Fund | | | Mid Cap
Fund | | | Small Cap
Value Fund | |
Federal tax cost | | $ | 24,290,186 | | | $ | 267,330,870 | | | $ | 524,940,385 | | | $ | 647,608,287 | | | $ | 315,755,086 | | | $ | 126,261,648 | |
| | | | | | | | | | | | | | | | | | | | | | | | |
Gross tax appreciation | | $ | 2,472,822 | | | $ | 105,350,186 | | | $ | 55,637,629 | | | $ | 417,190,540 | | | $ | 61,967,349 | | | $ | 27,479,047 | |
Gross tax depreciation | | | (3,597,205 | ) | | | (2,948,028 | ) | | | (49,107,156 | ) | | | (11,412,862 | ) | | | (9,982,356 | ) | | | (3,411,715 | ) |
| | | | | | | | | | | | | | | | | | | | | | | | |
Net tax appreciation (depreciation) | | $ | (1,124,383 | ) | | $ | 102,402,158 | | | $ | 6,530,473 | | | $ | 405,777,678 | | | $ | 51,984,993 | | | $ | 24,067,332 | |
| | | | | | | | | | | | | | | | | | | | | | | | |
The difference between these amounts and those reported in the components of distributable earnings, if any, are primarily attributable to foreign currency mark-to-market and foreign capital gains taxes.
g. Repurchase Agreements. Each Fund may enter into repurchase agreements, under the terms of a Master Repurchase Agreement, under which each Fund acquires securities as collateral and agrees to resell the securities at an agreed upon time and at an agreed upon price. It is each Fund’s policy that the market value of the collateral for repurchase agreements be at least equal to 102% of the repurchase price, including interest. Certain repurchase agreements are tri-party arrangements whereby the collateral is held in a segregated account for the benefit of the Fund and on behalf of the counterparty. Repurchase agreements could involve certain risks in the event of default or insolvency of the counterparty, including possible delays or restrictions upon a Fund’s ability to dispose of the underlying securities. As of December 31, 2021, each Fund, as applicable, had investments in repurchase agreements for which the value of the related collateral exceeded the value of the repurchase agreement. The gross value of repurchase agreements is included in the Statements of Assets and Liabilities for financial reporting purposes.
h. Securities Lending. Certain Funds have entered into an agreement with State Street Bank and Trust Company (“State Street Bank”), as agent of the Funds, to lend securities to certain designated borrowers. The loans are collateralized with cash or securities in an amount equal to at least 105% or 102% of the market value (including accrued interest) of the loaned international or domestic securities, respectively, when the loan is initiated. Thereafter, the value of the collateral must remain at least 102% of the market value (including accrued interest) of loaned securities for U.S. equities and U.S. corporate debt; at least 105% of the market value (including accrued interest) of loaned securities for non-U.S. equities; and at least 100% of the market value (including accrued interest) of loaned securities for U.S. Government securities, sovereign debt issued by non-U.S. Governments and non-U.S. corporate debt. In the event that the market value of the collateral falls below the required percentages described above, the borrower will deliver additional collateral on the next business day. As with other extensions of credit, the Funds may bear the risk of loss with respect to the investment of the collateral. The Funds invest cash collateral in short-term investments, a portion of the income from which is remitted to the borrowers and the remainder allocated between the Funds and State Street Bank as lending agent.
For the year ended December 31, 2021, none of the Funds had loaned securities under this agreement.
79 |
Notes to Financial Statements (continued)
December 31, 2021
i. Indemnifications. Under the Trusts’ organizational documents, their officers and Trustees are indemnified against certain liabilities arising out of the performance of their duties to the Funds. Additionally, in the normal course of business, the Funds enter into contracts with service providers that contain general indemnification clauses. The Funds’ maximum exposure under these arrangements is unknown as this would involve future claims that may be made against the Funds that have not yet occurred. However, based on experience, the Funds expect the risk of loss to be remote.
3. Fair Value Measurements. In accordance with accounting standards related to fair value measurements and disclosures, the Funds have categorized the inputs utilized in determining the value of each Fund’s assets or liabilities. These inputs are summarized in the three broad levels listed below:
| | • | | Level 1 – quoted prices in active markets for identical assets or liabilities; |
| | • | | Level 2 – prices determined using other significant inputs that are observable either directly, or indirectly through corroboration with observable market data (which could include quoted prices for similar assets or liabilities, interest rates, credit risk, etc.); and |
| | • | | Level 3 – prices determined using significant unobservable inputs when quoted prices or observable inputs are unavailable such as when there is little or no market activity for an asset or liability (unobservable inputs reflect each Fund’s own assumptions in determining the fair value of assets or liabilities and would be based on the best information available). |
The inputs or methodology used for valuing securities are not necessarily an indication of the risk associated with investing in those securities.
The following is a summary of the inputs used to value the Funds’ investments as of December 31, 2021, at value:
International Growth Fund
Asset Valuation Inputs
| | | | | | | | | | | | | | | | |
Description | | Level 1 | | | Level 2 | | | Level 3 | | | Total | |
Common Stocks | | | | | | | | | | | | | | | | |
Australia | | $ | — | | | $ | 1,400,680 | | | $ | — | | | $ | 1,400,680 | |
Belgium | | | — | | | | 484,731 | | | | — | | | | 484,731 | |
China | | | 3,314,207 | | | | 2,673,524 | | | | — | | | | 5,987,731 | |
Denmark | | | — | | | | 926,576 | | | | — | | | | 926,576 | |
France | | | — | | | | 1,175,262 | | | | — | | | | 1,175,262 | |
Germany | | | — | | | | 780,823 | | | | — | | | | 780,823 | |
Japan | | | — | | | | 1,102,092 | | | | — | | | | 1,102,092 | |
Macau | | | — | | | | 202,316 | | | | — | | | | 202,316 | |
Netherlands | | | — | | | | 1,336,125 | | | | — | | | | 1,336,125 | |
Switzerland | | | 503,103 | | | | 3,658,198 | | | | — | | | | 4,161,301 | |
United Kingdom | | | — | | | | 2,587,806 | | | | — | | | | 2,587,806 | |
All Other Common Stocks(a) | | | 2,637,549 | | | | — | | | | — | | | | 2,637,549 | |
| | | | | | | | | | | | | | | | |
Total Common Stocks | | | 6,454,859 | | | | 16,328,133 | | | | — | | | | 22,782,992 | |
| | | | | | | | | | | | | | | | |
Short-Term Investments | | | — | | | | 382,811 | | | | — | | | | 382,811 | |
| | | | | | | | | | | | | | | | |
Total | | $ | 6,454,859 | | | $ | 16,710,944 | | | $ | — | | | $ | 23,165,803 | |
| | | | | | | | | | | | | | | | |
| (a) | Details of the major categories of the Fund’s investments are reflected within the Portfolio of Investments. |
Natixis Oakmark Fund
Asset Valuation Inputs
| | | | | | | | | | | | | | | | |
Description | | Level 1 | | | Level 2 | | | Level 3 | | | Total | |
Common Stocks(a) | | $ | 349,508,948 | | | $ | — | | | $ | — | | | $ | 349,508,948 | |
Short-Term Investments | | | — | | | | 20,224,080 | | | | — | | | | 20,224,080 | |
| | | | | | | | | | | | | | | | |
Total | | $ | 349,508,948 | | | $ | 20,224,080 | | | $ | — | | | $ | 369,733,028 | |
| | | | | | | | | | | | | | | | |
| (a) | Details of the major categories of the Fund’s investments are reflected within the Portfolio of Investments. |
| 80
Notes to Financial Statements (continued)
December 31, 2021
Natixis Oakmark International Fund
Asset Valuation Inputs
| | | | | | | | | | | | | | | | |
Description | | Level 1 | | | Level 2 | | | Level 3 | | | Total | |
Common Stocks | | | | | | | | | | | | | | | | |
Australia | | $ | — | | | $ | 10,602,020 | | | $ | — | | | $ | 10,602,020 | |
Belgium | | | — | | | | 10,592,944 | | | | — | | | | 10,592,944 | |
China | | | 4,567,047 | | | | 22,353,730 | | | | — | | | | 26,920,777 | |
Finland | | | — | | | | 3,899,981 | | | | — | | | | 3,899,981 | |
France | | | — | | | | 66,983,639 | | | | — | | | | 66,983,639 | |
Germany | | | 4,260,991 | | | | 126,608,086 | | | | — | | | | 130,869,077 | |
India | | | — | | | | 5,642,961 | | | | — | | | | 5,642,961 | |
Indonesia | | | — | | | | 3,701,122 | | | | — | | | | 3,701,122 | |
Ireland | | | 7,023,727 | | | | 419,054 | | | | — | | | | 7,442,781 | |
Italy | | | — | | | | 17,222,157 | | | | — | | | | 17,222,157 | |
Japan | | | — | | | | 10,121,458 | | | | — | | | | 10,121,458 | |
Korea | | | — | | | | 6,269,071 | | | | — | | | | 6,269,071 | |
Netherlands | | | — | | | | 11,596,474 | | | | — | | | | 11,596,474 | |
South Africa | | | — | | | | 4,002,582 | | | | — | | | | 4,002,582 | |
Spain | | | — | | | | 8,365,329 | | | | — | | | | 8,365,329 | |
Sweden | | | — | | | | 24,954,415 | | | | — | | | | 24,954,415 | |
Switzerland | | | — | | | | 65,328,874 | | | | — | | | | 65,328,874 | |
United Kingdom | | | 9,720,984 | | | | 78,616,994 | | | | — | | | | 88,337,978 | |
All Other Common Stocks(a) | | | 16,184,364 | | | | — | | | | — | | | | 16,184,364 | |
| | | | | | | | | | | | | | | | |
Total Common Stocks | | | 41,757,113 | | | | 477,280,891 | | | | — | | | | 519,038,004 | |
| | | | | | | | | | | | | | | | |
Preferred Stocks(a) | | | — | | | | 6,851,437 | | | | — | | | | 6,851,437 | |
Short-Term Investments | | | — | | | | 5,581,234 | | | | — | | | | 5,581,234 | |
| | | | | | | | | | | | | | | | |
Total | | $ | 41,757,113 | | | $ | 489,713,562 | | | $ | — | | | $ | 531,470,675 | |
| | | | | | | | | | | | | | | | |
Liability Valuation Inputs | |
Description | | Level 1 | | | Level 2 | | | Level 3 | | | Total | |
Forward Foreign Currency Contracts (unrealized depreciation) | | $ | — | | | $ | (94,327 | ) | | $ | — | | | $ | (94,327 | ) |
| | | | | | | | | | | | | | | | |
| (a) | Details of the major categories of the Fund’s investments are reflected within the Portfolio of Investments. |
U.S. Equity Opportunities Fund
Asset Valuation Inputs
| | | | | | | | | | | | | | | | |
Description | | Level 1 | | | Level 2 | | | Level 3 | | | Total | |
Common Stocks(a) | | $ | 1,036,181,847 | | | $ | — | | | $ | — | | | $ | 1,036,181,847 | |
Short-Term Investments | | | — | | | | 17,204,118 | | | | — | | | | 17,204,118 | |
| | | | | | | | | | | | | | | | |
Total | | $ | 1,036,181,847 | | | $ | 17,204,118 | | | $ | — | | | $ | 1,053,385,965 | |
| | | | | | | | | | | | | | | | |
| (a) | Details of the major categories of the Fund’s investments are reflected within the Portfolio of Investments. |
Mid Cap Fund
Asset Valuation Inputs
| | | | | | | | | | | | | | | | |
Description | | Level 1 | | | Level 2 | | | Level 3 | | | Total | |
Common Stocks(a) | | $ | 360,653,875 | | | $ | — | | | $ | — | | | $ | 360,653,875 | |
Short-Term Investments | | | — | | | | 7,086,204 | | | | — | | | | 7,086,204 | |
| | | | | | | | | | | | | | | | |
Total | | $ | 360,653,875 | | | $ | 7,086,204 | | | $ | — | | | $ | 367,740,079 | |
| | | | | | | | | | | | | | | | |
| (a) | Details of the major categories of the Fund’s investments are reflected within the Portfolio of Investments. |
81 |
Notes to Financial Statements (continued)
December 31, 2021
Small Cap Value Fund
Asset Valuation Inputs
| | | | | | | | | | | | | | | | |
Description | | Level 1 | | | Level 2 | | | Level 3 | | | Total | |
Common Stocks(a) | | $ | 147,913,296 | | | $ | — | | | $ | — | | | $ | 147,913,296 | |
Short-Term Investments | | | — | | | | 2,415,684 | | | | — | | | | 2,415,684 | |
| | | | | | | | | | | | | | | | |
Total | | $ | 147,913,296 | | | $ | 2,415,684 | | | $ | — | | | $ | 150,328,980 | |
| | | | | | | | | | | | | | | | |
| (a) | Details of the major categories of the Fund’s investments are reflected within the Portfolio of Investments. |
4. Derivatives. Derivative instruments are defined as financial instruments whose value and performance are based on the value and performance of an underlying asset, reference rate or index. Derivative instruments that Natixis Oakmark International Fund used during the period include forward foreign currency contracts.
Natixis Oakmark International Fund is subject to the risk that changes in foreign currency exchange rates will have an unfavorable effect on the value of Fund assets denominated in foreign currencies. The Fund may enter into forward foreign currency contracts for hedging purposes to protect the value of the Fund’s holdings of foreign securities. During the year ended December 31, 2021, Natixis Oakmark International Fund engaged in forward foreign currency transactions for hedging purposes.
The following is a summary of derivative instruments for Natixis Oakmark International Fund as of December 31, 2021, as reflected within the Statements of Assets and Liabilities:
| | | | |
Liabilities | | Unrealized
depreciation on
forward foreign
currency contracts | |
Over-the-counter liability derivatives | | | | |
Foreign exchange contracts | | $ | (94,327 | ) |
Transactions in derivative instruments for Natixis Oakmark International Fund during the year ended December 31, 2021, as reflected within the Statements of Operations were as follows:
| | | | |
Net Realized Gain (Loss) on: | | Forward foreign
currency
contracts | |
Foreign exchange contracts | | $ | 386,242 | |
| |
Net Change in Unrealized
Appreciation (Depreciation) on: | | Forward foreign
currency
contracts | |
Foreign exchange contracts | | $ | (85,208 | ) |
As the Fund values its derivatives at fair value and recognizes changes in fair value through the Statement of Operations, it does not qualify for hedge accounting under authoritative guidance for derivative instruments. The Fund’s investments in derivatives may represent an economic hedge; however, they are considered to be non-hedge transactions for the purpose of these disclosures.
The volume of forward foreign currency contract activity, as a percentage of net assets, for Natixis Oakmark International Fund, based on gross month-end notional amounts outstanding during the period, including long and short positions at absolute value, was as follows for the year ended December 31, 2021:
| | | | |
Natixis Oakmark International Fund | | Forwards | |
Average Notional Amount Outstanding | | | 1.24 | % |
Highest Notional Amount Outstanding | | | 1.40 | % |
Lowest Notional Amount Outstanding | | | 1.16 | % |
Notional Amount Outstanding as of December 31, 2021 | | | 1.40 | % |
Notional amounts outstanding at the end of the prior period are included in the average notional amount outstanding.
Unrealized gain and/or loss on open forwards is recorded in the Statements of Assets and Liabilities. The aggregate notional values of forward contracts are not recorded in the Statements of Assets and Liabilities, and therefore are not included in the Fund’s net assets.
| 82
Notes to Financial Statements (continued)
December 31, 2021
Natixis Oakmark International Fund enters into over-the-counter derivatives, including forward foreign currency contracts, pursuant to an International Swaps and Derivatives Association, Inc. (“ISDA”) agreement between the Fund and its counterparty. ISDA agreements typically contain master netting provisions in the event of a default or other termination event. Master netting provisions allow the Fund and the counterparty, in the event of a default or other termination event, to offset amounts owed by each related to derivative contracts to one net amount payable by either the Fund or the counterparty. For financial reporting purposes, the Fund does not offset derivative assets and liabilities on the Statements of Assets and Liabilities.
As of December 31, 2021, gross amounts of derivative assets and liabilities not offset in the Statement of Assets and Liabilities and the related net amounts after taking into account master netting arrangements, by counterparty, are as follows:
| | | | | | | | | | | | |
Counterparty | | Gross Amounts of
Liabilities | | | Offset
Amount | | | Net
Amount | |
State Street Bank and Trust Company | | $ | (94,327 | ) | | $ | — | | | $ | (94,327 | ) |
Counterparty risk is managed based on policies and procedures established by each Fund’s adviser. Such policies and procedures may include, but are not limited to, minimum counterparty credit rating requirements and monitoring of counterparty credit default swap spreads. Based on balances reflected on the Fund’s Statement of Assets and Liabilities, the following table shows (i) the maximum amount of loss due to credit risk that, based on the gross fair value of the financial instrument, the Fund would incur if parties to the relevant financial instruments failed completely to perform according to the terms of the contracts and ii) the amount of loss that the Fund would incur after taking into account master netting provisions pursuant to ISDA agreements, as of December 31, 2021:
| | | | | | | | |
Fund | | Maximum Amount
of Loss - Gross | | | Maximum Amount
of Loss - Net | |
Natixis Oakmark International Fund | | $ | — | | | $ | — | |
5. Purchases and Sales of Securities. For the year ended December 31, 2021, purchases and sales of securities (excluding short-term investments) were as follows:
| | | | | | | | |
Fund | | Purchases | | | Sales | |
International Growth Fund | | $ | 11,283,579 | | | $ | 2,058,975 | |
Natixis Oakmark Fund | | | 97,254,108 | | | | 66,240,862 | |
Natixis Oakmark International Fund | | | 193,166,499 | | | | 193,866,549 | |
U.S. Equity Opportunities Fund | | | 181,532,952 | | | | 278,132,376 | |
Mid Cap Fund | | | 243,267,097 | | | | 230,953,070 | |
Small Cap Value Fund | | | 125,323,757 | | | | 121,931,217 | |
6. Management Fees and Other Transactions with Affiliates.
a. Management Fees. Loomis, Sayles & Company, L.P. (“Loomis Sayles”) serves as investment adviser to International Growth Fund. Loomis Sayles is a limited partnership whose sole general partner, Loomis, Sayles & Company, Inc., is indirectly owned by Natixis Investment Managers, LLC, which is part of Natixis Investment Managers, an international asset management group based in Paris, France.
Under the terms of the management agreement, International Growth Fund pays a management fee at the annual rate of 0.75%, calculated daily and payable monthly, based on the Fund’s average daily net assets.
Natixis Advisors, LLC (“Natixis Advisors”) serves as investment adviser to Natixis Oakmark Fund, Natixis Oakmark International Fund, U.S. Equity Opportunities Fund, Mid Cap Fund and Small Cap Value Fund. Under the terms of the management agreements, each Fund pays a management fee at the following annual rates, calculated daily and payable monthly, based on each Fund’s average daily net assets:
| | | | | | | | | | | | | | | | | | | | | | | | |
| | | Percentage of Average Daily Net Assets | |
Fund | | First $150 million | | | Next $50 million | | | Next $300 million | | | Next $500 million | | | Next $500 million | | | Over $1.5 billion | |
Natixis Oakmark Fund | | | 0.70 | % | | | 0.70 | % | | | 0.65 | % | | | 0.60 | % | | | 0.60 | % | | | 0.60 | % |
Natixis Oakmark International Fund | | | 0.85 | % | | | 0.75 | % | | | 0.75 | % | | | 0.75 | % | | | 0.70 | % | | | 0.70 | % |
U.S. Equity Opportunities Fund | | | 0.75 | % | | | 0.75 | % | | | 0.75 | % | | | 0.75 | % | | | 0.75 | % | | | 0.75 | % |
Mid Cap Fund | | | 0.75 | % | | | 0.75 | % | | | 0.75 | % | | | 0.75 | % | | | 0.75 | % | | | 0.70 | % |
Small Cap Value Fund | | | 0.85 | % | | | 0.85 | % | | | 0.85 | % | | | 0.85 | % | | | 0.85 | % | | | 0.85 | % |
83 |
Notes to Financial Statements (continued)
December 31, 2021
Prior to July 1, 2021, Mid Cap Fund and Small Cap Value Fund paid a management fee at the following annual rates, calculated daily and payable monthly, based on each Fund’s average daily net assets:
| | | | | | | | | | | | | | | | | | | | | | | | |
| | | Percentage of Average Daily Net Assets | |
Fund | | First $150 million | | | Next $50 million | | | Next $300 million | | | Next $500 million | | | Next $500 million | | | Over $1.5 billion | |
Mid Cap Fund | | | 0.80 | % | | | 0.80 | % | | | 0.80 | % | | | 0.80 | % | | | 0.80 | % | | | 0.75 | % |
Small Cap Value Fund | | | 0.90 | % | | | 0.90 | % | | | 0.90 | % | | | 0.90 | % | | | 0.90 | % | | | 0.90 | % |
Natixis Advisors has entered into subadvisory agreements for each Fund as listed below.
| | |
Natixis Oakmark Fund | | Harris Associates L.P. (“Harris”) |
Natixis Oakmark International Fund | | Harris |
U.S. Equity Opportunities Fund | | Harris Loomis Sayles |
Mid Cap Fund | | Vaughan Nelson Investment Management, L.P. (“Vaughan Nelson”) |
Small Cap Value Fund | | Vaughan Nelson |
Natixis Advisors, Harris and Vaughan Nelson are subsidiaries of Natixis Investment Managers, LLC.
Under the terms of the subadvisory agreements, each Fund has agreed to pay its respective subadviser a subadvisory fee at the following annual rates, calculated daily and payable monthly, based on each Fund’s average daily net assets:
| | | | | | | | | | | | | | | | | | | | | | |
| | | | | Percentage of Average Daily Net Assets | |
Fund | | Subadviser | | First $150 million | | | Next $50 million | | | Next $800 million | | | Next $500 million | | | Over $1.5 billion | |
Natixis Oakmark Fund | | Harris | | | 0.52 | % | | | 0.52 | % | | | 0.50 | % | | | 0.50 | % | | | 0.50 | % |
Natixis Oakmark International Fund | | Harris | | | 0.60 | % | | | 0.50 | % | | | 0.50 | % | | | 0.45 | % | | | 0.45 | % |
U.S. Equity Opportunities Fund | | | | | | | | | | | | | | | | | | | | | | |
Large Cap Value Segment | | Harris | | | 0.52 | % | | | 0.52 | % | | | 0.52 | % | | | 0.52 | % | | | 0.52 | % |
All Cap Growth Segment | | Loomis Sayles | | | 0.35 | % | | | 0.35 | % | | | 0.35 | % | | | 0.35 | % | | | 0.35 | % |
Mid Cap Fund | | Vaughan Nelson | | | 0.47 | % | | | 0.47 | % | | | 0.47 | % | | | 0.47 | % | | | 0.44 | % |
Small Cap Value Fund | | Vaughan Nelson | | | 0.52 | % | | | 0.52 | % | | | 0.52 | % | | | 0.52 | % | | | 0.52 | % |
Payments to Natixis Advisors are reduced by the amounts of payments to the subadvisers, as calculated based on the table above.
Prior to July 1, 2021, Mid Cap Fund and Small Cap Value Fund each paid their respective subadviser a subadvisory fee at the following annual rates, calculated daily and payable monthly, based on each Fund’s average daily net assets:
| | | | | | | | | | | | | | | | | | | | | | |
| | | | | Percentage of Average Daily Net Assets | |
Fund | | Subadviser | | First $150 million | | | Next $50 million | | | Next $800 million | | | Next $500 million | | | Over $1.5 billion | |
Mid Cap Fund | | Vaughan Nelson | | | 0.50 | % | | | 0.50 | % | | | 0.50 | % | | | 0.50 | % | | | 0.47 | % |
Small Cap Value Fund | | Vaughan Nelson | | | 0.55 | % | | | 0.55 | % | | | 0.55 | % | | | 0.55 | % | | | 0.55 | % |
Loomis Sayles and Natixis Advisors have given binding undertakings to the Funds to waive management fees and/or reimburse certain expenses to limit the Funds’ operating expenses, exclusive of acquired fund fees and expenses, brokerage expenses, interest expense, substitute dividend expenses on securities sold short, taxes, organizational and extraordinary expenses such as litigation and indemnification expenses. These undertakings are in effect until April 30, 2022 for International Growth Fund and U.S. Equity Opportunities Fund, and until April 30, 2023 for Natixis Oakmark Fund, Natixis Oakmark International Fund, Mid Cap Fund and Small Cap Value Fund, may be terminated before then only with the consent of the Funds’ Board of Trustees, and are reevaluated on an annual basis. Management fees payable, as reflected on the Statements of Assets and Liabilities, is net of waivers and/or expense reimbursements, if any, pursuant to these undertakings. Waivers/reimbursements that exceed management fees payable are reflected on the Statements of Assets and Liabilities as receivable from investment adviser.
| 84
Notes to Financial Statements (continued)
December 31, 2021
For the year ended December 31, 2021, the expense limits as a percentage of average daily net assets under the expense limitation agreements were as follows:
| | | | | | | | | | | | | | | | |
| | | Expense Limit as a Percentage of Average
Daily Net Assets | |
Fund | | Class A | | | Class C | | | Class N | | | Class Y | |
International Growth Fund | | | 1.20 | % | | | 1.95 | % | | | 0.90 | % | | | 0.95 | % |
Natixis Oakmark Fund | | | 1.05 | % | | | 1.80 | % | | | 0.75 | % | | | 0.80 | % |
Natixis Oakmark International Fund | | | 1.15 | % | | | 1.90 | % | | | 0.85 | % | | | 0.90 | % |
U.S. Equity Opportunities Fund | | | 1.20 | % | | | 1.95 | % | | | 0.90 | % | | | 0.95 | % |
Mid Cap Fund | | | 1.15 | % | | | 1.90 | % | | | 0.85 | % | | | 0.90 | % |
Small Cap Value Fund | | | 1.25 | % | | | 2.00 | % | | | 0.95 | % | | | 1.00 | % |
Prior to July 1, 2021, the expense limits as a percentage of average daily net assets under the expense limitation agreements for Natixis Oakmark Fund, Natixis Oakmark International Fund, Mid Cap Fund and Small Cap Value Fund were as follows:
| | | | | | | | | | | | | | | | |
| | | Expense Limit as a Percentage of Average
Daily Net Assets | |
Fund | | Class A | | | Class C | | | Class N | | | Class Y | |
Natixis Oakmark Fund | | | 1.30 | % | | | 2.05 | % | | | 1.00 | % | | | 1.05 | % |
Natixis Oakmark International Fund | | | 1.20 | % | | | 1.95 | % | | | 0.90 | % | | | 0.95 | % |
Mid Cap Fund | | | 1.20 | % | | | 1.95 | % | | | 0.90 | % | | | 0.95 | % |
Small Cap Value Fund | | | 1.30 | % | | | 2.05 | % | | | 1.00 | % | | | 1.05 | % |
Loomis Sayles and Natixis Advisors shall be permitted to recover expenses borne under the expense limitation agreements (whether through waiver of management fee or otherwise) on a class by class basis in later periods to the extent the annual operating expenses of a class fall below both (1) a class’ expense limitation ratio in place at the time such amounts were waived/reimbursed and (2) a class’ current applicable expense limitation ratio, provided, however, that a class is not obligated to pay such waived/reimbursed fees or expenses more than one year after the end of the fiscal year in which the fees or expenses were waived/reimbursed.
For the year ended December 31, 2021, the management fees and waiver of management fees for each Fund were as follows:
| | | | | | | | | | | | | | | | | | | | |
Fund | | Gross
Management Fees | | | Contractual
Waivers of
Management Fees1 | | | Net
Management Fees | | | Percentage
of Average
Daily Net Assets | |
| | Gross | | | Net | |
International Growth Fund | | $ | 181,065 | | | $ | 145,776 | | | $ | 35,289 | | | | 0.75 | % | | | 0.15 | % |
Natixis Oakmark Fund | | | 2,106,551 | | | | 87,307 | | | | 2,019,244 | | | | 0.68 | % | | | 0.65 | % |
Natixis Oakmark International Fund | | | 4,216,094 | | | | 918,026 | | | | 3,298,068 | | | | 0.78 | % | | | 0.61 | % |
U.S. Equity Opportunities Fund | | | 7,835,017 | | | | — | | | | 7,835,017 | | | | 0.75 | % | | | 0.75 | % |
Mid Cap Fund | | | 2,560,977 | | | | 172,115 | | | | 2,388,862 | | | | 0.77 | % | | | 0.72 | % |
Small Cap Value Fund | | | 1,202,924 | | | | 221,039 | | | | 981,885 | | | | 0.87 | % | | | 0.71 | % |
| 1 | Management fee waivers are subject to possible recovery until December 31, 2022. |
No expenses were recovered for any of the Funds during the year ended December 31, 2021 under the terms of the expense limitation agreements.
b. Service and Distribution Fees. Natixis Distribution, LLC (“Natixis Distribution”), which is a wholly-owned subsidiary of Natixis Investment Managers, LLC, has entered into a distribution agreement with the Trusts. Pursuant to this agreement, Natixis Distribution serves as principal underwriter of the Funds of the Trusts.
Pursuant to Rule 12b-1 under the 1940 Act, the Trusts have adopted a Service Plan relating to each Fund’s Class A shares (the “Class A Plans”) and a Distribution and Service Plan relating to each Fund’s Class C shares (the “Class C Plans”).
Under the Class A Plans, each Fund pays Natixis Distribution a monthly service fee at an annual rate not to exceed 0.25% of the average daily net assets attributable to the Funds’ Class A shares, as reimbursement for expenses incurred by Natixis Distribution in providing personal services to investors in Class A shares and/or the maintenance of shareholder accounts.
Under the Class C Plans, each Fund pays Natixis Distribution a monthly service fee at an annual rate not to exceed 0.25% of the average daily net assets attributable to the Funds’ Class C shares, as compensation for services provided by Natixis Distribution in providing personal services to investors in Class C shares and/or the maintenance of shareholder accounts.
85 |
Notes to Financial Statements (continued)
December 31, 2021
Also under the Class C Plans, each Fund pays Natixis Distribution a monthly distribution fee at an annual rate of 0.75% of the average daily net assets attributable to the Funds’ Class C shares, as compensation for services provided by Natixis Distribution in connection with the marketing or sale of Class C shares.
For the year ended December 31, 2021, the service and distribution fees for each Fund were as follows:
| | | | | | | | | | | | |
| | | Service Fees | | | Distribution Fees | |
Fund | | Class A | | | Class C | | | Class C | |
International Growth Fund | | $ | 196 | | | $ | 78 | | | $ | 235 | |
Natixis Oakmark Fund | | | 516,720 | | | | 105,696 | | | | 317,087 | |
Natixis Oakmark International Fund | | | 372,099 | | | | 213,579 | | | | 640,736 | |
U.S. Equity Opportunities Fund | | | 1,792,773 | | | | 154,497 | | | | 463,492 | |
Mid Cap Fund | | | 87,562 | | | | 33,242 | | | | 99,727 | |
Small Cap Value Fund | | | 187,732 | | | | 2,375 | | | | 7,125 | |
c. Administrative Fees. Natixis Advisors provides certain administrative services for the Funds and contracts with State Street Bank to serve as sub-administrator. Pursuant to an agreement among Natixis Funds Trusts, Loomis Sayles Funds Trusts, Natixis ETF Trusts and Natixis Advisors, each Fund pays Natixis Advisors monthly its pro rata portion of fees equal to an annual rate of 0.0540% of the first $15 billion of the average daily net assets of the Natixis Funds Trusts, Loomis Sayles Funds Trusts and Natixis ETF Trusts, 0.0500% of the next $15 billion, 0.0400% of the next $30 billion, 0.0275% of the next $30 billion and 0.0225% of such assets in excess of $90 billion, subject to an annual aggregate minimum fee for the Natixis Funds Trusts, Loomis Sayles Funds Trusts and Natixis ETF Trusts of $10 million, which is reevaluated on an annual basis.
For the year ended December 31, 2021, the administrative fees for each Fund were as follows:
| | | | |
Fund | | Administrative
Fees | |
International Growth Fund | | $ | 10,285 | |
Natixis Oakmark Fund | | | 131,502 | |
Natixis Oakmark International Fund | | | 231,005 | |
U.S. Equity Opportunities Fund | | | 446,102 | |
Mid Cap Fund | | | 141,096 | |
Small Cap Value Fund | | | 58,651 | |
d. Sub-Transfer Agent Fees. Natixis Distribution has entered into agreements, which include servicing agreements, with financial intermediaries that provide recordkeeping, processing, shareholder communications and other services to customers of the intermediaries that hold positions in the Funds and has agreed to compensate the intermediaries for providing those services. Intermediaries transact with the Funds primarily through the use of omnibus accounts on behalf of their customers who hold positions in the Funds. These services would have been provided by the Funds’ transfer agent and other service providers if the shareholders’ accounts were maintained directly at the Funds’ transfer agent. Accordingly, the Funds have agreed to reimburse Natixis Distribution for all or a portion of the servicing fees paid to these intermediaries. The reimbursement amounts (sub-transfer agent fees) paid to Natixis Distribution are subject to a current per-account equivalent fee limit approved by the Funds’ Board of Trustees, which is based on fees for similar services paid to the Funds’ transfer agent and other service providers. Class N shares do not bear such expenses.
For the year ended December 31, 2021, the sub-transfer agent fees (which are reflected in transfer agent fees and expenses in the Statements of Operations) for each Fund were as follows:
| | | | |
Fund | | Sub-Transfer
Agent Fees | |
International Growth Fund | | $ | 59 | |
Natixis Oakmark Fund | | | 98,476 | |
Natixis Oakmark International Fund | | | 865,845 | |
U.S. Equity Opportunities Fund | | | 310,467 | |
Mid Cap Fund | | | 233,280 | |
Small Cap Value Fund | | | 73,461 | |
| 86
Notes to Financial Statements (continued)
December 31, 2021
As of December 31, 2021, the Funds owe Natixis Distribution the following reimbursements for sub-transfer agent fees (which are reflected in the Statements of Assets and Liabilities as payable to distributor):
| | | | |
Fund | | Reimbursements
of Sub-Transfer
Agent Fees | |
International Growth Fund | | $ | 16 | |
Natixis Oakmark Fund | | | 1,267 | |
Natixis Oakmark International Fund | | | 11,131 | |
U.S. Equity Opportunities Fund | | | 3,103 | |
Mid Cap Fund | | | 2,274 | |
Small Cap Value Fund | | | 705 | |
Sub-transfer agent fees attributable to Class A, Class C and Class Y are allocated on a pro rata basis to each class based on the relative net assets of each class to the total net assets of those classes.
e. Commissions. Commissions (including CDSCs) on Fund shares retained by Natixis Distribution during the year ended December 31, 2021 was as follows:
| | | | |
Fund | | Commissions | |
International Growth Fund | | $ | 128 | |
Natixis Oakmark Fund | | | 25,774 | |
Natixis Oakmark International Fund | | | 10,743 | |
U.S. Equity Opportunities Fund | | | 26,294 | |
Mid Cap Fund | | | 575 | |
Small Cap Value Fund | | | 1,257 | |
f. Trustees Fees and Expenses. The Trusts do not pay any compensation directly to their officers or Trustees who are directors, officers or employees of Natixis Advisors, Natixis Distribution, Natixis Investment Managers, LLC or their affiliates. The Chairperson of the Board of Trustees receives a retainer fee at the annual rate of $369,000. The Chairperson does not receive any meeting attendance fees for Board of Trustees meetings or committee meetings that he attends. Each Independent Trustee (other than the Chairperson) receives, in the aggregate, a retainer fee at the annual rate of $199,000. Each Independent Trustee also receives a meeting attendance fee of $10,000 for each meeting of the Board of Trustees that he or she attends in person and $5,000 for each meeting of the Board of Trustees that he or she attends telephonically. In addition, the chairperson of the Contract Review Committee, the chairperson of the Audit Committee and the chairperson of the Governance Committee each receive an additional retainer fee at the annual rate of $20,000. Each Contract Review Committee member is compensated $6,000 for each Committee meeting that he or she attends in person and $3,000 for each meeting that he or she attends telephonically. Each Audit Committee member is compensated $6,000 for each Committee meeting that he or she attends in person and $3,000 for each meeting that he or she attends telephonically. These fees are allocated among the funds in the Natixis Funds Trusts, Loomis Sayles Funds Trusts and Natixis ETF Trusts based on a formula that takes into account, among other factors, the relative net assets of each fund. Trustees are reimbursed for travel expenses in connection with attendance at meetings.
Effective January 1, 2022, each Independent Trustee (other than the Chairperson) will receive, in the aggregate, a retainer fee at the annual rate of $210,000. All other Trustees fees will remain unchanged.
A deferred compensation plan (the “Plan”) is available to the Trustees on a voluntary basis. Deferred amounts remain in the Funds until distributed in accordance with the provisions of the Plan. The value of a participating Trustee’s deferral account is based on theoretical investments of deferred amounts, on the normal payment dates, in certain funds of the Natixis Funds Trusts, Loomis Sayles Funds Trusts and Natixis ETF Trusts as designated by the participating Trustees. Changes in the value of participants’ deferral accounts are allocated pro rata among the funds in the Natixis Funds Trusts, Loomis Sayles Funds Trusts and Natixis ETF Trusts, and are normally reflected as Trustees’ fees and expenses in the Statements of Operations. The portions of the accrued obligations allocated to the Funds under the Plan are reflected as Deferred Trustees’ fees in the Statements of Assets and Liabilities.
Certain officers and employees of Natixis Advisors, Loomis Sayles and affiliates are also officers and/or Trustees of the Trusts.
g. Affiliated Ownership. As of December 31, 2021, Natixis and affiliates held shares of International Growth Fund representing 98.53% of the Fund’s net assets.
Investment activities of affiliated shareholders could have material impacts on the Fund.
87 |
Notes to Financial Statements (continued)
December 31, 2021
h. Reimbursement of Transfer Agent Fees and Expenses. Natixis Advisors has given a binding contractual undertaking to the Funds (effective May 1, 2021 for Mid Cap Fund) to reimburse any and all transfer agency expenses for the Funds’ Class N shares. This undertaking is in effect through April 30, 2022 and is not subject to recovery under the expense limitation agreement described above.
For the year ended December 31, 2021 (for the period May 1, 2021 through December 31, 2021 for Mid Cap Fund), Natixis Advisors reimbursed the Funds for transfer agency expenses as follows:
| | | | |
| | | Reimbursement of
Transfer Agency
Expenses | |
Fund | | Class N | |
International Growth Fund | | $ | 768 | |
Natixis Oakmark Fund | | | 1,062 | |
Natixis Oakmark International Fund | | | 1,086 | |
U.S. Equity Opportunities Fund | | | 1,048 | |
Mid Cap Fund | | | 483 | |
Small Cap Value Fund | | | 1,050 | |
i. Payment by Affiliates. For the year ended December 31, 2021, Harris reimbursed Natixis Oakmark International Fund $1,896 in connection with trading errors.
7. Custodian and Regulatory Filing Fees and Expenses. State Street Bank, custodian and sub-administrator to the Funds, agreed to waive its fees and expenses for the first 12 months of operations for International Growth Fund. For the year ended December 31, 2021, total fees waived for the Fund were $21,084. Regulatory filing fees and expenses are included in miscellaneous expenses on the Statements of Operations.
8. Class-Specific Transfer Agent Fees and Expenses. Transfer agent fees and expenses attributable to Class A, Class C and Class Y are allocated on a pro rata basis to each class based on the relative net assets of each class to the total net assets of those classes. Transfer agent fees and expenses attributable to Class N are allocated to Class N.
For the year ended December 31, 2021, the Funds incurred the following class-specific transfer agent fees and expenses (including sub-transfer agent fees, where applicable):
| | | | | | | | | | | | | | | | |
| | | Transfer Agent Fees and Expenses | |
Fund | | Class A | | | Class C | | | Class N | | | Class Y | |
International Growth Fund | | $ | 689 | | | $ | 273 | | | $ | 768 | | | $ | 1,589 | |
Natixis Oakmark Fund | | | 143,286 | | | | 29,310 | | | | 1,062 | | | | 40,611 | |
Natixis Oakmark International Fund | | | 247,297 | | | | 141,567 | | | | 1,086 | | | | 511,019 | |
U.S. Equity Opportunities Fund | | | 410,917 | | | | 35,779 | | | | 1,048 | | | | 151,853 | |
Mid Cap Fund | | | 31,293 | | | | 12,007 | | | | 1,157 | | | | 213,548 | |
Small Cap Value Fund | | | 70,214 | | | | 897 | | | | 1,050 | | | | 56,770 | |
9. Line of Credit. Each Fund, together with certain other funds of Natixis Funds Trusts, Loomis Sayles Funds Trusts and Natixis ETF Trusts, entered into a $500,000,000 committed unsecured line of credit provided by State Street Bank. Any one Fund may borrow up to $350,000,000 under the line of credit agreement (as long as all borrowings by all Funds in the aggregate do not exceed the $500,000,000 limit at any time), subject to each Fund’s investment restrictions and its contractual obligations under the line of credit. Interest is charged to the Funds based upon the terms set forth in the agreement. In addition, a commitment fee of 0.15% per annum, payable at the end of each calendar quarter, is accrued and apportioned among the participating funds based on their average daily unused portion of the line of credit. The Funds paid certain legal fees in connection with the line of credit agreement, which are being amortized over a period of 364 days and are reflected in legal fees on the Statements of Operations. The unamortized balance is reflected as prepaid expenses on the Statements of Assets and Liabilities.
Prior to April 8, 2021, each Fund except for International Growth Fund, together with certain other funds of Natixis Funds Trusts, Loomis Sayles Funds Trusts and Natixis ETF Trusts, entered into a $400,000,000 committed unsecured line of credit provided by State Street Bank. Any one Fund may borrow up to $350,000,000 under the line of credit agreement (as long as all borrowings by all Funds in the aggregate do not exceed the $400,000,000 limit at any time), subject to each Fund’s investment restrictions and its contractual obligations under the line of credit.
For the year ended December 31, 2021, Mid Cap Fund had an average daily balance on the line of credit (for those days on which there were borrowings) of $7,860,000 at a weighted average interest rate of 1.17%. Interest expense incurred on the line of credit was $1,272.
| 88
Notes to Financial Statements (continued)
December 31, 2021
10. Risk. The Funds’ investments in foreign securities may be subject to greater political, economic, environmental, credit/counterparty and information risks. The Fund’s investments in foreign securities also are subject to foreign currency fluctuations and other foreign currency-related risks. Foreign securities may be subject to higher volatility than U.S. securities, varying degrees of regulation and limited liquidity.
The International Growth Fund may invest to a significant extent in variable interest entity (“VIE”) structures. VIE structures can vary, but generally consist of a U.S.-listed company with contractual arrangements, through one or more wholly-owned special purpose vehicles, with a Chinese company that ultimately provides the U.S.-listed company with contractual rights to obtain economic benefits from the Chinese company. The VIE structure enables foreign investors, such as the Fund, to obtain investment exposure similar to that of an equity owner in a Chinese company in situations in which the Chinese government has restricted or prohibited the ownership of such company by foreign investors. The Fund’s exposure to VIE structures may pose additional risks because the VIE structure is not formally recognized under Chinese law. The Chinese government may cease to tolerate VIE structures at any time or impose new restrictions. In addition, Chinese companies using the VIE structure, and listed on stock exchanges in the U.S., could also face delisting or other ramifications for failure to meet the expectations and/or requirements of the U.S. Securities and Exchange Commission, the Public Company Accounting Oversight Board, or other U.S. regulators. Any of these risks could reduce the liquidity and value of these investments or render them valueless.
International Growth Fund is non-diversified, which means that it is not limited under the 1940 Act to a percentage of assets that it may invest in any one issuer. Because the Fund may invest in the securities of a limited number of issuers, an investment in the Fund may involve a higher degree of risk than would be present in a diversified portfolio.
Global markets have experienced periods of high volatility triggered by the Covid-19 pandemic. The impact of this pandemic and any other epidemic or pandemic that may arise in the future could adversely affect the economies of many nations or the entire global economy and the financial performance of individual issuers, sectors, industries, asset classes, and markets in significant and unforeseen ways. Such effects could impair the Funds’ ability to maintain operational standards, disrupt the operations of the Funds’ service providers, adversely affect the value and liquidity of the Funds’ investments and negatively impact the Funds’ performance.
11. Concentration of Ownership. From time to time, a Fund may have a concentration of one or more accounts constituting a significant percentage of shares outstanding. Investment activities by holders of such accounts could have material impacts on the Funds. As of December 31, 2021, based on management’s evaluation of the shareholder account base, the Funds had accounts representing controlling ownership of more than 5% of the Funds’ total outstanding shares. The number of such accounts, based on accounts that represent more than 5% of an individual class of shares, and the aggregate percentage of net assets represented by such holdings were as follows:
| | | | | | | | |
| | | Number of 5%
Account Holders | | | Percentage of
Ownership | |
Fund | | | | | | |
Natixis Oakmark International Fund | | | 1 | | | | 28.22 | % |
Mid Cap Fund | | | 2 | | | | 30.76 | % |
Small Cap Value Fund | | | 2 | | | | 12.54 | % |
Omnibus shareholder accounts for which Natixis Advisors understands that the intermediary has discretion over the underlying shareholder accounts or investment models where a shareholder account may be invested for a non-discretionary customer are included in the table above. For other omnibus accounts, the Funds do not have information on the individual shareholder accounts underlying the omnibus accounts; therefore, there could be other 5% shareholders in addition to those disclosed in the table above.
89 |
Notes to Financial Statements (continued)
December 31, 2021
12. Capital Shares. Each Fund may issue an unlimited number of shares of beneficial interest, without par value. Transactions in capital shares were as follows:
| | | | | | | | | | | | | | | | |
| | | Year Ended
December 31, 2021 | | | Period Ended
December 31, 2020(a) | |
International Growth Fund | | Shares | | | Amount | | | Shares | | | Amount | |
| Class A | |
Issued from the sale of shares | | | 11,486 | | | $ | 119,493 | | | | 100 | | | $ | 1,000 | |
Issued in connection with the reinvestment of distributions | | | 178 | | | | 1,712 | | | | — | (b) | | | 1 | |
| | | | | | | | | | | | | | | | |
Net change | | | 11,664 | | | $ | 121,205 | | | | 100 | | | $ | 1,001 | |
| | | | | | | | | | | | | | | | |
| Class C | |
Issued from the sale of shares | | | 5,141 | | | $ | 52,756 | | | | 100 | | | $ | 1,000 | |
Issued in connection with the reinvestment of distributions | | | 56 | | | | 540 | | | | — | (b) | | | — | (c) |
Redeemed | | | (1,268 | ) | | | (12,908 | ) | | | — | | | | — | |
| | | | | | | | | | | | | | | | |
Net change | | | 3,929 | | | $ | 40,388 | | | | 100 | | | $ | 1,000 | |
| | | | | | | | | | | | | | | | |
| Class N | |
Issued from the sale of shares | | | 940,733 | | | $ | 10,000,000 | | | | 1,500,000 | | | $ | 15,000,000 | |
Issued in connection with the reinvestment of distributions | | | 517 | | | | 5,372 | | | | 1,224 | | | | 12,450 | |
Redeemed | | | (46,992 | ) | | | (500,000 | ) | | | — | | | | — | |
| | | | | | | | | | | | | | | | |
Net change | | | 894,258 | | | $ | 9,505,372 | | | | 1,501,224 | | | $ | 15,012,450 | |
| | | | | | | | | | | | | | | | |
| Class Y | |
Issued from the sale of shares | | | 24,598 | | | $ | 256,782 | | | | 1,163 | | | $ | 11,750 | |
Issued in connection with the reinvestment of distributions | | | 388 | | | | 3,739 | | | | 1 | | | | 9 | |
Redeemed | | | (2,953 | ) | | | (29,891 | ) | | | — | | | | — | |
| | | | | | | | | | | | | | | | |
Net change | | | 22,033 | | | $ | 230,630 | | | | 1,164 | | | $ | 11,759 | |
| | | | | | | | | | | | | | | | |
Increase from capital share transactions | | | 931,884 | | | $ | 9,897,595 | | | | 1,502,588 | | | $ | 15,026,210 | |
| | | | | | | | | | | | | | | | |
| (a) | From commencement of operations on December 15, 2020 through December 31, 2020. |
| (b) | Amount rounds to less than one share. |
| (c) | Amount rounds to less than $1.00. |
| | | | | | | | | | | | | | | | |
| | | Year Ended
December 31, 2021 | | | Year Ended
December 31, 2020 | |
Natixis Oakmark Fund | | Shares | | | Amount | | | Shares | | | Amount | |
| Class A | |
Issued from the sale of shares | | | 691,558 | | | $ | 20,206,685 | | | | 583,622 | | | $ | 11,675,703 | |
Issued in connection with the reinvestment of distributions | | | 463,894 | | | | 13,477,187 | | | | 589,672 | | | | 13,475,622 | |
Redeemed | | | (855,457 | ) | | | (24,491,426 | ) | | | (1,895,350 | ) | | | (37,988,760 | ) |
| | | | | | | | | | | | | | | | |
Net change | | | 299,995 | | | $ | 9,192,446 | | | | (722,056 | ) | | $ | (12,837,435 | ) |
| | | | | | | | | | | | | | | | |
| Class C | |
Issued from the sale of shares | | | 546,929 | | | $ | 13,338,620 | | | | 196,466 | | | $ | 3,196,499 | |
Issued in connection with the reinvestment of distributions | | | 147,029 | | | | 3,458,822 | | | | 166,000 | | | | 3,131,121 | |
Redeemed | | | (439,521 | ) | | | (10,138,945 | ) | | | (1,362,306 | ) | | | (22,568,463 | ) |
| | | | | | | | | | | | | | | | |
Net change | | | 254,437 | | | $ | 6,658,497 | | | | (999,840 | ) | | $ | (16,240,843 | ) |
| | | | | | | | | | | | | | | | |
| Class N | |
Issued from the sale of shares | | | 20,230 | | | $ | 668,794 | | | | 26 | | | $ | 561 | |
Issued in connection with the reinvestment of distributions | | | 1,354 | | | | 42,243 | | | | 1,266 | | | | 30,687 | |
Redeemed | | | (14,413 | ) | | | (395,951 | ) | | | (20,248 | ) | | | (414,541 | ) |
| | | | | | | | | | | | | | | | |
Net change | | | 7,171 | | | $ | 315,086 | | | | (18,956 | ) | | $ | (383,293 | ) |
| | | | | | | | | | | | | | | | |
| Class Y | |
Issued from the sale of shares | | | 2,239,599 | | | $ | 69,629,845 | | | | 898,502 | | | $ | 17,536,595 | |
Issued in connection with the reinvestment of distributions | | | 194,941 | | | | 6,059,178 | | | | 88,591 | | | | 2,151,945 | |
Redeemed | | | (767,848 | ) | | | (22,108,885 | ) | | | (1,435,875 | ) | | | (28,553,935 | ) |
| | | | | | | | | | | | | | | | |
Net change | | | 1,666,692 | | | $ | 53,580,138 | | | | (448,782 | ) | | $ | (8,865,395 | ) |
| | | | | | | | | | | | | | | | |
Increase (decrease) from capital share transactions | | | 2,228,295 | | | $ | 69,746,167 | | | | (2,189,634 | ) | | $ | (38,326,966 | ) |
| | | | | | | | | | | | | | | | |
| 90
Notes to Financial Statements (continued)
December 31, 2021
12. Capital Shares (continued).
| | | | | | | | | | | | | | | | |
| | | Year Ended
December 31, 2021 | | | Year Ended
December 31, 2020 | |
Natixis Oakmark International Fund | | Shares | | | Amount | | | Shares | | | Amount | |
| Class A | |
Issued from the sale of shares | | | 2,335,450 | | | $ | 36,472,444 | | | | 2,770,572 | | | $ | 30,737,529 | |
Issued in connection with the reinvestment of distributions | | | 105,442 | | | | 1,593,676 | | | | 14,764 | | | | 209,645 | |
Redeemed | | | (1,647,832 | ) | | | (25,699,049 | ) | | | (6,172,183 | ) | | | (66,211,902 | ) |
| | | | | | | | | | | | | | | | |
Net change | | | 793,060 | | | $ | 12,367,071 | | | | (3,386,847 | ) | | $ | (35,264,728 | ) |
| | | | | | | | | | | | | | | | |
| Class C | |
Issued from the sale of shares | | | 335,969 | | | $ | 5,138,230 | | | | 471,769 | | | $ | 5,126,354 | |
Issued in connection with the reinvestment of distributions | | | 25,276 | | | | 376,368 | | | | — | | | | — | |
Redeemed | | | (2,680,195 | ) | | | (40,587,344 | ) | | | (6,873,953 | ) | | | (71,978,638 | ) |
| | | | | | | | | | | | | | | | |
Net change | | | (2,318,950 | ) | | $ | (35,072,746 | ) | | | (6,402,184 | ) | | $ | (66,852,284 | ) |
| | | | | | | | | | | | | | | | |
| Class N | |
Issued from the sale of shares | | | 27,769 | | | $ | 415,638 | | | | 7,236 | | | $ | 76,266 | |
Issued in connection with the reinvestment of distributions | | | 837 | | | | 12,581 | | | | 131 | | | | 1,852 | |
Redeemed | | | (2,541 | ) | | | (37,341 | ) | | | (46,592 | ) | | | (500,123 | ) |
| | | | | | | | | | | | | | | | |
Net change | | | 26,065 | | | $ | 390,878 | | | | (39,225 | ) | | $ | (422,005 | ) |
| | | | | | | | | | | | | | | | |
| Class Y | |
Issued from the sale of shares | | | 5,468,533 | | | $ | 86,311,348 | | | | 22,716,726 | | | $ | 249,354,124 | |
Issued in connection with the reinvestment of distributions | | | 353,698 | | | | 5,316,490 | | | | 87,587 | | | | 1,237,605 | |
Redeemed | | | (4,621,536 | ) | | | (71,233,588 | ) | | | (21,280,488 | ) | | | (222,395,466 | ) |
| | | | | | | | | | | | | | | | |
Net change | | | 1,200,695 | | | $ | 20,394,250 | | | | 1,523,825 | | | $ | 28,196,263 | |
| | | | | | | | | | | | | | | | |
Decrease from capital share transactions | | | (299,130 | ) | | $ | (1,920,547 | ) | | | (8,304,431 | ) | | $ | (74,342,754 | ) |
| | | | | | | | | | | | | | | | |
| | |
| | | Year Ended
December 31, 2021 | | | Year Ended
December 31, 2020 | |
U.S. Equity Opportunities Fund | | Shares | | | Amount | | | Shares | | | Amount | |
| Class A | |
Issued from the sale of shares | | | 706,028 | | | $ | 30,893,730 | | | | 809,852 | | | $ | 28,587,906 | |
Issued in connection with the reinvestment of distributions | | | 1,609,947 | | | | 68,881,940 | | | | 1,934,829 | | | | 70,589,892 | |
Redeemed | | | (1,953,593 | ) | | | (84,776,070 | ) | | | (2,986,385 | ) | | | (103,892,894 | ) |
| | | | | | | | | | | | | | | | |
Net change | | | 362,382 | | | $ | 14,999,600 | | | | (241,704 | ) | | $ | (4,715,096 | ) |
| | | | | | | | | | | | | | | | |
| Class C | |
Issued from the sale of shares | | | 226,043 | | | $ | 5,356,200 | | | | 289,975 | | | $ | 6,110,793 | |
Issued in connection with the reinvestment of distributions | | | 475,273 | | | | 10,545,794 | | | | 553,577 | | | | 11,519,306 | |
Redeemed | | | (949,764 | ) | | | (22,561,088 | ) | | | (1,400,383 | ) | | | (29,908,911 | ) |
| | | | | | | | | | | | | | | | |
Net change | | | (248,448 | ) | | $ | (6,659,094 | ) | | | (556,831 | ) | | $ | (12,278,812 | ) |
| | | | | | | | | | | | | | | | |
| Class N | |
Issued from the sale of shares | | | — | | | $ | — | | | | 947 | | | $ | 37,836 | |
Issued in connection with the reinvestment of distributions | | | 293 | | | | 15,616 | | | | 500 | | | | 21,295 | |
Redeemed | | | (620 | ) | | | (35,725 | ) | | | (12,852 | ) | | | (496,375 | ) |
| | | | | | | | | | | | | | | | |
Net change | | | (327 | ) | | $ | (20,109 | ) | | | (11,405 | ) | | $ | (437,244 | ) |
| | | | | | | | | | | | | | | | |
| Class Y | |
Issued from the sale of shares | | | 1,490,330 | | | $ | 81,108,161 | | | | 1,666,973 | | | $ | 71,953,482 | |
Issued in connection with the reinvestment of distributions | | | 370,262 | | | | 19,743,173 | | | | 465,008 | | | | 20,643,018 | |
Redeemed | | | (1,682,880 | ) | | | (89,109,967 | ) | | | (3,552,649 | ) | | | (145,365,948 | ) |
| | | | | | | | | | | | | | | | |
Net change | | | 177,712 | | | $ | 11,741,367 | | | | (1,420,668 | ) | | $ | (52,769,448 | ) |
| | | | | | | | | | | | | | | | |
Increase (decrease) from capital share transactions | | | 291,319 | | | $ | 20,061,764 | | | | (2,230,608 | ) | | $ | (70,200,600 | ) |
| | | | | | | | | | | | | | | | |
91 |
Notes to Financial Statements (continued)
December 31, 2021
12. Capital Shares (continued).
| | | | | | | | | | | | | | | | |
| | | Year Ended
December 31, 2021 | | | Year Ended
December 31, 2020 | |
Mid Cap Fund | | Shares | | | Amount | | | Shares | | | Amount | |
| Class A | |
Issued from the sale of shares | | | 261,646 | | | $ | 6,416,364 | | | | 226,127 | | | $ | 4,488,446 | |
Issued in connection with the reinvestment of distributions | | | 216,292 | | | | 4,872,528 | | | | 162,666 | | | | 3,228,512 | |
Redeemed | | | (213,572 | ) | | | (5,159,634 | ) | | | (477,370 | ) | | | (9,158,673 | ) |
| | | | | | | | | | | | | | | | |
Net change | | | 264,366 | | | $ | 6,129,258 | | | | (88,577 | ) | | $ | (1,441,715 | ) |
| | | | | | | | | | | | | | | | |
| Class C | |
Issued from the sale of shares | | | 16,158 | | | $ | 374,819 | | | | 18,169 | | | $ | 328,156 | |
Issued in connection with the reinvestment of distributions | | | 85,496 | | | | 1,752,803 | | | | 92,379 | | | | 1,686,307 | |
Redeemed | | | (241,770 | ) | | | (5,500,556 | ) | | | (456,387 | ) | | | (8,272,196 | ) |
| | | | | | | | | | | | | | | | |
Net change | | | (140,116 | ) | | $ | (3,372,934 | ) | | | (345,839 | ) | | $ | (6,257,733 | ) |
| | | | | | | | | | | | | | | | |
| Class N | |
Issued from the sale of shares | | | 2,826,157 | | | $ | 72,192,384 | | | | 94,843 | | | $ | 1,960,180 | |
Issued in connection with the reinvestment of distributions | | | 531,924 | | | | 12,118,098 | | | | 99,203 | | | | 2,004,292 | |
Redeemed | | | (205,461 | ) | | | (5,123,004 | ) | | | (185,807 | ) | | | (3,709,379 | ) |
| | | | | | | | | | | | | | | | |
Net change | | | 3,152,620 | | | $ | 79,187,478 | | | | 8,239 | | | $ | 255,093 | |
| | | | | | | | | | | | | | | | |
| Class Y | |
Issued from the sale of shares | | | 1,675,522 | | | $ | 41,044,197 | | | | 2,378,301 | | | $ | 47,273,465 | |
Issued in connection with the reinvestment of distributions | | | 1,387,574 | | | | 31,819,928 | | | | 1,248,965 | | | | 25,109,423 | |
Redeemed | | | (3,531,602 | ) | | | (86,803,876 | ) | | | (6,496,334 | ) | | | (126,146,971 | ) |
| | | | | | | | | | | | | | | | |
Net change | | | (468,506 | ) | | $ | (13,939,751 | ) | | | (2,869,068 | ) | | $ | (53,764,083 | ) |
| | | | | | | | | | | | | | | | |
Increase (decrease) from capital share transactions | | | 2,808,364 | | | $ | 68,004,051 | | | | (3,295,245 | ) | | $ | (61,208,438 | ) |
| | | | | | | | | | | | | | | | |
| | |
| | | Year Ended
December 31, 2021 | | | Year Ended
December 31, 2020 | |
Small Cap Value Fund | | Shares | | | Amount | | | Shares | | | Amount | |
| Class A | |
Issued from the sale of shares | | | 642,790 | | | $ | 12,042,869 | | | | 158,490 | | | $ | 2,085,145 | |
Issued in connection with the reinvestment of distributions | | | 782,913 | | | | 13,763,408 | | | | 31,711 | | | | 358,304 | |
Redeemed | | | (555,154 | ) | | | (10,594,338 | ) | | | (872,436 | ) | | | (11,688,128 | ) |
| | | | | | | | | | | | | | | | |
Net change | | | 870,549 | | | $ | 15,211,939 | | | | (682,235 | ) | | $ | (9,244,679 | ) |
| | | | | | | | | | | | | | | | |
| Class C | |
Issued from the sale of shares | | | 6,936 | | | $ | 66,135 | | | | 40,156 | | | $ | 298,734 | |
Issued in connection with the reinvestment of distributions | | | 49,731 | | | | 339,165 | | | | 1,869 | | | | 10,560 | |
Redeemed | | | (35,173 | ) | | | (333,625 | ) | | | (109,068 | ) | | | (738,265 | ) |
| | | | | | | | | | | | | | | | |
Net change | | | 21,494 | | | $ | 71,675 | | | | (67,043 | ) | | $ | (428,971 | ) |
| | | | | | | | | | | | | | | | |
| Class N | |
Issued from the sale of shares | | | 59,076 | | | $ | 1,134,239 | | | | — | | | $ | — | |
Issued in connection with the reinvestment of distributions | | | 12,510 | | | | 233,321 | | | | 14 | | | | 179 | |
Redeemed | | | (1 | ) | | | (27 | ) | | | — | | | | — | |
| | | | | | | | | | | | | | | | |
Net change | | | 71,585 | | | $ | 1,367,533 | | | | 14 | | | $ | 179 | |
| | | | | | | | | | | | | | | | |
| Class Y | |
Issued from the sale of shares | | | 793,405 | | | $ | 16,230,504 | | | | 1,175,448 | | | $ | 16,303,249 | |
Issued in connection with the reinvestment of distributions | | | 591,535 | | | | 11,020,292 | | | | 25,025 | | | | 327,632 | |
Redeemed | | | (714,903 | ) | | | (14,531,447 | ) | | | (1,131,163 | ) | | | (15,630,462 | ) |
| | | | | | | | | | | | | | | | |
Net change | | | 670,037 | | | $ | 12,719,349 | | | | 69,310 | | | $ | 1,000,419 | |
| | | | | | | | | | | | | | | | |
Increase (decrease) from capital share transactions | | | 1,633,665 | | | $ | 29,370,496 | | | | (679,954 | ) | | $ | (8,673,052 | ) |
| | | | | | | | | | | | | | | | |
| 92
Report of Independent Registered Public Accounting Firm
To the Board of Trustees of Loomis Sayles Funds II, Natixis Funds Trust I and Natixis Funds Trust II and Shareholders of Loomis Sayles International Growth Fund, Natixis Oakmark International Fund, Natixis U.S. Equity Opportunities Fund, Vaughan Nelson Small Cap Value Fund, Natixis Oakmark Fund and Vaughan Nelson Mid Cap Fund
Opinions on the Financial Statements
We have audited the accompanying statements of assets and liabilities, including the portfolios of investments, of Loomis Sayles International Growth Fund (one of the funds constituting Loomis Sayles Funds II), Natixis Oakmark International Fund, Natixis U.S. Equity Opportunities Fund and Vaughan Nelson Small Cap Value Fund (three of the funds constituting Natixis Funds Trust I), and Natixis Oakmark Fund and Vaughn Nelson Mid Cap Fund (two of the funds constituting Natixis Funds Trust II) (hereafter collectively referred to as the “Funds”) as of December 31, 2021, the related statements of operations and of changes in net assets for each of the periods indicated in the table below, including the related notes, and the financial highlights for each of the periods indicated therein (collectively referred to as the “financial statements”). In our opinion, the financial statements present fairly, in all material respects, the financial position of each of the Funds as of December 31, 2021, the results of each of their operations and the changes in each of their net assets for the periods indicated in the table below, and each of the financial highlights for each of the periods indicated therein, in conformity with accounting principles generally accepted in the United States of America.
| | | | |
| Fund | | Statements of operations | | Statements of changes in net assets |
Loomis Sayles International Growth Fund | | For the year ended December 31, 2021 | | For the year ended December 31, 2021 and the period from December 15, 2020 (commencement of operations) through December 31, 2020 |
Natixis Oakmark International Fund | | For the year ended December 31, 2021 | | For the years ended December 31, 2021 and 2020 |
Natixis U.S. Equity Opportunities Fund | | For the year ended December 31, 2021 | | For the years ended December 31, 2021 and 2020 |
Vaughan Nelson Small Cap Value Fund | | For the year ended December 31, 2021 | | For the years ended December 31, 2021 and 2020 |
Natixis Oakmark Fund | | For the year ended December 31, 2021 | | For the years ended December 31, 2021 and 2020 |
Vaughan Nelson Mid Cap Fund | | For the year ended December 31, 2021 | | For the years ended December 31, 2021 and 2020 |
Basis for Opinions
These financial statements are the responsibility of the Funds’ management. Our responsibility is to express an opinion on the Funds’ financial statements based on our audits. We are a public accounting firm registered with the Public Company Accounting Oversight Board (United States) (PCAOB) and are required to be independent with respect to the Funds in accordance with the U.S. federal securities laws and the applicable rules and regulations of the Securities and Exchange Commission and the PCAOB.
We conducted our audits of these financial statements in accordance with the standards of the PCAOB. Those standards require that we plan and perform the audit to obtain reasonable assurance about whether the financial statements are free of material misstatement, whether due to error or fraud.
Our audits included performing procedures to assess the risks of material misstatement of the financial statements, whether due to error or fraud, and performing procedures that respond to those risks. Such procedures included examining, on a test basis, evidence regarding the amounts and disclosures in the financial statements. Our audits also included evaluating the accounting principles used and significant estimates made by management, as well as evaluating the overall presentation of the financial statements. Our procedures included confirmation of securities owned as of December 31, 2021 by correspondence with the custodian and brokers; when replies were not received from brokers, we performed other auditing procedures. We believe that our audits provide a reasonable basis for our opinions.
/s/ PricewaterhouseCoopers LLP
Boston, Massachusetts
February 22, 2022
We have served as the auditor of one or more of the investment companies in the Natixis Investment Company Complex since at least 1995. We have not been able to determine the specific year we began serving as auditor.
93 |
2021 U.S. Tax Distribution Information to Shareholders (Unaudited)
Corporate Dividends Received Deduction. For the fiscal year ended December 31, 2021, a percentage of dividends distributed by the Funds listed below qualify for the dividends received deduction for corporate shareholders. These percentages are as follows:
| | | | |
Fund | | Qualifying
Percentage | |
International Growth Fund | | | 1.44 | % |
Natixis Oakmark Fund | | | 100.00 | % |
U.S. Equity Opportunities Fund | | | 100.00 | % |
Mid Cap Fund | | | 34.22 | % |
Small Cap Value Fund | | | 6.62 | % |
Capital Gains Distributions. Pursuant to Internal Revenue Section 852(b), the following Funds paid distributions, which have been designated as capital gains distributions for the fiscal year ended December 31, 2021.
| | | | |
Fund | | Amount | |
Natixis Oakmark Fund | | $ | 22,797,197 | |
U.S. Equity Opportunities Fund | | | 105,015,654 | |
Mid Cap Fund | | | 41,214,262 | |
Small Cap Value Fund | | | 6,185,028 | |
Qualified Dividend Income. For the fiscal year ended December 31, 2021, a percentage of the ordinary income dividends paid by the Funds are considered qualified dividend income eligible for reduced tax rates. These lower rates range from 0% to 20% depending on an individual’s tax bracket. If the Funds paid a distribution during calendar year 2021, complete information will be reported in conjunction with Form 1099-DIV. These percentages are noted below:
| | | | |
Fund | | Qualifying
Percentage | |
International Growth Fund | | | 60.62 | % |
Natixis Oakmark Fund | | | 100.00 | % |
Natixis Oakmark International Fund | | | 100.00 | % |
U.S. Equity Opportunities Fund | | | 100.00 | % |
Mid Cap Fund | | | 38.22 | % |
Small Cap Value Fund | | | 8.99 | % |
Foreign Tax Credit. For the year ended December 31, 2021, the Fund intends to pass through foreign tax credits and have derived gross income from sources within foreign countries amounting to:
| | | | | | | | |
Fund | | Foreign Tax
Credit Pass-Through | | | Foreign Source
Income | |
International Growth Fund | | $ | 31,758 | | | $ | 312,432 | |
Natixis Oakmark International Fund | | | 1,138,609 | | | | 16,958,997 | |
| 94
Trustee and Officer Information
The tables below provide certain information regarding the Trustees and officers of Natixis Funds Trust I, Natixis Funds Trust II and Loomis Sayles Funds II (the “Trusts”). Unless otherwise indicated, the address of all persons below is 888 Boylston Street, Suite 800, Boston, MA 02199-8197. The Funds’ Statements of Additional Information include additional information about the Trustees of the Trusts and are available by calling Natixis Funds at 800-225-5478.
| | | | | | | | |
Name and Year of Birth | | Position(s) Held with
the Trusts, Length
of Time Served and Term of Office1 | | Principal
Occupation(s)
During Past 5 Years | | Number of Portfolios
in Fund Complex
Overseen2 and Other
Directorships Held
During Past 5 Years | | Experience,
Qualifications,
Attributes, Skills for
Board Membership |
|
| INDEPENDENT TRUSTEES |
| | | | |
Edmond J. English
(1953) | | Trustee since 2013 Chairperson of the Governance Committee and Contract Review Committee Member | | Executive Chairman of Bob’s Discount Furniture (retail) | | 55 Director, Burlington Stores, Inc. (retail) and Director, Rue Gilt Groupe, Inc. (e-commerce retail) | | Significant experience on the Board and on the boards of other business organizations (including retail companies and a bank); executive experience (including at a retail company) |
| | | | |
Richard A. Goglia
(1951) | | Trustee since 2015 Contract Review Committee Member and Governance Committee Member | | Retired | | 55 Formerly, Director of Triumph Group (aerospace industry) | | Significant experience on the Board and executive experience (including his role as vice president and treasurer of a defense company and experience at a financial services company) |
| | | | |
Wendell J. Knox
(1948) | | Trustee since 2009 Chairperson of the Contract Review Committee | | Retired | | 55 Director, Abt Associates Inc. (research and consulting); Director, The Hanover Insurance Group (property and casualty insurance); Formerly, Director, Eastern Bank (bank) | | Significant experience on the Board and on the boards of other business organizations (including at a bank and at a property and casualty insurance firm); executive experience (including roles as president and chief executive officer of a research and consulting company) |
95 |
Trustee and Officer Information
| | | | | | | | |
Name and Year of Birth | | Position(s) Held with
the Trusts, Length
of Time Served and Term of Office1 | | Principal
Occupation(s)
During Past 5 Years | | Number of Portfolios
in Fund Complex
Overseen2 and Other
Directorships Held
During Past 5 Years | | Experience,
Qualifications,
Attributes, Skills for
Board Membership |
|
| INDEPENDENT TRUSTEES – continued |
| | | | |
Martin T. Meehan
(1956) | | Trustee since 2012 Audit Committee Member and Governance Committee Member | | President, University of Massachusetts | | 55 None | | Significant experience on the Board and on the boards of other business organizations; experience as President of the University of Massachusetts; government experience (including as a member of the U.S. House of Representatives); academic experience |
| | | | |
Maureen B. Mitchell
(1951) | | Trustee since 2017 Audit Committee Member and Governance Committee Member | | Retired | | 55 Director, Sterling Bancorp (bank) | | Experience on the Board; financial services industry and executive experience (including role as president of global sales and marketing at a financial services company) |
| | | | |
James P. Palermo
(1955) | | Trustee since 2016 Audit Committee Member | | Founding Partner, Breton Capital Management, LLC (private equity); Partner, STEP Partners, LLC (private equity) | | 55 Director, FutureFuel.io (chemicals and biofuels) | | Significant experience on the Board; financial services industry and executive experience (including roles as chief executive officer of client management and asset servicing for a banking and financial services company) |
| | | | |
Erik R. Sirri
(1958) | | Chairperson of the Board of Trustees since January 2021 Trustee since 2009 Ex Officio member of the Audit Committee, Contract Review Committee and Governance Committee | | Professor of Finance at Babson College | | 55 None | | Significant experience on the Board; experience as Director of the Division of Trading and Markets at the Securities and Exchange Commission; academic experience; training as an economist |
| 96
Trustee and Officer Information
| | | | | | | | |
Name and Year of Birth | | Position(s) Held with
the Trusts, Length
of Time Served and Term of Office1 | | Principal
Occupation(s)
During Past 5 Years | | Number of Portfolios
in Fund Complex
Overseen2 and Other
Directorships Held
During Past 5 Years | | Experience,
Qualifications,
Attributes, Skills for
Board Membership |
|
| INDEPENDENT TRUSTEES – continued |
| | | | |
Peter J. Smail
(1952) | | Trustee since 2009 Audit Committee Member | | Retired | | 55 None | | Significant experience on the Board; mutual fund industry and executive experience (including roles as president and chief executive officer for an investment adviser) |
| | | | |
Kirk A. Sykes
(1958) | | Trustee since 2019 Contract Review Committee Member and Governance Committee Member | | Managing Director of Accordia Partners, LLC (real estate development); President of Primary Corporation (real estate development); Managing Principal of Merrick Capital Partners (infrastructure finance) | | 55 Trustee, Eastern Bank (bank); Director, Apartment Investment and Management Company (real estate investment trust); Formerly Director, Ares Commercial Real Estate Corporation (real estate investment trust) | | Experience on the Board and significant experience on the boards of other business organizations (including real estate companies and banks) |
| | | | |
Cynthia L. Walker
(1956) | | Trustee since 2005 Chairperson of the Audit Committee | | Retired; Formerly, Deputy Dean for Finance and Administration, Yale University School of Medicine | | 55 None | | Significant experience on the Board; executive experience in a variety of academic organizations (including roles as dean for finance and administration) |
|
| INTERESTED TRUSTEES |
| | | | |
Kevin P. Charleston3
(1965) One Financial Center Boston, MA 02111 | | Trustee since 2015 | | President, Chief Executive Officer and Chairman of the Board of Directors, Loomis, Sayles & Company, L.P. | | 55 None | | Significant experience on the Board; continuing service as President, Chief Executive Officer and Chairman of the Board of Directors of Loomis, Sayles & Company, L.P. |
97 |
Trustee and Officer Information
| | | | | | | | |
Name and Year of Birth | | Position(s) Held with
the Trusts, Length
of Time Served and Term of Office1 | | Principal
Occupation(s)
During Past 5 Years | | Number of Portfolios
in Fund Complex
Overseen2 and Other
Directorships Held
During Past 5 Years | | Experience,
Qualifications,
Attributes, Skills for
Board Membership |
|
| INTERESTED TRUSTEES – continued |
| | | | |
David L. Giunta4
(1965) | | Trustee since 2011 President and Chief Executive Officer of Natixis Funds Trust I, Natixis Funds Trust IIand President of Loomis Sayles Funds II; Chief Executive Officer of Loomis Sayles Funds II since 2015 | | President and Chief Executive Officer, Natixis Advisors, LLC and Natixis Distribution, LLC | | 55 None | | Significant experience on the Board; experience as President and Chief Executive Officer of Natixis Advisors, LLC and Natixis Distribution, LLC |
| 1 | Each Trustee serves until retirement, resignation or removal from the Board. The current retirement age is 75. The position of Chairperson of the Board is appointed for a three-year term. |
| 2 | The Trustees of the Trusts serve as Trustees of a fund complex that includes all series of the Natixis Funds Trust I, Natixis Funds Trust II, Natixis Funds Trust IV, Gateway Trust, Loomis Sayles Funds I, Loomis Sayles Funds II, Natixis ETF Trust and Natixis ETF Trust II (collectively, the “Fund Complex”). |
| 3 | Mr. Charleston is deemed an “interested person” of the Trusts because he holds the following positions with an affiliated person of the Trusts: President, Chief Executive Officer and Chairman of the Board of Directors of Loomis, Sayles & Company, L.P. |
| 4 | Mr. Giunta is deemed an “interested person” of the Trusts because he holds the following positions with an affiliated person of the Trusts: President and Chief Executive Officer, Natixis Advisors, LLC and Natixis Distribution, LLC. |
| 98
Trustee and Officer Information
| | | | | | |
Name and Year of Birth | | Position(s) Held
with the Trusts | | Term of Office1 and Length
of Time Served | | Principal Occupation(s)
During Past 5 Years2 |
|
| OFFICERS OF THE TRUSTS |
| | | |
Michael C. Kardok
(1959) | | Treasurer, Principal Financial and Accounting Officer | | Since 2004 | | Senior Vice President, Natixis Advisors, LLC and Natixis Distribution, LLC |
| | | |
Natalie R. Wagner
(1979) | | Chief Compliance Officer, Assistant Secretary and Anti-Money Laundering Officer Chief Legal Officer | | Since May 2021 Since July 2021 | | Senior Vice President, Natixis Advisors, LLC and Natixis Distribution, LLC; Formerly, Vice President, Head of Corporate Compliance, Global Atlantic Financial Group |
| 1 | Each officer of the Trusts serves for an indefinite term in accordance with the Trusts’ current by-laws until the date his or her successor is elected and qualified, or until he or she sooner dies, retires, is removed or becomes disqualified. |
| 2 | Each person listed above, except as noted, holds the same position(s) with the Fund Complex. Previous positions during the past five years with Natixis Distribution, LLC, Natixis Advisors, LLC or Loomis, Sayles & Company, L.P. are omitted, if not materially different from an officer’s current position with such entity. |
99 |


Annual Report
December 31, 2021
Gateway Fund
Gateway Equity Call Premium Fund
Mirova Global Green Bond Fund
Mirova Global Sustainable Equity Fund
Mirova International Sustainable Equity Fund
Mirova U.S. Sustainable Equity Fund
Table of Contents

GATEWAY FUND
| | |
| |
| Managers | | Symbols |
| |
| Daniel M. Ashcraft, CFA® | | Class A GATEX |
| |
| Michael T. Buckius, CFA® | | Class C GTECX |
| |
| Paul R. Stewart, CFA® | | Class N GTENX |
| |
| Kenneth H. Toft, CFA® | | Class Y GTEYX |
| |
| Mitchell J. Trotta, CFA® | | |
|
| Gateway Investment Advisers, LLC |
Investment Goal
The Fund seeks to capture the majority of returns associated with equity market investments, while exposing investors to less risk than other equity investments.
Management Discussion
2021 was the third consecutive year of double-digit return for the S&P 500® Index, powering its three-year cumulative return above 100% for the first time since early March 2012, a three-year period that began at the bear market bottom of the Great Financial Crisis. Additionally, returns were positive in each quarter of 2021, though the September equity market pullback brought that streak to the brink. The equity market started the year in impressive fashion with returns of 6.17% and 8.55% in the first and second quarters, respectively. Macroeconomic stabilization and improvement driven by a relaxation of pandemic mitigation policies and additional fiscal stimulus helped investors digest concerns surrounding the outlook for inflation, labor market imbalances, and rising interest rates. Equity market strength continued in July and August, but the S&P 500® Index eked out a third quarter return of just 0.58% as the market pulled back, surrendering to a growing list of investor concerns including new Covid-19 variants, the outlook for inflation and uncertainty surrounding fiscal and monetary policy. September’s decline carried into early October as the S&P 500® Index lost 5.12% from September 2 to October 4, its largest peak-to-trough drawdown of the year. The equity market’s fourth quarter was the strongest of all, with a return of 11.03%, but was not the smoothest as inflation and monetary policy concerns drove a short but intense bout of volatility mid-quarter. The S&P 500® Index ended the year just shy of its all-time high reached on December 29.
The downtrend in implied volatility that began after the Cboe® Volatility Index (the VIX®) peaked at record levels in March 2020 continued over the first half of 2021. The VIX® spent most of the year ranging from the mid-teens to the low 20s while posting 21 days of closing values above 25, including six days when it closed above 30. The result was an average closing value of 19.66 for the year, slightly above its long-term average of 19.48. While the downtrend brought the measure to below-average levels at various points throughout the year, it never closed below 15, thus establishing a Covid-19 era low that was above the low readings that persisted for several years prior to the pandemic. Specifically, the VIX® averaged 14.86 during the seven-year period from 2013 to 2019. Although implied volatility was elevated in 2021, realized volatility, as measured by the standard deviation of daily returns for the S&P 500® Index, was below-average at 13.09% for the year. The spread between S&P 500® Index realized volatility and average implied volatility, often referred to as the Volatility Risk Premium (VRP), was positive in 2021, as is typical. However, the spread was consistently wider than normal as VRP ended the year on a 15-month trend of readings that have been above the historical monthly average of 4.15%.
Performance Results
For the 12 months ended December 31, 2021, Class Y shares of the Gateway Fund returned 11.49% at net asset value. The Fund’s primary benchmark, the S&P 500® Index, returned 28.71% for the same period, while its secondary benchmark, the Bloomberg U.S. Aggregate Bond Index, returned -1.54%.
Explanation of Fund Performance
The Fund invests in a broadly diversified portfolio of common stocks that is designed to track the performance of the S&P 500® Index, while also selling index call options and purchasing index put options. The Fund seeks to generate returns by creating cash flow through writing at-the-money index call options against the full value of its underlying equity portfolio. The written call options, premium levels of which have a high correlation to volatility, provide cash flow into the Fund, yet may limit upside participation in an equity market advance. The Fund uses some of the cash flow from index call option writing to purchase out-of-the-money index put options to mitigate sudden and severe price declines in the equity portfolio. An index call option is considered at-the-money when the price of the underlying index is the same as the option’s strike price. Additionally, an index put option is deemed out-of-the money when its strike price is below the price of the underlying index. It is the net premium-to-earn from selling index call options less the price of protective index put options that is a significant factor in determining how much participation the Fund will have in a rising
1 |
market and how much downside mitigation is delivered in a declining market. In the long term, the combination of the diversified stock portfolio, steady cash flow from the sale of index call options and downside mitigation from index put options is intended to provide the Fund with a majority of the returns associated with equity market investments while exposing investors to less risk.
The Fund underperformed its primary benchmark for the year while achieving the risk component of its objective by exhibiting less than half the risk of the equity market. 2021 marked the Fund’s highest calendar year return since 2003. Returns for the year were buoyed by relatively elevated implied volatility and active management focused on the higher volatility priced into longer-dated call option contracts and a persistently above-average VRP. The Fund’s two-part option strategy delivered significant risk mitigation during market declines and equity market participation during the periods in which the equity market advanced. Specifically, the Fund had smaller losses than the S&P 500® Index when equity market returns were negative in January, September and November and provided 2.51 percentage points of risk mitigation with a return of -2.61% during the max drawdown period for the S&P 500® Index from September 2 through October 4. The Fund’s positive but lagging returns of 3.23%, 3.98% and 4.32% in the first, second and fourth quarters of 2021 led to underperformance for the year as the Fund was unable to keep pace with the S&P 500® Index’s strong advances. When the equity market advances at an above-average rate, underperformance is expected, as the risk-reducing option strategy generates losses that detract from return. Consequently, the fourth quarter, which was the strongest equity market quarter of the year, produced the most significant period of lagging performance for the Fund. From October 4 through November 18, the equity market’s recovery from its largest loss of the year developed into a rally to new highs and the S&P 500® Index advanced 9.60%, while the Fund generated a return of 4.06%. Over the remainder of the year, the S&P 500® Index added 1.47% to its return while the Fund returned 0.43%.
The Fund’s equity portfolio returned 28.38% in 2021, a performance differential of (0.33) percentage points versus the S&P 500® Index. Consistent with its investment objective, the measured risk of the Fund was low relative to the US equity market, as its standard deviation of daily returns for 2021 was 6.12% versus 13.09% for the S&P 500® Index.
The Fund began the year with index put option coverage in a range of 80% to 95%, a positioning that had been maintained since August 2020. The investment team incrementally added index put options in January, restoring put coverage to greater than 95% by the end of the month. The increases in put coverage in January were executed in conjunction with adjustments to the Fund’s written call option positions with the goal of maintaining a consistent risk profile while benefiting from lower put costs. Amid heightened equity market volatility in late November and early December, Gateway’s investment team opportunistically monetized higher volatility being priced into index put contracts and preserved index put gains in the event of a sudden and sharp market recovery, while maintaining the Fund’s typical risk profile. The investment team closed out one index put option position on December 3, lowering put coverage to a range of 80% to 95%. This position was maintained until December 16 when the investment team restored put coverage to greater than 95% as index put options became more reasonably priced when VIX® levels declined from their relatively elevated levels earlier in the month. The Fund maintained a portfolio of written index call options on the full value of its equity holdings over the course of the year, while making active adjustments to positions in response to changing market conditions and opportunistically taking advantage of the higher implied volatility that was priced into longer-dated contracts.
Outlook
Gateway’s investment philosophy is informed by its long history and maintains that the equity market is the most reliable source of attractive long-term returns, despite its high volatility relative to other asset classes and tendency to periodically deliver significant short-term losses. Gateway’s investment philosophy also holds that consistency is key to long-term success and that generating cash flow with index options, rather than seeking to forecast the market, can lower the risk of participating in equity markets. By staying true to this philosophy and continuing to manage strategies consistent with the firm’s historical approach, Gateway assists Fund shareholders in managing risk while pursuing long-term returns in an uncertain environment. Rather than attempting to anticipate how events will unfold, Gateway will continue to focus on making prudent adjustments to its option portfolios to maintain the risk profile of the Fund in response to changing market conditions.
| 2
GATEWAY FUND
Hypothetical Growth of $100,000 Investment in Class Y Shares4
December 31, 2011 through December 31, 2021
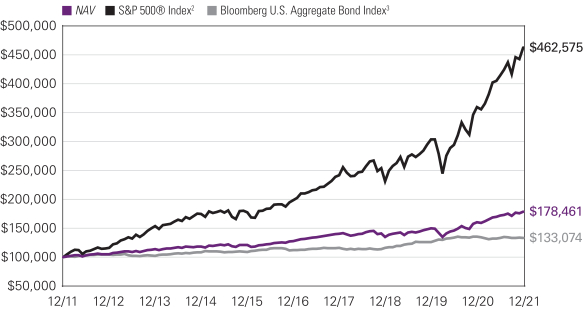
Top Ten Holdings as of December 31, 2021
| | | | | | | | |
| | |
| Security Name | | % of Net
Assets | |
| | 1 | | | Apple, Inc. | | | 7.07 | % |
| | 2 | | | Microsoft Corp. | | | 6.37 | |
| | 3 | | | Amazon.com, Inc. | | | 3.70 | |
| | 4 | | | Alphabet, Inc., Class C | | | 3.21 | |
| | 5 | | | Tesla, Inc. | | | 2.12 | |
| | 6 | | | Meta Platforms, Inc., Class A | | | 2.10 | |
| | 7 | | | NVIDIA Corp. | | | 1.88 | |
| | 8 | | | JPMorgan Chase & Co. | | | 1.70 | |
| | 9 | | | Berkshire Hathaway, Inc., Class B | | | 1.58 | |
| | 10 | | | UnitedHealth Group, Inc. | | | 1.54 | |
The portfolio is actively managed and holdings are subject to change. There is no guarantee the Fund continues to invest in the securities referenced. The holdings listed exclude any temporary cash investments, are presented on an individual security basis and do not represent holdings of the issuer.
3 |
Average Annual Total Returns – December 31, 20214
| | | | | | | | | | | | | | | | | | | | | | | | |
| | | | | | |
| | | 1 Year | | | 5 Years | | | 10 Years | | | Life of
Class N | | | Expense Ratios5 | |
| | Gross | | | Net | |
| | | | | | | |
| Class Y | | | | | | | | | | | | | | | | | | | | | | | | |
| NAV | | | 11.49 | % | | | 6.94 | % | | | 5.96 | % | | | — | | | | 0.72 | % | | | 0.70 | % |
| | | | | | | |
| Class A | | | | | | | | | | | | | | | | | | | | | | | | |
| NAV | | | 11.24 | | | | 6.69 | | | | 5.71 | | | | — | | | | 0.97 | | | | 0.94 | |
| With 5.75% Maximum Sales Charge | | | 4.85 | | | | 5.43 | | | | 5.09 | | | | — | | | | | | | | | |
| | | | | | | |
| Class C | | | | | | | | | | | | | | | | | | | | | | | | |
| NAV | | | 10.41 | | | | 5.89 | | | | 5.07 | | | | — | | | | 1.72 | | | | 1.70 | |
| With CDSC1 | | | 9.41 | | | | 5.89 | | | | 5.07 | | | | — | | | | | | | | | |
| | | | | | | |
| Class N (Inception 5/1/17) | | | | | | | | | | | | | | | | | | | | | | | | |
| NAV | | | 11.57 | | | | — | | | | — | | | | 6.66 | | | | 0.65 | | | | 0.65 | |
| | | | | | | |
| Comparative Performance | | | | | | | | | | | | | | | | | | | | | | | | |
| S&P 500® Index2 | | | 28.71 | | | | 18.47 | | | | 16.55 | | | | 18.02 | | | | | | | | | |
| Bloomberg U.S. Aggregate Bond Index3 | | | -1.54 | | | | 3.57 | | | | 2.90 | | | | 3.51 | | | | | | | | | |
Performance data shown represents past performance and is no guarantee of, and not necessarily indicative of, future results. Total return and value will vary, and you may have a gain or loss when shares are sold. Current performance may be lower or higher than quoted. For more recent month-end performance, visit im.natixis.com/performance. Performance for other share classes will be greater or less than shown based on differences in fees and sales charges. You may not invest directly in an index. Performance for periods less than one year is cumulative, not annualized. Returns reflect changes in share price and reinvestment of dividends and capital gains, if any. The table(s) do not reflect taxes shareholders might owe on any fund distributions or when they redeem their shares.
| 1 | Performance for Class C shares assumes a 1% contingent deferred sales charge (“CDSC”) applied when you sell shares within one year of purchase, and includes automatic conversion to Class A shares after eight years. |
| 2 | S&P 500® Index is a widely recognized measure of U.S. stock market performance. It is an unmanaged index of 500 common stocks chosen for market size, liquidity, and industry group representation, among other factors. It also measures the performance of the large cap segment of the US equities market. |
| 3 | The Bloomberg U.S. Aggregate Bond Index is a broad-based index that covers the U.S. dollar-denominated, investment-grade, fixed-rate, taxable bond market of SEC-registered securities. The index includes bonds from the Treasury, government-related, corporate, mortgage-backed securities, asset-backed securities, and collateralized mortgage-backed securities sectors. |
| 4 | Fund performance has been increased by fee waivers and/or expense reimbursements, if any, without which performance would have been lower. |
| 5 | Expense ratios are as shown in the Fund’s prospectus in effect as of the date of this report. The expense ratios for the current reporting period can be found in the Financial Highlights section of this report under Ratios to Average Net Assets. Net expenses reflect contractual expense limitations set to expire on 4/30/22. When a Fund’s expenses are below the limitation, gross and net expense ratios will be the same. See Note 6 of the Notes to Financial Statements for more information about the Fund’s expense limitations. |
| 4
GATEWAY EQUITY CALL PREMIUM FUND
| | |
| |
| Managers | | Symbols |
| |
| Daniel M. Ashcraft, CFA® | | Class A GCPAX |
| |
| Michael T. Buckius, CFA® | | Class C GCPCX |
| |
| Kenneth H. Toft, CFA® | | Class N GCPNX |
| |
| Mitchell J. Trotta, CFA® | | Class Y GCPYX |
| |
| Gateway Investment Advisers, LLC | | |
Investment Goal
The Fund seeks total return with less risk than U.S. equity markets.
Management Discussion
2021 was the third consecutive year of double-digit return for the S&P 500® Index, powering its three-year cumulative return above 100% for the first time since early March 2012, a three-year period that began at the bear market bottom of the Great Financial Crisis. Additionally, returns were positive in each quarter of 2021, though the September equity market pullback brought that streak to the brink. The equity market started the year in impressive fashion with returns of 6.17% and 8.55% in the first and second quarters, respectively. Macroeconomic stabilization and improvement driven by a relaxation of pandemic mitigation policies and additional fiscal stimulus helped investors digest concerns surrounding the outlook for inflation, labor market imbalances, and rising interest rates. Equity market strength continued in July and August, but the S&P 500® Index eked out a third quarter return of just 0.58% as the market pulled back, surrendering to a growing list of investor concerns including new Covid-19 variants, the outlook for inflation and uncertainty surrounding fiscal and monetary policy. September’s decline carried into early October as the S&P 500® Index lost 5.12% from September 2 to October 4, its largest peak-to-trough drawdown of the year. The equity market’s fourth quarter was the strongest of all, with a return of 11.03%, but was not the smoothest as inflation and monetary policy concerns drove a short but intense bout of volatility mid-quarter. The S&P 500® Index ended the year just shy of its all-time high reached on December 29.
The downtrend in implied volatility that began after the Cboe® Volatility Index (the VIX®) peaked at record levels in March 2020 continued over the first half of 2021. The VIX® spent most of the year ranging from the mid-teens to the low 20s while posting 21 days of closing values above 25, including 6 days when it closed above 30. The result was an average closing value of 19.66 for the year, slightly above its long-term average of 19.48. While the downtrend brought the measure to below-average levels at various points throughout the year, it never closed below 15, thus establishing a Covid-19 era low that was above the low readings that persisted for several years prior to the pandemic. Specifically, the VIX® averaged 14.86 during the seven-year period from 2013 to 2019. Although implied volatility was elevated in 2021, realized volatility, as measured by the standard deviation of daily returns for the S&P 500® Index, was below-average at 13.09% for the year. The spread between S&P 500® Index realized volatility and average implied volatility, often referred to as the Volatility Risk Premium (VRP), was positive in 2021, as is typical. However, the spread was consistently wider than normal as VRP ended the year on a 15-month trend of readings that have been above the historical monthly average of 4.15%.
Performance Results
For the 12 months ended December 31, 2021, Class Y shares of the Gateway Equity Call Premium Fund returned 19.43% at net asset value. The Fund underperformed its primary benchmark, the Cboe S&P 500 BuyWrite Index (BXMSM), which returned 20.47% for the period. The Fund also underperformed its secondary benchmark, the S&P 500® Index, returned 28.71%.
Explanation of Fund Performance
The Fund invests in a broadly diversified portfolio of common stocks that is designed to track the performance of the S&P 500® Index and support its index option-based risk management strategy as efficiently as possible while seeking to enhance the Fund’s after-tax total return. The Fund seeks to generate returns by writing at- and near-the-money index call options against the full value of its underlying equity portfolio. The steady cash flow from call option writing is intended to be an important source of the Fund’s return, although it reduces the Fund’s ability to profit from increases in the value of its equity portfolio. The index call options written by the Fund often have similar characteristics to the single index call option present in the BXMSM at any given time. However, unlike the BXMSM, the Fund employs an active strategy that gives its management team discretion to diversify expiration dates and strike prices across a portfolio of index call options and to opportunistically pursue attractive call premiums while maintaining a relatively consistent risk profile.
The Fund underperformed its primary benchmark for the year while achieving the risk component of its objective by exhibiting less risk than the equity market. 2021 marked the Fund’s highest calendar-year return since its inception in 2014. Returns for the year were buoyed by relatively elevated implied volatility and active management focused on the higher volatility priced into longer-dated call option contracts and a persistently above-average VRP. The Fund’s diversified and active index call option writing approach
5 |
generated risk reducing cash flow throughout 2021 while delivering equity market participation during periods in which the equity market advanced and downside risk mitigation during market declines. Specifically, the Fund produced positive returns in all four quarters while incurring smaller losses than the S&P 500® Index in January, September, and November when equity market returns were negative. Furthermore, the Fund provided loss mitigation of 2.28 percentage points during the maximum drawdown period for the S&P 500® Index with a return of -2.84% from September 2 through October 4. After outperforming the BXMSM in the first half of the year with a return of 11.41% compared to the BXM’sSM return of 11.10%, the Fund underperformed in the second half with a return of 7.20%, compared to the BXM’sSM return of 8.43%. This was due primarily to the Fund’s performance during the equity market’s recovery and rally to new highs after its brief but sharp decline from late November to early December. As the equity market began to recover, the BXMSM was better positioned for a market advance, having more market exposure than usual because the index call option it wrote in November was far out-of-the-money after the equity market decline. The Fund, in contrast, had less market exposure than the BXMSM because its actively managed approach lowered the weighted-average strike price of its written call option portfolio as the market declined in order to maintain its typical risk profile. Consequently, as the market advanced over the remainder of December, the BXMSM returned 4.86%, while the Fund returned 3.64%, underperforming by 1.22%. Prior to December’s equity market advance, the Fund had outperformed the BXMSM in 2021, as its year-to-date return through December 1 was 15.23% compared to 14.89% for the BXMSM. .
The Fund’s equity portfolio returned 28.87% for the year, a performance differential of positive 0.16 percentage points versus the S&P 500® Index. The measured risk of the Fund was lower than that of the US equity market and the BXMSM, as its standard deviation of daily returns for 2021 was 8.50%, versus 13.09% and 8.61% for the S&P 500® Index and the BXMSM, respectively.
Outlook
Gateway’s investment philosophy is informed by its long history and maintains that the equity market is the most reliable source of attractive long-term returns, despite its high volatility relative to other asset classes and tendency to periodically deliver significant short-term losses. Gateway’s investment philosophy also holds that consistency is key to long-term success and that generating cash flow with index options, rather than seeking to forecast the market, can lower the risk of participating in equity markets. By staying true to this philosophy and continuing to manage strategies consistent with the firm’s historical approach, Gateway assists Fund shareholders in managing risk while pursuing long-term returns in an uncertain environment. Rather than attempting to anticipate how events will unfold, Gateway will continue to focus on making prudent adjustments to its option portfolios to maintain the risk profile of the Fund in response to changing market conditions.
Hypothetical Growth of $100,000 Investment in Class Y Shares4
September 30, 2014 (inception) through December 31, 2021
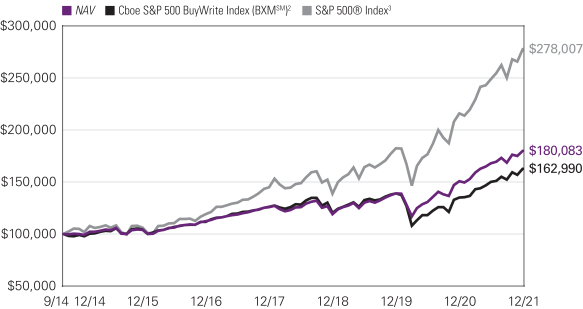
See notes to chart on page 7.
| 6
GATEWAY EQUITY CALL PREMIUM FUND
Top Ten Holdings as of December 31, 2021
| | | | | | | | |
| | |
| Security Name | | % of Net
Assets | |
| | 1 | | | Apple, Inc. | | | 6.84 | % |
| | 2 | | | Microsoft Corp. | | | 6.26 | |
| | 3 | | | Amazon.com, Inc. | | | 3.68 | |
| | 4 | | | Alphabet, Inc., Class A | | | 2.17 | |
| | 5 | | | Tesla, Inc. | | | 2.13 | |
| | 6 | | | Alphabet, Inc., Class C | | | 2.04 | |
| | 7 | | | Meta Platforms, Inc., Class A | | | 2.00 | |
| | 8 | | | NVIDIA Corp. | | | 1.88 | |
| | 9 | | | Berkshire Hathaway, Inc., Class B | | | 1.55 | |
| | 10 | | | UnitedHealth Group, Inc. | | | 1.46 | |
The portfolio is actively managed and holdings are subject to change. There is no guarantee the Fund continues to invest in the securities referenced. The holdings listed exclude any temporary cash investments, are presented on an individual security basis and do not represent holdings of the issuer.
Average Annual Total Returns – December 31, 20214
| | | | | | | | | | | | | | | | | | | | | | | | |
| | | | | |
| | | 1 Year | | | 5 Years | | | Life of Class | | | Expense Ratios5 | |
| | Gross | | | Net | |
| | | | | | | |
| Class Y (Inception 9/30/14) | | | | | | | | | | | Class Y/A/C | | | | Class N | | | | | | | | | |
| NAV | | | 19.43 | % | | | 9.91 | % | | | 8.45 | % | | | — | | | | 1.10 | % | | | 0.68 | % |
| | | | | | | |
| Class A (Inception 9/30/14) | | | | | | | | | | | | | | | | | | | | | | | | |
| NAV | | | 19.20 | | | | 9.63 | | | | 8.19 | | | | — | | | | 1.36 | | | | 0.93 | |
| With 5.75% Maximum Sales Charge | | | 12.32 | | | | 8.34 | | | | 7.31 | | | | — | | | | | | | | | |
| | | | | | | |
| Class C (Inception 9/30/14) | | | | | | | | | | | | | | | | | | | | | | | | |
| NAV | | | 18.28 | | | | 8.80 | | | | 7.39 | | | | — | | | | 2.10 | | | | 1.68 | |
| With CDSC1 | | | 17.28 | | | | 8.80 | | | | 7.39 | | | | — | | | | | | | | | |
| | | | | | | |
| Class N (Inception 5/1/17) | | | | | | | | | | | | | | | | | | | | | | | | |
| NAV | | | 19.49 | | | | — | | | | — | | | | 9.67 | | | | 1.22 | | | | 0.63 | |
| | | | | | | |
| Comparative Performance | | | | | | | | | | | | | | | | | | | | | | | | |
| Cboe S&P 500 BuyWrite Index (BXMSM)2 | | | 20.47 | | | | 7.84 | | | | 6.97 | | | | 7.28 | | | | | | | | | |
| S&P 500® Index3 | | | 28.71 | | | | 18.47 | | | | 15.08 | | | | 18.02 | | | | | | | | | |
Performance data shown represents past performance and is no guarantee of, and not necessarily indicative of, future results. Total return and value will vary, and you may have a gain or loss when shares are sold. Current performance may be lower or higher than quoted. For most recent month-end performance, visit im.natixis.com/performance. Performance for other share classes will be greater or less than shown based on differences in fees and sales charges. You may not invest directly in an index. Performance for periods less than one year is cumulative, not annualized. Returns reflect changes in share price and reinvestment of dividends and capital gains, if any. The table(s) do not reflect taxes shareholders might owe on any fund distributions or when they redeem their shares.
| 1 | Performance for Class C shares assumes a 1% contingent deferred sales charge (“CDSC”) applied when you sell shares within one year of purchase, and includes automatic conversion to Class A shares after eight years. |
| 2 | The Cboe S&P 500 BuyWrite Index (BXMSM) is a benchmark index designed to track the performance of a hypothetical buy-write strategy on the S&P 500® Index. The BXM is a passive total return index based on (1) buying an S&P 500 stock index portfolio, and (2) “writing” (or selling) the near-term S&P 500® Index (SPXSM) “covered” call option, generally on the third Friday of each month. The SPX call written will have about one month remaining to expiration, with an exercise price just above the prevailing index level (i.e., slightly out of the money). The SPX call is held until expiration and cash settled, at which time a new one-month, near-the-money call is written. |
| 3 | S&P 500® Index is a widely recognized measure of U.S. stock market performance. It is an unmanaged index of 500 common stocks chosen for market size, liquidity, and industry group representation, among other factors. It also measures the performance of the large cap segment of the US equities market. |
| 4 | Fund performance has been increased by fee waivers and/or expense reimbursements, if any, without which performance would have been lower. |
| 5 | Expense ratios are as shown in the Fund’s prospectus in effect as of the date of this report. The expense ratios for the current reporting period can be found in the Financial Highlights section of this report under Ratios to Average Net Assets. Net expenses reflect contractual expense limitations set to expire on 4/30/23. When a Fund’s expenses are below the limitation, gross and net expense ratios will be the same. See Note 6 of the Notes to Financial Statements for more information about the Fund’s expense limitations. |
7 |
MIROVA GLOBAL GREEN BOND FUND
| | |
| |
| Managers | | Symbols |
| |
| Marc Briand | | Class A MGGAX |
| |
| Charles Portier | | Class N MGGNX |
| |
| Bertrand Rocher | | Class Y MGGYX |
| |
| Mirova US LLC | | |
Investment Goal
The Fund seeks to provide total return, through a combination of capital appreciation and current income, by investing in green bonds.
Market Conditions
In wake of 2020, we anticipated that 2021 would be i) far less impacted by the Covid-19 crisis and ii) marked by inflation blips as a result of a combination of central banks’ balance sheet expansion, production bottlenecks, and consumers’ willingness to spend the cash reserves they had accumulated over lockdowns and curfews. The Delta variant has derailed this scenario, except for inflation, which has driven rates far higher on the back of fears that central banks would little by little have to accept that surging prices could last longer than they were previously claiming. This is what has driven the German Bund from -0.60% to -0.18% and US 10-year rates from 0.90% to 1.50% over the year, with dramatic swings which were largely attributable to Delta. Credit markets rallied up to the end of November when the discovery of the Omicron variant ignited a wave of panic that quickly dissipated due to the variants’ lack of severity.
Performance Results
For the 12 months ended December 31, 2021, Class Y shares of the Mirova Global Green Bond Fund returned -2.69% at net asset value. The Fund underperformed its benchmark, the Bloomberg MSCI Green Bond Index – USD Hedged, which returned -2.30%.
Explanation of Fund Performance
The duration and curve strategy detracted from performance as the Fund’s global duration was set lower than the index during February on the long end of the curve when yields globally went down due to the Delta variant. Furthermore, the curve flattening had negative performance implications for the Fund.
From an allocation perspective, the Fund’s strategy was positive. The long position in corporates versus other asset classes paid off. Since the beginning of the year, we saw value in this asset class, which had full support from central banks. Credit exposure represented approximately 50% of the Fund during the year.
Security selection decisions brought value, mainly within the corporate sector. The main contributors were Baywa, Vena Energy and Orsted. Baywa is a German group specialized in energy, agriculture and building materials. Credit spreads on the Fund’s holdings contracted by 100 basis points (bps), due to their positive business, driving performance. Vena Energy is a utility company from Singapore, whose credit spreads on the Fund’s holdings contracted, due to the issuer’s high beta profile, resulting in positive contributions to overall returns., Orsted, which is one of the leaders in offshore wind turbines in Europe, benefited from spreads contracting.
Outlook
As Omicron is reportedly less aggressive than the Delta variant it is beginning to overcome, there is a decent probability that the Covid-19 crisis loses further traction, which may fuel even more positive momentum for the economy, especially for the lowest paid workers, provided central banks manage to curb inflation without jeopardizing the growth prospects we think are very solid. We believe central bankers will have the means to reach that target, which means 2022 might be constructive. The only real cloud on the horizon remains whether Russia’s Putin and the Western leaders might find an agreement to avoid prompting any kind of intervention of either NATO or Russia, if not both, in Ukraine.
| 8
MIROVA GLOBAL GREEN BOND FUND
Hypothetical Growth of $100,000 Investment in Class Y Shares2
February 28, 2017 (inception) through December 31, 2021
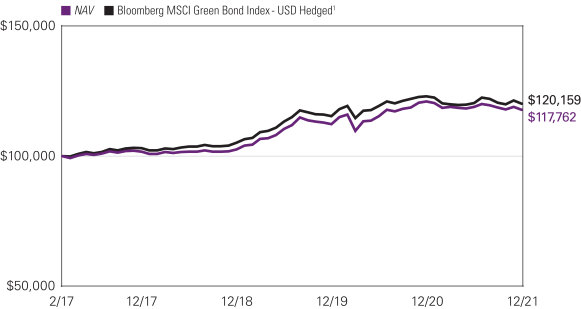
Average Annual Total Returns – December 31, 20212
| | | | | | | | | | | | | | | | |
| | | | |
| | | 1 Year | | | Life of Fund | | | Expense Ratios3 | |
| | | Gross | | | Net | |
| | | | | |
| Class Y (Inception 2/28/17) | | | | | | | | | | | | | | | | |
| NAV | | | -2.69 | % | | | 3.43 | % | | | 1.14 | % | | | 0.68 | % |
| | | | | |
| Class A (Inception 2/28/17) | | | | | | | | | | | | | | | | |
| NAV | | | -3.02 | | | | 3.17 | | | | 1.39 | | | | 0.93 | |
| With 4.25% Maximum Sales Charge | | | -7.16 | | | | 2.26 | | | | | | | | | |
| | | | | |
| Class N (Inception 2/28/17) | | | | | | | | | | | | | | | | |
| NAV | | | -2.73 | | | | 3.49 | | | | 1.03 | | | | 0.63 | |
| | | | | |
| Comparative Performance | | | | | | | | | | | | | | | | |
| Bloomberg MSCI Green Bond Index – USD Hedged1 | | | -2.30 | | | | 3.85 | | | | | | | | | |
Performance data shown represents past performance and is no guarantee of, and not necessarily indicative of, future results. Total return and value will vary, and you may have a gain or loss when shares are sold. Current performance may be lower or higher than quoted. For most recent month-end performance, visit im.natixis.com/performance. Performance for other share classes will be greater or less than shown based on differences in fees and sales charges. You may not invest directly in an index. Performance for periods less than one year is cumulative, not annualized. Returns reflect changes in share price and reinvestment of dividends and capital gains, if any. The table(s) do not reflect taxes shareholders might owe on any fund distributions or when they redeem their shares.
| 1 | The Bloomberg MSCI Green Bond Index - USD Hedged provides a broad-based measure of global fixed-income securities issued to fund projects with direct environmental benefits according to MSCI ESG Research’s green bond criteria. The green bonds are primarily investment-grade, or may be classified by other sources when bond ratings are not available. The Index may include green bonds from the corporate, securitized, Treasury, or government-related sectors. |
| 2 | Fund performance has been increased by fee waivers and/or expense reimbursements, if any, without which performance would have been lower. |
| 3 | Expense ratios are as shown in the Fund’s prospectus in effect as of the date of this report. The expense ratios for the current reporting period can be found in the Financial Highlights section of this report under Ratios to Average Net Assets. Net expenses reflect contractual expense limitations set to expire on 4/30/23. When a Fund’s expenses are below the limitation, gross and net expense ratios will be the same. See Note 6 of the Notes to Financial Statements for more information about the Fund’s expense limitations. |
9 |
MIROVA GLOBAL SUSTAINABLE EQUITY FUND
| | |
| |
| Managers | | Symbols |
| |
| Jens Peers, CFA® | | Class A ESGMX |
| |
| Hua Cheng, CFA®, PhD | | Class C ESGCX |
| |
| Amber Fairbanks, CFA® | | Class N ESGNX |
| |
| Mirova US LLC | | Class Y ESGYX |
Investment Goal
The Fund seeks long-term capital appreciation.
Market Conditions
2021 was generally a very positive year for global equity investors, albeit with high levels of volatility. Low interest rates and central bank support through bond buy-back programs provided an almost endless level of money supply for the economy and markets. This has pushed up valuations in equity markets, especially in high growth sectors and the US market in general. Inflation and concerns that this favorable low interest rate environment may soon end have led to a sector and style rotation during 2021. Traditional energy companies and banks benefited the most, also helped by higher oil prices and higher interest rates, respectively. Renewable energy stocks underperformed significantly, having entered the year with relatively high valuations. Increased competition from oil and gas companies, combined with supply chain issues (raw material price inflation and transportation issues), further impacted margins negatively in the wind sector, and less favorable proposed regulation in California adversely impacted solar companies. Growth stocks posted generally strong results, but we saw that many large technology stocks are also not immune to wage inflation and supply chain issues.
In the real world, natural disasters caused human and economic tragedies. Wildfires in southern Europe and California, floods in Germany, Austria and Belgium, and Hurricane Ida are major examples of this year’s climate change-related disasters, with a combined economic cost of well over $100 billion. Markets didn’t blink, at least not until September when it became clear that Chinese property developer China Evergrande, a group with $260 billion in debt, was in financial trouble; fears of another Lehman scenario led to a quick correction in equity prices globally. Elsewhere in the market, oil and gas prices continued their upward trajectory as demand increased while supply did not follow the same path, even causing some bankruptcies in the UK utility sector. A shortage of drivers in the transportation sector and a general lack of employees in other sectors created shortages and wage inflation. Nonetheless, earnings growth in developed markets was, on average, stronger than expected in 2021, pushing global equity markets to all-time highs in November. However, the year ended as it started, with high volatility as some economies found themselves again in lockdown because of concerns around the Omicron variant of the Covid-19 virus.
Performance Results
For the 12 months ended December 31, 2021, Class Y shares of the Mirova Global Sustainable Equity Fund returned 18.06% at net asset value. The Fund underperformed its benchmark, the MSCI World Index (Net), which returned 21.82%.
Explanation of Fund Performance
There were a few drivers of the strategy’s underperformance in 2021. The strategy focuses on investing in companies positively exposed to long-term secular trends, resulting in less cyclical exposure compared to the broad market. The strategy has no exposure to traditional energy and is underweight financials, particularly large banks as the team doesn’t see them as being positively exposed to secular trends. Energy and financials performed very strongly during the year, and the lack of exposure in these sectors hurt relative performance.
Alternative energy stocks Orsted and Vestas declined significantly during the year. Given a strong outlook for the long-term demand environment for renewable energy, particularly offshore wind, and with both stocks having sustainable competitive advantages, the team remains comfortable continuing to hold them. Although competition has increased, updated valuation analysis incorporating significantly increased competition in their markets shows both stocks are trading at significant discounts to intrinsic value.
Stock selection in Communication Services, coupled with a significant underweight to the sector, positively impacted performance. Additionally, stock selection within Health Care benefitted performance driven by continued strong performance from healthcare equipment providers ThermoFisher and Danaher, along with Novo Nordisk and Eli Lilly.
The portfolio invests in companies offering solutions to and/or expecting to benefit from the demographic, technological, environmental and governance-related transitions that are expected to transform the world’s economies and societies during the next decade.
| 10
MIROVA GLOBAL SUSTAINABLE EQUITY FUND
From a geographical standpoint, the portfolio is underweight the U.S. This regional allocation is driven by bottom-up valuation; the U.S. is on its 12th year of outperforming international markets and the team continues to find better valued opportunities outside the U.S.
The portfolio continues to have a bias to European names while being underweight US names; this bias is a result of bottom-up fundamental analysis where the team is finding more attractively priced securities outside of the US, given US outperformance over international markets since 2011. In terms of sector exposure, the portfolio currently has no exposure to energy (oil and gas extraction) or real estate and is underweight financials. This is mainly driven by valuation (real estate) and the team’s thematic and sustainability approach as trends like the digitalization of our economy, which saw strong Covid-19-related growth, are expected to continue to grow strongly. Similarly, support for the health care sector is expected to show solid growth as a reaction to COVID-19 in the short-term, and as a result of an aging population and continued focus on health and well-being in the longer-term; as such, the portfolio remains overweight health care. There is also an underweight position in the more defensive consumer staples sector, which to some extent is offset by an overweight position in materials (mainly natural food ingredients). With many governments still committed to keeping global warming limited to a 2-degree Celsius scenario, we expect climate change to remain a driver of political debate, and the portfolio will continue to shy away from fossil fuel extraction in favor of renewables and companies focused on energy efficiency. The team continues to prefer companies with strong balance sheets, solid management teams, and positive exposure to long-term secular trends.
During the first quarter of 2021, the investment team trimmed several stocks where they did not see as much upside in valuation after strong stock runs including Signature Bank, Aptiv, Novo Nordisk, and Alphabet. The proceeds were used to add to Takeda, the Japanese pharmaceutical company, and technology company Adobe. We also initiated positions in Nvidia Corp. and Eli Lilly & Co.
In the second quarter, the investment team exited positions in Chr. Hansen Holding A/S, Coloplast, and Danone, and added to Bright Horizons and NVIDIA.
During the third quarter the team added to their position in AIA Group Ltd. AIA is the leader in the Asian life insurance market with business in more than 15 Asian countries. It is uniquely positioned to benefit from the structural long-term opportunities driven by higher population growth, stronger income growth and lower life insurance penetration in Asian countries. Its stock price was recently hurt, partly by new Delta variant concerns, and its valuation became more attractive, presenting a great opportunity for the investment team to add to the position.
Over the course of the fourth quarter, the team exited positions in both Alphabet Inc. and Eaton Corp., added new positions in Iberdola, MercadoLibre, Sunrun, and Xylem, while also trimming their position in Nvidia Corp., and adding to Ball Corp., Mastercard, Ecolab, Eli Lilly, and Oracle.
Outook
Covid-19 stimulus spending is expected to provide a robust platform for long-term economic growth, as many governments try to stimulate their local economies by targeting infrastructure investments. Areas like water infrastructure, sustainable and local energy production, health care, education and transport infrastructure cannot be outsourced to other low-cost countries, thus creating local jobs while offering the additional benefit of providing platforms for companies to innovate and grow. The Covid-19 crisis has also accelerated the transition toward a more digital economy. While many companies are facing high costs to deal with this transition, others are expected to benefit from it, especially solution providers in areas like cloud computing, e-retail, and fintech. Fintech could also be disruptive for traditional banking models, offering solutions for financial inclusion of the poorest of our population, particularly in emerging markets. Climate change awareness is high, especially after the natural disasters that have hit many parts of the world in the past several months. With November’s 2021 United Nations Climate Change Conference (COP 26), we would expect many governments and multinational companies to announce strong and increased targets for renewable energy production, with multiple opportunities for renewable and traditional energy players, as the latter are also increasing their footprint in the renewable energy and hydrogen space.
Even after the recent correction in equity markets, valuations still do not look cheap. Risks are visible at many levels which could create high volatility. A potential collapse of the Chinese property market and financial system could have serious ripple effects in the rest of the world. The Delta and Omicron variants of Covid-19 are very contagious and not enough people in developing countries are vaccinated yet, while in many emerging countries vaccination has barely started. Problems in global supply chains, including shortages in the labor market, put upward pressure on prices while possibly also negatively impacting revenue growth, as growth may be slower than expected even if demand is increasing. Wage inflation and higher raw material and energy prices may put pressure on profit margins, especially in sectors where wages are typically not high such as hospitality and manufacturing. Higher inflation typically leads to higher interest rates. The political impasse on the US debt ceiling may also push interest rates higher. All this could have a negative impact on equity valuations, especially for companies with high earnings and cash flow growth as future earnings are worth less in a high interest rate environment. A potential interest rate-driven correction could provide a good buying opportunity if the fundamental outlook of companies has not changed, but for some companies higher interest rates could also mean higher costs and lower growth.
11 |
Hypothetical Growth of $100,000 Investment in Class Y Shares3
March 31, 2016 (inception) through December 31, 2021
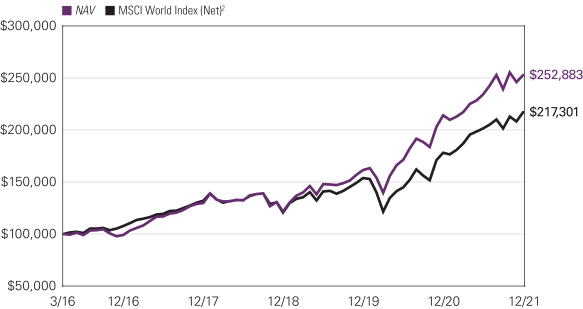
Top Ten Holdings as of December 31, 2021
| | | | | | | | |
| | |
| Security Name | | % of Net
Assets | |
| | 1 | | | Microsoft Corp. | | | 4.74 | % |
| | 2 | | | Thermo Fisher Scientific, Inc. | | | 4.46 | |
| | 3 | | | MasterCard, Inc., Class A | | | 4.01 | |
| | 4 | | | Danaher Corp. | | | 4.00 | |
| | 5 | | | eBay, Inc. | | | 3.85 | |
| | 6 | | | Ecolab, Inc. | | | 3.83 | |
| | 7 | | | Symrise AG | | | 3.42 | |
| | 8 | | | Novo Nordisk A/S, Class B | | | 2.99 | |
| | 9 | | | Roper Technologies, Inc. | | | 2.88 | |
| | 10 | | | Orsted A/S | | | 2.84 | |
The portfolio is actively managed and holdings are subject to change. There is no guarantee the Fund continues to invest in the securities referenced. The holdings listed exclude any temporary cash investments, are presented on an individual security basis and do not represent holdings of the issuer.
See notes to chart on page 13.
| 12
MIROVA GLOBAL SUSTAINABLE EQUITY FUND
Average Annual Total Returns – December 31, 20213
| | | | | | | | | | | | | | | | | | | | | | | | |
| | | | | |
| | | 1 Year | | | 5 Years | | | Life of Class | | | Expense Ratios4 | |
| | Gross | | | Net | |
| | | | | | | |
| Class Y (Inception 3/31/16) | | | | | | | | | | | Class Y/A/C | | | | Class N | | | | | | | | | |
| NAV | | | 18.06 | % | | | 20.56 | % | | | 17.50 | % | | | — | | | | 0.99% | | | | 0.95 | % |
| | | | | | | |
| Class A (Inception 3/31/16) | | | | | | | | | | | | | | | | | | | | | | | | |
| NAV | | | 17.82 | | | | 20.26 | | | | 17.22 | | | | — | | | | 1.24 | | | | 1.20 | |
| With 5.75% Maximum Sales Charge | | | 11.06 | | | | 18.86 | | | | 16.02 | | | | — | | | | | | | | | |
| | | | | | | |
| Class C (Inception 3/31/16) | | | | | | | | | | | | | | | | | | | | | | | | |
| NAV | | | 16.85 | | | | 19.35 | | | | 16.33 | | | | — | | | | 1.99 | | | | 1.95 | |
| With CDSC1 | | | 15.85 | | | | 19.35 | | | | 16.33 | | | | — | | | | | | | | | |
| | | | | | | |
| Class N (Inception 5/1/17) | | | | | | | | | | | | | | | | | | | | | | | | |
| NAV | | | 18.17 | | | | — | | | | — | | | | 18.87 | | | | 0.93 | | | | 0.90 | |
| | | | | | | |
| Comparative Performance | | | | | | | | | | | | | | | | | | | | | | | | |
| MSCI World Index (Net)2 | | | 21.82 | | | | 15.03 | | | | 14.39 | | | | 14.17 | | | | | | | | | |
Performance data shown represents past performance and is no guarantee of, and not necessarily indicative of, future results. Total return and value will vary, and you may have a gain or loss when shares are sold. Current performance may be lower or higher than quoted. For most recent month-end performance, visit im.natixis.com/performance. Performance for other share classes will be greater or less than shown based on differences in fees and sales charges. You may not invest directly in an index. Performance for periods less than one year is cumulative, not annualized. Returns reflect changes in share price and reinvestment of dividends and capital gains, if any. The table(s) do not reflect taxes shareholders might owe on any fund distributions or when they redeem their shares.
| 1 | Performance for Class C shares assumes a 1.00% contingent deferred sales charge (“CDSC”) applied when you sell shares within one year of purchase, and includes automatic conversion to Class A shares after eight years. |
| 2 | MSCI World Index (Net) is an unmanaged index that is designed to measure the equity market performance of developed markets. It is composed of common stocks of companies representative of the market structure of developed market countries in North America, Europe, and the Asia/Pacific Region. The index is calculated without dividends, with net or with gross dividends reinvested, in both U.S. dollars and local currencies. |
| 3 | Fund performance has been increased by fee waivers and/or expense reimbursements, if any, without which performance would have been lower. |
| 4 | Expense ratios are as shown in the Fund’s prospectus in effect as of the date of this report. The expense ratios for the current reporting period can be found in the Financial Highlights section of this report under Ratios to Average Net Assets. Net expenses reflect contractual expense limitations set to expire on 4/30/22. When a Fund’s expenses are below the limitation, gross and net expense ratios will be the same. See Note 6 of the Notes to Financial Statements for more information about the Fund’s expense limitations. |
13 |
MIROVA INTERNATIONAL SUSTAINABLE EQUITY FUND
| | |
| |
| Managers | | Symbols |
| |
| Jens Peers, CFA® | | Class A MRVAX |
| |
| Hua Cheng, CFA® PhD | | Class N MRVNX |
| |
| Amber Fairbanks, CFA® | | Class Y MRVYX |
|
| Mirova US LLC |
Investment Goal
The Fund seeks long-term capital appreciation.
Market Conditions
2021 was generally a very positive year for global equity investors, albeit with high levels of volatility. Low interest rates and central bank support through bond buy-back programs provided an almost endless level of money supply for the economy and markets. This has pushed up valuations in equity markets, especially in high growth sectors and the US market in general. Inflation and concerns that this favorable low interest rate environment may soon come to an end have led to a sector and style rotation during 2021. Traditional energy companies and banks benefited the most, also helped by higher oil prices and higher interest rates, respectively. Renewable energy stocks underperformed significantly, having entered the year with relatively high valuations. Increased competition from oil and gas companies, combined with supply chain issues (raw material price inflation and transportation issues), further impacted margins negatively in the wind sector, and less favorable proposed regulation in California adversely impacted solar companies. Growth stocks posted generally strong results, but we also saw that many of the large technology stocks are not immune to wage inflation and supply chain issues either.
In the real world, natural disasters caused human and economic tragedies. Wildfires in southern Europe and California, floods in Germany, Austria and Belgium, and Hurricane Ida are major examples of this year’s climate change-related disasters, with a combined economic cost of well over $100 billion. Markets didn’t blink, at least not until September when it became clear that Chinese property developer China Evergrande, a group with $260 billion in debt, was in financial trouble; fears of another Lehman scenario led to a quick correction in equity prices globally. Elsewhere in the market, oil and gas prices continued their upward trajectory as demand increased while supply did not follow the same path, leading to some bankruptcies in the UK utility sector. A shortage of drivers in the transportation sector and a general lack of employees in many sectors created shortages and wage inflation. Despite all of this, earnings growth in developed markets was, on average, stronger than expected in 2021, pushing global equity markets to all-time high levels in November. However, the year ended as it started, with high volatility as some economies found themselves again in lockdown because of concerns around the Omicron variant of the Covid-19 virus.
Overview
For the 12 months ended December 31, 2021, Class Y shares of the Mirova International Sustainable Equity Fund returned 6.39% at net asset value. The Fund underperformed its benchmark, the MSCI EAFE Index (Net) which returned 11.26%.
Performance Results
There were a few drivers of the strategy’s underperformance in 2021. The strategy focuses on investing in companies positively exposed to long-term secular trends, resulting in less cyclical exposure compared to the broad market. The strategy has no exposure to traditional energy and has little exposure to large banks within the financials sector as the team doesn’t see those companies as being positively exposed to secular trends.-Energy and large banks performed very strongly in the year and lack of exposure hurt relative performance.
Alternative energy stocks Orsted and Vestas declined significantly during the year. With a strong outlook for the long-term demand environment for renewable energy, particularly offshore wind, and with both stocks having sustainable competitive advantages, the team remains comfortable continuing to hold them. Although competition has increased, updated valuation analysis incorporating significantly increased competition in their markets shows both stocks are trading at significant discounts to intrinsic value.
Over the course of 2021, we saw positive contribution from ASML, increasing sharply on solid earnings reports and attractive growth opportunities as economic activity begins to accelerate, and Novo Nordisk with high single digit revenue growth at constant currency and high single digit diluted earnings growth. Throughout the year, Novo Nordisk increased its full year revenue guidance based on early 2021 results and a more favorable outlook.
The portfolio invests in companies offering solutions to and/or expecting to benefit from the demographic, technological, environmental, and governance-related transitions that are expected to transform the world’s economies and societies during the next decade.
| 14
MIROVA INTERNATIONAL SUSTAINABLE EQUITY FUND
As trends like the digitalization of our economy, which saw strong growth as a result of Covid-19, are expected to continue to grow strongly, the portfolio remains overweight technology. There is also an underweight position in the more defensive consumer staples sector, which to some extent is offset by an overweight position in materials (mainly natural food ingredients). With many governments still committed to keeping global warming limited to a 2-degree Celsius scenario, we expect climate change to remain a driver of political debate, and the portfolio will continue to shy away from fossil fuel extraction in favor of renewables and companies focused on energy efficiency. Although cyclical exposure increased modestly during the fourth quarter because of portfolio adjustments (see below), the team continues to like the downside protection that companies with strong balance sheets, solid management teams and positive exposure to long-term secular trends potentially offer.
During the second quarter of 2021 the investment team made several changes to the portfolio including adding to existing positions in Adyen, Kubota Corp., and Prudential.
In the third quarter the team added to existing positions in Kubota Corp. and Shimano Inc. and trimmed their position in ASML Holding NV.
Portfolio changes during the fourth quarter included exited positions in Chr. Hansen Holding A/S, Coloplast A/S, Danone SA, and Brambles Ltd.
Notable new positions in 2021 included Iberdrola, MercadoLibre, , and Sanofi. Iberdrola is the world’s leading utility in wind and solar generation with about 20% of generation capacity coming from alternative energy. The company has divested completely from coal and has doubled its offshore wind pipeline in the last 18 months and expects to double its renewable capacity by 2030. It’s very well positioned to address increasing demand for alternative energy. The company has a very strong forward thinking and stable management team with a strong track record; the spread between the company’s return on capital employed (ROCE) and cost of capital has been increasing as a result of the de-risking of its generation capacity; the investment team expects this spread differential to continue to increase, leading to higher returns. The company has strong customer relationships and diversified geographic end markets. From a valuation perspective, the company is trading at an attractive valuation in absolute and relative terms, offers an attractive dividend, and is trading at what the team believes is a very significant discount to intrinsic value. Additionally, a potential spin-off of the company’s alternative energy generation assets later this year could unlock value for shareholders.
From a thematic perspective, MercadoLibre, another new position, is positively exposed to long-term secular growth in e-commerce and fintech. The company is the largest e-commerce company in Latin America, controlling 28% of the market. Penetration of e-commerce in Latin America is low at 6%, relative to the rest of the world at 18%; the region is seeing strong growth and MercadoLibre is well positioned to address this. Within fintech, almost 50% of the Latin American population is unbanked with currently 80% of transactions being paid for in cash. Access to affordable financial services is critical for poverty reduction and economic growth and MercadoLibre addresses this long-term secular trend with an integrated digital platform. From a fundamental perspective, the company benefits from economies of scale, being the largest in its market and has built up customer trust and a strong brand image. Additionally, the company has built an extensive shipping service that is both significantly faster and cheaper. Further, its integrated marketplace and payment platform increases customer convenience leading to more loyal customers. From a sustainability perspective, although some percentage of its sales are of used goods (benefiting a circular economy) and its digital payment platform allows for access to affordable financial services (reducing poverty, providing for decent work and economic growth), the impact the company creates is currently fairly low. From a risk perspective, the company manages risks around privacy and the environment adequately. From a valuation perspective, the market is underestimating the long-term revenue growth potential for the company both with regards to growth of e-commerce and digital payments in the region. Additionally, the company has spent significantly in recent years to build its shipping and logistic capabilities; as the capex spend declines in future years, margin expansion opportunity is significant given the scalability of the company’s operations.
Sanofi is a global pharmaceutical company based in France. It has a diversified business with General Medicines including Diabetes and Cardiovascular (41% sales), Specialty Care including rare diseases, oncology and immunology (30% sales), Consumer Healthcare (12% sales), and Vaccines (16% sales) in 2020.
Sanofi is well positioned to benefit from the long-term Transition Demographics. Aging populations in developed countries and high population growth in emerging countries provide long-term structural demand for medicines. For example, it is estimated that there will be more than 640 million diabetes patients by 2040 (up from 415 million in 2015), and diabetes is associated with 15% of global all-cause mortality among people 20-79 years old.
From a sustainability analysis point of view, Sanofi clearly contributes favorably to global health, and thus the United Nation’s Sustainable Development Goal 3 (Health & Well-being), with the development and production of pharmaceutical products improving quality of life and reducing global disease burden. In particular, it addresses the Access To Medicine (ATM) and Rare and Tropical Diseases sustainability opportunities, with a strategy aimed at rare diseases and vaccines for tropical conditions. The vaccine business accounted for around 16% of its total revenue in 2020 (up from around 10% in 2011). From a risk perspective, Sanofi is aware
15 |
of the key sustainability challenges it is exposed to - in particular, ethical issues in R&D, marketing and product safety - and succeeds in showing responsible management policies for most of them. Its Sustainability Opinion is “Positive” within Mirova.
With its new management team from 2019, Sanofi initialized a long-term business plan to drive top line revenue growth, improve operating margins and enhance its R&D and pipeline. Its top line growth is expected to be mainly driven by existing leading medicines, vaccines and late-stage pipeline assets. It complements internal R&D investment within its innovative platform with M&A and collaboration with other pharmaceutical companies. It has also set a clear margin target of 32%+ in 2025.
We are starting to see initial encouraging progress on this strategic plan. These long-term turnaround opportunities are not yet taken into account by the actual very attractive valuation. We took this opportunity to introduce a small position into the portfolio.
Outlook
2022 looks like it will be another positive but volatile year. While the global economy is expected to continue its recovery, many uncertainties remain the same, with no real improvement in sight for probably another six months. Covid-19, inflation and supply chain issues, central bank action, and geopolitical issues (Russia/Ukraine and US/China) are expected to be main sources of bad news for equity markets.
The Omicron variant drives the number of Covid-19 cases past previous peaks in most countries, despite higher vaccination rates. The severeness of the variant is not yet fully known, but the fact that it is far more contagious than any previous variant is expected to put more pressure on health care systems, which may lead many countries to take restrictive actions. While many sectors are now adjusted to working from home, others need clients and employees to be on-premises to function properly, and will no doubt feel the financial consequences. Eventually, we will need to learn how to live with the presence of Covid-19, but even if and when things go back to some level of normality, many of the sectors which have been hit hardest may find it difficult to secure enough employees, and even if they do it will likely be at much higher wages. Shortages in the labor market mean that there will not only be a war for talent, but high competition for employees in general. Wage inflation will put pressure on margins, especially in areas where wages are traditionally relatively low, which means that the expected economic recovery may not translate into similar earnings growth. Inflation and supply chain issues (bottlenecks in production and transportation) are expected to ease somewhat during the second half of 2022 but will likely continue to negatively impact revenue and earnings growth during the first half of the year across most sectors.
Much of the strong equity market performance of the past few years has been driven by a combination of low interest rates and central banks injecting money into the economy. Higher valuation levels in all asset classes were the result, but we expect this support to be weaker in 2022. A slowing of the rate at which central banks buy back bonds (tapering), combined with higher inflation for longer should create upward pressure on interest rates. This in turn could push equity valuations lower, reversing the trend of the past few years. On a relative basis, this could benefit the traditional Energy and Financials sectors. Regionally, this could be short-term bad news for the US market. The US has significantly outperformed Europe and emerging markets in the past few years, and its valuation premium over those markets is at a very high level. Even considering that the US economy is more flexible than the European markets and may show higher growth, one needs to be aware that many US companies are active globally, and equally that many European companies are generating revenues from the US as well.
We do expect that many of the issues which may impact 2022 will ease in the second half of the year. Covid-19 vaccination rates and development of vaccines that are more effective against new variants should allow economies to fully reopen. This in turn may ease the pressure on inflation and the supply chains more generally. With interest rates expected to stabilize or normalize at that stage, we expect the focus will return to structural, less cyclical growth. The recent United National Climate Change Conference (COP26) may have been disappointing in terms of hard short-term commitments, but it still provided a strong pathway for growth in renewable energy for decades to come. Many fossil fuel companies are now entering the space and creating more competition, but the pie is more than big enough to share with additional players. Renewable energy companies have significantly underperformed in 2021, due to a combination of high valuations coming into the year, less favorable regulation in some key markets, and supply chain issues impacting margins in the wind sector. These issues are expected to persist somewhat during the first half of the year but should ease during the second half. The underperformance during 2021 and resulting lower valuation levels provide, in our opinion, an excellent opportunity to add to those positions. Health care remains another high conviction sector. Political pressure on drug prices has eased during the Covid-19 pandemic, and a greater focus on R&D provides many growth opportunities, including for manufacturers of analytical and testing equipment. Many traditional pharma companies have not benefited from the higher general market valuation levels during the past few years, which could also offer some protection during a period of rising interest rates. We do expect the transition of our economy to a more digital model to continue and anticipate e-retail and digital payment solutions to continue to benefit. We also expect that supply chain issues in the car manufacturing sector will ease during the year, and that the transition of the car fleet towards more electric cars will continue to offer good opportunities for manufacturers of energy-efficient car components. But generally, given the expected high volatility and continued high risks to a quick but sustained economic recovery, we remain prudent, and prefer companies with high quality characteristics such as relatively low levels of debt and high visibility on recurring revenue streams.
| 16
MIROVA INTERNATIONAL SUSTAINABLE EQUITY FUND
Covid-19 stimulus spending is expected to provide a robust platform for long-term economic growth, as many governments try to stimulate their local economies by targeting investments in infrastructure. Areas like water infrastructure, sustainable and local energy production, health care, education and transport infrastructure cannot be outsourced to other low-cost countries, thus creating local jobs while offering the additional benefit of providing platforms for companies to innovate and grow. The Covid-19 crisis has also accelerated the transition toward a more digital economy. While many companies are facing high costs to deal with this transition, others are expected to benefit from it, especially solution providers in areas like cloud computing, e-retail, and fin tech. Fin tech could also be disruptive for traditional banking models, offering solutions for financial inclusion of the poorest of our population, particularly in emerging markets. Climate change awareness is high, especially after the natural disasters which have hit many parts of the world in the past several months. With November’s 2021 COP 26, we would expect many governments and multinational companies to announce strong and increased targets for renewable energy production, with multiple opportunities for renewable and traditional energy players, as the latter are also increasing their footprint in the renewable energy and hydrogen space.
Even after the recent correction in equity markets, valuations still don’t look cheap. Risks are visible at many levels which could create high volatility. A potential collapse of the Chinese property market and financial system could have serious ripple effects in the rest of the world. The Delta and Omicron variants of Covid-19 are very contagious and not enough people in developing countries are vaccinated yet, while in many emerging countries vaccination has barely started. Problems in global supply chains, including shortages in the labor market, put upward pressure on prices while possibly also having a negative impact on revenue growth, as growth may be slower than expected even if demand is increasing. Wage inflation and higher raw material and energy prices may put pressure on profit margins, especially in sectors where wages are typically not high, such as hospitality and manufacturing. Higher inflation typically leads to higher interest rates. The political impasse on the debt ceiling in the US may also push interest rates higher. All this could have a negative impact on equity valuations, especially for companies with high earnings and cash flow growth as future earnings are worth less in a high interest rate environment. A potential interest rate-driven correction could provide a good buying opportunity if the fundamental outlook of companies has not changed, but for some companies higher interest rates could also mean higher costs and lower growth.
Hypothetical Growth of $100,000 Investment in Class Y Shares2
December 28, 2018 (inception) through December 31, 2021
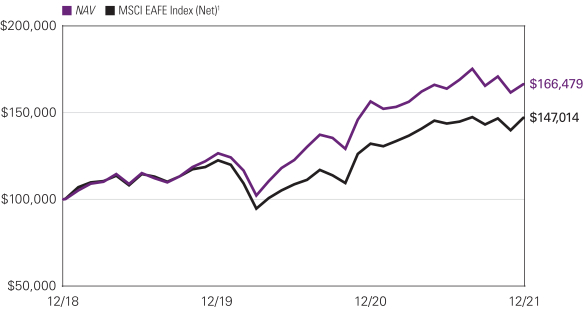
17 |
Top Ten Holdings as of December 31, 2021
| | | | | | | | |
| | |
| Security Name | | % of Net
Assets | |
| | 1 | | | Novo Nordisk A/S, Class B | | | 5.08 | % |
| | 2 | | | ASML Holding NV | | | 5.06 | |
| | 3 | | | Taiwan Semiconductor Manufacturing Co. Ltd., Sponsored ADR | | | 4.39 | |
| | 4 | | | KBC Group NV | | | 4.20 | |
| | 5 | | | Adyen NV | | | 3.89 | |
| | 6 | | | Kubota Corp. | | | 3.66 | |
| | 7 | | | Legal & General Group PLC | | | 3.55 | |
| | 8 | | | AIA Group Ltd. | | | 3.41 | |
| | 9 | | | Croda International PLC | | | 3.19 | |
| | 10 | | | Kingspan Group PLC | | | 3.15 | |
The portfolio is actively managed and holdings are subject to change. There is no guarantee the Fund continues to invest in the securities referenced. The holdings listed exclude any temporary cash investments, are presented on an individual security basis and do not represent holdings of the issuer.
Average Annual Total Returns – December 31, 20212
| | | | | | | | | | | | | | | | |
| | | | |
| | | 1 Year | | | Life of Fund | | | Expense Ratios3 | |
| | | Gross | | | Net | |
| | | | | |
| Class Y (Inception 12/28/18) | | | | | | | | | | | | | | | | |
| NAV | | | 6.39 | % | | | 18.46 | % | | | 6.51 | % | | | 1.00 | % |
| | | | | |
| Class A (Inception 12/28/18) | | | | | | | | | | | | | | | | |
| NAV | | | 6.22 | | | | 18.19 | | | | 5.69 | | | | 1.26 | |
| With 5.75% Maximum Sales Charge | | | 0.12 | | | | 15.88 | | | | | | | | | |
| | | | | |
| Class N (Inception 12/28/18) | | | | | | | | | | | | | | | | |
| NAV | | | 6.47 | | | | 18.52 | | | | 1.83 | | | | 0.93 | |
| | | | | |
| Comparative Performance | | | | | | | | | | | | | | | | |
| MSCI EAFE Index (Net)1 | | | 11.26 | | | | 13.61 | | | | | | | | | |
Performance data shown represents past performance and is no guarantee of, and not necessarily indicative of, future results. Total return and value will vary, and you may have a gain or loss when shares are sold. Current performance may be lower or higher than quoted. For most recent month-end performance, visit im.natixis.com/performance. Performance for other share classes will be greater or less than shown based on differences in fees and sales charges. You may not invest directly in an index. Performance for periods less than one year is cumulative, not annualized. Returns reflect changes in share price and reinvestment of dividends and capital gains, if any. The table(s) do not reflect taxes shareholders might owe on any fund distributions or when they redeem their shares.
| 1 | The MSCI EAFE Index (Net) is a free float-adjusted market capitalization index designed to measure large and mid-cap equity performance in developed markets, excluding the U.S. and Canada. The Index includes countries in Europe, Australasia, and the Far East. |
| 2 | Fund performance has been increased by fee waivers and/or expense reimbursements, if any, without which performance would have been lower. |
| 3 | Expense ratios are as shown in the Fund’s prospectus in effect as of the date of this report. The expense ratios for the current reporting period can be found in the Financial Highlights section of this report under Ratios to Average Net Assets. Net expenses reflect contractual expense limitations set to expire on 4/30/22. When a Fund’s expenses are below the limitation, gross and net expense ratios will be the same. See Note 6 of the Notes to Financial Statements for more information about the Fund’s expense limitations. |
| 18
MIROVA U.S. SUSTAINABLE EQUITY FUND
| | |
| |
| Managers | | Symbols |
| |
| Jens Peers, CFA® | | Class A MUSAX |
| |
| Hua Cheng, CFA® PhD | | Class C MUSCX |
| |
| Amber Fairbanks, CFA® | | Class N MUSNX |
| |
| Mirova US LLC | | Class Y MUSYX |
Investment Goal
The Fund seeks long-term capital appreciation.
Market Conditions
2021 was generally a very positive year for global equity investors, albeit with high levels of volatility. Low interest rates and central bank support through bond buy-back programs provided an almost endless level of money supply for the economy and markets. This has pushed up valuations in equity markets, especially in high growth sectors and the U.S. market in general. Inflation and concerns that this favorable low interest rate environment may soon come to an end have led to a sector and style rotation during 2021. Traditional energy companies and banks benefited the most, also helped by the higher oil prices and higher interest rates respectively. Renewable energy stocks underperformed significantly, having entered the year with relatively high valuations. Increased competition from oil and gas companies, combined with supply chain issues (raw material price inflation and transportation issues), further impacted margins negatively in the wind sector, and less favorable proposed regulation in California adversely impacted solar companies. Growth stocks posted generally strong results, but we also saw that many of the large technology stocks are not immune to wage inflation and supply chain issues either.
In the real world, natural disasters caused human and economic tragedies. Wildfires in southern Europe and California, floods in Germany, Austria and Belgium, and Hurricane Ida are major examples of this year’s climate change-related disasters, with a combined economic cost of well over 100 billion U.S. dollars. Markets didn’t blink, at least not until September when it became clear that Chinese property developer China Evergrande, a group with 260 billion U.S. dollars in debt, was in financial trouble; fears of another Lehman scenario led to a quick correction in equity prices globally. Elsewhere in the market, oil and gas prices continued their upward trajectory as demand increased while supply did not follow the same path. This caused some bankruptcies in the U.K. utility sector. A shortage of drivers in the transportation sector and a general lack of employees in many sectors created shortages and wage inflation. Despite all of this, earnings growth in developed markets was, on average, stronger than expected in 2021, pushing global equity markets to all-time high levels in November. However, the year ended as it started, with high volatility as some economies found themselves again in lockdown because of concerns around the Omicron variant of the Covid-19 virus.
Performance Results
For the 12 months ended December 31, 2021, Class Y shares of the Mirova U.S. Sustainable Equity Fund returned 29.97% at net asset value. The Fund outperformed its benchmark the S&P 500® Index, which returned 28.71%.
Explanation of Fund Performance
Outperformance of the strategy is attributable to solid stock selection, particularly in Health Care. Eli Lilly performed strongly after positive trial results of its Alzheimer’s drug, and Thermo Fisher and Danaher rose on continued spending on healthcare during the pandemic and positive outlooks for longer-term healthcare spending. Stock selection in Industrials also contributed positively, with water flow and regulation product manufacturer Watts Water and waste disposal company Waste Management both performing well for the year.
Over the course of 2021, detracting from performance were First Solar and Sunrun who both declined along with other solar stocks on a proposed California decrease in net metering rates, potentially reducing the attractive economics for installing residential solar panels for California residents. Additionally, corporate sponsored childcare provider Bright Horizons, detracted from performance. While the earnings for the quarter were stronger than expected, a lack of visibility into the trajectory of occupancy levels at their childcare centers pressured the stock.
The portfolio invests in companies offering solutions to and/or expected to benefit from the demographic, technological, environmental and governance-related transitions that are expected to transform the world’s economies and societies during the next decade.
The portfolio remains overweight in Technology and Health Care. due to trends like the digitalization of our economy, which saw strong growth as a result of Covid-19, are expected to continue to grow strongly Also, support for the health care sector is expected to
19 |
show solid growth as a reaction to Covid-19 in the short-term and due to an aging population and continued focus on health and well-being in the longer-term. There is also an underweight position in the more defensive Consumer Staples sector, which to some extent is offset by an overweight position in Materials (mainly natural food ingredients). With many governments still committed to keeping global warming limited to a 2-degree Celsius scenario, we expect climate change to remain a driver of political debate and the portfolio will continue to shy away from fossil fuel extraction in favor of renewables and companies focused on energy efficiency. The team continues to prefer companies with strong balance sheets, solid management teams, and positive exposure to long-term secular trends.
During the second quarter of 2021 the investment team made several changes to the portfolio, they exited their position in Ormat Technologies Inc. and added both Sunrun Inc. and Avalara.
During the fourth quarter of 2021 the investment team took opportunities to make several changes to the portfolio, they exited positions in both Alphabet Inc. and Eaton Corp., while taking the opportunity to trim their position in both Adobe and Nvidia Corp., and adding to existing positions in Ball Corp., Mastercard, Avalara Inc., Roper Technologies Inc., Sunrun, and Xylem.
Outlook
2022 looks like it will be another positive but volatile year. While the global economy is expected to continue its recovery, many uncertainties remain the same, with no real improvement in sight for probably another six months. Covid-19, inflation and supply chain issues, central bank action, and geopolitical issues (Russia/Ukraine and U.S./China) are expected to be main sources of bad news for equity markets.
The Omicron variant drives the number of Covid-19 cases past previous peaks in most countries, despite higher vaccination rates. The severeness of the variant is not yet fully known, but the fact that it is far more contagious than any previous variant is expected to put more pressure on health care systems, which may lead many countries to take restrictive actions. While many sectors are now adjusted to working from home, others need clients and employees to be on-premises to function properly, and will no doubt feel the financial consequences. Eventually, we will need to learn how to live with the presence of Covid-19, but even if and when things go back to some level of normality, many of the sectors which have been hit hardest may find it difficult to secure enough employees, and even if they do it will likely be at much higher wages. Shortages in the labor market mean that there will not only be a war for talent, but high competition for employees in general. Wage inflation will put pressure on margins, especially in areas where wages are traditionally relatively low, which means that the expected economic recovery may not translate into similar earnings growth. Inflation and supply chain issues (bottlenecks in production and transportation) are expected to ease somewhat during the second half of 2022 but will likely continue to have a negative impact on revenue and earnings growth during the first half of the year across most sectors.
Much of the strong equity market performance of the past few years has been driven by a combination of low interest rates and central banks injecting money into the economy. Higher valuation levels in all asset classes were the result, but we expect this support to be weaker in 2022. A slowing of the rate at which central banks buy back bonds (tapering), combined with higher inflation for longer should create upward pressure on interest rates. This in turn could push equity valuations lower, reversing the trend of the past few years. On a relative basis, this could benefit the traditional energy and financials sectors. Regionally, this could be short-term bad news for the U.S. market. The U.S. has significantly outperformed Europe and emerging markets during the past few years, and its valuation premium over those markets is at a very high level. Even considering that the U.S. economy is more flexible than the European markets and may show higher growth, one needs to be aware that many U.S. companies are active globally, and equally that many European companies are generating revenues from the U.S. as well.
We do expect that many of the issues which may impact 2022 will ease in the second half of the year. Covid-19 vaccination rates and the development of vaccines that are more effective against the new variants should allow economies to fully reopen. This in turn may ease the pressure on inflation and the supply chains more generally. With interest rates expected to stabilize or normalize at that stage, we expect that the focus will return to structural, less cyclical growth. The recent COP26 climate conference may have been disappointing in terms of hard short-term commitments, but it still provided a strong pathway for growth in renewable energy for decades to come. Many fossil-fuel companies are now entering the space and creating more competition, but the pie is more than big enough to share with additional players. Renewable energy companies have significantly underperformed in 2021, due to a combination of high valuations coming into the year, less favorable regulation in some key markets, and supply chain issues impacting margins in the wind sector. These issues are expected to persist somewhat during the first half of the year but should ease during the second half. The underperformance during 2021 and resulting lower valuation levels provide in our opinion an excellent opportunity to add to those positions. Health Care remains another high conviction sector. Political pressure on drug prices has eased during the Covid-19 pandemic, and a greater focus on R&D provides many growth opportunities, including for manufactures of analytical and testing equipment. Many traditional pharma companies have not benefited from the higher general market valuation levels during the past few years, which could also offer some protections during a period of rising interest rates. We do expect the transition of our economy to a more digital model to continue and anticipate e-retail and digital payment solutions to continue to benefit. We also
| 20
MIROVA U.S. SUSTAINABLE EQUITY FUND
expect that supply chain issues in the car manufacturing sector will ease during the year, and that the transition of the car fleet towards more electric cars will continue to offer good opportunities for manufactures of energy-efficient car components. But generally, given the expected high volatility and continued high risks to a quick but sustained economic recovery, we remain prudent, and prefer companies with high quality characteristics such as relatively low levels of debt and high visibility on recurring revenue streams.
Hypothetical Growth of $100,000 Investment in Class Y Shares3
December 15, 2020 (inception) through December 31, 2021
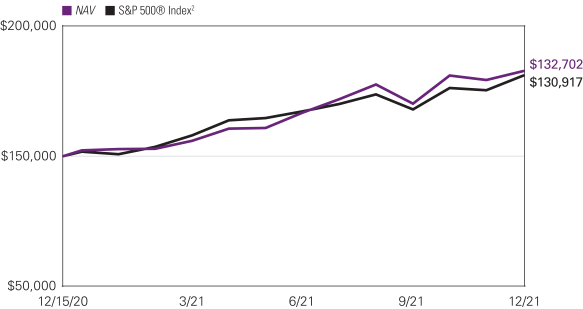
Top Ten Holdings as of December 31, 2021
| | | | | | | | |
| | |
| Security Name | | % of Net
Assets | |
| | 1 | | | Microsoft Corp. | | | 7.92 | % |
| | 2 | | | Danaher Corp. | | | 6.37 | |
| | 3 | | | Thermo Fisher Scientific, Inc. | | | 6.18 | |
| | 4 | | | NextEra Energy, Inc. | | | 4.70 | |
| | 5 | | | Roper Technologies, Inc. | | | 4.68 | |
| | 6 | | | MasterCard, Inc., Class A | | | 4.60 | |
| | 7 | | | NVIDIA Corp. | | | 4.59 | |
| | 8 | | | eBay, Inc. | | | 4.36 | |
| | 9 | | | Ecolab, Inc. | | | 4.04 | |
| | 10 | | | American Water Works Co., Inc. | | | 3.97 | |
The portfolio is actively managed and holdings are subject to change. There is no guarantee the Fund continues to invest in the securities referenced. The holdings listed exclude any temporary cash investments, are presented on an individual security basis and do not represent holdings of the issuer.
21 |
Average Annual Total Returns – December 31, 20213
| | | | | | | | | | | | | | | | |
| | | | |
| | | 1 Year | | | Life of Fund | | | Expense Ratios4 | |
| | | Gross | | | Net | |
| | | | | |
| Class Y (Inception 12/15/20) | | | | | | | | | | | | | | | | |
| NAV | | | 29.97 | % | | | 31.13 | % | | | 2.03 | % | | | 0.80 | % |
| | | | | |
| Class A (Inception 12/15/20) | | | | | | | | | | | | | | | | |
| NAV | | | 29.65 | | | | 30.82 | | | | 2.28 | | | | 1.05 | |
| With 5.75% Maximum Sales Charge | | | 22.22 | | | | 23.60 | | | | | | | | | |
| | | | | |
| Class C (Inception 12/15/20) | | | | | | | | | | | | | | | | |
| NAV | | | 28.62 | | | | 29.82 | | | | 3.03 | | | | 1.80 | |
| With CDSC1 | | | 27.62 | | | | 29.82 | | | | | | | | | |
| | | | | |
| Class N (Inception 12/15/20) | | | | | | | | | | | | | | | | |
| NAV | | | 29.99 | | | | 31.15 | | | | 1.88 | | | | 0.75 | |
| | | | | |
| Comparative Performance | | | | | | | | | | | | | | | | |
| S&P 500® Index2 | | | 28.71 | | | | 29.25 | | | | | | | | | |
Performance data shown represents past performance and is no guarantee of, and not necessarily indicative of, future results. Total return and value will vary, and you may have a gain or loss when shares are sold. Current performance may be lower or higher than quoted. For most recent month-end performance, visit im.natixis.com/performance. Performance for other share classes will be greater or less than shown based on differences in fees and sales charges. You may not invest directly in an index. Performance for periods less than one year is cumulative, not annualized. Returns reflect changes in share price and reinvestment of dividends and capital gains, if any. The table(s) do not reflect taxes shareholders might owe on any fund distributions or when they redeem their shares.
| 1 | Performance for Class C shares assumes a 1.00% contingent deferred sales charge (“CDSC”) applied when you sell shares within one year of purchase, and includes automatic conversion to Class A shares after eight years. |
| 2 | S&P 500® Index is a widely recognized measure of U.S. stock market performance. It is an unmanaged index of 500 common stocks chosen for market size, liquidity, and industry group representation, among other factors. It also measures the performance of the large cap segment of the U.S. equities market. |
| 3 | Fund performance has been increased by fee waivers and/or expense reimbursements, if any, without which performance would have been lower. |
| 4 | Expense ratios are as shown in the Fund’s prospectus in effect as of the date of this report. The expense ratios for the current reporting period can be found in the Financial Highlights section of this report under Ratios to Average Net Assets. Net expenses reflect contractual expense limitations set to expire on 4/30/22. When a Fund’s expenses are below the limitation, gross and net expense ratios will be the same. See Note 6 of the Notes to Financial Statements for more information about the Fund’s expense limitations. |
| 22
ADDITIONAL INFORMATION
The views expressed in this report reflect those of the portfolio managers as of the dates indicated. The managers’ views are subject to change at any time without notice based on changes in market or other conditions. References to specific securities or industries should not be regarded as investment advice. Because the Fund is actively managed, there is no assurance that they will continue to invest in the securities or industries mentioned.
All investing involves risk, including the risk of loss. There is no assurance that any investment will meet its performance objectives or that losses will be avoided.
ADDITIONAL INDEX INFORMATION
This document may contain references to third party copyrights, indexes, and trademarks, each of which is the property of its respective owner. Such owner is not affiliated with Natixis Investment Managers or any of its related or affiliated companies (collectively “Natixis Affiliates”) and does not sponsor, endorse or participate in the provision of any Natixis Affiliates services, funds or other financial products.
The index information contained herein is derived from third parties and is provided on an “as is” basis. The user of this information assumes the entire risk of use of this information. Each of the third party entities involved in compiling, computing or creating index information disclaims all warranties (including, without limitation, any warranties of originality, accuracy, completeness, timeliness, non-infringement, merchantability and fitness for a particular purpose) with respect to such information.
PROXY VOTING INFORMATION
A description of the Natixis Funds’ proxy voting policies and procedures is available without charge, upon request, by calling Natixis Funds at 800-225-5478; on the Natixis Funds’ website at im.natixis.com; and on the Securities and Exchange Commission’s (“SEC’s”) website at www.sec.gov. Information regarding how the Natixis Funds voted proxies relating to portfolio securities during the most recent 12-month period ended June 30 is available from the Natixis Funds’ website and the SEC’s website.
QUARTERLY PORTFOLIO SCHEDULES
The Natixis Funds file a complete schedule of portfolio holdings with the SEC for the first and third quarters of each fiscal year as an exhibit to its reports on Form N-PORT. The Funds’ Form N-PORT reports are available on the SEC’s website at www.sec.gov. First and third quarter schedules of portfolio holdings are also available at im.natixis.com/funddocuments. A hard copy may be requested from the Fund at no charge by calling 800-225-5478.
CFA® and Chartered Financial Analyst® are registered trademarks owned by the CFA Institute.
23 |
UNDERSTANDING FUND EXPENSES
As a mutual fund shareholder, you incur different costs: transaction costs, including sales charges (loads) on purchases and contingent deferred sales charges on redemptions, and ongoing costs, including management fees, distribution and/or service fees (12b-1 fees), and other fund expenses. Certain exemptions may apply. These costs are described in more detail in the Funds’ prospectus. The following examples are intended to help you understand the ongoing costs of investing in the Funds and help you compare these with the ongoing costs of investing in other mutual funds.
The first line in the table of each class of Fund shares shows the actual account values and actual Fund expenses you would have paid on a $1,000 investment in the Fund from July 1, 2021 through December 31, 2021. To estimate the expenses you paid over the period, simply divide your account value by $1,000 (for example $8,600 account value divided by $1,000 = 8.60) and multiply the result by the number in the Expenses Paid During Period column as shown for your class.
The second line in the table for each class of fund shares provides information about hypothetical account values and hypothetical expenses based on the Fund’s actual expense ratios and an assumed rate of return of 5% per year before expenses, which is not the Fund’s actual return. The hypothetical account values and expenses may not be used to estimate the actual ending account balance or expenses you paid on your investment for the period. You may use this information to compare the ongoing costs of investing in the Fund and other funds. To do so, compare this 5% hypothetical example with the 5% hypothetical examples that appear in the shareholder reports of the other funds.
Please note that the expenses shown reflect ongoing costs only, and do not include any transaction costs, such as sales charges. Therefore, the second line in the table of each fund is useful in comparing ongoing costs only, and will not help you determine the relative costs of owning funds. If transaction costs were included, total costs would be higher.
| | | | | | | | | | | | |
| GATEWAY FUND | | BEGINNING
ACCOUNT VALUE
7/1/2021 | | | ENDING
ACCOUNT VALUE
12/31/2021 | | | EXPENSES PAID
DURING PERIOD*
7/1/2021 – 12/31/2021 | |
| Class A | | | | | | | | | | | | |
| Actual | | | $1,000.00 | | | | $1,037.40 | | | | $4.83 | |
| Hypothetical (5% return before expenses) | | | $1,000.00 | | | | $1,020.47 | | | | $4.79 | |
| Class C | | | | | | | | | | | | |
| Actual | | | $1,000.00 | | | | $1,033.50 | | | | $8.71 | |
| Hypothetical (5% return before expenses) | | | $1,000.00 | | | | $1,016.64 | | | | $8.64 | |
| Class N | | | | | | | | | | | | |
| Actual | | | $1,000.00 | | | | $1,039.00 | | | | $3.34 | |
| Hypothetical (5% return before expenses) | | | $1,000.00 | | | | $1,021.93 | | | | $3.31 | |
| Class Y | | | | | | | | | | | | |
| Actual | | | $1,000.00 | | | | $1,038.70 | | | | $3.60 | |
| Hypothetical (5% return before expenses) | | | $1,000.00 | | | | $1,021.68 | | | | $3.57 | |
| * | Expenses are equal to the Fund’s annualized expense ratio (after waiver/reimbursement): 0.94%, 1.70%, 0.65% and 0.70% for Class A, C, N and Y, respectively, multiplied by the average account value over the period, multiplied by the number of days in the most recent fiscal half-year (184), divided by 365 (to reflect the half-year period). |
| 24
| | | | | | | | | | | | |
| GATEWAY EQUITY CALL PREMIUM FUND | | BEGINNING
ACCOUNT VALUE
7/1/2021 | | | ENDING
ACCOUNT VALUE
12/31/2021 | | | EXPENSES PAID
DURING PERIOD*
7/1/2021 – 12/31/2021 | |
| Class A | | | | | | | | | | | | |
| Actual | | | $1,000.00 | | | | $1,071.30 | | | | $4.75 | |
| Hypothetical (5% return before expenses) | | | $1,000.00 | | | | $1,020.62 | | | | $4.63 | |
| Class C | | | | | | | | | | | | |
| Actual | | | $1,000.00 | | | | $1,066.50 | | | | $8.65 | |
| Hypothetical (5% return before expenses) | | | $1,000.00 | | | | $1,016.84 | | | | $8.44 | |
| Class N | | | | | | | | | | | | |
| Actual | | | $1,000.00 | | | | $1,072.20 | | | | $3.29 | |
| Hypothetical (5% return before expenses) | | | $1,000.00 | | | | $1,022.03 | | | | $3.21 | |
| Class Y | | | | | | | | | | | | |
| Actual | | | $1,000.00 | | | | $1,072.00 | | | | $3.45 | |
| Hypothetical (5% return before expenses) | | | $1,000.00 | | | | $1,021.88 | | | | $3.36 | |
| * | Expenses are equal to the Fund’s annualized expense ratio (after waiver/reimbursement): 0.91%, 1.66%, 0.63% and 0.66% for Class A, C, N and Y, respectively, multiplied by the average account value over the period, multiplied by the number of days in the most recent fiscal half-year (184), divided by 365 (to reflect the half-year period). |
| | | | | | | | | | | | |
| MIROVA GLOBAL GREEN BOND FUND | | BEGINNING
ACCOUNT VALUE
7/1/2021 | | | ENDING
ACCOUNT VALUE
12/31/2021 | | | EXPENSES PAID
DURING PERIOD*
7/1/2021 – 12/31/2021 | |
| Class A | | | | | | | | | | | | |
| Actual | | | $1,000.00 | | | | $989.40 | | | | $4.71 | |
| Hypothetical (5% return before expenses) | | | $1,000.00 | | | | $1,020.47 | | | | $4.79 | |
| Class N | | | | | | | | | | | | |
| Actual | | | $1,000.00 | | | | $990.90 | | | | $3.21 | |
| Hypothetical (5% return before expenses) | | | $1,000.00 | | | | $1,021.98 | | | | $3.26 | |
| Class Y | | | | | | | | | | | | |
| Actual | | | $1,000.00 | | | | $990.70 | | | | $3.46 | |
| Hypothetical (5% return before expenses) | | | $1,000.00 | | | | $1,021.73 | | | | $3.52 | |
| * | Expenses are equal to the Fund’s annualized expense ratio (after waiver/reimbursement): 0.94%, 0.64% and 0.69% for Class A, N and Y, respectively, multiplied by the average account value over the period, multiplied by the number of days in the most recent fiscal half-year (184), divided by 365 (to reflect the half-year period). |
25 |
| | | | | | | | | | | | |
| MIROVA GLOBAL SUSTAINABLE EQUITY FUND | | BEGINNING
ACCOUNT VALUE
7/1/2021 | | | ENDING
ACCOUNT VALUE
12/31/2021 | | | EXPENSES PAID
DURING PERIOD*
7/1/2021 – 12/31/2021 | |
| Class A | | | | | | | | | | | | |
| Actual | | | $1,000.00 | | | | $1,077.90 | | | | $6.34 | |
| Hypothetical (5% return before expenses) | | | $1,000.00 | | | | $1,019.11 | | | | $6.16 | |
| Class C | | | | | | | | | | | | |
| Actual | | | $1,000.00 | | | | $1,073.40 | | | | $10.24 | |
| Hypothetical (5% return before expenses) | | | $1,000.00 | | | | $1,015.33 | | | | $9.96 | |
| Class N | | | | | | | | | | | | |
| Actual | | | $1,000.00 | | | | $1,079.80 | | | | $4.77 | |
| Hypothetical (5% return before expenses) | | | $1,000.00 | | | | $1,020.62 | | | | $4.63 | |
| Class Y | | | | | | | | | | | | |
| Actual | | | $1,000.00 | | | | $1,079.20 | | | | $5.03 | |
| Hypothetical (5% return before expenses) | | | $1,000.00 | | | | $1,020.37 | | | | $4.89 | |
| * | Expenses are equal to the Fund’s annualized expense ratio (after waiver/reimbursement): 1.21%, 1.96%, 0.91% and 0.96% for Class A, C, N and Y, respectively, multiplied by the average account value over the period, multiplied by the number of days in the most recent fiscal half-year (184), divided by 365 (to reflect the half-year period). |
| | | | | | | | | | | | |
| MIROVA INTERNATIONAL SUSTAINABLE EQUITY FUND | | BEGINNING
ACCOUNT VALUE
7/1/2021 | | | ENDING
ACCOUNT VALUE
12/31/2021 | | | EXPENSES PAID
DURING PERIOD*
7/1/2021 – 12/31/2021 | |
| Class A | | | | | | | | | | | | |
| Actual | | | $1,000.00 | | | | $1,015.20 | | | | $6.15 | |
| Hypothetical (5% return before expenses) | | | $1,000.00 | | | | $1,019.11 | | | | $6.16 | |
| Class N | | | | | | | | | | | | |
| Actual | | | $1,000.00 | | | | $1,016.40 | | | | $4.63 | |
| Hypothetical (5% return before expenses) | | | $1,000.00 | | | | $1,020.62 | | | | $4.63 | |
| Class Y | | | | | | | | | | | | |
| Actual | | | $1,000.00 | | | | $1,015.60 | | | | $4.88 | |
| Hypothetical (5% return before expenses) | | | $1,000.00 | | | | $1,020.37 | | | | $4.89 | |
| * | Expenses are equal to the Fund’s annualized expense ratio (after waiver/reimbursement): 1.21%, 0.91% and 0.96% for Class A, N and Y, respectively, multiplied by the average account value over the period, multiplied by the number of days in the most recent fiscal half-year (184), divided by 365 (to reflect the half-year period). |
| 26
| | | | | | | | | | | | |
| MIROVA U.S. SUSTAINABLE EQUITY FUND | | BEGINNING
ACCOUNT VALUE
7/1/2021 | | | ENDING
ACCOUNT VALUE
12/31/2021 | | | EXPENSES PAID
DURING PERIOD*
7/1/2021 – 12/31/2021 | |
| Class A | | | | | | | | | | | | |
| Actual | | | $1,000.00 | | | | $1,135.20 | | | | $5.65 | |
| Hypothetical (5% return before expenses) | | | $1,000.00 | | | | $1,019.91 | | | | $5.35 | |
| Class C | | | | | | | | | | | | |
| Actual | | | $1,000.00 | | | | $1,131.10 | | | | $9.67 | |
| Hypothetical (5% return before expenses) | | | $1,000.00 | | | | $1,016.13 | | | | $9.15 | |
| Class N | | | | | | | | | | | | |
| Actual | | | $1,000.00 | | | | $1,136.30 | | | | $4.04 | |
| Hypothetical (5% return before expenses) | | | $1,000.00 | | | | $1,021.43 | | | | $3.82 | |
| Class Y | | | | | | | | | | | | |
| Actual | | | $1,000.00 | | | | $1,137.10 | | | | $4.31 | |
| Hypothetical (5% return before expenses) | | | $1,000.00 | | | | $1,021.17 | | | | $4.08 | |
| * | Expenses are equal to the Fund’s annualized expense ratio (after waiver/reimbursement): 1.05%, 1.80%, 0.75% and 0.80% for Class A, C, N and Y, respectively, multiplied by the average account value over the period, multiplied by the number of days in the most recent fiscal half-year (184), divided by 365 (to reflect the half-year period). |
27 |
Portfolio of Investments – as of December 31, 2021
Gateway Fund
| | | | | | | | |
| Shares | | | Description | | Value (†) | |
| | Common Stocks — 99.8% of Net Assets | |
| | | | Aerospace & Defense — 1.2% | |
| | 148,078 | | | Boeing Co. (The)(a)(b) | | $ | 29,811,063 | |
| | 41,278 | | | HEICO Corp.(b) | | | 5,953,113 | |
| | 552,963 | | | Raytheon Technologies Corp.(b) | | | 47,587,996 | |
| | 24,274 | | | TransDigm Group, Inc.(a)(b) | | | 15,445,061 | |
| | | | | | | | |
| | | | | | | 98,797,233 | |
| | | | | | | | |
| | | | Air Freight & Logistics — 0.6% | |
| | 36,648 | | | GXO Logistics, Inc.(a)(b) | | | 3,328,738 | |
| | 216,722 | | | United Parcel Service, Inc., Class B(b) | | | 46,452,193 | |
| | | | | | | | |
| | | | | | | 49,780,931 | |
| | | | | | | | |
| | | | Airlines — 0.3% | |
| | 153,012 | | | Alaska Air Group, Inc.(a)(b) | | | 7,971,925 | |
| | 714,692 | | | JetBlue Airways Corp.(a)(b) | | | 10,177,214 | |
| | 144,851 | | | United Airlines Holdings, Inc.(a)(b) | | | 6,341,577 | |
| | | | | | | | |
| | | | | | | 24,490,716 | |
| | | | | | | | |
| | | | Auto Components — 0.1% | |
| | 36,852 | | | Autoliv, Inc.(b) | | | 3,810,865 | |
| | 106,265 | | | Goodyear Tire & Rubber Co. (The)(a)(b) | | | 2,265,570 | |
| | | | | | | | |
| | | | | | | 6,076,435 | |
| | | | | | | | |
| | | | Automobiles — 2.7% | |
| | 1,177,145 | | | Ford Motor Co.(b) | | | 24,449,302 | |
| | 339,114 | | | General Motors Co.(a)(b) | | | 19,882,254 | |
| | 164,484 | | | Tesla, Inc.(a)(b) | | | 173,823,401 | |
| | | | | | | | |
| | | | | | | 218,154,957 | |
| | | | | | | | |
| | | | Banks — 4.1% | |
| | 266,138 | | | Associated Banc-Corp(b) | | | 6,012,057 | |
| | 2,206,566 | | | Bank of America Corp.(b) | | | 98,170,121 | |
| | 607,150 | | | Citigroup, Inc.(b) | | | 36,665,789 | |
| | 876,691 | | | JPMorgan Chase & Co.(b) | | | 138,824,020 | |
| | 16,401 | | | Signature Bank(b) | | | 5,305,232 | |
| | 980,841 | | | Wells Fargo & Co.(b) | | | 47,060,751 | |
| | | | | | | | |
| | | | | | | 332,037,970 | |
| | | | | | | | |
| | | | Beverages — 1.4% | |
| | 494,297 | | | Keurig Dr Pepper, Inc.(b) | | | 18,219,787 | |
| | 245,539 | | | Monster Beverage Corp.(a)(b) | | | 23,581,566 | |
| | 429,766 | | | PepsiCo, Inc.(b) | | | 74,654,652 | |
| | | | | | | | |
| | | | | | | 116,456,005 | |
| | | | | | | | |
| | | | Biotechnology — 1.8% | |
| | 431,146 | | | AbbVie, Inc.(b) | | | 58,377,168 | |
| | 151,355 | | | Amgen, Inc.(b) | | | 34,050,334 | |
| | 42,405 | | | Biogen, Inc.(a)(b) | | | 10,173,808 | |
| | 25,167 | | | Exact Sciences Corp.(a)(b) | | | 1,958,748 | |
| | 83,007 | | | Ionis Pharmaceuticals, Inc.(a)(b) | | | 2,525,903 | |
| | 61,950 | | | Moderna, Inc.(a)(b) | | | 15,734,061 | |
| | 21,063 | | | Seagen, Inc.(a)(b) | | | 3,256,340 | |
| | 86,533 | | | Vertex Pharmaceuticals, Inc.(a)(b) | | | 19,002,647 | |
| | | | | | | | |
| | | | | | | 145,079,009 | |
| | | | | | | | |
| | | | Building Products — 0.3% | |
| | 355,197 | | | Carrier Global Corp.(b) | | | 19,265,885 | |
| | 20,800 | | | Lennox International, Inc.(b) | | | 6,746,688 | |
| | | | | | | | |
| | | | | | | 26,012,573 | |
| | | | | | | | |
| | | | Capital Markets — 2.2% | |
| | 404,895 | | | Charles Schwab Corp. (The)(b) | | | 34,051,669 | |
| | 17,521 | | | FactSet Research Systems, Inc.(b) | | | 8,515,381 | |
| | 247,065 | | | Intercontinental Exchange, Inc.(b) | | | 33,791,080 | |
| | 507,716 | | | Morgan Stanley(b) | | | 49,837,403 | |
| | 41,804 | | | MSCI, Inc.(b) | | | 25,612,893 | |
| | 63,999 | | | S&P Global, Inc.(b) | | | 30,203,048 | |
| | | | | | | | |
| | | | | | | 182,011,474 | |
| | | | | | | | |
| | | | Chemicals — 1.6% | |
| | 83,434 | | | Ashland Global Holdings, Inc.(b) | | $ | 8,982,504 | |
| | 104,391 | | | Celanese Corp.(b) | | | 17,543,952 | |
| | 335,148 | | | Corteva, Inc.(b) | | | 15,845,797 | |
| | 357,600 | | | Dow, Inc.(b) | | | 20,283,072 | |
| | 125,392 | | | Eastman Chemical Co.(b) | | | 15,161,147 | |
| | 63,650 | | | Ingevity Corp.(a)(b) | | | 4,563,705 | |
| | 167,820 | | | LyondellBasell Industries NV, Class A(b) | | | 15,478,039 | |
| | 192,960 | | | Mosaic Co. (The)(b) | | | 7,581,398 | |
| | 115,834 | | | Olin Corp.(b) | | | 6,662,772 | |
| | 95,921 | | | RPM International, Inc.(b) | | | 9,688,021 | |
| | 195,010 | | | Valvoline, Inc.(b) | | | 7,271,923 | |
| | | | | | | | |
| | | | | | | 129,062,330 | |
| | | | | | | | |
| | | | Commercial Services & Supplies — 0.8% | |
| | 122,157 | | | Copart, Inc.(a)(b) | | | 18,521,444 | |
| | 69,341 | | | Waste Connections, Inc.(b) | | | 9,449,098 | |
| | 244,724 | | | Waste Management, Inc.(b) | | | 40,844,436 | |
| | | | | | | | |
| | | | | | | 68,814,978 | |
| | | | | | | | |
| | | | Communications Equipment — 1.0% | |
| | 1,336,023 | | | Cisco Systems, Inc.(b) | | | 84,663,777 | |
| | | | | | | | |
| | | | Construction Materials — 0.3% | |
| | 48,861 | | | Martin Marietta Materials, Inc.(b) | | | 21,524,248 | |
| | | | | | | | |
| | | | Consumer Finance — 0.6% | |
| | 121,623 | | | Ally Financial, Inc.(b) | | | 5,790,471 | |
| | 180,444 | | | Discover Financial Services(b) | | | 20,852,108 | |
| | 445,997 | | | Synchrony Financial(b) | | | 20,689,801 | |
| | | | | | | | |
| | | | | | | 47,332,380 | |
| | | | | | | | |
| | | | Containers & Packaging — 0.5% | |
| | 73,855 | | | Avery Dennison Corp.(b) | | | 15,994,777 | |
| | 86,722 | | | Crown Holdings, Inc.(b) | | | 9,593,188 | |
| | 120,587 | | | Sonoco Products Co.(b) | | | 6,980,782 | |
| | 213,615 | | | WestRock Co.(b) | | | 9,475,961 | |
| | | | | | | | |
| | | | | | | 42,044,708 | |
| | | | | | | | |
| | | | Distributors — 0.2% | |
| | 107,529 | | | Genuine Parts Co.(b) | | | 15,075,566 | |
| | | | | | | | |
| | | | Diversified Consumer Services — 0.1% | |
| | 67,454 | | | Service Corp. International(b) | | | 4,788,559 | |
| | | | | | | | |
| | | | Diversified Financial Services — 1.7% | |
| | 432,825 | | | Berkshire Hathaway, Inc., Class B(a)(b) | | | 129,414,675 | |
| | 133,431 | | | Voya Financial, Inc.(b) | | | 8,847,810 | |
| | | | | | | | |
| | | | | | | 138,262,485 | |
| | | | | | | | |
| | | | Diversified Telecommunication Services — 0.9% | |
| | 319,876 | | | Liberty Global PLC, Class C(a)(b) | | | 8,985,317 | |
| | 541,642 | | | Lumen Technologies, Inc.(b) | | | 6,797,607 | |
| | 1,053,394 | | | Verizon Communications, Inc.(b) | | | 54,734,352 | |
| | | | | | | | |
| | | | | | | 70,517,276 | |
| | | | | | | | |
| | | | Electric Utilities — 1.0% | |
| | 323,243 | | | Alliant Energy Corp.(b) | | | 19,869,747 | |
| | 396,896 | | | American Electric Power Co., Inc.(b) | | | 35,311,837 | |
| | 138,237 | | | Evergy, Inc.(b) | | | 9,484,441 | |
| | 349,526 | | | FirstEnergy Corp.(b) | | | 14,536,786 | |
| | 153,399 | | | OGE Energy Corp.(b) | | | 5,887,454 | |
| | | | | | | | |
| | | | | | | 85,090,265 | |
| | | | | | | | |
| | | | Electrical Equipment — 0.6% | |
| | 197,284 | | | Eaton Corp. PLC(b) | | | 34,094,621 | |
| | 50,567 | | | Hubbell, Inc.(b) | | | 10,531,589 | |
| | | | | | | | |
| | | | | | | 44,626,210 | |
| | | | | | | | |
See accompanying notes to financial statements.
| 28
Portfolio of Investments – as of December 31, 2021
Gateway Fund – (continued)
| | | | | | | | |
| Shares | | | Description | | Value (†) | |
| | | | Electronic Equipment, Instruments & Components — 0.8% | |
| | 97,069 | | | CDW Corp.(b) | | $ | 19,877,790 | |
| | 375,436 | | | Corning, Inc.(b) | | | 13,977,482 | |
| | 26,442 | | | Teledyne Technologies, Inc.(a)(b) | | | 11,552,245 | |
| | 33,350 | | | Zebra Technologies Corp., Class A(a)(b) | | | 19,849,920 | |
| | | | | | | | |
| | | | | | | 65,257,437 | |
| | | | | | | | |
| | | | Energy Equipment & Services — 0.3% | |
| | 681,335 | | | Halliburton Co.(b) | | | 15,582,132 | |
| | 273,059 | | | Helmerich & Payne, Inc.(b) | | | 6,471,498 | |
| | | | | | | | |
| | | | | | | 22,053,630 | |
| | | | | | | | |
| | | | Entertainment — 1.8% | |
| | 81,510 | | | Live Nation Entertainment, Inc.(a)(b) | | | 9,755,932 | |
| | 108,915 | | | Netflix, Inc.(a)(b) | | | 65,614,753 | |
| | 7,222 | | | Roku, Inc.(a) | | | 1,648,060 | |
| | 447,756 | | | Walt Disney Co. (The)(a)(b) | | | 69,352,927 | |
| | | | | | | | |
| | | | | | | 146,371,672 | |
| | | | | | | | |
| | | | Food & Staples Retailing — 1.7% | |
| | 26,487 | | | Casey’s General Stores, Inc.(b) | | | 5,227,209 | |
| | 128,445 | | | Costco Wholesale Corp.(b) | | | 72,918,227 | |
| | 115,434 | | | U.S. Foods Holding Corp.(a)(b) | | | 4,020,566 | |
| | 396,050 | | | Walmart, Inc.(b) | | | 57,304,475 | |
| | | | | | | | |
| | | | | | | 139,470,477 | |
| | | | | | | | |
| | | | Food Products — 0.8% | |
| | 94,003 | | | Bunge Ltd.(b) | | | 8,776,120 | |
| | 74,762 | | | Lamb Weston Holdings, Inc. | | | 4,738,416 | |
| | 698,295 | | | Mondelez International, Inc., Class A(b) | | | 46,303,941 | |
| | 52,500 | | | Post Holdings, Inc.(a)(b) | | | 5,918,325 | |
| | | | | | | | |
| | | | | | | 65,736,802 | |
| | | | | | | | |
| | | | Gas Utilities — 0.0% | |
| | 76,973 | | | UGI Corp.(b) | | | 3,533,830 | |
| | | | | | | | |
| | | | Health Care Equipment & Supplies — 3.0% | |
| | 481,273 | | | Abbott Laboratories(b) | | | 67,734,362 | |
| | 221,229 | | | Baxter International, Inc.(b) | | | 18,990,297 | |
| | 554,460 | | | Boston Scientific Corp.(a)(b) | | | 23,553,461 | |
| | 257,529 | | | Edwards Lifesciences Corp.(a)(b) | | | 33,362,882 | |
| | 13,103 | | | Insulet Corp.(a)(b) | | | 3,486,315 | |
| | 124,239 | | | Intuitive Surgical, Inc.(a)(b) | | | 44,639,073 | |
| | 277,192 | | | Medtronic PLC(b) | | | 28,675,512 | |
| | 55,109 | | | STERIS PLC(b) | | | 13,414,082 | |
| | 24,419 | | | Teleflex, Inc.(b) | | | 8,021,153 | |
| | | | | | | | |
| | | | | | | 241,877,137 | |
| | | | | | | | |
| | | | Health Care Providers & Services — 3.0% | |
| | 83,702 | | | Anthem, Inc.(b) | | | 38,799,225 | |
| | 391,630 | | | CVS Health Corp.(b) | | | 40,400,551 | |
| | 109,787 | | | HCA Healthcare, Inc.(b) | | | 28,206,476 | |
| | 16,707 | | | Molina Healthcare, Inc.(a)(b) | | | 5,314,163 | |
| | 250,704 | | | UnitedHealth Group, Inc.(b) | | | 125,888,506 | |
| | 65,316 | | | Universal Health Services, Inc., Class B(b) | | | 8,468,873 | |
| | | | | | | | |
| | | | | | | 247,077,794 | |
| | | | | | | | |
| | | | Health Care Technology — 0.1% | |
| | 35,189 | | | Veeva Systems, Inc., Class A(a)(b) | | | 8,990,086 | |
| | | | | | | | |
| | | | Hotels, Restaurants & Leisure — 1.7% | |
| | 10,433 | | | Booking Holdings, Inc.(a)(b) | | | 25,031,167 | |
| | 153,850 | | | Hilton Grand Vacations, Inc.(a)(b) | | | 8,017,123 | |
| | 168,770 | | | Hilton Worldwide Holdings, Inc.(a)(b) | | | 26,326,432 | |
| | 228,480 | | | McDonald’s Corp.(b) | | | 61,248,634 | |
| | 174,700 | | | Melco Resorts & Entertainment Ltd., Sponsored ADR(a) | | | 1,778,446 | |
| | 163,196 | | | Restaurant Brands International, Inc.(b) | | | 9,902,733 | |
| | | | Hotels, Restaurants & Leisure — continued | |
| | 12,225 | | | Vail Resorts, Inc.(b) | | $ | 4,008,578 | |
| | 208,390 | | | Wendy’s Co. (The)(b) | | | 4,970,101 | |
| | | | | | | | |
| | | | | | | 141,283,214 | |
| | | | | | | | |
| | | | Household Durables — 0.3% | |
| | 2,420 | | | NVR, Inc.(a)(b) | | | 14,299,465 | |
| | 129,073 | | | Toll Brothers, Inc.(b) | | | 9,343,595 | |
| | | | | | | | |
| | | | | | | 23,643,060 | |
| | | | | | | | |
| | | | Household Products — 1.5% | |
| | 104,647 | | | Clorox Co. (The)(b) | | | 18,246,251 | |
| | 644,259 | | | Procter & Gamble Co. (The)(b) | | | 105,387,887 | |
| | | | | | | | |
| | | | | | | 123,634,138 | |
| | | | | | | | |
| | | | Industrial Conglomerates — 1.3% | |
| | 205,207 | | | 3M Co.(b) | | | 36,450,920 | |
| | 265,630 | | | General Electric Co.(b) | | | 25,094,066 | |
| | 213,732 | | | Honeywell International, Inc.(b) | | | 44,565,259 | |
| | | | | | | | |
| | | | | | | 106,110,245 | |
| | | | | | | | |
| | | | Insurance — 1.9% | |
| | 577,052 | | | Aflac, Inc.(b) | | | 33,694,066 | |
| | 62,761 | | | American Financial Group, Inc.(b) | | | 8,618,340 | |
| | 99,871 | | | Aon PLC, Class A(b) | | | 30,017,228 | |
| | 117,173 | | | Arch Capital Group Ltd.(a)(b) | | | 5,208,340 | |
| | 187,556 | | | Arthur J. Gallagher & Co.(b) | | | 31,822,626 | |
| | 161,064 | | | Brown & Brown, Inc.(b) | | | 11,319,578 | |
| | 74,687 | | | Fidelity National Financial, Inc.(b) | | | 3,897,168 | |
| | 229,450 | | | Lincoln National Corp.(b) | | | 15,662,257 | |
| | 3,155 | | | Markel Corp.(a)(b) | | | 3,893,270 | |
| | 25,430 | | | RenaissanceRe Holdings Ltd.(b) | | | 4,306,062 | |
| | 329,593 | | | Unum Group(b) | | | 8,098,100 | |
| | | | | | | | |
| | | | | | | 156,537,035 | |
| | | | | | | | |
| | | | Interactive Media & Services — 6.5% | |
| | 28,078 | | | Alphabet, Inc., Class A(a)(b) | | | 81,343,089 | |
| | 90,761 | | | Alphabet, Inc., Class C(a)(b) | | | 262,625,122 | |
| | 71,062 | | | Match Group, Inc.(a)(b) | | | 9,397,950 | |
| | 511,335 | | | Meta Platforms, Inc., Class A(a)(b) | | | 171,987,527 | |
| | 205,999 | | | Twitter, Inc.(a)(b) | | | 8,903,277 | |
| | | | | | | | |
| | | | | | | 534,256,965 | |
| | | | | | | | |
| | | | Internet & Direct Marketing Retail — 3.7% | |
| | 90,698 | | | Amazon.com, Inc.(a)(b) | | | 302,417,969 | |
| | 2,538 | | | MercadoLibre, Inc.(a)(b) | | | 3,422,239 | |
| | | | | | | | |
| | | | | | | 305,840,208 | |
| | | | | | | | |
| | | | IT Services — 4.0% | |
| | 147,645 | | | Automatic Data Processing, Inc.(b) | | | 36,406,304 | |
| | 24,277 | | | Block, Inc., Class A(a)(b) | | | 3,920,978 | |
| | 114,609 | | | DXC Technology Co.(a) | | | 3,689,264 | |
| | 19,886 | | | EPAM Systems, Inc.(a)(b) | | | 13,292,797 | |
| | 187,497 | | | MasterCard, Inc., Class A(b) | | | 67,371,422 | |
| | 190,802 | | | Paychex, Inc.(b) | | | 26,044,473 | |
| | 300,792 | | | PayPal Holdings, Inc.(a)(b) | | | 56,723,355 | |
| | 2,346 | | | Shopify, Inc., Class A(a)(b) | | | 3,231,357 | |
| | 12,519 | | | Twilio, Inc., Class A(a)(b) | | | 3,296,753 | |
| | 84,449 | | | VeriSign, Inc.(a)(b) | | | 21,434,845 | |
| | 423,256 | | | Visa, Inc., Class A(b) | | | 91,723,808 | |
| | | | | | | | |
| | | | | | | 327,135,356 | |
| | | | | | | | |
| | | | Leisure Products — 0.0% | |
| | 19,460 | | | Polaris, Inc.(b) | | | 2,138,849 | |
| | | | | | | | |
| | | | Life Sciences Tools & Services — 1.7% | |
| | 151,143 | | | Danaher Corp.(b) | | | 49,727,558 | |
| | 19,491 | | | ICON PLC(a)(b) | | | 6,036,363 | |
See accompanying notes to financial statements.
29 |
Portfolio of Investments – as of December 31, 2021
Gateway Fund – (continued)
| | | | | | | | |
| Shares | | | Description | | Value (†) | |
| | | | Life Sciences Tools & Services — continued | |
| | 50,834 | | | Illumina, Inc.(a)(b) | | $ | 19,339,287 | |
| | 92,656 | | | Thermo Fisher Scientific, Inc.(b) | | | 61,823,789 | |
| | | | | | | | |
| | | | | | | 136,926,997 | |
| | | | | | | | |
| | | | Machinery — 1.5% | |
| | 183,760 | | | Caterpillar, Inc.(b) | | | 37,990,542 | |
| | 89,903 | | | Cummins, Inc.(b) | | | 19,611,441 | |
| | 93,353 | | | Deere & Co.(b) | | | 32,009,810 | |
| | 62,061 | | | Parker-Hannifin Corp.(b) | | | 19,742,845 | |
| | 121,067 | | | Pentair PLC(b) | | | 8,841,523 | |
| | 63,733 | | | Timken Co. (The)(b) | | | 4,416,060 | |
| | | | | | | | |
| | | | | | | 122,612,221 | |
| | | | | | | | |
| | | | Media — 0.8% | |
| | 1,105,162 | | | Comcast Corp., Class A(b) | | | 55,622,803 | |
| | 33,220 | | | Liberty Broadband Corp., Class C(a)(b) | | | 5,351,742 | |
| | 532,406 | | | Sirius XM Holdings, Inc.(b) | | | 3,380,778 | |
| | | | | | | | |
| | | | | | | 64,355,323 | |
| | | | | | | | |
| | | | Metals & Mining — 0.3% | |
| | 116,378 | | | Southern Copper Corp.(b) | | | 7,181,686 | |
| | 137,093 | | | Steel Dynamics, Inc.(b) | | | 8,509,363 | |
| | 127,374 | | | Worthington Industries, Inc.(b) | | | 6,962,263 | |
| | | | | | | | |
| | | | | | | 22,653,312 | |
| | | | | | | | |
| | | | Multi-Utilities — 1.4% | |
| | 318,845 | | | Ameren Corp.(b) | | | 28,380,394 | |
| | 480,848 | | | Consolidated Edison, Inc.(b) | | | 41,025,951 | |
| | 335,214 | | | Public Service Enterprise Group, Inc.(b) | | | 22,368,830 | |
| | 249,784 | | | WEC Energy Group, Inc.(b) | | | 24,246,533 | |
| | | | | | | | |
| | | | | | | 116,021,708 | |
| | | | | | | | |
| | | | Multiline Retail — 0.5% | |
| | 101,909 | | | Nordstrom, Inc.(a)(b) | | | 2,305,181 | |
| | 182,363 | | | Target Corp.(b) | | | 42,206,093 | |
| | | | | | | | |
| | | | | | | 44,511,274 | |
| | | | | | | | |
| | | | Oil, Gas & Consumable Fuels — 2.4% | |
| | 61,621 | | | Cheniere Energy, Inc.(b) | | | 6,249,602 | |
| | 470,720 | | | Chevron Corp.(b) | | | 55,238,992 | |
| | 503,248 | | | ConocoPhillips(b) | | | 36,324,441 | |
| | 1,182,931 | | | Exxon Mobil Corp.(b) | | | 72,383,548 | |
| | 61,365 | | | HollyFrontier Corp.(b) | | | 2,011,545 | |
| | 340,048 | | | Occidental Petroleum Corp.(b) | | | 9,857,991 | |
| | 254,599 | | | ONEOK, Inc.(b) | | | 14,960,237 | |
| | | | | | | | |
| | | | | | | 197,026,356 | |
| | | | | | | | |
| | | | Personal Products — 0.0% | |
| | 77,900 | | | Herbalife Nutrition Ltd.(a)(b) | | | 3,188,447 | |
| | | | | | | | |
| | | | Pharmaceuticals — 3.9% | |
| | 630,571 | | | Bristol-Myers Squibb Co.(b) | | | 39,316,102 | |
| | 187,963 | | | Eli Lilly & Co.(b) | | | 51,919,140 | |
| | 14,229 | | | Jazz Pharmaceuticals PLC(a)(b) | | | 1,812,775 | |
| | 581,508 | | | Johnson & Johnson(b) | | | 99,478,573 | |
| | 597,588 | | | Merck & Co., Inc.(b) | | | 45,799,144 | |
| | 1,319,317 | | | Pfizer, Inc.(b) | | | 77,905,669 | |
| | | | | | | | |
| | | | | | | 316,231,403 | |
| | | | | | | | |
| | | | Professional Services — 0.3% | |
| | 29,915 | | | Booz Allen Hamilton Holding Corp.(b) | | | 2,536,493 | |
| | 97,840 | | | CoStar Group, Inc.(a)(b) | | | 7,732,295 | |
| | 63,383 | | | ManpowerGroup, Inc.(b) | | | 6,169,067 | |
| | 66,920 | | | TransUnion(b) | | | 7,935,374 | |
| | | | | | | | |
| | | | | | | 24,373,229 | |
| | | | | | | | |
| | | | Real Estate Management & Development — 0.0% | |
| | 56,375 | | | Zillow Group, Inc., Class C(a)(b) | | | 3,599,544 | |
| | | | | | | | |
| | | | REITs – Apartments — 0.7% | |
| | 252,006 | | | American Homes 4 Rent, Class A(b) | | $ | 10,989,982 | |
| | 85,332 | | | Camden Property Trust(b) | | | 15,247,122 | |
| | 409,105 | | | Invitation Homes, Inc.(b) | | | 18,548,821 | |
| | 265,036 | | | UDR, Inc.(b) | | | 15,899,509 | |
| | | | | | | | |
| | | | | | | 60,685,434 | |
| | | | | | | | |
| | | | REITs – Diversified — 0.8% | |
| | 115,876 | | | American Tower Corp.(b) | | | 33,893,730 | |
| | 361,090 | | | Duke Realty Corp.(b) | | | 23,701,947 | |
| | 100,874 | | | W.P. Carey, Inc.(b) | | | 8,276,712 | |
| | | | | | | | |
| | | | | | | 65,872,389 | |
| | | | | | | | |
| | | | REITs – Health Care — 0.3% | |
| | 260,504 | | | Healthcare Realty Trust, Inc.(b) | | | 8,242,347 | |
| | 453,565 | | | Medical Properties Trust, Inc.(b) | | | 10,717,741 | |
| | 450,523 | | | Sabra Health Care REIT, Inc.(b) | | | 6,100,081 | |
| | | | | | | | |
| | | | | | | 25,060,169 | |
| | | | | | | | |
| | | | REITs – Manufactured Homes — 0.3% | |
| | 143,552 | | | Equity LifeStyle Properties, Inc.(b) | | | 12,583,768 | |
| | 68,343 | | | Sun Communities, Inc.(b) | | | 14,349,980 | |
| | | | | | | | |
| | | | | | | 26,933,748 | |
| | | | | | | | |
| | | | REITs – Mortgage — 0.1% | |
| | 515,972 | | | Annaly Capital Management, Inc.(b) | | | 4,034,901 | |
| | | | | | | | |
| | | | REITs – Office Property — 0.1% | |
| | 188,262 | | | Douglas Emmett, Inc.(b) | | | 6,306,777 | |
| | 61,813 | | | Kilroy Realty Corp.(b) | | | 4,108,092 | |
| | | | | | | | |
| | | | | | | 10,414,869 | |
| | | | | | | | |
| | | | REITs – Single Tenant — 0.1% | |
| | 221,497 | | | National Retail Properties, Inc.(b) | | | 10,647,361 | |
| | | | | | | | |
| | | | REITs – Storage — 0.1% | |
| | 127,880 | | | CubeSmart(b) | | | 7,277,651 | |
| | | | | | | | |
| | | | Road & Rail — 1.1% | |
| | 115,540 | | | Canadian Pacific Railway Ltd.(b) | | | 8,311,948 | |
| | 1,067,511 | | | CSX Corp.(b) | | | 40,138,414 | |
| | 47,741 | | | J.B. Hunt Transport Services, Inc.(b) | | | 9,758,260 | |
| | 47,143 | | | Lyft, Inc., Class A(a)(b) | | | 2,014,420 | |
| | 62,946 | | | Old Dominion Freight Line, Inc.(b) | | | 22,558,587 | |
| | 53,335 | | | Uber Technologies, Inc.(a)(b) | | | 2,236,337 | |
| | 36,648 | | | XPO Logistics, Inc.(a)(b) | | | 2,837,655 | |
| | | | | | | | |
| | | | | | | 87,855,621 | |
| | | | | | | | |
| | | | Semiconductors & Semiconductor Equipment — 6.5% | |
| | 326,538 | | | Advanced Micro Devices, Inc.(a)(b) | | | 46,988,818 | |
| | 170,421 | | | Analog Devices, Inc.(b) | | | 29,954,899 | |
| | 201,281 | | | Applied Materials, Inc.(b) | | | 31,673,578 | |
| | 100,260 | | | Broadcom, Inc.(b) | | | 66,714,007 | |
| | 899,017 | | | Intel Corp.(b) | | | 46,299,376 | |
| | 83,719 | | | Marvell Technology, Inc.(b) | | | 7,324,575 | |
| | 304,535 | | | Micron Technology, Inc.(b) | | | 28,367,435 | |
| | 522,599 | | | NVIDIA Corp.(b) | | | 153,701,592 | |
| | 297,317 | | | QUALCOMM, Inc.(b) | | | 54,370,360 | |
| | 106,600 | | | Teradyne, Inc.(b) | | | 17,432,298 | |
| | 258,807 | | | Texas Instruments, Inc.(b) | | | 48,777,355 | |
| | | | | | | | |
| | | | | | | 531,604,293 | |
| | | | | | | | |
| | | | Software — 9.9% | |
| | 140,675 | | | Adobe, Inc.(a)(b) | | | 79,771,166 | |
| | 38,046 | | | Black Knight, Inc.(a) | | | 3,153,633 | |
| | 161,194 | | | Cadence Design Systems, Inc.(a)(b) | | | 30,038,502 | |
| | 63,098 | | | Fortinet, Inc.(a)(b) | | | 22,677,421 | |
| | 1,550,337 | | | Microsoft Corp.(b) | | | 521,409,340 | |
| | 101,347 | | | Nuance Communications, Inc.(a)(b) | | | 5,606,516 | |
See accompanying notes to financial statements.
| 30
Portfolio of Investments – as of December 31, 2021
Gateway Fund – (continued)
| | | | | | | | |
| Shares | | | Description | | Value (†) | |
| | | | Software — continued | |
| | 417,592 | | | Oracle Corp.(b) | | $ | 36,418,198 | |
| | 15,761 | | | Palo Alto Networks, Inc.(a)(b) | | | 8,775,094 | |
| | 214,136 | | | salesforce.com, Inc.(a)(b) | | | 54,418,382 | |
| | 52,154 | | | ServiceNow, Inc.(a)(b) | | | 33,853,683 | |
| | 50,394 | | | SS&C Technologies Holdings, Inc.(b) | | | 4,131,300 | |
| | 27,624 | | | VMware, Inc., Class A(b) | | | 3,201,069 | |
| | 24,757 | | | Workday, Inc., Class A(a)(b) | | | 6,763,117 | |
| | 13,721 | | | Zoom Video Communications, Inc., Class A(a) | | | 2,523,429 | |
| | | | | | | | |
| | | | | | | 812,740,850 | |
| | | | | | | | |
| | | | Specialty Retail — 2.2% | |
| | 169,038 | | | American Eagle Outfitters, Inc.(b) | | | 4,280,042 | |
| | 17,696 | | | Burlington Stores, Inc.(a)(b) | | | 5,158,561 | |
| | 106,125 | | | Foot Locker, Inc.(b) | | | 4,630,234 | |
| | 262,502 | | | Home Depot, Inc. (The)(b) | | | 108,940,955 | |
| | 234,164 | | | Lowe’s Cos., Inc.(b) | | | 60,526,711 | |
| | | | | | | | |
| | | | | | | 183,536,503 | |
| | | | | | | | |
| | | | Technology Hardware, Storage & Peripherals — 7.1% | |
| | 3,257,367 | | | Apple, Inc.(b) | | | 578,410,658 | |
| | 63,335 | | | Dell Technologies, Inc., Class C(a)(b) | | | 3,557,527 | |
| | | | | | | | |
| | | | | | | 581,968,185 | |
| | | | | | | | |
| | | | Textiles, Apparel & Luxury Goods — 0.7% | |
| | 16,507 | | | Lululemon Athletica, Inc.(a)(b) | | | 6,461,665 | |
| | 301,320 | | | NIKE, Inc., Class B(b) | | | 50,221,004 | |
| | | | | | | | |
| | | | | | | 56,682,669 | |
| | | | | | | | |
| | | | Tobacco — 0.5% | |
| | 835,913 | | | Altria Group, Inc.(b) | | | 39,613,917 | |
| | | | | | | | |
| | | | Trading Companies & Distributors — 0.1% | |
| | 38,324 | | | GATX Corp.(b) | | | 3,992,978 | |
| | | | | | | | |
| | | | Total Common Stocks
(Identified Cost $2,885,578,416) | | | 8,172,069,372 | |
| | | | | | | | |
| | | | | | | | |
| | | | Total Purchased Options — 0.6%
(Identified Cost $80,664,612) (see detail below) | | | 46,998,365 | |
| | | | | |
| | | | | | | | |
Principal
Amount | | | | | | |
| | Short-Term Investments — 1.9% | | | | |
| $ | 153,204,394 | | | Tri-Party Repurchase Agreement with Fixed Income Clearing Corporation, dated 12/31/2021 at 0.000% to be repurchased at $153,204,394 on 1/03/2022 collateralized by $112,278,300 U.S. Treasury Bond, 4.375% due 11/15/2039 valued at $156,268,601 including accrued interest (Note 2 of Notes to Financial Statements)
(Identified Cost $153,204,394) | | | 153,204,394 | |
| | | | | | | | |
| | | | | | | | |
| | | | Total Investments — 102.3%
(Identified Cost $3,119,447,422) | | | 8,372,272,131 | |
| | | | Other assets less liabilities — (2.3)% | | | (187,729,566 | ) |
| | | | | | | | |
| | | | Net Assets — 100.0% | | $ | 8,184,542,565 | |
| | | | | | | | |
| | | | | | | | |
| | | | | | | | | | | | | | | | | | | | | | |
| Purchased Options — 0.6% | |
| | | | | | |
| Description | | Expiration
Date | | | Exercise
Price | | Contracts | | | Notional
Amount | | | Cost | | | Value (†) | |
| Index Options — 0.6% | |
| S&P 500® Index, Put(a) | | | 2/18/2022 | | | 4,050 | | | 2,447 | | | $ | 1,166,284,246 | | | $ | 10,259,047 | | | $ | 2,801,815 | |
| S&P 500® Index, Put(a) | | | 2/18/2022 | | | 4,100 | | | 2,446 | | | | 1,165,807,628 | | | | 10,555,713 | | | | 3,130,880 | |
| S&P 500® Index, Put(a) | | | 2/18/2022 | | | 4,125 | | | 2,336 | | | | 1,113,379,648 | | | | 10,937,151 | | | | 3,200,320 | |
| S&P 500® Index, Put(a) | | | 2/18/2022 | | | 4,150 | | | 2,427 | | | | 1,156,751,886 | | | | 10,248,008 | | | | 3,531,285 | |
| S&P 500® Index, Put(a) | | | 3/18/2022 | | | 4,100 | | | 2,446 | | | | 1,165,807,628 | | | | 11,844,755 | | | | 7,068,940 | |
| S&P 500® Index, Put(a) | | | 3/18/2022 | | | 4,300 | | | 2,447 | | | | 1,166,284,246 | | | | 10,863,457 | | | | 10,901,385 | |
| S&P 500® Index, Put(a) | | | 4/14/2022 | | | 4,300 | | | 2,446 | | | | 1,165,807,628 | | | | 15,956,481 | | | | 16,363,740 | |
| | | | | | | | | | | | | | | | | | | | | | |
| Total | | | | | | | | | | | | | | | | $ | 80,664,612 | | | $ | 46,998,365 | |
| | | | | | | | | | | | | | | | | | | | | | |
| | | | | | | | | | | | | | | | | | | | | | |
| Written Options — (2.4%) | |
| | | | | | |
| Description | | Expiration
Date | | | Exercise
Price | | Contracts | | | Notional
Amount | | | Premiums
(Received) | | | Value (†) | |
| Index Options — (2.4%) | |
| S&P 500® Index, Call | | | 1/21/2022 | | | 4,700 | | | (1,898 | ) | | $ | (904,620,964 | ) | | $ | (19,071,916 | ) | | $ | (20,175,740 | ) |
| S&P 500® Index, Call | | | 1/21/2022 | | | 4,775 | | | (1,899 | ) | | | (905,097,582 | ) | | | (16,234,311 | ) | | | (9,950,760 | ) |
| S&P 500® Index, Call | | | 2/18/2022 | | | 4,600 | | | (1,888 | ) | | | (899,854,784 | ) | | | (23,740,596 | ) | | | (42,121,280 | ) |
| S&P 500® Index, Call | | | 2/18/2022 | | | 4,650 | | | (1,889 | ) | | | (900,331,402 | ) | | | (24,965,277 | ) | | | (34,436,470 | ) |
| S&P 500® Index, Call | | | 2/18/2022 | | | 4,700 | | | (1,899 | ) | | | (905,097,582 | ) | | | (28,392,396 | ) | | | (27,345,600 | ) |
| S&P 500® Index, Call | | | 2/18/2022 | | | 4,800 | | | (1,873 | ) | | | (892,705,514 | ) | | | (18,350,717 | ) | | | (14,497,020 | ) |
| S&P 500® Index, Call | | | 3/18/2022 | | | 4,800 | | | (1,888 | ) | | | (899,854,784 | ) | | | (19,383,152 | ) | | | (20,862,400 | ) |
| S&P 500® Index, Call | | | 3/18/2022 | | | 4,850 | | | (1,888 | ) | | | (899,854,784 | ) | | | (20,283,728 | ) | | | (15,604,320 | ) |
| S&P 500® Index, Call | | | 3/18/2022 | | | 4,900 | | | (1,873 | ) | | | (892,705,514 | ) | | | (13,450,827 | ) | | | (11,125,620 | ) |
| | | | | | | | | | | | | | | | | | | | | | |
| Total | | | | | | | | | | | | | | | | $ | (183,872,920 | ) | | $ | (196,119,210 | ) |
| | | | | | | | | | | | | | | | | | | | | | |
| | | | | | | | |
| | | | | | | | | |
| | (†) | | | See Note 2 of Notes to Financial Statements. | |
| | (a) | | | Non-income producing security. | |
| | (b) | | | Security (or a portion thereof) has been pledged as collateral for open derivative contracts. | |
| | | | | |
| | ADR | | | An American Depositary Receipt is a certificate issued by a custodian bank representing the right to receive securities of the foreign issuer described. The values of ADRs may be significantly influenced by trading on exchanges not located in the United States. | |
| | REITs | | | Real Estate Investment Trusts | |
See accompanying notes to financial statements.
31 |
Portfolio of Investments – as of December 31, 2021
Gateway Fund – (continued)
Industry Summary at December 31, 2021
| | | | |
Software | | | 9.9 | % |
Technology Hardware, Storage & Peripherals | | | 7.1 | |
Interactive Media & Services | | | 6.5 | |
Semiconductors & Semiconductor Equipment | | | 6.5 | |
Banks | | | 4.1 | |
IT Services | | | 4.0 | |
Pharmaceuticals | | | 3.9 | |
Internet & Direct Marketing Retail | | | 3.7 | |
Health Care Providers & Services | | | 3.0 | |
Health Care Equipment & Supplies | | | 3.0 | |
Automobiles | | | 2.7 | |
Oil, Gas & Consumable Fuels | | | 2.4 | |
Specialty Retail | | | 2.2 | |
Capital Markets | | | 2.2 | |
Other Investments, less than 2% each | | | 39.2 | |
Short-Term Investments | | | 1.9 | |
| | | | |
Total Investments | | | 102.3 | |
Other assets less liabilities (including open written options) | | | (2.3 | ) |
| | | | |
Net Assets | | | 100.0 | % |
| | | | |
See accompanying notes to financial statements.
| 32
Portfolio of Investments – as of December 31, 2021
Gateway Equity Call Premium Fund
| | | | | | | | |
Shares | | | Description | | Value (†) | |
| | Common Stocks — 97.7% of Net Assets | |
| | | | Aerospace & Defense — 1.2% | |
| | 1,971 | | | Boeing Co. (The)(a)(b) | | $ | 396,802 | |
| | 1,204 | | | Lockheed Martin Corp.(b) | | | 427,914 | |
| | 5,526 | | | Raytheon Technologies Corp.(b) | | | 475,567 | |
| | | | | | | | |
| | | | | | | 1,300,283 | |
| | | | | | | | |
| | | | Air Freight & Logistics — 0.4% | |
| | 1,605 | | | FedEx Corp.(b) | | | 415,117 | |
| | 492 | | | GXO Logistics, Inc.(a)(b) | | | 44,689 | |
| | | | | | | | |
| | | | | | | 459,806 | |
| | | | | | | | |
| | | | Airlines — 0.2% | |
| | 3,720 | | | Delta Air Lines, Inc.(a)(b) | | | 145,378 | |
| | 5,618 | | | JetBlue Airways Corp.(a)(b) | | | 80,000 | |
| | | | | | | | |
| | | | | | | 225,378 | |
| | | | | | | | |
| | | | Auto Components — 0.2% | |
| | 858 | | | Adient PLC(a)(b) | | | 41,081 | |
| | 1,374 | | | Gentex Corp.(b) | | | 47,884 | |
| | 343 | | | Lear Corp.(b) | | | 62,752 | |
| | 507 | | | Magna International, Inc.(b) | | | 41,036 | |
| | | | | | | | |
| | | | | | | 192,753 | |
| | | | | | | | |
| | | | Automobiles — 2.5% | |
| | 18,282 | | | Ford Motor Co.(b) | | | 379,717 | |
| | 2,131 | | | Tesla, Inc.(a)(b) | | | 2,251,998 | |
| | | | | | | | |
| | | | | | | 2,631,715 | |
| | | | | | | | |
| | | | Banks — 4.0% | |
| | 21,899 | | | Bank of America Corp.(b) | | | 974,287 | |
| | 5,696 | | | Citigroup, Inc.(b) | | | 343,981 | |
| | 1,199 | | | Comerica, Inc.(b) | | | 104,313 | |
| | 491 | | | East West Bancorp, Inc.(b) | | | 38,632 | |
| | 7,331 | | | Fifth Third Bancorp(b) | | | 319,265 | |
| | 1,351 | | | First Republic Bank(b) | | | 278,995 | |
| | 8,675 | | | JPMorgan Chase & Co.(b) | | | 1,373,686 | |
| | 375 | | | SVB Financial Group(a)(b) | | | 254,340 | |
| | 11,396 | | | Wells Fargo & Co.(b) | | | 546,780 | |
| | | | | | | | |
| | | | | | | 4,234,279 | |
| | | | | | | | |
| | | | Beverages — 1.5% | |
| | 12,930 | | | Coca-Cola Co. (The)(b) | | | 765,585 | |
| | 4,770 | | | PepsiCo, Inc.(b) | | | 828,597 | |
| | | | | | | | |
| | | | | | | 1,594,182 | |
| | | | | | | | |
| | | | Biotechnology — 1.5% | |
| | 5,522 | | | AbbVie, Inc.(b) | | | 747,679 | |
| | 414 | | | Alnylam Pharmaceuticals, Inc.(a)(b) | | | 70,206 | |
| | 2,150 | | | Amgen, Inc.(b) | | | 483,686 | |
| | 585 | | | Biogen, Inc.(a)(b) | | | 140,353 | |
| | 417 | | | Exact Sciences Corp.(a)(b) | | | 32,455 | |
| | 488 | | | Seagen, Inc.(a)(b) | | | 75,445 | |
| | | | | | | | |
| | | | | | | 1,549,824 | |
| | | | | | | | |
| | | | Building Products — 0.9% | |
| | 1,115 | | | A.O. Smith Corp.(b) | | | 95,723 | |
| | 3,686 | | | Carrier Global Corp.(b) | | | 199,928 | |
| | 1,240 | | | Fortune Brands Home & Security, Inc.(b) | | | 132,556 | |
| | 5,487 | | | Johnson Controls International PLC(b) | | | 446,148 | |
| | 203 | | | Lennox International, Inc.(b) | | | 65,845 | |
| | | | | | | | |
| | | | | | | 940,200 | |
| | | | | | | | |
| | | | Capital Markets — 2.9% | |
| | 4,133 | | | Bank of New York Mellon Corp. (The)(b) | | | 240,045 | |
| | 606 | | | BlackRock, Inc.(b) | | | 554,829 | |
| | 833 | | | Blackstone, Inc.(b) | | | 107,782 | |
| | 5,269 | | | Charles Schwab Corp. (The)(b) | | | 443,123 | |
| | 237 | | | FactSet Research Systems, Inc.(b) | | | 115,184 | |
| | | | Capital Markets — continued | |
| | 1,366 | | | Goldman Sachs Group, Inc. (The)(b) | | $ | 522,563 | |
| | 1,479 | | | KKR & Co., Inc.(b) | | | 110,186 | |
| | 5,055 | | | Morgan Stanley(b) | | | 496,199 | |
| | 429 | | | MSCI, Inc.(b) | | | 262,844 | |
| | 2,437 | | | Raymond James Financial, Inc.(b) | | | 244,675 | |
| | | | | | | | |
| | | | | | | 3,097,430 | |
| | | | | | | | |
| | | | Chemicals — 1.6% | |
| | 849 | | | AdvanSix, Inc.(b) | | | 40,115 | |
| | 922 | | | Air Products & Chemicals, Inc.(b) | | | 280,528 | |
| | 729 | | | Ashland Global Holdings, Inc.(b) | | | 78,484 | |
| | 2,066 | | | Huntsman Corp.(b) | | | 72,062 | |
| | 1,996 | | | Linde PLC(b) | | | 691,474 | |
| | 1,043 | | | Nutrien Ltd.(b) | | | 78,434 | |
| | 1,644 | | | PPG Industries, Inc.(b) | | | 283,492 | |
| | 848 | | | RPM International, Inc.(b) | | | 85,648 | |
| | 1,880 | | | Valvoline, Inc.(b) | | | 70,105 | |
| | | | | | | | |
| | | | | | | 1,680,342 | |
| | | | | | | | |
| | | | Commercial Services & Supplies — 0.6% | |
| | 1,131 | | | Waste Connections, Inc.(b) | | | 154,122 | |
| | 2,587 | | | Waste Management, Inc.(b) | | | 431,770 | |
| | | | | | | | |
| | | | | | | 585,892 | |
| | | | | | | | |
| | | | Communications Equipment — 0.9% | |
| | 1,006 | | | Ciena Corp.(a)(b) | | | 77,432 | |
| | 13,997 | | | Cisco Systems, Inc.(b) | | | 886,990 | |
| | 3,169 | | | Telefonaktiebolaget LM Ericsson, Sponsored ADR(b) | | | 34,447 | |
| | | | | | | | |
| | | | | | | 998,869 | |
| | | | | | | | |
| | | | Consumer Finance — 0.5% | |
| | 4,484 | | | Ally Financial, Inc.(b) | | | 213,483 | |
| | 6,190 | | | Synchrony Financial(b) | | | 287,154 | |
| | | | | | | | |
| | | | | | | 500,637 | |
| | | | | | | | |
| | | | Containers & Packaging — 0.4% | |
| | 975 | | | Crown Holdings, Inc.(b) | | | 107,855 | |
| | 1,388 | | | Packaging Corp. of America(b) | | | 188,976 | |
| | 2,565 | | | WestRock Co.(b) | | | 113,783 | |
| | | | | | | | |
| | | | | | | 410,614 | |
| | | | | | | | |
| | | | Diversified Financial Services — 1.6% | |
| | 5,498 | | | Berkshire Hathaway, Inc., Class B(a)(b) | | | 1,643,902 | |
| | | | | | | | |
| | | | Diversified Telecommunication Services — 0.8% | |
| | 16,542 | | | Verizon Communications, Inc.(b) | | | 859,522 | |
| | | | | | | | |
| | | | Electric Utilities — 1.3% | |
| | 4,416 | | | Alliant Energy Corp.(b) | | | 271,451 | |
| | 5,574 | | | American Electric Power Co., Inc.(b) | | | 495,919 | |
| | 1,669 | | | OGE Energy Corp.(b) | | | 64,056 | |
| | 8,308 | | | Southern Co. (The)(b) | | | 569,763 | |
| | | | | | | | |
| | | | | | | 1,401,189 | |
| | | | | | | | |
| | | | Electrical Equipment — 0.5% | |
| | 378 | | | Acuity Brands, Inc.(b) | | | 80,030 | |
| | 3,379 | | | Emerson Electric Co.(b) | | | 314,146 | |
| | 403 | | | Hubbell, Inc.(b) | | | 83,933 | |
| | 1,368 | | | Sensata Technologies Holding PLC(a)(b) | | | 84,392 | |
| | | | | | | | |
| | | | | | | 562,501 | |
| | | | | | | | |
| | | | Electronic Equipment, Instruments & Components — 0.6% | |
| | 712 | | | Arrow Electronics, Inc.(a)(b) | | | 95,600 | |
| | 1,274 | | | Avnet, Inc.(b) | | | 52,527 | |
| | 1,111 | | | CDW Corp.(b) | | | 227,511 | |
| | 4,536 | | | Flex Ltd.(a)(b) | | | 83,145 | |
| | 1,991 | | | Trimble, Inc.(a)(b) | | | 173,595 | |
| | | | | | | | |
| | | | | | | 632,378 | |
| | | | | | | | |
See accompanying notes to financial statements.
33 |
Portfolio of Investments – as of December 31, 2021
Gateway Equity Call Premium Fund – (continued)
| | | | | | | | |
Shares | | | Description | | Value (†) | |
| | | | Energy Equipment & Services — 0.1% | |
| | 6,809 | | | NOV, Inc.(b) | | $ | 92,262 | |
| | | | | | | | |
| | | | Entertainment — 1.6% | |
| | 760 | | | Live Nation Entertainment, Inc.(a)(b) | | | 90,964 | |
| | 200 | | | Madison Square Garden Entertainment Corp.(a)(b) | | | 14,068 | |
| | 475 | | | Madison Square Garden Sports Corp.(a)(b) | | | 82,522 | |
| | 1,207 | | | Netflix, Inc.(a)(b) | | | 727,145 | |
| | 51 | | | Roku, Inc.(a)(b) | | | 11,638 | |
| | 4,931 | | | Walt Disney Co. (The)(a)(b) | | | 763,763 | |
| | | | | | | | |
| | | | | | | 1,690,100 | |
| | | | | | | | |
| | | | Food & Staples Retailing — 1.5% | |
| | 1,407 | | | Costco Wholesale Corp.(b) | | | 798,754 | |
| | 2,216 | | | Sysco Corp.(b) | | | 174,067 | |
| | 4,334 | | | Walmart, Inc.(b) | | | 627,086 | |
| | | | | | | | |
| | | | | | | 1,599,907 | |
| | | | | | | | |
| | | | Food Products — 0.7% | |
| | 1,103 | | | Bunge Ltd.(b) | | | 102,976 | |
| | 1,836 | | | Hain Celestial Group, Inc. (The)(a)(b) | | | 78,232 | |
| | 614 | | | Ingredion, Inc.(b) | | | 59,337 | |
| | 4,997 | | | Kellogg Co.(b) | | | 321,907 | |
| | 854 | | | Post Holdings, Inc.(a)(b) | | | 96,271 | |
| | 1,107 | | | TreeHouse Foods, Inc.(a)(b) | | | 44,867 | |
| | | | | | | | |
| | | | | | | 703,590 | |
| | | | | | | | |
| | | | Gas Utilities — 0.1% | |
| | 1,531 | | | UGI Corp.(b) | | | 70,288 | |
| | | | | | | | |
| | | | Health Care Equipment & Supplies — 2.9% | |
| | 5,859 | | | Abbott Laboratories(b) | | | 824,596 | |
| | 1,359 | | | Alcon, Inc. | | | 118,396 | |
| | 329 | | | Align Technology, Inc.(a)(b) | | | 216,212 | |
| | 479 | | | Cooper Cos., Inc. (The)(b) | | | 200,672 | |
| | 1,558 | | | Hologic, Inc.(a)(b) | | | 119,280 | |
| | 504 | | | IDEXX Laboratories, Inc.(a)(b) | | | 331,864 | |
| | 201 | | | Insulet Corp.(a)(b) | | | 53,480 | |
| | 5,308 | | | Medtronic PLC(b) | | | 549,113 | |
| | 898 | | | ResMed, Inc.(b) | | | 233,911 | |
| | 1,061 | | | STERIS PLC(b) | | | 258,258 | |
| | 362 | | | Teleflex, Inc.(b) | | | 118,910 | |
| | | | | | | | |
| | | | | | | 3,024,692 | |
| | | | | | | | |
| | | | Health Care Providers & Services — 2.6% | |
| | 1,050 | | | Anthem, Inc.(b) | | | 486,717 | |
| | 2,900 | | | Centene Corp.(a)(b) | | | 238,960 | |
| | 1,572 | | | Cigna Corp.(b) | | | 360,978 | |
| | 2,386 | | | MEDNAX, Inc.(a)(b) | | | 64,923 | |
| | 260 | | | Molina Healthcare, Inc.(a)(b) | | | 82,701 | |
| | 3,073 | | | UnitedHealth Group, Inc.(b) | | | 1,543,076 | |
| | | | | | | | |
| | | | | | | 2,777,355 | |
| | | | | | | | |
| | | | Health Care Technology — 0.1% | |
| | 428 | | | Veeva Systems, Inc., Class A(a)(b) | | | 109,345 | |
| | | | | | | | |
| | | | Hotels, Restaurants & Leisure — 2.1% | |
| | 149 | | | Booking Holdings, Inc.(a)(b) | | | 357,485 | |
| | 4,286 | | | Carnival Corp.(a)(b) | | | 86,234 | |
| | 222 | | | Domino’s Pizza, Inc.(b) | | | 125,281 | |
| | 1,238 | | | Hilton Grand Vacations, Inc.(a)(b) | | | 64,512 | |
| | 1,489 | | | Hilton Worldwide Holdings, Inc.(a)(b) | | | 232,269 | |
| | 2,281 | | | McDonald’s Corp.(b) | | | 611,468 | |
| | 2,401 | | | MGM Resorts International(b) | | | 107,757 | |
| | 1,408 | | | Restaurant Brands International, Inc.(b) | | | 85,438 | |
| | 3,705 | | | Starbucks Corp.(b) | | | 433,374 | |
| | 905 | | | Trip.com Group Ltd., ADR(a)(b) | | | 22,281 | |
| | 205 | | | Vail Resorts, Inc.(b) | | | 67,220 | |
| | | | | | | | |
| | | | | | | 2,193,319 | |
| | | | | | | | |
| | | | Household Durables — 0.3% | |
| | 2,869 | | | PulteGroup, Inc.(b) | | $ | 163,992 | |
| | 2,218 | | | Toll Brothers, Inc.(b) | | | 160,561 | |
| | | | | | | | |
| | | | | | | 324,553 | |
| | | | | | | | |
| | | | Household Products — 1.4% | |
| | 1,269 | | | Clorox Co. (The)(b) | | | 221,263 | |
| | 7,968 | | | Procter & Gamble Co. (The)(b) | | | 1,303,405 | |
| | | | | | | | |
| | | | | | | 1,524,668 | |
| | | | | | | | |
| | | | Industrial Conglomerates — 1.0% | |
| | 2,621 | | | 3M Co.(b) | | | 465,568 | |
| | 2,911 | | | Honeywell International, Inc.(b) | | | 606,973 | |
| | | | | | | | |
| | | | | | | 1,072,541 | |
| | | | | | | | |
| | | | Insurance — 1.2% | |
| | 3,115 | | | Arch Capital Group Ltd.(a)(b) | | | 138,462 | |
| | 1,950 | | | Chubb Ltd.(b) | | | 376,955 | |
| | 1,138 | | | Cincinnati Financial Corp.(b) | | | 129,652 | |
| | 5,403 | | | Manulife Financial Corp.(b) | | | 103,035 | |
| | 2,758 | | | Prudential Financial, Inc.(b) | | | 298,526 | |
| | 301 | | | RenaissanceRe Holdings Ltd.(b) | | | 50,968 | |
| | 801 | | | Willis Towers Watson PLC(b) | | | 190,230 | |
| | | | | | | | |
| | | | | | | 1,287,828 | |
| | | | | | | | |
| | | | Interactive Media & Services — 6.3% | |
| | 794 | | | Alphabet, Inc., Class A(a)(b) | | | 2,300,250 | |
| | 745 | | | Alphabet, Inc., Class C(a)(b) | | | 2,155,724 | |
| | 1,048 | | | Match Group, Inc.(a)(b) | | | 138,598 | |
| | 6,280 | | | Meta Platforms, Inc., Class A(a)(b) | | | 2,112,278 | |
| | | | | | | | |
| | | | | | | 6,706,850 | |
| | | | | | | | |
| | | | Internet & Direct Marketing Retail — 3.7% | |
| | 1,169 | | | Amazon.com, Inc.(a)(b) | | | 3,897,843 | |
| | 454 | | | JD.com, Inc., ADR(a)(b) | | | 31,812 | |
| | 29 | | | MercadoLibre, Inc.(a)(b) | | | 39,104 | |
| | | | | | | | |
| | | | | | | 3,968,759 | |
| | | | | | | | |
| | | | IT Services — 4.2% | |
| | 2,469 | | | Accenture PLC, Class A(b) | | | 1,023,524 | |
| | 458 | | | Block, Inc., Class A(a)(b) | | | 73,972 | |
| | 274 | | | EPAM Systems, Inc.(a)(b) | | | 183,155 | |
| | 615 | | | FleetCor Technologies, Inc.(a)(b) | | | 137,662 | |
| | 1,125 | | | Global Payments, Inc.(b) | | | 152,077 | |
| | 3,003 | | | International Business Machines Corp.(b) | | | 401,381 | |
| | 600 | | | Kyndryl Holdings, Inc.(a)(b) | | | 10,860 | |
| | 2,633 | | | MasterCard, Inc., Class A(b) | | | 946,090 | |
| | 51 | | | Shopify, Inc., Class A(a)(b) | | | 70,247 | |
| | 138 | | | Twilio, Inc., Class A(a)(b) | | | 36,341 | |
| | 1,088 | | | VeriSign, Inc.(a)(b) | | | 276,156 | |
| | 5,136 | | | Visa, Inc., Class A(b) | | | 1,113,022 | |
| | | | | | | | |
| | | | | | | 4,424,487 | |
| | | | | | | | |
| | | | Leisure Products — 0.1% | |
| | 590 | | | Brunswick Corp.(b) | | | 59,431 | |
| | 515 | | | Polaris, Inc.(b) | | | 56,603 | |
| | | | | | | | |
| | | | | | | 116,034 | |
| | | | | | | | |
| | | | Life Sciences Tools & Services — 1.5% | |
| | 3,235 | | | Avantor, Inc.(a)(b) | | | 136,323 | |
| | 264 | | | Bio-Rad Laboratories, Inc., Class A(a)(b) | | | 199,470 | |
| | 384 | | | ICON PLC(a)(b) | | | 118,925 | |
| | 760 | | | Illumina, Inc.(a)(b) | | | 289,134 | |
| | 1,323 | | | Thermo Fisher Scientific, Inc.(b) | | | 882,759 | |
| | | | | | | | |
| | | | | | | 1,626,611 | |
| | | | | | | | |
| | | | Machinery — 1.4% | |
| | 471 | | | AGCO Corp.(b) | | | 54,646 | |
| | 2,087 | | | Caterpillar, Inc.(b) | | | 431,466 | |
See accompanying notes to financial statements.
| 34
Portfolio of Investments – as of December 31, 2021
Gateway Equity Call Premium Fund – (continued)
| | | | | | | | |
Shares | | | Description | | Value (†) | |
| | | | Machinery — continued | |
| | 1,140 | | | Cummins, Inc.(b) | | $ | 248,680 | |
| | 1,260 | | | Deere & Co.(b) | | | 432,041 | |
| | 616 | | | IDEX Corp.(b) | | | 145,573 | |
| | 2,533 | | | Otis Worldwide Corp.(b) | | | 220,548 | |
| | | | | | | | |
| | | | | | | 1,532,954 | |
| | | | | | | | |
| | | | Media — 0.9% | |
| | 12,562 | | | Comcast Corp., Class A(b) | | | 632,245 | |
| | 1,800 | | | Discovery, Inc., Class A(a) | | | 42,372 | |
| | 2,292 | | | Fox Corp., Class B(b) | | | 78,547 | |
| | 605 | | | Liberty Broadband Corp., Class C(a)(b) | | | 97,466 | |
| | 10,823 | | | Sirius XM Holdings, Inc.(b) | | | 68,726 | |
| | | | | | | | |
| | | | | | | 919,356 | |
| | | | | | | | |
| | | | Metals & Mining — 0.4% | |
| | 1,700 | | | Alcoa Corp.(b) | | | 101,286 | |
| | 3,584 | | | Barrick Gold Corp.(b) | | | 68,096 | |
| | 929 | | | Rio Tinto PLC, Sponsored ADR(b) | | | 62,187 | |
| | 590 | | | Southern Copper Corp.(b) | | | 36,409 | |
| | 1,435 | | | Steel Dynamics, Inc.(b) | | | 89,070 | |
| | 4,124 | | | Vale S.A., Sponsored ADR(b) | | | 57,819 | |
| | | | | | | | |
| | | | | | | 414,867 | |
| | | | | | | | |
| | | | Multi-Utilities — 0.8% | |
| | 4,959 | | | Ameren Corp.(b) | | | 441,401 | |
| | 5,513 | | | Public Service Enterprise Group, Inc.(b) | | | 367,882 | |
| | | | | | | | |
| | | | | | | 809,283 | |
| | | | | | | | |
| | | | Multiline Retail — 0.5% | |
| | 2,476 | | | Nordstrom, Inc.(a)(b) | | | 56,007 | |
| | 2,049 | | | Target Corp.(b) | | | 474,221 | |
| | | | | | | | |
| | | | | | | 530,228 | |
| | | | | | | | |
| | | | Oil, Gas & Consumable Fuels — 2.5% | |
| | 2,853 | | | Canadian Natural Resources Ltd.(b) | | | 120,539 | |
| | 1,002 | | | Cheniere Energy, Inc.(b) | | | 101,623 | |
| | 6,328 | | | Chevron Corp.(b) | | | 742,591 | |
| | 5,654 | | | ConocoPhillips(b) | | | 408,106 | |
| | 1,376 | | | Devon Energy Corp.(b) | | | 60,613 | |
| | 542 | | | Enbridge, Inc.(b) | | | 21,181 | |
| | 1,230 | | | EQT Corp.(a)(b) | | | 26,826 | |
| | 12,758 | | | Exxon Mobil Corp.(b) | | | 780,662 | |
| | 1,235 | | | HollyFrontier Corp.(b) | | | 40,483 | |
| | 1,124 | | | Ovintiv, Inc.(b) | | | 37,879 | |
| | 1,177 | | | Pioneer Natural Resources Co.(b) | | | 214,073 | |
| | 3,117 | | | Suncor Energy, Inc.(b) | | | 78,018 | |
| | 1,014 | | | TC Energy Corp. | | | 47,192 | |
| | | | | | | | |
| | | | | | | 2,679,786 | |
| | | | | | | | |
| | | | Pharmaceuticals — 4.0% | |
| | 1,543 | | | AstraZeneca PLC, Sponsored ADR(b) | | | 89,880 | |
| | 7,839 | | | Bristol-Myers Squibb Co.(b) | | | 488,762 | |
| | 2,239 | | | Eli Lilly & Co.(b) | | | 618,457 | |
| | 331 | | | Jazz Pharmaceuticals PLC(a)(b) | | | 42,169 | |
| | 7,283 | | | Johnson & Johnson(b) | | | 1,245,903 | |
| | 7,817 | | | Merck & Co., Inc.(b) | | | 599,095 | |
| | 454 | | | Novartis AG, Sponsored ADR(b) | | | 39,711 | |
| | 16,562 | | | Pfizer, Inc.(b) | | | 977,986 | |
| | 1,500 | | | Teva Pharmaceutical Industries Ltd., Sponsored ADR(a)(b) | | | 12,015 | |
| | 5,916 | | | Viatris, Inc.(b) | | | 80,043 | |
| | | | | | | | |
| | | | | | | 4,194,021 | |
| | | | | | | | |
| | | | Professional Services — 0.5% | |
| | 869 | | | CoStar Group, Inc.(a)(b) | | | 68,677 | |
| | 739 | | | Leidos Holdings, Inc.(b) | | | 65,697 | |
| | 342 | | | ManpowerGroup, Inc.(b) | | | 33,287 | |
| | | | Professional Services — continued | |
| | 810 | | | TransUnion(b) | | $ | 96,050 | |
| | 998 | | | Verisk Analytics, Inc.(b) | | | 228,272 | |
| | | | | | | | |
| | | | | | | 491,983 | |
| | | | | | | | |
| | | | Real Estate Management & Development — 0.0% | |
| | 176 | | | Jones Lang LaSalle, Inc.(a)(b) | | | 47,404 | |
| | | | | | | | |
| | | | REITs – Apartments — 0.9% | |
| | 1,056 | | | American Campus Communities, Inc.(b) | | | 60,498 | |
| | 836 | | | Camden Property Trust(b) | | | 149,377 | |
| | 566 | | | Essex Property Trust, Inc.(b) | | | 199,362 | |
| | 5,655 | | | Invitation Homes, Inc.(b) | | | 256,398 | |
| | 1,125 | | | Mid-America Apartment Communities, Inc.(b) | | | 258,120 | |
| | | | | | | | |
| | | | | | | 923,755 | |
| | | | | | | | |
| | | | REITs – Diversified — 1.1% | |
| | 1,679 | | | Crown Castle International Corp.(b) | | | 350,475 | |
| | 1,197 | | | Digital Realty Trust, Inc.(b) | | | 211,714 | |
| | 2,963 | | | Duke Realty Corp.(b) | | | 194,491 | |
| | 723 | | | Gaming & Leisure Properties, Inc.(b) | | | 35,181 | |
| | 698 | | | SBA Communications Corp.(b) | | | 271,536 | |
| | 846 | | | VICI Properties, Inc.(b) | | | 25,473 | |
| | 724 | | | W.P. Carey, Inc.(b) | | | 59,404 | |
| | | | | | | | |
| | | | | | | 1,148,274 | |
| | | | | | | | |
| | | | REITs – Health Care — 0.1% | |
| | 2,686 | | | Medical Properties Trust, Inc.(b) | | | 63,470 | |
| | | | | | | | |
| | | | REITs – Hotels — 0.1% | |
| | 2,742 | | | Park Hotels & Resorts, Inc.(a)(b) | | | 51,769 | |
| | | | | | | | |
| | | | REITs – Mortgage — 0.0% | |
| | 4,312 | | | Annaly Capital Management, Inc.(b) | | | 33,720 | |
| | | | | | | | |
| | | | REITs – Office Property — 0.1% | |
| | 1,073 | | | Kilroy Realty Corp.(b) | | | 71,312 | |
| | 370 | | | Orion Office REIT, Inc.(a)(b) | | | 6,908 | |
| | | | | | | | |
| | | | | | | 78,220 | |
| | | | | | | | |
| | | | REITs – Single Tenant — 0.3% | |
| | 461 | | | National Retail Properties, Inc.(b) | | | 22,160 | |
| | 3,708 | | | Realty Income Corp.(b) | | | 265,456 | |
| | | | | | | | |
| | | | | | | 287,616 | |
| | | | | | | | |
| | | | REITs – Storage — 0.2% | |
| | 984 | | | Extra Space Storage, Inc.(b) | | | 223,102 | |
| | | | | | | | |
| | | | Road & Rail — 1.2% | |
| | 1,142 | | | Norfolk Southern Corp.(b) | | | 339,985 | |
| | 778 | | | Old Dominion Freight Line, Inc.(b) | | | 278,820 | |
| | 2,250 | | | Union Pacific Corp.(b) | | | 566,842 | |
| | 492 | | | XPO Logistics, Inc.(a)(b) | | | 38,096 | |
| | | | | | | | |
| | | | | | | 1,223,743 | |
| | | | | | | | |
| | | | Semiconductors & Semiconductor Equipment — 6.1% | |
| | 3,949 | | | Advanced Micro Devices, Inc.(a)(b) | | | 568,261 | |
| | 2,341 | | | Analog Devices, Inc.(b) | | | 411,478 | |
| | 3,515 | | | Applied Materials, Inc.(b) | | | 553,120 | |
| | 134 | | | ASML Holding NV, (Registered)(b) | | | 106,683 | |
| | 560 | | | Enphase Energy, Inc.(a)(b) | | | 102,446 | |
| | 377 | | | First Solar, Inc.(a)(b) | | | 32,859 | |
| | 11,487 | | | Intel Corp.(b) | | | 591,580 | |
| | 1,569 | | | Marvell Technology, Inc.(b) | | | 137,272 | |
| | 6,761 | | | NVIDIA Corp.(b) | | | 1,988,478 | |
| | 1,256 | | | NXP Semiconductors NV(b) | | | 286,092 | |
| | 2,536 | | | ON Semiconductor Corp.(a)(b) | | | 172,245 | |
| | 3,473 | | | QUALCOMM, Inc.(b) | | | 635,107 | |
| | 1,424 | | | Teradyne, Inc.(b) | | | 232,867 | |
| | 3,476 | | | Texas Instruments, Inc.(b) | | | 655,122 | |
| | | | | | | | |
| | | | | | | 6,473,610 | |
| | | | | | | | |
See accompanying notes to financial statements.
35 |
Portfolio of Investments – as of December 31, 2021
Gateway Equity Call Premium Fund – (continued)
| | | | | | | | |
Shares | | | Description | | Value (†) | |
| | | | Software — 9.7% | |
| | 1,531 | | | Adobe, Inc.(a)(b) | | $ | 868,169 | |
| | 1,549 | | | Cadence Design Systems, Inc.(a)(b) | | | 288,656 | |
| | 470 | | | CDK Global, Inc.(b) | | | 19,618 | |
| | 331 | | | Check Point Software Technologies Ltd.(a)(b) | | | 38,581 | |
| | 703 | | | Fortinet, Inc.(a)(b) | | | 252,658 | |
| | 19,698 | | | Microsoft Corp.(b) | | | 6,624,831 | |
| | 5,019 | | | Oracle Corp.(b) | | | 437,707 | |
| | 282 | | | Palo Alto Networks, Inc.(a)(b) | | | 157,006 | |
| | 2,777 | | | salesforce.com, Inc.(a)(b) | | | 705,719 | |
| | 695 | | | ServiceNow, Inc.(a)(b) | | | 451,132 | |
| | 498 | | | SS&C Technologies Holdings, Inc.(b) | | | 40,826 | |
| | 745 | | | Synopsys, Inc.(a)(b) | | | 274,533 | |
| | 441 | | | VMware, Inc., Class A(b) | | | 51,103 | |
| | 287 | | | Workday, Inc., Class A(a)(b) | | | 78,403 | |
| | | | | | | | |
| | | | | | | 10,288,942 | |
| | | | | | | | |
| | | | Specialty Retail — 2.0% | |
| | 858 | | | Advance Auto Parts, Inc.(b) | | | 205,817 | |
| | 346 | | | Burlington Stores, Inc.(a)(b) | | | 100,862 | |
| | 933 | | | Dick’s Sporting Goods, Inc.(b) | | | 107,286 | |
| | 1,370 | | | Foot Locker, Inc.(b) | | | 59,773 | |
| | 3,410 | | | Home Depot, Inc. (The)(b) | | | 1,415,184 | |
| | 392 | | | Ulta Beauty, Inc.(a)(b) | | | 161,637 | |
| | 298 | | | Williams-Sonoma, Inc.(b) | | | 50,401 | |
| | | | | | | | |
| | | | | | | 2,100,960 | |
| | | | | | | | |
| | | | Technology Hardware, Storage & Peripherals — 7.2% | |
| | 40,771 | | | Apple, Inc.(b) | | | 7,239,706 | |
| | 1,296 | | | Dell Technologies, Inc., Class C(a)(b) | | | 72,796 | |
| | 7,897 | | | Hewlett Packard Enterprise Co.(b) | | | 124,536 | |
| | 6,261 | | | HP, Inc.(b) | | | 235,852 | |
| | | | | | | | |
| | | | | | | 7,672,890 | |
| | | | | | | | |
| | | | Textiles, Apparel & Luxury Goods — 0.8% | |
| | 579 | | | Carter’s, Inc.(b) | | | 58,606 | |
| | 232 | | | Lululemon Athletica, Inc.(a)(b) | | | 90,816 | |
| | 3,968 | | | NIKE, Inc., Class B(b) | | | 661,347 | |
| | 800 | | | Skechers U.S.A., Inc., Class A(a)(b) | | | 34,720 | |
| | 2,600 | | | Under Armour, Inc., Class C(a) | | | 46,904 | |
| | | | | | | | |
| | | | | | | 892,393 | |
| | | | | | | | |
| | | | Tobacco — 0.9% | |
| | 7,499 | | | Altria Group, Inc.(b) | | | 355,378 | |
| | 1,544 | | | British American Tobacco PLC, Sponsored ADR(b) | | | 57,761 | |
| | 6,154 | | | Philip Morris International, Inc.(b) | | | 584,630 | |
| | | | | | | | |
| | | | | | | 997,769 | |
| | | | | | | | |
| | | | Water Utilities — 0.3% | |
| | 1,833 | | | American Water Works Co., Inc.(b) | | | 346,180 | |
| | | | | | | | |
| | | | Wireless Telecommunication Services — 0.2% | |
| | 3,935 | | | America Movil SAB de CV, Series L, ADR(b) | | | 83,068 | |
| | 8,169 | | | Vodafone Group PLC, Sponsored ADR(b) | | | 121,963 | |
| | | | | | | | |
| | | | | | | 205,031 | |
| | | | | | | | |
| | | | Total Common Stocks
(Identified Cost $53,082,361) | | | 103,446,211 | |
| | | | | | | | |
| | | | | | | | |
Principal
Amount | | | Description | | Value (†) | |
| | Short-Term Investments — 2.8% | | | | |
| $ | 2,970,605 | | | Tri-Party Repurchase Agreement with Fixed Income Clearing Corporation, dated 12/31/2021 at 0.000% to be repurchased at $2,970,605 on 1/03/2022 collateralized by $2,177,100 U.S. Treasury Bond, 4.375% due 11/15/2039 valued at $3,030,081 including accrued interest (Note 2 of Notes to Financial Statements)
(Identified Cost $2,970,605) | | $ | 2,970,605 | |
| | | | | | | | |
| | | | | | | | |
| | | | Total Investments — 100.5%
(Identified Cost $56,052,966) | | | 106,416,816 | |
| | | | Other assets less liabilities — (0.5)% | | | (549,175 | ) |
| | | | | | | | |
| | | | Net Assets — 100.0% | | $ | 105,867,641 | |
| | | | | | | | |
| | | | | | | | |
| | | | | | | | | | | | | | | | | | | | | | |
| Written Options — (2.3%) | |
| | | | | | |
| Description | | Expiration
Date | | | Exercise
Price | | Contracts | | | Notional
Amount | | | Premiums
(Received) | | | Value (†) | |
| Index Options — (2.3%) | |
| S&P 500® Index, Call | | | 1/21/2022 | | | 4,700 | | | (24 | ) | | $ | (11,438,832 | ) | | $ | (241,193 | ) | | $ | (255,120 | ) |
| S&P 500® Index, Call | | | 1/21/2022 | | | 4,775 | | | (24 | ) | | | (11,438,832 | ) | | | (206,868 | ) | | | (125,760 | ) |
| S&P 500® Index, Call | | | 2/18/2022 | | | 4,600 | | | (24 | ) | | | (11,438,832 | ) | | | (300,732 | ) | | | (535,440 | ) |
| S&P 500® Index, Call | | | 2/18/2022 | | | 4,650 | | | (24 | ) | | | (11,438,832 | ) | | | (316,980 | ) | | | (437,520 | ) |
| S&P 500® Index, Call | | | 2/18/2022 | | | 4,700 | | | (24 | ) | | | (11,438,832 | ) | | | (357,772 | ) | | | (345,600 | ) |
| S&P 500® Index, Call | | | 2/18/2022 | | | 4,800 | | | (23 | ) | | | (10,962,214 | ) | | | (225,343 | ) | | | (178,020 | ) |
| S&P 500® Index, Call | | | 3/18/2022 | | | 4,800 | | | (24 | ) | | | (11,438,832 | ) | | | (246,396 | ) | | | (265,200 | ) |
| S&P 500® Index, Call | | | 3/18/2022 | | | 4,850 | | | (24 | ) | | | (11,438,832 | ) | | | (257,844 | ) | | | (198,360 | ) |
| S&P 500® Index, Call | | | 3/18/2022 | | | 4,900 | | | (24 | ) | | | (11,438,832 | ) | | | (172,354 | ) | | | (142,560 | ) |
| | | | | | | | | | | | | | | | | | | | | | |
| Total | | | | | | | | | | | | | | | | $ | (2,325,482 | ) | | $ | (2,483,580 | ) |
| | | | | | | | | | | | | | | | | | | | | | |
| | | | | | | | |
| | | | | | | | | |
| | (†) | | | See Note 2 of Notes to Financial Statements. | |
| | (a) | | | Non-income producing security. | |
| | (b) | | | Security (or a portion thereof) has been pledged as collateral for open derivative contracts. | |
| | | | | | | | |
| | ADR | | | An American Depositary Receipt is a certificate issued by a custodian bank representing the right to receive securities of the foreign issuer described. The values of ADRs may be significantly influenced by trading on exchanges not located in the United States. | |
| | REITs | | | Real Estate Investment Trusts | |
See accompanying notes to financial statements.
| 36
Portfolio of Investments – as of December 31, 2021
Gateway Equity Call Premium Fund – (continued)
Industry Summary at December 31, 2021
| | | | |
Software | | | 9.7 | % |
Technology Hardware, Storage & Peripherals | | | 7.2 | |
Interactive Media & Services | | | 6.3 | |
Semiconductors & Semiconductor Equipment | | | 6.1 | |
IT Services | | | 4.2 | |
Banks | | | 4.0 | |
Pharmaceuticals | | | 4.0 | |
Internet & Direct Marketing Retail | | | 3.7 | |
Capital Markets | | | 2.9 | |
Health Care Equipment & Supplies | | | 2.9 | |
Health Care Providers & Services | | | 2.6 | |
Oil, Gas & Consumable Fuels | | | 2.5 | |
Automobiles | | | 2.5 | |
Hotels, Restaurants & Leisure | | | 2.1 | |
Specialty Retail | | | 2.0 | |
Other Investments, less than 2% each | | | 35.0 | |
Short-Term Investments | | | 2.8 | |
| | | | |
Total Investments | | | 100.5 | |
Other assets less liabilities (including open written options) | | | (0.5 | ) |
| | | | |
Net Assets | | | 100.0 | % |
| | | | |
See accompanying notes to financial statements.
37 |
Portfolio of Investments – as of December 31, 2021
Mirova Global Green Bond Fund
| | | | | | | | |
Principal
Amount (‡) | | | Description | | Value (†) | |
| | Bonds and Notes — 88.9% of Net Assets | |
| | | | Canada — 1.8% | |
| | 1,000,000 | | | Province of Ontario Canada, 1.950%, 1/27/2023, (CAD)(a) | | $ | 800,530 | |
| | 50,000 | | | Province of Quebec Canada, 2.600%, 7/06/2025, (CAD)(a) | | | 41,141 | |
| | | | | | | | |
| | | | | | | 841,671 | |
| | | | | | | | |
| | | | Chile — 2.3% | |
| | 500,000 | | | Chile Government International Bond, 1.250%, 1/29/2040, (EUR)(a) | | | 552,172 | |
| | 500,000 | | | Chile Government International Bond, 3.500%, 1/25/2050(a) | | | 517,420 | |
| | | | | | | | |
| | | | | | | 1,069,592 | |
| | | | | | | | |
| | | | Denmark — 1.0% | |
| | 400,000 | | | Orsted A/S, (fixed rate to 9/09/2027, variable rate thereafter), 1.750%, 12/09/3019, (EUR)(a) | | | 465,077 | |
| | | | | | | | |
| | | | Finland — 1.2% | |
| | 500,000 | | | Citycon OYJ, (fixed rate to 11/24/2024, variable rate thereafter), 4.496%, (EUR)(a)(b) | | | 565,615 | |
| | | | | | | | |
| | | | France — 16.7% | |
| | 400,000 | | | Altarea SCA, 1.750%, 1/16/2030, (EUR)(a) | | | 446,040 | |
| | 400,000 | | | Covivio, 1.125%, 9/17/2031, (EUR)(a) | | | 461,908 | |
| | 500,000 | | | Derichebourg S.A., 2.250%, 7/15/2028, (EUR)(a) | | | 582,343 | |
| | 800,000 | | | Electricite de France S.A., 3.625%, 10/13/2025(a) | | | 853,518 | |
| | 400,000 | | | Faurecia SE, 2.375%, 6/15/2029, (EUR)(a) | | | 457,677 | |
| | 2,500,000 | | | France Government Bond OAT, 1.750%, 6/25/2039, 144A, (EUR)(a) | | | 3,437,409 | |
| | 100,000 | | | Getlink SE, 3.500%, 10/30/2025, (EUR)(a) | | | 117,220 | |
| | 600,000 | | | ICADE, 1.500%, 9/13/2027, (EUR)(a) | | | 717,726 | |
| | 600,000 | | | Societe du Grand Paris EPIC, EMTN, 1.700%, 5/25/2050, (EUR)(a) | | | 790,417 | |
| | | | | | | | |
| | | | | | | 7,864,258 | |
| | | | | | | | |
| | | | Germany — 4.0% | |
| | 500,000 | | | BayWa AG, EMTN, 3.125%, 6/26/2024, (EUR)(a) | | | 602,602 | |
| | 300,000 | | | E.ON SE, EMTN, 0.350%, 2/28/2030, (EUR)(a) | | | 338,562 | |
| | 500,000 | | | EnBW Energie Baden-Wuerttemberg AG, (fixed rate to 3/30/2026, variable rate thereafter), 1.875%, 6/29/2080, (EUR)(a) | | | 581,347 | |
| | 300,000 | | | Landesbank Baden-Wuerttemberg, Series 809, MTN, 0.375%, 7/29/2026, (EUR)(a) | | | 343,377 | |
| | | | | | | | |
| | | | | | | 1,865,888 | |
| | | | | | | | |
| | | | Hungary — 1.7% | |
| | 700,000 | | | Hungary Government International Bond, 1.750%, 6/05/2035, (EUR)(a) | | | 828,707 | |
| | | | | | | | |
| | | | Indonesia — 2.2% | |
| | 500,000 | | | Perusahaan Penerbit SBSN Indonesia III, 3.750%, 3/01/2023(a) | | | 516,475 | |
| | 500,000 | | | Perusahaan Penerbit SBSN Indonesia III, MTN, 3.900%, 8/20/2024(a) | | | 535,230 | |
| | | | | | | | |
| | | | | | | 1,051,705 | |
| | | | | | | | |
| | | | Ireland — 0.8% | |
| | 300,000 | | | AIB Group PLC, EMTN, (fixed rate to 5/30/2026, variable rate thereafter), 2.875%, 5/30/2031, (EUR)(a) | | | 360,031 | |
| | | | | | | | |
| | | | Italy — 7.3% | |
| | 400,000 | | | A2A SpA, EMTN, 1.000%, 7/16/2029, (EUR)(a) | | | 467,828 | |
| | 600,000 | | | Assicurazioni Generali SpA, EMTN, 2.124%, 10/01/2030, (EUR)(a) | | | 713,898 | |
| | 2,100,000 | | | Italy Buoni Poliennali Del Tesoro, 1.500%, 4/30/2045, 144A, (EUR)(a) | | | 2,243,268 | |
| | | | | | | | |
| | | | | | | 3,424,994 | |
| | | | | | | | |
| | | | Korea — 3.2% | |
| | 400,000 | | | Kia Corp., 1.750%, 10/16/2026(a) | | $ | 394,689 | |
| | 600,000 | | | Korea International Bond, Zero Coupon, 0.000%, 10/15/2026, (EUR)(a)(c) | | | 682,106 | |
| | 400,000 | | | Korea Water Resources Corp., EMTN, 3.875%, 5/15/2023(a) | | | 415,577 | |
| | | | | | | | |
| | | | | | | 1,492,372 | |
| | | | | | | | |
| | | | Lithuania — 2.3% | |
| | 500,000 | | | AB Ignitis Grupe, EMTN, 1.875%, 7/10/2028, (EUR)(a) | | | 608,869 | |
| | 400,000 | | | AB Ignitis Grupe, EMTN, 2.000%, 7/14/2027, (EUR)(a) | | | 489,271 | |
| | | | | | | | |
| | | | | | | 1,098,140 | |
| | | | | | | | |
| | | | Luxembourg — 0.7% | |
| | 300,000 | | | Eurofins Scientific SE, (fixed rate to 8/11/2022, variable rate thereafter), 2.875%, (EUR)(b) | | | 345,229 | |
| | | | | | | | |
| | | | Mexico — 2.0% | |
| | 800,000 | | | Mexico Government International Bond, 1.350%, 9/18/2027, (EUR)(a) | | | 927,905 | |
| | | | | | | | |
| | | | Netherlands — 8.2% | |
| | 700,000 | | | ABB Finance BV, EMTN, Zero Coupon, 0.271%-0.282%, 1/19/2030, (EUR)(a)(d) | | | 765,607 | |
| | 400,000 | | | CTP NV, EMTN, 2.125%, 10/01/2025, (EUR)(a) | | | 477,416 | |
| | 600,000 | | | de Volksbank NV, EMTN, (fixed rate to 10/22/2025, variable rate thereafter), 1.750%, 10/22/2030, (EUR)(a) | | | 707,412 | |
| | 700,000 | | | Signify NV, 2.375%, 5/11/2027, (EUR)(a) | | | 863,398 | |
| | 150,000 | | | TenneT Holding BV, EMTN, 1.250%, 10/24/2033, (EUR)(a) | | | 179,483 | |
| | 700,000 | | | TenneT Holding BV, EMTN, 1.875%, 6/13/2036, (EUR)(a) | | | 888,610 | |
| | | | | | | | |
| | | | | | | 3,881,926 | |
| | | | | | | | |
| | | | Singapore — 1.5% | |
| | 700,000 | | | Vena Energy Capital Pte Ltd., EMTN, 3.133%, 2/26/2025(a) | | | 713,411 | |
| | | | | | | | |
| | | | Spain — 7.0% | |
| | 400,000 | | | Banco Bilbao Vizcaya Argentaria S.A., 1.000%, 6/21/2026, (EUR)(a) | | | 466,293 | |
| | 500,000 | | | Bankinter S.A., 0.625%, 10/06/2027, (EUR)(a) | | | 566,927 | |
| | 500,000 | | | Iberdrola International BV, (fixed rate to 2/22/2023, variable rate thereafter), 1.875%, (EUR)(a)(b) | | | 580,362 | |
| | 900,000 | | | Spain Government Bond, 1.000%, 7/30/2042, 144A, (EUR)(a) | | | 997,645 | |
| | 600,000 | | | Telefonica Europe BV, (fixed rate to 2/05/2027, variable rate thereafter), 2.502%, (EUR)(a)(b) | | | 686,944 | |
| | | | | | | | |
| | | | | | | 3,298,171 | |
| | | | | | | | |
| | | | Supranationals — 7.8% | |
| | 3,500,000 | | | European Investment Bank, 2.375%, 5/24/2027(a) | | | 3,672,105 | |
| | | | | | | | |
| | | | United Kingdom — 6.9% | |
| | 500,000 | | | Anglian Water Services Financing PLC, EMTN, 1.625%, 8/10/2025, (GBP)(a) | | | 683,789 | |
| | 500,000 | | | SSE PLC, EMTN, 1.375%, 9/04/2027, (EUR)(a) | | | 598,895 | |
| | 1,500,000 | | | United Kingdom Gilt, 0.875%, 7/31/2033, (GBP)(a) | | | 1,994,325 | |
| | | | | | | | |
| | | | | | | 3,277,009 | |
| | | | | | | | |
| | | | United States — 10.3% | |
| | 500,000 | | | Air Products & Chemicals, Inc., 2.050%, 5/15/2030(a) | | | 502,933 | |
| | 300,000 | | | Arizona Public Service Co., 2.650%, 9/15/2050(a) | | | 270,529 | |
| | 600,000 | | | Digital Dutch Finco BV, 1.500%, 3/15/2030, (EUR)(a) | | | 708,037 | |
| | 400,000 | | | Digital Euro Finco LLC, 2.500%, 1/16/2026, (EUR)(a) | | | 491,585 | |
| | 300,000 | | | Digital Intrepid Holding BV, 0.625%, 7/15/2031, (EUR)(a) | | | 322,054 | |
| | 400,000 | | | Ford Motor Co., 3.250%, 2/12/2032(a) | | | 409,600 | |
| | 400,000 | | | Southern Power Co., 4.150%, 12/01/2025(a) | | | 435,019 | |
See accompanying notes to financial statements.
| 38
Portfolio of Investments – as of December 31, 2021
Mirova Global Green Bond Fund – (continued)
| | | | | | | | |
Principal
Amount (‡) | | | Description | | Value (†) | |
| | | | United States — continued | |
| | 200,000 | | | Thermo Fisher Scientific, Inc., 4.100%, 8/15/2047(a) | | $ | 246,695 | |
| | 700,000 | | | Verizon Communications, Inc., 3.875%, 2/08/2029(a) | | | 775,721 | |
| | 600,000 | | | Wabtec Transportation Netherlands BV, 1.250%, 12/03/2027, (EUR)(a) | | | 689,231 | |
| | | | | | | | |
| | | | | | | 4,851,404 | |
| | | | | | | | |
| | | | Total Bonds and Notes
(Identified Cost $42,412,324) | | | 41,895,210 | |
| | | | | | | | |
| | | | | | | | |
| | Short-Term Investments — 6.7% | |
| | 3,173,547 | | | Tri-Party Repurchase Agreement with Fixed Income Clearing Corporation, dated 12/31/2021 at 0.000% to be repurchased at $3,173,547 on 1/03/2022 collateralized by $2,325,800 U.S. Treasury Bond, 4.375% due 11/15/2039 valued at $3,237,041 including accrued interest (Note 2 of Notes to Financial Statements) (Identified Cost $3,173,547) | | | 3,173,547 | |
| | | | | | | | |
| | | | | | | | |
| | | | Total Investments — 95.6%
(Identified Cost $45,585,871) | | | 45,068,757 | |
| | | | Other assets less liabilities — 4.4% | | | 2,056,317 | |
| | | | | | | | |
| | | | Net Assets — 100.0% | | $ | 47,125,074 | |
| | | | | | | | |
| | | | | | | | |
| | (‡) | | | Principal Amount stated in U.S. dollars unless otherwise noted. | |
| | (†) | | | See Note 2 of Notes to Financial Statements. | |
| | (a) | | | Security (or a portion thereof) has been designated to cover the Fund’s obligations under open derivative contracts. | |
| | (b) | | | Perpetual bond with no specified maturity date. | |
| | (c) | | | Interest rate represents annualized yield at time of purchase; not a coupon rate. | |
| | (d) | | | Interest rate represents annualized yield at time of purchase; not a coupon rate. The Fund’s investment in this security is comprised of various lots with differing annualized yields. | |
| | | | | | | | |
| | 144A | | | All or a portion of these securities are exempt from registration under Rule 144A of the Securities Act of 1933. These securities may be resold in transactions exempt from registration, normally to qualified institutional buyers. At December 31, 2021, the value of Rule 144A holdings amounted to $6,678,322 or 14.2% of net assets. | |
| | EMTN | | | Euro Medium Term Note | |
| | MTN | | | Medium Term Note | |
| | | | | | | | |
| | CAD | | | Canadian Dollar | |
| | EUR | | | Euro | |
| | GBP | | | British Pound | |
At December 31, 2021, open long futures contracts were as follows:
| | | | | | | | | | | | | | | | | | | | |
| Financial Futures | | Expiration
Date | | | Contracts | | | Notional
Amount | | | Value | | | Unrealized
Appreciation
(Depreciation) | |
Ultra Long U.S. Treasury Bond | | | 3/22/2022 | | | | 2 | | | $ | 387,953 | | | $ | 394,250 | | | $ | 6,297 | |
UK Long Gilt | | | 3/29/2022 | | | | 7 | | | | 1,181,703 | | | | 1,183,408 | | | | 1,705 | |
German Euro Bund | | | 3/08/2022 | | | | 16 | | | | 3,177,222 | | | | 3,121,675 | | | | (55,547 | ) |
Euro-Buxl® 30 Year Bond | | | 3/08/2022 | | | | 6 | | | | 1,480,687 | | | | 1,412,240 | | | | (68,447 | ) |
| | | | | | | | | | | | | | | | | | | | |
Total | | | | | | | | | | | | | | | | | | $ | (115,992 | ) |
| | | | | | | | | | | | | | | | | | | | |
At December 31, 2021, open short futures contracts were as follows:
| | | | | | | | | | | | | | | | | | | | |
Financial and
Currency Futures | | Expiration
Date | | | Contracts | | | Notional
Amount | | | Value | | | Unrealized
Appreciation
(Depreciation) | |
10 Year U.S. Treasury Note | | | 3/22/2022 | | | | 20 | | | $ | 2,599,531 | | | $ | 2,609,375 | | | $ | (9,844 | ) |
British Pound | | | 3/14/2022 | | | | 27 | | | | 2,257,369 | | | | 2,283,356 | | | | (25,987 | ) |
Canadian Dollar | | | 3/15/2022 | | | | 11 | | | | 864,413 | | | | 869,550 | | | | (5,137 | ) |
Euro | | | 3/14/2022 | | | | 217 | | | | 30,612,011 | | | | 30,929,281 | | | | (317,270 | ) |
| | | | | | | | | | | | | | | | | | | | |
Total | | | $ | (358,238 | ) |
| | | | | | | | | | | | | | | | | | | | |
Industry Summary at December 31, 2021
| | | | |
Government National | | | 25.9 | % |
Industrial | | | 13.1 | |
Utility-Electric | | | 12.1 | |
Financial | | | 9.3 | |
Supranational | | | 7.8 | |
Special Purpose | | | 7.7 | |
Bank | | | 5.2 | |
Government Regional | | | 3.5 | |
Telephone | | | 3.1 | |
Government Agency | | | 0.9 | |
Transportation-Non Rail | | | 0.3 | |
Short-Term Investments | | | 6.7 | |
| | | | |
Total Investments | | | 95.6 | |
Other assets less liabilities (including futures contracts) | | | 4.4 | |
| | | | |
Net Assets | | | 100.0 | % |
| | | | |
Currency Exposure Summary at December 31, 2021
| | | | |
Euro | | | 59.8 | % |
United States Dollar | | | 28.4 | |
British Pound | | | 5.6 | |
Canadian Dollar | | | 1.8 | |
| | | | |
Total Investments | | | 95.6 | |
Other assets less liabilities (including futures contracts) | | | 4.4 | |
| | | | |
Net Assets | | | 100.0 | % |
| | | | |
See accompanying notes to financial statements.
39 |
Portfolio of Investments — as of December 31, 2021
Mirova Global Sustainable Equity Fund
| | | | | | | | |
| Shares | | | Description | | Value (†) | |
| | Common Stocks — 95.5% of Net Assets | |
| | | | Argentina — 1.1% | |
| | 9,099 | | | MercadoLibre, Inc.(a) | | $ | 12,269,092 | |
| | | | | | | | |
| | | | Belgium — 1.8% | |
| | 230,272 | | | KBC Group NV | | | 19,785,254 | |
| | | | | | | | |
| | | | Denmark — 8.2% | |
| | 297,813 | | | Novo Nordisk A/S, Class B | | | 33,452,103 | |
| | 248,124 | | | Orsted A/S, 144A | | | 31,776,513 | |
| | 882,863 | | | Vestas Wind Systems A/S | | | 26,887,703 | |
| | | | | | | | |
| | | | | | | 92,116,319 | |
| | | | | | | | |
| | | | France — 3.0% | |
| | 88,019 | | | EssilorLuxottica S.A. | | | 18,737,202 | |
| | 72,849 | | | Orpea S.A. | | | 7,305,893 | |
| | 265,612 | | | Valeo S.A. | | | 8,009,894 | |
| | | | | | | | |
| | | | | | | 34,052,989 | |
| | | | | | | | |
| | | | Germany — 5.1% | |
| | 49,206 | | | Allianz SE, (Registered) | | | 11,605,659 | |
| | 51,806 | | | SAP SE | | | 7,291,150 | |
| | 258,847 | | | Symrise AG | | | 38,282,083 | |
| | | | | | | | |
| | | | | | | 57,178,892 | |
| | | | | | | | |
| | | | Hong Kong — 2.0% | |
| | 2,201,751 | | | AIA Group Ltd. | | | 22,221,922 | |
| | | | | | | | |
| | | | Japan — 4.7% | |
| | 829,500 | | | Sekisui House Ltd. | | | 17,847,304 | |
| | 607,350 | | | Takeda Pharmaceutical Co. Ltd. | | | 16,585,690 | |
| | 436,600 | | | Terumo Corp. | | | 18,442,244 | |
| | | | | | | | |
| | | | | | | 52,875,238 | |
| | | | | | | | |
| | | | Netherlands — 4.1% | |
| | 9,649 | | | Adyen NV, 144A(a) | | | 25,328,621 | |
| | 25,269 | | | ASML Holding NV | | | 20,240,970 | |
| | | | | | | | |
| | | | | | | 45,569,591 | |
| | | | | | | | |
| | | | Spain — 2.6% | |
| | 2,457,429 | | | Iberdrola S.A. | | | 29,095,900 | |
| | | | | | | | |
| | | | Switzerland — 1.3% | |
| | 18,497 | | | Geberit AG, (Registered) | | | 15,077,527 | |
| | | | | | | | |
| | | | Taiwan — 2.7% | |
| | 249,621 | | | Taiwan Semiconductor Manufacturing Co. Ltd., Sponsored ADR | | | 30,031,903 | |
| | | | | | | | |
| | | | United Kingdom — 4.3% | |
| | 4,625,696 | | | Legal & General Group PLC | | | 18,679,905 | |
| | 1,110,417 | | | Prudential PLC | | | 19,202,269 | |
| | 184,236 | | | Unilever PLC | | | 9,876,196 | |
| | | | | | | | |
| | | | | | | 47,758,370 | |
| | | | | | | | |
| | | | United States — 54.6% | |
| | 55,755 | | | Adobe, Inc.(a) | | | 31,616,430 | |
| | 85,967 | | | American Water Works Co., Inc. | | | 16,235,728 | |
| | 168,015 | | | Aptiv PLC(a) | | | 27,714,074 | |
| | 182,528 | | | Ball Corp. | | | 17,571,971 | |
| | 70,480 | | | Bright Horizons Family Solutions, Inc.(a) | | | 8,872,022 | |
| | 136,144 | | | Danaher Corp. | | | 44,792,737 | |
| | 648,468 | | | eBay, Inc. | | | 43,123,122 | |
| | 182,747 | | | Ecolab, Inc. | | | 42,870,619 | |
| | 86,442 | | | Eli Lilly & Co. | | | 23,877,009 | |
| | 40,259 | | | Estee Lauder Cos., Inc. (The), Class A | | | 14,903,882 | |
| | 37,493 | | | Intuitive Surgical, Inc.(a) | | | 13,471,235 | |
| | 125,134 | | | MasterCard, Inc., Class A | | | 44,963,149 | |
| | 157,943 | | | Microsoft Corp. | | | 53,119,390 | |
| | 188,503 | | | NextEra Energy, Inc. | | | 17,598,640 | |
| | 99,607 | | | NVIDIA Corp. | | | 29,295,415 | |
| | | | United States — continued | |
| | 140,490 | | | Oracle Corp. | | $ | 12,252,133 | |
| | 65,594 | | | Roper Technologies, Inc. | | | 32,263,065 | |
| | 67,577 | | | Signature Bank | | | 21,859,132 | |
| | 266,006 | | | Sunrun, Inc.(a) | | | 9,124,006 | |
| | 74,980 | | | Thermo Fisher Scientific, Inc. | | | 50,029,655 | |
| | 126,999 | | | Visa, Inc., Class A | | | 27,521,953 | |
| | 66,349 | | | Watts Water Technologies, Inc., Series A | | | 12,882,985 | |
| | 133,389 | | | Xylem, Inc. | | | 15,996,009 | |
| | | | | | | | |
| | | | | | | 611,954,361 | |
| | | | | | | | |
| | | | Total Common Stocks
(Identified Cost $907,416,405) | | | 1,069,987,358 | |
| | | | | | | | |
| | | | | | | | |
Principal
Amount | | | | | | |
| | Short-Term Investments — 2.1% | |
| $ | 23,460,001 | | | Tri-Party Repurchase Agreement with Fixed Income Clearing Corporation, dated 12/31/2021 at 0.000% to be repurchased at $23,460,001 on 1/03/2022 collateralized by $17,193,100 U.S. Treasury Bond, 4.375% due 11/15/2039 valued at $23,929,305 including accrued interest (Note 2 of Notes to Financial Statements)
(Identified Cost $23,460,001) | | | 23,460,001 | |
| | | | | | | | |
| | | | | | | | |
| | | | Total Investments — 97.6%
(Identified Cost $930,876,406) | | | 1,093,447,359 | |
| | | | Other assets less liabilities — 2.4% | | | 27,234,632 | |
| | | | | | | | |
| | | | Net Assets — 100.0% | | $ | 1,120,681,991 | |
| | | | | | | | |
| | | | | | | | |
| | (†) | | | See Note 2 of Notes to Financial Statements. | |
| | (a) | | | Non-income producing security. | |
| | | | | |
| | 144A | | | All or a portion of these securities are exempt from registration under Rule 144A of the Securities Act of 1933. These securities may be resold in transactions exempt from registration, normally to qualified institutional buyers. At December 31, 2021, the value of Rule 144A holdings amounted to $57,105,134 or 5.1% of net assets. | |
| | ADR | | | An American Depositary Receipt is a certificate issued by a custodian bank representing the right to receive securities of the foreign issuer described. The values of ADRs may be significantly influenced by trading on exchanges not located in the United States. | |
See accompanying notes to financial statements.
| 40
Portfolio of Investments — as of December 31, 2021
Mirova Global Sustainable Equity Fund – (continued)
Industry Summary at December 31, 2021
| | | | |
Software | | | 9.3 | % |
IT Services | | | 8.8 | |
Life Sciences Tools & Services | | | 8.5 | |
Chemicals | | | 7.2 | |
Semiconductors & Semiconductor Equipment | | | 7.1 | |
Electric Utilities | | | 7.0 | |
Pharmaceuticals | | | 6.6 | |
Insurance | | | 6.4 | |
Internet & Direct Marketing Retail | | | 4.9 | |
Banks | | | 3.8 | |
Electrical Equipment | | | 3.2 | |
Auto Components | | | 3.2 | |
Industrial Conglomerates | | | 2.9 | |
Health Care Equipment & Supplies | | | 2.8 | |
Machinery | | | 2.6 | |
Personal Products | | | 2.2 | |
Other Investments, less than 2% each | | | 9.0 | |
Short-Term Investments | | | 2.1 | |
| | | | |
Total Investments | | | 97.6 | |
Other assets less liabilities | | | 2.4 | |
| | | | |
Net Assets | | | 100.0 | % |
| | | | |
Currency Exposure Summary at December 31, 2021
| | | | |
United States Dollar | | | 60.5 | % |
Euro | | | 17.5 | |
Danish Krone | | | 8.2 | |
Japanese Yen | | | 4.7 | |
British Pound | | | 3.4 | |
Hong Kong Dollar | | | 2.0 | |
Swiss Franc | | | 1.3 | |
| | | | |
Total Investments | | | 97.6 | |
Other assets less liabilities | | | 2.4 | |
| | | | |
Net Assets | | | 100.0 | % |
| | | | |
See accompanying notes to financial statements.
41 |
Portfolio of Investments — as of December 31, 2021
Mirova International Sustainable Equity Fund
| | | | | | | | |
| Shares | | | Description | | Value (†) | |
| | Common Stocks — 96.8% of Net Assets | |
| | | | Argentina — 1.2% | |
| | 268 | | | MercadoLibre, Inc.(a) | | $ | 361,371 | |
| | | | | | | | |
| | | | Australia — 1.0% | |
| | 92,274 | | | Stockland | | | 284,667 | |
| | | | | | | | |
| | | | Belgium — 5.0% | |
| | 14,550 | | | KBC Group NV | | | 1,250,154 | |
| | 6,132 | | | Umicore S.A. | | | 250,151 | |
| | | | | | | | |
| | | | | | | 1,500,305 | |
| | | | | | | | |
| | | | Denmark — 11.1% | |
| | 13,450 | | | Novo Nordisk A/S, Class B | | | 1,510,783 | |
| | 6,904 | | | Orsted A/S, 144A | | | 884,175 | |
| | 30,081 | | | Vestas Wind Systems A/S | | | 916,121 | |
| | | | | | | | |
| | | | | | | 3,311,079 | |
| | | | | | | | |
| | | | France — 15.1% | |
| | 2,227 | | | Air Liquide S.A. | | | 388,398 | |
| | 35,415 | | | Credit Agricole S.A. | | | 504,923 | |
| | 10,545 | | | Dassault Systemes SE | | | 625,797 | |
| | 2,345 | | | EssilorLuxottica S.A. | | | 499,196 | |
| | 1,086 | | | L’Oreal S.A. | | | 517,819 | |
| | 4,518 | | | Orpea S.A. | | | 453,102 | |
| | 3,103 | | | Sanofi | | | 311,367 | |
| | 18,779 | | | Suez S.A. | | | 423,535 | |
| | 12,348 | | | Valeo S.A. | | | 372,371 | |
| | 6,891 | | | Worldline S.A., 144A(a) | | | 383,554 | |
| | | | | | | | |
| | | | | | | 4,480,062 | |
| | | | | | | | |
| | | | Germany — 6.4% | |
| | 2,356 | | | Allianz SE, (Registered) | | | 555,683 | |
| | 6,047 | | | SAP SE | | | 851,052 | |
| | 3,287 | | | Symrise AG | | | 486,129 | |
| | | | | | | | |
| | | | | | | 1,892,864 | |
| | | | | | | | |
| | | | Hong Kong — 3.4% | |
| | 100,595 | | | AIA Group Ltd. | | | 1,015,289 | |
| | | | | | | | |
| | | | Ireland — 4.9% | |
| | 7,862 | | | Kingspan Group PLC | | | 937,819 | |
| | 9,360 | | | Smurfit Kappa Group PLC | | | 515,889 | |
| | | | | | | | |
| | | | | | | 1,453,708 | |
| | | | | | | | |
| | | | Japan — 11.9% | |
| | 4,200 | | | Kao Corp. | | | 219,972 | |
| | 48,900 | | | Kubota Corp. | | | 1,087,343 | |
| | 22,400 | | | Sekisui House Ltd. | | | 481,952 | |
| | 1,700 | | | Shimano, Inc. | | | 452,743 | |
| | 18,238 | | | Takeda Pharmaceutical Co. Ltd. | | | 498,048 | |
| | 14,600 | | | Terumo Corp. | | | 616,713 | |
| | 4,400 | | | West Japan Railway Co. | | | 184,021 | |
| | | | | | | | |
| | | | | | | 3,540,792 | |
| | | | | | | | |
| | | | Netherlands — 8.9% | |
| | 441 | | | Adyen NV, 144A(a) | | | 1,157,625 | |
| | 1,877 | | | ASML Holding NV | | | 1,503,514 | |
| | | | | | | | |
| | | | | | | 2,661,139 | |
| | | | | | | | |
| | | | Norway — 0.5% | |
| | 8,573 | | | Telenor ASA | | | 134,759 | |
| | | | | | | | |
| | | | Spain — 2.7% | |
| | 68,951 | | | Iberdrola S.A. | | | 816,378 | |
| | | | | | | | |
| | | | Switzerland — 2.9% | |
| | 1,052 | | | Geberit AG, (Registered) | | | 857,521 | |
| | | | | | | | |
| | | | Taiwan — 4.4% | |
| | 10,850 | | | Taiwan Semiconductor Manufacturing Co. Ltd., Sponsored ADR | | | 1,305,363 | |
| | | | | | | | |
| | | | United Kingdom — 17.4% | |
| | 6,924 | | | Croda International PLC | | $ | 948,390 | |
| | 21,396 | | | Halma PLC | | | 927,706 | |
| | 6,966 | | | Johnson Matthey PLC | | | 193,571 | |
| | 32,165 | | | Land Securities Group PLC | | | 339,468 | |
| | 261,344 | | | Legal & General Group PLC | | | 1,055,383 | |
| | 47,802 | | | Prudential PLC | | | 826,633 | |
| | 2,104 | | | Spirax-Sarco Engineering PLC | | | 457,895 | |
| | 7,669 | | | Unilever PLC | | | 411,106 | |
| | | | | | | | |
| | | | | | | 5,160,152 | |
| | | | | | | | |
| | | | Total Common Stocks
(Identified Cost $23,105,413) | | | 28,775,449 | |
| | | | | | | | |
| | | | | | | | |
Principal
Amount | | | | | | |
| | Short-Term Investments — 0.9% | |
| $ | 259,707 | | | Tri-Party Repurchase Agreement with Fixed Income Clearing Corporation, dated 12/31/2021 at 0.000% to be repurchased at $259,707 on 1/03/2022 collateralized by $190,400 U.S. Treasury Bond, 4.375% due 11/15/2039 valued at $264,998 including accrued interest (Note 2 of Notes to Financial Statements)
(Identified Cost $259,707) | | | 259,707 | |
| | | | | | | | |
| | | | | | | | |
| | | | Total Investments — 97.7%
(Identified Cost $23,365,120) | | | 29,035,156 | |
| | | | Other assets less liabilities — 2.3% | | | 696,790 | |
| | | | | | | | |
| | | | Net Assets — 100.0% | | $ | 29,731,946 | |
| | | | | | | | |
| | | | | | | | |
| | (†) | | | See Note 2 of Notes to Financial Statements. | |
| | (a) | | | Non-income producing security. | |
| | | | | |
| | 144A | | | All or a portion of these securities are exempt from registration under Rule 144A of the Securities Act of 1933. These securities may be resold in transactions exempt from registration, normally to qualified institutional buyers. At December 31, 2021, the value of Rule 144A holdings amounted to $2,425,354 or 8.2% of net assets. | |
| | ADR | | | An American Depositary Receipt is a certificate issued by a custodian bank representing the right to receive securities of the foreign issuer described. The values of ADRs may be significantly influenced by trading on exchanges not located in the United States. | |
See accompanying notes to financial statements.
| 42
Portfolio of Investments — as of December 31, 2021
Mirova International Sustainable Equity Fund – (continued)
Industry Summary at December 31, 2021
| | | | |
Insurance | | | 11.7 | % |
Semiconductors & Semiconductor Equipment | | | 9.4 | |
Pharmaceuticals | | | 7.9 | |
Chemicals | | | 7.6 | |
Building Products | | | 6.1 | |
Banks | | | 5.9 | |
Electric Utilities | | | 5.6 | |
Machinery | | | 5.2 | |
IT Services | | | 5.2 | |
Software | | | 5.0 | |
Personal Products | | | 3.8 | |
Electronic Equipment, Instruments & Components | | | 3.1 | |
Electrical Equipment | | | 3.1 | |
REITs - Diversified | | | 2.1 | |
Health Care Equipment & Supplies | | | 2.1 | |
Other Investments, less than 2% each | | | 13.0 | |
Short-Term Investments | | | 0.9 | |
| | | | |
Total Investments | | | 97.7 | |
Other assets less liabilities | | | 2.3 | |
| | | | |
Net Assets | | | 100.0 | % |
| | | | |
Currency Exposure Summary at December 31, 2021
| | | | |
Euro | | | 44.4 | % |
British Pound | | | 16.0 | |
Japanese Yen | | | 11.9 | |
Danish Krone | | | 11.1 | |
United States Dollar | | | 6.5 | |
Hong Kong Dollar | | | 3.4 | |
Swiss Franc | | | 2.9 | |
Other, less than 2% each | | | 1.5 | |
| | | | |
Total Investments | | | 97.7 | |
Other assets less liabilities | | | 2.3 | |
| | | | |
Net Assets | | | 100.0 | % |
| | | | |
See accompanying notes to financial statements.
43 |
Portfolio of Investments — as of December 31, 2021
Mirova U.S. Sustainable Equity Fund
| | | | | | | | |
| Shares | | | Description | | Value (†) | |
| | Common Stocks — 100.6% of Net Assets | |
| | | | Auto Components — 2.8% | |
| | 851 | | | Aptiv PLC(a) | | $ | 140,373 | |
| | | | | | | | |
| | | | Banks — 3.3% | |
| | 522 | | | Signature Bank | | | 168,851 | |
| | | | | | | | |
| | | | Chemicals — 4.0% | |
| | 869 | | | Ecolab, Inc. | | | 203,859 | |
| | | | | | | | |
| | | | Commercial Services & Supplies — 3.6% | |
| | 1,087 | | | Waste Management, Inc. | | | 181,420 | |
| | | | | | | | |
| | | | Communications Equipment — 1.0% | |
| | 833 | | | Cisco Systems, Inc. | | | 52,787 | |
| | | | | | | | |
| | | | Containers & Packaging — 2.0% | |
| | 1,037 | | | Ball Corp. | | | 99,832 | |
| | | | | | | | |
| | | | Diversified Consumer Services — 1.3% | |
| | 517 | | | Bright Horizons Family Solutions, Inc.(a) | | | 65,080 | |
| | | | | | | | |
| | | | Diversified Telecommunication Services — 1.0% | |
| | 936 | | | Verizon Communications, Inc. | | | 48,635 | |
| | | | | | | | |
| | | | Electric Utilities — 4.7% | |
| | 2,545 | | | NextEra Energy, Inc. | | | 237,601 | |
| | | | | | | | |
| | | | Electrical Equipment — 0.9% | |
| | 1,377 | | | Sunrun, Inc.(a) | | | 47,231 | |
| | | | | | | | |
| | | | Electronic Equipment, Instruments & Components — 1.4% | |
| | 817 | | | Trimble, Inc.(a) | | | 71,234 | |
| | | | | | | | |
| | | | Health Care Equipment & Supplies — 3.2% | |
| | 457 | | | Intuitive Surgical, Inc.(a) | | | 164,200 | |
| | | | | | | | |
| | | | Household Products — 1.2% | |
| | 735 | | | Colgate-Palmolive Co. | | | 62,725 | |
| | | | | | | | |
| | | | Industrial Conglomerates — 4.7% | |
| | 481 | | | Roper Technologies, Inc. | | | 236,585 | |
| | | | | | | | |
| | | | Internet & Direct Marketing Retail — 4.4% | |
| | 3,315 | | | eBay, Inc. | | | 220,448 | |
| | | | | | | | |
| | | | IT Services — 8.1% | |
| | 183 | | | Accenture PLC, Class A | | | 75,862 | |
| | 646 | | | MasterCard, Inc., Class A | | | 232,121 | |
| | 456 | | | Visa, Inc., Class A | | | 98,820 | |
| | | | | | | | |
| | | | | | | 406,803 | |
| | | | | | | | |
| | | | Life Sciences Tools & Services — 12.6% | |
| | 978 | | | Danaher Corp. | | | 321,772 | |
| | 468 | | | Thermo Fisher Scientific, Inc. | | | 312,268 | |
| | | | | | | | |
| | | | | | | 634,040 | |
| | | | | | | | |
| | | | Machinery — 6.3% | |
| | 700 | | | Watts Water Technologies, Inc., Series A | | | 135,919 | |
| | 1,517 | | | Xylem, Inc. | | | 181,919 | |
| | | | | | | | |
| | | | | | | 317,838 | |
| | | | | | | | |
| | | | Personal Products — 3.3% | |
| | 445 | | | Estee Lauder Cos., Inc. (The), Class A | | | 164,739 | |
| | | | | | | | |
| | | | Pharmaceuticals — 2.8% | |
| | 521 | | | Eli Lilly & Co. | | | 143,911 | |
| | | | | | | | |
| | | | Semiconductors & Semiconductor Equipment — 9.5% | |
| | 967 | | | First Solar, Inc.(a) | | | 84,284 | |
| | 788 | | | NVIDIA Corp. | | | 231,758 | |
| | 1,358 | | | Taiwan Semiconductor Manufacturing Co. Ltd., Sponsored ADR | | | 163,381 | |
| | | | | | | | |
| | | | | | | 479,423 | |
| | | | | | | | |
| | | | Software — 14.5% | |
| | 348 | | | Adobe, Inc.(a) | | | 197,337 | |
| | 399 | | | Avalara, Inc.(a) | | | 51,515 | |
| | | | Software — continued | |
| | 1,189 | | | Microsoft Corp. | | $ | 399,884 | |
| | 976 | | | Oracle Corp. | | | 85,117 | |
| | | | | | | | |
| | | | | | | 733,853 | |
| | | | | | | | |
| | | | Water Utilities — 4.0% | |
| | 1,062 | | | American Water Works Co., Inc. | | | 200,569 | |
| | | | | | | | |
| | | | Total Common Stocks
(Identified Cost $3,952,393) | | | 5,082,037 | |
| | | | | | | | |
| | | | | | | | |
Principal
Amount | | | | | | |
| | Short-Term Investments — 0.2% | |
| $ | 9,874 | | | Tri-Party Repurchase Agreement with Fixed Income Clearing Corporation, dated 12/31/2021 at 0.000% to be repurchased at $9,874 on 1/03/2022 collateralized by $7,300 U.S. Treasury Bond, 4.375% due 11/15/2039 valued at $10,160 including accrued interest (Note 2 of Notes to Financial Statements)
(Identified Cost $9,874) | | | 9,874 | |
| | | | | | | | |
| | | | | | | | |
| | | | Total Investments — 100.8%
(Identified Cost $3,962,267) | | | 5,091,911 | |
| | | | Other assets less liabilities — (0.8)% | | | (41,086 | ) |
| | | | | | | | |
| | | | Net Assets — 100.0% | | $ | 5,050,825 | |
| | | | | | | | |
| | | | | | | | |
| | (†) | | | See Note 2 of Notes to Financial Statements. | |
| | (a) | | | Non-income producing security. | |
| | | | | |
| | ADR | | | An American Depositary Receipt is a certificate issued by a custodian bank representing the right to receive securities of the foreign issuer described. The values of ADRs may be significantly influenced by trading on exchanges not located in the United States. | |
Industry Summary at December 31, 2021
| | | | |
Software | | | 14.5 | % |
Life Sciences Tools & Services | | | 12.6 | |
Semiconductors & Semiconductor Equipment | | | 9.5 | |
IT Services | | | 8.1 | |
Machinery | | | 6.3 | |
Electric Utilities | | | 4.7 | |
Industrial Conglomerates | | | 4.7 | |
Internet & Direct Marketing Retail | | | 4.4 | |
Chemicals | | | 4.0 | |
Water Utilities | | | 4.0 | |
Commercial Services & Supplies | | | 3.6 | |
Banks | | | 3.3 | |
Personal Products | | | 3.3 | |
Health Care Equipment & Supplies | | | 3.2 | |
Pharmaceuticals | | | 2.8 | |
Auto Components | | | 2.8 | |
Containers & Packaging | | | 2.0 | |
Other Investments, less than 2% each | | | 6.8 | |
Short-Term Investments | | | 0.2 | |
| | | | |
Total Investments | | | 100.8 | |
Other assets less liabilities | | | (0.8 | ) |
| | | | |
Net Assets | | | 100.0 | % |
| | | | |
See accompanying notes to financial statements.
| 44
Statements of Assets and Liabilities
December 31, 2021
| | | | | | | | | | | | |
| | | Gateway
Fund | | | Gateway Equity
Call Premium
Fund | | | Mirova Global
Green Bond
Fund | |
ASSETS | |
Investments at cost | | $ | 3,119,447,422 | | | $ | 56,052,966 | | | $ | 45,585,871 | |
Net unrealized appreciation (depreciation) | | | 5,252,824,709 | | | | 50,363,850 | | | | (517,114 | ) |
| | | | | | | | | | | | |
Investments at value | | | 8,372,272,131 | | | | 106,416,816 | | | | 45,068,757 | |
Cash | | | 463,379 | | | | 5,769 | | | | — | |
Due from brokers (including variation margin on futures contracts) (Note 2) | | | — | | | | — | | | | 1,394,440 | |
Foreign currency at value (identified cost $0, $0 and $652,314, respectively) | | | — | | | | — | | | | 657,831 | |
Receivable for Fund shares sold | | | 13,334,486 | | | | 2,039,612 | | | | 257,483 | |
Receivable from investment adviser (Note 6) | | | — | | | | — | | | | 17,789 | |
Dividends and interest receivable | | | 4,024,003 | | | | 67,203 | | | | 296,927 | |
Unrealized appreciation on futures contracts (Note 2) | | | — | | | | — | | | | 8,002 | |
Prepaid expenses (Note 9) | | | 448 | | | | 5 | | | | 2 | |
| | | | | | | | | | | | |
TOTAL ASSETS | | | 8,390,094,447 | | | | 108,529,405 | | | | 47,701,231 | |
| | | | | | | | | | | | |
LIABILITIES | |
Options written, at value (premiums received $183,872,920, $2,325,482 and $0, respectively) (Note 2) | | | 196,119,210 | | | | 2,483,580 | | | | — | |
Payable for Fund shares redeemed | | | 3,467,099 | | | | 20,349 | | | | 15,655 | |
Unrealized depreciation on futures contracts (Note 2) | | | — | | | | — | | | | 482,232 | |
Management fees payable (Note 6) | | | 4,008,908 | | | | 32,194 | | | | — | |
Deferred Trustees’ fees (Note 6) | | | 1,284,573 | | | | 58,421 | | | | 20,549 | |
Administrative fees payable (Note 6) | | | 292,814 | | | | 3,691 | | | | 1,700 | |
Payable to distributor (Note 6d) | | | 48,323 | | | | 264 | | | | 386 | |
Audit and tax services fees payable | | | 51,957 | | | | 50,701 | | | | 42,724 | |
Other accounts payable and accrued expenses | | | 278,998 | | | | 12,564 | | | | 12,911 | |
| | | | | | | | | | | | |
TOTAL LIABILITIES | | | 205,551,882 | | | | 2,661,764 | | | | 576,157 | |
| | | | | | | | | | | | |
NET ASSETS | | $ | 8,184,542,565 | | | $ | 105,867,641 | | | $ | 47,125,074 | |
| | | | | | | | | | | | |
NET ASSETS CONSIST OF: | |
Paid-in capital | | $ | 4,654,096,993 | | | $ | 70,919,980 | | | $ | 47,424,262 | |
Accumulated earnings (loss) | | | 3,530,445,572 | | | | 34,947,661 | | | | (299,188 | ) |
| | | | | | | | | | | | |
NET ASSETS | | $ | 8,184,542,565 | | | $ | 105,867,641 | | | $ | 47,125,074 | |
| | | | | | | | | | | | |
COMPUTATION OF NET ASSET VALUE AND OFFERING PRICE: | |
Class A shares: | |
Net assets | | $ | 1,073,713,024 | | | $ | 2,612,894 | | | $ | 6,797,979 | |
| | | | | | | | | | | | |
Shares of beneficial interest | | | 26,378,724 | | | | 156,857 | | | | 670,621 | |
| | | | | | | | | | | | |
Net asset value and redemption price per share | | $ | 40.70 | | | $ | 16.66 | | | $ | 10.14 | |
| | | | | | | | | | | | |
Offering price per share (100/[100-maximum sales charge] of net asset value) (Note 1) | | $ | 43.18 | | | $ | 17.68 | | | $ | 10.59 | |
| | | | | | | | | | | | |
Class C shares: (redemption price per share is equal to net asset value less any applicable contingent deferred sales charge) (Note 1) | | | | | | | | | | | | |
Net assets | | $ | 114,019,045 | | | $ | 813,543 | | | $ | — | |
| | | | | | | | | | | | |
Shares of beneficial interest | | | 2,821,874 | | | | 49,258 | | | | — | |
| | | | | | | | | | | | |
Net asset value and offering price per share | | $ | 40.41 | | | $ | 16.52 | | | $ | — | |
| | | | | | | | | | | | |
Class N shares: | |
Net assets | | $ | 504,299,257 | | | $ | 436,979 | | | $ | 8,109,637 | |
| | | | | | | | | | | | |
Shares of beneficial interest | | | 12,396,372 | | | | 26,273 | | | | 797,588 | |
| | | | | | | | | | | | |
Net asset value, offering and redemption price per share | | $ | 40.68 | | | $ | 16.63 | | | $ | 10.17 | |
| | | | | | | | | | | | |
Class Y shares: | |
Net assets | | $ | 6,492,511,239 | | | $ | 102,004,225 | | | $ | 32,217,458 | |
| | | | | | | | | | | | |
Shares of beneficial interest | | | 159,620,167 | | | | 6,127,780 | | | | 3,172,220 | |
| | | | | | | | | | | | |
Net asset value, offering and redemption price per share | | $ | 40.67 | | | $ | 16.65 | | | $ | 10.16 | |
| | | | | | | | | | | | |
See accompanying notes to financial statements.
45 |
Statements of Assets and Liabilities (continued)
December 31, 2021
| | | | | | | | | | | | |
| | | Mirova Global
Sustainable
Equity Fund | | | Mirova
International
Sustainable
Equity Fund | | | Mirova U.S.
Sustainable
Equity Fund | |
ASSETS | |
Investments at cost | | $ | 930,876,406 | | | $ | 23,365,120 | | | $ | 3,962,267 | |
Net unrealized appreciation | | | 162,570,953 | | | | 5,670,036 | | | | 1,129,644 | |
| | | | | | | | | | | | |
Investments at value | | | 1,093,447,359 | | | | 29,035,156 | | | | 5,091,911 | |
Foreign currency at value (identified cost $8,656,601, $574,019 and $0, respectively) | | | 8,618,760 | | | | 575,675 | | | | — | |
Receivable for Fund shares sold | | | 16,848,786 | | | | 112,562 | | | | — | |
Receivable from investment adviser (Note 6) | | | — | | | | — | | | | 5,112 | |
Receivable for securities sold | | | 4,791,932 | | | | — | | | | — | |
Dividends receivable | | | 241,865 | | | | 27,810 | | | | 1,314 | |
Tax reclaims receivable | | | 672,883 | | | | 58,363 | | | | — | |
Prepaid expenses (Note 9) | | | 65 | | | | 1 | | | | — | |
| | | | | | | | | | | | |
TOTAL ASSETS | | | 1,124,621,650 | | | | 29,809,567 | | | | 5,098,337 | |
| | | | | | | | | | | | |
LIABILITIES | |
Payable for securities purchased | | | 2,347,143 | | | | — | | | | — | |
Payable for Fund shares redeemed | | | 785,255 | | | | 1,241 | | | | — | |
Management fees payable (Note 6) | | | 616,319 | | | | 10,308 | | | | — | |
Deferred Trustees’ fees (Note 6) | | | 39,300 | | | | 11,585 | | | | 2,950 | |
Administrative fees payable (Note 6) | | | 39,641 | | | | 1,075 | | | | 188 | |
Payable to distributor (Note 6d) | | | 7,730 | | | | 14 | | | | 8 | |
Audit and tax services fees payable | | | 42,486 | | | | 42,323 | | | | 41,932 | |
Other accounts payable and accrued expenses | | | 61,785 | | | | 11,075 | | | | 2,434 | |
| | | | | | | | | | | | |
TOTAL LIABILITIES | | | 3,939,659 | | | | 77,621 | | | | 47,512 | |
| | | | | | | | | | | | |
NET ASSETS | | $ | 1,120,681,991 | | | $ | 29,731,946 | | | $ | 5,050,825 | |
| | | | | | | | | | | | |
NET ASSETS CONSIST OF: | |
Paid-in capital | | $ | 917,159,229 | | | $ | 24,310,970 | | | $ | 3,755,687 | |
Accumulated earnings | | | 203,522,762 | | | | 5,420,976 | | | | 1,295,138 | |
| | | | | | | | | | | | |
NET ASSETS | | $ | 1,120,681,991 | | | $ | 29,731,946 | | | $ | 5,050,825 | |
| | | | | | | | | | | | |
COMPUTATION OF NET ASSET VALUE AND OFFERING PRICE: | |
Class A shares: | |
Net assets | | $ | 43,116,668 | | | $ | 379,860 | | | $ | 12,381 | |
| | | | | | | | | | | | |
Shares of beneficial interest | | | 2,100,413 | | | | 26,480 | | | | 985 | |
| | | | | | | | | | | | |
Net asset value and redemption price per share | | $ | 20.53 | | | $ | 14.35 | | | $ | 12.57 | |
| | | | | | | | | | | | |
Offering price per share (100/94.25 of net asset value) (Note 1) | | $ | 21.78 | | | $ | 15.23 | | | $ | 13.34 | |
| | | | | | | | | | | | |
Class C shares: (redemption price per share is equal to net asset value less any applicable contingent deferred sales charge) (Note 1) | | | | | | | | | | | | |
Net assets | | $ | 17,248,198 | | | $ | — | | | $ | 101,223 | |
| | | | | | | | | | | | |
Shares of beneficial interest | | | 878,907 | | | | — | | | | 8,117 | |
| | | | | | | | | | | | |
Net asset value and offering price per share | | $ | 19.62 | | | $ | — | | | $ | 12.47 | |
| | | | | | | | | | | | |
Class N shares: | |
Net assets | | $ | 219,678,737 | | | $ | 27,569,056 | | | $ | 4,892,755 | |
| | | | | | | | | | | | |
Shares of beneficial interest | | | 10,604,351 | | | | 1,914,478 | | | | 388,535 | |
| | | | | | | | | | | | |
Net asset value, offering and redemption price per share | | $ | 20.72 | | | $ | 14.40 | | | $ | 12.59 | |
| | | | | | | | | | | | |
Class Y shares: | |
Net assets | | $ | 840,638,388 | | | $ | 1,783,030 | | | $ | 44,466 | |
| | | | | | | | | | | | |
Shares of beneficial interest | | | 40,585,735 | | | | 123,975 | | | | 3,533 | |
| | | | | | | | | | | | |
Net asset value, offering and redemption price per share | | $ | 20.71 | | | $ | 14.38 | | | $ | 12.59 | |
| | | | | | | | | | | | |
See accompanying notes to financial statements.
| 46
Statements of Operations
For the Year Ended December 31, 2021
| | | | | | | | | | | | |
| | | Gateway Fund | | | Gateway Equity
Call Premium
Fund | | | Mirova Global
Green Bond
Fund | |
INVESTMENT INCOME | |
Dividends | | $ | 105,816,473 | | | $ | 1,197,085 | | | $ | — | |
Interest | | | — | | | | — | | | | 579,048 | |
Less net foreign taxes withheld | | | (73,408 | ) | | | (4,324 | ) | | | — | |
| | | | | | | | | | | | |
| | | 105,743,065 | | | | 1,192,761 | | | | 579,048 | |
| | | | | | | | | | | | |
Expenses | |
Management fees (Note 6) | | | 45,948,325 | | | | 502,249 | | | | 225,596 | |
Service and distribution fees (Note 6) | | | 3,797,535 | | | | 12,414 | | | | 16,115 | |
Administrative fees (Note 6) | | | 3,226,022 | | | | 35,084 | | | | 18,346 | |
Trustees’ fees and expenses (Note 6) | | | 385,249 | | | | 21,669 | | | | 16,092 | |
Transfer agent fees and expenses (Notes 6 and 8) | | | 4,298,979 | | | | 29,262 | | | | 35,859 | |
Audit and tax services fees | | | 51,768 | | | | 50,702 | | | | 42,726 | |
Custodian fees and expenses (Note 7) | | | 206,340 | | | | 34,825 | | | | 12,370 | |
Interest expense (Note 11) | | | 1,036 | | | | — | | | | 15,665 | |
Legal fees (Note 9) | | | 253,242 | | | | 2,477 | | | | 1,414 | |
Registration fees | | | 166,017 | | | | 74,622 | | | | 84,612 | |
Regulatory filing fees (Note 7) | | | 13,000 | | | | 13,000 | | | | 13,000 | |
Shareholder reporting expenses | | | 336,361 | | | | 5,011 | | | | 9,220 | |
Miscellaneous expenses | | | 185,536 | | | | 16,865 | | | | 14,457 | |
| | | | | | | | | | | | |
Total expenses | | | 58,869,410 | | | | 798,180 | | | | 505,472 | |
Less waiver and/or expense reimbursement (Notes 6 and 7) | | | (2,382,973 | ) | | | (144,520 | ) | | | (188,408 | ) |
| | | | | | | | | | | | |
Net expenses | | | 56,486,437 | | | | 653,660 | | | | 317,064 | |
| | | | | | | | | | | | |
Net investment income | | | 49,256,628 | | | | 539,101 | | | | 261,984 | |
| | | | | | | | | | | | |
NET REALIZED AND UNREALIZED GAIN (LOSS) ON INVESTMENTS, FUTURES CONTRACTS, OPTIONS WRITTEN AND FOREIGN CURRENCY TRANSACTIONS | | | | | | | | | | | | |
Net realized gain (loss) on: | |
Investments | | | 24,159,462 | | | | 816,922 | | | | 499,144 | |
Futures contracts | | | — | | | | — | | | | 1,890,964 | |
Options written | | | (573,866,563 | ) | | | (6,218,472 | ) | | | — | |
Foreign currency transactions (Note 2c) | | | 265 | | | | (51 | ) | | | (71,202 | ) |
Net change in unrealized appreciation (depreciation) on: | |
Investments | | | 1,271,357,435 | | | | 18,758,911 | | | | (3,920,415 | ) |
Futures contracts | | | — | | | | — | | | | 134,931 | |
Options written | | | 42,892,077 | | | | 308,851 | | | | — | |
Foreign currency translations (Note 2c) | | | 101 | | | | 3 | | | | (36,583 | ) |
| | | | | | | | | | | | |
Net realized and unrealized gain (loss) on investments, futures contracts, options written and foreign currency transactions | | | 764,542,777 | | | | 13,666,164 | | | | (1,503,161 | ) |
| | | | | | | | | | | | |
NET INCREASE (DECREASE) IN NET ASSETS RESULTING FROM OPERATIONS | | $ | 813,799,405 | | | $ | 14,205,265 | | | $ | (1,241,177 | ) |
| | | | | | | | | | | | |
See accompanying notes to financial statements.
47 |
Statements of Operations (continued)
For the Year Ended December 31, 2021
| | | | | | | | | | | | |
| | | Mirova Global
Sustainable
Equity Fund | | | Mirova
International
Sustainable
Equity Fund | | | Mirova U.S.
Sustainable
Equity Fund | |
INVESTMENT INCOME | |
Dividends | | $ | 12,408,368 | | | $ | 558,518 | | | $ | 45,305 | |
Non-cash dividends (Note 2b) | | | 766,475 | | | | 29,875 | | | | — | |
Less net foreign taxes withheld | | | (856,412 | ) | | | (53,714 | ) | | | (605 | ) |
| | | | | | | | | | | | |
| | | 12,318,431 | | | | 534,679 | | | | 44,700 | |
| | | | | | | | | | | | |
Expenses | |
Management fees (Note 6) | | | 8,404,452 | | | | 231,931 | | | | 35,955 | |
Service and distribution fees (Note 6) | | | 251,362 | | | | 560 | | | | 179 | |
Administrative fees (Note 6) | | | 447,480 | | | | 12,350 | | | | 2,356 | |
Trustees’ fees and expenses (Note 6) | | | 48,563 | | | | 14,657 | | | | 12,790 | |
Transfer agent fees and expenses (Notes 6 and 8) | | | 856,657 | | | | 3,998 | | | | 3,136 | |
Audit and tax services fees | | | 42,643 | | | | 42,328 | | | | 41,934 | |
Custodian fees and expenses (Note 7) | | | 101,758 | | | | 23,680 | | | | 1,874 | |
Interest expense (Note 11) | | | 60,684 | | | | 2,889 | | | | 64 | |
Legal fees (Note 9) | | | 35,582 | | | | 885 | | | | 202 | |
Registration fees | | | 121,105 | | | | 52,857 | | | | 66,036 | |
Regulatory filing fees (Note 7) | | | 13,000 | | | | 13,000 | | | | 13,000 | |
Shareholder reporting expenses | | | 86,644 | | | | 5,313 | | | | 3,990 | |
Miscellaneous expenses | | | 56,373 | | | | 17,115 | | | | 14,570 | |
| | | | | | | | | | | | |
Total expenses | | | 10,526,303 | | | | 421,563 | | | | 196,086 | |
Fee/expense recovery (Note 6) | | | 11,260 | | | | — | | | | — | |
Less waiver and/or expense reimbursement (Notes 6 and 7) | | | (320,689 | ) | | | (156,481 | ) | | | (154,335 | ) |
| | | | | | | | | | | | |
Net expenses | | | 10,216,874 | | | | 265,082 | | | | 41,751 | |
| | | | | | | | | | | | |
Net investment income | | | 2,101,557 | | | | 269,597 | | | | 2,949 | |
| | | | | | | | | | | | |
NET REALIZED AND UNREALIZED GAIN (LOSS) ON INVESTMENTS AND FOREIGN CURRENCY TRANSACTIONS | | | | | | | | | | | | |
Net realized gain (loss) on: | | | | | | | | | | | | |
Investments | | | 150,957,057 | | | | 274,548 | | | | 433,439 | |
Foreign currency transactions (Note 2c) | | | (649,118 | ) | | | (48,805 | ) | | | — | |
Net change in unrealized appreciation (depreciation) on: | | | | | | | | | | | | |
Investments | | | 23,642,041 | | | | 1,058,413 | | | | 1,023,001 | |
Foreign currency translations (Note 2c) | | | (95,079 | ) | | | (16,102 | ) | | | — | |
| | | | | | | | | | | | |
Net realized and unrealized gain on investments and foreign currency transactions | | | 173,854,901 | | | | 1,268,054 | | | | 1,456,440 | |
| | | | | | | | | | | | |
NET INCREASE IN NET ASSETS RESULTING FROM OPERATIONS | | $ | 175,956,458 | | | $ | 1,537,651 | | | $ | 1,459,389 | |
| | | | | | | | | | | | |
See accompanying notes to financial statements.
| 48
Statements of Changes in Net Assets
| | | | | | | | | | | | | | | | |
| | | Gateway Fund | | | Gateway Equity Call
Premium Fund | |
| | | Year Ended
December 31,
2021 | | | Year Ended
December 31,
2020 | | | Year Ended
December 31,
2021 | | | Year Ended
December 31,
2020 | |
FROM OPERATIONS: | |
Net investment income | | $ | 49,256,628 | | | $ | 76,153,992 | | | $ | 539,101 | | | $ | 498,208 | |
Net realized gain (loss) on investments, options written and foreign currency transactions | | | (549,706,836 | ) | | | 46,860,691 | | | | (5,401,601 | ) | | | (3,316,965 | ) |
Net change in unrealized appreciation (depreciation) on investments, options written and foreign currency translations | | | 1,314,249,613 | | | | 276,701,398 | | | | 19,067,765 | | | | 5,853,897 | |
| | | | | | | | | | | | | | | | |
Net increase in net assets resulting from operations | | | 813,799,405 | | | | 399,716,081 | | | | 14,205,265 | | | | 3,035,140 | |
| | | | | | | | | | | | | | | | |
FROM DISTRIBUTIONS TO SHAREHOLDERS: | |
Class A | | | (4,616,139 | ) | | | (8,569,381 | ) | | | (7,926 | ) | | | (11,504 | ) |
Class C | | | — | | | | (262,085 | ) | | | (75 | ) | | | (567 | ) |
Class N | | | (3,190,505 | ) | | | (4,232,561 | ) | | | (4,105 | ) | | | (5,747 | ) |
Class Y | | | (41,377,637 | ) | | | (63,649,192 | ) | | | (532,807 | ) | | | (479,450 | ) |
| | | | | | | | | | | | | | | | |
Total distributions | | | (49,184,281 | ) | | | (76,713,219 | ) | | | (544,913 | ) | | | (497,268 | ) |
| | | | | | | | | | | | | | | | |
NET INCREASE (DECREASE) IN NET ASSETS FROM CAPITAL SHARE TRANSACTIONS (NOTE 13) | | | 294,964,158 | | | | (1,355,251,327 | ) | | | 32,303,743 | | | | (7,048,972 | ) |
| | | | | | | | | | | | | | | | |
Net increase (decrease) in net assets | | | 1,059,579,282 | | | | (1,032,248,465 | ) | | | 45,964,095 | | | | (4,511,100 | ) |
NET ASSETS | |
Beginning of the year | | | 7,124,963,283 | | | | 8,157,211,748 | | | | 59,903,546 | | | | 64,414,646 | |
| | | | | | | | | | | | | | | | |
End of the year | | $ | 8,184,542,565 | | | $ | 7,124,963,283 | | | $ | 105,867,641 | | | $ | 59,903,546 | |
| | | | | | | | | | | | | | | | |
See accompanying notes to financial statements.
49 |
Statements of Changes in Net Assets (continued)
| | | | | | | | | | | | | | | | |
| | | Mirova Global
Green Bond Fund | | | Mirova Global Sustainable
Equity Fund | |
| | | Year Ended
December 31,
2021 | | | Year Ended
December 31,
2020 | | | Year Ended
December 31,
2021 | | | Year Ended
December 31,
2020 | |
FROM OPERATIONS: | |
Net investment income | | $ | 261,984 | | | $ | 336,331 | | | $ | 2,101,557 | | | $ | 99,557 | |
Net realized gain on investments, futures contracts and foreign currency transactions | | | 2,318,906 | | | | 479,266 | | | | 150,307,939 | | | | 14,487,944 | |
Net change in unrealized appreciation (depreciation) on investments, futures contracts and foreign currency translations | | | (3,822,067 | ) | | | 1,935,396 | | | | 23,546,962 | | | | 109,269,573 | |
| | | | | | | | | | | | | | | | |
Net increase (decrease) in net assets resulting from operations | | | (1,241,177 | ) | | | 2,750,993 | | | | 175,956,458 | | | | 123,857,074 | |
| | | | | | | | | | | | | | | | |
FROM DISTRIBUTIONS TO SHAREHOLDERS: | |
Class A | | | (196,254 | ) | | | (169,497 | ) | | | (4,789,380 | ) | | | (119,993 | ) |
Class C | | | — | | | | — | | | | (1,953,531 | ) | | | (49,885 | ) |
Class N | | | (286,884 | ) | | | (504,197 | ) | | | (22,974,524 | ) | | | (227,737 | ) |
Class Y | | | (956,524 | ) | | | (699,849 | ) | | | (94,376,354 | ) | | | (2,280,679 | ) |
| | | | | | | | | | | | | | | | |
Total distributions | | | (1,439,662 | ) | | | (1,373,543 | ) | | | (124,093,789 | ) | | | (2,678,294 | ) |
| | | | | | | | | | | | | | | | |
NET INCREASE IN NET ASSETS FROM CAPITAL SHARE TRANSACTIONS (NOTE 13) | | | 10,270,116 | | | | 1,227,038 | | | | 191,048,671 | | | | 609,269,464 | |
| | | | | | | | | | | | | | | | |
Net increase in net assets | | | 7,589,277 | | | | 2,604,488 | | | | 242,911,340 | | | | 730,448,244 | |
NET ASSETS | |
Beginning of the year | | | 39,535,797 | | | | 36,931,309 | | | | 877,770,651 | | | | 147,322,407 | |
| | | | | | | | | | | | | | | | |
End of the year | | $ | 47,125,074 | | | $ | 39,535,797 | | | $ | 1,120,681,991 | | | $ | 877,770,651 | |
| | | | | | | | | | | | | | | | |
See accompanying notes to financial statements.
| 50
Statements of Changes in Net Assets (continued)
| | | | | | | | | | | | | | | | |
| | | Mirova International
Sustainable Equity Fund | | | Mirova U.S. Sustainable
Equity Fund | |
| | | Year Ended
December 31,
2021 | | | Year Ended
December 31,
2020 | | | Year Ended
December 31,
2021 | | | Period Ended
December 31,
2020(a) | |
FROM OPERATIONS: | |
Net investment income (loss) | | $ | 269,597 | | | $ | 96,908 | | | $ | 2,949 | | | $ | (864 | ) |
Net realized gain on investments and foreign currency transactions | | | 225,743 | | | | 1,661,085 | | | | 433,439 | | | | — | |
Net change in unrealized appreciation (depreciation) on investments and foreign currency translations | | | 1,042,311 | | | | 1,732,345 | | | | 1,023,001 | | | | 106,643 | |
| | | | | | | | | | | | | | | | |
Net increase in net assets resulting from operations | | | 1,537,651 | | | | 3,490,338 | | | | 1,459,389 | | | | 105,779 | |
| | | | | | | | | | | | | | | | |
FROM DISTRIBUTIONS TO SHAREHOLDERS: | |
Class A | | | (8,864 | ) | | | (6,930 | ) | | | (623 | ) | | | — | |
Class C | | | — | | | | — | | | | (5,097 | ) | | | — | |
Class N | | | (929,817 | ) | | | (1,544,820 | ) | | | (264,825 | ) | | | — | |
Class Y | | | (41,940 | ) | | | (6,899 | ) | | | (2,393 | ) | | | — | |
| | | | | | | | | | | | | | | | |
Total distributions | | | (980,621 | ) | | | (1,558,649 | ) | | | (272,938 | ) | | | — | |
| | | | | | | | | | | | | | | | |
NET INCREASE (DECREASE) IN NET ASSETS FROM CAPITAL SHARE TRANSACTIONS (NOTE 13) | | | 12,545,607 | | | | (2,508,593 | ) | | | (1,244,405 | ) | | | 5,003,000 | |
| | | | | | | | | | | | | | | | |
Net increase (decrease) in net assets | | | 13,102,637 | | | | (576,904 | ) | | | (57,954 | ) | | | 5,108,779 | |
NET ASSETS | |
Beginning of the year | | | 16,629,309 | | | | 17,206,213 | | | | 5,108,779 | | | | — | |
| | | | | | | | | | | | | | | | |
End of the year | | $ | 29,731,946 | | | $ | 16,629,309 | | | $ | 5,050,825 | | | $ | 5,108,779 | |
| | | | | | | | | | | | | | | | |
| (a) | From commencement of operations on December 15, 2020 through December 31, 2020. |
See accompanying notes to financial statements.
51 |
Financial Highlights
For a share outstanding throughout each period.
| | | | | | | | | | | | | | | | | | | | |
| | | Gateway Fund—Class A | |
| | | Year Ended
December 31,
2021 | | | Year Ended
December 31,
2020 | | | Year Ended
December 31,
2019 | | | Year Ended
December 31,
2018 | | | Year Ended
December 31,
2017 | |
Net asset value, beginning of the period | | $ | 36.76 | | | $ | 34.69 | | | $ | 31.65 | | | $ | 33.47 | | | $ | 30.84 | |
| | | | | | | | | | | | | | | | | | | | |
INCOME (LOSS) FROM INVESTMENT OPERATIONS: | |
Net investment income(a) | | | 0.18 | | | | 0.30 | | | | 0.37 | | | | 0.34 | | | | 0.39 | |
Net realized and unrealized gain (loss) | | | 3.93 | | | | 2.08 | | | | 3.05 | | | | (1.80 | ) | | | 2.58 | |
| | | | | | | | | | | | | | | | | | | | |
Total from Investment Operations | | | 4.11 | | | | 2.38 | | | | 3.42 | | | | (1.46 | ) | | | 2.97 | |
| | | | | | | | | | | | | | | | | | | | |
LESS DISTRIBUTIONS FROM: | |
Net investment income | | | (0.17 | ) | | | (0.31 | ) | | | (0.38 | ) | | | (0.36 | ) | | | (0.34 | ) |
| | | | | | | | | | | | | | | | | | | | |
Net asset value, end of the period | | $ | 40.70 | | | $ | 36.76 | | | $ | 34.69 | | | $ | 31.65 | | | $ | 33.47 | |
| | | | | | | | | | | | | | | | | | | | |
Total return(b)(c) | | | 11.24 | % | | | 6.92 | % | | | 10.84 | % | | | (4.39 | )% | | | 9.66 | % |
RATIOS TO AVERAGE NET ASSETS: | |
Net assets, end of the period (000’s) | | $ | 1,073,713 | | | $ | 987,702 | | | $ | 1,125,464 | | | $ | 1,177,641 | | | $ | 1,669,272 | |
Net expenses(d) | | | 0.94 | %(e) | | | 0.94 | % | | | 0.94 | % | | | 0.94 | % | | | 0.94 | % |
Gross expenses | | | 0.98 | %(e) | | | 1.02 | % | | | 1.01 | % | | | 1.01 | % | | | 1.02 | % |
Net investment income | | | 0.46 | % | | | 0.88 | % | | | 1.12 | % | | | 1.03 | % | | | 1.20 | % |
Portfolio turnover rate | | | 11 | % | | | 22 | % | | | 12 | % | | | 10 | % | | | 34 | % |
| (a) | Per share net investment income has been calculated using the average shares outstanding during the period. |
| (b) | Had certain expenses not been waived/reimbursed during the period, total returns would have been lower. |
| (c) | A sales charge for Class A shares is not reflected in total return calculations. |
| (d) | The investment adviser agreed to waive its fees and/or reimburse a portion of the Fund’s expenses during the period. Without this waiver/reimbursement, expenses would have been higher. |
| (e) | Includes refund of prior year service fee of 0.01%. See Note 6b of Notes to Financial Statements. |
See accompanying notes to financial statements.
| 52
Financial Highlights (continued)
For a share outstanding throughout each period.
| | | | | | | | | | | | | | | | | | | | |
| | | Gateway Fund—Class C | |
| | | Year Ended
December 31,
2021 | | | Year Ended
December 31,
2020 | | | Year Ended
December 31,
2019 | | | Year Ended
December 31,
2018 | | | Year Ended
December 31,
2017 | |
Net asset value, beginning of the period | | $ | 36.60 | | | $ | 34.54 | | | $ | 31.50 | | | $ | 33.32 | | | $ | 30.72 | |
| | | | | | | | | | | | | | | | | | | | |
INCOME (LOSS) FROM INVESTMENT OPERATIONS: | |
Net investment income (loss)(a) | | | (0.11 | ) | | | 0.04 | | | | 0.12 | | | | 0.09 | | | | 0.14 | |
Net realized and unrealized gain (loss) | | | 3.92 | | | | 2.07 | | | | 3.03 | | | | (1.80 | ) | | | 2.57 | |
| | | | | | | | | | | | | | | | | | | | |
Total from Investment Operations | | | 3.81 | | | | 2.11 | | | | 3.15 | | | | (1.71 | ) | | | 2.71 | |
| | | | | | | | | | | | | | | | | | | | |
LESS DISTRIBUTIONS FROM: | |
Net investment income | | | — | | | | (0.05 | ) | | | (0.11 | ) | | | (0.11 | ) | | | (0.11 | ) |
| | | | | | | | | | | | | | | | | | | | |
Net asset value, end of the period | | $ | 40.41 | | | $ | 36.60 | | | $ | 34.54 | | | $ | 31.50 | | | $ | 33.32 | |
| | | | | | | | | | | | | | | | | | | | |
Total return(b)(c) | | | 10.41 | % | | | 6.13 | % | | | 10.02 | % | | | (5.15 | )% | | | 8.85 | % |
RATIOS TO AVERAGE NET ASSETS: | |
Net assets, end of the period (000’s) | | $ | 114,019 | | | $ | 142,623 | | | $ | 215,947 | | | $ | 272,904 | | | $ | 336,891 | |
Net expenses(d) | | | 1.70 | % | | | 1.70 | % | | | 1.70 | % | | | 1.70 | % | | | 1.70 | % |
Gross expenses | | | 1.73 | % | | | 1.77 | % | | | 1.76 | % | | | 1.76 | % | | | 1.77 | % |
Net investment income (loss) | | | (0.30 | )% | | | 0.12 | % | | | 0.37 | % | | | 0.27 | % | | | 0.44 | % |
Portfolio turnover rate | | | 11 | % | | | 22 | % | | | 12 | % | | | 10 | % | | | 34 | % |
| (a) | Per share net investment income (loss) has been calculated using the average shares outstanding during the period. |
| (b) | Had certain expenses not been waived/reimbursed during the period, total returns would have been lower. |
| (c) | A contingent deferred sales charge for Class C shares is not reflected in total return calculations. |
| (d) | The investment adviser agreed to waive its fees and/or reimburse a portion of the Fund’s expenses during the period. Without this waiver/reimbursement, expenses would have been higher. |
See accompanying notes to financial statements.
53 |
Financial Highlights (continued)
For a share outstanding throughout each period.
| | | | | | | | | | | | | | | | | | | | |
| | | Gateway Fund—Class N | |
| | | Year Ended
December 31,
2021 | | | Year Ended
December 31,
2020 | | | Year Ended
December 31,
2019 | | | Year Ended
December 31,
2018 | | | Period Ended
December 31,
2017* | |
Net asset value, beginning of the period | | $ | 36.74 | | | $ | 34.68 | | | $ | 31.63 | | | $ | 33.46 | | | $ | 31.89 | |
| | | | | | | | | | | | | | | | | | | | |
INCOME (LOSS) FROM INVESTMENT OPERATIONS: | |
Net investment income(a) | | | 0.29 | | | | 0.40 | | | | 0.47 | | | | 0.44 | | | | 0.32 | |
Net realized and unrealized gain (loss) | | | 3.94 | | | | 2.07 | | | | 3.06 | | | | (1.81 | ) | | | 1.56 | |
| | | | | | | | | | | | | | | | | | | | |
Total from Investment Operations | | | 4.23 | | | | 2.47 | | | | 3.53 | | | | (1.37 | ) | | | 1.88 | |
| | | | | | | | | | | | | | | | | | | | |
LESS DISTRIBUTIONS FROM: | |
Net investment income | | | (0.29 | ) | | | (0.41 | ) | | | (0.48 | ) | | | (0.46 | ) | | | (0.31 | ) |
| | | | | | | | | | | | | | | | | | | | |
Net asset value, end of the period | | $ | 40.68 | | | $ | 36.74 | | | $ | 34.68 | | | $ | 31.63 | | | $ | 33.46 | |
| | | | | | | | | | | | | | | | | | | | |
Total return(b) | | | 11.57 | % | | | 7.25 | % | | | 11.17 | % | | | (4.13 | )% | | | 5.93 | %(c) |
RATIOS TO AVERAGE NET ASSETS: | |
Net assets, end of the period (000’s) | | $ | 504,299 | | | $ | 369,829 | | | $ | 369,793 | | | $ | 179,727 | | | $ | 126,262 | |
Net expenses(d) | | | 0.65 | % | | | 0.65 | % | | | 0.65 | % | | | 0.65 | % | | | 0.65 | %(e) |
Gross expenses | | | 0.67 | % | | | 0.70 | % | | | 0.69 | % | | | 0.70 | % | | | 0.74 | %(e) |
Net investment income | | | 0.74 | % | | | 1.17 | % | | | 1.40 | % | | | 1.32 | % | | | 1.42 | %(e) |
Portfolio turnover rate | | | 11 | % | | | 22 | % | | | 12 | % | | | 10 | % | | | 34 | %(f) |
| * | From commencement of Class operations on May 1, 2017 through December 31, 2017. |
| (a) | Per share net investment income has been calculated using the average shares outstanding during the period. |
| (b) | Had certain expenses not been waived/reimbursed during the period, total returns would have been lower. |
| (c) | Periods less than one year are not annualized. |
| (d) | The investment adviser agreed to waive its fees and/or reimburse a portion of the Fund’s expenses during the period. Without this waiver/reimbursement, expenses would have been higher. |
| (e) | Computed on an annualized basis for periods less than one year. |
| (f) | Represents the Fund’s portfolio turnover rate for the year ended December 31, 2017. |
See accompanying notes to financial statements.
| 54
Financial Highlights (continued)
For a share outstanding throughout each period.
| | | | | | | | | | | | | | | | | | | | |
| | | Gateway Fund—Class Y | |
| | | Year Ended
December 31,
2021 | | | Year Ended
December 31,
2020 | | | Year Ended
December 31,
2019 | | | Year Ended
December 31,
2018 | | | Year Ended
December 31,
2017 | |
Net asset value, beginning of the period | | $ | 36.73 | | | $ | 34.67 | | | $ | 31.63 | | | $ | 33.46 | | | $ | 30.83 | |
| | | | | | | | | | | | | | | | | | | | |
INCOME (LOSS) FROM INVESTMENT OPERATIONS: | |
Net investment income(a) | | | 0.27 | | | | 0.38 | | | | 0.46 | | | | 0.43 | | | | 0.47 | |
Net realized and unrealized gain (loss) | | | 3.94 | | | | 2.07 | | | | 3.04 | | | | (1.81 | ) | | | 2.58 | |
| | | | | | | | | | | | | | | | | | | | |
Total from Investment Operations | | | 4.21 | | | | 2.45 | | | | 3.50 | | | | (1.38 | ) | | | 3.05 | |
| | | | | | | | | | | | | | | | | | | | |
LESS DISTRIBUTIONS FROM: | |
Net investment income | | | (0.27 | ) | | | (0.39 | ) | | | (0.46 | ) | | | (0.45 | ) | | | (0.42 | ) |
| | | | | | | | | | | | | | | | | | | | |
Net asset value, end of the period | | $ | 40.67 | | | $ | 36.73 | | | $ | 34.67 | | | $ | 31.63 | | | $ | 33.46 | |
| | | | | | | | | | | | | | | | | | | | |
Total return(b) | | | 11.49 | % | | | 7.19 | % | | | 11.12 | % | | | (4.18 | )% | | | 9.93 | % |
RATIOS TO AVERAGE NET ASSETS: | |
Net assets, end of the period (000’s) | | $ | 6,492,511 | | | $ | 5,624,810 | | | $ | 6,446,007 | | | $ | 6,508,061 | | | $ | 6,392,640 | |
Net expenses(c) | | | 0.70 | % | | | 0.70 | % | | | 0.70 | % | | | 0.70 | % | | | 0.70 | % |
Gross expenses | | | 0.73 | % | | | 0.77 | % | | | 0.76 | % | | | 0.76 | % | | | 0.77 | % |
Net investment income | | | 0.70 | % | | | 1.12 | % | | | 1.37 | % | | | 1.28 | % | | | 1.44 | % |
Portfolio turnover rate | | | 11 | % | | | 22 | % | | | 12 | % | | | 10 | % | | | 34 | % |
| (a) | Per share net investment income has been calculated using the average shares outstanding during the period. |
| (b) | Had certain expenses not been waived/reimbursed during the period, total returns would have been lower. |
| (c) | The investment adviser agreed to waive its fees and/or reimburse a portion of the Fund’s expenses during the period. Without this waiver/reimbursement, expenses would have been higher. |
See accompanying notes to financial statements.
55 |
Financial Highlights (continued)
For a share outstanding throughout each period.
| | | | | | | | | | | | | | | | | | | | |
| | | Gateway Equity Call Premium Fund—Class A | |
| | | Year Ended
December 31,
2021 | | | Year Ended
December 31,
2020 | | | Year Ended
December 31,
2019 | | | Year Ended
December 31,
2018 | | | Year Ended
December 31,
2017 | |
Net asset value, beginning of the period | | $ | 14.03 | | | $ | 13.07 | | | $ | 11.32 | | | $ | 12.08 | | | $ | 10.89 | |
| | | | | | | | | | | | | | | | | | | | |
INCOME (LOSS) FROM INVESTMENT OPERATIONS: | |
Net investment income(a) | | | 0.07 | | | | 0.09 | | | | 0.10 | | | | 0.09 | | | | 0.10 | |
Net realized and unrealized gain (loss) | | | 2.62 | | | | 0.95 | | | | 1.76 | | | | (0.76 | ) | | | 1.18 | |
| | | | | | | | | | | | | | | | | | | | |
Total from Investment Operations | | | 2.69 | | | | 1.04 | | | | 1.86 | | | | (0.67 | ) | | | 1.28 | |
| | | | | | | | | | | | | | | | | | | | |
LESS DISTRIBUTIONS FROM: | |
Net investment income | | | (0.06 | ) | | | (0.08 | ) | | | (0.11 | ) | | | (0.09 | ) | | | (0.09 | ) |
| | | | | | | | | | | | | | | | | | | | |
Net asset value, end of the period | | $ | 16.66 | | | $ | 14.03 | | | $ | 13.07 | | | $ | 11.32 | | | $ | 12.08 | |
| | | | | | | | | | | | | | | | | | | | |
Total return(b)(c) | | | 19.20 | % | | | 8.06 | % | | | 16.46 | % | | | (5.60 | )% | | | 11.80 | % |
RATIOS TO AVERAGE NET ASSETS: | |
Net assets, end of the period (000’s) | | $ | 2,613 | | | $ | 1,456 | | | $ | 2,363 | | | $ | 2,375 | | | $ | 7,085 | |
Net expenses(d) | | | 1.03 | %(e)(f) | | | 1.20 | % | | | 1.20 | % | | | 1.20 | % | | | 1.20 | % |
Gross expenses | | | 1.20 | % | | | 1.43 | % | | | 1.42 | % | | | 1.44 | % | | | 1.30 | % |
Net investment income | | | 0.43 | % | | | 0.69 | % | | | 0.82 | % | | | 0.73 | % | | | 0.85 | % |
Portfolio turnover rate | | | 5 | % | | | 15 | % | | | 17 | % | | | 58 | % | | | 19 | % |
| (a) | Per share net investment income has been calculated using the average shares outstanding during the period. |
| (b) | A sales charge for Class A shares is not reflected in total return calculations. |
| (c) | Had certain expenses not been waived/reimbursed during the period, total returns would have been lower. |
| (d) | The investment adviser agreed to waive its fees and/or reimburse a portion of the Fund’s expenses during the period. Without this waiver/reimbursement, expenses would have been higher. |
| (e) | Effective July 1, 2021, the expense limit decreased from 1.20% to 0.93%. |
| (f) | Includes additional voluntary waiver of advisory fee of 0.02%. |
See accompanying notes to financial statements.
| 56
Financial Highlights (continued)
For a share outstanding throughout each period.
| | | | | | | | | | | | | | | | | | | | |
| | | Gateway Equity Call Premium Fund—Class C | |
| | | Year Ended
December 31,
2021 | | | Year Ended
December 31,
2020 | | | Year Ended
December 31,
2019 | | | Year Ended
December 31,
2018 | | | Year Ended
December 31,
2017 | |
Net asset value, beginning of the period | | $ | 13.96 | | | $ | 13.03 | | | $ | 11.29 | | | $ | 12.05 | | | $ | 10.87 | |
| | | | | | | | | | | | | | | | | | | | |
INCOME (LOSS) FROM INVESTMENT OPERATIONS: | |
Net investment income (loss)(a) | | | (0.05 | ) | | | (0.01 | ) | | | 0.01 | | | | 0.00 | (b) | | | 0.01 | |
Net realized and unrealized gain (loss) | | | 2.61 | | | | 0.95 | | | | 1.74 | | | | (0.75 | ) | | | 1.18 | |
| | | | | | | | | | | | | | | | | | | | |
Total from Investment Operations | | | 2.56 | | | | 0.94 | | | | 1.75 | | | | (0.75 | ) | | | 1.19 | |
| | | | | | | | | | | | | | | | | | | | |
LESS DISTRIBUTIONS FROM: | |
Net investment income | | | (0.00 | )(b) | | | (0.01 | ) | | | (0.01 | ) | | | (0.01 | ) | | | (0.01 | ) |
| | | | | | | | | | | | | | | | | | | | |
Net asset value, end of the period | | $ | 16.52 | | | $ | 13.96 | | | $ | 13.03 | | | $ | 11.29 | | | $ | 12.05 | |
| | | | | | | | | | | | | | | | | | | | |
Total return(c)(d) | | | 18.28 | % | | | 7.23 | % | | | 15.54 | % | | | (6.24 | )% | | | 10.95 | % |
RATIOS TO AVERAGE NET ASSETS: | |
Net assets, end of the period (000’s) | | $ | 814 | | | $ | 741 | | | $ | 727 | | | $ | 849 | | | $ | 648 | |
Net expenses(e) | | | 1.79 | %(f)(g) | | | 1.95 | % | | | 1.95 | % | | | 1.95 | % | | | 1.95 | % |
Gross expenses | | | 1.96 | % | | | 2.17 | % | | | 2.17 | % | | | 2.19 | % | | | 2.05 | % |
Net investment income (loss) | | | (0.33 | )% | | | (0.10 | )% | | | 0.07 | % | | | 0.02 | % | | | 0.10 | % |
Portfolio turnover rate | | | 5 | % | | | 15 | % | | | 17 | % | | | 58 | % | | | 19 | % |
| (a) | Per share net investment income (loss) has been calculated using the average shares outstanding during the period. |
| (b) | Amount rounds to less than $0.01 per share. |
| (c) | A contingent deferred sales charge for Class C shares is not reflected in total return calculations. |
| (d) | Had certain expenses not been waived/reimbursed during the period, total returns would have been lower. |
| (e) | The investment adviser agreed to waive its fees and/or reimburse a portion of the Fund’s expenses during the period. Without this waiver/reimbursement, expenses would have been higher. |
| (f) | Effective July 1, 2021, the expense limit decreased from 1.95% to 1.68%. |
| (g) | Includes additional voluntary waiver of advisory fee of 0.02%. |
See accompanying notes to financial statements.
57 |
Financial Highlights (continued)
For a share outstanding throughout each period.
| | | | | | | | | | | | | | | | | | | | |
| | | Gateway Equity Call Premium Fund—Class N | |
| | | Year Ended
December 31,
2021 | | | Year Ended
December 31,
2020 | | | Year Ended
December 31,
2019 | | | Year Ended
December 31,
2018 | | | Period Ended
December 31,
2017*
| |
Net asset value, beginning of the period | | $ | 14.01 | | | $ | 13.06 | | | $ | 11.32 | | | $ | 12.09 | | | $ | 11.34 | |
| | | | | | | | | | | | | | | | | | | | |
INCOME (LOSS) FROM INVESTMENT OPERATIONS: | |
Net investment income(a) | | | 0.11 | | | | 0.12 | | | | 0.13 | | | | 0.13 | | | | 0.10 | |
Net realized and unrealized gain (loss) | | | 2.61 | | | | 0.95 | | | | 1.76 | | | | (0.77 | ) | | | 0.75 | |
| | | | | | | | | | | | | | | | | | | | |
Total from Investment Operations | | | 2.72 | | | | 1.07 | | | | 1.89 | | | | (0.64 | ) | | | 0.85 | |
| | | | | | | | | | | | | | | | | | | | |
LESS DISTRIBUTIONS FROM: | |
Net investment income | | | (0.10 | ) | | | (0.12 | ) | | | (0.15 | ) | | | (0.13 | ) | | | (0.10 | ) |
| | | | | | | | | | | | | | | | | | | | |
Net asset value, end of the period | | $ | 16.63 | | | $ | 14.01 | | | $ | 13.06 | | | $ | 11.32 | | | $ | 12.09 | |
| | | | | | | | | | | | | | | | | | | | |
Total return(b) | | | 19.49 | % | | | 8.36 | % | | | 16.73 | % | | | (5.32 | )% | | | 7.50 | %(c) |
RATIOS TO AVERAGE NET ASSETS: | |
Net assets, end of the period (000’s) | | $ | 437 | | | $ | 728 | | | $ | 530 | | | $ | 1 | | | $ | 1 | |
Net expenses(d) | | | 0.77 | %(e) | | | 0.90 | % | | | 0.90 | % | | | 0.90 | % | | | 0.90 | %(f) |
Gross expenses | | | 1.08 | % | | | 1.29 | % | | | 1.63 | % | | | 15.41 | % | | | 14.26 | %(f) |
Net investment income | | | 0.70 | % | | | 0.95 | % | | | 1.03 | % | | | 1.04 | % | | | 1.22 | %(f) |
Portfolio turnover rate | | | 5 | % | | | 15 | % | | | 17 | % | | | 58 | % | | | 19 | %(g) |
| * | From commencement of Class operations on May 1, 2017 through December 31, 2017. |
| (a) | Per share net investment income has been calculated using the average shares outstanding during the period. |
| (b) | Had certain expenses not been waived/reimbursed during the period, total returns would have been lower. |
| (c) | Periods less than one year are not annualized. |
| (d) | The investment adviser agreed to waive its fees and/or reimburse a portion of the Fund’s expenses during the period. Without this waiver/reimbursement, expenses would have been higher. |
| (e) | Effective July 1, 2021, the expense limit decreased from 0.90% to 0.63%. |
| (f) | Computed on an annualized basis for periods less than one year. |
| (g) | Represents the Fund’s portfolio turnover rate for the year ended December 31, 2017. |
See accompanying notes to financial statements.
| 58
Financial Highlights (continued)
For a share outstanding throughout each period.
| | | | | | | | | | | | | | | | | | | | |
| | | Gateway Equity Call Premium Fund—Class Y | |
| | | Year Ended
December 31,
2021 | | | Year Ended
December 31,
2020 | | | Year Ended
December 31,
2019 | | | Year Ended
December 31,
2018 | | | Year Ended
December 31,
2017 | |
Net asset value, beginning of the period | | $ | 14.02 | | | $ | 13.07 | | | $ | 11.32 | | | $ | 12.09 | | | $ | 10.89 | |
| | | | | | | | | | | | | | | | | | | | |
INCOME (LOSS) FROM INVESTMENT OPERATIONS: | |
Net investment income(a) | | | 0.10 | | | | 0.11 | | | | 0.13 | | | | 0.12 | | | | 0.13 | |
Net realized and unrealized gain (loss) | | | 2.63 | | | | 0.96 | | | | 1.76 | | | | (0.76 | ) | | | 1.19 | |
| | | | | | | | | | | | | | | | | | | | |
Total from Investment Operations | | | 2.73 | | | | 1.07 | | | | 1.89 | | | | (0.64 | ) | | | 1.32 | |
| | | | | | | | | | | | | | | | | | | | |
LESS DISTRIBUTIONS FROM: | |
Net investment income | | | (0.10 | ) | | | (0.12 | ) | | | (0.14 | ) | | | (0.13 | ) | | | (0.12 | ) |
| | | | | | | | | | | | | | | | | | | | |
Net asset value, end of the period | | $ | 16.65 | | | $ | 14.02 | | | $ | 13.07 | | | $ | 11.32 | | | $ | 12.09 | |
| | | | | | | | | | | | | | | | | | | | |
Total return(b) | | | 19.43 | % | | | 8.38 | % | | | 16.67 | % | | | (5.37 | )% | | | 12.21 | % |
RATIOS TO AVERAGE NET ASSETS: | |
Net assets, end of the period (000’s) | | $ | 102,004 | | | $ | 56,979 | | | $ | 60,794 | | | $ | 67,125 | | | $ | 73,255 | |
Net expenses(c) | | | 0.78 | %(d)(e) | | | 0.95 | % | | | 0.95 | % | | | 0.95 | % | | | 0.95 | % |
Gross expenses | | | 0.95 | % | | | 1.17 | % | | | 1.17 | % | | | 1.19 | % | | | 1.05 | % |
Net investment income | | | 0.67 | % | | | 0.90 | % | | | 1.06 | % | | | 1.01 | % | | | 1.10 | % |
Portfolio turnover rate | | | 5 | % | | | 15 | % | | | 17 | % | | | 58 | % | | | 19 | % |
| (a) | Per share net investment income has been calculated using the average shares outstanding during the period. |
| (b) | Had certain expenses not been waived/reimbursed during the period, total returns would have been lower. |
| (c) | The investment adviser agreed to waive its fees and/or reimburse a portion of the Fund’s expenses during the period. Without this waiver/reimbursement, expenses would have been higher. |
| (d) | Effective July 1, 2021, the expense limit decreased from 0.95% to 0.68%. |
| (e) | Includes additional voluntary waiver of advisory fee of 0.02%. |
See accompanying notes to financial statements.
59 |
Financial Highlights (continued)
For a share outstanding throughout each period.
| | | | | | | | | | | | | | | | | | | | |
| | | Mirova Global Green Bond—Class A | |
| | | Year Ended
December 31,
2021 | | | Year Ended
December 31,
2020 | | | Year Ended
December 31,
2019 | | | Year Ended
December 31,
2018 | | | Period Ended
December 31,
2017* | |
Net asset value, beginning of the period | | $ | 10.77 | | | $ | 10.36 | | | $ | 9.71 | | | $ | 9.96 | | | $ | 10.00 | |
| | | | | | | | | | | | | | | | | | | | |
INCOME (LOSS) FROM INVESTMENT OPERATIONS: | |
Net investment income(a) | | | 0.04 | | | | 0.07 | | | | 0.09 | | | | 0.08 | | | | 0.04 | |
Net realized and unrealized gain (loss) | | | (0.37 | ) | | | 0.71 | | | | 0.80 | | | | (0.02 | ) | | | 0.11 | |
| | | | | | | | | | | | | | | | | | | | |
Total from Investment Operations | | | (0.33 | ) | | | 0.78 | | | | 0.89 | | | | 0.06 | | | | 0.15 | |
| | | | | | | | | | | | | | | | | | | | |
LESS DISTRIBUTIONS FROM: | |
Net investment income | | | (0.14 | ) | | | (0.18 | ) | | | (0.10 | ) | | | (0.31 | ) | | | (0.19 | ) |
Net realized capital gains | | | (0.16 | ) | | | (0.19 | ) | | | (0.14 | ) | | | — | | | | — | |
| | | | | | | | | | | | | | | | | | | | |
Total Distributions | | | (0.30 | ) | | | (0.37 | ) | | | (0.24 | ) | | | (0.31 | ) | | | (0.19 | ) |
| | | | | | | | | | | | | | | | | | | | |
Net asset value, end of the period | | $ | 10.14 | | | $ | 10.77 | | | $ | 10.36 | | | $ | 9.71 | | | $ | 9.96 | |
| | | | | | | | | | | | | | | | | | | | |
Total return(b)(c) | | | (3.02 | )% | | | 7.61 | % | | | 9.16 | % | | | 0.64 | % | | | 1.46 | %(d) |
RATIOS TO AVERAGE NET ASSETS: | |
Net assets, end of the period (000’s) | | $ | 6,798 | | | $ | 5,674 | | | $ | 2,549 | | | $ | 814 | | | $ | 139 | |
Net expenses(e) | | | 0.96 | %(f)(g) | | | 0.97 | %(h) | | | 0.96 | %(i) | | | 0.96 | %(j) | | | 0.96 | %(k)(l) |
Gross expenses | | | 1.41 | %(g) | | | 1.43 | %(h) | | | 1.56 | %(i) | | | 1.75 | %(j) | | | 5.23 | %(k)(l) |
Net investment income | | | 0.39 | % | | | 0.69 | % | | | 0.86 | % | | | 0.85 | % | | | 0.49 | %(k) |
Portfolio turnover rate | | | 37 | % | | | 53 | % | | | 25 | % | | | 46 | % | | | 46 | % |
| * | From commencement of operations on February 28, 2017 through December 31, 2017. |
| (a) | Per share net investment income has been calculated using the average shares outstanding during the period. |
| (b) | A sales charge for Class A shares is not reflected in total return calculations. |
| (c) | Had certain expenses not been waived/reimbursed during the period, total returns would have been lower. |
| (d) | Periods less than one year are not annualized. |
| (e) | The investment adviser agreed to waive its fees and/or reimburse a portion of the Fund’s expenses during the period. Without this waiver/reimbursement, expenses would have been higher. |
| (f) | Effective July 1, 2021, the expense limit decreased from 0.95% to 0.90%. |
| (g) | Includes interest expense. Without this expense the ratio of net expenses would have been 0.92% and the ratio of gross expenses would have been 1.37%. |
| (h) | Includes interest expense. Without this expense the ratio of net expenses would have been 0.95% and the ratio of gross expenses would have been 1.41%. |
| (i) | Includes interest expense. Without this expense the ratio of net expenses would have been 0.95% and the ratio of gross expenses would have been 1.55%. |
| (j) | Includes interest expense. Without this expense the ratio of net expenses would have been 0.95% and the ratio of gross expenses would have been 1.74%. |
| (k) | Computed on an annualized basis for periods less than one year. |
| (l) | Includes interest expense. Without this expense the ratio of net expenses would have been 0.95% and the ratio of gross expenses would have been 5.22%. |
See accompanying notes to financial statements.
| 60
Financial Highlights (continued)
For a share outstanding throughout each period.
| | | | | | | | | | | | | | | | | | | | |
| | | Mirova Global Green Bond—Class N | |
| | | Year Ended
December 31,
2021 | | | Year Ended
December 31,
2020 | | | Year Ended
December 31,
2019 | | | Year Ended
December 31,
2018 | | | Period Ended
December 31,
2017* | |
Net asset value, beginning of the period | | $ | 10.80 | | | $ | 10.39 | | | $ | 9.73 | | | $ | 9.98 | | | $ | 10.00 | |
| | | | | | | | | | | | | | | | | | | | |
INCOME (LOSS) FROM INVESTMENT OPERATIONS: | |
Net investment income(a) | | | 0.07 | | | | 0.10 | | | | 0.12 | | | | 0.11 | | | | 0.06 | |
Net realized and unrealized gain (loss) | | | (0.36 | ) | | | 0.71 | | | | 0.80 | | | | (0.02 | ) | | | 0.12 | |
| | | | | | | | | | | | | | | | | | | | |
Total from Investment Operations | | | (0.29 | ) | | | 0.81 | | | | 0.92 | | | | 0.09 | | | | 0.18 | |
| | | | | | | | | | | | | | | | | | | | |
LESS DISTRIBUTIONS FROM: | |
Net investment income | | | (0.18 | ) | | | (0.21 | ) | | | (0.12 | ) | | | (0.34 | ) | | | (0.20 | ) |
Net realized capital gains | | | (0.16 | ) | | | (0.19 | ) | | | (0.14 | ) | | | — | | | | — | |
| | | | | | | | | | | | | | | | | | | | |
Total Distributions | | | (0.34 | ) | | | (0.40 | ) | | | (0.26 | ) | | | (0.34 | ) | | | (0.20 | ) |
| | | | | | | | | | | | | | | | | | | | |
Net asset value, end of the period | | $ | 10.17 | | | $ | 10.80 | | | $ | 10.39 | | | $ | 9.73 | | | $ | 9.98 | |
| | | | | | | | | | | | | | | | | | | | |
Total return(b) | | | (2.73 | )% | | | 7.89 | % | | | 9.52 | % | | | 0.93 | % | | | 1.77 | %(c) |
RATIOS TO AVERAGE NET ASSETS: | |
Net assets, end of the period (000’s) | | $ | 8,110 | | | $ | 11,781 | | | $ | 27,322 | | | $ | 27,050 | | | $ | 25,805 | |
Net expenses(d) | | | 0.67 | %(e)(f) | | | 0.67 | %(g) | | | 0.66 | %(h) | | | 0.66 | %(i) | | | 0.67 | %(j)(k) |
Gross expenses | | | 1.05 | %(f) | | | 1.07 | %(g) | | | 1.08 | %(h) | | | 1.12 | %(i) | | | 1.11 | %(j)(k) |
Net investment income | | | 0.69 | % | | | 0.96 | % | | | 1.17 | % | | | 1.13 | % | | | 0.75 | %(j) |
Portfolio turnover rate | | | 37 | % | | | 53 | % | | | 25 | % | | | 46 | % | | | 46 | % |
| * | From commencement of operations on February 28, 2017 through December 31, 2017. |
| (a) | Per share net investment income has been calculated using the average shares outstanding during the period. |
| (b) | Had certain expenses not been waived/reimbursed during the period, total returns would have been lower. |
| (c) | Periods less than one year are not annualized. |
| (d) | The investment adviser agreed to waive its fees and/or reimburse a portion of the Fund’s expenses during the period. Without this waiver/reimbursement, expenses would have been higher. |
| (e) | Effective July 1, 2021, the expense limit decreased from 0.65% to 0.60%. |
| (f) | Includes interest expense. Without this expense the ratio of net expenses would have been 0.63% and the ratio of gross expenses would have been 1.02%. |
| (g) | Includes interest expense. Without this expense the ratio of net expenses would have been 0.65% and the ratio of gross expenses would have been 1.05%. |
| (h) | Includes interest expense. Without this expense the ratio of net expenses would have been 0.65% and the ratio of gross expenses would have been 1.07%. |
| (i) | Includes interest expense. Without this expense the ratio of net expenses would have been 0.65% and the ratio of gross expenses would have been 1.11%. |
| (j) | Computed on an annualized basis for periods less than one year. |
| (k) | Includes interest expense. Without this expense the ratio of net expenses would have been 0.65% and the ratio of gross expenses would have been 1.10%. |
See accompanying notes to financial statements.
61 |
Financial Highlights (continued)
For a share outstanding throughout each period.
| | | | | | | | | | | | | | | | | | | | |
| | | Mirova Global Green Bond—Class Y | |
| | | Year Ended
December 31,
2021 | | | Year Ended
December 31,
2020 | | | Year Ended
December 31,
2019 | | | Year Ended
December 31,
2018 | | | Period Ended
December 31,
2017* | |
Net asset value, beginning of the period | | $ | 10.79 | | | $ | 10.37 | | | $ | 9.72 | | | $ | 9.97 | | | $ | 10.00 | |
| | | | | | | | | | | | | | | | | | | | |
INCOME (LOSS) FROM INVESTMENT OPERATIONS: | |
Net investment income(a) | | | 0.07 | | | | 0.10 | | | | 0.11 | | | | 0.12 | | | | 0.06 | |
Net realized and unrealized gain (loss) | | | (0.37 | ) | | | 0.72 | | | | 0.80 | | | | (0.03 | ) | | | 0.11 | |
| | | | | | | | | | | | | | | | | | | | |
Total from Investment Operations | | | (0.30 | ) | | | 0.82 | | | | 0.91 | | | | 0.09 | | | | 0.17 | |
| | | | | | | | | | | | | | | | | | | | |
LESS DISTRIBUTIONS FROM: | |
Net investment income | | | (0.17 | ) | | | (0.21 | ) | | | (0.12 | ) | | | (0.34 | ) | | | (0.20 | ) |
Net realized capital gains | | | (0.16 | ) | | | (0.19 | ) | | | (0.14 | ) | | | — | | | | — | |
| | | | | | | | | | | | | | | | | | | | |
Total Distributions | | | (0.33 | ) | | | (0.40 | ) | | | (0.26 | ) | | | (0.34 | ) | | | (0.20 | ) |
| | | | | | | | | | | | | | | | | | | | |
Net asset value, end of the period | | $ | 10.16 | | | $ | 10.79 | | | $ | 10.37 | | | $ | 9.72 | | | $ | 9.97 | |
| | | | | | | | | | | | | | | | | | | | |
Total return(b) | | | (2.69 | )% | | | 7.85 | % | | | 9.38 | % | | | 0.89 | % | | | 1.66 | %(c) |
RATIOS TO AVERAGE NET ASSETS: | |
Net assets, end of the period (000’s) | | $ | 32,217 | | | $ | 22,081 | | | $ | 7,060 | | | $ | 1,205 | | | $ | 43 | |
Net expenses(d) | | | 0.71 | %(e)(f) | | | 0.72 | %(g) | | | 0.71 | %(h) | | | 0.71 | %(i) | | | 0.71 | %(j)(k) |
Gross expenses | | | 1.16 | %(f) | | | 1.18 | %(g) | | | 1.28 | %(h) | | | 1.39 | %(i) | | | 3.62 | %(j)(k) |
Net investment income | | | 0.63 | % | | | 0.94 | % | | | 1.10 | % | | | 1.19 | % | | | 0.71 | %(j) |
Portfolio turnover rate | | | 37 | % | | | 53 | % | | | 25 | % | | | 46 | % | | | 46 | % |
| * | From commencement of operations on February 28, 2017 through December 31, 2017. |
| (a) | Per share net investment income has been calculated using the average shares outstanding during the period. |
| (b) | Had certain expenses not been waived/reimbursed during the period, total returns would have been lower. |
| (c) | Periods less than one year are not annualized. |
| (d) | The investment adviser agreed to waive its fees and/or reimburse a portion of the Fund’s expenses during the period. Without this waiver/reimbursement, expenses would have been higher. |
| (e) | Effective July 1, 2021, the expense limit decreased from 0.70% to 0.65%. |
| (f) | Includes interest expense. Without this expense the ratio of net expenses would have been 0.67% and the ratio of gross expenses would have been 1.13%. |
| (g) | Includes interest expense. Without this expense the ratio of net expenses would have been 0.70% and the ratio of gross expenses would have been 1.16%. |
| (h) | Includes interest expense. Without this expense the ratio of net expenses would have been 0.70% and the ratio of gross expenses would have been 1.27%. |
| (i) | Includes interest expense. Without this expense the ratio of net expenses would have been 0.70% and the ratio of gross expenses would have been 1.39%. |
| (j) | Computed on an annualized basis for periods less than one year. |
| (k) | Includes interest expense. Without this expense the ratio of net expenses would have been 0.70% and the ratio of gross expenses would have been 3.62%. |
See accompanying notes to financial statements.
| 62
Financial Highlights (continued)
For a share outstanding throughout each period.
| | | | | | | | | | | | | | | | | | | | |
| | | Mirova Global Sustainable Equity Fund—Class A | |
| | | Year Ended
December 31,
2021 | | | Year Ended
December 31,
2020 | | | Year Ended
December 31,
2019 | | | Year Ended
December 31,
2018 | | | Year Ended
December 31,
2017 | |
Net asset value, beginning of the period | | $ | 19.57 | | | $ | 14.92 | | | $ | 11.45 | | | $ | 12.77 | | | $ | 9.90 | |
| | | | | | | | | | | | | | | | | | | | |
INCOME (LOSS) FROM INVESTMENT OPERATIONS: | |
Net investment income (loss)(a) | | | (0.01 | ) | | | (0.02 | ) | | | 0.03 | | | | 0.00 | (b) | | | (0.04 | ) |
Net realized and unrealized gain (loss) | | | 3.45 | | | | 4.77 | | | | 3.69 | | | | (0.84 | ) | | | 3.06 | |
| | | | | | | | | | | | | | | | | | | | |
Total from Investment Operations | | | 3.44 | | | | 4.75 | | | | 3.72 | | | | (0.84 | ) | | | 3.02 | |
| | | | | | | | | | | | | | | | | | | | |
LESS DISTRIBUTIONS FROM: | |
Net investment income | | | (0.00 | )(b) | | | (0.00 | )(b) | | | (0.03 | ) | | | (0.00 | )(b) | | | (0.03 | ) |
Net realized capital gains | | | (2.48 | ) | | | (0.10 | ) | | | (0.22 | ) | | | (0.48 | ) | | | (0.12 | ) |
| | | | | | | | | | | | | | | | | | | | |
Total Distributions | | | (2.48 | ) | | | (0.10 | ) | | | (0.25 | ) | | | (0.48 | ) | | | (0.15 | ) |
| | | | | | | | | | | | | | | | | | | | |
Net asset value, end of the period | | $ | 20.53 | | | $ | 19.57 | | | $ | 14.92 | | | $ | 11.45 | | | $ | 12.77 | |
| | | | | | | | | | | | | | | | | | | | |
Total return(c)(d) | | | 17.82 | % | | | 32.07 | % | | | 32.63 | % | | | (6.54 | )% | | | 30.44 | % |
RATIOS TO AVERAGE NET ASSETS: | |
Net assets, end of the period (000’s) | | $ | 43,117 | | | $ | 33,625 | | | $ | 12,884 | | | $ | 6,360 | | | $ | 3,260 | |
Net expenses(e) | | | 1.21 | %(f) | | | 1.20 | % | | | 1.21 | %(g) | | | 1.30 | %(h)(i) | | | 1.29 | % |
Gross expenses | | | 1.24 | %(f) | | | 1.24 | % | | | 1.39 | %(g) | | | 1.39 | %(h) | | | 1.43 | % |
Net investment income (loss) | | | (0.03 | )% | | | (0.14 | )% | | | 0.21 | % | | | 0.03 | % | | | (0.36 | )% |
Portfolio turnover rate | | | 40 | %(j) | | | 11 | % | | | 23 | % | | | 19 | % | | | 20 | % |
| (a) | Per share net investment income (loss) has been calculated using the average shares outstanding during the period. |
| (b) | Amount rounds to less than $0.01 per share. |
| (c) | Had certain expenses not been waived/reimbursed during the period, total returns would have been lower. |
| (d) | A sales charge for Class A shares is not reflected in total return calculations. |
| (e) | The investment adviser agreed to waive its fees and/or reimburse a portion of the Fund’s expenses during the period. Without this waiver/reimbursement, expenses would have been higher. |
| (f) | Includes interest expense. Without this expense the ratio of net expenses would have been 1.20% and the ratio of gross expenses would have been 1.24%. |
| (g) | Includes interest expense. Without this expense the ratio of net expenses would have been 1.20% and the ratio of gross expenses would have been 1.38%. |
| (h) | Includes interest expense of less than 0.01%. |
| (i) | Effective December 28, 2018, the expense limit decreased from 1.30% to 1.20%. |
| (j) | The variation in the Fund’s turnover rate from 2020 to 2021 was primarily due to an increase in shareholder activity. |
See accompanying notes to financial statements.
63 |
Financial Highlights (continued)
For a share outstanding throughout each period.
| | | | | | | | | | | | | | | | | | | | |
| | | Mirova Global Sustainable Equity Fund—Class C | |
| | | Year Ended
December 31,
2021 | | | Year Ended
December 31,
2020 | | | Year Ended
December 31,
2019 | | | Year Ended
December 31,
2018 | | | Year Ended
December 31,
2017 | |
Net asset value, beginning of the period | | $ | 18.95 | | | $ | 14.56 | | | $ | 11.24 | | | $ | 12.63 | | | $ | 9.85 | |
| | | | | | | | | | | | | | | | | | | | |
INCOME (LOSS) FROM INVESTMENT OPERATIONS: | |
Net investment loss(a) | | | (0.16 | ) | | | (0.13 | ) | | | (0.07 | ) | | | (0.09 | ) | | | (0.12 | ) |
Net realized and unrealized gain (loss) | | | 3.31 | | | | 4.62 | | | | 3.61 | | | | (0.82 | ) | | | 3.02 | |
| | | | | | | | | | | | | | | | | | | | |
Total from Investment Operations | | | 3.15 | | | | 4.49 | | | | 3.54 | | | | (0.91 | ) | | | 2.90 | |
| | | | | | | | | | | | | | | | | | | | |
LESS DISTRIBUTIONS FROM: | |
Net investment income | | | (0.00 | )(b) | | | (0.00 | )(b) | | | — | | | | — | | | | — | |
Net realized capital gains | | | (2.48 | ) | | | (0.10 | ) | | | (0.22 | ) | | | (0.48 | ) | | | (0.12 | ) |
| | | | | | | | | | | | | | | | | | | | |
Total Distributions | | | (2.48 | ) | | | (0.10 | ) | | | (0.22 | ) | | | (0.48 | ) | | | (0.12 | ) |
| | | | | | | | | | | | | | | | | | | | |
Net asset value, end of the period | | $ | 19.62 | | | $ | 18.95 | | | $ | 14.56 | | | $ | 11.24 | | | $ | 12.63 | |
| | | | | | | | | | | | | | | | | | | | |
Total return(c)(d) | | | 16.85 | % | | | 31.07 | % | | | 31.66 | % | | | (7.20 | )% | | | 29.40 | % |
RATIOS TO AVERAGE NET ASSETS: | |
Net assets, end of the period (000’s) | | $ | 17,248 | | | $ | 11,196 | | | $ | 5,406 | | | $ | 2,706 | | | $ | 1,164 | |
Net expenses(e) | | | 1.96 | %(f) | | | 1.95 | % | | | 1.96 | %(g) | | | 2.05 | %(h)(i) | | | 2.04 | % |
Gross expenses | | | 1.99 | %(f) | | | 1.99 | % | | | 2.14 | %(g) | | | 2.14 | %(h) | | | 2.18 | % |
Net investment loss | | | (0.79 | )% | | | (0.84 | )% | | | (0.52 | )% | | | (0.72 | )% | | | (1.02 | )% |
Portfolio turnover rate | | | 40 | %(j) | | | 11 | % | | | 23 | % | | | 19 | % | | | 20 | % |
| (a) | Per share net investment loss has been calculated using the average shares outstanding during the period. |
| (b) | Amount rounds to less than $0.01 per share. |
| (c) | Had certain expenses not been waived/reimbursed during the period, total returns would have been lower. |
| (d) | A contingent deferred sales charge for Class C shares is not reflected in total return calculations. |
| (e) | The investment adviser agreed to waive its fees and/or reimburse a portion of the Fund’s expenses during the period. Without this waiver/reimbursement, expenses would have been higher. |
| (f) | Includes interest expense. Without this expense the ratio of net expenses would have been 1.95% and the ratio of gross expenses would have been 1.99%. |
| (g) | Includes interest expense. Without this expense the ratio of net expenses would have been 1.95% and the ratio of gross expenses would have been 2.13%. |
| (h) | Includes interest expense of less than 0.01%. |
| (i) | Effective December 28, 2018, the expense limit decreased from 2.05% to 1.95%. |
| (j) | The variation in the Fund’s turnover rate from 2020 to 2021 was primarily due to an increase in shareholder activity. |
See accompanying notes to financial statements.
| 64
Financial Highlights (continued)
For a share outstanding throughout each period.
| | | | | | | | | | | | | | | | | | | | |
| | | Mirova Global Sustainable Equity Fund—Class N | |
| | | Year Ended
December 31,
2021 | | | Year Ended
December 31,
2020 | | | Year Ended
December 31,
2019 | | | Year Ended
December 31,
2018 | | | Period Ended
December 31,
2017* | |
Net asset value, beginning of the period | | $ | 19.71 | | | $ | 14.99 | | | $ | 11.49 | | | $ | 12.81 | | | $ | 11.29 | |
| | | | | | | | | | | | | | | | | | | | |
INCOME (LOSS) FROM INVESTMENT OPERATIONS: | |
Net investment income (loss)(a) | | | 0.05 | | | | 0.01 | | | | 0.06 | | | | (0.01 | ) | | | 0.02 | |
Net realized and unrealized gain (loss) | | | 3.49 | | | | 4.82 | | | | 3.72 | | | | (0.79 | ) | | | 1.66 | |
| | | | | | | | | | | | | | | | | | | | |
Total from Investment Operations | | | 3.54 | | | | 4.83 | | | | 3.78 | | | | (0.80 | ) | | | 1.68 | |
| | | | | | | | | | | | | | | | | | | | |
LESS DISTRIBUTIONS FROM: | |
Net investment income | | | (0.05 | ) | | | (0.01 | ) | | | (0.06 | ) | | | (0.04 | ) | | | (0.04 | ) |
Net realized capital gains | | | (2.48 | ) | | | (0.10 | ) | | | (0.22 | ) | | | (0.48 | ) | | | (0.12 | ) |
| | | | | | | | | | | | | | | | | | | | |
Total Distributions | | | (2.53 | ) | | | (0.11 | ) | | | (0.28 | ) | | | (0.52 | ) | | | (0.16 | ) |
| | | | | | | | | | | | | | | | | | | | |
Net asset value, end of the period | | $ | 20.72 | | | $ | 19.71 | | | $ | 14.99 | | | $ | 11.49 | | | $ | 12.81 | |
| | | | | | | | | | | | | | | | | | | | |
Total return(b) | | | 18.17 | % | | | 32.44 | % | | | 33.05 | % | | | (6.26 | )% | | | 14.81 | %(c) |
RATIOS TO AVERAGE NET ASSETS: | |
Net assets, end of the period (000’s) | | $ | 219,679 | | | $ | 72,768 | | | $ | 11,000 | | | $ | 2,842 | | | $ | 1 | |
Net expenses(d) | | | 0.91 | %(e)(f) | | | 0.90 | % | | | 0.90 | %(g) | | | 1.01 | %(h)(i) | | | 1.00 | %(j) |
Gross expenses | | | 0.91 | %(e)(f) | | | 0.93 | % | | | 1.08 | %(g) | | | 1.08 | %(h) | | | 14.30 | %(j) |
Net investment income (loss) | | | 0.24 | % | | | 0.08 | % | | | 0.46 | % | | | (0.08 | )% | | | 0.29 | %(j) |
Portfolio turnover rate | | | 40 | %(k) | | | 11 | % | | | 23 | % | | | 19 | % | | | 20 | %(l) |
| * | From commencement of Class operations on May 1, 2017 through December 31, 2017. |
| (a) | Per share net investment income (loss) has been calculated using the average shares outstanding during the period. |
| (b) | Had certain expenses not been waived/reimbursed during the period, total returns would have been lower. |
| (c) | Periods less than one year are not annualized. |
| (d) | The investment adviser agreed to waive its fees and/or reimburse a portion of the Fund’s expenses during the period. Without this waiver/reimbursement, expenses would have been higher. |
| (e) | Includes interest expense. Without this expense the ratio of net expenses would have been 0.90% and the ratio of gross expenses would have been 0.90%. |
| (f) | Includes fee/expense recovery of 0.01%. |
| (g) | Includes interest expense of less than 0.01%. |
| (h) | Includes interest expense. Without this expense the ratio of net expenses would have been 0.99% and the ratio of gross expenses would have been 1.07%. |
| (i) | Effective December 28, 2018, the expense limit decreased from 1.00% to 0.90%. |
| (j) | Computed on an annualized basis for periods less than one year. |
| (k) | The variation in the Fund’s turnover rate from 2020 to 2021 was primarily due to an increase in shareholder activity. |
| (l) | Represents the Fund’s portfolio turnover rate for the year ended December 31, 2017. |
See accompanying notes to financial statements.
65 |
Financial Highlights (continued)
For a share outstanding throughout each period.
| | | | | | | | | | | | | | | | | | | | |
| | | Mirova Global Sustainable Equity Fund—Class Y | |
| | | Year Ended
December 31,
2021 | | | Year Ended
December 31,
2020 | | | Year Ended
December 31,
2019 | | | Year Ended
December 31,
2018 | | | Year Ended
December 31,
2017 | |
Net asset value, beginning of the period | | $ | 19.71 | | | $ | 14.99 | | | $ | 11.49 | | | $ | 12.81 | | | $ | 9.91 | |
| | | | | | | | | | | | | | | | | | | | |
INCOME (LOSS) FROM INVESTMENT OPERATIONS: | |
Net investment income(a) | | | 0.05 | | | | 0.01 | | | | 0.07 | | | | 0.04 | | | | 0.03 | |
Net realized and unrealized gain (loss) | | | 3.46 | | | | 4.81 | | | | 3.70 | | | | (0.85 | ) | | | 3.02 | |
| | | | | | | | | | | | | | | | | | | | |
Total from Investment Operations | | | 3.51 | | | | 4.82 | | | | 3.77 | | | | (0.81 | ) | | | 3.05 | |
| | | | | | | | | | | | | | | | | | | | |
LESS DISTRIBUTIONS FROM: | |
Net investment income | | | (0.03 | ) | | | (0.00 | )(b) | | | (0.05 | ) | | | (0.03 | ) | | | (0.03 | ) |
Net realized capital gains | | | (2.48 | ) | | | (0.10 | ) | | | (0.22 | ) | | | (0.48 | ) | | | (0.12 | ) |
| | | | | | | | | | | | | | | | | | | | |
Total Distributions | | | (2.51 | ) | | | (0.10 | ) | | | (0.27 | ) | | | (0.51 | ) | | | (0.15 | ) |
| | | | | | | | | | | | | | | | | | | | |
Net asset value, end of the period | | $ | 20.71 | | | $ | 19.71 | | | $ | 14.99 | | | $ | 11.49 | | | $ | 12.81 | |
| | | | | | | | | | | | | | | | | | | | |
Total return(c) | | | 18.06 | % | | | 32.42 | % | | | 32.99 | % | | | (6.32 | )% | | | 30.75 | % |
RATIOS TO AVERAGE NET ASSETS: | |
Net assets, end of the period (000’s) | | $ | 840,638 | | | $ | 760,181 | | | $ | 118,032 | | | $ | 69,705 | | | $ | 63,359 | |
Net expenses(d) | | | 0.96 | %(e) | | | 0.95 | % | | | 0.96 | %(f) | | | 1.05 | %(g)(h) | | | 1.04 | % |
Gross expenses | | | 0.99 | %(e) | | | 0.99 | % | | | 1.14 | %(f) | | | 1.15 | %(g) | | | 1.16 | % |
Net investment income | | | 0.22 | % | | | 0.06 | % | | | 0.50 | % | | | 0.29 | % | | | 0.26 | % |
Portfolio turnover rate | | | 40 | %(i) | | | 11 | % | | | 23 | % | | | 19 | % | | | 20 | % |
| (a) | Per share net investment income has been calculated using the average shares outstanding during the period. |
| (b) | Amount rounds to less than $0.01 per share. |
| (c) | Had certain expenses not been waived/reimbursed during the period, total returns would have been lower. |
| (d) | The investment adviser agreed to waive its fees and/or reimburse a portion of the Fund’s expenses during the period. Without this waiver/reimbursement, expenses would have been higher. |
| (e) | Includes interest expense. Without this expense the ratio of net expenses would have been 0.95% and the ratio of gross expenses would have been 0.99%. |
| (f) | Includes interest expense. Without this expense the ratio of net expenses would have been 0.95% and the ratio of gross expenses would have been 1.13%. |
| (g) | Includes interest expense of less than 0.01%. |
| (h) | Effective December 28, 2018, the expense limit decreased from 1.05% to 0.95%. |
| (i) | The variation in the Fund’s turnover rate from 2020 to 2021 was primarily due to an increase in shareholder activity. |
See accompanying notes to financial statements.
| 66
Financial Highlights (continued)
For a share outstanding throughout each period.
| | | | | | | | | | | | | | | | |
| | | Mirova International Sustainable Equity Fund—Class A | |
| | | Year Ended
December 31,
2021 | | | Year Ended
December 31,
2020 | | | Year Ended
December 31,
2019 | | | Period Ended
December 31,
2018* | |
Net asset value, beginning of the period | | $ | 13.95 | | | $ | 12.51 | | | $ | 10.03 | | | $ | 10.00 | |
| | | | | | | | | | | | | | | | |
INCOME (LOSS) FROM INVESTMENT OPERATIONS: | |
Net investment income (loss)(a) | | | 0.08 | | | | (0.01 | ) | | | 0.12 | | | | (0.00 | )(b) |
Net realized and unrealized gain (loss) | | | 0.78 | | | | 2.87 | | | | 2.48 | | | | 0.03 | |
| | | | | | | | | | | | | | | | |
Total from Investment Operations | | | 0.86 | | | | 2.86 | | | | 2.60 | | | | 0.03 | |
| | | | | | | | | | | | | | | | |
LESS DISTRIBUTIONS FROM: | |
Net investment income | | | (0.09 | ) | | | (0.12 | ) | | | (0.12 | ) | | | — | |
Net realized capital gains | | | (0.37 | ) | | | (1.30 | ) | | | — | | | | — | |
| | | | | | | | | | | | | | | | |
Total Distributions | | | (0.46 | ) | | | (1.42 | ) | | | (0.12 | ) | | | — | |
| | | | | | | | | | | | | | | | |
Net asset value, end of the period | | $ | 14.35 | | | $ | 13.95 | | | $ | 12.51 | | | $ | 10.03 | |
| | | | | | | | | | | | | | | | |
Total return(c)(d) | | | 6.22 | % | | | 23.18 | % | | | 25.97 | % | | | 0.30 | %(e) |
RATIOS TO AVERAGE NET ASSETS: | |
Net assets, end of the period (000’s) | | $ | 380 | | | $ | 76 | | | $ | 4 | | | $ | 1 | |
Net expenses(f) | | | 1.21 | %(g) | | | 1.26 | %(h) | | | 1.21 | %(i) | | | 1.20 | %(j) |
Gross expenses | | | 2.08 | %(g) | | | 5.69 | %(h) | | | 107.91 | %(i) | | | 22.87 | %(j) |
Net investment income (loss) | | | 0.57 | % | | | (0.04 | )% | | | 1.09 | % | | | (1.20 | )%(j) |
Portfolio turnover rate | | | 8 | % | | | 11 | % | | | 8 | % | | | 0 | % |
| * | From commencement of operations on December 28, 2018 through December 31, 2018. |
| (a) | Per share net investment income (loss) has been calculated using the average shares outstanding during the period. |
| (b) | Amount rounds to less than $0.01 per share. |
| (c) | A sales charge for Class A shares is not reflected in total return calculations. |
| (d) | Had certain expenses not been waived/reimbursed during the period, total returns would have been lower. |
| (e) | Periods less than one year are not annualized. |
| (f) | The investment adviser agreed to waive its fees and/or reimburse a portion of the Fund’s expenses during the period. Without this waiver/reimbursement, expenses would have been higher. |
| (g) | Includes interest expense. Without this expense the ratio of net expenses would have been 1.20% and the ratio of gross expenses would have been 2.07%. |
| (h) | Includes interest expense. Without this expense the ratio of net expenses would have been 1.20% and the ratio of gross expenses would have been 5.64%. |
| (i) | Includes interest expense. Without this expense the ratio of net expenses would have been 1.20% and the ratio of gross expenses would have been 107.90%. |
| (j) | Computed on an annualized basis for periods less than one year. |
See accompanying notes to financial statements.
67 |
Financial Highlights (continued)
For a share outstanding throughout each period.
| | | | | | | | | | | | | | | | |
| | | Mirova International Sustainable Equity Fund—Class N | |
| | | Year Ended
December 31,
2021 | | | Year Ended
December 31,
2020 | | | Year Ended
December 31,
2019 | | | Period Ended
December 31,
2018* | |
Net asset value, beginning of the period | | $ | 13.99 | | | $ | 12.51 | | | $ | 10.03 | | | $ | 10.00 | |
| | | | | | | | | | | | | | | | |
INCOME (LOSS) FROM INVESTMENT OPERATIONS: | |
Net investment income (loss)(a) | | | 0.14 | | | | 0.07 | | | | 0.15 | | | | (0.00 | )(b) |
Net realized and unrealized gain (loss) | | | 0.76 | | | | 2.84 | | | | 2.49 | | | | 0.03 | |
| | | | | | | | | | | | | | | | |
Total from Investment Operations | | | 0.90 | | | | 2.91 | | | | 2.64 | | | | 0.03 | |
| | | | | | | | | | | | | | | | |
LESS DISTRIBUTIONS FROM: | |
Net investment income | | | (0.12 | ) | | | (0.13 | ) | | | (0.16 | ) | | | — | |
Net realized capital gains | | | (0.37 | ) | | | (1.30 | ) | | | — | | | | — | |
| | | | | | | | | | | | | | | | |
Total Distributions | | | (0.49 | ) | | | (1.43 | ) | | | (0.16 | ) | | | — | |
| | | | | | | | | | | | | | | | |
Net asset value, end of the period | | $ | 14.40 | | | $ | 13.99 | | | $ | 12.51 | | | $ | 10.03 | |
| | | | | | | | | | | | | | | | |
Total return(c) | | | 6.47 | % | | | 23.60 | % | | | 26.31 | % | | | 0.30 | %(d) |
RATIOS TO AVERAGE NET ASSETS: | |
Net assets, end of the period (000’s) | | $ | 27,569 | | | $ | 16,478 | | | $ | 17,193 | | | $ | 10,035 | |
Net expenses(e) | | | 0.91 | %(f) | | | 0.93 | %(g) | | | 0.92 | %(h) | | | 0.90 | %(i) |
Gross expenses | | | 1.44 | %(f) | | | 1.83 | %(g) | | | 1.99 | %(h) | | | 22.55 | %(i) |
Net investment income (loss) | | | 0.94 | % | | | 0.58 | % | | | 1.36 | % | | | (0.90 | )%(i) |
Portfolio turnover rate | | | 8 | % | | | 11 | % | | | 8 | % | | | 0 | % |
| * | From commencement of operations on December 28, 2018 through December 31, 2018. |
| (a) | Per share net investment income (loss) has been calculated using the average shares outstanding during the period. |
| (b) | Amount rounds to less than $0.01 per share. |
| (c) | Had certain expenses not been waived/reimbursed during the period, total returns would have been lower. |
| (d) | Periods less than one year are not annualized. |
| (e) | The investment adviser agreed to waive its fees and/or reimburse a portion of the Fund’s expenses during the period. Without this waiver/reimbursement, expenses would have been higher. |
| (f) | Includes interest expense. Without this expense the ratio of net expenses would have been 0.90% and the ratio of gross expenses would have been 1.43%. |
| (g) | Includes interest expense. Without this expense the ratio of net expenses would have been 0.90% and the ratio of gross expenses would have been 1.80%. |
| (h) | Includes interest expense. Without this expense the ratio of net expenses would have been 0.75% and the ratio of gross expenses would have been 1.22%. |
| (i) | Computed on an annualized basis for periods less than one year. |
See accompanying notes to financial statements.
| 68
Financial Highlights (continued)
For a share outstanding throughout each period.
| | | | | | | | | | | | | | | | |
| | | Mirova International Sustainable Equity Fund—Class Y | |
| | | Year Ended
December 31,
2021 | | | Year Ended
December 31,
2020 | | | Year Ended
December 31,
2019 | | | Period Ended
December 31,
2018* | |
Net asset value, beginning of the period | | $ | 13.98 | | | $ | 12.50 | | | $ | 10.03 | | | $ | 10.00 | |
| | | | | | | | | | | | | | | | |
INCOME (LOSS) FROM INVESTMENT OPERATIONS: | |
Net investment income (loss)(a) | | | 0.08 | | | | 0.03 | | | | 0.15 | | | | (0.00 | )(b) |
Net realized and unrealized gain (loss) | | | 0.80 | | | | 2.88 | | | | 2.48 | | | | 0.03 | |
| | | | | | | | | | | | | | | | |
Total from Investment Operations | | | 0.88 | | | | 2.91 | | | | 2.63 | | | | 0.03 | |
| | | | | | | | | | | | | | | | |
LESS DISTRIBUTIONS FROM: | |
Net investment income | | | (0.11 | ) | | | (0.13 | ) | | | (0.16 | ) | | | — | |
Net realized capital gains | | | (0.37 | ) | | | (1.30 | ) | | | — | | | | — | |
| | | | | | | | | | | | | | | | |
Total Distributions | | | (0.48 | ) | | | (1.43 | ) | | | (0.16 | ) | | | — | |
| | | | | | | | | | | | | | | | |
Net asset value, end of the period | | $ | 14.38 | | | $ | 13.98 | | | $ | 12.50 | | | $ | 10.03 | |
| | | | | | | | | | | | | | | | |
Total return(c) | | | 6.39 | % | | | 23.60 | % | | | 26.21 | % | | | 0.30 | %(d) |
RATIOS TO AVERAGE NET ASSETS: | |
Net assets, end of the period (000’s) | | $ | 1,783 | | | $ | 75 | | | $ | 9 | | | $ | 1 | |
Net expenses(e) | | | 0.96 | %(f) | | | 1.00 | %(g) | | | 0.96 | %(h) | | | 0.95 | %(i) |
Gross expenses | | | 1.83 | %(f) | | | 6.51 | %(g) | | | 94.13 | %(h) | | | 22.51 | %(i) |
Net investment income (loss) | | | 0.52 | % | | | 0.21 | % | | | 1.36 | % | | | (0.95 | )%(i) |
Portfolio turnover rate | | | 8 | % | | | 11 | % | | | 8 | % | | | 0 | % |
| * | From commencement of operations on December 28, 2018 through December 31, 2018. |
| (a) | Per share net investment income (loss) has been calculated using the average shares outstanding during the period. |
| (b) | Amount rounds to less than $0.01 per share. |
| (c) | Had certain expenses not been waived/reimbursed during the period, total returns would have been lower. |
| (d) | Periods less than one year are not annualized. |
| (e) | The investment adviser agreed to waive its fees and/or reimburse a portion of the Fund’s expenses during the period. Without this waiver/reimbursement, expenses would have been higher. |
| (f) | Includes interest expense. Without this expense the ratio of net expenses would have been 0.95% and the ratio of gross expenses would have been 1.82%. |
| (g) | Includes interest expense. Without this expense the ratio of net expenses would have been 0.95% and the ratio of gross expenses would have been 6.46%. |
| (h) | Includes interest expense. Without this expense the ratio of net expenses would have been 0.95% and the ratio of gross expenses would have been 94.12%. |
| (i) | Computed on an annualized basis for periods less than one year. |
See accompanying notes to financial statements.
69 |
Financial Highlights (continued)
For a share outstanding throughout each period.
| | | | | | | | |
| | | Mirova U.S. Sustainable
Equity Fund—Class A | |
| | | Year Ended
December 31,
2021 | | | Period Ended
December 31,
2020* | |
Net asset value, beginning of the period | | $ | 10.21 | | | $ | 10.00 | |
| | | | | | | | |
INCOME (LOSS) FROM INVESTMENT OPERATIONS: | |
Net investment loss(a) | | | (0.04 | ) | | | (0.00 | )(b) |
Net realized and unrealized gain (loss) | | | 3.06 | | | | 0.21 | |
| | | | | | | | |
Total from Investment Operations | | | 3.02 | | | | 0.21 | |
| | | | | | | | |
LESS DISTRIBUTIONS FROM: | |
Net investment income | | | (0.00 | )(b) | | | — | |
Net realized capital gains | | | (0.66 | ) | | | — | |
| | | | | | | | |
Total Distributions | | | (0.66 | ) | | | — | |
| | | | | | | | |
Net asset value, end of the period | | $ | 12.57 | | | $ | 10.21 | |
| | | | | | | | |
Total return(c)(d) | | | 29.65 | % | | | 2.10 | %(e) |
RATIOS TO AVERAGE NET ASSETS: | |
Net assets, end of the period (000’s) | | $ | 12 | | | $ | 1 | |
Net expenses(f) | | | 1.05 | % | | | 1.05 | %(g) |
Gross expenses | | | 8.99 | % | | | 23.61 | %(g) |
Net investment loss | | | (0.31 | )% | | | (0.73 | )%(g) |
Portfolio turnover rate | | | 9 | % | | | 0 | % |
| * | From commencement of operations on December 15, 2020 through December 31, 2020. |
| (a) | Per share net investment loss has been calculated using the average shares outstanding during the period. |
| (b) | Amount rounds to less than $0.01 per share. |
| (c) | Had certain expenses not been waived/reimbursed during the period, total returns would have been lower. |
| (d) | A sales charge for Class A shares is not reflected in total return calculations. |
| (e) | Periods less than one year are not annualized. |
| (f) | The investment adviser agreed to waive its fees and/or reimburse a portion of the Fund’s expenses during the period. Without this waiver/reimbursement, expenses would have been higher. |
| (g) | Computed on an annualized basis for periods less than one year. |
See accompanying notes to financial statements.
| 70
Financial Highlights (continued)
For a share outstanding throughout each period.
| | | | | | | | |
| | | Mirova U.S. Sustainable
Equity Fund—Class C | |
| | | Year Ended
December 31,
2021 | | | Period Ended
December 31,
2020* | |
Net asset value, beginning of the period | | $ | 10.21 | | | $ | 10.00 | |
| | | | | | | | |
INCOME (LOSS) FROM INVESTMENT OPERATIONS: | |
Net investment loss(a) | | | (0.12 | ) | | | (0.01 | ) |
Net realized and unrealized gain (loss) | | | 3.04 | | | | 0.22 | |
| | | | | | | | |
Total from Investment Operations | | | 2.92 | | | | 0.21 | |
| | | | | | | | |
LESS DISTRIBUTIONS FROM: | |
Net realized capital gains | | | (0.66 | ) | | | — | |
| | | | | | | | |
Net asset value, end of the period | | $ | 12.47 | | | $ | 10.21 | |
| | | | | | | | |
Total return(b)(c) | | | 28.62 | % | | | 2.10 | %(d) |
RATIOS TO AVERAGE NET ASSETS: | |
Net assets, end of the period (000’s) | | $ | 101 | | | $ | 1 | |
Net expenses(e) | | | 1.80 | % | | | 1.80 | %(f) |
Gross expenses | | | 9.37 | % | | | 24.34 | %(f) |
Net investment loss | | | (0.91 | )% | | | (1.45 | )%(f) |
Portfolio turnover rate | | | 9 | % | | | 0 | % |
| * | From commencement of operations on December 15, 2020 through December 31, 2020. |
| (a) | Per share net investment loss has been calculated using the average shares outstanding during the period. |
| (b) | Had certain expenses not been waived/reimbursed during the period, total returns would have been lower. |
| (c) | A contingent deferred sales charge for Class C shares is not reflected in total return calculations. |
| (d) | Periods less than one year are not annualized. |
| (e) | The investment adviser agreed to waive its fees and/or reimburse a portion of the Fund’s expenses during the period. Without this waiver/reimbursement, expenses would have been higher. |
| (f) | Computed on an annualized basis for periods less than one year. |
See accompanying notes to financial statements.
71 |
Financial Highlights (continued)
For a share outstanding throughout each period.
| | | | | | | | |
| | | Mirova U.S. Sustainable
Equity Fund—Class N | |
| | | Year Ended
December 31,
2021 | | | Period Ended
December 31,
2020* | |
Net asset value, beginning of the period | | $ | 10.21 | | | $ | 10.00 | |
| | | | | | | | |
INCOME (LOSS) FROM INVESTMENT OPERATIONS: | |
Net investment income (loss)(a) | | | 0.01 | | | | (0.00 | )(b) |
Net realized and unrealized gain (loss) | | | 3.05 | | | | 0.21 | |
| | | | | | | | |
Total from Investment Operations | | | 3.06 | | | | 0.21 | |
| | | | | | | | |
LESS DISTRIBUTIONS FROM: | |
Net investment income | | | (0.02 | ) | | | — | |
Net realized capital gains | | | (0.66 | ) | | | — | |
| | | | | | | | |
Total Distributions | | | (0.68 | ) | | | — | |
| | | | | | | | |
Net asset value, end of the period | | $ | 12.59 | | | $ | 10.21 | |
| | | | | | | | |
Total return(c) | | | 29.99 | % | | | 2.10 | %(d) |
RATIOS TO AVERAGE NET ASSETS: | |
Net assets, end of the period (000’s) | | $ | 4,893 | | | $ | 5,106 | |
Net expenses(e) | | | 0.75 | % | | | 0.75 | %(f) |
Gross expenses | | | 3.50 | % | | | 17.07 | %(f) |
Net investment income (loss) | | | 0.06 | % | | | (0.39 | )%(f) |
Portfolio turnover rate | | | 9 | % | | | 0 | % |
| * | From commencement of operations on December 15, 2020 through December 31, 2020. |
| (a) | Per share net investment income (loss) has been calculated using the average shares outstanding during the period. |
| (b) | Amount rounds to less than $0.01 per share. |
| (c) | Had certain expenses not been waived/reimbursed during the period, total returns would have been lower. |
| (d) | Periods less than one year are not annualized. |
| (e) | The investment adviser agreed to waive its fees and/or reimburse a portion of the Fund’s expenses during the period. Without this waiver/reimbursement, expenses would have been higher. |
| (f) | Computed on an annualized basis for periods less than one year. |
See accompanying notes to financial statements.
| 72
Financial Highlights (continued)
For a share outstanding throughout each period.
| | | | | | | | |
| | | Mirova U.S. Sustainable
Equity Fund—Class Y | |
| | | Year Ended
December 31,
2021 | | | Period Ended
December 31,
2020* | |
Net asset value, beginning of the period | | $ | 10.21 | | | $ | 10.00 | |
| | | | | | | | |
INCOME (LOSS) FROM INVESTMENT OPERATIONS: | |
Net investment loss(a)(b) | | | (0.00 | ) | | | (0.00 | ) |
Net realized and unrealized gain (loss) | | | 3.06 | | | | 0.21 | |
| | | | | | | | |
Total from Investment Operations | | | 3.06 | | | | 0.21 | |
| | | | | | | | |
LESS DISTRIBUTIONS FROM: | |
Net investment income | | | (0.02 | ) | | | — | |
Net realized capital gains | | | (0.66 | ) | | | — | |
| | | | | | | | |
Total Distributions | | | (0.68 | ) | | | — | |
| | | | | | | | |
Net asset value, end of the period | | $ | 12.59 | | | $ | 10.21 | |
| | | | | | | | |
Total return(c) | | | 29.97 | % | | | 2.10 | %(d) |
RATIOS TO AVERAGE NET ASSETS: | |
Net assets, end of the period (000’s) | | $ | 44 | | | $ | 1 | |
Net expenses(e) | | | 0.80 | % | | | 0.80 | %(f) |
Gross expenses | | | 8.79 | % | | | 23.24 | %(f) |
Net investment loss | | | (0.01 | )% | | | (0.36 | )%(f) |
Portfolio turnover rate | | | 9 | % | | | 0 | % |
| * | From commencement of operations on December 15, 2020 through December 31, 2020. |
| (a) | Per share net investment loss has been calculated using the average shares outstanding during the period. |
| (b) | Amount rounds to less than $0.01 per share. |
| (c) | Had certain expenses not been waived/reimbursed during the period, total returns would have been lower. |
| (d) | Periods less than one year are not annualized. |
| (e) | The investment adviser agreed to waive its fees and/or reimburse a portion of the Fund’s expenses during the period. Without this waiver/reimbursement, expenses would have been higher. |
| (f) | Computed on an annualized basis for periods less than one year. |
See accompanying notes to financial statements.
73 |
Notes to Financial Statements
December 31, 2021
1. Organization. Gateway Trust and Natixis Funds Trust I (the “Trusts” and each a “Trust”) are each organized as a Massachusetts business trust. Each Trust is registered under the Investment Company Act of 1940, as amended (the “1940 Act”), as an open-end management investment company. Each Declaration of Trust permits the Board of Trustees to authorize the issuance of an unlimited number of shares of the Trust in multiple series. The financial statements for certain funds of the Trusts are presented in separate reports. The following funds (individually, a “Fund” and collectively, the “Funds”) are included in this report:
Gateway Trust:
Gateway Fund
Gateway Equity Call Premium Fund
Natixis Funds Trust I:
Mirova Global Green Bond Fund (the “Global Green Bond Fund”)
Mirova Global Sustainable Equity Fund (the “Global Sustainable Equity Fund”)
Mirova International Sustainable Equity Fund (the “International Sustainable Equity Fund”)
Mirova U.S. Sustainable Equity Fund (the “U.S. Sustainable Equity Fund”)
Each Fund is a diversified investment company.
Each Fund offers Class A, Class C, Class N and Class Y shares, except for Global Green Bond Fund and International Sustainable Equity Fund, which do not offer Class C shares.
Class A shares are sold with a maximum front-end sales charge of 5.75% for all Funds except for Global Green Bond Fund which are sold with a maximum front-end sales charge of 4.25%. Class C shares do not pay a front-end sales charge, pay higher Rule 12b-1 fees than Class A shares for eight years (at which point they automatically convert to Class A shares) (prior to May 1, 2021, Class C shares automatically converted to Class A shares after ten years) and may be subject to a contingent deferred sales charge (“CDSC”) of 1.00% if those shares are redeemed within one year of acquisition, except for reinvested distributions. Class N and Class Y shares do not pay a front-end sales charge, a CDSC or Rule 12b-1 fees. Class N shares are offered with an initial minimum investment of $1,000,000. Class Y shares are offered with an initial minimum investment of $100,000. Certain categories of investors are exempted from the minimum investment amounts for Class N and Class Y as outlined in the relevant Funds’ prospectus.
Most expenses can be directly attributed to a Fund. Expenses which cannot be directly attributed to a Fund are generally apportioned based on the relative net assets of each of the Funds in Natixis Funds Trust I, Natixis Funds Trust II, Natixis Funds Trust IV and Gateway Trust (“Natixis Funds Trusts”), Loomis Sayles Funds I and Loomis Sayles Funds II (“Loomis Sayles Funds Trusts”) and Natixis ETF Trust and Natixis ETF Trust II (“Natixis ETF Trusts”). Expenses of a Fund are borne pro rata by the holders of each class of shares, except that each class bears expenses unique to that class (such as the Rule 12b-1 fees applicable to Class A and Class C), and transfer agent fees are borne collectively for Class A, Class C and Class Y, and individually for Class N. In addition, each class votes as a class only with respect to its own Rule 12b-1 Plan. Shares of each class would receive their pro rata share of the net assets of the Fund if the Fund were liquidated. The Trustees approve separate distributions from net investment income on each class of shares.
2. Significant Accounting Policies. The following is a summary of significant accounting policies consistently followed by each Fund in the preparation of its financial statements. The Funds’ financial statements follow the accounting and reporting guidelines provided for investment companies and are prepared in accordance with accounting principles generally accepted in the United States of America which require the use of management estimates that affect the reported amounts and disclosures in the financial statements. Actual results could differ from those estimates. Management has evaluated the events and transactions subsequent to year-end through the date the financial statements were issued and has determined that there were no material events that would require disclosure in the Funds’ financial statements.
a. Valuation. Fund securities and other investments are valued at market value based on market quotations obtained or determined by independent pricing services recommended by the adviser and approved by the Board of Trustees. Fund securities and other investments for which market quotations are not readily available are valued at fair value as determined in good faith by the adviser pursuant to procedures approved by the Board of Trustees, as described below. Market value is determined as follows:
Listed equity securities (including shares of closed-end investment companies and exchange-traded funds) are valued at the last sale price quoted on the exchange where they are traded most extensively or, if there is no reported sale during the day, the closing bid quotation as reported by an independent pricing service. Securities traded on the NASDAQ Global Select Market, NASDAQ Global Market and NASDAQ Capital Market are valued at the NASDAQ Official Closing Price (“NOCP”), or if lacking an NOCP, at the most recent bid quotations on the applicable NASDAQ Market. Unlisted equity securities (except unlisted preferred equity securities) are valued at the last sale price quoted in the market where they are traded most extensively or, if there is no reported sale during the day, the closing bid quotation as reported by an independent pricing service. If there is no last sale price or closing bid quotation available,
| 74
Notes to Financial Statements (continued)
December 31, 2021
unlisted equity securities will be valued using evaluated bids furnished by an independent pricing service, if available. In some foreign markets, an official close price and a last sale price may be available from the foreign exchange or market. In those cases, the official close price is used. Debt securities and unlisted preferred equity securities are valued based on evaluated bids furnished to the Funds by an independent pricing service or bid prices obtained from broker-dealers. Broker-dealer bid prices may be used to value debt and unlisted equity securities where an independent pricing service is unable to price a security or where an independent pricing service does not provide a reliable price for the security. Futures contracts are valued at the most recent settlement price on the exchange on which the adviser believes that, over time, they are traded most extensively. Domestic exchange-traded index option contracts are valued at the mean of the National Best Bid and Offer quotations as determined by the Options Price Reporting Authority.
Fund securities and other investments for which market quotations are not readily available are valued at fair value as determined in good faith by the adviser pursuant to procedures approved by the Board of Trustees. The Funds may also value securities and other investments at fair value in other circumstances such as when extraordinary events occur after the close of a foreign market but prior to the close of the New York Stock Exchange. This may include situations relating to a single issuer (such as a declaration of bankruptcy or a delisting of the issuer’s security from the primary market on which it has traded) as well as events affecting the securities markets in general (such as market disruptions or closings and significant fluctuations in U.S. and/or foreign markets). When fair valuing its securities or other investments, the Funds may, among other things, use modeling tools or other processes that may take into account factors such as securities or other market activity and/or significant events that occur after the close of the foreign market and before the time the Fund’s net asset value (“NAV”) is calculated. Fair value pricing may require subjective determinations about the value of a security, and fair values used to determine a Fund’s NAV may differ from quoted or published prices, or from prices that are used by others, for the same securities. In addition, the use of fair value pricing may not always result in adjustments to the prices of securities held by a Fund.
As of December 31, 2021, securities held by the Funds were fair valued as follows:
| | | | | | | | |
Fund | | Equity securities1 | | | Percentage of
Net Assets | |
Global Sustainable Equity Fund | | $ | 415,732,002 | | | | 37.1 | % |
International Sustainable Equity Fund | | | 26,685,180 | | | | 89.8 | % |
| 1 | Certain foreign equity securities were fair valued pursuant to procedures approved by the Board of Trustees as events occurring after the close of the foreign market were believed to materially affect the value of those securities. |
b. Investment Transactions and Related Investment Income. Investment transactions are accounted for on a trade date plus one day basis for daily NAV calculation. However, for financial reporting purposes, investment transactions are reported on trade date. Dividend income (including income reinvested) and foreign withholding tax, if applicable, are recorded on the ex-dividend date, or in the case of certain foreign securities, as soon as a Fund is notified, and interest income is recorded on an accrual basis. Dividends reinvested and stock dividends are reflected as non-cash dividends on the Statements of Operations. Interest income is increased by the accretion of discount and decreased by the amortization of premium, if applicable. For securities with paydown provisions, principal payments received are treated as a proportionate reduction to the cost basis of the securities, and excess or shortfall amounts are recorded as income. Distributions received from investments in securities that represent a return of capital or capital gain are recorded as a reduction of cost of investments or as a realized gain, respectively. The calendar year-end amounts of ordinary income, capital gains, and return of capital included in distributions received from the Funds’ investments in real estate investment trusts (“REITs”) are reported to the Funds after the end of the fiscal year; accordingly, the Funds estimate these amounts for accounting purposes until the characterization of REIT distributions is reported to the Funds after the end of the fiscal year. Estimates are based on the most recent REIT distribution information available. In determining net gain or loss on securities sold, the cost of securities has been determined on an identified cost basis. Investment income, non-class specific expenses and realized and unrealized gains and losses are allocated on a pro rata basis to each class based on the relative net assets of each class to the total net assets of the Fund.
c. Foreign Currency Translation. The books and records of the Funds are maintained in U.S. dollars. The values of securities, currencies and other assets and liabilities denominated in currencies other than U.S. dollars, if any, are translated into U.S. dollars based upon foreign exchange rates prevailing at the end of the period. Purchases and sales of investment securities, income and expenses are translated into U.S. dollars on the respective dates of such transactions.
Net realized foreign exchange gains or losses arise from sales of foreign currency, changes in exchange rates between the trade and settlement dates on securities transactions and the difference between the amounts of dividends, interest and foreign withholding taxes recorded on the Funds’ books and the U.S. dollar equivalent of the amounts actually received or paid. Net unrealized foreign exchange gains or losses arise from changes in the value of assets and liabilities, other than investment securities, as of the end of the
75 |
Notes to Financial Statements (continued)
December 31, 2021
fiscal period, resulting from changes in exchange rates. Net realized foreign exchange gains or losses and the net change in unrealized foreign exchange gains or losses are disclosed in the Statements of Operations. For federal income tax purposes, net realized foreign exchange gains or losses are characterized as ordinary income, and may, if the Funds have net losses, reduce the amount of income available to be distributed by the Funds.
The values of investment securities are presented at the foreign exchange rates prevailing at the end of the period for financial reporting purposes. Net realized and unrealized gains or losses on investments reported in the Statements of Operations reflect gains or losses resulting from changes in exchange rates and fluctuations which arise due to changes in market prices of investment securities. For federal income tax purposes, a portion of the net realized gain or loss on investments arising from changes in exchange rates, which is reflected in the Statements of Operations, may be characterized as ordinary income and may, if the Funds have net losses, reduce the amount of income available to be distributed by the Funds.
The Funds may use foreign currency exchange contracts to facilitate transactions in foreign-denominated investments. Losses may arise from changes in the value of the foreign currency or if the counterparties do not perform under the contracts’ terms.
d. Futures Contracts. A Fund may enter into futures contracts. Futures contracts are agreements between two parties to buy and sell a particular instrument or index for a specified price on a specified future date.
When a Fund enters into a futures contract, it is required to deposit with (or for the benefit of) its broker an amount of cash or short-term high-quality securities as “initial margin.” As the value of the contract changes, the value of the futures contract position increases or declines. Subsequent payments, known as “variation margin,” are made or received by a Fund, depending on the price fluctuations in the fair value of the contract and the value of cash or securities on deposit with the broker. Gross unrealized appreciation (depreciation) on futures contracts is recorded in the Statements of Assets and Liabilities as an asset (liability). The aggregate principal amounts of the contracts are not recorded in the financial statements. Fluctuations in the value of the contracts are recorded in the Statements of Operations as unrealized appreciation (depreciation) until the contracts are closed, when they are recorded as realized gains (losses). Realized gain or loss on a futures position is equal to the difference between the value of the contract at the time it was opened and the value at the time it was closed, minus brokerage commissions. When a Fund enters into a futures contract certain risks may arise, such as illiquidity in the futures market, which may limit a Fund’s ability to close out a futures contract prior to settlement date, and unanticipated movements in the value of securities or interest rates. Futures contracts outstanding at the end of the period, if any, are listed in each applicable Fund’s Portfolio of Investments.
Futures contracts are exchange-traded. Exchange-traded futures contracts are standardized and are settled through a clearing house with fulfillment supported by the credit of the exchange. Therefore, counterparty credit risks to the Funds are reduced; however, in the event that a counterparty enters into bankruptcy, a Fund’s claim against initial/variation margin on deposit with the counterparty may be subject to terms of a final settlement in bankruptcy court.
e. Option Contracts. Gateway Fund and Gateway Equity Call Premium Fund’s investment strategies make use of exchange-traded options. Exchange-traded options are standardized contracts and are settled through a clearing house with fulfillment supported by the credit of the exchange. Therefore, counterparty credit risks to a Fund are reduced.
When a Fund writes an index call option, an amount equal to the net premium received (the premium less commission) is recorded as a liability and is subsequently adjusted to the current value until the option expires or a Fund enters into a closing purchase transaction. When an index call option expires or a Fund enters into a closing purchase transaction, the difference between the net premium received and any amount paid at expiration or on effecting a closing purchase transaction, including commission, is treated as a realized gain or, if the net premium received is less than the amount paid, as a realized loss. A Fund, as writer of an index call option, bears the risk of an unfavorable change in the market value of the index underlying the written option.
When a Fund purchases an index put option, it pays a premium and the index put option is subsequently marked-to-market to reflect current value until the option expires or a Fund enters into a closing sale transaction. Premiums paid for purchasing index put options which expire are treated as realized losses. When a Fund enters into a closing sale transaction, the difference between the premium paid and the proceeds of the closing sale transaction is treated as a realized gain or loss. The risk associated with purchasing index put options is limited to the premium paid. Option contracts outstanding at the end of the period, if any, are listed in each applicable Fund’s Portfolio of Investments.
f. Due from Brokers. Transactions and positions in certain futures contracts are maintained and cleared by registered U.S. broker/dealers pursuant to customer agreements between a Fund and the various broker/dealers. The due from brokers balance in the Statements of Assets and Liabilities for Global Green Bond Fund represents cash pledged as collateral for futures contracts (including variation margin, as applicable). In certain circumstances the Fund’s use of cash held at brokers is restricted by regulation or broker mandated limits.
| 76
Notes to Financial Statements (continued)
December 31, 2021
g. Federal and Foreign Income Taxes. The Trusts treat each Fund as a separate entity for federal income tax purposes. Each Fund intends to meet the requirements of the Internal Revenue Code of 1986, as amended, applicable to regulated investment companies, and to distribute to its shareholders substantially all of its net investment income and any net realized capital gains at least annually. Management has performed an analysis of each Fund’s tax positions for the open tax years as of December 31, 2021 and has concluded that no provisions for income tax are required. The Funds’ federal tax returns for the prior three fiscal years, where applicable, remain subject to examination by the Internal Revenue Service. Management is not aware of any events that are reasonably possible to occur in the next twelve months that would result in the amounts of any unrecognized tax benefits significantly increasing or decreasing for the Funds. However, management’s conclusions regarding tax positions taken may be subject to review and adjustment at a later date based on factors including, but not limited to, new tax laws and accounting regulations and interpretations thereof.
A Fund may be subject to foreign withholding taxes on investment income and taxes on capital gains on investments that are accrued and paid based upon the Fund’s understanding of the tax rules and regulations that exist in the countries in which the Fund invests. Foreign withholding taxes on dividend and interest income are reflected on the Statements of Operations as a reduction of investment income, net of amounts that have been or are expected to be reclaimed and paid. Dividends and interest receivable on the Statements of Assets and Liabilities are net of foreign withholding taxes. Foreign withholding taxes where reclaims have been or are expected to be filed and paid are reflected on the Statements of Assets and Liabilities as tax reclaims receivable. Capital gains taxes paid are included in net realized gain (loss) on investments in the Statements of Operations. Accrued but unpaid capital gains taxes are reflected as foreign taxes payable on the Statements of Assets and Liabilities, if applicable, and reduce unrealized gains on investments. In the event that realized gains on investments are subsequently offset by realized losses, taxes paid on realized gains may be returned to a Fund. Such amounts, if applicable, are reflected as foreign tax rebates receivable on the Statements of Assets and Liabilities and are recorded as a realized gain when received.
Certain Funds have filed tax reclaims for previously withheld taxes on dividends earned in certain European Union countries (EU reclaims) and may continue to make such filings when it is determined to be in the best interest of the Funds and their shareholders. These filings are subject to various administrative proceedings by the local jurisdictions’ tax authorities within the European Union, as well as a number of related judicial proceedings. EU reclaims are recognized by a Fund when deemed more likely than not to be collected, and are reflected as a reduction of foreign taxes withheld in the Statements of Operations. Any related receivable is reflected as tax reclaims receivable in the Statements of Assets and Liabilities. Under certain circumstances, EU reclaims may be subject to closing agreements with the Internal Revenue Service (IRS), which may materially reduce the reclaim amounts realized by the Funds. Fees and expenses associated with closing agreements will be reflected in the Statements of Operations when it is determined that a closing agreement with the IRS is required.
h. Dividends and Distributions to Shareholders. Dividends and distributions are recorded on the ex-dividend date. The timing and characterization of certain income and capital gain distributions are determined in accordance with federal tax regulations, which may differ from accounting principles generally accepted in the United States of America. Permanent differences are primarily due to differing treatments for book and tax purposes of items such as premium amortization, futures contract mark-to-market, non-deductible expenses, capital gain distribution received, return of capital distributions received, distribution re-designations and foreign currency gains and losses. Permanent book and tax basis differences relating to shareholder distributions, net investment income and net realized gains will result in reclassifications to capital accounts reported on the Statements of Assets and Liabilities. Temporary differences between book and tax distributable earnings are primarily due to wash sales, deferred Trustees’ fees, premium amortization, foreign currency gains and losses, future contract mark-to-market, capital gain distribution received and return of capital distributions received. Amounts of income and capital gain available to be distributed on a tax basis are determined annually, and at other times during the Funds’ fiscal year as may be necessary to avoid knowingly declaring and paying a return of capital distribution. Distributions from net investment income and short-term capital gains are considered to be distributed from ordinary income for tax purposes.
77 |
Notes to Financial Statements (continued)
December 31, 2021
The tax characterization of distributions is determined on an annual basis. The tax character of distributions paid to shareholders during the years ended December 31, 2021 and 2020 was as follows:
| | | | | | | | | | | | | | | | | | | | | | | | |
| | | 2021 Distributions | | | 2020 Distributions | |
Fund | | Ordinary
Income | | | Long-Term
Capital
Gains | | | Total | | | Ordinary
Income | | | Long-Term
Capital
Gains | | | Total | |
Gateway Fund | | $ | 49,184,281 | | | $ | — | | | $ | 49,184,281 | | | $ | 76,713,219 | | | $ | — | | | $ | 76,713,219 | |
Gateway Equity Call Premium Fund | | | 544,913 | | | | — | | | | 544,913 | | | | 497,268 | | | | — | | | | 497,268 | |
Global Green Bond Fund | | | 901,804 | | | | 537,858 | | | | 1,439,662 | | | | 703,410 | | | | 670,133 | | | | 1,373,543 | |
Global Sustainable Equity Fund | | | 14,908,515 | | | | 109,185,274 | | | | 124,093,789 | | | | 262,732 | | | | 2,415,562 | | | | 2,678,294 | |
International Sustainable Equity Fund | | | 409,826 | | | | 570,795 | | | | 980,621 | | | | 508,537 | | | | 1,050,112 | | | | 1,558,649 | |
U.S. Sustainable Equity Fund | | | 272,938 | | | | — | | | | 272,938 | | | | — | | | | — | | | | — | |
Distributions paid to shareholders from net investment income and net realized capital gains, based on accounting principles generally accepted in the United States of America, are consolidated and reported on the Statements of Changes in Net Assets as Distributions to Shareholders. Distributions paid to shareholders from net investment income and net realized capital gains expressed in per-share amounts, based on accounting principles generally accepted in the United States of America, are separately stated and reported within the Financial Highlights.
As of December 31, 2021, the components of distributable earnings on a tax basis were as follows:
| | | | | | | | | | | | |
| | | Gateway
Fund | | | Gateway
Equity Call
Premium Fund | | | Global
Green
Bond Fund | |
Undistributed ordinary income | | $ | 808,164 | | | $ | 10,661 | | | $ | 137,521 | |
Undistributed long-term capital gains | | | — | | | | — | | | | 453,642 | |
| | | | | | | | | | | | |
Total undistributed earnings | | | 808,164 | | | | 10,661 | | | | 591,163 | |
| | | | | | | | | | | | |
Capital loss carryforward: | |
Short-term: | |
No expiration date | | | (1,184,785,617 | ) | | | (8,151,305 | ) | | | — | |
Long-term: | |
No expiration date | | | (573,854,387 | ) | | | (7,210,074 | ) | | | — | |
| | | | | | | | | | | | |
Total capital loss carryforward | | | (1,758,640,004 | ) | | | (15,361,379 | ) | | | — | |
| | | | | | | | | | | | |
Unrealized appreciation (depreciation) | | | 5,289,561,985 | | | | 50,356,798 | | | | (869,802 | ) |
| | | | | | | | | | | | |
Total accumulated earnings (losses) | | $ | 3,531,730,145 | | | $ | 35,006,080 | | | $ | (278,639 | ) |
| | | | | | | | | | | | |
| | | | | | | | | | | | |
| | | Global
Sustainable
Equity Fund | | | International
Sustainable
Equity Fund | | | U.S.
Sustainable
Equity Fund | |
Undistributed ordinary income | | $ | 18,048,604 | | | $ | — | | | $ | 154,457 | |
Undistributed long-term capital gains | | | 23,761,658 | | | | — | | | | 13,987 | |
| | | | | | | | | | | | |
Total undistributed earnings | | | 41,810,262 | | | | — | | | | 168,444 | |
| | | | | | | | | | | | |
Late-year ordinary and post-October capital loss deferrals* | | | — | | | | (189,581 | ) | | | — | |
| | | | | | | | | | | | |
Unrealized appreciation | | | 161,751,800 | | | | 5,622,142 | | | | 1,129,644 | |
| | | | | | | | | | | | |
Total accumulated earnings | | $ | 203,562,062 | | | $ | 5,432,561 | | | $ | 1,298,088 | |
| | | | | | | | | | | | |
| * | Under current tax law, capital losses, foreign currency losses, and losses on passive foreign investment companies and contingent payment debt instruments after October 31 or December 31, as applicable, may be deferred and treated as occurring on the first day of the following taxable year. International Sustainable Equity Fund is deferring capital and foreign currency losses. |
| 78
Notes to Financial Statements (continued)
December 31, 2021
As of December 31, 2021, the tax cost of investments (including derivatives, if applicable) and unrealized appreciation (depreciation) on a federal tax basis were as follows:
| | | | | | | | | | | | | | | | | | | | | | | | |
| | | Gateway
Fund | | | Gateway
Equity Call
Premium Fund | | | Global
Green
Bond Fund | | | Global
Sustainable
Equity Fund | | | International
Sustainable
Equity Fund | | | U.S.
Sustainable
Equity Fund | |
Federal tax cost | | $ | 3,035,711,922 | | | $ | 56,060,028 | | | $ | 45,935,323 | | | $ | 931,638,259 | | | $ | 23,414,371 | | | $ | 3,962,267 | |
| | | | | | | | | | | | | | | | | | | | | | | | |
Gross tax appreciation | | $ | 5,308,496,463 | | | $ | 50,559,616 | | | $ | 819,146 | | | $ | 188,575,557 | | | $ | 6,623,867 | | | $ | 1,181,466 | |
Gross tax depreciation | | | (18,934,619 | ) | | | (202,828 | ) | | | (1,685,712 | ) | | | (26,766,457 | ) | | | (1,003,082 | ) | | | (51,822 | ) |
| | | | | | | | | | | | | | | | | | | | | | | | |
Net tax appreciation (depreciation) | | $ | 5,289,561,844 | | | $ | 50,356,788 | | | $ | (866,566 | ) | | $ | 161,809,100 | | | $ | 5,620,785 | | | $ | 1,129,644 | |
| | | | | | | | | | | | | | | | | | | | | | | | |
The difference between these amounts and those reported in the components of distributable earnings are primarily attributable to foreign currency mark-to-market.
i. Repurchase Agreements. Each Fund may enter into repurchase agreements, under the terms of a Master Repurchase Agreement, under which each Fund acquires securities as collateral and agrees to resell the securities at an agreed upon time and at an agreed upon price. It is each Fund’s policy that the market value of the collateral for repurchase agreements be at least equal to 102% of the repurchase price, including interest. Certain repurchase agreements are tri-party arrangements whereby the collateral is held in a segregated account for the benefit of the Fund and on behalf of the counterparty. Repurchase agreements could involve certain risks in the event of default or insolvency of the counterparty, including possible delays or restrictions upon a Fund’s ability to dispose of the underlying securities. As of December 31, 2021, each Fund, as applicable, had investments in repurchase agreements for which the value of the related collateral exceeded the value of the repurchase agreement. The gross value of repurchase agreements is included in the Statements of Assets and Liabilities for financial reporting purposes.
j. Indemnifications. Under the Trusts’ organizational documents, their officers and Trustees are indemnified against certain liabilities arising out of the performance of their duties to the Funds. Additionally, in the normal course of business, the Funds enter into contracts with service providers that contain general indemnification clauses. The Funds’ maximum exposure under these arrangements is unknown as this would involve future claims that may be made against the Funds that have not yet occurred. However, based on experience, the Funds expect the risk of loss to be remote.
3. Fair Value Measurements. In accordance with accounting standards related to fair value measurements and disclosures, the Funds have categorized the inputs utilized in determining the value of each Fund’s assets or liabilities. These inputs are summarized in the three broad levels listed below:
| | • | | Level 1 – quoted prices in active markets for identical assets or liabilities; |
| | • | | Level 2 – prices determined using other significant inputs that are observable either directly, or indirectly through corroboration with observable market data (which could include quoted prices for similar assets or liabilities, interest rates, credit risk, etc.); and |
| | • | | Level 3 – prices determined using significant unobservable inputs when quoted prices or observable inputs are unavailable such as when there is little or no market activity for an asset or liability (unobservable inputs reflect each Fund’s own assumptions in determining the fair value of assets or liabilities and would be based on the best information available). |
The inputs or methodology used for valuing securities are not necessarily an indication of the risk associated with investing in those securities.
The following is a summary of the inputs used to value the Funds’ investments as of December 31, 2021, at value:
Gateway Fund
Asset Valuation Inputs
| | | | | | | | | | | | | | | | |
Description | | Level 1 | | | Level 2 | | | Level 3 | | | Total | |
Common Stocks(a) | | $ | 8,172,069,372 | | | $ | — | | | $ | — | | | $ | 8,172,069,372 | |
Purchased Options(a) | | | 46,998,365 | | | | — | | | | — | | | | 46,998,365 | |
Short-Term Investments | | | — | | | | 153,204,394 | | | | — | | | | 153,204,394 | |
| | | | | | | | | | | | | | | | |
Total | | $ | 8,219,067,737 | | | $ | 153,204,394 | | | $ | — | | | $ | 8,372,272,131 | |
| | | | | | | | | | | | | | | | |
Liability Valuation Inputs
| | | | | | | | | | | | | | | | |
Description | | Level 1 | | | Level 2 | | | Level 3 | | | Total | |
Written Options(a) | | $ | (196,119,210 | ) | | $ | — | | | $ | — | | | $ | (196,119,210 | ) |
| | | | | | | | | | | | | | | | |
| (a) | Details of the major categories of the Fund’s investments are reflected within the Portfolio of Investments. |
79 |
Notes to Financial Statements (continued)
December 31, 2021
Gateway Equity Call Premium Fund
Asset Valuation Inputs
| | | | | | | | | | | | | | | | |
Description | | Level 1 | | | Level 2 | | | Level 3 | | | Total | |
Common Stocks(a) | | $ | 103,446,211 | | | $ | — | | | $ | — | | | $ | 103,446,211 | |
Short-Term Investments | | | — | | | | 2,970,605 | | | | — | | | | 2,970,605 | |
| | | | | | | | | | | | | | | | |
Total | | $ | 103,446,211 | | | $ | 2,970,605 | | | $ | — | | | $ | 106,416,816 | |
| | | | | | | | | | | | | | | | |
Liability Valuation Inputs
| | | | | | | | | | | | | | | | |
Description | | Level 1 | | | Level 2 | | | Level 3 | | | Total | |
Written Options(a) | | $ | (2,483,580 | ) | | $ | — | | | $ | — | | | $ | (2,483,580 | ) |
| | | | | | | | | | | | | | | | |
| (a) | Details of the major categories of the Fund’s investments are reflected within the Portfolio of Investments. |
Global Green Bond Fund
Asset Valuation Inputs
| | | | | | | | | | | | | | | | |
Description | | Level 1 | | | Level 2 | | | Level 3 | | | Total | |
Bonds and Notes(a) | | $ | — | | | $ | 41,895,210 | | | $ | — | | | $ | 41,895,210 | |
Short-Term Investments | | | — | | | | 3,173,547 | | | | — | | | | 3,173,547 | |
Futures Contracts (unrealized appreciation) | | | 8,002 | | | | — | | | | — | | | | 8,002 | |
| | | | | | | | | | | | | | | | |
Total | | $ | 8,002 | | | $ | 45,068,757 | | | $ | — | | | $ | 45,076,759 | |
| | | | | | | | | | | | | | | | |
Liability Valuation Inputs
| | | | | | | | | | | | | | | | |
Description | | Level 1 | | | Level 2 | | | Level 3 | | | Total | |
Futures Contracts (unrealized depreciation) | | $ | (482,232 | ) | | $ | — | | | $ | — | | | $ | (482,232 | ) |
| | | | | | | | | | | | | | | | |
| (a) | Details of the major categories of the Fund’s investments are reflected within the Portfolio of Investments. |
Global Sustainable Equity Fund
Asset Valuation Inputs
| | | | | | | | | | | | | | | | |
Description | | Level 1 | | | Level 2 | | | Level 3 | | | Total | |
Common Stocks | | | | | | | | | | | | | | | | |
Belgium | | $ | — | | | $ | 19,785,254 | | | $ | — | | | $ | 19,785,254 | |
Denmark | | | — | | | | 92,116,319 | | | | — | | | | 92,116,319 | |
France | | | — | | | | 34,052,989 | | | | — | | | | 34,052,989 | |
Germany | | | — | | | | 57,178,892 | | | | — | | | | 57,178,892 | |
Hong Kong | | | — | | | | 22,221,922 | | | | — | | | | 22,221,922 | |
Japan | | | — | | | | 52,875,238 | | | | — | | | | 52,875,238 | |
Netherlands | | | — | | | | 45,569,591 | | | | — | | | | 45,569,591 | |
Spain | | | — | | | | 29,095,900 | | | | — | | | | 29,095,900 | |
Switzerland | | | — | | | | 15,077,527 | | | | — | | | | 15,077,527 | |
United Kingdom | | | — | | | | 47,758,370 | | | | — | | | | 47,758,370 | |
All Other Common Stocks(a) | | | 654,255,356 | | | | — | | | | — | | | | 654,255,356 | |
| | | | | | | | | | | | | | | | |
Total Common Stocks | | | 654,255,356 | | | | 415,732,002 | | | | — | | | | 1,069,987,358 | |
| | | | | | | | | | | | | | | | |
Short-Term Investments | | | — | | | | 23,460,001 | | | | — | | | | 23,460,001 | |
| | | | | | | | | | | | | | | | |
Total | | $ | 654,255,356 | | | $ | 439,192,003 | | | $ | — | | | $ | 1,093,447,359 | |
| | | | | | | | | | | | | | | | |
| (a) | Details of the major categories of the Fund’s investments are reflected within the Portfolio of Investments. |
| 80
Notes to Financial Statements (continued)
December 31, 2021
International Sustainable Equity Fund
Asset Valuation Inputs
| | | | | | | | | | | | | | | | |
Description | | Level 1 | | | Level 2 | | | Level 3 | | | Total | |
Common Stocks | | | | | | | | | | | | | | | | |
Australia | | $ | — | | | $ | 284,667 | | | $ | — | | | $ | 284,667 | |
Belgium | | | — | | | | 1,500,305 | | | | — | | | | 1,500,305 | |
Denmark | | | — | | | | 3,311,079 | | | | — | | | | 3,311,079 | |
France | | | 423,535 | | | | 4,056,527 | | | | — | | | | 4,480,062 | |
Germany | | | — | | | | 1,892,864 | | | | — | | | | 1,892,864 | |
Hong Kong | | | — | | | | 1,015,289 | | | | — | | | | 1,015,289 | |
Ireland | | | — | | | | 1,453,708 | | | | — | | | | 1,453,708 | |
Japan | | | — | | | | 3,540,792 | | | | — | | | | 3,540,792 | |
Netherlands | | | — | | | | 2,661,139 | | | | — | | | | 2,661,139 | |
Norway | | | — | | | | 134,759 | | | | — | | | | 134,759 | |
Spain | | | — | | | | 816,378 | | | | — | | | | 816,378 | |
Switzerland | | | — | | | | 857,521 | | | | — | | | | 857,521 | |
United Kingdom | | | — | | | | 5,160,152 | | | | — | | | | 5,160,152 | |
All Other Common Stocks(a) | | | 1,666,734 | | | | — | | | | — | | | | 1,666,734 | |
| | | | | | | | | | | | | | | | |
Total Common Stocks | | | 2,090,269 | | | | 26,685,180 | | | | — | | | | 28,775,449 | |
| | | | | | | | | | | | | | | | |
Short-Term Investments | | | — | | | | 259,707 | | | | — | | | | 259,707 | |
| | | | | | | | | | | | | | | | |
Total | | $ | 2,090,269 | | | $ | 26,944,887 | | | $ | — | | | $ | 29,035,156 | |
| | | | | | | | | | | | | | | | |
| (a) | Details of the major categories of the Fund’s investments are reflected within the Portfolio of Investments. |
U.S. Sustainable Equity Fund
Asset Valuation Inputs
| | | | | | | | | | | | | | | | |
Description | | Level 1 | | | Level 2 | | | Level 3 | | | Total | |
Common Stocks(a) | | $ | 5,082,037 | | | $ | — | | | $ | — | | | $ | 5,082,037 | |
Short-Term Investments | | | — | | | | 9,874 | | | | — | | | | 9,874 | |
| | | | | | | | | | | | | | | | |
Total | | $ | 5,082,037 | | | $ | 9,874 | | | $ | — | | | $ | 5,091,911 | |
| | | | | | | | | | | | | | | | |
| (a) | Details of the major categories of the Fund’s investments are reflected within the Portfolio of Investments. |
4. Derivatives. Derivative instruments are defined as financial instruments whose value and performance are based on the value and performance of an underlying asset, reference rate or index. Derivative instruments the Funds used during the period include written index call options, purchased index put options and futures contracts.
Through the use of index options, Gateway Fund and Gateway Equity Call Premium Fund intends that its risk management strategy will reduce the volatility inherent in equity investments while also allowing for more participation in equity returns than hybrid investments. Each Fund seeks to provide an efficient trade-off between risk and reward, where risk is characterized by volatility or fluctuations in value over time. To meet this objective, the Funds invest in a broadly diversified portfolio of common stocks, while also writing index call options and, for Gateway Fund, purchasing index put options. Writing index call options can reduce a Fund’s volatility, provide a steady cash flow and be an important source of a Fund’s return, although it also may reduce a Fund’s ability to profit from increases in the value of its equity portfolio. Buying index put options, can protect a Fund from a significant market decline that may occur over a short period of time. The value of an index put option generally increases as the prices of stocks constituting the index decrease and decreases as those stocks increase in price. For Gateway Fund, the combination of the diversified stock portfolio, the steady cash flow from writing of index call options and the downside protection from purchased index put options is intended to provide the Fund with the majority of the returns associated with equity market investments while exposing investors to less risk than other equity investments. For Gateway Equity Call Premium Fund, the combination of the diversified stock portfolio and the steady cash flow from writing of index call options is intended to moderate the volatility of returns relative to an all-equity portfolio. During the year ended December 31, 2021, Gateway Fund used written index call options and purchased index put options and Gateway Equity Call Premium Fund used written index call options in accordance with these strategies.
81 |
Notes to Financial Statements (continued)
December 31, 2021
Global Green Bond Fund seeks to provide total return, through a combination of capital appreciation and current income, by investing in green bonds. The Fund pursues its objective by primarily investing in fixed-income securities. In connection with its principal investment strategies, the Fund may also invest in various types of futures contracts for investment purposes. During the year ended December 31, 2021, Global Green Bond Fund used U.S. and foreign government bond futures to gain yield curve exposure.
Global Green Bond Fund is subject to the risk that changes in interest rates will affect the value of the Fund’s investments in fixed income securities. The Fund will be subject to increased interest rate risk to the extent that it invests in fixed-income securities with longer maturities or durations, as compared to investing in fixed-income securities with shorter maturities or durations. The Fund may use futures contracts to hedge against changes in interest rates and to manage duration without having to buy or sell portfolio securities. During the year ended December 31, 2021, Global Green Bond Fund used U.S. and foreign government bond futures to manage duration.
Global Green Bond Fund is also subject to the risk that changes in foreign currency exchange rates will have an unfavorable effect on the value of Fund assets denominated in foreign currencies. The Fund may use futures contracts for hedging purposes to protect the value of the Fund’s holdings of foreign securities. During the year ended December 31, 2021, Global Green Bond Fund used currency futures for hedging purposes.
The following is a summary of derivative instruments for Gateway Fund as of December 31, 2021, as reflected within the Statements of Assets and Liabilities:
| | | | |
Assets | | Investments
at value1 | |
Exchange-traded asset derivatives | |
Equity contracts | | $ | 46,998,365 | |
| |
Liabilities | | Options written
at value | |
Exchange-traded liability derivatives | |
Equity contracts | | $ | (196,119,210 | ) |
| 1 | Represents purchased options, at value. |
Transactions in derivative instruments for Gateway Fund during the year ended December 31, 2021, as reflected within the Statements of Operations were as follows:
| | | | | | | | |
Net Realized Gain (Loss) on: | | Investments2 | | | Options written | |
Equity contracts | | $ | (461,819,950 | ) | | $ | (573,866,563 | ) |
| | |
Net Change in Unrealized
Appreciation (Depreciation) on: | | Investments2 | | | Options written | |
Equity contracts | | $ | 4,084,260 | | | $ | 42,892,077 | |
| 2 | Represents realized loss and change in unrealized appreciation (depreciation), respectively, for purchased options during the period. |
The following is a summary of derivative instruments for Gateway Equity Call Premium Fund as of December 31, 2021, as reflected within the Statements of Assets and Liabilities:
| | | | |
Liabilities | | Options written
at value | |
Exchange-traded liability derivatives | |
Equity contracts | | $ | (2,483,580 | ) |
Transactions in derivative instruments for Gateway Equity Call Premium Fund during the year ended December 31, 2021, as reflected within the Statements of Operations were as follows:
| | | | |
Net Realized Gain (Loss) on: | | Options written | |
Equity contracts | | $ | (6,218,472 | ) |
| |
Net Change in Unrealized
Appreciation (Depreciation) on: | | Options written | |
Equity contracts | | $ | 308,851 | |
| 82
Notes to Financial Statements (continued)
December 31, 2021
The following is a summary of derivative instruments for Global Green Bond Fund as of December 31, 2021, as reflected within the Statements of Assets and Liabilities:
| | | | |
Assets | | Unrealized
appreciation on
futures contracts | |
Exchange-traded asset derivatives | |
Interest rate contracts | | $ | 8,002 | |
| |
Liabilities | | Unrealized
depreciation on
futures contracts | |
Exchange-traded liability derivatives | |
Interest rate contracts | | $ | (133,838 | ) |
Foreign exchange contracts | | | (348,394 | ) |
| | | | |
Total exchange-traded liability derivatives | | $ | (482,232 | ) |
| | | | |
Transactions in derivative instruments for Global Green Bond Fund during the year ended December 31, 2021, as reflected within the Statements of Operations were as follows:
| | | | |
Net Realized Gain (Loss) on: | | Futures contracts | |
Interest rate contracts | | $ | (119,015 | ) |
Foreign exchange contracts | | | 2,009,979 | |
| | | | |
Total | | $ | 1,890,964 | |
| | | | |
| |
Net Change in Unrealized Appreciation (Depreciation) on: | | Futures contracts | |
Interest rate contracts | | $ | (142,394 | ) |
Foreign exchange contracts | | | 277,325 | |
| | | | |
Total | | $ | 134,931 | |
| | | | |
As the Funds value their derivatives at fair value and recognize changes in fair value through the Statements of Operations, they do not qualify for hedge accounting under authoritative guidance for derivative instruments. The Funds’ investments in derivatives may represent an economic hedge; however, they are considered to be non-hedge transactions for the purpose of these disclosures.
The volume of option contract activity as a percentage of investments in common stocks, for Gateway Fund based on month-end notional amounts outstanding during the period, at absolute value, was as follows for the year ended December 31, 2021:
| | | | | | | | |
Gateway Fund | | Call Options
Written* | | | Put Options
Purchased* | |
Average Notional Amount Outstanding | | | 99.02 | % | | | 97.53 | % |
Highest Notional Amount Outstanding | | | 99.19 | % | | | 99.19 | % |
Lowest Notional Amount Outstanding | | | 98.87 | % | | | 96.40 | % |
Notional Amount Outstanding as of December 31, 2021 | | | 99.12 | % | | | 99.12 | % |
The volume of option contract activity as a percentage of investments in common stocks, for Gateway Equity Call Premium Fund, based on month-end notional amounts outstanding during the period, at absolute value, was as follows for the year ended December 31, 2021:
| | | | |
Gateway Equity Call Premium Fund | | Call Options Written* | |
Average Notional Amount Outstanding | | | 98.83 | % |
Highest Notional Amount Outstanding | | | 99.17 | % |
Lowest Notional Amount Outstanding | | | 98.40 | % |
Notional Amount Outstanding as of December 31, 2021 | | | 99.06 | % |
| * | Notional amounts outstanding are determined by multiplying option contracts by the contract multiplier by the price of the option’s underlying index, the S&P 500® Index. |
83 |
Notes to Financial Statements (continued)
December 31, 2021
The volume of futures contract activity as a percentage of net assets for Global Green Bond Fund, based on month-end notional amounts outstanding during the period, at absolute value, was as follows for the year ended December 31, 2021:
| | | | |
Global Green Bond Fund | | Futures | |
Average Notional Amount Outstanding | | | 84.67 | % |
Highest Notional Amount Outstanding | | | 90.83 | % |
Lowest Notional Amount Outstanding | | | 79.87 | % |
Notional Amount Outstanding as of December 31, 2021 | | | 90.83 | % |
Notional amounts outstanding at the end of the prior period are included in the average notional amount outstanding.
Unrealized gain and/or loss on open futures is recorded in the Statements of Assets and Liabilities. The aggregate notional values of futures contracts are not recorded in the Statements of Assets and Liabilities, and therefore are not included in the Funds’ net assets.
Counterparty risk is managed based on policies and procedures established by the Fund’s adviser. Such policies and procedures may include, but are not limited to, minimum counterparty credit rating requirements, monitoring of counterparty credit default swap spreads and posting of collateral. With exchange-traded derivatives, there is minimal counterparty credit risk to the Fund because the exchange’s clearing house, as counterparty to these instruments, stands between the buyer and the seller of the contract. Credit risk still exists in exchange-traded derivatives with respect to initial and variation margin that is held in a broker’s customer accounts. While brokers typically are required to segregate customer margin for exchange-traded derivatives from their own assets, in the event that a broker becomes insolvent or goes into bankruptcy and at that time there is a shortfall in the aggregate amount of margin held by the broker for all its customers, U.S. bankruptcy laws will typically allocate that shortfall on a pro rata basis across all of the broker’s customers, potentially resulting in losses to the Fund. The following table shows the maximum amount of loss due to credit risk that, based on the gross fair value of the financial instrument, the Fund would incur if parties to the relevant financial instruments failed completely to perform according to the terms of the contracts and the collateral or other security, if any, for the amount due proved to be of no value to the Fund, as of December 31, 2021:
| | | | | | | | |
Fund | | Maximum Amount
of Loss - Gross | | | Maximum Amount
of Loss - Net | |
Global Green Bond Fund | | $ | 1,410,378 | | | $ | 1,410,378 | |
5. Purchases and Sales of Securities. For the year ended December 31, 2021, purchases and sales of securities (excluding short-term investments, option contracts and including paydowns) were as follows:
| | | | | | | | |
Fund | | Purchases | | | Sales | |
Gateway Fund | | $ | 823,695,993 | | | $ | 1,476,587,250 | |
Gateway Equity Call Premium Fund | | | 27,648,578 | | | | 3,846,923 | |
Global Green Bond Fund | | | 25,412,093 | | | | 14,372,915 | |
Global Sustainable Equity Fund | | | 470,797,470 | | | | 398,055,920 | |
International Sustainable Equity Fund | | | 13,675,597 | | | | 2,043,549 | |
U.S. Sustainable Equity Fund | | | 491,893 | | | | 1,814,524 | |
6. Management Fees and Other Transactions with Affiliates.
a. Management Fees. Gateway Investment Advisers, LLC (“Gateway Advisers”) serves as investment adviser to Gateway Fund and Gateway Equity Call Premium Fund. Gateway Advisers is a subsidiary of Natixis Investment Managers, LLC, which is part of Natixis Investment Managers, an international asset management group based in Paris, France. Under the terms of the management agreements, each Fund pays a management fee at the following annual rates, calculated daily and payable monthly, based on each Fund’s average daily net assets:
| | | | | | | | | | | | |
| | | Percentage of Average Daily Net Assets | |
Fund | | First $5 billion | | | Next $5 billion | | | Over $10 billion | |
Gateway Fund | | | 0.60 | % | | | 0.55 | % | | | 0.53 | % |
Gateway Equity Call Premium Fund | | | 0.58 | % | | | 0.58 | % | | | 0.58 | % |
| 84
Notes to Financial Statements (continued)
December 31, 2021
Prior to July 1, 2021, Gateway Fund and Gateway Equity Call Premium Fund paid a management fee at the following annual rates, calculated daily and payable monthly, based on each Fund’s average daily net assets:
| | | | | | | | | | | | |
| | | Percentage of Average Daily Net Assets | |
Fund | | First $5 billion | | | Next $5 billion | | | Over $10 billion | |
Gateway Fund | | | 0.65 | % | | | 0.60 | % | | | 0.58 | % |
Gateway Equity Call Premium Fund | | | 0.65 | % | | | 0.65 | % | | | 0.65 | % |
Mirova US LLC (“Mirova US”) serves as investment adviser to Global Green Bond Fund, Global Sustainable Equity Fund, International Sustainable Equity Fund and U.S. Sustainable Equity Fund. Mirova US is a wholly-owned subsidiary of Mirova, which is in turn a subsidiary of Natixis Investment Managers. Under the terms of the management agreements, each Fund pays a management fee at the following annual rates, calculated daily and payable monthly, based on each Fund’s average daily net assets:
| | | | |
Fund | | Percentage of
Average Daily
Net Assets | |
Global Green Bond Fund | | | 0.50 | % |
Global Sustainable Equity Fund | | | 0.80 | % |
International Sustainable Equity Fund | | | 0.80 | % |
U.S. Sustainable Equity Fund | | | 0.65 | % |
Prior to July 1, 2021, Global Green Bond Fund paid a management fee at the annual rate of 0.55% of the Fund’s average daily net assets, calculated daily and payable monthly.
Gateway Advisers and Mirova US have given binding undertakings to the Funds to waive management fees and/or reimburse certain expenses to limit the Funds’ operating expenses, exclusive of acquired fund fees and expenses, brokerage expenses, interest expense, substitute dividend expenses on securities sold short, taxes, organizational and extraordinary expenses such as litigation and indemnification expenses. These undertakings are in effect until April 30, 2022, except for Gateway Equity Call Premium Fund and Global Green Bond Fund, which are in effect until April 30, 2023, may be terminated before then only with the consent of the Funds’ Board of Trustees, and are reevaluated on an annual basis. Management fees payable, as reflected on the Statements of Assets and Liabilities, is net of waivers and/or expense reimbursements, if any, pursuant to these undertakings. Waivers/reimbursements that exceed management fees payable are reflected on the Statements of Assets and Liabilities as receivable from investment adviser.
For the year ended December 31, 2021, the expense limits as a percentage of average daily net assets under the expense limitation agreements were as follows:
| | | | | | | | | | | | | | | | |
| | | Expense Limit as a Percentage of
Average Daily Net Assets | |
Fund | | Class A | | | Class C | | | Class N | | | Class Y | |
Gateway Fund | | | 0.94 | % | | | 1.70 | % | | | 0.65 | % | | | 0.70 | % |
Gateway Equity Call Premium Fund | | | 0.93 | % | | | 1.68 | % | | | 0.63 | % | | | 0.68 | % |
Global Green Bond Fund | | | 0.90 | % | | | — | | | | 0.60 | % | | | 0.65 | % |
Global Sustainable Equity Fund | | | 1.20 | % | | | 1.95 | % | | | 0.90 | % | | | 0.95 | % |
International Sustainable Equity Fund | | | 1.20 | % | | | — | | | | 0.90 | % | | | 0.95 | % |
U.S. Sustainable Equity Fund | | | 1.05 | % | | | 1.80 | % | | | 0.75 | % | | | 0.80 | % |
Prior to July 1, 2021, the expense limits as a percentage of average daily net assets under the expense limitation agreements for Gateway Equity Call Premium Fund and Global Green Bond Fund were as follows:
| | | | | | | | | | | | | | | | |
| | | Expense Limit as a Percentage of
Average Daily Net Assets | |
Fund | | Class A | | | Class C | | | Class N | | | Class Y | |
Gateway Equity Call Premium Fund | | | 1.20 | % | | | 1.95 | % | | | 0.90 | % | | | 0.95 | % |
Global Green Bond Fund | | | 0.95 | % | | | — | | | | 0.65 | % | | | 0.70 | % |
Gateway Advisers and Mirova US shall be permitted to recover expenses borne under the expense limitation agreements (whether through waiver of management fee or otherwise) on a class by class basis in later periods to the extent the annual operating expenses
85 |
Notes to Financial Statements (continued)
December 31, 2021
of a class fall below (1) a class’ expense limitation ratio in place at the time such amounts were waived/reimbursed and (2) a class’ current applicable expense limitation ratio, provided, however, that a class is not obligated to pay such waived/reimbursed fees or expenses more than one year after the end of the fiscal year in which the fees or expenses were waived/reimbursed.
For the year ended December 31, 2021, the management fees and waiver of management fees for each Fund were as follows:
| | | | | | | | | | | | | | | | | | | | | | | | |
Fund | | Gross
Management
Fees | | | Contractual
Waivers of
Management
Fees1 | | | Voluntary
Waivers of
Management
Fees2 | | | Net
Management
Fees | | | Percentage
of Average
Daily Net Assets | |
| | Gross | | | Net | |
Gateway Fund | | $ | 45,948,325 | | | $ | 2,279,676 | | | $ | — | | | $ | 43,668,649 | | | | 0.61 | % | | | 0.58 | % |
Gateway Equity Call Premium Fund | | | 502,249 | | | | 130,647 | | | | 12,840 | | | | 358,762 | | | | 0.61 | % | | | 0.44 | % |
Global Green Bond Fund | | | 225,596 | | | | 187,094 | | | | — | | | | 38,502 | | | | 0.52 | % | | | 0.09 | % |
Global Sustainable Equity Fund | | | 8,404,452 | | | | — | | | | — | | | | 8,404,452 | | | | 0.80 | % | | | 0.80 | % |
International Sustainable Equity Fund | | | 231,931 | | | | 155,291 | | | | — | | | | 76,640 | | | | 0.80 | % | | | 0.26 | % |
U.S. Sustainable Equity Fund | | | 35,955 | | | | 35,955 | | | | — | | | | — | | | | 0.65 | % | | | — | % |
For the year ended December 31, 2021, class-specific expenses have been reimbursed as follows:
| | | | | | | | | | | | | | | | | | | | |
| | | Reimbursement1 | |
Fund | | Class A | | | Class C | | | Class N | | | Class Y | | | Total | |
Gateway Fund | | $ | 103,297 | | | $ | — | | | $ | — | | | $ | — | | | $ | 103,297 | |
Global Sustainable Equity Fund | | | 14,967 | | | | 5,809 | | | | — | | | | 298,555 | | | | 319,331 | |
| 1 | Waiver/expense reimbursements are subject to possible recovery until December 31, 2022. |
| 2 | Voluntary management fee waivers are not subject to recovery under the expense limitation agreement described above. |
In addition, Mirova US reimbursed non-class-specific expenses of U.S. Sustainable Equity Fund in the amount of $103,989 for the year ended December 31, 2021, which are subject to possible recovery until December 31, 2022.
For the year ended December 31, 2021, expense reimbursements related to the prior fiscal year were recovered as follows:
| | | | |
Fund | | Recovered
Expenses | |
Global Sustainable Equity Fund | | $ | 11,260 | |
b. Service and Distribution Fees. Natixis Distribution, LLC (“Natixis Distribution”), which is a wholly-owned subsidiary of Natixis Investment Managers, LLC, has entered into a distribution agreement with the Trusts. Pursuant to this agreement, Natixis Distribution serves as principal underwriter of the Funds of the Trusts.
Pursuant to Rule 12b-1 under the 1940 Act, the Trusts have adopted a Service Plan relating to each Fund’s Class A shares (the “Class A Plans”) and a Distribution and Service Plan relating to each Fund’s Class C shares (the “Class C Plans”).
Under the Class A Plans, each Fund pays Natixis Distribution a monthly service fee at an annual rate not to exceed 0.25% of the average daily net assets attributable to the Funds’ Class A shares, as reimbursement for expenses incurred by Natixis Distribution in providing personal services to investors in Class A shares and/or the maintenance of shareholder accounts.
Under the Class C Plans, each Fund pays Natixis Distribution a monthly service fee at an annual rate not to exceed 0.25% of the average daily net assets attributable to the Funds’ Class C shares, as compensation for services provided by Natixis Distribution in providing personal services to investors in Class C shares and/or the maintenance of shareholder accounts.
Also under the Class C Plans, each Fund pays Natixis Distribution a monthly distribution fee at an annual rate of 0.75% of the average daily net assets attributable to the Funds’ Class C shares, as compensation for services provided by Natixis Distribution in connection with the marketing or sale of Class C shares.
| 86
Notes to Financial Statements (continued)
December 31, 2021
For the year ended December 31, 2021, the service and distribution fees for each Fund were as follows:
| | | | | | | | | | | | |
| | | Service Fees | | | Distribution Fees | |
Fund | | Class A | | | Class C | | | Class C | |
Gateway Fund | | $ | 2,552,779 | | | $ | 311,189 | | | $ | 933,567 | |
Gateway Equity Call Premium Fund | | | 4,823 | | | | 1,898 | | | | 5,693 | |
Global Green Bond Fund | | | 16,115 | | | | — | | | | — | |
Global Sustainable Equity Fund | | | 101,135 | | | | 37,557 | | | | 112,670 | |
International Sustainable Equity Fund | | | 560 | | | | — | | | | — | |
U.S. Sustainable Equity Fund | | | 12 | | | | 42 | | | | 125 | |
For the year ended December 31, 2021, Natixis Distribution refunded Gateway Fund $29,640 of prior year Class A service fees paid to Natixis Distribution in excess of amounts subsequently paid to securities dealers or financial intermediaries. Service and distribution fees on the Statements of Operations have been reduced by these amounts.
c. Administrative Fees. Natixis Advisors, LLC (“Natixis Advisors”) provides certain administrative services for the Funds and contracts with State Street Bank and Trust Company (“State Street Bank”) to serve as sub-administrator. Pursuant to an agreement among Natixis Funds Trusts, Loomis Sayles Funds Trusts, Natixis ETF Trusts and Natixis Advisors, each Fund pays Natixis Advisors monthly its pro rata portion of fees equal to an annual rate of 0.0540% of the first $15 billion of the average daily net assets of the Natixis Funds Trusts, Loomis Sayles Funds Trusts and Natixis ETF Trusts, 0.0500% of the next $15 billion, 0.0400% of the next $30 billion, 0.0275% of the next $30 billion and 0.0225% of such assets in excess of $90 billion, subject to an annual aggregate minimum fee for the Natixis Funds Trusts, Loomis Sayles Funds Trusts and Natixis ETF Trusts of $10 million, which is reevaluated on an annual basis.
For the year ended December 31, 2021, the administrative fees for each Fund were as follows:
| | | | |
Fund | | Administrative
Fees | |
Gateway Fund | | $ | 3,226,022 | |
Gateway Equity Call Premium Fund | | | 35,084 | |
Global Green Bond Fund | | | 18,346 | |
Global Sustainable Equity Fund | | | 447,480 | |
International Sustainable Equity Fund | | | 12,350 | |
U.S. Sustainable Equity Fund | | | 2,356 | |
d. Sub-Transfer Agent Fees. Natixis Distribution has entered into agreements, which include servicing agreements, with financial intermediaries that provide recordkeeping, processing, shareholder communications and other services to customers of the intermediaries that hold positions in the Funds and has agreed to compensate the intermediaries for providing those services. Intermediaries transact with the Funds primarily through the use of omnibus accounts on behalf of their customers who hold positions in the Funds. These services would have been provided by the Funds’ transfer agent and other service providers if the shareholders’ accounts were maintained directly at the Funds’ transfer agent. Accordingly, the Funds have agreed to reimburse Natixis Distribution for all or a portion of the servicing fees paid to these intermediaries. The reimbursement amounts (sub-transfer agent fees) paid to Natixis Distribution are subject to a current per-account equivalent fee limit approved by the Funds’ Board of Trustees, which is based on fees for similar services paid to the Funds’ transfer agent and other service providers. Class N shares do not bear such expenses.
For the year ended December 31, 2021, the sub-transfer agent fees (which are reflected in transfer agent fees and expenses in the Statements of Operations) for each Fund were as follows:
| | | | |
Fund | | Sub-Transfer
Agent Fees | |
Gateway Fund | | $ | 3,792,321 | |
Gateway Equity Call Premium Fund | | | 18,839 | |
Global Green Bond Fund | | | 29,514 | |
Global Sustainable Equity Fund | | | 832,556 | |
International Sustainable Equity Fund | | | 662 | |
U.S. Sustainable Equity Fund | | | 18 | |
87 |
Notes to Financial Statements (continued)
December 31, 2021
As of December 31, 2021, the Funds owe Natixis Distribution the following reimbursements for sub-transfer agent fees (which are reflected in the Statements of Assets and Liabilities as payable to distributor):
| | | | |
Fund | | Reimbursements
of Sub-Transfer
Agent Fees | |
Gateway Fund | | $ | 48,323 | |
Gateway Equity Call Premium Fund | | | 264 | |
Global Green Bond Fund | | | 386 | |
Global Sustainable Equity Fund | | | 7,730 | |
International Sustainable Equity Fund | | | 14 | |
U.S. Sustainable Equity Fund | | | 8 | |
Sub-transfer agent fees attributable to Class A, Class C and Class Y are allocated on a pro rata basis to each class based on the relative net assets of each class to the total net assets of those classes.
e. Commissions. Commissions (including CDSCs) on Fund shares retained by Natixis Distribution during the year ended December 31, 2021 was as follows:
| | | | |
Fund | | Commissions | |
Gateway Fund | | $ | 48,857 | |
Gateway Equity Call Premium Fund | | | 412 | |
Global Green Bond Fund | | | 739 | |
Global Sustainable Equity Fund | | | 14,716 | |
International Sustainable Equity Fund | | | 72 | |
f. Trustees Fees and Expenses. The Trusts do not pay any compensation directly to their officers or Trustees who are directors, officers or employees of Natixis Advisors, Natixis Distribution, Natixis Investment Managers, LLC or their affiliates. The Chairperson of the Board of Trustees receives a retainer fee at the annual rate of $369,000. The Chairperson does not receive any meeting attendance fees for Board of Trustees meetings or committee meetings that he attends. Each Independent Trustee (other than the Chairperson) receives, in the aggregate, a retainer fee at the annual rate of $199,000. Each Independent Trustee also receives a meeting attendance fee of $10,000 for each meeting of the Board of Trustees that he or she attends in person and $5,000 for each meeting of the Board of Trustees that he or she attends telephonically. In addition, the chairperson of the Contract Review Committee, the chairperson of the Audit Committee and the chairperson of the Governance Committee each receive an additional retainer fee at the annual rate of $20,000. Each Contract Review Committee member is compensated $6,000 for each Committee meeting that he or she attends in person and $3,000 for each meeting that he or she attends telephonically. Each Audit Committee member is compensated $6,000 for each Committee meeting that he or she attends in person and $3,000 for each meeting that he or she attends telephonically. These fees are allocated among the funds in the Natixis Funds Trusts, Loomis Sayles Funds Trusts and Natixis ETF Trusts based on a formula that takes into account, among other factors, the relative net assets of each fund. Trustees are reimbursed for travel expenses in connection with attendance at meetings.
Effective January 1, 2022, each Independent Trustee (other than the Chairperson) will receive, in the aggregate, a retainer fee at the annual rate of $210,000. All other Trustees fees will remain unchanged.
A deferred compensation plan (the “Plan”) is available to the Trustees on a voluntary basis. Deferred amounts remain in the Funds until distributed in accordance with the provisions of the Plan. The value of a participating Trustee’s deferral account is based on theoretical investments of deferred amounts, on the normal payment dates, in certain funds of the Natixis Funds Trusts, Loomis Sayles Funds Trusts and Natixis ETF Trusts as designated by the participating Trustees. Changes in the value of participants’ deferral accounts are allocated pro rata among the funds in the Natixis Funds Trusts, Loomis Sayles Funds Trusts and Natixis ETF Trusts, and are normally reflected as Trustees’ fees and expenses in the Statements of Operations. The portions of the accrued obligations allocated to the Funds under the Plan are reflected as Deferred Trustees’ fees in the Statements of Assets and Liabilities.
Certain officers and employees of Natixis Advisors and affiliates are also officers and/or Trustees of the Trusts.
| 88
Notes to Financial Statements (continued)
December 31, 2021
g. Affiliated Ownership. As of December 31, 2021, the percentage of each Fund’s net assets owned by Natixis and affiliates is as follows:
| | | | |
Global Green Bond Fund | | Percentage of
Net Assets | |
Natixis Sustainable Future 2015 Fund | | | 1.11 | % |
Natixis Sustainable Future 2020 Fund | | | 1.01 | % |
Natixis Sustainable Future 2025 Fund | | | 1.95 | % |
Natixis Sustainable Future 2030 Fund | | | 2.19 | % |
Natixis Sustainable Future 2035 Fund | | | 1.46 | % |
Natixis Sustainable Future 2040 Fund | | | 0.96 | % |
Natixis Sustainable Future 2045 Fund | | | 0.49 | % |
Natixis Sustainable Future 2050 Fund | | | 0.35 | % |
Natixis Sustainable Future 2055 Fund | | | 0.27 | % |
Natixis Sustainable Future 2060 Fund | | | 0.18 | % |
Natixis Sustainable Future 2065 Fund | | | 0.09 | % |
| | | | |
| | | 10.06 | % |
| | | | |
International Sustainable Equity Fund | | Percentage of
Net Assets | |
Natixis Sustainable Future 2015 Fund | | | 0.64 | % |
Natixis Sustainable Future 2020 Fund | | | 0.74 | % |
Natixis Sustainable Future 2025 Fund | | | 1.98 | % |
Natixis Sustainable Future 2030 Fund | | | 3.14 | % |
Natixis Sustainable Future 2035 Fund | | | 3.22 | % |
Natixis Sustainable Future 2040 Fund | | | 3.09 | % |
Natixis Sustainable Future 2045 Fund | | | 3.36 | % |
Natixis Sustainable Future 2050 Fund | | | 3.31 | % |
Natixis Sustainable Future 2055 Fund | | | 2.58 | % |
Natixis Sustainable Future 2060 Fund | | | 1.73 | % |
Natixis Sustainable Future 2065 Fund | | | 0.94 | % |
Natixis and affiliates | | | 67.97 | % |
| | | | |
| | | 92.70 | % |
| |
U.S. Sustainable Equity Fund | | Percentage of
Net Assets | |
Natixis and affiliates | | | 96.88 | % |
Investment activities of affiliated shareholders could have material impacts on the Fund.
h. Reimbursement of Transfer Agent Fees and Expenses. Natixis Advisors has given a binding contractual undertaking to Gateway Equity Call Premium Fund, Global Green Bond Fund, Global Sustainable Equity Fund, International Sustainable Equity Fund and U.S. Sustainable Equity Fund to reimburse any and all transfer agency expenses for the Funds’ Class N shares. This undertaking is in effect through April 30, 2022, and is not subject to recovery under the expense limitation agreement described above.
For the year ended December 31, 2021, Natixis Advisors reimbursed the Funds for transfer agency expenses as follows:
| | | | |
| | | Reimbursement of
Transfer Agency
Expenses | |
Fund | | Class N | |
Gateway Equity Call Premium Fund | | $ | 1,033 | |
Global Green Bond Fund | | | 1,314 | |
Global Sustainable Equity Fund | | | 1,358 | |
International Sustainable Equity Fund | | | 1,190 | |
U.S. Sustainable Equity Fund | | | 751 | |
89 |
Notes to Financial Statements (continued)
December 31, 2021
7. Custodian and Regulatory Filing Fees and Expenses. State Street Bank, custodian and sub-administrator to the Funds, agreed to waive its fees and expenses for the first 12 months of operations for U.S. Sustainable Equity Fund. For the year ended December 31, 2021, total fees waived for the Fund were $13,640.
8. Class-Specific Transfer Agent Fees and Expenses. Transfer agent fees and expenses attributable to Class A, Class C and Class Y are allocated on a pro rata basis to each class based on the relative net assets of each class to the total net assets of those classes. Transfer agent fees and expenses attributable to Class N are allocated to Class N.
For the year ended December 31, 2021, the Funds incurred the following class-specific transfer agent fees and expenses (including sub-transfer agent fees, where applicable):
| | | | | | | | | | | | | | | | |
| | | Transfer Agent Fees and Expenses | |
Fund | | Class A | | | Class C | | | Class N | | | Class Y | |
Gateway Fund | | $ | 621,241 | | | $ | 75,103 | | | $ | 2,483 | | | $ | 3,600,152 | |
Gateway Equity Call Premium Fund | | | 680 | | | | 268 | | | | 1,033 | | | | 27,281 | |
Global Green Bond Fund | | | 6,701 | | | | — | | | | 1,314 | | | | 27,844 | |
Global Sustainable Equity Fund | | | 38,780 | | | | 14,547 | | | | 1,358 | | | | 801,972 | |
International Sustainable Equity Fund | | | 881 | | | | — | | | | 1,190 | | | | 1,927 | |
U.S. Sustainable Equity Fund | | | 269 | | | | 899 | | | | 751 | | | | 1,217 | |
9. Line of Credit. Each Fund, together with certain other funds of Natixis Funds Trusts, Loomis Sayles Funds Trusts and Natixis ETF Trusts, entered into a $500,000,000 committed unsecured line of credit provided by State Street Bank. Any one Fund may borrow up to $350,000,000 under the line of credit agreement (as long as all borrowings by all Funds in the aggregate do not exceed the $500,000,000 limit at any time), subject to each Fund’s investment restrictions and its contractual obligations under the line of credit. Interest is charged to the Funds based upon the terms set forth in the agreement. In addition, a commitment fee of 0.15% per annum, payable at the end of each calendar quarter, is accrued and apportioned among the participating funds based on their average daily unused portion of the line of credit. The Funds paid certain legal fees in connection with the line of credit agreement, which are being amortized over a period of 364 days and are reflected in legal fees on the Statements of Operations. The unamortized balance is reflected as prepaid expenses on the Statements of Assets and Liabilities.
Prior to April 8, 2021, each Fund (except U.S. Sustainable Equity Fund), together with certain other funds of Natixis Funds Trusts, Loomis Sayles Funds Trusts and Natixis ETF Trusts, entered into a $400,000,000 committed unsecured line of credit provided by State Street Bank. Any one Fund may borrow up to $350,000,000 under the line of credit agreement (as long as all borrowings by all Funds in the aggregate do not exceed the $400,000,000 limit at any time), subject to each Fund’s investment restrictions and its contractual obligations under the line of credit.
For the year ended December 31, 2021, Global Sustainable Equity Fund had an average daily balance on the line of credit (for those days on which there were borrowings) of $27,575,000 at a weighted average interest rate of 1.17%. Interest expense incurred on the line of credit was $3,585.
10. Risk. The Funds’ investments in foreign securities may be subject to greater political, economic, environmental, credit/counterparty and information risks. The Fund’s investments in foreign securities also are subject to foreign currency fluctuations and other foreign currency-related risks. Foreign securities may be subject to higher volatility than U.S. securities, varying degrees of regulation and limited liquidity.
Global markets have experienced periods of high volatility triggered by the Covid-19 pandemic. The impact of this pandemic and any other epidemic or pandemic that may arise in the future could adversely affect the economies of many nations or the entire global economy and the financial performance of individual issuers, sectors, industries, asset classes, and markets in significant and unforeseen ways. Such effects could impair the Funds’ ability to maintain operational standards, disrupt the operations of the Funds’ service providers, adversely affect the value and liquidity of the Funds’ investments and negatively impact the Funds’ performance.
11. Interest Expense. The Funds incur interest expense on cash (including foreign currency) overdrafts at the custodian bank and, for Global Green Bond Fund, foreign currency debit balances at brokers. Interest expense incurred for the year ended December 31, 2021 is reflected on the Statements of Operations.
12. Concentration of Ownership. From time to time, a Fund may have a concentration of one or more accounts constituting a significant percentage of shares outstanding. Investment activities by holders of such accounts could have material impacts on the Funds. As of December 31, 2021, based on management’s evaluation of the shareholder account base, the Funds had accounts
| 90
Notes to Financial Statements (continued)
December 31, 2021
representing controlling ownership of more than 5% of the Funds’ total outstanding shares. The number of such accounts, based on accounts that represent more than 5% of an individual class of shares, and the aggregate percentage of net assets represented by such holdings were as follows:
| | | | | | | | | | | | | | | | |
Fund | | Number of 5%
Non-Affiliated
Account Holders | | | Percentage of
Non-Affiliated
Ownership | | | Percentage
of Affiliated
Ownership
(Note 6g) | | | Total
Percentage of
Ownership | |
Gateway Equity Call Premium Fund | | | 1 | | | | 75.12 | % | | | — | | | | 75.12 | % |
Global Green Bond Fund | | | 4 | | | | 37.54 | % | | | 10.06 | % | | | 47.60 | % |
Global Sustainable Equity Fund | | | 1 | | | | 15.80 | % | | | — | | | | 15.80 | % |
International Sustainable Equity Fund | | | 1 | | | | 5.38 | % | | | 92.70 | % | | | 98.08 | % |
Omnibus shareholder accounts for which Natixis Advisors understands that the intermediary has discretion over the underlying shareholder accounts or investment models where a shareholder account may be invested for a non-discretionary customer are included in the table above. For other omnibus accounts, the Funds do not have information on the individual shareholder accounts underlying the omnibus accounts; therefore, there could be other 5% shareholders in addition to those disclosed in the table above.
13. Capital Shares. Each Fund may issue an unlimited number of shares of beneficial interest, without par value. Transactions in capital shares were as follows:
| | | | | | | | | | | | | | | | |
| | | Year Ended
December 31, 2021 | | | Year Ended
December 31, 2020 | |
Gateway Fund | | Shares | | | Amount | | | Shares | | | Amount | |
| Class A | |
Issued from the sale of shares | | | 4,103,014 | | | $ | 159,384,742 | | | | 4,933,210 | | | $ | 166,881,524 | |
Issued in connection with the reinvestment of distributions | | | 100,047 | | | | 3,909,189 | | | | 226,078 | | | | 7,452,654 | |
Redeemed | | | (4,696,532 | ) | | | (182,041,657 | ) | | | (10,728,981 | ) | | | (357,437,934 | ) |
| | | | | | | | | | | | | | | | |
Net change | | | (493,471 | ) | | $ | (18,747,726 | ) | | | (5,569,693 | ) | | $ | (183,103,756 | ) |
| | | | | | | | | | | | | | | | |
| Class C | |
Issued from the sale of shares | | | 455,601 | | | $ | 17,700,327 | | | | 309,182 | | | $ | 10,611,120 | |
Issued in connection with the reinvestment of distributions | | | — | | | | — | | | | 6,581 | | | | 207,158 | |
Redeemed | | | (1,530,271 | ) | | | (58,832,782 | ) | | | (2,670,540 | ) | | | (90,111,982 | ) |
| | | | | | | | | | | | | | | | |
Net change | | | (1,074,670 | ) | | $ | (41,132,455 | ) | | | (2,354,777 | ) | | $ | (79,293,704 | ) |
| | | | | | | | | | | | | | | | |
| Class N | |
Issued from the sale of shares | | | 5,482,060 | | | $ | 215,874,763 | | | | 3,665,849 | | | $ | 124,426,497 | |
Issued in connection with the reinvestment of distributions | | | 44,030 | | | | 1,726,281 | | | | 59,627 | | | | 1,984,767 | |
Redeemed | | | (3,197,125 | ) | | | (126,136,905 | ) | | | (4,322,136 | ) | | | (146,692,114 | ) |
| | | | | | | | | | | | | | | | |
Net change | | | 2,328,965 | | | $ | 91,464,139 | | | | (596,660 | ) | | $ | (20,280,850 | ) |
| | | | | | | | | | | | | | | | |
| Class Y | |
Issued from the sale of shares | | | 37,955,789 | | | $ | 1,477,701,403 | | | | 41,200,429 | | | $ | 1,389,182,842 | |
Issued in connection with the reinvestment of distributions | | | 867,558 | | | | 33,970,801 | | | | 1,586,091 | | | | 52,425,527 | |
Redeemed | | | (32,342,708 | ) | | | (1,248,292,004 | ) | | | (75,560,637 | ) | | | (2,514,181,386 | ) |
| | | | | | | | | | | | | | | | |
Net change | | | 6,480,639 | | | $ | 263,380,200 | | | | (32,774,117 | ) | | $ | (1,072,573,017 | ) |
| | | | | | | | | | | | | | | | |
Increase (decrease) from capital share transactions | | | 7,241,463 | | | $ | 294,964,158 | | | | (41,295,247 | ) | | $ | (1,355,251,327 | ) |
| | | | | | | | | | | | | | | | |
91 |
Notes to Financial Statements (continued)
December 31, 2021
13. Capital Shares (continued).
| | | | | | | | | | | | | | | | |
| | | Year Ended
December 31, 2021 | | | Year Ended
December 31, 2020 | |
Gateway Equity Call Premium Fund | | Shares | | | Amount | | | Shares | | | Amount | |
| Class A | |
Issued from the sale of shares | | | 119,601 | | | $ | 1,838,974 | | | | 89,776 | | | $ | 1,165,671 | |
Issued in connection with the reinvestment of distributions | | | 486 | | | | 7,707 | | | | 973 | | | | 11,345 | |
Redeemed | | | (67,014 | ) | | | (1,010,211 | ) | | | (167,721 | ) | | | (2,061,010 | ) |
| | | | | | | | | | | | | | | | |
Net change | | | 53,073 | | | $ | 836,470 | | | | (76,972 | ) | | $ | (883,994 | ) |
| | | | | | | | | | | | | | | | |
| Class C | |
Issued from the sale of shares | | | 5,571 | | | $ | 83,540 | | | | 9,094 | | | $ | 114,580 | |
Issued in connection with the reinvestment of distributions | | | 5 | | | | 75 | | | | 49 | | | | 567 | |
Redeemed | | | (9,350 | ) | | | (135,497 | ) | | | (11,920 | ) | | | (161,150 | ) |
| | | | | | | | | | | | | | | | |
Net change | | | (3,774 | ) | | $ | (51,882 | ) | | | (2,777 | ) | | $ | (46,003 | ) |
| | | | | | | | | | | | | | | | |
| Class N | |
Issued from the sale of shares | | | 2,094 | | | $ | 31,390 | | | | 16,338 | | | $ | 204,818 | |
Issued in connection with the reinvestment of distributions | | | 263 | | | | 4,105 | | | | 475 | | | | 5,747 | |
Redeemed | | | (28,036 | ) | | | (439,160 | ) | | | (5,480 | ) | | | (64,140 | ) |
| | | | | | | | | | | | | | | | |
Net change | | | (25,679 | ) | | $ | (403,665 | ) | | | 11,333 | | | $ | 146,425 | |
| | | | | | | | | | | | | | | | |
| Class Y | |
Issued from the sale of shares | | | 2,374,121 | | | $ | 36,711,691 | | | | 870,053 | | | $ | 10,700,287 | |
Issued in connection with the reinvestment of distributions | | | 8,278 | | | | 130,618 | | | | 12,901 | | | | 152,845 | |
Redeemed | | | (318,518 | ) | | | (4,919,489 | ) | | | (1,471,881 | ) | | | (17,118,532 | ) |
| | | | | | | | | | | | | | | | |
Net change | | | 2,063,881 | | | $ | 31,922,820 | | | | (588,927 | ) | | $ | (6,265,400 | ) |
| | | | | | | | | | | | | | | | |
Increase (decrease) from capital share transactions | | | 2,087,501 | | | $ | 32,303,743 | | | | (657,343 | ) | | $ | (7,048,972 | ) |
| | | | | | | | | | | | | | | | |
| | | | | | | | | | | | | | | | |
| | | Year Ended
December 31, 2021 | | | Year Ended
December 31, 2020 | |
Global Green Bond Fund | | Shares | | | Amount | | | Shares | | | Amount | |
| Class A | |
Issued from the sale of shares | | | 330,121 | | | $ | 3,478,742 | | | | 357,151 | | | $ | 3,820,987 | |
Issued in connection with the reinvestment of distributions | | | 18,695 | | | | 191,969 | | | | 14,237 | | | | 152,385 | |
Redeemed | | | (205,158 | ) | | | (2,165,159 | ) | | | (90,528 | ) | | | (963,417 | ) |
| | | | | | | | | | | | | | | | |
Net change | | | 143,658 | | | $ | 1,505,552 | | | | 280,860 | | | $ | 3,009,955 | |
| | | | | | | | | | | | | | | | |
| Class N | |
Issued from the sale of shares | | | 402,160 | | | $ | 4,252,330 | | | | 445,619 | | | $ | 4,757,851 | |
Issued in connection with the reinvestment of distributions | | | 27,746 | | | | 286,884 | | | | 47,406 | | | | 504,197 | |
Redeemed | | | (723,427 | ) | | | (7,634,063 | ) | | | (2,032,767 | ) | | | (21,682,527 | ) |
| | | | | | | | | | | | | | | | |
Net change | | | (293,521 | ) | | $ | (3,094,849 | ) | | | (1,539,742 | ) | | $ | (16,420,479 | ) |
| | | | | | | | | | | | | | | | |
| Class Y | |
Issued from the sale of shares | | | 1,803,141 | | | $ | 19,007,559 | | | | 1,588,312 | | | $ | 16,962,425 | |
Issued in connection with the reinvestment of distributions | | | 84,947 | | | | 873,670 | | | | 59,234 | | | | 635,148 | |
Redeemed | | | (763,186 | ) | | | (8,021,816 | ) | | | (280,739 | ) | | | (2,960,011 | ) |
| | | | | | | | | | | | | | | | |
Net change | | | 1,124,902 | | | $ | 11,859,413 | | | | 1,366,807 | | | $ | 14,637,562 | |
| | | | | | | | | | | | | | | | |
Increase from capital share transactions | | | 975,039 | | | $ | 10,270,116 | | | | 107,925 | | | $ | 1,227,038 | |
| | | | | | | | | | | | | | | | |
| 92
Notes to Financial Statements (continued)
December 31, 2021
13. Capital Shares (continued).
| | | | | | | | | | | | | | | | |
| | | Year Ended
December 31, 2021 | | | Year Ended
December 31, 2020 | |
Global Sustainable Equity Fund | | Shares | | | Amount | | | Shares | | | Amount | |
| Class A | |
Issued from the sale of shares | | | 730,171 | | | $ | 15,268,213 | | | | 1,075,867 | | | $ | 18,317,282 | |
Issued in connection with the reinvestment of distributions | | | 137,134 | | | | 2,803,008 | | | | 4,893 | | | | 76,869 | |
Redeemed | | | (484,741 | ) | | | (10,404,320 | ) | | | (226,251 | ) | | | (3,533,077 | ) |
| | | | | | | | | | | | | | | | |
Net change | | | 382,564 | | | $ | 7,666,901 | | | | 854,509 | | | $ | 14,861,074 | |
| | | | | | | | | | | | | | | | |
| Class C | |
Issued from the sale of shares | | | 335,039 | | | $ | 6,688,657 | | | | 317,242 | | | $ | 4,892,971 | |
Issued in connection with the reinvestment of distributions | | | 35,331 | | | | 691,330 | | | | 1,026 | | | | 15,301 | |
Redeemed | | | (82,377 | ) | | | (1,707,925 | ) | | | (98,713 | ) | | | (1,588,779 | ) |
| | | | | | | | | | | | | | | | |
Net change | | | 287,993 | | | $ | 5,672,062 | | | | 219,555 | | | $ | 3,319,493 | |
| | | | | | | | | | | | | | | | |
| Class N | |
Issued from the sale of shares | | | 7,851,561 | | | $ | 166,251,848 | | | | 3,265,184 | | | $ | 55,475,365 | |
Issued in connection with the reinvestment of distributions | | | 1,098,456 | | | | 22,677,782 | | | | 13,079 | | | | 223,484 | |
Redeemed | | | (2,037,482 | ) | | | (42,874,998 | ) | | | (320,345 | ) | | | (5,566,304 | ) |
| | | | | | | | | | | | | | | | |
Net change | | | 6,912,535 | | | $ | 146,054,632 | | | | 2,957,918 | | | $ | 50,132,545 | |
| | | | | | | | | | | | | | | | |
| Class Y | |
Issued from the sale of shares | | | 23,278,352 | | | $ | 494,418,241 | | | | 33,728,583 | | | $ | 589,402,217 | |
Issued in connection with the reinvestment of distributions | | | 3,260,207 | | | | 67,203,764 | | | | 100,746 | | | | 1,724,842 | |
Redeemed | | | (24,519,480 | ) | | | (529,966,929 | ) | | | (3,134,944 | ) | | | (50,170,707 | ) |
| | | | | | | | | | | | | | | | |
Net change | | | 2,019,079 | | | $ | 31,655,076 | | | | 30,694,385 | | | $ | 540,956,352 | |
| | | | | | | | | | | | | | | | |
Increase from capital share transactions | | | 9,602,171 | | | $ | 191,048,671 | | | | 34,726,367 | | | $ | 609,269,464 | |
| | | | | | | | | | | | | | | | |
| | | | | | | | | | | | | | | | |
| | | Year Ended
December 31, 2021 | | | Year Ended
December 31, 2020 | |
International Sustainable Equity Fund | | Shares | | | Amount | | | Shares | | | Amount | |
| Class A | |
Issued from the sale of shares | | | 20,848 | | | $ | 301,831 | | | | 4,616 | | | $ | 62,533 | |
Issued in connection with the reinvestment of distributions | | | 621 | | | | 8,864 | | | | 505 | | | | 6,930 | |
Redeemed | | | (427 | ) | | | (6,066 | ) | | | (25 | ) | | | (337 | ) |
| | | | | | | | | | | | | | | | |
Net change | | | 21,042 | | | $ | 304,629 | | | | 5,096 | | | $ | 69,126 | |
| | | | | | | | | | | | | | | | |
| Class N | |
Issued from the sale of shares | | | 1,061,665 | | | $ | 15,350,795 | | | | 180,706 | | | $ | 2,022,459 | |
Issued in connection with the reinvestment of distributions | | | 32,137 | | | | 457,863 | | | | 113,091 | | | | 1,544,820 | |
Redeemed | | | (356,899 | ) | | | (5,294,442 | ) | | | (490,369 | ) | | | (6,206,793 | ) |
| | | | | | | | | | | | | | | | |
Net change | | | 736,903 | | | $ | 10,514,216 | | | | (196,572 | ) | | $ | (2,639,514 | ) |
| | | | | | | | | | | | | | | | |
| Class Y | |
Issued from the sale of shares | | | 129,002 | | | $ | 1,885,986 | | | | 4,191 | | | $ | 54,896 | |
Issued in connection with the reinvestment of distributions | | | 2,927 | | | | 41,940 | | | | 502 | | | | 6,899 | |
Redeemed | | | (13,329 | ) | | | (201,164 | ) | | | — | | | | — | |
| | | | | | | | | | | | | | | | |
Net change | | | 118,600 | | | $ | 1,726,762 | | | | 4,693 | | | $ | 61,795 | |
| | | | | | | | | | | | | | | | |
Increase (decrease) from capital share transactions | | | 876,545 | | | $ | 12,545,607 | | | | (186,783 | ) | | $ | (2,508,593 | ) |
| | | | | | | | | | | | | | | | |
93 |
Notes to Financial Statements (continued)
December 31, 2021
13. Capital Shares (continued).
| | | | | | | | | | | | | | | | |
| | | Year Ended
December 31, 2021 | | | Period Ended
December 31, 2020(a) | |
U.S. Sustainable Equity Fund | | Shares | | | Amount | | | Shares | | | Amount | |
| Class A | |
Issued from the sale of shares | | | 835 | | | $ | 10,270 | | | | 100 | | | $ | 1,000 | |
Issued in connection with the reinvestment of distributions | | | 50 | | | | 623 | | | | — | | | | — | |
| | | | | | | | | | | | | | | | |
Net change | | | 885 | | | $ | 10,893 | | | | 100 | | | $ | 1,000 | |
| | | | | | | | | | | | | | | | |
| Class C | |
Issued from the sale of shares | | | 7,608 | | | $ | 99,355 | | | | 100 | | | $ | 1,000 | |
Issued in connection with the reinvestment of distributions | | | 409 | | | | 5,097 | | | | — | | | | — | |
| | | | | | | | | | | | | | | | |
Net change | | | 8,017 | | | $ | 104,452 | | | | 100 | | | $ | 1,000 | |
| | | | | | | | | | | | | | | | |
| Class N | |
Issued from the sale of shares | | | — | | | $ | — | | | | 500,000 | | | $ | 5,000,000 | |
Redeemed | | | (111,465 | ) | | | (1,400,000 | ) | | | — | | | | — | |
| | | | | | | | | | | | | | | | |
Net change | | | (111,465 | ) | | $ | (1,400,000 | ) | | | 500,000 | | | $ | 5,000,000 | |
| | | | | | | | | | | | | | | | |
| Class Y | |
Issued from the sale of shares | | | 16,848 | | | $ | 195,494 | | | | 100 | | | $ | 1,000 | |
Issued in connection with the reinvestment of distributions | | | 190 | | | | 2,393 | | | | — | | | | — | |
Redeemed | | | (13,605 | ) | | | (157,637 | ) | | | — | | | | — | |
| | | | | | | | | | | | | | | | |
Net change | | | 3,433 | | | $ | 40,250 | | | | 100 | | | $ | 1,000 | |
| | | | | | | | | | | | | | | | |
Increase (decrease) from capital share transactions | | | (99,130 | ) | | $ | (1,244,405 | ) | | | 500,300 | | | $ | 5,003,000 | |
| | | | | | | | | | | | | | | | |
| (a) | From commencement of operations on December 15, 2020 through December 31, 2020. |
| 94
Report of Independent Registered Public Accounting Firm
To the Board of Trustees of Gateway Trust and Natixis Funds Trust I and Shareholders of Gateway Fund, Gateway Equity Call Premium Fund, Mirova Global Green Bond Fund, Mirova Global Sustainable Equity Fund, Mirova International Sustainable Equity Fund and Mirova U.S. Sustainable Equity Fund
Opinions on the Financial Statements
We have audited the accompanying statements of assets and liabilities, including the portfolios of investments, of Gateway Fund and Gateway Equity Call Premium Fund (two of the funds constituting Gateway Trust), Mirova Global Green Bond Fund, Mirova Global Sustainable Equity Fund, Mirova International Sustainable Equity Fund and Mirova U.S. Sustainable Equity Fund (four of the funds constituting Natixis Funds Trust I) (hereafter collectively referred to as the “Funds”) as of December 31, 2021, the related statements of operations and of changes in net assets for each of the periods indicated in the table below, including the related notes, and the financial highlights for each of the periods indicated therein (collectively referred to as the “financial statements”). In our opinion, the financial statements present fairly, in all material respects, the financial position of each of the Funds as of December 31, 2021, the results of each of their operations and the changes in each of their net assets for the periods indicated in the table below, and each of the financial highlights for each of the periods indicated therein, in conformity with accounting principles generally accepted in the United States of America.
| | | | |
| Fund | | Statements of operations | | Statements of changes in net assets |
Gateway Fund | | For the year ended December 31, 2021 | | For the years ended December 31, 2021 and 2020 |
Gateway Equity Call Premium Fund | | For the year ended December 31, 2021 | | For the years ended December 31, 2021 and 2020 |
Mirova Global Green Bond Fund | | For the year ended December 31, 2021 | | For the years ended December 31, 2021 and 2020 |
Mirova Global Sustainable Equity Fund | | For the year ended December 31, 2021 | | For the years ended December 31, 2021 and 2020 |
Mirova International Sustainable Equity Fund | | For the year ended December 31, 2021 | | For the years ended December 31, 2021 and 2020 |
Mirova U.S. Sustainable Equity Fund | | For the year ended December 31, 2021 | | For the year ended December 31, 2021 and the period from December 15, 2020 (commencement of operations) through December 31, 2020 |
Basis for Opinions
These financial statements are the responsibility of the Funds’ management. Our responsibility is to express an opinion on the Funds’ financial statements based on our audits. We are a public accounting firm registered with the Public Company Accounting Oversight Board (United States) (PCAOB) and are required to be independent with respect to the Funds in accordance with the U.S. federal securities laws and the applicable rules and regulations of the Securities and Exchange Commission and the PCAOB.
We conducted our audits of these financial statements in accordance with the standards of the PCAOB. Those standards require that we plan and perform the audit to obtain reasonable assurance about whether the financial statements are free of material misstatement, whether due to error or fraud.
Our audits included performing procedures to assess the risks of material misstatement of the financial statements, whether due to error or fraud, and performing procedures that respond to those risks. Such procedures included examining, on a test basis, evidence regarding the amounts and disclosures in the financial statements. Our audits also included evaluating the accounting principles used and significant estimates made by management, as well as evaluating the overall presentation of the financial statements. Our procedures included confirmation of securities owned as of December 31, 2021 by correspondence with the custodian and brokers; when replies were not received from brokers, we performed other auditing procedures. We believe that our audits provide a reasonable basis for our opinions.
/s/ PricewaterhouseCoopers LLP
Boston, Massachusetts
February 22, 2022
We have served as the auditor of one or more of the investment companies in the Natixis Investment Company Complex since at least 1995. We have not been able to determine the specific year we began serving as auditor.
95 |
2021 U.S. Tax Distribution Information to Shareholders (Unaudited)
Corporate Dividends Received Deduction. For the fiscal year ended December 31, 2021, a percentage of dividends distributed by the Funds listed below qualify for the dividends received deduction for corporate shareholders. These percentages are as follows:
| | | | |
Fund | | Qualifying
Percentage | |
Gateway Fund | | | 100.00 | % |
Gateway Equity Call Premium Fund | | | 100.00 | % |
Global Sustainable Equity Fund | | | 10.86 | % |
U.S. Sustainable Equity Fund | | | 8.57 | % |
Capital Gains Distributions. Pursuant to Internal Revenue Section 852(b), the following Funds paid distributions, which have been designated as capital gains distributions for the fiscal year ended December 31, 2021.
| | | | |
Fund | | Amount | |
Global Green Bond Fund | | $ | 537,858 | |
Global Sustainable Equity Fund | | | 109,185,274 | |
International Sustainable Equity Fund | | | 570,795 | |
Qualified Dividend Income. For the fiscal year ended December 31, 2021, a percentage of the ordinary income dividends paid by the Funds are considered qualified dividend income eligible for reduced tax rates. These lower rates range from 0% to 20% depending on an individual’s tax bracket. If the Funds paid a distribution during calendar year 2021, complete information will be reported in conjunction with Form 1099-DIV. These percentages are noted below:
| | | | |
Fund | | Qualifying
Percentage | |
Gateway Fund | | | 100.00 | % |
Gateway Equity Call Premium Fund | | | 100.00 | % |
Global Sustainable Equity Fund | | | 85.73 | % |
International Sustainable Equity Fund | | | 100.00 | % |
U.S. Sustainable Equity Fund | | | 16.52 | % |
Foreign Tax Credit. For the year ended December 31, 2021, the Fund intends to pass through foreign tax credits and have derived gross income from sources within foreign countries amounting to:
| | | | | | | | |
Fund | | Foreign Tax Credit Pass-Through | | | Foreign Source
Income | |
International Sustainable Equity Fund | | $ | 44,473 | | | $ | 597,050 | |
| 96
Trustee and Officer Information
The tables below provide certain information regarding the Trustees and officers of Natixis Funds Trust I and Gateway Trust (the “Trusts”). Unless otherwise indicated, the address of all persons below is 888 Boylston Street, Suite 800, Boston, MA 02199-8197. The Funds’ Statement of Additional Information includes additional information about the Trustees of the Trusts and is available by calling Natixis Funds at 800-225-5478.
| | | | | | | | |
Name and Year of Birth | | Position(s) Held with
the Trusts, Length
of Time Served and Term of Office1 | | Principal
Occupation(s)
During Past 5 Years | | Number of Portfolios
in Fund Complex
Overseen2 and Other
Directorships Held
During Past 5 Years | | Experience,
Qualifications,
Attributes, Skills for
Board Membership |
| | | |
| INDEPENDENT TRUSTEES | | | | | | |
| | | | |
Edmond J. English
(1953) | | Trustee since 2013 Chairperson of the Governance Committee and Contract Review Committee Member | | Executive Chairman of Bob’s Discount Furniture (retail) | | 55 Director, Burlington Stores, Inc. (retail) and Director, Rue Gilt Groupe, Inc. (e-commerce retail) | | Significant experience on the Board and on the boards of other business organizations (including retail companies and a bank); executive experience (including at a retail company) |
| | | | |
Richard A. Goglia
(1951) | | Trustee since 2015 Contract Review Committee Member and Governance Committee Member | | Retired | | 55 Formerly, Director of Triumph Group (aerospace industry) | | Significant experience on the Board and executive experience (including his role as vice president and treasurer of a defense company and experience at a financial services company) |
| | | | |
Wendell J. Knox
(1948) | | Trustee since 2009 Chairperson of the Contract Review Committee | | Retired | | 55 Director, Abt Associates Inc. (research and consulting); Director, The Hanover Insurance Group (property and casualty insurance); Formerly, Director, Eastern Bank (bank) | | Significant experience on the Board and on the boards of other business organizations (including at a bank and at a property and casualty insurance firm); executive experience (including roles as president and chief executive officer of a research and consulting company) |
97 |
Trustee and Officer Information
| | | | | | | | |
Name and Year of Birth | | Position(s) Held with
the Trusts, Length
of Time Served and Term of Office1 | | Principal
Occupation(s)
During Past 5 Years | | Number of Portfolios
in Fund Complex
Overseen2 and Other
Directorships Held
During Past 5 Years | | Experience,
Qualifications,
Attributes, Skills for
Board Membership |
| | | |
| INDEPENDENT TRUSTEES – continued | | | | | | |
| | | | |
Martin T. Meehan
(1956) | | Trustee since 2012 Audit Committee Member and Governance Committee Member | | President, University of Massachusetts | | 55 None | | Significant experience on the Board and on the boards of other business organizations; experience as President of the University of Massachusetts; government experience (including as a member of the U.S. House of Representatives); academic experience |
| | | | |
Maureen B. Mitchell
(1951) | | Trustee since 2017 Audit Committee Member and Governance Committee Member | | Retired | | 55 Director, Sterling Bancorp (bank) | | Experience on the Board; financial services industry and executive experience (including role as president of global sales and marketing at a financial services company) |
| | | | |
James P. Palermo
(1955) | | Trustee since 2016 Audit Committee Member | | Founding Partner, Breton Capital Management, LLC (private equity); Partner, STEP Partners, LLC (private equity) | | 55 Director, FutureFuel.io (chemicals and biofuels) | | Significant experience on the Board; financial services industry and executive experience (including roles as chief executive officer of client management and asset servicing for a banking and financial services company) |
| | | | |
Erik R. Sirri
(1958) | | Chairperson of the Board of Trustees since January 2021 Trustee since 2009 Ex Officio member of the Audit Committee, Contract Review Committee and Governance Committee | | Professor of Finance at Babson College | | 55 None | | Significant experience on the Board; experience as Director of the Division of Trading and Markets at the Securities and Exchange Commission; academic experience; training as an economist |
| 98
Trustee and Officer Information
| | | | | | | | |
Name and Year of Birth | | Position(s) Held with
the Trusts, Length
of Time Served and Term of Office1 | | Principal
Occupation(s)
During Past 5 Years | | Number of Portfolios
in Fund Complex
Overseen2 and Other
Directorships Held
During Past 5 Years | | Experience,
Qualifications,
Attributes, Skills for
Board Membership |
| | | |
| INDEPENDENT TRUSTEES – continued | | | | | | |
| | | | |
Peter J. Smail
(1952) | | Trustee since 2009 Audit Committee Member | | Retired | | 55 None | | Significant experience on the Board; mutual fund industry and executive experience (including roles as president and chief executive officer for an investment adviser) |
| | | | |
Kirk A. Sykes
(1958) | | Trustee since 2019 Contract Review Committee Member and Governance Committee Member | | Managing Director of Accordia Partners, LLC (real estate development); President of Primary Corporation (real estate development); Managing Principal of Merrick Capital Partners (infrastructure finance) | | 55 Trustee, Eastern Bank (bank); Director, Apartment Investment and Management Company (real estate investment trust); formerly Director, Ares Commercial Real Estate Corporation (real estate investment trust) | | Experience on the Board and significant experience on the boards of other business organizations (including real estate companies and banks) |
| | | | |
Cynthia L. Walker
(1956) | | Trustee since 2005 for Natixis Funds Trust I and 2007 for Gateway Trust Chairperson of the Audit Committee | | Retired; Formerly, Deputy Dean for Finance and Administration, Yale University School of Medicine | | 55 None | | Significant experience on the Board; executive experience in a variety of academic organizations (including roles as dean for finance and administration) |
|
| INTERESTED TRUSTEES |
| | | | |
Kevin P. Charleston3
(1965) One Financial Center Boston, MA 02111 | | Trustee since 2015 | | President, Chief Executive Officer and Chairman of the Board of Directors, Loomis, Sayles & Company, L.P. | | 55 None | | Significant experience on the Board; continuing service as President, Chief Executive Officer and Chairman of the Board of Directors of Loomis, Sayles & Company, L.P. |
| | | | |
David L. Giunta4
(1965) | | Trustee since 2011 President and Chief Executive Officer | | President and Chief Executive Officer, Natixis Advisors, LLC and Natixis Distribution, LLC | | 55 None | | Significant experience on the Board; experience as President and Chief Executive Officer of Natixis Advisors, LLC and Natixis Distribution, LLC |
99 |
Trustee and Officer Information
| 1 | Each Trustee serves until retirement, resignation or removal from the Board. The current retirement age is 75. The position of Chairperson of the Board is appointed for a three-year term. |
| 2 | The Trustees of the Trusts serve as Trustees of a fund complex that includes all series of the Natixis Funds Trust I, Natixis Funds Trust II, Natixis Funds Trust IV, Gateway Trust, Loomis Sayles Funds I, Loomis Sayles Funds II, Natixis ETF Trust and Natixis ETF Trust II (collectively, the “Fund Complex”). |
| 3 | Mr. Charleston is deemed an “interested person” of the Trusts because he holds the following positions with an affiliated person of the Trusts: President, Chief Executive Officer and Chairman of the Board of Directors of Loomis, Sayles & Company, L.P. |
| 4 | Mr. Giunta is deemed an “interested person” of the Trusts because he holds the following positions with an affiliated person of the Trusts: President and Chief Executive Officer, Natixis Advisors, LLC and Natixis Distribution, LLC. |
| 100
Trustee and Officer Information
| | | | | | |
Name and Year of Birth | | Position(s) Held
with the Trusts | | Term of Office1 and Length
of Time Served | | Principal Occupation(s)
During Past 5 Years2 |
|
| OFFICERS OF THE TRUSTS |
| | | |
Michael C. Kardok
(1959) | | Treasurer, Principal Financial and Accounting Officer | | Since 2004 for Natixis Funds Trust I and 2007 for Gateway Trust | | Senior Vice President, Natixis Advisors, LLC and Natixis Distribution, LLC |
| | | |
Natalie R. Wagner
(1979) | | Chief Compliance Officer, Assistant Secretary and Anti-Money Laundering Officer Chief Legal Officer | | Since May 2021 Since July 2021 | | Senior Vice President, Natixis Advisors, LLC and Natixis Distribution, LLC; Formerly, Vice President, Head of Corporate Compliance, Global Atlantic Financial Group |
| 1 | Each officer of the Trusts serves for an indefinite term in accordance with the Trusts’ current by-laws until the date his or her successor is elected and qualified, or until he or she sooner dies, retires, is removed or becomes disqualified. |
| 2 | Each person listed above, except as noted, holds the same position(s) with the Fund Complex. Previous positions during the past five years with Natixis Distribution, LLC, Natixis Advisors, LLC or Loomis, Sayles & Company, L.P. are omitted, if not materially different from an officer’s current position with such entity. |
101 |
Item 2. Code of Ethics.
The Registrant has adopted a code of ethics that applies to the Registrant’s principal executive officer, principal financial officer and persons performing similar functions. There have been no amendments or waivers of the Registrant’s code of ethics during the period.
Item 3. Audit Committee Financial Expert.
The Board of Trustees of the Registrant has established an audit committee. Mr. Martin T. Meehan, Ms. Maureen Mitchell, Mr. James Palermo, Mr. Peter J. Smail and Ms. Cynthia L. Walker are members of the audit committee and have been designated as “audit committee financial experts” by the Board of Trustees. Each of these individuals is also an Independent Trustee of the Registrant.
Item 4. Principal Accountant Fees and Services.
Fees billed by the Principal Accountant for services rendered to the Registrant.
The table below sets forth fees billed by the principal accountant, PricewaterhouseCoopers LLP, for the past two fiscal years for professional services rendered in connection with a) the audit of the Registrant’s annual financial statements and services provided in connection with regulatory filings; b) audit-related services (including services that are reasonably related to the performance of the audit of the Registrant’s financial statements but not reported under “Audit Fees”); c) tax compliance, tax advice and tax planning and d) all other fees billed for professional services rendered by the principal accountant to the Registrant, other than the services provided as reported as a part of (a) through (c) of this Item.
| | | | | | | | | | | | | | | | | | | | | | | | | | | | | | | | |
| | | Audit fees | | | Audit-related fees1 | | | Tax fees2 | | | All other fees | |
| | | 1/1/20-
12/31/20 | | | 1/1/21-
12/31/21 | | | 1/1/20-
12/31/20 | | | 1/1/21-
12/31/21 | | | 1/1/20-
12/31/20 | | | 1/1/21-
12/31/21 | | | 1/1/20-
12/31/20 | | | 1/1/21-
12/31/21 | |
Natixis Funds Trust I (except Loomis Sayles Core Plus Bond Fund) | | $ | 235,913 | | | $ | 239,331 | | | $ | 353 | | | $ | 480 | | | $ | 58,485 | | | $ | 93,292 | | | $ | — | | | $ | — | |
| | 1. | Audit-related fees consist of: |
2020 & 2021 – performance of agreed-upon procedures related to the Registrant’s deferred compensation plan.
2020 & 2021 – review of the Registrant’s tax returns (2020 & 2021) and filings to reclaim withholding taxes paid on French dividends (2021).
Aggregate fees billed to the Registrant for non-audit services during 2020 and 2021 were $58,838 and $93,772, respectively.
Fees billed by the Principal Accountant for services rendered to the Adviser and Control Affiliates.
The following table sets forth the fees billed by the Registrant’s principal accountant for non-audit services rendered to Natixis Advisors, LLC (“Natixis Advisors”), Mirova US LLC (“Mirova”) and entities controlling, controlled by or under common control with Natixis Advisors and Mirova (“Control Affiliates”) that provide ongoing services to the Registrant, for engagements that related directly to the operations and financial reporting of the Registrant for the last two fiscal years.
| | | | | | | | | | | | | | | | | | | | | | | | |
| | | Audit-related fees | | | Tax fees | | | All other fees | |
| | | 1/1/20-
12/31/20 | | | 1/1/21-
12/31/21 | | | 1/1/20-
12/31/20 | | | 1/1/21-
12/31/21 | | | 1/1/20-
12/31/20 | | | 1/1/21-
12/31/21 | |
Control Affiliates | | $ | — | | | $ | — | | | $ | 18,255 | | | $ | 31,137 | | | $ | 63,023 | | | $ | — | |
The following table sets forth the aggregate fees billed by the Registrant’s principal accountant for non-audit services rendered to Mirova, Natixis Advisors and Control Affiliates that provide ongoing services to the Registrant, for the last two fiscal years, including the fees disclosed in the table above.
| | | | | | | | |
| | | Aggregate Non-Audit Fees | |
| | | 1/1/20-12/31/20 | | | 1/1/21-12/31/21 | |
Control Affiliates | | $ | 308,800 | | | $ | 235,234 | |
None of the services described above were approved pursuant to paragraph (c)(7)(i)(C) of Regulation S-X.
Audit Committee Pre-Approval Policies.
Annually, the Registrant’s Audit Committee reviews the audit, audit-related, tax and other non-audit services together with the projected fees, for services proposed to be rendered to the Registrant and/or other entities for which pre-approval is required during the upcoming year. Any subsequent revisions to already pre-approved services or fees (including fee increases) and requests for pre-approval of new services would be presented for consideration quarterly as needed.
If, in the opinion of management, a proposed engagement by the Registrant’s independent accountants needs to commence before the next regularly scheduled Audit Committee meeting, any member of the Audit Committee who is an independent Trustee of the Registrant is authorized to pre-approve the engagement, but only for engagements to provide audit, audit-related and tax services. This approval is subject to review by the full Audit Committee at its next quarterly meeting. All other engagements require the approval of all the members of the Audit Committee.
Item 5. Audit Committee of Listed Registrants.
Not applicable.
Item 6. Schedule of Investments.
Included as part of the Report to Shareholders filed as Item 1 herewith.
Item 7. Disclosure of Proxy Voting Policies and Procedures for Closed-End Management Investment Companies.
Not applicable.
Item 8. Portfolio Managers of Closed-End Management Investment Companies.
Not applicable.
Item 9. Purchases of Equity Securities by Closed-End Management Investment Companies and Affiliated Purchasers.
Not applicable.
Item 10. Submission of Matters to a Vote of Securities Holders.
There were no material changes to the procedures by which shareholders may recommend nominees to the Registrant’s Board of Trustees.
Item 11. Controls and Procedures.
The Registrant’s principal executive officer and principal financial officer have concluded that the Registrant’s disclosure controls and procedures are sufficient to ensure that information required to be disclosed by the Registrant in this Form N-CSR was recorded, processed, summarized and reported within the time periods specified in the Securities and Exchange Commission’s rules and forms, based upon such officers’ evaluation of these controls and procedures as of a date within 90 days of the filing date of the report.
There were no changes in the Registrant’s internal control over financial reporting that occurred during the period covered by the report that have materially affected, or is reasonably likely to materially affect, the Registrant’s internal control over financial reporting.
Item 12. Disclosure of Securities Lending Activities for Closed-End Management Investment Companies.
Not applicable.
Item 13. Exhibits.
SIGNATURES
Pursuant to the requirements of the Securities Exchange Act of 1934 and the Investment Company Act of 1940, the Registrant has duly caused this report to be signed on its behalf by the undersigned, thereunto duly authorized.
| | |
| Natixis Funds Trust I |
| |
| By: | | /s/ David L. Giunta |
| |
| Name: | | David L. Giunta |
| Title: | | President and Chief Executive Officer |
| Date: | | February 22, 2022 |
Pursuant to the requirements of the Securities Exchange Act of 1934 and the Investment Company Act of 1940, this report has been signed by the following persons on behalf of the Registrant and in the capacities and on the dates indicated.
| | |
| By: | | /s/ David L. Giunta |
| |
| Name: | | David L. Giunta |
| Title: | | President and Chief Executive Officer |
| Date: | | February 22, 2022 |
| |
| By: | | /s/ Michael C. Kardok |
| |
| Name: | | Michael C. Kardok |
| Title: | | Treasurer and Principal Financial and |
| | Accounting Officer |
| Date: | | February 22, 2022 |