UNITED STATES
SECURITIES AND EXCHANGE COMMISSION
Washington, D.C. 20549
FORM N-CSR
CERTIFIED SHAREHOLDER REPORT OF REGISTERED
MANAGEMENT INVESTMENT COMPANIES
Investment Company Act file number: 811-04323
Natixis Funds Trust I
(Exact name of Registrant as specified in charter)
888 Boylston Street, Suite 800 Boston, Massachusetts 02199-8197
(Address of principal executive offices) (Zip code)
Russell L. Kane, Esq.
Natixis Distribution, L.P.
888 Boylston Street, Suite 800
Boston, Massachusetts 02199-8197
(Name and address of agent for service)
Registrant’s telephone number, including area code: (617) 449-2822
Date of fiscal year end: September 30
Date of reporting period: September 30, 2020
Item 1. Reports to Stockholders.
The Registrant’s annual report transmitted to shareholders pursuant to Rule 30e-1 under the Investment Company Act of 1940 is as follows:


Annual Report
September 30, 2020
Loomis Sayles Core Plus Bond Fund
Loomis Sayles Global Allocation Fund
Table of Contents
IMPORTANT NOTICE TO SHAREHOLDERS
Beginning on January 1, 2021, as permitted by regulations adopted by the Securities and Exchange Commission, paper copies of shareholder reports like this one will no longer be sent by mail, unless you specifically request paper copies of the reports from the Fund or from your financial intermediary, such as a broker-dealer or bank. Instead, the reports will be made available on the Funds’ website, and you will be notified by mail each time a report is posted and provided with a website link to access the report. If you wish to continue receiving paper copies of your shareholder reports after January 1, 2021, you can inform the Fund at any time by calling 1-800-225-5478. If you hold your account with a financial intermediary and you wish to continue receiving paper copies after January 1, 2021, you should call your financial intermediary directly. Paper copies are provided free of charge, and your election to receive reports in paper will apply to all funds held with the Natixis Funds complex. If you have already elected to receive shareholder reports electronically, you will not be affected by this change and you need not take any action. You currently may elect to receive shareholder reports and other communications from the Fund or your financial intermediary electronically at www.icsdelivery.com/natixisfunds.
LOOMIS SAYLES CORE PLUS BOND FUND
| | |
| |
| Managers | | Symbols |
| |
| Ian Anderson | | Class A NEFRX |
| |
| Peter W. Palfrey, CFA® | | Class C NECRX |
| |
| Richard G. Raczkowski | | Class N NERNX |
| |
| Barath Sankaran, CFA® | | Class Y NERYX |
| |
| Loomis, Sayles & Company, L.P. | | |
Investment Goal
The Fund seeks high total investment return through a combination of current income and capital appreciation.
Market Conditions
The global fixed-income market produced solid gains to finish the fiscal year, continuing its recovery since the turmoil of late March, albeit at a slower pace compared to the second quarter. Investors appeared confident that the US Federal Reserve (Fed) and other global central banks would keep interest rates low indefinitely in response to the growth slowdown caused by Covid-19. Most notably, the Fed formally adopted a new policy regime known as Flexible Average Inflation Targeting at this year’s Jackson Hole conference. Under this new approach, a 2% inflation rate is no longer the Fed’s implicit ceiling, but rather now clearly defined as its long-term average target. This shift implies that the Fed could keep interest rates low for an extended period even if inflation begins to tick up above the average inflation target. Together, these factors helped US Treasuries hold on to their gains from the first half of the year. The credit-sensitive segments of the market also performed well, as the combination of improving economic data and apparent progress toward a coronavirus vaccine helped support investors’ appetite for risk. However, the markets remained on edge as the period drew to a close, due to uncertainties surrounding the US elections, the continued spread of Covid-19, and the expected magnitude of the economic recovery in 2021.
US Treasuries posted narrow gains but finished with the weakest performance among the major bond market segments. Treasuries entered the quarter at historically low yields due to their significant rally earlier in the year. (Prices and yields move in opposite directions.) With little in the way of additional negative news to fuel a renewed “flight to quality,” Treasuries largely traded sideways in a tight range. As a result, the yield on the bellwether 10-year note finished the quarter little changed from the level at which it closed on June 30.
Investment-grade corporates performed well thanks to the combination of a benign rate environment and a persistent demand for yield. In addition, investors appeared confident that the Fed would continue to backstop the corporate bond market through direct purchases if necessary.
During the quarter, asset-backed securities (ABS) and commercial mortgage-backed securities (CMBS) outperformed Treasuries as securitized credit sectors continued to recover. Agency mortgage-backed securities (MBS) underperformed duration-matched
Treasuries for the period. Total returns for securitized assets were positive on the quarter as demand for yield drove spreads tighter.
High yield bonds outpaced investment-grade corporates in the quarter, as the generally favorable investment backdrop encouraged investors to take on higher risk in search of more attractive yields. Oil prices recovered from their April lows, which proved to be supportive for the many distressed energy issuers in the category.
Emerging market debt was one of the stronger performing major fixed-income categories in the quarter, partially due to weakness in the US dollar. The category’s outperformance occurred despite rising economic uncertainty in Brazil and a sharp decline in the Turkish lira. The strength in emerging market bonds in the face of these potential headwinds helps illustrate the extent of investors’ thirst for yield.
Performance Results
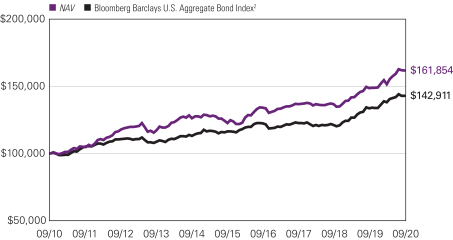
For the 12 months ended September 30, 2020, Class Y shares of the Loomis Sayles Core Plus Bond Fund returned 8.87% at net asset value. The Fund outperformed its benchmark, the Bloomberg Barclays U.S. Aggregate Bond Index, which returned 6.98%.
Explanation of Fund Performance
The Fund’s overweight to US investment grade corporate bonds, paired with strong security selection within the sector, was the largest contributor to relative return over the 12-month period. An out-of-benchmark allocation to high yield corporate bonds also benefited performance relative to the benchmark. The Fund’s slightly above-benchmark stance with respect to duration (and corresponding sensitivity to changes in interest rates) generated excess returns as Treasury yields declined over the period. Finally, allocations to and selection within securitized agency sectors, most notably pass-through MBS, boosted return over the period. On the downside, security selection within non-securitized US agency issues hindered relative performance for the 12-month period. The Fund’s allocation to floating rate bank loans acted as a constraint on performance, and an underweight to US Treasuries also weighed on relative performance as Treasury yields declined notably over the period.
Outlook
We expect the Federal Reserve’s fed funds rate to remain unchanged at the zero lower bound and the front end of the Treasury yield curve to remain anchored for the foreseeable future. We do not anticipate the Fed bringing rates into negative territory on the view that negative policy rates are broadly disruptive to a nation’s financial system. We believe US Treasury yields will trade in a fairly tight range through the US presidential election date, but may respond more acutely in the days following depending on the result and whether the result is contested. Once the results are determined, however, we see more potential for yields to rise as we move through 2021. In particular, improving prospects for a vaccine rollout could be a catalyst for rising intermediate and longer maturity Treasury yields, while the front end remains anchored. With the demand side of the equation improving, we believe there will likely be pockets of inflation as supply remains disrupted and we continue to see ultra-accommodative monetary policy and ample fiscal support.
LOOMIS SAYLES CORE PLUS BOND FUND
Our base case expectation is that we are in the credit repair phase of the credit cycle1 and are starting to push towards recovery in some segments of the US economy. Credit sector valuations have trended toward levels observed prior to the first quarter of 2020, but still present a potential opportunity to obtain an attractive yield advantage over duration-matched government bonds. We believe corporate credit spreads may continue to tighten, albeit much more gradually than what we saw in the second quarter. Despite the weakened fundamental picture in the post-Covid environment, we believe corporate credit remains supported by a strong technical backdrop headlined by committed central bank support and strong investor demand for incremental yield.
We are favoring sectors offering higher yield potential than Treasuries and remain underweight in government bonds given the low yield environment. In particular, investment grade and high yield corporate credit risk was dramatically increased at significantly cheaper levels during the peak of the Covid-induced selloff in risk assets. However, as valuations move closer to what we consider to be “fair value,” we have become more selective in adding to these exposures, and have started to cull those industries and issuers that we believe now offer less incremental value. We continue to participate in attractive new issues and may also look for swap opportunities along an individual issuer’s credit curve.
Currently, our overall portfolio credit quality is A1 with half of the portfolio remaining in AAA issues. Holdings in nominal Treasuries continue to be underweight on both a market value and contribution-to-duration basis (duration is a measure of sensitivity to changes in interest rates). Within securitized assets, we continue to be underweight in agency mortgage-backed securities, marginally overweight to agency commercial mortgage-backed securities, and continue to maintain an overweight to high-quality asset-backed securities. With respect to investment grade corporate credit, we have moved from a pre-Covid underweight position to an overweight position.
We continue to favor long Treasury inflation-protected securities (TIPS) as an alternative to long nominal Treasuries. We presently have an approximately 2% market value allocation to long TIPS, which is down significantly from earlier this year, but still accounts for about 10% of our total duration contribution. We continue to consider our TIPS position to be a potentially valuable hedge against an eventual abatement in virus contagion fears and as inflation expectations trend back towards more normal levels.
In addition to TIPS, we currently have about a 6.5% allocation to fixed rate high yield corporate bonds, as well as a 2%–3% market weight target to floating rate bank loans. We continue to favor higher quality, shorter duration fixed rate high yield and secured higher quality bank loans as a potential source of front-end yield. This exposure is up meaningfully versus levels just prior to the downturn.
Our portfolio duration (which reflects price sensitivity to changes in interest rate expectations) is approximately 0.70 years longer than the benchmark on a nominal basis. However, our empirical duration is running 0.80 years shorter than the benchmark, largely due to our TIPS, high yield corporate and investment grade corporate exposures. Our overall shorter empirical duration will continue to be our bias with higher rates in the
future likely in a post-Covid environment in which vaccines are widely available. However, we are maintaining some long end nominal rate exposure, as well as real rate exposure, which we believe could provide protection should we enter a period of greater uncertainty.
Our non-US dollar exposure is approximately 1.8% of total market value, composed primarily of the Mexican peso and a small allocation to the Uruguayan peso. Our focus has been on more pro-cyclical economies and foreign currencies tied to trade with the US, where we can also seek a potential yield advantage versus what is available in the US dollar market.
During periods in which the US dollar appreciates relative to foreign currencies, funds that hold non-US-dollar-denominated bonds may realize currency losses in connection with the maturity or sale of certain bonds. These losses impact a fund’s ordinary income distributions (to the extent that losses are not offset by realized currency gains within the fund’s fiscal year). A recognized currency loss, in accordance with federal tax rules, decreases the amount of ordinary income a fund has available to distribute, even though these bonds continue to generate coupon income.
Fund officers have analyzed the fund’s current portfolio of investments, realized currency gains and losses, schedule of maturities, and the corresponding amounts of unrealized currency losses that may become realized during the current fiscal year. This analysis is performed regularly to determine how realized currency losses will impact periodic ordinary income distributions for the fund. Based on the most recent quarterly analysis (as of September 30, 2020), fund officers believe that realized currency losses will have an impact on the distributions in the 2021 fiscal year. This analysis is based on certain assumptions including, but not limited to, the level of foreign currency exchange rates, security prices, interest rates, the Fund adviser’s ability to manage realized currency losses, and the net asset level of the fund. Changes to these assumptions could materially impact the analysis and the amounts of future fund distributions. Fund officers will continue to monitor these amounts on a regular basis and take the necessary actions required to manage the fund’s distributions to address realized currency losses while seeking to avoid a return of capital distribution.
| 1 | A credit cycle is a cyclical pattern that follows credit availability and corporate health. |
LOOMIS SAYLES CORE PLUS BOND FUND
Hypothetical Growth of $100,000 Investment in Class Y Shares3
September 30, 2010 to September 30, 2020
Average Annual Total Returns — September 30, 20203
| | | | | | | | | | | | | | | | | | | | | | | | |
| | | | | | |
| | | | | | | | | | | | Life of | | | Expense Ratios4 | |
| | | 1 Year | | | 5 Years | | | 10 Years | | | Class N | | | Gross | | | Net | |
| | | | |
| Class Y (Inception 12/30/94) | | | | | | | | | | | | | |
| NAV | | | 8.87 | % | | | 5.70 | % | | | 4.93 | % | | | — | % | | | 0.48 | % | | | 0.48 | % |
| | | | | | | |
| Class A (Inception 11/7/73) | | | | | | | | | | | | | | | | | | | | | | | | |
| NAV | | | 8.60 | | | | 5.42 | | | | 4.67 | | | | — | | | | 0.73 | | | | 0.73 | |
| With 4.25% Maximum Sales Charge | | | 3.97 | | | | 4.51 | | | | 4.21 | | | | — | | | | | | | | | |
| | | | |
| Class C (Inception 12/30/94) | | | | | | | | | | | | | |
| NAV | | | 7.83 | | | | 4.65 | | | | 3.88 | | | | — | | | | 1.48 | | | | 1.48 | |
| With CDSC1 | | | 6.83 | | | | 4.65 | | | | 3.88 | | | | — | | | | | | | | | |
| | | | | | | |
| Class N (Inception 2/1/13) | | | | | | | | | | | | | | | | | | | | | | | | |
| NAV | | | 8.95 | | | | 5.79 | | | | — | | | | 4.10 | | | | 0.39 | | | | 0.39 | |
| | | | | | | |
| Comparative Performance | | | | | | | | | | | | | | | | | | | | | | | | |
| Bloomberg Barclays U.S. Aggregate Bond Index2 | | | 6.98 | | | | 4.18 | | | | 3.64 | | | | 3.46 | | | | | | | | | |
Performance data shown represents past performance and is no guarantee of, and not necessarily indicative of, future results. Total return and value will vary, and you may have a gain or loss when shares are sold. Current performance may be lower or higher than quoted. For most recent month-end performance, visit im.natixis.com. Performance for other share classes will be greater or less than shown based on differences and sales charges. You may not invest directly in an index. Performance for periods less than one year is cumulative, not annualized. Returns reflect changes in share price and reinvestment of dividends and capital gains, if any. The table(s) do not reflect taxes shareholders might owe on any fund distributions or when they redeem their shares.
| 1 | Class C shares performance assumes a 1% CDSC applied when you sell shares within one year of purchase. |
| 2 | The Bloomberg Barclays U.S. Aggregate Bond Index is broad-based index that covers the U.S. dollar-denominated, investment-grade, fixed-rate, taxable bond market of SEC-registered securities. The index includes bonds from the Treasury, government-related, corporate, mortgage-backed securities, asset-backed securities, and collateralized mortgage-backed securities sectors. |
| 3 | Fund performance has been increased by fee waivers and/or expense reimbursements, if any, without which performance would have been lower. |
| 4 | Expense ratios are as shown in the Fund’s prospectus in effect as of the date of this report. The expense ratios for the current reporting period can be found in the Financial Highlights section of this report under Ratios to Average Net Assets. Net expenses reflect contractual expense limitations set to expire on 1/31/22. When a Fund’s expenses are below the limitation, gross and net expense ratios will be the same. See Note 6 of the Notes to Financial Statements for more information about the Fund’s expense limitations. |
LOOMIS SAYLES GLOBAL ALLOCATION FUND
| | |
| |
| Managers | | Symbols |
| |
| Daniel J. Fuss, CFA®, CIC | | Class A LGMAX |
| |
| Eileen N. Riley, CFA® | | Class C LGMCX |
| |
| David W. Rolley, CFA® | | Class N LGMNX |
| |
| Lee M. Rosenbaum | | Class Y LSWWX |
| |
| Loomis, Sayles & Company, L.P. | | |
Investment Goal
The Fund seeks high total investment return through a combination of capital appreciation and current income.
Market Conditions
Financial markets experienced significant volatility in the past year, as investors grappled with the uncertainty surrounding Covid-19. The bulk of the market disruptions occurred in February and March, when world governments first aimed to contain the virus by locking down broad swaths of their economies. Higher-risk assets were hit hard in the ensuing selloff, while demand for lower-risk investments surged.
The US Federal Reserve (Fed) sought to counter the extraordinary developments by cutting the Fed Funds rate to zero and reinstituting quantitative easing through the purchases of US Treasuries and mortgage-backed securities. The Fed revived lending facilities last used in 2008, such as the TALF (Term Asset-Backed Loan Facility), which is a funding backstop for the asset-backed securities market. The central bank also established facilities never used before, such as the Corporate Credit Facilities, which allowed the Fed to purchase corporate bond assets for the first time in its history. In conjunction with a $2.2 trillion stimulus package passed by the US Congress, the Fed’s response fueled an impressive recovery in higher-risk assets from late-March onward.
Global equity markets plunged in mid-February, as the coronavirus began to spread throughout the United States and Europe. Resulting uncertainty regarding the trajectory of economic growth and corporate earnings fueled largely indiscriminate selling across global equity markets in early spring. The downturn abated in late summer as lockdown restrictions were lifted and consumer confidence began to rise.
The ensuing rally allowed most major equity indices to close the period in positive territory, but returns among sectors were highly disparate. Gains were primarily driven by strength in mega-cap US technology stocks, leading to a wide performance advantage for the growth style over value, and for large-cap over small-cap.
In fixed income, investment-grade corporates were notable beneficiaries of rising risk appetite and investors’ demand for high-quality alternatives to low-yielding government debt. Despite their downturn in the February-March selloff, corporates outperformed the broader fixed-income market for the full 12-month period.
7 |
High-yield corporate bonds also delivered positive returns. The category was supported by hopes for an economic recovery, reduced investor risk aversion and general support from fiscal and monetary policy. However, high-yield issues trailed investment-grade securities. Lower-quality debt was generally harder hit in the downturn due to lower market liquidity and the effect of falling oil prices, weighing on return for the full period.
The uncertain environment worked to the benefit of US Treasuries due to their status as a relative “safe haven.” Longer duration (and thus more interest rate sensitive) bonds delivered particularly robust gains. The yield on the 10-year note fell to an all-time low in March and remained close to that level thereafter on expectations that the Fed would pursue its low-rate policy indefinitely. (Prices and yields move in opposite directions.)
Performance Results
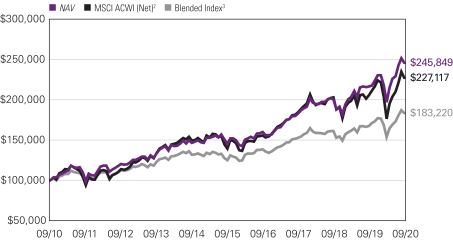
For the 12 months ended September 30, 2020 Class Y shares of the Loomis Sayles Global Allocation Fund returned 13.70% at net asset value. The Fund outperformed its primary index, the MSCI All Country World Index (Net), which returned 10.44%. The Fund outperformed its secondary blended benchmark, the 60% MSCI All Country World Index (Net)/40% Bloomberg Barclays Global Aggregate Index, which returned 9.26%.
Explanation of Performance
In equities, the largest contributors to return were Amazon, Alibaba, and Danaher. Shares of Amazon outperformed as the Covid-19 pandemic brought in-person shopping to a virtual standstill in many geographies, driving an increase in e-commerce penetration from both existing users as well as new users. We believe e-commerce penetration will remain at these levels as economies re-open, from its superior shopping experience and the closure of some brick and mortar retail stores. We also believe the current environment will advance the cloud adoption curve, with companies moving increasing amounts of data to the cloud to facilitate a remote work environment.
Shares of Alibaba, a Chinese e-commerce company, have outperformed as the pandemic has accelerated adoption of e-commerce, mobile shopping, and payments globally. In China, Alibaba has seen a growth in its user base as well as product categories. Additionally, the announcement of the Ant Group (formerly Ant Financial) initial public offering will likely provide increased visibility into the company’s payment business and how it interacts with Alibaba’s platforms.
Shares of Danaher, a healthcare technology company, outperformed over the period. The company has transformed from a conglomerate focused on cyclical end markets to a life sciences industry leader focusing on high-growth markets with recurring revenue characteristics. A recent example is Cytiva, the life science business which Danaher purchased from General Electric. Danaher is also playing an important part in the global pandemic effort as technologies from its Cytiva and Pall subsidiaries are being used in human trials as part of Covid-19 vaccine efforts.
In fixed income, corporate credit allocation was a positive source of relative return during the period. Particularly helpful to performance were overweight allocations to the
LOOMIS SAYLES GLOBAL ALLOCATION FUND
insurance, capital goods, and communications sectors. The fiscal support and backstops from leading central banks and attractiveness of corporate yields benefited the asset class.
Allocations to the crossover space (corporate bonds with ratings straddling the investment grade and high yield categories) also contributed to relative performance. In particular, BBB and BB holdings aided results as they generally outpaced higher-grade names. Industries that were beaten down in March and April, such as oil, automotive and home construction, recovered and outperformed higher quality bonds. Optimism surrounding a Covid vaccine, the phased re-opening of economies, and the ongoing fiscal and monetary support buoyed risk appetite.
With respect to interest rate positioning, the Fund’s large allocation to the US dollar fixed income market, where starting yields were globally competitive and yields declined considerably over the period, contributed to performance.
In equities, the largest detractors from performance were Marriott, M&T Bank, and CBRE. Shares of Marriott International, a global hotelier, underperformed as the Covid-19 pandemic caused a steep drop in demand. We eliminated our position as the pandemic made it difficult to quantify the downside, particularly as the fall in demand was unprecedented.
M&T Bank is a New York-based regional bank, focusing on small and mid-size business customers. US bank shares have generally been weak on concerns that sustained low interest rates will put pressure on revenue and economic weakness will impact loan quality. M&T Bank has been especially hard-hit due to its exposure to New York City commercial real estate, which accounts for about 10% of its loan book. While M&T’s New York commercial real estate exposure is higher than competitors, we are confident that the exposure is manageable given M&T’s strong loan underwriting experience, as well as the high level of collateral that it holds on these loans. We have a high degree of conviction in M&T’s quality and medium-term growth prospects.
Shares of CBRE, a global real estate services firm, underperformed. We eliminated our position as we believe the pandemic will likely result in structural changes in commercial real estate use, as a greater proportion of employees continue to work remotely in a post-pandemic world. This shift would likely reduce real estate demand, particularly in central business districts, resulting in sharper and longer-lasting falls in office rents and prices than in a typical recession. The pandemic is also accelerating the decline in mall and street-based retail real estate demand. Given the uncertainty in medium-term demand for CBRE’s services, our conviction in the holding declined and we decided to sell the stock.
In fixed income, select emerging market currencies had a negative impact. In particular, bonds denominated in the Brazilian real weighed on performance due to a deteriorating economic outlook as well as a surge in coronavirus cases in the country. Bonds denominated in the Turkish lira and the Chilean peso also detracted as these currencies depreciated over the period versus the dollar.
Exposure to US retail issuers also weighed on performance given general weakness in the sector on the back of coronavirus-related shutdowns, supply chain disruptions, and declining traffic numbers.
Select positions within high yield corporate bonds detracted. Global demand for oil has tapered in major growth regions such as India and China while stagnating in the US.
Currency and yield curve markets experienced slightly higher levels of volatility in the period and this resulted in derivatives driving a higher than typical level of total return. Although in line with the returns posted by the underlying cash bond markets, the fund’s use of forward and duration positions in managing relative exposures increased the derivative contributions to total return.
Outlook
The shape of the economic recovery depends on the trajectory of Covid-19, much of which will be determined by progress toward an effective antiviral therapy, a successful vaccine, and/or widely accessible and accurate testing capabilities. While progress has indeed been made in all of these areas, outcomes are still challenging to predict with certainty. A recovery is also reliant on the scope of continued fiscal and monetary support, as well as other relief packages, in the US and globally. Thus, our focus remains on investing in companies we believe have the ability to successfully navigate the crisis and generate value over the longer-term.
In equities, some of our holdings have been beneficiaries of the disruption, notably e-commerce companies, those with cloud offerings, and an online connected fitness company. For these businesses, the pandemic has accelerated demand. Many of our companies have leveraged this period of disruption to reduce costs. Some have increased use of augmented reality and virtual reality technologies to perform virtual sales and service visits. Many companies are reducing (or assessing) their real estate footprints; we anticipate an increased percentage of the work force will be working-from-home for an extended period of time. Across the portfolio, companies are opportunistically shoring up their balance sheets to ready themselves for a longer period of uncertainty, and in some cases positioning themselves for potential attractive opportunities.
Volatility has created attractive entry points for a number of new holdings in various industries. Over the 12 months we have added a diverse group of technology names spanning digital payments, cloud storage and collaboration, and semiconductor equipment. We have selectively initiated positions in consumer-related names, focusing on best-in-class retailers with compelling value propositions and the growing online fitness industry. We continue to have no direct exposure to the energy or utilities sectors as we typically (and certainly currently) do not find many opportunities which meet our three performance drivers.
As uncertainty around the pandemic persists, global equities could be impacted further. There is also the potential for heightened volatility in the fourth quarter with the US presidential elections in November. However, we believe our equity securities have sustainable competitive advantages and strong balance sheets which will prove resilient. This is evidenced by the portfolio’s average return on equity, which is meaningfully higher
LOOMIS SAYLES GLOBAL ALLOCATION FUND
than the MSCI ACWI benchmark, and financial leverage which is significantly less than the benchmark by our measures . This should allow most of our holdings the flexibility to weather challenging environments, and quite possibly emerge stronger.
In fixed income, we see opportunity for credit spreads to tighten further, albeit at a more gradual pace than we saw in the second quarter of 2020. Corporate credit offers an attractive yield advantage and our base case is that we are in the credit repair phase of the credit cycle. The credit repair phase is typically characterized by companies fortifying their balance sheets, reducing leverage, and cutting costs. Despite the weakening fundamental picture, corporate credit remains supported by a strong technical backdrop headlined by committed central bank support.
We expect US Treasury yields to trade in a fairly tight range through the US presidential election and into year end. We see more potential for yields to rise as we move into 2021, especially in the intermediate and long portions of the yield curve (which depicts the relationship among bond yields across the maturity spectrum). Rising prospects for a vaccine rollout could be a catalyst for yields to rise, especially for longer maturities given our view that the Fed will maintain very low short rates for the foreseeable future.
The probability of a multi-year weak dollar regime is rising as we head through the credit repair phase of the cycle. We expect that the US output gap will remain large for another year, reinforcing the Fed’s commitment to keeping rates lower for longer. Against this backdrop, there is also the possibility that European macroeconomic indicators normalize more quickly, which would reinforce the probability of a more sustained period of dollar weakness.
Hypothetical Growth of $100,000 Investment in Class Y Shares4
September 30, 2010 through September 30, 2020
See notes to chart on page 13.
Top Ten Holdings as of September 30, 2020
| | | | | | |
| | | Security Name | | % of
Assets | |
| 1 | | Danaher Corp. | | | 3.08 | % |
| 2 | | Amazon.com, Inc. | | | 2.99 | |
| 3 | | Alibaba Group Holding Ltd., Sponsored ADR | | | 2.79 | |
| 4 | | MasterCard, Inc., Class A | | | 2.55 | |
| 5 | | IQVIA Holdings, Inc. | | | 2.38 | |
| 6 | | Roper Technologies, Inc. | | | 2.38 | |
| 7 | | Facebook, Inc., Class A | | | 2.32 | |
| 8 | | Linde PLC | | | 2.24 | |
| 9 | | S&P Global, Inc. | | | 2.22 | |
| 10 | | UnitedHealth Group, Inc. | | | 2.15 | |
The portfolio is actively managed and holdings are subject to change. There is no guarantee the Fund continues to invest in the securities referenced. The holdings listed exclude any temporary cash investments.
Average Annual Total Returns — September 30, 20204
| | | | | | | | | | | | | | | | | | | | | | | | |
| | | | | | |
| | | | | | | | | | | | Life of | | | Expense Ratios5 | |
| | | 1 Year | | | 5 Years | | | 10 Years | | | Class N | | | Gross | | | Net | |
| | | | |
| Class Y (Inception 5/1/96) | | | | | | | | | | | | | |
| NAV | | | 13.70 | % | | | 11.08 | % | | | 9.42 | % | | | — | % | | | 0.91 | % | | | 0.91 | % |
| | | | | | | |
| Class A (Inception 2/1/06) | | | | | | | | | | | | | | | | | | | | | | | | |
| NAV | | | 13.41 | | | | 10.79 | | | | 9.15 | | | | — | | | | 1.16 | | | | 1.16 | |
| With 5.75% Maximum Sales Charge | | | 6.89 | | | | 9.48 | | | | 8.50 | | | | — | | | | | | | | | |
| | | | |
| Class C (Inception 2/1/06) | | | | | | | | | | | | | |
| NAV | | | 12.55 | | | | 9.97 | | | | 8.33 | | | | — | | | | 1.91 | | | | 1.91 | |
| With CDSC1 | | | 11.55 | | | | 9.97 | | | | 8.33 | | | | — | | | | | | | | | |
| | | | | | | |
| Class N (Inception 2/1/17) | | | | | | | | | | | | | | | | | | | | | | | | |
| NAV | | | 13.78 | | | | — | | | | — | | | | 12.22 | | | | 0.82 | | | | 0.82 | |
| | | | | | | |
| Comparative Performance | | | | | | | | | | | | | | | | | | | | | | | | |
| MSCI All Country World Index (Net)2 | | | 10.44 | | | | 10.30 | | | | 8.55 | | | | 9.62 | | | | | | | | | |
| Blended Index3 | | | 9.26 | | | | 7.96 | | | | 6.24 | | | | 7.96 | | | | | | | | | |
Performance data shown represents past performance and is no guarantee of, and not necessarily indicative of, future results. Total return and value will vary, and you may have a gain or loss when shares are sold. Current performance may be lower or higher than quoted. For most recent month-end performance, visit im.natixis.com. Performance for other share classes will be greater or less than shown based on differences in fees and sales charges. You may not invest directly in an index. Performance for periods less than one year is cumulative, not annualized. Returns reflect changes in share price and reinvestment of dividends and capital gains, if any. The table(s) do not reflect taxes shareholders might owe on any fund distributions or when they redeem their shares.
| 1 | Performance for Class C shares assumes a 1% contingent deferred sales charge (“CDSC”) applied when you sell shares within one year of purchase. |
| 2 | The MSCI All Country World Index (Net) is a free float-adjusted market capitalization weighted index that is designed to measure the equity market performance of developed and emerging markets. |
| 3 | The Blended Index is an unmanaged, blended index composed of the following weights: 60% MSCI All Country World Index (Net) and 40% Bloomberg Barclays Global Aggregate Bond Index. The Bloomberg Barclays Global Aggregate Bond Index provides a broad-based measure of the global investment-grade fixed income markets. The four major components of this index are the U.S. Aggregate, the Pan-European Aggregate, the Asian-Pacific Aggregate, and the Canadian Aggregate Indices. The index also includes Eurodollar and Euro-Yen corporate bonds, Canadian government, agency and corporate securities, and USD investment grade 144A securities. |
| 4 | Fund performance has been increased by fee waivers and/or expense reimbursements, if any, without which performance would have been lower. |
| 5 | Expense ratios are as shown in the Fund’s prospectus in effect as of the date of this report. The expense ratios for the current reporting period can be found in the Financial Highlights section of this report under Ratios to Average Net Assets. Net expenses reflect contractual expense limitations set to expire on 1/31/21. When a Fund’s expenses are below the limitation, gross and net expense ratios will be the same. See Note 6 of the Notes to Financial Statements for more information about the Fund’s expense limitations. |
ADDITIONAL INFORMATION
The views expressed in this report reflect those of the portfolio managers as of the dates indicated. The managers’ views are subject to change at any time without notice based on changes in market or other conditions. References to specific securities or industries should not be regarded as investment advice. Because the Fund is actively managed, there is no assurance that they will continue to invest in the securities or industries mentioned.
All investing involves risk, including the risk of loss. There is no assurance that any investment will meet its performance objectives or that losses will be avoided.
ADDITIONAL INDEX INFORMATION
This document may contain references to third party copyrights, indexes, and trademarks, each of which is the property of its respective owner. Such owner is not affiliated with Natixis Investment Managers or any of its related or affiliated companies (collectively “Natixis Affiliates”) and does not sponsor, endorse or participate in the provision of any Natixis Affiliates services, funds or other financial products.
The index information contained herein is derived from third parties and is provided on an “as is” basis. The user of this information assumes the entire risk of use of this information. Each of the third party entities involved in compiling, computing or creating index information disclaims all warranties (including, without limitation, any warranties of originality, accuracy, completeness, timeliness, non-infringement, merchantability and fitness for a particular purpose) with respect to such information.
PROXY VOTING INFORMATION
A description of the Natixis Funds’ proxy voting policies and procedures is available without charge, upon request, by calling Natixis Funds at 800-225-5478; on the Fund’s website at im.natixis.com; and on the Securities and Exchange Commission’s (“SEC’s”) website at www.sec.gov. Information regarding how the Fund voted proxies relating to portfolio securities the most recent 12-month period ended June 30 is available from the Fund’s website and the SEC’s website.
QUARTERLY PORTFOLIO SCHEDULES
The Natixis Funds file complete schedules of portfolio holdings with the SEC for the first and third quarters of each fiscal year on Form N-PORT. The Funds’ Form N-PORT reports are available on the SEC’s website at www.sec.gov.
CFA® and Chartered Financial Analyst® are registered trademarks owned by the CFA Institute.
UNDERSTANDING FUND EXPENSES
As a mutual fund shareholder, you incur different costs: transaction costs, including sales charges (loads) on purchases and contingent deferred sales charges on redemptions; and ongoing costs, including management fees, distribution and/or service fees (12b-1 fees), and other fund expenses. Certain exemptions may apply. These costs are described in more detail in the Fund’s prospectuses. The following examples are intended to help you understand the ongoing costs of investing in the Fund and help you compare these with the ongoing costs of investing in other mutual funds.
The first line in the table of each class of Fund shares shows the actual account values and actual fund expenses you would have paid on a $1,000 investment in the Fund from April 1, 2020 through September 30, 2020. To estimate the expenses you paid over the period, simply divide your account value by $1,000 (for example $8,600 account value divided by $1,000 = 8.6) and multiply the result by the number in the Expenses Paid During Period column as shown below for your class.
The second line in the table of each class of Fund shares provides information about hypothetical account values and hypothetical expenses based on the Fund’s actual expense ratios and an assumed rate of return of 5% per year before expenses, which is not the Fund’s actual return. The hypothetical account values and expenses may not be used to estimate the actual ending account balance or expenses you paid on your investment for the period. You may use this information to compare the ongoing costs of investing in the Fund to other funds. To do so, compare this 5% hypothetical example with the 5% hypothetical examples that appear in the shareholder reports of the other funds.
Please note that the expenses shown reflect ongoing costs only, and do not include any transaction costs, such as sales charges. Therefore, the second line in the table of the fund is useful in comparing ongoing costs only, and will not help you determine the relative costs of owning different funds. If transaction costs were included, total costs would be higher.
| | | | | | | | | | | | |
| LOOMIS SAYLES CORE PLUS BOND FUND | | BEGINNING ACCOUNT VALUE
4/1/2020 | | | ENDING ACCOUNT VALUE
9/30/2020 | | | EXPENSES PAID DURING PERIOD*
4/1/2020 - 9/30/2020 | |
| Class A | | | | | | | | | | | | |
| Actual | | | $1,000.00 | | | | $1,067.30 | | | | $3.67 | |
| Hypothetical (5% return before expenses) | | | $1,000.00 | | | | $1,021.45 | | | | $3.59 | |
| Class C | | | | | | | | | | | | |
| Actual | | | $1,000.00 | | | | $1,062.90 | | | | $7.53 | |
| Hypothetical (5% return before expenses) | | | $1,000.00 | | | | $1,017.70 | | | | $7.36 | |
| Class N | | | | | | | | | | | | |
| Actual | | | $1,000.00 | | | | $1,069.20 | | | | $1.97 | |
| Hypothetical (5% return before expenses) | | | $1,000.00 | | | | $1,023.10 | | | | $1.92 | |
| Class Y | | | | | | | | | | | | |
| Actual | | | $1,000.00 | | | | $1,068.80 | | | | $2.38 | |
| Hypothetical (5% return before expenses) | | | $1,000.00 | | | | $1,022.70 | | | | $2.33 | |
| * | Expenses are equal to the Fund’s annualized expense ratio: 0.71%, 1.46%, 0.38% and 0.46% for Class A, C, N and Y, respectively, multiplied by the average account value over the period, multiplied by the number of days in the most recent fiscal half-year (183), divided by 366 (to reflect the half-year period). |
| | | | | | | | | | | | |
LOOMIS SAYLES GLOBAL ALLOCATION
FUND | | BEGINNING
ACCOUNT VALUE
4/1/2020 | | | ENDING
ACCOUNT VALUE
9/30/2020 | | | EXPENSES PAID
DURING PERIOD*
4/1/2020 - 9/30/2020 | |
| Class A | | | | | | | | | | | | |
| Actual | | | $1,000.00 | | | | $1,247.90 | | | | $6.46 | |
| Hypothetical (5% return before expenses) | | | $1,000.00 | | | | $1,019.25 | | | | $5.81 | |
| Class C | | | | | | | | | | | | |
| Actual | | | $1,000.00 | | | | $1,243.00 | | | | $10.65 | |
| Hypothetical (5% return before expenses) | | | $1,000.00 | | | | $1,015.50 | | | | $9.57 | |
| Class N | | | | | | | | | | | | |
| Actual | | | $1,000.00 | | | | $1,249.80 | | | | $4.61 | |
| Hypothetical (5% return before expenses) | | | $1,000.00 | | | | $1,020.90 | | | | $4.14 | |
| Class Y | | | | | | | | | | | | |
| Actual | | | $1,000.00 | | | | $1,249.20 | | | | $5.06 | |
| Hypothetical (5% return before expenses) | | | $1,000.00 | | | | $1,020.50 | | | | $4.55 | |
| * | Expenses are equal to the Fund’s annualized expense ratio: 1.15%, 1.90%, 0.82% and 0.90% for Class A, C, N and Y, respectively, multiplied by the average account value over the period, multiplied by the number of days in the most recent fiscal half-year (183), divided by 366 (to reflect the half-year period). |
BOARD APPROVAL OF THE EXISTING
ADVISORY AGREEMENTS
The Board of Trustees of the Trusts (the “Board”), including the Independent Trustees, considers matters bearing on each Fund’s advisory agreement (collectively, the “Agreements”) at most of its meetings throughout the year. Each year, usually in the spring, the Contract Review Committee of the Board meets to review the Agreements to determine whether to recommend that the full Board approve the continuation of the Agreements, typically for an additional one-year period. After the Contract Review Committee has made its recommendation, the full Board, including the Independent Trustees, determines whether to approve the continuation of the Agreements.
In connection with these meetings, the Trustees receive materials that the Funds’ investment adviser and Loomis Sayles Core Plus Bond Fund’s advisory administrator (the “Advisers”) believes to be reasonably necessary for the Trustees to evaluate the Agreements. These materials generally include, among other items, (i) information on the investment performance of the Funds and the performance of peer groups of funds and the Funds’ performance benchmarks, (ii) information on the Funds’ advisory fees and other expenses, including information comparing the Funds’ advisory fees to the fees charged to institutional accounts with similar strategies managed by the Advisers, if any, and to those of peer groups of funds and information about any applicable expense caps and/or fee “breakpoints,” (iii) sales and redemption data in respect of the Funds, (iv) information about the profitability of the Agreements to the Advisers and (v) information obtained through the completion by the Advisers of a questionnaire distributed on behalf of the Trustees. The Board, including the Independent Trustees, also considers other matters such as (i) each Fund’s investment objective and strategies and the size, education and experience of the Advisers’ investment staffs and their use of technology, external research and trading cost measurement tools, (ii) arrangements in respect of the distribution of the Funds’ shares and the related costs, (iii) the allocation of the Funds’ brokerage, if any, including, to the extent applicable, the use of “soft” commission dollars to pay for research and other similar services, (iv) the Advisers’ policies and procedures relating to, among other things, compliance, trading and best execution, proxy voting and valuation, (v) information about amounts invested by the Funds’ portfolio managers in the Funds or in similar accounts that they manage and (vi) the general economic outlook with particular emphasis on the mutual fund industry. Throughout the process, the Trustees are afforded the opportunity to ask questions of and request additional materials from the Advisers.
In addition to the materials requested by the Trustees in connection with their annual consideration of the continuation of the Agreements, the Trustees receive materials in advance of each regular quarterly meeting of the Board that provide detailed information about the Funds’ investment performance and the fees charged to the Funds for advisory and other services. This information generally includes, among other things, an internal performance rating for each Fund based on agreed-upon criteria, graphs showing each Fund’s performance and expense differentials against each Fund’s peer group/category, performance ratings provided by a third-party, total return information for various periods, and third-party performance rankings for various periods comparing a Fund against similarly categorized funds. The portfolio management team for each Fund or other
representatives of the Advisers make periodic presentations to the Contract Review Committee and/or the full Board, and Funds identified as presenting possible performance concerns may be subject to more frequent Board or Committee presentations and reviews. In addition, each quarter the Trustees are provided with detailed statistical information about each Fund’s portfolio. The Trustees also receive periodic updates between meetings. These updates have increased in frequency during the Covid-19 crisis.
The Board most recently approved the continuation of the Agreements for a one-year period at its meeting held in June 2020. In considering whether to approve the continuation of the Agreements, the Board, including the Independent Trustees, did not identify any single factor as determinative. Individual Trustees may have evaluated the information presented differently from one another, giving different weights to various factors. Matters considered by the Trustees, including the Independent Trustees, in connection with their approval of the Agreements included, but were not limited to, the factors listed below.
The nature, extent and quality of the services provided to the Funds under the Agreements. The Trustees considered the nature, extent and quality of the services provided by the Advisers and their affiliates to the Funds and the resources dedicated to the Funds by the Advisers and their affiliates.
The Trustees considered not only the advisory services provided by the Advisers to the Funds, but also the monitoring and oversight services provided by Natixis Advisors, L.P. (“Natixis Advisors”). They also considered the administrative and shareholder services provided by Natixis Advisors and its affiliates to the Funds. They also took into consideration increases in the services provided resulting from new regulatory requirements.
For each Fund, the Trustees also considered the benefits to shareholders of investing in a mutual fund that is part of a family of funds that offers shareholders the right to exchange shares of one type of fund for shares of another type of fund, and provides a variety of fund and shareholder services.
After reviewing these and related factors, the Trustees concluded, within the context of their overall conclusions regarding each of the Agreements, that the nature, extent and quality of services provided supported the renewal of the Agreements.
Investment performance of the Funds and the Advisers. As noted above, the Trustees received information about the performance of the Funds over various time periods, including information that compared the performance of the Funds to the performance of peer groups and categories of funds and the Funds’ respective performance benchmarks. In addition, the Trustees reviewed data prepared by an independent third party that analyzed the performance of the Funds using a variety of performance metrics, including metrics that measured the performance of the Funds on a risk adjusted basis.
The Board noted that, through December 31, 2019, each Fund’s one-, three- and five-year performance stated as percentile rankings within categories selected by the independent third-party data provider was as follows (where the best performance would be in the first percentile of its category):
| | | | | | | | | | | | |
| | | One-Year | | | Three-Year | | | Five-Year | |
Loomis Sayles Core Plus Bond Fund | | | 64 | % | | | 42 | % | | | 52 | % |
Loomis Sayles Global Allocation Fund | | | 6 | % | | | 1 | % | | | 1 | % |
In the case of a Fund that had performance that lagged that of a relevant category median as determined by the independent third party for certain (although not necessarily all) periods, the Board concluded that other factors relevant to performance supported renewal of the Agreements. These factors included: (1) that the underperformance was attributable, to a significant extent, to investment decisions (such as security selection or sector allocation) by the Advisers that were reasonable and consistent with the Fund’s investment objective and policies and (2) that the Fund’s more recent performance has been stronger relative to its category. The Board also considered information about the Funds’ more recent performance, including how that performance had been impacted by the Covid-19 crisis.
The Trustees also considered the Advisers’ performance and reputation generally, the performance of the fund family generally, and the historical responsiveness of the Advisers to Trustee concerns about performance and the willingness of the Advisers to take steps intended to improve performance.
After reviewing these and related factors, the Trustees concluded, within the context of their overall conclusions regarding each of the Agreements, that the performance of the Funds and the Advisers and/or other relevant factors supported the renewal of the Agreements.
The costs of the services to be provided and profits to be realized by the Advisers and their affiliates from their respective relationships with the Funds. The Trustees considered the fees charged to the Funds for advisory and administrative services as well as the total expense levels of the Funds. This information included comparisons (provided both by management and by an independent third party) of the Funds’ advisory fees and total expense levels to those of their peer groups and information about the advisory fees charged by the Advisers to comparable accounts (such as institutional separate accounts), as well as information about differences in such fees and the reasons for any such differences. In considering the fees charged to comparable accounts, the Trustees considered, among other things, management’s representations about the differences between managing mutual funds as compared to other types of accounts, including the additional resources required to effectively manage mutual fund assets, the greater regulatory costs associated with the management of such assets, and the entrepreneurial, regulatory and other risks associated with sponsoring and managing mutual funds. In evaluating each Fund’s advisory fee, the Trustees also took into account the demands, complexity and quality of the investment management of such Fund, as well as the need for the Advisers to offer competitive compensation and the potential need to expend additional resources to the extent the Fund grows in size. The Trustees considered that over the past several years, management had made recommendations regarding reductions in advisory fee rates, implementation of
advisory fee breakpoints and the institution of advisory fee waivers and expense caps for various funds in the fund family. They noted that the Funds have expense caps in place, and that the current expenses were below their caps. They also considered the material terms of the Fund’s expense cap agreement. They further noted that management had proposed to reduce the expense cap for Loomis Sayles Core Plus Bond Fund on all share classes, effective as of July 1, 2020. The Trustees also noted that the total advisory fee rate for each Fund was at the median of its peer group of funds.
The Trustees also considered the compensation directly or indirectly received by the Advisers and their affiliates from their relationships with the Funds. The Trustees reviewed information provided by management as to the profitability of the Advisers’ and their affiliates’ relationships with the Funds, and information about how expenses are determined and allocated for purposes of profitability calculations. They also reviewed information provided by management about the effect of distribution costs and changes in asset levels on Adviser profitability, including information regarding resources spent on distribution activities. When reviewing profitability, the Trustees also considered information about court cases in which adviser compensation or profitability were issues, the performance of the Funds, the expense levels of the Funds, whether the Advisers had implemented breakpoints and/or expense caps with respect to such Funds and the overall profit margin of Natixis Investment Managers compared to that of certain other investment managers for which such data was available.
After reviewing these and related factors, the Trustees concluded, within the context of their overall conclusions regarding the Agreements, that the advisory fee charged to each of the Funds was fair and reasonable, and that the costs of these services generally and the related profitability of the Advisers and their affiliates in respect of their relationships with the Funds supported the renewal of the Agreements.
Economies of Scale. The Trustees considered the existence of any economies of scale in the provision of services by the Advisers and whether those economies are shared with the Funds through breakpoints in their investment advisory fees or other means, such as expense caps. The Trustees also considered management’s explanation of the factors that are taken into account with respect to the implementation of breakpoints in investment advisory fees or expense caps. With respect to economies of scale, the Trustees noted that each of the Funds had breakpoints in its advisory fee and that each of the Funds was subject to an expense cap. The Trustees also considered management’s proposal to reduce the expense cap for Loomis Sayles Core Plus Bond Fund. In considering these issues, the Trustees also took note of the costs of the services provided (both on an absolute and on a relative basis) and the profitability to the Advisers and their affiliates of their relationships with the Funds, as discussed above. The Trustees also considered that the Funds have benefitted from the substantial reinvestment each Adviser has made into its business.
After reviewing these and related factors, the Trustees concluded, within the context of their overall conclusions regarding the Agreements, that the extent to which economies of scale were shared with the Funds supported the renewal of the Agreements.
The Trustees also considered other factors, which included but were not limited to the following:
| · | | The effect of recent market and economic events, including but not limited to the Covid-19 crisis, on the performance, asset levels and expense ratios of each Fund. |
| · | | Whether each Fund has operated in accordance with its investment objective and the Fund’s record of compliance with its investment restrictions, and the compliance programs of the Funds and the Advisers. They also considered the compliance-related resources the Advisers and their affiliates were providing to the Funds. |
| · | | So-called “fallout benefits” to the Advisers, such as the engagement of affiliates of the Advisers to provide distribution and administrative services to the Funds, and the benefits of research made available to the Advisers by reason of brokerage commissions (if any) generated by the Funds’ securities transactions. The Trustees also considered the benefits to the parent company of Natixis Advisors from the retention of the Advisers. The Trustees considered the possible conflicts of interest associated with these fallout and other benefits, and the reporting, disclosure and other processes in place to disclose and monitor such possible conflicts of interest. |
| · | | The Trustees’ review and discussion of the Funds’ advisory arrangements in prior years, and management’s record of responding to Trustee concerns raised during the year and in prior years. |
Based on their evaluation of all factors that they deemed to be material, including those factors described above, and assisted by the advice of independent counsel, the Trustees, including the Independent Trustees, concluded that the existing Agreements should be continued through June 30, 2021.
Liquidity Risk Management Program
Annual Report for the Period Commencing on December 1, 2018 and ending December 31, 2019 (including updates through September 30, 2020)
Effective December 1, 2018, the Funds adopted a liquidity risk management program (the “Program”) pursuant to the requirements of Rule 22e-4 under the Investment Company Act of 1940, as amended (the “Rule”). The Rule requires registered open-end funds, including mutual funds and exchange-traded funds to establish liquidity risk management programs in order to effectively manage fund liquidity and mitigate the risk that a fund could not meet redemption requests without significantly diluting the interests of remaining investors.
The rule requires the Funds to assess, manage and review their liquidity risk considering applicable factors during normal and foreseeable stressed conditions. In fulfilling this requirement, each Fund assesses and reviews (where applicable and amongst other matters) its investment strategy, portfolio holdings, possible investment concentrations, use of derivatives, short-term and long-term cash flow projections, use of cash and cash equivalents, as well as borrowing arrangements and other funding sources. Each Program has established a Program Administrator which is the adviser of the Fund.
In accordance with the Program, each of the Funds’ portfolio investments is classified into one of four liquidity categories based on a determination of a reasonable expectation for how long it would take to convert the investment to cash (or sell or dispose of the investment) without significantly changing its market value.
Each Fund is prohibited from acquiring an investment if, after the acquisition, its holdings of illiquid assets will exceed 15% of its net assets. If a Fund does not hold a majority of highly liquid investments in its portfolio, then the Fund is required to establish a highly liquid investment minimum (“HLIM”). Loomis Sayles Core Plus Bond Fund has established an HLIM.
During the period from December 1, 2018 to December 31, 2019, there were no material changes to the Program and no material events that impacted the operation of the Funds’ Programs. During the period, the Funds held sufficient liquid assets to meet redemptions on a timely basis and did not have any HLIM or illiquid security violations during the period.
During the period January 1, 2020 through September 30, 2020, the Funds held sufficient liquid assets to meet redemptions on a timely basis and did not have any HLIM or illiquid security violations.
Annual Program Assessment and Conclusion
In the opinion of the Program Administrator, the Program of each Fund approved by the Funds’ Board has been implemented effectively. The Program Administrator has also monitored, assessed and managed each Fund’s liquidity risk regularly and has determined that the Program is operating effectively.
Pursuant to the Rule’s requirements, the Board has received and reviewed a written report prepared by each Fund’s Program Administrator that addressed the operation of the Program, assessed its adequacy and effectiveness and described any material changes made to the Program.
Portfolio of Investments – as of September 30, 2020
Loomis Sayles Core Plus Bond Fund
| | | | | | | | |
Principal
Amount (‡) | | | Description | | Value (†) | |
| | Bonds and Notes — 89.0% of Net Assets | |
| | Non-Convertible Bonds — 88.8% | |
| | | | ABS Car Loan — 0.7% | |
| $ | 11,349,000 | | | Avis Budget Rental Car Funding AESOP LLC, Series 2016-1A, Class A, 2.990%, 6/20/2022, 144A | | $ | 11,440,396 | |
| | 14,245,000 | | | Avis Budget Rental Car Funding AESOP LLC, Series 2016-2A, Class A,
2.720%, 11/20/2022, 144A | | | 14,457,504 | |
| | 9,825,000 | | | Avis Budget Rental Car Funding AESOP LLC, Series 2017-1A, Class A,
3.070%, 9/20/2023, 144A | | | 10,073,071 | |
| | 4,732,000 | | | Avis Budget Rental Car Funding AESOP LLC, Series 2019-1A, Class A,
3.450%, 3/20/2023, 144A | | | 4,842,289 | |
| | 7,691,697 | | | CarMax Auto Owner Trust, Series 2019-4, Class A2A, 2.010%, 3/15/2023 | | | 7,751,935 | |
| | 7,058,000 | | | Credit Acceptance Auto Loan Trust, Series 2017-3A, Class B,
3.210%, 8/17/2026, 144A | | | 7,090,924 | |
| | 3,205,779 | | | Santander Drive Auto Receivables Trust, Series 2018-2, Class C,
3.350%, 7/17/2023 | | | 3,242,969 | |
| | 2,350,000 | | | Santander Drive Auto Receivables Trust, Series 2019-3, Class A3,
2.160%, 11/15/2022 | | | 2,359,512 | |
| | | | | | | | |
| | | | | | | 61,258,600 | |
| | | | | | | | |
| | | | ABS Credit Card — 0.1% | |
| | 10,552,000 | | | World Financial Network Credit Card Master Trust, Series 2016-A, Class A,
2.030%, 4/15/2025 | | | 10,657,512 | |
| | | | | | | | |
| | | | ABS Home Equity — 1.1% | |
| | 1,705,593 | | | Bayview Koitere Fund Trust, Series 2017-SPL3, Class A,
4.000%, 11/28/2053, 144A(a) | | | 1,775,817 | |
| | 2,138,733 | | | Bayview Opportunity Master Fund IVa Trust, Series 2016-SPL1, Class A,
4.000%, 4/28/2055, 144A | | | 2,196,552 | |
| | 1,226,247 | | | Bayview Opportunity Master Fund IVa Trust, Series 2017-RT1, Class A1,
3.000%, 3/28/2057, 144A(a) | | | 1,257,587 | |
| | 6,567,657 | | | Bayview Opportunity Master Fund IVa Trust, Series 2017-RT5, Class A,
3.500%, 5/28/2069, 144A(a) | | | 6,795,801 | |
| | 3,766,958 | | | Bayview Opportunity Master Fund IVa Trust, Series 2017-SPL1, Class A,
4.000%, 10/28/2064, 144A(a) | | | 3,916,689 | |
| | 1,541,848 | | | Bayview Opportunity Master Fund IVb Trust, Series 2017-SPL2, Class A,
4.000%, 6/28/2054, 144A(a) | | | 1,582,979 | |
| | 5,508,713 | | | CoreVest American Finance Trust, Series 2019-3, Class A,
2.705%, 10/15/2052, 144A | | | 5,713,562 | |
| | 27,373 | | | Countrywide Asset-Backed Certificates, Series 2004-S1, Class A3,
5.115%, 2/25/2035(a)(b)(c) | | | 27,065 | |
| | 23,033,673 | | | Invitation Homes Trust, Series 2018-SFR2, Class A,
1-month LIBOR + 0.900%, 1.052%, 6/17/2037, 144A(d) | | | 22,990,393 | |
| | 6,379,100 | | | Lanark Master Issuer PLC, Series 2019-1A, Class 1A1,
3-month LIBOR + 0.770%, 1.026%, 12/22/2069, 144A(d) | | | 6,387,431 | |
| | 1,417,875 | | | Mill City Mortgage Loan Trust, Series 2016-1, Class A1,
2.500%, 4/25/2057, 144A(a) | | | 1,437,202 | |
| | 5,200,384 | | | Onslow Bay Financial LLC, Series 2018-EXP1, Class 1A3,
4.000%, 4/25/2048, 144A(a) | | | 5,408,800 | |
| | | | |
| 23 | | | See accompanying notes to financial statements. | | |
Portfolio of Investments – as of September 30, 2020
Loomis Sayles Core Plus Bond Fund – (continued)
| | | | | | | | |
Principal
Amount (‡) | | | Description | | Value (†) | |
| | | | ABS Home Equity — continued | |
| $ | 1,482,395 | | | Sequoia Mortgage Trust, Series 2017-CH1, Class A1,
4.000%, 8/25/2047, 144A(a) | | $ | 1,534,018 | |
| | 1,068,352 | | | Sequoia Mortgage Trust, Series 2017-CH2, Class A10,
4.000%, 12/25/2047, 144A(a) | | | 1,075,693 | |
| | 3,328,656 | | | Sequoia Mortgage Trust, Series 2018-CH1, Class A1,
4.000%, 2/25/2048, 144A(a) | | | 3,408,558 | |
| | 6,751,714 | | | Sequoia Mortgage Trust, Series 2018-CH3, Class A2,
4.000%, 8/25/2048, 144A(a) | | | 6,942,250 | |
| | 1,454,000 | | | Towd Point Mortgage Trust, Series 2015-1, Class A5,
3.660%, 10/25/2053, 144A(a) | | | 1,530,926 | |
| | 2,916,031 | | | Towd Point Mortgage Trust, Series 2015-2, Class 1A12,
2.750%, 11/25/2060, 144A(a) | | | 2,946,340 | |
| | 4,763,689 | | | Towd Point Mortgage Trust, Series 2015-4, Class M2,
3.750%, 4/25/2055, 144A(a) | | | 5,127,934 | |
| | 3,759,327 | | | Towd Point Mortgage Trust, Series 2016-2, Class A1A,
2.750%, 8/25/2055, 144A(a) | | | 3,853,506 | |
| | 5,712,060 | | | Towd Point Mortgage Trust, Series 2016-2, Class M2,
3.000%, 8/25/2055, 144A(a) | | | 6,007,664 | |
| | 10,281,531 | | | Towd Point Mortgage Trust, Series 2018-3, Class A1,
3.750%, 5/25/2058, 144A(a) | | | 11,120,481 | |
| | | | | | | | |
| | | | | | | 103,037,248 | |
| | | | | | | | |
| | | | ABS Student Loan — 0.0% | |
| | 4,229,000 | | | SoFi Professional Loan Program Trust, Series 2020-A, Class A2FX,
2.540%, 5/15/2046, 144A | | | 4,389,097 | |
| | | | | | | | |
| | | | ABS Whole Business — 0.3% | |
| | 17,992,598 | | | Coinstar Funding LLC, Series 2017-1A, Class A2,
5.216%, 4/25/2047, 144A | | | 17,071,342 | |
| | 13,471,080 | | | Planet Fitness Master Issuer LLC, Series 2018-1A, Class A2I,
4.262%, 9/05/2048, 144A | | | 13,473,640 | |
| | | | | | | | |
| | | | | | | 30,544,982 | |
| | | | | | | | |
| | | | Aerospace & Defense — 1.3% | |
| | 18,782,000 | | | Boeing Co. (The), 5.705%, 5/01/2040 | | | 22,142,519 | |
| | 18,792,000 | | | Boeing Co. (The), 5.805%, 5/01/2050 | | | 22,734,188 | |
| | 3,595,000 | | | Boeing Co. (The), 5.930%, 5/01/2060 | | | 4,449,313 | |
| | 874,000 | | | Bombardier, Inc., 5.750%, 3/15/2022, 144A | | | 846,906 | |
| | 14,175,000 | | | Embraer Netherlands Finance BV, 5.050%, 6/15/2025 | | | 13,608,000 | |
| | 1,813,000 | | | General Dynamics Corp., 4.250%, 4/01/2050 | | | 2,367,874 | |
| | 4,685,000 | | | Huntington Ingalls Industries, Inc., 4.200%, 5/01/2030, 144A | | | 5,377,416 | |
| | 13,257,000 | | | Raytheon Technologies Corp., 2.250%, 7/01/2030 | | | 14,021,093 | |
| | 29,465,000 | | | Textron, Inc., 3.000%, 6/01/2030 | | | 31,034,155 | |
| | | | | | | | |
| | | | | | | 116,581,464 | |
| | | | | | | | |
| | | | Agency Commercial Mortgage-Backed Securities — 1.4% | |
| | 5,968,533 | | | Federal National Mortgage Association, Series 2015-M17, Class A2,
3.014%, 11/25/2025(a) | | | 6,541,285 | |
| | 19,323,414 | | | Federal National Mortgage Association, Series 2017-M14, Class A2,
2.972%, 11/25/2027(a) | | | 21,783,416 | |
| | | | |
| | See accompanying notes to financial statements. | | | 24 |
Portfolio of Investments – as of September 30, 2020
Loomis Sayles Core Plus Bond Fund – (continued)
| | | | | | | | |
Principal
Amount (‡) | | | Description | | Value (†) | |
| | | | Agency Commercial Mortgage-Backed Securities — continued | |
| $ | 1,575,872 | | | Federal National Mortgage Association, Series 2017-M15, Class A2,
3.058%, 9/25/2027(a) | | $ | 1,774,949 | |
| | 7,206,290 | | | Federal National Mortgage Association, Series 2017-M3, Class A2,
2.565%, 12/25/2026(a) | | | 7,864,154 | |
| | 6,206,747 | | | Federal National Mortgage Association, Series 2017-M7, Class A2,
2.961%, 2/25/2027(a) | | | 6,943,209 | |
| | 11,259,203 | | | Federal National Mortgage Association, Series 2018-M1, Class A2,
3.084%, 12/25/2027(a) | | | 12,713,528 | |
| | 2,335,328 | | | Federal National Mortgage Association, Series 2018-M10, Class A2,
3.482%, 7/25/2028(a) | | | 2,715,669 | |
| | 17,016,566 | | | Federal National Mortgage Association, Series 2018-M7, Class A2,
3.150%, 3/25/2028(a) | | | 19,414,062 | |
| | 4,428,579 | | | Federal National Mortgage Association, Series 2018-M8, Class A2,
3.436%, 6/25/2028(a) | | | 5,131,048 | |
| | 2,629,617 | | | FHLMC Multifamily Structured Pass Through Certificates, Series K058, Class A2, 2.653%, 8/25/2026 | | | 2,904,364 | |
| | 5,881,039 | | | FHLMC Multifamily Structured Pass Through Certificates, Series K061, Class A2, 3.347%, 11/25/2026(a) | | | 6,736,917 | |
| | 6,640,495 | | | FHLMC Multifamily Structured Pass Through Certificates, Series K062, Class A2, 3.413%, 12/25/2026 | | | 7,642,316 | |
| | 4,846,745 | | | FHLMC Multifamily Structured Pass Through Certificates, Series K063, Class A2, 3.430%, 1/25/2027(a) | | | 5,593,829 | |
| | 868,628 | | | FHLMC Multifamily Structured Pass Through Certificates, Series K069, Class A2, 3.187%, 9/25/2027(a) | | | 997,496 | |
| | 1,243,610 | | | FHLMC Multifamily Structured Pass Through Certificates, Series K071, Class A2, 3.286%, 11/25/2027 | | | 1,433,887 | |
| | 7,637,281 | | | FHLMC Multifamily Structured Pass Through Certificates, Series K072, Class A2, 3.444%, 12/25/2027 | | | 8,911,532 | |
| | 2,420,767 | | | FHLMC Multifamily Structured Pass Through Certificates, Series K073, Class A2, 3.350%, 1/25/2028 | | | 2,800,703 | |
| | 9,934,637 | | | FHLMC Multifamily Structured Pass Through Certificates, Series K084, Class A2, 3.780%, 10/25/2028(a) | | | 11,751,010 | |
| | | | | | | | |
| | | | | | | 133,653,374 | |
| | | | | | | | |
| | | | Airlines — 0.4% | |
| | 442,490 | | | Continental Airlines Pass Through Trust, Series 2010-1, Class A,
4.750%, 7/12/2022 | | | 438,254 | |
| | 2,030,271 | | | Continental Airlines Pass Through Trust, Series 2012-2, Class A,
4.000%, 4/29/2026 | | | 1,943,051 | |
| | 18,085,000 | | | Delta Air Lines, Inc./SkyMiles IP Ltd., 4.750%, 10/20/2028, 144A | | | 18,777,278 | |
| | 15,670,000 | | | Southwest Airlines Co., 5.125%, 6/15/2027 | | | 17,129,127 | |
| | | | | | | | |
| | | | | | | 38,287,710 | |
| | | | | | | | |
| | | | Automotive — 2.4% | |
| | 11,401,000 | | | Ford Motor Credit Co. LLC, 3.336%, 3/18/2021 | | | 11,403,850 | |
| | 26,285,000 | | | Ford Motor Credit Co. LLC, 5.750%, 2/01/2021 | | | 26,449,281 | |
| | 15,580,000 | | | Ford Motor Credit Co. LLC, 5.875%, 8/02/2021 | | | 15,872,125 | |
| | 20,253,000 | | | General Motors Co., 5.000%, 4/01/2035 | | | 21,941,239 | |
| | | | |
| 25 | | | See accompanying notes to financial statements. | | |
Portfolio of Investments – as of September 30, 2020
Loomis Sayles Core Plus Bond Fund – (continued)
| | | | | | | | |
Principal
Amount (‡) | | | Description | | Value (†) | |
| | | | Automotive — continued | |
| $ | 7,913,000 | | | General Motors Financial Co., Inc., 2.900%, 2/26/2025 | | $ | 8,154,900 | |
| | 2,440,000 | | | Hyundai Capital America, 2.375%, 10/15/2027, 144A | | | 2,440,027 | |
| | 11,596,000 | | | Hyundai Capital America, 2.650%, 2/10/2025, 144A | | | 11,941,559 | |
| | 21,599,000 | | | Hyundai Capital America, 3.000%, 10/30/2020, 144A | | | 21,638,477 | |
| | 8,345,000 | | | Hyundai Capital America, 3.000%, 2/10/2027, 144A | | | 8,622,647 | |
| | 17,499,000 | | | Lear Corp., 5.250%, 5/15/2049 | | | 18,980,758 | |
| | 8,595,000 | | | Nissan Motor Co. Ltd., 3.043%, 9/15/2023, 144A | | | 8,712,876 | |
| | 16,460,000 | | | Nissan Motor Co. Ltd., 3.522%, 9/17/2025, 144A | | | 16,607,152 | |
| | 9,825,000 | | | Toyota Motor Corp., 2.358%, 7/02/2024 | | | 10,454,186 | |
| | 16,490,000 | | | Toyota Motor Credit Corp., MTN, 1.800%, 2/13/2025 | | | 17,228,270 | |
| | 7,946,000 | | | Volkswagen Group of America Finance LLC, 3.200%, 9/26/2026, 144A | | | 8,686,055 | |
| | 12,887,000 | | | Volkswagen Group of America Finance LLC, 3.750%, 5/13/2030, 144A | | | 14,496,290 | |
| | | | | | | | |
| | | | | | | 223,629,692 | |
| | | | | | | | |
| | | | Banking — 7.9% | |
| | 29,836,000 | | | Ally Financial, Inc., 3.050%, 6/05/2023 | | | 31,003,258 | |
| | 20,016,000 | | | American Express Co., 2.500%, 7/30/2024 | | | 21,303,604 | |
| | 11,254,000 | | | Banco Santander Chile, 2.700%, 1/10/2025, 144A | | | 11,863,123 | |
| | 15,204,000 | | | Banco Santander Chile, 3.875%, 9/20/2022, 144A | | | 16,040,220 | |
| | 29,885,000 | | | Bangkok Bank PCL, 4.050%, 3/19/2024, 144A | | | 32,488,454 | |
| | 9,656,000 | | | Bank of America Corp., (fixed rate to 12/20/2022, variable rate thereafter),
3.004%, 12/20/2023 | | | 10,136,823 | |
| | 54,402,000 | | | Bank of America Corp., (fixed rate to 4/23/2026, variable rate thereafter), MTN, 3.559%, 4/23/2027 | | | 60,763,226 | |
| | 6,700,000 | | | Barclays PLC, 3.200%, 8/10/2021 | | | 6,854,471 | |
| | 8,805,000 | | | BBVA Bancomer S.A., 1.875%, 9/18/2025, 144A | | | 8,602,485 | |
| | 29,799,000 | | | BNP Paribas S.A., (fixed rate to 11/19/2024, variable rate thereafter),
2.819%, 11/19/2025, 144A | | | 31,402,763 | |
| | 6,645,000 | | | Citigroup, Inc., 4.000%, 8/05/2024 | | | 7,311,999 | |
| | 28,532,000 | | | Citigroup, Inc., 4.050%, 7/30/2022 | | | 30,299,409 | |
| | 9,000,000 | | | Citigroup, Inc., (fixed rate to 3/31/2030, variable rate thereafter),
4.412%, 3/31/2031 | | | 10,788,537 | |
| | 5,853,000 | | | Credit Suisse AG, 2.100%, 11/12/2021 | | | 5,963,739 | |
| | 34,005,000 | | | DNB Bank ASA, 2.150%, 12/02/2022, 144A | | | 35,199,017 | |
| | 12,057,000 | | | Goldman Sachs Group, Inc. (The), 3.625%, 1/22/2023 | | | 12,888,384 | |
| | 14,766,000 | | | Goldman Sachs Group, Inc. (The), 6.750%, 10/01/2037 | | | 21,453,941 | |
| | 5,000,000 | | | Goldman Sachs Group, Inc. (The), (fixed rate to 6/5/2027, variable rate thereafter), 3.691%, 6/05/2028 | | | 5,604,644 | |
| | 2,605,000 | | | HSBC Holdings PLC, 4.950%, 3/31/2030 | | | 3,135,908 | |
| | 18,906,000 | | | Huntington Bancshares, Inc., 2.625%, 8/06/2024 | | | 20,136,835 | |
| | 14,082,000 | | | JPMorgan Chase & Co., (fixed rate to 5/13/2030, variable rate thereafter),
2.956%, 5/13/2031 | | | 15,108,638 | |
| | 10,366,000 | | | JPMorgan Chase & Co., 3.200%, 1/25/2023 | | | 11,018,831 | |
| | 9,705,000 | | | JPMorgan Chase & Co., 4.350%, 8/15/2021 | | | 10,053,366 | |
| | 22,401,000 | | | JPMorgan Chase & Co., 4.500%, 1/24/2022 | | | 23,616,462 | |
| | 31,750,000 | | | JPMorgan Chase & Co., (fixed rate to 10/15/2029, variable rate thereafter),
2.739%, 10/15/2030 | | | 34,014,795 | |
| | 3,235,000 | | | Lloyds Banking Group PLC, 3.000%, 1/11/2022 | | | 3,328,536 | |
| | | | |
| | See accompanying notes to financial statements. | | | 26 |
Portfolio of Investments – as of September 30, 2020
Loomis Sayles Core Plus Bond Fund – (continued)
| | | | | | | | |
Principal
Amount (‡) | | | Description | | Value (†) | |
| | | | Banking — continued | |
| $ | 3,755,000 | | | Lloyds Banking Group PLC, 3.100%, 7/06/2021 | | $ | 3,834,250 | |
| | 22,575,000 | | | Lloyds Banking Group PLC, 4.344%, 1/09/2048 | | | 26,532,575 | |
| | 6,000,000 | | | Morgan Stanley, (fixed rate to 7/22/2027, variable rate thereafter),
3.591%, 7/22/2028 | | | 6,748,144 | |
| | 3,210,000 | | | Morgan Stanley, GMTN, 3.700%, 10/23/2024 | | | 3,561,355 | |
| | 11,914,000 | | | Morgan Stanley, GMTN, 5.500%, 7/28/2021 | | | 12,412,643 | |
| | 20,667,000 | | | Morgan Stanley, Series F, 3.875%, 4/29/2024 | | | 22,806,841 | |
| | 15,854,000 | | | Nationwide Building Society, (fixed rate to 4/26/2022, variable rate thereafter), 3.622%, 4/26/2023, 144A | | | 16,472,536 | |
| | 17,572,000 | | | PNC Bank NA, (fixed rate to 12/9/2021, variable rate thereafter),
2.028%, 12/09/2022 | | | 17,901,699 | |
| | 8,661,000 | | | Santander UK Group Holdings PLC, 5.625%, 9/15/2045, 144A | | | 10,586,264 | |
| | 29,676,000 | | | Societe Generale S.A., 2.625%, 1/22/2025, 144A | | | 30,623,674 | |
| | 25,261,000 | | | Standard Chartered PLC, (fixed rate to 1/30/2025, variable rate thereafter),
2.819%, 1/30/2026, 144A | | | 26,171,534 | |
| | 16,310,000 | | | Sumitomo Mitsui Financial Group, Inc., 1.474%, 7/08/2025 | | | 16,609,941 | |
| | 20,961,000 | | | Sumitomo Mitsui Financial Group, Inc., 2.696%, 7/16/2024 | | | 22,302,173 | |
| | 13,675,000 | | | Sumitomo Mitsui Financial Group, Inc., 3.040%, 7/16/2029 | | | 14,904,520 | |
| | 24,004,000 | | | Toronto-Dominion Bank (The), MTN, 2.650%, 6/12/2024 | | | 25,682,465 | |
| | | | | | | | |
| | | | | | | 737,532,082 | |
| | | | | | | | |
| | | | Building Materials — 0.4% | |
| | 21,858,000 | | | Mohawk Industries, Inc., 3.625%, 5/15/2030 | | | 23,919,865 | |
| | 8,129,000 | | | Owens Corning, 4.200%, 12/01/2024 | | | 8,959,621 | |
| | 1,245,000 | | | Summit Materials LLC/Summit Materials Finance Corp.,
5.250%, 1/15/2029, 144A | | | 1,296,356 | |
| | | | | | | | |
| | | | | | | 34,175,842 | |
| | | | | | | | |
| | | | Cable Satellite — 0.8% | |
| | 25,075,000 | | | CCO Holdings LLC/CCO Holdings Capital Corp., 4.250%, 2/01/2031, 144A | | | 25,917,771 | |
| | 3,821,000 | | | CCO Holdings LLC/CCO Holdings Capital Corp., 5.750%, 2/15/2026, 144A | | | 3,973,840 | |
| | 10,784,000 | | | Comcast Corp., 2.650%, 2/01/2030 | | | 11,750,410 | |
| | 6,753,000 | | | Comcast Corp., 3.750%, 4/01/2040 | | | 7,897,496 | |
| | 6,120,000 | | | Time Warner Cable LLC, 4.500%, 9/15/2042 | | | 6,647,940 | |
| | 877,000 | | | Time Warner Cable LLC, 5.500%, 9/01/2041 | | | 1,062,387 | |
| | 2,514,000 | | | Time Warner Cable LLC, 5.875%, 11/15/2040 | | | 3,132,638 | |
| | 8,019,000 | | | Time Warner Cable LLC, 6.550%, 5/01/2037 | | | 10,660,961 | |
| | 1,911,000 | | | Time Warner Cable LLC, 6.750%, 6/15/2039 | | | 2,584,273 | |
| | | | | | | | |
| | | | | | | 73,627,716 | |
| | | | | | | | |
| | | | Chemicals — 1.1% | |
| | 3,498,000 | | | Air Products & Chemicals, Inc., 1.500%, 10/15/2025 | | | 3,628,692 | |
| | 27,393,000 | | | Braskem America Finance Co., 7.125%, 7/22/2041, 144A | | | 28,954,401 | |
| | 1,571,000 | | | Ecolab, Inc., 4.800%, 3/24/2030 | | | 2,003,877 | |
| | 5,633,000 | | | Koppers, Inc., 6.000%, 2/15/2025, 144A | | | 5,710,454 | |
| | 13,392,000 | | | Methanex Corp., 5.250%, 3/01/2022 | | | 14,185,476 | |
| | 9,723,000 | | | Orbia Advance Corp. SAB de CV, 5.875%, 9/17/2044, 144A | | | 11,327,295 | |
| | 10,599,000 | | | Orbia Advance Corp. SAB de CV, 6.750%, 9/19/2042, 144A | | | 13,492,527 | |
| | | | |
| 27 | | | See accompanying notes to financial statements. | | |
Portfolio of Investments – as of September 30, 2020
Loomis Sayles Core Plus Bond Fund – (continued)
| | | | | | | | |
Principal
Amount (‡) | | | Description | | Value (†) | |
| | | | Chemicals — continued | |
| $ | 4,179,000 | | | RPM International, Inc., 3.450%, 11/15/2022 | | $ | 4,330,688 | |
| | 12,792,000 | | | Sociedad Quimica y Minera de Chile S.A., Series 2020-A, Class A1FX,
4.250%, 1/22/2050, 144A | | | 13,997,262 | |
| | 6,213,000 | | | Univar Solutions USA, Inc., 5.125%, 12/01/2027, 144A | | | 6,376,091 | |
| | | | | | | | |
| | | | | | | 104,006,763 | |
| | | | | | | | |
| | | | Collateralized Mortgage Obligations — 0.2% | |
| | 4,746,601 | | | Federal Home Loan Mortgage Corp., Series 3654, Class DC,
5.000%, 4/15/2030 | | | 5,529,938 | |
| | 359,563 | | | Government National Mortgage Association, Series 2010-H24, Class FA,
1-month LIBOR + 0.350%, 0.505%, 10/20/2060(d) | | | 358,805 | |
| | 367,516 | | | Government National Mortgage Association, Series 2012-H18, Class NA,
1-month LIBOR + 0.520%, 0.675%, 8/20/2062(d) | | | 368,298 | |
| | 294,451 | | | Government National Mortgage Association, Series 2013-H01, Class FA,
1.650%, 1/20/2063(b)(c) | | | 293,555 | |
| | 587,048 | | | Government National Mortgage Association, Series 2013-H03, Class HA,
1.750%, 12/20/2062(b)(c) | | | 582,496 | |
| | 496,948 | | | Government National Mortgage Association, Series 2013-H04, Class BA,
1.650%, 2/20/2063(b)(c) | | | 495,599 | |
| | 871,792 | | | Government National Mortgage Association, Series 2013-H07, Class DA,
2.500%, 3/20/2063(b)(c) | | | 872,424 | |
| | 3,224,681 | | | Government National Mortgage Association, Series 2013-H10, Class PA,
2.500%, 4/20/2063 | | | 3,255,962 | |
| | 10,832,146 | | | Government National Mortgage Association, Series 2015-H10, Class JA,
2.250%, 4/20/2065 | | | 11,055,876 | |
| | 36,512 | | | Government National Mortgage Association, Series 2015-H13, Class FL,
1-month LIBOR + 0.280%, 0.435%, 5/20/2063(b)(c)(d) | | | 36,237 | |
| | | | | | | | |
| | | | | | | 22,849,190 | |
| | | | | | | | |
| | | | Construction Machinery — 0.4% | |
| | 6,702,000 | | | Caterpillar Financial Services Corp., MTN, 2.150%, 11/08/2024 | | | 7,126,844 | |
| | 6,500,000 | | | CNH Industrial Capital LLC, 1.950%, 7/02/2023 | | | 6,621,866 | |
| | 8,264,000 | | | CNH Industrial Capital LLC, 4.375%, 4/05/2022 | | | 8,661,498 | |
| | 5,648,000 | | | Deere & Co., 3.750%, 4/15/2050 | | | 7,078,241 | |
| | 4,547,000 | | | John Deere Capital Corp., MTN, 2.600%, 3/07/2024 | | | 4,861,617 | |
| | | | | | | | |
| | | | | | | 34,350,066 | |
| | | | | | | | |
| | | | Consumer Cyclical Services — 0.6% | |
| | 18,643,000 | | | Amazon.com, Inc., 4.250%, 8/22/2057 | | | 25,452,135 | |
| | 8,360,000 | | | Expedia Group, Inc., 3.600%, 12/15/2023, 144A | | | 8,539,740 | |
| | 4,120,000 | | | Expedia Group, Inc., 4.625%, 8/01/2027, 144A | | | 4,323,610 | |
| | 4,566,000 | | | Expedia Group, Inc., 6.250%, 5/01/2025, 144A | | | 5,035,882 | |
| | 3,878,000 | | | Expedia Group, Inc., 7.000%, 5/01/2025, 144A | | | 4,194,318 | |
| | 4,823,000 | | | Mastercard, Inc., 3.850%, 3/26/2050 | | | 6,157,628 | |
| | | | | | | | |
| | | | | | | 53,703,313 | |
| | | | | | | | |
| | | | Consumer Products — 0.4% | |
| | 6,911,000 | | | Hasbro, Inc., 3.550%, 11/19/2026 | | | 7,322,613 | |
| | 987,000 | | | Hasbro, Inc., 3.900%, 11/19/2029 | | | 1,038,777 | |
| | | | |
| | See accompanying notes to financial statements. | | | 28 |
Portfolio of Investments – as of September 30, 2020
Loomis Sayles Core Plus Bond Fund – (continued)
| | | | | | | | |
Principal
Amount (‡) | | | Description | | Value (†) | |
| | | | Consumer Products — continued | |
| $ | 2,415,000 | | | Kimberly-Clark de Mexico SAB de CV, 2.431%, 7/01/2031, 144A | | $ | 2,457,915 | |
| | 3,161,000 | | | Newell Brands, Inc., 4.875%, 6/01/2025 | | | 3,409,929 | |
| | 2,838,000 | | | Valvoline, Inc., 4.250%, 2/15/2030, 144A | | | 2,894,760 | |
| | 6,422,000 | | | Valvoline, Inc., 4.375%, 8/15/2025 | | | 6,606,632 | |
| | 12,185,000 | | | Whirlpool Corp., 4.750%, 2/26/2029 | | | 14,817,283 | |
| | 3,318,000 | | | Whirlpool Corp., MTN, 4.850%, 6/15/2021 | | | 3,421,273 | |
| | | | | | | | |
| | | | | | | 41,969,182 | |
| | | | | | | | |
| | | | Diversified Manufacturing — 0.4% | |
| | 3,085,000 | | | Clark Equipment Co., 5.875%, 6/01/2025, 144A | | | 3,196,831 | |
| | 16,591,000 | | | General Electric Co., 4.250%, 5/01/2040 | | | 16,832,559 | |
| | 4,181,000 | | | General Electric Co., 4.350%, 5/01/2050 | | | 4,262,992 | |
| | 8,705,000 | | | Roper Technologies, Inc., 1.400%, 9/15/2027 | | | 8,793,714 | |
| | | | | | | | |
| | | | | | | 33,086,096 | |
| | | | | | | | |
| | | | Electric — 1.8% | |
| | 4,016,000 | | | AES Corp. (The), 3.300%, 7/15/2025, 144A | | | 4,278,486 | |
| | 2,041,000 | | | AES Corp. (The), 3.950%, 7/15/2030, 144A | | | 2,255,223 | |
| | 5,899,000 | | | AES Corp. (The), 5.125%, 9/01/2027 | | | 6,283,025 | |
| | 2,729,000 | | | Berkshire Hathaway Energy Co., 4.250%, 10/15/2050, 144A | | | 3,397,647 | |
| | 16,660,000 | | | Calpine Corp., 5.000%, 2/01/2031, 144A | | | 16,981,538 | |
| | 26,353,950 | | | Cometa Energia S.A. de CV, 6.375%, 4/24/2035, 144A | | | 28,857,575 | |
| | 8,805,000 | | | Dominion Energy, Inc., Class C, 3.375%, 4/01/2030 | | | 9,927,896 | |
| | 3,816,000 | | | DPL, Inc., 4.125%, 7/01/2025, 144A | | | 3,995,848 | |
| | 954,000 | | | Edison International, 4.950%, 4/15/2025 | | | 1,044,247 | |
| | 3,147,000 | | | Enel Americas S.A., 4.000%, 10/25/2026 | | | 3,434,195 | |
| | 3,194,000 | | | Enel Generacion Chile S.A., 4.250%, 4/15/2024 | | | 3,447,135 | |
| | 7,514,000 | | | Entergy Corp., 2.800%, 6/15/2030 | | | 8,123,255 | |
| | 4,808,000 | | | Exelon Corp., 4.050%, 4/15/2030 | | | 5,639,969 | |
| | 9,488,000 | | | Florida Power & Light Co., 3.150%, 10/01/2049 | | | 10,761,005 | |
| | 16,373,000 | | | National Rural Utilities Cooperative Finance Corp., (fixed rate to 4/30/2023, variable rate thereafter), 4.750%, 4/30/2043 | | | 16,864,705 | |
| | 3,009,000 | | | Ohio Power Co., Series P, 2.600%, 4/01/2030 | | | 3,301,139 | |
| | 5,055,000 | | | Pattern Energy Operations LP/Pattern Energy Operations, Inc.,
4.500%, 8/15/2028, 144A | | | 5,244,562 | |
| | 2,207,000 | | | PG&E Corp., 5.000%, 7/01/2028 | | | 2,140,790 | |
| | 1,647,000 | | | PG&E Corp., 5.250%, 7/01/2030 | | | 1,593,472 | |
| | 5,629,000 | | | PPL Electric Utilities Corp., 3.000%, 10/01/2049 | | | 6,095,250 | |
| | 7,987,000 | | | Transelec S.A., 4.250%, 1/14/2025, 144A | | | 8,665,895 | |
| | 4,158,000 | | | Transelec S.A., 4.625%, 7/26/2023, 144A | | | 4,475,089 | |
| | 2,895,000 | | | Virginia Electric & Power Co., Class A, 2.875%, 7/15/2029 | | | 3,244,499 | |
| | 4,054,000 | | | Xcel Energy, Inc., 3.400%, 6/01/2030 | | | 4,656,106 | |
| | | | | | | | |
| | | | | | | 164,708,551 | |
| | | | | | | | |
| | | | Finance Companies — 0.7% | |
| | 1,534,000 | | | AerCap Ireland Capital DAC/AerCap Global Aviation Trust, 3.300%, 1/23/2023 | | | 1,539,489 | |
| | 19,621,000 | | | Air Lease Corp., GMTN, 3.750%, 6/01/2026 | | | 19,963,990 | |
| | 4,628,000 | | | GATX Corp., 4.000%, 6/30/2030 | | | 5,331,151 | |
| | | | |
| 29 | | | See accompanying notes to financial statements. | | |
Portfolio of Investments – as of September 30, 2020
Loomis Sayles Core Plus Bond Fund – (continued)
| | | | | | | | |
Principal
Amount (‡) | | | Description | | Value (†) | |
| | | | Finance Companies — continued | |
| $ | 3,712,000 | | | International Lease Finance Corp., 5.875%, 8/15/2022 | | $ | 3,972,386 | |
| | 11,553,000 | | | Navient Corp., 5.000%, 3/15/2027 | | | 10,848,614 | |
| | 1,016,000 | | | Navient Corp., 5.875%, 10/25/2024 | | | 1,010,290 | |
| | 1,068,000 | | | Navient Corp., 6.750%, 6/15/2026 | | | 1,065,330 | |
| | 8,451,000 | | | Navient Corp., MTN, 6.125%, 3/25/2024 | | | 8,514,383 | |
| | 2,235,000 | | | Quicken Loans LLC/Quicken Loans Co-Issuer, Inc., 3.625%, 3/01/2029, 144A | | | 2,215,444 | |
| | 8,775,000 | | | Quicken Loans LLC/Quicken Loans Co-Issuer, Inc., 3.875%, 3/01/2031, 144A | | | 8,665,312 | |
| | | | | | | | |
| | | | | | | 63,126,389 | |
| | | | | | | | |
| | | | Financial Other — 0.1% | |
| | 5,995,000 | | | Icahn Enterprises LP/Icahn Enterprises Finance Corp., 5.250%, 5/15/2027 | | | 6,245,591 | |
| | | | | | | | |
| | | | Food & Beverage — 2.2% | |
| | 23,505,000 | | | Anheuser-Busch Cos. LLC/Anheuser-Busch InBev Worldwide, Inc.,
4.900%, 2/01/2046 | | | 28,982,356 | |
| | 14,358,000 | | | Anheuser-Busch InBev Worldwide, Inc., 4.350%, 6/01/2040 | | | 16,781,844 | |
| | 14,363,000 | | | Anheuser-Busch InBev Worldwide, Inc., 4.600%, 6/01/2060 | | | 17,301,799 | |
| | 11,686,000 | | | Archer-Daniels-Midland Co., 3.250%, 3/27/2030 | | | 13,396,244 | |
| | 7,006,000 | | | Bacardi Ltd., 5.150%, 5/15/2038, 144A | | | 8,543,827 | |
| | 18,029,000 | | | Bacardi Ltd., 5.300%, 5/15/2048, 144A | | | 22,829,041 | |
| | 7,025,000 | | | BRF S.A., 5.750%, 9/21/2050, 144A | | | 6,976,317 | |
| | 2,500,000 | | | Bunge Ltd. Finance Corp., 1.630%, 8/17/2025 | | | 2,510,935 | |
| | 5,349,000 | | | Constellation Brands, Inc., 2.875%, 5/01/2030 | | | 5,775,480 | |
| | 1,903,000 | | | Constellation Brands, Inc., 3.750%, 5/01/2050 | | | 2,124,848 | |
| | 26,356,000 | | | Fomento Economico Mexicano SAB de CV, 3.500%, 1/16/2050 | | | 28,036,406 | |
| | 3,490,000 | | | Gruma SAB de CV, 4.875%, 12/01/2024, 144A | | | 3,878,298 | |
| | 13,061,000 | | | Kraft Heinz Foods Co., 3.875%, 5/15/2027, 144A | | | 13,834,349 | |
| | 11,245,000 | | | PepsiCo, Inc., 3.875%, 3/19/2060 | | | 14,198,049 | |
| | 16,271,000 | | | Post Holdings, Inc., 4.625%, 4/15/2030, 144A | | | 16,738,791 | |
| | 1,790,000 | | | Smithfield Foods, Inc., 3.000%, 10/15/2030, 144A | | | 1,793,866 | |
| | | | | | | | |
| | | | | | | 203,702,450 | |
| | | | | | | | |
| | | | Government Owned – No Guarantee — 2.2% | |
| | 7,364,000 | | | CNPC General Capital Ltd., 3.950%, 4/19/2022, 144A | | | 7,693,606 | |
| | 17,070,000 | | | Dolphin Energy Ltd. LLC, 5.500%, 12/15/2021, 144A | | | 17,945,520 | |
| | 4,370,000 | | | Empresa de los Ferrocarriles del Estado, 3.068%, 8/18/2050, 144A | | | 4,282,600 | |
| | 10,447,000 | | | Mexico City Airport Trust, 5.500%, 7/31/2047, 144A | | | 8,530,185 | |
| | 17,290,000 | | | OCP S.A., 5.625%, 4/25/2024, 144A | | | 18,738,867 | |
| | 6,982,000 | | | Ooredoo International Finance Ltd., 3.250%, 2/21/2023, 144A | | | 7,293,397 | |
| | 10,400,000 | | | Ooredoo International Finance Ltd., 3.875%, 1/31/2028, 144A | | | 11,904,755 | |
| | 10,680,000 | | | Saudi Arabian Oil Co., 4.375%, 4/16/2049, 144A | | | 12,868,242 | |
| | 44,487,000 | | | Tennessee Valley Authority, 4.250%, 9/15/2065 | | | 67,673,352 | |
| | 8,587,000 | | | Tennessee Valley Authority, 4.625%, 9/15/2060 | | | 13,535,914 | |
| | 6,077,000 | | | Tennessee Valley Authority, 4.875%, 1/15/2048 | | | 9,287,232 | |
| | 10,402,000 | | | Tennessee Valley Authority, 5.250%, 9/15/2039 | | | 16,044,635 | |
| | 10,376,000 | | | Transportadora de Gas Internacional S.A. E.S.P., 5.550%, 11/01/2028, 144A | | | 11,724,984 | |
| | | | | | | | |
| | | | | | | 207,523,289 | |
| | | | | | | | |
| | | | |
| | See accompanying notes to financial statements. | | | 30 |
Portfolio of Investments – as of September 30, 2020
Loomis Sayles Core Plus Bond Fund – (continued)
| | | | | | | | |
Principal
Amount (‡) | | �� | Description | | Value (†) | |
| | | | Health Insurance — 0.1% | |
| $ | 11,398,000 | | | Centene Corp., 3.375%, 2/15/2030 | | $ | 11,825,425 | |
| | | | | | | | |
| | | | Healthcare — 1.0% | |
| | 7,470,000 | | | CVS Health Corp., 4.300%, 3/25/2028 | | | 8,743,422 | |
| | 18,865,000 | | | CVS Health Corp., 5.050%, 3/25/2048 | | | 24,079,444 | |
| | 15,319,000 | | | DaVita, Inc., 4.625%, 6/01/2030, 144A | | | 15,691,252 | |
| | 17,790,000 | | | Partners Healthcare System, Inc., Series 2020, 3.342%, 7/01/2060 | | | 19,538,414 | |
| | 8,511,000 | | | Quest Diagnostics, Inc., 2.800%, 6/30/2031 | | | 9,167,001 | |
| | 11,416,000 | | | Stryker Corp., 1.950%, 6/15/2030 | | | 11,651,757 | |
| | | | | | | | |
| | | | | | | 88,871,290 | |
| | | | | | | | |
| | | | Home Construction — 0.2% | |
| | 275,000 | | | Lennar Corp., 4.500%, 4/30/2024 | | | 294,250 | |
| | 1,291,000 | | | Lennar Corp., 4.750%, 11/15/2022 | | | 1,342,640 | |
| | 16,257,000 | | | NVR, Inc., 3.000%, 5/15/2030 | | | 17,554,744 | |
| | | | | | | | |
| | | | | | | 19,191,634 | |
| | | | | | | | |
| | | | Hybrid ARMs — 0.0% | |
| | 24,877 | | | FNMA, 6-month LIBOR + 1.558%, 1.963%, 2/01/2037(d) | | | 25,633 | |
| | | | | | | | |
| | | | Independent Energy — 0.8% | |
| | 2,940,000 | | | Aker BP ASA, 3.000%, 1/15/2025, 144A | | | 2,949,079 | |
| | 9,289,000 | | | Diamondback Energy, Inc., 4.750%, 5/31/2025 | | | 10,020,396 | |
| | 10,165,000 | | | Leviathan Bond Ltd., 6.125%, 6/30/2025, 144A | | | 10,500,242 | |
| | 14,036,000 | | | Occidental Petroleum Corp., 2.600%, 8/13/2021 | | | 13,772,825 | |
| | 7,685,000 | | | Occidental Petroleum Corp., 5.875%, 9/01/2025 | | | 7,042,995 | |
| | 4,394,666 | | | Pan American Energy LLC, 7.875%, 5/07/2021, 144A | | | 4,284,800 | |
| | 8,886,000 | | | SM Energy Co., 10.000%, 1/15/2025, 144A | | | 8,479,998 | |
| | 13,613,000 | | | WPX Energy, Inc., 4.500%, 1/15/2030 | | | 13,383,417 | |
| | | | | | | | |
| | | | | | | 70,433,752 | |
| | | | | | | | |
| | | | Industrial Other — 0.4% | |
| | 10,447,000 | | | CK Hutchison International 16 Ltd., 2.750%, 10/03/2026, 144A | | | 11,242,539 | |
| | 9,417,000 | | | CK Hutchison International 20 Ltd., 2.500%, 5/08/2030, 144A | | | 9,875,702 | |
| | 3,816,000 | | | Georgetown University (The), Class A, 5.215%, 10/01/2118 | | | 5,172,359 | |
| | 3,560,000 | | | Georgetown University (The), Series B, 4.315%, 4/01/2049 | | | 4,517,818 | |
| | 5,620,000 | | | University of Pennsylvania, 3.610%, 2/15/2119 | | | 6,252,742 | |
| | | | | | | | |
| | | | | | | 37,061,160 | |
| | | | | | | | |
| | | | Integrated Energy — 0.1% | |
| | 4,163,000 | | | Chevron Corp., 3.078%, 5/11/2050 | | | 4,450,337 | |
| | 4,443,000 | | | Exxon Mobil Corp., 3.452%, 4/15/2051 | | | 4,881,765 | |
| | | | | | | | |
| | | | | | | 9,332,102 | |
| | | | | | | | |
| | | | Life Insurance — 0.7% | |
| | 26,875,000 | | | Athene Global Funding, 2.450%, 8/20/2027, 144A | | | 27,610,756 | |
| | 16,245,000 | | | Brighthouse Financial, Inc., 5.625%, 5/15/2030 | | | 18,918,361 | |
| | 9,994,000 | | | Northwestern Mutual Life Insurance Co. (The), 3.625%, 9/30/2059, 144A | | | 10,909,926 | |
| | 3,445,000 | | | OneAmerica Financial Partners, Inc., 4.250%, 10/15/2050, 144A | | | 3,507,630 | |
| | | | | | | | |
| | | | | | | 60,946,673 | |
| | | | | | | | |
| | | | |
| 31 | | | See accompanying notes to financial statements. | | |
Portfolio of Investments – as of September 30, 2020
Loomis Sayles Core Plus Bond Fund – (continued)
| | | | | | | | |
Principal
Amount (‡) | | | Description | | Value (†) | |
| | | | Lodging — 0.2% | |
| $ | 21,165,000 | | | Marriott International, Inc., 3.500%, 10/15/2032 | | $ | 21,003,431 | |
| | | | | | | | |
| | | | Media Entertainment — 0.8% | |
| | 19,895,000 | | | Activision Blizzard, Inc., 2.500%, 9/15/2050 | | | 18,539,086 | |
| | 60,490,000 | | | Grupo Televisa SAB, EMTN, 7.250%, 5/14/2043, (MXN) | | | 2,043,198 | |
| | 9,783,000 | | | Lamar Media Corp., 3.750%, 2/15/2028, 144A | | | 9,734,085 | |
| | 5,486,000 | | | Lamar Media Corp., 4.000%, 2/15/2030, 144A | | | 5,486,000 | |
| | 12,955,000 | | | Prosus NV, 3.680%, 1/21/2030, 144A | | | 13,976,483 | |
| | 14,843,000 | | | Prosus NV, 4.850%, 7/06/2027, 144A | | | 16,911,372 | |
| | 6,460,000 | | | ViacomCBS, Inc., 4.200%, 5/19/2032 | | | 7,392,535 | |
| | | | | | | | |
| | | | | | | 74,082,759 | |
| | | | | | | | |
| | | | Metals & Mining — 1.0% | |
| | 2,560,000 | | | Anglo American Capital PLC, 2.625%, 9/10/2030, 144A | | | 2,553,037 | |
| | 3,720,000 | | | Anglo American Capital PLC, 3.950%, 9/10/2050, 144A | | | 3,801,570 | |
| | 9,737,000 | | | Anglo American Capital PLC, 5.625%, 4/01/2030, 144A | | | 11,951,389 | |
| | 9,785,000 | | | Freeport-McMoRan, Inc., 4.625%, 8/01/2030 | | | 10,288,438 | |
| | 16,620,000 | | | Fresnillo PLC, 4.250%, 10/02/2050, 144A | | | 16,380,340 | |
| | 31,735,000 | | | Glencore Funding LLC, 2.500%, 9/01/2030, 144A | | | 30,854,988 | |
| | 3,816,000 | | | Steel Dynamics, Inc., 2.400%, 6/15/2025 | | | 3,981,509 | |
| | 1,889,000 | | | Steel Dynamics, Inc., 3.450%, 4/15/2030 | | | 2,082,706 | |
| | 9,945,000 | | | Vale Overseas Ltd., 3.750%, 7/08/2030 | | | 10,233,405 | |
| | | | | | | | |
| | | | | | | 92,127,382 | |
| | | | | | | | |
| | | | Midstream — 1.4% | |
| | 636,000 | | | Energy Transfer Operating LP, 5.150%, 2/01/2043 | | | 586,287 | |
| | 6,606,000 | | | Energy Transfer Operating LP, 5.950%, 10/01/2043 | | | 6,558,512 | |
| | 9,571,000 | | | Energy Transfer Operating LP, 6.500%, 2/01/2042 | | | 10,025,303 | |
| | 1,498,000 | | | Energy Transfer Operating LP, 6.625%, 10/15/2036 | | | 1,619,397 | |
| | 12,565,000 | | | Energy Transfer Partners LP/Regency Energy Finance Corp., 5.000%, 10/01/2022 | | | 13,223,788 | |
| | 2,606,000 | | | Energy Transfer Partners LP/Regency Energy Finance Corp., 5.875%, 3/01/2022 | | | 2,722,192 | |
| | 6,242,000 | | | EQM Midstream Partners LP, 6.500%, 7/01/2027, 144A | | | 6,616,645 | |
| | 2,255,000 | | | Gray Oak Pipeline LLC, 2.600%, 10/15/2025, 144A | | | 2,262,764 | |
| | 1,100,000 | | | Gray Oak Pipeline LLC, 3.450%, 10/15/2027, 144A | | | 1,123,919 | |
| | 2,426,000 | | | Kinder Morgan Energy Partners LP, 4.150%, 2/01/2024 | | | 2,654,656 | |
| | 11,760,000 | | | Kinder Morgan Energy Partners LP, 4.300%, 5/01/2024 | | | 12,970,450 | |
| | 4,615,000 | | | Kinder Morgan, Inc., 5.000%, 2/15/2021, 144A | | | 4,672,924 | |
| | 17,068,000 | | | Kinder Morgan, Inc., 5.625%, 11/15/2023, 144A | | | 19,219,215 | |
| | 6,354,000 | | | ONEOK, Inc., 5.850%, 1/15/2026 | | | 7,307,734 | |
| | 2,886,000 | | | Plains All American Pipeline LP/PAA Finance Corp., 3.800%, 9/15/2030 | | | 2,798,502 | |
| | 6,695,000 | | | Rattler Midstream LP, 5.625%, 7/15/2025, 144A | | | 6,745,213 | |
| | 4,475,000 | | | Sunoco Logistics Partners Operations LP, 5.400%, 10/01/2047 | | | 4,225,147 | |
| | 20,876,000 | | | Williams Cos., Inc. (The) , 3.500%, 11/15/2030 | | | 22,707,837 | |
| | | | | | | | |
| | | | | | | 128,040,485 | |
| | | | | | | | |
| | | | Mortgage Related — 22.5% | |
| | 1,552,681 | | | FHLMC, 2.000%, 8/01/2050 | | | 1,631,508 | |
| | | | |
| | See accompanying notes to financial statements. | | | 32 |
Portfolio of Investments – as of September 30, 2020
Loomis Sayles Core Plus Bond Fund – (continued)
| | | | | | | | |
Principal
Amount (‡) | | | Description | | Value (†) | |
| | | | Mortgage Related — continued | |
| $ | 35,326,116 | | | FHLMC, 2.500%, with various maturities in 2050(e) | | $ | 36,904,134 | |
| | 67,445,162 | | | FHLMC, 3.000%, with various maturities from 2042 to 2050(e)(f) | | | 70,926,220 | |
| | 25,228,983 | | | FHLMC, 3.500%, with various maturities from 2043 to 2050(e) | | | 27,307,832 | |
| | 24,934,821 | | | FHLMC, 4.000%, with various maturities from 2044 to 2048(e) | | | 27,473,829 | |
| | 106,576,901 | | | FHLMC, 4.500%, with various maturities from 2041 to 2049(e)(f) | | | 115,941,683 | |
| | 130,850,886 | | | FHLMC, 5.000%, with various maturities from 2048 to 2050(e)(f) | | | 143,390,885 | |
| | 8,503 | | | FHLMC, 6.000%, 6/01/2035 | | | 10,080 | |
| | 8,846,251 | | | FNMA, 2.000%, 9/01/2050 | | | 9,057,272 | |
| | 226,498,280 | | | FNMA, 2.500%, with various maturities from 2045 to 2050(e)(f) | | | 238,011,891 | |
| | 144,779,547 | | | FNMA, 3.000%, with various maturities from 2045 to 2050(e)(f) | | | 151,951,505 | |
| | 121,903,238 | | | FNMA, 3.500%, with various maturities from 2043 to 2050(e)(f) | | | 127,985,205 | |
| | 228,107,068 | | | FNMA, 4.000%, with various maturities from 2041 to 2050(e) | | | 244,954,812 | |
| | 227,050,278 | | | FNMA, 4.500%, with various maturities from 2043 to 2049(e)(f) | | | 246,282,441 | |
| | 61,058,370 | | | FNMA, 5.000%, with various maturities from 2048 to 2050(e) | | | 67,000,104 | |
| | 10,257,369 | | | FNMA, 6.000%, with various maturities from 2034 to 2049(e) | | | 11,531,257 | |
| | 11,160 | | | FNMA, 6.500%, with various maturities from 2029 to 2031(e) | | | 12,680 | |
| | 29,308 | | | FNMA, 7.000%, with various maturities in 2030(e) | | | 32,298 | |
| | 16,111 | | | FNMA, 7.500%, with various maturities from 2024 to 2032(e) | | | 18,568 | |
| | 5,722 | | | GNMA, 3.640%, 8/20/2062(a) | | | 5,825 | |
| | 23,029 | | | GNMA, 3.745%, 1/20/2063(a) | | | 23,353 | |
| | 17,428 | | | GNMA, 3.890%, 6/20/2062(a) | | | 17,478 | |
| | 21,180 | | | GNMA, 3.929%, 5/20/2063(a) | | | 21,672 | |
| | 53,256 | | | GNMA, 3.946%, 12/20/2062(a) | | | 54,004 | |
| | 14,336 | | | GNMA, 3.990%, 11/20/2062(a) | | | 14,917 | |
| | 45,191 | | | GNMA, 4.093%, 7/20/2063(a) | | | 46,691 | |
| | 281,909 | | | GNMA, 4.141%, 11/20/2062(a) | | | 286,710 | |
| | 106,487 | | | GNMA, 4.203%, 7/20/2063(a) | | | 108,692 | |
| | 5,459 | | | GNMA, 4.326%, 8/20/2061(a) | | | 6,098 | |
| | 8,433 | | | GNMA, 4.390%, with various maturities in 2062(a)(e) | | | 8,471 | |
| | 5,274,181 | | | GNMA, 4.405%, 11/20/2066(a) | | | 5,951,890 | |
| | 9,254,169 | | | GNMA, 4.408%, 12/20/2066(a) | | | 10,599,330 | |
| | 3,667,262 | | | GNMA, 4.430%, 2/20/2066(a) | | | 4,157,610 | |
| | 2,647,868 | | | GNMA, 4.435%, 10/20/2066(a) | | | 3,022,319 | |
| | 101,948 | | | GNMA, 4.448%, 5/20/2063(a) | | | 103,218 | |
| | 1,827,793 | | | GNMA, 4.484%, 2/20/2066(a) | | | 2,079,152 | |
| | 2,922,693 | | | GNMA, 4.517%, 9/20/2066(a) | | | 3,339,783 | |
| | 4,215,568 | | | GNMA, 4.521%, 6/20/2066(a) | | | 4,783,059 | |
| | 4,348,218 | | | GNMA, 4.524%, 2/20/2065(a) | | | 4,765,451 | |
| | 3,425,697 | | | GNMA, 4.526%, 6/20/2066(a) | | | 3,874,087 | |
| | 4,350,046 | | | GNMA, 4.533%, 12/20/2064(a) | | | 4,802,668 | |
| | 3,822,109 | | | GNMA, 4.537%, 12/20/2063(a) | | | 4,126,430 | |
| | 3,356,910 | | | GNMA, 4.546%, 6/20/2066(a) | | | 3,834,406 | |
| | 2,166,365 | | | GNMA, 4.557%, 4/20/2066(a) | | | 2,438,789 | |
| | 10,101,243 | | | GNMA, 4.568%, 12/20/2066(a) | | | 11,614,259 | |
| | 5,587,646 | | | GNMA, 4.579%, 2/20/2065(a) | | | 6,240,754 | |
| | 3,424,728 | | | GNMA, 4.580%, 6/20/2064(a) | | | 3,758,908 | |
| | 6,197,035 | | | GNMA, 4.592%, 12/20/2064(a) | | | 6,835,033 | |
| | | | |
| 33 | | | See accompanying notes to financial statements. | | |
Portfolio of Investments – as of September 30, 2020
Loomis Sayles Core Plus Bond Fund – (continued)
| | | | | | | | |
Principal
Amount (‡) | | | Description | | Value (†) | |
| | | | Mortgage Related — continued | |
| $ | 2,069,470 | | | GNMA, 4.595%, 1/20/2065(a) | | $ | 2,281,851 | |
| | 4,219,638 | | | GNMA, 4.611%, 1/20/2065(a) | | | 4,714,454 | |
| | 5,778,972 | | | GNMA, 4.629%, 10/20/2064(a) | | | 6,331,036 | |
| | 21,859 | | | GNMA, 4.630%, 12/20/2061(a) | | | 22,367 | |
| | 2,417,203 | | | GNMA, 4.632%, 3/20/2065(a) | | | 2,687,458 | |
| | 4,099,258 | | | GNMA, 4.633%, 3/20/2066(a) | | | 4,688,975 | |
| | 756,471 | | | GNMA, 4.637%, 1/20/2064(a) | | | 818,055 | |
| | 124,159 | | | GNMA, 4.650%, 1/20/2061(a) | | | 125,711 | |
| | 2,817,232 | | | GNMA, 4.667%, 1/20/2064(a) | | | 3,047,756 | |
| | 4,626,774 | | | GNMA, 4.673%, 6/20/2064(a) | | | 5,091,196 | |
| | 118,324 | | | GNMA, 4.700%, with various maturities from 2061 to 2062(a)(e) | | | 123,467 | |
| | 3,547,531 | | | GNMA, 4.710%, 1/20/2064(a) | | | 3,882,787 | |
| | 198,406 | | | GNMA, 5.500%, 4/15/2038 | | | 232,902 | |
| | 36,969 | | | GNMA, 6.000%, with various maturities from 2029 to 2038(e) | | | 43,426 | |
| | 32,248 | | | GNMA, 6.500%, with various maturities from 2029 to 2032(e) | | | 35,850 | |
| | 47,119 | | | GNMA, 7.000%, 9/15/2025 | | | 48,966 | |
| | 4,432 | | | GNMA, 7.500%, with various maturities from 2025 to 2030(e) | | | 4,701 | |
| | 174 | | | GNMA, 8.500%, 10/15/2022 | | | 175 | |
| | 194,470,000 | | | UMBS® (TBA), 2.000%, 11/01/2050(g) | | | 200,726,209 | |
| | 10,289,000 | | | UMBS® (TBA), 2.000%, 10/01/2050(g) | | | 10,637,861 | |
| | 220,100,000 | | | UMBS® (TBA), 2.500%, 11/01/2050(g) | | | 230,559,619 | |
| | | | | | | | |
| | | | | | | 2,083,450,083 | |
| | | | | | | | |
| | | | Natural Gas — 0.0% | |
| | 3,024,000 | | | Boston Gas Co., 3.001%, 8/01/2029, 144A | | | 3,327,374 | |
| | | | | | | | |
| | | | Non-Agency Commercial Mortgage-Backed Securities — 1.2% | |
| | 14,216,071 | | | BANK, Series 2019-BN22, Class A4, 2.978%, 11/15/2062 | | | 15,912,016 | |
| | 6,873,079 | | | BANK, Series 2019-BN24, Class A3, 2.960%, 11/15/2062 | | | 7,688,764 | |
| | 15,877,381 | | | Citigroup Commercial Mortgage Trust, Series 2019-C7, Class A4,
3.102%, 12/15/2072 | | | 17,900,461 | |
| | 17,548,185 | | | Citigroup Commercial Mortgage Trust, Series 2019-GC43, Class A4,
3.038%, 11/10/2052 | | | 19,662,792 | |
| | 1,025,000 | | | Commercial Mortgage Trust, Series 2010-C1, Class D,
6.050%, 7/10/2046, 144A(a) | | | 1,020,285 | |
| | 11,283,000 | | | Credit Suisse Mortgage Capital Certificates, Series 2014-USA, Class A2,
3.953%, 9/15/2037, 144A | | | 11,499,549 | |
| | 2,897,433 | | | DBUBS Mortgage Trust, Series 2011-LC1A, Class E,
5.790%, 11/10/2046, 144A(a) | | | 2,895,835 | |
| | 6,300,639 | | | GS Mortgage Securities Trust, Series 2011-GC5, Class C,
5.555%, 8/10/2044, 144A(a) | | | 5,831,732 | |
| | 7,385,712 | | | GS Mortgage Securities Trust, Series 2020-GC45, Class A
5, 2.911%, 2/13/2053 | | | 8,250,586 | |
| | 7,736,960 | | | UBS-Barclays Commercial Mortgage Trust, Series 2013-C5, Class A4,
3.185%, 3/10/2046 | | | 8,072,917 | |
| | 8,935,622 | | | Wells Fargo Commercial Mortgage Trust, Series 2010-C1, Class D,
5.732%, 11/15/2043, 144A(a) | | | 8,911,004 | |
| | | | |
| | See accompanying notes to financial statements. | | | 34 |
Portfolio of Investments – as of September 30, 2020
Loomis Sayles Core Plus Bond Fund – (continued)
| | | | | | | | |
Principal
Amount (‡) | | | Description | | Value (†) | |
| | | | Non-Agency Commercial Mortgage-Backed Securities — continued | |
| $ | 5,578,578 | | | WFRBS Commercial Mortgage Trust, Series 2011-C4, Class D,
5.390%, 6/15/2044, 144A(a) | | $ | 4,734,525 | |
| | | | | | | | |
| | | | | | | 112,380,466 | |
| | | | | | | | |
| | | | Oil Field Services — 0.4% | |
| | 28,400,000 | | | Thaioil Treasury Center Co. Ltd., 4.875%, 1/23/2043, 144A | | | 31,908,820 | |
| | 7,297,680 | | | Transocean Guardian Ltd., 5.875%, 1/15/2024, 144A | | | 4,707,003 | |
| | | | | | | | |
| | | | | | | 36,615,823 | |
| | | | | | | | |
| | | | Packaging — 0.2% | |
| | 7,713,000 | | | CCL Industries, Inc., 3.050%, 6/01/2030, 144A | | | 8,232,716 | |
| | 7,595,000 | | | Owens-Brockway Glass Container, Inc., 6.625%, 5/13/2027, 144A | | | 8,226,335 | |
| | | | | | | | |
| | | | | | | 16,459,051 | |
| | | | | | | | |
| | | | Paper — 0.3% | |
| | 5,503,000 | | | Celulosa Arauco y Constitucion S.A., 4.500%, 8/01/2024 | | | 6,020,557 | |
| | 12,325,000 | | | Klabin Austria GmbH, 7.000%, 4/03/2049, 144A | | | 13,958,063 | |
| | 2,230,000 | | | Suzano Austria GmbH, 3.750%, 1/15/2031 | | | 2,235,464 | |
| | 1,888,000 | | | WestRock RKT LLC, 4.900%, 3/01/2022 | | | 2,000,269 | |
| | 2,796,000 | | | WRKCo, Inc., 3.000%, 6/15/2033 | | | 3,041,472 | |
| | | | | | | | |
| | | | | | | 27,255,825 | |
| | | | | | | | |
| | | | Pharmaceuticals — 0.6% | |
| | 7,723,000 | | | Bausch Health Cos., Inc., 5.000%, 1/30/2028, 144A | | | 7,500,964 | |
| | 9,461,000 | | | Bausch Health Cos., Inc., 5.250%, 1/30/2030, 144A | | | 9,319,085 | |
| | 13,635,000 | | | Biogen, Inc., 2.250%, 5/01/2030 | | | 13,963,303 | |
| | 7,289,000 | | | Biogen, Inc., 3.150%, 5/01/2050 | | | 7,192,966 | |
| | 7,445,000 | | | Teva Pharmaceutical Finance Netherlands III BV, 3.150%, 10/01/2026 | | | 6,568,053 | |
| | 8,496,000 | | | Teva Pharmaceutical Finance Netherlands III BV, 7.125%, 1/31/2025 | | | 8,920,800 | |
| | 3,251,000 | | | Upjohn, Inc., 4.000%, 6/22/2050, 144A | | | 3,469,750 | |
| | | | | | | | |
| | | | | | | 56,934,921 | |
| | | | | | | | |
| | | | Property & Casualty Insurance — 0.2% | |
| | 7,006,000 | | | Liberty Mutual Group, Inc., 3.950%, 5/15/2060, 144A | | | 7,693,558 | |
| | 4,405,000 | | | Willis North America, Inc., 2.950%, 9/15/2029 | | | 4,746,734 | |
| | 3,010,000 | | | Willis Towers Watson PLC, 5.750%, 3/15/2021 | | | 3,077,248 | |
| | | | | | | | |
| | | | | | | 15,517,540 | |
| | | | | | | | |
| | | | Railroads — 0.1% | |
| | 5,848,000 | | | Burlington Northern Santa Fe LLC, 3.550%, 2/15/2050 | | | 6,843,707 | |
| | 5,326,000 | | | Kansas City Southern, 3.500%, 5/01/2050 | | | 5,508,078 | |
| | | | | | | | |
| | | | | | | 12,351,785 | |
| | | | | | | | |
| | | | Refining — 0.1% | |
| | 8,226,000 | | | Ultrapar International S.A., 5.250%, 10/06/2026, 144A | | | 8,810,457 | |
| | | | | | | | |
| | | | REITs – Diversified — 0.2% | |
| | 18,479,000 | | | iStar, Inc., 4.250%, 8/01/2025 | | | 17,243,124 | |
| | 1,419,000 | | | iStar, Inc., 4.750%, 10/01/2024 | | | 1,372,883 | |
| | | | | | | | |
| | | | | | | 18,616,007 | |
| | | | | | | | |
| | | | |
| 35 | | | See accompanying notes to financial statements. | | |
Portfolio of Investments – as of September 30, 2020
Loomis Sayles Core Plus Bond Fund – (continued)
| | | | | | | | |
Principal
Amount (‡) | | | Description | | Value (†) | |
| | | | REITs – Health Care — 0.1% | |
| $ | 6,085,000 | | | Welltower, Inc., 2.750%, 1/15/2031 | | $ | 6,270,399 | |
| | | | | | | | |
| | | | REITs – Shopping Centers — 0.0% | |
| | 2,269,000 | | | Brixmor Operating Partnership LP, 4.050%, 7/01/2030 | | | 2,426,898 | |
| | | | | | | | |
| | | | REITs – Single Tenant — 0.1% | |
| | 5,010,000 | | | Realty Income Corp., 3.250%, 1/15/2031 | | | 5,544,300 | |
| | | | | | | | |
| | | | Restaurants — 0.3% | |
| | 940,000 | | | McDonald’s Corp., MTN, 4.200%, 4/01/2050 | | | 1,144,071 | |
| | 7,699,000 | | | Starbucks Corp., 3.350%, 3/12/2050 | | | 7,900,550 | |
| | 21,559,000 | | | Starbucks Corp., 3.500%, 11/15/2050 | | | 22,955,451 | |
| | | | | | | | |
| | | | | | | 32,000,072 | |
| | | | | | | | |
| | | | Retailers — 1.0% | |
| | 2,175,000 | | | Asbury Automotive Group, Inc., 4.500%, 3/01/2028, 144A | | | 2,188,594 | |
| | 2,175,000 | | | Asbury Automotive Group, Inc., 4.750%, 3/01/2030, 144A | | | 2,191,313 | |
| | 28,230,000 | | | El Puerto de Liverpool SAB de CV, 3.875%, 10/06/2026, 144A | | | 29,183,045 | |
| | 9,426,000 | | | Falabella S.A., 3.750%, 4/30/2023, 144A | | | 9,825,720 | |
| | 7,176,000 | | | Falabella S.A., 4.375%, 1/27/2025, 144A | | | 7,717,687 | |
| | 4,935,000 | | | Group 1 Automotive, Inc., 4.000%, 8/15/2028, 144A | | | 4,848,637 | |
| | 959,000 | | | Hanesbrands, Inc., 4.625%, 5/15/2024, 144A | | | 997,159 | |
| | 3,726,000 | | | Hanesbrands, Inc., 4.875%, 5/15/2026, 144A | | | 3,977,505 | |
| | 5,626,000 | | | Hanesbrands, Inc., 5.375%, 5/15/2025, 144A | | | 5,935,430 | |
| | 2,312,000 | | | Home Depot, Inc. (The), 3.350%, 4/15/2050 | | | 2,676,391 | |
| | 4,355,000 | | | Ken Garff Automotive LLC, 4.875%, 9/15/2028, 144A | | | 4,284,231 | |
| | 11,485,000 | | | Lithia Motors, Inc., 4.375%, 1/15/2031, 144A | | | 11,485,000 | |
| | 7,001,000 | | | Target Corp., 2.650%, 9/15/2030 | | | 7,817,040 | |
| | | | | | | | |
| | | | | | | 93,127,752 | |
| | | | | | | | |
| | | | Sovereigns — 1.8% | |
| | 10,841,000 | | | Abu Dhabi Government International Bond, 3.875%, 4/16/2050, 144A | | | 13,226,020 | |
| | 4,375,000 | | | Bermuda Government International Bond, 3.375%, 8/20/2050, 144A | | | 4,498,900 | |
| | 8,795,000 | | | Colombia Government International Bond, 4.125%, 5/15/2051 | | | 9,168,788 | |
| | 21,915,000 | | | Dominican Republic, 4.875%, 9/23/2032, 144A | | | 21,794,468 | |
| | 7,609,000 | | | Indonesia Government International Bond, 3.700%, 1/08/2022, 144A | | | 7,876,532 | |
| | 30,516,000 | | | Kingdom of Saudi Arabia, 3.250%, 10/26/2026, 144A | | | 33,184,929 | |
| | 19,569,000 | | | Panama Government International Bond, 4.500%, 4/01/2056 | | | 24,510,173 | |
| | 3,337,000 | | | Peruvian Government International Bond, 2.392%, 1/23/2026 | | | 3,500,546 | |
| | 8,368,000 | | | Qatar Government International Bond, 4.400%, 4/16/2050, 144A | | | 10,767,106 | |
| | 10,561,000 | | | Republic of Oman, 3.875%, 3/08/2022, 144A | | | 10,455,601 | |
| | 11,230,000 | | | State of Qatar, 3.875%, 4/23/2023, 144A | | | 12,049,790 | |
| | 17,755,000 | | | Ukraine Government International Bond, 7.253%, 3/15/2033, 144A | | | 16,388,575 | |
| | | | | | | | |
| | | | | | | 167,421,428 | |
| | | | | | | | |
| | | | Supermarkets — 0.2% | |
| | 16,805,000 | | | Albertsons Cos, Inc./Safeway, Inc./New Albertsons LP/Albertsons LLC,
3.250%, 3/15/2026, 144A | | | 16,675,938 | |
| | | | | | | | |
| | | | Technology — 4.3% | |
| | 17,819,000 | | | Apple, Inc., 2.050%, 9/11/2026 | | | 19,051,971 | |
| | | | |
| | See accompanying notes to financial statements. | | | 36 |
Portfolio of Investments – as of September 30, 2020
Loomis Sayles Core Plus Bond Fund – (continued)
| | | | | | | | |
Principal
Amount (‡) | | | Description | | Value (†) | |
| | | | Technology — continued | |
| $ | 17,814,000 | | | Apple, Inc., 2.200%, 9/11/2029 | | $ | 19,157,377 | |
| | 5,055,000 | | | Baidu, Inc., 3.075%, 4/07/2025 | | | 5,357,592 | |
| | 21,035,000 | | | Broadcom, Inc., 3.150%, 11/15/2025 | | | 22,783,613 | |
| | 15,070,000 | | | Broadcom, Inc., 4.700%, 4/15/2025 | | | 17,124,230 | |
| | 18,488,000 | | | Corning, Inc., 5.450%, 11/15/2079 | | | 23,529,266 | |
| | 14,510,000 | | | DXC Technology Co., 4.000%, 4/15/2023 | | | 15,279,644 | |
| | 5,902,000 | | | DXC Technology Co., 4.125%, 4/15/2025 | | | 6,377,015 | |
| | 3,508,000 | | | Equifax, Inc., 2.600%, 12/15/2025 | | | 3,745,240 | |
| | 2,312,000 | | | Equifax, Inc., 3.100%, 5/15/2030 | | | 2,518,833 | |
| | 2,848,000 | | | Equifax, Inc., 3.300%, 12/15/2022 | | | 2,988,092 | |
| | 4,842,000 | | | Equifax, Inc., 7.000%, 7/01/2037 | | | 6,414,511 | |
| | 14,192,000 | | | Hewlett Packard Enterprise Co., 4.450%, 10/02/2023 | | | 15,596,015 | |
| | 17,506,000 | | | Hewlett Packard Enterprise Co., 6.200%, 10/15/2035 | | | 21,911,299 | |
| | 15,150,000 | | | Iron Mountain, Inc., 4.500%, 2/15/2031, 144A | | | 15,292,410 | |
| | 7,010,000 | | | Jabil, Inc., 3.000%, 1/15/2031 | | | 7,156,949 | |
| | 11,585,000 | | | Microchip Technology, Inc., 2.670%, 9/01/2023, 144A | | | 11,990,858 | |
| | 7,134,000 | | | Microchip Technology, Inc., 4.333%, 6/01/2023 | | | 7,677,687 | |
| | 12,669,000 | | | Micron Technology, Inc., 2.497%, 4/24/2023 | | | 13,156,181 | |
| | 6,887,000 | | | Molex Electronic Technologies LLC, 3.900%, 4/15/2025, 144A | | | 7,158,359 | |
| | 21,331,000 | | | MSCI, Inc., 3.875%, 2/15/2031, 144A | | | 22,231,168 | |
| | 13,504,000 | | | Oracle Corp., 3.600%, 4/01/2040 | | | 15,468,461 | |
| | 17,725,000 | | | Oracle Corp., 3.600%, 4/01/2050 | | | 19,979,075 | |
| | 18,167,000 | | | PayPal Holdings, Inc., 3.250%, 6/01/2050 | | | 20,096,567 | |
| | 17,845,000 | | | Qorvo, Inc., 3.375%, 4/01/2031, 144A | | | 18,134,981 | |
| | 5,570,000 | | | Sabre GLBL, Inc., 7.375%, 9/01/2025, 144A | | | 5,625,700 | |
| | 1,652,000 | | | Sabre GLBL, Inc., 9.250%, 4/15/2025, 144A | | | 1,818,142 | |
| | 1,538,000 | | | Science Applications International Corp., 4.875%, 4/01/2028, 144A | | | 1,561,516 | |
| | 2,307,000 | | | Seagate HDD Cayman, 4.125%, 1/15/2031, 144A | | | 2,489,696 | |
| | 7,950,000 | | | Sensata Technologies, Inc., 3.750%, 2/15/2031, 144A | | | 7,900,312 | |
| | 13,343,000 | | | Tencent Holdings Ltd., 3.290%, 6/03/2060, 144A | | | 13,582,774 | |
| | 5,829,000 | | | Texas Instruments, Inc., 2.250%, 9/04/2029 | | | 6,252,702 | |
| | 18,649,000 | | | Xilinx, Inc., 2.375%, 6/01/2030 | | | 19,577,531 | |
| | | | | | | | |
| | | | | | | 398,985,767 | |
| | | | | | | | |
| | | | Tobacco — 0.9% | |
| | 3,764,000 | | | Altria Group, Inc., 2.350%, 5/06/2025 | | | 3,977,085 | |
| | 8,264,000 | | | Altria Group, Inc., 4.400%, 2/14/2026 | | | 9,546,267 | |
| | 32,980,000 | | | BAT Capital Corp., 2.726%, 3/25/2031 | | | 32,863,086 | |
| | 35,552,000 | | | BAT Capital Corp., 2.789%, 9/06/2024 | | | 37,543,536 | |
| | | | | | | | |
| | | | | | | 83,929,974 | |
| | | | | | | | |
| | | | Transportation Services — 0.1% | |
| | 10,405,000 | | | Ryder System, Inc., MTN, 2.500%, 9/01/2024 | | | 10,935,543 | |
| | | | | | | | |
| | | | Treasuries — 18.9% | |
| | 11,015,900(††) | | | Mexican Fixed Rate Bonds, Series M, 5.750%, 3/05/2026, (MXN) | | | 51,002,499 | |
| | 4,582,100(††) | | | Mexican Fixed Rate Bonds, Series M, 6.500%, 6/10/2021, (MXN) | | | 20,994,376 | |
| | 12,884,631(††) | | | Mexican Fixed Rate Bonds, Series M 20, 8.500%, 5/31/2029, (MXN) | | | 68,899,255 | |
| | 524,841,000 | | | Republic of Uruguay, 8.500%, 3/15/2028, 144A, (UYU) | | | 12,870,845 | |
| | | | |
| 37 | | | See accompanying notes to financial statements. | | |
Portfolio of Investments – as of September 30, 2020
Loomis Sayles Core Plus Bond Fund – (continued)
| | | | | | | | |
Principal
Amount (‡) | | | Description | | Value (†) | |
| | | | Treasuries — continued | |
| | 280,039,000 | | | Republic of Uruguay, 9.875%, 6/20/2022, 144A, (UYU) | | $ | 6,870,185 | |
| | 38,845,000 | | | U.S. Treasury Bond, 1.375%, 8/15/2050 | | | 38,122,726 | |
| | 109,864,600 | | | U.S. Treasury Bond, 2.000%, 2/15/2050(f) | | | 124,644,822 | |
| | 22,394,500 | | | U.S. Treasury Bond, 2.375%, 11/15/2049 | | | 27,421,016 | |
| | 8,118,700 | | | U.S. Treasury Bond, 3.000%, 11/15/2045 | | | 10,930,117 | |
| | 32,376,600 | | | U.S. Treasury Bond, 3.375%, 11/15/2048 | | | 47,229,365 | |
| | 18,132,000 | | | U.S. Treasury Bond, 4.500%, 2/15/2036 | | | 27,462,897 | |
| | 24,455,180 | | | U.S. Treasury Inflation Indexed Bond, 0.250%, 2/15/2050(h) | | | 28,905,514 | |
| | 46,393,464 | | | U.S. Treasury Inflation Indexed Bond, 0.875%, 2/15/2047(h) | | | 61,809,022 | |
| | 2,583,976 | | | U.S. Treasury Inflation Indexed Bond, 1.000%, 2/15/2046(h) | | | 3,491,362 | |
| | 67,504,933 | | | U.S. Treasury Inflation Indexed Bond, 1.000%, 2/15/2049(h) | | | 94,339,022 | |
| | 104,781,700 | | | U.S. Treasury Note, 0.250%, 5/31/2025(f) | | | 104,793,979 | |
| | 118,595,000 | | | U.S. Treasury Note, 0.250%, 9/30/2025 | | | 118,465,287 | |
| | 59,100,000 | | | U.S. Treasury Note, 0.375%, 9/30/2027 | | | 58,739,859 | |
| | 142,985,000 | | | U.S. Treasury Note, 0.500%, 8/31/2027 | | | 143,387,145 | |
| | 157,810,900 | | | U.S. Treasury Note, 0.625%, 5/15/2030 | | | 157,342,399 | |
| | 63,520,000 | | | U.S. Treasury Note, 0.625%, 8/15/2030 | | | 63,202,400 | |
| | 15,198,600 | | | U.S. Treasury Note, 1.500%, 2/15/2030 | | | 16,404,989 | |
| | 43,483,600 | | | U.S. Treasury Note, 2.375%, 5/15/2029 | | | 50,055,399 | |
| | 35,509,300 | | | U.S. Treasury Note, 2.625%, 2/15/2029 | | | 41,493,172 | |
| | 50,850,300 | | | U.S. Treasury Note, 2.875%, 8/15/2028 | | | 60,053,012 | |
| | 256,497,300 | | | U.S. Treasury Note, 3.125%, 11/15/2028(f) | | | 309,119,324 | |
| | 104,240,000 | | | Uruguay Government International Bond, 8.500%, 3/15/2028, (UYU) | | | 2,556,311 | |
| | | | | | | | |
| | | | | | | 1,750,606,299 | |
| | | | | | | | |
| | | | Utility Other — 0.4% | |
| | 26,132,000 | | | Acwa Power Management & Investments One Ltd.,
5.950%, 12/15/2039, 144A | | | 29,499,579 | |
| | 7,856,000 | | | Essential Utilities, Inc., 2.704%, 4/15/2030 | | | 8,405,865 | |
| | | | | | | | |
| | | | | | | 37,905,444 | |
| | | | | | | | |
| | | | Wireless — 0.6% | |
| | 14,102,000 | | | America Movil SAB de CV, 2.875%, 5/07/2030 | | | 15,274,158 | |
| | 1,352,000 | | | American Tower Corp., 4.700%, 3/15/2022 | | | 1,432,850 | |
| | 19,910,000 | | | Bharti Airtel Ltd., 4.375%, 6/10/2025, 144A | | | 20,992,515 | |
| | 1,101,000 | | | Crown Castle International Corp., 4.150%, 7/01/2050 | | | 1,264,532 | |
| | 3,759,000 | | | Millicom International Cellular S.A., 6.625%, 10/15/2026, 144A | | | 4,031,603 | |
| | 22,875,000 | | | T-Mobile USA, Inc., 3.875%, 4/15/2030, 144A | | | 25,954,432 | |
| | | | | | | | |
| | | | | | | 68,950,090 | |
| | | | | | | | |
| | | | Wirelines — 0.7% | |
| | 8,909,000 | | | AT&T, Inc., 3.500%, 9/15/2053, 144A | | | 8,613,436 | |
| | 2,383,000 | | | AT&T, Inc., 3.550%, 9/15/2055, 144A | | | 2,309,538 | |
| | 4,325,000 | | | AT&T, Inc., 3.650%, 6/01/2051 | | | 4,362,413 | |
| | 16,793,000 | | | AT&T, Inc., 3.650%, 9/15/2059, 144A | | | 16,496,595 | |
| | 177,000 | | | AT&T, Inc., 4.350%, 6/15/2045 | | | 198,314 | |
| | 5,318,000 | | | AT&T, Inc., 4.500%, 3/09/2048 | | | 6,103,015 | |
| | | | |
| | See accompanying notes to financial statements. | | | 38 |
Portfolio of Investments – as of September 30, 2020
Loomis Sayles Core Plus Bond Fund – (continued)
| | | | | | | | |
Principal
Amount (‡) | | | Description | | Value (†) | |
| | | | Wirelines — continued | |
| $ | 22,097,000 | | | Telefonica Emisiones S.A., 5.462%, 2/16/2021 | | $ | 22,505,511 | |
| | | | | | | | |
| | | | | | | 60,588,822 | |
| | | | | | | | |
| | | | Total Non-Convertible Bonds
(Identified Cost $7,869,765,666) | | | 8,242,675,983 | |
| | | | | | | | |
| | | | | | | | |
| | Municipals — 0.2% | |
| | | | Local Authorities — 0.2% | |
| | 16,530,000 | | | University of Virginia, Revenue Bond, Series A, 3.227%, 9/01/2119 | | | 18,003,319 | |
| | | | | | | | |
| | | | Total Municipals
(Identified Cost $16,530,000) | | | 18,003,319 | |
| | | | | | | | |
| | | | | | | | |
| | | | Total Bonds and Notes
(Identified Cost $7,886,295,666) | | | 8,260,679,302 | |
| | | | | | | | |
| | | | | | | | |
| | Senior Loans — 2.3% | |
| | | | Automotive — 0.1% | |
| | 2,752,200 | | | KAR Auction Services, Inc., 2019 Term Loan B6, 1-month LIBOR + 2.250%,
2.438%, 9/19/2026(d) | | | 2,648,992 | |
| | 1,487,781 | | | Visteon Corp., 2018 Term Loan B, LIBOR + 1.750%, 1.912%, 3/25/2024(i) | | | 1,439,428 | |
| | | | | | | | |
| | | | | | | 4,088,420 | |
| | | | | | | | |
| | | | Building Materials — 0.1% | |
| | 12,532,319 | | | Summit Materials Cos. I, LLC, 2017 Term Loan B, 1-month LIBOR + 2.000%,
2.145%, 11/21/2024(d) | | | 12,381,931 | |
| | | | | | | | |
| | | | Cable Satellite — 0.3% | |
| | 12,373,028 | | | CSC Holdings LLC, 2017 Term Loan B1, 1-month LIBOR + 2.250%, 2.402%, 7/17/2025(d) | | | 11,948,757 | |
| | 12,405,000 | | | Virgin Media Bristol LLC, USD Term Loan N, 1-month LIBOR + 2.500%, 2.652%, 1/31/2028(d) | | | 12,022,554 | |
| | | | | | | | |
| | | | | | | 23,971,311 | |
| | | | | | | | |
| | | | Chemicals — 0.0% | |
| | 4,112,800 | | | Venator Materials Corp., Term Loan B, 1-month LIBOR + 3.000%, 3.147%, 8/08/2024(d) | | | 3,973,993 | |
| | | | | | | | |
| | | | Consumer Cyclical Services — 0.1% | |
| | 1,362,589 | | | FrontDoor, Inc., 2018 Term Loan B, 1-month LIBOR + 2.500%, 2.688%, 8/16/2025(d) | | | 1,348,963 | |
| | 12,340,968 | | | Trans Union LLC, 2019 Term Loan B5, 1-month LIBOR + 1.750%, 1.897%, 11/16/2026(d) | | | 12,015,043 | |
| | | | | | | | |
| | | | | | | 13,364,006 | |
| | | | | | | | |
| | | | Consumer Products — 0.1% | |
| | 11,162,032 | | | Coty, Inc., 2018 USD Term Loan B, 1-month LIBOR + 2.250%, 2.409%, 4/07/2025(d) | | | 9,941,241 | |
| | | | |
| 39 | | | See accompanying notes to financial statements. | | |
Portfolio of Investments – as of September 30, 2020
Loomis Sayles Core Plus Bond Fund – (continued)
| | | | | | | | |
Principal
Amount (‡) | | | Description | | Value (†) | |
| | | | Consumer Products — continued | |
| $ | 661,485 | | | Energizer Holdings, Inc., 2018 Term Loan B, 1-month LIBOR + 2.250%, 2.438%, 12/17/2025(d) | | $ | 649,909 | |
| | | | | | | | |
| | | | | | | 10,591,150 | |
| | | | | | | | |
| | | | Gaming — 0.1% | |
| | 4,408,343 | | | Churchill Downs, Inc., 2017 Term Loan B, 1-month LIBOR + 2.000%, 2.150%, 12/27/2024(d) | | | 4,255,417 | |
| | | | | | | | |
| | | | Industrial Other — 0.0% | |
| | 2,799,254 | | | Altra Industrial Motion Corp., 2018 Term Loan B, 1-month LIBOR + 2.000%, 2.147%, 10/01/2025(d) | | | 2,713,541 | |
| | | | | | | | |
| | | | Media Entertainment — 0.4% | |
| | 10,488,551 | | | Entercom Media Corp., 2019 Term Loan, 1-month LIBOR + 2.500%, 2.645%, 11/18/2024(d) | | | 9,846,127 | |
| | 3,468,383 | | | Lamar Media Corp., 2020 Term Loan B, 1-month LIBOR + 1.500%, 1.659%, 2/05/2027(d) | | | 3,388,887 | |
| | 3,287,231 | | | Meredith Corp., 2020 Term Loan B2, 1-month LIBOR + 2.500%, 2.647%, 1/31/2025(d) | | | 3,161,921 | |
| | 18,112,788 | | | Nielsen Finance LLC, USD Term Loan B4, 1-month LIBOR + 2.000%, 2.154%, 10/04/2023(d) | | | 17,732,419 | |
| | 5,989,500 | | | Sinclair Television Group, Inc., Term Loan B2B, 1-month LIBOR + 2.500%, 2.647%, 9/30/2026(d) | | | 5,827,784 | |
| | | | | | | | |
| | | | | | | 39,957,138 | |
| | | | | | | | |
| | | | Packaging — 0.0% | |
| | 2,611,771 | | | Plastipak Packaging, Inc., 2018 Term Loan B, 1-month LIBOR + 2.500%, 2.650%, 10/14/2024(d) | | | 2,567,162 | |
| | | | | | | | |
| | | | Pharmaceuticals — 0.2% | |
| | 5,171,643 | | | Bausch Health Cos., Inc., Term Loan B, 1-month LIBOR + 2.750%, 2.901%, 11/27/2025(d) | | | 5,042,352 | |
| | 7,070,668 | | | Change Healthcare Holdings LLC, 2017 Term Loan B, LIBOR + 2.500%, 3.500%, 3/01/2024(i) | | | 6,912,710 | |
| | 4,975,403 | | | Grifols Worldwide Operations USA, Inc., USD 2019 Term Loan B, 1 Week LIBOR + 2.000%, 2.100%, 11/15/2027(d) | | | 4,866,590 | |
| | | | | | | | |
| | | | | | | 16,821,652 | |
| | | | | | | | |
| | | | Property & Casualty Insurance — 0.1% | |
| | 2,686,900 | | | USI, Inc., 2017 Repriced Term Loan, 3-month LIBOR + 3.000%, 3.220%, 5/16/2024(d) | | | 2,595,088 | |
| | 2,109,063 | | | USI, Inc., 2019 Incremental Term Loan B, 3-month LIBOR + 4.000%, 4.220%, 12/02/2026(d) | | | 2,084,450 | |
| | | | | | | | |
| | | | | | | 4,679,538 | |
| | | | | | | | |
| | | | Restaurants — 0.2% | |
| | 18,356,288 | | | 1011778 B.C. Unlimited Liability Co., Term Loan B4, 1-month LIBOR + 1.750%, 1.897%, 11/19/2026(d) | | | 17,568,436 | |
| | | | | | | | |
| | | | Technology — 0.2% | |
| | 9,879,062 | | | Iron Mountain, Inc., 2018 Term Loan B, 1-month LIBOR + 1.750%, 1.897%, 1/02/2026(d) | | | 9,483,899 | |
| | | | |
| | See accompanying notes to financial statements. | | | 40 |
Portfolio of Investments – as of September 30, 2020
Loomis Sayles Core Plus Bond Fund – (continued)
| | | | | | | | |
Principal
Amount (‡) | | | Description | | Value (†) | |
| | | | Technology — continued | |
| $ | 1,944,855 | | | Sabre GLBL, Inc., 2018 Term Loan B, 1-month LIBOR + 2.000%, 2.147%, 2/22/2024(d) | | $ | 1,809,765 | |
| | 9,689,545 | | | SS&C Technologies Inc., 2018 Term Loan B5, 1-month LIBOR + 1.750%, 1.897%, 4/16/2025(d) | | | 9,374,635 | |
| | | | | | | | |
| | | | | | | 20,668,299 | |
| | | | | | | | |
| | | | Transportation Services — 0.1% | |
| | 9,663,836 | | | Uber Technologies, Inc., 2018 Incremental Term Loan, 1-month LIBOR + 3.500%, 3.647%, 7/13/2023(d) | | | 9,487,665 | |
| | | | | | | | |
| | | | Utility Other — 0.1% | |
| | 10,004,925 | | | Pacific Gas & Electric Co., 2020 Term Loan, 3-month LIBOR + 4.500%, 5.500%, 6/23/2025(d) | | | 9,788,118 | |
| | | | | | | | |
| | | | Wireless — 0.2% | |
| | 8,217,274 | | | Asurion LLC, 2017 Term Loan B4, 1-month LIBOR + 3.000%,
3.147%, 8/04/2022(d) | | | 8,112,832 | |
| | 4,113,201 | | | Asurion LLC, 2018 Term Loan B6, 1-month LIBOR + 3.000%,
3.147%, 11/03/2023(d) | | | 4,048,089 | |
| | 5,028,905 | | | T-Mobile USA, Inc., 2020 Term Loan, 1-month LIBOR + 3.000%, 3.147%, 4/01/2027(d) | | | 5,021,261 | |
| | | | | | | | |
| | | | | | | 17,182,182 | |
| | | | | | | | |
| | | | Total Senior Loans
(Identified Cost $219,666,717) | | | 214,059,959 | |
| | | | | | | | |
| | | | | | | | |
| Shares | | | | | | |
| | Preferred Stocks — 0.2% | |
| | | | Cable Satellite — 0.2% | |
| | 16,673,000 | | | NBCUniversal Enterprise, Inc., 5.250%, 144A (Identified Cost $17,320,290) | | | 16,839,730 | |
| | | | | | | | |
| | | | | | | | |
| | Common Stocks — 0.0% | |
| | | | Oil, Gas & Consumable Fuels — 0.0% | |
| | 77,870 | | | Paragon Offshore Ltd., Litigation Units, Class A(b)(c)(j)(k)(l) | | | — | |
| | 116,806 | | | Paragon Offshore Ltd., Litigation Units, Class B(j)(k) | | | 584,030 | |
| | | | | | | | |
| | | | Total Common Stocks
(Identified Cost $9,028,819) | | | 584,030 | |
| | | | | | | | |
| | | | | | | | |
Principal
Amount (‡) | | | | | | |
| | Short-Term Investments — 14.6% | |
| $ | 859,634,627 | | | Tri-Party Repurchase Agreement with Fixed Income Clearing Corporation, dated 9/30/2020 at 0.000% to be repurchased at $859,634,627 on 10/01/2020 collateralized by $35,194,100 U.S. Treasury Inflation Indexed Note, 0.125% due 4/15/2021 valued at $38,645,836; $617,904,200 U.S. Treasury Note, 2.625% due 6/15/2021 valued at $633,555,825; $200,000,000 U.S. Treasury Note, 2.375% due 4/15/2021 valued at $204,625,728 including accrued interest (Note 2 of Notes to Financial Statements) | | | 859,634,627 | |
| | 2,750,000 | | | U.S. Treasury Bills, 0.054%, 10/01/2020(m) | | | 2,750,000 | |
| | 106,670,000 | | | U.S. Treasury Bills, 0.068%, 10/13/2020(m) | | | 106,667,288 | |
| | | | |
| 41 | | | See accompanying notes to financial statements. | | |
Portfolio of Investments – as of September 30, 2020
Loomis Sayles Core Plus Bond Fund – (continued)
| | | | | | | | |
Principal
Amount (‡) | | | Description | | Value (†) | |
| | Short-Term Investments — continued | |
| $ | 385,853,100 | | | U.S. Treasury Bills, 0.105%-0.165%, 11/12/2020(m)(n) | | $ | 385,812,022 | |
| | | | | | | | |
| | | | Total Short-Term Investments
(Identified Cost $1,354,842,452) | | | 1,354,863,937 | |
| | | | | | | | |
| | | | | | | | |
| | | | Total Investments — 106.1%
(Identified Cost $9,487,153,944) | | | 9,847,026,958 | |
| | | | Other assets less liabilities — (6.1)% | | | (568,283,255 | ) |
| | | | | | | | |
| | | | Net Assets — 100.0% | | $ | 9,278,743,703 | |
| | | | | | | | |
| | | | | | | | |
| | (‡) | | | Principal Amount stated in U.S. dollars unless otherwise noted. | |
| | (†) | | | See Note 2 of Notes to Financial Statements. | |
| | (††) | | | Amount shown represents units. One unit represents a principal amount of 100. | |
| | (a) | | | Variable rate security. The interest rate adjusts periodically based on; (i) changes in current interest rates and/or prepayments on underlying pools of assets, if applicable, (ii) reference to a base lending rate plus or minus a margin, and/or (iii) reference to a base lending rate adjusted by a multiplier and/or subject to certain floors or caps. Rate as of September 30, 2020 is disclosed. | |
| | (b) | | | Fair valued by the Fund’s adviser. At September 30, 2020, the value of these securities amounted to $2,307,376 or less than 0.1% of net assets. See Note 2 of Notes to Financial Statements. | |
| | (c) | | | Level 3 security. Value has been determined using significant unobservable inputs. See Note 3 of Notes to Financial Statements. | |
| | (d) | | | Variable rate security. Rate as of September 30, 2020 is disclosed. | |
| | (e) | | | The Fund’s investment in mortgage related securities of Federal Home Loan Mortgage Corporation, Federal National Mortgage Association and Government National Mortgage Association are interests in separate pools of mortgages. All separate investments in securities of each issuer which have the same coupon rate have been aggregated for the purpose of presentation in the Portfolio of Investments. | |
| | (f) | | | Security (or a portion thereof) has been designated to cover the Fund’s obligations under open TBA transactions. | |
| | (g) | | | When-issued/delayed delivery. See Note 2 of Notes to Financial Statements. | |
| | (h) | | | Treasury Inflation Protected Security (TIPS). | |
| | (i) | | | Variable rate security. Rate shown represents the weighted average rate of underlying contracts at September 30, 2020. Interest rates on contracts are primarily redetermined either weekly, monthly or quarterly by reference to the indicated base lending rate and spread and the reset period. | |
| | (j) | | | Non-income producing security. | |
| | (k) | | | Securities subject to restriction on resale. At September 30, 2020, the restricted securities held by the Fund are as follows: | |
| | | | | | | | | | | | | | | | |
| | | | | | | | | | | | | | | | |
| | | Acquisition
Date | | | Acquisition
Cost | | | Value | | | % of
Net Assets | |
| Paragon Offshore Ltd., Litigation Units, Class A | | | 7/18/2017 | | | | $ 429,948 | | | $ | — | | | | — | |
| Paragon Offshore Ltd., Litigation Units, Class B | | | 7/18/2017 | | | | 8,598,870 | | | | 584,030 | | | | Less than 0.1% | |
| | | | |
| | See accompanying notes to financial statements. | | | 42 |
Portfolio of Investments – as of September 30, 2020
Loomis Sayles Core Plus Bond Fund – (continued)
| | | | | | | | |
| | (l) | | | Illiquid security. (Unaudited) | |
| | (m) | | | Interest rate represents discount rate at time of purchase; not a coupon rate. | |
| | (n) | | | The Fund’s investment in U.S. Government/Agency securities is comprised of various lots with differing discount rates. These separate investments, which have the same maturity date, have been aggregated for the purpose of presentation in the Portfolio of Investments. | |
| | | | | | | | |
| | 144A | | | All or a portion of these securities are exempt from registration under Rule 144A of the Securities Act of 1933. These securities may be resold in transactions exempt from registration, normally to qualified institutional buyers. At September 30, 2020, the value of Rule 144A holdings amounted to $1,810,948,993 or 19.5% of net assets. | |
| | ABS | | | Asset-Backed Securities | |
| | ARMs | | | Adjustable Rate Mortgages | |
| | EMTN | | | Euro Medium Term Note | |
| | FHLMC | | | Federal Home Loan Mortgage Corp. | |
| | FNMA | | | Federal National Mortgage Association | |
| | GMTN | | | Global Medium Term Note | |
| | GNMA | | | Government National Mortgage Association | |
| | LIBOR | | | London Interbank Offered Rate | |
| | MTN | | | Medium Term Note | |
| | REITs | | | Real Estate Investment Trusts | |
| | TBA | | | To Be Announced | |
| | UMBS® | | | Uniform Mortgage-Backed Securities | |
| | | | | | | | |
| | MXN | | | Mexican Peso | |
| | UYU | | | Uruguayan Peso | |
Industry Summary at September 30, 2020
| | | | |
Mortgage Related | | | 22.5 | % |
Treasuries | | | 18.9 | |
Banking | | | 7.9 | |
Technology | | | 4.5 | |
Automotive | | | 2.5 | |
Government Owned - No Guarantee | | | 2.2 | |
Food & Beverage | | | 2.2 | |
Other Investments, less than 2% each | | | 30.8 | |
Short-Term Investments | | | 14.6 | |
| | | | |
Total Investments | | | 106.1 | |
Other assets less liabilities | | | (6.1 | ) |
| | | | |
Net Assets | | | 100.0 | % |
| | | | |
| | | | |
| 43 | | | See accompanying notes to financial statements. | | |
Portfolio of Investments – as of September 30, 2020
Loomis Sayles Global Allocation Fund
| | | | | | | | |
Shares | | | Description | | Value (†) | |
| | Common Stocks — 67.1% of Net Assets | |
| | | | Canada — 2.7% | |
| | 71,019 | | | Canada Goose Holdings, Inc.(a) | | $ | 2,281,163 | |
| | 763,400 | | | CGI, Inc.(a) | | | 51,816,373 | |
| | 1,264,500 | | | Open Text Corp. | | | 53,446,029 | |
| | | | | | | | |
| | | | | | | 107,543,565 | |
| | | | | | | | |
| | | | China — 2.8% | |
| | 383,909 | | | Alibaba Group Holding Ltd., Sponsored ADR(a) | | | 112,861,568 | |
| | | | | | | | |
| | | | France — 1.5% | |
| | 314,201 | | | Dassault Systemes SE | | | 58,624,269 | |
| | | | | | | | |
| | | | Hong Kong — 1.0% | |
| | 4,111,000 | | | AIA Group Ltd. | | | 40,863,725 | |
| | | | | | | | |
| | | | India — 1.3% | |
| | 3,675,111 | | | HDFC Bank Ltd.(a) | | | 53,949,922 | |
| | | | | | | | |
| | | | Japan — 1.7% | |
| | 2,390,261 | | | Nomura Research Institute Ltd. | | | 70,379,992 | |
| | | | | | | | |
| | | | Netherlands — 1.5% | |
| | 160,017 | | | ASML Holding NV | | | 59,105,937 | |
| | | | | | | | |
| | | | Sweden — 1.5% | |
| | 1,264,721 | | | Atlas Copco AB, Class A | | | 60,300,319 | |
| | | | | | | | |
| | | | Switzerland — 3.0% | |
| | 614,374 | | | Nestle S.A., (Registered) | | | 73,117,859 | |
| | 348,754 | | | Temenos AG, (Registered) | | | 46,874,089 | |
| | | | | | | | |
| | | | | | | 119,991,948 | |
| | | | | | | | |
| | | | United Kingdom — 4.7% | |
| | 1,232,378 | | | Halma PLC | | | 37,232,417 | |
| | 379,819 | | | Linde PLC | | | 90,446,299 | |
| | 551,889 | | | London Stock Exchange Group PLC | | | 63,310,952 | |
| | | | | | | | |
| | | | | | | 190,989,668 | |
| | | | | | | | |
| | | | United States — 45.4% | |
| | 316,372 | | | Accenture PLC, Class A | | | 71,496,908 | |
| | 6,730 | | | Alphabet, Inc., Class C(a) | | | 9,890,408 | |
| | 53,391 | | | Alphabet, Inc., Class A(a) | | | 78,249,850 | |
| | 38,330 | | | Amazon.com, Inc.(a) | | | 120,690,821 | |
| | 177,460 | | | Becton Dickinson & Co. | | | 41,291,393 | |
| | 456,016 | | | Copart, Inc.(a) | | | 47,954,643 | |
| | 159,568 | | | Costco Wholesale Corp. | | | 56,646,640 | |
| | 578,496 | | | Danaher Corp. | | | 124,567,544 | |
| | 3,230,897 | | | Dropbox, Inc., Class A(a) | | | 62,227,076 | |
| | 336,297 | | | Estee Lauder Cos., Inc. (The), Class A | | | 73,396,820 | |
| | 357,712 | | | Facebook, Inc., Class A(a) | | | 93,684,773 | |
| | 131,886 | | | Goldman Sachs Group, Inc. (The) | | | 26,505,129 | |
| | 197,636 | | | Home Depot, Inc. (The) | | | 54,885,493 | |
| | 611,241 | | | IQVIA Holdings, Inc.(a) | | | 96,349,919 | |
| | | | |
| | See accompanying notes to financial statements. | | | 44 |
Portfolio of Investments – as of September 30, 2020
Loomis Sayles Global Allocation Fund – (continued)
| | | | | | | | |
Shares | | | Description | | Value (†) | |
| | | | United States — continued | |
| | 535,397 | | | M&T Bank Corp. | | $ | 49,304,710 | |
| | 304,894 | | | MasterCard, Inc., Class A | | | 103,106,004 | |
| | 43,586 | | | Mettler-Toledo International, Inc.(a) | | | 42,093,179 | |
| | 264,847 | | | Northrop Grumman Corp. | | | 83,556,580 | |
| | 7,718 | | | NVR, Inc.(a) | | | 31,513,520 | |
| | 115,891 | | | Parker-Hannifin Corp. | | | 23,449,385 | |
| | 549,531 | | | Peloton Interactive, Inc., Class A(a) | | | 54,535,456 | |
| | 243,235 | | | Roper Technologies, Inc. | | | 96,104,581 | |
| | 249,003 | | | S&P Global, Inc. | | | 89,790,482 | |
| | 90,350 | | | Sherwin-Williams Co. (The) | | | 62,950,459 | |
| | 417,216 | | | Texas Instruments, Inc. | | | 59,574,273 | |
| | 279,338 | | | UnitedHealth Group, Inc. | | | 87,089,208 | |
| | 131,830 | | | Vail Resorts, Inc. | | | 28,207,665 | |
| | 323,836 | | | VeriSign, Inc.(a) | | | 66,337,805 | |
| | 11,165 | | | Whiting Petroleum Corp.(a) | | | 193,043 | |
| | | | | | | | |
| | | | | | | 1,835,643,767 | |
| | | | | | | | |
| | | | Total Common Stocks
(Identified Cost $1,996,118,259) | | | 2,710,254,680 | |
| | | | | | | | |
| | | | | | | | |
Principal
Amount (‡) | | | | | | |
| | Bonds and Notes — 30.7% | |
| | Non-Convertible Bonds — 30.3% | |
| | | | Australia — 0.4% | |
| | 1,675,000 | | | Australia Government Bond, Series 133, 5.500%, 4/21/2023, (AUD)(b) | | | 1,362,625 | |
| | 670,000 | | | GAIF Bond Issuer Pty Ltd., 3.400%, 9/30/2026, 144A(b) | | | 709,518 | |
| | 3,560,000 | | | Glencore Funding LLC, 1.625%, 9/01/2025, 144A | | | 3,530,309 | |
| | 935,000 | | | National Australia Bank, 2.500%, 1/12/2021(b) | | | 940,713 | |
| | 11,610,000 | | | New South Wales Treasury Corp., 2.000%, 3/08/2033, (AUD)(b) | | | 8,814,726 | |
| | 1,505,000 | | | New South Wales Treasury Corp., Series 22, 6.000%, 3/01/2022, (AUD)(b) | | | 1,166,766 | |
| | 95,000 | | | Sydney Airport Finance Co. Pty Ltd., 3.375%, 4/30/2025, 144A | | | 100,443 | |
| | 1,370,000 | | | Westpac Banking Corp., 2.650%, 1/16/2030(b) | | | 1,517,223 | |
| | | | | | | | |
| | | | | | | 18,142,323 | |
| | | | | | | | |
| | | | Belgium — 0.1% | |
| | 2,745,000 | | | Anheuser-Busch InBev S.A., EMTN, 2.000%, 1/23/2035, (EUR)(b) | | | 3,495,818 | |
| | 1,690,000 | | | Anheuser-Busch InBev Worldwide, Inc., 4.750%, 1/23/2029(b) | | | 2,062,508 | |
| | | | | �� | | | |
| | | | | | | 5,558,326 | |
| | | | | | | | |
| | | | Brazil — 0.4% | |
| | 1,150,000 | | | Banco Bradesco S.A., 2.850%, 1/27/2023, 144A | | | 1,167,031 | |
| | 1,035,000 | | | Braskem Netherlands Finance BV, 4.500%, 1/10/2028 | | | 996,187 | |
| | 1,785,000 | | | Braskem Netherlands Finance BV, 4.500%, 1/31/2030 | | | 1,666,744 | |
| | 2,685,000 | | | Brazilian Government International Bond, 4.500%, 5/30/2029 | | | 2,864,761 | |
| | 1,085,000 | | | Brazilian Government International Bond, 4.625%, 1/13/2028 | | | 1,176,151 | |
| | 2,980,000 | | | BRF S.A., 4.875%, 1/24/2030 | | | 3,058,195 | |
| | 650,000 | | | Centrais Eletricas Brasileiras S.A., 4.625%, 2/04/2030, 144A | | | 651,950 | |
| | | | |
| 45 | | | See accompanying notes to financial statements. | | |
Portfolio of Investments – as of September 30, 2020
Loomis Sayles Global Allocation Fund – (continued)
| | | | | | | | |
Principal
Amount (‡) | | | Description | | Value (†) | |
| | | | Brazil — continued | |
| $ | 400,000 | | | Cosan Luxembourg S.A., 5.000%, 3/14/2023, 144A | | $ | 401,000 | |
| | 1,100,000 | | | Embraer Netherlands Finance BV, 5.050%, 6/15/2025 | | | 1,056,000 | |
| | 1,250,000 | | | Itau Unibanco Holding S.A., 2.900%, 1/24/2023, 144A | | | 1,264,225 | |
| | 2,465,000 | | | Petrobras Global Finance BV, 5.999%, 1/27/2028 | | | 2,738,615 | |
| | 150,000 | | | Petrobras Global Finance BV, 6.875%, 1/20/2040 | | | 166,799 | |
| | 575,000 | | | Raizen Fuels Finance S.A., 5.300%, 1/20/2027, 144A | | | 624,738 | |
| | 500,000 | | | Tupy Overseas S.A., 6.625%, 7/17/2024, 144A | | | 504,050 | |
| | | | | | | | |
| | | | | | | 18,336,446 | |
| | | | | | | | |
| | | | Canada — 4.4% | |
| | 399,521 | | | Air Canada Pass Through Trust, Series 2015-2, Class A,
4.125%, 6/15/2029, 144A(b) | | | 341,646 | |
| | 803,352 | | | Air Canada Pass Through Trust, Series 2017-1, Class AA,
3.300%, 7/15/2031, 144A(b) | | | 756,533 | |
| | 1,010,000 | | | Antares Holdings LP, 6.000%, 8/15/2023, 144A | | | 1,021,370 | |
| | 815,000 | | | Bank of Montreal, 1.750%, 6/15/2021, 144A(b) | | | 823,183 | |
| | 1,015,000 | | | Brookfield Finance, Inc., 3.900%, 1/25/2028(b) | | | 1,130,308 | |
| | 11,680,000 | | | Canadian Government Bond, 0.500%, 3/01/2022, (CAD)(b) | | | 8,809,187 | |
| | 23,060,000 | | | Canadian Government Bond, 0.500%, 9/01/2025, (CAD)(b) | | | 17,439,217 | |
| | 63,450,000 | | | Canadian Government Bond, 0.750%, 3/01/2021, (CAD)(b) | | | 47,771,315 | |
| | 63,755,000 | | | Canadian Government Bond, 0.750%, 9/01/2021, (CAD)(b) | | | 48,125,916 | |
| | 35,230,000 | | | Canadian Government Bond, 1.750%, 5/01/2021, (CAD)(b) | | | 26,702,623 | |
| | 970,000 | | | Canadian Imperial Bank of Commerce, 3.500%, 9/13/2023(b) | | | 1,054,023 | |
| | 1,800,000 | | | Canadian Imperial Bank of Commerce, (fixed rate to 7/22/2022, variable rate thereafter), 2.606%, 7/22/2023(b) | | | 1,865,481 | |
| | 800,000 | | | CPPIB Capital, Inc., 0.375%, 6/20/2024, 144A, (EUR)(b) | | | 963,763 | |
| | 430,000 | | | Enbridge, Inc., 2.900%, 7/15/2022(b) | | | 446,320 | |
| | 905,000 | | | Export Development Canada, 1.800%, 9/01/2022, (CAD)(b) | | | 699,002 | |
| | 593,848 | | | Institutional Mortgage Securities Canada, Inc., Series 2014-5A, Class A2, 2.616%, 7/12/2047, 144A, (CAD)(b) | | | 449,568 | |
| | 5,000,000 | | | Province of British Columbia Canada, Series 10, 1.750%, 9/27/2024(b) | | | 5,258,420 | |
| | 2,355,000 | | | Province of Quebec Canada, 2.300%, 9/01/2029, (CAD)(b) | | | 1,940,419 | |
| | 2,475,000 | | | Royal Bank of Canada, GMTN, 2.250%, 11/01/2024(b) | | | 2,623,464 | |
| | 2,500,000 | | | Toronto-Dominion Bank (The), 2.100%, 7/15/2022, 144A(b) | | | 2,576,302 | |
| | 1,690,000 | | | Toronto-Dominion Bank (The), GMTN, 3.500%, 7/19/2023(b) | | | 1,834,790 | |
| | 1,675,000 | | | Toronto-Dominion Bank (The), MTN, 1.150%, 6/12/2025(b) | | | 1,702,196 | |
| | 1,580,000 | | | Videotron Ltd., 5.125%, 4/15/2027, 144A | | | 1,662,160 | |
| | | | | | | | |
| | | | | | | 175,997,206 | |
| | | | | | | | |
| | | | Chile — 0.3% | |
| | 950,000 | | | Celulosa Arauco y Constitucion S.A., 4.500%, 8/01/2024 | | | 1,039,347 | |
| | 1,500,000 | | | Chile Government International Bond, 2.450%, 1/31/2031(b) | | | 1,577,265 | |
| | 570,000 | | | Corp. Nacional del Cobre de Chile, 3.750%, 1/15/2031, 144A(b) | | | 633,584 | |
| | 1,960,000 | | | Corp. Nacional del Cobre de Chile, 3.000%, 9/30/2029, 144A(b) | | | 2,070,289 | |
| | 1,700,000 | | | Corp. Nacional del Cobre de Chile, 4.500%, 9/16/2025(b) | | | 1,915,703 | |
| | 1,160,000 | | | Corp. Nacional del Cobre de Chile, 4.500%, 9/16/2025, 144A(b) | | | 1,307,185 | |
| | 525,000 | | | Enel Chile S.A., 4.875%, 6/12/2028(b) | | | 622,073 | |
| | 800,000 | | | Inversiones CMPC S.A., 4.375%, 5/15/2023, 144A(b) | | | 850,000 | |
| | | | |
| | See accompanying notes to financial statements. | | | 46 |
Portfolio of Investments – as of September 30, 2020
Loomis Sayles Global Allocation Fund – (continued)
| | | | | | | | |
Principal
Amount (‡) | | | Description | | Value (†) | |
| | | | Chile — continued | |
| $ | 935,000 | | | Republic of Chile, 3.240%, 2/06/2028(b) | | $ | 1,039,262 | |
| | 1,120,000 | | | Transelec S.A., 4.250%, 1/14/2025, 144A(b) | | | 1,215,200 | |
| | | | | | | | |
| | | | | | | 12,269,908 | |
| | | | | | | | |
| | | | China — 0.3% | |
| | 920,000 | | | Alibaba Group Holding Ltd., 3.400%, 12/06/2027(b) | | | 1,030,250 | |
| | 795,000 | | | Baidu, Inc., 3.875%, 9/29/2023(b) | | | 854,251 | |
| | 12,000,000 | | | China Government Bond, 3.300%, 7/04/2023, (CNY)(b) | | | 1,801,402 | |
| | 6,500,000 | | | China Government Bond, 3.390%, 5/21/2025, (CNH)(b) | | | 986,826 | |
| | 500,000 | | | China Government Bond, 3.480%, 6/29/2027, (CNH)(b) | | | 76,886 | |
| | 400,000 | | | China Resources Gas Group Ltd., 4.500%, 4/05/2022, 144A(b) | | | 417,674 | |
| | 905,000 | | | Industrial & Commercial Bank of China Ltd., 2.957%, 11/08/2022(b) | | | 940,413 | |
| | 500,000 | | | Tencent Holdings Ltd., 2.985%, 1/19/2023, 144A(b) | | | 521,495 | |
| | 1,175,000 | | | Tencent Holdings Ltd., 3.280%, 4/11/2024, 144A(b) | | | 1,252,591 | |
| | 1,820,000 | | | Three Gorges Finance I Cayman Islands Ltd., 3.150%, 6/02/2026(b) | | | 1,977,357 | |
| | 1,270,000 | | | Weibo Corp., 3.500%, 7/05/2024(b) | | | 1,336,252 | |
| | | | | | | | |
| | | | | | | 11,195,397 | |
| | | | | | | | |
| | | | Colombia — 0.5% | |
| | 1,395,000 | | | Colombia Government International Bond, 3.125%, 4/15/2031 | | | 1,431,284 | |
| | 960,000 | | | Colombia Telecomunicaciones S.A. E.S.P., 4.950%, 7/17/2030, 144A | | | 998,400 | |
| | 2,536,000 | | | Ecopetrol S.A., 5.875%, 5/28/2045 | | | 2,764,240 | |
| | 1,265,000,000 | | | Emgesa S.A. E.S.P., 8.750%, 1/25/2021, 144A, (COP) | | | 334,831 | |
| | 1,300,000 | | | Empresas Publicas de Medellin ESP, 4.250%, 7/18/2029, 144A | | | 1,303,900 | |
| | 1,140,000 | | | Millicom International Cellular S.A., 6.250%, 3/25/2029, 144A | | | 1,216,950 | |
| | 1,150,000 | | | Millicom International Cellular S.A., 6.625%, 10/15/2026 | | | 1,233,398 | |
| | 575,000 | | | Republic of Colombia, 3.875%, 4/25/2027 | | | 620,425 | |
| | 200,000,000 | | | Republic of Colombia, 7.750%, 4/14/2021, (COP) | | | 53,456 | |
| | 7,073,300,000 | | | Republic of Colombia, Series B, 6.250%, 11/26/2025, (COP) | | | 2,025,675 | |
| | 29,559,900,000 | | | Titulos De Tesoreria, Series B, 7.500%, 8/26/2026, (COP)(b) | | | 8,899,737 | |
| | 870,000 | | | Transportadora de Gas Internacional S.A. E.S.P., 5.550%, 11/01/2028, 144A | | | 983,109 | |
| | | | | | | | |
| | | | | | | 21,865,405 | |
| | | | | | | | |
| | | | Dem.Rep. Congo — 0.0% | |
| | 985,000 | | | HTA Group Ltd. Co., 7.000%, 12/18/2025, 144A | | | 1,029,079 | |
| | | | | | | | |
| | | | Dominican Republic — 0.1% | |
| | 1,155,000 | | | Dominican Republic, 4.875%, 9/23/2032, 144A | | | 1,148,647 | |
| | 1,410,000 | | | Dominican Republic, 5.500%, 1/27/2025, 144A | | | 1,499,902 | |
| | 590,000 | | | Dominican Republic, 5.950%, 1/25/2027, 144A | | | 633,123 | |
| | 995,000 | | | Dominican Republic, 6.000%, 7/19/2028, 144A | | | 1,070,789 | |
| | 425,000 | | | Dominican Republic, 8.625%, 4/20/2027, 144A | | | 496,723 | |
| | | | | | | | |
| | | | | | | 4,849,184 | |
| | | | | | | | |
| | | | Finland — 0.1% | |
| | 3,575,000 | | | Nordea Bank Abp, 0.750%, 8/28/2025, 144A(b) | | | 3,555,978 | |
| | | | | | | | |
| | | | |
| 47 | | | See accompanying notes to financial statements. | | |
Portfolio of Investments – as of September 30, 2020
Loomis Sayles Global Allocation Fund – (continued)
| | | | | | | | |
Principal
Amount (‡) | | | Description | | Value (†) | |
| | | | France — 0.3% | |
| | 200,000 | | | AXA S.A., 7.125%, 12/15/2020, (GBP)(b) | | $ | 261,427 | |
| | 890,000 | | | BNP Paribas S.A, (fixed rate to 6/09/2025, variable rate thereafter),
2.219%, 6/09/2026, 144A(b) | | | 917,759 | |
| | 205,000 | | | BNP Paribas S.A., 4.375%, 5/12/2026, 144A(b) | | | 229,621 | |
| | 1,415,000 | | | Caisse d’Amortissement de la Dette Sociale, 1.875%, 2/12/2022(b) | | | 1,445,154 | |
| | 250,000 | | | Credit Agricole S.A., 3.250%, 10/04/2024, 144A(b) | | | 270,052 | |
| | 1,300,000 | | | Edenred, 1.875%, 3/06/2026, (EUR)(b) | | | 1,635,923 | |
| | 1,400,000 | | | Engie S.A., 1.250%, 10/24/2041, (EUR)(b) | | | 1,709,792 | |
| | 1,550,000 | | | French Republic Government Bond OAT, 4.250%, 10/25/2023, (EUR)(b) | | | 2,093,890 | |
| | 500,000 | | | Holding d’Infrastructures de Transport SASU, EMTN,
1.625%, 11/27/2027, (EUR) | | | 592,922 | |
| | 500,000 | | | Holding d’Infrastructures de Transport SASU, EMTN,
0.625%, 3/27/2023, (EUR) | | | 582,765 | |
| | 1,015,000 | | | Societe Generale S.A., 4.750%, 11/24/2025, 144A(b) | | | 1,113,622 | |
| | | | | | | | |
| | | | | | | 10,852,927 | |
| | | | | | | | |
| | | | Germany — 0.1% | |
| | 1,165,000 | | | BMW U.S. Capital LLC, 3.150%, 4/18/2024, 144A(b) | | | 1,249,426 | |
| | 1,395,000 | | | BMW U.S. Capital LLC, 4.150%, 4/09/2030, 144A(b) | | | 1,653,061 | |
| | 1,450,000 | | | Siemens Financieringsmaatschappij NV, 2.350%, 10/15/2026, 144A(b) | | | 1,555,740 | |
| | 420,000 | | | Volkswagen Group of America Finance LLC, 3.350%, 5/13/2025, 144A(b) | | | 458,617 | |
| | | | | | | | |
| | | | | | | 4,916,844 | |
| | | | | | | | |
| | | | Hong Kong — 0.1% | |
| | 355,000 | | | AIA Group Ltd., 3.200%, 3/11/2025, 144A(b) | | | 380,754 | |
| | 1,405,000 | | | AIA Group Ltd., 3.600%, 4/09/2029(b) | | | 1,580,330 | |
| | 1,135,000 | | | AIA Group Ltd., 3.900%, 4/06/2028, 144A(b) | | | 1,290,098 | |
| | | | | | | | |
| | | | | | | 3,251,182 | |
| | | | | | | | |
| | | | India — 0.1% | |
| | 1,230,000 | | | ICICI Bank Ltd., EMTN, 3.250%, 9/09/2022 | | | 1,254,948 | |
| | 1,250,000 | | | Power Finance Corp. Ltd., 3.950%, 4/23/2030, 144A | | | 1,218,050 | |
| | | | | | | | |
| | | | | | | 2,472,998 | |
| | | | | | | | |
| | | | Indonesia — 0.3% | |
| | 300,000 | | | Indonesia Government International Bond, 4.125%, 1/15/2025, 144A | | | 334,796 | |
| | 1,385,000 | | | Indonesia Government International Bond, 4.200%, 10/15/2050(b) | | | 1,603,636 | |
| | 735,000 | | | Indonesia Government International Bond, 4.750%, 1/08/2026 | | | 853,074 | |
| | 50,092,000,000 | | | Indonesia Treasury Bond, Series FR75, 7.500%, 5/15/2038, (IDR)(b) | | | 3,337,783 | |
| | 43,840,000,000 | | | Indonesia Treasury Bond, Series FR82, 7.000%, 9/15/2030, (IDR)(b) | | | 2,955,665 | |
| | 1,475,000 | | | Republic of Indonesia, 2.850%, 2/14/2030(b) | | | 1,551,494 | |
| | 545,000 | | | Republic of Indonesia, 2.875%, 7/08/2021, 144A, (EUR) | | | 651,188 | |
| | 525,000 | | | Republic of Indonesia, 4.750%, 1/08/2026, 144A | | | 609,651 | |
| | | | | | | | |
| | | | | | | 11,897,287 | |
| | | | | | | | |
| | | | Ireland — 0.1% | |
| | 1,715,000 | | | AIB Group PLC, 4.750%, 10/12/2023, 144A(b) | | | 1,862,744 | |
| | 1,250,000 | | | Bank of Ireland Group PLC, 4.500%, 11/25/2023, 144A | | | 1,350,729 | |
| | 375,000 | | | Ireland Government Bond, 3.400%, 3/18/2024, (EUR)(b) | | | 500,695 | |
| | | | | | | | |
| | | | | | | 3,714,168 | |
| | | | | | | | |
| | | | |
| | See accompanying notes to financial statements. | | | 48 |
Portfolio of Investments – as of September 30, 2020
Loomis Sayles Global Allocation Fund – (continued)
| | | | | | | | |
Principal
Amount (‡) | | | Description | | Value (†) | |
| | | | Israel — 0.2% | |
| | 23,525,000 | | | State of Israel, 1.000%, 3/31/2030, (ILS) | | $ | 7,052,530 | |
| | | | | | | | |
| | | | Italy — 0.7% | |
| | 200,000 | | | Intesa Sanpaolo SpA, 5.710%, 1/15/2026, 144A | | | 218,054 | |
| | 530,000 | | | Intesa Sanpaolo SpA, EMTN, 3.928%, 9/15/2026, (EUR) | | | 675,197 | |
| | 6,965,000 | | | Italy Buoni Poliennali Del Tesoro, 1.350%, 4/01/2030, (EUR)(b) | | | 8,586,961 | |
| | 3,305,000 | | | Italy Buoni Poliennali Del Tesoro, 2.000%, 2/01/2028, (EUR) | | | 4,265,944 | |
| | 4,255,000 | | | Italy Buoni Poliennali Del Tesoro, 5.000%, 3/01/2022, (EUR)(b) | | | 5,361,286 | |
| | 1,975,000 | | | Italy Government International Bond, 2.375%, 10/17/2024 | | | 2,054,109 | |
| | 3,335,000 | | | Republic of Italy, 2.500%, 11/15/2025, (EUR) | | | 4,347,662 | |
| | 630,000 | | | UniCredit SpA, (fixed rate to 4/02/2029, variable rate thereafter),
7.296%, 4/02/2034, 144A | | | 724,935 | |
| | 635,000 | | | UniCredit SpA, (fixed rate to 6/19/2027, variable rate thereafter),
5.861%, 6/19/2032, 144A | | | 675,449 | |
| | | | | | | | |
| | | | | | | 26,909,597 | |
| | | | | | | | |
| | | | Japan — 0.8% | |
| | 988,761,200(††) | | | Japan Government CPI Linked Bond, Series 23, 0.100%, 3/10/2028, (JPY)(b) | | | 9,365,931 | |
| | 2,020,350,000 | | | Japan Government Thirty Year Bond, Series 62, 0.500%, 3/20/2049, (JPY)(b) | | | 18,792,809 | |
| | 2,000,000 | | | Mizuho Financial Group, Inc., (fixed rate to 7/10/2023, variable rate thereafter), 1.241%, 7/10/2024(b) | | | 2,015,702 | |
| | 2,000,000 | | | Nomura Holdings, Inc., 1.851%, 7/16/2025(b) | | | 2,035,233 | |
| | 1,445,000 | | | Sumitomo Mitsui Financial Group, Inc., 3.040%, 7/16/2029(b) | | | 1,574,920 | |
| | | | | | | | |
| | | | | | | 33,784,595 | |
| | | | | | | | |
| | | | Korea — 0.3% | |
| | 765,000 | | | Export-Import Bank of Korea, 3.000%, 11/01/2022(b) | | | 802,032 | |
| | 1,100,000 | | | Hyundai Capital Services, Inc., 3.750%, 3/05/2023, 144A(b) | | | 1,164,790 | |
| | 1,575,000 | | | Kia Motors Corp., 3.000%, 4/25/2023, 144A(b) | | | 1,645,560 | |
| | 1,515,000 | | | Korea East-West Power Co. Ltd., 1.750%, 5/06/2025, 144A(b) | | | 1,565,422 | |
| | 910,000 | | | Korea Gas Corp., 2.750%, 7/20/2022, 144A(b) | | | 944,744 | |
| | 670,000 | | | KT Corp., 2.500%, 7/18/2026, 144A(b) | | | 716,110 | |
| | 1,180,000 | | | LG Chem Ltd., 3.250%, 10/15/2024, 144A(b) | | | 1,270,478 | |
| | 1,440,000,000 | | | Republic of Korea, Series 2209, 2.000%, 9/10/2022, (KRW)(b) | | | 1,260,161 | |
| | 770,000 | | | Shinhan Bank Co. Ltd., 3.875%, 3/24/2026, 144A(b) | | | 848,152 | |
| | 140,000 | | | SK Telecom Co. Ltd., 6.625%, 7/20/2027, 144A(b) | | | 183,817 | |
| | 200,000 | | | Woori Bank, 5.875%, 4/13/2021, 144A(b) | | | 204,902 | |
| | | | | | | | |
| | | | | | | 10,606,168 | |
| | | | | | | | |
| | | | Malaysia — 0.2% | |
| | 28,570,000 | | | Malaysia Government Bond, 3.480%, 3/15/2023, (MYR)(b) | | | 7,116,202 | |
| | | | | | | | |
| | | | Mexico — 1.0% | |
| | 620,000 | | | Alfa SAB de CV, 6.875%, 3/25/2044 | | | 702,162 | |
| | 770,000 | | | America Movil SAB de CV, 2.125%, 3/10/2028, (EUR)(b) | | | 1,011,146 | |
| | 860,000 | | | America Movil SAB de CV, 2.875%, 5/07/2030(b) | | | 931,483 | |
| | 10,000,000 | | | America Movil SAB de CV, 6.450%, 12/05/2022, (MXN)(b) | | | 458,856 | |
| | | | |
| 49 | | | See accompanying notes to financial statements. | | |
Portfolio of Investments – as of September 30, 2020
Loomis Sayles Global Allocation Fund – (continued)
| | | | | | | | |
Principal
Amount (‡) | | | Description | | Value (†) | |
| | | | Mexico — continued | |
| $ | 675,000 | | | Banco Nacional de Comercio Exterior SNC, (fixed rate to 8/11/2021, variable rate thereafter), 3.800%, 8/11/2026, 144A | | $ | 673,319 | |
| | 730,000 | | | Banco Santander Mexico S.A. Institucion de Banca Multiple Grupo Financiero Santander, 5.375%, 4/17/2025, 144A(b) | | | 812,490 | |
| | 575,000 | | | CEMEX Finance LLC, 6.000%, 4/01/2024 | | | 587,535 | |
| | 855,000 | | | Cemex SAB de CV, 5.450%, 11/19/2029 | | | 864,619 | |
| | 2,045,000 | | | Cemex SAB de CV, 5.700%, 1/11/2025 | | | 2,087,873 | |
| | 400,000 | | | Cemex SAB de CV, 7.375%, 6/05/2027, 144A | | | 432,204 | |
| | 360,000 | | | Cemex SAB de CV, 7.750%, 4/16/2026 | | | 379,350 | |
| | 1,775,000 | | | Coca-Cola Femsa SAB de CV, 2.750%, 1/22/2030(b) | | | 1,887,784 | |
| | 1,205,000 | | | Comision Federal de Electricidad, 4.750%, 2/23/2027(b) | | | 1,293,869 | |
| | 800,000 | | | Gruma SAB de CV, 4.875%, 12/01/2024(b) | | | 889,008 | |
| | 10,000,000 | | | Grupo Televisa SAB, EMTN, 7.250%, 5/14/2043, (MXN)(b) | | | 337,774 | |
| | 840,000 | | | Kimberly-Clark de Mexico SAB de CV, 2.431%, 7/01/2031, 144A(b) | | | 854,927 | |
| | 142,000(†††) | | | Mexican Fixed Rate Bonds, Series M, 5.750%, 3/05/2026, (MXN)(b) | | | 657,446 | |
| | 190,229(†††) | | | Mexican Fixed Rate Bonds, Series M, 6.500%, 6/10/2021, (MXN)(b) | | | 871,596 | |
| | 1,123,620(†††) | | | Mexican Fixed Rate Bonds, Series M 20, 8.500%, 5/31/2029, (MXN)(b) | | | 6,008,444 | |
| | 637,836(†††) | | | Mexican Fixed Rate Bonds, Series M 30, 8.500%, 11/18/2038, (MXN)(b) | | | 3,380,965 | |
| | 2,665,000 | | | Mexico Government International Bond, 3.250%, 4/16/2030(b) | | | 2,729,786 | |
| | 3,600,000 | | | Mexico Government International Bond, 4.000%, 10/02/2023(b) | | | 3,911,436 | |
| | 196,000 | | | Mexico Government International Bond, 4.000%, 3/15/2115, (EUR)(b) | | | 229,846 | |
| | 1,240,000 | | | Orbia Advance Corp. SAB de CV, 4.000%, 10/04/2027 | | | 1,336,100 | |
| | 205,000 | | | Orbia Advance Corp. SAB de CV, 5.875%, 9/17/2044 | | | 238,825 | |
| | 3,505,000 | | | Petroleos Mexicanos, 5.950%, 1/28/2031(b) | | | 2,959,972 | |
| | 100,000 | | | Sigma Alimentos S.A. de CV, 2.625%, 2/07/2024, 144A, (EUR) | | | 121,666 | |
| | 835,000 | | | Sigma Alimentos S.A. de CV, 4.125%, 5/02/2026 | | | 888,858 | |
| | 1,205,000 | | | Sigma Finance Netherlands BV, 4.875%, 3/27/2028 | | | 1,328,525 | |
| | 1,010,000 | | | Unifin Financiera SAB de CV, 7.250%, 9/27/2023 | | | 869,519 | |
| | | | | | | | |
| | | | | | | 39,737,383 | |
| | | | | | | | |
| | | | Netherlands — 0.1% | |
| | 870,000 | | | Cooperatieve Rabobank UA, 4.375%, 8/04/2025(b) | | | 982,343 | |
| | 1,725,000 | | | ING Groep NV, (fixed rate to 7/01/2025, variable rate thereafter),
1.400%, 7/01/2026, 144A(b) | | | 1,744,671 | |
| | | | | | | | |
| | | | | | | 2,727,014 | |
| | | | | | | | |
| | | | New Zealand — 0.1% | |
| | 3,575,000 | | | New Zealand Government Bond, 3.000%, 4/20/2029, (NZD)(b) | | | 2,886,059 | |
| | | | | | | | |
| | | | Norway — 0.3% | |
| | 17,000,000 | | | City of Oslo, Norway, 3.550%, 2/12/2021, (NOK)(b) | | | 1,843,910 | |
| | 2,790,000 | | | Equinor ASA, 3.625%, 4/06/2040(b) | | | 3,178,134 | |
| | 3,815,000 | | | Norway Government Bond, Series 475, 2.000%, 5/24/2023, 144A, (NOK)(b) | | | 428,585 | |
| | 16,500,000 | | | Norway Government Bond, Series 478, 1.500%, 2/19/2026, 144A, (NOK)(b) | | | 1,876,799 | |
| | 46,500,000 | | | Norway Government Bond, Series 482, 1.375%, 8/19/2030, 144A, (NOK)(b) | | | 5,345,743 | |
| | | | | | | | |
| | | | | | | 12,673,171 | |
| | | | | | | | |
| | | | Panama — 0.1% | |
| | 1,485,000 | | | Cable Onda S.A., 4.500%, 1/30/2030, 144A | | | 1,545,588 | |
| | | | |
| | See accompanying notes to financial statements. | | | 50 |
Portfolio of Investments – as of September 30, 2020
Loomis Sayles Global Allocation Fund – (continued)
| | | | | | | | |
Principal
Amount (‡) | | | Description | | Value (†) | |
| | | | Panama — continued | |
| $ | 1,045,000 | | | Panama Government International Bond, 3.160%, 1/23/2030(b) | | $ | 1,136,448 | |
| | 1,250,000 | | | Panama Government International Bond, 4.500%, 4/01/2056(b) | | | 1,565,625 | |
| | | | | | | | |
| | | | | | | 4,247,661 | |
| | | | | | | | |
| | | | Paraguay — 0.1% | |
| | 1,420,000 | | | Paraguay Government International Bond, 4.950%, 4/28/2031, 144A | | | 1,635,130 | |
| | 800,000 | | | Republic of Paraguay, 5.000%, 4/15/2026, 144A | | | 910,008 | |
| | | | | | | | |
| | | | | | | 2,545,138 | |
| | | | | | | | |
| | | | Peru — 0.2% | |
| | 3,220,000 | | | Corp. Financiera de Desarrollo S.A., 2.400%, 9/28/2027, 144A | | | 3,239,513 | |
| | 2,005,000 | | | Peruvian Government International Bond, 2.392%, 1/23/2026(b) | | | 2,103,265 | |
| | 580,000 | | | Southern Copper Corp., 3.875%, 4/23/2025(b) | | | 640,624 | |
| | 1,050,000 | | | Transportadora de Gas del Peru S.A., 4.250%, 4/30/2028, 144A(b) | | | 1,162,885 | |
| | | | | | | | |
| | | | | | | 7,146,287 | |
| | | | | | | | |
| | | | Philippines — 0.0% | |
| | 1,060,000 | | | Philippine Government International Bond, 2.457%, 5/05/2030(b) | | | 1,143,888 | |
| | | | | | | | |
| | | | Poland — 0.2% | |
| | 26,400,000 | | | Republic of Poland Government Bond, 1.250%, 10/25/2030, (PLN)(b) | | | 6,784,695 | |
| | | | | | | | |
| | | | Portugal — 0.1% | |
| | 3,590,000 | | | EDP Finance BV, 1.710%, 1/24/2028, 144A | | | 3,570,399 | |
| | | | | | | | |
| | | | Singapore — 0.2% | |
| | 785,000 | | | BOC Aviation Ltd., 2.750%, 9/18/2022, 144A(b) | | | 799,808 | |
| | 1,450,000 | | | BOC Aviation Ltd., 3.250%, 4/29/2025, 144A(b) | | | 1,514,583 | |
| | 345,000 | | | DBS Group Holdings Ltd., (fixed rate to 12/11/2023, variable rate thereafter), 4.520%, 12/11/2028, 144A(b) | | | 376,081 | |
| | 4,510,000 | | | Republic of Singapore, 2.750%, 7/01/2023, (SGD) | | | 3,525,931 | |
| | 3,215,000 | | | United Overseas Bank Ltd., 3.200%, 4/23/2021, 144A(b) | | | 3,255,638 | |
| | | | | | | | |
| | | | | | | 9,472,041 | |
| | | | | | | | |
| | | | South Africa — 0.4% | |
| | 1,400,000 | | | Anglo American Capital PLC, 2.625%, 9/10/2030, 144A | | | 1,396,192 | |
| | 1,400,000 | | | Anglo American Capital PLC, 5.625%, 4/01/2030, 144A(b) | | | 1,718,388 | |
| | 1,420,000 | | | MTN (Mauritius) Investments Ltd., 4.755%, 11/11/2024 | | | 1,450,885 | |
| | 930,000 | | | MTN (Mauritius) Investments Ltd., 4.755%, 11/11/2024, 144A | | | 950,227 | |
| | 46,510,000 | | | Republic of South Africa, Series 2035, 8.875%, 2/28/2035, (ZAR) | | | 2,324,148 | |
| | 39,185,000 | | | Republic of South Africa, Series R213, 7.000%, 2/28/2031, (ZAR) | | | 1,902,120 | |
| | 7,585,000 | | | South Africa Government International Bond, 5.750%, 9/30/2049 | | | 6,422,068 | |
| | | | | | | | |
| | | | | | | 16,164,028 | |
| | | | | | | | |
| | | | Spain — 0.4% | |
| | 2,300,000 | | | Banco Bilbao Vizcaya Argentaria S.A., GMTN, 0.750%, 9/11/2022, (EUR)(b) | | | 2,730,752 | |
| | 400,000 | | | Banco Santander S.A., 3.125%, 2/23/2023(b) | | | 419,002 | |
| | 600,000 | | | CaixaBank S.A., (fixed rate to 4/17/2025, variable rate thereafter), EMTN,
2.250%, 4/17/2030, (EUR) | | | 710,178 | |
| | 500,000 | | | CaixaBank S.A., (fixed rate to 7/14/2023, variable rate thereafter), EMTN,
2.750%, 7/14/2028, (EUR) | | | 602,485 | |
| | | | |
| 51 | | | See accompanying notes to financial statements. | | |
Portfolio of Investments – as of September 30, 2020
Loomis Sayles Global Allocation Fund – (continued)
| | | | | | | | |
Principal
Amount (‡) | | | Description | | Value (†) | |
| | | | Spain — continued | |
| | 700,000 | | | Naturgy Finance BV, EMTN, 1.500%, 1/29/2028, (EUR)(b) | | $ | 886,732 | |
| | 725,000 | | | Spain Government Bond, 0.750%, 7/30/2021, (EUR)(b) | | | 858,484 | |
| | 430,000 | | | Spain Government Bond, 1.600%, 4/30/2025, 144A, (EUR)(b) | | | 548,054 | |
| | 2,525,000 | | | Spain Government Bond, 1.950%, 7/30/2030, 144A, (EUR)(b) | | | 3,463,118 | |
| | 1,400,000 | | | Spain Government Bond, 2.700%, 10/31/2048, 144A, (EUR)(b) | | | 2,317,285 | |
| | 2,565,000 | | | Spain Government Bond, 4.400%, 10/31/2023, 144A, (EUR)(b) | | | 3,457,026 | |
| | 1,300,000 | | | Telefonica Emisiones S.A., EMTN, 1.495%, 9/11/2025, (EUR)(b) | | | 1,619,202 | |
| | | | | | | | |
| | | | | | | 17,612,318 | |
| | | | | | | | |
| | | | Supranationals — 0.2% | |
| | 1,495,000 | | | Corporacion Andina de Fomento, 2.375%, 5/12/2023(b) | | | 1,550,375 | |
| | 1,115,000 | | | Corporacion Andina de Fomento, 4.375%, 6/15/2022(b) | | | 1,173,404 | |
| | 3,360,000 | | | European Investment Bank, 1.750%, 7/30/2024, 144A, (CAD)(b) | | | 2,637,659 | |
| | 2,560,000 | | | International Bank for Reconstruction & Development,
0.250%, 12/23/2022, (SEK)(b) | | | 286,934 | |
| | 3,515,000 | | | International Bank for Reconstruction & Development,
2.200%, 1/18/2022, (CAD)(b) | | | 2,704,534 | |
| | | | | | | | |
| | | | | | | 8,352,906 | |
| | | | | | | | |
| | | | Sweden — 0.0% | |
| | 1,675,000 | | | Svenska Handelsbanken AB, 0.625%, 6/30/2023, 144A(b) | | | 1,680,773 | |
| | | | | | | | |
| | | | Switzerland — 0.1% | |
| | 930,000 | | | Credit Suisse AG, 2.950%, 4/09/2025(b) | | | 1,015,337 | |
| | 1,390,000 | | | Credit Suisse Group AG, (fixed rate to 4/01/2030, variable rate thereafter), 4.194%, 4/01/2031, 144A(b) | | | 1,604,741 | |
| | 1,375,000 | | | Novartis Capital Corp., 2.000%, 2/14/2027(b) | | | 1,462,972 | |
| | 900,000 | | | Syngenta Finance NV, EMTN, 1.250%, 9/10/2027, (EUR) | | | 1,010,106 | |
| | 340,000 | | | Willow No. 2 (Ireland) PLC for Zurich Insurance Co. Ltd., EMTN, (fixed rate to 10/01/2025, variable rate thereafter), 4.250%, 10/01/2045(b) | | | 364,631 | |
| | | | | | | | |
| | | | | | | 5,457,787 | |
| | | | | | | | |
| | | | Thailand — 0.1% | |
| | 1,570,000 | | | Kasikornbank PCL, EMTN, 3.256%, 7/12/2023(b) | | | 1,650,251 | |
| | 85,000,000 | | | Thailand Government Bond, 2.125%, 12/17/2026, (THB)(b) | | | 2,859,708 | |
| | 950,000 | | | Thaioil Treasury Center Co. Ltd., 3.625%, 1/23/2023, 144A(b) | | | 990,803 | |
| | | | | | | | |
| | | | | | | 5,500,762 | |
| | | | | | | | |
| | | | Trinidad — 0.0% | |
| | 415,000 | | | Trinidad Generation UnLtd., 5.250%, 11/04/2027, 144A | | | 410,850 | |
| | | | | | | | |
| | | | Turkey — 0.3% | |
| | 2,830,000 | | | Turk Telekomunikasyon AS, 6.875%, 2/28/2025 | | | 2,886,600 | |
| | 525,000 | | | Turk Telekomunikasyon AS, 6.875%, 2/28/2025, 144A | | | 535,500 | |
| | 2,875,000 | | | Turkcell Iletisim Hizmetleri AS, 5.800%, 4/11/2028 | | | 2,798,985 | |
| | 6,970,000 | | | Turkey Government International Bond, 5.250%, 3/13/2030 | | | 6,200,289 | |
| | 1,345,000 | | | Turkey Government International Bond, 7.625%, 4/26/2029 | | | 1,384,072 | |
| | | | | | | | |
| | | | | | | 13,805,446 | |
| | | | | | | | |
| | | | |
| | See accompanying notes to financial statements. | | | 52 |
Portfolio of Investments – as of September 30, 2020
Loomis Sayles Global Allocation Fund – (continued)
| | | | | | | | |
Principal
Amount (‡) | | | Description | | Value (†) | |
| | | | United Arab Emirates — 0.1% | |
| $ | 1,610,000 | | | Abu Dhabi Crude Oil Pipeline LLC, 3.650%, 11/02/2029(b) | | $ | 1,827,801 | |
| | 1,295,000 | | | Abu Dhabi Government International Bond, 3.125%, 4/16/2030, 144A(b) | | | 1,447,654 | |
| | | | | | | | |
| | | | | | | 3,275,455 | |
| | | | | | | | |
| | | | United Kingdom — 0.4% | |
| | 95,000 | | | Avon Products, Inc., 8.950%, 3/15/2043 | | | 111,316 | |
| | 1,265,000 | | | British Telecommunications PLC, 3.250%, 11/08/2029, 144A | | | 1,354,343 | |
| | 1,350,000 | | | CK Hutchison International 19 Ltd., 3.625%, 4/11/2029, 144A(b) | | | 1,529,915 | |
| | 1,420,000 | | | Diageo Capital PLC, 2.125%, 4/29/2032(b) | | | 1,483,028 | |
| | 365,000 | | | HSBC Holdings PLC, 4.950%, 3/31/2030(b) | | | 439,388 | |
| | 1,125,000 | | | Lloyds Banking Group PLC, (fixed rate to 7/09/2024, variable rate thereafter), 3.870%, 7/09/2025(b) | | | 1,224,422 | |
| | 635,000 | | | Lloyds Banking Group PLC, 4.050%, 8/16/2023(b) | | | 687,185 | |
| | 400,000 | | | Lloyds Banking Group PLC, 4.500%, 11/04/2024(b) | | | 436,267 | |
| | 1,395,000 | | | Nationwide Building Society, (fixed rate to 7/18/2029, variable rate thereafter), 3.960%, 7/18/2030, 144A(b) | | | 1,575,139 | |
| | 1,130,000 | | | NatWest Group PLC, 6.000%, 12/19/2023(b) | | | 1,270,818 | |
| | 235,000 | | | Network Rail Infrastructure Finance PLC, EMTN, 4.750%, 1/22/2024, (GBP)(b) | | | 348,771 | |
| | 350,000 | | | Santander UK Group Holdings PLC, 4.750%, 9/15/2025, 144A(b) | | | 382,821 | |
| | 250,000 | | | Standard Chartered PLC, EMTN, 3.125%, 11/19/2024, (EUR)(b) | | | 320,020 | |
| | 1,035,000 | | | United Kingdom Gilt, 2.750%, 9/07/2024, (GBP)(b) | | | 1,484,328 | |
| | 1,660,000 | | | Vodafone Group PLC, 4.375%, 5/30/2028(b) | | | 1,964,942 | |
| | | | | | | | |
| | | | | | | 14,612,703 | |
| | | | | | | | |
| | | | United States — 16.1% | |
| | 165,000 | | | AES Corp. (The), 3.950%, 7/15/2030, 144A | | | 182,318 | |
| | 110,000 | | | Air Lease Corp., 2.250%, 1/15/2023 | | | 110,698 | |
| | 15,000 | | | Air Lease Corp., 3.250%, 3/01/2025 | | | 15,259 | |
| | 116,000 | | | Air Lease Corp., 3.250%, 10/01/2029 | | | 110,034 | |
| | 360,000 | | | Air Lease Corp., MTN, 3.000%, 2/01/2030 | | | 335,247 | |
| | 480,000 | | | Allison Transmission, Inc., 4.750%, 10/01/2027, 144A | | | 493,800 | |
| | 8,000,000 | | | Ally Financial, Inc., 4.125%, 2/13/2022 | | | 8,290,399 | |
| | 745,000 | | | Ally Financial, Inc., 5.125%, 9/30/2024 | | | 830,298 | |
| | 1,728,000 | | | Ally Financial, Inc., 8.000%, 11/01/2031 | | | 2,365,847 | |
| | 70,000 | | | American Airlines Group, Inc., 3.750%, 3/01/2025, 144A | | | 35,492 | |
| | 1,965,000 | | | American Airlines Group, Inc., 5.000%, 6/01/2022, 144A | | | 1,336,200 | |
| | 1,667,402 | | | American Airlines Pass Through Certificates, Series 2016-1, Class B,
5.250%, 7/15/2025 | | | 1,151,822 | |
| | 108,948 | | | American Airlines Pass Through Certificates, Series 2013-1, Class A,
4.000%, 1/15/2027 | | | 86,239 | |
| | 1,363,322 | | | American Airlines Pass Through Certificates, Series 2016-3, Class B,
3.750%, 4/15/2027 | | | 945,614 | |
| | 386,558 | | | American Airlines Pass Through Certificates, Series 2017-1B, Class B,
4.950%, 8/15/2026 | | | 263,837 | |
| | 502,606 | | | American Airlines Pass Through Certificates, Series 2017-2, Class B,
3.700%, 4/15/2027 | | | 319,745 | |
| | 5,335,000 | | | American Airlines, Inc., 11.750%, 7/15/2025, 144A | | | 5,148,275 | |
| | | | |
| 53 | | | See accompanying notes to financial statements. | | |
Portfolio of Investments – as of September 30, 2020
Loomis Sayles Global Allocation Fund – (continued)
| | | | | | | | |
Principal
Amount (‡) | | | Description | | Value (†) | |
| | | | United States — continued | |
| $ | 2,510,000 | | | American Honda Finance Corp., GMTN, 1.700%, 9/09/2021 | | $ | 2,539,951 | |
| | 3,975,000 | | | Apple, Inc., Series MPLE, 2.513%, 8/19/2024, (CAD)(b) | | | 3,169,522 | |
| | 260,000 | | | Aptiv PLC, 1.600%, 9/15/2028, (EUR) | | | 318,933 | |
| | 1,510,000 | | | AT&T, Inc., 3.400%, 5/15/2025 | | | 1,670,815 | |
| | 804,000 | | | AT&T, Inc., 3.650%, 9/15/2059, 144A | | | 789,809 | |
| | 3,960,000 | | | AT&T, Inc., 4.300%, 2/15/2030 | | | 4,693,908 | |
| | 424,000 | | | AT&T, Inc., 4.500%, 3/09/2048 | | | 486,589 | |
| | 925,000 | | | Aviation Capital Group LLC, 6.750%, 4/06/2021, 144A | | | 942,925 | |
| | 75,000 | | | Avis Budget Car Rental LLC/Avis Budget Finance, Inc., 5.750%, 7/15/2027, 144A | | | 67,646 | |
| | 2,700,000 | | | Bank of America Corp., 6.110%, 1/29/2037 | | | 3,811,464 | |
| | 115,000 | | | Bank of America Corp., MTN, 4.250%, 10/22/2026 | | | 133,162 | |
| | 3,180,000 | | | Beazer Homes USA, Inc., 7.250%, 10/15/2029 | | | 3,410,550 | |
| | 140,000 | | | Boeing Co. (The), 3.100%, 5/01/2026 | | | 139,656 | |
| | 25,000 | | | Boeing Co. (The), 3.250%, 2/01/2035 | | | 23,499 | |
| | 165,000 | | | Boeing Co. (The), 3.550%, 3/01/2038 | | | 150,305 | |
| | 25,000 | | | Boeing Co. (The), 3.625%, 3/01/2048 | | | 21,970 | |
| | 90,000 | | | Boeing Co. (The), 3.750%, 2/01/2050 | | | 82,126 | |
| | 635,000 | | | Boeing Co. (The), 3.850%, 11/01/2048 | | | 581,869 | |
| | 640,000 | | | Boeing Co. (The), 3.950%, 8/01/2059 | | | 579,368 | |
| | 585,000 | | | BP Capital Markets America, Inc., 3.216%, 11/28/2023(b) | | | 628,601 | |
| | 270,000 | | | Brighthouse Financial, Inc., 4.700%, 6/22/2047 | | | 259,847 | |
| | 1,860,000 | | | Brighthouse Financial, Inc., 5.625%, 5/15/2030 | | | 2,166,091 | |
| | 690,000 | | | Broadcom, Inc., 5.000%, 4/15/2030 | | | 813,922 | |
| | 60,000 | | | CenturyLink, Inc., 5.625%, 4/01/2025 | | | 64,102 | |
| | 880,000 | | | CenturyLink, Inc., Series S, 6.450%, 6/15/2021 | | | 903,100 | |
| | 3,210,000 | | | Chesapeake Energy Corp., 4.875%, 4/15/2022(c)(d)(e) | | | 130,454 | |
| | 315,000 | | | Chesapeake Energy Corp., 5.750%, 3/15/2023(c)(d)(e) | | | 11,813 | |
| | 7,295,000 | | | Chesapeake Energy Corp., 8.000%, 6/15/2027(c)(d)(e) | | | 246,206 | |
| | 780,000 | | | Chevron Corp., 2.419%, 11/17/2020(b) | | | 781,240 | |
| | 1,635,000 | | | Cimarex Energy Co., 4.375%, 6/01/2024 | | | 1,754,882 | |
| | 40,000 | | | Cincinnati Bell, Inc., 8.000%, 10/15/2025, 144A | | | 42,250 | |
| | 3,500,000 | | | Coca-Cola Co. (The), 1.550%, 9/01/2021 | | | 3,540,585 | |
| | 265,000 | | | Constellation Brands, Inc., 4.750%, 11/15/2024 | | | 304,736 | |
| | 485,000 | | | Continental Resources, Inc., 3.800%, 6/01/2024 | | | 447,412 | |
| | 640,000 | | | Continental Resources, Inc., 4.500%, 4/15/2023 | | | 609,920 | |
| | 63,000 | | | Continental Resources, Inc., 5.000%, 9/15/2022 | | | 62,533 | |
| | 375,000 | | | Cox Communications, Inc., 4.800%, 2/01/2035, 144A | | | 471,636 | |
| | 595,000 | | | CSC Holdings LLC, 5.375%, 2/01/2028, 144A | | | 628,469 | |
| | 155,000 | | | Cummins, Inc., 5.650%, 3/01/2098 | | | 187,900 | |
| | 490,000 | | | Dana, Inc., 5.375%, 11/15/2027 | | | 502,250 | |
| | 475,000 | | | Dell International LLC/EMC Corp., 6.020%, 6/15/2026, 144A | | | 557,735 | |
| | 75,270 | | | Delta Air Lines Pass Through Trust, Series 2007-1, Class B, 8.021%, 2/10/2024 | | | 70,809 | |
| | 940,000 | | | DH Europe Finance II S.a.r.l., 0.750%, 9/18/2031, (EUR)(b) | | | 1,084,983 | |
| | 50,000 | | | Dillard’s, Inc., 7.000%, 12/01/2028 | | | 51,296 | |
| | 8,000 | | | Dillard’s, Inc., 7.750%, 7/15/2026 | | | 8,391 | |
| | | | |
| | See accompanying notes to financial statements. | | | 54 |
Portfolio of Investments – as of September 30, 2020
Loomis Sayles Global Allocation Fund – (continued)
| | | | | | | | |
Principal
Amount (‡) | | | Description | | Value (†) | |
| | | | United States — continued | |
| $ | 1,680,000 | | | DISH DBS Corp., 5.000%, 3/15/2023 | | $ | 1,713,600 | |
| | 3,570,000 | | | DISH DBS Corp., 5.875%, 11/15/2024 | | | 3,661,035 | |
| | 1,385,000 | | | DISH DBS Corp., 7.750%, 7/01/2026 | | | 1,522,614 | |
| | 310,000 | | | DR Horton, Inc., 4.375%, 9/15/2022 | | | 328,833 | |
| | 140,000 | | | Ecolab, Inc., 4.800%, 3/24/2030(b) | | | 178,576 | |
| | 160,000 | | | Edison International, 4.950%, 4/15/2025 | | | 175,136 | |
| | 340,000 | | | Enable Midstream Partners LP, 5.000%, 5/15/2044 | | | 286,535 | |
| | 235,000 | | | Enbridge Energy Partners LP, 7.375%, 10/15/2045 | | | 344,073 | |
| | 1,075,000 | | | Energy Transfer Partners LP/Regency Energy Finance Corp.,
5.000%, 10/01/2022 | | | 1,131,363 | |
| | 600,000 | | | EnLink Midstream Partners LP, 4.150%, 6/01/2025 | | | 516,618 | |
| | 410,000 | | | FedEx Corp., 1.000%, 1/11/2023, (EUR) | | | 489,809 | |
| | 650,000 | | | FedEx Corp., 3.400%, 1/14/2022 | | | 673,785 | |
| | 4,910,000 | | | Ford Motor Co., 4.750%, 1/15/2043 | | | 4,445,637 | |
| | 2,515,000 | | | Ford Motor Co., 5.291%, 12/08/2046 | | | 2,359,384 | |
| | 25,000 | | | Ford Motor Co., 6.375%, 2/01/2029 | | | 25,993 | |
| | 50,000 | | | Ford Motor Co., 6.625%, 2/15/2028 | | | 52,519 | |
| | 2,105,000 | | | Ford Motor Co., 6.625%, 10/01/2028 | | | 2,268,137 | |
| | 5,000 | | | Ford Motor Co., 7.500%, 8/01/2026 | | | 5,444 | |
| | 875,000 | | | Ford Motor Credit Co. LLC, 5.113%, 5/03/2029 | | | 896,875 | |
| | 7,305,000 | | | Ford Motor Credit Co. LLC, 5.125%, 6/16/2025 | | | 7,533,281 | |
| | 200,000 | | | Ford Motor Credit Co. LLC, GMTN, 4.389%, 1/08/2026 | | | 197,718 | |
| | 2,710,000 | | | Freeport-McMoRan, Inc., 4.375%, 8/01/2028 | | | 2,802,018 | |
| | 9,830,000 | | | GE Capital Funding LLC, 4.550%, 5/15/2032, 144A | | | 10,565,920 | |
| | 295,000 | | | General Electric Co., 4.500%, 3/11/2044 | | | 304,725 | |
| | 50,000 | | | General Electric Co., GMTN, 3.100%, 1/09/2023 | | | 52,470 | |
| | 1,055,000 | | | General Motors Co., 5.200%, 4/01/2045 | | | 1,136,409 | |
| | 405,000 | | | General Motors Co., 6.250%, 10/02/2043 | | | 479,951 | |
| | 240,000 | | | General Motors Financial Co., Inc., 3.450%, 4/10/2022 | | | 246,750 | |
| | 7,680,000 | | | General Motors Financial Co., Inc., 3.600%, 6/21/2030 | | | 7,953,464 | |
| | 925,000 | | | General Motors Financial Co., Inc., 5.250%, 3/01/2026 | | | 1,040,677 | |
| | 100,000 | | | General Motors Financial Co., Inc., EMTN, 0.955%, 9/07/2023, (EUR) | | | 116,841 | |
| | 635,000 | | | General Motors Financial Co., Inc., EMTN, 2.250%, 9/06/2024, (GBP) | | | 814,348 | |
| | 770,000 | | | General Motors Financial of Canada Ltd., Series 5, 3.250%, 11/07/2023, (CAD) | | | 594,864 | |
| | 3,435,000 | | | Georgia-Pacific LLC, 7.250%, 6/01/2028 | | | 4,544,778 | |
| | 105,000 | | | Georgia-Pacific LLC, 7.375%, 12/01/2025 | | | 135,696 | |
| | 180,000 | | | Georgia-Pacific LLC, 7.750%, 11/15/2029 | | | 269,106 | |
| | 315,000 | | | Georgia-Pacific LLC, 8.875%, 5/15/2031 | | | 509,245 | |
| | 905,000 | | | Global Atlantic Fin Co., 8.625%, 4/15/2021, 144A | | | 934,125 | |
| | 2,295,000 | | | Goldman Sachs Group, Inc. (The), 6.750%, 10/01/2037 | | | 3,334,471 | |
| | 2,895,000 | | | Goodyear Tire & Rubber Co. (The), 4.875%, 3/15/2027 | | | 2,743,012 | |
| | 150,000 | | | Goodyear Tire & Rubber Co. (The), 5.000%, 5/31/2026 | | | 145,743 | |
| | 165,000 | | | Goodyear Tire & Rubber Co. (The), 7.000%, 3/15/2028 | | | 171,229 | |
| | 855,000 | | | Hanesbrands, Inc., 5.375%, 5/15/2025, 144A | | | 902,025 | |
| | 20,000 | | | HCA, Inc., 4.750%, 5/01/2023 | | | 21,818 | |
| | 6,670,000 | | | HCA, Inc., 5.375%, 9/01/2026 | | | 7,367,482 | |
| | | | |
| 55 | | | See accompanying notes to financial statements. | | |
Portfolio of Investments – as of September 30, 2020
Loomis Sayles Global Allocation Fund – (continued)
| | | | | | | | |
Principal
Amount (‡) | | | Description | | Value (†) | |
| | | | United States — continued | |
| $ | 225,000 | | | HCA, Inc., 7.050%, 12/01/2027 | | $ | 262,687 | |
| | 820,000 | | | HCA, Inc., 7.500%, 11/06/2033 | | | 1,090,600 | |
| | 395,000 | | | HCA, Inc., 8.360%, 4/15/2024 | | | 465,112 | |
| | 195,000 | | | HCA, Inc., MTN, 7.580%, 9/15/2025 | | | 232,537 | |
| | 75,000 | | | HCA, Inc., MTN, 7.750%, 7/15/2036 | | | 95,625 | |
| | 490,000 | | | Hewlett Packard Enterprise Co., 6.350%, 10/15/2045 | | | 624,552 | |
| | 485,000 | | | Huntington Ingalls Industries, Inc., 5.000%, 11/15/2025, 144A | | | 498,506 | |
| | 1,000,000 | | | Hyundai Capital America, 2.650%, 2/10/2025(b) | | | 1,029,800 | |
| | 835,000 | | | Hyundai Capital America, 2.650%, 2/10/2025, 144A(b) | | | 859,883 | |
| | 1,585,000 | | | Hyundai Capital America, 2.750%, 9/27/2026, 144A(b) | | | 1,640,943 | |
| | 1,395,000 | | | Hyundai Capital America, 6.375%, 4/08/2030, 144A(b) | | | 1,785,749 | |
| | 1,835,000 | | | iHeartCommunications, Inc., 8.375%, 5/01/2027 | | | 1,807,475 | |
| | 5,760,000 | | | Iron Mountain, Inc., 4.875%, 9/15/2029, 144A | | | 5,860,800 | |
| | 290,000 | | | iStar, Inc., 4.750%, 10/01/2024 | | | 280,575 | |
| | 48,000 | | | J.C. Penney Corp., Inc., 6.375%, 10/15/2036(c)(d)(e) | | | 229 | |
| | 5,000 | | | J.C. Penney Corp., Inc., 7.625%, 3/01/2097(c)(d)(e) | | | 31 | |
| | 1,070,000 | | | Jefferies Group LLC, 6.250%, 1/15/2036 | | | 1,326,020 | |
| | 7,760,000 | | | JELD-WEN, Inc., 4.625%, 12/15/2025, 144A | | | 7,798,800 | |
| | 1,875,000 | | | JELD-WEN, Inc., 4.875%, 12/15/2027, 144A | | | 1,910,719 | |
| | 1,885,000 | | | Kraft Heinz Foods Co., 4.375%, 6/01/2046 | | | 1,934,142 | |
| | 760,000 | | | Level 3 Financing, Inc., 5.375%, 5/01/2025 | | | 783,568 | |
| | 44,000 | | | Masco Corp., 6.500%, 8/15/2032 | | | 57,039 | |
| | 403,000 | | | Masco Corp., 7.750%, 8/01/2029 | | | 568,609 | |
| | 615,000 | | | Medtronic Global Holdings SCA, 1.125%, 3/07/2027, (EUR)(b) | | | 761,421 | |
| | 2,905,000 | | | MGIC Investment Corp., 5.250%, 8/15/2028 | | | 2,996,290 | |
| | 4,315,000 | | | Michaels Stores, Inc., 8.000%, 7/15/2027, 144A | | | 4,509,175 | |
| | 10,000,000 | | | Microsoft Corp., 1.550%, 8/08/2021 | | | 10,107,979 | |
| | 2,355,000 | | | Mileage Plus Holdings LLC/Mileage Plus Intellectual Property Assets Ltd., 6.500%, 6/20/2027, 144A | | | 2,452,144 | |
| | 1,025,000 | | | Minerals Technologies, Inc., 5.000%, 7/01/2028, 144A | | | 1,053,987 | |
| | 450,000 | | | Morgan Stanley, 3.950%, 4/23/2027 | | | 510,107 | |
| | 725,000 | | | Morgan Stanley, 5.750%, 1/25/2021 | | | 737,388 | |
| | 3,150,000 | | | Morgan Stanley, MTN, 4.100%, 5/22/2023 | | | 3,411,987 | |
| | 600,000 | | | Morgan Stanley, MTN, 6.250%, 8/09/2026 | | | 761,998 | |
| | 25,000 | | | MPLX LP, 4.500%, 7/15/2023 | | | 27,104 | |
| | 95,000 | | | MPLX LP, 4.875%, 6/01/2025 | | | 107,525 | |
| | 2,135,000 | | | Nationstar Mortgage Holdings, Inc., 5.500%, 8/15/2028, 144A | | | 2,132,331 | |
| | 3,890,000 | | | Nationstar Mortgage Holdings, Inc., 9.125%, 7/15/2026, 144A | | | 4,172,025 | |
| | 4,605,000 | | | Nationwide Mutual Insurance Co., 4.350%, 4/30/2050, 144A | | | 4,933,295 | |
| | 3,000,000 | | | Navient Corp., 5.000%, 10/26/2020 | | | 3,000,000 | |
| | 2,535,000 | | | Navient Corp., 5.000%, 3/15/2027 | | | 2,380,441 | |
| | 915,000 | | | Navient Corp., 5.500%, 1/25/2023 | | | 920,815 | |
| | 255,000 | | | Navient Corp., 5.875%, 10/25/2024 | | | 253,567 | |
| | 1,600(††††) | | | Navient Corp., 6.000%, 12/15/2043 | | | 34,124 | |
| | 1,130,000 | | | Navient Corp., 6.750%, 6/15/2026 | | | 1,127,175 | |
| | 4,318,000 | | | Navient Corp., MTN, 5.625%, 8/01/2033 | | | 3,634,137 | |
| | 760,000 | | | Navient Corp., MTN, 6.125%, 3/25/2024 | | | 765,700 | |
| | | | |
| | See accompanying notes to financial statements. | | | 56 |
Portfolio of Investments – as of September 30, 2020
Loomis Sayles Global Allocation Fund – (continued)
| | | | | | | | |
Principal
Amount (‡) | | | Description | | Value (†) | |
| | | | United States — continued | |
| $ | 415,000 | | | Navient Corp., MTN, 7.250%, 1/25/2022 | | $ | 425,375 | |
| | 1,200,000 | | | New Fortress Energy, Inc., 6.750%, 9/15/2025, 144A | | | 1,254,600 | |
| | 65,000 | | | Newfield Exploration Co., 5.625%, 7/01/2024 | | | 63,053 | |
| | 900,000 | | | NGL Energy Partners LP/NGL Energy Finance Corp., 6.125%, 3/01/2025 | | | 535,500 | |
| | 405,000 | | | NGL Energy Partners LP/NGL Energy Finance Corp., 7.500%, 11/01/2023 | | | 269,831 | |
| | 20,000 | | | NGPL PipeCo LLC, 7.768%, 12/15/2037, 144A | | | 25,458 | |
| | 1,765,000 | | | Nissan Motor Acceptance Corp., 3.650%, 9/21/2021, 144A(b) | | | 1,800,026 | |
| | 300,000 | | | Occidental Petroleum Corp., 4.500%, 7/15/2044 | | | 215,463 | |
| | 2,355,000 | | | Occidental Petroleum Corp., 6.625%, 9/01/2030 | | | 2,172,487 | |
| | 1,795,000 | | | Occidental Petroleum Corp., 8.875%, 7/15/2030 | | | 1,848,850 | |
| | 2,275,000 | | | Oceaneering International, Inc., 4.650%, 11/15/2024 | | | 1,662,160 | |
| | 420,000 | | | Old Republic International Corp., 4.875%, 10/01/2024 | | | 476,767 | |
| | 1,170,000 | | | OneMain Finance Corp., 5.625%, 3/15/2023 | | | 1,213,881 | |
| | 860,000 | | | OneMain Finance Corp., 6.875%, 3/15/2025 | | | 954,320 | |
| | 2,310,000 | | | OneMain Finance Corp., 7.125%, 3/15/2026 | | | 2,580,732 | |
| | 330,000 | | | OneMain Finance Corp., 7.750%, 10/01/2021 | | | 345,155 | |
| | 130,000 | | | OneMain Finance Corp., 8.250%, 10/01/2023 | | | 144,300 | |
| | 3,693,000 | | | ONEOK Partners LP, 4.900%, 3/15/2025 | | | 4,046,886 | |
| | 25,000 | | | ONEOK Partners LP, 6.200%, 9/15/2043 | | | 26,486 | |
| | 1,200,000 | | | Owens Corning, 4.400%, 1/30/2048 | | | 1,336,438 | |
| | 310,000 | | | Owens Corning, 7.000%, 12/01/2036 | | | 413,265 | |
| | 2,965,000 | | | Owens-Brockway Glass Container, Inc., 5.375%, 1/15/2025, 144A | | | 3,128,075 | |
| | 585,000 | | | Owens-Brockway Glass Container, Inc., 6.625%, 5/13/2027, 144A | | | 633,628 | |
| | 8,630,000 | | | Owl Rock Capital Corp., 4.250%, 1/15/2026 | | | 8,742,449 | |
| | 5,150,000 | | | Owl Rock Technology Finance Corp., 4.750%, 12/15/2025, 144A | | | 5,088,887 | |
| | 1,400,000 | | | Penske Truck Leasing Co. LP/PTL Finance Corp., 4.000%, 7/15/2025, 144A | | | 1,577,140 | |
| | 2,165,000 | | | Prologis Euro Finance LLC, 0.250%, 9/10/2027, (EUR)(b) | | | 2,534,658 | |
| | 1,530,000 | | | Prologis Euro Finance LLC, 0.375%, 2/06/2028, (EUR)(b) | | | 1,803,122 | |
| | 365,000 | | | Prologis LP, 2.250%, 6/30/2029, (GBP)(b) | | | 512,640 | |
| | 1,115,000 | | | Prudential Financial, Inc., MTN, 3.700%, 3/13/2051 | | | 1,225,853 | |
| | 540,000 | | | PulteGroup, Inc., 6.000%, 2/15/2035 | | | 666,900 | |
| | 785,000 | | | PulteGroup, Inc., 6.375%, 5/15/2033 | | | 987,137 | |
| | 220,000 | | | PulteGroup, Inc., 7.875%, 6/15/2032 | | | 302,500 | |
| | 285,000 | | | QEP Resources, Inc., 5.250%, 5/01/2023 | | | 207,337 | |
| | 210,000 | | | QEP Resources, Inc., 5.375%, 10/01/2022 | | | 172,200 | |
| | 295,000 | | | Quicken Loans LLC, 5.250%, 1/15/2028, 144A | | | 310,830 | |
| | 120,000 | | | Quicken Loans LLC, 5.750%, 5/01/2025, 144A | | | 123,540 | |
| | 95,000 | | | Qwest Corp., 7.250%, 9/15/2025 | | | 109,120 | |
| | 345,000 | | | Radian Group, Inc., 4.500%, 10/01/2024 | | | 342,481 | |
| | 195,000 | | | Radian Group, Inc., 4.875%, 3/15/2027 | | | 195,000 | |
| | 3,365,000 | | | Radian Group, Inc., 6.625%, 3/15/2025 | | | 3,550,075 | |
| | 890,000 | | | Range Resources Corp., 4.875%, 5/15/2025 | | | 803,314 | |
| | 165,000 | | | Range Resources Corp., 5.000%, 3/15/2023 | | | 156,750 | |
| | 1,100,000 | | | Realty Income Corp., EMTN, 1.625%, 12/15/2030, (GBP) | | | 1,409,988 | |
| | 810,000 | | | Santander Holdings USA, Inc., 3.450%, 6/02/2025(b) | | | 866,216 | |
| | 25,000 | | | Sealed Air Corp., 4.875%, 12/01/2022, 144A | | | 26,072 | |
| | 640,000 | | | Sealed Air Corp., 5.500%, 9/15/2025, 144A | | | 707,200 | |
| | | | |
| 57 | | | See accompanying notes to financial statements. | | |
Portfolio of Investments – as of September 30, 2020
Loomis Sayles Global Allocation Fund – (continued)
| | | | | | | | |
Principal
Amount (‡) | | | Description | | Value (†) | |
| | | | United States — continued | |
| $ | 35,000 | | | Service Properties Trust, 3.950%, 1/15/2028 | | $ | 29,050 | |
| | 395,000 | | | Service Properties Trust, 4.350%, 10/01/2024 | | | 357,475 | |
| | 115,000 | | | Service Properties Trust, 4.500%, 6/15/2023 | | | 112,778 | |
| | 60,000 | | | Service Properties Trust, 4.650%, 3/15/2024 | | | 55,800 | |
| | 50,000 | | | Service Properties Trust, 4.750%, 10/01/2026 | | | 44,466 | |
| | 185,000 | | | Service Properties Trust, 4.950%, 2/15/2027 | | | 164,650 | |
| | 420,000 | | | ServiceMaster Co. LLC (The), 7.450%, 8/15/2027 | | | 458,325 | |
| | 140,000 | | | Silgan Holdings, Inc., 3.250%, 3/15/2025, (EUR) | | | 165,742 | |
| | 5,051,000 | | | SM Energy Co., 10.000%, 1/15/2025, 144A | | | 4,820,220 | |
| | 2,785,000 | | | Summit Materials LLC/Summit Materials Finance Corp., 5.250%, 1/15/2029, 144A | | | 2,899,881 | |
| | 2,805,000 | | | T-Mobile USA, Inc., 3.875%, 4/15/2030, 144A | | | 3,182,609 | |
| | 3,960,000 | | | Tenet Healthcare Corp., 5.125%, 5/01/2025 | | | 3,996,828 | |
| | 14,910,000 | | | Tenet Healthcare Corp., 6.125%, 10/01/2028, 144A | | | 14,499,975 | |
| | 100,000 | | | Tenet Healthcare Corp., 6.750%, 6/15/2023 | | | 105,000 | |
| | 1,695,000 | | | Tenet Healthcare Corp., 6.875%, 11/15/2031 | | | 1,661,100 | |
| | 820,000 | | | Textron, Inc., 5.950%, 9/21/2021 | | | 851,308 | |
| | 100,000 | | | Thermo Fisher Scientific, Inc., EMTN, 1.500%, 10/01/2039, (EUR) | | | 116,971 | |
| | 245,000 | | | Thermo Fisher Scientific, Inc., EMTN, 1.875%, 10/01/2049, (EUR)(b) | | | 289,017 | |
| | 90,000 | | | Time Warner Cable LLC, 4.500%, 9/15/2042 | | | 97,764 | |
| | 85,000 | | | Time Warner Cable LLC, 5.500%, 9/01/2041 | | | 102,968 | |
| | 1,635,000 | | | Toyota Motor Credit Corp., MTN, 2.650%, 4/12/2022(b) | | | 1,691,107 | |
| | 1,680,000 | | | Transcontinental Gas Pipe Line Co. LLC, 7.850%, 2/01/2026 | | | 2,175,105 | |
| | 635,000 | | | TransDigm, Inc., 5.500%, 11/15/2027 | | | 610,267 | |
| | 171,000 | | | TransDigm, Inc., 6.500%, 7/15/2024 | | | 170,573 | |
| | 185,000 | | | TransDigm, Inc., 6.500%, 5/15/2025 | | | 184,422 | |
| | 50,000 | | | TransDigm, Inc., 7.500%, 3/15/2027 | | | 51,916 | |
| | 2,615,000 | | | TransDigm, Inc., 8.000%, 12/15/2025, 144A | | | 2,843,812 | |
| | 5,000 | | | TRI Pointe Group, Inc./TRI Pointe Homes, Inc., 5.875%, 6/15/2024 | | | 5,400 | |
| | 77,186 | | | U.S. Airways Pass Through Trust, Series 2012-1A, Class A, 5.900%, 4/01/2026 | | | 75,621 | |
| | 295,830 | | | U.S. Airways Pass Through Trust, Series 2012-2A, Class A, 4.625%, 12/03/2026 | | | 245,176 | |
| | 53,675,000 | | | U.S. Treasury Bond, 1.250%, 5/15/2050 | | | 51,024,797 | |
| | 55,610,000 | | | U.S. Treasury Bond, 1.375%, 8/15/2050 | | | 54,576,002 | |
| | 4,960,000 | | | U.S. Treasury Bond, 2.875%, 5/15/2049(b)(f) | | | 6,658,994 | |
| | 4,380,000 | | | U.S. Treasury Bond, 3.000%, 8/15/2048 | | | 5,983,662 | |
| | 4,143,706 | | | U.S. Treasury Inflation Indexed Note, 0.125%, 4/15/2022(b)(g) | | | 4,217,192 | |
| | 4,183,169 | | | U.S. Treasury Inflation Indexed Note, 0.375%, 7/15/2027(b)(g) | | | 4,651,569 | |
| | 13,193,191 | | | U.S. Treasury Inflation Indexed Note, 0.625%, 4/15/2023(b)(g) | | | 13,804,407 | |
| | 33,735,000 | | | U.S. Treasury Note, 1.500%, 9/30/2021 | | | 34,193,585 | |
| | 34,445,000 | | | U.S. Treasury Note, 1.500%, 10/31/2021 | | | 34,953,602 | |
| | 35,975,000 | | | U.S. Treasury Note, 1.500%, 11/30/2021 | | | 36,539,920 | |
| | 13,685,000 | | | U.S. Treasury Note, 1.625%, 10/31/2026(b) | | | 14,711,375 | |
| | 14,060,000 | | | U.S. Treasury Note, 1.625%, 8/15/2029(b) | | | 15,312,219 | |
| | 21,715,000 | | | U.S. Treasury Note, 1.750%, 11/30/2021 | | | 22,123,853 | |
| | 10,235,000 | | | U.S. Treasury Note, 1.750%, 11/15/2029(b) | | | 11,274,092 | |
| | | | |
| | See accompanying notes to financial statements. | | | 58 |
Portfolio of Investments – as of September 30, 2020
Loomis Sayles Global Allocation Fund – (continued)
| | | | | | | | |
Principal
Amount (‡) | | | Description | | Value (†) | |
| | | | United States — continued | |
| $ | 4,515,000 | | | U.S. Treasury Note, 1.875%, 3/31/2022 | | $ | 4,632,990 | |
| | 4,700,000 | | | U.S. Treasury Note, 2.875%, 5/15/2028(b) | | | 5,532,047 | |
| | 400,799 | | | United Airlines Pass Through Trust, Series 2016-2, Class B, 3.650%, 4/07/2027 | | | 302,310 | |
| | 1,450,000 | | | United States Steel Corp., 6.650%, 6/01/2037 | | | 891,750 | |
| | 25,000 | | | ViacomCBS, Inc., 4.375%, 3/15/2043 | | | 26,576 | |
| | 4,050,000 | | | ViacomCBS, Inc., 4.950%, 5/19/2050 | | | 4,752,096 | |
| | 395,000 | | | ViacomCBS, Inc., 5.250%, 4/01/2044 | | | 459,049 | |
| | 145,000 | | | ViacomCBS, Inc., 5.850%, 9/01/2043 | | | 183,932 | |
| | 145,000 | | | Vine Oil & Gas LP/Vine Oil & Gas Finance Corp., 9.750%, 4/15/2023, 144A | | | 98,600 | |
| | 1,150,000 | | | Walmart, Inc., 3.700%, 6/26/2028(b) | | | 1,359,835 | |
| | 60,000 | | | Weyerhaeuser Co., 6.950%, 10/01/2027 | | | 75,678 | |
| | 315,000 | | | Weyerhaeuser Co., 7.375%, 3/15/2032 | | | 459,245 | |
| | 1,380,000 | | | Whirlpool Corp., 4.600%, 5/15/2050 | | | 1,709,161 | |
| | | | | | | | |
| | | | | | | 650,233,211 | |
| | | | | | | | |
| | | | Uruguay — 0.0% | |
| | 1,415,000 | | | Uruguay Government International Bond, 4.375%, 1/23/2031(b) | | | 1,682,095 | |
| | | | | | | | |
| | | | Total Non-Convertible Bonds
(Identified Cost $1,180,453,500) | | | 1,227,095,820 | |
| | | | | | | | |
| | | | | | | | |
| | Convertible Bonds — 0.4% | |
| | | | United States — 0.4% | |
| | 1,450,000 | | | Booking Holdings, Inc., 0.900%, 9/15/2021 | | | 1,542,952 | |
| | 95,000 | | | Chesapeake Energy Corp., 5.500%, 9/15/2026(c)(d)(e) | | | 3,182 | |
| | 545,000 | | | DISH Network Corp., 2.375%, 3/15/2024 | | | 490,473 | |
| | 7,055,000 | | | DISH Network Corp., 3.375%, 8/15/2026 | | | 6,476,466 | |
| | 290,000 | | | Evolent Health, Inc., 3.500%, 12/01/2024, 144A | | | 284,200 | |
| | 1,855,000 | | | iStar, Inc., 3.125%, 9/15/2022 | | | 1,972,898 | |
| | 1,950,000 | | | Nuance Communications, Inc., 1.000%, 12/15/2035 | | | 2,851,758 | |
| | 205,000 | | | Nuance Communications, Inc., 1.250%, 4/01/2025 | | | 365,111 | |
| | 10,000 | | | Nuance Communications, Inc., 1.500%, 11/01/2035 | | | 16,437 | |
| | 825,000 | | | Western Digital Corp., 1.500%, 2/01/2024 | | | 783,252 | |
| | | | | | | | |
| | | | Total Convertible Bonds
(Identified Cost $13,164,254) | | | 14,786,729 | |
| | | | | | | | |
| | | | | | | | |
| | Municipals — 0.0% | |
| | | | United States — 0.0% | |
| | 155,000 | | | State of Illinois, 5.100%, 6/01/2033 | | | 156,641 | |
| | 130,000 | | | Tobacco Settlement Financing Corp., Series A-1, 6.706%, 6/01/2046 | | | 134,177 | |
| | | | | | | | |
| | | | Total Municipals
(Identified Cost $256,464) | | | 290,818 | |
| | | | | | | | |
| | | | | | | | |
| | | | Total Bonds and Notes
(Identified Cost $1,193,874,218) | | | 1,242,173,367 | |
| | | | | | | | |
| | | | | | | | |
| | | | |
| 59 | | | See accompanying notes to financial statements. | | |
Portfolio of Investments – as of September 30, 2020
Loomis Sayles Global Allocation Fund – (continued)
| | | | | | | | |
Shares | | | Description | | Value (†) | |
| | Preferred Stocks — 0.1% | |
| | | | United States — 0.1% | |
| | 460 | | | Chesapeake Energy Corp., 5.000%(a)(c)(h)(i) | | $ | — | |
| | 40 | | | Chesapeake Energy Corp., 5.750%(a)(c)(h)(i) | | | — | |
| | 736 | | | Chesapeake Energy Corp., 5.750%(a)(c)(h)(i) | | | — | |
| | 84 | | | Chesapeake Energy Corp., 5.750%, 144A(a)(c)(h)(i) | | | — | |
| | 38,952 | | | El Paso Energy Capital Trust I, 4.750% | | | 1,821,785 | |
| | | | | | | | |
| | | | | | | 1,821,785 | |
| | | | | | | | |
| | | | Total Preferred Stocks
(Identified Cost $2,285,617) | | | 1,821,785 | |
| | | | | | | | |
| | | | | | | | |
Principal
Amount (‡) | | | | | | |
| | Short-Term Investments — 1.6% | |
| $ | 57,946,780 | | | Tri-Party Repurchase Agreement with Fixed Income Clearing Corporation, dated 9/30/2020 at 0.000% to be repurchased at $57,946,780 on 10/01/2020 collateralized by $56,783,700 U.S. Treasury Note, 1.125% due 2/28/2025 valued at $59,105,774 including accrued interest (Note 2 of Notes to Financial Statements) | | | 57,946,780 | |
| | 8,535,000 | | | U.S. Treasury Bills, 0.160%, 12/24/2020(j) | | | 8,533,008 | |
| | | | | | | | |
| | | | Total Short-Term Investments
(Identified Cost $66,478,593) | | | 66,479,788 | |
| | | | | | | | |
| | | | | | | | |
| | | | Total Investments — 99.5%
(Identified Cost $3,258,756,687) | | | 4,020,729,620 | |
| | | | Other assets less liabilities — 0.5% | | | 20,828,034 | |
| | | | | | | | |
| | | | Net Assets — 100.0% | | $ | 4,041,557,654 | |
| | | | | | | | |
| | | | | | | | |
| | (‡) | | | Principal Amount stated in U.S. dollars unless otherwise noted. | |
| | (†) | | | See Note 2 of Notes to Financial Statements. | |
| | (††) | | | Amount shown represents principal amount including inflation adjustments. | |
| | (†††) | | | Amount shown represents units. One unit represents a principal amount of 100. | |
| | (††††) | | | Amount shown represents units. One unit represents a principal amount of 25. | |
| | (a) | | | Non-income producing security. | |
| | (b) | | | Security (or a portion thereof) has been designated to cover the Fund’s obligations under open derivative contracts. | |
| | (c) | | | Illiquid security. (Unaudited) | |
| | (d) | | | The issuer is in default with respect to interest and/or principal payments. Income is not being accrued. | |
| | (e) | | | Securities classified as fair valued pursuant to the Fund’s pricing policies and procedures. At September 30, 2020, the value of these securities amounted to $391,915 or less than 0.1% of net assets. See Note 2 of Notes to Financial Statements. | |
| | (f) | | | Security (or a portion thereof) has been pledged as collateral for open derivative contracts. | |
| | (g) | | | Treasury Inflation Protected Security (TIPS). | |
| | | | |
| | See accompanying notes to financial statements. | | | 60 |
Portfolio of Investments – as of September 30, 2020
Loomis Sayles Global Allocation Fund – (continued)
| | | | | | | | |
| | | | | | | | | |
| | (h) | | | Level 3 security. Value has been determined using significant unobservable inputs. See Note 3 of Notes to Financial Statements. | |
| | (i) | | | Fair valued by the Fund’s adviser. At September 30, 2020, the value of these securities amounted to $0. See Note 2 of Notes to Financial Statements. | |
| | (j) | | | Interest rate represents discount rate at time of purchase; not a coupon rate. | |
| | | | | |
| | 144A | | | All or a portion of these securities are exempt from registration under Rule 144A of the Securities Act of 1933. These securities may be resold in transactions exempt from registration, normally to qualified institutional buyers. At September 30, 2020, the value of Rule 144A holdings amounted to $229,707,819 or 5.7% of net assets. | |
| | ADR | | | An American Depositary Receipt is a certificate issued by a custodian bank representing the right to receive securities of the foreign issuer described. The values of ADRs may be significantly influenced by trading on exchanges not located in the United States. | |
| | CPI | | | Consumer Price Index | |
| | EMTN | | | Euro Medium Term Note | |
| | GMTN | | | Global Medium Term Note | |
| | MTN | | | Medium Term Note | |
| | | | | | | | |
| | AUD | | | Australian Dollar | |
| | CAD | | | Canadian Dollar | |
| | CNH | | | Chinese Yuan Renminbi Offshore | |
| | CNY | | | Chinese Yuan Renminbi | |
| | COP | | | Colombian Peso | |
| | EUR | | | Euro | |
| | GBP | | | British Pound | |
| | IDR | | | Indonesian Rupiah | |
| | ILS | | | Israeli Shekel | |
| | JPY | | | Japanese Yen | |
| | KRW | | | South Korean Won | |
| | MXN | | | Mexican Peso | |
| | MYR | | | Malaysian Ringgit | |
| | NOK | | | Norwegian Krone | |
| | NZD | | | New Zealand Dollar | |
| | PLN | | | Polish Zloty | |
| | SEK | | | Swedish Krona | |
| | SGD | | | Singapore Dollar | |
| | THB | | | Thai Baht | |
| | ZAR | | | South African Rand | |
| | | | |
| 61 | | | See accompanying notes to financial statements. | | |
Portfolio of Investments – as of September 30, 2020
Loomis Sayles Global Allocation Fund – (continued)
At September 30, 2020, the Fund had the following open forward foreign currency contracts:
| | | | | | | | | | | | | | | | | | | | | | | | | | |
| Counterparty | | Delivery
Date | | | Currency
Bought/
Sold (B/S) | | Units of
Currency | | | In
Exchange for | | | Notional
Value | | | Unrealized
Appreciation
(Depreciation) | |
| Bank of America, N.A. | | | 12/16/2020 | | | KRW | | | B | | | | 5,850,000,000 | | | $ | 4,934,627 | | | $ | 5,002,416 | | | $ | 67,789 | |
| Credit Suisse International | | | 12/16/2020 | | | CAD | | | S | | | | 198,988,000 | | | | 151,303,263 | | | | 149,490,605 | | | | 1,812,658 | |
| Credit Suisse International | | | 12/16/2020 | | | COP | | | S | | | | 38,844,665,000 | | | | 10,423,201 | | | | 10,110,682 | | | | 312,519 | |
| Credit Suisse International | | | 12/16/2020 | | | GBP | | | B | | | | 13,490,000 | | | | 17,256,502 | | | | 17,415,027 | | | | 158,525 | |
| Credit Suisse International | | | 12/16/2020 | | | GBP | | | S | | | | 1,119,000 | | | | 1,427,050 | | | | 1,444,583 | | | | (17,533 | ) |
| Credit Suisse International | | | 12/16/2020 | | | JPY | | | B | | | | 9,350,164,000 | | | | 88,161,520 | | | | 88,746,184 | | | | 584,664 | |
| HSBC Bank USA | | | 12/16/2020 | | | AUD | | | B | | | | 4,075,000 | | | | 2,961,140 | | | | 2,919,305 | | | | (41,835 | ) |
| Morgan Stanley Capital Services, Inc. | | | 12/16/2020 | | | EUR | | | B | | | | 144,331,000 | | | | 170,457,798 | | | | 169,506,058 | | | | (951,740 | ) |
| UBS AG | | | 12/16/2020 | | | IDR | | | S | | | | 40,354,000,000 | | | | 2,691,289 | | | | 2,693,302 | | | | (2,013 | ) |
| UBS AG | | | 12/16/2020 | | | SEK | | | B | | | | 7,350,000 | | | | 840,628 | | | | 821,457 | | | | (19,171 | ) |
| UBS AG | | | 12/16/2020 | | | THB | | | S | | | | 83,000,000 | | | | 2,628,412 | | | | 2,619,087 | | | | 9,325 | |
| | | | | | | | | | | | | | | | | | | | | | | | | | |
| Total | | | | | | | | | | | | | | | | | | | | | | | | $ | 1,913,188 | |
| | | | | | | | | | | | | | | | | | | | | | | | | | |
At September 30, 2020, the Fund had the following open forward cross currency contracts:
| | | | | | | | | | | | | | | | | | | | | | | | | | |
| Counterparty | | Settlement
Date | | | Deliver/Units
of Currency | | | Receive/Units
of Currency | | | Notional
Value | | | Unrealized
Appreciation
(Depreciation) | |
| Morgan Stanley Capital Services, Inc. | | | 12/16/2020 | | | NOK | | | 30,959,000 | | | | EUR | | | | 2,910,691 | | | $ | 3,418,390 | | | $ | 98,643 | |
| | | | | | | | | | | | | | | | | | | | | | | | | | |
At September 30, 2020, open long futures contracts were as follows:
| | | | | | | | | | | | | | | | | | |
| Financial Futures | | Expiration
Date | | | Contracts | | Notional
Amount | | | Value | | | Unrealized
Appreciation
(Depreciation) | |
| Ultra 10 Year U.S. Treasury Note | | | 12/21/2020 | | | 39 | | $ | 6,209,225 | | | $ | 6,236,953 | | | $ | 27,728 | |
| | | | | | | | | | | | | | | | | | |
| | | | |
| | See accompanying notes to financial statements. | | | 62 |
Portfolio of Investments – as of September 30, 2020
Loomis Sayles Global Allocation Fund – (continued)
Industry Summary at September 30, 2020
| | | | |
Treasuries | | | 15.9 | % |
IT Services | | | 8.9 | |
Internet & Direct Marketing Retail | | | 5.8 | |
Software | | | 5.5 | |
Capital Markets | | | 4.5 | |
Interactive Media & Services | | | 4.4 | |
Health Care Equipment & Supplies | | | 4.1 | |
Chemicals | | | 4.1 | |
Life Sciences Tools & Services | | | 3.4 | |
Semiconductors & Semiconductor Equipment | | | 3.0 | |
Banks | | | 2.5 | |
Industrial Conglomerates | | | 2.4 | |
Aerospace & Defense | | | 2.2 | |
Health Care Providers & Services | | | 2.2 | |
Machinery | | | 2.1 | |
Banking | | | 2.0 | |
Other Investments, less than 2% each | | | 24.9 | |
Short-Term Investments | | | 1.6 | |
| | | | |
Total Investments | | | 99.5 | |
Other assets less liabilities (including forward foreign currency and futures contracts) | | | 0.5 | |
| | | | |
Net Assets | | | 100.0 | % |
| | | | |
Currency Exposure Summary at September 30, 2020
| | | | |
United States Dollar | | | 73.9 | % |
Canadian Dollar | | | 6.8 | |
Euro | | | 4.6 | |
Swiss Franc | | | 3.0 | |
British Pound | | | 2.6 | |
Japanese Yen | | | 2.4 | |
Other, less than 2% each | | | 6.2 | |
| | | | |
Total Investments | | | 99.5 | |
Other assets less liabilities (including forward foreign currency and futures contracts) | | | 0.5 | |
| | | | |
Net Assets | | | 100.0 | % |
| | | | |
| | | | |
| 63 | | | See accompanying notes to financial statements. | | |
Statements of Assets and Liabilities
September 30, 2020
| | | | | | | | |
| | | Core Plus
Bond Fund | | | Global
Allocation Fund | |
ASSETS | |
Investments at cost | | $ | 9,487,153,944 | | | $ | 3,258,756,687 | |
Net unrealized appreciation | | | 359,873,014 | | | | 761,972,933 | |
| | | | | | | | |
Investments at value | | | 9,847,026,958 | | | | 4,020,729,620 | |
Cash | | | 18,534,006 | | | | 425 | |
Due from brokers (Note 2) | | | 633,698 | | | | 768,811 | |
Foreign currency at value (identified cost $0 and $12,921,128, respectively) | | | — | | | | 12,819,247 | |
Receivable for Fund shares sold | | | 39,155,010 | | | | 6,534,175 | |
Receivable for securities sold | | | 199,008,232 | | | | 896,298 | |
Receivable for when-issued/delayed delivery securities sold (Note 2) | | | 897,889,274 | | | | — | |
Collateral received for delayed delivery securities and open forward foreign currency contracts (Notes 2 and 4) | | | 946,000 | | | | 3,600,000 | |
Dividends and interest receivable | | | 53,224,532 | | | | 9,900,021 | |
Unrealized appreciation on forward foreign currency contracts (Note 2) | | | — | | | | 3,044,123 | |
Tax reclaims receivable | | | — | | | | 1,134,022 | |
Prepaid expenses (Note 8) | | | 964 | | | | 403 | |
| | | | | | | | |
TOTAL ASSETS | | | 11,056,418,674 | | | | 4,059,427,145 | |
| | | | | | | | |
LIABILITIES | |
Payable for securities purchased | | | 427,092,486 | | | | 7,261,964 | |
Payable for when-issued/delayed delivery securities purchased (Note 2) | | | 1,339,716,213 | | | | — | |
Payable for Fund shares redeemed | | | 6,006,628 | | | | 2,232,489 | |
Unrealized depreciation on forward foreign currency contracts (Note 2) | | | — | | | | 1,032,292 | |
Foreign taxes payable (Note 2) | | | — | | | | 571,027 | |
Due to brokers (Note 2) | | | 946,000 | | | | 3,600,000 | |
Payable for variation margin on futures contracts (Note 2) | | | — | | | | 18,281 | |
Management fees payable (Note 6) | | | 2,381,935 | | | | 2,440,207 | |
Deferred Trustees’ fees (Note 6) | | | 710,579 | | | | 310,876 | |
Administrative fees payable (Note 6) | | | 328,876 | | | | 144,166 | |
Payable to distributor (Note 6d) | | | 54,860 | | | | 56,767 | |
Other accounts payable and accrued expenses | | | 437,394 | | | | 201,422 | |
| | | | | | | | |
TOTAL LIABILITIES | | | 1,777,674,971 | | | | 17,869,491 | |
| | | | | | | | |
NET ASSETS | | $ | 9,278,743,703 | | | $ | 4,041,557,654 | |
| | | | | | | | |
NET ASSETS CONSIST OF: | |
Paid-in capital | | $ | 8,774,941,028 | | | $ | 3,063,703,863 | |
Accumulated earnings | | | 503,802,675 | | | | 977,853,791 | |
| | | | | | | | |
NET ASSETS | | $ | 9,278,743,703 | | | $ | 4,041,557,654 | |
| | | | | | | | |
| | | | |
| | See accompanying notes to financial statements. | | | 64 |
Statements of Assets and Liabilities (continued)
September 30, 2020
| | | | | | | | |
| | | Core Plus
Bond Fund | | | Global
Allocation Fund | |
COMPUTATION OF NET ASSET VALUE AND OFFERING PRICE: | |
Class A shares: | |
Net assets | | $ | 617,608,751 | | | $ | 632,478,639 | |
| | | | | | | | |
Shares of beneficial interest | | | 43,856,214 | | | | 24,117,087 | |
| | | | | | | | |
Net asset value and redemption price per share | | $ | 14.08 | | | $ | 26.23 | |
| | | | | | | | |
Offering price per share (100/[100-maximum sales charge] of net asset value) (Note 1) | | $ | 14.70 | | | $ | 27.83 | |
| | | | | | | | |
Class C shares: (redemption price per share is equal to net asset value less any applicable contingent deferred sales charge) (Note 1) | | | | | | | | |
Net assets | | $ | 132,590,092 | | | $ | 483,814,383 | |
| | | | | | | | |
Shares of beneficial interest | | | 9,411,222 | | | | 18,768,904 | |
| | | | | | | | |
Net asset value and offering price per share | | $ | 14.09 | | | $ | 25.78 | |
| | | | | | | | |
Class N shares: | |
Net assets | | $ | 2,682,487,368 | | | $ | 264,338,079 | |
| | | | | | | | |
Shares of beneficial interest | | | 188,793,604 | | | | 10,006,615 | |
| | | | | | | | |
Net asset value, offering and redemption price per share | | $ | 14.21 | | | $ | 26.42 | |
| | | | | | | | |
Class Y shares: | |
Net assets | | $ | 5,846,057,492 | | | $ | 2,660,926,553 | |
| | | | | | | | |
Shares of beneficial interest | | | 411,695,231 | | | | 100,733,772 | |
| | | | | | | | |
Net asset value, offering and redemption price per share | | $ | 14.20 | | | $ | 26.42 | |
| | | | | | | | |
| | | | |
| 65 | | | See accompanying notes to financial statements. | | |
Statements of Operations
For the Year Ended September 30, 2020
| | | | | | | | |
| | | Core Plus
Bond Fund | | | Global
Allocation Fund | |
INVESTMENT INCOME | |
Interest | | $ | 208,692,879 | | | $ | 33,453,760 | |
Dividends | | | — | | | | 21,613,832 | |
Less net foreign taxes withheld | | | — | | | | (804,522 | ) |
| | | | | | | | |
| | | 208,692,879 | | | | 54,263,070 | |
| | | | | | | | |
Expenses | |
Management fees (Note 6) | | | 25,753,852 | | | | 25,551,911 | |
Service and distribution fees (Note 6) | | | 2,865,398 | | | | 6,166,620 | |
Administrative fees (Note 6) | | | 3,575,619 | | | | 1,521,887 | |
Trustees’ fees and expenses (Note 6) | | | 383,582 | | | | 177,682 | |
Transfer agent fees and expenses (Notes 6 and 7) | | | 4,446,543 | | | | 2,701,347 | |
Audit and tax services fees | | | 53,547 | | | | 56,114 | |
Custodian fees and expenses | | | 267,274 | | | | 300,360 | |
Legal fees (Note 8) | | | 196,038 | | | | 83,993 | |
Registration fees | | | 368,335 | | | | 184,627 | |
Shareholder reporting expenses | | | 207,225 | | | | 153,500 | |
Miscellaneous expenses (Note 8) | | | 238,980 | | | | 155,965 | |
| | | | | | | | |
Total expenses | | | 38,356,393 | | | | 37,054,006 | |
Less waiver and/or expense reimbursement (Note 6) | | | — | | | | (782 | ) |
| | | | | | | | |
Net expenses | | | 38,356,393 | | | | 37,053,224 | |
| | | | | | | | |
Net investment income | | | 170,336,486 | | | | 17,209,846 | |
| | | | | | | | |
NET REALIZED AND UNREALIZED GAIN (LOSS) ON INVESTMENTS, FUTURES CONTRACTS, FORWARD FOREIGN CURRENCY CONTRACTS AND FOREIGN CURRENCY TRANSACTIONS | | | | | | | | |
Net realized gain (loss) on: | |
Investments | | | 299,976,650 | | | | 208,170,358 | |
Futures contracts | | | — | | | | 537,933 | |
Forward foreign currency contracts (Note 2d) | | | — | | | | 7,942,395 | |
Foreign currency transactions (Note 2c) | | | (148,893 | ) | | | 221,304 | |
Net change in unrealized appreciation (depreciation) on: | |
Investments | | | 200,603,746 | | | | 209,578,471 | |
Futures contracts | | | — | | | | 27,728 | |
Forward foreign currency contracts (Note 2d) | | | — | | | | 2,893,011 | |
Foreign currency translations (Note 2c) | | | 27,169 | | | | 110,369 | |
| | | | | | | | |
Net realized and unrealized gain on investments, futures contracts, forward foreign currency contracts and foreign currency transactions | | | 500,458,672 | | | | 429,481,569 | |
| | | | | | | | |
NET INCREASE IN NET ASSETS RESULTING FROM OPERATIONS | | $ | 670,795,158 | | | $ | 446,691,415 | |
| | | | | | | | |
| | | | |
| | See accompanying notes to financial statements. | | | 66 |
Statements of Changes in Net Assets
| | | | | | | | | | | | | | | | |
| | | Core Plus Bond Fund | | | Global Allocation Fund | |
| | | Year Ended
September 30,
2020 | | | Year Ended
September 30,
2019 | | | Year Ended
September 30,
2020 | | | Year Ended
September 30,
2019 | |
FROM OPERATIONS: | |
Net investment income | | $ | 170,336,486 | | | $ | 193,816,309 | | | $ | 17,209,846 | | | $ | 23,195,146 | |
Net realized gain on investments, futures contracts, forward foreign currency contracts and foreign currency transactions | | | 299,827,757 | | | | 37,103,540 | | | | 216,871,990 | | | | 60,158,656 | |
Net change in unrealized appreciation (depreciation) on investments, futures contracts, forward foreign currency contracts and foreign currency translations | | | 200,630,915 | | | | 342,043,742 | | | | 212,609,579 | | | | 124,957,256 | |
| | | | | | | | | | | | | | | | |
Net increase in net assets resulting from operations | | | 670,795,158 | | | | 572,963,591 | | | | 446,691,415 | | | | 208,311,058 | |
| | | | | | | | | | | | | | | | |
FROM DISTRIBUTIONS TO SHAREHOLDERS: | | | | | | | | | | | | | | | | |
Class A | | | (11,953,860 | ) | | | (14,225,845 | ) | | | (13,439,861 | ) | | | (15,303,424 | ) |
Class C | | | (2,056,615 | ) | | | (2,905,066 | ) | | | (11,301,039 | ) | | | (13,674,405 | ) |
Class N | | | (67,400,814 | ) | | | (62,882,079 | ) | | | (6,572,302 | ) | | | (3,466,169 | ) |
Class Y | | | (111,898,170 | ) | | | (103,228,686 | ) | | | (60,646,702 | ) | | | (64,089,255 | ) |
| | | | | | | | | | | | | | | | |
Total distributions | | | (193,309,459 | ) | | | (183,241,676 | ) | | | (91,959,904 | ) | | | (96,533,253 | ) |
| | | | | | | | | | | | | | | | |
NET INCREASE IN NET ASSETS FROM CAPITAL SHARE TRANSACTIONS (NOTE 11) | | | 1,308,282,070 | | | | 683,792,596 | | | | 612,522,950 | | | | 518,843,716 | |
| | | | | | | | | | | | | | | | |
Net increase in net assets | | | 1,785,767,769 | | | | 1,073,514,511 | | | | 967,254,461 | | | | 630,621,521 | |
NET ASSETS | |
Beginning of the year | | | 7,492,975,934 | | | | 6,419,461,423 | | | | 3,074,303,193 | | | | 2,443,681,672 | |
| | | | | | | | | | | | | | | | |
End of the year | | $ | 9,278,743,703 | | | $ | 7,492,975,934 | | | $ | 4,041,557,654 | | | $ | 3,074,303,193 | |
| | | | | | | | | | | | | | | | |
| | | | |
| 67 | | | See accompanying notes to financial statements. | | |
Financial Highlights
For a share outstanding throughout each period.
| | | | | | | | | | | | | | | | | | | | |
| | | Core Plus Bond Fund—Class A | |
| | | Year Ended
September 30,
2020 | | | Year Ended
September 30,
2019 | | | Year Ended
September 30,
2018 | | | Year Ended
September 30,
2017 | | | Year Ended
September 30,
2016 | |
Net asset value, beginning of the period | | $ | 13.25 | | | $ | 12.53 | | | $ | 12.96 | | | $ | 13.06 | | | $ | 12.34 | |
| | | | | | | | | | | | | | | | | | | | |
INCOME (LOSS) FROM INVESTMENT OPERATIONS: | | | | | | | | | | | | | | | | | | | | |
Net investment income(a) | | | 0.26 | | | | 0.34 | | | | 0.35 | | | | 0.28 | | | | 0.37 | |
Net realized and unrealized gain (loss) | | | 0.86 | | | | 0.70 | | | | (0.38 | ) | | | (0.04 | ) | | | 0.71 | |
| | | | | | | | | | | | | | | | | | | | |
Total from Investment Operations | | | 1.12 | | | | 1.04 | | | | (0.03 | ) | | | 0.24 | | | | 1.08 | |
| | | | | | | | | | | | | | | | | | | | |
LESS DISTRIBUTIONS FROM: | | | | | | | | | | | | | | | | | | | | |
Net investment income | | | (0.29 | ) | | | (0.32 | ) | | | (0.40 | ) | | | (0.34 | ) | | | (0.36 | ) |
| | | | | | | | | | | | | | | | | | | | |
Total Distributions | | | (0.29 | ) | | | (0.32 | ) | | | (0.40 | ) | | | (0.34 | ) | | | (0.36 | ) |
| | | | | | | | | | | | | | | | | | | | |
Net asset value, end of the period | | $ | 14.08 | | | $ | 13.25 | | | $ | 12.53 | | | $ | 12.96 | | | $ | 13.06 | |
| | | | | | | | | | | | | | | | | | | | |
Total return(b) | | | 8.60 | % | | | 8.39 | % | | | (0.27 | )% | | | 1.86 | % | | | 8.90 | % |
RATIOS TO AVERAGE NET ASSETS: | | | | | | | | | | | | | | | | | | | | |
Net assets, end of the period (000’s) | | $ | 617,609 | | | $ | 558,291 | | | $ | 600,762 | | | $ | 676,892 | | | $ | 776,566 | |
Net expenses | | | 0.72 | %(c) | | | 0.73 | % | | | 0.73 | % | | | 0.73 | % | | | 0.73 | % |
Gross expenses | | | 0.72 | % | | | 0.73 | % | | | 0.73 | % | | | 0.73 | % | | | 0.73 | % |
Net investment income | | | 1.88 | % | | | 2.63 | % | | | 2.71 | % | | | 2.19 | % | | | 2.91 | % |
Portfolio turnover rate | | | 359 | %(d) | | | 297 | %(e) | | | 181 | % | | | 195 | % | | | 143 | % |
| (a) | Per share net investment income has been calculated using the average shares outstanding during the period. |
| (b) | A sales charge for Class A shares is not reflected in total return calculations. |
| (c) | Effective July 1, 2020, the expense limit decreased from 0.80% to 0.75%. |
| (d) | The variation in the Fund’s turnover rate from 2019 to 2020 was primarily due to a significant repositioning of the portfolio. See Note 9 of Notes to Financial Statements. |
| (e) | The variation in the Fund’s turnover rate from 2018 to 2019 is due to an increase in the volume of U.S. Treasury securities related to certain trading strategies. |
| | | | |
| | See accompanying notes to financial statements. | | | 68 |
Financial Highlights (continued)
For a share outstanding throughout each period.
| | | | | | | | | | | | | | | | | | | | |
| | | Core Plus Bond Fund—Class C | |
| | | Year Ended
September 30,
2020 | | | Year Ended
September 30,
2019 | | | Year Ended
September 30,
2018 | | | Year Ended
September 30,
2017 | | | Year Ended
September 30,
2016 | |
Net asset value, beginning of the period | | $ | 13.25 | | | $ | 12.53 | | | $ | 12.96 | | | $ | 13.06 | | | $ | 12.33 | |
| | | | | | | | | | | | | | | | | | | | |
INCOME (LOSS) FROM INVESTMENT OPERATIONS: | | | | | | | | | | | | | | | | | | | | |
Net investment income(a) | | | 0.15 | | | | 0.24 | | | | 0.25 | | | | 0.19 | | | | 0.27 | |
Net realized and unrealized gain (loss) | | | 0.88 | | | | 0.70 | | | | (0.38 | ) | | | (0.05 | ) | | | 0.73 | |
| | | | | | | | | | | | | | | | | | | | |
Total from Investment Operations | | | 1.03 | | | | 0.94 | | | | (0.13 | ) | | | 0.14 | | | | 1.00 | |
| | | | | | | | | | | | | | | | | | | | |
LESS DISTRIBUTIONS FROM: | | | | | | | | | | | | | | | | | | | | |
Net investment income | | | (0.19 | ) | | | (0.22 | ) | | | (0.30 | ) | | | (0.24 | ) | | | (0.27 | ) |
| | | | | | | | | | | | | | | | | | | | |
Total Distributions | | | (0.19 | ) | | | (0.22 | ) | | | (0.30 | ) | | | (0.24 | ) | | | (0.27 | ) |
| | | | | | | | | | | | | | | | | | | | |
Net asset value, end of the period | | $ | 14.09 | | | $ | 13.25 | | | $ | 12.53 | | | $ | 12.96 | | | $ | 13.06 | |
| | | | | | | | | | | | | | | | | | | | |
Total return(b) | | | 7.83 | % | | | 7.57 | % | | | (1.03 | )% | | | 1.08 | % | | | 8.17 | % |
RATIOS TO AVERAGE NET ASSETS: | | | | | | | | | | | | | | | | | | | | |
Net assets, end of the period (000’s) | | $ | 132,590 | | | $ | 160,201 | | | $ | 185,758 | | | $ | 248,687 | | | $ | 321,626 | |
Net expenses | | | 1.47 | %(c) | | | 1.48 | % | | | 1.48 | % | | | 1.48 | % | | | 1.48 | % |
Gross expenses | | | 1.47 | % | | | 1.48 | % | | | 1.48 | % | | | 1.48 | % | | | 1.48 | % |
Net investment income | | | 1.13 | % | | | 1.88 | % | | | 1.96 | % | | | 1.44 | % | | | 2.16 | % |
Portfolio turnover rate | | | 359 | %(d) | | | 297 | %(e) | | | 181 | % | | | 195 | % | | | 143 | % |
| (a) | Per share net investment income has been calculated using the average shares outstanding during the period. |
| (b) | A contingent deferred sales charge for Class C shares is not reflected in total return calculations. |
| (c) | Effective July 1, 2020, the expense limit decreased from 1.55% to 1.50%. |
| (d) | The variation in the Fund’s turnover rate from 2019 to 2020 was primarily due to a significant repositioning of the portfolio. See Note 9 of Notes to Financial Statements. |
| (e) | The variation in the Fund’s turnover rate from 2018 to 2019 is due to an increase in the volume of U.S. Treasury securities related to certain trading strategies. |
| | | | |
| 69 | | | See accompanying notes to financial statements. | | |
Financial Highlights (continued)
For a share outstanding throughout each period.
| | | | | | | | | | | | | | | | | | | | |
| | | Core Plus Bond Fund—Class N | |
| | | Year Ended
September 30,
2020 | | | Year Ended
September 30,
2019 | | | Year Ended
September 30,
2018 | | | Year Ended
September 30,
2017 | | | Year Ended
September 30,
2016 | |
Net asset value, beginning of the period | | $ | 13.37 | | | $ | 12.63 | | | $ | 13.06 | | | $ | 13.17 | | | $ | 12.44 | |
| | | | | | | | | | | | | | | | | | | | |
INCOME (LOSS) FROM INVESTMENT OPERATIONS: | | | | | | | | | | | | | | | | | | | | |
Net investment income(a) | | | 0.30 | | | | 0.38 | | | | 0.39 | | | | 0.33 | | | | 0.41 | |
Net realized and unrealized gain (loss) | | | 0.88 | | | | 0.72 | | | | (0.38 | ) | | | (0.06 | ) | | | 0.73 | |
| | | | | | | | | | | | | | | | | | | | |
Total from Investment Operations | | | 1.18 | | | | 1.10 | | | | 0.01 | | | | 0.27 | | | | 1.14 | |
| | | | | | | | | | | | | | | | | | | | |
LESS DISTRIBUTIONS FROM: | | | | | | | | | | | | | | | | | | | | |
Net investment income | | | (0.34 | ) | | | (0.36 | ) | | | (0.44 | ) | | | (0.38 | ) | | | (0.41 | ) |
| | | | | | | | | | | | | | | | | | | | |
Total Distributions | | | (0.34 | ) | | | (0.36 | ) | | | (0.44 | ) | | | (0.38 | ) | | | (0.41 | ) |
| | | | | | | | | | | | | | | | | | | | |
Net asset value, end of the period | | $ | 14.21 | | | $ | 13.37 | | | $ | 12.63 | | | $ | 13.06 | | | $ | 13.17 | |
| | | | | | | | | | | | | | | | | | | | |
Total return | | | 8.95 | % | | | 8.85 | % | | | 0.07 | % | | | 2.12 | % | | | 9.33 | % |
RATIOS TO AVERAGE NET ASSETS: | | | | | | | | | | | | | | | | | | | | |
Net assets, end of the period (000’s) | | $ | 2,682,487 | | | $ | 2,610,699 | | | $ | 1,899,190 | | | $ | 1,784,150 | | | $ | 2,134,113 | |
Net expenses | | | 0.38 | %(b) | | | 0.39 | % | | | 0.39 | % | | | 0.39 | % | | | 0.39 | % |
Gross expenses | | | 0.38 | % | | | 0.39 | % | | | 0.39 | % | | | 0.39 | % | | | 0.39 | % |
Net investment income | | | 2.21 | % | | | 2.96 | % | | | 3.06 | % | | | 2.53 | % | | | 3.25 | % |
Portfolio turnover rate | | | 359 | %(c) | | | 297 | %(d) | | | 181 | % | | | 195 | % | | | 143 | % |
| (a) | Per share net investment income has been calculated using the average shares outstanding during the period. |
| (b) | Effective July 1, 2020, the expense limit decreased from 0.50% to 0.45%. |
| (c) | The variation in the Fund’s turnover rate from 2019 to 2020 was primarily due to a significant repositioning of the portfolio. See Note 9 of Notes to Financial Statements. |
| (d) | The variation in the Fund’s turnover rate from 2018 to 2019 is due to an increase in the volume of U.S. Treasury securities related to certain trading strategies. |
| | | | |
| | See accompanying notes to financial statements. | | | 70 |
Financial Highlights (continued)
For a share outstanding throughout each period.
| | | | | | | | | | | | | | | | | | | | |
| | | Core Plus Bond Fund—Class Y | |
| | | Year Ended
September 30,
2020 | | | Year Ended
September 30,
2019 | | | Year Ended
September 30,
2018 | | | Year Ended
September 30,
2017 | | | Year Ended
September 30,
2016 | |
Net asset value, beginning of the period | | $ | 13.36 | | | $ | 12.63 | | | $ | 13.06 | | | $ | 13.16 | | | $ | 12.43 | |
| | | | | | | | | | | | | | | | | | | | |
INCOME (LOSS) FROM INVESTMENT OPERATIONS: | | | | | | | | | | | | | | | | | | | | |
Net investment income(a) | | | 0.29 | | | | 0.37 | | | | 0.38 | | | | 0.31 | | | | 0.40 | |
Net realized and unrealized gain (loss) | | | 0.88 | | | | 0.71 | | | | (0.38 | ) | | | (0.04 | ) | | | 0.73 | |
| | | | | | | | | | | | | | | | | | | | |
Total from Investment Operations | | | 1.17 | | | | 1.08 | | | | 0.00 | (b) | | | 0.27 | | | | 1.13 | |
| | | | | | | | | | | | | | | | | | | | |
LESS DISTRIBUTIONS FROM: | | | | | | | | | | | | | | | | | | | | |
Net investment income | | | (0.33 | ) | | | (0.35 | ) | | | (0.43 | ) | | | (0.37 | ) | | | (0.40 | ) |
| | | | | | | | | | | | | | | | | | | | |
Total Distributions | | | (0.33 | ) | | | (0.35 | ) | | | (0.43 | ) | | | (0.37 | ) | | | (0.40 | ) |
| | | | | | | | | | | | | | | | | | | | |
Net asset value, end of the period | | $ | 14.20 | | | $ | 13.36 | | | $ | 12.63 | | | $ | 13.06 | | | $ | 13.16 | |
| | | | | | | | | | | | | | | | | | | | |
Total return | | | 8.87 | % | | | 8.67 | % | | | (0.02 | )% | | | 2.10 | % | | | 9.22 | % |
RATIOS TO AVERAGE NET ASSETS: | | | | | | | | | | | | | | | | | | | | |
Net assets, end of the period (000’s) | | $ | 5,846,057 | | | $ | 4,163,785 | | | $ | 3,733,751 | | | $ | 3,846,208 | | | $ | 2,953,919 | |
Net expenses | | | 0.47 | %(c) | | | 0.48 | % | | | 0.48 | % | | | 0.48 | % | | | 0.48 | % |
Gross expenses | | | 0.47 | % | | | 0.48 | % | | | 0.48 | % | | | 0.48 | % | | | 0.48 | % |
Net investment income | | | 2.11 | % | | | 2.87 | % | | | 2.97 | % | | | 2.43 | % | | | 3.15 | % |
Portfolio turnover rate | | | 359 | %(d) | | | 297 | %(e) | | | 181 | % | | | 195 | % | | | 143 | % |
| (a) | Per share net investment income has been calculated using the average shares outstanding during the period. |
| (b) | Amount rounds to less than $0.01 per share. |
| (c) | Effective July 1, 2020, the expense limit decreased from 0.55% to 0.50%. |
| (d) | The variation in the Fund’s turnover rate from 2019 to 2020 was primarily due to a significant repositioning of the portfolio. See Note 9 of Notes to Financial Statements. |
| (e) | The variation in the Fund’s turnover rate from 2018 to 2019 is due to an increase in the volume of U.S. Treasury securities related to certain trading strategies. |
| | | | |
| 71 | | | See accompanying notes to financial statements. | | |
Financial Highlights (continued)
For a share outstanding throughout each period.
| | | | | | | | | | | | | | | | | | | | |
| | | Global Allocation Fund—Class A | |
| | | Year Ended
September 30,
2020 | | | Year Ended
September 30,
2019 | | | Year Ended
September 30,
2018 | | | Year Ended
September 30,
2017 | | | Year Ended
September 30,
2016 | |
Net asset value, beginning of the period | | $ | 23.76 | | | $ | 23.10 | | | $ | 21.60 | | | $ | 19.17 | | | $ | 18.45 | |
| | | | | | | | | | | | | | | | | | | | |
INCOME (LOSS) FROM INVESTMENT OPERATIONS: | | | | | | | | | | | | | | | | | | | | |
Net investment income(a) | | | 0.10 | | | | 0.19 | | | | 0.23 | | | | 0.31 | | | | 0.24 | |
Net realized and unrealized gain (loss) | | | 3.05 | | | | 1.38 | | | | 1.75 | | | | 2.36 | | | | 1.47 | |
| | | | | | | | | | | | | | | | | | | | |
Total from Investment Operations | | | 3.15 | | | | 1.57 | | | | 1.98 | | | | 2.67 | | | | 1.71 | |
| | | | | | | | | | | | | | | | | | | | |
LESS DISTRIBUTIONS FROM: | | | | | | | | | | | | | | | | | | | | |
Net investment income | | | (0.12 | ) | | | (0.16 | ) | | | (0.19 | ) | | | (0.24 | ) | | | (0.15 | ) |
Net realized capital gains | | | (0.56 | ) | | | (0.75 | ) | | | (0.29 | ) | | | — | | | | (0.84 | ) |
| | | | | | | | | | | | | | | | | | | | |
Total Distributions | | | (0.68 | ) | | | (0.91 | ) | | | (0.48 | ) | | | (0.24 | ) | | | (0.99 | ) |
| | | | | | | | | | | | | | | | | | | | |
Net asset value, end of the period | | $ | 26.23 | | | $ | 23.76 | | | $ | 23.10 | | | $ | 21.60 | | | $ | 19.17 | |
| | | | | | | | | | | | | | | | | | | | |
Total return(b) | | | 13.41 | % | | | 7.66 | % | | | 9.26 | % | | | 14.10 | % | | | 9.64 | % |
RATIOS TO AVERAGE NET ASSETS: | | | | | | | | | | | | | | | | | | | | |
Net assets, end of the period (000’s) | | $ | 632,479 | | | $ | 453,009 | | | $ | 401,036 | | | $ | 305,275 | | | $ | 280,263 | |
Net expenses | | | 1.15 | % | | | 1.16 | % | | | 1.16 | % | | | 1.18 | % | | | 1.17 | % |
Gross expenses | | | 1.15 | % | | | 1.16 | % | | | 1.16 | % | | | 1.18 | % | | | 1.17 | % |
Net investment income | | | 0.42 | % | | | 0.83 | % | | | 1.03 | % | | | 1.57 | % | | | 1.32 | % |
Portfolio turnover rate | | | 37 | % | | | 27 | % | | | 22 | % | | | 35 | % | | | 43 | % |
| (a) | Per share net investment income has been calculated using the average shares outstanding during the period. |
| (b) | A sales charge for Class A shares is not reflected in total return calculations. |
| | | | |
| | See accompanying notes to financial statements. | | | 72 |
Financial Highlights (continued)
For a share outstanding throughout each period.
| | | | | | | | | | | | | | | | | | | | |
| | | Global Allocation Fund—Class C | |
| | | Year Ended
September 30,
2020 | | | Year Ended
September 30,
2019 | | | Year Ended
September 30,
2018 | | | Year Ended
September 30,
2017 | | | Year Ended
September 30,
2016 | |
Net asset value, beginning of the period | | $ | 23.43 | | | $ | 22.78 | | | $ | 21.29 | | | $ | 18.89 | | | $ | 18.19 | |
| | | | | | | | | | | | | | | | | | | | |
INCOME (LOSS) FROM INVESTMENT OPERATIONS: | | | | | | | | | | | | | | | | | | | | |
Net investment income (loss)(a) | | | (0.08 | ) | | | 0.02 | | | | 0.06 | | | | 0.16 | | | | 0.10 | |
Net realized and unrealized gain (loss) | | | 2.99 | | | | 1.38 | | | | 1.73 | | | | 2.33 | | | | 1.46 | |
| | | | | | | | | | | | | | | | | | | | |
Total from Investment Operations | | | 2.91 | | | | 1.40 | | | | 1.79 | | | | 2.49 | | | | 1.56 | |
| | | | | | | | | | | | | | | | | | | | |
LESS DISTRIBUTIONS FROM: | | | | | | | | | | | | | | | | | | | | |
Net investment income | | | — | | | | (0.00 | )(b) | | | (0.01 | ) | | | (0.09 | ) | | | (0.02 | ) |
Net realized capital gains | | | (0.56 | ) | | | (0.75 | ) | | | (0.29 | ) | | | — | | | | (0.84 | ) |
| | | | | | | | | | | | | | | | | | | | |
Total Distributions | | | (0.56 | ) | | | (0.75 | ) | | | (0.30 | ) | | | (0.09 | ) | | | (0.86 | ) |
| | | | | | | | | | | | | | | | | | | | |
Net asset value, end of the period | | $ | 25.78 | | | $ | 23.43 | | | $ | 22.78 | | | $ | 21.29 | | | $ | 18.89 | |
| | | | | | | | | | | | | | | | | | | | |
Total return(c) | | | 12.55 | % | | | 6.85 | % | | | 8.46 | % | | | 13.22 | % | | | 8.88 | % |
RATIOS TO AVERAGE NET ASSETS: | | | | | | | | | | | | | | | | | | | | |
Net assets, end of the period (000’s) | | $ | 483,814 | | | $ | 480,479 | | | $ | 412,610 | | | $ | 354,017 | | | $ | 423,350 | |
Net expenses | | | 1.90 | % | | | 1.91 | % | | | 1.91 | % | | | 1.93 | % | | | 1.92 | % |
Gross expenses | | | 1.90 | % | | | 1.91 | % | | | 1.91 | % | | | 1.93 | % | | | 1.92 | % |
Net investment income (loss) | | | (0.33 | )% | | | 0.08 | % | | | 0.29 | % | | | 0.84 | % | | | 0.57 | % |
Portfolio turnover rate | | | 37 | % | | | 27 | % | | | 22 | % | | | 35 | % | | | 43 | % |
| (a) | Per share net investment income (loss) has been calculated using the average shares outstanding during the period. |
| (b) | Amount rounds to less than $0.01 per share. |
| (c) | A contingent deferred sales charge for Class C shares is not reflected in total return calculations. |
| | | | |
| 73 | | | See accompanying notes to financial statements. | | |
Financial Highlights (continued)
For a share outstanding throughout each period.
| | | | | | | | | | | | | | | | |
| | | Global Allocation Fund—Class N | |
| | | Year Ended
September 30,
2020 | | | Year Ended
September 30,
2019 | | | Year Ended
September 30,
2018 | | | Period Ended
September 30,
2017* | |
Net asset value, beginning of the period | | $ | 23.92 | | | $ | 23.25 | | | $ | 21.73 | | | $ | 19.20 | |
| | | | | | | | | | | | | | | | |
INCOME (LOSS) FROM INVESTMENT OPERATIONS: | | | | | | | | | | | | | | | | |
Net investment income(a) | | | 0.18 | | | | 0.27 | | | | 0.31 | | | | 0.20 | |
Net realized and unrealized gain (loss) | | | 3.07 | | | | 1.38 | | | | 1.75 | | | | 2.33 | |
| | | | | | | | | | | | | | | | |
Total from Investment Operations | | | 3.25 | | | | 1.65 | | | | 2.06 | | | | 2.53 | |
| | | | | | | | | | | | | | | | |
LESS DISTRIBUTIONS FROM: | | | | | | | | | | | | | | | | |
Net investment income | | | (0.19 | ) | | | (0.23 | ) | | | (0.25 | ) | | | — | |
Net realized capital gains | | | (0.56 | ) | | | (0.75 | ) | | | (0.29 | ) | | | — | |
| | | | | | | | | | | | | | | | |
Total Distributions | | | (0.75 | ) | | | (0.98 | ) | | | (0.54 | ) | | | — | |
| | | | | | | | | | | | | | | | |
Net asset value, end of the period | | $ | 26.42 | | | $ | 23.92 | | | $ | 23.25 | | | $ | 21.73 | |
| | | | | | | | | | | | | | | | |
Total return | | | 13.78 | % | | | 8.04 | % | | | 9.60 | % | | | 13.18 | %(b) |
RATIOS TO AVERAGE NET ASSETS: | | | | | | | | | | | | | | | | |
Net assets, end of the period (000’s) | | $ | 264,338 | | | $ | 202,692 | | | $ | 80,346 | | | $ | 59,512 | |
Net expenses | | | 0.82 | % | | | 0.82 | % | | | 0.83 | % | | | 0.87 | %(c) |
Gross expenses | | | 0.82 | % | | | 0.82 | % | | | 0.83 | % | | | 0.87 | %(c) |
Net investment income | | | 0.76 | % | | | 1.20 | % | | | 1.36 | % | | | 1.48 | %(c) |
Portfolio turnover rate | | | 37 | % | | | 27 | % | | | 22 | % | | | 35 | %(d) |
| * | From commencement of Class operations on February 1, 2017 through September 30, 2017. |
| (a) | Per share net investment income has been calculated using the average shares outstanding during the period. |
| (b) | Periods less than one year are not annualized. |
| (c) | Computed on an annualized basis for periods less than one year. |
| (d) | Represents the Fund’s portfolio turnover rate for the year ended September 30, 2017. |
| | | | |
| | See accompanying notes to financial statements. | | | 74 |
Financial Highlights (continued)
For a share outstanding throughout each period.
| | | | | | | | | | | | | | | | | | | | |
| | | Global Allocation Fund—Class Y | |
| | | Year Ended
September 30,
2020 | | | Year Ended
September 30,
2019 | | | Year Ended
September 30,
2018 | | | Year Ended
September 30,
2017 | | | Year Ended
September 30,
2016 | |
Net asset value, beginning of the period | | $ | 23.92 | | | $ | 23.25 | | | $ | 21.74 | | | $ | 19.29 | | | $ | 18.55 | |
| | | | | | | | | | | | | | | | | | | | |
INCOME (LOSS) FROM INVESTMENT OPERATIONS: | | | | | | | | | | | | | | | | | | | | |
Net investment income(a) | | | 0.16 | | | | 0.24 | | | | 0.29 | | | | 0.36 | | | | 0.29 | |
Net realized and unrealized gain (loss) | | | 3.07 | | | | 1.40 | | | | 1.75 | | | | 2.37 | | | | 1.49 | |
| | | | | | | | | | | | | | | | | | | | |
Total from Investment Operations | | | 3.23 | | | | 1.64 | | | | 2.04 | | | | 2.73 | | | | 1.78 | |
| | | | | | | | | | | | | | | | | | | | |
LESS DISTRIBUTIONS FROM: | | | | | | | | | | | | | | | | | | | | |
Net investment income | | | (0.17 | ) | | | (0.22 | ) | | | (0.24 | ) | | | (0.28 | ) | | | (0.20 | ) |
Net realized capital gains | | | (0.56 | ) | | | (0.75 | ) | | | (0.29 | ) | | | — | | | | (0.84 | ) |
| | | | | | | | | | | | | | | | | | | | |
Total Distributions | | | (0.73 | ) | | | (0.97 | ) | | | (0.53 | ) | | | (0.28 | ) | | | (1.04 | ) |
| | | | | | | | | | | | | | | | | | | | |
Net asset value, end of the period | | $ | 26.42 | | | $ | 23.92 | | | $ | 23.25 | | | $ | 21.74 | | | $ | 19.29 | |
| | | | | | | | | | | | | | | | | | | | |
Total return | | | 13.70 | % | | | 7.95 | % | | | 9.49 | % | | | 14.42 | % | | | 9.97 | % |
RATIOS TO AVERAGE NET ASSETS: | | | | | | | | | | | | | | | | | | | | |
Net assets, end of the period (000’s) | | $ | 2,660,927 | | | $ | 1,938,124 | | | $ | 1,549,689 | | | $ | 1,067,062 | | | $ | 835,391 | |
Net expenses | | | 0.90 | % | | | 0.91 | % | | | 0.91 | % | | | 0.93 | % | | | 0.92 | % |
Gross expenses | | | 0.90 | % | | | 0.91 | % | | | 0.91 | % | | | 0.93 | % | | | 0.92 | % |
Net investment income | | | 0.67 | % | | | 1.08 | % | | | 1.29 | % | | | 1.79 | % | | | 1.58 | % |
Portfolio turnover rate | | | 37 | % | | | 27 | % | | | 22 | % | | | 35 | % | | | 43 | % |
| (a) | Per share net investment income has been calculated using the average shares outstanding during the period. |
| | | | |
| 75 | | | See accompanying notes to financial statements. | | |
Notes to Financial Statements
September 30, 2020
1. Organization. Natixis Funds Trust I and Loomis Sayles Funds II (the “Trusts” and each a “Trust”) are each organized as a Massachusetts business trust. Each Trust is registered under the Investment Company Act of 1940, as amended (the “1940 Act”) as an open-end management investment company. Each Declaration of Trust permits the Board of Trustees to authorize the issuance of an unlimited number of shares of the Trust in multiple series. The financial statements for certain funds of the Trusts are presented in separate reports. The following funds (individually, a “Fund” and collectively, the “Funds”) are included in this report:
Natixis Funds Trust I:
Loomis Sayles Core Plus Bond Fund (the “Core Plus Bond Fund”)
Loomis Sayles Funds II:
Loomis Sayles Global Allocation Fund (the “Global Allocation Fund”)
Each Fund is a diversified investment company.
Each Fund offers Class A, Class C, Class N and Class Y shares.
Class A shares are sold with a maximum front-end sales charge of 4.25% for Core Plus Bond Fund and 5.75% for Global Allocation Fund. Class C shares do not pay a front-end sales charge, pay higher Rule 12b-1 fees than Class A shares for ten years (at which point they automatically convert to Class A shares) and may be subject to a contingent deferred sales charge (“CDSC”) of 1.00% if those shares are redeemed within one year of acquisition, except for reinvested distributions. Class N and Class Y shares do not pay a front-end sales charge, a CDSC or Rule 12b-1 fees. Class N shares are offered with an initial minimum investment of $1,000,000. Class Y shares are offered with an initial minimum investment of $100,000. Certain categories of investors are exempted from the minimum investment amounts for Class N and Class Y as outlined in the relevant Funds’ prospectus.
Most expenses can be directly attributed to a Fund. Expenses which cannot be directly attributed to a Fund are generally apportioned based on the relative net assets of each of the funds in Natixis Funds Trust I, Natixis Funds Trust II, Natixis Funds Trust IV and Gateway Trust (“Natixis Funds Trusts”), Loomis Sayles Funds I and Loomis Sayles Funds II (“Loomis Sayles Funds Trusts”), and Natixis ETF Trust and Natixis ETF Trust II (“Natixis ETF Trusts”). Expenses of a Fund are borne pro rata by the holders of each class of shares, except that each class bears expenses unique to that class (such as the Rule 12b-1 fees applicable to Class A and Class C), and transfer agent fees are borne collectively for Class A, Class C and Class Y, and individually for Class N. In addition, each class votes as a class only with respect to its own Rule 12b-1 Plan. Shares of each class would receive their pro rata share of the net assets of the Fund if the Fund were liquidated. The Trustees approve separate distributions from net investment income on each class of shares.
Notes to Financial Statements (continued)
September 30, 2020
2. Significant Accounting Policies. The following is a summary of significant accounting policies consistently followed by each Fund in the preparation of its financial statements. The Funds’ financial statements follow the accounting and reporting guidelines provided for investment companies and are prepared in accordance with accounting principles generally accepted in the United States of America which require the use of management estimates that affect the reported amounts and disclosures in the financial statements. Actual results could differ from those estimates. Management has evaluated the events and transactions subsequent to year-end through the date the financial statements were issued and has determined that there were no material events that would require disclosure in the Funds’ financial statements.
a. Valuation. Fund securities and other investments are valued at market value based on market quotations obtained or determined by independent pricing services recommended by the adviser and approved by the Board of Trustees. Fund securities and other investments for which market quotations are not readily available are valued at fair value as determined in good faith by the adviser pursuant to procedures approved by the Board of Trustees, as described below. Market value is determined as follows:
Debt securities and unlisted preferred equity securities are valued based on evaluated bids furnished to the Funds by an independent pricing service or bid prices obtained from broker-dealers. Senior loans are valued at bid prices supplied by an independent pricing service, if available. Listed equity securities (including shares of closed-end investment companies and exchange-traded funds) are valued at the last sale price quoted on the exchange where they are traded most extensively or, if there is no reported sale during the day, the closing bid quotation as reported by an independent pricing service. Securities traded on the NASDAQ Global Select Market, NASDAQ Global Market and NASDAQ Capital Market are valued at the NASDAQ Official Closing Price (“NOCP”), or if lacking an NOCP, at the most recent bid quotations on the applicable NASDAQ Market. Unlisted equity securities (except unlisted preferred equity securities) are valued at the last sale price quoted in the market where they are traded most extensively or, if there is no reported sale during the day, the closing bid quotation as reported by an independent pricing service. If there is no last sale price or closing bid quotation available, unlisted equity securities will be valued using evaluated bids furnished by an independent pricing service, if available. In some foreign markets, an official close price and a last sale price may be available from the foreign exchange or market. In those cases, the official close price is used. Broker-dealer bid prices may be used to value debt and unlisted equity securities and senior loans where an independent pricing service is unable to price a security or where an independent pricing service does not provide a reliable price for the security. Forward foreign currency contracts are valued utilizing interpolated rates determined based on information provided by an independent pricing service. Futures contracts are valued
Notes to Financial Statements (continued)
September 30, 2020
at the most recent settlement price on the exchange on which the adviser believes that, over time, they are traded most extensively.
Fund securities and other investments for which market quotations are not readily available are valued at fair value as determined in good faith by the adviser pursuant to procedures approved by the Board of Trustees. The Funds may also value securities and other investments at fair value in other circumstances such as when extraordinary events occur after the close of a foreign market but prior to the close of the New York Stock Exchange. This may include situations relating to a single issuer (such as a declaration of bankruptcy or a delisting of the issuer’s security from the primary market on which it has traded) as well as events affecting the securities markets in general (such as market disruptions or closings and significant fluctuations in U.S. and/or foreign markets). When fair valuing its securities or other investments, the Funds may, among other things, use modeling tools or other processes that may take into account factors such as securities or other market activity and/or significant events that occur after the close of the foreign market and before the time the Fund’s net asset value (“NAV”) is calculated. Fair value pricing may require subjective determinations about the value of a security, and fair values used to determine a Fund’s NAV may differ from quoted or published prices, or from prices that are used by others, for the same securities. In addition, the use of fair value pricing may not always result in adjustments to the prices of securities held by a Fund.
Illiquid securities for which market quotations are readily available and have been evaluated by the adviser are considered and classified as fair valued securities pursuant to the Funds’ pricing policies and procedures.
As of September 30, 2020, securities held by the Funds were fair valued as follows:
| | | | | | | | | | | | | | | | | | | | | | | | |
Fund | | Equity
securities1 | | | Percentage of
Net Assets | | | Securities
classified as
fair valued | | | Percentage of
Net Assets | | | Securities fair
valued by the
Fund’s adviser | | | Percentage of
Net Assets | |
Core Plus Bond Fund | | $ | — | | | | — | | | $ | — | | | | — | | | $ | 2,307,376 | | | | Less than 0.1% | |
Global Allocation Fund | | | 563,759,481 | | | | 13.9 | % | | | 391,915 | | | | Less than 0.1% | | | | — | | | | — | |
| 1 | Certain foreign equity securities were fair valued pursuant to procedures approved by the Board of Trustees as events occurring after the close of the foreign market were believed to materially affect the value of those securities. |
b. Investment Transactions and Related Investment Income. Investment transactions are accounted for on a trade date plus one day basis for daily NAV calculation. However, for financial reporting purposes, investment transactions are reported on trade date. Dividend income (including income reinvested) and foreign withholding tax, if applicable, is recorded on the ex-dividend date, or in the case of certain foreign securities, as soon as a Fund is notified, and interest income is recorded on an accrual basis. Interest income is increased by the accretion of discount and decreased by the
Notes to Financial Statements (continued)
September 30, 2020
amortization of premium, if applicable. Periodic principal adjustments for inflation-protected securities are recorded to interest income. Negative principal adjustments (in the event of deflation) are recorded as reductions of interest income to the extent of interest income earned, not to exceed the amount of positive principal adjustments on a cumulative basis. In determining net gain or loss on securities sold, the cost of securities has been determined on an identified cost basis. Investment income, non-class specific expenses and realized and unrealized gains and losses are allocated on a pro rata basis to each class based on the relative net assets of each class to the total net assets of the Fund.
c. Foreign Currency Translation. The books and records of the Funds are maintained in U.S. dollars. The values of securities, currencies and other assets and liabilities denominated in currencies other than U.S. dollars, if any, are translated into U.S. dollars based upon foreign exchange rates prevailing at the end of the period. Purchases and sales of investment securities, income and expenses are translated into U.S. dollars on the respective dates of such transactions.
Net realized foreign exchange gains or losses arise from sales of foreign currency, changes in exchange rates between the trade and settlement dates on securities transactions and the difference between the amounts of dividends, interest and foreign withholding taxes recorded on the Funds’ books and the U.S. dollar equivalent of the amounts actually received or paid. Net unrealized foreign exchange gains or losses arise from changes in the value of assets and liabilities, other than investment securities, as of the end of the fiscal period, resulting from changes in exchange rates. Net realized foreign exchange gains or losses and the net change in unrealized foreign exchange gains or losses are disclosed in the Statements of Operations. For federal income tax purposes, net realized foreign exchange gains or losses are characterized as ordinary income and may, if the Funds have net losses, reduce the amount of income available to be distributed by the Funds.
The values of investment securities are presented at the foreign exchange rates prevailing at the end of the period for financial reporting purposes. Net realized and unrealized gains or losses on investments reported in the Statements of Operations reflect gains or losses resulting from changes in exchange rates and fluctuations which arise due to changes in market prices of investment securities. For federal income tax purposes, a portion of the net realized gain or loss on investments arising from changes in exchange rates, which is reflected in the Statements of Operations, may be characterized as ordinary income and may, if the Funds have net losses, reduce the amount of income available to be distributed by the Funds.
For the year ended September 30, 2020, the amount of income available to be distributed has been reduced by the following amounts as a result of losses arising from changes in exchange rates:
| | | | |
Core Plus Bond Fund | | $ | 13,576,656 | |
Notes to Financial Statements (continued)
September 30, 2020
The Funds may use foreign currency exchange contracts to facilitate transactions in foreign-denominated investments. Losses may arise from changes in the value of the foreign currency or if the counterparties do not perform under the contracts’ terms.
d. Forward Foreign Currency Contracts. The Funds may enter into forward foreign currency contracts, including forward foreign cross currency contracts to acquire exposure to foreign currencies or to hedge the Funds’ investments against currency fluctuation. A contract can also be used to offset a previous contract. These contracts involve market risk in excess of the unrealized appreciation (depreciation) reflected in the Funds’ Statements of Assets and Liabilities. The U.S. dollar value of the currencies a Fund has committed to buy or sell represents the aggregate exposure to each currency the Fund has acquired or hedged through currency contracts outstanding at period end. Gains or losses are recorded for financial statement purposes as unrealized until settlement date. Contracts are traded over-the-counter directly with a counterparty. Risks may arise upon entering into these contracts from the potential inability of counterparties to meet the terms of their contracts and from unanticipated movements in the value of a foreign currency relative to the U.S. dollar. Certain contracts may require the movement of cash and/or securities as collateral for the Funds’ or counterparty’s net obligations under the contracts.
e. Futures Contracts. The Funds may enter into futures contracts. Futures contracts are agreements between two parties to buy and sell a particular instrument or index for a specified price on a specified future date.
When a Fund enters into a futures contract, it is required to deposit with (or for the benefit of) its broker an amount of cash or short-term high-quality securities as “initial margin.” As the value of the contract changes, the value of the futures contract position increases or declines. Subsequent payments, known as “variation margin,” are made or received by a Fund, depending on the price fluctuations in the fair value of the contract and the value of cash or securities on deposit with the broker. The aggregate principal amounts of the contracts are not recorded in the financial statements. Daily fluctuations in the value of the contracts are recorded in the Statements of Assets and Liabilities as a receivable (payable) and in the Statements of Operations as unrealized appreciation (depreciation) until the contracts are closed, when they are recorded as realized gains (losses). Realized gain or loss on a futures position is equal to the difference between the value of the contract at the time it was opened and the value at the time it was closed, minus brokerage commissions. When a Fund enters into a futures contract certain risks may arise, such as illiquidity in the futures market, which may limit a Fund’s ability to close out a futures contract prior to settlement date, and unanticipated movements in the value of securities or interest rates.
Futures contracts are exchange-traded. Exchange-traded futures contracts are standardized and are settled through a clearing house with fulfillment supported by the
Notes to Financial Statements (continued)
September 30, 2020
credit of the exchange. Therefore, counterparty credit risks to the Funds are reduced; however, in the event that a counterparty enters into bankruptcy, a Fund’s claim against initial/variation margin on deposit with the counterparty may be subject to terms of a final settlement in bankruptcy court.
f. When-Issued and Delayed Delivery Transactions. The Funds may enter into when-issued or delayed delivery transactions. When-issued refers to transactions made conditionally because a security, although authorized, has not been issued. Delayed delivery refers to transactions for which delivery or payment will occur at a later date, beyond the normal settlement period. The price of when-issued and delayed delivery securities and the date when the securities will be delivered and paid for are fixed at the time the transaction is negotiated. The security and the obligation to pay for it are recorded by the Funds at the time the commitment is entered into. The value of the security may vary with market fluctuations during the time before the Funds take delivery of the security. No interest accrues to the Funds until the transaction settles.
Delayed delivery transactions include those designated as To Be Announced (“TBAs”) in the Portfolios of Investments. For TBAs, the actual security that will be delivered to fulfill the transaction is not designated at the time of the trade. The security is “to be announced” 48 hours prior to the established trade settlement date. Certain transactions require the Funds or counterparty to post cash and/or securities as collateral for the net mark-to-market exposure to the other party. The Funds cover their net obligations under outstanding delayed delivery commitments by segregating or earmarking cash or securities at the custodian.
Purchases of when-issued or delayed delivery securities may have a similar effect on the Funds’ NAV as if the Funds’ had created a degree of leverage in the portfolio. Risks may arise upon entering into such transactions from the potential inability of counterparties to meet their obligations under the transactions. Additionally, losses may arise due to changes in the value of the underlying securities.
g. Federal and Foreign Income Taxes. The Trusts treat each Fund as a separate entity for federal income tax purposes. Each Fund intends to meet the requirements of the Internal Revenue Code of 1986, as amended, applicable to regulated investment companies, and to distribute to its shareholders substantially all of its net investment income and any net realized capital gains at least annually. Management has performed an analysis of each Fund’s tax positions for the open tax years as of September 30, 2020 and has concluded that no provisions for income tax are required. The Funds’ federal tax returns for the prior three fiscal years remain subject to examination by the Internal Revenue Service. Management is not aware of any events that are reasonably possible to occur in the next twelve months that would result in the amounts of any unrecognized tax benefits significantly increasing or decreasing for the Funds. However, management’s conclusions regarding tax positions taken may be subject to review and adjustment at a later date based on factors including, but not limited to, new tax laws and accounting regulations and interpretations thereof.
Notes to Financial Statements (continued)
September 30, 2020
A Fund may be subject to foreign withholding taxes on investment income and taxes on capital gains on investments that are accrued and paid based upon the Fund’s understanding of the tax rules and regulations that exist in the countries in which the Fund invests. Foreign withholding taxes on dividend and interest income are reflected on the Statements of Operations as a reduction of investment income, net of amounts eligible to be reclaimed. Dividends and interest receivable on the Statements of Assets and Liabilities are net of foreign withholding taxes. Foreign withholding taxes where reclaims have been or will be filed are reflected on the Statements of Assets and Liabilities as tax reclaims receivable. Capital gains taxes paid are included in net realized gain (loss) on investments in the Statements of Operations. Accrued but unpaid capital gains taxes are reflected as foreign taxes payable on the Statements of Assets and Liabilities, if applicable, and reduce unrealized gains on investments. In the event that realized gains on investments are subsequently offset by realized losses, taxes paid on realized gains may be returned to a Fund. Such amounts, if applicable, are reflected as foreign tax rebates receivable on the Statements of Assets and Liabilities and are recorded as a realized gain when received.
h. Dividends and Distributions to Shareholders. Dividends and distributions are recorded on the ex-dividend date. The timing and characterization of certain income and capital gain distributions are determined in accordance with federal tax regulations, which may differ from accounting principles generally accepted in the United States of America. Permanent differences are primarily due to differing treatments for book and tax purposes of items such as foreign currency gains and losses, paydown gains and losses, convertible bonds, defaulted and/or non-income producing securities, capital gains taxes, deferred Trustees’ fees, distribution re-designations, contingent payment debt instruments, forward foreign currency contract mark-to-market, futures contract mark-to-market, trust preferred securities and premium amortization. Permanent book and tax basis differences relating to shareholder distributions will result in reclassifications to capital accounts reported on the Statements of Assets and Liabilities. Temporary differences between book and tax distributable earnings are primarily due to deferred Trustees’ fees, defaulted and/or non-income producing securities, forward foreign currency contract mark-to-market, wash sales, premium amortization, contingent payment debt instruments, trust preferred securities, capital gains taxes, foreign currency gains and losses, futures contract mark-to-market, paydown gains and losses and convertible bonds. Amounts of income and capital gain available to be distributed on a tax basis are determined annually, and at other times during the Funds’ fiscal year as may be necessary to avoid knowingly declaring and paying a return of capital distribution. Distributions from net investment income and net realized short-term capital gains are considered to be distributed from ordinary income for tax purposes.
Notes to Financial Statements (continued)
September 30, 2020
The tax characterization of distributions is determined on an annual basis. The tax character of distributions paid to shareholders during the years ended September 30, 2020 and 2019 were as follows:
| | | | | | | | | | | | | | | | | | | | | | | | |
| | | 2020 Distributions Paid From: | | | 2019 Distributions Paid From: | |
Fund | | Ordinary
Income | | | Long-Term
Capital Gains | | | Total | | | Ordinary
Income | | | Long-Term
Capital Gains | | | Total | |
Core Plus Bond Fund | | $ | 193,309,459 | | | $ | — | | | $ | 193,309,459 | | | $ | 183,241,676 | | | $ | — | | | $ | 183,241,676 | |
Global Allocation Fund | | | 18,191,927 | | | | 73,767,977 | | | | 91,959,904 | | | | 18,627,380 | | | | 77,905,873 | | | | 96,533,253 | |
Distributions paid to shareholders from net investment income and net realized capital gains, based on accounting principles generally accepted in the United States of America, are consolidated and reported on the Statements of Changes in Net Assets as Distributions to Shareholders. Distributions paid to shareholders from net investment income and net realized capital gains expressed in per-share amounts, based on accounting principles generally accepted in the United States of America, are separately stated and reported within the Financial Highlights.
As of September 30, 2020, the components of distributable earnings on a tax basis were as follows:
| | | | | | | | |
| | | Core Plus
Bond Fund | | | Global
Allocation Fund | |
Undistributed ordinary income | | $ | 151,108,769 | | | $ | 19,532,864 | |
Undistributed long-term capital gains | | | 27,812,288 | | | | 204,551,060 | |
| | | | | | | | |
Total undistributed earnings | | | 178,921,057 | | | | 224,083,924 | |
| | | | | | | | |
Unrealized appreciation | | | 325,592,198 | | | | 754,433,890 | |
| | | | | | | | |
Total accumulated earnings | | $ | 504,513,255 | | | $ | 978,517,814 | |
| | | | | | | | |
Capital loss carryforward utilized in the current year | | $ | 74,174,601 | | | $ | — | |
| | | | | | | | |
As of September 30, 2020, unrealized appreciation (depreciation) as a component of distributable earnings were as follows:
| | | | | | | | |
| | | Loomis Sayles
Core Plus
Bond Fund | | | Loomis Sayles
Global
Allocation Fund | |
Unrealized appreciation (depreciation) | | | | | | | | |
Investments | | $ | 349,485,307 | | | $ | 752,864,748 | |
Foreign currency translations | | | (23,893,109 | ) | | | 1,569,142 | |
| | | | | | | | |
Total unrealized appreciation | | $ | 325,592,198 | | | $ | 754,433,890 | |
| | | | | | | | |
Notes to Financial Statements (continued)
September 30, 2020
As of September 30, 2020, the tax cost of investments (including derivatives, if applicable) and unrealized appreciation (depreciation) on a federal tax basis were as follows:
| | | | | | | | |
| | | Core Plus
Bond Fund | | | Global
Allocation Fund | |
Federal tax cost | | $ | 9,521,438,809 | | | $ | 3,265,634,581 | |
| | | | | | | | |
Gross tax appreciation | | $ | 414,243,127 | | | $ | 819,937,079 | |
Gross tax depreciation | | | (88,654,978 | ) | | | (64,834,813 | ) |
| | | | | | | | |
Net tax appreciation | | $ | 325,588,149 | | | $ | 755,102,266 | |
| | | | | | | | |
The difference between these amounts and those reported in the components of distributable earnings are primarily attributable to capital gains taxes and foreign exchange gains or losses.
i. Senior Loans. Each Fund may invest in senior loans to corporate, governmental or other borrowers. Senior loans, which include both secured and unsecured loans made by banks and other financial institutions to corporate customers, typically hold the most senior position in a borrower’s capital structure, may be secured by the borrower’s assets and have interest rates that reset frequently. Senior Loans can include term loans, revolving credit facility loans and second lien loans. A senior loan is often administered by a bank or other financial institution that acts as agent for all holders. The agent administers the terms of the senior loan, as specified in the loan agreement. Large loans may be shared or syndicated among several lenders. A Fund may enter into the primary syndicate for a loan or it may also purchase all or a portion of loans from other lenders (sometimes referred to as loan assignments), in either case becoming a direct lender. Senior loans outstanding at the end of the period, if any, are listed in each applicable Fund’s Portfolio of Investments.
j. Repurchase Agreements. Each Fund may enter into repurchase agreements, under the terms of a Master Repurchase Agreement, under which each Fund acquires securities as collateral and agrees to resell the securities at an agreed upon time and at an agreed upon price. It is each Fund’s policy that the market value of the collateral for repurchase agreements be at least equal to 102% of the repurchase price, including interest. Certain repurchase agreements are tri-party arrangements whereby the collateral is held in a segregated account for the benefit of the Fund and on behalf of the counterparty. Repurchase agreements could involve certain risks in the event of default or insolvency of the counterparty, including possible delays or restrictions upon a Fund’s ability to dispose of the underlying securities. As of September 30, 2020, each Fund, as applicable, had investments in repurchase agreements for which the value of the related collateral exceeded the value of the repurchase agreement. The gross value of repurchase agreements is included in the Statements of Assets and Liabilities for financial reporting purposes.
Notes to Financial Statements (continued)
September 30, 2020
k. Due to/from Brokers. Transactions and positions in certain futures, forward foreign currency contracts and delayed delivery commitments are maintained and cleared by registered U.S. broker/dealers pursuant to customer agreements between the Funds and the various broker/dealers. The due from brokers balance in the Statements of Assets and Liabilities for Core Plus Bond Fund represents cash pledged as collateral for delayed delivery securities. The due from brokers balance in the Statements of Assets and Liabilities for Global Allocation Fund represents cash pledged as collateral for forward foreign currency contracts and as initial margin for futures contracts. The due to brokers balance in the Statements of Assets and Liabilities for Core Plus Fund represents cash received as collateral for delayed delivery securities. The due to brokers balance in the Statements of Assets and Liabilities for Global Allocation Fund represents cash received as collateral for forward foreign currency contracts. In certain circumstances a Fund’s use of cash held at brokers is restricted by regulation or broker mandated limits.
l. Securities Lending. The Funds have entered into an agreement with State Street Bank and Trust Company (“State Street Bank”), as agent of the Funds, to lend securities to certain designated borrowers. The loans are collateralized with cash or securities in an amount equal to at least 105% or 102% of the market value (including accrued interest) of the loaned international or domestic securities, respectively, when the loan is initiated. Thereafter, the value of the collateral must remain at least 102% of the market value (including accrued interest) of loaned securities for U.S. equities and U.S. corporate debt; at least 105% of the market value (including accrued interest) of loaned securities for non-U.S. equities; and at least 100% of the market value (including accrued interest) of loaned securities for U.S. Government securities, sovereign debt issued by non-U.S. Governments and non-U.S. corporate debt. In the event that the market value of the collateral falls below the required percentages described above, the borrower will deliver additional collateral on the next business day. As with other extensions of credit, the Funds may bear the risk of loss with respect to the investment of the collateral. The Funds invest cash collateral in short-term investments, a portion of the income from which is remitted to the borrowers and the remainder allocated between the Funds and State Street Bank as lending agent.
For the year ended September 30, 2020, neither Fund had loaned securities under this agreement.
m. Indemnifications. Under the Trusts’ organizational documents, their officers and Trustees are indemnified against certain liabilities arising out of the performance of their duties to the Funds. Additionally, in the normal course of business, the Funds enter into contracts with service providers that contain general indemnification clauses. The Funds’ maximum exposure under these arrangements is unknown as this would involve future claims that may be made against the Funds that have not yet occurred. However, based on experience, the Funds expect the risk of loss to be remote.
Notes to Financial Statements (continued)
September 30, 2020
n. New Accounting Pronouncement. In August 2018, the Financial Accounting Standards Board (“FASB”) issued Accounting Standards Update 2018-13, Fair Value Measurement (Topic 820): Disclosure Framework — Changes to the Disclosure Requirements for Fair Value Measurement (“ASU 2018-13”). The update introduces new fair value disclosure requirements, eliminates some prior fair value disclosure requirements, and modifies certain existing fair value disclosure requirements. ASU 2018-13 is effective for fiscal years beginning after December 15, 2019, including interim periods within those fiscal years. An entity is permitted to early adopt any eliminated or modified disclosures upon issuance of the update and delay adoption of any new disclosures until the required effective date. Management has evaluated the impact of the adoption of ASU 2018-13 and has determined to early adopt the removal of (i) the amount of and reasons for transfers between Level 1 and Level 2 of the fair value hierarchy and (ii) the policy for timing of transfers between levels. Amended disclosures required and permitted for early adoption by ASU 2018-13 have been incorporated in the Funds’ annual financial statements as of September 30, 2020.
In March 2020, the FASB issued Accounting Standard Update 2020-04, Reference Rate Reform (Topic 848) (“ASU 2020-04”). In response to concerns about structural risks of interbank offered rates, and particularly the risk of cessation of the London Interbank Offered Rate (“LIBOR”), which is expected to occur no later than December 31, 2021, regulators have undertaken reference rate reform initiatives to identify alternative reference rates that are more observable or transaction based and less susceptible to manipulation. ASU 2020-04 provides temporary guidance to ease the potential burden in accounting for (or recognizing the effects of) reference rate reform on financial reporting. ASU 2020-04 is elective and applies to all entities, subject to meeting certain criteria, that have contracts that reference LIBOR or another reference rate expected to be discontinued because of reference rate reform. ASU 2020-04 amendments offer optional expedients for contract modifications that would allow an entity to account for such modifications by prospectively adjusting the effective interest rate, instead of evaluating each contract, in accordance with existing accounting standards, as to whether reference rate modifications constitute the establishment of new contracts or the continuation of existing contracts. ASU 2020-04 amendments are currently effective and an entity may elect to apply its provisions as of any date from the beginning of an interim period that includes or is subsequent to March 12, 2020. No Fund contracts have yet been impacted by reference rate reform. Management expects to apply the optional expedients when appropriate.
3. Fair Value Measurements. In accordance with accounting standards related to fair value measurements and disclosures, the Funds have categorized the inputs utilized in determining the value of each Fund’s assets or liabilities. These inputs are summarized in the three broad levels listed below:
| | • | | Level 1 – quoted prices in active markets for identical assets or liabilities; |
Notes to Financial Statements (continued)
September 30, 2020
| | • | | Level 2 – prices determined using other significant inputs that are observable either directly, or indirectly through corroboration with observable market data (which could include quoted prices for similar assets or liabilities, interest rates, credit risk, etc.); and |
| | • | | Level 3 – prices determined using significant unobservable inputs when quoted prices or observable inputs are unavailable such as when there is little or no market activity for an asset or liability (unobservable inputs reflect each Fund’s own assumptions in determining the fair value of assets or liabilities and would be based on the best information available). |
The inputs or methodology used for valuing securities are not necessarily an indication of the risk associated with investing in those securities.
The Funds’ pricing policies and procedures are recommended by the adviser and approved by the Board of Trustees. Debt securities are valued based on evaluated bids furnished to the Funds by an independent pricing service. Broker-dealer bid prices may be used if an independent pricing service either is unable to price a security or does not provide a reliable price for a security. The Funds’ adviser may use internally developed models to validate broker-dealer bid prices that are only available from a single broker or market maker. Such securities are considered and classified as fair valued. Broker-dealer bid prices for which the Funds do not have knowledge of the inputs used by the broker-dealer are categorized in Level 3. Securities for which market quotations are not readily available are valued at fair value as determined in good faith by the Funds’ adviser pursuant to procedures approved by the Board of Trustees. Fair valued securities may be categorized in Level 3.
Notes to Financial Statements (continued)
September 30, 2020
The following is a summary of the inputs used to value the Funds’ investments as of September 30, 2020, at value:
Core Plus Bond Fund
Asset Valuation Inputs
| | | | | | | | | | | | | | | | |
Description | | Level 1 | | | Level 2 | | | Level 3 | | | Total | |
Bonds and Notes | | | | | | | | | | | | | | | | |
Non-Convertible Bonds | | | | | | | | | | | | | | | | |
ABS Home Equity | | $ | — | | | $ | 103,010,183 | | | $ | 27,065 | (b) | | $ | 103,037,248 | |
Collateralized Mortgage Obligations | | | — | | | | 20,568,879 | | | | 2,280,311 | (b) | | | 22,849,190 | |
All Other Non-Convertible Bonds(a) | | | — | | | | 8,116,789,545 | | | | — | | | | 8,116,789,545 | |
| | | | | | | | | | | | | | | | |
Total Non-Convertible Bonds | | | — | | | | 8,240,368,607 | | | | 2,307,376 | | | | 8,242,675,983 | |
| | | | | | | | | | | | | | | | |
Municipals(a) | | | — | | | | 18,003,319 | | | | — | | | | 18,003,319 | |
| | | | | | | | | | | | | | | | |
Total Bonds and Notes | | | — | | | | 8,258,371,926 | | | | 2,307,376 | | | | 8,260,679,302 | |
| | | | | | | | | | | | | | | | |
Senior Loans(a) | | | — | | | | 214,059,959 | | | | — | | | | 214,059,959 | |
Preferred Stocks(a) | | | — | | | | 16,839,730 | | | | — | | | | 16,839,730 | |
Common Stocks(a) | | | — | | | | 584,030 | | | | — | (c) | | | 584,030 | |
Short-Term Investments | | | — | | | | 1,354,863,937 | | | | — | | | | 1,354,863,937 | |
| | | | | | | | | | | | | | | | |
Total | | $ | — | | | $ | 9,844,719,582 | | | $ | 2,307,376 | | | $ | 9,847,026,958 | |
| | | | | | | | | | | | | | | | |
| (a) | Details of the major categories of the Fund’s investments are reflected within the Portfolio of Investments. |
| (b) | Fair valued by the Fund’s adviser. |
| (c) | Includes a security fair valued at zero by the Fund’s adviser using Level 3 inputs. |
Notes to Financial Statements (continued)
September 30, 2020
Global Allocation Fund
Asset Valuation Inputs
| | | | | | | | | | | | | | | | |
Description | | Level 1 | | | Level 2 | | | Level 3 | | | Total | |
Common Stocks | | | | | | | | | | | | | | | | |
France | | $ | — | | | $ | 58,624,269 | | | $ | — | | | $ | 58,624,269 | |
Hong Kong | | | — | | | | 40,863,725 | | | | — | | | | 40,863,725 | |
India | | | — | | | | 53,949,922 | | | | — | | | | 53,949,922 | |
Japan | | | — | | | | 70,379,992 | | | | — | | | | 70,379,992 | |
Netherlands | | | — | | | | 59,105,937 | | | | — | | | | 59,105,937 | |
Sweden | | | — | | | | 60,300,319 | | | | — | | | | 60,300,319 | |
Switzerland | | | — | | | | 119,991,948 | | | | — | | | | 119,991,948 | |
United Kingdom | | | 90,446,299 | | | | 100,543,369 | | | | — | | | | 190,989,668 | |
All Other Common Stocks(a) | | | 2,056,048,900 | | | | — | | | | — | | | | 2,056,048,900 | |
| | | | | | | | | | | | | | | | |
Total Common Stocks | | | 2,146,495,199 | | | | 563,759,481 | | | | — | | | | 2,710,254,680 | |
| | | | | | | | | | | | | | | | |
Bonds and Notes | | | | | | | | | | | | | | | | |
Non-Convertible Bonds | | | | | | | | | | | | | | | | |
United States | | | 34,124 | | | | 650,199,087 | | | | — | | | | 650,233,211 | |
All Other Non-Convertible Bonds(a) | | | — | | | | 576,862,609 | | | | — | | | | 576,862,609 | |
| | | | | | | | | | | | | | | | |
Total Non-Convertible Bonds | | | 34,124 | | | | 1,227,061,696 | | | | — | | | | 1,227,095,820 | |
| | | | | | | | | | | | | | | | |
Convertible Bonds(a) | | | — | | | | 14,786,729 | | | | — | | | | 14,786,729 | |
Municipals(a) | | | — | | | | 290,818 | | | | — | | | | 290,818 | |
| | | | | | | | | | | | | | | | |
Total Bonds and Notes | | | 34,124 | | | | 1,242,139,243 | | | | | | | | 1,242,173,367 | |
| | | | | | | | | | | | | | | | |
Preferred Stocks(a) | | | 1,821,785 | | | | — | | | | — | (b) | | | 1,821,785 | |
Short-Term Investments | | | — | | | | 66,479,788 | | | | — | | | | 66,479,788 | |
| | | | | | | | | | | | | | | | |
Total Investments | | | 2,148,351,108 | | | | 1,872,378,512 | | | | — | | | | 4,020,729,620 | |
| | | | | | | | | | | | | | | | |
Forward Foreign Currency Contracts (unrealized appreciation) | | | — | | | | 3,044,123 | | | | — | | | | 3,044,123 | |
Futures Contracts (unrealized appreciation) | | | 27,728 | | | | — | | | | — | | | | 27,728 | |
| | | | | | | | | | | | | | | | |
Total | | $ | 2,148,378,836 | | | $ | 1,875,422,635 | | | $ | — | | | $ | 4,023,801,471 | |
| | | | | | | | | | | | | | | | |
Notes to Financial Statements (continued)
September 30, 2020
Global Allocation Fund (continued)
Liability Valuation Inputs
| | | | | | | | | | | | | | | | |
Description | | Level 1 | | | Level 2 | | | Level 3 | | | Total | |
Forward Foreign Currency Contracts (unrealized depreciation) | | $ | — | | | $ | (1,032,292) | | | $ | — | | | $ | (1,032,292) | |
| | | | | | | | | | | | | | | | |
| (a) | Details of the major categories of the Fund’s investments are reflected within the Portfolio of Investments. |
| (b) | Includes securities fair valued at zero by the Fund’s adviser using Level 3 inputs. |
The following is a reconciliation of Level 3 investments for which significant unobservable inputs were used to determine fair value as of September 30, 2019 and/or September 30, 2020:
Core Plus Bond Fund
Asset Valuation Inputs
| | | | | | | | | | | | | | | | | | | | |
Investments in Securities | | Balance as of
September 30,
2019 | | | Accrued
Discounts
(Premiums) | | | Realized
Gain (Loss) | | | Change in
Unrealized
Appreciation
(Depreciation) | | | Purchases | |
Bonds and Notes | | | | | | | | | | | | | | | | | | | | |
Non-Convertible Bonds | | | | | | | | | | | | | | | | | | | | |
ABS Home Equity | | $ | 41,289 | | | $ | — | | | $ | (17 | ) | | $ | 152 | | | $ | — | |
Collateralized Mortgage Obligations | | | — | | | | — | | | | (140,243 | ) | | | 165,932 | | | | — | |
Common Stocks | | | | | | | | | | | | | | | | | | | | |
Oil, Gas & Consumable Fuels | | | 779 | | | | — | | | | — | | | | (779 | ) | | | — | |
| | | | | | | | | | | | | | | | | | | | |
Total | | $ | 42,068 | | | $ | — | | | $ | (140,260 | ) | | $ | 165,305 | | | $ | — | |
| | | | | | | | | | | | | | | | | | | | |
| | | | | |
Investments in Securities | | Sales | | | Transfers
into Level 3 | | | Transfers
out of
Level 3 | | | Balance as of
September 30,
2020 | | | Change in
Unrealized
Appreciation
(Depreciation)
from
Investments
Still Held at
September 30,
2020 | |
Bonds and Notes | | | | | | | | | | | | | | | | | | | | |
Non-Convertible Bonds | | | | | | | | | | | | | | | | | | | | |
ABS Home Equity | | $ | (14,359 | ) | | $ | — | | | $ | — | | | $ | 27,065 | | | $ | (6) | |
Collateralized Mortgage Obligations | | | (11,801,290 | ) | | | 14,055,912 | | | | — | | | | 2,280,311 | | | | 165,932 | |
Common Stocks | | | | | | | | | | | | | | | | | | | | |
Oil, Gas & Consumable Fuels | | | — | | | | — | | | | — | | | | — | (a) | | | (779 | ) |
| | | | | | | | | | | | | | | | | | | | |
Total | | $ | (11,815,649 | ) | | $ | 14,055,912 | | | $ | — | | | $ | 2,307,376 | | | $ | 165,147 | |
| | | | | | | | | | | | | | | | | | | | |
| (a) | Includes a security fair valued at zero by the Fund’s adviser using Level 3 Inputs. |
Notes to Financial Statements (continued)
September 30, 2020
Debt securities valued at $14,055,912 were transferred from Level 2 to Level 3 during the period ended September 30, 2020. At September 30, 2019, these securities were valued on the basis of evaluated bids furnished to the Fund by an independent pricing service in accordance with the Fund’s valuation policies. At September 30, 2020, these securities were valued at fair value as determined in good faith by the Fund’s adviser as an independent pricing service did not provide a reliable price for the securities.
Global Allocation Fund
Asset Valuation Inputs
| | | | | | | | | | | | | | | | | | | | |
Investments in Securities | | Balance as of
September 30,
2019 | | | Accrued
Discounts
(Premiums) | | | Realized
Gain
(Loss) | | | Change in
Unrealized
Appreciation
(Depreciation) | | | Purchases | |
Bonds and Notes | | | | | | | | | | | | | | | | | | | | |
Non-Convertible Bonds | | | | | | | | | | | | | | | | | | | | |
Canada | | $ | 4,819 | | | $ | — | | | $ | 17 | | | $ | 29 | | | $ | — | |
Preferred Stocks | | | | | | | | | | | | | | | | | | | | |
United States | | | 301,240 | | | | — | | | | — | | | | (318,720 | ) | | | — | |
| | | | | | | | | | | | | | | | | | | | |
Total | | $ | 306,059 | | | $ | — | | | $ | 17 | | | $ | (318,691 | ) | | $ | — | |
| | | | | | | | | | | | | | | | | | | | |
| | | | | |
Investments in Securities | | Sales | | | Transfers
into Level 3 | | | Transfers
out of
Level 3 | | | Balance as of
September 30,
2020 | | | Change in
Unrealized
Appreciation
(Depreciation)
from
Investments
Still Held at
September 30,
2020 | |
Bonds and Notes | | | | | | | | | | | | | | | | | | | | |
Non-Convertible Bonds | | | | | | | | | | | | | | | | | | | | |
Canada | | $ | (4,865 | ) | | $ | — | | | $ | — | | | $ | — | | | $ | — | |
Preferred Stocks | | | | | | | | | | | | | | | | | | | | |
United States | | | — | | | | 17,480 | | | | — | | | | — | (a) | | | (318,720 | ) |
| | | | | | | | | | | | | | | | | | | | |
Total | | $ | (4,865 | ) | | $ | 17,480 | | | $ | — | | | $ | — | | | $ | (318,720) | |
| | | | | | | | | | | | | | | | | | | | |
| (a) | Includes securities fair valued at zero by the Fund’s adviser using Level 3 Inputs. |
A preferred stock valued at $17,480 was transferred from Level 2 to Level 3 during the period ended September 30, 2020. At September 30, 2019, this security was valued on the basis of evaluated bids furnished to the Fund by an independent pricing service in accordance with the Fund’s valuation policies. At September 30, 2020, this security was
Notes to Financial Statements (continued)
September 30, 2020
valued at fair value as determined in good faith by the Fund’s adviser as an independent pricing service did not provide a reliable price for the security.
4. Derivatives. Derivative instruments are defined as financial instruments whose value and performance are based on the value and performance of an underlying asset, reference rate or index. Derivative instruments that Global Allocation Fund used during the period include forward foreign currency contracts and futures contracts.
The Fund is subject to the risk that changes in foreign currency exchange rates will have an unfavorable effect on the value of Fund assets denominated in foreign currencies. The Fund may enter into forward foreign currency contracts for hedging purposes to protect the value of the Fund’s holdings of foreign securities. The Fund may also use forward foreign currency contracts to gain exposure to foreign currencies, regardless of whether securities denominated in such currencies are held in the Fund. During the year ended September 30, 2020, Global Allocation Fund engaged in forward foreign currency transactions for hedging purposes and to gain exposure to foreign currencies.
The Fund is subject to the risk that changes in interest rates will affect the value of the Fund’s investments in fixed income securities. The Fund will be subject to increased interest rate risk to the extent that it invests in fixed income securities with longer maturities or durations, as compared to investing in fixed income securities with shorter maturities or durations. The Fund may use futures contracts to hedge against changes in interest rates and to manage duration without having to buy or sell portfolio securities. The Fund may also use futures contracts to gain investment exposure. During the year ended September 30, 2020, Global Allocation Fund used futures contracts to manage duration.
The following is a summary of derivative instruments for Global Allocation Fund as of September 30, 2020, as reflected within the Statements of Assets and Liabilities:
| | | | | | | | |
Assets | | Unrealized
appreciation
on forward
foreign
currency
contracts | | | Unrealized
appreciation
on futures
contracts1 | |
Over-the-counter asset derivatives | | | | | | | | |
Foreign exchange contracts | | $ | 3,044,123 | | | $ | — | |
| | | | | | | | |
Exchange-traded asset derivatives | | | | | | | | |
Interest rate contracts | | | — | | | | 27,728 | |
| | | | | | | | |
Total asset derivatives | | $ | 3,044,123 | | | $ | 27,728 | |
| | | | | | | | |
Notes to Financial Statements (continued)
September 30, 2020
| | | | | | | | |
Liabilities | | Unrealized
depreciation
on forward
foreign
currency
contracts | | | | |
Over-the-counter liability derivatives | | | | | | | | |
Foreign exchange contracts | | $ | (1,032,292 | ) | | | | |
| 1 | Represents cumulative unrealized appreciation (depreciation) on futures contracts. Only the current day’s variation margin on futures contracts is reported within the Statements of Assets and Liabilities as receivable or payable for variation margin, as applicable. |
Transactions in derivative instruments for Global Allocation Fund during the year ended September 30, 2020, as reflected within the Statements of Operations, were as follows:
| | | | | | | | |
Net Realized Gain (Loss) on: | | Forward
foreign
currency
contracts | | | Futures
contracts | |
Interest rate contracts | | $ | — | | | $ | 537,933 | |
Foreign exchange contracts | | | 7,942,395 | | | | — | |
| | | | | | | | |
Total | | $ | 7,942,395 | | | $ | 537,933 | |
| | | | | | | | |
| | |
Net Change in Unrealized
Appreciation (Depreciation) on: | | Forward
foreign
currency
contracts | | | Futures
contracts | |
Interest rate contracts | | $ | — | | | $ | 27,728 | |
Foreign exchange contracts | | | 2,893,011 | | | | — | |
| | | | | | | | |
Total | | $ | 2,893,011 | | | $ | 27,728 | |
| | | | | | | | |
As the Fund values its derivatives at fair value and recognizes changes in fair value through the Statement of Operations, it does not qualify for hedge accounting under authoritative guidance for derivative instruments. The Fund’s investments in derivatives may represent an economic hedge; however, they are considered to be non-hedge transactions for the purpose of these disclosures.
Notes to Financial Statements (continued)
September 30, 2020
The volume of forward foreign currency contract and futures contract activity, as a percentage of net assets, based on gross month-end notional amounts outstanding during the period, including long and short positions at absolute value, was as follows for the year ended September 30, 2020:
| | | | | | | | |
Global Allocation Fund | | Forwards | | | Futures | |
Average Notional Amount Outstanding | | | 9.88 | % | | | 0.17 | % |
Highest Notional Amount Outstanding | | | 11.47 | % | | | 0.22 | % |
Lowest Notional Amount Outstanding | | | 8.43 | % | | | 0.15 | % |
Notional Amount Outstanding as of September 30, 2020 | | | 11.32 | % | | | 0.15 | % |
Notional amounts outstanding at the end of the prior period, if applicable, are included in the average notional amount outstanding.
Unrealized gain and/or loss on open forwards and futures is recorded in the Statements of Assets and Liabilities. The aggregate notional values of forwards and futures contracts are not recorded in the Statements of Assets and Liabilities, and therefore are not included in the Funds’ net assets.
Over-the-counter derivatives, including forward foreign currency contracts, are entered into pursuant to International Swaps and Derivatives Association, Inc. (“ISDA”) agreements negotiated between the Funds and their counterparties. ISDA agreements typically contain, among other things, terms for the posting of collateral and master netting provisions in the event of a default or other termination event. Collateral is posted by a Fund or the counterparty to the extent of the net mark-to-market exposure to the other party of all open contracts under the agreement, subject to minimum transfer requirements. Master netting provisions allow the Funds and the counterparty, in the event of a default or other termination event, to offset amounts owed by each related to derivative contracts, including any posted collateral, to one net amount payable by either the Funds or the counterparty. The Funds’ ISDA agreements typically contain provisions that allow a counterparty to terminate open contracts early if the NAV of a Fund declines beyond a certain threshold. For financial reporting purposes, the Funds do not offset derivative assets and liabilities, and any related collateral received or pledged, on the Statements of Assets and Liabilities.
Notes to Financial Statements (continued)
September 30, 2020
As of September 30, 2020, gross amounts of over-the-counter derivative assets and liabilities not offset in the Statements of Assets and Liabilities and the related net amounts after taking into account master netting arrangements, by counterparty, are as follows:
Global Allocation Fund
| | | | | | | | | | | | | | | | | | | | |
Counterparty | | Gross Amounts of
Assets | | | Offset
Amount | | | Net Asset
Balance | | | Collateral
(Received)/
Pledged | | | Net
Amount | |
Bank of America, N.A. | | $ | 67,789 | | | $ | — | | | $ | 67,789 | | | $ | — | | | $ | 67,789 | |
Credit Suisse International | | | 2,868,366 | | | | (17,533 | ) | | | 2,850,833 | | | | (2,850,833 | ) | | | — | |
Morgan Stanley Capital Services, Inc. | | | 98,643 | | | | (98,643 | ) | | | — | | | | — | | | | — | |
UBS AG | | | 9,325 | | | | (9,325 | ) | | | — | | | | — | | | | — | |
| | | | | | | | | | | | | | | | | | | | |
| | $ | 3,044,123 | | | $ | (125,501 | ) | | $ | 2,918,622 | | | $ | (2,850,833 | ) | | $ | 67,789 | |
| | | | | | | | | | | | | | | | | | | | |
| | | | | |
Counterparty | | Gross Amounts of
Liabilities | | | Offset
Amount | | | Net
Liability
Balance | | | Collateral
(Received)/
Pledged | | | Net
Amount | |
Credit Suisse International | | $ | (17,533 | ) | | $ | 17,533 | | | $ | — | | | $ | — | | | $ | — | |
HSBC Bank USA | | | (41,835 | ) | | | — | | | | (41,835 | ) | | | — | | | | (41,835 | ) |
Morgan Stanley Capital Services, Inc. | | | (951,740 | ) | | | 98,643 | | | | (853,097 | ) | | | 693,811 | | | | (159,286 | ) |
UBS AG | | | (21,184 | ) | | | 9,325 | | | | (11,859 | ) | | | — | | | | (11,859 | ) |
| | | | | | | | | | | | | | | | | | | | |
| | $ | (1,032,292 | ) | | $ | 125,501 | | | $ | (906,791 | ) | | $ | 693,811 | | | $ | (212,980 | ) |
| | | | | | | | | | | | | | | | | | | | |
The actual collateral received or pledged, if any, may exceed the amounts shown in the table due to overcollateralization. Timing differences may exist between when contracts under the ISDA agreements are marked-to-market and when collateral moves. The ISDA agreements include tri-party control agreements under which collateral is held for the benefit of the secured party at a third party custodian, State Street Bank.
Counterparty risk is managed based on policies and procedures established by each Fund’s adviser. Such policies and procedures may include, but are not limited to, minimum counterparty credit rating requirements, monitoring of counterparty credit default swap spreads and posting of collateral. A Fund’s risk of loss from counterparty credit risk on over-the-counter derivatives is generally limited to the Fund’s aggregated unrealized gains and the amount of any collateral pledged to the counterparty, which may be offset by any collateral posted to the Fund by the counterparty. ISDA master
Notes to Financial Statements (continued)
September 30, 2020
agreements can help to manage counterparty risk by specifying collateral posting arrangements at pre-arranged exposure levels. Under these ISDA agreements, collateral is routinely transferred if the total net exposure in respect of certain transactions, net of existing collateral already in place, exceeds a specified amount (typically $250,000, depending on the counterparty). With exchange-traded derivatives, there is minimal counterparty credit risk to the Fund because the exchange’s clearing house, as counterparty to these instruments, stands between the buyer and the seller of the contract. Credit risk still exists in exchange-traded derivatives with respect to initial and variation margin that is held in a broker’s customer accounts. While brokers are required to segregate customer margin from their own assets, in the event that a broker becomes insolvent or goes into bankruptcy and at that time there is a shortfall in the aggregate amount of margin held by the broker for all its clients, U.S. bankruptcy laws will typically allocate that shortfall on a pro rata basis across all of the broker’s customers, potentially resulting in losses to the Fund. Based on balances reflected on each Fund’s Statement of Assets and Liabilities, the following table shows (i) the maximum amount of loss due to credit risk that, based on the gross fair value of the financial instrument, the Fund would incur if parties (including OTC derivative counterparties and brokers holding margin for exchange-traded derivatives) to the relevant financial instruments failed completely to perform according to the terms of the contracts and the collateral or other security, if any, for the amount due proved to be of no value to the Fund, and (ii) the amount of loss that the Fund would incur after taking into account master netting provisions pursuant to ISDA agreements, as of September 30, 2020:
| | | | | | | | |
Fund | | Maximum Amount of Loss - Gross | | | Maximum Amount of Loss - Net | |
Global Allocation Fund | | $ | 3,947,188 | | | $ | 277,043 | |
Net loss amount reflects cash received as collateral of $3,600,000, which is recorded on the Statements of Assets and Liabilities.
5. Purchases and Sales of Securities. For the year ended September 30, 2020, purchases and sales of securities (excluding short-term investments and including paydowns) were as follows:
| | | | | | | | | | | | | | | | |
| | | U.S. Government/Agency
Securities | | | Other Securities | |
Fund | | Purchases | | | Sales | | | Purchases | | | Sales | |
Core Plus Bond Fund | | $ | 25,650,126,245 | | | $ | 26,267,289,641 | | | $ | 2,701,867,371 | | | $ | 1,264,462,341 | |
Global Allocation Fund | | | 280,535,863 | | | | 139,563,611 | | | | 1,626,592,448 | | | | 1,088,869,754 | |
Notes to Financial Statements (continued)
September 30, 2020
6. Management Fees and Other Transactions with Affiliates.
a. Management Fees. Loomis, Sayles & Company, L.P. (“Loomis Sayles”) serves as investment adviser to each Fund. Loomis Sayles is a limited partnership whose sole general partner, Loomis, Sayles & Company, Inc., is indirectly owned by Natixis Investment Managers, LLC (“Natixis”), which is part of Natixis Investment Managers, an international asset management group based in Paris, France.
Under the terms of the management agreements, each Fund pays a management fee at the following annual rates, calculated daily and payable monthly, based on the Fund’s average daily net assets:
| | | | | | | | | | | | |
| | | Percentage of Average Daily Net Assets | |
Fund | | First $100 million | | | Next
$1.9 billion | | | Over
$2 billion | |
Core Plus Bond Fund | | | 0.2000 | % | | | 0.1875 | % | | | 0.1500 | % |
Global Allocation Fund | | | 0.7500 | % | | | 0.7500 | % | | | 0.7300 | % |
Natixis Advisors, L.P. (“Natixis Advisors”) serves as the advisory administrator to Core Plus Bond Fund. Natixis Advisors is a wholly-owned subsidiary of Natixis. Under the terms of the advisory administration agreement, the Fund pays an advisory administration fee at the following annual rates, calculated daily and payable monthly, based on its average daily net assets:
| | | | | | | | | | | | |
| | | Percentage of Average Daily Net Assets | |
Fund | | First $100 million | | | Next
$1.9 billion | | | Over
$2 billion | |
Core Plus Bond Fund | | | 0.2000 | % | | | 0.1875 | % | | | 0.1500 | % |
Management and advisory administration fees are presented in the Statements of Operations as management fees.
Loomis Sayles has given binding undertakings to the Funds to waive management fees and/or reimburse certain expenses to limit the Funds’ operating expenses, exclusive of acquired fund fees and expenses, brokerage expenses, interest expense, taxes, organizational and extraordinary expenses such as litigation and indemnification expenses. These undertakings are in effect until January 31, 2022 for Core Plus Bond Fund and until January 31, 2021 for Global Allocation Fund, may be terminated before then only with the consent of the Funds’ Board of Trustees and are reevaluated on an annual basis. Management fees payable, as reflected on the Statements of Assets and Liabilities, is net of waivers and/or expense reimbursements, if any, pursuant to these undertakings. Waivers/reimbursements that exceed management fees payable are reflected on the Statements of Assets and Liabilities as receivable from investment adviser.
Notes to Financial Statements (continued)
September 30, 2020
For the year ended September 30, 2020 the expense limits as a percentage of average daily net assets under the expense limitation agreements were as follows:
| | | | | | | | | | | | | | | | |
| | | Expense Limit as a Percentage of
Average Daily Net Assets | |
Fund | | Class A | | | Class C | | | Class N | | | Class Y | |
Core Plus Bond Fund | | | 0.75 | % | | | 1.50 | % | | | 0.45 | % | | | 0.50 | % |
Global Allocation Fund | | | 1.25 | % | | | 2.00 | % | | | 0.95 | % | | | 1.00 | % |
Prior to July 1, 2020, the expense limits as a percentage of average daily net assets under the expense limitation agreements were as follows:
| | | | | | | | | | | | | | | | |
| | | Expense Limit as a Percentage of
Average Daily Net Assets | |
Fund | | Class A | | | Class C | | | Class N | | | Class Y | |
Core Plus Bond Fund | | | 0.80 | % | | | 1.55 | % | | | 0.50 | % | | | 0.55 | % |
Loomis Sayles and Natixis Advisors have agreed to equally bear the waivers and/or expense reimbursements for Core Plus Bond Fund.
Loomis Sayles (and Natixis Advisors for Core Plus Bond Fund) shall be permitted to recover expenses borne under the expense limitation agreements (whether through waiver of management fees or otherwise) on a class by class basis in later periods to the extent the annual operating expenses of a class fall below a class’ expense limits, provided, however, that a class is not obligated to pay such waived/reimbursed fees or expenses more than one year after the end of the fiscal year in which the fees or expenses were waived/reimbursed.
For the year ended September 30, 2020, the management fees for each Fund were as follows:
| | | | | | | | |
Fund | | Gross
Management
Fees | | | Percentage of
Average
Daily Net Assets | |
Core Plus Bond Fund | | $ | 12,876,926 | | | | 0.16 | % |
Global Allocation Fund | | | 25,551,911 | | | | 0.74 | % |
For the year ended September 30, 2020, the advisory administration fees for Core Plus Bond Fund were $12,876,926 (effective rate of 0.16% of average daily net assets).
No expenses were recovered for either Fund during the year ended September 30, 2020 under the terms of the expense limitation agreements.
b. Service and Distribution Fees. Natixis Distribution, L.P. (“Natixis Distribution”), which is a wholly-owned subsidiary of Natixis, has entered into a distribution agreement with the Trusts. Pursuant to this agreement, Natixis Distribution serves as principal underwriter of the Funds of the Trusts.
Notes to Financial Statements (continued)
September 30, 2020
Pursuant to Rule 12b-1 under the 1940 Act, the Trusts have adopted a Service Plan relating to each Fund’s Class A shares (the “Class A Plans”), and a Distribution and Service Plan relating to each Fund’s Class C shares (the “Class C Plans”).
Under the Class A Plans, each Fund pays Natixis Distribution a monthly service fee at an annual rate not to exceed 0.25% of the average daily net assets attributable to the Fund’s Class A shares, as reimbursement for expenses incurred by Natixis Distribution in providing personal services to investors in Class A shares and/or the maintenance of shareholder accounts.
Under the Class C Plans, each Fund pays Natixis Distribution a monthly service fee at an annual rate not to exceed 0.25% of the average daily net assets attributable to the Fund’s Class C shares, as compensation for services provided by Natixis Distribution in providing personal services to investors in Class C shares and/or the maintenance of shareholder accounts.
Also under the Class C Plans, each Fund pays Natixis Distribution a monthly distribution fee at an annual rate of 0.75% of the average daily net assets attributable to the Fund’s Class C shares, as compensation for services provided by Natixis Distribution in connection with the marketing or sale of Class C shares.
For the year ended September 30, 2020, the service and distribution fees for each Fund were as follows:
| | | | | | | | | | | | |
| | | Service Fees | | | Distribution Fees | |
Fund | | Class A | | | Class C | | | Class C | |
Core Plus Bond Fund | | $ | 1,374,815 | | | $ | 372,646 | | | $ | 1,117,937 | |
Global Allocation Fund | | | 1,279,400 | | | | 1,221,805 | | | | 3,665,415 | |
c. Administrative Fees. Natixis Advisors provides certain administrative services for the Funds and contracts with State Street Bank to serve as sub-administrator. Pursuant to an agreement among Natixis Funds Trusts, Loomis Sayles Funds Trusts, Natixis ETF Trusts and Natixis Advisors, each Fund pays Natixis Advisors monthly its pro rata portion of fees equal to an annual rate of 0.0540% of the first $15 billion of the average daily net assets of the Natixis Funds Trusts, Loomis Sayles Funds Trusts and Natixis ETF Trusts, 0.0500% of the next $15 billion, 0.0400% of the next $30 billion, 0.0275% of the next $30 billion and 0.0225% of such assets in excess of $90 billion, subject to an annual aggregate minimum fee for the Natixis Funds Trusts, Loomis Sayles Funds Trusts and Natixis ETF Trusts of $10 million, which is reevaluated on an annual basis.
For the year ended September 30, 2020, the administrative fees for each Fund were as follows:
| | | | |
Fund | | Administrative Fees | |
Core Plus Bond Fund | | $ | 3,575,619 | |
Global Allocation Fund | | | 1,521,887 | |
Notes to Financial Statements (continued)
September 30, 2020
d. Sub-Transfer Agent Fees. Natixis Distribution has entered into agreements, which include servicing agreements, with financial intermediaries that provide recordkeeping, processing, shareholder communications and other services to customers of the intermediaries that hold positions in the Funds and has agreed to compensate the intermediaries for providing those services. Intermediaries transact with the Funds primarily through the use of omnibus accounts on behalf of their customers who hold positions in the Funds. These services would have been provided by the Funds’ transfer agent and other service providers if the shareholders’ accounts were maintained directly at the Funds’ transfer agent. Accordingly, the Funds have agreed to reimburse Natixis Distribution for all or a portion of the servicing fees paid to these intermediaries. The reimbursement amounts (sub-transfer agent fees) paid to Natixis Distribution are subject to a current per-account equivalent fee limit approved by the Funds’ Board of Trustees, which is based on fees for similar services paid to the Funds’ transfer agent and other service providers. Class N shares do not bear such expenses.
For the year ended September 30, 2020, the sub-transfer agent fees (which are reflected in transfer agent fees and expenses in the Statements of Operations) for each Fund were as follows:
| | | | |
Fund | | Sub-Transfer
Agent Fees | |
Core Plus Bond Fund | | $ | 4,216,850 | |
Global Allocation Fund | | | 2,613,013 | |
As of September 30, 2020, the Funds owe Natixis Distribution the following reimbursements for sub-transfer agent fees (which are reflected in the Statements of Assets and Liabilities as payable to distributor):
| | | | |
Fund | | Reimbursements
of Sub-Transfer
Agent Fees | |
Core Plus Bond Fund | | $ | 54,860 | |
Global Allocation Fund | | | 56,767 | |
Sub-transfer agent fees attributable to Class A, Class C and Class Y are allocated on a pro rata basis to each class based on the relative net assets of each class to the total net assets of those classes.
e. Commissions. Commissions (including CDSCs) on Fund shares retained by Natixis Distribution during the year ended September 30, 2020, were as follows:
| | | | |
Fund | | Commissions | |
Core Plus Bond Fund | | $ | 74,686 | |
Global Allocation Fund | | | 198,902 | |
Notes to Financial Statements (continued)
September 30, 2020
f. Trustees Fees and Expenses. The Trusts do not pay any compensation directly to their officers or Trustees who are directors, officers or employees of Natixis Advisors, Natixis Distribution, Natixis or their affiliates. The Chairperson of the Board of Trustees receives a retainer fee at the annual rate of $369,000. The Chairperson does not receive any meeting attendance fees for Board of Trustees meetings or committee meetings that he attends. Each Independent Trustee (other than the Chairperson) receives, in the aggregate, a retainer fee at the annual rate of $199,000. Each Independent Trustee also receives a meeting attendance fee of $10,000 for each meeting of the Board of Trustees that he or she attends in person and $5,000 for each meeting of the Board of Trustees that he or she attends telephonically. In addition, the chairperson of the Contract Review Committee, the chairperson of the Audit Committee and the chairperson of the Governance Committee each receive an additional retainer fee at the annual rate of $20,000. Each Contract Review Committee member is compensated $6,000 for each Committee meeting that he or she attends in person and $3,000 for each meeting that he or she attends telephonically. Each Audit Committee member is compensated $6,000 for each Committee meeting that he or she attends in person and $3,000 for each meeting that he or she attends telephonically. These fees are allocated among the funds in the Natixis Funds Trusts, Loomis Sayles Funds Trusts and Natixis ETF Trusts based on a formula that takes into account, among other factors, the relative net assets of each fund. Trustees are reimbursed for travel expenses in connection with attendance at meetings.
Prior to January 1, 2020, the Chairperson of the Board received a retainer fee at the annual rate of $360,000 and each Independent Trustee (other than the Chairperson) received, in the aggregate, a retainer fee at the annual rate of $190,000, and the chairperson of the Governance Committee received an additional retainer fee at the annual rate of $15,000. All other Trustee fees remained unchanged.
A deferred compensation plan (the “Plan”) is available to the Trustees on a voluntary basis. Deferred amounts remain in the Funds until distributed in accordance with the provisions of the Plan. The value of a participating Trustee’s deferral account is based on theoretical investments of deferred amounts, on the normal payment dates, in certain funds of the Natixis Funds Trusts, Loomis Sayles Funds Trusts and Natixis ETF Trusts as designated by the participating Trustees. Changes in the value of participants’ deferral accounts are allocated pro rata among the funds in the Natixis Funds Trusts, Loomis Sayles Funds Trusts and Natixis ETF Trusts, and are normally reflected as Trustees’ fees and expenses in the Statements of Operations. The portions of the accrued obligations allocated to the Funds under the Plan are reflected as Deferred Trustees’ fees in the Statements of Assets and Liabilities.
Certain officers and employees of Natixis Advisors and Loomis Sayles are also officers and/or Trustees of the Trusts.
Notes to Financial Statements (continued)
September 30, 2020
g. Affiliated Ownership. As of September 30, 2020, Loomis Sayles Employees’ Profit Sharing Retirement Plan held shares of the Core Plus Bond Fund and Global Allocation Fund representing 0.13% and 0.57%, respectively, of the Funds’ net assets.
h. Reimbursement of Transfer Agent Fees and Expenses. Natixis Advisors had given a binding contractual undertaking to Global Allocation Fund to reimburse any and all transfer agency expenses for the Fund’s Class N shares. This undertaking was in effect through January 31, 2020 and is not subject to recovery under the expense limitation agreement described above.
For the year ended September 30, 2020, Natixis Advisors reimbursed Global Allocation Fund $782 for transfer agency expenses related to Class N shares.
7. Class-Specific Transfer Agent Fees and Expenses. Transfer agent fees and expenses attributable to Class A, Class C and Class Y are allocated on a pro rata basis to each class based on the relative net assets of each class to the total net assets of those classes. Transfer agent fees and expenses attributable to Class N are allocated to Class N.
For the year ended September 30, 2020, the Funds incurred the following class-specific transfer agent fees and expenses (including sub-transfer agent fees, where applicable):
| | | | | | | | | | | | | | | | |
| | | Transfer Agent Fees and Expenses | |
Fund | | Class A | | | Class C | | | Class N | | | Class Y | |
Core Plus Bond Fund | | $ | 458,508 | | | $ | 125,024 | | | $ | 8,901 | | | $ | 3,854,110 | |
Global Allocation Fund | | | 429,392 | | | | 410,683 | | | | 2,413 | | | | 1,858,859 | |
8. Line of Credit. Each Fund, together with certain other funds of Natixis Funds Trusts, Loomis Sayles Funds Trusts and Natixis ETF Trusts, entered into a $400,000,000 committed unsecured line of credit provided by State Street Bank. Any one Fund may borrow up to $350,000,000 under the line of credit agreement (as long as all borrowings by all Funds in the aggregate do not exceed the $400,000,000 limit at any time), subject to each Fund’s investment restrictions and its contractual obligations under the line of credit. Interest is charged to the Funds based upon the terms set forth in the agreement. In addition, a commitment fee of 0.15% per annum, payable at the end of each calendar quarter, is accrued and apportioned among the participating funds based on their average daily unused portion of the line of credit. The Funds paid an arrangement fee, an upfront fee, and certain other legal fees in connection with the line of credit agreement, which are being amortized over a period of 364 days and are reflected in legal fees and/or miscellaneous expenses on the Statements of Operations. The unamortized balance is reflected as prepaid expenses on the Statements of Assets and Liabilities.
Notes to Financial Statements (continued)
September 30, 2020
For the year ended September 30, 2020, neither Fund had borrowings under this agreement.
9. Risk. Global Allocation Fund’s investments in foreign securities may be subject to greater political, economic, environmental, credit/counterparty and information risks. The Fund’s investments in foreign securities also are subject to foreign currency fluctuations and other foreign currency-related risks. Foreign securities may be subject to higher volatility than U.S. securities, varying degrees of regulation and limited liquidity.
Core Plus Bond Fund’s investments in mortgage-related and asset-backed securities are subject to certain risks not associated with investments in other securities. Mortgage-related and asset-backed securities are subject to the risk that unexpected changes in interest rates will have a direct effect on expected maturity. A shortened maturity may result in the reinvestment of prepaid amounts in securities with lower yields than the original obligations. An extended maturity may result in a reduction of a security’s value.
Global markets have experienced periods of high volatility triggered by the ongoing public health emergency known as coronavirus (“Covid-19”). As the situation continues, the extent and duration of the impact that the Covid-19 outbreak may have on financial markets and the economy as a whole remains highly uncertain. If the effects of the Covid-19 outbreak on financial markets and the economy continue for an extended period of time, the Funds’ future financial and investment results may be adversely affected.
10. Concentration of Ownership. From time to time, a Fund may have a concentration of one or more accounts constituting a significant percentage of shares outstanding. Investment activities by holders of such accounts could have material impacts on the Fund. As of September 30, 2020, based on management’s evaluation of the shareholder account base, the Fund had accounts representing controlling ownership of more than 5% of the Fund’s total outstanding shares. The number of such accounts, based on accounts that represent more than 5% of an individual class of shares, and the aggregate percentage of net assets represented by such holdings were as follows:
| | | | | | | | |
| | | Number of 5%
Account Holders | | | Percentage of
Ownership | |
Core Plus Bond Fund | | | 1 | | | | 11.44 | % |
Omnibus shareholder accounts for which Natixis Advisors understands that the intermediary has discretion over the underlying shareholder accounts or investment models where a shareholder account may be invested for a non-discretionary customer are included in the table above. For other omnibus accounts, the Funds do not have information on the individual shareholder accounts underlying the omnibus accounts; therefore, there could be other 5% shareholders in addition to those disclosed in the table above.
Notes to Financial Statements (continued)
September 30, 2020
11. Capital Shares. Each Fund may issue an unlimited number of shares of beneficial interest, without par value. Transactions in capital shares were as follows:
| | | | | | | | | | | | | | | | |
| |
| Year Ended
September 30, 2020 |
| |
| Year Ended
September 30, 2019 |
|
Core Plus Bond Fund | | | Shares | | | | Amount | | | | Shares | | | | Amount | |
| Class A | | | | | | | | | | | | | | | | |
Issued from the sale of shares | | | 17,898,810 | | | $ | 246,212,136 | | | | 12,426,857 | | | $ | 158,345,750 | |
Issued in connection with the reinvestment of distributions | | | 648,421 | | | | 8,793,629 | | | | 837,896 | | | | 10,721,395 | |
Redeemed | | | (16,819,374 | ) | | | (227,319,033 | ) | | | (19,090,450 | ) | | | (243,916,582 | ) |
| | | | | | | | | | | | | | | | |
Net change | | | 1,727,857 | | | $ | 27,686,732 | | | | (5,825,697 | ) | | $ | (74,849,437 | ) |
| | | | | | | | | | | | | | | | |
| Class C | | | | | | | | | | | | | | | | |
Issued from the sale of shares | | | 2,130,053 | | | $ | 29,237,104 | | | | 1,660,719 | | | $ | 21,057,183 | |
Issued in connection with the reinvestment of distributions | | | 119,932 | | | | 1,623,298 | | | | 172,807 | | | | 2,212,246 | |
Redeemed | | | (4,925,789 | ) | | | (67,833,185 | ) | | | (4,572,623 | ) | | | (58,229,725 | ) |
| | | | | | | | | | | | | | | | |
Net change | | | (2,675,804 | ) | | $ | (36,972,783 | ) | | | (2,739,097 | ) | | $ | (34,960,296 | ) |
| | | | | | | | | | | | | | | | |
| Class N | | | | | | | | | | | | | | | | |
Issued from the sale of shares | | | 84,014,957 | | | $ | 1,156,522,813 | | | | 74,861,614 | | | $ | 965,170,758 | |
Issued in connection with the reinvestment of distributions | | | 4,691,629 | | | | 64,237,460 | | | | 4,521,156 | | | | 58,566,539 | |
Redeemed | | | (62,741,955 | ) | | | (854,510,574 | ) | | | (34,409,887 | ) | | | (444,651,546 | ) |
Redeemed in-kind (Note 12) | | | (32,463,709 | ) | | | (456,764,389 | ) | | | — | | | | — | |
| | | | | | | | | | | | | | | | |
Net change | | | (6,499,078 | ) | | $ | (90,514,690 | ) | | | 44,972,883 | | | $ | 579,085,751 | |
| | | | | | | | | | | | | | | | |
| Class Y | | | | | | | | | | | | | | | | |
Issued from the sale of shares | | | 190,014,284 | | | $ | 2,636,656,671 | | | | 85,377,215 | | | $ | 1,102,722,145 | |
Issued in connection with the reinvestment of distributions | | | 6,961,003 | | | | 95,521,951 | | | | 6,833,439 | | | | 88,271,244 | |
Redeemed | | | (96,927,942 | ) | | | (1,324,095,811 | ) | | | (76,245,974 | ) | | | (976,476,811 | ) |
| | | | | | | | | | | | | | | | |
Net change | | | 100,047,345 | | | $ | 1,408,082,811 | | | | 15,964,680 | | | $ | 214,516,578 | |
| | | | | | | | | | | | | | | | |
Increase from capital share transactions | | | 92,600,320 | | | $ | 1,308,282,070 | | | | 52,372,769 | | | $ | 683,792,596 | |
| | | | | | | | | | | | | | | | |
Notes to Financial Statements (continued)
September 30, 2020
11. Capital Shares (continued).
| | | | | | | | | | | | | | | | |
| |
| Year Ended
September 30, 2020 |
| |
| Year Ended
September 30, 2019 |
|
Global Allocation Fund | | | Shares | | | | Amount | | | | Shares | | | | Amount | |
| Class A | | | | | | | | | | | | | | | | |
Issued from the sale of shares | | | 9,934,108 | | | $ | 244,510,222 | | | | 7,286,270 | | | $ | 162,617,493 | |
Issued in connection with the reinvestment of distributions | | | 408,536 | | | | 10,037,738 | | | | 622,284 | | | | 12,134,537 | |
Redeemed | | | (5,288,773 | ) | | | (125,525,882 | ) | | | (6,207,958 | ) | | | (137,784,719 | ) |
| | | | | | | | | | | | | | | | |
Net change | | | 5,053,871 | | | $ | 129,022,078 | | | | 1,700,596 | | | $ | 36,967,311 | |
| | | | | | | | | | | | | | | | |
| Class C | | | | | | | | | | | | | | | | |
Issued from the sale of shares | | | 5,429,302 | | | $ | 129,254,637 | | | | 5,953,693 | | | $ | 130,846,979 | |
Issued in connection with the reinvestment of distributions | | | 335,475 | | | | 8,148,688 | | | | 519,881 | | | | 10,054,504 | |
Redeemed | | | (7,501,444 | ) | | | (180,254,496 | ) | | | (4,084,514 | ) | | | (89,798,271 | ) |
| | | | | | | | | | | | | | | | |
Net change | | | (1,736,667 | ) | | $ | (42,851,171 | ) | | | 2,389,060 | | | $ | 51,103,212 | |
| | | | | | | | | | | | | | | | |
| Class N | | | | | | | | | | | | | | | | |
Issued from the sale of shares | | | 2,473,848 | | | $ | 60,506,193 | | | | 5,515,442 | | | $ | 122,986,662 | |
Issued in connection with the reinvestment of distributions | | | 229,737 | | | | 5,672,201 | | | | 168,053 | | | | 3,290,482 | |
Redeemed | | | (1,170,090 | ) | | | (28,432,814 | ) | | | (665,833 | ) | | | (15,132,556 | ) |
| | | | | | | | | | | | | | | | |
Net change | | | 1,533,495 | | | $ | 37,745,580 | | | | 5,017,662 | | | $ | 111,144,588 | |
| | | | | | | | | | | | | | | | |
| Class Y | | | | | | | | | | | | | | | | |
Issued from the sale of shares | | | 39,782,349 | | | $ | 960,786,370 | | | | 31,758,778 | | | $ | 709,981,758 | |
Issued in connection with the reinvestment of distributions | | | 1,901,677 | | | | 46,971,422 | | | | 2,439,526 | | | | 47,790,318 | |
Redeemed | | | (21,963,125 | ) | | | (519,151,329 | ) | | | (19,828,297 | ) | | | (438,143,471 | ) |
| | | | | | | | | | | | | | | | |
Net change | | | 19,720,901 | | | $ | 488,606,463 | | | | 14,370,007 | | | $ | 319,628,605 | |
| | | | | | | | | | | | | | | | |
Increase from capital share transactions | | | 24,571,600 | | | $ | 612,522,950 | | | | 23,477,325 | | | $ | 518,843,716 | |
| | | | | | | | | | | | | | | | |
12. Redemption In-Kind. In certain circumstances, a Fund may distribute portfolio securities rather than cash as payment for redemption of Fund shares (redemption in-kind). For financial reporting purposes, the Fund will recognize a gain on in-kind redemptions to the extent the value of the distributed securities on the date of redemption exceeds the cost of those securities; the Fund will recognize a loss if the cost exceeds value. Gains and losses realized on redemptions in-kind are not recognized for tax purposes, and are re-classified from realized gain (loss) to paid-in-capital. Core Plus Bond Fund realized a gain of $19,866,959 on redemptions-in-kind during the year ended September 30, 2020. This amount is included in realized gain (loss) on the Statements of Operations.
Report of Independent Registered Public Accounting Firm
To the Board of Trustees of Loomis Sayles Funds II and Natixis Funds Trust I and Shareholders of Loomis Sayles Global Allocation Fund and Loomis Sayles Core Plus Bond Fund:
Opinions on the Financial Statements
We have audited the accompanying statements of assets and liabilities, including the portfolios of investments, of Loomis Sayles Global Allocation Fund (one of the funds constituting Loomis Sayles Funds II) and Loomis Sayles Core Plus Bond Fund (one of the funds constituting Natixis Funds Trust I) (hereafter collectively referred to as the “Funds”) as of September 30, 2020, the related statements of operations for the year ended September 30, 2020, the statements of changes in net assets for each of the two years in the period ended September 30, 2020, including the related notes, and the financial highlights for each of the periods indicated therein (collectively referred to as the “financial statements”). In our opinion, the financial statements present fairly, in all material respects, the financial position of each of the Funds as of September 30, 2020, the results of each of their operations for the year then ended, the changes in each of their net assets for each of the two years in the period ended September 30, 2020 and each of the financial highlights for each of the periods indicated therein in conformity with accounting principles generally accepted in the United States of America.
Basis for Opinions
These financial statements are the responsibility of the Funds’ management. Our responsibility is to express an opinion on the Funds’ financial statements based on our audits. We are a public accounting firm registered with the Public Company Accounting Oversight Board (United States) (PCAOB) and are required to be independent with respect to the Funds in accordance with the U.S. federal securities laws and the applicable rules and regulations of the Securities and Exchange Commission and the PCAOB.
We conducted our audits of these financial statements in accordance with the standards of the PCAOB. Those standards require that we plan and perform the audit to obtain reasonable assurance about whether the financial statements are free of material misstatement, whether due to error or fraud.
Our audits included performing procedures to assess the risks of material misstatement of the financial statements, whether due to error or fraud, and performing procedures that respond to those risks. Such procedures included examining, on a test basis, evidence regarding the amounts and disclosures in the financial statements. Our audits also included evaluating the accounting principles used and significant estimates made by management, as well as evaluating the overall presentation of the financial statements. Our procedures included confirmation of securities owned as of September 30, 2020 by correspondence with the custodian, agent banks and brokers;
Report of Independent Registered Public Accounting Firm
when replies were not received from brokers, we performed other auditing procedures. We believe that our audits provide a reasonable basis for our opinions.
/s/ PricewaterhouseCoopers LLP
Boston, Massachusetts
November 20, 2020
We have served as the auditor of one or more investment companies in the Natixis Investment Company Complex since at least 1995. We have not determined the specific year we began serving as auditor.
2020 U.S. Tax Distribution Information to Shareholders (Unaudited)
Corporate Dividends Received Deduction. For the fiscal year ended September 30, 2020, a percentage of dividends distributed by the Fund listed below qualify for the dividends received deduction for corporate shareholders. These percentages are as follows:
| | | | |
Fund | | Qualifying
Percentage | |
Global Allocation Fund | | | 59.76 | % |
Capital Gains Distributions. Pursuant to Internal Revenue Section 852(b), the following Fund paid distributions, which have been designated as capital gains distributions for the fiscal year ended September 30, 2020, unless subsequently determined to be different.
| | | | |
Fund | | Amount | |
Global Allocation Fund | | $ | 73,767,977 | |
Qualified Dividend Income. For the fiscal year ended September 30, 2020, the Fund below will designate up to the maximum amount allowable pursuant to the Internal Revenue Code as qualified dividend income eligible for reduced tax rates. These lower rates range from 0% to 20% depending on an individual’s tax bracket. If the Fund pays a distribution during calendar year 2020, complete information will be reported in conjunction with Form 1099-DIV.
| | | | |
Fund | | | |
Global Allocation Fund | | | | |
Trustee and Officer Information
The tables below provide certain information regarding the trustees and officers of Natixis Funds Trust I and Loomis Sayles Funds II (the “Trusts”). Unless otherwise indicated, the address of all persons below is 888 Boylston Street, Suite 800, Boston, MA 02199-8197. The Funds’ Statement of Additional Information includes additional information about the trustees of the Trusts and are available by calling Natixis Funds at 800-225-5478.
| | | | | | | | |
Name and Year of Birth | | Position(s) Held with the Trusts, Length of Time
Served and Term
of Office1 | | Principal Occupation(s)
During Past 5 Years | | Number of
Portfolios in Fund Complex
Overseen2 and Other
Directorships Held
During Past 5 Years | | Experience,
Qualifications,
Attributes, Skills
for Board
Membership |
| | | |
| INDEPENDENT TRUSTEES | | | | | | |
| | | | |
Kenneth A. Drucker (1945) | | Chairperson of the Board of Trustees since January 2017 Trustee since 2008 Ex Officio member of Audit Committee, Contract Review Committee and Governance Committee | | Retired | | 54 None | | Significant experience on the Board and on the boards of other business organizations (including at investment companies); executive experience (including as treasurer of an aerospace, automotive, and metal manufacturing corporation) |
| | | | |
Edmond J. English
(1953) | | Trustee since 2013 Chairperson of Governance Committee and Audit Committee Member | | Executive Chairman of Bob’s Discount Furniture (retail) | | 54 Director, Burlington Stores, Inc. (retail) | | Significant experience on the Board and on the boards of other business organizations (including retail companies and a bank); executive experience (including at a retail company) |
Trustee and Officer Information
| | | | | | | | |
Name and Year of Birth | | Position(s) Held with the Trusts, Length of Time
Served and Term
of Office1 | | Principal Occupation(s)
During Past 5 Years | | Number of
Portfolios in Fund Complex
Overseen2 and Other
Directorships Held
During Past 5 Years | | Experience,
Qualifications,
Attributes, Skills
for Board
Membership |
| | | |
INDEPENDENT TRUSTEES continued | | | | | | |
| | | | |
Richard A. Goglia (1951) | | Trustee since 2015 Contract Review Committee Member and Governance Committee Member | | Retired | | 54 Director of Triumph Group (aerospace industry) | | Significant experience on the Board and executive experience (including his role as vice president and treasurer of a defense company and experience at a financial services company) |
| | | | |
Wendell J. Knox (1948) | | Trustee since 2009 Chairperson of Contract Review Committee | | Retired | | 54 Director of Abt Associates Inc. (research and consulting); Director, The Hanover Insurance Group (property and casualty insurance); formerly, Director, Eastern Bank (bank) | | Significant experience on the Board and on the boards of other business organizations (including at a bank and at a property and casualty insurance firm); executive experience (including roles as president and chief executive officer of a research and consulting company) |
Trustee and Officer Information
| | | | | | | | |
Name and Year of Birth | | Position(s) Held with the Trusts, Length of Time
Served and Term
of Office1 | | Principal Occupation(s)
During Past 5 Years | | Number of
Portfolios in Fund Complex
Overseen2 and Other
Directorships Held
During Past 5 Years | | Experience,
Qualifications,
Attributes, Skills
for Board
Membership |
| | | |
INDEPENDENT TRUSTEES continued | | | | | | |
| | | | |
| Martin T. Meehan (1956) | | Trustee since 2012 Audit Committee Member | | President, University of Massachusetts | | 54 None | | Significant experience on the Board and on the boards of other business organizations; experience as President of the University of Massachusetts; government experience (including as a member of the U.S. House of Representatives); academic experience |
| | | | |
Maureen B. Mitchell (1951) | | Trustee since 2017 Contract Review Committee Member and Governance Committee Member | | Retired; formerly President, Global Sales and Marketing, GE Asset Management, Inc. (financial services) | | 54 Director, Sterling Bancorp (bank) | | Experience on the Board; financial services industry and executive experience (including role as president of global sales and marketing at a financial services company) |
Trustee and Officer Information
| | | | | | | | |
Name and Year of Birth | | Position(s) Held with the Trusts, Length of Time
Served and Term
of Office1 | | Principal Occupation(s)
During Past 5 Years | | Number of
Portfolios in Fund Complex
Overseen2 and Other
Directorships Held
During Past 5 Years | | Experience,
Qualifications,
Attributes, Skills
for Board
Membership |
| | | |
INDEPENDENT TRUSTEES continued | | | | | | |
| | | | |
James P. Palermo (1955) | | Trustee since 2016 Contract Review Committee Member | | Founding Partner, Breton Capital Management, LLC (private equity); Partner, STEP Partners, LLC (private equity) | | 54 Director, FutureFuel.io (chemicals and biofuels) | | Experience on the Board; financial services industry and executive experience (including roles as chief executive officer of client management and asset servicing for a banking and financial services company) |
| | | | |
Erik R. Sirri (1958) | | Trustee since 2009 Audit Committee Member | | Professor of Finance at Babson College | | 54 None | | Significant experience on the Board; experience as Director of the Division of Trading and Markets at the Securities and Exchange Commission; academic experience; training as an economist |
| | | | |
Peter J. Smail (1952) | | Trustee since 2009 Audit Committee Member and Governance Committee Member | | Retired | | 54 None | | Significant experience on the Board; mutual fund industry and executive experience (including roles as president and chief executive officer for an investment adviser) |
Trustee and Officer Information
| | | | | | | | |
Name and Year of Birth | | Position(s) Held with the Trusts, Length of Time
Served and Term
of Office1 | | Principal Occupation(s)
During Past 5 Years | | Number of
Portfolios in Fund Complex
Overseen2 and Other
Directorships Held
During Past 5 Years | | Experience,
Qualifications,
Attributes, Skills
for Board
Membership |
| | | |
INDEPENDENT TRUSTEES continued | | | | | | |
| | | | |
Kirk A. Sykes (1958) | | Trustee since 2019 Contract Review Committee Member | | Managing Director of Accordia Partners, LLC (real estate development); President of Primary Corporation (real estate development); Managing Principal of Merrick Capital Partners (infrastructure finance); formerly, President of Urban Strategy America Fund (real estate fund manager) | | 54 Trustee, Eastern Bank (bank); formerly Director, Ares Commercial Real Estate Corporation (real estate investment trust) | | Experience on the Board and significant experience on the boards of other business organizations (including real estate companies and banks) |
| | | | |
Cynthia L. Walker (1956) | | Trustee since 2005 Chairperson of the Audit Committee and Governance Committee Member | | Deputy Dean for Finance and Administration, Yale University School of Medicine | | 54 None | | Significant experience on the Board; executive experience in a variety of academic organizations (including roles as dean for finance and administration) |
Trustee and Officer Information
| | | | | | | | |
Name and Year of Birth | | Position(s) Held with the Trusts, Length of Time
Served and Term
of Office1 | | Principal Occupation(s)
During Past 5 Years | | Number of
Portfolios in Fund Complex
Overseen2 and Other
Directorships Held
During Past 5 Years | | Experience,
Qualifications,
Attributes, Skills
for Board
Membership |
|
| INTERESTED TRUSTEES |
| | | | |
Kevin P. Charleston3 (1965) One Financial Center Boston, MA 02111 | | Trustee since 2015 | | President, Chief Executive Officer and Chairman of the Board of Directors; formerly, Chief Financial Officer, Loomis, Sayles & Company, L.P. | | 54 None | | Significant experience on the Board; continuing service as President, Chief Executive Officer and Chairman of the Board of Directors of Loomis, Sayles & Company, L.P. |
| | | | |
| David L. Giunta4 (1965) | | Trustee since 2011 President and Chief Executive Officer of Natixis Funds Trust I; President of Loomis Sayles Funds II since 2008; Chief Executive Officer of Loomis Sayles Funds II since 2015 | | President and Chief Executive Officer, Natixis Advisors, L.P., Natixis Distribution, L.P., Natixis Distribution Corporation and Chairman of the Board of Natixis Distribution Corporation | | 54 None | | Significant experience on the Board; experience as President and Chief Executive Officer of Natixis Advisors, L.P., Natixis Distribution, L.P., Natixis Distribution Corporation and Chairman of the Board of Natixis Distribution Corporation |
| 1 | Each trustee serves until retirement, resignation or removal from the Board. The current retirement age is 75. The position of Chairperson of the Board is appointed for a three-year term. Mr. Drucker was appointed to serve an additional one year term as the Chairperson of the Board on June 12, 2019. |
| 2 | The trustees of the Trusts serve as trustees of a fund complex that includes all series of the Trusts, Natixis Funds Trust II, Natixis Funds Trust IV, Gateway Trust, Loomis Sayles Funds I, Natixis ETF Trust and Natixis ETF Trust II (collectively, the “Fund Complex”). |
| 3 | Mr. Charleston is deemed an “interested person” of the Trusts because he holds the following positions with an affiliated person of the Trusts: President, Chief Executive Officer and Chairman of the Board of Directors of Loomis, Sayles & Company, L.P. |
| 4 | Mr. Giunta is deemed an “interested person” of the Trusts because he holds the following positions with an affiliated person of the Trusts: President and Chief Executive Officer, Natixis Advisors, L.P., Natixis Distribution, L.P., Natixis Distribution Corporation and Chairman of the Board of Natixis Distribution Corporation. |
Trustee and Officer Information
| | | | | | |
Name and Year of Birth | | Position(s) Held with the Trusts | | Term of Office1 and Length of Time Served | | Principal Occupation(s) During Past 5 Years2 |
| | |
| OFFICERS OF THE [TRUST/TRUSTS] | | | | |
| | | |
Daniel J. Fuss (1933) One Financial Center Boston, MA 02111 | | Executive Vice President of Loomis Sayles Funds II | | Since 2003 | | Vice Chairman and Director, Loomis, Sayles & Company, L.P. |
| | | |
Russell L. Kane (1969) | | Secretary, Clerk and Chief Legal Officer Chief Compliance Officer and Anti-Money Laundering Officer | | Since 2016 Since 2020 | | Executive Vice President, General Counsel, Secretary and Clerk, Natixis Distribution Corporation, Natixis Advisors, L.P. and Natixis Distribution, L.P.; formerly, Senior Vice President, Deputy General Counsel, Assistant Secretary and Assistant Clerk, Natixis Distribution Corporation, Natixis Advisors, L.P. and Natixis Distribution, L.P. |
| | | |
Michael C. Kardok (1959) | | Treasurer, Principal Financial and Accounting Officer | | Since 2004 | | Senior Vice President, Natixis Advisors, L.P. and Natixis Distribution, L.P. |
| 1 | Each officer of the Trusts serves for an indefinite term in accordance with the Trusts’ current by-laws until the date his or her successor is elected and qualified, or until he or she sooner dies, retires, is removed or becomes disqualified. |
| 2 | Each person listed above, except as noted, holds the same position(s) with the Fund Complex. Previous positions during the past five years with Natixis Distribution, L.P., Natixis Advisors, L.P. or Loomis, Sayles & Company, L.P. are omitted, if not materially different from an officer’s current position with such entity. |
Item 2. Code of Ethics.
The Registrant has adopted a code of ethics that applies to the Registrant’s principal executive officer, principal financial officer and persons performing similar functions. There have been no amendments or waivers of the Registrant’s code of ethics during the period.
Item 3. Audit Committee Financial Expert.
The Board of Trustees of the Registrant has established an audit committee. Mr. Edmond J. English, Mr. Martin T. Meehan, Mr. Peter Smail, Mr. Erik R. Sirri and Ms. Cynthia L. Walker are members of the audit committee and have been designated as “audit committee financial experts” by the Board of Trustees. Each of these individuals is also an Independent Trustee of the Registrant.
Item 4. Principal Accountant Fees and Services.
Fees billed by the Principal Accountant for services rendered to the Registrant.
The table below sets forth fees billed by the principal accountant, PricewaterhouseCoopers LLP, for the past two fiscal years for professional services rendered in connection with a) the audit of the Registrant’s annual financial statements and services provided in connection with regulatory filings; b) audit-related services (including services that are reasonably related to the performance of the audit of the Registrant’s financial statements and but not reported under “Audit Fees”); c) tax compliance, tax advice and tax planning and d) all other fees billed for professional services rendered by the principal accountant to the Registrant, other than the services reported as a part of (a) through (c) of this Item.
| | | | | | | | | | | | | | | | | | | | | | | | | | | | | | | | |
| | | Audit fees | | | Audit-related fees1 | | | Tax fees2 | | | All other fees | |
| | | 10/1/18-
9/30/19 | | | 10/1/19-
9/30/20 | | | 10/1/18-
9/30/19 | | | 10/1/19-
9/30/20 | | | 10/1/18-
9/30/19 | | | 10/1/19-
9/30/20 | | | 10/1/18-
9/30/19 | | | 10/1/19-
9/30/20 | |
Loomis Sayles Core Plus Bond Fund | | $ | 44,201 | | | $ | 44,643 | | | $ | 1,097 | | | $ | 1,311 | | | $ | 8,104 | | | $ | 8,104 | | | $ | — | | | $ | — | |
| 1. | Audit-related fees consist of: |
2019 & 2020 - performance of agreed-upon procedures related to the Registrant’s deferred compensation plan.
2019 & 2020 – review of Registrant’s tax returns.
Aggregate fees billed to the Registrant for non-audit services during 2019 and 2020 were $9,202 and $9,415, respectively.
Fees billed by the Principal Accountant for services rendered to the Adviser and Control Affiliates.
The following table sets forth the fees billed by the Registrant’s principal accountant for non-audit services rendered to Loomis, Sayles & Company, L.P. and entities controlling, controlled by or under common control with Loomis, Sayles & Company, L.P. (“Control Affiliates”) that provide ongoing services to the Registrant, for engagements that related directly to the operations and financial reporting of the Registrant for the last two fiscal years.
| | | | | | | | | | | | | | | | | | | | | | | | |
| | | Audit-related fees | | | Tax fees | | | All other fees | |
| | | 10/1/18-
9/30/19 | | | 10/1/19-
9/30/20 | | | 10/1/18-
9/30/19 | | | 10/1/19-
9/30/20 | | | 10/1/18-
9/30/19 | | | 10/1/19-
9/30/20 | |
Control Affiliates | | $ | — | | | $ | — | | | $ | — | | | $ | — | | | $ | — | | | $ | — | |
The following table sets forth the aggregate fees billed by the Registrant’s principal accountant for non-audit services rendered to Loomis, Sayles & Company, L.P. and Control Affiliates that provide ongoing services to the Registrant, for the last two fiscal years, including the fees disclosed in the table above.
| | | | | | | | |
| | | Aggregate Non-Audit Fees | |
| | | 10/1/18-9/30/19 | | | 10/1/19-9/30/20 | |
Control Affiliates | | $ | 32,252 | | | $ | 1,646 | |
None of the services described above were approved pursuant to (c)(7)(i)(C) of Regulation S-X.
Audit Committee Pre Approval Policies.
Annually, the Registrant’s Audit Committee reviews the audit, audit-related, tax and other non-audit services together with the projected fees, for services proposed to be rendered to the Trust and/or other entities for which pre-approval is required during the upcoming year. Any subsequent revisions to already pre-approved services or fees (including fee increases) and requests for pre-approval of new services would be presented for consideration quarterly as needed.
If, in the opinion of management, a proposed engagement by the Registrant’s independent accountants needs to commence before the next regularly scheduled Audit Committee meeting, any member of the Audit Committee who is an Independent Trustee of the Registrant is authorized to pre-approve the engagement, but only for engagements to provide audit, audit related and tax services. This approval is subject to review of the full Audit Committee at its next quarterly meeting. All other engagements require the approval of all the members of the Audit Committee.
Item 5. Audit Committee of Listed Registrants.
Not applicable.
Item 6. Schedule of Investments.
Included as part of the Report to Shareholders filed as Item 1 herewith.
Item 7. Disclosure of Proxy Voting Policies and Procedures for Closed-End Management Investment Companies.
Not applicable.
Item 8. Portfolio Managers of Closed-End Management Investment Companies
Not applicable.
Item 9. Purchases of Equity Securities by Closed-End Management Investment Companies and Affiliated Purchasers.
Not applicable.
Item 10. Submission of Matters to a Vote of Securities Holders.
There were no material changes to the procedures by which shareholders may recommend nominees to the Registrant’s Board of Trustees.
Item 11. Controls and Procedures.
The Registrant’s principal executive officer and principal financial officer have concluded that the Registrant’s disclosure controls and procedures are sufficient to ensure that information required to be disclosed by the Registrant in this Form N-CSR was recorded, processed, summarized and reported within the time periods specified in the Securities and Exchange Commission’s rules and forms, based upon such officers’ evaluation of these controls and procedures as of a date within 90 days of the filing date of the report.
There were no changes in the Registrant’s internal control over financial reporting that occurred during the period covered by the report that have materially affected, or is reasonably likely to materially affect, the Registrant’s internal control over financial reporting.
Item 12. Disclosure of Securities Lending Activities for Closed-End Management Investment Companies.
Not applicable.
Item 13. Exhibits.
SIGNATURES
Pursuant to the requirements of the Securities Exchange Act of 1934 and the Investment Company Act of 1940, the Registrant has duly caused this report to be signed on its behalf by the undersigned, thereunto duly authorized.
| | |
| Natixis Funds Trust I |
| |
| By: | | /s/ David L. Giunta |
| Name: | | David L. Giunta |
| Title: | | President and Chief Executive Officer |
| Date: | | November 23, 2020 |
Pursuant to the requirements of the Securities Exchange Act of 1934 and the Investment Company Act of 1940, this report has been signed by the following persons on behalf of the Registrant and in the capacities and on the dates indicated.
| | |
| By: | | /s/ David L. Giunta |
| Name: | | David L. Giunta |
| Title: | | President and Chief Executive Officer |
| Date: | | November 23, 2020 |
| | |
| By: | | /s/ Michael C. Kardok |
| Name: | | Michael C. Kardok |
| Title: | | Treasurer and Principal Financial and Accounting Officer |
| Date: | | November 23, 2020 |