UNITED STATES
SECURITIES AND EXCHANGE COMMISSION
Washington, D.C. 20549
FORMN-CSR
CERTIFIED SHAREHOLDER REPORT OF REGISTERED
MANAGEMENT INVESTMENT COMPANIES
Investment Company Act file number:811-04323
Natixis Funds Trust I
(Exact name of Registrant as specified in charter)
888 Boylston Street, Suite 800, Boston, Massachusetts 02199-8197
(Address of principal executive offices) (Zip code)
Russell L. Kane, Esq.
Natixis Distribution, L.P.
888 Boylston Street, Suite 800
Boston, Massachusetts 02199-8197
(Name and address of agent for service)
Registrant’s telephone number, including area code: (617)449-2822
Date of fiscal year end: December 31
Date of reporting period: December 31, 2019
Item 1. Reports to Stockholders.
The Registrant’s annual report transmitted to shareholders pursuant to Rule30e-1 under the Investment Company Act of 1940 is as follows:


Annual Report
December 31, 2019
Loomis Sayles High Income Fund
Loomis Sayles Investment Grade Bond Fund
Loomis Sayles Multi-Asset Income Fund
Table of Contents
IMPORTANT NOTICE TO SHAREHOLDERS
Beginning on January 1, 2021, as permitted by regulations adopted by the Securities and Exchange Commission, paper copies of shareholder reports like this one will no longer be sent by mail, unless you specifically request paper copies of the reports from the Fund or from your financial intermediary, such as a broker-dealer or bank. Instead, the reports will be made available on the Funds’ website, and you will be notified by mail each time a report is posted and provided with a website link to access the report. If you wish to continue receiving paper copies of your shareholder reports after January 1, 2021, you can inform the Fund at any time by calling 1-800-225-5478. If you hold your account with a financial intermediary and you wish to continue receiving paper copies after January 1, 2021, you should call your financial intermediary directly. Paper copies are provided free of charge, and your election to receive reports in paper will apply to all funds held with the Natixis Funds complex. If you have already elected to receive shareholder reports electronically, you will not be affected by this change and you need not take any action. You currently may elect to receive shareholder reports and other communications from the Fund or your financial intermediary electronically at www.icsdelivery.com/natixisfunds.
LOOMIS SAYLES HIGH INCOME FUND
| | |
| |
| Managers | | Symbols |
| |
| Matthew J. Eagan, CFA® | | Class A NEFHX |
| |
| Brian P. Kennedy | | Class C NEHCX |
| |
| Elaine M. Stokes | | Class N LSHNX |
| |
| Todd P. Vandam, CFA® | | Class Y NEHYX |
| |
| Loomis, Sayles & Company, L.P. | | |
Investment Goal
The Fund seeks high current income plus the opportunity for capital appreciation to produce a high total return.
Market Conditions
The fixed income markets produced robust returns in 2019, reflecting global central banks’ shift to more accommodative policies. A backdrop of moderate economic growth and low inflation provided the US Federal Reserve (the “Fed”) with the latitude to lower interest rates by a quarter point on three occasions in the span from July to October. While the Fed subsequently made it clear that it was unlikely to enact any further cuts in the near future barring a meaningful slowdown in growth, investors remained confident that it would keep rates steady throughout 2020. A number of other world central banks followed the Fed’s move toward easier policy, highlighted by the European Central Bank’s pledge to restart its stimulative quantitative easing program.
US Treasuries performed well in this environment, with falling yields (and rising prices) for bonds of all maturities. The yield on the bellwether 10-year note fell from 2.69% to 1.92% in 2019, while the two-year issue moved from 2.48% to 1.58%. As a result, the yield curve steepened compared to its level of December 31, 2018. The Treasury market reached its peak in late August, at which point yields began to tick higher as investors factored in improving economic data and the apparently low likelihood of further cuts in the coming year.
High-grade corporate bonds performed very well and finished the year as one of the best performing areas of the bond market. In addition to benefiting from the decline in Treasury yields, the asset class was helped by continued spread compression and elevated demand for high quality investments.
Lower-quality corporate debt also rallied in 2019 as the search for yield continued. The category was boosted by broad strength across higher-risk assets, an accommodative Fed and a benign economic outlook for 2020.
Domestic inflation remained tame, mirroring a trend that was in place across the globe. After flirting with the 2% level in late 2018, US core personal consumption expenditure inflation (which excludes food and energy) settled into a range between 1.5% and 1.7% from February onward. Low inflation was one of the key factors providing the Fed and foreign central banks with the ability to loosen policy in order to address slowing growth.
1 |
Performance Results
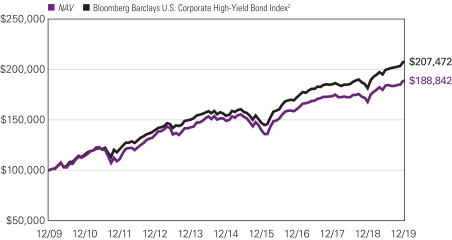
For the 12 months ended December 31, 2019, Class Y shares of the Loomis Sayles High Income Fund returned 12.52% at net asset value. The Fund underperformed its benchmark, the Bloomberg Barclays U.S. Corporate High-Yield Bond Index, which returned 14.32%.
Explanation of Fund Performance
Security selection was the primary source of underperformance for the year. Within convertibles, selected energy holdings weighed on returns. Allocations to securitized issues and defensive reserve-like positions were also detractors as they underperformed higher-yielding securities during the period.
The Fund’s longer-than-benchmark positioning with respect to duration (and corresponding interest rate sensitivity) aided relative performance as yields declined over the period. Emerging market credit exposure positively contributed to performance as well, led by basic industry, consumer non-cyclical and government-related names. Finally, security selection within investment grade credit positively impacted performance during the year, most notably holdings of electric, banking and technology issues.
Outlook
We continue to believe we are late in the credit cycle1 rather than at the end of it. Probabilities of a shift to a downturn in the cycle declined over the fourth quarter as the Fed provided additional rate cuts, a phase one deal with China became increasingly likely and odds of a no-deal Brexit declined. We do not see the US economy sliding into recession in 2020. These developments fueled further support for corporate bonds and risk assets, driving valuations up and delivering a strong year for fixed income assets in 2019.
Our macro outlook remains benign and the market backdrop has largely remained supportive. We believe that Fed rate cuts and relatively good news on trade and Brexit will allow the United States to emerge from a third “mini cycle” slow down within this long running late cycle phase without a recession. We expect global manufacturing to continue to improve into 2020 as uncertainty regarding global trade declines. We anticipate that slow, but positive, global growth will continue and that this will help support mid-single digit corporate profit growth and allow for reasonably strong corporate credit metrics in 2020.
We expect the US Fed to remain on hold for most, if not all, of 2020. Inflation remains well contained. Overall yield levels in the United States should remain within current established ranges, although there could be some modest upward pressure on yields should the global macro environment firm more quickly on better-than-expected news on the trade front. From a duration perspective, we remain modestly short relative to the broad market. Nonetheless, global developed market yields will likely remain low and relatively high US yields should be a supportive technical factor for US bonds.
The double-barreled market rally of lower yields and tighter spreads has pushed valuations on corporate bonds higher. High yield and investment grade corporate bond risk premiums declined over the course of 2019. While we believe that the global demand for yield and a continued late cycle environment can support spreads at current levels, we expect returns to be
| 2
LOOMIS SAYLES HIGH INCOME FUND
based more on carry in 2020. We believe corporate credit quality will continue to marginally decline but not enough to cause a dramatic move wider in spreads or a large uptick in corporate defaults. That said, we retain a cautious and “up in quality” bias. By historic standards we have less exposure to high yield bonds than usual, while retaining relatively high liquidity which can be deployed should opportunities develop within the sector.
We continue to strive for positive issue selection through our credit research efforts. Our portfolios are dominated by credits we believe are attractively priced relative to the credit quality we assign them. Communications and cable and media issues account for the bulk of this exposure, along with select areas within consumer cyclical. We believe that opportunities for positive carry in emerging market corporate bonds could expand should global growth strengthen. While we have pulled back some of our energy exposure, we believe sentiment regarding the sector has become too negative relative to the actual fundamentals. Accordingly, we believe there is upside potential for some of our best picks in this sector.
We also remain comfortable with the securitized sector, which largely lagged the bigger moves in other fixed income sectors in 2019. We still like the defensive nature of the sector based on good carry for higher quality.
Overall, we believe that the large rally seen in 2019 presents a challenge to fixed income return potential in 2020. However, some of those same market drivers could provide support as we enter a new year. These include global demand for yield, reduced uncertainty on global trade and Brexit, and positive global growth. The late cycle environment is likely to continue. We remain focused on maintaining favorable carry/yield, seeking to identify attractively priced bonds and retaining the liquidity and flexibility to adapt should the benign market conditions deteriorate.
| 1 | A credit cycle is a cyclical pattern that follows credit availability and corporate health. |
Hypothetical Growth of $100,000 Investment in Class Y Shares3
December 31, 2009 through December 31, 2019
3 |
Average Annual Total Returns — December 31, 20193
| | | | | | | | | | | | | | | | | | | | | | | | |
| | | | | | | | | | | | | | | Expense Ratios4 | |
| | | 1 Year | | | 5 Years | | | 10 Years | | | Life of
Class N | | | Gross | | | Net | |
| | | | | | | |
| Class Y (Inception 2/29/08) | | | | | | | | | | | | | | | | | | | | | | | | |
| NAV | | | 12.52 | % | | | 4.84 | % | | | 6.56 | % | | | — | % | | | 1.02 | % | | | 0.75 | % |
| | | | | | | |
| Class A (Inception 2/22/84) | | | | | | | | | | | | | | | | | | | | | | | | |
| NAV | | | 11.94 | | | | 4.51 | | | | 6.25 | | | | — | | | | 1.27 | | | | 1.00 | |
| With 4.25% Maximum Sales Charge | | | 7.11 | | | | 3.61 | | | | 5.79 | | | | — | | | | | | | | | |
| | | | | | | |
| Class C (Inception 3/2/98) | | | | | | | | | | | | | | | | | | | | | | | | |
| NAV | | | 11.32 | | | | 3.76 | | | | 5.46 | | | | — | | | | 2.02 | | | | 1.75 | |
| With CDSC1 | | | 10.32 | | | | 3.76 | | | | 5.46 | | | | — | | | | | | | | | |
| | | | | | | |
| Class N (Inception 11/30/16) | | | | | | | | | | | | | | | | | | | | | | | | |
| NAV | | | 12.28 | | | | — | | | | — | | | | 5.86 | | | | 0.89 | | | | 0.70 | |
| | | | | | | |
| Comparative Performance | | | | | | | | | | | | | | | | | | | | | | | | |
| Bloomberg Barclays U.S.Corporate High-Yield Bond Index2 | | | 14.32 | | | | 6.13 | | | | 7.57 | | | | 6.80 | | | | | | | | | |
Performance data shown represents past performance and is no guarantee of, and not necessarily indicative of, future results. Total return and value will vary, and you may have a gain or loss when shares are sold. Current performance may be lower or higher than quoted. For most recent month-end performance, visit im.natixis.com. Performance for other share classes will be greater or less than shown based on differences in fees and sales charges. You may not invest directly in an index. Performance for periods less than one year is cumulative, not annualized. Returns reflect changes in share price and reinvestment of dividends and capital gains, if any. The table(s) do not reflect taxes shareholders might owe on any fund distributions or when they redeem their shares.
| 1 | Class C shares performance assumes a 1% CDSC applied when you sell shares within one year of purchase. |
| 2 | The Bloomberg Barclays U.S. Corporate High-Yield Bond Index measures the market of USD-denominated, non-investment grade, fixed-rate, taxable corporate bonds. Securities are classified as high yield if the middle rating of Moody’s, Fitch, and S&P is Ba1/BB+/BB+ or below, excluding emerging market debt. The Bloomberg Barclays U.S. Corporate High-Yield Bond Index was created in 1986, with history backfilled to July 1, 1983, and rolls up into the Bloomberg Barclays U.S. Universal and Global High-Yield Indices. |
| 3 | Fund performance has been increased by fee waivers and/or expense reimbursements, if any, without which performance would have been lower. |
| 4 | Expense ratios are as shown in the Fund’s prospectus in effect as of the date of this report. The expense ratios for the current reporting period can be found in the Financial Highlights section of this report under Ratios to Average Net Assets. Net expenses reflect contractual expense limitations set to expire on 4/30/21. When a Fund’s expenses are below the limitation, gross and net expense ratios will be the same. See Note 6 of the Notes to Financial Statements for more information about the Fund’s expense limitations. |
| 4
LOOMIS SAYLES INVESTMENT GRADE BOND FUND
| | | | |
| | |
| Managers | | Symbols | | |
| | |
| Matthew J. Eagan, CFA® | | Class A | | LIGRX |
| | |
| Brian P. Kennedy | | Class C | | LGBCX |
| | |
| Elaine M. Stokes | | Class N | | LGBNX |
| | |
| Loomis, Sayles & Company, L.P. | | Class Y | | LSIIX |
| | |
| | Admin Class | | LIGAX |
Investment Goal
The Fund seeks high total investment return through a combination of current income and capital appreciation.
Market Conditions
The fixed income markets produced robust returns in 2019, reflecting global central banks’ shift to more accommodative policies. A backdrop of moderate economic growth and low inflation provided the US Federal Reserve (the “Fed”) with the latitude to lower interest rates by a quarter point on three occasions in the span from July to October. While the Fed subsequently made it clear that it was unlikely to enact any further cuts in the near future barring a meaningful slowdown in growth, investors remained confident that it would keep rates steady throughout 2020. A number of other world central banks followed the Fed’s move toward easier policy, highlighted by the European Central Bank’s pledge to restart its stimulative quantitative easing program.
US Treasuries performed well in this environment, with falling yields (and rising prices) for bonds of all maturities. The yield on the bellwether 10-year note fell from 2.69% to 1.92% in 2019, while the two-year issue moved from 2.48% to 1.58%. As a result, the yield curve steepened compared to its level of December 31, 2018. The Treasury market reached its peak in late August, at which point yields began to tick higher as investors factored in improving economic data and the apparently low likelihood of further cuts in the coming year.
High-grade corporate bonds performed very well and finished the year as one of the best performing areas of the bond market. In addition to benefiting from the decline in Treasury yields, the asset class was helped by continued spread compression and elevated demand for high quality investments.
Lower-quality corporate debt also rallied in 2019 as the search for yield continued. The category was boosted by broad strength across higher-risk assets, an accommodative Fed and a benign economic outlook for 2020.
Domestic inflation remained tame, mirroring a trend that was in place across the globe. After flirting with the 2% level in late 2018, US core personal consumption expenditure inflation (which excludes food and energy) settled into a range between 1.5% and 1.7% from February onward. Low inflation was one of the key factors providing the Fed and foreign central banks with the ability to loosen policy in order to address slowing growth.
5 |
Performance Results
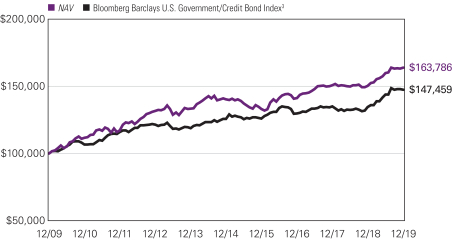
For the 12 months ended December 31, 2019, Class Y shares of the Loomis Sayles Investment Grade Bond Fund returned 9.04% at net asset value. The Fund underperformed its benchmark, the Bloomberg Barclays U.S. Government/Credit Bond Index, which returned 9.71%.
Explanation of Fund Performance
The Fund’s overall shorter-than-benchmark positioning with respect to duration weighed on return as interest rates declined over the period. Exposure to securitized issues had the largest negative impact on relative performance as the sector lagged both corporate credit and Treasuries. Additionally, holdings of defensive reserve-like positions detracted as these underperformed higher-yielding issues during the period.
A significant underweight to US Treasuries bolstered relative performance. An allocation to high yield corporate credit positively impacted performance during the year, aided by consumer non-cyclical, energy and banking names. Emerging market credit exposure also generated positive relative return, with metals & mining and government-related issues as top performers.
Outlook
We continue to believe we are late in the credit cycle1 rather than at the end of it. Probabilities of a shift to a downturn in the cycle declined over the fourth quarter as the Fed provided additional rate cuts, a phase one deal with China became increasingly likely and odds of a no-deal Brexit declined. We do not see the US economy sliding into recession in 2020. These developments fueled further support for corporate bonds and risk assets, driving valuations up and delivering a strong year for fixed income assets in 2019.
Our macro outlook remains benign and the market backdrop has largely remained supportive. We believe that Fed rate cuts and relatively good news on trade and Brexit will allow the US to emerge from a third “mini cycle” slow down within this long running late cycle phase without a recession. We expect global manufacturing to continue to improve into 2020 as uncertainty regarding global trade declines. We anticipate that slow, but positive, global growth will continue and that this will help support mid-single digit corporate profit growth and allow for reasonably strong corporate credit metrics in 2020.
We expect the Fed to remain on hold for most, if not all, of 2020. Inflation remains well contained. Overall yield levels in the United States should remain within current established ranges, although there could be some modest upward pressure on yields should the global macro environment firm more quickly on better-than-expected news on the trade front. From a duration perspective, we remain modestly short relative to the broad market. Nonetheless, global developed market yields will likely remain low and relatively high US yields should be a supportive technical factor for US bonds.
The double-barreled market rally of lower yields and tighter spreads has pushed valuations on corporate bonds higher. High yield and investment grade corporate bond risk premiums declined over the course of 2019. While we believe that the global demand for yield and a continued late cycle environment can support spreads at current levels, we expect returns to be
| 6
LOOMIS SAYLES INVESTMENT GRADE BOND FUND
based more on carry in 2020. We believe corporate credit quality will continue to marginally decline but not enough to cause a dramatic move wider in spreads or a large uptick in corporate defaults. That said, we retain a cautious and “up in quality” bias. By historic standards we have less exposure to high yield bonds than usual, while retaining relatively high liquidity which can be deployed should opportunities develop within the sector.
We continue to strive for positive issue selection through our credit research efforts. Our portfolios are dominated by credits we believe are attractively priced relative to the credit quality we assign them. Communications and cable and media issues account for the bulk of this exposure, along with select areas within consumer cyclical. We believe that opportunities for positive carry in emerging market corporate bonds could expand should global growth strengthen. While we have pulled back some of our energy exposure, we believe sentiment regarding the sector has become too negative relative to the actual fundamentals. Accordingly, we believe there is upside potential for some of our best picks in this sector.
We also remain comfortable with the securitized sector, which largely lagged the bigger moves in other fixed income sectors in 2019. We still like the defensive nature of the sector based on good carry for higher quality.
Overall, we believe that the large rally seen in 2019 presents a challenge to fixed income return potential in 2020. However, some of those same market drivers could provide support as we enter a new year. These include global demand for yield, reduced uncertainty on global trade and Brexit, and positive global growth. The late cycle environment is likely to continue. We remain focused on maintaining favorable carry/yield, seeking to identify attractively priced bonds and retaining the liquidity and flexibility to adapt should the benign market conditions deteriorate.
| 1 | A credit cycle is a cyclical pattern that follows credit availability and corporate health. |
Hypothetical Growth of $100,000 Investment in Class Y Shares4
December 31, 2009 through December 31, 2019
7 |
Average Annual Total Returns — December 31, 20194
| | | | | | | | | | | | | | | | | | | | | | | | |
| | | | | | | | | | | | | | | Expense Ratios5 | |
| | | 1 Year | | | 5 Years | | | 10 Years | | | Life of
Class N | | | Gross | | | Net | |
| | | | | | | |
| Class Y (Inception 12/31/96) | | | | | | | | | | | | | | | | | | | | | | | | |
| NAV | | | 9.04 | % | | | 3.16 | % | | | 5.06 | % | | | — | % | | | 0.57 | % | | | 0.51 | % |
| | | | | | | |
| Class A (Inception 12/31/96) | | | | | | | | | | | | | | | | | | | | | | | | |
| NAV | | | 8.78 | | | | 2.90 | | | | 4.79 | | | | — | | | | 0.82 | | | | 0.76 | |
| With 4.25% Maximum Sales Charge | | | 4.14 | | | | 2.01 | | | | 4.33 | | | | — | | | | | | | | | |
| | | | | | | |
| Class C (Inception 9/12/03) | | | | | | | | | | | | | | | | | | | | | | | | |
| NAV | | | 7.94 | | | | 2.12 | | | | 4.01 | | | | — | | | | 1.57 | | | | 1.51 | |
| With CDSC2 | | | 6.94 | | | | 2.12 | | | | 4.01 | | | | — | | | | | | | | | |
| | | | | | | |
| Class N (Inception 2/1/13) | | | | | | | | | | | | | | | | | | | | | | | | |
| NAV | | | 9.11 | | | | 3.25 | | | | — | | | | 3.20 | | | | 0.48 | | | | 0.46 | |
| | | | | | | |
| Admin Class (Inception 2/1/10)1 | | | | | | | | | | | | | | | | | | | | | | | | |
| NAV | | | 8.43 | | | | 2.67 | | | | 4.54 | | | | — | | | | 1.07 | | | | 1.01 | |
| | | | | | | |
| Comparative Performance | | | | | | | | | | | | | | | | | | | | | | | | |
| Bloomberg Barclays U.S. Government/Credit Bond Index3 | | | 9.71 | | | | 3.23 | | | | 3.96 | | | | 2.97 | | | | | | | | | |
Performance data shown represents past performance and is no guarantee of, and not necessarily indicative of, future results. Total return and value will vary, and you may have a gain or loss when shares are sold. Current performance may be lower or higher than quoted. For most recent month-end performance, visit im.natixis.com. Performance for other share classes will be greater or less than shown based on differences in fees and sales charges. You may not invest directly in an index. Performance for periods less than one year is cumulative, not annualized. Returns reflect changes in share price and reinvestment of dividends and capital gains, if any. The table(s) do not reflect taxes shareholders might owe on any fund distributions or when they redeem their shares.
| 1 | Prior to the inception of Admin Class shares (2/1/10), performance is that of Class A shares, restated to reflect the higher net expenses of Admin Class shares. |
| 2 | Performance for Class C shares assumes a 1% contingent deferred sales charge (“CDSC”) applied when you sell shares within one year of purchase. |
| 3 | The Bloomberg Barclays U.S. Government/Credit Bond Index is the non-securitized component of the U.S. Aggregate Index and was the first macro index launched by Barclays Capital. The U.S. Government/Credit Bond Index includes investment grade, US dollar denominated, fixed rate Treasuries (i.e., public obligations of the U.S. Treasury that have remaining maturities of more than one year), government-related issues (i.e., agency, sovereign, supranational, and local authority debt), and corporate securities. The U.S. Government/Credit Index was launched on January 1, 1979, with index history backfilled to 1973, and is a subset of the Bloomberg Barclays U.S. Aggregate Index. |
| 4 | Fund performance has been increased by fee waivers and/or expense reimbursements, if any, without which performance would have been lower. |
| 5 | Expense ratios are as shown in the Fund’s prospectus in effect as of the date of this report. The expense ratios for the current reporting period can be found in the Financial Highlights section of this report under Ratios to Average Net Assets. Net expenses reflect contractual expense limitations set to expire on 4/30/21. When a Fund’s expenses are below the limitation, gross and net expense ratios will be the same. See Note 6 of the Notes to Financial Statements for more information about the Fund’s expense limitations. |
| 8
LOOMIS SAYLES MULTI-ASSET INCOME FUND
| | | | |
| | |
| Managers | | Symbols | | |
| | |
| Thomas Fahey | | Class A | | IIDPX |
| | |
| Kevin Kearns | | Class C | | CIDPX |
| | |
| Maura Murphy, CFA® | | Class N | | LMINX |
| | |
| Loomis, Sayles & Company, L.P. | | Class Y | | YIDPX |
Investment Goal
The Fund seeks current income with a secondary objective of capital appreciation.
Market Conditions
Subdued inflation has allowed central banks to maintain largely accommodative policies, which have supported risk assets. The US Federal Reserve’s (the “Fed”) indication that it will pause has given way to the expectation of yields to be tightly range bound.
Despite persistently soft data, some signs have been seen to indicate that the manufacturing slowdown may be bottoming out. Easy monetary policy has largely been used to counteract anemic global growth encumbered by the manufacturing slowdown.
Risk assets have been supported by the macro risk landscape softening in several regards since the end of the previous year. Central banks have shown a willingness to continue economic stimulus through monetary policy. The likelihood of a no deal Brexit appears to have diminished with negotiations spanning multiple Brexit deadlines. Trade negotiations between China and the US seem to have taken on a less tenuous tone; suggesting a lower probability of escalation and higher probability of a “phase one” agreement being reached.
Performance Results
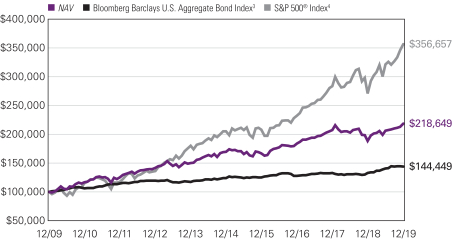
For the 12 months ended December 31, 2019, Class Y shares of the Loomis Sayles Multi-Asset Income Fund returned 15.80% at net asset value. The Fund outperformed its primary benchmark, the Bloomberg Barclays U.S. Aggregate Bond Index, which returned 8.72%.
Explanation of Fund Performance
Our allocation to US dividend-paying equities provided the largest positive contribution to performance for the year. During the period, markets remained focused on the direction of the US/China trade negotiations, the state of the Chinese economy and central bank policy in response to anemic growth and soft manufacturing data. Equity markets were assisted by a Fed that remained largely supportive throughout the year.
Our allocation to preferred stock benefited from a strong equity market and accommodative central bank policy throughout the period. In addition, the Fund’s focus on financial issues within preferreds added to the performance.
Exposure to emerging market fixed income assets aided performance despite a strong dollar. The perceived softening of Chinese trade-related macro risks buoyed the asset class. There remains a concern that a protracted trade conflict between the United States and
9 |
China could exacerbate the global growth slowdown and increase pressure on export-driven economies. The focus within emerging markets remains on China regarding both its trade relations with the US and its pace of growth. Within the portfolio, the most significant contributions came from our Brazilian, Qatari and South African exposures.
An allocation to bank loan assets was the largest detractor during the year. The accommodative tack taken by the Fed throughout the year created headwinds for floating rate instruments. Within the portfolio, energy issues had the largest negative impact on performance.
Outlook
While near-term downside risks remain present, we expect to exit the manufacturing slowdown without an economy-wide recession. This view hinges on the idea that the Fed will remain supportive and continue accommodative monetary policy. We project the Fed to remain on hold for the next twelve months. Chair Powell has indicated that a rate cut is unlikely in the near term, barring any significant, unexpected increase in inflation acceleration.
We maintain our cautious outlook on risk sentiment. While the Fed appears likely to continue to maintain an accommodative monetary policy, China’s economic recovery is faltering and risk related to the United States/China trade war remains despite an increased likelihood of a phase one agreement. Markets will remain focused on Chinese stimulus as a potential catalyst for global growth. So far, however, Chinese policy makers have been reluctant to utilize all options available, instead favoring an incremental approach that emphasizes leverage stabilization.
Despite some volatility, the US dollar has essentially traded within a range. We expect a continuation of this theme, which should be supportive for risk assets in general. While there was some dollar weakening during October, we haven’t seen much of a breakout in either direction since. The perception of softening risks related to United States/China trade has caused the dollar’s recent bid as a safe-haven to largely evaporate. Volatility shocks and weakening risk appetite are factors that could prove constructive for the dollar.
The fund closed as of February 3, 2020, and as it closed, primary consideration was given to clients and their interests. There was no unusual market action that affected our trading of the portfolio during liquidation. All fund assets were subsequently redeemed or distributed to fund shareholders.
| 10
LOOMIS SAYLES MULTI-ASSET INCOME FUND
Hypothetical Growth of $100,000 Investment in Class Y Shares1,5,6
December 31, 2009 through December 31, 2019
Top Ten Holdings as of December 31, 2019
| | | | | | |
| | | Security Name | | % of
Assets | |
| 1 | | Alerian MLP ETF | | | 5.06 | % |
| 2 | | Gol LuxCo S.A., 1st Lien Term Loan, 6.500%, 8/31/2020 | | | 2.41 | |
| 3 | | Standard Chartered PLC, (fixed rate to 4/02/2023, variable rate thereafter), 7.750% | | | 2.30 | |
| 4 | | Apple, Inc. | | | 1.98 | |
| 5 | | HSBC Holdings PLC, (fixed rate to 3/23/2023, variable rate thereafter), 6.250% | | | 1.92 | |
| 6 | | Royal Bank of Scotland Group PLC, (fixed rate to 8/10/2025, variable rate thereafter), 8.000% | | | 1.87 | |
| 7 | | Banco BTG Pactual SA, (fixed rate to 2/15/2024, variable rate thereafter), 7.750%, 2/15/2029 | | | 1.86 | |
| 8 | | Credit Agricole S.A., (fixed rate to 1/23/2024, variable rate thereafter), 7.875% | | | 1.85 | |
| 9 | | Microsoft Corp. | | | 1.76 | |
| 10 | | Banco Bilbao Vizcaya Argentaria S.A., (fixed rate to 11/16/2027, variable rate thereafter), 6.125% | | | 1.43 | |
The portfolio is actively managed and holdings are subject to change. There is no guarantee the Fund continues to invest in the securities referenced. The holdings listed exclude any temporary cash investments.
11 |
Average Annual Total Returns — December 31, 20195,6
| | | | | | | | | | | | | | | | | | | | | | | | |
| | | | | | |
| | | | | | | | | | | | Life of
| | | Expense Ratios7 | |
| | | 1 Year | | | 5 Years | | | 10 Years | | | Class N | | | Gross | | | Net | |
| | | | | | | |
| Class Y (Inception 12/3/12)1 | | | | | | | | | | | | | | | | | | | | | | | | |
| NAV | | | 15.80 | % | | | 5.18 | % | | | 8.13 | % | | | — | % | | | 0.89 | % | | | 0.75 | % |
| | | | | | | |
| Class A (Inception 11/17/05) | | | | | | | | | | | | | | | | | | | | | | | | |
| NAV | | | 15.39 | | | | 4.92 | | | | 7.98 | | | | — | | | | 1.14 | | | | 1.00 | |
| With 4.25% Maximum Sales Charge | | | 10.51 | | | | 4.00 | | | | 7.52 | | | | — | | | | | | | | | |
| | | | | | | |
| Class C (Inception 11/17/05) | | | | | | | | | | | | | | | | | | | | | | | | |
| NAV | | | 14.59 | | | | 4.14 | | | | 7.18 | | | | — | | | | 1.89 | | | | 1.75 | |
| With CDSC2 | | | 13.59 | | | | 4.14 | | | | 7.18 | | | | — | | | | | | | | | |
| | | | | | | |
| Class N (Inception 8/31/15) | | | | | | | | | | | | | | | | | | | | | | | | |
| NAV | | | 15.86 | | | | — | | | | — | | | | 6.98 | | | | 1.38 | | | | 0.70 | |
| | | | | | | |
| Comparative Performance | | | | | | | | | | | | | | | | | | | | | | | | |
| Bloomberg Barclays U.S. Aggregate Bond Index3 | | | 8.72 | | | | 3.05 | | | | 3.75 | | | | 3.40 | | | | | | | | | |
| S&P 500® Index4 | | | 31.49 | | | | 11.70 | | | | 13.56 | | | | 14.32 | | | | | | | | | |
Performance data shown represents past performance and is no guarantee of, and not necessarily indicative of, future results. Total return and value will vary, and you may have a gain or loss when shares are sold. Current performance may be lower or higher than quoted. For most recent month-end performance, visit im.natixis.com. Performance for other share classes will be greater or less than shown based on differences in fees and sales charges. You may not invest directly in an index. Performance for periods less than one year is cumulative, not annualized. Returns reflect changes in share price and reinvestment of dividends and capital gains, if any. The table(s) do not reflect taxes shareholders might owe on any fund distributions or when they redeem their shares.
| 1 | Prior to the inception of Class Y shares (12/3/2012), performance is that of Class A shares and reflects the higher net expenses of that share class. |
| 2 | Class C share performance assumes a 1.00% contingent deferred sales charge (“CDSC”) applied when you sell shares within one year of purchase. |
| 3 | The Bloomberg Barclays U.S. Aggregate Bond Index is an unmanaged index that covers the U.S.-dollar denominated, investment grade, fixed-rate, taxable bond market of SEC-registered securities. The index includes bonds from the Treasury, government-related, corporate, mortgage-backed securities, asset-backed securities, and collateralized mortgage-backed securities sectors. |
| 4 | S&P 500® Index is a widely recognized measure of U.S. stock market performance. It is an unmanaged index of 500 common stocks chosen for market size, liquidity, and industry group representation, among other factors. |
| 5 | Fund performance has been increased by fee waivers and/or expense reimbursements, if any, without which performance would have been lower. |
| 6 | Prior to the stock market close August 31, 2015, the Fund had multiple subadvisers. The performance results shown above for the periods prior to the stock market close August 31, 2015 reflect results achieved by those subadvisers using different investment strategies. |
| 7 | Expense ratios are as shown in the Fund’s prospectus in effect as of the date of this report. The expense ratios for the current reporting period can be found in the Financial Highlights section of this report under Ratios to Average Net Assets. Net expenses reflect contractual expense limitations set to expire on 4/30/20. When a Fund’s expenses are below the limitation, gross and net expense ratios will be the same. See Note 6 of the Notes to Financial Statements for more information about the Fund’s expense limitations. |
| 12
ADDITIONAL INFORMATION
The views expressed in this report reflect those of the portfolio managers as of the dates indicated. The managers’ views are subject to change at any time without notice based on changes in market or other conditions. References to specific securities or industries should not be regarded as investment advice. Because the Fund is actively managed, there is no assurance that they will continue to invest in the securities or industries mentioned.
All investing involves risk, including the risk of loss. There is no assurance that any investment will meet its performance objectives or that losses will be avoided.
ADDITIONAL INDEX INFORMATION
This document may contain references to third party copyrights, indexes, and trademarks, each of which is the property of its respective owner. Such owner is not affiliated with Natixis Investment Managers or any of its related or affiliated companies (collectively “Natixis Affiliates”) and does not sponsor, endorse or participate in the provision of any Natixis Affiliates services, funds or other financial products.
The index information contained herein is derived from third parties and is provided on an “as is” basis. The user of this information assumes the entire risk of use of this information. Each of the third party entities involved in compiling, computing or creating index information disclaims all warranties (including, without limitation, any warranties of originality, accuracy, completeness, timeliness, non-infringement, merchantability and fitness for a particular purpose) with respect to such information.
PROXY VOTING INFORMATION
A description of the Natixis Funds’ proxy voting policies and procedures is available without charge, upon request, by calling Natixis Funds at 800-225-5478; on the Natixis Funds’ website at im.natixis.com; and on the Securities and Exchange Commission’s (“SEC’s”) website at www.sec.gov. Information regarding how the funds voted proxies relating to portfolio securities during the most recent 12-month period ended June 30 is available from the Natixis Funds’ website and the SEC’s website.
QUARTERLY PORTFOLIO SCHEDULES
Natixis Funds file complete schedules of portfolio holdings with the SEC for the first and third quarters of each fiscal year on Form N-PORT. The Funds’ Forms N-PORT reports are available on the SEC’s website at www.sec.gov.
CFA® and Chartered Financial Analyst® are registered trademarks owned by the CFA Institute.
13 |
UNDERSTANDING FUND EXPENSES
As a mutual fund shareholder, you incur different costs: transaction costs, including sales charges (loads) on purchases and contingent deferred sales charges on redemptions, and ongoing costs, including management fees, distribution and/or service fees (12b-1 fees), and other fund expenses. Certain exemptions may apply. These costs are described in more detail in the Funds’ prospectuses. The following examples are intended to help you understand the ongoing costs of investing in the Funds and help you compare these with the ongoing costs of investing in other mutual funds.
The first line in the table of each class of Fund shares shows the actual account values and actual Fund expenses you would have paid on a $1,000 investment in the Fund from July 1, 2019 through December 31, 2019. To estimate the expenses you paid over the period, simply divide your account value by $1,000 (for example $8,600 account value divided by $1,000 = 8.6) and multiply the result by the number in the Expenses Paid During Period column as shown below for your class.
The second line in the table of each class of Fund shares provides information about hypothetical account values and hypothetical expenses based on the Fund’s actual expense ratios and an assumed rate of return of 5% per year before expenses, which is not the Fund’s actual return. The hypothetical account values and expenses may not be used to estimate the actual ending account balance or expenses you paid on your investment for the period. You may use this information to compare the ongoing costs of investing in the Fund to other funds. To do so, compare this 5% hypothetical example with the 5% hypothetical examples that appear in the shareholder reports of the other funds.
Please note that the expenses shown reflect ongoing costs only, and do not include any transaction costs, such as sales charges. Therefore, the second line in the table of each fund is useful in comparing ongoing costs only, and will not help you determine the relative costs of owning different funds. If transaction costs were included, total costs would be higher.
| 14
| | | | | | | | | | | | |
| LOOMIS SAYLES HIGH INCOME FUND | | BEGINNING
ACCOUNT VALUE
7/1/2019 | | | ENDING
ACCOUNT VALUE
12/31/2019 | | | EXPENSES PAID
DURING PERIOD*
7/1/2019 – 12/31/2019 | |
| Class A | | | | | | | | | | | | |
| Actual | | | $1,000.00 | | | | $1,022.20 | | | | $5.10 | |
| Hypothetical (5% return before expenses) | | | $1,000.00 | | | | $1,020.16 | | | | $5.09 | |
| Class C | | | | | | | | | | | | |
| Actual | | | $1,000.00 | | | | $1,020.50 | | | | $8.91 | |
| Hypothetical (5% return before expenses) | | | $1,000.00 | | | | $1,016.38 | | | | $8.89 | |
| Class N | | | | | | | | | | | | |
| Actual | | | $1,000.00 | | | | $1,023.80 | | �� | | $3.57 | |
| Hypothetical (5% return before expenses) | | | $1,000.00 | | | | $1,021.68 | | | | $3.57 | |
| Class Y | | | | | | | | | | | | |
| Actual | | | $1,000.00 | | | | $1,026.00 | | | | $3.83 | |
| Hypothetical (5% return before expenses) | | | $1,000.00 | | | | $1,021.43 | | | | $3.82 | |
| * | Expenses are equal to the Fund’s annualized expense ratio (after waiver/reimbursement): 1.00%, 1.75%, 0.70% and 0.75% for Class A, C, N and Y, respectively, multiplied by the average account value over the period, multiplied by the number of days in the most recent fiscal half-year (184), divided by 365 (to reflect the half-year period). |
| | | | | | | | | | | | |
LOOMIS SAYLES INVESTMENT GRADE
BOND FUND | | BEGINNING
ACCOUNT VALUE
7/1/2019 | | | ENDING
ACCOUNT VALUE
12/31/2019 | | | EXPENSES PAID
DURING PERIOD*
7/1/2019 – 12/31/2019 | |
| Class A | | | | | | | | | | | | |
| Actual | | | $1,000.00 | | | | $1,024.40 | | | | $3.88 | |
| Hypothetical (5% return before expenses) | | | $1,000.00 | | | | $1,021.37 | | | | $3.87 | |
| Class C | | | | | | | | | | | | |
| Actual | | | $1,000.00 | | | | $1,020.60 | | | | $7.69 | |
| Hypothetical (5% return before expenses) | | | $1,000.00 | | | | $1,017.59 | | | | $7.68 | |
| Class N | | | | | | | | | | | | |
| Actual | | | $1,000.00 | | | | $1,026.00 | | | | $2.35 | |
| Hypothetical (5% return before expenses) | | | $1,000.00 | | | | $1,022.89 | | | | $2.35 | |
| Class Y | | | | | | | | | | | | |
| Actual | | | $1,000.00 | | | | $1,025.70 | | | | $2.60 | |
| Hypothetical (5% return before expenses) | | | $1,000.00 | | | | $1,022.64 | | | | $2.60 | |
| Admin Class | | | | | | | | | | | | |
| Actual | | | $1,000.00 | | | | $1,023.20 | | | | $5.15 | |
| Hypothetical (5% return before expenses) | | | $1,000.00 | | | | $1,020.11 | | | | $5.14 | |
| * | Expenses are equal to the Fund’s annualized expense ratio (after waiver/reimbursement): 0.76%, 1.51%, 0.46%, 0.51% and 1.01% for Class A, C, N, Y and Admin Class, respectively, multiplied by the average account value over the period, multiplied by the number of days in the most recent fiscal half-year (184), divided by 365 (to reflect the half-year period). |
15 |
| | | | | | | | | | | | |
LOOMIS SAYLES MULTI-ASSET INCOME
FUND | | BEGINNING
ACCOUNT VALUE
7/1/2019 | | | ENDING
ACCOUNT VALUE
12/31/2019 | | | EXPENSES PAID
DURING PERIOD*
7/1/2019 – 12/31/2019 | |
| Class A | | | | | | | | | | | | |
| Actual | | | $1,000.00 | | | | $1,055.70 | | | | $4.92 | |
| Hypothetical (5% return before expenses) | | | $1,000.00 | | | | $1,020.42 | | | | $4.84 | |
| Class C | | | | | | | | | | | | |
| Actual | | | $1,000.00 | | | | $1,052.60 | | | | $8.80 | |
| Hypothetical (5% return before expenses) | | | $1,000.00 | | | | $1,016.64 | | | | $8.64 | |
| Class N | | | | | | | | | | | | |
| Actual | | | $1,000.00 | | | | $1,057.70 | | | | $3.37 | |
| Hypothetical (5% return before expenses) | | | $1,000.00 | | | | $1,021.93 | | | | $3.31 | |
| Class Y | | | | | | | | | | | | |
| Actual | | | $1,000.00 | | | | $1,057.50 | | | | $3.63 | |
| Hypothetical (5% return before expenses) | | | $1,000.00 | | | | $1,021.68 | | | | $3.57 | |
| * | Expenses are equal to the Fund’s annualized expense ratio (after waiver/reimbursement): 0.95%, 1.70%, 0.65% and 0.70% for Class A, C, N and Y, respectively, multiplied by the average account value over the period, multiplied by the number of days in the most recent fiscal half-year (184), divided by 365 (to reflect the half-year period). |
| 16
Portfolio of Investments – as of December 31, 2019
Loomis Sayles High Income Fund
| | | | | | | | |
Principal
Amount | | | Description | | Value (†) | |
| | Bonds and Notes — 93.6% of Net Assets | |
| | Non-Convertible Bonds — 87.8% | |
| | | | ABS Home Equity — 0.2% | |
| $ | 70,254 | | | Banc of America Alternative Loan Trust, Series2003-8, Class 1CB1, 5.500%, 10/25/2033 | | $ | 73,692 | |
| | 53,688 | | | Banc of America Funding Trust, Series2007-4, Class 5A1, 5.500%, 11/25/2034 | | | 53,667 | |
| | 159,769 | | | DSLA Mortgage Loan Trust, Series2005-AR5, Class 2A1A,1-month LIBOR + 0.330%, 2.094%, 9/19/2045(a) | | | 130,510 | |
| | | | | | | | |
| | | | | | | 257,869 | |
| | | | | | | | |
| | | | Aerospace & Defense — 2.4% | |
| | 740,000 | | | Bombardier, Inc., 6.000%, 10/15/2022, 144A | | | 739,778 | |
| | 638,000 | | | Leonardo U.S. Holdings, Inc., 6.250%, 1/15/2040, 144A | | | 700,218 | |
| | 383,000 | | | Leonardo U.S. Holdings, Inc., 7.375%, 7/15/2039, 144A | | | 475,839 | |
| | 60,000 | | | Moog, Inc., 4.250%, 12/15/2027, 144A | | | 61,056 | |
| | 365,000 | | | Signature Aviation U.S. Holdings, Inc., 4.000%, 3/01/2028, 144A | | | 359,999 | |
| | 1,155,000 | | | TransDigm, Inc., 6.250%, 3/15/2026, 144A | | | 1,250,415 | |
| | | | | | | | |
| | | | | | | 3,587,305 | |
| | | | | | | | |
| | | | Airlines — 0.5% | |
| | 535,000 | | | Latam Finance Ltd., 6.875%, 4/11/2024, 144A | | | 565,233 | |
| | 200,000 | | | Latam Finance Ltd., 7.000%, 3/01/2026, 144A | | | 216,502 | |
| | | | | | | | |
| | | | | | | 781,735 | |
| | | | | | | | |
| | | | Automotive — 1.2% | |
| | 195,000 | | | Allison Transmission, Inc., 5.000%, 10/01/2024, 144A | | | 199,631 | |
| | 510,000 | | | Allison Transmission, Inc., 5.875%, 6/01/2029, 144A | | | 558,450 | |
| | 285,000 | | | Dana Financing Luxembourg S.a.r.l., 5.750%, 4/15/2025, 144A | | | 297,825 | |
| | 255,000 | | | Delphi Technologies PLC, 5.000%, 10/01/2025, 144A | | | 235,875 | |
| | 115,000 | | | Goodyear Tire & Rubber Co. (The), 5.000%, 5/31/2026 | | | 119,600 | |
| | 420,000 | | | Midas Intermediate Holdco II LLC/Midas Intermediate Holdco II Finance, Inc., 7.875%, 10/01/2022, 144A | | | 383,250 | |
| | | | | | | | |
| | | | | | | 1,794,631 | |
| | | | | | | | |
| | | | Banking — 3.0% | |
| | 700,000 | | | Ally Financial, Inc., 3.875%, 5/21/2024 | | | 733,250 | |
| | 1,730,000 | | | Ally Financial, Inc., 4.625%, 3/30/2025 | | | 1,872,725 | |
| | 485,000 | | | Ally Financial, Inc., 5.750%, 11/20/2025 | | | 542,594 | |
| | 120,000 | | | CIT Group, Inc., 4.125%, 3/09/2021 | | | 122,263 | |
| | 425,000 | | | Deutsche Bank AG, (fixed rate to 12/01/2027, variable rate thereafter), 4.875%, 12/01/2032 | | | 400,563 | |
| | 470,000 | | | Intesa Sanpaolo SpA, 5.017%, 6/26/2024, 144A | | | 493,864 | |
| | 265,000 | | | Intesa Sanpaolo SpA, 5.710%, 1/15/2026, 144A | | | 286,848 | |
| | | | | | | | |
| | | | | | | 4,452,107 | |
| | | | | | | | |
| | | | Building Materials — 2.2% | |
| | 280,000 | | | American Builders & Contractors Supply Co., Inc., 4.000%, 1/15/2028, 144A | | | 284,200 | |
| | 230,000 | | | Cemex SAB de CV, 5.700%, 1/11/2025, 144A | | | 236,327 | |
| | 350,000 | | | Cemex SAB de CV, 7.750%, 4/16/2026, 144A | | | 380,625 | |
| | 420,000 | | | James Hardie International Finance Ltd., 4.750%, 1/15/2025, 144A | | | 435,750 | |
See accompanying notes to financial statements.
17 |
Portfolio of Investments – as of December 31, 2019
Loomis Sayles High Income Fund – (continued)
| | | | | | | | |
Principal
Amount | | | Description | | Value (†) | |
| | | | Building Materials — continued | |
| $ | 445,000 | | | James Hardie International Finance Ltd., 5.000%, 1/15/2028, 144A | | $ | 467,250 | |
| | 360,000 | | | JELD-WEN, Inc., 4.625%, 12/15/2025, 144A | | | 370,620 | |
| | 160,000 | | | JELD-WEN, Inc., 4.875%, 12/15/2027, 144A | | | 163,600 | |
| | 110,000 | | | Summit Materials LLC/Summit Materials Finance Corp., 6.125%, 7/15/2023 | | | 111,788 | |
| | 685,000 | | | U.S. Concrete, Inc., 6.375%, 6/01/2024 | | | 714,969 | |
| | | | | | | | |
| | | | | | | 3,165,129 | |
| | | | | | | | |
| | | | Cable Satellite — 9.2% | |
| | 2,700,000 | | | CCO Holdings LLC/CCO Holdings Capital Corp., 4.750%, 3/01/2030, 144A | | | 2,748,681 | |
| | 450,000 | | | CCO Holdings LLC/CCO Holdings Capital Corp., 5.375%, 5/01/2025, 144A | | | 464,625 | |
| | 405,000 | | | CCO Holdings LLC/CCO Holdings Capital Corp., 5.375%, 6/01/2029, 144A | | | 433,350 | |
| | 865,000 | | | CCO Holdings LLC/CCO Holdings Capital Corp., 5.750%, 2/15/2026, 144A | | | 912,592 | |
| | 1,360,000 | | | CSC Holdings LLC, 5.500%, 4/15/2027, 144A | | | 1,460,436 | |
| | 390,000 | | | CSC Holdings LLC, 6.500%, 2/01/2029, 144A | | | 434,850 | |
| | 415,000 | | | DISH DBS Corp., 7.750%, 7/01/2026 | | | 439,647 | |
| | 70,000 | | | Intelsat Jackson Holdings S.A., 5.500%, 8/01/2023 | | | 60,133 | |
| | 195,000 | | | Intelsat Jackson Holdings S.A., 8.500%, 10/15/2024, 144A | | | 177,612 | |
| | 430,000 | | | Intelsat Jackson Holdings S.A., 9.750%, 7/15/2025, 144A | | | 397,750 | |
| | 355,000 | | | Sirius XM Radio, Inc., 5.000%, 8/01/2027, 144A | | | 374,525 | |
| | 1,400,000 | | | Telenet Finance Luxembourg Notes S.a.r.l., 5.500%, 3/01/2028, 144A | | | 1,498,518 | |
| | 265,000 | | | Virgin Media Finance PLC, 6.000%, 10/15/2024, 144A | | | 272,950 | |
| | 1,070,000 | | | Virgin Media Secured Finance PLC, 5.500%, 5/15/2029, 144A | | | 1,132,862 | |
| | 2,570,000 | | | Ziggo BV, 5.500%, 1/15/2027, 144A | | | 2,730,625 | |
| | | | | | | | |
| | | | | | | 13,539,156 | |
| | | | | | | | |
| | | | Chemicals — 1.3% | |
| | 1,510,000 | | | Hercules LLC, 6.500%, 6/30/2029 | | | 1,593,050 | |
| | 245,000 | | | SASOL Financing USA LLC, 5.875%, 3/27/2024 | | | 265,301 | |
| | | | | | | | |
| | | | | | | 1,858,351 | |
| | | | | | | | |
| | | | Construction Machinery — 0.8% | |
| | 615,000 | | | United Rentals North America, Inc., 4.625%, 10/15/2025 | | | 632,282 | |
| | 15,000 | | | United Rentals North America, Inc., 5.500%, 5/15/2027 | | | 16,069 | |
| | 235,000 | | | United Rentals North America, Inc., 5.875%, 9/15/2026 | | | 252,096 | |
| | 195,000 | | | United Rentals North America, Inc., 6.500%, 12/15/2026 | | | 214,317 | |
| | | | | | | | |
| | | | | | | 1,114,764 | |
| | | | | | | | |
| | | | Consumer Cyclical Services — 1.2% | |
| | 350,000 | | | ServiceMaster Co. LLC (The), 7.450%, 8/15/2027 | | | 395,500 | |
| | 180,000 | | | Staples, Inc., 7.500%, 4/15/2026, 144A | | | 186,750 | |
| | 680,000 | | | Uber Technologies, Inc., 7.500%, 11/01/2023, 144A | | | 710,600 | |
| | 345,000 | | | Uber Technologies, Inc., 7.500%, 9/15/2027, 144A | | | 353,949 | |
| | 150,000 | | | Uber Technologies, Inc., 8.000%, 11/01/2026, 144A | | | 156,375 | |
| | | | | | | | |
| | | | | | | 1,803,174 | |
| | | | | | | | |
| | | | Consumer Products — 0.2% | |
| | 115,000 | | | Mattel, Inc., 5.875%, 12/15/2027, 144A | | | 121,181 | |
| | 175,000 | | | Prestige Brands, Inc., 5.125%, 1/15/2028, 144A | | | 183,313 | |
| | | | | | | | |
| | | | | | | 304,494 | |
| | | | | | | | |
See accompanying notes to financial statements.
| 18
Portfolio of Investments – as of December 31, 2019
Loomis Sayles High Income Fund – (continued)
| | | | | | | | |
Principal
Amount | | | Description | | Value (†) | |
| | | | Electric — 3.2% | |
| $ | 125,000 | | | AES Corp. (The), 5.125%, 9/01/2027 | | $ | 133,438 | |
| | 479,000 | | | AES Corp. (The), 5.500%, 4/15/2025 | | | 495,262 | |
| | 150,000 | | | AES Corp. (The), 6.000%, 5/15/2026 | | | 159,750 | |
| | 1,105,000 | | | Calpine Corp., 5.125%, 3/15/2028, 144A | | | 1,127,874 | |
| | 1,502,000 | | | Enel SpA, (fixed rate to 9/24/2023, variable rate thereafter), 8.750%, 9/24/2073, 144A | | | 1,762,972 | |
| | 1,055,000 | | | Vistra Operations Co. LLC, 3.700%, 1/30/2027, 144A | | | 1,048,319 | |
| | | | | | | | |
| | | | | | | 4,727,615 | |
| | | | | | | | |
| | | | Finance Companies — 3.2% | |
| | 820,000 | | | Navient Corp., 6.500%, 6/15/2022 | | | 888,675 | |
| | 315,000 | | | Provident Funding Associates LP/PFG Finance Corp., 6.375%, 6/15/2025, 144A | | | 308,700 | |
| | 1,305,000 | | | Quicken Loans, Inc., 5.250%, 1/15/2028, 144A | | | 1,350,675 | |
| | 710,000 | | | Quicken Loans, Inc., 5.750%, 5/01/2025, 144A | | | 733,962 | |
| | 185,000 | | | Springleaf Finance Corp., 6.875%, 3/15/2025 | | | 210,438 | |
| | 700,000 | | | Springleaf Finance Corp., 7.125%, 3/15/2026 | | | 809,340 | |
| | 405,000 | | | Unifin Financiera SAB de CV, 7.250%, 9/27/2023, 144A | | | 421,795 | |
| | | | | | | | |
| | | | | | | 4,723,585 | |
| | | | | | | | |
| | | | Financial Other — 1.5% | |
| | 745,000 | | | Icahn Enterprises LP/Icahn Enterprises Finance Corp., 4.750%, 9/15/2024, 144A | | | 765,487 | |
| | 635,000 | | | Icahn Enterprises LP/Icahn Enterprises Finance Corp., 5.250%, 5/15/2027, 144A | | | 649,370 | |
| | 465,000 | | | Nationstar Mortgage Holdings, Inc., 8.125%, 7/15/2023, 144A | | | 492,212 | |
| | 330,000 | | | Nationstar Mortgage Holdings, Inc., 9.125%, 7/15/2026, 144A | | | 365,475 | |
| | | | | | | | |
| | | | | | | 2,272,544 | |
| | | | | | | | |
| | | | Food & Beverage — 2.2% | |
| | 245,000 | | | BRF S.A., 4.875%, 1/24/2030, 144A | | | 252,659 | |
| | 330,000 | | | JBS USA LUX S.A./JBS USA Finance, Inc., 5.750%, 6/15/2025, 144A | | | 341,550 | |
| | 285,000 | | | JBS USA LUX S.A./JBS USA Food Co./JBS USA Finance, Inc., 5.500%, 1/15/2030, 144A | | | 306,118 | |
| | 385,000 | | | Marfrig Holdings Europe BV, Class B, 8.000%, 6/08/2023, 144A | | | 401,081 | |
| | 250,000 | | | NBM U.S Holdings, Inc., 7.000%, 5/14/2026, 144A | | | 270,753 | |
| | 225,000 | | | Performance Food Group, Inc., 5.500%, 10/15/2027, 144A | | | 240,469 | |
| | 280,000 | | | Pilgrim’s Pride Corp., 5.750%, 3/15/2025, 144A | | | 289,416 | |
| | 540,000 | | | Pilgrim’s Pride Corp., 5.875%, 9/30/2027, 144A | | | 583,875 | |
| | 550,000 | | | Post Holdings, Inc., 5.750%, 3/01/2027, 144A | | | 589,875 | |
| | | | | | | | |
| | | | | | | 3,275,796 | |
| | | | | | | | |
| | | | Gaming — 1.8% | |
| | 375,000 | | | Boyd Gaming Corp., 4.750%, 12/01/2027, 144A | | | 389,531 | |
| | 175,000 | | | Boyd Gaming Corp., 6.375%, 4/01/2026 | | | 188,289 | |
| | 200,000 | | | Melco Resorts Finance Ltd., 5.375%, 12/04/2029, 144A | | | 205,187 | |
| | 210,000 | | | MGM Growth Properties Operating Partnership LP/MGP FinanceCo-Issuer, Inc., 4.500%, 1/15/2028 | | | 218,925 | |
| | 345,000 | | | MGM Growth Properties Operating Partnership LP/MGP FinanceCo-Issuer, Inc., 5.750%, 2/01/2027, 144A | | | 384,675 | |
| | 380,000 | | | MGM Resorts International, 7.750%, 3/15/2022 | | | 425,125 | |
| | 155,000 | | | Scientific Games International, Inc., 7.000%, 5/15/2028, 144A | | | 166,238 | |
See accompanying notes to financial statements.
19 |
Portfolio of Investments – as of December 31, 2019
Loomis Sayles High Income Fund – (continued)
| | | | | | | | |
Principal
Amount | | | Description | | Value (†) | |
| | | | Gaming — continued | |
| $ | 160,000 | | | Scientific Games International, Inc., 7.250%, 11/15/2029, 144A | | $ | 173,600 | |
| | 250,000 | | | Wynn Macau Ltd., 5.125%, 12/15/2029, 144A | | | 255,127 | |
| | 215,000 | | | Wynn Resorts Finance LLC/Wynn Resorts Capital Corp., 5.125%, 10/01/2029, 144A | | | 230,588 | |
| | | | | | | | |
| | | | | | | 2,637,285 | |
| | | | | | | | |
| | | | Government Owned – No Guarantee — 1.0% | |
| | 550,000 | | | Petrobras Global Finance BV, 5.750%, 2/01/2029 | | | 620,400 | |
| | 225,000 | | | Petrobras Global Finance BV, 6.900%, 3/19/2049 | | | 263,925 | |
| | 710,000 | | | YPF S.A., 6.950%, 7/21/2027, 144A | | | 631,900 | |
| | | | | | | | |
| | | | | | | 1,516,225 | |
| | | | | | | | |
| | | | Health Insurance — 0.8% | |
| | 630,000 | | | Centene Corp., 4.250%, 12/15/2027, 144A | | | 648,112 | |
| | 290,000 | | | Centene Corp., 4.625%, 12/15/2029, 144A | | | 304,892 | |
| | 210,000 | | | Centene Corp., 4.750%, 1/15/2025, 144A | | | 218,133 | |
| | | | | | | | |
| | | | | | | 1,171,137 | |
| | | | | | | | |
| | | | Healthcare — 6.0% | |
| | 590,000 | | | CHS/Community Health Systems, Inc., 6.250%, 3/31/2023 | | | 598,850 | |
| | 160,000 | | | CHS/Community Health Systems, Inc., 8.000%, 3/15/2026, 144A | | | 164,800 | |
| | 350,000 | | | Encompass Health Corp., 4.500%, 2/01/2028 | | | 362,688 | |
| | 365,000 | | | Encompass Health Corp., 4.750%, 2/01/2030 | | | 378,688 | |
| | 170,000 | | | HCA, Inc., 7.050%, 12/01/2027 | | | 201,450 | |
| | 655,000 | | | HCA, Inc., 7.500%, 12/15/2023 | | | 741,787 | |
| | 145,000 | | | HCA, Inc., 7.500%, 11/06/2033 | | | 182,700 | |
| | 590,000 | | | HCA, Inc., 7.690%, 6/15/2025 | | | 710,950 | |
| | 480,000 | | | HCA, Inc., 8.360%, 4/15/2024 | | | 583,200 | |
| | 820,000 | | | HCA, Inc., MTN, 7.580%, 9/15/2025 | | | 979,900 | |
| | 515,000 | | | HCA, Inc., MTN, 7.750%, 7/15/2036 | | | 612,850 | |
| | 95,000 | | | Hill Rom Holdings, Inc., 4.375%, 9/15/2027, 144A | | | 97,731 | |
| | 275,000 | | | Hologic, Inc., 4.375%, 10/15/2025, 144A | | | 283,938 | |
| | 140,000 | | | Hologic, Inc., 4.625%, 2/01/2028, 144A | | | 148,400 | |
| | 200,000 | | | IQVIA, Inc., 5.000%, 10/15/2026, 144A | | | 211,000 | |
| | 715,000 | | | MPH Acquisition Holdings LLC, 7.125%, 6/01/2024, 144A | | | 691,762 | |
| | 850,000 | | | Polaris Intermediate Corp., 9.250% PIK or 8.500% Cash, 12/01/2022, 144A(b) | | | 791,562 | |
| | 725,000 | | | Tenet Healthcare Corp., 4.625%, 7/15/2024 | | | 742,219 | |
| | 390,000 | | | Tenet Healthcare Corp., 5.125%, 5/01/2025 | | | 401,700 | |
| | | | | | | | |
| | | | | | | 8,886,175 | |
| | | | | | | | |
| | | | Home Construction — 1.7% | |
| | 1,200,000 | | | Corporacion GEO SAB de CV, 8.875%, 2/27/2022, 144A(e)(f)(h) | | | — | |
| | 230,000 | | | KB Home, 4.800%, 11/15/2029 | | | 235,175 | |
| | 800,000 | | | Lennar Corp., 4.750%, 5/30/2025 | | | 860,000 | |
| | 1,130,000 | | | PulteGroup, Inc., 5.500%, 3/01/2026 | | | 1,262,775 | |
| | 185,000 | | | Taylor Morrison Communities, Inc., 5.750%, 1/15/2028, 144A | | | 201,650 | |
| | | | | | | | |
| | | | | | | 2,559,600 | |
| | | | | | | | |
| | | | Independent Energy — 4.8% | |
| | 460,000 | | | Aker BP ASA, 5.875%, 3/31/2025, 144A | | | 488,750 | |
| | 685,000 | | | Baytex Energy Corp., 5.625%, 6/01/2024, 144A | | | 623,350 | |
See accompanying notes to financial statements.
| 20
Portfolio of Investments – as of December 31, 2019
Loomis Sayles High Income Fund – (continued)
| | | | | | | | |
Principal
Amount | | | Description | | Value (†) | |
| | | | Independent Energy — continued | |
| $ | 1,025,000 | | | Bruin E&P Partners LLC, 8.875%, 8/01/2023, 144A | | $ | 667,336 | |
| | 90,000 | | | California Resources Corp., 5.500%, 9/15/2021(c)(d) | | | 42,300 | |
| | 41,000 | | | California Resources Corp., 6.000%, 11/15/2024(c)(d) | | | 12,300 | |
| | 950,000 | | | California Resources Corp., 8.000%, 12/15/2022, 144A(c)(d) | | | 424,717 | |
| | 425,000 | | | Centennial Resource Production LLC, 6.875%, 4/01/2027, 144A | | | 442,000 | |
| | 195,000 | | | Denbury Resources, Inc., 7.750%, 2/15/2024, 144A | | | 172,575 | |
| | 375,000 | | | Gulfport Energy Corp., 6.000%, 10/15/2024 | | | 266,250 | |
| | 595,000 | | | Gulfport Energy Corp., 6.375%, 5/15/2025 | | | 377,825 | |
| | 365,000 | | | Gulfport Energy Corp., 6.375%, 1/15/2026 | | | 226,300 | |
| | 690,000 | | | Montage Resources Corp., 8.875%, 7/15/2023 | | | 636,525 | |
| | 302,000 | | | Oasis Petroleum, Inc., 6.875%, 3/15/2022 | | | 290,675 | |
| | 685,000 | | | Seven Generations Energy Ltd., 5.375%, 9/30/2025, 144A | | | 688,425 | |
| | 175,000 | | | Seven Generations Energy Ltd., 6.875%, 6/30/2023, 144A | | | 180,031 | |
| | 320,000 | | | SM Energy Co., 5.000%, 1/15/2024 | | | 304,800 | |
| | 425,000 | | | Vine Oil & Gas LP/Vine Oil & Gas Finance Corp., 9.750%, 4/15/2023, 144A | | | 212,500 | |
| | 50,000 | | | Viper Energy Partners LP, 5.375%, 11/01/2027, 144A | | | 52,000 | |
| | 405,000 | | | Whiting Petroleum Corp., 5.750%, 3/15/2021 | | | 383,130 | |
| | 50,000 | | | Whiting Petroleum Corp., 6.250%, 4/01/2023 | | | 42,085 | |
| | 805,000 | | | Whiting Petroleum Corp., 6.625%, 1/15/2026 | | | 548,591 | |
| | | | | | | | |
| | | | | | | 7,082,465 | |
| | | | | | | | |
| | | | Industrial Other — 0.1% | |
| | 130,000 | | | Installed Building Products, Inc., 5.750%, 2/01/2028, 144A | | | 138,938 | |
| | | | | | | | |
| | | | Integrated Energy — 0.1% | |
| | 200,000 | | | Geopark Ltd., 6.500%, 9/21/2024, 144A | | | 208,404 | |
| | | | | | | | |
| | | | Leisure — 0.4% | |
| | 330,000 | | | Live Nation Entertainment, Inc., 4.750%, 10/15/2027, 144A | | | 341,550 | |
| | 300,000 | | | Speedway Motorsports LLC/Speedway Funding II, Inc., 4.875%, 11/01/2027, 144A | | | 304,125 | |
| | | | | | | | |
| | | | | | | 645,675 | |
| | | | | | | | |
| | | | Life Insurance — 0.3% | |
| | 340,000 | | | CNO Financial Group, Inc., 5.250%, 5/30/2025 | | | 376,550 | |
| | | | | | | | |
| | | | Local Authorities — 0.2% | |
| | 325,000 | | | Provincia de Buenos Aires, 6.500%, 2/15/2023, 144A | | | 134,875 | |
| | 270,000 | | | Provincia de Buenos Aires, 7.875%, 6/15/2027, 144A | | | 114,750 | |
| | | | | | | | |
| | | | | | | 249,625 | |
| | | | | | | | |
| | | | Lodging — 1.2% | |
| | 150,000 | | | Hilton Domestic Operating Co., Inc., 4.250%, 9/01/2024 | | | 152,813 | |
| | 755,000 | | | Hilton Worldwide Finance LLC/Hilton Worldwide Finance Corp., 4.625%, 4/01/2025 | | | 775,762 | |
| | 565,000 | | | Marriott Ownership Resorts, Inc., 4.750%, 1/15/2028, 144A | | | 578,419 | |
| | 60,000 | | | Marriott Ownership Resorts, Inc./ILG LLC, 6.500%, 9/15/2026 | | | 65,325 | |
| | 255,000 | | | Wyndham Destinations, Inc., 4.625%, 3/01/2030, 144A | | | 255,637 | |
| | | | | | | | |
| | | | | | | 1,827,956 | |
| | | | | | | | |
See accompanying notes to financial statements.
21 |
Portfolio of Investments – as of December 31, 2019
Loomis Sayles High Income Fund – (continued)
| | | | | | | | |
Principal
Amount | | | Description | | Value (†) | |
| | | | Media Entertainment — 3.5% | |
| $ | 735,000 | | | AMC Networks, Inc., 4.750%, 8/01/2025 | | $ | 737,756 | |
| | 720,000 | | | Diamond Sports Group LLC/Diamond Sports Finance Co., 5.375%, 8/15/2026, 144A | | | 728,317 | |
| | 120,000 | | | Gray Television, Inc., 5.125%, 10/15/2024, 144A | | | 124,500 | |
| | 275,000 | | | iHeartCommunications, Inc., 4.750%, 1/15/2028, 144A | | | 281,875 | |
| | 99,931 | | | iHeartCommunications, Inc., 6.375%, 5/01/2026 | | | 108,425 | |
| | 346,125 | | | iHeartCommunications, Inc., 8.375%, 5/01/2027 | | | 382,468 | |
| | 395,000 | | | Meredith Corp., 6.875%, 2/01/2026 | | | 410,682 | |
| | 740,000 | | | Netflix, Inc., 4.875%, 4/15/2028 | | | 768,638 | |
| | 390,000 | | | Netflix, Inc., 5.375%, 11/15/2029, 144A | | | 415,342 | |
| | 105,000 | | | Nexstar Broadcasting, Inc., 5.625%, 7/15/2027, 144A | | | 110,649 | |
| | 805,000 | | | Nielsen Finance LLC/Nielsen Finance Co., 5.000%, 4/15/2022, 144A | | | 808,019 | |
| | 120,000 | | | Outfront Media Capital LLC/Outfront Media Capital Corp., 4.625%, 3/15/2030, 144A | | | 122,100 | |
| | 170,000 | | | Terrier Media Buyer, Inc., 8.875%, 12/15/2027, 144A | | | 179,775 | |
| | | | | | | | |
| | | | | | | 5,178,546 | |
| | | | | | | | |
| | | | Metals & Mining — 2.7% | |
| | 60,000 | | | Allegheny Technologies, Inc., 5.875%, 12/01/2027 | | | 63,000 | |
| | 190,000 | | | Commercial Metals Co., 4.875%, 5/15/2023 | | | 197,600 | |
| | 665,000 | | | First Quantum Minerals Ltd., 6.500%, 3/01/2024, 144A | | | 666,663 | |
| | 835,000 | | | First Quantum Minerals Ltd., 6.875%, 3/01/2026, 144A | | | 845,437 | |
| | 200,000 | | | First Quantum Minerals Ltd., 7.250%, 4/01/2023, 144A | | | 207,056 | |
| | 210,000 | | | First Quantum Minerals Ltd., 7.500%, 4/01/2025, 144A | | | 214,725 | |
| | 840,000 | | | FMG Resources (August 2006) Pty Ltd., 4.750%, 5/15/2022, 144A | | | 867,300 | |
| | 370,000 | | | FMG Resources (August 2006) Pty Ltd., 5.125%, 5/15/2024, 144A | | | 393,125 | |
| | 435,000 | | | Mineral Resources Ltd., 8.125%, 5/01/2027, 144A | | | 477,413 | |
| | | | | | | | |
| | | | | | | 3,932,319 | |
| | | | | | | | |
| | | | Midstream — 3.7% | |
| | 385,000 | | | EnLink Midstream Partners LP, 5.050%, 4/01/2045 | | | 304,150 | |
| | 205,000 | | | EnLink Midstream Partners LP, 5.450%, 6/01/2047 | | | 165,537 | |
| | 435,000 | | | EnLink Midstream Partners LP, 5.600%, 4/01/2044 | | | 352,350 | |
| | 1,265,000 | | | Hess Midstream Operations LP, 5.625%, 2/15/2026, 144A | | | 1,321,723 | |
| | 145,000 | | | NGL Energy Partners LP/NGL Energy Finance Corp., 6.125%, 3/01/2025 | | | 136,663 | |
| | 350,000 | | | NGL Energy Partners LP/NGL Energy Finance Corp., 7.500%, 11/01/2023 | | | 350,000 | |
| | 165,000 | | | NGPL PipeCo LLC, 4.375%, 8/15/2022, 144A | | | 171,391 | |
| | 700,000 | | | NGPL PipeCo LLC, 4.875%, 8/15/2027, 144A | | | 744,056 | |
| | 935,000 | | | Summit Midstream Holdings LLC/Summit Midstream Finance Corp., 5.500%, 8/15/2022 | | | 832,150 | |
| | 95,000 | | | Targa Resources Partners LP/Targa Resources Partners Finance Corp., 4.250%, 11/15/2023 | | | 95,950 | |
| | 640,000 | | | Targa Resources Partners LP/Targa Resources Partners Finance Corp., 5.250%, 5/01/2023 | | | 646,400 | |
| | 255,000 | | | Targa Resources Partners LP/Targa Resources Partners Finance Corp., 5.500%, 3/01/2030, 144A | | | 262,012 | |
| | | | | | | | |
| | | | | | | 5,382,382 | |
| | | | | | | | |
See accompanying notes to financial statements.
| 22
Portfolio of Investments – as of December 31, 2019
Loomis Sayles High Income Fund – (continued)
| | | | | | | | |
Principal
Amount | | | Description | | Value (†) | |
| | | | Non-Agency Commercial Mortgage-Backed Securities — 1.4% | |
| $ | 100,000 | | | CG-CCRE Commercial Mortgage Trust, Series2014-FL2, Class COL1,1-month LIBOR + 3.500%, 5.240%, 11/15/2031, 144A(a)(c)(d) | | $ | 99,782 | |
| | 225,000 | | | CG-CCRE Commercial Mortgage Trust, Series2014-FL2, Class COL2,1-month LIBOR + 4.500%, 6.240%, 11/15/2031, 144A(a)(c)(d) | | | 224,270 | |
| | 1,020,000 | | | Credit Suisse Mortgage Trust, Series2014-USA, Class E, 4.373%, 9/15/2037, 144A | | | 959,114 | |
| | 380,000 | | | Starwood Retail Property Trust, Series 2014-STAR, Class D,1-month LIBOR + 3.500%, 5.240%, 11/15/2027, 144A(a)(c)(d) | | | 322,911 | |
| | 420,000 | | | Starwood Retail Property Trust, Series 2014-STAR, Class E,1-month LIBOR + 4.400%, 6.140%, 11/15/2027, 144A(a)(c)(e)(f) | | | 325,435 | |
| | 125,000 | | | WFRBS Commercial Mortgage Trust, Series2012-C7, Class E, 4.813%, 6/15/2045, 144A(g) | | | 107,207 | |
| | | | | | | | |
| | | | | | | 2,038,719 | |
| | | | | | | | |
| | | | Oil Field Services — 1.8% | |
| | 935,000 | | | McDermott Technology Americas, Inc./McDermott Technology U.S., Inc., 10.625%, 5/01/2024, 144A(c)(d)(h) | | | 79,475 | |
| | 160,000 | | | Noble Holding International Ltd., 5.250%, 3/15/2042 | | | 57,970 | |
| | 1,145,000 | | | Shelf Drilling Holdings Ltd., 8.250%, 2/15/2025, 144A | | | 1,090,612 | |
| | 360,450 | | | Transocean Guardian Ltd., 5.875%, 1/15/2024, 144A | | | 368,560 | |
| | 22,250 | | | Transocean Pontus Ltd., 6.125%, 8/01/2025, 144A | | | 22,806 | |
| | 196,000 | | | Transocean Proteus Ltd., 6.250%, 12/01/2024, 144A | | | 201,880 | |
| | 695,000 | | | Transocean Sentry Ltd., 5.375%, 5/15/2023, 144A | | | 707,162 | |
| | 175,000 | | | Transocean, Inc., 7.500%, 1/15/2026, 144A | �� | | 172,813 | |
| | | | | | | | |
| | | | | | | 2,701,278 | |
| | | | | | | | |
| | | | Packaging — 0.3% | |
| | 370,000 | | | ARD Finance S.A., 7.250% PIK or 6.500% Cash, 6/30/2027, 144A(b) | | | 382,562 | |
| | | | | | | | |
| | | | Pharmaceuticals — 3.9% | |
| | 400,000 | | | Bausch Health Cos., Inc., 5.000%, 1/30/2028, 144A | | | 410,556 | |
| | 395,000 | | | Bausch Health Cos., Inc., 5.250%, 1/30/2030, 144A | | | 409,615 | |
| | 53,000 | | | Bausch Health Cos., Inc., 5.500%, 3/01/2023, 144A | | | 53,265 | |
| | 36,000 | | | Bausch Health Cos., Inc., 5.875%, 5/15/2023, 144A | | | 36,315 | |
| | 220,000 | | | Bausch Health Cos., Inc., 6.125%, 4/15/2025, 144A | | | 227,311 | |
| | 170,000 | | | Bausch Health Cos., Inc., 9.000%, 12/15/2025, 144A | | | 193,324 | |
| | 280,000 | | | Catalent Pharma Solutions, Inc., 4.875%, 1/15/2026, 144A | | | 289,800 | |
| | 600,000 | | | Endo Dac/Endo Finance LLC/Endo Finco, Inc., 6.000%, 2/01/2025, 144A | | | 404,628 | |
| | 445,000 | | | Mylan NV, 5.250%, 6/15/2046 | | | 500,519 | |
| | 75,000 | | | Mylan, Inc., 5.200%, 4/15/2048 | | | 83,973 | |
| | 150,000 | | | Mylan, Inc., 5.400%, 11/29/2043 | | | 166,238 | |
| | 1,065,000 | | | Teva Pharmaceutical Finance Netherlands III BV, 2.800%, 7/21/2023 | | | 986,020 | |
| | 65,000 | | | Teva Pharmaceutical Finance Netherlands III BV, 3.150%, 10/01/2026 | | | 54,112 | |
| | 2,155,000 | | | Teva Pharmaceutical Finance Netherlands III BV, 4.100%, 10/01/2046 | | | 1,551,600 | |
| | 405,000 | | | Teva Pharmaceutical Finance Netherlands III BV, 7.125%, 1/31/2025, 144A | | | 416,016 | |
| | | | | | | | |
| | | | | | | 5,783,292 | |
| | | | | | | | |
| | | | Property & Casualty Insurance — 0.6% | |
| | 45,000 | | | AmWINS Group, Inc., 7.750%, 7/01/2026, 144A | | | 49,731 | |
| | 780,000 | | | Ardonagh Midco 3 PLC, 8.625%, 7/15/2023, 144A | | | 774,150 | |
| | | | | | | | |
| | | | | | | 823,881 | |
| | | | | | | | |
See accompanying notes to financial statements.
23 |
Portfolio of Investments – as of December 31, 2019
Loomis Sayles High Income Fund – (continued)
| | | | | | | | |
Principal
Amount | | | Description | | Value (†) | |
| | | | Refining — 0.8% | |
| $ | 405,000 | | | Parkland Fuel Corp., 5.875%, 7/15/2027, 144A | | $ | 435,521 | |
| | 635,000 | | | Parkland Fuel Corp., 6.000%, 4/01/2026, 144A | | | 670,750 | |
| | | | | | | | |
| | | | | | | 1,106,271 | |
| | | | | | | | |
| | | | REITs – Diversified — 0.3% | |
| | 395,000 | | | iStar, Inc., 5.250%, 9/15/2022 | | | 405,369 | |
| | | | | | | | |
| | | | REITs – Hotels — 0.7% | |
| | 350,000 | | | Service Properties Trust, 4.750%, 10/01/2026 | | | 359,056 | |
| | 715,000 | | | Service Properties Trust, 4.350%, 10/01/2024 | | | 734,794 | |
| | | | | | | | |
| | | | | | | 1,093,850 | |
| | | | | | | | |
| | | | REITs – Mortgage — 0.7% | |
| | 720,000 | | | Ladder Capital Finance Holdings LLLP/Ladder Capital Finance Corp., 5.250%, 10/01/2025, 144A | | | 747,000 | |
| | 255,000 | | | Ladder Capital Finance Holdings LLLP/Ladder Capital Finance Corp., 5.875%, 8/01/2021, 144A | | | 258,506 | |
| | | | | | | | |
| | | | | | | 1,005,506 | |
| | | | | | | | |
| | | | REITs – Regional Malls — 0.5% | |
| | 695,000 | | | Brookfield Property REIT, Inc./BPR Cumulus LLC/BPR Nimbus LLC/GGSI Sellco LL, 5.750%, 5/15/2026, 144A | | | 733,225 | |
| | | | | | | | |
| | | | Restaurants — 1.0% | |
| | 400,000 | | | 1011778 B.C. ULC/New Red Finance, Inc., 4.375%, 1/15/2028, 144A | | | 401,000 | |
| | 890,000 | | | 1011778 B.C. ULC/New Red Finance, Inc., 5.000%, 10/15/2025, 144A | | | 918,925 | |
| | 110,000 | | | Yum Brands, Inc., 4.750%, 1/15/2030, 144A | | | 115,225 | |
| | | | | | | | |
| | | | | | | 1,435,150 | |
| | | | | | | | |
| | | | Retailers — 2.2% | |
| | 830,000 | | | Asbury Automotive Group, Inc., 6.000%, 12/15/2024 | | | 856,975 | |
| | 820,000 | | | Group 1 Automotive, Inc., 5.000%, 6/01/2022 | | | 831,275 | |
| | 480,000 | | | Hanesbrands, Inc., 4.875%, 5/15/2026, 144A | | | 508,200 | |
| | 505,000 | | | J.C. Penney Corp., Inc., 5.875%, 7/01/2023, 144A | | | 433,038 | |
| | 105,000 | | | Murphy Oil USA, Inc., 4.750%, 9/15/2029 | | | 110,887 | |
| | 385,000 | | | PetSmart, Inc., 7.125%, 3/15/2023, 144A | | | 377,300 | |
| | 125,000 | | | William Carter Co. (The), 5.625%, 3/15/2027, 144A | | | 134,375 | |
| | | | | | | | |
| | | | | | | 3,252,050 | |
| | | | | | | | |
| | | | Technology — 5.4% | |
| | 335,000 | | | Camelot Finance S.A., 4.500%, 11/01/2026, 144A | | | 344,213 | |
| | 120,000 | | | CDK Global, Inc., 5.250%, 5/15/2029, 144A | | | 128,700 | |
| | 595,000 | | | CDW LLC/CDM Finance Corp., 4.250%, 4/01/2028 | | | 624,006 | |
| | 825,000 | | | CommScope Technologies LLC, 5.000%, 3/15/2027, 144A | | | 775,500 | |
| | 100,000 | | | CommScope Technologies LLC, 6.000%, 6/15/2025, 144A | | | 100,113 | |
| | 1,455,000 | | | CommScope, Inc., 5.500%, 3/01/2024, 144A | | | 1,516,837 | |
| | 620,000 | | | Dun & Bradstreet Corp. (The), 6.875%, 8/15/2026, 144A | | | 684,325 | |
| | 690,000 | | | Iron Mountain, Inc., 4.875%, 9/15/2029, 144A | | | 700,902 | |
| | 140,000 | | | MSCI, Inc., 4.000%, 11/15/2029, 144A | | | 141,925 | |
| | 865,000 | | | Nokia Oyj, 4.375%, 6/12/2027 | | | 901,762 | |
| | 190,000 | | | Open Text Corp., 5.875%, 6/01/2026, 144A | | | 203,300 | |
See accompanying notes to financial statements.
| 24
Portfolio of Investments – as of December 31, 2019
Loomis Sayles High Income Fund – (continued)
| | | | | | | | |
Principal
Amount | | | Description | | Value (†) | |
| | | | Technology — continued | |
| $ | 275,000 | | | Sabre GLBL, Inc., 5.250%, 11/15/2023, 144A | | $ | 282,219 | |
| | 590,000 | | | SS&C Technologies, Inc., 5.500%, 9/30/2027, 144A | | | 629,825 | |
| | 900,000 | | | Western Digital Corp., 4.750%, 2/15/2026 | | | 938,250 | |
| | | | | | | | |
| | | | | | | 7,971,877 | |
| | | | | | | | |
| | | | Transportation Services — 0.2% | |
| | 275,000 | | | APL Ltd., 8.000%, 1/15/2024(c)(d) | | | 244,778 | |
| | | | | | | | |
| | | | Treasuries — 0.5% | |
| | 715,000 | | | U.S. Treasury Note, 2.125%, 5/31/2021 | | | 720,167 | |
| | | | | | | | |
| | | | Wireless — 4.2% | |
| | 1,000,000 | | | Altice Luxembourg S.A., 10.500%, 5/15/2027, 144A | | | 1,140,050 | |
| | 200,000 | | | Bharti Airtel Ltd., 4.375%, 6/10/2025 | | | 203,682 | |
| | 345,000 | | | Kenbourne Invest S.A., 6.875%, 11/26/2024, 144A | | | 358,862 | |
| | 200,000 | | | Millicom International Cellular S.A., 5.125%, 1/15/2028, 144A | | | 209,702 | |
| | 200,000 | | | Millicom International Cellular S.A., 6.250%, 3/25/2029, 144A | | | 220,658 | |
| | 810,000 | | | Sprint Capital Corp., 6.875%, 11/15/2028 | | | 872,775 | |
| | 20,000 | | | Sprint Capital Corp., 8.750%, 3/15/2032 | | | 24,275 | |
| | 890,000 | | | Sprint Corp., 7.125%, 6/15/2024 | | | 960,087 | |
| | 650,000 | | | Sprint Corp., 7.250%, 9/15/2021 | | | 687,375 | |
| | 1,085,000 | | | Sprint Corp., 7.875%, 9/15/2023 | | | 1,197,113 | |
| | 315,000 | | | T-Mobile USA, Inc., 4.500%, 2/01/2026 | | | 322,875 | |
| | | | | | | | |
| | | | | | | 6,197,454 | |
| | | | | | | | |
| | | | Wirelines — 2.7% | |
| | 130,000 | | | Cincinnati Bell Telephone Co. LLC, 6.300%, 12/01/2028 | | | 133,457 | |
| | 555,000 | | | Frontier Communications Corp., 8.000%, 4/01/2027, 144A | | | 579,975 | |
| | 725,000 | | | Frontier Communications Corp., 8.500%, 4/01/2026, 144A | | | 734,062 | |
| | 755,000 | | | Level 3 Financing, Inc., 4.625%, 9/15/2027, 144A | | | 772,969 | |
| | 120,000 | | | Telecom Italia Capital S.A., 7.200%, 7/18/2036 | | | 142,176 | |
| | 1,485,000 | | | Windstream Services LLC/Windstream Finance Corp., 8.625%, 10/31/2025, 144A | | | 1,425,600 | |
| | 505,000 | | | Windstream Services LLC/Windstream Finance Corp., 10.500%, 6/30/2024, 144A(h) | | | 196,950 | |
| | | | | | | | |
| | | | | | | 3,985,189 | |
| | | | | | | | |
| | | | TotalNon-Convertible Bonds
(Identified Cost $127,159,786) | | | 129,332,155 | |
| | | | | | | | |
| | | | | | | | |
| | Convertible Bonds — 5.8% | |
| | | | Cable Satellite — 1.3% | |
| | 1,515,000 | | | DISH Network Corp., 2.375%, 3/15/2024 | | | 1,383,346 | |
| | 580,000 | | | DISH Network Corp., 3.375%, 8/15/2026 | | | 557,902 | |
| | | | | | | | |
| | | | | | | 1,941,248 | |
| | | | | | | | |
| | | | Diversified Manufacturing — 0.5% | |
| | 755,000 | | | Greenbrier Cos., Inc. (The), 2.875%, 2/01/2024 | | | 728,818 | |
| | | | | | | | |
| | | | Independent Energy — 0.4% | |
| | 645,000 | | | Chesapeake Energy Corp., 5.500%, 9/15/2026 | | | 307,267 | |
| | 325,000 | | | PDC Energy, Inc., 1.125%, 9/15/2021 | | | 305,156 | |
| | 31,000 | | | Whiting Petroleum Corp., 1.250%, 4/01/2020 | | | 30,259 | |
| | | | | | | | |
| | | | | | | 642,682 | |
| | | | | | | | |
See accompanying notes to financial statements.
25 |
Portfolio of Investments – as of December 31, 2019
Loomis Sayles High Income Fund – (continued)
| | | | | | | | |
Principal
Amount | | | Description | | Value (†) | |
| | | | Oil Field Services — 0.5% | |
| $ | 510,000 | | | Nabors Industries, Inc., 0.750%, 1/15/2024 | | $ | 382,184 | |
| | 395,000 | | | Oil States International, Inc., 1.500%, 2/15/2023 | | | 354,552 | |
| | | | | | | | |
| | | | | | | 736,736 | |
| | | | | | | | |
| | | | Pharmaceuticals — 1.9% | |
| | 1,530,000 | | | BioMarin Pharmaceutical, Inc., 0.599%, 8/01/2024 | | | 1,616,443 | |
| | 220,000 | | | Dermira, Inc., 3.000%, 5/15/2022 | | | 202,586 | |
| | 230,000 | | | Flexion Therapeutics, Inc., 3.375%, 5/01/2024 | | | 245,390 | |
| | 275,000 | | | Intercept Pharmaceuticals, Inc., 3.250%, 7/01/2023 | | | 277,292 | |
| | 330,000 | | | PTC Therapeutics, Inc., 3.000%, 8/15/2022 | | | 380,682 | |
| | | | | | | | |
| | | | | | | 2,722,393 | |
| | | | | | | | |
| | | | Technology — 1.2% | |
| | 625,000 | | | Avaya Holdings Corp., 2.250%, 6/15/2023 | | | 550,856 | |
| | 655,000 | | | CalAmp Corp., 2.000%, 8/01/2025 | | | 544,403 | |
| | 245,000 | | | Palo Alto Networks, Inc., 0.750%, 7/01/2023 | | | 270,233 | |
| | 340,000 | | | Pure Storage, Inc., 0.125%, 4/15/2023 | | | 337,162 | |
| | | | | | | | |
| | | | | | | 1,702,654 | |
| | | | | | | | |
| | | | Total Convertible Bonds
(Identified Cost $8,963,204) | | | 8,474,531 | |
| | | | | | | | |
| | | | | | | | |
| | | | Total Bonds and Notes
(Identified Cost $136,122,990) | | | 137,806,686 | |
| | | | | | | | |
| | | | | | | | |
| | Senior Loans — 1.4% | |
| | | | Media Entertainment — 0.1% | |
| | 215,643 | | | iHeartCommunications, Inc., Exit Term Loan,1-month LIBOR + 4.000%, 5.691%, 5/01/2026(a) | | | 217,170 | |
| | | | | | | | |
| | | | Retailers — 0.6% | |
| | 921,922 | | | J.C. Penney Corp., Inc., 2016 Term Loan B,3-month LIBOR + 4.250%, 6.159%, 6/23/2023(a) | | | 810,425 | |
| | | | | | | | |
| | | | Transportation Services — 0.7% | |
| | 1,026,589 | | | Uber Technologies, Inc., 2018 Term Loan,1-month LIBOR + 4.000%, 5.745%, 4/04/2025(a) | | | 1,023,653 | |
| | | | | | | | |
| | | | Total Senior Loans
(Identified Cost $2,127,859) | | | 2,051,248 | |
| | | | | | | | |
| | | | | | | | |
| | Loan Participations — 0.3% | |
| | | | ABS Other — 0.3% | |
| | 397,714 | | | Harbour Aircraft Investments Ltd., Series2017-1, Class C,
8.000%, 11/15/2037
(Identified Cost $396,837) | | | 398,373 | |
| | | | | | | | |
| | | | | | | | |
| Shares | | | | | | |
| | Preferred Stocks — 1.6% | |
| | | | Food & Beverage — 1.5% | |
| | 21,381 | | | Bunge Ltd., 4.875% | | | 2,201,691 | |
| | | | | | | | |
See accompanying notes to financial statements.
| 26
Portfolio of Investments – as of December 31, 2019
Loomis Sayles High Income Fund – (continued)
| | | | | | | | |
Shares | | | Description | | Value (†) | |
| | | | Midstream — 0.1% | |
| | 988 | | | Chesapeake Energy Corp., 5.750%(c)(d)(f) | | $ | 169,412 | |
| | 20 | | | Chesapeake Energy Corp., 5.750%, 144A(c)(d)(f) | | | 3,430 | |
| | 137 | | | Chesapeake Energy Corp., 5.750%(c)(d)(f) | | | 23,508 | |
| | | | | | | | |
| | | | | | | 196,350 | |
| | | | | | | | |
| | | | Total Preferred Stocks
(Identified Cost $2,900,221) | | | 2,398,041 | |
| | | | | | | | |
| | | | | | | | |
| | Other Investments — 0.6% | |
| | | | Aircraft ABS — 0.6% | |
| | 100 | | | ECAF I Blocker Ltd.(c)(e)(f)(i)
(Identified Cost $1,000,000) | | | 864,000 | |
| | | | | | | | |
| | | | | | | | |
| | Common Stocks — 0.4% | |
| | | | Chemicals — 0.1% | |
| | 12,177 | | | Hexion Holdings Corp., Class B(j) | | | 155,257 | |
| | | | | | | | |
| | | | Media — 0.3% | |
| | 41,970 | | | Clear Channel Outdoor Holdings, Inc.(j) | | | 120,034 | |
| | 17,670 | | | iHeartMedia, Inc., Class A(j) | | | 298,623 | |
| | | | | | | | |
| | | | | | | 418,657 | |
| | | | | | | | |
| | | | Oil, Gas & Consumable Fuels — 0.0% | |
| | 3,650 | | | Halcon Resources Corp.(c)(e)(f)(j) | | | 52,304 | |
| | | | | | | | |
| | | | Total Common Stocks
(Identified Cost $1,412,096) | | | 626,218 | |
| | | | | | | | |
| | | | | | | | |
Principal
Amount | | | | | | |
| | Short-Term Investments — 0.6% | |
| $ | 924,835 | | | Tri-Party Repurchase Agreement with Fixed Income Clearing Corporation, dated 12/31/2019 at 0.900% to be repurchased at $924,882 on 1/02/2020 collateralized by $900,000 U.S. Treasury Note, 2.875% due 10/31/2023 valued at $945,191 including accrued interest (Note 2 of Notes to Financial Statements) (Identified Cost $924,835) | | | 924,835 | |
| | | | | | | | |
| | | | | | | | |
| | | | Total Investments — 98.5%
(Identified Cost $144,884,838) | | | 145,069,401 | |
| | | | Other assets less liabilities — 1.5% | | | 2,257,583 | |
| | | | | | | | |
| | | | Net Assets — 100.0% | | $ | 147,326,984 | |
| | | | | | | | |
| | | | | | | | |
| | (†) | | | See Note 2 of Notes to Financial Statements. | |
| | (a) | | | Variable rate security. Rate as of December 31, 2019 is disclosed. | |
| | (b) | | | Payment-in-kind security for which the issuer, at each interest payment date, may make interest payments in cash and/or additional principal. For the period ended December 31, 2019, interest payments were made in cash. | |
| | (c) | | | Illiquid security. (Unaudited) | |
| | (d) | | | Securities classified as fair valued pursuant to the Fund’s pricing policies and procedures. At December 31, 2019, the value of these securities amounted to $1,646,883 or 1.1% of net assets. See Note 2 of Notes to Financial Statements. | |
See accompanying notes to financial statements.
27 |
Portfolio of Investments – as of December 31, 2019
Loomis Sayles High Income Fund – (continued)
| | | | | | | | |
| | | | | | | | |
| | (e) | | | Fair valued by the Fund’s adviser. At December 31, 2019, the value of these securities amounted to $1,241,739 or 0.8% of net assets. See Note 2 of Notes to Financial Statements. | |
| | (f) | | | Level 3 security. Value has been determined using significant unobservable inputs. See Note 3 of Notes to Financial Statements. | |
| | (g) | | | Variable rate security. The interest rate adjusts periodically based on; (i) changes in current interest rates and/or prepayments on underlying pools of assets, if applicable, (ii) reference to a base lending rate plus or minus a margin, and/or (iii) reference to a base lending rate adjusted by a multiplier and/or subject to certain floors or caps. Rate as of December 31, 2019 is disclosed. | |
| | (h) | | | The issuer is in default with respect to interest and/or principal payments. Income is not being accrued. | |
| | (i) | | | Securities subject to restriction on resale. At December 31, 2019, the restricted securities held by the Fund are as follows: | |
| | | | | | | | | | | | | | | | |
| | | | | | | | | | | | | | | | |
| | | Acquisition
Date | | | Acquisition
Cost | | | Value | | | % of
Net Assets | |
| ECAF I Blocker Ltd. | | | 12/20/2016 | | | $ | 1,000,000 | | | $ | 864,000 | | | | 0.6% | |
| | | | | | | | |
| | | | | | | | |
| | (j) | | | Non-income producing security. | |
| | | | | | | | |
| | | | | | | | |
| | 144A | | | All or a portion of these securities are exempt from registration under Rule 144A of the Securities Act of 1933. These securities may be resold in transactions exempt from registration, normally to qualified institutional buyers. At December 31, 2019, the value of Rule 144A holdings amounted to $82,598,504 or 56.1% of net assets. | |
| | ABS | | | Asset-Backed Securities | |
| | LIBOR | | | London Interbank Offered Rate | |
| | MTN | | | Medium Term Note | |
| | PIK | | | Payment-in-Kind | |
| | REITs | | | Real Estate Investment Trusts | |
Industry Summary at December 31, 2019
| | | | |
Cable Satellite | | | 10.5 | % |
Technology | | | 6.6 | |
Healthcare | | | 6.0 | |
Pharmaceuticals | | | 5.8 | |
Independent Energy | | | 5.2 | |
Wireless | | | 4.2 | |
Midstream | | | 3.8 | |
Food & Beverage | | | 3.7 | |
Media Entertainment | | | 3.6 | |
Electric | | | 3.2 | |
Finance Companies | | | 3.2 | |
Banking | | | 3.0 | |
Retailers | | | 2.8 | |
Wirelines | | | 2.7 | |
Metals & Mining | | | 2.7 | |
Aerospace & Defense | | | 2.4 | |
Oil Field Services | | | 2.3 | |
Building Materials | | | 2.2 | |
Other Investments, less than 2% each | | | 24.0 | |
Short-Term Investments | | | 0.6 | |
| | | | |
Total Investments | | | 98.5 | |
Other assets less liabilities | | | 1.5 | |
| | | | |
Net Assets | | | 100.0 | % |
| | | | |
See accompanying notes to financial statements.
|�� 28
Portfolio of Investments – as of December 31, 2019
Loomis Sayles Investment Grade Bond Fund
| | | | | | | | |
Principal
Amount (‡) | | | Description | | Value (†) | |
| | Bonds and Notes — 94.7% of Net Assets | |
| | Non-Convertible Bonds — 93.9% | |
| | | | ABS Car Loan — 7.6% | |
| $ | 6,688,850 | | | Ally Auto Receivables Trust, Series2017-3, Class A3, 1.740%, 9/15/2021 | | $ | 6,684,620 | |
| | 16,590,000 | | | Ally Auto Receivables Trust, Series2019-1, Class A3, 2.910%, 9/15/2023 | | | 16,794,882 | |
| | 13,085,000 | | | Ally Auto Receivables Trust, Series2019-4, Class A3, 1.840%, 6/17/2024 | | | 13,060,610 | |
| | 7,865,000 | | | American Credit Acceptance Receivables Trust, Series2019-3, Class D, 2.890%, 9/12/2025, 144A | | | 7,850,543 | |
| | 1,965,000 | | | AmeriCredit Automobile Receivables Trust, Series2018-2, Class D, 4.010%, 7/18/2024 | | | 2,046,347 | |
| | 10,515,000 | | | AmeriCredit Automobile Receivables Trust, Series2018-3, Class D, 4.040%, 11/18/2024 | | | 10,981,783 | |
| | 25,880,000 | | | AmeriCredit Automobile Receivables Trust, Series2019-1, Class D, 3.620%, 3/18/2025 | | | 26,584,971 | |
| | 12,340,000 | | | AmeriCredit Automobile Receivables Trust, Series2019-2, Class D, 2.990%, 6/18/2025 | | | 12,475,541 | |
| | 3,650,000 | | | CarMax Auto Owner Trust, Series2018-3, Class D, 3.910%, 1/15/2025 | | | 3,757,921 | |
| | 13,585,000 | | | CarMax Auto Owner Trust, Series2019-1, Class D, 4.040%, 8/15/2025(a)(b) | | | 14,117,199 | |
| | 5,811,000 | | | CarMax Auto Owner Trust, Series2019-2, Class D, 3.410%, 10/15/2025 | | | 5,915,195 | |
| | 2,315,000 | | | CarMax Auto Owner Trust, Series2019-3, Class D, 2.850%, 1/15/2026 | | | 2,318,994 | |
| | 5,122,000 | | | CPS Auto Receivables Trust , Series2019-D, Class D, 2.720%, 9/15/2025, 144A | | | 5,100,904 | |
| | 13,965,000 | | | CPS Auto Receivables Trust, Series2019-A, Class D, 4.350%, 12/16/2024, 144A | | | 14,424,842 | |
| | 1,800,000 | | | Credit Acceptance Auto Loan Trust, Series2017-3A, Class C, 3.480%, 10/15/2026, 144A | | | 1,825,684 | |
| | 23,320,000 | | | Credit Acceptance Auto Loan Trust, Series2019-1A, Class C, 3.940%, 6/15/2028, 144A(a)(b) | | | 24,091,624 | |
| | 6,555,000 | | | Drive Auto Receivables Trust, Series2018-5, Class D, 4.300%, 4/15/2026 | | | 6,769,307 | |
| | 16,395,000 | | | Drive Auto Receivables Trust, Series2019-1, Class D, 4.090%, 6/15/2026 | | | 16,880,684 | |
| | 3,700,000 | | | Drive Auto Receivables Trust, Series2019-2, Class D, 3.690%, 8/17/2026 | | | 3,787,872 | |
| | 10,760,000 | | | DT Auto Owner Trust, Series2019-1A, Class D, 3.870%, 11/15/2024, 144A | | | 10,990,159 | |
| | 3,950,000 | | | DT Auto Owner Trust, Series2019-2A, Class D, 3.480%, 2/18/2025, 144A | | | 4,005,320 | |
| | 3,400,000 | | | DT Auto Owner Trust, Series2019-3A, Class D, 2.960%, 4/15/2025, 144A | | | 3,401,958 | |
| | 3,790,000 | | | First Investors Auto Owner Trust, Series2019-1A, Class D, 3.550%, 4/15/2025, 144A | | | 3,860,700 | |
| | 4,610,000 | | | Flagship Credit Auto Trust, Series2019-3, Class D, 2.860%, 12/15/2025, 144A | | | 4,576,674 | |
| | 1,549,198 | | | Ford Credit Auto Owner Trust, Series2017-B, Class A3, 1.690%, 11/15/2021 | | | 1,547,673 | |
| | 15,246,806 | | | Ford Credit Auto Owner Trust, Series2018-A, Class A3, 3.030%, 11/15/2022 | | | 15,372,022 | |
| | 8,555,000 | | | GLS Auto Receivables Trust, Series2019-A, Class C, 3.540%, 2/18/2025, 144A | | | 8,697,608 | |
| | 3,218,000 | | | GM Financial Consumer Automobile Receivables Trust, Series2018-2, Class A3, 2.810%, 12/16/2022 | | | 3,244,805 | |
| | 2,000,000 | | | GM Financial Consumer Automobile Receivables Trust, Series2018-3, Class A3, 3.020%, 5/16/2023 | | | 2,024,540 | |
| | 15,645,000 | | | GM Financial Consumer Automobile Receivables Trust, Series2019-1, Class A3, 2.970%, 11/16/2023 | | | 15,859,937 | |
See accompanying notes to financial statements.
29 |
Portfolio of Investments – as of December 31, 2019
Loomis Sayles Investment Grade Bond Fund – (continued)
| | | | | | | | |
Principal
Amount (‡) | | | Description | | Value (†) | |
| | | | ABS Car Loan — continued | |
| $ | 810,236 | | | Honda Auto Receivables Owner Trust, Series2016-4, Class A3, 1.210%, 12/18/2020 | | $ | 809,602 | |
| | 857,354 | | | Honda Auto Receivables Owner Trust, Series2017-2, Class A3, 1.680%, 8/16/2021 | | | 856,558 | |
| | 3,925,000 | | | Honda Auto Receivables Owner Trust, Series2017-2, Class A4, 1.870%, 9/15/2023 | | | 3,919,858 | |
| | 28,000,000 | | | Honda Auto Receivables Owner Trust, Series2018-4, Class A3, 3.160%, 1/17/2023 | | | 28,459,970 | |
| | 5,925,000 | | | Honda Auto Receivables Owner Trust, Series2019-1, Class A3, 2.830%, 3/20/2023 | | | 6,015,848 | |
| | 6,655,000 | | | Nissan Auto Receivables Owner Trust, Series2019-C, Class A3, 1.930%, 7/15/2024 | | | 6,657,644 | |
| | 2,685,000 | | | Nissan Auto Receivables Owner Trust, Series2016-C, Class A3, 1.180%, 1/15/2021 | | | 2,683,427 | |
| | 27,665,000 | | | Santander Drive Auto Receivables Trust, Series2019-1, Class D, 3.650%, 4/15/2025 | | | 28,338,048 | |
| | 6,995,000 | | | Santander Drive Auto Receivables Trust, Series2019-2, Class D, 3.220%, 7/15/2025 | | | 7,130,455 | |
| | 8,455,000 | | | Santander Drive Auto Receivables Trust, Series2019-H13, Class D, 2.680%, 10/15/2025 | | | 8,423,722 | |
| | 4,936,517 | | | Toyota Auto Receivables Owner Trust, Series2017-B, Class A3, 1.760%, 7/15/2021 | | | 4,933,575 | |
| | 12,473,250 | | | Toyota Auto Receivables Owner Trust, Series2017-D, Class A3, 1.930%, 1/18/2022 | | | 12,471,431 | |
| | 25,405,559 | | | Toyota Auto Receivables Owner Trust, Series2018-A, Class A3, 2.350%, 5/16/2022 | | | 25,471,977 | |
| | 1,981,871 | | | Toyota Auto Receivables Owner Trust, Series2018-C, Class A2A, 2.770%, 8/16/2021 | | | 1,986,058 | |
| | 15,495,000 | | | Westlake Automobile Receivables Trust, Series2019-1A, Class D, 3.670%, 3/15/2024, 144A | | | 15,792,079 | |
| | | | | | | | |
| | | | | | | 423,001,171 | |
| | | | | | | | |
| | | | ABS Credit Card — 1.7% | |
| | 14,559,000 | | | American Express Credit Account Master Trust, Series2017-1, Class A, 1.930%, 9/15/2022 | | | 14,558,339 | |
| | 10,434,000 | | | American Express Credit Account Master Trust, Series2017-6, Class A, 2.040%, 5/15/2023 | | | 10,449,952 | |
| | 3,000,000 | | | American Express Credit Account Master Trust, Series2018-1, Class A, 2.670%, 10/17/2022 | | | 3,004,616 | |
| | 8,000,000 | | | American Express Credit Account Master Trust, Series2019-1, Class A, 2.870%, 10/15/2024 | | | 8,173,779 | |
| | 25,135,000 | | | Capital One Multi-Asset Execution Trust, Series2015-A2, Class A2, 2.080%, 3/15/2023 | | | 25,152,127 | |
| | 6,170,000 | | | Capital One Multi-Asset Execution Trust, Series2017-A4, Class A4, 1.990%, 7/17/2023 | | | 6,176,529 | |
| | 11,730,000 | | | Capital One Multi-Asset Execution Trust, Series2019-A1, Class A1, 2.840%, 12/15/2024 | | | 11,967,846 | |
| | 7,915,000 | | | Chase Issuance Trust, Series2015-A4, Class A4, 1.840%, 4/15/2022 | | | 7,913,172 | |
See accompanying notes to financial statements.
| 30
Portfolio of Investments – as of December 31, 2019
Loomis Sayles Investment Grade Bond Fund – (continued)
| | | | | | | | |
Principal
Amount (‡) | | | Description | | Value (†) | |
| | | | ABS Credit Card — continued | |
| $ | 10,366,000 | | | Citibank Credit Card Issuance Trust, Series2017-A3, Class A3, 1.920%, 4/07/2022 | | $ | 10,365,443 | |
| | | | | | | | |
| | | | | | | 97,761,803 | |
| | | | | | | | |
| | | | ABS Home Equity — 4.7% | |
| | 15,451,000 | | | American Homes 4 Rent, Series 2015-SFR1, Class E, 5.639%, 4/17/2052, 144A | | | 16,634,191 | |
| | 12,875,000 | | | AMSR Trust, Series 2019-SFR1, Class A, 2.774%, 1/19/2039, 144A | | | 12,869,361 | |
| | 6,077,236 | | | Bayview Opportunity Master Fund IVb Trust, Series2019-RN4, Class A1, 3.278%, 10/28/2034, 144A(c) | | | 6,063,651 | |
| | 1,579,142 | | | Bayview Opportunity Master Fund Trust, Series2019-RN1, Class A1, 4.090%, 2/28/2034, 144A(c) | | | 1,576,799 | |
| | 1,401,782 | | | Bayview Opportunity Master Fund Trust, Series2019-RN2, Class A1, 3.967%, 3/28/2034, 144A(c) | | | 1,403,222 | |
| | 6,075,000 | | | Brass PLC, Series 8A,Class A1, 3-month LIBOR + 0.700%, 2.806%, 11/16/2066, 144A(d) | | | 6,076,567 | |
| | 5,466,450 | | | Citigroup Mortgage Loan Trust, Series2019-B, Class A1, 3.258%, 4/25/2066, 144A(c) | | | 5,472,867 | |
| | 7,838,772 | | | Citigroup Mortgage Loan Trust, Series2019-RP1, Class A1, 3.500%, 1/25/2066, 144A(c) | | | 8,003,802 | |
| | 5,513,144 | | | Colony American Finance Ltd., Series2019-3, Class A, 2.705%, 10/15/2052, 144A | | | 5,510,491 | |
| | 2,929,000 | | | Colony American Finance Ltd., Series2019-3, Class B, 3.163%, 10/15/2052, 144A | | | 2,911,078 | |
| | 2,434,000 | | | CoreVest American Finance Trust, Series2019-1, Class D, 4.818%, 3/15/2052, 144A | | | 2,612,904 | |
| | 7,702,256 | | | GCAT Trust, Series2019-3, Class A1, 3.352%, 10/25/2049, 144A(c) | | | 7,693,564 | |
| | 9,039,363 | | | GCAT Trust, Series 2019-RPL1, Class A1, 2.650%, 10/25/2068, 144A(c) | | | 9,028,412 | |
| | 948,753 | | | Gosforth Funding PLC, Series2018-1A,Class A1, 3-month LIBOR + 0.450%, 2.360%, 8/25/2060, 144A(d) | | | 947,210 | |
| | 1,835,670 | | | Grand Avenue Mortgage Loan Trust, Series 2017-RPL1, Class A1, 3.250%, 8/25/2064, 144A | | | 1,812,163 | |
| | 1,630,371 | | | Holmes Master Issuer PLC, Series2018-1A,Class A2, 3-month LIBOR + 0.360%, 2.361%, 10/15/2054, 144A(d) | | | 1,629,309 | |
| | 2,902,375 | | | Home Partners of America Trust, Series2019-1, Class D, 3.406%, 9/17/2039, 144A | | | 2,865,615 | |
| | 2,628,289 | | | Home Partners of America Trust, Series2019-2, Class D, 3.121%, 10/19/2039, 144A | | | 2,575,723 | |
| | 3,050,000 | | | Invitation Homes Trust, Series 2018-SFR4,Class D, 1-month LIBOR + 1.650%, 3.387%, 1/17/2038, 144A(d) | | | 3,061,402 | |
| | 4,008,333 | | | Lanark Master Issuer PLC, Series2019-1A,Class 1A1, 3-month LIBOR + 0.770%, 2.669%, 12/22/2069, 144A(d) | | | 4,019,208 | |
| | 7,020,000 | | | Lanark Master Issuer PLC, Series2019-2A, Class 1A, 2.710%, 12/22/2069, 144A(c) | | | 7,047,961 | |
| | 9,486,722 | | | Legacy Mortgage Asset Trust, Series2019-GS7, Class A1, 3.250%, 11/25/2059, 144A(c) | | | 9,493,732 | |
| | 4,116,300 | | | Legacy Mortgage Asset Trust, Series2019-GS3, Class A1, 3.750%, 4/25/2059, 144A(c) | | | 4,149,776 | |
See accompanying notes to financial statements.
31 |
Portfolio of Investments – as of December 31, 2019
Loomis Sayles Investment Grade Bond Fund – (continued)
| | | | | | | | |
Principal
Amount (‡) | | | Description | | Value (†) | |
| | | | ABS Home Equity — continued | |
| $ | 12,061,613 | | | Mill City Mortgage Loan Trust, Series2019-GS1, Class A1, 2.750%, 7/25/2059, 144A(c) | | $ | 12,122,192 | |
| | 5,005,300 | | | Mill City Mortgage Trust, Series2019-1, Class A1, 3.250%, 10/25/2069, 144A(c) | | | 5,097,741 | |
| | 6,695,495 | | | Onslow Bay Financial LLC , Series 2019-EXP3, Class 1A8, 3.500%, 10/25/2059, 144A(c) | | | 6,742,656 | |
| | 3,327,372 | | | Preston Ridge Partners Mortgage LLC, Series2019-3A, Class A1, 3.351%, 7/25/2024, 144A(c) | | | 3,332,005 | |
| | 3,708,000 | | | Progress Residential Trust, Series 2017-SFR2, Class E, 4.142%, 12/17/2034, 144A | | | 3,728,872 | |
| | 1,332,000 | | | Progress Residential Trust, Series 2018-SFR2, Class E, 4.656%, 8/17/2035, 144A | | | 1,361,294 | |
| | 2,830,000 | | | Progress Residential Trust, Series 2019-SFR1, Class D, 4.168%, 8/17/2035, 144A | | | 2,890,678 | |
| | 4,732,000 | | | Progress Residential Trust, Series 2019-SFR2, Class D, 3.794%, 5/17/2036, 144A | | | 4,803,748 | |
| | 3,860,000 | | | Progress Residential Trust, Series 2019-SFR4, Class D, 3.136%, 10/17/2036, 144A | | | 3,836,015 | |
| | 5,506,820 | | | PRPM LLC, Series2019-4A, Class A1, 3.351%, 11/25/2024, 144A(c) | | | 5,506,759 | |
| | 5,709,291 | | | RCO V Mortgage LLC, Series2019-1, Class A1, 3.721%, 5/24/2024, 144A(c) | | | 5,715,345 | |
| | 3,143,539 | | | Sequoia Mortgage Trust, Series2017-CH2, Class A1, 4.000%, 12/25/2047, 144A(c) | | | 3,248,122 | |
| | 6,864,056 | | | Sequoia Mortgage Trust, Series2019-CH2, Class A1, 4.500%, 8/25/2049, 144A(c) | | | 6,963,957 | |
| | 5,000,475 | | | Silverstone Master Issuer PLC, Series2019-1A,Class 1A, 3-month LIBOR + 0.570%, 2.536%, 1/21/2070, 144A(d) | | | 5,002,275 | |
| | 4,930,000 | | | Towd Point Mortgage Trust, Series2017-4, Class M2, 3.250%, 6/25/2057, 144A(c) | | | 4,925,840 | |
| | 4,207,213 | | | Towd Point Mortgage Trust, Series2015-2, Class 1A13, 2.500%, 11/25/2060, 144A(c) | | | 4,196,295 | |
| | 1,443,284 | | | Towd Point Mortgage Trust, Series2016-1, Class A1B, 2.750%, 2/25/2055, 144A(c) | | | 1,443,959 | |
| | 10,959,121 | | | Towd Point Mortgage Trust, Series2019-4, Class A1, 2.900%, 10/25/2059, 144A(c) | | | 11,022,139 | |
| | 2,575,000 | | | Tricon American Homes Trust, Series 2019-SFR1, Class D, 3.198%, 3/17/2038, 144A | | | 2,559,706 | |
| | 13,259,594 | | | Vericrest Opportunity Loan Trust, Series 2019-NPL8, Class A1A, 3.278%, 11/25/2049, 144A(c) | | | 13,227,526 | |
| | 8,358,268 | | | Vericrest Opportunity Loan Trust, Series 2019-NPL3, Class A1, 3.967%, 3/25/2049, 144A(c) | | | 8,401,162 | |
| | 12,652,190 | | | Vericrest Opportunity Loan Trust, Series 2019-NPL5, Class A1A, 3.352%, 9/25/2049, 144A(c) | | | 12,646,578 | |
| | 1,407,847 | | | VOLT LXXII LLC, Series 2018-NPL8, Class A1A, 4.213%, 10/26/2048, 144A(c) | | | 1,406,428 | |
| | 5,318,288 | | | VOLT LXXV LLC, Series 2019-NPL1, Class A1A, 4.336%, 1/25/2049, 144A(c) | | | 5,349,987 | |
| | 4,934,679 | | | VOLT LXXXIII LLC, Series 2019-NPL9, Class A1A, 3.327%, 11/26/2049, 144A(c) | | | 4,932,247 | |
| | | | | | | | |
| | | | | | | 263,922,534 | |
| | | | | | | | |
See accompanying notes to financial statements.
| 32
Portfolio of Investments – as of December 31, 2019
Loomis Sayles Investment Grade Bond Fund – (continued)
| | | | | | | | |
Principal
Amount (‡) | | | Description | | Value (†) | |
| | | | ABS Other — 3.5% | |
| $ | 39,262,848 | | | FAN Engine Securitization Ltd., Series2013-1A, Class 1A, 4.625%, 10/15/2043, 144A(a)(b) | | $ | 39,261,741 | |
| | 12,372,896 | | | Horizon Aircraft Finance I Ltd., Series2018-1, Class A, 4.458%, 12/15/2038, 144A | | | 12,702,154 | |
| | 2,923,205 | | | Horizon Aircraft Finance II Ltd., Series2019-1, Class A, 3.721%, 7/15/2039, 144A | | | 2,919,606 | |
| | 1,975,000 | | | HPEFS Equipment Trust, Series2019-1A, Class C, 2.490%, 9/20/2029, 144A | | | 1,974,637 | |
| | 8,041,680 | | | Kestrel Aircraft Funding Ltd., Series2018-1A, Class A, 4.250%, 12/15/2038, 144A | | | 8,172,861 | |
| | 14,088,288 | | | MAPS Ltd., Series2018-1A, Class A, 4.212%, 5/15/2043, 144A | | | 14,340,492 | |
| | 4,096,091 | | | MAPS Ltd., Series2019-1A, Class A, 4.458%, 3/15/2044, 144A | | | 4,216,395 | |
| | 13,610,000 | | | Mariner Finance Issuance Trust, Series2018-AA, Class A, 4.200%, 11/20/2030, 144A | | | 13,882,847 | |
| | 5,222,850 | | | Marlette Funding Trust, Series2019-4A, Class A, 2.390%, 12/17/2029, 144A | | | 5,226,606 | |
| | 2,406,243 | | | Marlette Funding Trust, Series2019-1A, Class A, 3.440%, 4/16/2029, 144A | | | 2,423,702 | |
| | 8,040,000 | | | OneMain Financial Issuance Trust, Series2019-1A, Class D, 4.220%, 2/14/2031, 144A | | | 8,322,842 | |
| | 15,600,403 | | | S-Jets Ltd., Series2017-1, Class A, 3.967%, 8/15/2042, 144A | | | 15,612,523 | |
| | 940,000 | | | SLM Private Credit Student Loan Trust, Series2003-C,Class A3, 28-day ARS, 5.080%, 9/15/2032(d) | | | 938,892 | |
| | 1,495,000 | | | SLM Private Credit Student Loan Trust, Series2003-C,Class A4, 28-day ARS, 5.080%, 9/15/2032(d) | | | 1,492,476 | |
| | 13,765,000 | | | SoFi Consumer Loan Program Trust, Series2019-1, Class C, 3.730%, 2/25/2028, 144A | | | 14,077,175 | |
| | 3,459,000 | | | SoFi Consumer Loan Program Trust, Series2018-1, Class B, 3.650%, 2/25/2027, 144A | | | 3,525,296 | |
| | 6,720,000 | | | SoFi Consumer Loan Program Trust, Series2018-4, Class C, 4.170%, 11/26/2027, 144A | | | 6,943,605 | |
| | 6,805,000 | | | SoFi Consumer Loan Program Trust, Series2019-2, Class C, 3.460%, 4/25/2028, 144A | | | 6,921,100 | |
| | 12,755,000 | | | SoFi Consumer Loan Program Trust, Series2019-3, Class C, 3.350%, 5/25/2028, 144A | | | 12,956,024 | |
| | 7,370,000 | | | SoFi Consumer Loan Program Trust, Series2019-4, Class C, 2.840%, 8/25/2028, 144A | | | 7,350,316 | |
| | 13,234,382 | | | SpringCastle Funding Asset-Backed Notes, Series2019-AA, Class A, 3.200%, 5/27/2036, 144A | | | 13,283,534 | |
| | | | | | | | |
| | | | | | | 196,544,824 | |
| | | | | | | | |
| | | | ABS Student Loan — 1.6% | |
| | 11,813,199 | | | ELFI Graduate Loan Program LLC, Series2019-A, Class A, 2.540%, 3/25/2044, 144A | | | 11,662,331 | |
| | 14,080,000 | | | Navient Private Education Refi Loan Trust, Series2019-FA, Class A2, 2.600%, 8/15/2068, 144A | | | 14,054,456 | |
| | 4,020,000 | | | Navient Private Education Refi Loan Trust, Series2019-CA, Class A2, 3.130%, 2/15/2068, 144A | | | 4,040,302 | |
| | 6,910,000 | | | Navient Student Loan Trust, Series2018-EA, Class A2, 4.000%, 12/15/2059, 144A | | | 7,155,941 | |
See accompanying notes to financial statements.
33 |
Portfolio of Investments – as of December 31, 2019
Loomis Sayles Investment Grade Bond Fund – (continued)
| | | | | | | | |
Principal
Amount (‡) | | | Description | | Value (†) | |
| | | | ABS Student Loan — continued | |
| $ | 796,000 | | | SLM Private Credit Student Loan Trust, Series2003-A,Class A3, 28-day ARS, 5.040%, 6/15/2032(d) | | $ | 794,917 | |
| | 575,000 | | | SLM Private Credit Student Loan Trust, Series2003-A,Class A4, 28-day ARS, 4.440%, 6/15/2032(d) | | | 575,081 | |
| | 1,150,000 | | | SLM Private Credit Student Loan Trust, Series2003-B,Class A3, 28-day ARS, 5.040%, 3/15/2033(d) | | | 1,147,862 | |
| | 786,000 | | | SLM Private Credit Student Loan Trust, Series2003-B,Class A4, 28-day ARS, 4.590%, 3/15/2033(d) | | | 785,546 | |
| | 2,500,000 | | | SMB Private Education Loan Trust, Series2015-C, Class B, 3.500%, 9/15/2043, 144A | | | 2,538,399 | |
| | 565,000 | | | SMB Private Education Loan Trust, Series2018-B, Class B, 4.000%, 7/15/2042, 144A | | | 584,884 | |
| | 1,525,000 | | | SMB Private Education Loan Trust, Series2018-C, Class B, 4.000%, 11/17/2042, 144A | | | 1,568,676 | |
| | 10,385,000 | | | SMB Private Education Loan Trust, Series2019-A, Class A2A, 3.440%, 7/15/2036, 144A | | | 10,546,403 | |
| | 16,265,000 | | | SMB Private Education Loan Trust, Series2019-B, Class A2A, 2.840%, 6/15/2037, 144A | | | 16,328,643 | |
| | 9,075,000 | | | SoFi Professional Loan Program LLC, Series2019-A, Class A2FX, 3.690%, 6/15/2048, 144A | | | 9,376,797 | |
| | 8,217,000 | | | SoFi Professional Loan Program LLC, Series2019-C, Class A2FX, 2.370%, 11/16/2048, 144A | | | 8,061,895 | |
| | | | | | | | |
| | | | | | | 89,222,133 | |
| | | | | | | | |
| | | | ABS Whole Business — 2.0% | |
| | 10,278,610 | | | Adams Outdoor Advertising LP, Series2018-1, Class A, 4.810%, 11/15/2048, 144A | | | 10,665,474 | |
| | 3,595,000 | | | Adams Outdoor Advertising LP, Series2018-1, Class B, 5.653%, 11/15/2048, 144A | | | 3,714,392 | |
| | 27,202,500 | | | Coinstar Funding LLC, Series2017-1A, Class A2, 5.216%, 4/25/2047, 144A | | | 27,908,233 | |
| | 7,260,515 | | | DB Master Finance LLC, Series2019-1A, Class A23, 4.352%, 5/20/2049, 144A | | | 7,522,111 | |
| | 2,383,360 | | | Domino’s Pizza Master Issuer LLC, Series2017-1A, Class A23, 4.118%, 7/25/2047, 144A | | | 2,468,780 | |
| | 133,313 | | | Domino’s Pizza Master Issuer LLC, Series2018-1A, Class A2I, 4.116%, 7/25/2048, 144A | | | 137,101 | |
| | 5,244,613 | | | Domino’s Pizza Master Issuer LLC, Series2018-1A, Class A2II, 4.328%, 7/25/2048, 144A | | | 5,462,002 | |
| | 4,035,000 | | | Domino’s Pizza Master Issuer LLC, Series2019-1A, Class A2, 3.668%, 10/25/2049, 144A | | | 4,035,686 | |
| | 2,285,200 | | | Driven Brands Funding LLC, Series2018-1A, Class A2, 4.739%, 4/20/2048, 144A | | | 2,369,204 | |
| | 5,046,863 | | | Driven Brands Funding LLC, Series2019-1A, Class A2, 4.641%, 4/20/2049, 144A | | | 5,218,002 | |
| | 4,962,500 | | | Five Guys Funding LLC, Series2017-1A, Class A2, 4.600%, 7/25/2047, 144A | | | 5,148,779 | |
| | 17,582,250 | | | Stack Infrastructure Issuer LLC, Series2019-1A, Class A2, 4.540%, 2/25/2044, 144A | | | 18,408,863 | |
See accompanying notes to financial statements.
| 34
Portfolio of Investments – as of December 31, 2019
Loomis Sayles Investment Grade Bond Fund – (continued)
| | | | | | | | |
Principal
Amount (‡) | | | Description | | Value (†) | |
| | | | ABS Whole Business — continued | |
| $ | 13,459,050 | | | Taco Bell Funding LLC, Series2018-1A, Class A2I, 4.318%, 11/25/2048, 144A | | $ | 13,771,031 | |
| | 3,672,250 | | | Wingstop Funding LLC, Series2018-1, Class A2, 4.970%, 12/05/2048, 144A | | | 3,779,994 | |
| | | | | | | | |
| | | | | | | 110,609,652 | |
| | | | | | | | |
| | | | Aerospace & Defense — 1.5% | |
| | 650,000 | | | Leonardo U.S. Holdings, Inc., 7.375%, 7/15/2039 | | | 807,560 | |
| | 78,795,000 | | | Textron, Inc., 5.950%, 9/21/2021 | | | 83,206,395 | |
| | | | | | | | |
| | | | | | | 84,013,955 | |
| | | | | | | | |
| | | | Airlines — 1.8% | |
| | 2,811,133 | | | Air Canada Pass Through Trust, Series2013-1, Class B, 5.375%, 11/15/2022, 144A | | | 2,890,127 | |
| | 1,687,628 | | | American Airlines Pass Through Certificates, Series2016-3, Class B, 3.750%, 4/15/2027 | | | 1,706,646 | |
| | 3,782,751 | | | American Airlines Pass Through Certificates, Series 2017-2, Class B, 3.700%, 4/15/2027 | | | 3,823,925 | |
| | 8,007,826 | | | American Airlines Pass Through Trust, Series2016-1, Class B, 5.250%, 7/15/2025 | | | 8,470,516 | |
| | 2,014,937 | | | American Airlines Pass Through Trust, Series2015-2, Class B, 4.400%, 3/22/2025 | | | 2,087,379 | |
| | 23,269,000 | | | American Airlines Pass Through Trust, Series2019-1, Class B, 3.850%, 8/15/2029 | | | 23,634,789 | |
| | 6,855,000 | | | British Airways Pass Through Trust, Series2019-1, Class A, 3.350%, 12/15/2030, 144A | | | 6,970,781 | |
| | 1,045,800 | | | Continental Airlines Pass Through Certificates, Series2012-1, Class B, 6.250%, 10/11/2021 | | | 1,055,275 | |
| | 324,173 | | | Continental Airlines Pass Through Trust, Series2001-1,Class A-1, 6.703%, 12/15/2022 | | | 341,549 | |
| | 1,039,170 | | | Delta Air Lines Pass Through Trust, Series2007-1, Class A, 6.821%, 2/10/2024 | | | 1,128,160 | |
| | 4,926,025 | | | Delta Air Lines Pass Through Trust, Series2007-1, Class B, 8.021%, 2/10/2024 | | | 5,388,385 | |
| | 835,182 | | | Latam Airlines Pass Through Trust, Series2015-1, Class B, 4.500%, 8/15/2025 | | | 836,218 | |
| | 13,000,876 | | | UAL Pass Through Trust, Series2007-1, Class A, 6.636%, 1/02/2024 | | | 13,733,865 | |
| | 24,981,273 | | | United Airlines Pass Through Trust, Series2016-2, Class B, 3.650%, 4/07/2027 | | | 25,127,913 | |
| | 2,724,967 | | | United Airlines Pass Through Trust, Series2018-1, Class A, 3.700%, 9/01/2031 | | | 2,796,037 | |
| | | | | | | | |
| | | | | | | 99,991,565 | |
| | | | | | | | |
| | | | Automotive — 2.1% | |
| | 18,836,000 | | | Cummins, Inc., 5.650%, 3/01/2098 | | | 23,942,816 | |
| | 5,274,000 | | | Cummins, Inc., 6.750%, 2/15/2027 | | | 6,509,068 | |
| | 14,000,000 | | | Toyota Motor Credit Corp., 1.950%, 4/17/2020 | | | 13,999,712 | |
| | 10,000,000 | | | Toyota Motor Credit Corp., MTN, 2.150%, 3/12/2020 | | | 10,002,611 | |
| | 38,060,000 | | | Toyota Motor Credit Corp., MTN, 2.650%, 4/12/2022 | | | 38,739,333 | |
| | 4,750,000 | | | Volkswagen Group of America Finance LLC, 2.500%, 9/24/2021, 144A | | | 4,791,431 | |
See accompanying notes to financial statements.
35 |
Portfolio of Investments – as of December 31, 2019
Loomis Sayles Investment Grade Bond Fund – (continued)
| | | | | | | | |
Principal
Amount (‡) | | | Description | | Value (†) | |
| | | | Automotive — continued | |
| $ | 12,005,000 | | | Volkswagen Group of America Finance LLC, 2.700%, 9/26/2022, 144A | | $ | 12,142,182 | |
| | 7,565,000 | | | ZF North America Capital, Inc., 4.750%, 4/29/2025, 144A | | | 7,959,864 | |
| | | | | | | | |
| | | | | | | 118,087,017 | |
| | | | | | | | |
| | | | Banking — 7.9% | |
| | 39,613,000 | | | Ally Financial, Inc., 4.625%, 3/30/2025 | | | 42,881,072 | |
| | 1,468,000 | | | Ally Financial, Inc., 8.000%, 11/01/2031 | | | 2,011,681 | |
| | 49,304,000 | | | Bank of America Corp., (fixed rate to 12/20/2027, variable rate thereafter), 3.419%, 12/20/2028 | | | 51,776,288 | |
| | 100,000 | | | Bank of America Corp., MTN, 4.250%, 10/22/2026 | | | 109,081 | |
| | 25,627,000 | | | Bank of America Corp., Series L, MTN, 4.183%, 11/25/2027 | | | 27,791,119 | |
| | 22,500,000 | | | BNP Paribas S.A., (fixed rate to 3/01/2028, variable rate thereafter), 4.375%, 3/01/2033, 144A | | | 24,303,449 | |
| | 460,000 | | | Capital One Financial Corp., 4.200%, 10/29/2025 | | | 496,563 | |
| | 17,000,000 | | | Citigroup, Inc., 3.500%, 5/15/2023 | | | 17,694,194 | |
| | 1,230,000 | | | Citigroup, Inc., 4.125%, 7/25/2028 | | | 1,342,261 | |
| | 1,660,000 | | | Citigroup, Inc., 4.500%, 1/14/2022 | | | 1,740,490 | |
| | 7,155,000 | | | Credit Agricole S.A., (fixed rate to 1/10/2028, variable rate thereafter), 4.000%, 1/10/2033, 144A | | | 7,549,455 | |
| | 17,940,000 | | | Danske Bank A/S, 5.000%, 1/12/2022, 144A | | | 18,844,044 | |
| | 14,200,000 | | | Danske Bank A/S, 5.375%, 1/12/2024, 144A | | | 15,543,803 | |
| | 3,390,000 | | | Danske Bank A/S, (fixed rate to 12/20/2024, variable rate thereafter), 3.244%, 12/20/2025, 144A | | | 3,431,010 | |
| | 13,075,000 | | | Danske Bank A/S, (fixed rate to 9/20/2021, variable rate thereafter), 3.001%, 9/20/2022, 144A | | | 13,190,898 | |
| | 20,999,000 | | | Deutsche Bank AG, (fixed rate to 12/01/2027, variable rate thereafter), 4.875%, 12/01/2032 | | | 19,791,558 | |
| | 6,645,000 | | | Goldman Sachs Group, Inc. (The), GMTN, 5.375%, 3/15/2020 | | | 6,690,024 | |
| | 70,245,000 | | | JPMorgan Chase & Co., 4.125%, 12/15/2026 | | | 76,956,398 | |
| | 100,000 | | | KeyBank NA, 6.950%, 2/01/2028 | | | 126,434 | |
| | 5,900,000 | | | Morgan Stanley, 5.750%, 1/25/2021 | | | 6,127,564 | |
| | 1,845,000 | | | Morgan Stanley, GMTN, 4.350%, 9/08/2026 | | | 2,018,216 | |
| | 20,695,000 | | | Morgan Stanley, MTN, 4.100%, 5/22/2023 | | | 21,853,083 | |
| | 15,160,000 | | | Santander Holdings USA, Inc., 3.244%, 10/05/2026, 144A | | | 15,327,930 | |
| | 20,295,000 | | | Societe Generale S.A., 4.250%, 4/14/2025, 144A | | | 21,208,275 | |
| | 21,340,000 | | | Standard Chartered PLC,3-month LIBOR + 1.150%, 3.116%, 1/20/2023, 144A(d) | | | 21,478,497 | |
| | 5,900,000 | | | Standard Chartered PLC, (fixed rate to 1/20/2022, variable rate thereafter), 4.247%, 1/20/2023, 144A | | | 6,110,984 | |
| | 7,580,000 | | | Synchrony Financial, 2.850%, 7/25/2022 | | | 7,673,669 | |
| | 3,865,000 | | | Synchrony Financial, 4.375%, 3/19/2024 | | | 4,123,986 | |
| | | | | | | | |
| | | | | | | 438,192,026 | |
| | | | | | | | |
| | | | Brokerage — 1.6% | |
| | 50,270,000 | | | Jefferies Group LLC, 5.125%, 1/20/2023 | | | 54,290,526 | |
| | 19,498,000 | | | Jefferies Group LLC, 6.250%, 1/15/2036 | | | 23,294,876 | |
| | 8,760,000 | | | Jefferies Group LLC, 6.450%, 6/08/2027 | | | 10,276,571 | |
| | | | | | | | |
| | | | | | | 87,861,973 | |
| | | | | | | | |
See accompanying notes to financial statements.
| 36
Portfolio of Investments – as of December 31, 2019
Loomis Sayles Investment Grade Bond Fund – (continued)
| | | | | | | | |
Principal
Amount (‡) | | | Description | | Value (†) | |
| | | | Building Materials — 0.5% | |
| $ | 925,000 | | | Masco Corp., 6.500%, 8/15/2032 | | $ | 1,135,631 | |
| | 23,975,000 | | | Owens Corning, 7.000%, 12/01/2036 | | | 29,869,531 | |
| | | | | | | | |
| | | | | | | 31,005,162 | |
| | | | | | | | |
| | | | Cable Satellite — 1.5% | |
| | 15,215,000 | | | Charter Communication Operating LLC/Charter Communication Operating Capital Corp., 4.800%, 3/01/2050 | | | 16,044,284 | |
| | 6,695,000 | | | Charter Communications Operating LLC/Charter Communications Operating Capital Corp., 5.750%, 4/01/2048 | | | 7,819,254 | |
| | 10,320,000 | | | Cox Communications, Inc., 4.500%, 6/30/2043, 144A | | | 10,750,045 | |
| | 5,820,000 | | | Cox Communications, Inc., 4.700%, 12/15/2042, 144A | | | 6,310,272 | |
| | 13,630,000 | | | Time Warner Cable LLC, 4.125%, 2/15/2021 | | | 13,850,621 | |
| | 9,055,000 | | | Time Warner Cable LLC, 4.500%, 9/15/2042 | | | 9,257,638 | |
| | 15,815,000 | | | Time Warner Cable LLC, 5.500%, 9/01/2041 | | | 17,667,049 | |
| | | | | | | | |
| | | | | | | 81,699,163 | |
| | | | | | | | |
| | | | Chemicals — 0.8% | |
| | 27,205,000 | | | CF Industries, Inc., 4.500%, 12/01/2026, 144A | | | 29,608,549 | |
| | 3,740,000 | | | FMC Corp., 3.450%, 10/01/2029 | | | 3,867,088 | |
| | 2,075,000 | | | FMC Corp., 4.500%, 10/01/2049 | | | 2,264,229 | |
| | 8,145,000 | | | LYB International Finance III LLC, 4.200%, 10/15/2049 | | | 8,501,263 | |
| | | | | | | | |
| | | | | | | 44,241,129 | |
| | | | | | | | |
| | | | Consumer Products — 0.2% | |
| | 7,458,000 | | | Hasbro, Inc., 6.600%, 7/15/2028 | | | 8,895,400 | |
| | | | | | | | |
| | | | Diversified Manufacturing — 0.1% | |
| | 5,305,000 | | | General Electric Co., Series A, MTN,3-month LIBOR + 0.300%, 2.301%, 5/13/2024(d) | | | 5,102,002 | |
| | | | | | | | |
| | | | Electric — 2.2% | |
| | 20,316,424 | | | Alta Wind Holdings LLC, 7.000%, 6/30/2035, 144A | | | 22,661,634 | |
| | 30,430,000 | | | EDP Finance BV, 4.125%, 1/15/2020, 144A | | | 30,397,014 | |
| | 13,025,000 | | | Enel Finance International NV, 6.000%, 10/07/2039, 144A | | | 16,411,808 | |
| | 9,007,000 | | | Enel Finance International NV, 6.800%, 9/15/2037, 144A | | | 11,991,613 | |
| | 39,280,000 | | | Vistra Operations Co. LLC, 3.700%, 1/30/2027, 144A | | | 39,031,256 | |
| | | | | | | | |
| | | | | | | 120,493,325 | |
| | | | | | | | |
| | | | Finance Companies — 1.5% | |
| | 12,430,000 | | | Aircastle Ltd., 4.125%, 5/01/2024 | | | 13,060,361 | |
| | 20,595,000 | | | Aircastle Ltd., 4.400%, 9/25/2023 | | | 21,776,176 | |
| | 8,160,000 | | | Aircastle Ltd., 5.000%, 4/01/2023 | | | 8,727,782 | |
| | 6,700,000 | | | Antares Holdings LP, 6.000%, 8/15/2023, 144A | | | 7,049,272 | |
| | 18,830,000 | | | International Lease Finance Corp., 4.625%, 4/15/2021 | | | 19,418,448 | |
| | 7,805,000 | | | Quicken Loans, Inc., 5.250%, 1/15/2028, 144A | | | 8,078,175 | |
| | 6,392,000 | | | Quicken Loans, Inc., 5.750%, 5/01/2025, 144A | | | 6,607,730 | |
| | | | | | | | |
| | | | | | | 84,717,944 | |
| | | | | | | | |
| | | | Food & Beverage — 2.1% | |
| | 8,980,000 | | | BRF S.A., 4.875%, 1/24/2030, 144A | | | 9,260,715 | |
| | 13,750,000 | | | General Mills, Inc., 2.600%, 10/12/2022 | | | 13,960,789 | |
See accompanying notes to financial statements.
37 |
Portfolio of Investments – as of December 31, 2019
Loomis Sayles Investment Grade Bond Fund – (continued)
| | | | | | | | |
Principal
Amount (‡) | | | Description | | Value (†) | |
| | | | Food & Beverage — continued | |
| $ | 8,595,000 | | | JBS USA LUX S.A./JBS USA Finance, Inc., 5.750%, 6/15/2025, 144A | | $ | 8,895,825 | |
| | 4,910,000 | | | JBS USA LUX S.A./JBS USA Finance, Inc., 6.750%, 2/15/2028, 144A | | | 5,425,599 | |
| | 10,660,000 | | | JBS USA LUX S.A./JBS USA Food Co./JBS USA Finance, Inc., 5.500%, 1/15/2030, 144A | | | 11,449,906 | |
| | 10,465,000 | | | NBM U.S Holdings, Inc., 7.000%, 5/14/2026, 144A | | | 11,333,700 | |
| | 9,535,000 | | | PepsiCo, Inc., 1.700%, 10/06/2021 | | | 9,539,187 | |
| | 45,980,000 | | | PepsiCo, Inc., 2.000%, 4/15/2021 | | | 46,111,181 | |
| | | | | | | | |
| | | | | | | 115,976,902 | |
| | | | | | | | |
| | | | Government Guaranteed — 1.0% | |
| | 55,000,000 | | | Kreditanstalt fuer Wiederaufbau, 1.500%, 4/20/2020 | | | 54,963,095 | |
| | | | | | | | |
| | | | Government Owned – No Guarantee — 0.6% | |
| | 21,545,000 | | | Petrobras Global Finance BV, 5.750%, 2/01/2029 | | | 24,302,760 | |
| | 6,130,000 | | | Petrobras Global Finance BV, 6.900%, 3/19/2049 | | | 7,190,490 | |
| | | | | | | | |
| | | | | | | 31,493,250 | |
| | | | | | | | |
| | | | Health Insurance — 0.5% | |
| | 27,570,000 | | | Anthem, Inc., 2.500%, 11/21/2020 | | | 27,692,669 | |
| | 3,040,000 | | | Centene Corp., 6.125%, 2/15/2024 | | | 3,154,000 | |
| | | | | | | | |
| | | | | | | 30,846,669 | |
| | | | | | | | |
| | | | Healthcare — 2.3% | |
| | 19,420,000 | | | Cigna Corp., 4.375%, 10/15/2028 | | | 21,515,185 | |
| | 1,261,000 | | | Cigna Corp., 7.875%, 5/15/2027, 144A | | | 1,636,465 | |
| | 13,765,000 | | | CVS Health Corp., 4.100%, 3/25/2025 | | | 14,778,987 | |
| | 23,120,000 | | | HCA, Inc., 4.500%, 2/15/2027 | | | 24,934,707 | |
| | 24,240,000 | | | HCA, Inc., 5.250%, 4/15/2025 | | | 27,122,373 | |
| | 4,580,000 | | | HCA, Inc., 5.250%, 6/15/2026 | | | 5,131,121 | |
| | 17,055,000 | | | HCA, Inc., 5.250%, 6/15/2049 | | | 19,066,276 | |
| | 4,806,000 | | | HCA, Inc., 7.050%, 12/01/2027 | | | 5,695,110 | |
| | 1,592,000 | | | HCA, Inc., 7.500%, 11/06/2033 | | | 2,005,920 | |
| | 1,295,000 | | | HCA, Inc., 7.690%, 6/15/2025 | | | 1,560,475 | |
| | 2,480,000 | | | HCA, Inc., MTN, 7.580%, 9/15/2025 | | | 2,963,600 | |
| | 3,068,000 | | | HCA, Inc., MTN, 7.750%, 7/15/2036 | | | 3,650,920 | |
| | | | | | | | |
| | | | | | | 130,061,139 | |
| | | | | | | | |
| | | | Independent Energy — 2.4% | |
| | 30,195,000 | | | Continental Resources, Inc., 3.800%, 6/01/2024 | | | 31,230,311 | |
| | 10,525,000 | | | Continental Resources, Inc., 4.375%, 1/15/2028 | | | 11,192,075 | |
| | 20,900,000 | | | Diamondback Energy, Inc., 3.500%, 12/01/2029 | | | 21,267,840 | |
| | 10,475,000 | | | Hess Corp., 4.300%, 4/01/2027 | | | 11,170,788 | |
| | 21,000,000 | | | Newfield Exploration Co., 5.625%, 7/01/2024 | | | 23,076,580 | |
| | 6,090,000 | | | Occidental Petroleum Corp., 5.550%, 3/15/2026 | | | 6,906,736 | |
| | 26,185,000 | | | Seven Generations Energy Ltd., 5.375%, 9/30/2025, 144A | | | 26,315,925 | |
| | 1,885,000 | | | Viper Energy Partners LP, 5.375%, 11/01/2027, 144A | | | 1,960,400 | |
| | 60,000 | | | Whiting Petroleum Corp., 6.250%, 4/01/2023 | | | 50,501 | |
| | | | | | | | |
| | | | | | | 133,171,156 | |
| | | | | | | | |
See accompanying notes to financial statements.
| 38
Portfolio of Investments – as of December 31, 2019
Loomis Sayles Investment Grade Bond Fund – (continued)
| | | | | | | | |
Principal
Amount (‡) | | | Description | | Value (†) | |
| | | | Integrated Energy — 1.9% | |
| $ | 55,470,000 | | | Chevron Corp., 2.100%, 5/16/2021 | | $ | 55,820,295 | |
| | 52,303,000 | | | Shell International Finance BV, 1.875%, 5/10/2021 | | | 52,364,230 | |
| | | | | | | | |
| | | | | | | 108,184,525 | |
| | | | | | | | |
| | | | Life Insurance — 2.9% | |
| | 5,653,000 | | | American International Group, Inc., 4.200%, 4/01/2028 | | | 6,222,858 | |
| | 1,475,000 | | | American International Group, Inc., 4.875%, 6/01/2022 | | | 1,574,744 | |
| | 8,255,000 | | | CNO Financial Group, Inc., 5.250%, 5/30/2029 | | | 9,214,644 | |
| | 15,000,000 | | | Global Atlantic Fin Co., 8.625%, 4/15/2021, 144A | | | 16,032,411 | |
| | 5,895,000 | | | Metropolitan Life Global Funding I,3-month LIBOR + 0.230%, 2.257%, 1/08/2021, 144A(d) | | | 5,896,889 | |
| | 30,030,000 | | | Metropolitan Life Global Funding I, 3.375%, 1/11/2022, 144A | | | 30,874,969 | |
| | 9,063,000 | | | Mutual of Omaha Insurance Co., 6.800%, 6/15/2036, 144A | | | 11,839,927 | |
| | 26,914,000 | | | National Life Insurance Co., 10.500%, 9/15/2039, 144A(a)(b) | | | 44,419,441 | |
| | 6,440,000 | | | NLV Financial Corp., 7.500%, 8/15/2033, 144A(a)(b) | | | 8,686,031 | |
| | 2,872,000 | | | Penn Mutual Life Insurance Co. (The), 6.650%, 6/15/2034, 144A | | | 3,695,130 | |
| | 14,489,000 | | | Penn Mutual Life Insurance Co. (The), 7.625%, 6/15/2040, 144A | | | 20,845,306 | |
| | | | | | | | |
| | | | | | | 159,302,350 | |
| | | | | | | | |
| | | | Metals & Mining — 3.5% | |
| | 34,334,000 | | | Anglo American Capital PLC, 4.500%, 3/15/2028, 144A | | | 36,798,080 | |
| | 8,785,000 | | | Anglo American Capital PLC, 4.750%, 4/10/2027, 144A | | | 9,609,741 | |
| | 47,920,000 | | | ArcelorMittal S.A., 6.750%, 3/01/2041 | | | 57,080,018 | |
| | 19,365,000 | | | ArcelorMittal S.A., 7.000%, 10/15/2039 | | | 23,604,524 | |
| | 7,688,000 | | | Glencore Funding LLC, 3.875%, 10/27/2027, 144A | | | 7,963,615 | |
| | 39,092,000 | | | Glencore Funding LLC, 4.000%, 3/27/2027, 144A | | | 40,632,231 | |
| | 11,700,000 | | | Glencore Funding LLC, 4.125%, 3/12/2024, 144A | | | 12,254,535 | |
| | 7,375,000 | | | Minera Mexico S.A. de CV, 4.500%, 1/26/2050, 144A | | | 7,493,737 | |
| | | | | | | | |
| | | | | | | 195,436,481 | |
| | | | | | | | |
| | | | Midstream — 4.3% | |
| | 22,495,000 | | | Cheniere Corpus Christi Holdings LLC, 3.700%, 11/15/2029, 144A | | | 22,972,276 | |
| | 650,000 | | | DCP Midstream Operating LP, 6.450%, 11/03/2036, 144A | | | 682,500 | |
| | 7,000,000 | | | Energy Transfer Operating LP, 4.950%, 6/15/2028 | | | 7,670,707 | |
| | 36,405,000 | | | Energy Transfer Operating LP, 5.250%, 4/15/2029 | | | 40,908,672 | |
| | 3,115,000 | | | EnLink Midstream Partners LP, 5.050%, 4/01/2045 | | | 2,460,850 | |
| | 35,850,000 | | | EnLink Midstream Partners LP, 5.450%, 6/01/2047 | | | 28,948,875 | |
| | 7,695,000 | | | EnLink Midstream Partners LP, 5.600%, 4/01/2044 | | | 6,232,950 | |
| | 26,650,000 | | | EQM Midstream Partners LP, Series 10Y, 5.500%, 7/15/2028 | | | 26,195,171 | |
| | 14,300,000 | | | IFM U.S. Colonial Pipeline 2 LLC, 6.450%, 5/01/2021, 144A | | | 14,951,661 | |
| | 14,660,000 | | | Kinder Morgan Energy Partners LP, 3.500%, 9/01/2023 | | | 15,193,563 | |
| | 3,105,000 | | | Kinder Morgan Energy Partners LP, 5.300%, 9/15/2020 | | | 3,175,567 | |
| | 7,461,000 | | | Kinder Morgan Energy Partners LP, 5.800%, 3/01/2021 | | | 7,767,080 | |
| | 14,040,000 | | | MPLX LP, 4.250%, 12/01/2027, 144A | | | 14,784,260 | |
| | 85,000 | | | NGPL PipeCo LLC, 7.768%, 12/15/2037, 144A | | | 109,751 | |
| | 225,000 | | | Plains All American Pipeline LP/PAA Finance Corp., 2.850%, 1/31/2023 | | | 227,246 | |
| | 40,610,000 | | | Sunoco Logistics Partners Operations LP, 4.000%, 10/01/2027 | | | 42,017,038 | |
| | 8,405,000 | | | Williams Cos., Inc., 3.350%, 8/15/2022 | | | 8,612,025 | |
| | | | | | | | |
| | | | | | | 242,910,192 | |
| | | | | | | | |
See accompanying notes to financial statements.
39 |
Portfolio of Investments – as of December 31, 2019
Loomis Sayles Investment Grade Bond Fund – (continued)
| | | | | | | | |
Principal
Amount (‡) | | | Description | | Value (†) | |
| | | | Mortgage Related — 0.0% | |
| $ | 1,531 | | | FNMA, 6.000%, 7/01/2029 | | $ | 1,714 | |
| | | | | | | | |
| | | | Non-Agency Commercial Mortgage-Backed Securities — 0.8% | |
| | 405,000 | | | Commercial Mortgage Trust, Series2012-LC4, Class C, 5.537%, 12/10/2044(c) | | | 420,541 | |
| | 3,205,000 | | | Credit Suisse Commercial Mortgage Securities Corp., Series 2019-SKLZ, Class D,1-month LIBOR + 3.600%, 5.340%, 1/15/2034, 144A(d) | | | 3,221,000 | |
| | 12,790,000 | | | Credit Suisse Mortgage Trust, Series2014-USA, Class D, 4.373%, 9/15/2037, 144A | | | 12,565,772 | |
| | 5,095,000 | | | DBUBS Mortgage Trust, Series 2017-BRBK, Class D, 3.530%, 10/10/2034, 144A(c) | | | 5,168,617 | |
| | 9,406,000 | | | GS Mortgage Securities Corp. Trust, Series 2013-PEMB, Class D, 3.550%, 3/05/2033, 144A(c) | | | 8,168,264 | |
| | 3,456,000 | | | Morgan Stanley Capital I Trust, Series2011-C2, Class E, 5.488%, 6/15/2044, 144A(c) | | | 3,359,799 | |
| | 6,706,000 | | | UBS-Barclays Commercial Mortgage Trust, Series2012-C2, Class E, 4.890%, 5/10/2063, 144A(a)(b)(c) | | | 5,600,395 | |
| | 3,557,000 | | | WFRBS Commercial Mortgage Trust, Series2011-C2, Class D, 5.652%, 2/15/2044, 144A(c) | | | 3,621,132 | |
| | 2,125,000 | | | WFRBS Commercial Mortgage Trust, Series2011-C3, Class D, 5.683%, 3/15/2044, 144A(c) | | | 1,624,085 | |
| | 1,746,000 | | | WFRBS Commercial Mortgage Trust, Series2012-C7, Class C, 4.813%, 6/15/2045(c) | | | 1,782,563 | |
| | 865,000 | | | WFRBS Commercial Mortgage Trust, Series2012-C7, Class E, 4.813%, 6/15/2045, 144A(c) | | | 741,872 | |
| | | | | | | | |
| | | | | | | 46,274,040 | |
| | | | | | | | |
| | | | Paper — 0.1% | |
| | 2,910,000 | | | WestRock MWV LLC, 7.550%, 3/01/2047(a)(b) | | | 4,003,917 | |
| | | | | | | | |
| | | | Pharmaceuticals — 1.3% | |
| | 27,550,000 | | | Gilead Science, Inc., 2.550%, 9/01/2020 | | | 27,667,397 | |
| | 10,312,000 | | | Mylan NV, 5.250%, 6/15/2046 | | | 11,598,532 | |
| | 2,459,000 | | | Mylan, Inc., 5.200%, 4/15/2048 | | | 2,753,192 | |
| | 2,764,000 | | | Mylan, Inc., 5.400%, 11/29/2043 | | | 3,063,221 | |
| | 17,010,000 | | | Teva Pharmaceutical Finance Netherlands III BV, 2.800%, 7/21/2023 | | | 15,748,539 | |
| | 8,000,000 | | | Teva Pharmaceutical Finance Netherlands III BV, 3.150%, 10/01/2026 | | | 6,660,000 | |
| | 5,500,000 | | | Teva Pharmaceutical Finance Netherlands III BV, 6.000%, 4/15/2024 | | | 5,572,820 | |
| | | | | | | | |
| | | | | | | 73,063,701 | |
| | | | | | | | |
| | | | Property & Casualty Insurance — 0.1% | |
| | 2,740,000 | | | Fidelity National Financial, Inc., 5.500%, 9/01/2022 | | | 2,950,234 | |
| | | | | | | | |
| | | | REITs – Health Care — 0.1% | |
| | 5,972,000 | | | Welltower, Inc., 6.500%, 3/15/2041 | | | 8,093,807 | |
| | | | | | | | |
| | | | REITs – Mortgage — 0.2% | |
| | 8,565,000 | | | Ladder Capital Finance Holdings LLLP/Ladder Capital Finance Corp., 5.250%, 3/15/2022, 144A | | | 8,896,894 | |
| | | | | | | | |
| | | | REITs – Single Tenant — 0.2% | |
| | 8,690,000 | | | Realty Income Corp., 5.750%, 1/15/2021 | | | 8,939,740 | |
| | | | | | | | |
See accompanying notes to financial statements.
| 40
Portfolio of Investments – as of December 31, 2019
Loomis Sayles Investment Grade Bond Fund – (continued)
| | | | | | | | |
Principal
Amount (‡) | | | Description | | Value (†) | |
| | | | Retailers — 0.5% | |
| $ | 391,381 | | | CVS Pass Through Trust, 5.773%, 1/10/2033, 144A | | $ | 440,687 | |
| | 430,009 | | | CVS Pass Through Trust, 6.036%, 12/10/2028 | | | 478,846 | |
| | 11,637,350 | | | CVS Pass Through Trust, Series 2013, 4.704%, 1/10/2036, 144A | | | 12,463,253 | |
| | 1,220,180 | | | CVS Pass Through Trust, Series 2014, 4.163%, 8/11/2036, 144A | | | 1,265,376 | |
| | 1,255,000 | | | Group 1 Automotive, Inc., 5.000%, 6/01/2022 | | | 1,272,256 | |
| | 8,064,000 | | | Marks & Spencer PLC, 7.125%, 12/01/2037, 144A | | | 9,108,965 | |
| | 3,755,000 | | | PVH Corp., 7.750%, 11/15/2023 | | | 4,412,876 | |
| | | | | | | | |
| | | | | | | 29,442,259 | |
| | | | | | | | |
| | | | Supermarkets — 0.0% | |
| | 325,000 | | | Koninklijke Ahold Delhaize NV, 5.700%, 10/01/2040 | | | 401,319 | |
| | | | | | | | |
| | | | Technology — 4.0% | |
| | 27,985,000 | | | Avnet, Inc., 4.625%, 4/15/2026 | | | 29,615,642 | |
| | 26,185,000 | | | Broadcom Corp./Broadcom Cayman Finance Ltd., 3.000%, 1/15/2022 | | | 26,572,385 | |
| | 27,405,000 | | | Broadcom, Inc., 4.750%, 4/15/2029, 144A | | | 29,966,901 | |
| | 27,558,000 | | | Cisco Systems, Inc., 1.850%, 9/20/2021 | | | 27,576,871 | |
| | 22,066,000 | | | Cisco Systems, Inc., 2.200%, 2/28/2021 | | | 22,195,159 | |
| | 13,560,000 | | | Equifax, Inc., 3.600%, 8/15/2021 | | | 13,873,934 | |
| | 17,195,000 | | | Equinix, Inc., 3.200%, 11/18/2029 | | | 17,258,965 | |
| | 7,440,000 | | | Jabil, Inc., 4.700%, 9/15/2022 | | | 7,884,816 | |
| | 16,735,000 | | | KLA Corp., 5.650%, 11/01/2034 | | | 20,059,106 | |
| | 10,768,000 | | | Micron technology, Inc., 4.663%, 2/15/2030 | | | 11,864,116 | |
| | 1,857,000 | | | Micron Technology, Inc., 5.327%, 2/06/2029 | | | 2,130,327 | |
| | 5,000,000 | | | Oracle Corp., 2.800%, 7/08/2021 | | | 5,076,442 | |
| | 9,135,000 | | | Verisk Analytics, Inc., 4.125%, 3/15/2029 | | | 10,032,340 | |
| | | | | | | | |
| | | | | | | 224,107,004 | |
| | | | | | | | |
| | | | Treasuries — 19.6% | |
| | 210,910,000 | | | U.S. Treasury Bond, 3.000%, 8/15/2048 | | | 238,138,810 | |
| | 111,500,000 | | | U.S. Treasury Bond, 3.000%, 2/15/2049 | | | 126,116,953 | |
| | 55,260,000 | | | U.S. Treasury Note, 1.500%, 8/31/2021 | | | 55,173,656 | |
| | 88,910,000 | | | U.S. Treasury Note, 1.625%, 8/15/2029 | | | 86,683,777 | |
| | 30,000,000 | | | U.S. Treasury Note, 1.500%, 4/15/2020 | | | 29,991,797 | |
| | 166,145,000 | | | U.S. Treasury Note, 1.500%, 10/31/2021 | | | 165,917,848 | |
| | 67,000,000 | | | U.S. Treasury Note, 1.500%, 11/30/2021 | | | 66,911,016 | |
| | 28,000,000 | | | U.S. Treasury Note, 2.375%, 4/30/2020 | | | 28,067,813 | |
| | 284,065,000 | | | U.S. Treasury Note, 2.375%, 5/15/2029 | | | 295,460,890 | |
| | | | | | | | |
| | | | | | | 1,092,462,560 | |
| | | | | | | | |
| | | | Wireless — 0.6% | |
| | 22,660,000 | | | Crown Castle International Corp., 3.650%, 9/01/2027 | | | 23,981,445 | |
| | 6,615,000 | | | Crown Castle International Corp., 4.000%, 3/01/2027 | | | 7,143,059 | |
| | | | | | | | |
| | | | | | | 31,124,504 | |
| | | | | | | | |
| | | | Wirelines — 2.1% | |
| | 61,415,000 | | | AT&T, Inc., 4.300%, 2/15/2030 | | | 68,243,795 | |
| | 435,000 | | | AT&T, Inc., 4.350%, 6/15/2045 | | | 469,631 | |
| | 3,105,000 | | | AT&T, Inc., 4.500%, 3/09/2048 | | | 3,430,398 | |
| | 7,980,000 | | | AT&T, Inc., 4.850%, 3/01/2039 | | | 9,204,291 | |
| | 27,220,000 | | | Telefonica Emisiones S.A., 5.520%, 3/01/2049 | | | 34,149,463 | |
| | | | | | | | |
| | | | | | | 115,497,578 | |
| | | | | | | | |
| | | | TotalNon-Convertible Bonds
(Identified Cost $4,909,449,415) | | | 5,232,967,808 | |
| | | | | | | | |
See accompanying notes to financial statements.
41 |
Portfolio of Investments – as of December 31, 2019
Loomis Sayles Investment Grade Bond Fund – (continued)
| | | | | | | | |
Principal
Amount (‡) | | | Description | | Value (†) | |
| | Convertible Bonds — 0.7% | |
| | | | Cable Satellite — 0.2% | |
| $ | 9,050,000 | | | DISH Network Corp., 2.375%, 3/15/2024 | | $ | 8,263,555 | |
| | 6,190,000 | | | DISH Network Corp., 3.375%, 8/15/2026 | | | 5,954,161 | |
| | | | | | | | |
| | | | | | | 14,217,716 | |
| | | | | | | | |
| | | | Diversified Manufacturing — 0.1% | |
| | 5,165,000 | | | Greenbrier Cos., Inc. (The), 2.875%, 2/01/2024 | | | 4,985,885 | |
| | | | | | | | |
| | | | Independent Energy — 0.1% | |
| | 6,390,000 | | | Chesapeake Energy Corp., 5.500%, 9/15/2026 | | | 3,044,094 | |
| | | | | | | | |
| �� | | | Pharmaceuticals — 0.3% | |
| | 14,075,000 | | | BioMarin Pharmaceutical, Inc., 0.599%, 8/01/2024 | | | 14,870,220 | |
| | | | | | | | |
| | | | Total Convertible Bonds
(Identified Cost $40,552,831) | | | 37,117,915 | |
| | | | | | | | |
| | | | | | | | |
| | Municipals — 0.1% | |
| | | | Michigan — 0.0% | |
| | 1,575,000 | | | Michigan Tobacco Settlement Finance Authority Taxable Turbo, Series A, 7.309%, 6/01/2034 | | | 1,630,141 | |
| | | | | | | | |
| | | | Virginia — 0.1% | |
| | 7,595,000 | | | Tobacco Settlement Financing Corp., SeriesA-1, 6.706%, 6/01/2046 | | | 7,315,124 | |
| | | | | | | | |
| | | | Total Municipals
(Identified Cost $8,905,434) | | | 8,945,265 | |
| | | | | | | | |
| | | | | | | | |
| | | | Total Bonds and Notes
(Identified Cost $4,958,907,680) | | | 5,279,030,988 | |
| | | | | | | | |
| | | | | | | | |
| | Collateralized Loan Obligations — 2.0% | |
| | 2,905,000 | | | Atrium XII, Series 12A,Class AR, 3-month LIBOR + 0.830%, 2.783%, 4/22/2027, 144A(d) | | | 2,901,318 | |
| | 9,918,973 | | | CVP Cascade CLO Ltd., Series2014-2A,Class A1R, 3-month LIBOR + 1.200%, 3.203%, 7/18/2026, 144A(d) | | | 9,918,489 | |
| | 8,702,094 | | | Elevation CLO Ltd., Series2015-4A,Class AR, 3-month LIBOR + 0.990%, 2.993%, 4/18/2027, 144A(d) | | | 8,701,466 | |
| | 1,785,164 | | | Flatiron CLO Ltd., Series2015-1A,Class AR, 3-month LIBOR + 0.890%, 2.891%, 4/15/2027, 144A(d) | | | 1,783,831 | |
| | 5,490,000 | | | Halcyon Loan Advisors Funding, Series2014-3A,Class B1R, 3-month LIBOR + 1.700%, 3.653%, 10/22/2025, 144A(d) | | | 5,502,457 | |
| | 6,696,544 | | | Halcyon Loan Advisors Funding Ltd., Series2014-2A, Class A1BR,3-month LIBOR + 1.180%, 3.116%, 4/28/2025, 144A(d) | | | 6,696,410 | |
| | 11,630,006 | | | Jamestown CLO VII Ltd., Series2015-7A,Class A1R, 3-month LIBOR + 0.830%, 2.770%, 7/25/2027, 144A(d) | | | 11,626,822 | |
| | 966,464 | | | Limerock CLO III LLC, Series2014-3A,Class A1R, 3-month LIBOR + 1.200%, 3.166%, 10/20/2026, 144A(d) | | | 965,735 | |
| | 13,685,000 | | | Mountain View CLO X Ltd., Series2015-10A,Class AR, 3-month LIBOR + 0.820%, 2.821%, 10/13/2027, 144A(d) | | | 13,636,346 | |
| | 11,250,000 | | | OCP CLO Ltd, Series2015-10A,Class A1R, 3-month LIBOR + 0.820%, 2.756%, 10/26/2027, 144A(d) | | | 11,246,469 | |
See accompanying notes to financial statements.
| 42
Portfolio of Investments – as of December 31, 2019
Loomis Sayles Investment Grade Bond Fund – (continued)
| | | | | | | | |
Principal
Amount (‡) | | | Description | | Value (†) | |
| | Collateralized Loan Obligations — (continued) | |
| $ | 3,115,383 | | | OFSI Fund VII Ltd., Series2014-7A,Class AR, 3-month LIBOR + 0.900%, 2.903%, 10/18/2026, 144A(d) | | $ | 3,115,245 | |
| | 13,210,000 | | | Parallel Ltd., Series2015-1A,Class AR, 3-month LIBOR + 0.850%, 2.816%, 7/20/2027, 144A(d) | | | 13,186,096 | |
| | 6,012,067 | | | Staniford Street CLO Ltd., Series2014-1A,Class AR, 3-month LIBOR + 1.180%, 3.074%, 6/15/2025, 144A(d) | | | 6,010,854 | |
| | 4,471,640 | | | Venture VII CDO Ltd., Series2006-7A,Class B, 3-month LIBOR + 0.380%, 2.346%, 1/20/2022, 144A(d) | | | 4,470,318 | |
| | 5,960,386 | | | Venture XII CLO Ltd., Series2012-12A,Class ARR, 3-month LIBOR + 0.800%, 2.714%, 2/28/2026, 144A(d) | | | 5,950,385 | |
| | 8,219,760 | | | West CLO Ltd., Series2014-1A,Class A1R, 3-month LIBOR + 0.920%, 2.923%, 7/18/2026, 144A(d) | | | 8,212,081 | |
| | | | | | | | |
| | | | Total Collateralized Loan Obligations
(Identified Cost $114,044,833) | | | 113,924,322 | |
| | | | | | | | |
| | | | | | | | |
| Shares | | | | | | |
| | Preferred Stocks — 0.3% | |
| | | | Food & Beverage — 0.3% | |
| | 138,889 | | | Bunge Ltd., 4.875% | | | 14,301,982 | |
| | | | | | | | |
| | | | Independent Energy — 0.0% | |
| | 40,860 | | | Chesapeake Energy Corp., 5.000%(a)(b)(e) | | | 721,179 | |
| | | | | | | | |
| | | | Total Preferred Stocks
(Identified Cost $17,780,899) | | | 15,023,161 | |
| | | | | | | | |
| | | | | | | | |
Principal
Amount (‡) | | | | | | |
| | Short-Term Investments — 2.3% | |
| | 2,690,358,211 | | | Central Bank of Iceland, 0.000%, (ISK)(a)(b)(d)(f) | | | 22,221,510 | |
| | 104,719,265 | | | Tri-Party Repurchase Agreement with Fixed Income Clearing Corporation, dated 12/31/2019 at 0.900% to be repurchased at $104,724,501 on 1/02/2020 collateralized by $105,170,000 U.S. Treasury Note, 2.000% due 5/31/2024 valued at $106,815,385 including accrued interest (Note 2 of Notes to Financial Statements) | | | 104,719,265 | |
| | | | | | | | |
| | | | Total Short-Term Investments
(Identified Cost $126,617,021) | | | 126,940,775 | |
| | | | | | | | |
| | | | | | | | |
| | | | Total Investments — 99.3%
(Identified Cost $5,217,350,433) | | | 5,534,919,246 | |
| | | | Other assets less liabilities — 0.7% | | | 39,076,851 | |
| | | | | | | | |
| | | | Net Assets — 100.0% | | $ | 5,573,996,097 | |
| | | | | | | | |
| | | | | | | | |
| | (‡) | | | Principal Amount stated in U.S. dollars unless otherwise noted. | | | | |
| | (†) | | | See Note 2 of Notes to Financial Statements. | |
| | (a) | | | Illiquid security. (Unaudited) | |
See accompanying notes to financial statements.
43 |
Portfolio of Investments – as of December 31, 2019
Loomis Sayles Investment Grade Bond Fund – (continued)
| | | | | | | | |
| | | | | | | | |
| | (b) | | | Securities classified as fair valued pursuant to the Fund’s pricing policies and procedures. At December 31, 2019, the value of these securities amounted to $163,123,037 or 2.9% of net assets. See Note 2 of Notes to Financial Statements. | |
| | (c) | | | Variable rate security. The interest rate adjusts periodically based on; (i) changes in current interest rates and/or prepayments on underlying pools of assets, if applicable, (ii) reference to a base lending rate plus or minus a margin, and/or (iii) reference to a base lending rate adjusted by a multiplier and/or subject to certain floors or caps. Rate as of December 31, 2019 is disclosed. | |
| | (d) | | | Variable rate security. Rate as of December 31, 2019 is disclosed. | |
| | (e) | | | Level 3 security. Value has been determined using significant unobservable inputs. See Note 3 of Notes to Financial Statements. | |
| | (f) | | | Security callable by issuer at any time. No specified maturity date. | |
| | | | | | | | |
| | 144A | | | All or a portion of these securities are exempt from registration under Rule 144A of the Securities Act of 1933. These securities may be resold in transactions exempt from registration, normally to qualified institutional buyers. At December 31, 2019, the value of Rule 144A holdings amounted to $1,736,780,922 or 31.2% of net assets. | |
| | ABS | | | Asset-Backed Securities | |
| | ARS | | | Auction Rate Security | |
| | FNMA | | | Federal National Mortgage Association | |
| | GMTN | | | Global Medium Term Note | |
| | LIBOR | | | London Interbank Offered Rate | |
| | MTN | | | Medium Term Note | |
| | REITs | | | Real Estate Investment Trusts | |
| | SLM | | | Sallie Mae | |
| | | | | |
| | ISK | | | Icelandic Krona | |
Industry Summary at December 31, 2019
| | | | |
Treasuries | | | 19.6 | % |
Banking | | | 7.9 | |
ABS Car Loan | | | 7.6 | |
ABS Home Equity | | | 4.7 | |
Midstream | | | 4.3 | |
Technology | | | 4.0 | |
ABS Other | | | 3.5 | |
Metals & Mining | | | 3.5 | |
Life Insurance | | | 2.9 | |
Independent Energy | | | 2.5 | |
Food & Beverage | | | 2.4 | |
Healthcare | | | 2.3 | |
Electric | | | 2.2 | |
Automotive | | | 2.1 | |
Wirelines | | | 2.1 | |
ABS Whole Business | | | 2.0 | |
Other Investments, less than 2% each | | | 21.4 | |
Short-Term Investments | | | 2.3 | |
Collateralized Loan Obligations | | | 2.0 | |
| | | | |
Total Investments | | | 99.3 | |
Other assets less liabilities | | | 0.7 | |
| | | | |
Net Assets | | | 100.0 | % |
| | | | |
See accompanying notes to financial statements.
| 44
Portfolio of Investments – as of December 31, 2019
Loomis Sayles Multi-Asset Income Fund
| | | | | | | | |
Shares | | | Description | | Value (†) | |
| | Common Stocks — 44.0% of Net Assets | |
| | | | Aerospace & Defense — 0.9% | |
| | 693 | | | Boeing Co. (The) | | $ | 225,752 | |
| | 463 | | | General Dynamics Corp. | | | 81,650 | |
| | 443 | | | HEICO Corp. | | | 50,568 | |
| | 263 | | | Huntington Ingalls Industries, Inc. | | | 65,981 | |
| | 456 | | | L3Harris Technologies, Inc. | | | 90,229 | |
| | 677 | | | Spirit AeroSystems Holdings, Inc., Class A | | | 49,340 | |
| | 1,195 | | | United Technologies Corp. | | | 178,963 | |
| | | | | | | | |
| | | | | | | 742,483 | |
| | | | | | | | |
| | | | Air Freight & Logistics — 0.2% | |
| | 441 | | | FedEx Corp. | | | 66,684 | |
| | 984 | | | United Parcel Service, Inc., Class B | | | 115,187 | |
| | | | | | | | |
| | | | | | | 181,871 | |
| | | | | | | | |
| | | | Airlines — 0.1% | |
| | 100 | | | Delta Air Lines, Inc. | | | 5,848 | |
| | 2,900 | | | Japan Airlines Co. Ltd. | | | 90,294 | |
| | | | | | | | |
| | | | | | | 96,142 | |
| | | | | | | | |
| | | | Auto Components — 0.3% | |
| | 5,224 | | | Faurecia SE | | | 283,599 | |
| | | | | | | | |
| | | | Automobiles — 0.1% | |
| | 6,257 | | | Ford Motor Co. | | | 58,190 | |
| | 1,788 | | | General Motors Co. | | | 65,441 | |
| | | | | | | | |
| | | | | | | 123,631 | |
| | | | | | | | |
| | | | Banks — 6.5% | |
| | 10,749 | | | Bank of America Corp. | | | 378,580 | |
| | 122,722 | | | Barclays PLC | | | 292,627 | |
| | 10,973 | | | BNP Paribas S.A. | | | 652,214 | |
| | 89,017 | | | CaixaBank S.A. | | | 280,320 | |
| | 200 | | | Canadian Imperial Bank of Commerce | | | 16,643 | |
| | 2,621 | | | Citigroup, Inc. | | | 209,392 | |
| | 1,590 | | | Citizens Financial Group, Inc. | | | 64,570 | |
| | 21,427 | | | Credit Agricole S.A. | | | 311,791 | |
| | 45,081 | | | DNB ASA | | | 843,596 | |
| | 2,059 | | | Fifth Third Bancorp | | | 63,294 | |
| | 3,983 | | | Huntington Bancshares, Inc. | | | 60,064 | |
| | 4,132 | | | JPMorgan Chase & Co. | | | 576,001 | |
| | 3,203 | | | KeyCorp | | | 64,829 | |
| | 330,303 | | | Lloyds Banking Group PLC | | | 273,630 | |
| | 569 | | | PNC Financial Services Group, Inc. (The) | | | 90,829 | |
| | 3,588 | | | Regions Financial Corp. | | | 61,570 | |
| | 28,051 | | | Societe Generale S.A. | | | 978,923 | |
| | 1,099 | | | Truist Financial Corp. | | | 61,896 | |
| | 934 | | | U.S. Bancorp | | | 55,377 | |
| | 4,927 | | | Wells Fargo & Co. | | | 265,072 | |
| | | | | | | | |
| | | | | | | 5,601,218 | |
| | | | | | | | |
See accompanying notes to financial statements.
45 |
Portfolio of Investments – as of December 31, 2019
Loomis Sayles Multi-Asset Income Fund – (continued)
| | | | | | | | |
Shares | | | Description | | Value (†) | |
| | | | Beverages — 0.8% | |
| | 1,800 | | | Asahi Group Holdings Ltd. | | $ | 82,117 | |
| | 5,510 | | | Coca-Cola Co. (The) | | | 304,978 | |
| | 282 | | | Constellation Brands, Inc., Class A | | �� | 53,510 | |
| | 321 | | | Molson Coors Brewing Co., Class B | | | 17,302 | |
| | 1,896 | | | PepsiCo, Inc. | | | 259,126 | |
| | | | | | | | |
| | | | | | | 717,033 | |
| | | | | | | | |
| | | | Biotechnology — 0.8% | |
| | 2,788 | | | AbbVie, Inc. | | | 246,849 | |
| | 1,083 | | | Amgen, Inc. | | | 261,079 | |
| | 3,105 | | | Gilead Sciences, Inc. | | | 201,763 | |
| | | | | | | | |
| | | | | | | 709,691 | |
| | | | | | | | |
| | | | Building Products — 0.1% | |
| | 1,376 | | | Johnson Controls International PLC | | | 56,017 | |
| | | | | | | | |
| | | | Capital Markets — 1.3% | |
| | 1,261 | | | Bank of New York Mellon Corp. (The) | | | 63,466 | |
| | 145 | | | BlackRock, Inc. | | | 72,892 | |
| | 1,754 | | | Charles Schwab Corp. (The) | | | 83,420 | |
| | 271 | | | CME Group, Inc. | | | 54,395 | |
| | 1,334 | | | Cohen & Steers, Inc. | | | 83,722 | |
| | 1,211 | | | Federated Investors, Inc., Class B | | | 39,466 | |
| | 505 | | | Goldman Sachs Group, Inc. (The) | | | 116,115 | |
| | 591 | | | Intercontinental Exchange, Inc. | | | 54,697 | |
| | 267 | | | Moody’s Corp. | | | 63,388 | |
| | 1,934 | | | Morgan Stanley | | | 98,866 | |
| | 246 | | | MSCI, Inc. | | | 63,512 | |
| | 229 | | | Northern Trust Corp. | | | 24,329 | |
| | 356 | | | S&P Global, Inc. | | | 97,206 | |
| | 13,500 | | | Singapore Exchange Ltd. | | | 88,913 | |
| | 453 | | | State Street Corp. | | | 35,832 | |
| | 496 | | | T. Rowe Price Group, Inc. | | | 60,433 | |
| | | | | | | | |
| | | | | | | 1,100,652 | |
| | | | | | | | |
| | | | Chemicals — 0.8% | |
| | 262 | | | Air Products & Chemicals, Inc. | | | 61,567 | |
| | 467 | | | Celanese Corp. | | | 57,497 | |
| | 1,208 | | | Dow, Inc. | | | 66,114 | |
| | 1,086 | | | DuPont de Nemours, Inc. | | | 69,721 | |
| | 347 | | | Ecolab, Inc. | | | 66,967 | |
| | 674 | | | Linde PLC | | | 143,495 | |
| | 660 | | | LyondellBasell Industries NV, Class A | | | 62,357 | |
| | 497 | | | PPG Industries, Inc. | | | 66,345 | |
| | 119 | | | Sherwin-Williams Co. (The) | | | 69,441 | |
| | | | | | | | |
| | | | | | | 663,504 | |
| | | | | | | | |
| | | | Commercial Services & Supplies — 0.4% | |
| | 232 | | | Cintas Corp. | | | 62,427 | |
| | 3,100 | | | Dai Nippon Printing Co. Ltd. | | | 83,847 | |
See accompanying notes to financial statements.
| 46
Portfolio of Investments – as of December 31, 2019
Loomis Sayles Multi-Asset Income Fund – (continued)
| | | | | | | | |
Shares | | | Description | | Value (†) | |
| | | | Commercial Services & Supplies — continued | |
| | 1,013 | | | Republic Services, Inc. | | $ | 90,795 | |
| | 1,324 | | | Waste Management, Inc. | | | 150,883 | |
| | | | | | | | |
| | | | | | | 387,952 | |
| | | | | | | | |
| | | | Communications Equipment — 0.4% | |
| | 5,934 | | | Cisco Systems, Inc. | | | 284,595 | |
| | 346 | | | Motorola Solutions, Inc. | | | 55,754 | |
| | | | | | | | |
| | | | | | | 340,349 | |
| | | | | | | | |
| | | | Construction & Engineering — 0.5% | |
| | 2,264 | | | ACS Actividades de Construccion y Servicios S.A. | | | 90,818 | |
| | 2,348 | | | Eiffage S.A. | | | 269,379 | |
| | 615 | | | Jacobs Engineering Group, Inc. | | | 55,245 | |
| | | | | | | | |
| | | | | | | 415,442 | |
| | | | | | | | |
| | | | Consumer Finance — 0.3% | |
| | 613 | | | American Express Co. | | | 76,313 | |
| | 697 | | | Capital One Financial Corp. | | | 71,728 | |
| | 693 | | | Discover Financial Services | | | 58,780 | |
| | 634 | | | Synchrony Financial | | | 22,830 | |
| | | | | | | | |
| | | | | | | 229,651 | |
| | | | | | | | |
| | | | Containers & Packaging — 0.1% | |
| | 1,021 | | | Ball Corp. | | | 66,028 | |
| | 1,376 | | | International Paper Co. | | | 63,365 | |
| | | | | | | | |
| | | | | | | 129,393 | |
| | | | | | | | |
| | | | Diversified Telecommunication Services — 1.1% | |
| | 12,367 | | | AT&T, Inc. | | | 483,302 | |
| | 51,000 | | | HKT Trust & HKT Ltd. | | | 71,874 | |
| | 6,265 | | | Verizon Communications, Inc. | | | 384,671 | |
| | | | | | | | |
| | | | | | | 939,847 | |
| | | | | | | | |
| | | | Electric Utilities — 1.0% | |
| | 8,074 | | | Contact Energy Ltd. | | | 38,784 | |
| | 863 | | | Duke Energy Corp. | | | 78,714 | |
| | 795 | | | Edison International | | | 59,951 | |
| | 1,375 | | | Evergy, Inc. | | | 89,499 | |
| | 1,376 | | | Exelon Corp. | | | 62,732 | |
| | 1,203 | | | FirstEnergy Corp. | | | 58,466 | |
| | 2,128 | | | Fortum OYJ | | | 52,526 | |
| | 1,564 | | | Pinnacle West Capital Corp. | | | 140,651 | |
| | 4,430 | | | PPL Corp. | | | 158,948 | |
| | 1,466 | | | Southern Co. (The) | | | 93,384 | |
| | | | | | | | |
| | | | | | | 833,655 | |
| | | | | | | | |
| | | | Electrical Equipment — 0.3% | |
| | 636 | | | AMETEK, Inc. | | | 63,435 | |
| | 675 | | | Eaton Corp. PLC | | | 63,936 | |
| | 891 | | | Emerson Electric Co. | | | 67,948 | |
| | 356 | | | Rockwell Automation, Inc. | | | 72,150 | |
| | | | | | | | |
| | | | | | | 267,469 | |
| | | | | | | | |
See accompanying notes to financial statements.
47 |
Portfolio of Investments – as of December 31, 2019
Loomis Sayles Multi-Asset Income Fund – (continued)
| | | | | | | | |
Shares | | | Description | | Value (†) | |
| | | | Electronic Equipment, Instruments & Components — 0.2% | |
| | 609 | | | Amphenol Corp., Class A | | $ | 65,912 | |
| | 2,059 | | | Corning, Inc. | | | 59,938 | |
| | 617 | | | TE Connectivity Ltd. | | | 59,133 | |
| | | | | | | | |
| | | | | | | 184,983 | |
| | | | | | | | |
| | | | Energy Equipment & Services — 0.1% | |
| | 1,910 | | | Schlumberger Ltd. | | | 76,782 | |
| | | | | | | | |
| | | | Entertainment — 0.5% | |
| | 1,205 | | | Activision Blizzard, Inc. | | | 71,601 | |
| | 2,519 | | | Walt Disney Co. (The) | | | 364,323 | |
| | | | | | | | |
| | | | | | | 435,924 | |
| | | | | | | | |
| | | | Food & Staples Retailing — 0.8% | |
| | 415 | | | Costco Wholesale Corp. | | | 121,977 | |
| | 2,225 | | | Kroger Co. (The) | | | 64,503 | |
| | 1,900 | | | Seven & I Holdings Co. Ltd. | | | 69,645 | |
| | 1,448 | | | Sysco Corp. | | | 123,862 | |
| | 1,140 | | | Walgreens Boots Alliance, Inc. | | | 67,214 | |
| | 1,943 | | | Walmart, Inc. | | | 230,906 | |
| | | | | | | | |
| | | | | | | 678,107 | |
| | | | | | | | |
| | | | Food Products — 0.7% | |
| | 1,370 | | | Archer-Daniels-Midland Co. | | | 63,499 | |
| | 2,913 | | | General Mills, Inc. | | | 156,020 | |
| | 566 | | | Hershey Co. (The) | | | 83,191 | |
| | 2,023 | | | Kraft Heinz Co. (The) | | | 64,999 | |
| | 1,815 | | | Mondelez International, Inc., Class A | | | 99,970 | |
| | 9,385 | | | Tate & Lyle PLC | | | 94,562 | |
| | 647 | | | Tyson Foods, Inc., Class A | | | 58,903 | |
| | | | | | | | |
| | | | | | | 621,144 | |
| | | | | | | | |
| | | | Health Care Equipment & Supplies — 1.2% | |
| | 2,255 | | | Abbott Laboratories | | | 195,869 | |
| | 776 | | | Baxter International, Inc. | | | 64,889 | |
| | 403 | | | Becton Dickinson & Co. | | | 109,604 | |
| | 895 | | | Danaher Corp. | | | 137,365 | |
| | 2,666 | | | Medtronic PLC | | | 302,458 | |
| | 432 | | | ResMed, Inc. | | | 66,947 | |
| | 494 | | | Stryker Corp. | | | 103,710 | |
| | 414 | | | Zimmer Biomet Holdings, Inc. | | | 61,968 | |
| | | | | | | | |
| | | | | | | 1,042,810 | |
| | | | | | | | |
| | | | Health Care Providers & Services — 1.1% | |
| | 1,017 | | | AmerisourceBergen Corp. | | | 86,465 | |
| | 355 | | | Anthem, Inc. | | | 107,221 | |
| | 569 | | | Cigna Corp. | | | 116,355 | |
| | 1,903 | | | CVS Health Corp. | | | 141,374 | |
| | 455 | | | HCA Healthcare, Inc. | | | 67,253 | |
| | 215 | | | Humana, Inc. | | | 78,802 | |
| | 397 | | | McKesson Corp. | | | 54,913 | |
See accompanying notes to financial statements.
| 48
Portfolio of Investments – as of December 31, 2019
Loomis Sayles Multi-Asset Income Fund – (continued)
| | | | | | | | |
Shares | | | Description | | Value (†) | |
| | | | Health Care Providers & Services — continued | |
| | 1,185 | | | UnitedHealth Group, Inc. | | $ | 348,366 | |
| | | | | | | | |
| | | | | | | 1,000,749 | |
| | | | | | | | |
| | | | Health Care Technology — 0.1% | |
| | 850 | | | Cerner Corp. | | | 62,382 | |
| | | | | | | | |
| | | | Hotels, Restaurants & Leisure — 0.8% | |
| | 605 | | | Hilton Worldwide Holdings, Inc. | | | 67,100 | |
| | 565 | | | Las Vegas Sands Corp. | | | 39,008 | |
| | 518 | | | Marriott International, Inc., Class A | | | 78,441 | |
| | 956 | | | McDonald’s Corp. | | | 188,915 | |
| | 2,842 | | | Starbucks Corp. | | | 249,869 | |
| | 655 | | | Yum! Brands, Inc. | | | 65,978 | |
| | | | | | | | |
| | | | | | | 689,311 | |
| | | | | | | | |
| | | | Household Durables — 0.1% | |
| | 1,165 | | | DR Horton, Inc. | | | 61,454 | |
| | 500 | | | Sekisui House Ltd. | | | 10,677 | |
| | 388 | | | Whirlpool Corp. | | | 57,242 | |
| | | | | | | | |
| | | | | | | 129,373 | |
| | | | | | | | |
| | | | Household Products — 0.8% | |
| | 472 | | | Clorox Co. (The) | | | 72,471 | |
| | 1,075 | | | Colgate-Palmolive Co. | | | 74,003 | |
| | 718 | | | Kimberly-Clark Corp. | | | 98,761 | |
| | 3,749 | | | Procter & Gamble Co. (The) | | | 468,250 | |
| | | | | | | | |
| | | | | | | 713,485 | |
| | | | | | | | |
| | | | Independent Power & Renewable Electricity Producers — 0.2% | |
| | 3,615 | | | AES Corp. (The) | | | 71,939 | |
| | 4,400 | | | Northland Power, Inc. | | | 92,164 | |
| | | | | | | | |
| | | | | | | 164,103 | |
| | | | | | | | |
| | | | Industrial Conglomerates — 0.5% | |
| | 800 | | | 3M Co. | | | 141,136 | |
| | 5,585 | | | General Electric Co. | | | 62,328 | |
| | 855 | | | Honeywell International, Inc. | | | 151,335 | |
| | 160 | | | Roper Technologies, Inc. | | | 56,677 | |
| | | | | | | | |
| | | | | | | 411,476 | |
| | | | | | | | |
| | | | Insurance — 2.3% | |
| | 1,323 | | | Aflac, Inc. | | | 69,987 | |
| | 1,447 | | | American International Group, Inc. | | | 74,274 | |
| | 352 | | | Aon PLC | | | 73,318 | |
| | 98,694 | | | Aviva PLC | | | 547,806 | |
| | 20,772 | | | AXA S.A. | | | 586,939 | |
| | 584 | | | Chubb Ltd. | | | 90,905 | |
| | 1,853 | | | Fidelity National Financial, Inc. | | | 84,034 | |
| | 1,129 | | | Loews Corp. | | | 59,261 | |
| | 677 | | | Marsh & McLennan Cos., Inc. | | | 75,425 | |
| | 1,265 | | | MetLife, Inc. | | | 64,477 | |
See accompanying notes to financial statements.
49 |
Portfolio of Investments – as of December 31, 2019
Loomis Sayles Multi-Asset Income Fund – (continued)
| | | | | | | | |
Shares | | | Description | | Value (†) | |
| | | | Insurance — continued | |
| | 1,016 | | | Principal Financial Group, Inc. | | $ | 55,880 | |
| | 864 | | | Progressive Corp. (The) | | | 62,545 | |
| | 714 | | | Prudential Financial, Inc. | | | 66,930 | |
| | 494 | | | Travelers Cos., Inc. (The) | | | 67,653 | |
| | 293 | | | Willis Towers Watson PLC | | | 59,168 | |
| | | | | | | | |
| | | | | | | 2,038,602 | |
| | | | | | | | |
| | | | Internet & Direct Marketing Retail — 0.1% | |
| | 1,439 | | | eBay, Inc. | | | 51,962 | |
| | | | | | | | |
| | | | IT Services — 2.3% | |
| | 841 | | | Accenture PLC, Class A | | | 177,090 | |
| | 1,273 | | | Amdocs Ltd. | | | 91,898 | |
| | 1,114 | | | Automatic Data Processing, Inc. | | | 189,937 | |
| | 909 | | | Cognizant Technology Solutions Corp., Class A | | | 56,376 | |
| | 937 | | | Fidelity National Information Services, Inc. | | | 130,327 | |
| | 347 | | | Global Payments, Inc. | | | 63,348 | |
| | 1,096 | | | International Business Machines Corp. | | | 146,908 | |
| | 980 | | | Leidos Holdings, Inc. | | | 95,932 | |
| | 1,161 | | | MasterCard, Inc., Class A | | | 346,663 | |
| | 1,600 | | | Nihon Unisys Ltd. | | | 50,190 | |
| | 1,779 | | | Paychex, Inc. | | | 151,322 | |
| | 2,433 | | | Visa, Inc., Class A | | | 457,161 | |
| | | | | | | | |
| | | | | | | 1,957,152 | |
| | | | | | | | |
| | | | Leisure Products — 0.1% | |
| | 2,500 | | | Sankyo Co. Ltd. | | | 83,032 | |
| | | | | | | | |
| | | | Life Sciences Tools & Services — 0.3% | |
| | 751 | | | Agilent Technologies, Inc. | | | 64,068 | |
| | 565 | | | Thermo Fisher Scientific, Inc. | | | 183,551 | |
| | | | | | | | |
| | | | | | | 247,619 | |
| | | | | | | | |
| | | | Machinery — 0.9% | |
| | 776 | | | Caterpillar, Inc. | | | 114,599 | |
| | 352 | | | Cummins, Inc. | | | 62,994 | |
| | 461 | | | Deere & Co. | | | 79,873 | |
| | 836 | | | Fortive Corp. | | | 63,862 | |
| | 508 | | | Illinois Tool Works, Inc. | | | 91,252 | |
| | 465 | | | Ingersoll-Rand PLC | | | 61,808 | |
| | 1,900 | | | Mitsubishi Heavy Industries Ltd. | | | 73,676 | |
| | 1,397 | | | PACCAR, Inc. | | | 110,503 | |
| | 327 | | | Parker-Hannifin Corp. | | | 67,303 | |
| | 147 | | | Stanley Black & Decker, Inc. | | | 24,364 | |
| | | | | | | | |
| | | | | | | 750,234 | |
| | | | | | | | |
| | | | Marine — 0.1% | |
| | 78,000 | | | SITC International Holdings Co. Ltd. | | | 95,189 | |
| | | | | | | | |
| | | | Media — 0.7% | |
| | 1,000 | | | Cogeco Communications, Inc. | | | 87,174 | |
| | 8,266 | | | Comcast Corp., Class A | | | 371,722 | |
See accompanying notes to financial statements.
| 50
Portfolio of Investments – as of December 31, 2019
Loomis Sayles Multi-Asset Income Fund – (continued)
| | | | | | | | |
Shares | | | Description | | Value (†) | |
| | | | Media — continued | |
| | 1,119 | | | Omnicom Group, Inc. | | $ | 90,662 | |
| | 657 | | | ViacomCBS, Inc., Class B | | | 27,574 | |
| | | | | | | | |
| | | | | | | 577,132 | |
| | | | | | | | |
| | | | Metals & Mining — 0.1% | |
| | 1,105 | | | Nucor Corp. | | | 62,189 | |
| | | | | | | | |
| | | | Multi-Utilities — 0.7% | |
| | 6,429 | | | AGL Energy Ltd. | | | 92,536 | |
| | 1,800 | | | Canadian Utilities Ltd., Class A | | | 54,296 | |
| | 2,487 | | | CenterPoint Energy, Inc. | | | 67,821 | |
| | 800 | | | Consolidated Edison, Inc. | | | 72,376 | |
| | 943 | | | Dominion Energy, Inc. | | | 78,099 | |
| | 554 | | | DTE Energy Co. | | | 71,948 | |
| | 2,496 | | | NiSource, Inc. | | | 69,489 | |
| | 940 | | | Public Service Enterprise Group, Inc. | | | 55,507 | |
| | 402 | | | Sempra Energy | | | 60,895 | |
| | | | | | | | |
| | | | | | | 622,967 | |
| | | | | | | | |
| | | | Multiline Retail — 0.3% | |
| | 424 | | | Dollar General Corp. | | | 66,136 | |
| | 1,363 | | | Target Corp. | | | 174,750 | |
| | | | | | | | |
| | | | | | | 240,886 | |
| | | | | | | | |
| | | | Oil, Gas & Consumable Fuels — 1.7% | |
| | 2,522 | | | Chevron Corp. | | | 303,926 | |
| | 1,482 | | | ConocoPhillips | | | 96,374 | |
| | 1,370 | | | CVR Energy, Inc. | | | 55,389 | |
| | 2,467 | | | Devon Energy Corp. | | | 64,068 | |
| | 855 | | | EOG Resources, Inc. | | | 71,615 | |
| | 5,587 | | | Exxon Mobil Corp. | | | 389,861 | |
| | 2,807 | | | Kinder Morgan, Inc. | | | 59,424 | |
| | 1,093 | | | Marathon Petroleum Corp. | | | 65,853 | |
| | 1,036 | | | Occidental Petroleum Corp. | | | 42,694 | |
| | 957 | | | ONEOK, Inc. | | | 72,416 | |
| | 556 | | | Phillips 66 | | | 61,944 | |
| | 523 | | | Pioneer Natural Resources Co. | | | 79,166 | |
| | 681 | | | Valero Energy Corp. | | | 63,776 | |
| | 2,948 | | | Williams Cos., Inc. (The) | | | 69,927 | |
| | | | | | | | |
| | | | | | | 1,496,433 | |
| | | | | | | | |
| | | | Personal Products — 0.2% | |
| | 327 | | | Estee Lauder Cos., Inc. (The), Class A | | | 67,539 | |
| | 1,402 | | | Unilever PLC | | | 80,254 | |
| | | | | | | | |
| | | | | | | 147,793 | |
| | | | | | | | |
| | | | Pharmaceuticals — 2.3% | |
| | 3,863 | | | Bristol-Myers Squibb Co. | | | 247,966 | |
| | 1,652 | | | Eli Lilly & Co. | | | 217,122 | |
| | 3,960 | | | Johnson & Johnson | | | 577,645 | |
| | 4,522 | | | Merck & Co., Inc. | | | 411,276 | |
See accompanying notes to financial statements.
51 |
Portfolio of Investments – as of December 31, 2019
Loomis Sayles Multi-Asset Income Fund – (continued)
| | | | | | | | |
Shares | | | Description | | Value (†) | |
| | | | Pharmaceuticals — continued | |
| | 8,034 | | | Pfizer, Inc. | | $ | 314,772 | |
| | 290 | | | Roche Holding AG | | | 94,251 | |
| | 814 | | | Zoetis, Inc. | | | 107,733 | |
| | | | | | | | |
| | | | | | | 1,970,765 | |
| | | | | | | | |
| | | | Professional Services — 0.2% | |
| | 408 | | | Equifax, Inc. | | | 57,169 | |
| | 710 | | | TransUnion | | | 60,783 | |
| | 460 | | | Verisk Analytics, Inc. | | | 68,697 | |
| | | | | | | | |
| | | | | | | 186,649 | |
| | | | | | | | |
| | | | Road & Rail — 0.5% | |
| | 1,132 | | | CSX Corp. | | | 81,912 | |
| | 438 | | | Kansas City Southern | | | 67,084 | |
| | 424 | | | Norfolk Southern Corp. | | | 82,311 | |
| | 890 | | | Union Pacific Corp. | | | 160,903 | |
| | 900 | | | West Japan Railway Co. | | | 77,844 | |
| | | | | | | | |
| | | | | | | 470,054 | |
| | | | | | | | |
| | | | Semiconductors & Semiconductor Equipment — 1.5% | |
| | 501 | | | Analog Devices, Inc. | | | 59,539 | |
| | 1,138 | | | Applied Materials, Inc. | | | 69,463 | |
| | 724 | | | ASM International NV | | | 81,720 | |
| | 475 | | | Broadcom, Inc. | | | 150,109 | |
| | 5,708 | | | Intel Corp. | | | 341,624 | |
| | 376 | | | KLA Corp. | | | 66,992 | |
| | 245 | | | Lam Research Corp. | | | 71,638 | |
| | 557 | | | NVIDIA Corp. | | | 131,062 | |
| | 1,708 | | | QUALCOMM, Inc. | | | 150,697 | |
| | 1,227 | | | Texas Instruments, Inc. | | | 157,412 | |
| | 555 | | | Xilinx, Inc. | | | 54,262 | |
| | | | | | | | |
| | | | | | | 1,334,518 | |
| | | | | | | | |
| | | | Software — 2.2% | |
| | 394 | | | Intuit, Inc. | | | 103,200 | |
| | 646 | | | j2 Global, Inc. | | | 60,537 | |
| | 9,674 | | | Microsoft Corp. | | | 1,525,590 | |
| | 4,335 | | | Oracle Corp. | | | 229,668 | |
| | | | | | | | |
| | | | | | | 1,918,995 | |
| | | | | | | | |
| | | | Specialty Retail — 0.9% | |
| | 1,300 | | | ABC-Mart, Inc. | | | 88,740 | |
| | 1,571 | | | Home Depot, Inc. (The) | | | 343,075 | |
| | 1,158 | | | Lowe’s Cos., Inc. | | | 138,682 | |
| | 599 | | | Ross Stores, Inc. | | | 69,736 | |
| | 1,837 | | | TJX Cos., Inc. (The) | | | 112,167 | |
| | | | | | | | |
| | | | | | | 752,400 | |
| | | | | | | | |
| | | | Technology Hardware, Storage & Peripherals — 2.1% | |
| | 5,826 | | | Apple, Inc. | | | 1,710,805 | |
See accompanying notes to financial statements.
| 52
Portfolio of Investments – as of December 31, 2019
Loomis Sayles Multi-Asset Income Fund – (continued)
| | | | | | | | |
Shares | | | Description | | Value (†) | |
| | | | Technology Hardware, Storage & Peripherals — continued | |
| | 1,329 | | | Hewlett Packard Enterprise Co. | | $ | 21,078 | |
| | 3,068 | | | HP, Inc. | | | 63,047 | |
| | | | | | | | |
| | | | | | | 1,794,930 | |
| | | | | | | | |
| | | | Textiles, Apparel & Luxury Goods — 0.3% | |
| | 1,845 | | | NIKE, Inc., Class B | | | 186,917 | |
| | 659 | | | VF Corp. | | | 65,676 | |
| | | | | | | | |
| | | | | | | 252,593 | |
| | | | | | | | |
| | | | Tobacco — 0.8% | |
| | 4,567 | | | Altria Group, Inc. | | | 227,939 | |
| | 2,341 | | | British American Tobacco PLC | | | 99,497 | |
| | 3,377 | | | Imperial Brands PLC | | | 83,548 | |
| | 3,079 | | | Philip Morris International, Inc. | | | 261,992 | |
| | | | | | | | |
| | | | | | | 672,976 | |
| | | | | | | | |
| | | | Trading Companies & Distributors — 0.1% | |
| | 1,748 | | | Fastenal Co. | | | 64,589 | |
| | 1,400 | | | ITOCHU Corp. | | | 32,447 | |
| | 1,200 | | | Sumitomo Corp. | | | 17,824 | |
| | | | | | | | |
| | | | | | | 114,860 | |
| | | | | | | | |
| | | | Transportation Infrastructure — 0.1% | |
| | 9,401 | | | Enav SpA, 144A | | | 56,105 | |
| | | | | | | | |
| | | | Wireless Telecommunication Services — 0.1% | |
| | 2,900 | | | KDDI Corp. | | | 86,525 | |
| | | | | | | | |
| | | | Total Common Stocks
(Identified Cost $35,187,434) | | | 38,012,788 | |
| | | | | | | | |
| | | | | | | | |
Principal
Amount (‡) | | | | | | |
| | Bonds and Notes — 38.6% | |
| | | | Banking — 16.3% | |
| $ | 1,200,000 | | | Banco Bilbao Vizcaya Argentaria S.A., (fixed rate to 11/16/2027, variable rate thereafter), 6.125%(a) | | | 1,234,500 | |
| | 1,520,000 | | | Banco BTG Pactual SA, (fixed rate to 2/15/2024, variable rate thereafter), 7.750%, 2/15/2029, 144A | | | 1,609,315 | |
| | 985,000 | | | Barclays PLC, (fixed rate to 6/15/2024, variable rate thereafter), 8.000%(a) | | | 1,101,969 | |
| | 495,000 | | | Barclays PLC, (fixed rate to 9/15/2023, variable rate thereafter), 7.750%(a) | | | 540,788 | |
| | 400,000 | | | CaixaBank S.A., (fixed rate to 3/23/2026, variable rate thereafter), 5.250%, (EUR)(a) | | | 457,990 | |
| | 1,400,000 | | | Credit Agricole S.A., (fixed rate to 1/23/2024, variable rate thereafter), 7.875%, 144A(a) | | | 1,595,720 | |
| | 1,100,000 | | | Credit Suisse Group AG, (fixed rate to 9/12/2025, variable rate thereafter), 7.250%, 144A(a) | | | 1,227,875 | |
| | 1,560,000 | | | HSBC Holdings PLC, (fixed rate to 3/23/2023, variable rate thereafter), 6.250%(a) | | | 1,655,550 | |
| | 600,000 | | | Lloyds Banking Group PLC, (fixed rate to 9/27/2025, variable rate thereafter), 7.500%(a) | | | 672,750 | |
See accompanying notes to financial statements.
53 |
Portfolio of Investments – as of December 31, 2019
Loomis Sayles Multi-Asset Income Fund – (continued)
| | | | | | | | |
Principal
Amount (‡) | | | Description | | Value (†) | |
| | | | Banking — continued | |
| $ | 1,405,000 | | | Royal Bank of Scotland Group PLC, (fixed rate to 8/10/2025, variable rate thereafter), 8.000%(a) | | $ | 1,617,267 | |
| | 1,800,000 | | | Standard Chartered PLC, (fixed rate to 4/02/2023, variable rate thereafter), 7.750%, 144A(a) | | | 1,991,250 | |
| | 310,000 | | | UniCredit SpA, (fixed rate to 6/03/2023, variable rate thereafter), 6.625%, (EUR)(a) | | | 375,980 | |
| | | | | | | | |
| | | | | | | 14,080,954 | |
| | | | | | | | |
| | | | Cable Satellite — 0.4% | |
| | 325,000 | | | DISH DBS Corp., 7.750%, 7/01/2026 | | | 344,302 | |
| | | | | | | | |
| | | | Chemicals — 1.6% | |
| | 335,000 | | | Alpek SAB de CV, 4.250%, 9/18/2029, 144A | | | 341,700 | |
| | 985,000 | | | SASOL Financing USA LLC, 5.875%, 3/27/2024 | | | 1,066,617 | |
| | | | | | | | |
| | | | | | | 1,408,317 | |
| | | | | | | | |
| | | | Finance Companies — 1.6% | |
| | 565,000 | | | Quicken Loans, Inc., 5.250%, 1/15/2028, 144A | | | 584,775 | |
| | 795,000 | | | Unifin Financiera SAB de CV, 8.375%, 1/27/2028, 144A | | | 813,881 | |
| | | | | | | | |
| | | | | | | 1,398,656 | |
| | | | | | | | |
| | | | Financial Other — 0.6% | |
| | 490,000 | | | Kuwait Projects Co. SPC Ltd., EMTN, 4.500%, 2/23/2027 | | | 512,148 | |
| | | | | | | | |
| | | | Food & Beverage — 1.2% | |
| | 495,000 | | | JBS Investments II GmbH, 7.000%, 1/15/2026, 144A | | | 538,476 | |
| | 470,000 | | | NBM U.S Holdings, Inc., 7.000%, 5/14/2026, 144A | | | 509,015 | |
| | | | | | | | |
| | | | | | | 1,047,491 | |
| | | | | | | | |
| | | | Government Owned – No Guarantee — 2.8% | |
| | 515,000 | | | DP World Crescent Ltd., 4.848%, 9/26/2028, 144A | | | 565,387 | |
| | 415,000 | | | OCP S.A., 6.875%, 4/25/2044, 144A | | | 527,457 | |
| | 240,000 | | | Oztel Holdings SPC Ltd., 5.625%, 10/24/2023, 144A | | | 255,900 | |
| | 480,000 | | | Perusahaan Listrik Negara PT, 4.125%, 5/15/2027, 144A | | | 505,800 | |
| | 480,000 | | | Petrobras Global Finance BV, 5.750%, 2/01/2029 | | | 541,440 | |
| | | | | | | | |
| | | | | | | 2,395,984 | |
| | | | | | | | |
| | | | Independent Energy — 2.0% | |
| | 540,000 | | | MEG Energy Corp., 6.375%, 1/30/2023, 144A | | | 541,350 | |
| | 1,165,000 | | | MEG Energy Corp., 7.000%, 3/31/2024, 144A | | | 1,172,281 | |
| | | | | | | | |
| | | | | | | 1,713,631 | |
| | | | | | | | |
| | | | Industrial Other — 0.6% | |
| | 475,000 | | | GEMS MENASA Cayman Ltd./GEMS Education Delaware LLC, 7.125%, 7/31/2026, 144A | | | 499,938 | |
| | | | | | | | |
| | | | Media Entertainment — 0.6% | |
| | 515,000 | | | Prosus NV, 4.850%, 7/06/2027, 144A | | | 561,268 | |
| | | | | | | | |
| | | | Metals & Mining — 1.8% | |
| | 625,000 | | | First Quantum Minerals Ltd., 7.500%, 4/01/2025, 144A | | | 639,062 | |
| | 820,000 | | | Gold Fields Orogen Holdings BVI Ltd., 6.125%, 5/15/2029, 144A | | | 910,200 | |
| | | | | | | | |
| | | | | | | 1,549,262 | |
| | | | | | | | |
See accompanying notes to financial statements.
| 54
Portfolio of Investments – as of December 31, 2019
Loomis Sayles Multi-Asset Income Fund – (continued)
| | | | | | | | |
Principal
Amount (‡) | | | Description | | Value (†) | |
| | | | Midstream — 0.5% | |
| $ | 380,000 | | | Delek & Avner Tamar Bond Ltd., 5.412%, 12/30/2025, 144A | | $ | 400,734 | |
| | | | | | | | |
| | | | Oil Field Services — 0.7% | |
| | 600,000 | | | Transocean Poseidon Ltd., 6.875%, 2/01/2027, 144A | | | 636,000 | |
| | | | | | | | |
| | | | Property & Casualty Insurance — 0.8% | |
| | 510,000 | | | Ardonagh Midco 3 PLC, 8.375%, 7/15/2023, 144A, (GBP) | | | 671,371 | |
| | | | | | | | |
| | | | Sovereigns — 1.7% | |
| | 530,000 | | | Oman Government International Bond, 6.000%, 8/01/2029, 144A | | | 554,327 | |
| | 355,000 | | | Qatar Government International Bond, 4.000%, 3/14/2029, 144A | | | 396,181 | |
| | 405,000 | | | Saudi Government International Bond, 5.250%, 1/16/2050 | | | 503,229 | |
| | | | | | | | |
| | | | | | | 1,453,737 | |
| | | | | | | | |
| | | | Supranational — 1.0% | |
| | 830,000 | | | African Export-Import Bank (The), 3.994%, 9/21/2029, 144A | | | 842,243 | |
| | | | | | | | |
| | | | Technology — 1.0% | |
| | 290,000 | | | Dell International LLC/EMC Corp., 8.350%, 7/15/2046, 144A | | | 399,602 | |
| | 455,000 | | | MTN Mauritius Investments Ltd., 6.500%, 10/13/2026, 144A | | | 502,775 | |
| | | | | | | | |
| | | | | | | 902,377 | |
| | | | | | | | |
| | | | Treasuries — 0.6% | |
| | 6,514,000,000 | | | Indonesia Treasury Bond, 8.250%, 5/15/2029, (IDR) | | | 505,823 | |
| | | | | | | | |
| | | | Utility Other — 0.3% | |
| | 260,000 | | | Acwa Power Management And Investments One Ltd., 5.950%, 12/15/2039, 144A | | | 276,487 | |
| | | | | | | | |
| | | | Wireless — 2.5% | |
| | 900,000 | | | GTH Finance BV, 7.250%, 4/26/2023, 144A | | | 1,013,886 | |
| | 505,000 | | | Millicom International Cellular S.A., 6.250%, 3/25/2029, 144A | | | 557,161 | |
| | 565,000 | | | Sprint Corp., 7.625%, 3/01/2026 | | | 623,082 | |
| | | | | | | | |
| | | | | | | 2,194,129 | |
| | | | | | | | |
| | | | Total Bonds and Notes
(Identified Cost $31,652,905) | | | 33,394,852 | |
| | | | | | | | |
| | | | | | | | |
| Shares | | | | | | |
| | Exchange-Traded Funds — 5.1% | |
| | 514,600 | | | Alerian MLP ETF
(Identified Cost $4,707,757) | | | 4,374,100 | |
| | | | | | | | |
| | | | | | | | |
Principal
Amount (‡) | | | | | | |
| | Senior Loans — 2.4% | |
| | | | Airlines — 2.4% | |
| $ | 2,063,636 | | | Gol LuxCo S.A., 1st Lien Term Loan, 6.500%, 8/31/2020(b)(c) (Identified Cost $2,061,137) | | | 2,084,272 | |
| | | | | | | | |
| | | | | | | | |
| Shares | | | | | | |
| | Preferred Stocks — 0.7% | |
| | | | Technology — 0.7% | |
| | 515 | | | Broadcom, Inc., Series A, 8.000%
(Identified Cost $523,250) | | | 606,655 | |
| | | | | | | | |
See accompanying notes to financial statements.
55 |
Portfolio of Investments – as of December 31, 2019
Loomis Sayles Multi-Asset Income Fund – (continued)
| | | | | | | | |
Principal
Amount (‡) | | | Description | | Value (†) | |
| | Short-Term Investments — 9.0% | |
| $ | 7,827,130 | | | Tri-Party Repurchase Agreement with Fixed Income Clearing Corporation, dated 12/31/2019 at 0.900% to be repurchased at $7,827,521 on 1/02/2020 collateralized by $7,105,000 U.S. Treasury Inflation Indexed Note, 0.125% due 7/15/2022 valued at $7,983,952 including accrued interest (Note 2 of Notes to Financial Statements) (Identified Cost $7,827,130) | | $ | 7,827,130 | |
| | | | | | | | |
| | | | | | | | |
| | | | Total Investments — 99.8%
(Identified Cost $81,959,613) | | | 86,299,797 | |
| | | | Other assets less liabilities — 0.2% | | | 140,350 | |
| | | | | | | | |
| | | | Net Assets — 100.0% | | $ | 86,440,147 | |
| | | | | | | | |
| | | | | | | | |
| | (‡) | | | Principal Amount stated in U.S. dollars unless otherwise noted. | |
| | (†) | | | See Note 2 of Notes to Financial Statements. | |
| | (a) | | | Perpetual bond with no specified maturity date. | |
| | (b) | | | Illiquid security. (Unaudited) | |
| | (c) | | | Securities classified as fair valued pursuant to the Fund’s pricing policies and procedures. At December 31, 2019, the value of these securities amounted to $2,084,272 or 2.4% of net assets. See Note 2 of Notes to Financial Statements. | |
| | | | | |
| | 144A | | | All or a portion of these securities are exempt from registration under Rule 144A of the Securities Act of 1933. These securities may be resold in transactions exempt from registration, normally to qualified institutional buyers. At December 31, 2019, the value of Rule 144A holdings amounted to $21,697,522 or 25.1% of net assets. | |
| | EMTN | | | Euro Medium Term Note | |
| | ETF | | | Exchange-Traded Fund | |
| | | | | |
| | EUR | | | Euro | |
| | GBP | | | British Pound | |
| | IDR | | | Indonesian Rupiah | |
Industry Summary at December 31, 2019
| | | | |
Banking | | | 16.3 | % |
Banks | | | 6.5 | |
Government Owned – No Guarantee | | | 2.8 | |
Wireless | | | 2.5 | |
Airlines | | | 2.5 | |
Chemicals | | | 2.4 | |
Insurance | | | 2.3 | |
Pharmaceuticals | | | 2.3 | |
IT Services | | | 2.3 | |
Software | | | 2.2 | |
Technology Hardware, Storage & Peripherals | | | 2.1 | |
Independent Energy | | | 2.0 | |
Other Investments, less than 2% each | | | 39.5 | |
Short-Term Investments | | | 9.0 | |
Exchange-Traded Funds | | | 5.1 | |
| | | | |
Total Investments | | | 99.8 | |
Other assets less liabilities | | | 0.2 | |
| | | | |
Net Assets | | | 100.0 | % |
| | | | |
See accompanying notes to financial statements.
| 56
Statements of Assets and Liabilities
December 31, 2019
| | | | | | | | | | | | |
| | | High Income
Fund | | | Investment
Grade Bond
Fund | | | Multi-Asset
Income Fund | |
ASSETS | |
Investments at cost | | $ | 144,884,838 | | | $ | 5,217,350,433 | | | $ | 81,959,613 | |
Net unrealized appreciation | | | 184,563 | | | | 317,568,813 | | | | 4,340,184 | |
| | | | | | | | | | | | |
Investments at value | | | 145,069,401 | | | | 5,534,919,246 | | | | 86,299,797 | |
Cash | | | 19,643 | | | | 482 | | | | 30,757 | |
Due from broker | | | 103,848 | | | | — | | | | — | |
Foreign currency at value (identified cost $0, $34,356 and $9,422, respectively) | | | — | | | | 34,864 | | | | 9,462 | |
Receivable for Fund shares sold | | | 288,823 | | | | 9,988,794 | | | | 16,822 | |
Receivable for securities sold | | | 261,814 | | | | 104,000 | | | | — | |
Dividends and interest receivable | | | 1,949,048 | | | | 40,239,831 | | | | 640,699 | |
Tax reclaims receivable | | | — | | | | 479 | | | | 24,292 | |
Prepaid expenses (Note 8) | | | 6 | | | | 226 | | | | 4 | |
| | | | | | | | | | | | |
TOTAL ASSETS | | | 147,692,583 | | | | 5,585,287,922 | | | | 87,021,833 | |
| | | | | | | | | | | | |
LIABILITIES | | | | | | | | | | | | |
Payable for Fund shares redeemed | | | 30,991 | | | | 8,011,293 | | | | 372,762 | |
Management fees payable (Note 6) | | | 61,121 | | | | 1,729,877 | | | | 33,618 | |
Deferred Trustees’ fees (Note 6) | | | 179,116 | | | | 925,935 | | | | 94,834 | |
Administrative fees payable (Note 6) | | | 5,058 | | | | 207,086 | | | | 3,315 | |
Payable to distributor (Note 6d) | | | 1,772 | | | | 41,954 | | | | 583 | |
Other accounts payable and accrued expenses | | | 87,541 | | | | 375,680 | | | | 76,574 | |
| | | | | | | | | | | | |
TOTAL LIABILITIES | | | 365,599 | | | | 11,291,825 | | | | 581,686 | |
| | | | | | | | | | | | |
NET ASSETS | | $ | 147,326,984 | | | $ | 5,573,996,097 | | | $ | 86,440,147 | |
| | | | | | | | | | | | |
NET ASSETS CONSIST OF: | | | | | | | | | | | | |
Paid-in capital | | $ | 152,974,132 | | | $ | 5,229,586,800 | | | $ | 87,066,139 | |
Accumulated earnings (loss) | | | (5,647,148 | ) | | | 344,409,297 | | | | (625,992 | ) |
| | | | | | | | | | | | |
NET ASSETS | | $ | 147,326,984 | | | $ | 5,573,996,097 | | | $ | 86,440,147 | |
| | | | | | | | | | | | |
See accompanying notes to financial statements.
57 |
Statements of Assets and Liabilities (continued)
December 31, 2019
| | | | | | | | | | | | |
| | | High Income
Fund | | | Investment
Grade Bond
Fund | | | Multi-Asset
Income Fund | |
COMPUTATION OF NET ASSET VALUE AND OFFERING PRICE: | | | | | | | | | | | | |
Class A shares: | | | | | | | | | | | | |
Net assets | | $ | 23,199,445 | | | $ | 772,485,362 | | | $ | 28,845,182 | |
| | | | | | | | | | | | |
Shares of beneficial interest | | | 5,454,982 | | | | 68,180,197 | | | | 2,199,442 | |
| | | | | | | | | | | | |
Net asset value and redemption price per share | | $ | 4.25 | | | $ | 11.33 | | | $ | 13.11 | |
| | | | | | | | | | | | |
Offering price per share (100/95.75 of net asset value) (Note 1) | | $ | 4.44 | | | $ | 11.83 | | | $ | 13.69 | |
| | | | | | | | | | | | |
Class C shares:(redemption price per share is equal to net asset value less any applicable contingent deferred sales charge) (Note 1) | | | | | | | | | | | | |
Net assets | | $ | 3,835,901 | | | $ | 204,394,573 | | | $ | 16,737,912 | |
| | | | | | | | | | | | |
Shares of beneficial interest | | | 898,802 | | | | 18,249,265 | | | | 1,282,081 | |
| | | | | | | | | | | | |
Net asset value and offering price per share | | $ | 4.27 | | | $ | 11.20 | | | $ | 13.06 | |
| | | | | | | | | | | | |
Class N shares: | | | | | | | | | | | | |
Net assets | | $ | 11,976,561 | | | $ | 1,367,171,989 | | | $ | 198,001 | |
| | | | | | | | | | | | |
Shares of beneficial interest | | | 2,814,782 | | | | 120,656,644 | | | | 15,196 | |
| | | | | | | | | | | | |
Net asset value, offering and redemption price per share | | $ | 4.25 | | | $ | 11.33 | | | $ | 13.03 | |
| | | | | | | | | | | | |
Class Y shares: | | | | | | | | | | | | |
Net assets | | $ | 108,315,077 | | | $ | 3,118,505,157 | | | $ | 40,659,052 | |
| | | | | | | | | | | | |
Shares of beneficial interest | | | 25,504,177 | | | | 275,056,548 | | | | 3,120,428 | |
| | | | | | | | | | | | |
Net asset value, offering and redemption price per share | | $ | 4.25 | | | $ | 11.34 | | | $ | 13.03 | |
| | | | | | | | | | | | |
Admin Class shares: | | | | | | | | | | | | |
Net assets | | $ | — | | | $ | 111,439,016 | | | $ | — | |
| | | | | | | | | | | | |
Shares of beneficial interest | | | — | | | | 9,861,865 | | | | — | |
| | | | | | | | | | | | |
Net asset value, offering and redemption price per share | | $ | — | | | $ | 11.30 | | | $ | — | |
| | | | | | | | | | | | |
See accompanying notes to financial statements.
| 58
Statements of Operations
For the Year Ended December 31, 2019
| | | | | | | | | | | | |
| | | High Income
Fund | | | Investment
Grade Bond
Fund | | | Multi-Asset
Income Fund | |
INVESTMENT INCOME | |
Interest | | $ | 8,398,038 | | | $ | 213,518,155 | | | $ | 3,324,106 | |
Dividends | | | 201,777 | | | | 857,168 | | | | 1,370,894 | |
Less net foreign taxes withheld | | | (732 | ) | | | (17,886 | ) | | | (17,196 | ) |
| | | | | | | | | | | | |
| | | 8,599,083 | | | | 214,357,437 | | | | 4,677,804 | |
| | | | | | | | | | | | |
Expenses | |
Management fees (Note 6) | | | 881,481 | | | | 22,174,684 | | | | 595,472 | |
Service and distribution fees (Note 6) | | | 104,123 | | | | 5,236,025 | | | | 314,220 | |
Administrative fees (Note 6) | | | 64,514 | | | | 2,440,159 | | | | 47,707 | |
Trustees’ fees and expenses (Note 6) | | | 37,018 | | | | 278,420 | | | | 27,552 | |
Transfer agent fees and expenses (Notes 6 and 7) | | | 161,197 | | | | 3,672,993 | | | | 75,793 | |
Audit and tax services fees | | | 54,952 | | | | 64,267 | | | | 48,212 | |
Custodian fees and expenses | | | 12,794 | | | | 134,406 | | | | 43,164 | |
Legal fees (Note 8) | | | 4,232 | | | | 170,820 | | | | 3,084 | |
Registration fees | | | 77,677 | | | | 206,502 | | | | 66,381 | |
Shareholder reporting expenses | | | 34,722 | | | | 440,542 | | | | 8,553 | |
Miscellaneous expenses (Note 8) | | | 28,698 | | | | 174,794 | | | | 33,389 | |
| | | | | | | | | | | | |
Total expenses | | | 1,461,408 | | | | 34,993,612 | | | | 1,263,527 | |
Less waiver and/or expense reimbursement (Note 6) | | | (224,533 | ) | | | (1,590,978 | ) | | | (190,284 | ) |
| | | | | | | | | | | | |
Net expenses | | | 1,236,875 | | | | 33,402,634 | | | | 1,073,243 | |
| | | | | | | | | | | | |
Net investment income | | | 7,362,208 | | | | 180,954,803 | | | | 3,604,561 | |
| | | | | | | | | | | | |
NET REALIZED AND UNREALIZED GAIN (LOSS) ON INVESTMENTS, FORWARD FOREIGN CURRENCY CONTRACTS AND FOREIGN CURRENCY TRANSACTIONS | | | | | | | | | | | | |
Net realized gain (loss) on: | |
Investments | | | (386,388 | ) | | | 73,163,029 | | | | (1,281,468 | ) |
Forward foreign currency contracts (Note 2d) | | | (44,094 | ) | | | (670,701 | ) | | | (5,147 | ) |
Foreign currency transactions (Note 2c) | | | — | | | | 2,368,603 | | | | (78,839 | ) |
Net change in unrealized appreciation (depreciation) on: | |
Investments | | | 9,712,862 | | | | 217,944,856 | | | | 13,596,978 | |
Forward foreign currency contracts (Note 2d) | | | 44,094 | | | | 670,701 | | | | — | |
Foreign currency translations (Note 2c) | | | 17 | | | | (2,229,110 | ) | | | 1,859 | |
| | | | | | | | | | | | |
Net realized and unrealized gain on investments, forward foreign currency contracts and foreign currency transactions | | | 9,326,491 | | | | 291,247,378 | | | | 12,233,383 | |
| | | | | | | | | | | | |
NET INCREASE IN NET ASSETS RESULTING FROM OPERATIONS | | $ | 16,688,699 | | | $ | 472,202,181 | | | $ | 15,837,944 | |
| | | | | | | | | | | | |
See accompanying notes to financial statements.
59 |
Statements of Changes in Net Assets
| | | | | | | | | | | | |
| | | High Income Fund | |
| | | Year Ended
December 31,
2019 | | | Period Ended
December 31,
2018(a) | | | Year Ended
September 30,
2018 | |
FROM OPERATIONS: | | | | | | | | | | | | |
Net investment income | | $ | 7,362,208 | | | $ | 2,214,373 | | | $ | 8,475,372 | |
Net realized gain (loss) on investments and forward foreign currency contracts | | | (430,482 | ) | | | (6,387,716 | ) | | | 1,205,344 | |
Net change in unrealized appreciation (depreciation) on investments, forward foreign currency contracts and foreign currency translations | | | 9,756,973 | | | | (3,483,546 | ) | | | (7,029,759 | ) |
| | | | | | | | | | | | |
Net increase (decrease) in net assets resulting from operations | | | 16,688,699 | | | | (7,656,889 | ) | | | 2,650,957 | |
| | | | | | | | | | | | |
FROM DISTRIBUTIONS TO SHAREHOLDERS: | | | | | | | | | | | | |
Class A | | | (1,135,803 | ) | | | (410,882 | ) | | | (1,227,019 | ) |
Class C | | | (194,240 | ) | | | (81,814 | ) | | | (311,547 | ) |
Class N | | | (609,528 | ) | | | (178,711 | ) | | | (259,688 | ) |
Class Y | | | (5,638,962 | ) | | | (2,141,392 | ) | | | (5,752,686 | ) |
| | | | | | | | | | | | |
Total distributions | | | (7,578,533 | ) | | | (2,812,799 | ) | | | (7,550,940 | ) |
| | | | | | | | | | | | |
NET INCREASE (DECREASE) IN NET ASSETS FROM CAPITAL SHARE TRANSACTIONS (NOTE 11) | | | 1,738,584 | | | | (23,511,576 | ) | | | (3,848,432 | ) |
| | | | | | | | | | | | |
Net increase (decrease) in net assets | | | 10,848,750 | | | | (33,981,264 | ) | | | (8,748,415 | ) |
NET ASSETS | | | | | | | | | | | | |
Beginning of the year | | | 136,478,234 | | | | 170,459,498 | | | | 179,207,913 | |
| | | | | | | | | | | | |
End of the year | | $ | 147,326,984 | | | $ | 136,478,234 | | | $ | 170,459,498 | |
| | | | | | | | | | | | |
| (a) | For the three month period ended December 31, 2018. See Note 1 of Notes to Financial Statements. |
See accompanying notes to financial statements.
| 60
Statements of Changes in Net Assets (continued)
| | | | | | | | | | | | |
| | | Investment Grade Bond Fund | |
| | | Year Ended
December 31,
2019 | | | Period Ended
December 31,
2018(a) | | | Year Ended
September 30,
2018 | |
FROM OPERATIONS: | |
Net investment income | | $ | 180,954,803 | | | $ | 44,450,885 | | | $ | 171,956,415 | |
Net realized gain (loss) on investments, forward foreign currency contracts and foreign currency transactions | | | 74,860,931 | | | | (228,459,921 | ) | | | (68,790,141 | ) |
Net change in unrealized appreciation (depreciation) on investments, forward foreign currency contracts and foreign currency translations | | | 216,386,447 | | | | 150,673,092 | | | | (88,370,511 | ) |
| | | | | | | | | | | | |
Net increase (decrease) in net assets resulting from operations | | | 472,202,181 | | | | (33,335,944 | ) | | | 14,795,763 | |
| | | | | | | | | | | | |
FROM DISTRIBUTIONS TO SHAREHOLDERS: | |
Class A | | | (25,364,474 | ) | | | (9,439,602 | ) | | | (26,935,957 | ) |
Class C | | | (6,942,862 | ) | | | (4,075,458 | ) | | | (15,654,049 | ) |
Class N | | | (47,788,079 | ) | | | (16,768,000 | ) | | | (41,987,053 | ) |
Class Y | | | (111,238,434 | ) | | | (39,150,105 | ) | | | (111,284,265 | ) |
Admin Class | | | (3,581,152 | ) | | | (1,369,684 | ) | | | (778,851 | ) |
| | | | | | | | | | | | |
Total distributions | | | (194,915,001 | ) | | | (70,802,849 | ) | | | (196,640,175 | ) |
| | | | | | | | | | | | |
NET DECREASE IN NET ASSETS FROM CAPITAL SHARE TRANSACTIONS (NOTE 11) | | | (31,559,822 | ) | | | (126,167,759 | ) | | | (534,159,760 | ) |
| | | | | | | | | | | | |
Net increase (decrease) in net assets | | | 245,727,358 | | | | (230,306,552 | ) | | | (716,004,172 | ) |
NET ASSETS | |
Beginning of the year | | | 5,328,268,739 | | | | 5,558,575,291 | | | | 6,274,579,463 | |
| | | | | | | | | | | | |
End of the year | | $ | 5,573,996,097 | | | $ | 5,328,268,739 | | | $ | 5,558,575,291 | |
| | | | | | | | | | | | |
| (a) | For the three month period ended December 31, 2018. See Note 1 of Notes to Financial Statements. |
See accompanying notes to financial statements.
61 |
Statements of Changes in Net Assets (continued)
| | | | | | | | |
| | | Multi-Asset Income Fund | |
| | | Year Ended
December 31,
2019 | | | Year Ended
December 31,
2018 | |
FROM OPERATIONS: | |
Net investment income | | $ | 3,604,561 | | | $ | 5,207,147 | |
Net realized loss on investments, forward foreign currency contracts and foreign currency transactions | | | (1,365,454 | ) | | | (1,541,137 | ) |
Net change in unrealized appreciation (depreciation) on investments and foreign currency translations | | | 13,598,837 | | | | (16,770,929 | ) |
| | | | | | | | |
Net increase (decrease) in net assets resulting from operations | | | 15,837,944 | | | | (13,104,919 | ) |
| | | | | | | | |
FROM DISTRIBUTIONS TO SHAREHOLDERS: | |
Accumulated earnings | | | | | | | | |
Class A | | | (1,407,776 | ) | | | (3,689,139 | ) |
Class C | | | (591,756 | ) | | | (1,796,319 | ) |
Class N | | | (2,159 | ) | | | (2,353 | ) |
Class Y | | | (1,679,151 | ) | | | (3,691,567 | ) |
Paid-in capital | | | | | | | | |
Class A | | | (72,102 | ) | | | — | |
Class C | | | (28,844 | ) | | | — | |
Class N | | | (532 | ) | | | — | |
Class Y | | | (109,510 | ) | | | — | |
| | | | | | | | |
Total distributions | | | (3,891,830 | ) | | | (9,179,378 | ) |
| | | | | | | | |
NET DECREASE IN NET ASSETS FROM CAPITAL SHARE TRANSACTIONS (NOTE 11) | | | (44,926,409 | ) | | | (2,836,090 | ) |
| | | | | | | | |
Net decrease in net assets | | | (32,980,295 | ) | | | (25,120,387 | ) |
NET ASSETS | |
Beginning of the year | | | 119,420,442 | | | | 144,540,829 | |
| | | | | | | | |
End of the year | | $ | 86,440,147 | | | $ | 119,420,442 | |
| | | | | | | | |
See accompanying notes to financial statements.
| 62
Financial Highlights
For a share outstanding throughout each period.
| | | | | | | | | | | | | | | | | | | | | | | | |
| | | High Income Fund—Class A | |
| | | Year Ended
December 31,
2019
| | | Period Ended
December 31,
2018*
| | | Year Ended
September 30,
2018
| | | Year Ended
September 30,
2017
| | | Year Ended
September 30,
2016
| | | Year Ended
September 30,
2015
| |
Net asset value, beginning of the period | | $ | 3.99 | | | $ | 4.25 | | | $ | 4.37 | | | $ | 4.23 | | | $ | 3.99 | | | $ | 4.49 | |
| | | | | | | | | | | | | | | | | | | | | | | | |
INCOME (LOSS) FROM INVESTMENT OPERATIONS: | | | | | | | | | | | | | | | | | | | | | | | | |
Net investment income(a) | | | 0.20 | | | | 0.05 | | | | 0.20 | | | | 0.22 | | | | 0.20 | | | | 0.19 | |
Net realized and unrealized gain (loss) | | | 0.27 | | | | (0.24 | ) | | | (0.14 | ) | | | 0.12 | | | | 0.21 | | | | (0.39 | ) |
| | | | | | | | | | | | | | | | | | | | | | | | |
Total from Investment Operations | | | 0.47 | | | | (0.19 | ) | | | 0.06 | | | | 0.34 | | | | 0.41 | | | | (0.20 | ) |
| | | | | | | | | | | | | | | | | | | | | | | | |
LESS DISTRIBUTIONS FROM: | | | | | | | | | | | | | | | | | | | | | | | | |
Net investment income | | | (0.21 | ) | | | (0.06 | ) | | | (0.18 | ) | | | (0.20 | ) | | | (0.16 | ) | | | (0.19 | ) |
Net realized capital gains | | | — | | | | (0.01 | ) | | | — | | | | — | | | | (0.01 | ) | | | (0.11 | ) |
| | | | | | | | | | | | | | | | | | | | | | | | |
Total Distributions | | | (0.21 | ) | | | (0.07 | ) | | | (0.18 | ) | | | (0.20 | ) | | | (0.17 | ) | | | (0.30 | ) |
| | | | | | | | | | | | | | | | | | | | | | | | |
Net asset value, end of the period | | $ | 4.25 | | | $ | 3.99 | | | $ | 4.25 | | | $ | 4.37 | | | $ | 4.23 | | | $ | 3.99 | |
| | | | | | | | | | | | | | | | | | | | | | | | |
Total return(b)(c) | | | 11.94 | % | | | (4.54 | )%(d) | | | 1.41 | % | | | 8.17 | % | | | 10.66 | % | | | (4.78 | )% |
RATIOS TO AVERAGE NET ASSETS: | | | | | | | | | | | | | | | | | | | | | | | | |
Net assets, end of the period (000’s) | | $ | 23,199 | | | $ | 23,125 | | | $ | 26,175 | | | $ | 34,039 | | | $ | 34,820 | | | $ | 37,870 | |
Net expenses(e) | | | 1.03 | %(f) | | | 1.05 | %(g) | | | 1.05 | % | | | 1.09 | %(h) | | | 1.10 | % | | | 1.11 | %(i) |
Gross expenses | | | 1.18 | % | | | 1.27 | %(g) | | | 1.16 | % | | | 1.15 | % | | | 1.14 | % | | | 1.13 | % |
Net investment income | | | 4.84 | % | | | 5.13 | %(g) | | | 4.73 | % | | | 5.03 | % | | | 5.16 | % | | | 4.41 | % |
Portfolio turnover rate | | | 48 | % | | | 17 | % | | | 55 | % | | | 46 | % | | | 38 | % | | | 69 | % |
| * | For the three month period ended December 31, 2018. See Note 1 of Notes to Financial Statements. |
| (a) | Per share net investment income has been calculated using the average shares outstanding during the period. |
| (b) | A sales charge for Class A shares is not reflected in total return calculations. |
| (c) | Had certain expenses not been waived/reimbursed during the period, total returns would have been lower. |
| (d) | Periods less than one year are not annualized. |
| (e) | The investment adviser agreed to waive its fees and/or reimburse a portion of the Fund’s expenses during the period. Without this waiver/reimbursement, expenses would have been higher. |
| (f) | Effective July 1, 2019, the expense limit decreased from 1.05% to 1.00%. See Note 6 of Notes to Financial Statements. |
| (g) | Computed on an annualized basis for periods less than one year. |
| (h) | Effective July 1, 2017, the expense limit decreased to 1.05%. |
| (i) | Effective July 1, 2015, the expense limit decreased to 1.10%. |
See accompanying notes to financial statements.
63 |
Financial Highlights (continued)
For a share outstanding throughout each period.
| | | | | | | | | | | | | | | | | | | | | | | | |
| | | High Income Fund—Class C | |
| | | Year Ended
December 31,
2019
| | | Period Ended
December 31,
2018*
| | | Year Ended
September 30,
2018
| | | Year Ended
September 30,
2017
| | | Year Ended
September 30,
2016
| | | Year Ended
September 30,
2015
| |
Net asset value, beginning of the period | | $ | 4.00 | | | $ | 4.27 | | | $ | 4.38 | | | $ | 4.24 | | | $ | 4.00 | | | $ | 4.50 | |
| | | | | | | | | | | | | | | | | | | | | | | | |
INCOME (LOSS) FROM INVESTMENT OPERATIONS: | | | | | | | | | | | | | | | | | | | | | | | | |
Net investment income(a) | | | 0.17 | | | | 0.05 | | | | 0.17 | | | | 0.18 | | | | 0.18 | | | | 0.16 | |
Net realized and unrealized gain (loss) | | | 0.28 | | | | (0.26 | ) | | | (0.13 | ) | | | 0.12 | | | | 0.20 | | | | (0.39 | ) |
| | | | | | | | | | | | | | | | | | | | | | | | |
Total from Investment Operations | | | 0.45 | | | | (0.21 | ) | | | 0.04 | | | | 0.30 | | | | 0.38 | | | | (0.23 | ) |
| | | | | | | | | | | | | | | | | | | | | | | | |
LESS DISTRIBUTIONS FROM: | | | | | | | | | | | | | | | | | | | | | | | | |
Net investment income | | | (0.18 | ) | | | (0.05 | ) | | | (0.15 | ) | | | (0.16 | ) | | | (0.13 | ) | | | (0.16 | ) |
Net realized capital gains | | | — | | | | (0.01 | ) | | | — | | | | — | | | | (0.01 | ) | | | (0.11 | ) |
| | | | | | | | | | | | | | | | | | | | | | | | |
Total Distributions | | | (0.18 | ) | | | (0.06 | ) | | | (0.15 | ) | | | (0.16 | ) | | | (0.14 | ) | | | (0.27 | ) |
| | | | | | | | | | | | | | | | | | | | | | | | |
Net asset value, end of the period | | $ | 4.27 | | | $ | 4.00 | | | $ | 4.27 | | | $ | 4.38 | | | $ | 4.24 | | | $ | 4.00 | |
| | | | | | | | | | | | | | | | | | | | | | | | |
Total return(b)(c) | | | 11.32 | % | | | (4.95 | )%(d) | | | 0.86 | % | | | 7.33 | % | | | 9.81 | % | | | (5.48 | )% |
RATIOS TO AVERAGE NET ASSETS: | | | | | | | | | | | | | | | | | | | | | | | | |
Net assets, end of the period (000’s) | | $ | 3,836 | | | $ | 5,351 | | | $ | 6,248 | | | $ | 11,227 | | | $ | 12,288 | | | $ | 12,609 | |
Net expenses(e) | | | 1.78 | %(f) | | | 1.80 | %(g) | | | 1.80 | % | | | 1.84 | %(h) | | | 1.85 | % | | | 1.86 | %(i) |
Gross expenses | | | 1.93 | % | | | 2.02 | %(g) | | | 1.91 | % | | | 1.90 | % | | | 1.89 | % | | | 1.88 | % |
Net investment income | | | 4.11 | % | | | 4.38 | %(g) | | | 3.99 | % | | | 4.29 | % | | | 4.43 | % | | | 3.68 | % |
Portfolio turnover rate | | | 48 | % | | | 17 | % | | | 55 | % | | | 46 | % | | | 38 | % | | | 69 | % |
| * | For the three month period ended December 31, 2018. See Note 1 of Notes to Financial Statements. |
| (a) | Per share net investment income has been calculated using the average shares outstanding during the period. |
| (b) | A contingent deferred sales charge for Class C shares is not reflected in total return calculations. |
| (c) | Had certain expenses not been waived/reimbursed during the period, total returns would have been lower. |
| (d) | Periods less than one year are not annualized. |
| (e) | The investment adviser agreed to waive its fees and/or reimburse a portion of the Fund’s expenses during the period. Without this waiver/reimbursement, expenses would have been higher. |
| (f) | Effective July 1, 2019, the expense limit decreased from 1.80% to 1.75%. See Note 6 of Notes to Financial Statements. |
| (g) | Computed on an annualized basis for periods less than one year. |
| (h) | Effective July 1, 2017, the expense limit decreased to 1.80%. |
| (i) | Effective July 1, 2015, the expense limit decreased to 1.85%. |
See accompanying notes to financial statements.
| 64
Financial Highlights (continued)
For a share outstanding throughout each period.
| | | | | | | | | | | | | | | | |
| | | High Income Fund—Class N | |
| | | Year Ended
December 31,
2019
| | | Period Ended
December 31,
2018*
| | | Year Ended
September 30,
2018
| | | Period Ended
September 30,
2017**
| |
Net asset value, beginning of the period | | $ | 3.99 | | | $ | 4.25 | | | $ | 4.36 | | | $ | 4.16 | |
| | | | | | | | | | | | | | | | |
INCOME (LOSS) FROM INVESTMENT OPERATIONS: | | | | | | | | | | | | | | | | |
Net investment income(a) | | | 0.22 | | | | 0.06 | | | | 0.20 | | | | 0.19 | |
Net realized and unrealized gain (loss) | | | 0.26 | | | | (0.25 | ) | | | (0.12 | ) | | | 0.18 | |
| | | | | | | | | | | | | | | | |
Total from Investment Operations | | | 0.48 | | | | (0.19 | ) | | | 0.08 | | | | 0.37 | |
| | | | | | | | | | | | | | | | |
LESS DISTRIBUTIONS FROM: | |
Net investment income | | | (0.22 | ) | | | (0.06 | ) | | | (0.19 | ) | | | (0.17 | ) |
Net realized capital gains | | | — | | | | (0.01 | ) | | | — | | | | — | |
| | | | | | | | | | | | | | | | |
Total Distributions | | | (0.22 | ) | | | (0.07 | ) | | | (0.19 | ) | | | (0.17 | ) |
| | | | | | | | | | | | | | | | |
Net asset value, end of the period | | $ | 4.25 | | | $ | 3.99 | | | $ | 4.25 | | | $ | 4.36 | |
| | | | | | | | | | | | | | | | |
Total return(b) | | | 12.28 | % | | | (4.47 | )%(c) | | | 1.96 | % | | | 8.99 | %(c) |
RATIOS TO AVERAGE NET ASSETS: | |
Net assets, end of the period (000’s) | | $ | 11,977 | | | $ | 10,417 | | | $ | 10,338 | | | $ | 1 | |
Net expenses(d) | | | 0.72 | %(e) | | | 0.75 | %(f) | | | 0.75 | % | | | 0.75 | %(f)(g) |
Gross expenses | | | 0.82 | % | | | 0.89 | %(f) | | | 0.79 | % | | | 31.73 | %(f) |
Net investment income | | | 5.13 | % | | | 5.45 | %(f) | | | 4.65 | % | | | 5.19 | %(f) |
Portfolio turnover rate | | | 48 | % | | | 17 | % | | | 55 | % | | | 46 | %(h) |
| * | For the three month period ended December 31, 2018. See Note 1 of Notes to Financial Statements. |
| ** | From commencement of Class operations on November 30, 2016 through September 30, 2017. |
| (a) | Per share net investment income has been calculated using the average shares outstanding during the period. |
| (b) | Had certain expenses not been waived/reimbursed during the period, total returns would have been lower. |
| (c) | Periods less than one year are not annualized. |
| (d) | The investment adviser agreed to waive its fees and/or reimburse a portion of the Fund’s expenses during the period. Without this waiver/reimbursement, expenses would have been higher. |
| (e) | Effective July 1, 2019, the expense limit decreased from 0.75% to 0.70%. See Note 6 of Notes to Financial Statements. |
| (f) | Computed on an annualized basis for periods less than one year. |
| (g) | Effective July 1, 2017, the expense limit decreased to 0.75%. |
| (h) | Represents the Fund’s portfolio turnover rate for the year ended September 30, 2017. |
See accompanying notes to financial statements.
65 |
Financial Highlights (continued)
For a share outstanding throughout each period.
| | | | | | | | | | | | | | | | | | | | | | | | |
| | | High Income Fund—Class Y | |
| | | Year Ended
December 31,
2019 | | | Period Ended
December 31,
2018* | | | Year Ended
September 30,
2018 | | | Year Ended
September 30,
2017 | | | Year Ended
September 30,
2016 | | | Year Ended
September 30,
2015 | |
Net asset value, beginning of the period | | $ | 3.98 | | | $ | 4.24 | | | $ | 4.36 | | | $ | 4.22 | | | $ | 3.98 | | | $ | 4.48 | |
| | | | | | | | | | | | | | | | | | | | | | | | |
INCOME (LOSS) FROM INVESTMENT OPERATIONS: | | | | | | | | | | | | | | | | | | | | | | | | |
Net investment income(a) | | | 0.21 | | | | 0.06 | | | | 0.21 | | | | 0.23 | | | | 0.21 | | | | 0.20 | |
Net realized and unrealized gain (loss) | | | 0.28 | | | | (0.25 | ) | | | (0.14 | ) | | | 0.12 | | | | 0.21 | | | | (0.39 | ) |
| | | | | | | | | | | | | | | | | | | | | | | | |
Total from Investment Operations | | | 0.49 | | | | (0.19 | ) | | | 0.07 | | | | 0.35 | | | | 0.42 | | | | (0.19 | ) |
| | | | | | | | | | | | | | | | | | | | | | | | |
LESS DISTRIBUTIONS FROM: | | | | | | | | | | | | | | | | | | | | | | | | |
Net investment income | | | (0.22 | ) | | | (0.06 | ) | | | (0.19 | ) | | | (0.21 | ) | | | (0.17 | ) | | | (0.20 | ) |
Net realized capital gains | | | — | | | | (0.01 | ) | | | — | | | | — | | | | (0.01 | ) | | | (0.11 | ) |
| | | | | | | | | | | | | | | | | | | | | | | | |
Total Distributions | | | (0.22 | ) | | | (0.07 | ) | | | (0.19 | ) | | | (0.21 | ) | | | (0.18 | ) | | | (0.31 | ) |
| | | | | | | | | | | | | | | | | | | | | | | | |
Net asset value, end of the period | | $ | 4.25 | | | $ | 3.98 | | | $ | 4.24 | | | $ | 4.36 | | | $ | 4.22 | | | $ | 3.98 | |
| | | | | | | | | | | | | | | | | | | | | | | | |
Total return(b) | | | 12.52 | % | | | (4.49 | )%(c) | | | 1.68 | % | | | 8.47 | % | | | 10.98 | % | | | (4.54 | )% |
RATIOS TO AVERAGE NET ASSETS: | | | | | | | | | | | | | | | | | | | | | | | | |
Net assets, end of the period (000’s) | | $ | 108,315 | | | $ | 97,585 | | | $ | 127,699 | | | $ | 133,940 | | | $ | 129,169 | | | $ | 116,837 | |
Net expenses(d) | | | 0.77 | %(e) | | | 0.80 | %(f) | | | 0.80 | % | | | 0.84 | %(g) | | | 0.85 | % | | | 0.86 | %(h) |
Gross expenses | | | 0.93 | % | | | 1.02 | %(f) | | | 0.91 | % | | | 0.90 | % | | | 0.89 | % | | | 0.88 | % |
Net investment income | | | 5.07 | % | | | 5.39 | %(f) | | | 4.98 | % | | | 5.28 | % | | | 5.43 | % | | | 4.67 | % |
Portfolio turnover rate | | | 48 | % | | | 17 | % | | | 55 | % | | | 46 | % | | | 38 | % | | | 69 | % |
| * | For the three month period ended December 31, 2018. See Note 1 of Notes to Financial Statements. |
| (a) | Per share net investment income has been calculated using the average shares outstanding during the period. |
| (b) | Had certain expenses not been waived/reimbursed during the period, total returns would have been lower. |
| (c) | Periods less than one year are not annualized. |
| (d) | The investment adviser agreed to waive its fees and/or reimburse a portion of the Fund’s expenses during the period. Without this waiver/reimbursement, expenses would have been higher. |
| (e) | Effective July 1, 2019, the expense limit decreased from 0.80% to 0.75%. See Note 6 of Notes to Financial Statements. |
| (f) | Computed on an annualized basis for periods less than one year. |
| (g) | Effective July 1, 2017, the expense limit decreased to 0.80%. |
| (h) | Effective July 1, 2015, the expense limit decreased to 0.85%. |
See accompanying notes to financial statements.
| 66
Financial Highlights (continued)
For a share outstanding throughout each period.
| | | | | | | | | | | | | | | | | | | | | | | | |
| | | Investment Grade Bond Fund—Class A | |
| | | Year Ended
December 31,
2019
| | | Period Ended
December 31,
2018*
| | | Year Ended
September 30,
2018
| | | Year Ended
September 30,
2017
| | | Year Ended
September 30,
2016
| | | Year Ended
September 30,
2015
| |
Net asset value, beginning of the period | | $ | 10.77 | | | $ | 10.98 | | | $ | 11.30 | | | $ | 11.59 | | | $ | 11.10 | | | $ | 12.11 | |
| | | | | | | | | | | | | | | | | | | | | | | | |
INCOME (LOSS) FROM INVESTMENT OPERATIONS: | | | | | | | | | | | | | | | | | | | | | | | | |
Net investment income(a) | | | 0.35 | | | | 0.08 | | | | 0.30 | | | | 0.36 | | | | 0.39 | | | | 0.40 | |
Net realized and unrealized gain (loss) | | | 0.58 | | | | (0.16 | ) | | | (0.28 | ) | | | 0.05 | | | | 0.48 | | | | (0.95 | ) |
| | | | | | | | | | | | | | | | | | | | | | | | |
Total from Investment Operations | | | 0.93 | | | | (0.08 | ) | | | 0.02 | | | | 0.41 | | | | 0.87 | | | | (0.55 | ) |
| | | | | | | | | | | | | | | | | | | | | | | | |
LESS DISTRIBUTIONS FROM: | | | | | | | | | | | | | | | | | | | | | | | | |
Net investment income | | | (0.36 | ) | | | (0.08 | ) | | | (0.21 | ) | | | (0.26 | ) | | | (0.23 | ) | | | (0.34 | ) |
Net realized capital gains | | | (0.01 | ) | | | (0.05 | ) | | | (0.13 | ) | | | (0.44 | ) | | | (0.15 | ) | | | (0.12 | ) |
| | | | | | | | | | | | | | | | | | | | | | | | |
Total Distributions | | | (0.37 | ) | | | (0.13 | ) | | | (0.34 | ) | | | (0.70 | ) | | | (0.38 | ) | | | (0.46 | ) |
| | | | | | | | | | | | | | | | | | | | | | | | |
Net asset value, end of the period | | $ | 11.33 | | | $ | 10.77 | | | $ | 10.98 | | | $ | 11.30 | | | $ | 11.59 | | | $ | 11.10 | |
| | | | | | | | | | | | | | | | | | | | | | | | |
Total return(b) | | | 8.78 | %(c) | | | (0.66 | )%(c)(d) | | | 0.19 | %(c) | | | 3.88 | % | | | 8.06 | % | | | (4.72 | )% |
RATIOS TO AVERAGE NET ASSETS: | | | | | | | | | | | | | | | | | | | | | | | | |
Net assets, end of the period (000’s) | | $ | 772,485 | | | $ | 721,110 | | | $ | 777,391 | | | $ | 902,955 | | | $ | 1,130,260 | | | $ | 1,628,216 | |
Net expenses | | | 0.77 | %(e)(f) | | | 0.78 | %(e)(g) | | | 0.80 | %(e)(h) | | | 0.82 | %(i) | | | 0.85 | % | | | 0.83 | % |
Gross expenses | | | 0.81 | % | | | 0.82 | %(g) | | | 0.82 | % | | | 0.82 | % | | | 0.85 | % | | | 0.83 | % |
Net investment income | | | 3.10 | % | | | 3.09 | %(g) | | | 2.73 | % | | | 3.23 | % | | | 3.49 | % | | | 3.38 | % |
Portfolio turnover rate | | | 44 | %(j) | | | 39 | %(j) | | | 3 | % | | | 10 | % | | | 11 | % | | | 23 | % |
| * | For the three month period ended December 31, 2018. See Note 1 of Notes to Financial Statements. |
| (a) | Per share net investment income has been calculated using the average shares outstanding during the period. |
| (b) | A sales charge for Class A shares is not reflected in total return calculations. |
| (c) | Had certain expenses not been waived/reimbursed during the period, total returns would have been lower. |
| (d) | Periods less than one year are not annualized. |
| (e) | The investment adviser agreed to waive its fees and/or reimburse a portion of the Fund’s expenses during the period. Without this waiver/reimbursement, expenses would have been higher. |
| (f) | Effective July 1, 2019, the expense limit decreased from 0.78% to 0.76%. See Note 6 of Notes to Financial Statements. |
| (g) | Computed on an annualized basis for periods less than one year. |
| (h) | Effective July 1, 2018, the expense limit decreased to 0.78%. |
| (i) | Effective July 1, 2017, the expense limit decreased to 0.80%. |
| (j) | The variation in the Fund’s turnover rate from the year ended September 30, 2018 to the period ended December 31, 2018 was primarily due to a changes in the investment strategy and portfolio management team of the Fund. During 2019, turnover has remained elevated due to a continued repositioning of the Fund. |
See accompanying notes to financial statements.
67 |
Financial Highlights (continued)
For a share outstanding throughout each period.
| | | | | | | | | | | | | | | | | | | | | | | | |
| | | Investment Grade Bond Fund—Class C | |
| | | Year Ended
December 31,
2019
| | | Period Ended
December 31,
2018*
| | | Year Ended
September 30,
2018
| | | Year Ended
September 30,
2017
| | | Year Ended
September 30,
2016
| | | Year Ended
September 30,
2015
| |
Net asset value, beginning of the period | | $ | 10.65 | | | $ | 10.86 | | | $ | 11.19 | | | $ | 11.48 | | | $ | 11.00 | | | $ | 12.00 | |
| | | | | | | | | | | | | | | | | | | | | | | | |
INCOME (LOSS) FROM INVESTMENT OPERATIONS: | | | | | | | | | | | | | | | | | | | | | | | | |
Net investment income(a) | | | 0.26 | | | | 0.06 | | | | 0.22 | | | | 0.27 | | | | 0.30 | | | | 0.31 | |
Net realized and unrealized gain (loss) | | | 0.58 | | | | (0.16 | ) | | | (0.28 | ) | | | 0.06 | | | | 0.47 | | | | (0.94 | ) |
| | | | | | | | | | | | | | | | | | | | | | | | |
Total from Investment Operations | | | 0.84 | | | | (0.10 | ) | | | (0.06 | ) | | | 0.33 | | | | 0.77 | | | | (0.63 | ) |
| | | | | | | | | | | | | | | | | | | | | | | | |
LESS DISTRIBUTIONS FROM: | | | | | | | | | | | | | | | | | | | | | | | | |
Net investment income | | | (0.28 | ) | | | (0.06 | ) | | | (0.14 | ) | | | (0.18 | ) | | | (0.14 | ) | | | (0.25 | ) |
Net realized capital gains | | | (0.01 | ) | | | (0.05 | ) | | | (0.13 | ) | | | (0.44 | ) | | | (0.15 | ) | | | (0.12 | ) |
| | | | | | | | | | | | | | | | | | | | | | | | |
Total Distributions | | | (0.29 | ) | | | (0.11 | ) | | | (0.27 | ) | | | (0.62 | ) | | | (0.29 | ) | | | (0.37 | ) |
| | | | | | | | | | | | | | | | | | | | | | | | |
Net asset value, end of the period | | $ | 11.20 | | | $ | 10.65 | | | $ | 10.86 | | | $ | 11.19 | | | $ | 11.48 | | | $ | 11.00 | |
| | | | | | | | | | | | | | | | | | | | | | | | |
Total return(b) | | | 7.94 | %(c) | | | (0.86 | )%(c)(d) | | | (0.53 | )%(c) | | | 3.12 | % | | | 7.18 | % | | | (5.40 | )% |
RATIOS TO AVERAGE NET ASSETS: | | | | | | | | | | | | | | | | | | | | | | | | |
Net assets, end of the period (000’s) | | $ | 204,395 | | | $ | 366,068 | | | $ | 412,788 | | | $ | 689,798 | | | $ | 1,001,522 | | | $ | 1,219,687 | |
Net expenses | | | 1.52 | %(e)(f) | | | 1.53 | %(e)(g) | | | 1.55 | %(e)(h) | | | 1.57 | %(i) | | | 1.60 | % | | | 1.58 | % |
Gross expenses | | | 1.56 | % | | | 1.57 | %(g) | | | 1.57 | % | | | 1.57 | % | | | 1.60 | % | | | 1.58 | % |
Net investment income | | | 2.35 | % | | | 2.34 | %(g) | | | 1.96 | % | | | 2.49 | % | | | 2.74 | % | | | 2.63 | % |
Portfolio turnover rate | | | 44 | %(j) | | | 39 | %(j) | | | 3 | % | | | 10 | % | | | 11 | % | | | 23 | % |
| * | For the three month period ended December 31, 2018. See Note 1 of Notes to Financial Statements. |
| (a) | Per share net investment income has been calculated using the average shares outstanding during the period. |
| (b) | A contingent deferred sales charge for Class C shares is not reflected in total return calculations. |
| (c) | Had certain expenses not been waived/reimbursed during the period, total returns would have been lower. |
| (d) | Periods less than one year are not annualized. |
| (e) | The investment adviser agreed to waive its fees and/or reimburse a portion of the Fund’s expenses during the period. Without this waiver/reimbursement, expenses would have been higher. |
| (f) | Effective July 1, 2019, the expense limit decreased from 1.53% to 1.51%. See Note 6 of Notes to Financial Statements. |
| (g) | Computed on an annualized basis for periods less than one year. |
| (h) | Effective July 1, 2018, the expense limit decreased to 1.53%. |
| (i) | Effective July 1, 2017, the expense limit decreased to 1.55%. |
| (j) | The variation in the Fund’s turnover rate from the year ended September 30, 2018 to the period ended December 31, 2018 was primarily due to a changes in the investment strategy and portfolio management team of the Fund. During 2019, turnover has remained elevated due to a continued repositioning of the Fund. |
See accompanying notes to financial statements.
| 68
Financial Highlights (continued)
For a share outstanding throughout each period.
| | | | | | | | | | | | | | | | | | | | | | | | |
| | | Investment Grade Bond Fund—Class N | |
| | | Year Ended
December 31,
2019
| | | Period Ended
December 31,
2018*
| | | Year Ended
September 30,
2018
| | | Year Ended
September 30,
2017
| | | Year Ended
September 30,
2016
| | | Year Ended
September 30,
2015
| |
Net asset value, beginning of the period | | $ | 10.78 | | | $ | 10.98 | | | $ | 11.30 | | | $ | 11.58 | | | $ | 11.11 | | | $ | 12.11 | |
| | | | | | | | | | | | | | | | | | | | | | | | |
INCOME (LOSS) FROM INVESTMENT OPERATIONS: | | | | | | | | | | | | | | | | | | | | | | | | |
Net investment income(a) | | | 0.38 | | | | 0.09 | | | | 0.34 | | | | 0.39 | | | | 0.43 | | | | 0.44 | |
Net realized and unrealized gain (loss) | | | 0.58 | | | | (0.15 | ) | | | (0.28 | ) | | | 0.07 | | | | 0.47 | | | | (0.93 | ) |
| | | | | | | | | | | | | | | | | | | | | | | | |
Total from Investment Operations | | | 0.96 | | | | (0.06 | ) | | | 0.06 | | | | 0.46 | | | | 0.90 | | | | (0.49 | ) |
| | | | | | | | | | | | | | | | | | | | | | | | |
LESS DISTRIBUTIONS FROM: | | | | | | | | | | | | | | | | | | | | | | | | |
Net investment income | | | (0.40 | ) | | | (0.09 | ) | | | (0.25 | ) | | | (0.30 | ) | | | (0.28 | ) | | | (0.39 | ) |
Net realized capital gains | | | (0.01 | ) | | | (0.05 | ) | | | (0.13 | ) | | | (0.44 | ) | | | (0.15 | ) | | | (0.12 | ) |
| | | | | | | | | | | | | | | | | | | | | | | | |
Total Distributions | | | (0.41 | ) | | | (0.14 | ) | | | (0.38 | ) | | | (0.74 | ) | | | (0.43 | ) | | | (0.51 | ) |
| | | | | | | | | | | | | | | | | | | | | | | | |
Net asset value, end of the period | | $ | 11.33 | | | $ | 10.78 | | | $ | 10.98 | | | $ | 11.30 | | | $ | 11.58 | | | $ | 11.11 | |
| | | | | | | | | | | | | | | | | | | | | | | | |
Total return | | | 9.11 | % | | | (0.58 | )%(b) | | | 0.50 | % | | | 4.34 | % | | | 8.31 | % | | | (4.28 | )% |
RATIOS TO AVERAGE NET ASSETS: | | | | | | | | | | | | | | | | | | | | | | | | |
Net assets, end of the period (000’s) | | $ | 1,367,172 | | | $ | 1,216,690 | | | $ | 1,251,189 | | | $ | 1,203,169 | | | $ | 47,343 | | | $ | 21,851 | |
Net expenses | | | 0.47 | %(c) | | | 0.48 | %(d) | | | 0.47 | %(e) | | | 0.48 | %(f) | | | 0.47 | % | | | 0.47 | % |
Gross expenses | | | 0.47 | % | | | 0.48 | %(d) | | | 0.47 | % | | | 0.48 | % | | | 0.47 | % | | | 0.47 | % |
Net investment income | | | 3.40 | % | | | 3.40 | %(d) | | | 3.05 | % | | | 3.51 | % | | | 3.88 | % | | | 3.78 | % |
Portfolio turnover rate | | | 44 | %(g) | | | 39 | %(g) | | | 3 | % | | | 10 | % | | | 11 | % | | | 23 | % |
| * | For the three month period ended December 31, 2018. See Note 1 of Notes to Financial Statements. |
| (a) | Per share net investment income has been calculated using the average shares outstanding during the period. |
| (b) | Periods less than one year are not annualized. |
| (c) | Effective July 1, 2019, the expense limit decreased from 0.48% to 0.46%. See Note 6 of Notes to Financial Statements. |
| (d) | Computed on an annualized basis for periods less than one year. |
| (e) | Effective July 1, 2018, the expense limit decreased to 0.48%. |
| (f) | Effective July 1, 2017, the expense limit decreased to 0.50%. |
| (g) | The variation in the Fund’s turnover rate from the year ended September 30, 2018 to the period ended December 31, 2018 was primarily due to a changes in the investment strategy and portfolio management team of the Fund. During 2019, turnover has remained elevated due to a continued repositioning of the Fund. |
See accompanying notes to financial statements.
69 |
Financial Highlights (continued)
For a share outstanding throughout each period.
| | | | | | | | | | | | | | | | | | | | | | | | |
| | | Investment Grade Bond Fund—Class Y | |
| | | Year Ended
December 31,
2019
| | | Period Ended
December 31,
2018*
| | | Year Ended
September 30,
2018
| | | Year Ended
September 30,
2017
| | | Year Ended
September 30,
2016
| | | Year Ended
September 30,
2015
| |
Net asset value, beginning of the period | | $ | 10.78 | | | $ | 10.99 | | | $ | 11.31 | | | $ | 11.59 | | | $ | 11.11 | | | $ | 12.12 | |
| | | | | | | | | | | | | | | | | | | | | | | | |
INCOME (LOSS) FROM INVESTMENT OPERATIONS: | | | | | | | | | | | | | | | | | | | | | | | | |
Net investment income(a) | | | 0.37 | | | | 0.09 | | | | 0.33 | | | | 0.39 | | | | 0.42 | | | | 0.43 | |
Net realized and unrealized gain (loss) | | | 0.59 | | | | (0.16 | ) | | | (0.28 | ) | | | 0.06 | | | | 0.47 | | | | (0.95 | ) |
| | | | | | | | | | | | | | | | | | | | | | | | |
Total from Investment Operations | | | 0.96 | | | | (0.07 | ) | | | 0.05 | | | | 0.45 | | | | 0.89 | | | | (0.52 | ) |
| | | | | | | | | | | | | | | | | | | | | | | | |
LESS DISTRIBUTIONS FROM: | | | | | | | | | | | | | | | | | | | | | | | | |
Net investment income | | | (0.39 | ) | | | (0.09 | ) | | | (0.24 | ) | | | (0.29 | ) | | | (0.26 | ) | | | (0.37 | ) |
Net realized capital gains | | | (0.01 | ) | | | (0.05 | ) | | | (0.13 | ) | | | (0.44 | ) | | | (0.15 | ) | | | (0.12 | ) |
| | | | | | | | | | | | | | | | | | | | | | | | |
Total Distributions | | | (0.40 | ) | | | (0.14 | ) | | | (0.37 | ) | | | (0.73 | ) | | | (0.41 | ) | | | (0.49 | ) |
| | | | | | | | | | | | | | | | | | | | | | | | |
Net asset value, end of the period | | $ | 11.34 | | | $ | 10.78 | | | $ | 10.99 | | | $ | 11.31 | | | $ | 11.59 | | | $ | 11.11 | |
| | | | | | | | | | | | | | | | | | | | | | | | |
Total return | | | 9.04 | %(b) | | | (0.59 | )%(b)(c) | | | 0.43 | %(b) | | | 4.24 | % | | | 8.25 | % | | | (4.47 | )% |
RATIOS TO AVERAGE NET ASSETS: | | | | | | | | | | | | | | | | | | | | | | | | |
Net assets, end of the period (000’s) | | $ | 3,118,505 | | | $ | 2,912,537 | | | $ | 3,001,906 | | | $ | 3,453,137 | | | $ | 4,571,167 | | | $ | 6,081,536 | |
Net expenses | | | 0.52 | %(d)(e) | | | 0.53 | %(d)(f) | | | 0.55 | %(d)(g) | | | 0.57 | %(h) | | | 0.60 | % | | | 0.58 | % |
Gross expenses | | | 0.56 | % | | | 0.57 | %(f) | | | 0.57 | % | | | 0.57 | % | | | 0.60 | % | | | 0.58 | % |
Net investment income | | | 3.35 | % | | | 3.35 | %(f) | | | 2.98 | % | | | 3.48 | % | | | 3.74 | % | | | 3.63 | % |
Portfolio turnover rate | | | 44 | %(i) | | | 39 | %(i) | | | 3 | % | | | 10 | % | | | 11 | % | | | 23 | % |
| * | For the three month period ended December 31, 2018. See Note 1 of Notes to Financial Statements. |
| (a) | Per share net investment income has been calculated using the average shares outstanding during the period. |
| (b) | Had certain expenses not been waived/reimbursed during the period, total returns would have been lower. |
| (c) | Periods less than one year are not annualized. |
| (d) | The investment adviser agreed to waive its fees and/or reimburse a portion of the Fund’s expenses during the period. Without this waiver/reimbursement, expenses would have been higher. |
| (e) | Effective July 1, 2019, the expense limit decreased from 0.53% to 0.51%. See Note 6 of Notes to Financial Statements. |
| (f) | Computed on an annualized basis for periods less than one year. |
| (g) | Effective July 1, 2018, the expense limit decreased to 0.53%. |
| (h) | Effective July 1, 2017, the expense limit decreased to 0.55%. |
| (i) | The variation in the Fund’s turnover rate from the year ended September 30, 2018 to the period ended December 31, 2018 was primarily due to a changes in the investment strategy and portfolio management team of the Fund. During 2019, turnover has remained elevated due to a continued repositioning of the Fund. |
See accompanying notes to financial statements.
| 70
Financial Highlights (continued)
For a share outstanding throughout each period.
| | | | | | | | | | | | | | | | | | | | | | | | |
| | | Investment Grade Bond Fund—Admin Class | |
| | | Year Ended
December 31,
2019
| | | Period Ended
December 31,
2018*
| | | Year Ended
September 30,
2018
| | | Year Ended
September 30,
2017
| | | Year Ended
September 30,
2016
| | | Year Ended
September 30,
2015
| |
Net asset value, beginning of the period | | $ | 10.75 | | | $ | 10.95 | | | $ | 11.28 | | | $ | 11.56 | | | $ | 11.08 | | | $ | 12.09 | |
| | | | | | | | | | | | | | | | | | | | | | | | |
INCOME (LOSS) FROM INVESTMENT OPERATIONS: | | | | | | | | | | | | | | | | | | | | | | | | |
Net investment income(a) | | | 0.32 | | | | 0.08 | | | | 0.28 | | | | 0.34 | | | | 0.37 | | | | 0.37 | |
Net realized and unrealized gain (loss) | | | 0.58 | | | | (0.15 | ) | | | (0.28 | ) | | | 0.06 | | | | 0.47 | | | | (0.95 | ) |
| | | | | | | | | | | | | | | | | | | | | | | | |
Total from Investment Operations | | | 0.90 | | | | (0.07 | ) | | | 0.00 | (b) | | | 0.40 | | | | 0.84 | | | | (0.58 | ) |
| | | | | | | | | | | | | | | | | | | | | | | | |
LESS DISTRIBUTIONS FROM: | | | | | | | | | | | | | | | | | | | | | | | | |
Net investment income | | | (0.34 | ) | | | (0.08 | ) | | | (0.20 | ) | | | (0.24 | ) | | | (0.21 | ) | | | (0.31 | ) |
Net realized capital gains | | | (0.01 | ) | | | (0.05 | ) | | | (0.13 | ) | | | (0.44 | ) | | | (0.15 | ) | | | (0.12 | ) |
| | | | | | | | | | | | | | | | | | | | | | | | |
Total Distributions | | | (0.35 | ) | | | (0.13 | ) | | | (0.33 | ) | | | (0.68 | ) | | | (0.36 | ) | | | (0.43 | ) |
| | | | | | | | | | | | | | | | | | | | | | | | |
Net asset value, end of the period | | $ | 11.30 | | | $ | 10.75 | | | $ | 10.95 | | | $ | 11.28 | | | $ | 11.56 | | | $ | 11.08 | |
| | | | | | | | | | | | | | | | | | | | | | | | |
Total return | | | 8.43 | %(c) | | | (0.63 | )%(c)(d) | | | (0.07 | )%(c) | | | 3.76 | %(c) | | | 7.73 | % | | | (4.95 | )% |
RATIOS TO AVERAGE NET ASSETS: | | | | | | | | | | | | | | | | | | | | | | | | |
Net assets, end of the period (000’s) | | $ | 111,439 | | | $ | 111,864 | | | $ | 115,301 | | | $ | 25,521 | | | $ | 35,294 | | | $ | 37,355 | |
Net expenses | | | 1.02 | %(e)(f) | | | 1.03 | %(e)(g) | | | 1.02 | %(e)(h)(i) | | | 1.02 | %(e)(j)(k) | | | 1.07 | %(l) | | | 1.08 | % |
Gross expenses | | | 1.06 | % | | | 1.07 | %(g) | | | 1.05 | %(h) | | | 1.03 | %(j) | | | 1.07 | %(l) | | | 1.08 | % |
Net investment income | | | 2.85 | % | | | 2.85 | %(g) | | | 2.56 | % | | | 3.03 | % | | | 3.27 | % | | | 3.14 | % |
Portfolio turnover rate | | | 44 | %(m) | | | 39 | %(m) | | | 3 | % | | | 10 | % | | | 11 | % | | | 23 | % |
| * | For the three month period ended December 31, 2018. See Note 1 of Notes to Financial Statements. |
| (a) | Per share net investment income has been calculated using the average shares outstanding during the period. |
| (b) | Amount rounds to less than $0.01 per share. |
| (c) | Had certain expenses not been waived/reimbursed during the period, total returns would have been lower. |
| (d) | Periods less than one year are not annualized. |
| (e) | The investment adviser agreed to waive its fees and/or reimburse a portion of the Fund’s expenses during the period. Without this waiver/reimbursement, expenses would have been higher. |
| (f) | Effective July 1, 2019, the expense limit decreased from 1.03% to 1.01%. See Note 6 of Notes to Financial Statements. |
| (g) | Computed on an annualized basis for periods less than one year. |
| (h) | Includes refund of prior year service fee of 0.02%. |
| (i) | Effective July 1, 2018, the expense limit decreased to 1.03%. |
| (j) | Includes refund of prior year service fee of 0.05%. |
| (k) | Effective July 1, 2017, the expense limit decreased to 1.05%. |
| (l) | Includes refund of prior year service fee of 0.03%. |
| (m) | The variation in the Fund’s turnover rate from the year ended September 30, 2018 to the period ended December 31, 2018 was primarily due to a change in the investment strategy and management structure of the Fund. During 2019, turnover has remained elevated due to a continued repositioning of the Fund. |
See accompanying notes to financial statements.
71 |
Financial Highlights (continued)
��
For a share outstanding throughout each period.
| | | | | | | | | | | | | | | | | | | | |
| | | Multi-Asset Income Fund—Class A | |
| | | Year Ended
December 31,
2019
| | | Year Ended
December 31,
2018
| | | Year Ended
December 31,
2017
| | | Year Ended
December 31,
2016
| | | Year Ended
December 31,
2015
| |
Net asset value, beginning of the period | | $ | 11.78 | | | $ | 13.87 | | | $ | 13.24 | | | $ | 12.85 | | | $ | 13.45 | |
| | | | | | | | | | | | | | | | | | | | |
INCOME (LOSS) FROM INVESTMENT OPERATIONS: | | | | | | | | | | | | | | | | | | | | |
Net investment income(a) | | | 0.42 | | | | 0.48 | | | | 0.47 | | | | 0.49 | | | | 0.32 | |
Net realized and unrealized gain (loss) | | | 1.36 | | | | (1.71 | ) | | | 1.15 | | | | 0.80 | | | | (0.58 | ) |
| | | | | | | | | | | | | | | | | | | | |
Total from Investment Operations | | | 1.78 | | | | (1.23 | ) | | | 1.62 | | | | 1.29 | | | | (0.26 | ) |
| | | | | | | | | | | | | | | | | | | | |
LESS DISTRIBUTIONS FROM: | | | | | | | | | | | | | | | | | | | | |
Net investment income | | | (0.42 | ) | | | (0.42 | ) | | | (0.45 | ) | | | (0.40 | ) | | | (0.34 | ) |
Net realized capital gains | | | — | | | | (0.44 | ) | | | (0.54 | ) | | | (0.50 | ) | | | — | |
Paid-in capital | | | (0.03 | ) | | | — | | | | — | | | | — | | | | — | |
| | | | | | | | | | | | | | | | | | | | |
Total Distributions | | | (0.45 | ) | | | (0.86 | ) | | | (0.99 | ) | | | (0.90 | ) | | | (0.34 | ) |
| | | | | | | | | | | | | | | | | | | | |
Net asset value, end of the period | | $ | 13.11 | | | $ | 11.78 | | | $ | 13.87 | | | $ | 13.24 | | | $ | 12.85 | |
| | | | | | | | | | | | | | | | | | | | |
Total return(b)(c) | | | 15.39 | % | | | (9.24 | )% | | | 12.41 | % | | | 10.14 | % | | | (1.96 | )% |
RATIOS TO AVERAGE NET ASSETS: | | | | | | | | | | | | | | | | | | | | |
Net assets, end of the period (000’s) | | $ | 28,845 | | | $ | 51,028 | | | $ | 54,754 | | | $ | 57,320 | | | $ | 63,254 | |
Net expenses(d) | | | 0.95 | % | | | 0.95 | % | | | 0.95 | % | | | 0.95 | % | | | 1.04 | %(e) |
Gross expenses | | | 1.13 | % | | | 1.11 | % | | | 1.13 | % | | | 1.09 | % | | | 1.11 | % |
Net investment income | | | 3.37 | % | | | 3.63 | % | | | 3.37 | % | | | 3.70 | % | | | 2.40 | % |
Portfolio turnover rate | | | 277 | % | | | 282 | % | | | 221 | % | | | 341 | %(f) | | | 93 | % |
| (a) | Per share net investment income has been calculated using the average shares outstanding during the period. |
| (b) | A sales charge for Class A shares is not reflected in total return calculations. |
| (c) | Had certain expenses not been waived/reimbursed during the period, total returns would have been lower. |
| (d) | The investment adviser agreed to waive its fees and/or reimburse a portion of the Fund’s expenses during the period. Without this waiver/reimbursement, expenses would have been higher. |
| (e) | Effective September 1, 2015, the expense limit decreased from 1.25% to 0.95%. |
| (f) | The variation in the Fund’s turnover rate from 2015 to 2016 was primarily due to a repositioning of the portfolio as well as sales of additional securities as a result of a change in investment strategy in 2015. |
See accompanying notes to financial statements.
| 72
Financial Highlights (continued)
For a share outstanding throughout each period.
| | | | | | | | | | | | | | | | | | | | |
| | | Multi-Asset Income Fund—Class C | |
| | | Year Ended
December 31,
2019
| | | Year Ended
December 31,
2018
| | | Year Ended
December 31,
2017
| | | Year Ended
December 31,
2016
| | | Year Ended
December 31,
2015
| |
Net asset value, beginning of the period | | $ | 11.73 | | | $ | 13.82 | | | $ | 13.18 | | | $ | 12.80 | | | $ | 13.41 | |
| | | | | | | | | | | | | | | | | | | | |
INCOME (LOSS) FROM INVESTMENT OPERATIONS: | | | | | | | | | | | | | | | | | | | | |
Net investment income(a) | | | 0.33 | | | | 0.38 | | | | 0.36 | | | | 0.39 | | | | 0.24 | |
Net realized and unrealized gain (loss) | | | 1.36 | | | | (1.71 | ) | | | 1.16 | | | | 0.79 | | | | (0.60 | ) |
| | | | | | | | | | | | | | | | | | | | |
Total from Investment Operations | | | 1.69 | | | | (1.33 | ) | | | 1.52 | | | | 1.18 | | | | (0.36 | ) |
| | | | | | | | | | | | | | | | | | | | |
LESS DISTRIBUTIONS FROM: | | | | | | | | | | | | | | | | | | | | |
Net investment income | | | (0.34 | ) | | | (0.32 | ) | | | (0.34 | ) | | | (0.30 | ) | | | (0.25 | ) |
Net realized capital gains | | | — | | | | (0.44 | ) | | | (0.54 | ) | | | (0.50 | ) | | | — | |
Paid-in capital | | | (0.02 | ) | | | — | | | | — | | | | — | | | | — | |
| | | | | | | | | | | | | | | | | | | | |
Total Distributions | | | (0.36 | ) | | | (0.76 | ) | | | (0.88 | ) | | | (0.80 | ) | | | (0.25 | ) |
| | | | | | | | | | | | | | | | | | | | |
Net asset value, end of the period | | $ | 13.06 | | | $ | 11.73 | | | $ | 13.82 | | | $ | 13.18 | | | $ | 12.80 | |
| | | | | | | | | | | | | | | | | | | | |
Total return(b)(c) | | | 14.59 | % | | | (9.96 | )% | | | 11.70 | % | | | 9.27 | % | | | (2.73 | )% |
RATIOS TO AVERAGE NET ASSETS: | | | | | | | | | | | | | | | | | | | | |
Net assets, end of the period (000’s) | | $ | 16,738 | | | $ | 24,058 | | | $ | 36,814 | | | $ | 46,351 | | | $ | 47,791 | |
Net expenses(d) | | | 1.70 | % | | | 1.70 | % | | | 1.70 | % | | | 1.70 | % | | | 1.80 | %(e) |
Gross expenses | | | 1.88 | % | | | 1.86 | % | | | 1.88 | % | | | 1.84 | % | | | 1.87 | % |
Net investment income | | | 2.62 | % | | | 2.83 | % | | | 2.65 | % | | | 2.96 | % | | | 1.78 | % |
Portfolio turnover rate | | | 277 | % | | | 282 | % | | | 221 | % | | | 341 | %(f) | | | 93 | % |
| (a) | Per share net investment income has been calculated using the average shares outstanding during the period. |
| (b) | A contingent deferred sales charge for Class C shares is not reflected in total return calculations. |
| (c) | Had certain expenses not been waived/reimbursed during the period, total returns would have been lower. |
| (d) | The investment adviser agreed to waive its fees and/or reimburse a portion of the Fund’s expenses during the period. Without this waiver/reimbursement, expenses would have been higher. |
| (e) | Effective September 1, 2015, the expense limit decreased from 2.00% to 1.70%. |
| (f) | The variation in the Fund’s turnover rate from 2015 to 2016 was primarily due to a repositioning of the portfolio as well as sales of additional securities as a result of a change in investment strategy in 2015. |
See accompanying notes to financial statements.
73 |
Financial Highlights (continued)
For a share outstanding throughout each period.
| | | | | | | | | | | | | | | | | | | | |
| | | Multi-Asset Income Fund—Class N | |
| | | Year Ended
December 31,
2019
| | | Year Ended
December 31,
2018
| | | Year Ended
December 31,
2017
| | | Year Ended
December 31,
2016
| | | Period Ended
December 31,
2015*
| |
Net asset value, beginning of the period | | $ | 11.70 | | | $ | 13.79 | | | $ | 13.16 | | | $ | 12.77 | | | $ | 12.70 | |
| | | | | | | | | | | | | | | | | | | | |
INCOME (LOSS) FROM INVESTMENT OPERATIONS: | | | | | | | | | | | | | | | | | | | | |
Net investment income(a) | | | 0.45 | | | | 0.52 | | | | 0.51 | | | | 0.53 | | | | 0.14 | |
Net realized and unrealized gain (loss) | | | 1.37 | | | | (1.71 | ) | | | 1.15 | | | | 0.80 | | | | 0.10 | |
| | | | | | | | | | | | | | | | | | | | |
Total from Investment Operations | | | 1.82 | | | | (1.19 | ) | | | 1.66 | | | | 1.33 | | | | 0.24 | |
| | | | | | | | | | | | | | | | | | | | |
LESS DISTRIBUTIONS FROM: | | | | | | | | | | | | | | | | | | | | |
Net investment income | | | (0.46 | ) | | | (0.46 | ) | | | (0.49 | ) | | | (0.44 | ) | | | (0.17 | ) |
Net realized capital gains | | | — | | | | (0.44 | ) | | | (0.54 | ) | | | (0.50 | ) | | | — | |
Paid-in capital | | | (0.03 | ) | | | — | | | | — | | | | — | | | | — | |
| | | | | | | | | | | | | | | | | | | | |
Total Distributions | | | (0.49 | ) | | | (0.90 | ) | | | (1.03 | ) | | | (0.94 | ) | | | (0.17 | ) |
| | | | | | | | | | | | | | | | | | | | |
Net asset value, end of the period | | $ | 13.03 | | | $ | 11.70 | | | $ | 13.79 | | | $ | 13.16 | | | $ | 12.77 | |
| | | | | | | | | | | | | | | | | | | | |
Total return(b) | | | 15.86 | % | | | (9.02 | )% | | | 12.83 | % | | | 10.53 | % | | | 1.91 | %(c) |
RATIOS TO AVERAGE NET ASSETS: | | | | | | | | | | | | | | | | | | | | |
Net assets, end of the period (000’s) | | $ | 198 | | | $ | 32 | | | $ | 35 | | | $ | 1 | | | $ | 1 | |
Net expenses(d) | | | 0.65 | % | | | 0.65 | % | | | 0.65 | % | | | 0.65 | % | | | 0.65 | %(e) |
Gross expenses | | | 1.96 | % | | | 1.35 | % | | | 1.35 | % | | | 13.53 | % | | | 13.66 | %(e) |
Net investment income | | | 3.57 | % | | | 3.93 | % | | | 3.71 | % | | | 4.02 | % | | | 3.22 | %(e) |
Portfolio turnover rate | | | 277 | % | | | 282 | % | | | 221 | % | | | 341 | %(f) | | | 93 | % |
| * | From commencement of Class operations on August 31, 2015 through December 31, 2015. |
| (a) | Per share net investment income has been calculated using the average shares outstanding during the period. |
| (b) | Had certain expenses not been waived/reimbursed during the period, total returns would have been lower. |
| (c) | Periods less than one year are not annualized. |
| (d) | The investment adviser agreed to waive its fees and/or reimburse a portion of the Fund’s expenses during the period. Without this waiver/reimbursement, expenses would have been higher. |
| (e) | Computed on an annualized basis for periods less than one year. |
| (f) | The variation in the Fund’s turnover rate from 2015 to 2016 was primarily due to a repositioning of the portfolio as well as sales of additional securities as a result of a change in investment strategy in 2015. |
See accompanying notes to financial statements.
| 74
Financial Highlights (continued)
For a share outstanding throughout each period.
| | | | | | | | | | | | | | | | | | | | |
| | | Multi-Asset Income Fund—Class Y | |
| | | Year Ended
December 31,
2019
| | | Year Ended
December 31,
2018
| | | Year Ended
December 31,
2017
| | | Year Ended
December 31,
2016
| | | Year Ended
December 31,
2015
| |
Net asset value, beginning of the period | | $ | 11.70 | | | $ | 13.80 | | | $ | 13.17 | | | $ | 12.79 | | | $ | 13.39 | |
| | | | | | | | | | | | | | | | | | | | |
INCOME (LOSS) FROM INVESTMENT OPERATIONS: | | | | | | | | | | | | | | | | | | | | |
Net investment income(a) | | | 0.45 | | | | 0.52 | | | | 0.49 | | | | 0.53 | | | | 0.36 | |
Net realized and unrealized gain (loss) | | | 1.37 | | | | (1.73 | ) | | | 1.16 | | | | 0.78 | | | | (0.59 | ) |
| | | | | | | | | | | | | | | | | | | | |
Total from Investment Operations | | | 1.82 | | | | (1.21 | ) | | | 1.65 | | | | 1.31 | | | | (0.23 | ) |
| | | | | | | | | | | | | | | | | | | | |
LESS DISTRIBUTIONS FROM: | | | | | | | | | | | | | | | | | | | | |
Net investment income | | | (0.46 | ) | | | (0.45 | ) | | | (0.48 | ) | | | (0.43 | ) | | | (0.37 | ) |
Net realized capital gains | | | — | | | | (0.44 | ) | | | (0.54 | ) | | | (0.50 | ) | | | — | |
Paid-in capital | | | (0.03 | ) | | | — | | | | — | | | | — | | | | — | |
| | | | | | | | | | | | | | | | | | | | |
Total Distributions | | | (0.49 | ) | | | (0.89 | ) | | | (1.02 | ) | | | (0.93 | ) | | | (0.37 | ) |
| | | | | | | | | | | | | | | | | | | | |
Net asset value, end of the period | | $ | 13.03 | | | $ | 11.70 | | | $ | 13.80 | | | $ | 13.17 | | | $ | 12.79 | |
| | | | | | | | | | | | | | | | | | | | |
Total return(b) | | | 15.80 | % | | | (9.13 | )% | | | 12.77 | % | | | 10.38 | % | | | (1.72 | )% |
RATIOS TO AVERAGE NET ASSETS: | | | | | | | | | | | | | | | | | | | | |
Net assets, end of the period (000’s) | | $ | 40,659 | | | $ | 44,303 | | | $ | 52,938 | | | $ | 20,101 | | | $ | 11,272 | |
Net expenses(c) | | | 0.70 | % | | | 0.70 | % | | | 0.70 | % | | | 0.70 | % | | | 0.80 | %(d) |
Gross expenses | | | 0.87 | % | | | 0.86 | % | | | 0.88 | % | | | 0.84 | % | | | 0.86 | % |
Net investment income | | | 3.62 | % | | | 3.88 | % | | | 3.53 | % | | | 4.00 | % | | | 2.73 | % |
Portfolio turnover rate | | | 277 | % | | | 282 | % | | | 221 | % | | | 341 | %(e) | | | 93 | % |
| (a) | Per share net investment income has been calculated using the average shares outstanding during the period. |
| (b) | Had certain expenses not been waived/reimbursed during the period, total returns would have been lower. |
| (c) | The investment adviser agreed to waive its fees and/or reimburse a portion of the Fund’s expenses during the period. Without this waiver/reimbursement, expenses would have been higher. |
| (d) | Effective September 1, 2015, the expense limit decreased from 1.00% to 0.70%. |
| (e) | The variation in the Fund’s turnover rate from 2015 to 2016 was primarily due to a repositioning of the portfolio as well as sales of additional securities as a result of a change in investment strategy in 2015. |
See accompanying notes to financial statements.
75 |
Notes to Financial Statements
December 31, 2019
1. Organization. Natixis Funds Trust I and Loomis Sayles Funds II (the “Trusts” and each a “Trust”) are each organized as a Massachusetts business trust. Each Trust is registered under the Investment Company Act of 1940, as amended (the “1940 Act”), as anopen-end management investment company. Each Declaration of Trust permits the Board of Trustees to authorize the issuance of an unlimited number of shares of the Trust in multiple series. The financial statements for certain funds of the Trusts are presented in separate reports. The following funds (individually, a “Fund” and collectively, the “Funds”) are included in this report:
Natixis Funds Trust I:
Loomis Sayles Multi-Asset Income Fund (the “Multi-Asset Income Fund”)
Loomis Sayles Funds II:
Loomis Sayles High Income Fund (the “High Income Fund”)
Loomis Sayles Investment Grade Bond Fund (the “Investment Grade Bond Fund”)
Each Fund is a diversified investment company.
On October 5, 2018, the Board of Trustees approved a change to the fiscal year end of High Income Fund and Investment Grade Bond Fund from September 30 to December 31. Accordingly, the Funds’ financial statements and related notes include information as of and for the three month period ended December 31, 2018, and the year ended September 30, 2018.
Each Fund offers Class A, Class C, Class N and Class Y shares. In addition, Investment Grade Bond Fund also offers Admin Class shares.
Class A shares are sold with a maximumfront-end sales charge of 4.25%. Class C shares do not pay afront-end sales charge, pay higher Rule12b-1 fees than Class A shares for ten years (at which point they automatically convert to Class A shares) and may be subject to a contingent deferred sales charge (“CDSC”) of 1.00% if those shares are redeemed within one year of acquisition, except for reinvested distributions. Class N and Class Y shares do not pay afront-end sales charge, a CDSC or Rule12b-1 fees. Class N shares are offered with an initial minimum investment of $1,000,000. Class Y shares are offered with an initial minimum investment of $100,000. Certain categories of investors are exempted from the minimum investment amounts for Class N and Class Y as outlined in the relevant Funds’ prospectus. Admin Class shares do not pay afront-end sales charge or a CDSC, but do pay a Rule12b-1 fee. Admin Class shares are offered exclusively through intermediaries.
Most expenses can be directly attributed to a Fund. Expenses which cannot be directly attributed to a Fund are generally apportioned based on the relative net assets of each of the funds in Natixis Funds Trust I, Natixis Funds Trust II, Natixis Funds Trust IV and Gateway Trust (“Natixis Funds Trusts”), Loomis Sayles Funds I and Loomis Sayles Funds II (“Loomis Sayles Funds Trusts”), and Natixis ETF Trust. Expenses of a Fund are
| 76
Notes to Financial Statements (continued)
December 31, 2019
bornepro rata by the holders of each class of shares, except that each class bears expenses unique to that class (such as the Rule12b-1 fees applicable to Class A, Class C and Admin Class), and transfer agent fees are borne collectively for Class A, Class C, Class Y, and Admin Class and individually for Class N. In addition, each class votes as a class only with respect to its own Rule12b-1 Plan. Shares of each class would receive theirpro rata share of the net assets of the Fund if the Fund were liquidated. The Trustees approve separate distributions from net investment income on each class of shares.
2. Significant Accounting Policies. The following is a summary of significant accounting policies consistently followed by each Fund in the preparation of its financial statements. The Funds’ financial statements follow the accounting and reporting guidelines provided for investment companies and are prepared in accordance with accounting principles generally accepted in the United States of America which require the use of management estimates that affect the reported amounts and disclosures in the financial statements. Actual results could differ from those estimates. Management has evaluated the events and transactions subsequent toyear-end through the date the financial statements were issued and has determined that there were no material events that would require disclosure in the Funds’ financial statements.
a. Valuation. Fund securities and other investments are valued at market value based on market quotations obtained or determined by independent pricing services recommended by the adviser and approved by the Board of Trustees. Fund securities and other investments for which market quotations are not readily available are valued at fair value as determined in good faith by the adviser pursuant to procedures approved by the Board of Trustees, as described below. Market value is determined as follows:
Debt securities and unlisted preferred equity securities are valued based on evaluated bids furnished to the Funds by an independent pricing service or bid prices obtained from broker-dealers. Senior loans and collateralized loan obligations are valued at bid prices supplied by an independent pricing service, if available. Listed equity securities (including shares ofclosed-end investment companies and exchange-traded funds) are valued at the last sale price quoted on the exchange where they are traded most extensively or, if there is no reported sale during the day, the closing bid quotation as reported by an independent pricing service. Securities traded on the NASDAQ Global Select Market, NASDAQ Global Market and NASDAQ Capital Market are valued at the NASDAQ Official Closing Price (“NOCP”), or if lacking an NOCP, at the most recent bid quotations on the applicable NASDAQ Market. Unlisted equity securities (except unlisted preferred equity securities) are valued at the last sale price quoted in the market where they are traded most extensively or, if there is no reported sale during the day, the closing bid quotation as reported by an independent pricing service. If
77 |
Notes to Financial Statements (continued)
December 31, 2019
there is no last sale price or closing bid quotation available, unlisted equity securities will be valued using evaluated bids furnished by an independent pricing service, if available. In some foreign markets, an official close price and a last sale price may be available from the foreign exchange or market. In those cases, the official close price is used. Broker-dealer bid prices may be used to value debt and unlisted equity securities and senior loans and collateralized loan obligations where an independent pricing service is unable to price a security or where an independent pricing service does not provide a reliable price for the security. Forward foreign currency contracts are valued utilizing interpolated rates determined based on information provided by an independent pricing service. Futures contracts are valued at the most recent settlement price on the exchange on which the adviser believes that, over time, they are traded most extensively.
Fund securities and other investments for which market quotations are not readily available are valued at fair value as determined in good faith by the adviser pursuant to procedures approved by the Board of Trustees. The Funds may also value securities and other investments at fair value in other circumstances such as when extraordinary events occur after the close of a foreign market but prior to the close of the New York Stock Exchange. This may include situations relating to a single issuer (such as a declaration of bankruptcy or a delisting of the issuer’s security from the primary market on which it has traded) as well as events affecting the securities markets in general (such as market disruptions or closings and significant fluctuations in U.S. and/or foreign markets). When fair valuing its securities or other investments, the Funds may, among other things, use modeling tools or other processes that may take into account factors such as securities or other market activity and/or significant events that occur after the close of the foreign market and before the time the Fund’s net asset value (“NAV”) is calculated. Fair value pricing may require subjective determinations about the value of a security, and fair values used to determine a Fund’s NAV may differ from quoted or published prices, or from prices that are used by others, for the same securities. In addition, the use of fair value pricing may not always result in adjustments to the prices of securities held by a Fund.
Illiquid securities for which market quotations are readily available and have been evaluated by the adviser are considered and classified as fair valued securities pursuant to the Funds’ pricing policies and procedures.
| 78
Notes to Financial Statements (continued)
December 31, 2019
As of December 31, 2019, securities held by the Funds were fair valued as follows:
| | | | | | | | | | | | | | | | | | | | | | | | |
Fund | | Equity
securities1 | | | Percentage of Net Assets | | | Securities
classified as
fair valued | | | Percentage of Net Assets | | | Securities
fair valued
by the
Fund’s
adviser | | | Percentage of Net Assets | |
High Income Fund | | $ | — | | | | — | % | | $ | 1,646,883 | | | | 1.1 | % | | $ | 1,241,739 | | | | 0.8 | % |
Investment Grade Bond Fund | | | — | | | | — | % | | | 163,123,037 | | | | 2.9 | % | | | — | | | | — | % |
Multi-Asset Income Fund | | | 7,288,259 | | | | 8.4 | % | | | 2,084,272 | | | | 2.4 | % | | | — | | | | — | % |
| 1 | Certain foreign equity securities were fair valued pursuant to procedures approved by the Board of Trustees as events occurring after the close of the foreign market were believed to materially affect the value of those securities. |
b. Investment Transactions and Related Investment Income. Investment transactions are accounted for on a trade date plus one day basis for daily NAV calculation. However, for financial reporting purposes, investment transactions are reported on trade date. Dividend income (including income reinvested) and foreign withholding tax, if applicable, is recorded on theex-dividend date, or in the case of certain foreign securities, as soon as a Fund is notified, and interest income is recorded on an accrual basis. Interest income is increased by the accretion of discount and decreased by the amortization of premium, if applicable. Distributions received from investments in securities that represent a return of capital or capital gain are recorded as a reduction of cost of investments or as a realized gain, respectively. The calendaryear-end amounts of ordinary income, capital gains, and return of capital included in distributions received from the Funds’ investments in real estate investment trusts (“REITs”) are reported to the Funds after the end of the fiscal year; accordingly, the Funds estimate these amounts for accounting purposes until the characterization of REIT distributions is reported to the Funds after the end of the fiscal year. Estimates are based on the most recent REIT distribution information available. In determining net gain or loss on securities sold, the cost of securities has been determined on an identified cost basis. Investment income,non-class specific expenses and realized and unrealized gains and losses are allocated on apro rata basis to each class based on the relative net assets of each class to the total net assets of the Fund.
c. Foreign Currency Translation. The books and records of the Funds are maintained in U.S. dollars. The values of securities, currencies and other assets and liabilities denominated in currencies other than U.S. dollars, if any, are translated into U.S. dollars based upon foreign exchange rates prevailing at the end of the period. Purchases and sales of investment securities, income and expenses are translated into U.S. dollars on the respective dates of such transactions.
Net realized foreign exchange gains or losses arise from sales of foreign currency, changes in exchange rates between the trade and settlement dates on securities transactions and the difference between the amounts of dividends, interest and foreign
79 |
Notes to Financial Statements (continued)
December 31, 2019
withholding taxes recorded on the Funds’ books and the U.S. dollar equivalent of the amounts actually received or paid. Net unrealized foreign exchange gains or losses arise from changes in the value of assets and liabilities, other than investment securities, as of the end of the fiscal period, resulting from changes in exchange rates. Net realized foreign exchange gains or losses and the net change in unrealized foreign exchange gains or losses are disclosed in the Statements of Operations. For federal income tax purposes, net realized foreign exchange gains or losses are characterized as ordinary income and may, if the Funds have net losses, reduce the amount of income available to be distributed by the Funds.
The values of investment securities are presented at the foreign exchange rates prevailing at the end of the period for financial reporting purposes. Net realized and unrealized gains or losses on investments reported in the Statements of Operations reflect gains or losses resulting from changes in exchange rates and fluctuations which arise due to changes in market prices of investment securities. For federal income tax purposes, a portion of the net realized gain or loss on investments arising from changes in exchange rates, which is reflected in the Statements of Operations, may be characterized as ordinary income and may, if the Funds have net losses, reduce the amount of income available to be distributed by the Funds.
For the year ended December 31, 2019, the amount of income available to be distributed has been reduced by the following amount as a result of losses arising from changes in exchange rates:
| | | | |
Multi-Asset Income Fund | | $ | 475,027 | |
The Funds may use foreign currency exchange contracts to facilitate transactions in foreign-denominated investments. Losses may arise from changes in the value of the foreign currency or if the counterparties do not perform under the contracts’ terms.
d. Forward Foreign Currency Contracts. The Funds may enter into forward foreign currency contracts, including forward foreign cross currency contracts to acquire exposure to foreign currencies or to hedge the Funds’ investments against currency fluctuation. A contract can also be used to offset a previous contract. These contracts involve market risk in excess of the unrealized appreciation (depreciation) reflected in the Funds’ Statements of Assets and Liabilities. The U.S. dollar value of the currencies a Fund has committed to buy or sell represents the aggregate exposure to each currency a Fund has acquired or hedged through currency contracts outstanding at period end. Gains or losses are recorded for financial statement purposes as unrealized until settlement date. Contracts are tradedover-the-counter directly with a counterparty. Risks may arise upon entering into these contracts from the potential inability of counterparties to meet the terms of their contracts and from unanticipated movements in the value of a foreign currency relative to the U.S. dollar. Certain contracts may require the movement of cash and/or securities as collateral for the Funds’ or counterparty’s net obligations under the contracts.
| 80
Notes to Financial Statements (continued)
December 31, 2019
e. Futures Contracts. The Funds may enter into futures contracts. Futures contracts are agreements between two parties to buy and sell a particular instrument or index for a specified price on a specified future date.
When a Fund enters into a futures contract, it is required to deposit with (or for the benefit of) its broker an amount of cash or short-term high-quality securities as “initial margin.” As the value of the contract changes, the value of the futures contract position increases or declines. Subsequent payments, known as “variation margin,” are made or received by a Fund, depending on the price fluctuations in the fair value of the contract and the value of cash or securities on deposit with the broker. The aggregate principal amounts of the contracts are not recorded in the financial statements. Daily fluctuations in the value of the contracts are recorded in the Statements of Assets and Liabilities as a receivable (payable) and in the Statements of Operations as unrealized appreciation (depreciation) until the contracts are closed, when they are recorded as realized gains (losses). Realized gain or loss on a futures position is equal to the difference between the value of the contract at the time it was opened and the value at the time it was closed, minus brokerage commissions. When a Fund enters into a futures contract certain risks may arise, such as illiquidity in the futures market, which may limit a Fund’s ability to close out a futures contract prior to settlement date, and unanticipated movements in the value of securities or interest rates.
Futures contracts are exchange-traded. Exchange-traded futures contracts are standardized and are settled through a clearing house with fulfillment supported by the credit of the exchange. Therefore, counterparty credit risks to the Funds are reduced; however, in the event that a counterparty enters into bankruptcy, a Fund’s claim against initial/variation margin on deposit with the counterparty may be subject to terms of a final settlement in bankruptcy court.
No futures contracts were held by the Funds during the year ended December 31, 2019.
f. When-Issued and Delayed Delivery Transactions. The Funds may enter into when-issued or delayed delivery transactions. When-issued refers to transactions made conditionally because a security, although authorized, has not been issued. Delayed delivery refers to transactions for which delivery or payment will occur at a later date, beyond the normal settlement period. The price of when-issued and delayed delivery securities and the date when the securities will be delivered and paid for are fixed at the time the transaction is negotiated. The security and the obligation to pay for it are recorded by the Funds at the time the commitment is entered into. The value of the security may vary with market fluctuations during the time before the Funds take delivery of the security. No interest accrues to the Funds until the transaction settles.
Delayed delivery transactions include those designated as To Be Announced (“TBAs”) in the Portfolios of Investments. For TBAs, the actual security that will be delivered to
81 |
Notes to Financial Statements (continued)
December 31, 2019
fulfill the transaction is not designated at the time of the trade. The security is “to be announced” 48 hours prior to the established trade settlement date. Certain transactions require the Funds or counterparty to post cash and/or securities as collateral for the netmark-to-market exposure to the other party. The Funds cover their net obligations under outstanding delayed delivery commitments by segregating or earmarking cash or securities at the custodian.
Purchases of when-issued or delayed delivery securities may have a similar effect on the Funds’ NAV as if the Funds’ had created a degree of leverage in the portfolio. Risks may arise upon entering into such transactions from the potential inability of counterparties to meet their obligations under the transactions. Additionally, losses may arise due to changes in the value of the underlying securities.
There were no when-issued or delayed delivery securities held by the Funds as of December 31, 2019.
g. Federal and Foreign Income Taxes. The Trusts treat each Fund as a separate entity for federal income tax purposes. Each Fund intends to meet the requirements of the Internal Revenue Code of 1986, as amended, applicable to regulated investment companies, and to distribute to its shareholders substantially all of its net investment income and any net realized capital gains at least annually. Management has performed an analysis of each Fund’s tax positions for the open tax years as of December 31, 2019 and has concluded that no provisions for income tax are required. The Funds’ federal tax returns for the prior three fiscal years remain subject to examination by the Internal Revenue Service. Management is not aware of any events that are reasonably possible to occur in the next twelve months that would result in the amounts of any unrecognized tax benefits significantly increasing or decreasing for the Funds. However, management’s conclusions regarding tax positions taken may be subject to review and adjustment at a later date based on factors including, but not limited to, new tax laws and accounting regulations and interpretations thereof.
A Fund may be subject to foreign withholding taxes on investment income and taxes on capital gains on investments that are accrued and paid based upon the Fund’s understanding of the tax rules and regulations that exist in the countries in which the Fund invests. Foreign withholding taxes on dividend and interest income are reflected on the Statements of Operations as a reduction of investment income, net of amounts eligible to be reclaimed. Dividends and interest receivable on the Statements of Assets and Liabilities are net of foreign withholding taxes. Foreign withholding taxes where reclaims have been or will be filed are reflected on the Statements of Assets and Liabilities as tax reclaims receivable. Capital gains taxes paid are included in net realized gain (loss) on investments in the Statements of Operations. Accrued but unpaid capital gains taxes are reflected as foreign taxes payable on the Statements of Assets and Liabilities, if applicable, and reduce unrealized gains on investments. In the event that realized gains on investments are subsequently offset by realized losses,
| 82
Notes to Financial Statements (continued)
December 31, 2019
taxes paid on realized gains may be returned to a Fund. Such amounts, if applicable, are reflected as foreign tax rebates receivable on the Statements of Assets and Liabilities and are recorded as a realized gain when received.
h. Dividends and Distributions to Shareholders. Dividends and distributions are recorded on theex-dividend date. The timing and characterization of certain income and capital gain distributions are determined in accordance with federal tax regulations, which may differ from accounting principles generally accepted in the United States of America. Permanent differences are primarily due to differing treatments for book and tax purposes of items such as contingent payment debt instruments, convertible bonds, defaulted and/ornon-income producing securities, capital gains taxes, distributions in excess of income and/or capital gain, return of capital distributions received, perpetual bond adjustments, distributionre-designations, foreign currency gains and losses, passive foreign investment company adjustments, paydown gains and losses and premium amortization. Permanent book and tax basis differences relating to shareholder distributions will result in reclassifications to capital accounts. Temporary differences between book and tax distributable earnings are primarily due to convertible bonds, defaulted and/ornon-income producing securities, deferred Trustees’ fees, premium amortization, perpetual bond adjustments and wash sales. Amounts of income and capital gain available to be distributed on a tax basis are determined annually, and at other times during the Funds’ fiscal year as may be necessary to avoid knowingly declaring and paying a return of capital distribution. Distributions from net investment income and net realized short-term capital gains are reported as distributed from ordinary income for tax purposes.
The tax characterization of distributions is determined on an annual basis. The tax character of distributions paid to shareholders during the years ended December 31, 2019 and 2018 were as follows:
| | | | | | | | | | | | | | | | | | | | | | | | | | | | |
| | | 2019 Distributions Paid From: | | | 2018 Distributions Paid From: | |
Fund | | Ordinary
Income | | | Long-Term
Capital Gains | | | Return of
Capital | | | Total | | | Ordinary
Income | | | Long-Term
Capital Gains | | | Total | |
High Income Fund | | $ | 7,578,533 | | | $ | — | | | $ | — | | | $ | 7,578,533 | | | $ | 2,342,939 | | | $ | 469,860 | | | $ | 2,812,799 | |
Investment Grade Bond Fund | | | 194,915,001 | | | | — | | | | — | | | | 194,915,001 | | | | 44,211,096 | | | | 26,591,753 | | | | 70,802,849 | |
Multi-Asset Income Fund | | | 3,680,842 | | | | — | | | | 210,988 | | | | 3,891,830 | | | | 6,314,655 | | | | 2,864,723 | | | | 9,179,378 | |
Distributions paid to shareholders from net investment income and net realized capital gains, based on accounting principles generally accepted in the United States of America, are consolidated and reported on the Statements of Changes in Net Assets as Distributions to Shareholders. Distributions paid to shareholders from net investment income and net realized capital gains expressed inper-share amounts, based on accounting principles generally accepted in the United States of America, are separately stated and reported within the Financial Highlights.
83 |
Notes to Financial Statements (continued)
December 31, 2019
As of December 31, 2019, the components of distributable earnings on a tax basis were as follows:
| | | | | | | | | | | | |
| | | High Income
Fund | | | Investment
Grade
Bond Fund | | | Multi-Asset
Income Fund | |
Undistributed ordinary income | | $ | 47,010 | | | $ | 16,063,355 | | | $ | — | |
Undistributed long-term capital gains | | | — | | | | 16,757,612 | | | | — | |
| | | | | | | | | | | | |
Total undistributed earnings | | | 47,010 | | | | 32,820,967 | | | | — | |
| | | | | | | | | | | | |
Capital loss carryforward: | |
Short-term: | |
No expiration date | | | (525,013 | ) | | | — | | | | (1,585,026 | ) |
Long-term: | |
No expiration date | | | (4,818,541 | ) | | | — | | | | (2,918,756 | ) |
| | | | | | | | | | | | |
Total capital loss carryforward | | | (5,343,554 | ) | | | — | | | | (4,503,782 | ) |
| | | | | | | | | | | | |
Late-year ordinary and post-October capital loss deferrals* | | | — | | | | — | | | | (7,746 | ) |
| | | | | | | | | | | | |
Unrealized appreciation (depreciation) | | | (143,972 | ) | | | 312,514,263 | | | | 3,924,968 | |
| | | | | | | | | | | | |
Total accumulated earnings (losses) | | $ | (5,440,516 | ) | | $ | 345,335,230 | | | $ | (586,560 | ) |
| | | | | | | | | | | | |
| * | Under current tax law, capital losses, foreign currency losses, and losses on passive foreign investment companies and contingent payment debt instruments after October 31 or December 31, as applicable, may be deferred and treated as occurring on the first day of the following taxable year. Multi-Asset Income Fund is deferring foreign currency losses and losses on contingent payment debt instruments. |
As of December 31, 2019, the tax cost of investments (including derivatives, if applicable) and unrealized appreciation (depreciation) on a federal tax basis were as follows:
| | | | | | | | | | | | |
| | | High Income
Fund | | | Investment
Grade
Bond Fund | | | Multi-Asset
Income Fund | |
Federal tax cost | | $ | 145,213,373 | | | $ | 5,222,405,497 | | | $ | 82,375,380 | |
| | | | | | | | | | | | |
Gross tax appreciation | | $ | 7,355,358 | | | $ | 334,098,218 | | | $ | 4,704,011 | |
Gross tax depreciation | | | (7,499,330 | ) | | | (21,584,469 | ) | | | (779,594 | ) |
| | | | | | | | | | | | |
Net tax appreciation | | $ | (143,972 | ) | | $ | 312,513,749 | | | $ | 3,924,417 | |
| | | | | | | | | | | | |
The difference between these amounts and those reported in the components of distributable earnings are primarily attributable to foreign currencymark-to-market.
| 84
Notes to Financial Statements (continued)
December 31, 2019
i. Senior Loans. Each Fund may invest in senior loans to corporate, governmental or other borrowers. Senior loans, which include both secured and unsecured loans made by banks and other financial institutions to corporate customers, typically hold the most senior position in a borrower’s capital structure, may be secured by the borrower’s assets and have interest rates that reset frequently. Senior Loans can include term loans, revolving credit facility loans and second lien loans. A senior loan is often administered by a bank or other financial institution that acts as agent for all holders. The agent administers the terms of the senior loan, as specified in the loan agreement. Large loans may be shared or syndicated among several lenders. A Fund may enter into the primary syndicate for a loan or it may also purchase all or a portion of loans from other lenders (sometimes referred to as loan assignments), in either case becoming a direct lender. Senior loans outstanding at the end of the period, if any, are listed in each applicable Fund’s Portfolio of Investments.
j. Loan Participations. A Fund’s investments in senior loans may be in the form of participations in loans. When investing in a loan participation, a Fund has the right to receive payments of principal, interest and any fees to which it is entitled only from the party from whom the Fund has purchased the participation and only upon receipt by that party of payments from the borrower. A Fund generally has no right to enforce compliance by the borrower with the terms of the loan agreement or to vote on matters arising under the loan agreement. Thus, a Fund may be subject to credit risk from both the party from whom it purchased the loan participation and the borrower. Additionally, a Fund may have minimal control over the terms of any loan modification. Loan participations outstanding at the end of the period, if any, are listed in each applicable Fund’s Portfolio of Investments.
k. Collateralized Loan Obligations. Certain Funds may invest in collateralized loan obligations (“CLOs”). A CLO is a type of asset-backed security designed to redirect the cash flows from a pool of leveraged loans to investors based on their risk preferences. Cash flows from a CLO are split into two or more portions, called tranches, varying in risk and yield. The risk of an investment in a CLO depends largely on the type of the collateral securities and the class of the instrument in which a Fund invests. The intent of the Funds when investing in CLOs is to purchase only higher level, investment grade level select tranches. CLOs outstanding at the end of the period, if any, are listed in each applicable Fund’s Portfolio of Investments.
l. Repurchase Agreements. Each Fund may enter into repurchase agreements, under the terms of a Master Repurchase Agreement, under which each Fund acquires securities as collateral and agrees to resell the securities at an agreed upon time and at an agreed upon price. It is each Fund’s policy that the market value of the collateral for repurchase agreements be at least equal to 102% of the repurchase price, including interest. Certain repurchase agreements aretri-party arrangements whereby the collateral is held in a segregated account for the benefit of the Fund and on behalf of the counterparty. Repurchase agreements could involve certain risks in the event of
85 |
Notes to Financial Statements (continued)
December 31, 2019
default or insolvency of the counterparty, including possible delays or restrictions upon a Fund’s ability to dispose of the underlying securities. As of December 31, 2019, each Fund, as applicable, had investments in repurchase agreements for which the value of the related collateral exceeded the value of the repurchase agreement. The gross value of repurchase agreements is included in the Statements of Assets and Liabilities for financial reporting purposes.
m. Securities Lending. The Funds have entered into an agreement with State Street Bank and Trust Company (“State Street Bank”), as agent of the Funds, to lend securities to certain designated borrowers. The loans are collateralized with cash or securities in an amount equal to at least 105% or 102% of the market value (including accrued interest) of the loaned international or domestic securities, respectively, when the loan is initiated. Thereafter, the value of the collateral must remain at least 102% of the market value (including accrued interest) of loaned securities for U.S. equities and U.S. corporate debt; at least 105% of the market value (including accrued interest) of loaned securities fornon-U.S. equities; and at least 100% of the market value (including accrued interest) of loaned securities for U.S. Government securities, sovereign debt issued bynon-U.S. Governments andnon-U.S. corporate debt. In the event that the market value of the collateral falls below the required percentages described above, the borrower will deliver additional collateral on the next business day. As with other extensions of credit, the Funds may bear the risk of loss with respect to the investment of the collateral. The Funds invest cash collateral in short-term investments, a portion of the income from which is remitted to the borrowers and the remainder allocated between the Funds and State Street Bank as lending agent.
For the year ended December 31, 2019, none of the Funds had loaned securities under this agreement.
n. Indemnifications. Under the Trusts’ organizational documents, their officers and Trustees are indemnified against certain liabilities arising out of the performance of their duties to the Funds. Additionally, in the normal course of business, the Funds enter into contracts with service providers that contain general indemnification clauses. The Funds’ maximum exposure under these arrangements is unknown as this would involve future claims that may be made against the Funds that have not yet occurred. However, based on experience, the Funds expect the risk of loss to be remote.
o. Change in Accounting Policy. The Funds have adopted Financial Accounting Standards Board (FASB) Accounting Standards Update2017-08. Under the new standard, certain debt securities withnon-contingent call features purchased at a premium are amortized to the earliest call date. In accordance with the transition provisions of the standard, the Funds applied the new standard on a modified retrospective basis beginning with the fiscal period ended December 31, 2019. This change in accounting policy resulted in reclassifications to capital accounts as of the beginning of the period, but had no impact on the net asset value of the Funds.
| 86
Notes to Financial Statements (continued)
December 31, 2019
p. New Accounting Pronouncement. In August 2018, the FASB issued Accounting Standards Update2018-13, Fair Value Measurement (Topic 820): Disclosure Framework —Changes to the Disclosure Requirements for Fair Value Measurement (“ASU2018-13”). The update introduces new fair value disclosure requirements, eliminates some prior fair value disclosure requirements, and modifies certain existing fair value disclosure requirements. ASU2018-13 will be effective for fiscal years beginning after December 15, 2019, including interim periods within those fiscal years. Management has evaluated the impact of the adoption of ASU 2018-13 and will incorporate required disclosure updates in the Funds’ semiannual financial statements as of June 30, 2020.
3. Fair Value Measurements. In accordance with accounting standards related to fair value measurements and disclosures, the Funds have categorized the inputs utilized in determining the value of each Fund’s assets or liabilities. These inputs are summarized in the three broad levels listed below:
| | • | | Level 1 – quoted prices in active markets for identical assets or liabilities; |
| | • | | Level 2 – prices determined using other significant inputs that are observable either directly, or indirectly through corroboration with observable market data (which could include quoted prices for similar assets or liabilities, interest rates, credit risk, etc.); and |
| | • | | Level 3 – prices determined using significant unobservable inputs when quoted prices or observable inputs are unavailable such as when there is little or no market activity for an asset or liability (unobservable inputs reflect each Fund’s own assumptions in determining the fair value of assets or liabilities and would be based on the best information available). |
The inputs or methodology used for valuing securities are not necessarily an indication of the risk associated with investing in those securities.
The Funds’ pricing policies and procedures are recommended by the adviser and approved by the Board of Trustees. Debt securities are valued based on evaluated bids furnished to the Funds by an independent pricing service. Broker-dealer bid prices may be used if an independent pricing service either is unable to price a security or does not provide a reliable price for a security. Broker-dealer bid prices for which the Funds do not have knowledge of the inputs used by the broker-dealer are categorized in Level 3. All security prices, including those obtained from an independent pricing service and broker-dealer bid prices, are reviewed on a daily basis by the adviser, subject to oversight by Fund management and the Board of Trustees. If the adviser, in good faith, believes that the price provided by an independent pricing service is unreliable, broker-dealer bid prices may be used until the price provided by the independent pricing service is considered to be reliable. Reliability of all security prices, including those obtained from an independent pricing service and broker-dealer bid prices, is tested in a variety of ways, including comparison to recent transaction prices and daily fluctuations, amongst
87 |
Notes to Financial Statements (continued)
December 31, 2019
other validation procedures in place. Securities for which market quotations are not readily available are valued at fair value as determined in good faith by the Funds’ adviser pursuant to procedures approved by the Board of Trustees. Fair valued securities may be categorized in Level 3.
The following is a summary of the inputs used to value the Funds’ investments as of December 31, 2019, at value:
High Income Fund
Asset Valuation Inputs
| | | | | | | | | | | | | | | | |
Description | | Level 1 | | | Level 2 | | | Level 3 | | | Total | |
Bonds and Notes | | | | | | | | | | | | | | | | |
Non-Convertible Bonds | | | | | | | | | | | | | | | | |
Home Construction | | $ | — | | | $ | 2,559,600 | | | $ | — | (d) | | $ | 2,559,600 | |
Non-Agency Commercial Mortgage-Backed Securities | | | — | | | | 1,713,284 | | | | 325,435 | (b) | | | 2,038,719 | |
All OtherNon-Convertible Bonds(a) | | | — | | | | 124,733,836 | | | | — | | | | 124,733,836 | |
| | | | | | | | | | | | | | | | |
TotalNon-Convertible Bonds | | | — | | | | 129,006,720 | | | | 325,435 | | | | 129,332,155 | |
| | | | | | | | | | | | | | | | |
Convertible Bonds(a) | | | — | | | | 8,474,531 | | | | — | | | | 8,474,531 | |
| | | | | | | | | | | | | | | | |
Total Bonds and Notes | | | — | | | | 137,481,251 | | | | 325,435 | | | | 137,806,686 | |
| | | | | | | | | | | | | | | | |
Senior Loans(a) | | | — | | | | 2,051,248 | | | | — | | | | 2,051,248 | |
Loan Participations(a) | | | — | | | | 398,373 | | | | — | | | | 398,373 | |
Preferred Stocks | | | | | | | | | | | | | | | | |
Food & Beverage | | | — | | | | 2,201,691 | | | | — | | | | 2,201,691 | |
Midstream | | | — | | | | — | | | | 196,350 | (c) | | | 196,350 | |
| | | | | | | | | | | | | | | | |
Total Preferred Stocks | | | — | | | | 2,201,691 | | | | 196,350 | | | | 2,398,041 | |
| | | | | | | | | | | | | | | | |
Other Investments(a) | | | — | | | | — | | | | 864,000 | (b) | | | 864,000 | |
Common Stocks | | | | | | | | | | | | | | | | |
Chemicals | | | — | | | | 155,257 | | | | — | | | | 155,257 | |
Media | | | 418,657 | | | | — | | | | — | | | | 418,657 | |
Oil, Gas & Consumable Fuels | | | — | | | | — | | | | 52,304 | (b) | | | 52,304 | |
| | | | | | | | | | | | | | | | |
Total Common Stocks | | | 418,657 | | | | 155,257 | | | | 52,304 | | | | 626,218 | |
| | | | | | | | | | | | | | | | |
Short-Term Investments | | | — | | | | 924,835 | | | | — | | | | 924,835 | |
| | | | | | | | | | | | | | | | |
Total | | $ | 418,657 | | | $ | 143,212,655 | | | $ | 1,438,089 | | | $ | 145,069,401 | |
| | | | | | | | | | | | | | | | |
| (a) | Details of the major categories of the Fund’s investments are reflected within the Portfolio of Investments. |
| (b) | Fair valued by the Fund’s adviser. |
| (c) | Valued using broker-dealer bid prices. |
| (d) | Includes securities fair valued at zero by the Fund’s adviser using level 3 inputs. |
| 88
Notes to Financial Statements (continued)
December 31, 2019
Investment Grade Bond Fund
Asset Valuation Inputs
| | | | | | | | | | | | | | | | |
Description | | Level 1 | | | Level 2 | | | Level 3 | | | Total | |
Bonds and Notes | | | | | | | | | | | | | | | | |
Non-Convertible Bonds(a) | | $ | — | | | $ | 5,232,967,808 | | | $ | — | | | $ | 5,232,967,808 | |
Convertible Bonds(a) | | | — | | | | 37,117,915 | | | | — | | | | 37,117,915 | |
Municipals(a) | | | — | | | | 8,945,265 | | | | — | | | | 8,945,265 | |
| | | | | | | | | | | | | | | | |
Total Bonds and Notes | | | — | | | | 5,279,030,988 | | | | — | | | | 5,279,030,988 | |
| | | | | | | | | | | | | | | | |
Collateralized Loan Obligations(a) | | | — | | | | 113,924,322 | | | | — | | | | 113,924,322 | |
Preferred Stocks | | | | | | | | | | | | | | | | |
Food & Beverage | | | — | | | | 14,301,982 | | | | — | | | | 14,301,982 | |
Independent Energy | | | — | | | | — | | | | 721,179 | (b) | | | 721,179 | |
| | | | | | | | | | | | | | | | |
Total Preferred Stocks | | | — | | | | 14,301,982 | | | | 721,179 | | | | 15,023,161 | |
| | | | | | | | | | | | | | | | |
Short-Term Investments | | | — | | | | 126,940,775 | | | | — | | | | 126,940,775 | |
| | | | | | | | | | | | | | | | |
Total | | $ | — | | | $ | 5,534,198,067 | | | $ | 721,179 | | | $ | 5,534,919,246 | |
| | | | | | | | | | | | | | | | |
| (a) | Details of the major categories of the Fund’s investments are reflected within the Portfolio of Investments. |
| (b) | Valued using broker-dealer bid prices. |
89 |
Notes to Financial Statements (continued)
December 31, 2019
Multi-Asset Income Fund
Asset Valuation Inputs
| | | | | | | | | | | | | | | | |
Description | | Level 1 | | | Level 2 | | | Level 3 | | | Total | |
Common Stocks | | | | | | | | | | | | | | | | |
Airlines | | $ | 5,848 | | | $ | 90,294 | | | $ | — | | | $ | 96,142 | |
Auto Components | | | — | | | | 283,599 | | | | — | | | | 283,599 | |
Banks | | | 1,968,117 | | | | 3,633,101 | | | | — | | | | 5,601,218 | |
Beverages | | | 634,916 | | | | 82,117 | | | | — | | | | 717,033 | |
Capital Markets | | | 1,011,739 | | | | 88,913 | | | | — | | | | 1,100,652 | |
Commercial Services & Supplies | | | 304,105 | | | | 83,847 | | | | — | | | | 387,952 | |
Construction & Engineering | | | 55,245 | | | | 360,197 | | | | — | | | | 415,442 | |
Diversified Telecommunication Services | | | 867,973 | | | | 71,874 | | | | — | | | | 939,847 | |
Electric Utilities | | | 742,345 | | | | 91,310 | | | | — | | | | 833,655 | |
Food & Staples Retailing | | | 608,462 | | | | 69,645 | | | | — | | | | 678,107 | |
Food Products | | | 526,582 | | | | 94,562 | | | | — | | | | 621,144 | |
Household Durables | | | 118,696 | | | | 10,677 | | | | — | | | | 129,373 | |
Insurance | | | 903,857 | | | | 1,134,745 | | | | — | | | | 2,038,602 | |
IT Services | | | 1,906,962 | | | | 50,190 | | | | — | | | | 1,957,152 | |
Leisure Products | | | — | | | | 83,032 | | | | — | | | | 83,032 | |
Machinery | | | 676,558 | | | | 73,676 | | | | — | | | | 750,234 | |
Marine | | | — | | | | 95,189 | | | | — | | | | 95,189 | |
Multi-Utilities | | | 530,431 | | | | 92,536 | | | | — | | | | 622,967 | |
Personal Products | | | 67,539 | | | | 80,254 | | | | — | | | | 147,793 | |
Pharmaceuticals | | | 1,876,514 | | | | 94,251 | | | | — | | | | 1,970,765 | |
Road & Rail | | | 392,210 | | | | 77,844 | | | | — | | | | 470,054 | |
Semiconductors & Semiconductor Equipment | | | 1,252,798 | | | | 81,720 | | | | — | | | | 1,334,518 | |
Specialty Retail | | | 663,660 | | | | 88,740 | | | | — | | | | 752,400 | |
Tobacco | | | 489,931 | | | | 183,045 | | | | — | | | | 672,976 | |
Trading Companies & Distributors | | | 64,589 | | | | 50,271 | | | | — | | | | 114,860 | |
Transportation Infrastructure | | | — | | | | 56,105 | | | | — | | | | 56,105 | |
Wireless Telecommunication Services | | | — | | | | 86,525 | | | | — | | | | 86,525 | |
All Other Common Stocks(a) | | | 15,055,452 | | | | — | | | | — | | | | 15,055,452 | |
| | | | | | | | | | | | | | | | |
Total Common Stocks | | | 30,724,529 | | | | 7,288,259 | | | | — | | | | 38,012,788 | |
| | | | | | | | | | | | | | | | |
Bonds and Notes(a) | | | — | | | | 33,394,852 | | | | — | | | | 33,394,852 | |
Exchange-Traded Funds | | | 4,374,100 | | | | — | | | | — | | | | 4,374,100 | |
Senior Loans(a) | | | — | | | | 2,084,272 | | | | — | | | | 2,084,272 | |
Preferred Stocks(a) | | | 606,655 | | | | — | | | | — | | | | 606,655 | |
Short-Term Investments | | | — | | | | 7,827,130 | | | | — | | | | 7,827,130 | |
| | | | | | | | | | | | | | | | |
Total | | $ | 35,705,284 | | | $ | 50,594,513 | | | $ | — | | | $ | 86,299,797 | |
| | | | | | | | | | | | | | | | |
| (a) | Details of the major categories of the Fund’s investments are reflected within the Portfolio of Investments. |
| 90
Notes to Financial Statements (continued)
December 31, 2019
For the year ended December 31, 2019, there were no transfers among Levels 1, 2 and 3.
The following is a reconciliation of Level 3 investments for which significant unobservable inputs were used to determine fair value as of December 31, 2019:
High Income Fund
Asset Valuation Inputs
| | | | | | | | | | | | | | | | | | | | |
Investments in Securities | | Balance as of
December 31,
2018 | | | Accrued
Discounts
(Premiums) | | | Realized
Gain
(Loss) | | | Change in
Unrealized
Appreciation
(Depreciation) | | | Purchases | |
Bonds and Notes | | | | | | | | | | | | | | | | | | | | |
Non-Convertible Bonds | | | | | | | | | | | | | | | | | | | | |
ABS Home Equity | | $ | 574 | | | $ | — | | | $ | 55 | | | $ | 122 | | | $ | — | |
Home Construction | | | 12 | | | | (16,439 | ) | | | — | | | | 16,427 | | | | — | |
Non-Agency Commercial Mortgage-Backed Securities | | | — | | | | — | | | | — | | | | 9,014 | | | | — | |
Loan Participations | | | | | | | | | | | | | | | | | | | | |
ABS Other | | | 425,679 | | | | — | | | | — | | | | — | | | | — | |
Preferred Stocks | | | | | | | | | | | | | | | | | | | | |
Convertible Preferred Stocks | | | | | | | | | | | | | | | | | | | | |
Midstream | | | 58,567 | | | | — | | | | — | | | | (382,196 | ) | | | — | |
Other Investments | | | | | | | | | | | | | | | | | | | | |
Aircraft ABS | | | 865,625 | | | | — | | | | — | | | | (1,625 | ) | | | — | |
Common Stocks | | | | | | | | | | | | | | | | | | | | |
Oil, Gas & Consumable Fuels | | | — | | | | — | | | | (122 | ) | | | (521,755 | ) | | | 574,181 | |
| | | | | | | | | | | | | | | | | | | | |
Total | | $ | 1,350,457 | | | $ | (16,439 | ) | | $ | (67 | ) | | $ | (880,013 | ) | | $ | 574,181 | |
| | | | | | | | | | | | | | | | | | | | |
91 |
Notes to Financial Statements (continued)
December 31, 2019
High Income Fund (continued)
Asset Valuation Inputs (continued)
| | | | | | | | | | | | | | | | | | | | |
Investments in Securities | | Sales | | | Transfers
into
Level 3 | | | Transfers
out of
Level 3 | | | Balance as of
December 31,
2019 | | | Change in
Unrealized
Appreciation
(Depreciation)
from
Investments
Still Held at
December 31,
2019 | |
Bonds and Notes | | | | | | | | | | | | | | | | | | | | |
Non-Convertible Bonds | | | | | | | | | | | | | | | | | | | | |
ABS Home Equity | | $ | (751 | ) | | $ | — | | | $ | — | | | $ | — | | | $ | — | |
Home Construction | | | — | | | | — | | | | — | | | | — | (a) | | | — | |
Non-Agency Commercial Mortgage-Backed Securities | | | — | | | | 316,421 | | | | — | | | | 325,435 | | | | 9,014 | |
Loan Participations | | | | | | | | | | | | | | | | | | | | |
ABS Other | | | — | | | | — | | | | (425,679 | ) | | | — | | | | — | |
Preferred Stocks | | | | | | | | | | | | | | | | | | | | |
Convertible Preferred Stocks | | | | | | | | | | | | | | | | | | | | |
Midstream | | | — | | | | 519,979 | | | | — | | | | 196,350 | | | | (382,196 | ) |
Other Investments | | | | | | | | | | | | | | | | | | | | |
Aircraft ABS | | | — | | | | — | | | | — | | | | 864,000 | | | | (1,625 | ) |
Common Stocks | | | | | | | | | | | | | | | | | | | | |
Oil, Gas & Consumable Fuels | | | — | | | | — | | | | — | | | | 52,304 | | | | (521,755 | ) |
| | | | | | | | | | | | | | | | | | | | |
Total | | $ | (751 | ) | | $ | 836,400 | | | $ | (425,679 | ) | | $ | 1,438,089 | | | $ | (896,562 | ) |
| | | | | | | | | | | | | | | | | | | | |
| (a) | Includes a security fair valued at zero using level 3 inputs. |
A debt security valued at $316,421 was transferred from Level 2 to Level 3 during the period ended December 31, 2019. At December 31, 2018, this security was valued on the basis of evaluated bids furnished to the Fund by an independent pricing service in accordance with the Fund’s valuation policies. At December 31, 2019 this security was valued at fair value as determined in good faith by the Fund’s adviser as an independent pricing service did not provide a reliable price for the security.
| 92
Notes to Financial Statements (continued)
December 31, 2019
A debt security valued at $425,679 was transferred from Level 3 to Level 2 during the period ended December 31, 2019. At December 31, 2018, this security was valued using broker-dealer bid prices based on inputs unobservable to the Fund as an independent pricing service was unable to price the security. At December 31, 2019, this security was valued on the basis of evaluated bids furnished to the Fund by an independent pricing service in accordance with the Fund’s valuation policies.
Preferred stocks valued at $519,979 were transferred from Level 2 to Level 3 during the period ended December 31, 2019. At December 31, 2018, these securities were valued on the basis of evaluated bids furnished to the Fund by an independent pricing service in accordance with the Fund’s valuation policies. At December 31, 2019, these securities were valued using broker-dealer bid prices based on inputs unobservable to the Fund as an independent pricing service did not provide a reliable price for the securities.
All transfers are recognized as of the beginning of the reporting period.
Investment Grade Bond Fund
Asset Valuation Inputs
| | | | | | | | | | | | | | | | | | | | |
Investments in Securities | | Balance as of
December 31,
2018 | | | Accrued
Discounts
(Premiums) | | | Realized
Gain
(Loss) | | | Change in
Unrealized
Appreciation
(Depreciation) | | | Purchases | |
Bonds and Notes | | | | | | | | | | | | | | | | | | | | |
Non-Convertible Bonds | | | | | | | | | | | | | | | | | | | | |
ABS Other | | $ | 57,551,934 | | | $ | — | | | $ | — | | | $ | — | | | $ | — | |
ABS Student Loan | | | 4,259,110 | | | | — | | | | — | | | | — | | | | — | |
Airlines | | | 1,202,015 | | | | — | | | | — | | | | — | | | | — | |
Metals & Mining | | | 845 | | | | (8,513 | ) | | | (1,663,073 | ) | | | 1,670,741 | | | | — | |
Preferred Stocks | | | | | | | | | | | | | | | | | | | | |
Independent Energy | | | — | | | | — | | | | (94,793 | ) | | | (1,325,403 | ) | | | — | |
| | | | | | | | | | | | | | | | | | | | |
Total | | $ | 63,013,904 | | | $ | (8,513 | ) | | $ | (1,757,866 | ) | | $ | 345,338 | | | $ | — | |
| | | | | | | | | | | | | | | | | | | | |
93 |
Notes to Financial Statements (continued)
December 31, 2019
Investment Grade Bond Fund (continued)
Asset Valuation Inputs (continued)
| | | | | | | | | | | | | | | | | | | | |
Investments in Securities | | Sales | | | Transfers
into
Level 3 | | | Transfers
out of
Level 3 | | | Balance as of
December 31,
2019 | | | Change in
Unrealized
Appreciation
(Depreciation)
from
Investments
Still Held at
December 31,
2019 | |
Bonds and Notes | | | | | | | | | | | | | | | | | | | | |
Non-Convertible Bonds | | | | | | | | | | | | | | | | | | | | |
ABS Other | | $ | — | | | $ | — | | | $ | (57,551,934 | ) | | $ | — | | | $ | — | |
ABS Student Loan | | | — | | | | — | | | | (4,259,110 | ) | | | — | | | | — | |
Airlines | | | — | | | | — | | | | (1,202,015 | ) | | | — | | | | — | |
Metals & Mining | | | — | | | | — | | | | — | | | | — | | | | — | |
Preferred Stocks | | | | | | | | | | | | | | | | | | | | |
Independent Energy | | | (91,073 | ) | | | 2,232,448 | | | | — | | | | 721,179 | | | | (1,325,403 | ) |
| | | | | | | | | | | | | | | | | | | | |
Total | | $ | (91,073 | ) | | $ | 2,232,448 | | | $ | (63,013,059 | ) | | $ | 721,179 | | | $ | (1,325,403 | ) |
| | | | | | | | | | | | | | | | | | | | |
Debt securities valued at $47,877,340 were transferred from Level 3 to Level 2 during the period ended December 31, 2019. At December 31, 2018, these securities were valued using broker-dealer bid prices based on inputs unobservable to the Fund as an independent pricing service did not provide a reliable price for the securities. At December 31, 2019 these securities were valued on the basis of evaluated bids furnished to the Fund by an independent pricing service in accordance with the Fund’s valuation policies.
Debt securities valued at $15,135,719 were transferred from Level 3 to Level 2 during the period ended December 31, 2019. At December 31, 2018, these securities were valued using broker-dealer bid prices based on inputs unobservable to the Fund as an independent pricing service was unable to price the securities. At December 31, 2019, these securities were valued on the basis of evaluated bids furnished to the Fund by an independent pricing service in accordance with the Fund’s valuation policies.
A preferred stock valued at $2,232,448 was transferred from Level 2 to Level 3 during the period ended December 31, 2019. At December 31, 2018, this security was valued on the basis of evaluated bids furnished to the Fund by an independent pricing service in accordance with the Fund’s valuation policies. At December 31, 2019, this security was valued using broker-dealer bid prices based on inputs unobservable to the Fund as an independent pricing service did not provide a reliable price for the security.
| 94
Notes to Financial Statements (continued)
December 31, 2019
All transfers are recognized as of the beginning of the reporting period.
4. Derivatives. Derivative instruments are defined as financial instruments whose value and performance are based on the value and performance of an underlying asset, reference rate or index. Derivative instruments that the Funds used during the period include forward foreign currency contracts.
The Funds are subject to the risk that changes in foreign currency exchange rates will have an unfavorable effect on the value of Fund assets denominated in foreign currencies. The Funds may enter into forward foreign currency contracts for hedging purposes to protect the value of the Funds’ holdings of foreign securities. The Funds may also use forward foreign currency contracts to gain exposure to foreign currencies, regardless of whether securities denominated in such currencies are held in the Funds. During the year ended December 31, 2019, the Funds engaged in forward foreign currency transactions for hedging purposes and to gain investment exposure.
Transactions in derivative instruments for High Income Fund during the year ended December 31, 2019, as reflected within the Statements of Operations, were as follows:
| | | | |
Net Realized Gain (Loss) on: | | Forward foreign
currency contracts | |
Foreign exchange contracts | | $ | (44,094 | ) |
| |
Net Change in Unrealized Appreciation (Depreciation) on: | | Forward foreign currency contracts | |
Foreign exchange contracts | | $ | 44,094 | |
Transactions in derivative instruments for Investment Grade Bond Fund during the year ended December 31, 2019, as reflected within the Statements of Operations, were as follows:
| | | | |
Net Realized Gain (Loss) on: | | Forward foreign currency contracts | |
Foreign exchange contracts | | $ | (670,701 | ) |
| |
Net Change in Unrealized
Appreciation (Depreciation) on: | | Forward foreign currency contracts | |
Foreign exchange contracts | | $ | 670,701 | |
Transactions in derivative instruments for Multi-Asset Income Fund during the year ended December 31, 2019, as reflected within the Statements of Operations, were as follows:
| | | | |
Net Realized Gain (Loss) on: | | Forward foreign currency contracts | |
Foreign exchange contracts | | $ | (5,147 | ) |
95 |
Notes to Financial Statements (continued)
December 31, 2019
As the Funds value their derivatives at fair value and recognize changes in fair value through the Statements of Operations, they do not qualify for hedge accounting under authoritative guidance for derivative instruments. The Funds’ investments in derivatives may represent an economic hedge; however, they are considered to benon-hedge transactions for the purpose of these disclosures.
The volume of forward foreign currency contract activity, as a percentage of net assets, based on grossmonth-end notional amounts outstanding during the period, including long and short positions at absolute value, was as follows for the year ended December 31, 2019:
| | | | |
High Income Fund | | Forwards | |
Average Notional Amount Outstanding | | | 0.48 | % |
Highest Notional Amount Outstanding | | | 3.29 | % |
Lowest Notional Amount Outstanding | | | 0.00 | % |
Notional Amount Outstanding as of December 31, 2019 | | | 0.00 | % |
| |
Investment Grade Bond Fund | | Forwards | |
Average Notional Amount Outstanding | | | 0.16 | % |
Highest Notional Amount Outstanding | | | 1.09 | % |
Lowest Notional Amount Outstanding | | | 0.00 | % |
Notional Amount Outstanding as of December 31, 2019 | | | 0.00 | % |
| |
Multi-Asset Income Fund | | Forwards | |
Average Notional Amount Outstanding | | | 0.07 | % |
Highest Notional Amount Outstanding | | | 0.87 | % |
Lowest Notional Amount Outstanding | | | 0.00 | % |
Notional Amount Outstanding as of December 31, 2019 | | | 0.00 | % |
Notional amounts outstanding at the end of the prior period, if applicable, are included in the average notional amount outstanding.
5. Purchases and Sales of Securities. For the year ended December 31, 2019, purchases and sales of securities (excluding short-term investments and including paydowns) were as follows:
| | | | | | | | | | | | | | | | |
| | | U.S. Government/
Agency Securities | | | Other Securities | |
Fund | | Purchases | | | Sales | | | Purchases | | | Sales | |
High Income Fund | | $ | 3,705,584 | | | $ | 2,989,526 | | | $ | 68,037,667 | | | $ | 63,686,186 | |
Investment Grade Bond Fund | | | 943,732,762 | | | | 272,410,181 | | | | 1,963,530,750 | | | | 2,003,034,970 | |
Multi-Asset Income Fund | | | 43,464,668 | | | | 44,988,414 | | | | 243,108,075 | | | | 287,701,022 | |
| 96
Notes to Financial Statements (continued)
December 31, 2019
6. Management Fees and Other Transactions with Affiliates.
a. Management Fees. Loomis, Sayles & Company, L.P. (“Loomis Sayles”) serves as investment adviser to High Income Fund and Investment Grade Bond Fund. Loomis Sayles is a limited partnership whose sole general partner, Loomis, Sayles & Company, Inc., is indirectly owned by Natixis Investment Managers, LLC (“Natixis”), which is part of Natixis Investment Managers, an international asset management group based in Paris, France.
Under the terms of the management agreements, each Fund pays a management fee at the following annual rates, calculated daily and payable monthly, based on each Fund’s average daily net assets:
| | | | | | | | |
| | | Percentage of Average
Daily Net Assets | |
Fund | | First $15 billion | | | Over $15 billion | |
High Income Fund | | | 0.60 | % | | | 0.60 | % |
Investment Grade Bond Fund | | | 0.40 | % | | | 0.38 | % |
Natixis Advisors, L.P. (“Natixis Advisors”) serves as investment adviser to Multi-Asset Income Fund. Natixis Advisors is a wholly-owned subsidiary of Natixis.
Under the terms of the management agreement, Multi-Asset Income Fund pays a management fee at the following annual rates, calculated daily and payable monthly, based on the Fund’s average daily net assets:
| | | | | | | | |
| | | Percentage of Average
Daily Net Assets | |
Fund | | First $1 billion | | | Over $1 billion | |
Multi-Asset Income Fund | | | 0.55 | % | | | 0.50 | % |
Natixis Advisors has entered into a subadvisory agreement for the Fund with Loomis Sayles. Under the terms of the subadvisory agreement, the Fund has agreed to pay Loomis Sayles a subadvisory fee at the following annual rates, calculated daily and payable monthly, based on the Fund’s average daily net assets:
| | | | | | | | | | | | |
| | | | | | Percentage of Average
Daily Net Assets | |
Fund | | Subadviser | | | First $1 billion | | | Over $1 billion | |
Multi-Asset Income Fund | | | Loomis Sayles | | | | 0.325 | % | | | 0.30 | % |
Payments to Natixis Advisors are reduced by the amounts of payments to Loomis Sayles, as calculated based on the table above.
97 |
Notes to Financial Statements (continued)
December 31, 2019
Natixis Advisors and Loomis Sayles have given binding undertakings to the Funds to waive management fees and/or reimburse certain expenses to limit the Funds’ operating expenses, exclusive of acquired fund fees and expenses, brokerage expenses, interest expense, taxes, organizational and extraordinary expenses such as litigation and indemnification expenses. These undertakings are in effect until April 30, 2020 for Multi-Asset Income Fund and are in effect until April 30, 2021 for High Income Fund and Investment Grade Bond Fund, may be terminated before then only with the consent of the Funds’ Board of Trustees, and are reevaluated on an annual basis. Management fees payable, as reflected on the Statements of Assets and Liabilities, is net of waivers and/or expense reimbursements, if any, pursuant to these undertakings. Waivers/reimbursements that exceed management fees payable are reflected on the Statements of Assets and Liabilities as receivable from investment adviser.
For the year ended December 31, 2019 the expense limits as a percentage of average daily net assets under the expense limitation agreements were as follows:
| | | | | | | | | | | | | | | | | | | | |
| | | Expense Limit as a Percentage of
Average Daily Net Assets | |
Fund | | Class A | | | Class C | | | Class N | | | Class Y | | | Admin Class | |
High Income Fund | | | 1.00 | % | | | 1.75 | % | | | 0.70 | % | | | 0.75 | % | | | — | % |
Investment Grade Bond Fund | | | 0.76 | % | | | 1.51 | % | | | 0.46 | % | | | 0.51 | % | | | 1.01 | % |
Multi-Asset Income Fund | | | 0.95 | % | | | 1.70 | % | | | 0.65 | % | | | 0.70 | % | | | — | % |
Prior to July 1, 2019, the expense limits as a percentage of average daily net assets under the expense limitation agreements are as follows:
| | | | | | | | | | | | | | | | | | | | |
| | | Expense Limit as a Percentage of
Average Daily Net Assets | |
Fund | | Class A | | | Class C | | | Class N | | | Class Y | | | Admin Class | |
High Income Fund | | | 1.05 | % | | | 1.80 | % | | | 0.75 | % | | | 0.80 | % | | | — | % |
Investment Grade Bond Fund | | | 0.78 | % | | | 1.53 | % | | | 0.48 | % | | | 0.53 | % | | | 1.03 | % |
Natixis Advisors and Loomis Sayles shall be permitted to recover expenses borne under the expense limitation agreements (whether through waiver of management fees or otherwise) on a class by class basis in later periods to the extent the annual operating expenses of a class fall below a class’ expense limits, provided, however, that a class is not obligated to pay such waived/reimbursed fees or expenses more than one year after the end of the fiscal year in which the fees or expenses were waived/reimbursed.
| 98
Notes to Financial Statements (continued)
December 31, 2019
For the year ended December 31, 2019, the management fees and waivers of management fees for each Fund were as follows:
| | | | | | | | | | | | | | | | | | | | |
Fund | | Gross
Management
Fees | | | Contractual
Waivers of
Management
Fees1 | | | Net
Management
Fees | | | Percentage of
Average
Daily Net Assets | |
| | Gross | | | Net | |
High Income Fund | | $ | 881,481 | | | $ | 222,936 | | | $ | 658,545 | | | | 0.60 | % | | | 0.45 | % |
Investment Grade Bond Fund | | | 22,174,684 | | | | 1,562,210 | | | | 20,612,474 | | | | 0.40 | % | | | 0.37 | % |
Multi-Asset Income Fund | | | 595,472 | | | | 188,849 | | | | 406,623 | | | | 0.55 | % | | | 0.38 | % |
| 1 | Waiver/expense reimbursements are subject to possible recovery until December 31, 2020. |
No expenses were recovered for any of the Funds during the year ended December 31, 2019 under the terms of the expense limitation agreements.
b. Service and Distribution Fees. Natixis Distribution, L.P. (“Natixis Distribution), which is a wholly-owned subsidiary of Natixis, has entered into a distribution agreement with the Trusts. Pursuant to this agreement, Natixis Distribution serves as principal underwriter of the Funds of the Trusts.
Pursuant to Rule12b-1 under the 1940 Act, the Trusts has adopted a Service Plan relating to each Fund’s Class A shares (the “Class A Plans”), a Distribution and Service Plan relating to each Fund’s Class C shares (the “Class C Plans”), and Investment Grade Bond Fund has adopted a Distribution Plan relating to its Admin Class shares (the “Admin Class Plan”).
Under the Class A Plans, each Fund pays Natixis Distribution a monthly service fee at an annual rate not to exceed 0.25% of the average daily net assets attributable to the Fund’s Class A shares, as reimbursement for expenses incurred by Natixis Distribution in providing personal services to investors in Class A shares and/or the maintenance of shareholder accounts.
Under the Class C Plans, each Fund pays Natixis Distribution a monthly service fee at an annual rate not to exceed 0.25% of the average daily net assets attributable to the Fund’s Class C shares, as compensation for services provided by Natixis Distribution in providing personal services to investors in Class C shares and/or the maintenance of shareholder accounts.
Also under the Class C Plans, each Fund pays Natixis Distribution a monthly distribution fee at an annual rate of 0.75% of the average daily net assets attributable to the Fund’s Class C shares, as compensation for services provided by Natixis Distribution in connection with the marketing or sale of Class C shares.
99 |
Notes to Financial Statements (continued)
December 31, 2019
Under the Admin Class Plan, Investment Grade Bond Fund pays Natixis Distribution a monthly distribution fee at an annual rate not to exceed 0.25% of the average daily net assets attributable to the Fund’s Admin Class shares, as compensation for services provided by Natixis Distribution in connection with the marketing or sale of Admin Class shares or for payments made by Natixis Distribution to securities dealers or other financial intermediaries as commissions, asset-based sales charges or other compensation with respect to the sale of Admin Class shares, or for providing personal services to investors and/or the maintenance of shareholder accounts.
In addition, the Admin Class shares of Investment Grade Bond Fund may pay Natixis Distribution an administrative service fee, at an annual rate not to exceed 0.25% of the average daily net assets attributable to Admin Class shares. These fees are subsequently paid to securities dealers or financial intermediaries for providing personal services and/or account maintenance for their customers who hold such shares.
For the year ended December 31, 2019, the service and distribution fees for each Fund were as follows:
| | | | | | | | | | | | | | | | | | | | |
| | | Service Fees | | | Distribution Fees | |
Fund | | Class A | | | Class C | | | Admin Class | | | Class C | | | Admin Class | |
High Income Fund | | $ | 57,435 | | | $ | 11,672 | | | $ | — | | | $ | 35,016 | | | $ | — | |
Investment Grade Bond Fund | | | 1,889,585 | | | | 692,224 | | | | 288,773 | | | | 2,076,670 | | | | 288,773 | |
Multi-Asset Income Fund | | | 100,831 | | | | 53,347 | | | | — | | | | 160,042 | | | | — | |
c. Administrative Fees. Natixis Advisors provides certain administrative services for the Funds and contracts with State Street Bank to serve assub-administrator. Pursuant to an agreement among Natixis Funds Trusts, Loomis Sayles Funds Trusts, Natixis ETF Trust and Natixis Advisors, effective July 1, 2019, each Fund pays Natixis Advisors monthly itspro rataportion of fees equal to an annual rate of 0.0540% of the first $15 billion of the average daily net assets of the Natixis Funds Trusts, Loomis Sayles Funds Trusts and Natixis ETF Trust, 0.0500% of the next $15 billion, 0.0400% of the next $30 billion, 0.0275% of the next $30 billion and 0.0225% of such assets in excess of $90 billion, subject to an annual aggregate minimum fee for the Natixis Funds Trusts, Loomis Sayles Funds Trusts and Natixis ETF Trust of $10 million, which is reevaluated on an annual basis.
Prior to July 1, 2019, each Fund paid Natixis Advisors monthly itspro rataportion of fees equal to an annual rate of 0.0575% of the first $15 billion of the average daily net assets of the Natixis Funds Trusts, Loomis Sayles Funds Trusts and Natixis ETF Trust, 0.0500% of the next $15 billion, 0.0400% of the next $30 billion, 0.0275% of the next
| 100
Notes to Financial Statements (continued)
December 31, 2019
$30 billion and 0.0225% of such assets in excess of $90 billion, subject to an annual aggregate minimum fee for the Natixis Funds Trusts, Loomis Sayles Funds Trusts and Natixis ETF Trust of $10 million.
Effective October 1, 2018, State Street Bank agreed to reduce the fees it receives from Natixis Advisors for serving assub-administrator to the Funds. Also, effective October 1, 2018, Natixis Advisors agreed to voluntarily waive fees paid by the Funds in an amount equal to the reduction insub-administrative fees discussed above. The waiver was in effect through June 30, 2019.
For the year ended December 31, 2019, the administrative fees for each Fund were as follows:
| | | | | | | | | | | | |
Fund | | Gross
Administrative
Fees | | | Waiver of
Administrative
Fees | | | Net
Administrative
Fees | |
High Income Fund | | $ | 64,514 | | | $ | 763 | | | $ | 63,751 | |
Investment Grade Bond Fund | | | 2,440,159 | | | | 28,768 | | | | 2,411,391 | |
Multi-Asset Income Fund | | | 47,707 | | | | 600 | | | | 47,107 | |
d. Sub-Transfer Agent Fees. Natixis Distribution has entered into agreements, which include servicing agreements, with financial intermediaries that provide recordkeeping, processing, shareholder communications and other services to customers of the intermediaries that hold positions in the Funds and has agreed to compensate the intermediaries for providing those services. Intermediaries transact with the Funds primarily through the use of omnibus accounts on behalf of their customers who hold positions in the Funds. These services would have been provided by the Funds’ transfer agent and other service providers if the shareholders’ accounts were maintained directly at the Funds’ transfer agent. Accordingly, the Funds have agreed to reimburse Natixis Distribution for all or a portion of the servicing fees paid to these intermediaries. The reimbursement amounts(sub-transfer agent fees) paid to Natixis Distribution are subject to a currentper-account equivalent fee limit approved by the Funds’ Board of Trustees, which is based on fees for similar services paid to the Funds’ transfer agent and other service providers. Class N shares do not bear such expenses.
For the year ended December 31, 2019, thesub-transfer agent fees (which are reflected in transfer agent fees and expenses in the Statements of Operations) for each Fund were as follows:
| | | | |
Fund | | Sub-Transfer
Agent Fees | |
High Income Fund | | $ | 139,162 | |
Investment Grade Bond Fund | | | 3,460,985 | |
Multi-Asset Income Fund | | | 60,028 | |
101 |
Notes to Financial Statements (continued)
December 31, 2019
As of December 31, 2019, the Funds owe Natixis Distribution the following reimbursements forsub-transfer agent fees (which are reflected in the Statements of Assets and Liabilities as payable to distributor):
| | | | |
Fund | | Reimbursements
ofSub-Transfer
Agent Fees | |
High Income Fund | | $ | 1,772 | |
Investment Grade Bond Fund | | | 41,954 | |
Multi-Asset Income Fund | | | 583 | |
Sub-transfer agent fees attributable to Class A, Class C, Class Y and Admin Class are allocated on apro rata basis to each class based on the relative net assets of each class to the total net assets of those classes.
e. Commissions. Commissions (including CDSCs) on Fund shares retained by Natixis Distribution during the year ended December 31, 2019 were as follows:
| | | | |
Fund | | Commissions | |
High Income Fund | | $ | 2,107 | |
Investment Grade Bond Fund | | | 33,030 | |
Multi-Asset Income Fund | | | 6,160 | |
f. Trustees Fees and Expenses. The Trusts do not pay any compensation directly to their officers or Trustees who are directors, officers or employees of Natixis Advisors, Natixis Distribution, Natixis or their affiliates. The Chairperson of the Board of Trustees receives a retainer fee at the annual rate of $360,000. The Chairperson does not receive any meeting attendance fees for Board of Trustees meetings or committee meetings that he attends. Each Independent Trustee (other than the Chairperson) receives, in the aggregate, a retainer fee at the annual rate of $190,000. Each Independent Trustee also receives a meeting attendance fee of $10,000 for each meeting of the Board of Trustees that he or she attends in person and $5,000 for each meeting of the Board of Trustees that he or she attends telephonically. In addition, the chairperson of the Contract Review Committee and the chairperson of the Audit Committee each receive an additional retainer fee at the annual rate of $20,000. The chairperson of the Governance Committee receives an additional retainer fee at the annual rate of $15,000. Each Contract Review Committee member is compensated $6,000 for each Committee meeting that he or she attends in person and $3,000 for each meeting that he or she attends telephonically. Each Audit Committee member is compensated $6,000 for each Committee meeting that he or she attends in person and $3,000 for each meeting that he or she attends telephonically. These fees are allocated among the funds in the Natixis Funds Trusts, Loomis Sayles Funds Trusts and Natixis ETF Trust based on a formula that takes into account, among other factors, the relative net assets of each fund. Trustees are reimbursed for travel expenses in connection with attendance at meetings.
| 102
Notes to Financial Statements (continued)
December 31, 2019
Effective January 1, 2020, the Chairperson of the Board will receive a retainer fee at the annual rate of $369,000, each Independent Trustee (other than the Chairperson) will receive, in the aggregate, a retainer fee at the annual rate of $199,000, and the chairperson of the Governance Committee will receive an additional retainer fee at the annual rate of $20,000. All other Trustee fees will remain unchanged.
A deferred compensation plan (the “Plan”) is available to the Trustees on a voluntary basis. Deferred amounts remain in the Funds until distributed in accordance with the provisions of the Plan. The value of a participating Trustee’s deferral account is based on theoretical investments of deferred amounts, on the normal payment dates, in certain funds of the Natixis Funds Trusts, Loomis Sayles Funds Trusts and Natixis ETF Trust as designated by the participating Trustees. Changes in the value of participants’ deferral accounts are allocatedpro rata among the funds in the Natixis Funds Trusts, Loomis Sayles Funds Trusts and Natixis ETF Trust, and are normally reflected as Trustees’ fees and expenses in the Statements of Operations. The portions of the accrued obligations allocated to the Funds under the Plan are reflected as Deferred Trustees’ fees in the Statements of Assets and Liabilities.
Certain officers and employees of Natixis Advisors and Loomis Sayles are also officers and/or Trustees of the Trusts.
g. Affiliated Ownership. As of December 31, 2019, Loomis Sayles Employees’ Profit Sharing Retirement Plan held shares of Investment Grade Bond Fund and Multi-Asset Income Fund representing 0.11% and 0.53%, respectively, of the Funds’ net assets.
Investment activities of affiliated shareholders could have material impacts on the Funds.
h. Reimbursement of Transfer Agent Fees and Expenses. Natixis Advisors has given a binding contractual undertaking to the High Income Fund and Multi-Asset Income Fund to reimburse any and all transfer agency expenses for the Funds’ Class N shares. This undertaking is in effect through April 30, 2020 and is not subject to recovery under the expense limitation agreement described above.
For the year ended December 31, 2019, Natixis Advisors reimbursed the Funds for transfer agency expenses as follows:
| | | | |
| | | Reimbursement of
Transfer Agent
Fees and
Expenses | |
Fund | | Class N | |
High Income Fund | | $ | 834 | |
Multi-Asset Income Fund | | | 835 | |
103 |
Notes to Financial Statements (continued)
December 31, 2019
7. Class-Specific Transfer Agent Fees and Expenses. Transfer agent fees and expenses attributable to Class A, Class C, Class Y and Admin Class are allocated on apro rata basis to each class based on the relative net assets of each class to the total net assets of those classes. Transfer agent fees and expenses attributable to Class N are allocated to Class N.
For the year ended December 31, 2019, the Funds incurred the following class-specific transfer agent fees and expenses (includingsub-transfer agent fees, where applicable):
| | | | | | | | | | | | | | | | | | | | |
| | | Transfer Agent Fees and Expenses | |
Fund | | Class A | | | Class C | | | Class N | | | Class Y | | | Admin Class | |
High Income Fund | | $ | 27,380 | | | $ | 5,602 | | | $ | 834 | | | $ | 127,381 | | | $ | — | |
Investment Grade Bond Fund | | | 653,750 | | | | 240,470 | | | | 5,494 | | | | 2,673,316 | | | | 99,963 | |
Multi-Asset Income Fund | | | 28,559 | | | | 14,801 | | | | 835 | | | | 31,598 | | | | — | |
8. Line of Credit. Each Fund, together with certain other funds of Natixis Funds Trusts, Loomis Sayles Funds Trusts and Natixis ETF Trust, entered into a $400,000,000 committed unsecured line of credit provided by State Street Bank. Any one Fund may borrow up to $350,000,000 under the line of credit agreement (as long as all borrowings by all Funds in the aggregate do not exceed the $400,000,000 limit at any time), subject to each Fund’s investment restrictions and its contractual obligations under the line of credit. Interest is charged to the Funds based upon the terms set forth in the agreement. In addition, a commitment fee of 0.15% per annum, payable at the end of each calendar quarter, is accrued and apportioned among the participating funds based on their average daily unused portion of the line of credit. The Funds paid an arrangement fee, an upfront fee, and certain other legal fees in connection with the line of credit agreement, which are being amortized over a period of 364 days and are reflected in legal fees and/or miscellaneous expenses on the Statements of Operations. The unamortized balance is reflected as prepaid expenses on the Statements of Assets and Liabilities.
For the year ended December 31, 2019, none of the Funds had borrowings under this agreement.
9. Concentration of Risk. Each Fund’s investments in foreign securities may be subject to greater political, economic, environmental, credit/counterparty and information risks. The Fund’s investments in foreign securities also are subject to foreign currency fluctuations and other foreign currency-related risks. Foreign securities may be subject to higher volatility than U.S. securities, varying degrees of regulation and limited liquidity.
10. Concentration of Ownership. From time to time, a Fund may have a concentration of one or more accounts constituting a significant percentage of shares outstanding.
| 104
Notes to Financial Statements (continued)
December 31, 2019
Investment activities by holders of such accounts could have material impacts on the Funds. As of December 31, 2019, based on management’s evaluation of the shareholder account base, the Funds had accounts representing controlling ownership of more than 5% of the Fund’s total outstanding shares. The number of such accounts, based on accounts that represent more than 5% of an individual class of shares, and the aggregate percentage of net assets represented by such holdings were as follows:
| | | | | | | | |
Fund | | Number of 5%
Account Holders | | | Percentage of
Ownership | |
High Income Fund | | | 2 | | | | 13.46 | % |
Investment Grade Bond Fund | | | 1 | | | | 19.51 | % |
Multi-Asset Income Fund | | | 1 | | | | 12.54 | % |
Omnibus shareholder accounts for which Natixis Advisors understands that the intermediary has discretion over the underlying shareholder accounts or investment models where a shareholder account may be invested for anon-discretionary customer are included in the table above. For other omnibus accounts, the Fund does not have information on the individual shareholder accounts underlying the omnibus accounts; therefore, there could be other 5% shareholders in addition to those disclosed in the table above.
105 |
Notes to Financial Statements (continued)
December 31, 2019
11. Capital Shares. Each Fund may issue an unlimited number of shares of beneficial interest, without par value. Transactions in capital shares were as follows:
| | | | | | | | | | | | | | | | |
| |
| Year Ended
December 31, 2019 |
| |
| Period Ended
December 31, 2018(a) |
|
High Income Fund | | | Shares | | | | Amount | | | | Shares | | | | Amount | |
| Class A | |
Issued from the sale of shares | | | 1,181,562 | | | $ | 4,961,757 | | | | 318,942 | | | $ | 1,321,333 | |
Issued in connection with the reinvestment of distributions | | | 224,427 | | | | 943,693 | | | | 84,926 | | | | 349,137 | |
Redeemed | | | (1,744,701 | ) | | | (7,332,092 | ) | | | (764,361 | ) | | | (3,151,340 | ) |
| | | | | | | | | | | | | | | | |
Net change | | | (338,712 | ) | | $ | (1,426,642 | ) | | | (360,493 | ) | | $ | (1,480,870 | ) |
| | | | | | | | | | | | | | | | |
| Class C | |
Issued from the sale of shares | | | 104,622 | | | $ | 442,064 | | | | 42,068 | | | $ | 171,916 | |
Issued in connection with the reinvestment of distributions | | | 40,123 | | | | 169,298 | | | | 16,483 | | | | 68,043 | |
Redeemed | | | (582,159 | ) | | | (2,454,372 | ) | | | (186,823 | ) | | | (777,538 | ) |
| | | | | | | | | | | | | | | | |
Net change | | | (437,414 | ) | | $ | (1,843,010 | ) | | | (128,272 | ) | | $ | (537,579 | ) |
| | | | | | | | | | | | | | | | |
| Class N | |
Issued from the sale of shares | | | 347,075 | | | $ | 1,464,639 | | | | 169,687 | | | $ | 691,887 | |
Issued in connection with the reinvestment of distributions | | | 144,891 | | | | 609,528 | | | | 43,495 | | | | 178,710 | |
Redeemed | | | (290,834 | ) | | | (1,225,972 | ) | | | (33,788 | ) | | | (139,949 | ) |
| | | | | | | | | | | | | | | | |
Net change | | | 201,132 | | | $ | 848,195 | | | | 179,394 | | | $ | 730,648 | |
| | | | | | | | | | | | | | | | |
| Class Y | |
Issued from the sale of shares | | | 5,715,875 | | | $ | 23,998,846 | | | | 2,504,282 | | | $ | 10,312,064 | |
Issued in connection with the reinvestment of distributions | | | 1,050,566 | | | | 4,412,148 | | | | 433,237 | | | | 1,776,880 | |
Redeemed | | | (5,779,231 | ) | | | (24,250,953 | ) | | | (8,528,009 | ) | | | (34,312,719 | ) |
| | | | | | | | | | | | | | | | |
Net change | | | 987,210 | | | $ | 4,160,041 | | | | (5,590,490 | ) | | $ | (22,223,775 | ) |
| | | | | | | | | | | | | | | | |
Increase (decrease) from capital share transactions | | | 412,216 | | | $ | 1,738,584 | | | | (5,899,861 | ) | | $ | (23,511,576 | ) |
| | | | | | | | | | | | | | | | |
| (a) | For the period October 1, 2018 through December 31, 2018. |
| 106
Notes to Financial Statements (continued)
December 31, 2019
11. Capital Shares (continued).
| | | | | | | | |
| |
| Year Ended
September 30, 2018 |
|
High Income Fund | | | Shares | | | | Amount | |
| Class A | |
Issued from the sale of shares | | | 1,898,245 | | | $ | 8,166,854 | |
Issued in connection with the reinvestment of distributions | | | 243,140 | | | | 1,040,786 | |
Redeemed | | | (3,771,177 | ) | | | (16,210,208 | ) |
| | | | | | | | |
Net change | | | (1,629,792 | ) | | $ | (7,002,568 | ) |
| | | | | | | | |
| Class C | |
Issued from the sale of shares | | | 122,450 | | | $ | 527,966 | |
Issued in connection with the reinvestment of distributions | | | 61,116 | | | | 262,711 | |
Redeemed | | | (1,279,539 | ) | | | (5,486,771 | ) |
| | | | | | | | |
Net change | | | (1,095,973 | ) | | $ | (4,696,094 | ) |
| | | | | | | | |
| Class N | |
Issued from the sale of shares | | | 2,698,050 | | | $ | 11,518,120 | |
Issued in connection with the reinvestment of distributions | | | 61,394 | | | | 259,688 | |
Redeemed | | | (325,438 | ) | | | (1,383,775 | ) |
| | | | | | | | |
Net change | | | 2,434,006 | | | $ | 10,394,033 | |
| | | | | | | | |
| Class Y | |
Issued from the sale of shares | | | 9,865,696 | | | $ | 42,237,402 | |
Issued in connection with the reinvestment of distributions | | | 1,120,509 | | | | 4,782,844 | |
Redeemed | | | (11,587,593 | ) | | | (49,564,049 | ) |
| | | | | | | | |
Net change | | | (601,388 | ) | | $ | (2,543,803 | ) |
| | | | | | | | |
Increase (decrease) from capital share transactions | | | (893,147 | ) | | $ | (3,848,432 | ) |
| | | | | | | | |
107 |
Notes to Financial Statements (continued)
December 31, 2019
11. Capital Shares (continued).
| | | | | | | | | | | | | | | | |
| |
| Year Ended
December 31, 2019 |
| |
| Period Ended
December 31, 2018(a) |
|
Investment Grade Bond Fund | | | Shares | | | | Amount | | | | Shares | | | | Amount | |
| Class A | |
Issued from the sale of shares | | | 21,746,077 | | | $ | 242,390,732 | | | | 6,491,737 | | | $ | 70,239,572 | |
Issued in connection with the reinvestment of distributions | | | 1,759,350 | | | | 19,703,186 | | | | 692,485 | | | | 7,466,489 | |
Redeemed | | | (22,252,474 | ) | | | (248,006,281 | ) | | | (11,048,598 | ) | | | (119,531,449 | ) |
| | | | | | | | | | | | | | | | |
Net change | | | 1,252,953 | | | $ | 14,087,637 | | | | (3,864,376 | ) | | $ | (41,825,388 | ) |
| | | | | | | | | | | | | | | | |
| Class C | |
Issued from the sale of shares | | | 1,602,835 | | | $ | 17,702,080 | | | | 945,273 | | | $ | 10,091,858 | |
Issued in connection with the reinvestment of distributions | | | 469,346 | | | | 5,182,790 | | | | 284,418 | | | | 3,032,080 | |
Redeemed | | | (18,184,031 | ) | | | (200,209,503 | ) | | | (4,883,774 | ) | | | (52,357,128 | ) |
| | | | | | | | | | | | | | | | |
Net change | | | (16,111,850 | ) | | $ | (177,324,633 | ) | | | (3,654,083 | ) | | $ | (39,233,190 | ) |
| | | | | | | | | | | | | | | | |
| Class N | |
Issued from the sale of shares | | | 30,937,052 | | | $ | 345,100,891 | | | | 7,202,004 | | | $ | 78,146,326 | |
Issued in connection with the reinvestment of distributions | | | 4,168,997 | | | | 46,698,958 | | | | 1,542,978 | | | | 16,637,378 | |
Redeemed | | | (27,365,168 | ) | | | (305,705,875 | ) | | | (9,753,310 | ) | | | (105,566,599 | ) |
| | | | | | | | | | | | | | | | |
Net change | | | 7,740,881 | | | $ | 86,093,974 | | | | (1,008,328 | ) | | $ | (10,782,895 | ) |
| | | | | | | | | | | | | | | | |
| Class Y | |
Issued from the sale of shares | | | 75,690,305 | | | $ | 842,848,095 | | | | 26,286,587 | | | $ | 284,802,649 | |
Issued in connection with the reinvestment of distributions | | | 8,703,543 | | | | 97,536,256 | | | | 3,150,471 | | | | 33,984,081 | |
Redeemed | | | (79,477,156 | ) | | | (888,490,131 | ) | | | (32,471,159 | ) | | | (351,840,854 | ) |
| | | | | | | | | | | | | | | | |
Net change | | | 4,916,692 | | | $ | 51,894,220 | | | | (3,034,101 | ) | | $ | (33,054,124 | ) |
| | | | | | | | | | | | | | | | |
| Admin Class | |
Issued from the sale of shares | | | 1,693,129 | | | $ | 18,816,328 | | | | 286,732 | | | $ | 3,102,815 | |
Issued in connection with the reinvestment of distributions | | | 297,880 | | | | 3,326,874 | | | | 117,845 | | | | 1,266,981 | |
Redeemed | | | (2,538,140 | ) | | | (28,454,222 | ) | | | (521,944 | ) | | | (5,641,958 | ) |
| | | | | | | | | | | | | | | | |
Net change | | | (547,131 | ) | | $ | (6,311,020 | ) | | | (117,367 | ) | | $ | (1,272,162 | ) |
| | | | | | | | | | | | | | | | |
Decrease from capital share transactions | | | (2,748,455 | ) | | $ | (31,559,822 | ) | | | (11,678,255 | ) | | $ | (126,167,759 | ) |
| | | | | | | | | | | | | | | | |
| (a) | For the period October 1, 2018 through December 31, 2018. |
| 108
Notes to Financial Statements (continued)
December 31, 2019
11. Capital Shares (continued).
| | | | | | | | |
| |
| Year Ended
September 30, 2018 |
|
Investment Grade Bond Fund | | | Shares | | | | Amount | |
| Class A | |
Issued from the sale of shares | | | 26,350,729 | | | $ | 290,166,021 | |
Issued in connection with the reinvestment of distributions | | | 1,939,385 | | | | 21,405,938 | |
Redeemed | | | (37,379,900 | ) | | | (411,498,034 | ) |
| | | | | | | | |
Net change | | | (9,089,786 | ) | | $ | (99,926,075 | ) |
| | | | | | | | |
| Class C | |
Issued from the sale of shares | | | 2,011,124 | | | $ | 22,000,351 | |
Issued in connection with the reinvestment of distributions | | | 1,080,461 | | | | 11,807,321 | |
Redeemed | | | (26,695,866 | ) | | | (290,792,159 | ) |
| | | | | | | | |
Net change | | | (23,604,281 | ) | | $ | (256,984,487 | ) |
| | | | | | | | |
| Class N | |
Issued from the sale of shares | | | 47,337,549 | | | $ | 520,862,751 | |
Issued in connection with the reinvestment of distributions | | | 3,799,061 | | | | 41,897,623 | |
Redeemed | | | (43,651,422 | ) | | | (478,691,782 | ) |
| | | | | | | | |
Net change | | | 7,485,188 | | | $ | 84,068,592 | |
| | | | | | | | |
| Class Y | |
Issued from the sale of shares | | | 83,609,222 | | | $ | 923,226,055 | |
Issued in connection with the reinvestment of distributions | | | 8,916,183 | | | | 98,436,771 | |
Redeemed | | | (124,671,025 | ) | | | (1,373,103,002 | ) |
| | | | | | | | |
Net change | | | (32,145,620 | ) | | $ | (351,440,176 | ) |
| | | | | | | | |
| Admin Class | |
Issued from the sale of shares | | | 9,244,822 | | | $ | 100,929,159 | |
Issued in connection with the reinvestment of distributions | | | 37,178 | | | | 408,621 | |
Redeemed | | | (1,018,175 | ) | | | (11,215,394 | ) |
| | | | | | | | |
Net change | | | 8,263,825 | | | $ | 90,122,386 | |
| | | | | | | | |
Increase (decrease) from capital share transactions | | | (49,090,674 | ) | | $ | (534,159,760 | ) |
| | | | | | | | |
109 |
Notes to Financial Statements (continued)
December 31, 2019
11. Capital Shares (continued).
| | | | | | | | | | | | | | | | |
| |
| Year Ended
December 31, 2019 |
| |
| Year Ended
December 31, 2018 |
|
Multi-Asset Income Fund | | | Shares | | | | Amount | | | | Shares | | | | Amount | |
| Class A | |
Issued from the sale of shares | | | 443,182 | | | $ | 5,566,407 | | | | 1,636,199 | | | $ | 21,887,217 | |
Issued in connection with the reinvestment of distributions | | | 97,878 | | | | 1,223,830 | | | | 246,032 | | | | 3,167,673 | |
Redeemed | | | (2,674,820 | ) | | | (33,490,367 | ) | | | (1,495,395 | ) | | | (19,584,653 | ) |
| | | | | | | | | | | | | | | | |
Net change | | | (2,133,760 | ) | | $ | (26,700,130 | ) | | | 386,836 | | | $ | 5,470,237 | |
| | | | | | | | | | | | | | | | |
| Class C | |
Issued from the sale of shares | | | 126,997 | | | $ | 1,590,185 | | | | 610,774 | | | $ | 8,033,966 | |
Issued in connection with the reinvestment of distributions | | | 34,171 | | | | 425,455 | | | | 102,629 | | | | 1,321,750 | |
Redeemed | | | (930,886 | ) | | | (11,679,177 | ) | | | (1,326,399 | ) | | | (17,492,118 | ) |
| | | | | | | | | | | | | | | | |
Net change | | | (769,718 | ) | | $ | (9,663,537 | ) | | | (612,996 | ) | | $ | (8,136,402 | ) |
| | | | | | | | | | | | | | | | |
| Class N | |
Issued from the sale of shares | | | 12,277 | | | $ | 154,650 | | | | — | | | $ | — | |
Issued in connection with the reinvestment of distributions | | | 196 | | | | 2,469 | | | | 184 | | | | 2,352 | |
Redeemed | | | (1 | ) | | | (12 | ) | | | — | | | | — | |
| | | | | | | | | | | | | | | | |
Net change | | | 12,472 | | | $ | 157,107 | | | | 184 | | | $ | 2,352 | |
| | | | | | | | | | | | | | | | |
| Class Y | |
Issued from the sale of shares | | | 1,737,754 | | | $ | 21,459,332 | | | | 1,950,280 | | | $ | 25,895,828 | |
Issued in connection with the reinvestment of distributions | | | 106,224 | | | | 1,325,157 | | | | 213,365 | | | | 2,746,556 | |
Redeemed | | | (2,509,023 | ) | | | (31,504,338 | ) | | | (2,215,349 | ) | | | (28,814,661 | ) |
| | | | | | | | | | | | | | | | |
Net change | | | (665,045 | ) | | $ | (8,719,849 | ) | | | (51,704 | ) | | $ | (172,277 | ) |
| | | | | | | | | | | | | | | | |
Decrease from capital share transactions | | | (3,556,051 | ) | | $ | (44,926,409 | ) | | | (277,680 | ) | | $ | (2,836,090 | ) |
| | | | | | | | | | | | | | | | |
12. Subsequent Event. On December 4, 2019, the Board of Trustees approved a plan to liquidate the Multi-Asset Income Fund. Such liquidation took place on February 3, 2020.
| 110
Report of Independent Registered Public
Accounting Firm
To the Board of Trustees of Natixis Funds Trust I and Loomis Sayles Funds II and Shareholders of Sayles High Income Fund, Loomis Sayles Investment Grade Bond Fund and Loomis Sayles Multi-Asset Income Fund
Opinions on the Financial Statements
We have audited the accompanying statements of assets and liabilities, including the portfolios of investments, of Loomis Sayles High Income Fund and Loomis Sayles Investment Grade Bond Fund (two of the funds constituting Loomis Sayles Funds II), and Loomis Sayles Multi-Asset Income Fund (one of the funds constituting Natixis Funds Trust I) (hereafter collectively referred to as the “Funds”) as of December 31, 2019, the related statements of operations and of changes in net assets for each of the periods indicated therein, including the related notes, and the financial highlights for each of the periods indicated in the table below (collectively referred to as the “financial statements”). In our opinion, the financial statements present fairly, in all material respects, the financial position of each of the Funds as of December 31, 2019, the results of each of their operations, the changes in each of their net assets, and each of the financial highlights for each of the periods therein, in conformity with accounting principles generally accepted in the United States of America.
| | | | |
| Fund | | Statement of operations | | Statement of changes in
net assets |
Loomis Sayles High Income Fund Loomis Sayles Investment Grade Bond Fund | | For the year ended December 31, 2019 | | For the year ended December 31, 2019, period October 1, 2018 through December 31, 2018, and year ended September 31, 2018 |
Loomis Sayles Multi-Asset Income Fund | | For the year ended December 31, 2019 | | For the two years ended December 31, 2019 |
Basis for Opinions
These financial statements are the responsibility of the Funds’ management. Our responsibility is to express an opinion on the Funds’ financial statements based on our audits. We are a public accounting firm registered with the Public Company Accounting Oversight Board (United States) (PCAOB) and are required to be independent with respect to the Funds in accordance with the U.S. federal securities laws and the applicable rules and regulations of the Securities and Exchange Commission and the PCAOB.
111 |
Report of Independent Registered Public
Accounting Firm
We conducted our audits of these financial statements in accordance with the standards of the PCAOB. Those standards require that we plan and perform the audit to obtain reasonable assurance about whether the financial statements are free of material misstatement, whether due to error or fraud.
Our audits included performing procedures to assess the risks of material misstatement of the financial statements, whether due to error or fraud, and performing procedures that respond to those risks. Such procedures included examining, on a test basis, evidence regarding the amounts and disclosures in the financial statements. Our audits also included evaluating the accounting principles used and significant estimates made by management, as well as evaluating the overall presentation of the financial statements. Our procedures included confirmation of securities owned as of December 31, 2019 by correspondence with the custodian and brokers; when replies were not received from brokers, we performed other auditing procedures. We believe that our audits provide a reasonable basis for our opinions.
/s/ PricewaterhouseCoopers LLP
Boston, Massachusetts
February 21, 2020
We have served as the auditor of one or more of the investment companies in the Natixis Investment Company Complex since at least 1995. We have not been able to determine the specific year we began serving as auditor.
| 112
2019 U.S. Tax Distribution Information to Shareholders (Unaudited)
Corporate Dividends Received Deduction. For the fiscal year ended December 31, 2019, a percentage of dividends distributed by the Funds listed below qualify for the dividends received deduction for corporate shareholders. These percentages are as follows:
| | | | |
Fund | | Qualifying
Percentage | |
High Income Fund | | | 0.95 | % |
Investment Grade Bond Fund | | | 0.21 | % |
Multi-Asset Income Fund | | | 28.39 | % |
Qualified Dividend Income. For the fiscal year ended December 31, 2019, a percentage of the ordinary income dividends paid by the Funds are considered qualified dividend income eligible for reduced tax rates. These lower rates range from 0% to 20% depending on an individual’s tax bracket. If the Funds paid a distribution during calendar year 2019, complete information will be reported in conjunction withForm 1099-DIV. These percentages are noted below:
| | | | |
Fund | | Qualifying
Percentage | |
High Income Fund | | | 2.36 | % |
Investment Grade Bond Fund | | | 0.61 | % |
Multi-Asset Income Fund | | | 29.94 | % |
113 |
Trustee and Officer Information
The tables below provide certain information regarding the trustees and officers of Natixis Funds Trust I and Loomis Sayles Funds II (the “Trusts”). Unless otherwise indicated, the address of all persons below is 888 Boylston Street, Suite 800, Boston, MA 02199-8197. The Funds’ Statement of Additional Information includes additional information about the trustees of the Trusts and is available by calling Natixis Funds at800-225-5478.
| | | | | | | | |
Name and Year of
Birth | | Position(s) Held
with the Trusts,
Length of Time
Served and Term
of Office1 | | Principal
Occupation(s)
During Past
5 Years | | Number of
Portfolios in
Fund Complex
Overseen2 and Other
Directorships Held
During Past
5 Years | | Experience,
Qualifications,
Attributes, Skills
for Board
Membership |
|
| INDEPENDENT TRUSTEES |
| | | | |
Kenneth A. Drucker (1945) | | Chairperson of the Board of Trustees since January 2017 Trustee since 2008 Ex Officio member of Audit Committee, Contract Review Committee and Governance Committee | | Retired | | 51 None | | Significant experience on the Board and on the boards of other business organizations (including at investment companies); executive experience (including as treasurer of an aerospace, automotive, and metal manufacturing corporation) |
| | | | |
Edmond J. English (1953) | | Trustee since 2013 Chairperson of Governance Committee and Audit Committee Member | | Executive Chairman of Bob’s Discount Furniture (retail) | | 51 Director, Burlington Stores, Inc. (retail) | | Significant experience on the Board and on the boards of other business organizations (including retail companies and a bank); executive experience (including at a retail company) |
| 114
Trustee and Officer Information
| | | | | | | | |
Name and Year of
Birth | | Position(s) Held
with the Trusts,
Length of Time
Served and Term
of Office1 | | Principal
Occupation(s)
During Past
5 Years | | Number of
Portfolios in
Fund Complex
Overseen2 and Other
Directorships Held
During Past
5 Years | | Experience,
Qualifications,
Attributes, Skills
for Board
Membership |
|
INDEPENDENT TRUSTEES continued |
| | | | |
Richard A. Goglia (1951) | | Trustee since 2015 Contract Review Committee Member and Governance Committee Member | | Retired; formerly Vice President and Treasurer of Raytheon Company (defense) | | 51 None | | Experience on the Board and executive experience (including his role as vice president and treasurer of a defense company and experience at a financial services company) |
| | | | |
Wendell J. Knox (1948) | | Trustee since 2009 Chairperson of Contract Review Committee | | Director of Abt Associates Inc. (research and consulting) | | 51 Director, The Hanover Insurance Group (property and casualty insurance); formerly, Director, Eastern Bank (bank) | | Significant experience on the Board and on the boards of other business organizations (including at a bank and at a property and casualty insurance firm); executive experience (including roles as president and chief executive officer of a research and consulting company) |
115 |
Trustee and Officer Information
| | | | | | | | |
Name and Year of
Birth | | Position(s) Held
with the Trusts,
Length of Time
Served and Term
of Office1 | | Principal
Occupation(s)
During Past
5 Years | | Number of
Portfolios in
Fund Complex
Overseen2 and Other
Directorships Held
During Past
5 Years | | Experience,
Qualifications,
Attributes, Skills
for Board
Membership |
|
INDEPENDENT TRUSTEES continued |
| | | | |
Martin T. Meehan (1956) | | Trustee since 2012 Audit Committee Member | | President, University of Massachusetts; formerly, Chancellor and faculty member, University of Massachusetts Lowell | | 51 None | | Significant experience on the Board and on the boards of other business organizations; experience as President of the University of Massachusetts; government experience (including as a member of the U.S. House of Representatives); academic experience |
| | | | |
Maureen B. Mitchell (1951) | | Trustee since 2017 Contract Review Committee Member and Governance Committee Member | | Retired; formerly President, Global Sales and Marketing, GE Asset Management, Inc. (financial services) | | 51 Director, Sterling Bancorp (bank) | | Experience on the Board ; financial services industry and executive experience (including role as president of global sales and marketing at a financial services company) |
| 116
Trustee and Officer Information
| | | | | | | | |
Name and Year of
Birth | | Position(s) Held
with the Trusts,
Length of Time
Served and Term
of Office1 | | Principal
Occupation(s)
During Past
5 Years | | Number of
Portfolios in
Fund Complex
Overseen2 and Other
Directorships Held
During Past
5 Years | | Experience,
Qualifications,
Attributes, Skills
for Board
Membership |
|
INDEPENDENT TRUSTEES continued |
| | | | |
James P. Palermo (1955) | | Trustee since 2016 Contract Review Committee Member | | Founding Partner, Breton Capital Management, LLC (private equity); Partner, STEP Partners, LLC (private equity) | | 51 Director, FutureFuel.io (chemicals and biofuels) | | Experience on the Board; financial services industry and executive experience (including roles as chief executive officer of client management and asset servicing for a banking and financial services company) |
| | | | |
Erik R. Sirri (1958) | | Trustee since 2009 Chairperson of the Audit Committee | | Professor of Finance at Babson College | | 51 None | | Significant experience on the Board; experience as Director of the Division of Trading and Markets at the Securities and Exchange Commission; academic experience; training as an economist |
| | | | |
Peter J. Smail (1952) | | Trustee since 2009 Audit Committee Member and Governance Committee Member | | Retired | | 51 None | | Significant experience on the Board; mutual fund industry and executive experience (including roles as president and chief executive officer for an investment adviser) |
117 |
Trustee and Officer Information
| | | | | | | | |
Name and Year of
Birth | | Position(s) Held
with the Trusts,
Length of Time
Served and Term
of Office1 | | Principal
Occupation(s)
During Past
5 Years | | Number of
Portfolios in
Fund Complex
Overseen2 and Other
Directorships Held
During Past
5 Years | | Experience,
Qualifications,
Attributes, Skills
for Board
Membership |
|
INDEPENDENT TRUSTEES continued |
| | | | |
Kirk A. Sykes (1958) | | Trustee since 2019 Contract Review Committee Member | | Managing Director of Accordia Partners, LLC (real estate development); President of Primary Corporation (real estate development); Managing Principal of Merrick Capital Partners (infrastructure finance); formerly, President of Urban Strategy America Fund (real estate fund manager) | | 51 Trustee, Eastern Bank (bank); formerly Director, Ares Commercial Real Estate Corporation (real estate investment trust) | | Experience on the Board and significant experience on the boards of other business organizations (including real estate companies and banks) |
| | | | |
Cynthia L. Walker (1956) | | Trustee since 2005 for Natixis Funds Trust I Audit Committee Member and Governance Committee Member | | Deputy Dean for Finance and Administration, Yale University School of Medicine | | 51 None | | Significant experience on the Board; executive experience in a variety of academic organizations (including roles as dean for finance and administration) |
| 118
Trustee and Officer Information
| | | | | | | | |
Name and Year of
Birth | | Position(s) Held
with the Trusts,
Length of Time
Served and Term
of Office1 | | Principal
Occupation(s)
During Past
5 Years | | Number of
Portfolios in
Fund Complex
Overseen2 and Other
Directorships Held
During Past
5 Years | | Experience,
Qualifications,
Attributes, Skills
for Board
Membership |
|
INTERESTED TRUSTEES |
| | | | |
Kevin P. Charleston3 (1965) One Financial Center Boston, MA 02111 | | Trustee since 2015 | | President, Chief Executive Officer and Chairman of the Board of Directors; formerly, Chief Financial Officer, Loomis, Sayles & Company, L.P. | | 51 None | | Experience on the Board; continuing service as President, Chief Executive Officer and Chairman of the Board of Directors of Loomis, Sayles & Company, L.P. |
| | | | |
David L. Giunta4 (1965) | | Trustee since 2011 President and Chief Executive Officer of Natixis Funds Trust I; President of Loomis Sayles Funds II; Chief Executive Officer of Loomis Sayles Funds II since 2015 | | President and Chief Executive Officer, Natixis Advisors, L.P., Natixis Distribution, L.P., Natixis Distribution Corporation and Chairman of the Board of Natixis Distribution Corporation | | 51 None | | Significant experience on the Board; experience as President and Chief Executive Officer, Natixis Advisors, L.P., Natixis Distribution, L.P., Natixis Distribution Corporation and Chairman of the Board of Natixis Distribution Corporation |
| 1 | Each trustee serves until retirement, resignation or removal from the Board. The current retirement age is 75. The position of Chairperson of the Board is appointed for a three-year term. Mr. Drucker was appointed to serve an additional one year term as the Chairperson of the Board on June 12, 2019. |
| 2 | The trustees of the Trusts serve as trustees of a fund complex that includes all series of the Trusts, Natixis Funds Trust II, Natixis Funds Trust IV, Gateway Trust, Loomis Sayles Funds I, and Natixis ETF Trust (collectively, the “Fund Complex”). |
| 3 | Mr. Charleston is deemed an “interested person” of the Trusts because he holds the following positions with an affiliated person of the Trusts: President, Chief Executive Officer and Chairman of the Board of Directors of Loomis, Sayles & Company, L.P. |
| 4 | Mr. Giunta is deemed an “interested person” of the Trusts because he holds the following positions with an affiliated person of the Trusts: President and Chief Executive Officer, Natixis Advisors, L.P., Natixis Distribution, L.P., Natixis Distribution Corporation and Chairman of the Board of Natixis Distribution Corporation. |
119 |
Trustee and Officer Information
| | | | | | |
Name and Year of Birth | | Position(s) Held with the Trusts | | Term of Office1 and Length of Time Served | | Principal Occupation(s) During Past 5 Years2 |
|
| OFFICERS OF THE TRUSTS |
| | | |
Daniel J. Fuss (1933) One Financial Center Boston, MA 02111 | | Executive Vice President of Loomis Sayles Funds II | | Since 2003 | | Vice Chairman and Director, Loomis, Sayles & Company, L.P. |
| | | |
Russell L. Kane (1969) | | Secretary, Clerk and Chief Legal Officer | | Since 2016 | | Executive Vice President, General Counsel, Secretary and Clerk, Natixis Distribution Corporation, Natixis Advisors, L.P. and Natixis Distribution, L.P.; formerly, Chief Compliance Officer for Mutual Funds, Senior Vice President, Deputy General Counsel, Assistant Secretary and Assistant Clerk, Natixis Distribution Corporation, Natixis Advisors, L.P. and Natixis Distribution, L.P. |
| | | |
Michael C. Kardok (1959) | | Treasurer, Principal Financial and Accounting Officer | | Since 2004 | | Senior Vice President, Natixis Advisors, L.P. and Natixis Distribution, L.P. |
| | | |
Kirk D. Johnson (1981) | | Chief Compliance Officer, Assistant Secretary and Anti-Money Laundering Officer | | Since 2018 | | Senior Vice President, Deputy General Counsel, Assistant Secretary and Assistant Clerk, Natixis Distribution Corporation, Natixis Advisors, L.P. and Natixis Distribution, L.P.; formerly, Associate General Counsel, Natixis Distribution, L.P.; Vice President and Counsel, Natixis Investment Managers, LLC. |
| 120
Trustee and Officer Information
| 1 | Each officer of the Trusts serves for an indefinite term in accordance with the Trusts’ currentby-laws until the date his or her successor is elected and qualified, or until he or she sooner dies, retires, is removed or becomes disqualified. |
| 2 | Each person listed above, except as noted, holds the same position(s) with the Fund Complex. Previous positions during the past five years with Natixis Distribution, L.P., Natixis Advisors, L.P. or Loomis, Sayles & Company, L.P. are omitted, if not materially different from an officer’s current position with such entity. |
121 |


Annual Report
December 31, 2019
Mirova Global Green Bond Fund
Mirova Global Sustainable Equity Fund
Mirova International Sustainable Equity Fund
Table of Contents
IMPORTANT NOTICE TO SHAREHOLDERS
Beginning on January 1, 2021, as permitted by regulations adopted by the Securities and Exchange Commission, paper copies of shareholder reports like this one will no longer be sent by mail, unless you specifically request paper copies of the reports from the Fund or from your financial intermediary, such as a broker-dealer or bank. Instead, the reports will be made available on the Funds’ website, and you will be notified by mail each time a report is posted and provided with a website link to access the report. If you wish to continue receiving paper copies of your shareholder reports after January 1, 2021, you can inform the Fund at any time by calling 1-800-225-5478. If you hold your account with a financial intermediary and you wish to continue receiving paper copies after January 1, 2021, you should call your financial intermediary directly. Paper copies are provided free of charge, and your election to receive reports in paper will apply to all funds held with the Natixis Funds complex. If you have already elected to receive shareholder reports electronically, you will not be affected by this change and you need not take any action. You currently may elect to receive shareholder reports and other communications from the Fund or your financial intermediary electronically atwww.icsdelivery.com/natixisfunds.
MIROVA GLOBAL GREEN BOND FUND
| | |
| |
| Managers | | Symbols |
| |
| Marc Briand | | Class A MGGAX |
| |
| Charles Portier | | Class N MGGNX |
| |
| Mirova US LLC | | Class Y MGGYX |
| (formerly, a division within Ostrum Asset Management U.S., LLC) | | |
|
|
Investment Goal
The Fund seeks to provide total return, through a combination of capital appreciation and current income, by investing in green bonds.
Market Conditions
The year was characterized by massive net inflows to the green bond market (a10-year record of €130 billion in euro investment grade credit) underpinning a huge technical backdrop. Accommodative central banks (three cuts at the US Federal Reserve, one at the European Central Bank) and lingeringrisk-off phases made the duration a major source of performance and outperformance in 2019. Credit posted stellar performances in 2019 across the board. The largest contributors in Investment Grade indices were subordinated financials, telecoms and industrials; the worst performers were energy, technology and consumer staples. The geopolitical situation was on a roller-coaster ride in 2019: First half credit spreads declined sharply, and went down by 38 basis points, and another 22 basis points in first half of 2019. Fortunately, at the end of December, many of the geopolitical woes vanished despite the headline risks they wrought. TheUS-ChinaPhase-One Deal, pertaining to intellectual property and currency fixing, almost came to be at the end of the year; Italy’s budget was passed at the eleventh hour; and in the UK Boris Johnson overthrew his opponents, winning an absolute majority at the general election for his party, which is a positive development.
Performance Results
For the 12 months ended December 31, 2019, Class Y shares of Mirova Global Green Bond Fund returned 9.38% at net asset value. The Fund underperformed its benchmark, the Bloomberg Barclays MSCI Green Bond Index, which returned 9.65%.
Explanation of Fund Performance
Allocation had a positive impact on the portfolio due to the long position on corporates. Issue selection was also positive within the corporate and government-related sectors. Duration and yield curve positioning (flattening) had a positive impact. Foreign currency hedges detracted from results due to our long exposure to euro currency issuers.
From issue selection, top contributors were: EDF — indications of a potential spinoff of its nuclear activity from the renewable activities were seen as a positive for the credit profile in the long run. Energia de Portugal — this subordinated high yield issue outperformed and we have seen an improvement in its business model over the past few years. Iberdrola outperformed in line with all peripheral debts and the issue was a hybrid subordinated debt, which benefited from the quest for yield.
1 |
The most significant detractors: DTE Electric suffered from a combination of an earnings miss and growing diversification towardnon-utility businesses — theoretically a slightly riskier business mix, plus the rating cut from Moody’s after its acquisition of Haynesville. Anglian Water was down slightly due to the UK situation and also was too defensive in therisk-on environment that prevailed during the period. Mizuho also lagged as a low beta issue in therisk-on environment, especially after a spectacular rally the previous year.
Outlook
The agreement between the US and China, theso-calledphase-one deal, was signed inmid-January 2020. Geopolitical risks softened, so they might weigh to a lesser extent than last year. These include pressure from Salvini’s euro-skeptical party in Italy to overthrow the market-friendly coalition in place(EU-friendly as well), conflicts with Iran or North Korea, and interventions in Libya, to name just a few. In any case, we think central banks will play their role of last-resort buyers for the foreseeable future.
The global economy seems better off than it was one year ago, despite the remaining hurdles such as the ongoing discussions about patent property rights within the EU, the GAFA (Google, Apple, Facebook, and Amazon) tax and, above all, the situation in Italy, which may still fuel volatility in the coming months. The US might exhibit better macro-economic factors than Europe, which regularly records lackluster figures (like the Purchasing Manager’s Index, GDP growth, etc.). China will still demonstrate signs of economic weakness due to lagging effects of the trade war, despite the preliminary deal with the US. Further accommodative measures (like rate cuts) are a possibility, albeit not under normal circumstances. If needed for some unexpected reasons, we do not rule out rate cuts in the US or EU.
The first half of 2020 seems better suited for performance of credit than the second half in our view. Technicals should be strong, owing to lower net supply than last year, resumption of quantitative easing, large repurchase in January, and substantial amounts of cash from net inflows in 2019 to be reinvested. The accommodative measures’ effects will take shape during the first half, less so during the second half.
Given the context, we reckon that:
| · | | Policymakers are allegedly exploring budget stimulus in Europe. The Netherlands, Germany (€50 billion) and even Italy are devising spending plans. The UK passed a law to back a spending round of £14 billion. Fiscal stimuli, some green, others not, are the last aces up government’s sleeves and could constitute a tipping point after a decade-long reliance on monetary accommodative measures. |
| · | | Economic weakness in 2020 could be reflected from time to time in leading indicators |
| · | | Central banks can be accommodative if need be. |
Lastly, corporate bonds have continued to offer value, especially after the European Central Bank’s announcement of a potential purchase program. Credit can still outperform another semester. We lifted weights of cyclical within the Fund to gradually turn neutral versus index. We will adopt await-and-see attitude toward Italian securities.
| 2
MIROVA GLOBAL GREEN BOND FUND
Volatility will likely remain high, which will enable the Fund to continue searching for value in certain assets that exhibit a potential of outperformance in the long run.
Hypothetical Growth of $100,000 Investment in Class Y Shares2
February 28, 2017 (inception) through December 31, 2019
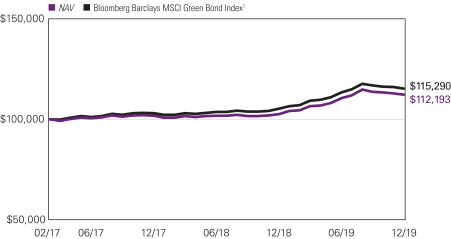
3 |
Average Annual Total Returns — December 31, 20192
| | | | | | | | | | | | | | | | |
| | | | |
| | | | | | | | | Expense Ratios3 | |
| | | 1 Year | | | Life of Fund | | | Gross | | | Net | |
| | | | | |
| Class Y (Inception 2/28/17) | | | | | | | | | | | | | | | | |
| NAV | | | 9.38 | % | | | 4.13 | % | | | 1.39 | % | | | 0.71 | % |
| | | | | |
| Class A (Inception 2/28/17) | | | | | | | | | | | | | | | | |
| NAV | | | 9.16 | | | | 3.90 | | | | 1.75 | | | | 0.96 | |
| With 4.25% Maximum Sales Charge | | | 4.53 | | | | 2.33 | | | | | | | | | |
| | | | | |
| Class N (Inception 2/28/17) | | | | | | | | | | | | | | | | |
| NAV | | | 9.52 | | | | 4.23 | | | | 1.12 | | | | 0.66 | |
| | | | | |
| Comparative Performance | | | | | | | | | | | | | | | | |
| Bloomberg Barclays MSCI Green Bond Index1 | | | 9.65 | | | | 5.13 | | | | | | | | | |
Performance data shown represents past performance and is no guarantee of, and not necessarily indicative of, future results. Total return and value will vary, and you may have a gain or loss when shares are sold. Current performance may be lower or higher than quoted. For most recentmonth-end performance, visit im.natixis.com/performance. Performance for other share classes will be greater or less than shown based on differences in fees and sales charges. You may not invest directly in an index. Performance for periods less than one year is cumulative, not annualized. Returns reflect changes in share price and reinvestment of dividends and capital gains, if any. The table(s) do not reflect taxes shareholders might owe on any fund distributions or when they redeem their shares.
| 1 | The Bloomberg Barclays MSCI Green Bond Index provides a broad-based measure of global fixed-income securities issued to fund projects with direct environmental benefits according to MSCI ESG Research’s green bond criteria. The green bonds are primarily investment-grade, or may be classified by other sources when bond ratings are not available. The Index may include green bonds from the corporate, securitized, Treasury, or government-related sectors. |
| 2 | Fund performance has been increased by fee waivers and/or expense reimbursements, if any, without which performance would have been lower. |
| 3 | Expense ratios are as shown in the Fund’s prospectus in effect as of the date of this report. The expense ratios for the current reporting period can be found in the Financial Highlights section of this report under Ratios to Average Net Assets. Net expenses reflect contractual expense limitations set to expire on 4/30/20. When a Fund’s expenses are below the limitation, gross and net expense ratios will be the same. See Note 6 of the Notes to Financial Statements for more information about the Fund’s expense limitations. |
| 4
MIROVA GLOBAL SUSTAINABLE EQUITY FUND
| | |
| |
| Managers | | Symbols |
| |
| Jens Peers, CFA® | | Class A ESGMX |
| |
| Hua Cheng, CFA®, PhD | | Class C ESGCX |
| |
| Amber Fairbanks, CFA® | | Class N ESGNX |
| |
| Mirova US LLC | | Class Y ESGYX |
| (formerly, a division within Ostrum Asset Management U.S., LLC) |
Investment Goal
The Fund seeks long-term capital appreciation.
Market Conditions
Global equity market performance was very strong in 2019, due largely to better-than-expected earnings growth, continued accommodative monetary policy, and the absence of real negative news. Throughout the year, the decreasing probability of a disorderly Brexit and severe trade war between the US and China energized the market and boosted valuations.
While overall momentum has been positive, there were some market pullbacks, especially in May and August, mainly driven by trade war fears. However, these ultimately proved to be short-term volatility, which created opportunities to initiate new positions and add to existing holdings.
Performance Results
For the 12 months ended December 31, 2019, Class Y Shares of the Mirova Global Sustainable Equity Fund returned 32.99% at net asset value. The Fund outperformed its benchmark, the MSCI World Index (Net), which returned 27.67% over the same period. It is important to note that there are material differences between the Fund and this benchmark.
Explanation of Fund Performance
The Fund’s outperformance was mainly driven by stock selection with sector allocation of the strategy also contributing positively, albeit less pronounced. The Energy sector was by far the worst performing sector in the market and the Fund’s lack of exposure was a positive contributor to performance. As the transition towardslow-carbon energy sources continues to occur, the renewable energy companies held in the portfolio (Ørsted, Vestas, and NextEra) all outperformed significantly. On the other side of the spectrum, the IT sector was the best performing sector in the market; this sector represents the highest weighted sector in the Fund with top performing stocks in the portfolio (ASML, MasterCard, TSMC) also contributing positively to outperformance. The high relative allocation we have in the Health Care sector, which underperformed the market, detracted slightly from performance; however, positive stock selection in this sector more than offset the negative allocation effect.
5 |
The biggest contributors throughout the year included MasterCard, which reported persistent, strong double-digit growth; Microsoft with strong growth driven by its cloud computing business; and Thermo Fisher Scientific, which had strong high single-digit organic growth. The biggest detractors on the year were International Flavors & Fragrances (“IFF”), which published disappointing results and poorly executed the acquisition of Frutarom; Unilever with organic sales growth lower than expected and below its range of 3%-5%; and BYD Company, which had lower earnings due to a challenging market and lower subsidies on enterprise values. IFF and BYD were sold outright from the portfolio on weakened fundamentals.
Overall, the portfolio’s composition did not change significantly throughout the year. While the market exhibited a short-lived rotation towards value stocks during August and September, its bias towards high-quality and growth stocks has also contributed positively towards the absolute and relative performance for the year.
Outlook
Our view for 2020 is that if the geopolitical atmosphere stabilizes and there are no major catastrophes, the market should offermid-single-digit returns in line with earnings growth.
Concerns about the US and China trade war may remain an overhang on stock markets. President Trump will need to walk a fine line between saving face and harming his voter base in an election year, and that uncertainty could affect investor risk appetite. We expect a reasonably orderly Brexit, as does, seemingly, everyone else; investors thus far appear mostly unconcerned about the UK’s departure from the European Union. Central banks have been and will continue to be accommodative, we believe, in 2020 though concerns remain about their ability to continue to expand their own balance sheets and drive economic expansion. In the US, the economic environment appears stable with continuedlow-single-digit GDP growth and low unemployment likely to continue in 2020, leading tomid-single-digit growth for sales and earnings. Outside of the US, Europe appears to be stabilizing and may produce stronger economic data in the next several quarters. We think that valuations are reasonable, particularly compared to bonds, and more attractive in Europe and Asia than the US currently. We do not expect further significant valuation expansion, but could see periods of valuation contraction if tradewar-related economic risks intensify.
| 6
MIROVA GLOBAL SUSTAINABLE EQUITY FUND
Hypothetical Growth of $100,000 Investment in Class Y Shares3
March 31, 2016 (inception) through December 31, 2019
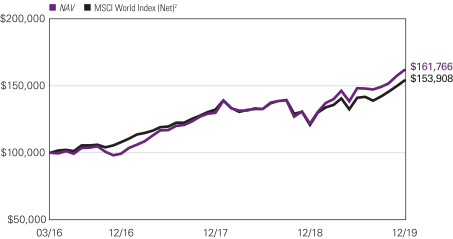
Top Ten Holdings as of December 31, 2019
| | | | | | |
| | | Security Name | | % of
Assets | |
| 1 | | Microsoft Corp. | | | 5.13 | % |
| 2 | | MasterCard, Inc., Class A | | | 5.03 | |
| 3 | | Thermo Fisher Scientific, Inc. | | | 4.75 | |
| 4 | | Danaher Corp. | | | 4.23 | |
| 5 | | Ecolab, Inc. | | | 3.57 | |
| 6 | | Eaton Corp. PLC | | | 3.56 | |
| 7 | | Symrise AG | | | 3.49 | |
| 8 | | Novo Nordisk AS, Class B | | | 3.48 | |
| 9 | | Visa, Inc., Class A | | | 3.40 | |
| 10 | | eBay, Inc. | | | 3.34 | |
The portfolio is actively managed and holdings are subject to change. There is no guarantee the Fund continues to invest in the securities referenced. The holdings listed exclude any temporary cash investments.
7 |
Average Annual Total Returns — December 31, 20193
| | | | | | | | | | | | | | | | | | | | |
| | | | | |
| | | | | | | | | | | | Expense Ratios4 | |
| | | 1 Year | | | Life of Class | | | Gross | | | Net | |
| | | | | | |
| Class Y (Inception 3/31/16) | | | | | | | Class Y/A/C | | | | Class N | | | | | | | | | |
| NAV | | | 32.99 | % | | | 13.67 | % | | | — | % | | | 1.14 | % | | | 0.95 | % |
| | | | | | |
| Class A (Inception 3/31/16) | | | | | | | | | | | | | | | | | | | | |
| NAV | | | 32.63 | | | | 13.40 | | | | — | | | | 1.38 | | | | 1.20 | |
| With 5.75% Maximum Sales Charge | | | 24.99 | | | | 11.62 | | | | — | | | | | | | | | |
| | | | | | |
| Class C (Inception 3/31/16) | | | | | | | | | | | | | | | | | | | | |
| NAV | | | 31.66 | | | | 12.56 | | | | — | | | | 2.13 | | | | 1.95 | |
| With CDSC1 | | | 30.66 | | | | 12.56 | | | | — | | | | | | | | | |
| | | | | | |
| Class N (Inception 5/1/17) | | | | | | | | | | | | | | | | | | | | |
| NAV | | | 33.05 | | | | — | | | | 14.40 | | | | 1.07 | | | | 0.92 | |
| | | | | | |
| Comparative Performance | | | | | | | | | | | | | | | | | | | | |
| MSCI World Index (Net)2 | | | 27.67 | | | | 12.15 | | | | 10.88 | | | | | | | | | |
Performance data shown represents past performance and is no guarantee of, and not necessarily indicative of, future results. Total return and value will vary, and you may have a gain or loss when shares are sold. Current performance may be lower or higher than quoted. For most recent month-end performance, visit im.natixis.com/performance.Performance for other share classes will be greater or less than shown based on differences in fees and sales charges. You may not invest directly in an index. Performance for periods less than one year is cumulative, not annualized. Returns reflect changes in share price and reinvestment of dividends and capital gains, if any. The table(s) do not reflect taxes shareholders might owe on any fund distributions or when they redeem their shares.
| 1 | Performance for Class C shares assumes a 1.00% contingent deferred sales charge (“CDSC”) applied when you sell shares within one year of purchase. |
| 2 | MSCI World Index (Net) is an unmanaged index that is designed to measure the equity market performance of developed markets. It is composed of common stocks of companies representative of the market structure of developed market countries in North America, Europe, and the Asia/Pacific Region. The index is calculated without dividends, with net or with gross dividends reinvested, in both U.S. dollars and local currencies. |
| 3 | Fund performance has been increased by fee waivers and/or expense reimbursements, if any, without which performance would have been lower. |
| 4 | Expense ratios are as shown in the Fund’s prospectus in effect as of the date of this report. The expense ratios for the current reporting period can be found in the Financial Highlights section of this report under Ratios to Average Net Assets. Net expenses reflect contractual expense limitations set to expire on 4/30/20. When a Fund’s expenses are below the limitation, gross and net expense ratios will be the same. See Note 6 of the Notes to Financial Statements for more information about the Fund’s expense limitations. |
| 8
MIROVA INTERNATIONAL SUSTAINABLE EQUITY FUND
| | |
| |
| Managers | | Symbols |
| |
| Jens Peers, CFA® | | Class A MRVAX |
| |
| Hua Cheng, CFA® PhD | | Class N MRVNX |
| |
| Amber Fairbanks, CFA® | | Class Y MRVYX |
|
Mirova US LLC (formerly, a division within Ostrum Asset Management U.S., LLC) |
Investment Goal
The Fund seeks long-term capital appreciation.
Market Conditions
International equity performance was very strong in 2019, due largely to better-than-expected earnings growth, continued accommodative monetary policy, and the absence of real negative news. Throughout the year, the decreasing probability of a disorderly Brexit and severe trade war between the US and China energized the market and boosted valuations.
While overall momentum has been positive, there were some market pullbacks, especially in May and August, mainly driven by trade war fears. However, these ultimately proved to be short-term volatility, which created opportunities to initiate new positions and add to existing holdings.
Performance Results
For the 12 months ended December 31, 2019, Class Y Shares of the Mirova International Sustainable Equity Fund returned 26.46% at net asset value. The Fund outperformed its benchmark, the MSCI EAFE Index (Net), which returned 22.01% over the same period.
Explanation of Fund Performance
The Fund’s outperformance was mainly driven by stock selection with sector allocation of the strategy also contributing positively, albeit less pronounced. Energy was by far the worst performing sector in the market and the Fund’s lack of exposure was a positive contributor to performance. As the transition towardslow-carbon energy sources continues to occur, the renewable energy companies held in the portfolio — Ørsted and Vestas — both outperformed significantly. At the other end of the spectrum, Information Technology was the best performing sector in the market. IT represents the highest weighted sector in the Fund with the three best performing stocks in the fund — ASML, Taiwan Semiconductor (“TSMC”) and Halma — contributing positively to outperformance. The high relative allocation we have in the Health Care sector, which underperformed the market, detracted from performance.
The top contributors throughout the year included three Information Technology names: TSMC, which benefited from the continuing improvement of the global semiconductor industry; ASML Holding, also a beneficiary of improving semiconductor fundamentals;
9 |
and Halma for its solid execution on its earnings-compounding model. The biggest detractors on the year were Kubota with weak sales and disappointing earnings reports; Chr. Hansen Holding, which reduced its revenue growth guidance on weaker demand; and BYD Company, which had lower earnings due to a challenging market and lower subsidies from the Chinese government for short-range enterprise values.
Overall, the portfolio’s composition did not change significantly throughout the year. While the market exhibited a short-lived rotation towards value stocks during August and September, the portfolio’s bias towards high-quality and growth stocks has also contributed positively towards the absolute and relative performance for the year.
Outlook
Our view for 2020 is that, if the geopolitical atmosphere stabilizes and there are no major catastrophes, the market should offermid-single-digit returns in line with earnings growth.
Concerns about the US and China trade war may remain an overhang on stock markets. President Trump will need to walk a fine line between saving face and harming his voter base in an election year, and that uncertainty could affect investor risk appetite. We expect a reasonably orderly Brexit, as does, seemingly, everyone else; investors thus far appear mostly unconcerned about the UK’s departure from the European Union. Central banks have been and will continue to be accommodative, we believe, in 2020 though concerns remain about their ability to continue to expand their own balance sheets and drive economic expansion. In the US, the economic environment appears stable with continuedlow-single-digit GDP growth and low unemployment likely to continue in 2020 leading tolow- tomid-single-digit growth for sales and earnings. Outside of the US, Europe appears to be stabilizing and may produce stronger economic data in the next several quarters. We think that valuations are reasonable, particularly compared to bonds, and more attractive in Europe and Asia than the US currently. We do not expect further significant valuation expansion, but could see periods of valuation contraction if tradewar-related economic risks intensify.
| 10
MIROVA INTERNATIONAL SUSTAINABLE EQUITY FUND
Hypothetical Growth of $100,000 Investment in Class Y Shares2
December 28, 2018 (inception) through December 31, 2019
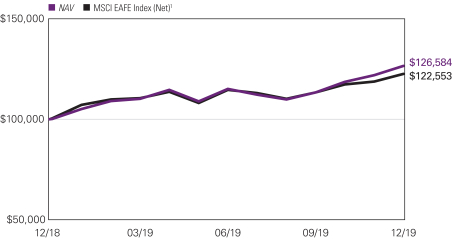
Top Ten Holdings as of December 31, 2019
| | | | | | |
| | | Security Name | | % of
Assets | |
| 1 | | Taiwan Semiconductor Manufacturing Co. Ltd., Sponsored ADR | | | 4.71 | % |
| 2 | | KBC Group NV | | | 3.99 | |
| 3 | | AIA Group Ltd. | | | 3.79 | |
| 4 | | Orsted AS | | | 3.77 | |
| 5 | | Legal & General Group PLC | | | 3.63 | |
| 6 | | Vestas Wind Systems AS | | | 3.48 | |
| 7 | | SAP SE | | | 3.44 | |
| 8 | | ASML Holding NV | | | 3.42 | |
| 9 | | Novo Nordisk AS, Class B | | | 3.32 | |
| 10 | | Danone S.A. | | | 2.99 | |
The portfolio is actively managed and holdings are subject to change. There is no guarantee the Fund continues to invest in the securities referenced. The holdings listed exclude any temporary cash investments.
11 |
Average Annual Total Returns — December 31, 20192
| | | | | | | | | | | | | | | | |
| | | | |
| | | | | | | | | Expense Ratios3 | |
| | | 1 Year4 | | | Life of Fund | | | Gross | | | Net | |
| | | | | |
| Class Y (Inception 12/28/18) | | | | | | | | | | | | | | | | |
| NAV | | | 26.46 | % | | | 26.34 | % | | | 1.74 | % | | | 0.95 | % |
| | | | | |
| Class A (Inception 12/28/18) | | | | | | | | | | | | | | | | |
| NAV | | | 26.22 | | | | 26.11 | | | | 1.99 | | | | 1.20 | |
| With 5.75% Maximum Sales Charge | | | 18.97 | | | | 18.92 | | | | | | | | | |
| | | | | |
| Class N (Inception 12/28/18) | | | | | | | | | | | | | | | | |
| NAV | | | 26.57 | | | | 26.45 | | | | 1.64 | | | | 0.90 | |
| | | | | |
| Comparative Performance | | | | | | | | | | | | | | | | |
| MSCI EAFE Index (Net)1 | | | 22.01 | | | | 22.36 | | | | | | | | | |
Performance data shown represents past performance and is no guarantee of, and not necessarily indicative of, future results. Total return and value will vary, and you may have a gain or loss when shares are sold. Current performance may be lower or higher than quoted. For most recent month-end performance, visit im.natixis.com/performance.Performance for other share classes will be greater or less than shown based on differences in fees and sales charges. You may not invest directly in an index. Performance for periods less than one year is cumulative, not annualized. Returns reflect changes in share price and reinvestment of dividends and capital gains, if any. The table(s) do not reflect taxes shareholders might owe on any fund distributions or when they redeem their shares.
| 1 | The MSCI EAFE Index (Net) is a free float-adjusted market capitalization index designed to measure large andmid-cap equity performance in developed markets, excluding the U.S. and Canada. The Index includes countries in Europe, Australasia, and the Far East. |
| 2 | Fund performance has been increased by fee waivers and/or expense reimbursements, if any, without which performance would have been lower. |
| 3 | Expense ratios are as shown in the Fund’s prospectus in effect as of the date of this report. The expense ratios for the current reporting period can be found in the Financial Highlights section of this report under Ratios to Average Net Assets. Net expenses reflect contractual expense limitations set to expire on 4/30/20. When a Fund’s expenses are below the limitation, gross and net expense ratios will be the same. See Note 6 of the Notes to Financial Statements for more information about the Fund’s expense limitations. |
| 4 | Generally accepted accounting principles require certain adjustments to be made to the net assets of the Fund for financial reporting purposes only, and as such, the total returns reflected above are different from the total returns reported in the financial highlights. The returns presented in the table above are what an investor would have actually experienced. |
| 12
ADDITIONAL INFORMATION
The views expressed in this report reflect those of the portfolio managers as of the dates indicated. The managers’ views are subject to change at any time without notice based on changes in market or other conditions. References to specific securities or industries should not be regarded as investment advice. Because the Fund is actively managed, there is no assurance that they will continue to invest in the securities or industries mentioned.
All investing involves risk, including the risk of loss. There is no assurance that any investment will meet its performance objectives or that losses will be avoided.
ADDITIONAL INDEX INFORMATION
This document may contain references to third party copyrights, indexes, and trademarks, each of which is the property of its respective owner. Such owner is not affiliated with Natixis Investment Managers or any of its related or affiliated companies (collectively “Natixis Affiliates”) and does not sponsor, endorse or participate in the provision of any Natixis Affiliates services, funds or other financial products.
The index information contained herein is derived from third parties and is provided on an “as is” basis. The user of this information assumes the entire risk of use of this information. Each of the third party entities involved in compiling, computing or creating index information, disclaims all warranties (including, without limitation, any warranties of originality, accuracy, completeness, timeliness, non-infringement, merchantability and fitness for a particular purpose) with respect to such information.
PROXY VOTING INFORMATION
A description of Natixis Funds’ proxy voting policies and procedures is available without charge, upon request, by calling Natixis Funds at 800-225-5478; on Natixis Funds’ website at im.natixis.com; and on the Securities and Exchange Commission’s (SEC) website at www.sec.gov. Information regarding how Natixis Funds voted proxies relating to portfolio securities during the most recent 12-month period ended June 30 is available on Natixis Funds’ website and the SEC’s website.
QUARTERLY PORTFOLIO SCHEDULES
Natixis Funds file complete schedules of portfolio holdings with the SEC for the first and third quarters of each fiscal year on Form N-PORT. The Funds’ Form N-PORT reports are available on the SEC’s website at www.sec.gov.
CFA® and Chartered Financial Analyst® are registered trademarks owned by the CFA Institute.
13 |
UNDERSTANDING FUND EXPENSES
As a mutual fund shareholder, you incur different types of costs: transaction costs, including sales charges (loads) on purchases, contingent deferred sales charges on redemptions, and ongoing costs, including management fees, distribution and/or service fees (12b-1 fees), and other fund expenses. Certain exemptions may apply. These costs are described in more detail in the Fund’s prospectus. The following examples are intended to help you understand the ongoing costs of investing in the Fund and help you compare these with the ongoing costs of investing in other mutual funds.
The first line in the table for each class shows the actual account values and actual Fund expenses you would have paid on a $1,000 investment in the Fund from July 1, 2019 through December 31, 2019. To estimate the expenses you paid over the period, simply divide your account value by $1,000 (for example, $8,600 account value divided by $1,000 = 8.60) and multiply the result by the number in the Expenses Paid During Period column as shown for your Class.
The second line for the table of each class provides information about hypothetical account values and hypothetical expenses based on the Fund’s actual expense ratios and an assumed rate of return of 5% per year before expenses, which is not the Fund’s actual return. The hypothetical account values and expenses may not be used to estimate the actual ending account balance or expenses you paid on your investment for the period. You may use this information to compare the ongoing costs of investing in the Fund and other funds. To do so, compare this 5% hypothetical example with the 5% hypothetical examples that appear in the shareholder reports of the other funds.
Please note that the expenses shown reflect ongoing costs only, and do not include any transaction costs, such as sales charges. Therefore, the second line in the table of each Fund is useful in comparing ongoing costs only, and will not help you determine the relative costs of owning different funds. If transaction costs were included, total costs would be higher.
| | | | | | | | | | | | |
| MIROVA GLOBAL GREEN BOND FUND | | BEGINNING
ACCOUNT VALUE
7/1/2019 | | | ENDING
ACCOUNT VALUE
12/31/2019 | | | EXPENSES PAID
DURING PERIOD*
7/1/2019 – 12/31/2019 | |
| Class A | | | | | | | | | | | | |
| Actual | | | $1,000.00 | | | | $1,015.10 | | | | $4.88 | |
| Hypothetical (5% return before expenses) | | | $1,000.00 | | | | $1,020.37 | | | | $4.89 | |
| Class N | | | | | | | | | | | | |
| Actual | | | $1,000.00 | | | | $1,017.20 | | | | $3.36 | |
| Hypothetical (5% return before expenses) | | | $1,000.00 | | | | $1,021.88 | | | | $3.36 | |
| Class Y | | | | | | | | | | | | |
| Actual | | | $1,000.00 | | | | $1,016.00 | | | | $3.61 | |
| Hypothetical (5% return before expenses) | | | $1,000.00 | | | | $1,021.63 | | | | $3.62 | |
| * | Expenses are equal to the Fund’s annualized expense ratio (after waiver/reimbursement): 0.96%, 0.66% and 0.71% for Class A, N and Y, respectively, multiplied by the average account value over the period, multiplied by the number of days in the most recent fiscal half-year (184), divided by 365 (to reflect the half-year period). |
| 14
| | | | | | | | | | | | |
MIROVA GLOBAL SUSTAINABLE EQUITY
FUND | | BEGINNING
ACCOUNT VALUE
7/1/2019 | | | ENDING
ACCOUNT VALUE
12/31/2019 | | | EXPENSES PAID
DURING PERIOD*
7/1/2019 – 12/31/2019 | |
| Class A | | | | | | | | | | | | |
| Actual | | | $1,000.00 | | | | $1,091.80 | | | | $6.33 | |
| Hypothetical (5% return before expenses) | | | $1,000.00 | | | | $1,019.16 | | | | $6.11 | |
| Class C | | | | | | | | | | | | |
| Actual | | | $1,000.00 | | | | $1,088.20 | | | | $10.26 | |
| Hypothetical (5% return before expenses) | | | $1,000.00 | | | | $1,015.38 | | | | $9.91 | |
| Class N | | | | | | | | | | | | |
| Actual | | | $1,000.00 | | | | $1,093.60 | | | | $4.75 | |
| Hypothetical (5% return before expenses) | | | $1,000.00 | | | | $1,020.67 | | | | $4.58 | |
| Class Y | | | | | | | | | | | | |
| Actual | | | $1,000.00 | | | | $1,093.20 | | | | $5.01 | |
| Hypothetical (5% return before expenses) | | | $1,000.00 | | | | $1,020.42 | | | | $4.84 | |
| * | Expenses are equal to the Fund’s annualized expense ratio (after waiver/reimbursement): 1.20%, 1.95%, 0.90% and 0.95% for Class A, C, N and Y, respectively, multiplied by the average account value over the period, multiplied by the number of days in the most recent fiscal half-year (184), divided by 365 (to reflect the half-year period). |
| | | | | | | | | | | | |
MIROVA INTERNATIONAL
SUSTAINABLE EQUITY FUND | | BEGINNING
ACCOUNT VALUE
7/1/2019 | | | ENDING
ACCOUNT VALUE
12/31/2019 | | | EXPENSES PAID
DURING PERIOD*
7/1/2019 – 12/31/2019 | |
| Class A | | | | | | | | | | | | |
| Actual | | | $1,000.00 | | | | $1,099.30 | | | | $6.40 | |
| Hypothetical (5% return before expenses) | | | $1,000.00 | | | | $1,019.11 | | | | $6.16 | |
| Class N | | | | | | | | | | | | |
| Actual | | | $1,000.00 | | | | $1,100.30 | | | | $4.87 | |
| Hypothetical (5% return before expenses) | | | $1,000.00 | | | | $1,020.57 | | | | $4.69 | |
| Class Y | | | | | | | | | | | | |
| Actual | | | $1,000.00 | | | | $1,099.40 | | | | $5.08 | |
| Hypothetical (5% return before expenses) | | | $1,000.00 | | | | $1,020.37 | | | | $4.89 | |
| * | Expenses are equal to the Fund’s annualized expense ratio (after waiver/reimbursement): 1.21%, 0.92% and 0.96% for Class A, N and Y, respectively, multiplied by the average account value over the period, multiplied by the number of days in the most recent fiscal half-year (184), divided by 365 (to reflect the half-year period). |
15 |
Portfolio of Investments – as of December 31, 2019
Mirova Global Green Bond Fund
| | | | | | | | |
Principal
Amount (‡) | | | Description | | Value (†) | |
| | | | | | | | |
| | Bonds and Notes — 93.1% of Net Assets | |
| | | | Australia — 0.9% | |
| | 300,000 | | | Westpac Banking Corp., EMTN, 0.625%, 11/22/2024, (EUR)(a) | | $ | 342,736 | |
| | | | | | | | |
| | | | Austria — 0.7% | |
| | 200,000 | | | Verbund AG, 1.500%, 11/20/2024, (EUR)(a) | | | 239,067 | |
| | | | | | | | |
| | | | Belgium — 1.9% | |
| | 400,000 | | | KBC Group NV, EMTN, 0.875%, 6/27/2023, (EUR)(a) | | | 460,615 | |
| | 200,000 | | | Kingdom of Belgium, Series 86, 1.250%, 4/22/2033, (EUR)(a) | | | 251,277 | |
| | | | | | | | |
| | | | | | | 711,892 | |
| | | | | | | | |
| | | | Brazil — 2.0% | |
| | 300,000 | | | Banco Nacional de Desenvolvimento Economico e Social, 4.750%, 5/09/2024(a) | | | 318,378 | |
| | 400,000 | | | Fibria Overseas Finance Ltd., 5.500%, 1/17/2027(a) | | | 437,504 | |
| | | | | | | | |
| | | | | | | 755,882 | |
| | | | | | | | |
| | | | Canada — 2.2% | |
| | 1,000,000 | | | Province of Ontario Canada, 1.950%, 1/27/2023, (CAD)(a) | | | 771,160 | |
| | 50,000 | | | Province of Quebec Canada, 2.600%, 7/06/2025, (CAD)(a) | | | 39,585 | |
| | | | | | | | |
| | | | | | | 810,745 | |
| | | | | | | | |
| | | | Denmark — 2.0% | |
| | 600,000 | | | Orsted AS, 1.500%, 11/26/2029, (EUR)(a) | | | 732,041 | |
| | | | | | | | |
| | | | Finland — 1.6% | |
| | 600,000 | | | Municipality Finance PLC, 1.375%, 9/21/2021(a) | | | 596,465 | |
| | | | | | | | |
| | | | France — 17.3% | |
| | 400,000 | | | Covivio, 1.125%, 9/17/2031, (EUR)(a) | | | 452,090 | |
| | 400,000 | | | Covivio, 1.875%, 5/20/2026, (EUR)(a) | | | 483,030 | |
| | 800,000 | | | Electricite de France S.A., 3.625%, 10/13/2025(a) | | | 849,226 | |
| | 200,000 | | | Electricite de France S.A., EMTN, 1.000%, 10/13/2026, (EUR)(a) | | | 234,458 | |
| | 2,050,000 | | | France Government Bond OAT, 1.750%, 6/25/2039, 144A, (EUR)(a) | | | 2,782,561 | |
| | 600,000 | | | ICADE, 1.500%, 9/13/2027, (EUR)(a) | | | 711,281 | |
| | 200,000 | | | SNCF Reseau, EMTN, 1.000%, 11/09/2031, (EUR)(a) | | | 236,595 | |
| | 400,000 | | | SNCF Reseau, EMTN, 1.875%, 3/30/2034, (EUR)(a) | | | 520,891 | |
| | 100,000 | | | Societe du Grand Paris EPIC, EMTN, 1.700%, 5/25/2050, (EUR)(a) | | | 128,431 | |
| | | | | | | | |
| | | | | | | 6,398,563 | |
| | | | | | | | |
| | | | Germany — 3.4% | |
| | 500,000 | | | Berlin Hyp AG, EMTN, 0.500%, 9/26/2023, (EUR)(a) | | | 568,319 | |
| | 400,000 | | | E.ON SE, EMTN, 0.350%, 2/28/2030, (EUR)(a) | | | 431,316 | |
| | 370,000 | | | Kreditanstalt fuer Wiederaufbau, MTN, 2.400%, 7/02/2020, (AUD)(a) | | | 261,360 | |
| | | | | | | | |
| | | | | | | 1,260,995 | |
| | | | | | | | |
| | | | India — 1.7% | |
| | 600,000 | | | Indian Railway Finance Corp. Ltd., 3.835%, 12/13/2027(a) | | | 623,826 | |
| | | | | | | | |
| | | | Indonesia — 1.4% | |
| | 500,000 | | | Republic of Indonesia, 3.750%, 3/01/2023(a) | | | 519,800 | |
| | | | | | | | |
| | | | Italy — 8.1% | |
| | 400,000 | | | A2A SpA, EMTN, 1.000%, 7/16/2029, (EUR)(a) | | | 457,391 | |
| | 300,000 | | | Assicurazioni Generali SpA, EMTN, 2.124%, 10/01/2030, (EUR)(a) | | | 349,343 | |
See accompanying notes to financial statements.
| 16
Portfolio of Investments – as of December 31, 2019
Mirova Global Green Bond Fund – (continued)
| | | | | | | | |
Principal
Amount (‡) | | | Description | | Value (†) | |
| | | | Italy — continued | |
| | 300,000 | | | Ferrovie dello Stato Italiane SpA, EMTN, 0.875%, 12/07/2023, (EUR)(a) | | $ | 343,087 | |
| | 500,000 | | | Ferrovie dello Stato Italiane SpA, EMTN, 1.125%, 7/09/2026, (EUR)(a) | | | 573,147 | |
| | 300,000 | | | Intesa Sanpaolo SpA, EMTN, 0.875%, 6/27/2022, (EUR)(a) | | | 342,072 | |
| | 800,000 | | | Unione di Banche Italiane SpA, EMTN, 1.500%, 4/10/2024, (EUR)(a) | | | 916,570 | |
| | | | | | | | |
| | | | | | | 2,981,610 | |
| | | | | | | | |
| | | | Japan — 3.4% | |
| | 700,000 | | | Mizuho Financial Group, Inc., EMTN, 0.956%, 10/16/2024, (EUR)(a) | | | 808,231 | |
| | 400,000 | | | Sumitomo Mitsui Financial Group, Inc., EMTN, 0.934%, 10/11/2024, (EUR)(a) | | | 460,466 | |
| | | | | | | | |
| | | | | | | 1,268,697 | |
| | | | | | | | |
| | | | Korea — 1.7% | |
| | 400,000 | | | Hyundai Capital Services, Inc., EMTN, 2.875%, 3/16/2021(a) | | | 402,031 | |
| | 200,000 | | | Korea Water Resources Corp., EMTN, 3.875%, 5/15/2023(a) | | | 210,029 | |
| | | | | | | | |
| | | | | | | 612,060 | |
| | | | | | | | |
| | | | Lithuania — 2.9% | |
| | 500,000 | | | Lietuvos Energija UAB, EMTN, 1.875%, 7/10/2028, (EUR)(a) | | | 599,253 | |
| | 400,000 | | | Lietuvos Energija UAB, EMTN, 2.000%, 7/14/2027, (EUR)(a) | | | 484,933 | |
| | | | | | | | |
| | | | | | | 1,084,186 | |
| | | | | | | | |
| | | | Mexico — 0.5% | |
| | 200,000 | | | Nacional Financiera SNC, 3.375%, 11/05/2020(a) | | | 200,890 | |
| | | | | | | | |
| | | | Netherlands — 6.5% | |
| | 200,000 | | | Nederlandse Waterschapsbank NV, EMTN, 2.375%, 3/24/2026(a) | | | 204,768 | |
| | 500,000 | | | Royal Schiphol Group NV, EMTN, 1.500%, 11/05/2030, (EUR)(a) | | | 613,441 | |
| | 300,000 | | | TenneT Holding BV, (fixed rate to 3/01/2024, variable rate thereafter), 2.995%, (EUR)(a)(b) | | | 360,066 | |
| | 300,000 | | | TenneT Holding BV, EMTN, 1.250%, 10/24/2033, (EUR)(a) | | | 351,961 | |
| | 300,000 | | | TenneT Holding BV, EMTN, 1.375%, 6/26/2029, (EUR)(a) | | | 362,157 | |
| | 200,000 | | | TenneT Holding BV, EMTN, 1.750%, 6/04/2027, (EUR)(a) | | | 247,695 | |
| | 200,000 | | | TenneT Holding BV, EMTN, 1.875%, 6/13/2036, (EUR)(a) | | | 254,933 | |
| | | | | | | | |
| | | | | | | 2,395,021 | |
| | | | | | | | |
| | | | Norway — 1.4% | |
| | 500,000 | | | Kommunalbanken AS, EMTN, 1.375%, 10/26/2020(a) | | | 498,358 | |
| | | | | | | | |
| | | | Portugal — 2.7% | |
| | 500,000 | | | EDP - Energias de Portugal S.A., (fixed rate to 1/30/2024, variable rate thereafter), 4.496%, 4/30/2079, (EUR)(a) | | | 626,750 | |
| | 300,000 | | | EDP Finance BV, EMTN, 1.875%, 10/13/2025, (EUR)(a) | | | 363,800 | |
| | | | | | | | |
| | | | | | | 990,550 | |
| | | | | | | | |
| | | | Spain — 5.4% | |
| | 300,000 | | | ACS Servicios Comunicaciones y Energia, S.L., 1.875%, 4/20/2026, (EUR)(a) | | | 355,449 | |
| | 400,000 | | | Banco Bilbao Vizcaya Argentaria S.A., 1.000%, 6/21/2026, (EUR)(a) | | | 461,692 | |
| | 500,000 | | | Iberdrola International BV, (fixed rate to 2/22/2023, variable rate thereafter), 1.875%, (EUR)(a)(b) | | | 576,310 | |
| | 500,000 | | | Iberdrola International BV, EMTN, 1.125%, 4/21/2026, (EUR)(a) | | | 590,036 | |
| | | | | | | | |
| | | | | | | 1,983,487 | |
| | | | | | | | |
See accompanying notes to financial statements.
17 |
Portfolio of Investments – as of December 31, 2019
Mirova Global Green Bond Fund – (continued)
| | | | | | | | |
Principal
Amount (‡) | | | Description | | Value (†) | |
| | | | Supranationals — 5.8% | |
| $ | 100,000 | | | Asian Development Bank, GMTN, 2.375%, 8/10/2027(a) | | $ | 102,984 | |
| | 600,000 | | | European Investment Bank, 2.375%, 5/24/2027(a) | | | 619,245 | |
| | 700,000 | | | European Investment Bank, 2.500%, 10/15/2024(a) | | | 723,723 | |
| | 200,000 | | | International Bank for Reconstruction & Development, Series GDIF, 2.125%, 3/03/2025(a) | | | 203,434 | |
| | 500,000 | | | International Finance Corp., GMTN, 2.125%, 4/07/2026(a) | | | 506,210 | |
| | | | | | | | |
| | | | | | | 2,155,596 | |
| | | | | | | | |
| | | | Sweden — 1.6% | |
| | 600,000 | | | Svensk Exportkredit AB, GMTN, 1.875%, 6/23/2020(a) | | | 600,247 | |
| | | | | | | | |
| | | | United Kingdom — 5.7% | |
| | 500,000 | | | Anglian Water Services Financing PLC, EMTN, 1.625%, 8/10/2025, (GBP)(a) | | | 665,502 | |
| | 200,000 | | | SSE PLC, EMTN, 0.875%, 9/06/2025, (EUR)(a) | | | 230,170 | |
| | 200,000 | | | SSE PLC, EMTN, 1.375%, 9/04/2027, (EUR)(a) | | | 237,024 | |
| | 600,000 | | | Standard Chartered PLC, (fixed rate to 7/02/2026, variable rate thereafter), EMTN, 0.900%, 7/02/2027, (EUR)(a) | | | 680,632 | |
| | 200,000 | | | Transport for London, EMTN, 2.125%, 4/24/2025, (GBP)(a) | | | 277,204 | |
| | | | | | | | |
| | | | | | | 2,090,532 | |
| | | | | | | | |
| | | | United States — 12.3% | |
| | 300,000 | | | Apple, Inc., 2.850%, 2/23/2023(a) | | | 308,579 | |
| | 900,000 | | | Apple, Inc., 3.000%, 6/20/2027(a) | | | 943,488 | |
| | 600,000 | | | Bank of America Corp., (fixed rate to 5/17/2021, variable rate thereafter), MTN, 3.499%, 5/17/2022(a) | | | 612,055 | |
| | 200,000 | | | Citigroup, Inc., EMTN, 0.500%, 1/29/2022, (EUR)(a) | | | 226,843 | |
| | 400,000 | | | Digital Euro Finco LLC, 2.500%, 1/16/2026, (EUR)(a) | | | 487,824 | |
| | 600,000 | | | Digital Realty Trust LP, 3.950%, 7/01/2022(a) | | | 624,782 | |
| | 200,000 | | | DTE Electric Co., Series A, 4.050%, 5/15/2048(a) | | | 232,208 | |
| | 100,000 | | | Southern Power Co., 1.850%, 6/20/2026, (EUR)(a) | | | 121,696 | |
| | 400,000 | | | Southern Power Co., 4.150%, 12/01/2025(a) | | | 433,925 | |
| | 500,000 | | | Verizon Communications, Inc., 3.875%, 2/08/2029(a) | | | 551,557 | |
| | | | | | | | |
| | | | | | | 4,542,957 | |
| | | | | | | | |
| | | | Total Bonds and Notes
(Identified Cost $33,103,395) | | | 34,396,203 | |
| | | | | | | | |
| | | | | | | | |
| | Short-Term Investments — 3.4% | |
| | 1,247,298 | | | Tri-Party Repurchase Agreement with Fixed Income Clearing Corporation, dated 12/31/2019 at 0.900% to be repurchased at $1,247,361 on 1/02/2020 collateralized by $1,215,000 U.S. Treasury Note, 2.875% due 10/31/2023 valued at $1,276,008 including accrued interest (Note 2 of Notes to Financial Statements) (Identified Cost $1,247,298) | | | 1,247,298 | |
| | | | | | | | |
| | | | Total Investments — 96.5%
(Identified Cost $34,350,693) | | | 35,643,501 | |
| | | | Other assets less liabilities — 3.5% | | | 1,287,808 | |
| | | | | | | | |
| | | | Net Assets — 100.0% | | $ | 36,931,309 | |
| | | | | | | | |
See accompanying notes to financial statements.
| 18
Portfolio of Investments – as of December 31, 2019
Mirova Global Green Bond Fund – (continued)
| | | | | | | | |
| | | | | | | | |
| | (‡) | | | Principal Amount stated in U.S. dollars unless otherwise noted. | |
| | (†) | | | See Note 2 of Notes to Financial Statements. | |
| | (a) | | | Security (or a portion thereof) has been designated to cover the Fund’s obligations under open derivative contracts. | |
| | (b) | | | Perpetual bond with no specified maturity date. | | | | |
| | | | | | | | |
| | 144A | | | All or a portion of these securities are exempt from registration under Rule 144A of the Securities Act of 1933. These securities may be resold in transactions exempt from registration, normally to qualified institutional buyers. At December 31, 2019, the value of Rule 144A holdings amounted to $2,782,561 or 7.5% of net assets. | |
| | EMTN | | | Euro Medium Term Note | | | | |
| | GMTN | | | Global Medium Term Note | | | | |
| | MTN | | | Medium Term Note | | | | |
| | | | | | | | |
| | AUD | | | Australian Dollar | | | | |
| | CAD | | | Canadian Dollar | | | | |
| | EUR | | | Euro | | | | |
| | GBP | | | British Pound | | | | |
At December 31, 2019, open long futures contracts were as follows:
| | | | | | | | | | | | | | | | | | | | |
| Financial and Currency Futures | | Expiration
Date | | | Contracts | | | Notional
Amount | | | Value | | | Unrealized
Appreciation
(Depreciation) | |
30 Year U.S. Treasury Bond | | | 3/20/2020 | | | | 5 | | | $ | 799,063 | | | $ | 779,531 | | | $ | (19,532 | ) |
Euro-Buxl® 30 Year Bond | | | 3/06/2020 | | | | 3 | | | | 694,153 | | | | 667,569 | | | | (26,584 | ) |
German Euro Bund | | | 3/06/2020 | | | | 13 | | | | 2,523,286 | | | | 2,486,102 | | | | (37,184 | ) |
Ultra Long U.S. Treasury Bond | | | 3/20/2020 | | | | 5 | | | | 932,929 | | | | 908,281 | | | | (24,648 | ) |
| | | | | | | | | | | | | | | | | | | | |
Total | | | $ | (107,948 | ) |
| | | | | | | | | | | | | | | | | | | | |
At December 31, 2019, open short futures contracts were as follows:
| | | | | | | | | | | | | | | | | | | | |
| Financial and Currency Futures | | Expiration
Date | | | Contracts | | | Notional
Amount | | | Value | | | Unrealized
Appreciation
(Depreciation) | |
10 Year U.S. Treasury Note | | | 3/20/2020 | | | | 21 | | | $ | 2,718,156 | | | $ | 2,696,859 | | | $ | 21,297 | |
Australian Dollar | | | 3/16/2020 | | | | 5 | | | | 342,125 | | | | 351,900 | | | | (9,775 | ) |
British Pound | | | 3/16/2020 | | | | 12 | | | | 990,150 | | | | 996,900 | | | | (6,750 | ) |
Canadian Dollar | | | 3/17/2020 | | | | 11 | | | | 829,950 | | | | 847,935 | | | | (17,985 | ) |
Euro | | | 3/16/2020 | | | | 151 | | | | 21,018,067 | | | | 21,294,775 | | | | (276,708 | ) |
UK Long Gilt | | | 3/27/2020 | | | | 1 | | | | 176,172 | | | | 174,026 | | | | 2,146 | |
| | | | | | | | | | | | | | | | | | | | |
Total | | | $ | (287,775 | ) |
| | | | | | | | | | | | | | | | | | | | |
See accompanying notes to financial statements.
19 |
Portfolio of Investments – as of December 31, 2019
Mirova Global Green Bond Fund – (continued)
Industry Summary at December 31, 2019
| | | | |
Utility - Electric | | | 20.1 | % |
Bank | | | 16.4 | |
Financial | | | 12.1 | |
Industrial | | | 10.4 | |
Government National | | | 9.6 | |
Supra-National | | | 5.8 | |
Government Agency | | | 5.4 | |
Special Purpose | | | 4.3 | |
Government Regional | | | 4.2 | |
Transportation - Rail | | | 3.3 | |
Telephone | | | 1.5 | |
Short-Term Investments | | | 3.4 | |
| | | | |
Total Investments | | | 96.5 | |
Other assets less liabilities (including futures contracts) | | | 3.5 | |
| | | | |
Net Assets | | | 100.0 | % |
| | | | |
Currency Exposure Summary at December 31, 2019
| | | | |
Euro | | | 57.0 | % |
United States Dollar | | | 34.0 | |
British Pound | | | 2.6 | |
Canadian Dollar | | | 2.2 | |
Australian Dollar | | | 0.7 | |
| | | | |
Total Investments | | | 96.5 | |
Other assets less liabilities (including futures contracts) | | | 3.5 | |
| | | | |
Net Assets | | | 100.0 | % |
| | | | |
See accompanying notes to financial statements.
| 20
Portfolio of Investments – as of December 31, 2019
Mirova Global Sustainable Equity Fund
| | | | | | | | |
| Shares | | | Description | | Value (†) | |
| | Common Stocks — 95.4% of Net Assets | |
| | | | Belgium — 2.1% | |
| | 41,244 | | | KBC Group NV | | $ | 3,109,574 | |
| | | | | | | | |
| | | | Denmark — 11.3% | |
| | 16,961 | | | Chr. Hansen Holding AS | | | 1,348,313 | |
| | 10,170 | | | Coloplast AS, Series B | | | 1,261,701 | |
| | 88,486 | | | Novo Nordisk AS, Class B | | | 5,127,661 | |
| | 46,355 | | | Orsted AS, 144A | | | 4,794,253 | |
| | 41,137 | | | Vestas Wind Systems AS | | | 4,155,101 | |
| | | | | | | | |
| | | | | | | 16,687,029 | |
| | | | | | | | |
| | | | France — 4.9% | |
| | 29,855 | | | Danone S.A. | | | 2,479,335 | |
| | 18,489 | | | EssilorLuxottica S.A. | | | 2,826,626 | |
| | 55,759 | | | Valeo S.A. | | | 1,976,280 | |
| | | | | | | | |
| | | | | | | 7,282,241 | |
| | | | | | | | |
| | | | Germany — 6.5% | |
| | 6,017 | | | Allianz SE, (Registered) | | | 1,474,332 | |
| | 26,811 | | | Fresenius SE & Co. KGaA | | | 1,508,748 | |
| | 10,584 | | | SAP SE | | | 1,424,587 | |
| | 48,951 | | | Symrise AG | | | 5,145,184 | |
| | | | | | | | |
| | | | | | | 9,552,851 | |
| | | | | | | | |
| | | | Hong Kong — 2.2% | |
| | 301,658 | | | AIA Group Ltd. | | | 3,172,827 | |
| | | | | | | | |
| | | | Japan — 4.7% | |
| | 115,000 | | | Sekisui House Ltd. | | | 2,455,807 | |
| | 33,200 | | | Takeda Pharmaceutical Co. Ltd. | | | 1,313,133 | |
| | 88,300 | | | Terumo Corp. | | | 3,132,381 | |
| | | | | | | | |
| | | | | | | 6,901,321 | |
| | | | | | | | |
| | | | Netherlands — 2.7% | |
| | 3,006 | | | Adyen NV, 144A(a) | | | 2,472,722 | |
| | 5,318 | | | ASML Holding NV | | | 1,574,428 | |
| | | | | | | | |
| | | | | | | 4,047,150 | |
| | | | | | | | |
| | | | Switzerland — 0.9% | |
| | 2,297 | | | Geberit AG, (Registered) | | | 1,289,263 | |
| | | | | | | | |
| | | | Taiwan — 2.5% | |
| | 62,179 | | | Taiwan Semiconductor Manufacturing Co. Ltd., Sponsored ADR | | | 3,612,600 | |
| | | | | | | | |
| | | | United Kingdom — 4.3% | |
| | 554,081 | | | Legal & General Group PLC | | | 2,225,775 | |
| | 95,485 | | | Prudential PLC | | | 1,829,552 | |
| | 38,684 | | | Unilever NV | | | 2,220,101 | |
| | | | | | | | |
| | | | | | | 6,275,428 | |
| | | | | | | | |
| | | | United States — 53.3% | |
| | 9,470 | | | Adobe, Inc.(a) | | | 3,123,301 | |
| | 3,425 | | | Alphabet, Inc., Class A(a) | | | 4,587,411 | |
See accompanying notes to financial statements.
21 |
Portfolio of Investments – as of December 31, 2019
Mirova Global Sustainable Equity Fund – (continued)
| | | | | | | | |
| Shares | | | Description | | Value (†) | |
| | | | United States — continued | |
| | 31,721 | | | American Water Works Co., Inc. | | $ | 3,896,925 | |
| | 26,967 | | | Aptiv PLC | | | 2,561,056 | |
| | 40,638 | | | Danaher Corp. | | | 6,237,120 | |
| | 55,445 | | | Eaton Corp. PLC | | | 5,251,751 | |
| | 136,184 | | | eBay, Inc. | | | 4,917,604 | |
| | 27,285 | | | Ecolab, Inc. | | | 5,265,732 | |
| | 8,463 | | | Estee Lauder Cos., Inc. (The), Class A | | | 1,747,948 | |
| | 31,310 | | | Gilead Sciences, Inc. | | | 2,034,524 | |
| | 24,817 | | | MasterCard, Inc., Class A | | | 7,410,108 | |
| | 47,946 | | | Microsoft Corp. | | | 7,561,084 | |
| | 9,907 | | | NextEra Energy, Inc. | | | 2,399,079 | |
| | 22,725 | | | Oracle Corp. | | | 1,203,971 | |
| | 13,787 | | | Roper Technologies, Inc. | | | 4,883,769 | |
| | 15,035 | | | Signature Bank | | | 2,053,931 | |
| | 21,531 | | | Thermo Fisher Scientific, Inc. | | | 6,994,776 | |
| | 26,681 | | | Visa, Inc., Class A | | | 5,013,360 | |
| | 13,928 | | | Watts Water Technologies, Inc., Series A | | | 1,389,457 | |
| | | | | | | | |
| | | | | | | 78,532,907 | |
| | | | | | | | |
| | | | Total Common Stocks
(Identified Cost $110,787,995) | | | 140,463,191 | |
| | | | | | | | |
| | | | | | | | |
Principal
Amount | | | | |
| | Short-Term Investments — 3.0% | |
| $ | 4,430,972 | | | Tri-Party Repurchase Agreement with Fixed Income Clearing Corporation, dated 12/31/2019 at 0.900% to be repurchased at $4,431,193 on 1/02/2020 collateralized by $4,305,000 U.S. Treasury Note, 2.875% due 10/31/2023 valued at $4,521,163 including accrued interest (Note 2 of Notes to Financial Statements) (Identified Cost $4,430,972) | | | 4,430,972 | |
| | | | | | | | |
| | | | Total Investments — 98.4%
(Identified Cost $115,218,967) | | | 144,894,163 | |
| | | | Other assets less liabilities — 1.6% | | | 2,428,244 | |
| | | | | | | | |
| | | | Net Assets — 100.0% | | $ | 147,322,407 | |
| | | | | | | | |
| | | | | | | | |
| | (†) | | | See Note 2 of Notes to Financial Statements. | |
| | (a) | | | Non-income producing security. | |
| | | | | | | | |
| | 144A | | | All or a portion of these securities are exempt from registration under Rule 144A of the Securities Act of 1933. These securities may be resold in transactions exempt from registration, normally to qualified institutional buyers. At December 31, 2019, the value of Rule 144A holdings amounted to $7,266,975 or 4.9% of net assets. | |
| | ADR | | | An American Depositary Receipt is a certificate issued by a custodian bank representing the right to receive securities of the foreign issuer described. The values of ADRs may be significantly influenced by trading on exchanges not located in the United States. | |
See accompanying notes to financial statements.
| 22
Portfolio of Investments – as of December 31, 2019
Mirova Global Sustainable Equity Fund – (continued)
Industry Summary at December 31, 2019
| | | | |
IT Services | | | 10.1 | % |
Software | | | 9.0 | |
Chemicals | | | 8.0 | |
Health Care Equipment & Supplies | | | 7.2 | |
Electrical Equipment | | | 6.4 | |
Insurance | | | 6.0 | |
Electric Utilities | | | 4.8 | |
Life Sciences Tools & Services | | | 4.8 | |
Pharmaceuticals | | | 4.4 | |
Semiconductors & Semiconductor Equipment | | | 3.5 | |
Banks | | | 3.5 | |
Internet & Direct Marketing Retail | | | 3.3 | |
Industrial Conglomerates | | | 3.3 | |
Interactive Media & Services | | | 3.1 | |
Auto Components | | | 3.0 | |
Personal Products | | | 2.7 | |
Water Utilities | | | 2.7 | |
Other Investments, less than 2% each | | | 9.6 | |
Short-Term Investments | | | 3.0 | |
| | | | |
Total Investments | | | 98.4 | |
Other assets less liabilities | | | 1.6 | |
| | | | |
Net Assets | | | 100.0 | % |
| | | | |
Currency Exposure Summary at December 31, 2019
| | | | |
United States Dollar | | | 58.8 | % |
Euro | | | 17.7 | |
Danish Krone | | | 11.3 | |
Japanese Yen | | | 4.7 | |
British Pound | | | 2.8 | |
Hong Kong Dollar | | | 2.2 | |
Swiss Franc | | | 0.9 | |
| | | | |
Total Investments | | | 98.4 | |
Other assets less liabilities | | | 1.6 | |
| | | | |
Net Assets | | | 100.0 | % |
| | | | |
See accompanying notes to financial statements.
23 |
Portfolio of Investments – as of December 31, 2019
Mirova International Sustainable Equity Fund
| | | | | | | | |
| Shares | | | Description | | Value (†) | |
| | Common Stocks — 93.9% of Net Assets | |
| | | | Australia — 2.6% | |
| | 26,199 | | | Brambles Ltd. | | $ | 215,636 | |
| | 72,076 | | | Stockland | | | 233,855 | |
| | | | | | | | |
| | | | | | | 449,491 | |
| | | | | | | | |
| | | | Belgium — 5.4% | |
| | 9,100 | | | KBC Group NV | | | 686,091 | |
| | 4,788 | | | Umicore S.A. | | | 233,338 | |
| | | | | | | | |
| | | | | | | 919,429 | |
| | | | | | | | |
| | | | Denmark — 12.6% | |
| | 4,297 | | | Chr. Hansen Holding AS | | | 341,590 | |
| | 9,863 | | | Novo Nordisk AS, Class B | | | 571,549 | |
| | 6,280 | | | Orsted AS, 144A | | | 649,507 | |
| | 5,923 | | | Vestas Wind Systems AS | | | 598,261 | |
| | | | | | | | |
| | | | | | | 2,160,907 | |
| | | | | | | | |
| | | | France — 17.0% | |
| | 1,740 | | | Air Liquide S.A. | | | 246,681 | |
| | 18,102 | | | Credit Agricole S.A. | | | 263,408 | |
| | 6,203 | | | Danone S.A. | | | 515,134 | |
| | 1,649 | | | Dassault Systemes SE | | | 271,962 | |
| | 2,492 | | | EssilorLuxottica S.A. | | | 380,981 | |
| | 848 | | | L’Oreal S.A. | | | 250,760 | |
| | 1,904 | | | Orpea | | | 244,273 | |
| | 14,669 | | | Suez | | | 222,283 | |
| | 9,644 | | | Valeo S.A. | | | 341,815 | |
| | 2,700 | | | Worldline S.A., 144A(a) | | | 191,405 | |
| | | | | | | | |
| | | | | | | 2,928,702 | |
| | | | | | | | |
| | | | Germany — 7.7% | |
| | 964 | | | Allianz SE, (Registered) | | | 236,207 | |
| | 3,986 | | | Fresenius SE & Co. KGaA | | | 224,306 | |
| | 4,402 | | | SAP SE | | | 592,501 | |
| | 2,567 | | | Symrise AG | | | 269,814 | |
| | | | | | | | |
| | | | | | | 1,322,828 | |
| | | | | | | | |
| | | | Hong Kong — 3.8% | |
| | 62,000 | | | AIA Group Ltd. | | | 652,114 | |
| | | | | | | | |
| | | | Ireland — 3.8% | |
| | 6,140 | | | Kingspan Group PLC | | | 375,010 | |
| | 7,311 | | | Smurfit Kappa Group PLC | | | 281,891 | |
| | | | | | | | |
| | | | | | | 656,901 | |
| | | | | | | | |
| | | | Japan — 13.2% | |
| | 3,400 | | | Kao Corp. | | | 280,415 | |
| | 26,900 | | | Kubota Corp. | | | 422,417 | |
| | 17,500 | | | Sekisui House Ltd. | | | 373,710 | |
| | 800 | | | Shimano, Inc. | | | 129,785 | |
| | 9,000 | | | Takeda Pharmaceutical Co. Ltd. | | | 355,970 | |
See accompanying notes to financial statements.
| 24
Portfolio of Investments – as of December 31, 2019
Mirova International Sustainable Equity Fund – (continued)
| | | | | | | | |
| Shares | | | Description | | Value (†) | |
| | | | Japan — continued | |
| | 11,400 | | | Terumo Corp. | | $ | 404,407 | |
| | 3,600 | | | West Japan Railway Co. | | | 311,377 | |
| | | | | | | | |
| | | | | | | 2,278,081 | |
| | | | | | | | |
| | | | Netherlands — 5.0% | |
| | 339 | | | Adyen NV, 144A(a) | | | 278,860 | |
| | 1,988 | | | ASML Holding NV | | | 588,560 | |
| | | | | | | | |
| | | | | | | 867,420 | |
| | | | | | | | |
| | | | Norway — 0.7% | |
| | 6,695 | | | Telenor ASA | | | 120,012 | |
| | | | | | | | |
| | | | Switzerland — 1.7% | |
| | 507 | | | Geberit AG, (Registered) | | | 284,570 | |
| | | | | | | | |
| | | | Taiwan — 4.7% | |
| | 13,947 | | | Taiwan Semiconductor Manufacturing Co. Ltd., Sponsored ADR | | | 810,321 | |
| | | | | | | | |
| | | | United Kingdom — 15.7% | |
| | 4,229 | | | Croda International PLC | | | 287,270 | |
| | 15,106 | | | Halma PLC | | | 423,008 | |
| | 5,442 | | | Johnson Matthey PLC | | | 216,381 | |
| | 25,124 | | | Land Securities Group PLC | | | 329,791 | |
| | 155,379 | | | Legal & General Group PLC | | | 624,166 | |
| | 14,803 | | | Prudential PLC | | | 283,635 | |
| | 1,644 | | | Spirax-Sarco Engineering PLC | | | 193,521 | |
| | 5,990 | | | Unilever NV | | | 343,770 | |
| | | | | | | | |
| | | | | | | 2,701,542 | |
| | | | | | | | |
| | | | Total Common Stocks
(Identified Cost $13,260,927) | | | 16,152,318 | |
| | | | | | | | |
| | | | | | | | |
Principal
Amount | | | | |
| | Short-Term Investments — 0.6% | |
| $ | 113,256 | | | Tri-Party Repurchase Agreement with Fixed Income Clearing Corporation, dated 12/31/2019 at 0.900% to be repurchased at $113,262 on 1/02/2020 collateralized by $110,000 U.S. Treasury Note, 2.875% due 10/31/2023 valued at $115,523 including accrued interest (Note 2 of Notes to Financial Statements)
(Identified Cost $113,256) | | | 113,256 | |
| | | | | | | | |
| | | | Total Investments — 94.5%
(Identified Cost $13,374,183) | | | 16,265,574 | |
| | | | Other assets less liabilities — 5.5% | | | 940,639 | |
| | | | | | | | |
| | | | Net Assets — 100.0% | | $ | 17,206,213 | |
| | | | | | | | |
| | | | | | | | |
| | (†) | | | See Note 2 of Notes to Financial Statements. | |
| | (a) | | | Non-income producing security. | |
See accompanying notes to financial statements.
25 |
Portfolio of Investments – as of December 31, 2019
Mirova International Sustainable Equity Fund – (continued)
| | | | | | | | |
| | | | | | | | |
| | 144A | | | All or a portion of these securities are exempt from registration under Rule 144A of the Securities Act of 1933. These securities may be resold in transactions exempt from registration, normally to qualified institutional buyers. At December 31, 2019, the value of Rule 144A holdings amounted to $1,119,772 or 6.5% of net assets. | |
| | ADR | | | An American Depositary Receipt is a certificate issued by a custodian bank representing the right to receive securities of the foreign issuer described. The values of ADRs may be significantly influenced by trading on exchanges not located in the United States. | |
Industry Summary at December 31, 2019
| | | | |
Insurance | | | 10.4 | % |
Chemicals | | | 9.4 | |
Semiconductors & Semiconductor Equipment | | | 8.1 | |
Banks | | | 5.5 | |
Pharmaceuticals | | | 5.4 | |
Personal Products | | | 5.1 | |
Software | | | 5.0 | |
Building Products | | | 3.9 | |
Electric Utilities | | | 3.8 | |
Machinery | | | 3.6 | |
Electrical Equipment | | | 3.5 | |
Food Products | | | 3.0 | |
IT Services | | | 2.7 | |
Health Care Providers & Services | | | 2.7 | |
Electronic Equipment, Instruments & Components | | | 2.5 | |
Health Care Equipment & Supplies | | | 2.3 | |
Textiles, Apparel & Luxury Goods | | | 2.2 | |
Household Durables | | | 2.2 | |
Auto Components | | | 2.0 | |
Other Investments, less than 2% each | | | 10.6 | |
Short-Term Investments | | | 0.6 | |
| | | | |
Total Investments | | | 94.5 | |
Other assets less liabilities | | | 5.5 | |
| | | | |
Net Assets | | | 100.0 | % |
| | | | |
See accompanying notes to financial statements.
| 26
Portfolio of Investments – as of December 31, 2019
Mirova International Sustainable Equity Fund – (continued)
Currency Exposure Summary at December 31, 2019
| | | | |
Euro | | | 40.9 | % |
British Pound | | | 13.7 | |
Japanese Yen | | | 13.2 | |
Danish Krone | | | 12.6 | |
United States Dollar | | | 5.3 | |
Hong Kong Dollar | | | 3.8 | |
Australian Dollar | | | 2.6 | |
Other, less than 2% each | | | 2.4 | |
| | | | |
Total Investments | | | 94.5 | |
Other assets less liabilities | | | 5.5 | |
| | | | |
Net Assets | | | 100.0 | % |
| | | | |
See accompanying notes to financial statements.
27 |
This Page Intentionally Left Blank
| 28
Statements of Assets and Liabilities
December 31, 2019
| | | | | | | | | | | | |
| | | Mirova Global
Green Bond
Fund | | | Mirova Global
Sustainable
Equity Fund | | | Mirova
International
Sustainable
Equity Fund | |
ASSETS | |
Investments at cost | | $ | 34,350,693 | | | $ | 115,218,967 | | | $ | 13,374,183 | |
Net unrealized appreciation | | | 1,292,808 | | | | 29,675,196 | | | | 2,891,391 | |
| | | | | | | | | | | | |
Investments at value | | | 35,643,501 | | | | 144,894,163 | | | | 16,265,574 | |
Cash | | | — | | | | 13 | | | | — | |
Due from brokers (including variation margin on futures contracts) (Note 2) | | | 990,360 | | | | — | | | | — | |
Foreign currency at value (identified cost $362,104, $1,699,862 and $742,043, respectively) | | | 354,049 | | | | 1,722,991 | | | | 747,051 | |
Receivable for Fund shares sold | | | 180,274 | | | | 805,265 | | | | 209,574 | |
Receivable from investment adviser (Note 6) | | | — | | | | — | | | | 5,281 | |
Dividends and interest receivable | | | 232,824 | | | | 43,188 | | | | 21,018 | |
Tax reclaims receivable | | | 4,237 | | | | 92,454 | | | | 21,337 | |
Unrealized appreciation on futures contracts (Note 2) | | | 23,443 | | | | — | | | | — | |
Prepaid expenses (Note 8) | | | 2 | | | | 3 | | | | 1 | |
| | | | | | | | | | | | |
TOTAL ASSETS | | | 37,428,690 | | | | 147,558,077 | | | | 17,269,836 | |
| | | | | | | | | | | | |
LIABILITIES | |
Payable for Fund shares redeemed | | | 693 | | | | 46,471 | | | | — | |
Unrealized depreciation on futures contracts (Note 2) | | | 419,166 | | | | — | | | | — | |
Management fees payable (Note 6) | | | 9,737 | | | | 86,179 | | | | — | |
Deferred Trustees’ fees (Note 6) | | | 10,471 | | | | 17,110 | | | | 4,167 | |
Administrative fees payable (Note 6) | | | 1,377 | | | | 5,218 | | | | 623 | |
Payable to distributor (Note 6d) | | | 176 | | | | 1,233 | | | | — | |
Other accounts payable and accrued expenses | | | 55,761 | | | | 79,459 | | | | 58,833 | |
| | | | | | | | | | | | |
TOTAL LIABILITIES | | | 497,381 | | | | 235,670 | | | | 63,623 | |
| | | | | | | | | | | | |
NET ASSETS | | $ | 36,931,309 | | | $ | 147,322,407 | | | $ | 17,206,213 | |
| | | | | | | | | | | | |
NET ASSETS CONSIST OF: | |
Paid-in capital | | $ | 35,926,305 | | | $ | 116,839,781 | | | $ | 14,279,610 | |
Accumulated earnings | | | 1,005,004 | | | | 30,482,626 | | | | 2,926,603 | |
| | | | | | | | | | | | |
NET ASSETS | | $ | 36,931,309 | | | $ | 147,322,407 | | | $ | 17,206,213 | |
| | | | | | | | | | | | |
See accompanying notes to financial statements.
29 |
Statements of Assets and Liabilities (continued)
December 31, 2019
| | | | | | | | | | | | |
| | | Mirova Global
Green Bond
Fund | | | Mirova Global
Sustainable
Equity Fund | | | Mirova
International
Sustainable
Equity Fund | |
COMPUTATION OF NET ASSET VALUE AND OFFERING PRICE: | | | | | | | | | | | | |
Class A shares: | |
Net assets | | $ | 2,549,449 | | | $ | 12,884,430 | | | $ | 4,274 | |
| | | | | | | | | | | | |
Shares of beneficial interest | | | 246,103 | | | | 863,340 | | | | 342 | |
| | | | | | | | | | | | |
Net asset value and redemption price per share | | $ | 10.36 | | | $ | 14.92 | | | $ | 12.51 | * |
| | | | | | | | | | | | |
Offering price per share(100/[100-maximum sales charge] of net asset value) (Note 1) | | $ | 10.82 | | | $ | 15.83 | | | $ | 13.27 | |
| | | | | | | | | | | | |
Class C shares:(redemption price per share is equal to net asset value less any applicable contingent deferred sales charge) (Note 1) | | | | | | | | | | | | |
Net assets | | $ | — | | | $ | 5,406,343 | | | $ | — | |
| | | | | | | | | | | | |
Shares of beneficial interest | | | — | | | | 371,359 | | | | — | |
| | | | | | | | | | | | |
Net asset value and offering price per share | | $ | — | | | $ | 14.56 | | | $ | — | |
| | | | | | | | | | | | |
Class N shares: | |
Net assets | | $ | 27,322,006 | | | $ | 10,999,920 | | | $ | 17,193,418 | |
| | | | | | | | | | | | |
Shares of beneficial interest | | | 2,630,851 | | | | 733,898 | | | | 1,374,147 | |
| | | | | | | | | | | | |
Net asset value, offering and redemption price per share | | $ | 10.39 | | | $ | 14.99 | | | $ | 12.51 | |
| | | | | | | | | | | | |
Class Y shares: | |
Net assets | | $ | 7,059,854 | | | $ | 118,031,714 | | | $ | 8,521 | |
| | | | | | | | | | | | |
Shares of beneficial interest | | | 680,511 | | | | 7,872,271 | | | | 682 | |
| | | | | | | | | | | | |
Net asset value, offering and redemption price per share | | $ | 10.37 | | | $ | 14.99 | | | $ | 12.50 | * |
| | | | | | | | | | | | |
| * | Net asset value calculations have been determined utilizing fractional share and penny amounts. |
See accompanying notes to financial statements.
| 30
Statements of Operations
For the Year Ended December 31, 2019
| | | | | | | | | | | | |
| | | Mirova Global
Green Bond
Fund | | | Mirova Global
Sustainable
Equity Fund | | | Mirova
International
Sustainable
Equity Fund | |
INVESTMENT INCOME | |
Dividends | | $ | — | | | $ | 1,663,752 | | | $ | 354,756 | |
Interest | | | 589,746 | | | | 32,293 | | | | 79 | |
Less net foreign taxes withheld | | | — | | | | (139,099 | ) | | | (45,706 | ) |
| | | | | | | | | | | | |
| | | 589,746 | | | | 1,556,946 | | | | 309,129 | |
| | | | | | | | | | | | |
Expenses | |
Management fees (Note 6) | | | 177,527 | | | | 861,692 | | | | 108,299 | |
Service and distribution fees (Note 6) | | | 3,200 | | | | 58,815 | | | | 4 | |
Administrative fees (Note 6) | | | 14,205 | | | | 47,389 | | | | 5,955 | |
Trustees’ fees and expenses (Note 6) | | | 17,362 | | | | 20,348 | | | | 15,800 | |
Transfer agent fees and expenses (Notes 6 and 7) | | | 11,327 | | | | 78,857 | | | | 2,674 | |
Audit and tax services fees | | | 42,384 | | | | 41,995 | | | | 41,979 | |
Custodian fees and expenses | | | 10,946 | | | | 20,201 | | | | 11,664 | |
Interest expense (Note 10) | | | 2,826 | | | | 5,838 | | | | 2,633 | |
Legal fees (Note 8) | | | 850 | | | | 2,778 | | | | 349 | |
Registration fees | | | 53,770 | | | | 76,626 | | | | 56,210 | |
Shareholder reporting expenses | | | 3,624 | | | | 41,017 | | | | 7,797 | |
Miscellaneous expenses (Note 8) | | | 23,264 | | | | 28,691 | | | | 18,748 | |
| | | | | | | | | | | | |
Total expenses | | | 361,285 | | | | 1,284,247 | | | | 272,112 | |
Less waiver and/or expense reimbursement (Note 6) | | | (142,850 | ) | | | (198,421 | ) | | | (147,637 | ) |
| | | | | | | | | | | | |
Net expenses | | | 218,435 | | | | 1,085,826 | | | | 124,475 | |
| | | | | | | | | | | | |
Net investment income | | | 371,311 | | | | 471,120 | | | | 184,654 | |
| | | | | | | | | | | | |
NET REALIZED AND UNREALIZED GAIN (LOSS) ON INVESTMENTS, FUTURES CONTRACTS AND FOREIGN CURRENCY TRANSACTIONS | | | | | | | | | | | | |
Net realized gain (loss) on: | |
Investments | | | 86,497 | | | | 1,868,058 | | | | 34,369 | |
Futures contracts | | | 934,579 | | | | — | | | | — | |
Foreign currency transactions (Note 2c) | | | (21,069 | ) | | | 921 | | | | 7,604 | |
Net change in unrealized appreciation (depreciation) on: | |
Investments | | | 1,587,231 | | | | 27,289,082 | | | | 2,861,020 | |
Futures contracts | | | (340,762 | ) | | | — | | | | — | |
Foreign currency translations (Note 2c) | | | 9,587 | | | | 22,251 | | | | 187 | |
| | | | | | | | | | | | |
Net realized and unrealized gain on investments, futures contracts and foreign currency transactions | | | 2,256,063 | | | | 29,180,312 | | | | 2,903,180 | |
| | | | | | | | | | | | |
NET INCREASE IN NET ASSETS RESULTING FROM OPERATIONS | | $ | 2,627,374 | | | $ | 29,651,432 | | | $ | 3,087,834 | |
| | | | | | | | | | | | |
See accompanying notes to financial statements.
31 |
Statements of Changes in Net Assets
| | | | | | | | |
| | | Mirova Global Green
Bond Fund | |
| | | Year Ended
December 31,
2019 | | | Year Ended
December 31,
2018 | |
FROM OPERATIONS: | |
Net investment income | | $ | 371,311 | | | $ | 310,130 | |
Net realized gain on investments, futures contracts and foreign currency transactions | | | 1,000,007 | | | | 1,457,603 | |
Net change in unrealized appreciation (depreciation) on investments, futures contracts and foreign currency translations | | | 1,256,056 | | | | (1,486,601 | ) |
| | | | | | | | |
Net increase in net assets resulting from operations | | | 2,627,374 | | | | 281,132 | |
| | | | | | | | |
FROM DISTRIBUTIONS TO SHAREHOLDERS: | |
Class A | | | (48,042 | ) | | | (25,878 | ) |
Class N | | | (686,274 | ) | | | (914,209 | ) |
Class Y | | | (140,394 | ) | | | (25,543 | ) |
| | | | | | | | |
Total distributions | | | (874,710 | ) | | | (965,630 | ) |
| | | | | | | | |
NET INCREASE IN NET ASSETS FROM CAPITAL SHARE TRANSACTIONS (NOTE 12) | | | 6,110,172 | | | | 3,764,971 | |
| | | | | | | | |
Net increase in net assets | | | 7,862,836 | | | | 3,080,473 | |
NET ASSETS | |
Beginning of the year | | | 29,068,473 | | | | 25,988,000 | |
| | | | | | | | |
End of the year | | $ | 36,931,309 | | | $ | 29,068,473 | |
| | | | | | | | |
See accompanying notes to financial statements.
| 32
Statements of Changes in Net Assets (continued)
| | | | | | | | |
| | | Mirova Global Sustainable
Equity Fund | |
| | | Year Ended
December 31,
2019 | | | Year Ended
December 31,
2018 | |
FROM OPERATIONS: | |
Net investment income | | $ | 471,120 | | | $ | 216,571 | |
Net realized gain on investments and foreign currency transactions | | | 1,868,979 | | | | 3,491,955 | |
Net change in unrealized appreciation (depreciation) on investments and foreign currency translations | | | 27,311,333 | | | | (10,610,033 | ) |
| | | | | | | | |
Net increase (decrease) in net assets resulting from operations | | | 29,651,432 | | | | (6,901,507 | ) |
| | | | | | | | |
FROM DISTRIBUTIONS TO SHAREHOLDERS: | |
Class A | | | (181,226 | ) | | | (230,293 | ) |
Class C | | | (68,161 | ) | | | (99,367 | ) |
Class N | | | (139,240 | ) | | | (102,891 | ) |
Class Y | | | (1,933,861 | ) | | | (2,994,214 | ) |
| | | | | | | | |
Total distributions | | | (2,322,488 | ) | | | (3,426,765 | ) |
| | | | | | | | |
NET INCREASE IN NET ASSETS FROM CAPITAL SHARE TRANSACTIONS (NOTE 12) | | | 38,380,676 | | | | 24,155,904 | |
| | | | | | | | |
Net increase in net assets | | | 65,709,620 | | | | 13,827,632 | |
NET ASSETS | |
Beginning of the year | | | 81,612,787 | | | | 67,785,155 | |
| | | | | | | | |
End of the year | | $ | 147,322,407 | | | $ | 81,612,787 | |
| | | | | | | | |
See accompanying notes to financial statements.
33 |
Statements of Changes in Net Assets (continued)
| | | | | | | | |
| | | Mirova International
Sustainable Equity Fund | |
| | | Year Ended
December 31,
2019 | | | Period Ended
December 31,
2018(a) | |
FROM OPERATIONS: | |
Net investment income (loss) | | $ | 184,654 | | | $ | (740 | ) |
Net realized gain on investments and foreign currency transactions | | | 41,973 | | | | — | |
Net change in unrealized appreciation (depreciation) on investments and foreign currency translations | | | 2,861,207 | | | | 35,530 | |
| | | | | | | | |
Net increase in net assets resulting from operations | | | 3,087,834 | | | | 34,790 | |
| | | | | | | | |
FROM DISTRIBUTIONS TO SHAREHOLDERS: | |
Class A | | | (12 | ) | | | — | |
Class N | | | (205,624 | ) | | | — | |
Class Y | | | (86 | ) | | | — | |
| | | | | | | | |
Total distributions | | | (205,722 | ) | | | — | |
| | | | | | | | |
NET INCREASE IN NET ASSETS FROM CAPITAL SHARE TRANSACTIONS (NOTE 12) | | | 4,287,311 | | | | 10,002,000 | |
| | | | | | | | |
Net increase in net assets | | | 7,169,423 | | | | 10,036,790 | |
NET ASSETS | |
Beginning of the year | | | 10,036,790 | | | | — | |
| | | | | | | | |
End of the year | | $ | 17,206,213 | | | $ | 10,036,790 | |
| | | | | | | | |
| (a) | From commencement of operations on December 28, 2018 through December 31, 2018. |
See accompanying notes to financial statements.
| 34
Financial Highlights
For a share outstanding throughout each period.
| | | | | | | | | | | | |
| | |
Mirova Global Green Bond—Class A | |
| | | Year Ended
December 31,
2019 | | | Year Ended
December 31,
2018 | | | Period Ended
December 31,
2017* | |
Net asset value, beginning of the period | | $ | 9.71 | | | $ | 9.96 | | | $ | 10.00 | |
| | | | | | | | | | | | |
INCOME (LOSS) FROM INVESTMENT OPERATIONS: | | | | | | | | | | | | |
Net investment income(a) | | | 0.09 | | | | 0.08 | | | | 0.04 | |
Net realized and unrealized gain (loss) | | | 0.80 | | | | (0.02 | ) | | | 0.11 | |
| | | | | | | | | | | | |
Total from Investment Operations | | | 0.89 | | | | 0.06 | | | | 0.15 | |
| | | | | | | | | | | | |
LESS DISTRIBUTIONS FROM: | | | | | | | | | | | | |
Net investment income | | | (0.10 | ) | | | (0.31 | ) | | | (0.19 | ) |
Net realized capital gains | | | (0.14 | ) | | | — | | | | — | |
| | | | | | | | | | | | |
Total Distributions | | | (0.24 | ) | | | (0.31 | ) | | | (0.19 | ) |
| | | | | | | | | | | | |
Net asset value, end of the period | | $ | 10.36 | | | $ | 9.71 | | | $ | 9.96 | |
| | | | | | | | | | | | |
Total return(b)(c) | | | 9.16 | % | | | 0.64 | % | | | 1.46 | %(d) |
RATIOS TO AVERAGE NET ASSETS: | | | | | | | | | | | | |
Net assets, end of the period (000’s) | | $ | 2,549 | | | $ | 814 | | | $ | 139 | |
Net expenses(e) | | | 0.96 | %(f) | | | 0.96 | %(g) | | | 0.96 | %(h)(i) |
Gross expenses | | | 1.56 | %(f) | | | 1.75 | %(g) | | | 5.23 | %(h)(i) |
Net investment income | | | 0.86 | % | | | 0.85 | % | | | 0.49 | %(i) |
Portfolio turnover rate | | | 25 | % | | | 46 | % | | | 46 | % |
| * | From commencement of operations on February 28, 2017 through December 31, 2017. |
| (a) | Per share net investment income has been calculated using the average shares outstanding during the period. |
| (b) | A sales charge for Class A shares is not reflected in total return calculations. |
| (c) | Had certain expenses not been waived/reimbursed during the period, total returns would have been lower. |
| (d) | Periods less than one year are not annualized. |
| (e) | The investment adviser agreed to waive its fees and/or reimburse a portion of the Fund’s expenses during the period. Without this waiver/reimbursement, expenses would have been higher. |
| (f) | Includes interest expense. Without this expense the ratio of net expenses would have been 0.95% and the ratio of gross expenses would have been 1.55%. |
| (g) | Includes interest expense. Without this expense the ratio of net expenses would have been 0.95% and the ratio of gross expenses would have been 1.74%. |
| (h) | Includes interest expense. Without this expense the ratio of net expenses would have been 0.95% and the ratio of gross expenses would have been 5.22%. |
| (i) | Computed on an annualized basis for periods less than one year. |
See accompanying notes to financial statements.
35 |
Financial Highlights (continued)
For a share outstanding throughout each period.
| | | | | | | | | | | | |
| | |
Mirova Global Green Bond—Class N | |
| | | Year Ended
December 31,
2019 | | | Year Ended
December 31,
2018 | | | Period Ended
December 31,
2017* | |
Net asset value, beginning of the period | | $ | 9.73 | | | $ | 9.98 | | | $ | 10.00 | |
| | | | | | | | | | | | |
INCOME (LOSS) FROM INVESTMENT OPERATIONS: | | | | | | | | | | | | |
Net investment income(a) | | | 0.12 | | | | 0.11 | | | | 0.06 | |
Net realized and unrealized gain (loss) | | | 0.80 | | | | (0.02 | ) | | | 0.12 | |
| | | | | | | | | | | | |
Total from Investment Operations | | | 0.92 | | | | 0.09 | | | | 0.18 | |
| | | | | | | | | | | | |
LESS DISTRIBUTIONS FROM: | | | | | | | | | | | | |
Net investment income | | | (0.12 | ) | | | (0.34 | ) | | | (0.20 | ) |
Net realized capital gains | | | (0.14 | ) | | | — | | | | — | |
| | | | | | | | | | | | |
Total Distributions | | | (0.26 | ) | | | (0.34 | ) | | | (0.20 | ) |
| | | | | | | | | | | | |
Net asset value, end of the period | | $ | 10.39 | | | $ | 9.73 | | | $ | 9.98 | |
| | | | | | | | | | | | |
Total return(b) | | | 9.52 | % | | | 0.93 | % | | | 1.77 | %(c) |
RATIOS TO AVERAGE NET ASSETS: | | | | | | | | | | | | |
Net assets, end of the period (000’s) | | $ | 27,322 | | | $ | 27,050 | | | $ | 25,805 | |
Net expenses(d) | | | 0.66 | %(e) | | | 0.66 | %(f) | | | 0.67 | %(g)(h) |
Gross expenses | | | 1.08 | %(e) | | | 1.12 | %(f) | | | 1.11 | %(g)(h) |
Net investment income | | | 1.17 | % | | | 1.13 | % | | | 0.75 | %(h) |
Portfolio turnover rate | | | 25 | % | | | 46 | % | | | 46 | % |
| * | From commencement of operations on February 28, 2017 through December 31, 2017. |
| (a) | Per share net investment income has been calculated using the average shares outstanding during the period. |
| (b) | Had certain expenses not been waived/reimbursed during the period, total returns would have been lower. |
| (c) | Periods less than one year are not annualized. |
| (d) | The investment adviser agreed to waive its fees and/or reimburse a portion of the Fund’s expenses during the period. Without this waiver/reimbursement, expenses would have been higher. |
| (e) | Includes interest expense. Without this expense the ratio of net expenses would have been 0.65% and the ratio of gross expenses would have been 1.07%. |
| (f) | Includes interest expense. Without this expense the ratio of net expenses would have been 0.65% and the ratio of gross expenses would have been 1.11%. |
| (g) | Includes interest expense. Without this expense the ratio of net expenses would have been 0.65% and the ratio of gross expenses would have been 1.10%. |
| (h) | Computed on an annualized basis for periods less than one year. |
See accompanying notes to financial statements.
| 36
Financial Highlights (continued)
For a share outstanding throughout each period.
| | | | | | | | | | | | |
| | |
Mirova Global Green Bond—Class Y | |
| | | Year Ended
December 31,
2019 | | | Year Ended
December 31,
2018 | | | Period Ended
December 31,
2017* | |
Net asset value, beginning of the period | | $ | 9.72 | | | $ | 9.97 | | | $ | 10.00 | |
| | | | | | | | | | | | |
INCOME (LOSS) FROM INVESTMENT OPERATIONS: | | | | | | | | | | | | |
Net investment income(a) | | | 0.11 | | | | 0.12 | | | | 0.06 | |
Net realized and unrealized gain (loss) | | | 0.80 | | | | (0.03 | ) | | | 0.11 | |
| | | | | | | | | | | | |
Total from Investment Operations | | | 0.91 | | | | 0.09 | | | | 0.17 | |
| | | | | | | | | | | | |
LESS DISTRIBUTIONS FROM: | | | | | | | | | | | | |
Net investment income | | | (0.12 | ) | | | (0.34 | ) | | | (0.20 | ) |
Net realized capital gains | | | (0.14 | ) | | | — | | | | — | |
| | | | | | | | | | | | |
Total Distributions | | | (0.26 | ) | | | (0.34 | ) | | | (0.20 | ) |
| | | | | | | | | | | | |
Net asset value, end of the period | | $ | 10.37 | | | $ | 9.72 | | | $ | 9.97 | |
| | | | | | | | | | | | |
Total return(b) | | | 9.38 | % | | | 0.89 | % | | | 1.66 | %(c) |
RATIOS TO AVERAGE NET ASSETS: | | | | | | | | | | | | |
Net assets, end of the period (000’s) | | $ | 7,060 | | | $ | 1,205 | | | $ | 43 | |
Net expenses(d) | | | 0.71 | %(e) | | | 0.71 | %(f) | | | 0.71 | %(g)(h) |
Gross expenses | | | 1.28 | %(e) | | | 1.39 | %(f) | | | 3.62 | %(g)(h) |
Net investment income | | | 1.10 | % | | | 1.19 | % | | | 0.71 | %(h) |
Portfolio turnover rate | | | 25 | % | | | 46 | % | | | 46 | % |
| * | From commencement of operations on February 28, 2017 through December 31, 2017. |
| (a) | Per share net investment income has been calculated using the average shares outstanding during the period. |
| (b) | Had certain expenses not been waived/reimbursed during the period, total returns would have been lower. |
| (c) | Periods less than one year are not annualized. |
| (d) | The investment adviser agreed to waive its fees and/or reimburse a portion of the Fund’s expenses during the period. Without this waiver/reimbursement, expenses would have been higher. |
| (e) | Includes interest expense. Without this expense the ratio of net expenses would have been 0.70% and the ratio of gross expenses would have been 1.27%. |
| (f) | Includes interest expense. Without this expense the ratio of net expenses would have been 0.70% and the ratio of gross expenses would have been 1.39%. |
| (g) | Includes interest expense. Without this expense the ratio of net expenses would have been 0.70% and the ratio of gross expenses would have been 3.62%. |
| (h) | Computed on an annualized basis for periods less than one year. |
See accompanying notes to financial statements.
37 |
Financial Highlights (continued)
For a share outstanding throughout each period.
| | | | | | | | | | | | | | | | |
| | |
Mirova Global Sustainable Equity Fund—Class A | |
| | | Year Ended
December 31,
2019 | | | Year Ended
December 31,
2018 | | | Year Ended
December 31,
2017 | | | Period Ended
December 31,
2016* | |
Net asset value, beginning of the period | | $ | 11.45 | | | $ | 12.77 | | | $ | 9.90 | | | $ | 10.00 | |
| | | | | | | | | | | | | | | | |
INCOME (LOSS) FROM INVESTMENT OPERATIONS: | | | | | | | | | | | | | | | | |
Net investment income (loss)(a) | | | 0.03 | | | | 0.00 | (b) | | | (0.04 | ) | | | 0.02 | |
Net realized and unrealized gain (loss) | | | 3.69 | | | | (0.84 | ) | | | 3.06 | | | | (0.11 | ) |
| | | | | | | | | | | | | | | | |
Total from Investment Operations | | | 3.72 | | | | (0.84 | ) | | | 3.02 | | | | (0.09 | ) |
| | | | | | | | | | | | | | | | |
LESS DISTRIBUTIONS FROM: | | | | | | | | | | | | | | | | |
Net investment income | | | (0.03 | ) | | | (0.00 | )(b) | | | (0.03 | ) | | | (0.00 | )(b) |
Net realized capital gains | | | (0.22 | ) | | | (0.48 | ) | | | (0.12 | ) | | | (0.01 | ) |
| | | | | | | | | | | | | | | | |
Total Distributions | | | (0.25 | ) | | | (0.48 | ) | | | (0.15 | ) | | | (0.01 | ) |
| | | | | | | | | | | | | | | | |
Net asset value, end of the period | | $ | 14.92 | | | $ | 11.45 | | | $ | 12.77 | | | $ | 9.90 | |
| | | | | | | | | | | | | | | | |
Total return(c)(d) | | | 32.63 | % | | | (6.54 | )% | | | 30.44 | % | | | (0.85 | )%(e) |
RATIOS TO AVERAGE NET ASSETS: | | | | | | | | | | | | | | | | |
Net assets, end of the period (000’s) | | $ | 12,884 | | | $ | 6,360 | | | $ | 3,260 | | | $ | 71 | |
Net expenses(f) | | | 1.21 | %(g) | | | 1.30 | %(h)(i) | | | 1.29 | % | | | 1.30 | %(j) |
Gross expenses | | | 1.39 | %(g) | | | 1.39 | %(i) | | | 1.43 | % | | | 1.72 | %(j) |
Net investment income (loss) | | | 0.21 | % | | | 0.03 | % | | | (0.36 | )% | | | 0.23 | %(j) |
Portfolio turnover rate | | | 23 | % | | | 19 | % | | | 20 | % | | | 20 | % |
| * | From commencement of operations on March 31, 2016 through December 31, 2016. |
| (a) | Per share net investment income (loss) has been calculated using the average shares outstanding during the period. |
| (b) | Amount rounds to less than $0.01 per share. |
| (c) | A sales charge for Class A shares is not reflected in total return calculations. |
| (d) | Had certain expenses not been waived/reimbursed during the period, total returns would have been lower. |
| (e) | Periods less than one year are not annualized. |
| (f) | The investment adviser agreed to waive its fees and/or reimburse a portion of the Fund’s expenses during the period. Without this waiver/reimbursement, expenses would have been higher. |
| (g) | Includes interest expense. Without this expense the ratio of net expenses would have been 1.20% and the ratio of gross expenses would have been 1.38%. |
| (h) | Effective December 28, 2018, the expense limit decreased from 1.30% to 1.20%. |
| (i) | Includes interest expense of less than 0.01%. |
| (j) | Computed on an annualized basis for periods less than one year. |
See accompanying notes to financial statements.
| 38
Financial Highlights (continued)
For a share outstanding throughout each period.
| | | | | | | | | | | | | | | | |
| | |
Mirova Global Sustainable Equity Fund—Class C | |
| | | Year Ended
December 31,
2019 | | | Year Ended
December 31,
2018 | | | Year Ended
December 31,
2017 | | | Period Ended
December 31,
2016* | |
Net asset value, beginning of the period | | $ | 11.24 | | | $ | 12.63 | | | $ | 9.85 | | | $ | 10.00 | |
| | | | | | | | | | | | | | | | |
INCOME (LOSS) FROM INVESTMENT OPERATIONS: | | | | | | | | | | | | | | | | |
Net investment loss(a) | | | (0.07 | ) | | | (0.09 | ) | | | (0.12 | ) | | | (0.06 | ) |
Net realized and unrealized gain (loss) | | | 3.61 | | | | (0.82 | ) | | | 3.02 | | | | (0.08 | ) |
| | | | | | | | | | | | | | | | |
Total from Investment Operations | | | 3.54 | | | | (0.91 | ) | | | 2.90 | | | | (0.14 | ) |
| | | | | | | | | | | | | | | | |
LESS DISTRIBUTIONS FROM: | | | | | | | | | | | | | | | | |
Net realized capital gains | | | (0.22 | ) | | | (0.48 | ) | | | (0.12 | ) | | | (0.01 | ) |
| | | | | | | | | | | | | | | | |
Net asset value, end of the period | | $ | 14.56 | | | $ | 11.24 | | | $ | 12.63 | | | $ | 9.85 | |
| | | | | | | | | | | | | | | | |
Total return(b)(c) | | | 31.66 | % | | | (7.20 | )% | | | 29.40 | % | | | (1.39 | )%(d) |
RATIOS TO AVERAGE NET ASSETS: | | | | | | | | | | | | | | | | |
Net assets, end of the period (000’s) | | $ | 5,406 | | | $ | 2,706 | | | $ | 1,164 | | | $ | 52 | |
Net expenses(e) | | | 1.96 | %(f) | | | 2.05 | %(g)(h) | | | 2.04 | % | | | 2.05 | %(i) |
Gross expenses | | | 2.14 | %(f) | | | 2.14 | %(g) | | | 2.18 | % | | | 2.20 | %(i) |
Net investment loss | | | (0.52 | )% | | | (0.72 | )% | | | (1.02 | )% | | | (0.77 | )%(i) |
Portfolio turnover rate | | | 23 | % | | | 19 | % | | | 20 | % | | | 20 | % |
| * | From commencement of operations on March 31, 2016 through December 31, 2016. |
| (a) | Per share net investment loss has been calculated using the average shares outstanding during the period. |
| (b) | A contingent deferred sales charge for Class C shares is not reflected in total return calculations. |
| (c) | Had certain expenses not been waived/reimbursed during the period, total returns would have been lower. |
| (d) | Periods less than one year are not annualized. |
| (e) | The investment adviser agreed to waive its fees and/or reimburse a portion of the Fund’s expenses during the period. Without this waiver/reimbursement, expenses would have been higher. |
| (f) | Includes interest expense. Without this expense the ratio of net expenses would have been 1.95% and the ratio of gross expenses would have been 2.13%. |
| (g) | Includes interest expense of less than 0.01%. |
| (h) | Effective December 28, 2018, the expense limit decreased from 2.05% to 1.95%. |
| (i) | Computed on an annualized basis for periods less than one year. |
See accompanying notes to financial statements.
39 |
Financial Highlights (continued)
For a share outstanding throughout each period.
| | | | | | | | | | | | |
| | |
Mirova Global Sustainable Equity
Fund—Class N | |
| | | Year Ended
December 31,
2019 | | | Year Ended
December 31,
2018 | | | Period Ended
December 31,
2017* | |
Net asset value, beginning of the period | | $ | 11.49 | | | $ | 12.81 | | | $ | 11.29 | |
| | | | | | | | | | | | |
INCOME (LOSS) FROM INVESTMENT OPERATIONS: | | | | | | | | | | | | |
Net investment income (loss)(a) | | | 0.06 | | | | (0.01 | ) | | | 0.02 | |
Net realized and unrealized gain (loss) | | | 3.72 | | | | (0.79 | ) | | | 1.66 | |
| | | | | | | | | | | | |
Total from Investment Operations | | | 3.78 | | | | (0.80 | ) | | | 1.68 | |
| | | | | | | | | | | | |
LESS DISTRIBUTIONS FROM: | | | | | | | | | | | | |
Net investment income | | | (0.06 | ) | | | (0.04 | ) | | | (0.04 | ) |
Net realized capital gains | | | (0.22 | ) | | | (0.48 | ) | | | (0.12 | ) |
| | | | | | | | | | | | |
Total Distributions | | | (0.28 | ) | | | (0.52 | ) | | | (0.16 | ) |
| | | | | | | | | | | | |
Net asset value, end of the period | | $ | 14.99 | | | $ | 11.49 | | | $ | 12.81 | |
| | | | | | | | | | | | |
Total return(b) | | | 33.05 | % | | | (6.26 | )% | | | 14.81 | %(c) |
RATIOS TO AVERAGE NET ASSETS: | | | | | | | | | | | | |
Net assets, end of the period (000’s) | | $ | 11,000 | | | $ | 2,842 | | | $ | 1 | |
Net expenses(d) | | | 0.90 | %(e) | | | 1.01 | %(f)(g) | | | 1.00 | %(h) |
Gross expenses | | | 1.08 | %(e) | | | 1.08 | %(g) | | | 14.30 | %(h) |
Net investment income (loss) | | | 0.46 | % | | | (0.08 | )% | | | 0.29 | %(h) |
Portfolio turnover rate | | | 23 | % | | | 19 | % | | | 20 | %(i) |
| * | From commencement of Class operations on May 1, 2017 through December 31, 2017. |
| (a) | Per share net investment income (loss) has been calculated using the average shares outstanding during the period. |
| (b) | Had certain expenses not been waived/reimbursed during the period, total returns would have been lower. |
| (c) | Periods less than one year are not annualized. |
| (d) | The investment adviser agreed to waive its fees and/or reimburse a portion of the Fund’s expenses during the period. Without this waiver/reimbursement, expenses would have been higher. |
| (e) | Includes interest expense of less than 0.01%. |
| (f) | Effective December 28, 2018, the expense limit decreased from 1.00% to 0.90%. |
| (g) | Includes interest expense. Without this expense the ratio of net expenses would have been 0.99% and the ratio of gross expenses would have been 1.07%. |
| (h) | Computed on an annualized basis for periods less than one year. |
| (i) | Represents the Fund’s portfolio turnover rate for the year ended December 31, 2017. |
See accompanying notes to financial statements.
| 40
Financial Highlights (continued)
For a share outstanding throughout each period.
| | | | | | | | | | | | | | | | |
| | |
Mirova Global Sustainable Equity Fund—Class Y | |
| | | Year Ended
December 31,
2019 | | | Year Ended
December 31,
2018 | | | Year Ended
December 31,
2017 | | | Period Ended
December 31,
2016* | |
Net asset value, beginning of the period | | $ | 11.49 | | | $ | 12.81 | | | $ | 9.91 | | | $ | 10.00 | |
| | | | | | | | | | | | | | | | |
INCOME (LOSS) FROM INVESTMENT OPERATIONS: | | | | | | | | | | | | | | | | |
Net investment income(a) | | | 0.07 | | | | 0.04 | | | | 0.03 | | | | 0.03 | |
Net realized and unrealized gain (loss) | | | 3.70 | | | | (0.85 | ) | | | 3.02 | | | | (0.10 | ) |
| | | | | | | | | | | | | | | | |
Total from Investment Operations | | | 3.77 | | | | (0.81 | ) | | | 3.05 | | | | (0.07 | ) |
| | | | | | | | | | | | | | | | |
LESS DISTRIBUTIONS FROM: | | | | | | | | | | | | | | | | |
Net investment income | | | (0.05 | ) | | | (0.03 | ) | | | (0.03 | ) | | | (0.01 | ) |
Net realized capital gains | | | (0.22 | ) | | | (0.48 | ) | | | (0.12 | ) | | | (0.01 | ) |
| | | | | | | | | | | | | | | | |
Total Distributions | | | (0.27 | ) | | | (0.51 | ) | | | (0.15 | ) | | | (0.02 | ) |
| | | | | | | | | | | | | | | | |
Net asset value, end of the period | | $ | 14.99 | | | $ | 11.49 | | | $ | 12.81 | | | $ | 9.91 | |
| | | | | | | | | | | | | | | | |
Total return(b) | | | 32.99 | % | | | (6.32 | )% | | | 30.75 | % | | | (0.70 | )%(c) |
RATIOS TO AVERAGE NET ASSETS: | | | | | | | | | | | | | | | | |
Net assets, end of the period (000’s) | | $ | 118,032 | | | $ | 69,705 | | | $ | 63,359 | | | $ | 49,593 | |
Net expenses(d) | | | 0.96 | %(e) | | | 1.05 | %(f)(g) | | | 1.04 | % | | | 1.05 | %(h) |
Gross expenses | | | 1.14 | %(e) | | | 1.15 | %(f) | | | 1.16 | % | | | 1.21 | %(h) |
Net investment income | | | 0.50 | % | | | 0.29 | % | | | 0.26 | % | | | 0.35 | %(h) |
Portfolio turnover rate | | | 23 | % | | | 19 | % | | | 20 | % | | | 20 | % |
| * | From commencement of operations on March 31, 2016 through December 31, 2016. |
| (a) | Per share net investment income has been calculated using the average shares outstanding during the period. |
| (b) | Had certain expenses not been waived/reimbursed during the period, total returns would have been lower. |
| (c) | Periods less than one year are not annualized. |
| (d) | The investment adviser agreed to waive its fees and/or reimburse a portion of the Fund’s expenses during the period. Without this waiver/reimbursement, expenses would have been higher. |
| (e) | Includes interest expense. Without this expense the ratio of net expenses would have been 0.95% and the ratio of gross expenses would have been 1.13%. |
| (f) | Includes interest expense of less than 0.01%. |
| (g) | Effective December 28, 2018, the expense limit decreased from 1.05% to 0.95%. |
| (h) | Computed on an annualized basis for periods less than one year. |
See accompanying notes to financial statements.
41 |
Financial Highlights (continued)
For a share outstanding throughout each period.
| | | | | | | | |
| | | Mirova International
Sustainable Equity
Fund—Class A | |
| | | Year Ended
December 31,
2019 | | | Period Ended
December 31,
2018* | |
Net asset value, beginning of the period | | $ | 10.03 | | | $ | 10.00 | |
| | | | | | | | |
INCOME (LOSS) FROM INVESTMENT OPERATIONS: | | | | | | | | |
Net investment income (loss)(a) | | | 0.12 | | | | (0.00 | )(b) |
Net realized and unrealized gain (loss) | | | 2.48 | | | | 0.03 | |
| | | | | | | | |
Total from Investment Operations | | | 2.60 | | | | 0.03 | |
| | | | | | | | |
LESS DISTRIBUTIONS FROM: | | | | | | | | |
Net investment income | | | (0.12 | ) | | | — | |
| | | | | | | | |
Net asset value, end of the period | | $ | 12.51 | | | $ | 10.03 | |
| | | | | | | | |
Total return(c)(d) | | | 25.97 | %(e) | | | 0.30 | %(f) |
RATIOS TO AVERAGE NET ASSETS: | | | | | | | | |
Net assets, end of the period (000’s) | | $ | 4 | | | $ | 1 | |
Net expenses(g) | | | 1.21 | %(h) | | | 1.20 | %(i) |
Gross expenses | | | 107.91 | %(h) | | | 22.87 | %(i) |
Net investment income (loss) | | | 1.09 | % | | | (1.20 | )%(i) |
Portfolio turnover rate | | | 8 | % | | | 0 | % |
| * | From commencement of operations on December 28, 2018 through December 31, 2018. |
| (a) | Per share net investment income (loss) has been calculated using the average shares outstanding during the period. |
| (b) | Amount rounds to less than $0.01 per share. |
| (c) | A sales charge for Class A shares is not reflected in total return calculations. |
| (d) | Had certain expenses not been waived/reimbursed during the period, total returns would have been lower. |
| (e) | Generally accepted accounting principles require certain adjustments to be made to the net assets of the Fund for financial reporting purposes only, and as such, the total returns based on the adjusted net asset values per share may differ from the total returns reported in the average annual total return table. |
| (f) | Periods less than one year are not annualized. |
| (g) | The investment adviser agreed to waive its fees and/or reimburse a portion of the Fund’s expenses during the period. Without this waiver/reimbursement, expenses would have been higher. |
| (h) | Includes interest expense. Without this expense the ratio of net expenses would have been 1.20% and the ratio of gross expenses would have been 107.90%. |
| (i) | Computed on an annualized basis for periods less than one year. |
See accompanying notes to financial statements.
| 42
Financial Highlights (continued)
For a share outstanding throughout each period.
| | | | | | | | |
| | | Mirova International
Sustainable Equity
Fund—Class N | |
| | | Year Ended
December 31,
2019
| | | Period Ended
December 31,
2018*
| |
Net asset value, beginning of the period | | $ | 10.03 | | | $ | 10.00 | |
| | | | | | | | |
INCOME (LOSS) FROM INVESTMENT OPERATIONS: | | | | | | | | |
Net investment income (loss)(a) | | | 0.15 | | | | (0.00 | )(b) |
Net realized and unrealized gain (loss) | | | 2.49 | | | | 0.03 | |
| | | | | | | | |
Total from Investment Operations | | | 2.64 | | | | 0.03 | |
| | | | | | | | |
LESS DISTRIBUTIONS FROM: | | | | | | | | |
Net investment income | | | (0.16 | ) | | | — | |
| | | | | | | | |
Net asset value, end of the period | | $ | 12.51 | | | $ | 10.03 | |
| | | | | | | | |
Total return(c) | | | 26.31 | %(d) | | | 0.30 | %(e) |
RATIOS TO AVERAGE NET ASSETS: | | | | | | | | |
Net assets, end of the period (000’s) | | $ | 17,193 | | | $ | 10,035 | |
Net expenses(f) | | | 0.92 | %(g) | | | 0.90 | %(h) |
Gross expenses | | | 1.99 | %(g) | | | 22.55 | %(h) |
Net investment income (loss) | | | 1.36 | % | | | (0.90 | )%(h) |
Portfolio turnover rate | | | 8 | % | | | 0 | % |
| * | From commencement of operations on December 28, 2018 through December 31, 2018. |
| (a) | Per share net investment income (loss) has been calculated using the average shares outstanding during the period. |
| (b) | Amount rounds to less than $0.01 per share. |
| (c) | Had certain expenses not been waived/reimbursed during the period, total returns would have been lower. |
| (d) | Generally accepted accounting principles require certain adjustments to be made to the net assets of the Fund for financial reporting purposes only, and as such, the total returns based on the adjusted net asset values per share may differ from the total returns reported in the average annual total return table. |
| (e) | Periods less than one year are not annualized. |
| (f) | The investment adviser agreed to waive its fees and/or reimburse a portion of the Fund’s expenses during the period. Without this waiver/reimbursement, expenses would have been higher. |
| (g) | Includes interest expense. Without this expense the ratio of net expenses would have been 0.90% and the ratio of gross expenses would have been 1.97%. |
| (h) | Computed on an annualized basis for periods less than one year. |
See accompanying notes to financial statements.
43 |
Financial Highlights (continued)
For a share outstanding throughout each period.
| | | | | | | | |
| | | Mirova International
Sustainable Equity
Fund—Class Y | |
| | | Year Ended
December 31,
2019
| | | Period Ended
December 31,
2018*
| |
Net asset value, beginning of the period | | $ | 10.03 | | | $ | 10.00 | |
| | | | | | | | |
INCOME (LOSS) FROM INVESTMENT OPERATIONS: | | | | | | | | |
Net investment income (loss)(a) | | | 0.15 | | | | (0.00 | )(b) |
Net realized and unrealized gain (loss) | | | 2.48 | | | | 0.03 | |
| | | | | | | | |
Total from Investment Operations | | | 2.63 | | | | 0.03 | |
| | | | | | | | |
LESS DISTRIBUTIONS FROM: | | | | | | | | |
Net investment income | | | (0.16 | ) | | | — | |
| | | | | | | | |
Net asset value, end of the period | | $ | 12.50 | | | $ | 10.03 | |
| | | | | | | | |
Total return(c) | | | 26.21 | %(d) | | | 0.30 | %(e) |
RATIOS TO AVERAGE NET ASSETS: | | | | | | | | |
Net assets, end of the period (000’s) | | $ | 9 | | | $ | 1 | |
Net expenses(f) | | | 0.96 | %(g) | | | 0.95 | %(h) |
Gross expenses | | | 94.13 | %(g) | | | 22.51 | %(h) |
Net investment income (loss) | | | 1.36 | % | | | (0.95 | )%(h) |
Portfolio turnover rate | | | 8 | % | | | 0 | % |
| * | From commencement of operations on December 28, 2018 through December 31, 2018. |
| (a) | Per share net investment income (loss) has been calculated using the average shares outstanding during the period. |
| (b) | Amount rounds to less than $0.01 per share. |
| (c) | Had certain expenses not been waived/reimbursed during the period, total returns would have been lower. |
| (d) | Generally accepted accounting principles require certain adjustments to be made to the net assets of the Fund for financial reporting purposes only, and as such, the total returns based on the adjusted net asset values per share may differ from the total returns reported in the average annual total return table. |
| (e) | Periods less than one year are not annualized. |
| (f) | The investment adviser agreed to waive its fees and/or reimburse a portion of the Fund’s expenses during the period. Without this waiver/reimbursement, expenses would have been higher. |
| (g) | Includes interest expense. Without this expense the ratio of net expenses would have been 0.95% and the ratio of gross expenses would have been 94.12%. |
| (h) | Computed on an annualized basis for periods less than one year. |
See accompanying notes to financial statements.
| 44
Notes to Financial Statements
December 31, 2019
1. Organization. Natixis Funds Trust I (the “Trust”) is organized as a Massachusetts business trust. The Trust is registered under the Investment Company Act of 1940, as amended (the “1940 Act”), as anopen-end management investment company. The Declaration of Trust permits the Board of Trustees to authorize the issuance of an unlimited number of shares of the Trust in multiple series. The financial statements for certain funds of the Trust are presented in separate reports. The following funds (individually, a “Fund” and collectively, the “Funds”) are included in this report:
Mirova Global Green Bond Fund (the “Global Green Bond Fund”)
Mirova Global Sustainable Equity Fund (the “Global Sustainable Equity Fund”)
Mirova International Sustainable Equity Fund (the “International Sustainable Equity Fund”)
Global Sustainable Equity Fund and International Sustainable Equity Fund are diversified investment companies. Global Green Bond Fund is anon-diversified investment company.
Each Fund offers Class A, Class N and Class Y shares. Global Sustainable Equity Fund also offers Class C shares.
Class A shares are sold with a maximumfront-end sales charge of 5.75% for Global Sustainable Equity Fund and International Sustainable Equity Fund and 4.25% for Global Green Bond Fund. Class C shares do not pay afront-end sales charge, pay higher Rule12b-1 fees than Class A shares for ten years (at which point they automatically convert to Class A shares) and may be subject to a contingent deferred sales charge (“CDSC”) of 1.00% if those shares are redeemed within one year of acquisition, except for reinvested distributions. Class N and Class Y shares do not pay afront-end sales charge, a CDSC or Rule12b-1 fees. Class N shares are offered with an initial minimum investment of $1,000,000. Class Y shares are offered with an initial minimum investment of $100,000. Certain categories of investors are exempted from the minimum investment amounts for Class N and Class Y as outlined in the relevant Funds’ prospectus.
Most expenses can be directly attributed to a Fund. Expenses which cannot be directly attributed to a Fund are generally apportioned based on the relative net assets of each of the funds in Natixis Funds Trust I, Natixis Funds Trust II, Natixis Funds Trust IV and Gateway Trust (“Natixis Funds Trusts”), Loomis Sayles Funds I and Loomis Sayles Funds II (“Loomis Sayles Funds Trusts”) and Natixis ETF Trust. Expenses of a Fund are bornepro rata by the holders of each class of shares, except that each class bears expenses unique to that class (such as the Rule12b-1 fees applicable to Class A and Class C), and transfer agent fees are borne collectively for Class A, Class C and Class Y, and individually for Class N. In addition, each class votes as a class only with respect to its own Rule12b-1 Plan. Shares of each class would receive theirpro rata share of the net assets of the Fund if the Fund were liquidated. The Trustees approve separate distributions from net investment income on each class of shares.
45 |
Notes to Financial Statements (continued)
December 31, 2019
2. Significant Accounting Policies. The following is a summary of significant accounting policies consistently followed by each Fund in the preparation of its financial statements. The Funds’ financial statements follow the accounting and reporting guidelines provided for investment companies and are prepared in accordance with accounting principles generally accepted in the United States of America which require the use of management estimates that affect the reported amounts and disclosures in the financial statements. Actual results could differ from those estimates. Management has evaluated the events and transactions subsequent to year-end through the date the financial statements were issued and has determined that there were no material events that would require disclosure in the Funds’ financial statements.
a. Valuation. Fund securities and other investments are valued at market value based on market quotations obtained or determined by independent pricing services recommended by the adviser and approved by the Board of Trustees. Fund securities and other investments for which market quotations are not readily available are valued at fair value as determined in good faith by the adviser pursuant to procedures approved by the Board of Trustees, as described below. Market value is determined as follows:
Listed equity securities (including shares ofclosed-end investment companies and exchange-traded funds) are valued at the last sale price quoted on the exchange where they are traded most extensively or, if there is no reported sale during the day, the closing bid quotation as reported by an independent pricing service. Securities traded on the NASDAQ Global Select Market, NASDAQ Global Market and NASDAQ Capital Market are valued at the NASDAQ Official Closing Price (“NOCP”), or if lacking an NOCP, at the most recent bid quotations on the applicable NASDAQ Market. Unlisted equity securities (except unlisted preferred equity securities) are valued at the last sale price quoted in the market where they are traded most extensively or, if there is no reported sale during the day, the closing bid quotation as reported by an independent pricing service. If there is no last sale price or closing bid quotation available, unlisted equity securities will be valued using evaluated bids furnished by an independent pricing service, if available. In some foreign markets, an official close price and a last sale price may be available from the foreign exchange or market. In those cases, the official close price is used. Debt securities and unlisted preferred equity securities are valued based on evaluated bids furnished to the Funds by an independent pricing service or bid prices obtained from broker-dealers. Broker-dealer bid prices may be used to value debt and unlisted equity securities where an independent pricing service is unable to price a security or where an independent pricing service does not provide a reliable price for the security. Futures contracts are valued at the most recent settlement price on the exchange on which the adviser believes that, over time, they are traded most extensively.
| 46
Notes to Financial Statements (continued)
December 31, 2019
Fund securities and other investments for which market quotations are not readily available are valued at fair value as determined in good faith by the adviser pursuant to procedures approved by the Board of Trustees. The Funds may also value securities and other investments at fair value in other circumstances such as when extraordinary events occur after the close of a foreign market but prior to the close of the New York Stock Exchange. This may include situations relating to a single issuer (such as a declaration of bankruptcy or a delisting of the issuer’s security from the primary market on which it has traded) as well as events affecting the securities markets in general (such as market disruptions or closings and significant fluctuations in U.S. and/or foreign markets). When fair valuing its securities or other investments, the Funds may, among other things, use modeling tools or other processes that may take into account factors such as securities or other market activity and/or significant events that occur after the close of the foreign market and before the time the Fund’s net asset value (“NAV”) is calculated. Fair value pricing may require subjective determinations about the value of a security, and fair values used to determine a Fund’s NAV may differ from quoted or published prices, or from prices that are used by others, for the same securities. In addition, the use of fair value pricing may not always result in adjustments to the prices of securities held by a Fund.
As of December 31, 2019, securities held by the Funds were fair valued as follows:
| | | | | | | | |
Fund | | Equity
securities1 | | | Percentage of
Net Assets | |
Global Sustainable Equity Fund | | $ | 53,523,431 | | | | 36.3 | % |
International Sustainable Equity Fund | | | 14,317,480 | | | | 83.2 | % |
| 1 | Certain foreign equity securities were fair valued pursuant to procedures approved by the Board of Trustees as events occurring after the close of the foreign market were believed to materially affect the value of those securities. |
b. Investment Transactions and Related Investment Income. Investment transactions are accounted for on a trade date plus one day basis for daily NAV calculation. However, for financial reporting purposes, investment transactions are reported on trade date. Dividend income (including income reinvested) and foreign withholding tax, if applicable, is recorded on theex-dividend date, or in the case of certain foreign securities, as soon as a Fund is notified, and interest income is recorded on an accrual basis. Interest income is increased by the accretion of discount and decreased by the amortization of premium, if applicable. In determining net gain or loss on securities sold, the cost of securities has been determined on an identified cost basis. Investment income,non-class specific expenses and realized and unrealized gains and losses are allocated on apro ratabasis to each class based on the relative net assets of each class to the total net assets of the Fund.
c. Foreign Currency Translation. The books and records of the Funds are maintained in U.S. dollars. The values of securities, currencies and other assets and liabilities
47 |
Notes to Financial Statements (continued)
December 31, 2019
denominated in currencies other than U.S. dollars, if any, are translated into U.S. dollars based upon foreign exchange rates prevailing at the end of the period. Purchases and sales of investment securities, income and expenses are translated into U.S. dollars on the respective dates of such transactions.
Net realized foreign exchange gains or losses arise from sales of foreign currency, changes in exchange rates between the trade and settlement dates on securities transactions and the difference between the amounts of dividends, interest and foreign withholding taxes recorded on the Funds’ books and the U.S. dollar equivalent of the amounts actually received or paid. Net unrealized foreign exchange gains or losses arise from changes in the value of assets and liabilities, other than investment securities, as of the end of the fiscal period, resulting from changes in exchange rates. Net realized foreign exchange gains or losses and the net change in unrealized foreign exchange gains or losses are disclosed in the Statements of Operations. For federal income tax purposes, net realized foreign exchange gains or losses are characterized as ordinary income, and may, if the Funds have net losses, reduce the amount of income available to be distributed by the Funds.
The values of investment securities are presented at the foreign exchange rates prevailing at the end of the period for financial reporting purposes. Net realized and unrealized gains or losses on investments reported in the Statements of Operations reflect gains or losses resulting from changes in exchange rates and fluctuations which arise due to changes in market prices of investment securities. For federal income tax purposes, a portion of the net realized gain or loss on investments arising from changes in exchange rates, which is reflected in the Statements of Operations, may be characterized as ordinary income and may, if the Funds have net losses, reduce the amount of income available to be distributed by the Funds.
For the year ended December 31, 2019, the amount of income available to be distributed has been reduced by the following amounts as a result of losses arising from changes in exchange rates:
| | | | |
Global Green Bond Fund | | $ | 78,881 | |
International Sustainable Equity Fund | | | 6,979 | |
The Funds may use foreign currency exchange contracts to facilitate transactions in foreign-denominated investments. Losses may arise from changes in the value of the foreign currency or if the counterparties do not perform under the contracts’ terms.
d. Futures Contracts. The Funds may enter into futures contracts. Futures contracts are agreements between two parties to buy and sell a particular instrument or index for a specified price on a specified future date.
When a Fund enters into a futures contract, it is required to deposit with (or for the benefit of) its broker an amount of cash or short-term high-quality securities as “initial
| 48
Notes to Financial Statements (continued)
December 31, 2019
margin.” As the value of the contract changes, the value of the futures contract position increases or declines. Subsequent payments, known as “variation margin,” are made or received by a Fund, depending on the price fluctuations in the fair value of the contract and the value of cash or securities on deposit with the broker. Gross unrealized appreciation (depreciation) on futures contracts is recorded in the Statements of Assets and Liabilities as an asset (liability). The aggregate principal amounts of the contracts are not recorded in the financial statements. Fluctuations in the value of the contracts are recorded in the Statements of Operations as unrealized appreciation (depreciation) until the contracts are closed, when they are recorded as realized gains (losses). Realized gain or loss on a futures position is equal to the difference between the value of the contract at the time it was opened and the value at the time it was closed, minus brokerage commissions. When a Fund enters into a futures contract certain risks may arise, such as illiquidity in the futures market, which may limit a Fund’s ability to close out a futures contract prior to settlement date, and unanticipated movements in the value of securities or interest rates.
Futures contracts are exchange-traded. Exchange-traded futures contracts are standardized and are settled through a clearing house with fulfillment supported by the credit of the exchange. Therefore, counterparty credit risks to the Funds are reduced; however, in the event that a counterparty enters into bankruptcy, a Fund’s claim against initial/variation margin on deposit with the counterparty may be subject to terms of a final settlement in bankruptcy court.
e. Due from Brokers. Transactions and positions in certain futures contracts are maintained and cleared by registered U.S. broker/dealers pursuant to customer agreements between a Fund and the various broker/dealers. The due from brokers balance in the Statements of Assets and Liabilities for Global Green Bond Fund represents cash pledged as collateral for futures contracts (including variation margin, as applicable). In certain circumstances the Fund’s use of cash held at brokers is restricted by regulation or broker mandated limits.
f. Federal and Foreign Income Taxes. The Trust treats each Fund as a separate entity for federal income tax purposes. Each Fund intends to meet the requirements of the Internal Revenue Code of 1986, as amended, applicable to regulated investment companies, and to distribute to its shareholders substantially all of its net investment income and any net realized capital gains at least annually. Management has performed an analysis of each Fund’s tax positions for the open tax years as of December 31, 2019 and has concluded that no provisions for income tax are required. The Funds’ federal tax returns for the prior three fiscal years, where applicable, remain subject to examination by the Internal Revenue Service. Management is not aware of any events that are reasonably possible to occur in the next twelve months that would result in the amounts of any unrecognized tax benefits significantly increasing or decreasing for the Funds. However, management’s conclusions regarding tax positions
49 |
Notes to Financial Statements (continued)
December 31, 2019
taken may be subject to review and adjustment at a later date based on factors including, but not limited to, new tax laws and accounting regulations and interpretations thereof.
A Fund may be subject to foreign withholding taxes on investment income and taxes on capital gains on investments that are accrued and paid based upon the Fund’s understanding of the tax rules and regulations that exist in the countries in which the Fund invests. Foreign withholding taxes on dividend and interest income are reflected on the Statements of Operations as a reduction of investment income, net of amounts eligible to be reclaimed. Dividends and interest receivable on the Statements of Assets and Liabilities are net of foreign withholding taxes. Foreign withholding taxes where reclaims have been or will be filed are reflected on the Statements of Assets and Liabilities as tax reclaims receivable. Capital gains taxes paid are included in net realized gain (loss) on investments in the Statements of Operations. Accrued but unpaid capital gains taxes are reflected as foreign taxes payable on the Statements of Assets and Liabilities, if applicable, and reduce unrealized gains on investments. In the event that realized gains on investments are subsequently offset by realized losses, taxes paid on realized gains may be returned to a Fund. Such amounts, if applicable, are reflected as foreign tax rebates receivable on the Statements of Assets and Liabilities and are recorded as a realized gain when received.
g. Dividends and Distributions to Shareholders. Dividends and distributions are recorded on theex-dividend date. The timing and characterization of certain income and capital gain distributions are determined in accordance with federal tax regulations, which may differ from accounting principles generally accepted in the United States of America. Permanent differences are primarily due to differing treatments for book and tax purposes of items such as foreign currency gains and losses, premium amortization, distributionre-designations andnon-deductible expenses. Permanent book and tax basis differences relating to shareholder distributions, net investment income and net realized gains will result in reclassifications to capital accounts reported on the Statements of Assets and Liabilities. Temporary differences between book and tax distributable earnings are primarily due to wash sales, deferred Trustees’ fees, return of capital distributions received, premium amortization and futures contractmark-to-market. Amounts of income and capital gain available to be distributed on a tax basis are determined annually, and at other times during the Funds’ fiscal year as may be necessary to avoid knowingly declaring and paying a return of capital distribution. Distributions from net investment income and short-term capital gains are considered to be distributed from ordinary income for tax purposes.
| 50
Notes to Financial Statements (continued)
December 31, 2019
The tax characterization of distributions is determined on an annual basis. The tax character of distributions paid to shareholders during the years ended December 31, 2019 and 2018 were as follows:
| | | | | | | | | | | | | | | | | | | | | | | | |
| | | 2019 Distributions Paid From: | | | 2018 Distributions Paid From: | |
Fund | | Ordinary
Income | | | Long-Term
Capital
Gains | | | Total | | | Ordinary
Income | | | Long-Term
Capital
Gains | | | Total | |
Global Green Bond Fund | | $ | 608,967 | | | $ | 265,743 | | | $ | 874,710 | | | $ | 965,630 | | | $ | — | | | $ | 965,630 | |
Global Sustainable Equity Fund | | | 460,922 | | | | 1,861,566 | | | | 2,322,488 | | | | 188,601 | | | | 3,238,164 | | | | 3,426,765 | |
International Sustainable Equity Fund | | | 205,722 | | | | — | | | | 205,722 | | | | — | | | | — | | | | — | |
Distributions paid to shareholders from net investment income and net realized capital gains, based on accounting principles generally accepted in the United States of America, are consolidated and reported on the Statements of Changes in Net Assets as Distributions to Shareholders. Distributions paid to shareholders from net investment income and net realized capital gains expressed inper-share amounts, based on accounting principles generally accepted in the United States of America, are separately stated and reported within the Financial Highlights.
As of December 31, 2019, the components of distributable earnings on a tax basis were as follows:
| | | | | | | | | | | | |
| | | Global
Green Bond
Fund | | | Global
Sustainable
Equity Fund | | | International
Sustainable
Equity Fund | |
Undistributed ordinary income | | $ | — | | | $ | 2,070 | | | $ | 34,090 | |
Undistributed long-term capital gains | | | — | | | | 930,790 | | | | — | |
| | | | | | | | | | | | |
Total undistributed earnings | | | — | | | | 932,860 | | | | 34,090 | |
| | | | | | | | | | | | |
Late-year ordinary and post-October capital loss deferrals* | | | (195,168 | ) | | | — | | | | — | |
| | | | | | | | | | | | |
Unrealized appreciation | | | 1,210,643 | | | | 29,566,876 | | | | 2,896,680 | |
| | | | | | | | | | | | |
Total accumulated earnings | | $ | 1,015,475 | | | $ | 30,499,736 | | | $ | 2,930,770 | |
| | | | | | | | | | | | |
Capital loss carryforward utilized in the current year | | $ | 436,934 | | | $ | — | | | $ | — | |
| | | | | | | | | | | | |
| * | Under current tax law, capital losses, foreign currency losses and losses on passive foreign investment companies and contingent payment debt instruments after October 31 or December 31, as applicable, may be deferred and treated as occurring on the first day of the following taxable year. Global Green Bond Fund is deferring capital and foreign currency losses. |
51 |
Notes to Financial Statements (continued)
December 31, 2019
As of December 31, 2019, unrealized appreciation (depreciation) as a component of distributable earnings were as follows:
| | | | | | | | | | | | |
| | | Global
Green Bond
Fund | | | Global
Sustainable Equity Fund | | | International
Sustainable Equity Fund | |
Unrealized appreciation (depreciation) | | | | | | | | | | | | |
Investments | | $ | 1,102,226 | | | $ | 29,544,954 | | | $ | 2,891,334 | |
Foreign currency translations | | | 108,417 | | | | 21,922 | | | | 5,346 | |
| | | | | | | | | | | | |
Total unrealized appreciation | | | $1,210,643 | | | $ | 29,566,876 | | | $ | 2,896,680 | |
| | | | | | | | | | | | |
As of December 31, 2019, the tax cost of investments (including derivatives, if applicable) and unrealized appreciation (depreciation) on a federal tax basis were as follows:
| | | | | | | | | | | | |
| | | Global
Green Bond
Fund | | | Global
Sustainable
Equity Fund | | | International
Sustainable
Equity Fund | |
Federal tax cost | | $ | 34,427,864 | | | $ | 115,349,209 | | | $ | 13,374,240 | |
| | | | | | | | | | | | |
Gross tax appreciation | | $ | 1,359,701 | | | $ | 30,573,256 | | | $ | 2,949,348 | |
Gross tax depreciation | | | (144,064 | ) | | | (1,028,302 | ) | | | (58,014 | ) |
| | | | | | | | | | | | |
Net tax appreciation | | $ | 1,215,637 | | | $ | 29,544,954 | | | $ | 2,891,334 | |
| | | | | | | | | | | | |
The difference between these amounts and those reported in the components of distributable earnings are primarily attributable to foreign currencymark-to-market.
h. Repurchase Agreements. Each Fund may enter into repurchase agreements, under the terms of a Master Repurchase Agreement, under which each Fund acquires securities as collateral and agrees to resell the securities at an agreed upon time and at an agreed upon price. It is each Fund’s policy that the market value of the collateral for repurchase agreements be at least equal to 102% of the repurchase price, including interest. Certain repurchase agreements aretri-party arrangements whereby the collateral is held in a segregated account for the benefit of the Fund and on behalf of the counterparty. Repurchase agreements could involve certain risks in the event of default or insolvency of the counterparty, including possible delays or restrictions upon a Fund’s ability to dispose of the underlying securities. As of December 31, 2019, each Fund, as applicable, had investments in repurchase agreements for which the value of the related collateral exceeded the value of the repurchase agreement. The gross value of repurchase agreements is included in the Statements of Assets and Liabilities for financial reporting purposes.
i. Indemnifications. Under the Trust’s organizational documents, its officers and Trustees are indemnified against certain liabilities arising out of the performance of
| 52
Notes to Financial Statements (continued)
December 31, 2019
their duties to the Funds. Additionally, in the normal course of business, the Funds enter into contracts with service providers that contain general indemnification clauses. The Funds’ maximum exposure under these arrangements is unknown as this would involve future claims that may be made against the Funds that have not yet occurred. However, based on experience, the Funds expect the risk of loss to be remote.
j. New Accounting Pronouncement. In August 2018, the Financial Accounting Standards Board issued Accounting Standards Update2018-13, Fair Value Measurement (Topic 820): Disclosure Framework — Changes to the Disclosure Requirements for Fair Value Measurement (“ASU2018-13”). The update introduces new fair value disclosure requirements, eliminates some prior fair value disclosure requirements, and modifies certain existing fair value disclosure requirements. ASU2018-13 will be effective for fiscal years beginning after December 15, 2019, including interim periods within those fiscal years. Management has evaluated the impact of the adoption of ASU 2018-13 and will incorporate required disclosure updates in the Funds’ semiannual financial statements as of June 30, 2020.
3. Fair Value Measurements. In accordance with accounting standards related to fair value measurements and disclosures, the Funds have categorized the inputs utilized in determining the value of each Fund’s assets or liabilities. These inputs are summarized in the three broad levels listed below:
| | • | | Level 1 – quoted prices in active markets for identical assets or liabilities; |
| | • | | Level 2 – prices determined using other significant inputs that are observable either directly, or indirectly through corroboration with observable market data (which could include quoted prices for similar assets or liabilities, interest rates, credit risk, etc.); and |
| | • | | Level 3 – prices determined using significant unobservable inputs when quoted prices or observable inputs are unavailable such as when there is little or no market activity for an asset or liability (unobservable inputs reflect each Fund’s own assumptions in determining the fair value of assets or liabilities and would be based on the best information available). |
The inputs or methodology used for valuing securities are not necessarily an indication of the risk associated with investing in those securities.
53 |
Notes to Financial Statements (continued)
December 31, 2019
The following is a summary of the inputs used to value the Funds’ investments as of December 31, 2019, at value:
Global Green Bond Fund
Asset Valuation Inputs
| | | | | | | | | | | | | | | | |
Description | | Level 1 | | | Level 2 | | | Level 3 | | | Total | |
Bonds and Notes(a) | | $ | — | | | $ | 34,396,203 | | | $ | — | | | $ | 34,396,203 | |
Short-Term Investments | | | — | | | | 1,247,298 | | | | — | | | | 1,247,298 | |
Futures Contracts (unrealized appreciation) | | | 23,443 | | | | — | | | | — | | | | 23,443 | |
| | | | | | | | | | | | | | | | |
Total | | $ | 23,443 | | | $ | 35,643,501 | | | $ | — | | | $ | 35,666,944 | |
| | | | | | | | | | | | | | | | |
Liability Valuation Inputs
| | | | | | | | | | | | | | | | |
Description | | Level 1 | | | Level 2 | | | Level 3 | | | Total | |
Futures Contracts (unrealized depreciation) | | $ | (419,166 | ) | | $ | — | | | $ | — | | | $ | (419,166 | ) |
| | | | | | | | | | | | | | | | |
| (a) | Details of the major categories of the Fund’s investments are reflected within the Portfolio of Investments. |
For the year ended December 31, 2019, there were no transfers among Levels 1, 2 and 3.
Global Sustainable Equity Fund
Asset Valuation Inputs
| | | | | | | | | | | | | | | | |
Description | | Level 1 | | | Level 2 | | | Level 3 | | | Total | |
Common Stocks | | | | | | | | | | | | | | | | |
Belgium | | $ | — | | | $ | 3,109,574 | | | $ | — | | | $ | 3,109,574 | |
Denmark | | | 4,794,253 | | | | 11,892,776 | | | | — | | | | 16,687,029 | |
France | | | — | | | | 7,282,241 | | | | — | | | | 7,282,241 | |
Germany | | | — | | | | 9,552,851 | | | | — | | | | 9,552,851 | |
Hong Kong | | | — | | | | 3,172,827 | | | | — | | | | 3,172,827 | |
Japan | | | — | | | | 6,901,321 | | | | — | | | | 6,901,321 | |
Netherlands | | | — | | | | 4,047,150 | | | | — | | | | 4,047,150 | |
Switzerland | | | — | | | | 1,289,263 | | | | — | | | | 1,289,263 | |
United Kingdom | | | — | | | | 6,275,428 | | | | — | | | | 6,275,428 | |
All Other Common Stocks(a) | | | 82,145,507 | | | | — | | | | — | | | | 82,145,507 | |
| | | | | | | | | | | | | | | | |
Total Common Stocks | | | 86,939,760 | | | | 53,523,431 | | | | — | | | | 140,463,191 | |
| | | | | | | | | | | | | | | | |
Short-Term Investments | | | — | | | | 4,430,972 | | | | — | | | | 4,430,972 | |
| | | | | | | | | | | | | | | | |
Total | | $ | 86,939,760 | | | $ | 57,954,403 | | | $ | — | | | $ | 144,894,163 | |
| | | | | | | | | | | | | | | | |
| (a) | Details of the major categories of the Fund’s investments are reflected within the Portfolio of Investments. |
| 54
Notes to Financial Statements (continued)
December 31, 2019
For the year ended December 31, 2019, there were no transfers among Levels 1, 2 and 3.
International Sustainable Equity Fund
Asset Valuation Inputs
| | | | | | | | | | | | | | | | |
Description | | Level 1 | | | Level 2 | | | Level 3 | | | Total | |
Common Stocks | | | | | | | | | | | | | | | | |
Australia | | $ | — | | | $ | 449,491 | | | $ | — | | | $ | 449,491 | |
Belgium | | | — | | | | 919,429 | | | | — | | | | 919,429 | |
Denmark | | | 649,507 | | | | 1,511,400 | | | | — | | | | 2,160,907 | |
France | | | — | | | | 2,928,702 | | | | — | | | | 2,928,702 | |
Germany | | | — | | | | 1,322,828 | | | | — | | | | 1,322,828 | |
Hong Kong | | | — | | | | 652,114 | | | | — | | | | 652,114 | |
Ireland | | | 375,010 | | | | 281,891 | | | | — | | | | 656,901 | |
Japan | | | — | | | | 2,278,081 | | | | — | | | | 2,278,081 | |
Netherlands | | | — | | | | 867,420 | | | | — | | | | 867,420 | |
Norway | | | — | | | | 120,012 | | | | — | | | | 120,012 | |
Switzerland | | | — | | | | 284,570 | | | | — | | | | 284,570 | |
Taiwan | | | 810,321 | | | | — | | | | — | | | | 810,321 | |
United Kingdom | | | — | | | | 2,701,542 | | | | — | | | | 2,701,542 | |
| | | | | | | | | | | | | | | | |
Total Common Stocks | | | 1,834,838 | | | | 14,317,480 | | | | — | | | | 16,152,318 | |
| | | | | | | | | | | | | | | | |
Short-Term Investments | | | — | | | | 113,256 | | | | — | | | | 113,256 | |
| | | | | | | | | | | | | | | | |
Total | | $ | 1,834,838 | | | $ | 14,430,736 | | | $ | — | | | $ | 16,265,574 | |
| | | | | | | | | | | | | | | | |
Common stocks valued at $413,483 were transferred from Level 2 to Level 1 during the period ended December 31, 2019. At December 31, 2018, these securities were fair valued pursuant to procedures approved by the Board of Trustees as events occurring after the close of the foreign market were believed to materially affect the value of the securities. At December 31, 2019, these securities were valued at the market price in the foreign market in accordance with the Fund’s valuation policies.
A common stock valued at $154,206 was transferred from Level 1 to Level 2 during the period ended December 31, 2019. At December 31, 2018, this security was valued at the market price in the foreign market in accordance with the Fund’s valuation policies. At December 31, 2019, this security was fair valued pursuant to procedures approved by the Board of Trustees as events occurring after the close of the foreign market were believed to materially affect the value of the security.
All transfers are recognized as of the beginning of the reporting period.
4. Derivatives. Derivative instruments are defined as financial instruments whose value and performance are based on the value and performance of an underlying asset, reference rate or index. Derivative instruments that the Global Green Bond Fund used during the period include futures contracts.
55 |
Notes to Financial Statements (continued)
December 31, 2019
Global Green Bond Fund seeks to provide total return, through a combination of capital appreciation and current income, by investing in green bonds. The Fund pursues its objective by primarily investing in fixed-income securities. In connection with its principal investment strategies, the Fund may also invest in various types of futures contracts for investment purposes. During the year ended December 31, 2019, the Fund used U.S. and foreign Treasury bond futures to gain yield curve exposure.
Global Green Bond Fund is subject to the risk that changes in interest rates will affect the value of the Fund’s investments in fixed-income securities. The Fund will be subjected to increased interest rate risk to the extent that it invests in fixed-income securities with longer maturities or durations, as compared to investing in fixed-income securities with shorter maturities or durations. The Fund may use futures contracts to hedge against changes in interest rates and to manage duration without having to buy or sell portfolio securities. During the year ended December 31, 2019, the Fund used U.S. and foreign Treasury bond futures to manage duration.
Global Green Bond Fund is also subject to the risk that changes in foreign currency exchange rates will have an unfavorable effect on the value of Fund assets denominated in foreign currencies. The may use futures contracts for hedging purposes to protect the value of the Fund’s holdings of foreign securities. During the year ended December 31, 2019, the Fund used currency futures for hedging purposes.
The following is a summary of derivative instruments for Global Green Bond Fund as of December 31, 2019, as reflected within the Statements of Assets and Liabilities:
| | | | |
Assets | | Unrealized
appreciation on
futures contracts | |
Exchange-traded asset derivatives | |
Interest rate contracts | | $ | 23,443 | |
| |
Liabilities | | Unrealized
depreciation on
futures contracts | |
Exchange-traded liability derivatives | | | | |
Interest rate contracts | | $ | (107,948 | ) |
Foreign exchange contracts | | | (311,218 | ) |
| | | | |
Total exchange-traded liability derivatives | | $ | (419,166 | ) |
| | | | |
| 56
Notes to Financial Statements (continued)
December 31, 2019
Transactions in derivative instruments for Global Green Bond Fund during the year ended December 31, 2019, as reflected within the Statements of Operations were as follows:
| | | | |
Net Realized Gain (Loss) on: | | Futures contracts | |
Interest rate contracts | | $ | 33,075 | |
Foreign exchange contracts | | | 901,504 | |
| | | | |
Total | | $ | 934,579 | |
| | | | |
| |
Net Change in Unrealized
Appreciation (Depreciation) on: | | Futures contracts | |
Interest rate contracts | | $ | (52,197 | ) |
Foreign exchange contracts | | | (288,565 | ) |
| | | | |
Total | | $ | (340,762 | ) |
| | | | |
As the Fund values its derivatives at fair value and recognizes changes in fair value through the Statement of Operations, it does not qualify for hedge accounting under authoritative guidance for derivative instruments. The Fund’s investments in derivatives may represent an economic hedge; however, they are considered to benon-hedge transactions for the purpose of these disclosures.
The volume of futures contract activity as a percentage of net assets for Global Green Bond Fund, based onmonth-end notional amounts outstanding during the period, at absolute value, was as follows for the year ended December 31, 2019:
| | | | |
Global Green Bond Fund | | Futures | |
Average Notional Amount Outstanding | | | 77.77 | % |
Highest Notional Amount Outstanding | | | 84.49 | % |
Lowest Notional Amount Outstanding | | | 70.74 | % |
Notional Amount Outstanding as of December 31, 2019 | | | 84.49 | % |
Notional amounts outstanding at the end of the prior period are included in the averages above.
Counterparty risk is managed based on policies and procedures established by each Fund’s adviser. Such policies and procedures may include, but are not limited to, minimum counterparty credit rating requirements, monitoring of counterparty credit default swap spreads and posting of collateral. With exchange-traded derivatives, there is minimal counterparty credit risk to the Fund because the exchange’s clearing house, as counterparty to these instruments, stands between the buyer and the seller of the contract. Credit risk still exists in exchange-traded derivatives with respect to initial and variation margin that is held in a broker’s customer accounts. While brokers are required to segregate customer margin from their own assets, in the event that a
57 |
Notes to Financial Statements (continued)
December 31, 2019
broker becomes insolvent or goes into bankruptcy and at that time there is a shortfall in the aggregate amount of margin held by the broker for all its clients, U.S. bankruptcy laws will typically allocate that shortfall on apro rata basis across all of the broker’s customers, potentially resulting in losses to the Fund. The following table shows the maximum amount of loss due to credit risk that, based on the gross fair value of the financial instrument, the Fund would incur if parties to the relevant financial instruments failed completely to perform according to the terms of the contracts and the collateral or other security, if any, for the amount due proved to be of no value to the Fund, as of December 31, 2019:
| | | | | | | | |
Fund | | Maximum Amount of Loss - Gross | | | Maximum Amount of Loss - Net | |
Global Green Bond Fund | | $ | 1,029,926 | | | $ | 1,029,926 | |
5. Purchases and Sales of Securities. For the year ended December 31, 2019, purchases and sales of securities (excluding short-term investments and U.S. Government/Agency securities and including paydowns) were as follows:
| | | | | | | | |
Fund | | Purchases | | | Sales | |
Global Green Bond Fund | | $ | 13,810,702 | | | $ | 7,275,132 | |
Global Sustainable Equity Fund | | | 54,016,780 | | | | 24,104,457 | |
International Sustainable Equity Fund | | | 4,872,638 | | | | 986,118 | |
6. Management Fees and Other Transactions with Affiliates.
a. Management Fees. Mirova US LLC (“Mirova US”) (formerly a division within Ostrum Asset Management U.S., LLC (“Ostrum US”)) serves as investment adviser to the Funds. Under the terms of the management agreements, each Fund pays a management fee at the following annual rates, calculated daily and payable monthly, based on each Fund’s average daily net assets:
| | | | |
Fund | | Percentage of
Average
Daily Net Assets | |
Global Green Bond Fund | | | 0.55 | % |
Global Sustainable Equity Fund | | | 0.80 | % |
International Sustainable Equity Fund | | | 0.80 | % |
Prior to March 29, 2019, Ostrum US served as investment advisor to the Fund, and was paid a management fee at the same annual rates.
Mirova US has given binding undertakings to the Funds to waive management fees and/or reimburse certain expenses to limit the Funds’ operating expenses, exclusive of acquired fund fees and expenses, brokerage expenses, interest expense, taxes, organizational and extraordinary expenses such as litigation and indemnification
| 58
Notes to Financial Statements (continued)
December 31, 2019
expenses. These undertakings are in effect until April 30, 2020, may be terminated before then only with the consent of the Funds’ Board of Trustees, and are reevaluated on an annual basis. Management fees payable, as reflected on the Statements of Assets and Liabilities, is net of waivers and/or expense reimbursements, if any, pursuant to these undertakings. Waivers/reimbursements that exceed management fees payable are reflected on the Statements of Assets and Liabilities as receivable from investment adviser.
For the year ended December 31, 2019, the expense limits as a percentage of average daily net assets under the expense limitation agreement were as follows:
| | | | | | | | | | | | | | | | |
| | | Expense Limit as a Percentage of
Average Daily Net Assets | |
Fund | | Class A | | | Class C | | | Class N | | | Class Y | |
Global Green Bond Fund | | | 0.95 | % | | | — | | | | 0.65 | % | | | 0.70 | % |
Global Sustainable Equity Fund | | | 1.20 | % | | | 1.95 | % | | | 0.90 | % | | | 0.95 | % |
International Sustainable Equity Fund | | | 1.20 | % | | | — | | | | 0.90 | % | | | 0.95 | % |
Mirova US shall be permitted to recover expenses borne under the expense limitation agreement (whether through waiver of management fee or otherwise) on a class by class basis in later periods to the extent the annual operating expenses of a class fall below a class’ expense limits, provided, however, that a class is not obligated to pay such waived/reimbursed fees or expenses more than one year after the end of the fiscal year in which the fees or expenses were waived/reimbursed.
For the year ended December 31, 2019, the management fees and waiver of management fees for each Fund were as follows:
| | | | | | | | | | | | | | | | | | | | |
Fund | | Gross
Management
Fees | | | Contractual
Waivers of
Management
Fees1 | | | Net
Management
Fees | | | Percentage of
Average
Daily Net Assets | |
| | Gross | | | Net | |
Global Green Bond Fund | | $ | 177,527 | | | $ | 142,695 | | | $ | 34,832 | | | | 0.55 | % | | | 0.11 | % |
Global Sustainable Equity Fund | | | 861,692 | | | | 197,054 | | | | 664,638 | | | | 0.80 | % | | | 0.62 | % |
International Sustainable Equity Fund | | | 108,299 | | | | 108,299 | | | | — | | | | 0.80 | % | | | — | % |
| 1 | Management fee waiver is subject to possible recovery until December 31, 2020. |
For the year ended December 31, 2019, class-specific expenses have been reimbursed as follows:
| | | | |
Fund | | Reimbursement | |
International Sustainable Equity Fund | | $ | 2,392 | |
59 |
Notes to Financial Statements (continued)
December 31, 2019
In addition, Mirova US reimbursednon-class-specific expenses of International Sustainable Equity Fund in the amount of $36,884, for the year ended December 31, 2019.
No expenses were recovered for any of the Funds during the year ended December 31, 2019 under the terms of the expense limitation agreements.
b. Service and Distribution Fees. Natixis Distribution, L.P. (“Natixis Distribution”), which is a wholly-owned subsidiary of Natixis Investment Managers, LLC (“Natixis”), has entered into a distribution agreement with the Trust. Pursuant to this agreement, Natixis Distribution serves as principal underwriter of the Funds of the Trust.
Pursuant to Rule12b-1 under the 1940 Act, the Trust has adopted a Service Plan relating to each Fund’s Class A shares (the “Class A Plans”) and a Distribution and Service Plan relating to each Fund’s Class C shares (the “Class C Plans”).
Under the Class A Plans, each Fund pays Natixis Distribution a monthly service fee at an annual rate not to exceed 0.25% of the average daily net assets attributable to the Funds’ Class A shares, as reimbursement for expenses incurred by Natixis Distribution in providing personal services to investors in Class A shares and/or the maintenance of shareholder accounts.
Under the Class C Plans, each Fund pays Natixis Distribution a monthly service fee at an annual rate not to exceed 0.25% of the average daily net assets attributable to the Funds’ Class C shares, as compensation for services provided by Natixis Distribution in providing personal services to investors in Class C shares and/or the maintenance of shareholder accounts.
Also under the Class C Plans, each Fund pays Natixis Distribution a monthly distribution fee at an annual rate of 0.75% of the average daily net assets attributable to the Funds’ Class C shares, as compensation for services provided by Natixis Distribution in connection with the marketing or sale of Class C shares.
For the year ended December 31, 2019, the service and distribution fees for each Fund were as follows:
| | | | | | | | | | | | |
| | | Service Fees | | | Distribution Fees | |
Fund | | Class A | | | Class C | | | Class C | |
Global Green Bond Fund | | $ | 3,200 | | | $ | — | | | $ | — | |
Global Sustainable Equity Fund | | | 22,095 | | | | 9,180 | | | | 27,540 | |
International Sustainable Equity Fund | | | 4 | | | | — | | | | — | |
c. Administrative Fees. Natixis Advisors, L.P. (“Natixis Advisors”) provides certain administrative services for the Funds and contracts with State Street Bank and Trust Company (“State Street Bank”) to serve assub-administrator. Natixis Advisors is a wholly-owned subsidiary of Natixis. Pursuant to an agreement among Natixis Funds
| 60
Notes to Financial Statements (continued)
December 31, 2019
Trusts, Loomis Sayles Funds Trusts, Natixis ETF Trust and Natixis Advisors, effective July 1, 2019 each Fund pays Natixis Advisors monthly itspro rataportion of fees equal to an annual rate of 0.0540% of the first $15 billion of the average daily net assets of the Natixis Funds Trusts, Loomis Sayles Funds Trusts and Natixis ETF Trust, 0.0500% of the next $15 billion, 0.0400% of the next $30 billion, 0.0275% of the next $30 billion and 0.0225% of such assets in excess of $90 billion, subject to an annual aggregate minimum fee for the Natixis Funds Trusts, Loomis Sayles Funds Trusts and Natixis ETF Trust of $10 million, which is reevaluated on an annual basis.
Prior to July 1, 2019, each Fund paid Natixis Advisors monthly itspro rataportion of fees equal to an annual rate of 0.0575% of the first $15 billion of the average daily net assets of the Natixis Funds Trusts, Loomis Sayles Funds Trusts and Natixis ETF Trust, 0.0500% of the next $15 billion, 0.0400% of the next $30 billion, 0.0275% of the next $30 billion and 0.0225% of such assets in excess of $90 billion, subject to an annual aggregate minimum fee for the Natixis Funds Trusts, Loomis Sayles Funds Trusts and Natixis ETF Trust of $10 million.
Effective October 1, 2018, State Street Bank agreed to reduce the fees it receives from Natixis Advisors for serving assub-administrator to the Funds. Also, effective October 1, 2018, Natixis Advisors agreed to voluntarily waive fees paid by the Funds in an amount equal to the reduction insub-administrative fees discussed above. The waiver was in effect through June 30, 2019.
For the year ended December 31, 2019, the administrative fees for each Fund were as follows:
| | | | | | | | | | | | |
Fund | | Gross
Administrative
Fees | | | Waiver of
Administrative
Fees | | | Net
Administrative
Fees | |
Global Green Bond Fund | | $ | 14,205 | | | $ | 155 | | | $ | 14,050 | |
Global Sustainable Equity Fund | | | 47,389 | | | | 505 | | | | 46,884 | |
International Sustainable Equity Fund | | | 5,955 | | | | 62 | | | | 5,893 | |
d. Sub-Transfer Agent Fees. Natixis Distribution has entered into agreements, which include servicing agreements, with financial intermediaries that provide recordkeeping, processing, shareholder communications and other services to customers of the intermediaries that hold positions in the Funds and has agreed to compensate the intermediaries for providing those services. Intermediaries transact with the Funds primarily through the use of omnibus accounts on behalf of their customers who hold positions in the Funds. These services would have been provided by the Funds’ transfer agent and other service providers if the shareholders’ accounts were maintained directly at the Funds’ transfer agent. Accordingly, the Funds have agreed to reimburse Natixis Distribution for all or a portion of the servicing fees paid to these intermediaries. The reimbursement amounts(sub-transfer agent fees) paid to
61 |
Notes to Financial Statements (continued)
December 31, 2019
Natixis Distribution are subject to a currentper-account equivalent fee limit approved by the Funds’ Board of Trustees, which is based on fees for similar services paid to the Funds’ transfer agent and other service providers. Class N shares do not bear such expenses.
For the year ended December 31, 2019, thesub-transfer agent fees (which are reflected in transfer agent fees and expenses in the Statements of Operations) for each Fund were as follows:
| | | | |
Fund | | Sub-Transfer
Agent Fees | |
Global Green Bond Fund | | $ | 8,311 | |
Global Sustainable Equity Fund | | | 69,661 | |
As of December 31, 2019, the Funds owe Natixis Distribution the following reimbursements forsub-transfer agent fees (which are reflected in the Statements of Assets and Liabilities as payable to distributor):
| | | | |
Fund | | Reimbursements of
Sub-Transfer
Agent Fees | |
Global Green Bond Fund | | $ | 176 | |
Global Sustainable Equity Fund | | | 1,233 | |
Sub-transfer agent fees attributable to Class A, Class C and Class Y are allocated on apro rata basis to each class based on the relative net assets of each class to the total net assets of those classes.
e. Commissions. Commissions (including CDSCs) on Fund shares retained by Natixis Distribution during the year ended December 31, 2019 was as follows:
| | | | |
Fund | | Commissions | |
Global Green Bond Fund | | $ | 298 | |
Global Sustainable Equity Fund | | | 4,199 | |
f. Trustees Fees and Expenses. The Trust does not pay any compensation directly to its officers or Trustees who are directors, officers or employees of Natixis Advisors, Natixis Distribution, Natixis or their affiliates. The Chairperson of the Board of Trustees receives a retainer fee at the annual rate of $360,000. The Chairperson does not receive any meeting attendance fees for Board of Trustees meetings or committee meetings that he attends. Each Independent Trustee (other than the Chairperson) receives, in the aggregate, a retainer fee at the annual rate of $190,000. Each Independent Trustee also receives a meeting attendance fee of $10,000 for each meeting of the Board of Trustees that he or she attends in person and $5,000 for each meeting of the Board of Trustees that he or she attends telephonically. In addition, the chairperson of the Contract
| 62
Notes to Financial Statements (continued)
December 31, 2019
Review Committee and the chairperson of the Audit Committee each receive an additional retainer fee at the annual rate of $20,000. The chairperson of the Governance Committee receives an additional retainer fee at the annual rate of $15,000. Each Contract Review Committee member is compensated $6,000 for each Committee meeting that he or she attends in person and $3,000 for each meeting that he or she attends telephonically. Each Audit Committee member is compensated $6,000 for each Committee meeting that he or she attends in person and $3,000 for each meeting that he or she attends telephonically. These fees are allocated among the funds in the Natixis Funds Trusts, Loomis Sayles Funds Trusts and Natixis ETF Trust based on a formula that takes into account, among other factors, the relative net assets of each fund. Trustees are reimbursed for travel expenses in connection with attendance at meetings.
Effective January 1, 2020, the Chairperson of the Board will receive a retainer fee at the annual rate of $369,000, each Independent Trustee (other than the Chairperson) will receive, in the aggregate, a retainer fee at the annual rate of $199,000, and the chairperson of the Governance Committee will receive an additional retainer fee at the annual rate of $20,000. All other Trustee fees will remain unchanged.
A deferred compensation plan (the “Plan”) is available to the Trustees on a voluntary basis. Deferred amounts remain in the Funds until distributed in accordance with the provisions of the Plan. The value of a participating Trustee’s deferral account is based on theoretical investments of deferred amounts, on the normal payment dates, in certain funds of the Natixis Funds Trusts, Loomis Sayles Funds Trusts, and Natixis ETF Trust as designated by the participating Trustees. Changes in the value of participants’ deferral accounts are allocatedpro rata among the funds in the Natixis Funds Trusts, Loomis Sayles Funds Trusts and Natixis ETF Trust, and are normally reflected as Trustees’ fees and expenses in the Statements of Operations. The portions of the accrued obligations allocated to the Funds under the Plan are reflected as Deferred Trustees’ fees in the Statements of Assets and Liabilities.
Certain officers and employees of Natixis Advisors and its affiliates are also officers and/or Trustees of the Trust.
63 |
Notes to Financial Statements (continued)
December 31, 2019
g. Affiliated Ownership. As of December 31, 2019, the percentage of each Fund’s net assets owned by affiliates is as follows:
| | | | |
Global Green Bond Fund | | Percentage of
Net Assets | |
Natixis Sustainable Future 2015 Fund | | | 1.68 | % |
Natixis Sustainable Future 2020 Fund | | | 1.60 | % |
Natixis Sustainable Future 2025 Fund | | | 1.41 | % |
Natixis Sustainable Future 2030 Fund | | | 1.08 | % |
Natixis Sustainable Future 2035 Fund | | | 0.62 | % |
Natixis Sustainable Future 2040 Fund | | | 0.59 | % |
Natixis Sustainable Future 2045 Fund | | | 0.22 | % |
Natixis Sustainable Future 2050 Fund | | | 0.20 | % |
Natixis Sustainable Future 2055 Fund | | | 0.16 | % |
Natixis Sustainable Future 2060 Fund | | | 0.12 | % |
Natixis and affiliates | | | 63.26 | % |
| | | | |
| | | 70.94 | % |
| | | | |
International Sustainable Equity Fund | | Percentage of
Net Assets | |
Natixis Sustainable Future 2015 Fund | | | 2.89 | % |
Natixis Sustainable Future 2020 Fund | | | 3.32 | % |
Natixis Sustainable Future 2025 Fund | | | 3.78 | % |
Natixis Sustainable Future 2030 Fund | | | 4.83 | % |
Natixis Sustainable Future 2035 Fund | | | 4.28 | % |
Natixis Sustainable Future 2040 Fund | | | 5.28 | % |
Natixis Sustainable Future 2045 Fund | | | 4.77 | % |
Natixis Sustainable Future 2050 Fund | | | 4.57 | % |
Natixis Sustainable Future 2055 Fund | | | 3.68 | % |
Natixis Sustainable Future 2060 Fund | | | 3.18 | % |
Natixis and affiliates | | | 59.35 | % |
| | | | |
| | | 99.93 | % |
Investment activities of affiliated shareholders could have material impacts on the Funds.
h. Reimbursement of Transfer Agent Fees and Expenses. Natixis Advisors has given a binding contractual undertaking to Global Sustainable Equity Fund to reimburse any and all transfer agency expenses for the Funds’ Class N shares. This undertaking is in effect through April 30, 2020 and is not subject to recovery under the expense limitation agreement described above.
| 64
Notes to Financial Statements (continued)
December 31, 2019
For the year ended December 31, 2019, Natixis Advisors reimbursed the Fund for transfer agency expenses as follows:
| | | | |
| | | Reimbursement of
Transfer Agency
Expenses | |
Fund | | Class N | |
Global Sustainable Equity Fund | | $ | 862 | |
7. Class-Specific Transfer Agent Fees and Expenses. Transfer agent fees and expenses attributable to Class A, Class C and Class Y are allocated on apro ratabasis to each class based on the relative net assets of each class to the total net assets of those classes. Transfer agent fees and expenses attributable to Class N are allocated to Class N.
For the year ended December 31, 2019, the Funds incurred the following class-specific transfer agent fees and expenses (includingsub-transfer agent fees, where applicable):
| | | | | | | | | | | | | | | | |
| | | Transfer Agent Fees and Expenses | |
Fund | | Class A | | | Class C | | | Class N | | | Class Y | |
Global Green Bond Fund | | $ | 3,046 | | | $ | — | | | $ | 315 | | | $ | 7,966 | |
Global Sustainable Equity Fund | | | 6,658 | | | | 2,763 | | | | 862 | | | | 68,574 | |
International Sustainable Equity Fund | | | 1,193 | | | | — | | | | 254 | | | | 1,227 | |
8. Line of Credit. Each Fund, together with certain other funds of Natixis Funds Trusts, Loomis Sayles Funds Trusts and Natixis ETF Trust, entered into a $400,000,000 committed unsecured line of credit provided by State Street Bank. Any one Fund may borrow up to $350,000,000 under the line of credit agreement (as long as all borrowings by all Funds in the aggregate do not exceed the $400,000,000 limit at any time), subject to each Fund’s investment restrictions and its contractual obligations under the line of credit. Interest is charged to the Funds based upon the terms set forth in the agreement. In addition, a commitment fee of 0.15% per annum, payable at the end of each calendar quarter, is accrued and apportioned among the participating funds based on their average daily unused portion of the line of credit. The Funds paid an arrangement fee, an upfront fee, and certain other legal fees in connection with the line of credit agreement, which are being amortized over a period of 364 days and are reflected in legal fees and/or miscellaneous expenses on the Statements of Operations. The unamortized balance is reflected as prepaid expenses on the Statements of Assets and Liabilities.
For the year ended December 31, 2019, none of the Funds had borrowings under this agreement.
65 |
Notes to Financial Statements (continued)
December 31, 2019
9. Concentration of Risk. Each Fund’s investments in foreign securities may be subject to greater political, economic, environmental, credit/counterparty and information risks. The Fund’s investments in foreign securities also are subject to foreign currency fluctuations and other foreign currency-related risks. Foreign securities may be subject to higher volatility than U.S. securities, varying degrees of regulation and limited liquidity.
10. Interest Expense. The Funds incur interest expense on cash overdrafts and foreign currency debit balances held at the custodian bank and, for Global Green Bond Fund, accounts held at brokers. Interest expense incurred for the year ended December 31, 2019 is reflected on the Statements of Operations.
11. Concentration of Ownership. From time to time, a Fund may have a concentration of one or more accounts constituting a significant percentage of shares outstanding. Investment activities by holders of such accounts could have material impacts on the Funds. As of December 31, 2019, based on management’s evaluation of the shareholder account base, the Funds had accounts representing controlling ownership of more than 5% of the Funds’ total outstanding shares. The number of such accounts, based on accounts that represent more than 5% of an individual class of shares, and the aggregate percentage of net assets represented by such holdings were as follows:
| | | | | | | | | | | | | | | | |
Fund | | Number of 5%
Non-Affiliated
Account Holders | | | Percentage of
Non-Affiliated
Ownership | | | Percentage of
Affiliated
Ownership
(Note 6g) | | | Total
Percentage of
Ownership | |
Global Green Bond Fund | | | 1 | | | | 5.82 | % | | | 70.94 | % | | | 76.76 | % |
Global Sustainable Equity Fund | | | 1 | | | | 7.03 | % | | | — | | | | 7.03 | % |
International Sustainable Equity Fund | | | — | | | | — | | | | 99.93 | % | | | 99.93 | % |
Omnibus shareholder accounts for which Natixis Advisors understands that the intermediary has discretion over the underlying shareholder accounts or investment models where a shareholder account may be invested for anon-discretionary customer are included in the table above. For other omnibus accounts, the Funds do not have information on the individual shareholder accounts underlying the omnibus accounts; therefore, there could be other 5% shareholders in addition to those disclosed in the table above.
| 66
Notes to Financial Statements (continued)
December 31, 2019
12. Capital Shares. Each Fund may issue an unlimited number of shares of beneficial interest, without par value. Transactions in capital shares were as follows:
| | | | | | | | | | | | | | | | |
| |
| Year Ended
December 31, 2019 |
| |
| Year Ended
December 31, 2018 |
|
Global Green Bond Fund | | | Shares | | | | Amount | | | | Shares | | | | Amount | |
| Class A | |
Issued from the sale of shares | | | 213,955 | | | $ | 2,256,341 | | | | 96,583 | | | $ | 954,782 | |
Issued in connection with the reinvestment of distributions | �� | | 3,961 | | | | 41,148 | | | | 2,659 | | | | 25,878 | |
Redeemed | | | (55,616 | ) | | | (576,973 | ) | | | (29,439 | ) | | | (289,444 | ) |
| | | | | | | | | | | | | | | | |
Net change | | | 162,300 | | | $ | 1,720,516 | | | | 69,803 | | | $ | 691,216 | |
| | | | | | | | | | | | | | | | |
| Class N | |
Issued from the sale of shares | | | 197,653 | | | $ | 2,056,718 | | | | 165,547 | | | $ | 1,638,046 | |
Issued in connection with the reinvestment of distributions | | | 66,143 | | | | 686,274 | | | | 93,723 | | | | 914,209 | |
Redeemed | | | (412,919 | ) | | | (4,197,811 | ) | | | (66,105 | ) | | | (651,384 | ) |
| | | | | | | | | | | | | | | | |
Net change | | | (149,123 | ) | | $ | (1,454,819 | ) | | | 193,165 | | | $ | 1,900,871 | |
| | | | | | | | | | | | | | | | |
| Class Y | |
Issued from the sale of shares | | | 711,084 | | | $ | 7,480,033 | | | | 119,626 | | | $ | 1,172,690 | |
Issued in connection with the reinvestment of distributions | | | 11,941 | | | | 124,307 | | | | 2,517 | | | | 24,445 | |
Redeemed | | | (166,513 | ) | | | (1,759,865 | ) | | | (2,471 | ) | | | (24,251 | ) |
| | | | | | | | | | | | | | | | |
Net change | | | 556,512 | | | $ | 5,844,475 | | | | 119,672 | | | $ | 1,172,884 | |
| | | | | | | | | | | | | | | | |
Increase from capital share transactions | | | 569,689 | | | $ | 6,110,172 | | | | 382,640 | | | $ | 3,764,971 | |
| | | | | | | | | | | | | | | | |
67 |
Notes to Financial Statements (continued)
December 31, 2019
12. Capital Shares (continued).
| | | | | | | | | | | | | | | | |
| |
| Year Ended
December 31, 2019 |
| |
| Year Ended
December 31, 2018 |
|
Global Sustainable Equity Fund | | | Shares | | | | Amount | | | | Shares | | | | Amount | |
| Class A | |
Issued from the sale of shares | | | 421,391 | | | $ | 5,771,615 | | | | 348,428 | | | $ | 4,451,380 | |
Issued in connection with the reinvestment of distributions | | | 9,280 | | | | 131,736 | | | | 17,523 | | | | 198,567 | |
Redeemed | | | (122,875 | ) | | | (1,613,835 | ) | | | (65,761 | ) | | | (832,079 | ) |
| | | | | | | | | | | | | | | | |
Net change | | | 307,796 | | | $ | 4,289,516 | | | | 300,190 | | | $ | 3,817,868 | |
| | | | | | | | | | | | | | | | |
| Class C | |
Issued from the sale of shares | | | 152,601 | | | $ | 2,081,444 | | | | 160,246 | | | $ | 2,031,467 | |
Issued in connection with the reinvestment of distributions | | | 1,646 | | | | 22,845 | | | | 3,196 | | | | 35,492 | |
Redeemed | | | (23,760 | ) | | | (318,560 | ) | | | (14,749 | ) | | | (176,377 | ) |
| | | | | | | | | | | | | | | | |
Net change | | | 130,487 | | | $ | 1,785,729 | | | | 148,693 | | | $ | 1,890,582 | |
| | | | | | | | | | | | | | | | |
| Class N | |
Issued from the sale of shares | | | 479,051 | | | $ | 6,954,884 | | | | 238,121 | | | $ | 3,000,333 | |
Issued in connection with the reinvestment of distributions | | | 9,538 | | | | 139,234 | | | | 9,228 | | | | 102,891 | |
Redeemed | | | (2,130 | ) | | | (31,125 | ) | | | — | | | | — | |
| | | | | | | | | | | | | | | | |
Net change | | | 486,459 | | | $ | 7,062,993 | | | | 247,349 | | | $ | 3,103,224 | |
| | | | | | | | | | | | | | | | |
| Class Y | |
Issued from the sale of shares | | | 4,887,232 | | | $ | 66,779,728 | | | | 3,242,405 | | | $ | 42,546,284 | |
Issued in connection with the reinvestment of distributions | | | 92,160 | | | | 1,315,613 | | | | 207,621 | | | | 2,371,303 | |
Redeemed | | | (3,173,224 | ) | | | (42,852,903 | ) | | | (2,329,061 | ) | | | (29,573,357 | ) |
| | | | | | | | | | | | | | | | |
Net change | | | 1,806,168 | | | $ | 25,242,438 | | | | 1,120,965 | | | $ | 15,344,230 | |
| | | | | | | | | | | | | | | | |
Increase from capital share transactions | | | 2,730,910 | | | $ | 38,380,676 | | | | 1,817,197 | | | $ | 24,155,904 | |
| | | | | | | | | | | | | | | | |
| 68
Notes to Financial Statements (continued)
December 31, 2019
12. Capital Shares (continued).
| | | | | | | | | | | | | | | | |
| |
| Year Ended
December 31, 2019 |
| |
| Period Ended
December 31, 2018(a) |
|
International Sustainable Equity Fund | | | Shares | | | | Amount | | | | Shares | | | | Amount | |
| Class A | |
Issued from the sale of shares | | | 241 | | | $ | 3,002 | | | | 100 | | | $ | 1,000 | |
Issued in connection with the reinvestment of distributions | | | 1 | | | | 12 | | | | — | | | | — | |
| | | | | | | | | | | | | | | | |
Net change | | | 242 | | | $ | 3,014 | | | | 100 | | | $ | 1,000 | |
| | | | | | | | | | | | | | | | |
| Class N | |
Issued from the sale of shares | | | 624,516 | | | $ | 6,901,909 | | | | 1,000,000 | | | $ | 10,000,000 | |
Issued in connection with the reinvestment of distributions | | | 16,672 | | | | 205,624 | | | | — | | | | — | |
Redeemed | | | (267,041 | ) | | | (2,830,518 | ) | | | — | | | | — | |
| | | | | | | | | | | | | | | | |
Net change | | | 374,147 | | | $ | 4,277,015 | | | | 1,000,000 | | | $ | 10,000,000 | |
| | | | | | | | | | | | | | | | |
| Class Y | |
Issued from the sale of shares | | | 575 | | | $ | 7,196 | | | | 100 | | | $ | 1,000 | |
Issued in connection with the reinvestment of distributions | | | 7 | | | | 86 | | | | — | | | | — | |
| | | | | | | | | | | | | | | | |
Net change | | | 582 | | | $ | 7,282 | | | | 100 | | | $ | 1,000 | |
| �� | | | | | | | | | | | | | | | |
Increase from capital share transactions | | | 374,971 | | | $ | 4,287,311 | | | | 1,000,200 | | | $ | 10,002,000 | |
| | | | | | | | | | | | | | | | |
| (a) | From commencement of operations on December 28, 2018 through December 31, 2018. |
69 |
Report of Independent Registered Public Accounting Firm
To the Board of Trustees of Natixis Funds Trust I and Shareholders of Mirova Global Green Bond Fund, Mirova Global Sustainable Equity Fund, and Mirova International Sustainable Equity Fund
Opinions on the Financial Statements
We have audited the accompanying statements of assets and liabilities, including the portfolios of investments, of Mirova Global Sustainable Equity Fund, Mirova Global Green Bond Fund and Mirova International Sustainable Equity Fund (three of the funds constituting Natixis Trust I, hereafter collectively referred to as the “Funds”) as of December 31, 2019, the related statements of operations for the year ended December 31, 2019, the statements of changes in net assets for each of the two years in the period ended December 31, 2019, including the related notes, and the financial highlights for each of the periods indicated therein (collectively referred to as the “financial statements”). In our opinion, the financial statements present fairly, in all material respects, the financial position of each of the Funds as of December 31, 2019, the results of each of their operations for the year then ended, the changes in each of their net assets for each of the two years in the period ended December 31, 2019 and each of the financial highlights for each of the periods indicated therein in conformity with accounting principles generally accepted in the United States of America.
Basis for Opinions
These financial statements are the responsibility of the Funds’ management. Our responsibility is to express an opinion on the Funds’ financial statements based on our audits. We are a public accounting firm registered with the Public Company Accounting Oversight Board (United States) (PCAOB) and are required to be independent with respect to the Funds in accordance with the U.S. federal securities laws and the applicable rules and regulations of the Securities and Exchange Commission and the PCAOB.
We conducted our audits of these financial statements in accordance with the standards of the PCAOB. Those standards require that we plan and perform the audit to obtain reasonable assurance about whether the financial statements are free of material misstatement, whether due to error or fraud.
Our audits included performing procedures to assess the risks of material misstatement of the financial statements, whether due to error or fraud, and performing procedures that respond to those risks. Such procedures included examining, on a test basis, evidence regarding the amounts and disclosures in the financial statements. Our audits also included evaluating the accounting principles used and significant estimates made by management, as well as evaluating the overall presentation of the financial statements. Our procedures included confirmation of securities owned as of December 31, 2019 by correspondence with the custodian, and brokers; when replies
| 70
Report of Independent Registered Public Accounting Firm
were not received from brokers, we performed other auditing procedures. We believe that our audits provide a reasonable basis for our opinions.
/s/PricewaterhouseCoopers LLP
Boston, Massachusetts
February 21, 2020
We have served as the auditor of one or more of the investment companies in the Natixis Investment Company Complex since at least 1995. We have not been able to determine the specific year we began serving as auditor.
71 |
2019 U.S. Tax Distribution Information to Shareholders (Unaudited)
Qualified Dividend Income. For the fiscal year ended December 31, 2019, a percentage of the ordinary income dividends paid by the Funds are considered qualified dividend income eligible for reduced tax rates. These lower rates range from 0% to 20% depending on an individual’s tax bracket. If the Funds paid a distribution during calendar year 2019, complete information will be reported in conjunction with Form1099-DIV. These percentages are noted below:
| | | | |
Fund | | Qualifying
Percentage | |
Global Sustainable Equity Fund | | | 100.00 | % |
International Sustainable Equity Fund | | | 100.00 | % |
Corporate Dividends Received Deduction. For the fiscal year ended December 31, 2019, a percentage of dividends distributed by the Fund listed below qualifies for the dividends received deduction for corporate shareholders. This percentage is as follows:
| | | | |
Fund | | Qualifying
Percentage | |
Global Sustainable Equity Fund | | | 100.00 | % |
Capital Gains Distributions. Pursuant to Internal Revenue Section 852(b), the following Funds paid distributions, which have been designated as capital gains distributions for the fiscal year ended December 31, 2019.
| | | | |
Fund | | Amount | |
Global Green Bond Fund | | $ | 265,743 | |
Global Sustainable Equity Fund | | | 1,861,566 | |
Foreign Tax Credit. For the year ended December 31, 2019, the Fund intends to pass through foreign tax credits and have derived gross income from sources within foreign countries amounting to:
| | | | | | | | |
Fund | | Foreign Tax
Credit Pass-Through | | | Foreign Source
Income | |
International Sustainable Equity Fund | | $ | 37,948 | | | $ | 354,756 | |
| 72
Trustee and Officer Information
The tables below provide certain information regarding the trustees and officers of Natixis Funds Trust I (the “Trust”). Unless otherwise indicated, the address of all persons below is 888 Boylston Street, Suite 800, Boston, MA 02199-8197. The Funds’ Statement of Additional Information includes additional information about the trustees of the Trust and is available by calling Natixis Funds at800-225-5478.
| | | | | | | | |
Name and Year of Birth | | Position(s) Held
with the Trust,
Length of Time
Served and Term of Office1 | | Principal
Occupation(s)
During Past 5 Years | | Number of
Portfolios in Fund Complex
Overseen2 and Other
Directorships Held
During Past 5 Years | | Experience,
Qualifications,
Attributes, Skills
for Board Membership |
| | | |
| INDEPENDENT TRUSTEES | | | | | | |
| | | | |
Kenneth A. Drucker (1945) | | Chairperson of the Board of Trustees since January 2017 Trustee since 2008 Ex Officio member of Audit Committee, Contract Review Committee and Governance Committee | | Retired | | 51 None | | Significant experience on the Board and on the boards of other business organizations (including at investment companies); executive experience (including as treasurer of an aerospace, automotive, and metal manufacturing corporation) |
| | | | |
Edmond J. English (1953) | | Trustee since 2013 Chairperson of the Governance Committee and Audit Committee Member | | Executive Chairman; formerly, Chief Executive Officer of Bob’s Discount Furniture (retail) | | 51 Director, Burlington Stores, Inc. (retail) | | Experience on the Board and significant experience on the boards of other business organizations (including retail companies and a bank); executive experience (including at a retail company) |
73 |
Trustee and Officer Information
| | | | | | | | |
Name and Year of Birth | | Position(s) Held
with the Trust,
Length of Time
Served and Term of Office1 | | Principal
Occupation(s)
During Past 5 Years | | Number of
Portfolios in Fund Complex
Overseen2 and Other
Directorships Held
During Past 5 Years | | Experience,
Qualifications,
Attributes, Skills
for Board Membership |
| | | |
INDEPENDENT TRUSTEES continued | | | | | | |
| | | | |
Richard A. Goglia (1951) | | Trustee since 2015 Contract Review Committee Member and Governance Committee Member | | Retired; formerly Vice President and Treasurer of Raytheon Retired; formerly Vice President and Treasurer of Raytheon Company (defense) | | 51 None | | Experience on the Board and executive experience (including his role as vice president and treasurer of a defense company and experience at a financial services company) |
| | | | |
Wendell J. Knox (1948) | | Trustee since 2009 Chairperson of Contract Review Committee | | Director of Abt Associates Inc. (research and consulting) | | 51 Director, The Hanover Insurance Group (property and casualty insurance); formerly, Director, Eastern Bank (bank) | | Significant experience on the Board and on the boards of other business organizations (including at a bank and at a property and casualty insurance firm); executive experience (including roles as president and chief executive officer of a research and consulting company) |
| 74
Trustee and Officer Information
| | | | | | | | |
Name and Year of Birth | | Position(s) Held
with the Trust,
Length of Time
Served and Term of Office1 | | Principal
Occupation(s)
During Past 5 Years | | Number of
Portfolios in Fund Complex
Overseen2 and Other
Directorships Held
During Past 5 Years | | Experience,
Qualifications,
Attributes, Skills
for Board Membership |
| | | |
INDEPENDENT TRUSTEES continued | | | | | | |
| | | | |
Martin T. Meehan (1956) | | Trustee since 2012 Audit Committee Member | | President, University of Massachusetts; formerly, Chancellor and faculty member, University of Massachusetts Lowell | | 51 None | | Significant experience on the Board and on the boards of other business organizations; experience as President of the University of Massachusetts; government experience (including as a member of the U.S. House of Representatives); academic experience |
| | | | |
Maureen B. Mitchell (1951) | | Trustee since 2017 Contract Review Committee Member and Governance Committee Member | | Retired; formerly President, Global Sales and Retired; formerly President, Global Sales and Marketing, GE Asset Management, Inc. (financial services) | | 51 Director, Sterling Bancorp (Bank) | | Experience on the Board ; financial services industry and executive experience (including role as president of global sales and marketing at a financial services company) |
75 |
Trustee and Officer Information
| | | | | | | | |
Name and Year of Birth | | Position(s) Held
with the Trust,
Length of Time
Served and Term of Office1 | | Principal
Occupation(s)
During Past 5 Years | | Number of
Portfolios in Fund Complex
Overseen2 and Other
Directorships Held
During Past 5 Years | | Experience,
Qualifications,
Attributes, Skills
for Board
Membership |
| | | |
INDEPENDENT TRUSTEES continued | | | | | | |
| | | | |
James P. Palermo (1955) | | Trustee since 2016 Contract Review Committee Member | | Founding Partner, Breton Capital Management, LLC (private equity); Partner, STEP Partners, LLC (private equity); formerly, Chief Executive Officer of Global Client Management of The Bank of New York Mellon Corporation | | 51 Director, FutureFuel.io (Chemicals and Biofuels) | | Experience on the Board ; financial services industry and executive experience (including roles as chief executive officer of client management and asset servicing for a banking and financial services company) |
| | | | |
Erik R. Sirri (1958) | | Trustee since 2009 Chairperson of the Audit Committee | | Professor of Finance at Babson College | | 51 None | | Significant experience on the Board; experience as Director of the Division of Trading and Markets at the Securities and Exchange Commission; academic experience; training as an economist |
| | | | |
Peter J. Smail (1952) | | Trustee since 2009 Audit Committee Member and Governance Committee Member | | Retired | | 51 None | | Significant experience on the Board; mutual fund industry and executive experience (including roles as president and chief executive officer for an investment adviser) |
| 76
Trustee and Officer Information
| | | | | | | | |
Name and Year of Birth | | Position(s) Held
with the Trust,
Length of Time
Served and Term of Office1 | | Principal
Occupation(s)
During Past 5 Years | | Number of
Portfolios in Fund Complex
Overseen2 and Other
Directorships Held
During Past 5 Years | | Experience,
Qualifications,
Attributes, Skills
for Board Membership |
| | | |
INDEPENDENT TRUSTEES continued | | | | | | |
| | | | |
Kirk A. Sykes (1958) | | Trustee since 2019 Contract Review Committee Member | | Managing Director of Accordia Partners, LLC (real estate development); President of Primary Corporation (real estate development); Managing Principal of Merrick Capital Partners (infrastructure finance); formerly, President of Urban Strategy America Fund (real estate fund manager) | | 51 Trustee, Eastern Bank (bank); formerly Director, Ares Commercial Real Estate Corporation (real estate investment trust) | | Significant experience on the boards of other business organizations (including real estate companies and banks) |
| | | | |
Cynthia L. Walker (1956) | | Trustee since 2005 Governance Committee Member and Audit Committee Member | | Deputy Dean for Finance and Administration, Yale University School of Medicine | | 51 None | | Significant experience on the Board; executive experience in a variety of academic organizations (including roles as dean for finance and administration) |
77 |
Trustee and Officer Information
| | | | | | | | |
Name and Year of Birth | | Position(s) Held
with the Trust,
Length of Time
Served and Term of Office1 | | Principal
Occupation(s)
During Past 5 Years | | Number of
Portfolios in Fund Complex
Overseen2 and Other
Directorships Held
During Past 5 Years | | Experience,
Qualifications,
Attributes, Skills
for Board Membership |
|
| INTERESTED TRUSTEES |
| | | | |
Kevin P. Charleston3 (1965) One Financial Center Boston, MA 02111 | | Trustee since 2015 | | President, Chief Executive Officer and Chairman of the Board of Directors; formerly, Chief Financial Officer, Loomis, Sayles & Company, L.P. | | 51 None | | Experience on the Board; continuing service as President, Chief Executive Officer and Chairman of the Board of Directors of Loomis, Sayles & Company, L.P. |
| | | | |
David L. Giunta4 (1965) | | Trustee since 2011 President and Chief Executive Officer of the Trust | | President and Chief Executive Officer, Natixis Advisors, L.P., Natixis Distribution, L.P., Natixis Distribution Corporation and Chairman of the Board of Natixis Distribution Corporation | | 51 None | | Significant experience on the Board; experience as President and Chief Executive Officer, Natixis Advisors, L.P., Natixis Distribution, L.P., Natixis Distribution Corporation and Chairman of the Board of Natixis Distribution Corporation |
| 1 | Each trustee serves until retirement, resignation or removal from the Board. The current retirement age is 75. The position of Chairperson of the Board is appointed for a three-year term. Mr. Drucker was appointed to serve an additional one year term as the Chairperson of the Board on June 12, 2019. |
| 2 | The trustees of the Trust serve as trustees of a fund complex that includes all series of the Natixis Funds Trust I, Natixis Funds Trust II, Natixis Funds Trust IV, Gateway Trust, Loomis Sayles Funds I, Loomis Sayles Funds II and Natixis ETF Trust (collectively, the “Fund Complex”). |
| 3 | Mr. Charleston is deemed an “interested person” of the Trust because he holds the following positions with an affiliated person of the Trust: President, Chief Executive Officer and Chairman of the Board of Directors of Loomis, Sayles & Company, L.P. |
| 4 | Mr. Giunta is deemed an “interested person” of the Trust because he holds the following positions with an affiliated person of the Trust: President and Chief Executive Officer, Natixis Advisors, L.P., Natixis Distribution, L.P., Natixis Distribution Corporation and Chairman of the Board of Natixis Distribution Corporation. |
| 78
Trustee and Officer Information
| | | | | | |
Name and Year of Birth | | Position(s) Held with the Trust | | Term of Office1 and Length of Time Served | | Principal Occupation(s) During Past 5 Years2 |
|
| OFFICERS OF THE TRUST |
| | | |
Russell L. Kane (1969) | | Secretary, Clerk and Chief Legal Officer | | Since 2016 | | Executive Vice President, General Counsel, Secretary and Clerk, Natixis Distribution Corporation, Natixis Advisors, L.P. and Natixis Distribution, L.P.; formerly, Chief Compliance Officer for Mutual Funds, Senior Vice President, Deputy General Counsel, Assistant Secretary and Assistant Clerk, Natixis Distribution Corporation, Natixis Advisors, L.P. and Natixis Distribution, L.P. |
| | | |
Michael C. Kardok (1959) | | Treasurer, Principal Financial and Accounting Officer | | Since 2004 | | Senior Vice President, Natixis Advisors, L.P. and Natixis Distribution, L.P. |
| | | |
Kirk D. Johnson (1981) | | Chief Compliance Officer, Assistant Secretary and Anti-Money Laundering Officer | | Since 2018 | | Senior Vice President, Deputy General Counsel, Assistant Secretary and Assistant Clerk, Natixis Distribution Corporation, Natixis Advisors, L.P. and Natixis Distribution, L.P.; formerly, Vice President and Counsel, Natixis Investment Managers, LLC. |
| 1 | Each officer of the Trust serves for an indefinite term in accordance with the Trust’s currentby-laws until the date his or her successor is elected and qualified, or until he or she sooner dies, retires, is removed or becomes disqualified. |
| 2 | Each person listed above, except as noted, holds the same position(s) with the Fund Complex. Previous positions during the past five years with Natixis Distribution, L.P., Natixis Advisors, L.P. or Loomis, Sayles & Company, L.P. are omitted, if not materially different from an officer’s current position with such entity. |
79 |


Annual Report
December 31, 2019
Loomis Sayles Intermediate Municipal Bond Fund
Natixis Oakmark Fund
Natixis Oakmark International Fund
Vaughan Nelson Small Cap Value Fund
Vaughan Nelson Value Opportunity Fund
Table of Contents
IMPORTANT NOTICE TO SHAREHOLDERS
Beginning on January 1, 2021, as permitted by regulations adopted by the Securities and Exchange Commission, paper copies of shareholder reports like this one will no longer be sent by mail, unless you specifically request paper copies of the reports from the Fund or from your financial intermediary, such as a broker-dealer or bank. Instead, the reports will be made available on the Funds’ website, and you will be notified by mail each time a report is posted and provided with a website link to access the report. If you wish to continue receiving paper copies of your shareholder reports after January 1, 2021, you can inform the Fund at any time by calling 1-800-225-5478. If you hold your account with a financial intermediary and you wish to continue receiving paper copies after January 1, 2021, you should call your financial intermediary directly. Paper copies are provided free of charge, and your election to receive reports in paper will apply to all funds held with the Natixis Funds complex. If you have already elected to receive shareholder reports electronically, you will not be affected by this change and you need not take any action. You currently may elect to receive shareholder reports and other communications from the Fund or your financial intermediary electronically atwww.icsdelivery.com/natixisfunds.
LOOMIS SAYLES INTERMEDIATE MUNICIPAL BOND FUND
| | |
| |
| Managers | | Symbols |
| |
| Dawn Mangerson | | Class A MIMAX |
| |
| James Grabovac, CFA® | | Class C MIMCX |
| |
| Lawrence Jones | | Class Y MIMYX |
| |
| Loomis, Sayles & Company, L.P. | | |
Investment Goal
The Fund seeks a high level of federal tax-exempt current income, consistent with the preservation of capital.
Market Conditions
Capital market returns were decidedly strong across the board in 2019. Interest rates declined, credit spreads tightened and equity markets rallied, despite an ongoing trade war and global manufacturing recession. Boosting investor risk sentiment were indications of a gradual cooling in United States-China trade tensions and a sanguine economic and monetary assessment from the Federal Reserve (the “Fed”). The Fed engineered three reductions in short-term interest rates in what it characterized as amid-cycle adjustment, lowering the fed funds policy range to 1.5% — 1.75%. Furthermore, the Fed indicated that it expected to stay on the sidelines throughout the next 12 months. Counterpoised to positive market developments, however, remain longer-term concerns about the combination of monetary accommodation and a nearly $1 trillion fiscal deficit concurrent with unemployment at a50-year low. Inflation remains quiescent, but the unorthodox policy mix provides an uneasy backdrop. Municipal mutual funds experienced record net shareholder inflows topping $93 billion for the year, which contributed to credit and sector spread compression as investors reached for yield. New issue supply rose by more than $75 billion in 2019, but nearly half the increase came in the form of taxable issuance which increased by $37 billion from year ago levels.
Performance Results
For the 12 months ended December 31, 2019, Class Y shares of the Loomis Sayles Intermediate Municipal Bond Fund returned 6.80% at net asset value. The Fund underperformed its benchmark, the Bloomberg Barclays Municipal Bond Index, which returned 7.54%.
Explanation of Fund Performance
Although the Fund produced a meaningfully positive return for the year, it underperformed its benchmark primarily due to yield curve posture. More specifically, lack of exposure to the longest portion of the yield curve (22 years and longer), which produced the greatest returns for the period caused this negative impact to performance. Additionally, reduced exposure to the Lease and Special Tax sectors hampered performance as spread compression persisted. Credit decisions to avoid weaker state issuers such as Illinois and New Jersey were a significant drag on performance as strong investor demand for municipals and a reach for
1 |
yield environment remained. However, overall security selection, duration posture and credit quality exposures were additive. Particularly, security selection within the Transportation, Higher Education and Water & Sewer sectors enhanced performance as did an overweight to the Hospital sector, especially lower quality, long duration holdings.
Outlook
The economic expansion appears on track to reach the11-year mark atmid-year and market consensus anticipates that we are not nearing a business cycle peak over the medium-term horizon. We concur with that view but are cognizant of the strong performance of the capital markets over the past year. Municipal yields declined by more than 75 basis points in 2019 and valuations have richened versus Treasuries. Countering those factors, however, are improved valuations versus corporates and constrainedtax-exempt supply. The impact of the 2017 tax changes remain a significant factor influencing market development. The law restrictedtax-exempt supply and incentivized demand from individuals subject to the limitation on the deductibility of state and local taxes. We expect capital markets will have a difficult time matching the past year’s performance; however, we do anticipate the municipal market continuing to find support from the relatively constrained supply oftax-exempt issuance and strong demand from individuals, particularly those in high tax states.
Hypothetical Growth of $100,000 Investment in Class Y Shares1,4
December 31, 2012 (inception) through December 31, 2019
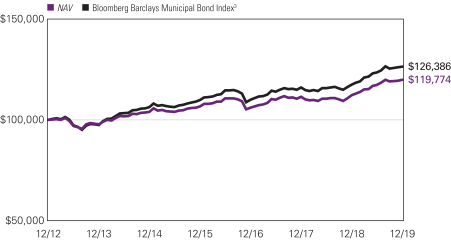
See notes to chart on page 3.
| 2
LOOMIS SAYLES INTERMEDIATE MUNICIPAL BOND FUND
Average Annual Total Returns — December 31, 20194
| | | | | | | | | | | | | | | | | | | | |
| | | | | |
| | | | | | | | | | | | Expense Ratios5 | |
| | | 1 Year | | | 5 Years | | | Life of Fund | | | Gross | | | Net | |
| | | | | | |
| Class Y (Inception 12/31/12)1 | | | | | | | | | | | | | | | | | | | | |
| NAV | | | 6.80 | % | | | 2.88 | % | | | 2.61 | % | | | 1.05% | | | | 0.46 | % |
| | | | | | |
| Class A (Inception 12/31/12)1 | | | | | | | | | | | | | | | | | | | | |
| NAV | | | 6.54 | | | | 2.59 | | | | 2.31 | | | | 1.31 | | | | 0.71 | |
| With 3.00% Maximum Sales Charge | | | 3.33 | | | | 1.96 | | | | 1.86 | | | | | | | | | |
| | | | | | |
| Class C (Inception 12/31/12)1 | | | | | | | | | | | | | | | | | | | | |
| NAV | | | 5.64 | | | | 1.85 | | | | 1.55 | | | | 2.06 | | | | 1.46 | |
| With CDSC2 | | | 4.64 | | | | 1.85 | | | | 1.55 | | | | | | | | | |
| | | | | | |
| Comparative Performance | | | | | | | | | | | | | | | | | | | | |
| Bloomberg Barclays Municipal Bond Index3 | | | 7.54 | | | | 3.53 | | | | 3.39 | | | | | | | | | |
Performance data shown represents past performance and is no guarantee of, and not necessarily indicative of, future results. Total return and value will vary, and you may have a gain or loss when shares are sold. Current performance may be lower or higher than quoted. For most recent month-end performance, visit im.natixis.com/performance. Performance for other share classes will be greater or less than shown based on differences in fees and sales charges. You may not invest directly in an index. Performance for periods less than one year is cumulative, not annualized. Returns reflect changes in share price and reinvestment of dividends and capital gains, if any. The table(s) do not reflect taxes shareholders might owe on any fund distributions or when they redeem their shares.
| 1 | December 31, 2012 represents the date shares were first registered for public sale under the Securities Act of 1933. November 16, 2012 represents commencement of operations for accounting and financial reporting purposes only. |
| 2 | Performance for Class C shares assumes a 1.00% contingent deferred sales charge (“CDSC”) applied when you sell shares within one year of purchase. |
| 3 | Bloomberg Barclays Municipal Bond Index is a market value-weighted index of investment-grade municipal bonds with maturities of one year or more. |
| 4 | Fund performance has been increased by fee waivers and/or expense reimbursements, if any, without which performance would have been lower. |
| 5 | Expense ratios are as shown in the Fund’s prospectus in effect as of the date of this report. The expense ratios for the current reporting period can be found in the Financial Highlights section of this report under Ratios to Average Net Assets. Net expenses reflect contractual expense limitations set to expire on 4/30/20. When a Fund’s expenses are below the limitation, gross and net expense ratios will be the same. See Note 6 of the Notes to Financial Statements for more information about the Fund’s expense limitations. |
3 |
NATIXIS OAKMARK FUND
| | |
| |
| Managers | | Symbols |
| |
| William C. Nygren, CFA® | | Class A NEFOX |
| |
| Kevin G. Grant, CFA® | | Class C NECOX |
| |
| M. Colin Hudson, CFA® | | Class N NOANX |
| |
| Michael J. Mangan, CFA® | | Class Y NEOYX |
| |
| Michael A. Nicolas, CFA®* | | |
| |
| Harris Associates L.P. | | |
| * | Effective January 28, 2020, Michael A. Nicolas joined the portfolio management team of the Fund. |
Investment Goal
The Fund seeks long-term capital appreciation.
Market Conditions
At the outset of the fourth quarter, investors faced a continuation of some unresolved difficulties that started the year. In typical fashion, markets reacted to news that was mainly driven by “Deal or No Deal” issues, such as U.S. trade disputes with China along with Mexico and Canada. Late in the quarter, the United States and China reached a partial trade deal and a new version of an agreement between the United States, Mexico and Canada moved toward implementation in 2020. Because these developments have provided more solid foundations for businesses to make capital allocation and investment decisions going forward, the news pushed key US indexes toall-time high levels. In fact, all 11 GICS sectors in the S&P 500® Index gained value in 2019 and produced double-digit returns for the year.
Economic indicators also influenced markets, with positive news largely outweighing negative news.Disappointing data included gross domestic product growth of only 2.1% in the third quarter, well short of comparable 2017 and 2018 quarters as well as policymakers’ targets. In addition, the Institute for Supply Management indicated that manufacturing activity continued to contract as new orders declined in November for the fourth consecutive month. Meanwhile, the unemployment rate remained at a multi-decades low level, new residential home sales rose nearly 17% year-over-year in Novemberand November construction of new homes grew 3.2%, which reflected a12-year high level. Furthermore, in a survey conducted by Bankrate, the country’s top economists revealed that although some areas of the economy have slowed, there is only about a 35% chance that a recession will occur within the next year as tradewar-related threats have moderated. Importantly, consumer spending, a key economic growth driver, was strong. Retail industry experts reported November sales increased 2.1% from a year ago with record-setting Black Friday and Cyber Monday online holiday spending followed by Super Saturday spending that exceeded $34 billion, making it the largest single retail sales day in U.S. history.
| 4
NATIXIS OAKMARK FUND
Performance Results
For the 12 months ended December 31, 2019, Class Y shares of Natixis Oakmark Fund returned 27.06% at net asset value. The Fund underperformed its benchmark, the S&P 500® Index, which returned 31.49%.
Explanation of Fund Performance
The leading contributors to fund performance for the year were Citigroup and Apple. Citigroup’s results released over the course of the year showed the company achieved revenues of slightly more than $18 billion in all four reported quarters. In addition, earnings per share were better than market expectations consistently across reporting periods. From our standpoint, the company’s fundamental performance showed strengthening trends that we found notable. Most recently, Citigroup reported third-quarter results inmid-October that we saw as solid. Constant currency revenue grew 3% from a year earlier and earnings per share rose nearly 20% to $2.07 (including aone-time tax benefit), which was about 6% better than market expectations. We were particularly pleased with performance in the global consumer bank segment that realized an increase in underlyingpre-provision net revenue of 11%, driven by 4% revenue growth along with a 1% decline in operating expenses. Lastly, management returned more than $6 billion of capital to shareholders through buybacks and dividend payments in the third quarter and reduced the share count by over 250 million from the prior year. Even accounting for the share price increase in 2019, we continue to believe that Citigroup is undervalued relative to its normalized earnings power. Apple’s fundamental performance has been consistently solid, in our view, which led to revenue and earnings per share that outpaced market expectations in all four reported quarters in 2019. The company’s first-quarter earnings per share rose 8% to $4.18, while the services segment generated revenue of $11 billion and the installed base grew by more than 100 million units in the first quarter. In March, news that Apple would soon unveil its plans for video, news and finance offerings helped its share price advance. Later, the company officially announced it was launching apay-for-news application (News), a game subscription service (Apple Arcade), a video subscription service (Apple TV+) and a credit card (partnering with Goldman Sachs and Mastercard). Apple reported fiscal third-quarter total net revenue and earnings per share that surpassed market projections and reinforced our view that innovation continues to thrive at the company. Net revenues accelerated most in the wearables, home and accessories segment, which advanced 48% and far outpaced market forecasts. Revenues also rose in the Mac and iPad segments by about 11% and 8%, respectively. Importantly, the higher margin services segment realized a revenue increase of 13% and reached a record level of nearly $11.5 billion. Later, Apple’s fiscal fourth-quarter results exceeded investor expectations. Total revenue grew 2% from a year earlier to $64.04 billion, while earnings per share rose 4% to a record level $3.03, which was more than 7% higher than market projections. Even though the company’s share price rose progressively over the year, we elected to increase our sell target price as we continue to believe Apple offers further upside potential.
Qurate Retail and Chesapeake Energy were the largest detractors to fund performance for the calendar year. Qurate Retail issued mixed results throughout 2019 with revenue that
5 |
lagged market expectations in three reported quarters, while operating income exceeded forecasts in three reported quarters. Revenues in the company’s underlying businesses (QVC, Zulily and QxH) were also inconsistent over the past 12 months. Most recently, Qurate reported third-quarter revenue of $3.09 billion, which undershot market projections of $3.12 billion. Concurrently, operating income reached $456 million and was better than the $388.1 million the market had estimated. From our perspective, results were in line with recent trends in the business. Revenues from QxH (QVC/HSN in the U.S.) declined 4% year-over-year, which is the third sequential quarter of contraction. QVC International revenue growth improved slightly (+3%) as demand in Japan shifted ahead owing to a pending consumption tax increase. Zulily is struggling as revenue fell 17% from a year earlier, and management anticipates results in this business will likely worsen and cause a $1 billion impairment charge of intangible assets from the acquisition. While we were disappointed by Qurate’s recent performance, we are hopeful that management’s objectives can lead to improved results going forward. Chesapeake Energy’s first-quarter revenue and earnings (before exploration expense) fell short of market expectations. However, we saw the company’s progress as solid. Chesapeake’s total production was up 8% from last year and organic oil volumes rose 13%; both metrics were ahead of market forecasts. Later, Chesapeake’s second-quarter earnings results were in line with our expectations and included increased guidance for 2019 on higher oil production and lower costs. Oil volumes increased 10% organically as the company continued to shift activity toward its Powder River and WildHorse assets, with good results in both basins, in our view. However, as part of its third-quarter earnings report, Chesapeake indicated it would reduce spending on drilling and completions in 2020. Ultimately, we opted to eliminate our position in the company todeploy the proceeds from the sale into more attractive holdings that offer stronger cash flow profiles, better balance sheets and potentially more compelling risk-adjusted returns.
Outlook
Owing to our experience, we are prepared to confidently navigate a wide array of macro environments. We apply the same disciplined investment approach when markets advance as well as when markets retreat. Throughout our history, we have implemented a consistent philosophy and an intensive research process. We continue to stay alert for attractive investment opportunities while ensuring that our clients’ goals remain at the forefront.
| 6
NATIXIS OAKMARK FUND
Hypothetical Growth of $100,000 Investment in Class Y Shares3
December 31, 2009 through December 31, 2019
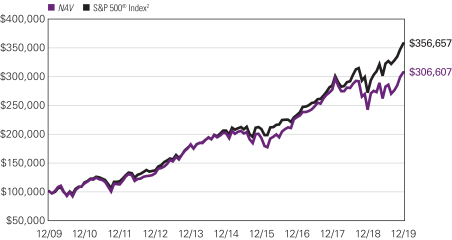
Top Ten Holdings as of December 31, 2019
| | | | | | |
| | | Security Name | | % of
net assets | |
| 1 | | Alphabet, Inc., Class A | | | 3.93 | % |
| 2 | | Citigroup, Inc. | | | 3.69 | % |
| 3 | | Bank of America Corp. | | | 3.67 | % |
| 4 | | Capital One Financial Corp. | | | 3.14 | % |
| 5 | | Netflix, Inc. | | | 3.12 | % |
| 6 | | Ally Financial, Inc. | | | 3.00 | % |
| 7 | | Regeneron Pharmaceuticals, Inc. | | | 2.98 | % |
| 8 | | State Street Corp. | | | 2.83 | % |
| 9 | | Charter Communications, Inc., Class A | | | 2.77 | % |
| 10 | | Charles Schwab Corp. (The) | | | 2.62 | % |
The portfolio is actively managed and holdings are subject to change. There is no guarantee the Fund continues to invest in the securities referenced. The holdings listed exclude any temporary cash investments.
7 |
Average Annual Total Returns — December 31, 20193
| | | | | | | | | | | | | | | | | | | | | | | | |
| | | | | | |
| | | | | | | | | | | | Life of
Class N | | | Expense Ratios4 | |
| | | 1 Year | | | 5 Years | | | 10 Years | | | Gross | | | Net | |
| | | | | | | |
| Class Y (Inception 11/18/98) | | | | | | | | | | | | | | | | | | | | | | | | |
| NAV | | | 27.06 | % | | | 8.82 | % | | | 11.85 | % | | | — | % | | | 0.88 | % | | | 0.88 | % |
| | | | | | | |
| Class A (Inception 5/6/31) | | | | | | | | | | | | | | | | | | | | | | | | |
| NAV | | | 26.77 | | | | 8.54 | | | | 11.57 | | | | — | | | | 1.13 | | | | 1.13 | |
| With 5.75% Maximum Sales Charge | | | 19.45 | | | | 7.26 | | | | 10.90 | | | | — | | | | | | | | | |
| | | | | | | |
| Class C (Inception 5/1/95) | | | | | | | | | | | | | | | | | | | | | | | | |
| NAV | | | 25.82 | | | | 7.75 | | | | 10.74 | | | | — | | | | 1.88 | | | | 1.88 | |
| With CDSC1 | | | 24.82 | | | | 7.75 | | | | 10.74 | | | | — | | | | | | | | | |
| | | | | | | |
| Class N (Inception 5/1/17) | | | | | | | | | | | | | | | | | | | | | | | | |
| NAV | | | 27.16 | | | | — | | | | — | | | | 9.80 | | | | 3.79 | | | | 0.75 | |
| | | | | | | |
| Comparative Performance | | | | | | | | | | | | | | | | | | | | | | | | |
| S&P 500® Index2 | | | 31.49 | | | | 11.70 | | | | 13.56 | | | | 14.20 | | | | | | | | | |
Performance data shown represents past performance and is no guarantee of, and not necessarily indicative of, future results. Total return and value will vary, and you may have a gain or loss when shares are sold. Current performance may be lower or higher than quoted. For most recent month-end performance, visit im.natixis.com/performance.Performance for other share classes will be greater or less than shown based on differences in fees and sales charges. You may not invest directly in an index. Performance for periods less than one year is cumulative, not annualized. Returns reflect changes in share price and reinvestment of dividends and capital gains, if any. The table(s) do not reflect taxes shareholders might owe on any fund distributions or when they redeem their shares.
| 1 | Performance for Class C shares assumes a 1.00% contingent deferred sales charge (“CDSC”) applied when you sell shares within one year of purchase. |
| 2 | S&P 500® Index is a widely recognized measure of U.S. stock market performance. It is an unmanaged index of 500 common stocks chosen for market size, liquidity, and industry group representation, among other factors. It also measures the performance of the large cap segment of the US equities market. |
| 3 | Fund performance has been increased by fee waivers and/or expense reimbursements, if any, without which performance would have been lower. |
| 4 | Expense ratios are as shown in the Fund’s prospectus in effect as of the date of this report. The expense ratios for the current reporting period can be found in the Financial Highlights section of this report under Ratios to Average Net Assets. Net expenses reflect contractual expense limitations set to expire on 4/30/20. When a Fund’s expenses are below the limitations, gross and net expense ratios will be the same. See Note 6 of the Notes to Financial Statements for more information about the Fund’s expense limitations. |
| 8
NATIXIS OAKMARK INTERNATIONAL FUND
| | |
| |
| Managers | | Symbols |
| |
| David G. Herro, CFA® | | Class A NOIAX |
| |
| Michael L. Manelli, CFA® | | Class C NOICX |
| |
| Harris Associates L.P. | | Class N NIONX |
| |
| | Class Y NOIYX |
Investment Goal
The Fund seeks long-term capital appreciation.
Market Conditions
Volatility afflicted indexes around the world during the year, but the fourth quarter brought a steady recovery in global markets. As was the case last year, 2019 featured extreme price movements as the latest news, including trade talks, Brexit, European Union political instability and even a political conflict between South Korea and Japan dating back to World War II, influenced stock prices. As an example, while global markets started the year off strong, a few tweets that fueled trade war fears in May sent indexes around the world tumbling. August also saw more measurable declines until markets began to recover and rebound based, in part, on more positive geopolitical headlines.
Other fears that weighed on markets later in 2019 were the possibility of a Jeremy Corbyn victory in the UK general election and continued uncertainty surrounding Brexit. With a large, historical victory by the Conservative Party in the UK, investors’ fears of aCorbyn-led socialist-style government were alleviated for the medium term. Instead, Prime Minister Boris Johnson’s government acted quickly to move its Brexit bill through Parliament in an attempt to ensure a smooth exit from the European Union.
Meanwhile, China and the USde-escalated their trade dispute with an agreement of a“phase-one” trade deal. These events boosted global equity market sentiment toward the end of 2019 and entering into 2020. These developments also provided more solid foundations for businesses to make capital allocation and investment decisions going forward as the news pushed key US indexes toall-time high levels. In fact, all 11 GICS sectors in the S&P 500® Index gained value in 2019 and produced double-digit returns for the year. In China, the Shanghai Composite increased 22% for the year, while Japan’s Nikkei 225 Index finished 18% higher in 2019.
Performance Results
For the 12 months ended December 31, 2019, Class Y shares of Natixis Oakmark International Fund returned 24.64% at net asset value. The Fund outperformed its benchmark, the MSCI World ex USA Index (Net), which returned 22.49%.
Explanation of Fund Performance
The top contributors to the yearly return were BNP Paribas and H&M. BNP Paribas issued a healthy set of first quarter financials, in our assessment. The report included first
9 |
quarter year-over-year increases in revenue,pre-tax profit and net income of 3.2%, 6.2% and 0.2%, respectively. All of these metrics surpassed market forecasts. Notably, the bank’s return on tangible equity (ROTE) ratio improved to 11.2% (excluding exceptional items) in the first quarter from 10.2% in the fourth quarter of 2018, which illustrated to us that management is following through on reaching its full-year 2020 ROTE target of over 10.5%. Later, BNP’s first half earnings results were largely in line with our expectations with good revenue growth at +2.5% for the reporting period. Importantly, operating expenditures were only up 0.7% in the first half, which enabled the company to generate operational leverage across all three segments. BNP also delivered a positive third quarter earnings report with total revenue of EUR 10.90 billion,pre-tax income of EUR 2.81 billion and net income of EUR 1.94 billion, all of which exceeded market forecasts. For the nine-month period ended September 30, 2019, underlying results were good, by our measure, with constant currency revenue growth from core divisions of 2.8% and operating expenditure growth of only 0.8%. In addition, loan growth for the third quarter increased 5.5% year-over-year. Notably, the company generated operational leverage across all three segments following low growth in operating expenditures in the first half of the year. In our view, BNP continues to benefit from its 2020 Transformation Plan, which has now generated cumulative savings of EUR 1.5 billion since 2017 and is on track to generate EUR 3.3 billion in savings through 2020. The company’s Common Equity Tier 1 ratio expanded 10 basis points sequentially to 12.0%, in line with management’s target, which, in our view, positions it for an increased scope of shareholder capital returns. H&M’s share price soared upon the release of its fiscal first quarter earnings results. Earnings per share (SEK 0.49 vs. SEK 0.31) and earnings (SEK 1.01 billion vs. SEK 650.6 million) bested consensus estimates. Sales increased 4% in local currency, despite the replacement of the online platform in Germany that pressured sales in the country. Sales in China grew quite strongly in the first quarter at 18%, while sales in Sweden increased 11%, implying stronglike-for-like performance. Moreover, H&M reported a gross margin increase year-over-year to 50% compared to the market’s expectation for a decline in the gross margin. In our view, the makeup of H&M’s second-quarter sales were encouraging as the company’s online (+20%) and new business (+18%) segments both grew quite strongly in local currency. Sales in China (+8%), the UK (+5%) and Sweden (+5%) delivered strong growth. The sales successes also translated to lower markdowns, which fell 100 basis points in the second-quarter year-over-year and were consistent with H&M’s guidance. The company’s nine-month sales release showed an 8% increase in sales in local currency year-over-year, which bested consensus expectations. H&M also benefited in the third quarter from a positive analyst note that upgraded the company. In addition, the company’s fourth-quarter earnings results were also largely in line with analysts’ estimates. We believe H&M is progressing well, thus far, on its strategy for improvement, adding to our confidence in the investment.
The largest detractors from return were Rolls-Royce Holdings and thyssenkrupp. Investors proved disappointed with Rolls-Royce Holdings’ indication in its first half earnings report that free cash flow was off to a sluggish start in 2019. However, the company reiterated its guidance for full year 2019 free cash flow given what it perceived to be temporary headwinds in the first half and the fact that the second half of the year is seasonally
| 10
NATIXIS OAKMARK INTERNATIONAL FUND
stronger for the company. Along with its third quarter trading update, Rolls-Royce stated that full-year free cash flow and earnings would be at the low end of the previously issued guidance range, which weighed on its share price. Management expected that 2019 free cash flow and earnings would be closer to GBP 600 million, owing to design fixes for the Trent 1000 engine and higher costs associated with the Trent 1000 TEN engine. Even so, management maintained full-year 2020 free cash flow guidance at GBP 1 billion. Shortly after releasing the trading update, the US Navy awarded Rolls-Royce a $1.21 billion contract to provide maintenance, repair and other services for theV-22 AE1107C aircraft engine. Later, Bradley Singer, COO at activist firm ValueAct Capital, resigned from the Rolls-Royce Board of Directors after serving for three years. We spoke with Singer who expressed that he is comfortable with the other board members and the direction management is taking considering the positive changes enacted at the company, including better accounting practices, improved key performance indicators and a significant cost efficiency program. In our view, Rolls-Royce’s civil aerospace business is positioning the company for future success. The development of wide-body aircraft engines with improved fuel efficiency resulted in a loss-making phase, including a material erosion of cash profits for the group in recent years. Rolls-Royce is emerging from this period of major development, and we like that the company now holds strong market shares in the production of a number of wide-body engines with large order books and robust aftermarket business. As we expected, thyssenkrupp reported weak first quarter results due to reduced demand from the auto industry, raw material pressures and operational issues. Earnings were flat to down in all divisions, but management maintained guidance that calls for a meaningful increase year-over-year. As reported last year, the board recommended splitting the company in two: thyssenkrupp industrials and thyssenkrupp materials. The company also announced further details on the split, which would target improved efficiency and simplification. The new companies would give full profit and loss responsibility to the business and consolidate central functions. The goal was to reduce selling, general and administrative costs by roughly EUR 80 million. We viewed this incremental detail positively, but thyssenkrupp ultimately dropped the plans given regulatory opposition. Later, the company’s third quarter and fourth quarter earnings reports also fell short of analysts’ expectations, and investors were disappointed to learn management had no expectations for earnings or free cash flow improvement in fiscal year 2020. We spoke with CEO Martina Merz following the company’s Capital Markets Day in December who noted that the sale of the elevators business was stimulating “wonderful competition” among bidders. Merz also believes the concurrent preparation of the business for an initial public offering is helping stimulate bidding activity that is more attractive for thyssenkrupp, a process that is likely to end in February. Overall, we believe the company’s actions to reshape the portfolio are likely to improve the attractiveness of the group and reduce conglomerate discount on the shares. In addition, thyssenkrupp’s largest shareholders are highly motivated to improve the operating and share price performance of the company, in our estimation. We continue to believe the valuation for the company remains attractive, offering a compelling reason to own.
11 |
Geographically, our average weightings for the year were 80% in Europe, 5% in Japan and 3% in South Korea. The remaining positions were in Australia, South Africa, Canada, China, Mexico, Indonesia, Taiwan, the United States and India.
Outlook
Despite the recovery in 2019, we still believe our investment approach offers good upside potential. In fact, our investment philosophy and team have been consistent throughout our history. We continue to look for opportunities to achieve higher returns by estimating business value and buying at a discount. We utilize this strategy with the goal of long-term outperformance for the benefit of our shareholders.
Hypothetical Growth of $100,000 Investment in Class Y Shares1,4
December 15, 2010 through December 31, 2019
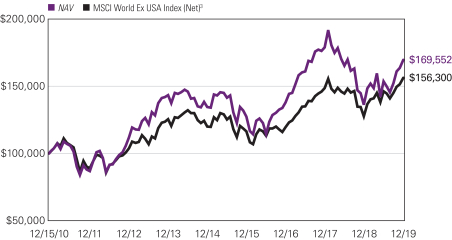
See notes to chart on page 14.
| 12
NATIXIS OAKMARK INTERNATIONAL FUND
Top Ten Holdings as of December 31, 2019
| | | | | | |
| | | Security Name | | % of
net assets | |
| 1 | | Glencore PLC | | | 4.38 | % |
| 2 | | BNP Paribas S.A. | | | 3.68 | % |
| 3 | | Intesa Sanpaolo SpA | | | 3.61 | % |
| 4 | | Continental AG | | | 3.57 | % |
| 5 | | Credit Suisse Group AG, (Registered) | | | 3.55 | % |
| 6 | | Daimler AG, (Registered) | | | 3.49 | % |
| 7 | | CNH Industrial NV | | | 3.38 | % |
| 8 | | Bayerische Motoren Werke AG | | | 3.24 | % |
| 9 | | Lloyds Banking Group PLC | | | 3.06 | % |
| 10 | | Bayer AG, (Registered) | | | 2.98 | % |
The portfolio is actively managed and holdings are subject to change. There is no guarantee the Fund continues to invest in the securities referenced. The holdings listed exclude any temporary cash investments.
13 |
Average Annual Total Returns — December 31, 20194
| | | | | | | | | | | | | | | | | | | | | | | | |
| | | | | |
| | | | | | | | | | | | Expense Ratios5 | |
| | | 1 Year | | | 5 Years | | | Life of Class | | | Gross | | | Net | |
| | | | | | | |
| Class Y (5/1/17)1 | | | | | | | | | | | Class A/C | | | | Class Y/N | | | | | | | | | |
| NAV | | | 24.64 | % | | | 4.73 | % | | | — | % | | | 2.55 | % | | | 0.97 | % | | | 0.97 | % |
| | | | | | | |
| Class A (Inception 12/15/10) | | | | | | | | | | | | | | | | | | | | | | | | |
| NAV | | | 24.35 | | | | 4.59 | | | | 5.93 | | | | — | | | | 1.21 | | | | 1.21 | |
| With 5.75% Maximum Sales Charge | | | 17.19 | | | | 3.35 | | | | 5.24 | | | | — | | | | | | | | | |
| | | | | | | |
| Class C (Inception 12/15/10) | | | | | | | | | | | | | | | | | | | | | | | | |
| NAV | | | 23.44 | | | | 3.79 | | | | 5.15 | | | | — | | | | 1.97 | | | | 1.97 | |
| With CDSC2 | | | 22.44 | | | | 3.79 | | | | 5.15 | | | | — | | | | | | | | | |
| | | | | | | |
| Class N (Inception 5/1/17) | | | | | | | | | | | | | | | | | | | | | | | | |
| NAV | | | 24.75 | | | | — | | | | — | | | | 2.63 | | | | 0.92 | | | | 0.89 | |
| | | | | | | |
| Comparative Performance | | | | | | | | | | | | | | | | | | | | | | | | |
| MSCI World ex USA Index (Net)3 | | | 22.49 | | | | 5.42 | | | | 5.05 | | | | 6.88 | | | | | | | | | |
Performance data shown represents past performance and is no guarantee of, and not necessarily indicative of, future results. Total return and value will vary, and you may have a gain or loss when shares are sold. Current performance may be lower or higher than quoted. For most recent month-end performance, visit im.natixis.com/performance.Performance for other share classes will be greater or less than shown based on differences in fees and sales charges. You may not invest directly in an index. Performance for periods less than one year is cumulative, not annualized. Returns reflect changes in share price and reinvestment of dividends and capital gains, if any. The table(s) do not reflect taxes shareholders might owe on any fund distributions or when they redeem their shares.
| 1 | Prior to the inception of Class Y shares (5/1/2017), performance is that of Class A shares and reflects the higher net expenses of that share class. |
| 2 | Performance for Class C shares assumes a 1.00% contingent deferred sales charge (“CDSC”) applied when you sell shares within one year of purchase. |
| 3 | MSCI World ex USA Index (Net) is an unmanaged index that is designed to measure the equity market performance of developed markets, excluding the United States. |
| 4 | Fund performance has been increased by fee waivers and/or expense reimbursements, if any, without which performance would have been lower. |
| 5 | Expense ratios are as shown in the Funds prospectus in effect as of the date of this report. The expense ratios for the current reporting period can be found in the Financial Highlights section of this report under Ratios to Average Net Assets. Net expenses reflect contractual expense limitations set to expire on 4/30/21. When a Funds expenses are below the limitation, gross and net expense ratios will be the same. See Note 6 of the Notes to Financial Statements for more information about the Funds expense limitations. |
| 14
VAUGHAN NELSON SMALL CAP VALUE FUND
| | |
| |
| Managers | | Symbols |
| |
| Chris D. Wallis, CFA® | | Class A NEFJX |
| |
| Stephan Davis, CFA® | | Class C NEJCX |
| |
| | Class N VSCNX |
| |
| | Class Y NEJYX |
| |
| Vaughan Nelson Investment Management, L.P. | | |
Investment Goal
The Fund seeks capital appreciation.
Market Conditions
During 2019, the equity market continued to recover from the steepsell-off experienced in the fourth quarter of 2018. The powerful rally was triggered by global central banks’ acknowledgement of tightening liquidity conditions and an increase in monetary stimulus by China.
Global central banks are increasing monetary stimulus to reinvigorate global growth and the US Federal Reserve (the “Fed”) began cutting rates during the third quarter. Unfortunately, given the prior reliance on monetary stimulus, the extended period ofultra-low rates, the rebalancing of the Chinese economy, and the secular shift in trade flows, central banks’ policies will have less of an impact on underlying economic growth.
There are many structural elements suppressing economic growth that cannot be addressed by simply lowering the federal funds rate. Global negative interest rates and inverted yield curves reflect a growing shortage of US dollar funding liquidity outside of the United States. In order to address this US dollar funding shortage, central banks will be forced to resume quantitative easing (QE) or a coordinated devaluing of the US dollar versus major trading currencies. QE will be necessary to boost dollar liquidity.
We expect only a modest resolution to US trade negotiations with China and other countries. It is important to note that the global slowdown began prior to the implementation of tariffs and trade negotiations and we do not expect a resolution to the trade discussions to result in a material or sustainable increase in economic growth.
Performance Results
For the 12 months ended December 31, 2019, Class Y shares of Vaughan Nelson Small Cap Value Fund returned 24.88% at net asset value. The Fund outperformed its benchmark, the Russell 2000® Value Index, which returned 22.39%.
Explanation of Fund Performance
The Fund outperformed the benchmark, primarily due to stock selection within the technology, communication services, energy, consumer staples, and materials sectors. The Fund was also underweight energy, the worst performing sector, during the year. The
15 |
portfolio was underweight the traditional defensive sectors such as consumer staples, REITs, and utilities while also underweight the more cyclical areas of the benchmark. As such, we continue to experience better support in broad market selloffs but remain economically exposed should economic growth reaccelerate.
The technology sector contributed the most to the Fund’s performance for the year. The Fund was overweight the technology sector, which was up over 50% in 2019. Stock selection within technology was also good, adding to relative performance. Two outstanding stocks for 2019 include Lattice Semiconductor and CACI International. Lattice Semiconductor outperformed moderate expectations with its new management team driving necessary changes to make its product portfolio relevant again and for years to come — starting with the 5G network rollout. CACI performed well due to strong organic growth in its defense, intelligence and cyber end markets — along with two sound acquisitions giving rise to multiple portfolio synergies.
The communication services sector experienced a relatively flat year; however, the Fund’s media holdings within this sector performed exceptionally well with Nexstar Media and TEGNA each up over 50%. Nexstar and TEGNA both benefited from better than expected fundamentals in the local broadcast TV industry — stronger than expected retransmissions rates garnered from continued scale, and a stronger than expected TV political ad spending environment heading into the 2020 election.
Like 2018, the energy sector was the worst performing sector in 2019. The Fund was underweight the energy sector during the year, which was positive for performance. Also, the Fund’s energy stocks outperformed the benchmark’s with Kosmos Energy the best performer. Kosmos benefited from a more diversified production profile in 2019 after acquiring Gulf of Mexico assets in late 2018. The company expects to further reduce its gas portfolio holdings while improving the balance sheet and maintaining optionality in Ghana.
The consumer staples sector lagged the benchmark for the year. The Fund was underweight the sector, only owning one consumer staples stock, Performance Food Group. Performance Food Group returned over 50% during the year adding to relative performance. The company performed well due to strong performance in its VISTAR division with continued revenue and margin expansion. The company also announced two strategic acquisitions that will further expand its delivery network and move the company into the convenience store market.
The materials sector performed well during the year as economic growth stabilized and due to positive trade negotiations. Graphic Packaging and Versum Materials were both strong performers, which contributed to relative performance. Graphic Packaging rebounded nicely after a rough 2018 as the company returned to a positive price/cost environment within the concentrated paperboard industry. Versum materials was acquired by Merck KGaA because of its attractive position in the semiconductor materials markets.
| 16
VAUGHAN NELSON SMALL CAP VALUE FUND
The Fund was overweight the healthcare sector, which lagged the market. The Fund’s healthcare holdings also underperformed the benchmark’s. LivaNova and Meridian Bioscience detracted the most from relative performance. LivaNova, a provider of cardiac surgery, neuromodulation, and cardiac rhythm management products, declined due to a slowdown in its neuromodulation business with more potential competition coming from the drug therapeutics market. Meridian Bioscience missed its second quarter guidance, suspended its dividend, and made an unexpected acquisition. Both stocks were sold during the year.
Financials performed in line with the benchmark for the year. The Fund’s stock selection lagged the benchmark with Green Dot and Virtu Financial detracting the most from relative performance. Green Dot sold off due to slowing revenue growth as the company took steps to optimize their customer base while making technology investments and significantly slowing earnings growth. The Fund sold the stock in the fourth quarter. Virtu Financial performed poorly during the year due to sluggish trading volume and volatility trends, while its penetration into newer markets was slower than expected.
Stock selection within the consumer discretionary sector also detracted from returns. Adtalem declined due to concerns surrounding free education legislation and earnings growth expectations slowed as Adtalem continued to divestnon-core assets. The Fund was underweight the consumer discretionary sector, which underperformed the market, offsetting some of the loss due to Adtalem.
Real estate outperformed the market in 2019, propelled by falling interest rates. The Fund’s real estate holdings outperformed the benchmark’s; however, the Fund was underweight the sector, which detracted from relative performance. Stock selection within Utilities also hurt performance, with Southwest Gas and Spire lagging the benchmark.
Outlook
The primary excess during the currentten-year bull market has been liquidity in the form of QE. The excess liquidity that wasn’t absorbed in the real economy found its way into risk asset prices. Liquidity began to retreat with the implementation of quantitative tightening by the Federal Reserve and with tightening capital controls by China. We have seen the declining liquidity conditions impact asset prices, as global equity index valuations, commodity prices, and global luxury real estate prices have declined. Most recently, the market has repriced the private equity “unicorns” and the IPO market has cooled with several high-profile offerings postponed.
Rising US deficits and slowing private sector fundamentals will further pressure liquidity — and ultimately risk assets — unless the Fed begins to materially and sustainably increase its balance sheet. While central banks globally are beginning to cut interest rates, this will have a minimal impact on liquidity. Low rates are not the problem; the issue is interbank lending and the availability of US dollar funding capacity. We suspect the Federal Reserve will slowly be forced to provide dollar liquidity on a sustainable basis. Should this occur, the Federal Reserve willfind itself at a familiar crossroad, where it can either choose to control
17 |
the price of money (i.e. interest rates) or the quantity of money (i.e. US dollar exchange rate/inflation), but not both. We suspect they will choose the former over the latter.
US equity markets continue to price in a recovery in earnings growth. The leading economic indicators we track show economic activity stabilizing inEurope, but further weakness is expected in Japan, the United States, and China. The next few months will be critical in determining whether the increasing stability we are forecasting in Europe can spread to China and the United States, or whether the stability is a transitory improvement that presages further economic weakness. Valuations have risen materially in 2019 as markets recovered, and we expect markets to remain volatile until we are in an environment of sustained economic growth with adequate US dollar funding liquidity.
Hypothetical Growth of $100,000 Investment in Class Y Shares3
December 31, 2009 through December 31, 2019
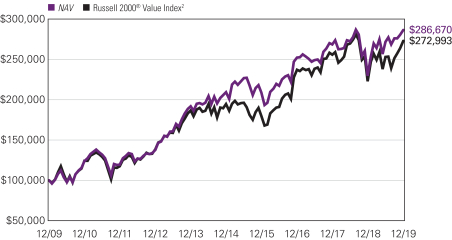
See notes to chart on page 20.
| 18
VAUGHAN NELSON SMALL CAP VALUE FUND
Top Ten Holdings as of December 31, 2019
| | | | | | |
| Security Name | | % of
net assets | |
| 1 | | iShares® Russell 2000 Value Index ETF | | | 4.87 | % |
| 2 | | CACI International, Inc., Class A | | | 3.36 | % |
| 3 | | Cabot Microelectronics Corp. | | | 2.93 | % |
| 4 | | Nexstar Media Group, Inc., Class A | | | 2.51 | % |
| 5 | | Element Solutions, Inc. | | | 2.49 | % |
| 6 | | MGIC Investment Corp. | | | 2.43 | % |
| 7 | | Brady Corp., Class A | | | 2.32 | % |
| 8 | | TEGNA, Inc. | | | 2.32 | % |
| 9 | | Entegris, Inc. | | | 2.32 | % |
| 10 | | Landstar System, Inc. | | | 2.18 | % |
The portfolio is actively managed and holdings are subject to change. There is no guarantee the Fund continues to invest in the securities referenced. The holdings listed exclude any temporary cash investments.
19 |
Average Annual Total Returns — December 31, 20193
| | | | | | | | | | | | | | | | | | | | | | | | |
| | | | | | |
| | | | | | | | | | | | Life of Class N | | | Expense Ratios4 | |
| | | 1 Year | | | 5 Years | | | 10 Years | | | Gross | | | Net | |
| | | | | | | |
| Class Y (Inception 8/31/06) | | | | | | | | | | | | | | | | | | | | | | | | |
| NAV | | | 24.88 | % | | | 6.49 | % | | | 11.11 | % | | | — | % | | | 1.24 | % | | | 1.21 | % |
| | | | | | | |
| Class A (Inception 12/31/96) | | | | | | | | | | | | | | | | | | | | | | | | |
| NAV | | | 24.66 | | | | 6.23 | | | | 10.84 | | | | — | | | | 1.50 | | | | 1.46 | |
| With 5.75% Maximum Sales Charge | | | 17.50 | | | | 4.98 | | | | 10.18 | | | | — | | | | | | | | | |
| | | | | | |
| Class C (Inception 12/31/96) | | | | | | | | | | | | | | | | | | | | | |
| NAV | | | 23.69 | | | | 5.42 | | | | 10.00 | | | | — | | | | 2.24 | | | | 2.21 | |
| With CDSC1 | | | 22.69 | | | | 5.42 | | | | 10.00 | | | | — | | | | | | | | | |
| | | | | | | |
| Class N (Inception 5/1/17) | | | | | | | | | | | | | | | | | | | | | | | | |
| NAV | | | 25.08 | | | | — | | | | — | | | | 5.25 | | | | 15.29 | | | | 1.08 | |
| | | | | | | |
| Comparative Performance | | | | | | | | | | | | | | | | | | | | | | | | |
| Russell 2000® Value Index2 | | | 22.39 | | | | 6.99 | | | | 10.56 | | | | 5.09 | | | | | | | | | |
Performance data shown represents past performance and is no guarantee of, and not necessarily indicative of, future results. Total return and value will vary, and you may have a gain or loss when shares are sold. Current performance may be lower or higher than quoted. For most recent month-end performance, visit im.natixis.com/performance. Performance for other share classes will be greater or less than shown based on differences in fees and sales charges. You may not invest directly in an index. Performance for periods less than one year is cumulative, not annualized. Returns reflect changes in share price and reinvestment of dividends and capital gains, if any. The table(s) do not reflect taxes shareholders might owe on any fund distributions or when they redeem their shares.
| 1 | Performance for Class C shares assumes a 1.00% contingent deferred sales charge (“CDSC”) applied when you sell shares within one year of purchase. |
| 2 | Russell 2000® Value Index is an unmanaged index that measures the performance of the small-cap value segment of the U.S. equity universe. It includes those Russell 2000® companies with lower price-to-book ratios and lower forecasted growth values. |
| 3 | Fund performance has been increased by fee waivers and/or expense reimbursements, if any, without which performance would have been lower. |
| 4 | Expense ratios are as shown in the Fund’s prospectus in effect as of the date of this report. The expense ratios for the current reporting period can be found in the Financial Highlights section of this report under Ratios to Average Net Assets. Net expenses reflect contractual expense limitations set to expire on 4/30/21. When a Fund’s expenses are below the limitation, gross and net expense ratios will be the same. See Note 6 of the Notes to Financial Statements for more information about the Fund’s expense limitations. |
| 20
VAUGHAN NELSON VALUE OPPORTUNITY FUND
| | |
| |
| Managers | | Symbols |
| |
| Dennis G. Alff, CFA® | | Class A VNVAX |
| |
| Chad D. Fargason | | Class C VNVCX |
| |
| Chris D. Wallis, CFA® | | Class N VNVNX |
| |
| | Class Y VNVYX |
| |
| Vaughan Nelson Investment Management, L.P. | | |
Investment Goal
The Fund seeks long-term capital appreciation.
Market Conditions
During 2019, the equity market continued to recover from the steepsell-off experienced in the fourth quarter of 2018. The powerful rally was triggered by global central banks’ acknowledgement of tightening liquidity conditions and an increase in monetary stimulus by China.
Global central banks are increasing monetary stimulus to reinvigorate global growth and the US Federal Reserve (the “Fed”) began cutting rates during the third quarter. Unfortunately, given the prior reliance on monetary stimulus, the extended period ofultra-low rates, the rebalancing of the Chinese economy, and the secular shift in trade flows, central banks’ policies will have less of an impact on underlying economic growth.
There are many structural elements suppressing economic growth that cannot be addressed by simply lowering the federal funds rate. Global negative interest rates and inverted yield curves reflect a growing shortage of US dollar funding liquidity outside of the United States. In order to address this US dollar funding shortage, central banks will be forced to resume quantitative easing (QE) or a coordinated devaluing of the US dollar versus major trading currencies. QE will be necessary to boost dollar liquidity.
We expect only a modest resolution to US trade negotiations with China and other countries. It is important to note that the global slowdown began prior to the implementation of tariffs and trade negotiations and we do not expect a resolution to the trade discussions to result in a material or sustainable increase in economic growth.
Performance Results
For the 12 months ended December 31, 2019, Class Y shares of Vaughan Nelson Value Opportunity Fundreturned 30.52% at net asset value. The Fund outperformed its benchmark, the Russell Midcap® Value Index, which returned 27.06%.
Explanation of Fund Performance
The Fund outperformed the benchmark for the year primarily due to stock selection in the technology, materials, communication services, industrials, healthcare, and utilities sectors. Also, the Fund was underweight the consumer discretionary, energy, and real estate
21 |
sectors, which added to relative performance since all three sectors underperformed the market. Last, the Fund was materially overweight technology stocks during the year, which was a positive since the technology sector was the best performing sector.
Stock selection was good within the technology sector with CACI International and Global Payments contributing the most to returns. CACI performed well due to strong organic growth in its cyber consulting business and due to merger and acquisition synergies. Global Payments reported strong earnings growth throughout the year due to double digit revenue growth and margin expansion. The company also announced the accretive acquisition of Total System Services.
The Fund’s materials stocks outperformed the benchmark’s and were one of the top contributors to relative performance for the year. Crown Holdings and Constellium contributed the most to performance. Crown Holdings shares performed well as beverage can volumes improved and as the Transit acquisition was integrated. Constellium, a specialty aluminum manufacturer, benefited from strong performance in the aerospace and transportation segment due to higher prices and an improving mix.
The Fund’s communication services holdings were also a top contributor to relative performance. Both Electronic Arts and Nexstar Media outperformed. Electronic Arts was purchased following the steep market selloff in the fourth quarter of 2018. During 2019, the company increased earnings guidance due to better growth in Live Services, which benefited from Apex Legends. Meanwhile, Nexstar continues to benefit from strong growth in network transmission fees while the legacy advertisement business moves to higher value digital avenues. The company also closed the Tribune acquisition, which is expected to be highly accretive.
The industrials sector was one of the best performing sectors for the year, up more than 35%. The Fund’s industrials holdings were up even more, leading to strong relative performance. Allegion and WillScot contributed the most to returns. Willscot, a provider of modular workspace and storage solutions, performed well during the year due to strong business conditions leading to good pricing power. The company also acquired its peer, ModSpace. Allegion is a provider of security products and solutions to residential and commercial clients and benefited from the secular shift to electronic locks.
The Fund had positive stock selection within the healthcare sector, leading to strong relative performance. West Pharmaceutical Services and IQVIA Holdings were two top performers. As a provider of drug delivery systems to pharmaceutical companies, West has seen revenue and margin growth as more advanced drugs are requiring more innovative containment and usage solutions. IQVIA, a contract research organization, continues to benefit from the Quintiles/IMS merger synergies and from strong bookings growth in its Next Gen platform. The company is also aggressively buying back shares.
Utilities performed well again this year after being the best performing sector in 2018. The Fund’s holdings outperformed the benchmark’s, leading to relative outperformance. WEC
| 22
VAUGHAN NELSON VALUE OPPORTUNITY FUND
Energy and Eversource were two top performers for the year. Both benefited from strong base rate growth and an improved regulatory environment.
Stock selection within the financials sector was the primary detractor from relative performance. Mr. Cooper and Virtu Financial were the primary detractors. Mr. Cooper, a residential mortgage servicer, performed poorly as interest rates declined during the year. The Fund sold Mr. Cooper in the second quarter. Virtu Financial performed poorly during the year due to sluggish trading volume and volatility trends, which drive revenue growth.
The Fund’s holding in the consumer staples sector, Constellation Brands, also detracted from performance. Constellation shares were impacted by tariff fears and concerns around weak beer sales.
Outlook
The primary excess during the currentten-year bull market has been liquidity in the form of QE. The excess liquidity that wasn’t absorbed in the real economy found its way into risk asset prices. Liquidity began to retreat with the implementation of quantitative tightening by the Federal Reserve and with tightening capital controls by China. We have seen the declining liquidity conditions impact asset prices, as global equity index valuations, commodity prices, and global luxury real estate prices have declined. Most recently, the market has repriced the private equity “unicorns” and the IPO market has cooled with several high-profile offerings postponed.
Rising US deficits and slowing private sector fundamentals will further pressure liquidity — and ultimately risk assets — unless the Fed begins to materially and sustainably increase its balance sheet. While central banks globally are beginning to cut interest rates, this will have a minimal impact on liquidity. Low rates are not the problem; the issue is interbank lending and the availability of US dollar funding capacity. We suspect the Fed will slowly be forced to provide dollar liquidity on a sustainable basis. Should this occur, the Fed willfind itself at a familiar crossroad, where it can either choose to control the price of money (i.e. interest rates) or the quantity of money (i.e. US dollar exchange rate/inflation), but not both. We suspect they will choose the former over the latter.
US equity markets continue to price in a recovery in earnings growth. The leading economic indicators we track show economic activity stabilizing inEurope, but further weakness is expected in Japan, the United States, and China. The next few months will be critical in determining whether the increasing stability we are forecasting in Europe can spread to China and the United States, or whether the stability is a transitory improvement that presages further economic weakness. Valuations have risen materially in 2019 as markets recovered, and we expect markets to remain volatile until we are in an environment of sustained economic growth with adequate US dollar funding liquidity.
23 |
Hypothetical Growth of $100,000 Investment in Class Y Shares3
December 31, 2009 through December 31, 2019
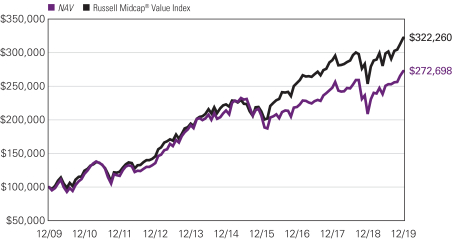
See notes to chart on page 25.
Top Ten Holdings as of December 31, 2019
| | | | | | |
| Security Name | | % of
net assets | |
| 1 | | Nexstar Media Group, Inc., Class A | | | 3.46 | % |
| 2 | | TCF Financial Corp. | | | 2.95 | % |
| 3 | | Fiserv, Inc. | | | 2.63 | % |
| 4 | | CACI International, Inc., Class A | | | 2.57 | % |
| 5 | | Fidelity National Information Services, Inc. | | | 2.43 | % |
| 6 | | Global Payments, Inc. | | | 2.26 | % |
| 7 | | Evergy, Inc. | | | 2.25 | % |
| 8 | | Vistra Energy Corp. | | | 2.23 | % |
| 9 | | IQVIA Holdings, Inc. | | | 2.10 | % |
| 10 | | Allstate Corp. (The) | | | 2.09 | % |
The portfolio is actively managed and holdings are subject to change. There is no guarantee the Fund continues to invest in the securities referenced. The holdings listed exclude any temporary cash investments.
| 24
VAUGHAN NELSON VALUE OPPORTUNITY FUND
Average Annual Total Returns — December 31, 20193
| | | | | | | | | | | | | | | | | | | | | | | | |
| | | | | | |
| | | | | | | | | | | | Life of
Class N | | | Expense Ratios4 | |
| | | 1 Year | | | 5 Years | | | 10 Years | | | Gross | | | Net | |
| | | | | | | |
| Class Y (Inception 10/31/08) | | | | | | | | | | | | | | | | | | | | | | | | |
| NAV | | | 30.52 | % | | | 4.96 | % | | | 10.55 | % | | | — | % | | | 1.20 | % | | | 1.16 | % |
| | | | | | | |
| Class A (Inception 10/31/08) | | | | | | | | | | | | | | | | | | | | | | | | |
| NAV | | | 30.21 | | | | 4.70 | | | | 10.27 | | | | — | | | | 1.45 | | | | 1.41 | |
| With 5.75% Maximum Sales Charge | | | 22.72 | | | | 3.46 | | | | 9.62 | | | | — | | | | | | | | | |
| | | | | | | |
| Class C (Inception 10/31/08) | | | | | | | | | | | | | | | | | | | | | | | | |
| NAV | | | 29.25 | | | | 3.92 | | | | 9.46 | | | | — | | | | 2.19 | | | | 2.16 | |
| With CDSC1 | | | 28.25 | | | | 3.92 | | | | 9.46 | | | | — | | | | | | | | | |
| | | | | | | |
| Class N (Inception 5/1/13) | | | | | | | | | | | | | | | | | | | | | | | | |
| NAV | | | 30.67 | | | | 5.06 | | | | — | | | | 8.99 | | | | 1.09 | | | | 1.09 | |
| | | | | | | |
| Comparative Performance | | | | | | | | | | | | | | | | | | | | | | | | |
| Russell Midcap® Value Index | | | 27.06 | | | | 7.62 | | | | 12.41 | | | | 10.40 | | | | | | | | | |
Performance data shown represents past performance and is no guarantee of, and not necessarily indicative of, future results. Total return and value will vary, and you may have a gain or loss when shares are sold. Current performance may be lower or higher than quoted. For most recent month-end performance, visit im.natixis.com/performance.Performance for other share classes will be greater or less than shown based on differences in fees and sales charges. You may not invest directly in an index. Performance for periods less than one year is cumulative, not annualized. Returns reflect changes in share price and reinvestment of dividends and capital gains, if any. The table(s) do not reflect taxes shareholders might owe on any fund distributions or when they redeem their shares.
| 1 | Performance for Class C shares assumes a 1.00% contingent deferred sales charge (“CDSC”) applied when you sell shares within one year of purchase. |
| 2 | Russell Midcap® Value Index is an unmanaged index that measures the performance of the mid-cap value segment of the U.S. equity universe. It includes those Russell Midcap® Index companies with lower price-to-book ratios and lower forecasted growth values. |
| 3 | Fund performance has been increased by fee waivers and/or expense reimbursements, if any, without which performance would have been lower. |
| 4 | Expense ratios are as shown in the Fund’s prospectus in effect as of the date of this report. The expense ratios for the current reporting period can be found in the Financial Highlights section of this report under Ratios to Average Net Assets. Net expenses reflect contractual expense limitations set to expire on 4/30/21. When a Fund’s expenses are below the limitation, gross and net expense ratios will be the same. See Note 6 of the Notes to Financial Statements for more information about the Fund’s expense limitations. |
25 |
ADDITIONAL INFORMATION
The views expressed in this report reflect those of the portfolio managers as of the dates indicated. The managers’ views are subject to change at any time without notice based on changes in market or other conditions. References to specific securities or industries should not be regarded as investment advice. Because the Fund is actively managed, there is no assurance that they will continue to invest in the securities or industries mentioned.
All investing involves risk, including the risk of loss. There is no assurance that any investment will meet its performance objectives or that losses will be avoided.
ADDITIONAL INDEX INFORMATION
This document may contain references to third party copyrights, indexes, and trademarks, each of which is the property of its respective owner. Such owner is not affiliated with Natixis Investment Managers or any of its related or affiliated companies (collectively “Natixis Affiliates”) and does not sponsor, endorse or participate in the provision of any Natixis Affiliates services, funds or other financial products.
The index information contained herein is derived from third parties and is provided on an “as is” basis. The user of this information assumes the entire risk of use of this information. Each of the third party entities involved in compiling, computing or creating index information disclaims all warranties (including, without limitation, any warranties of originality, accuracy, completeness, timeliness, non-infringement, merchantability and fitness for a particular purpose) with respect to such information.
PROXY VOTING INFORMATION
A description of the Natixis Funds proxy voting policies and procedures is available without charge, upon request, by calling Natixis Funds at 800-225-5478; on the Natixis Funds’ website at im.natixis.com; and on the Securities and Exchange Commission’s (“SEC’s”) website at www.sec.gov. Information regarding how the Natixis Funds voted proxies relating to portfolio securities during the most recent 12-month period ended June 30 is available from the Natixis Funds’ website and the SEC’s website.
QUARTERLY PORTFOLIO SCHEDULES
Natixis Funds file complete schedules of portfolio holdings with the SEC for the first and third quarters of each fiscal year as an exhibit on Form N-PORT. The Funds’ Form N-PORT reports are available on the SEC’s website at www.sec.gov.
CFA® and Chartered Financial Analyst® are registered trademarks owned by the CFA Institute.
| 26
UNDERSTANDING FUND EXPENSES
As a mutual fund shareholder, you incur different costs: transaction costs, including sales charges (loads) on purchases and contingent deferred sales charges on redemptions, and ongoing costs, including management fees, distribution and/or service fees (12b-1 fees), and other fund expenses. Certain exemptions may apply. These costs are described in more detail in the Funds’ prospectus. The following examples are intended to help you understand the ongoing costs of investing in the Funds and help you compare these with the ongoing costs of investing in other mutual funds.
The first line in the table of each class of Fund shares shows the actual account values and actual Fund expenses you would have paid on a $1,000 investment in the Fund from July 1, 2019 through December 31, 2019. To estimate the expenses you paid over the period, simply divide your account value by $1,000 (for example $8,600 account value divided by $1,000 = 8.60) and multiply the result by the number in the Expenses Paid During Period column as shown for your class.
The second line in the table for each class of fund shares provides information about hypothetical account values and hypothetical expenses based on the Fund’s actual expense ratios and an assumed rate of return of 5% per year before expenses, which is not the Fund’s actual return. The hypothetical account values and expenses may not be used to estimate the actual ending account balance or expenses you paid on your investment for the period. You may use this information to compare the ongoing costs of investing in the Fund and other funds. To do so, compare this 5% hypothetical example with the 5% hypothetical examples that appear in the shareholder reports of the other funds.
Please note that the expenses shown reflect ongoing costs only, and do not include any transaction costs, such as sales charges. Therefore, the second line in the table of each fund is useful in comparing ongoing costs only, and will not help you determine the relative costs of owning funds. If transaction costs were included, total costs would be higher.
| | | | | | | | | | | | |
LOOMIS SAYLES INTERMEDIATE
MUNICIPAL BOND FUND | | BEGINNING
ACCOUNT VALUE
7/1/2019 | | | ENDING
ACCOUNT VALUE
12/31/2019 | | | EXPENSES PAID
DURING PERIOD*
7/1/2019 – 12/31/2019 | |
| Class A | | | | | | | | | | | | |
| Actual | | | $1,000.00 | | | | $1,018.30 | | | | $3.56 | |
| Hypothetical (5% return before expenses) | | | $1,000.00 | | | | $1,021.68 | | | | $3.57 | |
| Class C | | | | | | | | | | | | |
| Actual | | | $1,000.00 | | | | $1,014.50 | | | | $7.36 | |
| Hypothetical (5% return before expenses) | | | $1,000.00 | | | | $1,017.90 | | | | $7.38 | |
| Class Y | | | | | | | | | | | | |
| Actual | | | $1,000.00 | | | | $1,020.60 | | | | $2.29 | |
| Hypothetical (5% return before expenses) | | | $1,000.00 | | | | $1,022.94 | | | | $2.29 | |
| * | Expenses are equal to the Fund’s annualized expense ratio (after waiver/reimbursement): 0.70%, 1.45% and 0.45% for Class A, C and Y, respectively, multiplied by the average account value over the period, multiplied by the number of days in the most recent fiscal half-year (184), divided by 365 (to reflect the half-year period). |
27 |
| | | | | | | | | | | | |
| NATIXIS OAKMARK FUND | | BEGINNING
ACCOUNT VALUE
7/1/2019 | | | ENDING
ACCOUNT VALUE
12/31/2019 | | | EXPENSES PAID
DURING PERIOD*
7/1/2019 – 12/31/2019 | |
| Class A | | | | | | | | | | | | |
| Actual | | | $1,000.00 | | | | $1,088.10 | | | | $6.16 | |
| Hypothetical (5% return before expenses) | | | $1,000.00 | | | | $1,019.31 | | | | $5.96 | |
| Class C | | | | | | | | | | | | |
| Actual | | | $1,000.00 | | | | $1,084.00 | | | | $10.09 | |
| Hypothetical (5% return before expenses) | | | $1,000.00 | | | | $1,015.53 | | | | $9.75 | |
| Class N | | | | | | | | | | | | |
| Actual | | | $1,000.00 | | | | $1,089.70 | | | | $4.37 | |
| Hypothetical (5% return before expenses) | | | $1,000.00 | | | | $1,021.02 | | | | $4.23 | |
| Class Y | | | | | | | | | | | | |
| Actual | | | $1,000.00 | | | | $1,089.60 | | | | $4.85 | |
| Hypothetical (5% return before expenses) | | | $1,000.00 | | | | $1,020.57 | | | | $4.69 | |
| * | Expenses are equal to the Fund’s annualized expense ratio (after waiver/reimbursement): 1.17%, 1.92%, 0.83% and 0.92% for Class A, C, N and Y, respectively, multiplied by the average account value over the period, multiplied by the number of days in the most recent fiscal half-year (184), divided by 365 (to reflect the half-year period). |
| | | | | | | | | | | | |
NATIXIS OAKMARK INTERNATIONAL
FUND | | BEGINNING
ACCOUNT VALUE
7/1/2019 | | | ENDING
ACCOUNT VALUE
12/31/2019 | | | EXPENSES PAID
DURING PERIOD*
7/1/2019 – 12/31/2019 | |
| Class A | | | | | | | | | | | | |
| Actual | | | $1,000.00 | | | | $1,102.80 | | | | $6.68 | |
| Hypothetical (5% return before expenses) | | | $1,000.00 | | | | $1,018.85 | | | | $6.41 | |
| Class C | | | | | | | | | | | | |
| Actual | | | $1,000.00 | | | | $1,098.10 | | | | $10.63 | |
| Hypothetical (5% return before expenses) | | | $1,000.00 | | | | $1,015.07 | | | | $10.21 | |
| Class N | | | | | | | | | | | | |
| Actual | | | $1,000.00 | | | | $1,104.20 | | | | $4.88 | |
| Hypothetical (5% return before expenses) | | | $1,000.00 | | | | $1,020.57 | | | | $4.69 | |
| Class Y | | | | | | | | | | | | |
| Actual | | | $1,000.00 | | | | $1,104.10 | | | | $5.36 | |
| Hypothetical (5% return before expenses) | | | $1,000.00 | | | | $1,020.11 | | | | $5.14 | |
| * | Expenses are equal to the Fund’s annualized expense ratio (after waiver/reimbursement): 1.26%, 2.01%, 0.92% and 1.01% for Class A, C, N and Y, respectively, multiplied by the average account value over the period, multiplied by the number of days in the most recent fiscal half-year (184), divided by 365 (to reflect the half-year period). |
| 28
UNDERSTANDING FUND EXPENSES
| | | | | | | | | | | | |
VAUGHAN NELSON SMALL CAP VALUE
FUND | | BEGINNING
ACCOUNT VALUE
7/1/2019 | | | ENDING
ACCOUNT VALUE
12/31/2019 | | | EXPENSES PAID
DURING PERIOD*
7/1/2019 – 12/31/2019 | |
| Class A | | | | | | | | | | | | |
| Actual | | | $1,000.00 | | | | $1,053.90 | | | | $6.94 | |
| Hypothetical (5% return before expenses) | | | $1,000.00 | | | | $1,018.45 | | | | $6.82 | |
| Class C | | | | | | | | | | | | |
| Actual | | | $1,000.00 | | | | $1,049.90 | | | | $10.80 | |
| Hypothetical (5% return before expenses) | | | $1,000.00 | | | | $1,014.67 | | | | $10.61 | |
| Class N | | | | | | | | | | | | |
| Actual | | | $1,000.00 | | | | $1,055.40 | | | | $5.34 | |
| Hypothetical (5% return before expenses) | | | $1,000.00 | | | | $1,020.01 | | | | $5.24 | |
| Class Y | | | | | | | | | | | | |
| Actual | | | $1,000.00 | | | | $1,055.10 | | | | $5.65 | |
| Hypothetical (5% return before expenses) | | | $1,000.00 | | | | $1,019.71 | | | | $5.55 | |
| * | Expenses are equal to the Fund’s annualized expense ratio (after waiver/reimbursement): 1.34%, 2.09%, 1.03% and 1.09% for Class A, C, N and Y, respectively, multiplied by the average account value over the period, multiplied by the number of days in the most recent fiscal half-year (184), divided by 365 (to reflect the half-year period). |
| | | | | | | | | | | | |
VAUGHAN NELSON VALUE OPPORTUNITY
FUND | | BEGINNING
ACCOUNT VALUE
7/1/2019 | | | ENDING
ACCOUNT VALUE
12/31/2019 | | | EXPENSES PAID
DURING PERIOD*
7/1/2019 – 12/31/2019 | |
| Class A | | | | | | | | | | | | |
| Actual | | | $1,000.00 | | | | $1,085.70 | | | | $6.31 | |
| Hypothetical (5% return before expenses) | | | $1,000.00 | | | | $1,019.16 | | | | $6.11 | |
| Class C | | | | | | | | | | | | |
| Actual | | | $1,000.00 | | | | $1,081.70 | | | | $10.23 | |
| Hypothetical (5% return before expenses) | | | $1,000.00 | | | | $1,015.38 | | | | $9.91 | |
| Class N | | | | | | | | | | | | |
| Actual | | | $1,000.00 | | | | $1,087.70 | | | | $4.74 | |
| Hypothetical (5% return before expenses) | | | $1,000.00 | | | | $1,020.67 | | | | $4.58 | |
| Class Y | | | | | | | | | | | | |
| Actual | | | $1,000.00 | | | | $1,087.20 | | | | $5.00 | |
| Hypothetical (5% return before expenses) | | | $1,000.00 | | | | $1,020.42 | | | | $4.84 | |
| * | Expenses are equal to the Fund’s annualized expense ratio (after waiver/reimbursement): 1.20%, 1.95%, 0.90% and 0.95% for Class A, C, N and Y, respectively, multiplied by the average account value over the period, multiplied by the number of days in the most recent fiscal half-year (184), divided by 365 (to reflect the half-year period). |
29 |
Portfolio of Investments – as of December 31, 2019
Loomis Sayles Intermediate Municipal Bond Fund
| | | | | | | | |
Principal
Amount | | | Description | | Value (†) | |
| | Bonds and Notes — 93.1% of Net Assets | |
| | Municipals — 93.1% | |
| | | | Colorado — 11.2% | |
| $ | 260,000 | | | Colorado Springs Utilities System Revenue,Series B-2, 5.000%, 11/15/2033 | | $ | 293,992 | |
| | 400,000 | | | Colorado State Health Facilities Authority Revenue, Craig Hospital Project, 5.000%, 12/01/2028 | | | 435,284 | |
| | 400,000 | | | Denver City & County School District No. 1, GO, Prerefunded 12/01/2022@100, Series B, (State Aid Withholding), 5.000%, 12/01/2026 | | | 445,180 | |
| | 250,000 | | | Denver City & County, Airport System Revenue, Series A, AMT, 5.000%, 11/15/2030 | | | 303,175 | |
| | 500,000 | | | Regional Transportation District Sales Tax Revenue, Series A, 5.000%, 11/01/2028 | | | 643,290 | |
| | | | | | | | |
| | | | | | | 2,120,921 | |
| | | | | | | | |
| | | | Connecticut — 2.5% | |
| | 400,000 | | | Connecticut State Health & Educational Facilities Authority, University of New Haven,Series K-1, 5.000%, 7/01/2033 | | | 473,540 | |
| | | | | | | | |
| | | | Florida — 14.1% | |
| | 235,000 | | | City of Cape Coral FL Utility Improvement Assessment, Various Areas, Water & Sewer Revenue, (AGM Insured), 3.000%, 9/01/2027 | | | 250,611 | |
| | 95,000 | | | City of Cape Coral FL Utility Improvement Assessment, Various Areas, Water & Sewer Revenue, (AGM Insured), 3.000%, 9/01/2028 | | | 101,527 | |
| | 700,000 | | | City of Cape Coral FL Water & Sewer Revenue, 5.000%, 10/01/2039 | | | 840,455 | |
| | 500,000 | | | Fernandina Beach Utility System Revenue, Refunding, Series A, 5.000%, 9/01/2027 | | | 562,670 | |
| | 400,000 | | | Sarasota County Utility System Revenue, 5.000%, 10/01/2023 | | | 456,868 | |
| | 400,000 | | | Volusia County Educational Facility Authority Revenue, Embry-Riddle Aeronautical University, Inc., Series B, 5.000%, 10/15/2025 | | | 470,372 | |
| | | | | | | | |
| | | | | | | 2,682,503 | |
| | | | | | | | |
| | | | Georgia — 1.5% | |
| | 250,000 | | | Savannah Hospital Authority Revenue, St. Joseph’s/Candler Health System Obligated Group, Series A, 5.500%, 7/01/2027 | | | 285,428 | |
| | | | | | | | |
| | | | Illinois — 3.7% | |
| | 540,000 | | | Chicago Midway International Airport Revenue, Second Lien, Refunding, Series A, AMT, 5.000%, 1/01/2031 | | | 606,987 | |
| | 100,000 | | | Illinois Finance Authority Revenue, Loyola University Chicago, Series B, 5.000%, 7/01/2021 | | | 105,458 | |
| | | | | | | | |
| | | | | | | 712,445 | |
| | | | | | | | |
| | | | Louisiana — 2.8% | |
| | 200,000 | | | New Orleans Aviation Board, General Airport Revenue, North Terminal Project, Series B, AMT, 5.000%, 1/01/2035 | | | 234,338 | |
| | 250,000 | | | New Orleans Aviation Board, General Airport Revenue, North Terminal Project, Series B, AMT, 5.000%, 1/01/2036 | | | 292,210 | |
| | | | | | | | |
| | | | | | | 526,548 | |
| | | | | | | | |
| | | | Missouri — 4.2% | |
| | 700,000 | | | Missouri Joint Municipal Electric Utility Commission Power Project Revenue, Refunding, 5.000%, 1/01/2024 | | | 800,800 | |
| | | | | | | | |
See accompanying notes to financial statements.
| 30
Portfolio of Investments – as of December 31, 2019
Loomis Sayles Intermediate Municipal Bond Fund – (continued)
| | | | | | | | |
Principal
Amount | | | Description | | Value (†) | |
| | | | Nevada — 3.0% | |
| $ | 500,000 | | | City of Henderson, GO, Various Purpose, Refunding, 5.000%, 6/01/2026 | | $ | 578,990 | |
| | | | | | | | |
| | | | New Jersey — 7.6% | |
| | 265,000 | | | New Jersey Health Care Facilities Financing Authority Revenue, Refunding, Virtua Health, Inc., 5.000%, 7/01/2023 | | | 299,013 | |
| | 500,000 | | | New Jersey State Turnpike Authority Revenue, Series A, 5.000%, 1/01/2032 | | | 575,980 | |
| | 500,000 | | | Rutgers The State University of New Jersey, Refunding, Series J, 5.000%, 5/01/2024 | | | 563,870 | |
| | | | | | | | |
| | | | | | | 1,438,863 | |
| | | | | | | | |
| | | | New Mexico — 3.1% | |
| | 500,000 | | | New Mexico Hospital Equipment Loan Council Revenue, Presbyterian Healthcare Services Obligated Group, Refunding, 5.000%, 8/01/2031 | | | 586,305 | |
| | | | | | | | |
| | | | New York — 1.2% | |
| | 200,000 | | | New York State Dormitory Authority, Series D, 4.000%, 2/15/2038 | | | 229,082 | |
| | | | | | | | |
| | | | Ohio — 6.0% | |
| | 500,000 | | | Columbus, GO, Various Purpose, Series A, 5.000%, 8/15/2023 | | | 569,155 | |
| | 500,000 | | | Hamilton County Hospital Facilities Revenue, UC Health Obligated Group, 5.000%, 2/01/2024 | | | 570,850 | |
| | | | | | | | |
| | | | | | | 1,140,005 | |
| | | | | | | | |
| | | | Pennsylvania — 1.6% | |
| | 285,000 | | | Delaware River Joint Toll Bridge Commission Revenue, Refunding, Series A, 4.000%, 7/01/2027 | | | 304,916 | |
| | | | | | | | |
| | | | Rhode Island — 3.0% | |
| | 500,000 | | | Rhode Island Clean Water Finance Agency Pollution Control Agency Revolving Fund-Pooled Loan, Series A, 5.000%, 10/01/2024 | | | 571,875 | |
| | | | | | | | |
| | | | Tennessee — 3.1% | |
| | 500,000 | | | Metropolitan Government Nashville & Davidson County Health & Educational Facilities Board Revenue, Vanderbilt University Medical Center Obligated Group, Series A, 5.000%, 7/01/2030 | | | 596,320 | |
| | | | | | | | |
| | | | Texas — 11.4% | | | |
| | 700,000 | | | Houston TX Airport System Revenue, Refunding, Series C, AMT, 5.000%, 7/01/2026 | | | 847,763 | |
| | 400,000 | | | Tarrant County Cultural Education Facilities Finance Corp. Revenue, Methodist Hospitals of Dallas, 5.000%, 10/01/2024 | | | 453,084 | |
| | 250,000 | | | Texas City Independent School District, GO,(PSF-GTD), 4.000%, 8/15/2034 | | | 288,257 | |
| | 500,000 | | | Texas Public Finance Authority, Refunding, 4.000%, 2/01/2034 | | | 577,950 | |
| | | | | | | | |
| | | | | | | 2,167,054 | |
| | | | | | | | |
| | | | Washington — 9.0% | | | |
| | 500,000 | | | King County Public Hospital District No. 2, GO, Evergreen Healthcare, Series B, 5.000%, 12/01/2032 | | | 574,940 | |
| | 500,000 | | | Port of Seattle Revenue, AMT, 5.000%, 7/01/2029 | | | 557,630 | |
| | 500,000 | | | Snohomish County School District No. 15 Edmonds, GO, 5.000%, 12/01/2031 | | | 574,140 | |
| | | | | | | | |
| | | | | | | 1,706,710 | |
| | | | | | | | |
See accompanying notes to financial statements.
31 |
Portfolio of Investments – as of December 31, 2019
Loomis Sayles Intermediate Municipal Bond Fund – (continued)
| | | | | | | | |
Principal
Amount | | | Description | | Value (†) | |
| | | | Wisconsin — 4.1% | |
| $ | 500,000 | | | State of Wisconsin, GO, Prerefunded 05/01/2021@100, Series B, 5.000%, 5/01/2022 | | $ | 525,625 | |
| | 225,000 | | | Wisconsin Health & Educational Facilities Authority Revenue, Aspirus, Inc. Obligated Group, Refunding, Series A, 5.000%, 8/15/2031 | | | 258,131 | |
| | | | | | | | |
| | | | | | | 783,756 | |
| | | | | | | | |
| | | | Total Bonds and Notes
(Identified Cost $16,564,542) | | | 17,706,061 | |
| | | | | | | | |
| | | | | | | | |
| Shares | | | | | | |
| | Exchange-Traded Funds — 4.4% | |
| | 10,000 | | | SPDR® Nuveen Bloomberg Barclays High Yield Municipal Bond ETF | | | 590,000 | |
| | 10,000 | | | VanEck Vectors® Short High-Yield Municipal Index ETF | | | 252,000 | |
| | | | | | | | |
| | | | Total Exchange-Traded Funds
(Identified Cost $811,628) | | | 842,000 | |
| | | | | | | | |
| | | | | | | | |
Principal
Amount | | | | | | |
| | Short-Term Investments— 3.1% | |
| $ | 596,026 | | | Tri-Party Repurchase Agreement with Fixed Income Clearing Corporation, dated 12/31/2019 at 0.900% to be repurchased at $596,056 on 1/02/2020 collateralized by $600,000 U.S. Treasury Note, 2.000% due 5/31/2024 valued at $609,387 including accrued interest (Note 2 of Notes to Financial Statements) (Identified Cost $596,026) | | | 596,026 | |
| | | | | | | | |
| | | | | | | | |
| | | | Total Investments — 100.6%
(Identified Cost $17,972,196) | | | 19,144,087 | |
| | | | Other assets less liabilities — (0.6)% | | | (119,083 | ) |
| | | | | | | | |
| | | | Net Assets — 100.0% | | $ | 19,025,004 | |
| | | | | | | | |
| | | | | | | | |
| | (†) | | | See Note 2 of Notes to Financial Statements. | |
| | | | | |
| | AGM | | | Assured Guaranty Municipal Corporation | |
| | AMT | | | Alternative Minimum Tax | |
| | ETF | | | Exchange-Traded Fund | |
| | GO | | | General Obligation | |
| | SPDR | | | Standard & Poor’s Depositary Receipt | |
See accompanying notes to financial statements.
| 32
Portfolio of Investments – as of December 31, 2019
Loomis Sayles Intermediate Municipal Bond Fund – (continued)
Industry Summary at December 31, 2019
| | | | |
Hospitals | | | 18.3 | % |
General Purpose Public Improvement | | | 16.0 | |
Airports | | | 15.1 | |
Water and Sewer | | | 11.6 | |
Higher Education | | | 8.5 | |
Primary Secondary Education | | | 6.8 | |
Electric Public Power | | | 4.2 | |
Mass Rapid Transportation | | | 3.4 | |
Toll Roads, Streets & Highways | | | 3.0 | |
Pollution Control | | | 3.0 | |
Other Investments, less than 2% each | | | 3.2 | |
Exchange-Traded Funds | | | 4.4 | |
Short-Term Investments | | | 3.1 | |
| | | | |
Total Investments | | | 100.6 | |
Other assets less liabilities | | | (0.6 | ) |
| | | | |
Net Assets | | | 100.0 | % |
| | | | |
See accompanying notes to financial statements.
33 |
Portfolio of Investments – as of December 31, 2019
Natixis Oakmark Fund
| | | | | | | | |
| Shares | | | Description | | Value (†) | |
| | Common Stocks — 98.2% of Net Assets | |
| | | | Air Freight & Logistics — 1.0% | | | |
| | 19,025 | | | FedEx Corp. | | $ | 2,876,770 | |
| | | | | | | | |
| | | | Airlines — 1.4% | | | | |
| | 140,000 | | | American Airlines Group, Inc. | | | 4,015,200 | |
| | | | | | | | |
| | | | Auto Components — 1.5% | | | |
| | 37,100 | | | Aptiv PLC | | | 3,523,387 | |
| | 64,266 | | | Delphi Technologies PLC(a) | | | 824,533 | |
| | | | | | | | |
| | | | | | | 4,347,920 | |
| | | | | | | | |
| | | | Automobiles — 4.3% | | | |
| | 429,100 | | | Fiat Chrysler Automobiles NV | | | 6,303,479 | |
| | 159,400 | | | General Motors Co. | | | 5,834,040 | |
| | | | | | | | |
| | | | | | | 12,137,519 | |
| | | | | | | | |
| | | | Banks — 9.6% | | | |
| | 295,300 | | | Bank of America Corp. | | | 10,400,466 | |
| | 130,900 | | | Citigroup, Inc. | | | 10,457,601 | |
| | 120,345 | | | Wells Fargo & Co. | | | 6,474,561 | |
| | | | | | | | |
| | | | | | | 27,332,628 | |
| | | | | | | | |
| | | | Beverages — 1.9% | | | |
| | 27,900 | | | Constellation Brands, Inc., Class A | | | 5,294,025 | |
| | | | | | | | |
| | | | Biotechnology — 3.0% | | | |
| | 22,520 | | | Regeneron Pharmaceuticals, Inc.(a) | | | 8,455,810 | |
| | | | | | | | |
| | | | Capital Markets — 12.4% | | | |
| | 107,200 | | | Bank of New York Mellon Corp. (The) | | | 5,395,376 | |
| | 156,100 | | | Charles Schwab Corp. (The) | | | 7,424,116 | |
| | 18,665 | | | Goldman Sachs Group, Inc. (The) | | | 4,291,644 | |
| | 25,385 | | | Moody’s Corp. | | | 6,026,653 | |
| | 14,585 | | | S&P Global, Inc. | | | 3,982,434 | |
| | 101,400 | | | State Street Corp. | | | 8,020,740 | |
| | | | | | | | |
| | | | | | | 35,140,963 | |
| | | | | | | | |
| | | | Consumer Finance — 6.1% | | | |
| | 278,500 | | | Ally Financial, Inc. | | | 8,510,960 | |
| | 86,465 | | | Capital One Financial Corp. | | | 8,898,113 | |
| | | | | | | | |
| | | | | | | 17,409,073 | |
| | | | | | | | |
| | | | Electronic Equipment, Instruments & Components — 2.5% | | | |
| | 74,500 | | | TE Connectivity Ltd. | | | 7,140,080 | |
| | | | | | | | |
| | | | Entertainment — 3.1% | | | |
| | 27,365 | | | Netflix, Inc.(a) | | | 8,854,493 | |
| | | | | | | | |
| | | | Health Care Providers & Services — 4.9% | | | |
| | 76,985 | | | CVS Health Corp. | | | 5,719,215 | |
| | 25,207 | | | HCA Healthcare, Inc. | | | 3,725,847 | |
| | 11,765 | | | Humana, Inc. | | | 4,312,108 | |
| | | | | | | | |
| | | | | | | 13,757,170 | |
| | | | | | | | |
See accompanying notes to financial statements.
| 34
Portfolio of Investments – as of December 31, 2019
Natixis Oakmark Fund – (continued)
| | | | | | | | |
| Shares | | | Description | | Value (†) | |
| | | | Hotels, Restaurants & Leisure — 3.7% | |
| | 46,645 | | | Hilton Worldwide Holdings, Inc. | | $ | 5,173,397 | |
| | 158,800 | | | MGM Resorts International | | | 5,283,276 | |
| | | | | | | | |
| | | | | | | 10,456,673 | |
| | | | | | | | |
| | | | Industrial Conglomerates — 2.2% | |
| | 563,400 | | | General Electric Co. | | | 6,287,544 | |
| | | | | | | | |
| | | | Insurance — 2.2% | |
| | 118,845 | | | American International Group, Inc. | | | 6,100,314 | |
| | | | | | | | |
| | | | Interactive Media & Services — 6.4% | |
| | 8,325 | | | Alphabet, Inc., Class A(a) | | | 11,150,422 | |
| | 33,290 | | | Facebook, Inc., Class A(a) | | | 6,832,772 | |
| | | | | | | | |
| | | | | | | 17,983,194 | |
| | | | | | | | |
| | | | Internet & Direct Marketing Retail — 4.4% | |
| | 3,280 | | | Booking Holdings, Inc.(a) | | | 6,736,234 | |
| | 109,500 | | | eBay, Inc. | | | 3,954,045 | |
| | 199,200 | | | Qurate Retail, Inc., Class A(a) | | | 1,679,256 | |
| | | | | | | | |
| | | | | | | 12,369,535 | |
| | | | | | | | |
| | | | IT Services — 6.4% | |
| | 18,620 | | | Automatic Data Processing, Inc. | | | 3,174,710 | |
| | 115,200 | | | DXC Technology Co. | | | 4,330,368 | |
| | 30,465 | | | Gartner, Inc.(a) | | | 4,694,656 | |
| | 9,860 | | | MasterCard, Inc., Class A | | | 2,944,097 | |
| | 16,005 | | | Visa, Inc., Class A | | | 3,007,340 | |
| | | | | | | | |
| | | | | | | 18,151,171 | |
| | | | | | | | |
| | | | Machinery — 5.8% | |
| | 29,481 | | | Caterpillar, Inc. | | | 4,353,754 | |
| | 29,060 | | | Cummins, Inc. | | | 5,200,578 | |
| | 32,755 | | | Parker-Hannifin Corp. | | | 6,741,634 | |
| | | | | | | | |
| | | | | | | 16,295,966 | |
| | | | | | | | |
| | | | Media — 5.2% | |
| | 16,210 | | | Charter Communications, Inc., Class A(a) | | | 7,863,147 | |
| | 152,500 | | | Comcast Corp., Class A | | | 6,857,925 | |
| | | | | | | | |
| | | | | | | 14,721,072 | |
| | | | | | | | |
| | | | Oil, Gas & Consumable Fuels — 5.5% | |
| | 195,300 | | | Apache Corp. | | | 4,997,727 | |
| | 44,300 | | | Concho Resources, Inc. | | | 3,879,351 | |
| | 34,100 | | | Diamondback Energy, Inc. | | | 3,166,526 | |
| | 43,700 | | | EOG Resources, Inc. | | | 3,660,312 | |
| | | | | | | | |
| | | | | | | 15,703,916 | |
| | | | | | | | |
| | | | Semiconductors & Semiconductor Equipment — 3.0% | |
| | 87,300 | | | Intel Corp. | | | 5,224,905 | |
| | 26,200 | | | Texas Instruments, Inc. | | | 3,361,198 | |
| | | | | | | | |
| | | | | | | 8,586,103 | |
| | | | | | | | |
See accompanying notes to financial statements.
35 |
Portfolio of Investments – as of December 31, 2019
Natixis Oakmark Fund – (continued)
| | | | | | | | |
| Shares | | | Description | | Value (†) | |
| | | | Technology Hardware, Storage & Peripherals — 1.7% | |
| | 16,230 | | | Apple, Inc. | | $ | 4,765,940 | |
| | | | | | | | |
| | | | Total Common Stocks
(Identified Cost $226,571,332) | | | 278,183,079 | |
| | | | | | | | |
| | | | | | | | |
Principal
Amount | | | | | | |
| | Short-Term Investments — 1.8% | |
| $ | 5,183,485 | | | Tri-Party Repurchase Agreement with Fixed Income Clearing Corporation, dated 12/31/2019 at 0.900% to be repurchased at $5,183,744 on 1/02/2020 collateralized by $5,035,000 U.S. Treasury Note, 2.875% due 10/31/2023 valued at $5,287,817 including accrued interest (Note 2 of Notes to Financial Statements) (Identified Cost $5,183,485) | | | 5,183,485 | |
| | | | | | | | |
| | | | | | | | |
| | | | Total Investments — 100.0%
(Identified Cost $231,754,817) | | | 283,366,564 | |
| | | | Other assets less liabilities — 0.0% | | | 71,151 | |
| | | | | | | | |
| | | | Net Assets — 100.0% | | $ | 283,437,715 | |
| | | | | | | | |
| | | | | | | | |
| | (†) | | | See Note 2 of Notes to Financial Statements. | |
| | (a) | | | Non-income producing security. | |
Industry Summary at December 31, 2019
| | | | |
Capital Markets | | | 12.4 | % |
Banks | | | 9.6 | |
IT Services | | | 6.4 | |
Interactive Media & Services | | | 6.4 | |
Consumer Finance | | | 6.1 | |
Machinery | | | 5.8 | |
Oil, Gas & Consumable Fuels | | | 5.5 | |
Media | | | 5.2 | |
Health Care Providers & Services | | | 4.9 | |
Internet & Direct Marketing Retail | | | 4.4 | |
Automobiles | | | 4.3 | |
Hotels, Restaurants & Leisure | | | 3.7 | |
Entertainment | | | 3.1 | |
Semiconductors & Semiconductor Equipment | | | 3.0 | |
Biotechnology | | | 3.0 | |
Electronic Equipment, Instruments & Components | | | 2.5 | |
Industrial Conglomerates | | | 2.2 | |
Insurance | | | 2.2 | |
Other Investments, less than 2% each | | | 7.5 | |
Short-Term Investments | | | 1.8 | |
| | | | |
Total Investments | | | 100.0 | |
Other assets less liabilities | | | 0.0 | * |
| | | | |
Net Assets | | | 100.0 | % |
| | | | |
* Less than 0.1%
See accompanying notes to financial statements.
| 36
Portfolio of Investments – as of December 31, 2019
Natixis Oakmark International Fund
| | | | | | | | |
| Shares | | | Description | | Value (†) | |
| | Common Stocks — 97.5% of Net Assets | |
| | | | Australia — 2.4% | | | | |
| | 3,897,150 | | | AMP Ltd. | | $ | 5,242,435 | |
| | 408,000 | | | Brambles Ltd. | | | 3,358,127 | |
| | 358,458 | | | Orica Ltd. | | | 5,527,596 | |
| | | | | | | | |
| | | | | | | 14,128,158 | |
| | | | | | | | |
| | | | Canada — 2.2% | | | |
| | 878,467 | | | Cenovus Energy, Inc. | | | 8,929,779 | |
| | 96,000 | | | Open Text Corp. | | | 4,230,195 | |
| | | | | | | | |
| | | | | | | 13,159,974 | |
| | | | | | | | |
| | | | China — 2.4% | | | |
| | 67,834 | | | Baidu, Inc., Sponsored ADR(a) | | | 8,574,217 | |
| | 53,935 | | | Prosus NV(a) | | | 4,036,579 | |
| | 50,400 | | | Trip.com Group Ltd., ADR(a) | | | 1,690,416 | |
| | | | | | | | |
| | | | | | | 14,301,212 | |
| | | | | | | | |
| | | | Finland — 0.8% | | | |
| | 136,400 | | | UPM-Kymmene OYJ | | | 4,732,328 | |
| | | | | | | | |
| | | | France — 11.3% | | | |
| | 275,848 | | | Accor S.A. | | | 12,947,968 | |
| | 370,191 | | | BNP Paribas S.A.(b) | | | 22,003,441 | |
| | 188,022 | | | Bureau Veritas S.A. | | | 4,915,258 | |
| | 21,100 | | | EssilorLuxottica S.A. | | | 3,225,799 | |
| | 276,248 | | | Publicis Groupe S.A. | | | 12,525,469 | |
| | 344,500 | | | Valeo S.A. | | | 12,210,200 | |
| | | | | | | | |
| | | | | | | 67,828,135 | |
| | | | | | | | |
| | | | Germany — 18.0% | | | |
| | 61,210 | | | Allianz SE, (Registered) | | | 14,998,150 | |
| | 219,130 | | | Bayer AG, (Registered) | | | 17,814,523 | |
| | 236,700 | | | Bayerische Motoren Werke AG | | | 19,387,075 | |
| | 165,359 | | | Continental AG | | | 21,369,385 | |
| | 377,714 | | | Daimler AG, (Registered) | | | 20,881,652 | |
| | 15,900 | | | Henkel AG & Co. KGaA | | | 1,494,481 | |
| | 862,400 | | | thyssenkrupp AG | | | 11,588,160 | |
| | | | | | | | |
| | | | | | | 107,533,426 | |
| | | | | | | | |
| | | | India — 0.7% | | | |
| | 367,975 | | | Axis Bank Ltd. | | | 3,889,823 | |
| | | | | | | | |
| | | | Indonesia — 0.8% | | | |
| | 8,632,500 | | | Bank Mandiri Persero Tbk PT | | | 4,770,005 | |
| | | | | | | | |
| | | | Ireland — 2.8% | | | |
| | 191,702 | | | Ryanair Holdings PLC, Sponsored ADR(a) | | | 16,795,012 | |
| | | | | | | | |
| | | | Italy — 3.6% | |
| | 8,187,300 | | | Intesa Sanpaolo SpA | | | 21,566,886 | |
| | | | | | | | |
| | | | Japan — 3.4% | |
| | 407,700 | | | Komatsu Ltd. | | | 9,785,385 | |
See accompanying notes to financial statements.
37 |
Portfolio of Investments – as of December 31, 2019
Natixis Oakmark International Fund – (continued)
| | | | | | | | |
| Shares | | | Description | | Value (†) | |
| | | | Japan — continued | |
| | 119,500 | | | Olympus Corp. | | $ | 1,841,818 | |
| | 126,300 | | | Toyota Motor Corp. | | | 8,899,283 | |
| | | | | | | | |
| | | | | | | 20,526,486 | |
| | | | | | | | |
| | | | Korea — 3.1% | |
| | 77,400 | | | NAVER Corp. | | | 12,453,268 | |
| | 122,800 | | | Samsung Electronics Co. Ltd. | | | 5,917,344 | |
| | | | | | | | |
| | | | | | 18,370,612 | |
| | | | | | | | |
| | | | Mexico — 1.2% | |
| | 629,900 | | | Grupo Televisa SAB, Sponsored ADR | | | 7,388,727 | |
| | | | | | | | |
| | | | Netherlands — 2.3% | |
| | 2,030 | | | ASML Holding NV | | | 600,995 | |
| | 169,382 | | | EXOR NV | | | 13,132,429 | |
| | | | | | | | |
| | | | | | | 13,733,424 | |
| | | | | | | | |
| | | | South Africa — 2.0% | |
| | 72,335 | | | Naspers Ltd., N Shares | | | 11,837,399 | |
| | | | | | | | |
| | | | Sweden — 6.0% | |
| | 644,755 | | | Hennes & Mauritz AB, B Shares | | | 13,151,415 | |
| | 494,500 | | | SKF AB, B Shares | | | 10,011,804 | |
| | 749,300 | | | Volvo AB, B Shares | | | 12,544,172 | |
| | | | | | | | |
| | | | | | | 35,707,391 | |
| | | | | | | | |
| | | | Switzerland — 12.0% | |
| | 100,800 | | | Cie Financiere Richemont S.A., (Registered) | | | 7,877,611 | |
| | 1,569,536 | | | Credit Suisse Group AG, (Registered)(b) | | | 21,216,478 | |
| | 8,411,700 | | | Glencore PLC(b) | | | 26,191,652 | |
| | 12,530 | | | Kuehne & Nagel International AG, (Registered) | | | 2,113,393 | |
| | 137,921 | | | LafargeHolcim Ltd., (Registered) | | | 7,651,507 | |
| | 24,355 | | | Swatch Group AG (The) | | | 6,800,046 | |
| | | | | | | | |
| | | | | | | 71,850,687 | |
| | | | | | | | |
| | | | Taiwan — 0.2% | |
| | 135,000 | | | Taiwan Semiconductor Manufacturing Co. Ltd. | | | 1,494,156 | |
| | | | | | | | |
| | | | United Kingdom — 21.4% | |
| | 368,867 | | | Ashtead Group PLC | | | 11,794,419 | |
| | 101,000 | | | Bunzl PLC | | | 2,762,422 | |
| | 1,838,700 | | | CNH Industrial NV | | | 20,188,730 | |
| | 2,425,600 | | | G4S PLC | | | 7,014,495 | |
| | 400,121 | | | Liberty Global PLC, Class A(a) | | | 9,098,752 | |
| | 50,326 | | | Liberty Global PLC, Class C(a) | | | 1,096,855 | |
| | 22,072,500 | | | Lloyds Banking Group PLC | | | 18,285,314 | |
| | 61,900 | | | Reckitt Benckiser Group PLC | | | 5,028,043 | |
| | 1,645,900 | | | Rolls-Royce Holdings PLC | | | 14,875,660 | |
| | 2,916,300 | | | Royal Bank of Scotland Group PLC | | | 9,355,322 | |
| | 288,089 | | | Schroders PLC | | | 12,720,889 | |
| | 100 | | | Schroders PLC, (Non Voting) | | | 3,333 | |
| | 187,300 | | | Smiths Group PLC | | | 4,183,371 | |
See accompanying notes to financial statements.
| 38
Portfolio of Investments – as of December 31, 2019
Natixis Oakmark International Fund – (continued)
| | | | | | | | |
| Shares | | | Description | | Value (†) | |
| | | | United Kingdom — continued | |
| | 820,500 | | | WPP PLC | | $ | 11,546,286 | |
| | | | | | | | |
| | | | | | | 127,953,891 | |
| | | | | | | | |
| | | | United States — 0.9% | |
| | 46,950 | | | Ferguson PLC | | | 4,272,771 | |
| | 5,177 | | | Willis Towers Watson PLC | | | 1,045,443 | |
| | | | | | | | |
| | | | | | | 5,318,214 | |
| | | | | | | | |
| | | | Total Common Stocks
(Identified Cost $629,832,027) | | | 582,885,946 | |
| | | | | | | | |
| | | | | | | | |
| | Preferred Stocks — 0.4% | |
| | | | Germany — 0.4% | |
| | 24,800 | | | Henkel AG & Co. KGaA
(Identified Cost $2,551,720) | | | 2,561,851 | |
| | | | | | | | |
| | | | | | | | |
Principal
Amount | | | | | | |
| | Short-Term Investments — 2.1% | |
| $ | 12,573,625 | | | Tri-Party Repurchase Agreement with Fixed Income Clearing Corporation, dated 12/31/2019 at 0.900% to be repurchased at $12,574,253 on 1/02/2020 collateralized by $12,680,000 U.S. Treasury Note, 1.750% due 7/15/2022 valued at $12,828,495 including accrued interest (Note 2 of Notes to Financial Statements) (Identified Cost $12,573,625) | | | 12,573,625 | |
| | | | | | | | |
| | | | | | | | |
| | | | Total Investments — 100.0%
(Identified Cost $644,957,372) | | | 598,021,422 | |
| | | | Other assets less liabilities — (0.0)% | | | (185,252 | ) |
| | | | | | | | |
| | | | Net Assets — 100.0% | | $ | 597,836,170 | |
| | | | | | | | |
| | | | | | | | |
| | (†) | | | See Note 2 of Notes to Financial Statements. | |
| | (a) | | | Non-income producing security. | |
| | (b) | | | Security (or a portion thereof) has been designated to cover the Fund’s obligations under open derivative contracts. | |
| | | | | | | | |
| | ADR | | | An American Depositary Receipt is a certificate issued by a custodian bank representing the right to receive securities of the foreign issuer described. The values of ADRs may be significantly influenced by trading on exchanges not located in the United States. | |
| | | | | | | | |
| | CHF | | | Swiss Franc | |
See accompanying notes to financial statements.
39 |
Portfolio of Investments – as of December 31, 2019
Natixis Oakmark International Fund – (continued)
At December 31, 2019, the Fund had the following open forward foreign currency contracts:
| | | | | | | | | | | | | | | | | | | | | | | | | | |
| Counterparty | | Delivery
Date | | | Currency
Bought/
Sold (B/S) | | | Units
of
Currency | | | In Exchange for | | | Notional
Value | | | Unrealized
Appreciation
(Depreciation) | |
| State Street Bank and Trust Company | | | 6/17/2020 | | | CHF | | | S | | | | 4,286,000 | | | $ | 4,409,465 | | | $ | 4,479,724 | | | $ | (70,259 | ) |
| | | | | | | | | | | | | | | | | | | | | | | | | | |
Industry Summary at December 31, 2019
| | | | |
Banks | | | 13.4 | % |
Machinery | | | 8.8 | |
Automobiles | | | 8.2 | |
Media | | | 6.9 | |
Metals & Mining | | | 6.3 | |
Capital Markets | | | 5.6 | |
Auto Components | | | 5.6 | |
Interactive Media & Services | | | 3.5 | |
Trading Companies & Distributors | | | 3.2 | |
Diversified Financial Services | | | 3.1 | |
Pharmaceuticals | | | 3.0 | |
Internet & Direct Marketing Retail | | | 3.0 | |
Textiles, Apparel & Luxury Goods | | | 2.9 | |
Airlines | | | 2.8 | |
Insurance | | | 2.7 | |
Aerospace & Defense | | | 2.5 | |
Specialty Retail | | | 2.2 | |
Hotels, Restaurants & Leisure | | | 2.2 | |
Other Investments, less than 2% each | | | 12.0 | |
Short-Term Investments | | | 2.1 | |
| | | | |
Total Investments | | | 100.0 | |
Other assets less liabilities (including forward foreign currency contracts) | | | (0.0 | )* |
| | | | |
Net Assets | | | 100.0 | % |
| | | | |
* Less than 0.1%
See accompanying notes to financial statements.
| 40
Portfolio of Investments – as of December 31, 2019
Natixis Oakmark International Fund – (continued)
Currency Exposure Summary at December 31, 2019
| | | | |
Euro | | | 40.5 | % |
British Pound | | | 21.4 | |
United States Dollar | | | 9.7 | |
Swiss Franc | | | 7.6 | |
Swedish Krona | | | 6.0 | |
Japanese Yen | | | 3.4 | |
South Korean Won | | | 3.1 | |
Australian Dollar | | | 2.4 | |
Canadian Dollar | | | 2.2 | |
South African Rand | | | 2.0 | |
Other, less than 2% each | | | 1.7 | |
| | | | |
Total Investments | | | 100.0 | |
Other assets less liabilities (including forward foreign currency contracts) | | | (0.0 | )* |
| | | | |
Net Assets | | | 100.0 | % |
| | | | |
* Less than 0.1%
See accompanying notes to financial statements.
41 |
Portfolio of Investments – as of December 31, 2019
Vaughan Nelson Small Cap Value Fund
| | | | | | | | |
Shares | | | Description | | Value (†) | |
| | Common Stocks — 95.1% of Net Assets | |
| | | | Aerospace & Defense — 1.4% | |
| | 19,246 | | | Moog, Inc., Class A | | $ | 1,642,261 | |
| | | | | | | | |
| | | | Banks — 14.0% | |
| | 56,750 | | | Atlantic Union Bankshares Corp. | | | 2,130,962 | |
| | 37,975 | | | Enterprise Financial Services Corp. | | | 1,830,775 | |
| | 43,275 | | | First Bancorp | | | 1,727,105 | |
| | 92,000 | | | First Financial Bancorp | | | 2,340,480 | |
| | 53,300 | | | First Merchants Corp. | | | 2,216,747 | |
| | 26,000 | | | Lakeland Financial Corp. | | | 1,272,180 | |
| | 74,150 | | | United Community Banks, Inc. | | | 2,289,752 | |
| | 39,375 | | | Webster Financial Corp. | | | 2,101,050 | |
| | | | | | | | |
| | | | | | | 15,909,051 | |
| | | | | | | | |
| | | | Biotechnology — 0.6% | |
| | 12,813 | | | Emergent BioSolutions, Inc.(a) | | | 691,261 | |
| | | | | | | | |
| | | | Capital Markets — 2.9% | |
| | 23,400 | | | LPL Financial Holdings, Inc. | | | 2,158,650 | |
| | 70,375 | | | Virtu Financial, Inc., Class A | | | 1,125,296 | |
| | | | | | | | |
| | | | | | | 3,283,946 | |
| | | | | | | | |
| | | | Chemicals — 3.3% | |
| | 241,550 | | | Element Solutions, Inc.(a) | | | 2,821,304 | |
| | 39,950 | | | Huntsman Corp. | | | 965,192 | |
| | | | | | | | |
| | | | | | | 3,786,496 | |
| | | | | | | | |
| | | | Commercial Services & Supplies — 4.2% | |
| | 46,050 | | | Brady Corp., Class A | | | 2,636,823 | |
| | 23,100 | | | Brink’s Co. (The) | | | 2,094,708 | |
| | | | | | | | |
| | | | | | | 4,731,531 | |
| | | | | | | | |
| | | | Consumer Finance — 1.4% | |
| | 19,475 | | | FirstCash, Inc. | | | 1,570,269 | |
| | | | | | | | |
| | | | Diversified Consumer Services — 0.9% | |
| | 27,993 | | | Adtalem Global Education, Inc.(a) | | | 978,915 | |
| | | | | | | | |
| | | | Electrical Equipment — 1.2% | |
| | 113,650 | | | GrafTech International Ltd. | | | 1,320,613 | |
| | | | | | | | |
| | | | Electronic Equipment, Instruments & Components — 2.3% | |
| | 29,805 | | | Fabrinet(a) | | | 1,932,556 | |
| | 10,250 | | | Insight Enterprises, Inc.(a) | | | 720,473 | |
| | | | | | | | |
| | | | | | | 2,653,029 | |
| | | | | | | | |
| | | | Energy Equipment & Services — 0.6% | |
| | 99,550 | | | Newpark Resources, Inc.(a) | | | 624,179 | |
| | | | | | | | |
| | | | Food & Staples Retailing — 1.1% | |
| | 23,625 | | | Performance Food Group Co.(a) | | | 1,216,215 | |
| | | | | | | | |
| | | | Gas Utilities — 3.9% | |
| | 28,625 | | | Southwest Gas Holdings, Inc. | | | 2,174,641 | |
See accompanying notes to financial statements.
| 42
Portfolio of Investments – as of December 31, 2019
Vaughan Nelson Small Cap Value Fund – (continued)
| | | | | | | | |
Shares | | | Description | | Value (†) | |
| | | | Gas Utilities — continued | |
| | 26,625 | | | Spire, Inc. | | $ | 2,218,129 | |
| | | | | | | | |
| | | | | | | 4,392,770 | |
| | | | | | | | |
| | | | Health Care Equipment & Supplies — 2.4% | |
| | 29,175 | | | Integra LifeSciences Holdings Corp.(a) | | | 1,700,319 | |
| | 51,328 | | | Lantheus Holdings, Inc.(a) | | | 1,052,737 | |
| | | | | | | | |
| | | | | | | 2,753,056 | |
| | | | | | | | |
| | | | Health Care Providers & Services — 1.8% | |
| | 33,200 | | | AMN Healthcare Services, Inc.(a) | | | 2,068,692 | |
| | | | | | | | |
| | | | Hotels, Restaurants & Leisure — 1.5% | |
| | 15,500 | | | Dunkin’ Brands Group, Inc. | | | 1,170,870 | |
| | 20,850 | | | Scientific Games Corp., Class A(a) | | | 558,363 | |
| | | | | | | | |
| | | | | | | 1,729,233 | |
| | | | | | | | |
| | | | Household Durables — 1.0% | |
| | 31,000 | | | MDC Holdings, Inc. | | | 1,182,960 | |
| | | | | | | | |
| | | | Insurance — 6.4% | |
| | 14,375 | | | Hanover Insurance Group, Inc. (The) | | | 1,964,631 | |
| | 28,025 | | | Mercury General Corp. | | | 1,365,658 | |
| | 86,900 | | | Old Republic International Corp. | | | 1,943,953 | |
| | 30,825 | | | Selective Insurance Group, Inc. | | | 2,009,482 | |
| | | | | | | | |
| | | | | | | 7,283,724 | |
| | | | | | | | |
| | | | IT Services — 4.6% | |
| | 15,265 | | | CACI International, Inc., Class A(a) | | | 3,816,097 | |
| | 53,400 | | | Perspecta, Inc. | | | 1,411,896 | |
| | | | | | | | |
| | | | | | | 5,227,993 | |
| | | | | | | | |
| | | | Life Sciences Tools & Services — 1.9% | |
| | 19,300 | | | PRA Health Sciences, Inc.(a) | | | 2,145,195 | |
| | | | | | | | |
| | | | Machinery — 4.2% | |
| | 10,325 | | | Alamo Group, Inc. | | | 1,296,304 | |
| | 13,075 | | | Albany International Corp., Class A | | | 992,654 | |
| | 33,525 | | | Franklin Electric Co., Inc. | | | 1,921,653 | |
| | 25,025 | | | Trinity Industries, Inc. | | | 554,304 | |
| | | | | | | | |
| | | | | | | 4,764,915 | |
| | | | | | | | |
| | | | Media — 6.1% | |
| | 66,775 | | | Gray Television, Inc.(a) | | | 1,431,656 | |
| | 24,300 | | | Nexstar Media Group, Inc., Class A | | | 2,849,175 | |
| | 157,600 | | | TEGNA, Inc. | | | 2,630,344 | |
| | | | | | | | |
| | | | | | | 6,911,175 | |
| | | | | | | | |
| | | | Oil, Gas & Consumable Fuels — 3.5% | |
| | 70,625 | | | Callon Petroleum Co.(a) | | | 341,119 | |
| | 281,725 | | | Kosmos Energy Ltd. | | | 1,605,832 | |
| | 109,225 | | | Parsley Energy, Inc., Class A | | | 2,065,445 | |
| | | | | | | | |
| | | | | | | 4,012,396 | |
| | | | | | | | |
See accompanying notes to financial statements.
43 |
Portfolio of Investments – as of December 31, 2019
Vaughan Nelson Small Cap Value Fund – (continued)
| | | | | | | | |
Shares | | | Description | | Value (†) | |
| | | | Professional Services — 0.5% | |
| | 8,175 | | | ASGN, Inc.(a) | | $ | 580,180 | |
| | | | | | | | |
| | | | Real Estate Management & Development — 1.9% | |
| | 105,600 | | | Cushman & Wakefield PLC(a) | | | 2,158,464 | |
| | | | | | | | |
| | | | REITs – Health Care — 2.4% | |
| | 26,118 | | | Community Healthcare Trust, Inc. | | | 1,119,417 | |
| | 81,940 | | | Physicians Realty Trust | | | 1,551,944 | |
| | | | | | | | |
| | | | | | | 2,671,361 | |
| | | | | | | | |
| | | | REITs – Office Property — 1.2% | |
| | 83,850 | | | Brandywine Realty Trust | | | 1,320,638 | |
| | | | | | | | |
| | | | REITs – Storage — 1.1% | |
| | 38,100 | | | National Storage Affiliates Trust | | | 1,280,922 | |
| | | | | | | | |
| | | | Road & Rail — 2.2% | |
| | 21,725 | | | Landstar System, Inc. | | | 2,473,826 | |
| | | | | | | | |
| | | | Semiconductors & Semiconductor Equipment — 9.9% | |
| | 23,025 | | | Cabot Microelectronics Corp. | | | 3,322,968 | |
| | 52,475 | | | Entegris, Inc. | | | 2,628,473 | |
| | 28,725 | | | Lattice Semiconductor Corp.(a) | | | 549,797 | |
| | 51,450 | | | MaxLinear, Inc.(a) | | | 1,091,769 | |
| | 42,025 | | | Nova Measuring Instruments Ltd.(a) | | | 1,589,806 | |
| | 82,075 | | | Rambus, Inc.(a) | | | 1,130,583 | |
| | 40,625 | | | Tower Semiconductor Ltd.(a) | | | 977,437 | |
| | | | | | | | |
| | | | | | | 11,290,833 | |
| | | | | | | | |
| | | | Software — 0.5% | |
| | 4,600 | | | CyberArk Software Ltd.(a) | | | 536,268 | |
| | | | | | | | |
| | | | Specialty Retail — 1.8% | |
| | 34,900 | | | Aaron’s, Inc. | | | 1,993,139 | |
| | | | | | | | |
| | | | Thrifts & Mortgage Finance — 2.4% | |
| | 194,650 | | | MGIC Investment Corp. | | | 2,758,191 | |
| | | | | | | | |
| | | | Total Common Stocks
(Identified Cost $95,510,081) | | | 107,943,697 | |
| | | | | | | | |
| | | | | | | | |
| | Exchange-Traded Funds — 4.9% | | | | |
| | 43,000 | | | iShares® Russell 2000 Value Index ETF
(Identified Cost $5,073,901) | | | 5,528,940 | |
| | | | | | | | |
| | | | | | | | |
See accompanying notes to financial statements.
| 44
Portfolio of Investments – as of December 31, 2019
Vaughan Nelson Small Cap Value Fund – (continued)
| | | | | | | | |
Principal Amount | | | Description | | Value (†) | |
| | Short-Term Investments — 0.5% | | | | |
| $ | 594,567 | | | Tri-Party Repurchase Agreement with Fixed Income Clearing Corporation, dated 12/31/2019 at 0.900% to be repurchased at $594,597 on 1/02/2020 collateralized by $580,000 U.S. Treasury Note, 2.875% due 10/31/2023 valued at $609,123 including accrued interest (Note 2 of Notes to Financial Statements) (Identified Cost $594,567) | | $ | 594,567 | |
| | | | | | | | |
| | | | | | | | |
| | | | Total Investments — 100.5%
(Identified Cost $101,178,549) | | | 114,067,204 | |
| | | | Other assets less liabilities — (0.5)% | | | (589,248 | ) |
| | | | | | | | |
| | | | Net Assets — 100.0% | | $ | 113,477,956 | |
| | | | | | | | |
| | | | | | | | |
| | (†) | | | See Note 2 of Notes to Financial Statements. | | | | |
| | (a) | | | Non-income producing security. | | | | |
| | | | | | | | |
| | ETF | | | Exchange-Traded Fund | | | | |
| | REITs | | | Real Estate Investment Trusts | | | | |
Industry Summary at December 31, 2019
| | | | |
Banks | | | 14.0 | % |
Semiconductors & Semiconductor Equipment | | | 9.9 | |
Insurance | | | 6.4 | |
Media | | | 6.1 | |
IT Services | | | 4.6 | |
Machinery | | | 4.2 | |
Commercial Services & Supplies | | | 4.2 | |
Gas Utilities | | | 3.9 | |
Oil, Gas & Consumable Fuels | | | 3.5 | |
Chemicals | | | 3.3 | |
Capital Markets | | | 2.9 | |
Thrifts & Mortgage Finance | | | 2.4 | |
Health Care Equipment & Supplies | | | 2.4 | |
REITs – Health Care | | | 2.4 | |
Electronic Equipment, Instruments & Components | | | 2.3 | |
Road & Rail | | | 2.2 | |
Other Investments, less than 2% each | | | 20.4 | |
Exchange-Traded Funds | | | 4.9 | |
Short-Term Investments | | | 0.5 | |
| | | | |
Total Investments | | | 100.5 | |
Other assets less liabilities | | | (0.5 | ) |
| | | | |
Net Assets | | | 100.0 | % |
| | | | |
See accompanying notes to financial statements.
45 |
Portfolio of Investments – as of December 31, 2019
Vaughan Nelson Value Opportunity Fund
| | | | | | | | |
Shares | | | Description | | Value (†) | |
| | Common Stocks — 98.9% of Net Assets | |
| | | | Banks — 5.7% | | | |
| | 158,900 | | | Bank of NT Butterfield & Son Ltd. (The) | | $ | 5,882,478 | |
| | 118,400 | | | PacWest Bancorp | | | 4,531,168 | |
| | 234,350 | | | TCF Financial Corp. | | | 10,967,580 | |
| | | | | | | | |
| | | | | | | 21,381,226 | |
| | | | | | | | |
| | | | Beverages — 2.0% | | | |
| | 38,845 | | | Constellation Brands, Inc., Class A | | | 7,370,839 | |
| | | | | | | | |
| | | | Building Products — 1.1% | | | |
| | 33,425 | | | Allegion PLC | | | 4,162,750 | |
| | | | | | | | |
| | | | Capital Markets — 3.5% | | | |
| | 111,050 | | | Ares Management Corp., Class A | | | 3,963,374 | |
| | 69,950 | | | Nasdaq, Inc. | | | 7,491,645 | |
| | 107,050 | | | Virtu Financial, Inc., Class A | | | 1,711,730 | |
| | | | | | | | |
| | | | | | | 13,166,749 | |
| | | | | | | | |
| | | | Chemicals — 3.1% | | | |
| | 59,825 | | | FMC Corp. | | | 5,971,732 | |
| | 59,200 | | | LyondellBasell Industries NV, Class A | | | 5,593,216 | |
| | | | | | | | |
| | | | | | | 11,564,948 | |
| | | | | | | | |
| | | | Commercial Services & Supplies — 1.8% | | | |
| | 75,150 | | | Brink’s Co. (The) | | | 6,814,602 | |
| | | | | | | | |
| | | | Construction & Engineering — 1.5% | | | |
| | 306,150 | | | WillScot Corp.(a) | | | 5,660,714 | |
| | | | | | | | |
| | | | Consumer Finance — 0.7% | | | |
| | 74,550 | | | Synchrony Financial | | | 2,684,546 | |
| | | | | | | | |
| | | | Containers & Packaging — 3.3% | | | |
| | 27,600 | | | AptarGroup, Inc. | | | 3,191,112 | |
| | 27,300 | | | Avery Dennison Corp. | | | 3,571,386 | |
| | 74,225 | | | Crown Holdings, Inc.(a) | | | 5,384,281 | |
| | | | | | | | |
| | | | | | | 12,146,779 | |
| | | | | | | | |
| | | | Distributors — 0.5% | | | |
| | 8,155 | | | POOL CORP. | | | 1,731,959 | |
| | | | | | | | |
| | | | Diversified Consumer Services — 3.3% | | | |
| | 39,275 | | | Grand Canyon Education, Inc.(a) | | | 3,762,152 | |
| | 277,000 | | | Laureate Education, Inc., Class A(a) | | | 4,877,970 | |
| | 97,550 | | | ServiceMaster Global Holdings, Inc.(a) | | | 3,771,283 | |
| | | | | | | | |
| | | | | | | 12,411,405 | |
| | | | | | | | |
| | | | Electric Utilities — 4.2% | | | |
| | 128,825 | | | Evergy, Inc. | | | 8,385,219 | |
| | 85,275 | | | Eversource Energy | | | 7,254,344 | |
| | | | | | | | |
| | | | | | | 15,639,563 | |
| | | | | | | | |
| | | | Electrical Equipment — 3.3% | | | |
| | 48,475 | | | AMETEK, Inc. | | | 4,834,896 | |
See accompanying notes to financial statements.
| 46
Portfolio of Investments – as of December 31, 2019
Vaughan Nelson Value Opportunity Fund – (continued)
| | | | | | | | |
Shares | | | Description | | Value (†) | |
| | | | Electrical Equipment — continued | | | |
| | 24,850 | | | Hubbell, Inc. | | $ | 3,673,327 | |
| | 151,850 | | | nVent Electric PLC | | | 3,884,323 | |
| | | | | | | | |
| | | | | | | 12,392,546 | |
| | | | | | | | |
| | | | Electronic Equipment, Instruments & Components — 1.9% | |
| | 12,875 | | | CDW Corp. | | | 1,839,065 | |
| | 50,000 | | | Keysight Technologies, Inc.(a) | | | 5,131,500 | |
| | | | | | | | |
| | | | | | | 6,970,565 | |
| | | | | | | | |
| | | | Energy Equipment & Services — 1.1% | |
| | 159,200 | | | Baker Hughes Co. | | | 4,080,296 | |
| | | | | | | | |
| | | | Entertainment — 1.2% | |
| | 40,175 | | | Electronic Arts, Inc.(a) | | | 4,319,214 | |
| | | | | | | | |
| | | | Health Care Equipment & Supplies — 3.0% | |
| | 14,230 | | | Cooper Cos., Inc. (The) | | | 4,571,957 | |
| | 91,725 | | | Hologic, Inc.(a) | | | 4,788,962 | |
| | 11,650 | | | West Pharmaceutical Services, Inc. | | | 1,751,344 | |
| | | | | | | | |
| | | | | | | 11,112,263 | |
| | | | | | | | |
| | | | Health Care Providers & Services — 1.9% | |
| | 112,575 | | | Centene Corp.(a) | | | 7,077,590 | |
| | | | | | | | |
| | | | Hotels, Restaurants & Leisure — 1.4% | |
| | 120,850 | | | Aramark | | | 5,244,890 | |
| | | | | | | | |
| | | | Independent Power & Renewable Electricity Producers — 3.5% | |
| | 185,275 | | | Atlantica Yield PLC | | | 4,889,407 | |
| | 361,350 | | | Vistra Energy Corp. | | | 8,307,437 | |
| | | | | | | | |
| | | | | | | 13,196,844 | |
| | | | | | | | |
| | | | Insurance — 5.7% | |
| | 69,325 | | | Allstate Corp. (The) | | | 7,795,596 | |
| | 48,475 | | | Arthur J. Gallagher & Co. | | | 4,616,274 | |
| | 70,550 | | | Athene Holding Ltd., Class A(a) | | | 3,317,967 | |
| | 32,825 | | | Reinsurance Group of America, Inc. | | | 5,352,444 | |
| | | | | | | | |
| | | | | | | 21,082,281 | |
| | | | | | | | |
| | | | IT Services — 13.1% | |
| | 18,710 | | | Alliance Data Systems Corp. | | | 2,099,262 | |
| | 63,500 | | | Booz Allen Hamilton Holding Corp. | | | 4,516,755 | |
| | 38,340 | | | CACI International, Inc., Class A(a) | | | 9,584,617 | |
| | 65,025 | | | Fidelity National Information Services, Inc. | | | 9,044,327 | |
| | 84,675 | | | Fiserv, Inc.(a) | | | 9,790,970 | |
| | 46,025 | | | Global Payments, Inc. | | | 8,402,324 | |
| | 69,025 | | | MAXIMUS, Inc. | | | 5,134,770 | |
| | | | | | | | |
| | | | | | | 48,573,025 | |
| | | | | | | | |
| | | | Life Sciences Tools & Services — 3.1% | |
| | 45,400 | | | Agilent Technologies, Inc. | | | 3,873,074 | |
See accompanying notes to financial statements.
47 |
Portfolio of Investments – as of December 31, 2019
Vaughan Nelson Value Opportunity Fund – (continued)
| | | | | | | | |
Shares | | | Description | | Value (†) | |
| | | | Life Sciences Tools & Services — continued | |
| | 50,687 | | | IQVIA Holdings, Inc.(a) | | $ | 7,831,648 | |
| | | | | | | | |
| | | | | | | 11,704,722 | |
| | | | | | | | |
| | | | Machinery — 2.4% | | | |
| | 41,100 | | | Oshkosh Corp. | | | 3,890,115 | |
| | 89,575 | | | Timken Co. (The) | | | 5,043,968 | |
| | | | | | | | |
| | | | | | | 8,934,083 | |
| | | | | | | | |
| | | | Media — 3.5% | | | |
| | 109,825 | | | Nexstar Media Group, Inc., Class A | | | 12,876,981 | |
| | | | | | | | |
| | | | Metals & Mining — 1.1% | | | |
| | 302,150 | | | Constellium SE(a) | | | 4,048,810 | |
| | | | | | | | |
| | | | Multi-Utilities — 5.7% | | | |
| | 92,650 | | | Ameren Corp. | | | 7,115,520 | |
| | 113,500 | | | CMS Energy Corp. | | | 7,132,340 | |
| | 77,000 | | | WEC Energy Group, Inc. | | | 7,101,710 | |
| | | | | | | | |
| | | | | | | 21,349,570 | |
| | | | | | | | |
| | | | Multiline Retail — 1.0% | | | |
| | 23,325 | | | Dollar General Corp. | | | 3,638,234 | |
| | | | | | | | |
| | | | Oil, Gas & Consumable Fuels — 3.8% | | | |
| | 48,475 | | | Pioneer Natural Resources Co. | | | 7,337,661 | |
| | 499,700 | | | WPX Energy, Inc.(a) | | | 6,865,878 | |
| | | | | | | | |
| | | | | | | 14,203,539 | |
| | | | | | | | |
| | | | REITs – Diversified — 0.9% | | | |
| | 214,125 | | | New Residential Investment Corp. | | | 3,449,554 | |
| | | | | | | | |
| | | | REITs – Warehouse/Industrials — 1.8% | | | |
| | 104,000 | | | CyrusOne, Inc. | | | 6,804,720 | |
| | | | | | | | |
| | | | Semiconductors & Semiconductor Equipment — 2.4% | | | |
| | 34,050 | | | Analog Devices, Inc. | | | 4,046,502 | |
| | 95,100 | | | Entegris, Inc. | | | 4,763,559 | |
| | | | | | | | |
| | | | | | | 8,810,061 | |
| | | | | | | | |
| | | | Software — 4.0% | | | |
| | 47,550 | | | Check Point Software Technologies Ltd.(a) | | | 5,276,148 | |
| | 12,275 | | | RingCentral, Inc., Class A(a) | | | 2,070,424 | |
| | 400,000 | | | SolarWinds Corp.(a) | | | 7,420,000 | |
| | | | | | | | |
| | | | | | | 14,766,572 | |
| | | | | | | | |
| | | | Thrifts & Mortgage Finance — 2.4% | | | |
| | 55,825 | | | Essent Group Ltd. | | | 2,902,342 | |
| | 207,375 | | | MGIC Investment Corp. | | | 2,938,504 | |
| | 118,725 | | | Radian Group, Inc. | | | 2,987,121 | |
| | | | | | | | |
| | | | | | | 8,827,967 | |
| | | | | | | | |
| | | | Total Common Stocks
(Identified Cost $300,966,313) | | | 368,200,407 | |
| | | | | | | | |
| | | | | | | | |
See accompanying notes to financial statements.
| 48
Portfolio of Investments – as of December 31, 2019
Vaughan Nelson Value Opportunity Fund – (continued)
| | | | | | | | |
Principal
Amount | | | Description | | Value (†) | |
| | Short-Term Investments — 0.8% | |
| $ | 2,968,895 | | | Tri-Party Repurchase Agreement with Fixed Income Clearing Corporation, dated 12/31/2019 at 0.900% to be repurchased at $2,969,044 on 1/02/2020 collateralized by $2,695,000 U.S. Treasury Inflation Indexed Note, 0.125% due 7/15/2022 valued at $3,028,396 including accrued interest (Note 2 of Notes to Financial Statements) (Identified Cost $2,968,895) | | $ | 2,968,895 | |
| | | | | | | | |
| | | | | | | | |
| | | | Total Investments — 99.7%
(Identified Cost $303,935,208) | | | 371,169,302 | |
| | | | Other assets less liabilities — 0.3% | | | 1,163,188 | |
| | | | | | | | |
| | | | Net Assets — 100.0% | | $ | 372,332,490 | |
| | | | | | | | |
| | | | | | | | |
| | (†) | | | See Note 2 of Notes to Financial Statements. | |
| | (a) | | | Non-income producing security. | |
| | | | | | | | |
| | REITs | | | Real Estate Investment Trusts | �� |
Industry Summary at December 31, 2019
| | | | |
IT Services | | | 13.1 | % |
Banks | | | 5.7 | |
Multi-Utilities | | | 5.7 | |
Insurance | | | 5.7 | |
Electric Utilities | | | 4.2 | |
Software | | | 4.0 | |
Oil, Gas & Consumable Fuels | | | 3.8 | |
Independent Power & Renewable Electricity Producers | | | 3.5 | |
Capital Markets | | | 3.5 | |
Media | | | 3.5 | |
Diversified Consumer Services | | | 3.3 | |
Electrical Equipment | | | 3.3 | |
Containers & Packaging | | | 3.3 | |
Life Sciences Tools & Services | | | 3.1 | |
Chemicals | | | 3.1 | |
Health Care Equipment & Supplies | | | 3.0 | |
Machinery | | | 2.4 | |
Thrifts & Mortgage Finance | | | 2.4 | |
Semiconductors & Semiconductor Equipment | | | 2.4 | |
Beverages | | | 2.0 | |
Other Investments, less than 2% each | | | 17.9 | |
Short-Term Investments | | | 0.8 | |
| | | | |
Total Investments | | | 99.7 | |
Other assets less liabilities | | | 0.3 | |
| | | | |
Net Assets | | | 100.0 | % |
| | | | |
See accompanying notes to financial statements.
49 |
This Page Intentionally Left Blank
| 50
Statements of Assets and Liabilities
December 31, 2019
| | | | | | | | | | | | |
| | | Loomis Sayles
Intermediate
Municipal
Bond Fund | | | Natixis
Oakmark
Fund | | | Natixis
Oakmark
International
Fund | |
ASSETS | | | | | | | | | | | | |
Investments at cost | | $ | 17,972,196 | | | $ | 231,754,817 | | | $ | 644,957,372 | |
Net unrealized appreciation (depreciation) | | | 1,171,891 | | | | 51,611,747 | | | | (46,935,950 | ) |
| | | | | | | | | | | | |
Investments at value | | | 19,144,087 | | | | 283,366,564 | | | | 598,021,422 | |
Cash | | | — | | | | — | | | | 57 | |
Foreign currency at value (identified cost $0, $0 and $38,434, respectively) | | | — | | | | — | | | | 38,654 | |
Receivable for Fund shares sold | | | 10,118 | | | | 904,916 | | | | 448,959 | |
Receivable from investment adviser (Note 6) | | | 3,042 | | | | — | | | | — | |
Receivable for securities sold | | | — | | | | — | | | | 484,645 | |
Dividends and interest receivable | | | 244,573 | | | | 108,113 | | | | 18,570 | |
Tax reclaims receivable | | | — | | | | 95,492 | | | | 2,165,510 | |
Prepaid expenses (Note 8) | | | 1 | | | | 14 | | | | 28 | |
| | | | | | | | | | | | |
TOTAL ASSETS | | | 19,401,821 | | | | 284,475,099 | | | | 601,177,845 | |
| | | | | | | | | | | | |
LIABILITIES | | | | | | | | | | | | |
Payable for securities purchased | | | 228,780 | | | | — | | | | 523,624 | |
Payable for Fund shares redeemed | | | 5,791 | | | | 219,801 | | | | 1,915,394 | |
Unrealized depreciation on forward foreign currency contracts (Note 2) | | | — | | | | — | | | | 70,259 | |
Foreign taxes payable (Note 2) | | | — | | | | — | | | | 123,175 | |
Distributions payable | | | 17,361 | | | | — | | | | — | |
Management fees payable (Note 6) | | | — | | | | 165,456 | | | | 393,168 | |
Deferred Trustees’ fees (Note 6) | | | 55,582 | | | | 549,423 | | | | 92,427 | |
Administrative fees payable (Note 6) | | | 704 | | | | 10,599 | | | | 22,259 | |
Payable to distributor (Note 6d) | | | 51 | | | | 1,772 | | | | 8,122 | |
Other accounts payable and accrued expenses | | | 68,548 | | | | 90,333 | | | | 193,247 | |
| | | | | | | | | | | | |
TOTAL LIABILITIES | | | 376,817 | | | | 1,037,384 | | | | 3,341,675 | |
| | | | | | | | | | | | |
NET ASSETS | | $ | 19,025,004 | | | $ | 283,437,715 | | | $ | 597,836,170 | |
| | | | | | | | | | | | |
NET ASSETS CONSIST OF: | |
Paid-in capital | | $ | 18,427,937 | | | $ | 232,632,914 | | | $ | 694,656,195 | |
Accumulated earnings (loss) | | | 597,067 | | | | 50,804,801 | | | | (96,820,025 | ) |
| | | | | | | | | | | | |
NET ASSETS | | $ | 19,025,004 | | | $ | 283,437,715 | | | $ | 597,836,170 | |
| | | | | | | | | | | | |
See accompanying notes to financial statements.
51 |
Statements of Assets and Liabilities (continued)
December 31, 2019
| | | | | | | | | | | | |
| | | Loomis Sayles
Intermediate
Municipal
Bond Fund | | | Natixis
Oakmark
Fund | | | Natixis
Oakmark
International
Fund | |
COMPUTATION OF NET ASSET VALUE AND OFFERING PRICE: | | | | | | | | | | | | |
Class A shares: | | | | | | | | | | | | |
Net assets | | $ | 7,566,512 | | | $ | 181,416,615 | | | $ | 172,906,246 | |
| | | | | | | | | | | | |
Shares of beneficial interest | | | 728,865 | | | | 8,081,453 | | | | 12,689,449 | |
| | | | | | | | | | | | |
Net asset value and redemption price per share | | $ | 10.38 | | | $ | 22.45 | | | $ | 13.63 | |
| | | | | | | | | | | | |
Offering price per share(100/[100-maximum sales charge] of net asset value) (Note 1) | | $ | 10.70 | | | $ | 23.82 | | | $ | 14.46 | |
| | | | | | | | | | | | |
Class C shares:(redemption price per share is equal to net asset value less any applicable contingent deferred sales charge) (Note 1) | | | | | | | | | | | | |
Net assets | | $ | 1,419,637 | | | $ | 54,383,992 | | | $ | 179,533,096 | |
| | | | | | | | | | | | |
Shares of beneficial interest | | | 136,714 | | | | 2,875,089 | | | | 13,387,094 | |
| | | | | | | | | | | | |
Net asset value and offering price per share | | $ | 10.38 | | | $ | 18.92 | | | $ | 13.41 | |
| | | | | | | | | | | | |
Class N shares: | |
Net assets | | $ | — | | | $ | 801,213 | | | $ | 810,891 | |
| | | | | | | | | | | | |
Shares of beneficial interest | | | — | | | | 33,691 | | | | 59,807 | |
| | | | | | | | | | | | |
Net asset value, offering and redemption price per share | | $ | — | | | $ | 23.78 | | | $ | 13.56 | |
| | | | | | | | | | | | |
Class Y shares: | |
Net assets | | $ | 10,038,855 | | | $ | 46,835,895 | | | $ | 244,585,937 | |
| | | | | | | | | | | | |
Shares of beneficial interest | | | 965,623 | | | | 1,972,047 | | | | 18,041,625 | |
| | | | | | | | | | | | |
Net asset value, offering and redemption price per share | | $ | 10.40 | | | $ | 23.75 | | | $ | 13.56 | |
| | | | | | | | | | | | |
See accompanying notes to financial statements.
| 52
Statements of Assets and Liabilities (continued)
December 31, 2019
| | | | | | | | |
| | | Vaughan Nelson
Small Cap
Value Fund | | | Vaughan Nelson
Value
Opportunity
Fund | |
ASSETS | | | | | | | | |
Investments at cost | | $ | 101,178,549 | | | $ | 303,935,208 | |
Net unrealized appreciation | | | 12,888,655 | | | | 67,234,094 | |
| | | | | | | | |
Investments at value | | | 114,067,204 | | | | 371,169,302 | |
Cash | | | 11 | | | | — | |
Receivable for Fund shares sold | | | 25,802 | | | | 1,649,007 | |
Dividends and interest receivable | | | 66,822 | | | | 250,336 | |
Prepaid expenses (Note 8) | | | 5 | | | | 19 | |
| | | | | | | | |
TOTAL ASSETS | | | 114,159,844 | | | | 373,068,664 | |
| | | | | | | | |
LIABILITIES | | | | | | | | |
Payable for securities purchased | | | 251,862 | | | | — | |
Payable for Fund shares redeemed | | | 90,466 | | | | 227,406 | |
Management fees payable (Note 6) | | | 71,875 | | | | 232,564 | |
Deferred Trustees’ fees (Note 6) | | | 181,416 | | | | 154,742 | |
Administrative fees payable (Note 6) | | | 4,070 | | | | 12,951 | |
Payable to distributor (Note 6d) | | | 966 | | | | 4,371 | |
Other accounts payable and accrued expenses | | | 81,233 | | | | 104,140 | |
| | | | | | | | |
TOTAL LIABILITIES | | | 681,888 | | | | 736,174 | |
| | | | | | | | |
NET ASSETS | | $ | 113,477,956 | | | $ | 372,332,490 | |
| | | | | | | | |
NET ASSETS CONSIST OF: | | | | | | | | |
Paid-in capital | | $ | 102,170,961 | | | $ | 301,754,217 | |
Accumulated earnings | | | 11,306,995 | | | | 70,578,273 | |
| | | | | | | | |
NET ASSETS | | $ | 113,477,956 | | | $ | 372,332,490 | |
| | | | | | | | |
See accompanying notes to financial statements.
53 |
Statements of Assets and Liabilities (continued)
December 31, 2019
| | | | | | | | |
| | | Vaughan Nelson
Small Cap
Value Fund | | | Vaughan Nelson
Value
Opportunity
Fund | |
COMPUTATION OF NET ASSET VALUE AND OFFERING PRICE: | | | | | | | | |
Class A shares: | | | | | | | | |
Net assets | | $ | 67,524,857 | | | $ | 33,433,638 | |
| | | | | | | | |
Shares of beneficial interest | | | 4,370,758 | | | | 1,491,385 | |
| | | | | | | | |
Net asset value and redemption price per share | | $ | 15.45 | | | $ | 22.42 | |
| | | | | | | | |
Offering price per share(100/[100-maximum sales charge] of net asset value) (Note 1) | | $ | 16.39 | | | $ | 23.79 | |
| | | | | | | | |
Class C shares:(redemption price per share is equal to net asset value less any applicable contingent deferred sales charge) (Note 1) | | | | | | | | |
Net assets | | $ | 1,449,797 | | | $ | 21,932,439 | |
| | | | | | | | |
Shares of beneficial interest | | | 184,875 | | | | 1,041,586 | |
| | | | | | | | |
Net asset value and offering price per share | | $ | 7.84 | | | $ | 21.06 | |
| | | | | | | | |
Class N shares: | | | | | | | | |
Net assets | | $ | 21,251 | | | $ | 18,261,630 | |
| | | | | | | | |
Shares of beneficial interest | | | 1,312 | | | | 805,860 | |
| | | | | | | | |
Net asset value, offering and redemption price per share | | $ | 16.20 | | | $ | 22.66 | |
| | | | | | | | |
Class Y shares: | | | | | | | | |
Net assets | | $ | 44,482,051 | | | $ | 298,704,783 | |
| | | | | | | | |
Shares of beneficial interest | | | 2,746,942 | | | | 13,162,660 | |
| | | | | | | | |
Net asset value, offering and redemption price per share | | $ | 16.19 | | | $ | 22.69 | |
| | | | | | | | |
See accompanying notes to financial statements.
| 54
Statements of Operations
For the Year Ended December 31, 2019
| | | | | | | | | | | | |
| | | Loomis Sayles
Intermediate
Municipal
Bond Fund | | | Natixis
Oakmark
Fund | | | Natixis
Oakmark
International
Fund | |
INVESTMENT INCOME | | | | | | | | | | | | |
Dividends | | $ | 31,368 | | | $ | 5,473,081 | (a) | | $ | 27,615,008 | (b) |
Non-cash dividends (Note 2b) | | | — | | | | 352,443 | | | | 1,267,333 | |
Interest | | | 579,869 | | | | 187,859 | | | | 134,346 | |
Less net foreign taxes withheld | | | — | | | | (1,493 | ) | | | (2,471,787 | ) |
| | | | | | | | | | | | |
| | | 611,237 | | | | 6,011,890 | | | | 26,544,900 | |
| | | | | | | | | | | | |
Expenses | | | | | | | | | | | | |
Management fees (Note 6) | | | 81,140 | | | | 2,024,486 | | | | 5,285,519 | |
Service and distribution fees (Note 6) | | | 31,762 | | | | 1,014,866 | | | | 2,606,623 | |
Administrative fees (Note 6) | | | 8,937 | | | | 130,418 | | | | 285,779 | |
Trustees’ fees and expenses (Note 6) | | | 21,393 | | | | 77,586 | | | | 43,416 | |
Transfer agent fees and expenses (Notes 6 and 7) | | | 11,085 | | | | 263,379 | | | | 652,725 | |
Audit and tax services fees | | | 52,346 | | | | 40,776 | | | | 42,143 | |
Custodian fees and expenses | | | 5,225 | | | | 12,850 | | | | 180,308 | |
Legal fees (Note 8) | | | 47,606 | | | | 8,496 | | | | 18,087 | |
Registration fees | | | 61,446 | | | | 92,607 | | | | 88,823 | |
Shareholder reporting expenses | | | 12,406 | | | | 27,914 | | | | 59,535 | |
Miscellaneous expenses (Note 8) | | | 21,972 | | | | 32,701 | | | | 80,197 | |
| | | | | | | | | | | | |
Total expenses | | | 355,318 | | | | 3,726,079 | | | | 9,343,155 | |
Less waiver and/or expense reimbursement (Note 6) | | | (232,273 | ) | | | (2,413 | ) | | | (4,513 | ) |
| | | | | | | | | | | | |
Net expenses | | | 123,045 | | | | 3,723,666 | | | | 9,338,642 | |
| | | | | | | | | | | | |
Net investment income | | | 488,192 | | | | 2,288,224 | | | | 17,206,258 | |
| | | | | | | | | | | | |
NET REALIZED AND UNREALIZED GAIN (LOSS) ON INVESTMENTS, FORWARD FOREIGN CURRENCY CONTRACTS AND FOREIGN CURRENCY TRANSACTIONS | | | | | | | | | | | | |
Net realized gain (loss) on: | | | | | | | | | | | | |
Investments | | | 156,434 | | | | 14,578,257 | | | | (16,726,400 | ) |
Forward foreign currency contracts (Note 2d) | | | — | | | | — | | | | 826,022 | |
Foreign currency transactions (Note 2c) | | | — | | | | — | | | | 42,014 | |
Net change in unrealized appreciation (depreciation) on: | | | | | | | | | | | | |
Investments | | | 682,883 | | | | 50,910,323 | | | | 137,040,346 | |
Forward foreign currency contracts (Note 2d) | | | — | | | | — | | | | (561,459 | ) |
Foreign currency translations (Note 2c) | | | — | | | | — | | | | (31,191 | ) |
| | | | | | | | | | | | |
Net realized and unrealized gain on investments, forward foreign currency contracts and foreign currency transactions | | | 839,317 | | | | 65,488,580 | | | | 120,589,332 | |
| | | | | | | | | | | | |
NET INCREASE IN NET ASSETS RESULTING FROM OPERATIONS | | $ | 1,327,509 | | | $ | 67,776,804 | | | $ | 137,795,590 | |
| | | | | | | | | | | | |
| (a) | Includes anon-recurring dividend of $712,261. |
| (b) | Includes anon-recurring dividend of $4,169,677. |
See accompanying notes to financial statements.
55 |
Statements of Operations (continued)
For the Year Ended December 31, 2019
| | | | | | | | |
| | | Vaughan Nelson
Small Cap
Value Fund | | | Vaughan Nelson
Value
Opportunity
Fund | |
INVESTMENT INCOME | |
Dividends | | $ | 1,848,929 | | | $ | 5,925,174 | |
Interest | | | 62,839 | | | | 212,893 | |
Less net foreign taxes withheld | | | — | | | | (9,495 | ) |
| | | | | | | | |
| | | 1,911,768 | | | | 6,128,572 | |
| | | | | | | | |
Expenses | |
Management fees (Note 6) | | | 1,138,555 | | | | 3,346,992 | |
Service and distribution fees (Note 6) | | | 199,126 | | | | 309,564 | |
Administrative fees (Note 6) | | | 55,743 | | | | 184,437 | |
Trustees’ fees and expenses (Note 6) | | | 35,178 | | | | 43,200 | |
Transfer agent fees and expenses (Notes 6 and 7) | | | 144,102 | | | | 362,614 | |
Audit and tax services fees | | | 40,784 | | | | 41,738 | |
Custodian fees and expenses | | | 15,446 | | | | 22,931 | |
Interest expense (Note 9) | | | — | | | | 48,098 | |
Legal fees (Note 8) | | | 3,319 | | | | 12,090 | |
Registration fees | | | 75,231 | | | | 92,902 | |
Shareholder reporting expenses | | | 14,421 | | | | 32,933 | |
Miscellaneous expenses (Note 8) | | | 27,801 | | | | 30,282 | |
| | | | | | | | |
Total expenses | | | 1,749,706 | | | | 4,527,781 | |
Less waiver and/or expense reimbursement (Note 6) | | | (95,991 | ) | | | (96,662 | ) |
| | | | | | | | |
Net expenses | | | 1,653,715 | | | | 4,431,119 | |
| | | | | | | | |
Net investment income | | | 258,053 | | | | 1,697,453 | |
| | | | | | | | |
NET REALIZED AND UNREALIZED GAIN ON INVESTMENTS | |
Net realized gain on: | |
Investments | | | 3,647,835 | | | | 26,643,511 | |
Net change in unrealized appreciation (depreciation) on: | |
Investments | | | 24,895,047 | | | | 96,669,546 | |
| | | | | | | | |
Net realized and unrealized gain on investments | | | 28,542,882 | | | | 123,313,057 | |
| | | | | | | | |
NET INCREASE IN NET ASSETS RESULTING FROM OPERATIONS | | $ | 28,800,935 | | | $ | 125,010,510 | |
| | | | | | | | |
See accompanying notes to financial statements.
| 56
Statements of Changes in Net Assets
| | | | | | | | |
| | | Loomis Sayles Intermediate
Municipal Bond Fund | |
| | | Year Ended
December 31,
2019 | | | Year Ended
December 31,
2018 | |
FROM OPERATIONS: | | | | | | | | |
Net investment income | | $ | 488,192 | | | $ | 646,589 | |
Net realized gain (loss) on investments | | | 156,434 | | | | (22,955 | ) |
Net change in unrealized appreciation (depreciation) on investments | | | 682,883 | | | | (735,309 | ) |
| | | | | | | | |
Net increase (decrease) in net assets resulting from operations | | | 1,327,509 | | | | (111,675 | ) |
| | | | | | | | |
FROM DISTRIBUTIONS TO SHAREHOLDERS: | | | | | | | | |
Class A | | | (157,363 | ) | | | (153,865 | ) |
Class C | | | (23,074 | ) | | | (30,521 | ) |
Class Y | | | (307,772 | ) | | | (484,050 | ) |
| | | | | | | | |
Total distributions | | | (488,209 | ) | | | (668,436 | ) |
| | | | | | | | |
NET DECREASE IN NET ASSETS FROM CAPITAL SHARE TRANSACTIONS (NOTE 12) | | | (4,018,800 | ) | | | (14,374,067 | ) |
| | | | | | | | |
Net decrease in net assets | | | (3,179,500 | ) | | | (15,154,178 | ) |
NET ASSETS | | | | | | | | |
Beginning of the year | | | 22,204,504 | | | | 37,358,682 | |
| | | | | | | | |
End of the year | | $ | 19,025,004 | | | $ | 22,204,504 | |
| | | | | | | | |
See accompanying notes to financial statements.
57 |
Statements of Changes in Net Assets (continued)
| | | | | | | | |
| | |
Natixis Oakmark Fund | |
| | | Year Ended
December 31,
2019 | | | Year Ended
December 31,
2018 | |
FROM OPERATIONS: | | | | | | | | |
Net investment income | | $ | 2,288,224 | | | $ | 1,069,674 | |
Net realized gain on investments | | | 14,578,257 | | | | 32,340,899 | |
Net change in unrealized appreciation (depreciation) on investments | | | 50,910,323 | | | | (79,134,938 | ) |
| | | | | | | | |
Net increase (decrease) in net assets resulting from operations | | | 67,776,804 | | | | (45,724,365 | ) |
| | | | | | | | |
FROM DISTRIBUTIONS TO SHAREHOLDERS: | | | | | | | | |
Class A | | | (16,820,039 | ) | | | (16,729,106 | ) |
Class C | | | (5,798,979 | ) | | | (5,776,265 | ) |
Class N | | | (37,043 | ) | | | (783 | ) |
Class Y | | | (5,261,958 | ) | | | (5,137,882 | ) |
| | | | | | | | |
Total distributions | | | (27,918,019 | ) | | | (27,644,036 | ) |
| | | | | | | | |
NET INCREASE (DECREASE) IN NET ASSETS FROM CAPITAL SHARE TRANSACTIONS (NOTE 12) | | | (28,613,857 | ) | | | 29,541,538 | |
| | | | | | | | |
Net increase (decrease) in net assets | | | 11,244,928 | | | | (43,826,863 | ) |
NET ASSETS | | | | | | | | |
Beginning of the year | | | 272,192,787 | | | | 316,019,650 | |
| | | | | | | | |
End of the year | | $ | 283,437,715 | | | $ | 272,192,787 | |
| | | | | | | | |
See accompanying notes to financial statements.
| 58
Statements of Changes in Net Assets (continued)
| | | | | | | | |
| | | Natixis Oakmark
International Fund | |
| | | Year Ended
December 31,
2019 | | | Year Ended
December 31,
2018 | |
FROM OPERATIONS: | |
Net investment income | | $ | 17,206,258 | | | $ | 16,259,770 | |
Net realized gain (loss) on investments, forward foreign currency contracts and foreign currency transactions | | | (15,858,364 | ) | | | 50,075,433 | |
Net change in unrealized appreciation (depreciation) on investments, forward foreign currency contracts and foreign currency translations | | | 136,447,696 | | | | (341,618,930 | ) |
| | | | | | | | |
Net increase (decrease) in net assets resulting from operations | | | 137,795,590 | | | | (275,283,727 | ) |
| | | | | | | | |
FROM DISTRIBUTIONS TO SHAREHOLDERS: | | | | | | | | |
Class A | | | (5,093,122 | ) | | | (12,193,845 | ) |
Class C | | | (4,034,677 | ) | | | (7,685,820 | ) |
Class N | | | (27,558 | ) | | | (36,370 | ) |
Class Y | | | (8,066,849 | ) | | | (10,861,877 | ) |
| | | | | | | | |
Total distributions | | | (17,222,206 | ) | | | (30,777,912 | ) |
| | | | | | | | |
NET DECREASE IN NET ASSETS FROM CAPITAL SHARE TRANSACTIONS (NOTE 12) | | | (208,787,046 | ) | | | (147,874,002 | ) |
| | | | | | | | |
Net decrease in net assets | | | (88,213,662 | ) | | | (453,935,641 | ) |
NET ASSETS | | | | | | | | |
Beginning of the year | | | 686,049,832 | | | | 1,139,985,473 | |
| | | | | | | | |
End of the year | | $ | 597,836,170 | | | $ | 686,049,832 | |
| | | | | | | | |
See accompanying notes to financial statements.
59 |
Statements of Changes in Net Assets (continued)
| | | | | | | | |
| | | Vaughan Nelson
Small Cap Value Fund | |
| | | Year Ended
December 31,
2019 | | | Year Ended
December 31,
2018 | |
FROM OPERATIONS: | |
Net investment income | | $ | 258,053 | | | $ | 247,839 | |
Net realized gain on investments | | | 3,647,835 | | | | 23,578,542 | |
Net change in unrealized appreciation (depreciation) on investments | | | 24,895,047 | | | | (48,703,398 | ) |
| | | | | | | | |
Net increase (decrease) in net assets resulting from operations | | | 28,800,935 | | | | (24,877,017 | ) |
| | | | | | | | |
FROM DISTRIBUTIONS TO SHAREHOLDERS: | |
Class A | | | (475,801 | ) | | | (15,434,632 | ) |
Class C | | | (18,939 | ) | | | (1,814,602 | ) |
Class N | | | (194 | ) | | | (200 | ) |
Class Y | | | (411,969 | ) | | | (16,863,125 | ) |
| | | | | | | | |
Total distributions | | | (906,903 | ) | | | (34,112,559 | ) |
| | | | | | | | |
NET DECREASE IN NET ASSETS FROM CAPITAL SHARE TRANSACTIONS (NOTE 12) | | | (42,810,460 | ) | | | (99,064,102 | ) |
| | | | | | | | |
Net decrease in net assets | | | (14,916,428 | ) | | | (158,053,678 | ) |
NET ASSETS | |
Beginning of the year | | | 128,394,384 | | | | 286,448,062 | |
| | | | | | | | |
End of the year | | $ | 113,477,956 | | | $ | 128,394,384 | |
| | | | | | | | |
See accompanying notes to financial statements.
| 60
Statements of Changes in Net Assets (continued)
| | | | | | | | |
| | | Vaughan Nelson
Value Opportunity Fund | |
| | | Year Ended
December 31,
2019 | | | Year Ended
December 31,
2018 | |
FROM OPERATIONS: | |
Net investment income | | $ | 1,697,453 | | | $ | 5,677,254 | |
Net realized gain on investments | | | 26,643,511 | | | | 30,646,121 | |
Net change in unrealized appreciation (depreciation) on investments | | | 96,669,546 | | | | (163,168,095 | ) |
| | | | | | | | |
Net increase (decrease) in net assets resulting from operations | | | 125,010,510 | | | | (126,844,720 | ) |
| | | | | | | | |
FROM DISTRIBUTIONS TO SHAREHOLDERS: | |
Class A | | | (293,257 | ) | | | (4,208,463 | ) |
Class C | | | (183,363 | ) | | | (2,370,741 | ) |
Class N | | | (212,174 | ) | | | (6,683,144 | ) |
Class Y | | | (3,167,841 | ) | | | (47,408,833 | ) |
| | | | | | | | |
Total distributions | | | (3,856,635 | ) | | | (60,671,181 | ) |
| | | | | | | | |
NET DECREASE IN NET ASSETS FROM CAPITAL SHARE TRANSACTIONS (NOTE 12) | | | (340,544,321 | ) | | | (244,014,953 | ) |
| | | | | | | | |
Net decrease in net assets | | | (219,390,446 | ) | | | (431,530,854 | ) |
NET ASSETS | |
Beginning of the year | | | 591,722,936 | | | | 1,023,253,790 | |
| | | | | | | | |
End of the year | | $ | 372,332,490 | | | $ | 591,722,936 | |
| | | | | | | | |
See accompanying notes to financial statements.
61 |
Financial Highlights
For a share outstanding throughout each period.
| | | | | | | | | | | | | | | | | | | | |
| | |
Loomis Sayles Intermediate Municipal Bond Fund—Class A | |
| | | Year Ended
December 31,
2019 | | | Year Ended
December 31,
2018 | | | Year Ended
December 31,
2017 | | | Year Ended
December 31,
2016 | | | Year Ended
December 31,
2015 | |
Net asset value, beginning of the period | | $ | 9.97 | | | $ | 10.17 | | | $ | 9.89 | | | $ | 10.09 | | | $ | 10.00 | |
| | | | | | | | | | | | | | | | | | | | |
INCOME (LOSS) FROM INVESTMENT OPERATIONS: | | | | | | | | | | | | | | | | | | | | |
Net investment income(a) | | | 0.24 | | | | 0.22 | | | | 0.19 | | | | 0.12 | | | | 0.13 | |
Net realized and unrealized gain (loss) | | | 0.41 | | | | (0.19 | ) | | | 0.28 | | | | (0.20 | ) | | | 0.10 | |
| | | | | | | | | | | | | | | | | | | | |
Total from Investment Operations | | | 0.65 | | | | 0.03 | | | | 0.47 | | | | (0.08 | ) | | | 0.23 | |
| | | | | | | | | | | | | | | | | | | | |
LESS DISTRIBUTIONS FROM: | | | | | | | | | | | | | | | | | | | | |
Net investment income | | | (0.24 | ) | | | (0.23 | ) | | | (0.19 | ) | | | (0.12 | ) | | | (0.14 | ) |
| | | | | | | | | | | | | | | | | | | | |
Net asset value, end of the period | | $ | 10.38 | | | $ | 9.97 | | | $ | 10.17 | | | $ | 9.89 | | | $ | 10.09 | |
| | | | | | | | | | | | | | | | | | | | |
Total return(b)(c) | | | 6.54 | % | | | 0.33 | % | | | 4.77 | % | | | (0.79 | )% | | | 2.28 | % |
RATIOS TO AVERAGE NET ASSETS: | | | | | | | | | | | | | | | | | | | | |
Net assets, end of the period (000’s) | | $ | 7,567 | | | $ | 6,019 | | | $ | 6,004 | | | $ | 5,474 | | | $ | 6,427 | |
Net expenses(d) | | | 0.70 | % | | | 0.70 | % | | | 0.70 | % | | | 0.70 | % | | | 0.74 | %(e) |
Gross expenses | | | 1.84 | % | | | 1.30 | % | | | 1.10 | % | | | 0.88 | % | | | 1.12 | % |
Net investment income | | | 2.31 | % | | | 2.24 | % | | | 1.87 | % | | | 1.19 | % | | | 1.27 | % |
Portfolio turnover rate | | | 11 | % | | | 65 | % | | | 34 | % | | | 48 | % | | | 20 | % |
| (a) | Per share net investment income has been calculated using the average shares outstanding during the period. |
| (b) | Had certain expenses not been waived/reimbursed during the period, total returns would have been lower. |
| (c) | A sales charge for Class A shares is not reflected in total return calculations. |
| (d) | The investment adviser agreed to waive its fees and/or reimburse a portion of the Fund’s expenses during the period. Without this waiver/reimbursement, expenses would have been higher. |
| (e) | Effective July 1, 2015, the expense limit decreased from 0.80% to 0.70%. |
See accompanying notes to financial statements.
| 62
Financial Highlights (continued)
For a share outstanding throughout each period.
| | | | | | | | | | | | | | | | | | | | |
| | |
Loomis Sayles Intermediate Municipal Bond Fund—Class C | |
| | | Year Ended
December 31,
2019 | | | Year Ended
December 31,
2018 | | | Year Ended
December 31,
2017 | | | Year Ended
December 31,
2016 | | | Year Ended
December 31,
2015 | |
Net asset value, beginning of the period | | $ | 9.98 | | | $ | 10.18 | | | $ | 9.90 | | | $ | 10.09 | | | $ | 9.99 | |
| | | | | | | | | | | | | | | | | | | | |
INCOME (LOSS) FROM INVESTMENT OPERATIONS: | | | | | | | | | | | | | | | | | | | | |
Net investment income(a) | | | 0.16 | | | | 0.15 | | | | 0.11 | | | | 0.04 | | | | 0.05 | |
Net realized and unrealized gain (loss) | | | 0.40 | | | | (0.19 | ) | | | 0.28 | | | | (0.18 | ) | | | 0.11 | |
| | | | | | | | | | | | | | | | | | | | |
Total from Investment Operations | | | 0.56 | | | | (0.04 | ) | | | 0.39 | | | | (0.14 | ) | | | 0.16 | |
| | | | | | | | | | | | | | | | | | | | |
LESS DISTRIBUTIONS FROM: | | | | | | | | | | | | | | | | | | | | |
Net investment income | | | (0.16 | ) | | | (0.16 | ) | | | (0.11 | ) | | | (0.05 | ) | | | (0.06 | ) |
| | | | | | | | | | | | | | | | | | | | |
Net asset value, end of the period | | $ | 10.38 | | | $ | 9.98 | | | $ | 10.18 | | | $ | 9.90 | | | $ | 10.09 | |
| | | | | | | | | | | | | | | | | | | | |
Total return(b)(c) | | | 5.64 | % | | | (0.42 | )% | | | 3.98 | % | | | (1.44 | )% | | | 1.63 | % |
RATIOS TO AVERAGE NET ASSETS: | | | | | | | | | | | | | | | | | | | | |
Net assets, end of the period (000’s) | | $ | 1,420 | | | $ | 1,675 | | | $ | 2,395 | | | $ | 4,015 | | | $ | 6,355 | |
Net expenses(d) | | | 1.45 | % | | | 1.45 | % | | | 1.45 | % | | | 1.45 | % | | | 1.49 | %(e) |
Gross expenses | | | 2.60 | % | | | 2.05 | % | | | 1.83 | % | | | 1.63 | % | | | 1.88 | % |
Net investment income | | | 1.57 | % | | | 1.49 | % | | | 1.10 | % | | | 0.44 | % | | | 0.52 | % |
Portfolio turnover rate | | | 11 | % | | | 65 | % | | | 34 | % | | | 48 | % | | | 20 | % |
| (a) | Per share net investment income has been calculated using the average shares outstanding during the period. |
| (b) | Had certain expenses not been waived/reimbursed during the period, total returns would have been lower. |
| (c) | A contingent deferred sales charge for Class C shares is not reflected in total return calculations. |
| (d) | The investment adviser agreed to waive its fees and/or reimburse a portion of the Fund’s expenses during the period. Without this waiver/reimbursement, expenses would have been higher. |
| (e) | Effective July 1, 2015, the expense limit decreased from 1.55% to 1.45%. |
See accompanying notes to financial statements.
63 |
Financial Highlights (continued)
For a share outstanding throughout each period.
| | | | | | | | | | | | | | | | | | | | |
| | |
Loomis Sayles Intermediate Municipal Bond Fund—Class Y | |
| | | Year Ended
December 31,
2019 | | | Year Ended
December 31,
2018 | | | Year Ended
December 31,
2017 | | | Year Ended
December 31,
2016 | | | Year Ended
December 31,
2015 | |
Net asset value, beginning of the period | | $ | 9.99 | | | $ | 10.19 | | | $ | 9.90 | | | $ | 10.10 | | | $ | 10.00 | |
| | | | | | | | | | | | | | | | | | | | |
INCOME (LOSS) FROM INVESTMENT OPERATIONS: | | | | | | | | | | | | | | | | | | | | |
Net investment income(a) | | | 0.26 | | | | 0.25 | | | | 0.21 | | | | 0.15 | | | | 0.15 | |
Net realized and unrealized gain (loss) | | | 0.41 | | | | (0.20 | ) | | | 0.29 | | | | (0.20 | ) | | | 0.11 | |
| | | | | | | | | | | | | | | | | | | | |
Total from Investment Operations | | | 0.67 | | | | 0.05 | | | | 0.50 | | | | (0.05 | ) | | | 0.26 | |
| | | | | | | | | | | | | | | | | | | | |
LESS DISTRIBUTIONS FROM: | | | | | | | | | | | | | | | | | | | | |
Net investment income | | | (0.26 | ) | | | (0.25 | ) | | | (0.21 | ) | | | (0.15 | ) | | | (0.16 | ) |
| | | | | | | | | | | | | | | | | | | | |
Net asset value, end of the period | | $ | 10.40 | | | $ | 9.99 | | | $ | 10.19 | | | $ | 9.90 | | | $ | 10.10 | |
| | | | | | | | | | | | | | | | | | | | |
Total return(b) | | | 6.80 | % | | | 0.58 | % | | | 5.13 | % | | | (0.55 | )% | | | 2.63 | % |
RATIOS TO AVERAGE NET ASSETS: | | | | | | | | | | | | | | | | | | | | |
Net assets, end of the period (000’s) | | $ | 10,039 | | | $ | 14,510 | | | $ | 28,960 | | | $ | 49,179 | | | $ | 66,713 | |
Net expenses(c) | | | 0.45 | % | | | 0.45 | % | | | 0.45 | % | | | 0.45 | % | | | 0.49 | %(d) |
Gross expenses | | | 1.60 | % | | | 1.04 | % | | | 0.83 | % | | | 0.63 | % | | | 0.85 | % |
Net investment income | | | 2.57 | % | | | 2.47 | % | | | 2.09 | % | | | 1.44 | % | | | 1.48 | % |
Portfolio turnover rate | | | 11 | % | | | 65 | % | | | 34 | % | | | 48 | % | | | 20 | % |
| (a) | Per share net investment income has been calculated using the average shares outstanding during the period. |
| (b) | Had certain expenses not been waived/reimbursed during the period, total returns would have been lower. |
| (c) | The investment adviser agreed to waive its fees and/or reimburse a portion of the Fund’s expenses during the period. Without this waiver/reimbursement, expenses would have been higher. |
| (d) | Effective July 1, 2015, the expense limit decreased from 0.55% to 0.45%. |
See accompanying notes to financial statements.
| 64
Financial Highlights (continued)
For a share outstanding throughout each period.
| | | | | | | | | | | | | | | | | | | | |
| | |
Natixis Oakmark Fund—Class A | |
| | | Year Ended
December 31,
2019 | | | Year Ended
December 31,
2018 | | | Year Ended
December 31,
2017 | | | Year Ended
December 31,
2016 | | | Year Ended
December 31,
2015 | |
Net asset value, beginning of the period | | $ | 19.44 | | | $ | 24.72 | | | $ | 21.37 | | | $ | 18.79 | | | $ | 20.43 | |
| | | | | | | | | | | | | | | | | | | | |
INCOME (LOSS) FROM INVESTMENT OPERATIONS: | | | | | | | | | | | | | | | | | | | | |
Net investment income(a) | | | 0.18 | (b) | | | 0.10 | | | | 0.11 | | | | 0.16 | | | | 0.14 | |
Net realized and unrealized gain (loss) | | | 4.93 | | | | (3.28 | ) | | | 4.28 | | | | 3.20 | | | | (1.02 | ) |
| | | | | | | | | | | | | | | | | | | | |
Total from Investment Operations | | | 5.11 | | | | (3.18 | ) | | | 4.39 | | | | 3.36 | | | | (0.88 | ) |
| | | | | | | | | | | | | | | | | | | | |
LESS DISTRIBUTIONS FROM: | | | | | | | | | | | | | | | | | | | | |
Net investment income | | | (0.21 | ) | | | (0.08 | ) | | | (0.10 | ) | | | (0.16 | ) | | | (0.13 | ) |
Net realized capital gains | | | (1.89 | ) | | | (2.02 | ) | | | (0.94 | ) | | | (0.62 | ) | | | (0.63 | ) |
| | | | | | | | | | | | | | | | | | | | |
Total Distributions | | | (2.10 | ) | | | (2.10 | ) | | | (1.04 | ) | | | (0.78 | ) | | | (0.76 | ) |
| | | | | | | | | | | | | | | | | | | | |
Net asset value, end of the period | | $ | 22.45 | | | $ | 19.44 | | | $ | 24.72 | | | $ | 21.37 | | | $ | 18.79 | |
| | | | | | | | | | | | | | | | | | | | |
Total return(c) | | | 26.77 | %(b) | | | (13.01 | )% | | | 20.75 | % | | | 18.37 | % | | | (4.41 | )% |
RATIOS TO AVERAGE NET ASSETS: | | | | | | | | | | | | | | | | | | | | |
Net assets, end of the period (000’s) | | $ | 181,417 | | | $ | 164,748 | | | $ | 203,792 | | | $ | 173,036 | | | $ | 173,925 | |
Net expenses | | | 1.17 | % | | | 1.13 | % | | | 1.18 | % | | | 1.18 | % | | | 1.14 | % |
Gross expenses | | | 1.17 | % | | | 1.13 | % | | | 1.18 | % | | | 1.18 | % | | | 1.14 | % |
Net investment income | | | 0.85 | %(b) | | | 0.41 | % | | | 0.48 | % | | | 0.82 | % | | | 0.68 | % |
Portfolio turnover rate | | | 15 | % | | | 39 | % | | | 16 | % | | | 16 | % | | | 23 | % |
| (a) | Per share net investment income has been calculated using the average shares outstanding during the period. |
| (b) | Includes anon-recurring dividend. Without this dividend, net investment income per share would have been $0.13, total return would have been 26.50% and the ratio of net investment income to average net assets would have been 0.62%. |
| (c) | A sales charge for Class A shares is not reflected in total return calculations. |
See accompanying notes to financial statements.
65 |
Financial Highlights (continued)
For a share outstanding throughout each period.
| | | | | | | | | | | | | | | | | | | | |
| | |
Natixis Oakmark Fund—Class C | |
| | | Year Ended
December 31,
2019 | | | Year Ended
December 31,
2018 | | | Year Ended
December 31,
2017 | | | Year Ended
December 31,
2016 | | | Year Ended
December 31,
2015 | |
Net asset value, beginning of the period | | $ | 16.66 | | | $ | 21.58 | | | $ | 18.83 | | | $ | 16.65 | | | $ | 18.19 | |
| | | | | | | | | | | | | | | | | | | | |
INCOME (LOSS) FROM INVESTMENT OPERATIONS: | | | | | | | | | | | | | | | | | | | | |
Net investment income (loss)(a) | | | 0.02 | (b) | | | (0.07 | ) | | | (0.05 | ) | | | 0.01 | | | | (0.01 | ) |
Net realized and unrealized gain (loss) | | | 4.20 | | | | (2.83 | ) | | | 3.74 | | | | 2.80 | | | | (0.90 | ) |
| | | | | | | | | | | | | | | | | | | | |
Total from Investment Operations | | | 4.22 | | | | (2.90 | ) | | | 3.69 | | | | 2.81 | | | | (0.91 | ) |
| | | | | | | | | | | | | | | | | | | | |
LESS DISTRIBUTIONS FROM: | | | | | | | | | | | | | | | | | | | | |
Net investment income | | | (0.07 | ) | | | — | | | | (0.00 | )(c) | | | (0.01 | ) | | | (0.00 | )(c) |
Net realized capital gains | | | (1.89 | ) | | | (2.02 | ) | | | (0.94 | ) | | | (0.62 | ) | | | (0.63 | ) |
| | | | | | | | | | | | | | | | | | | | |
Total Distributions | | | (1.96 | ) | | | (2.02 | ) | | | (0.94 | ) | | | (0.63 | ) | | | (0.63 | ) |
| | | | | | | | | | | | | | | | | | | | |
Net asset value, end of the period | | $ | 18.92 | | | $ | 16.66 | | | $ | 21.58 | | | $ | 18.83 | | | $ | 16.65 | |
| | | �� | | | | | | | | | | | | | | | | | |
Total return(d) | | | 25.82 | %(b) | | | (13.63 | )% | | | 19.85 | % | | | 17.45 | % | | | (5.07 | )% |
RATIOS TO AVERAGE NET ASSETS: | | | | | | | | | | | | | | | | | | | | |
Net assets, end of the period (000’s) | | $ | 54,384 | | | $ | 53,606 | | | $ | 62,272 | | | $ | 55,910 | | | $ | 70,616 | |
Net expenses | | | 1.92 | % | | | 1.88 | % | | | 1.93 | % | | | 1.93 | % | | | 1.89 | % |
Gross expenses | | | 1.92 | % | | | 1.88 | % | | | 1.93 | % | | | 1.93 | % | | | 1.89 | % |
Net investment income (loss) | | | 0.12 | %(b) | | | (0.33 | )% | | | (0.27 | )% | | | 0.09 | % | | | (0.07 | )% |
Portfolio turnover rate | | | 15 | % | | | 39 | % | | | 16 | % | | | 16 | % | | | 23 | % |
| (a) | Per share net investment income (loss) has been calculated using the average shares outstanding during the period. |
| (b) | Includes anon-recurring dividend. Without this dividend, net investment loss per share would have been $(0.02), total return would have been 25.50% and the ratio of net investment loss to average net assets would have been (0.12)% |
| (c) | Amount rounds to less than $0.01 per share. |
| (d) | A contingent deferred sales charge for Class C shares is not reflected in total return calculations. |
See accompanying notes to financial statements.
| 66
Financial Highlights (continued)
For a share outstanding throughout each period.
| | | | | | | | | | | | |
| | |
Natixis Oakmark Fund—Class N | |
| | | Year Ended
December 31,
2019 | | | Year Ended
December 31,
2018 | | | Period Ended
December 31,
2017* | |
Net asset value, beginning of the period | | $ | 20.49 | | | $ | 25.91 | | | $ | 23.13 | |
| | | | | | | | | | | | |
INCOME (LOSS) FROM INVESTMENT OPERATIONS: | | | | | | | | | | | | |
Net investment income(a) | | | 0.22 | (b) | | | 0.22 | | | | 0.14 | |
Net realized and unrealized gain (loss) | | | 5.25 | | | | (3.45 | ) | | | 3.44 | |
| | | | | | | | | | | | |
Total from Investment Operations | | | 5.47 | | | | (3.23 | ) | | | 3.58 | |
| | | | | | | | | | | | |
LESS DISTRIBUTIONS FROM: | | | | | | | | | | | | |
Net investment income | | | (0.29 | ) | | | (0.17 | ) | | | (0.17 | ) |
Net realized capital gains | | | (1.89 | ) | | | (2.02 | ) | | | (0.63 | ) |
| | | | | | | | | | | | |
Total Distributions | | | (2.18 | ) | | | (2.19 | ) | | | (0.80 | ) |
| | | | | | | | | | | | |
Net asset value, end of the period | | $ | 23.78 | | | $ | 20.49 | | | $ | 25.91 | |
| | | | | | | | | | | | |
Total return(c) | | | 27.16 | %(b) | | | (12.60 | )% | | | 15.46 | %(d) |
RATIOS TO AVERAGE NET ASSETS: | | | | | | | | | | | | |
Net assets, end of the period (000’s) | | $ | 801 | | | $ | 10 | | | $ | 1 | |
Net expenses(e) | | | 0.83 | % | | | 0.75 | % | | | 0.75 | %(f) |
Gross expenses | | | 1.25 | % | | | 3.79 | % | | | 13.79 | %(f) |
Net investment income | | | 0.93 | %(b) | | | 0.88 | % | | | 0.84 | %(f) |
Portfolio turnover rate | | | 15 | % | | | 39 | % | | | 16 | %(g) |
| * | From commencement of Class operations on May 1, 2017 through December 31, 2017. |
| (a) | Per share net investment income has been calculated using the average shares outstanding during the period. |
| (b) | Includes anon-recurring dividend. Without this dividend, net investment income per share would have been $0.22, total return would have been 26.90% and the ratio of net investment income to average net assets would have been 0.92%. |
| (c) | Had certain expenses not been waived/reimbursed during the period, total returns would have been lower. |
| (d) | Periods less than one year are not annualized. |
| (e) | The investment adviser agreed to waive its fees and/or reimburse a portion of the Fund’s expenses during the period. Without this waiver/reimbursement, expenses would have been higher. |
| (f) | Computed on an annualized basis for periods less than one year. |
| (g) | Represents the Fund’s portfolio turnover rate for the year ended December 31, 2017. |
See accompanying notes to financial statements.
67 |
Financial Highlights (continued)
For a share outstanding throughout each period.
| | | | | | | | | | | | | | | | | | | | |
| | |
Natixis Oakmark Fund—Class Y | |
| | | Year Ended
December 31,
2019 | | | Year Ended
December 31,
2018 | | | Year Ended
December 31,
2017 | | | Year Ended
December 31,
2016 | | | Year Ended
December 31,
2015 | |
Net asset value, beginning of the period | | $ | 20.46 | | | $ | 25.90 | | | $ | 22.34 | | | $ | 19.60 | | | $ | 21.28 | |
| | | | | | | | | | | | | | | | | | | | |
INCOME (LOSS) FROM INVESTMENT OPERATIONS: | | | | | | | | | | | | | | | | | | | | |
Net investment income(a) | | | 0.27 | (b) | | | 0.17 | | | | 0.17 | | | | 0.21 | | | | 0.19 | |
Net realized and unrealized gain (loss) | | | 5.17 | | | | (3.44 | ) | | | 4.48 | | | | 3.36 | | | | (1.06 | ) |
| | | | | | | | | | | | | | | | | | | | |
Total from Investment Operations | | | 5.44 | | | | (3.27 | ) | | | 4.65 | | | | 3.57 | | | | (0.87 | ) |
| | | | | | | | | | | | | | | | | | | | |
LESS DISTRIBUTIONS FROM: | | | | | | | | | | | | | | | | | | | | |
Net investment income | | | (0.26 | ) | | | (0.15 | ) | | | (0.15 | ) | | | (0.21 | ) | | | (0.18 | ) |
Net realized capital gains | | | (1.89 | ) | | | (2.02 | ) | | | (0.94 | ) | | | (0.62 | ) | | | (0.63 | ) |
| | | | | | | | | | | | | | | | | | | | |
Total Distributions | | | (2.15 | ) | | | (2.17 | ) | | | (1.09 | ) | | | (0.83 | ) | | | (0.81 | ) |
| | | | | | | | | | | | | | | | | | | | |
Net asset value, end of the period | | $ | 23.75 | | | $ | 20.46 | | | $ | 25.90 | | | $ | 22.34 | | | $ | 19.60 | |
| | | | | | | | | | | | | | | | | | | | |
Total return | | | 27.06 | %(b)(c) | | | (12.76 | )% | | | 21.05 | % | | | 18.69 | % | | | (4.18 | )% |
RATIOS TO AVERAGE NET ASSETS: | | | | | | | | | | | | | | | | | | | | |
Net assets, end of the period (000’s) | | $ | 46,836 | | | $ | 53,829 | | | $ | 49,955 | | | $ | 26,252 | | | $ | 21,696 | |
Net expenses | | | 0.91 | %(d) | | | 0.88 | % | | | 0.93 | % | | | 0.92 | % | | | 0.89 | % |
Gross expenses | | | 0.92 | % | | | 0.88 | % | | | 0.93 | % | | | 0.92 | % | | | 0.89 | % |
Net investment income | | | 1.16 | %(b) | | | 0.68 | % | | | 0.71 | % | | | 1.05 | % | | | 0.92 | % |
Portfolio turnover rate | | | 15 | % | | | 39 | % | | | 16 | % | | | 16 | % | | | 23 | % |
| (a) | Per share net investment income has been calculated using the average shares outstanding during the period. |
| (b) | Includes anon-recurring dividend. Without this dividend, net investment income per share would have been $0.20, total return would have been 26.80% and the ratio of net investment income to average net assets would have been 0.90%. |
| (c) | Had certain expenses not been waived/reimbursed during the period, total returns would have been lower. |
| (d) | The administrator agreed to waive its fees and/or reimburse a portion of the Fund’s expenses during the period. Without this waiver/reimbursement, expenses would have been higher. |
See accompanying notes to financial statements.
| 68
Financial Highlights (continued)
For a share outstanding throughout each period.
| | | | | | | | | | | | | | | | | | | | |
| | |
Natixis Oakmark International Fund—Class A | |
| | | Year Ended
December 31,
2019 | | | Year Ended
December 31,
2018 | | | Year Ended
December 31,
2017 | | | Year Ended
December 31,
2016 | | | Year Ended
December 31,
2015 | |
Net asset value, beginning of the period | | $ | 11.29 | | | $ | 15.58 | | | $ | 12.15 | | | $ | 11.47 | | | $ | 12.44 | |
| | | | | | | | | | | | | | | | | | | | |
INCOME (LOSS) FROM INVESTMENT OPERATIONS: | | | | | | | | | | | | | | | | | | | | |
Net investment income(a) | | | 0.37 | (b) | | | 0.25 | | | | 0.18 | | | | 0.17 | | | | 0.15 | |
Net realized and unrealized gain (loss) | | | 2.38 | | | | (4.02 | ) | | | 3.41 | | | | 0.76 | | | | (0.80 | ) |
| | | | | | | | | | | | | | | | | | | | |
Total from Investment Operations | | | 2.75 | | | | (3.77 | ) | | | 3.59 | | | | 0.93 | | | | (0.65 | ) |
| | | | | | | | | | | | | | | | | | | | |
LESS DISTRIBUTIONS FROM: | | | | | | | | | | | | | | | | | | | | |
Net investment income | | | (0.41 | ) | | | (0.29 | ) | | | (0.16 | ) | | | (0.21 | ) | | | (0.20 | ) |
Net realized capital gains | | | — | | | | (0.23 | ) | | | — | | | | (0.04 | ) | | | (0.12 | ) |
| | | | | | | | | | | | | | | | | | | | |
Total Distributions | | | (0.41 | ) | | | (0.52 | ) | | | (0.16 | ) | | | (0.25 | ) | | | (0.32 | ) |
| | | | | | | | | | | | | | | | | | | | |
Net asset value, end of the period | | $ | 13.63 | | | $ | 11.29 | | | $ | 15.58 | | | $ | 12.15 | | | $ | 11.47 | |
| | | | | | | | | | | | | | | | | | | | |
Total return(c) | | | 24.35 | %(b) | | | (24.15 | )% | | | 29.56 | % | | | 8.19 | % | | | (5.35 | )% |
RATIOS TO AVERAGE NET ASSETS: | | | | | | | | | | | | | | | | | | | | |
Net assets, end of the period (000’s) | | $ | 172,906 | | | $ | 257,551 | | | $ | 603,988 | | | $ | 533,112 | | | $ | 722,805 | |
Net expenses | | | 1.29 | % | | | 1.31 | % | | | 1.32 | % | | | 1.34 | % | | | 1.31 | % |
Gross expenses | | | 1.29 | % | | | 1.31 | % | | | 1.32 | % | | | 1.34 | % | | | 1.31 | % |
Net investment income | | | 2.91 | %(b) | | | 1.72 | % | | | 1.28 | % | | | 1.54 | % | | | 1.17 | % |
Portfolio turnover rate | | | 28 | % | | | 50 | % | | | 40 | % | | | 41 | % | | | 51 | % |
| (a) | Per share net investment income has been calculated using the average shares outstanding during the period. |
| (b) | Includesnon-recurring dividends. Without this dividend, net investment income per share would have been $0.29, total return would have been 23.55% and the ratio of net investment income to average net assets would have been 2.26%. |
| (c) | A sales charge for Class A shares is not reflected in total return calculations. |
See accompanying notes to financial statements.
69 |
Financial Highlights (continued)
For a share outstanding throughout each period.
| | | | | | | | | | | | | | | | | | | | |
| | |
Natixis Oakmark International Fund—Class C | |
| | | Year Ended
December 31,
2019 | | | Year Ended
December 31,
2018 | | | Year Ended
December 31,
2017 | | | Year Ended
December 31,
2016 | | | Year Ended
December 31,
2015 | |
Net asset value, beginning of the period | | $ | 11.11 | | | $ | 15.30 | | | $ | 11.96 | | | $ | 11.29 | | | $ | 12.25 | |
| | | | | | | | | | | | | | | | | | | | |
INCOME (LOSS) FROM INVESTMENT OPERATIONS: | | | | | | | | | | | | | | | | | | | | |
Net investment income(a) | | | 0.26 | (b) | | | 0.13 | | | | 0.06 | | | | 0.08 | | | | 0.05 | |
Net realized and unrealized gain (loss) | | | 2.34 | | | | (3.92 | ) | | | 3.35 | | | | 0.74 | | | | (0.78 | ) |
| | | | | | | | | | | | | | | | | | | | |
Total from Investment Operations | | | 2.60 | | | | (3.79 | ) | | | 3.41 | | | | 0.82 | | | | (0.73 | ) |
| | | | | | | | | | | | | | | | | | | | |
LESS DISTRIBUTIONS FROM: | | | | | | | | | | | | | | | | | | | | |
Net investment income | | | (0.30 | ) | | | (0.17 | ) | | | (0.07 | ) | | | (0.11 | ) | | | (0.11 | ) |
Net realized capital gains | | | — | | | | (0.23 | ) | | | — | | | | (0.04 | ) | | | (0.12 | ) |
| | | | | | | | | | | | | | | | | | | | |
Total Distributions | | | (0.30 | ) | | | (0.40 | ) | | | (0.07 | ) | | | (0.15 | ) | | | (0.23 | ) |
| | | | | | | | | | | | | | | | | | | | |
Net asset value, end of the period | | $ | 13.41 | | | $ | 11.11 | | | $ | 15.30 | | | $ | 11.96 | | | $ | 11.29 | |
| | | | | | | | | | | | | | | | | | | | |
Total return(c) | | | 23.44 | %(b) | | | (24.74 | )% | | | 28.55 | % | | | 7.36 | % | | | (6.08 | )% |
RATIOS TO AVERAGE NET ASSETS: | | | | | | | | | | | | | | | | | | | | |
Net assets, end of the period (000’s) | | $ | 179,533 | | | $ | 212,618 | | | $ | 363,018 | | | $ | 255,249 | | | $ | 341,959 | |
Net expenses | | | 2.04 | % | | | 2.07 | % | | | 2.07 | % | | | 2.09 | % | | | 2.06 | % |
Gross expenses | | | 2.04 | % | | | 2.07 | % | | | 2.07 | % | | | 2.09 | % | | | 2.06 | % |
Net investment income | | | 2.09 | %(b) | | | 0.94 | % | | | 0.42 | % | | | 0.73 | % | | | 0.39 | % |
Portfolio turnover rate | | | 28 | % | | | 50 | % | | | 40 | % | | | 41 | % | | | 51 | % |
| (a) | Per share net investment income has been calculated using the average shares outstanding during the period. |
| (b) | Includesnon-recurring dividends. Without this dividend, net investment income per share would have been $0.18, total return would have been 22.63% and the ratio of net investment income to average net assets would have been 1.43%. |
| (c) | A contingent deferred sales charge for Class C shares is not reflected in total return calculations. |
See accompanying notes to financial statements.
| 70
Financial Highlights (continued)
For a share outstanding throughout each period.
| | | | | | | | | | | | |
| | | Natixis Oakmark International Fund—
Class N | |
| | | Year Ended
December 31,
2019 | | | Year Ended
December 31,
2018 | | | Period Ended
December 31,
2017* | |
Net asset value, beginning of the period | | $ | 11.25 | | | $ | 15.58 | | | $ | 13.98 | |
| | | | | | | | | | | | |
INCOME (LOSS) FROM INVESTMENT OPERATIONS: | | | | | | | | | | | | |
Net investment income(a) | | | 0.33 | (b) | | | 0.28 | | | | 0.15 | |
Net realized and unrealized gain (loss) | | | 2.45 | | | | (4.02 | ) | | | 1.66 | |
| | | | | | | | | | | | |
Total from Investment Operations | | | 2.78 | | | | (3.74 | ) | | | 1.81 | |
| | | | | | | | | | | | |
LESS DISTRIBUTIONS FROM: | | | | | | | | | | | | |
Net investment income | | | (0.47 | ) | | | (0.36 | ) | | | (0.21 | ) |
Net realized capital gains | | | — | | | | (0.23 | ) | | | — | |
| | | | | | | | | | | | |
Total Distributions | | | (0.47 | ) | | | (0.59 | ) | | | (0.21 | ) |
| | | | | | | | | | | | |
Net asset value, end of the period | | $ | 13.56 | | | $ | 11.25 | | | $ | 15.58 | |
| | | | | | | | | | | | |
Total return(c) | | | 24.75 | %(b) | | | (23.94 | )% | | | 12.96 | %(d) |
RATIOS TO AVERAGE NET ASSETS: | | | | | | | | | | | | |
Net assets, end of the period (000’s) | | $ | 811 | | | $ | 758 | | | $ | 1 | |
Net expenses(e) | | | 0.94 | % | | | 0.99 | % | | | 0.92 | %(f) |
Gross expenses | | | 1.08 | % | | | 1.02 | % | | | 25.21 | %(f) |
Net investment income | | | 2.56 | %(b) | | | 2.04 | % | | | 1.54 | %(f) |
Portfolio turnover rate | | | 28 | % | | | 50 | % | | | 40 | %(g) |
| * | From commencement of Class operations on May 1, 2017 through December 31, 2017. |
| (a) | Per share net investment income has been calculated using the average shares outstanding during the period. |
| (b) | Includesnon-recurring dividends. Without this dividend, net investment income per share would have been $0.27, total return would have been 23.94% and the ratio of net investment income to average net assets would have been 2.15%. |
| (c) | Had certain expenses not been waived/reimbursed during the period, total returns would have been lower. |
| (d) | Periods less than one year are not annualized. |
| (e) | The investment adviser agreed to waive its fees and/or reimburse a portion of the Fund’s expenses during the period. Without this waiver/reimbursement, expenses would have been higher. |
| (f) | Computed on an annualized basis for periods less than one year. |
| (g) | Represents the Fund’s portfolio turnover rate for the year ended December 31, 2017. |
See accompanying notes to financial statements.
71 |
Financial Highlights (continued)
For a share outstanding throughout each period.
| | | | | | | | | | | | |
| | | Natixis Oakmark International Fund—
Class Y | |
| | | Year Ended
December 31,
2019 | | | Year Ended
December 31,
2018 | | | Period Ended
December 31,
2017* | |
Net asset value, beginning of the period | | $ | 11.25 | | | $ | 15.56 | | | $ | 13.98 | |
| | | | | | | | | | | | |
INCOME (LOSS) FROM INVESTMENT OPERATIONS: | | | | | | | | | | | | |
Net investment income(a) | | | 0.37 | (b) | | | 0.26 | | | | 0.00 | (c) |
Net realized and unrealized gain (loss) | | | 2.40 | | | | (3.99 | ) | | | 1.79 | |
| | | | | | | | | | | | |
Total from Investment Operations | | | 2.77 | | | | (3.73 | ) | | | 1.79 | |
| | | | | | | | | | | | |
LESS DISTRIBUTIONS FROM: | | | | | | | | | | | | |
Net investment income | | | (0.46 | ) | | | (0.35 | ) | | | (0.21 | ) |
Net realized capital gains | | | — | | | | (0.23 | ) | | | — | |
| | | | | | | | | | | | |
Total Distributions | | | (0.46 | ) | | | (0.58 | ) | | | (0.21 | ) |
| | | | | | | | | | | | |
Net asset value, end of the period | | $ | 13.56 | | | $ | 11.25 | | | $ | 15.56 | |
| | | | | | | | | | | | |
Total return | | | 24.64 | %(b) | | | (23.93 | )% | | | 12.79 | %(d) |
RATIOS TO AVERAGE NET ASSETS: | | | | | | | | | | | | |
Net assets, end of the period (000’s) | | $ | 244,586 | | | $ | 215,123 | | | $ | 172,978 | |
Net expenses | | | 1.04 | % | | | 1.07 | % | | | 1.07 | %(e) |
Gross expenses | | | 1.04 | % | | | 1.07 | % | | | 1.07 | %(e) |
Net investment income | | | 2.91 | %(b) | | | 1.85 | % | | | 0.03 | %(e) |
Portfolio turnover rate | | | 28 | % | | | 50 | % | | | 40 | %(f) |
| * | From commencement of Class operations on May 1, 2017 through December 31, 2017. |
| (a) | Per share net investment income has been calculated using the average shares outstanding during the period. |
| (b) | Includesnon-recurring dividends. Without this dividend, net investment income per share would have been $0.29, total return would have been 23.84% and the ratio of net investment income to average net assets would have been 2.29%. |
| (c) | Amount rounds to less than $0.01 per share. |
| (d) | Periods less than one year are not annualized. |
| (e) | Computed on an annualized basis for periods less than one year. |
| (f) | Represents the Fund’s portfolio turnover rate for the year ended December 31, 2017. |
See accompanying notes to financial statements.
| 72
Financial Highlights (continued)
For a share outstanding throughout each period.
| | | | | | | | | | | | | | | | | | | | |
| | |
Vaughan Nelson Small Cap Value Fund—Class A | |
| | | Year Ended
December 31,
2019 | | | Year Ended
December 31,
2018 | | | Year Ended
December 31,
2017 | | | Year Ended
December 31,
2016 | | | Year Ended
December 31,
2015 | |
Net asset value, beginning of the period | | $ | 12.48 | | | $ | 18.71 | | | $ | 19.79 | | | $ | 17.74 | | | $ | 20.65 | |
| | | | | | | | | | | | | | | | | | | | |
INCOME (LOSS) FROM INVESTMENT OPERATIONS: | | | | | | | | | | | | | | | | | | | | |
Net investment income (loss)(a) | | | 0.02 | | | | 0.01 | | | | (0.01 | ) | | | 0.02 | | | | 0.06 | (b) |
Net realized and unrealized gain (loss) | | | 3.06 | | | | (2.76 | ) | | | 1.21 | | | | 3.49 | | | | (0.07 | ) |
| | | | | | | | | | | | | | | | | | | | |
Total from Investment Operations | | | 3.08 | | | | (2.75 | ) | | | 1.20 | | | | 3.51 | | | | (0.01 | ) |
| | | | | | | | | | | | | | | | | | | | |
LESS DISTRIBUTIONS FROM: | | | | | | | | | | | | | | | | | | | | |
Net investment income | | | (0.03 | ) | | | (0.00 | )(c) | | | (0.00 | )(c) | | | (0.01 | ) | | | (0.04 | ) |
Net realized capital gains | | | (0.08 | ) | | | (3.48 | ) | | | (2.28 | ) | | | (1.45 | ) | | | (2.86 | ) |
| | | | | | | | | | | | | | | | | | | | |
Total Distributions | | | (0.11 | ) | | | (3.48 | ) | | | (2.28 | ) | | | (1.46 | ) | | | (2.90 | ) |
| | | | | | | | | | | | | | | | | | | | |
Net asset value, end of the period | | $ | 15.45 | | | $ | 12.48 | | | $ | 18.71 | | | $ | 19.79 | | | $ | 17.74 | |
| | | | | | | | | | | | | | | | | | | | |
Total return(d) | | | 24.66 | %(e) | | | (14.84 | )% | | | 6.28 | % | | | 20.24 | % | | | (0.29 | )%(b) |
RATIOS TO AVERAGE NET ASSETS: | | | | | | | | | | | | | | | | | | | | |
Net assets, end of the period (000’s) | | $ | 67,525 | | | $ | 66,376 | | | $ | 93,751 | | | $ | 106,447 | | | $ | 103,092 | |
Net expenses | | | 1.40 | %(f)(g) | | | 1.38 | % | | | 1.36 | % | | | 1.35 | % | | | 1.35 | % |
Gross expenses | | | 1.47 | % | | | 1.38 | % | | | 1.36 | % | | | 1.35 | % | | | 1.35 | % |
Net investment income (loss) | | | 0.12 | % | | | 0.03 | % | | | (0.03 | )% | | | 0.11 | % | | | 0.26 | %(b) |
Portfolio turnover rate | | | 61 | % | | | 70 | % | | | 92 | % | | | 74 | % | | | 62 | % |
| (a) | Per share net investment income (loss) has been calculated using the average shares outstanding during the period. |
| (b) | Includesnon-recurring dividends. Without these dividends, net investment loss per share would have been $(0.04), total return would have been (0.77)% and the ratio of net investment loss to average net assets would have been (0.20)%. |
| (c) | Amount rounds to less than $0.01 per share. |
| (d) | A sales charge for Class A shares is not reflected in total return calculations. |
| (e) | Had certain expenses not been waived/reimbursed during the period, total returns would have been lower. |
| (f) | The investment adviser agreed to waive its fees and/or reimburse a portion of the Fund’s expenses during the period. Without this waiver/reimbursement, expenses would have been higher. |
| (g) | Effective July 1, 2019, the expense limit decreased from 1.45% to 1.34%. See Note 6 of Notes to Financial Statements. |
See accompanying notes to financial statements.
73 |
Financial Highlights (continued)
For a share outstanding throughout each period.
| | | | | | | | | | | | | | | | | | | | |
| | |
Vaughan Nelson Small Cap Value Fund—Class C | |
| | | Year Ended
December 31,
2019 | | | Year Ended
December 31,
2018 | | | Year Ended
December 31,
2017 | | | Year Ended
December 31,
2016 | | | Year Ended
December 31,
2015 | |
Net asset value, beginning of the period | | $ | 6.41 | | | $ | 11.67 | | | $ | 13.26 | | | $ | 12.39 | | | $ | 15.36 | |
| | | | | | | | | | | | | | | | | | | | |
INCOME (LOSS) FROM INVESTMENT OPERATIONS: | | | | | | | | | | | | | | | | | | | | |
Net investment loss(a) | | | (0.05 | ) | | | (0.09 | ) | | | (0.10 | ) | | | (0.08 | ) | | | (0.08 | )(b) |
Net realized and unrealized gain (loss) | | | 1.57 | | | | (1.69 | ) | | | 0.79 | | | | 2.40 | | | | (0.03 | ) |
| | | | | | | | | | | | | | | | | | | | |
Total from Investment Operations | | | 1.52 | | | | (1.78 | ) | | | 0.69 | | | | 2.32 | | | | (0.11 | ) |
| | | | | | | | | | | | | | | | | | | | |
LESS DISTRIBUTIONS FROM: | | | | | | | | | | | | | | | | | | | | |
Net investment income | | | (0.01 | ) | | | (0.00 | )(c) | | | (0.00 | )(c) | | | — | | | | — | |
Net realized capital gains | | | (0.08 | ) | | | (3.48 | ) | | | (2.28 | ) | | | (1.45 | ) | | | (2.86 | ) |
| | | | | | | | | | | | | | | | | | | | |
Total Distributions | | | (0.09 | ) | | | (3.48 | ) | | | (2.28 | ) | | | (1.45 | ) | | | (2.86 | ) |
| | | | | | | | | | | | | | | | | | | | |
Net asset value, end of the period | | $ | 7.84 | | | $ | 6.41 | | | $ | 11.67 | | | $ | 13.26 | | | $ | 12.39 | |
| | | | | | | | | | | | | | | | | | | | |
Total return(d) | | | 23.69 | %(e) | | | (15.51 | )% | | | 5.50 | % | | | 19.32 | % | | | (1.02 | )%(b) |
RATIOS TO AVERAGE NET ASSETS: | | | | | | | | | | | | | | | | | | | | |
Net assets, end of the period (000’s) | | $ | 1,450 | | | $ | 3,480 | | | $ | 15,756 | | | $ | 20,379 | | | $ | 21,188 | |
Net expenses | | | 2.16 | %(f)(g) | | | 2.12 | % | | | 2.11 | % | | | 2.10 | % | | | 2.10 | % |
Gross expenses | | | 2.23 | % | | | 2.12 | % | | | 2.11 | % | | | 2.10 | % | | | 2.10 | % |
Net investment loss | | | (0.68 | )% | | | (0.83 | )% | | | (0.79 | )% | | | (0.64 | )% | | | (0.48 | )%(b) |
Portfolio turnover rate | | | 61 | % | | | 70 | % | | | 92 | % | | | 74 | % | | | 62 | % |
| (a) | Per share net investment loss has been calculated using the average shares outstanding during the period. |
| (b) | Includesnon-recurring dividends. Without these dividends, net investment loss per share would have been $(0.15), total return would have been (1.48)% and the ratio of net investment loss to average net assets would have been (0.96)%. |
| (c) | Amount rounds to less than $0.01 per share. |
| (d) | A contingent deferred sales charge for Class C shares is not reflected in total return calculations. |
| (e) | Had certain expenses not been waived/reimbursed during the period, total returns would have been lower. |
| (f) | The investment adviser agreed to waive its fees and/or reimburse a portion of the Fund’s expenses during the period. Without this waiver/reimbursement, expenses would have been higher. |
| (g) | Effective July 1, 2019, the expense limit decreased from 2.20% to 2.09%. See Note 6 of Notes to Financial Statements. |
See accompanying notes to financial statements.
| 74
Financial Highlights (continued)
For a share outstanding throughout each period.
| | | | | | | | | | | | |
| | | Vaughan Nelson Small Cap Value Fund—
Class N | |
| | | Year Ended
December 31,
2019 | | | Year Ended
December 31,
2018 | | | Period Ended
December 31,
2017* | |
Net asset value, beginning of the period | | $ | 13.08 | | | $ | 19.37 | | | $ | 19.55 | |
| | | | | | | | | | | | |
INCOME (LOSS) FROM INVESTMENT OPERATIONS: | | | | | | | | | | | | |
Net investment income(a) | | | 0.08 | | | | 0.08 | | | | 0.07 | |
Net realized and unrealized gain (loss) | | | 3.20 | | | | (2.86 | ) | | | 1.35 | |
| | | | | | | | | | | | |
Total from Investment Operations | | | 3.28 | | | | (2.78 | ) | | | 1.42 | |
| | | | | | | | | | | | |
LESS DISTRIBUTIONS FROM: | | | | | | | | | | | | |
Net investment income | | | (0.08 | ) | | | (0.03 | ) | | | (0.02 | ) |
Net realized capital gains | | | (0.08 | ) | | | (3.48 | ) | | | (1.58 | ) |
| | | | | | | | | | | | |
Total Distributions | | | (0.16 | ) | | | (3.51 | ) | | | (1.60 | ) |
| | | | | | | | | | | | |
Net asset value, end of the period | | $ | 16.20 | | | $ | 13.08 | | | $ | 19.37 | |
| | | | | | | | | | | | |
Total return(b) | | | 25.08 | % | | | (14.48 | )% | | | 7.17 | %(c) |
RATIOS TO AVERAGE NET ASSETS: | | | | | | | | | | | | |
Net assets, end of the period (000’s) | | $ | 21 | | | $ | 1 | | | $ | 1 | |
Net expenses(d) | | | 1.03 | %(e) | | | 0.96 | % | | | 0.96 | %(f) |
Gross expenses | | | 11.80 | % | | | 15.17 | % | | | 14.68 | %(f) |
Net investment income | | | 0.52 | % | | | 0.43 | % | | | 0.56 | %(f) |
Portfolio turnover rate | | | 61 | % | | | 70 | % | | | 92 | %(g) |
| * | From commencement of Class operations on May 1, 2017 through December 31, 2017. |
| (a) | Per share net investment income has been calculated using the average shares outstanding during the period. |
| (b) | Had certain expenses not been waived/reimbursed during the period, total returns would have been lower. |
| (c) | Periods less than one year are not annualized. |
| (d) | The investment adviser agreed to waive its fees and/or reimburse a portion of the Fund’s expenses during the period. Without this waiver/reimbursement, expenses would have been higher. |
| (e) | Effective July 1, 2019, the expense limit decreased from 1.15% to 1.04%. See Note 6 of Notes to Financial Statements. |
| (f) | Computed on an annualized basis for periods less than one year. |
| (g) | Represents the Fund’s portfolio turnover rate for the year ended December 31, 2017. |
See accompanying notes to financial statements.
75 |
Financial Highlights (continued)
For a share outstanding throughout each period.
| | | | | | | | | | | | | | | | | | | | |
| | |
Vaughan Nelson Small Cap Value Fund—Class Y | |
| | | Year Ended
December 31,
2019 | | | Year Ended
December 31,
2018 | | | Year Ended
December 31,
2017 | | | Year Ended
December 31,
2016 | | | Year Ended
December 31,
2015 | |
Net asset value, beginning of the period | | $ | 13.08 | | | $ | 19.37 | | | $ | 20.36 | | | $ | 18.21 | | | $ | 21.13 | |
| | | | | | | | | | | | | | | | | | | | |
INCOME (LOSS) FROM INVESTMENT OPERATIONS: | | | | | | | | | | | | | | | | | | | | |
Net investment income(a) | | | 0.05 | | | | 0.04 | | | | 0.05 | | | | 0.07 | | | | 0.11 | (b) |
Net realized and unrealized gain (loss) | | | 3.21 | | | | (2.84 | ) | | | 1.25 | | | | 3.59 | | | | (0.07 | ) |
| | | | | | | | | | | | | | | | | | | | |
Total from Investment Operations | | | 3.26 | | | | (2.80 | ) | | | 1.30 | | | | 3.66 | | | | 0.04 | |
| | | | | | | | | | | | | | | | | | | | |
LESS DISTRIBUTIONS FROM: | | | | | | | | | | | | | | | | | | | | |
Net investment income | | | (0.07 | ) | | | (0.01 | ) | | | (0.01 | ) | | | (0.06 | ) | | | (0.10 | ) |
Net realized capital gains | | | (0.08 | ) | | | (3.48 | ) | | | (2.28 | ) | | | (1.45 | ) | | | (2.86 | ) |
| | | | | | | | | | | | | | | | | | | | |
Total Distributions | | | (0.15 | ) | | | (3.49 | ) | | | (2.29 | ) | | | (1.51 | ) | | | (2.96 | ) |
| | | | | | | | | | | | | | | | | | | | |
Net asset value, end of the period | | $ | 16.19 | | | $ | 13.08 | | | $ | 19.37 | | | $ | 20.36 | | | $ | 18.21 | |
| | | | | | | | | | | | | | | | | | | | |
Total return | | | 24.88 | %(c) | | | (14.61 | )% | | | 6.60 | % | | | 20.53 | % | | | (0.05 | )%(b) |
RATIOS TO AVERAGE NET ASSETS: | | | | | | | | | | | | | | | | | | | | |
Net assets, end of the period (000’s) | | $ | 44,482 | | | $ | 58,538 | | | $ | 176,940 | | | $ | 183,145 | | | $ | 179,322 | |
Net expenses | | | 1.15 | %(d)(e) | | | 1.12 | % | | | 1.11 | % | | | 1.10 | % | | | 1.10 | % |
Gross expenses | | | 1.23 | % | | | 1.12 | % | | | 1.11 | % | | | 1.10 | % | | | 1.10 | % |
Net investment income | | | 0.35 | % | | | 0.22 | % | | | 0.23 | % | | | 0.36 | % | | | 0.50 | %(b) |
Portfolio turnover rate | | | 61 | % | | | 70 | % | | | 92 | % | | | 74 | % | | | 62 | % |
| (a) | Per share net investment income (loss) has been calculated using the average shares outstanding during the period. |
| (b) | Includesnon-recurring dividends. Without these dividends, net investment income per share would have been $0.02, total return would have been (0.53)% and the ratio of net investment income to average net assets would have been 0.07%. |
| (c) | Had certain expenses not been waived/reimbursed during the period, total returns would have been lower. |
| (d) | The investment adviser agreed to waive its fees and/or reimburse a portion of the Fund’s expenses during the period. Without this waiver/reimbursement, expenses would have been higher. |
| (e) | Effective July 1, 2019, the expense limit decreased from 1.20% to 1.09%. See Note 6 of Notes to Financial Statements. |
See accompanying notes to financial statements.
| 76
Financial Highlights (continued)
For a share outstanding throughout each period.
| | | | | | | | | | | | | | | | | | | | |
| | |
Vaughan Nelson Value Opportunity Fund—Class A | |
| | | Year Ended
December 31,
2019 | | | Year Ended
December 31,
2018 | | | Year Ended
December 31,
2017 | | | Year Ended
December 31,
2016 | | | Year Ended
December 31,
2015 | |
Net asset value, beginning of the period | | $ | 17.37 | | | $ | 22.65 | | | $ | 20.55 | | | $ | 20.04 | | | $ | 21.29 | |
| | | | | | | | | | | | | | | | | | | | |
INCOME (LOSS) FROM INVESTMENT OPERATIONS: | | | | | | | | | | | | | | | | | | | | |
Net investment income(a) | | | 0.03 | | | | 0.09 | | | | 0.17 | (b) | | | 0.07 | | | | 0.03 | (c) |
Net realized and unrealized gain (loss) | | | 5.21 | | | | (3.71 | ) | | | 2.48 | | | | 1.05 | | | | (0.79 | ) |
| | | | | | | | | | | | | | | | | | | | |
Total from Investment Operations | | | 5.24 | | | | (3.62 | ) | | | 2.65 | | | | 1.12 | | | | (0.76 | ) |
| | | | | | | | | | | | | | | | | | | | |
LESS DISTRIBUTIONS FROM: | | | | | | | | | | | | | | | | | | | | |
Net investment income | | | (0.02 | ) | | | (0.15 | ) | | | (0.18 | ) | | | (0.05 | ) | | | (0.02 | ) |
Net realized capital gains | | | (0.17 | ) | | | (1.51 | ) | | | (0.37 | ) | | | (0.56 | ) | | | (0.47 | ) |
| | | | | | | | | | | | | | | | | | | | |
Total Distributions | | | (0.19 | ) | | | (1.66 | ) | | | (0.55 | ) | | | (0.61 | ) | | | (0.49 | ) |
| | | | | | | | | | | | | | | | | | | | |
Net asset value, end of the period | | $ | 22.42 | | | $ | 17.37 | | | $ | 22.65 | | | $ | 20.55 | | | $ | 20.04 | |
| | | | | | | | | | | | | | | | | | | | |
Total return(d) | | | 30.21 | %(e) | | | (16.10 | )% | | | 12.93 | %(b) | | | 5.85 | % | | | (3.66 | )%(c) |
RATIOS TO AVERAGE NET ASSETS: | | | | | | | | | | | | | | | | | | | | |
Net assets, end of the period (000’s) | | $ | 33,434 | | | $ | 43,769 | | | $ | 67,186 | | | $ | 87,536 | | | $ | 142,833 | |
Net expenses | | | 1.25 | %(f)(g)(h) | | | 1.24 | % | | | 1.22 | % | | | 1.23 | % | | | 1.23 | % |
Gross expenses | | | 1.28 | %(g) | | | 1.24 | % | | | 1.22 | % | | | 1.23 | % | | | 1.23 | % |
Net investment income | | | 0.16 | % | | | 0.42 | % | | | 0.77 | %(b) | | | 0.35 | % | | | 0.16 | %(c) |
Portfolio turnover rate | | | 52 | % | | | 44 | % | | | 42 | % | | | 57 | % | | | 32 | % |
| (a) | Per share net investment income has been calculated using the average shares outstanding during the period. |
| (b) | Includes anon-recurring dividend. Without this dividend, net investment income per share would have been $0.09, total return would have been 12.53% and the ratio of net investment income to average net assets would have been 0.41%. |
| (c) | Includes anon-recurring dividend. Without this dividend, net investment loss per share would have been $(0.01), total return would have been (3.94)% and the ratio of net investment loss to average net assets would have been (0.04)%. |
| (d) | A sales charge for Class A shares is not reflected in total return calculations. |
| (e) | Had certain expenses not been waived/reimbursed during the period, total returns would have been lower. |
| (f) | The investment adviser agreed to waive its fees and/or reimburse a portion of the Fund’s expenses during the period. Without this waiver/reimbursement, expenses would have been higher. |
| (g) | Includes interest expense. Without this expense the ratio of net expenses would have been 1.23% and the ratio of gross expenses would have been 1.26%. |
| (h) | Effective July 1, 2019, the expense limit decreased from 1.40% to 1.20%. See Note 6 of Notes to Financial Statements. |
See accompanying notes to financial statements.
77 |
Financial Highlights (continued)
For a share outstanding throughout each period.
| | | | | | | | | | | | | | | | | | | | |
| | |
Vaughan Nelson Value Opportunity Fund—Class C | |
| | | Year Ended
December 31,
2019 | | | Year Ended
December 31,
2018 | | | Year Ended
December 31,
2017 | | | Year Ended
December 31,
2016 | | | Year Ended
December 31,
2015 | |
Net asset value, beginning of the period | | $ | 16.43 | | | $ | 21.50 | | | $ | 19.51 | | | $ | 19.16 | | | $ | 20.51 | |
| | | | | | | | | | | | | | | | | | | | |
INCOME (LOSS) FROM INVESTMENT OPERATIONS: | | | | | | | | | | | | | | | | | | | | |
Net investment income (loss)(a) | | | (0.10 | ) | | | (0.08 | ) | | | 0.00 | (b)(c) | | | (0.07 | ) | | | (0.13 | )(d) |
Net realized and unrealized gain (loss) | | | 4.90 | | | | (3.48 | ) | | | 2.36 | | | | 0.98 | | | | (0.75 | ) |
| | | | | | | | | | | | | | | | | | | | |
Total from Investment Operations | | | 4.80 | | | | (3.56 | ) | | | 2.36 | | | | 0.91 | | | | (0.88 | ) |
| | | | | | | | | | | | | | | | | | | | |
LESS DISTRIBUTIONS FROM: | | | | | | | | | | | | | | | | | | | | |
Net investment income | | | (0.00 | )(b) | | | — | | | | — | | | | (0.00 | )(b) | | | — | |
Net realized capital gains | | | (0.17 | ) | | | (1.51 | ) | | | (0.37 | ) | | | (0.56 | ) | | | (0.47 | ) |
| | | | | | | | | | | | | | | | | | | | |
Total Distributions | | | (0.17 | ) | | | (1.51 | ) | | | (0.37 | ) | | | (0.56 | ) | | | (0.47 | ) |
| | | | | | | | | | | | | | | | | | | | |
Net asset value, end of the period | | $ | 21.06 | | | $ | 16.43 | | | $ | 21.50 | | | $ | 19.51 | | | $ | 19.16 | |
| | | | | | | | | | | | | | | | | | | | |
Total return(e) | | | 29.25 | %(j) | | | (16.71 | )% | | | 12.11 | %(c) | | | 5.03 | % | | | (4.39 | )%(d) |
RATIOS TO AVERAGE NET ASSETS: | | | | | | | | | | | | | | | | | | | | |
Net assets, end of the period (000’s) | | $ | 21,932 | | | $ | 23,967 | | | $ | 47,559 | | | $ | 68,923 | | | $ | 89,284 | |
Net expenses | | | 1.99 | %(f)(g)(h) | | | 1.98 | % | | | 1.97 | % | | | 1.98 | % | | | 1.98 | % |
Gross expenses | | | 2.02 | %(g) | | | 1.98 | % | | | 1.97 | % | | | 1.98 | % | | | 1.98 | % |
Net investment income (loss) | | | (0.50 | )% | | | (0.36 | )% | | | 0.00 | %(c)(i) | | | (0.38 | )% | | | (0.61 | )%(d) |
Portfolio turnover rate | | | 52 | % | | | 44 | % | | | 42 | % | | | 57 | % | | | 32 | % |
| (a) | Per share net investment income (loss) has been calculated using the average shares outstanding during the period. |
| (b) | Amount rounds to less than $0.01 per share. |
| (c) | Includes anon-recurring dividend. Without this dividend, net investment loss per share would have been $(0.07), total return would have been 11.70% and the ratio of net investment loss to average net assets would have been (0.35)%. |
| (d) | Includes anon-recurring dividend. Without this dividend, net investment loss per share would have been $(0.16), total return would have been (4.68)% and the ratio of net investment loss to average net assets would have been (0.77)%. |
| (e) | A contingent deferred sales charge for Class C shares is not reflected in total return calculations. |
| (f) | The investment adviser agreed to waive its fees and/or reimburse a portion of the Fund’s expenses during the period. Without this waiver/reimbursement, expenses would have been higher. |
| (g) | Includes interest expense. Without this expense the ratio of net expenses would have been 1.98% and the ratio of gross expenses would have been 2.01%. |
| (h) | Effective July 1, 2019, the expense limit decreased from 2.15% to 1.95%. See Note 6 of Notes to Financial Statements. |
| (i) | Amount rounds to less than 0.01%. |
| (j) | Had certain expenses not been waived/reimbursed during the period, total returns would have been lower. |
See accompanying notes to financial statements.
| 78
Financial Highlights (continued)
For a share outstanding throughout each period.
| | | | | | | | | | | | | | | | | | | | |
| | |
Vaughan Nelson Value Opportunity Fund—Class N | |
| | | Year Ended
December 31,
2019 | | | Year Ended
December 31,
2018 | | | Year Ended
December 31,
2017 | | | Year Ended
December 31,
2016 | | | Year Ended
December 31,
2015 | |
Net asset value, beginning of the period | | $ | 17.54 | | | $ | 22.87 | | | $ | 20.75 | | | $ | 20.26 | | | $ | 21.50 | |
| | | | | | | | | | | | | | | | | | | | |
INCOME (LOSS) FROM INVESTMENT OPERATIONS: | | | | | | | | | | | | | | | | | | | | |
Net investment income(a) | | | 0.11 | | | | 0.17 | | | | 0.25 | (b) | | | 0.16 | | | | 0.11 | (c) |
Net realized and unrealized gain (loss) | | | 5.27 | | | | (3.75 | ) | | | 2.51 | | | | 1.04 | | | | (0.81 | ) |
| | | | | | | | | | | | | | | | | | | | |
Total from Investment Operations | | | 5.38 | | | | (3.58 | ) | | | 2.76 | | | | 1.20 | | | | (0.70 | ) |
| | | | | | | | | | | | | | | | | | | | |
LESS DISTRIBUTIONS FROM: | | | | | | | | | | | | | | | | | | | | |
Net investment income | | | (0.09 | ) | | | (0.24 | ) | | | (0.27 | ) | | | (0.15 | ) | | | (0.07 | ) |
Net realized capital gains | | | (0.17 | ) | | | (1.51 | ) | | | (0.37 | ) | | | (0.56 | ) | | | (0.47 | ) |
| | | | | | | | | | | | | | | | | | | | |
Total Distributions | | | (0.26 | ) | | | (1.75 | ) | | | (0.64 | ) | | | (0.71 | ) | | | (0.54 | ) |
| | | | | | | | | | | | | | | | | | | | |
Net asset value, end of the period | | $ | 22.66 | | | $ | 17.54 | | | $ | 22.87 | | | $ | 20.75 | | | $ | 20.26 | |
| | | | | | | | | | | | | | | | | | | | |
Total return | | | 30.67 | %(g) | | | (15.78 | )% | | | 13.31 | %(b) | | | 6.21 | % | | | (3.35 | )%(c) |
RATIOS TO AVERAGE NET ASSETS: | | | | | | | | | | | | | | | | | | | | |
Net assets, end of the period (000’s) | | $ | 18,262 | | | $ | 70,902 | | | $ | 134,205 | | | $ | 148,365 | | | $ | 65,010 | |
Net expenses | | | 0.92 | %(d)(e)(f) | | | 0.88 | % | | | 0.88 | % | | | 0.88 | % | | | 0.89 | % |
Gross expenses | | | 0.93 | %(e) | | | 0.88 | % | | | 0.88 | % | | | 0.88 | % | | | 0.89 | % |
Net investment income | | | 0.51 | % | | | 0.76 | % | | | 1.16 | %(b) | | | 0.78 | % | | | 0.50 | %(c) |
Portfolio turnover rate | | | 52 | % | | | 44 | % | | | 42 | % | | | 57 | % | | | 32 | % |
| (a) | Per share net investment income has been calculated using the average shares outstanding during the period. |
| (b) | Includes anon-recurring dividend. Without this dividend, net investment income per share would have been $0.17, total return would have been 12.92% and the ratio of net investment income to average net assets would have been 0.76%. |
| (c) | Includes anon-recurring dividend. Without this dividend, net investment income per share would have been $0.08, total return would have been (3.59)% and the ratio of net investment income to average net assets would have been 0.35%. |
| (d) | The investment adviser agreed to waive its fees and/or reimburse a portion of the Fund’s expenses during the period. Without this waiver/reimbursement, expenses would have been higher. |
| (e) | Includes interest expense. Without this expense the ratio of net expenses would have been 0.91% and the ratio of gross expenses would have been 0.91%. |
| (f) | Effective July 1, 2019, the expense limit decreased from 1.10% to 0.90%. See Note 6 of Notes to Financial Statements. |
| (g) | Had certain expenses not been waived/reimbursed during the period, total returns would have been lower. |
See accompanying notes to financial statements.
79 |
Financial Highlights (continued)
For a share outstanding throughout each period.
| | | | | | | | | | | | | | | | | | | | |
| | |
Vaughan Nelson Value Opportunity Fund—Class Y | |
| | | Year Ended
December 31,
2019 | | | Year Ended
December 31,
2018 | | | Year Ended
December 31,
2017 | | | Year Ended
December 31,
2016 | | | Year Ended
December 31,
2015 | |
Net asset value, beginning of the period | | $ | 17.57 | | | $ | 22.89 | | | $ | 20.77 | | | $ | 20.27 | | | $ | 21.52 | |
| | | | | | | | | | | | | | | | | | | | |
INCOME (LOSS) FROM INVESTMENT OPERATIONS: | | | | | | | | | | | | | | | | | | | | |
Net investment income(a) | | | 0.10 | | | | 0.15 | | | | 0.23 | (b) | | | 0.12 | | | | 0.09 | (c) |
Net realized and unrealized gain (loss) | | | 5.26 | | | | (3.75 | ) | | | 2.51 | | | | 1.07 | | | | (0.82 | ) |
| | | | | | | | | | | | | | | | | | | | |
Total from Investment Operations | | | 5.36 | | | | (3.60 | ) | | | 2.74 | | | | 1.19 | | | | (0.73 | ) |
| | | | | | | | | | | | | | | | | | | | |
LESS DISTRIBUTIONS FROM: | | | | | | | | | | | | | | | | | | | | |
Net investment income | | | (0.07 | ) | | | (0.21 | ) | | | (0.25 | ) | | | (0.13 | ) | | | (0.05 | ) |
Net realized capital gains | | | (0.17 | ) | | | (1.51 | ) | | | (0.37 | ) | | | (0.56 | ) | | | (0.47 | ) |
| | | | | | | | | | | | | | | | | | | | |
Total Distributions | | | (0.24 | ) | | | (1.72 | ) | | | (0.62 | ) | | | (0.69 | ) | | | (0.52 | ) |
| | | | | | | | | | | | | | | | | | | | |
Net asset value, end of the period | | $ | 22.69 | | | $ | 17.57 | | | $ | 22.89 | | | $ | 20.77 | | | $ | 20.27 | |
| | | | | | | | | | | | | | | | | | | | |
Total return | | | 30.52 | %(g) | | | (15.85 | )% | | | 13.19 | %(b) | | | 6.14 | % | | | (3.47 | )%(c) |
RATIOS TO AVERAGE NET ASSETS: | | | | | | | | | | | | | | | | | | | | |
Net assets, end of the period (000’s) | | $ | 298,705 | | | $ | 453,085 | | | $ | 774,304 | | | $ | 903,545 | | | $ | 1,133,634 | |
Net expenses | | | 1.00 | %(d)(e)(f) | | | 0.99 | % | | | 0.97 | % | | | 0.98 | % | | | 0.98 | % |
Gross expenses | | | 1.02 | %(e) | | | 0.99 | % | | | 0.97 | % | | | 0.98 | % | | | 0.98 | % |
Net investment income | | | 0.48 | % | | | 0.66 | % | | | 1.04 | %(b) | | | 0.62 | % | | | 0.39 | %(c) |
Portfolio turnover rate | | | 52 | % | | | 44 | % | | | 42 | % | | | 57 | % | | | 32 | % |
| (a) | Per share net investment income has been calculated using the average shares outstanding during the period. |
| (b) | Includes anon-recurring dividend. Without this dividend, net investment income per share would have been $0.15, total return would have been 12.80% and the ratio of net investment income to average net assets would have been 0.67%. |
| (c) | Includes anon-recurring dividend. Without this dividend, net investment income per share would have been $0.05, total return would have been (3.70)% and the ratio of net investment income to average net assets would have been 0.20%. |
| (d) | The investment adviser agreed to waive its fees and/or reimburse a portion of the Fund’s expenses during the period. Without this waiver/reimbursement, expenses would have been higher. |
| (e) | Includes interest expense. Without this expense the ratio of net expenses would have been 0.98% and the ratio of gross expenses would have been 1.01%. |
| (f) | Effective July 1, 2019, the expense limit decreased from 1.15% to 0.95%. See Note 6 of Notes to Financial Statements. |
| (g) | Had certain expenses not been waived/reimbursed during the period, total returns would have been lower. |
See accompanying notes to financial statements.
| 80
Notes to Financial Statements
December 31, 2019
1. Organization. Natixis Funds Trust I and Natixis Funds Trust II (the “Trusts” and each a “Trust”) are each organized as a Massachusetts business trust. Each Trust is registered under the Investment Company Act of 1940, as amended (the “1940 Act”), as an open-end management investment company. Each Declaration of Trust permits the Board of Trustees to authorize the issuance of an unlimited number of shares of the Trust in multiple series. The financial statements for certain funds of the Trusts are presented in separate reports. The following funds (individually, a “Fund” and collectively, the “Funds”) are included in this report:
Natixis Funds Trust I:
Natixis Oakmark International Fund
Vaughan Nelson Small Cap Value Fund (the “Small Cap Value Fund”)
Natixis Funds Trust II:
Loomis Sayles Intermediate Municipal Bond Fund (the “Intermediate Municipal Bond Fund”)
Natixis Oakmark Fund
Vaughan Nelson Value Opportunity Fund (the “Value Opportunity Fund”)
Each Fund is a diversified investment company.
Each Fund offers Class A, Class C and Class Y shares. Natixis Oakmark Fund, Natixis Oakmark International Fund, Small Cap Value Fund and Value Opportunity Fund also offer Class N shares.
Effective July 31, 2009, the Small Cap Value Fund was closed to new investors. The Fund, in its sole discretion, may permit an investor in another Vaughan Nelson-managed fund or product that follows the same investment strategy as the Fund to transfer assets from that fund or product into the Fund.
Class A shares are sold with a maximumfront-end sales charge of 3.00% for Intermediate Municipal Bond Fund and 5.75% for Natixis Oakmark Fund, Natixis Oakmark International Fund, Small Cap Value Fund and Value Opportunity Fund. Class C shares do not pay afront-end sales charge, pay higher Rule12b-1 fees than Class A shares for ten years (at which point they automatically convert to Class A shares) and may be subject to a contingent deferred sales charge (“CDSC”) of 1.00% if those shares are redeemed within one year of acquisition, except for reinvested distributions. Class N and Class Y shares do not pay afront-end sales charge, a CDSC or Rule12b-1 fees. Class N shares are offered with an initial minimum investment of $1,000,000. Class Y shares are offered with an initial minimum investment of $100,000. Certain categories of investors are exempted from the minimum investment amounts for Class N and Class Y as outlined in the relevant Fund’s prospectus.
Most expenses can be directly attributed to a Fund. Expenses which cannot be directly attributed to a Fund are generally apportioned based on the relative net assets of each
81 |
Notes to Financial Statements (continued)
December 31, 2019
of the funds in Natixis Funds Trust I, Natixis Funds Trust II, Natixis Funds Trust IV and Gateway Trust (“Natixis Funds Trusts”), Loomis Sayles Funds I and Loomis Sayles Funds II (“Loomis Sayles Funds Trusts”) and Natixis ETF Trust. Expenses of a Fund are bornepro rata by the holders of each class of shares, except that each class bears expenses unique to the class (such as the Rule12b-1 fees applicable to Class A and Class C) and transfer agent fees for each Fund are borne collectively for Class A, Class C and Class Y and individually for Class N. In addition, each class votes as a class only with respect to its own Rule12b-1 Plan. Shares of each class would receive theirpro ratashare of the net assets of a Fund if the Fund were liquidated. The Trustees approve separate distributions from net investment income on each class of shares.
2. Significant Accounting Policies. The following is a summary of significant accounting policies consistently followed by each Fund in the preparation of its financial statements. The Funds’ financial statements follow the accounting and reporting guidelines provided for investment companies and are prepared in accordance with accounting principles generally accepted in the United States of America which require the use of management estimates that affect the reported amounts and disclosures in the financial statements. Actual results could differ from those estimates. Management has evaluated the events and transactions subsequent to year-end through the date the financial statements were issued and has determined that there were no material events that would require disclosure in the Funds’ financial statements.
a. Valuation. Fund securities and other investments are valued at market value based on market quotations obtained or determined by independent pricing services recommended by the adviser orsub-adviser and approved by the Board of Trustees. Fund securities and other investments for which market quotations are not readily available are valued at fair value as determined in good faith by the adviser orsub-adviser pursuant to procedures approved by the Board of Trustees, as described below. Market value is determined as follows:
Listed equity securities (including shares ofclosed-end investment companies and exchange-traded funds) are valued at the last sale price quoted on the exchange where they are traded most extensively or, if there is no reported sale during the day, the closing bid quotation as reported by an independent pricing service. Securities traded on the NASDAQ Global Select Market, NASDAQ Global Market and NASDAQ Capital Market are valued at the NASDAQ Official Closing Price (“NOCP”), or if lacking an NOCP, at the most recent bid quotations on the applicable NASDAQ Market. Unlisted equity securities (except unlisted preferred equity securities) are valued at the last sale price quoted in the market where they are traded most extensively or, if there is no reported sale during the day, the closing bid quotation as reported by an independent pricing service. If there is no last sale price or closing bid quotation available, unlisted equity securities will be valued using evaluated bids furnished by an
| 82
Notes to Financial Statements (continued)
December 31, 2019
independent pricing service, if available. In some foreign markets, an official close price and a last sale price may be available from the foreign exchange or market. In those cases, the official close price is used. Debt securities and unlisted preferred equity securities are valued based on evaluated bids furnished to the Funds by an independent pricing service or bid prices obtained from broker-dealers. Broker-dealer bid prices may be used to value debt and unlisted equity securities where an independent pricing service is unable to price a security or where an independent pricing service does not provide a reliable price for the security. Forward foreign currency contracts are valued utilizing interpolated rates determined based on information provided by an independent pricing service.
Fund securities and other investments for which market quotations are not readily available are valued at fair value as determined in good faith by the adviser pursuant to procedures approved by the Board of Trustees. The Funds may also value securities and other investments at fair value in other circumstances such as when extraordinary events occur after the close of a foreign market but prior to the close of the New York Stock Exchange. This may include situations relating to a single issuer (such as a declaration of bankruptcy or a delisting of the issuer’s security from the primary market on which it has traded) as well as events affecting the securities markets in general (such as market disruptions or closings and significant fluctuations in U.S. and/or foreign markets). When fair valuing its securities or other investments, the Funds may, among other things, use modeling tools or other processes that may take into account factors such as securities or other market activity and/or significant events that occur after the close of the foreign market and before the time the Fund’s net asset value (“NAV”) is calculated. Fair value pricing may require subjective determinations about the value of a security, and fair values used to determine a Fund’s NAV may differ from quoted or published prices, or from prices that are used by others, for the same securities. In addition, the use of fair value pricing may not always result in adjustments to the prices of securities held by a Fund.
As of December 31, 2019, securities held by Natixis Oakmark International Fund were fair valued as follows:
| | |
Equity securities1 | | Percentage of
Net Assets |
| $524,036,550 | | 87.7% |
| 1 | Certain foreign equity securities were fair valued pursuant to procedures approved by the Board of Trustees as events occurring after the close of the foreign market were believed to materially affect the value of those securities. |
b. Investment Transactions and Related Investment Income. Investment transactions are accounted for on a trade date plus one day basis for daily NAV calculation. However, for financial reporting purposes, investment transactions are reported on trade date. Dividend income (including income reinvested) and foreign withholding tax,
83 |
Notes to Financial Statements (continued)
December 31, 2019
if applicable, is recorded on theex-dividend date, or in the case of certain foreign securities, as soon as a Fund is notified, and interest income is recorded on an accrual basis. Dividends reinvested are reflected asnon-cash dividends on the Statements of Operations. Interest income is increased by the accretion of discount and decreased by the amortization of premium, if applicable. Distributions received from investments in securities that represent a return of capital or capital gain are recorded as a reduction of cost of investments or as a realized gain, respectively. The calendaryear-end amounts of ordinary income, capital gains, and return of capital included in distributions received from the Funds’ investments in real estate investment trusts (“REITs”) are reported to the Funds after the end of the fiscal year; accordingly, the Funds estimate these amounts for accounting purposes until the characterization of REIT distributions is reported to the Funds after the end of the fiscal year. Estimates are based on the most recent REIT distribution information available. In determining net gain or loss on securities sold, the cost of securities has been determined on an identified cost basis. Investment income,non-class specific expenses and realized and unrealized gains and losses are allocated on apro rata basis to each class based on the relative net assets of each class to the total net assets of the Fund.
c. Foreign Currency Translation. The books and records of the Funds are maintained in U.S. dollars. The values of securities, currencies and other assets and liabilities denominated in currencies other than U.S. dollars, if any, are translated into U.S. dollars based upon foreign exchange rates prevailing at the end of the period. Purchases and sales of investment securities, income and expenses are translated into U.S. dollars on the respective dates of such transactions.
Net realized foreign exchange gains or losses arise from sales of foreign currency, changes in exchange rates between the trade and settlement dates on securities transactions and the difference between the amounts of dividends, interest and foreign withholding taxes recorded on the Funds’ books and the U.S. dollar equivalent of the amounts actually received or paid. Net unrealized foreign exchange gains or losses arise from changes in the value of assets and liabilities, other than investment securities, as of the end of the fiscal period, resulting from changes in exchange rates. Net realized foreign exchange gains or losses and the net change in unrealized foreign exchange gains or losses are disclosed in the Statements of Operations. For federal income tax purposes, net realized foreign exchange gains or losses are characterized as ordinary income, and may, if the Funds have net losses, reduce the amount of income available to be distributed by the Funds.
The values of investment securities are presented at the foreign exchange rates prevailing at the end of the period for financial reporting purposes. Net realized and unrealized gains or losses on investments reported in the Statements of Operations reflect gains or losses resulting from changes in exchange rates and fluctuations which arise due to changes in market prices of investment securities.
| 84
Notes to Financial Statements (continued)
December 31, 2019
The Funds may use foreign currency exchange contracts to facilitate transactions in foreign-denominated investments. Losses may arise from changes in the value of the foreign currency or if the counterparties do not perform under the contracts’ terms.
d. Forward Foreign Currency Contracts. Certain Funds may enter into forward foreign currency contracts, including forward foreign cross currency contracts, to acquire exposure to foreign currencies or to hedge the Fund’s investments against currency fluctuation. A contract can also be used to offset a previous contract. These contracts involve market risk in excess of the unrealized appreciation (depreciation) reflected in the Funds’ Statements of Assets and Liabilities. The U.S. dollar value of the currencies a Fund has committed to buy or sell represents the aggregate exposure to each currency a Fund has acquired or hedged through currency contracts outstanding at period end. Gains or losses are recorded for financial statement purposes as unrealized until settlement date. Contracts are tradedover-the-counter directly with a counterparty. Risks may arise upon entering into these contracts from the potential inability of counterparties to meet the terms of their contracts and from unanticipated movements in the value of a foreign currency relative to the U.S. dollar. Certain contracts may require the movement of cash and/or securities as collateral for the Fund’s or counterparty’s net obligations under the contracts.
e. Federal and Foreign Income Taxes. The Trusts treat each Fund as a separate entity for federal income tax purposes. Each Fund intends to meet the requirements of the Internal Revenue Code of 1986, as amended, applicable to regulated investment companies, and to distribute to its shareholders substantially all of its net investment income and any net realized capital gains at least annually. Management has performed an analysis of each Fund’s tax positions for the open tax years as of December 31, 2019 and has concluded that no provisions for income tax are required. The Funds’ federal tax returns for the prior three fiscal years remain subject to examination by the Internal Revenue Service. Management is not aware of any events that are reasonably possible to occur in the next twelve months that would result in the amounts of any unrecognized tax benefits significantly increasing or decreasing for the Funds. However, management’s conclusions regarding tax positions taken may be subject to review and adjustment at a later date based on factors including, but not limited to, new tax laws and accounting regulations and interpretations thereof.
A Fund may be subject to foreign withholding taxes on investment income and taxes on capital gains on investments that are accrued and paid based upon the Fund’s understanding of the tax rules and regulations that exist in the countries in which the Fund invests. Foreign withholding taxes on dividend and interest income are reflected on the Statements of Operations as a reduction of investment income, net of amounts eligible to be reclaimed. Dividends and interest receivable on the Statements of Assets and Liabilities are net of foreign withholding taxes. Foreign withholding taxes where reclaims have been or will be filed are reflected on the Statements of Assets and
85 |
Notes to Financial Statements (continued)
December 31, 2019
Liabilities as tax reclaims receivable. Capital gains taxes paid are included in net realized gain (loss) on investments in the Statements of Operations. Accrued but unpaid capital gains taxes are reflected as foreign taxes payable on the Statements of Assets and Liabilities, if applicable, and reduce unrealized gains on investments. In the event that realized gains on investments are subsequently offset by realized losses, taxes paid on realized gains may be returned to a Fund. Such amounts, if applicable, are reflected as foreign tax rebates receivable on the Statements of Assets and Liabilities and are recorded as a realized gain when received.
f. Dividends and Distributions to Shareholders. Dividends and distributions are recorded on theex-dividend date. The timing and characterization of certain income and capital gain distributions are determined in accordance with federal tax regulations, which may differ from accounting principles generally accepted in the United States of America. Permanent differences are primarily due to differing treatments for book and tax purposes of items such as distributionre-designations, return of capital distributions received, distributions in excess of income and/or capital gain, foreign currency gains and losses and capital gains taxes. Permanent book and tax basis differences relating to shareholder distributions, net investment income and net realized gains will result in reclassifications to capital accounts reported on the Statements of Assets and Liabilities. Temporary differences between book and tax distributable earnings are primarily due to deferred Trustees’ fees, wash sales, return of capital distributions received and forward foreign currency contractmark-to-market. Amounts of income and capital gain available to be distributed on a tax basis are determined annually, and at other times during the Funds’ fiscal year as may be necessary to avoid knowingly declaring and paying a return of capital distribution. Distributions from net investment income and net realized short-term capital gains are reported as distributed from ordinary income for tax purposes.
The tax characterization of distributions is determined on an annual basis. The tax character of distributions paid to shareholders during the years ended December 31, 2019 and 2018 were as follows:
| | | | | | | | | | | | | | | | |
| | | 2019 Distributions Paid From: | |
Fund | | Ordinary
Income | | | Tax Exempt
Income | | | Long-Term
Capital Gains | | | Total | |
Intermediate Municipal Bond Fund | | $ | 3,751 | | | $ | 484,458 | | | $ | — | | | $ | 488,209 | |
Natixis Oakmark Fund | | | 2,339,088 | | | | — | | | | 25,578,931 | | | | 27,918,019 | |
Natixis Oakmark International Fund | | | 17,222,206 | | | | — | | | | — | | | | 17,222,206 | |
Small Cap Value Fund | | | 348,253 | | | | — | | | | 558,650 | | | | 906,903 | |
Value Opportunity Fund | | | 996,088 | | | | — | | | | 2,860,547 | | | | 3,856,635 | |
| 86
Notes to Financial Statements (continued)
December 31, 2019
| | | | | | | | | | | | | | | | |
| | | 2018 Distributions Paid From: | |
Fund | | Ordinary
Income | | | Tax Exempt
Income | | | Long-Term
Capital Gains | | | Total | |
Intermediate Municipal Bond Fund | | $ | 5,716 | | | $ | 662,720 | | | $ | — | | | $ | 668,436 | |
Natixis Oakmark Fund | | | 2,211,730 | | | | — | | | | 25,432,306 | | | | 27,644,036 | |
Natixis Oakmark International Fund | | | 16,730,811 | | | | — | | | | 14,047,101 | | | | 30,777,912 | |
Small Cap Value Fund | | | 6,205,741 | | | | — | | | | 27,906,818 | | | | 34,112,559 | |
Value Opportunity Fund | | | 6,805,023 | | | | — | | | | 53,866,158 | | | | 60,671,181 | |
Distributions paid to shareholders from net investment income and net realized capital gains, based on accounting principles generally accepted in the United States of America, are consolidated and reported on the Statements of Changes in Net Assets as Distributions to Shareholders. Distributions paid to shareholders from net investment income and net realized capital gains expressed inper-share amounts, based on accounting principles generally accepted in the United States of America, are separately stated and reported within the Financial Highlights.
As of December 31, 2019, the components of distributable earnings on a tax basis were as follows:
| | | | | | | | | | | | | | | | | | | | |
| | | Intermediate
Municipal
Bond Fund | | | Natixis
Oakmark
Fund | | | Natixis
Oakmark
International
Fund | | | Small Cap
Value Fund | | | Value
Opportunity
Fund | |
Undistributed ordinary income | | $ | — | | | $ | — | | | $ | — | | | $ | 1,799 | | | $ | — | |
Undistributed tax exempt income | | | 8,541 | | | | — | | | | — | | | | — | | | | — | |
Undistributed long-term capital gains | | | — | | | | 388,836 | | | | — | | | | 614,435 | | | | 8,939,388 | |
| | | | | | | | | | | | | | | | | | | | |
Total undistributed earnings | | | 8,541 | | | | 388,836 | | | | — | | | | 616,234 | | | | 8,939,388 | |
| | | | | | | | | | | | | | | | | | | | |
Capital loss carryforward: | | | | | | | | | | | | | | | | | | | | |
Short-term: | | | | | | | | | | | | | | | | | | | | |
No expiration date | | | (527,783 | ) | | | — | | | | — | | | | — | | | | — | |
Long-term: | | | | | | | | | | | | | | | | | | | | |
No expiration date | | | — | | | | — | | | | (32,773,225 | ) | | | — | | | | — | |
| | | | | | | | | | | | | | | | | | | | |
Total capital loss carryforward | | | (527,783 | ) | | | — | | | | (32,773,225 | ) | | | — | | | | — | |
| | | | | | | | | | | | | | | | | | | | |
87 |
Notes to Financial Statements (continued)
December 31, 2019
| | | | | | | | | | | | | | | | | | | | |
| | | Intermediate
Municipal
Bond Fund | | | Natixis
Oakmark
Fund | | | Natixis
Oakmark
International
Fund | | | Small Cap
Value Fund | | | Value
Opportunity
Fund | |
Late-year ordinary and post-October capital loss deferrals* | | $ | — | | | $ | — | | | $ | (62,337 | ) | | $ | — | | | $ | — | |
| | | | | | | | | | | | | | | | | | | | |
Unrealized appreciation (depreciation) | | | 1,171,891 | | | | 50,965,388 | | | | (63,892,037 | ) | | | 10,872,177 | | | | 61,793,627 | |
| | | | | | | | | | | | | | | | | | | | |
Total accumulated earnings (losses) | | $ | 652,649 | | | $ | 51,354,224 | | | $ | (96,727,599 | ) | | $ | 11,488,411 | | | $ | 70,733,015 | |
| | | | | | | | | | | | | | | | | | | | |
Capital loss carryforward utilized in the current year | | $ | 156,434 | | | $ | — | | | $ | — | | | $ | — | | | $ | — | |
| | | | | | | | | | | | | | | | | | | | |
| * | Under current tax law, capital losses, foreign currency losses and losses on passive foreign investment companies and contingent payment debt instruments after October 31 or December 31, as applicable, may be deferred and treated as occurring on the first day of the following taxable year. Natixis Oakmark International Fund is deferring foreign currency losses. |
As of December 31, 2019, the tax cost of investments (including derivatives, if applicable) and unrealized appreciation (depreciation) on a federal tax basis were as follows:
| | | | | | | | | | | | | | | | | | | | |
| | | Intermediate
Municipal
Bond Fund | | | Natixis
Oakmark
Fund | | | Natixis
Oakmark
International
Fund | | | Small Cap
Value Fund | | | Value
Opportunity
Fund | |
Federal tax cost | | $ | 17,972,196 | | | $ | 232,401,176 | | | $ | 661,742,810 | | | $ | 103,195,027 | | | $ | 309,375,675 | |
| | | | | | | | | | | | | | | | | | | | |
Gross tax appreciation | | $ | 1,172,513 | | | $ | 67,293,746 | | | $ | 31,980,766 | | | $ | 13,318,717 | | | $ | 67,371,201 | |
Gross tax depreciation | | | (622 | ) | | | (16,328,358 | ) | | | (95,702,480 | ) | | | (2,446,540 | ) | | | (5,577,574 | ) |
| | | | | | | | | | | | | | | | | | | | |
Net tax appreciation (depreciation) | | $ | 1,171,891 | | | $ | 50,965,388 | | | $ | (63,721,714 | ) | | $ | 10,872,177 | | | $ | 61,793,627 | |
| | | | | | | | | | | | | | | | | | | | |
The difference between these amounts and those reported in the components of distributable earnings are primarily attributable to foreign currencymark-to-market and foreign capital gains taxes.
| 88
Notes to Financial Statements (continued)
December 31, 2019
g. Repurchase Agreements. Each Fund may enter into repurchase agreements, under the terms of a Master Repurchase Agreement, under which each Fund acquires securities as collateral and agrees to resell the securities at an agreed upon time and at an agreed upon price. It is each Fund’s policy that the market value of the collateral for repurchase agreements be at least equal to 102% of the repurchase price, including interest. Certain repurchase agreements aretri-party arrangements whereby the collateral is held in a segregated account for the benefit of the Fund and on behalf of the counterparty. Repurchase agreements could involve certain risks in the event of default or insolvency of the counterparty, including possible delays or restrictions upon a Fund’s ability to dispose of the underlying securities. As of December 31, 2019, each Fund, as applicable, had investments in repurchase agreements for which the value of the related collateral exceeded the value of the repurchase agreement. The gross value of repurchase agreements is included in the Statements of Assets and Liabilities for financial reporting purposes.
h. Securities Lending. Certain Funds have entered into an agreement with State Street Bank and Trust Company (“State Street Bank”), as agent of the Funds, to lend securities to certain designated borrowers. The loans are collateralized with cash or securities in an amount equal to at least 105% or 102% of the market value (including accrued interest) of the loaned international or domestic securities, respectively, when the loan is initiated. Thereafter, the value of the collateral must remain at least 102% of the market value (including accrued interest) of loaned securities for U.S. equities and U.S. corporate debt; at least 105% of the market value (including accrued interest) of loaned securities fornon-U.S. equities; and at least 100% of the market value (including accrued interest) of loaned securities for U.S. Government securities, sovereign debt issued bynon-U.S. Governments andnon-U.S. corporate debt. In the event that the market value of the collateral falls below the required percentages described above, the borrower will deliver additional collateral on the next business day. As with other extensions of credit, the Funds may bear the risk of loss with respect to the investment of the collateral. The Funds invest cash collateral in short-term investments, a portion of the income from which is remitted to the borrowers and the remainder allocated between the Funds and State Street Bank as lending agent.
For the year ended December 31, 2019, none of the Funds had loaned securities under this agreement.
i. Indemnifications. Under the Trusts’ organizational documents, their officers and Trustees are indemnified against certain liabilities arising out of the performance of their duties to the Funds. Additionally, in the normal course of business, the Funds enter into contracts with service providers that contain general indemnification clauses. The Funds’ maximum exposure under these arrangements is unknown as this would involve future claims that may be made against the Funds that have not yet occurred. However, based on experience, the Funds expect the risk of loss to be remote.
89 |
Notes to Financial Statements (continued)
December 31, 2019
j. New Accounting Pronouncement. In August 2018, the Financial Accounting Standards Board issued Accounting Standards Update2018-13, Fair Value Measurement (Topic 820): Disclosure Framework—Changes to the Disclosure Requirements for Fair Value Measurement (“ASU2018-13”). The update introduces new fair value disclosure requirements, eliminates some prior fair value disclosure requirements, and modifies certain existing fair value disclosure requirements. ASU2018-13 will be effective for fiscal years beginning after December 15, 2019, including interim periods within those fiscal years. Management has evaluated the impact of the adoption ofASU 2018-13 and will incorporate required disclosure updates in the Funds’ semiannual financial statements as of June 30, 2020.
3. Fair Value Measurements. In accordance with accounting standards related to fair value measurements and disclosures, the Funds have categorized the inputs utilized in determining the value of each Fund’s assets or liabilities. These inputs are summarized in the three broad levels listed below:
| | • | | Level 1 – quoted prices in active markets for identical assets or liabilities; |
| | • | | Level 2 – prices determined using other significant inputs that are observable either directly, or indirectly through corroboration with observable market data (which could include quoted prices for similar assets or liabilities, interest rates, credit risk, etc.); and |
| | • | | Level 3 – prices determined using significant unobservable inputs when quoted prices or observable inputs are unavailable such as when there is little or no market activity for an asset or liability (unobservable inputs reflect each Fund’s own assumptions in determining the fair value of assets or liabilities and would be based on the best information available). |
The inputs or methodology used for valuing securities are not necessarily an indication of the risk associated with investing in those securities.
The following is a summary of the inputs used to value the Funds’ investments as of December 31, 2019, at value:
Intermediate Municipal Bond Fund
Asset Valuation Inputs
| | | | | | | | | | | | | | | | |
Description | | Level 1 | | | Level 2 | | | Level 3 | | | Total | |
Bonds and Notes(a) | | $ | — | | | $ | 17,706,061 | | | $ | — | | | $ | 17,706,061 | |
Exchange-Traded Funds | | | 842,000 | | | | — | | | | — | | | | 842,000 | |
Short-Term Investments | | | — | | | | 596,026 | | | | — | | | | 596,026 | |
| | | | | | | | | | | | | | | | |
Total | | $ | 842,000 | | | $ | 18,302,087 | | | $ | — | | | $ | 19,144,087 | |
| | | | | | | | | | | | | | | | |
| (a) | Details of the major categories of the Fund’s investments are reflected within the Portfolio of Investments. |
| 90
Notes to Financial Statements (continued)
December 31, 2019
For the year ended December 31, 2019, there were no transfers among Levels 1, 2 and 3.
Natixis Oakmark Fund
Asset Valuation Inputs
| | | | | | | | | | | | | | | | |
Description | | Level 1 | | | Level 2 | | | Level 3 | | | Total | |
Common Stocks(a) | | $ | 278,183,079 | | | $ | — | | | $ | — | | | $ | 278,183,079 | |
Short-Term Investments | | | — | | | | 5,183,485 | | | | — | | | | 5,183,485 | |
| | | | | | | | | | | | | | | | |
Total | | $ | 278,183,079 | | | $ | 5,183,485 | | | $ | — | | | $ | 283,366,564 | |
| | | | | | | | | | | | | | | | |
| (a) | Details of the major categories of the Fund’s investments are reflected within the Portfolio of Investments. |
For the year ended December 31, 2019, there were no transfers among Levels 1, 2 and 3.
Natixis Oakmark International Fund
Asset Valuation Inputs
| | | | | | | | | | | | | | | | |
Description | | Level 1 | | | Level 2 | | | Level 3 | | | Total | |
Common Stocks | | | | | | | | | | | | | | | | |
Australia | | $ | — | | | $ | 14,128,158 | | | $ | — | | | $ | 14,128,158 | |
China | | | 10,264,633 | | | | 4,036,579 | | | | — | | | | 14,301,212 | |
Finland | | | — | | | | 4,732,328 | | | | — | | | | 4,732,328 | |
France | | | — | | | | 67,828,135 | | | | — | | | | 67,828,135 | |
Germany | | | — | | | | 107,533,426 | | | | — | | | | 107,533,426 | |
India | | | — | | | | 3,889,823 | | | | — | | | | 3,889,823 | |
Indonesia | | | — | | | | 4,770,005 | | | | — | | | | 4,770,005 | |
Italy | | | — | | | | 21,566,886 | | | | — | | | | 21,566,886 | |
Japan | | | — | | | | 20,526,486 | | | | — | | | | 20,526,486 | |
Korea | | | — | | | | 18,370,612 | | | | — | | | | 18,370,612 | |
Netherlands | | | — | | | | 13,733,424 | | | | — | | | | 13,733,424 | |
South Africa | | | — | | | | 11,837,399 | | | | — | | | | 11,837,399 | |
Sweden | | | — | | | | 35,707,391 | | | | — | | | | 35,707,391 | |
Switzerland | | | — | | | | 71,850,687 | | | | — | | | | 71,850,687 | |
Taiwan | | | — | | | | 1,494,156 | | | | — | | | | 1,494,156 | |
United Kingdom | | | 10,195,607 | | | | 117,758,284 | | | | — | | | | 127,953,891 | |
United States | | | 1,045,443 | | | | 4,272,771 | | | | — | | | | 5,318,214 | |
All Other Common Stocks(a) | | | 37,343,713 | | | | — | | | | — | | | | 37,343,713 | |
| | | | | | | | | | | | | | | | |
Total Common Stocks | | | 58,849,396 | | | | 524,036,550 | | | | — | | | | 582,885,946 | |
| | | | | | | | | | | | | | | | |
Preferred Stocks(a) | | | — | | | | 2,561,851 | | | | — | | | | 2,561,851 | |
Short-Term Investments | | | — | | | | 12,573,625 | | | | — | | | | 12,573,625 | |
| | | | | | | | | | | | | | | | |
Total | | $ | 58,849,396 | | | $ | 539,172,026 | | | $ | — | | | $ | 598,021,422 | |
| | | | | | | | | | | | | | | | |
91 |
Notes to Financial Statements (continued)
December 31, 2019
Natixis Oakmark International Fund (continued)
Liability Valuation Inputs
| | | | | | | | | | | | | | | | |
Description | | Level 1 | | | Level 2 | | | Level 3 | | | Total | |
Forward Foreign Currency Contracts (unrealized depreciation) | | $ | — | | | $ | (70,259 | ) | | $ | — | | | $ | (70,259 | ) |
| | | | | | | | | | | | | | | | |
| (a) | Details of the major categories of the Fund’s investments are reflected within the Portfolio of Investments. |
For the year ended December 31, 2019, there were no transfers among Levels 1, 2 and 3.
Small Cap Value Fund
Asset Valuation Inputs
| | | | | | | | | | | | | | | | |
Description | | Level 1 | | | Level 2 | | | Level 3 | | | Total | |
Common Stocks(a) | | $ | 107,943,697 | | | $ | — | | | $ | — | | | $ | 107,943,697 | |
Exchange-Traded Funds | | | 5,528,940 | | | | — | | | | — | | | | 5,528,940 | |
Short-Term Investments | | | — | | | | 594,567 | | | | — | | | | 594,567 | |
| | | | | | | | | | | | | | | | |
Total | | $ | 113,472,637 | | | $ | 594,567 | | | $ | — | | | $ | 114,067,204 | |
| | | | | | | | | | | | | | | | |
| (a) | Details of the major categories of the Fund’s investments are reflected within the Portfolio of Investments. |
For the year ended December 31, 2019, there were no transfers among Levels 1, 2 and 3.
Value Opportunity Fund
Asset Valuation Inputs
| | | | | | | | | | | | | | | | |
Description | | Level 1 | | | Level 2 | | | Level 3 | | | Total | |
Common Stocks(a) | | $ | 368,200,407 | | | $ | — | | | $ | — | | | $ | 368,200,407 | |
Short-Term Investments | | | — | | | | 2,968,895 | | | | — | | | | 2,968,895 | |
| | | | | | | | | | | | | | | | |
Total | | $ | 368,200,407 | | | $ | 2,968,895 | | | $ | — | | | $ | 371,169,302 | |
| | | | | | | | | | | | | | | | |
| (a) | Details of the major categories of the Fund’s investments are reflected within the Portfolio of Investments. |
For the year ended December 31, 2019, there were no transfers among Levels 1, 2 and 3.
4. Derivatives. Derivative instruments are defined as financial instruments whose value and performance are based on the value and performance of an underlying asset, reference rate or index. Derivative instruments that Natixis Oakmark International Fund used during the period include forward foreign currency contracts.
The Fund is subject to the risk that changes in foreign currency exchange rates will have an unfavorable effect on the value of Fund assets denominated in foreign currencies. The Fund may enter into forward foreign currency contracts for hedging purposes to protect the value of the Fund’s holdings of foreign securities. During the
| 92
Notes to Financial Statements (continued)
December 31, 2019
year ended December 31, 2019, the Fund engaged in forward foreign currency transactions for hedging purposes.
The following is a summary of derivative instruments for Natixis Oakmark International Fund as of December 31, 2019, as reflected within the Statements of Assets and Liabilities:
| | | | |
Liabilities | | Unrealized
depreciation on
forward foreign
currency contracts | |
Over-the-counter liability derivatives | | | | |
Foreign exchange contracts | | | $(70,259) | |
Transactions in derivative instruments for Natixis Oakmark International Fund during the year ended December 31, 2019, as reflected within the Statements of Operations were as follows:
| | |
Net Realized Gain (Loss) on: | | Forward foreign
currency
contracts |
| Foreign exchange contracts | | $826,022 |
| |
Net Change in Unrealized
Appreciation (Depreciation) on: | | Forward foreign
currency
contracts |
| Foreign exchange contracts | | $(561,459) |
As the Fund values its derivatives at fair value and recognizes changes in fair value through the Statement of Operations, it does not qualify for hedge accounting under authoritative guidance for derivative instruments. The Fund’s investments in derivatives may represent an economic hedge; however, they are considered to benon-hedge transactions for the purpose of these disclosures.
The volume of forward foreign currency contract activity, as a percentage of net assets, for Natixis Oakmark International Fund, based on grossmonth-end notional amounts outstanding during the period, including long and short positions at absolute value, was as follows for the year ended December 31, 2019:
| | |
Natixis Oakmark International Fund | | Forwards |
| Average Notional Amount Outstanding | | 2.40% |
| Highest Notional Amount Outstanding | | 4.16% |
| Lowest Notional Amount Outstanding | | 0.75% |
| Notional Amount Outstanding as of December 31, 2019 | | 0.75% |
Notional amounts outstanding at the end of the prior period are included in the average notional amount outstanding.
93 |
Notes to Financial Statements (continued)
December 31, 2019
Unrealized gain and/or loss on open forwards is recorded in the Statements of Assets and Liabilities. The aggregate notional values of forward contracts are not recorded in the Statements of Assets and Liabilities, and therefore are not included in the Fund’s net assets.
The Fund enters intoover-the-counter derivatives, including forward foreign currency contracts, pursuant to an International Swaps and Derivatives Association, Inc. (“ISDA”) agreement between the Fund and its counterparty. ISDA agreements typically contain master netting provisions in the event of a default or other termination event. Master netting provisions allow the Fund and the counterparty, in the event of a default or other termination event, to offset amounts owed by each related to derivative contracts to one net amount payable by either the Fund or the counterparty. For financial reporting purposes, the Fund does not offset derivative assets and liabilities on the Statements of Assets and Liabilities.
As of December 31, 2019, gross amounts of derivative assets and liabilities not offset in the Statement of Assets and Liabilities and the related net amounts after taking into account master netting arrangements, by counterparty, are as follows:
Natixis Oakmark International Fund
| | | | | | | | | | | | |
Counterparty | | Gross Amounts of
Liabilities | | | Offset
Amount | | | Net
Amount | |
State Street Bank and Trust Company | | $ | (70,259 | ) | | $ | — | | | $ | (70,259 | ) |
Counterparty risk is managed based on policies and procedures established by each Fund’s adviser. Such policies and procedures may include, but are not limited to, minimum counterparty credit rating requirements and monitoring of counterparty credit default swap spreads. Based on balances reflected on the Fund’s Statement of Assets and Liabilities, the following table shows (i) the maximum amount of loss due to credit risk that, based on the gross fair value of the financial instrument, the Fund would incur if parties to the relevant financial instruments failed completely to perform according to the terms of the contracts and ii) the amount of loss that the Fund would incur after taking into account master netting provisions pursuant to ISDA agreements, as of December 31, 2019:
| | | | | | | | |
Fund | | Maximum Amount
of Loss - Gross | | | Maximum Amount
of Loss - Net | |
Natixis Oakmark International Fund | | $ | — | | | $ | — | |
| 94
Notes to Financial Statements (continued)
December 31, 2019
5. Purchases and Sales of Securities. For the year ended December 31, 2019, purchases and sales of securities (excluding short-term investments and U.S. Government/Agency securities and including paydowns) were as follows:
| | | | | | | | |
Fund | | Purchases | | | Sales | |
Intermediate Municipal Bond Fund | | $ | 2,142,750 | | | $ | 5,083,448 | |
Natixis Oakmark Fund | | | 42,299,107 | | | | 88,360,981 | |
Natixis Oakmark International Fund | | | 179,570,578 | | | | 411,012,531 | |
Small Cap Value Fund | | | 73,816,347 | | | | 114,985,029 | |
Value Opportunity Fund | | | 211,822,014 | | | | 544,579,082 | |
6. Management Fees and Other Transactions with Affiliates.
a. Management Fees. Natixis Advisors, L.P. (“Natixis Advisors”) serves as investment adviser to each Fund. Under the terms of the management agreements, each Fund pays a management fee at the following annual rates, calculated daily and payable monthly, based on each Fund’s average daily net assets:
| | | | | | | | | | | | | | | | | | | | | | | | |
| | | Percentage of Average Daily Net Assets | |
Fund | | First $150 million | | | Next $50 million | | | Next $300 million | | | Next $500 million | | | Next $500 million | | | Over $1.5 billion | |
Intermediate Municipal Bond Fund | | | 0.40 | % | | | 0.40 | % | | | 0.40 | % | | | 0.40 | % | | | 0.40 | % | | | 0.40 | % |
Natixis Oakmark Fund | | | 0.70 | % | | | 0.70 | % | | | 0.65 | % | | | 0.60 | % | | | 0.60 | % | | | 0.60 | % |
Natixis Oakmark International Fund | | | 0.85 | % | | | 0.75 | % | | | 0.75 | % | | | 0.75 | % | | | 0.70 | % | | | 0.70 | % |
Small Cap Value Fund | | | 0.90 | % | | | 0.90 | % | | | 0.90 | % | | | 0.90 | % | | | 0.90 | % | | | 0.90 | % |
Value Opportunity Fund | | | 0.80 | % | | | 0.80 | % | | | 0.80 | % | | | 0.80 | % | | | 0.80 | % | | | 0.75 | % |
Prior to July 1, 2019, Natixis Oakmark International Fund paid a management fee at the annual rate of 0.85% of the Fund’s average daily net assets, calculated daily and payable monthly.
95 |
Notes to Financial Statements (continued)
December 31, 2019
Natixis Advisors has entered into subadvisory agreements for each Fund as listed below.
| | |
Intermediate Municipal Bond Fund | | Loomis, Sayles & Company, L.P. (“Loomis Sayles”) |
Natixis Oakmark Fund | | Harris Associates L.P. (“Harris”) |
Natixis Oakmark International Fund | | Harris |
Small Cap Value Fund | | Vaughan Nelson Investment Management, L.P. (“Vaughan Nelson”) |
Value Opportunity Fund | | Vaughan Nelson |
Natixis Advisors, Harris and Vaughan Nelson are subsidiaries of Natixis Investment Managers, LLC (“Natixis”), which is part of Natixis Investment Managers, an international asset management group based in Paris, France. Loomis Sayles is a limited partnership whose sole general partner, Loomis, Sayles & Company, Inc. is indirectly owned by Natixis.
Under the terms of the subadvisory agreements, each Fund has agreed to pay its respective subadviser a subadvisory fee at the following annual rates, calculated daily and payable monthly, based on each Fund’s average daily net assets:
| | | | | | | | | | | | | | | | | | | | | | |
| | | | | Percentage of Average
Daily Net Assets | |
Fund | | Subadviser | | First $150 million | | | Next $50 million | | | Next $800 million | | | Next $500 million | | | Over $1.5 billion | |
Intermediate Municipal Bond Fund | | Loomis
Sayles | | | 0.20 | % | | | 0.20 | % | | | 0.20 | % | | | 0.20 | % | | | 0.20 | % |
Natixis Oakmark Fund | | Harris | | | 0.52 | % | | | 0.52 | % | | | 0.50 | % | | | 0.50 | % | | | 0.50 | % |
Natixis Oakmark International Fund | | Harris | | | 0.60 | % | | | 0.50 | % | | | 0.50 | % | | | 0.45 | % | | | 0.45 | % |
Small Cap Value Fund | | Vaughan
Nelson | | | 0.55 | % | | | 0.55 | % | | | 0.55 | % | | | 0.55 | % | | | 0.55 | % |
Value Opportunity Fund | | Vaughan
Nelson | | | 0.50 | % | | | 0.50 | % | | | 0.50 | % | | | 0.50 | % | | | 0.47 | % |
Prior to June 30, 2019, McDonnell Investment Management, LLC (“McDonnell”), which was owned by Loomis, Sayles & Company, Inc., was thesub-adviser to the Intermediate Municipal Bond Fund and was paid a subadvisory fee at the same rates.
| 96
Notes to Financial Statements (continued)
December 31, 2019
Prior to July 1, 2019, Natixis Oakmark International Fund paid its respective subadviser a subadvisory fee at an annual rate of 0.60%, calculated daily and payable monthly, based on the Fund’s average daily net assets.
Natixis Advisors has given binding undertakings to the Funds to waive management fees and/or reimburse certain expenses to limit the Funds’ operating expenses, exclusive of acquired fund fees and expenses, brokerage expenses, interest expense, substitute dividend expenses on securities sold short, taxes, organizational and extraordinary expenses, such as litigation and indemnification expenses. These undertakings are in effect until April 30, 2020 for Intermediate Municipal Bond Fund and Natixis Oakmark Fund and until April 30, 2021 for Natixis Oakmark International Fund, Small Cap Value Fund and Value Opportunity Fund, may be terminated before then only with the consent of the Funds’ Board of Trustees, and are reevaluated on an annual basis. Management fees payable, as reflected on the Statements of Assets and Liabilities, is net of waivers and/or expense reimbursements, if any, pursuant to these undertakings. Waivers/reimbursements that exceed management fees payable are reflected on the Statements of Assets and Liabilities as receivable from investment adviser.
For the year ended December 31, 2019 the expense limits as a percentage of average daily net assets under the expense limitation agreements were as follows:
| | | | | | | | | | | | | | | | |
| | | Expense Limit as a Percentage of
Average Daily Net Assets | |
Fund | | Class A | | | Class C | | | Class N | | | Class Y | |
Intermediate Municipal Bond Fund | | | 0.70 | % | | | 1.45 | % | | | — | | | | 0.45 | % |
Natixis Oakmark Fund | | | 1.30 | % | | | 2.05 | % | | | 1.00 | % | | | 1.05 | % |
Natixis Oakmark International Fund | | | 1.37 | % | | | 2.12 | % | | | 1.07 | % | | | 1.12 | % |
Small Cap Value Fund | | | 1.34 | % | | | 2.09 | % | | | 1.04 | % | | | 1.09 | % |
Value Opportunity Fund | | | 1.20 | % | | | 1.95 | % | | | 0.90 | % | | | 0.95 | % |
Prior to July 1, 2019, the expense limits as a percentage of average daily net assets under the expense limitation agreements for Natixis Oakmark International Fund, Small Cap Value Fund and Value Opportunity Fund were as follows:
| | | | | | | | | | | | | | | | |
| | | Expense Limit as a Percentage of
Average Daily Net Assets | |
Fund | | Class A | | | Class C | | | Class N | | | Class Y | |
Natixis Oakmark International Fund | | | 1.45 | % | | | 2.20 | % | | | 1.15 | % | | | 1.20 | % |
Small Cap Value Fund | | | 1.45 | % | | | 2.20 | % | | | 1.15 | % | | | 1.20 | % |
Value Opportunity Fund | | | 1.40 | % | | | 2.15 | % | | | 1.10 | % | | | 1.15 | % |
Natixis Advisors shall be permitted to recover expenses borne under the expense limitation agreements (whether through waiver of management fees or otherwise) on a class by class basis in later periods to the extent the annual operating expenses of a
97 |
Notes to Financial Statements (continued)
December 31, 2019
class fall below a class’ expense limits, provided, however, that a class is not obligated to pay such waived/reimbursed fees or expenses more than one year after the end of the fiscal year in which the fees or expenses were waived/reimbursed.
For the year ended December 31, 2019, the management fees and waivers of management fees for each Fund were as follows:
| | | | | | | | | | | | | | | | | | | | |
Fund | | Gross
Management
Fees | | | Contractual
Waivers of
Management
Fees1 | | | Net
Management
Fees | | | Percentage of
Average Daily
Net Assets | |
| | Gross | | | Net | |
Intermediate Municipal Bond Fund | | $ | 81,140 | | | $ | 81,140 | | | $ | — | | | | 0.40 | % | | | — | % |
Natixis Oakmark Fund | | | 2,024,486 | | | | — | | | | 2,024,486 | | | | 0.68 | % | | | 0.68 | % |
Natixis Oakmark International Fund | | | 5,285,519 | | | | — | | | | 5,285,519 | | | | 0.82 | % | | | 0.82 | % |
Small Cap Value Fund | | | 1,138,555 | | | | 94,489 | | | | 1,044,066 | | | | 0.90 | % | | | 0.83 | % |
Value Opportunity Fund | | | 3,346,992 | | | | 94,264 | | | | 3,252,728 | | | | 0.80 | % | | | 0.78 | % |
| 1 | Management fee waivers are subject to possible recovery until December 31, 2020. |
For the year ended December 31, 2019, expenses have been reimbursed as follows:
| | | | |
Fund | | Reimbursement | |
Intermediate Municipal Bond Fund | | $ | 151,023 | |
No expenses were recovered for any of the Funds during the year ended December 31, 2019 under the terms of the expense limitation agreements.
b. Service and Distribution Fees. Natixis Distribution, L.P. (“Natixis Distribution”), which is a wholly-owned subsidiary of Natixis, has entered into a distribution agreement with the Trusts. Pursuant to this agreement, Natixis Distribution serves as principal underwriter of the Funds of the Trusts.
Pursuant to Rule12b-1 under the 1940 Act, the Trusts have adopted a Service Plan relating to each Fund’s Class A shares (the “Class A Plans”) and a Distribution and Service Plan relating to each Fund’s Class C shares (the “Class C Plans”).
Under the Class A Plans, each Fund pays Natixis Distribution a monthly service fee at an annual rate not to exceed 0.25% of the average daily net assets attributable to the Funds’ Class A shares, as reimbursement for expenses incurred by Natixis Distribution in providing personal services to investors in Class A shares and/or the maintenance of shareholder accounts.
Under the Class C Plans, each Fund pays Natixis Distribution a monthly service fee at an annual rate not to exceed 0.25% of the average daily net assets attributable to the
| 98
Notes to Financial Statements (continued)
December 31, 2019
Funds’ Class C shares, as compensation for services provided by Natixis Distribution in providing personal services to investors in Class C shares and/or the maintenance of shareholder accounts.
Also under the Class C Plans, each Fund pays Natixis Distribution a monthly distribution fee at an annual rate of 0.75% of the average daily net assets attributable to the Funds’ Class C shares, as compensation for services provided by Natixis Distribution in connection with the marketing or sale of Class C shares.
For the year ended December 31, 2019, the service and distribution fees for each Fund were as follows:
| | | | | | | | | | | | |
| | | Service Fees | | | Distribution Fees | |
Fund | | Class A | | | Class C | | | Class C | |
Intermediate Municipal Bond Fund | | $ | 17,042 | | | $ | 3,680 | | | $ | 11,040 | |
Natixis Oakmark Fund | | | 448,350 | | | | 141,629 | | | | 424,887 | |
Natixis Oakmark International Fund | | | 575,256 | | | | 507,842 | | | | 1,523,525 | |
Small Cap Value Fund | | | 175,945 | | | | 5,795 | | | | 17,386 | |
Value Opportunity Fund | | | 70,991 | | | | 59,643 | | | | 178,930 | |
c. Administrative Fees. Natixis Advisors provides certain administrative services for the Funds and contracts with State Street Bank to serve assub-administrator. Pursuant to an agreement among Natixis Funds Trusts, Loomis Sayles Funds Trusts, Natixis ETF Trust and Natixis Advisors, effective July 1, 2019 each Fund pays Natixis Advisors monthly itspro rata portion of fees equal to an annual rate of 0.0540% of the first $15 billion of the average daily net assets of the Natixis Funds Trusts, Loomis Sayles Funds Trusts and Natixis ETF Trust, 0.0500% of the next $15 billion, 0.0400% of the next $30 billion, 0.0275% of the next $30 billion and 0.0225% of such assets in excess of $90 billion, subject to an annual aggregate minimum fee for the Natixis Funds Trusts, Loomis Sayles Funds Trusts and Natixis ETF Trust of $10 million, which is reevaluated on an annual basis.
Prior to July 1, 2019, each Fund paid Natixis Advisors monthly itspro rata portion of fees equal to an annual rate of 0.0575% of the first $15 billion of the average daily net assets of the Natixis Funds Trusts, Loomis Sayles Funds Trusts and Natixis ETF Trust, 0.0500% of the next $15 billion, 0.0400% of the next $30 billion, 0.0275% of the next $30 billion and 0.0225% of such assets in excess of $90 billion, subject to an annual aggregate minimum fee for the Natixis Funds Trusts, Loomis Sayles Funds Trusts and Natixis ETF Trust of $10 million.
Effective October 1, 2018, State Street Bank agreed to reduce the fees it receives from Natixis Advisors for serving assub-administrator to the Funds. Also, effective October 1, 2018, Natixis Advisors agreed to voluntarily waive fees paid by the Funds in an amount equal to the reduction insub-administrative fees discussed above. The waiver was in effect through June 30, 2019.
99 |
Notes to Financial Statements (continued)
December 31, 2019
For the year ended December 31, 2019, the administrative fees for each Fund were as follows:
| | | | | | | | | | | | |
Fund | | Gross Administrative
Fees | | | Waiver of
Administrative
Fees | | | Net
Administrative
Fees | |
Intermediate Municipal Bond Fund | | $ | 8,937 | | | $ | 110 | | | $ | 8,827 | |
Natixis Oakmark Fund | | | 130,418 | | | | 1,608 | | | | 128,810 | |
Natixis Oakmark International Fund | | | 285,779 | | | | 3,660 | | | | 282,119 | |
Small Cap Value Fund | | | 55,743 | | | | 706 | | | | 55,037 | |
Value Opportunity Fund | | | 184,437 | | | | 2,398 | | | | 182,039 | |
d. Sub-Transfer Agent Fees. Natixis Distribution has entered into agreements, which include servicing agreements, with financial intermediaries that provide recordkeeping, processing, shareholder communications and other services to customers of the intermediaries that hold positions in the Funds and has agreed to compensate the intermediaries for providing those services. Intermediaries transact with the Funds primarily through the use of omnibus accounts on behalf of their customers who hold positions in the Funds. These services would have been provided by the Funds’ transfer agent and other service providers if the shareholders’ accounts were maintained directly at the Funds’ transfer agent. Accordingly, the Funds have agreed to reimburse Natixis Distribution for all or a portion of the servicing fees paid to these intermediaries. The reimbursement amounts(sub-transfer agent fees) paid to Natixis Distribution are subject to a currentper-account equivalent fee limit approved by the Funds’ Board of Trustees, which is based on fees for similar services paid to the Funds’ transfer agent and other service providers. Class N shares do not bear such expenses.
For the year ended December 31, 2019, thesub-transfer agent fees (which are reflected in transfer agent fees and expenses in the Statements of Operations) for each Fund were as follows:
| | | | |
Fund | | Sub-Transfer
Agent Fees | |
Intermediate Municipal Bond Fund | | $ | 3,974 | |
Natixis Oakmark Fund | | | 135,040 | |
Natixis Oakmark International Fund | | | 600,878 | |
Small Cap Value Fund | | | 83,142 | |
Value Opportunity Fund | | | 318,560 | |
| 100
Notes to Financial Statements (continued)
December 31, 2019
As of December 31, 2019, the Funds owe Natixis Distribution the following reimbursements forsub-transfer agent fees (which are reflected in the Statements of Assets and Liabilities as payable to distributor):
| | | | |
Fund | | Reimbursements
ofSub-Transfer
Agent Fees | |
Intermediate Municipal Bond Fund | | $ | 51 | |
Natixis Oakmark Fund | | | 1,772 | |
Natixis Oakmark International Fund | | | 8,122 | |
Small Cap Value Fund | | | 966 | |
Value Opportunity Fund | | | 4,371 | |
Sub-transfer agent fees attributable to Class A, Class C and Class Y are allocated on apro rata basis to each class based on the relative net assets of each class to the total net assets of those classes.
e. Commissions. Commissions (including CDSCs) on Fund shares retained by Natixis Distribution during the year ended December 31, 2019, were as follows:
| | | | |
Fund | | Commissions | |
Intermediate Municipal Bond Fund | | $ | 215 | |
Natixis Oakmark Fund | | | 35,158 | |
Natixis Oakmark International Fund | | | 56,309 | |
Small Cap Value Fund | | | 818 | |
Value Opportunity Fund | | | 1,613 | |
f. Trustees Fees and Expenses. The Trusts do not pay any compensation directly to their officers or Trustees who are directors, officers or employees of Natixis Advisors, Natixis Distribution, Natixis or their affiliates. The Chairperson of the Board of Trustees receives a retainer fee at the annual rate of $360,000. The Chairperson does not receive any meeting attendance fees for Board of Trustees meetings or committee meetings that he attends. Each Independent Trustee (other than the Chairperson) receives, in the aggregate, a retainer fee at the annual rate of $190,000. Each Independent Trustee also receives a meeting attendance fee of $10,000 for each meeting of the Board of Trustees that he or she attends in person and $5,000 for each meeting of the Board of Trustees that he or she attends telephonically. In addition, the chairperson of the Contract Review Committee and the chairperson of the Audit Committee each receive an additional retainer fee at the annual rate of $20,000. The chairperson of the Governance Committee receives an additional retainer fee at the annual rate of $15,000. Each Contract Review Committee member is compensated $6,000 for each Committee meeting that he or she attends in person and $3,000 for each meeting that he or she attends telephonically. Each Audit Committee member is compensated $6,000 for each Committee meeting that he or she attends in person and $3,000 for each meeting that
101 |
Notes to Financial Statements (continued)
December 31, 2019
he or she attends telephonically. These fees are allocated among the funds in the Natixis Funds Trusts, Loomis Sayles Funds Trusts and Natixis ETF Trust based on a formula that takes into account, among other factors, the relative net assets of each fund. Trustees are reimbursed for travel expenses in connection with attendance at meetings.
Effective January 1, 2020, the Chairperson of the Board will receive a retainer fee at the annual rate of $369,000, each Independent Trustee (other than the Chairperson) will receive, in the aggregate, a retainer fee at the annual rate of $199,000, and the chairperson of the Governance Committee will receive an additional retainer fee at the annual rate of $20,000. All other Trustee fees will remain unchanged.
A deferred compensation plan (the “Plan”) is available to the Trustees on a voluntary basis. Deferred amounts remain in the Funds until distributed in accordance with the provisions of the Plan. The value of a participating Trustee’s deferral account is based on theoretical investments of deferred amounts, on the normal payment dates, in certain funds of the Natixis Funds Trusts, Loomis Sayles Funds Trusts and Natixis ETF Trust as designated by the participating Trustees. Changes in the value of participants’ deferral accounts are allocatedpro rataamong the funds in the Natixis Funds Trusts, Loomis Sayles Funds Trusts and Natixis ETF Trust, and are normally reflected as Trustees’ fees and expenses in the Statements of Operations. The portions of the accrued obligations allocated to the Funds under the Plan are reflected as Deferred Trustees’ fees in the Statements of Assets and Liabilities.
Certain officers and employees of Natixis Advisors and affiliates are also officers and/or Trustees of the Trusts.
g. Affiliated Ownership. As of December 31, 2019, Natixis and affiliates held shares of the Small Cap Value Fund representing less than 0.01% of the Fund’s net assets.
Investment activities of affiliated shareholders could have material impacts on the Fund.
h. Reimbursement of Transfer Agent Fees and Expenses. Natixis Advisors has given a binding contractual undertaking to Natixis Oakmark Fund, Natixis Oakmark International Fund and Small Cap Value Fund to reimburse any and all transfer agency expenses for the Funds’ Class N shares. This undertaking is in effect through April 30, 2020 and is not subject to recovery under the expense limitation agreement described above.
| 102
Notes to Financial Statements (continued)
December 31, 2019
For the year ended December 31, 2019, Natixis Advisors reimbursed the Funds for transfer agency expenses as follows:
| | | | |
| | | Reimbursement of
Transfer Agency
Expenses | |
Fund | | Class N | |
Natixis Oakmark Fund | | $ | 805 | |
Natixis Oakmark International Fund | | | 853 | |
Small Cap Value Fund | | | 796 | |
7. Class-Specific Transfer Agent Fees and Expenses. Transfer agent fees and expenses for Natixis Oakmark Fund, Natixis Oakmark International Fund, Small Cap Value Fund and Value Opportunity Fund attributable to Class A, Class C and Class Y are allocated on apro ratabasis to each class based on the relative net assets of each class to the total net assets of those classes. Transfer agent fees and expenses attributable to Class N are allocated to Class N.
Intermediate Municipal Bond Fund allocates transfer agent fees and expenses on apro ratabasis based on the relative net assets of each class to the total net assets of those classes.
For the year ended December 31, 2019, Natixis Oakmark Fund, Natixis Oakmark International Fund, Small Cap Value Fund and Value Opportunity Fund incurred the following class-specific transfer agent fees and expenses (includingsub-transfer agent fees, where applicable):
| | | | | | | | | | | | | | | | |
| | | Transfer Agent Fees and Expenses | |
Fund | | Class A | | | Class C | | | Class N | | | Class Y | |
Natixis Oakmark Fund | | $ | 159,270 | | | $ | 50,309 | | | $ | 805 | | | $ | 52,995 | |
Natixis Oakmark International Fund | | | 232,721 | | | | 204,374 | | | | 853 | | | | 214,777 | |
Small Cap Value Fund | | | 79,581 | | | | 2,643 | | | | 796 | | | | 61,082 | |
Value Opportunity Fund | | | 29,040 | | | | 23,600 | | | | 784 | | | | 309,190 | |
8. Line of Credit. Each Fund, together with certain other funds of Natixis Funds Trusts, Loomis Sayles Funds Trusts and Natixis ETF Trust, entered into a $400,000,000 committed unsecured line of credit provided by State Street Bank. Any one Fund may borrow up to $350,000,000 under the line of credit agreement (as long as all borrowings by all Funds in the aggregate do not exceed the $400,000,000 limit at any time), subject to each Fund’s investment restrictions and its contractual obligations under the line of credit. Interest is charged to the Funds based upon the terms set forth in the agreement. In addition, a commitment fee of 0.15% per annum, payable at the end of each calendar quarter, is accrued and apportioned among the participating funds based on their average daily unused portion of the line of credit. The Funds paid an arrangement fee, an upfront fee, and certain other legal fees in connection with the
103 |
Notes to Financial Statements (continued)
December 31, 2019
line of credit agreement, which are being amortized over a period of 364 days and are reflected in legal fees and/or miscellaneous expenses on the Statements of Operations. The unamortized balance is reflected as prepaid expenses on the Statements of Assets and Liabilities.
For the year ended December 31, 2019, Value Opportunity Fund had an average daily balance on the line of credit (for those days on which there were borrowings) of $78,214,167 at a weighted average interest rate of 3.45%. Interest expense incurred was $44,968.
9. Interest Expense. The Fund may incur interest expense on cash overdrafts at the custodian or from use of the line of credit. Interest expense incurred for the year ended December 31, 2019 is reflected on the Statement of Operations.
10. Concentration of Risk. Natixis Oakmark International Fund’s investments in foreign securities may be subject to greater political, economic, environmental, credit/counterparty and information risks. The Fund’s investments in foreign securities also are subject to foreign currency fluctuations and other foreign currency-related risks. Foreign securities may be subject to higher volatility than U.S. securities, varying degrees of regulation and limited liquidity.
11. Concentration of Ownership. From time to time, a Fund may have a concentration of one or more accounts constituting a significant percentage of shares outstanding. Investment activities by holders of such accounts could have material impacts on the Funds. As of December 31, 2019, based on management’s evaluation of the shareholder account base, the Funds had accounts representing controlling ownership of more than 5% of the Funds’ total outstanding shares. The number of such accounts, based on accounts that represent more than 5% of an individual class of shares, and the aggregate percentage of net assets represented by such holdings were as follows:
| | | | | | | | |
Fund | | Number of 5%
Account Holders | | | Percentage of
Ownership | |
Intermediate Municipal Bond Fund | | | 4 | | | | 33.38 | % |
Value Opportunity Fund | | | 2 | | | | 26.24 | % |
Omnibus shareholder accounts for which Natixis Advisors understands that the intermediary has discretion over the underlying shareholder accounts or investment models where a shareholder account may be invested for anon-discretionary customer are included in the table above. For other omnibus accounts, the Funds do not have information on the individual shareholder accounts underlying the omnibus accounts; therefore, there could be other 5% shareholders in addition to those disclosed in the table above.
| 104
Notes to Financial Statements (continued)
December 31, 2019
12. Capital Shares. Each Fund may issue an unlimited number of shares of beneficial interest, without par value. Transactions in capital shares were as follows:
| | | | | | | | | | | | | | | | |
| |
| Year Ended
December 31, 2019 |
| |
| Year Ended
December 31, 2018 |
|
Intermediate Municipal Bond Fund | | | Shares | | | | Amount | | | | Shares | | | | Amount | |
| Class A | |
Issued from the sale of shares | | | 172,592 | | | $ | 1,769,797 | | | | 275,455 | | | $ | 2,764,015 | |
Issued in connection with the reinvestment of distributions | | | 12,521 | | | | 128,813 | | | | 12,617 | | | | 125,269 | |
Redeemed | | | (59,824 | ) | | | (609,217 | ) | | | (274,616 | ) | | | (2,717,698 | ) |
| | | | | | | | | | | | | | | | |
Net change | | | 125,289 | | | $ | 1,289,393 | | | | 13,456 | | | $ | 171,586 | |
| | | | | | | | | | | | | | | | |
| Class C | |
Issued from the sale of shares | | | 43,687 | | | $ | 451,336 | | | | 10,557 | | | $ | 105,987 | |
Issued in connection with the reinvestment of distributions | | | 967 | | | | 9,940 | | | | 1,243 | | | | 12,351 | |
Redeemed | | | (75,820 | ) | | | (777,366 | ) | | | (79,290 | ) | | | (790,619 | ) |
| | | | | | | | | | | | | | | | |
Net change | | | (31,166 | ) | | $ | (316,090 | ) | | | (67,490 | ) | | $ | (672,281 | ) |
| | | | | | | | | | | | | | | | |
| Class Y | |
Issued from the sale of shares | | | 118,355 | | | $ | 1,214,783 | | | | 422,343 | | | $ | 4,210,756 | |
Issued in connection with the reinvestment of distributions | | | 14,927 | | | | 153,521 | | | | 14,182 | | | | 141,017 | |
Redeemed | | | (620,551 | ) | | | (6,360,407 | ) | | | (1,826,504 | ) | | | (18,225,145 | ) |
| | | | | | | | | | | | | | | | |
Net change | | | (487,269 | ) | | $ | (4,992,103 | ) | | | (1,389,979 | ) | | $ | (13,873,372 | ) |
| | | | | | | | | | | | | | | | |
Decrease from capital share transactions | | | (393,146 | ) | | $ | (4,018,800 | ) | | | (1,444,013 | ) | | $ | (14,374,067 | ) |
| | | | | | | | | | | | | | | | |
105 |
Notes to Financial Statements (continued)
December 31, 2019
12. Capital Shares (continued).
| | | | | | | | | | | | | | | | |
| |
| Year Ended
December 31, 2019 |
| |
| Year Ended
December 31, 2018 |
|
Natixis Oakmark Fund | | | Shares | | | | Amount | | | | Shares | | | | Amount | |
| Class A | |
Issued from the sale of shares | | | 341,587 | | | $ | 7,422,550 | | | | 1,710,227 | | | $ | 42,259,538 | |
Issued in connection with the reinvestment of distributions | | | 707,759 | | | | 15,556,227 | | | | 759,153 | | | | 15,279,946 | |
Redeemed | | | (1,440,445 | ) | | | (31,399,881 | ) | | | (2,242,255 | ) | | | (53,142,329 | ) |
| | | | | | | | | | | | | | | | |
Net change | | | (391,099 | ) | | $ | (8,421,104 | ) | | | 227,125 | | | $ | 4,397,155 | |
| | | | | | | | | | | | | | | | |
| Class C | |
Issued from the sale of shares | | | 411,202 | | | $ | 7,542,498 | | | | 1,327,534 | | | $ | 27,139,192 | |
Issued in connection with the reinvestment of distributions | | | 258,850 | | | | 4,802,209 | | | | 277,335 | | | | 4,799,814 | |
Redeemed | | | (1,012,379 | ) | | | (18,545,938 | ) | | | (1,273,226 | ) | | | (26,235,921 | ) |
| | | | | | | | | | | | | | | | |
Net change | | | (342,327 | ) | | $ | (6,201,231 | ) | | | 331,643 | | | $ | 5,703,085 | |
| | | | | | | | | | | | | | | | |
| Class N | |
Issued from the sale of shares | | | 38,538 | | | $ | 856,493 | | | | 386 | | | $ | 10,194 | |
Issued in connection with the reinvestment of distributions | | | 1,564 | | | | 37,043 | | | | 38 | | | | 783 | |
Redeemed | | | (6,880 | ) | | | (164,534 | ) | | | — | | | | — | |
| | | | | | | | | | | | | | | | |
Net change | | | 33,222 | | | $ | 729,002 | | | | 424 | | | $ | 10,977 | |
| | | | | | | | | | | | | | | | |
| Class Y | |
Issued from the sale of shares | | | 1,091,333 | | | $ | 25,027,333 | | | | 2,241,985 | | | $ | 58,092,396 | |
Issued in connection with the reinvestment of distributions | | | 178,407 | | | | 4,126,503 | | | | 190,395 | | | | 4,001,696 | |
Redeemed | | | (1,928,446 | ) | | | (43,874,360 | ) | | | (1,730,567 | ) | | | (42,663,771 | ) |
| | | | | | | | | | | | | | | | |
Net change | | | (658,706 | ) | | $ | (14,720,524 | ) | | | 701,813 | | | $ | 19,430,321 | |
| | | | | | | | | | | | | | | | |
Increase (decrease) from capital share transactions | | | (1,358,910 | ) | | $ | (28,613,857 | ) | | | 1,261,005 | | | $ | 29,541,538 | |
| | | | | | | | | | | | | | | | |
| 106
Notes to Financial Statements (continued)
December 31, 2019
12. Capital Shares (continued).
| | | | | | | | | | | | | | | | |
| |
| Year Ended
December 31, 2019 |
| |
| Year Ended
December 31, 2018 |
|
Natixis Oakmark International Fund | | | Shares | | | | Amount | | | | Shares | | | | Amount | |
| Class A | |
Issued from the sale of shares | | | 3,833,342 | | | $ | 48,961,166 | | | | 8,614,434 | | | $ | 129,879,929 | |
Issued in connection with the reinvestment of distributions | | | 293,582 | | | | 3,983,907 | | | | 995,963 | | | | 10,965,551 | |
Redeemed | | | (14,255,482 | ) | | | (182,428,373 | ) | | | (25,557,109 | ) | | | (364,431,088 | ) |
| | | | | | | | | | | | | | | | |
Net change | | | (10,128,558 | ) | | $ | (129,483,300 | ) | | | (15,946,712 | ) | | $ | (223,585,608 | ) |
| | | | | | | | | | | | | | | | |
| Class C | |
Issued from the sale of shares | | | 1,189,713 | | | $ | 14,652,748 | | | | 4,347,532 | | | $ | 64,671,210 | |
Issued in connection with the reinvestment of distributions | | | 235,439 | | | | 3,145,368 | | | | 567,617 | | | | 6,152,971 | |
Redeemed | | | (7,169,411 | ) | | | (88,659,492 | ) | | | (9,503,667 | ) | | | (126,163,655 | ) |
| | | | | | | | | | | | | | | | |
Net change | | | (5,744,259 | ) | | $ | (70,861,376 | ) | | | (4,588,518 | ) | | $ | (55,339,474 | ) |
| | | | | | | | | | | | | | | | |
| Class N | |
Issued from the sale of shares | | | 35,523 | | | $ | 453,334 | | | | 92,040 | | | $ | 1,342,548 | |
Issued in connection with the reinvestment of distributions | | | 2,041 | | | | 27,558 | | | | 3,315 | | | | 36,370 | |
Redeemed | | | (45,088 | ) | | | (565,153 | ) | | | (28,097 | ) | | | (387,970 | ) |
| | | | | | | | | | | | | | | | |
Net change | | | (7,524 | ) | | $ | (84,261 | ) | | | 67,258 | | | $ | 990,948 | |
| | | | | | | | | | | | | | | | |
| Class Y | |
Issued from the sale of shares | | | 7,903,073 | | | $ | 103,147,261 | | | | 18,731,471 | | | $ | 276,949,870 | |
Issued in connection with the reinvestment of distributions | | | 590,961 | | | | 7,977,970 | | | | 965,209 | | | | 10,588,341 | |
Redeemed | | | (9,581,271 | ) | | | (119,483,340 | ) | | | (11,681,703 | ) | | | (157,478,079 | ) |
| | | | | | | | | | | | | | | | |
Net change | | | (1,087,237 | ) | | $ | (8,358,109 | ) | | | 8,014,977 | | | $ | 130,060,132 | |
| | | | | | | | | | | | | | | | |
Decrease from capital share transactions | | | (16,967,578 | ) | | $ | (208,787,046 | ) | | | (12,452,995 | ) | | $ | (147,874,002 | ) |
| | | | | | | | | | | | | | | | |
107 |
Notes to Financial Statements (continued)
December 31, 2019
12. Capital Shares (continued).
| | | | | | | | | | | | | | | | |
| |
| Year Ended
December 31, 2019 |
| |
| Year Ended
December 31, 2018 |
|
Small Cap Value Fund | | | Shares | | | | Amount | | | | Shares | | | | Amount | |
| Class A | |
Issued from the sale of shares | | | 291,593 | | | $ | 4,253,300 | | | | 712,683 | | | $ | 12,873,039 | |
Issued in connection with the reinvestment of distributions | | | 29,009 | | | | 447,550 | | | | 1,087,949 | | | | 14,101,401 | |
Redeemed | | | (1,267,013 | ) | | | (18,496,699 | ) | | | (1,494,118 | ) | | | (27,125,775 | ) |
| | | | | | | | | | | | | | | | |
Net change | | | (946,411 | ) | | $ | (13,795,849 | ) | | | 306,514 | | | $ | (151,335 | ) |
| | | | | | | | | | | | | | | | |
| Class C | |
Issued from the sale of shares | | | 14,584 | | | $ | 107,063 | | | | 67,032 | | | $ | 586,716 | |
Issued in connection with the reinvestment of distributions | | | 1,709 | | | | 13,304 | | | | 201,322 | | | | 1,524,443 | |
Redeemed | | | (374,191 | ) | | | (2,772,672 | ) | | | (1,075,636 | ) | | | (12,147,004 | ) |
| | | | | | | | | | | | | | | | |
Net change | | | (357,898 | ) | | $ | (2,652,305 | ) | | | (807,282 | ) | | $ | (10,035,845 | ) |
| | | | | | | | | | | | | | | | |
| Class N | |
Issued from the sale of shares | | | 2,117 | | | $ | 32,857 | | | | — | | | $ | — | |
Issued in connection with the reinvestment of distributions | | | 12 | | | | 194 | | | | 15 | | | | 200 | |
Redeemed | | | (887 | ) | | | (14,210 | ) | | | — | | | | — | |
| | | | | | | | | | | | | | | | |
Net change | | | 1,242 | | | $ | 18,841 | | | | 15 | | | $ | 200 | |
| | | | | | | | | | | | | | | | |
| Class Y | |
Issued from the sale of shares | | | 255,977 | | | $ | 3,867,153 | | | | 441,361 | | | $ | 8,044,129 | |
Issued in connection with the reinvestment of distributions | | | 24,035 | | | | 388,742 | | | | 1,132,316 | | | | 15,826,362 | |
Redeemed | | | (2,009,269 | ) | | | (30,637,042 | ) | | | (6,233,772 | ) | | | (112,747,613 | ) |
| | | | | | | | | | | | | | | | |
Net change | | | (1,729,257 | ) | | $ | (26,381,147 | ) | | | (4,660,095 | ) | | $ | (88,877,122 | ) |
| | | | | | | | | | | | | | | | |
Decrease from capital share transactions | | | (3,032,324 | ) | | $ | (42,810,460 | ) | | | (5,160,848 | ) | | $ | (99,064,102 | ) |
| | | | | | | | | | | | | | | | |
| 108
Notes to Financial Statements (continued)
December 31, 2019
12. Capital Shares (continued).
| | | | | | | | | | | | | | | | |
| |
| Year Ended
December 31, 2019 |
| |
| Year Ended
December 31, 2018 |
|
Value Opportunity Fund | | | Shares | | | | Amount | | | | Shares | | | | Amount | |
| Class A | |
Issued from the sale of shares | | | 861,269 | | | $ | 17,619,199 | | | | 495,715 | | | $ | 10,630,321 | |
Issued in connection with the reinvestment of distributions | | | 12,533 | | | | 280,906 | | | | 171,431 | | | | 3,074,190 | |
Redeemed | | | (1,901,968 | ) | | | (37,334,239 | ) | | | (1,114,049 | ) | | | (23,838,889 | ) |
| | | | | | | | | | | | | | | | |
Net change | | | (1,028,166 | ) | | $ | (19,434,134 | ) | | | (446,903 | ) | | $ | (10,134,378 | ) |
| | | | | | | | | | | | | | | | |
| Class C | |
Issued from the sale of shares | | | 41,784 | | | $ | 804,347 | | | | 74,034 | | | $ | 1,500,519 | |
Issued in connection with the reinvestment of distributions | | | 7,533 | | | | 158,588 | | | | 121,282 | | | | 2,078,925 | |
Redeemed | | | (466,640 | ) | | | (9,000,145 | ) | | | (948,504 | ) | | | (19,327,431 | ) |
| | | | | | | | | | | | | | | | |
Net change | | | (417,323 | ) | | $ | (8,037,210 | ) | | | (753,188 | ) | | $ | (15,747,987 | ) |
| | | | | | | | | | | | | | | | |
| Class N | |
Issued from the sale of shares | | | 265,852 | | | $ | 5,433,660 | | | | 1,690,373 | | | $ | 38,824,913 | |
Issued in connection with the reinvestment of distributions | | | 9,232 | | | | 208,696 | | | | 369,511 | | | | 6,683,144 | |
Redeemed | | | (3,511,497 | ) | | | (74,546,739 | ) | | | (3,884,820 | ) | | | (89,963,901 | ) |
| | | | | | | | | | | | | | | | |
Net change | | | (3,236,413 | ) | | $ | (68,904,383 | ) | | | (1,824,936 | ) | | $ | (44,455,844 | ) |
| | | | | | | | | | | | | | | | |
| Class Y | |
Issued from the sale of shares | | | 2,842,232 | | | $ | 59,252,207 | | | | 7,576,178 | | | $ | 168,906,227 | |
Issued in connection with the reinvestment of distributions | | | 129,190 | | | | 2,931,301 | | | | 2,423,432 | | | | 44,084,799 | |
Redeemed | | | (15,601,071 | ) | | | (306,352,102 | ) | | | (18,028,194 | ) | | | (386,667,770 | ) |
| | | | | | | | | | | | | | | | |
Net change | | | (12,629,649 | ) | | $ | (244,168,594 | ) | | | (8,028,584 | ) | | $ | (173,676,744 | ) |
| | | | | | | | | | | | | | | | |
Decrease from capital share transactions | | | (17,311,551 | ) | | $ | (340,544,321 | ) | | | (11,053,611 | ) | | $ | (244,014,953 | ) |
| | | | | | | | | | | | | | | | |
109 |
Report of Independent Registered Public Accounting Firm
To the Board of Trustees of Natixis Funds Trust I and Natixis Funds Trust II and Shareholders of Loomis Sayles Intermediate Municipal Bond Fund, Natixis Oakmark Fund, Natixis Oakmark International Fund, Vaughan Nelson Small Cap Value Fund, and Vaughan Nelson Value Opportunity Fund
Opinions on the Financial Statements
We have audited the accompanying statements of assets and liabilities, including the portfolios of investments, of Natixis Oakmark International Fund and Vaughan Nelson Small Cap Value Fund (two of the funds constituting the Natixis Funds Trust I), and Loomis Sayles Intermediate Municipal Bond Fund, Natixis Oakmark Fund, and Vaughan Nelson Value Opportunity Fund (three of the funds constituting the Natixis Funds Trust II) (hereafter collectively referred to as the “Funds”) as of December 31, 2019, the related statements of operations for the year ended December 31, 2019, the statements of changes in net assets for each of the two years in the period ended December 31, 2019, including the related notes, and the financial highlights for each of the periods indicated therein (collectively referred to as the “financial statements”). In our opinion, the financial statements present fairly, in all material respects, the financial position of each of the Funds as of December 31, 2019, the results of each of their operations for the year then ended, the changes in each of their net assets for each of the two years in the period ended December 31, 2019 and each of the financial highlights for each of the periods indicated therein in conformity with accounting principles generally accepted in the United States of America.
Basis for Opinions
These financial statements are the responsibility of the Funds’ management. Our responsibility is to express an opinion on the Funds’ financial statements based on our audits. We are a public accounting firm registered with the Public Company Accounting Oversight Board (United States) (PCAOB) and are required to be independent with respect to the Funds in accordance with the U.S. federal securities laws and the applicable rules and regulations of the Securities and Exchange Commission and the PCAOB.
We conducted our audits of these financial statements in accordance with the standards of the PCAOB. Those standards require that we plan and perform the audit to obtain reasonable assurance about whether the financial statements are free of material misstatement, whether due to error or fraud.
Our audits included performing procedures to assess the risks of material misstatement of the financial statements, whether due to error or fraud, and performing procedures that respond to those risks. Such procedures included examining, on a test basis, evidence regarding the amounts and disclosures in the financial statements. Our audits also included evaluating the accounting principles used and significant
| 110
Report of Independent Registered Public Accounting Firm
estimates made by management, as well as evaluating the overall presentation of the financial statements. Our procedures included confirmation of securities owned as of December 31, 2019 by correspondence with the custodian, and brokers; when replies were not received from brokers, we performed other auditing procedures. We believe that our audits provide a reasonable basis for our opinions.
/s/PricewaterhouseCoopers LLP
Boston, Massachusetts
February 21, 2020
We have served as the auditor of one or more of the investment companies in the Natixis Investment Company Complex since at least 1995. We have not been able to determine the specific year we began serving as auditor.
111 |
2019 U.S. Tax Distribution Information to
Shareholders (Unaudited)
Corporate Dividends Received Deduction. For the fiscal year ended December 31, 2019, a percentage of dividends distributed by the Funds listed below qualify for the dividends received deduction for corporate shareholders. These percentages are as follows:
| | | | |
Fund | | Qualifying
Percentage | |
Natixis Oakmark Fund | | | 100.00 | % |
Small Cap Value Fund | | | 83.44 | % |
Value Opportunity Fund | | | 100.00 | % |
Capital Gains Distributions. Pursuant to Internal Revenue Section 852(b), the following Funds paid distributions, which have been designated as capital gains distributions for the fiscal year ended December 31, 2019.
| | | | |
Fund | | Amount | |
Natixis Oakmark Fund | | $ | 25,578,931 | |
Small Cap Value Fund | | | 558,650 | |
Value Opportunity Fund | | | 2,860,547 | |
Qualified Dividend Income. For the fiscal year ended December 31, 2019, a percentage of the ordinary income dividends paid by the Funds are considered qualified dividend income eligible for reduced tax rates. These lower rates range from 0% to 20% depending on an individual’s tax bracket. If the Funds paid a distribution during calendar year 2019, complete information will be reported in conjunction with Form1099-DIV. These percentages are noted below:
| | | | |
Fund | | Qualifying
Percentage | |
Natixis Oakmark Fund | | | 100.00 | % |
Natixis Oakmark International Fund | | | 100.00 | % |
Small Cap Value Fund | | | 100.00 | % |
Value Opportunity Fund | | | 100.00 | % |
Foreign Tax Credit. For the year ended December 31, 2019, the Fund intends to pass through foreign tax credits and have derived gross income from sources within foreign countries amounting to:
| | | | | | | | |
Fund | | Foreign Tax
Credit Pass-Through | | | Foreign Source
Income | |
Natixis Oakmark International Fund | | $ | 2,276,940 | | | $ | 28,882,341 | |
| 112
2019 U.S. Tax Distribution Information to
Shareholders (Unaudited)
Exempt Interest Dividends
During the year ended December 31, 2019, Intermediate Municipal Bond paid dividends to shareholders from net investment income, of which 99.23% are designated as exempt interest dividends for federal tax purposes. However, state and local taxes differ from state to state and a portion of the dividends may be subject to the individual Alternative Minimum Tax, so it is suggested that you consult your own tax adviser.
113 |
Trustee and Officer Information
The tables below provide certain information regarding the trustees and officers of Natixis Funds Trust I and Natixis Funds Trust II (the “Trusts”). Unless otherwise indicated, the address of all persons below is 888 Boylston Street, Suite 800, Boston, MA 02199-8197. The Funds’ Statements of Additional Information include additional information about the trustees of the Trusts and are available by calling Natixis Funds at800-225-5478.
| | | | | | | | |
Name and Year of Birth | | Position(s) Held
with the Trusts,
Length of Time
Served and Term of Office1 | | Principal
Occupation(s)
During Past 5 Years | | Number of
Portfolios in
Fund Complex
Overseen2
and Other
Directorships Held
During Past 5 Years | | Experience,
Qualifications,
Attributes, Skills
for Board Membership |
| | | |
| INDEPENDENT TRUSTEES | | | | | | |
| | | | |
Kenneth A. Drucker (1945) | | Chairperson of the Board of Trustees since January 2017 Trustee since 2008 Ex Officio member of Audit Committee, Contract Review Committee and Governance Committee | | Retired | | 51 None | | Significant experience on the Board and on the boards of other business organizations (including at investment companies); executive experience (including as treasurer of an aerospace, automotive, and metal manufacturing corporation) |
| | | | |
| Edmond J. English(1953) | | Trustee since 2013 Chairperson of Governance Committee and Audit Committee Member | | Executive Chairman of Bob’s Discount Furniture (retail) | | 51 Director, Burlington Stores, Inc. (retail) | | Significant experience on the Board and on the boards of other business organizations (including retail companies and a bank); executive experience (including at a retail company) |
| 114
Trustee and Officer Information
| | | | | | | | |
Name and Year of
Birth | | Position(s) Held
with the Trusts,
Length of Time
Served and Term
of Office1 | | Principal
Occupation(s)
During Past 5 Years | | Number of
Portfolios in
Fund Complex
Overseen2
and Other
Directorships Held
During Past 5 Years | | Experience,
Qualifications,
Attributes, Skills
for Board
Membership |
| | | |
| INDEPENDENT TRUSTEES continued | | | | | | |
| | | | |
| Richard A. Goglia(1951) | | Trustee since 2015 Contract Review Committee Member and Governance Committee Member | | Retired; formerly Vice President and Treasurer of Raytheon Company (defense) | | 51 None | | Experience on the Board and executive experience (including his role as vice president and treasurer of a defense company and experience at a financial services company) |
| | | | |
| Wendell J. Knox(1948) | | Trustee since 2009 Chairperson of Contract Review Committee | | Director of Abt Associates Inc. (research and consulting) | | 51 Director, The Hanover Insurance Group (property and casualty insurance); formerly, Director, Eastern Bank (bank) | | Significant experience on the Board and on the boards of other business organizations (including at a bank and at a property and casualty insurance firm); executive experience (including roles as president and chief executive officer of a research and consulting company) |
115 |
Trustee and Officer Information
| | | | | | | | |
Name and Year of
Birth | | Position(s) Held
with the Trusts,
Length of Time
Served and Term
of Office1 | | Principal
Occupation(s)
During Past 5 Years | | Number of
Portfolios in
Fund Complex
Overseen2
and Other
Directorships Held
During Past 5 Years | | Experience,
Qualifications,
Attributes, Skills
for Board
Membership |
| | | |
| INDEPENDENT TRUSTEES continued | | | | | | |
| | | | |
| Martin T. Meehan(1956) | | Trustee since 2012 Audit Committee Member | | President, University of Massachusetts; formerly, Chancellor and faculty member, University of Massachusetts Lowell | | 51 None | | Significant experience on the Board and on the boards of other business organizations; experience as President of the University of Massachusetts; government experience (including as a member of the U.S. House of Representatives); academic experience |
| | | | |
| Maureen B. Mitchell(1951) | | Trustee since 2017 Contract Review Committee Member and Governance Committee Member | | Retired; formerly President, Global Sales and Marketing, GE Asset Management, Inc. (financial services) | | 51 Director, Sterling Bancorp (bank) | | Experience on the Board; financial services industry and executive experience (including role as president of global sales and marketing at a financial services company) |
| | | | |
| James P. Palermo(1955) | | Trustee since 2016 Contract Review Committee Member | | Founding Partner, Breton Capital Management, LLC (private equity); Partner, STEP Partners, LLC (private equity) | | 51 Director, FutureFuel.io (chemicals and biofuels) | | Experience on the Board ; financial services industry and executive experience (including roles as chief executive officer of client management and asset servicing for a banking and financial services company) |
| 116
Trustee and Officer Information
| | | | | | | | |
Name and Year of
Birth | | Position(s) Held
with the Trusts,
Length of Time
Served and Term
of Office1 | | Principal
Occupation(s)
During Past 5 Years | | Number of
Portfolios in
Fund Complex
Overseen2
and Other
Directorships Held
During Past 5 Years | | Experience,
Qualifications,
Attributes, Skills
for Board
Membership |
| | | |
| INDEPENDENT TRUSTEES continued | | | | | | |
| | | | |
Erik R. Sirri
(1958) | | Trustee since 2009 Chairperson of the Audit Committee | | Professor of Finance at Babson College | | 51 None | | Significant experience on the Board; experience as Director of the Division of Trading and Markets at the Securities and Exchange Commission; academic experience; training as an economist |
| | | | |
Peter J. Smail
(1952) | | Trustee since 2009 Audit Committee Member and Governance Committee Member | | Retired | | 51 None | | Significant experience on the Board; mutual fund industry and executive experience (including roles as president and chief executive officer for an investment adviser) |
117 |
Trustee and Officer Information
| | | | | | | | |
Name and Year of
Birth | | Position(s) Held
with the Trusts,
Length of Time
Served and Term
of Office1 | | Principal
Occupation(s)
During Past 5 Years | | Number of
Portfolios in
Fund Complex
Overseen2
and Other
Directorships Held
During Past 5 Years | | Experience,
Qualifications,
Attributes, Skills
for Board
Membership |
| | | |
| INDEPENDENT TRUSTEES continued | | | | | | |
| | | | |
Kirk A. Sykes
(1958) | | Trustee since 2019 Contract Review Committee Member | | Managing Director of Accordia Partners, LLC (real estate development); President of Primary Corporation (real estate development); Managing Principal of Merrick Capital Partners (infrastructure finance); formerly, President of Urban Strategy America Fund (real estate fund manager) | | 51 Trustee, Eastern Bank (bank); formerly Director, Ares Commercial Real Estate Corporation (real estate investment trust) | | Experience on the Board and significant experience on the boards of other business organizations (including real estate companies and banks) |
| | | | |
Cynthia L. Walker (1956) | | Trustee since 2005 Audit Committee Member and Governance Committee Member | | Deputy Dean for Finance and Administration, Yale University School of Medicine | | 51 None | | Significant experience on the Board; executive experience in a variety of academic organizations (including roles as dean for finance and administration) |
| 118
Trustee and Officer Information
| | | | | | | | |
Name and Year of
Birth | | Position(s) Held
with the Trusts,
Length of Time
Served and Term
of Office1 | | Principal
Occupation(s)
During Past 5 Years | | Number of
Portfolios in
Fund Complex
Overseen2
and Other
Directorships Held
During Past 5 Years | | Experience,
Qualifications,
Attributes, Skills
for Board
Membership |
| | | |
| INTERESTED TRUSTEES | | | | | | |
| | | | |
Kevin P. Charleston3 (1965) One Financial Center Boston, MA 02111 | | Trustee since 2015 | | President, Chief Executive Officer and Chairman of the Board of Directors; formerly, Chief Financial Officer, Loomis, Sayles & Company, L.P. | | 51 None | | Experience on the Board; continuing service as President, Chief Executive Officer and Chairman of the Board of Directors of Loomis, Sayles & Company, L.P. |
| | | | |
David L. Giunta4
(1965) | | Trustee since 2011 President and Chief Executive Officer since 2008 | | President and Chief Executive Officer, Natixis Advisors, L.P., Natixis Distribution, L.P., Natixis Distribution Corporation and Chairman of the Board of Natixis Distribution Corporation | | 51 None | | Significant experience on the Board; experience as President and Chief Executive Officer, Natixis Advisors, L.P., Natixis Distribution, L.P., Natixis Distribution Corporation and Chairman of the Board of Natixis Distribution Corporation |
| 1 | Each trustee serves until retirement, resignation or removal from the Board. The current retirement age is 75. The position of Chairperson of the Board is appointed for a three-year term. Mr. Drucker was appointed to serve an additional one year term as the Chairperson of the Board on June 12, 2019. |
| 2 | The trustees of the Trusts serve as trustees of a fund complex that includes all series of the Trusts, Natixis Funds Trust IV, Gateway Trust, Loomis Sayles Funds I, Loomis Sayles Funds II and Natixis ETF Trust (collectively, the “Fund Complex”). |
| 3 | Mr. Charleston is deemed an “interested person” of the Trusts because he holds the following positions with an affiliated person of the Trusts: President, Chief Executive Officer and Chairman of the Board of Directors of Loomis, Sayles & Company, L.P. |
| 4 | Mr. Giunta is deemed an “interested person” of the Trusts because he holds the following positions with an affiliated person of the Trusts: President and Chief Executive Officer, Natixis Advisors, L.P., Natixis Distribution, L.P., Natixis Distribution Corporation and Chairman of the Board of Natixis Distribution Corporation. |
119 |
Trustee and Officer Information
| | | | | | |
Name and Year of Birth | | Position(s) Held
with the Trusts | | Term of Office1 and
Length of Time Served | | Principal Occupation(s)
During Past 5 Years2 |
| | |
| OFFICERS OF THE TRUSTS | | | | |
| | | |
Russell L. Kane
(1969) | | Secretary, Clerk and Chief Legal Officer | | Since 2016 | | Executive Vice President, General Counsel, Secretary and Clerk, Natixis Distribution Corporation, Natixis Advisors, L.P. and Natixis Distribution, L.P.; formerly, Chief Compliance Officer for Mutual Funds, Senior Vice President, Deputy General Counsel, Assistant Secretary and Assistant Clerk, Natixis Distribution Corporation, Natixis Advisors, L.P. and Natixis Distribution, L.P. |
| | | |
Michael C. Kardok
(1959) | | Treasurer, Principal Financial and Accounting Officer | | Since 2004 | | Senior Vice President, Natixis Advisors, L.P. and Natixis Distribution, L.P. |
| | | |
Kirk D. Johnson
(1981) | | Chief Compliance Officer, Assistant Secretary and Anti-Money Laundering Officer | | Since 2018 | | Senior Vice President, Deputy General Counsel, Assistant Secretary and Assistant Clerk, Natixis Distribution Corporation, Natixis Advisors, L.P. and Natixis Distribution, L.P.; formerly, Associate General Counsel, Natixis Distribution, L.P.; Vice President and Counsel, Natixis Investment Managers, LLC. |
| 1 | Each officer of the Trusts serves for an indefinite term in accordance with the Trusts’ currentby-laws until the date his or her successor is elected and qualified, or until he or she sooner dies, retires, is removed or becomes disqualified. |
| 2 | Each person listed above, except as noted, holds the same position(s) with the Fund Complex. Previous positions during the past five years with Natixis Distribution, L.P., Natixis Advisors, L.P. or Loomis, Sayles & Company, L.P. are omitted, if not materially different from an officer’s current position with such entity. |
| 120


Annual Report
December 31, 2019
Loomis Sayles Strategic Alpha Fund
Natixis U.S. Equity Opportunities Fund
Table of Contents
IMPORTANT NOTICE TO SHAREHOLDERS
Beginning on January 1, 2021, as permitted by regulations adopted by the Securities and Exchange Commission, paper copies of shareholder reports like this one will no longer be sent by mail, unless you specifically request paper copies of the reports from the Fund or from your financial intermediary, such as a broker-dealer or bank. Instead, the reports will be made available on the Funds’ website, and you will be notified by mail each time a report is posted and provided with a website link to access the report. If you wish to continue receiving paper copies of your shareholder reports after January 1, 2021, you can inform the Fund at any time by calling 1-800-225-5478. If you hold your account with a financial intermediary and you wish to continue receiving paper copies after January 1, 2021, you should call your financial intermediary directly. Paper copies are provided free of charge, and your election to receive reports in paper will apply to all funds held with the Natixis Funds complex. If you have already elected to receive shareholder reports electronically, you will not be affected by this change and you need not take any action. You currently may elect to receive shareholder reports and other communications from the Fund or your financial intermediary electronically atwww.icsdelivery.com/natixisfunds.
LOOMIS SAYLES STRATEGIC ALPHA FUND
| | |
| |
| Managers | | Symbols |
| |
| Matthew J. Eagan, CFA® | | Class A LABAX |
| |
| Kevin P. Kearns | | Class C LABCX |
| |
| Todd P. Vandam, CFA® | | Class N LASNX |
| |
| Loomis, Sayles & Company, L.P. | | Class Y LASYX |
Investment Goal
The Fund seeks to provide an attractive absolute total return, complemented by prudent investment management designed to manage risks and protect investor capital. The secondary goal of the Fund is to achieve these returns with relatively low volatility.
Market Conditions
The fixed income markets produced robust returns in 2019, reflecting global central banks’ shift to more accommodative policies. A backdrop of moderate economic growth and low inflation provided the US Federal Reserve (Fed) with the latitude to lower interest rates by a quarter point on three occasions in the span from July to October. While the Fed subsequently made it clear that it was unlikely to enact any further cuts in the near future barring a meaningful slowdown in growth, investors remained confident that it would keep rates steady throughout 2020. A number of other world central banks followed the Fed’s move toward easier policy, highlighted by the European Central Bank’s pledge to restart its simulative quantitative easing program.
High-grade corporate bonds performed very well and finished the year as one of the best performing areas of the bond market. In addition to benefiting from the decline in Treasury yields, the asset class was helped by continued spread compression and elevated demand for high-quality investments. Lower-quality corporate debt also rallied in 2019 as the search for yield continued. The category was boosted by broad strength across higher-risk assets, an accommodative Fed and a benign economic outlook for 2020.
Securitized assets (such as mortgage-backed securities, asset-backed securities, and commercial mortgage-backed securities) generated solid gains as a group. However, they lagged the overall market due in part to investors’ preference for longer-term and/or riskier securities.
Performance Results
For the 12 months ended December 31, 2019, the Class Y shares of the Loomis Sayles Strategic Alpha Fund returned 3.96% at net asset value. The Fund outperformed its benchmark,3-Month LIBOR, which returned 2.33% for the period. The Fund follows an absolute return strategy and is not managed to an index.
Explanation of Fund Performance
The largest positive contribution to performance during the period came from our allocation to investment grade corporate bonds. The Fed remained generally
1 |
accommodative throughout the period, unencumbered by the presence of inflation, providing a major tailwind to risk assets. Within investment grade corporates, the Fund’s holdings of financial, consumer and technology names led positive contributions.
Exposure to securitized assets contributed to return during the period. Asset-backed securities, the largest of our exposures within the securitized sector, generated positive results fromsub-sectors such as aircraft-related, auto loans and personal loans. Residential mortgage-backed securities also contributed to performance, as housing remained generally solid throughout the period and sentiment was supported by attractive rates for borrowers.
Our allocation to bank loans also buoyed performance for the 12 months despite headwinds created for floating rate instruments by the generally accommodative trajectory of Fed policy. Investors have been drawn to the relative safety of these securities given their senior position in the capital structure. During the period, selected communications, capital goods and consumernon-cyclical loan names led contributions to performance.
Our global interest rate tools, primarily sovereign bonds, interest rate swaps and futures, detracted from performance for the year. Most of the negative performance was the result of a short Euro Bund futures position where we expected rates to bottom earlier in the year and exposure to Argentine sovereigns that were impacted by the recent unexpected election results. Markets are weighing the likelihood that the newly elected president of Argentina will be able to effectively address the country’s economic woes.
Currency positioning also weighed on performance. The US dollar remained strong against most currencies until the last quarter when it started to revert. At different points in the year, idiosyncratic exposure from a short forward position in the Singapore dollar and a long forward position in the Norwegian krone detracted the most. Currency markets remain focused on the pace of global growth, which has been constrained by the global manufacturing slowdown despite some signs of conditions bottoming out.
Our allocation to equities hurt performance during the period, despite equity markets exhibiting strength and ending the year near historical highs. Much of the negative performance within our allocation to equities can be attributed to energy-related names and the use of S&P 500® Index futures designed to mitigate risk during elevated geopolitical tensions.
Outlook
We expect to exit the manufacturing slowdown without an economy-wide recession; however, downside risks remain present in the near term. This view hinges on the idea that the Fed will remain supportive and continue accommodative monetary policy. We project the Fed to remain on hold for the next twelve months. Chair Powell has indicated that additional rate cuts are unlikely in the near term, barring any significant, unexpected acceleration in inflation.
We maintain our cautious outlook on risk sentiment. As noted, the Fed appears likely to continue to provide stimulus by maintaining accommodative monetary policy. However, China’s economic recovery is faltering, and risks related to theUS-China trade war remain
| 2
LOOMIS SAYLES STRATEGIC ALPHA FUND
despite being tempered somewhat by completion of a phase one agreement. Markets will remain focused on Chinese stimulus as a potential catalyst for global growth. So far, however, policy makers have been reluctant to utilize all available options, instead favoring an incremental approach.
The US dollar has been range-bound despite some choppiness. We expect a continuation of these themes, which should be supportive for risk assets in general. We saw some dollar weakening during October, but haven’t seen much of a breakout in either direction since. The perception of an easing in risks related toUS-China trade has caused the dollar’s recent bid as a safe haven to largely evaporate. Volatility shocks and weakening risk appetite are factors that could prove constructive for the dollar.
Hypothetical Growth of $100,000 Investment in Class Y Shares4
December 15, 2010 (inception) through December 31, 2019
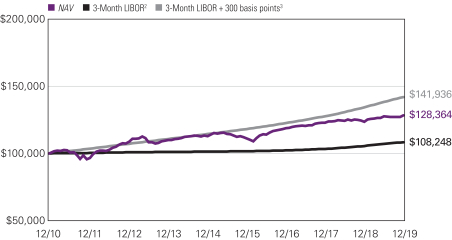
3 |
Average Annual Total Returns — December 31, 20194
| | | | | | | | | | | | | | | | | | | | | | | | |
| | | | | | |
| | | | | | | | | | | | | | | Expense Ratios5 | |
| | | 1 Year | | | 5 Years | | | Life of Class | | | Gross | | | Net | |
| | | | | | | |
| Class Y (Inception 12/15/10) | | | | | | | | | | | Class Y/A/C | | | | Class N | | | | | | | | | |
| NAV | | | 3.96 | % | | | 2.62 | % | | | 2.80 | % | | | — | % | | | 0.75 | % | | | 0.75 | % |
| | | | | | | |
| Class A (Inception 12/15/10) | | | | | | | | | | | | | | | | | | | | | | | | |
| NAV | | | 3.58 | | | | 2.35 | | | | 2.55 | | | | — | | | | 1.00 | | | | 1.00 | |
| With 4.25% Maximum Sales Charge | | | -0.85 | | | | 1.47 | | | | 2.06 | | | | — | | | | | | | | | |
| | | | | | | |
| Class C (Inception 12/15/10) | | | | | | | | | | | | | | | | | | | | | | | | |
| NAV | | | 2.87 | | | | 1.59 | | | | 1.77 | | | | — | | | | 1.75 | | | | 1.75 | |
| With CDSC1 | | | 1.87 | | | | 1.59 | | | | 1.77 | | | | — | | | | | | | | | |
| | | | | | | |
| Class N (Inception 5/1/17) | | | | | | | | | | | | | | | | | | | | | | | | |
| NAV | | | 3.92 | | | | — | | | | — | | | | 2.47 | | | | 0.70 | | | | 0.70 | |
| | | | | | | |
| Comparative Performance | | | | | | | | | | | | | | | | | | | | | | | | |
| 3-Month LIBOR2 | | | 2.33 | | | | 1.39 | | | | 0.91 | | | | 2.07 | | | | | | | | | |
| 3-Month LIBOR + 300 basis points3 | | | 5.33 | | | | 4.39 | | | | 3.89 | | | | 5.06 | | | | | | | | | |
Performance data shown represents past performance and is no guarantee of, and not necessarily indicative of, future results. Total return and value will vary, and you may have again or loss when shares are sold. Current performance may be lower or higher than quoted. For most recent month-end performance, visit im.natixis.com/performance.Performance for other share classes will be greater or less than shown based on differences in fees and sales charges. You may not invest directly in an index. Performance for periods less than one year is cumulative, not annualized. Returns reflect changes in share price and reinvestment of dividends and capital gains, if any. The table(s) do not reflect taxes shareholders might owe on any fund distributions or when they redeem their shares.
| 1 | Performance for Class C shares assumes a 1% contingent deferred sales charge (“CDSC”) applied when you sell shares within one year of purchase. |
| 2 | 3-Month LIBOR, or the London Interbank Offered Rate, represents the average rate at which a leading bank, for a given currency (in this case U.S. dollars), can obtain unsecured funding, and is representative of short-term interest rates. |
| 3 | 3-Month LIBOR + 300 basis points is created by adding 3.00% to the annual return of 3-Month LIBOR. The calculation is performed on a monthly basis and is subject to the effects of compounding. |
| 4 | Fund performance has been increased by fee waivers and/or expense reimbursements, if any, without which performance would have been lower. |
| 5 | Expense ratios are as shown in the Fund’s prospectus in effect as of the date of this report. The expense ratios for the current reporting period can be found in the Financial Highlights section of this report under Ratios to Average Net Assets. Net expenses reflect contractual expense limitations set to expire on 4/30/20. When a Fund’s expenses are below the limitation, gross and net expense ratios will be the same. See Note 6 of the Notes to Financial Statements for more information about the Fund’s expense limitations. |
| 4
NATIXIS U.S. EQUITY OPPORTUNITIES FUND
| | |
| |
| Managers | | Symbols |
| |
| Large Cap Value Segment | | Class A NEFSX |
| |
| Harris Associates L.P. | | Class C NECCX |
| |
| All Cap Growth Segment | | Class N NESNX |
| |
| Loomis, Sayles & Company, L.P. | | Class Y NESYX |
Investment Goal
The Fund seeks long-term growth of capital.
Market Conditions
While the US economy suffered from volatility due to trade tensions with China, markets were up phased as the three major indexes hit new highs for the year. Although growth slowed in 2019 from 2.6 percent to an estimated 2.3%, the unemployment rate fell to 3.5 percent. That represents the lowest rate since December, 1969. Job creation weakened a bit from 2018, but remained steady at an average of 176,000 a month in 2019. Labor force participation is increasing, as workers who had previously been unemployed move back into the workforce. Wage gains slowed but were still healthy at an average of 2.9 percent on a year-over-year basis. For only the second time since records have been kept, women outnumbered men in the paid workforce, highlighting the evolving diversity of the American labor market. Not only have women been joining the workforce at a more rapid clip than men, but women also represent the majority in growth-oriented occupations such as healthcare and education.
Fears of a slowing economy led the US Federal Reserve Board (Fed) to cut benchmark federal funds rates three times during 2019 in an effort to protect the economy from downside risk. Following four rate hikes in 2018, the Fed lowered rates for the first time since 2008 in July of 2019. Fed leaders characterized the three rate cuts as an adjustment designed to sustain the nation’s longest running economic expansion rather than the beginning of a prolonged series of cuts. Minutes of the Fed’s October meeting revealed a consensus around pausing rate decreases. Officials believe that the economy is in solid shape and likely to continue on a path of moderate economic growth along with a strong job market and stable inflation.
The US economy continued to shine in contrast to the rest of the global economy, which was characterized by weak growth, rising trade barriers and economic uncertainty. The European Central Bank also cut interest rates to head off a recession in Europe. The British election results set the United Kingdom firmly on the path to a negotiated Brexit. China and the United States were working towards a resolution of their trade dispute as the year drew to an end. Several emerging market economies also cut rates in an effort to stimulate flagging growth.
Following a down year in 2018, major US market indexes rallied sharply in 2019. Buoyed by the Fed’s rate cuts, record low unemployment and fairly steady growth, the Dow,
5 |
S&P 500 and Nasdaq all experienced gains in excess of 20 percent. Heading into the beginning of 2019, many economists were fearful of escalating trade wars, a global economic slowdown and further Fed rate hikes. However, while trade issues did take center stage for much of the year, the impact was less severe than expected. Heading into 2020, trade tensions are easing, rates are expected to remain stable and economic growth is projected to continue at its moderate pace.
Performance Results
For the 12 months ended December 31, 2019, Class Y shares of Natixis U.S. Equity Opportunities Fund returned 31.36% at net asset value. The Fund slightly underperformed its primary benchmark, the S&P 500® Index, which returned 31.49%. The Fund also slightly underperformed its secondary benchmark, the Russell 1000®Index, which returned 31.43%.
Explanation of Fund Performance
Each of the portfolio’s segments uses a distinct investment style, providing shareholders with exposure to a variety of different stocks:
| · | | The Harris Associates L.P. Large Cap Value segment invests primarily in the common stocks of larger-capitalization companies that Harris Associates believes are trading at a substantial discount to the company’s “true business value.” |
| · | | The Loomis, Sayles & Company, L.P. All Cap Growth segment invests primarily in equity securities and may invest in companies of any size. The segment employs a growth style of equity management that emphasizes companies with sustainable competitive advantages, long-term structural growth drivers, attractive cash flow returns on invested capital, and management teams focused on creatinglong-term value for shareholders. The segment aims to invest in companies when they trade at a significant discount to the estimate of intrinsic value. |
Although the Fund underperformed the benchmarks, both the Harris Associates L.P. Large Cap Value and Loomis, Sayles & Company, L.P. All Cap Growth segments posted strong absolute returns.
Harris Associates Large Cap Value Segment
As value investors with an emphasis on individual stock selection, our sector weights are a byproduct of ourbottom-up process. On an absolute return basis, shares in the consumer staples sector advanced the smallest amount, while holdings in the technology sector gained the most value.
Qurate Retail was the largest detractor to Fund performance in the calendar year. Qurate issued mixed results throughout 2019 with revenue that lagged market expectations in three reported quarters, while operating income exceeded forecasts in three reported quarters. Revenues in the company’s underlying businesses (QVC, Zulily and QxH) were also inconsistent over the past 12 months. Most recently, Qurate reported third quarter revenue of $3.09 billion, which undershot market projections of $3.12 billion. Concurrently, operating income reached $456 million and was better than the
| 6
NATIXIS U.S. EQUITY OPPORTUNITIES FUND
$388.1 million the market had estimated. From our perspective, results were in line with recent trends in the business. Revenues from QxH (QVC/HSN in the US) declined 4% year-over-year, which is the third sequential quarter of contraction. QVC International revenue growth improved slightly (+3%) as demand in Japan shifted ahead owing to a pending consumption tax increase. Zulily is struggling, as revenue fell 17% from a year earlier, and management anticipates results in this business will likely worsen and cause a $1 billion impairment charge of intangible assets from the acquisition. While we were disappointed by Qurate Retail’s recent performance, we are hopeful that management’s objectives can lead to improved results going forward.
The largest contributor to Fund performance for the year was Citigroup. Citigroup’s results released over the course of the year showed the company achieved revenues of slightly more than $18 billion in all four reported quarters. In addition, earnings per share were better than market expectations consistently across reporting periods. From our standpoint, the company’s fundamental performance showed strengthening trends that we found notable. Most recently, Citigroup reported third quarter results inmid-October that we saw as solid. Constant currency revenue grew 3% from a year earlier and earnings per share rose nearly 20% to $2.07 (including a one-time tax benefit), which was about 6% better than market expectations. We were particularly pleased with performance in the global consumer bank segment that realized an increase in underlyingpre-provision net revenue of 11%, driven by 4% revenue growth along with a 1% decline in operating expenses. Lastly, management returned more than $6 billion of capital to shareholders through buybacks and dividend payments in the third quarter and reduced the share count by over 250 million from the prior year. Even accounting for the share price increase in 2019, we continue to believe that Citigroup is undervalued relative to its normalized earnings power.
Loomis, Sayles and Company All Cap Growth Segment
We are an active manager with a long-term, private equity approach to investing. Through our proprietarybottom-up research framework, we look to invest in those few high-quality businesses with sustainable competitive advantages and profitable growth when they trade at a significant discount to intrinsic value. For the period, the All Cap Growth segment posted a positive absolute return. Our holdings in the information technology, consumer discretionary, communication services, financials, health care, consumer staples, industrials, and energy sectors contributed positively to results.
Alcon, United Parcel Service (UPS), and Compass Minerals International were the three lowest contributors during the period, with only Alcon contributing negatively. In April 2019, Novartis completed a spinoff of its Alcon eye care division to shareholders. As a result of our ownership of Novartis, the segment received an approximately 16 basis point allocation in Alcon, Inc. The newly public company had modestly negatively returns for the period and was the only detractor from segment performance during the year. From time to time we receive shares of subsidiary businesses arising from our ownership of their parent companies. Given the fact that these businesses are part of the companies we own, we already have a good understanding of the company’s profit pools. In each instance we further assess whether or not the stand-alone entity meets our quality, growth, and valuation
7 |
criteria. Based on our analysis, Alcon is a high-quality business with secular growth drivers. The company is a global leader in ophthalmologic medical devices, focused on eye surgery equipment and related accessories used to perform cataract surgery, as well as a leading global producer of consumer ophthalmic products such as contact lenses and other ocular health products. With a greater than70-year history in ophthalmology, Alcon carries with it a brand and legacy known for innovation in eye care. With more than $7 billion in revenue and a restructured business as its foundation, we believe Alcon will be able to grow on its own. Within Alcon’s core markets, the underlying structural growth dynamics remain intact, with a growing elderly population and improving health care in developing markets. We believe Alcon’s future growth will stem from an increased focus on the fundamental drivers of its business, its scale in efficient manufacturing and distribution to a leading global network of installed surgical equipment clients, as well as a reinvigorated focus on innovation and differentiation. While the company continues to meet our quality and growth criteria, we substantially trimmed our position in the period in favor of betterreward-to-risk opportunities.
UPS is the world’s largest package delivery company and a leading global provider of specialized transportation and logistics services. We first purchased UPS in 2007 and built our position during a cyclical downturn, adding to the position in 2008, 2009, and 2010. Over our greater than10-year holding period, the position was among the top twenty-five contributors to strategy performance. Typical of our gradual approach to building and exiting positions, we first began to exit the position in the first quarter of 2018. We sold our remaining stake of approximately 68 basis points in January 2019 because the company had approached our estimate of intrinsic value. Due to our short holding period in calendar year 2019, and the strategy’s substantial appreciation over the course of the year, UPS appears among the lowest contributors to strategy performance for the full year. We used the proceeds from selling UPS to initiate a new position in Nvidia Corporation, the world leader in visual computing that enables computers to produce and utilize highly realistic 3D graphic imagery and models. Nvidia returned 62% for the year and was a top ten contributor to segment performance.
Compass Minerals International is a leading producer of salt used primarily in highwayde-icing, as well as a range of consumer and industrial applications. The company is also the largest producer in North America of organic-approved sulfate of potash (SOP) specialty fertilizer. A long-term segment holding, the position contributed positively in 2019 but was among the three lowest contributors for the period. When we initiated our position in Compass we believed the company’s strong and sustainable competitive advantages included its salt mining and SOP assets, which accounted for the majority of the company’s revenues and would be very difficult for a competitor to replicate. The company’s main salt mine was by far the largest and lowest cost producer in North America and possessed strategic access to deep-water ports for cost-advantaged transportation. The company’s solar evaporation method of SOP production was the lowest cost in North America and among only three such operations globally. We believed management understood the value of their two advantaged assets, and we agreed with steps they were taking tode-leverage the company. However, the company later took on further leverage to
| 8
NATIXIS U.S. EQUITY OPPORTUNITIES FUND
diversify away from the salt business, where they had a clear competitive advantage, to buy a plant nutrition business in Brazil where they had little geographic or strategic overlap. Further, misexecution in the company’s salt business and another winter with lower than average demand led the company to operate under tighter financial conditions than we had anticipated. With consistent review of the fundamentals of the business and our investment thesis, it became clear that our original base case investment thesis was becoming a less likely outcome, and that the downside risk to our thesis and the company valuation was greater than anticipated. In January 2019 we sold our approximately 32 basis point position in Compass and used the proceeds to initiate a new position in Nvidia Corporation.
Alibaba Group, Facebook, and Visa were the largest contributors during the period. Demonstrating the power of its brands and network ecosystem, Chinae-commerce and consumer-engagement platform provider Alibaba reported fundamentally strong results during the period. Revenue growth in themid- double digits was well above our estimates for China consumer spending, China online physical goods sales, and China IT spending, indicating the company continues to grow its leading market share. Operating margins declined year over year due to management’s significant ongoing reinvestment in the business. Areas of focus for strategic reinvestment include improving user experience, local services through recently acquired delivery company Ele.me, “new retail,” logistics, globalization, cloud services, digital media, and greater operating efficiency. We believe these investments are consistent with Alibaba’s long-term strategy to strengthen and extend its competitive positioning across commerce, advertising, and cloud computing, while expanding its addressable market both internationally and through its “new retail” initiative. Further, while many of these strategic initiatives are currently loss making, we believe they will become profitable over time and contribute to earnings and free cash flow growth. With GMV (gross merchandise volume) of $853 billion and 654 million active annual consumers on its China commerce retail sites in its latest fiscal year, Alibaba is the world’s largest retail platform. The long-term structural expansion of internet users and online shopping are drivers of secular growth for Alibaba in China, where because of a lack of traditional retail infrastructure,e-commerce is expanding consumption rather than simply replacing offline spending. Alibaba continues to execute well on its business model, allowing it to expand its already dominant market position and to invest to strengthen its competitive advantages. We believe the current market price embeds expectations for key revenue and cash flow growth drivers that are well below our long-term assumptions.
A strategy holding since its IPO in 2012, social media company Facebook reported strong and above-expectations growth in revenue during the period that was approximately two times our estimate for the rate of growth in online advertising, indicating the company grew its market share. Despite reporting in July that it had reached a $5 billion settlement with the US Federal Trade Commission (FTC) regarding its privacy practices and that the FTC has also opened an antitrust investigation, Facebook continues to grow its global user base, and user engagement as measured by daily and monthly active users has remained solid. In addition, demand from advertisers remains robust, and the company grew its average revenue per user throughout the year. We believe Facebook is a high quality company, benefiting from the secular shift from traditional advertising to online advertising
9 |
and positioned for strong and sustainable growth over our investment horizon. We will continue to monitor ongoing regulatory actions, but we believe management’s decisions and actions illustrate their commitment to preserve platform integrity and to sustain the company’s leadership. With 2.8 billion people worldwide using its apps and more than 90 million global businesses with Facebook pages, the scale and reach of Facebook’s network is unrivaled. We believe that corporations will continue to allocate an increasing proportion of their advertising spending online, and Facebook remains one of very few platforms where advertisers can reach consumers at such scale.
Visa is the largest payments technology company in the world, with a comprehensive offering of digital payment products including credit cards, debit cards — which Visa invented — and transaction security services known as tokenization. Visa has one of the world’s most recognized brands, which took decades and significant investment to build. Through its open loop, multi-party system, Visa has built a massive global network, orchestrating transaction settlements between merchants and cardholders in more than 200 countries. A growing global network with over 3.3 billion Visa-branded cards outstanding that are accepted by 54 million merchants worldwide creates a powerful virtuous cycle, reinforcing Visa’sdifficult-to-replicate competitive advantages. During the year, Visa reported healthy revenue and earnings growth that was above market expectations. Payment volume growth of almost 10% in constant currency was well above the rate of growth in the approximately $47 trillion of global personal consumer expenditures, reflecting the ongoing, long-term secular shift from cash to electronic payments. Other areas of growth for Visa include expansion of its network capabilities into new segments such asperson-to-person payments,business-to-business payments, and government and corporate disbursements to consumers. In aggregate, these new segments represent an estimated $30 trillion of addressable spending. We estimate Visa can generate double-digit revenue growth over our forecast period. As the company continues to scale its businesses in regions around the world, we expect it will be able to expand operating margins, improve its return on invested capital, and grow free cash flow faster than revenues. We believe the assumptions embedded in Visa’s share price underestimate the company’s significant long-term growth opportunities and the sustainability of its business model. We believe the shares of Alibaba, Facebook and Visa are selling at significant discounts to our estimates of their intrinsic values and offer compellingreward-to-risk opportunities.
| 10
NATIXIS U.S. EQUITY OPPORTUNITIES FUND
Hypothetical Growth of $100,000 Investment in Class Y Shares4
December 31, 2009 through December 31, 2019
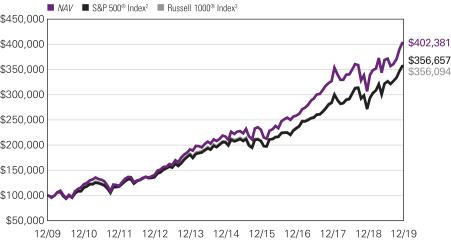
Top Ten Holdings as of December 31, 2019
| | | | | | |
| Security Name | | % of
net assets | |
| 1 | | Facebook, Inc., Class A | | | 4.59 | % |
| 2 | | Alphabet, Inc., Class A | | | 3.76 | |
| 3 | | Regeneron Pharmaceuticals, Inc. | | | 3.58 | |
| 4 | | Visa, Inc., Class A | | | 3.55 | |
| 5 | | Amazon.com, Inc. | | | 3.43 | |
| 6 | | Alibaba Group Holding Ltd., Sponsored ADR | | | 3.34 | |
| 7 | | Monster Beverage Corp. | | | 2.54 | |
| 8 | | Autodesk, Inc. | | | 2.52 | |
| 9 | | Oracle Corp. | | | 2.44 | |
| 10 | | Citigroup, Inc. | | | 2.33 | |
The portfolio is actively managed and holdings are subject to change. There is no guarantee the Fund continues to invest in the securities referenced. The holdings listed exclude any temporary cash investments.
11 |
Average Annual Total Returns — December 31, 20194
| | | | | | | | | | | | | | | | | | | | | | | | |
| | | | | | |
| | | | | | | | | | | | Life of
Class N | | | Expense Ratios5 | |
| | | 1 Year | | | 5 Years | | | 10 Years | | | Gross | | | Net | |
| | | | | | | |
| Class Y (Inception 11/15/94) | | | | | | | | | | | | | | | | | | | | | | | | |
| NAV | | | 31.36 | % | | | 13.16 | % | | | 14.93 | % | | | — | % | | | 0.91 | % | | | 0.91 | % |
| | | | | | | |
| Class A (Inception 7/7/94) | | | | | | | | | | | | | | | | | | | | | | | | |
| NAV | | | 31.03 | | | | 12.88 | | | | 14.64 | | | | — | | | | 1.16 | | | | 1.16 | |
| With 5.75% Maximum Sales Charge | | | 23.50 | | | | 11.55 | | | | 13.97 | | | | — | | | | | | | | | |
| | | | | | | |
| Class C (Inception 7/7/94) | | | | | | | | | | | | | | | | | | | | | | | | |
| NAV | | | 30.06 | | | | 12.03 | | | | 13.79 | | | | — | | | | 1.91 | | | | 1.91 | |
| With CDSC1 | | | 29.06 | | | | 12.03 | | | | 13.79 | | | | — | | | | | | | | | |
| | | | | | | |
| Class N (Inception 5/1/17) | | | | | | | | | | | | | | | | | | | | | | | | |
| NAV | | | 31.44 | | | | — | | | | — | | | | 14.68 | | | | 13.35 | | | | 0.76 | |
| | | | | | | |
| Comparative Performance | | | | | | | | | | | | | | | | | | | | | | | | |
| S&P 500® Index2 | | | 31.49 | | | | 11.70 | | | | 13.56 | | | | 14.20 | | | | | | | | | |
| Russell 1000® Index3 | | | 31.43 | | | | 11.48 | | | | 13.54 | | | | 13.95 | | | | | | | | | |
Performance data shown represents past performance and is no guarantee of, and not necessarily indicative of, future results. Total return and value will vary, and you may have a gain or loss when shares are sold. Current performance may be lower or higher than quoted. For most recent month-end performance, visit im.natixis.com/performance. Performance for other share classes will be greater or less than shown based on differences in fees and sales charges. You may not invest directly in an index. Performance for periods less than one year is cumulative, not annualized. Returns reflect changes in share price and reinvestment of dividends and capital gains, if any. The table(s) do not reflect taxes shareholders might owe on any fund distributions or when they redeem their shares.
| 1 | Performance for Class C shares assumes a 1.00% contingent deferred sales charge (“CDSC”) applied when you sell shares within one year of purchase. |
| 2 | S&P 500® Index is a widely recognized measure of U.S. stock market performance. It is an unmanaged index of 500 common stocks chosen for market size, liquidity, and industry group representation, among other factors. It also measures the performance of the large cap segment of the US equities market. |
| 3 | Russell 1000® Index measures the performance of the large-cap segment of the U.S. equity universe. It is a subset of the Russell 3000® Index and includes approximately 1000 of the largest securities based on a combination of their market cap and current index membership. The Russell 1000® Index represents approximately 92% of the U.S. market and is constructed to provide a comprehensive and unbiased barometer for the large-cap segment and is completely reconstituted annually to ensure new and growing equities are reflected. |
| 4 | Fund performance has been increased by fee waivers and/or expense reimbursements, if any, without which performance would have been lower. |
| 5 | Expense ratios are as shown in the Fund’s prospectus in effect as of the date of this report. The expense ratios for the current reporting period can be found in the Financial Highlights section of this report under Ratios to Average Net Assets. Net expenses reflect contractual expense limitations set to expire on 4/30/20. When a Fund’s expenses are below the limitation, gross and net expense ratios will be the same. See Note 6 of the Notes to Financial Statements for more information about the Fund’s expense limitations. |
| 12
ADDITIONAL INFORMATION
The views expressed in this report reflect those of the portfolio managers as of the dates indicated. The managers’ views are subject to change at any time without notice based on changes in market or other conditions. References to specific securities or industries should not be regarded as investment advice. Because the Fund is actively managed, there is no assurance that they will continue to invest in the securities or industries mentioned.
All investing involves risk, including the risk of loss. There is no assurance that any investment will meet its performance objectives or that losses will be avoided.
ADDITIONAL INDEX INFORMATION
This document may contain references to third party copyrights, indexes, and trademarks, each of which is the property of its respective owner. Such owner is not affiliated with Natixis Investment Managers or any of its related or affiliated companies (collectively “Natixis affiliates”) and does not sponsor, endorse or participate in the provision of any Natixis affiliates services, funds or other financial products.
The index information contained herein is derived from third parties and is provided on an “as is” basis. The user of this information assumes the entire risk of use of this information. Each of the third party entities involved in compiling, computing or creating index information, disclaims all warranties (including, without limitation, any warranties of originality, accuracy, completeness, timeliness, non-infringement, merchantability and fitness for a particular purpose) with respect to such information.
PROXY VOTING INFORMATION
A description of the Natixis Funds’ proxy voting policies and procedures is available without charge, upon request, by calling Natixis Funds at 800-225-5478; on Natixis Funds’ website at im.natixis.com; and on the Securities and Exchange Commission’s (SEC) website at www.sec.gov. Information regarding how Natixis Funds voted proxies relating to portfolio securities during the most recent 12-month period ended June 30 is available from Natixis Funds’ website and the SEC’s website.
QUARTERLY PORTFOLIO SCHEDULES
Natixis Funds file a complete schedule of portfolio holdings with the SEC for the first and third quarters of each fiscal year on Form N-PORT. The Funds’ Forms N-PORT reports are available on the SEC’s website at www.sec.gov.
CFA® and Chartered Financial Analyst® are registered trademarks owned by the CFA Institute.
13 |
UNDERSTANDING FUND EXPENSES
As a mutual fund shareholder, you incur different costs: transaction costs, including sales charges (loads) on purchases and contingent deferred sales charges on redemptions, and ongoing costs, including management fees, distribution and/or service fees (12b-1 fees), and other fund expenses. Certain exemptions may apply. These costs are described in more detail in the Funds’ prospectuses. The following examples are intended to help you understand the ongoing costs of investing in the Funds and help you compare these with the ongoing costs of investing in other mutual funds.
The first line in the table of each class of Fund shares shows the actual account values and actual Fund expenses you would have paid on a $1,000 investment in the Fund from July 1, 2019 through December 31, 2019. To estimate the expenses you paid over the period, simply divide your account value by $1,000 (for example $8,600 account value divided by $1,000 = 8.60) and multiply the result by the number in the Expenses Paid During Period column as shown for your class.
The second line in the table for each class of Fund shares provides information about hypothetical account values and hypothetical expenses based on the Fund’s actual expense ratios and an assumed rate of return of 5% per year before expenses, which is not the Fund’s actual return. The hypothetical account values and expenses may not be used to estimate the actual ending account balance or expenses you paid on your investment for the period. You may use this information to compare the ongoing costs of investing in each Fund and other funds. To do so, compare this 5% hypothetical example with the 5% hypothetical examples that appear in the shareholder reports of the other funds.
Please note that the expenses shown reflect ongoing costs only, and do not include any transaction costs, such as sales charges. Therefore, the second line in the table of each Fund is useful in comparing ongoing costs only, and will not help you determine the relative costs of owning different funds. If transaction costs were included, total costs would be higher.
| 14
| | | | | | | | | | | | |
LOOMIS SAYLES STRATEGIC ALPHA
FUND | | BEGINNING
ACCOUNT VALUE
7/1/2019 | | | ENDING
ACCOUNT VALUE
12/31/2019 | | | EXPENSES PAID
DURING PERIOD*
7/1/2019 – 12/31/2019 | |
| Class A | | | | | | | | | | | | |
| Actual | | | $1,000.00 | | | | $1,005.20 | | | | $5.00 | |
| Hypothetical (5% return before expenses) | | | $1,000.00 | | | | $1,020.22 | | | | $5.04 | |
| Class C | | | | | | | | | | | | |
| Actual | | | $1,000.00 | | | | $1,001.20 | | | | $8.78 | |
| Hypothetical (5% return before expenses) | | | $1,000.00 | | | | $1,016.43 | | | | $8.84 | |
| Class N | | | | | | | | | | | | |
| Actual | | | $1,000.00 | | | | $1,005.90 | | | | $3.44 | |
| Hypothetical (5% return before expenses) | | | $1,000.00 | | | | $1,021.78 | | | | $3.47 | |
| Class Y | | | | | | | | | | | | |
| Actual | | | $1,000.00 | | | | $1,006.60 | | | | $3.74 | |
| Hypothetical (5% return before expenses) | | | $1,000.00 | | | | $1,021.48 | | | | $3.77 | |
| * | Expenses are equal to the Fund’s annualized expense ratio (after waiver/reimbursement): 0.99%, 1.74%, 0.68% and 0.74% for Class A, C, N and Y, respectively, multiplied by the average account value over the period, multiplied by the number of days in the most recent fiscal half-year (184), divided by 365 (to reflect the half-year period). |
| | | | | | | | | | | | |
NATIXIS U.S. EQUITY OPPORTUNITIES
FUND | | BEGINNING
ACCOUNT VALUE
7/1/2019 | | | ENDING
ACCOUNT VALUE
12/31/2019 | | | EXPENSES PAID
DURING PERIOD*
7/1/2019 – 12/31/2019 | |
| Class A | | | | | | | | | | | | |
| Actual | | | $1,000.00 | | | | $1,089.00 | | | | $6.11 | |
| Hypothetical (5% return before expenses) | | | $1,000.00 | | | | $1,019.36 | | | | $5.90 | |
| Class C | | | | | | | | | | | | |
| Actual | | | $1,000.00 | | | | $1,085.10 | | | | $10.04 | |
| Hypothetical (5% return before expenses) | | | $1,000.00 | | | | $1,015.58 | | | | $9.70 | |
| Class N | | | | | | | | | | | | |
| Actual | | | $1,000.00 | | | | $1,090.50 | | | | $4.37 | |
| Hypothetical (5% return before expenses) | | | $1,000.00 | | | | $1,021.02 | | | | $4.23 | |
| Class Y | | | | | | | | | | | | |
| Actual | | | $1,000.00 | | | | $1,090.40 | | | | $4.79 | |
| Hypothetical (5% return before expenses) | | | $1,000.00 | | | | $1,020.62 | | | | $4.63 | |
| * | Expenses are equal to the Fund’s annualized expense ratio (after waiver/reimbursement): 1.16%, 1.91%, 0.83% and 0.91% for Class A, C, N and Y, respectively, multiplied by the average account value over the period, multiplied by the number of days in the most recent fiscal half-year (184), divided by 365 (to reflect the half-year period). |
15 |
Portfolio of Investments – as of December 31, 2019
Loomis Sayles Strategic Alpha Fund
| | | | | | | | |
Principal
Amount (‡) | | | Description | | Value (†) | |
| | Bonds and Notes — 83.9% of Net Assets | |
| | Non-Convertible Bonds — 82.8% | |
| | | | ABS Car Loan — 12.1% | |
| $ | 26,361 | | | ACC Trust, Series2018-1, Class A, 3.700%, 12/21/2020, 144A | | $ | 26,379 | |
| | 7,250,000 | | | Ally Auto Receivables Trust, Series2019-1, Class A3, 2.910%, 9/15/2023(a) | | | 7,339,535 | |
| | 2,805,000 | | | AmeriCredit Automobile Receivables Trust, Series2018-2, Class D, 4.010%, 7/18/2024 | | | 2,921,121 | |
| | 1,623,015 | | | AmeriCredit Automobile Receivables Trust, Series2018-3, Class A2B,1-month LIBOR + 0.250%, 1.995%, 1/18/2022(a)(b) | | | 1,622,808 | |
| | 3,845,000 | | | AmeriCredit Automobile Receivables Trust, Series2018-3, Class D, 4.040%, 11/18/2024 | | | 4,015,688 | |
| | 2,500,000 | | | AmeriCredit Automobile Receivables Trust, Series2019-3, Class A3, 2.060%, 4/18/2024 | | | 2,501,701 | |
| | 1,210,000 | | | Avid Automobile Receivables Trust, Series2019-1, Class C, 3.140%, 7/15/2026, 144A | | | 1,205,710 | |
| | 1,035,000 | | | Avid Automobile Receivables Trust, Series2019-1, Class D, 4.030%, 7/15/2026, 144A | | | 1,031,363 | |
| | 1,785,000 | | | California Republic Auto Receivables Trust, Series2018-1, Class D, 4.330%, 4/15/2025 | | | 1,846,912 | |
| | 25,338 | | | CarMax Auto Owner Trust, Series2018-1, Class A2B,1-month LIBOR + 0.150%, 1.890%, 5/17/2021(a)(b) | | | 25,338 | |
| | 135,000 | | | CarMax Auto Owner Trust, Series2018-1, Class D, 3.370%, 7/15/2024 | | | 137,178 | |
| | 1,435,000 | | | CarMax Auto Owner Trust, Series2018-2, Class D, 3.990%, 4/15/2025 | | | 1,477,474 | |
| | 2,227,339 | | | CarMax Auto Owner Trust, Series2018-3, Class A2B,1-month LIBOR + 0.200%, 1.940%, 10/15/2021(a)(b) | | | 2,227,727 | |
| | 2,735,305 | | | CarMax Auto Owner Trust, Series2018-4, Class A2B,1-month LIBOR + 0.200%, 1.940%, 2/15/2022(a)(b) | | | 2,736,069 | |
| | 1,125,000 | | | CarMax Auto Owner Trust, Series2018-4, Class D, 4.150%, 4/15/2025 | | | 1,166,362 | |
| | 7,285,000 | | | CarMax Auto Owner Trust, Series2019-1, Class A3, 3.050%, 3/15/2024(a) | | | 7,405,651 | |
| | 2,350,000 | | | CarMax Auto Owner Trust, Series2019-1, Class D, 4.040%, 8/15/2025 | | | 2,442,062 | |
| | 89,068 | | | CIG Auto Receivables Trust, Series2017-1A, Class A, 2.710%, 5/15/2023, 144A(a) | | | 89,166 | |
| | 760,000 | | | CPS Auto Receivables Trust , Series2019-D, Class D, 2.720%, 9/15/2025, 144A | | | 756,870 | |
| | 815,000 | | | CPS Auto Receivables Trust, Series2017-D, Class D, 3.730%, 9/15/2023, 144A(a) | | | 826,359 | |
| | 230,000 | | | CPS Auto Receivables Trust, Series2018-A, Class C, 3.050%, 12/15/2023, 144A(a) | | | 230,993 | |
| | 1,795,000 | | | CPS Auto Receivables Trust, Series2018-D, Class C, 3.830%, 9/15/2023, 144A | | | 1,827,784 | |
| | 830,000 | | | CPS Auto Receivables Trust, Series2019-A, Class D, 4.350%, 12/16/2024, 144A | | | 857,330 | |
| | 525,000 | | | Credit Acceptance Auto Loan Trust, Series2017-3A, Class C, 3.480%, 10/15/2026, 144A | | | 532,491 | |
| | 1,205,000 | | | Credit Acceptance Auto Loan Trust, Series2018-2A, Class C, 4.160%, 9/15/2027, 144A(a) | | | 1,244,355 | |
See accompanying notes to financial statements.
| 16
Portfolio of Investments – as of December 31, 2019
Loomis Sayles Strategic Alpha Fund – (continued)
| | | | | | | | |
Principal
Amount (‡) | | | Description | | Value (†) | |
| | | | ABS Car Loan — continued | |
| $ | 4,745,000 | | | Credit Acceptance Auto Loan Trust, Series2019-1A, Class C, 3.940%, 6/15/2028, 144A | | $ | 4,902,005 | |
| | 2,955,000 | | | Drive Auto Receivables Trust, Series2018-1, Class D, 3.810%, 5/15/2024(a) | | | 3,003,661 | |
| | 195,000 | | | Drive Auto Receivables Trust, Series2018-3, Class D, 4.300%, 9/16/2024 | | | 199,827 | |
| | 2,395,000 | | | Drive Auto Receivables Trust, Series2018-5, Class D, 4.300%, 4/15/2026 | | | 2,473,301 | |
| | 1,330,000 | | | Drive Auto Receivables Trust, Series2019-1, Class D, 4.090%, 6/15/2026 | | | 1,369,400 | |
| | 2,365,000 | | | Drive Auto Receivables Trust, Series2019-3, Class A3, 2.490%, 6/15/2023(a) | | | 2,375,972 | |
| | 2,155,000 | | | DT Auto Owner Trust, Series2018-3A, Class C, 3.790%, 7/15/2024, 144A | | | 2,189,496 | |
| | 1,825,471 | | | DT Auto Owner Trust, Series2016-1A, Class D, 4.660%, 12/15/2022, 144A(a) | | | 1,827,596 | |
| | 1,390,000 | | | DT Auto Owner Trust, Series2018-2A, Class D, 4.150%, 3/15/2024, 144A | | | 1,425,123 | |
| | 1,655,000 | | | DT Auto Owner Trust, Series2019-2A, Class D, 3.480%, 2/18/2025, 144A | | | 1,678,178 | |
| | 635,000 | | | First Investors Auto Owner Trust , Series2019-2A, Class D, 2.800%, 12/15/2025, 144A | | | 634,114 | |
| | 1,475,000 | | | First Investors Auto Owner Trust , Series2019-2A, Class E, 3.880%, 1/15/2026, 144A | | | 1,469,413 | |
| | 220,000 | | | First Investors Auto Owner Trust, Series2016-2A, Class D, 3.350%, 11/15/2022, 144A(a) | | | 221,836 | |
| | 650,000 | | | Flagship Credit Auto Trust, Series2016-3, Class D, 3.890%, 11/15/2022, 144A(a) | | | 661,671 | |
| | 3,305,000 | | | Flagship Credit Auto Trust, Series2019-2, Class D, 3.530%, 5/15/2025, 144A | | | 3,366,716 | |
| | 1,632,335 | | | Ford Credit Auto Lease Trust, Series2018-B, Class A2B,1-month LIBOR + 0.160%, 1.900%, 4/15/2021(a)(b) | | | 1,632,206 | |
| | 1,260,000 | | | GLS Auto Receivables Trust, Series2018-3A, Class B, 3.780%, 8/15/2023, 144A(a) | | | 1,277,546 | |
| | 5,030,000 | | | GLS Auto Receivables Trust, Series2019-A, Class C, 3.540%, 2/18/2025, 144A | | | 5,113,848 | |
| | 379,142 | | | GM Financial Automobile Leasing Trust, Series2018-3, Class A2B,1-month LIBOR + 0.170%, 1.935%, 9/21/2020(a)(b) | | | 379,156 | |
| | 1,288,847 | | | GM Financial Consumer Automobile Receivables Trust, Series2018-3, Class A2B,1-month LIBOR + 0.110%, 1.850%, 7/16/2021(a)(b) | | | 1,288,595 | |
| | 1,362,000 | | | Hertz Vehicle Financing II LP, Series2017-2A, Class A, 3.290%, 10/25/2023, 144A(a) | | | 1,392,241 | |
| | 3,135,000 | | | Honda Auto Receivables Owner Trust, Series2019-1, Class A3, 2.830%, 3/20/2023(a) | | | 3,183,069 | |
| | 3,045,000 | | | NextGear Floorplan Master Owner Trust, Series2017-1A, Class A1,1-month LIBOR + 0.850%, 2.590%, 4/18/2022, 144A(a)(b) | | | 3,049,095 | |
| | 4,355,000 | | | NextGear Floorplan Master Owner Trust, Series2017-2A, Class A1,1-month LIBOR + 0.680%, 2.420%, 10/17/2022, 144A(a)(b) | | | 4,364,727 | |
| | 2,590,000 | | | NextGear Floorplan Master Owner Trust, Series2018-1A, Class A1,1-month LIBOR + 0.640%, 2.380%, 2/15/2023, 144A(a)(b) | | | 2,596,368 | |
| | 2,820,000 | | | NextGear Floorplan Master Owner Trust, Series2018-2A, Class A1,1-month LIBOR + 0.600%, 2.340%, 10/15/2023, 144A(a)(b) | | | 2,827,000 | |
See accompanying notes to financial statements.
17 |
Portfolio of Investments – as of December 31, 2019
Loomis Sayles Strategic Alpha Fund – (continued)
| | | | | | | | |
Principal
Amount (‡) | | | Description | | Value (†) | |
| | | | ABS Car Loan — continued | |
| $ | 8,095,000 | | | Nissan Auto Receivables Owner Trust, Series2019-A, Class A3, 2.900%, 10/16/2023(a) | | $ | 8,221,376 | |
| | 559,043 | | | Nissan Auto Receivables Owner Trust, Series2017-A, Class A3, 1.740%, 8/16/2021(a) | | | 558,685 | |
| | 3,162,965 | | | Nissan Auto Receivables Owner Trust, Series2018-A, Class A3, 2.650%, 5/16/2022(a) | | | 3,176,539 | |
| | 1,195,465 | | | Nissan Auto Receivables Owner Trust, Series2018-B, Class A2B,1-month LIBOR + 0.100%, 1.840%, 7/15/2021(a)(b) | | | 1,195,367 | |
| | 3,045,000 | | | Prestige Auto Receivables Trust, Series2016-1A, Class D, 5.150%, 11/15/2021, 144A(a) | | | 3,091,842 | |
| | 910,000 | | | Prestige Auto Receivables Trust, Series2019-1A, Class E, 3.900%, 5/15/2026, 144A | | | 916,479 | |
| | 3,585,000 | | | Santander Drive Auto Receivables Trust, Series2018-2, Class D, 3.880%, 2/15/2024 | | | 3,671,286 | |
| | 2,720,000 | | | Santander Drive Auto Receivables Trust, Series2018-5, Class C, 3.810%, 12/16/2024 | | | 2,760,600 | |
| | 4,140,000 | | | Santander Drive Auto Receivables Trust, Series2019-2, Class D, 3.220%, 7/15/2025 | | | 4,220,169 | |
| | 353,000 | | | Tidewater Auto Receivables Trust, Series2018-AA, Class D, 4.300%, 11/15/2024, 144A | | | 359,526 | |
| | 2,188,867 | | | Toyota Auto Receivables Owner Trust, Series2018-C, Class A2B,1-month LIBOR + 0.120%, 1.860%, 8/16/2021(a)(b) | | | 2,188,338 | |
| | 9,550,000 | | | Toyota Auto Receivables Owner Trust, Series2019-A, Class A3, 2.910%, 7/17/2023(a) | | | 9,691,425 | |
| | 3,025,000 | | | United Auto Credit Securitization Trust, Series2019-1, Class C, 3.160%, 8/12/2024, 144A | | | 3,047,642 | |
| | 1,110,242 | | | Volkswagen Auto Loan Enhanced Trust, Series2018-1, Class A2B,1-month LIBOR + 0.180%, 1.945%, 7/20/2021(a)(b) | | | 1,110,268 | |
| | 4,605,000 | | | Volvo Financial Equipment Master Owner Trust, Series2018-A, Class A,1-month LIBOR + 0.520%, 2.260%, 7/17/2023, 144A(a)(b) | | | 4,621,123 | |
| | 740,000 | | | Westlake Automobile Receivables Trust, Series2018-1A, Class D, 3.410%, 5/15/2023, 144A(a) | | | 748,421 | |
| | 2,167,748 | | | Westlake Automobile Receivables Trust, Series2018-3A, Class A2B,1-month LIBOR + 0.350%, 2.090%, 1/18/2022, 144A(a)(b) | | | 2,168,027 | |
| | 1,140,000 | | | Westlake Automobile Receivables Trust, Series2018-3A, Class D, 4.000%, 10/16/2023, 144A | | | 1,166,041 | |
| | 2,405,838 | | | World Omni Automobile Lease Securitization Trust, Series18-B, Class A2B,1-month LIBOR + 0.180%, 1.920%, 6/15/2021(a)(b) | | | 2,405,313 | |
| | | | | | | | |
| | | | | | | 156,715,053 | |
| | | | | | | | |
| | | | ABS Credit Card — 3.8% | |
| | 3,790,000 | | | American Express Credit Account Master Trust, Series2018-8, Class A, 3.180%, 4/15/2024(a) | | | 3,874,844 | |
| | 2,385,000 | | | American Express Credit Account Master Trust, Series2019-1, Class A, 2.870%, 10/15/2024(a) | | | 2,436,808 | |
| | 4,385,000 | | | Bank of America Credit Card Trust, Series2017-A1, Class A1, 1.950%, 8/15/2022(a) | | | 4,385,438 | |
See accompanying notes to financial statements.
| 18
Portfolio of Investments – as of December 31, 2019
Loomis Sayles Strategic Alpha Fund – (continued)
| | | | | | | | |
Principal
Amount (‡) | | | Description | | Value (†) | |
| | | | ABS Credit Card — continued | |
| $ | 5,875,000 | | | Bank of America Credit Card Trust, Series2018-A1, Class A1, 2.700%, 7/17/2023(a) | | $ | 5,932,887 | |
| | 2,585,000 | | | Capital One Multi-Asset Execution Trust, Series2017-A1, Class A1, 2.000%, 1/17/2023(a) | | | 2,585,312 | |
| | 3,440,000 | | | Capital One Multi-Asset Execution Trust, Series2019-A1, Class A1, 2.840%, 12/15/2024(a) | | | 3,509,752 | |
| | 3,500,000 | | | Chase Issuance Trust, Series2015-A4, Class A4, 1.840%, 4/15/2022(a) | | | 3,499,192 | |
| | 6,880,000 | | | Discover Card Execution Note Trust, Series2018-A5, Class A5, 3.320%, 3/15/2024(a) | | | 7,049,015 | |
| | 5,425,000 | | | Discover Card Execution Note Trust, Series2018-A3, Class A3,1-month LIBOR + 0.230%, 1.970%, 12/15/2023(a)(b) | | | 5,429,814 | |
| | 3,190,000 | | | Discover Card Execution Note Trust, Series2019-A1, Class A1, 3.040%, 7/15/2024(a) | | | 3,266,174 | |
| | 640,000 | | | Genesis Sales Finance Master Trust, Series2019-AA, Class A, 4.680%, 8/20/2023, 144A | | | 651,479 | |
| | 6,995,000 | | | World Financial Network Credit Card Master Trust, Series2019-C, Class M, 2.710%, 7/15/2026 | | | 6,986,185 | |
| | | | | | | | |
| | | | | | | 49,606,900 | |
| | | | | | | | |
| | | | ABS Home Equity — 9.2% | |
| | 1,179,740 | | | Ajax Mortgage Loan Trust, Series2017-B, Class A, 3.163%, 9/25/2056, 144A(a)(c) | | | 1,180,234 | |
| | 319,536 | | | Alternative Loan Trust, Series 2004-16CB, Class 1A1, 5.500%, 7/25/2034(a) | | | 327,396 | |
| | 355,344 | | | Alternative Loan Trust, Series 2004-16CB, Class 3A1, 5.500%, 8/25/2034(a) | | | 364,065 | |
| | 568,882 | | | Alternative Loan Trust, Series2005-J1, Class 2A1, 5.500%, 2/25/2025 | | | 582,106 | |
| | 300,000 | | | American Homes 4 Rent, Series 2014-SFR2, Class D, 5.149%, 10/17/2036, 144A(a) | | | 324,098 | |
| | 2,170,000 | | | American Homes 4 Rent, Series 2014-SFR2, Class E, 6.231%, 10/17/2036, 144A(a) | | | 2,413,057 | |
| | 1,200,000 | | | American Homes 4 Rent, Series 2014-SFR3, Class E, 6.418%, 12/17/2036, 144A(a) | | | 1,347,975 | |
| | 3,138,000 | | | American Homes 4 Rent, Series 2015-SFR1, Class E, 5.639%, 4/17/2052, 144A | | | 3,378,299 | |
| | 1,281,000 | | | AMSR Trust, Series 2019-SFR1, Class B, 3.023%, 1/19/2039, 144A | | | 1,280,388 | |
| | 514,571 | | | Banc of America Alternative Loan Trust, Series2003-8, Class 1CB1, 5.500%, 10/25/2033 | | | 539,757 | |
| | 580,493 | | | Banc of America Funding Trust, Series2005-7, Class 3A1, 5.750%, 11/25/2035 | | | 626,620 | |
| | 409,906 | | | Banc of America Funding Trust, Series2007-4, Class 5A1, 5.500%, 11/25/2034 | | | 409,747 | |
| | 833,231 | | | Bayview Opportunity Master Fund Trust, Series2019-RN1, Class A1, 4.090%, 2/28/2034, 144A(c) | | | 831,994 | |
| | 826,539 | | | Bayview Opportunity Master Fund Trust, Series2019-RN2, Class A1, 3.967%, 3/28/2034, 144A(c) | | | 827,388 | |
| | 4,089,404 | | | Citigroup Mortgage Loan Trust, Series2019-E, Class A1, 3.228%, 11/25/2070, 144A(c) | | | 4,087,129 | |
| | 1,175,958 | | | Citigroup Mortgage Loan Trust, Series2018-A, Class A1, 4.000%, 1/25/2068, 144A(c) | | | 1,179,600 | |
See accompanying notes to financial statements.
19 |
Portfolio of Investments – as of December 31, 2019
Loomis Sayles Strategic Alpha Fund – (continued)
| | | | | | | | |
Principal
Amount (‡) | | | Description | | Value (†) | |
| | | | ABS Home Equity — continued | |
| $ | 2,822,778 | | | Citigroup Mortgage Loan Trust, Series2018-C, Class A1, 4.125%, 3/25/2059, 144A(c) | | $ | 2,851,290 | |
| | 2,201,126 | | | Citigroup Mortgage Loan Trust, Series2019-B, Class A1, 3.258%, 4/25/2066, 144A(c) | | | 2,203,710 | |
| | 2,200,000 | | | Colony American Finance Ltd., Series2015-1, Class D, 5.649%, 10/15/2047, 144A | | | 2,205,533 | |
| | 1,065,000 | | | Colony American Finance Ltd., Series2016-1, Class C, 4.638%, 6/15/2048, 144A(a)(c) | | | 1,075,318 | |
| | 1,830,000 | | | Colony American Finance Ltd., Series2019-2, Class B, 3.424%, 6/15/2052, 144A | | | 1,863,466 | |
| | 489,104 | | | Countrywide Alternative Loan Trust, Series 2003-22CB, Class 1A1, 5.750%, 12/25/2033(a) | | | 502,577 | |
| | 918,792 | | | Countrywide Alternative Loan Trust, Series2004-J10, Class 2CB1, 6.000%, 9/25/2034 | | | 946,243 | |
| | 63,774 | | | Countrywide Home Loan Mortgage Pass Through Trust, Series 2004-HYB4, Class 2A1, 4.223%, 9/20/2034(a)(c)(d)(e) | | | 62,483 | |
| | 2,555,286 | | | Credit Suisse Mortgage Trust, Series 2018-RPL2, Class A1, 4.030%, 8/25/2062, 144A(c) | | | 2,554,734 | |
| | 1,109,718 | | | Credit Suisse Mortgage Trust, Series 2018-RPL7, Class A1, 4.000%, 8/26/2058, 144A | | | 1,118,831 | |
| | 2,600,000 | | | Credit Suisse Mortgage Trust, Series 2019-RP10, Class A1, 3.318%, 12/25/2059, 144A(c) | | | 2,600,582 | |
| | 186,349 | | | CSFB Mortgage-Backed Pass-Through Certificates, Series2003-27, Class 4A4, 5.750%, 11/25/2033(a) | | | 191,486 | |
| | 516,567 | | | DSLA Mortgage Loan Trust, Series2005-AR5, Class 2A1A,1-month LIBOR + 0.330%, 2.094%, 9/19/2045(b) | | | 421,965 | |
| | 1,395,691 | | | Dukinfield II PLC, Series 2, Class A, GBP3-month LIBOR + 1.250%, 2.048%, 12/20/2052, (GBP)(a)(b) | | | 1,863,215 | |
| | 465,938 | | | Eurosail PLC, Series2007-2X, Class A3C, GBP3-month LIBOR + 0.150%, 0.950%, 3/13/2045, (GBP)(a)(b) | | | 603,784 | |
| | 1,505,000 | | | Federal National Mortgage Association Connecticut Avenue Securities, Series2017-C05, Class 1M2,1-month LIBOR + 2.200%, 3.992%, 1/25/2030(b) | | | 1,530,914 | |
| | 320,000 | | | Federal National Mortgage Association Connecticut Avenue Securities, Series2017-C07, Class 1M2,1-month LIBOR + 2.400%, 4.192%, 5/25/2030(b) | | | 325,915 | |
| | 812,001 | | | Freddie Mac Structured Agency Credit Risk Debt Notes,Series 2014-DN1, Class M2,1-month LIBOR + 2.200%, 3.992%, 2/25/2024(a)(b) | | | 820,753 | |
| | 282,980 | | | Freddie Mac Structured Agency Credit Risk Debt Notes,Series 2014-DN2, Class M2,1-month LIBOR + 1.650%, 3.442%, 4/25/2024(a)(b) | | | 283,787 | |
| | 1,181,911 | | | Freddie Mac Structured Agency Credit Risk Debt Notes, Series 2015-DNA1, Class M2,1-month LIBOR + 1.850%, 3.642%, 10/25/2027(a)(b) | | | 1,189,384 | |
| | 130,000 | | | Freddie Mac Structured Agency Credit Risk Debt Notes, Series 2018-DNA1, Class M2,1-month LIBOR + 1.800%, 3.592%, 7/25/2030(b) | | | 130,257 | |
| | 3,084,862 | | | GCAT Trust, Series 2019-RPL1, Class A1, 2.650%, 10/25/2068, 144A(c) | | | 3,081,125 | |
| | 1,325,610 | | | Gosforth Funding PLC, Series2018-1A, Class A1,3-month LIBOR + 0.450%, 2.360%, 8/25/2060, 144A(a)(b) | | | 1,323,453 | |
See accompanying notes to financial statements.
| 20
Portfolio of Investments – as of December 31, 2019
Loomis Sayles Strategic Alpha Fund – (continued)
| | | | | | | | |
Principal
Amount (‡) | | | Description | | Value (†) | |
| | | | ABS Home Equity — continued | |
| $ | 720,976 | | | Grand Avenue Mortgage Loan Trust, Series 2017-RPL1, Class A1, 3.250%, 8/25/2064, 144A | | $ | 711,743 | |
| | 611,877 | | | IndyMac Index Mortgage Loan Trust, Series2004-AR7, Class A5,1-month LIBOR + 1.220%, 3.012%, 9/25/2034(b) | | | 575,112 | |
| | 2,666,308 | | | IndyMac Index Mortgage Loan Trust, Series2006-AR2, Class 2A1,1-month LIBOR + 0.210%, 2.002%, 2/25/2046(b) | | | 2,258,956 | |
| | 2,614,643 | | | Invitation Homes Trust, Series 2018-SFR1, Class E,1-month LIBOR + 2.000%, 3.737%, 3/17/2037, 144A(b) | | | 2,617,144 | |
| | 4,475,000 | | | Invitation Homes Trust, Series 2018-SFR2, Class E,1-month LIBOR + 2.000%, 3.740%, 6/17/2037, 144A(b) | | | 4,486,131 | |
| | 1,246,881 | | | JPMorgan Mortgage Trust, Series2004-S1, Class 2A1, 6.000%, 9/25/2034 | | | 1,284,142 | |
| | 1,499,333 | | | Lanark Master Issuer PLC, Series2019-1A, Class 1A1,3-month LIBOR + 0.770%, 2.669%, 12/22/2069, 144A(a)(b) | | | 1,503,401 | |
| | 2,370,186 | | | Legacy Mortgage Asset Trust, Series2019-GS3, Class A1, 3.750%, 4/25/2059, 144A(c) | | | 2,389,462 | |
| | 479,134 | | | Lehman XS Trust, Series2006-2N, Class 1A1,1-month LIBOR + 0.260%, 2.052%, 2/25/2046(b) | | | 442,464 | |
| | 439,359 | | | Ludgate Funding PLC, Series2007-1, Class A2B,3-month EURIBOR + 0.160%, Zero Coupon, 1/01/2061, (EUR)(a)(b) | | | 467,497 | |
| | 1,615,528 | | | Ludgate Funding PLC, Series2008-W1X, Class A1, GBP3-month LIBOR + 0.600%, 1.360%, 1/01/2061, (GBP)(a)(b) | | | 2,075,105 | |
| | 262,742 | | | MASTR Adjustable Rate Mortgages Trust, Series2004-4, Class 5A1, 4.764%, 5/25/2034(a)(c)(d)(e) | | | 262,535 | |
| | 311,385 | | | MASTR Alternative Loan Trust, Series2003-9, Class 4A1, 5.250%, 11/25/2033(a) | | | 317,942 | |
| | 302,992 | | | MASTR Alternative Loan Trust, Series2004-5, Class 1A1, 5.500%, 6/25/2034(a) | | | 310,579 | |
| | 355,949 | | | MASTR Alternative Loan Trust, Series2004-5, Class 2A1, 6.000%, 6/25/2034(a) | | | 366,799 | |
| | 1,066,942 | | | MASTR Alternative Loan Trust, Series2004-8, Class 2A1, 6.000%, 9/25/2034 | | | 1,115,215 | |
| | 77,649 | | | Merrill Lynch Mortgage Investors Trust, Series2006-2, Class 2A, 3.925%, 5/25/2036(a)(c)(d)(e) | | | 78,446 | |
| | 439,751 | | | Morgan Stanley Mortgage Loan Trust, Series2005-7, Class 4A2, 5.500%, 11/25/2035(d)(e) | | | 398,058 | |
| | 888,573 | | | Morgan Stanley Mortgage Loan Trust, Series2005-7, Class 7A5, 5.500%, 11/25/2035 | | | 922,633 | |
| | 631,899 | | | Newgate Funding PLC, Series2007-3X, Class A2B,3-month EURIBOR + 0.600%, 0.204%, 12/15/2050, (EUR)(a)(b) | | | 687,848 | |
| | 2,315,876 | | | Onslow Bay Financial LLC , Series 2019-EXP3, Class 1A8, 3.500%, 10/25/2059, 144A(c) | | | 2,332,188 | |
| | 768,688 | | | Preston Ridge Partners Mortgage LLC, Series2017-3A, Class A1, 3.470%, 11/25/2022, 144A(a)(c) | | | 769,188 | |
| | 405,000 | | | Preston Ridge Partners Mortgage LLC, Series2017-3A, Class A2, 5.000%, 11/25/2022, 144A(c) | | | 403,014 | |
| | 895,000 | | | Preston Ridge Partners Mortgage LLC, Series2018-1A, Class A2, 5.000%, 4/25/2023, 144A(c) | | | 896,395 | |
See accompanying notes to financial statements.
21 |
Portfolio of Investments – as of December 31, 2019
Loomis Sayles Strategic Alpha Fund – (continued)
| | | | | | | | |
Principal
Amount (‡) | | | Description | | Value (†) | |
| | | | ABS Home Equity — continued | |
| $ | 1,005,000 | | | Progress Residential Trust, Series 2019-SFR3, Class D, 2.871%, 9/17/2036, 144A | | $ | 991,319 | |
| | 681,000 | | | Progress Residential Trust, Series 2017-SFR2, Class E, 4.142%, 12/17/2034, 144A | | | 684,833 | |
| | 564,000 | | | Progress Residential Trust, Series 2018-SFR2, Class E, 4.656%, 8/17/2035, 144A | | | 576,404 | |
| | 2,398,000 | | | Progress Residential Trust, Series 2019-SFR1, Class E, 4.466%, 8/17/2035, 144A | | | 2,444,341 | |
| | 1,853,781 | | | PRPM LLC, Series2019-4A, Class A1, 3.351%, 11/25/2024, 144A(c) | | | 1,853,760 | |
| | 3,386,711 | | | RCO V Mortgage LLC, Series2019-1, Class A1, 3.721%, 5/24/2024, 144A(c) | | | 3,390,302 | |
| | 1,213,784 | | | Residential Asset Securitization Trust, Series 2005-A8CB, Class A9, 5.375%, 7/25/2035 | | | 1,095,388 | |
| | 378 | | | Residential Funding Mortgage Securities, Series2006-SA2, Class 3A1, 5.298%, 8/25/2036(c) | | | 364 | |
| | 357,962 | | | RMAC Securities No. 1 PLC, Series 2006-NS1X, Class A2C,3-month EURIBOR + 0.150%, Zero Coupon, 6/12/2044, (EUR)(a)(b) | | | 385,505 | |
| | 271,825 | | | RMAC Securities No. 1 PLC, Series 2007-NS1X, Class A2A, GBP3-month LIBOR + 0.150%, 0.929%, 6/12/2044, (GBP)(a)(b) | | | 339,618 | |
| | 1,059,410 | | | Sequoia Mortgage Trust, Series2018-CH1, Class A1, 4.000%, 2/25/2048, 144A(c) | | | 1,075,822 | |
| | 4,103,402 | | | Sequoia Mortgage Trust, Series2019-CH1, Class A1, 4.500%, 3/25/2049, 144A(c) | | | 4,175,664 | |
| | 2,984,474 | | | Structured Adjustable Rate Mortgage Loan Trust, Series2005-14, Class A1,1-month LIBOR + 0.310%, 2.102%, 7/25/2035(b) | | | 2,353,952 | |
| | 1,685,651 | | | Towd Point Mortgage Trust, Series2015-2, Class 1A13, 2.500%, 11/25/2060, 144A(a)(c) | | | 1,681,277 | |
| | 1,083,202 | | | Towd Point Mortgage Trust, Series2017-6, Class A1, 2.750%, 10/25/2057, 144A(c) | | | 1,089,750 | |
| | 1,660,000 | | | Tricon American Homes Trust, Series 2019-SFR1, Class A, 2.750%, 3/17/2038, 144A | | | 1,663,142 | |
| | 2,189,582 | | | Vericrest Opportunity Loan Trust, Series 2019-NPL3, Class A1, 3.967%, 3/25/2049, 144A(c) | | | 2,200,819 | |
| | 4,941,119 | | | Vericrest Opportunity Loan Trust, Series 2019-NPL5, Class A1A, 3.352%, 9/25/2049, 144A(c) | | | 4,938,927 | |
| | 7,056,761 | | | VOLT LXXII LLC, Series 2018-NPL8, Class A1A, 4.213%, 10/26/2048, 144A(c) | | | 7,049,650 | |
| | 3,039,576 | | | VOLT LXXV LLC, Series 2019-NPL1, Class A1A, 4.336%, 1/25/2049, 144A(c) | | | 3,057,694 | |
| | 1,679,689 | | | VOLT LXXXIII LLC, Series 2019-NPL9, Class A1A, 3.327%, 11/26/2049, 144A(c) | | | 1,678,861 | |
| | | | | | | | |
| | | | | | | 119,850,047 | |
| | | | | | | | |
| | | | ABS Other — 5.6% | |
| | 799,792 | | | Accelerated Assets LLC, Series18-1, Class B, 4.510%, 12/02/2033, 144A | | | 818,935 | |
| | 2,399,698 | | | AIM Aviation Finance Ltd., Series2015-1A, Class B1, 5.072%, 2/15/2040, 144A(a)(c) | | | 2,396,183 | |
| | 350,000 | | | Ascentium Equipment Receivables Trust, Series2017-2A, Class C, 2.870%, 8/10/2022, 144A(a) | | | 353,109 | |
See accompanying notes to financial statements.
| 22
Portfolio of Investments – as of December 31, 2019
Loomis Sayles Strategic Alpha Fund – (continued)
| | | | | | | | |
Principal
Amount (‡) | | | Description | | Value (†) | |
| | | | ABS Other — continued | |
| $ | 1,013,958 | | | Blackbird Capital Aircraft Lease Securitization Ltd., Series2016-1A, Class A, 4.213%, 12/16/2041, 144A(a)(c) | | $ | 1,034,910 | |
| | 1,361,484 | | | Blackbird Capital Aircraft Lease Securitization Ltd., Series2016-1A, Class B, 5.682%, 12/16/2041, 144A(a)(c) | | | 1,413,185 | |
| | 1,204,598 | | | Castlelake Aircraft Securitization Trust, Series18-1, Class B, 5.300%, 6/15/2043, 144A | | | 1,225,725 | |
| | 250,000 | | | CCG Receivables Trust, Series2018-1, Class C, 3.420%, 6/16/2025, 144A(a) | | | 252,940 | |
| | 580,000 | | | Chesapeake Funding II LLC, Series2017-2A, Class D, 3.710%, 5/15/2029, 144A | | | 587,575 | |
| | 775,000 | | | Chesapeake Funding II LLC, Series2017-4A, Class D, 3.260%, 11/15/2029, 144A | | | 779,213 | |
| | 790,000 | | | Chesapeake Funding II LLC, Series2018-1A, Class C, 3.570%, 4/15/2030, 144A | | | 805,056 | |
| | 2,125,000 | | | Chesapeake Funding II LLC, Series2018-1A, Class D, 3.920%, 4/15/2030, 144A | | | 2,158,020 | |
| | 384,385 | | | Diamond Resorts Owner Trust, Series2017-1A, Class C, 6.070%, 10/22/2029, 144A | | | 393,658 | |
| | 1,549,541 | | | Diamond Resorts Owner Trust, Series2018-1, Class C, 4.530%, 1/21/2031, 144A | | | 1,584,266 | |
| | 2,201,141 | | | Diamond Resorts Owner Trust, Series2019-1, Class B, 3.530%, 2/20/2032, 144A | | | 2,199,586 | |
| | 3,100,000 | | | Fairstone Financial Issuance Trust I, Series2019-1A, Class A, 3.948%, 3/21/2033, 144A, (CAD)(a) | | | 2,398,331 | |
| | 2,136,024 | | | GCA2014 Holdings Ltd., Series2014-1, Class C, 6.000%, 1/05/2030, 144A(d)(e)(f)(g) | | | 1,779,094 | |
| | 942,002 | | | GCA2014 Holdings Ltd., Series2014-1, Class D, 7.500%, 1/05/2030, 144A(d)(e)(f)(g) | | | 558,136 | |
| | 3,410,000 | | | GCA2014 Holdings Ltd., Series2014-1, Class E, Zero Coupon, 1/05/2030, 144A(d)(e)(f)(g)(h) | | | — | |
| | 873,084 | | | Global Container Assets Ltd., Series2015-1A, Class B, 4.500%, 2/05/2030, 144A(g)(i) | | | 862,539 | |
| | 4,573,285 | | | Horizon Aircraft Finance I Ltd., Series2018-1, Class A, 4.458%, 12/15/2038, 144A | | | 4,694,985 | |
| | 2,245,584 | | | Kestrel Aircraft Funding Ltd., Series2018-1A, Class A, 4.250%, 12/15/2038, 144A | | | 2,282,215 | |
| | 1,364,367 | | | MAPS Ltd., Series2018-1A, Class A, 4.212%, 5/15/2043, 144A | | | 1,388,792 | |
| | 1,778,472 | | | MAPS Ltd., Series2018-1A, Class B, 5.193%, 5/15/2043, 144A | | | 1,823,885 | |
| | 960,723 | | | Marlette Funding Trust, Series2019-1A, Class A, 3.440%, 4/16/2029, 144A | | | 967,694 | |
| | 2,639,383 | | | Marlette Funding Trust, Series2019-3A, Class A, 2.690%, 9/17/2029, 144A(a) | | | 2,646,419 | |
| | 681,923 | | | MVW Owner Trust, Series2019-1A, Class C, 3.330%, 11/20/2036, 144A | | | 689,274 | |
| | 1,100,000 | | | Navistar Financial Dealer Note Master Owner Trust II, Series2018-1, Class A,1-month LIBOR + 0.630%, 2.422%, 9/25/2023, 144A(a)(b) | | | 1,101,817 | |
| | 3,120,000 | | | OneMain Financial Issuance Trust, Series2015-3A, Class B, 4.160%, 11/20/2028, 144A(a) | | | 3,134,198 | |
See accompanying notes to financial statements.
23 |
Portfolio of Investments – as of December 31, 2019
Loomis Sayles Strategic Alpha Fund – (continued)
| | | | | | | | |
Principal
Amount (‡) | | | Description | | Value (†) | |
| | | | ABS Other — continued | |
| $ | 3,100,000 | | | OneMain Financial Issuance Trust, Series2016-1A, Class C, 6.000%, 2/20/2029, 144A(a) | | $ | 3,153,792 | |
| | 3,230,000 | | | OneMain Financial Issuance Trust, Series2019-1A, Class D, 4.220%, 2/14/2031, 144A | | | 3,343,629 | |
| | 810,000 | | | Oxford Finance Funding Trust, Series2019-1A, Class A2, 4.459%, 2/15/2027, 144A | | | 821,985 | |
| | 3,980,000 | | | Republic Finance Issuance Trust, Series2019-A, Class A, 3.430%, 11/22/2027, 144A | | | 3,973,154 | |
| | 4,245,947 | | | S-Jets Ltd., Series2017-1, Class A, 3.967%, 8/15/2042, 144A(a) | | | 4,249,245 | |
| | 3,718,000 | | | SCF Equipment Trust LLC, Series2018-1A, Class C, 4.210%, 4/20/2027, 144A(a) | | | 3,732,703 | |
| | 580,000 | | | SoFi Consumer Loan Program Trust, Series2018-1, Class B, 3.650%, 2/25/2027, 144A | | | 591,116 | |
| | 1,410,000 | | | SoFi Consumer Loan Program Trust, Series2018-2, Class A2, 3.350%, 4/26/2027, 144A | | | 1,418,502 | |
| | 1,690,000 | | | SoFi Consumer Loan Program Trust, Series2018-2, Class B, 3.790%, 4/26/2027, 144A | | | 1,721,468 | |
| | 1,010,000 | | | SoFi Consumer Loan Program Trust, Series2018-4, Class C, 4.170%, 11/26/2027, 144A | | | 1,043,607 | |
| | 1,072,419 | | | Sprite Ltd., Series2017-1, Class B, 5.750%, 12/15/2037, 144A(a) | | | 1,110,439 | |
| | 1,453,083 | | | TAL Advantage V LLC, Series2013-2A, Class A, 3.550%, 11/20/2038, 144A(a) | | | 1,450,846 | |
| | 4,531,459 | | | Verizon Owner Trust, Series2017-3A, Class A1B,1-month LIBOR + 0.270%, 2.035%, 4/20/2022, 144A(a)(b) | | | 4,533,429 | |
| | 1,061,934 | | | Wave LLC, Series2017-1A, Class B, 5.682%, 11/15/2042, 144A(a) | | | 1,093,602 | |
| | | | | | | | |
| | | | | | | 72,567,257 | |
| | | | | | | | |
| | | | ABS Student Loan — 1.3% | |
| | 2,932,307 | | | Massachusetts Educational Financing Authority, Series2018-A, Class A, 3.850%, 5/25/2033(a) | | | 2,963,184 | |
| | 3,410,000 | | | Navient Private Education Refi Loan Trust, Series2019-FA, Class B, 3.120%, 8/15/2068, 144A | | | 3,316,438 | |
| | 1,035,000 | | | Navient Private Education Refi Loan Trust, Series2018-A, Class B, 3.680%, 2/18/2042, 144A | | | 1,053,458 | |
| | 590,990 | | | Navient Student Loan Trust, Series18-4A, Class A1,1-month LIBOR + 0.250%, 2.042%, 6/27/2067, 144A(a)(b) | | | 589,677 | |
| | 695,000 | | | Navient Student Loan Trust, Series2019-GA, Class B, 3.080%, 10/15/2068, 144A | | | 680,281 | |
| | 828,000 | | | SLM Private Credit Student Loan Trust, Series2003-A, Class A3,28-day ARS, 5.040%, 6/15/2032(a)(b) | | | 826,874 | |
| | 2,307,000 | | | SLM Private Credit Student Loan Trust, Series2003-B, Class A3,28-day ARS, 5.040%, 3/15/2033(a)(b) | | | 2,302,711 | |
| | 250,000 | | | SLM Private Credit Student Loan Trust, Series2003-B, Class A4,28-day ARS, 4.590%, 3/15/2033(b) | | | 249,856 | |
| | 800,000 | | | SMB Private Education Loan Trust, Series2015-C, Class B, 3.500%, 9/15/2043, 144A | | | 812,288 | |
| | 1,198,190 | | | SMB Private Education Loan Trust, Series2017-B, Class A2B,1-month LIBOR + 0.750%, 2.490%, 10/15/2035, 144A(a)(b) | | | 1,193,685 | |
See accompanying notes to financial statements.
| 24
Portfolio of Investments – as of December 31, 2019
Loomis Sayles Strategic Alpha Fund – (continued)
| | | | | | | | |
Principal
Amount (‡) | | | Description | | Value (†) | |
| | | | ABS Student Loan — continued | |
| $ | 190,000 | | | SMB Private Education Loan Trust, Series2018-B, Class B, 4.000%, 7/15/2042, 144A | | $ | 196,687 | |
| | 482,429 | | | SMB Private Education Loan Trust, Series2018-C, Class A1,1-month LIBOR + 0.300%, 2.040%, 9/15/2025, 144A(a)(b) | | | 482,203 | |
| | 510,000 | | | SMB Private Education Loan Trust, Series2018-C, Class B, 4.000%, 11/17/2042, 144A | | | 524,606 | |
| | 278,580 | | | SoFi Professional Loan Program LLC, Series2015-A, Class A1,1-month LIBOR + 1.200%, 2.992%, 3/25/2033, 144A(a)(b) | | | 278,927 | |
| | 904,216 | | | SoFi Professional Loan Program LLC, Series2016-A, Class B, 3.570%, 1/26/2038, 144A(a) | | | 916,908 | |
| | | | | | | | |
| | | | | | | 16,387,783 | |
| | | | | | | | |
| | | | ABS Whole Business — 2.6% | |
| | 4,283,574 | | | Adams Outdoor Advertising LP, Series2018-1, Class A, 4.810%, 11/15/2048, 144A | | | 4,444,798 | |
| | 3,427,125 | | | Coinstar Funding LLC, Series2017-1A, Class A2, 5.216%, 4/25/2047, 144A(a) | | | 3,516,037 | |
| | 497,500 | | | DB Master Finance LLC, Series2019-1A, Class A23, 4.352%, 5/20/2049, 144A | | | 515,425 | |
| | 2,850,820 | | | Domino’s Pizza Master Issuer LLC, Series2017-1A, Class A23, 4.118%, 7/25/2047, 144A | | | 2,952,993 | |
| | 212,313 | | | Domino’s Pizza Master Issuer LLC, Series2018-1A, Class A2I, 4.116%, 7/25/2048, 144A | | | 218,346 | |
| | 1,487,350 | | | Driven Brands Funding LLC, Series2018-1A, Class A2, 4.739%, 4/20/2048, 144A | | | 1,542,025 | |
| | 2,168,613 | | | Five Guys Funding LLC, Series2017-1A, Class A2, 4.600%, 7/25/2047, 144A | | | 2,250,017 | |
| | 2,987,188 | | | Planet Fitness Master Issuer LLC, Series2018-1A, Class A2I, 4.262%, 9/05/2048, 144A | | | 3,036,835 | |
| | 2,430,000 | | | Planet Fitness Master Issuer LLC, Series2019-1A, Class A2, 3.858%, 12/05/2049, 144A | | | 2,422,494 | |
| | 2,588,250 | | | Stack Infrastructure Issuer LLC, Series2019-1A, Class A2, 4.540%, 2/25/2044, 144A | | | 2,709,934 | |
| | 5,544,000 | | | Taco Bell Funding LLC, Series2018-1A, Class A2I, 4.318%, 11/25/2048, 144A | | | 5,672,510 | |
| | 3,376,100 | | | Wendy’s Funding LLC, Series2018-1A, Class A2II, 3.884%, 3/15/2048, 144A | | | 3,433,089 | |
| | 731,325 | | | Wendy’s Funding LLC, Series2019-1A, Class A2II, 4.080%, 6/15/2049, 144A | | | 752,160 | |
| | 893,250 | | | Wingstop Funding LLC, Series2018-1, Class A2, 4.970%, 12/05/2048, 144A | | | 919,458 | |
| | | | | | | | |
| | | | | | | 34,386,121 | |
| | | | | | | | |
| | | | Aerospace & Defense — 1.7% | |
| | 7,380,000 | | | Boeing Co.(The), 2.700%, 5/01/2022 | | | 7,495,777 | |
| | 3,425,000 | | | General Dynamics Corp.,3-month LIBOR + 0.380%, 2.281%, 5/11/2021(a)(b) | | | 3,435,093 | |
| | 2,550,000 | | | Leonardo U.S. Holdings, Inc., 6.250%, 1/15/2040, 144A | | | 2,798,676 | |
| | 8,700,000 | | | Rolls-Royce PLC, 2.375%, 10/14/2020, 144A | | | 8,695,998 | |
| | | | | | | | |
| | | | | | | 22,425,544 | |
| | | | | | | | |
See accompanying notes to financial statements.
25 |
Portfolio of Investments – as of December 31, 2019
Loomis Sayles Strategic Alpha Fund – (continued)
| | | | | | | | |
Principal
Amount (‡) | | | Description | | Value (†) | |
| | | | Airlines — 0.8% | |
| $ | 3,726,196 | | | Latam Airlines Pass Through Trust, Series2015-1, Class B, 4.500%, 8/15/2025 | | $ | 3,730,819 | |
| | 6,950,000 | | | United Airlines Pass Through Trust, Series2019-2, Class B, 3.500%, 11/01/2029 | | | 6,983,847 | |
| | | | | | | | |
| | | | | | | 10,714,666 | |
| | | | | | | | |
| | | | Automotive — 4.3% | |
| | 2,645,000 | | | American Honda Finance Corp., 1.950%, 5/20/2022 | | | 2,654,597 | |
| | 5,985,000 | | | BMW U.S. Capital LLC,3-month LIBOR + 0.410%, 2.411%, 4/12/2021, 144A(a)(b) | | | 5,994,615 | |
| | 3,135,000 | | | Daimler Finance North America LLC, 3.100%, 5/04/2020, 144A | | | 3,145,323 | |
| | 4,780,000 | | | Daimler Finance North America LLC, 3.400%, 2/22/2022, 144A | | | 4,897,800 | |
| | 3,585,000 | | | General Motors Financial Co., Inc.,3-month LIBOR + 0.850%, 2.862%, 4/09/2021(b) | | | 3,592,048 | |
| | 7,750,000 | | | Hyundai Capital America, 3.950%, 2/01/2022, 144A | | | 7,969,537 | |
| | 6,865,000 | | | Nissan Motor Acceptance Corp., 3.650%, 9/21/2021, 144A | | | 7,008,095 | |
| | 7,925,000 | | | Toyota Industries Corp., 3.110%, 3/12/2022, 144A(a) | | | 8,070,544 | |
| | 12,395,000 | | | Toyota Motor Credit Corp., MTN,3-month LIBOR + 0.280%, 2.281%, 4/13/2021(a)(b) | | | 12,415,253 | |
| | | | | | | | |
| | | | | | | 55,747,812 | |
| | | | | | | | |
| | | | Banking — 6.3% | |
| | 4,910,000 | | | American Express Co.,3-month LIBOR + 0.600%, 2.491%, 11/05/2021(b) | | | 4,931,281 | |
| | 3,375,000 | | | American Express Co., 3.000%, 2/22/2021 | | | 3,415,413 | |
| | 44,570,000 | | | Banco Hipotecario S.A., Argentina Deposit Rates Badlar Pvt Banks + 4.000%, 41.563%, 11/07/2022, 144A, (ARS)(b) | | | 530,913 | |
| | 14,994,930 | | | Banco Hipotecario S.A., Argentina Deposit Rates Badlar Pvt Banks + 2.500%, 59.958%, 1/12/2020, 144A, (ARS)(b)(g)(i) | | | 178,366 | |
| | 21,970,000 | | | Banco Macro S.A., 17.500%, 5/08/2022, 144A, (ARS) | | | 137,517 | |
| | 46,000,000 | | | Banco Supervielle S.A., Argentina Deposit Rates Badlar Pvt Banks + 4.500%, 52.771%, 8/09/2020, 144A, (ARS)(b) | | | 588,321 | |
| | 5,245,000 | | | Citibank NA, (fixed rate to 2/19/2021, variable rate thereafter), 3.165%, 2/19/2022 | | | 5,311,447 | |
| | 4,885,000 | | | Citigroup, Inc., 2.350%, 8/02/2021 | | | 4,915,148 | |
| | 7,975,000 | | | Citizens Bank NA, 3.250%, 2/14/2022(a) | | | 8,172,822 | |
| | 1,430,000 | | | Danske Bank A/S, (fixed rate to 12/20/2024, variable rate thereafter), 3.244%, 12/20/2025, 144A | | | 1,447,299 | |
| | 6,860,000 | | | HSBC Holdings PLC,3-month LIBOR + 0.650%, 2.537%, 9/11/2021(a)(b) | | | 6,875,021 | |
| | 2,550,000 | | | JPMorgan Chase & Co.,3-month LIBOR + 0.680%, 2.587%, 6/01/2021(a)(b) | | | 2,554,870 | |
| | 3,960,000 | | | JPMorgan Chase Bank NA, (fixed rate to 4/26/2020, variable rate thereafter), 3.086%, 4/26/2021(a) | | | 3,973,596 | |
| | 6,720,000 | | | Mitsubishi UFJ Financial Group, Inc.,3-month LIBOR + 0.650%, 2.586%, 7/26/2021(a)(b) | | | 6,749,448 | |
| | 8,035,000 | | | PNC Bank NA,3-month LIBOR + 0.350%, 2.237%, 3/12/2021(b) | | | 8,038,375 | |
| | 5,370,000 | | | PNC Bank NA,3-month LIBOR + 0.430%, 2.315%, 12/09/2022(b) | | | 5,375,612 | |
| | 3,460,000 | | | Standard Chartered PLC,3-month LIBOR + 1.150%, 3.116%, 1/20/2023, 144A(b) | | | 3,482,455 | |
See accompanying notes to financial statements.
| 26
Portfolio of Investments – as of December 31, 2019
Loomis Sayles Strategic Alpha Fund – (continued)
| | | | | | | | |
Principal
Amount (‡) | | | Description | | Value (†) | |
| | | | Banking — continued | |
| $ | 3,460,000 | | | Standard Chartered PLC, (fixed rate to 1/20/2022, variable rate thereafter), 4.247%, 1/20/2023, 144A | | $ | 3,583,730 | |
| | 8,070,000 | | | Sumitomo Mitsui Financial Group, Inc., 2.846%, 1/11/2022(a) | | | 8,196,113 | |
| | 3,510,000 | | | Wells Fargo Bank NA, 3.625%, 10/22/2021(a) | | | 3,612,516 | |
| | | | | | | | |
| | | | | | | 82,070,263 | |
| | | | | | | | |
| | | | Brokerage — 0.2% | |
| | 3,140,000 | | | Ameriprise Financial, Inc., 3.000%, 3/22/2022 | | | 3,211,977 | |
| | | | | | | | |
| | | | Cable Satellite — 0.1% | |
| | 1,725,000 | | | Ziggo BV, 4.875%, 1/15/2030, 144A | | | 1,781,390 | |
| | | | | | | | |
| | | | Chemicals — 0.3% | |
| | 3,770,000 | | | Methanex Corp., 5.250%, 12/15/2029 | | | 3,895,818 | |
| | | | | | | | |
| | | | Construction Machinery — 1.5% | |
| | 3,050,000 | | | Caterpillar Financial Services Corp., GMTN,3-month LIBOR + 0.290%, 2.190%, 9/04/2020(a)(b) | | | 3,053,254 | |
| | 2,400,000 | | | Caterpillar Financial Services Corp., MTN, 3.150%, 9/07/2021 | | | 2,453,248 | |
| | 6,350,000 | | | John Deere Capital Corp., MTN,3-month LIBOR + 0.240%, 2.127%, 3/12/2021(a)(b) | | | 6,353,957 | |
| | 6,875,000 | | | John Deere Capital Corp., MTN, 3.125%, 9/10/2021(a) | | | 7,033,520 | |
| | | | | | | | |
| | | | | | | 18,893,979 | |
| | | | | | | | |
| | | | Consumer Cyclical Services — 0.5% | |
| | 4,295,000 | | | Uber Technologies, Inc., 7.500%, 9/15/2027, 144A | | | 4,406,412 | |
| | 1,915,000 | | | Uber Technologies, Inc., 8.000%, 11/01/2026, 144A | | | 1,996,388 | |
| | | | | | | | |
| | | | | | | 6,402,800 | |
| | | | | | | | |
| | | | Consumer Products — 1.1% | |
| | 6,740,000 | | | Hasbro, Inc., 3.900%, 11/19/2029 | | | 6,788,888 | |
| | 7,040,000 | | | Unilever Capital Corp., 3.000%, 3/07/2022(a) | | | 7,207,693 | |
| | | | | | | | |
| | | | | | | 13,996,581 | |
| | | | | | | | |
| | | | Diversified Manufacturing — 0.6% | |
| | 7,945,000 | | | 3M Co., MTN, 2.750%, 3/01/2022(a) | | | 8,089,089 | |
| | | | | | | | |
| | | | Electric — 1.6% | |
| | 2,855,000 | | | Enel SpA, (fixed rate to 9/24/2023, variable rate thereafter), 8.750%, 9/24/2073, 144A(a) | | | 3,351,056 | |
| | 8,230,000 | | | Florida Power & Light Co.,3-month LIBOR + 0.400%, 2.308%, 5/06/2022(b) | | | 8,230,248 | |
| | 9,600,000 | | | Vistra Operations Co. LLC, 3.700%, 1/30/2027, 144A | | | 9,539,207 | |
| | | | | | | | |
| | | | | | | 21,120,511 | |
| | | | | | | | |
| | | | Finance Companies — 0.8% | |
| | 6,000,000 | | | Aircastle Ltd., 4.250%, 6/15/2026 | | | 6,349,745 | |
| | 3,535,000 | | | USSA Capital Corp., MTN, 2.625%, 6/01/2021, 144A(a) | | | 3,574,291 | |
| | | | | | | | |
| | | | | | | 9,924,036 | |
| | | | | | | | |
| | | | Financial Other — 0.5% | |
| | 6,550,000 | | | Mitsubishi UFJ Lease & Finance Co. Ltd., 3.406%, 2/28/2022, 144A | | | 6,685,716 | |
| | 370,000 | | | Yanlord Land (HK) Co. Ltd., 5.875%, 1/23/2022 | | | 373,506 | |
| | | | | | | | |
| | | | | | | 7,059,222 | |
| | | | | | | | |
See accompanying notes to financial statements.
27 |
Portfolio of Investments – as of December 31, 2019
Loomis Sayles Strategic Alpha Fund – (continued)
| | | | | | | | |
Principal
Amount (‡) | | | Description | | Value (†) | |
| | | | Food & Beverage — 1.7% | |
| $ | 4,415,000 | | | BRF S.A., 4.875%, 1/24/2030, 144A | | $ | 4,553,013 | |
| | 3,065,000 | | | Campbell Soup Co.,3-month LIBOR + 0.500%, 2.394%, 3/16/2020(a)(b) | | | 3,065,911 | |
| | 3,925,000 | | | General Mills, Inc., 3.200%, 4/16/2021 | | | 3,995,860 | |
| | 2,870,000 | | | JBS USA LUX S.A./JBS USA Food Co./JBS USA Finance, Inc., 5.500%, 1/15/2030, 144A | | | 3,082,667 | |
| | 6,390,000 | | | NBM U.S Holdings, Inc., 7.000%, 5/14/2026, 144A | | | 6,920,434 | |
| | | | | | | | |
| | | | | | | 21,617,885 | |
| | | | | | | | |
| | | | Gaming — 0.3% | |
| | 3,825,000 | | | Boyd Gaming Corp., 4.750%, 12/01/2027, 144A | | | 3,973,219 | |
| | | | | | | | |
| | | | Government Owned – No Guarantee — 2.0% | |
| | 4,120,000 | | | Export-Import Bank of Korea,3-month LIBOR + 0.525%, 2.472%, 6/25/2022(a)(b) | | | 4,130,774 | |
| | 18,670,000,000 | | | Financiera de Desarrollo Territorial S.A., 7.875%, 8/12/2024, 144A, (COP)(a) | | | 5,988,879 | |
| | 4,935,000 | | | Petrobras Global Finance BV, 5.750%, 2/01/2029 | | | 5,566,680 | |
| | 950,000 | | | Petrobras Global Finance BV, 7.250%, 3/17/2044 | | | 1,152,350 | |
| | 6,730,000 | | | Sinopec Group Overseas Development Ltd., 2.500%, 11/12/2024, 144A | | | 6,752,007 | |
| | 1,770,000 | | | YPF S.A., 6.950%, 7/21/2027, 144A | | | 1,575,300 | |
| | 1,930,000 | | | YPF S.A., Argentina Deposit Rates Badlar Pvt Banks + 4.000%, 63.354%, 7/07/2020, 144A(b) | | | 408,909 | |
| | | | | | | | |
| | | | | | | 25,574,899 | |
| | | | | | | | |
| | | | Health Insurance — 0.8% | |
| | 6,900,000 | | | Cigna Corp., Series WI,3-month LIBOR + 0.650%, 2.550%, 9/17/2021(a)(b) | | | 6,900,386 | |
| | 3,125,000 | | | Humana, Inc., 2.500%, 12/15/2020 | | | 3,138,218 | |
| | | | | | | | |
| | | | | | | 10,038,604 | |
| | | | | | | | |
| | | | Healthcare — 0.5% | |
| | 6,065,000 | | | CVS Health Corp.,3-month LIBOR + 0.720%, 2.605%, 3/09/2021(a)(b) | | | 6,102,189 | |
| | | | | | | | |
| | | | Home Construction — 0.4% | |
| | 370,000 | | | CIFI Holdings Group Co. Ltd., 5.500%, 1/23/2022 | | | 372,407 | |
| | 1,565,000 | | | Greenland Global Investment Ltd., 5.875%, 7/03/2024 | | | 1,514,857 | |
| | 1,675,000 | | | Kaisa Group Holding Ltd., 11.950%, 10/22/2022, 144A | | | 1,746,355 | |
| | 740,000 | | | Shimao Property Holdings Ltd., 4.750%, 7/03/2022 | | | 754,764 | |
| | 1,330,000 | | | Sunac China Holdings Ltd., 7.250%, 6/14/2022 | | | 1,364,856 | |
| | | | | | | | |
| | | | | | | 5,753,239 | |
| | | | | | | | |
| | | | Independent Energy — 0.9% | |
| | 872,000 | | | Bellatrix Exploration Ltd., 8.500%, 9/11/2023(d)(e)(f)(g)(j) | | | 523,200 | |
| | 864,577 | | | Bellatrix Exploration Ltd., 12.500%, (9.500% PIK, 3.000% Cash), 12/15/2023(d)(e)(f)(g)(j)(k) | | | — | |
| | 4,155,000 | | | Bruin E&P Partners LLC, 8.875%, 8/01/2023, 144A | | | 2,705,154 | |
| | 5,895,000 | | | California Resources Corp., 8.000%, 12/15/2022, 144A(g)(i) | | | 2,635,478 | |
| | 2,075,000 | | | Gulfport Energy Corp., 6.000%, 10/15/2024 | | | 1,473,250 | |
| | 3,080,000 | | | Gulfport Energy Corp., 6.375%, 5/15/2025 | | | 1,955,800 | |
| | 3,465,000 | | | Vine Oil & Gas LP/Vine Oil & Gas Finance Corp., 9.750%, 4/15/2023, 144A | | | 1,732,500 | |
| | | | | | | | |
| | | | | | | 11,025,382 | |
| | | | | | | | |
See accompanying notes to financial statements.
| 28
Portfolio of Investments – as of December 31, 2019
Loomis Sayles Strategic Alpha Fund – (continued)
| | | | | | | | |
Principal
Amount (‡) | | | Description | | Value (†) | |
| | | | Industrial Other — 0.1% | |
| $ | 740,000 | | | CFLD Cayman Investment Ltd., 6.500%, 12/21/2020 | | $ | 739,075 | |
| | | | | | | | |
| | | | Life Insurance — 2.2% | |
| | 4,545,000 | | | AEGON Funding Co. LLC, 5.750%, 12/15/2020 | | | 4,705,710 | |
| | 2,770,000 | | | AIA Group Ltd.,3-month LIBOR + 0.520%, 2.428%, 9/20/2021, 144A(b) | | | 2,770,055 | |
| | 7,735,000 | | | Jackson National Life Global Funding, 3.300%, 2/01/2022, 144A(a) | | | 7,954,076 | |
| | 2,420,000 | | | MassMutual Global Funding II, 2.500%, 4/13/2022, 144A(a) | | | 2,454,101 | |
| | 4,270,000 | | | Metropolitan Life Global Funding I, 3.375%, 1/11/2022, 144A | | | 4,390,147 | |
| | 6,780,000 | | | New York Life Global Funding,3-month LIBOR + 0.320%, 2.228%, 8/06/2021, 144A(a)(b) | | | 6,798,009 | |
| | | | | | | | |
| | | | | | | 29,072,098 | |
| | | | | | | | |
| | | | Local Authorities — 0.2% | |
| | 2,280,000 | | | Provincia de Buenos Aires, 6.500%, 2/15/2023, 144A | | | 946,200 | |
| | 216,360,000 | | | Provincia de Buenos Aires, Argentina Deposit Rates Badlar Pvt Banks + 3.830%, 44.548%, 5/31/2022, (ARS)(b) | | | 1,649,844 | |
| | 67,000,000 | | | Provincia de Buenos Aires, Argentina Deposit Rates Badlar Pvt Banks + 3.750%, 53.110%, 4/12/2025, 144A, (ARS)(b) | | | 490,248 | |
| | | | | | | | |
| | | | | | | 3,086,292 | |
| | | | | | | | |
| | | | Lodging — 0.4% | |
| | 5,145,000 | | | Marriott International, Inc.,3-month LIBOR + 0.650%, 2.535%, 3/08/2021(b) | | | 5,163,960 | |
| | | | | | | | |
| | | | Media Entertainment — 0.8% | |
| | 1,405,000 | | | Cable Onda S.A., 4.500%, 1/30/2030, 144A | | | 1,479,465 | |
| | 4,710,000 | | | Fox Corp., 3.666%, 1/25/2022, 144A | | | 4,864,135 | |
| | 2,830,000 | | | iHeartCommunications, Inc., 4.750%, 1/15/2028, 144A | | | 2,900,750 | |
| | 1,075,000 | | | Outfront Media Capital LLC/Outfront Media Capital Corp., 4.625%, 3/15/2030, 144A | | | 1,093,812 | |
| | | | | | | | |
| | | | | | | 10,338,162 | |
| | | | | | | | |
| | | | Metals & Mining — 1.0% | |
| | 1,215,000 | | | First Quantum Minerals Ltd., 6.875%, 3/01/2026, 144A | | | 1,230,188 | |
| | 1,460,000 | | | First Quantum Minerals Ltd., 7.500%, 4/01/2025, 144A | | | 1,492,850 | |
| | 3,665,000 | | | Minera Mexico S.A. de CV, 4.500%, 1/26/2050, 144A | | | 3,724,006 | |
| | 6,730,000 | | | POSCO, 2.375%, 11/12/2022, 144A | | | 6,724,549 | |
| | | | | | | | |
| | | | | | | 13,171,593 | |
| | | | | | | | |
| | | | Midstream — 0.9% | |
| | 5,460,000 | | | Cheniere Corpus Christi Holdings LLC, 3.700%, 11/15/2029, 144A | | | 5,575,844 | |
| | 4,960,000 | | | Midwest Connector Capital Co. LLC, 3.625%, 4/01/2022, 144A | | | 5,078,561 | |
| | 800,000 | | | Tennessee Gas Pipeline Co. LLC, 7.000%, 3/15/2027 | | | 996,516 | |
| | | | | | | | |
| | | | | | | 11,650,921 | |
| | | | | | | | |
| | | | Non-Agency Commercial Mortgage-Backed Securities — 3.8% | |
| | 4,565,000 | | | CFCRE Commercial Mortgage Trust, Series2011-C1, Class D, 6.089%, 4/15/2044, 144A(a)(c) | | | 4,719,085 | |
| | 140,000 | | | Commercial Mortgage Trust, Series2012-LC4, Class C, 5.537%, 12/10/2044(c) | | | 145,372 | |
See accompanying notes to financial statements.
29 |
Portfolio of Investments – as of December 31, 2019
Loomis Sayles Strategic Alpha Fund – (continued)
| | | | | | | | |
Principal
Amount (‡) | | | Description | | Value (†) | |
| | | | Non-Agency Commercial Mortgage-Backed Securities — continued | |
| $ | 790,000 | | | Credit Suisse Commercial Mortgage Securities Corp., Series 2019-SKLZ, Class D,1-month LIBOR + 3.600%, 5.340%, 1/15/2034, 144A(b) | | $ | 793,944 | |
| | 5,680,000 | | | Credit Suisse Mortgage Trust, Series2014-USA, Class E, 4.373%, 9/15/2037, 144A | | | 5,340,948 | |
| | 750,000 | | | DBUBS Mortgage Trust, Series 2017-BRBK, Class D, 3.530%, 10/10/2034, 144A(c) | | | 760,837 | |
| | 2,552,340 | | | DBUBS Mortgage Trust, Series 2011-LC1A, Class E, 5.702%, 11/10/2046, 144A(a)(c) | | | 2,605,860 | |
| | 3,195,000 | | | GS Mortgage Securities Corp. Trust, Series 2013-PEMB, Class D, 3.550%, 3/05/2033, 144A(c) | | | 2,774,570 | |
| | 2,170,000 | | | GS Mortgage Securities Trust, Series2011-GC5, Class D, 5.390%, 8/10/2044, 144A(c) | | | 2,159,262 | |
| | 1,825,662 | | | Hospitality Mortagage Trust, Series2019-HIT, Class C,1-month LIBOR + 1.600%, 3.340%, 11/15/2036, 144A(b) | | | 1,822,208 | |
| | 1,570,000 | | | Morgan Stanley Capital I Trust, Series2011-C2, Class D, 5.488%, 6/15/2044, 144A(a)(c) | | | 1,582,084 | |
| | 2,515,000 | | | Morgan Stanley Capital I Trust, Series2011-C2, Class E, 5.488%, 6/15/2044, 144A(c) | | | 2,444,992 | |
| | 4,628,092 | | | Motel 6 Trust, Series 2017-M6MZ, Class M,1-month LIBOR + 6.927%, 8.666%, 8/15/2024, 144A(b) | | | 4,674,699 | |
| | 1,060,000 | | | Starwood Retail Property Trust, Series 2014-STAR, Class C,1-month LIBOR + 2.750%, 4.490%, 11/15/2027, 144A(b) | | | 1,049,153 | |
| | 4,243,654 | | | Starwood Retail Property Trust, Series 2014-STAR, Class D,1-month LIBOR + 3.500%, 5.240%, 11/15/2027, 144A(b)(g)(i) | | | 3,606,116 | |
| | 3,575,000 | | | Starwood Retail Property Trust, Series 2014-STAR, Class E,1-month LIBOR + 4.400%, 6.140%, 11/15/2027, 144A(b)(d)(e)(g) | | | 2,770,066 | |
| | 1,370,000 | | | UBS-Barclays Commercial Mortgage Trust, Series2012-C2, Class E, 4.890%, 5/10/2063, 144A(c)(g)(i) | | | 1,144,131 | |
| | 4,885,000 | | | Wells Fargo Commercial Mortgage Trust, Series 2019-JWDR, Class C, 3.139%, 9/15/2031, 144A(c) | | | 4,788,255 | |
| | 2,987,500 | | | WFRBS Commercial Mortgage Trust, Series2011-C2, Class D, 5.652%, 2/15/2044, 144A(a)(c) | | | 3,041,364 | |
| | 1,809,189 | | | WFRBS Commercial Mortgage Trust, Series2011-C3, Class D, 5.683%, 3/15/2044, 144A(c) | | | 1,382,718 | |
| | 605,000 | | | WFRBS Commercial Mortgage Trust, Series2012-C7, Class C, 4.813%, 6/15/2045(c) | | | 617,669 | |
| | 950,000 | | | WFRBS Commercial Mortgage Trust, Series2012-C7, Class E, 4.813%, 6/15/2045, 144A(c) | | | 814,773 | |
| | | | | | | | |
| | | | | | | 49,038,106 | |
| | | | | | | | |
| | | | Pharmaceuticals — 2.6% | |
| | 4,020,000 | | | Bristol-Myers Squibb Co., 2.250%, 8/15/2021, 144A | | | 4,045,366 | |
| | 8,040,000 | | | Bristol-Myers Squibb Co., 2.600%, 5/16/2022, 144A | | | 8,173,941 | |
| | 4,010,000 | | | Bristol-Myers Squibb Co., 2.875%, 8/15/2020, 144A | | | 4,032,857 | |
| | 6,860,000 | | | Pfizer, Inc., 3.000%, 9/15/2021(a) | | | 7,005,385 | |
| | 1,665,000 | | | Teva Pharmaceutical Finance Netherlands II BV, 6.000%, 1/31/2025, 144A, (EUR) | | | 1,972,685 | |
| | 10,035,000 | | | Teva Pharmaceutical Finance Netherlands III BV, 4.100%, 10/01/2046 | | | 7,225,200 | |
See accompanying notes to financial statements.
| 30
Portfolio of Investments – as of December 31, 2019
Loomis Sayles Strategic Alpha Fund – (continued)
| | | | | | | | |
Principal
Amount (‡) | | | Description | | Value (†) | |
| | | | Pharmaceuticals — continued | |
| $ | 1,860,000 | | | Teva Pharmaceutical Finance Netherlands III BV, 7.125%, 1/31/2025, 144A | | $ | 1,910,592 | |
| | | | | | | | |
| | | | | | | 34,366,026 | |
| | | | | | | | |
| | | | Property & Casualty Insurance — 0.9% | |
| | 6,000,000 | | | Berkshire Hathaway Finance Corp.,3-month LIBOR + 0.320%, 2.330%, 1/10/2020(a)(b) | | | 6,000,805 | |
| | 5,520,000 | | | Marsh & McLennan Cos., Inc., 3.500%, 12/29/2020 | | | 5,601,045 | |
| | | | | | | | |
| | | | | | | 11,601,850 | |
| | | | | | | | |
| | | | Railroads — 0.4% | |
| | 4,675,000 | | | Union Pacific Corp., 2.950%, 3/01/2022 | | | 4,777,488 | |
| | | | | | | | |
| | | | Real Estate Operations/Development — 0.1% | |
| | 1,365,000 | | | Easy Tactic Ltd., 8.125%, 2/27/2023 | | | 1,398,956 | |
| | 370,000 | | | Logan Property Holdings Co. Ltd., 5.250%, 2/23/2023 | | | 369,523 | |
| | | | | | | | |
| | | | | | | 1,768,479 | |
| | | | | | | | |
| | | | Restaurants — 0.4% | |
| | 5,000,000 | | | 1011778 B.C. ULC/New Red Finance, Inc., 4.375%, 1/15/2028, 144A | | | 5,012,500 | |
| | | | | | | | |
| | | | Retailers — 1.0% | |
| | 5,955,000 | | | Home Depot, Inc. (The),3-month LIBOR + 0.310%, 2.217%, 3/01/2022(b) | | | 5,968,323 | |
| | 6,635,000 | | | Walmart, Inc.,3-month LIBOR + 0.230%, 2.158%, 6/23/2021(a)(b) | | | 6,646,346 | |
| | | | | | | | |
| | | | | | | 12,614,669 | |
| | | | | | | | |
| | | | Sovereigns — 0.0% | |
| | 29,460,000 | | | Argentina Politica Monetaria, Argentina Central Bank7-day Repo Reference Rate, 54.606%, 6/21/2020, (ARS)(b) | | | 257,616 | |
| | | | | | | | |
| | | | Technology — 2.4% | |
| | 2,515,000 | | | Alliance Data Systems Corp., 4.750%, 12/15/2024, 144A | | | 2,508,712 | |
| | 6,045,000 | | | Apple, Inc.,3-month LIBOR + 0.070%, 1.971%, 5/11/2020(a)(b) | | | 6,047,502 | |
| | 12,555,000 | | | Broadcom, Inc., 4.750%, 4/15/2029, 144A(a) | | | 13,728,679 | |
| | 4,075,000 | | | CommScope Technologies LLC, 5.000%, 3/15/2027, 144A | | | 3,830,500 | |
| | 230,000 | | | CommScope Technologies LLC, 6.000%, 6/15/2025, 144A | | | 230,260 | |
| | 3,250,000 | | | Hewlett Packard Enterprise Co., 3.600%, 10/15/2020 | | | 3,286,917 | |
| | 1,325,000 | | | MSCI, Inc., 4.000%, 11/15/2029, 144A | | | 1,343,219 | |
| | | | | | | | |
| | | | | | | 30,975,789 | |
| | | | | | | | |
| | | | Transportation Services — 1.0% | |
| | 5,050,000 | | | FedEx Corp., 3.400%, 1/14/2022 | | | 5,187,141 | |
| | 1,645,000 | | | GMR Hyderabad International Airport Ltd., 5.375%, 4/10/2024 | | | 1,703,298 | |
| | 5,805,000 | | | Penske Truck Leasing Co. LP/PTL Finance Corp., 3.650%, 7/29/2021, 144A | | | 5,939,025 | |
| | | | | | | | |
| | | | | | | 12,829,464 | |
| | | | | | | | |
| | | | Treasuries — 1.6% | |
| | 338,660,000 | | | Republic of South Africa Government Bond, Series 2037, 8.500%, 1/31/2037, (ZAR)(a) | | | 21,409,864 | |
| | | | | | | | |
| | | | Wireless — 0.6% | |
| | 1,740,000 | | | Bharti Airtel Ltd., 4.375%, 6/10/2025 | | | 1,772,031 | |
| | 1,985,000 | | | IHS Netherlands Holdco BV, 7.125%, 3/18/2025, 144A | | | 2,072,499 | |
See accompanying notes to financial statements.
31 |
Portfolio of Investments – as of December 31, 2019
Loomis Sayles Strategic Alpha Fund – (continued)
| | | | | | | | |
Principal
Amount (‡) | | | Description | | Value (†) | |
| | | | Wireless — continued | |
| $ | 3,170,000 | | | Kenbourne Invest S.A., 6.875%, 11/26/2024, 144A | | $ | 3,297,371 | |
| | 1,130,000 | | | Millicom International Cellular S.A., 5.125%, 1/15/2028, 144A | | | 1,184,816 | |
| | | | | | | | |
| | | | | | | 8,326,717 | |
| | | | | | | | |
| | | | Wirelines — 0.9% | |
| | 4,070,000 | | | AT&T, Inc., 3.000%, 2/15/2022 | | | 4,151,603 | |
| | 1,200,000 | | | AT&T, Inc., 3.000%, 6/30/2022 | | | 1,225,859 | |
| | 1,245,000 | | | AT&T, Inc., 3.200%, 3/01/2022 | | | 1,274,562 | |
| | 4,670,000 | | | AT&T, Inc., 3.800%, 3/15/2022 | | | 4,847,495 | |
| | | | | | | | |
| | | | | | | 11,499,519 | |
| | | | | | | | |
| | | | TotalNon-Convertible Bonds
(Identified Cost $1,105,026,213) | | | 1,076,632,454 | |
| | | | | | | | |
| | | | | | | | |
| | Convertible Bonds — 1.1% | |
| | | | Cable Satellite — 0.6% | |
| | 4,280,000 | | | DISH Network Corp., 2.375%, 3/15/2024 | | | 3,908,068 | |
| | 3,625,000 | | | DISH Network Corp., 3.375%, 8/15/2026 | | | 3,486,887 | |
| | | | | | | | |
| | | | | | | 7,394,955 | |
| | | | | | | | |
| | | | Diversified Manufacturing — 0.0% | |
| | 600,000 | | | Greenbrier Cos., Inc. (The), 2.875%, 2/01/2024 | | | 579,193 | |
| | | | | | | | |
| | | | Independent Energy — 0.0% | |
| | 1,280,000 | | | Chesapeake Energy Corp., 5.500%, 9/15/2026 | | | 609,772 | |
| | | | | | | | |
| | | | Pharmaceuticals — 0.3% | |
| | 3,460,000 | | | BioMarin Pharmaceutical, Inc., 0.599%, 8/01/2024 | | | 3,655,486 | |
| | | | | | | | |
| | | | Technology — 0.2% | |
| | 2,590,000 | | | CalAmp Corp., 2.000%, 8/01/2025 | | | 2,152,678 | |
| | | | | | | | |
| | | | Total Convertible Bonds
(Identified Cost $15,479,315) | | | 14,392,084 | |
| | | | | | | | |
| | | | | | | | |
| | | | Total Bonds and Notes
(Identified Cost $1,120,505,528) | | | 1,091,024,538 | |
| | | | | | | | |
| | | | | | | | |
| | Senior Loans — 2.4% | |
| | | | Aerospace & Defense — 0.0% | |
| | 367,609 | | | Science Applications International Corp., 2018 Term Loan B,1-month LIBOR + 1.750%, 3.549%, 10/31/2025(b) | | | 368,469 | |
| | | | | | | | |
| | | | Building Materials — 0.6% | |
| | 2,214,450 | | | American Builders & Contractors Supply Co., Inc., 2019 Term Loan,1-month LIBOR + 2.000%, 3.799%, 1/15/2027(b) | | | 2,224,149 | |
| | 5,114,692 | | | Jeld-Wen, Inc., 2017 1st Lien Term Loan,3-month LIBOR + 2.000%, 3.945%, 12/14/2024(b) | | | 5,116,841 | |
| | | | | | | | |
| | | | | | | 7,340,990 | |
| | | | | | | | |
| | | | Cable Satellite — 0.2% | |
| | 919,529 | | | CSC Holdings LLC, 2019 Term Loan B5,1-month LIBOR + 2.500%, 4.240%, 4/15/2027(b) | | | 922,591 | |
See accompanying notes to financial statements.
| 32
Portfolio of Investments – as of December 31, 2019
Loomis Sayles Strategic Alpha Fund – (continued)
| | | | | | | | |
Principal
Amount (‡) | | | Description | | Value (†) | |
| | | | Cable Satellite — continued | |
| | 1,930,000 | | | Ziggo BV, 2019 EUR Term Loan H,3-month EURIBOR + 3.000%, 3.000%, 1/31/2029, (EUR)(b) | | $ | 2,163,430 | |
| | | | | | | | |
| | | | | | | 3,086,021 | |
| | | | | | | | |
| | | | Chemicals — 0.2% | |
| | 3,347,251 | | | Axalta Coating Systems US Holdings, Inc., USD Term Loan B3,3-month LIBOR + 1.750%, 3.695%, 6/01/2024(b) | | | 3,351,903 | |
| | | | | | | | |
| | | | Electric — 0.1% | |
| | 193,573 | | | AES Corp., 2018 Term Loan B,3-month LIBOR + 1.750%, 3.659%, 5/31/2022(b) | | | 193,573 | |
| | 867,728 | | | Calpine Corp., Term Loan B5, 1/15/2024(l) | | | 871,659 | |
| | | | | | | | |
| | | | | | | 1,065,232 | |
| | | | | | | | |
| | | | Food & Beverage — 0.1% | |
| | 650,000 | | | Aramark Services, Inc., 2019 Term Loan B4, 1/27/2027(l) | | | 653,048 | |
| | | | | | | | |
| | | | Healthcare — 0.4% | |
| | 4,672,603 | | | IQVIA, Inc., 2018 USD Term Loan B3,3-month LIBOR + 1.750%, 3.695%, 6/11/2025(b) | | | 4,693,069 | |
| | | | | | | | |
| | | | Independent Energy — 0.2% | |
| | 811,000 | | | California Resources Corp., 2017 1st Lien Term Loan,1-month LIBOR + 4.750%, 6.555%, 12/31/2022(b) | | | 722,804 | |
| | 3,740,000 | | | Gavilan Resources LLC, 2nd Lien Term Loan,1-month LIBOR + 6.000%, 7.799%, 3/01/2024(b) | | | 1,421,200 | |
| | | | | | | | |
| | | | | | | 2,144,004 | |
| | | | | | | | |
| | | | Restaurants — 0.1% | |
| | 2,050,782 | | | 1011778 B.C. Unlimited Liability Co., Term Loan B4,1-month LIBOR + 1.750%, 3.549%, 11/19/2026(b) | | | 2,052,813 | |
| | | | | | | | |
| | | | Technology — 0.3% | |
| | 4,580,943 | | | Iron Mountain, Inc., 2018 Term Loan B,1-month LIBOR + 1.750%, 3.549%, 1/02/2026(b) | | | 4,565,185 | |
| | | | | | | | |
| | | | Transportation Services — 0.2% | |
| | 2,435,873 | | | Uber Technologies, Inc., 2018 Incremental Term Loan,1-month LIBOR + 3.500%, 5.299%, 7/13/2023(b) | | | 2,428,467 | |
| | | | | | | | |
| | | | Total Senior Loans
(Identified Cost $33,826,561) | | | 31,749,201 | |
| | | | | | | | |
| | | | | | | | |
| | Collateralized Loan Obligations — 2.6% | |
| | 480,000 | | | Apidos CLO XX, Series2015-20A, Class BRR,3-month LIBOR + 1.950%, 3.951%, 7/16/2031, 144A(b) | | | 461,949 | |
| | 475,000 | | | Apidos CLO XXXII, Series2019-32A, Class D,3-month LIBOR + 3.500%, 2.946%, 1/20/2033, 144A(b)(e) | | | 475,000 | |
| | 3,275,188 | | | CVP Cascade CLO Ltd., Series2014-2A, Class A1R,3-month LIBOR + 1.200%, 3.203%, 7/18/2026, 144A(a)(b) | | | 3,275,028 | |
| | 875,000 | | | Dryden 45 Senior Loan Fund, Series2016-45A, Class ER,3-month LIBOR + 5.850%, 7.851%, 10/15/2030, 144A(b)(g)(i) | | | 825,942 | |
See accompanying notes to financial statements.
33 |
Portfolio of Investments – as of December 31, 2019
Loomis Sayles Strategic Alpha Fund – (continued)
| | | | | | | | |
Principal
Amount (‡) | | | Description | | Value (†) | |
| | Collateralized Loan Obligations — (continued) | |
| $ | 5,046,148 | | | Elevation CLO Ltd., Series2015-4A, Class AR,3-month LIBOR + 0.990%, 2.993%, 4/18/2027, 144A(a)(b) | | $ | 5,045,784 | |
| | 1,405,000 | | | Galaxy XXVI CLO Ltd., Series2018-26A, Class E,3-month LIBOR + 5.850%, 7.749%, 11/22/2031, 144A(b)(g)(i) | | | 1,324,590 | |
| | 1,998,438 | | | Halcyon Loan Advisors Funding Ltd., Series2014-2A, Class A1BR,3-month LIBOR + 1.180%, 3.116%, 4/28/2025, 144A(a)(b) | | | 1,998,398 | |
| | 3,447,834 | | | Jamestown CLO VII Ltd., Series2015-7A, Class A1R,3-month LIBOR + 0.830%, 2.770%, 7/25/2027, 144A(a)(b) | | | 3,446,890 | |
| | 350,168 | | | Limerock CLO III LLC, Series2014-3A, Class A1R,3-month LIBOR + 1.200%, 3.166%, 10/20/2026, 144A(b) | | | 349,904 | |
| | 1,175,000 | | | Madison Park Funding XII Ltd., Series2014-12A, Class B1R,3-month LIBOR + 1.650%, 3.616%, 7/20/2026, 144A(b) | | | 1,176,638 | |
| | 475,000 | | | Madison Park Funding XXXI Ltd., Series2018-31A, Class C,3-month LIBOR + 2.150%, 4.084%, 1/23/2031, 144A(b) | | | 459,495 | |
| | 300,000 | | | Madison Park Funding XXXI Ltd., Series2018-31A, Class D,3-month LIBOR + 3.000%, 4.934%, 1/23/2031, 144A(b) | | | 292,949 | |
| | 815,000 | | | Milos CLO Ltd., Series2017-1A, Class E,3-month LIBOR + 6.300%, 8.266%, 10/20/2030, 144A(b)(g)(i) | | | 800,830 | |
| | 4,085,000 | | | Mountain View CLO X Ltd., Series2015-10A, Class AR,3-month LIBOR + 0.820%, 2.821%, 10/13/2027, 144A(a)(b) | | | 4,070,477 | |
| | 495,000 | | | Octagon Investment Partners 39 Ltd., Series2018-3A, Class E,3-month LIBOR + 5.750%, 7.716%, 10/20/2030, 144A(b)(g)(i) | | | 472,409 | |
| | 600,000 | | | Octagon Investment Partners XXIII Ltd., Series2015-1A, Class A1R,3-month LIBOR + 0.850%, 2.851%, 7/15/2027, 144A(b) | | | 598,672 | |
| | 250,000 | | | OZLM XIII Ltd., Series2015-13A, Class A1R,3-month LIBOR + 1.080%, 3.016%, 7/30/2027, 144A(b) | | | 249,477 | |
| | 3,965,000 | | | Parallel Ltd., Series2015-1A, Class AR,3-month LIBOR + 0.850%, 2.816%, 7/20/2027, 144A(a)(b) | | | 3,957,825 | |
| | 250,000 | | | Sound Point CLO XIV Ltd., Series2016-3A, Class AR,3-month LIBOR + 1.150%, 3.084%, 1/23/2029, 144A(b) | | | 249,922 | |
| | 169,322 | | | Staniford Street CLO Ltd., Series2014-1A, Class AR,3-month LIBOR + 1.180%, 3.074%, 6/15/2025, 144A(b) | | | 169,288 | |
| | 895,000 | | | TRESTLES CLO II Ltd., Series2018-2A, Class D,3-month LIBOR + 5.750%, 7.690%, 7/25/2031, 144A(b)(g)(i) | | | 858,574 | |
| | 194,276 | | | Venture XII CLO Ltd., Series2012-12A, Class ARR,3-month LIBOR + 0.800%, 2.714%, 2/28/2026, 144A(b) | | | 193,950 | |
| | 2,780,876 | | | West CLO Ltd., Series2014-1A, Class A1R,3-month LIBOR + 0.920%, 2.923%, 7/18/2026, 144A(b) | | | 2,778,278 | |
| | | | | | | | |
| | | | Total Collateralized Loan Obligations
(Identified Cost $33,614,330) | | | 33,532,269 | |
| | | | | | | | |
| | | | | | | | |
| | Loan Participations — 0.4% | |
| | | | ABS Other — 0.4% | |
| | 4,995,282 | | | Harbour Aircraft Investments Ltd., Series2017-1, Class C, 8.000%, 11/15/2037 (Identified Cost $4,984,272) | | | 5,003,559 | |
| | | | | | | | |
See accompanying notes to financial statements.
| 34
Portfolio of Investments – as of December 31, 2019
Loomis Sayles Strategic Alpha Fund – (continued)
| | | | | | | | |
Shares | | | Description | | Value (†) | |
| | Common Stocks — 1.4% | | | | |
| | | | Aerospace & Defense — 0.0% | |
| | 518 | | | Lockheed Martin Corp. | | $ | 201,699 | |
| | | | | | | | |
| | | | Airlines — 0.0% | |
| | 927 | | | Delta Air Lines, Inc. | | | 54,211 | |
| | | | | | | | |
| | | | Banks — 0.0% | |
| | 2,534 | | | Citigroup, Inc. | | | 202,441 | |
| | 3,376 | | | Popular, Inc. | | | 198,340 | |
| | | | | | | | |
| | | | | | | 400,781 | |
| | | | | | | | |
| | | | Biotechnology — 0.1% | |
| | 2,228 | | | AbbVie, Inc. | | | 197,267 | |
| | 821 | | | Amgen, Inc. | | | 197,919 | |
| | 2,999 | | | Gilead Sciences, Inc. | | | 194,875 | |
| | | | | | | | |
| | | | | | | 590,061 | |
| | | | | | | | |
| | | | Capital Markets — 0.0% | |
| | 562 | | | Apollo Global Management, Inc. | | | 26,813 | |
| | 2,133 | | | LPL Financial Holdings, Inc. | | | 196,769 | |
| | | | | | | | |
| | | | | | | 223,582 | |
| | | | | | | | |
| | | | Chemicals — 0.2% | |
| | 4,054 | | | CF Industries Holdings, Inc. | | | 193,538 | |
| | 138,555 | | | Hexion Holdings Corp., Class B(h) | | | 1,766,576 | |
| | 331 | | | LyondellBasell Industries NV, Class A | | | 31,273 | |
| | | | | | | | |
| | | | | | | 1,991,387 | |
| | | | | | | | |
| | | | Communications Equipment — 0.0% | |
| | 4,253 | | | Cisco Systems, Inc. | | | 203,974 | |
| | | | | | | | |
| | | | Construction Materials — 0.2% | |
| | 673,076 | | | Cemex SAB de CV, Sponsored ADR | | | 2,544,227 | |
| | | | | | | | |
| | | | Diversified Telecommunication Services — 0.0% | |
| | 5,221 | | | AT&T, Inc. | | | 204,037 | |
| | 3,300 | | | Verizon Communications, Inc. | | | 202,620 | |
| | | | | | | | |
| | | | | | | 406,657 | |
| | | | | | | | |
| | | | Electric Utilities — 0.1% | |
| | 1,925 | | | Duke Energy Corp. | | | 175,579 | |
| | 2,150 | | | Evergy, Inc. | | | 139,944 | |
| | 4,385 | | | Exelon Corp. | | | 199,912 | |
| | 2,507 | | | FirstEnergy Corp. | | | 121,840 | |
| | | | | | | | |
| | | | | | | 637,275 | |
| | | | | | | | |
| | | | Electrical Equipment — 0.0% | |
| | 2,095 | | | Eaton Corp. PLC | | | 198,438 | |
| | 609 | | | Rockwell Automation, Inc. | | | 123,426 | |
| | | | | | | | |
| | | | | | | 321,864 | |
| | | | | | | | |
| | | | Food Products — 0.0% | |
| | 2,179 | | | Tyson Foods, Inc., Class A | | | 198,376 | |
| | | | | | | | |
See accompanying notes to financial statements.
35 |
Portfolio of Investments – as of December 31, 2019
Loomis Sayles Strategic Alpha Fund – (continued)
| | | | | | | | |
Shares | | | Description | | Value (†) | |
| | | | Health Care Providers & Services — 0.1% | |
| | 2,235 | | | AmerisourceBergen Corp. | | $ | 190,020 | |
| | 541 | | | Humana, Inc. | | | 198,287 | |
| | 669 | | | UnitedHealth Group, Inc. | | | 196,673 | |
| | | | | | | | |
| | | | | | | 584,980 | |
| | | | | | | | |
| | | | Hotels, Restaurants & Leisure — 0.0% | |
| | 875 | | | McDonald’s Corp. | | | 172,909 | |
| | 2,295 | | | Starbucks Corp. | | | 201,776 | |
| | 1,993 | | | Yum! Brands, Inc. | | | 200,755 | |
| | | | | | | | |
| | | | | | | 575,440 | |
| | | | | | | | |
| | | | Household Durables — 0.0% | |
| | 2,033 | | | Garmin Ltd. | | | 198,340 | |
| | | | | | | | |
| | | | Household Products — 0.0% | |
| | 1,592 | | | Procter & Gamble Co. (The) | | | 198,841 | |
| | | | | | | | |
| | | | Industrial Conglomerates — 0.0% | |
| | 1,167 | | | Honeywell International, Inc. | | | 206,559 | |
| | | | | | | | |
| | | | Insurance — 0.1% | |
| | 3,903 | | | MetLife, Inc. | | | 198,936 | |
| | 2,800 | | | Progressive Corp. (The) | | | 202,692 | |
| | 1,682 | | | Prudential Financial, Inc. | | | 157,671 | |
| | 6,743 | | | Unum Group | | | 196,626 | |
| | | | | | | | |
| | | | | | | 755,925 | |
| | | | | | | | |
| | | | Internet & Direct Marketing Retail — 0.0% | |
| | 1,434 | | | Expedia Group, Inc. | | | 155,073 | |
| | | | | | | | |
| | | | IT Services — 0.1% | |
| | 1,215 | | | Automatic Data Processing, Inc. | | | 207,158 | |
| | 1,516 | | | Fidelity National Information Services, Inc. | | | 210,860 | |
| | 2,087 | | | Leidos Holdings, Inc. | | | 204,296 | |
| | 673 | | | MasterCard, Inc., Class A | | | 200,951 | |
| | 2,351 | | | Paychex, Inc. | | | 199,976 | |
| | 345 | | | Visa, Inc., Class A | | | 64,826 | |
| | | | | | | | |
| | | | | | | 1,088,067 | |
| | | | | | | | |
| | | | Machinery — 0.1% | |
| | 1,354 | | | Caterpillar, Inc. | | | 199,959 | |
| | 1,100 | | | Cummins, Inc. | | | 196,856 | |
| | 1,109 | | | Illinois Tool Works, Inc. | | | 199,209 | |
| | | | | | | | |
| | | | | | | 596,024 | |
| | | | | | | | |
| | | | Media — 0.1% | |
| | 4,589 | | | Comcast Corp., Class A | | | 206,367 | |
| | 2,544 | | | Omnicom Group, Inc. | | | 206,115 | |
| | 4,429 | | | ViacomCBS, Inc., Class B | | | 185,885 | |
| | | | | | | | |
| | | | | | | 598,367 | |
| | | | | | | | |
| | | | Multiline Retail — 0.0% | |
| | 1,548 | | | Target Corp. | | | 198,469 | |
| | | | | | | | |
See accompanying notes to financial statements.
| 36
Portfolio of Investments – as of December 31, 2019
Loomis Sayles Strategic Alpha Fund – (continued)
| | | | | | | | |
Shares | | | Description | | Value (†) | |
| | | | Oil, Gas & Consumable Fuels — 0.1% | |
| | 349,549 | | | Bellatrix Exploration Ltd.(d)(e)(f)(g)(h) | | $ | — | |
| | 1,884 | | | Dommo Energia S.A., Sponsored ADR(h) | | | 8,384 | |
| | 7,100 | | | Enterprise Products Partners LP | | | 199,936 | |
| | 3,171 | | | Magellan Midstream Partners LP | | | 199,361 | |
| | 1,846 | | | Phillips 66 | | | 205,663 | |
| | 10,149 | | | Plains GP Holdings LP, Class A(h) | | | 192,323 | |
| | 73,856 | | | Whiting Petroleum Corp.(h) | | | 542,103 | |
| | | | | | | | |
| | | | | | | 1,347,770 | |
| | | | | | | | |
| | | | Pharmaceuticals — 0.1% | |
| | 3,152 | | | Bristol-Myers Squibb Co. | | | 202,327 | |
| | 1,414 | | | Johnson & Johnson | | | 206,260 | |
| | 2,336 | | | Merck & Co., Inc. | | | 212,459 | |
| | 5,100 | | | Pfizer, Inc. | | | 199,818 | |
| | | | | | | | |
| | | | | | | 820,864 | |
| | | | | | | | |
| | | | REITs – Storage — 0.0% | |
| | 6,125 | | | Iron Mountain, Inc. | | | 195,204 | |
| | | | | | | | |
| | | | Semiconductors & Semiconductor Equipment — 0.1% | |
| | 3,305 | | | Applied Materials, Inc. | | | 201,737 | |
| | 608 | | | Broadcom, Inc. | | | 192,140 | |
| | 3,445 | | | Intel Corp. | | | 206,183 | |
| | 1,143 | | | KLA Corp. | | | 203,648 | |
| | 247 | | | Lam Research Corp. | | | 72,223 | |
| | 2,257 | | | QUALCOMM, Inc. | | | 199,135 | |
| | 1,512 | | | Texas Instruments, Inc. | | | 193,975 | |
| | 1,002 | | | Universal Display Corp. | | | 206,482 | |
| | | | | | | | |
| | | | | | | 1,475,523 | |
| | | | | | | | |
| | | | Software — 0.0% | |
| | 100 | | | Intuit, Inc. | | | 26,193 | |
| | 1,282 | | | Microsoft Corp. | | | 202,171 | |
| | 3,552 | | | Oracle Corp. | | | 188,185 | |
| | | | | | | | |
| | | | | | | 416,549 | |
| | | | | | | | |
| | | | Specialty Retail — 0.0% | |
| | 2,264 | | | Best Buy Co., Inc. | | | 198,779 | |
| | 844 | | | Home Depot, Inc. (The) | | | 184,313 | |
| | | | | | | | |
| | | | | | | 383,092 | |
| | | | | | | | |
| | | | Technology Hardware, Storage & Peripherals — 0.0% | |
| | 232 | | | Apple, Inc. | | | 68,127 | |
| | 5,503 | | | Hewlett Packard Enterprise Co. | | | 87,278 | |
| | 9,759 | | | HP, Inc. | | | 200,547 | |
| | | | | | | | |
| | | | | | | 355,952 | |
| | | | | | | | |
| | | | Tobacco — 0.0% | |
| | 3,848 | | | Altria Group, Inc. | | | 192,053 | |
See accompanying notes to financial statements.
37 |
Portfolio of Investments – as of December 31, 2019
Loomis Sayles Strategic Alpha Fund – (continued)
| | | | | | | | |
Shares | | | Description | | Value (†) | |
| | | | Tobacco — continued | |
| | 2,297 | | | Philip Morris International, Inc. | | $ | 195,452 | |
| | | | | | | | |
| | | | | | | 387,505 | |
| | | | | | | | |
| | | | Total Common Stocks
(Identified Cost $33,985,382) | | | 18,312,638 | |
| | | | | | | | |
| | | | | | | | |
| | Preferred Stocks — 0.7% | | | | |
| | Convertible Preferred Stocks — 0.4% | |
| | | | Food & Beverage — 0.4% | |
| | 42,272 | | | Bunge Ltd., 4.875% | | | 4,352,925 | |
| | | | | | | | |
| | | | Midstream — 0.0% | |
| | 1,714 | | | Chesapeake Energy Corp., 5.750%(e)(g)(i) | | | 293,900 | |
| | 2,329 | | | El Paso Energy Capital Trust I, 4.750% | | | 119,850 | |
| | | | | | | | |
| | | | | | | 413,750 | |
| | | | | | | | |
| | | | Total Convertible Preferred Stocks
(Identified Cost $5,225,333) | | | 4,766,675 | |
| | | | | | | | |
| | | | | | | | |
| | Non-Convertible Preferred Stocks — 0.3% | |
| | | | Cable Satellite — 0.3% | |
| | 4,040,000 | | | NBCUniversal Enterprise, Inc., 5.250%, 144A(a)
(Identified Cost $4,040,000) | | | 4,171,300 | |
| | | | | | | | |
| | | | Total Preferred Stocks
(Identified Cost $9,265,333) | | | 8,937,975 | |
| | | | | | | | |
| | | | | | | | |
Principal
Amount (‡) | | | | | | |
| | Other Investments — 0.6% | |
| | | | Aircraft ABS — 0.6% | |
| | 900 | | | ECAF I Blocker Ltd.(d)(e)(f)(g)
(Identified Cost $9,000,000) | | | 7,776,000 | |
| | | | | | | | |
| | | | | | | | |
| | Equity Linked Notes — 0.1% | |
| | 38,287 | | | Citigroup Global Markets Inc. (HP Inc.), 19.680%, 1/10/2020, 144A(e)(g)(i)
(Identified Cost $666,730) | | | 688,113 | |
| | | | | | | | |
| | | | | | | | |
| | Total Purchased Options — 0.0% | |
| | | | (Identified Cost $286,084) (see detail below) | | | 264,620 | |
| | | | | |
| | | | | | | | |
| | Short-Term Investments — 5.9% | |
| | 44,862,197 | | | Tri-Party Repurchase Agreement with Fixed Income Clearing Corporation, dated 12/31/2019 at 0.900% to be repurchased at $44,864,440 on 1/02/2020 collateralized by $200,000 U.S. Treasury Bond, 2.875% due 8/15/2045 valued at $222,582; $32,125,000 U.S. Treasury Note, 1.750% due 7/15/2022 valued at $32,501,216; $11,605,000 U.S. Treasury Inflation Indexed Note, 0.125% due 7/15/2022 valued at $13,040,643 including accrued interest (Note 2 of Notes to Financial Statements) | | | 44,862,197 | |
See accompanying notes to financial statements.
| 38
Portfolio of Investments – as of December 31, 2019
Loomis Sayles Strategic Alpha Fund – (continued)
| | | | | | | | |
Principal
Amount (‡) | | | Description | | Value (†) | |
| | Short-Term Investments — (continued) | |
| | 13,535,000 | | | U.S. Treasury Bills, 1.519%, 9/10/2020(m) | | $ | 13,390,988 | |
| | 13,550,000 | | | U.S. Treasury Bills, 1.526%, 10/08/2020(m) | | | 13,390,599 | |
| | 5,755,000 | | | U.S. Treasury Bills, 1.875%, 6/18/2020(m)(n) | | | 5,713,636 | |
| | | | | | | | |
| | | | Total Short-Term Investments
(Identified Cost $77,345,654) | | | 77,357,420 | |
| | | | | | | | |
| | | | | | | | |
| | | | Total Investments — 98.0%
(Identified Cost $1,323,479,874) | | | 1,274,646,333 | |
| | | | Other assets less liabilities — 2.0% | | | 26,076,422 | |
| | | | | | | | |
| | | | Net Assets — 100.0% | | $ | 1,300,722,755 | |
| | | | | | | | |
| | | | | | | | | | | | | | | | | | | | | | |
| | | | | | | | | | | | | | | | | | | | | | |
| Purchased Options — 0.0% | | | | | | | | | | | | | |
| | | | | | | | | | | | | | | | | | | | | | |
| Description | | Expiration
Date | | Exercise
Price | | | Shares (††) | | | Notional
Amount | | | Cost | | | Value (†) | |
Options on Securities — 0.0% | |
| iShares® iBoxx $ High Yield Corporate Bond ETF, Put(h) | | 3/20/2020 | | | 86 | | | | 524,000 | | | $ | 46,080,560 | | | $ | 286,084 | | | $ | 264,620 | |
| | | | | | | | | | | | | | | | | | | | | | |
| | | | | | | | | | | | | | | | | | | | | | |
| Written Options — (0.0%) | | | | | | | | | | | | | |
| | | | | | | | | | | | | | | | | | | | | | |
| Description | | Expiration
Date | | Exercise
Price | | | Shares (††) | | | Notional
Amount | | | Premiums
(Received) | | | Value (†) | |
Options on Securities — (0.0%) | |
| AbbVie, Inc., Call | | 2/21/2020 | | | 92.50 | | | | (800 | ) | | $ | (70,832 | ) | | $ | (1,446 | ) | | $ | (992 | ) |
| AmerisourceBergen Corp., Call | | 2/21/2020 | | | 87.50 | | | | (800 | ) | | | (68,016 | ) | | | (2,239 | ) | | | (2,040 | ) |
| Applied Materials, Inc., Call | | 2/21/2020 | | | 62.50 | | | | (2,300 | ) | | | (140,392 | ) | | | (5,444 | ) | | | (4,865 | ) |
| AT&T, Inc., Call | | 2/21/2020 | | | 40.00 | | | | (5,200 | ) | | | (203,216 | ) | | | (3,365 | ) | | | (3,146 | ) |
| Automatic Data Processing, Inc., Call | | 2/21/2020 | | | 175.00 | | | | (800 | ) | | | (136,400 | ) | | | (2,678 | ) | | | (2,320 | ) |
| Best Buy Co., Inc., Call | | 2/21/2020 | | | 92.50 | | | | (1,500 | ) | | | (131,700 | ) | | | (2,606 | ) | | | (2,393 | ) |
| Bristol-Myers Squibb Co., Call | | 2/21/2020 | | | 65.00 | | | | (2,200 | ) | | | (141,218 | ) | | | (3,184 | ) | | | (3,707 | ) |
| Broadcom, Inc., Call | | 2/21/2020 | | | 340.00 | | | | (200 | ) | | | (63,204 | ) | | | (769 | ) | | | (550 | ) |
| Caterpillar, Inc., Call | | 2/21/2020 | | | 150.00 | | | | (900 | ) | | | (132,912 | ) | | | (3,984 | ) | | | (3,713 | ) |
| CF Industries Holdings, Inc., Call | | 2/21/2020 | | | 50.00 | | | | (1,600 | ) | | | (76,384 | ) | | | (2,059 | ) | | | (1,792 | ) |
| Citigroup, Inc., Call | | 2/21/2020 | | | 80.00 | | | | (1,700 | ) | | | (135,813 | ) | | | (3,242 | ) | | | (4,055 | ) |
| Comcast Corp., Call | | 2/21/2020 | | | 45.00 | | | | (1,800 | ) | | | (80,946 | ) | | | (1,759 | ) | | | (2,403 | ) |
| Delta Air Lines, Inc., Call | | 2/21/2020 | | | 62.50 | | | | (700 | ) | | | (40,936 | ) | | | (705 | ) | | | (392 | ) |
| Exelon Corp., Call | | 2/21/2020 | | | 46.00 | | | | (1,700 | ) | | | (77,503 | ) | | | (1,304 | ) | | | (1,530 | ) |
| Gilead Sciences, Inc., Call | | 2/21/2020 | | | 70.00 | | | | (2,900 | ) | | | (188,442 | ) | | | (4,603 | ) | | | (2,842 | ) |
| Hewlett Packard Enterprise Co., Call | | 2/21/2020 | | | 17.00 | | | | (3,800 | ) | | | (60,268 | ) | | | (1,053 | ) | | | (1,007 | ) |
| HP, Inc., Call | | 2/21/2020 | | | 21.00 | | | | (6,800 | ) | | | (139,740 | ) | | | (3,790 | ) | | | (3,434 | ) |
| Humana, Inc., Call | | 2/21/2020 | | | 375.00 | | | | (400 | ) | | | (146,608 | ) | | | (5,283 | ) | | | (4,500 | ) |
| Intel Corp., Call | | 2/21/2020 | | | 60.00 | | | | (2,400 | ) | | | (143,640 | ) | | | (4,865 | ) | | | (5,112 | ) |
| Johnson & Johnson, Call | | 2/21/2020 | | | 150.00 | | | | (900 | ) | | | (131,283 | ) | | | (1,761 | ) | | | (1,701 | ) |
| Leidos Holdings, Inc., Call | | 2/21/2020 | | | 100.00 | | | | (2,000 | ) | | | (195,780 | ) | | | (5,179 | ) | | | (5,400 | ) |
See accompanying notes to financial statements.
39 |
Portfolio of Investments – as of December 31, 2019
Loomis Sayles Strategic Alpha Fund – (continued)
| | | | | | | | | | | | | | | | | | | | | | | | |
| Description | | Expiration
Date | | | Exercise
Price | | | Shares (††) | | | Notional
Amount | | | Premiums
(Received) | | | Value (†) | |
Options on Securities — (continued) | | | | | | | | | | | | | | | | | | | | | | | | |
| Merck & Co., Inc., Call | | | 2/21/2020 | | | | 92.50 | | | | (900 | ) | | $ | (81,855 | ) | | $ | (1,896 | ) | | $ | (1,552 | ) |
| MetLife, Inc., Call | | | 2/21/2020 | | | | 52.50 | | | | (2,700 | ) | | | (137,619 | ) | | | (2,017 | ) | | | (1,890 | ) |
| Microsoft Corp., Call | | | 2/21/2020 | | | | 160.00 | | | | (500 | ) | | | (78,850 | ) | | | (1,849 | ) | | | (1,837 | ) |
| Phillips 66, Call | | | 2/21/2020 | | | | 115.00 | | | | (1,400 | ) | | | (155,974 | ) | | | (3,370 | ) | | | (2,345 | ) |
| Plains GP Holdings LP, Call | | | 2/21/2020 | | | | 20.00 | | | | (7,100 | ) | | | (134,545 | ) | | | (2,536 | ) | | | (2,130 | ) |
| Procter & Gamble Co. (The), Call | | | 2/21/2020 | | | | 130.00 | | | | (1,100 | ) | | | (137,390 | ) | | | (1,570 | ) | | | (1,237 | ) |
| QUALCOMM, Inc., Call | | | 2/21/2020 | | | | 95.00 | | | | (1,800 | ) | | | (158,814 | ) | | | (3,091 | ) | | | (2,439 | ) |
| Starbucks Corp., Call | | | 2/21/2020 | | | | 90.00 | | | | (900 | ) | | | (79,128 | ) | | | (1,932 | ) | | | (1,620 | ) |
| Target Corp., Call | | | 2/21/2020 | | | | 130.00 | | | | (1,000 | ) | | | (128,210 | ) | | | (3,787 | ) | | | (3,550 | ) |
| Tyson Foods, Inc., Call | | | 2/21/2020 | | | | 92.50 | | | | (1,700 | ) | | | (154,768 | ) | | | (4,738 | ) | | | (4,888 | ) |
| Verizon Communications, Inc., Call | | | 2/21/2020 | | | | 62.50 | | | | (2,300 | ) | | | (141,220 | ) | | | (2,123 | ) | | | (1,529 | ) |
| | | | | | | | | | | | | | | | | | | | | | | | |
| Total | | | | | | | | | | | | | | | | | | $ | (90,227 | ) | | $ | (82,911 | ) |
| | | | | | | | | | | | | | | | | | | | | | | | |
| | | | |
| | | | | |
| | (‡) | | | Principal Amount/Par Value stated in U.S. dollars unless otherwise noted. |
| | (†) | | | See Note 2 of Notes to Financial Statements. |
| | (††) | | | Options on securities are expressed as shares. |
| | (a) | | | Security (or a portion thereof) has been designated to cover the Fund’s obligations under open derivative contracts. |
| | (b) | | | Variable rate security. Rate as of December 31, 2019 is disclosed. |
| | (c) | | | Variable rate security. The interest rate adjusts periodically based on; (i) changes in current interest rates and/or prepayments on underlying pools of assets, if applicable, (ii) reference to a base lending rate plus or minus a margin, and/or (iii) reference to a base lending rate adjusted by a multiplier and/or subject to certain floors or caps. Rate as of December 31, 2019 is disclosed. |
| | (d) | | | Fair valued by the Fund’s adviser. At December 31, 2019, the value of these securities amounted to $14,208,018 or 1.1% of net assets. See Note 2 of Notes to Financial Statements. |
| | (e) | | | Level 3 security. Value has been determined using significant unobservable inputs. See Note 3 of Notes to Financial Statements. |
| | (f) | | | Securities subject to restriction on resale. At December 31, 2019, the restricted securities held by the Fund are as follows: |
| | | | | | | | | | | | | | | | |
| | | | | | | | | | | | | | | | |
| | | Acquisition
Date | | | Acquisition
Cost | | | Value | | | % of
Net Assets | |
| Bellatrix Exploration Ltd., 8.500% | | | 6/04/2019 | | | $ | 854,560 | | | $ | 523,200 | | | | Less than 0.1% | |
Bellatrix Exploration Ltd., 12.500%
(9.500% PIK, 3.000% Cash) | | | 6/04/2019 | | | | 570,621 | | | | — | | | | — | |
| Bellatrix Exploration Ltd. | | | 6/04/2019 | | | | 439,289 | | | | — | | | | — | |
| ECAF I Blocker Ltd. | | | 6/18/2015 | | | | 9,000,000 | | | | 7,776,000 | | | | 0.6% | |
| GCA2014 Holdings Ltd., Series2014-1, Class C | | | 12/18/2014 | | | | 2,136,024 | | | | 1,779,094 | | | | 0.1% | |
| GCA2014 Holdings Ltd., Series2014-1, Class D | | | 12/18/2014 | | | | 942,002 | | | | 558,136 | | | | Less than 0.1% | |
| GCA2014 Holdings Ltd., Series2014-1, Class E | | | 12/18/2014 | | | | 2,657,606 | | | | — | | | | — | |
| | | | |
| | | | | |
| | (g) | | | Illiquid security. (Unaudited) |
| | (h) | | | Non-income producing security. |
| | (i) | | | Securities classified as fair valued pursuant to the Fund’s pricing policies and procedures. At December 31, 2019, the value of these securities amounted to $13,690,988 or 1.1% of net assets. See Note 2 of Notes to Financial Statements. |
| | (j) | | | The issuer is in default with respect to interest and/or principal payments. Income is not being accrued. |
See accompanying notes to financial statements.
| 40
Portfolio of Investments – as of December 31, 2019
Loomis Sayles Strategic Alpha Fund – (continued)
| | | | |
| | | | |
| | (k) | | | Payment-in-kind security for which the issuer, at each interest payment date, may make interest payments in cash and/or additional principal. No payments were made during the period. |
| | (l) | | | Position is unsettled. Contract rate was not determined at December 31, 2019 and does not take effect until settlement date. Maturity date is not finalized until settlement date. |
| | (m) | | | Interest rate represents discount rate at time of purchase; not a coupon rate. |
| | (n) | | | Security (or a portion thereof) has been pledged as collateral for open derivative contracts. |
| | | | |
| | 144A | | | All or a portion of these securities are exempt from registration under Rule 144A of the Securities Act of 1933. These securities may be resold in transactions exempt from registration, normally to qualified institutional buyers. At December 31, 2019, the value of Rule 144A holdings amounted to $611,638,653 or 47.0% of net assets. |
| | ABS | | | Asset-Backed Securities |
| | ADR | | | An American Depositary Receipt is a certificate issued by a custodian bank representing the right to receive securities of the foreign issuer described. The values of ADRs may be significantly influenced by trading on exchanges not located in the United States. |
| | ARS | | | Auction Rate Security |
| | ETF | | | Exchange-Traded Fund |
| | EURIBOR | | | Euro Interbank Offered Rate |
| | GMTN | | | Global Medium Term Note |
| | LIBOR | | | London Interbank Offered Rate |
| | MTN | | | Medium Term Note |
| | PIK | | | Payment-in-Kind |
| | REITs | | | Real Estate Investment Trusts |
| | SLM | | | Sallie Mae |
| | | | |
| | ARS | | | Argentine Peso |
| | AUD | | | Australian Dollar |
| | BRL | | | Brazilian Real |
| | CAD | | | Canadian Dollar |
| | COP | | | Colombian Peso |
| | EUR | | | Euro |
| | GBP | | | British Pound |
| | HUF | | | Hungarian Forint |
| | MYR | | | Malaysian Ringgit |
| | NOK | | | Norwegian Krone |
| | SGD | | | Singapore Dollar |
| | THB | | | Thai Baht |
| | USD | | | U.S. Dollar |
| | ZAR | | | South African Rand |
See accompanying notes to financial statements.
41 |
Portfolio of Investments – as of December 31, 2019
Loomis Sayles Strategic Alpha Fund – (continued)
At December 31, 2019, the Fund had the following open bilateral credit default swap agreements:
| | | | | | | | | | | | | | | | | | | | | | | | |
| Buy Protection | |
| Counterparty | | Reference
Obligation | | (Pay)/
Receive
Fixed Rate1 | | Expiration
Date | | | Notional
Value | | | Unamortized
Up Front
Premium
Paid/
(Received) | | | Market
Value | | | Unrealized
Appreciation
(Depreciation) | |
| Bank of America, N.A. | | Enel SpA | | (1.00%) | | | 6/20/2023 | | | | 550,000 EUR | | | $ | (221 | ) | | $ | (13,563 | ) | | $ | (13,342 | ) |
| Morgan Stanley Capital Services, Inc. | | Enel SpA | | (1.00%) | | | 12/20/2023 | | | | 6,115,000 EUR | | | | 32,446 | | | | (155,604 | ) | | | (188,050 | ) |
| | | | | | | | | | | | | | | | | | | | | | | | |
| Total | | | $ | (169,167 | ) | | $ | (201,392 | ) |
| | | | | | | | | | | | | | | | | | | | | | | | |
| 1 | Payments are made quarterly. |
At December 31, 2019, the Fund had the following open forward foreign currency contracts:
| | | | | | | | | | | | | | | | | | | | | | | | | | |
| Counterparty | | Delivery
Date | | | Currency
Bought/
Sold (B/S) | | | Units
of
Currency | | | In Exchange for | | | Notional
Value | | | Unrealized
Appreciation
(Depreciation) | |
| Bank of America, N.A. | | | 1/21/2020 | | | CAD | | | S | | | | 3,020,000 | | | $ | 2,286,216 | | | $ | 2,325,917 | | | $ | (39,701 | ) |
| Bank of America, N.A. | | | 2/21/2020 | | | EUR | | | S | | | | 1,665,000 | | | | 1,855,997 | | | | 1,873,333 | | | | (17,336 | ) |
| Bank of America, N.A. | | | 1/15/2020 | | | NOK | | | B | | | | 130,790,000 | | | | 14,348,482 | | | | 14,898,455 | | | | 549,973 | |
| Barclays Bank PLC | | | 1/21/2020 | | | EUR | | | S | | | | 1,955,000 | | | | 2,189,214 | | | | 2,195,376 | | | | (6,162 | ) |
| Barclays Bank PLC | | | 3/16/2020 | | | MYR | | | B | | | | 62,755,000 | | | | 15,077,363 | | | | 15,316,733 | | | | 239,370 | |
| Citibank N.A. | | | 1/30/2020 | | | BRL | | | B | | | | 27,615,000 | | | | 6,897,715 | | | | 6,859,479 | | | | (38,236 | ) |
| Citibank N.A. | | | 2/18/2020 | | | SGD | | | S | | | | 45,150,000 | | | | 33,158,909 | | | | 33,582,661 | | | | (423,752 | ) |
| Credit Suisse International | | | 1/02/2020 | | | COP | | | S | | | | 18,400,000,000 | | | | 5,295,574 | | | | 5,597,418 | | | | (301,844 | ) |
| Deutsche Bank AG | | | 1/31/2020 | | | EUR | | | S | | | | 2,000,000 | | | | 2,233,298 | | | | 2,247,302 | | | | (14,004 | ) |
| Deutsche Bank AG | | | 1/31/2020 | | | GBP | | | B | | | | 1,375,000 | | | | 1,777,749 | | | | 1,822,791 | | | | 45,042 | |
| Deutsche Bank AG | | | 1/31/2020 | | | GBP | | | S | | | | 5,095,000 | | | | 6,570,130 | | | | 6,754,268 | | | | (184,138 | ) |
| HSBC Bank USA | | | 1/22/2020 | | | AUD | | | B | | | | 19,130,000 | | | | 13,157,560 | | | | 13,430,981 | | | | 273,421 | |
| Morgan Stanley Capital Services, Inc. | | | 1/02/2020 | | | COP | | | B | | | | 18,400,000,000 | | | | 5,535,832 | | | | 5,597,417 | | | | 61,585 | |
| Morgan Stanley Capital Services, Inc. | | | 4/07/2020 | | | COP | | | S | | | | 18,400,000,000 | | | | 5,507,498 | | | | 5,569,177 | | | | (61,679 | ) |
| Morgan Stanley Capital Services, Inc. | | | 1/31/2020 | | | ZAR | | | S | | | | 315,790,000 | | | | 21,345,094 | | | | 22,463,234 | | | | (1,118,140 | ) |
| UBS AG | | | 1/15/2020 | | | HUF | | | B | | | | 2,031,865,000 | | | | 6,770,777 | | | | 6,890,346 | | | | 119,569 | |
| UBS AG | | | 1/22/2020 | | | THB | | | S | | | | 471,555,000 | | | | 15,561,074 | | | | 15,750,132 | | | | (189,058 | ) |
| | | | | | | | | | | | | | | | | | | | | | | | | | |
| Total | | | $ | (1,105,090 | ) |
| | | | | | | | | | | | | | | | | | | | | | | | | | |
At December 31, 2019, open short futures contracts were as follows:
| | | | | | | | | | | | | | | | | | | | |
| Financial Futures | | Expiration
Date | | | Contracts | | | Notional
Amount | | | Value | | | Unrealized
Appreciation
(Depreciation) | |
Ultra Long U.S. Treasury Bond | | | 3/20/2020 | | | | 175 | | | $ | 31,786,632 | | | $ | 31,789,844 | | | $ | (3,212 | ) |
| | | | | | | | | | | | | | | | | | | | |
See accompanying notes to financial statements.
| 42
Portfolio of Investments – as of December 31, 2019
Loomis Sayles Strategic Alpha Fund – (continued)
Industry Summary at December 31, 2019
| | | | |
ABS Car Loan | | | 12.1 | % |
ABS Home Equity | | | 9.2 | |
Banking | | | 6.3 | |
ABS Other | | | 6.0 | |
Automotive | | | 4.3 | |
ABS Credit Card | | | 3.8 | |
Non-Agency Commercial Mortgage-Backed Securities | | | 3.8 | |
Pharmaceuticals | | | 3.0 | |
Technology | | | 2.9 | |
ABS Whole Business | | | 2.6 | |
Life Insurance | | | 2.2 | |
Food & Beverage | | | 2.2 | |
Government Owned-No Guarantee | | | 2.0 | |
Other Investments, less than 2% each | | | 29.0 | |
Short-Term Investments | | | 5.9 | |
Collateralized Loan Obligations | | | 2.6 | |
Equity Linked Notes | | | 0.1 | |
| | | | |
Total Investments | | | 98.0 | |
Other assets less liabilities (including open written options, swap agreements, forward foreign currency and futures contracts) | | | 2.0 | |
| | | | |
Net Assets | | | 100.0 | % |
| | | | |
See accompanying notes to financial statements.
43 |
Portfolio of Investments – as of December 31, 2019
Natixis U.S. Equity Opportunities Fund
| | | | | | | | |
| Shares | | | Description | | Value (†) | |
| | Common Stocks — 98.3% of Net Assets | | | | |
| | | | Air Freight & Logistics — 1.9% | | | |
| | 244,599 | | | Expeditors International of Washington, Inc. | | $ | 19,083,614 | |
| | | | | | | | |
| | | | Airlines — 0.9% | | | |
| | 298,100 | | | American Airlines Group, Inc. | | | 8,549,508 | |
| | | | | | | | |
| | | | Automobiles — 2.7% | | | |
| | 923,200 | | | Fiat Chrysler Automobiles NV | | | 13,561,808 | |
| | 348,600 | | | General Motors Co. | | | 12,758,760 | |
| | | | | | | | |
| | | | | | | 26,320,568 | |
| | | | | | | | |
| | | | Banks — 6.0% | | | |
| | 634,470 | | | Bank of America Corp. | | | 22,346,033 | |
| | 285,300 | | | Citigroup, Inc. | | | 22,792,617 | |
| | 255,800 | | | Wells Fargo & Co. | | | 13,762,040 | |
| | | | | | | | |
| | | | | | | 58,900,690 | |
| | | | | | | | |
| | | | Beverages — 4.6% | | | |
| | 153,316 | | | Coca-Cola Co. (The) | | | 8,486,041 | |
| | 59,400 | | | Constellation Brands, Inc., Class A | | | 11,271,150 | |
| | 391,977 | | | Monster Beverage Corp.(a) | | | 24,910,138 | |
| | | | | | | | |
| | | | | | | 44,667,329 | |
| | | | | | | | |
| | | | Biotechnology — 5.1% | | | |
| | 26,851 | | | Amgen, Inc. | | | 6,472,970 | |
| | 97,669 | | | BioMarin Pharmaceutical, Inc.(a) | | | 8,257,914 | |
| | 93,264 | | | Regeneron Pharmaceuticals, Inc.(a) | | | 35,018,767 | |
| | | | | | | | |
| | | | | | | 49,749,651 | |
| | | | | | | | |
| | | | Capital Markets — 8.1% | | | |
| | 229,700 | | | Bank of New York Mellon Corp. (The) | | | 11,560,801 | |
| | 345,000 | | | Charles Schwab Corp. (The) | | | 16,408,200 | |
| | 34,125 | | | FactSet Research Systems, Inc. | | | 9,155,738 | |
| | 46,044 | | | MSCI, Inc. | | | 11,887,640 | |
| | 209,930 | | | SEI Investments Co. | | | 13,746,216 | |
| | 214,600 | | | State Street Corp. | | | 16,974,860 | |
| | | | | | | | |
| | | | | | | 79,733,455 | |
| | | | | | | | |
| | | | Communications Equipment — 1.2% | | | |
| | 244,734 | | | Cisco Systems, Inc. | | | 11,737,443 | |
| | | | | | | | |
| | | | Consumer Finance — 2.0% | | | |
| | 2,142 | | | American Express Co. | | | 266,657 | |
| | 186,200 | | | Capital One Financial Corp. | | | 19,161,842 | |
| | | | | | | | |
| | | | | | | 19,428,499 | |
| | | | | | | | |
| | | | Electronic Equipment, Instruments & Components — 1.6% | | | |
| | 159,100 | | | TE Connectivity Ltd. | | | 15,248,144 | |
| | | | | | | | |
| | | | Energy Equipment & Services — 0.9% | | | |
| | 229,212 | | | Schlumberger Ltd. | | | 9,214,322 | |
| | | | | | | | |
| | | | Entertainment — 2.0% | | | |
| | 59,490 | | | Netflix, Inc.(a) | | | 19,249,179 | |
| | | | | | | | |
See accompanying notes to financial statements.
| 44
Portfolio of Investments – as of December 31, 2019
Natixis U.S. Equity Opportunities Fund – (continued)
| | | | | | | | |
| Shares | | | Description | | Value (†) | |
| | | | Food Products — 0.9% | | | |
| | 541,791 | | | Danone S.A., Sponsored ADR | | $ | 8,934,134 | |
| | | | | | | | |
| | | | Health Care Equipment & Supplies — 0.6% | | | |
| | 1,016 | | | Alcon, Inc.(a) | | | 57,475 | |
| | 37,918 | | | Varian Medical Systems, Inc.(a) | | | 5,384,735 | |
| | | | | | | | |
| | | | | | | 5,442,210 | |
| | | | | | | | |
| | | | Health Care Providers & Services — 1.2% | | | |
| | 158,700 | | | CVS Health Corp. | | | 11,789,823 | |
| | | | | | | | |
| | | | Health Care Technology — 1.3% | | | |
| | 178,442 | | | Cerner Corp. | | | 13,095,858 | |
| | | | | | | | |
| | | | Hotels, Restaurants & Leisure — 4.9% | | | |
| | 100,200 | | | Hilton Worldwide Holdings, Inc. | | | 11,113,182 | |
| | 137,941 | | | Starbucks Corp. | | | 12,127,773 | |
| | 353,782 | | | Yum China Holdings, Inc. | | | 16,985,074 | |
| | 74,833 | | | Yum! Brands, Inc. | | | 7,537,928 | |
| | | | | | | | |
| | | | | | | 47,763,957 | |
| | | | | | | | |
| | | | Household Products — 1.6% | | | |
| | 102,885 | | | Colgate-Palmolive Co. | | | 7,082,603 | |
| | 71,201 | | | Procter & Gamble Co. (The) | | | 8,893,005 | |
| | | | | | | | |
| | | | | | | 15,975,608 | |
| | | | | | | | |
| | | | Industrial Conglomerates — 1.4% | | | |
| | 1,217,750 | | | General Electric Co. | | | 13,590,090 | |
| | | | | | | | |
| | | | Insurance — 1.3% | | | |
| | 255,555 | | | American International Group, Inc. | | | 13,117,638 | |
| | | | | | | | |
| | | | Interactive Media & Services — 9.6% | | | |
| | 27,460 | | | Alphabet, Inc., Class A(a) | | | 36,779,650 | |
| | 9,311 | | | Alphabet, Inc., Class C(a) | | | 12,448,993 | |
| | 219,096 | | | Facebook, Inc., Class A(a) | | | 44,969,454 | |
| | | | | | | | |
| | | | | | | 94,198,097 | |
| | | | | | | | |
| | | | Internet & Direct Marketing Retail — 8.5% | | | |
| | 154,130 | | | Alibaba Group Holding Ltd., Sponsored ADR(a) | | | 32,690,973 | |
| | 18,155 | | | Amazon.com, Inc.(a) | | | 33,547,535 | |
| | 7,100 | | | Booking Holdings, Inc.(a) | | | 14,581,483 | |
| | 290,543 | | | Qurate Retail, Inc., Class A(a) | | | 2,449,278 | |
| | | | | | | | |
| | | | | | | 83,269,269 | |
| | | | | | | | |
| | | | IT Services — 4.7% | | | |
| | 31,215 | | | Automatic Data Processing, Inc. | | | 5,322,158 | |
| | 21,500 | | | MasterCard, Inc., Class A | | | 6,419,685 | |
| | 185,188 | | | Visa, Inc., Class A | | | 34,796,825 | |
| | | | | | | | |
| | | | | | | 46,538,668 | |
| | | | | | | | |
| | | | Machinery — 2.2% | |
| | 63,100 | | | Caterpillar, Inc. | | | 9,318,608 | |
| | 69,111 | | | Deere & Co. | | | 11,974,172 | |
| | | | | | | | |
| | | | | | | 21,292,780 | |
| | | | | | | | |
See accompanying notes to financial statements.
45 |
Portfolio of Investments – as of December 31, 2019
Natixis U.S. Equity Opportunities Fund – (continued)
| | | | | | | | |
| Shares | | | Description | | Value (†) | |
| | | | Media — 3.2% | |
| | 34,260 | | | Charter Communications, Inc., Class A(a) | | $ | 16,618,841 | |
| | 328,200 | | | Comcast Corp., Class A | | | 14,759,154 | |
| | | | | | | | |
| | | | | | | 31,377,995 | |
| | | | | | | | |
| | | | Oil, Gas & Consumable Fuels — 2.0% | |
| | 425,400 | | | Apache Corp. | | | 10,885,986 | |
| | 95,900 | | | Concho Resources, Inc. | | | 8,397,963 | |
| | | | | | | | |
| | | | | | | 19,283,949 | |
| | | | | | | | |
| | | | Pharmaceuticals — 4.3% | |
| | 43,465 | | | Merck & Co., Inc. | | | 3,953,142 | |
| | 92,482 | | | Novartis AG, Sponsored ADR | | | 8,757,121 | |
| | 232,806 | | | Novo Nordisk AS, Sponsored ADR | | | 13,474,811 | |
| | 387,437 | | | Roche Holding AG, Sponsored ADR | | | 15,753,188 | |
| | | | | | | | |
| | | | | | | 41,938,262 | |
| | | | | | | | |
| | | | Semiconductors & Semiconductor Equipment — 4.5% | |
| | 184,230 | | | Intel Corp. | | | 11,026,166 | |
| | 75,121 | | | NVIDIA Corp. | | | 17,675,971 | |
| | 173,273 | | | QUALCOMM, Inc. | | | 15,287,877 | |
| | | | | | | | |
| | | | | | | 43,990,014 | |
| | | | | | | | |
| | | | Software — 6.4% | |
| | 134,370 | | | Autodesk, Inc.(a) | | | 24,651,520 | |
| | 91,318 | | | Microsoft Corp. | | | 14,400,849 | |
| | 451,156 | | | Oracle Corp. | | | 23,902,245 | |
| | | | | | | | |
| | | | | | | 62,954,614 | |
| | | | | | | | |
| | | | Technology Hardware, Storage & Peripherals — 1.0% | |
| | 34,190 | | | Apple, Inc. | | | 10,039,893 | |
| | | | | | | | |
| | | | Textiles, Apparel & Luxury Goods — 1.7% | |
| | 770,615 | | | Under Armour, Inc., Class A(a) | | | 16,645,284 | |
| | | | | | | | |
| | | | Total Common Stocks
(Identified Cost $685,170,165) | | | 963,120,545 | |
| | | | | | | | |
| | | | | | | | |
Principal
Amount | | | | | | |
| | Short-Term Investments — 1.9% | |
| $ | 18,184,899 | | | Tri-Party Repurchase Agreement with Fixed Income Clearing Corporation, dated 12/31/2019 at 0.900% to be repurchased at $18,185,809 on 1/02/2020 collateralized by $16,710,000 U.S. Treasury Note, 2.875% due 10/31/2023 valued at $17,549,042; $905,000 U.S. Treasury Bond, 2.875% due 8/15/2045 valued at $1,007,183 including accrued interest (Note 2 of Notes to Financial Statements) (Identified Cost $18,184,899) | | | 18,184,899 | |
| | | | | | | | |
| | | | Total Investments — 100.2%
(Identified Cost $703,355,064) | | | 981,305,444 | |
| | | | Other assets less liabilities — (0.2)% | | | (1,941,049 | ) |
| | | | | | | | |
| | | | Net Assets — 100.0% | | $ | 979,364,395 | |
| | | | | | | | |
See accompanying notes to financial statements.
| 46
Portfolio of Investments – as of December 31, 2019
Natixis U.S. Equity Opportunities Fund – (continued)
| | | | | | | | |
| | | | | | | | |
| | (†) | | | See Note 2 of Notes to Financial Statements. | | | | |
| | (a) | | | Non-income producing security. | | | | |
| | | | | | | | |
| | ADR | | | An American Depositary Receipt is a certificate issued by a custodian bank representing the right to receive securities of the foreign issuer described. The values of ADRs may be significantly influenced by trading on exchanges not located in the United States. | |
Industry Summary at December 31, 2019
| | | | |
Interactive Media & Services | | | 9.6 | % |
Internet & Direct Marketing Retail | | | 8.5 | |
Capital Markets | | | 8.1 | |
Software | | | 6.4 | |
Banks | | | 6.0 | |
Biotechnology | | | 5.1 | |
Hotels, Restaurants & Leisure | | | 4.9 | |
IT Services | | | 4.7 | |
Beverages | | | 4.6 | |
Semiconductors & Semiconductor Equipment | | | 4.5 | |
Pharmaceuticals | | | 4.3 | |
Media | | | 3.2 | |
Automobiles | | | 2.7 | |
Machinery | | | 2.2 | |
Consumer Finance | | | 2.0 | |
Oil, Gas & Consumable Fuels | | | 2.0 | |
Entertainment | | | 2.0 | |
Other Investments, less than 2% each | | | 17.5 | |
Short-Term Investments | | | 1.9 | |
| | | | |
Total Investments | | | 100.2 | |
Other assets less liabilities | | | (0.2 | ) |
| | | | |
Net Assets | | | 100.0 | % |
| | | | |
See accompanying notes to financial statements.
47 |
This Page Intentionally Left Blank
| 48
Statements of Assets and Liabilities
December 31, 2019
| | | | | | | | |
| | | Loomis Sayles
Strategic
Alpha Fund | | | Natixis
U.S. Equity
Opportunities
Fund | |
ASSETS | | | | | | | | |
Investments at cost | | $ | 1,323,479,874 | | | $ | 703,355,064 | |
Net unrealized appreciation (depreciation) | | | (48,833,541 | ) | | | 277,950,380 | |
| | | | | | | | |
Investments at value | | | 1,274,646,333 | | | | 981,305,444 | |
Cash | | | 2,203,496 | | | | 671,465 | |
Due from brokers (Note 2) | | | 16,160,000 | | | | — | |
Foreign currency at value (identified cost $2,836,527 and $0, respectively) | | | 2,663,704 | | | | — | |
Receivable for Fund shares sold | | | 2,252,850 | | | | 497,370 | |
Receivable for securities sold | | | 3,057,862 | | | | 2,050,631 | |
Collateral received for open forward foreign currency contracts (Notes 2 and 4) | | | 390,000 | | | | — | |
Dividends and interest receivable | | | 7,496,111 | | | | 434,304 | |
Unrealized appreciation on forward foreign currency contracts (Note 2) | | | 1,288,960 | | | | — | |
Tax reclaims receivable | | | 22,411 | | | | 310,370 | |
Unamortized upfront premiums paid on bilateral swap agreements (Note 2) | | | 32,446 | | | | — | |
Prepaid expenses (Note 8) | | | 67 | | | | 42 | |
| | | | | | | | |
TOTAL ASSETS | | | 1,310,214,240 | | | | 985,269,626 | |
| | | | | | | | |
LIABILITIES | | | | | | | | |
Options written, at value (premiums received $90,227 and $0, respectively) (Note 2) | | | 82,911 | | | | — | |
Payable for securities purchased | | | 4,154,320 | | | | 4,007,997 | |
Unrealized depreciation on bilateral swap agreements (Note 2) | | | 201,392 | | | | — | |
Payable for Fund shares redeemed | | | 1,128,647 | | | | 671,169 | |
Unrealized depreciation on forward foreign currency contracts (Note 2) | | | 2,394,050 | | | | — | |
Unamortized upfront premiums received on bilateral swap agreements (Note 2) | | | 221 | | | | — | |
Due to brokers (Note 2) | | | 390,000 | | | | — | |
Payable for variation margin on futures contracts (Note 2) | | | 63,144 | | | | — | |
Fees payable on swap agreements (Note 2) | | | 2,471 | | | | — | |
Management fees payable (Note 6) | | | 668,353 | | | | 621,713 | |
Deferred Trustees’ fees (Note 6) | | | 164,270 | | | | 411,134 | |
Administrative fees payable (Note 6) | | | 47,421 | | | | 36,249 | |
Payable to distributor (Note 6d) | | | 7,767 | | | | 6,556 | |
Other accounts payable and accrued expenses | | | 186,518 | | | | 150,413 | |
| | | | | | | | |
TOTAL LIABILITIES | | | 9,491,485 | | | | 5,905,231 | |
| | | | | | | | |
NET ASSETS | | $ | 1,300,722,755 | | | $ | 979,364,395 | |
| | | | | | | | |
NET ASSETS CONSIST OF: | | | | | | | | |
Paid-in capital | | $ | 1,404,274,922 | | | $ | 682,334,358 | |
Accumulated earnings (loss) | | | (103,552,167 | ) | | | 297,030,037 | |
| | | | | | | | |
NET ASSETS | | $ | 1,300,722,755 | | | $ | 979,364,395 | |
| | | | | | | | |
See accompanying notes to financial statements.
49 |
Statements of Assets and Liabilities (continued)
December 31, 2019
| | | | | | | | |
| | | Loomis Sayles
Strategic
Alpha Fund | | | Natixis
U.S. Equity
Opportunities
Fund | |
COMPUTATION OF NET ASSET VALUE AND OFFERING PRICE: | | | | | | | | |
Class A shares: | | | | | | | | |
Net assets | | $ | 48,814,956 | | | $ | 616,921,773 | |
| | | | | | | | |
Shares of beneficial interest | | | 5,037,207 | | | | 16,887,109 | |
| | | | | | | | |
Net asset value and redemption price per share | | $ | 9.69 | | | $ | 36.53 | |
| | | | | | | | |
Offering price per share(100/[100-maximum sales charge] of net asset value) (Note 1) | | $ | 10.12 | | | $ | 38.76 | |
| | | | | | | | |
Class C shares:(redemption price per share is equal to net asset value less any applicable contingent deferred sales charge) (Note 1) | | | | | | | | |
Net assets | | $ | 16,336,934 | | | $ | 77,923,877 | |
| | | | | | | | |
Shares of beneficial interest | | | 1,691,200 | | | | 3,440,545 | |
| | | | | | | | |
Net asset value and offering price per share | | $ | 9.66 | | | $ | 22.65 | |
| | | | | | | | |
Class N shares: | | | | | | | | |
Net assets | | $ | 297,300,361 | | | $ | 654,338 | |
| | | | | | | | |
Shares of beneficial interest | | | 30,739,683 | | | | 15,005 | |
| | | | | | | | |
Net asset value, offering and redemption price per share | | $ | 9.67 | | | $ | 43.61 | |
| | | | | | | | |
Class Y shares: | | | | | | | | |
Net assets | | $ | 938,270,504 | | | $ | 283,864,407 | |
| | | | | | | | |
Shares of beneficial interest | | | 97,056,748 | | | | 6,516,644 | |
| | | | | | | | |
Net asset value, offering and redemption price per share | | $ | 9.67 | | | $ | 43.56 | |
| | | | | | | | |
See accompanying notes to financial statements.
| 50
Statements of Operations
For the Year Ended December 31, 2019
| | | | | | | | |
| | | Loomis Sayles
Strategic
Alpha Fund | | | Natixis
U.S. Equity
Opportunities
Fund | |
INVESTMENT INCOME | | | | | | | | |
Dividends | | $ | 2,086,720 | | | $ | 14,706,847 | (a) |
Non-cash dividends (Note 2b) | | | — | | | | 816,007 | |
Interest | | | 59,005,425 | | | | 239,769 | |
Less net foreign taxes withheld | | | (21,881 | ) | | | (126,474 | ) |
| | | | | | | | |
| | | 61,070,264 | | | | 15,636,149 | |
| | | | | | | | |
Expenses | | | | | | | | |
Management fees (Note 6) | | | 8,883,753 | | | | 7,358,759 | |
Service and distribution fees (Note 6) | | | 353,262 | | | | 2,310,926 | |
Administrative fees (Note 6) | | | 661,632 | | | | 432,141 | |
Trustees’ fees and expenses (Note 6) | | | 78,066 | | | | 81,830 | |
Transfer agent fees and expenses (Notes 6 and 7) | | | 798,150 | | | | 801,193 | |
Audit and tax services fees | | | 84,763 | | | | 41,779 | |
Custodian fees and expenses | | | 107,057 | | | | 37,663 | |
Legal fees (Note 8) | | | 44,310 | | | | 27,577 | |
Registration fees | | | 102,827 | | | | 88,473 | |
Shareholder reporting expenses | | | 53,060 | | | | 62,869 | |
Miscellaneous expenses (Note 8) | | | 61,878 | | | | 51,795 | |
| | | | | | | | |
Total expenses | | | 11,228,758 | | | | 11,295,005 | |
Less waiver and/or expense reimbursement (Note 6) | | | (8,607 | ) | | | (6,044 | ) |
| | | | | | | | |
Net expenses | | | 11,220,151 | | | | 11,288,961 | |
| | | | | | | | |
Net investment income | | | 49,850,113 | | | | 4,347,188 | |
| | | | | | | | |
NET REALIZED AND UNREALIZED GAIN (LOSS) ON INVESTMENTS, FUTURES CONTRACTS, OPTIONS WRITTEN, SWAP AGREEMENTS, FORWARD FOREIGN CURRENCY CONTRACTS AND FOREIGN CURRENCY TRANSACTIONS | | | | | | | | |
Net realized gain (loss) on: | | | | | | | | |
Investments | | | 5,038,961 | | | | 90,186,547 | |
Futures contracts | | | (12,532,939 | ) | | | — | |
Options written | | | (754,866 | ) | | | — | |
Swap agreements | | | 3,926,446 | | | | — | |
Forward foreign currency contracts (Note 2d) | | | (2,918,485 | ) | | | — | |
Foreign currency transactions (Note 2c) | | | (830,605 | ) | | | — | |
Net change in unrealized appreciation (depreciation) on: | | | | | | | | |
Investments | | | 23,392,481 | | | | 167,414,696 | |
Futures contracts | | | (360,158 | ) | | | — | |
Options written | | | (94,539 | ) | | | — | |
Swap agreements | | | (6,019,174 | ) | | | — | |
Forward foreign currency contracts (Note 2d) | | | (979,355 | ) | | | — | |
Foreign currency translations (Note 2c) | | | 32,082 | | | | — | |
| | | | | | | | |
Net realized and unrealized gain on investments, futures contracts, options written, swap agreements, forward foreign currency contracts and foreign currency transactions | | | 7,899,849 | | | | 257,601,243 | |
| | | | | | | | |
NET INCREASE IN NET ASSETS RESULTING FROM OPERATIONS | | $ | 57,749,962 | | | $ | 261,948,431 | |
| | | | | | | | |
| (a) | Includes anon-recurring dividend of $1,569,910. |
See accompanying notes to financial statements.
51 |
Statements of Changes in Net Assets
| | | | | | | | |
| | | Loomis Sayles Strategic
Alpha Fund | |
| | | Year Ended
December 31,
2019 | | | Year Ended
December 31,
2018 | |
FROM OPERATIONS: | | | | | | | | |
Net investment income | | $ | 49,850,113 | | | $ | 45,919,105 | |
Net realized gain (loss) on investments, futures contracts, options written, swap agreements, forward foreign currency contracts and foreign currency transactions | | | (8,071,488 | ) | | | 10,761,528 | |
Net change in unrealized appreciation (depreciation) on investments, futures contracts, options written, swap agreements, forward foreign currency contracts and foreign currency translations | | | 15,971,337 | | | | (53,347,336 | ) |
| | | | | | | | |
Net increase in net assets resulting from operations | | | 57,749,962 | | | | 3,333,297 | |
| | | | | | | | |
FROM DISTRIBUTIONS TO SHAREHOLDERS: | | | | | | | | |
Class A | | | (1,581,199 | ) | | | (974,914 | ) |
Class C | | | (411,487 | ) | | | (700,709 | ) |
Class N | | | (8,768,965 | ) | | | (9,315,262 | ) |
Class Y | | | (34,262,581 | ) | | | (38,722,335 | ) |
| | | | | | | | |
Total distributions | | | (45,024,232 | ) | | | (49,713,220 | ) |
| | | | | | | | |
NET INCREASE (DECREASE) IN NET ASSETS FROM CAPITAL SHARE TRANSACTIONS (NOTE 11) | | | (216,962,192 | ) | | | 398,742,039 | |
| | | | | | | | |
Net increase (decrease) in net assets | | | (204,236,462 | ) | | | 352,362,116 | |
NET ASSETS | | | | | | | | |
Beginning of the year | | | 1,504,959,217 | | | | 1,152,597,101 | |
| | | | | | | | |
End of the year | | $ | 1,300,722,755 | | | $ | 1,504,959,217 | |
| | | | | | | | |
See accompanying notes to financial statements.
| 52
Statements of Changes in Net Assets (continued)
| | | | | | | | |
| | | Natixis U.S. Equity
Opportunities Fund | |
| | | Year Ended
December 31,
2019 | | | Year Ended
December 31,
2018 | |
FROM OPERATIONS: | | | | | | | | |
Net investment income | | $ | 4,347,188 | | | $ | 2,195,963 | |
Net realized gain on investments | | | 90,186,547 | | | | 99,574,323 | |
Net change in unrealized appreciation (depreciation) on investments | | | 167,414,696 | | | | (167,182,286 | ) |
| | | | | | | | |
Net increase (decrease) in net assets resulting from operations | | | 261,948,431 | | | | (65,412,000 | ) |
| | | | | | | | |
FROM DISTRIBUTIONS TO SHAREHOLDERS: | | | | | | | | |
Class A | | | (63,482,836 | ) | | | (55,296,627 | ) |
Class C | | | (12,360,421 | ) | | | (12,571,844 | ) |
Class N | | | (44,503 | ) | | | (100 | ) |
Class Y | | | (26,597,489 | ) | | | (27,216,994 | ) |
| | | | | | | | |
Total distributions | | | (102,485,249 | ) | | | (95,085,565 | ) |
| | | | | | | | |
NET INCREASE (DECREASE) IN NET ASSETS FROM CAPITAL SHARE TRANSACTIONS (NOTE 11) | | | (78,802,617 | ) | | | 57,246,243 | |
| | | | | | | | |
Net increase (decrease) in net assets | | | 80,660,565 | | | | (103,251,322 | ) |
NET ASSETS | | | | | | | | |
Beginning of the year | | | 898,703,830 | | | | 1,001,955,152 | |
| | | | | | | | |
End of the year | | $ | 979,364,395 | | | $ | 898,703,830 | |
| | | | | | | | |
See accompanying notes to financial statements.
53 |
Financial Highlights
For a share outstanding throughout each period.
| | | | | | | | | | | | | | | | | | | | |
| | | Loomis Sayles Strategic Alpha Fund—Class A | |
| | | Year Ended
December 31,
2019 | | | Year Ended
December 31,
2018 | | | Year Ended
December 31,
2017 | | | Year Ended
December 31,
2016 | | | Year Ended
December 31,
2015 | |
Net asset value, beginning of the period | | $ | 9.62 | | | $ | 9.92 | | | $ | 9.86 | | | $ | 9.45 | | | $ | 9.96 | |
| | | | | | | | | | | | | | | | | | | | |
INCOME (LOSS) FROM INVESTMENT OPERATIONS: | | | | | | | | | | | | | | | | | | | | |
Net investment income(a) | | | 0.30 | | | | 0.33 | | | | 0.32 | | | | 0.30 | | | | 0.26 | |
Net realized and unrealized gain (loss) | | | 0.04 | | | | (0.30 | ) | | | (0.01 | ) | | | 0.31 | | | | (0.42 | ) |
| | | | | | | | | | | | | | | | | | | | |
Total from Investment Operations | | | 0.34 | | | | 0.03 | | | | 0.31 | | | | 0.61 | | | | (0.16 | ) |
| | | | | | | | | | | | | | | | | | | | |
LESS DISTRIBUTIONS FROM: | | | | | | | | | | | | | | | | | | | | |
Net investment income | | | (0.27 | ) | | | (0.33 | ) | | | (0.25 | ) | | | (0.20 | ) | | | (0.35 | ) |
| | | | | | | | | | | | | | | | | | | | |
Net asset value, end of the period | | $ | 9.69 | | | $ | 9.62 | | | $ | 9.92 | | | $ | 9.86 | | | $ | 9.45 | |
| | | | | | | | | | | | | | | | | | | | |
Total return(b) | | | 3.58 | % | | | 0.39 | % | | | 3.22 | %(c) | | | 6.57 | % | | | (1.68 | )% |
RATIOS TO AVERAGE NET ASSETS: | | | | | | | | | | | | | | | | | | | | |
Net assets, end of the period (000’s) | | $ | 48,815 | | | $ | 36,528 | | | $ | 28,020 | | | $ | 67,746 | | | $ | 116,055 | |
Net expenses | | | 0.99 | % | | | 1.00 | %(d) | | | 1.05 | %(e)(f) | | | 1.10 | % | | | 1.10 | % |
Gross expenses | | | 0.99 | % | | | 1.00 | %(d) | | | 1.06 | % | | | 1.10 | % | | | 1.10 | % |
Net investment income | | | 3.10 | % | | | 3.29 | % | | | 3.26 | % | | | 3.14 | % | | | 2.66 | % |
Portfolio turnover rate | | | 414 | %(g) | | | 379 | %(g) | | | 178 | %(h) | | | 72 | % | | | 72 | % |
| (a) | Per share net investment income has been calculated using the average shares outstanding during the period. |
| (b) | A sales charge for Class A shares is not reflected in total return calculations. |
| (c) | Had certain expenses not been waived/reimbursed during the period, total returns would have been lower. |
| (d) | Includes fee/expense recovery of less than 0.01%. |
| (e) | The investment adviser agreed to waive its fees and/or reimburse a portion of the Fund’s expenses during the period. Without this waiver/reimbursement, expenses would have been higher. |
| (f) | Effective July 1, 2017, the expense limit decreased from 1.30% to 1.00%. |
| (g) | The variation in the Fund’s turnover rate from 2017 to 2018 was primarily due to a repositioning of the portfolio. During 2019, turnover has remained elevated due to a larger volume of short duration securities held by the Fund. |
| (h) | The variation in the Fund’s turnover rate from 2016 to 2017 was primarily due to a repositioning of the portfolio. |
See accompanying notes to financial statements.
| 54
Financial Highlights (continued)
For a share outstanding throughout each period.
| | | | | | | | | | | | | | | | | | | | |
| | | Loomis Sayles Strategic Alpha Fund—Class C | |
| | | Year Ended
December 31,
2019 | | | Year Ended
December 31,
2018 | | | Year Ended
December 31,
2017 | | | Year Ended
December 31,
2016 | | | Year Ended
December 31,
2015 | |
Net asset value, beginning of the period | | $ | 9.58 | | | $ | 9.88 | | | $ | 9.82 | | | $ | 9.42 | | | $ | 9.93 | |
| | | | | | | | | | | | | | | | | | | | |
INCOME (LOSS) FROM INVESTMENT OPERATIONS: | | | | | | | | | | | | | | | | | | | | |
Net investment income(a) | | | 0.23 | | | | 0.26 | | | | 0.25 | | | | 0.23 | | | | 0.19 | |
Net realized and unrealized gain (loss) | | | 0.04 | | | | (0.31 | ) | | | 0.00 | (b)(c) | | | 0.30 | | | | (0.43 | ) |
| | | | | | | | | | | | | | | | | | | | |
Total from Investment Operations | | | 0.27 | | | | (0.05 | ) | | | 0.25 | | | | 0.53 | | | | (0.24 | ) |
| | | | | | | | | | | | | | | | | | | | |
LESS DISTRIBUTIONS FROM: | | | | | | | | | | | | | | | | | | | | |
Net investment income | | | (0.19 | ) | | | (0.25 | ) | | | (0.19 | ) | | | (0.13 | ) | | | (0.27 | ) |
| | | | | | | | | | | | | | | | | | | | |
Net asset value, end of the period | | $ | 9.66 | | | $ | 9.58 | | | $ | 9.88 | | | $ | 9.82 | | | $ | 9.42 | |
| | | | | | | | | | | | | | | | | | | | |
Total return(d) | | | 2.87 | %(j) | | | (0.42 | )% | | | 2.53 | % | | | 5.70 | % | | | (2.44 | )% |
RATIOS TO AVERAGE NET ASSETS: | | | | | | | | | | | | | | | | | | | | |
Net assets, end of the period (000’s) | | $ | 16,337 | | | $ | 26,883 | | | $ | 33,759 | | | $ | 45,674 | | | $ | 62,453 | |
Net expenses | | | 1.73 | %(e) | | | 1.75 | %(f) | | | 1.81 | %(g) | | | 1.85 | % | | | 1.85 | % |
Gross expenses | | | 1.74 | % | | | 1.75 | %(f) | | | 1.81 | % | | | 1.85 | % | | | 1.85 | % |
Net investment income | | | 2.33 | % | | | 2.61 | % | | | 2.52 | % | | | 2.40 | % | | | 1.91 | % |
Portfolio turnover rate | | | 414 | %(h) | | | 379 | %(h) | | | 178 | %(i) | | | 72 | % | | | 72 | % |
| (a) | Per share net investment income has been calculated using the average shares outstanding during the period. |
| (b) | Amount rounds to less than $0.01 per share. |
| (c) | The amount shown for a share outstanding does not correspond with the aggregate realized and unrealized gain (loss) on investments for the period due to the timing of sales and redemptions of fund shares in relation to fluctuating market values of investments of the Fund. |
| (d) | A contingent deferred sales charge for Class C shares is not reflected in total return calculations. |
| (e) | The administrator agreed to waive its fees and/or reimburse a portion of the Fund’s expenses during the period. Without this waiver/reimbursement, expenses would have been higher. |
| (f) | Includes fee/expense recovery of less than 0.01%. |
| (g) | Effective July 1, 2017, the expense limit decreased from 2.05% to 1.75%. |
| (h) | The variation in the Fund’s turnover rate from 2017 to 2018 was primarily due to a repositioning of the portfolio. During 2019, turnover has remained elevated due to a larger volume of short duration securities held by the Fund. |
| (i) | The variation in the Fund’s turnover rate from 2016 to 2017 was primarily due to a repositioning of the portfolio. |
| (j) | Had certain expenses not been waived/reimbursed during the period, total returns would have been lower. |
See accompanying notes to financial statements.
55 |
Financial Highlights (continued)
For a share outstanding throughout each period.
| | | | | | | | | | | | |
| | | Loomis Sayles Strategic Alpha Fund—Class N | |
| | | Year Ended
December 31,
2019 | | | Year Ended
December 31,
2018 | | | Period Ended
December 31,
2017* | |
Net asset value, beginning of the period | | $ | 9.60 | | | $ | 9.90 | | | $ | 9.90 | |
| | | | | | | | | | | | |
INCOME (LOSS) FROM INVESTMENT OPERATIONS: | | | | | | | | | | | | |
Net investment income(a) | | | 0.33 | | | | 0.34 | | | | 0.25 | |
Net realized and unrealized gain (loss) | | | 0.04 | | | | (0.28 | ) | | | (0.04 | ) |
| | | | | | | | | | | | |
Total from Investment Operations | | | 0.37 | | | | 0.06 | | | | 0.21 | |
| | | | | | | | | | | | |
LESS DISTRIBUTIONS FROM: | | | | | | | | | | | | |
Net investment income | | | (0.30 | ) | | | (0.36 | ) | | | (0.21 | ) |
| | | | | | | | | | | | |
Net asset value, end of the period | | $ | 9.67 | | | $ | 9.60 | | | $ | 9.90 | |
| | | | | | | | | | | | |
Total return | | | 3.92 | % | | | 0.68 | % | | | 2.11 | %(b)(c) |
RATIOS TO AVERAGE NET ASSETS: | | | | | | | | | | | | |
Net assets, end of the period (000’s) | | $ | 297,300 | | | $ | 255,226 | | | $ | 59,282 | |
Net expenses | | | 0.67 | % | | | 0.70 | %(d) | | | 0.70 | %(e)(f)(g) |
Gross expenses | | | 0.67 | % | | | 0.70 | %(d) | | | 0.72 | %(e) |
Net investment income | | | 3.39 | % | | | 3.44 | % | | | 3.83 | %(e) |
Portfolio turnover rate | | | 414 | %(h) | | | 379 | %(h) | | | 178 | %(i) |
| * | From commencement of Class operations on May 1, 2017 through December 31, 2017. |
| (a) | Per share net investment income has been calculated using the average shares outstanding during the period. |
| (b) | Periods less than one year are not annualized. |
| (c) | Had certain expenses not been waived/reimbursed during the period, total returns would have been lower. |
| (d) | Includes fee/expense recovery of 0.01%. |
| (e) | Computed on an annualized basis for periods less than one year. |
| (f) | The investment adviser agreed to waive its fees and/or reimburse a portion of the Fund’s expenses during the period. Without this waiver/reimbursement, expenses would have been higher. |
| (g) | Effective July 1, 2017, the expense limit decreased from 1.00% to 0.70%. |
| (h) | The variation in the Fund’s turnover rate from 2017 to 2018 was primarily due to a repositioning of the portfolio. During 2019, turnover has remained elevated due to a larger volume of short duration securities held by the Fund. |
| (i) | Represents the Fund’s portfolio turnover rate for the year ended December 31, 2017. |
See accompanying notes to financial statements.
| 56
Financial Highlights (continued)
For a share outstanding throughout each period.
| | | | | | | | | | | | | | | | | | | | |
| | | Loomis Sayles Strategic Alpha Fund—Class Y | |
| | | Year Ended
December 31,
2019 | | | Year Ended
December 31,
2018 | | | Year Ended
December 31,
2017 | | | Year Ended
December 31,
2016 | | | Year Ended
December 31,
2015 | |
Net asset value, beginning of the period | | $ | 9.59 | | | $ | 9.90 | | | $ | 9.85 | | | $ | 9.44 | | | $ | 9.95 | |
| | | | | | | | | | | | | | | | | | | | |
INCOME (LOSS) FROM INVESTMENT OPERATIONS: | | | | | | | | | | | | | | | | | | | | |
Net investment income(a) | | | 0.32 | | | | 0.35 | | | | 0.35 | | | | 0.32 | | | | 0.29 | |
Net realized and unrealized gain (loss) | | | 0.06 | | | | (0.31 | ) | | | (0.01 | ) | | | 0.32 | | | | (0.43 | ) |
| | | | | | | | | | | | | | | | | | | | |
Total from Investment Operations | | | 0.38 | | | | 0.04 | | | | 0.34 | | | | 0.64 | | | | (0.14 | ) |
| | | | | | | | | | | | | | | | | | | | |
LESS DISTRIBUTIONS FROM: | | | | | | | | | | | | | | | | | | | | |
Net investment income | | | (0.30 | ) | | | (0.35 | ) | | | (0.29 | ) | | | (0.23 | ) | | | (0.37 | ) |
| | | | | | | | | | | | | | | | | | | | |
Net asset value, end of the period | | $ | 9.67 | | | $ | 9.59 | | | $ | 9.90 | | | $ | 9.85 | | | $ | 9.44 | |
| | | | | | | | | | | | | | | | | | | | |
Total return | | | 3.96 | % | | | 0.53 | % | | | 3.48 | %(b) | | | 6.86 | % | | | (1.43 | )% |
RATIOS TO AVERAGE NET ASSETS: | | | | | | | | | | | | | | | | | | | | |
Net assets, end of the period (000’s) | | $ | 938,271 | | | $ | 1,186,322 | | | $ | 1,031,537 | | | $ | 1,083,527 | | | $ | 1,183,723 | |
Net expenses | | | 0.74 | % | | | 0.75 | %(c) | | | 0.80 | %(d)(e) | | | 0.85 | % | | | 0.85 | % |
Gross expenses | | | 0.74 | % | | | 0.75 | %(c) | | | 0.81 | % | | | 0.85 | % | | | 0.85 | % |
Net investment income | | | 3.33 | % | | | 3.51 | % | | | 3.53 | % | | | 3.39 | % | | | 2.91 | % |
Portfolio turnover rate | | | 414 | %(f) | | | 379 | %(f) | | | 178 | %(g) | | | 72 | % | | | 72 | % |
| (a) | Per share net investment income has been calculated using the average shares outstanding during the period. |
| (b) | Had certain expenses not been waived/reimbursed during the period, total returns would have been lower. |
| (c) | Includes fee/expense recovery of less than 0.01%. |
| (d) | The investment adviser agreed to waive its fees and/or reimburse a portion of the Fund’s expenses during the period. Without this waiver/reimbursement, expenses would have been higher. |
| (e) | Effective July 1, 2017, the expense limit decreased from 1.05% to 0.75%. |
| (f) | The variation in the Fund’s turnover rate from 2017 to 2018 was primarily due to a repositioning of the portfolio. During 2019, turnover has remained elevated due to a larger volume of short duration securities held by the Fund. |
| (g) | The variation in the Fund’s turnover rate from 2016 to 2017 was primarily due to a repositioning of the portfolio. |
See accompanying notes to financial statements.
57 |
Financial Highlights (continued)
For a share outstanding throughout each period.
| | | | | | | | | | | | | | | | | | | | |
| | | Natixis U.S. Equity Opportunities Fund—Class A | |
| | | Year Ended
December 31,
2019 | | | Year Ended
December 31,
2018 | | | Year Ended
December 31,
2017 | | | Year Ended
December 31,
2016 | | | Year Ended
December 31,
2015 | |
Net asset value, beginning of the period | | $ | 31.00 | | | $ | 36.90 | | | $ | 30.27 | | | $ | 27.60 | | | $ | 27.40 | |
| | | | | | | | | | | | | | | | | | | | |
INCOME (LOSS) FROM INVESTMENT OPERATIONS: | | | | | | | | | | | | | | | | | | | | |
Net investment income(a) | | | 0.15 | (b) | | | 0.08 | | | | 0.06 | | | | 0.12 | | | | 0.06 | |
Net realized and unrealized gain (loss) | | | 9.34 | | | | (2.51 | ) | | | 7.88 | | | | 3.12 | | | | 1.55 | |
| | | | | | | | | | | | | | | | | | | | |
Total from Investment Operations | | | 9.49 | | | | (2.43 | ) | | | 7.94 | | | | 3.24 | | | | 1.61 | |
| | | | | | | | | | | | | | | | | | | | |
LESS DISTRIBUTIONS FROM: | | | | | | | | | | | | | | | | | | | | |
Net investment income | | | (0.17 | ) | | | (0.05 | ) | | | (0.06 | ) | | | (0.12 | ) | | | — | |
Net realized capital gains | | | (3.79 | ) | | | (3.42 | ) | | | (1.25 | ) | | | (0.45 | ) | | | (1.41 | ) |
| | | | | | | | | | | | | | | | | | | | |
Total Distributions | | | (3.96 | ) | | | (3.47 | ) | | | (1.31 | ) | | | (0.57 | ) | | | (1.41 | ) |
| | | | | | | | | | | | | | | | | | | | |
Net asset value, end of the period | | $ | 36.53 | | | $ | 31.00 | | | $ | 36.90 | | | $ | 30.27 | | | $ | 27.60 | |
| | | | | | | | | | | | | | | | | | | | |
Total return(c) | | | 31.03 | %(b) | | | (6.48 | )% | | | 26.28 | % | | | 11.86 | % | | | 5.86 | % |
RATIOS TO AVERAGE NET ASSETS: | | | | | | | | | | | | | | | | | | | | |
Net assets, end of the period (000’s) | | $ | 616,922 | | | $ | 523,665 | | | $ | 604,330 | | | $ | 472,436 | | | $ | 422,069 | |
Net expenses | | | 1.17 | % | | | 1.16 | % | | | 1.21 | %(d) | | | 1.23 | %(e) | | | 1.25 | %(f) |
Gross expenses | | | 1.17 | % | | | 1.16 | % | | | 1.21 | % | | | 1.23 | %(e) | | | 1.25 | % |
Net investment income | | | 0.42 | %(b) | | | 0.20 | % | | | 0.16 | % | | | 0.42 | % | | | 0.21 | % |
Portfolio turnover rate | | | 12 | % | | | 23 | % | | | 17 | % | | | 17 | % | | | 20 | % |
| (a) | Per share net investment income has been calculated using the average shares outstanding during the period. |
| (b) | Includesnon-recurring dividends. Without this dividend, net investment income per share would have been $0.09, total return would have been 30.87% and the ratio of net investment income to average net assets would have been 0.26%. |
| (c) | A sales charge for Class A shares is not reflected in total return calculations. |
| (d) | Effective July 1, 2017, the expense limit decreased from 1.25% to 1.20%. |
| (e) | Includes fee/expense recovery of less than 0.01%. |
| (f) | Effective July 1, 2015, the expense limit decreased from 1.30% to 1.25%. |
See accompanying notes to financial statements.
| 58
Financial Highlights (continued)
For a share outstanding throughout each period.
| | | | | | | | | | | | | | | | | | | | |
| | | Natixis U.S. Equity Opportunities Fund—Class C | |
| | | Year Ended
December 31,
2019 | | | Year Ended
December 31,
2018 | | | Year Ended
December 31,
2017 | | | Year Ended
December 31,
2016 | | | Year Ended
December 31,
2015 | |
Net asset value, beginning of the period | | $ | 20.42 | | | $ | 25.73 | | | $ | 21.54 | | | $ | 19.86 | | | $ | 20.24 | |
| | | | | | | | | | | | | | | | | | | | |
INCOME (LOSS) FROM INVESTMENT OPERATIONS: | | | | | | | | | | | | | | | | | | | | |
Net investment loss(a) | | | (0.07 | )(b) | | | (0.14 | ) | | | (0.14 | ) | | | (0.07 | ) | | | (0.11 | ) |
Net realized and unrealized gain (loss) | | | 6.10 | | | | (1.75 | ) | | | 5.58 | | | | 2.22 | | | | 1.14 | |
| | | | | | | | | | | | | | | | | | | | |
Total from Investment Operations | | | 6.03 | | | | (1.89 | ) | | | 5.44 | | | | 2.15 | | | | 1.03 | |
| | | | | | | | | | | | | | | | | | | | |
LESS DISTRIBUTIONS FROM: | | | | | | | | | | | | | | | | | | | | |
Net investment income | | | (0.01 | ) | | | — | | | | (0.00 | )(c) | | | (0.02 | ) | | | — | |
Net realized capital gains | | | (3.79 | ) | | | (3.42 | ) | | | (1.25 | ) | | | (0.45 | ) | | | (1.41 | ) |
| | | | | | | | | | | | | | | | | | | | |
Total Distributions | | | (3.80 | ) | | | (3.42 | ) | | | (1.25 | ) | | | (0.47 | ) | | | (1.41 | ) |
| | | | | | | | | | | | | | | | | | | | |
Net asset value, end of the period | | $ | 22.65 | | | $ | 20.42 | | | $ | 25.73 | | | $ | 21.54 | | | $ | 19.86 | |
| | | | | | | | | | | | | | | | | | | | |
Total return(d) | | | 30.06 | %(b) | | | (7.18 | )% | | | 25.35 | % | | | 11.02 | % | | | 5.06 | % |
RATIOS TO AVERAGE NET ASSETS: | | | | | | | | | | | | | | | | | | | | |
Net assets, end of the period (000’s) | | $ | 77,924 | | | $ | 78,783 | | | $ | 112,615 | | | $ | 72,768 | | | $ | 61,864 | |
Net expenses | | | 1.92 | % | | | 1.91 | % | | | 1.96 | %(e) | | | 1.98 | %(f) | | | 2.00 | %(g) |
Gross expenses | | | 1.92 | % | | | 1.91 | % | | | 1.96 | % | | | 1.98 | %(f) | | | 2.00 | % |
Net investment loss | | | (0.31 | )%(b) | | | (0.54 | )% | | | (0.59 | )% | | | (0.33 | )% | | | (0.54 | )% |
Portfolio turnover rate | | | 12 | % | | | 23 | % | | | 17 | % | | | 17 | % | | | 20 | % |
| (a) | Per share net investment loss has been calculated using the average shares outstanding during the period. |
| (b) | Includesnon-recurring dividends. Without this dividend, net investment loss per share would have been $(0.11), total return would have been 29.85% and the ratio of net investment loss to average net assets would have been (0.48)%. |
| (c) | Amount rounds to less than $0.01 per share. |
| (d) | A contingent deferred sales charge for Class C shares is not reflected in total return calculations. |
| (e) | Effective July 1, 2017, the expense limit decreased from 2.00% to 1.95%. |
| (f) | Includes fee/expense recovery of less than 0.01%. |
| (g) | Effective July 1, 2015, the expense limit decreased from 2.05% to 2.00%. |
See accompanying notes to financial statements.
59 |
Financial Highlights (continued)
For a share outstanding throughout each period.
| | | | | | | | | | | | |
| | | Natixis U.S. Equity Opportunities Fund—Class N | |
| | | Year Ended
December 31,
2019 | | | Year Ended
December 31,
2018 | | | Period Ended
December 31,
2017* | |
Net asset value, beginning of the period | | $ | 36.37 | | | $ | 42.63 | | | $ | 37.62 | |
| | | | | | | | | | | | |
INCOME (LOSS) FROM INVESTMENT OPERATIONS: | | | | | | | | | | | | |
Net investment income(a) | | | 0.19 | (b) | | | 0.25 | | | | 0.12 | |
Net realized and unrealized gain (loss) | | | 11.14 | | | | (2.91 | ) | | | 6.20 | |
| | | | | | | | | | | | |
Total from Investment Operations | | | 11.33 | | | | (2.66 | ) | | | 6.32 | |
| | | | | | | | | | | | |
LESS DISTRIBUTIONS FROM: | | | | | | | | | | | | |
Net investment income | | | (0.30 | ) | | | (0.18 | ) | | | (0.16 | ) |
Net realized capital gains | | | (3.79 | ) | | | (3.42 | ) | | | (1.15 | ) |
| | | | | | | | | | | | |
Total Distributions | | | (4.09 | ) | | | (3.60 | ) | | | (1.31 | ) |
| | | | | | | | | | | | |
Net asset value, end of the period | | $ | 43.61 | | | $ | 36.37 | | | $ | 42.63 | |
| | | | | | | | | | | | |
Total return(c) | | | 31.44 | %(b) | | | (6.11 | )% | | | 16.78 | %(d) |
RATIOS TO AVERAGE NET ASSETS: | | | | | | | | | | | | |
Net assets, end of the period (000’s) | | $ | 654 | | | $ | 1 | | | $ | 1 | |
Net expenses(e) | | | 0.83 | % | | | 0.76 | % | | | 0.78 | %(f)(g) |
Gross expenses | | | 1.42 | % | | | 13.35 | % | | | 13.41 | %(f) |
Net investment income | | | 0.44 | %(b) | | | 0.56 | % | | | 0.44 | %(f) |
Portfolio turnover rate | | | 12 | % | | | 23 | % | | | 17 | %(h) |
| * | From commencement of Class operations on May 1, 2017 through December 31, 2017. |
| (a) | Per share net investment income has been calculated using the average shares outstanding during the period. |
| (b) | Includesnon-recurring dividends. Without this dividend, net investment income per share would have been $0.19, total return would have been 31.27% and the ratio of net investment income to average net assets would have been 0.44%. |
| (c) | Had certain expenses not been waived/reimbursed during the period, total returns would have been lower. |
| (d) | Periods less than one year are not annualized. |
| (e) | The investment adviser agreed to waive its fees and/or reimburse a portion of the Fund’s expenses during the period. Without this waiver/reimbursement, expenses would have been higher. |
| (f) | Computed on an annualized basis for periods less than one year. |
| (g) | Effective July 1, 2017, the expense limit decreased from 0.95% to 0.90%. |
| (h) | Represents the Fund’s portfolio turnover rate for the year ended December 31, 2017. |
See accompanying notes to financial statements.
| 60
Financial Highlights (continued)
For a share outstanding throughout each period.
| | | | | | | | | | | | | | | | | | | | |
| | | Natixis U.S. Equity Opportunities Fund—Class Y | |
| | | Year Ended
December 31,
2019 | | | Year Ended
December 31,
2018 | | | Year Ended
December 31,
2017 | | | Year Ended
December 31,
2016 | | | Year Ended
December 31,
2015 | |
Net asset value, beginning of the period | | $ | 36.33 | | | $ | 42.61 | | | $ | 34.77 | | | $ | 31.61 | | | $ | 31.18 | |
| | | | | | | | | | | | | | | | | | | | |
INCOME (LOSS) FROM INVESTMENT OPERATIONS: | | | | | | | | | | | | | | | | | | | | |
Net investment income(a) | | | 0.29 | (b) | | | 0.20 | | | | 0.16 | | | | 0.21 | | | | 0.15 | |
Net realized and unrealized gain (loss) | | | 10.99 | | | | (2.92 | ) | | | 9.07 | | | | 3.59 | | | | 1.76 | |
| | | | | | | | | | | | | | | | | | | | |
Total from Investment Operations | | | 11.28 | | | | (2.72 | ) | | | 9.23 | | | | 3.80 | | | | 1.91 | |
| | | | | | | | | | | | | | | | | | | | |
LESS DISTRIBUTIONS FROM: | | | | | | | | | | | | | | | | | | | | |
Net investment income | | | (0.26 | ) | | | (0.14 | ) | | | (0.14 | ) | | | (0.19 | ) | | | (0.07 | ) |
Net realized capital gains | | | (3.79 | ) | | | (3.42 | ) | | | (1.25 | ) | | | (0.45 | ) | | | (1.41 | ) |
| | | | | | | | | | | | | | | | | | | | |
Total Distributions | | | (4.05 | ) | | | (3.56 | ) | | | (1.39 | ) | | | (0.64 | ) | | | (1.48 | ) |
| | | | | | | | | | | | | | | | | | | | |
Net asset value, end of the period | | $ | 43.56 | | | $ | 36.33 | | | $ | 42.61 | | | $ | 34.77 | | | $ | 31.61 | |
| | | | | | | | | | | | | | | | | | | | |
Total return | | | 31.36 | %(b)(g) | | | (6.24 | )% | | | 26.60 | % | | | 12.13 | % | | | 6.11 | % |
RATIOS TO AVERAGE NET ASSETS: | | | | | | | | | | | | | | | | | | | | |
Net assets, end of the period (000’s) | | $ | 283,864 | | | $ | 296,255 | | | $ | 285,008 | | | $ | 143,231 | | | $ | 70,643 | |
Net expenses | | | 0.91 | %(c) | | | 0.91 | % | | | 0.95 | %(d) | | | 0.98 | %(e) | | | 1.00 | %(f) |
Gross expenses | | | 0.92 | % | | | 0.91 | % | | | 0.95 | % | | | 0.98 | %(e) | | | 1.00 | % |
Net investment income | | | 0.69 | %(b) | | | 0.45 | % | | | 0.40 | % | | | 0.63 | % | | | 0.46 | % |
Portfolio turnover rate | | | 12 | % | | | 23 | % | | | 17 | % | | | 17 | % | | | 20 | % |
| (a) | Per share net investment income has been calculated using the average shares outstanding during the period. |
| (b) | Includesnon-recurring dividends. Without this dividend, net investment income per share would have been $0.22, total return would have been 31.16% and the ratio of net investment income to average net assets would have been 0.53%. |
| (c) | The administrator agreed to waive its fees and/or reimburse a portion of the Fund’s expenses during the period. Without this waiver/reimbursement, expenses would have been higher. |
| (d) | Effective July 1, 2017, the expense limit decreased from 1.00% to 0.95%. |
| (e) | Includes fee/expense recovery of less than 0.01%. |
| (f) | Effective July 1, 2015, the expense limit decreased from 1.05% to 1.00%. |
| (g) | Had certain expenses not been waived/reimbursed during the period, total returns would have been lower. |
See accompanying notes to financial statements.
61 |
Notes to Financial Statements
December 31, 2019
1. Organization. Natixis Funds Trust I and Natixis Funds Trust II (the “Trusts” and each a “Trust”) are each organized as a Massachusetts business trust. Each Trust is registered under the Investment Company Act of 1940, as amended (the “1940 Act”), as anopen-end management investment company. Each Declaration of Trust permits the Board of Trustees to authorize the issuance of an unlimited number of shares of the Trust in multiple series. The financial statements for certain funds of the Trusts are presented in separate reports. The following funds (individually, a “Fund” and collectively, the “Funds”) are included in this report:
Natixis Funds Trust I:
Natixis U.S. Equity Opportunities Fund (the “U.S. Equity Opportunities Fund”)
Natixis Funds Trust II:
Loomis Sayles Strategic Alpha Fund (the “Strategic Alpha Fund”)
The U.S. Equity Opportunities Fund is a diversified investment company and the Strategic Alpha Fund is anon-diversified investment company.
Each Fund offers Class A, Class C, Class N and Class Y shares.
Class A shares are sold with a maximumfront-end sales charge of 4.25% for Strategic Alpha Fund and 5.75% for U.S. Equity Opportunities Fund. Class C shares do not pay afront-end sales charge, pay higher Rule12b-1 fees than Class A shares for ten years (at which point they automatically convert to Class A shares) and may be subject to a contingent deferred sales charge (“CDSC”) of 1.00% if those shares are redeemed within one year of acquisition, except for reinvested distributions. Class N and Class Y shares do not pay afront-end sales charge, a CDSC or Rule12b-1 fees. Class N shares are offered with an initial minimum investment of $1,000,000. Class Y shares are offered with an initial minimum investment of $100,000. Certain categories of investors are exempted from the minimum investment amounts for Class N and Class Y as outlined in the relevant Funds’ prospectus.
Most expenses can be directly attributed to a Fund. Expenses which cannot be directly attributed to a Fund are generally apportioned based on the relative net assets of each of the funds in Natixis Funds Trust I, Natixis Funds Trust II, Natixis Funds Trust IV and Gateway Trust (“Natixis Funds Trusts”), Loomis Sayles Funds I and Loomis Sayles Funds II (“Loomis Sayles Funds Trusts”), and Natixis ETF Trust. Expenses of a Fund are bornepro rata by the holders of each class of shares, except that each class bears expenses unique to that class (such as the Rule12b-1 fee applicable to Class A and Class C) and transfer agent fees are borne collectively for Class A, Class C and Class Y, and individually for Class N. In addition, each class votes as a class only with respect to its own Rule12b-1 Plan. Shares of each class would receive theirpro rata share of the net assets of a Fund if the Fund were liquidated. The Trustees approve separate distributions from net investment income on each class of shares.
| 62
Notes to Financial Statements (continued)
December 31, 2019
2. Significant Accounting Policies. The following is a summary of significant accounting policies consistently followed by each Fund in the preparation of its financial statements. The Funds’ financial statements follow the accounting and reporting guidelines provided for investment companies and are prepared in accordance with accounting principles generally accepted in the United States of America which require the use of management estimates that affect the reported amounts and disclosures in the financial statements. Actual results could differ from those estimates. Management has evaluated the events and transactions subsequent to year-end through the date the financial statements were issued and has determined that there were no material events that would require disclosure in the Funds’ financial statements.
a. Valuation. Fund securities and other investments are valued at market value based on market quotations obtained or determined by independent pricing services recommended by the adviser orsub-adviser and approved by the Board of Trustees. Fund securities and other investments for which market quotations are not readily available are valued at fair value as determined in good faith by the adviser orsub-adviser pursuant to procedures approved by the Board of Trustees, as described below. Market value is determined as follows:
Listed equity securities (including shares ofclosed-end investment companies and exchange-traded funds) are valued at the last sale price quoted on the exchange where they are traded most extensively or, if there is no reported sale during the day, the closing bid quotation as reported by an independent pricing service. Securities traded on the NASDAQ Global Select Market, NASDAQ Global Market and NASDAQ Capital Market are valued at the NASDAQ Official Closing Price (“NOCP”), or if lacking an NOCP, at the most recent bid quotations on the applicable NASDAQ Market. Unlisted equity securities (except unlisted preferred equity securities) are valued at the last sale price quoted in the market where they are traded most extensively or, if there is no reported sale during the day, the closing bid quotation as reported by an independent pricing service. If there is no last sale price or closing bid quotation available, unlisted equity securities will be valued using evaluated bids furnished by an independent pricing service, if available. In some foreign markets, an official close price and a last sale price may be available from the foreign exchange or market. In those cases, the official close price is used. Debt securities and unlisted preferred equity securities are valued based on evaluated bids furnished to the Funds by an independent pricing service or bid prices obtained from broker-dealers. Senior loans and collateralized loan obligations are valued at bid prices supplied by an independent pricing service, if available. Equity linked notes are valued using broker-dealer bid prices. Broker-dealer bid prices may be used to value debt, unlisted equity securities, senior loans and collateralized loan obligations where an independent pricing service is unable to price a security or where an independent pricing service does not provide a reliable price for the security. Forward foreign currency contracts are valued utilizing
63 |
Notes to Financial Statements (continued)
December 31, 2019
interpolated rates determined based on information provided by an independent pricing service. Futures contracts are valued at the most recent settlement price on the exchange on which the adviser believes that, over time, they are traded most extensively. Centrally cleared swap agreements are valued at settlement prices of the clearing house on which the contracts were traded or prices obtained from broker-dealers. Bilateral credit default swaps are valued based on mid prices (between the bid price and the ask price) supplied by an independent pricing service. Bilateral interest rate swaps are valued based on prices supplied by an independent pricing source. Domestic exchange-traded single name equity option contracts are valued at the mean of the National Best Bid and Offer quotations. Options on futures contracts are valued using the current settlement price on the exchange on which, over time, they are traded most extensively. Option contracts on domestic indices are valued at the average of the closing bid and ask quotations as of the close of trading on the Chicago Board Options Exchange (“CBOE”). Option contracts on foreign indices are priced at the most recent settlement price. Other exchange-traded options are valued at the average of the closing bid and ask quotations on the exchange on which, over time, they are traded most extensively.Over-the-counter (“OTC”) currency options and swaptions are valued at mid prices (between the bid and the ask price) supplied by an independent pricing service, if available. Other OTC option contracts (including currency options and swaptions not priced through an independent pricing service) are valued based on quotations obtained from broker-dealers.
Fund securities and other investments for which market quotations are not readily available are valued at fair value as determined in good faith by the adviser pursuant to procedures approved by the Board of Trustees. The Funds may also value securities and other investments at fair value in other circumstances such as when extraordinary events occur after the close of a foreign market but prior to the close of the New York Stock Exchange. This may include situations relating to a single issuer (such as a declaration of bankruptcy or a delisting of the issuer’s security from the primary market on which it has traded) as well as events affecting the securities markets in general (such as market disruptions or closings and significant fluctuations in U.S. and/or foreign markets). When fair valuing its securities or other investments, the Funds may, among other things, use modeling tools or other processes that may take into account factors such as securities or other market activity and/or significant events that occur after the close of the foreign market and before the time the Fund’s net asset value (“NAV”) is calculated. Fair value pricing may require subjective determinations about the value of a security, and fair values used to determine a Fund’s NAV may differ from quoted or published prices, or from prices that are used by others, for the same securities. In addition, the use of fair value pricing may not always result in adjustments to the prices of securities held by a Fund.
| 64
Notes to Financial Statements (continued)
December 31, 2019
Illiquid securities for which market quotations are readily available and have been evaluated by the adviser are considered and classified as fair valued securities pursuant to the Funds’ pricing policies and procedures.
As of December 31, 2019, securities and other investments of the funds included in net assets were fair valued as follows:
| | | | | | | | | | | | | | | | |
Fund | | Securities
classified
as fair
valued | | | Percentage
of Net
Assets | | | Securities
fair
valued by
the Fund’s
adviser | | | Percentage
of Net
Assets | |
Strategic Alpha Fund | | $ | 13,690,988 | | | | 1.1 | % | | $ | 14,208,018 | | | | 1.1 | % |
b. Investment Transactions and Related Investment Income. Investment transactions are accounted for on a trade date plus one day basis for daily NAV calculation. However, for financial reporting purposes, investment transactions are reported on trade date. Dividend income (including income reinvested) and foreign withholding tax, if applicable, is recorded on theex-dividend date, or in the case of certain foreign securities, as soon as a Fund is notified, and interest income is recorded on an accrual basis. Dividends reinvested are reflected asnon-cash dividends on the Statements of Operations. Interest income is increased by the accretion of discount and decreased by the amortization of premium, if applicable. Periodic principal adjustments for inflation-protected securities are recorded to interest income. Negative principal adjustments (in the event of deflation) are recorded as reductions of interest income to the extent of interest income earned, not to exceed the amount of positive principal adjustments on a cumulative basis. Distributions received from investments in securities that represent a return of capital or capital gain are recorded as a reduction of cost of the investments or as a realized gain, respectively. The calendaryear-end amounts of ordinary income, capital gains, and return of capital included in distributions received from the Funds’ investments in real estate investment trusts (“REITs”) are reported to the Funds after the end of the fiscal year; accordingly, the Funds estimate these amounts for accounting purposes until the characterization of REIT distributions is reported to the Funds after the end of the fiscal year. Estimates are based on the most recent REIT distribution information available. In determining net gain or loss on securities sold, the cost of securities has been determined on an identified cost basis. Investment income,non-class specific expenses and realized and unrealized gains and losses are allocated on apro rata basis to each class based on the relative net assets of each class to the total net assets of the Fund.
c. Foreign Currency Translation. The books and records of the Funds are maintained in U.S. dollars. The values of securities, currencies and other assets and liabilities denominated in currencies other than U.S. dollars, if any, are translated into U.S. dollars based upon foreign exchange rates prevailing at the end of the period.
65 |
Notes to Financial Statements (continued)
December 31, 2019
Purchases and sales of investment securities, income and expenses are translated into U.S. dollars on the respective dates of such transactions.
Net realized foreign exchange gains or losses arise from sales of foreign currency, changes in exchange rates between the trade and settlement dates on securities transactions and the difference between the amounts of dividends, interest and foreign withholding taxes recorded on the Funds’ books and the U.S. dollar equivalent of the amounts actually received or paid. Net unrealized foreign exchange gains or losses arise from changes in the value of assets and liabilities, other than investment securities, as of the end of the fiscal period, resulting from changes in exchange rates. Net realized foreign exchange gains or losses and the net change in unrealized foreign exchange gains or losses are disclosed in the Statements of Operations. For federal income tax purposes, net realized foreign exchange gains or losses are characterized as ordinary income, and may, if the Funds have net losses, reduce the amount of income available to be distributed by the Funds.
The values of investment securities are presented at the foreign exchange rates prevailing at the end of the period for financial reporting purposes. Net realized and unrealized gains or losses on investments reported in the Statements of Operations reflect gains or losses resulting from changes in exchange rates and fluctuations which arise due to changes in market prices of investment securities. For federal income tax purposes, a portion of the net realized gain or loss on investments arising from changes in exchange rates, which is reflected in the Statements of Operations, may be characterized as ordinary income and may, if the Funds have net losses, reduce the amount of income available to be distributed by the Funds.
For the year ended December 31, 2019, the amount of income available to be distributed has been reduced by the following amounts as a result of losses arising from changes in exchange rates:
| | | | |
Strategic Alpha Fund | | $ | 9,741,920 | |
The Funds may use foreign currency exchange contracts to facilitate transactions in foreign-denominated investments. Losses may arise from changes in the value of the foreign currency or if the counterparties do not perform under the contracts’ terms.
d. Forward Foreign Currency Contracts. The Funds may enter into forward foreign currency contracts, including forward foreign cross currency contracts, to acquire exposure to foreign currencies or to hedge the Fund’s investments against currency fluctuation. A contract can also be used to offset a previous contract. These contracts involve market risk in excess of the unrealized appreciation (depreciation) reflected in the Funds’ Statements of Assets and Liabilities. The U.S. dollar value of the currencies a Fund has committed to buy or sell represents the aggregate exposure to each currency a Fund has acquired or hedged through currency contracts outstanding at period end. Gains or losses are recorded for financial statement purposes as
| 66
Notes to Financial Statements (continued)
December 31, 2019
unrealized until settlement date. Contracts are tradedover-the-counter directly with a counterparty. Risks may arise upon entering into these contracts from the potential inability of counterparties to meet the terms of their contracts and from unanticipated movements in the value of a foreign currency relative to the U.S. dollar. Certain contracts may require the movement of cash and/or securities as collateral for the Fund’s or counterparty’s net obligations under the contracts.
e. Futures Contracts. The Funds may enter into futures contracts. Futures contracts are agreements between two parties to buy and sell a particular instrument or index for a specified price on a specified future date.
When a Fund enters into a futures contract, it is required to deposit with (or for the benefit of) its broker an amount of cash or short-term high-quality securities as “initial margin.” As the value of the contract changes, the value of the futures contract position increases or declines. Subsequent payments, known as “variation margin,” are made or received by a Fund, depending on the price fluctuations in the fair value of the contract and the value of cash or securities on deposit with the broker. The aggregate principal amounts of the contracts are not recorded in the financial statements. Daily fluctuations in the value of the contracts are recorded in the Statements of Assets and Liabilities as a receivable (payable) and in the Statements of Operations as unrealized appreciation (depreciation) until the contracts are closed, when they are recorded as realized gains (losses). Realized gain or loss on a futures position is equal to the difference between the value of the contract at the time it was opened and the value at the time it was closed, minus brokerage commissions. When a Fund enters into a futures contract certain risks may arise, such as illiquidity in the futures market, which may limit a Fund’s ability to close out a futures contract prior to settlement date, and unanticipated movements in the value of securities or interest rates.
Futures contracts are exchange-traded. Exchange-traded futures contracts are standardized and are settled through a clearing house with fulfillment supported by the credit of the exchange. Therefore, counterparty credit risks to the Funds are reduced; however, in the event that a counterparty enters into bankruptcy, a Fund’s claim against initial/variation margin on deposit with the counterparty may be subject to terms of a final settlement in bankruptcy court.
f. Option Contracts. The Funds may enter into option contracts. When a Fund purchases an option, it pays a premium and the option is subsequentlymarked-to-market to reflect current value. Premiums paid for purchasing options which expire are treated as realized losses. Premiums paid for purchasing options which are exercised are added to the cost or deducted from the proceeds on the underlying instrument to determine the realized gain or loss. If the Fund enters into a closing sale transaction, the difference between the premium paid and the proceeds of the closing sale transaction is treated as a realized gain or loss. The risk associated with purchasing options is limited to the premium paid.
67 |
Notes to Financial Statements (continued)
December 31, 2019
When a Fund writes an option, an amount equal to the net premium received (the premium less commission) is recorded as a liability and is subsequently adjusted to the current value. Net premiums received for written options which expire are treated as realized gains. Net premiums received for written options which are exercised are deducted from the cost or added to the proceeds on the underlying instrument to determine the realized gain or loss. If the Fund enters into a closing purchase transaction, the difference between the net premium received and any amount paid on effecting a closing purchase transaction, including commissions, is treated as a realized gain or, if the net premium received is less than the amount paid, as a realized loss. The Fund, as writer of a written option, bears the risk of an unfavorable change in the market value of the instrument or index underlying the written option.
Exchange-traded options contracts are standardized and are settled through a clearing house with fulfillment supported by the credit of the exchange. Therefore, counterparty credit risks to the Funds are reduced. OTC options are subject to the risk that the counterparty is unable or unwilling to meet its obligations under the option.
g. Swaptions. The Funds may enter into interest rate swaptions. An interest rate swaption gives the holder the right, but not the obligation, to enter into or cancel an interest rate swap agreement at a future date. Interest rate swaptions may be either purchased or written. The buyer of an interest rate swaption may purchase either the right to receive a fixed rate in the underlying swap (known as a “receiver swaption”) or to pay a fixed rate (known as a “payer swaption”), based on the notional amount of the swap agreement, in exchange for a floating rate. The notional amounts of swaptions are not recorded in the financial statements.
When a Fund purchases an interest rate swaption, it pays a premium and the swaption is subsequentlymarked-to-market to reflect current value. Premiums paid for purchasing interest rate swaptions which expire are treated as realized losses. Premiums paid for purchasing interest rate swaptions which are exercised are added to the cost or deducted from the proceeds on the underlying swap to determine the realized gain or loss. If a Fund enters into a closing sale transaction, the difference between the premium paid and the proceeds of the closing sale transaction is treated as a realized gain or loss. The risk associated with purchasing interest rate swaptions is limited to the premium paid.
When a Fund writes an interest rate swaption, an amount equal to the premium received is recorded as a liability and is subsequently adjusted to the current value. Premiums received for written interest rate swaptions which expire are treated as realized gains. Premiums received for written interest rate swaptions which are exercised are deducted from the cost or added to the proceeds on the underlying swap to determine the realized gain or loss. If a Fund enters into a closing purchase transaction, the difference between the premium received and any amount paid on effecting a closing purchase transaction, including commission, is treated as a realized
| 68
Notes to Financial Statements (continued)
December 31, 2019
gain or, if the premium received is less than the amount paid, as a realized loss. A Fund, as writer of a written interest rate swaption, bears the risk of an unfavorable change in the market value of the swap underlying the written interest rate swaption.
OTC interest rate swaptions are subject to the risk that the counterparty is unable or unwilling to meet its obligations under the swaption.
There were no swaptions held by the Funds as of December 31, 2019.
h. Swap Agreements. The Funds may enter into credit default and interest rate swaps. A credit default swap is an agreement between two parties (the “protection buyer” and “protection seller”) to exchange the credit risk of an issuer (“reference obligation”) for a specified time period. The reference obligation may be one or more debt securities or an index of such securities. The Funds may be either the protection buyer or the protection seller. As a protection buyer, the Funds have the ability to hedge the downside risk of an issuer or group of issuers. As a protection seller, the Funds have the ability to gain exposure to an issuer or group of issuers whose bonds are unavailable or in short supply in the cash bond market, as well as realize additional income in the form of fees paid by the protection buyer. The protection buyer is obligated to pay the protection seller a stream of payments (“fees”) over the term of the contract, provided that no credit event, such as a default or a downgrade in credit rating, occurs on the reference obligation. The Funds may also pay or receive upfront premiums. If a credit event occurs, the protection seller must pay the protection buyer the difference between the agreed upon notional value and market value of the reference obligation. Market value in this case is determined by a facilitated auction whereby a minimum number of allowable broker bids, together with a specified valuation method, are used to calculate the value. The maximum potential amount of undiscounted future payments that a Fund as the protection seller could be required to make under a credit default swap agreement would be an amount equal to the notional amount of the agreement.
Implied credit spreads, represented in absolute terms, are disclosed in the Portfolio of Investments for those agreements for which the Fund is the protection seller. Implied credit spreads serve as an indicator of the current status of the payment/performance risk and represent the likelihood or risk of default for the credit derivative. The implied credit spread of a particular reference entity reflects the cost of buying/selling protection and may include upfront payments required to be made to enter into the agreement. Wider credit spreads represent a deterioration of the reference entity’s credit soundness and a greater likelihood or risk of default or other credit event occurring as defined under the terms of the agreement.
An interest rate swap is an agreement with another party to receive or pay interest (e.g., an exchange of fixed rate payments for floating rate payments) to protect themselves from interest rate fluctuations. This type of swap is an agreement that
69 |
Notes to Financial Statements (continued)
December 31, 2019
obligates two parties to exchange a series of cash flows at specified intervals based upon or calculated by reference to a specified interest rate(s) for a specified notional amount. The payment flows are usually netted against each other, with the difference being paid by one party to the other.
The notional amounts of swap agreements are not recorded in the financial statements. Swap agreements are valued daily, and fluctuations in value are recorded in the Statements of Operations as change in unrealized appreciation (depreciation) on swap agreements. Fees are accrued in accordance with the terms of the agreement and are recorded in the Statements of Assets and Liabilities as fees receivable or payable. When received or paid, fees are recorded in the Statements of Operations as realized gain or loss. Upfront premiums paid or received by the Funds are recorded on the Statements of Assets and Liabilities as an asset or liability, respectively, and are amortized or accreted over the term of the agreement and recorded as realized gain or loss. Payments made or received by the Funds as a result of a credit event or termination of the agreement are recorded as realized gain or loss.
Swap agreements are privately negotiated in the OTC market and may be entered into as a bilateral contract or centrally cleared (“centrally cleared swaps”). Bilateral swap agreements are traded between counterparties and, as such, are subject to the risk that a party to the agreement will not be able to meet its obligations. In a centrally cleared swap, immediately following execution of the swap agreement, the swap agreement is novated to a central counterparty (the “CCP”) and the Funds face the CCP through a broker. Upon entering into a centrally cleared swap, the Funds are required to deposit initial margin with the broker in the form of cash or securities in an amount that varies depending on the size and risk profile of the particular swap. Subsequent payments, known as “variation margin,” are made or received by the Funds based on the daily change in the value of the centrally cleared swap agreement. For centrally cleared swaps, the Funds’ counterparty credit risk is reduced as the CCP stands between the Funds and the counterparty. The Funds cover their net obligations under outstanding swap agreements by segregating or earmarking cash or securities.
i. Due to/from Brokers. Transactions and positions in certain options, futures, forward foreign currency contracts and swap agreements are maintained and cleared by registered U.S. broker/dealers pursuant to customer agreements between the Funds and the various broker/dealers. The due from brokers balance in the Statements of Assets and Liabilities for Strategic Alpha Fund represents cash pledged as collateral for forward foreign currency contracts, options, bilateral swap agreements and as initial margin for futures contracts and centrally cleared swap agreements. The due to brokers balance in the Statements of Assets and Liabilities for Strategic Alpha Fund represents cash received as collateral for forward foreign currency contracts. In certain circumstances the Funds’ use of cash, securities and/or foreign currency held at brokers is restricted by regulation or broker mandated limits.
| 70
Notes to Financial Statements (continued)
December 31, 2019
j. Federal and Foreign Income Taxes. The Trusts treat each Fund as a separate entity for federal income tax purposes. Each Fund intends to meet the requirements of the Internal Revenue Code of 1986, as amended, applicable to regulated investment companies, and to distribute to its shareholders substantially all of its net investment income and any net realized capital gains at least annually. Management has performed an analysis of each Fund’s tax positions for the open tax years as of December 31, 2019 and has concluded that no provisions for income tax are required. The Funds’ federal tax returns for the prior three fiscal years remain subject to examination by the Internal Revenue Service. Management is not aware of any events that are reasonably possible to occur in the next twelve months that would result in the amounts of any unrecognized tax benefits significantly increasing or decreasing for the Funds. However, management’s conclusions regarding tax positions taken may be subject to review and adjustment at a later date based on factors including, but not limited to, new tax laws and accounting regulations and interpretations thereof.
A Fund may be subject to foreign withholding taxes on investment income and taxes on capital gains on investments that are accrued and paid based upon the Fund’s understanding of the tax rules and regulations that exist in the countries in which the Fund invests. Foreign withholding taxes on dividend and interest income are reflected on the Statements of Operations as a reduction of investment income, net of amounts eligible to be reclaimed. Dividends and interest receivable on the Statements of Assets and Liabilities are net of foreign withholding taxes. Foreign withholding taxes where reclaims have been or will be filed are reflected on the Statements of Assets and Liabilities as tax reclaims receivable. Capital gains taxes paid are included in net realized gain (loss) on investments in the Statements of Operations. Accrued but unpaid capital gains taxes are reflected as foreign taxes payable on the Statements of Assets and Liabilities, if applicable, and reduce unrealized gains on investments. In the event that realized gains on investments are subsequently offset by realized losses, taxes paid on realized gains may be returned to a Fund. Such amounts, if applicable, are reflected as foreign tax rebates receivable on the Statements of Assets and Liabilities and are recorded as a realized gain when received.
k. Dividends and Distributions to Shareholders. Dividends and distributions are recorded on theex-dividend date. The timing and characterization of certain income and capital gain distributions are determined in accordance with federal tax regulations, which may differ from accounting principles generally accepted in the United States of America. Permanent differences are primarily due to differing treatments for book and tax purposes of items such as paydown gains and losses, partnership basis adjustments, capital gains taxes, defaulted and/ornon-income producing securities, swap adjustments, foreign currency gains and losses, convertible bond adjustments, distribution redesignations and premium amortization. Permanent book and tax basis differences relating to shareholder distributions, net investment income and net realized gains will result in reclassifications to capital accounts
71 |
Notes to Financial Statements (continued)
December 31, 2019
reported on the Statements of Assets and Liabilities. Temporary differences between book and tax distributable earnings are primarily due to deferred Trustees’ fees, premium amortization, trust preferred securities, partnership basis adjustments, defaulted and/ornon-income producing securities, swap adjustments, wash sales, convertible bond adjustments, forward foreign currency contractmark-to-market, straddle loss deferrals and corporate actions. Amounts of income and capital gain available to be distributed on a tax basis are determined annually, and at other times during the Funds’ fiscal year as may be necessary to avoid knowingly declaring and paying a return of capital distribution. Distributions from net investment income and net realized short-term capital gains are reported as distributed from ordinary income for tax purposes.
The tax characterization of distributions is determined on an annual basis. The tax character of distributions paid to shareholders during the years ended December 31, 2019 and 2018 were as follows:
| | | | | | | | | | | | | | | | | | | | | | | | |
| | | 2019 Distributions Paid From: | | | 2018 Distributions Paid From: | |
Fund | | Ordinary
Income | | | Long-Term
Capital
Gains | | | Total | | | Ordinary
Income | | | Long-Term
Capital
Gains | | | Total | |
Strategic Alpha Fund | | $ | 45,024,232 | | | $ | — | | | $ | 45,024,232 | | | $ | 49,713,220 | | | $ | — | | | $ | 49,713,220 | |
U.S. Equity Opportunities Fund | | | 6,527,175 | | | | 95,958,074 | | | | 102,485,249 | | | | 7,917,360 | | | | 87,168,205 | | | | 95,085,565 | |
Distributions paid to shareholders from net investment income and net realized capital gains, based on accounting principles generally accepted in the United States of America, are consolidated and reported on the Statements of Changes in Net Assets as Distributions to Shareholders. Distributions paid to shareholders from net investment income and net realized capital gains expressed inper-share amounts, based on accounting principles generally accepted in the United States of America, are separately stated and reported within the Financial Highlights.
| 72
Notes to Financial Statements (continued)
December 31, 2019
As of December 31, 2019, the components of distributable earnings on a tax basis were as follows:
| | | | | | | | |
| | | Strategic
Alpha Fund | | | U.S. Equity
Opportunities
Fund | |
Undistributed ordinary income | | $ | — | | | $ | 297,964 | |
Undistributed long-term capital gains | | | — | | | | 20,787,177 | |
| | | | | | | | |
Total undistributed earnings | | | — | | | | 21,085,141 | |
| | | | | | | | |
Capital loss carryforward: | |
Short-term: | |
No expiration date | | | (32,119,936 | ) | | | — | |
Long-term: | |
No expiration date | | | (18,331,675 | ) | | | — | |
| | | | | | | | |
Total capital loss carryforward | | | (50,451,611 | ) | | | — | |
| | | | | | | | |
Late-year ordinary and post-October capital loss deferrals* | | | (2,056,475 | ) | | | — | |
| | | | | | | | |
Unrealized appreciation (depreciation) | | | (50,764,145 | ) | | | 276,356,031 | |
| | | | | | | | |
Total accumulated earnings (losses) | | $ | (103,272,231 | ) | | $ | 297,441,172 | |
| | | | | | | | |
Capital loss carryforward utilized in the current year | | $ | — | | | $ | — | |
| | | | | | | | |
| * | Under current tax law, capital losses, foreign currency losses, and losses on passive foreign investment companies and contingent payment debt instruments after October 31 or December 31, as applicable, may be deferred and treated as occurring on the first day of the following taxable year. Strategic Alpha Fund is deferring foreign currency losses. |
As of December 31, 2019, unrealized appreciation (depreciation) as a component of distributable earnings were as follows:
| | | | | | | | |
| | | Strategic Alpha Fund | | | U.S. Equity Opportunities Fund | |
Unrealized appreciation (depreciation) | | | | | | | | |
Investments | | $ | (21,483,154 | ) | | $ | 276,356,031 | |
Foreign currency translations | | | (29,280,991 | ) | | | — | |
| | | | | | | | |
Total unrealized appreciation (depreciation) | | $ | (50,764,145 | ) | | $ | 276,356,031 | |
| | | | | | | | |
73 |
Notes to Financial Statements (continued)
December 31, 2019
As of December 31, 2019, the tax cost of investments (including derivatives, if applicable) and unrealized appreciation (depreciation) on a federal tax basis were as follows:
| | | | | | | | |
| | | Strategic
Alpha Fund | | | U.S. Equity
Opportunities
Fund | |
Federal tax cost | | $ | 1,324,751,305 | | | $ | 704,949,413 | |
| | | | | | | | |
Gross tax appreciation | | $ | 22,166,033 | | | $ | 309,959,076 | |
Gross tax depreciation | | | (72,809,506 | ) | | | (33,603,045 | ) |
| | | | | | | | |
Net tax appreciation (depreciation) | | $ | (50,643,473 | ) | | $ | 276,356,031 | |
| | | | | | | | |
The difference between these amounts and those reported in the components of distributable earnings are primarily attributable to foreign currencymark-to-market.
l. Senior Loans. Strategic Alpha Fund may invest in senior loans to corporate, governmental or other borrowers. Senior loans, which include both secured and unsecured loans made by banks and other financial institutions to corporate customers, typically hold the most senior position in a borrower’s capital structure, may be secured by the borrower’s assets and have interest rates that reset frequently. Senior Loans can include term loans, revolving credit facility loans and second lien loans. A senior loan is often administered by a bank or other financial institution that acts as agent for all holders. The agent administers the terms of the senior loan, as specified in the loan agreement. Large loans may be shared or syndicated among several lenders. The Fund may enter into the primary syndicate for a loan or it may also purchase all or a portion of loans from other lenders (sometimes referred to as loan assignments), in either case becoming a direct lender. Senior loans outstanding at the end of the period are listed in the Fund’s Portfolio of Investments.
m. Loan Participations. Strategic Alpha Fund’s investments in senior loans may be in the form of participations in loans. When investing in a loan participation, the Fund has the right to receive payments of principal, interest and any fees to which it is entitled only from the party from whom the Fund has purchased the participation and only upon receipt by that party of payments from the borrower. The Fund generally has no right to enforce compliance by the borrower with the terms of the loan agreement or to vote on matters arising under the loan agreement. Thus, the Fund may be subject to credit risk from both the party from whom it purchased the loan participation and the borrower. Additionally, the Fund may have minimal control over the terms of any loan modification. Loan participations outstanding at the end of the period, are listed in the Fund’s Portfolio of Investments.
n. Collateralized Loan Obligations. Strategic Alpha Fund may invest in collateralized loan obligations (“CLOs”). A CLO is a type of asset-backed security designed to redirect
| 74
Notes to Financial Statements (continued)
December 31, 2019
the cash flows from a pool of leveraged loans to investors based on their risk preferences. Cash flows from a CLO are split into two or more portions, called tranches, varying in risk and yield. The risk of an investment in a CLO depends largely on the type of the collateralized securities and the class of the instrument in which the Fund invests. The intent of the Funds when investing in CLOs is to purchase only higher level, investment grade level select tranches. CLOs outstanding at the end of the period are listed in the Fund’s Portfolio of Investments.
o. Equity Linked Notes. Strategic Alpha Fund may invest in equity linked notes. An equity linked note is a structured product that differs from a standard debt instrument where the cash payouts will be based on the return of an underlying equity. An equity linked note is typically purchased at a full nominal amount and includes a coupon with an enhanced yield relative to the dividend yield of the underlying security. At maturity the Fund will receive a redemption amount based on the final price of the underlying equity. The risk of investment in an equity linked note depends on the principal protection offered. Some equity linked notes may guarantee total principal or partial principal amounts while others may not provide any guarantee of principal. The maturity value may also be impacted to the extent of any limit on the return value as part of the note structure. Equity linked notes outstanding at the end of the period are listed in the Fund’s Portfolio of Investments.
p. Repurchase Agreements. Each Fund may enter into repurchase agreements, under the terms of a Master Repurchase Agreement, under which each Fund acquires securities as collateral and agrees to resell the securities at an agreed upon time and at an agreed upon price. It is each Fund’s policy that the market value of the collateral for repurchase agreements be at least equal to 102% of the repurchase price, including interest. Certain repurchase agreements aretri-party arrangements whereby the collateral is held in a segregated account for the benefit of the Fund and on behalf of the counterparty. Repurchase agreements could involve certain risks in the event of default or insolvency of the counterparty, including possible delays or restrictions upon a Fund’s ability to dispose of the underlying securities. As of December 31, 2019, each Fund, as applicable, had investments in repurchase agreements for which the value of the related collateral exceeded the value of the repurchase agreement. The gross value of repurchase agreements is included in the Statements of Assets and Liabilities for financial reporting purposes.
q. When-Issued and Delayed Delivery Transactions. The Funds may enter into when-issued or delayed delivery transactions. When-issued refers to transactions made conditionally because a security, although authorized, has not been issued. Delayed delivery refers to transactions for which delivery or payment will occur at a later date, beyond the normal settlement period. The price of when-issued and delayed delivery securities and the date when the securities will be delivered and paid for are fixed at the time the transaction is negotiated. The security and the obligation to pay for it are
75 |
Notes to Financial Statements (continued)
December 31, 2019
recorded by the Funds at the time the commitment is entered into. The value of the security may vary with market fluctuations during the time before the Funds take delivery of the security. No interest accrues to the Funds until the transaction settles.
Delayed delivery transactions include those designated as To Be Announced (“TBAs”) in the Portfolios of Investments. For TBAs, the actual security that will be delivered to fulfill the transaction is not designated at the time of the trade. The security is “to be announced” 48 hours prior to the established trade settlement date. Certain transactions require the Funds or counterparty to post cash and/or securities as collateral for the netmark-to-market exposure to the other party. The Funds cover their net obligations under outstanding delayed delivery commitments by segregating or earmarking cash or securities at the custodian.
Purchases of when-issued or delayed delivery securities may have a similar effect on the Funds’ NAV as if the Funds’ had created a degree of leverage in the portfolio. Risks may arise upon entering into such transactions from the potential inability of counterparties to meet their obligations under the transactions. Additionally, losses may arise due to changes in the value of the underlying securities.
There were no when-issued or delayed delivery securities held by the Funds as of December 31, 2019.
r. Stripped Securities. Each Fund may invest in stripped securities, which are usually structured with two or more classes that receive different proportions of the interest and principal distribution on a pool of U.S. or foreign government securities or mortgage assets. In some cases, one class will receive all of the interest (the interest-only or “IO” class), while the other class will receive all of the principal (the principal-only or “PO” class). Stripped securities commonly have greater market volatility than other types of fixed-income securities. In the case of stripped mortgage securities, if the underlying mortgage assets experience greater than anticipated prepayments of principal, a Fund may fail to recoup fully its investments in IOs.
s. Securities Lending. The Funds have entered into an agreement with State Street Bank and Trust Company (“State Street Bank”), as agent of the Funds, to lend securities to certain designated borrowers. The loans are collateralized with cash or securities in an amount equal to at least 105% or 102% of the market value (including accrued interest) of the loaned international or domestic securities, respectively, when the loan is initiated. Thereafter, the value of the collateral must remain at least 102% of the market value (including accrued interest) of loaned securities for U.S. equities and U.S. corporate debt; at least 105% of the market value (including accrued interest) of loaned securities fornon-U.S. equities; and at least 100% of the market value (including accrued interest) of loaned securities for U.S. Government securities, sovereign debt issued bynon-U.S. Governments andnon-U.S. corporate debt. In the event that the market value of the collateral falls below the required percentages described above,
| 76
Notes to Financial Statements (continued)
December 31, 2019
the borrower will deliver additional collateral on the next business day. As with other extensions of credit, the Funds may bear the risk of loss with respect to the investment of the collateral. The Funds invest cash collateral in short-term investments, a portion of the income from which is remitted to the borrowers and the remainder allocated between the Funds and State Street Bank as lending agent.
For the year ended December 31, 2019, the Funds did not loan securities under this agreement.
t. Unfunded Loan Commitments. The Funds may enter into unfunded loan commitments, which are contractual obligations for future funding at the option of the borrower. Unfunded loan commitments represent a future obligation, in full, even though a percentage of the committed amount may not be utilized by the borrower. Unfunded loan commitments, and the obligation for future funding, are recorded as a liability on the Statements of Assets and Liabilities at par value at the time the commitment is entered into. Purchases of unfunded loan commitments may have a similar effect on the Fund’s NAV as if the Fund had created a degree of leverage in the portfolio. Market risk exists with these commitments to the same extent as if the securities were owned on a settled basis. Losses may arise due to changes in the value of the unfunded loan commitments.
As of December 31, 2019, the Funds did not have any unfunded loan commitments.
u. Indemnifications. Under the Trusts’ organizational documents, its officers and Trustees are indemnified against certain liabilities arising out of the performance of their duties to the Funds. Additionally, in the normal course of business, the Funds enter into contracts with service providers that contain general indemnification clauses. The Funds’ maximum exposure under these arrangements is unknown as this would involve future claims that may be made against the Funds that have not yet occurred. However, based on experience, the Funds expect the risk of loss to be remote.
v. New Accounting Pronouncement. In August 2018, the Financial Accounting Standards Board issued Accounting Standards Update2018-13, Fair Value Measurement (Topic 820): Disclosure Framework — Changes to the Disclosure Requirements for Fair Value Measurement (“ASU2018-13”). The update introduces new fair value disclosure requirements, eliminates some prior fair value disclosure requirements, and modifies certain existing fair value disclosure requirements. ASU2018-13 will be effective for fiscal years beginning after December 15, 2019, including interim periods within those fiscal years. Management has evaluated the impact of the adoption of ASU 2018-13 and will incorporate required disclosure updates in the Funds’ semiannual financial statements as of June 30, 2020.
77 |
Notes to Financial Statements (continued)
December 31, 2019
3. Fair Value Measurements. In accordance with accounting standards related to fair value measurements and disclosures, the Funds have categorized the inputs utilized in determining the value of each Fund’s assets or liabilities. These inputs are summarized in the three broad levels listed below:
| | • | | Level 1 – quoted prices in active markets for identical assets or liabilities; |
| | • | | Level 2 – prices determined using other significant inputs that are observable either directly, or indirectly through corroboration with observable market data (which could include quoted prices for similar assets or liabilities, interest rates, credit risk, etc.); and |
| | • | | Level 3 – prices determined using significant unobservable inputs when quoted prices or observable inputs are unavailable such as when there is little or no market activity for an asset or liability (unobservable inputs reflect each Fund’s own assumptions in determining the fair value of assets or liabilities and would be based on the best information available). |
The inputs or methodology used for valuing securities are not necessarily an indication of the risk associated with investing in those securities.
The Funds’ pricing policies and procedures are recommended by the adviser and approved by the Board of Trustees. Debt securities are valued based on evaluated bids furnished to the Funds by an independent pricing service. Broker-dealer bid prices may be used if an independent pricing service either is unable to price a security or does not provide a reliable price for a security. The Funds’ adviser may use internally developed models to validate broker-dealer bid prices that are only available from a single broker or market maker. Such securities are considered and classified as fair valued. Broker-dealer bid prices for which the Funds do not have knowledge of the inputs used by the broker-dealer are categorized in Level 3. All security prices, including those obtained from an independent pricing service and broker-dealer bid prices, are reviewed on a daily basis by the adviser, subject to oversight by Fund management and the Board of Trustees. If the adviser, in good faith, believes that the price provided by an independent pricing service is unreliable, broker-dealer bid prices may be used until the price provided by the independent pricing service is considered to be reliable. Reliability of all security prices, including those obtained from an independent pricing service and broker-dealer bid prices, is tested in a variety of ways, including comparison to recent transaction prices and daily fluctuations, amongst other validation procedures in place. Securities for which market quotations are not readily available are valued at fair value as determined in good faith by the Funds’ adviser pursuant to procedures approved by the Board of Trustees. Fair valued securities may be categorized in Level 3.
| 78
Notes to Financial Statements (continued)
December 31, 2019
The following is a summary of the inputs used to value the Funds’ investments as of December 31, 2019, at value:
Strategic Alpha Fund
Asset Valuation Inputs
| | | | | | | | | | | | | | | | |
Description | | Level 1 | | | Level 2 | | | Level 3 | | | Total | |
Bonds and Notes | | | | | | | | | | | | | | | | |
Non-Convertible Bonds | | | | | | | | | | | | | | | | |
ABS Home Equity | | $ | — | | | $ | 119,048,525 | | | $ | 801,522 | (b) | | $ | 119,850,047 | |
ABS Other | | | — | | | | 70,230,027 | | | | 2,337,230 | (c)(d) | | | 72,567,257 | |
Independent Energy | | | — | | | | 10,502,182 | | | | 523,200 | (b)(d) | | | 11,025,382 | |
Non-Agency Commercial Mortgage-Backed Securities | | | — | | | | 46,268,040 | | | | 2,770,066 | (b) | | | 49,038,106 | |
All OtherNon-Convertible
Bonds(a) | | | — | | | | 824,151,662 | | | | — | | | | 824,151,662 | |
| | | | | | | | | | | | | | | | |
TotalNon-Convertible Bonds | | | — | | | | 1,070,200,436 | | | | 6,432,018 | | | | 1,076,632,454 | |
| | | | | | | | | | | | | | | | |
Convertible Bonds(a) | | | — | | | | 14,392,084 | | | | — | | | | 14,392,084 | |
| | | | | | | | | | | | | | | | |
Total Bonds and Notes | | | | | | | 1,084,592,520 | | | | 6,432,018 | | | | 1,091,024,538 | |
| | | | | | | | | | | | | | | | |
Senior Loans(a) | | | — | | | | 31,749,201 | | | | — | | | | 31,749,201 | |
Collateralized Loan Obligations | | | — | | | | 33,057,269 | | | | 475,000 | (e) | | | 33,532,269 | |
Loan Participations(a) | | | — | | | | 5,003,559 | | | | — | | | | 5,003,559 | |
Common Stocks | | | | | | | | | | | | | | | | |
Chemicals | | | 224,811 | | | | 1,766,576 | | | | — | | | | 1,991,387 | |
Oil, Gas & Consumable Fuels | | | 1,347,770 | | | | — | | | | — | (d) | | | 1,347,770 | |
All Other Common Stocks(a) | | | 14,973,481 | | | | — | | | | — | | | | 14,973,481 | |
| | | | | | | | | | | | | | | | |
Total Common Stocks | | | 16,546,062 | | | | 1,766,576 | | | | — | | | | 18,312,638 | |
| | | | | | | | | | | | | | | | |
79 |
Notes to Financial Statements (continued)
December 31, 2019
Strategic Alpha Fund (continued)
Asset Valuation Inputs (continued)
| | | | | | | | | | | | | | | | |
Description | | Level 1 | | | Level 2 | | | Level 3 | | | Total | |
Preferred Stocks | | | | | | | | | | | | | | | | |
Convertible Preferred Stocks | | | | | | | | | | | | | | | | |
Food & Beverage | | $ | — | | | $ | 4,352,925 | | | $ | — | | | $ | 4,352,925 | |
Midstream | | | 119,850 | | | | — | | | | 293,900 | (e) | | | 413,750 | |
Non-Convertible Preferred Stocks | | | | | | | | | | | | | | | | |
Cable Satellite | | | — | | | | 4,171,300 | | | | — | | | | 4,171,300 | |
| | | | | | | | | | | | | | | | |
Total Preferred Stocks | | | 119,850 | | | | 8,524,225 | | | | 293,900 | | | | 8,937,975 | |
| | | | | | | | | | | | | | | | |
Other Investments(a) | | | — | | | | — | | | | 7,776,000 | (b) | | | 7,776,000 | |
Equity Linked Notes | | | — | | | | — | | | | 688,113 | (e) | | | 688,113 | |
Purchased Options(a) | | | 264,620 | | | | — | | | | — | | | | 264,620 | |
Short-Term Investments | | | — | | | | 77,357,420 | | | | — | | | | 77,357,420 | |
| | | | | | | | | | | | | | | | |
Total Investments | | | 16,930,532 | | | | 1,242,050,770 | | | | 15,665,031 | | | | 1,274,646,333 | |
| | | | | | | | | | | | | | | | |
Forward Foreign Currency Contracts (unrealized appreciation) | | | — | | | | 1,288,960 | | | | — | | | | 1,288,960 | |
| | | | | | | | | | | | | | | | |
Total | | $ | 16,930,532 | | | $ | 1,243,339,730 | | | $ | 15,665,031 | | | $ | 1,275,935,293 | |
| | | | | | | | | | | | | | | | |
| | | | |
| Liability Valuation Inputs | | | | | | | | | | | | |
| | | | |
Description | | Level 1 | | | Level 2 | | | Level 3 | | | Total | |
Written Options(a) | | $ | (82,911 | ) | | $ | — | | | $ | — | | | $ | (82,911 | ) |
Bilateral Credit Default Swap Agreements (unrealized depreciation) | | | — | | | | (201,392 | ) | | | — | | | | (201,392 | ) |
Forward Foreign Currency Contracts (unrealized depreciation) | | | — | | | | (2,394,050 | ) | | | — | | | | (2,394,050 | ) |
Futures Contracts (unrealized depreciation) | | | (3,212 | ) | | | — | | | | — | | | | (3,212 | ) |
| | | | | | | | | | | | | | | | |
Total | | $ | (86,123 | ) | | $ | (2,595,442 | ) | | $ | — | | | $ | (2,681,565 | ) |
| | | | | | | | | | | | | | | | |
| (a) | Details of the major categories of the Fund’s investments are reflected within the Portfolio of Investments. |
| (b) | Fair valued by the Fund’s adviser. |
| (c) | Fair valued by the Fund’s adviser using a broker dealer bid price provided by a single market maker. |
| (d) | Includes securities fair valued at zero by the Fund’s adviser using level 3 inputs. |
| (e) | Valued using broker-dealer bid prices. |
| 80
Notes to Financial Statements (continued)
December 31, 2019
U.S. Equity Opportunities Fund
Asset Valuation Inputs
| | | | | | | | | | | | | | | | |
Description | | Level 1 | | | Level 2 | | | Level 3 | | | Total | |
Common Stocks(a) | | $ | 963,120,545 | | | $ | — | | | $ | — | | | $ | 963,120,545 | |
Short-Term Investments | | | — | | | | 18,184,899 | | | | — | | | | 18,184,899 | |
| | | | | | | | | | | | | | | | |
Total | | $ | 963,120,545 | | | $ | 18,184,899 | | | $ | — | | | $ | 981,305,444 | |
| | | | | | | | | | | | | | | | |
| (a) | Details of the major categories of the Fund’s investments are reflected within the Portfolio of Investments. |
For the year ended December 31, 2019, there were no transfers among Levels 1, 2 and 3.
The following is a reconciliation of Level 3 investments for which significant unobservable inputs were used to determine fair value as of December 31, 2018 and/or December 31, 2019:
Strategic Alpha Fund
Asset Valuation Inputs
| | | | | | | | | | | | | | | | | | | | |
Investments in Securities | | Balance as of
December 31,
2018 | | | Accrued
Discounts
(Premiums) | | | Realized
Gain
(Loss) | | | Change in
Unrealized
Appreciation
(Depreciation) | | | Purchases | |
Bonds and Notes | | | | | | | | | | | | | | | | | | | | |
Non-Convertible Bonds | | | | | | | | | | | | | | | | | | | | |
ABS Home Equity | | $ | 1 | | | $ | — | | | $ | 20,814 | | | $ | (12,565 | ) | | $ | — | |
ABS Other | | | 4,468,825 | | | | — | | | | — | | | | 230,731 | | | | 90,268 | |
ABS Student Loan | | | 4,307,138 | | | | — | | | | — | | | | — | | | | — | |
Independent Energy | | | — | (a) | | | (80,267 | ) | | | (58,230 | ) | | | 10,170,796 | | | | 1,481,560 | |
Non-Agency Commercial Mortgage-Backed Securities | | | — | | | | — | | | | — | | | | 76,723 | | | | — | |
Collateralized Loan Obligations | | | — | | | | — | | | | — | | | | — | | | | 475,000 | |
Loan Participations | | | 6,733,310 | | | | — | | | | (10,723 | ) | | | 53,613 | | | | — | |
Common Stocks | | | | | | | | | | | | | | | | | | | | |
Oil, Gas & Consumable Fuels | | | — | | | | — | | | | — | | | | (439,289 | ) | | | 439,289 | |
Preferred Stocks | | | | | | | | | | | | | | | | | | | | |
Midstream | | | — | | | | — | | | | — | | | | (590,270 | ) | | | — | |
Other Investments | | | | | | | | | | | | | | | | | | | | |
Aircraft ABS | | | 7,790,625 | | | | — | | | | — | | | | (14,625 | ) | | | — | |
Equity Linked Notes | | | — | | | | — | | | | — | | | | 21,383 | | | | 666,730 | |
| | | | | | | | | | | | | | | | | | | | |
Total | | $ | 23,299,899 | | | $ | (80,267 | ) | | $ | (48,139 | ) | | $ | 9,496,497 | | | $ | 3,152,847 | |
| | | | | | | | | | | | | | | | | | | | |
81 |
Notes to Financial Statements (continued)
December 31, 2019
Strategic Alpha Fund (continued)
Asset Valuation Inputs (continued)
| | | | | | | | | | | | | | | | | | | | |
Investments in
Securities | | Sales | | | Transfers
into Level 3 | | | Transfers
out of
Level 3 | | | Balance as of
December 31,
2019 | | | Change in
Unrealized
Appreciation
(Depreciation)
from
Investments
Still Held at
December 31,
2019 | |
Bonds and Notes | | | | | | | | | | | | | | | | | | | | |
Non-Convertible Bonds | | | | | | | | | | | | | | | | | | | | |
ABS Home Equity | | $ | (254,603 | ) | | $ | 1,047,875 | | | $ | — | | | $ | 801,522 | | | $ | (12,565 | ) |
ABS Other | | | (86,459 | ) | | | — | | | | (2,366,135 | ) | | | 2,337,230 | (a) | | | 218,142 | |
ABS Student Loan | | | — | | | | — | | | | (4,307,138 | ) | | | — | | | | — | |
Independent Energy | | | (10,990,659 | ) | | | — | | | | — | | | | 523,200 | (a) | | | (926,299 | ) |
Non-Agency Commercial Mortgage-Backed Securities | | | — | | | | 2,693,343 | | | | — | | | | 2,770,066 | | | | 76,723 | |
Collateralized Loan Obligations | | | — | | | | — | | | | — | | | | 475,000 | | | | — | |
Loan Participations | | | (1,429,671 | ) | | | — | | | | (5,346,529 | ) | | | — | | | | — | |
Common Stocks | | | | | | | | | | | | | | | | | | | | |
Oil, Gas & Consumable Fuels | | | — | | | | — | | | | — | | | | — | (a) | | | (439,289 | ) |
Preferred Stocks | | | | | | | | | | | | | | | | | | | | |
Midstream | | | — | | | | 884,170 | | | | — | | | | 293,900 | | | | (590,270 | ) |
Other Investments | | | | | | | | | | | | | | | | | | | | |
Aircraft ABS | | | — | | | | — | | | | — | | | | 7,776,000 | | | | (14,625 | ) |
Equity Linked Notes | | | — | | | | — | | | | — | | | | 688,113 | | | | 21,383 | |
| | | | | | | | | | | | | | | | | | | | |
Total | | $ | (12,761,392 | ) | | $ | 4,625,388 | | | $ | (12,019,802 | ) | | $ | 15,665,031 | | | $ | (1,666,800 | ) |
| | | | | | | | | | | | | | | | | | | | |
| (a) | Includes securities fair valued at zero using level 3 inputs. |
| 82
Notes to Financial Statements (continued)
December 31, 2019
Debt securities valued at $3,741,218 were transferred from Level 2 to Level 3 during the period ended December 31, 2019. At December 31, 2018, these securities were valued on the basis of evaluated bids furnished to the Fund by an independent pricing service in accordance with the Fund’s valuation policies. At December 31, 2019, these securities were valued at fair value as determined in good faith by the Fund’s adviser as an independent pricing service did not provide a reliable price for the securities.
Debt securities valued at $12,019,802 were transferred from Level 3 to Level 2 during the period ended December 31, 2019. At December 31, 2018, these securities were valued using broker-dealer bid prices based on inputs unobservable to the Fund as an independent pricing service was unable to price the securities. At December 31, 2019, these securities were valued on the basis of evaluated bids furnished to the Fund by an independent pricing service in accordance with the Fund’s valuation policies.
A preferred stock valued at $884,170 was transferred from Level 2 to Level 3 during the period ended December 31, 2019. At December 31, 2018, this security was valued on the basis of evaluated bids furnished to the Fund by an independent pricing service in accordance with the Fund’s valuation policies. At December 31, 2019, this security was valued using broker-dealer bid prices based on inputs unobservable to the Fund as an independent pricing service did not provide a reliable price for the security.
All transfers are recognized as of the beginning of the reporting period.
4. Derivatives. Derivative instruments are defined as financial instruments whose value and performance are based on the value and performance of an underlying asset, reference rate or index. Derivative instruments that Strategic Alpha Fund used during the period include forward foreign currency contracts, futures contracts, option contracts and swap agreements.
Strategic Alpha Fund seeks to achieve positive total returns over a full market cycle. The Fund pursues its objective by utilizing a flexible investment approach that allocates investments across a global range of investment opportunities related to credit, currencies and interest rates, while employing risk management techniques to mitigate downside risk. At times, the Fund expects to gain its investment exposure substantially through the use of derivatives, including forward foreign currency contracts, futures and option contracts, interest rate swaptions and swap agreements. During the year ended December 31, 2019, the Fund used futures, forward foreign currency contracts, option contracts, interest rate swap agreements and credit default swap agreements (as a protection seller) to gain investment exposures in accordance with its objective.
Strategic Alpha Fund is subject to the risk that changes in foreign currency exchange rates will have an unfavorable effect on the value of Fund assets denominated in foreign currencies. The Fund may enter into forward foreign currency exchange contracts and option contracts for hedging purposes to protect the value of the Fund’s holdings of foreign securities. During the year ended December 31, 2019, the Fund engaged in forward foreign currency and option contracts for hedging purposes.
83 |
Notes to Financial Statements (continued)
December 31, 2019
Strategic Alpha Fund is subject to the risk that companies in which the Fund invests will fail financially or otherwise be unwilling or unable to meet their obligations to the Fund. The Fund may use credit default swaps, as a protection buyer, to hedge its credit exposure to issuers of bonds it holds without having to sell the bonds. During the year ended December 31, 2019, the Fund engaged in credit default swap transactions (as a protection buyer) to hedge its credit exposure.
Strategic Alpha Fund is subject to the risk of unpredictable declines in the value of individual equity securities and periods of below-average performance in individual securities or in the equity market as a whole. The Fund may use futures contracts, purchased put options and written call options to hedge against a decline in value of an equity security that it owns. The Fund may also write put options to offset the cost of options used for hedging purposes. During the year ended December 31, 2019, the Fund engaged in futures and option contracts for hedging purposes.
The following is a summary of derivative instruments for Strategic Alpha Fund as of December 31, 2019, as reflected within the Statements of Assets and Liabilities:
| | | | | | | | | | | | |
Assets | | Investments
at value1 | | | Unrealized
appreciation
on forward
foreign
currency
contracts | | | Total | |
Over-the-counter asset derivatives | | | | | | | | | | | | |
Foreign exchange contracts | | $ | — | | | $ | 1,288,960 | | | $ | 1,288,960 | |
| | | | | | | | | | | | |
Totalover-the counter asset derivatives | | $ | — | | | $ | 1,288,960 | | | $ | 1,288,960 | |
| | | | | | | | | | | | |
Exchange-traded/cleared asset derivatives | | | | | | | | | | | | |
Interest rate contracts | | $ | 264,620 | | | $ | — | | | $ | 264,620 | |
| | | | | | | | | | | | |
Total exchange-traded/cleared asset derivatives | | $ | 264,620 | | | $ | — | | | $ | 264,620 | |
| | | | | | | | | | | | |
Total asset derivatives | | $ | 264,620 | | | $ | 1,288,960 | | | $ | 1,553,580 | |
| | | | | | | | | | | | |
| 84
Notes to Financial Statements (continued)
December 31, 2019
| | | | | | | | | | | | | | | | | | | | |
Liabilities | | Options
written
at value | | | Unrealized
depreciation
on forward
foreign
currency
contracts | | | Unrealized
depreciation
on futures
contracts2 | | | Swap
agreements
at value3 | | | Total | |
Over-the-counter liability derivatives | | | | | | | | | | | | | | | | | | | | |
Foreign exchange contracts | | $ | — | | | $ | (2,394,050 | ) | | $ | — | | | $ | — | | | $ | (2,394,050 | ) |
Credit contracts | | | — | | | | — | | | | — | | | | (169,167 | ) | | | (169,167 | ) |
| | | | | | | | | | | | | | | | | | | | |
Totalover-the counter liability derivatives | | $ | — | | | $ | (2,394,050 | ) | | $ | — | | | $ | (169,167 | ) | | $ | (2,563,217 | ) |
| | | | | | | | | | | | | | | | | | | | |
Exchange-traded/cleared liability derivatives | | | | | | | | | | | | | | | | | | | | |
Interest rate contracts | | $ | — | | | $ | — | | | $ | (3,212 | ) | | $ | — | | | $ | (3,212 | ) |
Equity contracts | | | (82,911 | ) | | | — | | | | — | | | | — | | | | (82,911 | ) |
| | | | | | | | | | | | | | | | | | | | |
Total exchange-traded/cleared liability derivatives | | $ | (82,911 | ) | | $ | — | | | $ | (3,212 | ) | | $ | — | | | $ | (86,123 | ) |
| | | | | | | | | | | | | | | | | | | | |
Total liability derivatives | | $ | (82,911 | ) | | $ | (2,394,050 | ) | | $ | (3,212 | ) | | $ | (169,167 | ) | | $ | (2,649,340 | ) |
| | | | | | | | | | | | | | | | | | | | |
| 1 | Represents purchased options, at value. |
| 2 | Represents cumulative unrealized appreciation (depreciation) on futures contracts. Only the current day’s variation margin on futures contracts is reported within the Statements of Assets and Liabilities as receivable or payable for variation margin, as applicable. |
| 3 | Represents swap agreements, at value. Market value of swap agreements is reported in the Portfolio of Investments along with the unamortized upfront premium paid (received), if any, and unrealized appreciation (depreciation) on each individual contract. Unrealized appreciation (depreciation) and upfront premiums paid (received) for bilateral swap agreements are reported within the Statements of Assets and Liabilities. |
85 |
Notes to Financial Statements (continued)
December 31, 2019
Transactions in derivative instruments for Strategic Alpha Fund during the year ended December 31, 2019, as reflected within the Statements of Operations were as follows:
| | | | | | | | | | | | | | | | | | | | |
Net Realized Gain
(Loss) on: | | Investments4 | | | Futures
contracts | | | Options
written | | | Swap
agreements | | | Forward
foreign
currency
contracts | |
Interest rate contracts | | $ | — | | | $ | (5,894,204 | ) | | $ | — | | | $ | 4,799,353 | | | $ | — | |
Foreign exchange contracts | | | (346,401 | ) | | | — | | | | — | | | | — | | | | (2,918,485 | ) |
Credit contracts | | | — | | | | — | | | | — | | | | (872,907 | ) | | | — | |
Equity contracts | | | (821,890 | ) | | | (6,638,735 | ) | | | (754,866 | ) | | | — | | | | — | |
| | | | | | | | | | | | | | | | | | | | |
Total | | $ | (1,168,291 | ) | | $ | (12,532,939 | ) | | $ | (754,866 | ) | | $ | 3,926,446 | | | $ | (2,918,485 | ) |
| | | | | | | | | | | | | | | | | | | | |
| | | | | |
Net Change in
Unrealized Appreciation
(Depreciation) on: | | Investments4 | | | Futures
contracts | | | Options
written | | | Swap
agreements | | | Forward
foreign
currency
contracts | |
Interest rate contracts | | $ | — | | | $ | (32,456 | ) | | $ | — | | | $ | (5,824,977 | ) | | $ | — | |
Foreign exchange contracts | | | 276,968 | | | | — | | | | — | | | | — | | | | (979,355 | ) |
Credit contracts | | | — | | | | — | | | | — | | | | (194,197 | ) | | | — | |
Equity contracts | | | (21,464 | ) | | | (327,702 | ) | | | (94,539 | ) | | | — | | | | — | |
| | | | | | | | | | | | | | | | | | | | |
Total | | $ | 255,504 | | | $ | (360,158 | ) | | $ | (94,539 | ) | | $ | (6,019,174 | ) | | $ | (979,355 | ) |
| | | | | | | | | | | | | | | | | | | | |
| 4 | Represents realized loss and change in unrealized appreciation (depreciation), respectively, for purchased options during the period. |
As the Fund values its derivatives at fair value and recognizes changes in fair value through the Statement of Operations, it does not qualify for hedge accounting under authoritative guidance for derivative instruments. The Fund’s investments in derivatives may represent an economic hedge; however, they are considered to benon-hedge transactions for the purpose of these disclosures.
The volume of forward foreign currency contract, futures contract and swap agreement activity, as a percentage of net assets for Strategic Alpha Fund, based on
| 86
Notes to Financial Statements (continued)
December 31, 2019
grossmonth-end notional amounts outstanding during the period, including long and short positions at absolute value, was as follows for the year ended December 31, 2019:
| | | | | | | | | | | | | | | | |
Strategic Alpha Fund | | Forwards | | | Futures | | | Credit Default Swaps | | | Interest Rate Swaps | |
Average Notional Amount Outstanding | | | 9.30 | % | | | 9.77 | % | | | 2.37 | % | | | 24.99 | % |
Highest Notional Amount Outstanding | | | 12.54 | % | | | 17.92 | % | | | 5.00 | % | | | 113.28 | % |
Lowest Notional Amount Outstanding | | | 6.61 | % | | | 2.44 | % | | | 0.57 | % | | | 0.00 | % |
Notional Amount Outstanding as of December 31, 2019 | | | 12.54 | % | | | 2.44 | % | | | 0.57 | % | | | 0.00 | % |
Unrealized gain and/or loss on open forwards, futures and swaps is recorded in the Statements of Assets and Liabilities. The aggregate notional values of forward, futures and swap contracts are not recorded in the Statements of Assets and Liabilities, and therefore are not included in the Fund’s net assets.
The volume of option contract activity, as a percentage of net assets for Strategic Alpha Fund, based on themonth-end market values of instruments underlying purchased and written options, at absolute value, was as follows for the year ended December 31, 2019:
| | | | | | | | | | | | | | | | |
Strategic Alpha Fund | | Call Options
Purchased* | | | Put Options Purchased* | | | Call Options Written* | | | Put Options Written* | |
Average Market Value of Underlying Instruments | | | 0.06 | % | | | 0.95 | % | | | 2.02 | % | | | 0.71 | % |
Highest Market Value of Underlying Instruments | | | 0.00 | % | | | 3.54 | % | | | 2.92 | % | | | 2.69 | % |
Lowest Market Value of Underlying Instruments | | | 0.00 | % | | | 0.00 | % | | | 0.30 | % | | | 0.00 | % |
Market Value of Underlying Instruments as of December 31, 2019 | | | 0.00 | % | | | 3.54 | % | | | 0.30 | % | | | 0.00 | % |
| * | Market value of underlying instruments is determined as follows: for securities by multiplying option shares by the price of the option’s underlying security, for currencies by multiplying par value by the strike price and dividing by the foreign currency exchange rate, for foreign indices by multiplying the number of contracts by the contract multiplier by the price of the underlying index and dividing by the foreign currency exchange rate and for futures by multiplying the number of contracts by the contract multiplier by the price of the underlying futures contract. |
Amounts outstanding at the end of the prior period are included in the average amount outstanding.
Over-the-counter derivatives, including forward foreign currency contracts and swap agreements are entered into pursuant to International Swaps and Derivatives
87 |
Notes to Financial Statements (continued)
December 31, 2019
Association, Inc. (“ISDA”) agreements negotiated between the Funds and their counterparties. ISDA agreements typically contain, among other things, terms for the posting of collateral and master netting provisions in the event of a default or other termination event. Collateral is posted by a Fund or the counterparty to the extent of the netmark-to-market exposure to the other party of all open contracts under the agreement, subject to minimum transfer requirements. Master netting provisions allow the Funds and the counterparty, in the event of a default or other termination event, to offset amounts owed by each related to derivative contracts, including any posted collateral, to one net amount payable by either the Funds or the counterparty. The Funds’ ISDA agreements typically contain provisions that allow a counterparty to terminate open contracts early if the NAV of a Fund declines beyond a certain threshold. For financial reporting purposes, the Funds do not offset derivative assets and liabilities, and any related collateral received or pledged, on the Statements of Assets and Liabilities.
As of December 31, 2019, gross amounts ofover-the-counter derivative assets and liabilities not offset in the Statements of Assets and Liabilities and the related net amounts after taking into account master netting arrangements, by counterparty, are as follows:
Strategic Alpha Fund
| | | | | | | | | | | | | | | | | | | | |
Counterparty | | Gross Amounts of
Assets | | | Offset
Amount | | | Net
Asset
Balance | | | Collateral
(Received)/
Pledged | | | Net
Amount | |
Bank of America, N.A. | | $ | 549,973 | | | $ | (70,600 | ) | | $ | 479,373 | | | $ | (300,000 | ) | | $ | 179,373 | |
Barclays Bank PLC | | | 239,370 | | | | (6,162 | ) | | | 233,208 | | | | (90,000 | ) | | | 143,208 | |
Deutsche Bank AG | | | 45,042 | | | | (45,042 | ) | | | — | | | | — | | | | — | |
HSBC Bank USA | | | 273,421 | | | | — | | | | 273,421 | | | | — | | | | 273,421 | |
Morgan Stanley Capital Services, Inc. | | | 61,585 | | | | (61,585 | ) | | | — | | | | — | | | | — | |
UBS AG | | | 119,569 | | | | (119,569 | ) | | | — | | | | — | | | | — | |
| | | | | | | | | | | | | | | | | | | | |
| | $ | 1,288,960 | | | $ | (302,958 | ) | | $ | 986,002 | | | $ | (390,000 | ) | | $ | 596,002 | |
| | | | | | | | | | | | | | | | | | | | |
| 88
Notes to Financial Statements (continued)
December 31, 2019
Strategic Alpha Fund (continued)
| | | | | | | | | | | | | | | | | | | | |
Counterparty | | Gross Amounts of
Liabilities | | | Offset
Amount | | | Net
Liability
Balance | | | Collateral
(Received)/
Pledged | | | Net
Amount | |
Bank of America, N.A. | | $ | (70,600 | ) | | $ | 70,600 | | | $ | — | | | $ | — | | | $ | — | |
Barclays Bank PLC | | | (6,162 | ) | | | 6,162 | | | | — | | | | — | | | | — | |
Citibank N.A. | | | (461,988 | ) | | | — | | | | (461,988 | ) | | | 350,000 | | | | (111,988 | ) |
Credit Suisse International | | | (301,844 | ) | | | — | | | | (301,844 | ) | | | 250,000 | | | | (51,844 | ) |
Deutsche Bank AG | | | (198,142 | ) | | | 45,042 | | | | (153,100 | ) | | | — | | | | (153,100 | ) |
Morgan Stanley Capital Services, Inc. | | | (1,335,423 | ) | | | 61,585 | | | | (1,273,838 | ) | | | 1,273,838 | | | | — | |
UBS AG | | | (189,058 | ) | | | 119,569 | | | | (69,489 | ) | | | — | | | | (69,489 | ) |
| | | | | | | | | | | | | | | | | | | | |
| | $ | (2,563,217 | ) | | $ | 302,958 | | | $ | (2,260,259 | ) | | $ | 1,873,838 | | | $ | (386,421 | ) |
| | | | | | | | | | | | | | | | | | | | |
The actual collateral received or pledged, if any, may exceed the amounts shown in the table due to overcollateralization. Timing differences may exist between when contracts under the ISDA agreements aremarked-to-market and when collateral moves. The ISDA agreements includetri-party control agreements under which collateral is held for the benefit of the secured party at a third party custodian, State Street Bank.
Counterparty risk is managed based on policies and procedures established by each Fund’s adviser. Such policies and procedures may include, but are not limited to, minimum counterparty credit rating requirements, monitoring of counterparty credit default swap spreads and posting of collateral. A Fund’s risk of loss from counterparty credit risk onover-the-counter derivatives is generally limited to the Fund’s aggregated unrealized gains and the amount of any collateral pledged to the counterparty, which may be offset by any collateral posted to the Fund by the counterparty. ISDA master agreements can help to manage counterparty risk by specifying collateral posting arrangements atpre-arranged exposure levels. Under these ISDA agreements, collateral is routinely transferred if the total net exposure in respect of certain transactions, net of existing collateral already in place, exceeds a specified amount (typically $250,000, depending on the counterparty). With exchange-traded derivatives, there is minimal counterparty credit risk to the Fund because the exchange’s clearing house, as counterparty to these instruments, stands between the buyer and the seller of the contract. Credit risk still exists in exchange-traded derivatives with respect to initial and variation margin that is held in a broker’s customer accounts. While brokers are required to segregate customer margin from their own assets, in the event that a broker becomes insolvent or goes into bankruptcy and at that time there is a shortfall in the aggregate amount of margin held by the broker for all its clients, U.S. bankruptcy laws will typically allocate that shortfall on a pro rata basis across all of the broker’s
89 |
Notes to Financial Statements (continued)
December 31, 2019
customers, potentially resulting in losses to the Fund. Based on balances reflected on each Fund’s Statement of Assets and Liabilities, the following table shows (i) the maximum amount of loss due to credit risk that, based on the gross fair value of the financial instrument, the Fund would incur if parties (including OTC derivative counterparties and brokers holding margin for exchange-traded derivatives) to the relevant financial instruments failed completely to perform according to the terms of the contracts and the collateral or other security, if any, for the amount due proved to be of no value to the Fund, and (ii) the amount of loss that the Fund would incur after taking into account master netting provisions pursuant to ISDA agreements, as of December 31, 2019:
| | | | | | | | |
Fund | | Maximum Amount of Loss - Gross | | | Maximum Amount of Loss - Net | |
Strategic Alpha Fund | | $ | 20,824,523 | | | $ | 18,257,727 | |
Net loss amount reflects cash received as collateral of $390,000, which is recorded on the Statements of Assets and Liabilities.
5. Purchases and Sales of Securities. For the year ended December 31, 2019, purchases and sales of securities (excluding short-term investments and option/swaption contracts and including paydowns) were as follows:
| | | | | | | | | | | | | | | | |
| | | U.S. Government/Agency
Securities | | | Other Securities | |
Fund | | Purchases | | | Sales | | | Purchases | | | Sales | |
Strategic Alpha Fund | | $ | 4,184,284,850 | | | $ | 4,185,766,825 | | | $ | 1,365,915,872 | | | $ | 1,456,510,423 | |
U.S. Equity Opportunities Fund | | | — | | | | — | | | | 119,509,918 | | | | 301,756,378 | |
6. Management Fees and Other Transactions with Affiliates.
a. Management Fees. Natixis Advisors, L.P. (“Natixis Advisors”) serves as investment adviser to U.S. Equity Opportunities Fund. Natixis Advisors is a wholly-owned subsidiary of Natixis Investment Managers, LLC (“Natixis”), which is part of Natixis Investment Managers, an international asset management group based in Paris, France.
Under the terms of the management agreement, the Fund pays a management fee at the annual rate of 0.75% of the Fund’s average daily net assets, calculated daily and payable monthly.
Natixis Advisors has entered into subadvisory agreements for the Fund as listed below.
| | |
U.S. Equity Opportunities Fund | | Harris Associates L.P. (“Harris”) |
| | Loomis, Sayles & Company, L.P. (“Loomis Sayles”) |
| 90
Notes to Financial Statements (continued)
December 31, 2019
Loomis Sayles is a limited partnership whose sole general partner, Loomis, Sayles & Company, Inc., is indirectly owned by Natixis. Harris is a wholly-owned subsidiary of Natixis.
Under the terms of the subadvisory agreement, the Fund has agreed to pay its subadvisers a subadvisory fee at the following annual rates, calculated daily and payable monthly, based on each Segment’s average daily net assets:
| | | | | | |
Fund | | Subadviser | | Percentage of
Average
Daily Net Assets | |
U.S. Equity Opportunities Fund | | | | | | |
Large Cap Value Segment | | Harris | | | 0.52 | % |
All Cap Growth Segment | | Loomis Sayles | | | 0.35 | % |
Payments to Natixis Advisors are reduced by the amounts of payments to the subadvisers, as calculated based on the table above.
Loomis Sayles is the investment adviser to Strategic Alpha Fund. Under the terms of the management agreement, the Fund pays a management fee at the annual rate of 0.60% of the first $1.25 billion and 0.55% in excess of $1.25 billion of the Fund’s average daily net assets, calculated daily and payable monthly.
Natixis Advisors and Loomis Sayles have given binding undertakings to the Funds to waive management fees and/or reimburse certain expenses to limit the Funds’ operating expenses, exclusive of acquired fund fees and expenses, brokerage expenses, interest expense, taxes, organizational and extraordinary expenses such as litigation and indemnification expenses. These undertakings are in effect until April 30, 2020, may be terminated before then only with the consent of the Funds’ Board of Trustees, and are reevaluated on an annual basis. Management fees payable, as reflected on the Statements of Assets and Liabilities, is net of waivers and/or expense reimbursements, if any, pursuant to these undertakings. Waivers/reimbursements that exceed management fees payable are reflected on the Statements of Assets and Liabilities as receivable from investment adviser.
For the year ended December 31, 2019, the expense limits as a percentage of average daily net assets under the expense limitation agreements were as follows:
| | | | | | | | | | | | | | | | |
| | | Expense Limit as a Percentage of
Average Daily Net Assets | |
Fund | | Class A | | | Class C | | | Class N | | | Class Y | |
Strategic Alpha Fund | | | 1.00 | % | | | 1.75 | % | | | 0.70 | % | | | 0.75 | % |
U.S. Equity Opportunities Fund | | | 1.20 | % | | | 1.95 | % | | | 0.90 | % | | | 0.95 | % |
Natixis Advisors and Loomis Sayles shall be permitted to recover expenses borne under the expense limitation agreements (whether through waiver of management fees
91 |
Notes to Financial Statements (continued)
December 31, 2019
or otherwise) on a class by class basis in later periods to the extent the annual operating expenses of a class fall below a class’ expense limits, provided, however, that a class is not obligated to pay such waived/reimbursed fees or expenses more than one year after the end of the fiscal year in which the fees or expenses were waived/reimbursed.
For the year ended December 31, 2019, the management fees for each Fund were as follows:
| | | | | | | | |
Fund | | Gross
Management
Fees | | | Percentage of
Average
Daily Net Assets | |
Strategic Alpha Fund | | $ | 8,883,753 | | | | 0.59 | % |
U.S. Equity Opportunities Fund | | | 7,358,759 | | | | 0.75 | % |
No expenses were recovered for either Fund during the year ended December 31, 2019 under the terms of the expense limitation agreements.
b. Service and Distribution Fees. Natixis Distribution, L.P. (“Natixis Distribution”), which is a wholly-owned subsidiary of Natixis, has entered into a distribution agreement with the Trusts. Pursuant to this agreement, Natixis Distribution serves as principal underwriter of the Funds of the Trusts.
Pursuant to Rule12b-1 under the 1940 Act, the Trusts have adopted a Service Plan relating to each Fund’s Class A shares (the “Class A Plans”) and a Distribution and Service Plan relating to each Fund’s Class C shares (the “Class C Plans”).
Under the Class A Plans, each Fund pays Natixis Distribution a monthly service fee at an annual rate not to exceed 0.25% of the average daily net assets attributable to the Fund’s Class A shares, as reimbursement for expenses incurred by Natixis Distribution in providing personal services to investors in Class A shares and/or the maintenance of shareholder accounts.
Under the Class C Plans, each Fund pays Natixis Distribution a monthly service fee at an annual rate not to exceed 0.25% of the average daily net assets attributable to the Fund’s Class C shares, as compensation for services provided by Natixis Distribution in providing personal services to investors in Class C shares and/or the maintenance of shareholder accounts.
Also under the Class C Plans, each Fund pays Natixis Distribution a monthly distribution fee at the annual rate of 0.75% of the average daily net assets attributable to the Fund’s Class C shares, as compensation for services provided by Natixis Distribution in connection with the marketing or sale of Class C shares.
| 92
Notes to Financial Statements (continued)
December 31, 2019
For the year ended December 31, 2019, the service and distribution fees for each Fund were as follows:
| | | | | | | | | | | | |
| | | Service Fees | | | Distribution Fees | |
Fund | | Class A | | | Class C | | | Class C | |
Strategic Alpha Fund | | $ | 138,896 | | | $ | 53,592 | | | $ | 160,774 | |
U.S. Equity Opportunities Fund | | | 1,487,223 | | | | 205,926 | | | | 617,777 | |
c. Administrative Fees. Natixis Advisors provides certain administrative services for the Funds and contracts with State Street Bank to serve assub-administrator. Pursuant to an agreement among Natixis Funds Trusts, Loomis Sayles Funds Trusts, Natixis ETF Trust and Natixis Advisors, effective July 1, 2019, each Fund pays Natixis Advisors monthly itspro rataportion of fees equal to an annual rate of 0.0540% of the first $15 billion of the average daily net assets of the Natixis Funds Trusts, Loomis Sayles Funds Trusts and Natixis ETF Trust, 0.0500% of the next $15 billion, 0.0400% of the next $30 billion, 0.0275% of the next $30 billion and 0.0225% of such assets in excess of $90 billion, subject to an annual aggregate minimum fee for the Natixis Funds Trusts, Loomis Sayles Funds Trusts and Natixis ETF Trust of $10 million, which is reevaluated on an annual basis.
Prior to July 1, 2019, each Fund paid Natixis Advisors monthly itspro rataportion of fees equal to an annual rate of 0.0575% of the first $15 billion of the average daily net assets of the Natixis Funds Trusts, Loomis Sayles Funds Trusts and Natixis ETF Trust, 0.0500% of the next $15 billion, 0.0400% of the next $30 billion, 0.0275% of the next $30 billion and 0.0225% of such assets in excess of $90 billion, subject to an annual aggregate minimum fee for the Natixis Funds Trusts, Loomis Sayles Funds Trusts and Natixis ETF Trust of $10 million.
Effective October 1, 2018, State Street Bank agreed to reduce the fees it receives from Natixis Advisors for serving assub-administrator to the Funds. Also, effective October 1, 2018, Natixis Advisors agreed to voluntarily waive fees paid by the Funds in an amount equal to the reduction insub-administrative fees discussed above. The waiver was in effect through June 30, 2019.
For the year ended December 31, 2019, the administrative fees for each Fund were as follows:
| | | | | | | | | | | | |
Fund | | Gross Administrative
Fees | | | Waiver of
Administrative
Fees | | | Net
Administrative
Fees | |
Strategic Alpha Fund | | $ | 661,632 | | | $ | 8,402 | | | $ | 653,230 | |
U.S. Equity Opportunities Fund | | | 432,141 | | | | 5,237 | | | | 426,904 | |
d. Sub-Transfer Agent Fees. Natixis Distribution has entered into agreements, which include servicing agreements, with financial intermediaries that provide recordkeeping,
93 |
Notes to Financial Statements (continued)
December 31, 2019
processing, shareholder communications and other services to customers of the intermediaries that hold positions in the Funds and has agreed to compensate the intermediaries for providing those services. Intermediaries transact with the Funds primarily through the use of omnibus accounts on behalf of their customers who hold positions in the Funds. These services would have been provided by the Funds’ transfer agent and other service providers if the shareholders’ accounts were maintained directly at the Funds’ transfer agent. Accordingly, the Funds have agreed to reimburse Natixis Distribution for all or a portion of the servicing fees paid to these intermediaries. The reimbursement amounts(sub-transfer agent fees) paid to Natixis Distribution are subject to a currentper-account equivalent fee limit approved by the Funds’ Board of Trustees, which is based on fees for similar services paid to the Funds’ transfer agent and other service providers. Class N shares do not bear such expenses.
For the year ended December 31, 2019, thesub-transfer agent fees (which are reflected in transfer agent fees and expenses in the Statements of Operations) for each Fund were as follows:
| | | | |
Fund | | Sub-Transfer
Agent Fees | |
Strategic Alpha Fund | | $ | 766,962 | |
U.S. Equity Opportunities Fund | | | 490,344 | |
As of December 31, 2019, the Funds owe Natixis Distribution the following reimbursements forsub-transfer agent fees (which are reflected in the Statements of Assets and Liabilities as payable to distributor):
| | | | |
Fund | | Reimbursements of
Sub-Transfer
Agent Fees | |
Strategic Alpha Fund | | $ | 7,767 | |
U.S. Equity Opportunities Fund | | | 6,556 | |
Sub-transfer agent fees attributable to Class A, Class C and Class Y are allocated on apro rata basis to each class based on the relative net assets of each class to the total net assets of those classes.
e. Commissions. Commissions (including CDSCs) on Fund shares retained by Natixis Distribution during the year ended December 31, 2019 were as follows:
| | | | |
Fund | | Commissions | |
Strategic Alpha Fund | | $ | 1,673 | |
U.S. Equity Opportunities Fund | | | 27,750 | |
f. Trustees Fees and Expenses. The Trusts do not pay any compensation directly to their officers or Trustees who are directors, officers or employees of Natixis Advisors,
| 94
Notes to Financial Statements (continued)
December 31, 2019
Natixis Distribution, Natixis or their affiliates. The Chairperson of the Board of Trustees receives a retainer fee at the annual rate of $360,000. The Chairperson does not receive any meeting attendance fees for Board of Trustees meetings or committee meetings that he attends. Each Independent Trustee (other than the Chairperson) receives, in the aggregate, a retainer fee at the annual rate of $190,000. Each Independent Trustee also receives a meeting attendance fee of $10,000 for each meeting of the Board of Trustees that he or she attends in person and $5,000 for each meeting of the Board of Trustees that he or she attends telephonically. In addition, the chairperson of the Contract Review Committee and the chairperson of the Audit Committee each receive an additional retainer fee at the annual rate of $20,000. The chairperson of the Governance Committee receives an additional retainer fee at the annual rate of $15,000. Each Contract Review Committee member is compensated $6,000 for each Committee meeting that he or she attends in person and $3,000 for each meeting that he or she attends telephonically. Each Audit Committee member is compensated $6,000 for each Committee meeting that he or she attends in person and $3,000 for each meeting that he or she attends telephonically. These fees are allocated among the funds in the Natixis Funds Trusts, Loomis Sayles Funds Trusts and Natixis ETF Trust based on a formula that takes into account, among other factors, the relative net assets of each fund. Trustees are reimbursed for travel expenses in connection with attendance at meetings.
Effective January 1, 2020, the Chairperson of the Board will receive a retainer fee at the annual rate of $369,000, each Independent Trustee (other than the Chairperson) will receive, in the aggregate, a retainer fee at the annual rate of $199,000, and the chairperson of the Governance Committee will receive an additional retainer fee at the annual rate of $20,000. All other Trustee fees will remain unchanged.
A deferred compensation plan (the “Plan”) is available to the Trustees on a voluntary basis. Deferred amounts remain in the Funds until distributed in accordance with the provisions of the Plan. The value of a participating Trustee’s deferral account is based on theoretical investments of deferred amounts, on the normal payment dates, in certain funds of the Natixis Funds Trusts, Loomis Sayles Funds Trusts and Natixis ETF Trust as designated by the participating Trustees. Changes in the value of participants’ deferral accounts are allocatedpro rata among the funds in the Natixis Funds Trusts, Loomis Sayles Funds Trusts and Natixis ETF Trust, and are normally reflected as Trustees’ fees and expenses in the Statements of Operations. The portions of the accrued obligations allocated to the Funds under the Plan are reflected as Deferred Trustees’ fees in the Statements of Assets and Liabilities.
Certain officers and employees of Natixis Advisors and Loomis Sayles are also officers and/or Trustees of the Trusts.
g. Reimbursement of Transfer Agent Fees and Expenses. Natixis Advisors has given a binding contractual undertaking to the U.S. Equity Opportunities Fund to reimburse
95 |
Notes to Financial Statements (continued)
December 31, 2019
any and all transfer agency expenses for the Fund’s Class N shares. This undertaking is in effect through April 30, 2020 and is not subject to recovery under the expense limitation agreement described above. Natixis Advisors had given a binding contractual undertaking to the Strategic Alpha Fund to reimburse any and all transfer agency expenses for the Fund’s Class N shares. This undertaking was in effect through April 30, 2019 and is not subject to recovery under the expense limitation agreement described above.
For the year ended December 31, 2019, Natixis Advisors reimbursed the Funds for transfer agency expenses as follows:
| | | | |
| | | Reimbursement of
Transfer Agency
Expenses | |
Fund | | Class N | |
Strategic Alpha Fund | | $ | 205 | |
U.S. Equity Opportunities Fund | | | 807 | |
h. Affiliated Ownership. As of December 31, 2019, the Loomis Sayles Employees’ Profit Sharing Retirement Plan held shares of Strategic Alpha Fund representing 0.20% of the Fund’s net assets.
Investment activities of affiliated shareholders could have material impacts on the Fund.
7. Class-Specific Transfer Agent Fees and Expenses. Transfer agent fees and expenses attributable to Class A, Class C, and Class Y are allocated on apro ratabasis to each class based on the relative net assets of each class to the total net assets of those classes. Transfer agent fees and expenses attributable to Class N are allocated to Class N.
For the year ended December 31, 2019, the Funds incurred the following class-specific transfer agent fees and expenses (includingsub-transfer agent fees, where applicable):
| | | | | | | | | | | | | | | | |
| | | Transfer Agent Fees and Expenses | |
Fund | | Class A | | | Class C | | | Class N | | | Class Y | |
Strategic Alpha Fund | | $ | 36,332 | | | $ | 13,936 | | | $ | 1,270 | | | $ | 746,612 | |
U.S. Equity Opportunities Fund | | | 485,415 | | | | 67,258 | | | | 807 | | | | 247,713 | |
8. Line of Credit. Each Fund, together with certain other funds of Natixis Funds Trusts, Loomis Sayles Funds Trusts and Natixis ETF Trust, entered into a $400,000,000 committed unsecured line of credit provided by State Street Bank. Any one Fund may borrow up to $350,000,000 under the line of credit agreement (as long as all borrowings by all Funds in the aggregate do not exceed the $400,000,000 limit at any time), subject
| 96
Notes to Financial Statements (continued)
December 31, 2019
to each Fund’s investment restrictions and its contractual obligations under the line of credit. Interest is charged to the Funds based upon the terms set forth in the agreement. In addition, a commitment fee of 0.15% per annum, payable at the end of each calendar quarter, is accrued and apportioned among the participating funds based on their average daily unused portion of the line of credit. The Funds paid an arrangement fee, an upfront fee, and certain other legal fees in connection with the line of credit agreement, which are being amortized over a period of 364 days and are reflected in legal fees and/or miscellaneous expenses on the Statements of Operations. The unamortized balance is reflected as prepaid expenses on the Statements of Assets and Liabilities.
For the year ended December 31, 2019, neither Fund had borrowings under this agreement.
9. Concentration of Risk. Each Fund’s investments in foreign securities may be subject to greater political, economic, environmental credit/counterparty and information risks. The Funds’ investments in foreign securities also are subject to foreign currency fluctuations and other foreign currency-related risks. Foreign securities may be subject to higher volatility than U.S. securities, varying degrees of regulation and limited liquidity.
Strategic Alpha Fund isnon-diversified, which means it is not limited under the 1940 Act to a percentage of assets that it may invest in any one issuer. Because the Fund may invest in the securities of a limited number of issuers, an investment in the Fund may involve a higher degree of risk than would be present in a diversified portfolio.
10. Concentration of Ownership. From time to time, a Fund may have a concentration of one or more accounts constituting a significant percentage of shares outstanding. Investment activities by holders of such accounts could have material impacts on the Funds. As of December 31, 2019, based on management’s evaluation of the shareholder account base, the Funds had accounts representing controlling ownership of more than 5% of the Fund’s total outstanding shares. The number of such accounts, based on accounts that represent more than 5% of an individual class of shares, and the aggregate percentage of net assets represented by such holdings were as follows:
| | | | | | | | |
Fund | | Number of 5%
Account Holders | | | Percentage of
Ownership | |
Strategic Alpha Fund | | | 2 | | | | 12.43 | % |
Omnibus shareholder accounts for which Natixis Advisors understands that the intermediary has discretion over the underlying shareholder accounts or investment models where a shareholder account may be invested for anon-discretionary customer are included in the table above. For other omnibus accounts, the Fund does not have information on the individual shareholder accounts underlying the omnibus accounts; therefore, there could be other 5% shareholders in addition to those disclosed in the table above.
97 |
Notes to Financial Statements (continued)
December 31, 2019
11. Capital Shares. Each Fund may issue an unlimited number of shares of beneficial interest, without par value. Transactions in capital shares were as follows:
| | | | | | | | | | | | | | | | |
| |
| Year Ended
December 31, 2019 |
| |
| Year Ended
December 31, 2018 |
|
Strategic Alpha Fund | | | Shares | | | | Amount | | | | Shares | | | | Amount | |
| Class A | |
Issued from the sale of shares | | | 4,057,576 | | | $ | 39,431,401 | | | | 1,902,859 | | | $ | 18,643,184 | |
Issued in connection with the reinvestment of distributions | | | 153,689 | | | | 1,492,303 | | | | 87,934 | | | | 860,102 | |
Redeemed | | | (2,971,674 | ) | | | (28,966,949 | ) | | | (1,018,074 | ) | | | (10,074,904 | ) |
| | | | | | | | | | | | | | | | |
Net change | | | 1,239,591 | | | $ | 11,956,755 | | | | 972,719 | | | $ | 9,428,382 | |
| | | | | | | | | | | | | | | | |
| Class C | |
Issued from the sale of shares | | | 166,733 | | | $ | 1,611,447 | | | | 632,600 | | | $ | 6,161,447 | |
Issued in connection with the reinvestment of distributions | | | 26,221 | | | | 253,548 | | | | 51,094 | | | | 498,519 | |
Redeemed | | | (1,308,080 | ) | | | (12,656,029 | ) | | | (1,295,865 | ) | | | (12,777,946 | ) |
| | | | | | | | | | | | | | | | |
Net change | | | (1,115,126 | ) | | $ | (10,791,034 | ) | | | (612,171 | ) | | $ | (6,117,980 | ) |
| | | | | | | | | | | | | | | | |
| Class N | |
Issued from the sale of shares | | | 3,995,830 | | | $ | 38,781,677 | | | | 22,029,860 | | | $ | 218,736,227 | |
Issued in connection with the reinvestment of distributions | | | 905,302 | | | | 8,768,965 | | | | 952,881 | | | | 9,315,262 | |
Redeemed | | | (750,043 | ) | | | (7,281,454 | ) | | | (2,385,120 | ) | | | (23,546,282 | ) |
| | | | | | | | | | | | | | | | |
Net change | | | 4,151,089 | | | $ | 40,269,188 | | | | 20,597,621 | | | $ | 204,505,207 | |
| | | | | | | | | | | | | | | | |
| Class Y | |
Issued from the sale of shares | | | 33,476,137 | | | $ | 325,247,908 | | | | 60,785,713 | | | $ | 599,944,907 | |
Issued in connection with the reinvestment of distributions | | | 2,397,834 | | | | 23,222,284 | | | | 2,375,280 | | | | 23,181,067 | |
Redeemed | | | (62,461,312 | ) | | | (606,867,293 | ) | | | (43,762,727 | ) | | | (432,199,544 | ) |
| | | | | | | | | | | | | | | | |
Net change | | | (26,587,341 | ) | | $ | (258,397,101 | ) | | | 19,398,266 | | | $ | 190,926,430 | |
| | | | | | | | | | | | | | | | |
Increase (decrease) from capital share transactions | | | (22,311,787 | ) | | $ | (216,962,192 | ) | | | 40,356,435 | | | $ | 398,742,039 | |
| | | | | | | | | | | | | | | | |
| 98
Notes to Financial Statements (continued)
December 31, 2019
11. Capital Shares (continued).
| | | | | | | | | | | | | | | | |
| |
| Year Ended
December 31, 2019 |
| |
| Year Ended
December 31, 2018 |
|
U.S. Equity Opportunities Fund | | | Shares | | | | Amount | | | | Shares | | | | Amount | |
| Class A | |
Issued from the sale of shares | | | 1,147,417 | | | $ | 39,768,929 | | | | 2,296,546 | | | $ | 86,556,990 | |
Issued in connection with the reinvestment of distributions | | | 1,642,521 | | | | 59,555,999 | | | | 1,653,093 | | | | 51,341,261 | |
Redeemed | | | (2,797,920 | ) | | | (100,075,167 | ) | | | (3,432,504 | ) | | | (126,242,869 | ) |
| | | | | | | | | | | | | | | | |
Net change | | | (7,982 | ) | | $ | (750,239 | ) | | | 517,135 | | | $ | 11,655,382 | |
| | | | | | | | | | | | | | | | |
| Class C | |
Issued from the sale of shares | | | 409,399 | | | $ | 9,361,060 | | | | 1,030,778 | | | $ | 25,786,943 | |
Issued in connection with the reinvestment of distributions | | | 443,035 | | | | 10,083,593 | | | | 503,353 | | | | 10,537,724 | |
Redeemed | | | (1,269,592 | ) | | | (29,351,029 | ) | | | (2,053,605 | ) | | | (52,913,322 | ) |
| | | | | | | | | | | | | | | | |
Net change | | | (417,158 | ) | | $ | (9,906,376 | ) | | | (519,474 | ) | | $ | (16,588,655 | ) |
| | | | | | | | | | | | | | | | |
| Class N | |
Issued from the sale of shares | | | 14,461 | | | $ | 605,261 | | | | — | | | $ | — | |
Issued in connection with the reinvestment of distributions | | | 1,020 | | | | 44,503 | | | | 3 | | | | 100 | |
Redeemed | | | (506 | ) | | | (22,193 | ) | | | — | | | | — | |
| | | | | | | | | | | | | | | | |
Net change | | | 14,975 | | | $ | 627,571 | | | | 3 | | | $ | 100 | |
| | | | | | | | | | | | | | | | |
| Class Y | |
Issued from the sale of shares | | | 1,739,715 | | | $ | 72,112,902 | | | | 3,676,417 | | | $ | 160,325,492 | |
Issued in connection with the reinvestment of distributions | | | 514,088 | | | | 22,126,509 | | | | 628,147 | | | | 22,760,558 | |
Redeemed | | | (3,890,590 | ) | | | (163,012,984 | ) | | | (2,840,359 | ) | | | (120,906,634 | ) |
| | | | | | | | | | | | | | | | |
Net change | | | (1,636,787 | ) | | $ | (68,773,573 | ) | | | 1,464,205 | | | $ | 62,179,416 | |
| | | | | | | | | | | | | | | | |
Increase (decrease) from capital share transactions | | | (2,046,952 | ) | | $ | (78,802,617 | ) | | | 1,461,869 | | | $ | 57,246,243 | |
| | | | | | | | | | | | | | | | |
99 |
Report of Independent Registered Public Accounting Firm
To the Board of Trustees of Natixis Funds Trust I and Natixis Funds Trust II and Shareholders of Natixis U.S. Equity Opportunities Fund and Loomis Sayles Strategic Alpha Fund
Opinions on the Financial Statements
We have audited the accompanying statements of assets and liabilities, including the portfolios of investments, of Natixis U.S. Equity Opportunities Fund (one of the funds constituting the Natixis Funds Trust I), and Loomis Sayles Strategic Alpha Fund (one of the funds constituting the Natixis Funds II) (hereafter collectively referred to as the “Funds”) as of December 31, 2019, the related statements of operations for the year ended December 31, 2019, the statements of changes in net assets for each of the two years in the period ended December 31, 2019, including the related notes, and the financial highlights for each of the periods indicated therein (collectively referred to as the “financial statements”). In our opinion, the financial statements present fairly, in all material respects, the financial position of each of the Funds as of December 31, 2019, the results of each of their operations for the year then ended, the changes in each of their net assets for each of the two years in the period ended December 31, 2019 and each of the financial highlights for each of the periods indicated therein in conformity with accounting principles generally accepted in the United States of America.
Basis for Opinions
These financial statements are the responsibility of the Funds’ management. Our responsibility is to express an opinion on the Funds’ financial statements based on our audits. We are a public accounting firm registered with the Public Company Accounting Oversight Board (United States) (PCAOB) and are required to be independent with respect to the Funds in accordance with the U.S. federal securities laws and the applicable rules and regulations of the Securities and Exchange Commission and the PCAOB.
We conducted our audits of these financial statements in accordance with the standards of the PCAOB. Those standards require that we plan and perform the audit to obtain reasonable assurance about whether the financial statements are free of material misstatement, whether due to error or fraud.
Our audits included performing procedures to assess the risks of material misstatement of the financial statements, whether due to error or fraud, and performing procedures that respond to those risks. Such procedures included examining, on a test basis, evidence regarding the amounts and disclosures in the financial statements. Our audits also included evaluating the accounting principles used and significant estimates made by management, as well as evaluating the overall presentation of the financial statements. Our procedures included confirmation of securities owned as of December 31, 2019 by correspondence with the custodian, and brokers; when replies
| 100
Report of Independent Registered Public Accounting Firm
were not received from brokers, we performed other auditing procedures. We believe that our audits provide a reasonable basis for our opinions.
/s/ PricewaterhouseCoopers LLP
Boston, Massachusetts
February 21, 2020
We have served as the auditor of one or more of the investment companies in the Natixis Investment Company Complex since at least 1995. We have not been able to determine the specific year we began serving as auditor.
101 |
2019 U.S. Tax Distribution Information to Shareholders (Unaudited)
Corporate Dividends Received Deduction. For the fiscal year ended December 31, 2019, a percentage of dividends distributed by the Funds listed below qualify for the dividends received deduction for corporate shareholders. These percentages are as follows:
| | | | |
Fund | | Qualifying Percentage | |
Strategic Alpha Fund | | | 2.66 | % |
U.S. Equity Opportunities Fund | | | 100.00 | % |
Capital Gains Distributions. Pursuant to Internal Revenue Section 852(b), the following Fund paid distributions, which have been designated as capital gains distributions for the fiscal year ended December 31, 2019.
| | | | |
Fund | | Amount | |
U.S. Equity Opportunities Fund | | $ | 95,958,074 | |
Qualified Dividend Income. For the fiscal year ended December 31, 2019, a percentage of the ordinary income dividends paid by the Funds are considered qualified dividend income eligible for reduced tax rates. These lower rates range from 0% to 20% depending on an individual’s tax bracket. If the Funds paid a distribution during calendar year 2019, complete information will be reported in conjunction with Form1099-DIV. These percentages are noted below:
| | | | |
Fund | | Qualifying Percentage | |
Strategic Alpha Fund | | | 3.39 | % |
U.S. Equity Opportunities Fund | | | 100.00 | % |
| 102
Trustee and Officer Information
The tables below provide certain information regarding the trustees and officers of Natixis Funds Trust I and Natixis Funds Trust II (the “Trusts”). Unless otherwise indicated, the address of all persons below is 888 Boylston Street, Suite 800, Boston, MA 02199-8197. The Funds’ Statements of Additional Information include additional information about the trustees of the Trusts and are available by calling Natixis Funds at800-225-5478.
| | | | | | | | |
Name and Year of Birth | | Position(s) Held
with the Trusts,
Length of Time
Served and Term of Office1 | | Principal
Occupation(s)
During Past 5 Years | | Number of
Portfolios in Fund Complex
Overseen2 and Other
Directorships Held
During Past 5 Years | | Experience,
Qualifications,
Attributes, Skills
for Board Membership |
| | | |
| INDEPENDENT TRUSTEES | | | | | | |
| | | | |
Kenneth A. Drucker (1945) | | Chairperson of the Board of Trustees since January 2017 Trustee since 2008 Ex Officio member of Audit Committee, Contract Review Committee and Governance Committee | | Retired | | 51 None | | Significant experience on the Board and on the boards of other business organizations (including at investment companies); executive experience (including as treasurer of an aerospace, automotive, and metal manufacturing corporation) |
| | | | |
| Edmond J. English(1953) | | Trustee since 2013 Chairperson of Governance Committee and Audit Committee Member | | Executive Chairman of Bob’s Discount Furniture (retail) | | 51 Director, Burlington Stores, Inc. (retail) | | Significant experience on the Board and on the boards of other business organizations (including retail companies and a bank); executive experience (including at a retail company) |
103 |
Trustee and Officer Information
| | | | | | | | |
Name and Year of Birth | | Position(s) Held
with the Trusts,
Length of Time
Served and Term of Office1 | | Principal
Occupation(s)
During Past 5 Years | | Number of
Portfolios in Fund Complex
Overseen2 and Other
Directorships Held
During Past 5 Years | | Experience,
Qualifications,
Attributes, Skills
for Board Membership |
| | | |
| INDEPENDENT TRUSTEES continued | | | | | | |
| | | | |
Richard A. Goglia (1951) | | Trustee since 2015 Contract Review Committee Member and Governance Committee Member | | Retired; formerly Vice President and Treasurer of Raytheon Company (defense) | | 51 None | | Experience on the Board and executive experience (including his role as vice president and treasurer of a defense company and experience at a financial services company) |
| | | | |
Wendell J. Knox (1948) | | Trustee since 2009 Chairperson of Contract Review Committee | | Director of Abt Associates Inc. (research and consulting) | | 51 Director, The Hanover Insurance Group (property and casualty insurance); formerly, Director, Eastern Bank (bank) | | Significant experience on the Board and on the boards of other business organizations (including at a bank and at a property and casualty insurance firm); executive experience (including roles as president and chief executive officer of a research and consulting company) |
| 104
Trustee and Officer Information
| | | | | | | | |
Name and Year of Birth | | Position(s) Held
with the Trusts,
Length of Time
Served and Term of Office1 | | Principal
Occupation(s)
During Past 5 Years | | Number of
Portfolios in Fund Complex
Overseen2 and Other
Directorships Held
During Past 5 Years | | Experience,
Qualifications,
Attributes, Skills
for Board Membership |
| | | |
| INDEPENDENT TRUSTEES continued | | | | | | |
| | | | |
Martin T. Meehan (1956) | | Trustee since 2012 Audit Committee Member | | President, University of Massachusetts; formerly, Chancellor and faculty member, University of Massachusetts Lowell | | 51 None | | Significant experience on the Board and on the boards of other business organizations; experience as President of the University of Massachusetts; government experience (including as a member of the U.S. House of Representatives); academic experience |
| | | | |
Maureen B. Mitchell (1951) | | Trustee since 2017 Contract Review Committee Member and Governance Committee Member | | Retired; formerly President, Global Sales and Marketing, GE Asset Management, Inc. (financial services) | | 51 Director, Sterling Bancorp (bank) | | Experience on the Board; financial services industry and executive experience (including role as president of global sales and marketing at a financial services company) |
105 |
Trustee and Officer Information
| | | | | | | | |
Name and Year of Birth | | Position(s) Held
with the Trusts,
Length of Time
Served and Term of Office1 | | Principal
Occupation(s)
During Past 5 Years | | Number of
Portfolios in Fund Complex
Overseen2 and Other
Directorships Held
During Past 5 Years | | Experience,
Qualifications,
Attributes, Skills
for Board Membership |
| | | |
| INDEPENDENT TRUSTEES continued | | | | | | |
| | | | |
James P. Palermo (1955) | | Trustee since 2016 Contract Review Committee Member | | Founding Partner, Breton Capital Management, LLC (private equity); Partner, STEP Partners, LLC (private equity) | | 51 Director, FutureFuel.io (chemicals and biofuels) | | Experience on the Board; financial services industry and executive experience (including roles as chief executive officer of client management and asset servicing for a banking and financial services company) |
| | | | |
Erik R. Sirri (1958) | | Trustee since 2009 Chairperson of the Audit Committee | | Professor of Finance at Babson College | | 51 None | | Significant experience on the Board; experience as Director of the Division of Trading and Markets at the Securities and Exchange Commission; academic experience; training as an economist |
| | | | |
Peter J. Smail (1952) | | Trustee since 2009 Audit Committee Member and Governance Committee Member | | Retired | | 51 None | | Significant experience on the Board; mutual fund industry and executive experience (including roles as president and chief executive officer for an investment adviser) |
| 106
Trustee and Officer Information
| | | | | | | | |
Name and Year of Birth | | Position(s) Held
with the Trusts,
Length of Time
Served and Term of Office1 | | Principal
Occupation(s)
During Past 5 Years | | Number of
Portfolios in Fund Complex
Overseen2 and Other
Directorships Held
During Past 5 Years | | Experience,
Qualifications,
Attributes, Skills
for Board Membership |
| | | |
| INDEPENDENT TRUSTEES continued | | | | | | |
| | | | |
Kirk A. Sykes (1958) | | Trustee since 2019 Contract Review Committee Member | | Managing Director of Accordia Partners, LLC (real estate development); President of Primary Corporation (real estate development); Managing Principal of Merrick Capital Partners (infrastructure finance); formerly, President of Urban Strategy America Fund (real estate fund manager) | | 51 Trustee, Eastern Bank (bank); formerly, Director, Ares Commercial Real Estate Corporation (real estate investment trust) | | Experience on the Board and significant experience on the boards of other business organizations (including real estate companies and banks) |
| | | | |
Cynthia L. Walker (1956) | | Trustee since 2005 Audit Committee Member and Governance Committee Member | | Deputy Dean for Finance and Administration, Yale University School of Medicine | | 51 None | | Significant experience on the Board; executive experience in a variety of academic organizations (including roles as dean for finance and administration) |
107 |
Trustee and Officer Information
| | | | | | | | |
Name and Year of Birth | | Position(s) Held
with the Trusts,
Length of Time
Served and Term of Office1 | | Principal
Occupation(s)
During Past 5 Years | | Number of
Portfolios in Fund Complex
Overseen2 and Other
Directorships Held
During Past 5 Years | | Experience,
Qualifications,
Attributes, Skills
for Board Membership |
| | | |
| INTERESTED TRUSTEES | | | | | | |
| | | | |
Kevin P. Charleston3 (1965) One Financial Center Boston, MA 02111 | | Trustee since 2015 | | President, Chief Executive Officer and Chairman of the Board of Directors; formerly, Chief Financial Officer, Loomis, Sayles & Company, L.P. | | 51 None | | Significant experience on the Board; continuing service as President, Chief Executive Officer and Chairman of the Board of Directors of Loomis, Sayles & Company, L.P. |
| | | | |
David L. Giunta4 (1965) | | Trustee since 2011 President and Chief Executive Officer | | President and Chief Executive Officer, Natixis Advisors, L.P., Natixis Distribution, L.P., Natixis Distribution Corporation and Chairman of the Board of Natixis Distribution Corporation | | 51 None | | Significant experience on the Board; experience as President and Chief Executive Officer, Natixis Advisors, L.P., Natixis Distribution, L.P., Natixis Distribution Corporation and Chairman of the Board of Natixis Distribution Corporation |
| 1 | Each trustee serves until retirement, resignation or removal from the Board. The current retirement age is 75. The position of Chairperson of the Board is appointed for a three-year term. Mr. Drucker was appointed to serve an additional one year term as the Chairperson of the Board on June 12, 2019. |
| 2 | The trustees of the Trusts serve as trustees of a fund complex that includes all series of the Trusts, Natixis Funds Trust IV, Gateway Trust, Loomis Sayles Funds I, Loomis Sayles Funds II and Natixis ETF Trust (collectively, the “Fund Complex”). |
| 3 | Mr. Charleston is deemed an “interested person” of the Trusts because he holds the following positions with an affiliated person of the Trusts: President, Chief Executive Officer and Chairman of the Board of Directors of Loomis, Sayles & Company, L.P. |
| 4 | Mr. Giunta is deemed an “interested person” of the Trusts because he holds the following positions with an affiliated person of the Trusts: President and Chief Executive Officer, Natixis Advisors, L.P., Natixis Distribution, L.P., Natixis Distribution Corporation and Chairman of the Board of Natixis Distribution Corporation. |
| 108
Trustee and Officer Information
| | | | | | |
Name and Year of Birth | | Position(s) Held
with the Trusts | | Term of Office1 and
Length of Time Served | | Principal Occupation(s)
During Past 5 Years2 |
| | |
| OFFICERS OF THE TRUSTS | | | | |
| | | |
Russell L. Kane (1969) | | Secretary, Clerk and Chief Legal Officer | | Since 2016 | | Executive Vice President, General Counsel, Secretary and Clerk, Natixis Distribution Corporation, Natixis Advisors, L.P. and Natixis Distribution, L.P.; formerly, Chief Compliance Officer for Mutual Funds, Senior Vice President, Deputy General Counsel, Assistant Secretary and Assistant Clerk, Natixis Distribution Corporation, Natixis Advisors, L.P. and Natixis Distribution, L.P. |
| | | |
Michael C. Kardok (1959) | | Treasurer, Principal Financial and Accounting Officer | | Since 2004 | | Senior Vice President, Natixis Advisors, L.P. and Natixis Distribution, L.P. |
| | | |
Kirk Johnson (1981) | | Chief Compliance Officer, Assistant Secretary and Anti-Money Laundering Officer | | Since 2018 | | Senior Vice President, Deputy General Counsel, Assistant Secretary and Assistant Clerk, Natixis Distribution Corporation, Natixis Advisors, L.P. and Natixis Distribution, L.P.; formerly, Associate General Counsel, Natixis Distribution, L.P., Vice President and Counsel, Natixis Investment Managers, LLC. |
| 1 | Each officer of the Trusts serves for an indefinite term in accordance with the Trusts currentby-laws until the date his or her successor is elected and qualified, or until he or she sooner dies, retires, is removed or becomes disqualified. |
| 2 | Each person listed above, except as noted, holds the same position(s) with the Fund Complex. Previous positions during the past five years with Natixis Distribution, L.P., Natixis Advisors, L.P. or Loomis, Sayles & Company, L.P. are omitted, if not materially different from an officer’s current position with such entity. |
109 |
Item 2. Code of Ethics.
The Registrant has adopted a code of ethics that applies to the Registrant’s principal executive officer, principal financial officer and persons performing similar functions. There have been no amendments or waivers of the Registrant’s code of ethics during the period.
Item 3. Audit Committee Financial Expert.
The Board of Trustees of the Registrant has established an audit committee. Mr. Edmond J. English, Mr. Martin T. Meehan, Mr. Erik R. Sirri, Mr. Peter J. Smail and Ms. Cynthia L. Walker are members of the audit committee and have been designated as “audit committee financial experts” by the Board of Trustees. Each of these individuals is also an Independent Trustee of the Registrant.
Item 4. Principal Accountant Fees and Services.
Fees billed by the Principal Accountant for services rendered to the Registrant.
The table below sets forth fees billed by the principal accountant, PricewaterhouseCoopers LLP, for the past two fiscal years for professional services rendered in connection with a) the audit of the Registrant’s annual financial statements and services provided in connection with regulatory filings; b) audit-related services (including services that are reasonably related to the performance of the audit of the Registrant’s financial statements but not reported under “Audit Fees”); c) tax compliance, tax advice and tax planning and d) all other fees billed for professional services rendered by the principal accountant to the Registrant, other than the services provided as reported as a part of (a) through (c) of this Item.
| | | | | | | | | | | | | | | | | | | | | | | | | | | | | | | | |
| | | Audit fees | | | Audit-related fees1 | | | Tax fees2 | | | All other fees | |
| | | 1/1/18-
12/31/18 | | | 1/1/19-
12/31/19 | | | 1/1/18-
12/31/18 | | | 1/1/19-
12/31/19 | | | 1/1/18-
12/31/18 | | | 1/1/19-
12/31/19 | | | 1/1/18-
12/31/18 | | | 1/1/19-
12/31/19 | |
Natixis Funds Trust I (except Loomis Sayles Core Plus Bond Fund) | | $ | 229,219 | | | $ | 243,960 | | | $ | 469 | | | $ | 450 | | | $ | 47,760 | | | $ | 54,885 | | | $ | — | | | $ | — | |
| 1. | Audit-related fees consist of: |
2018 & 2019 – performance of agreed-upon procedures related to the Registrant’s deferred compensation plan.
2018 & 2019 – review of the Registrant’s tax returns.
Aggregate fees billed to the Registrant fornon-audit services during 2018 and 2019 were $48,229 and $55,335, respectively.
Fees billed by the Principal Accountant for services rendered to the Adviser and Control Affiliates.
The following table sets forth the fees billed by the Registrant’s principal accountant fornon-audit services rendered to Natixis Advisors, L.P. (“Natixis Advisors”), Mirova US LLC (“Mirova”) and entities controlling, controlled by or under common control with Natixis Advisors and Mirova (“Control Affiliates”) that provide ongoing services to the Registrant, for engagements that related directly to the operations and financial reporting of the Registrant for the last two fiscal years.
| | | | | | | | | | | | | | | | | | | | | | | | |
| | | Audit-related fees | | | Tax fees | | | All other fees | |
| | | 1/1/18-
12/31/18 | | | 1/1/19-
12/31/19 | | | 1/1/18-
12/31/18 | | | 1/1/19-
12/31/19 | | | 1/1/18-
12/31/18 | | | 1/1/19-
12/31/19 | |
Control Affiliates | | $ | — | | | $ | — | | | $ | — | | | $ | 26,750 | | | $ | — | | | $ | — | |
The following table sets forth the aggregate fees billed by the Registrant’s principal accountant fornon-audit services rendered to Mirova, Loomis, Natixis Advisors and Control Affiliates that provide ongoing services to the Registrant, for the last two fiscal years, including the fees disclosed in the table above.
| | | | | | | | |
| | | Aggregate Non-Audit Fees | |
| | | 1/1/18-
12/31/18 | | | 1/1/19-
12/31/19 | |
Control Affiliates | | $ | 237,200 | | | $ | 302,257 | |
None of the services described above were approved pursuant to paragraph (c)(7)(i)(C) of RegulationS-X.
Audit CommitteePre-Approval Policies.
Annually, the Registrant’s Audit Committee reviews the audit, audit-related, tax and othernon-audit services together with the projected fees, for services proposed to be rendered to the Registrant and/or other entities for whichpre-approval is required during the upcoming year. Any subsequent revisions to alreadypre-approved services or fees (including fee increases) and requests forpre-approval of new services would be presented for consideration quarterly as needed.
If, in the opinion of management, a proposed engagement by the Registrant’s independent accountants needs to commence before the next regularly scheduled Audit Committee meeting, any member of the Audit Committee who is an independent Board member is authorized topre-approve the engagement, but only for engagements to provide audit, audit-related and tax services. This approval is subject to review by the full Audit Committee at its next quarterly meeting. All other engagements require the approval of all the members of the Audit Committee.
Item 5. Audit Committee of Listed Registrants.
Not applicable.
Item 6. Schedule of Investments.
Included as part of the Report to Shareholders filed as Item 1 herewith.
Item 7. Disclosure of Proxy Voting Policies and Procedures forClosed-End Management Investment Companies.
Not applicable.
Item 8. Portfolio Managers ofClosed-End Management Investment Companies.
Not applicable.
Item 9. Purchases of Equity Securities byClosed-End Management Investment Companies and Affiliated Purchasers.
Not applicable.
Item 10. Submission of Matters to a Vote of Securities Holders.
There were no material changes to the procedures by which shareholders may recommend nominees to the Registrant’s Board of Trustees.
Item 11. Controls and Procedures.
The Registrant’s principal executive officer and principal financial officer have concluded that the Registrant’s disclosure controls and procedures are sufficient to ensure that information required to be disclosed by the Registrant in this FormN-CSR was recorded, processed, summarized and reported within the time periods specified in the Securities and Exchange Commission’s rules and forms, based upon such officers’ evaluation of these controls and procedures as of a date within 90 days of the filing date of the report.
There were no changes in the Registrant’s internal control over financial reporting that occurred during the Registrant’s last fiscal quarter of the period covered by this report that has materially affected, or is reasonably likely to materially affect, the Registrant’s internal control over financial reporting.
Item 12. Disclosure of Securities Lending Activities forClosed-End Management Investment Companies.
Not applicable.
Item 13. Exhibits.
| | | | |
| | | (a) | | (1) Code of Ethics required by Item 2 hereof, filed herewith as Exhibit (a)(1). |
| | |
| | (a) | | (2) Certifications of Principal Executive Officer and Principal Financial Officer pursuant to Rule30a-2(a) under the Investment Company Act of 1940 [17 CFR270.30a-2(a)], filed herewith as Exhibits (a)(2)(1)and (a)(2)(2), respectively. |
| | |
| | (a) | | (3) Not applicable. |
| | |
| | (b) | | Certifications of Principal Executive Officer and Principal Financial Officer pursuant to Section 906 of Sarbanes-Oxley Act of 2002 filed herewith as Exhibit (b). |
SIGNATURES
Pursuant to the requirements of the Securities Exchange Act of 1934 and the Investment Company Act of 1940, the Registrant has duly caused this report to be signed on its behalf by the undersigned, thereunto duly authorized.
| | |
| Natixis Funds Trust I |
| |
| By: | | /s/ David L. Giunta |
| | |
| Name: | | David L. Giunta |
| Title: | | President and Chief Executive Officer |
| Date: | | February 21, 2020 |
Pursuant to the requirements of the Securities Exchange Act of 1934 and the Investment Company Act of 1940, this report has been signed by the following persons on behalf of the Registrant and in the capacities and on the dates indicated.
| | |
| Name: | | David L. Giunta |
| Title: | | President and Chief Executive Officer |
| Date: | | February 21, 2020 |
| | |
| |
| By: | | /s/ Michael C. Kardok |
| | |
| Name: | | Michael C. Kardok |
| Title: | | Treasurer |
| Date: | | February 21, 2020 |