| UNITED STATES |
| SECURITIES AND EXCHANGE COMMISSION |
| WASHINGTON, D.C. 20549 |
| -------- |
| FORM N-CSR |
| -------- |
| CERTIFIED SHAREHOLDER REPORT OF REGISTERED MANAGEMENT |
| INVESTMENT COMPANIES |
| INVESTMENT COMPANY ACT FILE NUMBER 811-4325 |
| FIRST INVESTORS LIFE SERIES FUNDS |
| (Exact name of registrant as specified in charter) |
| 110 Wall Street |
| New York, NY 10005 |
| (Address of principal executive offices) (Zip code) |
| Joseph I. Benedek |
| First Investors Management Company, Inc. |
| Raritan Plaza I |
| Edison, NJ 08837-3620 |
| (Name and address of agent for service) |
| REGISTRANT'S TELEPHONE NUMBER, INCLUDING AREA CODE: |
| 1-212-858-8000 |
| DATE OF FISCAL YEAR END: DECEMBER 31, 2011 |
| DATE OF REPORTING PERIOD: JUNE 30, 2011 |
| Item 1. | Reports to Stockholders |
| The semi-annual report to stockholders follows |
| FOREWORD |
This report is for the information of the shareholders of the Funds. It is the policy of each Fund described in this report to mail only one copy of a Fund’s prospectus, annual report, semi-annual report and proxy statements to all shareholders who share the same address and share the same last name and have invested in a Fund covered by the same document. You are deemed to consent to this policy unless you specifically revoke this policy and request that separate copies of such documents be mailed to you. In such case, you will begin to receive your own copies within 30 days after our receipt of the revocation. You may request that separate copies of these disclosure documents be mailed to you by writing to us at: Administrative Data Management Corp., Raritan Plaza I, Edison, NJ 08837-3620 or calling us at 1-800-423-4026.
You may obtain a free prospectus for any of the Funds by contacting your representative, calling 1-800-423-4026, writing to us at the following address: First Investors Corporation, 110 Wall Street, New York, NY 10005, or by visiting our website at www.firstinvestors.com. You should consider the investment objectives, risks, charges and expenses of a Fund carefully before investing. The prospectus contains this and other information about the Fund, and should be read carefully before investing.
An investment in a Fund is not a bank deposit and is not insured or guaranteed by the Federal Deposit Insurance Corporation (FDIC) or any other government agency. Although the Cash Management Fund seeks to preserve a net asset value at $1.00 per share, it is possible to lose money by investing in it, just as it is possible to lose money by investing in any of the other Funds. Past performance is no guarantee of future results.
A Statement of Additional Information (“SAI”) for any of the Funds may also be obtained, without charge, upon request by calling 1-800-423-4026, writing to us at our address or by visiting our website listed above. The SAI contains more detailed information about the Funds, including information about their Trustees.
Equity & Bond Markets Overview
FIRST INVESTORS LIFE SERIES FUNDS
Dear Investor:
We are pleased to provide you with our report for the first six months of 2011 (“the review period”). During this time, investment returns were generally good, despite a number of economic and geopolitical uncertainties.
Economic Overview
The year began with an upbeat forecast for overall economic growth, with companies raising dividends and buying back stock. The investment climate began to change in March, however, as markets became unsettled by several events, including the earthquake in Japan, unrest in the Middle East and the European sovereign debt crisis. Near the end of the review period there was also concern about raising the U.S. debt ceiling and the conclusion of the Federal Reserve’s (the “Fed’s”) quantitative easing program, which had involved large-scale purchases of U.S. Treasury securities.
Higher gas prices following unrest in the Middle East and supply chain disruptions due to the earthquake slowed economic growth to below 2% and contributed to a rise in the unemployment rate to 9.2% in the second quarter. The housing market also remained stagnant and state and local governments cut back on spending in response to budget deficits. As a result, interest rates declined in the second quarter and the Fed reaffirmed its commitment to maintain short-term interest rates at exceptionally low levels for an extended period of time.
The Stock Market
The stock market began the review period with solid earnings, an increase in dividends and an uptick in merger and acquisition activity. Through April, 80% of the companies in the S&P 500 Index reported profits that beat earnings expectations. However, as the review period continued, stocks didn’t do nearly as well. The Dow Jones Industrial Average (the “Dow”) lost some 250 points in May, as downbeat economic data weighed on the markets. The downward trend continued through mid June, taking stocks lower by 7% from the April highs. Markets rallied in the last week of the quarter to end the period on an upbeat note.
Despite this weakness, the benchmark indices all posted solid returns for the first half of 2011, with most of the gains coming in the early part of the review period. The S&P 500 Index was up 6.0% on a total return basis and the Dow performed even better, ending the period up 7.2%. The Russell 2000 Index rose 5.6% and the MSCI EAFE Index showed the period’s smallest increase at 3.0%. Health care was the best performing sector during the review period, followed by energy and consumer discretionary. The worst performing sector was financials, the only market sector to show a decline during the period.
The Bond Market
At the beginning of the review period, the bond market initially declined due to rising interest rates. For the review period as a whole, however, the bond market generally performed well as interest rates fell slightly and bond prices increased commensurately.
| 1 |
Equity & Bond Markets Overview (continued)
FIRST INVESTORS LIFE SERIES FUNDS
According to Bank of America Merrill Lynch, the broad U.S. bond market returned 2.8%. Riskier sectors tended to have better performance during the period by virtue of their higher yield or “spread.” In particular, Bank of America Merrill Lynch reported that high yield bonds gained 4.9%, followed by investment grade corporate bonds at 3.3%, mortgage-backed securities at 2.9%, and U.S. government securities at 2.3%. Money market returns were at or close to zero, reflecting the Fed’s continuation of its very accommodative monetary policy.
Thank you for placing your trust in First Investors. As always, we appreciate the opportunity to serve your investment needs.
The Funds are only available through the purchase of variable life insurance policies and variable annuity contracts issued by First Investors Life Insurance Company. The reports do not reflect the additional expenses and charges that are applicable to variable life insurance policies and variable annuity contracts.
This Equity & Bond Markets Overview is not part of the Funds’ financial report and is submitted for the general information of the shareholders of the Funds. It is not authorized for distribution to prospective investors in the Funds, unless preceded or accompanied by an effective prospectus. The views expressed in this Overview reflect those views of the Director of Equities and Director of Fixed Income of First Investors Management Company, Inc. through the end of the period covered. Any such views are subject to change at any time based upon market or other conditions and we disclaim any responsibility to update such views. This Overview may not be relied upon as investment advice or an indication of current or future trading intent on behalf of any Fund.
There are a variety of risks associated with investing in variable life and annuity subaccounts. For all subaccounts, there is the risk that securities selected by the portfolio manager may perform differently than the overall market or may not meet the portfolio manager’s expectations. For stock subaccounts, the risks include market risk (the risk that the entire stock market will decline because of an event such as a deterioration in the economy or a rise in interest rates), as well as special risks associated with investing in certain types of stock subaccounts such as small-cap, global or international funds. For bond subaccounts, the risks include interest rate risk and credit risk. Interest rate risk is the risk that bonds will decrease in value as interest rates rise. As a general matter, bonds with longer maturities fluctuate more than bonds with shorter maturities in reaction to changes in interest rates. Credit risk is the risk that bonds will decline in value as the result of a decline in the credit rating of the bonds or the economy as a whole, or that the issuer will be unable to pay interest and/or principal when due. You should consult your prospectus for a precise explanation of the risks associated with your subaccounts.
| 2 |
Understanding Your Fund’s Expenses
FIRST INVESTORS LIFE SERIES FUNDS
As a mutual fund shareholder, you incur two types of costs: (1) transaction costs, and (2) ongoing costs, including advisory fees and other expenses. This example is intended to help you understand your ongoing costs (in dollars) of investing in the Fund and to compare these costs with the ongoing costs of investing in other mutual funds.
The examples are based on an investment of $1,000 in each Fund at the beginning of the period, January 1, 2011, and held for the entire six-month period ended June 30, 2011. The calculations assume that no shares were bought or sold during the period. Your actual costs may have been higher or lower, depending on the amount of your investment and the timing of any purchases or redemptions.
Actual Expense Example:
These amounts help you to estimate the actual expenses that you paid over the period. The “Ending Account Value” shown is derived from the Fund’s actual return, and the “Expenses Paid During Period” shows the dollar amount that would have been paid by an investor who started with $1,000 in the Fund. You may use the information here, together with the amount you invested, to estimate the expenses that you paid during the period.
To estimate the expenses you paid on your account during this period simply divide your ending account value by $1,000 (for example, an $8,600 account value divided by $1,000 = 8.60), then multiply the result by the number given for your Fund under the heading “Expenses Paid During Period”.
Hypothetical Expense Example:
These amounts provide information about hypothetical account values and hypothetical expenses based on the Fund’s actual expense ratio and an assumed rate of return of 5% per year before expenses, which is not the Fund’s actual return. The hypothetical account values and expenses may not be used to estimate the actual ending account balance or expenses you paid for the period. You may use this information to compare the ongoing costs of investing in the Fund and other funds. To do so, compare this 5% hypothetical example with the 5% hypothetical examples that appear in the shareholder reports of the other funds.
Please note that the expenses shown in the table are meant to highlight and help you compare your ongoing costs only and do not reflect any transactional costs. Therefore, the hypothetical expense example is useful in comparing ongoing costs only, and will not help you determine the relative total costs of owning different funds. In addition, if these transactional costs were included, your costs would have been higher.
| 3 |
Fund Expenses (unaudited)
BLUE CHIP FUND
The examples below show the ongoing costs (in dollars) of investing in your Fund and will help you in comparing these costs with costs of other mutual funds. Please refer to page 3 for a detailed explanation of the information presented in these examples.
| Beginning | Ending | ||
| Account | Account | Expenses Paid | |
| Value | Value | During Period | |
| (1/1/11) | (6/30/11) | (1/1/11–6/30/11)* | |
| Expense Examples | |||
| Actual | $1,000.00 | $1,056.88 | $4.23 |
| Hypothetical | |||
| (5% annual return before expenses) | $1,000.00 | $1,020.67 | $4.16 |
| * | Expenses are equal to the annualized expense ratio of .83%, multiplied by the average account |
| value over the period, multiplied by 181/365 (to reflect the one-half year period). |
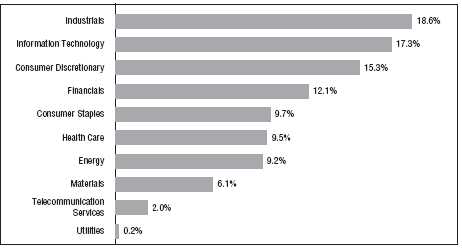
Portfolio Composition
TOP TEN SECTORS
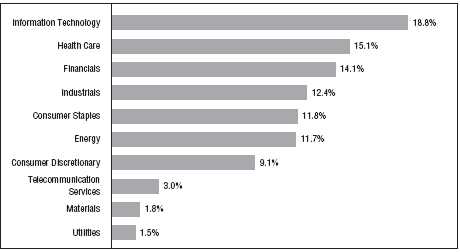
Portfolio holdings and allocations are subject to change. Percentages are as of June 30, 2011, and are based on the total value of investments.
| 4 |
Portfolio of Investments
BLUE CHIP FUND
June 30, 2011
| Shares | Security | Value | ||
| COMMON STOCKS—98.8% | ||||
| Consumer Discretionary—9.0% | ||||
| 46,800 | Best Buy Company, Inc. | $ 1,469,988 | ||
| 35,700 | CBS Corporation – Class “B” | 1,017,093 | ||
| 19,900 | Home Depot, Inc. | 720,778 | ||
| 13,700 | Kohl’s Corporation | 685,137 | ||
| 22,500 | Limited Brands, Inc. | 865,125 | ||
| 54,900 | Lowe’s Companies, Inc. | 1,279,719 | ||
| 8,900 | McDonald’s Corporation | 750,448 | ||
| 20,200 | Target Corporation | 947,582 | ||
| 26,800 | Time Warner, Inc. | 974,716 | ||
| 13,000 | Viacom, Inc. – Class “B” | 663,000 | ||
| 30,300 | Walt Disney Company | 1,182,912 | ||
| 27,300 | Wyndham Worldwide Corporation | 918,645 | ||
| 11,475,143 | ||||
| Consumer Staples—11.7% | ||||
| 33,500 | Avon Products, Inc. | 938,000 | ||
| 27,700 | Coca-Cola Company | 1,863,933 | ||
| 8,700 | Costco Wholesale Corporation | 706,788 | ||
| 28,000 | CVS Caremark Corporation | 1,052,240 | ||
| 37,661 | Kraft Foods, Inc. – Class “A” | 1,326,797 | ||
| 34,400 | Kroger Company | 853,120 | ||
| 35,300 | PepsiCo, Inc. | 2,486,179 | ||
| 24,800 | Philip Morris International, Inc. | 1,655,896 | ||
| 20,000 | Procter & Gamble Company | 1,271,400 | ||
| 33,500 | Walgreen Company | 1,422,410 | ||
| 25,000 | Wal-Mart Stores, Inc. | 1,328,500 | ||
| 14,905,263 | ||||
| Energy—11.6% | ||||
| 11,500 | Anadarko Petroleum Corporation | 882,740 | ||
| 30,300 | Chevron Corporation | 3,116,052 | ||
| 24,371 | ConocoPhillips | 1,832,456 | ||
| 14,700 | Devon Energy Corporation | 1,158,507 | ||
| 33,000 | ExxonMobil Corporation | 2,685,540 | ||
| 8,200 | Hess Corporation | 613,032 | ||
| 30,500 | Marathon Oil Corporation | 1,606,740 | ||
| 5 |
Portfolio of Investments (continued)
BLUE CHIP FUND
June 30, 2011
| Shares | Security | Value | ||
| Energy (continued) | ||||
| 21,200 | Noble Corporation | $ 835,492 | ||
| 14,700 | Schlumberger, Ltd. | 1,270,080 | ||
| 19,600 | Suncor Energy, Inc. | 766,360 | ||
| 14,766,999 | ||||
| Financials—14.1% | ||||
| 15,100 | ACE, Ltd. | 993,882 | ||
| 21,000 | Allstate Corporation | 641,130 | ||
| 28,200 | American Express Company | 1,457,940 | ||
| 15,600 | Ameriprise Financial, Inc. | 899,808 | ||
| 24,405 | Bank of New York Mellon Corporation | 625,256 | ||
| 16,800 | Capital One Financial Corporation | 868,056 | ||
| 15,100 | Chubb Corporation | 945,411 | ||
| 52,732 | JPMorgan Chase & Company | 2,158,848 | ||
| 9,300 | M&T Bank Corporation | 817,935 | ||
| 21,500 | MetLife, Inc. | 943,205 | ||
| 25,700 | Morgan Stanley | 591,357 | ||
| 14,100 | Northern Trust Corporation | 648,036 | ||
| 16,600 | PNC Financial Services Group, Inc. | 989,526 | ||
| 9,000 | SPDR S&P 500 ETF Trust (ETF) | 1,187,730 | ||
| 20,000 | State Street Corporation | 901,800 | ||
| 17,700 | Travelers Companies, Inc. | 1,033,326 | ||
| 43,400 | U.S. Bancorp | 1,107,134 | ||
| 38,400 | Wells Fargo & Company | 1,077,504 | ||
| 17,887,884 | ||||
| Health Care—15.0% | ||||
| 41,400 | Abbott Laboratories | 2,178,468 | ||
| 21,500 | * | Amgen, Inc. | 1,254,525 | |
| 25,400 | Bristol-Myers Squibb Company | 735,584 | ||
| 17,100 | * | Gilead Sciences, Inc. | 708,111 | |
| 40,000 | Johnson & Johnson | 2,660,800 | ||
| 8,200 | McKesson Corporation | 685,930 | ||
| 31,700 | Medtronic, Inc. | 1,221,401 | ||
| 37,400 | Merck & Company, Inc. | 1,319,846 | ||
| 23,700 | Novartis AG (ADR) | 1,448,307 | ||
| 107,157 | Pfizer, Inc. | 2,207,434 | ||
| 17,500 | St. Jude Medical, Inc. | 834,400 | ||
| 14,800 | Teva Pharmaceutical Industries, Ltd. (ADR) | 713,656 | ||
| 6 |
| Shares | Security | Value | ||
| Health Care (continued) | ||||
| 21,500 | * | Thermo Fisher Scientific, Inc. | $ 1,384,385 | |
| 18,000 | UnitedHealth Group, Inc. | 928,440 | ||
| 12,100 | * | Zimmer Holdings, Inc. | 764,720 | |
| 19,046,007 | ||||
| Industrials—12.3% | ||||
| 13,200 | 3M Company | 1,252,020 | ||
| 9,500 | Caterpillar, Inc. | 1,011,370 | ||
| 66,600 | General Electric Company | 1,256,076 | ||
| 11,800 | Goodrich Corporation | 1,126,900 | ||
| 16,800 | Honeywell International, Inc. | 1,001,112 | ||
| 13,500 | Illinois Tool Works, Inc. | 762,615 | ||
| 20,000 | Ingersoll-Rand, PLC | 908,200 | ||
| 20,700 | ITT Corporation | 1,219,851 | ||
| 11,100 | Northrop Grumman Corporation | 769,785 | ||
| 11,400 | Parker Hannifin Corporation | 1,023,036 | ||
| 18,900 | Raytheon Company | 942,165 | ||
| 32,200 | Republic Services, Inc. | 993,370 | ||
| 20,525 | Tyco International, Ltd. | 1,014,551 | ||
| 8,800 | United Parcel Service, Inc. – Class “B” | 641,784 | ||
| 19,700 | United Technologies Corporation | 1,743,647 | ||
| 15,666,482 | ||||
| Information Technology—18.8% | ||||
| 25,700 | * | Adobe Systems, Inc. | 808,265 | |
| 6,000 | * | Apple, Inc. | 2,014,020 | |
| 15,000 | Automatic Data Processing, Inc. | 790,200 | ||
| 29,800 | CA, Inc. | 680,632 | ||
| 94,900 | Cisco Systems, Inc. | 1,481,389 | ||
| 35,000 | * | eBay, Inc. | 1,129,450 | |
| 57,500 | * | EMC Corporation | 1,584,125 | |
| 43,000 | Hewlett-Packard Company | 1,565,200 | ||
| 90,600 | Intel Corporation | 2,007,696 | ||
| 13,000 | International Business Machines Corporation | 2,230,150 | ||
| 130,200 | Microsoft Corporation | 3,385,200 | ||
| 62,000 | * | NCR Corporation | 1,171,180 | |
| 49,900 | Oracle Corporation | 1,642,209 | ||
| 22,200 | QUALCOMM, Inc. | 1,260,738 | ||
| 7 |
Portfolio of Investments (continued)
BLUE CHIP FUND
June 30, 2011
| Shares or | |||||||
| Principal | |||||||
| Amount | Security | Value | |||||
| Information Technology (continued) | |||||||
| 27,500 | * | Symantec Corporation | $ 542,300 | ||||
| 19,300 | Texas Instruments, Inc. | 633,619 | |||||
| 43,800 | Western Union Company | 877,314 | |||||
| 23,803,687 | |||||||
| Materials—1.8% | |||||||
| 27,800 | Dow Chemical Company | 1,000,800 | |||||
| 15,000 | DuPont (E.I.) de Nemours & Company | 810,750 | |||||
| 9,700 | Freeport-McMoRan Copper & Gold, Inc. | 513,130 | |||||
| 2,324,680 | |||||||
| Telecommunication Services—3.0% | |||||||
| 61,700 | AT&T, Inc. | 1,937,997 | |||||
| 50,600 | Verizon Communications, Inc. | 1,883,838 | |||||
| 3,821,835 | |||||||
| Utilities—1.5% | |||||||
| 21,800 | American Electric Power Company, Inc. | 821,424 | |||||
| 17,800 | NextEra Energy, Inc. | 1,022,788 | |||||
| 1,844,212 | |||||||
| Total Value of Common Stocks (cost $88,502,365) | 125,542,192 | ||||||
| SHORT-TERM INVESTMENTS—.7% | |||||||
| Money Market Fund | |||||||
| $850M | First Investors Cash Reserve Fund, .04% (cost $850,000)** | 850,000 | |||||
| Total Value of Investments (cost $89,352,365) | 99.5 | % | 126,392,192 | ||||
| Other Assets, Less Liabilities | .5 | 587,025 | |||||
| Net Assets | 100.0 | % | $126,979,217 | ||||
| * | Non-income producing |
| ** | Affiliated unregistered money market fund available only to First Investors funds and certain |
| accounts managed by First Investors Management Company, Inc. Rate shown is the 7-day yield | |
| at June 30, 2011 (see Note 3). |
| Summary of Abbreviations: | |||
| ADR | American Depositary Receipts | ||
| ETF | Exchange Traded Fund | ||
| 8 |
Accounting Standards Codification (“ASC”) 820 established a three-tier hierarchy of inputs to establish a classification of fair value measurements for disclosure purposes. The three-tier hierarchy of inputs is summarized in the three broad Levels listed below:
| Level 1 — Unadjusted quoted prices in active markets for identical securities that the Fund has the ability to access. |
| Level 2 — Observable inputs other than quoted prices included in Level 1 that are observable for the asset or liability, either directly or indirectly. These inputs may include quoted prices for the identical instrument on an inactive market, prices for similar instruments, interest rates, prepayment speeds, credit risk, yield curves, default rates and similar data. |
| Level 3 — Unobservable inputs for the asset or liability, to the extent relevant observable inputs are not available, representing the Fund’s own assumption about the assumptions a market participant would use in valuing the asset or liability, and would be based on the best information available. |
The inputs methodology used for valuing securities are not necessarily an indication of the risk associated with investing in those securities.
The following is a summary, by category of Level, of inputs used to value the Fund’s investments as of June 30, 2011:
| Level 1 | Level 2 | Level 3 | Total | |||||||||
| Common Stocks | $ | 125,542,192 | $ | — | $ | — | $ | 125,542,192 | ||||
| Money Market Fund | 850,000 | — | — | 850,000 | ||||||||
| Total Investments in Securities* | $ | 126,392,192 | $ | — | $ | — | $ | 126,392,192 |
| * | The Portfolio of Investments provides information on the industry categorization for the portfolio. |
| There were no transfers into or from Level 1 and Level 2 by the Fund during the period ended | |
| June 30, 2011. |
| See notes to financial statements | 9 |
Fund Expenses (unaudited)
CASH MANAGEMENT FUND
The examples below show the ongoing costs (in dollars) of investing in your Fund and will help you in comparing these costs with costs of other mutual funds. Please refer to page 3 for a detailed explanation of the information presented in these examples.
| Beginning | Ending | ||
| Account | Account | Expenses Paid | |
| Value | Value | During Period | |
| (1/1/11) | (6/30/11) | (1/1/11–6/30/11)* | |
| Expense Examples | |||
| Actual | $1,000.00 | $1,000.00 | $0.84 |
| Hypothetical | |||
| (5% annual return before expenses) | $1,000.00 | $1,023.95 | $0.85 |
| * | Expenses are equal to the annualized expense ratio of .17%, multiplied by the average account |
| value over the period, multiplied by 181/365 (to reflect the one-half year period). Expenses paid | |
| during the period are net of expenses waived or assumed. |
Portfolio Composition
BY SECTOR
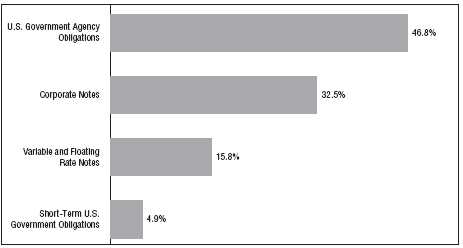
Portfolio holdings and allocations are subject to change. Percentages are as of June 30, 2011, and are based on the total value of investments.
| 10 |
Portfolio of Investments
CASH MANAGEMENT FUND
June 30, 2011
| Principal | Interest | ||||||
| Amount | Security | Rate | * | Value | |||
| U.S. GOVERNMENT AGENCY | |||||||
| OBLIGATIONS—47.5% | |||||||
| Fannie Mae: | |||||||
| $560M | 7/13/11 | 0.14 | % | $ 559,975 | |||
| 700M | 7/20/11 | 0.14 | 699,948 | ||||
| 500M | 7/22/11 | 0.18 | 499,947 | ||||
| 400M | 8/8/11 | 0.08 | 399,966 | ||||
| 250M | Federal Farm Credit Bank, 7/11/11 | 0.28 | 250,273 | ||||
| Federal Home Loan Bank: | |||||||
| 700M | 7/22/11 | 0.08 | 699,967 | ||||
| 500M | 9/14/11 | 0.08 | 499,922 | ||||
| Freddie Mac: | |||||||
| 300M | 7/25/11 | 0.09 | 299,982 | ||||
| 548M | 9/1/11 | 0.08 | 547,924 | ||||
| 300M | 9/20/11 | 0.11 | 299,926 | ||||
| Total Value of U.S. Government Agency Obligations (cost $4,757,830) | 4,757,830 | ||||||
| CORPORATE NOTES—33.0% | |||||||
| 500M | Abbott Laboratories, 8/23/11 (a) | 0.12 | 499,912 | ||||
| 550M | Johnson & Johnson, 8/10/11 (a) | 0.20 | 549,878 | ||||
| 400M | Medtronic, Inc., 9/13/11 (a) | 0.12 | 399,901 | ||||
| 400M | National Rural Utilities Cooperative | ||||||
| Finance Corp., 8/16/11 | 0.11 | 399,944 | |||||
| 500M | Novartis Securities Investment, Ltd., 11/14/11 (a) | 0.17 | 499,679 | ||||
| 450M | PepsiCo, Inc., 8/11/11 (a) | 0.10 | 449,949 | ||||
| 500M | Walt Disney Co., 7/14/11 (a) | 0.15 | 499,973 | ||||
| Total Value of Corporate Notes (cost $3,299,236) | 3,299,236 | ||||||
| VARIABLE AND FLOATING RATE NOTES—16.0% | |||||||
| 400M | Federal Farm Credit Bank, 9/20/11 | 0.12 | 400,000 | ||||
| 300M | Freddie Mac, 11/9/11 | 0.06 | 299,940 | ||||
| 400M | Mississippi Business Finance Corp. | ||||||
| (Chevron USA, Inc.), 12/1/30 | 0.03 | 400,000 | |||||
| Valdez, Alaska Marine Terminal Rev.: | |||||||
| 300M | Exxon Pipeline Co., Project B 12/1/33 | 0.02 | 300,000 | ||||
| 200M | Exxon Pipeline Co., Project C 12/1/33 | 0.02 | 200,000 | ||||
| Total Value of Variable and Floating Rate Notes (cost $1,599,940) | 1,599,940 | ||||||
| 11 |
Portfolio of Investments (continued)
CASH MANAGEMENT FUND
June 30, 2011
| Principal | Interest | ||||||
| Amount | Security | Rate | * | Value | |||
| SHORT-TERM U.S. GOVERNMENT | |||||||
| OBLIGATIONS—5.0% | |||||||
| $500M | U.S. Treasury Bills, 9/15/11 (cost $499,905) | 0.09 | % | $ 499,905 | |||
| Total Value of Investments (cost $10,156,911)** | 101.5 | % | 10,156,911 | ||||
| Excess of Liabilities Over Other Assets | (1.5 | ) | (148,935) | ||||
| Net Assets | 100.0 | % | $10,007,976 | ||||
| * | The interest rates shown are the effective rates at the time of purchase by the Fund. The interest |
| rates shown on variable and floating rate notes are adjusted periodically; the rates shown are the | |
| rates in effect at June 30, 2011. | |
| ** | Aggregate cost for federal income tax purposes is the same. |
| (a) | Security exempt from registration under Section 4(2) of the Securities Act of 1933 (see Note 5). |
| 12 |
Accounting Standards Codification (“ASC”) 820 established a three-tier hierarchy of inputs to establish a classification of fair value measurements for disclosure purposes. The three-tier hierarchy of inputs is summarized in the three broad Levels listed below:
| Level 1 — Unadjusted quoted prices in active markets for identical securities that the Fund has the ability to access. |
| Level 2 — Observable inputs other than quoted prices included in Level 1 that are observable for the asset or liability, either directly or indirectly. These inputs may include quoted prices for the identical instrument on an inactive market, prices for similar instruments, interest rates, prepayment speeds, credit risk, yield curves, default rates and similar data. |
| Level 3 — Unobservable inputs for the asset or liability, to the extent relevant observable inputs are not available, representing the Fund’s own assumption about the assumptions a market participant would use in valuing the asset or liability, and would be based on the best information available. |
The inputs methodology used for valuing securities are not necessarily an indication of the risk associated with investing in those securities.
The following is a summary, by category of Level, of inputs used to value the Fund’s investments as of June 30, 2011:
| Level 1 | Level 2 | Level 3 | Total | |||||||||
| U.S. Government Agency | ||||||||||||
| Obligations | $ | — | $ | 4,757,830 | $ | — | $ | 4,757,830 | ||||
| Corporate Notes | — | 3,299,236 | — | 3,299,236 | ||||||||
| Variable and Floating Rate Notes: | ||||||||||||
| Municipal Bonds | — | 900,000 | — | 900,000 | ||||||||
| U.S. Government Agency | ||||||||||||
| Obligations | — | 699,940 | — | 699,940 | ||||||||
| Short-Term U.S. Government | ||||||||||||
| Obligations | — | 499,905 | — | 499,905 | ||||||||
| Total Investments in Securities | $ | — | $ | 10,156,911 | $ | — | $ | 10,156,911 |
There were no transfers into or from Level 1 and Level 2 by the Fund during the period ended June 30, 2011.
| See notes to financial statements | 13 |
Fund Expenses (unaudited)
DISCOVERY FUND
The examples below show the ongoing costs (in dollars) of investing in your Fund and will help you in comparing these costs with costs of other mutual funds. Please refer to page 3 for a detailed explanation of the information presented in these examples.
| Beginning | Ending | ||
| Account | Account | Expenses Paid | |
| Value | Value | During Period | |
| (1/1/11) | (6/30/11) | (1/1/11–6/30/11)* | |
| Expense Examples | |||
| Actual | $1,000.00 | $1,071.41 | $4.21 |
| Hypothetical | |||
| (5% annual return before expenses) | $1,000.00 | $1,020.72 | $4.11 |
| * | Expenses are equal to the annualized expense ratio of .82%, multiplied by the average account |
| value over the period, multiplied by 181/365 (to reflect the one-half year period). |
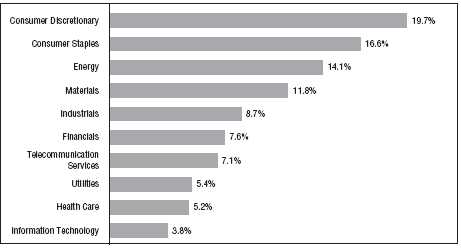
Portfolio Composition
TOP TEN SECTORS
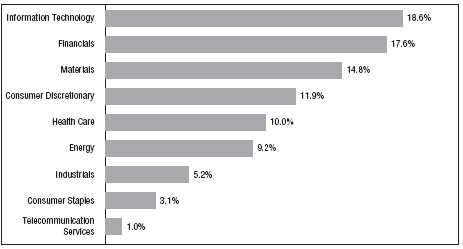
Portfolio holdings and allocations are subject to change. Percentages are as of June 30, 2011, and are based on the total value of investments.
| 14 |
Portfolio of Investments
DISCOVERY FUND
June 30, 2011
| Shares | Security | Value | ||
| COMMON STOCKS—91.3% | ||||
| Consumer Discretionary—11.9% | ||||
| 221,800 | American Eagle Outfitters, Inc. | $ 2,827,950 | ||
| 70,900 | * | Big Lots, Inc. | 2,350,335 | |
| 103,400 | * | Career Education Corporation | 2,186,910 | |
| 126,600 | Express, Inc. | 2,759,880 | ||
| 53,100 | Foot Locker, Inc. | 1,261,656 | ||
| 60,500 | Men’s Wearhouse, Inc. | 2,038,850 | ||
| 48,700 | Phillips Van-Heusen Corporation | 3,188,389 | ||
| 200,800 | Regal Entertainment Group – Class “A” | 2,477,872 | ||
| 19,091,842 | ||||
| Consumer Staples—3.1% | ||||
| 25,900 | Cal-Maine Foods, Inc. | 827,764 | ||
| 172,300 | * | Dole Food Company, Inc. | 2,329,496 | |
| 22,700 | J. M. Smucker Company | 1,735,188 | ||
| 4,892,448 | ||||
| Energy—9.2% | ||||
| 49,800 | * | Carrizo Oil & Gas, Inc. | 2,079,150 | |
| 134,400 | EXCO Resources, Inc. | 2,372,160 | ||
| 153,700 | * | Matrix Service Company | 2,056,506 | |
| 204,800 | * | PetroQuest Energy, Inc. | 1,437,696 | |
| 72,500 | * | Plains Exploration & Production Company | 2,763,700 | |
| 69,700 | * | Resolute Energy Corporation | 1,126,352 | |
| 113,800 | * | Venoco, Inc. | 1,449,812 | |
| 26,800 | * | Whiting Petroleum Corporation | 1,525,188 | |
| 14,810,564 | ||||
| Financials—17.6% | ||||
| 7,652 | * | Alleghany Corporation | 2,548,958 | |
| 62,800 | American Financial Group, Inc. | 2,241,332 | ||
| 418,200 | Anworth Mortgage Asset Corporation (REIT) | 3,140,682 | ||
| 231,300 | Capitol Federal Financial, Inc. | 2,720,088 | ||
| 70,500 | * | EZCORP, Inc. – Class “A” | 2,508,037 | |
| 43,400 | Harleysville Group, Inc. | 1,352,778 | ||
| 112,200 | Invesco Mortgage Capital, Inc. (REIT) | 2,370,786 | ||
| 91,700 | Jefferies Group, Inc. | 1,870,680 | ||
| 283,600 | * | Knight Capital Group, Inc. – Class “A” | 3,125,272 | |
| 15 |
Portfolio of Investments (continued)
DISCOVERY FUND
June 30, 2011
| Shares | Security | Value | ||
| Financials (continued) | ||||
| 3,400 | * | Markel Corporation | $ 1,349,154 | |
| 317,100 | MFA Financial, Inc. (REIT) | 2,549,484 | ||
| 36,100 | Mid-America Apartment Communities, Inc. (REIT) | 2,435,667 | ||
| 28,212,918 | ||||
| Health Care—10.0% | ||||
| 27,500 | * | AMERIGROUP Corporation | 1,937,925 | |
| 48,300 | * | Endo Pharmaceuticals Holdings, Inc. | 1,940,211 | |
| 30,100 | * | Life Technologies Corporation | 1,567,307 | |
| 57,300 | * | Magellan Health Services, Inc. | 3,136,602 | |
| 31,900 | * | MEDNAX, Inc. | 2,302,861 | |
| 126,800 | * | Myriad Genetics, Inc. | 2,879,628 | |
| 85,500 | PerkinElmer, Inc. | 2,300,805 | ||
| 16,065,339 | ||||
| Industrials—5.2% | ||||
| 30,700 | Alliant Techsystems, Inc. | 2,189,831 | ||
| 90,400 | * | EMCOR Group, Inc. | 2,649,624 | |
| 44,900 | * | FTI Consulting, Inc. | 1,703,506 | |
| 11,300 | Precision Castparts Corporation | 1,860,545 | ||
| 8,403,506 | ||||
| Information Technology—18.5% | ||||
| 386,700 | * | Brightpoint, Inc. | 3,136,137 | |
| 195,500 | * | Compuware Corporation | 1,908,080 | |
| 237,500 | * | Convergys Corporation | 3,239,500 | |
| 67,000 | * | Cymer, Inc. | 3,317,170 | |
| 53,500 | * | Diodes, Inc. | 1,396,350 | |
| 82,500 | * | IAC/InterActiveCorp | 3,149,025 | |
| 139,600 | * | Kulicke and Soffa Industries, Inc. | 1,555,144 | |
| 121,500 | Lender Processing Services, Inc. | 2,540,565 | ||
| 124,300 | * | Microsemi Corporation | 2,548,150 | |
| 222,400 | * | QLogic Corporation | 3,540,608 | |
| 228,300 | * | Vishay Intertechnology, Inc. | 3,433,632 | |
| 29,764,361 | ||||
| Materials—14.8% | ||||
| 48,100 | AptarGroup, Inc. | 2,517,554 | ||
| 138,200 | * | Chemtura Corporation | 2,515,240 | |
| 9,200 | Compass Minerals International, Inc. | 791,844 | ||
| 16 |
| Shares or | |||||||
| Principal | |||||||
| Amount | Security | Value | |||||
| Materials (continued) | |||||||
| 43,800 | * | Innospec, Inc. | $ 1,472,118 | ||||
| 115,000 | Olin Corporation | 2,605,900 | |||||
| 44,360 | Rock-Tenn Company – Class “A” | 2,942,842 | |||||
| 43,000 | Royal Gold, Inc. | 2,518,510 | |||||
| 42,000 | Schnitzer Steel Industries, Inc. – Class “A” | 2,419,200 | |||||
| 92,400 | Sensient Technologies Corporation | 3,425,268 | |||||
| 47,600 | Westlake Chemical Corporation | 2,470,440 | |||||
| 23,678,916 | |||||||
| Telecommunication Services—1.0% | |||||||
| 193,800 | * | Premiere Global Services, Inc. | 1,546,524 | ||||
| Total Value of Common Stocks (cost $114,652,643) | 146,466,418 | ||||||
| SHORT-TERM INVESTMENTS—8.5% | |||||||
| Money Market Fund | |||||||
| $13,705M | First Investors Cash Reserve Fund, .04% (cost $13,705,000)** | 13,705,000 | |||||
| Total Value of Investments (cost $128,357,643) | 99.8 | % | 160,171,418 | ||||
| Other Assets, Less Liabilities | .2 | 306,158 | |||||
| Net Assets | 100.0 | % | $160,477,576 | ||||
| * | Non-income producing |
| ** | Affiliated unregistered money market fund available only to First Investors funds and certain |
| accounts managed by First Investors Management Company, Inc. Rate shown is the 7-day yield at | |
| June 30, 2011 (see Note 3). |
| Summary of Abbreviations: | |||
| REIT | Real Estate Investment Trust | ||
| 17 |
Portfolio of Investments (continued)
DISCOVERY FUND
June 30, 2011
Accounting Standards Codification (“ASC”) 820 established a three-tier hierarchy of inputs to establish a classification of fair value measurements for disclosure purposes. The three-tier hierarchy of inputs is summarized in the three broad Levels listed below:
| Level 1 — Unadjusted quoted prices in active markets for identical securities that the Fund has the ability to access. |
| Level 2 — Observable inputs other than quoted prices included in Level 1 that are observable for the asset or liability, either directly or indirectly. These inputs may include quoted prices for the identical instrument on an inactive market, prices for similar instruments, interest rates, prepayment speeds, credit risk, yield curves, default rates and similar data. |
| Level 3 — Unobservable inputs for the asset or liability, to the extent relevant observable inputs are not available, representing the Fund’s own assumption about the assumptions a market participant would use in valuing the asset or liability, and would be based on the best information available. |
The inputs methodology used for valuing securities are not necessarily an indication of the risk associated with investing in those securities.
The following is a summary, by category of Level, of inputs used to value the Fund’s investments as of June 30, 2011:
| Level 1 | Level 2 | Level 3 | Total | |||||||||
| Common Stocks | $ | 146,466,418 | $ | — | $ | — | $ | 146,466,418 | ||||
| Money Market Fund | 13,705,000 | — | — | 13,705,000 | ||||||||
| Total Investments in Securities* | $ | 160,171,418 | $ | — | $ | — | $ | 160,171,418 |
| * | The Portfolio of Investments provides information on the industry categorization for the portfolio. |
| There were no transfers into or from Level 1 and Level 2 by the Fund during the period ended | |
| June 30, 2011. |
| 18 | See notes to financial statements |
Fund Expenses (unaudited)
GOVERNMENT FUND
The examples below show the ongoing costs (in dollars) of investing in your Fund and will help you in comparing these costs with costs of other mutual funds. Please refer to page 3 for a detailed explanation of the information presented in these examples.
| Beginning | Ending | ||
| Account | Account | Expenses Paid | |
| Value | Value | During Period | |
| (1/1/11) | (6/30/11) | (1/1/11–6/30/11)* | |
| Expense Examples | |||
| Actual | $1,000.00 | $1,023.05 | $4.46 |
| Hypothetical | |||
| (5% annual return before expenses) | $1,000.00 | $1,020.38 | $4.46 |
| * | Expenses are equal to the annualized expense ratio of .89%, multiplied by the average account |
| value over the period, multiplied by 181/365 (to reflect the one-half year period). Expenses paid | |
| during the period are net of expenses waived. |
Portfolio Composition
BY SECTOR
Portfolio holdings and allocations are subject to change. Percentages are as of June 30, 2011, and are based on the total value of investments.
| 19 |
Portfolio of Investments
GOVERNMENT FUND
June 30, 2011
| Principal | ||||
| Amount | Security | Value | ||
| RESIDENTIAL MORTGAGE-BACKED | ||||
| SECURITIES—66.3% | ||||
| Fannie Mae—9.7% | ||||
| $2,068M | 5.5%, 9/1/2033 – 10/1/2039 | $ 2,256,118 | ||
| 206M | 9%, 11/1/2026 | 243,928 | ||
| 153M | 11%, 10/1/2015 | 178,121 | ||
| 2,678,167 | ||||
| Freddie Mac—3.2% | ||||
| 803M | 5.5%, 1/1/2040 | 868,349 | ||
| Government National Mortgage Association I | ||||
| Program—53.4% | ||||
| 1,472M | 4%, 10/15/2040 – 12/15/2040 | 1,502,669 | ||
| 4,064M | 4.5%, 6/15/2039 – 8/15/2040 | 4,301,666 | ||
| 5,204M | 5%, 6/15/2033 – 6/15/2040 | 5,666,273 | ||
| 2,387M | 5.5%, 2/15/2033 – 4/15/2039 | 2,647,084 | ||
| 297M | 6%, 11/15/2032 – 4/15/2036 | 333,746 | ||
| 282M | 6.5%, 8/15/2032 | 321,749 | ||
| 14,773,187 | ||||
| Total Value of Residential Mortgage-Backed Securities (cost $17,713,234) | 18,319,703 | |||
| U.S. GOVERNMENT AGENCY | ||||
| OBLIGATIONS—20.6% | ||||
| Fannie Mae: | ||||
| 1,000M | 1.625%, 2015 | 996,719 | ||
| 500M | 5%, 2031 | 506,342 | ||
| Federal Farm Credit Bank: | ||||
| 1,000M | 1.75%, 2013 | 1,020,035 | ||
| 1,000M | 2.6%, 2016 | 1,013,923 | ||
| 1,000M | Freddie Mac, 3%, 2014 | 1,059,094 | ||
| 1,000M | Tennessee Valley Authority, 4.5%, 2018 | 1,108,643 | ||
| Total Value of U.S. Government Agency Obligations (cost $5,585,246) | 5,704,756 | |||
| U.S. GOVERNMENT FDIC GUARANTEED | ||||
| DEBT—6.5% | ||||
| 750M | Bank of America Corp, 3.125%, 2012 | 770,686 | ||
| 1,000M | JPMorgan Chase & Co., 2.125%, 2012 | 1,024,403 | ||
| Total Value of U.S. Government FDIC Guaranteed Debt (cost $1,778,613) | 1,795,089 | |||
| 20 |
| Principal | |||||||
| Amount | Security | Value | |||||
| U.S. GOVERNMENT OBLIGATIONS—6.0% | |||||||
| $ 551M | FDA Queens LP, 6.99%, 2017* | $ 619,340 | |||||
| 1,000M | U.S. Treasury Note, 2.375%, 2015 | 1,044,846 | |||||
| Total Value of U.S. Government Obligations (cost $1,625,194) | 1,664,186 | ||||||
| Total Value of Investments (cost $26,702,287) | 99.4 | % | 27,483,734 | ||||
| Other Assets, Less Liabilities | .6 | 162,553 | |||||
| Net Assets | 100.0 | % | $27,646,287 | ||||
| * | Security exempt from registration under Rule 144A of Securities Act of 1933 (see Note 5). |
Accounting Standards Codification (“ASC”) 820 established a three-tier hierarchy of inputs to establish a classification of fair value measurements for disclosure purposes. The three-tier hierarchy of inputs is summarized in the three broad Levels listed below:
| Level 1 — Unadjusted quoted prices in active markets for identical securities that the Fund has the ability to access. |
| Level 2 — Observable inputs other than quoted prices included in Level 1 that are observable for the asset or liability, either directly or indirectly. These inputs may include quoted prices for the identical instrument on an inactive market, prices for similar instruments, interest rates, prepayment speeds, credit risk, yield curves, default rates and similar data. |
| Level 3 — Unobservable inputs for the asset or liability, to the extent relevant observable inputs are not available, representing the Fund’s own assumption about the assumptions a market participant would use in valuing the asset or liability, and would be based on the best information available. |
The inputs methodology used for valuing securities are not necessarily an indication of the risk associated with investing in those securities.
The following is a summary, by category of Level, of inputs used to value the Fund’s investments as of June 30, 2011:
| Level 1 | Level 2 | Level 3 | Total | |||||||||
| Residential Mortgage-Backed | ||||||||||||
| Securities | $ | — | $ | 18,319,703 | $ | — | $ | 18,319,703 | ||||
| U.S. Government Agency | ||||||||||||
| Obligations | — | 5,704,756 | — | 5,704,756 | ||||||||
| U.S. Government FDIC | ||||||||||||
| Guaranteed Debt | — | 1,795,089 | — | 1,795,089 | ||||||||
| U.S. Government Obligations | — | 1,664,186 | — | 1,664,186 | ||||||||
| Total Investments in Securities | $ | — | $ | 27,483,734 | $ | — | $ | 27,483,734 |
There were no transfers into or from Level 1 and Level 2 by the Fund during the period ended June 30, 2011.
| See notes to financial statements | 21 |
Fund Expenses (unaudited)
GROWTH & INCOME FUND
The examples below show the ongoing costs (in dollars) of investing in your Fund and will help you in comparing these costs with costs of other mutual funds. Please refer to page 3 for a detailed explanation of the information presented in these examples.
| Beginning | Ending | ||
| Account | Account | Expenses Paid | |
| Value | Value | During Period | |
| (1/1/11) | (6/30/11) | (1/1/11–6/30/11)* | |
| Expense Examples | |||
| Actual | $1,000.00 | $1,090.70 | $4.25 |
| Hypothetical | |||
| (5% annual return before expenses) | $1,000.00 | $1,020.72 | $4.11 |
| * | Expenses are equal to the annualized expense ratio of .82%, multiplied by the average account |
| value over the period, multiplied by 181/365 (to reflect the one-half year period). |
Portfolio Composition
TOP TEN SECTORS
Portfolio holdings and allocations are subject to change. Percentages are as of June 30, 2011, and are based on the total value of investments.
| 22 |
Portfolio of Investments
GROWTH & INCOME FUND
June 30, 2011
| Shares | Security | Value | ||
| COMMON STOCKS—99.8% | ||||
| Consumer Discretionary—15.3% | ||||
| 56,600 | American Greetings Corporation – Class “A” | $ 1,360,664 | ||
| 61,000 | Best Buy Company, Inc. | 1,916,010 | ||
| 25,800 | * | BorgWarner, Inc. | 2,084,382 | |
| 49,055 | Brown Shoe Company, Inc. | 522,436 | ||
| 94,185 | CBS Corporation – Class “B” | 2,683,331 | ||
| 20,861 | CEC Entertainment, Inc. | 836,735 | ||
| 20,064 | Coach, Inc. | 1,282,692 | ||
| 45,600 | * | GameStop Corporation – Class “A” | 1,216,152 | |
| 43,600 | * | GNC Acquisition Holdings, Inc. | 950,916 | |
| 45,800 | Home Depot, Inc. | 1,658,876 | ||
| 50,600 | Limited Brands, Inc. | 1,945,570 | ||
| 20,500 | Lincoln Educational Services Corporation | 351,575 | ||
| 24,300 | McDonald’s Corporation | 2,048,976 | ||
| 121,800 | * | Morgans Hotel Group Company | 875,742 | |
| 80,843 | Newell Rubbermaid, Inc. | 1,275,703 | ||
| 7,100 | NIKE, Inc. – Class “B” | 638,858 | ||
| 12,200 | Oxford Industries, Inc. | 411,872 | ||
| 195,100 | * | Pier 1 Imports, Inc. | 2,257,307 | |
| 85,645 | * | Ruby Tuesday, Inc. | 923,253 | |
| 38,498 | * | Steiner Leisure, Ltd. | 1,758,589 | |
| 180,870 | Stewart Enterprises, Inc. – Class “A” | 1,320,351 | ||
| 31,400 | * | TRW Automotive Holdings Corporation | 1,853,542 | |
| 22,400 | Tupperware Brands Corporation | 1,510,880 | ||
| 67,183 | Wyndham Worldwide Corporation | 2,260,708 | ||
| 33,945,120 | ||||
| Consumer Staples—9.7% | ||||
| 116,100 | Altria Group, Inc. | 3,066,201 | ||
| 50,900 | Avon Products, Inc. | 1,425,200 | ||
| 35,789 | Coca-Cola Company | 2,408,242 | ||
| 41,700 | CVS Caremark Corporation | 1,567,086 | ||
| 22,800 | McCormick & Company, Inc. | 1,130,196 | ||
| 41,827 | Nu Skin Enterprises, Inc. – Class “A” | 1,570,604 | ||
| 21,600 | PepsiCo, Inc. | 1,521,288 | ||
| 59,800 | Philip Morris International, Inc. | 3,992,846 | ||
| 19,713 | Procter & Gamble Company | 1,253,155 | ||
| 39,400 | Walgreen Company | 1,672,924 | ||
| 37,064 | Wal-Mart Stores, Inc. | 1,969,581 | ||
| 21,577,323 | ||||
| 23 |
Portfolio of Investments (continued)
GROWTH & INCOME FUND
June 30, 2011
| Shares | Security | Value | ||
| Energy—9.2% | ||||
| 20,900 | Anadarko Petroleum Corporation | $ 1,604,284 | ||
| 12,400 | Chevron Corporation | 1,275,216 | ||
| 31,518 | ConocoPhillips | 2,369,838 | ||
| 42,000 | Ensco, PLC (ADR) | 2,238,600 | ||
| 38,611 | ExxonMobil Corporation | 3,142,163 | ||
| 52,922 | Marathon Oil Corporation | 2,787,931 | ||
| 57,600 | Noble Corporation | 2,270,016 | ||
| 16,994 | Sasol, Ltd. (ADR) | 898,813 | ||
| 8,000 | Schlumberger, Ltd. | 691,200 | ||
| 67,507 | Suncor Energy, Inc. | 2,639,524 | ||
| 7,500 | Transocean, Ltd. | 484,200 | ||
| 20,401,785 | ||||
| Financials—12.1% | ||||
| 35,306 | American Express Company | 1,825,320 | ||
| 35,500 | Ameriprise Financial, Inc. | 2,047,640 | ||
| 114,800 | Brookline Bancorp, Inc. | 1,064,196 | ||
| 18,405 | Capital One Financial Corporation | 950,986 | ||
| 42,743 | Discover Financial Services | 1,143,375 | ||
| 80,200 | Financial Select Sector SPDR Fund (ETF) | 1,229,466 | ||
| 82,170 | First Niagara Financial Group, Inc. | 1,084,644 | ||
| 85,500 | FirstMerit Corporation | 1,411,605 | ||
| 11,600 | IBERIABANK Corporation | 668,624 | ||
| 37,100 | Invesco, Ltd. | 868,140 | ||
| 61,856 | JPMorgan Chase & Company | 2,532,385 | ||
| 19,500 | M&T Bank Corporation | 1,715,025 | ||
| 45,313 | Morgan Stanley | 1,042,652 | ||
| 133,600 | New York Community Bancorp, Inc. | 2,002,664 | ||
| 33,300 | PNC Financial Services Group, Inc. | 1,985,013 | ||
| 54,800 | SPDR KBW Regional Banking (ETF) | 1,394,660 | ||
| 103,279 | * | Sunstone Hotel Investors, Inc. (REIT) | 957,396 | |
| 29,688 | U.S. Bancorp | 757,341 | ||
| 68,600 | Urstadt Biddle Properties – Class “A” (REIT) | 1,242,346 | ||
| 31,367 | Wells Fargo & Company | 880,158 | ||
| 26,803,636 | ||||
| Health Care—9.5% | ||||
| 44,100 | Abbott Laboratories | 2,320,542 | ||
| 13,446 | * | Amgen, Inc. | 784,574 | |
| 15,730 | Baxter International, Inc. | 938,924 | ||
| 33,900 | * | Gilead Sciences, Inc. | 1,403,799 | |
| 24 |
| Shares | Security | Value | ||
| Health Care (continued) | ||||
| 34,100 | Hill-Rom Holdings, Inc. | $ 1,569,964 | ||
| 48,375 | Johnson & Johnson | 3,217,905 | ||
| 22,800 | Medtronic, Inc. | 878,484 | ||
| 51,543 | Merck & Company, Inc. | 1,818,952 | ||
| 138,482 | Pfizer, Inc. | 2,852,729 | ||
| 34,953 | Sanofi-Aventis (ADR) | 1,404,062 | ||
| 18,500 | St. Jude Medical, Inc. | 882,080 | ||
| 47,443 | * | Thermo Fisher Scientific, Inc. | 3,054,855 | |
| 21,126,870 | ||||
| Industrials—18.5% | ||||
| 31,394 | 3M Company | 2,977,721 | ||
| 39,895 | * | Altra Holdings, Inc. | 957,081 | |
| 36,100 | Armstrong World Industries, Inc. | 1,644,716 | ||
| 21,300 | Caterpillar, Inc. | 2,267,598 | ||
| 50,137 | Chicago Bridge & Iron Company NV – NY Shares | 1,950,329 | ||
| 25,000 | * | Esterline Technologies Corporation | 1,910,000 | |
| 14,700 | * | Generac Holdings, Inc. | 285,180 | |
| 36,796 | General Electric Company | 693,973 | ||
| 21,535 | Goodrich Corporation | 2,056,592 | ||
| 38,640 | Honeywell International, Inc. | 2,302,558 | ||
| 39,153 | IDEX Corporation | 1,795,165 | ||
| 15,700 | Lockheed Martin Corporation | 1,271,229 | ||
| 48,119 | * | Mobile Mini, Inc. | 1,019,642 | |
| 17,118 | Northrop Grumman Corporation | 1,187,133 | ||
| 24,800 | Parker Hannifin Corporation | 2,225,552 | ||
| 57,768 | * | PGT, Inc. | 104,560 | |
| 21,400 | Raytheon Company | 1,066,790 | ||
| 23,450 | Republic Services, Inc. | 723,433 | ||
| 36,000 | Snap-on, Inc. | 2,249,280 | ||
| 125,100 | TAL International Group, Inc. | 4,319,703 | ||
| 48,500 | Textainer Group Holdings, Ltd. | 1,490,890 | ||
| 42,300 | * | Thermon Group Holdings, Inc. | 507,600 | |
| 74,868 | Tyco International, Ltd. | 3,700,725 | ||
| 28,700 | United Technologies Corporation | 2,540,237 | ||
| 41,247,687 | ||||
| Information Technology—17.2% | ||||
| 56,900 | Avago Technologies, Ltd. | 2,162,200 | ||
| 174,900 | * | Brocade Communications Systems, Inc. | 1,129,854 | |
| 21,300 | * | CACI International, Inc. – Class “A” | 1,343,604 | |
| 25 |
Portfolio of Investments (continued)
GROWTH & INCOME FUND
June 30, 2011
| Shares | Security | Value | ||
| Information Technology (continued) | ||||
| 12,100 | * | Checkpoint Systems, Inc. | $ 216,348 | |
| 85,600 | Cisco Systems, Inc. | 1,336,216 | ||
| 100,000 | * | EMC Corporation | 2,755,000 | |
| 49,240 | Hewlett-Packard Company | 1,792,336 | ||
| 85,952 | Intel Corporation | 1,904,696 | ||
| 30,729 | International Business Machines Corporation | 5,271,560 | ||
| 65,800 | Intersil Corporation – Class “A” | 845,530 | ||
| 126,800 | Microsoft Corporation | 3,296,800 | ||
| 44,800 | National Semiconductor Corporation | 1,102,528 | ||
| 53,825 | * | NCI, Inc. – Class “A” | 1,222,904 | |
| 126,500 | * | NCR Corporation | 2,389,585 | |
| 68,355 | * | Parametric Technology Corporation | 1,567,380 | |
| 59,788 | QUALCOMM, Inc. | 3,395,361 | ||
| 71,160 | * | Symantec Corporation | 1,403,275 | |
| 57,400 | TE Connectivity, Ltd. | 2,110,024 | ||
| 15,100 | * | Varian Semiconductor Equipment Associates, Inc. | 927,744 | |
| 103,200 | Western Union Company | 2,067,096 | ||
| 38,240,041 | ||||
| Materials—6.1% | ||||
| 60,133 | Buckeye Technologies, Inc. | 1,622,388 | ||
| 39,600 | Celanese Corporation – Series “A” | 2,111,076 | ||
| 45,340 | Freeport-McMoRan Copper & Gold, Inc. | 2,398,486 | ||
| 64,200 | Kronos Worldwide, Inc. | 2,019,090 | ||
| 11,600 | Praxair, Inc. | 1,257,324 | ||
| 68,320 | RPM International, Inc. | 1,572,726 | ||
| 85,464 | Temple-Inland, Inc. | 2,541,699 | ||
| 13,522,789 | ||||
| Telecommunication Services—2.0% | ||||
| 64,083 | AT&T, Inc. | 2,012,847 | ||
| 63,200 | Verizon Communications, Inc. | 2,352,936 | ||
| 4,365,783 | ||||
| 26 |
| Shares | Security | Value | |||||
| Utilities—.2% | |||||||
| 12,026 | Atmos Energy Corporation | $ 399,864 | |||||
| Total Value of Common Stocks (cost $179,356,966) | 99.8 | % | 221,630,898 | ||||
| Other Assets, Less Liabilities | .2 | 473,097 | |||||
| Net Assets | 100.0 | % | $222,103,995 | ||||
| * | Non-income producing |
| Summary of Abbreviations: | |||
| ADR | American Depositary Receipts | ||
| ETF | Exchange Traded Fund | ||
| REIT | Real Estate Investment Trust | ||
Accounting Standards Codification (“ASC”) 820 established a three-tier hierarchy of inputs to establish a classification of fair value measurements for disclosure purposes. The three-tier hierarchy of inputs is summarized in the three broad Levels listed below:
| Level 1 — Unadjusted quoted prices in active markets for identical securities that the Fund has the ability to access. |
| Level 2 — Observable inputs other than quoted prices included in Level 1 that are observable for the asset or liability, either directly or indirectly. These inputs may include quoted prices for the identical instrument on an inactive market, prices for similar instruments, interest rates, prepayment speeds, credit risk, yield curves, default rates and similar data. |
| Level 3 — Unobservable inputs for the asset or liability, to the extent relevant observable inputs are not available, representing the Fund’s own assumption about the assumptions a market participant would use in valuing the asset or liability, and would be based on the best information available. |
The inputs methodology used for valuing securities are not necessarily an indication of the risk associated with investing in those securities.
The following is a summary, by category of Level, of inputs used to value the Fund’s investments as of June 30, 2011:
| Level 1 | Level 2 | Level 3 | Total | |||||||||
| Common Stocks** | $ | 221,630,898 | $ | — | $ | — | $ | 221,630,898 |
| ** | The Portfolio of Investments provides information on the industry categorization for the portfolio. |
| There were no transfers into or from Level 1 and Level 2 by the Fund during the period ended | |
| June 30, 2011. |
| See notes to financial statements | 27 |
Fund Expenses (unaudited)
HIGH YIELD FUND
The examples below show the ongoing costs (in dollars) of investing in your Fund and will help you in comparing these costs with costs of other mutual funds. Please refer to page 3 for a detailed explanation of the information presented in these examples.
| Beginning | Ending | ||
| Account | Account | Expenses Paid | |
| Value | Value | During Period | |
| (1/1/11) | (6/30/11) | (1/1/11–6/30/11)* | |
| Expense Examples | |||
| Actual | $1,000.00 | $1,041.75 | $4.56 |
| Hypothetical | |||
| (5% annual return before expenses) | $1,000.00 | $1,020.33 | $4.51 |
| * | Expenses are equal to the annualized expense ratio of .90%, multiplied by the average account |
| value over the period, multiplied by 181/365 (to reflect the one-half year period). |
Portfolio Composition
TOP TEN SECTORS
Portfolio holdings and allocations are subject to change. Percentages are as of June 30, 2011, and are based on the total value of investments.
| 28 |
Portfolio of Investments
HIGH YIELD FUND
June 30, 2011
| Principal | ||||
| Amount | Security | Value | ||
| CORPORATE BONDS—95.7% | ||||
| Automotive—5.0% | ||||
| $ 575M | Chrysler Group, LLC/CG Co. – Issuer, Inc., 8.25%, 2021 (a) | $ 566,375 | ||
| 425M | Cooper Tire & Rubber Co., 8%, 2019 | 448,375 | ||
| 300M | Cooper-Standard Automotive, Inc., 8.5%, 2018 | 318,000 | ||
| 500M | Exide Technologies, 8.625%, 2018 (a) | 522,500 | ||
| 350M | Ford Motor Co., 6.625%, 2028 | 344,879 | ||
| Goodyear Tire & Rubber Co.: | ||||
| 112M | 10.5%, 2016 | 126,560 | ||
| 225M | 8.25%, 2020 | 244,125 | ||
| 450M | Hertz Corp., 6.75%, 2019 (a) | 447,750 | ||
| 325M | Jaguar Land Rover, PLC, 7.75%, 2018 (a) | 328,250 | ||
| 300M | Oshkosh Corp., 8.5%, 2020 | 326,250 | ||
| 3,673,064 | ||||
| Building Materials—3.7% | ||||
| 525M | Associated Materials, LLC, 9.125%, 2017 (a) | 525,000 | ||
| Building Materials Corp.: | ||||
| 475M | 6.875%, 2018 (a) | 486,875 | ||
| 575M | 7.5%, 2020 (a) | 608,062 | ||
| 275M | Calcipar SA, 6.875%, 2018 (a) | 277,062 | ||
| 325M | Griffon Corp., 7.125%, 2018 (a) | 327,844 | ||
| 500M | Texas Industries, Inc., 9.25%, 2020 | 486,250 | ||
| 2,711,093 | ||||
| Capital Goods—.6% | ||||
| 375M | Belden CDT, Inc., 9.25%, 2019 | 419,063 | ||
| Chemicals—4.3% | ||||
| 400M | Ferro Corp., 7.875%, 2018 | 417,000 | ||
| 225M | Huntsman International, LLC, 8.625%, 2021 | 245,813 | ||
| 225M | Kinove German Bondco GmbH, 9.625%, 2018 (a) | 235,688 | ||
| 425M | Lyondell Chemical Co., 11%, 2018 | 478,125 | ||
| 350M | Polymer Group, Inc., 7.75%, 2019 (a) | 352,625 | ||
| 175M | PolyOne Corp., 7.375%, 2020 | 183,750 | ||
| 400M | Rhodia SA, 6.875%, 2020 (a) | 470,500 | ||
| Solutia, Inc.: | ||||
| 525M | 8.75%, 2017 | 572,250 | ||
| 175M | 7.875%, 2020 | 188,125 | ||
| 3,143,876 | ||||
| 29 |
Portfolio of Investments (continued)
HIGH YIELD FUND
June 30, 2011
| Principal | ||||
| Amount | Security | Value | ||
| Consumer Durables—.7% | ||||
| $ 500M | Sealy Mattress Co., 8.25%, 2014 | $ 503,750 | ||
| Consumer Non-Durables—1.3% | ||||
| 450M | Easton-Bell Sports, Inc., 9.75%, 2016 | 498,375 | ||
| 100M | Levi Strauss & Co., 7.625%, 2020 | 100,500 | ||
| 325M | Phillips Van-Heusen Corp., 7.375%, 2020 | 349,375 | ||
| 948,250 | ||||
| Energy—13.5% | ||||
| Basic Energy Services, Inc.: | ||||
| 75M | 7.125%, 2016 | 75,375 | ||
| 325M | 7.75%, 2019 (a) | 327,437 | ||
| Berry Petroleum Co.: | ||||
| 300M | 10.25%, 2014 | 344,250 | ||
| 400M | 8.25%, 2016 | 419,000 | ||
| 275M | Chesapeake Energy Corp., 7.25%, 2018 | 301,125 | ||
| Concho Resources, Inc.: | ||||
| 325M | 8.625%, 2017 | 355,875 | ||
| 75M | 7%, 2021 | 77,812 | ||
| 175M | 6.5%, 2022 | 175,656 | ||
| Consol Energy, Inc.: | ||||
| 225M | 8%, 2017 | 246,375 | ||
| 525M | 8.25%, 2020 | 574,875 | ||
| 75M | Continental Resources, 7.125%, 2021 | 79,500 | ||
| Copano Energy, LLC: | ||||
| 75M | 7.75%, 2018 | 77,625 | ||
| 150M | 7.125%, 2021 | 148,500 | ||
| 675M | Crosstex Energy, LP, 8.875%, 2018 | 722,250 | ||
| 175M | Denbury Resources, Inc., 8.25%, 2020 | 191,625 | ||
| 100M | Encore Acquisition Co., 9.5%, 2016 | 111,625 | ||
| 550M | Expro Finance Luxembourg SCA, 8.5%, 2016 (a) | 533,500 | ||
| Ferrellgas Partners, LP: | ||||
| 475M | 9.125%, 2017 | 512,406 | ||
| 240M | 8.625%, 2020 | 254,400 | ||
| 425M | Forest Oil Corp., 7.25%, 2019 | 435,625 | ||
| 450M | Genesis Energy, LP, 7.875%, 2018 (a) | 448,875 | ||
| 275M | Helix Energy Solutions Group, Inc., 9.5%, 2016 (a) | 284,625 | ||
| Hilcorp Energy I, LP: | ||||
| 25M | 7.75%, 2015 (a) | 25,875 | ||
| 575M | 8%, 2020 (a) | 621,000 | ||
| 30 |
| Principal | ||||
| Amount | Security | Value | ||
| Energy (continued) | ||||
| Inergy, LP: | ||||
| $ 325M | 7%, 2018 | $ 329,875 | ||
| 125M | 6.875%, 2021 (a) | 125,156 | ||
| 100M | Linn Energy, LLC, 6.5%, 2019 (a) | 99,250 | ||
| 325M | Murray Energy Corp., 10.25%, 2015 (a) | 342,875 | ||
| Penn Virginia Corp.: | ||||
| 150M | 10.375%, 2016 | 166,875 | ||
| 100M | 7.25%, 2019 | 96,875 | ||
| Quicksilver Resources, Inc.: | ||||
| 125M | 8.25%, 2015 | 132,344 | ||
| 300M | 11.75%, 2016 | 345,000 | ||
| 350M | 9.125%, 2019 | 383,250 | ||
| 275M | Sandridge Energy, Inc., 7.5%, 2021 (a) | 278,781 | ||
| 225M | SESI, LLC, 6.375%, 2019 (a) | 223,312 | ||
| 75M | SM Energy Co., 6.625%, 2019 (a) | 75,375 | ||
| 9,944,179 | ||||
| Financials—4.5% | ||||
| Ally Financial, Inc.: | ||||
| 500M | 6.25%, 2017 (a) | 498,541 | ||
| 675M | 8%, 2020 | 718,875 | ||
| Ford Motor Credit Co., LLC: | ||||
| 375M | 8.7%, 2014 | 420,746 | ||
| 475M | 6.625%, 2017 | 505,578 | ||
| 100M | General Motors Financial Co., 6.75%, 2018 (a) | 100,750 | ||
| International Lease Finance Corp.: | ||||
| 625M | 8.625%, 2015 | 679,687 | ||
| 275M | 8.75%, 2017 | 301,469 | ||
| 75M | 8.25%, 2020 | 81,187 | ||
| 3,306,833 | ||||
| Food/Beverage/Tobacco—1.0% | ||||
| CF Industries, Inc.: | ||||
| 250M | 6.875%, 2018 | 284,063 | ||
| 100M | 7.125%, 2020 | 116,625 | ||
| 375M | JBS USA, LLC, 7.25%, 2021 (a) | 366,563 | ||
| 767,251 | ||||
| 31 |
Portfolio of Investments (continued)
HIGH YIELD FUND
June 30, 2011
| Principal | ||||
| Amount | Security | Value | ||
| Food/Drug—1.8% | ||||
| $ 625M | McJunkin Red Man Corp., 9.5%, 2016 (a) | $ 639,063 | ||
| 475M | NBTY, Inc., 9%, 2018 (a) | 503,500 | ||
| 200M | Tops Holding Corp./Tops Markets, LLC, 10.125%, 2015 | 213,250 | ||
| 1,355,813 | ||||
| Forest Products/Containers—2.2% | ||||
| 200M | Clearwater Paper Corp., 7.125%, 2018 | 206,000 | ||
| 225M | Exopack Holding Corp., 10%, 2018 (a) | 224,438 | ||
| 175M | JSG Funding, PLC (Smurfit Kappa Funding, PLC), 7.75%, 2015 | 177,625 | ||
| 350M | Mercer International, Inc., 9.5%, 2017 | 377,125 | ||
| 400M | Reynolds Group Escrow, LLC, 7.75%, 2016 (a) | 419,000 | ||
| 225M | Reynolds Group Issuer, Inc., 9%, 2019 (a) | 223,313 | ||
| 1,627,501 | ||||
| Gaming/Leisure—2.0% | ||||
| 250M | Ameristar Casinos, Inc., 7.5%, 2021 (a) | 259,063 | ||
| 325M | MCE Finance, Ltd., 10.25%, 2018 | 363,594 | ||
| 200M | National CineMedia, LLC, 7.875%, 2021 (a) | 203,570 | ||
| 100M | NCL Corp., Ltd., 11.75%, 2016 | 115,750 | ||
| 200M | Vail Resorts, Inc., 6.5%, 2019 (a) | 202,000 | ||
| 327M | Yonkers Racing Corp., 11.375%, 2016 (a) | 356,430 | ||
| 1,500,407 | ||||
| Health Care—5.0% | ||||
| 600M | Aviv Healthcare Properties, LP, 7.75%, 2019 (a) | 616,500 | ||
| 175M | Capella Healthcare, 9.25%, 2017 (a) | 185,500 | ||
| 425M | Community Health Systems, Inc., 8.875%, 2015 | 438,812 | ||
| 350M | ConvaTec Healthcare, 10.5%, 2018 (a) | 364,000 | ||
| DaVita, Inc.: | ||||
| 200M | 6.375%, 2018 | 203,000 | ||
| 75M | 6.625%, 2020 | 76,687 | ||
| 100M | Endo Pharmaceuticals Holdings, Inc., 7%, 2019 (a) | 103,000 | ||
| 600M | Genesis Health Ventures, Inc., 9.75%, 2005 (b)(c) | 375 | ||
| Healthsouth Corp.: | ||||
| 300M | 7.25%, 2018 | 314,250 | ||
| 150M | 7.75%, 2022 | 158,812 | ||
| 525M | IASIS Healthcare, LLC, 8.375%, 2019 (a) | 519,750 | ||
| 40M | Select Medical Corp., 7.625%, 2015 | 39,800 | ||
| 225M | Universal Hospital Services, Inc., 8.5%, 2015 (a) | 232,875 | ||
| 32 |
| Principal | ||||
| Amount | Security | Value | ||
| Health Care (continued) | ||||
| Vanguard Health Holding Co. II, LLC: | ||||
| $ 250M | 8%, 2018 | $ 259,375 | ||
| 150M | 7.75%, 2019 | 152,625 | ||
| 3,665,361 | ||||
| Information Technology—3.2% | ||||
| Brocade Communications Systems, Inc.: | ||||
| 100M | 6.625%, 2018 | 106,000 | ||
| 125M | 6.875%, 2020 | 135,312 | ||
| 550M | Equinix, Inc., 8.125%, 2018 | 601,562 | ||
| Fidelity National Information Services, Inc.: | ||||
| 175M | 7.625%, 2017 | 186,594 | ||
| 50M | 7.875%, 2020 | 53,312 | ||
| 175M | iGATE Corp., 9%, 2016 (a) | 177,625 | ||
| Jabil Circuit, Inc.: | ||||
| 50M | 7.75%, 2016 | 55,625 | ||
| 550M | 8.25%, 2018 | 631,125 | ||
| 275M | MEMC Electronic Materials, Inc., 7.75%, 2019 (a) | 272,937 | ||
| 125M | Seagate HDD Cayman, 7.75%, 2018 (a) | 131,875 | ||
| 2,351,967 | ||||
| Manufacturing—3.0% | ||||
| 325M | Amsted Industries, 8.125%, 2018 (a) | 342,875 | ||
| 515M | Case New Holland, Inc., 7.875%, 2017 (a) | 569,075 | ||
| 100M | Coleman Cable, Inc., 9%, 2018 | 105,000 | ||
| 650M | Manitowoc Co., Inc., 8.5%, 2020 | 697,125 | ||
| 325M | Park-Ohio Industries, Inc., 8.125%, 2021 (a) | 326,625 | ||
| 175M | Terex Corp., 10.875%, 2016 | 202,563 | ||
| 2,243,263 | ||||
| Media-Broadcasting—4.6% | ||||
| 375M | Allbritton Communication Co., 8%, 2018 | 383,437 | ||
| Belo Corp.: | ||||
| 575M | 7.25%, 2027 | 516,063 | ||
| 100M | 7.75%, 2027 | 94,250 | ||
| 575M | Cumulus Media, Inc., 7.75%, 2019 (a) | 557,750 | ||
| 350M | Nexstar/Mission Broadcasting, Inc., 8.875%, 2017 | 370,125 | ||
| 33 |
Portfolio of Investments (continued)
HIGH YIELD FUND
June 30, 2011
| Principal | ||||
| Amount | Security | Value | ||
| Media-Broadcasting (continued) | ||||
| Sinclair Television Group, Inc.: | ||||
| $ 575M | 9.25%, 2017 (a) | $ 633,938 | ||
| 100M | 8.375%, 2018 | 105,500 | ||
| 700M | XM Satellite Radio, Inc., 7.625%, 2018 (a) | 735,000 | ||
| 3,396,063 | ||||
| Media-Cable TV—7.0% | ||||
| 100M | AMC Networks, Inc., 7.75%, 2021 (a) | 104,750 | ||
| 550M | Cablevision Systems Corp., 8.625%, 2017 | 598,812 | ||
| CCO Holdings, LLC: | ||||
| 50M | 7%, 2019 (a) | 51,625 | ||
| 325M | 7%, 2019 | 336,375 | ||
| 350M | Cequel Communications Holdings I, Inc., 8.625%, 2017 (a) | 365,750 | ||
| Clear Channel Worldwide: | ||||
| 350M | 9.25%, 2017 Series “A” | 382,375 | ||
| 725M | 9.25%, 2017 Series “B” | 793,875 | ||
| 675M | DISH DBS Corp., 7.875%, 2019 | 731,531 | ||
| 200M | Echostar DBS Corp., 7.125%, 2016 | 212,000 | ||
| 400M | Quebecor Media, Inc., 7.75%, 2016 | 415,500 | ||
| 675M | UPC Germany GmbH, 8.125%, 2017 (a) | 720,562 | ||
| 400M | UPC Holding BV, 9.875%, 2018 (a) | 446,000 | ||
| 5,159,155 | ||||
| Media-Diversified—1.4% | ||||
| 450M | Entravision Communications Corp., 8.75%, 2017 | 468,000 | ||
| 425M | Lamar Media Corp., 7.875%, 2018 | 447,313 | ||
| 125M | NAI Entertainment Holdings, LLC, 8.25%, 2017 (a) | 134,688 | ||
| 1,050,001 | ||||
| Metals/Mining—6.8% | ||||
| 450M | AK Steel Corp., 7.625%, 2020 | 463,500 | ||
| Arch Coal, Inc.: | ||||
| 325M | 7.25%, 2020 | 332,312 | ||
| 125M | 7.25%, 2021 (a) | 125,781 | ||
| FMG Resources (August 2006) Property, Ltd.: | ||||
| 175M | 6.375%, 2016 (a) | 175,437 | ||
| 200M | 6.875%, 2018 (a) | 204,000 | ||
| 350M | JMC Steel Group, 8.25%, 2018 (a) | 357,000 | ||
| 375M | Metals USA, Inc., 11.125%, 2015 | 397,500 | ||
| 675M | Novelis, Inc., 8.375%, 2017 | 723,937 | ||
| 34 |
| Principal | ||||
| Amount | Security | Value | ||
| Metals/Mining (continued) | ||||
| $ 250M | Thompson Creek Metals Co., Inc., 7.375%, 2018 (a) | $ 246,250 | ||
| United States Steel Corp.: | ||||
| 125M | 7%, 2018 | 126,875 | ||
| 750M | 7.375%, 2020 | 774,375 | ||
| 325M | Vedanta Resources, PLC, 9.5%, 2018 (a) | 355,875 | ||
| Vulcan Materials Co.: | ||||
| 225M | 6.5%, 2016 | 223,866 | ||
| 100M | 6.4%, 2017 | 97,731 | ||
| 175M | 7%, 2018 | 173,262 | ||
| 225M | 7.5%, 2021 | 225,091 | ||
| 5,002,792 | ||||
| Real Estate Investment Trusts—2.0% | ||||
| CB Richard Ellis Service: | ||||
| 400M | 11.625%, 2017 | 465,500 | ||
| 125M | 6.625%, 2020 | 129,063 | ||
| Developers Diversified Realty Corp.: | ||||
| 100M | 9.625%, 2016 | 120,780 | ||
| 100M | 7.875%, 2020 | 114,848 | ||
| 375M | Dupont Fabros Technology, LP, 8.5%, 2017 | 411,563 | ||
| Omega Healthcare Investors, Inc.: | ||||
| 125M | 7.5%, 2020 | 133,125 | ||
| 125M | 6.75%, 2022 (a) | 123,906 | ||
| 1,498,785 | ||||
| Retail-General Merchandise—4.8% | ||||
| 600M | DineEquity, Inc., 9.5%, 2018 (a) | 654,000 | ||
| 325M | J.C. Penney Corp., Inc., 7.95%, 2017 | 367,656 | ||
| Limited Brands, Inc.: | ||||
| 225M | 8.5%, 2019 | 257,625 | ||
| 50M | 6.625%, 2021 | 51,375 | ||
| 325M | Needle Merger Sub Corp., 8.125%, 2019 (a) | 329,063 | ||
| 500M | Sears Holding Corp., 6.625%, 2018 (a) | 466,250 | ||
| 550M | Toys R Us Property Co. I, Inc., 10.75%, 2017 | 614,625 | ||
| 175M | Toys R Us Property Co. II, Inc., 8.5%, 2017 | 183,750 | ||
| 250M | Wendy’s/Arby’s Restaurant, LLC, 10%, 2016 | 278,125 | ||
| 75M | Yankee Acquisition Corp., 8.5%, 2015 | 77,625 | ||
| 225M | YCC Holdings, LLC/Yankee Finance, Inc., 10.25%, 2016 (a) | 226,688 | ||
| 3,506,782 | ||||
| 35 |
Portfolio of Investments (continued)
HIGH YIELD FUND
June 30, 2011
| Principal | ||||
| Amount | Security | Value | ||
| Services—2.3% | ||||
| $ 275M | CoreLogic, Inc., 7.25%, 2021 (a) | $ 269,500 | ||
| FTI Consulting, Inc.: | ||||
| 175M | 7.75%, 2016 | 183,750 | ||
| 125M | 6.75%, 2020 | 126,875 | ||
| 300M | Iron Mountain, Inc., 8.375%, 2021 | 316,500 | ||
| 350M | PHH Corp., 9.25%, 2016 | 384,563 | ||
| 375M | Reliance Intermediate Holdings, LP, 9.5%, 2019 (a) | 411,094 | ||
| 1,692,282 | ||||
| Telecommunications—6.8% | ||||
| 225M | Buccaneer Merger Sub, Inc. (Syniverse Holdings, Inc.), | |||
| 9.125%, 2019 (a) | 235,125 | |||
| Citizens Communications Co.: | ||||
| 750M | 7.125%, 2019 | 772,500 | ||
| 100M | 9%, 2031 | 103,000 | ||
| Frontier Communications Corp.: | ||||
| 275M | 8.125%, 2018 | 300,094 | ||
| 200M | 8.5%, 2020 | 219,000 | ||
| 300M | GCI, Inc., 8.625%, 2019 | 330,000 | ||
| 750M | Inmarsat Finance, PLC, 7.375%, 2017 (a) | 798,750 | ||
| Intelsat Jackson Holdings, Ltd.: | ||||
| 150M | 7.25%, 2019 (a) | 149,250 | ||
| 150M | 7.5%, 2021 (a) | 149,438 | ||
| Sprint Capital Corp.: | ||||
| 50M | 6.9%, 2019 | 51,750 | ||
| 475M | 6.875%, 2028 | 451,250 | ||
| 925M | Wind Acquisition Finance SA, 11.75%, 2017 (a) | 1,052,188 | ||
| Windstream Corp.: | ||||
| 225M | 7.875%, 2017 | 239,906 | ||
| 125M | 7.75%, 2020 | 131,563 | ||
| 4,983,814 | ||||
| Transportation—3.0% | ||||
| 625M | Aguila 3 SA, 7.875%, 2018 (a) | 632,031 | ||
| 650M | CHC Helicopter SA, 9.25%, 2020 (a) | 589,875 | ||
| Navios Maritime Holdings: | ||||
| 250M | 8.875%, 2017 | 258,750 | ||
| 375M | 8.125%, 2019 (a) | 361,875 | ||
| 350M | Swift Services Holdings, Inc., 10%, 2018 | 372,313 | ||
| 2,214,844 | ||||
| 36 |
| Principal | |||||||
| Amount | |||||||
| or Shares | Security | Value | |||||
| Utilities—5.2% | |||||||
| AES Corp.: | |||||||
| $ 125M | 9.75%, 2016 | $ 142,500 | |||||
| 100M | 8%, 2017 | 106,500 | |||||
| 125M | 7.375%, 2021 (a) | 127,031 | |||||
| 350M | Calpine Construction Finance Co., LP, 8%, 2016 (a) | 379,750 | |||||
| 375M | Calpine Corp., 7.5%, 2021 (a) | 384,375 | |||||
| 500M | Energy Future Holdings Corp., 10.25%, 2020 | 533,230 | |||||
| 214M | Indiantown Cogeneration Utilities, LP, 9.77%, 2020 | 228,785 | |||||
| 400M | Intergen NV, 9%, 2017 (a) | 425,000 | |||||
| NRG Energy, Inc.: | |||||||
| 625M | 7.375%, 2017 | 656,250 | |||||
| 275M | 7.625%, 2019 (a) | 274,313 | |||||
| 225M | 8.5%, 2019 | 234,000 | |||||
| 298M | NSG Holdings, LLC, 7.75%, 2025 (a) | 293,530 | |||||
| 3,785,264 | |||||||
| Total Value of Corporate Bonds (cost $68,434,701) | 70,451,453 | ||||||
| COMMON STOCKS—.0% | |||||||
| Telecommunications | |||||||
| 3 | * | Viatel Holding (Bermuda), Ltd. (b) | — | ||||
| 5,970 | * | World Access, Inc. | 6 | ||||
| Total Value of Common Stocks (cost $97,361) | 6 | ||||||
| Total Value of Investments (cost $68,532,062) | 95.7 | % | 70,451,459 | ||||
| Other Assets, Less Liabilities | 4.3 | 3,170,715 | |||||
| Net Assets | 100.0 | % | $73,622,174 | ||||
| * | Non-income producing |
| (a) | Security exempt from registration under Rule 144A of Securities Act of 1933 (see Note 5). |
| (b) | Securities valued at fair value (see Note 1A). |
| (c) | In default as to principal and/or interest payment |
| 37 |
Portfolio of Investments (continued)
HIGH YIELD FUND
June 30, 2011
Accounting Standards Codification (“ASC”) 820 established a three-tier hierarchy of inputs to establish a classification of fair value measurements for disclosure purposes. The three-tier hierarchy of inputs is summarized in the three broad Levels listed below:
| Level 1 — Unadjusted quoted prices in active markets for identical securities that the Fund has the ability to access. |
| Level 2 — Observable inputs other than quoted prices included in Level 1 that are observable for the asset or liability, either directly or indirectly. These inputs may include quoted prices for the identical instrument on an inactive market, prices for similar instruments, interest rates, prepayment speeds, credit risk, yield curves, default rates and similar data. |
| Level 3 — Unobservable inputs for the asset or liability, to the extent relevant observable inputs are not available, representing the Fund’s own assumption about the assumptions a market participant would use in valuing the asset or liability, and would be based on the best information available. |
The inputs methodology used for valuing securities are not necessarily an indication of the risk associated with investing in those securities.
The following is a summary, by category of Level, of inputs used to value the Fund’s investments as of June 30, 2011:
| Level 1 | Level 2 | Level 3 | Total | |||||||||
| Corporate Bonds | $ | — | $ | 70,451,078 | $ | 375 | $ | 70,451,453 | ||||
| Common Stocks | 6 | — | — | 6 | ||||||||
| Total Investments in Securities* | $ | 6 | $ | 70,451,078 | $ | 375 | $ | 70,451,459 |
| * | The Portfolio of Investments provides information on the industry categorization for the portfolio. |
| There were no transfers into or from Level 1 and Level 2 by the Fund during the period ended | |
| June 30, 2011. |
The following is a reconciliation of Fund investments valued using Level 3 inputs for the period:
| Investments | Investments | |||||||||||
| in Corporate | in Common | Investments | ||||||||||
| Bonds | Stocks | in Warrants | Total | |||||||||
| Balance, December 31, 2010 | $ | 375 | $ | — | $ | 21 | $ | 396 | ||||
| Net sales* | — | — | (1,941) | (1,941) | ||||||||
| Change in unrealized | ||||||||||||
| appreciation* | — | — | 753,562 | 753,562 | ||||||||
| Realized loss | — | — | (751,642) | (751,642) | ||||||||
| Transfer in and/or out | — | — | — | — | ||||||||
| of Level 3 | ||||||||||||
| Balance, June 30, 2011 | $ | 375 | $ | — | $ | — | $ | 375 |
| * | Includes conversion of corporate bonds to warrants which were subsequently sold. |
| 38 |
The following is a summary of Level 3 inputs by industry:
| Health Care | $375 |
| Telecommunications | — |
| $375 |
| See notes to financial statements | 39 |
Fund Expenses (unaudited)
INTERNATIONAL FUND
The examples below show the ongoing costs (in dollars) of investing in your Fund and will help you in comparing these costs with costs of other mutual funds. Please refer to page 3 for a detailed explanation of the information presented in these examples.
| Beginning | Ending | ||
| Account | Account | Expenses Paid | |
| Value | Value | During Period | |
| (1/1/11) | (6/30/11) | (1/1/11–6/30/11)* | |
| Expense Examples | |||
| Actual | $1,000.00 | $1,075.58 | $5.15 |
| Hypothetical | |||
| (5% annual return before expenses) | $1,000.00 | $1,019.83 | $5.01 |
| * | Expenses are equal to the annualized expense ratio of 1.00%, multiplied by the average account |
| value over the period, multiplied by 181/365 (to reflect the one-half year period). |
Portfolio Composition
BY SECTOR
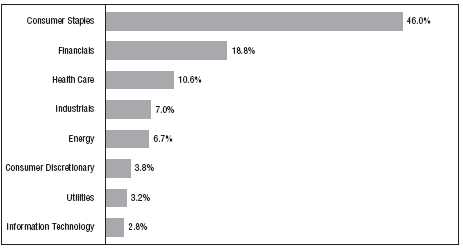
Portfolio holdings and allocations are subject to change. Percentages are as of June 30, 2011, and are based on the total value of investments.
| 40 |
Portfolio of Investments
INTERNATIONAL FUND
June 30, 2011
| Shares | Security | Value | ||
| COMMON STOCKS—98.7% | ||||
| United Kingdom—25.6% | ||||
| 49,082 | Admiral Group, PLC | $ 1,309,304 | ||
| 255,967 | Amlin, PLC | 1,669,093 | ||
| 150,081 | British American Tobacco, PLC | 6,583,321 | ||
| 65,475 | Bunzl, PLC | 820,173 | ||
| 117,594 | Diageo, PLC | 2,406,591 | ||
| 211,013 | Domino’s Pizza UK & IRL, PLC | 1,367,418 | ||
| 129,241 | Imperial Tobacco Group, PLC | 4,304,082 | ||
| 39,196 | Reckitt Benckiser Group, PLC | 2,165,545 | ||
| 61,935 | SABMiller, PLC | 2,261,357 | ||
| 44,228 | Scottish and Southern Energy, PLC | 989,491 | ||
| 118,942 | Standard Chartered, PLC | 3,125,293 | ||
| 397,829 | Tesco, PLC | 2,571,158 | ||
| 29,572,826 | ||||
| India—13.0% | ||||
| 24,092 | Bharat Heavy Electricals, Ltd. | 1,107,507 | ||
| 82,469 | HDFC Bank, Ltd. | 4,658,161 | ||
| 274,918 | Housing Development Finance Corporation, Ltd. | 4,358,182 | ||
| 669,012 | ITC, Ltd. | 3,043,898 | ||
| 14,042 | Nestle India, Ltd. | 1,292,231 | ||
| 22,100 | * | Tata Consultancy Services, Ltd. | 587,151 | |
| 15,047,130 | ||||
| Brazil—8.8% | ||||
| 98,690 | AES Tiete SA | 1,604,561 | ||
| 87,630 | CETIP SA – Balcao Organizado de Ativos e Derivativos | 1,350,700 | ||
| 645 | * | CETIP SA – Receipts | 9,653 | |
| 58,950 | Companhia de Bebidas das Americas (ADR) | 1,988,383 | ||
| 78,800 | CPFL Energia SA | 1,117,248 | ||
| 116,958 | Redecard SA | 1,751,843 | ||
| 188,285 | Souza Cruz SA | 2,374,277 | ||
| 10,196,665 | ||||
| 41 |
Portfolio of Investments (continued)
INTERNATIONAL FUND
June 30, 2011
| Shares | Security | Value | ||
| France—7.7% | ||||
| 13,977 | bioMerieux | $ 1,621,121 | ||
| 18,847 | Bureau Veritas SA | 1,591,228 | ||
| 26,122 | Essilor International SA | 2,119,058 | ||
| 2,172 | Hermes International | 641,325 | ||
| 9,276 | L’Oreal SA | 1,203,529 | ||
| 17,196 | Pernod Ricard SA | 1,695,614 | ||
| 8,871,875 | ||||
| Switzerland—7.3% | ||||
| 5,952 | Kuehne & Nagel International AG – Registered | 902,915 | ||
| 81,660 | Nestle SA – Registered | 5,074,039 | ||
| 40,600 | Novartis AG – Registered | 2,484,563 | ||
| 8,461,517 | ||||
| United States—5.4% | ||||
| 93,407 | Philip Morris International, Inc. | 6,236,785 | ||
| Netherlands—5.3% | ||||
| 27,240 | Core Laboratories NV | 3,038,350 | ||
| 46,329 | Royal Dutch Shell, PLC – Class “A” | 1,644,734 | ||
| 43,164 | Unilever NV-CVA | 1,416,371 | ||
| 6,099,455 | ||||
| Australia—5.0% | ||||
| 147,874 | Coca-Cola Amatil, Ltd. | 1,811,092 | ||
| 79,626 | QBE Insurance Group, Ltd. | 1,475,167 | ||
| 83,596 | Woolworths, Ltd. | 2,489,682 | ||
| 5,775,941 | ||||
| Canada—3.9% | ||||
| 21,132 | Canadian National Railway Company | 1,687,757 | ||
| 68,542 | Canadian Natural Resources, Ltd. | 2,865,682 | ||
| 4,553,439 | ||||
| Japan—3.9% | ||||
| 10,600 | * | Daito Trust Construction Co., Ltd. | 897,097 | |
| 24,800 | Nitori Company, Ltd. | 2,346,332 | ||
| 27,200 | Secom Company, Ltd. | 1,300,029 | ||
| 4,543,458 | ||||
| 42 |
| Shares or | |||||||
| Principal | |||||||
| Amount | Security | Value | |||||
| Belgium—3.1% | |||||||
| 36,904 | Anheuser-Busch InBev NV | $ 2,141,359 | |||||
| 28,943 | Colruyt SA | 1,447,717 | |||||
| 3,589,076 | |||||||
| Ireland—2.9% | |||||||
| 61,919 | Covidien, PLC | 3,295,948 | |||||
| Denmark—2.3% | |||||||
| 20,995 | Novo Nordisk A/S – Series “B” | 2,629,626 | |||||
| Germany—1.4% | |||||||
| 10,464 | Muenchener Rueckversicherungs-Gesellschaft AG – Registered | 1,597,045 | |||||
| Singapore—1.1% | |||||||
| 165,100 | Oversea-Chinese Banking Corporation, Ltd. | 1,261,811 | |||||
| China—.8% | |||||||
| 6,516 | * | Baidu.com, Inc. (ADR) | 913,087 | ||||
| Spain—.6% | |||||||
| 12,130 | Prosegur, Compania de Seguridad SA | 644,900 | |||||
| Mexico—.4% | |||||||
| 164,960 | Wal-Mart de Mexico SAB de CV | 488,821 | |||||
| Colombia—.2% | |||||||
| 4,495 | Ecopetrol SA (ADR) | 197,825 | |||||
| Total Value of Common Stocks (cost $80,559,362) | 113,977,230 | ||||||
| SHORT-TERM INVESTMENTS—1.1% | |||||||
| Money Market Fund | |||||||
| $1,250M | First Investors Cash Reserve Fund, .04% (cost $1,250,000)** | 1,250,000 | |||||
| Total Value of Investments (cost $81,809,362) | 99.8 | % | 115,227,230 | ||||
| Other Assets, Less Liabilities | .2 | 197,761 | |||||
| Net Assets | 100.0 | % | $115,424,991 | ||||
| * | Non-income producing |
| ** | Affiliated unregistered money market fund available only to First Investors funds and certain |
| accounts managed by First Investors Management Company, Inc. Rate shown is the 7-day yield at | |
| June 30, 2011 (see Note 3). |
| 43 |
Portfolio of Investments (continued)
INTERNATIONAL FUND
June 30, 2011
| Summary of Abbreviations: | |||
| ADR | American Depositary Receipts | ||
Accounting Standards Codification (“ASC”) 820 established a three-tier hierarchy of inputs to establish a classification of fair value measurements for disclosure purposes. The three-tier hierarchy of inputs is summarized in the three broad Levels listed below:
| Level 1 — Unadjusted quoted prices in active markets for identical securities that the Fund has the ability to access. |
| Level 2 — Observable inputs other than quoted prices included in Level 1 that are observable for the asset or liability, either directly or indirectly. These inputs may include quoted prices for the identical instrument on an inactive market, prices for similar instruments, interest rates, prepayment speeds, credit risk, yield curves, default rates and similar data. |
| Level 3 — Unobservable inputs for the asset or liability, to the extent relevant observable inputs are not available, representing the Fund’s own assumption about the assumptions a market participant would use in valuing the asset or liability, and would be based on the best information available. |
The inputs methodology used for valuing securities are not necessarily an indication of the risk associated with investing in those securities.
The following is a summary, by category of Level, of inputs used to value the Fund’s investments as of June 30, 2011:
| Level 1 | Level 2 | Level 3 | Total | |||||||||
| Common Stocks | ||||||||||||
| Consumer Staples | $ | 12,535,983 | $ | 40,459,869 | $ | — | $ | 52,995,852 | ||||
| Financials | 1,360,353 | 20,351,153 | — | 21,711,506 | ||||||||
| Health Care | 3,295,948 | 8,854,368 | — | 12,150,316 | ||||||||
| Industrials | 2,332,657 | 5,721,852 | — | 8,054,509 | ||||||||
| Energy | 6,101,857 | 1,644,734 | — | 7,746,591 | ||||||||
| Consumer Discretionary | — | 4,355,075 | — | 4,355,075 | ||||||||
| Utilities | 2,721,809 | 989,491 | — | 3,711,300 | ||||||||
| Information Technology | 2,664,930 | 587,151 | — | 3,252,081 | ||||||||
| Money Market Fund | 1,250,000 | — | — | 1,250,000 | ||||||||
| Total Investments in Securities* | $ | 32,263,537 | $ | 82,963,693 | ** | $ | — | $ | 115,227,230 |
| * | The Portfolio of Investments provides information on the country categorization for the portfolio. |
| ** | Includes certain securities trading outside of the U.S. whose values were adjusted as a result of |
| significant market movements following the close of local trading; therefore, $82,963,693 of | |
| investment securities were classified as Level 2 instead of Level 1. |
| 44 | See notes to financial statements |
Fund Expenses (unaudited)
INVESTMENT GRADE FUND
The examples below show the ongoing costs (in dollars) of investing in your Fund and will help you in comparing these costs with costs of other mutual funds. Please refer to page 3 for a detailed explanation of the information presented in these examples.
| Beginning | Ending | ||
| Account | Account | Expenses Paid | |
| Value | Value | During Period | |
| (1/1/11) | (6/30/11) | (1/1/11–6/30/11)* | |
| Expense Examples | |||
| Actual | $1,000.00 | $1,034.88 | $3.63 |
| Hypothetical | |||
| (5% annual return before expenses) | $1,000.00 | $1,021.22 | $3.61 |
| * | Expenses are equal to the annualized expense ratio of .72%, multiplied by the average account |
| value over the period, multiplied by 181/365 (to reflect the one-half year period). Expenses paid | |
| during the period are net of expenses waived. |
Portfolio Composition
TOP TEN SECTORS
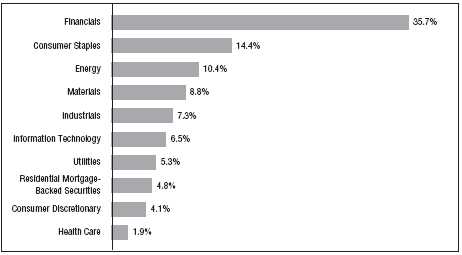
Portfolio holdings and allocations are subject to change. Percentages are as of June 30, 2011, and are based on the total value of investments.
| 45 |
Portfolio of Investments
INVESTMENT GRADE FUND
June 30, 2011
| Principal | ||||
| Amount | Security | Value | ||
| CORPORATE BONDS—92.8% | ||||
| Aerospace/Defense—.5% | ||||
| $ 200M | BAE Systems Holdings, Inc., 4.95%, 2014 (a) | $ 215,026 | ||
| Agriculture—.9% | ||||
| 340M | Cargill, Inc., 6%, 2017 (a) | 392,361 | ||
| Chemicals—2.1% | ||||
| 425M | Chevron Phillips Chemicals Co., LLC, 8.25%, 2019 (a) | 527,722 | ||
| 400M | Dow Chemical Co., 4.25%, 2020 | 391,873 | ||
| 919,595 | ||||
| Consumer Durables—2.4% | ||||
| 400M | Black & Decker Corp., 5.75%, 2016 | 459,466 | ||
| 300M | Newell Rubbermaid, Inc., 6.75%, 2012 | 312,013 | ||
| 300M | Stanley Black & Decker, 5.2%, 2040 | 290,319 | ||
| 1,061,798 | ||||
| Energy—10.2% | ||||
| 400M | Canadian Oil Sands, Ltd., 7.75%, 2019 (a) | 481,307 | ||
| 200M | DCP Midstream, LLC, 9.75%, 2019 (a) | 261,770 | ||
| 200M | Energy Transfer Partners, LP, 8.5%, 2014 | 232,838 | ||
| 459M | Maritime & Northeast Pipeline, LLC, 7.5%, 2014 (a) | 499,750 | ||
| 400M | Nabors Industries, Inc., 6.15%, 2018 | 442,809 | ||
| 500M | Petrobras International Finance Co., 5.375%, 2021 | 515,905 | ||
| 400M | Reliance Holdings USA, Inc., 4.5%, 2020 (a) | 374,423 | ||
| 400M | Spectra Energy Capital, LLC, 6.2%, 2018 | 454,208 | ||
| 489M | Suncor Energy, Inc., 6.85%, 2039 | 554,059 | ||
| 200M | Valero Energy Corp., 9.375%, 2019 | 255,825 | ||
| 400M | Weatherford International, Inc., 6.35%, 2017 | 453,300 | ||
| 4,526,194 | ||||
| Financial Services—11.9% | ||||
| 250M | Aflac, Inc., 8.5%, 2019 | 306,207 | ||
| 600M | American Express Co., 7%, 2018 | 707,069 | ||
| 375M | Amvescap, PLC, 5.375%, 2013 | 398,375 | ||
| 400M | BlackRock, Inc., 5%, 2019 | 425,922 | ||
| 350M | CoBank, ACB, 7.875%, 2018 (a) | 406,486 | ||
| 200M | Compass Bank, 6.4%, 2017 | 216,247 | ||
| 300M | ERAC USA Finance Co., 6.375%, 2017 (a) | 345,467 | ||
| 400M | Ford Motor Credit Co., LLC, 5.625%, 2015 | 415,076 | ||
| 46 |
| Principal | ||||
| Amount | Security | Value | ||
| Financial Services (continued) | ||||
| General Electric Capital Corp.: | ||||
| $ 400M | 5.625%, 2017 | $ 442,191 | ||
| 300M | 5.5%, 2020 | 321,817 | ||
| Harley-Davidson Funding Corp.: | ||||
| 200M | 5.75%, 2014 (a) | 218,778 | ||
| 210M | 6.8%, 2018 (a) | 237,674 | ||
| 400M | Protective Life Corp., 7.375%, 2019 | 455,492 | ||
| 400M | Prudential Financial Corp., 4.75%, 2015 | 430,761 | ||
| 5,327,562 | ||||
| Financials—16.9% | ||||
| Bank of America Corp.: | ||||
| 200M | 5.65%, 2018 | 211,164 | ||
| 200M | 5%, 2021 | 197,950 | ||
| 300M | Barclays Bank, PLC, 5.125%, 2020 | 305,003 | ||
| 300M | Bear Stearns Cos., Inc., 7.25%, 2018 | 356,724 | ||
| Citigroup, Inc.: | ||||
| 650M | 6.375%, 2014 | 719,231 | ||
| 500M | 6.125%, 2017 | 552,961 | ||
| Goldman Sachs Group, Inc.: | ||||
| 500M | 6.15%, 2018 | 544,926 | ||
| 400M | 6.75%, 2037 | 401,218 | ||
| 600M | JPMorgan Chase & Co., 6%, 2018 | 668,202 | ||
| Merrill Lynch & Co., Inc.: | ||||
| 400M | 5%, 2015 | 423,774 | ||
| 400M | 6.4%, 2017 | 437,190 | ||
| Morgan Stanley: | ||||
| 600M | 5.95%, 2017 | 645,898 | ||
| 500M | 6.625%, 2018 | 551,551 | ||
| 600M | SunTrust Banks, Inc., 6%, 2017 | 667,109 | ||
| 300M | UBS AG, 5.875%, 2017 | 329,536 | ||
| Wells Fargo & Co.: | ||||
| 300M | 5.625%, 2017 | 331,832 | ||
| 200M | 4.6%, 2021 | 201,502 | ||
| 7,545,771 | ||||
| Food/Beverage/Tobacco—7.6% | ||||
| 400M | Altria Group, Inc., 9.7%, 2018 | 526,380 | ||
| 500M | Anheuser-Busch InBev Worldwide, Inc., 5.375%, 2020 | 551,750 | ||
| 300M | Bottling Group, LLC, 5.125%, 2019 | 332,779 | ||
| 200M | Bunge Limited Finance Corp., 5.35%, 2014 | 215,761 | ||
| 47 |
Portfolio of Investments (continued)
INVESTMENT GRADE FUND
June 30, 2011
| Principal | ||||
| Amount | Security | Value | ||
| Food/Beverage/Tobacco (continued) | ||||
| $ 400M | Corn Products International, Inc., 4.625%, 2020 | $ 404,265 | ||
| 400M | Dr. Pepper Snapple Group, Inc., 6.82%, 2018 | 479,035 | ||
| 400M | Lorillard Tobacco Co., 6.875%, 2020 | 434,696 | ||
| 400M | Philip Morris International, Inc., 5.65%, 2018 | 450,518 | ||
| 3,395,184 | ||||
| Forest Products/Container—.9% | ||||
| 300M | International Paper Co., 9.375%, 2019 | 383,666 | ||
| Health Care—1.8% | ||||
| 400M | Biogen IDEC, Inc., 6.875%, 2018 | 467,761 | ||
| 200M | Novartis, 5.125%, 2019 | 222,448 | ||
| 100M | Roche Holdings, Inc., 6%, 2019 (a) | 115,396 | ||
| 805,605 | ||||
| Information Technology—6.3% | ||||
| 300M | Cisco Systems, Inc., 4.95%, 2019 | 326,255 | ||
| 300M | Computer Sciences Corp., 6.5%, 2018 | 321,723 | ||
| 300M | Dell, Inc., 5.875%, 2019 | 337,204 | ||
| 300M | Dun & Bradstreet Corp., 6%, 2013 | 322,590 | ||
| 400M | Harris Corp., 4.4%, 2020 | 402,017 | ||
| 500M | Motorola, Inc., 6%, 2017 | 569,701 | ||
| Pitney Bowes, Inc.: | ||||
| 100M | 5%, 2015 | 107,614 | ||
| 400M | 5.75%, 2017 | 438,214 | ||
| 2,825,318 | ||||
| Manufacturing—4.1% | ||||
| 300M | General Electric Co., 5.25%, 2017 | 332,804 | ||
| 700M | Ingersoll-Rand Global Holdings Co., 6.875%, 2018 | 830,716 | ||
| 300M | Johnson Controls, Inc., 5%, 2020 | 319,339 | ||
| 300M | Tyco Electronics Group SA, 6.55%, 2017 | 353,937 | ||
| 1,836,796 | ||||
| 48 |
| Principal | ||||
| Amount | Security | Value | ||
| Media-Broadcasting—4.9% | ||||
| $ 400M | British Sky Broadcasting Group, PLC, 9.5%, 2018 (a) | $ 531,980 | ||
| Comcast Corp.: | ||||
| 400M | 5.15%, 2020 | 431,433 | ||
| 400M | 6.95%, 2037 | 452,994 | ||
| 400M | DirecTV Holdings, LLC, 7.625%, 2016 | 436,444 | ||
| 300M | Time Warner Cable, Inc., 6.75%, 2018 | 348,402 | ||
| 2,201,253 | ||||
| Media-Diversified—1.5% | ||||
| McGraw-Hill Cos., Inc.: | ||||
| 200M | 5.9%, 2017 | 223,615 | ||
| 200M | 6.55%, 2037 | 216,861 | ||
| 200M | News America, Inc., 5.3%, 2014 | 223,116 | ||
| 663,592 | ||||
| Metals/Mining—4.8% | ||||
| 400M | Alcoa, Inc., 6.15%, 2020 | 424,495 | ||
| 500M | ArcelorMittal, 6.125%, 2018 | 536,295 | ||
| 400M | Newmont Mining Corp., 5.125%, 2019 | 430,328 | ||
| 260M | Rio Tinto Finance USA, Ltd., 6.5%, 2018 | 304,093 | ||
| 400M | Vale Overseas, Ltd., 5.625%, 2019 | 428,904 | ||
| 2,124,115 | ||||
| Real Estate Investment Trusts—5.9% | ||||
| 500M | Boston Properties, LP, 5.875%, 2019 | 548,725 | ||
| 300M | Digital Realty Trust, LP, 5.25%, 2021 | 299,004 | ||
| 500M | HCP, Inc., 5.375%, 2021 | 516,676 | ||
| 400M | Prologis, LP, 6.625%, 2018 | 442,866 | ||
| 400M | Simon Property Group, LP, 5.75%, 2015 | 449,448 | ||
| 400M | Ventas Realty, LP, 4.75%, 2021 | 391,224 | ||
| 2,647,943 | ||||
| Retail-General Merchandise—1.6% | ||||
| 300M | GAP, Inc., 5.95%, 2021 | 288,736 | ||
| 400M | Home Depot, Inc., 5.875%, 2036 | 410,741 | ||
| 699,477 | ||||
| Telecommunications—.8% | ||||
| 309M | GTE Corp., 6.84%, 2018 | 359,948 | ||
| 49 |
Portfolio of Investments (continued)
INVESTMENT GRADE FUND
June 30, 2011
| Principal | |||||||
| Amount | Security | Value | |||||
| Transportation—1.9% | |||||||
| $ 300M | Con-way, Inc., 7.25%, 2018 | $ 330,470 | |||||
| 459M | GATX Corp., 8.75%, 2014 | 534,112 | |||||
| 864,582 | |||||||
| Utilities—5.2% | |||||||
| 300M | E. ON International Finance BV, 5.8%, 2018 (a) | 333,566 | |||||
| 300M | Electricite de France SA, 6.5%, 2019 (a) | 351,190 | |||||
| 400M | Exelon Generation Co., LLC, 6.2%, 2017 | 451,834 | |||||
| Great River Energy Co.: | |||||||
| 162M | 5.829%, 2017 (a) | 180,155 | |||||
| 300M | 4.478%, 2030 (a) | 295,960 | |||||
| 400M | Ohio Power Co., 5.375%, 2021 | 431,733 | |||||
| 200M | Sempra Energy, 9.8%, 2019 | 268,666 | |||||
| 2,313,104 | |||||||
| Waste Management—.6% | |||||||
| 265M | Republic Services, Inc., 3.8%, 2018 | 266,534 | |||||
| Total Value of Corporate Bonds (cost $38,727,675) | 41,375,424 | ||||||
| RESIDENTIAL MORTGAGE-BACKED | |||||||
| SECURITIES—4.7% | |||||||
| Fannie Mae | |||||||
| 1,956M | 5%, 12/1/2039 – 10/1/2040 (cost $2,044,568) | 2,089,921 | |||||
| Total Value of Investments (cost $40,772,243) | 97.5 | % | 43,465,345 | ||||
| Other Assets, Less Liabilities | 2.5 | 1,122,283 | |||||
| Net Assets | 100.0 | % | $44,587,628 | ||||
| (a) | Security exempt from registration under Rule 144A of Securities Act of 1933 (see Note 5). |
| 50 |
Accounting Standards Codification (“ASC”) 820 established a three-tier hierarchy of inputs to establish a classification of fair value measurements for disclosure purposes. The three-tier hierarchy of inputs is summarized in the three broad Levels listed below:
| Level 1 — Unadjusted quoted prices in active markets for identical securities that the Fund has the ability to access. |
| Level 2 — Observable inputs other than quoted prices included in Level 1 that are observable for the asset or liability, either directly or indirectly. These inputs may include quoted prices for the identical instrument on an inactive market, prices for similar instruments, interest rates, prepayment speeds, credit risk, yield curves, default rates and similar data. |
| Level 3 — Unobservable inputs for the asset or liability, to the extent relevant observable inputs are not available, representing the Fund’s own assumption about the assumptions a market participant would use in valuing the asset or liability, and would be based on the best information available. |
The inputs methodology used for valuing securities are not necessarily an indication of the risk associated with investing in those securities.
The following is a summary, by category of Level, of inputs used to value the Fund’s investments as of June 30, 2011:
| Level 1 | Level 2 | Level 3 | Total | |||||||||
| Corporate Bonds | $ | — | $ | 41,375,424 | $ | — | $ | 41,375,424 | ||||
| Residential Mortgage-Backed | ||||||||||||
| Securities | — | 2,089,921 | — | 2,089,921 | ||||||||
| Total Investments in Securities* | $ | — | $ | 43,465,345 | $ | — | $ | 43,465,345 |
| * | The Portfolio of Investments provides information on the industry categorization for the portfolio. |
| There were no transfers into or from Level 1 and Level 2 by the Fund during the period ended | |
| June 30, 2011. |
| See notes to financial statements | 51 |
Fund Expenses (unaudited)
SELECT GROWTH FUND
The examples below show the ongoing costs (in dollars) of investing in your Fund and will help you in comparing these costs with costs of other mutual funds. Please refer to page 3 for a detailed explanation of the information presented in these examples.
| Beginning | Ending | ||
| Account | Account | Expenses Paid | |
| Value | Value | During Period | |
| (1/1/11) | (6/30/11) | (1/1/11–6/30/11)* | |
| Expense Examples | |||
| Actual | $1,000.00 | $1,132.16 | $4.76 |
| Hypothetical | |||
| (5% annual return before expenses) | $1,000.00 | $1,020.33 | $4.51 |
| * | Expenses are equal to the annualized expense ratio of .90%, multiplied by the average account |
| value over the period, multiplied by 181/365 (to reflect the one-half year period). |
Portfolio Composition
TOP SECTORS
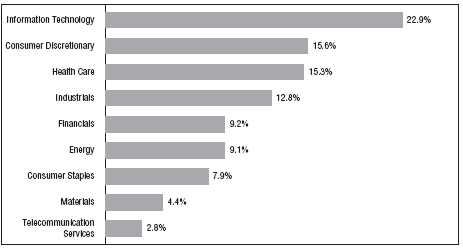
Portfolio holdings and allocations are subject to change. Percentages are as of June 30, 2011, and are based on the total value of investments.
| 52 |
Portfolio of Investments
SELECT GROWTH FUND
June 30, 2011
| Shares | Security | Value | ||
| COMMON STOCKS—98.0% | ||||
| Consumer Discretionary—15.3% | ||||
| 3,860 | Autoliv, Inc. | $ 302,817 | ||
| 9,310 | * | Bed Bath & Beyond, Inc. | 543,425 | |
| 1,860 | * | Chipotle Mexican Grill, Inc. | 573,233 | |
| 8,650 | Mattel, Inc. | 237,789 | ||
| 750 | * | Priceline.com, Inc. | 383,948 | |
| 7,330 | Ross Stores, Inc. | 587,280 | ||
| 2,628,492 | ||||
| Consumer Staples—7.7% | ||||
| 14,340 | Coca-Cola Enterprises, Inc. | 418,441 | ||
| 6,830 | Corn Products International, Inc. | 377,562 | ||
| 8,360 | Whole Foods Market, Inc. | 530,442 | ||
| 1,326,445 | ||||
| Energy—9.0% | ||||
| 3,770 | Chevron Corporation | 387,707 | ||
| 3,260 | ExxonMobil Corporation | 265,299 | ||
| 4,910 | Helmerich & Payne, Inc. | 324,649 | ||
| 3,500 | Noble Energy, Inc. | 313,705 | ||
| 2,410 | Occidental Petroleum Corporation | 250,736 | ||
| 1,542,096 | ||||
| Financials—9.0% | ||||
| 8,260 | American Express Company | 427,042 | ||
| 4,570 | Capital One Financial Corporation | 236,132 | ||
| 14,210 | East West Bancorp, Inc. | 287,184 | ||
| 2,100 | Franklin Resources, Inc. | 275,709 | ||
| 7,880 | JPMorgan Chase & Company | 322,607 | ||
| 1,548,674 | ||||
| Health Care—14.9% | ||||
| 6,100 | Aetna, Inc. | 268,949 | ||
| 5,700 | Cooper Companies, Inc. | 451,668 | ||
| 12,000 | * | Endo Pharmaceuticals Holdings, Inc. | 482,040 | |
| 8,690 | * | Express Scripts, Inc. | 469,086 | |
| 4,770 | McKesson Corporation | 399,011 | ||
| 7,280 | * | Watson Pharmaceuticals, Inc. | 500,354 | |
| 2,571,108 | ||||
| 53 |
Portfolio of Investments (continued)
SELECT GROWTH FUND
June 30, 2011
| Shares | Security | Value | |||||
| Industrials—12.5% | |||||||
| 16,410 | CSX Corporation | $ 430,270 | |||||
| 5,740 | Eaton Corporation | 295,323 | |||||
| 7,330 | Illinois Tool Works, Inc. | 414,072 | |||||
| 5,260 | Manpower, Inc. | 282,199 | |||||
| 4,970 | Parker Hannifin Corporation | 446,008 | |||||
| 5,000 | Ryder System, Inc. | 284,250 | |||||
| 2,152,122 | |||||||
| Information Technology—22.5% | |||||||
| 6,870 | * | ANSYS, Inc. | 375,583 | ||||
| 2,040 | * | Apple, Inc. | 684,767 | ||||
| 8,090 | * | Arrow Electronics, Inc. | 335,735 | ||||
| 10,950 | * | BMC Software, Inc. | 598,965 | ||||
| 8,130 | * | Check Point Software Technologies, Ltd. | 462,191 | ||||
| 3,030 | International Business Machines Corporation | 519,796 | |||||
| 14,800 | * | TIBCO Software, Inc. | 429,496 | ||||
| 4,580 | * | VMware, Inc. – Class “A” | 459,053 | ||||
| 3,865,586 | |||||||
| Materials—4.3% | |||||||
| 3,050 | CF Industries Holdings, Inc. | 432,093 | |||||
| 3,330 | PPG Industries, Inc. | 302,331 | |||||
| 734,424 | |||||||
| Telecommunication Services—2.8% | |||||||
| 27,900 | * | MetroPCS Communications, Inc. | 480,159 | ||||
| Total Value of Common Stocks (cost $12,795,370) | 98.0 | % | 16,849,106 | ||||
| Other Assets, Less Liabilities | 2.0 | 348,183 | |||||
| Net Assets | 100.0 | % | $17,197,289 | ||||
| * | Non-income producing |
| 54 |
Accounting Standards Codification (“ASC”) 820 established a three-tier hierarchy of inputs to establish a classification of fair value measurements for disclosure purposes. The three-tier hierarchy of inputs is summarized in the three broad Levels listed below:
| Level 1 — Unadjusted quoted prices in active markets for identical securities that the Fund has the ability to access. |
| Level 2 — Observable inputs other than quoted prices included in Level 1 that are observable for the asset or liability, either directly or indirectly. These inputs may include quoted prices for the identical instrument on an inactive market, prices for similar instruments, interest rates, prepayment speeds, credit risk, yield curves, default rates and similar data. |
| Level 3 — Unobservable inputs for the asset or liability, to the extent relevant observable inputs are not available, representing the Fund’s own assumption about the assumptions a market participant would use in valuing the asset or liability, and would be based on the best information available. |
The inputs methodology used for valuing securities are not necessarily an indication of the risk associated with investing in those securities.
The following is a summary, by category of Level, of inputs used to value the Fund’s investments as of June 30, 2011:
| Level 1 | Level 2 | Level 3 | Total | |||||||||
| Common Stocks* | $ | 16,849,106 | $ | — | $ | — | $ | 16,849,106 |
| * | The Portfolio of Investments provides information on the industry categorization for the portfolio. |
| There were no transfers into or from Level 1 and Level 2 by the Fund during the period ended | |
| June 30, 2011. |
| See notes to financial statements | 55 |
Fund Expenses (unaudited)
TARGET MATURITY 2015 FUND
The examples below show the ongoing costs (in dollars) of investing in your Fund and will help you in comparing these costs with costs of other mutual funds. Please refer to page 3 for a detailed explanation of the information presented in these examples.
| Beginning | Ending | ||
| Account | Account | Expenses Paid | |
| Value | Value | During Period | |
| (1/1/11) | (6/30/11) | (1/1/11–6/30/11)* | |
| Expense Examples | |||
| Actual | $1,000.00 | $1,030.57 | $3.62 |
| Hypothetical | |||
| (5% annual return before expenses) | $1,000.00 | $1,021.22 | $3.61 |
| * | Expenses are equal to the annualized expense ratio of .72%, multiplied by the average account |
| value over the period, multiplied by 181/365 (to reflect the one-half year period). Expenses paid | |
| during the period are net of expenses waived. |
Portfolio Composition
BY SECTOR
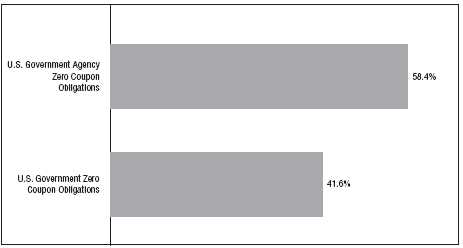
Portfolio holdings and allocations are subject to change. Percentages are as of June 30, 2011, and are based on the total value of investments.
| 56 |
Portfolio of Investments
TARGET MATURITY 2015 FUND
June 30, 2011
| Principal | Effective | ||||||
| Amount | Security | Yield | † | Value | |||
| U.S. GOVERNMENT AGENCY ZERO COUPON | |||||||
| OBLIGATIONS—58.4% | |||||||
| Agency For International Development – Israel: | |||||||
| $ 698M | 9/15/2015 | 1.76 | % | $ 648,357 | |||
| 2,784M | 11/15/2015 | 1.84 | 2,569,601 | ||||
| Fannie Mae: | |||||||
| 243M | 8/12/2015 | 1.79 | 225,788 | ||||
| 600M | 9/23/2015 | 1.90 | 553,849 | ||||
| 3,533M | 11/15/2015 | 1.67 | 3,284,796 | ||||
| 650M | Federal Judiciary Office Building, 2/15/2015 | 2.05 | 603,602 | ||||
| Freddie Mac: | |||||||
| 550M | 3/15/2015 | 1.84 | 513,839 | ||||
| 930M | 9/15/2015 | 2.09 | 852,066 | ||||
| 830M | 9/15/2015 | 2.09 | 760,462 | ||||
| 210M | Government Trust Certificate – Turkey Trust, 5/15/2015 | 2.16 | 193,244 | ||||
| 200M | International Bank for Reconstruction & | ||||||
| Development, 2/15/2015 | 1.66 | 188,342 | |||||
| 3,657M | Resolution Funding Corporation, 10/15/2015 | 1.73 | 3,396,340 | ||||
| 2,000M | Tennessee Valley Authority, 11/1/2015 | 2.17 | 1,821,092 | ||||
| Total Value of U.S. Government Agency Zero Coupon | |||||||
| Obligations (cost $13,417,665) | 15,611,378 | ||||||
| U.S. GOVERNMENT ZERO COUPON | |||||||
| OBLIGATIONS—41.6% | |||||||
| 11,875M | U.S. Treasury Strips, 11/15/2015 (cost $9,336,866) | 1.50 | 11,124,880 | ||||
| Total Value of Investments (cost $22,754,531) | 100.0 | % | 26,736,258 | ||||
| Excess of Liabilities Over Other Assets | — | (4,253) | |||||
| Net Assets | 100.0 | % | $26,732,005 | ||||
| † | The effective yields shown for the zero coupon obligations are the effective yields at |
| June 30, 2011. |
| 57 |
Portfolio of Investments (continued)
TARGET MATURITY 2015 FUND
June 30, 2011
Accounting Standards Codification (“ASC”) 820 established a three-tier hierarchy of inputs to establish a classification of fair value measurements for disclosure purposes. The three-tier hierarchy of inputs is summarized in the three broad Levels listed below:
| Level 1 — Unadjusted quoted prices in active markets for identical securities that the Fund has the ability to access. |
| Level 2 — Observable inputs other than quoted prices included in Level 1 that are observable for the asset or liability, either directly or indirectly. These inputs may include quoted prices for the identical instrument on an inactive market, prices for similar instruments, interest rates, prepayment speeds, credit risk, yield curves, default rates and similar data. |
| Level 3 — Unobservable inputs for the asset or liability, to the extent relevant observable inputs are not available, representing the Fund’s own assumption about the assumptions a market participant would use in valuing the asset or liability, and would be based on the best information available. |
The inputs methodology used for valuing securities are not necessarily an indication of the risk associated with investing in those securities.
The following is a summary, by category of Level, of inputs used to value the Fund’s investments as of June 30, 2011:
| Level 1 | Level 2 | Level 3 | Total | |||||||||
| U.S. Government Agency Zero | ||||||||||||
| Coupon Obligations | $ | — | $ | 15,611,378 | $ | — | $ | 15,611,378 | ||||
| U.S. Government Zero Coupon | ||||||||||||
| Obligations | — | 11,124,880 | — | 11,124,880 | ||||||||
| Total Investments | ||||||||||||
| in Securities | $ | — | $ | 26,736,258 | $ | — | $ | 26,736,258 |
There were no transfers into or from Level 1 and Level 2 by the Fund during the period ended June 30, 2011.
| 58 | See notes to financial statements |
Fund Expenses (unaudited)
VALUE FUND
The examples below show the ongoing costs (in dollars) of investing in your Fund and will help you in comparing these costs with costs of other mutual funds. Please refer to page 3 for a detailed explanation of the information presented in these examples.
| Beginning | Ending | ||
| Account | Account | Expenses Paid | |
| Value | Value | During Period | |
| (1/1/11) | (6/30/11) | (1/1/11–6/30/11)* | |
| Expense Examples | |||
| Actual | $1,000.00 | $1,049.85 | $4.27 |
| Hypothetical | |||
| (5% annual return before expenses) | $1,000.00 | $1,020.62 | $4.21 |
| * | Expenses are equal to the annualized expense ratio of .84%, multiplied by the average account |
| value over the period, multiplied by 181/365 (to reflect the one-half year period). |
Portfolio Composition
TOP TEN SECTORS
Portfolio holdings and allocations are subject to change. Percentages are as of June 30, 2011, and are based on the total value of investments.
| 59 |
Portfolio of Investments
VALUE FUND
June 30, 2011
| Shares | Security | Value | ||
| COMMON STOCKS—97.7% | ||||
| Consumer Discretionary—13.0% | ||||
| 27,900 | American Eagle Outfitters, Inc. | $ 355,725 | ||
| 16,100 | American Greetings Corporation – Class “A” | 387,044 | ||
| 18,200 | Best Buy Company, Inc. | 571,662 | ||
| 37,300 | Brown Shoe Company, Inc. | 397,245 | ||
| 9,900 | Carnival Corporation | 372,537 | ||
| 23,800 | Chico’s FAS, Inc. | 362,474 | ||
| 19,600 | Comcast Corporation – Special Shares “A” | 474,908 | ||
| 6,800 | Fortune Brands, Inc. | 433,636 | ||
| 10,300 | Genuine Parts Company | 560,320 | ||
| 12,200 | Home Depot, Inc. | 441,884 | ||
| 22,800 | International Game Technology | 400,824 | ||
| 13,700 | J.C. Penney Company, Inc. | 473,198 | ||
| 31,500 | Lowe’s Companies, Inc. | 734,265 | ||
| 12,900 | Macy’s, Inc. | 377,196 | ||
| 4,400 | McDonald’s Corporation | 371,008 | ||
| 22,500 | Newell Rubbermaid, Inc. | 355,050 | ||
| 5,400 | Omnicom Group, Inc. | 260,064 | ||
| 3,000 | * | Ruby Tuesday, Inc. | 32,340 | |
| 3,800 | Stage Stores, Inc. | 63,840 | ||
| 23,300 | Staples, Inc. | 368,140 | ||
| 11,600 | Target Corporation | 544,156 | ||
| 12,466 | Time Warner, Inc. | 453,388 | ||
| 17,400 | Walt Disney Company | 679,296 | ||
| 9,470,200 | ||||
| Consumer Staples—16.1% | ||||
| 11,900 | Archer-Daniels-Midland Company | 358,785 | ||
| 19,700 | Avon Products, Inc. | 551,600 | ||
| 5,300 | Clorox Company | 357,432 | ||
| 13,100 | Coca-Cola Company | 881,499 | ||
| 15,400 | ConAgra Foods, Inc. | 397,474 | ||
| 2,400 | Costco Wholesale Corporation | 194,976 | ||
| 16,300 | CVS Caremark Corporation | 612,554 | ||
| 10,500 | Diageo, PLC (ADR) | 859,635 | ||
| 7,400 | H.J. Heinz Company | 394,272 | ||
| 3,900 | Hershey Company | 221,715 | ||
| 13,700 | Kimberly-Clark Corporation | 911,872 | ||
| 27,100 | Kraft Foods, Inc. – Class “A” | 954,733 | ||
| 18,600 | Kroger Company | 461,280 | ||
| 15,746 | PepsiCo, Inc. | 1,108,991 | ||
| 60 |
| Shares | Security | Value | ||
| Consumer Staples (continued) | ||||
| 14,300 | Philip Morris International, Inc. | $ 954,811 | ||
| 5,400 | Procter & Gamble Company | 343,278 | ||
| 17,200 | Safeway, Inc. | 401,964 | ||
| 16,100 | Walgreen Company | 683,606 | ||
| 20,900 | Wal-Mart Stores, Inc. | 1,110,626 | ||
| 11,761,103 | ||||
| Energy—10.1% | ||||
| 11,012 | Chevron Corporation | 1,132,474 | ||
| 13,000 | ConocoPhillips | 977,470 | ||
| 7,700 | Devon Energy Corporation | 606,837 | ||
| 6,100 | Diamond Offshore Drilling, Inc. | 429,501 | ||
| 10,500 | ExxonMobil Corporation | 854,490 | ||
| 5,300 | Hess Corporation | 396,228 | ||
| 20,400 | Marathon Oil Corporation | 1,074,672 | ||
| 12,100 | Royal Dutch Shell, PLC – Class “A” (ADR) | 860,673 | ||
| 8,000 | SPDR S&P Oil & Gas Exploration & Production (ETF) | 470,240 | ||
| 10,300 | Tidewater, Inc. | 554,243 | ||
| 7,356,828 | ||||
| Financials—13.0% | ||||
| 7,400 | ACE, Ltd. | 487,068 | ||
| 11,400 | Allstate Corporation | 348,042 | ||
| 7,300 | Ameriprise Financial, Inc. | 421,064 | ||
| 26,306 | Bank of America Corporation | 288,314 | ||
| 18,573 | Bank of New York Mellon Corporation | 475,840 | ||
| 8,694 | Capital One Financial Corporation | 449,219 | ||
| 8,722 | Chubb Corporation | 546,084 | ||
| 8,722 | Cincinnati Financial Corporation | 254,508 | ||
| 9,100 | Comerica, Inc. | 314,587 | ||
| 7,800 | EMC Insurance Group, Inc. | 148,980 | ||
| 1,200 | First Financial Bancorp. | 20,028 | ||
| 29,590 | First Niagara Financial Group, Inc. | 390,588 | ||
| 12,900 | First Potomac Realty Trust (REIT) | 197,499 | ||
| 23,000 | FirstMerit Corporation | 379,730 | ||
| 5,000 | FXCM, Inc. – Class “A” | 49,600 | ||
| 7,100 | IBERIABANK Corporation | 409,244 | ||
| 11,400 | Invesco, Ltd. | 266,760 | ||
| 39,100 | Investors Real Estate Trust (REIT) | 338,606 | ||
| 19,900 | JPMorgan Chase & Company | 814,706 | ||
| 14,800 | Morgan Stanley | 340,548 | ||
| 61 |
Portfolio of Investments (continued)
VALUE FUND
June 30, 2011
| Shares | Security | Value | ||
| Financials (continued) | ||||
| 28,800 | People’s United Financial, Inc. | $ 387,072 | ||
| 7,100 | PNC Financial Services Group, Inc. | 423,231 | ||
| 15,500 | Protective Life Corporation | 358,515 | ||
| 12,700 | Tower Group, Inc. | 302,514 | ||
| 8,900 | Unitrin, Inc. | 264,063 | ||
| 22,100 | Wells Fargo & Company | 620,126 | ||
| 24,500 | Westfield Financial, Inc. | 198,940 | ||
| 9,495,476 | ||||
| Health Care—9.7% | ||||
| 22,100 | Abbott Laboratories | 1,162,902 | ||
| 8,200 | Baxter International, Inc. | 489,458 | ||
| 4,500 | Becton, Dickinson & Company | 387,765 | ||
| 12,700 | GlaxoSmithKline, PLC (ADR) | 544,830 | ||
| 18,600 | Johnson & Johnson | 1,237,272 | ||
| 13,400 | Medtronic, Inc. | 516,302 | ||
| 20,070 | Merck & Company, Inc. | 708,270 | ||
| 13,000 | Novartis AG (ADR) | 794,430 | ||
| 39,900 | Pfizer, Inc. | 821,940 | ||
| 6,800 | Quest Diagnostics, Inc. | 401,880 | ||
| 7,065,049 | ||||
| Industrials—12.8% | ||||
| 7,400 | 3M Company | 701,890 | ||
| 6,400 | Armstrong World Industries, Inc. | 291,584 | ||
| 14,500 | Avery Dennison Corporation | 560,135 | ||
| 11,200 | Con-way, Inc. | 434,672 | ||
| 14,200 | Curtiss-Wright Corporation | 459,654 | ||
| 8,600 | Dover Corporation | 583,080 | ||
| 7,000 | Dun & Bradstreet Corporation | 528,780 | ||
| 10,600 | Equifax, Inc. | 368,032 | ||
| 8,700 | General Dynamics Corporation | 648,324 | ||
| 30,200 | General Electric Company | 569,572 | ||
| 10,100 | Honeywell International, Inc. | 601,859 | ||
| 11,100 | Illinois Tool Works, Inc. | 627,039 | ||
| 13,900 | ITT Corporation | 819,127 | ||
| 9,800 | Pitney Bowes, Inc. | 225,302 | ||
| 9,900 | TAL International Group, Inc. | 341,847 | ||
| 7,800 | Textainer Group Holdings, Ltd. | 239,772 | ||
| 62 |
| Shares | Security | Value | ||
| Industrials (continued) | ||||
| 4,000 | Triumph Group, Inc. | $ 398,320 | ||
| 7,525 | Tyco International, Ltd. | 371,961 | ||
| 7,600 | United Parcel Service, Inc. – Class “B” | 554,268 | ||
| 9,325,218 | ||||
| Information Technology—9.3% | ||||
| 17,500 | Automatic Data Processing, Inc. | 921,900 | ||
| 13,900 | Bel Fuse, Inc. – Class “B” | 301,491 | ||
| 47,000 | Cisco Systems, Inc. | 733,670 | ||
| 23,300 | Hewlett-Packard Company | 848,120 | ||
| 17,000 | Intel Corporation | 376,720 | ||
| 29,100 | Intersil Corporation – Class “A” | 373,935 | ||
| 33,800 | Microsoft Corporation | 878,800 | ||
| 16,950 | Molex, Inc. | 436,802 | ||
| 21,800 | National Semiconductor Corporation | 536,498 | ||
| 4,400 | QUALCOMM, Inc. | 249,876 | ||
| 10,225 | TE Connectivity, Ltd. | 375,871 | ||
| 10,600 | Texas Instruments, Inc. | 347,998 | ||
| 19,400 | Western Union Company | 388,582 | ||
| 6,770,263 | ||||
| Materials—5.6% | ||||
| 14,800 | Alcoa, Inc. | 234,728 | ||
| 16,600 | Bemis Company, Inc. | 560,748 | ||
| 4,400 | Compass Minerals International, Inc. | 378,708 | ||
| 20,900 | Dow Chemical Company | 752,400 | ||
| 13,790 | DuPont (E.I.) de Nemours & Company | 745,350 | ||
| 24,400 | Glatfelter | 375,272 | ||
| 17,700 | H.B. Fuller Company | 432,234 | ||
| 10,500 | Sonoco Products Company | 373,170 | ||
| 13,300 | Steel Dynamics, Inc. | 216,125 | ||
| 4,068,735 | ||||
| Telecommunication Services—3.9% | ||||
| 39,210 | AT&T, Inc. | 1,231,586 | ||
| 5,780 | CenturyLink, Inc. | 233,685 | ||
| 9,100 | Telephone & Data Systems, Inc. – Special Shares | 245,063 | ||
| 29,718 | Verizon Communications, Inc. | 1,106,401 | ||
| 2,816,735 | ||||
| 63 |
Portfolio of Investments (continued)
VALUE FUND
June 30, 2011
| Shares or | |||||||
| Principal | |||||||
| Amount | Security | Value | |||||
| Utilities—4.2% | |||||||
| $10,100 | American Electric Power Company, Inc. | $ 380,568 | |||||
| 12,800 | MDU Resources Group, Inc. | 288,000 | |||||
| 8,400 | NextEra Energy, Inc. | 482,664 | |||||
| 25,600 | NiSource, Inc. | 518,400 | |||||
| 3,100 | ONEOK, Inc. | 229,431 | |||||
| 16,900 | Portland General Electric Company | 427,232 | |||||
| 10,700 | Southwest Gas Corporation | 413,127 | |||||
| 12,600 | Vectren Corporation | 351,036 | |||||
| 3,090,458 | |||||||
| Total Value of Common Stocks (cost $58,627,667) | 71,220,065 | ||||||
| PREFERRED STOCKS—.4% | |||||||
| Telecommunication Services | |||||||
| 9,500 | AT&T, Inc., 6.375%, 2056 (cost $237,359) | 254,125 | |||||
| SHORT-TERM INVESTMENTS—1.5% | |||||||
| Money Market Fund | |||||||
| $ 1,120M | First Investors Cash Reserve Fund, .04% (cost $1,120,000)** | 1,120,000 | |||||
| Total Value of Investments (cost $59,985,026) | 99.6 | % | 72,594,190 | ||||
| Other Assets, Less Liabilities | .4 | 282,953 | |||||
| Net Assets | 100.0 | % | $72,877,143 | ||||
| * | Non-income producing |
| ** | Affiliated unregistered money market fund available only to First Investors funds and certain |
| accounts managed by First Investors Management Company, Inc. Rate shown is the 7-day yield at | |
| June 30, 2011 (see Note 3). |
| Summary of Abbreviations: | |||
| ADR | American Depositary Receipts | ||
| ETF | Exchange Traded Fund | ||
| REIT | Real Estate Investment Trust | ||
| 64 |
Accounting Standards Codification (“ASC”) 820 established a three-tier hierarchy of inputs to establish a classification of fair value measurements for disclosure purposes. The three-tier hierarchy of inputs is summarized in the three broad Levels listed below:
| Level 1 — Unadjusted quoted prices in active markets for identical securities that the Fund has the ability to access. |
| Level 2 — Observable inputs other than quoted prices included in Level 1 that are observable for the asset or liability, either directly or indirectly. These inputs may include quoted prices for the identical instrument on an inactive market, prices for similar instruments, interest rates, prepayment speeds, credit risk, yield curves, default rates and similar data. |
| Level 3 — Unobservable inputs for the asset or liability, to the extent relevant observable inputs are not available, representing the Fund’s own assumption about the assumptions a market participant would use in valuing the asset or liability, and would be based on the best information available. |
The inputs methodology used for valuing securities are not necessarily an indication of the risk associated with investing in those securities.
The following is a summary, by category of Level, of inputs used to value the Fund’s investments as of June 30, 2011:
| Level 1 | Level 2 | Level 3 | Total | |||||||||
| Common Stocks | $ | 71,220,065 | $ | — | $ | — | $ | 71,220,065 | ||||
| Preferred Stocks | 254,125 | — | — | 254,125 | ||||||||
| Money Market Fund | 1,120,000 | — | — | 1,120,000 | ||||||||
| Total Investments in Securities* | $ | 72,594,190 | $ | — | $ | — | $ | 72,594,190 |
| * | The Portfolio of Investments provides information on the industry categorization for the portfolio. |
| There were no transfers into or from Level 1 and Level 2 by the Fund during the period ended | |
| June 30, 2011. |
| See notes to financial statements | 65 |
Statements of Assets and Liabilities
FIRST INVESTORS LIFE SERIES FUNDS
June 30, 2011
| CASH | GROWTH & | |||||||||||||||||
| BLUE CHIP | MANAGEMENT | DISCOVERY | GOVERNMENT | INCOME | HIGH YIELD | |||||||||||||
| Assets | ||||||||||||||||||
| Investments in securities: | ||||||||||||||||||
| Cost — Unaffiliated issuers | $ | 88,502,365 | $ | 10,156,911 | $ | 114,652,643 | $ | 26,702,287 | $ | 179,356,966 | $ | 68,532,062 | ||||||
| Cost — Affiliated money market fund (Note 3) | 850,000 | — | 13,705,000 | — | — | — | ||||||||||||
| Total cost of investments | $ | 89,352,365 | $ | 10,156,911 | $ | 128,357,643 | $ | 26,702,287 | $ | 179,356,966 | $ | 68,532,062 | ||||||
| Value — Unaffiliated issuers (Note 1A) | $ | 125,542,192 | $ | 10,156,911 | $ | 146,466,418 | $ | 27,483,734 | $ | 221,630,898 | $ | 70,451,459 | ||||||
| Value — Affiliated money market fund (Note 3) | 850,000 | — | 13,705,000 | — | — | — | ||||||||||||
| Total value of investments | 126,392,192 | 10,156,911 | 160,171,418 | 27,483,734 | 221,630,898 | 70,451,459 | ||||||||||||
| Cash | 116,017 | 146,553 | 114,506 | 77,198 | — | 2,162,499 | ||||||||||||
| Receivables: | ||||||||||||||||||
| Investment securities sold | 1,549,434 | — | 207,168 | — | 1,310,870 | 291,406 | ||||||||||||
| Interest and dividends | 192,110 | 5,092 | 113,903 | 128,799 | 272,899 | 1,280,249 | ||||||||||||
| Trust shares sold | 18,457 | 24,555 | 134,643 | 4,957 | 81,516 | 25,985 | ||||||||||||
| Other assets | 15,075 | 1,248 | 16,697 | 3,473 | 23,772 | 8,720 | ||||||||||||
| Total Assets | 128,283,285 | 10,334,359 | 160,758,335 | 27,698,161 | 223,319,955 | 74,220,318 | ||||||||||||
| Liabilities | ||||||||||||||||||
| Cash overdraft | — | — | — | — | 277,890 | — | ||||||||||||
| Payables: | ||||||||||||||||||
| Investment securities purchased | 1,152,164 | — | 95,876 | — | 725,565 | 503,323 | ||||||||||||
| Trust shares redeemed | 61,588 | 319,811 | 73,480 | 27,405 | 62,174 | 32,808 | ||||||||||||
| Accrued advisory fees | 76,533 | — | 96,980 | 13,677 | 132,392 | 45,402 | ||||||||||||
| Accrued expenses | 13,783 | 6,572 | 14,423 | 10,792 | 17,939 | 16,611 | ||||||||||||
| Total Liabilities | 1,304,068 | 326,383 | 280,759 | 51,874 | 1,215,960 | 598,144 | ||||||||||||
| Net Assets | $ | 126,979,217 | $ | 10,007,976 | $ | 160,477,576 | $ | 27,646,287 | $ | 222,103,995 | $ | 73,622,174 | ||||||
| Net Assets Consist of: | ||||||||||||||||||
| Capital paid in | $ | 99,053,412 | $ | 10,007,976 | $ | 114,674,399 | $ | 26,948,847 | $ | 199,534,214 | $ | 97,220,023 | ||||||
| Undistributed net investment income | 935,938 | — | 242,820 | 371,170 | 1,462,899 | 2,354,579 | ||||||||||||
| Accumulated net realized gain (loss) on investments | (10,049,960 | ) | — | 13,746,582 | (455,177 | ) | (21,167,050 | ) | (27,871,825 | ) | ||||||||
| Net unrealized appreciation of investments | 37,039,827 | — | 31,813,775 | 781,447 | 42,273,932 | 1,919,397 | ||||||||||||
| Total | $ | 126,979,217 | $ | 10,007,976 | $ | 160,477,576 | $ | 27,646,287 | $ | 222,103,995 | $ | 73,622,174 | ||||||
| Shares of beneficial interest outstanding (Note 2) | 5,817,599 | 10,007,976 | 4,794,987 | 2,704,014 | 7,299,801 | 11,633,032 | ||||||||||||
| Net asset value, offering and redemption price per share — | ||||||||||||||||||
| (Net assets divided by shares outstanding) | $ | 21.83 | $ | 1.00 | $ | 33.47 | $ | 10.22 | $ | 30.43 | $ | 6.33 | ||||||
| 66 | See notes to financial statements | 67 |
Statements of Assets and Liabilities
FIRST INVESTORS LIFE SERIES FUNDS
June 30, 2011
| INVESTMENT | SELECT | TARGET | |||||||||||||
| INTERNATIONAL | GRADE | GROWTH | MATURITY 2015 | VALUE | |||||||||||
| Assets | |||||||||||||||
| Investments in securities: | |||||||||||||||
| Cost — Unaffiliated issuers | $ | 80,559,362 | $ | 40,772,243 | $ | 12,795,370 | $ | 22,754,531 | $ | 58,865,026 | |||||
| Cost — Affiliated money market fund (Note 3) | 1,250,000 | — | — | — | 1,120,000 | ||||||||||
| Total cost of investments | $ | 81,809,362 | $ | 40,772,243 | $ | 12,795,370 | $ | 22,754,531 | $ | 59,985,026 | |||||
| Value — Unaffiliated issuers (Note 1A) | $ | 113,977,230 | $ | 43,465,345 | $ | 16,849,106 | $ | 26,736,258 | $ | 71,474,190 | |||||
| Value — Affiliated money market fund (Note 3) | 1,250,000 | — | — | — | 1,120,000 | ||||||||||
| Total value of investments | 115,227,230 | 43,465,345 | 16,849,106 | 26,736,258 | 72,594,190 | ||||||||||
| Cash | 92,003 | 535,155 | 379,558 | 21,054 | 107,446 | ||||||||||
| Receivables: | |||||||||||||||
| Investment securities sold | — | — | 528,268 | — | 130,859 | ||||||||||
| Interest and dividends | 423,781 | 554,394 | 16,872 | — | 139,317 | ||||||||||
| Trust shares sold | 11,823 | 72,754 | 606 | 528 | 8,909 | ||||||||||
| Other assets | 13,260 | 5,308 | 1,408 | 3,599 | 8,387 | ||||||||||
| Total Assets | 115,768,097 | 44,632,956 | 17,775,818 | 26,761,439 | 72,989,108 | ||||||||||
| Liabilities | |||||||||||||||
| Payables: | |||||||||||||||
| Investment securities purchased | 194,234 | — | 545,025 | — | 19,484 | ||||||||||
| Trust shares redeemed | 41,394 | 12,283 | 15,592 | 7,473 | 37,354 | ||||||||||
| Accrued advisory fees | 69,748 | 22,147 | 10,153 | 13,321 | 43,976 | ||||||||||
| Accrued expenses | 37,730 | 10,898 | 7,759 | 8,640 | 11,151 | ||||||||||
| Total Liabilities | 343,106 | 45,328 | 578,529 | 29,434 | 111,965 | ||||||||||
| Net Assets | $ | 115,424,991 | $ | 44,587,628 | $ | 17,197,289 | $ | 26,732,005 | $ | 72,877,143 | |||||
| Net Assets Consist of: | |||||||||||||||
| Capital paid in | $ | 112,038,031 | $ | 44,973,684 | $ | 16,533,837 | $ | 22,153,047 | $ | 64,231,624 | |||||
| Undistributed net investment income | 2,452,368 | 674,165 | 7,982 | 531,791 | 680,234 | ||||||||||
| Accumulated net realized gain (loss) on investments | |||||||||||||||
| and foreign security transactions | (32,486,883 | ) | (3,753,323 | ) | (3,398,266 | ) | 65,440 | (4,643,879 | ) | ||||||
| Net unrealized appreciation in value of investments | |||||||||||||||
| and foreign security transactions | 33,421,475 | 2,693,102 | 4,053,736 | 3,981,727 | 12,609,164 | ||||||||||
| Total | $ | 115,424,991 | $ | 44,587,628 | $ | 17,197,289 | $ | 26,732,005 | $ | 72,877,143 | |||||
| Shares of beneficial interest outstanding (Note 2) | 6,570,659 | 4,213,464 | 1,888,921 | 1,707,658 | 4,701,400 | ||||||||||
| Net asset value, offering and redemption price per share — | |||||||||||||||
| (Net assets divided by shares outstanding) | $ | 17.57 | $ | 10.58 | $ | 9.10 | $ | 15.65 | $ | 15.50 | |||||
| 68 | See notes to financial statements | 69 |
Statements of Operations
FIRST INVESTORS LIFE SERIES FUNDS
Six Months Ended June 30, 2011
| CASH | GROWTH & | |||||||||||||||||
| BLUE CHIP | MANAGEMENT | DISCOVERY | GOVERNMENT | INCOME | HIGH YIELD | |||||||||||||
| Investment Income | ||||||||||||||||||
| Income: | ||||||||||||||||||
| Interest | $ | — | $ | 8,873 | $ | — | $ | 491,932 | $ | — | $ | 2,756,422 | ||||||
| Dividends | 1,456,822 | (a) | — | 884,106 | — | 2,337,749 | (b) | — | ||||||||||
| Dividends from affiliate (Note 3) | 533 | — | 7,425 | — | 745 | 523 | ||||||||||||
| Total income | 1,457,355 | 8,873 | 891,531 | 491,932 | 2,338,494 | 2,756,945 | ||||||||||||
| Expenses (Notes 1 and 4): | ||||||||||||||||||
| Advisory fees | 473,945 | 41,411 | 595,148 | 101,358 | 805,199 | 271,992 | ||||||||||||
| Professional fees | 20,838 | 8,028 | 20,248 | 24,701 | 27,223 | 13,403 | ||||||||||||
| Custodian fees and expenses | 2,785 | 3,211 | 5,853 | 5,617 | 5,797 | 8,613 | ||||||||||||
| Reports and notices to shareholders | 10,996 | 2,148 | 12,376 | 2,958 | 17,765 | 7,290 | ||||||||||||
| Registration fees | 75 | 60 | 1,056 | 75 | 75 | 75 | ||||||||||||
| Trustees’ fees | 3,218 | 290 | 4,017 | 691 | 5,433 | 1,834 | ||||||||||||
| Other expenses | 10,244 | 312 | 10,923 | 5,738 | 15,329 | 21,757 | ||||||||||||
| Total expenses | 522,101 | 55,460 | 649,621 | 141,138 | 876,821 | 324,964 | ||||||||||||
| Less: Expenses waived | — | (46,315 | ) | — | (20,272 | ) | — | — | ||||||||||
| Expenses paid indirectly | (735 | ) | (272 | ) | (923 | ) | (118 | ) | (1,249 | ) | (321 | ) | ||||||
| Net expenses | 521,366 | 8,873 | 648,698 | 120,748 | 875,572 | 324,643 | ||||||||||||
| Net investment income | 935,989 | — | 242,833 | 371,184 | 1,462,922 | 2,432,302 | ||||||||||||
| Realized and Unrealized Gain (Loss) on Investments | ||||||||||||||||||
| (Note 3): | ||||||||||||||||||
| Net realized gain on investments | 2,116,574 | — | 15,096,967 | 107,245 | 2,492,619 | 1,494,929 | ||||||||||||
| Net unrealized appreciation (depreciation) of investments | 3,907,395 | — | (4,538,715 | ) | 161,276 | 14,657,465 | (960,384 | ) | ||||||||||
| Net gain on investments | 6,023,969 | — | 10,558,252 | 268,521 | 17,150,084 | 534,545 | ||||||||||||
| Net Increase in Net Assets Resulting | ||||||||||||||||||
| from Operations | $ | 6,959,958 | $ | — | $ | 10,801,085 | $ | 639,705 | $ | 18,613,006 | $ | 2,966,847 | ||||||
(a) Net of $9,092 foreign taxes withheld
(b) Net of $18,360 foreign taxes withheld
| 70 | See notes to financial statements | 71 |
Statements of Operations
FIRST INVESTORS LIFE SERIES FUNDS
Six Months Ended June 30, 2011
| INVESTMENT | SELECT | TARGET | ||||||||||||||
| INTERNATIONAL | GRADE | GROWTH | MATURITY 2015 | VALUE | ||||||||||||
| Investment Income | ||||||||||||||||
| Income: | ||||||||||||||||
| Interest | $ | 227 | $ | 1,091,349 | $ | — | $ | 628,695 | $ | — | ||||||
| Dividends | 2,093,591 | (c) | — | 77,575 | — | 983,252 | (d) | |||||||||
| Dividends from affiliate (Note 3) | 330 | 290 | — | — | 1,122 | |||||||||||
| Total income | 2,094,148 | 1,091,639 | 77,575 | 628,695 | 984,374 | |||||||||||
| Expenses (Notes 1 and 4): | ||||||||||||||||
| Advisory fees | 409,140 | 162,673 | 57,857 | 101,724 | 271,383 | |||||||||||
| Professional fees | 33,553 | 8,863 | 6,197 | 7,482 | 13,729 | |||||||||||
| Custodian fees and expenses | 77,814 | 4,621 | 1,628 | 1,142 | 2,611 | |||||||||||
| Reports and notices to shareholders | 9,327 | 4,540 | 2,066 | 2,858 | 6,765 | |||||||||||
| Registration fees | 75 | 75 | 75 | 90 | 61 | |||||||||||
| Trustees’ fees | 2,760 | 1,096 | 380 | 698 | 1,841 | |||||||||||
| Other expenses | 13,927 | 7,389 | 1,466 | 3,360 | 8,172 | |||||||||||
| Total expenses | 546,596 | 189,257 | 69,669 | 117,354 | 304,562 | |||||||||||
| Less: | Expenses waived | — | (32,535 | ) | — | (20,345 | ) | — | ||||||||
| Expenses paid indirectly | (634 | ) | (190 | ) | (90 | ) | (119 | ) | (421 | ) | ||||||
| Net expenses | 545,962 | 156,532 | 69,579 | 96,890 | 304,141 | |||||||||||
| Net investment income | 1,548,186 | 935,107 | 7,996 | 531,805 | 680,233 | |||||||||||
| Realized and Unrealized Gain (Loss) on Investments | ||||||||||||||||
and Foreign Currency Transactions (Notes 3 and 7): | ||||||||||||||||
| Net realized gain (loss) on: | ||||||||||||||||
| Investments | 2,984,505 | 497,570 | 940,383 | 79,205 | 748,925 | |||||||||||
| Foreign currency transactions | (1,496,493 | ) | — | — | — | — | ||||||||||
| Net realized gain on investments and foreign | ||||||||||||||||
| currency transactions | 1,488,012 | 497,570 | 940,383 | 79,205 | 748,925 | |||||||||||
| Net unrealized appreciation of: | ||||||||||||||||
| Investments | 4,147,720 | 84,560 | 946,109 | 207,391 | 2,110,405 | |||||||||||
| Foreign currency transactions | 895,333 | — | — | — | — | |||||||||||
| Net unrealized appreciation on investments and foreign | ||||||||||||||||
| currency transactions | 5,043,053 | 84,560 | 946,109 | 207,391 | 2,110,405 | |||||||||||
| Net gain on investments and foreign | ||||||||||||||||
| currency transactions | 6,531,065 | 582,130 | 1,886,492 | 286,596 | 2,859,330 | |||||||||||
| Net Increase in Net Assets Resulting | ||||||||||||||||
| from Operations | $ | 8,079,251 | $ | 1,517,237 | $ | 1,894,488 | $ | 818,401 | $ | 3,539,563 | ||||||
(c) Net of $179,121 foreign taxes withheld
(d) Net of $11,666 foreign taxes withheld
| 72 | See notes to financial statements | 73 |
Statements of Changes in Net Assets
FIRST INVESTORS LIFE SERIES FUNDS
| BLUE CHIP | CASH MANAGEMENT | DISCOVERY | GOVERNMENT | |||||||||||||||||||||
| 1/1/11 to | 1/1/10 to | 1/1/11 to | 1/1/10 to | 1/1/11 to | 1/1/10 to | 1/1/11 to | 1/1/10 to | |||||||||||||||||
| 6/30/11 | 12/31/10 | 6/30/11 | 12/31/10 | 6/30/11 | 12/31/10 | 6/30/11 | 12/31/10 | |||||||||||||||||
| Increase (Decrease) in Net Assets From Operations | ||||||||||||||||||||||||
| Net investment income | $ | 935,989 | $ | 1,761,801 | $ | — | $ | — | $ | 242,833 | $ | 777,225 | $ | 371,184 | $ | 839,439 | ||||||||
| Net realized gain on investments | 2,116,574 | 3,948,811 | — | — | 15,096,967 | 12,465,705 | 107,245 | 258,494 | ||||||||||||||||
| Net unrealized appreciation (depreciation) | ||||||||||||||||||||||||
| of investments | 3,907,395 | 5,846,267 | — | — | (4,538,715 | ) | 19,044,427 | 161,276 | 135,067 | |||||||||||||||
| Net increase in net assets resulting from operations | 6,959,958 | 11,556,879 | — | — | 10,801,085 | 32,287,357 | 639,705 | 1,233,000 | ||||||||||||||||
| Dividends to Shareholders | ||||||||||||||||||||||||
| Net investment income | (1,761,805 | ) | (1,905,253 | ) | — | — | (777,234 | ) | (1,116,657 | ) | (941,760 | ) | (1,061,623 | ) | ||||||||||
| Trust Share Transactions * | ||||||||||||||||||||||||
| Proceeds from shares sold | 973,583 | 1,700,928 | 8,429,458 | 10,508,677 | 2,172,141 | 2,310,619 | 1,378,057 | 4,159,375 | ||||||||||||||||
| Reinvestment of dividends | 1,761,805 | 1,905,253 | — | — | 777,234 | 1,116,657 | 941,760 | 1,061,623 | ||||||||||||||||
| Cost of shares redeemed | (4,816,056 | ) | (10,258,555 | ) | (10,760,356 | ) | (9,080,933 | ) | (4,390,086 | ) | (9,336,535 | ) | (2,090,882 | ) | (3,681,458 | ) | ||||||||
| Net increase (decrease) from trust share transactions | (2,080,668 | ) | (6,652,374 | ) | (2,330,898 | ) | 1,427,744 | (1,440,711 | ) | (5,909,259 | ) | 228,935 | 1,539,540 | |||||||||||
| Net increase (decrease) in net assets | 3,117,485 | 2,999,252 | (2,330,898 | ) | 1,427,744 | 8,583,140 | 25,261,441 | (73,120 | ) | 1,710,917 | ||||||||||||||
| Net Assets | ||||||||||||||||||||||||
| Beginning of period | 123,861,732 | 120,862,480 | 12,338,874 | 10,911,130 | 151,894,436 | 126,632,995 | 27,719,407 | 26,008,490 | ||||||||||||||||
| End of period † | $ | 126,979,217 | $ | 123,861,732 | $ | 10,007,976 | $ | 12,338,874 | $ | 160,477,576 | $ | 151,894,436 | $ | 27,646,287 | $ | 27,719,407 | ||||||||
| †Includes undistributed net investment income of | $ | 935,938 | $ | 1,761,754 | $ | — | $ | — | $ | 242,820 | $ | 777,221 | $ | 371,170 | $ | 941,746 | ||||||||
| *Trust Shares Issued and Redeemed | ||||||||||||||||||||||||
| Sold | 44,939 | 87,553 | 8,429,458 | 10,508,677 | 65,436 | 85,919 | 135,622 | 404,081 | ||||||||||||||||
| Issued for dividends reinvested | 81,003 | 101,074 | — | — | 23,326 | 44,400 | 94,082 | 105,740 | ||||||||||||||||
| Redeemed | (222,223 | ) | (532,405 | ) | (10,760,356 | ) | (9,080,933 | ) | (132,394 | ) | (352,295 | ) | (204,492 | ) | (357,487 | ) | ||||||||
| Net increase (decrease) in trust shares outstanding | (96,281 | ) | (343,778 | ) | (2,330,898 | ) | 1,427,744 | (43,632 | ) | (221,976 | ) | 25,212 | 152,334 | |||||||||||
| 74 | See notes to financial statements | 75 |
Statements of Changes in Net Assets
FIRST INVESTORS LIFE SERIES FUNDS
| GROWTH & INCOME | HIGH YIELD | INTERNATIONAL | INVESTMENT GRADE | |||||||||||||||||||||
| 1/1/11 to | 1/1/10 to | 1/1/11 to | 1/1/10 to | 1/1/11 to | 1/1/10 to | 1/1/11 to | 1/1/10 to | |||||||||||||||||
| 6/30/11 | 12/31/10 | 6/30/11 | 12/31/10 | 6/30/11 | 12/31/10 | 6/30/11 | 12/31/10 | |||||||||||||||||
| Increase (Decrease) in Net Assets From Operations | ||||||||||||||||||||||||
| Net investment income | $ | 1,462,922 | $ | 3,610,508 | $ | 2,432,302 | $ | 5,054,098 | $ | 1,548,186 | $ | 2,186,108 | $ | 935,107 | $ | 1,903,757 | ||||||||
| Net realized gain (loss) on investments | 2,492,619 | (4,294,539 | ) | 1,494,929 | 916,983 | 1,488,012 | (64,097 | ) | 497,570 | 1,585,170 | ||||||||||||||
| Net unrealized appreciation (depreciation) | ||||||||||||||||||||||||
| of investments and foreign currency transactions | 14,657,465 | 29,726,354 | (960,384 | ) | 2,687,951 | 5,043,053 | 10,943,740 | 84,560 | 104,952 | |||||||||||||||
| Net increase in net assets resulting from operations | 18,613,006 | 29,042,323 | 2,966,847 | 8,659,032 | 8,079,251 | 13,065,751 | 1,517,237 | 3,593,879 | ||||||||||||||||
| Dividends to Shareholders | ||||||||||||||||||||||||
| Net investment income | (3,610,453 | ) | (2,050,814 | ) | (5,160,095 | ) | (5,168,287 | ) | (2,350,061 | ) | — | (2,081,740 | ) | (1,995,057 | ) | |||||||||
| Trust Share Transactions * | ||||||||||||||||||||||||
| Proceeds from shares sold | 2,436,119 | 3,788,063 | 2,404,269 | 2,458,561 | 1,758,266 | 2,221,935 | 2,759,326 | 4,542,717 | ||||||||||||||||
| Reinvestment of dividends | 3,610,453 | 2,050,814 | 5,160,095 | 5,168,287 | 2,350,061 | — | 2,081,740 | 1,995,057 | ||||||||||||||||
| Cost of shares redeemed | (6,245,468 | ) | (12,930,165 | ) | (2,404,501 | ) | (6,379,151 | ) | (2,960,436 | ) | (7,574,668 | ) | (2,512,310 | ) | (4,320,083 | ) | ||||||||
| Net increase (decrease) from trust share transactions | (198,896 | ) | (7,091,288 | ) | 5,159,863 | 1,247,697 | 1,147,891 | (5,352,733 | ) | 2,328,756 | 2,217,691 | |||||||||||||
| Net increase in net assets | 14,803,657 | 19,900,221 | 2,966,615 | 4,738,442 | 6,877,081 | 7,713,018 | 1,764,253 | 3,816,513 | ||||||||||||||||
| Net Assets | ||||||||||||||||||||||||
| Beginning of period | 207,300,338 | 187,400,117 | 70,655,559 | 65,917,117 | 108,547,910 | 100,834,892 | 42,823,375 | 39,006,862 | ||||||||||||||||
| End of period † | $ | 222,103,995 | $ | 207,300,338 | $ | 73,622,174 | $ | 70,655,559 | $ | 115,424,991 | $ | 108,547,910 | $ | 44,587,628 | $ | 42,823,375 | ||||||||
| †Includes undistributed net investment income of | $ | 1,462,899 | $ | 3,610,430 | $ | 2,354,579 | $ | 5,082,372 | $ | 2,452,368 | $ | 3,254,243 | $ | 674,165 | $ | 1,820,798 | ||||||||
| *Trust Shares Issued and Redeemed | ||||||||||||||||||||||||
| Sold | 82,101 | 148,800 | 373,070 | 393,361 | 104,776 | 145,824 | 260,589 | 429,611 | ||||||||||||||||
| Issued for dividends reinvested | 122,264 | 84,084 | 822,982 | 889,550 | 144,619 | — | 201,329 | 198,513 | ||||||||||||||||
| Redeemed | (211,500 | ) | (514,577 | ) | (372,178 | ) | (1,029,775 | ) | (177,185 | ) | (495,382 | ) | (237,038 | ) | (409,825 | ) | ||||||||
| Net increase (decrease) in trust shares outstanding | (7,135 | ) | (281,693 | ) | 823,874 | 253,136 | 72,210 | (349,558 | ) | 224,880 | 218,299 | |||||||||||||
| 76 | See notes to financial statements | 77 |
Statements of Changes in Net Assets
FIRST INVESTORS LIFE SERIES FUNDS
| SELECT GROWTH | TARGET MATURITY 2015 | VALUE | ||||||||||||||||
| 1/1/11 to | 1/1/10 to | 1/1/11 to | 1/1/10 to | 1/1/11 to | 1/1/10 to | |||||||||||||
| 6/30/11 | 12/31/10 | 6/30/11 | 12/31/10 | 6/30/11 | 12/31/10 | |||||||||||||
| Increase (Decrease) in Net Assets From Operations | ||||||||||||||||||
| Net investment income | $ | 7,996 | $ | 22,827 | $ | 531,805 | $ | 1,064,164 | $ | 680,233 | $ | 1,450,280 | ||||||
| Net realized gain on investments | 940,383 | 503,659 | 79,205 | 375,640 | 748,925 | 2,968,227 | ||||||||||||
| Net unrealized appreciation of investments | 946,109 | 1,823,595 | 207,391 | 795,110 | 2,110,405 | 4,538,379 | ||||||||||||
| Net increase in net assets resulting from operations | 1,894,488 | 2,350,081 | 818,401 | 2,234,914 | 3,539,563 | 8,956,886 | ||||||||||||
| Distributions to Shareholders | ||||||||||||||||||
| Net investment income | (22,822 | ) | (20,097 | ) | (1,064,157 | ) | (1,102,367 | ) | (1,450,240 | ) | (1,385,162 | ) | ||||||
| Net realized gains | — | — | (375,599 | ) | (130,516 | ) | — | — | ||||||||||
| Total distributions | (22,822 | ) | (20,097 | ) | (1,439,756 | ) | (1,232,883 | ) | (1,450,240 | ) | (1,385,162 | ) | ||||||
| Trust Share Transactions* | ||||||||||||||||||
| Proceeds from shares sold | 1,797,117 | 1,795,150 | 645,534 | 2,702,248 | 1,425,558 | 2,912,201 | ||||||||||||
| Reinvestment of distributions | 22,822 | 20,097 | 1,439,756 | 1,232,883 | 1,450,240 | 1,385,162 | ||||||||||||
| Cost of shares redeemed | (367,765 | ) | (715,099 | ) | (2,701,544 | ) | (4,459,020 | ) | (3,041,155 | ) | (6,733,297 | ) | ||||||
| Net increase (decrease) from trust share transactions | 1,452,174 | 1,100,148 | (616,254 | ) | (523,889 | ) | (165,357 | ) | (2,435,934 | ) | ||||||||
| Net increase (decrease) in net assets | 3,323,840 | 3,430,132 | (1,237,609 | ) | 478,142 | 1,923,966 | 5,135,790 | |||||||||||
| Net Assets | ||||||||||||||||||
| Beginning of period | 13,873,449 | 10,443,317 | 27,969,614 | 27,491,472 | 70,953,177 | 65,817,387 | ||||||||||||
| End of period † | $ | 17,197,289 | $ | 13,873,449 | $ | 26,732,005 | $ | 27,969,614 | $ | 72,877,143 | $ | 70,953,177 | ||||||
| †Includes undistributed net investment income of | $ | 7,982 | $ | 22,808 | $ | 531,791 | $ | 1,064,143 | $ | 680,234 | $ | 1,450,241 | ||||||
| *Trust Shares Issued and Redeemed | ||||||||||||||||||
| Sold | 205,262 | 255,872 | 40,979 | 166,796 | 92,428 | 211,998 | ||||||||||||
| Issued for distributions reinvested | 2,660 | 3,036 | 94,659 | 81,218 | 93,684 | 105,176 | ||||||||||||
| Redeemed | (43,033 | ) | (102,987 | ) | (173,426 | ) | (281,934 | ) | (197,202 | ) | (495,982 | ) | ||||||
| Net increase (decrease) in trust shares outstanding | 164,889 | 155,921 | (37,788 | ) | (33,920 | ) | (11,090 | ) | (178,808 | ) | ||||||||
| 78 | See notes to financial statements | 79 |
Notes to Financial Statements
FIRST INVESTORS LIFE SERIES FUNDS
June 30, 2011
1. Significant Accounting Policies—First Investors Life Series Funds, a Delaware statutory trust (“the Trust”), is registered under the Investment Company Act of 1940 (the “1940 Act”) as a diversified, open-end management investment company. The Trust operates as a series fund, issuing shares of beneficial interest in the Blue Chip Fund, Cash Management Fund, Discovery Fund, Government Fund, Growth & Income Fund, High Yield Fund, International Fund, Investment Grade Fund, Select Growth Fund, Target Maturity 2015 Fund and Value Fund (each a “Fund”, collectively, “the Funds”), and accounts separately for the assets, liabilities and operations of each Fund. The objective of each Fund is as follows:
Blue Chip Fund seeks high total investment return.
Cash Management Fund seeks to earn a high rate of current income consistent with the preservation of capital and maintenance of liquidity.
Discovery Fund seeks long-term growth of capital.
Government Fund seeks to achieve a significant level of current income which is consistent with security and liquidity of principal.
Growth & Income Fund seeks long-term growth of capital and current income.
High Yield Fund seeks high current income.
International Fund primarily seeks long-term capital growth.
Investment Grade Fund seeks to generate a maximum level of income consistent with investment in investment grade debt securities.
Select Growth Fund seeks long-term growth of capital.
Target Maturity 2015 Fund seeks a predictable compounded investment return for investors who hold their Fund shares until the Fund’s maturity, consistent with the preservation of capital.
Value Fund seeks total return.
A. Security Valuation—Except as provided below, a security listed or traded on an exchange or the Nasdaq Stock Market is valued at its last sale price on the exchange or market where the security is principally traded, and lacking any sales, the security is valued at the mean between the closing bid and asked prices. Securities traded in the over-the-counter (“OTC”) market (including securities listed on exchanges whose primary market is believed to be OTC) are valued at the mean between the last bid and asked prices based on quotes furnished by a market maker for such securities. Securities may also be priced by pricing services approved by the Trust’s
| 80 |
Board of Trustees (“the Board”). The pricing services consider security type, rating, market condition and yield data as well as market quotations, prices provided by market makers and other available information in determining value. Short-term debt securities that mature in 60 days or less are valued at amortized cost.
The Funds monitor for significant events occurring prior to the close of trading on the New York Stock Exchange that could have a material impact on the value of any securities that are held by the Funds. Examples of such events include trading halts, natural disasters, political events and issuer-specific developments. If First Investors Management Company, Inc.’s (“FIMCO”) Valuation Committee decides that such events warrant using fair value estimates, it will take such events into consideration in determining the fair values of such securities. If market quotations or prices are not readily available or determined to be unreliable, the securities will be valued at fair value as determined in good faith pursuant to procedures adopted by the Board. The Funds also use a pricing service to fair value foreign securities in the event that fluctuations in U.S. securities markets exceed a predetermined level or if a foreign market is closed. For valuation purposes, where applicable, quotations of foreign securities in foreign currency are translated to U.S. dollar equivalents using the foreign exchange quotation in effect. At June 30, 2011, the High Yield Fund held two securities that were fair valued by FIMCO’s Valuation Committee with an aggregate value of $375 representing 0% of the Fund’s net assets. At June 30, 2011, fair value pricing was used for certain foreign securities in the International Fund portfolio.
The Cash Management Fund values its portfolio securities in accordance with the amortized cost method of valuation under Rule 2a-7 under the 1940 Act. Amortized cost is an approximation of market value of an instrument, whereby the difference between its acquisition cost and market value at maturity is amortized on a straight-line basis over the remaining life of the instrument. The effect of changes in the market value of a security as a result of fluctuating interest rates is not taken into account and thus the amortized cost method of valuation may result in the value of a security being higher or lower than its actual market value.
In accordance with Accounting Standards Codification (“ASC”) 820 “Fair Value Measurements and Disclosures” (“ASC 820”), investments held by the Funds are carried at “fair value”. As defined by ASC 820, fair value is the price that a fund would receive upon selling an investment in an orderly transaction to an independent buyer in the principal or most advantageous market for the investment under current market conditions. Various inputs are used in determining the value of the Funds’ investments.
| 81 |
Notes to Financial Statements (continued)
FIRST INVESTORS LIFE SERIES FUNDS
June 30, 2011
In addition to defining fair value, ASC 820 established a three-tier hierarchy of inputs to establish a classification of fair value measurements for disclosure purposes. The three-tier hierarchy of inputs is summarized in the three broad Levels listed below:
Level 1 — Unadjusted quoted prices in active markets for identical securities that the Fund has the ability to access.
Level 2 — Observable inputs other than quoted prices included in Level 1 that are observable for the asset or liability, either directly or indirectly. These inputs may include quoted prices for the identical instrument on an inactive market, prices for similar instruments, interest rates, prepayment speeds, credit risk, yield curves, default rates and similar data.
Level 3 — Unobservable inputs for the asset or liability, to the extent relevant observable inputs are not available, representing the Fund’s own assumption about the assumptions a market participant would use in valuing the asset or liability, and would be based on the best information available.
Equity securities traded on an exchange or the Nasdaq Stock Market are categorized in Level 1 of the fair value hierarchy to the extent that they are actively traded and valuation adjustments are not applied. Foreign securities that are fair valued in the event that fluctuations in U.S. securities markets exceed a predetermined level or if a foreign market is closed are categorized in Level 2. Corporate and municipal bonds, asset backed, U.S. Government and U.S. Government Agency securities are categorized in Level 2 to the extent that the inputs are observable and timely, otherwise they would be categorized as Level 3. Short-term notes that are valued at amortized cost are categorized in Level 2. Investments in the affiliated unregistered money market fund are categorized as Level 1. Foreign exchange contracts that are considered derivative instruments and are valued at the net unrealized appreciation or depreciation on the instruments are categorized in Level 2. Restricted securities and securities that are fair valued by FIMCO’s Valuation Committee may be categorized in either Level 2 or Level 3 of the fair value hierarchy depending on the relative significance of valuation inputs.
The aggregate value by input level, as of June 30, 2011, for each Fund’s investments is included at the end of each Fund’s portfolio of investments.
B. Federal Income Tax—No provision has been made for federal income taxes on net income or capital gains since it is the policy of each Fund to continue to comply with the special provisions of the Internal Revenue Code applicable to investment companies, and to make sufficient distributions of income and capital gains (in excess
| 82 |
of any available capital loss carryovers), to relieve each Fund from all, or substantially all, federal income taxes. At December 31, 2010, capital loss carryovers were as follows:
| Year Capital Loss Carryovers Expire | |||||||||||||||||||||||||||
| Fund | Total | 2011 | 2012 | 2013 | 2014 | 2015 | 2016 | 2017 | 2018 | ||||||||||||||||||
| Blue Chip | $10,146,550 | $4,132,026 | $ | — | $ | — | $ | — | $ | — | $ | 3,493,173 | $ | 2,521,351 | $ | — | |||||||||||
| Discovery | 551,263 | — | — | — | — | — | — | 551,263 | — | ||||||||||||||||||
| Government | 562,422 | 102,584 | 51,149 | 193,688 | 177,059 | 37,942 | — | — | — | ||||||||||||||||||
| Growth & Income | 23,482,697 | — | — | — | — | — | 13,700,802 | 5,518,321 | 4,263,574 | ||||||||||||||||||
| High Yield* | 29,365,254 | 5,337,824 | 1,392,331 | 1,059,640 | 1,944,836 | 433,726 | 3,694,844 | 15,502,053 | — | ||||||||||||||||||
| International | 33,046,863 | — | — | — | — | — | 23,624,881 | 8,389,229 | 1,032,753 | ||||||||||||||||||
| Investment Grade | 4,250,893 | — | — | — | — | — | 3,105,792 | 1,145,101 | — | ||||||||||||||||||
| Select Growth | 4,337,113 | — | — | — | — | — | 2,834,582 | 1,502,531 | — | ||||||||||||||||||
| Value | 5,385,580 | 1,198,371 | — | — | — | — | 3,055,616 | 1,131,593 | — | ||||||||||||||||||
*Due to a tax free reorganization on August 10, 2007 with the Special Bond Fund that was approved by the Life Series Funds’ Board of Trustees, the Fund will have available for utilization $1,630,437 in capital loss carryovers that will become available at $601,552 per year for the taxable years 2011 through 2012 and $427,333 for taxable year 2013. These capital loss carryovers will expire as follows: $601,552 in 2011; $212,617 in 2012; $153,634 in 2013; and $662,634 in 2014.
As a result of the passage of the Regulated Investment Modernization Act of 2011, losses incurred in this fiscal year and beyond will retain their character short-term or long-term, and will have no expiration date.
The Funds recognize the tax benefits of uncertain tax positions only where the position is “more likely than not” to be sustained assuming examination by tax authorities. Management has analyzed the Funds’ tax positions, and has concluded that no liability for unrecognized tax benefits should be recorded related to uncertain tax positions taken on returns filed for open tax years 2008–2010, or expected to be taken in the Funds’ 2011 tax returns. The Funds identify their major tax jurisdictions as U.S. Federal, New York State, New York City and foreign jurisdictions where the Funds make significant investments; however, the Funds are not aware of any tax position for which it is reasonably possible that the total amounts of unrecognized tax benefits will change materially in the next twelve months.
C. Foreign Currency Translations—The accounting records of the International Fund are maintained in U.S. dollars. Portfolio securities and other assets and liabilities denominated in foreign currencies are translated into U.S. dollars at the date of valuation. Purchases and sales of investment securities, dividend income and certain
| 83 |
Notes to Financial Statements (continued)
FIRST INVESTORS LIFE SERIES FUNDS
June 30, 2011
expenses are translated to U.S. dollars at the prevailing rates of exchange on the respective dates of such transactions.
The International Fund does not isolate that portion of gains and losses on investments which is due to changes in foreign exchange rates from that which is due to changes in market prices of the investments. These changes are included with the net realized and unrealized gains and losses from investments.
Net realized and unrealized gains and losses on foreign currency transactions include gains and losses from the sales of foreign currency and gains and losses on accrued foreign dividends and related withholding taxes.
D. Distributions to Shareholders—Distributions to shareholders from net investment income and net realized capital gains are generally declared and paid annually on all Funds, except for the Cash Management Fund which declares dividends, if any, from the total of net investment income (plus or minus all realized short-term gains and losses on investments) daily and pays monthly. Dividends from net investment income and capital gain distributions are determined in accordance with income tax regulations which may differ from accounting principles generally accepted in the United States of America. These differences are primarily due to differing treatments for foreign currency transactions, capital loss carryforwards, deferral of wash sales and post-October capital losses.
E. Expense Allocation—Expenses directly charged or attributable to a Fund are paid from the assets of that Fund. General expenses of the Trust are allocated among and charged to the assets of each Fund on a fair and equitable basis, which may be based on the relative assets of each Fund or the nature of the services performed and relative applicability to each Fund.
F. Use of Estimates—The preparation of the financial statements in conformity with accounting principles generally accepted in the United States of America requires management to make estimates and assumptions that affect the reported amounts of assets and liabilities at the date of the financial statements and the reported amounts of revenue and expense during the reporting period. Actual results could differ from those estimates.
G. Other—Security transactions are generally accounted for on the first business day following the date the securities are purchased or sold except for financial reporting purposes which is trade date. Investments in securities issued on a when-issued or delayed delivery basis are generally reflected in the assets of the Funds and the Funds segregate assets for these transactions on the first business day following the date the
| 84 |
securities are purchased. Cost is determined and gains and losses are based on the identified cost basis for securities for both financial statement and federal income tax purposes. Dividend income is recorded on the ex-dividend date. Interest income and estimated expenses are accrued daily. Bond premiums and discounts are accreted or amortized using the interest method. Interest income on zero coupon bonds and step bonds is accrued daily at the effective interest rate. For the six months ended June 30, 2011, The Bank of New York Mellon, custodian for the Cash Management, Government, High Yield, Investment Grade and Target Maturity 2015 Funds, has provided credits in the amount of $3 against custodian charges based on the uninvested cash balances of the Funds. Brown Brothers Harriman & Co. serves as custodian for the Blue Chip, Discovery, Growth & Income, International, Select Growth and Value Funds. The Funds reduced expenses through brokerage service arrangements. For the six months ended June 30, 2011, the Funds’ expenses were reduced by $5,069 under these arrangements.
2. Trust Shares—The Trust is authorized to issue an unlimited number of shares of beneficial interest without par value. The Trust consists of the Funds listed on the cover page, each of which is a separate and distinct series of the Trust. Shares in the Funds are acquired through the purchase of variable annuity or variable life insurance contracts sold by First Investors Life Insurance Company.
3. Security Transactions—For the six months ended June 30, 2011, purchases and sales (including pay-downs on Government Fund) of securities and long-term U.S. Government obligations (excluding short-term U.S. Government obligations, foreign currencies and short-term securities), were as follows:
| Long-Term U.S. | |||||||||||
| Securities | Government Obligations | ||||||||||
| Cost of | Proceeds | Cost of | Proceeds | ||||||||
| Fund | Purchases | of Sales | Purchases | of Sales | |||||||
| Blue Chip | $16,819,025 | $20,423,465 | $ | — | $ | — | |||||
| Discovery | 47,404,559 | 54,795,425 | — | — | |||||||
| Government | 3,653,994 | 3,858,128 | 1,497,500 | 1,265,316 | |||||||
| Growth & Income | 31,858,523 | 34,267,249 | — | — | |||||||
| High Yield | 33,254,074 | 31,085,747 | — | — | |||||||
| International | 17,147,102 | 18,675,984 | — | — | |||||||
| Investment Grade | 8,259,735 | 7,901,828 | — | — | |||||||
| Select Growth | 5,757,537 | 4,462,923 | — | — | |||||||
| Target Maturity 2015 | — | 2,065,999 | — | — | |||||||
| Value | 6,480,761 | 6,573,739 | — | — | |||||||
| 85 |
Notes to Financial Statements (continued)
FIRST INVESTORS LIFE SERIES FUNDS
June 30, 2011
At June 30, 2011, aggregate cost and net unrealized appreciation of securities for federal income tax purposes were as follows:
| Gross | Gross | Net | |||||
| Aggregate | Unrealized | Unrealized | Unrealized | ||||
| Fund | Cost | Appreciation | Depreciation | Appreciation | |||
| Blue Chip | $ 91,247,681 | $37,235,605 | $ 2,091,094 | $35,144,511 | |||
| Discovery | 128,760,724 | 35,370,173 | 3,959,479 | 31,410,694 | |||
| Government | 26,702,287 | 822,588 | 41,141 | 781,447 | |||
| Growth & Income | 179,499,638 | 50,183,431 | 8,052,171 | 42,131,260 | |||
| High Yield | 68,662,666 | 2,840,752 | 1,051,959 | 1,788,793 | |||
| International | 82,729,621 | 32,747,468 | 249,859 | 32,497,609 | |||
| Investment Grade | 41,026,690 | 2,573,675 | 135,020 | 2,438,655 | |||
| Select Growth | 12,796,344 | 4,176,212 | 123,450 | 4,052,762 | |||
| Target Maturity 2015 | 22,768,297 | 3,967,961 | — | 3,967,961 | |||
| Value | 59,992,249 | 16,117,188 | 3,515,247 | 12,601,941 |
Certain of the Funds may invest in First Investors Cash Reserve Fund (“Cash Reserve Fund”), an affiliated unregistered money market fund managed by First Investors Management Company, Inc. During the six months ended June 30, 2011, purchases, sales and dividend income earned by the Funds that invested in the Cash Reserve Fund were as follows:
| Value at | Purchases | Sales | Value at | Dividend | |||||
| Fund | 12/31/10 | Shares/Cost | Shares/Cost | 6/30/11 | Income | ||||
| Blue Chip | $ 600,000 | $ 8,875,000 | $ 8,625,000 | $ 850,000 | $ 533 | ||||
| Discovery | 9,070,000 | 31,150,000 | 26,515,000 | 13,705,000 | 7,425 | ||||
| Growth & Income | 275,000 | 14,380,000 | 14,655,000 | — | 745 | ||||
| High Yield | 1,330,000 | 8,975,000 | 10,305,000 | — | 523 | ||||
| International | 950,000 | 9,650,000 | 9,350,000 | 1,250,000 | 330 | ||||
| Investment Grade | 1,615,000 | 2,425,000 | 4,040,000 | — | 290 | ||||
| Value | 2,015,000 | 3,465,000 | 4,360,000 | 1,120,000 | 1,122 | ||||
4. Advisory Fee and Other Transactions With Affiliates—Certain officers and trustees of the Trust are officers and trustees of its investment adviser, FIMCO and/or its transfer agent, Administrative Data Management Corp. (“ADM”). Trustees of the Trust who are not “interested persons” of the Trust as defined in the 1940 Act are remunerated by the Funds. For the six months ended June 30, 2011, total trustee fees accrued by the Funds amounted to $22,258.
The Investment Advisory Agreement provides as compensation to FIMCO an annual fee, payable monthly, at the rate of .75% on the first $250 million of each
| 86 |
Fund’s average daily net assets, .72% on the next $250 million, .69% on the next $250 million, .66% on the next $500 million, declining by .02% on each $500 million thereafter, down to .60% on average daily net assets over $2.25 billion. For the six months ended June 30, 2011, FIMCO has voluntarily waived 20% of the .75% annual fee on the first $250 million of average daily net assets of the Government, Investment Grade and Target Maturity 2015 Funds. During the six months ended June 30, 2011, FIMCO has voluntarily waived $22,045 in advisory fees to limit the Cash Management Fund’s over all expense ratio to .60%. Also, FIMCO has voluntarily waived an additional $19,366 in advisory fees and assumed $4,904 of other expenses to prevent a negative yield on the Fund’s shares. For the six months ended June 30, 2011, total advisory fees accrued to FIMCO were $3,291,830 of which $114,563 was waived as noted above.
Paradigm Capital Management, Inc. serves as investment subadviser to the Discovery Fund, Muzinich & Co., Inc. serves as investment subadviser to the High Yield Fund, Vontobel Asset Management, Inc. serves as investment subadviser to the International Fund and Smith Asset Management Group, L.P. serves as investment subadviser to Select Growth Fund. The subadvisers are paid by FIMCO and not by the Funds.
5. Restricted Securities—Certain restricted securities are exempt from the registration requirements under Rule 144A of the Securities Act of 1933 and may only be sold to qualified institutional investors. At June 30, 2011, the Government Fund held one 144A security with a value of $619,340 representing 2.2% of the Fund’s net assets, the High Yield Fund held eighty-four 144A securities with an aggregate value of $29,920,898 representing 40.6% of the Fund’s net assets, and the Investment Grade Fund held seventeen 144A securities with an aggregate value of $5,769,011 representing 12.9% of the Fund’s net assets. Unless otherwise noted, 144A securities are deemed to be liquid. Certain restricted securities are exempt from the registration requirements under Section 4(2) of the Securities Act of 1933 and may only be sold to qualified investors. At June 30, 2011, the Cash Management Fund held six Section 4(2) securities with an aggregate value of $2,899,292 representing 29.0% of the Fund’s net assets. These securities are valued as set forth in Note 1A.
6. Forward Currency Contracts—Forward currency contracts are obligations to purchase or sell a specific currency for an agreed-upon price at a future date. When the International Fund purchases or sells foreign securities the Fund may enter into a forward currency contract to attempt to manage exposure to foreign exchange risk between the trade date and the settlement date of such transactions. The Fund could be exposed to risk if counter parties to the contracts are unable to meet the terms of their contracts or if the value of the foreign currency changes unfavorably. Forward
| 87 |
Notes to Financial Statements (continued)
FIRST INVESTORS LIFE SERIES FUNDS
June 30, 2011
currency contracts are “marked-to-market” daily at the applicable translation rate and the resulting unrealized gains or losses are reflected in the Fund’s assets.
The International Fund had no forward currency contracts outstanding at June 30, 2011.
7. Foreign Exchange Contracts—The International Fund may enter into foreign exchange contracts for the purchase or sale of foreign currencies at negotiated rates at future dates. These contracts are considered derivative instruments and are used to decrease exposure to foreign exchange risk associated with foreign currency denominated securities held by the Fund. The Fund could be exposed to risk if counter parties to the contracts are unable to meet the terms of their contracts or if the value of the foreign currency changes unfavorably. Foreign exchange contracts are “marked-to-market” daily at the applicable translation rate and the resulting unrealized gains and losses are reflected in the Fund’s assets.
The International Fund had no foreign exchange contracts open at June 30, 2011.
The effect of derivative instruments on the Statements of Operations is as follows:
| Amount of Realized Gain or Loss Recognized on Derivatives | ||||
| Derivatives not accounted | Net Realized Loss | |||
| for as hedging instruments | on Foreign Currency | |||
| under ASC 815 | Transactions | |||
| Foreign currency transactions: | $(1,496,493) | |||
| Amount of Change in Unrealized Gain or Loss Recognized on Derivatives | ||||
| Derivatives not accounted | Net Unrealized Appreciation | |||
| for as hedging instruments | on Foreign Currency | |||
| under ASC 815 | Transactions | |||
| Foreign currency transactions: | $895,333 | |||
8. High Yield Credit Risk—The High Yield Fund’s investment in high yield securities, whether rated or unrated, may be considered speculative and subject to greater market fluctuations and risks of loss of income and principal than lower-yielding, higher-rated, fixed-income securities. The risk of loss due to default by the issuer may be significantly greater for the holders of high-yielding securities, because such securities are generally unsecured and are often subordinated to other creditors of the issuer.
9. New Accounting Pronouncements—In May 2011, the Financial Accounting Standards Board issued Accounting Standards Update (“ASU”) No. 2011-04 (“ASU 2001-04”) “Amendments to Achieve Common Fair Value Measurement and
| 88 |
Disclosure Requirements in U.S. GAAP and International Financial Reporting Standards (“IFRS”)” (“ASU 2001-04”). ASU 2001-04 includes common requirements for measurement of and disclosure about fair value between U.S. GAAP and IFRS. ASU 2011-04 will require reporting entities to disclose the following information for fair value measurements categorized within Level 3 of the fair value hierarchy: quantitative information about the unobservable inputs used in the fair value measurement, the valuation processes used by the reporting entity, and a narrative description of the sensitivity of the fair value measurement to changes in unobservable inputs and the interrelationships between those unobservable inputs. In addition, ASU 2011-04 will require reporting entities to make disclosures about amounts and reasons for all transfers in and out of Level 1 and Level 2 fair value measurements. The new and revised disclosures are effective for interim and annual reporting periods beginning after December 15, 2011. At this time, management is evaluating the implications of ASU 2011-04 and its impact on the financial statements.
10. Subsequent Events—Subsequent events occurring after June 30, 2011 have been evaluated for potential impact to this report through the date the financial statements were issued. There were no subsequent events to report that would have a material impact on the Funds’ financial statements.
11. Foresters Transaction—On September 21, 2010, First Investors Consolidated Corporation (“FICC”), the parent company of FIMCO, entered into an agreement with The Independent Order of Foresters (“Foresters”) pursuant to which FICC would be acquired by Foresters (the “Transaction”). The Transaction was completed on January 19, 2011, after the parties obtained the required regulatory and shareholder approvals. FICC, FIMCO, First Investors Corporation, the principal underwriter of the First Investors Funds and ADM, the transfer agent for the First Investors Funds are now subsidiaries of Foresters. Foresters is a fraternal benefit society with financial services operations in Canada, the United States and the United Kingdom.
12. Litigation—The Blue Chip and Value Funds have received notice that they may be putative members of the proposed defendant class of shareholders in a lawsuit filed in the United States Bankruptcy Court for the District of Delaware on November 1, 2010, by the Official Committee of Unsecured Creditors of the Tribune Company (the “Committee”). The Committee is seeking to recover some or all payments made to beneficial owners of common stock in connection with a leveraged buyout of the Tribune Company, including those made in connection with a 2007 tender offer into which the Blue Chip and Value Funds tendered their shares of common stock of the Tribune Company. The amounts sought from the Blue Chip and Value Funds, excluding interest and court costs, are $288,456 and $376,754, respectively,
| 89 |
Notes to Financial Statements (continued)
FIRST INVESTORS LIFE SERIES FUNDS
June 30, 2011
representing 0.23% and 0.52% of net assets, respectively, as of June 30, 2011. In addition, a Tribune Company bondholders’ group has been granted its motion to file an action or actions against former Tribune Company shareholders who tendered their shares of common stock in the leveraged buyout. The extent of the Funds’ potential liability in any such action has not been determined. The Funds have been advised by counsel that the Funds could be held liable to return all or part of the proceeds received in any of these actions, even though the Funds had no knowledge of, or participation in, any misconduct. In addition, the Blue Chip and Value Funds have been named in two actions brought in New York State court and removed to the Southern District of New York. These actions similarly seek recovery of payments made in connection with the leveraged buyout. The Blue Chip and Value Funds cannot predict the outcome of these proceedings, and thus have not accrued any of the amounts sought in these actions in the accompanying financial statements.
| 90 |
| This page left intentionally blank. |
| 91 |
Financial Highlights
FIRST INVESTORS LIFE SERIES FUNDS
The following table sets forth the per share operating performance data for a trust share outstanding,
total return, ratios to average net assets and other supplemental data for each period indicated.
| P E R S H A R E D A T A | R A T I O S / S U P P L E M E N T A L D A T A | ||||||||||||||||||||||||||||||||||
| Less Distributions | Ratio to Average Net | ||||||||||||||||||||||||||||||||||
| Investment Operations | from | Ratio to Average Net | Assets Before Expenses | ||||||||||||||||||||||||||||||||
| Net Asset | Net Realized | Net Asset | Assets** | Waived or Assumed | |||||||||||||||||||||||||||||||
| Value, | Net | and Unrealized | Total from | Net | Net | Value, | Net Assets | Expenses | Net | Net | Portfolio | ||||||||||||||||||||||||
| Beginning | Investment | Gain (Loss) on | Investment | Investment | Realized | Total | End of | Total | End of Period | Before Fee | Investment | Investment | Turnover | ||||||||||||||||||||||
| of Period | Income | Investments | Operations | Income | Gains | Distributions | Period | Return | * | (in millions) | Credits | (a) | Income | Expenses | Income (Loss) | Rate | |||||||||||||||||||
| BLUE CHIP FUND | |||||||||||||||||||||||||||||||||||
| 2006 | $20.85 | $ .26 | $ 2.74 | $ 3.00 | $ .20 | — | $ .20 | $ 23.65 | 14.49 | % | $ 181 | .82 | % | 1.13 | % | N/A | N/A | 4 | % | ||||||||||||||||
| 2007 | 23.65 | .31 | .67 | .98 | .26 | — | .26 | 24.37 | 4.21 | 173 | .81 | 1.20 | N/A | N/A | 5 | ||||||||||||||||||||
| 2008 | 24.37 | .36 | (8.10 | ) | (7.74 | ) | .31 | — | .31 | 16.32 | (32.08 | ) | 107 | .83 | 1.67 | N/A | N/A | 8 | |||||||||||||||||
| 2009 | 16.32 | .31 | 3.04 | 3.35 | .36 | — | .36 | 19.31 | 21.61 | 121 | .84 | 1.78 | N/A | N/A | 15 | ||||||||||||||||||||
| 2010 | 19.31 | .30 | 1.64 | 1.94 | .31 | — | .31 | 20.94 | 10.22 | 124 | .83 | 1.49 | N/A | N/A | 15 | ||||||||||||||||||||
| 2011(b) | 20.94 | .16 | 1.03 | 1.19 | .30 | — | .30 | 21.83 | 5.69 | 127 | .83 | † | 1.48 | † | N/A | N/A | 13 | ||||||||||||||||||
| CASH MANAGEMENT FUND | |||||||||||||||||||||||||||||||||||
| 2006 | $ 1.00 | $.043 | — | $ .043 | $ .043 | — | $ .043 | $ 1.00 | 4.35 | % | $ 7 | .74 | %(c) | 4.26 | % | 1.09 | % | 3.87 | % | N/A | |||||||||||||||
| 2007 | 1.00 | .045 | — | .045 | .045 | — | .045 | 1.00 | 4.62 | 15 | .72 | (c) | 4.49 | 1.04 | 4.14 | N/A | |||||||||||||||||||
| 2008 | 1.00 | .020 | — | .020 | .020 | — | .020 | 1.00 | 2.03 | 13 | .71 | (c) | 2.02 | .96 | 1.77 | N/A | |||||||||||||||||||
| 2009 | 1.00 | .002 | — | .002 | .002 | — | .002 | 1.00 | .17 | 11 | .56 | (c) | .18 | .98 | (.24 | ) | N/A | ||||||||||||||||||
| 2010 | 1.00 | — | — | — | — | — | — | 1.00 | .00 | 12 | .23 | (c) | .00 | 1.04 | (.81 | ) | N/A | ||||||||||||||||||
| 2011(b) | 1.00 | — | — | — | — | — | — | 1.00 | .00 | 10 | .17 | †(c) | .00 | † | 1.00 | † | (.84 | )† | N/A | ||||||||||||||||
| DISCOVERY FUND | |||||||||||||||||||||||||||||||||||
| 2006 | $25.79 | $ .06 | $ 5.74 | $ 5.80 | $ .04 | $ — | $ .04 | $ 31.55 | 22.51 | % | $ 158 | .82 | % | .19 | % | N/A | N/A | 58 | % | ||||||||||||||||
| 2007 | 31.55 | .11 | 1.86 | 1.97 | .06 | 2.66 | 2.72 | 30.80 | 6.62 | 161 | .82 | .35 | N/A | N/A | 55 | ||||||||||||||||||||
| 2008 | 30.80 | .30 | (10.11 | ) | (9.81 | ) | .11 | 1.44 | 1.55 | 19.44 | (33.25 | ) | 101 | .83 | 1.15 | N/A | N/A | 52 | |||||||||||||||||
| 2009 | 19.44 | .22 | 5.63 | 5.85 | .27 | — | .27 | 25.02 | 30.77 | 127 | .84 | 1.03 | N/A | N/A | 66 | ||||||||||||||||||||
| 2010 | 25.02 | .16 | 6.43 | 6.59 | .22 | — | .22 | 31.39 | 26.57 | 152 | .83 | .59 | N/A | N/A | 64 | ||||||||||||||||||||
| 2011(b) | 31.39 | .05 | 2.19 | 2.24 | .16 | — | .16 | 33.47 | 7.14 | 160 | .82 | † | .31 | † | N/A | N/A | 32 | ||||||||||||||||||
| GOVERNMENT FUND | |||||||||||||||||||||||||||||||||||
| 2006 | $10.10 | $ .51 | $ (.14 | ) | $ .37 | $ .51 | — | $ .51 | $ 9.96 | 3.80 | % | $ 20 | .78 | % | 5.10 | % | .93 | % | 4.95 | % | 28 | % | |||||||||||||
| 2007 | 9.96 | .48 | .15 | .63 | .52 | — | .52 | 10.07 | 6.55 | 21 | .80 | 4.94 | .95 | 4.75 | 24 | ||||||||||||||||||||
| 2008 | 10.07 | .44 | .24 | .68 | .45 | — | .45 | 10.30 | 6.93 | 24 | .79 | 4.56 | .94 | 4.41 | 39 | ||||||||||||||||||||
| 2009 | 10.30 | .42 | — | .42 | .43 | — | .43 | 10.29 | 4.28 | 26 | .80 | 3.87 | .95 | 3.72 | 51 | ||||||||||||||||||||
| 2010 | 10.29 | .32 | .16 | .48 | .42 | — | .42 | 10.35 | 4.82 | 28 | .78 | 3.11 | .93 | 2.96 | 54 | ||||||||||||||||||||
| 2011(b) | 10.35 | .15 | .08 | .23 | .36 | — | .36 | 10.22 | 2.31 | 28 | .89 | † | 2.75 | † | 1.04 | † | 2.60 | † | 19 | ||||||||||||||||
| GROWTH & INCOME FUND(d) | |||||||||||||||||||||||||||||||||||
| 2006 | $35.91 | $ .20 | $ 4.68 | $ 4.88 | $ .16 | $ 2.27 | $ 2.43 | $ 38.36 | 14.35 | % | $ 268 | .82 | % | .55 | % | N/A | N/A | 127 | % | ||||||||||||||||
| 2007 | 38.36 | .41 | .25 | .66 | .20 | 5.43 | 5.63 | 33.39 | 1.98 | 258 | .81 | 1.14 | N/A | N/A | 38 | ||||||||||||||||||||
| 2008 | 33.39 | .40 | (11.38 | ) | (10.98 | ) | .41 | 2.24 | 2.65 | 19.76 | (35.22 | ) | 155 | .83 | 1.48 | N/A | N/A | 28 | |||||||||||||||||
| 2009 | 19.76 | .27 | 5.06 | 5.33 | .40 | — | .40 | 24.69 | 28.05 | 187 | .84 | 1.27 | N/A | N/A | 25 | ||||||||||||||||||||
| 2010 | 24.69 | .50 | 3.45 | 3.95 | .27 | — | .27 | 28.37 | 16.19 | 207 | .82 | 1.91 | N/A | N/A | 27 | ||||||||||||||||||||
| 2011(b) | 28.37 | .20 | 2.36 | 2.56 | .50 | — | .50 | 30.43 | 9.07 | 222 | .82 | † | 1.36 | † | N/A | N/A | 15 | ||||||||||||||||||
| 92 | 93 |
Financial Highlights (continued)
FIRST INVESTORS LIFE SERIES FUNDS
| P E R S H A R E D A TA | R A T I O S / S U P P L E M E N T A L D A T A | |||||||||||||||||||||||||||||||||
| Less Distributions | Ratio to Average Net | |||||||||||||||||||||||||||||||||
| Investment Operations | from | Ratio to Average Net | Assets Before Expenses | |||||||||||||||||||||||||||||||
| Net Asset | Net Realized | Net Asset | Assets** | Waived or Assumed | ||||||||||||||||||||||||||||||
| Value, | Net | and Unrealized | Total from | Net | Net | Value, | Net Assets | Expenses | Net | Net | Portfolio | |||||||||||||||||||||||
| Beginning | Investment | Gain (Loss) on | Investment | Investment | Realized | Total | End of | Total | End of Period | Before Fee | Investment | Investment | Turnover | |||||||||||||||||||||
| of Period | Income | Investments | Operations | Income | Gains | Distributions | Period | Return | * | (in millions) | Credits | (a) | Income (Loss) | Expenses | Income | Rate | ||||||||||||||||||
| HIGH YIELD FUND | ||||||||||||||||||||||||||||||||||
| 2006 | $ 8.07 | $.62 | $ .12 | $ .74 | $.67 | — | $ .67 | $ 8.14 | 9.77 | % | $ 68 | .85 | % | 7.63 | % | N/A | N/A | 31 | % | |||||||||||||||
| 2007 | 8.14 | .57 | (.47 | ) | .10 | .63 | — | .63 | 7.61 | 1.06 | 79 | .86 | 7.19 | N/A | N/A | 28 | ||||||||||||||||||
| 2008 | 7.61 | .56 | (2.39 | ) | (1.83 | ) | .59 | — | .59 | 5.19 | (25.86 | ) | 52 | .86 | 8.27 | N/A | N/A | 17 | ||||||||||||||||
| 2009 | 5.19 | .51 | 1.12 | 1.63 | .58 | — | .58 | 6.24 | 35.15 | 66 | .90 | 8.66 | N/A | N/A | 102 | |||||||||||||||||||
| 2010 | 6.24 | .48 | .31 | .79 | .49 | — | .49 | 6.54 | 13.71 | 71 | .87 | 7.43 | N/A | N/A | 71 | |||||||||||||||||||
| 2011(b) | 6.54 | .21 | .06 | .27 | .48 | — | .48 | 6.33 | 4.18 | 74 | .90 | † | 6.71 | † | N/A | N/A | 44 | |||||||||||||||||
| INTERNATIONAL FUND(e) | ||||||||||||||||||||||||||||||||||
| 2006 | $20.00 | $.29 | $ 5.09 | $5.38 | $.15 | $ .64 | $ .79 | $24.59 | 27.79 | % | $129 | .97 | % | 1.24 | % | N/A | N/A | 157 | % | |||||||||||||||
| 2007 | 24.59 | .04 | 4.26 | 4.30 | .83 | 3.36 | 4.19 | 24.70 | 20.99 | 154 | .90 | 1.30 | N/A | N/A | 97 | |||||||||||||||||||
| 2008 | 24.70 | .30 | (9.68 | ) | (9.38 | ) | .04 | 2.65 | 2.69 | 12.63 | (41.89 | ) | 85 | .94 | 1.41 | N/A | N/A | 128 | ||||||||||||||||
| 2009 | 12.63 | .65 | 2.03 | 2.68 | .59 | — | .59 | 14.72 | 23.24 | 101 | 1.01 | 2.30 | N/A | N/A | 53 | |||||||||||||||||||
| 2010 | 14.72 | .34 | 1.64 | 1.98 | — | — | — | 16.70 | 13.45 | 109 | .99 | 2.15 | N/A | N/A | 35 | |||||||||||||||||||
| 2011(b) | 16.70 | .24 | .99 | 1.23 | .36 | — | .36 | 17.57 | 7.56 | 115 | 1.00 | † | 2.84 | † | N/A | N/A | 15 | |||||||||||||||||
| INVESTMENT GRADE FUND | ||||||||||||||||||||||||||||||||||
| 2006 | $11.14 | $.53 | $ (.11 | ) | $ .42 | $.62 | — | $ .62 | $10.94 | 3.99 | % | $ 37 | .74 | % | 4.82 | % | .89 | % | 4.67 | % | 86 | % | ||||||||||||
| 2007 | 10.94 | .43 | .15 | .58 | .60 | — | .60 | 10.92 | 5.52 | 39 | .73 | 4.97 | .88 | 4.81 | 38 | |||||||||||||||||||
| 2008 | 10.92 | .41 | (1.60 | ) | (1.19 | ) | .57 | — | .57 | 9.16 | (11.60 | ) | 32 | .74 | 5.30 | .89 | 5.15 | 133 | ||||||||||||||||
| 2009 | 9.16 | .69 | 1.10 | 1.79 | .60 | — | .60 | 10.35 | 20.94 | 39 | .76 | 5.38 | .91 | 5.23 | 79 | |||||||||||||||||||
| 2010 | 10.35 | .51 | .41 | .92 | .53 | — | .53 | 10.74 | 9.26 | 43 | .73 | 4.62 | .88 | 4.47 | 55 | |||||||||||||||||||
| 2011 | 10.74 | .23 | .13 | .36 | .52 | — | .52 | 10.58 | 3.49 | 45 | .72 | † | 4.31 | † | .87 | † | 4.16 | † | 18 | |||||||||||||||
| SELECT GROWTH FUND(f) | ||||||||||||||||||||||||||||||||||
| 2006 | $ 8.70 | $.07 | $ .75 | $ .82 | $.05 | $ — | $ .05 | $ 9.47 | 9.47 | % | $ 12 | .92 | % | .77 | % | N/A | N/A | 80 | % | |||||||||||||||
| 2007 | 9.47 | .01 | 1.06 | 1.07 | .07 | — | .07 | 10.47 | 11.42 | 13 | 1.14 | .15 | N/A | N/A | 161 | |||||||||||||||||||
| 2008 | 10.47 | — | (4.31 | ) | (4.31 | ) | .01 | .09 | .10 | 6.06 | (41.47 | ) | 9 | .99 | (.05 | ) | N/A | N/A | 107 | |||||||||||||||
| 2009 | 6.06 | .01 | .59 | .60 | — | — | — | 6.66 | 9.90 | 10 | 1.00 | .22 | N/A | N/A | 102 | |||||||||||||||||||
| 2010 | 6.66 | .01 | 1.39 | 1.40 | .01 | — | .01 | 8.05 | 21.10 | 14 | .98 | .20 | N/A | N/A | 87 | |||||||||||||||||||
| 2011(b) | 8.05 | — | 1.06 | 1.06 | .01 | — | .01 | 9.10 | 13.22 | 17 | .90 | † | .10 | † | N/A | N/A | 29 | |||||||||||||||||
| TARGET MATURITY 2015 FUND | ||||||||||||||||||||||||||||||||||
| 2006 | $14.46 | $.57 | $ (.32 | ) | $ .25 | $.52 | $ — | $ .52 | $14.19 | 1.85 | % | $ 24 | .70 | % | 4.38 | % | .85 | % | 4.23 | % | 2 | % | ||||||||||||
| 2007 | 14.19 | .59 | .74 | 1.33 | .58 | — | .58 | 14.94 | 9.70 | 27 | .70 | 4.32 | .85 | 4.16 | 3 | |||||||||||||||||||
| 2008 | 14.94 | .63 | 1.49 | 2.12 | .58 | — | .58 | 16.48 | 14.56 | 29 | .69 | 4.01 | .84 | 3.86 | 0 | |||||||||||||||||||
| 2009 | 16.48 | .62 | (1.00 | ) | (.38 | ) | .63 | .02 | .65 | 15.45 | (2.22 | ) | 27 | .71 | 3.91 | .86 | 3.76 | 0 | ||||||||||||||||
| 2010 | 15.45 | .63 | .66 | 1.29 | .64 | .08 | .72 | 16.02 | 8.58 | 28 | .71 | 3.87 | .86 | 3.72 | 4 | |||||||||||||||||||
| 2011(b) | 16.02 | .32 | .15 | .47 | .62 | .22 | .84 | 15.65 | 3.06 | 27 | .72 | † | 3.92 | † | .87 | † | 3.77 | † | 0 | |||||||||||||||
| 94 | 95 |
Financial Highlights (continued)
FIRST INVESTORS LIFE SERIES FUNDS
| P E R S H A R E D A T A | R A T I O S / S U P P L E M E N T A L D A T A | ||||||||||||||||||||||||||||||||
| Less Distributions | Ratio to Average Net | ||||||||||||||||||||||||||||||||
| Investment Operations | from | Ratio to Average Net | Assets Before Expenses | ||||||||||||||||||||||||||||||
| Net Asset | Net Realized | Net Asset | Assets** | Waived or Assumed | |||||||||||||||||||||||||||||
| Value, | Net | and Unrealized | Total from | Net | Net | Value, | Net Assets | Expenses | Net | Net | Portfolio | ||||||||||||||||||||||
| Beginning | Investment | Gain (Loss) on | Investment | Investment | Realized | Total | End of | Total | End of Period | Before Fee | Investment | Investment | Turnover | ||||||||||||||||||||
| of Period | Income | Investments | Operations | Income | Gains | Distributions | Period | Return | * | (in millions) | Credits | (a) | Income | Expenses | Income | Rate | |||||||||||||||||
| VALUE FUND | |||||||||||||||||||||||||||||||||
| 2006 | $ 14.31 | $ .27 | $ 2.76 | $ 3.03 | $.26 | — | $.26 | $17.08 | 21.43 | % | $ 94 | .83 | % | 1.73 | % | N/A | N/A | 15 | % | ||||||||||||||
| 2007 | 17.08 | .31 | (.42 | ) | (.11 | ) | .27 | — | .27 | 16.70 | (.66 | ) | 91 | .83 | 1.75 | N/A | N/A | 17 | |||||||||||||||
| 2008 | 16.70 | .40 | (5.24 | ) | (4.84 | ) | .29 | — | .29 | 11.57 | (29.41 | ) | 58 | .85 | 2.47 | N/A | N/A | 15 | |||||||||||||||
| 2009 | 11.57 | .29 | 1.96 | 2.25 | .36 | — | .36 | 13.46 | 21.03 | 66 | .88 | 2.45 | N/A | N/A | 11 | ||||||||||||||||||
| 2010 | 13.46 | .31 | 1.58 | 1.89 | .29 | — | .29 | 15.06 | 14.32 | 71 | .86 | 2.25 | N/A | N/A | 21 | ||||||||||||||||||
| 2011(b) | 15.06 | .15 | .60 | .75 | .31 | — | .31 | 15.50 | 4.99 | 73 | .84 | † | 1.88 | † | N/A | N/A | 9 | ||||||||||||||||
| * | The effect of fees and charges incurred at the separate account level are not reflected in these | |
| performance figures. | ||
| ** | Net of expenses waived or assumed by the investment adviser (Note 4). | |
| † | Annualized | |
| (a) | The ratios do not include a reduction of expenses from cash balances maintained with the Bank of | |
| New York Mellon or from brokerage service arrangements (Note 1H). | ||
| (b) | For the period January 1, 2011 to June 30, 2011. | |
| (c) | For the years ended December 31, 2006 through December 31, 2008, the expense ratio after fee | |
| credits was .70%. FIMCO has voluntarily waived advisory fees to limit the Fund’s overall expense | ||
| to .70% for those years. For the period January 1, 2009 to Decmeber 31, 2009, the expense ratio | ||
| after fee credits was .56%. FIMCO has voluntarily waived advisory fees to limit the Fund’s overall | ||
| expense to .70% for the period January 1, 2009 to January 31, 2009 and .60% for the period | ||
| February 1, 2009 to December 31, 2009. For the period January 1, 2010 to December 31, 2010, | ||
| the expense ratio after fee credits was .23%. FIMCO has voluntarily waived advisory fees to | ||
| limit the Fund’s overall expense to .60%. For the period January 1, 2011 to June 30, 2011, the | ||
| expense ratio after fee credits was .16%. FIMCO has voluntarily waived advisory fees to limit | ||
| the Fund’s overall expense to .60% (Note 4). | ||
| (d) | Prior to October 18, 2006, known as Growth Fund. | |
| (e) | Prior to June 27, 2006, known as International Securities Fund. | |
| (f) | Prior to July 26, 2007, known as Focused Equity Fund. |
| See notes to financial statements | ||
| 96 | 97 |
Report of Independent Registered Public
Accounting Firm
To the Shareholders and Board of Trustees of
First Investors Life Series Funds
We have audited the accompanying statements of assets and liabilities, including the portfolios of investments, of the eleven Funds comprising First Investors Life Series Funds, as of June 30, 2011, the related statements of operations, the statements of changes in net assets, and the financial highlights for each of the periods indicated thereon. These financial statements and financial highlights are the responsibility of the Life Series Funds’ management. Our responsibility is to express an opinion on these financial statements and financial highlights based on our audits.
We conducted our audits in accordance with the standards of the Public Company Accounting Oversight Board (United States). Those standards require that we plan and perform the audit to obtain reasonable assurance about whether the financial statements and financial highlights are free of material misstatement. The Funds are not required to have, nor were we engaged to perform, an audit of the Funds’ internal control over financial reporting. Our audits included consideration of internal control over financial reporting as a basis for designing audit procedures that are appropriate in the circumstances, but not for the purpose of expressing an opinion on the effectiveness of the Funds’ internal control over financial reporting. Accordingly, we express no such opinion. An audit includes examining, on a test basis, evidence supporting the amounts and disclosures in the financial statements. Our procedures included confirmation of securities owned as of June 30, 2011, by correspondence with the custodian and brokers. Where brokers have not replied to our confirmation requests, we have carried out other appropriate auditing procedures. An audit also includes assessing the accounting principles used and significant estimates made by management, as well as evaluating the overall financial statement presentation. We believe that our audits provide a reasonable basis for our opinion.
In our opinion, the financial statements and financial highlights referred to above present fairly, in all material respects, the financial position of each of the eleven Funds comprising First Investors Life Series Funds, as of June 30, 2011, and the results of their operations, changes in their net assets, and their financial highlights for the periods presented, in conformity with accounting principles generally accepted in the United States of America.
| Tait, Weller & Baker LLP |
Philadelphia, Pennsylvania
August 26, 2011
| 98 |
FIRST INVESTORS LIFE SERIES FUNDS
| Trustees | ||
| Charles R. Barton, III | ||
| Stefan L. Geiringer | ||
| Robert M. Grohol | ||
| Christopher H. Pinkerton | ||
| Arthur M. Scutro, Jr. | ||
| Mark R. Ward | ||
| Officers | ||
| Christopher H. Pinkerton | ||
| President | ||
| Marc S. Milgram | ||
| Chief Compliance Officer | ||
| Joseph I. Benedek | ||
| Treasurer | ||
| Mark S. Spencer | ||
| Assistant Treasurer | ||
| Mary C. Carty | ||
| Secretary | ||
| Carol Lerner Brown | ||
| Assistant Secretary |
| 99 |
FIRST INVESTORS LIFE SERIES FUNDS
| Shareholder Information | ||
| Investment Adviser | Custodian | |
| First Investors Management | (Cash Management, Government, | |
| Company, Inc. | High Yield, Investment Grade and | |
| 110 Wall Street | Target Maturity 2015 Funds) | |
| New York, NY 10005 | The Bank of New York Mellon | |
| One Wall Street | ||
| New York, NY 10286 | ||
| Subadviser | Custodian | |
| (Discovery Fund) | (Blue Chip, Discovery, Growth & Income, | |
| Paradigm Capital Management, Inc. | International, Select Growth and Value Funds) | |
| Nine Elk Street | Brown Brothers Harriman & Co. | |
| Albany, NY 12207 | 40 Water Street | |
| Boston, MA 02109 | ||
| Subadviser | Transfer Agent | |
| (High Yield Fund) | Administrative Data Management Corp. | |
| Muzinich & Co., Inc. | Raritan Plaza I — 8th Floor | |
| 450 Park Avenue | Edison, NJ 08837-3620 | |
| New York, NY 10022 | ||
| Subadviser | Independent Registered Public | |
| (International Fund) | Accounting Firm | |
| Vontobel Asset Management, Inc. | Tait, Weller & Baker LLP | |
| 1540 Broadway | 1818 Market Street | |
| New York, NY 10036 | Philadelphia, PA 19103 | |
| Subadviser | Legal Counsel | |
| (Select Growth Fund) | K&L Gates LLP | |
| Smith Asset Management Group, L.P. | 1601 K Street, N.W. | |
| 100 Crescent Court | Washington, D.C. 20006 | |
| Dallas, TX 75201 | ||
| 100 |
A description of the policies and procedures that the Funds use to vote proxies relating to a portfolio’s securities is available, without charge, upon request by calling toll free 1-800-423-4026 or can be viewed online or downloaded from the EDGAR database on the Securities and Exchange Commission’s (“SEC”) internet website at http://www.sec.gov. In addition, information regarding how the Funds voted proxies relating to portfolio securities during the most recent 12-month period ended June 30, is available, without charge, upon request in writing or by calling 1-800-423-4026 and on the SEC’s internet website at http://www.sec.gov.
The Funds file their complete schedule of portfolio holdings with the SEC on Form N-Q for the first and third quarters of each fiscal year. The Funds’ Form N-Q is available on the SEC’s website at http://www.sec.gov; and may also be reviewed and copied at the SEC’s Public Reference Room in Washington D.C. Information on the operation of the Public Reference Room may be obtained by calling 1-800-SEC-0330. The schedule of portfolio holdings is available, without charge, upon request in writing or by calling 1-800-423-4026.
| 101 |

| Item 2. | Code of Ethics |
| Not applicable | |
| Item 3. | Audit Committee Financial Expert |
| Not applicable | |
| Item 4. | Principal Accountant Fees and Services |
| Not applicable | |
| Item 5. | Audit Committee of Listed Registrants |
| Not applicable | |
| Item 6. | Schedule of Investments |
| Schedule is included as part of the report to shareholders filed under Item 1 of this | |
| Form. | |
| Item 7. | Disclosure of Proxy Voting Policies and Procedures for |
| Closed-End Management Investment Companies | |
| Not applicable | |
| Item 8. | Portfolio Managers of Closed-End Management Investment Companies |
| Not applicable | |
| Item 9. | Purchases of Equity Securities by Closed-End Management |
| Investment Companies and Affiliated Purchasers | |
| Not applicable | |
| Item 10. | Submission of Matters to a Vote of Security Holders |
| There were no material changes to the procedure by which shareholders may recommend nominees | |
| to the Registrant's Board of Trustees. | |
| Item 11. | Controls and Procedures |
| (a) | The Registrant's Principal Executive Officer and Principal Financial Officer have concluded |
| that the Registrant's disclosure controls and procedures (as defined in Rule 30a-3(c) under the | |
| Investment Company Act of 1940, as amended) are effective, based on their evaluation of these | |
| disclosure controls and procedures as of a date within 90 days of the filing date of this report. | |
| (b) | There were no changes in the Registrant's internal control over financial reporting (as |
| defined in Rule 30a-3(d) under the Investment Company Act of 1940 as amended) that occurred | |
| during the second fiscal quarter of the period covered by this report that have materially affected, or | |
| are reasonably likely to materially affect, the Registrant's internal control over financial reporting. | |
| Item 12. Exhibits | |
| (a)(1) | Code of Ethics - Not applicable |
| (a)(2) | Certifications pursuant to Section 302 of the Sarbanes-Oxley Act |
| of 2002 - Filed herewith | |
| (b) | Certifications pursuant to Section 906 of the Sarbanes-Oxley Act |
| of 2002 - Filed herewith | |
| SIGNATURES | |
| Pursuant to the requirements of the Securities Exchange Act of 1934 and the Investment | |
| Company Act of 1940, the Registrant has duly caused this report to be signed on its behalf by the | |
| undersigned, thereunto duly authorized. | |
| First Investors Life Series Funds | |
| By | /S/ CHRISTOPHER H. PINKERTON |
| Christopher H. Pinkerton | |
| President and Principal Executive Officer | |
| Date: | September 7, 2011 |
| Pursuant to the requirements of the Securities Exchange Act of 1934 and the Investment | |
| Company Act of 1940, this report has been signed below by the following persons on behalf of the | |
| Registrant and in the capacities and on the dates indicated. | |
| First Investors Life Series Funds | |
| By | /S/ CHRISTOPHER H. PINKERTON |
| Christopher H. Pinkerton | |
| President and Principal Executive Officer | |
| By | /S/ JOSEPH I. BENEDEK |
| Joseph I. Benedek | |
| Treasurer and Principal Financial Officer | |
| Date: | September 7, 2011 |