| | |
| UNITED STATES
SECURITIES AND EXCHANGE COMMISSION |
| | |
| CERTIFIED SHAREHOLDER REPORT OF REGISTERED
MANAGEMENT INVESTMENT COMPANIES
|
| | |
| Investment Company Act file number: | (811-04345) |
| | |
| Exact name of registrant as specified in charter: | Putnam Tax Free Income Trust |
| | |
| Address of principal executive offices: | One Post Office Square, Boston, Massachusetts 02109 |
| | |
| Name and address of agent for service: | Robert T. Burns, Vice President
One Post Office Square
Boston, Massachusetts 02109 |
| | |
| Copy to: | Bryan Chegwidden, Esq.
Ropes & Gray LLP
1211 Avenue of the Americas
New York, New York 10036 |
| | |
| Registrant's telephone number, including area code: | (617) 292-1000 |
| | |
| Date of fiscal year end: | July 31, 2016 |
| | |
| Date of reporting period: | August 1, 2015 — January 31, 2016 |
| | |
|
Item 1. Report to Stockholders: | |
| | |
| The following is a copy of the report transmitted to stockholders pursuant to Rule 30e-1 under the Investment Company Act of 1940: | |
Putnam
Tax-Free High Yield
Fund
Semiannual report
1 | 31 | 16
| | | |
| Message from the Trustees | 1 | | |
| | |
| About the fund | 2 | | |
| | |
| Performance snapshot | 4 | | |
| | |
| Interview with your fund’s portfolio manager | 5 | | |
| | |
| Your fund’s performance | 10 | | |
| | |
| Your fund’s expenses | 13 | | |
| | |
| Terms and definitions | 15 | | |
| | |
| Other information for shareholders | 16 | | |
| | |
| Financial statements | 17 | | |
| | |
Consider these risks before investing: Capital gains, if any, are taxed at the federal and, in most cases, state levels. For some investors, investment income may be subject to the federal alternative minimum tax. Income from federally tax-exempt funds may be subject to state and local taxes. Bond investments are subject to interest-rate risk (the risk of bond prices falling if interest rates rise) and credit risk (the risk of an issuer defaulting on interest or principal payments). Interest-rate risk is greater for longer-term bonds, and credit risk is greater for below-investment-grade bonds. Unlike bonds, funds that invest in bonds have fees and expenses. The fund may invest significantly in particular segments of the tax-exempt debt market, making it more vulnerable to fluctuations in the values of the securities it holds than a more broadly invested fund. Interest the fund receives might be taxable. Bond prices may fall or fail to rise over time for several reasons, including general financial market conditions, changing market perceptions of the risk of default, changes in government intervention, and factors related to a specific issuer. These factors may also lead to periods of high volatility and reduced liquidity in the bond markets. You can lose money by investing in the fund.
Message from the Trustees
Dear Fellow Shareholder:
In markets around the world, 2016 began with a sharp downturn, driven mainly by fears of weak global growth. Equity and fixed-income markets are again showing some of the negative trends seen during late summer of 2015. Generally speaking, only high-quality bonds appear to be weathering the storm. Of course, as in any downturn, attractive valuation opportunities may be emerging.
While economic growth may be muted in many parts of the world, notably in China and in emerging markets, the U.S. economy appears to be among the more resilient. The unemployment rate has fallen below 5%, with some signs of moderate wage growth and solid housing market conditions. Low energy prices, while a negative for energy companies, mean more money in consumers’ pockets, helping to buoy consumption. Moreover, divergent economic policies among central banks around the globe may create potential opportunities for capturing growth.
Although no one can predict where markets will head going forward, Putnam’s experienced portfolio managers are actively seeking fundamental insights to maneuver in all types of conditions, relying on a proprietary global research framework to help guide their investment decisions. The interview on the following pages provides an overview of your fund’s performance for the reporting period ended January 31, 2016, as well as an outlook for the coming months.
For questions on market turbulence, it may be helpful for you to consult your financial advisor to ensure that your portfolio is aligned with your investment goals, time horizon, and risk tolerance.
As always, thank you for investing with Putnam.

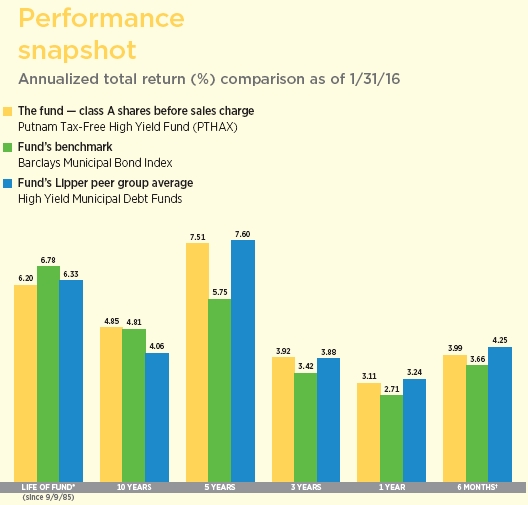
Current performance may be lower or higher than the quoted past performance, which cannot guarantee future results. Share price, principal value, and return will fluctuate, and you may have a gain or a loss when you sell your shares. Performance of class A shares assumes reinvestment of distributions and does not account for taxes. Fund returns in the bar chart do not reflect a sales charge of 4.00%; had they, returns would have been lower. See pages 5 and 10–12 for additional performance information. For a portion of the periods, the fund had expense limitations, without which returns would have been lower. To obtain the most recent month-end performance, visit putnam.com.
* Performance for class A shares before their inception (9/20/93) is derived from the historical performance of class B shares.
† Returns for the six-month period are not annualized, but cumulative.
| |
| 4 | Tax-Free High Yield Fund |
Interview with your fund’s portfolio manager

What was the environment like for municipal bonds during the six-month reporting period ended January 31, 2016?
The market environment proved to be challenging for many asset classes, but municipal bonds performed well on an absolute and a relative basis — returning 3.66%, according to the Barclays Municipal Bond Index, and generally outperforming widely followed benchmarks for U.S. and international fixed-income markets. Expectations for the Federal Reserve’s first interest-rate hike since June 2006 weighed on most bond markets throughout much of the reporting period, but the tax-free, income-producing benefits of municipal bond investing proved to be a strong draw for U.S. income-oriented investors.
The Fed’s intention to begin normalizing U.S. interest rates was complicated by a convergence of global factors — notably, overlapping economic slowdowns in Europe and China and low commodity prices. However, the long-awaited quarter-point interest-rate hike from the Federal Reserve finally came in December. For all the anxiety about the prospect of the first rise in the federal funds rate in almost a decade, the Fed’s decision had little immediate impact on market rates. In the closing weeks of the period, however, sentiment turned negative as oil prices tumbled anew, triggering further
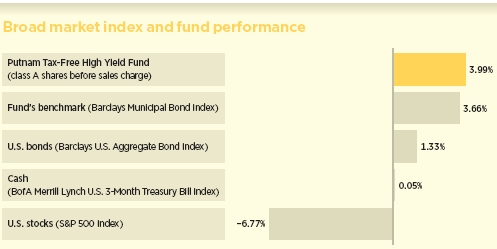
This comparison shows your fund’s performance in the context of broad market indexes for the six months ended 1/31/16. See pages 4 and 10–12 for additional fund performance information. Index descriptions can be found on page 15.
| |
| Tax-Free High Yield Fund | 5 |
losses in energy stocks and currencies of commodity-exporting countries.
Against this backdrop, municipal market technicals [supply/demand dynamics] were generally supportive of municipal bond prices during the reporting period and helped to offset negative pressure from the risk of higher interest rates. New issuance unexpectedly slowed in the final months of the reporting period after climbing steadily in the first half of 2015. About two thirds of the new issuance coming to market was earmarked for refinancing older, higher-coupon debt. Demand for municipal bonds held up well, and mutual fund inflows continued to be solid despite the heightened market volatility that characterized the reporting period. With a few notable exceptions, municipal fundamental credit quality remained sound.
How did Putnam Tax-Free High Yield Fund perform in this environment?
The fund delivered positive absolute performance that exceeded that of the Barclays Municipal Bond Index for the six months ended January 31, 2016. The fund’s focus on high-yield municipal bonds was a tailwind for performance, as demand for these bonds helped push prices higher. The fund’s slightly shorter-duration positioning, somewhat higher cash allocation, and the underperformance of certain industrial revenue bonds were detractors from relative performance during the reporting period versus that of its Lipper peers, as interest rates were generally flat to marginally lower during the period.
The Supreme Court has agreed to hear Puerto Rico’s case for restructuring its municipal debt obligations. States and cities across the United States are considering
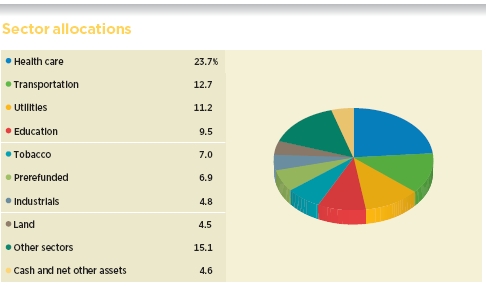
Allocations are shown as a percentage of the fund’s net assets as of 1/31/16. Cash and net other assets, if any, represent the market value weights of cash, derivatives, short-term securities, and other unclassified assets in the portfolio. Summary information may differ from the information in the portfolio schedule notes included in the financial statements due to the inclusion of derivative securities, any interest accruals, and the use of different classifications of securities for presentation purposes. Holdings and allocations may vary over time.
| |
| 6 | Tax-Free High Yield Fund |
pension reform to address budget deficits. What do these developments portend for the municipal bond market?
In December 2015, the U.S. Supreme Court agreed to review a Puerto Rico debt-restructuring law that would allow some public agencies to ask bondholders to accept losses on the securities in the form of lower payments. Efforts by states and municipalities to rethink complex issues, such as public pension-funding obligations, have become political and economic issues, oftentimes ending up in state or federal courts. A municipal bond issuer’s inability to meet fixed-cost budget commitments, or budget debate impasses that paralyze government action, can pressure credit ratings — potentially driving up potential borrowing costs that further stress budgets. Budget wrangling within state and local governments also can potentially lead to increased tax burdens on taxpayers or add uncertainty for public employees with regard to future retirement benefits.

We do not anticipate a widespread contagion from pension commitments in the U.S. municipal bond market. We do, however, believe these municipal bond issuers reveal increasing complexities in the municipal bond market, underscoring more than ever the importance of dedicated professional investment management. Integral to our research process is parsing the ability of state and local legislators to implement a realistic plan to fund long-term pensions and other financial obligations and to achieve sustainable, structurally balanced budgets. We also
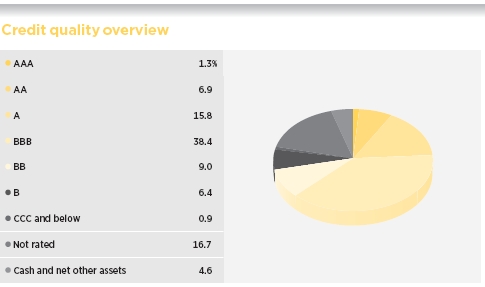
Credit qualities are shown as a percentage of net assets as of 1/31/16. A bond rated BBB or higher (SP-3 or higher, for short-term debt) is considered investment grade. This chart reflects the highest security rating provided by one or more of Standard & Poor’s, Moody’s, and Fitch. Ratings may vary over time.
Cash and net other assets, if any, represent the market value weights of cash, derivatives, and short-term securities in the portfolio. The fund itself has not been rated by an independent rating agency.
| |
| Tax-Free High Yield Fund | 7 |
analyze other third-party interpretations of those efforts.
For several years, you have limited the fund’s exposure to general obligation [G.O.] bonds. Is this still the case?
Yes. Even though we are generally seeing improvement at the state and local levels, we continued to keep the portfolio’s weighting in G.O.’s below that of the peer group, adding selectively when we uncover compelling value. However, we continued to emphasize essential service revenue bonds with strong credit fundamentals. These bonds typically are issued by state and local government entities to finance specific revenue-generating projects.
Elsewhere in the portfolio, many of the same investment themes remain in place — namely duration positioning, or interest-rate sensitivity, that is below the median of its respective Lipper peer group; an overweight exposure to municipal bonds rated Baa relative to the benchmark, generally speaking; and a preference for essential service utilities, continuing-care retirement communities, airports and airlines, and higher education bonds relative to the fund’s Lipper peer group.
We maintained an underweight exposure to issuers in Puerto Rico relative to the fund’s Lipper peer group, given the island commonwealth’s weak credit fundamentals. However, the fund’s investments in bonds issued by the Commonwealth of Puerto Rico Sales Tax Financing Corporation [COFINA] detracted from results in the aftermath of the governor’s comments in June 2015 that the U.S. island territory was struggling to meet its $72 billion debt burden and that he would seek a moratorium with creditors.
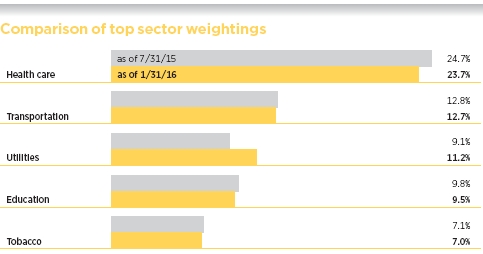
This chart shows how the fund’s top weightings have changed over the past six months. Allocations are shown as a percentage of the fund’s net assets. Current period summary information may differ from the information in the portfolio schedule notes included in the financial statements due to the inclusion of derivative securities, any interest accruals, and the use of different classifications of securities for presentation purposes. Holdings and allocations may vary over time.
| |
| 8 | Tax-Free High Yield Fund |
What should municipal bond investors keep in mind as 2016 unfolds?
Investors greeted the global financial markets with trepidation as 2016 began. However, from our standpoint, the economic story in the United States remains intact, although we are seeing manufacturing contracting and the energy sector cutting jobs. Overall, the labor market appears to be robust, and we are cautiously optimistic that its strength will continue to spread. And while we agree with many that China has given global markets some cause for concern, we believe that China’s slowdown and the high risk of policy error in the world’s second-largest economy will not by themselves have the power to derail improving economic growth and recovery in the developed world. While the risk of sluggish growth is higher, we do not think a decelerating economy — or continued bouts of financial market volatility — materially raises the risk of a U.S. recession in 2016.
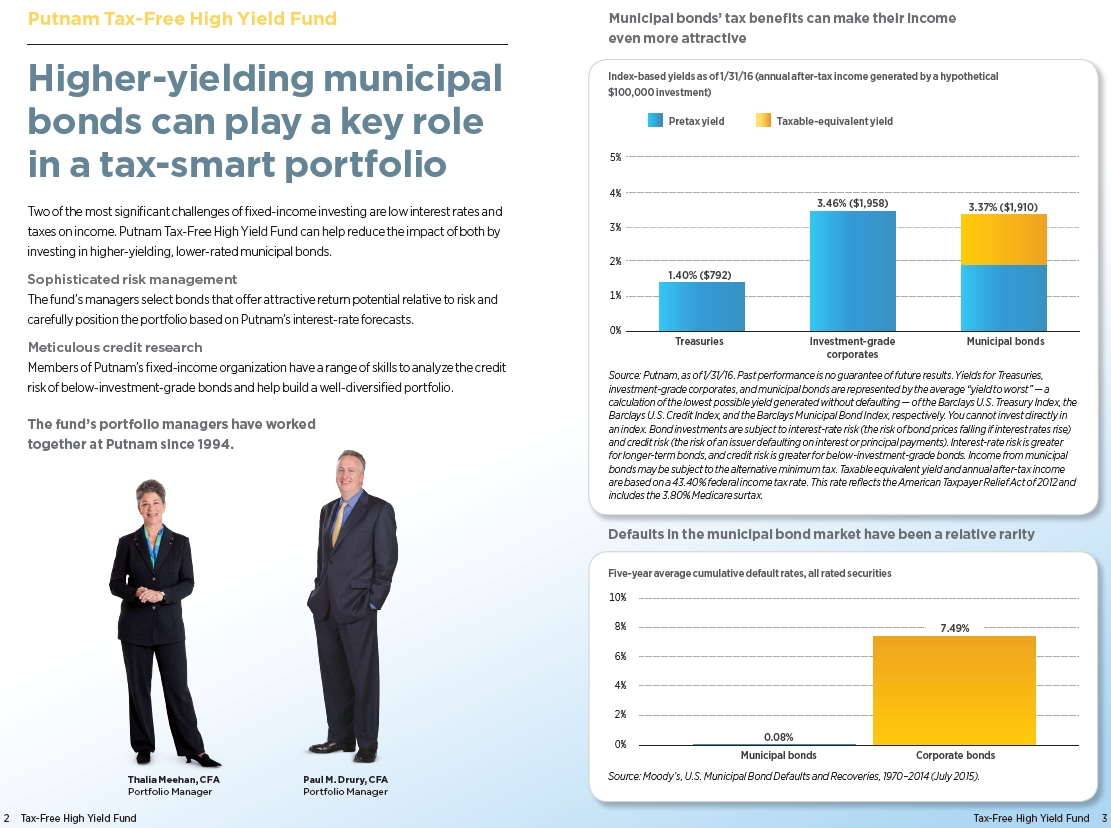
Against this backdrop, we do not foresee widespread credit challenges within the municipal bond market. The overall fiscal health and creditworthiness of the municipal bond market remains sound, in our view. Broadly speaking, we have seen progress at the state and local levels, with revenue growth and other key debt metrics improving along with the strengthening U.S. economy. According to Moody’s, the ratio of municipal bond rating upgrades to downgrades has been rising in recent years. Widely followed measures of municipal bond default levels remain low. According to Municipal Market Analytics, the default rate stood at 0.05% on January 31, 2016, a fraction of the $3.7 trillion municipal bond market, and we expect that trend to continue. On the other hand, should economic growth slow, we believe troubled issuers could face more headwinds.
With the presidential campaign season in full swing and the candidates more clearly defining their policy agendas, some candidates have discussed individual and corporate tax reform and the elimination of some loopholes and tax deductions. We would caution municipal bond investors from overreacting to discussions about changes to the tax code until after the November election, when it will be clearer if reform is to become a bona fide priority. As we have seen in previous instances, headlines about isolated municipal issuers can lead to investor overreaction and temporary price dislocation. Such price action often results in investment opportunities for Putnam’s Tax Exempt team.
Thank you, Paul, for your time and insights today.
The views expressed in this report are exclusively those of Putnam Management and are subject to change. They are not meant as investment advice.
Please note that the holdings discussed in this report may not have been held by the fund for the entire period. Portfolio composition is subject to review in accordance with the fund’s investment strategy and may vary in the future. Current and future portfolio holdings are subject to risk.
Portfolio Manager Paul M. Drury has a B.A. from Suffolk University. He has been in the investment industry since he joined Putnam in 1989.
In addition to Paul, your fund’s portfolio manager is Thalia Meehan, CFA.
| |
| Tax-Free High Yield Fund | 9 |
Your fund’s performance
This section shows your fund’s performance, price, and distribution information for periods ended January 31, 2016, the end of the first half of its current fiscal year. In accordance with regulatory requirements for mutual funds, we also include performance information as of the most recent calendar quarter-end and expense information taken from the fund’s current prospectus. Performance should always be considered in light of a fund’s investment strategy. Data represent past performance. Past performance does not guarantee future results. More recent returns may be less or more than those shown. Investment return and principal value will fluctuate, and you may have a gain or a loss when you sell your shares. Performance information does not reflect any deduction for taxes a shareholder may owe on fund distributions or on the redemption of fund shares. For the most recent month-end performance, please visit the Individual Investors section at putnam.com or call Putnam at 1-800-225-1581. Class Y shares are not available to all investors. See the Terms and Definitions section in this report for definitions of the share classes offered by your fund.
Fund performance Total return for periods ended 1/31/16
| | | | | | | | | |
| | Class A | Class B | Class C | Class M | Class Y |
| (inception dates) | (9/20/93) | (9/9/85) | (2/1/99) | (12/29/94) | (1/2/08) |
|
| | Before | After | | | | | Before | After | Net |
| | sales | sales | Before | After | Before | After | sales | sales | asset |
| | charge | charge | CDSC | CDSC | CDSC | CDSC | charge | charge | value |
|
| Annual average | | | | | | | | | |
| (life of fund) | 6.20% | 6.05% | 6.20% | 6.20% | 5.36% | 5.36% | 5.95% | 5.84% | 5.98% |
|
| 10 years | 60.64 | 54.22 | 52.92 | 52.92 | 48.87 | 48.87 | 56.33 | 51.25 | 62.23 |
| Annual average | 4.85 | 4.43 | 4.34 | 4.34 | 4.06 | 4.06 | 4.57 | 4.22 | 4.96 |
|
| 5 years | 43.65 | 37.90 | 39.20 | 37.20 | 38.27 | 38.27 | 41.75 | 37.14 | 45.54 |
| Annual average | 7.51 | 6.64 | 6.84 | 6.53 | 6.70 | 6.70 | 7.23 | 6.52 | 7.79 |
|
| 3 years | 12.22 | 7.73 | 10.13 | 7.19 | 9.73 | 9.73 | 11.32 | 7.70 | 13.13 |
| Annual average | 3.92 | 2.51 | 3.27 | 2.34 | 3.14 | 3.14 | 3.64 | 2.50 | 4.20 |
|
| 1 year | 3.11 | –1.01 | 2.47 | –2.47 | 2.32 | 1.33 | 2.83 | –0.51 | 3.42 |
|
| 6 months | 3.99 | –0.17 | 3.58 | –1.42 | 3.58 | 2.58 | 3.85 | 0.47 | 4.09 |
|
Current performance may be lower or higher than the quoted past performance, which cannot guarantee future results. After-sales-charge returns for class A and M shares reflect the deduction of the maximum 4.00% and 3.25% sales charge, respectively, levied at the time of purchase. Class B share returns after contingent deferred sales charge (CDSC) reflect the applicable CDSC, which is 5% in the first year, declining over time to 1% in the sixth year, and is eliminated thereafter. Class C share returns after CDSC reflect a 1% CDSC for the first year that is eliminated thereafter. Class Y shares have no initial sales charge or CDSC. Performance for class A, C, M, and Y shares before their inception is derived from the historical performance of class B shares, adjusted for the applicable sales charge (or CDSC) and, for class C shares, the higher operating expenses for such shares.
For a portion of the periods, the fund had expense limitations, without which returns would have been lower.
Class B share performance reflects conversion to class A shares after eight years.
| |
| 10 | Tax-Free High Yield Fund |
Comparative index returns For periods ended 1/31/16
| | |
| | | Lipper High Yield |
| | Barclays Municipal | Municipal Debt Funds |
| | Bond Index | category average* |
|
| Annual average (life of fund) | 6.78% | 6.33% |
|
| 10 years | 59.99 | 49.42 |
| Annual average | 4.81 | 4.06 |
|
| 5 years | 32.28 | 44.37 |
| Annual average | 5.75 | 7.60 |
|
| 3 years | 10.62 | 12.12 |
| Annual average | 3.42 | 3.88 |
|
| 1 year | 2.71 | 3.24 |
|
| 6 months | 3.66 | 4.25 |
|
Index and Lipper results should be compared with fund performance before sales charge, before CDSC, or at net asset value.
* Over the 6-month, 1-year, 3-year, 5-year, 10-year, and life-of-fund periods ended 1/31/16, there were 156, 144, 121, 110, 67, and 4 funds, respectively, in this Lipper category.
Fund performance as of most recent calendar quarter
Total return for periods ended 12/31/15
| | | | | | | | | |
| | Class A | Class B | Class C | Class M | Class Y |
| (inception dates) | (9/20/93) | (9/9/85) | (2/1/99) | (12/29/94) | (1/2/08) |
|
| | Before | After | | | | | Before | After | Net |
| | sales | sales | Before | After | Before | After | sales | sales | asset |
| | charge | charge | CDSC | CDSC | CDSC | CDSC | charge | charge | value |
|
| Annual average | | | | | | | | | |
| (life of fund) | 6.18% | 6.04% | 6.18% | 6.18% | 5.34% | 5.34% | 5.94% | 5.82% | 5.96% |
|
| 10 years | 59.76 | 53.37 | 51.96 | 51.96 | 47.93 | 47.93 | 55.48 | 50.42 | 61.11 |
| Annual average | 4.80 | 4.37 | 4.27 | 4.27 | 3.99 | 3.99 | 4.51 | 4.17 | 4.88 |
|
| 5 years | 40.34 | 34.73 | 36.00 | 34.00 | 34.98 | 34.98 | 38.49 | 33.98 | 42.09 |
| Annual average | 7.01 | 6.14 | 6.34 | 6.03 | 6.18 | 6.18 | 6.73 | 6.03 | 7.28 |
|
| 3 years | 12.25 | 7.76 | 10.16 | 7.22 | 9.58 | 9.58 | 11.35 | 7.73 | 12.99 |
| Annual average | 3.93 | 2.52 | 3.28 | 2.35 | 3.10 | 3.10 | 3.65 | 2.51 | 4.15 |
|
| 1 year | 4.36 | 0.18 | 3.71 | –1.29 | 3.55 | 2.55 | 4.08 | 0.70 | 4.58 |
|
| 6 months | 3.46 | –0.68 | 3.13 | –1.87 | 2.97 | 1.97 | 3.32 | –0.04 | 3.56 |
|
See the discussion following the fund performance table on page 10 for information about the calculation of fund performance.
| |
| Tax-Free High Yield Fund | 11 |
Fund price and distribution information For the six-month period ended 1/31/16
| | | | | | | |
| Distributions | Class A | Class B | Class C | Class M | Class Y |
|
| Number | 6 | 6 | 6 | 6 | 6 |
|
| Income1 | $0.268696 | $0.230231 | $0.220928 | $0.252061 | $0.283066 |
|
| Capital gains2 | — | — | — | — | — |
|
| Total | $0.268696 | $0.230231 | $0.220928 | $0.252061 | $0.283066 |
|
| | Before | After | Net | Net | Before | After | Net |
| | sales | sales | asset | asset | sales | sales | asset |
| Share value | charge | charge | value | value | charge | charge | value |
|
| 7/31/15 | $12.39 | $12.91 | $12.42 | $12.42 | $12.39 | $12.81 | $12.44 |
|
| 1/31/16 | 12.61 | 13.14 | 12.63 | 12.64 | 12.61 | 13.03 | 12.66 |
|
| | Before | After | Net | Net | Before | Net | Net |
| | sales | sales | asset | asset | sales | asset | asset |
| Current rate (end of period) | charge | charge | value | value | charge | value | value |
|
| Current dividend rate3 | 3.87% | 3.71% | 3.24% | 3.09% | 3.60% | 3.48% | 4.08% |
|
| Taxable equivalent4 | 6.84 | 6.55 | 5.72 | 5.46 | 6.36 | 6.15 | 7.21 |
|
| Current 30-day SEC yield5 | N/A | 2.46 | 1.95 | 1.80 | N/A | 2.22 | 2.79 |
|
| Taxable equivalent4 | N/A | 4.35 | 3.45 | 3.18 | N/A | 3.92 | 4.93 |
|
The classification of distributions, if any, is an estimate. Before-sales-charge share value and current dividend rate for class A and M shares, if applicable, do not take into account any sales charge levied at the time of purchase. After-sales-charge share value, current dividend rate, and current 30-day SEC yield, if applicable, are calculated assuming that the maximum sales charge (4.00% for class A shares and 3.25% for class M shares) was levied at the time of purchase. Final distribution information will appear on your year-end tax forms.
1 For some investors, investment income may be subject to the federal alternative minimum tax.
2 Capital gains, if any, are taxable for federal and, in most cases, state purposes.
3 Most recent distribution, including any return of capital and excluding capital gains, annualized and divided by share price before or after sales charge at period-end.
4 Assumes maximum 43.40% federal tax rate for 2016. Results for investors subject to lower tax rates would not be as advantageous.
5 Based only on investment income and calculated using the maximum offering price for each share class, in accordance with SEC guidelines.
| |
| 12 | Tax-Free High Yield Fund |
Your fund’s expenses
As a mutual fund investor, you pay ongoing expenses, such as management fees, distribution fees (12b-1 fees), and other expenses. Using the following information, you can estimate how these expenses affect your investment and compare them with the expenses of other funds. You may also pay one-time transaction expenses, including sales charges (loads) and redemption fees, which are not shown in this section and would have resulted in higher total expenses. For more information, see your fund’s prospectus or talk to your financial representative.
Expense ratios
| | | | | |
| | Class A | Class B | Class C | Class M | Class Y |
|
| Total annual operating expenses for the fiscal | | | | | |
| year ended 7/31/15 | 0.80% | 1.42% | 1.57% | 1.07% | 0.57% |
|
| Annualized expense ratio for the six-month | | | | | |
| period ended 1/31/16 | 0.82% | 1.44% | 1.59% | 1.09% | 0.59% |
|
Fiscal-year expense information in this table is taken from the most recent prospectus, is subject to change, and may differ from that shown for the annualized expense ratio and in the financial highlights of this report.
Expenses are shown as a percentage of average net assets.
Expenses per $1,000
The following table shows the expenses you would have paid on a $1,000 investment in each class of the fund from 8/1/15 to 1/31/16. It also shows how much a $1,000 investment would be worth at the close of the period, assuming actual returns and expenses.
| | | | | |
| | Class A | Class B | Class C | Class M | Class Y |
|
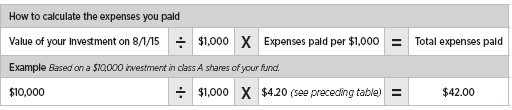
| Expenses paid per $1,000*† | $4.20 | $7.37 | $8.14 | $5.59 | $3.03 |
|
| Ending value (after expenses) | $1,039.90 | $1,035.80 | $1,035.80 | $1,038.50 | $1,040.90 |
|
* Expenses for each share class are calculated using the fund’s annualized expense ratio for each class, which represents the ongoing expenses as a percentage of average net assets for the six months ended 1/31/16. The expense ratio may differ for each share class.
† Expenses are calculated by multiplying the expense ratio by the average account value for the period; then multiplying the result by the number of days in the period; and then dividing that result by the number of days in the year.
| |
| Tax-Free High Yield Fund | 13 |
Estimate the expenses you paid
To estimate the ongoing expenses you paid for the six months ended 1/31/16, use the following calculation method. To find the value of your investment on 8/1/15, call Putnam at 1-800-225-1581.
Compare expenses using the SEC’s method
The Securities and Exchange Commission (SEC) has established guidelines to help investors assess fund expenses. Per these guidelines, the following table shows your fund’s expenses based on a $1,000 investment, assuming a hypothetical 5% annualized return. You can use this information to compare the ongoing expenses (but not transaction expenses or total costs) of investing in the fund with those of other funds. All mutual fund shareholder reports will provide this information to help you make this comparison. Please note that you cannot use this information to estimate your actual ending account balance and expenses paid during the period.
| | | | | |
| | Class A | Class B | Class C | Class M | Class Y |
|
| Expenses paid per $1,000*† | $4.17 | $7.30 | $8.06 | $5.53 | $3.00 |
|
| Ending value (after expenses) | $1,021.01 | $1,017.90 | $1,017.14 | $1,019.66 | $1,022.17 |
|
* Expenses for each share class are calculated using the fund’s annualized expense ratio for each class, which represents the ongoing expenses as a percentage of average net assets for the six months ended 1/31/16. The expense ratio may differ for each share class.
† Expenses are calculated by multiplying the expense ratio by the average account value for the six-month period; then multiplying the result by the number of days in the six-month period; and then dividing that result by the number of days in the year.
| |
| 14 | Tax-Free High Yield Fund |
Terms and definitions
Important terms
Total return shows how the value of the fund’s shares changed over time, assuming you held the shares through the entire period and reinvested all distributions in the fund.
Before sales charge, or net asset value, is the price, or value, of one share of a mutual fund, without a sales charge. Before-sales-charge figures fluctuate with market conditions, and are calculated by dividing the net assets of each class of shares by the number of outstanding shares in the class.
After sales charge is the price of a mutual fund share plus the maximum sales charge levied at the time of purchase. After-sales-charge performance figures shown here assume the 4.00% maximum sales charge for class A shares and 3.25% for class M shares.
Contingent deferred sales charge (CDSC) is generally a charge applied at the time of the redemption of class B or C shares and assumes redemption at the end of the period. Your fund’s class B CDSC declines over time from a 5% maximum during the first year to 1% during the sixth year. After the sixth year, the CDSC no longer applies. The CDSC for class C shares is 1% for one year after purchase.
Share classes
Class A shares are generally subject to an initial sales charge and no CDSC (except on certain redemptions of shares bought without an initial sales charge).
Class B shares are not subject to an initial sales charge and may be subject to a CDSC.
Class C shares are not subject to an initial sales charge and are subject to a CDSC only if the shares are redeemed during the first year.
Class M shares have a lower initial sales charge and a higher 12b-1 fee than class A shares and no CDSC.
Class Y shares are not subject to an initial sales charge or CDSC, and carry no 12b-1 fee.
They are generally only available to corporate and institutional clients and clients in other approved programs.
Fixed-income terms
Current rate is the annual rate of return earned from dividends or interest of an investment. Current rate is expressed as a percentage of the price of a security, fund share, or principal investment.
Yield curve is a graph that plots the yields of bonds with equal credit quality against their differing maturity dates, ranging from shortest to longest. It is used as a benchmark for other debt, such as mortgage or bank lending rates.
Comparative indexes
Barclays Municipal Bond Index is an unmanaged index of long-term fixed-rate investment-grade tax-exempt bonds.
Barclays U.S. Aggregate Bond Index is an unmanaged index of U.S. investment-grade fixed-income securities.
BofA Merrill Lynch U.S. 3-Month Treasury Bill Index is an unmanaged index that seeks to measure the performance of U.S. Treasury bills available in the marketplace.
S&P 500 Index is an unmanaged index of common stock performance.
Indexes assume reinvestment of all distributions and do not account for fees. Securities and performance of a fund and an index will differ. You cannot invest directly in an index.
Lipper is a third-party industry-ranking entity that ranks mutual funds. Its rankings do not reflect sales charges. Lipper rankings are based on total return at net asset value relative to other funds that have similar current investment styles or objectives as determined by Lipper. Lipper may change a fund’s category assignment at its discretion. Lipper category averages reflect performance trends for funds within a category.
| |
| Tax-Free High Yield Fund | 15 |
Other information for shareholders
Important notice regarding delivery of shareholder documents
In accordance with Securities and Exchange Commission (SEC) regulations, Putnam sends a single copy of annual and semiannual shareholder reports, prospectuses, and proxy statements to Putnam shareholders who share the same address, unless a shareholder requests otherwise. If you prefer to receive your own copy of these documents, please call Putnam at 1-800-225-1581, and Putnam will begin sending individual copies within 30 days.
Proxy voting
Putnam is committed to managing our mutual funds in the best interests of our shareholders. The Putnam funds’ proxy voting guidelines and procedures, as well as information regarding how your fund voted proxies relating to portfolio securities during the 12-month period ended June 30, 2015, are available in the Individual Investors section of putnam.com, and on the SEC’s website, www.sec.gov. If you have questions about finding forms on the SEC’s website, you may call the SEC at 1-800-SEC-0330. You may also obtain the Putnam funds’ proxy voting guidelines and procedures at no charge by calling Putnam’s Shareholder Services at 1-800-225-1581.
Fund portfolio holdings
The fund will file a complete schedule of its portfolio holdings with the SEC for the first and third quarters of each fiscal year on Form N-Q. Shareholders may obtain the fund’s Form N-Q on the SEC’s website at www.sec.gov. In addition, the fund’s Form N-Q may be reviewed and copied at the SEC’s Public Reference Room in Washington, D.C. You may call the SEC at 1-800-SEC-0330 for information about the SEC’s website or the operation of the Public Reference Room.
Trustee and employee fund ownership
Putnam employees and members of the Board of Trustees place their faith, confidence, and, most importantly, investment dollars in Putnam mutual funds. As of January 31, 2016, Putnam employees had approximately $463,000,000 and the Trustees had approximately $124,000,000 invested in Putnam mutual funds. These amounts include investments by the Trustees’ and employees’ immediate family members as well as investments through retirement and deferred compensation plans.
| |
| 16 | Tax-Free High Yield Fund |
Financial statements
A guide to financial statements
These sections of the report, as well as the accompanying Notes, constitute the fund’s financial statements.
The fund’s portfolio lists all the fund’s investments and their values as of the last day of the reporting period. Holdings are organized by asset type and industry sector, country, or state to show areas of concentration and diversification.
Statement of assets and liabilities shows how the fund’s net assets and share price are determined. All investment and non-investment assets are added together. Any unpaid expenses and other liabilities are subtracted from this total. The result is divided by the number of shares to determine the net asset value per share, which is calculated separately for each class of shares. (For funds with preferred shares, the amount subtracted from total assets includes the liquidation preference of preferred shares.)
Statement of operations shows the fund’s net investment gain or loss. This is done by first adding up all the fund’s earnings — from dividends and interest income — and subtracting its operating expenses to determine net investment income (or loss). Then, any net gain or loss the fund realized on the sales of its holdings — as well as any unrealized gains or losses over the period — is added to or subtracted from the net investment result to determine the fund’s net gain or loss for the fiscal period.
Statement of changes in net assets shows how the fund’s net assets were affected by the fund’s net investment gain or loss, by distributions to shareholders, and by changes in the number of the fund’s shares. It lists distributions and their sources (net investment income or realized capital gains) over the current reporting period and the most recent fiscal year-end. The distributions listed here may not match the sources listed in the Statement of operations because the distributions are determined on a tax basis and may be paid in a different period from the one in which they were earned. Dividend sources are estimated at the time of declaration. Actual results may vary. Any non-taxable return of capital cannot be determined until final tax calculations are completed after the end of the fund’s fiscal year.
Financial highlights provide an overview of the fund’s investment results, per-share distributions, expense ratios, net investment income ratios, and portfolio turnover in one summary table, reflecting the five most recent reporting periods. In a semiannual report, the highlights table also includes the current reporting period.
| |
| Tax-Free High Yield Fund | 17 |
The fund’s portfolio 1/31/16 (Unaudited)
Key to holding’s abbreviations
| |
| ABAG Association Of Bay Area Governments | G.O. Bonds General Obligation Bonds |
| AGC Assured Guaranty Corp. | NATL National Public Finance Guarantee Corp. |
| AGM Assured Guaranty Municipal Corporation | U.S. Govt. Coll. U.S. Government Collateralized |
| AMBAC AMBAC Indemnity Corporation | VRDN Variable Rate Demand Notes, which are |
| Cmnwlth. of PR Gtd. Commonwealth of Puerto | floating-rate securities with long-term maturities |
| Rico Guaranteed | that carry coupons that reset and are payable upon |
| COP Certificates of Participation | demand either daily, weekly or monthly. The rate |
| FRB Floating Rate Bonds: the rate shown | shown is the current interest rate at the close of the |
| is the current interest rate at the close of the | reporting period. |
| reporting period | |
| | | |
| MUNICIPAL BONDS AND NOTES (97.6%)* | Rating** | Principal amount | Value |
|
| Alabama (1.7%) | | | |
| Cullman Cnty., Hlth. Care Auth. Rev. Bonds | | | |
| (Cullman Regl. Med. Ctr.), Ser. A, 7s, 2/1/36 | Ba1 | $2,300,000 | $2,505,091 |
|
| Jefferson Cnty., Swr. Rev. Bonds | | | |
| Ser. D, 6 1/2s, 10/1/53 | BBB– | 3,000,000 | 3,607,950 |
| zero %, 10/1/46 | BBB– | 8,800,000 | 6,400,768 |
|
| Selma, Indl. Dev. Board Rev. Bonds (Gulf | | | |
| Opportunity Zone Intl. Paper Co.), Ser. A | | | |
| 6 1/4s, 11/1/33 | BBB | 3,000,000 | 3,483,570 |
| 5.8s, 5/1/34 | Baa2 | 1,750,000 | 1,962,363 |
|
| | 17,959,742 |
| American Samoa (0.1%) | | | |
| Econ. Dev. Auth. Rev. Bonds, Ser. A, | | | |
| 6 5/8s, 9/1/35 | Ba3 | 1,000,000 | 1,025,200 |
|
| | 1,025,200 |
| Arizona (3.2%) | | | |
| Casa Grande, Indl. Dev. Auth. Rev. Bonds | | | |
| (Casa Grande Regl. Med. Ctr.) | | | |
| Ser. A, 7 5/8s, 12/1/29 (escrow) F | D/P | 5,575,000 | 16,664 |
| 7 1/4s, 12/1/19 (escrow) F | D/P | 500,000 | 1,495 |
|
| Coconino Cnty., Poll. Control Rev. Bonds (Tucson | | | |
| Elec. Pwr. Co. — Navajo), Ser. A, 5 1/8s, 10/1/32 | A3 | 2,000,000 | 2,206,860 |
|
| Glendale, Indl. Dev. Auth. Rev. Bonds (John | | | |
| C. Lincoln Hlth. Network), 5s, 12/1/42 | | | |
| (Prerefunded 12/1/17) | AAA/P | 1,100,000 | 1,182,819 |
|
| Maricopa Cnty., Poll. Control Rev. Bonds | | | |
| (El Paso Elec. Co.), Ser. A, 7 1/4s, 2/1/40 | Baa1 | 4,800,000 | 5,583,744 |
|
| Phoenix, Indl. Dev. Auth. Ed. Rev. Bonds | | | |
| (Great Hearts Academies Project), 6.3s, 7/1/42 | BB/F | 430,000 | 457,241 |
| (Great Hearts Academies), 6s, 7/1/32 | BB/F | 300,000 | 322,428 |
| (Choice Academies, Inc.), 5 3/8s, 9/1/32 | BB+ | 2,000,000 | 2,089,340 |
| (Great Hearts Academies), 5s, 7/1/44 | BBB– | 3,800,000 | 3,945,160 |
| (BASIS School, Inc.), 5s, 7/1/35 | BB | 1,500,000 | 1,584,075 |
|
| Phoenix, Indl. Dev. Auth. Ed. 144A Rev. Bonds | | | |
| (BASIS Schools, Inc.), Ser. A | | | |
| 5s, 7/1/46 | BB | 750,000 | 777,315 |
| 5s, 7/1/35 | BB | 1,750,000 | 1,848,088 |
|
| |
| 18 | Tax-Free High Yield Fund |
| | | |
| MUNICIPAL BONDS AND NOTES (97.6%)* cont. | Rating** | Principal amount | Value |
|
| Arizona cont. | | | |
| Pima Cnty., Indl. Dev. Auth. Rev. Bonds | | | |
| (Horizon Cmnty. Learning Ctr.) | | | |
| 5 1/4s, 6/1/35 | BBB– | $1,395,000 | $1,396,242 |
| 5.05s, 6/1/25 | BBB– | 2,450,000 | 2,451,960 |
|
| Salt Verde, Fin. Corp. Gas Rev. Bonds | | | |
| 5 1/2s, 12/1/29 | Baa1 | 1,525,000 | 1,916,330 |
| 5s, 12/1/37 | Baa1 | 1,430,000 | 1,694,750 |
| 5s, 12/1/32 | Baa1 | 1,500,000 | 1,809,855 |
|
| Tempe, Indl. Dev. Auth. Rev. Bonds | | | |
| (Friendship Village), Ser. A, 6s, 12/1/32 | BB–/P | 1,350,000 | 1,459,161 |
|
| Yavapai Cnty., Indl. Dev. Ed. Auth. Rev. Bonds | | | |
| (Agribusiness & Equine Ctr.), 5s, 3/1/32 | BB+ | 1,600,000 | 1,633,184 |
|
| Yavapai Cnty., Indl. Dev. Ed. Auth. 144A Rev. | | | |
| Bonds, Ser. A, 5s, 9/1/34 | BB+ | 500,000 | 506,900 |
|
| | 32,883,611 |
| Arkansas (0.2%) | | | |
| Arkadelphia, Pub. Ed. Fac. Board Rev. Bonds | | | |
| (Ouachita Baptist U.), 6s, 3/1/33 | BB+/P | 2,000,000 | 2,129,520 |
|
| | 2,129,520 |
| California (12.2%) | | | |
| ABAG Fin. Auth. for Nonprofit Corps. Rev. Bonds | | | |
| (Episcopal Sr. Cmntys.), 6s, 7/1/31 | BBB+/F | 1,295,000 | 1,482,115 |
|
| CA Muni. Fin. Auth. COP | | | |
| (Cmnty. Hosp. Central CA) | | | |
| 5 1/4s, 2/1/46 | A– | 6,180,000 | 6,382,333 |
| U.S. Govt. Coll., 5 1/4s, 2/1/46 | | | |
| (Prerefunded 2/1/17) | AAA/P | 820,000 | 858,589 |
| 5 1/4s, 2/1/37 | A– | 1,585,000 | 1,638,494 |
| U.S. Govt. Coll., 5 1/4s, 2/1/37 | | | |
| (Prerefunded 2/1/17) | AAA/P | 1,120,000 | 1,172,707 |
|
| CA Muni. Fin. Auth. Rev. Bonds | | | |
| (Emerson College), 6s, 1/1/42 | Baa1 | 3,330,000 | 3,981,148 |
| (Cmnty. Med. Ctrs.), Ser. A, 5s, 2/1/46 | A– | 2,500,000 | 2,807,725 |
|
| CA School Fin. Auth. Rev. Bonds | | | |
| (2023 Union, LLC), Ser. A, 6s, 7/1/33 | BBB– | 1,000,000 | 1,116,270 |
| (Klare Holdings), Ser. A, 5s, 7/1/34 | BBB– | 2,075,000 | 2,288,891 |
|
| CA State G.O. Bonds, 5s, 9/1/30 | Aa3 | 6,000,000 | 7,038,840 |
|
| CA State Muni. Fin. Auth Mobile Home Park | | | |
| Rev. Bonds (Caritas Affordable Hsg., Inc.), | | | |
| 5 1/4s, 8/15/39 | BBB | 800,000 | 909,448 |
|
| CA State Muni. Fin. Auth. Charter School Rev. | | | |
| Bonds (Partnerships Uplift Cmnty.), Ser. A | | | |
| 5 1/4s, 8/1/42 | BB+ | 850,000 | 896,317 |
| 5s, 8/1/32 | BB+ | 665,000 | 703,484 |
|
| CA State Poll. Control Fin. Auth. Rev. Bonds | | | |
| (Wtr. Furnishing), 5s, 11/21/45 | Baa3 | 5,000,000 | 5,487,400 |
|
| CA State Poll. Control Fin. Auth. Solid Waste Disp. | | | |
| 144A Mandatory Put Bonds (2/1/16) | | | |
| (Republic Svcs., Inc.), Ser. A, 0.65s, 8/1/23 | A–2 | 3,000,000 | 3,000,000 |
|
| |
| Tax-Free High Yield Fund | 19 |
| | | |
| MUNICIPAL BONDS AND NOTES (97.6%)* cont. | Rating** | Principal amount | Value |
|
| California cont. | | | |
| CA State Pub. Wks. Board Rev. Bonds | | | |
| Ser. A-1, 6s, 3/1/35 | A1 | $2,000,000 | $2,345,160 |
| (States Prisons — LA), Ser. C, 5 3/4s, 10/1/31 | A1 | 1,000,000 | 1,213,470 |
| (Judicial Council Projects), Ser. D, 5s, 12/1/31 | A1 | 1,000,000 | 1,178,080 |
| (Capital Projects), Ser. A, 5s, 4/1/30 | A1 | 5,000,000 | 5,900,250 |
|
| CA Statewide Cmnty. Dev. Auth. Rev. Bonds | | | |
| (Terraces at San Joaquin Gardens), Ser. A, | | | |
| 6s, 10/1/47 | BB/P | 500,000 | 535,885 |
| (Terraces at San Joaquin Gardens), Ser. A, | | | |
| 6s, 10/1/42 | BB/P | 1,750,000 | 1,885,958 |
| (Irvine, LLC-UCI East Campus), 6s, 5/15/40 | Baa2 | 6,000,000 | 6,497,820 |
| (Terraces at San Joaquin Gardens), Ser. A, | | | |
| 5 5/8s, 10/1/32 | BB/P | 1,105,000 | 1,183,665 |
| (U. CA Irvine E. Campus Apts. Phase 1), | | | |
| 5 3/8s, 5/15/38 | Baa2 | 1,500,000 | 1,696,275 |
| (899 Charleston, LLC), Ser. A, 5 1/4s, 11/1/44 | BB/P | 850,000 | 870,281 |
| (American Baptist Homes of the West), | | | |
| 5s, 10/1/43 | BBB+/F | 1,000,000 | 1,080,980 |
| (Sr. Living-Presbyterian Homes), Ser. A, 4 7/8s, | | | |
| 11/15/36 (Prerefunded 11/15/16) | BBB– | 1,000,000 | 1,034,880 |
|
| CA Statewide Cmnty. Dev. Auth. 144A Rev. Bonds | | | |
| (American Baptist Homes West), | | | |
| 6 1/4s, 10/1/39 | BBB+/F | 2,500,000 | 2,820,325 |
| (Front Porch Cmntys. & Svcs.), Ser. A, | | | |
| 5 1/8s, 4/1/37 | BBB+ | 3,300,000 | 3,365,241 |
|
| Foothill/Eastern Corridor Agcy. Rev. Bonds, | | | |
| Ser. A, 6s, 1/15/53 | BBB– | 5,145,000 | 6,109,327 |
|
| Golden State Tobacco Securitization | | | |
| Corp. Rev. Bonds | | | |
| Ser. A-2, 5.3s, 6/1/37 | B3 | 8,000,000 | 7,485,520 |
| Ser. A-1, 5 1/8s, 6/1/47 | B3 | 7,390,000 | 6,556,556 |
|
| La Verne, COP (Brethren Hillcrest Homes), | | | |
| 5s, 5/15/36 | BBB–/F | 775,000 | 836,775 |
|
| Long Beach, Bond Fin. Auth. Rev. Bonds | | | |
| (Natural Gas Purchase), Ser. A, 5 1/2s, 11/15/37 | Baa1 | 2,000,000 | 2,566,680 |
|
| M-S-R Energy Auth. Rev. Bonds | | | |
| Ser. A, 6 1/2s, 11/1/39 | BBB+ | 1,250,000 | 1,804,813 |
| Ser. B, 6 1/2s, 11/1/39 | BBB+ | 2,000,000 | 2,887,700 |
|
| Oakland, Alameda Cnty. Unified School | | | |
| Dist. G.O. Bonds | | | |
| (Election of 2012), 6 1/4s, 8/1/30 | BBB/P | 1,500,000 | 1,786,260 |
| (Election of 2006), Ser. A, 5 1/2s, 8/1/32 | BBB/P | 1,500,000 | 1,730,310 |
|
| Oakley, Pub. Fin. Auth. Special Assmt. | | | |
| Bonds, 5s, 9/2/31 | BBB | 1,645,000 | 1,788,872 |
|
| Rancho Cordova, Cmnty. Fac. Dist. Special Tax | | | |
| Bonds (Sunridge Anatolia), Ser. 03-1, 5s, 9/1/37 | BB+/P | 1,000,000 | 1,097,900 |
|
| Riverside Cnty., Trans. Comm. Toll Rev. Bonds, | | | |
| Ser. A, 5 3/4s, 6/1/44 | BBB– | 750,000 | 864,480 |
|
| San Bernardino, Cmnty. College Dist. G.O. Bonds | | | |
| (Election of 2008), Ser. B, zero %, 8/1/44 | Aa2 | 15,000,000 | 4,538,550 |
|
| |
| 20 | Tax-Free High Yield Fund |
| | | |
| MUNICIPAL BONDS AND NOTES (97.6%)* cont. | Rating** | Principal amount | Value |
|
| California cont. | | | |
| San Diego, Unified School Dist. G.O. Bonds | | | |
| (Election of 2008), Ser. C, zero %, 7/1/40 | Aa2 | $5,000,000 | $1,919,750 |
|
| San Francisco City & Cnty. Redev. Agcy. Cmnty. | | | |
| Fac. Dist. Special Tax Bonds (No. 6 Mission Bay | | | |
| South), Ser. A, 5.15s, 8/1/35 | BBB–/P | 1,000,000 | 1,003,380 |
|
| San Francisco City & Cnty., Redev. Agcy. Cmnty. | | | |
| Successor Special Tax Bonds (No. 6 Mission Bay | | | |
| Pub. Impts.), Ser. C, zero %, 8/1/43 | BBB–/P | 8,000,000 | 1,782,240 |
|
| San Francisco, City & Cnty. Redev. Fin. Auth. Tax | | | |
| Alloc. Bonds (Mission Bay South Redev.), Ser. D, | | | |
| 6 1/2s, 8/1/31 | BBB+ | 500,000 | 562,955 |
|
| Santaluz, Cmnty. Fac. Dist. No. 2 Special Tax | | | |
| Bonds (Impt. Area No. 1), Ser. A | | | |
| 5s, 9/1/29 (Prerefunded 9/1/21) | BBB+ | 980,000 | 1,087,398 |
| 5s, 9/1/28 (Prerefunded 9/1/21) | BBB+ | 985,000 | 1,096,167 |
|
| Selma, Unified School Dist. G.O. Bonds | | | |
| (Election of 2006), Ser. C, AGC, zero %, 8/1/37 | AA | 2,400,000 | 969,888 |
|
| Southern CA Pub. Pwr. Auth. Rev. Bonds | | | |
| (Natural Gas), Ser. A, 5 1/4s, 11/1/21 | A3 | 1,500,000 | 1,750,845 |
|
| Sunnyvale, Special Tax Bonds (Cmnty. Fac. | | | |
| Dist. No. 1), 7 3/4s, 8/1/32 | B+/P | 3,780,000 | 3,790,697 |
|
| | 125,389,094 |
| Colorado (3.5%) | | | |
| Central Platte Valley, Metro. Dist. G.O. Bonds, | | | |
| 5s, 12/1/43 | BB+ | 850,000 | 894,336 |
|
| CO Pub. Hwy. Auth. Rev. Bonds | | | |
| (E-470), zero %, 9/1/41 | Baa1 | 1,000,000 | 361,310 |
| Ser. A, NATL, zero %, 9/1/28 | AA– | 5,000,000 | 3,263,850 |
|
| CO State Hlth. Fac. Auth. Rev. Bonds | | | |
| (Christian Living Cmnty.), 6 3/8s, 1/1/41 | BB–/P | 810,000 | 864,643 |
| (Total Longterm Care National), Ser. A, | | | |
| 6 1/4s, 11/15/40 | A/F | 800,000 | 905,864 |
| (Christian Living Cmntys.), Ser. A, | | | |
| 5 3/4s, 1/1/26 | BB–/P | 2,850,000 | 2,893,805 |
| (Evangelical Lutheran Good Samaritan Society | | | |
| Oblig. Group (The)), 5 5/8s, 6/1/43 | Baa1 | 650,000 | 746,259 |
| (Evangelical Lutheran Good Samaritan Society | | | |
| Oblig. Group (The)), 5 1/2s, 6/1/33 | Baa1 | 200,000 | 231,310 |
| (Valley View Assn.), 5 1/4s, 5/15/42 | A– | 3,025,000 | 3,151,596 |
| (Christian Living Cmntys.), 5 1/4s, 1/1/37 | BB–/P | 750,000 | 778,883 |
| (Valley View Assn.), 5 1/8s, 5/15/37 | A– | 1,000,000 | 1,041,710 |
| (Christian Living Cmntys.), 5 1/8s, 1/1/30 | BB–/P | 1,415,000 | 1,479,071 |
| (Evangelical Lutheran Good Samaritan Society | | | |
| Oblig. Group (The)), Ser. A, 5s, 6/1/40 | Baa1 | 1,250,000 | 1,361,688 |
| (Covenant Retirement Cmnty.), Ser. A, | | | |
| 5s, 12/1/33 | BBB+/F | 2,100,000 | 2,241,078 |
| (Evangelical Lutheran Good Samaritan Society | | | |
| Oblig. Group (The)), 5s, 12/1/33 | Baa1 | 5,250,000 | 5,787,233 |
|
| E-470 CO Pub. Hwy. Auth. Rev. Bonds, Ser. A, | | | |
| NATL, zero %, 9/1/34 | AA– | 12,000,000 | 5,995,680 |
|
| |
| Tax-Free High Yield Fund | 21 |
| | | |
| MUNICIPAL BONDS AND NOTES (97.6%)* cont. | Rating** | Principal amount | Value |
|
| Colorado cont. | | | |
| Eaton, Area Park & Recreation Dist. G.O. Bonds, | | | |
| 5 1/4s, 12/1/34 | BB/P | $330,000 | $348,559 |
|
| Park Creek Metro. Dist. Tax Allocation Bonds | | | |
| (Sr. Ltd. Property Tax Supported), Ser. A, | | | |
| 5s, 12/1/45 | BBB/F | 350,000 | 393,015 |
|
| Plaza, Tax Alloc. Bonds (Metro. Dist. No. 1), | | | |
| 5s, 12/1/40 | BB/P | 3,000,000 | 3,142,830 |
|
| | 35,882,720 |
| Delaware (1.4%) | | | |
| DE State Econ. Dev. Auth. Rev. Bonds | | | |
| (Delmarva Pwr.), 5.4s, 2/1/31 | Baa1 | 1,700,000 | 1,893,035 |
| (Indian River Pwr.), 5 3/8s, 10/1/45 | Baa3 | 5,000,000 | 5,190,300 |
|
| DE State Hlth. Fac. Auth. VRDN | | | |
| (Christiana Care), Ser. A, 0.01s, 10/1/38 | VMIG1 | 7,240,000 | 7,240,000 |
|
| | 14,323,335 |
| District of Columbia (1.4%) | | | |
| DC Rev. Bonds | | | |
| (Howard U.), Ser. A, 6 1/2s, 10/1/41 | BBB | 4,000,000 | 4,279,000 |
| (Kipp Charter School), 6s, 7/1/33 | BBB+ | 1,000,000 | 1,155,570 |
|
| DC, Rev. Bonds (Methodist Home of | | | |
| The DC (The)), Ser. A, 5 1/4s, 1/1/39 | BB–/P | 765,000 | 772,007 |
|
| Metro. Washington, Arpt. Auth. Dulles Toll Rd. | | | |
| Rev. Bonds, Ser. B | | | |
| zero %, 10/1/40 | Baa1 | 995,000 | 351,006 |
| zero %, 10/1/38 | Baa1 | 20,000,000 | 7,797,600 |
|
| | 14,355,183 |
| Florida (6.0%) | | | |
| Broward Cnty., Arpt. Syst. Rev. Bonds, Ser. A, | | | |
| 5s, 10/1/45 | A1 | 2,500,000 | 2,800,675 |
|
| Broward Cnty., Arpt. Syst. Rev. Bonds, Ser. A, | | | |
| 5s, 10/1/40 | A1 | 3,000,000 | 3,381,780 |
|
| Fishhawk, CCD IV Special Assmt. Bonds, | | | |
| 7 1/4s, 5/1/43 | B/P | 600,000 | 655,332 |
|
| Greater Orlando Aviation Auth. Rev. Bonds | | | |
| (JetBlue Airways Corp.), 5s, 11/15/36 | B/P | 1,000,000 | 1,038,870 |
|
| Jacksonville, Econ. Dev. Comm. Hlth. Care | | | |
| Fac. Rev. Bonds (FL Proton Therapy Inst.), | | | |
| Ser. A, 6s, 9/1/17 | BB–/P | 250,000 | 260,918 |
|
| Jacksonville, Econ. Dev. Comm. Indl. Dev. Rev. | | | |
| Bonds (Gerdau Ameristeel US, Inc.), 5.3s, 5/1/37 | Baa3 | 5,250,000 | 5,249,633 |
|
| Lakeland, Hosp. Syst. Rev. Bonds | | | |
| (Lakeland Regl. Hlth.), 5s, 11/15/40 | A2 | 1,075,000 | 1,198,550 |
|
| Lakeland, Retirement Cmnty. 144A Rev. Bonds | | | |
| (1st Mtge. — Carpenters), 6 3/8s, 1/1/43 | BBB–/F | 1,820,000 | 1,920,464 |
|
| Lakewood Ranch, Stewardship Dist. Special | | | |
| Assessment Bonds (Village of Lakewood | | | |
| Ranch South), 5s, 5/1/36 | B+/P | 1,000,000 | 1,004,700 |
|
| Lakewood Ranch, Stewardship Dist. Special | | | |
| Assmt. Bonds, 4 7/8s, 5/1/35 | BB–/P | 1,000,000 | 1,032,620 |
|
| |
| 22 | Tax-Free High Yield Fund |
| | | |
| MUNICIPAL BONDS AND NOTES (97.6%)* cont. | Rating** | Principal amount | Value |
|
| Florida cont. | | | |
| Lee Cnty., Indl. Dev. Auth. Hlth. Care Fac. Rev. | | | |
| Bonds (Shell Pt./Alliance Oblig. Group) | | | |
| 5 1/8s, 11/15/36 | BBB– | $4,925,000 | $5,041,526 |
| 5s, 11/15/32 | BBB– | 3,210,000 | 3,286,912 |
|
| Martin Cnty., Rev. Bonds (Indiantown | | | |
| Cogeneration), 4.2s, 12/15/25 | Ba1 | 1,000,000 | 1,020,760 |
|
| Miami-Dade Cnty., Aviation Rev. Bonds | | | |
| Ser. B, 5s, 10/1/41 | A2 | 4,500,000 | 4,919,310 |
| Ser. A, 5s, 10/1/38 | A | 1,750,000 | 1,992,760 |
|
| Miami-Dade Cnty., Indl. Dev. Auth. Rev. Bonds | | | |
| (Pinecrest Academy, Inc.), 5s, 9/15/34 | BBB– | 1,845,000 | 1,939,796 |
|
| Middle Village Cmnty. Dev. Dist. Special Assmt. | | | |
| Bonds, Ser. A, 6s, 5/1/35 | D/P | 1,860,000 | 1,640,111 |
|
| Midtown Miami Cmnty. Dev. Dist. Special Assmt. | | | |
| Bonds (Garage), Ser. A, 5s, 5/1/29 | BB–/P | 750,000 | 802,073 |
|
| Myrtle Creek, Impt. Dist. Special Assmt. Bonds, | | | |
| Ser. A, 5.2s, 5/1/37 | B+/P | 1,800,000 | 1,804,608 |
|
| Orlando Cmnty. Redev. Agcy. Tax Alloc. Bonds | | | |
| (Republic Drive/Universal), 5s, 4/1/24 | A–/F | 2,000,000 | 2,221,020 |
|
| Palm Beach Cnty., Hlth. Fac. Auth. Rev. Bonds | | | |
| (Acts Retirement-Life Cmnty.), 5 1/2s, 11/15/33 | BBB+ | 6,000,000 | 6,573,780 |
|
| Palm Coast Pk. Cmnty. Dev. Dist. Special Assmt. | | | |
| Bonds, 5.7s, 5/1/37 | B–/P | 580,000 | 499,131 |
|
| Sarasota Cnty., Hlth. Fac. Auth. Retirement Fac. | | | |
| Rev. Bonds (Village On The Isle), 5 1/2s, 1/1/27 | A–/F | 1,950,000 | 2,062,593 |
|
| Southeast Overtown Park West Cmnty. Redev. | | | |
| Agcy. 144A Tax Alloc. Bonds, Ser. A-1, 5s, 3/1/30 | BBB+ | 1,440,000 | 1,581,134 |
|
| Town Ctr. at Palm Coast, Cmnty. Dev. Dist. Special | | | |
| Assmt. Bonds, 6s, 5/1/36 | B–/P | 1,660,000 | 1,619,944 |
|
| Verandah, West Cmnty. Dev. Dist. Special Assmt. | | | |
| Bonds (Cap. Impt.), 5s, 5/1/33 | BB–/P | 1,000,000 | 1,035,550 |
|
| Village Cmnty. Dev. Dist. No. 10 Special Assmt. | | | |
| Bonds, 5 3/4s, 5/1/31 | BB/P | 1,200,000 | 1,382,988 |
|
| Village Cmnty. Dev. Dist. No. 11 Special Assmt. | | | |
| Bonds, 4 1/2s, 5/1/45 | BB–/P | 1,500,000 | 1,561,050 |
|
| Village Cmnty. Dev. Dist. No. 8 Special Assmt. | | | |
| Bonds (Phase II), 6 1/8s, 5/1/39 | BBB–/P | 805,000 | 928,101 |
|
| Village Cmnty. Dev. Dist. No. 9 Special Assmt. | | | |
| Bonds, 5s, 5/1/22 | BBB–/P | 570,000 | 601,037 |
|
| | 61,057,726 |
| Georgia (3.5%) | | | |
| Atlanta, Arpt. Passenger Fac. Charge Rev. Bonds | | | |
| 5s, 1/1/32 | AA– | 1,150,000 | 1,349,778 |
| 5s, 1/1/31 | AA– | 1,925,000 | 2,271,481 |
|
| Atlanta, Wtr. & Waste Wtr. Rev. Bonds | | | |
| Ser. A, 6 1/4s, 11/1/39 (Prerefunded 11/1/19) | Aa3 | 5,000,000 | 5,982,700 |
| 5s, 11/1/40 | Aa3 | 6,000,000 | 6,978,060 |
|
| Clayton Cnty., Dev. Auth. Special Fac. Rev. Bonds | | | |
| (Delta Airlines), Ser. A, 8 3/4s, 6/1/29 | BB | 2,000,000 | 2,494,680 |
|
| |
| Tax-Free High Yield Fund | 23 |
| | | |
| MUNICIPAL BONDS AND NOTES (97.6%)* cont. | Rating** | Principal amount | Value |
|
| Georgia cont. | | | |
| Cobb Cnty., Dev. Auth. Student Hsg. Rev. Bonds | | | |
| (Kennesaw State U. Real Estate Oblig. Group), | | | |
| Ser. C, 5s, 7/15/38 | Baa2 | $1,250,000 | $1,359,850 |
|
| GA State Private College & U. Auth. Rev. Bonds | | | |
| (Mercer U.), Ser. A, 5s, 10/1/32 | Baa2 | 1,100,000 | 1,229,503 |
|
| Gainesville & Hall Cnty., Devauth Retirement | | | |
| Cmnty. Rev. Bonds (Acts Retirement-Life Cmnty.), | | | |
| Ser. A-2, 6 5/8s, 11/15/39 | BBB+ | 1,200,000 | 1,354,416 |
|
| Main St. Natural Gas, Inc. Rev. Bonds (GA Gas), | | | |
| Ser. A, 5 1/2s, 9/15/21 | Baa1 | 1,255,000 | 1,489,434 |
|
| Marietta, Dev. Auth. Rev. Bonds | | | |
| (Fac. of Life U., Inc.), 7s, 6/15/39 | Ba3 | 3,150,000 | 3,306,650 |
|
| Med. Ctr. Hosp. Auth. Rev. Bonds | | | |
| (Spring Harbor Green Island), 5 1/4s, 7/1/27 | BB–/P | 2,375,000 | 2,452,235 |
|
| Muni. Election Auth. of GA Rev. Bonds (Plant | | | |
| Voltage Units 3 & 4), Ser. A, 5 1/2s, 7/1/60 | A+ | 3,500,000 | 4,115,370 |
|
| Rockdale Cnty., Dev. Auth. Rev. Bonds | | | |
| (Visy Paper), Ser. A, 6 1/8s, 1/1/34 | BB/P | 1,400,000 | 1,435,798 |
|
| | 35,819,955 |
| Guam (0.2%) | | | |
| Territory of GU, Rev. Bonds, Ser. A, | | | |
| 5 3/8s, 12/1/24 | BBB+ | 1,000,000 | 1,122,170 |
|
| Territory of GU, Dept. of Ed. COP (John F. | | | |
| Kennedy High School), Ser. A, 6 7/8s, 12/1/40 | B+ | 500,000 | 552,835 |
|
| | 1,675,005 |
| Hawaii (1.1%) | | | |
| HI State Dept. Budget & Fin. Rev. Bonds | | | |
| (Craigside), Ser. A, 9s, 11/15/44 | B/P | 1,350,000 | 1,675,863 |
| (Hawaiian Elec. Co. — Subsidiary), | | | |
| 6 1/2s, 7/1/39 | Baa1 | 7,000,000 | 7,963,970 |
| (Kahala Nui), 5 1/8s, 11/15/32 | BBB/F | 1,050,000 | 1,142,915 |
|
| | 10,782,748 |
| Illinois (7.3%) | | | |
| Chicago, G.O. Bonds | | | |
| Ser. D-05, 5 1/2s, 1/1/37 | BBB+ | 3,250,000 | 3,297,840 |
| Ser. G-07, 5 1/2s, 1/1/35 | BBB+ | 1,200,000 | 1,223,640 |
| Ser. A, 5 1/4s, 1/1/33 | BBB+ | 3,100,000 | 3,115,779 |
| Ser. C, 5s, 1/1/38 | BBB+ | 2,000,000 | 1,922,680 |
|
| Chicago, Special Assmt. Bonds (Lake Shore East), | | | |
| 6 3/4s, 12/1/32 | BB/P | 5,027,000 | 5,036,602 |
|
| Chicago, Board of Ed. G.O. Bonds, Ser. C, | | | |
| 5 1/4s, 12/1/39 | B+ | 4,000,000 | 3,132,160 |
|
| Chicago, Motor Fuel Tax Rev. Bonds | | | |
| AGM, 5s, 1/1/30 | AA | 200,000 | 214,142 |
| 5s, 1/1/28 | BBB+ | 1,000,000 | 1,056,100 |
|
| Chicago, O’Hare Intl. Arpt. Rev. Bonds | | | |
| Ser. A, 5 3/4s, 1/1/39 | A2 | 5,000,000 | 5,854,950 |
| Ser. C, 5s, 1/1/46 | A | 1,000,000 | 1,102,680 |
|
| Chicago, Transit Auth. Rev. Bonds (Federal Transit | | | |
| Administration Section 5307), 5s, 6/1/18 | A | 2,000,000 | 2,150,920 |
|
| Chicago, Waste Wtr. Transmission Rev. Bonds, | | | |
| Ser. C, 5s, 1/1/33 | A | 1,000,000 | 1,111,520 |
|
| |
| 24 | Tax-Free High Yield Fund |
| | | |
| MUNICIPAL BONDS AND NOTES (97.6%)* cont. | Rating** | Principal amount | Value |
|
| Illinois cont. | | | |
| Chicago, Waste Wtr. Transmission Rev. | | | |
| Bonds, Ser. C | | | |
| 5s, 1/1/39 | A | $2,850,000 | $3,108,638 |
| 5s, 1/1/34 | A | 1,950,000 | 2,159,606 |
|
| Chicago, Wtr. Wks Rev. Bonds | | | |
| 5s, 11/1/42 | A– | 650,000 | 688,051 |
| 5s, 11/1/39 | A– | 1,075,000 | 1,172,664 |
|
| Du Page Cnty., Special Svc. Area No. 31 Special | | | |
| Tax Bonds (Monarch Landing), 5 5/8s, 3/1/36 | B/P | 900,000 | 900,405 |
|
| IL Fin. Auth. Rev. Bonds | | | |
| (Provena Hlth.), Ser. A, 7 3/4s, 8/15/34 | BBB+ | 3,500,000 | 4,204,445 |
| (Rush U. Med. Ctr.), Ser. A, U.S. Govt. Coll., | | | |
| 7 1/4s, 11/1/38 (Prerefunded 11/1/18) | Aaa | 2,150,000 | 2,516,038 |
| (Silver Cross Hosp. & Med. Ctr.), 7s, 8/15/44 | | | |
| (Prerefunded 8/15/19) | AAA/P | 5,250,000 | 6,326,618 |
| (Rush U. Med. Ctr.), Ser. C, U.S. Govt. Coll., | | | |
| 6 5/8s, 11/1/39 (Prerefunded 5/1/19) | Aaa | 1,425,000 | 1,678,223 |
| (Navistar Intl. Recvy. Zone), 6 1/2s, 10/15/40 | Caa1 | 2,155,000 | 2,100,155 |
| (Roosevelt U.), 6 1/2s, 4/1/39 | Baa3 | 2,000,000 | 2,214,540 |
| (Elmhurst Memorial), Ser. A, 5 5/8s, 1/1/37 | Baa2 | 2,000,000 | 2,125,920 |
|
| IL Fin. Auth. Solid Waste Disposal Rev. Bonds | | | |
| (Waste Mgmt., Inc.), Ser. A, 5.05s, 8/1/29 | A– | 5,045,000 | 5,111,291 |
|
| IL State G.O. Bonds | | | |
| 5 1/4s, 2/1/30 | A– | 1,000,000 | 1,109,340 |
| 5s, 1/1/41 | A– | 6,000,000 | 6,311,040 |
|
| IL State Fin. Auth. Rev. Bonds (Plymouth Place), | | | |
| 5 1/4s, 5/15/45 | BB+/F | 850,000 | 878,322 |
|
| Railsplitter, Tobacco Settlement Auth. Rev. | | | |
| Bonds, 6s, 6/1/28 | A– | 2,150,000 | 2,553,792 |
|
| | 74,378,101 |
| Indiana (1.4%) | | | |
| IN State Fin. Auth. Rev. Bonds | | | |
| (I-69 Dev. Partners, LLC), 5 1/4s, 9/1/34 | BBB– | 3,750,000 | 4,235,513 |
| (OH Valley Elec. Corp.), Ser. A, 5s, 6/1/32 | Baa3 | 250,000 | 266,575 |
|
| IN State Fin. Auth. VRDN, Ser. A-2, 0.01s, 2/1/37 | VMIG1 | 4,810,000 | 4,810,000 |
|
| IN State Fin. Auth. Econ. Dev. Mandatory | | | |
| Put Bonds (3/1/16) (Republic Svcs., Inc.), | | | |
| 0.58s, 12/1/37 | A–2 | 2,750,000 | 2,750,055 |
|
| Valparaiso, Exempt Facs. Rev. Bonds | | | |
| (Pratt Paper, LLC), 6 3/4s, 1/1/34 | B+/P | 1,875,000 | 2,289,956 |
|
| | 14,352,099 |
| Iowa (1.9%) | | | |
| IA Fin. Auth. Hlth. Fac. Rev. Bonds | | | |
| (Dev. Care Initiatives), Ser. A | | | |
| 5 1/2s, 7/1/25 | BB+ | 3,185,000 | 3,215,735 |
| 5s, 7/1/20 | BB+ | 1,700,000 | 1,719,686 |
|
| |
| Tax-Free High Yield Fund | 25 |
| | | |
| MUNICIPAL BONDS AND NOTES (97.6%)* cont. | Rating** | Principal amount | Value |
|
| Iowa cont. | | | |
| IA State Fin. Auth. Midwestern Disaster Rev. | | | |
| Bonds (IA Fertilizer Co., LLC) | | | |
| 5 1/2s, 12/1/22 | BB– | $1,500,000 | $1,579,605 |
| 5 1/4s, 12/1/25 | BB– | 3,000,000 | 3,289,860 |
|
| Tobacco Settlement Auth. of IA Rev. Bonds, | | | |
| Ser. C, 5 3/8s, 6/1/38 | B+ | 10,000,000 | 9,814,400 |
|
| | 19,619,286 |
| Kansas (0.2%) | | | |
| Lenexa, Hlth. Care Fac. Rev. Bonds | | | |
| (LakeView Village, Inc.), 7 1/4s, 5/15/39 | BB/P | 1,500,000 | 1,654,800 |
| 5 3/8s, 5/15/27 | BB/P | 500,000 | 506,420 |
|
| | 2,161,220 |
| Kentucky (1.1%) | | | |
| KY Econ. Dev. Fin. Auth. Rev. Bonds | | | |
| (Masonic Home Indpt. Living II) | | | |
| 7 3/8s, 5/15/46 | BB–/P | 1,350,000 | 1,599,521 |
| 7 1/4s, 5/15/41 | BB–/P | 900,000 | 1,063,350 |
|
| KY Pub. Trans. Infrastructure Auth. Rev. Bonds | | | |
| (1st Tier Downtown Crossing), Ser. A, 6s, 7/1/53 | Baa3 | 2,000,000 | 2,340,920 |
|
| KY State Econ. Dev. Fin. Auth. Hlth. Care Rev. | | | |
| Bonds (Masonic Homes of KY), 5 3/8s, 11/15/42 | BB–/P | 1,400,000 | 1,423,086 |
|
| Louisville & Jefferson Cnty., Metro. Govt. College | | | |
| Rev. Bonds (Bellarmine U.), Ser. A, 6s, 5/1/38 | Baa3 | 855,000 | 909,652 |
|
| Louisville & Jefferson Cnty., Metro. Govt. Hlth. | | | |
| Syst. Rev. Bonds (Norton Hlth. Care, Inc.), | | | |
| 5s, 10/1/30 | A– | 4,000,000 | 4,108,080 |
|
| | 11,444,609 |
| Louisiana (0.5%) | | | |
| LA State Pub. Fac. Auth. Rev. Bonds | | | |
| (Ochsner Clinic Foundation), 5s, 5/15/47 | Baa1 | 525,000 | 569,588 |
|
| LA State Pub. Fac. Solid Waste Disp. Auth. Rev. | | | |
| Bonds (LA Pellets, Inc.), Ser. A, 8 3/8s, 7/1/39 | CCC/P | 1,000,000 | 800,710 |
|
| Pub. Fac. Auth. Dock & Wharf 144A Rev. Bonds | | | |
| (Impala Warehousing, LLC), 6 1/2s, 7/1/36 | B+/P | 1,000,000 | 1,124,140 |
|
| Rapides, Fin. Auth. FRB (Cleco Pwr.), AMBAC, | | | |
| 4.7s, 11/1/36 | A3 | 2,250,000 | 2,281,185 |
|
| St. Tammany, Public Trust Fin. Auth. Rev. Bonds | | | |
| (Christwood), 5 1/4s, 11/15/37 | BB/P | 765,000 | 780,583 |
|
| | 5,556,206 |
| Maine (0.4%) | | | |
| ME Hlth. & Higher Edl. Fac. Auth. Rev. Bonds | | | |
| (ME Gen. Med. Ctr.), 7 1/2s, 7/1/32 | Ba2 | 3,000,000 | 3,570,480 |
|
| ME State Fin. Auth. Solid Waste Disp. 144A | | | |
| Mandatory Put Bonds (8/1/25) (Casella Waste | | | |
| Syst.), 5 1/8s, 8/1/35 | B1 | 1,000,000 | 1,015,400 |
|
| | 4,585,880 |
| Maryland (1.0%) | | | |
| MD Econ. Dev. Corp. Poll. Control Rev. Bonds | | | |
| (Potomac Electric Power Co.), 6.2s, 9/1/22 | A2 | 1,700,000 | 1,952,722 |
|
| MD State Hlth. & Higher Edl. Fac. Auth. Rev. Bonds | | | |
| (Peninsula Regl. Med. Ctr.), 5s, 7/1/39 | A2 | 1,500,000 | 1,710,750 |
|
| MD State Hlth. & Higher Edl. Fac. Auth. Rev. Bonds | | | |
| (Edenwald Issue), 5 1/4s, 1/1/37 | BBB/F | 2,000,000 | 2,220,900 |
|
| |
| 26 | Tax-Free High Yield Fund |
| | | |
| MUNICIPAL BONDS AND NOTES (97.6%)* cont. | Rating** | Principal amount | Value |
|
| Maryland cont. | | | |
| Westminster, Rev. Bonds | | | |
| (Lutheran Village at Miller’s Grant, Inc. (The)), | | | |
| Ser. A, 6s, 7/1/34 | B–/P | $750,000 | $831,345 |
| (Carroll Lutheran Village, Inc.), 5 1/8s, 7/1/34 | BB/P | 3,000,000 | 3,157,890 |
|
| | 9,873,607 |
| Massachusetts (3.4%) | | | |
| MA State VRDN (Construction Loan), Ser. A, | | | |
| 0.01s, 3/1/26 | VMIG1 | 2,900,000 | 2,900,000 |
|
| MA State Dev. Fin. Agcy. Rev. Bonds | | | |
| (Sabis Intl.), Ser. A, 8s, 4/15/39 | | | |
| (Prerefunded 10/15/19) | BBB | 2,140,000 | 2,679,194 |
| (Linden Ponds, Inc. Fac.), Ser. A-1, | | | |
| 6 1/4s, 11/15/46 | B–/P | 1,816,363 | 1,760,728 |
| (Linden Ponds, Inc. Fac.), Ser. A-1, | | | |
| 6 1/4s, 11/15/31 | B–/P | 704,147 | 688,205 |
| (Loomis Cmntys.), Ser. A, 6s, 1/1/33 | BBB– | 500,000 | 563,860 |
| (Milford Regl. Med. Ctr. Oblig. Group), Ser. F, | | | |
| 5 3/4s, 7/15/43 | Baa3 | 1,000,000 | 1,104,980 |
| (Linden Ponds, Inc. Fac.), Ser. A-2, | | | |
| 5 1/2s, 11/15/46 | B–/P | 238,451 | 207,426 |
| (New England Conservatory | | | |
| of Music), U.S. Govt. Coll., 5 1/4s, 7/1/38 | | | |
| (Prerefunded 7/1/18) | AAA/P | 1,900,000 | 2,098,607 |
| (Wheelock College), Ser. C, 5 1/4s, 10/1/37 | BBB | 2,000,000 | 2,075,280 |
| (Suffolk U.), 5 1/8s, 7/1/40 | Baa2 | 2,000,000 | 2,124,980 |
| (Linden Ponds, Inc. Fac.), Ser. B, | | | |
| zero %, 11/15/56 | B–/P | 1,186,016 | 8,350 |
|
| MA State Dev. Fin. Agcy. Hlth. Care Fac. 144A Rev. | | | |
| Bonds (Adventcare), Ser. A, 6.65s, 10/15/28 | B/P | 2,150,000 | 2,210,458 |
|
| MA State Hlth. & Edl. Fac. Auth. Rev. Bonds | | | |
| (Quincy Med. Ctr.), Ser. A, 6 1/2s, 1/15/38 | | | |
| (In default) † | D/P | 972,870 | 97 |
| (Suffolk U.), Ser. A, 6 1/4s, 7/1/30 | Baa2 | 1,400,000 | 1,593,732 |
| (Suffolk U.), Ser. A, U.S. Govt. Coll., 5 3/4s, | | | |
| 7/1/39 (Prerefunded 7/1/19) | Baa2 | 2,125,000 | 2,365,635 |
| (Springfield College), 5 5/8s, 10/15/40 | Baa1 | 3,500,000 | 3,792,495 |
| (Winchester Hosp.), 5 1/4s, 7/1/38 | A | 3,050,000 | 3,410,358 |
| (Fisher College), Ser. A, 5 1/8s, 4/1/37 | BBB– | 1,400,000 | 1,425,284 |
| (Milford Regl. Med.), Ser. E, 5s, 7/15/32 | Baa3 | 1,000,000 | 1,036,560 |
| (Milford Regl. Med.), Ser. E, 5s, 7/15/27 | Baa3 | 2,750,000 | 2,862,888 |
|
| | 34,909,117 |
| Michigan (2.1%) | | | |
| Advanced Tech. Academy Pub. School Rev. | | | |
| Bonds, 6s, 11/1/28 | BBB– | 1,435,000 | 1,483,503 |
|
| Ann Arbor, Econ. Dev. Corp. Ltd. Oblig. Rev. | | | |
| Bonds (Glacier Hills, Inc.), 8 3/8s, 1/15/19 | | | |
| (Escrowed to maturity) | AA+ | 866,000 | 983,248 |
|
| Flint, Hosp. Bldg. Auth. Rev. Bonds | | | |
| (Hurley Med. Ctr.), 7 1/2s, 7/1/39 | Ba1 | 700,000 | 801,794 |
| Ser. A, 5 1/4s, 7/1/39 | Ba1 | 500,000 | 507,950 |
|
| |
| Tax-Free High Yield Fund | 27 |
| | | |
| MUNICIPAL BONDS AND NOTES (97.6%)* cont. | Rating** | Principal amount | Value |
|
| Michigan cont. | | | |
| MI State Fin. Auth. Rev. Bonds | | | |
| (Presbyterian Villages of MI), 5 1/2s, 11/15/45 | BB+/F | $1,000,000 | $1,037,450 |
| (Beaumont Hlth. Credit Group), Ser. A, | | | |
| 5s, 11/1/44 ## | A1 | 1,750,000 | 1,963,483 |
| (Local Govt. Loan Program — Detroit Wtr. & Swr. | | | |
| Dept. (DWSD)), Ser. C, 5s, 7/1/35 | BBB+ | 400,000 | 452,888 |
| (Local Govt. Loan Program — Detroit Wtr. & Swr. | | | |
| Dept. (DWSD)), Ser. C, 5s, 7/1/34 | BBB+ | 4,600,000 | 5,228,084 |
| (Local Govt. Program Detroit Wtr. & Swr.), | | | |
| Ser. D4, 5s, 7/1/34 | A– | 1,900,000 | 2,160,908 |
| (Local Govt. Loan Program), Ser. F1, | | | |
| 4 1/2s, 10/1/29 | A | 650,000 | 709,345 |
|
| MI State Hosp. Fin. Auth. Rev. Bonds | | | |
| (Henry Ford Hlth.), 5 3/4s, 11/15/39 | A3 | 4,400,000 | 5,013,712 |
|
| Star Intl. Academy Rev. Bonds | | | |
| (Pub. School Academy), 5s, 3/1/33 | BBB | 1,675,000 | 1,738,751 |
|
| | 22,081,116 |
| Minnesota (1.8%) | | | |
| Douglas Cnty., Gross Hlth. Care Fac. Rev. Bonds | | | |
| (Douglas Cnty. Hosp.) | | | |
| 6 1/4s, 7/1/34 (Prerefunded 7/1/18) | AAA/P | 1,550,000 | 1,748,927 |
| 6 1/4s, 7/1/34 (Prerefunded 7/1/18) | AAA/P | 850,000 | 959,089 |
|
| Inver Grove Heights, Nursing Home Rev. Bonds | | | |
| (Presbyterian Homes Care), 5 1/2s, 10/1/41 | B/P | 1,000,000 | 1,000,390 |
|
| North Oaks, Sr. Hsg. Rev. Bonds | | | |
| (Presbyterian Homes North Oaks) | | | |
| 6 1/8s, 10/1/39 | BB/P | 1,375,000 | 1,435,624 |
| 6s, 10/1/27 | BB/P | 1,250,000 | 1,317,138 |
|
| Northfield, Hosp. Rev. Bonds, 5 3/8s, 11/1/31 | BBB | 1,500,000 | 1,538,760 |
|
| Otsego, Charter School Lease Rev. Bonds | | | |
| (Kaleidoscope Charter School), Ser. A | | | |
| 5s, 9/1/44 | BB+ | 925,000 | 936,553 |
| 5s, 9/1/34 | BB+ | 300,000 | 308,415 |
|
| Rochester, Hlth. Care Fac. VRDN (Mayo Clinic), | | | |
| Ser. B, 0.01s, 11/15/38 | VMIG1 | 2,050,000 | 2,050,000 |
|
| St. Paul, Hsg. & Redev. Auth. Charter School Lease | | | |
| Rev. Bonds (Nova Classical Academy), Ser. A, | | | |
| 6 3/8s, 9/1/31 | BBB– | 500,000 | 576,080 |
|
| St. Paul, Hsg. & Redev. Auth. Hlth. Care Fac. Rev. | | | |
| Bonds (HealthPartners Oblig. Group), U.S. Govt. | | | |
| Coll., 5 1/4s, 5/15/36 (Prerefunded 11/15/16) | Aaa | 5,035,000 | 5,224,165 |
|
| St. Paul, Hsg. & Redev. Auth. Hosp. Fac. | | | |
| Rev. Bonds (Healtheast Care Syst.), Ser. A, | | | |
| 5s, 11/15/40 | BBB– | 700,000 | 770,462 |
|
| St. Paul, Port Auth. Solid Waste Disp. 144A | | | |
| Rev. Bonds (Gerdau St. Paul Steel Mill), Ser. 7, | | | |
| 4 1/2s, 10/1/37 | Baa3 | 900,000 | 834,084 |
|
| | | | 18,699,687 |
| |
| 28 | Tax-Free High Yield Fund |
| | | |
| MUNICIPAL BONDS AND NOTES (97.6%)* cont. | Rating** | Principal amount | Value |
|
| Mississippi (1.3%) | | | |
| MS State Bus. Fin. Commission Gulf Opportunity | | | |
| Zone VRDN (Chevron USA, Inc.), Ser. E, | | | |
| 0.01s, 12/1/30 | VMIG1 | $7,150,000 | $7,150,000 |
|
| Warren Cnty., Gulf Opportunity Zone Rev. Bonds | | | |
| (Intl. Paper Co.), Ser. A, 6 1/2s, 9/1/32 | Baa2 | 5,400,000 | 6,068,412 |
|
| | 13,218,412 |
| Montana (0.1%) | | | |
| MT Fac. Fin. Auth. Rev. Bonds (Sr. Living | | | |
| St. John’s Lutheran), Ser. A, 6s, 5/15/25 | B+/P | 750,000 | 757,680 |
|
| | 757,680 |
| Nebraska (0.7%) | | | |
| Central Plains, Energy Rev. Bonds | | | |
| (NE Gas No. 1), Ser. A, 5 1/4s, 12/1/18 | A3 | 1,500,000 | 1,661,745 |
| (NE Gas No. 3), 5s, 9/1/32 | A3 | 3,000,000 | 3,407,430 |
|
| Lancaster Cnty., Hosp. Auth. Rev. Bonds | | | |
| (Immanuel Oblig. Group), 5 5/8s, 1/1/40 | AA/F | 1,825,000 | 2,047,778 |
|
| | 7,116,953 |
| Nevada (1.2%) | | | |
| Clark Cnty., Impt. Dist. No. 159 Special | | | |
| Assessment Bonds (Summerlin Village 16A), | | | |
| 5s, 8/1/35 | B+/P | 700,000 | 717,549 |
|
| Henderson, Local Impt. Dist. Special Assmt. | | | |
| Bonds (No. T-17), 5s, 9/1/25 | BBB–/P | 735,000 | 756,734 |
|
| Las Vegas, Special Assmt. Bonds | | | |
| 5s, 6/1/30 | B+/P | 575,000 | 606,596 |
| (Dist. No. 607 Local Impt.), 5s, 6/1/22 | BBB–/P | 440,000 | 474,558 |
|
| Las Vegas, Impt. Dist. No. 812 Special Assessment | | | |
| Bonds (Summerlin Village 24), 5s, 12/1/35 | B/P | 750,000 | 764,543 |
|
| Reno, Sales Tax VRDN (Reno Trans. Rail Access | | | |
| Corridor (ReTRAC)), 0.02s, 6/1/42 | VMIG1 | 8,840,000 | 8,840,000 |
|
| | 12,159,980 |
| New Hampshire (0.1%) | | | |
| NH State Bus. Fin. Auth. Solid Waste Disp. 144A | | | |
| Mandatory Put Bonds (10/1/19) (Casella Waste | | | |
| Syst., Inc.), 4s, 4/1/29 | B1 | 650,000 | 657,040 |
|
| | 657,040 |
| New Jersey (6.5%) | | | |
| Burlington Cnty., Bridge Comm. Econ. Dev. Rev. | | | |
| Bonds (The Evergreens), 5 5/8s, 1/1/38 | BB+/P | 3,500,000 | 3,575,040 |
|
| NJ State Econ. Dev. Auth. Rev. Bonds | | | |
| (Paterson Charter School Science & Tech.), | | | |
| Ser. A, 6.1s, 7/1/44 | BB+ | 655,000 | 657,712 |
| (Cranes Mill), Ser. A, 6s, 7/1/38 | BBB/F | 1,750,000 | 1,830,028 |
| (Paterson Charter School Science & Tech.), | | | |
| Ser. A, 6s, 7/1/32 | BB+ | 300,000 | 303,957 |
| (MSU Student Hsg.), 5 7/8s, 6/1/42 | Baa3 | 5,110,000 | 5,695,248 |
| (Continental Airlines, Inc.), 5 1/2s, 6/1/33 | BB– | 2,000,000 | 2,229,360 |
| (NYNJ Link Borrower, LLC), 5 3/8s, 1/1/43 | BBB– | 2,500,000 | 2,788,475 |
| (Paterson Charter School), Ser. C, 5.3s, 7/1/44 | BB+ | 2,250,000 | 2,030,670 |
| (Lions Gate), 5 1/4s, 1/1/44 | BB–/P | 500,000 | 519,310 |
| (Continental Airlines, Inc.), 5 1/4s, 9/15/29 | BB– | 3,500,000 | 3,846,780 |
|
| |
| Tax-Free High Yield Fund | 29 |
| | | |
| MUNICIPAL BONDS AND NOTES (97.6%)* cont. | Rating** | Principal amount | Value |
|
| New Jersey cont. | | | |
| NJ State Econ. Dev. Auth. Energy Fac. Rev. Bonds | | | |
| (UMM Energy Partners, LLC), Ser. A | | | |
| 5s, 6/15/37 | Baa3 | $1,000,000 | $1,053,370 |
| 4 3/4s, 6/15/32 | Baa3 | 170,000 | 178,656 |
|
| NJ State Econ. Dev. Auth. Fac. Rev. Bonds | | | |
| (Continental Airlines, Inc.), 5 5/8s, 11/15/30 | BB– | 1,000,000 | 1,135,650 |
|
| NJ State Econ. Dev. Auth. Retirement Cmnty. Rev. | | | |
| Bonds (Seabrook Village, Inc.), 5 1/4s, 11/15/36 | | | |
| (Prerefunded 11/15/16) | AAA/P | 3,590,000 | 3,721,968 |
|
| NJ State Hlth. Care Fac. Fin. Auth. Rev. Bonds | | | |
| (St. Joseph Hlth. Care Syst.), 6 5/8s, 7/1/38 | Baa3 | 6,000,000 | 6,651,420 |
| (St. Peter’s U. Hosp.), 6 1/4s, 7/1/35 | Ba1 | 2,500,000 | 2,746,925 |
| (U. Hosp. of NJ), Ser. A, AGM, 5s, 7/1/46 | AA | 500,000 | 556,290 |
| (Holy Name Hosp.), 5s, 7/1/36 | Baa2 | 3,500,000 | 3,535,735 |
|
| Rutgers State U. VRDN, Ser. A, 0.01s, 5/1/18 | VMIG1 | 3,500,000 | 3,500,000 |
|
| Salem Cnty., Poll Control Fin. Auth. Rev. Bonds | | | |
| (Chambers Cogeneration LP), Ser. A, 5s, 12/1/23 | Baa3 | 1,400,000 | 1,528,604 |
|
| Tobacco Settlement Fin. Corp. Rev. Bonds | | | |
| Ser. 1A, 5s, 6/1/41 | B3 | 8,000,000 | 6,682,800 |
| Ser. 1A, 4 3/4s, 6/1/34 | B3 | 7,700,000 | 6,427,399 |
| zero %, 6/1/41 | A– | 20,000,000 | 5,116,600 |
|
| | 66,311,997 |
| New Mexico (1.3%) | | | |
| Farmington, Poll. Control Rev. Bonds | | | |
| (Public Service Co. of San Juan, NM) | | | |
| Ser. D, 5.9s, 6/1/40 | BBB+ | 3,000,000 | 3,324,780 |
| Ser. A, 4 7/8s, 4/1/33 | BBB+ | 7,660,000 | 7,757,742 |
| Ser. B, 4 7/8s, 4/1/33 | BBB+ | 2,750,000 | 2,785,090 |
|
| | 13,867,612 |
| New York (3.8%) | | | |
| Brooklyn Arena Local Dev. Corp. Rev. Bonds | | | |
| (Barclays Ctr.), 6 3/8s, 7/15/43 | Baa3 | 3,000,000 | 3,492,330 |
|
| Broome Cnty., Indl. Dev. Agcy. Continuing | | | |
| Care Retirement Rev. Bonds (Good Shepard | | | |
| Village), Ser. A, U.S. Govt. Coll., 6 7/8s, 7/1/40 | | | |
| (Prerefunded 7/1/18) | AAA/P | 715,000 | 817,960 |
|
| NY City, Indl. Dev. Agcy. Rev. Bonds | | | |
| (Yankee Stadium — Pilot), AGC, 7s, 3/1/49 | AA | 1,000,000 | 1,167,110 |
|
| NY City, Indl. Dev. Agcy. Special Fac. Mandatory | | | |
| Put Bonds (8/1/16) (JFK Intl. Arpt.), | | | |
| Ser. B, 2s, 8/1/28 | BB/P | 1,950,000 | 1,955,168 |
|
| NY City, Indl. Dev. Agcy. Special Fac. Rev. | | | |
| Bonds (American Airlines — JFK Intl. Arpt.), | | | |
| 7 1/2s, 8/1/16 | B+/P | 675,000 | 695,797 |
|
| NY State Dorm. Auth. Non-State Supported | | | |
| Debt Rev. Bonds (Orange Regl. Med. Ctr.), | | | |
| 6 1/4s, 12/1/37 | Ba1 | 4,180,000 | 4,559,711 |
|
| NY State Energy Research & Dev. Auth. Gas Fac. | | | |
| Rev. Bonds (Brooklyn Union Gas), 6.952s, 7/1/26 | A2 | 1,800,000 | 1,805,400 |
|
| |
| 30 | Tax-Free High Yield Fund |
| | | |
| MUNICIPAL BONDS AND NOTES (97.6%)* cont. | Rating** | Principal amount | Value |
|
| New York cont. | | | |
| NY State Env. Fac. Corp. Solid Waste Disp. 144A | | | |
| Mandatory Put Bonds (12/2/19) (Casella Waste | | | |
| Syst., Inc.), 3 3/4s, 12/1/44 | B1 | $1,500,000 | $1,504,635 |
|
| NY State Liberty Dev. Corp. Rev. Bonds | | | |
| (7 World Trade Ctr.), Class 3, 5s, 3/15/44 | A2 | 1,000,000 | 1,091,690 |
|
| NY State Liberty Dev. Corp. 144A Rev. Bonds | | | |
| (World Trade Ctr.) | | | |
| Class 2, 5 3/8s, 11/15/40 | BB–/P | 1,250,000 | 1,338,850 |
| Class 1, 5s, 11/15/44 | BB–/P | 8,250,000 | 8,779,980 |
|
| Oneida Cnty., Indl. Dev. Agcy. Rev. Bonds | | | |
| (St. Elizabeth Med.), Ser. A, 5 7/8s, 12/1/29 | BB–/P | 1,500,000 | 1,501,350 |
|
| Onondaga, Civic Dev. Corp. Rev. Bonds | | | |
| (St. Joseph’s Hosp. Hlth. Ctr.) | | | |
| 5 1/8s, 7/1/31 (Prerefunded 7/1/19) | BB | 2,310,000 | 2,634,601 |
| 5s, 7/1/42 (Prerefunded 7/1/22) | BB | 1,000,000 | 1,224,810 |
|
| Port Auth. NY & NJ Special Oblig. Rev. Bonds | | | |
| (JFK Intl. Air Term.), 6s, 12/1/42 | BBB | 2,100,000 | 2,455,131 |
|
| Westchester Cnty., Indl Dev. Agcy. Civic Fac. Rev. | | | |
| Bonds (Pace U.), Ser. A, 5 1/2s, 5/1/42 | BB+ | 2,750,000 | 3,136,540 |
|
| Yonkers, Indl. Dev. Agcy. Civic Fac. Rev. Bonds | | | |
| (St. John’s Riverside Hosp.), Ser. A, | | | |
| 7 1/8s, 7/1/31 | BB– | 500,000 | 500,330 |
|
| | 38,661,393 |
| North Carolina (1.6%) | | | |
| Dept. Trans. Private Activity Rev. Bonds | | | |
| (I-77 Hot Lanes), 5s, 12/31/37 | BBB–/F | 700,000 | 760,704 |
|
| NC Cap. Fin. Agcy. Edl. Fac. Rev. Bonds | | | |
| (Meredith College), 6s, 6/1/31 | BBB | 1,000,000 | 1,075,100 |
|
| NC State Med. Care Cmnty. Hlth. Care | | | |
| Fac. Rev. Bonds | | | |
| (Deerfield), Ser. A, 6 1/8s, 11/1/38 | BBB+/F | 450,000 | 484,047 |
| (First Mtge. — Presbyterian Homes), | | | |
| 5 3/8s, 10/1/22 | BB/P | 750,000 | 766,620 |
|
| NC State Med. Care Comm. Hlth. Fac. Rev. Bonds | | | |
| (Pennybyrn at Maryfield, Inc.), 5s, 10/1/35 | BB/P | 625,000 | 660,956 |
|
| NC State Med. Care Comm. Retirement | | | |
| Fac. Rev. Bonds | | | |
| (Carolina Village), 6s, 4/1/38 | BB/P | 3,500,000 | 3,662,015 |
| (First Mtge. United Methodist), Ser. C, | | | |
| 5 1/2s, 10/1/32 | BB+/P | 2,000,000 | 2,001,700 |
| (Salemtowne), 5 1/4s, 10/1/37 | BB/P | 3,750,000 | 3,917,325 |
| (Aldersgate United Methodist | | | |
| Church), 5s, 7/1/45 | BB/P | 1,500,000 | 1,571,625 |
| (United Church Homes & Svcs. Oblig. Group), | | | |
| Ser. A, 5s, 9/1/37 | BB/P | 1,000,000 | 1,018,820 |
|
| | | | 15,918,912 |
| |
| Tax-Free High Yield Fund | 31 |
| | | |
| MUNICIPAL BONDS AND NOTES (97.6%)* cont. | Rating** | Principal amount | Value |
|
| Ohio (3.5%) | | | |
| Buckeye, Tobacco Settlement Fin. | | | |
| Auth. Rev. Bonds | | | |
| Ser. A-3, 6 1/4s, 6/1/37 | B– | $3,300,000 | $3,072,300 |
| Ser. A-2, 6s, 6/1/42 | B3 | 2,500,000 | 2,228,300 |
| Ser. A-2, 5 7/8s, 6/1/47 | B3 | 7,000,000 | 6,172,390 |
| Ser. A-2, 5 7/8s, 6/1/30 | B– | 6,055,000 | 5,429,155 |
| Ser. A-2, 5 3/4s, 6/1/34 | B– | 3,925,000 | 3,473,978 |
|
| Franklin Cnty., Hlth. Care Fac. Rev. Bonds | | | |
| (OH Presbyterian Retirement Svcs. (OPRS) | | | |
| Cmntys. Oblig. Group), Ser. A, 6s, 7/1/35 | BBB– | 3,000,000 | 3,313,050 |
|
| Hickory Chase Cmnty. Auth. Rev. Bonds | | | |
| (Infrastructure Impt.), 7s, 12/1/38 F | CCC/P | 1,560,000 | 136,812 |
|
| Lake Cnty., Hosp. Fac. Rev. Bonds | | | |
| (Lake Hosp. Syst., Inc.), Ser. C | | | |
| 6s, 8/15/43 | A3 | 250,000 | 275,690 |
| U.S. Govt. Coll., 6s, 8/15/43 | | | |
| (Prerefunded 8/15/18) | AAA/P | 1,300,000 | 1,466,738 |
|
| Lucas Cnty., Hlth. Care Fac. Rev. Bonds | | | |
| (Lutheran Homes), Ser. A, 7s, 11/1/45 | | | |
| (Prerefunded 11/1/20) | BB+/P | 500,000 | 634,405 |
|
| OH State Air Quality Dev. Auth. Rev. Bonds | | | |
| (Valley Elec. Corp.), Ser. E, 5 5/8s, 10/1/19 | Baa3 | 1,000,000 | 1,106,430 |
|
| OH State Higher Edl. Fac. Comm. Rev. Bonds | | | |
| (Kenyon College), 5s, 7/1/44 | A1 | 4,850,000 | 5,379,038 |
|
| Southeastern OH Port Auth. Hosp. | | | |
| Fac. Rev. Bonds | | | |
| 5 3/4s, 12/1/32 | BB/F | 2,225,000 | 2,441,582 |
| (Memorial Hlth. Syst. Oblig. Group), | | | |
| 5 1/2s, 12/1/43 | BB/F | 235,000 | 252,837 |
|
| | 35,382,705 |
| Oklahoma (0.5%) | | | |
| OK Cnty., Fin. Auth. Rev. Bonds (Epworth Village), | | | |
| Ser. A, 5s, 4/1/33 | BB–/P | 1,070,000 | 1,032,871 |
|
| Tulsa, Muni. Arpt. Trust Mandatory Put Bonds | | | |
| (6/1/25) (American Airlines, Inc.), 5s, 6/1/35 | BB– | 1,750,000 | 1,946,980 |
|
| Tulsa, Muni. Arpt. Trust Rev. Bonds (American | | | |
| Airlines, Inc.), Ser. B, 5 1/2s, 12/1/35 | B+/P | 2,000,000 | 2,186,140 |
|
| | 5,165,991 |
| Oregon (0.3%) | | | |
| Multnomah Cnty., Hosp. Fac. Auth. Rev. | | | |
| Bonds (Mirabella at South Waterfront), Ser. A, | | | |
| 5.4s, 10/1/44 | BB–/P | 1,000,000 | 1,104,660 |
|
| Warm Springs Reservation, Confederated Tribes | | | |
| 144A Rev. Bonds (Pelton Round Butte Tribal), | | | |
| Ser. B, 6 3/8s, 11/1/33 | A3 | 1,800,000 | 1,985,346 |
|
| | 3,090,006 |
| Pennsylvania (2.7%) | | | |
| Allegheny Cnty., Higher Ed. Bldg. | | | |
| Auth. Rev. Bonds | | | |
| (Robert Morris U.), Ser. A, 5 3/4s, 10/15/40 | Baa3 | 765,000 | 831,693 |
| (Chatham U.), Ser. A, 5s, 9/1/35 | BBB | 1,000,000 | 1,072,840 |
| (Chatham U.), Ser. A, 5s, 9/1/30 | BBB | 1,500,000 | 1,632,060 |
|
| |
| 32 | Tax-Free High Yield Fund |
| | | |
| MUNICIPAL BONDS AND NOTES (97.6%)* cont. | Rating** | Principal amount | Value |
|
| Pennsylvania cont. | | | |
| Allegheny Cnty., Indl. Dev. Auth. Rev. Bonds | | | |
| (U.S. Steel Corp.), 5 3/4s, 8/1/42 | B2 | $1,000,000 | $590,000 |
|
| Chester Cnty., Indl. Dev. Auth. Rev. Bonds | | | |
| (Renaissance Academy Charter School), | | | |
| 5s, 10/1/34 | BBB– | 625,000 | 673,656 |
|
| Cumberland Cnty., Muni. Auth. Rev. Bonds | | | |
| (Diakon Lutheran Social Ministries), 5s, 1/1/38 | BBB+/F | 1,900,000 | 2,090,532 |
| (Diakon Lutheran Ministries), 5s, 1/1/36 | | | |
| (Prerefunded 1/1/17) | BBB+/F | 1,790,000 | 1,859,434 |
|
| East Hempfield Twp., Indl. Dev. Auth. Rev. | | | |
| Bonds (Millersville U. Student Hsg. & Svcs., | | | |
| Inc.), 5s, 7/1/34 | Baa3 | 800,000 | 869,136 |
|
| Lancaster Cnty., Hosp. & Hlth. Ctr. Auth. Rev. | | | |
| Bonds (Landis Homes Retirement Cmnty.), | | | |
| Ser. A, 5s, 7/1/45 | BBB–/F | 1,500,000 | 1,563,990 |
|
| Lancaster Cnty., Hosp. Auth. Rev. Bonds | | | |
| (Brethren Village), Ser. A | | | |
| 6 1/2s, 7/1/40 | BB–/P | 3,000,000 | 3,081,420 |
| 6 3/8s, 7/1/30 | BB–/P | 1,375,000 | 1,416,071 |
|
| Montgomery Cnty., Higher Ed. & Hlth. Auth. Rev. | | | |
| Bonds (Arcadia U.), 5 1/4s, 4/1/30 | BBB | 1,530,000 | 1,642,577 |
|
| Moon, Indl. Dev. Auth. Rev. Bonds (Baptist Homes | | | |
| Society Oblig. Group), 5 3/4s, 7/1/35 | B+/P | 2,000,000 | 2,030,360 |
|
| Northampton Cnty., Indl. Dev. Auth. Tax Alloc. | | | |
| Bonds (Rte. 33), 7s, 7/1/32 | B/P | 1,200,000 | 1,311,324 |
|
| Northeastern PA Hosp. & Ed. Auth. Rev. Bonds | | | |
| (Wilkes U.), Ser. A, 5 1/4s, 3/1/42 | BBB | 1,000,000 | 1,039,460 |
|
| PA State Higher Edl. Fac. Auth. Rev. Bonds | | | |
| (Shippensburg U.), 6 1/4s, 10/1/43 | Baa3 | 1,000,000 | 1,129,650 |
| (Indiana U.), Ser. A, 5s, 7/1/32 | BBB+ | 500,000 | 540,040 |
|
| Philadelphia, Auth. for Indl. Dev. Rev. Bonds | | | |
| (Master Charter School), 6s, 8/1/35 | BBB+ | 2,175,000 | 2,378,493 |
|
| Philadelphia, Hosp. & Higher Ed. Fac. | | | |
| Auth. Rev. Bonds | | | |
| (Graduate Hlth. Syst. Oblig. Group), 7 1/4s, | | | |
| 7/1/18 (In default) † | D/P | 5,263,244 | 526 |
| (Graduate Hlth. Syst.), Ser. B, 6 1/4s, 7/1/13 | | | |
| (In default) ***† | D/P | 510,506 | 5 |
|
| Susquehanna, Area Regl. Arpt. Syst. Auth. Rev. | | | |
| Bonds, Ser. A, 6 1/2s, 1/1/38 | Baa3 | 2,000,000 | 2,121,840 |
|
| | 27,875,107 |
| Puerto Rico (1.2%) | | | |
| Children’s Trust Fund Tobacco Settlement (The) | | | |
| Rev. Bonds, 5 5/8s, 5/15/43 | Ba2 | 2,295,000 | 2,295,230 |
|
| Cmnwlth. of PR, G.O. Bonds (Pub. Impt.), Ser. A, | | | |
| 5 3/4s, 7/1/41 | Caa3 | 5,000,000 | 3,162,500 |
|
| Cmnwlth. of PR, Pub. Bldg. Auth. Rev. Bonds | | | |
| (Govt. Fac.), Ser. P, Cmnwlth. of PR Gtd., | | | |
| 6 3/4s, 7/1/36 | Caa3 | 2,500,000 | 1,503,125 |
|
| |
| Tax-Free High Yield Fund | 33 |
| | | |
| MUNICIPAL BONDS AND NOTES (97.6%)* cont. | Rating** | Principal amount | Value |
|
| Puerto Rico cont. | | | |
| Cmnwlth. of PR, Sales Tax Fin. Corp. Rev. | | | |
| Bonds, Ser. A | | | |
| 5 1/2s, 8/1/37 | Ca | $2,765,000 | $1,043,788 |
| 5 3/8s, 8/1/39 | Ca | 2,370,000 | 894,675 |
| NATL, zero %, 8/1/43 | AA– | 20,000,000 | 3,407,000 |
|
| | 12,306,318 |
| Rhode Island (0.3%) | | | |
| Tobacco Settlement Fin. Corp. Rev. Bonds, | | | |
| Ser. B, 5s, 6/1/50 | BBB+/F | 3,000,000 | 3,108,420 |
|
| | 3,108,420 |
| South Carolina (1.0%) | | | |
| SC State Pub. Svc. Auth. Rev. Bonds, Ser. A | | | |
| 5 1/2s, 12/1/54 | AA– | 6,000,000 | 6,822,900 |
| 5s, 12/1/50 | AA– | 2,000,000 | 2,231,840 |
|
| SC State Pub. Svcs. Auth. Rev. Bonds, Ser. A, | | | |
| 5s, 12/1/38 ## | AA– | 1,000,000 | 1,154,100 |
|
| | 10,208,840 |
| South Dakota (0.1%) | | | |
| SD State Hlth. & Edl. Fac. Auth. Rev. Bonds | | | |
| (Sanford Oblig Group), 5s, 11/1/35 | A1 | 755,000 | 871,383 |
|
| | 871,383 |
| Tennessee (0.1%) | | | |
| Chattanooga Hlth. Edl. & Student Hsg. Fac. Board | | | |
| Rev. Bonds (CDFI Phase I, LLC), 5s, 10/1/35 | BBB | 700,000 | 800,842 |
|
| | 800,842 |
| Texas (10.0%) | | | |
| Brazos River Harbor Naval Dist. Env. Rev. Bonds | | | |
| (Dow Chemical Co.), Ser. A-4, 5.95s, 5/15/33 | BBB | 5,150,000 | 5,657,275 |
|
| Brazos, Harbor Indl. Dev. Corp. Env. Fac. | | | |
| Mandatory Put Bonds (5/1/28) (Dow Chemical), | | | |
| 5.9s, 5/1/38 | BBB | 3,850,000 | 4,128,586 |
|
| Clifton, Higher Ed. Fin. Corp. Rev. Bonds | | | |
| (Idea Pub. Schools) | | | |
| 6s, 8/15/33 | BBB | 500,000 | 586,475 |
| 5s, 8/15/32 | BBB | 2,100,000 | 2,277,408 |
|
| Dallas-Fort Worth, Intl. Arpt. Fac. Impt. Corp. Rev. | | | |
| Bonds, Ser. A, 5 1/4s, 11/1/30 | A+ | 2,000,000 | 2,361,840 |
|
| Grand Parkway Trans. Corp. Rev. Bonds | | | |
| (Sub. Tier Toll Syst.), Ser. B, 5s, 4/1/53 | AA+ | 900,000 | 998,928 |
|
| Harris Cnty., Cultural Ed. Fac. Fin. Corp. VRDN | | | |
| (The Methodist Hosp.), Ser. C-1, 0.01s, 12/1/24 | A-1+ | 7,820,000 | 7,820,000 |
|
| Houston, Arpt. Syst. Rev. Bonds | | | |
| (Continental Airlines, Inc. Term. Project), | | | |
| 6 1/2s, 7/15/30 | BB– | 3,200,000 | 3,715,552 |
| Ser. B-1, 5s, 7/15/35 | BB– | 200,000 | 212,210 |
| Ser. B-1, 5s, 7/15/30 | BB– | 2,000,000 | 2,164,240 |
| (United Airlines, Inc.), 4 3/4s, 7/1/24 | BB– | 2,700,000 | 3,023,325 |
|
| Houston, Higher Ed. Fin. Co. Rev. Bonds | | | |
| (Cosmos Foundation), Ser. A | | | |
| 5s, 2/15/42 | BBB | 2,250,000 | 2,411,865 |
| 5s, 2/15/32 | BBB | 2,250,000 | 2,484,878 |
|
| |
| 34 | Tax-Free High Yield Fund |
| | | |
| MUNICIPAL BONDS AND NOTES (97.6%)* cont. | Rating** | Principal amount | Value |
|
| Texas cont. | | | |
| La Vernia, Higher Ed. Fin. Corp. Rev. Bonds | | | |
| (Kipp, Inc.), Ser. A | | | |
| 6 3/8s, 8/15/44 (Prerefunded 8/15/19) | BBB | $2,450,000 | $2,904,157 |
| 6 1/4s, 8/15/39 (Prerefunded 8/15/19) | BBB | 2,375,000 | 2,804,970 |
|
| Love Field, Arpt. Modernization Corp. Special | | | |
| Fac. Rev. Bonds (Southwest Airlines Co.), | | | |
| 5 1/4s, 11/1/40 | Baa1 | 4,850,000 | 5,362,936 |
|
| Lower CO River Auth. Rev. Bonds, Ser. D, | | | |
| 5s, 5/15/32 | A | 3,000,000 | 3,496,110 |
|
| Matagorda Cnty., Poll. Control Rev. Bonds | | | |
| (Central Pwr. & Light Co.), Ser. A, 6.3s, 11/1/29 | Baa1 | 2,400,000 | 2,701,608 |
| (Dist. No. 1), Ser. A, AMBAC, 4.4s, 5/1/30 | Baa1 | 3,000,000 | 3,347,160 |
|
| New Hope, Cultural Ed. Fac. Fin. Corp. Rev. Bonds | | | |
| (Wesleyan Homes, Inc.), 5 1/2s, 1/1/43 | BB–/P | 1,050,000 | 1,082,004 |
| (NCCD College Station Properties, LLC), | | | |
| Ser. A, 5s, 7/1/47 | Baa3 | 1,000,000 | 1,046,570 |
| (Collegiate Hsg.-Tarleton St.), 5s, 4/1/39 | Baa3 | 500,000 | 526,310 |
| (Collegiate Hsg.-Tarleton St.), 5s, 4/1/34 | Baa3 | 750,000 | 808,245 |
| (TX A&M U. Collegiate & Student Hsg. College | | | |
| Station I, LLC), Ser. A, 5s, 4/1/29 | Baa3 | 1,605,000 | 1,738,985 |
|
| Newark, Cultural Ed. Fac. Fin. Corp. Rev. Bonds | | | |
| (AW Brown-Fellowship Leadership Academy), | | | |
| Ser. A, 6s, 8/15/32 | BBB– | 600,000 | 613,362 |
|
| North TX, Edl. Fin. Co. Rev. Bonds (Uplift Edl.), | | | |
| Ser. A, 5 1/8s, 12/1/42 | BBB– | 2,500,000 | 2,671,575 |
|
| North TX, Thruway Auth. Rev. Bonds, Ser. B, | | | |
| zero %, 9/1/37 | AA+ | 3,000,000 | 1,222,410 |
|
| North TX, Tollway Auth. Rev. Bonds | | | |
| (1st Tier), Ser. I, 6 1/2s, 1/1/43 | A1 | 5,300,000 | 6,726,654 |
| (Toll 2nd Tier), Ser. F, 5 3/4s, 1/1/38 | | | |
| (Prerefunded 1/1/18) | A2 | 870,000 | 951,858 |
|
| Red River, Hlth. Retirement Fac. Dev. | | | |
| Corp. Rev. Bonds | | | |
| (Happy Harbor Methodist Home, Inc.), Ser. A, | | | |
| 7 3/4s, 11/15/44 | B–/P | 830,000 | 978,263 |
| (Sears Methodist Retirement Syst. Oblig. | | | |
| Group), Ser. C, 6 1/4s, 5/9/53 (In default) † | D/P | 162,000 | 243 |
| (Sears Methodist Retirement Syst. Oblig. | | | |
| Group), Ser. B, 6.15s, 11/15/49 (In default) † | D/P | 2,766,000 | 4,149 |
| (Sears Methodist Retirement Syst. Oblig. | | | |
| Group), Ser. A, 6.05s, 11/15/46 (In default) † | D/P | 1,833,000 | 2,750 |
| (Sears Methodist Retirement Syst. Oblig. | | | |
| Group), Ser. D, 6.05s, 11/15/46 (In default) † | D/P | 317,000 | 476 |
| (Sears Methodist Retirement Syst. Oblig. | | | |
| Group), Ser. A, 5.45s, 11/15/38 (In default) † | D/P | 4,122,000 | 6,183 |
|
| Tarrant Cnty., Cultural Ed. Fac. Fin. Corp. | | | |
| Retirement Fac. Rev. Bonds | | | |
| (Sr. Living Ctr.), Ser. A, 8 1/4s, 11/15/44 | B+/P | 2,550,000 | 2,556,018 |
| (Air Force Village), 6 3/8s, 11/15/44 | BBB–/F | 4,000,000 | 4,398,000 |
| (Buckingham Sr. Living Cmnty., Inc.), Ser. A, | | | |
| 5 1/2s, 11/15/45 | BB/F | 1,500,000 | 1,562,070 |
|
| |
| Tax-Free High Yield Fund | 35 |
| | | |
| MUNICIPAL BONDS AND NOTES (97.6%)* cont. | Rating** | Principal amount | Value |
|
| Texas cont. | | | |
| Travis Cnty., Cultural Ed. Fac. Fin. Corp. Rev. | | | |
| Bonds (Wayside Schools), Ser. A | | | |
| 5 1/4s, 8/15/42 | BB+ | $810,000 | $825,147 |
| 5s, 8/15/27 | BB+ | 500,000 | 531,220 |
|
| TX Muni. Gas Acquisition & Supply Corp. I Rev. | | | |
| Bonds, Ser. A, 5 1/4s, 12/15/24 | Baa1 | 4,500,000 | 5,454,630 |
|
| TX Private Activity Surface Trans. | | | |
| Corp. Rev. Bonds | | | |
| (LBJ Infrastructure), 7s, 6/30/40 | Baa3 | 4,500,000 | 5,442,660 |
| (NTE Mobility), 6 7/8s, 12/31/39 | Baa2 | 3,350,000 | 3,999,029 |
|
| Uptown, Dev. Auth. Tax Increment Contract | | | |
| Tax Alloc. Bonds (Infrastructure Impt. Fac.), | | | |
| 5 1/2s, 9/1/29 | BBB | 1,000,000 | 1,084,540 |
|
| | 102,692,874 |
| Utah (0.5%) | | | |
| Murray City, Hosp. VRDN (IHC Hlth. Svcs., Inc.), | | | |
| Ser. A, 0.01s, 5/15/37 | VMIG1 | 5,000,000 | 5,000,000 |
|
| | 5,000,000 |
| Vermont (0.1%) | | | |
| VT State Edl. & Hlth. Bldg. Fin. Agcy. Rev. Bonds | | | |
| (U. of VT Med. Ctr.), Ser. A, 5s, 12/1/35 | A3 | 1,000,000 | 1,168,710 |
|
| | 1,168,710 |
| Virginia (1.9%) | | | |
| Albemarle Cnty., Indl. Dev. Auth. Res. Care Fac. | | | |
| Rev. Bonds (Westminster-Canterbury), | | | |
| 5s, 1/1/31 | BB/P | 575,000 | 579,152 |
|
| Alexandria, Indl. Dev. Auth. Res. Care Fac. Mtge. | | | |
| Rev. Bonds (Goodwin House, Inc.), 5s, 10/1/45 | BBB/F | 1,500,000 | 1,684,335 |
|
| Cherry Hill Cmnty., Dev. Auth. 144A Special | | | |
| Assmt. Bonds (Potomac Shores), 5.15s, 3/1/35 | B/P | 500,000 | 510,890 |
|
| Chesterfield Cnty., Hlth. Ctr. Cmnty. Res. Care | | | |
| Fac. Rev. Bonds (Lucy Corr Village), Ser. A, | | | |
| 6 1/4s, 12/1/38 | B–/P | 1,450,000 | 1,223,148 |
|
| Lexington, Indl. Dev. Auth. Res. Care Fac. | | | |
| Rev. Bonds (Kendal at Lexington), Ser. A, | | | |
| 5 1/2s, 1/1/37 | BB+/P | 1,460,000 | 1,487,229 |
|
| Lower Magnolia Green Cmnty., Dev. Auth. 144A | | | |
| Special Assmt. Bonds, 5s, 3/1/35 | B/P | 855,000 | 873,109 |
|
| VA State Small Bus. Fin. Auth. Rev. Bonds | | | |
| (Elizabeth River Crossings OPCO, LLC), | | | |
| 6s, 1/1/37 | BBB– | 2,100,000 | 2,419,914 |
| (95 Express Lanes, LLC), 5s, 1/1/40 | BBB– | 4,500,000 | 4,857,480 |
|
| Washington Cnty., Indl. Dev. Auth. Hosp. Fac. Rev. | | | |
| Bonds (Mountain States Hlth. Alliance), Ser. C, | | | |
| 7 3/4s, 7/1/38 | Baa1 | 5,100,000 | 5,831,646 |
|
| | 19,466,903 |
| Washington (1.0%) | | | |
| Port Seattle, Port Indl. Dev. Corp. Rev. Bonds | | | |
| (Delta Airlines, Inc.), 5s, 4/1/30 | BB+ | 700,000 | 736,939 |
|
| WA State Higher Ed. Fac. Auth. Rev. Bonds | | | |
| (Whitworth U.), 5 5/8s, 10/1/40 | Baa1 | 1,600,000 | 1,725,504 |
|
| |
| 36 | Tax-Free High Yield Fund |
| | | |
| MUNICIPAL BONDS AND NOTES (97.6%)* cont. | Rating** | Principal amount | Value |
|
| Washington cont. | | | |
| WA State Hlth. Care Fac. Auth. Rev. Bonds | | | |
| (WA Hlth. Svcs.), 7s, 7/1/39 | | | |
| (Prerefunded 7/1/19) | Baa1 | $3,000,000 | $3,606,600 |
| (Kadlec Med. Ctr.), 5 1/2s, 12/1/39 | | | |
| (Prerefunded 12/1/20) | AAA/P | 1,200,000 | 1,447,572 |
| (Central WA Hlth. Svcs. Assn.), 4s, 7/1/36 | Baa1 | 1,620,000 | 1,630,449 |
|
| WA State Hsg. Fin. Comm. 144A Rev. Bonds | | | |
| (Heron’s Key Oblig. Group), Ser. A, 7s, 7/1/50 | B–/P | 1,000,000 | 1,021,310 |
|
| | 10,168,374 |
| West Virginia (0.3%) | | | |
| Pleasants Cnty., Poll. Control Rev. Bonds | | | |
| (Allegheny), Ser. F, 5 1/4s, 10/15/37 | Baa3 | 500,000 | 517,225 |
|
| WV State Hosp. Fin. Auth. Rev. Bonds | | | |
| (Thomas Hlth. Syst.), 6 3/4s, 10/1/43 | B+/P | 2,330,000 | 2,470,126 |
|
| | 2,987,351 |
| Wisconsin (1.9%) | | | |
| Platteville, Redev. Auth. Rev. Bonds | | | |
| (UW-Platteville Real Estate), 5s, 7/1/32 | BBB– | 1,500,000 | 1,593,630 |
|
| Pub. Fin. Auth. Arpt. Fac. Rev. Bonds | | | |
| (Sr. Oblig. Group), 5 1/4s, 7/1/28 | BBB | 800,000 | 877,344 |
| (Trans. Infrastructure Properties), 5s, 7/1/42 | BBB | 3,500,000 | 3,649,835 |
|
| WI State Hlth. & Edl. Fac. Auth. Rev. Bonds | | | |
| (St. Johns Cmntys. Inc.), Ser. A, 7 5/8s, 9/15/39 | | | |
| (Prerefunded 9/15/19) | AAA/F | 1,550,000 | 1,915,087 |
| (St. Johns Cmntys. Inc.), Ser. A, 7 1/4s, 9/15/29 | | | |
| (Prerefunded 9/15/19) | AAA/F | 1,000,000 | 1,222,240 |
| (Prohealth Care, Inc.), 6 5/8s, 2/15/39 | | | |
| (Prerefunded 2/15/19) | A1 | 3,000,000 | 3,506,880 |
| (St. John’s Cmnty., Inc.), Ser. B, 5s, 9/15/45 | BBB+/F | 750,000 | 798,128 |
| (Prohealth Care, Inc.), 5s, 8/15/39 | A1 | 750,000 | 839,820 |
|
| WI State Pub. Fin. Auth Sr. Living Rev. Bonds | | | |
| (Rose Villa, Inc.), Ser. A | | | |
| 6s, 11/15/49 | BB–/P | 1,000,000 | 1,087,340 |
| 5 3/4s, 11/15/44 | BB–/P | 500,000 | 536,640 |
| 5 1/2s, 11/15/34 | BB–/P | 1,685,000 | 1,800,979 |
|
| WI State Pub. Fin. Auth. 144A Rev. Bonds | | | |
| (Church Home of Hartford, Inc.), | | | |
| Ser. A, 5s, 9/1/38 | BB/F | 1,500,000 | 1,510,350 |
|
| | | | 19,338,273 |
| | | |
| Total municipal bonds and notes (cost $913,526,517) | | $999,246,843 |
|
| |
| PREFERRED STOCKS (1.2%)* | | Shares | Value |
|
| MuniMae Tax Exempt Bond Subsidiary, LLC 144A Ser. A-5, 5s cum. pfd. | 5,175,000 | $5,616,428 |
|
| MuniMae Tax Exempt Bond Subsidiary, LLC 144A Ser. B, | | |
| 7 3/4s cum. pfd. | | 6,000,000 | 6,473,160 |
|
| Total preferred stocks (cost $11,175,000) | | | $12,089,588 |
| |
| Tax-Free High Yield Fund | 37 |
| | |
| UNITIZED TRUST (0.1%)* | Shares | Value |
|
| CMS Liquidating Trust 144A F | 400 | $991,752 |
|
| Total unitized trust (cost $1,206,477) | | $991,752 |
|
| |
| COMMON STOCKS (0.0%)* | Shares | Value |
|
| Tembec, Inc. (Canada) † | 10,751 | 7,137 |
|
| Total common stocks (cost $8,077,612) | | $7,137 |
|
| |
| TOTAL INVESTMENTS | | |
|
| Total investments (cost $933,985,606) | | $1,012,335,320 |
Notes to the fund’s portfolio
Unless noted otherwise, the notes to the fund’s portfolio are for the close of the fund’s reporting period, which ran from August 1, 2015 through January 31, 2016 (the reporting period). Within the following notes to the portfolio, references to “ASC 820” represent Accounting Standards Codification 820 Fair Value Measurements and Disclosures and references to “OTC”, if any, represent over-the-counter.
* Percentages indicated are based on net assets of $1,023,760,012.
** The Moody’s, Standard & Poor’s or Fitch ratings indicated are believed to be the most recent ratings available at the close of the reporting period for the securities listed. Ratings are generally ascribed to securities at the time of issuance. While the agencies may from time to time revise such ratings, they undertake no obligation to do so, and the ratings do not necessarily represent what the agencies would ascribe to these securities at the close of the reporting period. Securities rated by Putnam are indicated by “/P.” Securities rated by Fitch are indicated by “/F.” If a security is insured, it will usually be rated by the ratings organizations based on the financial strength of the insurer. For further details regarding security ratings, please see the Statement of Additional Information.
*** This security is in default of principal and interest.
† This security is non-income-producing.
## Forward commitment, in part or in entirety (Note 1).
F This security is valued by Putnam Management at fair value following procedures approved by the Trustees.
Securities may be classified as Level 2 or Level 3 for ASC 820 based on the securities’ valuation inputs (Note 1).
144A after the name of an issuer represents securities exempt from registration under Rule 144A under the Securities Act of 1933, as amended. These securities may be resold in transactions exempt from registration, normally to qualified institutional buyers.
On Mandatory Put Bonds, the rates shown are the current interest rates at the close of the reporting period and the dates shown represent the next mandatory put dates.
The dates shown parenthetically on prerefunded bonds represent the next prerefunding dates.
The dates shown on debt obligations are the original maturity dates.
The fund had the following sector concentrations greater than 10% at the close of the reporting period (as a percentage of net assets):
| | | | | | |
| Health care | | 25.3% | | | | |
| Transportation | | 12.5 | | | | |
| Utilities | | 11.0 | | | | |
| |
| 38 | Tax-Free High Yield Fund |
ASC 820 establishes a three-level hierarchy for disclosure of fair value measurements. The valuation hierarchy is based upon the transparency of inputs to the valuation of the fund’s investments. The three levels are defined as follows:
Level 1: Valuations based on quoted prices for identical securities in active markets.
Level 2: Valuations based on quoted prices in markets that are not active or for which all significant inputs are observable, either directly or indirectly.
Level 3: Valuations based on inputs that are unobservable and significant to the fair value measurement.
The following is a summary of the inputs used to value the fund’s net assets as of the close of the reporting period:
| | | | |
| | | | | Valuation inputs | |
|
| Investments in securities: | | Level 1 | Level 2 | Level 3 |
|
| Common stocks*: | | | | |
|
| Basic materials | | $7,137 | $— | $— |
|
| Total common stocks | | 7,137 | — | — |
| | | | | |
| Municipal bonds and notes | | $— | $999,077,443 | $169,400 |
|
| Preferred stocks | | — | 12,089,588 | — |
|
| Unitized trust | | — | — | 991,752 |
|
| Totals by level | | $7,137 | $1,011,167,031 | $1,161,152 |
* Common stock classifications are presented at the sector level, which may differ from the fund’s portfolio presentation.
During the reporting period, transfers within the fair value hierarchy, if any, did not represent, in the aggregate, more than 1% of the fund’s net assets measured as of the end of the period. Transfers are accounted for using the end of period pricing valuation method.
At the start and close of the reporting period, Level 3 investments in securities represented less than 1% of the fund’s net assets and were not considered a significant portion of the fund’s portfolio.
The accompanying notes are an integral part of these financial statements.
| |
| Tax-Free High Yield Fund | 39 |
Statement of assets and liabilities 1/31/16 (Unaudited)
| |
| ASSETS | |
|
| Investment in securities, at value (Note 1): | |
| Unaffiliated issuers (identified cost $933,985,606) | $1,012,335,320 |
|
| Cash | 1,590,458 |
|
| Interest and other receivables | 10,912,430 |
|
| Receivable for shares of the fund sold | 2,784,202 |
|
| Receivable for investments sold | 6,742,963 |
|
| Receivable for sales of delayed delivery securities (Note 1) | 2,948,955 |
|
| Prepaid assets | 52,550 |
|
| Total assets | 1,037,366,878 |
| |
| LIABILITIES | |
|
| Payable for investments purchased | 3,661,970 |
|
| Payable for purchases of delayed delivery securities (Note 1) | 6,083,492 |
|
| Payable for shares of the fund repurchased | 1,728,871 |
|
| Payable for compensation of Manager (Note 2) | 409,973 |
|
| Payable for custodian fees (Note 2) | 6,052 |
|
| Payable for investor servicing fees (Note 2) | 114,537 |
|
| Payable for Trustee compensation and expenses (Note 2) | 386,002 |
|
| Payable for administrative services (Note 2) | 9,518 |
|
| Payable for distribution fees (Note 2) | 224,182 |
|
| Distributions payable to shareholders | 885,290 |
|
| Other accrued expenses | 96,979 |
|
| Total liabilities | 13,606,866 |
| | |
| Net assets | $1,023,760,012 |
|
| |
| REPRESENTED BY | |
|
| Paid-in capital (Unlimited shares authorized) (Notes 1 and 4) | $1,047,605,758 |
|
| Undistributed net investment income (Note 1) | 4,322,725 |
|
| Accumulated net realized loss on investments (Note 1) | (106,518,185) |
|
| Net unrealized appreciation of investments | 78,349,714 |
|
| Total — Representing net assets applicable to capital shares outstanding | $1,023,760,012 |
(Continued on next page)
| |
| 40 | Tax-Free High Yield Fund |
Statement of assets and liabilities (Continued)
| |
| COMPUTATION OF NET ASSET VALUE AND OFFERING PRICE | |
|
| Net asset value and redemption price per class A share | |
| ($780,429,875 divided by 61,899,960 shares) | $12.61 |
|
| Offering price per class A share (100/96.00 of $12.61)* | $13.14 |
|
| Net asset value and offering price per class B share ($12,112,012 divided by 958,726 shares)** | $12.63 |
|
| Net asset value and offering price per class C share ($70,594,555 divided by 5,586,825 shares)** | $12.64 |
|
| Net asset value and redemption price per class M share ($8,717,401 divided by 691,353 shares) | $12.61 |
|
| Offering price per class M share (100/96.75 of $12.61)† | $13.03 |
|
| Net asset value, offering price and redemption price per class Y share | |
| ($151,906,169 divided by 12,002,916 shares) | $12.66 |
|
* On single retail sales of less than $100,000. On sales of $100,000 or more the offering price is reduced.
** Redemption price per share is equal to net asset value less any applicable contingent deferred sales charge.
† On single retail sales of less than $50,000. On sales of $50,000 or more the offering price is reduced.
The accompanying notes are an integral part of these financial statements.
| |
| Tax-Free High Yield Fund | 41 |
Statement of operations Six months ended 1/31/16 (Unaudited)
| |
| INTEREST INCOME | $24,654,464 |
|
| EXPENSES | |
|
| Compensation of Manager (Note 2) | $2,352,910 |
|
| Investor servicing fees (Note 2) | 339,343 |
|
| Custodian fees (Note 2) | 7,131 |
|
| Trustee compensation and expenses (Note 2) | 38,410 |
|
| Distribution fees (Note 2) | 1,311,823 |
|
| Administrative services (Note 2) | 15,610 |
|
| Other | 172,386 |
|
| Total expenses | 4,237,613 |
| | |
| Expense reduction (Note 2) | (720) |
|
| Net expenses | 4,236,893 |
| | |
| Net investment income | 20,417,571 |
|
| |
| Net realized loss on investments (Notes 1 and 3) | (523,060) |
|
| Net unrealized appreciation of investments during the period | 18,872,560 |
|
| Net gain on investments | 18,349,500 |
| | |
| Net increase in net assets resulting from operations | $38,767,071 |
|
The accompanying notes are an integral part of these financial statements.
| |
| 42 | Tax-Free High Yield Fund |
Statement of changes in net assets
| | |
| INCREASE IN NET ASSETS | Six months ended 1/31/16* | Year ended 7/31/15 |
|
| Operations: | | |
| Net investment income | $20,417,571 | $42,334,314 |
|
| Net realized gain (loss) on investments | (523,060) | 5,597,883 |
|
| Net unrealized appreciation of investments | 18,872,560 | 5,065,741 |
|
| Net increase in net assets resulting from operations | 38,767,071 | 52,997,938 |
|
| Distributions to shareholders (Note 1): | | |
| From ordinary income | | |
| Taxable net investment income | | |
|
| Class A | (1,130,045) | (1,541,786) |
|
| Class B | (17,643) | (23,672) |
|
| Class C | (101,220) | (120,251) |
|
| Class M | (12,489) | (15,455) |
|
| Class Y | (217,795) | (170,902) |
|
| From tax-exempt net investment income | | |
| Class A | (15,598,765) | (33,365,589) |
|
| Class B | (203,286) | (441,002) |
|
| Class C | (1,107,470) | (2,192,720) |
|
| Class M | (159,403) | (328,185) |
|
| Class Y | (2,870,911) | (4,994,756) |
|
| Increase from capital share transactions (Note 4) | 24,265,938 | 8,605,415 |
|
| Total increase in net assets | 41,613,982 | 18,409,035 |
| |
| NET ASSETS | | |
|
| Beginning of period | 982,146,030 | 963,736,995 |
|
| End of period (including undistributed net investment | | |
| income of $4,322,725 and $5,324,181, respectively) | $1,023,760,012 | $982,146,030 |
|
* Unaudited.
The accompanying notes are an integral part of these financial statements.
| |
| Tax-Free High Yield Fund | 43 |
Financial highlights (For a common share outstanding throughout the period)
| | | | | | | | | | | | | | |
| INVESTMENT OPERATIONS: | | LESS DISTRIBUTIONS: | | | RATIOS AND SUPPLEMENTAL DATA: | |
|
| | | | | | | | | | | | | Ratio | Ratio | |
| | | | Net realized | | | | | | | | | of expenses | of net investment | |
| | Net asset value, | | and unrealized | Total from | From | | | | | Total return | Net assets, | to average | income (loss) | Portfolio |
| | beginning | Net investment | gain (loss) | investment | net investment | Total | Redemption | Non-recurring | Net asset value, | at net asset | end of period | net assets | to average | turnover |
| Period ended | of period | income (loss) | on investments | operations | income | distributions | fees | reimbursements | end of period | value (%)a | (in thousands) | (%)b | net assets (%) | (%) |
|
| Class A | | | | | | | | | | | | | | |
| January 31, 2016** | $12.39 | .27 | .22 | .49 | (.27) | (.27) | — | — | $12.61 | 3.99* | $780,430 | .41* | 2.07* | 10* |
| July 31, 2015 | 12.27 | .55 | .12 | .67 | (.55) | (.55) | — | — | 12.39 | 5.48 | 765,887 | .80 | 4.28 | 17 |
| July 31, 2014 | 11.85 | .55 | .42 | .97 | (.55) | (.55) | — | — | 12.27 | 8.47 | 807,290 | .80 | 4.73 | 19 |
| July 31, 2013 | 12.66 | .57 | (.83) | (.26) | (.55) | (.55) | —c | — | 11.85 | (2.22) | 843,916 | .80 | 4.43 | 16 |
| July 31, 2012 | 11.56 | .60 | 1.10 | 1.70 | (.60) | (.60) | —c | —d | 12.66 | 15.03 | 1,008,921 | .81 | 4.94 | 13 |
| July 31, 2011 | 11.77 | .65 | (.23) | .42 | (.63) | (.63) | —c | —e | 11.56 | 3.79 | 862,832 | .80 | 5.74 | 14 |
|
| Class B | | | | | | | | | | | | | | |
| January 31, 2016** | $12.42 | .23 | .21 | .44 | (.23) | (.23) | — | — | $12.63 | 3.58* | $12,112 | .72* | 1.76* | 10* |
| July 31, 2015 | 12.29 | .47 | .13 | .60 | (.47) | (.47) | — | — | 12.42 | 4.91 | 11,828 | 1.42 | 3.66 | 17 |
| July 31, 2014 | 11.87 | .48 | .42 | .90 | (.48) | (.48) | — | — | 12.29 | 7.79 | 12,503 | 1.42 | 4.11 | 19 |
| July 31, 2013 | 12.68 | .49 | (.83) | (.34) | (.47) | (.47) | —c | — | 11.87 | (2.82) | 13,324 | 1.42 | 3.82 | 16 |
| July 31, 2012 | 11.58 | .52 | 1.10 | 1.62 | (.52) | (.52) | —c | —d | 12.68 | 14.33 | 13,768 | 1.43 | 4.32 | 13 |
| July 31, 2011 | 11.79 | .58 | (.23) | .35 | (.56) | (.56) | —c | —e | 11.58 | 3.20 | 11,987 | 1.42 | 5.09 | 14 |
|
| Class C | | | | | | | | | | | | | | |
| January 31, 2016** | $12.42 | .22 | .22 | .44 | (.22) | (.22) | — | — | $12.64 | 3.58* | $70,595 | .80* | 1.69* | 10* |
| July 31, 2015 | 12.29 | .45 | .13 | .58 | (.45) | (.45) | — | — | 12.42 | 4.75 | 66,342 | 1.57 | 3.51 | 17 |
| July 31, 2014 | 11.88 | .46 | .41 | .87 | (.46) | (.46) | — | — | 12.29 | 7.54 | 60,957 | 1.57 | 3.96 | 19 |
| July 31, 2013 | 12.69 | .47 | (.83) | (.36) | (.45) | (.45) | —c | — | 11.88 | (2.97) | 69,981 | 1.57 | 3.67 | 16 |
| July 31, 2012 | 11.58 | .50 | 1.11 | 1.61 | (.50) | (.50) | —c | —d | 12.69 | 14.24 | 70,823 | 1.58 | 4.13 | 13 |
| July 31, 2011 | 11.79 | .57 | (.23) | .34 | (.55) | (.55) | —c | —e | 11.58 | 2.99 | 40,797 | 1.57 | 4.98 | 14 |
|
| Class M | | | | | | | | | | | | | | |
| January 31, 2016** | $12.39 | .25 | .22 | .47 | (.25) | (.25) | — | — | $12.61 | 3.85* | $8,717 | .55* | 1.94* | 10* |
| July 31, 2015 | 12.27 | .51 | .12 | .63 | (.51) | (.51) | — | — | 12.39 | 5.20 | 8,549 | 1.07 | 4.00 | 17 |
| July 31, 2014 | 11.85 | .52 | .42 | .94 | (.52) | (.52) | — | — | 12.27 | 8.18 | 8,014 | 1.07 | 4.46 | 19 |
| July 31, 2013 | 12.66 | .53 | (.82) | (.29) | (.52) | (.52) | —c | — | 11.85 | (2.48) | 8,543 | 1.07 | 4.16 | 16 |
| July 31, 2012 | 11.57 | .56 | 1.09 | 1.65 | (.56) | (.56) | —c | —d | 12.66 | 14.68 | 9,357 | 1.08 | 4.68 | 13 |
| July 31, 2011 | 11.77 | .62 | (.22) | .40 | (.60) | (.60) | —c | —e | 11.57 | 3.61 | 8,544 | 1.07 | 5.47 | 14 |
|
| Class Y | | | | | | | | | | | | | | |
| January 31, 2016** | $12.44 | .28 | .22 | .50 | (.28) | (.28) | — | — | $12.66 | 4.09* | $151,906 | .29* | 2.19* | 10* |
| July 31, 2015 | 12.31 | .57 | .13 | .70 | (.57) | (.57) | — | — | 12.44 | 5.79 | 129,540 | .57 | 4.51 | 17 |
| July 31, 2014 | 11.89 | .58 | .42 | 1.00 | (.58) | (.58) | — | — | 12.31 | 8.69 | 74,972 | .57 | 4.93 | 19 |
| July 31, 2013 | 12.70 | .60 | (.83) | (.23) | (.58) | (.58) | —c | — | 11.89 | (1.99) | 50,405 | .57 | 4.65 | 16 |
| July 31, 2012 | 11.59 | .62 | 1.11 | 1.73 | (.62) | (.62) | —c | —d | 12.70 | 15.38 | 103,030 | .58 | 5.11 | 13 |
| July 31, 2011 | 11.79 | .68 | (.22) | .46 | (.66) | (.66) | —c | —e | 11.59 | 4.17 | 58,265 | .57 | 5.98 | 14 |
|
See notes to financial highlights at the end of this section.
The accompanying notes are an integral part of these financial statements.
| | | |
| 44 | Tax-Free High Yield Fund | Tax-Free High Yield Fund | 45 |
Financial highlights (Continued)
* Not annualized.
** Unaudited.
a Total return assumes dividend reinvestment and does not reflect the effect of sales charges.
b Includes amounts paid through expense offset arrangements, if any (Note 2). Also excludes acquired fund fees and expenses, if any.
c Amount represents less than $0.01 per share.
d Reflects a non-recurring reimbursement pursuant to a settlement between the Securities and Exchange Commission (the SEC) and Southwest Capital, which amounted to less than $0.01 per share outstanding as of August 22, 2011.
e Reflects a non-recurring reimbursement related to restitution amounts in connection with a distribution plan approved by the SEC which amounted to less than $0.01 per share outstanding on July 21, 2011. Also reflects a non-recurring reimbursal related to short-term trading related lawsuits, which amounted to less than $0.01 per share outstanding on May 11, 2011.
The accompanying notes are an integral part of these financial statements.
| |
| 46 | Tax-Free High Yield Fund |
Notes to financial statements 1/31/16 (Unaudited)
Within the following Notes to financial statements, references to “State Street” represent State Street Bank and Trust Company, references to “the SEC” represent the Securities and Exchange Commission, references to “Putnam Management” represent Putnam Investment Management, LLC, the fund’s manager, an indirect wholly-owned subsidiary of Putnam Investments, LLC and references to “OTC”, if any, represent over-the-counter. Unless otherwise noted, the “reporting period” represents the period from August 1, 2015 through January 31, 2016.
Putnam Tax Free High Yield Fund (the fund) is a diversified series of Putnam Tax-Free Income Trust (the Trust), a Massachusetts business trust registered under the Investment Company Act of 1940, as amended, as an open-end management investment company. The goal of the fund is to seek high current income exempt from federal income tax. The fund invests mainly in bonds that pay interest that is exempt from federal income tax (but that may be subject to federal alternative minimum tax (AMT)), are a combination of below-investment-grade and investment grade securities, and have intermediate- to long-term maturities (three years or longer). Under normal circumstances, the fund invests at least 80% of the fund’s net assets in tax-exempt investments. This policy cannot be changed without the approval of the fund’s shareholders. Putnam Management may consider, among other factors, credit, interest rate and prepayment risks, as well as general market conditions, when deciding whether to buy or sell investments.
The fund offers class A, class B, class C, class M and class Y shares. Class A and class M shares are sold with a maximum front-end sales charge of 4.00% and 3.25%, respectively. Class A shares generally do not pay a contingent deferred sales charge and class M shares do not pay a contingent deferred sales charge. Class B shares, which convert to class A shares after approximately eight years, do not pay a front-end sales charge and are subject to a contingent deferred sales charge if those shares are redeemed within six years of purchase. Class C shares have a one-year 1.00% contingent deferred sales charge and do not convert to class A shares. The expenses for class A, class B, class C, and class M shares may differ based on the distribution fee of each class, which is identified in Note 2. Class Y shares, which are sold at net asset value, are generally subject to the same expenses as class A, class B, class C, and class M shares, but do not bear a distribution fee. Class Y shares are not available to all investors.
In the normal course of business, the fund enters into contracts that may include agreements to indemnify another party under given circumstances. The fund’s maximum exposure under these arrangements is unknown as this would involve future claims that may be, but have not yet been, made against the fund. However, the fund’s management team expects the risk of material loss to be remote.
Note 1: Significant accounting policies
The following is a summary of significant accounting policies consistently followed by the fund in the preparation of its financial statements. The preparation of financial statements is in conformity with accounting principles generally accepted in the United States of America and requires management to make estimates and assumptions that affect the reported amounts of assets and liabilities in the financial statements and the reported amounts of increases and decreases in net assets from operations. Actual results could differ from those estimates. Subsequent events after the Statement of assets and liabilities date through the date that the financial statements were issued have been evaluated in the preparation of the financial statements.
Investment income, realized and unrealized gains and losses and expenses of the fund are borne pro-rata based on the relative net assets of each class to the total net assets of the fund, except that each class bears expenses unique to that class (including the distribution fees applicable to such classes). Each class votes as a class only with respect to its own distribution plan or other matters on which a class vote is required by law or determined by the Trustees. If the fund were liquidated, shares of each class would receive their pro-rata share of the net assets of the fund. In addition, the Trustees declare separate dividends on each class of shares.
Security valuation Portfolio securities and other investments are valued using policies and procedures adopted by the Board of Trustees. The Trustees have formed a Pricing Committee to oversee the implementation of these procedures and have delegated responsibility for valuing the fund’s assets in accordance with these procedures to Putnam Management. Putnam Management has established an internal Valuation Committee that is responsible for making fair value determinations, evaluating the effectiveness of the pricing policies of the fund and reporting to the Pricing Committee.
Tax-exempt bonds and notes are generally valued on the basis of valuations provided by an independent pricing service approved by the Trustees. Such services use information with respect to transactions in bonds, quotations
| |
| Tax-Free High Yield Fund | 47 |
from bond dealers, market transactions in comparable securities and various relationships between securities in determining value. These securities will generally be categorized as Level 2.
Certain investments, including certain restricted and illiquid securities and derivatives, are also valued at fair value following procedures approved by the Trustees. To assess the continuing appropriateness of fair valuations, the Valuation Committee reviews and affirms the reasonableness of such valuations on a regular basis after considering all relevant information that is reasonably available. Such valuations and procedures are reviewed periodically by the Trustees. These valuations consider such factors as significant market or specific security events such as interest rate or credit quality changes, various relationships with other securities, discount rates, U.S. Treasury, U.S. swap and credit yields, index levels, convexity exposures, recovery rates, sales and other multiples and resale restrictions. These securities are classified as Level 2 or as Level 3 depending on the priority of the significant inputs. The fair value of securities is generally determined as the amount that the fund could reasonably expect to realize from an orderly disposition of such securities over a reasonable period of time. By its nature, a fair value price is a good faith estimate of the value of a security in a current sale and does not reflect an actual market price, which may be different by a material amount.
Security transactions and related investment income Security transactions are recorded on the trade date (the date the order to buy or sell is executed). Gains or losses on securities sold are determined on the identified cost basis.
Interest income is recorded on the accrual basis. All premiums/discounts are amortized/accreted on a yield-to-maturity basis. The premium in excess of the call price, if any, is amortized to the call date; thereafter, any remaining premium is amortized to maturity.
Securities purchased or sold on a delayed delivery basis may be settled at a future date beyond customary settlement time; interest income is accrued based on the terms of the securities. Losses may arise due to changes in the fair value of the underlying securities or if the counterparty does not perform under the contract.
Interfund lending The fund, along with other Putnam funds, may participate in an interfund lending program pursuant to an exemptive order issued by the SEC. This program allows the fund to borrow from other Putnam funds that permit such transactions. Interfund lending transactions are subject to each fund’s investment policies and borrowing and lending limits. Interest earned or paid on the interfund lending transaction will be based on the average of certain current market rates. During the reporting period, the fund did not utilize the program.
Lines of credit The fund participates, along with other Putnam funds, in a $392.5 million syndicated unsecured committed line of credit provided by State Street ($292.5 million) and Northern Trust Company ($100 million) and a $235.5 million unsecured uncommitted line of credit provided by State Street. Borrowings may be made for temporary or emergency purposes, including the funding of shareholder redemption requests and trade settlements. Interest is charged to the fund based on the fund’s borrowing at a rate equal to the higher of (1) the Federal Funds rate and (2) the overnight LIBOR plus 1.25% for the committed line of credit and the Federal Funds rate plus 1.30% for the uncommitted line of credit. A closing fee equal to 0.04% of the committed line of credit and 0.04% of the uncommitted line of credit has been paid by the participating funds. In addition, a commitment fee of 0.16% per annum on any unutilized portion of the committed line of credit is allocated to the participating funds based on their relative net assets and paid quarterly. During the reporting period, the fund had no borrowings against these arrangements.
Federal taxes It is the policy of the fund to distribute all of its income within the prescribed time period and otherwise comply with the provisions of the Internal Revenue Code of 1986, as amended (the Code), applicable to regulated investment companies. It is also the intention of the fund to distribute an amount sufficient to avoid imposition of any excise tax under Section 4982 of the Code.
The fund is subject to the provisions of Accounting Standards Codification 740 Income Taxes (ASC 740). ASC 740 sets forth a minimum threshold for financial statement recognition of the benefit of a tax position taken or expected to be taken in a tax return. The fund did not have a liability to record for any unrecognized tax benefits in the accompanying financial statements. No provision has been made for federal taxes on income, capital gains or unrealized appreciation on securities held nor for excise tax on income and capital gains. Each of the fund’s federal tax returns for the prior three fiscal years remains subject to examination by the Internal Revenue Service.
| |
| 48 | Tax-Free High Yield Fund |
At July 31, 2015, the fund had a capital loss carryover of $106,998,800 available to the extent allowed by the Code to offset future net capital gain, if any. The amounts of the carryovers and the expiration dates are:
| | | |
| Loss carryover |
|
| Short-term | Long-term | Total | Expiration |
|
| $3,073,566 | $33,528,532 | $36,602,098 | * |
|
| 4,270,473 | N/A | 4,270,473 | July 31, 2016 |
|
| 17,411,277 | N/A | 17,411,277 | July 31, 2017 |
|
| 33,971,635 | N/A | 33,971,635 | July 31, 2018 |
|
| 14,743,317 | N/A | 14,743,317 | July 31, 2019 |
|
* Under the Regulated Investment Company Modernization Act of 2010, the fund will be permitted to carry forward capital losses incurred in taxable years beginning after December 22, 2010 for an unlimited period. However, any losses incurred will be required to be utilized prior to the losses incurred in pre-enactment tax years. As a result of this ordering rule, pre-enactment capital loss carryforwards may be more likely to expire unused. Additionally, post-enactment capital losses that are carried forward will retain their character as either short-term or long-term capital losses rather than being considered all short-term as under previous law.
Pursuant to federal income tax regulations applicable to regulated investment companies, the fund has elected to defer certain capital losses of $90,367 recognized during the period between November 1, 2014 and July 31, 2015 to its fiscal year ending July 31, 2016.
The aggregate identified cost on a tax basis is $932,891,563, resulting in gross unrealized appreciation and depreciation of $105,759,716 and $26,315,959, respectively, or net unrealized appreciation of $79,443,757.
Distributions to shareholders Income dividends are recorded daily by the fund and are paid monthly. Distributions from capital gains, if any, are recorded on the ex-dividend date and paid at least annually. The amount and character of income and gains to be distributed are determined in accordance with income tax regulations which may differ from generally accepted accounting principles. Dividend sources are estimated at the time of declaration. Actual results may vary. Any non-taxable return of capital cannot be determined until final tax calculations are completed after the end of the fund’s fiscal year. Reclassifications are made to the fund’s capital accounts to reflect income and gains available for distribution (or available capital loss carryovers) under income tax regulations.
Expenses of the Trust Expenses directly charged or attributable to any fund will be paid from the assets of that fund. Generally, expenses of the Trust will be allocated among and charged to the assets of each fund on a basis that the Trustees deem fair and equitable, which may be based on the relative assets of each fund or the nature of the services performed and relative applicability to each fund.
Note 2: Management fee, administrative services and other transactions
The fund pays Putnam Management a management fee (based on the fund’s average net assets and computed and paid monthly) at annual rates that may vary based on the average of the aggregate net assets of most open-end funds, as defined in the fund’s management contract, sponsored by Putnam Management. Such annual rates may vary as follows:
| | | | |
| 0.630% | of the first $5 billion, | | 0.430% | of the next $50 billion, |
| |
|
| 0.580% | of the next $5 billion, | | 0.410% | of the next $50 billion, |
| |
|
| 0.530% | of the next $10 billion, | | 0.400% | of the next $100 billion and |
| |
|
| 0.480% | of the next $10 billion, | | 0.395% | of any excess thereafter. |
| |
|
Putnam Management has contractually agreed, through November 30, 2016, to waive fees or reimburse the fund’s expenses to the extent necessary to limit the cumulative expenses of the fund, exclusive of brokerage, interest, taxes, investment-related expenses, extraordinary expenses, acquired fund fees and expenses and payments under the fund’s investor servicing contract, investment management contract and distribution plans, on a fiscal year-to-date basis to an annual rate of 0.20% of the fund’s average net assets over such fiscal year-to-date period. During the reporting period, the fund’s expenses were not reduced as a result of this limit.
Putnam Investments Limited (PIL), an affiliate of Putnam Management, is authorized by the Trustees to manage a separate portion of the assets of the fund as determined by Putnam Management from time to time. Putnam
| |
| Tax-Free High Yield Fund | 49 |
Management pays a quarterly sub-management fee to PIL for its services at an annual rate of 0.40% of the average net assets of the portion of the fund managed by PIL.
The fund reimburses Putnam Management an allocated amount for the compensation and related expenses of certain officers of the fund and their staff who provide administrative services to the fund. The aggregate amount of all such reimbursements is determined annually by the Trustees.
Custodial functions for the fund’s assets are provided by State Street. Custody fees are based on the fund’s asset level, the number of its security holdings and transaction volumes.
Putnam Investor Services, Inc., an affiliate of Putnam Management, provides investor servicing agent functions to the fund. Putnam Investor Services, Inc. received fees for investor servicing that included (1) a per account fee for each direct and underlying non-defined contribution account (“retail account”) of the fund and each of the other funds in its specified category, which was totaled and then allocated to each fund in the category based on its average daily net assets; (2) a specified rate of the fund’s assets attributable to defined contribution plan accounts; and (3) a specified rate based on the average net assets in retail accounts. Putnam Investor Services has agreed that the aggregate investor servicing fees for each fund’s retail and defined contribution accounts will not exceed an annual rate of 0.320% of the fund’s average assets attributable to such accounts. During the reporting period, the expenses for each class of shares related to investor servicing fees were as follows:
| | | | |
| Class A | $263,092 | | Class M | 2,881 |
| |
|
| Class B | 4,061 | | Class Y | 46,154 |
| |
|
| Class C | 23,155 | | Total | $339,343 |
| |
|
The fund has entered into expense offset arrangements with Putnam Investor Services, Inc. and State Street whereby Putnam Investor Services, Inc.’s and State Street’s fees are reduced by credits allowed on cash balances. For the reporting period, the fund’s expenses were reduced by $720 under the expense offset arrangements.
Each Independent Trustee of the fund receives an annual Trustee fee, of which $701, as a quarterly retainer, has been allocated to the fund, and an additional fee for each Trustees meeting attended. Trustees also are reimbursed for expenses they incur relating to their services as Trustees.
The fund has adopted a Trustee Fee Deferral Plan (the Deferral Plan) which allows the Trustees to defer the receipt of all or a portion of Trustees fees payable on or after July 1, 1995. The deferred fees remain invested in certain Putnam funds until distribution in accordance with the Deferral Plan.
The fund has adopted an unfunded noncontributory defined benefit pension plan (the Pension Plan) covering all Trustees of the fund who have served as a Trustee for at least five years and were first elected prior to 2004. Benefits under the Pension Plan are equal to 50% of the Trustee’s average annual attendance and retainer fees for the three years ended December 31, 2005. The retirement benefit is payable during a Trustee’s lifetime, beginning the year following retirement, for the number of years of service through December 31, 2006. Pension expense for the fund is included in Trustee compensation and expenses in the Statement of operations. Accrued pension liability is included in Payable for Trustee compensation and expenses in the Statement of assets and liabilities. The Trustees have terminated the Pension Plan with respect to any Trustee first elected after 2003.
The fund has adopted distribution plans (the Plans) with respect to its class A, class B, class C and class M shares pursuant to Rule 12b–1 under the Investment Company Act of 1940. The purpose of the Plans is to compensate Putnam Retail Management Limited Partnership, an indirect wholly-owned subsidiary of Putnam Investments, LLC, for services provided and expenses incurred in distributing shares of the fund. The Plans provide for payments by the fund to Putnam Retail Management Limited Partnership at an annual rate of up to 0.35%, 1.00%, 1.00% and 1.00% of the average net assets attributable to class A, class B, class C and class M shares, respectively. The Trustees have approved payment by the fund at the annual rate of 0.85%, 1.00% and 0.50% of the average net assets for class B, class C and class M shares, respectively. For class A shares, the annual payment rate will equal the weighted average of (i) 0.20% on the net assets of the fund attributable to class A shares purchased and paid for prior to March 21, 2005 and (ii) 0.25% on all other net assets of the fund attributable to class A shares. During the reporting period, the class specific expenses related to distribution fees were as follows:
| | | | |
| Class A | $898,504 | | Class M | 21,227 |
| |
|
| Class B | 50,870 | | Total | $1,311,823 |
| |
|
| Class C | 341,222 | | | |
| | |
| |
| 50 | Tax-Free High Yield Fund |
For the reporting period, Putnam Retail Management Limited Partnership, acting as underwriter, received net commissions of $18,844 and $433 from the sale of class A and class M shares, respectively, and received $7,624 and $1,960 in contingent deferred sales charges from redemptions of class B and class C shares, respectively.
A deferred sales charge of up to 1.00% is assessed on certain redemptions of class A shares. For the reporting period, Putnam Retail Management Limited Partnership, acting as underwriter, received $1,138 on class A redemptions.
Note 3: Purchases and sales of securities
During the reporting period, the cost of purchases and the proceeds from sales, excluding short-term investments, were as follows:
| | |
| | Cost of purchases | Proceeds from sales |
|
| Investments in securities (Long-term) | $110,255,879 | $90,776,037 |
|
| U.S. government securities (Long-term) | — | — |
|
| Total | $110,255,879 | $90,766,037 |
|
The fund may purchase or sell investments from or to other Putnam funds in the ordinary course of business, which can reduce the fund’s transaction costs, at prices determined in accordance with SEC requirements and policies approved by the Trustees. During the reporting period, purchases or sales from or to other Putnam funds, if any, did not represent more than 5% of the fund’s total cost of purchases and/or total proceeds from sales.
Note 4: Capital shares
At the close of the reporting period, there were an unlimited number of shares of beneficial interest authorized. Transactions in capital shares were as follows:
| | | | |
| | Six months ended 1/31/16 | Year ended 7/31/15 |
|
| Class A | Shares | Amount | Shares | Amount |
|
| Shares sold | 3,303,066 | $41,227,396 | 5,977,639 | $74,830,746 |
|
| Shares issued in connection with | | | | |
| reinvestment of distributions | 1,104,563 | 13,793,954 | 2,277,181 | 28,488,827 |
|
| | 4,407,629 | 55,021,350 | 8,254,820 | 103,319,573 |
|
| Shares repurchased | (4,319,155) | (53,865,018) | (12,255,159) | (153,443,969) |
|
| Net increase (decrease) | 88,474 | $1,156,332 | (4,000,339) | $(50,124,396) |
|
| |
| | Six months ended 1/31/16 | Year ended 7/31/15 |
|
| Class B | Shares | Amount | Shares | Amount |
|
| Shares sold | 74,130 | $927,604 | 112,802 | $1,413,005 |
|
| Shares issued in connection with | | | | |
| reinvestment of distributions | 14,938 | 186,899 | 30,842 | 386,562 |
|
| | 89,068 | 1,114,503 | 143,644 | 1,799,567 |
|
| Shares repurchased | (83,006) | (1,037,110) | (208,319) | (2,601,427) |
|
| Net increase (decrease) | 6,062 | $77,393 | (64,675) | $(801,860) |
|
| |
| | Six months ended 1/31/16 | Year ended 7/31/15 |
|
| Class C | Shares | Amount | Shares | Amount |
|
| Shares sold | 569,964 | $7,130,187 | 1,135,456 | $14,261,996 |
|
| Shares issued in connection with | | | | |
| reinvestment of distributions | 56,587 | 708,092 | 111,988 | 1,403,887 |
|
| | 626,551 | 7,838,279 | 1,247,444 | 15,665,883 |
|
| Shares repurchased | (382,262) | (4,775,782) | (864,120) | (10,800,088) |
|
| Net increase | 244,289 | $3,062,497 | 383,324 | $4,865,795 |
|
| |
| Tax-Free High Yield Fund | 51 |
| | | | |
| | Six months ended 1/31/16 | Year ended 7/31/15 |
|
| Class M | Shares | Amount | Shares | Amount |
|
| Shares sold | 56,444 | $705,831 | 103,264 | $1,290,469 |
|
| Shares issued in connection with | | | | |
| reinvestment of distributions | 12,458 | 155,618 | 25,405 | 317,823 |
|
| | 68,902 | 861,449 | 128,669 | 1,608,292 |
|
| Shares repurchased | (67,470) | (840,275) | (91,988) | (1,148,789) |
|
| Net increase | 1,432 | $21,174 | 36,681 | $459,503 |
|
| |
| | Six months ended 1/31/16 | Year ended 7/31/15 |
|
| Class Y | Shares | Amount | Shares | Amount |
|
| Shares sold | 3,832,352 | $48,058,878 | 8,507,598 | $106,883,117 |
|
| Shares issued in connection with | | | | |
| reinvestment of distributions | 120,161 | 1,506,874 | 217,641 | 2,732,643 |
|
| | 3,952,513 | 49,565,752 | 8,725,239 | 109,615,760 |
|
| Shares repurchased | (2,366,237) | (29,617,210) | (4,400,609) | (55,409,387) |
|
| Net increase | 1,586,276 | $19,948,542 | 4,324,630 | $54,206,373 |
|
Note 5: Market, credit and other risks
In the normal course of business, the fund trades financial instruments and enters into financial transactions where risk of potential loss exists due to changes in the market (market risk) or failure of the contracting party to the transaction to perform (credit risk). The fund may be exposed to additional credit risk that an institution or other entity with which the fund has unsettled or open transactions will default. The fund may invest in higher-yielding, lower-rated bonds that may have a higher rate of default.
| |
| 52 | Tax-Free High Yield Fund |
Fund information
Founded over 75 years ago, Putnam Investments was built around the concept that a balance between risk and reward is the hallmark of a well-rounded financial program. We manage over 100 funds across income, value, blend, growth, asset allocation, absolute return, and global sector categories.
| | |
| Investment Manager | Trustees | Robert T. Burns |
| Putnam Investment | Jameson A. Baxter, Chair | Vice President and |
| Management, LLC | Liaquat Ahamed | Chief Legal Officer |
| One Post Office Square | Ravi Akhoury | |
| Boston, MA 02109 | Barbara M. Baumann | James F. Clark |
| | Robert J. Darretta | Chief Compliance Officer |
| Investment Sub-Manager | Katinka Domotorffy | |
| Putnam Investments Limited | John A. Hill | Michael J. Higgins |
| 57–59 St James’s Street | Paul L. Joskow | Vice President, Treasurer, |
| London, England SW1A 1LD | Kenneth R. Leibler | and Clerk |
| | Robert E. Patterson | |
| Marketing Services | George Putnam, III | Janet C. Smith |
| Putnam Retail Management | Robert L. Reynolds | Vice President, |
| One Post Office Square | W. Thomas Stephens | Principal Accounting Officer, |
| Boston, MA 02109 | | and Assistant Treasurer |
| | Officers | |
| Custodian | Robert L. Reynolds | Susan G. Malloy |
| State Street Bank | President | Vice President and |
| and Trust Company | | Assistant Treasurer |
| | Jonathan S. Horwitz | |
| Legal Counsel | Executive Vice President, | James P. Pappas |
| Ropes & Gray LLP | Principal Executive Officer, and | Vice President |
| | Compliance Liaison | |
| | | Mark C. Trenchard |
| | Steven D. Krichmar | Vice President and |
| | Vice President and | BSA Compliance Officer |
| | Principal Financial Officer | |
| | Nancy E. Florek |
| | | Vice President, Director of |
| | | Proxy Voting and Corporate |
| | | Governance, Assistant Clerk, |
| | | and Associate Treasurer |
This report is for the information of shareholders of Putnam Tax-Free High Yield Fund. It may also be used as sales literature when preceded or accompanied by the current prospectus, the most recent copy of Putnam’s Quarterly Performance Summary, and Putnam’s Quarterly Ranking Summary. For more recent performance, please visit putnam.com. Investors should carefully consider the investment objectives, risks, charges, and expenses of a fund, which are described in its prospectus. For this and other information or to request a prospectus or summary prospectus, call 1-800-225-1581 toll free. Please read the prospectus carefully before investing. The fund’s Statement of Additional Information contains additional information about the fund’s Trustees and is available without charge upon request by calling 1-800-225-1581.
| |
| Item 3. Audit Committee Financial Expert: |
| |
| Item 4. Principal Accountant Fees and Services: |
| |
| Item 5. Audit Committee of Listed Registrants |
| |
| Item 6. Schedule of Investments: |
| |
| The registrant's schedule of investments in unaffiliated issuers is included in the report to shareholders in Item 1 above. |
| |
| Item 7. Disclosure of Proxy Voting Policies and Procedures For Closed-End Management Investment Companies: |
| |
| Item 8. Portfolio Managers of Closed-End Investment Companies |
| |
| Item 9. Purchases of Equity Securities by Closed-End Management Investment Companies and Affiliated Purchasers: |
| |
| Item 10. Submission of Matters to a Vote of Security Holders: |
| |
| Item 11. Controls and Procedures: |
| |
| (a) The registrant's principal executive officer and principal financial officer have concluded, based on their evaluation of the effectiveness of the design and operation of the registrant's disclosure controls and procedures as of a date within 90 days of the filing date of this report, that the design and operation of such procedures are generally effective to provide reasonable assurance that information required to be disclosed by the registrant in this report is recorded, processed, summarized and reported within the time periods specified in the Commission's rules and forms. |
| |
| (b) Changes in internal control over financial reporting: Not applicable |
| |
| (a)(2) Separate certifications for the principal executive officer and principal financial officer of the registrant as required by Rule 30a-2(a) under the Investment Company Act of 1940, as amended, are filed herewith. |
| |
| (b) The certifications required by Rule 30a-2(b) under the Investment Company Act of 1940, as amended, are filed herewith. |
| |
| Putnam Tax Free Income Trust |
| |
| By (Signature and Title): |
| |
| /s/ Janet C. Smith
Janet C. Smith
Principal Accounting Officer
|
| |
| Pursuant to the requirements of the Securities Exchange Act of 1934 and the Investment Company Act of 1940, this report has been signed below by the following persons on behalf of the registrant and in the capacities and on the dates indicated. |
| |
| By (Signature and Title): |
| |
| /s/ Jonathan S. Horwitz
Jonathan S. Horwitz
Principal Executive Officer
|
| |
| By (Signature and Title): |
| |
| /s/ Steven D. Krichmar
Steven D. Krichmar
Principal Financial Officer
|