| UNITED STATES SECURITIES AND EXCHANGE COMMISSION | ||
| Washington, D.C. 20549 | ||
FORM N-CSR | ||
| CERTIFIED SHAREHOLDER REPORT OF REGISTERED MANAGEMENT INVESTMENT COMPANIES | ||
| Investment Company Act file number: | (811-04345) |
| Exact name of registrant as specified in charter: | Putnam Tax Free Income Trust |
| Address of principal executive offices: | One Post Office Square, Boston, Massachusetts 02109 |
| Name and address of agent for service: | Robert T. Burns, Vice President One Post Office Square Boston, Massachusetts 02109 |
| Copy to: | Bryan Chegwidden, Esq. Ropes & Gray LLP 1211 Avenue of the Americas New York, New York 10036 |
| Registrant’s telephone number, including area code: | (617) 292-1000 |
| Date of fiscal year end: | July 31, 2015 |
| Date of reporting period: | August 1, 2014 – January 31, 2015 |
Item 1. Report to Stockholders: |
| The following is a copy of the report transmitted to stockholders pursuant to Rule 30e-1 under the Investment Company Act of 1940: | |||
Putnam
Tax-Free High Yield
Fund
Semiannual report
1 | 31 | 15
Message from the Trustees | 1 |
About the fund | 2 |
Performance snapshot | 4 |
Interview with your fund’s portfolio manager | 5 |
Your fund’s performance | 11 |
Your fund’s expenses | 14 |
Terms and definitions | 16 |
Other information for shareholders | 17 |
Financial statements | 18 |
Consider these risks before investing: Capital gains, if any, are taxed at the federal and, in most cases, state levels. For some investors, investment income may be subject to the federal alternative minimum tax. Income from federally tax-exempt funds may be subject to state and local taxes. Bond investments are subject to interest-rate risk (the risk of bond prices falling if interest rates rise) and credit risk (the risk of an issuer defaulting on interest or principal payments). Interest-rate risk is greater for longer-term bonds, and credit risk is greater for below-investment-grade bonds. Unlike bonds, funds that invest in bonds have fees and expenses. The fund may invest significantly in particular segments of the tax-exempt debt market, making it more vulnerable to fluctuations in the values of the securities it holds than a more broadly invested fund. Interest the fund receives might be taxable. The value of bonds in the fund’s portfolio may fall or fail to rise over time for several reasons, including general financial market conditions, changing market perceptions of the risk of default, changes in government intervention, and factors related to a specific issuer or industry. These factors may also lead to periods of high volatility and reduced liquidity in the bond markets. You can lose money by investing in the fund.
Message from the Trustees
Dear Fellow Shareholder:
The U.S. economic recovery is gaining steam, with three consecutive quarters of positive GDP growth, accelerated hiring, and rising consumer confidence, which recently hit multi-year highs. U.S. markets, however, have experienced some turbulence since the start of the year.
Cheaper energy prices benefit consumers and many businesses, but the sharp decline in oil prices has also fostered uncertainty. A stronger U.S. dollar may hurt profits for many large multinational companies headquartered in the United States that rely on exports for growth. In addition, investors appear to be anticipating when the Federal Reserve will begin raising interest rates. Overseas growth, meanwhile, remains tepid at best.
In an economically uncertain environment, it can be worthwhile to consider a range of investment opportunities. Putnam invests across many asset classes and pursues flexible strategies that seek out opportunities for growth or income with careful awareness of risk. Our experienced equity and fixed-income teams employ new ways of thinking and integrate innovative investment ideas into time-tested, traditional strategies. In today’s environment, it is also important to rely on your financial advisor, who can ensure your portfolio matches your individual goals and tolerance for risk.
As always, thank you for investing with Putnam.
Respectfully yours,

Robert L. Reynolds
President and Chief Executive Officer
Putnam Investments

Jameson A. Baxter
Chair, Board of Trustees
March 10, 2015

Performance
snapshot
Annualized total return (%) comparison as of 1/31/15
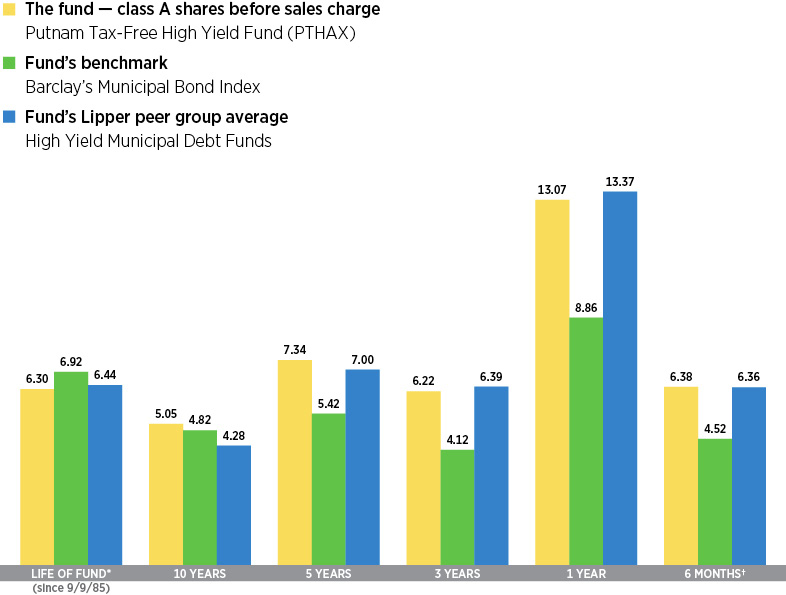
Current performance may be lower or higher than the quoted past performance, which cannot guarantee future results. Share price, principal value, and return will fluctuate, and you may have a gain or a loss when you sell your shares. Performance of class A shares assumes reinvestment of distributions and does not account for taxes. Fund returns in the bar chart do not reflect a sales charge of 4.00%; had they, returns would have been lower. See pages 5 and 11–13 for additional performance information. For a portion of the periods, the fund had expense limitations, without which returns would have been lower. To obtain the most recent month-end performance, visit putnam.com.
* Performance for class A shares before their inception (9/20/93) is derived from the historical performance of class B shares.
† Returns for the six-month period are not annualized, but cumulative.
4 Tax-Free High Yield Fund
Interview with your fund’s portfolio manager
|
Paul M. Drury, CFA |

Paul, what was the municipal bond market environment like during the six-month reporting period ended January 31, 2015?
Municipal bonds enjoyed solid absolute and relative performance during the reporting period. The asset class, as measured by the Barclays Municipal Bond Index, posted positive monthly gains and a six-month return that surpassed stocks [S&P 500 Index] and bonds [Barclays U.S. Aggregate Bond Index].
The accommodative policies of central banks around the globe to promote growth in their respective economies contributed to an environment of low interest rates, which helped to push municipal bond prices higher. With the U.S. economy further along in its recovery, however, the Federal Reserve terminated its bond-buying stimulus program this past October. The plunging price of oil added a new dimension to the debate on U.S. growth. One of the more immediate effects of falling oil prices is on inflation, which, if it stays low, should grant the Federal Reserve more flexibility to hold off raising rates.
Technical [supply/demand] factors also provided price support to municipal bonds, as strong investor demand continued to exceed supply. In addition, there were positive credit developments at the state level as the benefits of stronger U.S. growth rippled throughout the economy. Several states, including California and New York,

Broad market index and fund performance
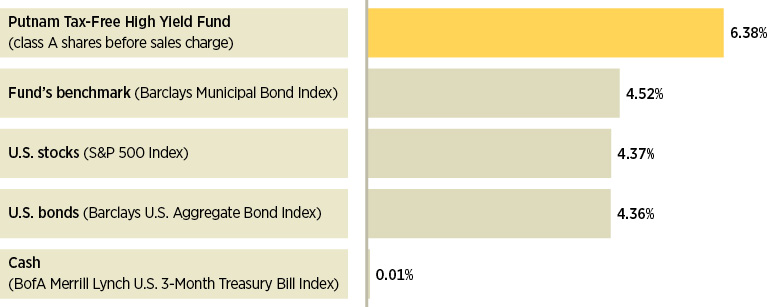
This comparison shows your fund’s performance in the context of broad market indexes for the six months ended 1/31/15. See pages 4 and 11–13 for additional fund performance information. Index descriptions can be found on page 16.
Tax-Free High Yield Fund 5
benefited from their improving economies, disciplined fiscal leadership, and structurally balanced operations, which in turn led to an improved ratings outlook for those states. Accordingly, upgrades for U.S. public finance rating revisions led downgrades in the fourth quarter of 2014 — the first time since 2008 [Moody’s Investors Service].
How did Putnam Tax-Free High Yield Fund perform against this backdrop?
For the six months ended January 31, 2015, the fund outperformed the average return of its Lipper peer group and its benchmark, the Barclays Municipal Bond Index.
How was the fund positioned during the reporting period?
We maintained our defensive bias in the portfolio because we believed that the municipal bond market’s attractive returns during the period could be attributed primarily to a combination of lower interest rates and strong market technicals. We kept the fund’s duration positioning, or interest-rate sensitivity, below that of its Lipper peer group. This included maintaining a slightly higher-than-average cash position in the portfolio to help shelter it from price pressures, given the risk of interest rates moving higher. We also believed that carrying a slightly higher-than-average cash balance gave us greater flexibility to act swiftly
Sector allocations
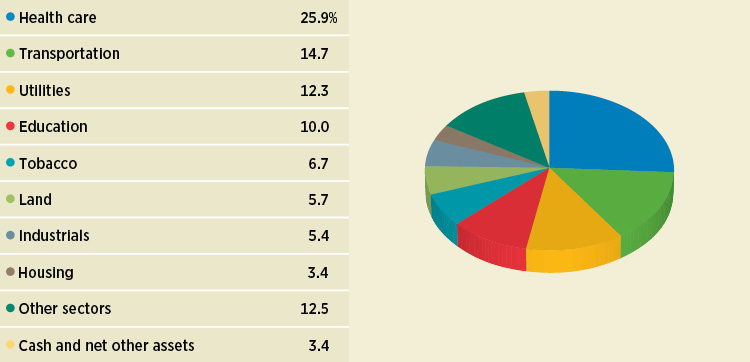
Allocations are shown as a percentage of the fund’s net assets as of 1/31/15. Cash and net other assets, if any, represent the market value weights of cash, derivatives, short-term securities, and other unclassified assets in the portfolio. Summary information may differ from the information in the portfolio schedule notes included in the financial statements due to the inclusion of derivative securities, any interest accruals, and the use of different classifications of securities for presentation purposes. Holdings and allocations may vary over time.
6 Tax-Free High Yield Fund
“We currently plan to maintain our
underweight exposure to Puerto Rico,
given our negative credit outlook for
the Commonwealth.”
Paul Drury
when timely investment opportunities presented themselves.
We continued to emphasize essential service revenue bonds, which are typically issued by state and local government entities to finance specific revenue-generating projects. While we believed that conditions were improving at the state and local levels, we continued to underweight local general obligation [G.O.] bonds relative to the benchmark. These securities rely on the taxing power of the issuer and the health of the local economy to make payments from property taxes or sales and income taxes.
Relative to the benchmark, the fund retained an overweight exposure to municipal bonds rated Baa. In terms of sectors, we favored transportation, higher education, and essential service utilities bonds in the portfolio relative to the fund’s Lipper peer group. Overall, this positioning contributed positively to performance. Our shorter-duration interest-rate positioning was one of the biggest detractors from relative performance versus our Lipper peers, as interest rates moved lower during the period. Underweight exposures to Puerto Rico
Credit quality overview
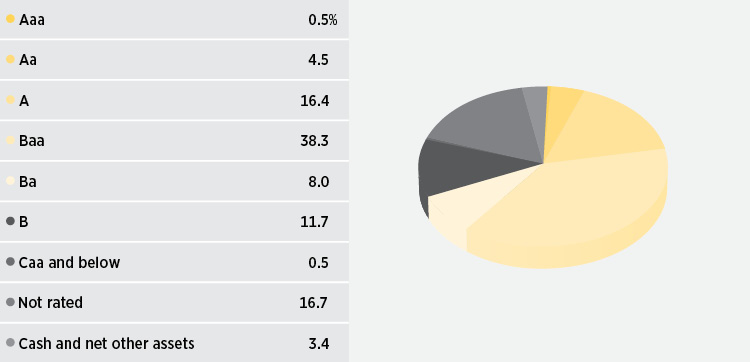
Credit qualities are shown as a percentage of the fund’s net assets as of 1/31/15. A bond rated Baa or higher (MIG3/VMIG3 or higher, for short-term debt) is considered investment grade. The chart reflects Moody’s ratings; percentages may include bonds or derivatives not rated by Moody’s but rated by Standard & Poor’s (S&P) or, if unrated by S&P, by Fitch ratings, and then included in the closest equivalent Moody’s rating based on analysis of these agencies’ respective ratings criteria. Moody’s ratings are used in recognition of its prominence among rating agencies and breadth of coverage of rated securities. Ratings may vary over time.
Cash and net other assets, if any, represent the market value weights of cash, derivatives, short-term securities, and other unclassified assets in the portfolio. The fund itself has not been rated by an independent rating agency.
Tax-Free High Yield Fund 7
bonds also dampened results as compared with the fund’s Lipper peer group. However, we currently plan to maintain our underweight exposure to issuers in Puerto Rico, given our negative credit outlook for the Commonwealth. Finally, our underweight to non-rated bonds versus our Lipper peers was a headwind for performance, as demand for high-yield municipal bonds helped push prices higher.
What is contributing to the imbalance in supply and demand?
Much of the new issue volume we saw during the period was for refunding purposes, while longer-term new municipal issuance declined. The declining volume of new long-term municipal bonds coming to market was due in part to state and local governments undertaking fewer projects while turning their fiscal attention toward funding employee pensions and other fixed costs in their budgets. Combined with maturing debt and early redemptions of existing municipal bonds, the municipal bond market contracted 4% to $3.6 trillion in 2014, according to Bloomberg.
Meanwhile, crossover buyers and hedge fund investors that appeared to have been drawn to the competitive yields and attractive relative value offered by this asset class rather than by its tax benefit joined traditional tax-sensitive retail investors to create strong demand. Consequently, the municipal market saw positive inflows to tax-free mutual funds in 2014 — making the year
Comparison of top sector weightings
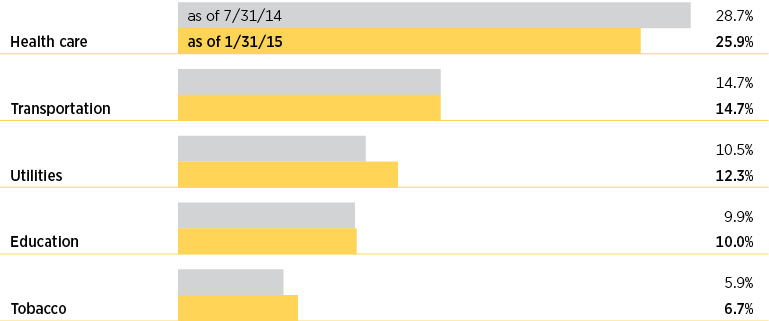
This chart shows how the fund’s top weightings have changed over the past six months. Allocations are shown as a percentage of the fund’s net assets. Current period summary information may differ from the information in the portfolio schedule notes included in the financial statements due to the inclusion of derivative securities, any interest accruals, and the use of different classifications of securities for presentation purposes. Holdings and allocations may vary over time.
8 Tax-Free High Yield Fund
one of the best on record for the asset class, historically speaking. Tax-free high-yield and intermediate-term bond funds were the primary beneficiaries of this strong investor interest. With interest rates low and fundamental credit quality stable, there was greater investor appetite for yields offered by the relatively riskier municipal bonds further out on the maturity spectrum as well as for those in the lower-rated, higher-yielding sectors.
Some isolated credit situations continue to make headlines, but would you say that the creditworthiness of the municipal bond market remains strong?
While revenue growth has been sluggish in comparison with past recoveries, we believe the overall fiscal health and creditworthiness of the municipal bond market improved during 2014. According to the U.S. Census Bureau, aggregate state tax revenues were up 4.5% year-over-year in the third quarter of 2014, after two consecutive quarters of essentially flat year-over-year growth in collections. Furthermore, the default rate remained low in 2014 [0.03% of the $3.6 trillion municipal bond market according to BofA Merrill Lynch], and we don’t believe defaults will increase meaningfully in the near future.
Of course, there are outliers, but for the most part, these have been isolated credit situations, in our view. Despite a volatile year that included a downgrade to below investment grade and fluctuating bond performance, Puerto Rico underperformed the broader municipal market but still managed to post positive returns during 2014. We continue to maintain a negative fundamental outlook on the territory given the continued contraction of the island’s economy, which we believe will continue to weigh on credits of the various issuing entities. In Detroit, Michigan, and Stockton, California, we saw the bankruptcy processes play out. The outcomes highlight the importance of bottom-up fundamental credit analysis, which is a cornerstone of our investment process.
What factors are likely to influence the performance of municipal bonds in the coming months?
While investors should stay mindful of the long-term potential for tax reform, we believe the most significant driver of municipal bond returns in 2015 will be the Fed’s interest-rate policy and its effect on demand for the asset class. At their closely watched meeting this past December, Fed officials modified their policy statement by adding that they “can be patient” on the timing of rate increases. But questions about the timing of an increase are likely to dominate the public discourse until the central bank implements its first rate increase. Accordingly, we believe the Fed’s actions, along with the direction of longer-term U.S. Treasuries, will highly influence the performance of municipal bonds in 2015.
Lower oil and energy prices should be a net positive for the municipal bond market, in our opinion. Certain sectors, such as transportation — notably airlines — and toll roads, could see a positive impact from the decline in prices. However, we believe that oil-producing states, such as Texas, North Dakota, and Alaska, are likely to see falling revenues as production decreases or ceases for a period of time.
In the cases of Alaska and North Dakota, however, these states do not issue much municipal bond debt and have set aside healthy reserves to ease budget pressures that typically accompany such a downturn. In the case of Texas, we believe the decline in oil and energy prices is likely to be more widely felt. If oil prices remain low for an extended period of time, affected issuers may come under more pressure and be subject to credit downgrades or defaults. The susceptibility of local G.O. bonds to macroeconomic developments, such as a sharp decline in oil prices, reinforces our predisposition to underweight
Tax-Free High Yield Fund 9
G.O. bonds in the portfolio relative to the benchmark.
In this environment, we will continue to manage the fund with an eye toward keeping its interest-rate sensitivity lower than that of its Lipper peers. As part of this strategy, we believe overweighting bonds rated Baa while managing duration with cash and security selection will be the best path.
Thank you, Paul, for your time and insights today.
The views expressed in this report are exclusively those of Putnam Management and are subject to change. They are not meant as investment advice.
Please note that the holdings discussed in this report may not have been held by the fund for the entire period. Portfolio composition is subject to review in accordance with the fund’s investment strategy and may vary in the future. Current and future portfolio holdings are subject to risk.
Portfolio Manager Paul M. Drury has a B.A. from Suffolk University. He has been in the investment industry since he joined Putnam in 1989.
In addition to Paul, your fund’s portfolio managers are Susan A. McCormack, CFA, and Thalia Meehan, CFA.
IN THE NEWS
How can an increase in the unemployment rate — to 5.7% in January 2015 from 5.6% in December 2014 — mean good news? The answer: More than one million people entered the workforce in January — which includes those actively seeking work. This is good news because it appeared that many people had abandoned looking for a job altogether in the wake of the Great Recession. That’s changing. The labor participation rate ticked up to 62.9% in January from 62.7% in December, according to the Bureau of Labor Statistics (BLS). Many believe that, for the economic recovery to continue, more people who have been sitting on the sidelines will need to reenter the labor market, even though they may not land a job right away. The BLS also noted that 257,000 jobs were added in January, slightly above expectations. More importantly, figures from previous months were revised higher: There were 329,000 additional jobs in December and an even more impressive 423,000 jobs in November. The BLS also reported a gain in average hourly earnings, which rose 0.5% in January after declining slightly in December. Wage growth might be luring people back to the workforce, particularly within lower-paying industries such as retail.
10 Tax-Free High Yield Fund
Your fund’s performance |
This section shows your fund’s performance, price, and distribution information for periods ended January 31, 2015, the end of the first half of its current fiscal year. In accordance with regulatory requirements for mutual funds, we also include performance information as of the most recent calendar quarter-end and expense information taken from the fund’s current prospectus. Performance should always be considered in light of a fund’s investment strategy. Data represent past performance. Past performance does not guarantee future results. More recent returns may be less or more than those shown. Investment return and principal value will fluctuate, and you may have a gain or a loss when you sell your shares. Performance information does not reflect any deduction for taxes a shareholder may owe on fund distributions or on the redemption of fund shares. For the most recent month-end performance, please visit the Individual Investors section at putnam.com or call Putnam at 1-800-225-1581. Class Y shares are not available to all investors. See the Terms and Definitions section in this report for definitions of the share classes offered by your fund. |
Fund performance Total return for periods ended 1/31/15
Class A | Class B | Class C | Class M | Class Y | |||||
(inception dates) | (9/20/93) | (9/9/85) | (2/1/99) | (12/29/94) | (1/2/08) | ||||
Before | After | Before | After | Before | After | Before | After | Net | |
Annual average | |||||||||
(life of fund) | 6.30% | 6.16% | 6.30% | 6.30% | 5.47% | 5.47% | 6.06% | 5.94% | 6.07% |
10 years | 63.70 | 57.15 | 55.66 | 55.66 | 51.68 | 51.68 | 59.28 | 54.10 | 63.78 |
Annual average | 5.05 | 4.62 | 4.52 | 4.52 | 4.25 | 4.25 | 4.77 | 4.42 | 5.06 |
5 years | 42.52 | 36.82 | 38.12 | 36.12 | 37.19 | 37.19 | 40.63 | 36.06 | 44.31 |
Annual average | 7.34 | 6.47 | 6.67 | 6.36 | 6.53 | 6.53 | 7.06 | 6.35 | 7.61 |
3 years | 19.85 | 15.06 | 17.62 | 14.62 | 17.18 | 17.18 | 18.90 | 15.04 | 20.73 |
Annual average | 6.22 | 4.79 | 5.56 | 4.65 | 5.43 | 5.43 | 5.94 | 4.78 | 6.48 |
1 year | 13.07 | 8.55 | 12.26 | 7.26 | 12.18 | 11.18 | 12.77 | 9.11 | 13.29 |
6 months | 6.38 | 2.13 | 6.04 | 1.04 | 6.04 | 5.04 | 6.24 | 2.79 | 6.48 |
Current performance may be lower or higher than the quoted past performance, which cannot guarantee future results. After-sales-charge returns for class A and M shares reflect the deduction of the maximum 4.00% and 3.25% sales charge, respectively, levied at the time of purchase. Class B share returns after contingent deferred sales charge (CDSC) reflect the applicable CDSC, which is 5% in the first year, declining over time to 1% in the sixth year, and is eliminated thereafter. Class C share returns after CDSC reflect a 1% CDSC for the first year that is eliminated thereafter. Class Y shares have no initial sales charge or CDSC. Performance for class A, C, M, and Y shares before their inception is derived from the historical performance of class B shares, adjusted for the applicable sales charge (or CDSC) and, for class C shares, the higher operating expenses for such shares.
For a portion of the periods, the fund had expense limitations, without which returns would have been lower.
Class B share performance reflects conversion to class A shares after eight years.
Tax-Free High Yield Fund 11
Comparative index returns For periods ended 1/31/15
Barclay’s Municipal Bond Index | Lipper High Yield Municipal Debt Funds category average* | |
Annual average (life of fund) | 6.92% | 6.44% |
10 years | 60.17 | 52.57 |
Annual average | 4.82 | 4.28 |
5 years | 30.20 | 40.36 |
Annual average | 5.42 | 7.00 |
3 years | 12.87 | 20.47 |
Annual average | 4.12 | 6.39 |
1 year | 8.86 | 13.37 |
6 months | 4.52 | 6.36 |
Index and Lipper results should be compared with fund performance before sales charge, before CDSC, or at net asset value.
* Over the 6-month, 1-year, 3-year, 5-year, 10-year, and life-of-fund periods ended 1/31/15, there were 145, 137, 112, 101, 64, and 4 funds, respectively, in this Lipper category.
Fund performance as of most recent calendar quarter
Total return for periods ended 12/31/14
Class A | Class B | Class C | Class M | Class Y | |||||
(inception dates) | (9/20/93) | (9/9/85) | (2/1/99) | (12/29/94) | (1/2/08) | ||||
Before | After | Before | After | Before | After | Before | After | Net | |
Annual average | |||||||||
(life of fund) | 6.24% | 6.10% | 6.24% | 6.24% | 5.40% | 5.40% | 6.00% | 5.88% | 6.01% |
10 years | 62.12 | 55.63 | 54.16 | 54.16 | 50.10 | 50.10 | 57.74 | 52.61 | 62.09 |
Annual average | 4.95 | 4.52 | 4.42 | 4.42 | 4.14 | 4.14 | 4.66 | 4.32 | 4.95 |
5 years | 41.38 | 35.73 | 37.02 | 35.02 | 36.11 | 36.11 | 39.51 | 34.98 | 43.17 |
Annual average | 7.17 | 6.30 | 6.50 | 6.19 | 6.36 | 6.36 | 6.89 | 6.18 | 7.44 |
3 years | 21.56 | 16.70 | 19.29 | 16.29 | 18.75 | 18.75 | 20.59 | 16.67 | 22.44 |
Annual average | 6.72 | 5.28 | 6.06 | 5.16 | 5.90 | 5.90 | 6.44 | 5.27 | 6.98 |
1 year | 13.71 | 9.16 | 12.98 | 7.98 | 12.81 | 11.81 | 13.40 | 9.72 | 13.92 |
6 months | 4.49 | 0.31 | 4.16 | –0.84 | 3.99 | 2.99 | 4.35 | 0.96 | 4.60 |
See the discussion following the fund performance table on page 11 for information about the calculation of fund performance.
12 Tax-Free High Yield Fund
Fund price and distribution information For the six-month period ended 1/31/15
Distributions | Class A | Class B | Class C | Class M | Class Y | ||
Number | 6 | 6 | 6 | 6 | 6 | ||
Income 1 | $0.283825 | $0.245086 | $0.235664 | $0.267107 | $0.298377 | ||
Capital gains 2 | — | — | — | — | — | ||
Total | $0.283825 | $0.245086 | $0.235664 | $0.267107 | $0.298377 | ||
Share value | Before | After | Net | Net | Before | After | Net |
7/31/14 | $12.27 | $12.78 | $12.29 | $12.29 | $12.27 | $12.68 | $12.31 |
1/31/15 | 12.76 | 13.29 | 12.78 | 12.79 | 12.76 | 13.19 | 12.80 |
Current rate (end of period) | Before | After | Net | Net | Before | After | Net |
Current dividend rate 3 | 3.99% | 3.83% | 3.37% | 3.22% | 3.72% | 3.60% | 4.21% |
Taxable equivalent 4 | 7.05% | 6.77% | 5.95% | 5.69% | 6.57% | 6.36% | 7.44% |
Current 30-day SEC yield (with expense limitation) 5 | N/A | 2.72 | 2.22 | 2.07 | N/A | 2.48 | 3.06 |
Taxable equivalent 4 | N/A | 4.81 | 3.92 | 3.66 | N/A | 4.38 | 5.41 |
The classification of distributions, if any, is an estimate. Before-sales-charge share value and current dividend rate for class A and M shares, if applicable, do not take into account any sales charge levied at the time of purchase. After-sales-charge share value, current dividend rate, and current 30-day SEC yield, if applicable, are calculated assuming that the maximum sales charge (4.00% for class A shares and 3.25% for class M shares) was levied at the time of purchase. Final distribution information will appear on your year-end tax forms.
1For some investors, investment income may be subject to the federal alternative minimum tax.
2Capital gains, if any, are taxable for federal and, in most cases, state purposes.
3Most recent distribution, including any return of capital and excluding capital gains, annualized and divided by share price before or after sales charge at period-end.
4Assumes maximum 43.40% federal tax rate for 2015. Results for investors subject to lower tax rates would not be as advantageous.
5Based only on investment income and calculated using the maximum offering price for each share class, in accordance with SEC guidelines.
Tax-Free High Yield Fund 13
Your fund’s expenses |
As a mutual fund investor, you pay ongoing expenses, such as management fees, distribution fees (12b-1 fees), and other expenses. Using the following information, you can estimate how these expenses affect your investment and compare them with the expenses of other funds. You may also pay one-time transaction expenses, including sales charges (loads) and redemption fees, which are not shown in this section and would have resulted in higher total expenses. For more information, see your fund’s prospectus or talk to your financial representative. |
Expense ratios
Class A | Class B | Class C | Class M | Class Y | |
Total annual operating expenses for the fiscal year ended 7/31/14 | 0.80% | 1.42% | 1.57% | 1.07% | 0.57% |
Annualized expense ratio for the six-month period ended 1/31/15 | 0.79% | 1.41% | 1.56% | 1.06% | 0.56% |
Fiscal-year expense information in this table is taken from the most recent prospectus, is subject to change, and may differ from that shown for the annualized expense ratio and in the financial highlights of this report.
Expenses are shown as a percentage of average net assets.
Expenses per $1,000
The following table shows the expenses you would have paid on a $1,000 investment in the fund from August 1, 2014, to January 31, 2015. It also shows how much a $1,000 investment would be worth at the close of the period, assuming actual returns and expenses.
Class A | Class B | Class C | Class M | Class Y | |
Expenses paid per $1,000*† | $4.11 | $7.32 | $8.10 | $5.51 | $2.91 |
Ending value (after expenses) | $1,063.80 | $1,060.40 | $1,060.40 | $1,062.40 | $1,064.80 |
* Expenses for each share class are calculated using the fund’s annualized expense ratio for each class, which represents the ongoing expenses as a percentage of average net assets for the six months ended 1/31/15. The expense ratio may differ for each share class.
† Expenses are calculated by multiplying the expense ratio by the average account value for the period; then multiplying the result by the number of days in the period; and then dividing that result by the number of days in the year.
14 Tax-Free High Yield Fund
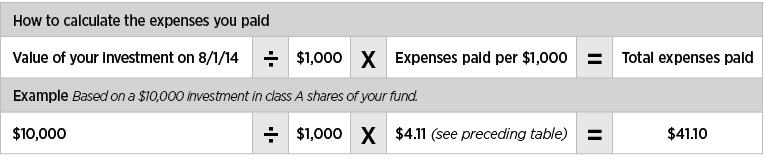
Estimate the expenses you paid |
To estimate the ongoing expenses you paid for the six months ended January 31, 2015, use the following calculation method. To find the value of your investment on August 1, 2014, call Putnam at 1-800-225-1581. |
|
Compare expenses using the SEC’s method
The Securities and Exchange Commission (SEC) has established guidelines to help investors assess fund expenses. Per these guidelines, the following table shows your fund’s expenses based on a $1,000 investment, assuming a hypothetical 5% annualized return. You can use this information to compare the ongoing expenses (but not transaction expenses or total costs) of investing in the fund with those of other funds. All mutual fund shareholder reports will provide this information to help you make this comparison. Please note that you cannot use this information to estimate your actual ending account balance and expenses paid during the period.
Class A | Class B | Class C | Class M | Class Y | |
Expenses paid per $1,000*† | $4.02 | $7.17 | $7.93 | $5.40 | $2.85 |
Ending value (after expenses) | $1,021.22 | $1,018.10 | $1,017.34 | $1,019.86 | $1,022.38 |
* Expenses for each share class are calculated using the fund’s annualized expense ratio for each class, which represents the ongoing expenses as a percentage of average net assets for the six months ended 1/31/15. The expense ratio may differ for each share class.
† Expenses are calculated by multiplying the expense ratio by the average account value for the six-month period; then multiplying the result by the number of days in the six-month period; and then dividing that result by the number of days in the year.
Tax-Free High Yield Fund 15
Terms and definitions
Important terms
Total return shows how the value of the fund’s shares changed over time, assuming you held the shares through the entire period and reinvested all distributions in the fund.
Before sales charge, or net asset value, is the price, or value, of one share of a mutual fund, without a sales charge. Before-sales-charge figures fluctuate with market conditions, and are calculated by dividing the net assets of each class of shares by the number of outstanding shares in the class.
After sales charge is the price of a mutual fund share plus the maximum sales charge levied at the time of purchase. After-sales-charge performance figures shown here assume the 4.00% maximum sales charge for class A shares and 3.25% for class M shares.
Contingent deferred sales charge (CDSC) is generally a charge applied at the time of the redemption of class B or C shares and assumes redemption at the end of the period. Your fund’s class B CDSC declines over time from a 5% maximum during the first year to 1% during the sixth year. After the sixth year, the CDSC no longer applies. The CDSC for class C shares is 1% for one year after purchase.
Share classes
Class A shares are generally subject to an initial sales charge and no CDSC (except on certain redemptions of shares bought without an initial sales charge).
Class B shares are not subject to an initial sales charge and may be subject to a CDSC.
Class C shares are not subject to an initial sales charge and are subject to a CDSC only if the shares are redeemed during the first year.
Class M shares have a lower initial sales charge and a higher 12b-1 fee than class A shares and no CDSC.
Class Y shares are not subject to an initial sales charge or CDSC, and carry no 12b-1 fee. They are generally only available to corporate and institutional clients and clients in other approved programs.
Fixed-income terms
Current rate is the annual rate of return earned from dividends or interest of an investment. Current rate is expressed as a percentage of the price of a security, fund share, or principal investment.
Yield curve is a graph that plots the yields of bonds with equal credit quality against their differing maturity dates, ranging from shortest to longest. It is used as a benchmark for other debt, such as mortgage or bank lending rates.
Comparative indexes
Barclays Municipal Bond Index is an unmanaged index of long-term fixed-rate investment-grade tax-exempt bonds.
Barclays U.S. Aggregate Bond Index is an unmanaged index of U.S. investment-grade fixed-income securities.
BofA Merrill Lynch U.S. 3-Month Treasury Bill Index is an unmanaged index that seeks to measure the performance of U.S. Treasury bills available in the marketplace.
S&P 500 Index is an unmanaged index of common stock performance.
Indexes assume reinvestment of all distributions and do not account for fees. Securities and performance of a fund and an index will differ. You cannot invest directly in an index.
Lipper is a third-party industry-ranking entity that ranks mutual funds. Its rankings do not reflect sales charges. Lipper rankings are based on total return at net asset value relative to other funds that have similar current investment styles or objectives as determined by Lipper. Lipper may change a fund’s category assignment at its discretion. Lipper category averages reflect performance trends for funds within a category.
16 Tax-Free High Yield Fund
Other information for shareholders
Important notice regarding delivery of shareholder documents
In accordance with Securities and Exchange Commission (SEC) regulations, Putnam sends a single copy of annual and semiannual shareholder reports, prospectuses, and proxy statements to Putnam shareholders who share the same address, unless a shareholder requests otherwise. If you prefer to receive your own copy of these documents, please call Putnam at 1-800-225-1581, and Putnam will begin sending individual copies within 30 days.
Proxy voting
Putnam is committed to managing our mutual funds in the best interests of our shareholders. The Putnam funds’ proxy voting guidelines and procedures, as well as information regarding how your fund voted proxies relating to portfolio securities during the 12-month period ended June 30, 2014, are available in the Individual Investors section of putnam.com, and on the SEC’s website, www.sec.gov. If you have questions about finding forms on the SEC’s website, you may call the SEC at 1-800-SEC-0330. You may also obtain the Putnam funds’ proxy voting guidelines and procedures at no charge by calling Putnam’s Shareholder Services at 1-800-225-1581.
Fund portfolio holdings
The fund will file a complete schedule of its portfolio holdings with the SEC for the first and third quarters of each fiscal year on Form N-Q. Shareholders may obtain the fund’s Form N-Q on the SEC’s website at www.sec.gov. In addition, the fund’s Form N-Q may be reviewed and copied at the SEC’s Public Reference Room in Washington, D.C. You may call the SEC at 1-800-SEC-0330 for information about the SEC’s website or the operation of the Public Reference Room.
Trustee and employee fund ownership
Putnam employees and members of the Board of Trustees place their faith, confidence, and, most importantly, investment dollars in Putnam mutual funds. As of January 31, 2015, Putnam employees had approximately $470,000,000 and the Trustees had approximately $138,000,000 invested in Putnam mutual funds. These amounts include investments by the Trustees’ and employees’ immediate family members as well as investments through retirement and deferred compensation plans.
Tax-Free High Yield Fund 17
Financial statements
A guide to financial statements
These sections of the report, as well as the accompanying Notes, constitute the fund’s financial statements.
The fund’s portfolio lists all the fund’s investments and their values as of the last day of the reporting period. Holdings are organized by asset type and industry sector, country, or state to show areas of concentration and diversification.
Statement of assets and liabilities shows how the fund’s net assets and share price are determined. All investment and non-investment assets are added together. Any unpaid expenses and other liabilities are subtracted from this total. The result is divided by the number of shares to determine the net asset value per share, which is calculated separately for each class of shares. (For funds with preferred shares, the amount subtracted from total assets includes the liquidation preference of preferred shares.)
Statement of operations shows the fund’s net investment gain or loss. This is done by first adding up all the fund’s earnings — from dividends and interest income — and subtracting its operating expenses to determine net investment income (or loss). Then, any net gain or loss the fund realized on the sales of its holdings — as well as any unrealized gains or losses over the period — is added to or subtracted from the net investment result to determine the fund’s net gain or loss for the fiscal period.
Statement of changes in net assets shows how the fund’s net assets were affected by the fund’s net investment gain or loss, by distributions to shareholders, and by changes in the number of the fund’s shares. It lists distributions and their sources (net investment income or realized capital gains) over the current reporting period and the most recent fiscal year-end. The distributions listed here may not match the sources listed in the Statement of operations because the distributions are determined on a tax basis and may be paid in a different period from the one in which they were earned. Dividend sources are estimated at the time of declaration. Actual results may vary. Any non-taxable return of capital cannot be determined until final tax calculations are completed after the end of the fund’s fiscal year.
Financial highlights provide an overview of the fund’s investment results, per-share distributions, expense ratios, net investment income ratios, and portfolio turnover in one summary table, reflecting the five most recent reporting periods. In a semiannual report, the highlights table also includes the current reporting period.
18 Tax-Free High Yield Fund
The fund’s portfolio 1/31/15 (Unaudited)
Key to holding’s abbreviations |
ABAG Association Of Bay Area Governments
AGM Assured Guaranty Municipal Corporation
AGO Assured Guaranty, Ltd.
AMBAC AMBAC Indemnity Corporation
Cmnwlth. of PR Gtd. Commonwealth of
Puerto Rico Guaranteed
COP Certificates of Participation
FRB Floating Rate Bonds: the rate shown is the current interest rate at the close of the reporting period
G.O. Bonds General Obligation Bonds
NATL National Public Finance Guarantee Corp.
Radian Insd. Radian Group Insured
VRDN Variable Rate Demand Notes, which are floating-rate securities with long-term maturities that carry coupons that reset and are payable upon demand either daily, weekly or monthly. The rate shown is the current interest rate at the close of the reporting period.
MUNICIPAL BONDS AND NOTES (98.6%)* | Rating** | Principal | Value | ||
Alabama (1.6%) | |||||
Cullman Cnty., Hlth. Care Auth. Rev. Bonds (Cullman Regl. Med. Ctr.), Ser. A, 7s, 2/1/36 | Ba1 | $2,300,000 | $2,521,122 | ||
Jefferson Cnty., Swr. Rev. Bonds | |||||
Ser. D, 6 1/2s, 10/1/53 | BBB– | 3,000,000 | 3,504,270 | ||
zero %, 10/1/46 | BBB– | 8,800,000 | 5,737,512 | ||
Selma, Indl. Dev. Board Rev. Bonds (Gulf Opportunity Zone Intl. Paper Co.), Ser. A | |||||
6 1/4s, 11/1/33 | BBB | 3,000,000 | 3,513,120 | ||
5.8s, 5/1/34 | Baa2 | 1,750,000 | 2,017,120 | ||
17,293,144 | |||||
Arizona (2.9%) | |||||
Casa Grande, Indl. Dev. Auth. Rev. Bonds (Casa Grande Regl. Med. Ctr.) | |||||
Ser. A, 7 5/8s, 12/1/29 F | D/P | 5,575,000 | 16,664 | ||
7 1/4s, 12/1/19 F | D/P | 500,000 | 1,495 | ||
Coconino Cnty., Poll. Control Rev. Bonds (Tucson Elec. Pwr. Co. — Navajo), Ser. A, 5 1/8s, 10/1/32 | Baa1 | 4,000,000 | 4,485,080 | ||
Glendale, Indl. Dev. Auth. Rev. Bonds (John C. Lincoln Hlth. Network), 5s, 12/1/42 (Prerefunded 12/1/17) | AAA/P | 1,100,000 | 1,232,726 | ||
Maricopa Cnty., Poll. Control Rev. Bonds (El Paso Elec. Co.), Ser. A, 7 1/4s, 2/1/40 | Baa1 | 4,800,000 | 5,655,024 | ||
Phoenix, Indl. Dev. Auth. Ed. Rev. Bonds | |||||
(Great Hearts Academies Project), 6.3s, 7/1/42 | BB/F | 430,000 | 454,514 | ||
(Great Hearts Academies), 6s, 7/1/32 | BB/F | 300,000 | 324,972 | ||
(Choice Academies, Inc.), 5 3/8s, 9/1/32 | BB+ | 2,000,000 | 2,100,740 | ||
(Great Hearts Academies), 5s, 7/1/44 | BB+ | 3,950,000 | 4,118,467 | ||
Pima Cnty., Indl. Dev. Auth. Rev. Bonds (Horizon Cmnty. Learning Ctr.) | |||||
5 1/4s, 6/1/35 | BBB | 1,395,000 | 1,396,995 | ||
5.05s, 6/1/25 | BBB | 2,450,000 | 2,453,283 | ||
Salt Verde, Fin. Corp. Gas Rev. Bonds | |||||
5 1/2s, 12/1/29 | A– | 1,525,000 | 1,903,535 | ||
5s, 12/1/37 | A– | 1,430,000 | 1,729,685 | ||
5s, 12/1/32 | A– | 1,500,000 | 1,798,650 |
Tax-Free High Yield Fund 19
MUNICIPAL BONDS AND NOTES (98.6%)* cont. | Rating** | Principal | Value | ||
Arizona cont. | |||||
Tempe, Indl. Dev. Auth. Rev. Bonds (Friendship Village), Ser. A, 6s, 12/1/32 | BB–/P | $1,350,000 | $1,481,895 | ||
Yavapai Cnty., Indl. Dev. Ed. Auth. Rev. Bonds (Agribusiness & Equine Ctr.), 5s, 3/1/32 | BB+ | 1,600,000 | 1,649,776 | ||
30,803,501 | |||||
Arkansas (0.2%) | |||||
Arkadelphia, Pub. Ed. Fac. Board Rev. Bonds (Ouachita Baptist U.), 6s, 3/1/33 | BB+/P | 2,000,000 | 2,105,120 | ||
2,105,120 | |||||
California (13.1%) | |||||
ABAG Fin. Auth. for Nonprofit Corps. Rev. Bonds (Episcopal Sr. Cmntys.), 6s, 7/1/31 | BBB+/F | 1,295,000 | 1,519,929 | ||
CA Muni. Fin. Auth. COP (Cmnty. Hosp. Central CA) | |||||
5 1/4s, 2/1/46 | Baa1 | 7,000,000 | 7,191,520 | ||
5 1/4s, 2/1/37 | Baa1 | 2,705,000 | 2,850,258 | ||
CA Muni. Fin. Auth. Rev. Bonds (Emerson College), 6s, 1/1/42 | Baa1 | 3,330,000 | 3,896,932 | ||
CA Poll. Control Fin. Auth. Solid Waste Disp. 144A Rev. Bonds (Waste Management, Inc.), Ser. A-2, 5.4s, 4/1/25 | A– | 2,000,000 | 2,032,520 | ||
CA School Fin. Auth. Rev. Bonds | |||||
(2023 Union, LLC), Ser. A, 6s, 7/1/33 | BBB– | 1,000,000 | 1,138,510 | ||
(Klare Holdings), Ser. A, 5s, 7/1/34 | BB+ | 2,075,000 | 2,197,881 | ||
CA State G.O. Bonds, 5s, 9/1/30 | Aa3 | 6,000,000 | 7,043,160 | ||
CA State Edl. Fac. Auth. Rev. Bonds (U. of La Verne), Ser. A, 5s, 6/1/35 | Baa1 | 1,000,000 | 1,008,940 | ||
CA State Muni. Fin. Auth Mobile Home Park Rev. Bonds (Caritas Affordable Hsg., Inc.), 5 1/4s, 8/15/39 | BBB | 800,000 | 911,224 | ||
CA State Muni. Fin. Auth. Charter School Rev. Bonds (Partnerships Uplift Cmnty.), Ser. A | |||||
5 1/4s, 8/1/42 | BB+ | 850,000 | 895,688 | ||
5s, 8/1/32 | BB+ | 665,000 | 706,795 | ||
CA State Poll. Control Fin. Auth. Rev. Bonds (Wtr. Furnishing), 5s, 11/21/45 | Baa3 | 5,000,000 | 5,489,000 | ||
CA State Pub. Wks. Board Rev. Bonds | |||||
Ser. A-1, 6s, 3/1/35 | A1 | 2,000,000 | 2,406,480 | ||
(States Prisons — LA), Ser. C, 5 3/4s, 10/1/31 | A1 | 1,000,000 | 1,227,760 | ||
(Judicial Council Projects), Ser. D, 5s, 12/1/31 | A1 | 1,000,000 | 1,149,170 | ||
(Capital Projects), Ser. A, 5s, 4/1/30 | A1 | 5,000,000 | 5,821,600 | ||
CA Statewide Cmnty. Dev. Auth. Rev. Bonds | |||||
(American Baptist Homes West), 6 1/4s, 10/1/39 | BBB+/F | 2,500,000 | 2,839,800 | ||
(Terraces at San Joaquin Gardens), Ser. A, 6s, 10/1/47 | BB/P | 500,000 | 543,040 | ||
(Terraces at San Joaquin Gardens), Ser. A, 6s, 10/1/42 | BB/P | 1,750,000 | 1,912,417 | ||
(Irvine, LLC-UCI East Campus), 6s, 5/15/40 | Baa2 | 6,000,000 | 6,643,200 | ||
(Terraces at San Joaquin Gardens), Ser. A, 5 5/8s, 10/1/32 | BB/P | 1,105,000 | 1,199,610 |
20 Tax-Free High Yield Fund
MUNICIPAL BONDS AND NOTES (98.6%)* cont. | Rating** | Principal | Value | ||
California cont. | |||||
CA Statewide Cmnty. Dev. Auth. Rev. Bonds | |||||
(U. CA Irvine E. Campus Apts. Phase 1), 5 3/8s, 5/15/38 | Baa2 | $1,500,000 | $1,695,150 | ||
(899 Charleston, LLC), Ser. A, 5 1/4s, 11/1/44 | BB/P | 850,000 | 872,100 | ||
(American Baptist Homes of the West), 5s, 10/1/43 | BBB+/F | 1,000,000 | 1,092,230 | ||
(Sr. Living-Presbyterian Homes), Ser. A, 4 7/8s, 11/15/36 | BBB– | 1,000,000 | 1,014,490 | ||
CA Statewide Cmnty. Dev. Auth. 144A Rev. Bonds (Front Porch Cmntys. & Svcs.), Ser. A, 5 1/8s, 4/1/37 | BBB+ | 3,300,000 | 3,393,753 | ||
Cathedral City, Impt. Board Act of 1915 Special Assmt. Bonds (Cove Impt. Dist.), Ser. 04-02 | |||||
5.05s, 9/2/35 | BB+/P | 1,760,000 | 1,765,790 | ||
5s, 9/2/30 | BB+/P | 1,685,000 | 1,691,117 | ||
Chula Vista, Cmnty. Fac. Dist. Special Tax Rev. Bonds (No. 07-I Otay Ranch Village Eleven), 5.1s, 9/1/26 | BBB–/P | 335,000 | 339,281 | ||
Foothill/Eastern Corridor Agcy. Rev. Bonds, Ser. A, 6s, 1/15/53 | BBB– | 5,145,000 | 6,164,996 | ||
Golden State Tobacco Securitization Corp. Rev. Bonds | |||||
Ser. A-1, 5 3/4s, 6/1/47 | B3 | 2,000,000 | 1,773,780 | ||
Ser. A-2, 5.3s, 6/1/37 | B3 | 12,000,000 | 10,239,480 | ||
Ser. A-1, 5 1/8s, 6/1/47 | B3 | 5,390,000 | 4,393,497 | ||
Ser. A-1, 5s, 6/1/33 | B3 | 1,950,000 | 1,684,176 | ||
La Verne, COP (Brethren Hillcrest Homes), 5s, 5/15/36 | BBB–/F | 775,000 | 843,642 | ||
Long Beach, Bond Fin. Auth. Rev. Bonds (Natural Gas Purchase), Ser. A, 5 1/2s, 11/15/37 | A– | 2,000,000 | 2,579,840 | ||
M-S-R Energy Auth. Rev. Bonds | |||||
Ser. A, 6 1/2s, 11/1/39 | A– | 1,250,000 | 1,793,250 | ||
Ser. B, 6 1/2s, 11/1/39 | A– | 2,000,000 | 2,869,200 | ||
North Natomas, Cmnty. Fac. Special Tax Bonds, Ser. D, 5s, 9/1/26 | BBB+/P | 1,070,000 | 1,083,364 | ||
Oakland, Unified School Dist. Alameda Cnty., G.O. Bonds | |||||
(Election of 2012), 6 1/4s, 8/1/30 | BBB/P | 1,500,000 | 1,820,115 | ||
(Election 2006), Ser. A, 5 1/2s, 8/1/32 | BBB/P | 1,500,000 | 1,757,610 | ||
Oakley, Pub. Fin. Auth. Special Assmt. Bonds, 5s, 9/2/31 | BBB | 1,645,000 | 1,826,443 | ||
Rancho Cordova, Cmnty. Fac. Dist. Special Tax Bonds (Sunridge Anatolia), Ser. 03-1, 5s, 9/1/37 | BB+/P | 1,000,000 | 1,054,070 | ||
Riverside Cnty., Trans. Comm. Toll Rev. Bonds, Ser. A, 5 3/4s, 6/1/44 | BBB– | 750,000 | 866,813 | ||
Sacramento, Special Tax Rev. Bonds (North Natomas Cmnty. Fac.), Ser. 97-01 | |||||
5.1s, 9/1/35 | BBB–/P | 2,500,000 | 2,501,100 | ||
5s, 9/1/29 | BBB–/P | 1,355,000 | 1,355,623 |
Tax-Free High Yield Fund 21
MUNICIPAL BONDS AND NOTES (98.6%)* cont. | Rating** | Principal | Value | ||
California cont. | |||||
San Bernardino, Cmnty. College Dist. G.O. Bonds (Election of 2008), Ser. B, zero %, 8/1/44 | Aa2 | $15,000,000 | $4,390,050 | ||
San Diego, Unified School Dist. G.O. Bonds (Election of 2008), Ser. C, zero %, 7/1/40 | Aa3 | 5,000,000 | 1,836,950 | ||
San Francisco City & Cnty. Redev. Agcy. Cmnty. Fac. Dist. Special Tax Bonds (No. 6 Mission Bay South), Ser. A, 5.15s, 8/1/35 | BB+/P | 1,000,000 | 1,003,650 | ||
San Francisco City & Cnty., Redev. Agcy. Cmnty. Successor Special Tax Bonds (No. 6 Mission Bay Pub. Impts.), Ser. C, zero %, 8/1/43 | BB+/P | 8,000,000 | 1,590,400 | ||
San Francisco, City & Cnty. Redev. Fin. Auth. Tax Alloc. Bonds (Mission Bay South Redev.), Ser. D, 6 1/2s, 8/1/31 | BBB+ | 500,000 | 579,175 | ||
San Joaquin Hills, Trans. Corridor Agcy. Toll Road Rev. Bonds, Ser. A, 5s, 1/15/34 | BBB– | 3,155,000 | 3,572,280 | ||
Santaluz, Cmnty. Facs. Dist. No. 2 Special Tax Bonds (Impt. Area No. 1), Ser. A | |||||
5s, 9/1/29 (Prerefunded 9/1/21) | BBB+ | 985,000 | 1,114,291 | ||
5s, 9/1/28 (Prerefunded 9/1/21) | BBB+ | 990,000 | 1,123,759 | ||
Selma, Unified School Dist. G.O. Bonds (Election of 2006), Ser. C, AGO, zero %, 8/1/37 | AA | 2,400,000 | 882,120 | ||
Southern CA Pub. Pwr. Auth. Rev. Bonds (Natural Gas), Ser. A, 5 1/4s, 11/1/21 | A– | 1,500,000 | 1,757,445 | ||
Sunnyvale, Special Tax Rev. Bonds (Cmnty. Fac. Dist. No. 1), 7 3/4s, 8/1/32 | B+/P | 3,780,000 | 3,787,598 | ||
138,734,062 | |||||
Colorado (3.3%) | |||||
Central Platte Valley, Metro. Dist. G.O. Bonds, 5s, 12/1/43 | BB+ | 850,000 | 896,453 | ||
CO Pub. Hwy. Auth. Rev. Bonds | |||||
(E-470), zero %, 9/1/41 | Baa2 | 1,000,000 | 354,560 | ||
Ser. A, NATL, zero %, 9/1/28 | AA– | 5,000,000 | 3,159,550 | ||
CO State Hlth. Fac. Auth. Rev. Bonds | |||||
(Christian Living Cmnty.), 6 3/8s, 1/1/41 | BB–/P | 810,000 | 876,307 | ||
(Total Longterm Care National), Ser. A, 6 1/4s, 11/15/40 | BBB+/F | 800,000 | 895,080 | ||
(Christian Living Cmntys.), Ser. A, 5 3/4s, 1/1/26 | BB–/P | 2,850,000 | 2,944,363 | ||
(Evangelical Lutheran Good Samaritan Society), 5 5/8s, 6/1/43 | A3 | 650,000 | 756,113 | ||
(Evangelical Lutheran Good Samaritan Society), 5 1/2s, 6/1/33 | A3 | 200,000 | 238,370 | ||
(Valley View Assn.), 5 1/4s, 5/15/42 | A– | 3,025,000 | 3,258,500 | ||
(Christian Living Cmntys.), 5 1/4s, 1/1/37 | BB–/P | 750,000 | 786,683 | ||
(Valley View Assn.), 5 1/8s, 5/15/37 | A– | 1,000,000 | 1,074,870 | ||
(Christian Living Cmntys.), 5 1/8s, 1/1/30 | BB–/P | 1,415,000 | 1,495,330 | ||
(Covenant Retirement Cmnty.), Ser. A, 5s, 12/1/33 | BBB– | 2,100,000 | 2,257,311 | ||
(Evangelical Lutheran Good Samaritan Society), 5s, 12/1/33 | A3 | 5,250,000 | 5,902,627 |
22 Tax-Free High Yield Fund
MUNICIPAL BONDS AND NOTES (98.6%)* cont. | Rating** | Principal | Value | ||
Colorado cont. | |||||
E-470 CO Pub. Hwy. Auth. Rev. Bonds, Ser. A, NATL, zero %, 9/1/34 | AA– | $12,000,000 | $5,809,920 | ||
Plaza, Tax Assoc. Bonds (Metro. Dist. No. 1), 5s, 12/1/40 | BB/P | 3,850,000 | 4,093,512 | ||
34,799,549 | |||||
Delaware (1.3%) | |||||
DE State Econ. Dev. Auth. Rev. Bonds | |||||
(Delmarva Pwr.), 5.4s, 2/1/31 | Baa1 | 1,700,000 | 1,936,538 | ||
(Indian River Pwr.), 5 3/8s, 10/1/45 | Baa3 | 5,000,000 | 5,509,600 | ||
DE State Hlth. Facs. Auth. VRDN (Christiana Care), Ser. A, 0.03s, 10/1/38 | VMIG1 | 6,135,000 | 6,135,000 | ||
13,581,138 | |||||
District of Columbia (1.8%) | |||||
DC Rev. Bonds | |||||
(Howard U.), Ser. A, 6 1/2s, 10/1/41 | BBB+ | 6,000,000 | 7,014,420 | ||
(Kipp Charter School), 6s, 7/1/33 | BBB+ | 1,000,000 | 1,183,100 | ||
Metro. Washington, Arpt. Auth. Dulles Toll Rd. Rev. Bonds | |||||
(Dulles Metrorail), 5s, 10/1/53 | Baa1 | 3,000,000 | 3,304,590 | ||
(2nd Sr. Lien), Ser. B, zero %, 10/1/40 | Baa1 | 995,000 | 322,460 | ||
(2nd Sr. Lien), Ser. B, zero %, 10/1/38 | Baa1 | 20,000,000 | 7,109,400 | ||
18,933,970 | |||||
Florida (5.8%) | |||||
Capital Trust Agcy Rev. Bonds (Faulk Sr. Svcs., LLC), 6 3/4s, 12/1/44 | B–/P | 335,000 | 342,923 | ||
Escambia Cnty., Env. Impt. Rev. Bonds (Intl. Paper Co.), Ser. A, 5s, 8/1/26 | Baa2 | 1,500,000 | 1,501,380 | ||
Fishhawk, CCD IV Special Assmt. Bonds, 7 1/4s, 5/1/43 | B/P | 600,000 | 661,758 | ||
Greater Orlando Aviation Auth. Rev. Bonds (JetBlue Airways Corp.), 5s, 11/15/36 | B/P | 1,000,000 | 1,024,450 | ||
Heritage Harbour Marketplace Cmnty., Dev. Dist. Special Assmt. Bonds, 5.6s, 5/1/36 | B–/P | 2,180,000 | 2,096,070 | ||
Jacksonville, Econ. Dev. Comm. Hlth. Care Fac. Rev. Bonds (FL Proton Therapy Inst.), Ser. A, 6s, 9/1/17 | BB–/P | 440,000 | 473,823 | ||
Jacksonville, Econ. Dev. Comm. Indl. Dev. Rev. Bonds (Gerdau Ameristeel US, Inc.), 5.3s, 5/1/37 | Baa3 | 5,250,000 | 5,251,365 | ||
Lakeland, Hosp. Syst. Rev. Bonds (Lakeland Regl. Hlth.), 5s, 11/15/40 ## | A2 | 3,250,000 | 3,734,867 | ||
Lakeland, Retirement Cmnty. 144A Rev. Bonds (1st Mtge. — Carpenters), 6 3/8s, 1/1/43 | BBB–/F | 1,820,000 | 1,957,519 | ||
Lakewood Ranch, Stewardship Dist. Special Assmt. Bonds, 4 7/8s, 5/1/35 | BB–/P | 1,000,000 | 1,001,130 | ||
Lee Cnty., Indl. Dev. Auth. Hlth. Care Fac. Rev. Bonds | |||||
(Shell Pt./Alliance Oblig. Group), 5 1/8s, 11/15/36 | BB+ | 4,925,000 | 5,082,403 | ||
(Shell Pt./Alliance), 5s, 11/15/32 | BB+ | 3,210,000 | 3,308,515 | ||
Martin Cnty., Rev. Bonds (Indiantown Cogeneration), 4.2s, 12/15/25 | Ba1 | 1,000,000 | 1,032,940 |
Tax-Free High Yield Fund 23
MUNICIPAL BONDS AND NOTES (98.6%)* cont. | Rating** | Principal | Value | ||
Florida cont. | |||||
Miami-Dade Cnty., Aviation Rev. Bonds, Ser. B, 5s, 10/1/41 | A2 | $4,500,000 | $4,969,935 | ||
Miami-Dade Cnty., Indl. Dev. Auth. Rev. Bonds (Pinecrest Academy, Inc.), 5s, 9/15/34 | BBB– | 1,750,000 | 1,851,202 | ||
Middle Village Cmnty. Dev. Dist. Special Assmt. Bonds, Ser. A, 6s, 5/1/35 | D/P | 1,860,000 | 1,646,695 | ||
Midtown Miami Cmnty. Dev. Dist. Special Assmt. Bonds (Garage), Ser. A, 5s, 5/1/29 | BB–/P | 750,000 | 829,335 | ||
Myrtle Creek, Impt. Dist. Special Assmt. Bonds, Ser. A, 5.2s, 5/1/37 | B+/P | 1,840,000 | 1,864,601 | ||
Orlando Cmnty. Redev. Agcy. Tax Alloc. Bonds (Republic Drive/Universal), 5s, 4/1/24 | A–/F | 2,760,000 | 3,053,719 | ||
Palm Beach Cnty., Hlth. Fac. Auth. Rev. Bonds (Acts Retirement-Life Cmnty.), 5 1/2s, 11/15/33 | BBB+ | 6,000,000 | 6,709,260 | ||
Palm Coast Pk. Cmnty. Dev. Dist. Special Assmt. Bonds, 5.7s, 5/1/37 | B–/P | 2,410,000 | 2,004,783 | ||
Sarasota Cnty., Hlth. Fac. Auth. Retirement Fac. Rev. Bonds (Village On The Isle), 5 1/2s, 1/1/27 | BBB+/F | 1,950,000 | 2,084,179 | ||
Southeast Overtown Park West Cmnty. Redev. Agcy. 144A Tax Allocation Bonds, Ser. A-1, 5s, 3/1/30 | BBB+ | 1,440,000 | 1,633,003 | ||
Town Ctr. at Palm Coast, Cmnty. Dev. Dist. Special Assmt. Bonds, 6s, 5/1/36 | B–/P | 1,700,000 | 1,659,965 | ||
Verandah, West Cmnty. Dev. Dist. Special Assmt. Bonds (Cap. Impt.), 5s, 5/1/33 | BB–/P | 1,000,000 | 1,040,330 | ||
Village Cmnty. Dev. Dist. No. 11 Special Assessment Bonds, 4 1/2s, 5/1/45 | BB–/P | 1,500,000 | 1,527,840 | ||
Village Cmnty. Dev. Dist. No. 8 Special Assmt. Bonds (Phase II), 6 1/8s, 5/1/39 | BB/P | 825,000 | 953,469 | ||
Village Cmnty. Dev. Dist. No. 9 Special Assmt. Bonds, 5s, 5/1/22 | BB/P | 655,000 | 697,287 | ||
Village Community Development District No. 10 Special Assmt. Bonds, 5 3/4s, 5/1/31 | BB/P | 1,200,000 | 1,405,848 | ||
61,400,594 | |||||
Georgia (2.6%) | |||||
Atlanta, Arpt. Passenger Fac. Charge Rev. Bonds | |||||
5s, 1/1/32 | A1 | 1,150,000 | 1,367,178 | ||
5s, 1/1/31 | A1 | 1,925,000 | 2,296,987 | ||
Atlanta, Wtr. & Waste Wtr. Rev. Bonds, Ser. A, 6 1/4s, 11/1/39 | Aa3 | 5,000,000 | 6,152,550 | ||
Clayton Cnty., Dev. Auth. Special Fac. Rev. Bonds (Delta Airlines) | |||||
Ser. B, 9s, 6/1/35 | BB– | 3,935,000 | 4,014,841 | ||
Ser. A, 8 3/4s, 6/1/29 | BB– | 2,000,000 | 2,512,560 | ||
GA State Private College & U. Auth. Rev. Bonds (Mercer U.), Ser. A, 5s, 10/1/32 | Baa2 | 1,100,000 | 1,222,023 | ||
Gainesville & Hall Cnty., Devauth Retirement Cmnty. Rev. Bonds (Acts Retirement-Life Cmnty.), Ser. A-2, 6 5/8s, 11/15/39 | BBB+ | 1,200,000 | 1,389,996 | ||
Main St. Natural Gas, Inc. Rev. Bonds (GA Gas), Ser. A, 5 1/2s, 9/15/21 | A– | 1,255,000 | 1,496,663 |
24 Tax-Free High Yield Fund
MUNICIPAL BONDS AND NOTES (98.6%)* cont. | Rating** | Principal | Value | ||
Georgia cont. | |||||
Marietta, Dev. Auth. Rev. Bonds (U. Fac. — Life U., Inc.), 7s, 6/15/39 | Ba3 | $3,150,000 | $3,375,792 | ||
Med. Ctr. Hosp. Auth. Rev. Bonds (Spring Harbor Green Island), 5 1/4s, 7/1/27 | BB–/P | 2,375,000 | 2,429,815 | ||
Rockdale Cnty., Dev. Auth. Rev. Bonds (Visy Paper), Ser. A, 6 1/8s, 1/1/34 | BB/P | 1,400,000 | 1,434,244 | ||
27,692,649 | |||||
Guam (0.2%) | |||||
Territory of GU, Rev. Bonds, Ser. A, 5 3/8s, 12/1/24 | BBB+ | 1,000,000 | 1,126,430 | ||
Territory of GU, Dept. of Ed. COP (John F. Kennedy High School), Ser. A, 6 7/8s, 12/1/40 | B+ | 500,000 | 566,285 | ||
1,692,715 | |||||
Hawaii (1.0%) | |||||
HI State Dept. Budget & Fin. Rev. Bonds | |||||
(Craigside), Ser. A, 9s, 11/15/44 | B/P | 1,350,000 | 1,707,453 | ||
(Hawaiian Elec. Co. — Subsidiary), 6 1/2s, 7/1/39 | Baa1 | 7,000,000 | 8,228,850 | ||
(Kahala Nui), 5 1/8s, 11/15/32 | BBB/F | 1,050,000 | 1,161,510 | ||
11,097,813 | |||||
Illinois (5.6%) | |||||
Chicago, G.O. Bonds, Ser. A | |||||
5s, 1/1/36 | A+ | 1,000,000 | 1,066,560 | ||
5s, 1/1/34 | A+ | 3,100,000 | 3,327,881 | ||
Chicago, Special Assmt. Bonds (Lake Shore East), 6 3/4s, 12/1/32 | BB/P | 5,044,000 | 5,054,744 | ||
Chicago, Motor Fuel Tax Rev. Bonds | |||||
AGM, 5s, 1/1/30 | AA+ | 200,000 | 232,078 | ||
5s, 1/1/28 | AA+ | 1,000,000 | 1,141,870 | ||
Chicago, O’Hare Intl. Arpt. Rev. Bonds, Ser. A, 5 3/4s, 1/1/39 | A2 | 5,000,000 | 5,963,000 | ||
Chicago, Waste Wtr. Transmission Rev. Bonds (2nd Lien), 5s, 1/1/39 | AA– | 2,720,000 | 3,094,544 | ||
Chicago, Wtr. Wks Rev. Bonds (2nd Lien), 5s, 11/1/39 | AA– | 1,725,000 | 1,981,473 | ||
Du Page Cnty., Special Svc. Area No. 31 Special Tax Bonds (Monarch Landing), 5 5/8s, 3/1/36 | B/P | 900,000 | 907,074 | ||
IL Fin. Auth. Rev. Bonds | |||||
(Provena Hlth.), Ser. A, 7 3/4s, 8/15/34 | BBB+ | 3,500,000 | 4,402,125 | ||
(Rush U. Med. Ctr.), Ser. A, 7 1/4s, 11/1/38 (Prerefunded 11/1/18) | A1 | 2,150,000 | 2,657,443 | ||
(Silver Cross Hosp. & Med. Ctr.), 7s, 8/15/44 | BBB– | 5,250,000 | 6,191,850 | ||
(IL Rush U. Med. Ctr.), Ser. C, 6 5/8s, 11/1/39 (Prerefunded 5/1/19) | A1 | 1,425,000 | 1,761,728 | ||
(Navistar Intl. Recvy. Zone), 6 1/2s, 10/15/40 | B3 | 4,155,000 | 4,535,515 | ||
(Roosevelt U.), 6 1/2s, 4/1/39 | Baa3 | 2,000,000 | 2,200,640 | ||
(Elmhurst Memorial), Ser. A, 5 5/8s, 1/1/37 | Baa2 | 2,000,000 | 2,173,640 | ||
IL Fin. Auth. Solid Waste Disposal Rev. Bonds (Waste Mgmt., Inc.), Ser. A, 5.05s, 8/1/29 | A– | 5,045,000 | 5,195,391 | ||
IL Hlth. Fac. Auth. Rev. Bonds (Cmnty. Rehab. Providers Fac.), Ser. A, 7 7/8s, 7/1/20 | CCC/P | 366,239 | 190,444 |
Tax-Free High Yield Fund 25
MUNICIPAL BONDS AND NOTES (98.6%)* cont. | Rating** | Principal | Value | ||
Illinois cont. | |||||
IL State G.O. Bonds, 5 1/4s, 2/1/30 | A3 | $1,000,000 | $1,142,290 | ||
IL State Fin. Auth. Rev. Bonds (Rush U. Med. Ctr.), Ser. A, 5s, 11/15/33 ## | A1 | 1,500,000 | 1,772,370 | ||
IL State Sports Fac. Auth. Rev. Bonds, AGM, 5 1/4s, 6/15/32 | AA | 1,000,000 | 1,176,210 | ||
Railsplitter, Tobacco Settlement Auth. Rev. Bonds, 6s, 6/1/28 | A– | 2,150,000 | 2,576,495 | ||
58,745,365 | |||||
Indiana (1.9%) | |||||
IN State Fin. Auth. Rev. Bonds | |||||
(I-69 Dev. Partners, LLC), 5 1/4s, 9/1/34 | BBB– | 3,750,000 | 4,257,037 | ||
(OH Valley Elec. Corp.), Ser. A, 5s, 6/1/32 | Baa3 | 1,750,000 | 1,905,260 | ||
IN State Fin. Auth. VRDN, Ser. A-2, 0.03s, 2/1/37 | VMIG1 | 12,075,000 | 12,075,000 | ||
Valparaiso, Exempt Facs. Rev. Bonds (Pratt Paper, LLC), 6 3/4s, 1/1/34 | B+/P | 1,875,000 | 2,331,356 | ||
20,568,653 | |||||
Iowa (1.8%) | |||||
IA Fin. Auth. Hlth. Fac. Rev. Bonds (Dev. Care Initiatives), Ser. A | |||||
5 1/2s, 7/1/25 | BB+ | 3,185,000 | 3,293,099 | ||
5s, 7/1/20 | BB+ | 1,700,000 | 1,768,748 | ||
IA State Fin. Auth. Midwestern Disaster Rev. Bonds | |||||
(IA Fertilizer Co., LLC), 5 1/2s, 12/1/22 | BB– | 1,500,000 | 1,597,605 | ||
(IA Fertilizer Co.), 5 1/4s, 12/1/25 | BB– | 3,000,000 | 3,321,030 | ||
Tobacco Settlement Auth. of IA Rev. Bonds, Ser. C, 5 3/8s, 6/1/38 | B+ | 10,000,000 | 9,011,400 | ||
18,991,882 | |||||
Kansas (0.2%) | |||||
Lenexa, Hlth. Care Fac. Rev. Bonds | |||||
(LakeView Village, Inc.), 7 1/4s, 5/15/39 | BB/P | 1,500,000 | 1,703,175 | ||
5 3/8s, 5/15/27 | BB/P | 500,000 | 512,070 | ||
2,215,245 | |||||
Kentucky (1.1%) | |||||
KY Econ. Dev. Fin. Auth. Rev. Bonds (Masonic Home Indpt. Living II) | |||||
7 3/8s, 5/15/46 | BB–/P | 1,350,000 | 1,573,817 | ||
7 1/4s, 5/15/41 | BB–/P | 900,000 | 1,045,233 | ||
KY Pub. Trans. Infrastructure Auth. Rev. Bonds (1st Tier Downtown Crossing), Ser. A, 6s, 7/1/53 | Baa3 | 2,000,000 | 2,392,000 | ||
KY State Econ. Dev. Fin. Auth. Hlth. Care Rev. Bonds (Masonic Homes of KY), 5 3/8s, 11/15/42 | BB–/P | 1,400,000 | 1,445,220 | ||
Louisville & Jefferson Cnty., Metro. Govt. College Rev. Bonds (Bellarmine U., Inc.), Ser. A, 6s, 5/1/38 | Baa3 | 855,000 | 933,352 | ||
Louisville & Jefferson Cnty., Metro. Govt. Hlth. Syst. Rev. Bonds (Norton Hlth. Care, Inc.), 5s, 10/1/30 | A– | 4,000,000 | 4,254,240 | ||
11,643,862 |
26 Tax-Free High Yield Fund
MUNICIPAL BONDS AND NOTES (98.6%)* cont. | Rating** | Principal | Value | ||
Louisiana (0.5%) | |||||
LA State Pub. Facs. Solid Waste Disp. Auth. Rev. Bonds (LA Pellets, Inc.), Ser. A, 8 3/8s, 7/1/39 | B–/P | $1,000,000 | $1,041,090 | ||
Pub. Facs. Auth. Dock & Wharf Rev. Bonds (Impala Warehousing, LLC), 6 1/2s, 7/1/36 | B+/P | 1,000,000 | 1,134,180 | ||
Rapides, Fin. Auth. FRB (Cleco Pwr.), AMBAC, 4.7s, 11/1/36 | A3 | 2,250,000 | 2,283,682 | ||
St. Tammany, Public Trust Fin. Auth. Rev. Bonds (Christwood), 5 1/4s, 11/15/37 | BB/P | 765,000 | 786,749 | ||
5,245,701 | |||||
Maine (0.3%) | |||||
ME Hlth. & Higher Edl. Fac. Auth. Rev. Bonds (ME Gen. Med. Ctr.), 7 1/2s, 7/1/32 | Ba1 | 3,000,000 | 3,677,610 | ||
3,677,610 | |||||
Maryland (0.9%) | |||||
MD Econ. Dev. Corp. Poll. Control Rev. Bonds (Potomac Electric Power Co.), 6.2s, 9/1/22 | A2 | 1,700,000 | 2,028,049 | ||
MD State Hlth. & Higher Edl. Fac. Auth. Rev. Bonds (Peninsula Regl. Med. Ctr.) | |||||
5s, 7/1/45 | A2 | 1,000,000 | 1,161,080 | ||
5s, 7/1/39 | A2 | 1,500,000 | 1,749,645 | ||
MD State Indl. Dev. Fin. Auth. Econ. Dev. Rev. Bonds (Our Lady of Good Counsel School), Ser. A, 6s, 5/1/35 (Prerefunded 5/1/15) | BB/P | 600,000 | 608,388 | ||
Westminster, Rev. Bonds | |||||
(Lutheran Village at Miller’s Grant, Inc. (The)), Ser. A, 6s, 7/1/34 | B–/P | 750,000 | 813,323 | ||
(Carroll Lutheran Village, Inc.), 5 1/8s, 7/1/34 | BB/P | 3,000,000 | 3,192,120 | ||
9,552,605 | |||||
Massachusetts (4.3%) | |||||
MA State Dev. Fin. Agcy. Rev. Bonds | |||||
(Sabis Intl.), Ser. A, 8s, 4/15/39 | BBB | 2,140,000 | 2,547,584 | ||
(Linden Ponds, Inc. Fac.), Ser. A-1, 6 1/4s, 11/15/46 | B–/P | 1,816,363 | 1,775,767 | ||
(Linden Ponds, Inc. Fac.), Ser. A-1, 6 1/4s, 11/15/31 | B–/P | 704,147 | 691,486 | ||
(Loomis Cmntys.), Ser. A, 6s, 1/1/33 | BBB– | 500,000 | 567,930 | ||
(Milford Regl. Med. Ctr. Oblig. Group), Ser. F, 5 3/4s, 7/15/43 | Baa3 | 1,000,000 | 1,134,340 | ||
(Linden Ponds, Inc. Fac.), Ser. A-2, 5 1/2s, 11/15/46 | B–/P | 238,451 | 208,986 | ||
(New England Conservatory of Music), 5 1/4s, 7/1/38 (Prerefunded 7/1/18) | AAA/P | 1,900,000 | 2,185,095 | ||
(Wheelock College), Ser. C, 5 1/4s, 10/1/37 | BBB | 2,000,000 | 2,183,720 | ||
(Suffolk U.), 5 1/8s, 7/1/40 | Baa2 | 2,000,000 | 2,158,820 | ||
(Linden Ponds, Inc. Fac.), Ser. B, zero %, 11/15/56 | B–/P | 1,186,016 | 7,484 | ||
MA State Dev. Fin. Agcy. Hlth. Care Fac. 144A Rev. Bonds (Adventcare), Ser. A, 6.65s, 10/15/28 | B/P | 2,150,000 | 2,248,749 | ||
MA State Hlth. & Edl. Fac. Auth. Rev. Bonds | |||||
(Jordan Hosp.), Ser. E, 6 3/4s, 10/1/33 | B+ | 6,035,000 | 6,050,148 | ||
(Quincy Med. Ctr.), Ser. A, 6 1/2s, 1/15/38 (In default) † | D/P | 972,870 | 97 |
Tax-Free High Yield Fund 27
MUNICIPAL BONDS AND NOTES (98.6%)* cont. | Rating** | Principal | Value | ||
Massachusetts cont. | |||||
MA State Hlth. & Edl. Fac. Auth. Rev. Bonds | |||||
(Suffolk U.), Ser. A, 6 1/4s, 7/1/30 | Baa2 | $1,400,000 | $1,653,078 | ||
(Suffolk U.), Ser. A, 5 3/4s, 7/1/39 (Prerefunded 7/1/19) | Baa2 | 2,125,000 | 2,440,244 | ||
(Springfield College), 5 5/8s, 10/15/40 | Baa1 | 3,500,000 | 3,864,035 | ||
(Milton Hosp.), Ser. D, 5 3/8s, 7/1/35 | BB+ | 3,950,000 | 3,965,247 | ||
(Winchester Hosp.), 5 1/4s, 7/1/38 | A– | 3,050,000 | 3,369,335 | ||
(Fisher College), Ser. A, 5 1/8s, 4/1/37 | BBB– | 1,400,000 | 1,425,214 | ||
(Milford Regl. Med.), Ser. E, 5s, 7/15/32 | Baa3 | 1,000,000 | 1,044,190 | ||
(Milford Regl. Med.), Ser. E, 5s, 7/15/27 | Baa3 | 2,750,000 | 2,892,752 | ||
(Emerson Hosp.), Ser. E, Radian Insd., 5s, 8/15/25 | BB/P | 3,500,000 | 3,552,325 | ||
45,966,626 | |||||
Michigan (1.4%) | |||||
Advanced Tech. Academy Pub. School Rev. Bonds, 6s, 11/1/28 | BBB– | 1,505,000 | 1,579,181 | ||
Ann Arbor, Econ. Dev. Corp. Ltd. Oblig. Rev. Bonds (Glacier Hills, Inc.), State & Local Govt. Coll., 8 3/8s, 1/15/19 (Escrowed to maturity) | AA+ | 1,099,000 | 1,270,620 | ||
Flint, Hosp. Bldg. Auth. Rev. Bonds | |||||
(Hurley Med. Ctr.), 7 1/2s, 7/1/39 | Ba1 | 700,000 | 813,995 | ||
(Hurley Med. Ctr.), 6s, 7/1/20 | Ba1 | 170,000 | 170,218 | ||
Ser. A, 5 1/4s, 7/1/39 | Ba1 | 500,000 | 485,250 | ||
MI State Fin. Auth. Rev. Bonds (Local Govt. Program Detroit Wtr. & Swr.), Ser. D4, 5s, 7/1/34 | BBB+ | 1,900,000 | 2,086,770 | ||
MI State Fin. Auth. Rev. Notes (Detroit School Dist. Student Aid), Ser. E, 2.85s, 8/20/15 | SP-1 | 1,650,000 | 1,659,504 | ||
MI State Hosp. Fin. Auth. Rev. Bonds (Henry Ford Hlth.), 5 3/4s, 11/15/39 | A3 | 4,400,000 | 5,188,128 | ||
Star Intl. Academy Rev. Bonds (Pub. School Academy), 5s, 3/1/33 | BBB | 1,675,000 | 1,760,810 | ||
15,014,476 | |||||
Minnesota (2.1%) | |||||
Douglas Cnty., Gross Hlth. Care Fac. Rev. Bonds (Douglas Cnty. Hosp.) | |||||
6 1/4s, 7/1/34 (Prerefunded 7/1/18) | BBB– | 1,550,000 | 1,834,611 | ||
6 1/4s, 7/1/34 (Prerefunded 7/1/18) | AAA/P | 850,000 | 1,006,077 | ||
Inver Grove Heights, Nursing Home Rev. Bonds (Presbyterian Homes Care), 5 1/2s, 10/1/41 | B/P | 1,000,000 | 1,000,500 | ||
Minneapolis & St. Paul, Hsg. & Redev. Auth. Hlth. Care VRDN (Allina Hlth. Syst.), Ser. B-1, 0.01s, 11/15/35 | VMIG1 | 1,800,000 | 1,800,000 | ||
North Oaks, Sr. Hsg. Rev. Bonds | |||||
(Presbyterian Homes North Oaks), 6 1/8s, 10/1/39 | BB/P | 1,375,000 | 1,473,381 | ||
(Presbyterian Homes), 6s, 10/1/27 | BB/P | 1,250,000 | 1,358,763 | ||
Northfield, Hosp. Rev. Bonds, 5 3/8s, 11/1/31 | BBB | 1,500,000 | 1,590,165 | ||
Otsego, Charter School Lease Rev. Bonds (Kaleidoscope Charter School), Ser. A | |||||
5s, 9/1/44 | BB+ | 925,000 | 946,164 | ||
5s, 9/1/34 | BB+ | 300,000 | 312,027 |
28 Tax-Free High Yield Fund
MUNICIPAL BONDS AND NOTES (98.6%)* cont. | Rating** | Principal | Value | ||
Minnesota cont. | |||||
Rochester, Hlth. Care Fac. VRDN (Mayo Clinic), Ser. B, 0.01s, 11/15/38 | VMIG1 | $2,550,000 | $2,550,000 | ||
St. Paul, Hsg. & Redev. Auth. Charter School Lease Rev. Bonds (Nova Classical Academy), Ser. A, 6 3/8s, 9/1/31 | BBB– | 500,000 | 592,140 | ||
St. Paul, Hsg. & Redev. Auth. Hlth. Care Fac. Rev. Bonds (HealthPartners Oblig. Group), 5 1/4s, 5/15/36 | A2 | 5,035,000 | 5,387,500 | ||
St. Paul, Hsg. & Redev. Auth. Hosp. Rev. Bonds (Healtheast), 6s, 11/15/35 | BBB– | 1,250,000 | 1,292,263 | ||
St. Paul, Port Auth. Solid Waste Disp. Rev. Bonds (Gerdau Ameristeel US, Inc.), Ser. 7, 4 1/2s, 10/1/37 | Baa3 | 900,000 | 912,177 | ||
22,055,768 | |||||
Mississippi (0.7%) | |||||
MS Bus. Fin. Corp. Gulf Opportunity Zone Rev. Bonds, Ser. A, 5s, 5/1/37 | A3 | 1,000,000 | 1,128,340 | ||
Warren Cnty., Gulf Opportunity Zone Rev. Bonds (Intl. Paper Co.), Ser. A, 6 1/2s, 9/1/32 | Baa2 | 5,400,000 | 6,266,700 | ||
7,395,040 | |||||
Montana (0.1%) | |||||
MT Fac. Fin. Auth. Rev. Bonds (Sr. Living St. John’s Lutheran), Ser. A, 6s, 5/15/25 | B+/P | 750,000 | 779,378 | ||
779,378 | |||||
Nebraska (0.7%) | |||||
Central Plains, Energy Rev. Bonds | |||||
(NE Gas No. 1), Ser. A, 5 1/4s, 12/1/18 | A– | 1,500,000 | 1,707,105 | ||
(NE Gas No. 3), 5s, 9/1/32 | A– | 3,000,000 | 3,384,300 | ||
Lancaster Cnty., Hosp. Auth. Rev. Bonds (Immanuel Oblig. Group), 5 5/8s, 1/1/40 | AA–/F | 1,825,000 | 2,053,618 | ||
7,145,023 | |||||
Nevada (1.5%) | |||||
Clark Cnty., Arpt. Rev. Bonds, Ser. A-2, 5s, 7/1/33 | A1 | 1,560,000 | 1,839,271 | ||
Clark Cnty., Impt. Dist. Special Assmt. Bonds (Summerlin No. 151) | |||||
5s, 8/1/25 | BB–/P | 300,000 | 278,349 | ||
5s, 8/1/20 | BB–/P | 335,000 | 328,206 | ||
5s, 8/1/19 | BB–/P | 1,100,000 | 1,100,451 | ||
5s, 8/1/18 | BB–/P | 1,060,000 | 1,061,007 | ||
5s, 8/1/17 | BB–/P | 1,255,000 | 1,257,774 | ||
Henderson, Local Impt. Dist. Special Assmt. Bonds (No. T-17), 5s, 9/1/25 | BB+/P | 750,000 | 773,303 | ||
Las Vegas, Special Assmt. Bonds | |||||
5s, 6/1/30 | B+/P | 575,000 | 595,775 | ||
(Dist. No. 607 Local Impt.), 5s, 6/1/22 | BB/P | 475,000 | 520,985 | ||
Reno, Sales Tax VRDN (Reno Trans. Rail Access Corridor (ReTRAC)), 0.03s, 6/1/42 | VMIG1 | 7,955,000 | 7,955,000 | ||
15,710,121 | |||||
New Hampshire (0.1%) | |||||
NH State Bus. Fin. Auth. Solid Waste Disp. Mandatory Put Bonds (10/1/19) (Casella Waste Syst., Inc.), 4s, 4/1/29 | B2 | 650,000 | 659,919 | ||
659,919 |
Tax-Free High Yield Fund 29
MUNICIPAL BONDS AND NOTES (98.6%)* cont. | Rating** | Principal | Value | ||
New Jersey (6.0%) | |||||
Burlington Cnty., Bridge Comm. Econ. Dev. Rev. Bonds (The Evergreens), 5 5/8s, 1/1/38 | BB+/P | $4,500,000 | $4,643,775 | ||
NJ State Econ. Dev. Auth. Rev. Bonds | |||||
(Paterson Charter School Science & Tech.), Ser. A, 6.1s, 7/1/44 | BB+ | 1,130,000 | 1,143,334 | ||
(Cranes Mill), Ser. A, 6s, 7/1/38 | BBB–/F | 1,750,000 | 1,825,828 | ||
(Paterson Charter School Science & Tech.), Ser. A, 6s, 7/1/32 | BB+ | 300,000 | 311,781 | ||
(MSU Student Hsg.), 5 7/8s, 6/1/42 | Baa3 | 5,110,000 | 5,676,290 | ||
(Continental Airlines, Inc.), 5 1/2s, 6/1/33 | B | 2,000,000 | 2,188,620 | ||
(NYNJ Link Borrower, LLC), 5 3/8s, 1/1/43 | BBB– | 2,500,000 | 2,837,575 | ||
(Paterson Charter School), Ser. C, 5.3s, 7/1/44 | BB+ | 2,250,000 | 2,062,440 | ||
(Lions Gate), 5 1/4s, 1/1/44 | BB–/P | 500,000 | 521,285 | ||
(Continental Airlines, Inc.), 5 1/4s, 9/15/29 | B | 3,500,000 | 3,796,485 | ||
NJ State Econ. Dev. Auth. Energy Fac. Rev. Bonds (UMM Energy Partners, LLC), Ser. A | |||||
5s, 6/15/37 | Baa3 | 1,000,000 | 1,064,510 | ||
4 3/4s, 6/15/32 | Baa3 | 170,000 | 178,942 | ||
NJ State Econ. Dev. Auth. Fac. Rev. Bonds (Continental Airlines, Inc.), 5 5/8s, 11/15/30 | B | 1,000,000 | 1,115,140 | ||
NJ State Econ. Dev. Auth. Retirement Cmnty. Rev. Bonds (Seabrook Village, Inc.), 5 1/4s, 11/15/36 | BB–/P | 3,590,000 | 3,664,313 | ||
NJ State Hlth. Care Facs. Fin. Auth. Rev. Bonds | |||||
(St. Joseph Hlth. Care Syst.), 6 5/8s, 7/1/38 | Baa3 | 6,000,000 | 6,776,340 | ||
(St. Peter’s U. Hosp.), 6 1/4s, 7/1/35 | Ba1 | 2,500,000 | 2,788,200 | ||
(Holy Name Hosp.), 5s, 7/1/36 | Baa2 | 3,500,000 | 3,621,730 | ||
Salem Cnty., Poll Control Fin. Auth. Rev. Bonds (Chambers Cogeneration LP), Ser. A, 5s, 12/1/23 | BBB | 1,400,000 | 1,608,138 | ||
Tobacco Settlement Fin. Corp. Rev. Bonds | |||||
Ser. 1A, 5s, 6/1/41 | B2 | 8,000,000 | 6,444,640 | ||
Ser. 1A, 4 3/4s, 6/1/34 | B2 | 7,700,000 | 6,106,562 | ||
zero %, 6/1/41 | A– | 20,000,000 | 4,920,200 | ||
63,296,128 | |||||
New Mexico (1.3%) | |||||
Farmington, Poll. Control Rev. Bonds | |||||
(Public Service Co. of NM San Juan), Ser. D, 5.9s, 6/1/40 | Baa2 | 3,000,000 | 3,371,670 | ||
(San Juan), Ser. A, 4 7/8s, 4/1/33 | Baa2 | 7,660,000 | 7,850,045 | ||
(San Juan), Ser. B, 4 7/8s, 4/1/33 | Baa2 | 2,750,000 | 2,818,227 | ||
14,039,942 | |||||
New York (5.5%) | |||||
Brooklyn Arena Local Dev. Corp. Rev. Bonds (Barclays Ctr.), 6 3/8s, 7/15/43 | Baa3 | 3,000,000 | 3,629,430 | ||
Broome Cnty., Indl. Dev. Agcy. Continuing Care Retirement Rev. Bonds (Good Shepard Village), Ser. A, 6 7/8s, 7/1/40 | B/P | 715,000 | 754,497 | ||
NY City, Cultural Resource VRDN (Lincoln Ctr.), Ser. A-1, 0.02s, 12/1/35 | VMIG1 | 6,000,000 | 6,000,000 | ||
NY City, Indl. Dev. Agcy. Rev. Bonds (Yankee Stadium — Pilot), AGO, 7s, 3/1/49 | AA | 1,000,000 | 1,206,040 |
30 Tax-Free High Yield Fund
MUNICIPAL BONDS AND NOTES (98.6%)* cont. | Rating** | Principal | Value | ||
New York cont. | |||||
NY City, Indl. Dev. Agcy. Special Fac. Rev. Bonds | |||||
(American Airlines — JFK Intl. Arpt.), 7 1/2s, 8/1/16 | B+/P | $1,295,000 | $1,354,233 | ||
(British Airways PLC), 5 1/4s, 12/1/32 | BB | 2,325,000 | 2,333,672 | ||
(Jetblue Airways Corp.), 5 1/8s, 5/15/30 | B | 3,680,000 | 3,688,979 | ||
(Jetblue Airways Corp.), 5s, 5/15/20 | B | 480,000 | 481,152 | ||
NY City, Muni. Wtr. & Swr. Fin. Auth. Rev. Bonds, 5s, 6/15/46 | AA+ | 11,125,000 | 12,884,530 | ||
NY City, Transitional Fin. Auth. Bldg. Aid Rev. Bonds (Fiscal 2015), Ser. S-1, 5s, 7/15/43 | Aa2 | 1,750,000 | 2,068,885 | ||
NY State Dorm. Auth. Non-State Supported Debt Rev. Bonds (Orange Regl. Med. Ctr.), 6 1/4s, 12/1/37 | Ba1 | 4,180,000 | 4,570,705 | ||
NY State Energy Research & Dev. Auth. Gas Fac. Rev. Bonds (Brooklyn Union Gas), 6.952s, 7/1/26 | A2 | 1,800,000 | 1,806,048 | ||
NY State Env. Fac. Corp. Solid Waste Disp. Mandatory Put Bonds (12/2/19) (Casella Waste Syst., Inc.), 3 3/4s, 12/1/44 | B+ | 1,500,000 | 1,511,700 | ||
NY State Liberty Dev. Corp. Rev. Bonds (7 World Trade Ctr.), Class 3, 5s, 3/15/44 | Baa2 | 1,000,000 | 1,100,980 | ||
NY State Liberty Dev. Corp. 144A Rev. Bonds (World Trade Ctr.) | |||||
Class 2, 5 3/8s, 11/15/40 | BB–/P | 1,250,000 | 1,423,738 | ||
Class 1, 5s, 11/15/44 | BB–/P | 2,250,000 | 2,411,685 | ||
Oneida Cnty., Indl. Dev. Agcy. Rev. Bonds (St. Elizabeth Med.), Ser. A, 5 7/8s, 12/1/29 | BB–/P | 1,500,000 | 1,501,470 | ||
Onondaga, Civic Dev. Corp. Rev. Bonds (St. Joseph’s Hosp. Hlth. Ctr.) | |||||
5 1/8s, 7/1/31 | Ba2 | 2,310,000 | 2,524,206 | ||
5s, 7/1/42 | Ba2 | 1,000,000 | 1,032,440 | ||
Port Auth. NY & NJ Special Oblig. Rev. Bonds (JFK Intl. Air Term.), 6s, 12/1/42 | Baa3 | 2,100,000 | 2,499,798 | ||
Westchester Cnty., Indl Dev. Agcy. Civic Fac. Rev. Bonds (Pace U.), Ser. A, 5 1/2s, 5/1/42 | BB+ | 2,750,000 | 3,199,817 | ||
Yonkers, Indl. Dev. Agcy. Civic Fac. Rev. Bonds (St. John’s Riverside Hosp.), Ser. A, 7 1/8s, 7/1/31 | B+ | 500,000 | 500,300 | ||
58,484,305 | |||||
North Carolina (0.8%) | |||||
NC Cap. Fin. Agcy. Edl. Fac. Rev. Bonds (Meredith College), 6s, 6/1/31 | BBB | 1,000,000 | 1,078,420 | ||
NC Med. Care Cmnty. Hlth. Care Fac. Rev. Bonds | |||||
(Deerfield), Ser. A, 6 1/8s, 11/1/38 | BBB+/F | 450,000 | 497,048 | ||
(First Mtge. — Presbyterian Homes), 5 3/8s, 10/1/22 | BB/P | 750,000 | 770,843 | ||
NC Med. Care Comm. Retirement Fac. Rev. Bonds | |||||
(Carolina Village), 6s, 4/1/38 | BB/P | 3,500,000 | 3,741,185 | ||
(First Mtge. United Methodist), Ser. C, 5 1/2s, 10/1/32 | BB+/P | 2,000,000 | 2,017,360 | ||
8,104,856 |
Tax-Free High Yield Fund 31
MUNICIPAL BONDS AND NOTES (98.6%)* cont. | Rating** | Principal | Value | ||
Ohio (4.2%) | |||||
American Muni. Pwr., Inc. Rev. Bonds, Ser. A, 5 1/4s, 2/15/33 | A1 | $2,250,000 | $2,621,407 | ||
Buckeye, Tobacco Settlement Fin. Auth. Rev. Bonds | |||||
Ser. A-3, 6 1/4s, 6/1/37 | B3 | 3,300,000 | 2,953,929 | ||
Ser. A-2, 6s, 6/1/42 | B3 | 2,500,000 | 2,132,850 | ||
Ser. A-2, 5 7/8s, 6/1/47 | B3 | 4,000,000 | 3,408,320 | ||
Ser. A-2, 5 7/8s, 6/1/30 | B3 | 8,055,000 | 7,005,675 | ||
Ser. A-2, 5 3/4s, 6/1/34 | B3 | 6,425,000 | 5,412,998 | ||
Franklin Cnty., Hlth. Care Fac. Rev. Bonds (OH Presbyterian Retirement Svcs. (OPRS) Cmntys. Oblig. Group), Ser. A, 6s, 7/1/35 | BBB– | 3,000,000 | 3,371,070 | ||
Hickory Chase Cmnty. Auth. Rev. Bonds (Infrastructure Impt.), 7s, 12/1/38 F | CCC/P | 1,560,000 | 187,044 | ||
Lake Cnty., Hosp. Fac. Rev. Bonds (Lake Hosp. Syst.), Ser. C, 6s, 8/15/43 | A3 | 1,550,000 | 1,787,228 | ||
Lucas Cnty., Hlth. Care Rev. Bonds (Lutheran Homes), Ser. A, 7s, 11/1/45 | BB+ | 500,000 | 557,500 | ||
OH State Rev. Bonds (Northeast OH Regl. Swr. Dist.), 5s, 11/15/44 | Aa1 | 1,500,000 | 1,793,325 | ||
OH State Air Quality Dev. Auth. Rev. Bonds (Valley Elec. Corp.), Ser. E, 5 5/8s, 10/1/19 | Baa3 | 1,450,000 | 1,653,508 | ||
OH State Higher Edl. Fac. Comm. Rev. Bonds (Kenyon College), 5s, 7/1/44 | A1 | 4,850,000 | 5,399,941 | ||
OH State Wtr. Dev. Auth. Poll. Control Mandatory Put Bonds (6/3/19) (FirstEnergy Nuclear Generation, LLC), 4s, 12/1/33 | Baa3 | 3,150,000 | 3,396,424 | ||
Southeastern OH Port Auth. Hosp. Fac. Rev. Bonds, 5 3/4s, 12/1/32 | BB/P | 2,225,000 | 2,368,824 | ||
44,050,043 | |||||
Oklahoma (0.3%) | |||||
OK Cnty., Fin. Auth. Rev. Bonds (Epworth Village), Ser. A, 5s, 4/1/33 | BB–/P | 1,070,000 | 893,867 | ||
Tulsa, Muni. Arpt. Trust Rev. Bonds (American Airlines, Inc.), Ser. B, 5 1/2s, 12/1/35 | B+/P | 2,000,000 | 2,173,620 | ||
3,067,487 | |||||
Oregon (0.3%) | |||||
Multnomah Cnty., Hosp. Fac. Auth. Rev. Bonds (Mirabella at South Waterfront), Ser. A, 5.4s, 10/1/44 | BB–/P | 1,000,000 | 1,077,120 | ||
Warm Springs Reservation, Confederated Tribes 144A Rev. Bonds (Pelton Round Butte Tribal), Ser. B, 6 3/8s, 11/1/33 | A3 | 1,800,000 | 2,040,156 | ||
3,117,276 | |||||
Pennsylvania (4.1%) | |||||
Allegheny Cnty., Higher Ed. Bldg. Auth. Rev. Bonds | |||||
(Robert Morris U.), Ser. A, 5 3/4s, 10/15/40 | Baa3 | 765,000 | 834,998 | ||
(Chatham U.), Ser. A, 5s, 9/1/35 | BBB | 1,000,000 | 1,087,920 | ||
(Chatham U.), Ser. A, 5s, 9/1/30 | BBB | 1,500,000 | 1,657,995 |
32 Tax-Free High Yield Fund
MUNICIPAL BONDS AND NOTES (98.6%)* cont. | Rating** | Principal | Value | ||
Pennsylvania cont. | |||||
Allegheny Cnty., Indl. Dev. Auth. Rev. Bonds | |||||
(Env. Impt. — USX Corp.), 6 7/8s, 5/1/30 | BB– | $3,400,000 | $3,930,876 | ||
(United States Steel Corp.), 5 3/4s, 8/1/42 | BB– | 1,800,000 | 1,868,688 | ||
Allentown, Neighborhood Impt. Zone Dev. Auth. Rev. Bonds, Ser. A, 5s, 5/1/42 | Baa2 | 2,250,000 | 2,456,595 | ||
Bucks Cnty., Indl. Dev. Auth. Rev. Bonds (US Steel Corp.), 6 3/4s, 6/1/26 | BB– | 1,460,000 | 1,736,977 | ||
Chester Cnty., Indl. Dev. Auth. Rev. Bonds (Renaissance Academy Charter School), 5s, 10/1/34 | BBB– | 625,000 | 684,600 | ||
Cumberland Cnty., Muni. Auth. Rev. Bonds (Diakon Lutheran Ministries), 5s, 1/1/36 | BBB+/F | 1,790,000 | 1,845,776 | ||
East Hempfield Twp., Indl. Dev. Auth. Rev. Bonds (Student Svcs., Inc. Student Hsg. at Millersville U. of PA), 5s, 7/1/34 | Baa3 | 800,000 | 863,488 | ||
Lancaster Cnty., Hosp. Auth. Rev. Bonds (Brethren Village), Ser. A | |||||
6 1/2s, 7/1/40 | BB–/P | 3,000,000 | 3,141,630 | ||
6 3/8s, 7/1/30 | BB–/P | 1,375,000 | 1,446,308 | ||
Montgomery Cnty., Higher Ed. & Hlth. Auth. Rev. Bonds (Arcadia U.), 5 1/4s, 4/1/30 | BBB | 1,530,000 | 1,668,113 | ||
Montgomery Cnty., Indl. Auth. Resource Recvy. Rev. Bonds | |||||
(Whitemarsh Cont. Care), 6 1/4s, 2/1/35 | B–/P | 2,400,000 | 2,404,992 | ||
(Whitemarsh Continuing Care Retirement Cmnty, Inc.), 6 1/8s, 2/1/28 | B–/P | 700,000 | 701,799 | ||
Northampton Cnty., Indl. Dev. Auth. Tax Alloc. Bonds (Rte. 33), 7s, 7/1/32 | B/P | 1,200,000 | 1,330,884 | ||
Northeastern PA Hosp. & Ed. Auth. Rev. Bonds (Wilkes U.), Ser. A, 5 1/4s, 3/1/42 | BBB | 1,000,000 | 1,082,740 | ||
PA State Higher Edl. Fac. Auth. Rev. Bonds | |||||
(Shippensburg U.), 6 1/4s, 10/1/43 | Baa3 | 1,000,000 | 1,144,140 | ||
(Edinboro U. Foundation), 5 7/8s, 7/1/38 | Baa3 | 1,000,000 | 1,087,720 | ||
(Indiana U.), Ser. A, 5s, 7/1/32 | BBB+ | 500,000 | 546,850 | ||
PA State Tpk. Comm. Rev. Bonds, Ser. C, 5s, 12/1/44 | A1 | 4,050,000 | 4,715,941 | ||
Philadelphia, Auth. for Indl. Dev. Rev. Bonds (Master Charter School), 6s, 8/1/35 | BBB+ | 2,175,000 | 2,392,065 | ||
Philadelphia, Hosp. & Higher Ed. Fac. Auth. Rev. Bonds | |||||
(Graduate Hlth. Syst. Oblig. Group), 7 1/4s, 7/1/18 (In default) † | D/P | 5,263,244 | 6,579 | ||
(Graduate Hlth. Syst.), Ser. B, 6 1/4s, 7/1/13 (In default) ***† | D/P | 510,506 | 5 | ||
Susquehanna, Area Regl. Arpt. Syst. Auth. Rev. Bonds, Ser. A, 6 1/2s, 1/1/38 | Baa3 | 3,675,000 | 3,980,392 | ||
Washington Cnty., Indl. Dev. Auth. Hlth. Care Fac. Rev. Bonds (First Mtge. AHF/Central), 8 1/2s, 1/1/29 | B/P | 990,000 | 997,732 | ||
43,615,803 |
Tax-Free High Yield Fund 33
MUNICIPAL BONDS AND NOTES (98.6%)* cont. | Rating** | Principal | Value | ||
Puerto Rico (1.8%) | |||||
Children’s Trust Fund Tobacco Settlement (The) Rev. Bonds (Asset Backed Bonds), 5 5/8s, 5/15/43 | Ba2 | $2,295,000 | $2,248,641 | ||
Cmnwlth. of PR, G.O. Bonds (Pub. Impt.), Ser. A, 5 3/4s, 7/1/41 | BB | 5,000,000 | 3,512,600 | ||
Cmnwlth. of PR, Aqueduct & Swr. Auth. Rev. Bonds, Ser. A, 6s, 7/1/47 | BB– | 1,485,000 | 1,046,866 | ||
Cmnwlth. of PR, Hwy. & Trans. Auth. Rev. Bonds, Ser. AA-2, 5.3s, 7/1/35 | B | 480,000 | 351,466 | ||
Cmnwlth. of PR, Pub. Bldg. Auth. Rev. Bonds (Govt. Fac.), Ser. P, Cmnwlth. of PR Gtd., 6 3/4s, 7/1/36 | BB | 5,000,000 | 3,700,100 | ||
Cmnwlth. of PR, Sales Tax Fin. Corp. Rev. Bonds | |||||
Ser. A, 5 1/2s, 8/1/37 | BBB– | 2,765,000 | 1,996,330 | ||
Ser. A, 5 3/8s, 8/1/39 | BBB– | 3,605,000 | 2,539,470 | ||
Ser. C, 5 3/8s, 8/1/36 | BBB– | 1,175,000 | 845,507 | ||
Ser. A, NATL, zero %, 8/1/43 | AA– | 20,000,000 | 3,304,600 | ||
19,545,580 | |||||
South Carolina (1.5%) | |||||
Georgetown Cnty., Env. Impt. Rev. Bonds (Intl. Paper Co.), Ser. A, 5.3s, 3/1/28 | BBB | 500,000 | 500,515 | ||
SC State Pub. Svc. Auth. Rev. Bonds | |||||
Ser. A, 5 1/2s, 12/1/54 | AA– | 6,000,000 | 7,174,260 | ||
Ser. E, 5s, 12/1/48 | AA– | 7,500,000 | 8,586,300 | ||
16,261,075 | |||||
Texas (11.6%) | |||||
Brazos River Harbor Naval Dist. Env. (Dow Chemical Co.), Ser. A-4, 5.95s, 5/15/33 | BBB | 5,150,000 | 5,796,634 | ||
Brazos, Harbor Indl. Dev. Corp. Env. Fac. Mandatory Put Bonds (5/1/28) (Dow Chemical), 5.9s, 5/1/38 | BBB | 3,850,000 | 4,322,741 | ||
Clifton, Higher Ed. Fin. Corp. Rev. Bonds (Idea Pub. Schools) | |||||
6s, 8/15/33 | BBB | 500,000 | 602,545 | ||
5s, 8/15/32 | BBB | 2,100,000 | 2,328,921 | ||
Dallas-Fort Worth, Intl. Arpt. Fac. Impt. Corp. Rev. Bonds, Ser. A, 5 1/4s, 11/1/30 | A+ | 2,000,000 | 2,374,120 | ||
Grand Parkway Trans. Corp. Rev. Bonds | |||||
Ser. B, 5 1/4s, 10/1/51 | AA+ | 3,295,000 | 3,815,643 | ||
(Sub. Tier Toll Syst.), Ser. B, 5s, 4/1/53 | AA+ | 900,000 | 1,021,626 | ||
Harris Cnty., Cultural Ed. Fac. Fin. Corp. VRDN (The Methodist Hosp.), Ser. C-1, 0.03s, 12/1/24 | A-1+ | 9,370,000 | 9,370,000 | ||
Houston, Arpt. Syst. Rev. Bonds | |||||
(Continental Airlines, Inc. Term. Project), 6 1/2s, 7/15/30 | B | 3,200,000 | 3,769,920 | ||
(Continental Airlines, Inc.), Ser. C, 5.7s, 7/15/29 | B | 4,985,000 | 4,989,437 | ||
(United Airlines, Inc.), 4 3/4s, 7/1/24 | B | 2,700,000 | 2,970,756 | ||
Houston, Higher Ed. Fin. Co. Rev. Bonds (Cosmos Foundation), Ser. A | |||||
5s, 2/15/42 | BBB | 2,250,000 | 2,442,645 | ||
5s, 2/15/32 | BBB | 2,250,000 | 2,512,147 |
34 Tax-Free High Yield Fund
MUNICIPAL BONDS AND NOTES (98.6%)* cont. | Rating** | Principal | Value | ||
Texas cont. | |||||
La Vernia, Higher Ed. Fin. Corp. Rev. Bonds (Kipp, Inc.), Ser. A | |||||
6 3/8s, 8/15/44 | BBB | $2,450,000 | $2,771,195 | ||
6 1/4s, 8/15/39 | BBB | 2,375,000 | 2,679,285 | ||
Love Field, Arpt. Modernization Corp. Special Fac. Rev. Bonds (Southwest Airlines Co.), 5 1/4s, 11/1/40 | Baa2 | 4,850,000 | 5,354,109 | ||
Matagorda Cnty., Poll. Control Rev. Bonds | |||||
(Central Pwr. & Light Co.), Ser. A, 6.3s, 11/1/29 | Baa1 | 2,400,000 | 2,779,776 | ||
(Dist. No. 1), Ser. A, AMBAC, 4.4s, 5/1/30 | Baa1 | 3,000,000 | 3,309,210 | ||
New Hope, Cultural Ed. Facs. Fin. Corp. Rev. Bonds | |||||
(Wesleyan Homes, Inc.), 5 1/2s, 1/1/43 | BB–/P | 1,050,000 | 1,082,298 | ||
(Collegiate Hsg.-Tarleton St.), 5s, 4/1/39 | Baa3 | 500,000 | 540,790 | ||
(Collegiate Hsg.-Tarleton St.), 5s, 4/1/34 | Baa3 | 750,000 | 822,068 | ||
(TX A&M U. Collegiate & Student Hsg. College Station I, LLC), Ser. A, 5s, 4/1/29 | Baa3 | 1,605,000 | 1,786,863 | ||
Newark, Cultural Ed. Facs. Fin. Corp. Rev. Bonds (AW Brown-Fellowship Leadership Academy), Ser. A, 6s, 8/15/32 | BBB– | 600,000 | 619,512 | ||
North TX, Edl. Fin. Co. Rev. Bonds (Uplift Edl.), Ser. A, 5 1/8s, 12/1/42 | BBB– | 2,500,000 | 2,714,925 | ||
North TX, Thruway Auth. Rev. Bonds, Ser. B, zero %, 9/1/37 | AA+ | 3,000,000 | 1,059,360 | ||
North TX, Tollway Auth. Rev. Bonds (Toll 2nd Tier), Ser. F, 5 3/4s, 1/1/38 | A3 | 3,370,000 | 3,741,408 | ||
North TX, Tollway Auth. stepped-coupon Rev. Bonds (1st Tier), Ser. I, 6 1/2s, 1/1/43 | A2 | 5,300,000 | 6,853,271 | ||
Red River, Hlth. Retirement Facs. Dev. Corp. Rev. Bonds | |||||
(Happy Harbor Methodist Home, Inc.), Ser. A, 7 3/4s, 11/15/44 | B–/P | 830,000 | 961,530 | ||
(Sears Methodist Retirement Syst. Oblig. Group), Ser. C, 6 1/4s, 5/9/53 (In default) † | D/P | 162,000 | 98,820 | ||
(Sears Methodist Retirement Syst. Oblig. Group), Ser. B, 6.15s, 11/15/49 (In default) † | D/P | 2,766,000 | 1,687,260 | ||
(Sears Methodist Retirement Syst. Oblig. Group), Ser. A, 6.05s, 11/15/46 (In default) † | D/P | 1,833,000 | 1,118,130 | ||
(Sears Methodist Retirement Syst. Oblig. Group), Ser. D, 6.05s, 11/15/46 (In default) † | D/P | 317,000 | 193,370 | ||
(Sears Methodist Retirement Syst. Oblig. Group), Ser. A, 5.45s, 11/15/38 (In default) † | D/P | 4,122,000 | 2,514,420 | ||
Tarrant Cnty., Cultural Ed. Fac. Fin. Corp. Retirement Fac. Rev. Bonds | |||||
(Sr. Living Ctr.), Ser. A, 8 1/4s, 11/15/44 | B+/P | 2,550,000 | 2,574,582 | ||
(Sr. Living Ctr.), Ser. A, 8 1/4s, 11/15/39 | B+/P | 1,000,000 | 1,009,640 | ||
(Air Force Village), 6 3/8s, 11/15/44 | BBB–/F | 4,000,000 | 4,498,200 | ||
Travis Cnty., Cultural Ed. Facs. Fin. Corp. Rev. Bonds (Wayside Schools), Ser. A | |||||
5 1/4s, 8/15/42 | BB+ | 450,000 | 465,305 | ||
5s, 8/15/27 | BB+ | 500,000 | 536,800 |
Tax-Free High Yield Fund 35
MUNICIPAL BONDS AND NOTES (98.6%)* cont. | Rating** | Principal | Value | ||
Texas cont. | |||||
TX A&M U. Board of Regents Rev. Bonds, Ser. B, 5s, 5/15/35 ## | Aaa | $1,050,000 | $1,251,264 | ||
TX Muni. Gas Acquisition & Supply Corp. I Rev. Bonds, Ser. A, 5 1/4s, 12/15/24 | A– | 4,500,000 | 5,397,120 | ||
TX Private Activity Surface Trans. Corp. Rev. Bonds | |||||
(LBJ Infrastructure), 7s, 6/30/40 | Baa3 | 4,500,000 | 5,461,965 | ||
(NTE Mobility), 6 7/8s, 12/31/39 | Baa2 | 3,350,000 | 3,990,520 | ||
TX State G.O. Bonds (Trans. Auth.), Ser. A, 5s, 10/1/44 | Aaa | 3,625,000 | 4,367,182 | ||
TX State Trans. Comm. Tpk. Syst. Rev. Bonds, Ser. B, 5s, 8/15/37 | A3 | 2,750,000 | 3,200,477 | ||
Uptown, Dev. Auth. Tax Increment Contract Tax Alloc. Bonds (Infrastructure Impt. Fac.), 5 1/2s, 9/1/29 | BBB | 1,000,000 | 1,110,620 | ||
122,868,410 | |||||
Virginia (1.6%) | |||||
Albemarle Cnty., Indl. Dev. Auth. Res. Care Fac. Rev. Bonds (Westminster-Canterbury), 5s, 1/1/31 | BB–/P | 575,000 | 584,384 | ||
Chesterfield Cnty., Hlth. Ctr. Cmnty. Res. Care Fac. Rev. Bonds (Lucy Corr Village), Ser. A, 6 1/4s, 12/1/38 | B–/P | 1,450,000 | 1,136,322 | ||
Lexington, Indl. Dev. Auth. Res. Care Fac. Rev. Bonds (Kendal at Lexington), Ser. A, 5 1/2s, 1/1/37 | BB/P | 1,460,000 | 1,494,398 | ||
VA ST Small Bus. Fin. Sr. Lien Auth. Rev. Bonds (95 Express Lanes, LLC), 5s, 1/1/40 | BBB– | 4,500,000 | 4,862,160 | ||
VA State Small Bus. Fin. Auth. Rev. Bonds (Elizabeth River Crossings OPCO, LLC), 6s, 1/1/37 | BBB– | 2,100,000 | 2,466,870 | ||
Washington Cnty., Indl. Dev. Auth. Hosp. Fac. Rev. Bonds (Mountain States Hlth. Alliance), Ser. C, 7 3/4s, 7/1/38 | Baa1 | 5,100,000 | 6,055,281 | ||
16,599,415 | |||||
Washington (0.7%) | |||||
Port Seattle, Port Indl. Dev. Corp. Rev. Bonds (Delta Airlines, Inc.), 5s, 4/1/30 | BB | 700,000 | 729,953 | ||
WA State Higher Ed. Fac. Auth. Rev. Bonds (Whitworth U.), 5 5/8s, 10/1/40 | Baa1 | 1,600,000 | 1,733,440 | ||
WA State Hlth. Care Fac. Auth. Rev. Bonds | |||||
(WA Hlth. Svcs.), 7s, 7/1/39 | Baa2 | 3,000,000 | 3,502,740 | ||
(Kadlec Med. Ctr.), 5 1/2s, 12/1/39 (Prerefunded 12/1/20) | Baa3 | 1,200,000 | 1,487,160 | ||
7,453,293 | |||||
West Virginia (0.3%) | |||||
Pleasants Cnty., Poll. Control Rev. Bonds (Allegheny), Ser. F, 5 1/4s, 10/15/37 | Baa3 | 500,000 | 517,740 | ||
WV State Hosp. Fin. Auth. Rev. Bonds (Thomas Hlth. Syst.), 6 3/4s, 10/1/43 | B+/P | 2,330,000 | 2,447,898 | ||
2,965,638 |
36 Tax-Free High Yield Fund
MUNICIPAL BONDS AND NOTES (98.6%)* cont. | Rating** | Principal | Value | ||
Wisconsin (1.6%) | |||||
Platteville, Redev. Auth. Rev. Bonds (UW-Platteville Real Estate), 5s, 7/1/32 | BBB– | $1,500,000 | $1,610,220 | ||
Pub. Fin. Auth. Arpt. Fac. Rev. Bonds | |||||
(Sr. Oblig. Group), 5 1/4s, 7/1/28 | BBB | 800,000 | 897,848 | ||
(Trans. Infrastructure Properties), 5s, 7/1/42 | BBB | 3,500,000 | 3,764,180 | ||
WI State Hlth. & Edl. Facs. Auth. Rev. Bonds | |||||
(St. Johns Cmntys. Inc.), Ser. A, 7 5/8s, 9/15/39 | BB+/P | 1,550,000 | 1,853,722 | ||
(St. Johns Cmntys. Inc.), Ser. A, 7 1/4s, 9/15/29 | BB+/P | 1,000,000 | 1,183,230 | ||
(Prohealth Care, Inc.), 6 5/8s, 2/15/39 (Prerefunded 2/15/19) | A1 | 3,000,000 | 3,687,720 | ||
(Prohealth Care, Inc.), 5s, 8/15/39 | A1 | 750,000 | 868,815 | ||
WI State Pub. Fin. Auth Sr. Living Rev. Bonds (Rose Villa, Inc.), Ser. A | |||||
6s, 11/15/49 | BB–/P | 1,000,000 | 1,054,360 | ||
5 1/2s, 11/15/34 | BB–/P | 1,685,000 | 1,742,155 | ||
16,662,250 | |||||
Total municipal bonds and notes (cost $942,277,383) |
| ||||
PREFERRED STOCKS (1.2%)* | Shares | Value | |
MuniMae Tax Exempt Bond Subsidiary, LLC 144A Ser. A-5, $5.00 cum. pfd. | 5,550,000 | $5,787,485 | |
MuniMae Tax Exempt Bond Subsidiary, LLC 144A Ser. B, 7 3/4s cum. pfd. | 6,000,000 | 6,473,160 | |
Total preferred stocks (cost $11,550,000) |
| ||
UNITIZED TRUST (0.1%)* | Shares | Value | |
CMS Liquidating Trust 144A F | 400 | $1,058,716 | |
Total unitized trust (cost $1,206,477) |
| ||
COMMON STOCKS (—%)* | Shares | Value | |
Tembec, Inc. (Canada) † | 10,751 | $23,859 | |
Total common stocks (cost $8,077,612) |
| ||
TOTAL INVESTMENTS | ||
Total investments (cost $963,111,472) | $1,056,976,250 |
Notes to the fund’s portfolio | ||
Unless noted otherwise, the notes to the fund’s portfolio are for the close of the fund’s reporting period, which ran from August 1, 2014 through January 31, 2015 (the reporting period). Within the following notes to the portfolio, references to “ASC 820” represent Accounting Standards Codification 820 Fair Value Measurements and Disclosures and references to “OTC”, if any, represent over-the-counter. | ||
* | Percentages indicated are based on net assets of $1,058,258,468. | |
** | The Moody’s, Standard & Poor’s or Fitch ratings indicated are believed to be the most recent ratings available at the close of the reporting period for the securities listed. Ratings are generally ascribed to securities at the time of issuance. While the agencies may from time to time revise such ratings, they undertake no obligation to do so, and the ratings do not necessarily represent what the agencies would ascribe to these securities at the close of the reporting period. Securities rated by Putnam are indicated by “/P.” Securities rated by Fitch are indicated by “/F.” If a security is insured, it will usually be rated by the ratings organizations based on the financial strength of the insurer. For further details regarding security ratings, please see the Statement of Additional Information. | |
Tax-Free High Yield Fund 37
*** | This security is in default of principal and interest. | |
† | This security is non-income-producing. | |
## | Forward commitment, in part or in entirety (Note 1). | |
F | This security is valued at fair value following procedures approved by the Trustees. Securities may be classified as Level 2 or Level 3 for ASC 820 based on the securities’ valuation inputs (Note 1). | |
144A after the name of an issuer represents securities exempt from registration under Rule 144A under the Securities Act of 1933, as amended. These securities may be resold in transactions exempt from registration, normally to qualified institutional buyers. | ||
On Mandatory Put Bonds, the rates shown are the current interest rates at the close of the reporting period and the dates shown represent the next mandatory put dates. | ||
The dates shown parenthetically on prerefunded bonds represent the next prerefunding dates. | ||
The dates shown on debt obligations are the original maturity dates. | ||
The fund had the following sector (concentrations) greater than 10% at the close of the reporting period (as a percentage of net assets): | ||
Health care | 27.2% | |
Transportation | 14.6 | |
Utilities | 12.2 |
ASC 820 establishes a three-level hierarchy for disclosure of fair value measurements. The valuation hierarchy is based upon the transparency of inputs to the valuation of the fund’s investments. The three levels are defined as follows: | |
Level 1: Valuations based on quoted prices for identical securities in active markets. | |
Level 2: Valuations based on quoted prices in markets that are not active or for which all significant inputs are observable, either directly or indirectly. | |
Level 3: Valuations based on inputs that are unobservable and significant to the fair value measurement. | |
The following is a summary of the inputs used to value the fund’s net assets as of the close of the reporting period: |
Valuation inputs | ||||
Investments in securities: | Level 1 | Level 2 | Level 3 | |
Common stocks*: | ||||
Basic materials | $23,859 | $— | $— | |
Total common stocks | 23,859 | — | — | |
Municipal bonds and notes | $— | $1,043,230,702 | $402,328 | |
Preferred stocks | — | 12,260,645 | — | |
Unitized trust | — | — | 1,058,716 | |
Totals by level | $23,859 | $1,055,491,347 | $1,461,044 | |
* Common stock classifications are presented at the sector level, which may differ from the fund’s portfolio presentation. | ||||
During the reporting period, transfers within the fair value hierarchy, if any, (other than certain transfers involving non-U.S. equity securities as described in Note 1) did not represent, in the aggregate, more than 1% of the fund’s net assets measured as of the end of the period. | ||||
At the start and close of the reporting period, Level 3 investments in securities represented less than 1% of the fund’s net assets and were not considered a significant portion of the fund’s portfolio. | ||||
The accompanying notes are an integral part of these financial statements.
38 Tax-Free High Yield Fund
Statement of assets and liabilities 1/31/15 (Unaudited) | ||
ASSETS | ||
Investment in securities, at value (Note 1): | ||
Unaffiliated issuers (identified cost $963,111,472) | $1,056,976,250 | |
Cash | 3,337,001 | |
Interest and other receivables | 11,569,592 | |
Receivable for shares of the fund sold | 2,053,633 | |
Receivable for investments sold | 1,683,830 | |
Prepaid assets | 53,994 | |
Total assets | 1,075,674,300 | |
LIABILITIES | ||
Payable for investments purchased | 7,048,400 | |
Payable for purchases of delayed delivery securities (Note 1) | 6,707,374 | |
Payable for shares of the fund repurchased | 1,507,856 | |
Payable for compensation of Manager (Note 2) | 414,057 | |
Payable for custodian fees (Note 2) | 3,788 | |
Payable for investor servicing fees (Note 2) | 79,233 | |
Payable for Trustee compensation and expenses (Note 2) | 385,166 | |
Payable for administrative services (Note 2) | 8,256 | |
Payable for distribution fees (Note 2) | 230,391 | |
Distributions payable to shareholders | 924,187 | |
Other accrued expenses | 107,124 | |
Total liabilities | 17,415,832 | |
Net assets | $1,058,258,468 | |
REPRESENTED BY | ||
Paid-in capital (Unlimited shares authorized) (Notes 1 and 4) | $1,069,622,480 | |
Undistributed net investment income (Note 1) | 4,191,240 | |
Accumulated net realized loss on investments (Note 1) | (109,420,030) | |
Net unrealized appreciation of investments | 93,864,778 | |
Total — Representing net assets applicable to capital shares outstanding | $1,058,258,468 | |
(Continued on next page) |
The accompanying notes are an integral part of these financial statements.
Tax-Free High Yield Fund 39
Statement of assets and liabilities (Continued) | ||
COMPUTATION OF NET ASSET VALUE AND OFFERING PRICE | ||
Net asset value and redemption price per class A share ($829,736,004 divided by 65,028,707 shares) | $12.76 | |
Offering price per class A share (100/96.00 of $12.76)* | $13.29 | |
Net asset value and offering price per class B share ($12,712,827 divided by 994,409 shares)** | $12.78 | |
Net asset value and offering price per class C share ($66,473,842 divided by 5,198,800 shares)** | $12.79 | |
Net asset value and redemption price per class M share ($8,678,863 divided by 680,125 shares) | $12.76 | |
Offering price per class M share (100/96.75 of $12.76)† | $13.19 | |
Net asset value, offering price and redemption price per class Y share ($140,656,932 divided by 10,984,563 shares) | $12.80 | |
* | On single retail sales of less than $100,000. On sales of $100,000 or more the offering price is reduced. | |
** | Redemption price per share is equal to net asset value less any applicable contingent deferred sales charge. | |
† | On single retail sales of less than $50,000. On sales of $50,000 or more the offering price is reduced. | |
The accompanying notes are an integral part of these financial statements.
40 Tax-Free High Yield Fund
Statement of operations Six months ended 1/31/15 (Unaudited) | ||
INTEREST INCOME | $25,205,698 | |
EXPENSES | ||
Compensation of Manager (Note 2) | $2,343,749 | |
Investor servicing fees (Note 2) | 234,593 | |
Custodian fees (Note 2) | 7,914 | |
Trustee compensation and expenses (Note 2) | 6,023 | |
Distribution fees (Note 2) | 1,339,415 | |
Administrative services (Note 2) | 14,583 | |
Other | 166,902 | |
Total expenses | 4,113,179 | |
Expense reduction (Note 2) | (677) | |
Net expenses | 4,112,502 | |
Net investment income | 21,093,196 | |
Net realized gain on investments (Notes 1 and 3) | 1,539,559 | |
Net unrealized appreciation of investments during the period | 39,453,365 | |
Net gain on investments | 40,992,924 | |
Net increase in net assets resulting from operations | $62,086,120 |
The accompanying notes are an integral part of these financial statements.
Tax-Free High Yield Fund 41
Statement of changes in net assets | |||
INCREASE (DECREASE) IN NET ASSETS | Six months ended 1/31/15* | Year ended 7/31/14 | |
Operations: | |||
Net investment income | $21,093,196 | $44,092,590 | |
Net realized gain (loss) on investments | 1,539,559 | (9,484,864) | |
Net unrealized appreciation of investments | 39,453,365 | 39,905,401 | |
Net increase in net assets resulting from operations | 62,086,120 | 74,513,127 | |
Distributions to shareholders (Note 1): | |||
From ordinary income | |||
Taxable net investment income | |||
Class A | (1,541,786) | (207,521) | |
Class B | (23,672) | (3,123) | |
Class C | (120,251) | (14,804) | |
Class M | (15,455) | (2,004) | |
Class Y | (170,902) | (14,149) | |
From tax-exempt net investment income | |||
Class A | (16,984,914) | (37,203,684) | |
Class B | (221,258) | (492,264) | |
Class C | (1,062,824) | (2,282,749) | |
Class M | (161,434) | (342,436) | |
Class Y | (2,150,226) | (2,822,327) | |
Increase (decrease) from capital share transactions (Note 4) | 54,888,075 | (53,560,602) | |
Total increase (decrease) in net assets | 94,521,473 | (22,432,536) | |
NET ASSETS | |||
Beginning of period | 963,736,995 | 986,169,531 | |
End of period (including undistributed net investment income of $4,191,240 and $5,550,766, respectively) | $1,058,258,468 | $963,736,995 | |
* | Unaudited. | ||
The accompanying notes are an integral part of these financial statements.
42 Tax-Free High Yield Fund
This page left blank intentionally.
Tax-Free High Yield Fund 43
Financial highlights (For a common share outstanding throughout the period)
INVESTMENT OPERATIONS: | LESS DISTRIBUTIONS: | RATIOS AND SUPPLEMENTAL DATA: | ||||||||||||
Period ended | Net asset value, beginning of period | Net investment income (loss) | Net realized and unrealized gain (loss) on investments | Total from investment operations | From | Total | Redemption | Non-recurring reimbursements | Net asset value, end of period | Total return at net asset value (%)a | Net assets, end of period (in thousands) | Ratio of expenses to average net assets (%)b | Ratio of net investment income (loss) to average net assets (%) | Portfolio turnover (%) |
Class A | ||||||||||||||
January 31, 2015** | $12.27 | .28 | .49 | .77 | (.28) | (.28) | — | — | $12.76 | 6.38* | $829,736 | .40* | 2.15* | 5* |
July 31, 2014 | 11.85 | .55 | .42 | .97 | (.55) | (.55) | — | — | 12.27 | 8.47 | 807,290 | .80 | 4.73 | 19 |
July 31, 2013 | 12.66 | .57 | (.83) | (.26) | (.55) | (.55) | —c | — | 11.85 | (2.22) | 843,916 | .80 | 4.43 | 16 |
July 31, 2012 | 11.56 | .60 | 1.10 | 1.70 | (.60) | (.60) | —c | —d | 12.66 | 15.03 | 1,008,921 | .81 | 4.94 | 13 |
July 31, 2011 | 11.77 | .65 | (.23) | .42 | (.63) | (.63) | —c | —e | 11.56 | 3.79 | 862,832 | .80 | 5.74 | 14 |
July 31, 2010 | 10.39 | .65 | 1.36 | 2.01 | (.63) | (.63) | —c | —f | 11.77 | 19.64 | 908,190 | .83 | 5.71 | 23 |
Class B | ||||||||||||||
January 31, 2015** | $12.29 | .25 | .49 | .74 | (.25) | (.25) | — | — | $12.78 | 6.04* | $12,713 | .71* | 1.83* | 5* |
July 31, 2014 | 11.87 | .48 | .42 | .90 | (.48) | (.48) | — | — | 12.29 | 7.79 | 12,503 | 1.42 | 4.11 | 19 |
July 31, 2013 | 12.68 | .49 | (.83) | (.34) | (.47) | (.47) | —c | — | 11.87 | (2.82) | 13,324 | 1.42 | 3.82 | 16 |
July 31, 2012 | 11.58 | .52 | 1.10 | 1.62 | (.52) | (.52) | —c | —d | 12.68 | 14.33 | 13,768 | 1.43 | 4.32 | 13 |
July 31, 2011 | 11.79 | .58 | (.23) | .35 | (.56) | (.56) | —c | —e | 11.58 | 3.20 | 11,987 | 1.42 | 5.09 | 14 |
July 31, 2010 | 10.40 | .58 | 1.37 | 1.95 | (.56) | (.56) | —c | —f | 11.79 | 18.99 | 21,822 | 1.45 | 5.12 | 23 |
Class C | ||||||||||||||
January 31, 2015** | $12.29 | .24 | .50 | .74 | (.24) | (.24) | — | — | $12.79 | 6.04* | $66,474 | .78* | 1.76* | 5* |
July 31, 2014 | 11.88 | .46 | .41 | .87 | (.46) | (.46) | — | — | 12.29 | 7.54 | 60,957 | 1.57 | 3.96 | 19 |
July 31, 2013 | 12.69 | .47 | (.83) | (.36) | (.45) | (.45) | —c | — | 11.88 | (2.97) | 69,981 | 1.57 | 3.67 | 16 |
July 31, 2012 | 11.58 | .50 | 1.11 | 1.61 | (.50) | (.50) | —c | —d | 12.69 | 14.24 | 70,823 | 1.58 | 4.13 | 13 |
July 31, 2011 | 11.79 | .57 | (.23) | .34 | (.55) | (.55) | —c | —e | 11.58 | 2.99 | 40,797 | 1.57 | 4.98 | 14 |
July 31, 2010 | 10.40 | .56 | 1.37 | 1.93 | (.54) | (.54) | —c | —f | 11.79 | 18.83 | 36,864 | 1.60 | 4.92 | 23 |
Class M | ||||||||||||||
January 31, 2015** | $12.27 | .27 | .49 | .76 | (.27) | (.27) | — | — | $12.76 | 6.24* | $8,679 | .53* | 2.01* | 5* |
July 31, 2014 | 11.85 | .52 | .42 | .94 | (.52) | (.52) | — | — | 12.27 | 8.18 | 8,014 | 1.07 | 4.46 | 19 |
July 31, 2013 | 12.66 | .53 | (.82) | (.29) | (.52) | (.52) | —c | — | 11.85 | (2.48) | 8,543 | 1.07 | 4.16 | 16 |
July 31, 2012 | 11.57 | .56 | 1.09 | 1.65 | (.56) | (.56) | —c | —d | 12.66 | 14.68 | 9,357 | 1.08 | 4.68 | 13 |
July 31, 2011 | 11.77 | .62 | (.22) | .40 | (.60) | (.60) | —c | —e | 11.57 | 3.61 | 8,544 | 1.07 | 5.47 | 14 |
July 31, 2010 | 10.39 | .62 | 1.36 | 1.98 | (.60) | (.60) | —c | —f | 11.77 | 19.32 | 9,549 | 1.10 | 5.44 | 23 |
Class Y | ||||||||||||||
January 31, 2015** | $12.31 | .30 | .49 | .79 | (.30) | (.30) | — | — | $12.80 | 6.48* | $140,657 | .28* | 2.26* | 5* |
July 31, 2014 | 11.89 | .58 | .42 | 1.00 | (.58) | (.58) | — | — | 12.31 | 8.69 | 74,972 | .57 | 4.93 | 19 |
July 31, 2013 | 12.70 | .60 | (.83) | (.23) | (.58) | (.58) | —c | — | 11.89 | (1.99) | 50,405 | .57 | 4.65 | 16 |
July 31, 2012 | 11.59 | .62 | 1.11 | 1.73 | (.62) | (.62) | —c | —d | 12.70 | 15.38 | 103,030 | .58 | 5.11 | 13 |
July 31, 2011 | 11.79 | .68 | (.22) | .46 | (.66) | (.66) | —c | —e | 11.59 | 4.17 | 58,265 | .57 | 5.98 | 14 |
July 31, 2010 | 10.40 | .68 | 1.36 | 2.04 | (.65) | (.65) | —c | —f | 11.79 | 20.01 | 38,287 | .60 | 5.85 | 23 |
See notes to financial highlights at the end of this section.
The accompanying notes are an integral part of these financial statements.
44 | Tax-Free High Yield Fund | Tax-Free High Yield Fund | 45 |
Financial highlights (Continued)
* Not annualized.
** Unaudited.
aTotal return assumes dividend reinvestment and does not reflect the effect of sales charges.
bIncludes amounts paid through expense offset arrangements, if any (Note 2). Also excludes acquired fund fees and expenses, if any.
cAmount represents less than $0.01 per share.
dReflects a non-recurring reimbursement pursuant to a settlement between the Securities and Exchange Commission (the SEC) and Southwest Capital, which amounted to less than $0.01 per share outstanding as of August 22, 2011.
eReflects a non-recurring reimbursement related to restitution amounts in connection with a distribution plan approved by the SEC which amounted to less than $0.01 per share outstanding on July 21, 2011. Also reflects a non-recurring reimbursal related to short-term trading related lawsuits, which amounted to less than $0.01 per share outstanding on May 11, 2011.
fReflects a non-recurring reimbursement pursuant to a settlement between the SEC and Prudential Securities, Inc., which amounted to less than $0.01 per share outstanding as of March 30, 2010.
The accompanying notes are an integral part of these financial statements.
46 Tax-Free High Yield Fund
Notes to financial statements 1/31/15 (Unaudited)
Within the following Notes to financial statements, references to “State Street” represent State Street Bank and Trust Company, references to “the SEC” represent the Securities and Exchange Commission, references to “Putnam Management” represent Putnam Investment Management, LLC, the fund’s manager, an indirect wholly-owned subsidiary of Putnam Investments, LLC and references to “OTC”, if any, represent over-the-counter. Unless otherwise noted, the “reporting period” represents the period from August 1, 2014 through January 31, 2015.
Putnam Tax Free High Yield Fund (the fund) is a diversified series of Putnam Tax-Free Income Trust (the Trust), a Massachusetts business trust registered under the Investment Company Act of 1940, as amended, as an open-end management investment company. The goal of the fund is to seek high current income exempt from federal income tax. The fund invests mainly in bonds that pay interest that is exempt from federal income tax (but that may be subject to federal alternative minimum tax (AMT)), are a combination of below-investment-grade and investment grade securities, and have intermediate- to long-term maturities (three years or longer). Putnam Management may consider, among other factors, credit, interest rate and prepayment risks, as well as general market conditions, when deciding whether to buy or sell investments.
The fund offers class A, class B, class C, class M and class Y shares. Class A and class M shares are sold with a maximum front-end sales charge of 4.00% and 3.25%, respectively, and generally do not pay a contingent deferred sales charge. Class B shares, which convert to class A shares after approximately eight years, do not pay a front-end sales charge and are subject to a contingent deferred sales charge if those shares are redeemed within six years of purchase. Class C shares have a one-year 1.00% contingent deferred sales charge and do not convert to class A shares. The expenses for class A, class B, class C, and class M shares may differ based on the distribution fee of each class, which is identified in Note 2. Class Y shares, which are sold at net asset value, are generally subject to the same expenses as class A, class B, class C, and class M shares, but do not bear a distribution fee. Class Y shares are not available to all investors.
In the normal course of business, the fund enters into contracts that may include agreements to indemnify another party under given circumstances. The fund’s maximum exposure under these arrangements is unknown as this would involve future claims that may be, but have not yet been, made against the fund. However, the fund’s management team expects the risk of material loss to be remote.
Note 1: Significant accounting policies
The following is a summary of significant accounting policies consistently followed by the fund in the preparation of its financial statements. The preparation of financial statements is in conformity with accounting principles generally accepted in the United States of America and requires management to make estimates and assumptions that affect the reported amounts of assets and liabilities in the financial statements and the reported amounts of increases and decreases in net assets from operations. Actual results could differ from those estimates. Subsequent events after the Statement of assets and liabilities date through the date that the financial statements were issued have been evaluated in the preparation of the financial statements.
Investment income, realized and unrealized gains and losses and expenses of the fund are borne pro-rata based on the relative net assets of each class to the total net assets of the fund, except that each class bears expenses unique to that class (including the distribution fees applicable to such classes). Each class votes as a class only with respect to its own distribution plan or other matters on which a class vote is required by law or determined by the Trustees. If the fund were liquidated, shares of each class would receive their pro-rata share of the net assets of the fund. In addition, the Trustees declare separate dividends on each class of shares.
Security valuation Portfolio securities and other investments are valued using policies and procedures adopted by the Board of Trustees. The Trustees have formed a Pricing Committee to oversee the implementation of these procedures and has delegated responsibility for valuing the fund’s assets in accordance with these procedures to Putnam Management. Putnam Management has established an internal Valuation Committee that is responsible for making fair value determinations, evaluating the effectiveness of the pricing policies of the fund and reporting to the Pricing Committee.
Tax-exempt bonds and notes are generally valued on the basis of valuations provided by an independent pricing service approved by the Trustees. Such services use information with respect to transactions in bonds, quotations from bond dealers, market transactions in comparable securities and various relationships between securities in determining value. These securities will generally be categorized as Level 2.
Tax-Free High Yield Fund 47
Certain investments, including certain restricted and illiquid securities and derivatives, are also valued at fair value following procedures approved by the Trustees. To assess the continuing appropriateness of fair valuations, the Valuation Committee reviews and affirms the reasonableness of such valuations on a regular basis after considering all relevant information that is reasonably available. Such valuations and procedures are reviewed periodically by the Trustees. These valuations consider such factors as significant market or specific security events such as interest rate or credit quality changes, various relationships with other securities, discount rates, U.S. Treasury, U.S. swap and credit yields, index levels, convexity exposures, recovery rates, sales and other multiples and resale restrictions. These securities are classified as Level 2 or as Level 3 depending on the priority of the significant inputs. The fair value of securities is generally determined as the amount that the fund could reasonably expect to realize from an orderly disposition of such securities over a reasonable period of time. By its nature, a fair value price is a good faith estimate of the value of a security in a current sale and does not reflect an actual market price, which may be different by a material amount.
Security transactions and related investment income Security transactions are recorded on the trade date (the date the order to buy or sell is executed). Gains or losses on securities sold are determined on the identified cost basis.
Interest income is recorded on the accrual basis. All premiums/discounts are amortized/accreted on a yield-to-maturity basis. The premium in excess of the call price, if any, is amortized to the call date; thereafter, any remaining premium is amortized to maturity.
Securities purchased or sold on a delayed delivery basis may be settled at a future date beyond customary settlement time; interest income is accrued based on the terms of the securities. Losses may arise due to changes in the fair value of the underlying securities or if the counterparty does not perform under the contract.
Interfund lending The fund, along with other Putnam funds, may participate in an interfund lending program pursuant to an exemptive order issued by the SEC. This program allows the fund to borrow from other Putnam funds that permit such transactions. Interfund lending transactions are subject to each fund’s investment policies and borrowing and lending limits. Interest earned or paid on the interfund lending transaction will be based on the average of certain current market rates. During the reporting period, the fund did not utilize the program.
Lines of credit The fund participates, along with other Putnam funds, in a $392.5 million unsecured committed line of credit and a $235.5 million unsecured uncommitted line of credit, both provided by State Street. Borrowings may be made for temporary or emergency purposes, including the funding of shareholder redemption requests and trade settlements. Interest is charged to the fund based on the fund’s borrowing at a rate equal to the Federal Funds rate plus 1.25% for the committed line of credit and the Federal Funds rate plus 1.30% for the uncommitted line of credit. A closing fee equal to 0.04% of the committed line of credit and 0.04% of the uncommitted line of credit has been paid by the participating funds. In addition, a commitment fee of 0.11% per annum on any unutilized portion of the committed line of credit is allocated to the participating funds based on their relative net assets and paid quarterly. During the reporting period, the fund had no borrowings against these arrangements.
Federal taxes It is the policy of the fund to distribute all of its income within the prescribed time period and otherwise comply with the provisions of the Internal Revenue Code of 1986, as amended (the Code), applicable to regulated investment companies. It is also the intention of the fund to distribute an amount sufficient to avoid imposition of any excise tax under Section 4982 of the Code.
The fund is subject to the provisions of Accounting Standards Codification 740 Income Taxes (ASC 740). ASC 740 sets forth a minimum threshold for financial statement recognition of the benefit of a tax position taken or expected to be taken in a tax return. The fund did not have a liability to record for any unrecognized tax benefits in the accompanying financial statements. No provision has been made for federal taxes on income, capital gains or unrealized appreciation on securities held nor for excise tax on income and capital gains. Each of the fund’s federal tax returns for the prior three fiscal years remains subject to examination by the Internal Revenue Service.
48 Tax-Free High Yield Fund
At July 31, 2014, the fund had a capital loss carryover of $108,903,444 available to the extent allowed by the Code to offset future net capital gain, if any. The amounts of the carryovers and the expiration dates are:
Loss carryover | |||
Short-term | Long-term | Total | Expiration |
$4,428,812 | $34,077,930 | $38,506,742 | * |
4,270,473 | N/A | 4,270,473 | July 31, 2016 |
17,411,277 | N/A | 17,411,277 | July 31, 2017 |
33,971,635 | N/A | 33,971,635 | July 31, 2018 |
14,743,317 | N/A | 14,743,317 | July 31, 2019 |
* Under the Regulated Investment Company Modernization Act of 2010, the fund will be permitted to carry forward capital losses incurred in taxable years beginning after December 22, 2010 for an unlimited period. However, any losses incurred will be required to be utilized prior to the losses incurred in pre-enactment tax years. As a result of this ordering rule, pre-enactment capital loss carryforwards may be more likely to expire unused. Additionally, post-enactment capital losses that are carried forward will retain their character as either short-term or long-term capital losses rather than being considered all short-term as under previous law.
Pursuant to federal income tax regulations applicable to regulated investment companies, the fund has elected to defer certain capital losses of $3,240,382 recognized during the period between November 1, 2013 and July 31, 2014 to its fiscal year ending July 31, 2015.
The aggregate identified cost on a tax basis is $961,927,236, resulting in gross unrealized appreciation and depreciation of $119,462,510 and $24,413,496, respectively, or net unrealized appreciation of $95,049,014.
Distributions to shareholders Income dividends are recorded daily by the fund and are paid monthly. Distributions from capital gains, if any, are recorded on the ex-dividend date and paid at least annually. The amount and character of income and gains to be distributed are determined in accordance with income tax regulations which may differ from generally accepted accounting principles. Dividend sources are estimated at the time of declaration. Actual results may vary. Any non-taxable return of capital cannot be determined until final tax calculations are completed after the end of the fund’s fiscal year. Reclassifications are made to the fund’s capital accounts to reflect income and gains available for distribution (or available capital loss carryovers) under income tax regulations.
Expenses of the Trust Expenses directly charged or attributable to any fund will be paid from the assets of that fund. Generally, expenses of the Trust will be allocated among and charged to the assets of each fund on a basis that the Trustees deem fair and equitable, which may be based on the relative assets of each fund or the nature of the services performed and relative applicability to each fund.
Note 2: Management fee, administrative services and other transactions
The fund pays Putnam Management a management fee (based on the fund’s average net assets and computed and paid monthly) at annual rates that may vary based on the average of the aggregate net assets of most open-end funds, as defined in the fund’s management contract, sponsored by Putnam Management. Such annual rates may vary as follows:
0.630% | of the first $5 billion, |
0.580% | of the next $5 billion, |
0.530% | of the next $10 billion, |
0.480% | of the next $10 billion, |
0.430% | of the next $50 billion, |
0.410% | of the next $50 billion, |
0.400% | of the next $100 billion and |
0.395% | of any excess thereafter. |
Putnam Management has contractually agreed, through June 30, 2015, to waive fees or reimburse the fund’s expenses to the extent necessary to limit the cumulative expenses of the fund, exclusive of brokerage, interest, taxes, investment-related expenses, extraordinary expenses, acquired fund fees and expenses and payments under the fund’s investor servicing contract, investment management contract and distribution plans, on a fiscal year-to-date basis to an annual rate of 0.20% of the fund’s average net assets over such fiscal year-to-date period. During the reporting period, the fund’s expenses were not reduced as a result of this limit.
Tax-Free High Yield Fund 49
Putnam Investments Limited (PIL), an affiliate of Putnam Management, is authorized by the Trustees to manage a separate portion of the assets of the fund as determined by Putnam Management from time to time. Putnam Management pays a quarterly sub-management fee to PIL for its services at an annual rate of 0.40% of the average net assets of the portion of the fund managed by PIL.
The fund reimburses Putnam Management an allocated amount for the compensation and related expenses of certain officers of the fund and their staff who provide administrative services to the fund. The aggregate amount of all such reimbursements is determined annually by the Trustees.
Custodial functions for the fund’s assets are provided by State Street. Custody fees are based on the fund’s asset level, the number of its security holdings and transaction volumes.
Putnam Investor Services, Inc., an affiliate of Putnam Management, provides investor servicing agent functions to the fund. Putnam Investor Services, Inc. received fees for investor servicing based on the fund’s retail asset level, the number of shareholder accounts in the fund and the level of defined contribution plan assets in the fund. Investor servicing fees will not exceed an annual rate of 0.32% of the fund’s average net assets. During the reporting period, the expenses for each class of shares related to investor servicing fees were as follows:
Class A | $191,616 |
Class B | 2,940 |
Class C | 14,767 |
Class M | 1,947 |
Class Y | 23,323 |
Total | $234,593 |
The fund has entered into expense offset arrangements with Putnam Investor Services, Inc. and State Street whereby Putnam Investor Services, Inc.’s and State Street’s fees are reduced by credits allowed on cash balances. For the reporting period, the fund’s expenses were reduced by $677 under the expense offset arrangements.
Each Independent Trustee of the fund receives an annual Trustee fee, of which $554 as a quarterly retainer, has been allocated to the fund, and an additional fee for each Trustees meeting attended. Trustees also are reimbursed for expenses they incur relating to their services as Trustees.
The fund has adopted a Trustee Fee Deferral Plan (the Deferral Plan) which allows the Trustees to defer the receipt of all or a portion of Trustees fees payable on or after July 1, 1995. The deferred fees remain invested in certain Putnam funds until distribution in accordance with the Deferral Plan.
The fund has adopted an unfunded noncontributory defined benefit pension plan (the Pension Plan) covering all Trustees of the fund who have served as a Trustee for at least five years and were first elected prior to 2004. Benefits under the Pension Plan are equal to 50% of the Trustee’s average annual attendance and retainer fees for the three years ended December 31, 2005. The retirement benefit is payable during a Trustee’s lifetime, beginning the year following retirement, for the number of years of service through December 31, 2006. Pension expense for the fund is included in Trustee compensation and expenses in the Statement of operations. Accrued pension liability is included in Payable for Trustee compensation and expenses in the Statement of assets and liabilities. The Trustees have terminated the Pension Plan with respect to any Trustee first elected after 2003.
The fund has adopted distribution plans (the Plans) with respect to its class A, class B, class C and class M shares pursuant to Rule 12b–1 under the Investment Company Act of 1940. The purpose of the Plans is to compensate Putnam Retail Management Limited Partnership, an indirect wholly-owned subsidiary of Putnam Investments, LLC, for services provided and expenses incurred in distributing shares of the fund. The Plans provide for payments by the fund to Putnam Retail Management Limited Partnership at an annual rate of up to 0.35%, 1.00%, 1.00% and 1.00% of the average net assets attributable to class A, class B, class C and class M shares, respectively. The Trustees have approved payment by the fund at the annual rate of 0.85%, 1.00% and 0.50% of the average net assets for class B, class C and class M shares, respectively. For class A shares, the annual payment rate will equal the weighted average of (i) 0.20% of the net assets of the fund attributable to class A shares purchased and paid for prior to March 21, 2005 and (ii) 0.25% of all other net assets of the fund attributable to class A shares. During the reporting period, the class specific expenses related to distribution fees were as follows:
Class A | $950,610 |
Class B | 53,277 |
Class C | 314,766 |
Class M | 20,762 |
Total | $1,339,415 |
50 Tax-Free High Yield Fund
For the reporting period, Putnam Retail Management Limited Partnership, acting as underwriter, received net commissions of $25,260 and $420 from the sale of class A and class M shares, respectively, and received $1,558 and $30 in contingent deferred sales charges from redemptions of class B and class C shares, respectively.
A deferred sales charge of up to 1.00% is assessed on certain redemptions of class A shares. For the reporting period, Putnam Retail Management Limited Partnership, acting as underwriter, received $1,269 on class A redemptions.
Note 3: Purchases and sales of securities
During the reporting period, cost of purchases and proceeds from sales, excluding short-term investments were as follows:
Cost of purchases | Proceeds from sales | |
Investments in securities, including TBA commitments (Long-term) | $115,396,216 | $51,043,893 |
U.S. government securities (Long-term) | — | — |
Total | $115,396,216 | $51,043,893 |
Note 4: Capital shares
At the close of the reporting period, there were an unlimited number of shares of beneficial interest authorized. Transactions in capital shares were as follows:
Six months ended 1/31/15 | Year ended 7/31/14 | |||
Class A | Shares | Amount | Shares | Amount |
Shares sold | 3,626,583 | $45,360,643 | 9,257,336 | $109,855,299 |
Shares issued in connection with reinvestment of distributions | 1,191,483 | 14,900,327 | 2,547,970 | 30,246,505 |
4,818,066 | 60,260,970 | 11,805,306 | 140,101,804 | |
Shares repurchased | (5,601,184) | (69,891,759) | (17,191,301) | (203,192,342) |
Net decrease | (783,118) | $(9,630,789) | (5,385,995) | $(63,090,538) |
Six months ended 1/31/15 | Year ended 7/31/14 | |||
Class B | Shares | Amount | Shares | Amount |
Shares sold | 76,246 | $952,770 | 147,705 | $1,761,752 |
Shares issued in connection with reinvestment of distributions | 16,158 | 202,441 | 34,746 | 413,244 |
92,404 | 1,155,211 | 182,451 | 2,174,996 | |
Shares repurchased | (115,334) | (1,438,687) | (287,207) | (3,383,417) |
Net decrease | (22,930) | $(283,476) | (104,756) | $(1,208,421) |
Six months ended 1/31/15 | Year ended 7/31/14 | |||
Class C | Shares | Amount | Shares | Amount |
Shares sold | 652,890 | $8,188,798 | 892,349 | $10,700,633 |
Shares issued in connection with reinvestment of distributions | 57,537 | 721,054 | 117,165 | 1,393,257 |
710,427 | 8,909,852 | 1,009,514 | 12,093,890 | |
Shares repurchased | (470,839) | (5,872,961) | (1,942,916) | (22,813,563) |
Net increase (decrease) | 239,588 | $3,036,891 | (933,402) | $(10,719,673) |
Tax-Free High Yield Fund 51
Six months ended 1/31/15 | Year ended 7/31/14 | |||
Class M | Shares | Amount | Shares | Amount |
Shares sold | 78,040 | $974,152 | 56,031 | $669,288 |
Shares issued in connection with reinvestment of distributions | 12,984 | 162,382 | 26,358 | 312,877 |
91,024 | 1,136,534 | 82,389 | 982,165 | |
Shares repurchased | (64,139) | (799,150) | (149,873) | (1,754,213) |
Net increase (decrease) | 26,885 | $337,384 | (67,484) | $(772,048) |
Six months ended 1/31/15 | Year ended 7/31/14 | |||
Class Y | Shares | Amount | Shares | Amount |
Shares sold | 6,906,642 | $86,718,731 | 4,658,920 | $55,276,258 |
Shares issued in connection with reinvestment of distributions | 110,372 | 1,385,254 | 149,020 | 1,780,347 |
7,017,014 | 88,103,985 | 4,807,940 | 57,056,605 | |
Shares repurchased | (2,124,461) | (26,675,920) | (2,956,143) | (34,826,527) |
Net increase | 4,892,553 | $61,428,065 | 1,851,797 | $22,230,078 |
Note 5: Market, credit and other risks
In the normal course of business, the fund trades financial instruments and enters into financial transactions where risk of potential loss exists due to changes in the market (market risk) or failure of the contracting party to the transaction to perform (credit risk). The fund may be exposed to additional credit risk that an institution or other entity with which the fund has unsettled or open transactions will default. The fund may invest in higher yielding, lower rated bonds that may have a higher rate of default.
52 Tax-Free High Yield Fund
Fund information
Founded over 75 years ago, Putnam Investments was built around the concept that a balance between risk and reward is the hallmark of a well-rounded financial program. We manage over 100 funds across income, value, blend, growth, asset allocation, absolute return, and global sector categories.
Investment Manager
Putnam Investment
Management, LLC
One Post Office Square
Boston, MA 02109
Investment Sub-Manager
Putnam Investments Limited
57–59 St James’s Street
London, England SW1A 1LD
Marketing Services
Putnam Retail Management
One Post Office Square
Boston, MA 02109
Custodian
State Street Bank
and Trust Company
Legal Counsel
Ropes & Gray LLP
Trustees
Jameson A. Baxter, Chair
Liaquat Ahamed
Ravi Akhoury
Barbara M. Baumann
Charles B. Curtis
Robert J. Darretta
Katinka Domotorffy
John A. Hill
Paul L. Joskow
Kenneth R. Leibler
Robert E. Patterson
George Putnam, III
Robert L. Reynolds
W. Thomas Stephens
Officers
Robert L. Reynolds
President
Jonathan S. Horwitz
Executive Vice President,
Principal Executive Officer, and
Compliance Liaison
Steven D. Krichmar
Vice President and
Principal Financial Officer
Robert T. Burns
Vice President and
Chief Legal Officer
Robert R. Leveille
Vice President and
Chief Compliance Officer
Michael J. Higgins
Vice President, Treasurer,
and Clerk
Janet C. Smith
Vice President,
Principal Accounting Officer,
and Assistant Treasurer
Susan G. Malloy
Vice President and
Assistant Treasurer
James P. Pappas
Vice President
Mark C. Trenchard
Vice President and
BSA Compliance Officer
Nancy E. Florek
Vice President, Director of
Proxy Voting and Corporate
Governance, Assistant Clerk,
and Associate Treasurer
This report is for the information of shareholders of Putnam Tax-Free High Yield Fund. It may also be used as sales literature when preceded or accompanied by the current prospectus, the most recent copy of Putnam’s Quarterly Performance Summary, and Putnam’s Quarterly Ranking Summary. For more recent performance, please visit putnam.com. Investors should carefully consider the investment objectives, risks, charges, and expenses of a fund, which are described in its prospectus. For this and other information or to request a prospectus or summary prospectus, call 1-800-225-1581 toll free. Please read the prospectus carefully before investing. The fund’s Statement of Additional Information contains additional information about the fund’s Trustees and is available without charge upon request by calling 1-800-225-1581.
| Item 2. Code of Ethics: |
| Not applicable |
| Item 3. Audit Committee Financial Expert: |
| Not applicable |
| Item 4. Principal Accountant Fees and Services: |
| Not applicable |
| Item 5. Audit Committee of Listed Registrants |
| Not applicable |
| Item 6. Schedule of Investments: |
| The registrant’s schedule of investments in unaffiliated issuers is included in the report to shareholders in Item 1 above. |
| Item 7. Disclosure of Proxy Voting Policies and Procedures For Closed-End Management Investment Companies: |
| Not applicable |
| Item 8. Portfolio Managers of Closed-End Investment Companies |
| Not Applicable |
| Item 9. Purchases of Equity Securities by Closed-End Management Investment Companies and Affiliated Purchasers: |
| Not applicable |
| Item 10. Submission of Matters to a Vote of Security Holders: |
| Not applicable |
| Item 11. Controls and Procedures: |
| (a) The registrant’s principal executive officer and principal financial officer have concluded, based on their evaluation of the effectiveness of the design and operation of the registrant’s disclosure controls and procedures as of a date within 90 days of the filing date of this report, that the design and operation of such procedures are generally effective to provide reasonable assurance that information required to be disclosed by the registrant in this report is recorded, processed, summarized and reported within the time periods specified in the Commission’s rules and forms. |
| (b) Changes in internal control over financial reporting: Not applicable |
| Item 12. Exhibits: |
| (a)(1) Not applicable |
| (a)(2) Separate certifications for the principal executive officer and principal financial officer of the registrant as required by Rule 30a-2(a) under the Investment Company Act of 1940, as amended, are filed herewith. |
| (b) The certifications required by Rule 30a-2(b) under the Investment Company Act of 1940, as amended, are filed herewith. |
| Putnam Tax Free Income Trust |
| By (Signature and Title): |
| /s/ Janet C. Smith Janet C. Smith Principal Accounting Officer |
| Date: March 31, 2015 |
| Pursuant to the requirements of the Securities Exchange Act of 1934 and the Investment Company Act of 1940, this report has been signed below by the following persons on behalf of the registrant and in the capacities and on the dates indicated. |
| By (Signature and Title): |
| /s/ Jonathan S. Horwitz Jonathan S. Horwitz Principal Executive Officer |
| Date: March 31, 2015 |
| By (Signature and Title): |
| /s/ Steven D. Krichmar Steven D. Krichmar Principal Financial Officer |
| Date: March 31, 2015 |