| | |
| UNITED STATES
SECURITIES AND EXCHANGE COMMISSION |
| | |
| CERTIFIED SHAREHOLDER REPORT OF REGISTERED
MANAGEMENT INVESTMENT COMPANIES
|
| | |
| Investment Company Act file number: | (811-04345) |
| | |
| Exact name of registrant as specified in charter: | Putnam Tax Free Income Trust |
| | |
| Address of principal executive offices: | One Post Office Square, Boston, Massachusetts 02109 |
| | |
| Name and address of agent for service: | Robert T. Burns, Vice President
One Post Office Square
Boston, Massachusetts 02109 |
| | |
| Copy to: | John W. Gerstmayr, Esq.
Ropes & Gray LLP
800 Boylston Street
Boston, Massachusetts 02199-3600 |
| | |
| Registrant’s telephone number, including area code: | (617) 292-1000 |
| | |
| Date of fiscal year end: | July 31, 2013 |
| | |
| Date of reporting period: | August 1, 2012 — January 31, 2013 |
| | |
|
Item 1. Report to Stockholders: | |
| | |
| The following is a copy of the report transmitted to stockholders pursuant to Rule 30e-1 under the Investment Company Act of 1940: | |
Putnam
Tax-Free High Yield
Fund
Semiannual report
1 | 31 | 13
| | | |
| Message from the Trustees | 1 | | |
| | |
| About the fund | 2 | | |
| | |
| Performance snapshot | 4 | | |
| | |
| Interview with your fund’s portfolio manager | 5 | | |
| | |
| Your fund’s performance | 10 | | |
| | |
| Your fund’s expenses | 13 | | |
| | |
| Terms and definitions | 15 | | |
| | |
| Other information for shareholders | 16 | | |
| | |
| Financial statements | 17 | | |
| | |
Consider these risks before investing: Lower-rated bonds may offer higher yields in return for more risk. Capital gains, if any, are taxable for federal and, in most cases, state purposes. For some investors, investment income may be subject to the federal alternative minimum tax. Income from federally tax-exempt funds may be subject to state and local taxes. Bond investments are subject to interest-rate risk, which means the prices of the fund’s bond investments are likely to fall if interest rates rise. Bond investments also are subject to credit risk, which is the risk that the issuer of the bond may default on payment of interest or principal. Interest-rate risk is generally greater for longer-term bonds, and credit risk is generally greater for below-investment-grade bonds, which may be considered speculative. Unlike bonds, funds that invest in bonds have ongoing fees and expenses. The fund may invest significantly in particular segments of the tax-exempt debt market, making it more vulnerable to fluctuations in the values of the securities it holds than a fund that invests more broadly. The prices of bonds in the fund’s portfolio may fall or fail to rise over extended periods of time for a variety of reasons, including both general financial market conditions and factors related to a specific issuer.
Message from the Trustees
Dear Fellow Shareholder:
Stock markets around the world have continued to show strength into 2013, with the S&P 500 Index delivering its best January return since 1997. Investors witnessed several positive developments, including the U.S. fiscal cliff bill that Congress passed on January 1, 2013; the improving employment and housing situations; a more stable Europe; and China’s “soft landing” and positive growth.
Today’s market environment is one of slow and steady improvement, but uncertainties linger. Questions remain about potential economic fallout from the upcoming debt ceiling and budget sequestration debates in the United States. And the sovereign debt situation in Europe, while stabilized, is far from resolved.
At Putnam, our investment team is focused on actively managing risk and pursuing returns in today’s volatile global market. As always, it is important to rely on the guidance of your financial advisor to help you manage your investment portfolio in accordance with your goals and risk tolerance.
We would also like to extend a welcome to new shareholders of the fund and to thank all of our investors for your continued confidence in Putnam.

About the fund
Seeking high current income exempt from federal income tax
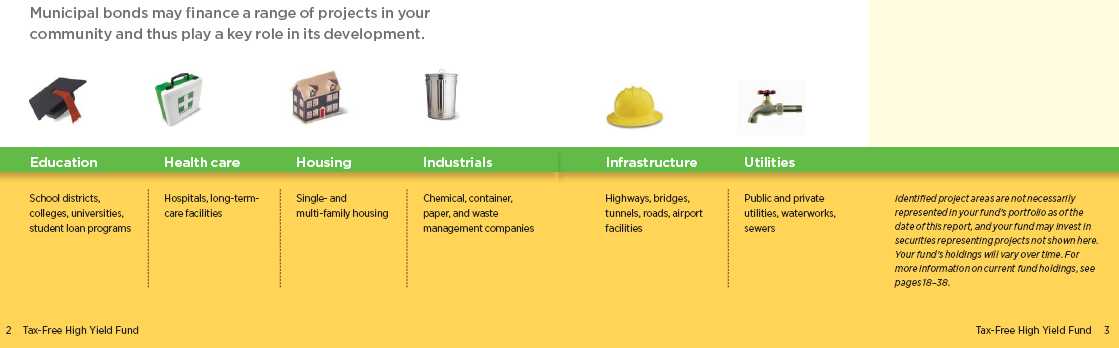
Two of the most significant challenges of fixed-income investing are low interest rates and taxes on income. Putnam Tax-Free High Yield Fund can help investors reduce the impact of both by investing in higher-yielding municipal bonds, which offer the potential for a greater stream of income along with tax advantages.
Municipal bonds are typically issued by states and local municipalities to raise funds for building and maintaining public facilities. The income from a municipal bond is generally exempt from federal income tax, and from state taxes for residents of the state in which the bond is issued.
Municipal bonds are backed by either the issuing city or town or by revenues collected from usage fees, and, as a result, have varying degrees of credit risk (the risk that the issuer will not be able to repay the bond).
Many high-yield municipal bonds are not rated by independent rating agencies such as Standard & Poor’s and Moody’s. This is mainly because many issuers decide not to pursue a rating that might be below investment grade. As a result, investment managers must do additional research to determine whether these bonds are prudent investments.
Once the fund has invested in a bond, the fund’s managers continue to monitor developments that affect the bond market, the sector, and the issuer of the bond.
The goal of this in-depth research and active management is to stay a step ahead of the industry and pinpoint opportunities for investors.
Understanding tax-equivalent yield
To understand the value of tax-free income, it is helpful to compare a municipal bond’s yield with the “tax-equivalent yield” — the before-tax yield that must be offered by a taxable bond in order to equal the municipal bond’s yield after taxes.
How to calculate tax-equivalent yield:
The tax-equivalent yield equals the municipal bond’s yield divided by “one minus the tax rate.” For example, if a municipal bond’s yield is 5%, then its tax-equivalent yield is 7.7%, assuming the maximum 35% federal tax rate for 2013.
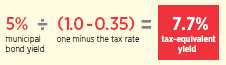
Results for investors subject to lower tax rates would not be as advantageous.
Current performance may be lower or higher than the quoted past performance, which cannot guarantee future results. Share price, principal value, and return will fluctuate, and you may have a gain or a loss when you sell your shares. Performance of class A shares assumes reinvestment of distributions and does not account for taxes. Fund returns in the bar chart do not reflect a sales charge of 4.00%; had they, returns would have been lower. See pages 5 and 10–13 for additional performance information. For a portion of the periods, the fund had expense limitations, without which returns would have been lower. A short-term trading fee of 1.00% may apply to redemptions or exchanges within the time period specified in the fund’s prospectus. To obtain the most recent month-end performance, visit putnam.com.
* Performance for class A shares before their inception (9/20/93) is derived from the historical performance of class B shares.
† Returns for the six-month period are not annualized, but cumulative.
| |
| 4 | Tax-Free High Yield Fund |
Interview with your fund’s portfolio manager

Putnam Tax-Free High Yield Fund posted gains during the first half of its fiscal year. How would you describe the investment environment?
Over the past six months, municipal bonds continued to post gains despite some heightened uncertainty for investors as 2012 came to a close. Investor and media attention centered on the fiscal cliff looming at the end of 2012. As part of the 2011 debt-ceiling negotiations, Congress had scheduled $1.2 trillion in tax increases and spending cuts to begin taking effect in January 2013 — a situation that many investors and analysts assumed would be avoided via last-minute legislation. While that turned out to be the case, uncertainty surrounding the nature of the agreement Congress would ultimately reach to avert the across-the-board tax hikes and draconian spending cuts contributed to a municipal bond sell-off in December. Many investors worried that changes to the tax treatment of municipal bonds could be in the works, and while their tax status remains unchanged to date, there is still much to be addressed on the spending side of the equation as it relates to the fiscal cliff.
These headlines, along with an increase in Treasury rates, caused the volatility and negative performance during the month of December. The municipal market reversed this trend and kicked off 2013 on a stronger note, posting positive returns for the month of January. Throughout the past six months,
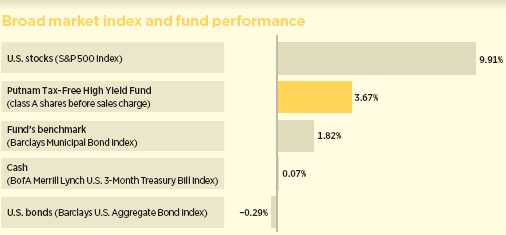
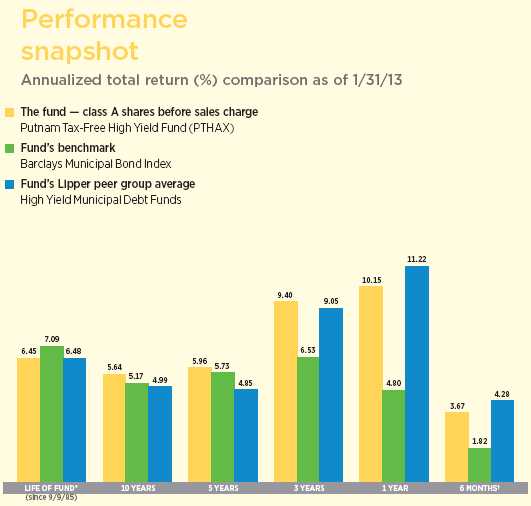
This comparison shows your fund’s performance in the context of broad market indexes for the six months ended 1/31/13. See pages 4 and 10–12 for additional fund performance information. Index descriptions can be found on pages 15–16.
| |
| Tax-Free High Yield Fund | 5 |
technical factors continued to serve as a tailwind for investors, as strong market demand generally outpaced supply.
Against this backdrop, tax-exempt bonds posted gains and outpaced the broad taxable bond market, as measured by the Barclays U.S. Aggregate Bond Index. Moreover, the fund outperformed its benchmark index, although it did trail the average return of its Lipper peer group.
How did the recent tax policy changes affect the municipal bond market?
On January 1, 2013, Congress passed a bill that brought temporary clarity to the tax landscape and delayed the automatic spending cuts for two months. The top federal income tax rates for most individuals earning more than $400,000 and couples earning more than $450,000 will rise to 39.6% for tax year 2013. In addition, taxpayers with incomes above those thresholds are subject to a 20% tax rate on long-term capital gains and qualified dividends, up from 15%. Once the new Medicare net investment income surtax is factored in, the effective tax rate can be as high as 23.8%. The legislation also phases out certain itemized deductions and personal exemptions for most individuals and couples with incomes above $250,000 and $300,000, respectively, but these provisions do not limit the exemption for municipal bond interest.
The key takeaways are that higher income earners will face higher tax burdens in 2013, and while broader tax reform is still a possibility, for the near term tax rates are now a known entity. It’s hard to predict whether changes to the tax-exempt status of municipal bonds will reenter negotiations over the coming months, but the current tax changes now in effect will likely make
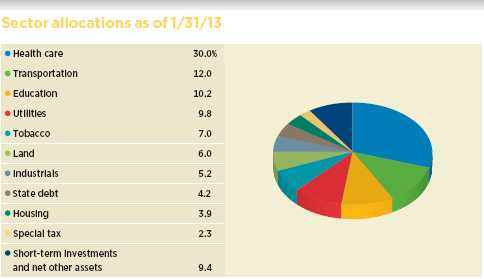
Allocations are represented as a percentage of the fund’s net assets. Summary information may differ from the portfolio schedule included in the financial statements due to the inclusion of derivative securities, any interest accruals, the exclusion of as-of trades, if any, and the use of different classifications of securities for presentation purposes. Holdings and allocations may vary over time.
| |
| 6 | Tax-Free High Yield Fund |
municipal bonds’ tax-free income attractive as part of a well-diversified portfolio.

How are states’ finances faring today?
We generally have seen improvements across the board. For fiscal year 2013, 48 states are projecting increased tax revenues versus those of 2012, according to the National Conference of State Legislatures. While this is an encouraging trend, challenges continue to exist at the local level. Many states have lowered expenses by reducing their financial support to cities and counties, and should the economy begin to decelerate in the first half of 2013, we believe that would almost certainly negatively affect municipal finances.
With this in mind, we maintain a cautious view on the outlook for local general obligation bonds [G.O.s] overall, and remain underweight. To offer shareholders some perspective, G.O. bonds represent approximately one third of the municipal bond market, while revenue bonds make up the other two thirds.
What has the default picture looked like in the municipal bond market?
For calendar year 2012, bankruptcy filings represented approximately 0.12% of the $3.6 trillion municipal bond market. This default rate is in line with historical averages, and we do not believe defaults will increase meaningfully in the near future. We do expect to see occasional isolated incidents of insolvency, however, which can create headline risk. For example, this past summer, three California cities gained national attention after filing for bankruptcy protection — moves
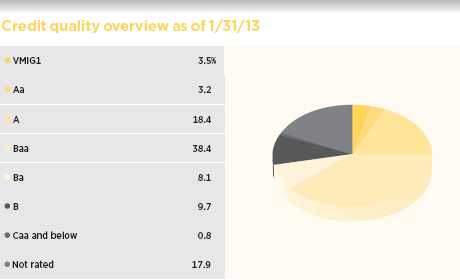
Credit qualities are shown as a percentage of portfolio market value. A bond rated Baa or higher (MIG3/VMIG3 or higher, for short-term debt) is considered investment grade. The chart reflects Moody’s ratings; percentages may include bonds or derivatives not rated by Moody’s but rated by Standard & Poor’s (S&P) or, if unrated by S&P, by Fitch ratings, and then included in the closest equivalent Moody’s rating. Ratings will vary over time.
Credit qualities are included for portfolio securities and are not included for derivative instruments and cash. The fund itself has not been rated by an independent rating agency.
| |
| Tax-Free High Yield Fund | 7 |
that captured headlines, but had a limited effect on the municipal bond market.
How did you position the portfolio during the reporting period?
We sought to benefit from improving fundamentals and still attractive spreads in the municipal bond market. To this end, we maintained our overweight positions in BBB-rated revenue bonds. While we believed that the budget challenges faced by many municipalities were significant, we were confident that conditions would improve as long as the broad economy did not stall. Our overweight to essential-service revenue bonds was offset by the fund’s underweight positioning in local G.O.s, which are securities issued at the city or county level. As the federal government looks to reduce transfer payments to the states, we believe that these types of bonds are at risk for downgrades or other headline-driven price volatility. And unlike state general obligation bonds, local G.O.s rely more on property tax revenue than on income or sales taxes. With real-estate prices still under pressure in some markets, property taxes have been slower to recover than other tax sources. In terms of sectors, relative to the benchmark index, we favored higher education, utility, and health-care bonds, including those of hospitals and continuing-care retirement communities.
Overall, this credit positioning generally helped the fund’s relative performance during its reporting period. On the other hand, our shorter duration positioning was an overall detractor from performance relative to our Lipper peers, as interest rates in the municipal bond market fell for much of the past six months. Also, an underweight position in non-rated municipal bonds hampered relative performance for the fund.
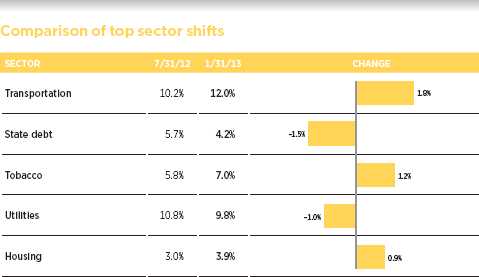
This chart shows the fund’s largest allocation shifts, by percentage, over the past six months. Allocations are represented as a percentage of the fund’s net assets. Current period summary information may differ from the portfolio schedule included in the financial statements due to the inclusion of derivative securities, any interest accruals, the exclusion of as-of trades, if any, and the use of different classifications of securities for presentation purposes. Holdings may vary over time.
| |
| 8 | Tax-Free High Yield Fund |
What is your outlook?
We have a constructive outlook for municipal bonds, though we believe that returns in 2013 will be less about price appreciation and more about coupon income in the tax-exempt market. While spreads — the difference in yield between municipal bonds of various credit ratings — are much narrower than they were at their peak, they remain attractive, in our opinion. Technical factors in the market have been positive — specifically, higher refunding activity and strong investor demand. While investors now have more near-term certainty on tax rates for 2013, there is still much to be resolved, including federal budget sequestration, the debt ceiling, and the potential for broader tax reform during the year, all of which could impact the value of municipal bonds. As always, we are monitoring the situation closely and positioning the fund accordingly.
Thank you, Paul, for bringing us up to date.
The views expressed in this report are exclusively those of Putnam Management and are subject to change. They are not meant as investment advice.
Please note that the holdings discussed in this report may not have been held by the fund for the entire period. Portfolio composition is subject to review in accordance with the fund’s investment strategy and may vary in the future. Current and future portfolio holdings are subject to risk.
Portfolio Manager Paul M. Drury has a B.A. from Suffolk University. A CFA charterholder, Paul has been in the investment industry since he joined Putnam in 1989.
In addition to Paul, your fund’s portfolio managers are Susan A. McCormack, CFA, and Thalia Meehan, CFA.
IN THE NEWS
Mixed signals are coming from the U.S. economy. On the positive side, the unemployment rate continues to tick down, the housing sector is recovering, and the stock market has reached multi-year highs. But uncertainty remains. The nation’s GDP was essentially flat in the fourth quarter of 2012, after several consecutive quarters of expansion. A precipitous drop in military spending contributed to the slowdown, and many questions remain about government spending and its impact on GDP going forward. Consumer confidence recently dropped following the tax increases resulting from the fiscal cliff resolution, as people anticipate the pinch of less take-home pay. The next few months should provide clearer direction for the markets on government spending and the resilience of the recovery.
| |
| Tax-Free High Yield Fund | 9 |
Your fund’s performance
This section shows your fund’s performance, price, and distribution information for periods ended January 31, 2013, the end of the first half of its current fiscal year. In accordance with regulatory requirements for mutual funds, we also include performance information as of the most recent calendar quarter-end and expense information taken from the fund’s current prospectus. Performance should always be considered in light of a fund’s investment strategy. Data represent past performance. Past performance does not guarantee future results. More recent returns may be less or more than those shown. Investment return and principal value will fluctuate, and you may have a gain or a loss when you sell your shares. Performance information does not reflect any deduction for taxes a shareholder may owe on fund distributions or on the redemption of fund shares. For the most recent month-end performance, please visit the Individual Investors section at putnam.com or call Putnam at 1-800-225-1581. Class Y shares are not available to all investors. See the Terms and Definitions section in this report for definitions of the share classes offered by your fund.
Fund performance Total return for periods ended 1/31/13
| | | | | | | | | |
| | Class A | Class B | Class C | Class M | Class Y |
| (inception dates) | (9/20/93) | (9/9/85) | (2/1/99) | (12/29/94) | (1/2/08) |
|
| | Before | After | | | | | Before | After | Net |
| | sales | sales | Before | After | Before | After | sales | sales | asset |
| | charge | charge | CDSC | CDSC | CDSC | CDSC | charge | charge | value |
|
| Annual average (life of fund) | 6.45% | 6.29% | 6.00% | 6.00% | 5.61% | 5.61% | 6.21% | 6.08% | 6.17% |
|
| 10 years | 73.16 | 66.12 | 62.49 | 62.49 | 60.35 | 60.35 | 68.36 | 62.72 | 70.14 |
| Annual average | 5.64 | 5.21 | 4.97 | 4.97 | 4.84 | 4.84 | 5.35 | 4.99 | 5.46 |
|
| 5 years | 33.56 | 28.25 | 29.47 | 27.47 | 28.63 | 28.63 | 31.80 | 27.49 | 35.43 |
| Annual average | 5.96 | 5.10 | 5.30 | 4.97 | 5.16 | 5.16 | 5.68 | 4.98 | 6.25 |
|
| 3 years | 30.95 | 25.65 | 28.48 | 25.48 | 27.93 | 27.93 | 29.90 | 25.75 | 31.91 |
| Annual average | 9.40 | 7.91 | 8.71 | 7.86 | 8.56 | 8.56 | 9.11 | 7.94 | 9.67 |
|
| 1 year | 10.15 | 5.69 | 9.43 | 4.43 | 9.27 | 8.27 | 9.83 | 6.27 | 10.35 |
|
| 6 months | 3.67 | –0.48 | 3.36 | –1.64 | 3.17 | 2.17 | 3.52 | 0.13 | 3.70 |
|
Current performance may be lower or higher than the quoted past performance, which cannot guarantee future results. After-sales-charge returns for class A and M shares reflect the deduction of the maximum 4.00% and 3.25% sales charge, respectively, levied at the time of purchase. Class B share returns after contingent deferred sales charge (CDSC) reflect the applicable CDSC, which is 5% in the first year, declining over time to 1% in the sixth year, and is eliminated thereafter. Class C share returns after CDSC reflect a 1% CDSC for the first year that is eliminated thereafter. Class Y shares have no initial sales charge or CDSC. Performance for class A, C, M, and Y shares before their inception is derived from the historical performance of class B shares, adjusted for the applicable sales charge (or CDSC) and, for class C shares, the higher operating expenses for such shares.
For a portion of the periods, the fund had expense limitations, without which returns would have been lower.
A short-term trading fee of 1% may apply to redemptions or exchanges within the time period specified in the fund’s prospectus.
Class B share performance does not assume conversion to class A shares.
| |
| 10 | Tax-Free High Yield Fund |
Fund price and distribution information For the six-month period ended 1/31/13
| | | | | | | |
| Distributions | Class A | Class B | Class C | Class M | Class Y |
|
| Number | 6 | 6 | 6 | 6 | 6 |
|
| Income 1 | $0.280201 | $0.240496 | $0.230761 | $0.263147 | $0.295330 |
|
| Capital gains 2 | — | — | — | — | — |
|
| Total | $0.280201 | $0.240496 | $0.230761 | $0.263147 | $0.295330 |
|
| | Before | After | Net | Net | Before | After | Net |
| | sales | sales | asset | asset | sales | sales | asset |
| Share value | charge | charge | value | value | charge | charge | value |
|
| 7/31/12 | $12.66 | $13.19 | $12.68 | $12.69 | $12.66 | $13.09 | $12.70 |
|
| 1/31/13 | 12.84 | 13.38 | 12.86 | 12.86 | 12.84 | 13.27 | 12.87 |
|
| | Before | After | Net | Net | Before | After | Net |
| | sales | sales | asset | asset | sales | sales | asset |
| Current rate (end of period) | charge | charge | value | value | charge | charge | value |
|
| Current dividend rate 3 | 4.07% | 3.91% | 3.45% | 3.30% | 3.81% | 3.69% | 4.30% |
|
| Taxable equivalent 4 | 7.19 | 6.91 | 6.10 | 5.83 | 6.73 | 6.52 | 7.60 |
|
| Current 30-day SEC yield | | | | | | | |
| (with expense limitation) 5 | N/A | 3.27 | 2.80 | 2.65 | N/A | 3.04 | 3.65 |
|
| Taxable equivalent 4 | N/A | 5.78 | 4.95 | 4.68 | N/A | 5.37 | 6.45 |
|
The classification of distributions, if any, is an estimate. Before-sales-charge share value and current dividend rate for class A and M shares, if applicable, do not take into account any sales charge levied at the time of purchase. After-sales-charge share value, current dividend rate, and current 30-day SEC yield, if applicable, are calculated assuming that the maximum sales charge (4.00% for class A shares and 3.25% for class M shares) was levied at the time of purchase. Final distribution information will appear on your year-end tax forms.
1 For some investors, investment income may be subject to the federal alternative minimum tax.
2 Capital gains, if any, are taxable for federal and, in most cases, state purposes.
3 Most recent distribution, excluding capital gains, annualized and divided by share price before or after sales charge at period-end.
4 Assumes maximum 43.40% federal and state combined tax rate for 2013. Results for investors subject to lower tax rates would not be as advantageous.
5 Based only on investment income and calculated using the maximum offering price for each share class, in accordance with SEC guidelines.
| |
| Tax-Free High Yield Fund | 11 |
Comparative index returns For periods ended 1/31/13
| | |
| | | Lipper High Yield |
| | Barclays Municipal | Municipal Debt Funds |
| | Bond Index | category average* |
|
| Annual average (life of fund) | 7.09% | 6.48% |
|
| 10 years | 65.59 | 63.03 |
| Annual average | 5.17 | 4.99 |
|
| 5 years | 32.15 | 26.95 |
| Annual average | 5.73 | 4.85 |
|
| 3 years | 20.89 | 29.72 |
| Annual average | 6.53 | 9.05 |
|
| 1 year | 4.80 | 11.22 |
|
| 6 months | 1.82 | 4.28 |
|
Index and Lipper results should be compared with fund performance before sales charge, before CDSC, or at net asset value.
* Over the 6-month, 1-year, 3-year, 5-year, 10-year, and life-of-fund periods ended 1/31/13, there were 120, 119, 108, 90, 66, and 5 funds, respectively, in this Lipper category.
Fund performance as of most recent calendar quarter
Total return for periods ended 12/31/12
| | | | | | | | | |
| | Class A | Class B | Class C | Class M | Class Y |
| (inception dates) | (9/20/93) | (9/9/85) | (2/1/99) | (12/29/94) | (1/2/08) |
|
| | Before | After | | | | | Before | After | Net |
| | sales | sales | Before | After | Before | After | sales | sales | asset |
| | charge | charge | CDSC | CDSC | CDSC | CDSC | charge | charge | value |
|
| Annual average (life of fund) | 6.43% | 6.27% | 5.98% | 5.98% | 5.59% | 5.59% | 6.19% | 6.06% | 6.16% |
|
| 10 years | 71.37 | 64.46 | 60.85 | 60.85 | 58.69 | 58.69 | 66.60 | 61.05 | 68.42 |
| Annual average | 5.53 | 5.10 | 4.87 | 4.87 | 4.73 | 4.73 | 5.24 | 4.88 | 5.35 |
|
| 5 years | 34.15 | 28.80 | 30.00 | 28.00 | 29.23 | 29.23 | 32.39 | 28.01 | 36.08 |
| Annual average | 6.05 | 5.19 | 5.39 | 5.06 | 5.26 | 5.26 | 5.77 | 5.06 | 6.36 |
|
| 3 years | 31.46 | 26.21 | 28.97 | 25.97 | 28.60 | 28.60 | 30.38 | 26.14 | 32.56 |
| Annual average | 9.55 | 8.07 | 8.85 | 8.00 | 8.75 | 8.75 | 9.25 | 8.05 | 9.85 |
|
| 1 year | 13.03 | 8.53 | 12.29 | 7.29 | 12.22 | 11.22 | 12.71 | 9.02 | 13.33 |
|
| 6 months | 4.70 | 0.51 | 4.37 | –0.63 | 4.37 | 3.37 | 4.58 | 1.14 | 4.90 |
|
See the discussion following the Fund performance table on page 10 for information about the calculation of fund performance.
| |
| 12 | Tax-Free High Yield Fund |
Your fund’s expenses
As a mutual fund investor, you pay ongoing expenses, such as management fees, distribution fees (12b-1 fees), and other expenses. Using the following information, you can estimate how these expenses affect your investment and compare them with the expenses of other funds. You may also pay one-time transaction expenses, including sales charges (loads) and redemption fees, which are not shown in this section and would have resulted in higher total expenses. For more information, see your fund’s prospectus or talk to your financial representative.
Expense ratios
| | | | | |
| | Class A | Class B | Class C | Class M | Class Y |
|
| Total annual operating expenses for the fiscal | | | | | |
| year ended 7/31/12 | 0.82% | 1.43% | 1.58% | 1.08% | 0.58% |
|
| Annualized expense ratio for the six-month | | | | | |
| period ended 1/31/13 | 0.80% | 1.42% | 1.57% | 1.07% | 0.57% |
|
Fiscal-year expense information in this table is taken from the most recent prospectus, is subject to change, and may differ from that shown for the annualized expense ratio and in the financial highlights of this report. Expenses are shown as a percentage of average net assets.
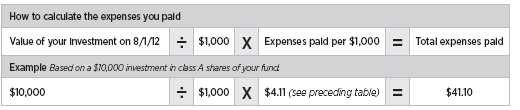
Expenses per $1,000
The following table shows the expenses you would have paid on a $1,000 investment in the fund from August 1, 2012, to January 31, 2013. It also shows how much a $1,000 investment would be worth at the close of the period, assuming actual returns and expenses.
| | | | | |
| | Class A | Class B | Class C | Class M | Class Y |
|
| Expenses paid per $1,000*† | $4.11 | $7.28 | $8.04 | $5.49 | $2.93 |
|
| Ending value (after expenses) | $1,036.70 | $1,033.60 | $1,031.70 | $1,035.20 | $1,037.00 |
|
* Expenses for each share class are calculated using the fund’s annualized expense ratio for each class, which represents the ongoing expenses as a percentage of average net assets for the six months ended 1/31/13. The expense ratio may differ for each share class.
† Expenses are calculated by multiplying the expense ratio by the average account value for the period; then multiplying the result by the number of days in the period; and then dividing that result by the number of days in the year.
| |
| Tax-Free High Yield Fund | 13 |
Estimate the expenses you paid
To estimate the ongoing expenses you paid for the six months ended January 31, 2013, use the following calculation method. To find the value of your investment on August 1, 2012, call Putnam at 1-800-225-1581.
Compare expenses using the SEC’s method
The Securities and Exchange Commission (SEC) has established guidelines to help investors assess fund expenses. Per these guidelines, the following table shows your fund’s expenses based on a $1,000 investment, assuming a hypothetical 5% annualized return. You can use this information to compare the ongoing expenses (but not transaction expenses or total costs) of investing in the fund with those of other funds. All mutual fund shareholder reports will provide this information to help you make this comparison. Please note that you cannot use this information to estimate your actual ending account balance and expenses paid during the period.
| | | | | |
| | Class A | Class B | Class C | Class M | Class Y |
|
| Expenses paid per $1,000*† | $4.08 | $7.22 | $7.98 | $5.45 | $2.91 |
|
| Ending value (after expenses) | $1,021.17 | $1,018.05 | $1,017.29 | $1,019.81 | $1,022.33 |
|
* Expenses for each share class are calculated using the fund’s annualized expense ratio for each class, which represents the ongoing expenses as a percentage of average net assets for the six months ended 1/31/13. The expense ratio may differ for each share class.
† Expenses are calculated by multiplying the expense ratio by the average account value for the period; then multiplying the result by the number of days in the period; and then dividing that result by the number of days in the year.
| |
| 14 | Tax-Free High Yield Fund |
Terms and definitions
Important terms
Total return shows how the value of the fund’s shares changed over time, assuming you held the shares through the entire period and reinvested all distributions in the fund.
Before sales charge, or net asset value, is the price, or value, of one share of a mutual fund, without a sales charge. Before-sales-charge figures fluctuate with market conditions, and are calculated by dividing the net assets of each class of shares by the number of outstanding shares in the class.
After sales charge is the price of a mutual fund share plus the maximum sales charge levied at the time of purchase. After-sales-charge performance figures shown here assume the 4.00% maximum sales charge for class A shares and 3.25% for class M shares.
Contingent deferred sales charge (CDSC) is generally a charge applied at the time of the redemption of class B or C shares and assumes redemption at the end of the period. Your fund’s class B CDSC declines over time from a 5% maximum during the first year to 1% during the sixth year. After the sixth year, the CDSC no longer applies. The CDSC for class C shares is 1% for one year after purchase.
Share classes
Class A shares are generally subject to an initial sales charge and no CDSC (except on certain redemptions of shares bought without an initial sales charge).
Class B shares are not subject to an initial sales charge. They may be subject to a CDSC.
Class C shares are not subject to an initial sales charge and are subject to a CDSC only if the shares are redeemed during the first year.
Class M shares have a lower initial sales charge and a higher 12b-1 fee than class A shares and no CDSC.
Class Y shares are not subject to an initial sales charge or CDSC, and carry no 12b-1 fee. They are generally only available to corporate and institutional clients and clients in other approved programs.
Fixed-income terms
Current yield is the annual rate of return earned from dividends or interest of an investment. Current yield is expressed as a percentage of the price of a security, fund share, or principal investment.
Yield curve is a graph that plots the yields of bonds with equal credit quality against their differing maturity dates, ranging from shortest to longest. It is used as a benchmark for other debt, such as mortgage or bank lending rates.
Comparative indexes
Barclays Municipal Bond Index is an unmanaged index of long-term fixed-rate investment-grade tax-exempt bonds.
Barclays U.S. Aggregate Bond Index is an unmanaged index of U.S. investment-grade fixed-income securities.
BofA (Bank of America) Merrill Lynch U.S. 3-Month Treasury Bill Index is an unmanaged index that seeks to measure the performance of U.S. Treasury bills available in the marketplace.
S&P 500 Index is an unmanaged index of common stock performance.
Indexes assume reinvestment of all distributions and do not account for fees. Securities and performance of a fund and an index will differ. You cannot invest directly in an index.
| |
| Tax-Free High Yield Fund | 15 |
Lipper is a third-party industry-ranking entity that ranks mutual funds. Its rankings do not reflect sales charges. Lipper rankings are based on total return at net asset value relative to other funds that have similar current investment styles or objectives as determined by Lipper. Lipper may change a fund’s category assignment at its discretion. Lipper category averages reflect performance trends for funds within a category.
Other information for shareholders
Important notice regarding delivery of shareholder documents
In accordance with Securities and Exchange Commission (SEC) regulations, Putnam sends a single copy of annual and semiannual shareholder reports, prospectuses, and proxy statements to Putnam shareholders who share the same address, unless a shareholder requests otherwise. If you prefer to receive your own copy of these documents, please call Putnam at 1-800-225-1581, and Putnam will begin sending individual copies within 30 days.
Proxy voting
Putnam is committed to managing our mutual funds in the best interests of our shareholders. The Putnam funds’ proxy voting guidelines and procedures, as well as information regarding how your fund voted proxies relating to portfolio securities during the 12-month period ended June 30, 2012, are available in the Individual Investors section of putnam.com, and on the SEC’s website, www.sec.gov. If you have questions about finding forms on the SEC’s website, you may call the SEC at 1-800-SEC-0330. You may also obtain the Putnam funds’ proxy voting guidelines and procedures at no charge by calling Putnam’s Shareholder Services at 1-800-225-1581.
Fund portfolio holdings
The fund will file a complete schedule of its portfolio holdings with the SEC for the first and third quarters of each fiscal year on Form N-Q. Shareholders may obtain the fund’s Forms N-Q on the SEC’s website at www.sec.gov. In addition, the fund’s Forms N-Q may be reviewed and copied at the SEC’s Public Reference Room in Washington, D.C. You may call the SEC at 1-800-SEC-0330 for information about the SEC’s website or the operation of the Public Reference Room.
Trustee and employee fund ownership
Putnam employees and members of the Board of Trustees place their faith, confidence, and, most importantly, investment dollars in Putnam mutual funds. As of January 31, 2013, Putnam employees had approximately $364,000,000 and the Trustees had approximately $87,000,000 invested in Putnam mutual funds. These amounts include investments by the Trustees’ and employees’ immediate family members as well as investments through retirement and deferred compensation plans.
| |
| 16 | Tax-Free High Yield Fund |
Financial statements
A guide to financial statements
These sections of the report, as well as the accompanying Notes, constitute the fund’s financial statements.
The fund’s portfolio lists all the fund’s investments and their values as of the last day of the reporting period. Holdings are organized by asset type and industry sector, country, or state to show areas of concentration and diversification.
Statement of assets and liabilities shows how the fund’s net assets and share price are determined. All investment and non-investment assets are added together. Any unpaid expenses and other liabilities are subtracted from this total. The result is divided by the number of shares to determine the net asset value per share, which is calculated separately for each class of shares. (For funds with preferred shares, the amount subtracted from total assets includes the liquidation preference of preferred shares.)
Statement of operations shows the fund’s net investment gain or loss. This is done by first adding up all the fund’s earnings — from dividends and interest income — and subtracting its operating expenses to determine net investment income (or loss). Then, any net gain or loss the fund realized on the sales of its holdings — as well as any unrealized gains or losses over the period — is added to or subtracted from the net investment result to determine the fund’s net gain or loss for the fiscal period.
Statement of changes in net assets shows how the fund’s net assets were affected by the fund’s net investment gain or loss, by distributions to shareholders, and by changes in the number of the fund’s shares. It lists distributions and their sources (net investment income or realized capital gains) over the current reporting period and the most recent fiscal year-end. The distributions listed here may not match the sources listed in the Statement of operations because the distributions are determined on a tax basis and may be paid in a different period from the one in which they were earned. Dividend sources are estimated at the time of declaration. Actual results may vary. Any non-taxable return of capital cannot be determined until final tax calculations are completed after the end of the fund’s fiscal year.
Financial highlights provide an overview of the fund’s investment results, per-share distributions, expense ratios, net investment income ratios, and portfolio turnover in one summary table, reflecting the five most recent reporting periods. In a semiannual report, the highlights table also includes the current reporting period.
| |
| Tax-Free High Yield Fund | 17 |
The fund’s portfolio 1/31/13 (Unaudited)
| |
| Key to holding’s abbreviations | |
| ABAG Association Of Bay Area Governments | G.O. Bonds General Obligation Bonds |
| AGM Assured Guaranty Municipal Corporation | NATL National Public Finance Guarantee Corp. |
| AGO Assured Guaranty, Ltd. | Radian Insd. Radian Group Insured |
| AMBAC AMBAC Indemnity Corporation | VRDN Variable Rate Demand Notes, which are floating- |
| Cmnwlth. of PR Gtd. Commonwealth of Puerto | rate securities with long-term maturities, that carry |
| Rico Guaranteed | coupons that reset every one or seven days. The rate |
| COP Certificates of Participation | shown is the current interest rate at the close of the |
| FRB Floating Rate Bonds: the rate shown is the current | reporting period. |
| interest rate at the close of the reporting period | |
| | | |
| MUNICIPAL BONDS AND NOTES (97.9%)* | Rating** | Principal amount | Value |
|
| Alabama (0.9%) | | | |
| Cullman Cnty., Hlth. Care Auth. Rev. Bonds | | | |
| (Cullman Regl. Med. Ctr.), Ser. A, 7s, 2/1/36 | Ba1 | $4,800,000 | $5,262,960 |
|
| Selma, Indl. Dev. Board Rev. Bonds (Gulf | | | |
| Opportunity Zone Intl. Paper Co.), Ser. A | | | |
| 6 1/4s, 11/1/33 | BBB | 3,000,000 | 3,421,680 |
| 5.8s, 5/1/34 | BBB | 1,750,000 | 1,973,107 |
|
| | | | 10,657,747 |
| Arizona (4.1%) | | | |
| Apache Cnty., Indl. Dev. Auth. Poll. Control | | | |
| Rev. Bonds (Tucson Elec. Pwr. Co.), Ser. A, | | | |
| 4 1/2s, 3/1/30 | Baa3 | 3,000,000 | 3,127,020 |
|
| AZ State Sports & Tourism Auth. Rev. Bonds | | | |
| (Multipurpose Stadium Fac.), Ser. A, 5s, 7/1/31 | A1 | 5,000,000 | 5,626,350 |
|
| Casa Grande, Indl. Dev. Auth. Rev. Bonds (Casa | | | |
| Grande Regl. Med. Ctr.), Ser. A | | | |
| 7 5/8s, 12/1/29 | BB–/P | 5,575,000 | 5,783,225 |
| 7 1/4s, 12/1/19 | BB–/P | 500,000 | 518,800 |
|
| Cochise Cnty., Indl. Dev. Auth. Rev. Bonds | | | |
| (Sierra Vista Regl. Hlth. Ctr.), 7 3/4s, 12/1/30 | BBB+/P | 2,735,000 | 2,782,971 |
| (Sierra Vista Cmnty. Hosp.), 6.45s, 12/1/17 | BBB+/P | 1,295,000 | 1,394,805 |
| (Sierra Vista Regl. Hlth. Ctr.), Ser. A, | | | |
| 6.2s, 12/1/21 | BBB+/P | 790,000 | 902,338 |
|
| Coconino Cnty., Poll. Control Rev. Bonds (Tucson | | | |
| Elec. Pwr. Co. — Navajo), Ser. A, 5 1/8s, 10/1/32 | Baa3 | 4,000,000 | 4,262,880 |
|
| Glendale, Indl. Dev. Auth. Rev. Bonds (John C. | | | |
| Lincoln Hlth. Network), 5s, 12/1/42 | BBB+ | 1,100,000 | 1,142,855 |
|
| Maricopa Cnty., Poll. Control Rev. Bonds (El Paso | | | |
| Elec. Co.), Ser. A, 7 1/4s, 2/1/40 | Baa2 | 4,800,000 | 5,696,495 |
|
| Phoenix, Indl. Dev. Auth. Ed. Rev. Bonds | | | |
| (Great Hearts Academies Project), 6.3s, 7/1/42 | BBB/F | 430,000 | 464,589 |
| (Choice Academies, Inc.), 5 3/8s, 9/1/32 | BB+ | 2,000,000 | 2,047,260 |
|
| Phoenix, Indl. Dev. Auth. Ed. 144A Rev. Bonds | | | |
| (Career Success Schools), 7 1/8s, 1/1/45 | BB+ | 500,000 | 528,205 |
|
| Pima Cnty., Indl. Dev. Auth. Rev. Bonds | | | |
| (Tucson Elec. Pwr. Co.), Ser. A, 6 3/8s, 9/1/29 | Baa3 | 2,500,000 | 2,506,650 |
|
| |
| 18 | Tax-Free High Yield Fund |
| | | |
| MUNICIPAL BONDS AND NOTES (97.9%)* cont. | Rating** | Principal amount | Value |
|
| Arizona cont. | | | |
| Pima Cnty., Indl. Dev. Auth. Rev. Bonds | | | |
| (Horizon Cmnty. Learning Ctr.), 5 1/4s, 6/1/35 | BBB | $1,395,000 | $1,394,887 |
| (Horizon Cmnty. Learning Ctr.), 5.05s, 6/1/25 | BBB | 2,450,000 | 2,443,140 |
|
| Salt Verde, Fin. Corp. Gas Rev. Bonds | | | |
| 5s, 12/1/37 | A– | 1,430,000 | 1,638,922 |
| 5s, 12/1/32 | A– | 1,500,000 | 1,739,850 |
|
| Tempe, Indl. Dev. Auth. Rev. Bonds (Friendship | | | |
| Village), Ser. A, 6s, 12/1/32 | BB–/P | 1,350,000 | 1,474,430 |
|
| Yavapai Cnty., Indl. Dev. Ed. Auth. Rev. Bonds | | | |
| (Agribusiness & Equine Ctr.), 5s, 3/1/32 | BB+ | 1,600,000 | 1,594,096 |
|
| | | | 48,129,628 |
| Arkansas (0.2%) | | | |
| Arkadelphia, Pub. Ed. Fac. Board Rev. Bonds | | | |
| (Ouachita Baptist U.), 6s, 3/1/33 | BB+/P | 2,000,000 | 2,208,960 |
|
| | | | 2,208,960 |
| California (15.0%) | | | |
| ABAG Fin. Auth. for Nonprofit Corps. Rev. Bonds | | | |
| (Episcopal Sr. Cmnty.), 6s, 7/1/31 | BBB | 1,295,000 | 1,524,811 |
| (Episcopal Sr. Cmntys.), Ser. A, 5s, 7/1/42 | BBB | 1,000,000 | 1,067,200 |
|
| CA Rev. Bonds (Catholic Hlth. Care West), | | | |
| Ser. A, 6s, 7/1/39 | A | 5,000,000 | 5,817,450 |
|
| CA Edl. Fac. Auth. Rev. Bonds | | | |
| (Pacific U.), Ser. A, 5s, 11/1/42 | A2 | 785,000 | 866,114 |
| (U. of La Verne), Ser. A, 5s, 6/1/35 | Baa2 | 1,500,000 | 1,550,714 |
|
| CA Hlth. Fac. Fin. Auth. Rev. Bonds (Stanford | | | |
| Hosp. Clinics), Ser. A, 5s, 8/15/42 | Aa3 | 3,000,000 | 3,432,480 |
|
| CA Muni. Fin. Auth. COP (Cmnty. Hosp. | | | |
| Central CA) | | | |
| 5 1/4s, 2/1/46 | Baa2 | 7,000,000 | 7,330,120 |
| 5 1/4s, 2/1/37 | Baa2 | 3,205,000 | 3,385,216 |
|
| CA Muni. Fin. Auth. Rev. Bonds (Emerson | | | |
| College), 6s, 1/1/42 | Baa1 | 3,330,000 | 3,998,831 |
|
| CA Poll. Control Fin. Auth. Rev. Bonds (Wtr. | | | |
| Furnishing), 5s, 11/21/45 | Baa3 | 6,000,000 | 6,251,100 |
|
| CA Poll. Control Fin. Auth. Solid Waste Disp. 144A | | | |
| Rev. Bonds (Waste Management, Inc.), Ser. A-2, | | | |
| 5.4s, 4/1/25 | BBB | 2,000,000 | 2,129,840 |
|
| CA State G.O. Bonds | | | |
| 5 1/4s, 4/1/35 | A1 | 7,000,000 | 8,246,350 |
| 5s, 9/1/30 | A1 | 7,500,000 | 8,793,224 |
|
| CA State Muni. Fin. Auth. Charter School Rev. | | | |
| Bonds (Partnerships Uplift Cmnty.), Ser. A | | | |
| 5 1/4s, 8/1/42 | BB+ | 850,000 | 873,001 |
| 5s, 8/1/32 | BB+ | 665,000 | 674,024 |
|
| CA State Pub. Wks. Board Rev. Bonds | | | |
| Ser. I-1, 6 5/8s, 11/1/34 | A2 | 3,725,000 | 4,604,583 |
| Ser. A-1, 6s, 3/1/35 | A2 | 2,000,000 | 2,410,840 |
| (States Prisons — LA), Ser. C, 5 3/4s, 10/1/31 | A2 | 1,000,000 | 1,203,990 |
| (Dept. of Forestry & Fire), Ser. E, 5s, 11/1/32 | A2 | 1,750,000 | 1,902,653 |
| (Judicial Council Projects), Ser. D, 5s, 12/1/31 | A2 | 1,000,000 | 1,135,710 |
| (Capital Projects), Ser. A, 5s, 4/1/30 | A2 | 5,000,000 | 5,722,000 |
|
| |
| Tax-Free High Yield Fund | 19 |
| | | |
| MUNICIPAL BONDS AND NOTES (97.9%)* cont. | Rating** | Principal amount | Value |
|
| California cont. | | | |
| CA Statewide Cmnty. Dev. Auth. Rev. Bonds | | | |
| (American Baptist Homes West), | | | |
| 6 1/4s, 10/1/39 | BBB | $2,500,000 | $2,839,750 |
| (Terraces at San Joaquin Gardens), Ser. A, | | | |
| 6s, 10/1/42 | BB/P | 1,750,000 | 1,897,945 |
| (Irvine, LLC-UCI East Campus), 6s, 5/15/40 | Baa2 | 6,000,000 | 6,613,440 |
| (Terraces at San Joaquin Gardens), Ser. A, | | | |
| 5 5/8s, 10/1/32 | BB/P | 1,105,000 | 1,178,228 |
| (U. CA Irvine E. Campus Apts. Phase 1), | | | |
| 5 3/8s, 5/15/38 | Baa2 | 1,500,000 | 1,657,380 |
| (Sr. Living-Presbyterian Homes), Ser. A, | | | |
| 4 7/8s, 11/15/36 | BBB– | 1,000,000 | 1,006,960 |
|
| CA Statewide Cmnty. Dev. Auth. 144A Rev. Bonds | | | |
| (Thomas Jefferson School of Law), Ser. A, | | | |
| 7 1/4s, 10/1/38 | BB | 2,025,000 | 2,059,344 |
| (Front Porch Cmntys. & Svcs.), Ser. A, | | | |
| 5 1/8s, 4/1/37 | BBB | 3,300,000 | 3,469,059 |
|
| Cathedral City, Impt. Board Act of 1915 Special | | | |
| Assmt. Bonds (Cove Impt. Dist.), Ser. 04-02 | | | |
| 5.05s, 9/2/35 | BB+/P | 1,780,000 | 1,782,350 |
| 5s, 9/2/30 | BB+/P | 1,695,000 | 1,704,221 |
|
| Chula Vista, Cmnty. Fac. Dist. Special Tax Rev. | | | |
| Bonds (No. 07-I Otay Ranch Village Eleven) | | | |
| 5.8s, 9/1/28 | BB+/P | 1,775,000 | 1,804,998 |
| 5.1s, 9/1/26 | BB+/P | 335,000 | 342,109 |
|
| Foothill/Eastern Corridor Agcy. Rev. Bonds | | | |
| (CA Toll Road), 5.85s, 1/15/23 | Baa3 | 1,500,000 | 1,549,935 |
| (CA Toll Road), 5 3/4s, 1/15/40 | Baa3 | 3,200,000 | 3,202,880 |
| zero %, 1/15/38 | Baa3 | 9,000,000 | 2,015,550 |
| zero %, 1/15/37 | Baa3 | 5,000,000 | 1,188,950 |
| zero %, 1/15/30 | Baa3 | 6,000,000 | 2,192,880 |
|
| Golden State Tobacco Securitization | | | |
| Corp. Rev. Bonds | | | |
| Ser. A-2, 5.3s, 6/1/37 | B3 | 9,000,000 | 8,273,880 |
| Ser. A-1, 5s, 6/1/33 | B3 | 5,000,000 | 4,707,650 |
| Ser. A-1, 4 1/2s, 6/1/27 | B | 2,000,000 | 1,890,640 |
|
| Irvine Pub. Fac. & Infrastructure Auth. Special | | | |
| Assmt. Bonds, Ser. A, 4 1/2s, 9/2/26 | BBB+ | 1,000,000 | 1,033,570 |
|
| Irvine, Impt. Board Act of 1915 Special Assmt. | | | |
| Bonds (Dist. No. 03-19) | | | |
| 5s, 9/2/29 | BB–/P | 1,650,000 | 1,633,434 |
| 5s, 9/2/25 | BB–/P | 1,255,000 | 1,260,547 |
|
| Irvine, Impt. Board Act of 1915 Ltd. Oblig. Special | | | |
| Assmt. Bonds (No. 03-19 Group 4), 5s, 9/2/29 | BB/P | 655,000 | 678,678 |
|
| Los Angeles, Regl. Arpt. Impt. Corp. Lease Rev. | | | |
| Bonds (Laxfuel Corp.), 5s, 1/1/32 | A | 1,500,000 | 1,652,730 |
|
| M-S-R Energy Auth. Rev. Bonds | | | |
| Ser. A, 6 1/2s, 11/1/39 | A– | 1,250,000 | 1,716,675 |
| Ser. B, 6 1/2s, 11/1/39 | A– | 2,000,000 | 2,746,680 |
|
| |
| 20 | Tax-Free High Yield Fund |
| | | |
| MUNICIPAL BONDS AND NOTES (97.9%)* cont. | Rating** | Principal amount | Value |
|
| California cont. | | | |
| North Natomas, Cmnty. Fac. Special Tax Bonds | | | |
| (Dist. No. 4), Ser. D, 5s, 9/1/33 | BBB–/P | $340,000 | $342,972 |
| Ser. D, 5s, 9/1/26 | BBB–/P | 1,070,000 | 1,091,678 |
|
| Oakland, Unified School Dist. Alameda Cnty., G.O. | | | |
| Bonds (Election 2006), Ser. A, 5 1/2s, 8/1/32 | BBB/P | 1,500,000 | 1,643,925 |
|
| Oakley, Pub. Fin. Auth. Special Assmt. | | | |
| Bonds, 5s, 9/2/31 | BBB– | 1,645,000 | 1,707,066 |
|
| Orange Cnty., Cmnty. Fac. Dist. Special Tax | | | |
| Rev. Bonds (Ladera Ranch — No. 02-1), Ser. A, | | | |
| 5.55s, 8/15/33 | BBB–/P | 2,875,000 | 2,892,308 |
|
| Poway, Unified School Dist. G.O. Bonds, | | | |
| zero %, 8/1/40 | Aa2 | 7,000,000 | 1,855,000 |
|
| Rancho Cordova, Cmnty. Fac. Dist. Special Tax | | | |
| Bonds (Sunridge Anatolia), Ser. 03-1, 5s, 9/1/37 | BB+/P | 1,000,000 | 1,011,340 |
|
| Sacramento, Special Tax Rev. Bonds (North | | | |
| Natomas Cmnty. Fac.) | | | |
| Ser. 01-03, 6s, 9/1/28 | BBB/P | 680,000 | 682,842 |
| Ser. 97-01, 5.1s, 9/1/35 | BB+/P | 2,895,000 | 2,902,672 |
| Ser. 97-01, 5s, 9/1/29 | BB+/P | 1,355,000 | 1,360,434 |
|
| San Bernardino, Cmnty. College Dist. G.O. Bonds | | | |
| (Election of 2008), Ser. B, zero %, 8/1/44 | Aa2 | 15,000,000 | 2,969,700 |
|
| San Diego Cnty., Regl. Arpt. Auth. Rev. Bonds, | | | |
| Ser. B, 5s, 7/1/43 | A1 | 2,500,000 | 2,810,675 |
|
| San Diego, Unified School Dist. G.O. Bonds | | | |
| Ser. C, zero %, 7/1/46 | Aa2 | 5,000,000 | 995,550 |
| (Election of 2008), Ser. C, zero %, 7/1/40 | Aa2 | 5,000,000 | 1,344,650 |
|
| San Francisco City & Cnty. Arpt. Comm. Intl. Arpt. | | | |
| Rev. Bonds, Ser. A, 5s, 5/1/30 | A1 | 400,000 | 445,324 |
|
| San Francisco City & Cnty. Redev. Agcy. Cmnty. | | | |
| Fac. Dist. Special Tax Bonds (No. 6 Mission Bay | | | |
| South), Ser. A, 5.15s, 8/1/35 | BB+/P | 1,000,000 | 1,013,260 |
|
| San Francisco City & Cnty., Redev. Agcy. Cmnty. | | | |
| Successor Special Tax Bonds (No. 6 Mission Bay | | | |
| Pub. Impts.), Ser. C, zero %, 8/1/43 | BB+/P | 8,000,000 | 1,354,640 |
|
| San Francisco, City & Cnty. Redev. Fin. Auth. Tax | | | |
| Alloc. Bonds (Mission Bay South Redev.), Ser. D, | | | |
| 6 1/2s, 8/1/31 | BBB | 500,000 | 545,745 |
|
| Santaluz, Cmnty. Facs. Dist. No. 2 Special Tax | | | |
| Bonds (Impt. Area No. 1), Ser. A | | | |
| 5s, 9/1/29 (Prerefunded 9/1/21) | BBB+ | 990,000 | 1,056,776 |
| 5s, 9/1/28 (Prerefunded 9/1/21) | BBB+ | 990,000 | 1,058,993 |
|
| Selma, Unified School Dist. G.O. Bonds (Election | | | |
| of 2006), Ser. C, AGO, zero %, 8/1/37 | AA– | 2,400,000 | 700,872 |
|
| Southern CA Pub. Pwr. Auth. Rev. Bonds (Natural | | | |
| Gas), Ser. A, 5 1/4s, 11/1/21 | Baa1 | 1,500,000 | 1,750,155 |
|
| Sunnyvale, Special Tax Rev. Bonds (Cmnty. Fac. | | | |
| Dist. No. 1), 7 3/4s, 8/1/32 | B+/P | 3,780,000 | 3,785,103 |
|
| Turlock, Irrigation Dist. Rev. Bonds, | | | |
| 5 1/2s, 1/1/41 | A2 | 5,000,000 | 5,652,050 |
|
| Vernon, Elec. Syst. Rev. Bonds, Ser. A, | | | |
| 5 1/2s, 8/1/41 | A– | 750,000 | 818,295 |
|
| | | | 176,812,739 |
| |
| Tax-Free High Yield Fund | 21 |
| | | |
| MUNICIPAL BONDS AND NOTES (97.9%)* cont. | Rating** | Principal amount | Value |
|
| Colorado (3.3%) | | | |
| CO Hlth. Fac. Auth. Rev. Bonds | | | |
| (Christian Living Cmntys.), Ser. A, 9s, 1/1/34 | | | |
| (Prerefunded 1/1/14) | AA+ | $750,000 | $815,348 |
| (Christian Living Cmnty.), 6 3/8s, 1/1/41 | BB–/P | 810,000 | 925,498 |
| (Total Longterm Care National), Ser. A, | | | |
| 6 1/4s, 11/15/40 | BBB–/F | 800,000 | 891,512 |
| (Evangelical Lutheran), Ser. A, 6 1/8s, 6/1/38 | | | |
| (Prerefunded 6/1/14) | A3 | 4,810,000 | 5,179,408 |
| (Christian Living Cmntys.), Ser. A, | | | |
| 5 3/4s, 1/1/26 | BB–/P | 2,850,000 | 3,058,392 |
| (Valley View Assn.), 5 1/4s, 5/15/42 | BBB+ | 3,025,000 | 3,147,997 |
| (Christian Living Cmntys.), 5 1/4s, 1/1/37 | BB–/P | 750,000 | 801,083 |
| (Valley View Assn.), 5 1/8s, 5/15/37 | BBB+ | 1,000,000 | 1,038,190 |
| (Christian Living Cmntys.), 5 1/8s, 1/1/30 | BB–/P | 1,415,000 | 1,525,526 |
| (Covenant Retirement Cmnty.), Ser. A, | | | |
| 5s, 12/1/33 | BBB– | 2,100,000 | 2,258,466 |
| (Evangelical Lutheran Good Samaritan Society), | | | |
| 5s, 12/1/33 | A3 | 5,250,000 | 5,770,695 |
| (Covenant Retirement Cmntys.), Ser. A, | | | |
| 5s, 12/1/27 | BBB– | 400,000 | 436,280 |
|
| CO Pub. Hwy. Auth. Rev. Bonds | | | |
| (E-470), zero %, 9/1/41 | Baa2 | 1,000,000 | 242,530 |
| Ser. A, NATL, zero %, 9/1/28 | Baa2 | 5,000,000 | 2,589,600 |
|
| Denver City & Cnty., Arpt. Rev. Bonds, Ser. A, | | | |
| 5s, 11/15/28 | A1 | 700,000 | 794,339 |
|
| E-470 CO Pub. Hwy. Auth. Rev. Bonds, Ser. A, | | | |
| NATL, zero %, 9/1/34 | Baa2 | 12,000,000 | 4,377,240 |
|
| Plaza, Tax Allocation Bonds (Metro. Dist. No. 1), | | | |
| 5s, 12/1/40 | BB/P | 3,850,000 | 3,991,950 |
|
| Travis Cnty., Cultural Ed. Facs. Fin. Corp. Rev. | | | |
| Bonds (Wayside Schools), Ser. A | | | |
| 5 1/4s, 8/15/42 | BB+ | 450,000 | 451,832 |
| 5s, 8/15/27 | BB+ | 500,000 | 498,460 |
|
| | | | 38,794,346 |
| Connecticut (0.3%) | | | |
| Hamden, Fac. Rev. Bonds (Whitney Ctr.), Ser. A, | | | |
| 7 3/4s, 1/1/43 | BB/P | 2,800,000 | 3,038,924 |
|
| | | | 3,038,924 |
| Delaware (0.7%) | | | |
| DE St. Econ. Dev. Auth. Rev. Bonds | | | |
| (Delmarva Pwr.), 5.4s, 2/1/31 | BBB+ | 1,700,000 | 1,921,918 |
| (Indian River Pwr.), 5 3/8s, 10/1/45 | Baa3 | 6,200,000 | 6,812,808 |
|
| | | | 8,734,726 |
| District of Columbia (1.8%) | | | |
| DC Rev. Bonds (Howard U.), Ser. A, | | | |
| 6 1/2s, 10/1/41 | A3 | 7,000,000 | 8,483,860 |
|
| DC Tobacco Settlement Fin. Corp. Rev. Bonds, | | | |
| Ser. A, zero %, 6/15/46 | B/F | 34,730,000 | 3,217,040 |
|
| DC U. Rev. Bonds (Gallaudet U.), 5 1/2s, 4/1/41 | A+ | 2,000,000 | 2,267,900 |
|
| |
| 22 | Tax-Free High Yield Fund |
| | | |
| MUNICIPAL BONDS AND NOTES (97.9%)* cont. | Rating** | Principal amount | Value |
|
| District of Columbia cont. | | | |
| Metro. Washington, Arpt. Auth. Dulles Toll Rd. | | | |
| Rev. Bonds (2nd Sr. Lien), Ser. B | | | |
| zero %, 10/1/40 | Baa1 | $995,000 | $221,895 |
| zero %, 10/1/39 | Baa1 | 10,000,000 | 2,354,500 |
| zero %, 10/1/38 | Baa1 | 20,000,000 | 4,971,600 |
|
| | | | 21,516,795 |
| Florida (5.0%) | | | |
| Broward Cnty., Arpt. Syst. Rev. Bonds, Ser. Q-2 | | | |
| 5s, 10/1/37 | A1 | 1,750,000 | 1,937,705 |
| 5s, 10/1/31 | A1 | 175,000 | 197,566 |
|
| Escambia Cnty., Env. Impt. Rev. Bonds (Intl. Paper | | | |
| Co.), Ser. A, 5s, 8/1/26 | BBB | 1,500,000 | 1,505,415 |
|
| Fishhawk, Cmnty. Dev. Dist. II Special Assmt. | | | |
| Bonds, Ser. B, 7.04s, 11/1/14 | B/P | 40,000 | 40,463 |
|
| Heritage Harbour Marketplace Cmnty., Dev. Dist. | | | |
| Special Assmt. Bonds, 5.6s, 5/1/36 | B/P | 2,280,000 | 2,083,760 |
|
| Jacksonville, Econ. Dev. Comm. Hlth. Care | | | |
| Fac. Rev. Bonds (FL Proton Therapy Inst.), | | | |
| Ser. A, 6s, 9/1/17 | BB–/P | 635,000 | 699,262 |
|
| Jacksonville, Econ. Dev. Comm. Indl. Dev. Rev. | | | |
| Bonds (Gerdau Ameristeel US, Inc.), 5.3s, 5/1/37 | Baa3 | 5,250,000 | 5,251,208 |
|
| Jacksonville, Port Auth. Rev. Bonds, 5s, 11/1/38 | A2 | 1,400,000 | 1,513,092 |
|
| Lakeland, Edl. Facs. Rev. Bonds (FL Southern | | | |
| College), Ser. A, 5s, 9/1/37 | BBB+ | 600,000 | 652,788 |
|
| Lakeland, Retirement Cmnty. 144A Rev. Bonds | | | |
| (1st Mtge. — Carpenters), 6 3/8s, 1/1/43 | BBB–/F | 1,820,000 | 1,905,795 |
|
| Lee Cnty., Indl. Dev. Auth. Hlth. Care | | | |
| Fac. Rev. Bonds | | | |
| (Shell Pt./Alliance Oblig. Group), | | | |
| 5 1/8s, 11/15/36 | BB | 4,925,000 | 4,942,188 |
| (Shell Pt./Alliance), 5s, 11/15/32 | BB | 3,210,000 | 3,220,721 |
|
| Miami-Dade Cnty., Aviation Rev. Bonds | | | |
| (Miami Intl. Arpt.), Ser. A-1, 5 3/8s, 10/1/41 | A2 | 1,000,000 | 1,137,150 |
| Ser. B, 5s, 10/1/41 | A2 | 4,500,000 | 4,991,130 |
|
| Middle Village Cmnty. Dev. Dist. Special Assmt. | | | |
| Bonds, Ser. A, 6s, 5/1/35 | BB/P | 2,000,000 | 1,583,100 |
|
| Myrtle Creek, Impt. Dist. Special Assmt. Bonds, | | | |
| Ser. A, 5.2s, 5/1/37 | B+/P | 2,020,000 | 1,863,107 |
|
| Orlando Cmnty. Redev. Agcy. Tax Alloc. Bonds | | | |
| (Republic Drive/Universal), 5s, 4/1/24 | A–/F | 2,760,000 | 3,130,364 |
|
| Palm Beach Cnty., Hlth. Fac. Auth. Rev. Bonds | | | |
| (Acts Retirement-Life Cmnty.), 5 1/2s, 11/15/33 | BBB+ | 7,000,000 | 7,824,390 |
|
| Palm Coast Pk. Cmnty. Dev. Dist. Special Assmt. | | | |
| Bonds, 5.7s, 5/1/37 | B–/P | 2,505,000 | 1,672,839 |
|
| Pinellas Cnty., Edl. Fac. Auth. Rev. | | | |
| Bonds (Barry U.) | | | |
| 5 1/4s, 10/1/30 | BBB | 1,210,000 | 1,321,986 |
| 5s, 10/1/27 | BBB | 1,750,000 | 1,916,845 |
|
| |
| Tax-Free High Yield Fund | 23 |
| | | |
| MUNICIPAL BONDS AND NOTES (97.9%)* cont. | Rating** | Principal amount | Value |
|
| Florida cont. | | | |
| Sarasota Cnty., Hlth. Fac. Auth. Retirement Fac. | | | |
| Rev. Bonds (Village On The Isle), 5 1/2s, 1/1/27 | BBB+/F | $1,950,000 | $2,076,360 |
|
| South Bay, Cmnty. Dev. Dist. Special Assmt. | | | |
| Bonds, Ser. B-1, 5 1/8s, 11/1/13 (In default) † | D/P | 2,035,000 | 691,900 |
|
| Tolomato, Cmnty. Dev. Dist. Special Assmt. | | | |
| Bonds, 5.4s, 5/1/37 | CCC/P | 3,060,000 | 3,061,897 |
|
| Town Ctr. at Palm Coast, Cmnty. Dev. Dist. Special | | | |
| Assmt. Bonds, 6s, 5/1/36 | B/P | 1,830,000 | 1,522,908 |
|
| Verandah, West Cmnty. Dev. Dist. Special Assmt. | | | |
| Bonds (Cap. Impt.), Ser. A, 6 5/8s, 5/1/33 | B+/P | 845,000 | 853,137 |
|
| Village Cmnty. Dev. Dist. No. 8 Special Assmt. | | | |
| Bonds (Phase II), 6 1/8s, 5/1/39 | BB/P | 910,000 | 1,075,629 |
|
| Village Cmnty. Dev. Dist. No. 9 Special Assmt. | | | |
| Bonds, 5s, 5/1/22 | B+/P | 850,000 | 913,708 |
|
| | | | 59,586,413 |
| Georgia (2.3%) | | | |
| Atlanta, Wtr. & Waste Wtr. Rev. Bonds, Ser. A, | | | |
| 6 1/4s, 11/1/39 | A1 | 5,000,000 | 6,142,050 |
|
| Clayton Cnty., Dev. Auth. Special Fac. Rev. Bonds | | | |
| (Delta Airlines), Ser. B, 9s, 6/1/35 | B– | 4,000,000 | 4,480,520 |
|
| Fulton Cnty., Res. Care Fac. Rev. Bonds | | | |
| (Canterbury Court), Class A, 6 1/8s, 2/15/34 | BB/P | 1,800,000 | 1,837,656 |
|
| GA State Private College & U. Auth. Rev. Bonds | | | |
| (Mercer U.) | | | |
| Ser. C, 5 1/4s, 10/1/30 | Baa2 | 1,990,000 | 2,294,311 |
| Ser. A, 5s, 10/1/32 | Baa2 | 1,100,000 | 1,228,337 |
|
| Gainesville & Hall Cnty., Devauth Retirement | | | |
| Cmnty. Rev. Bonds (Acts Retirement-Life Cmnty.), | | | |
| Ser. A-2, 6 5/8s, 11/15/39 | BBB+ | 1,200,000 | 1,402,368 |
|
| Main St. Natural Gas, Inc. Rev. Bonds (GA Gas), | | | |
| Ser. A, 5 1/2s, 9/15/21 | A– | 1,255,000 | 1,495,696 |
|
| Marietta, Dev. Auth. Rev. Bonds (U. Fac. — Life U., | | | |
| Inc.), 7s, 6/15/39 | Ba3 | 4,150,000 | 4,483,162 |
|
| Med. Ctr. Hosp. Auth. Rev. Bonds (Spring Harbor | | | |
| Green Island), 5 1/4s, 7/1/27 | B+/P | 2,375,000 | 2,432,024 |
|
| Rockdale Cnty., Dev. Auth. Rev. Bonds (Visy | | | |
| Paper), Ser. A, 6 1/8s, 1/1/34 | B–/P | 1,400,000 | 1,464,764 |
|
| | | | 27,260,888 |
| Guam (0.2%) | | | |
| Territory of GU, Rev. Bonds, Ser. A, | | | |
| 5 3/8s, 12/1/24 | BBB+ | 1,000,000 | 1,100,120 |
|
| Territory of GU, Dept. of Ed. COP (John F. | | | |
| Kennedy High School), Ser. A, 6 7/8s, 12/1/40 | B | 500,000 | 551,190 |
|
| Territory of GU, Pwr. Auth. Rev. Bonds, Ser. A, | | | |
| 5s, 10/1/34 | BBB | 700,000 | 759,080 |
|
| | | | 2,410,390 |
| Hawaii (0.9%) | | | |
| HI State Dept. Budget & Fin. Rev. Bonds | | | |
| (Craigside), Ser. A, 9s, 11/15/44 | B/P | 1,350,000 | 1,619,217 |
| (Hawaiian Elec. Co. — Subsidary), | | | |
| 6 1/2s, 7/1/39 | Baa1 | 7,000,000 | 8,164,870 |
| (Kahala Nui), 5 1/8s, 11/15/32 | BB–/F | 1,050,000 | 1,152,774 |
|
| | | | 10,936,861 |
| |
| 24 | Tax-Free High Yield Fund |
| | | |
| MUNICIPAL BONDS AND NOTES (97.9%)* cont. | Rating** | Principal amount | Value |
|
| Illinois (4.4%) | | | |
| Chicago, Special Assmt. Bonds (Lake Shore East), | | | |
| 6 3/4s, 12/1/32 | BB/P | $5,465,000 | $5,596,761 |
|
| Chicago, O’Hare Intl. Arpt. Rev. Bonds | | | |
| Ser. A, 5 3/4s, 1/1/39 | A2 | 5,000,000 | 5,861,300 |
| (Gen. Sr. Lien), Ser. B, 5s, 1/1/27 | A2 | 3,000,000 | 3,351,390 |
|
| Du Page Cnty., Special Svc. Area No. 31 Special | | | |
| Tax Bonds (Monarch Landing), 5 5/8s, 3/1/36 | B/P | 900,000 | 901,836 |
|
| IL Fin. Auth. Rev. Bonds | | | |
| (Provena Hlth.), Ser. A, 7 3/4s, 8/15/34 | Baa1 | 3,500,000 | 4,431,420 |
| (Rush U. Med. Ctr.), Ser. A, 7 1/4s, 11/1/38 | A2 | 2,150,000 | 2,665,441 |
| (Silver Cross Hosp. & Med. Ctr.), 7s, 8/15/44 | BBB– | 5,250,000 | 6,313,965 |
| (IL Rush U. Med Ctr.), Ser. C, 6 5/8s, 11/1/39 | A2 | 1,425,000 | 1,719,548 |
| (Navistar Intl. Recvy. Zone), 6 1/2s, 10/15/40 | B3 | 1,300,000 | 1,399,944 |
| (Roosevelt U.), 6 1/2s, 4/1/39 | Baa3 | 4,000,000 | 4,566,480 |
| (Landing At Plymouth Place), Ser. A, | | | |
| 6s, 5/15/25 | B+/P | 1,550,000 | 1,468,656 |
| (Elmhurst Memorial), Ser. A, 5 5/8s, 1/1/37 | Baa2 | 2,000,000 | 2,238,740 |
|
| IL Fin. Auth. Solid Waste Disposal (Waste Mgmt., | | | |
| Inc.), Ser. A, 5.05s, 8/1/29 | BBB | 5,045,000 | 5,340,587 |
|
| IL Hlth. Fac. Auth. Rev. Bonds (Cmnty. Rehab. | | | |
| Providers Fac.), Ser. A, 7 7/8s, 7/1/20 | CCC/P | 487,744 | 370,417 |
|
| IL State G.O. Bonds, 5s, 3/1/34 | A2 | 1,250,000 | 1,379,300 |
|
| Metro. Pier & Exposition Auth. Dedicated State | | | |
| Tax Rev. Bonds (McCormick), Ser. B, AGM, | | | |
| zero %, 6/15/43 | AAA | 7,000,000 | 1,567,510 |
|
| Railsplitter, Tobacco Settlement Auth. Rev. | | | |
| Bonds, 6s, 6/1/28 | A– | 2,150,000 | 2,618,270 |
|
| | | | 51,791,565 |
| Indiana (1.3%) | | | |
| IN State Fin. Auth. Rev. Bonds | | | |
| (U.S. Steel Corp.), 6s, 12/1/26 | BB | 2,000,000 | 2,108,680 |
| (OH Valley Elec. Corp.), Ser. A, 5s, 6/1/32 | Baa3 | 1,750,000 | 1,896,300 |
| (Duke Energy Ind.), Ser. C, 4.95s, 10/1/40 | A2 | 4,660,000 | 5,040,629 |
|
| IN State Fin. Auth. VRDN | | | |
| Ser. A-3, 0.13s, 2/1/37 | VMIG1 | 1,500,000 | 1,500,000 |
| Ser. A-2, 0.12s, 2/1/37 | VMIG1 | 2,500,000 | 2,500,000 |
|
| IN State Fin. Auth. Edl. Fac. Rev. Bonds (Butler | | | |
| U.), Ser. B | | | |
| 5s, 2/1/34 | BBB+ | 1,170,000 | 1,276,061 |
| 5s, 2/1/28 | BBB+ | 1,000,000 | 1,115,640 |
|
| | | | 15,437,310 |
| Iowa (1.3%) | | | |
| IA Fin. Auth. Hlth. Fac. Rev. Bonds (Dev. Care | | | |
| Initiatives), Ser. A | | | |
| 5 1/2s, 7/1/25 | BB+ | 3,185,000 | 3,424,799 |
| 5s, 7/1/20 | BB+ | 1,700,000 | 1,818,915 |
|
| Marion Hlth. Care Fac. Rev. Bonds (First Mtge.), | | | |
| Ser. IA, 8s, 1/1/29 | B+/P | 45,000 | 46,110 |
|
| Tobacco Settlement Auth. of IA Rev. Bonds, | | | |
| Ser. C, 5 3/8s, 6/1/38 | B+ | 10,000,000 | 9,540,600 |
|
| | | | 14,830,424 |
| |
| Tax-Free High Yield Fund | 25 |
| | | |
| MUNICIPAL BONDS AND NOTES (97.9%)* cont. | Rating** | Principal amount | Value |
|
| Kansas (0.4%) | | | |
| Lenexa, Hlth. Care Fac. Rev. Bonds | | | |
| (LakeView Village, Inc.), 7 1/4s, 5/15/39 | BB/P | $1,500,000 | $1,703,100 |
| 5 3/8s, 5/15/27 | BB/P | 3,400,000 | 3,521,040 |
|
| | | | 5,224,140 |
| Kentucky (0.9%) | | | |
| Breckinridge Cnty., Lease Program VRDN, Ser. A, | | | |
| 0.12s, 2/1/32 | VMIG1 | 1,190,000 | 1,190,000 |
|
| KY Econ. Dev. Fin. Auth. Rev. Bonds | | | |
| (First Mtge.), Ser. IA, 8s, 1/1/29 | B+/P | 227,000 | 232,600 |
| (Masonic Home Indpt. Living II), | | | |
| 7 3/8s, 5/15/46 | BB–/P | 1,350,000 | 1,573,088 |
| (Masonic Home Indpt. Living II), | | | |
| 7 1/4s, 5/15/41 | BB–/P | 900,000 | 1,045,134 |
|
| KY State Econ. Dev. Fin. Auth. Hlth. Care Rev. | | | |
| Bonds (Masonic Homes of KY), 5 3/8s, 11/15/42 | BB–/P | 1,400,000 | 1,427,076 |
|
| Louisville & Jefferson Cnty., Metro. Govt. | | | |
| College Rev. Bonds (Bellarmine U., Inc.), | | | |
| Ser. A, 6s, 5/1/38 | Baa3 | 855,000 | 932,087 |
|
| Louisville & Jefferson Cnty., Metro. Govt. Hlth. | | | |
| Syst. Rev. Bonds (Norton Hlth. Care, Inc.), | | | |
| 5s, 10/1/30 | A– | 4,000,000 | 4,240,680 |
|
| | | | 10,640,665 |
| Louisiana (1.0%) | | | |
| Rapides, Fin. Auth. FRB (Cleco Pwr.), AMBAC, | | | |
| 4.7s, 11/1/36 | Baa2 | 2,250,000 | 2,318,265 |
|
| St. John Baptist Parish Rev. Bonds (Marathon Oil | | | |
| Corp.), Ser. A, 5 1/8s, 6/1/37 | Baa2 | 3,690,000 | 3,945,200 |
|
| Tobacco Settlement Fin. Corp. Rev. Bonds, | | | |
| Ser. 01-B, 5 7/8s, 5/15/39 | A3 | 5,350,000 | 5,476,207 |
|
| | | | 11,739,672 |
| Maine (0.8%) | | | |
| ME Hlth. & Higher Edl. Fac. Auth. Rev. Bonds | | | |
| (ME Gen. Med. Ctr.), 7 1/2s, 7/1/32 | Baa3 | 3,000,000 | 3,874,770 |
|
| Rumford, Solid Waste Disp. Rev. Bonds (Boise | | | |
| Cascade Corp.), 6 7/8s, 10/1/26 | B2 | 5,000,000 | 4,999,650 |
|
| | | | 8,874,420 |
| Maryland (1.4%) | | | |
| MD Econ. Dev. Corp. Rev. Bonds (Salisbury | | | |
| U.), 5s, 6/1/27 | Baa3 | 1,050,000 | 1,149,803 |
|
| MD Econ. Dev. Corp. Poll. Control Rev. Bonds | | | |
| (Potomac Electric Power Co.), 6.2s, 9/1/22 | A | 1,700,000 | 2,082,347 |
|
| MD State Econ. Dev. Corp. Rev. Bonds (Salisbury | | | |
| U.), 5s, 6/1/30 | Baa3 | 625,000 | 673,706 |
|
| MD State Hlth. & Higher Edl. Fac. Auth. Rev. Bonds | | | |
| (Washington Cnty. Hosp.), 6s, 1/1/43 | BBB– | 4,760,000 | 5,188,876 |
|
| MD State Indl. Dev. Fin. Auth. Econ. Dev. Rev. | | | |
| Bonds (Our Lady of Good Counsel School), | | | |
| Ser. A, 6s, 5/1/35 | BB–/P | 600,000 | 627,642 |
|
| Westminster, Econ. Dev. Rev. Bonds (Carroll | | | |
| Lutheran Village), Ser. A | | | |
| 6 1/4s, 5/1/34 | BB/P | 4,800,000 | 4,816,992 |
| 6s, 5/1/24 | BB/P | 2,000,000 | 2,011,620 |
|
| | | | 16,550,986 |
| |
| 26 | Tax-Free High Yield Fund |
| | | |
| MUNICIPAL BONDS AND NOTES (97.9%)* cont. | Rating** | Principal amount | Value |
|
| Massachusetts (4.6%) | | | |
| MA Dev. Fin. Agcy. Sr. Living Fac. Rev. Bonds | | | |
| (Groves-Lincoln), Ser. A, 7 3/4s, 6/1/39 | | | |
| (In default) † | D/P | $2,000,000 | $954,360 |
|
| MA State Dev. Fin. Agcy. Rev. Bonds | | | |
| (Berklee College of Music), 5 1/4s, 10/1/41 | A2 | 2,000,000 | 2,237,140 |
| (Boston U.), 6s, 5/15/59 | A2 | 1,575,000 | 1,948,921 |
| (Linden Ponds, Inc. Fac.), Ser. A-1, | | | |
| 6 1/4s, 11/15/31 | B–/P | 704,147 | 578,837 |
| (Linden Ponds, Inc. Fac.), Ser. A-1, | | | |
| 6 1/4s, 11/15/39 | B–/P | 1,159,997 | 899,705 |
| (Linden Ponds, Inc. Fac.), Ser. A-1, | | | |
| 6 1/4s, 11/15/46 | B–/P | 2,616,363 | 1,983,255 |
| (Linden Ponds, Inc. Fac.), Ser. A-2, | | | |
| 5 1/2s, 11/15/46 | B–/P | 238,451 | 160,826 |
| (Linden Ponds, Inc. Fac.), Ser. B, | | | |
| zero %, 11/15/56 | B–/P | 1,186,016 | 16,984 |
| (Merrimack College), Ser. A, 5s, 7/1/32 | Baa3 | 700,000 | 774,641 |
| (New England Conservatory of Music), | | | |
| 5 1/4s, 7/1/38 | Baa1 | 1,900,000 | 2,038,206 |
| (Sabis Intl.), Ser. A, 8s, 4/15/39 | BBB | 2,140,000 | 2,634,105 |
| (Suffolk U.), 5 1/8s, 7/1/40 | Baa2 | 2,000,000 | 2,206,220 |
| (Wheelock College), Ser. C, 5 1/4s, 10/1/37 | BBB | 2,000,000 | 2,103,400 |
|
| MA State Dev. Fin. Agcy. Hlth. Care Fac. 144A Rev. | | | |
| Bonds (Adventcare), Ser. A, 6.65s, 10/15/28 | B/P | 2,150,000 | 2,291,986 |
|
| MA State Hlth. & Edl. Fac. Auth. Rev. Bonds | | | |
| (Emerson Hosp.), Ser. E, Radian Insd., | | | |
| 5s, 8/15/25 | BB/P | 3,500,000 | 3,522,225 |
| (Fisher College), Ser. A, 5 1/8s, 4/1/37 | BBB– | 1,400,000 | 1,423,198 |
| (Jordan Hosp.), Ser. E, 6 3/4s, 10/1/33 | BB– | 6,035,000 | 6,119,309 |
| (Milford Regl. Med.), Ser. E, 5s, 7/15/27 | Baa3 | 2,750,000 | 2,846,168 |
| (Milford Regl. Med.), Ser. E, 5s, 7/15/32 | Baa3 | 1,000,000 | 1,020,720 |
| (Milton Hosp.), Ser. D, 5 3/8s, 7/1/35 | BB– | 3,950,000 | 4,061,351 |
| (Quincy Med. Ctr.), Ser. A, 6 1/2s, 1/15/38 | | | |
| (In default) † | D/P | 1,061,526 | 1,062 |
| (Springfield College), 5 5/8s, 10/15/40 | Baa1 | 3,500,000 | 3,874,220 |
| (Suffolk U.), Ser. A, 5 3/4s, 7/1/39 | Baa2 | 2,125,000 | 2,423,329 |
| (Suffolk U.), Ser. A, 6 1/4s, 7/1/30 | Baa2 | 1,400,000 | 1,649,928 |
| (Winchester Hosp.), 5 1/4s, 7/1/38 | BBB+ | 3,050,000 | 3,391,234 |
|
| MA State Hlth. & Edl. Fac. Auth. VRDN (Wellesley | | | |
| College), Ser. G, 0.09s, 7/1/39 | VMIG1 | 3,035,000 | 3,035,000 |
|
| | | | 54,196,330 |
| Michigan (2.1%) | | | |
| Advanced Tech. Academy Pub. School Rev. | | | |
| Bonds, 6s, 11/1/28 | BBB– | 1,635,000 | 1,712,237 |
|
| Ann Arbor, Econ. Dev. Corp. Ltd. Oblig. Rev. | | | |
| Bonds (Glacier Hills, Inc.), State & Local Govt. | | | |
| Coll., 8 3/8s, 1/15/19 (Escrowed to maturity) | AA+ | 1,498,000 | 1,891,959 |
|
| Detroit, G.O. Bonds (Cap. Impt.), | | | |
| Ser. A-1, 5s, 4/1/15 | B | 2,880,000 | 2,644,272 |
|
| Detroit, Wtr. & Swr. Dept. Rev. Bonds, | | | |
| Ser. A, 5s, 7/1/32 | A+ | 3,600,000 | 3,862,260 |
|
| |
| Tax-Free High Yield Fund | 27 |
| | | |
| MUNICIPAL BONDS AND NOTES (97.9%)* cont. | Rating** | Principal amount | Value |
|
| Michigan cont. | | | |
| Flint, Hosp. Bldg. Auth. Rev. Bonds | | | |
| (Hurley Med. Ctr.) | | | |
| 7 1/2s, 7/1/39 | Ba1 | $700,000 | $819,917 |
| 6s, 7/1/20 | Ba1 | 1,500,000 | 1,516,395 |
|
| Garden City, Hosp. Fin. Auth. Rev. Bonds (Garden | | | |
| City Hosp.), Ser. A, 5 3/4s, 9/1/17 | Ba3 | 1,205,000 | 1,206,832 |
|
| King Cnty., Wtr & Swr. Rev. Bonds, 5s, 1/1/45 | AA+ | 4,470,000 | 5,006,042 |
|
| MI State Hosp. Fin. Auth. Rev. Bonds (Henry Ford | | | |
| Hlth.), 5 3/4s, 11/15/39 | A2 | 4,400,000 | 4,995,320 |
|
| Star Intl. Academy Rev. Bonds (Pub. School | | | |
| Academy), 5s, 3/1/33 | BBB | 1,000,000 | 1,018,580 |
|
| | | | 24,673,814 |
| Minnesota (1.4%) | | | |
| Douglas Cnty., Gross Hlth. Care Fac. Rev. Bonds | | | |
| (Douglas Cnty. Hosp.), Ser. A, 6 1/4s, 7/1/34 | BBB– | 2,400,000 | 2,669,928 |
|
| Inver Grove Heights, Nursing Home Rev. Bonds | | | |
| (Presbyterian Homes Care), 5 1/2s, 10/1/41 | B/P | 1,000,000 | 1,008,090 |
|
| North Oaks, Sr. Hsg. Rev. Bonds | | | |
| (Presbyterian Homes North Oaks), | | | |
| 6 1/8s, 10/1/39 | BB/P | 1,375,000 | 1,469,009 |
| (Presbyterian Homes), 6s, 10/1/27 | BB/P | 1,250,000 | 1,342,525 |
|
| Northfield, Hosp. Rev. Bonds, 5 3/8s, 11/1/31 | BBB– | 1,500,000 | 1,587,960 |
|
| St. Paul, Hsg. & Redev. Auth. Charter School Lease | | | |
| Rev. Bonds (Nova Classical Academy), Ser. A, | | | |
| 6 3/8s, 9/1/31 | BBB– | 500,000 | 543,800 |
|
| St. Paul, Hsg. & Redev. Auth. Hlth. Care Fac. | | | |
| Rev. Bonds (HealthPartners Oblig. Group), | | | |
| 5 1/4s, 5/15/36 | A3 | 5,035,000 | 5,298,431 |
|
| St. Paul, Hsg. & Redev. Auth. Hosp. Rev. Bonds | | | |
| (Healtheast), 6s, 11/15/35 | BBB– | 1,250,000 | 1,351,600 |
|
| St. Paul, Port Auth. Solid Waste Disp. Rev. Bonds | | | |
| (Gerdau Ameristeel US, Inc.), 4 1/2s, 10/1/37 | Baa3 | 900,000 | 919,053 |
|
| | | | 16,190,396 |
| Mississippi (0.7%) | | | |
| MS Bus. Fin. Corp. Gulf Opportunity Zone Rev. | | | |
| Bonds, Ser. A, 5s, 5/1/37 | A3 | 1,000,000 | 1,088,040 |
|
| St. Louis Cnty., Indl. Dev. Auth. Sr. Living Facs. | | | |
| Rev. Bonds (Friendship Village of Sunset Hills | | | |
| Cnty.), 5s, 9/1/32 | A/F | 1,120,000 | 1,212,019 |
|
| Warren Cnty., Gulf Opportunity Zone Rev. Bonds | | | |
| (Intl. Paper Co.), Ser. A, 6 1/2s, 9/1/32 | BBB | 5,400,000 | 6,231,222 |
|
| | | | 8,531,281 |
| Missouri (0.8%) | | | |
| MO State Hlth. & Edl. Fac. Auth. VRDN | | | |
| (Washington U. (The)) | | | |
| Ser. A, 0.11s, 9/1/30 | VMIG1 | 7,000,000 | 7,000,000 |
| Ser. B, 0.11s, 9/1/30 | VMIG1 | 2,000,000 | 2,000,000 |
|
| | | | 9,000,000 |
| Montana (0.6%) | | | |
| MT Fac. Fin. Auth. Rev. Bonds (Sr. Living St. | | | |
| John’s Lutheran), Ser. A, 6s, 5/15/25 | B+/P | 750,000 | 773,970 |
|
| MT Fac. Fin. Auth. VRDN (Sisters of Charity | | | |
| of Leavenworth), Ser. A, 0.12s, 12/1/25 | VMIG1 | 5,910,000 | 5,910,000 |
|
| | | | 6,683,970 |
| |
| 28 | Tax-Free High Yield Fund |
| | | |
| MUNICIPAL BONDS AND NOTES (97.9%)* cont. | Rating** | Principal amount | Value |
|
| Nebraska (0.7%) | | | |
| Central Plains, Energy Rev. Bonds | | | |
| (NE Gas No. 1), Ser. A, 5 1/4s, 12/1/18 | B2 | $1,500,000 | $1,693,530 |
| (NE Gas No. 3), 5s, 9/1/32 | A3 | 3,000,000 | 3,358,080 |
|
| Lancaster Cnty., Hosp. Auth. Rev. Bonds | | | |
| (Immanuel Oblig. Group), 5 5/8s, 1/1/40 | A–/F | 1,825,000 | 2,018,560 |
|
| NE Edl. Fin. Auth. VRDN (Creighton U.), | | | |
| 0.12s, 7/1/35 | VMIG1 | 1,805,000 | 1,805,000 |
|
| | | | 8,875,170 |
| Nevada (1.0%) | | | |
| Clark Cnty., Impt. Dist. Special Assmt. Bonds | | | |
| (Summerlin No. 151), 5s, 8/1/25 | BB–/P | 300,000 | 243,018 |
| (Mountains Edge Local No. 142), 5s, 8/1/21 | BBB– | 980,000 | 1,070,591 |
| (Summerlin No. 151), 5s, 8/1/20 | BB–/P | 335,000 | 294,318 |
| (Summerlin No. 151), 5s, 8/1/19 | BB–/P | 1,135,000 | 1,018,765 |
| (Summerlin No. 151), 5s, 8/1/18 | BB–/P | 1,085,000 | 994,891 |
| (Summerlin No. 151), 5s, 8/1/17 | BB–/P | 1,285,000 | 1,204,328 |
|
| Henderson, Local Impt. Dist. Special | | | |
| Assmt. Bonds | | | |
| (No. T-17), 5s, 9/1/25 | BB+/P | 775,000 | 779,797 |
| (No. T-18), 5s, 9/1/14 | CCC/P | 2,320,000 | 2,215,646 |
|
| Las Vegas, Local Impt. Board Special | | | |
| Assmt. Bonds | | | |
| (Special Impt. Dist. No. 607), 6s, 6/1/19 | BB/P | 930,000 | 949,279 |
| (Dist. No. 607), 5.9s, 6/1/18 | BB/P | 190,000 | 194,606 |
| (Dist. No. 607), 5.9s, 6/1/17 | BB/P | 1,410,000 | 1,454,034 |
|
| Reno, Sales Tax VRDN, 0.12s, 6/1/42 | VMIG1 | 1,400,000 | 1,400,000 |
|
| | | | 11,819,273 |
| New Hampshire (1.3%) | | | |
| NH Higher Edl. & Hlth. Fac. Auth. Rev. Bonds | | | |
| (Rivermead at Peterborough), 5 3/4s, 7/1/28 | BB+/P | 6,000,000 | 6,002,100 |
|
| NH Hlth. & Ed. Fac. Auth. Rev. Bonds (Huntington | | | |
| at Nashua), Ser. A, 6 7/8s, 5/1/33 | BB+/P | 2,400,000 | 2,409,936 |
|
| NH Hlth. & Ed. Fac. Auth. VRDN | | | |
| (U. Syst. of NH), Ser. B, 0.12s, 7/1/33 | VMIG1 | 5,445,000 | 5,445,000 |
| (Dartmouth College), Ser. A, 0.1s, 6/1/31 | VMIG1 | 1,835,000 | 1,835,000 |
|
| | | | 15,692,036 |
| New Jersey (5.3%) | | | |
| Burlington Cnty., Bridge Comm. Econ. Dev. Rev. | | | |
| Bonds (The Evergreens), 5 5/8s, 1/1/38 | BB+/P | 5,500,000 | 5,691,125 |
|
| NJ Hlth. Care Fac. Fin. Auth. Rev. Bonds | | | |
| (St. Joseph Hlth. Care Syst.), 6 5/8s, 7/1/38 | BBB– | 6,000,000 | 6,960,780 |
| (St. Peter’s U. Hosp.), 6 1/4s, 7/1/35 | Ba1 | 2,500,000 | 2,880,725 |
| (St. Peter’s U. Hosp.), 5 3/4s, 7/1/37 | Ba1 | 2,000,000 | 2,149,440 |
| (Holy Name Hosp.), 5s, 7/1/36 | Baa2 | 3,500,000 | 3,664,780 |
|
| NJ State Econ. Dev. Auth. Rev. Bonds | | | |
| (Newark Arpt. Marriott Hotel), 7s, 10/1/14 | Baa3 | 4,000,000 | 4,013,280 |
| (United Methodist Homes), Ser. A-1, | | | |
| 6 1/4s, 7/1/33 | BB+ | 3,000,000 | 3,104,850 |
| (Paterson Charter School Science & Tech.), | | | |
| Ser. A, 6.1s, 7/1/44 | BBB– | 1,130,000 | 1,219,666 |
|
| |
| Tax-Free High Yield Fund | 29 |
| | | |
| MUNICIPAL BONDS AND NOTES (97.9%)* cont. | Rating** | Principal amount | Value |
|
| New Jersey cont. | | | |
| NJ State Econ. Dev. Auth. Rev. Bonds | | | |
| (Cranes Mill), Ser. A, 6s, 7/1/38 | BBB–/F | $1,750,000 | $1,842,050 |
| (MSU Student Hsg.), 5 7/8s, 6/1/42 | Baa3 | 5,110,000 | 5,729,843 |
| (First Mtge. Lions Gate), Ser. A, 5 7/8s, 1/1/37 | B/P | 800,000 | 806,888 |
| 5s, 6/15/26 | Baa1 | 500,000 | 573,160 |
| (Continental Airlines, Inc.), 4 7/8s, 9/15/19 | B | 3,500,000 | 3,600,380 |
|
| NJ State Econ. Dev. Auth. Continental Airlines, Inc. | | | |
| (Paterson Charter School), Ser. C, 5.3s, 7/1/44 | BBB– | 2,250,000 | 2,310,233 |
|
| NJ State Econ. Dev. Auth. Energy Fac. Rev. Bonds | | | |
| (Umm Energy Partners, LLC), Ser. A, 5s, 6/15/37 | Baa3 | 1,000,000 | 1,044,020 |
|
| NJ State Econ. Dev. Auth. Retirement Cmnty. Rev. | | | |
| Bonds (Seabrook Village, Inc.), 5 1/4s, 11/15/36 | BB–/P | 3,590,000 | 3,699,926 |
|
| Tobacco Settlement Fin. Corp. Rev. Bonds, Ser. 1A | | | |
| 4 3/4s, 6/1/34 | B2 | 5,000,000 | 4,468,750 |
| 4 1/2s, 6/1/23 | B1 | 8,955,000 | 8,939,866 |
|
| | | | 62,699,762 |
| New Mexico (1.2%) | | | |
| Farmington, Poll. Control Rev. Bonds | | | |
| (Public Service Co. of NM San Juan), Ser. D, | | | |
| 5.9s, 6/1/40 | Baa3 | 3,000,000 | 3,364,590 |
| (San Juan), Ser. A, 4 7/8s, 4/1/33 | Baa3 | 7,660,000 | 7,968,009 |
| (San Juan), Ser. B, 4 7/8s, 4/1/33 | Baa3 | 2,750,000 | 2,860,578 |
|
| | | | 14,193,177 |
| New York (4.0%) | | | |
| Brooklyn Arena Local Dev. Corp. Rev. Bonds | | | |
| (Barclays Ctr.), 6 3/8s, 7/15/43 | Baa3 | 3,000,000 | 3,537,900 |
|
| Broome Cnty., Indl. Dev. Agcy. Continuing Care | | | |
| Retirement Rev. Bonds (Good Shepard Village), | | | |
| Ser. A, 6 7/8s, 7/1/40 | B/P | 715,000 | 763,956 |
|
| Liberty, Dev. Corp. Rev. Bonds (Goldman Sachs | | | |
| Headquarters, LLC), 5 1/4s, 10/1/35 | A3 | 2,000,000 | 2,390,140 |
|
| Niagara, Area Dev. Corp. Solid Waste Disp. Fac. | | | |
| Rev. Bonds (Covanta Holding Corp.), Ser. A, | | | |
| 5 1/4s, 11/1/42 | Ba2 | 2,650,000 | 2,737,212 |
|
| NY City, Indl. Dev. Agcy. Rev. Bonds (Yankee | | | |
| Stadium — Pilot), AGO, 7s, 3/1/49 | AA– | 1,000,000 | 1,238,680 |
|
| NY City, Indl. Dev. Agcy. Special Fac. Rev. Bonds | | | |
| (American Airlines — JFK Intl. Arpt.), 7 1/2s, | | | |
| 8/1/16 (In default) † | D/P | 3,465,000 | 3,784,230 |
| (British Airways PLC), 5 1/4s, 12/1/32 | BB | 2,325,000 | 2,328,255 |
| (Jetblue Airways Corp.), 5 1/8s, 5/15/30 | B– | 3,680,000 | 3,677,608 |
| (Jetblue Airways Corp.), 5s, 5/15/20 | B– | 615,000 | 614,982 |
|
| NY State Dorm. Auth. Non-State Supported | | | |
| Debt Rev. Bonds (Orange Regl. Med. Ctr.), | | | |
| 6 1/4s, 12/1/37 | Ba1 | 4,180,000 | 4,631,858 |
|
| NY State Energy Research & Dev. Auth. Gas Fac. | | | |
| Rev. Bonds (Brooklyn Union Gas), 6.952s, 7/1/26 | A3 | 1,800,000 | 1,805,850 |
|
| NY State Liberty Dev. Corp. Rev. Bonds | | | |
| (4 World Trade Ctr., LLC), 5s, 11/15/44 | A+ | 1,500,000 | 1,673,505 |
| (7 World Trade Ctr.), Class 3, 5s, 3/15/44 | Baa2 | 1,000,000 | 1,082,830 |
| (1 WTC Port Auth. Construction), 5s, 12/15/41 | Aa3 | 4,475,000 | 5,080,960 |
|
| |
| 30 | Tax-Free High Yield Fund |
| | | |
| MUNICIPAL BONDS AND NOTES (97.9%)* cont. | Rating** | Principal amount | Value |
|
| New York cont. | | | |
| Oneida Cnty., Indl. Dev. Agcy. Rev. Bonds (St. | | | |
| Elizabeth Med.), Ser. A, 5 7/8s, 12/1/29 | BB+/P | $1,500,000 | $1,501,125 |
|
| Onondaga Civic Dev. Corp. Rev. Bonds (St. | | | |
| Joseph’s Hosp. Hlth. Ctr.), 5s, 7/1/42 | Ba1 | 1,000,000 | 1,034,080 |
|
| Port Auth. NY & NJ Special Oblig. Rev. Bonds (JFK | | | |
| Intl. Air Term.), 6s, 12/1/42 | Baa3 | 2,100,000 | 2,472,141 |
|
| Seneca Cnty., Indl. Dev. Agcy. Solid Waste Disp. | | | |
| 144A Mandatory Put Bonds (10/1/13) (IESI | | | |
| Corp.), 6 5/8s, 10/1/35 | BB– | 1,660,000 | 1,671,238 |
|
| Suffolk Cnty., Indl. Dev. Agcy. Civic | | | |
| Fac. Rev. Bonds | | | |
| (Southampton Hosp. Assn.), Ser. B, | | | |
| 7 5/8s, 1/1/30 | B–/P | 3,250,000 | 3,255,005 |
| (Southampton Hosp. Assn.), Ser. A, | | | |
| 7 1/4s, 1/1/30 | B–/P | 750,000 | 750,945 |
| (Gurwin Jewish-Phase II), 6.7s, 5/1/39 | B+/P | 945,000 | 976,809 |
|
| Yonkers, Indl. Dev. Agcy. Civic Fac. Rev. Bonds (St. | | | |
| John’s Riverside Hosp.), Ser. A, 7 1/8s, 7/1/31 | B+ | 500,000 | 500,200 |
|
| | | | 47,509,509 |
| North Carolina (0.6%) | | | |
| NC Cap. Fin. Agcy. Edl. Fac. Rev. Bonds (Meredith | | | |
| College), 6s, 6/1/31 | BBB | 1,000,000 | 1,129,710 |
|
| NC Med. Care Cmnty. Hlth. Care Fac. Rev. Bonds | | | |
| (Deerfield), Ser. A, 6 1/8s, 11/1/38 | BBB+/F | 450,000 | 493,736 |
| (First Mtge. — Presbyterian Homes), | | | |
| 5 3/8s, 10/1/22 | BB/P | 750,000 | 792,548 |
|
| NC Med. Care Comm. Retirement Fac. Rev. Bonds | | | |
| (Carolina Village), 6s, 4/1/38 | BB/P | 2,500,000 | 2,630,725 |
| (First Mtge. United Methodist), Ser. C, | | | |
| 5 1/2s, 10/1/32 | BB+/P | 2,000,000 | 2,042,880 |
|
| | | | 7,089,599 |
| Ohio (3.3%) | | | |
| Buckeye, Tobacco Settlement Fin. Auth. Rev. | | | |
| Bonds, Ser. A-2 | | | |
| 5 7/8s, 6/1/30 | B3 | 8,480,000 | 7,744,021 |
| 5 3/4s, 6/1/34 | B3 | 13,300,000 | 11,875,437 |
| 5 1/8s, 6/1/24 | B3 | 2,500,000 | 2,316,075 |
|
| Cleveland, Arpt. Syst. Rev. Bonds, | | | |
| Ser. A, 5s, 1/1/29 | A– | 1,000,000 | 1,140,160 |
|
| Erie Cnty., OH Hosp. Fac. Rev. Bonds (Firelands | | | |
| Regl. Med. Ctr.), Ser. A, 5 1/4s, 8/15/46 | A– | 4,000,000 | 4,229,000 |
|
| Hickory Chase, Cmnty. Auth. Infrastructure | | | |
| Impt. Rev. Bonds (Hickory Chase), 7s, 12/1/38 | | | |
| (In default) † | D/P | 1,560,000 | 936,000 |
|
| Lake Cnty., Hosp. Fac. Rev. Bonds (Lake Hosp. | | | |
| Syst.), Ser. C, 6s, 8/15/43 | A3 | 1,550,000 | 1,720,190 |
|
| OH State Air Quality Dev. Auth. Rev. Bonds (Valley | | | |
| Elec. Corp.), Ser. E, 5 5/8s, 10/1/19 | Baa3 | 1,450,000 | 1,676,142 |
|
| OH State Higher Edl. Fac. Comm. Rev. Bonds | | | |
| (Kenyon College), 5s, 7/1/44 | A1 | 4,850,000 | 5,222,432 |
|
| Southeastern OH Port Auth. Hosp. Fac. Rev. | | | |
| Bonds, 5 3/4s, 12/1/32 | BB/P | 2,225,000 | 2,412,412 |
|
| | | | 39,271,869 |
| |
| Tax-Free High Yield Fund | 31 |
| | | |
| MUNICIPAL BONDS AND NOTES (97.9%)* cont. | Rating** | Principal amount | Value |
|
| Oklahoma (0.3%) | | | |
| OK Cnty., Fin. Auth. Rev. Bonds (Epworth Village), | | | |
| Ser. A, 5s, 4/1/33 | BB–/P | $1,070,000 | $1,091,999 |
|
| OK State Tpk. Auth. VRDN, Ser. F, 0.12s, 1/1/28 | VMIG1 | 2,000,000 | 2,000,000 |
|
| | | | 3,091,999 |
| Oregon (0.3%) | | | |
| Multnomah Cnty., Hosp. Fac. Auth. Rev. Bonds | | | |
| (Terwilliger Plaza, Inc.), 5s, 12/1/29 | BBB/F | 1,090,000 | 1,218,130 |
|
| OR State Hsg. & Cmnty. Svcs. Dept. Rev. Bonds | | | |
| (Single Fam. Mtge.), Ser. B, 5 3/8s, 7/1/34 | Aa2 | 2,000 | 2,011 |
|
| Warm Springs Reservation, Confederated Tribes | | | |
| 144A Rev. Bonds (Pelton Round Butte Tribal), | | | |
| Ser. B, 6 3/8s, 11/1/33 | A3 | 1,800,000 | 2,087,064 |
|
| | | | 3,307,205 |
| Pennsylvania (4.6%) | | | |
| Allegheny Cnty., Higher Ed. Bldg. | | | |
| Auth. Rev. Bonds | | | |
| (Robert Morris U.), Ser. A, 5 3/4s, 10/15/40 | Baa3 | 765,000 | 873,531 |
| (Chatham U.), Ser. A, 5s, 9/1/35 | BBB | 1,000,000 | 1,103,960 |
| (Chatham U.), Ser. A, 5s, 9/1/30 | BBB | 1,500,000 | 1,680,345 |
|
| Allegheny Cnty., Hosp. Dev. Auth. Rev. Bonds | | | |
| (Hlth. Syst.-West PA), Ser. A, 5 3/8s, 11/15/40 | Ca | 3,095,000 | 2,638,488 |
|
| Allegheny Cnty., Indl. Dev. Auth. Rev. Bonds | | | |
| (Env. Impt. — USX Corp.), 6 7/8s, 5/1/30 | BB | 3,400,000 | 3,667,852 |
| (U.S. Steel Corp.), 6 3/4s, 11/1/24 | BB | 1,000,000 | 1,097,780 |
|
| Allentown, Neighborhood Impt. Zone Dev. Auth. | | | |
| Rev. Bonds, Ser. A, 5s, 5/1/42 | Baa2 | 3,250,000 | 3,498,788 |
|
| Bucks Cnty., Indl. Dev. Auth. Rev. Bonds (US Steel | | | |
| Corp.), 6 3/4s, 6/1/26 | BB | 1,460,000 | 1,598,890 |
|
| Cumberland Cnty., Muni. Auth. Rev. Bonds | | | |
| (Diakon Lutheran Ministries), 5s, 1/1/36 | BBB+/F | 1,790,000 | 1,841,659 |
|
| Geisinger, Auth. VRDN (Geisinger Hlth. Syst.), | | | |
| Ser. C, 0.05s, 8/1/28 | VMIG1 | 1,300,000 | 1,300,000 |
|
| Lancaster Cnty., Hosp. Auth. Rev. Bonds (Brethren | | | |
| Village), Ser. A | | | |
| 6 1/2s, 7/1/40 | BB–/P | 3,000,000 | 3,217,410 |
| 6 3/8s, 7/1/30 | BB–/P | 1,375,000 | 1,479,761 |
|
| Montgomery Cnty., Higher Ed. & Hlth. Auth. Rev. | | | |
| Bonds (Arcadia U.), 5 1/4s, 4/1/30 | BBB+ | 1,530,000 | 1,684,882 |
|
| Montgomery Cnty., Indl. Auth. Resource | | | |
| Recvy. Rev. Bonds (Whitemarsh Cont. Care), | | | |
| 6 1/4s, 2/1/35 | B–/P | 2,400,000 | 2,443,848 |
|
| Northeastern PA Hosp. & Ed. Auth. Rev. Bonds | | | |
| (Wilkes U.), Ser. A, 5 1/4s, 3/1/42 | BBB | 1,000,000 | 1,080,850 |
|
| PA Econ. Dev. Fin. Auth. Exempt Fac. Rev. Bonds | | | |
| (Allegheny Energy Supply Co.), 7s, 7/15/39 | Baa3 | 4,000,000 | 4,803,920 |
|
| PA State Higher Edl. Fac. Auth. Rev. Bonds | | | |
| (Shippensburg U.), 6 1/4s, 10/1/43 | Baa3 | 1,000,000 | 1,170,370 |
| (Edinboro U. Foundation), 6s, 7/1/43 | Baa3 | 1,400,000 | 1,585,542 |
| (Edinboro U. Foundation), 5 7/8s, 7/1/38 | Baa3 | 1,000,000 | 1,096,910 |
| (Indiana U.), Ser. A, 5s, 7/1/32 | BBB+ | 500,000 | 550,800 |
|
| |
| 32 | Tax-Free High Yield Fund |
| | | |
| MUNICIPAL BONDS AND NOTES (97.9%)* cont. | Rating** | Principal amount | Value |
|
| Pennsylvania cont. | | | |
| PA State Higher Edl. Fac. Auth. Student Hsg. Rev. | | | |
| Bonds (East Stroudsburg U.), 5s, 7/1/42 | Baa3 | $1,655,000 | $1,737,386 |
|
| PA State Pub. School Bldg. Auth. Rev. Bonds | | | |
| (School Dist. of Philadelphia) | | | |
| 5s, 4/1/31 | Aa3 | 500,000 | 557,055 |
| 5s, 4/1/30 | Aa3 | 1,000,000 | 1,118,260 |
| 5s, 4/1/29 | Aa3 | 1,500,000 | 1,684,890 |
| 5s, 4/1/28 | Aa3 | 1,460,000 | 1,647,303 |
|
| Philadelphia, Auth. for Indl. Dev. Rev. Bonds | | | |
| (Master Charter School), 6s, 8/1/35 | BBB+ | 1,720,000 | 1,933,607 |
|
| Philadelphia, Hosp. & Higher Ed. Fac. Auth. Rev. | | | |
| Bonds (Graduate Hlth. Syst. Oblig. Group), 7 1/4s, | | | |
| 7/1/18 (In default) † | D/P | 5,489,822 | 549 |
|
| Philadelphia, Hosp. & Higher Edl. Fac. Auth. Rev. | | | |
| Bonds (Graduate Hlth. Syst.), Ser. B, 6 1/4s, | | | |
| 7/1/13 (In default) † | D/P | 532,753 | 53 |
|
| Pittsburgh G.O. Bonds, Ser. B, 5s, 9/1/26 | A1 | 2,000,000 | 2,318,000 |
|
| Susquehanna, Area Regl. Arpt. Syst. Auth. Rev. | | | |
| Bonds, Ser. A, 6 1/2s, 1/1/38 | Baa3 | 3,675,000 | 4,125,592 |
|
| Washington Cnty., Indl. Dev. Auth. Hlth. Care | | | |
| Fac. Rev. Bonds (First Mtge. AHF/Central), | | | |
| 8 1/2s, 1/1/29 | B/P | 1,081,000 | 1,092,134 |
|
| | | | 54,630,415 |
| Puerto Rico (3.0%) | | | |
| Cmnwlth. of PR, G.O. Bonds | | | |
| Ser. C, 6s, 7/1/39 | BBB | 2,515,000 | 2,649,854 |
| (Pub. Impt.), Ser. A, 5 3/4s, 7/1/41 | BBB | 5,000,000 | 5,188,500 |
|
| Cmnwlth. of PR, Aqueduct & Swr. Auth. Rev. | | | |
| Bonds, Ser. A, 6s, 7/1/44 | BBB– | 6,500,000 | 6,692,595 |
|
| Cmnwlth. of PR, Pub. Bldg. Auth. Rev. Bonds | | | |
| (Govt. Fac.), Ser. P, Cmnwlth. of PR Gtd., | | | |
| 6 3/4s, 7/1/36 | BBB | 5,000,000 | 5,503,000 |
|
| Cmnwlth. of PR, Sales Tax Fin. Corp. Rev. | | | |
| Bonds, Ser. A | | | |
| NATL, zero %, 8/1/43 | Aa3 | 20,000,000 | 3,713,000 |
| zero %, 8/1/31 | A+ | 31,000,000 | 11,246,180 |
|
| | | | 34,993,129 |
| South Carolina (—%) | | | |
| Georgetown Cnty., Env. Impt. Rev. Bonds (Intl. | | | |
| Paper Co.), Ser. A, 5.3s, 3/1/28 | BBB | 500,000 | 505,900 |
|
| | | | 505,900 |
| South Dakota (0.3%) | | | |
| SD Edl. Enhancement Funding Corp. SD Tobacco | | | |
| Rev. Bonds, Ser. B, 6 1/2s, 6/1/32 | A3 | 3,615,000 | 3,728,836 |
|
| | | | 3,728,836 |
| Texas (9.8%) | | | |
| Abilene, Hlth. Fac. Dev. Corp. Rev. Bonds (Sears | | | |
| Methodist Retirement), Ser. A | | | |
| 7s, 11/15/33 (In default) † | D/P | 2,500,000 | 1,635,650 |
| 5.9s, 11/15/25 (In default) † | D/P | 6,122,000 | 4,021,724 |
|
| Bexar Cnty., Hsg. Fin. Auth. Corp. Rev. Bonds | | | |
| (American Opty-Waterford), Ser. A1, 7s, 12/1/36 | B2 | 4,500,000 | 4,520,385 |
|
| |
| Tax-Free High Yield Fund | 33 |
| | | |
| MUNICIPAL BONDS AND NOTES (97.9%)* cont. | Rating** | Principal amount | Value |
|
| Texas cont. | | | |
| Brazos River Harbor Naval Dist. Env. FRB (Dow | | | |
| Chemical Co.), Ser. A-4, 5.95s, 5/15/33 | BBB | $5,150,000 | $5,908,698 |
|
| Brazos River, Auth. Poll. Control Rev. Bonds (TXU | | | |
| Energy Co., LLC), 5s, 3/1/41 | Ca | 1,000,000 | 107,700 |
|
| Brazos, Harbor Indl. Dev. Corp. Env. Fac. | | | |
| Mandatory Put Bonds (5/1/18) (Dow Chemical), | | | |
| 5.9s, 5/1/38 | BBB | 1,850,000 | 2,099,564 |
|
| Clifton, Higher Ed. Fin. Corp. Rev. Bonds (Idea | | | |
| Pub. Schools), 5s, 8/15/32 | BBB | 1,500,000 | 1,657,905 |
|
| Dallas-Fort Worth, Intl. Arpt. Fac. Impt. Corp. Rev. | | | |
| Bonds, Ser. D, 5s, 11/1/38 | A1 | 3,000,000 | 3,286,440 |
|
| Harris Cnty., Cultural Ed. Fac. Fin. Corp. VRDN | | | |
| (Texas Med. Ctr.), Ser. B-1, 0.12s, 9/1/31 | VMIG1 | 2,365,000 | 2,365,000 |
|
| Houston, Arpt. Syst. Rev. Bonds | | | |
| (Continental Airlines, Inc.), Ser. E, 7s, 7/1/29 | B | 500,000 | 501,625 |
| (Special Fac. — Continental Airlines, Inc.), Ser. E, | | | |
| 6 3/4s, 7/1/21 | B | 8,400,000 | 8,440,656 |
| (Continental Airlines, Inc. Term. Project), | | | |
| 6 1/2s, 7/15/30 | B | 3,200,000 | 3,611,840 |
| (Continental Airlines, Inc.), Ser. C, 5.7s, 7/15/29 | B | 4,985,000 | 5,000,154 |
|
| Houston, Higher Ed. Fin. Co. Rev. Bonds (Cosmos | | | |
| Foundation), Ser. A | | | |
| 5s, 2/15/42 | BBB | 2,250,000 | 2,392,762 |
| 5s, 2/15/32 | BBB | 2,250,000 | 2,452,882 |
|
| La Vernia, Higher Ed. Fin. Corp. Rev. Bonds (Kipp, | | | |
| Inc.), Ser. A | | | |
| 6 3/8s, 8/15/44 | BBB | 2,450,000 | 2,837,884 |
| 6 1/4s, 8/15/39 | BBB | 2,375,000 | 2,745,833 |
|
| Love Field, Arpt. Modernization Corp. Special | | | |
| Fac. Rev. Bonds (Southwest Airlines Co.), | | | |
| 5 1/4s, 11/1/40 | Baa3 | 7,000,000 | 7,654,990 |
|
| Matagorda Cnty., Poll. Control Rev. Bonds | | | |
| (Cent Pwr. & Light Co.), Ser. A, 6.3s, 11/1/29 | Baa2 | 2,400,000 | 2,807,352 |
| (Dist. No. 1), Ser. A, AMBAC, 4.4s, 5/1/30 | Baa2 | 3,000,000 | 3,198,510 |
|
| Newark, Cultural Ed. Facs. Fin. Corp. Rev. Bonds | | | |
| (AW Brown-Fellowship Leadership Academy), | | | |
| Ser. A, 6s, 8/15/32 | BBB– | 600,000 | 632,394 |
|
| North TX, Edl. Fin. Co. Rev. Bonds (Uplift Edl.), | | | |
| Ser. A, 5 1/8s, 12/1/42 | BBB– | 2,500,000 | 2,706,800 |
|
| North TX, Thruway Auth. Rev. Bonds, Ser. B, | | | |
| zero %, 9/1/37 | AA | 3,000,000 | 813,000 |
|
| North TX, Tollway Auth. Rev. Bonds (Toll 2nd Tier), | | | |
| Ser. F, 5 3/4s, 1/1/38 | A3 | 3,370,000 | 3,731,364 |
|
| North TX, Tollway Auth. stepped-coupon Rev. | | | |
| Bonds (1st Tier), Ser. I, stepped-coupon | | | |
| zero %, (6 1/2s, 1/1/15), 1/1/43 †† | A2 | 5,300,000 | 5,902,451 |
|
| Tarrant Cnty., Cultural Ed. Fac. Fin. Corp. | | | |
| Retirement Fac. Rev. Bonds | | | |
| (Sr. Living Ctr.), Ser. A, 8 1/4s, 11/15/44 | B+/P | 6,000,000 | 6,706,560 |
| (Sr. Living Ctr.), Ser. A, 8 1/4s, 11/15/39 | B+/P | 1,000,000 | 1,119,520 |
| (Air Force Village), 6 3/8s, 11/15/44 | BBB–/F | 5,825,000 | 6,452,877 |
|
| |
| 34 | Tax-Free High Yield Fund |
| | | |
| MUNICIPAL BONDS AND NOTES (97.9%)* cont. | Rating** | Principal amount | Value |
|
| Texas cont. | | | |
| TX Muni. Gas Acquisition & Supply Corp. I Rev. | | | |
| Bonds, Ser. A, 5 1/4s, 12/15/24 | A– | $4,500,000 | $5,369,984 |
|
| TX Private Activity Surface Trans. | | | |
| Corp. Rev. Bonds | | | |
| (LBJ Infrastructure), 7s, 6/30/40 | Baa3 | 4,500,000 | 5,463,494 |
| (NTE Mobility), 6 7/8s, 12/31/39 | Baa2 | 3,350,000 | 3,999,565 |
|
| TX State Trans. Comm. Tpk. Syst. Rev. Bonds | | | |
| (1st Tier), Ser. A, 5s, 8/15/41 | A– | 4,300,000 | 4,756,273 |
|
| Uptown, Dev. Auth. Tax Increment Contract | | | |
| Tax Alloc. Bonds (Infrastructure Impt. Fac.), | | | |
| 5 1/2s, 9/1/29 | BBB | 1,000,000 | 1,127,120 |
|
| | | | 116,028,956 |
| Utah (0.2%) | | | |
| Murray City, Hosp. Rev. VRDN (IHC Hlth. Svcs., | | | |
| Inc.), Ser. A, 0.12s, 5/15/37 | VMIG1 | 2,000,000 | 2,000,000 |
|
| | | | 2,000,000 |
| Virginia (2.6%) | | | |
| Albemarle Cnty., Econ. Dev. Auth. Res. Care Fac. | | | |
| Mtge. Rev. Bonds (Westminster-Canterbury Blue | | | |
| Ridge), Ser. A, 5s, 1/1/42 | BB–/P | 1,000,000 | 1,009,980 |
|
| Albemarle Cnty., Indl. Dev. Auth. Res. | | | |
| Care Fac. Rev. Bonds (Westminster- | | | |
| Canterbury), 5s, 1/1/31 | BB–/P | 1,100,000 | 1,128,160 |
|
| Chesapeake, Toll Rd. Rev. Bonds (Sr. Trans. Syst.), | | | |
| Ser. A, 5s, 7/15/47 | BBB | 1,000,000 | 1,072,300 |
|
| Chesterfield Cnty., Hlth. Ctr. Cmnty. Res. Care | | | |
| Fac. Rev. Bonds (Lucy Corr Village), Ser. A, | | | |
| 6 1/4s, 12/1/38 | BB–/P | 1,700,000 | 1,735,037 |
|
| Henrico Cnty., Econ. Dev. Auth. Res. Care Fac. | | | |
| Rev. Bonds (United Methodist Homes) | | | |
| 5s, 6/1/24 | BB+/P | 395,000 | 428,666 |
| 5s, 6/1/21 | BB+/P | 985,000 | 1,092,326 |
|
| James Cnty., Indl. Dev. Auth. Rev. Bonds | | | |
| (Williamsburg), Ser. A, 6 1/8s, 3/1/32 | BB-/P | 2,500,000 | 2,510,625 |
|
| Lexington, Indl. Dev. Auth. Res. Care Fac. | | | |
| Rev. Bonds (Kendal at Lexington), Ser. A, | | | |
| 5 1/2s, 1/1/37 | B+/P | 1,460,000 | 1,481,404 |
|
| Peninsula Ports Auth. Res. Care Fac. Rev. Bonds | | | |
| (VA Baptist Homes), Ser. A, 7 3/8s, 12/1/32 | | | |
| (Prerefunded 12/1/13) | AA+ | 4,000,000 | 4,232,560 |
|
| Route 460 Funding Corp. Toll Rd. Rev. Bonds (Sr. | | | |
| Lien), Ser. A, 5 1/8s, 7/1/49 | Baa3 | 1,050,000 | 1,151,577 |
|
| VA ST Small Bus. Fin. Auth. Rev. Bonds | | | |
| (Elizabeth River Crossings OPCO, | | | |
| LLC), 6s, 1/1/37 | BBB– | 2,100,000 | 2,447,949 |
| (Express Lanes, LLC), 5s, 7/1/34 | BBB– | 2,400,000 | 2,519,496 |
|
| VA ST Small Bus. Fin. Sr. Lien Auth. Rev. Bonds | | | |
| (95 Express Lanes, LLC), 5s, 1/1/40 | BBB– | 1,000,000 | 1,038,540 |
|
| Washington Cnty., Indl. Dev. Auth. Hosp. Fac. Rev. | | | |
| Bonds (Mountain States Hlth. Alliance), Ser. C, | | | |
| 7 3/4s, 7/1/38 | Baa1 | 5,100,000 | 6,439,770 |
|
| |
| Tax-Free High Yield Fund | 35 |
| | | |
| MUNICIPAL BONDS AND NOTES (97.9%)* cont. | Rating** | Principal amount | Value |
|
| Virginia cont. | | | |
| Winchester, Indl. Dev. Auth. Res. Care Fac. | | | |
| Rev. Bonds (Westminster-Canterbury), Ser. A, | | | |
| 5.3s, 1/1/35 | BBB+/F | $2,000,000 | $2,039,060 |
|
| | | | 30,327,450 |
| Washington (1.6%) | | | |
| Port Seattle, Port Indl. Dev. Corp. Rev. Bonds | | | |
| (Delta Airlines, Inc.), 5s, 4/1/30 | B– | 700,000 | 711,669 |
|
| Tobacco Settlement Auth. of WA Rev. Bonds | | | |
| 6 5/8s, 6/1/32 | Baa1 | 2,065,000 | 2,113,713 |
| 6 1/2s, 6/1/26 | A3 | 4,395,000 | 4,567,636 |
|
| WA State Higher Ed. Fac. Auth. Rev. Bonds | | | |
| (Whitworth U.) | | | |
| 5 5/8s, 10/1/40 | Baa1 | 1,600,000 | 1,754,432 |
| 5 1/4s, 10/1/46 | Baa1 | 2,000,000 | 2,183,560 |
| 5s, 10/1/32 | Baa1 | 815,000 | 897,274 |
|
| WA State Hlth. Care Fac. Auth. Rev. Bonds | | | |
| (WA Hlth. Svcs.), 7s, 7/1/39 | Baa3 | 3,000,000 | 3,496,620 |
| (Kadlec Med. Ctr.), 5 1/2s, 12/1/39 | Baa3 | 2,000,000 | 2,196,860 |
| (Kadlec Regl. Med. Ctr.), 5s, 12/1/32 | Baa3 | 750,000 | 808,140 |
|
| | | | 18,729,904 |
| West Virginia (0.3%) | | | |
| Pleasants Cnty., Poll. Control Rev. Bonds | | | |
| (Allegheny), Ser. F, 5 1/4s, 10/15/37 | BBB | 500,000 | 534,645 |
|
| WV State Hosp. Fin. Auth. Rev. Bonds (Thomas | | | |
| Hlth. Syst.), 6 3/4s, 10/1/43 | B/P | 2,330,000 | 2,450,181 |
|
| | | | 2,984,826 |
| Wisconsin (1.1%) | | | |
| Platteville, Redev. Auth. Rev. Bonds | | | |
| (UW-Platteville Real Estate), 5s, 7/1/32 | BBB– | 2,500,000 | 2,652,000 |
|
| Pub. Fin. Auth. Arpt. Fac. Rev. Bonds | | | |
| (Sr. Oblig. Group), 5 1/4s, 7/1/28 | BBB– | 800,000 | 880,352 |
| (Trans. Infrastructure Properties), 5s, 7/1/42 | BBB– | 3,500,000 | 3,646,474 |
|
| WI State Hlth. & Edl. Fac. Auth. Rev. Bonds | | | |
| (St. Johns Cmntys. Inc.), Ser. A, 7 5/8s, 9/15/39 | BB/P | 1,350,000 | 1,572,899 |
| (St. Johns Cmntys. Inc.), Ser. A, 7 1/4s, 9/15/29 | BB/P | 1,000,000 | 1,168,760 |
| (Prohealth Care, Inc.), 6 5/8s, 2/15/39 | A1 | 3,000,000 | 3,532,200 |
|
| | | | 13,452,685 |
| | | |
| Total municipal bonds and notes (cost $1,051,874,094) | | $1,155,385,090 |
|
| |
| PREFERRED STOCKS (1.4%)* | | Shares | Value |
|
| MuniMae Tax Exempt Bond Subsidiary, LLC 144A Ser. A-5, | | |
| $5.00 cum. pfd. | | 6,000,000 | $6,000,000 |
|
| MuniMae Tax Exempt Bond Subsidiary, LLC 144A Ser. A, | | |
| 7.50% cum. pfd. | | 4,673,038 | 4,674,767 |
|
| MuniMae Tax Exempt Bond Subsidiary, LLC 144A Ser. B, | | |
| 7 3/4s cum. pfd. | | 6,000,000 | 5,700,660 |
|
| Total preferred stocks (cost $16,673,038) | | | $16,375,427 |
| |
| 36 | Tax-Free High Yield Fund |
| | |
| COMMON STOCKS (0.1%)* | Shares | Value |
|
| CMS Liquidating 144A | 400 | $1,280,000 |
|
| Tembec, Inc. (Canada) † | 10,751 | 31,690 |
|
| Total common stocks (cost $9,284,089) | | $1,311,690 |
| |
| TOTAL INVESTMENTS | | |
|
| Total investments (cost $1,077,831,221) | | $1,173,072,207 |
Notes to the fund’s portfolio
Unless noted otherwise, the notes to the fund’s portfolio are for the close of the fund’s reporting period, which ran from August 1, 2012 through January 31, 2013 (the reporting period). Within the following notes to the portfolio, references to “ASC 820” represent Accounting Standards Codification ASC 820 Fair Value Measurements and Disclosures and references to “OTC”, if any, represent over-the-counter.
* Percentages indicated are based on net assets of $1,180,409,164.
** The Moody’s, Standard & Poor’s or Fitch ratings indicated are believed to be the most recent ratings available at the close of the reporting period for the securities listed. Ratings are generally ascribed to securities at the time of issuance. While the agencies may from time to time revise such ratings, they undertake no obligation to do so, and the ratings do not necessarily represent what the agencies would ascribe to these securities at the close of the reporting period. Securities rated by Putnam are indicated by “/P.” Securities rated by Fitch are indicated by “/F.” The rating of an insured security represents what is believed to be the most recent rating of the insurer’s claims-paying ability available at the close of the reporting period, if higher than the rating of the direct issuer of the bond, and does not reflect any subsequent changes. Security ratings are defined in the Statement of Additional Information.
† Non-income-producing security.
144A after the name of an issuer represents securities exempt from registration under Rule 144A under the Securities Act of 1933, as amended. These securities may be resold in transactions exempt from registration, normally to qualified institutional buyers.
The rates shown on Mandatory Put Bonds are the current interest rates at the close of the reporting period.
The dates shown parenthetically on Mandatory Put Bonds represent the next mandatory put dates.
The dates shown parenthetically on prerefunded bonds represent the next prerefunding dates.
The dates shown on debt obligations are the original maturity dates.
The fund had the following sector concentrations greater than 10% at the close of the reporting period (as a percentage of net assets):
| | | |
| Health care | 30.5% | | |
| Transportation | 12.1 | | |
| Education | 11.8 | | |
| |
| Tax-Free High Yield Fund | 37 |
ASC 820 establishes a three-level hierarchy for disclosure of fair value measurements. The valuation hierarchy is based upon the transparency of inputs to the valuation of the fund’s investments. The three levels are defined as follows:
Level 1: Valuations based on quoted prices for identical securities in active markets.
Level 2: Valuations based on quoted prices in markets that are not active or for which all significant inputs are observable, either directly or indirectly.
Level 3: Valuations based on inputs that are unobservable and significant to the fair value measurement.
The following is a summary of the inputs used to value the fund’s net assets as of the close of the reporting period:
| | | |
| | | Valuation inputs | |
|
| Investments in securities: | Level 1 | Level 2 | Level 3 |
|
| Common stocks: | | | |
|
| Basic materials | $31,690 | $— | $— |
|
| Health care | — | 1,280,000 | — |
|
| Total common stocks | 31,690 | 1,280,000 | — |
| | | | |
| Municipal bonds and notes | $— | $1,155,385,090 | $— |
|
| Preferred stocks | — | 16,375,427 | — |
|
| Totals by level | $31,690 | $1,173,040,517 | $— |
The accompanying notes are an integral part of these financial statements.
| |
| 38 | Tax-Free High Yield Fund |
Statement of assets and liabilities 1/31/13 (Unaudited)
| |
| ASSETS | |
|
| Investment in securities, at value (Note 1): | |
| Unaffiliated issuers (identified cost $1,077,831,221) | $1,173,072,207 |
|
| Cash | 641,321 |
|
| Interest and other receivables | 12,903,008 |
|
| Receivable for shares of the fund sold | 2,035,494 |
|
| Receivable for investments sold | 2,982,358 |
|
| Total assets | 1,191,634,388 |
| |
| LIABILITIES | |
|
| Payable for investments purchased | 7,345,840 |
|
| Payable for shares of the fund repurchased | 1,612,310 |
|
| Payable for compensation of Manager (Note 2) | 481,083 |
|
| Payable for custodian fees (Note 2) | 5,791 |
|
| Payable for investor servicing fees (Note 2) | 44,211 |
|
| Payable for Trustee compensation and expenses (Note 2) | 339,511 |
|
| Payable for administrative services (Note 2) | 11,805 |
|
| Payable for distribution fees (Note 2) | 273,324 |
|
| Distributions payable to shareholders | 1,028,058 |
|
| Other accrued expenses | 83,291 |
|
| Total liabilities | 11,225,224 |
| | |
| Net assets | $1,180,409,164 |
|
| |
| REPRESENTED BY | |
|
| Paid-in capital (Unlimited shares authorized) (Notes 1 and 4) | $1,213,445,536 |
|
| Undistributed net investment income (Note 1) | 3,618,918 |
|
| Accumulated net realized loss on investments (Note 1) | (131,896,276) |
|
| Net unrealized appreciation of investments | 95,240,986 |
|
| Total — Representing net assets applicable to capital shares outstanding | $1,180,409,164 |
| |
| COMPUTATION OF NET ASSET VALUE AND OFFERING PRICE | |
|
| Net asset value and redemption price per class A share | |
| ($963,426,583 divided by 75,060,455 shares) | $12.84 |
|
| Offering price per class A share (100/96.00 of $12.84)* | $13.38 |
|
| Net asset value and offering price per class B share ($14,766,853 divided by 1,148,528 shares)** | $12.86 |
|
| Net asset value and offering price per class C share ($80,770,571 divided by 6,280,983 shares)** | $12.86 |
|
| Net asset value and redemption price per class M share ($9,510,473 divided by 740,898 shares) | $12.84 |
|
| Offering price per class M share (100/96.75 of $12.84)† | $13.27 |
|
| Net asset value, offering price and redemption price per class Y share | |
| ($111,934,684 divided by 8,696,704 shares) | $12.87 |
|
* On single retail sales of less than $100,000. On sales of $100,000 or more the offering price is reduced.
** Redemption price per share is equal to net asset value less any applicable contingent deferred sales charge.
† On single retail sales of less than $50,000. On sales of $50,000 or more the offering price is reduced.
The accompanying notes are an integral part of these financial statements.
| |
| Tax-Free High Yield Fund | 39 |
Statement of operations Six months ended 1/31/13 (Unaudited)
| |
| INTEREST INCOME | $31,482,101 |
|
| EXPENSES | |
|
| Compensation of Manager (Note 2) | $2,950,315 |
|
| Investor servicing fees (Note 2) | 257,217 |
|
| Custodian fees (Note 2) | 7,803 |
|
| Trustee compensation and expenses (Note 2) | 63,880 |
|
| Distribution fees (Note 2) | 1,654,574 |
|
| Administrative services (Note 2) | 20,970 |
|
| Other | 157,375 |
|
| Total expenses | 5,112,134 |
| | |
| Expense reduction (Note 2) | (1,119) |
|
| Net expenses | 5,111,015 |
| | |
| Net investment income | 26,371,086 |
|
| |
| Net realized gain on investments (Notes 1 and 3) | 2,185,993 |
|
| Net unrealized appreciation of investments during the period | 13,788,099 |
|
| Net gain on investments | 15,974,092 |
| | |
| Net increase in net assets resulting from operations | $42,345,178 |
|
The accompanying notes are an integral part of these financial statements.
| |
| 40 | Tax-Free High Yield Fund |
Statement of changes in net assets
| | |
| INCREASE (DECREASE) IN NET ASSETS | Six months ended 1/31/13* | Year ended 7/31/12 |
|
| Operations: | | |
| Net investment income | $26,371,086 | $51,863,671 |
|
| Net realized gain (loss) on investments | 2,185,993 | (12,008,693) |
|
| Net unrealized appreciation of investments | 13,788,099 | 108,752,117 |
|
| Net increase in net assets resulting from operations | 42,345,178 | 148,607,095 |
|
| Distributions to shareholders (Note 1): | | |
| From ordinary income | | |
| Taxable net investment income | | |
|
| Class A | (624,172) | (525,053) |
|
| Class B | (9,408) | (6,866) |
|
| Class C | (52,212) | (28,040) |
|
| Class M | (6,422) | (5,180) |
|
| Class Y | (71,461) | (36,701) |
|
| From tax-exempt net investment income | | |
| Class A | (21,329,353) | (44,401,079) |
|
| Class B | (253,466) | (517,062) |
|
| Class C | (1,333,664) | (2,087,782) |
|
| Class M | (193,684) | (412,336) |
|
| Class Y | (2,396,280) | (3,702,483) |
|
| Increase in capital from settlement payments | — | 2,171 |
|
| Redemption fees (Note 1) | 5,289 | 4,041 |
|
| Increase (decrease) from capital share transactions (Note 4) | (41,571,087) | 126,584,666 |
|
| Total increase (decrease) in net assets | (25,490,742) | 223,475,391 |
| |
| NET ASSETS | | |
|
| Beginning of period | 1,205,899,906 | 982,424,515 |
|
| End of period (including undistributed net investment | | |
| income of $3,618,918 and $3,517,954, respectively) | $1,180,409,164 | $1,205,899,906 |
|
* Unaudited
The accompanying notes are an integral part of these financial statements.
| |
| Tax-Free High Yield Fund | 41 |
Financial highlights (For a common share outstanding throughout the period)
| | | | | | | | | | | | | | |
| INVESTMENT OPERATIONS: | | LESS DISTRIBUTIONS: | | RATIOS AND SUPPLEMENTAL DATA: |
|
| | | | | | | | | | | | | Ratio | Ratio | |
| | | | Net realized | | | | | | | | | of expenses | of net investment | |
| | Net asset value, | | and unrealized | Total from | From | | | | | Total return | Net assets, | to average | income (loss) | Portfolio |
| | beginning | Net investment | gain (loss) | investment | net investment | Total | Redemption | Non-recurring | Net asset value, | at net asset | end of period | net assets | to average | turnover |
| Period ended | of period | income (loss) | on investments | operations | income | distributions | fees a | reimbursements | end of period | value (%) b | (in thousands) | (%) c | net assets (%) | (%) |
|
| Class A | | | | | | | | | | | | | | |
| January 31, 2013** | $12.66 | .28 | .18 | .46 | (.28) | (.28) | — | — | $12.84 | 3.67* | $963,427 | .40* | 2.20* | 10* |
| July 31, 2012 | 11.56 | .60 | 1.10 | 1.70 | (.60) | (.60) | — | — d | 12.66 | 15.03 | 1,008,921 | .81 | 4.94 | 13 |
| July 31, 2011 | 11.77 | .65 | (.23) | .42 | (.63) | (.63) | — | — e | 11.56 | 3.79 | 862,832 | .80 | 5.74 | 14 |
| July 31, 2010 | 10.39 | .65 | 1.36 | 2.01 | (.63) | (.63) | — | — f | 11.77 | 19.64 | 908,190 | .83 | 5.71 | 23 |
| July 31, 2009 | 11.93 | .62 | (1.52) | (.90) | (.64) | (.64) | — | — | 10.39 | (7.15) | 806,921 | .83 g | 6.31 g | 16 |
| July 31, 2008 | 12.88 | .64 | (.96) | (.32) | (.63) | (.63) | — | — | 11.93 | (2.57) | 1,049,449 | .82 g | 5.14 g | 46 |
|
| Class B | | | | | | | | | | | | | | |
| January 31, 2013** | $12.68 | .24 | .18 | .42 | (.24) | (.24) | — | — | $12.86 | 3.36* | $14,767 | .71* | 1.89* | 10* |
| July 31, 2012 | 11.58 | .52 | 1.10 | 1.62 | (.52) | (.52) | — | — d | 12.68 | 14.33 | 13,768 | 1.43 | 4.32 | 13 |
| July 31, 2011 | 11.79 | .58 | (.23) | .35 | (.56) | (.56) | — | — e | 11.58 | 3.20 | 11,987 | 1.42 | 5.09 | 14 |
| July 31, 2010 | 10.40 | .58 | 1.37 | 1.95 | (.56) | (.56) | — | — f | 11.79 | 18.99 | 21,822 | 1.45 | 5.12 | 23 |
| July 31, 2009 | 11.94 | .56 | (1.52) | (.96) | (.58) | (.58) | — | — | 10.40 | (7.76) | 32,843 | 1.46 g | 5.65 g | 16 |
| July 31, 2008 | 12.90 | .57 | (.98) | (.41) | (.55) | (.55) | — | — | 11.94 | (3.25) | 64,075 | 1.45 g | 4.49 g | 46 |
|
| Class C | | | | | | | | | | | | | | |
| January 31, 2013** | $12.69 | .23 | .17 | .40 | (.23) | (.23) | — | — | $12.86 | 3.17* | $80,771 | .79* | 1.82* | 10* |
| July 31, 2012 | 11.58 | .50 | 1.11 | 1.61 | (.50) | (.50) | — | — d | 12.69 | 14.24 | 70,823 | 1.58 | 4.13 | 13 |
| July 31, 2011 | 11.79 | .57 | (.23) | .34 | (.55) | (.55) | — | — e | 11.58 | 2.99 | 40,797 | 1.57 | 4.98 | 14 |
| July 31, 2010 | 10.40 | .56 | 1.37 | 1.93 | (.54) | (.54) | — | — f | 11.79 | 18.83 | 36,864 | 1.60 | 4.92 | 23 |
| July 31, 2009 | 11.93 | .54 | (1.51) | (.97) | (.56) | (.56) | — | — | 10.40 | (7.78) | 21,010 | 1.61 g | 5.56 g | 16 |
| July 31, 2008 | 12.88 | .55 | (.97) | (.42) | (.53) | (.53) | — | — | 11.93 | (3.27) | 19,022 | 1.60 g | 4.36 g | 46 |
|
| Class M | | | | | | | | | | | | | | |
| January 31, 2013** | $12.66 | .26 | .18 | .44 | (.26) | (.26) | — | — | $12.84 | 3.52* | $9,510 | .54* | 2.07* | 10* |
| July 31, 2012 | 11.57 | .56 | 1.09 | 1.65 | (.56) | (.56) | — | — d | 12.66 | 14.68 | 9,357 | 1.08 | 4.68 | 13 |
| July 31, 2011 | 11.77 | .62 | (.22) | .40 | (.60) | (.60) | — | — e | 11.57 | 3.61 | 8,544 | 1.07 | 5.47 | 14 |
| July 31, 2010 | 10.39 | .62 | 1.36 | 1.98 | (.60) | (.60) | — | — f | 11.77 | 19.32 | 9,549 | 1.10 | 5.44 | 23 |
| July 31, 2009 | 11.92 | .59 | (1.51) | (.92) | (.61) | (.61) | — | — | 10.39 | (7.35) | 7,781 | 1.11 g | 6.02 g | 16 |
| July 31, 2008 | 12.88 | .61 | (.98) | (.37) | (.59) | (.59) | — | — | 11.92 | (2.89) | 10,204 | 1.10 g | 4.85 g | 46 |
|
| Class Y | | | | | | | | | | | | | | |
| January 31, 2013** | $12.70 | .30 | .17 | .47 | (.30) | (.30) | — | — | $12.87 | 3.70* | $111,935 | .29* | 2.32* | 10* |
| July 31, 2012 | 11.59 | .62 | 1.11 | 1.73 | (.62) | (.62) | — | — d | 12.70 | 15.38 | 103,030 | .58 | 5.11 | 13 |
| July 31, 2011 | 11.79 | .68 | (.22) | .46 | (.66) | (.66) | — | — e | 11.59 | 4.17 | 58,265 | .57 | 5.98 | 14 |
| July 31, 2010 | 10.40 | .68 | 1.36 | 2.04 | (.65) | (.65) | — | — f | 11.79 | 20.01 | 38,287 | .60 | 5.85 | 23 |
| July 31, 2009 | 11.93 | .64 | (1.50) | (.86) | (.67) | (.67) | — | — | 10.40 | (6.88) | 4,340 | .61 g | 6.57 g | 16 |
| July 31, 2008 † | 12.49 | .40 | (.57) | (.17) | (.39) | (.39) | — | — | 11.93 | (1.41)* | 167 | .35 g* | 3.21 g* | 46 |
|
See notes to financial highlights at the end of this section.
The accompanying notes are an integral part of these financial statements.
| | | |
| 42 | Tax-Free High Yield Fund | Tax-Free High Yield Fund | 43 |
Financial highlights (Continued)
* Not annualized.
** Unaudited.
† For the period January 2, 2008 (commencement of operations) to July 31, 2008.
a Amount represents less than $0.01 per share.
b Total return assumes dividend reinvestment and does not reflect the effect of sales charges.
c Includes amounts paid through expense offset arrangements (Note 2).
d Reflects a non-recurring reimbursement pursuant to a settlement between the Securities and Exchange Commission (the SEC) and Southwest Capital, which amounted to less than $0.01 per share outstanding as of August 22, 2011.
e Reflects a non-recurring reimbursement related to restitution amounts in connection with a distribution plan approved by the SEC which amounted to less than $0.01 per share outstanding on July 21, 2011. Also reflects a non-recurring reimbursal related to short-term trading related lawsuits, which amounted to less than $0.01 per share outstanding on May 11, 2011.
f Reflects a non-recurring reimbursement pursuant to a settlement between the SEC and Prudential Securities, Inc., which amounted to less than $0.01 per share outstanding as of March 30, 2010.
g Reflects an involuntary contractual expense limitation in effect during the period. As a result of such limitation, the expenses of each class reflect a reduction of the following amounts:
| |
| | Percentage of |
| | average net assets |
|
| July 31, 2009 | 0.02% |
|
| July 31, 2008 | 0.01 |
|
The accompanying notes are an integral part of these financial statements.
| |
| 44 | Tax-Free High Yield Fund |
Notes to financial statements 1/31/13 (Unaudited)
Within the following Notes to financial statements, references to “State Street” represent State Street Bank and Trust Company, references to “the SEC” represent the Securities and Exchange Commission, references to “Putnam Management” represent Putnam Investment Management, LLC, the fund’s manager, an indirect wholly-owned subsidiary of Putnam Investments, LLC and references to “OTC”, if any, represent over-the-counter. Unless otherwise noted, the “reporting period” represents the period from August 1, 2012 through January 31, 2013.
Putnam Tax-Free High Yield Fund (the fund) is a diversified series of Putnam Tax-Free Income Trust (the Trust), a Massachusetts business trust registered under the Investment Company Act of 1940, as amended, as an open-end management investment company. The investment objective of the fund is to seek high current income exempt from federal income tax by investing mainly in bonds that pay interest that is exempt from federal income tax (but that may be subject to federal alternative minimum tax (AMT)), are a combination of below-investment-grade and investment-grade securities, and have intermediate to long-term maturities (three years or longer).
The fund offers class A, class B, class C, class M and class Y shares. Class A and class M shares are sold with a maximum front-end sales charge of 4.00% and 3.25%, respectively, and generally do not pay a contingent deferred sales charge. Class B shares, which convert to class A shares after approximately eight years, do not pay a front-end sales charge and are subject to a contingent deferred sales charge if those shares are redeemed within six years of purchase. Class C shares have a one-year 1.00% contingent deferred sales charge and do not convert to class A shares. The expenses for class A, class B, class C, and class M shares may differ based on the distribution fee of each class, which is identified in Note 2. Class Y shares, which are sold at net asset value, are generally subject to the same expenses as class A, class B, class C, and class M shares, but do not bear a distribution fee. Class Y shares are not available to all investors.
In the normal course of business, the fund enters into contracts that may include agreements to indemnify another party under given circumstances. The fund’s maximum exposure under these arrangements is unknown as this would involve future claims that may be, but have not yet been, made against the fund. However, the fund’s management team expects the risk of material loss to be remote.
Note 1: Significant accounting policies
The following is a summary of significant accounting policies consistently followed by the fund in the preparation of its financial statements. The preparation of financial statements is in conformity with accounting principles generally accepted in the United States of America and requires management to make estimates and assumptions that affect the reported amounts of assets and liabilities in the financial statements and the reported amounts of increases and decreases in net assets from operations. Actual results could differ from those estimates. Subsequent events after the Statement of assets and liabilities date through the date that the financial statements were issued have been evaluated in the preparation of the financial statements.
A 1.00% redemption fee may apply on shares that are redeemed (either by selling or exchanging into another fund) within 30 days of purchase. The redemption fee is accounted for as an addition to paid-in-capital.
Investment income, realized and unrealized gains and losses and expenses of the fund are borne pro-rata based on the relative net assets of each class to the total net assets of the fund, except that each class bears expenses unique to that class (including the distribution fees applicable to such classes). Each class votes as a class only with respect to its own distribution plan or other matters on which a class vote is required by law or determined by the Trustees. If the fund were liquidated, shares of each class would receive their pro-rata share of the net assets of the fund. In addition, the Trustees declare separate dividends on each class of shares.
Security valuation Tax-exempt bonds and notes are generally valued on the basis of valuations provided by an independent pricing service approved by the Trustees. Such services use information with respect to transactions in bonds, quotations from bond dealers, market transactions in comparable securities and various relationships between securities in determining value. These securities will generally be categorized as Level 2.
Certain investments, including certain restricted and illiquid securities and derivatives, are also valued at fair value following procedures approved by the Trustees. Such valuations and procedures are reviewed periodically by the Trustees. These valuations consider such factors as significant market or specific security events such as interest rate or credit quality changes, various relationships with other securities, discount rates, U.S. Treasury, U.S. swap and credit yields, index levels, convexity exposures and recovery rates. These securities are classified as Level 2 or as Level 3 depending on the priority of the significant inputs. The fair value of securities is generally determined
| |
| Tax-Free High Yield Fund | 45 |
as the amount that the fund could reasonably expect to realize from an orderly disposition of such securities over a reasonable period of time. By its nature, a fair value price is a good faith estimate of the value of a security in a current sale and does not reflect an actual market price, which may be different by a material amount.
Security transactions and related investment income Security transactions are recorded on the trade date (the date the order to buy or sell is executed). Gains or losses on securities sold are determined on the identified cost basis.
Interest income is recorded on the accrual basis. All premiums/discounts are amortized/accreted on a yield-to-maturity basis. The premium in excess of the call price, if any, is amortized to the call date; thereafter, any remaining premium is amortized to maturity.
Interfund lending The fund, along with other Putnam funds, may participate in an interfund lending program pursuant to an exemptive order issued by the SEC. This program allows the fund to borrow from other Putnam funds that permit such transactions. Interfund lending transactions are subject to each fund’s investment policies and borrowing and lending limits. Interest earned or paid on the interfund lending transaction will be based on the average of certain current market rates. During the reporting period, the fund did not utilize the program.
Line of credit The fund participates, along with other Putnam funds, in a $315 million unsecured committed line of credit and a $185 million unsecured uncommitted line of credit, both provided by State Street. Borrowings may be made for temporary or emergency purposes, including the funding of shareholder redemption requests and trade settlements. Interest is charged to the fund based on the fund’s borrowing at a rate equal to the Federal Funds rate plus 1.25% for the committed line of credit and the Federal Funds rate plus 1.30% for the uncommitted line of credit. A closing fee equal to 0.02% of the committed line of credit and $50,000 for the uncommitted line of credit has been paid by the participating funds. In addition, a commitment fee of 0.11% per annum on any unutilized portion of the committed line of credit is allocated to the participating funds based on their relative net assets and paid quarterly. During the reporting period, the fund had no borrowings against these arrangements.
Federal taxes It is the policy of the fund to distribute all of its income within the prescribed time period and otherwise comply with the provisions of the Internal Revenue Code of 1986, as amended (the Code), applicable to regulated investment companies. It is also the intention of the fund to distribute an amount sufficient to avoid imposition of any excise tax under Section 4982 of the Code.
The fund is subject to the provisions of Accounting Standards Codification ASC 740 Income Taxes (ASC 740). ASC 740 sets forth a minimum threshold for financial statement recognition of the benefit of a tax position taken or expected to be taken in a tax return. The fund did not have a liability to record for any unrecognized tax benefits in the accompanying financial statements. No provision has been made for federal taxes on income, capital gains or unrealized appreciation on securities held nor for excise tax on income and capital gains. Each of the fund’s federal tax returns for the prior three fiscal years remains subject to examination by the Internal Revenue Service.
At July 31, 2012, the fund had a capital loss carryover of $123,907,651 available to the extent allowed by the Code to offset future net capital gain, if any. The amounts of the carryovers and the expiration dates are:
| | | |
| | Loss carryover | |
|
| Short-term | Long-term | Total | Expiration |
|
| $ — | $16,840,197 | $16,840,197 | * |
|
| 36,670,752 | N/A | 36,670,752 | July 31, 2013 |
|
| 4,270,473 | N/A | 4,270,473 | July 31, 2016 |
|
| 17,411,277 | N/A | 17,411,277 | July 31, 2017 |
|
| 33,971,635 | N/A | 33,971,635 | July 31, 2018 |
|
| 14,743,317 | N/A | 14,743,317 | July 31, 2019 |
|
* Under the Regulated Investment Company Modernization Act of 2010, the fund will be permitted to carry forward capital losses incurred in taxable years beginning after December 22, 2010 for an unlimited period. However, any losses incurred will be required to be utilized prior to the losses incurred in pre-enactment tax years. As a result of this ordering rule, pre-enactment capital loss carryforwards may be more likely to expire unused. Additionally, post-enactment capital losses that are carried forward will retain their character as either short-term or long-term capital losses rather than being considered all short-term as under previous law.
| |
| 46 | Tax-Free High Yield Fund |
Pursuant to federal income tax regulations applicable to regulated investment companies, the fund has elected to defer certain capital losses of $11,320,887 recognized during the period between November 1, 2011 and July 31, 2012 to its fiscal year ending July 31, 2013.
The aggregate identified cost on a tax basis is $1,076,536,639, resulting in gross unrealized appreciation and depreciation of $123,826,012 and $27,290,444, respectively, or net unrealized appreciation of $96,535,568.
Distributions to shareholders Income dividends are recorded daily by the fund and are paid monthly. Distributions from capital gains, if any, are recorded on the ex-dividend date and paid at least annually. The amount and character of income and gains to be distributed are determined in accordance with income tax regulations which may differ from generally accepted accounting principles. Dividend sources are estimated at the time of declaration. Actual results may vary. Any non-taxable return of capital cannot be determined until final tax calculations are completed after the end of the fund’s fiscal year. Reclassifications are made to the fund’s capital accounts to reflect income and gains available for distribution (or available capital loss carryovers) under income tax regulations.
Expenses of the Trust Expenses directly charged or attributable to any fund will be paid from the assets of that fund. Generally, expenses of the Trust will be allocated among and charged to the assets of each fund on a basis that the Trustees deem fair and equitable, which may be based on the relative assets of each fund or the nature of the services performed and relative applicability to each fund.
Note 2: Management fee, administrative services and other transactions
The fund pays Putnam Management a management fee (based on the fund’s average net assets and computed and paid monthly) at annual rates that may vary based on the average of the aggregate net assets of most open-end funds, as defined in the fund’s management contract, sponsored by Putnam Management. Such annual rates may vary as follows:
| | | | |
| 0.630% | of the first $5 billion, | | 0.430% | of the next $50 billion, |
| |
|
| 0.580% | of the next $5 billion, | | 0.410% | of the next $50 billion, |
| |
|
| 0.530% | of the next $10 billion, | | 0.400% | of the next $100 billion, and |
| |
|
| 0.480% | of the next $10 billion, | | 0.395% | of any excess thereafter. |
| |
|
|
Putnam Management has contractually agreed, through June 30, 2013, to waive fees or reimburse the fund’s expenses to the extent necessary to limit the cumulative expenses of the fund, exclusive of brokerage, interest, taxes, investment-related expenses, extraordinary expenses, acquired fund fees and expenses and payments under the fund’s investor servicing contract, investment management contract and distribution plans, on a fiscal year-to-date basis to an annual rate of 0.20% of the fund’s average net assets over such fiscal year-to-date period. During the reporting period, the fund’s expenses were not reduced as a result of this limit.
Putnam Investments Limited (PIL), an affiliate of Putnam Management, is authorized by the Trustees to manage a separate portion of the assets of the fund as determined by Putnam Management from time to time. Putnam Management pays a quarterly sub-management fee to PIL for its services at an annual rate of 0.40% of the average net assets of the portion of the fund managed by PIL.
The fund reimburses Putnam Management an allocated amount for the compensation and related expenses of certain officers of the fund and their staff who provide administrative services to the fund. The aggregate amount of all such reimbursements is determined annually by the Trustees.
Custodial functions for the fund’s assets are provided by State Street. Custody fees are based on the fund’s asset level, the number of its security holdings and transaction volumes.
Putnam Investor Services, Inc., an affiliate of Putnam Management, provides investor servicing agent functions to the fund. Putnam Investor Services, Inc. received fees for investor servicing based on the fund’s retail asset level, the number of shareholder accounts in the fund and the level of defined contribution plan assets in the fund. Investor servicing fees will not exceed an annual rate of 0.32% of the fund’s average net assets. Prior to March 1, 2012, investor servicing fees could not exceed an annual rate of 0.375% of the fund’s average net assets. During the reporting period, the expenses for each class of shares related to investor servicing fees were as follows:
| | | | |
| Class A | $212,950 | | Class M | 2,066 |
| |
|
| Class B | 2,977 | | Class Y | 22,836 |
| |
|
| Class C | 16,388 | | Total | $257,217 |
| |
|
|
| |
| Tax-Free High Yield Fund | 47 |
The fund has entered into expense offset arrangements with Putnam Investor Services, Inc. and State Street whereby Putnam Investor Services, Inc.’s and State Street’s fees are reduced by credits allowed on cash balances. For the reporting period, the fund’s expenses were reduced by $1,119 under the expense offset arrangements.
Each independent Trustee of the fund receives an annual Trustee fee, of which $960, as a quarterly retainer, has been allocated to the fund, and an additional fee for each Trustees meeting attended. Trustees also are reimbursed for expenses they incur relating to their services as Trustees.
The fund has adopted a Trustee Fee Deferral Plan (the Deferral Plan) which allows the Trustees to defer the receipt of all or a portion of Trustees fees payable on or after July 1, 1995. The deferred fees remain invested in certain Putnam funds until distribution in accordance with the Deferral Plan.
The fund has adopted an unfunded noncontributory defined benefit pension plan (the Pension Plan) covering all Trustees of the fund who have served as a Trustee for at least five years and were first elected prior to 2004. Benefits under the Pension Plan are equal to 50% of the Trustee’s average annual attendance and retainer fees for the three years ended December 31, 2005. The retirement benefit is payable during a Trustee’s lifetime, beginning the year following retirement, for the number of years of service through December 31, 2006. Pension expense for the fund is included in Trustee compensation and expenses in the Statement of operations. Accrued pension liability is included in Payable for Trustee compensation and expenses in the Statement of assets and liabilities. The Trustees have terminated the Pension Plan with respect to any Trustee first elected after 2003.
The fund has adopted distribution plans (the Plans) with respect to its class A, class B, class C and class M shares pursuant to Rule 12b–1 under the Investment Company Act of 1940. The purpose of the Plans is to compensate Putnam Retail Management Limited Partnership, an indirect wholly-owned subsidiary of Putnam Investments, LLC, for services provided and expenses incurred in distributing shares of the fund. The Plans provide for payments by the fund to Putnam Retail Management Limited Partnership at an annual rate of up to 0.35%, 1.00%, 1.00% and 1.00% of the average net assets attributable to class A, class B, class C and class M shares, respectively. The Trustees have approved payment by the fund at the annual rate of 0.85%, 1.00% and 0.50% of the average net assets for class B, class C and class M shares, respectively. For class A shares, the annual payment rate will equal the weighted average of (i) 0.20% on the net assets of the fund attributable to class A shares purchased and paid for prior to March 21, 2005 and (ii) 0.25% on all other net assets of the fund attributable to class A shares. During the reporting period, the class specific expenses related to distribution fees were as follows:
| | | | |
| Class A | $1,183,679 | | Class M | 24,400 |
| |
|
| Class B | 59,760 | | Total | $1,654,574 |
| |
|
| Class C | 386,735 | | | |
| | |
For the reporting period, Putnam Retail Management Limited Partnership, acting as underwriter, received net commissions of $57,001 and $748 from the sale of class A and class M shares, respectively, and received $1,779 and $3,297 in contingent deferred sales charges from redemptions of class B and class C shares, respectively.
A deferred sales charge of up to 1.00% is assessed on certain redemptions of class A shares. For the reporting period, Putnam Retail Management Limited Partnership, acting as underwriter, received $1,133 on class A redemptions.
Note 3: Purchases and sales of securities
During the reporting period, cost of purchases and proceeds from sales of investment securities other than short-term investments aggregated $119,132,718 and $136,904,945, respectively. There were no purchases or proceeds from sales of long-term U.S. government securities.
| |
| 48 | Tax-Free High Yield Fund |
Note 4: Capital shares
At the close of the reporting period, there was an unlimited number of shares of beneficial interest authorized. Transactions in capital shares were as follows:
| | | | |
| | Six months ended 1/31/13 | Year ended 7/31/12 |
|
| Class A | Shares | Amount | Shares | Amount |
|
| Shares sold | 4,628,874 | $59,142,080 | 13,475,495 | $164,363,459 |
|
| Shares issued in connection with | | | | |
| reinvestment of distributions | 1,304,101 | 16,659,190 | 2,773,421 | 33,466,495 |
|
| | 5,932,975 | 75,801,270 | 16,248,916 | 197,829,954 |
|
| Shares repurchased | (10,539,628) | (134,597,418) | (11,189,820) | (134,847,793) |
|
| Net increase (decrease) | (4,606,653) | $(58,796,148) | 5,059,096 | $62,982,161 |
|
| |
| | Six months ended 1/31/13 | Year ended 7/31/12 |
|
| Class B | Shares | Amount | Shares | Amount |
|
| Shares sold | 170,154 | $2,176,157 | 346,505 | $4,210,579 |
|
| Shares issued in connection with | | | | |
| reinvestment of distributions | 16,520 | 211,374 | 30,843 | 373,096 |
|
| | 186,674 | 2,387,531 | 377,348 | 4,583,675 |
|
| Shares repurchased | (123,548) | (1,578,891) | (326,840) | (3,914,051) |
|
| Net increase | 63,126 | $808,640 | 50,508 | $669,624 |
|
| |
| | Six months ended 1/31/13 | Year ended 7/31/12 |
|
| Class C | Shares | Amount | Shares | Amount |
|
| Shares sold | 1,296,635 | $16,565,702 | 2,462,381 | $30,038,688 |
|
| Shares issued in connection with | | | | |
| reinvestment of distributions | 59,669 | 763,956 | 92,413 | 1,121,650 |
|
| | 1,356,304 | 17,329,658 | 2,554,794 | 31,160,338 |
|
| Shares repurchased | (657,721) | (8,416,370) | (494,619) | (5,966,960) |
|
| Net increase | 698,583 | $8,913,288 | 2,060,175 | $25,193,378 |
|
| |
| | Six months ended 1/31/13 | Year ended 7/31/12 |
|
| Class M | Shares | Amount | Shares | Amount |
|
| Shares sold | 59,033 | $750,201 | 69,816 | $844,356 |
|
| Shares issued in connection with | | | | |
| reinvestment of distributions | 14,262 | 182,203 | 28,973 | 349,430 |
|
| | 73,295 | 932,404 | 98,789 | 1,193,786 |
|
| Shares repurchased | (71,202) | (910,446) | (98,745) | (1,189,530) |
|
| Net increase | 2,093 | $21,958 | 44 | $4,256 |
|
| |
| | Six months ended 1/31/13 | Year ended 7/31/12 |
|
| Class Y | Shares | Amount | Shares | Amount |
|
| Shares sold | 1,983,706 | $25,395,850 | 6,230,188 | $75,471,820 |
|
| Shares issued in connection with | | | | |
| reinvestment of distributions | 72,338 | 927,343 | 62,102 | 759,493 |
|
| | 2,056,044 | 26,323,193 | 6,292,290 | 76,231,313 |
|
| Shares repurchased | (1,473,040) | (18,842,018) | (3,205,714) | (38,496,066) |
|
| Net increase | 583,004 | $7,481,175 | 3,086,576 | $37,735,247 |
|
| |
| Tax-Free High Yield Fund | 49 |
Note 5: Market, credit and other risks
In the normal course of business, the fund trades financial instruments and enters into financial transactions where risk of potential loss exists due to changes in the market (market risk) or failure of the contracting party to the transaction to perform (credit risk). The fund may be exposed to additional credit risk that an institution or other entity with which the fund has unsettled or open transactions will default. The fund may invest in higher yielding, lower rated bonds that may have a higher rate of default.
Note 6: New accounting pronouncement
In December 2011, the FASB issued ASU No. 2011–11 “Disclosures about Offsetting Assets and Liabilities”. The update creates new disclosure requirements requiring entities to disclose both gross and net information for derivatives and other financial instruments that are either offset in the Statement of assets and liabilities or subject to an enforceable master netting arrangement or similar agreement. The disclosure requirements are effective for annual reporting periods beginning on or after January 1, 2013 and interim periods within those annual periods. Putnam Management is currently evaluating the application of ASU 2011–11 and its impact, if any, on the fund’s financial statements.
| |
| 50 | Tax-Free High Yield Fund |
The Putnam family of funds
The following is a list of Putnam’s open-end mutual funds offered to the public. Investors should carefully consider the investment objective, risks, charges, and expenses of a fund before investing. For a prospectus, or a summary prospectus if available, containing this and other information for any Putnam fund or product, call your financial advisor at 1-800-225-1581 and ask for a prospectus. Please read the prospectus carefully before investing.
| |
| Growth | Income |
| Growth Opportunities Fund | American Government Income Fund |
| International Growth Fund | Diversified Income Trust |
| Multi-Cap Growth Fund | Floating Rate Income Fund |
| Small Cap Growth Fund | Global Income Trust |
| Voyager Fund | High Yield Advantage Fund |
| | High Yield Trust |
| Blend | Income Fund |
| Asia Pacific Equity Fund | Money Market Fund* |
| Capital Opportunities Fund | Short Duration Income Fund |
| Capital Spectrum Fund | U.S. Government Income Trust |
| Emerging Markets Equity Fund | |
| Equity Spectrum Fund | Tax-free income |
| Europe Equity Fund | AMT-Free Municipal Fund |
| Global Equity Fund | Tax Exempt Income Fund |
| International Capital Opportunities Fund | Tax Exempt Money Market Fund* |
| International Equity Fund | Tax-Free High Yield Fund |
| Investors Fund | |
| Multi-Cap Core Fund | State tax-free income funds: |
| Research Fund | Arizona, California, Massachusetts, Michigan, |
| | Minnesota, New Jersey, New York, Ohio, |
| Value | and Pennsylvania. |
| Convertible Securities Fund | |
| Equity Income Fund | Absolute Return |
| George Putnam Balanced Fund | Absolute Return 100 Fund® |
| The Putnam Fund for Growth and Income | Absolute Return 300 Fund® |
| International Value Fund | Absolute Return 500 Fund® |
| Multi-Cap Value Fund | Absolute Return 700 Fund® |
| Small Cap Value Fund | |
* An investment in a money market fund is not insured or guaranteed by the Federal Deposit Insurance Corporation or any other government agency. Although the fund seeks to preserve the value of your investment at $1.00 per share, it is possible to lose money by investing in the fund.
| |
| Tax-Free High Yield Fund | 51 |
| |
| Global Sector | Putnam RetirementReady® Funds — portfolios |
| Global Consumer Fund | with automatically adjusting allocations to |
| Global Energy Fund | stocks, bonds, and money market instruments, |
| Global Financials Fund | becoming more conservative over time. |
| Global Health Care Fund | |
| Global Industrials Fund | RetirementReady 2055 Fund |
| Global Natural Resources Fund | RetirementReady 2050 Fund |
| Global Sector Fund | RetirementReady 2045 Fund |
| Global Technology Fund | RetirementReady 2040 Fund |
| Global Telecommunications Fund | RetirementReady 2035 Fund |
| Global Utilities Fund | RetirementReady 2030 Fund |
| | RetirementReady 2025 Fund |
| Asset Allocation | RetirementReady 2020 Fund |
| Putnam Global Asset Allocation Funds — | RetirementReady 2015 Fund |
| portfolios with allocations to stocks, bonds, | |
| and money market instruments that are | Putnam Retirement Income Lifestyle |
| adjusted dynamically within specified ranges | Funds — portfolios with managed |
| as market conditions change. | allocations to stocks, bonds, and money |
| | market investments to generate |
| Dynamic Asset Allocation Balanced Fund | retirement income. |
| Dynamic Asset Allocation | |
| Conservative Fund | Retirement Income Fund Lifestyle 1 |
| Dynamic Asset Allocation Growth Fund | Retirement Income Fund Lifestyle 2 |
| Dynamic Risk Allocation Fund | Retirement Income Fund Lifestyle 3 |
| |
A short-term trading fee of 1% may apply to redemptions or exchanges from certain funds within the time period specified in the fund's prospectus.
Check your account balances and the most recent month-end performance in the Individual Investors section at putnam.com.
| |
| 52 | Tax-Free High Yield Fund |
Fund information
Founded over 75 years ago, Putnam Investments was built around the concept that a balance between risk and reward is the hallmark of a well-rounded financial program. We manage over 100 funds across income, value, blend, growth, asset allocation, absolute return, and global sector categories.
| | |
| Investment Manager | Trustees | Robert R. Leveille |
| Putnam Investment | Jameson A. Baxter, Chair | Vice President and |
| Management, LLC | Liaquat Ahamed | Chief Compliance Officer |
| One Post Office Square | Ravi Akhoury | |
| Boston, MA 02109 | Barbara M. Baumann | Michael J. Higgins |
| | Charles B. Curtis | Vice President and Treasurer |
| Investment Sub-Manager | Robert J. Darretta | |
| Putnam Investments Limited | Katinka Domotorffy | Janet C. Smith |
| 57–59 St James’s Street | John A. Hill | Vice President, |
| London, England SW1A 1LD | Paul L. Joskow | Principal Accounting Officer, |
| | Elizabeth T. Kennan | and Assistant Treasurer |
| Marketing Services | Kenneth R. Leibler | |
| Putnam Retail Management | Robert E. Patterson | Susan G. Malloy |
| One Post Office Square | George Putnam, III | Vice President and |
| Boston, MA 02109 | Robert L. Reynolds | Assistant Treasurer |
| | W. Thomas Stephens | |
| Custodian | | James P. Pappas |
| State Street Bank | Officers | Vice President |
| and Trust Company | Robert L. Reynolds | |
| | President | Mark C. Trenchard |
| Legal Counsel | | Vice President and |
| Ropes & Gray LLP | Jonathan S. Horwitz | BSA Compliance Officer |
| | Executive Vice President, | |
| | Principal Executive Officer, and | Judith Cohen |
| | Compliance Liaison | Vice President, Clerk, and |
| | | Associate Treasurer |
| | Steven D. Krichmar | |
| | Vice President and | Nancy E. Florek |
| | Principal Financial Officer | Vice President, Proxy |
| | | Manager, Assistant Clerk, and |
| | Robert T. Burns | Associate Treasurer |
| | Vice President and | |
| | Chief Legal Officer | |
This report is for the information of shareholders of Putnam Tax-Free High Yield Fund. It may also be used as sales literature when preceded or accompanied by the current prospectus, the most recent copy of Putnam’s Quarterly Performance Summary, and Putnam’s Quarterly Ranking Summary. For more recent performance, please visit putnam.com. Investors should carefully consider the investment objectives, risks, charges, and expenses of a fund, which are described in its prospectus. For this and other information or to request a prospectus or summary prospectus, call 1-800-225-1581 toll free. Please read the prospectus carefully before investing. The fund’s Statement of Additional Information contains additional information about the fund’s Trustees and is available without charge upon request by calling 1-800-225-1581.
| |
| Item 3. Audit Committee Financial Expert: |
| |
| Item 4. Principal Accountant Fees and Services: |
| |
| Item 5. Audit Committee of Listed Registrants |
| |
| Item 6. Schedule of Investments: |
| |
| The registrant’s schedule of investments in unaffiliated issuers is included in the report to shareholders in Item 1 above. |
| |
| Item 7. Disclosure of Proxy Voting Policies and Procedures For Closed-End Management Investment Companies: |
| |
| Item 8. Portfolio Managers of Closed-End Investment Companies |
| |
| Item 9. Purchases of Equity Securities by Closed-End Management Investment Companies and Affiliated Purchasers: |
| |
| Item 10. Submission of Matters to a Vote of Security Holders: |
| |
| Item 11. Controls and Procedures: |
| |
| (a) The registrant’s principal executive officer and principal financial officer have concluded, based on their evaluation of the effectiveness of the design and operation of the registrant’s disclosure controls and procedures as of a date within 90 days of the filing date of this report, that the design and operation of such procedures are generally effective to provide reasonable assurance that information required to be disclosed by the registrant in this report is recorded, processed, summarized and reported within the time periods specified in the Commission’s rules and forms. |
| |
| (b) Changes in internal control over financial reporting: Not applicable |
| |
| (a)(2) Separate certifications for the principal executive officer and principal financial officer of the registrant as required by Rule 30a-2(a) under the Investment Company Act of 1940, as amended, are filed herewith. |
| |
| (b) The certifications required by Rule 30a-2(b) under the Investment Company Act of 1940, as amended, are filed herewith. |
| |
| Putnam Tax Free Income Trust |
| |
| By (Signature and Title): |
| |
| /s/Janet C. Smith
Janet C. Smith
Principal Accounting Officer
|
| |
| Pursuant to the requirements of the Securities Exchange Act of 1934 and the Investment Company Act of 1940, this report has been signed below by the following persons on behalf of the registrant and in the capacities and on the dates indicated. |
| |
| By (Signature and Title): |
| |
| /s/Jonathan S. Horwitz
Jonathan S. Horwitz
Principal Executive Officer
|
| |
| By (Signature and Title): |
| |
| /s/Steven D. Krichmar
Steven D. Krichmar
Principal Financial Officer
|