| | | |
| | |
| UNITED STATES |
| SECURITIES AND EXCHANGE COMMISSION |
| Washington, D.C. 20549 |
| |
| FORM N-CSR |
| |
| CERTIFIED SHAREHOLDER REPORT OF REGISTERED |
| MANAGEMENT INVESTMENT COMPANIES |
| | |
| Investment Company Act file number: (811-04345) | |
| | |
| Exact name of registrant as specified in charter: | Putnam Tax Free Income Trust |
| |
| Address of principal executive offices: One Post Office Square, Boston, Massachusetts 02109 |
| | |
| Name and address of agent for service: | | Beth S. Mazor, Vice President |
| | One Post Office Square |
| | Boston, Massachusetts 02109 |
| | |
| Copy to: | | John W. Gerstmayr, Esq. |
| | Ropes & Gray LLP |
| | One International Place |
| | Boston, Massachusetts 02110 |
| | |
| Registrant’s telephone number, including area code: | (617) 292-1000 |
| | | |
| Date of fiscal year end: July 31, 2010 | | |
| |
| Date of reporting period: August 1, 2009 — January 31, 2010 |
Item 1. Report to Stockholders:
The following is a copy of the report transmitted to stockholders pursuant to Rule 30e-1 under the Investment Company Act of 1940:

A BALANCED APPROACH
Since 1937, when George Putnam created a diverse mix of stocks and bonds in a single, professionally managed portfolio, Putnam has championed the balanced approach.
A WORLD OF INVESTING
Today, we offer investors a world of equity, fixed-income, multi-asset, and absolute-return portfolios to suit a range of financial goals.
A COMMITMENT TO EXCELLENCE
Our portfolio managers seek superior results over time, backed by original, fundamental research on a global scale. We believe in the value of experienced financial advice, in providing exemplary service, and in putting clients first in all we do.

Putnam
AMT-Free
Municipal Fund
Semiannual report
1 | 31 | 10
| |
| Message from the Trustees | 2 |
|
| About the fund | 4 |
|
| Performance snapshot | 6 |
|
| Interview with your fund’s portfolio manager | 7 |
|
| Your fund’s performance | 11 |
|
| Your fund’s expenses | 13 |
|
| Terms and definitions | 15 |
|
| Trustee approval of management contract | 16 |
|
| Other information for shareholders | 27 |
|
| Financial statements | 28 |
|
| Shareholder meeting results | 50 |
|
Message from the Trustees
Dear Fellow Shareholder:
Last year’s rally in both stocks and bonds helped investors recoup some of the losses in their portfolios, and Putnam’s shareholders were particularly well served. After such strong growth, we are not surprised that the markets paused at the start of 2010.
While no one believes that 2010 will be a repeat performance of 2009, we do feel that today’s markets — based on an optimistic earnings outlook and growing evidence of a global economic recovery — offer ample opportunities for active money management, which is something that Putnam does well.
If there is any lesson to be learned from the extraordinary volatility of the past year, it is the importance of positioning one’s portfolio to limit downside risk. It is our belief that the best way to achieve this is by diversifying across all asset classes and investment strategies, and by adhering to your plan in every type of market environment.
Lastly, we would like to thank all shareholders who took the time to vote by proxy on a number of issues, including shareholder-friendly management fee changes, presented at the Putnam Funds’ shareholder meetings. We would also like to
2
welcome new shareholders to the fund and thank all of our investors for your continued confidence in Putnam.

About the fund
Seeking high current income free from federal taxes
Municipal bonds have long been popular investments because they provide income exempt from federal tax, though capital gains are taxable. Putnam AMT-Free Municipal Fund seeks income exempt from traditional income tax as well as from the federal alternative minimum tax, or AMT.
The AMT is a federal tax that operates in tandem with the regular income tax system. Taxpayers subject to the AMT generally must pay a larger amount in tax determined by AMT rules — and the difference can be thousands of dollars for many with household incomes above $150,000. It is estimated that by 2010, nearly every household with an income of $100,000 or more will be paying the AMT, unless the federal government changes the law.
If you are subject to the AMT, investments that could increase your tax liability include private-activity municipal bonds, which back development projects, including certain housing and resource recovery projects.
Putnam AMT-Free Municipal Fund aims to serve investors subject to the AMT. The fund seeks to avoid bonds whose income would be taxable under AMT rules, though income may be subject to state taxes.
The fund’s portfolio managers research the municipal market to buy bonds that are not subject to the AMT. Pursuing the fund’s mandate, they also keep the fund invested in high-quality bonds, favoring those that have intermediate- to long-term maturities. The managers’ goal is to provide an attractive level of income exempt from all federal taxes.
Consider these risks before investing:
Capital gains, if any, are taxable for federal and, in most cases, state purposes. Income from federal tax-exempt funds may be subject to state and local taxes. Mutual funds that invest in bonds are subject to certain risks, including interest-rate risk, credit risk, and inflation risk. As interest rates rise, the prices of bonds fall. Long-term bonds are more exposed to interest-rate risk than short-term bonds. Unlike bonds, bond funds have ongoing fees and expenses. Tax-free funds may not be suitable for IRAs and other non-taxable accounts. Please consult your tax advisor for more information.
Understanding the AMT
The AMT is a separate, parallel federal income tax system, with two marginal tax rates, 26% and 28%, and different exemption amounts.
Under AMT rules, certain exclusions, exemptions, deductions, and credits that would reduce your regular taxable income are not allowed. You must “adjust” your regular taxable income to arrive at your alternative minimum taxable income (AMTI). Then, after subtracting your AMT exemption amount, if your AMT liability is greater than your regular tax liability, you must pay both your regular tax and the difference. It is important to understand that a higher level of income will not necessarily cause you to owe AMT. Rather, it is the relationship between your income and various trigger items, such as credits and deductions, that determines your AMT liability.
Managing this relationship can help avoid a costly surprise at tax time. Any number of items may trigger the tax, but large capital gains, personal exemptions, and deductions are the worst culprits.
From “class tax” to “mass tax”: Without a change in the tax laws,
millions more taxpayers may become subject to the AMT.

Performance
snapshot
Average annual total return (%) comparison as of 1/31/10
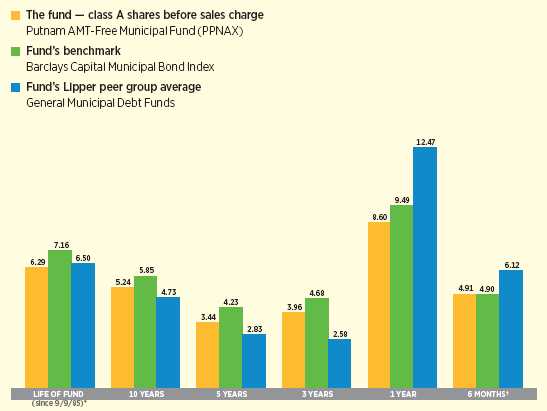
Current performance may be lower or higher than the quoted past performance, which cannot guarantee future results. Share price, principal value, and return will fluctuate, and you may have a gain or a loss when you sell your shares. Performance of class A shares assumes reinvestment of distributions and does not account for taxes. Fund returns in the bar chart do not reflect a sales charge of 4.00%; had they, returns would have been lower. See pages 7 and 11–13 for additional performance information. For a portion of the periods, this fund may have limited expenses, without which returns would have been lower. A 1% short-term trading fee may apply. To obtain the most recent month-end performance, visit putnam.com.
* Performance for class A shares before their inception (9/20/93) is derived from the historical performance of class B shares.
† Returns for the six-month period are not annualized, but cumulative.
6
Interview with your
fund’s portfolio manager
Thalia Meehan
Thalia, how did Putnam AMT-Free Municipal Fund perform for the period?
In the past six months, we were pleased to deliver positive returns for our investors, gaining 4.91%, and slightly topping our benchmark, the Barclays Capital Municipal Bond Index, which grew by 4.90%. At the same time, the fund lagged its Lipper peers, General Municipal Debt Funds, which returned an average of 6.12%. It’s important to understand, however, that our fund is constituted a bit differently than its peers.
How so?
Putnam AMT-Free Municipal Fund has much stricter guidelines than its peers when it comes to the credit quality of the securities we hold. That goes back to its roots as the Putnam AMT-Free Insured Municipal Fund, when at least 80% of the fund’s holdings needed to be insured, which meant higher credit ratings and lower interest rates. Those fund guidelines changed in February 2009, however, when the number of AAA-rated insurers all but disappeared. At the end of 2007, seven companies were rated AAA by both S&P and Moody’s, but that number dropped to zero by last year due to ratings downgrades and skepticism over bond insurance’s real worth. As a result, Putnam’s Trustees changed the fund’s name, removing the insured issuance requirement to reflect
Broad market index and fund performance
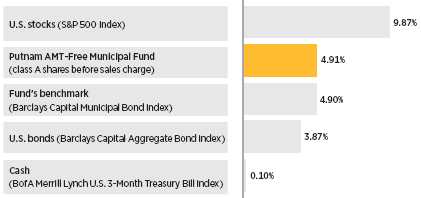
This comparison shows your fund’s performance in the context of broad market indexes for the six months ended 1/31/10. See pages 6 and 11–13 for additional fund performance information. Index descriptions can be found on page 15.
7
market conditions and changing the focus to a quality national fund. In doing so, one strict guideline remained: We must keep the quality of issuance very high at all times, limiting the fund’s investments in securities rated lower than A or its equivalent as a percentage of the fund’s net assets. Today, that means stricter credit quality guidelines for the fund than for its peers.
How does that generally impact performance?
The fund typically will lag the broader municipal bond universe when lower-quality issuance outperforms and will typically lead the market when higher-quality issuance outperforms.
The former was certainly the case during this six-month period. As municipal debt continued to rally through much of 2009, investors found increased confidence to invest in undervalued, lower-quality issues that had been overly punished due to perceived credit risks the prior year.
What effects have Build America Bonds had on the municipal bond market?
The fund does not hold Build America Bonds, or BABs, but they have made a significant impact in reducing supply of higher-quality issues in the market. BABs are taxable securities issued by state and local governments, in which the issuer receives a subsidy direct from the U.S. Treasury to cover 35% of the interest payments. This financing alternative has been attractive to municipal issuers, allowing them to access a broader base of buyers for their bonds. At the same time, the popularity of BABs created concern about the future of the tax-exempt supply, helping to strengthen prices of municipal bonds.
Did you make any changes to the fund during the period?
To the extent that we are allowed under the fund’s credit quality guidelines, we continued
Credit quality overview

Credit qualities are shown as a percentage of net assets as of 1/31/10. A bond rated Baa or higher (MIG3/VMIG3 or higher, for short-term debt) is considered investment grade. The chart reflects Moody’s ratings; percentages may include bonds not rated by Moody’s but considered by Putnam Management to be of comparable quality. Ratings will vary over time.
8
to add to the lower-quality area of the market — mainly BBB and single A-rated issues. We certainly want to take advantage of the dislocation in that lower tier of the market where we think some issues are still cheap. However, the fund is designed to limit its allocation to bonds rated lower than A. The fund is designed to be of higher average quality than other municipal bond funds.
“It’s important to understand that our
fund is constituted a bit differently
than its peers... The fund is designed
to be of higher average quality than
other municipal bond funds.”
Thalia Meehan
Can you give an example of a holding that aided performance during the period?
Buckeye Tobacco was certainly a winner for us. Tobacco bonds are a large, liquid BBB-rated sector of the municipal bond market. In 2008, this sector suffered dramatic underperformance before bouncing back strongly in 2009 and into 2010. Buckeye was one of the lower-quality holdings that buoyed our performance.
Did any holdings significantly detract from performance?
California Health Facility bonds hurt our overall returns. In general, this issuance suffered as it was purchased prior to the sell-off that occurred in October. We continue to believe that these bonds have strong relative value.
What is your outlook for the municipal bond market?
We see some real positives for municipals over the longer term — the Bush administration’s tax cuts are set to expire on January 1, 2011, supply of higher-grade issuance should remain constrained due to BABs, and we see continued demand in the marketplace. Given that the credit quality
Comparison of top sector weightings
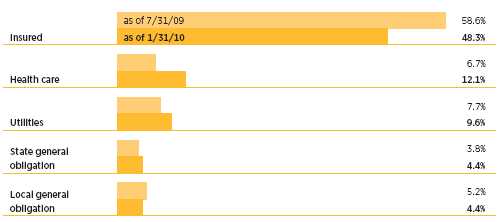
This chart shows how the fund’s top weightings have changed over the past six months. Weightings are shown as a percentage of net assets. Holdings will vary over time. Sector concentrations listed after the portfolio schedule in the Financial Statements section of this shareholder report are exclusive of insured status and any interest accruals and may differ from the summary information above.
9
of the asset class remains very sound, we believe municipal bonds remain an attractive sector.
IN THE NEWS
Prices rose again in January, with the Consumer Price Index (CPI) climbing 0.2% for the month, but is deflation on its way? The surprise came in the “core” numbers that exclude more volatile food and energy prices. In January, the core numbers dropped for the first time in more than 25 years, due to falling home prices and high unemployment. It is our belief that this monthly dip is too isolated an incident to be deemed deflation, which can damage an economy as prices spiral downward, eroding companies’ profitability and their ability to retain workers. Economists agree that mild, stable inflation is generally the healthiest state for consumer prices.
Thank you, Thalia, for your time and insight.
The views expressed in this report are exclusively those of Putnam Management. They are not meant as investment advice.
Please note that the holdings discussed in this report may not have been held by the fund for the entire period. Portfolio composition is subject to review in accordance with the fund’s investment strategy and may vary in the future. Current and future portfolio holdings are subject to risk.

Portfolio Manager Thalia Meehan is Team Leader of Tax Exempt Fixed Income at Putnam. She holds a B.A. from Williams College. A CFA charterholder, Thalia joined Putnam in 1989 and has been in the investment industry since 1983.
In addition to Thalia, your fund’s portfolio managers are Paul Drury and Susan McCormack.
10
Your fund’s performance
This section shows your fund’s performance, price, and distribution information for periods ended January 31, 2010, the end of the first half of its current fiscal year. In accordance with regulatory requirements for mutual funds, we also include performance as of the most recent calendar quarter-end and expense information taken from the fund’s current prospectus. Performance should always be considered in light of a fund’s investment strategy. Data represents past performance. Past performance does not guarantee future results. More recent returns may be less or more than those shown. Investment return and principal value will fluctuate, and you may have a gain or a loss when you sell your shares. Performance information does not reflect any deduction for taxes a shareholder may owe on fund distributions or on the redemption of fund shares. For the most recent month-end performance, please visit the Individual Investors section at putn am.com or call Putnam at 1-800-225-1581. Class Y shares are generally only available to corporate and institutional clients and clients in other approved programs. See the Terms and Definitions section in this report for definitions of the share classes offered by your fund.
Fund performance Total return for periods ended 1/31/10
| | | | | | | | | |
| | Class A | Class B | Class C | Class M | Class Y |
| (inception dates) | (9/20/93) | (9/9/85) | (7/26/99) | (6/1/95) | (1/2/08) |
|
| | NAV | POP | NAV | CDSC | NAV | CDSC | NAV | POP | NAV |
|
| Annual average | | | | | | | | | |
| (life of fund) | 6.29% | 6.11% | 5.94% | 5.94% | 5.67% | 5.67% | 6.06% | 5.92% | 6.03% |
|
| 10 years | 66.72 | 60.09 | 57.19 | 57.19 | 54.28 | 54.28 | 62.02 | 56.73 | 60.19 |
| Annual average | 5.24 | 4.82 | 4.63 | 4.63 | 4.43 | 4.43 | 4.94 | 4.60 | 4.82 |
|
| 5 years | 18.44 | 13.72 | 14.70 | 12.77 | 13.88 | 13.88 | 16.69 | 12.97 | 16.78 |
| Annual average | 3.44 | 2.60 | 2.78 | 2.43 | 2.63 | 2.63 | 3.14 | 2.47 | 3.15 |
|
| 3 years | 12.35 | 7.91 | 10.24 | 7.26 | 9.85 | 9.85 | 11.50 | 7.91 | 12.28 |
| Annual average | 3.96 | 2.57 | 3.30 | 2.36 | 3.18 | 3.18 | 3.70 | 2.57 | 3.94 |
|
| 1 year | 8.60 | 4.24 | 7.91 | 2.91 | 7.81 | 6.81 | 8.35 | 4.82 | 8.96 |
|
| 6 months | 4.91 | 0.78 | 4.61 | –0.39 | 4.52 | 3.52 | 4.78 | 1.36 | 5.11 |
|
Current performance may be lower or higher than the quoted past performance, which cannot guarantee future results. After sales charge returns (public offering price, or POP) for class A and M shares reflect a maximum 4.00% and 3.25% load, respectively. Class B share returns reflect the applicable contingent deferred sales charge (CDSC), which is 5% in the first year, declining to 1% in the sixth year, and is eliminated thereafter. Class C shares reflect a 1% CDSC for the first year that is eliminated thereafter. Class Y shares have no initial sales charge or CDSC. Performance for class A, C, M, and Y shares before their inception is derived from the historical performance of class B shares, adjusted for the applicable sales charge (or CDSC) and, for class C shares, the higher operating expenses for such shares.
For a portion of the periods, this fund may have limited expenses, without which returns would have been lower.
A 1% short-term trading fee may be applied to shares exchanged or sold within 7 days of purchase.
11
Comparative index returns For periods ended 1/31/10
| | |
| | Barclays Capital Municipal | Lipper General Municipal Debt Funds |
| | Bond Index | category average* |
|
| Annual average (life of fund) | 7.16% | 6.50% |
|
| 10 years | 76.58 | 59.22 |
| Annual average | 5.85 | 4.73 |
|
| 5 years | 23.02 | 15.14 |
| Annual average | 4.23 | 2.83 |
|
| 3 years | 14.71 | 8.08 |
| Annual average | 4.68 | 2.58 |
|
| 1 year | 9.49 | 12.47 |
|
| 6 months | 4.90 | 6.12 |
|
Index and Lipper results should be compared to fund performance at net asset value.
* Over the 6-month, 1-year, 3-year, 5-year, 10-year, and life-of-fund periods ended 1/31/10, there were 262, 247, 220, 204, 163, and 36 funds, respectively, in this Lipper category.
Fund price and distribution information For the six-month period ended 1/31/10
| | | | | | | |
| Distributions | Class A | Class B | Class C | Class M | Class Y |
|
| Number | 6 | 6 | 6 | 6 | 6 |
|
| Income 1 | $0.309572 | $0.263616 | $0.252863 | $0.290170 | $0.326424 |
|
| Capital gains 2 | — | — | — | — | — |
|
| Total | $0.309572 | $0.263616 | $0.252863 | $0.290170 | $0.326424 |
|
| Share value | NAV | POP | NAV | NAV | NAV | POP | NAV |
|
| 7/31/09 | $14.27 | $14.86 | $14.29 | $14.30 | $14.31 | $14.79 | $14.27 |
|
| 1/31/10 | 14.66 | 15.27 | 14.68 | 14.69 | 14.70 | 15.19 | 14.67 |
|
| Current yield (end of period) | NAV | POP | NAV | NAV | NAV | POP | NAV |
|
| Current dividend rate 3 | 4.29% | 4.12% | 3.67% | 3.52% | 4.02% | 3.89% | 4.52% |
|
| Taxable equivalent 4 | 6.60% | 6.34% | 5.65% | 5.42% | 6.18% | 5.98% | 6.95% |
|
| Current 30-day SEC yield | | | | | | | |
| (with expense limitation) 5 | N/A | 3.63% | 3.17% | 3.01% | N/A | 3.40% | 4.02% |
|
| Taxable equivalent 4 | N/A | 5.58% | 4.88% | 4.63% | N/A | 5.23% | 6.18% |
|
The classification of distributions, if any, is an estimate. Final distribution information will appear on your year-end tax forms.
1 For some investors, investment income may be subject to the federal alternative minimum tax.
2 Capital gains, if any, are taxable for federal and, in most cases, state purposes.
3 Most recent distribution, excluding capital gains, are annualized and divided by NAV or POP at end of period.
4 Assumes maximum 35.00% federal tax rate for 2010. Results for investors subject to lower tax rates would not be as advantageous.
5 Based only on investment income and calculated using the maximum offering price for each share class, in accordance with SEC guidelines.
12
Fund performance as of most recent calendar quarter
Total return for periods ended 12/31/09
| | | | | | | | | |
| | Class A | Class B | Class C | Class M | Class Y |
| (inception dates) | (9/20/93) | (9/9/85) | (7/26/99) | (6/1/95) | (1/2/08) |
|
| | NAV | POP | NAV | CDSC | NAV | CDSC | NAV | POP | NAV |
|
| Annual average | | | | | | | | | |
| (life of fund) | 6.28% | 6.10% | 5.94% | 5.94% | 5.67% | 5.67% | 6.05% | 5.91% | 6.02% |
|
| 10 years | 64.61 | 58.04 | 55.28 | 55.28 | 52.47 | 52.47 | 60.02 | 54.85 | 58.09 |
| Annual average | 5.11 | 4.68 | 4.50 | 4.50 | 4.31 | 4.31 | 4.81 | 4.47 | 4.69 |
|
| 5 years | 18.76 | 14.13 | 15.09 | 13.15 | 14.34 | 14.34 | 17.09 | 13.28 | 17.12 |
| Annual average | 3.50 | 2.68 | 2.85 | 2.50 | 2.72 | 2.72 | 3.21 | 2.53 | 3.21 |
|
| 3 years | 11.16 | 6.75 | 9.09 | 6.14 | 8.80 | 8.80 | 10.37 | 6.79 | 11.06 |
| Annual average | 3.59 | 2.20 | 2.94 | 2.01 | 2.85 | 2.85 | 3.34 | 2.21 | 3.56 |
|
| 1 year | 11.30 | 6.82 | 10.56 | 5.56 | 10.50 | 9.50 | 11.05 | 7.48 | 11.61 |
|
| 6 months | 5.73 | 1.53 | 5.42 | 0.42 | 5.41 | 4.41 | 5.60 | 2.10 | 5.95 |
|
Your fund’s expenses
As a mutual fund investor, you pay ongoing expenses, such as management fees, distribution fees (12b-1 fees), and other expenses. In the most recent six-month period, your fund limited these expenses; had it not done so, expenses would have been higher. Using the following information, you can estimate how these expenses affect your investment and compare them with the expenses of other funds. You may also pay one-time transaction expenses, including sales charges (loads) and redemption fees, which are not shown in this section and would have resulted in higher total expenses. For more information, see your fund’s prospectus or talk to your financial representative.
Expense ratios
| | | | | |
| | Class A | Class B | Class C | Class M | Class Y |
|
| Net expenses for the fiscal year ended 7/31/09*† | 0.79% | 1.41% | 1.56% | 1.06% | 0.56% |
|
| Total annual operating expenses for the fiscal year | | | | | |
| ended 7/31/09† | 0.84% | 1.46% | 1.61% | 1.11% | 0.61% |
|
| Annualized expense ratio for the six-month period | | | | | |
| ended 1/31/10 | 0.80% | 1.42% | 1.57% | 1.07% | 0.57% |
|
Fiscal-year expense information in this table is taken from the most recent prospectus, is subject to change, and may differ from that shown for the annualized expense ratio and in the financial highlights of this report. Expenses are shown as a percentage of average net assets.
* Reflects Putnam Management’s decision to contractually limit expenses through 7/31/10.
† Reflects projected expenses based on a new expense arrangement and the fund’s recent (8/31/09) asset level.
13
Expenses per $1,000
The following table shows the expenses you would have paid on a $1,000 investment in Putnam AMT-Free Municipal Fund from August 1, 2009, to January 31, 2010. It also shows how much a $1,000 investment would be worth at the close of the period, assuming actual returns and expenses.
| | | | | |
| | Class A | Class B | Class C | Class M | Class Y |
|
| Expenses paid per $1,000 *† | $4.13 | $7.32 | $8.09 | $5.52 | $2.95 |
|
| Ending value (after expenses) | $1,049.10 | $1,046.10 | $1,045.20 | $1,047.80 | $1,051.10 |
|
* Expenses for each share class are calculated using the fund’s annualized expense ratio for each class, which represents the ongoing expenses as a percentage of average net assets for the six months ended 1/31/10. The expense ratio may differ for each share class.
† Expenses are calculated by multiplying the expense ratio by the average account value for the period; then multiplying the result by the number of days in the period; and then dividing that result by the number of days in the year.
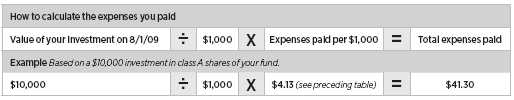
Estimate the expenses you paid
To estimate the ongoing expenses you paid for the six months ended January 31, 2010, use the following calculation method. To find the value of your investment on August 1, 2009, call Putnam at 1-800-225-1581.
Compare expenses using the SEC’s method
The Securities and Exchange Commission (SEC) has established guidelines to help investors assess fund expenses. Per these guidelines, the following table shows your fund’s expenses based on a $1,000 investment, assuming a hypothetical 5% annualized return. You can use this information to compare the ongoing expenses (but not transaction expenses or total costs) of investing in the fund with those of other funds. All mutual fund shareholder reports will provide this information to help you make this comparison. Please note that you cannot use this information to estimate your actual ending account balance and expenses paid during the period.
| | | | | |
| | Class A | Class B | Class C | Class M | Class Y |
|
| Expenses paid per $1,000 *† | $4.08 | $7.22 | $7.98 | $5.45 | $2.91 |
|
| Ending value (after expenses) | $1,021.17 | $1,018.05 | $1,017.29 | $1,019.81 | $1,022.33 |
|
* Expenses for each share class are calculated using the fund’s annualized expense ratio for each class, which represents the ongoing expenses as a percentage of average net assets for the six months ended 1/31/10. The expense ratio may differ for each share class.
† Expenses are calculated by multiplying the expense ratio by the average account value for the period; then multiplying the result by the number of days in the period; and then dividing that result by the number of days in the year.
14
Terms and definitions
Important terms
Total return shows how the value of the fund’s shares changed over time, assuming you held the shares through the entire period and reinvested all distributions in the fund.
Net asset value (NAV) is the price, or value, of one share of a mutual fund, without a sales charge. NAVs fluctuate with market conditions. NAV is calculated by dividing the net assets of each class of shares by the number of outstanding shares in the class.
Public offering price (POP) is the price of a mutual fund share plus the maximum sales charge levied at the time of purchase. POP performance figures shown here assume the 4.00% maximum sales charge for class A shares and 3.25% for class M shares.
Contingent deferred sales charge (CDSC) is generally a charge applied at the time of the redemption of class B shares and assumes redemption at the end of the period. Your fund’s class B CDSC declines from a 5% maximum during the first year to 1% during the sixth year. After the sixth year, the CDSC no longer applies. The CDSC for class C is 1% for one year after purchase.
Current yield is the annual rate of return earned from dividends or interest of an investment. Current yield is expressed as a percentage of the price of a security, fund share, or principal investment.
Share classes
Class A shares are generally subject to an initial sales charge and no CDSC (except on certain redemptions of shares bought without an initial sales charge).
Class B shares are not subject to an initial sales charge. They may be subject to a CDSC.
Class C shares are not subject to an initial sales charge and are subject to a CDSC only if the shares are redeemed during the first year.
Class M shares have a lower initial sales charge and a higher 12b-1 fee than class A shares and no CDSC.
Class Y shares are not subject to an initial sales charge or CDSC, and carry no 12b-1 fee. They are generally only available to corporate and institutional clients and clients in other approved programs.
Comparative indexes
Barclays Capital Aggregate Bond Index is an unmanaged index of U.S. investment-grade fixed-income securities.
Barclays Capital Municipal Bond Index is an unmanaged index of long-term fixed-rate investment-grade tax-exempt bonds.
BofA Merrill Lynch U.S. 3-Month Treasury Bill Index is an unmanaged index that seeks to measure the performance of U.S. Treasury bills available in the marketplace.
S&P 500 Index is an unmanaged index of common stock performance.
Indexes assume reinvestment of all distributions and do not account for fees. Securities and performance of a fund and an index will differ. You cannot invest directly in an index.
Lipper is a third-party industry-ranking entity that ranks mutual funds. Its rankings do not reflect sales charges. Lipper rankings are based on total return at net asset value relative to other funds that have similar current investment styles or objectives as determined by Lipper. Lipper may change a fund’s category assignment at its discretion. Lipper category averages reflect performance trends for funds within a category.
15
Trustee approval of management contract
General conclusions
The Board of Trustees of the Putnam funds oversees the management of each fund and, as required by law, determines annually whether to approve the continuance of your fund’s management contract with Putnam Investment Management (“Putnam Management”).
In this regard, the Board of Trustees, with the assistance of its Contract Committee consisting solely of Trustees who are not “interested persons” (as such term is defined in the Investment Company Act of 1940, as amended) of the Putnam funds (the “Independent Trustees”), requests and evaluates all information it deems reasonably necessary under the circumstances. Over the course of several months ending in June 2009, the Contract Committee met several times to consider the information provided by Putnam Management and other information developed with the assistance of the Board’s independent counsel and independent staff. The Contract Committee reviewed and discussed key aspects of this information with all of the Independent Trustees. At the Trustees’ June 12, 2009 meeting, the Contract Committee recommended, and the Independent Trustees approved, the continuance of your fund’s management contract, effective July 1 , 2009. In addition, at the Trustees’ September 11, 2009 meeting, the Contract Committee recommended, and the Independent Trustees approved, a sub-management contract with respect to your fund between Putnam Management and its affiliate, Putnam Investments Limited (“PIL”), effective November 30, 2009. (Because PIL is an affiliate of Putnam Management and Putnam Management remains fully responsible for all services provided by PIL, the Trustees have not evaluated PIL as a separate entity, and all subsequent references to Putnam Management below should be deemed to include reference to PIL as necessary or appropriate in the context.)
The Independent Trustees’ approval was based on the following conclusions:
• That the fee schedule in effect for your fund represented reasonable compensation in light of the nature and quality of the services being provided to the fund, the fees paid by competitive funds and the costs incurred by Putnam Management in providing such services, and
• That such fee schedule represented an appropriate sharing between fund shareholders and Putnam Management of such economies of scale as may exist in the management of the fund at current asset levels.
These conclusions were based on a comprehensive consideration of all information provided to the Trustees, were subject to the continued application of certain expense reductions and waivers pending other considerations noted below, and were not the result of any single factor. Some of the factors that figured particularly in the Trustees’ deliberations and how the Trustees considered these factors are described below, although individual Trustees may have evaluated the information presented differently, giving different weights to various factors. It is also important to recognize that the fee arrangements for your fund and the other Putnam funds are the result of many years of review and discussion between the Independent Trustees and Putnam Management, that certain aspects of the arrangements may receive greater scrutiny in some years than others, and that the Trustees’ conclusions may be based, in part, on their consideration of these sam e arrangements in prior years.
16
Consideration of strategic
pricing proposal
The Trustees considered that the Contract Committee had been engaged in a detailed review of Putnam Management’s strategic pricing proposal that was first presented to the Committee at its May 2009 meeting. The proposal included proposed changes to the basic structure of the management fees in place for all open-end funds (except the Putnam RetirementReady® Funds and Putnam Money Market Liquidity Fund), including implementation of a breakpoint structure based on the aggregate net assets of all such funds in lieu of the individual breakpoint structures in place for each fund, as well as implementation of performance fees for certain funds. In addition, the proposal recommended substituting separate expense limitations on investor servicing fees and on other expenses as a group in lieu of the total expense limitations in place for many funds.
While the Contract Committee noted the likelihood that the Trustees and Putnam Management would reach agreement on the strategic pricing matters in later months, the terms of the management contracts required that the Trustees approve the continuance of the contracts in order to prevent their expiration at June 30, 2009. The Contract Committee’s recommendations in June reflect its conclusion that the terms of the contractual arrangements for your fund continued to be appropriate for the upcoming term, absent any possible agreement with respect to the matters addressed in Putnam Management’s proposal.
The Trustees were mindful of the significant changes that had occurred at Putnam Management in the past two years, including a change of ownership, the installation of a new senior management team at Putnam Management, the substantial decline in assets under management resulting from extraordinary market forces as well as continued net redemptions in many funds, the introduction of new fund products representing novel investment strategies and the introduction of performance fees for certain new funds. The Trustees were also mindful that many other leading firms in the industry had also been experiencing significant challenges due to the changing financial and competitive environment. For these reasons, even though the Trustees believed that the current contractual arrangements in place between the funds and Putnam Management and its affiliates have served shareholders well and continued to be appropriate for the nea r term, the Trustees believed that it was an appropriate time to reconsider the current structure of the funds’ contractual arrangements with Putnam Management with a view to possible changes that might better serve the interests of shareholders in this new environment. The Trustees concluded their review of Putnam Management’s strategic pricing proposal in July 2009, and their considerations regarding the proposal are discussed below under the heading “Subsequent approval of strategic pricing proposal.” With the exception of the discussion under this heading, the following discussion generally addresses only the Trustees’ reasons for recommending the continuance of the current contractual arrangements (and the new sub-management contract between Putnam Management and PIL, which the Trustees evaluated in large part based on their review of contractual arrangements in June 2009) as, at the time the Trustees determined to make this recommendation, the Trustees had not yet reached any c onclusions with respect to the strategic pricing proposal.
Management fee schedules and
categories; total expenses
The Trustees reviewed the management fee schedules in effect for all Putnam funds, including fee levels and breakpoints, and the assignment of funds to particular fee categories. The general fee structure has been carefully
17
developed over the years and re-examined on many occasions and adjusted where appropriate. In this regard, the Trustees noted that shareholders of all funds voted by overwhelming majorities in 2007 to approve new management contracts containing identical fee schedules.
In reviewing fees and expenses, the Trustees generally focused their attention on material changes in circumstances — for example, changes in a fund’s size or investment style, changes in Putnam Management’s operating costs, or changes in competitive practices in the mutual fund industry — that suggest that consideration of fee changes might be warranted. The Trustees concluded that the circumstances did not warrant changes to the management fee structure of your fund at that time but, as indicated above, based on their detailed review of the current fee structure, were prepared to consider possible changes to this arrangement that might better serve the interests of shareholders in the future. The Trustees focused on two areas of particular interest, as discussed further below:
• Competitiveness. The Trustees reviewed comparative fee and expense information for competitive funds, which indicated that, in a custom peer group of competitive funds selected by Lipper Inc., your fund ranked in the 76th percentile in management fees and in the 52nd percentile in total expenses (less any applicable 12b-1 fees) as of December 31, 2008 (the first percentile being the least expensive funds and the 100th percentile being the most expensive funds).
The Trustees noted that expense ratios for a number of Putnam funds, which show the percentage of fund assets used to pay for management and administrative services, distribution (12b-1) fees (as applicable) and other expenses, had been increasing recently as a result of declining net assets and the natural operation of fee breakpoints. The Trustees expressed their intention to monitor the funds’ percentile rankings in management fees and in total expenses to ensure that fees and expenses of the funds continue to meet evolving competitive standards.
The Trustees noted that the expense ratio increases described above were being controlled by expense limitations initially implemented in January 2004. These expense limitations give effect to a commitment by Putnam Management that the expense ratio of each open-end fund would be no higher than the average expense ratio of the competitive funds included in the fund’s relevant Lipper universe (exclusive of any applicable 12b-1 charges in each case). The Trustees observed that this commitment to limit fund expenses has served shareholders well since its inception and, while the Contract Committee was reviewing proposed alternative expense limitation arrangements as noted above, the Trustees received a commitment from Putnam Management and its parent company to continue this program through at least June 30, 2010, or such earlier time as the Trustees and Putnam Management reach agreement on alternative arrangements.
In order to ensure that the expenses of the Putnam funds continue to meet evolving competitive standards, the Trustees requested, and Putnam Management agreed, to extend for the twelve months beginning July 1, 2009, or until such earlier time as the Trustees and Putnam Management reach agreement on alternative expense limitation arrangements, an additional expense limitation for certain funds at an amount equal to the average expense ratio (exclusive of 12b-1 charges) of a custom peer group of competitive funds selected by Lipper to correspond to the size of the fund. This additional expense limitation is applicable to those open-end funds that had above-average expense ratios (exclusive of 12b-1 charges) based on the custom peer group
18
data for the period ended December 31, 2007. This additional expense limitation was not applied to your fund because it had a below-average expense ratio relative to its custom peer group.
• Economies of scale. Your fund currently has the benefit of breakpoints in its management fee that provide shareholders with significant economies of scale, which means that the effective management fee rate of the fund (as a percentage of fund assets) declines as the fund grows in size and crosses specified asset thresholds. Conversely, as the fund shrinks in size — as has been the case for many Putnam funds in recent years — these breakpoints result in increasing fee levels. In recent years, the Trustees have examined the operation of the existing breakpoint structure during periods of both growth and decline in asset levels. The Trustees concluded that the fee schedule in effect for your fund represented an appropriate sharing of economies of scale at that time but, as noted above, were in the process of reviewing a proposal to eliminate individual fund br eakpoints for all of the open-end funds (except for the Putnam RetirementReady® Funds and Putnam Money Market Liquidity Fund) in favor of a breakpoint structure based on the aggregate net assets of all such funds.
In connection with their review of the management fees and total expenses of the Putnam funds, the Trustees also reviewed the costs of the services provided and profits realized by Putnam Management and its affiliates from their contractual relationships with the funds. This information included trends in revenues, expenses and profitability of Putnam Management and its affiliates relating to the investment management and distribution services provided to the funds. In this regard, the Trustees also reviewed an analysis of Putnam Management’s revenues, expenses and profitability with respect to the funds’ management contracts, allocated on a fund-by-fund basis.
Investment performance
The quality of the investment process provided by Putnam Management represented a major factor in the Trustees’ evaluation of the quality of services provided by Putnam Management under your fund’s management contract. The Trustees were assisted in their review of the Putnam funds’ investment process and performance by the work of the Investment Oversight Coordinating Committee of the Trustees and the Investment Oversight Committees of the Trustees, which had met on a regular monthly basis with the funds’ portfolio teams throughout the year. The Trustees concluded that Putnam Management generally provides a high-quality investment process — as measured by the experience and skills of the individuals assigned to the management of fund portfolios, the resources made available to such personnel, and in general the ability of Putnam Management to attract and retain high-quality personnel — but also recognized that this does no t guarantee favorable investment results for every fund in every time period. The Trustees considered the investment performance of each fund over multiple time periods and considered information comparing each fund’s performance with various benchmarks and with the performance of competitive funds.
The Trustees noted the disappointing investment performance of many of the funds for periods ended March 31, 2009. They discussed with senior management of Putnam Management the factors contributing to such underperformance and the actions being taken to improve performance. The Trustees recognized that, in recent years, Putnam Management has taken steps to strengthen its investment personnel and processes to address areas of underperformance, including Putnam Management’s continuing efforts to strengthen the equity research function, recent changes in portfolio managers including increased accountability of individual
19
managers rather than teams, recent changes in Putnam Management’s approach to incentive compensation, including emphasis on top quartile performance over a rolling three-year period, and the recent arrival of a new chief investment officer. The Trustees also recognized the substantial improvement in performance of many funds since the implementation of those changes. The Trustees indicated their intention to continue to monitor performance trends to assess the effectiveness of these efforts and to evaluate whether additional changes to address areas of underperformance are warranted.
In the case of your fund, the Trustees considered that your fund’s class A share cumulative total return performance at net asset value was in the following percentiles of its Lipper Inc. peer group (Lipper General Municipal Debt Funds) (compared using tax-adjusted performance to recognize the different federal income tax treatment for capital gains distributions and exempt-interest distributions) for the one-year, three-year and five-year periods ended March 31, 2009 (the first percentile being the best-performing funds and the 100th percentile being the worst-performing funds):
| | | |
| One-year period | 17th | | |
| | |
| Three-year period | 19th | | |
| | |
| Five-year period | 28th | | |
| | |
Over the one-year, three-year and five-year periods ended March 31, 2009, there were 240, 214, and 205 funds, respectively, in your fund’s Lipper peer group. Past performance is no guarantee of future results.
As a general matter, the Trustees believe that cooperative efforts between the Trustees and Putnam Management represent the most effective way to address investment performance problems. The Trustees noted that investors in the Putnam funds have, in effect, placed their trust in the Putnam organization, under the oversight of the funds’ Trustees, to make appropriate decisions regarding the management of the funds. Based on the responsiveness of Putnam Management in the recent past to Trustee concerns about investment performance, the Trustees concluded that it is preferable to seek change within Putnam Management to address performance shortcomings. In the Trustees’ view, the alternative of engaging a new investment adviser for an underperforming fund would entail significant disruptions and would not provide any greater assurance of improved investment performance.
Brokerage and soft-dollar allocations;
other benefits
The Trustees considered various potential benefits that Putnam Management may receive in connection with the services it provides under the management contract with your fund. These include benefits related to brokerage and soft-dollar allocations, whereby a portion of the commissions paid by a fund for brokerage may be used to acquire research services that may be useful to Putnam Management in managing the assets of the fund and of other clients. The Trustees considered a change made, at Putnam Management’s request, to the Putnam funds’ brokerage allocation policy commencing in 2009, which increased the permitted soft dollar allocation to third-party services over what had been authorized in previous years. The Trustees noted that a portion of available soft dollars continue to be allocated to the payment of fund expenses, although the amount allocated for this purpose has declined in recent years. The Trustees indicated their continued int ent to monitor regulatory developments in this area with the assistance of their Brokerage Committee and also indicated their continued intent to monitor the potential benefits associated with the allocation of fund brokerage and trends in industry practice to ensure that the principle of seeking best price and execution remains paramount in the portfolio trading process.
20
The Trustees’ annual review of your fund’s management contract also included the review of the investor servicing agreement with Putnam Investor Services, Inc. (“PSERV”), which agreement provides benefits to an affiliate of Putnam Management. The Trustees considered that effective January 1, 2009, the Trustees, PSERV and Putnam Management entered into a new fee schedule that includes for the open-end funds (other than funds of Putnam Variable Trust and Putnam Money Market Liquidity Fund) an expense limitation but, as noted above, also considered that this expense limitation is subject to review as part of the Trustees’ pending review of Putnam’s strategic pricing proposal.
In the case of your fund, the Trustees’ annual review of the fund’s management contract also included the review of the fund’s distributor’s contract and distribution plans with Putnam Retail Management Limited Partnership, which contract and plans also provide benefits to an affiliate of Putnam Management.
Comparison of retail and institutional
fee schedules
The information examined by the Trustees as part of their annual contract review has included for many years information regarding fees charged by Putnam Management and its affiliates to institutional clients such as defined benefit pension plans, college endowments, etc. This information included comparisons of such fees with fees charged to the funds, as well as a detailed assessment of the differences in the services provided to these two types of clients. The Trustees observed, in this regard, that the differences in fee rates between institutional clients and mutual funds are by no means uniform when examined by individual asset sectors, suggesting that differences in the pricing of investment management services to these types of clients reflect to a substantial degree historical competitive forces operating in separate market places. The Trustees considered the fact that fee rates across different asset classe s are typically higher on average for mutual funds than for institutional clients, as well as the differences between the services that Putnam Management provides to the Putnam funds and those that it provides to institutional clients of the firm, but did not rely on such comparisons to any significant extent in concluding that the management fees paid by your fund are reasonable.
Subsequent approval of strategic
pricing proposal
As mentioned above, at a series of meetings beginning in May 2009 and ending on July 10, 2009, the Contract Committee and the Trustees engaged in a detailed review of Putnam Management’s strategic pricing proposal. Following this review, the Trustees of each fund, including all of the Independent Trustees, voted unanimously on July 10, 2009 to approve proposed management contracts reflecting the proposal, as modified based on discussions between the Independent Trustees and Putnam Management, for each fund. In considering the proposed contracts, the Independent Trustees focused largely on the specific proposed changes described below relating to management fees. They also took into account the factors that they considered in connection with their most recent annual approval on June 12, 2009 of the continuance of the funds’ current management contracts and the extensive materials that they had reviewed in connection with that approval process, as described above.
At a meeting held on November 19, 2009, shareholders approved the proposed management contract for your fund. The new management contract was implemented on January 1, 2010.
• Considerations relating to Fund Family fee rate calculations. The Independent Trustees considered that the proposed management contracts would change the manner in which
21
fund shareholders share in potential economies of scale associated with the management of the funds. Under the current management contracts, shareholders of a fund (other than Putnam Money Market Liquidity Fund and the Putnam RetirementReady® Funds) benefit from increased fund size through reductions in the effective management fee paid to Putnam Management once the fund’s net assets exceed the first breakpoint in the fund’s fee schedule ($500 million for most funds). Conversely, in the case of funds with net assets above the level of the first breakpoint, the effective management fee increases as the fund’s average net assets decline below a breakpoint. These breakpoints are measured solely by the net assets of each individual fund and are not affected by possible growth (or decline) of net assets of other funds in the Fund Family. (“Fund Family” for purposes of this discussion refers to all open-end mutual funds sponsore d by Putnam Management, except for the Putnam RetirementReady® Funds and Putnam Money Market Liquidity Fund.) Under the proposed management contracts, potential economies of scale would be shared ratably among shareholders of all funds, regardless of their size. The management fees paid by a fund (and indirectly by shareholders) would no longer be affected by the growth (or decline) of assets of the particular fund, but rather would be affected solely by the growth (or decline) of the aggregate net assets of all funds in the Fund Family, regardless of whether the net assets of the particular fund are growing or declining.
The table below shows the proposed effective management fee rate for your fund, based on June 30, 2009 net assets of the Fund Family ($52.3 billion). This table also shows the effective management fee rate payable by your fund under its current management contract, based on the net assets of the fund as of June 30, 2009. Finally, this table shows the difference in the effective management fees, based on net assets as of June 30, 2009, between the proposed management contract and the current contract.
| | | |
| | Proposed Effective | Current Effective | |
| Name of Fund | Contractual Rate | Contractual Rate | Difference |
|
| Putnam AMT-Free Municipal Fund | 0.452% | 0.500% | (0.048)% |
As shown in the foregoing table, based on June 30, 2009 net asset levels, the proposed management contract would provide for payment of a management fee rate that is lower for your fund than the management fee rate payable under the current management contract. For a small number of funds (although not your fund), the management fee rate would be slightly higher under the proposed contract at these asset levels, but by only immaterial amounts. In the aggregate, the financial impact on Putnam Management of implementing this proposed change for all funds at June 30, 2009 net asset levels is a reduction in annual management fee revenue of approximately $24.0 million. (Putnam Management has already incurred a significant portion of this revenue reduction through the waiver of a portion of its current management fees for certain funds pending shareholder consideration of the proposed management contracts. Putna m is not obliged to continue such waivers beyond July 31, 2010 in the event that the proposed contracts are not approved by shareholders.) The Independent Trustees carefully considered the implications of this proposed change under a variety of economic circumstances. They considered the fact that at current asset levels the management fees paid by the funds under the proposed contract would be lower for almost all funds, and would not be materially higher for any fund. They considered the possibility that under some circumstances, the current management contract could result in a
22
lower fee for a particular fund than the proposed management contract. Such circumstances might occur, for example, if the aggregate net assets of the Fund Family remain largely unchanged and the net assets of an individual fund grew substantially, or if the net assets of an individual fund remain largely unchanged and the aggregate net assets of the Fund Family declined substantially.
The Independent Trustees noted that future changes in the net assets of individual funds are inherently unpredictable and that experience has shown that funds often grow in size and decline in size over time depending on market conditions and the changing popularity of particular investment styles and asset classes. They noted that, while the aggregate net assets of the Fund Family have changed substantially over time, basing a management fee on the aggregate level of assets of the Fund Family would likely reduce fluctuations in costs paid by individual funds and lead to greater stability and predictability of fund operating costs over time.
The Independent Trustees considered that the proposed management contract would likely be advantageous for newly organized funds that have yet to attract significant assets and for funds in specialty asset classes that are unlikely to grow to a significant size. In each case, such funds would participate in the benefits of scale made possible by the aggregate size of the Fund Family to an extent that would not be possible based solely on their individual size.
The Independent Trustees also considered that for funds that have achieved or are likely to achieve considerable scale on their own, the proposed management contract could result in sharing of economies which might lead to slightly higher costs under some circumstances, but they noted that any such increases are immaterial at current asset levels and that over time such funds are likely to realize offsetting benefits from their opportunity to participate, both through the exchange privilege and through the Fund Family breakpoint fee structure, in the improved growth prospects of a diversified Fund Family able to offer competitively priced products.
The Independent Trustees noted that the implementation of the proposed management contracts would result in a reduction in aggregate fee revenues for Putnam Management at current asset levels. They also noted that applying various projections of growth equally to the aggregate net assets of the Fund Family and to the net assets of individual funds also showed revenue reductions for Putnam Management. They recognized, however, the possibility that under some scenarios Putnam Management might realize greater future revenues, with respect to certain funds, under the proposed contracts than under the current contracts, but considered such circumstances to be both less likely and inherently unpredictable.
The Independent Trustees considered the extent to which Putnam Management may realize economies of scale in connection with the management of the funds. In this regard, they considered the possibility that such economies of scale as may exist in the management of mutual funds may be associated more closely with the size of the aggregate assets of the mutual fund complex than with the size of any individual fund. In this regard the Independent Trustees considered the financial information provided to them by Putnam Management over a period of many years regarding the allocation of costs involved in calculating the profitability of its mutual fund business as a whole and the profitability of individual funds. The Independent Trustees noted that the methodologies for such cost allocations had been reviewed on a number of occasions in the past by independent financial consultants engaged by the Independent Trustees. The Independent Trustees noted that thes e methodologies support Putnam
23
Management’s assertion that many of its operating costs and any associated economies of scale are related more to the aggregate net assets under management in various sectors of its business than to the size of individual funds. They noted that on a number of occasions in the past the Independent Trustees had separately considered the possibility of calculating management fees in whole or in part based on aggregate net assets of the Putnam funds.
The Independent Trustees considered the fact that the proposed contracts would result in a sharing among the affected funds of economies of scale that for the most part are now enjoyed by the larger funds, without materially increasing the current costs of any of the larger funds. They concluded that this sharing of economies among funds was appropriate in light of the diverse investment opportunities available to shareholders of all funds through the existence of the exchange privilege. They also considered that the proposed change in management fee structure would allow Putnam Management to introduce new investment products at more attractive pricing levels than may be currently be the case.
After considering all of the foregoing, the Independent Trustees concluded that the proposed calculation of management fees based on the aggregate net assets of the Fund Family represented a fair and reasonable means of sharing possible economies of scale among the shareholders of all funds.
• Considerations relating to addition of fee rate adjustments based on investment performance for certain funds. The Independent Trustees considered that Putnam’s proposal to add fee rate adjustments based on investment performance to the management contracts of certain funds reflected a desire by Putnam Management to align its fee revenues more closely with investment performance in the case of certain funds. They noted that Putnam Management already has a significant financial interest in achieving good performance results for the funds it manages. Putnam Management’s fees are based on the assets under its management (whether calculated on an individual fund or complex-wide basis). Good performance results in higher asset levels and therefore higher revenues to Putnam Management. Moreover, good performance also tends to at tract additional investors to particular funds or the complex generally, also resulting in higher revenues. Nevertheless, the Independent Trustees concluded that adjusting management fees based on performance for certain selected funds could provide additional benefits to shareholders.
The Independent Trustees noted that Putnam Management proposed the addition of performance adjustments only for certain of the funds and considered whether similar adjustments might be appropriate for other funds. In this regard, they considered Putnam Management’s belief that the addition of performance adjustments would be most appropriate for shareholders of U.S. growth funds, international equity funds and Putnam Global Equity Fund. They also considered Putnam Management’s view that it would continue to monitor whether performance fees would be appropriate for other funds. Accordingly, the Independent Trustees concluded that it would be desirable to gain further experience with the operation of performance adjustments for certain funds and the market’s receptivity to such fee structures before giving further consideration to whether similar performance adjustments would be appropriate for other funds as well.
• Considerations relating to standardization of payment terms. The proposed management contracts for all funds provide that management fees will be computed and paid monthly within 15 days after the end of each month. The current contracts of the funds contain quarterly computation and payment terms in
24
some cases. These differences largely reflect practices in place at earlier times when many of the funds were first organized. Under the proposed contract, certain funds would make payments to Putnam Management earlier than they do under their current contract. This would reduce a fund’s opportunity to earn income on accrued but unpaid management fees by a small amount, but would not have a material effect on a fund’s operating costs.
The Independent Trustees considered the fact that standardizing the payment terms for all funds would involve an acceleration in the timing of payments to Putnam Management for some funds and a corresponding loss of a potential opportunity for such funds to earn income on accrued but unpaid management fees. The Independent Trustees did not view this change as having a material impact on shareholders of any fund. In this regard, the Independent Trustees noted that the proposed contracts conform to the payment terms included in management contracts for all Putnam funds organized in recent years and that standardizing payment terms across all funds would reduce administrative burdens for both the funds and Putnam Management.
• Considerations relating to comparisons with management fees and total expenses of competitive funds. As part of their evaluation of the proposed management contracts, the Independent Trustees also reviewed the general approach taken by Putnam Management and the Independent Trustees in recent years in imposing appropriate limits on total fund expenses. As part of the annual contract review process in recent years, Putnam Management agreed to waive fees as needed to limit total fund expenses to a maximum level equal to the average total expenses of comparable competitive funds in the mutual fund industry. In connection with its proposal to implement new management contracts, Putnam Management also proposed, and the Independent Trustees approved, certain changes in this approach that shift the focus from controlling total expenses to i mposing separate limits on certain categories of expenses, as required. As a general matter, Putnam Management and the Independent Trustees concluded that management fees for the Putnam funds are competitive with the fees charged by comparable funds in the industry. Nevertheless, the Independent Trustees considered specific management fee waivers proposed to be implemented as of August 1, 2009 by Putnam Management with respect to the current management fees of certain funds, as well as projected reductions in management fees for almost all funds that would result under the proposed contracts. Putnam Management and the Independent Trustees also agreed to impose separate expense limitations of 37.5 basis points on the general category of shareholder servicing expenses and 20 basis points on the general category of other ordinary operating expenses. These new expense limitations, as well as the fee waivers, were implemented for all funds effective as of August 1, 2009, replacing the expense limitation referred to above.
These changes resulted in lower total expenses for many funds, but in the case of some funds total expenses increased after application of the new waivers and expense limitations (as compared with the results obtained using the expense limitation method previously in place). In this regard, the Independent Trustees considered the likelihood that total expenses for most of these funds would have increased in any event in the normal course under the previous expense limitation arrangement, as the reported total expense levels of many competitive funds increased in response to the major decline in asset values that began in September 2008. These new waivers and expense limitations will continue in effect until at least July 31, 2010 and will be re-evaluated by the Independent Trustees as part of the annual contract review process prior to their
25
scheduled expiration. However, the management fee waivers referred to above would largely become permanent reductions in fees as a result of the implementation of the proposed management contracts.
Under these new expense limitation arrangements effective August 1, 2009, the fixed income funds, including your fund, and asset allocation funds were subject to management fee waivers that reduced these funds’ management fees pending implementation of the proposed management contracts, and in any event, through July 31, 2010. In addition, your fund is subject to expense limitations of 37.5 basis points on the category of shareholder servicing fees and 20 basis points on the general category of other ordinary operating expenses.
26
Other information for shareholders
Important notice regarding delivery
of shareholder documents
In accordance with SEC regulations, Putnam sends a single copy of annual and semiannual shareholder reports, prospectuses, and proxy statements to Putnam shareholders who share the same address, unless a shareholder requests otherwise. If you prefer to receive your own copy of these documents, please call Putnam at 1-800-225-1581, and Putnam will begin sending individual copies within 30 days.
Proxy voting
Putnam is committed to managing our mutual funds in the best interests of our shareholders. The Putnam funds’ proxy voting guidelines and procedures, as well as information regarding how your fund voted proxies relating to portfolio securities during the 12-month period ended June 30, 2009, are available in the Individual Investors section of putnam.com, and on the SEC’s Web site, www.sec.gov. If you have questions about finding forms on the SEC’s Web site, you may call the SEC at 1-800-SEC-0330. You may also obtain the Putnam funds’ proxy voting guidelines and procedures at no charge by calling Putnam’s Shareholder Services at 1-800-225-1581.
Fund portfolio holdings
The fund will file a complete schedule of its portfolio holdings with the SEC for the first and third quarters of each fiscal year on Form N-Q. Shareholders may obtain the fund’s Forms N-Q on the SEC’s Web site at www.sec.gov. In addition, the fund’s Forms N-Q may be reviewed and copied at the SEC’s Public Reference Room in Washington, D.C. You may call the SEC at 1-800-SEC-0330 for information about the SEC’s Web site or the operation of the Public Reference Room.
Trustee and employee
fund ownership
Putnam employees and members of the Board of Trustees place their faith, confidence, and, most importantly, investment dollars in Putnam mutual funds. As of January 31, 2010, Putnam employees had approximately $294,000,000 and the Trustees had approximately $45,000,000 invested in Putnam mutual funds. These amounts include investments by the Trustees’ and employees’ immediate family members as well as investments through retirement and deferred compensation plans.
27
Financial statements
A guide to financial statements
These sections of the report, as well as the accompanying Notes, constitute the fund’s financial statements.
The fund’s portfolio lists all the fund’s investments and their values as of the last day of the reporting period. Holdings are organized by asset type and industry sector, country, or state to show areas of concentration and diversification.
Statement of assets and liabilities shows how the fund’s net assets and share price are determined. All investment and noninvestment assets are added together. Any unpaid expenses and other liabilities are subtracted from this total. The result is divided by the number of shares to determine the net asset value per share, which is calculated separately for each class of shares. (For funds with preferred shares, the amount subtracted from total assets includes the liquidation preference of preferred shares.)
Statement of operations shows the fund’s net investment gain or loss. This is done by first adding up all the fund’s earnings — from dividends and interest income — and subtracting its operating expenses to determine net investment income (or loss). Then, any net gain or loss the fund realized on the sales of its holdings — as well as any unrealized gains or losses over the period — is added to or subtracted from the net investment result to determine the fund’s net gain or loss for the fiscal period.
Statement of changes in net assets shows how the fund’s net assets were affected by the fund’s net investment gain or loss, by distributions to shareholders, and by changes in the number of the fund’s shares. It lists distributions and their sources (net investment income or realized capital gains) over the current reporting period and the most recent fiscal year-end. The distributions listed here may not match the sources listed in the Statement of operations because the distributions are determined on a tax basis and may be paid in a different period from the one in which they were earned. Dividend sources are estimated at the time of declaration. Actual results may vary. Any non-taxable return of capital cannot be determined until final tax calculations are completed after the end of the fund’s fiscal year.
Financial highlights provide an overview of the fund’s investment results, per-share distributions, expense ratios, net investment income ratios, and portfolio turnover in one summary table, reflecting the five most recent reporting periods. In a semiannual report, the highlights table also includes the current reporting period.
28
The fund’s portfolio 1/31/10 (Unaudited)
| |
| Key to holding’s abbreviations | |
| ABAG Association Of Bay Area Governments | FSA Financial Security Assurance |
| AMBAC AMBAC Indemnity Corporation | G.O. Bonds General Obligation Bonds |
| COP Certificates of Participation | GNMA Coll. Government National Mortgage |
| FGIC Financial Guaranty Insurance Company | Association Collateralized |
| FHA Insd. Federal Housing Administration Insured | MTNH Medium Term Notes Class H |
| FHLMC Coll. Federal Home Loan Mortgage | NATL National Public Finance Guarantee Corp. |
| Corporation Collateralized | PSFG Permanent School Fund Guaranteed |
| FNMA Coll. Federal National Mortgage | SGI Syncora Guarantee, Inc. |
| Association Collateralized | U.S. Govt. Coll. U.S. Government Collateralized |
| FRB Floating Rate Bonds | VRDN Variable Rate Demand Notes |
| | | |
| MUNICIPAL BONDS AND NOTES (98.4%)* | Rating** | Principal amount | Value |
|
| Alabama (1.3%) | | | |
| AL Hsg. Fin. Auth. Rev. Bonds (Single Fam. Mtge.) | | | |
| Ser. A-1, GNMA Coll., FNMA Coll., 6.05s, 4/1/17 | Aaa | $255,000 | $262,574 |
| Ser. G, GNMA Coll., FNMA Coll., FHLMC Coll., | | | |
| 5 1/2s, 10/1/37 | Aaa | 2,350,000 | 2,430,534 |
|
| Cullman Cnty., Hlth. Care Auth. Rev. Bonds | | | |
| (Cullman Regl. Med. Ctr.), Ser. A, 6 3/4s, 2/1/29 | Baa3 | 1,000,000 | 1,009,370 |
|
| Selma, Indl. Dev. Board Rev. Bonds (Gulf | | | |
| Opportunity Zone Intl. Paper Co.), Ser. A, | | | |
| 6 1/4s, 11/1/33 | BBB | 1,500,000 | 1,515,075 |
|
| | | | 5,217,553 |
| Alaska (1.3%) | | | |
| AK State Hsg. Fin. Corp. Rev. Bonds, Ser. A, | | | |
| 4.4s, 12/1/31 | Aaa | 1,430,000 | 1,444,086 |
|
| Anchorage, G.O. Bonds, Ser. D, AMBAC, 5s, 8/1/25 | AA | 3,420,000 | 3,657,861 |
|
| | | | 5,101,947 |
| Arizona (2.1%) | | | |
| Coconino Cnty., Poll. Control Rev. Bonds (Tucson | | | |
| Elec. Pwr. Co. — Navajo), Ser. A, 5 1/8s, 10/1/32 | Baa3 | 1,000,000 | 947,960 |
|
| Glendale, Wtr. & Swr. Rev. Bonds, AMBAC, 5s, | | | |
| 7/1/28 | AA | 2,000,000 | 2,068,280 |
|
| Navajo Cnty., Poll. Control Corp. Mandatory Put | | | |
| Bonds, Ser. E, 5 3/4s, 6/1/16 | Baa2 | 3,250,000 | 3,380,585 |
|
| U. Medical Ctr. Corp. AZ Hosp. Rev. Bonds, | | | |
| 6 1/2s, 7/1/39 | Baa1 | 1,750,000 | 1,863,890 |
|
| | | | 8,260,715 |
| Arkansas (0.2%) | | | |
| Fayetteville, Sales & Use Tax Cap. Impt. Rev. | | | |
| Bonds, Ser. A, FSA, 4s, 11/1/21 | AAA | 615,000 | 629,588 |
|
| | | | 629,588 |
| California (16.1%) | | | |
| Assn. of Bay Area Governments Fin. Auth. for | | | |
| Nonprofit Corps. Rev. Bonds (St. Rose Hosp.), | | | |
| Ser. A, 6s, 5/15/29 | A– | 3,000,000 | 3,147,630 |
|
| Beaumont, Fin. Auth. Local Agcy. Special Tax | | | |
| Bonds, Ser. C, AMBAC, 4 3/4s, 9/1/28 | BBB/P | 1,870,000 | 1,576,878 |
|
29
| | | |
| MUNICIPAL BONDS AND NOTES (98.4%)* cont. | Rating** | Principal amount | Value |
|
| California cont. | | | |
| CA Rev. Bonds | | | |
| (Catholic Hlth. Care West), Ser. A, 6s, 7/1/39 | A2 | $750,000 | $793,598 |
| (Adventist Hlth. Syst.-West), Ser. A, 5 3/4s, 9/1/39 | A | 1,000,000 | 1,004,330 |
|
| CA Edl. Fac. Auth. Rev. Bonds (Claremont Graduate | | | |
| U.), Ser. A, 5s, 3/1/42 | A3 | 1,750,000 | 1,597,208 |
|
| CA Hlth. Fac. Fin. Auth. Rev. Bonds (Cedars Sinai | | | |
| Med. Ctr.), 5s, 8/15/39 | A2 | 1,800,000 | 1,644,750 |
|
| CA Muni. Fin. Auth. Certificates of Participation | | | |
| (Cmnty. Hosp. of Central CA), 5 1/2s, 2/1/39 | Baa2 | 3,910,000 | 3,430,087 |
|
| CA Muni. Fin. Auth. Sr. Living Rev. Bonds | | | |
| (Pilgrim Place Claremont), Ser. A, 5 7/8s, 5/15/29 | A– | 1,500,000 | 1,506,765 |
|
| CA State G.O. Bonds | | | |
| 6 1/2s, 4/1/33 | A– | 5,000,000 | 5,355,600 |
| 5 3/4s, 4/1/31 | A– | 2,000,000 | 2,031,120 |
|
| CA State Dept. of Wtr. Resources Rev. Bonds | | | |
| (Central Valley), Ser. AE, 5s, 12/1/29 | AAA | 2,500,000 | 2,666,325 |
|
| CA State Econ. Recvy. G.O. Bonds, Ser. A, 5 1/4s, | | | |
| 7/1/21 | A1 | 1,000,000 | 1,089,820 |
|
| CA State Pub. Wks. Board Rev. Bonds | | | |
| (Riverside Campus), Ser. B, 6s, 4/1/25 | BBB+ | 3,000,000 | 3,091,320 |
| Ser. G-1, 5 1/4s, 10/1/23 | BBB+ | 3,000,000 | 2,968,110 |
|
| CA Statewide Cmnty., Dev. Auth. Rev. Bonds | | | |
| (Sr. Living — Presbyterian Homes), 6 5/8s, 11/15/24 | BBB | 2,000,000 | 2,114,000 |
| (St. Joseph), NATL, 5 1/8s, 7/1/24 | AA | 2,000,000 | 2,012,800 |
|
| Golden State Tobacco Securitization Corp. Rev. Bonds | | | |
| (Tobacco Settlement), Ser. B, AMBAC, FHLMC Coll., | | | |
| FNMA Coll., 5s, 6/1/38 (Prerefunded) | Aaa | 2,475,000 | 2,768,807 |
| Ser. A, AMBAC, zero %, 6/1/24 | Aa3 | 5,000,000 | 1,992,750 |
|
| Grossmont-Cuyamaca, Cmnty. College Dist. G.O. | | | |
| Bonds (Election of 2002), Ser. B, FGIC, NATL, | | | |
| zero %, 8/1/17 | AA | 2,100,000 | 1,491,273 |
|
| M-S-R Energy Auth. Rev. Bonds, Ser. A, | | | |
| 6 1/2s, 11/1/39 | A | 750,000 | 790,853 |
|
| Merced, City School Dist. G.O. Bonds (Election | | | |
| of 2003), NATL | | | |
| zero %, 8/1/25 | A | 1,190,000 | 435,623 |
| zero %, 8/1/24 | A | 1,125,000 | 444,364 |
| zero %, 8/1/23 | A | 1,065,000 | 451,794 |
| zero %, 8/1/22 | A | 1,010,000 | 460,722 |
|
| Oakland, Unified School Dist. Alameda Cnty., G.O. | | | |
| Bonds (Election 2006), Ser. A, 6 1/2s, 8/1/24 | Baa1 | 2,500,000 | 2,731,300 |
|
| Sacramento, City Fin. Auth. Tax Alloc. Bonds, | | | |
| Ser. A, FGIC, NATL, zero %, 12/1/21 | A | 5,500,000 | 2,556,235 |
|
| San Diego, Unified School Dist. G.O. Bonds | | | |
| (Election of 1998), Ser. E, FSA, 5 1/4s, | | | |
| 7/1/19 (Prerefunded) | AAA | 2,000,000 | 2,271,060 |
|
| Santa Ana, Fin. Auth. Lease Rev. Bonds (Police | | | |
| Admin. & Hldg. Fac.), Ser. A, NATL, 6 1/4s, 7/1/17 | A | 3,680,000 | 4,158,510 |
|
| Tuolumne Wind Project Auth. Rev. Bonds | | | |
| (Tuolumne Co.), Ser. A, 5 1/4s, 1/1/24 | A1 | 1,000,000 | 1,047,040 |
|
30
| | | |
| MUNICIPAL BONDS AND NOTES (98.4%)* cont. | Rating** | Principal amount | Value |
|
| California cont. | | | |
| Ventura Cnty., COP (Pub. Fin. Auth. III), 5s, 8/15/20 | AA | $1,000,000 | $1,043,920 |
|
| Walnut Valley, Unified School Dist. G.O. Bonds | | | |
| (Election of 2007), Ser. A, FSA | | | |
| 5s, 8/1/28 | AAA | 1,055,000 | 1,085,890 |
| 5s, 8/1/27 | AAA | 1,745,000 | 1,806,023 |
|
| Walnut, Energy Ctr. Auth. Rev. Bonds, Ser. A, | | | |
| AMBAC, 5s, 1/1/24 | A1 | 2,000,000 | 2,035,420 |
|
| | | | 63,601,925 |
| Colorado (1.0%) | | | |
| CO Hlth. Fac. Auth. Rev. Bonds | | | |
| (Evangelical Lutheran), Ser. A, 6 1/8s, 6/1/38 | A3 | 2,545,000 | 2,547,112 |
|
| CO Pub. Hwy. Auth. Rev. Bonds | | | |
| (E-470 Pub. Hwy.), Ser. C1, NATL, 5 1/2s, 9/1/24 | A | 1,000,000 | 991,060 |
| (E-470 Pub. Hwy.), Ser. A, NATL, zero %, 9/1/34 | A | 3,525,000 | 627,662 |
|
| | | | 4,165,834 |
| Florida (8.5%) | | | |
| Brevard Cnty., Hlth. Care Fac. Auth. Rev. Bonds | | | |
| (Health First, Inc.), 7s, 4/1/39 | A3 | 1,250,000 | 1,372,075 |
|
| Broward Cnty., Arpt. Syst. Rev. Bonds, Ser. O, | | | |
| 5 3/8s, 10/1/29 | A1 | 1,000,000 | 1,023,000 |
|
| Hernando Cnty., Rev. Bonds (Criminal Justice | | | |
| Complex Fin.), FGIC, NATL, 7.65s, 7/1/16 | A | 13,675,000 | 16,584,356 |
|
| Lee Cnty., Rev. Bonds, SGI, 5s, 10/1/25 | Aa3 | 2,000,000 | 2,065,020 |
|
| Miami-Dade Cnty., Wtr. & Swr. Rev. Bonds, FSA, | | | |
| XLCA, 5s, 10/1/23 | AAA | 1,000,000 | 1,049,880 |
|
| Orlando & Orange Cnty., Expressway Auth. Rev. | | | |
| Bonds, FGIC, NATL, 8 1/4s, 7/1/14 | A1 | 5,000,000 | 6,146,500 |
|
| South Lake Hosp. Dist. (South Lake Hosp.), | | | |
| Ser. A, 6s, 4/1/29 | Baa2 | 660,000 | 668,283 |
|
| Sumter Cnty., School Dist. Rev. Bonds | | | |
| (Multi-Dist. Loan Program), FSA, 7.15s, 11/1/15 | AAA | 3,935,000 | 4,809,160 |
|
| | | | 33,718,274 |
| Georgia (2.1%) | | | |
| Atlanta, Wtr. & Waste Wtr. Rev. Bonds, Ser. A, | | | |
| 6 1/4s, 11/1/39 | A | 1,500,000 | 1,580,370 |
|
| Burke Cnty., Poll. Control Dev. Auth. Mandatory | | | |
| Put Bonds (Oglethorpe Pwr. Corp.), Class E, | | | |
| NATL, 4 3/4s, 4/1/11 | A | 3,000,000 | 3,124,890 |
|
| Fulton Cnty., Dev. Auth. Rev. Bonds (Klaus Pkg. & | | | |
| Fam. Hsg. Project), NATL, 5 1/4s, 11/1/20 | Aa3 | 3,360,000 | 3,531,931 |
|
| | | | 8,237,191 |
| Guam (0.3%) | | | |
| Territory of Guam Rev. Bonds, Ser. A, 5 3/8s, | | | |
| 12/1/24 | BBB– | 1,000,000 | 1,028,760 |
|
| | | | 1,028,760 |
| Illinois (7.5%) | | | |
| Chicago, G.O. Bonds, Ser. A, AMBAC, 5 5/8s, 1/1/39 | Aa3 | 155,000 | 161,890 |
|
| Chicago, Board of Ed. G.O. Bonds, Ser. A, NATL, | | | |
| 5 1/4s, 12/1/19 | AA– | 1,500,000 | 1,565,085 |
|
| Chicago, Waste Wtr. Transmission VRDN, Ser. C-2, | | | |
| 0.15s, 1/1/39 | VMIG1 | 2,400,000 | 2,400,000 |
|
| Cicero, G.O. Bonds, Ser. A, SGI, 5 1/4s, 1/1/21 | BBB+/P | 2,250,000 | 2,211,435 |
|
31
| | | |
| MUNICIPAL BONDS AND NOTES (98.4%)* cont. | Rating** | Principal amount | Value |
|
| Illinois cont. | | | |
| Du Page Cnty., Cmnty. High School Dist. G.O. | | | |
| Bonds (Dist. No. 108 — Lake Park), FSA, 5.6s, 1/1/20 | Aa3 | $1,000,000 | $1,074,830 |
|
| IL Fin. Auth. Rev. Bonds | | | |
| (Roosevelt U.), 6 1/4s, 4/1/29 | Baa2 | 1,500,000 | 1,538,100 |
| (Rush U. Med. Ctr.), Ser. B, NATL, 5 3/4s, 11/1/28 | A | 2,500,000 | 2,577,675 |
| (Elmhurst Memorial), Ser. A, 5 5/8s, 1/1/37 | Baa1 | 1,000,000 | 923,900 |
| (American Wtr. Cap. Corp.), 5 1/4s, 10/1/39 | BBB+ | 1,575,000 | 1,549,296 |
|
| IL State Toll Hwy. Auth. Rev. Bonds, Ser. A-1, FSA | | | |
| 5s, 1/1/23 | AAA | 3,750,000 | 3,957,938 |
| 5s, 1/1/22 | AAA | 2,500,000 | 2,648,750 |
|
| Metro. Pier & Exposition Auth. Dedicated State | | | |
| Tax Rev. Bonds (McCormick), Ser. A, NATL, | | | |
| zero %, 12/15/22 | A2 | 5,500,000 | 2,712,490 |
|
| Regl. Trans. Auth. Rev. Bonds, Ser. A, AMBAC, | | | |
| 8s, 6/1/17 | Aa3 | 5,000,000 | 6,380,050 |
|
| | | | 29,701,439 |
| Indiana (3.4%) | | | |
| Center Grove, Ind. Bldg. Corp. Rev. Bonds (First | | | |
| Mtge.), FGIC, NATL, 5s, 7/15/25 | AA+ | 1,345,000 | 1,393,823 |
|
| IN Muni. Pwr. Agcy. Supply Syst. Rev. Bonds | | | |
| Ser. B, 5 3/4s, 1/1/29 | A1 | 1,000,000 | 1,090,120 |
| Ser. A, AMBAC, 5s, 1/1/20 | A1 | 5,695,000 | 6,053,557 |
|
| IN State Hsg. Fin. Auth. Rev. Bonds (Single | | | |
| Family Mtge.), Ser. A-1, GNMA Coll., FNMA Coll. | | | |
| 4.2s, 7/1/17 | Aaa | 185,000 | 190,620 |
| 4.15s, 7/1/16 | Aaa | 260,000 | 268,221 |
| 4.1s, 7/1/15 | Aaa | 80,000 | 82,499 |
| 3.95s, 7/1/14 | Aaa | 255,000 | 263,973 |
| 3.9s, 1/1/14 | Aaa | 185,000 | 190,622 |
|
| Rockport, Poll. Control FRB (IN-MI Pwr. Co.) | | | |
| Ser. A, 6 1/4s, 6/1/25 | Baa2 | 2,000,000 | 2,236,160 |
| Ser. B, 6 1/4s, 6/1/25 | Baa2 | 1,500,000 | 1,677,120 |
|
| | | | 13,446,715 |
| Kentucky (0.5%) | | | |
| Owen Cnty., Wtr. Wks. Syst. Rev. Bonds (American | | | |
| Wtr. Co.) | | | |
| Ser. A, 6 1/4s, 6/1/39 | BBB+ | 800,000 | 854,688 |
| Ser. B, 5 5/8s, 9/1/39 | BBB+ | 1,000,000 | 1,020,350 |
|
| | | | 1,875,038 |
| Louisiana (1.6%) | | | |
| Ernest N. Morial-New Orleans Exhibit Hall Auth. | | | |
| Special Tax, AMBAC, 5s, 7/15/20 | BBB | 4,730,000 | 4,313,334 |
|
| LA Rev. Bonds, Ser. A, AMBAC, 5 3/8s, 6/1/19 | Aa2 | 2,000,000 | 2,141,840 |
|
| | | | 6,455,174 |
| Maryland (0.5%) | | | |
| MD State Hlth. & Higher Edl. Fac. Auth. Rev. Bonds | | | |
| (U. of MD Med. Syst.), AMBAC, 5 1/4s, 7/1/28 | A2 | 2,000,000 | 2,031,160 |
|
| | | | 2,031,160 |
| Massachusetts (3.0%) | | | |
| MA State Dev. Fin. Agcy. Rev. Bonds | | | |
| (Sabis Intl.), Ser. A, 6.8s, 4/15/22 | BBB | 700,000 | 723,492 |
| (Boston U.), Ser. V-1, 5s, 10/1/29 | A2 | 2,000,000 | 2,060,140 |
|
32
| | | |
| MUNICIPAL BONDS AND NOTES (98.4%)* cont. | Rating** | Principal amount | Value |
|
| Massachusetts cont. | | | |
| MA State Dev. Fin. Agcy. Solid Waste Disp. | | | |
| Mandatory Put Bonds (Dominion Energy Brayton), | | | |
| Ser. 1, 5 3/4s, 5/1/19 | A– | $1,000,000 | $1,060,970 |
|
| MA State Hlth. & Edl. Fac. Auth. Rev. Bonds | | | |
| (Suffolk U.), Ser. A, 6 1/4s, 7/1/30 | Baa2 | 2,000,000 | 2,127,060 |
| (Baystate Med. Ctr.), Ser. I, 5 3/4s, 7/1/36 | A+ | 500,000 | 524,030 |
| (Harvard U.), Ser. A, 5 1/2s, 11/15/36 | Aaa | 1,815,000 | 2,019,115 |
| (Care Group), Ser. B-2, NATL, 5 3/8s, 2/1/28 | A | 1,000,000 | 988,080 |
|
| MA State Hlth. & Edl. Fac. Auth. VRDN (Harvard | | | |
| U.), Ser. R, 0.17s, 11/1/49 | VMIG1 | 2,300,000 | 2,300,000 |
|
| | | | 11,802,887 |
| Michigan (5.6%) | | | |
| Detroit, Swr. Disp. Rev. Bonds, Ser. B, FSA, | | | |
| 7 1/2s, 7/1/33 | AAA | 1,000,000 | 1,175,920 |
|
| Detroit, Wtr. Supply Syst. Rev. Bonds, Ser. B, | | | |
| FSA, 6 1/4s, 7/1/36 | AAA | 1,575,000 | 1,677,453 |
|
| Kent, Hosp. Fin. Auth. Rev. Bonds (Spectrum Hlth. | | | |
| Care), Ser. A, NATL, 5 1/2s, 1/15/17 (Prerefunded) | AA | 500,000 | 540,350 |
|
| MI State Hosp. Fin. Auth. Rev. Bonds | | | |
| Ser. A, 6 1/8s, 6/1/39 | A1 | 1,000,000 | 1,057,750 |
| (Henry Ford Hlth.), 5 1/4s, 11/15/24 | A1 | 1,000,000 | 968,940 |
|
| MI State Strategic Fund Rev. Bonds | | | |
| (Dow Chemical), Ser. B-2, 6 1/4s, 6/1/14 | Baa3 | 1,000,000 | 1,132,240 |
|
| MI State Strategic Fund, Ltd. Mandatory Put Bonds | | | |
| (Detroit Edison Co.), AMBAC, 4.85s, 9/1/11 | Baa1 | 3,500,000 | 3,634,680 |
|
| MI State Strategic Fund, Ltd. Rev. Bonds (Detroit | | | |
| Edison Co.), AMBAC, 7s, 5/1/21 | A2 | 4,000,000 | 4,835,080 |
|
| Midland Cnty., Bldg. Auth. G.O. Bonds, FSA, | | | |
| 5s, 10/1/25 | AAA | 1,000,000 | 1,042,770 |
|
| Northern Michigan U. Rev. Bonds, Ser. A, FSA, | | | |
| 5s, 12/1/27 | AAA | 1,775,000 | 1,893,091 |
|
| Wayne Charter Cnty., G.O. Bonds (Bldg. Impt.), | | | |
| Ser. A, 6 3/4s, 11/1/39 | A | 500,000 | 517,725 |
|
| Western MI U. Rev. Bonds, FSA, 5s, 11/15/28 | AAA | 3,500,000 | 3,729,250 |
|
| | | | 22,205,249 |
| Minnesota (0.8%) | | | |
| Northfield, Hosp. Rev. Bonds, 5 3/8s, 11/1/26 | BBB– | 1,500,000 | 1,465,080 |
|
| St. Paul, Hsg. & Redev. Auth. Hlth. Care Fac. Rev. | | | |
| Bonds (HealthPartners Oblig. Group), 5 1/4s, 5/15/36 | Baa1 | 1,800,000 | 1,651,266 |
|
| | | | 3,116,346 |
| Mississippi (1.0%) | | | |
| Bus. Fin. Corp. Gulf Opportunity Zone Rev. Bonds, | | | |
| Ser. A, 5s, 5/1/37 | A3 | 1,750,000 | 1,691,760 |
|
| MS Home Corp. Rev. Bonds (Single Fam. Mtge.), | | | |
| Ser. D-1, GNMA Coll., FNMA Coll., 6.1s, 6/1/38 | Aaa | 2,025,000 | 2,146,358 |
|
| | | | 3,838,118 |
| Missouri (1.0%) | | | |
| Cape Girardeau Cnty., Indl. Dev. Auth. Hlth. Care | | | |
| Fac. Rev. Bonds (St. Francis Med. Ctr.), Ser. A, | | | |
| 5 3/4s, 6/1/39 | A+ | 1,150,000 | 1,179,095 |
|
| MO State Hlth. & Edl. Fac. Auth. Rev. Bonds | | | |
| (Washington U. (The)), Ser. A, 5 3/8s, 3/15/39 | Aaa | 2,000,000 | 2,171,580 |
|
33
| | | |
| MUNICIPAL BONDS AND NOTES (98.4%)* cont. | Rating** | Principal amount | Value |
|
| Missouri cont. | | | |
| MO State Hlth. & Edl. Fac. Auth. VRDN (Washington | | | |
| U. (The)) | | | |
| Ser. C, 1.18s, 9/1/30 | VMIG1 | $200,000 | $200,000 |
| Ser. D, 0.18s, 9/1/30 | VMIG1 | 500,000 | 500,000 |
|
| | | | 4,050,675 |
| Nevada (0.3%) | | | |
| Reno, Sales Tax VRDN, 0.2s, 6/1/42 | VMIG1 | 990,000 | 990,000 |
|
| | | | 990,000 |
| New Hampshire (0.3%) | | | |
| NH State Bus. Fin. Auth. Rev. Bonds (Elliot Hosp. | | | |
| Oblig. Group), Ser. A, 6s, 10/1/27 | Baa1 | 1,300,000 | 1,318,902 |
|
| | | | 1,318,902 |
| New Jersey (1.7%) | | | |
| NJ Hlth. Care Fac. Fin. Auth. Rev. Bonds (St. | | | |
| Peter’s U. Hosp.), 5 3/4s, 7/1/37 | Baa2 | 2,500,000 | 2,479,400 |
|
| NJ State Higher Ed. Assistance Auth. Rev. Bonds | | | |
| (Student Loan), Ser. A, 5 5/8s, 6/1/30 | AA | 1,000,000 | 1,059,910 |
|
| NJ State Tpk. Auth. Rev. Bonds, Ser. A, AMBAC, | | | |
| 5s, 1/1/30 | A+ | 3,000,000 | 3,034,530 |
|
| | | | 6,573,840 |
| New York (5.4%) | | | |
| Erie Cnty., Indl. Dev. Agcy. School Fac. Rev. | | | |
| Bonds (City School Dist. Buffalo), Ser. A, FSA | | | |
| 5 3/4s, 5/1/28 | AAA | 2,275,000 | 2,495,175 |
| 5 3/4s, 5/1/27 | AAA | 6,590,000 | 7,266,133 |
|
| NY City, G.O. Bonds, Ser. H-1, 5s, 3/1/18 | AA | 1,500,000 | 1,674,975 |
|
| NY State Dorm. Auth. Rev. Bonds (Brooklyn Law | | | |
| School), Ser. B, SGI | | | |
| 5 3/8s, 7/1/22 | Baa1 | 2,270,000 | 2,295,583 |
| 5 3/8s, 7/1/20 | Baa1 | 2,215,000 | 2,249,665 |
|
| NY State Dorm. Auth. Personal Income Tax Rev. | | | |
| Bonds (Ed.), Ser. B, 5 3/4s, 3/15/36 | AAA | 2,000,000 | 2,223,080 |
|
| Sales Tax Asset Receivable Corp. Rev. Bonds, | | | |
| Ser. A, AMBAC, 5s, 10/15/29 | AAA | 2,000,000 | 2,132,440 |
|
| Syracuse, Indl. Dev. Agcy. School Fac. Rev. Bonds | | | |
| (Syracuse City School Dist.), Ser. A, FSA, 5s, 5/1/25 | AAA | 1,000,000 | 1,075,400 |
|
| | | | 21,412,451 |
| North Carolina (1.4%) | | | |
| NC Cap. Fin. Agcy. Edl. Fac. Rev. Bonds | | | |
| (Meredith College), 6s, 6/1/31 | BBB | 500,000 | 514,460 |
|
| NC Eastern Muni. Pwr. Agcy. Syst. Rev. Bonds | | | |
| Ser. A, 5 1/2s, 1/1/26 | A– | 1,500,000 | 1,599,975 |
| Ser. B, 5s, 1/1/26 | A– | 2,000,000 | 2,063,780 |
|
| U. of NC Syst. Pool Rev. Bonds, Ser. C, | | | |
| 5 3/8s, 10/1/29 | A3 | 1,500,000 | 1,561,245 |
|
| | | | 5,739,460 |
| Ohio (6.4%) | | | |
| Buckeye, Tobacco Settlement Fin. Auth. Rev. | | | |
| Bonds, Ser. A-2 | | | |
| 5 7/8s, 6/1/30 | BBB | 5,890,000 | 5,051,559 |
| 5 3/4s, 6/1/34 | BBB | 500,000 | 411,355 |
| 5 3/8s, 6/1/24 | BBB | 4,235,000 | 3,944,055 |
| 5 1/8s, 6/1/24 | BBB | 1,755,000 | 1,626,130 |
|
34
| | | |
| MUNICIPAL BONDS AND NOTES (98.4%)* cont. | Rating** | Principal amount | Value |
|
| Ohio cont. | | | |
| Erie Cnty., Hosp. Fac. Rev. Bonds (Firelands | | | |
| Regl. Med. Ctr.), Ser. A, 5 1/2s, 8/15/22 | A | $3,150,000 | $3,023,244 |
|
| Lorain Cnty., Hosp. Rev. Bonds (Catholic), | | | |
| Ser. C-2, FSA, 5s, 4/1/24 | AAA | 2,000,000 | 2,059,900 |
|
| Morley Library Dist. G.O. Bonds (Lake Cnty. Dist. | | | |
| Library), AMBAC, 5 1/4s, 12/1/19 | A2 | 1,535,000 | 1,595,725 |
|
| OH Hsg. Fin. Agcy. Single Fam. Mtge. Rev. Bonds, | | | |
| Ser. 85-A, FGIC, FHA Insd., zero %, 1/15/15 | AAA/P | 30,000 | 18,291 |
|
| OH State Air Quality Dev. Auth. Rev. Bonds | | | |
| (First Energy), Ser. A, 5.7s, 2/1/14 | Baa1 | 2,800,000 | 3,071,544 |
| (Valley Elec. Corp.), Ser. E, 5 5/8s, 10/1/19 | Baa3 | 750,000 | 771,038 |
|
| U. of Akron Rev. Bonds, Ser. B, FSA, 5 1/4s, 1/1/26 | AAA | 3,375,000 | 3,604,298 |
|
| | | | 25,177,139 |
| Oklahoma (0.3%) | | | |
| Tulsa, Arpt. Impt. Trust Rev. Bonds, Ser. A, | | | |
| 5 3/8s, 6/1/24 | A3 | 1,300,000 | 1,278,875 |
|
| | | | 1,278,875 |
| Oregon (0.2%) | | | |
| OR Hlth. Sciences U. Rev. Bonds, Ser. A, | | | |
| 5 3/4s, 7/1/39 | A2 | 750,000 | 806,348 |
|
| | | | 806,348 |
| Pennsylvania (3.9%) | | | |
| Allegheny Cnty., Hosp. Dev. Auth. Rev. Bonds (U. | | | |
| of Pittsburgh Med.), 5 5/8s, 8/15/39 | Aa3 | 3,000,000 | 3,031,890 |
|
| Berks Cnty., Muni. Auth. Rev. Bonds (Reading | | | |
| Hosp. & Med. Ctr.), Ser. A-3, 5 1/2s, 11/1/31 | AA | 3,000,000 | 3,142,650 |
|
| Dauphin Cnty., Gen. Auth. Hlth. Syst. Rev. Bonds | | | |
| (Pinnacle Hlth. Syst.), Ser. A, 6s, 6/1/29 | A2 | 2,500,000 | 2,580,825 |
|
| Erie Cnty., Indl. Dev. Poll. Control Rev. Bonds | | | |
| (Intl. Paper), Ser. A, 5.3s, 4/1/12 | BBB | 500,000 | 514,555 |
|
| Lycoming Cnty., Auth. Hlth. Syst. Rev. Bonds | | | |
| (Susquehanna Hlth. Syst.), Ser. A, 5 3/8s, 7/1/23 | BBB+ | 3,000,000 | 2,967,390 |
|
| Montgomery Cnty., Indl. Dev. Auth. Retirement | | | |
| Cmnty. Rev. Bonds (Acts Retirement-Life Cmnty.), | | | |
| Ser. A-1, 5 1/4s, 11/15/16 | BBB+ | 1,100,000 | 1,122,539 |
|
| PA Econ. Dev. Fin. Auth. Wtr. Fac. Rev. Bonds | | | |
| (American Wtr. Co.), 6.2s, 4/1/39 | A2 | 1,900,000 | 2,021,258 |
|
| | | | 15,381,107 |
| Puerto Rico (3.2%) | | | |
| Cmnwlth. of PR, G.O. Bonds, Ser. C-7, NATL, | | | |
| 6s, 7/1/27 | A | 1,500,000 | 1,537,695 |
|
| Cmnwlth. of PR, Aqueduct & Swr. Auth. Rev. Bonds, | | | |
| Ser. A, 6s, 7/1/38 | Baa3 | 2,890,000 | 2,950,978 |
|
| Cmnwlth. of PR, Infrastructure Fin. Auth. Special | | | |
| Tax Bonds, Ser. C, FGIC, 5 1/2s, 7/1/19 | BBB+ | 865,000 | 897,766 |
|
| Cmnwlth. of PR, Sales Tax Fin. Corp. Rev. Bonds, | | | |
| Ser. A, 6s, 8/1/42 | A+ | 7,000,000 | 7,261,380 |
|
| | | | 12,647,819 |
| South Dakota (0.3%) | | | |
| SD Hsg. Dev. Auth. Rev. Bonds (Home Ownership | | | |
| Mtge.), Ser. J, 4.6s, 5/1/19 | AAA | 1,250,000 | 1,276,488 |
|
| | | | 1,276,488 |
35
| | | |
| MUNICIPAL BONDS AND NOTES (98.4%)* cont. | Rating** | Principal amount | Value |
|
| Texas (9.3%) | | | |
| Dallas Cnty., Util. & Reclamation Dist. G.O. | | | |
| Bonds, Ser. B, AMBAC, 5 3/8s, 2/15/29 | BBB+ | $2,500,000 | $2,431,750 |
|
| Dallas, Indpt. School Dist. G.O. Bonds (School | | | |
| Bldg.), PSFG, 6s, 2/15/27 | Aaa | 2,500,000 | 2,894,524 |
|
| Harris Cnty., Cultural Ed. Fac. Fin. Corp. VRDN | | | |
| (Texas Med. Ctr.), Ser. B-1, 0.2s, 9/1/31 | VMIG1 | 7,540,000 | 7,540,000 |
|
| Hays Cnty., G.O. Bonds, FSA, 5s, 8/15/24 | Aa3 | 1,190,000 | 1,265,244 |
|
| Houston, Arpt. Syst. Rev. Bonds, FSA, 5s, 7/1/21 | AAA | 5,280,000 | 5,436,763 |
|
| La Joya, Indpt. School Dist. G.O. Bonds (School | | | |
| Bldg.), PSFG, 5s, 2/15/30 | Aaa | 2,500,000 | 2,661,450 |
|
| Laredo, I S D Pub. Fac. Corp. Rev. Bonds, Ser. C, | | | |
| AMBAC, 5s, 8/1/29 | A | 1,000,000 | 1,009,450 |
|
| Mansfield, Indpt. School Dist. G.O. Bonds, PSFG, | | | |
| 5s, 2/15/27 | Aaa | 2,000,000 | 2,105,239 |
|
| Matagorda Cnty., Poll. Control Rev. Bonds (Cent | | | |
| Pwr. & Light Co.), Ser. A, 6.3s, 11/1/29 | Baa2 | 600,000 | 647,112 |
|
| Mission Cons., Indpt. School Dist. G.O. Bonds, | | | |
| PSFG, 5s, 2/15/23 | Aaa | 1,000,000 | 1,074,740 |
|
| Nacogdoches, Indpt. School Dist. G.O. Bonds, | | | |
| PSFG, 5 1/2s, 2/15/15 | Aaa | 140,000 | 145,734 |
|
| North TX Thruway Auth. Rev. Bonds, | | | |
| Ser. A, NATL, 5 1/8s, 1/1/28 | A2 | 1,500,000 | 1,500,405 |
| (First Tier), Ser. A, 6 1/4s, 1/1/24 | A2 | 3,500,000 | 3,907,295 |
|
| Pharr, San Juan — Alamo, Indpt. School Dist. G.O. | | | |
| Bonds (School Bldg.), PSFG, 5s, 2/1/30 | Aaa | 2,000,000 | 2,128,660 |
|
| TX Trans. Comm. Mandatory Put Bonds (Central | | | |
| Texas Tpk. Syst.), 5s, 2/15/11 | Baa1 | 2,000,000 | 2,041,200 |
|
| | | | 36,789,566 |
| Utah (1.4%) | | | |
| Intermountain Pwr. Agcy. Rev. Bonds, Ser. A, | | | |
| NATL, U.S. Govt. Coll., 6.15s, 7/1/14 (Prerefunded) | A+ | 5,545,000 | 5,739,075 |
|
| | | | 5,739,075 |
| Virginia (0.4%) | | | |
| Chesterfield Cnty., Econ. Dev. Auth. Poll. Control | | | |
| Rev. Bonds (VA Elec. & Pwr.), Ser. A, 5s, 5/1/23 | A– | 1,575,000 | 1,723,649 |
|
| | | | 1,723,649 |
| Washington (3.4%) | | | |
| WA State Higher Ed. Fac. Auth. Rev. Bonds | | | |
| (Whitworth U.), 5 1/8s, 10/1/24 | Baa1 | 2,500,000 | 2,450,625 |
|
| WA State Hlth. Care Fac. Auth. Rev. Bonds | | | |
| (WA Hlth. Svcs.), 7s, 7/1/39 | Baa2 | 1,000,000 | 1,065,120 |
| Ser. B, NATL, 5s, 2/15/27 | A | 2,415,000 | 2,198,254 |
|
| WA State Pub. Pwr. Supply Syst. Rev. Bonds | | | |
| (Nuclear No. 3), Ser. B, NATL, 7 1/8s, 7/1/16 | Aaa | 6,000,000 | 7,553,160 |
|
| | | | 13,267,159 |
| West Virginia (1.3%) | | | |
| Econ. Dev. Auth. Lease Rev. Bonds (Correctional | | | |
| Juvenile Safety), Ser. A, NATL, 5s, 6/1/29 | AA– | 5,000,000 | 5,102,900 |
|
| | | | 5,102,900 |
| Wisconsin (0.9%) | | | |
| WI State Rev. Bonds, Ser. A, 6s, 5/1/27 | AA– | 2,000,000 | 2,266,740 |
|
| WI State Hlth. & Edl. Fac. Auth. Rev. Bonds | | | |
| (Prohealth Care, Inc.), 6 5/8s, 2/15/39 | A1 | 1,250,000 | 1,339,838 |
|
| | | | 3,606,578 |
36
| | | |
| MUNICIPAL BONDS AND NOTES (98.4%)* cont. | Rating** | Principal amount | Value |
|
| Wyoming (0.5%) | | | |
| Sweetwater Cnty., Poll. Control Rev. Bonds (Idaho | | | |
| Power Co.), 5 1/4s, 7/15/26 | A3 | $1,800,000 | $1,836,360 |
|
| | | | 1,836,360 |
|
| |
| TOTAL INVESTMENTS | | | |
|
| Total investments (cost $369,913,554) | | | $389,152,304 |
* Percentages indicated are based on net assets of $395,365,556.
** The Moody’s, Standard & Poor’s or Fitch ratings indicated are believed to be the most recent ratings available at January 31, 2010 for the securities listed. Ratings are generally ascribed to securities at the time of issuance. While the agencies may from time to time revise such ratings, they undertake no obligation to do so, and the ratings do not necessarily represent what the agencies would ascribe to these securities at January 31, 2010. Securities rated by Putnam are indicated by “/P.” Securities rated by Fitch are indicated by “/F.” The rating of an insured security represents what is believed to be the most recent rating of the insurer’s claims-paying ability available at January 31, 2010 and does not reflect any subsequent changes. Security ratings are defined in the Statement of Additional Information.
The rates shown on FRB, Mandatory Put Bonds and VRDN are the current interest rates at January 31, 2010.
The dates shown on Mandatory Put Bonds are the next mandatory put dates.
The dates shown on debt obligations other than Mandatory Put Bonds are the original maturity dates.
The fund had the following sector concentrations greater than 10% at January 31, 2010 (as a percentage of net assets):
| | | |
| Utilities | 19.6% | | |
| Health care | 16.8 | | |
| Local government | 13.4 | | |
| Education | 10.6 | | |
The fund had the following insurance concentrations greater than 10% at January 31, 2010 (as a percentage of net assets):
| | | |
| NATL | 19.3% | | |
| AMBAC | 13.6 | | |
| FSA | 13.2 | | |
ASC 820, Fair Value Measurements and Disclosures, establishes a three-level hierarchy for disclosure of fair value measurements. The valuation hierarchy is based upon the transparency of inputs to the valuation of the fund’s investments. The three levels are defined as follows:
Level 1 — Valuations based on quoted prices for identical securities in active markets.
Level 2 — Valuations based on quoted prices in markets that are not active or for which all significant inputs are observable, either directly or indirectly.
Level 3 — Valuations based on inputs that are unobservable and significant to the fair value measurement.
The following is a summary of the inputs used to value the fund’s net assets as of January 31, 2010:
| | | |
| | | Valuation inputs |
|
| Investments in securities: | Level 1 | Level 2 | Level 3 |
|
| Municipal bonds and notes | $— | $389,152,304 | $— |
|
| Totals by level | $— | $389,152,304 | $— |
The accompanying notes are an integral part of these financial statements.
37
Statement of assets and liabilities 1/31/10 (Unaudited)
| |
| ASSETS | |
|
| Investment in securities, at value (Note 1): | |
| Unaffiliated issuers (identified cost $369,913,554) | $389,152,304 |
|
| Cash | 205,458 |
|
| Interest and other receivables | 4,645,567 |
|
| Receivable for shares of the fund sold | 3,312,066 |
|
| Receivable for investments sold | 100,153 |
|
| Total assets | 397,415,548 |
|
| |
| LIABILITIES | |
|
| Distributions payable to shareholders | 544,102 |
|
| Payable for shares of the fund repurchased | 1,089,934 |
|
| Payable for compensation of Manager (Note 2) | 148,196 |
|
| Payable for investor servicing fees (Note 2) | 17,779 |
|
| Payable for custodian fees (Note 2) | 2,258 |
|
| Payable for Trustee compensation and expenses (Note 2) | 86,082 |
|
| Payable for administrative services (Note 2) | 1,204 |
|
| Payable for distribution fees (Note 2) | 98,708 |
|
| Payable for auditing fees (Note 1) | 32,829 |
|
| Other accrued expenses | 28,900 |
|
| Total liabilities | 2,049,992 |
| |
| Net assets | $395,365,556 |
|
| |
| REPRESENTED BY | |
|
| Paid-in capital (Unlimited shares authorized) (Notes 1 and 4) | $380,987,377 |
|
| Distributions in excess of net investment income (Note 1) | (381,417) |
|
| Accumulated net realized loss on investments (Note 1) | (4,479,154) |
|
| Net unrealized appreciation of investments | 19,238,750 |
|
| Total — Representing net assets applicable to capital shares outstanding | $395,365,556 |
|
| |
| COMPUTATION OF NET ASSET VALUE AND OFFERING PRICE | |
|
| Net asset value and redemption price per class A share | |
| ($349,904,665 divided by 23,865,797 shares) | $14.66 |
|
| Offering price per class A share (100/96.00 of $14.66)* | $15.27 |
|
| Net asset value and offering price per class B share ($11,371,305 divided by 774,770 shares)** | $14.68 |
|
| Net asset value and offering price per class C share ($25,929,849 divided by 1,764,763 shares)** | $14.69 |
|
| Net asset value and redemption price per class M share ($1,344,958 divided by 91,499 shares) | $14.70 |
|
| Offering price per class M share (100/96.75 of $14.70)*** | $15.19 |
|
| Net asset value, offering price and redemption price per class Y share | |
| ($6,814,779 divided by 464,655 shares) | $14.67 |
|
* On single retail sales of less than $100,000. On sales of $100,000 or more the offering price is reduced.
** Redemption price per share is equal to net asset value less any applicable contingent deferred sales charge.
*** On single retail sales of less than $50,000. On sales of $50,000 or more the offering price is reduced.
The accompanying notes are an integral part of these financial statements.
38
Statement of operations Six months ended 1/31/10 (Unaudited)
| |
| INTEREST INCOME | $9,683,802 |
|
| |
| EXPENSES | |
|
| Compensation of Manager (Note 2) | $949,162 |
|
| Investor servicing fees (Note 2) | 105,962 |
|
| Custodian fees (Note 2) | 7,063 |
|
| Trustee compensation and expenses (Note 2) | 14,006 |
|
| Administrative services (Note 2) | 6,855 |
|
| Distribution fees — Class A (Note 2) | 391,444 |
|
| Distribution fees — Class B (Note 2) | 56,505 |
|
| Distribution fees — Class C (Note 2) | 117,431 |
|
| Distribution fees — Class M (Note 2) | 3,054 |
|
| Other | 93,321 |
|
| Fees waived and reimbursed by Manager (Note 2) | (76,893) |
|
| Total expenses | 1,667,910 |
| | |
| Expense reduction (Note 2) | (937) |
|
| Net expenses | 1,666,973 |
| |
| Net investment income | 8,016,829 |
|
| |
| Net realized loss on investments (Notes 1 and 3) | (737,823) |
|
| Net unrealized appreciation of investments during the period | 10,383,351 |
|
| Net gain on investments | 9,645,528 |
| |
| Net increase in net assets resulting from operations | $17,662,357 |
|
The accompanying notes are an integral part of these financial statements.
39
Statement of changes in net assets
| | |
| INCREASE IN NET ASSETS | Six months ended 1/31/10* | Year ended 7/31/09 |
|
| Operations: | | |
| Net investment income | $8,016,829 | $12,917,835 |
|
| Net realized loss on investments | (737,823) | (2,945,264) |
|
| Net unrealized appreciation of investments | 10,383,351 | 2,534,246 |
|
| Net increase in net assets resulting from operations | 17,662,357 | 12,506,817 |
|
| Distributions to shareholders (Note 1): | | |
| From ordinary income | | |
| Taxable net investment income | | |
|
| Class A | (36,589) | (31,845) |
|
| Class B | (1,549) | (2,317) |
|
| Class C | (1,682) | (1,597) |
|
| Class M | (134) | (99) |
|
| Class Y | (434) | (124) |
|
| From tax-exempt net investment income | | |
| Class A | (7,170,806) | (12,015,821) |
|
| Class B | (236,368) | (684,531) |
|
| Class C | (397,463) | (487,711) |
|
| Class M | (23,749) | (42,574) |
|
| Class Y | (113,419) | (43,903) |
|
| Redemption fees (Note 1) | — | 71 |
|
| Increase from capital share transactions (Note 4) | 27,390,930 | 55,375,515 |
|
| Total increase in net assets | 37,071,094 | 54,571,881 |
|
| |
| NET ASSETS | | |
|
| Beginning of period | 358,294,462 | 303,722,581 |
|
| End of period (including distributions in excess of net | | |
| investment income of $381,417 and $416,053, respectively) | $395,365,556 | $358,294,462 |
|
* Unaudited
The accompanying notes are an integral part of these financial statements.
40
|
| This page left blank intentionally. |
41
Financial highlights (For a common share outstanding throughout the period)
| | | | | | | | | | | | | | |
| INVESTMENT OPERATIONS: | | LESS DISTRIBUTIONS: | | RATIOS AND SUPPLEMENTAL DATA: |
|
| | | | | | | | | | | | | Ratio | Ratio of net | |
| | | | Net realized | | | | | | | | | of expenses | investment | |
| | Net asset value, | | and unrealized | Total from | From net | From net | | | Net asset | Total return | Net assets, | to average | income (loss) | |
| | beginning | Net investment | gain (loss) on | investment | investment | realized gain | Total | Redemption | value, end | at net asset | end of period | net assets | to average | Portfolio |
| Period ended | of period | income (loss) | investments | operations | income | on investments | distributions | fees | period | value (%) a | (in thousands) | (%) b,c | net assets (%) b | turnover (%) |
|
| Class A | | | | | | | | | | | | | | |
| January 31, 2010 ** | $14.27 | .31 | .39 | .70 | (.31) | — | (.31) | — | $14.66 | 4.91 * | $349,905 | .40 * | 2.12 * | 10.22 * |
| July 31, 2009 | 14.33 | .58 | (.05) | .53 | (.59) | — | (.59) | — d | 14.27 | 3.84 | 317,964 | .85 | 4.07 | 21.73 |
| July 31, 2008 | 14.59 | .56 | (.23) | .33 | (.57) | (.02) | (.59) | — | 14.33 | 2.30 | 267,448 | .85 | 3.85 | 39.26 |
| July 31, 2007 | 14.70 | .56 | (.06) | .50 | (.57) | (.04) | (.61) | — | 14.59 | 3.41 | 257,709 | .85 | 3.78 | 18.88 |
| July 31, 2006 | 15.07 | .57 | (.30) | .27 | (.56) | (.08) | (.64) | — d | 14.70 | 1.85 | 270,331 | .85 | 3.81 | 6.97 |
| July 31, 2005 | 14.92 | .54 | .26 | .80 | (.54) | (.11) | (.65) | — d | 15.07 | 5.39 | 277,931 | .84 | 3.57 | 12.61 |
|
| Class B | | | | | | | | | | | | | | |
| January 31, 2010 ** | $14.29 | .27 | .38 | .65 | (.26) | — | (.26) | — | $14.68 | 4.61 * | $11,371 | .72 * | 1.78 * | 10.22 * |
| July 31, 2009 | 14.35 | .49 | (.05) | .44 | (.50) | — | (.50) | — d | 14.29 | 3.21 | 15,259 | 1.48 | 3.43 | 21.73 |
| July 31, 2008 | 14.61 | .47 | (.23) | .24 | (.48) | (.02) | (.50) | — | 14.35 | 1.62 | 23,548 | 1.49 | 3.21 | 39.26 |
| July 31, 2007 | 14.72 | .47 | (.07) | .40 | (.47) | (.04) | (.51) | — | 14.61 | 2.73 | 33,472 | 1.49 | 3.13 | 18.88 |
| July 31, 2006 | 15.09 | .47 | (.29) | .18 | (.47) | (.08) | (.55) | — d | 14.72 | 1.26 | 59,527 | 1.50 | 3.15 | 6.97 |
| July 31, 2005 | 14.94 | .44 | .26 | .70 | (.44) | (.11) | (.55) | — d | 15.09 | 4.71 | 88,337 | 1.49 | 2.92 | 12.61 |
|
| Class C | | | | | | | | | | | | | | |
| January 31, 2010 ** | $14.30 | .26 | .38 | .64 | (.25) | — | (.25) | — | $14.69 | 4.52 * | $25,930 | .79 * | 1.75 * | 10.22 * |
| July 31, 2009 | 14.36 | .47 | (.05) | .42 | (.48) | — | (.48) | — d | 14.30 | 3.05 | 18,802 | 1.63 | 3.29 | 21.73 |
| July 31, 2008 | 14.61 | .45 | (.22) | .23 | (.46) | (.02) | (.48) | — | 14.36 | 1.57 | 11,689 | 1.64 | 3.06 | 39.26 |
| July 31, 2007 | 14.73 | .44 | (.07) | .37 | (.45) | (.04) | (.49) | — | 14.61 | 2.60 | 8,405 | 1.64 | 2.99 | 18.88 |
| July 31, 2006 | 15.09 | .45 | (.29) | .16 | (.44) | (.08) | (.52) | — d | 14.73 | 1.12 | 8,723 | 1.65 | 3.01 | 6.97 |
| July 31, 2005 | 14.94 | .42 | .26 | .68 | (.42) | (.11) | (.53) | — d | 15.09 | 4.54 | 8,835 | 1.64 | 2.77 | 12.61 |
|
| Class M | | | | | | | | | | | | | | |
| January 31, 2010 ** | $14.31 | .29 | .39 | .68 | (.29) | — | (.29) | — | $14.70 | 4.78 * | $1,345 | .54 * | 2.00 * | 10.22 * |
| July 31, 2009 | 14.37 | .54 | (.05) | .49 | (.55) | — | (.55) | — d | 14.31 | 3.57 | 1,236 | 1.13 | 3.79 | 21.73 |
| July 31, 2008 | 14.63 | .52 | (.23) | .29 | (.53) | (.02) | (.55) | — | 14.37 | 2.03 | 1,028 | 1.14 | 3.56 | 39.26 |
| July 31, 2007 | 14.74 | .52 | (.06) | .46 | (.53) | (.04) | (.57) | — | 14.63 | 3.19 | 1,059 | 1.14 | 3.49 | 18.88 |
| July 31, 2006 | 15.11 | .53 | (.30) | .23 | (.52) | (.08) | (.60) | — d | 14.74 | 1.55 | 1,124 | 1.15 | 3.51 | 6.97 |
| July 31, 2005 | 14.96 | .50 | .25 | .75 | (.49) | (.11) | (.60) | — d | 15.11 | 5.05 | 1,135 | 1.14 | 3.27 | 12.61 |
|
| Class Y | | | | | | | | | | | | | | |
| January 31, 2010 ** | $14.27 | .33 | .40 | .73 | (.33) | — | (.33) | — | $14.67 | 5.11 * | $6,815 | .29 * | 2.31 * | 10.22 * |
| July 31, 2009 | 14.34 | .61 | (.06) | .55 | (.62) | — | (.62) | — d | 14.27 | 4.01 | 5,033 | .63 | 4.33 | 21.73 |
| July 31, 2008 † | 14.71 | .34 | (.36) | (.02) | (.35) | — | (.35) | — | 14.34 | (.09) * | 10 | .37 * | .28 * | 39.26 |
|
See notes to financial highlights at the end of this section.
The accompanying notes are an integral part of these financial statements.
Financial highlights (Continued)
* Not annualized.
** Unaudited.
† For the period January 2, 2008 (commencement of operations) to July 31, 2008.
a Total return assumes dividend reinvestment and does not reflect the effect of sales charges.
b Reflects an involuntary contractual expense limitation in effect during the period. As a result of such limitation, the expenses of each class reflect a reduction of the following amounts (Note 2):
| |
| | Percentage of |
| | average net assets |
|
| January 31, 2010 | 0.02% |
|
| July 31, 2009 | 0.01 |
|
| July 31, 2008 | 0.01 |
|
| July 31, 2007 | <0.01 |
|
| July 31, 2006 | <0.01 |
|
| July 31, 2005 | <0.01 |
|
c Includes amounts paid through expense offset arrangements (Note 2).
d Amount represents less than $0.01 per share.
The accompanying notes are an integral part of these financial statements.
44
Notes to financial statements 1/31/10 (Unaudited)
Note 1: Significant accounting policies
Putnam AMT-Free Municipal Fund (the “fund”) is a series of Putnam Tax-Free Income Trust (the “trust”), a Massachusetts business trust, which is registered under the Investment Company Act of 1940, as amended, as a diversified, open end management investment company. The fund pursues its objective of seeking high current income exempt from federal income tax by investing in tax exempt securities that are investment grade in quality, and have intermediate-to-long-term maturities. The fund may invest in higher yielding, lower rated bonds that may have a higher rate of default.
The fund offers class A, class B, class C, class M and class Y shares. Class A and class M shares are sold with a maximum front-end sales charge of 4.00% and 3.25%, respectively, and generally do not pay a contingent deferred sales charge. Class B shares, which convert to class A shares after approximately eight years, do not pay a front-end sales charge and are subject to a contingent deferred sales charge, if those shares are redeemed within six years of purchase. Class C shares have a one-year 1.00% contingent deferred sales charge and do not convert to class A shares. The expenses for class A, class B, class C, and class M shares may differ based on the distribution fee of each class, which is identified in Note 2. Class Y shares, which are sold at net asset value, are generally subject to the same expenses as class A, class B, class C, and class M shares, but do not bear a distribution fee. Class Y shares are generally only available to corpo rate and institutional clients and clients in other approved programs.
A 1.00% redemption fee may apply on any shares that are redeemed (either by selling or exchanging into another fund) within 7 days of purchase. The redemption fee is accounted for as an addition to paid-in-capital.
Investment income, realized and unrealized gains and losses and expenses of the fund are borne pro-rata based on the relative net assets of each class to the total net assets of the fund, except that each class bears expenses unique to that class (including the distribution fees applicable to such classes). Each class votes as a class only with respect to its own distribution plan or other matters on which a class vote is required by law or determined by the Trustees. If the fund were liquidated, shares of each class would receive their pro-rata share of the net assets of the fund. In addition, the Trustees declare separate dividends on each class of shares.
In the normal course of business, the fund enters into contracts that may include agreements to indemnify another party under given circumstances. The fund’s maximum exposure under these arrangements is unknown as this would involve future claims that may be, but have not yet been, made against the fund. However, the fund’s management team expects the risk of material loss to be remote.
The following is a summary of significant accounting policies consistently followed by the fund in the preparation of its financial statements. The preparation of financial statements is in conformity with accounting principles generally accepted in the United States of America and requires management to make estimates and assumptions that affect the reported amounts of assets and liabilities in the financial statements and the reported amounts of increases and decreases in net assets from operations during the reporting period. Actual results could differ from those estimates. Subsequent events after the Statement of assets and liabilities date through the date that the financial statements were issued, March 12, 2010, have been evaluated in the preparation of the financial statements.
A) Security valuation Tax-exempt bonds and notes are generally valued on the basis of valuations provided by an independent pricing service approved by the Trustees. Such services use information with respect to transactions in bonds, quotations from bond dealers, market transactions in comparable securities and various relationships between securities in determining value. Certain investments, including certain restricted and illiquid securities and derivatives are also valued at fair value following procedures approved by the Trustees. Such valuations and procedures are reviewed periodically by the Trustees. The fair value of securities is generally determined as the amount that the fund could reasonably expect to realize from an orderly disposition of such securities over a reasonable period of time. By its nature, a fair value price is a good faith estimate of the value of a security in a current sale and does not reflect an actual market price, which may be different by a material amount.
B) Security transactions and related investment income Security transactions are recorded on the trade date (the date the order to buy or sell is executed). Gains or losses on securities sold are determined on the identified cost basis. Interest income is recorded on the accrual basis. All premiums/discounts are amortized/accreted on a yield-to-maturity basis. The premium in excess of the call price, if any, is amortized to the call date; thereafter, any remaining premium is amortized to maturity.
C) Federal taxes It is the policy of the fund to distribute all of its income within the prescribed time and
45
otherwise comply with the provisions of the Internal Revenue Code of 1986, as amended (the “Code”), applicable to regulated investment companies. It is also the intention of the fund to distribute an amount sufficient to avoid imposition of any excise tax under Section 4982 of the Code. The fund is subject to the provisions of Accounting Standards Codification ASC 740 Income Taxes (“ASC 740”). ASC 740 sets forth a minimum threshold for financial statement recognition of the benefit of a tax position taken or expected to be taken in a tax return. The fund did not have any unrecognized tax benefits in the accompanying financial statements. No provision has been made for federal taxes on income, capital gains or unrealized appreciation on securities held nor for excise tax on income and capital gains. Each of the fund’s federal tax returns for the prior three fiscal years remains subject to examination by the Internal Revenue Service and state departments of revenue.
At July 31, 2009, the fund had a capital loss carryover of $106,659 available to the extent allowed by the Code to offset future net capital gain, if any. This capital loss carryover will expire on July 31, 2017.
Pursuant to federal income tax regulations applicable to regulated investment companies, the fund has elected to defer to its fiscal year ending July 31, 2010 $2,944,275 of losses recognized during the period November 1, 2008 to July 31, 2009.
The aggregate identified cost on a tax basis is $369,913,554, resulting in gross unrealized appreciation and depreciation of $22,969,855 and $3,731,105, respectively, or net unrealized appreciation of $19,238,750.
D) Distributions to shareholders Income dividends are recorded daily by the fund and are paid monthly. Distributions from capital gains, if any, are recorded on the ex-dividend date and paid at least annually. The amount and character of income and gains to be distributed are determined in accordance with income tax regulations which may differ from generally accepted accounting principles. Dividend sources are estimated at the time of declaration. Actual results may vary. Any non-taxable return of capital cannot be determined until final tax calculations are completed after the end of the fund’s fiscal year. Reclassifications are made to the fund’s capital accounts to reflect income and gains available for distribution (or available capital loss carryovers) under income tax regulations.
E) Expenses of the trust Expenses directly charged or attributable to any fund will be paid from the assets of that fund. Generally, expenses of the trust will be allocated among and charged to the assets of each fund on a basis that the Trustees deem fair and equitable, which may be based on the relative assets of each fund or the nature of the services performed and relative applicability to each fund.
Note 2: Management fee, administrative
services and other transactions
Effective January 1, 2010, the fund pays Putnam Management a management fee (based on the fund’s average net assets and computed and paid monthly) at annual rates that may vary based on the average of the aggregate net assets of most open-end funds, as defined in the fund’s management contract, sponsored by Putnam Management. Such annual rates may vary as follows: 0.59% of the first $5 billion of average net assets, 0.54% of the next $5 billions, 0.49% of the next $10 billions, 0.44 % of the next $10 billions, 0.39% of the next $50 billions, 0.37% of the next $50 billions, 0.36% of the next $100 billions and 0.355% thereafter.
Prior to January 1, 2010, the fund paid Putnam Management for management and investment advisory services monthly based on the average net assets of the fund. Such fee was based on the lesser of (i) an annual rate of 0.50% of the average net asset value of the fund or (ii) the following annual rates: 0.60% of the first $500 million of average net assets, 0.50% of the next $500 million, 0.45% of the next $500 million, 0.40% of the next $5 billion, 0.375% of the next $5 billion, 0.355% of the next $5 billion, and 0.34% of the next $5 billion and 0.33% thereafter.
Effective August 1, 2009 through July 31, 2010, Putnam Management has also contractually agreed to reimburse the fund’s expenses to the extent necessary to limit the cumulative expenses of the fund, exclusive of brokerage, interest, taxes, investment-related expenses, extraordinary expenses and payments under the fund’s investor servicing contract, investment management contract and distribution plans, on a fiscal year-to-date basis (or from August 1, 2009 through the fund’s next fiscal year end, as applicable), to an annual rate of 0.20% of the fund’s average net assets over such fiscal year-to-date period (or since August 1, 2009, as applicable). During the period ended January 31, 2010 the fund’s expenses were not reduced as a result of this limit.
Putnam Management has contractually agreed, from August 1, 2009 through July 31, 2010, to limit the management fee for the fund to an annual rate of 0.452% of the fund’s average net assets. During the period ended January 31, 2010, the fund’s expenses were reduced by $76,892 as a result of this limit.
Effective November 30, 2009, Putnam Investments Limited (“PIL”), an affiliate of Putnam Management, is authorized by the Trustees to manage a separate portion of the assets of the fund as determined by Putnam Management from time to time. Putnam
46
Management pays a quarterly sub-management fee to PIL for its services at an annual rate of 0.40% of the average net assets of the portion of the fund managed by PIL.
The fund reimburses Putnam Management an allocated amount for the compensation and related expenses of certain officers of the fund and their staff who provide administrative services to the fund. The aggregate amount of all such reimbursements is determined annually by the Trustees.
Custodial functions for the fund’s assets are provided by State Street Bank and Trust Company (“State Street”). Custody fees are based on the fund’s asset level, the number of its security holdings and transaction volumes.
Putnam Investor Services, Inc., an affiliate of Putnam Management, provided investor servicing agent functions to the fund. Putnam Investor Services, Inc. received fees for investor servicing, subject to certain limitations, based on the fund’s retail asset level, the number of shareholder accounts in the fund and the level of defined contribution plan assets in the fund. The amounts incurred for investor servicing agent functions during the six months ended January, 31, 2010 are included in Investor servicing fees in the Statement of operations.
The fund has entered into expense offset arrangements with Putnam Investor Services, Inc. and State Street whereby Putnam Investor Services, Inc.’s and State Street’s fees are reduced by credits allowed on cash balances. For the six months ended January, 31, 2010, the fund’s expenses were reduced by $937 under the expense offset arrangements.
Each independent Trustee of the fund receives an annual Trustee fee, of which $285, as a quarterly retainer, has been allocated to the fund, and an additional fee for each Trustees meeting attended. Trustees receive additional fees for attendance at certain committee meetings and industry seminars and for certain compliance-related matters. Trustees also are reimbursed for expenses they incur relating to their services as Trustees.
The fund has adopted a Trustee Fee Deferral Plan (the “Deferral Plan”) which allows the Trustees to defer the receipt of all or a portion of Trustees fees payable on or after July 1, 1995. The deferred fees remain invested in certain Putnam funds until distribution in accordance with the Deferral Plan.
The fund has adopted an unfunded noncontributory defined benefit pension plan (the “Pension Plan”) covering all Trustees of the fund who have served as a Trustee for at least five years and were first elected prior to 2004. Benefits under the Pension Plan are equal to 50% of the Trustee’s average annual attendance and retainer fees for the three years ended December 31, 2005. The retirement benefit is payable during a Trustee’s lifetime, beginning the year following retirement, for the number of years of service through December 31, 2006. Pension expense for the fund is included in Trustee compensation and expenses in the Statement of operations. Accrued pension liability is included in Payable for Trustee compensation and expenses in the Statement of assets and liabilities. The Trustees have terminated the Pension Plan with respect to any Trustee first elected after 2003.
The fund has adopted distribution plans (the “Plans”) with respect to its class A, class B, class C and class M shares pursuant to Rule 12b-1 under the Investment Company Act of 1940. The purpose of the Plans is to compensate Putnam Retail Management Limited Partnership, a wholly-owned subsidiary of Putnam Investments, LLC and Putnam Retail Management GP, Inc., for services provided and expenses incurred in distributing shares of the fund. The Plans provide for payments by the fund to Putnam Retail Management Limited Partnership at an annual rate of up to 0.35%, 1.00%, 1.00% and 1.00% of the average net assets attributable to class A, class B, class C and class M shares, respectively. The Trustees have approved payment by the fund at the annual rate of 0.85%, 1.00% and 0.50% of the average net assets for class B, class C and class M shares, respectively. For class A shares, the annual payment rate will equal the weighted average of (i) 0.20% on the net assets of the fund attributable to class A shares purchased and paid for prior to April 1, 2005 and (ii) 0.25% on all other net assets of the fund attributable to class A shares.
For the six months ended January 31, 2010, Putnam Retail Management Limited Partnership, acting as underwriter, received net commissions of $39,075 and $573 from the sale of class A and class M shares, respectively, and received $3,412 and $1,426 in contingent deferred sales charges from redemptions of class B and class C shares, respectively.
A deferred sales charge of up to 1.00% is assessed on certain redemptions of class A shares that were purchased without an initial sales charge as part of an investment of $1 million or more. For the six months ended January 31, 2010, Putnam Retail Management Limited Partnership, acting as underwriter, received $67,019 on class A redemptions.
Note 3: Purchases and sales of securities
During the six months ended January 31, 2010, cost of purchases and proceeds from sales of investment securities other than short-term investments aggregated $63,616,607 and $37,123,024, respectively. There were no purchases or sales of U.S. government securities.
47
Note 4: Capital shares
At January 31, 2010, there was an unlimited number of shares of beneficial interest authorized. Transactions in capital shares were as follows:
| | | | |
| | Six months ended 1/31/10 | Year ended 7/31/09 |
|
| Class A | Shares | Amount | Shares | Amount |
|
| Shares sold | 3,796,057 | $55,716,047 | 7,811,447 | $108,993,222 |
|
| Shares issued in connection with | | | | |
| reinvestment of distributions | 312,223 | 4,578,231 | 569,010 | 7,950,517 |
|
| | 4,108,280 | 60,294,278 | 8,380,457 | 116,943,739 |
|
| Shares repurchased | (2,523,428) | (36,956,186) | (4,757,463) | (65,865,747) |
|
| Net increase | 1,584,852 | $23,338,092 | 3,622,994 | $51,077,992 |
|
| |
| | Six months ended 1/31/10 | Year ended 7/31/09 |
|
| Class B | Shares | Amount | Shares | Amount |
|
| Shares sold | 42,415 | $621,880 | 126,630 | $1,753,546 |
|
| Shares issued in connection with | | | | |
| reinvestment of distributions | 9,365 | 137,484 | 30,366 | 424,183 |
|
| | 51,780 | 759,364 | 156,996 | 2,177,729 |
|
| Shares repurchased | (344,901) | (5,050,018) | (729,609) | (10,164,522) |
|
| Net decrease | (293,121) | $(4,290,654) | (572,613) | $(7,986,793) |
|
| |
| | Six months ended 1/31/10 | Year ended 7/31/09 |
|
| Class C | Shares | Amount | Shares | Amount |
|
| Shares sold | 585,445 | $8,599,926 | 754,309 | $10,639,248 |
|
| Shares issued in connection with | | | | |
| reinvestment of distributions | 18,601 | 273,377 | 24,657 | 345,345 |
|
| | 604,046 | 8,873,303 | 778,966 | 10,984,593 |
|
| Shares repurchased | (154,122) | (2,271,428) | (277,966) | (3,884,778) |
|
| Net increase | 449,924 | $6,601,875 | 501,000 | $7,099,815 |
|
| |
| | Six months ended 1/31/10 | Year ended 7/31/09 |
|
| Class M | Shares | Amount | Shares | Amount |
|
| Shares sold | 21,312 | $313,189 | 38,807 | $541,224 |
|
| Shares issued in connection with | | | | |
| reinvestment of distributions | 939 | 13,798 | 1,693 | 23,708 |
|
| | 22,251 | 326,987 | 40,500 | 564,932 |
|
| Shares repurchased | (17,131) | (251,131) | (25,616) | (344,387) |
|
| Net increase | 5,120 | $75,856 | 14,884 | $220,545 |
|
| |
| | Six months ended 1/31/10 | Year ended 7/31/09 |
|
| Class Y | Shares | Amount | Shares | Amount |
|
| Shares sold | 230,962 | $3,389,188 | 392,541 | $5,540,339 |
|
| Shares issued in connection with | | | | |
| reinvestment of distributions | 2,698 | 39,558 | 1,600 | 22,519 |
|
| | 233,660 | 3,428,746 | 394,141 | 5,562,858 |
|
| Shares repurchased | (121,636) | (1,762,985) | (42,207) | (598,902) |
|
| Net increase | 112,024 | $1,665,761 | 351,934 | $4,963,956 |
|
48
At January 31, 2010, Putnam Investments, LLC owned 739 class Y shares of the fund (0.2% of class Y shares outstanding), valued at $10,841.
Note 5: Regulatory matters and litigation
In late 2003 and 2004, Putnam Management settled charges brought by the Securities and Exchange Commission (the “SEC”) and the Massachusetts Securities Division in connection with excessive short-term trading in Putnam funds. Distribution of payments from Putnam Management to certain open-end Putnam funds and their shareholders is expected to be completed in the next several months. These allegations and related matters have served as the general basis for certain lawsuits, including purported class action lawsuits against Putnam Management and, in a limited number of cases, some Putnam funds. Putnam Management believes that these lawsuits will have no material adverse effect on the funds or on Putnam Management’s ability to provide investment management services. In addition, Putnam Management has agreed to bear any costs incurred by the Putnam funds as a result of these matters.
Note 6: Market and credit risk
In the normal course of business, the fund trades financial instruments and enters into financial transactions where risk of potential loss exists due to changes in the market (market risk) or failure of the contracting party to the transaction to perform (credit risk). The fund may be exposed to additional credit risk that an institution or other entity with which the fund has unsettled or open transactions will default.
49
Shareholder meeting results (Unaudited)
November 19, 2009 meeting
At the meeting, each of the nominees for Trustees was elected, with all fund’s of the Trust voting together as a single class, as follows:
| | |
| | Votes for | Votes withheld |
|
| Ravi Akhoury | 87,629,571 | 3,211,141 |
|
| Jameson A. Baxter | 87,685,078 | 3,155,634 |
|
| Charles B. Curtis | 87,636,864 | 3,203,847 |
|
| Robert J. Darretta | 87,718,101 | 3,122,610 |
|
| Myra R. Drucker | 87,676,864 | 3,163,848 |
|
| John A. Hill | 87,663,405 | 3,177,307 |
|
| Paul L. Joskow | 87,703,115 | 3,137,597 |
|
| Elizabeth T. Kennan | 87,603,595 | 3,237,116 |
|
| Kenneth R. Leibler | 87,728,152 | 3,112,560 |
|
| Robert E Patterson | 87,682,188 | 3,158,524 |
|
| George Putnam, III | 87,703,624 | 3,137,088 |
|
| Robert L. Reynolds | 87,732,364 | 3,108,348 |
|
| W. Thomas Stephens | 87,702,525 | 3,138,187 |
|
| Richard B. Worley | 87,699,031 | 3,141,681 |
|
A proposal to approve a new management contract between the fund and Putnam Management was approved as follows:
| | | |
| Votes | Votes | | Broker |
| for | against | Abstentions | non-votes |
|
| 13,254,498 | 412,837 | 829,437 | 6,186,145 |
|
All tabulations are rounded to the nearest whole number.
50
The Putnam family of funds
The following is a list of Putnam’s open-end mutual funds offered to the public. Investors should carefully consider the investment objective, risks, charges, and expenses of a fund before investing. For a prospectus, or a summary prospectus if available, containing this and other information for any Putnam fund or product, call your financial advisor at 1-800-225-1581 and ask for a prospectus. Please read the prospectus carefully before investing.
Growth
Growth Opportunities Fund
International Growth Fund* **
New Opportunities Fund
Small Cap Growth Fund*
Vista Fund
Voyager Fund
Blend
Asia Pacific Equity Fund*
Capital Opportunities Fund*
Capital Spectrum Fund‡
Emerging Markets Equity Fund*
Equity Spectrum Fund‡
Europe Equity Fund*
Global Equity Fund*
Global Natural Resources Fund*
International Capital Opportunities Fund*
International Equity Fund*
Investors Fund
Research Fund
Value
Convertible Income-Growth Trust
Equity Income Fund
The George Putnam Fund of Boston
The Putnam Fund for Growth and Income
International Value Fund*††
Mid Cap Value Fund
Small Cap Value Fund*
Income
American Government Income Fund
Diversified Income Trust
Floating Rate Income Fund
Global Income Trust*
High Yield Advantage Fund*
High Yield Trust*
Income Fund
Money Market Fund†
U.S. Government Income Trust
* A 1% redemption fee on total assets redeemed or exchanged within 90 days of purchase may be imposed for all share classes of these funds.
† An investment in a money market fund is not insured or guaranteed by the Federal Deposit Insurance Corporation or any other government agency. Although the fund seeks to preserve the value of your investment at $1.00 per share, it is possible to lose money by investing in the fund.
** Prior to January 1, 2010, the fund was known as Putnam International New Opportunities Fund.
†† Prior to January 1, 2010, the fund was known as Putnam International Growth and Income Fund.
51
Tax-free income
AMT-Free Municipal Fund
Tax Exempt Income Fund
Tax Exempt Money Market Fund†
Tax-Free High Yield Fund
State tax-free income funds:
Arizona, California, Massachusetts, Michigan, Minnesota, New Jersey, New York, Ohio, and Pennsylvania
Absolute Return
Absolute Return 100 Fund
Absolute Return 300 Fund
Absolute Return 500 Fund
Absolute Return 700 Fund
Global Sector*
Global Consumer Fund
Global Energy Fund
Global Financials Fund
Global Health Care Fund
Global Industrials Fund
Global Natural Resources Fund
Global Technology Fund
Global Telecommunications Fund
Global Utilities Fund
Asset allocation
Income Strategies Fund
Putnam Asset Allocation Funds — three investment portfolios that spread your money across a variety of stocks, bonds, and money market investments.
The three portfolios:
Asset Allocation: Balanced Portfolio
Asset Allocation: Conservative Portfolio
Asset Allocation: Growth Portfolio
Putnam RetirementReady®
Putnam RetirementReady Funds — 10 investment portfolios that offer diversification among stocks, bonds, and money market instruments and adjust to become more conservative over time based on a target date for withdrawing assets.
The 10 funds:
Putnam RetirementReady 2050 Fund
Putnam RetirementReady 2045 Fund
Putnam RetirementReady 2040 Fund
Putnam RetirementReady 2035 Fund
Putnam RetirementReady 2030 Fund
Putnam RetirementReady 2025 Fund
Putnam RetirementReady 2020 Fund
Putnam RetirementReady 2015 Fund
Putnam RetirementReady 2010 Fund
Putnam RetirementReady Maturity Fund
‡ A 1% redemption fee on total assets redeemed or exchanged within 30 days of purchase may be imposed for all share classes of these funds.
With the exception of money market funds, a 1% redemption fee may be applied to shares exchanged or sold within 7 days of purchase (90 days, for certain funds).
Check your account balances and the most recent month-end performance in the Individual Investors section at putnam.com.
52
Fund information
Founded over 70 years ago, Putnam Investments was built around the concept that a balance between risk and reward is the hallmark of a well-rounded financial program. We manage over 100 funds across income, value, blend, growth, asset allocation, absolute return, and global sector categories.
| | |
| Investment Manager | George Putnam, III | Francis J. McNamara, III |
| Putnam Investment | Robert L. Reynolds | Vice President and Chief |
| Management, LLC | W. Thomas Stephens | Legal Officer |
| One Post Office Square | Richard B. Worley | |
| Boston, MA 02109 | | Robert R. Leveille |
| | Officers | Vice President and Chief |
| Investment Sub-Manager | Robert L. Reynolds | Compliance Officer |
| Putnam Investments Limited | President | |
| 57–59 St James’s Street | | Mark C. Trenchard |
| London, England SW1A 1LD | Jonathan S. Horwitz | Vice President and BSA |
| | Executive Vice President, | Compliance Officer |
| Marketing Services | Principal Executive | |
| Putnam Retail Management | Officer, Treasurer and | Judith Cohen |
| One Post Office Square | Compliance Liaison | Vice President, Clerk and |
| Boston, MA 02109 | | Assistant Treasurer |
| Charles E. Porter | |
| Custodian | Senior Advisor to the Trustees | Wanda M. McManus |
| State Street Bank and | | Vice President, Senior Associate |
| Trust Company | Steven D. Krichmar | Treasurer and Assistant Clerk |
| Vice President and Principal | |
| Legal Counsel | Financial Officer | Nancy E. Florek |
| Ropes & Gray LLP | | Vice President, Assistant Clerk, |
| | Janet C. Smith | Assistant Treasurer and |
| Trustees | Vice President, Principal | Proxy Manager |
| John A. Hill, Chairman | Accounting Officer and | |
| Jameson A. Baxter, | Assistant Treasurer | |
| Vice Chairman | | |
| Ravi Akhoury | Susan G. Malloy | |
| Charles B. Curtis | Vice President and Assistant | |
| Robert J. Darretta | Treasurer | |
| Myra R. Drucker | | |
| Paul L. Joskow | Beth S. Mazor | |
| Elizabeth T. Kennan | Vice President | |
| Kenneth R. Leibler | | |
| Robert E. Patterson | James P. Pappas | |
| | Vice President | |
This report is for the information of shareholders of Putnam AMT-Free Municipal Fund. It may also be used as sales literature when preceded or accompanied by the current prospectus, the most recent copy of Putnam’s Quarterly Performance Summary, and Putnam’s Quarterly Ranking Summary. For more recent performance, please visit putnam.com. Investors should carefully consider the investment objective, risks, charges, and expenses of a fund, which are described in its prospectus. For this and other information or to request a prospectus, or a summary prospectus if available, call 1-800-225-1581 toll free. Please read the prospectus carefully before investing. The fund’s Statement of Additional Information contains additional information about the fund’s Trustees and is available without charge upon request by calling 1-800-225-1581.

Item 2. Code of Ethics:
Not applicable
Item 3. Audit Committee Financial Expert:
Not applicable
Item 4. Principal Accountant Fees and Services:
Not applicable
Item 5. Audit Committee of Listed Registrants
Not applicable
Item 6. Schedule of Investments:
The registrant’s schedule of investments in unaffiliated issuers is included in the report to shareholders in Item 1 above.
Item 7. Disclosure of Proxy Voting Policies and Procedures For Closed-End Management
Investment Companies:
Not applicable
Item 8. Portfolio Managers of Closed-End Investment Companies
Not Applicable
Item 9. Purchases of Equity Securities by Closed-End Management Investment Companies and
Affiliated Purchasers:
Not applicable
Item 10. Submission of Matters to a Vote of Security Holders:
Not applicable
Item 11. Controls and Procedures:
(a) The registrant's principal executive officer and principal financial officer have concluded, based on their evaluation of the effectiveness of the design and operation of the registrant's disclosure controls and procedures as of a date within 90 days of the filing date of this report, that the design and operation of such procedures are generally effective to provide reasonable assurance that information required to be disclosed by the registrant in this report is recorded, processed, summarized and reported within the time periods specified in the Commission's rules and forms.
(b) Changes in internal control over financial reporting: Not applicable
Item 12. Exhibits:
(a)(1) Not applicable
(a)(2) Separate certifications for the principal executive officer and principal financial officer of the registrant as required by Rule 30a-2(a) under the Investment Company Act of 1940, as amended, are filed herewith.
(b) The certifications required by Rule 30a-2(b) under the Investment Company Act of 1940, as amended, are filed herewith.
Putnam Tax Free Income Trust
By (Signature and Title):
/s/Janet C. Smith
Janet C. Smith
Principal Accounting Officer
Date: March 31, 2010
Pursuant to the requirements of the Securities Exchange Act of 1934 and the Investment Company Act of 1940, this report has been signed below by the following persons on behalf of the registrant and in the capacities and on the dates indicated.
By (Signature and Title):
/s/Jonathan S. Horwitz
Jonathan S. Horwitz
Principal Executive Officer
Date: March 31, 2010
By (Signature and Title):
/s/Steven D. Krichmar
Steven D. Krichmar
Principal Financial Officer
Date: March 31, 2010
| | | |
| | |
| UNITED STATES |
| SECURITIES AND EXCHANGE COMMISSION |
| Washington, D.C. 20549 |
| |
| FORM N-CSR |
| |
| CERTIFIED SHAREHOLDER REPORT OF REGISTERED |
| MANAGEMENT INVESTMENT COMPANIES |
| | |
| Investment Company Act file number: (811-04345) | |
| | |
| Exact name of registrant as specified in charter: | Putnam Tax Free Income Trust |
| |
| Address of principal executive offices: One Post Office Square, Boston, Massachusetts 02109 |
| | |
| Name and address of agent for service: | | Beth S. Mazor, Vice President |
| | One Post Office Square |
| | Boston, Massachusetts 02109 |
| | |
| Copy to: | | John W. Gerstmayr, Esq. |
| | Ropes & Gray LLP |
| | One International Place |
| | Boston, Massachusetts 02110 |
| | |
| Registrant’s telephone number, including area code: | (617) 292-1000 |
| | | |
| Date of fiscal year end: July 31, 2010 | | |
| |
| Date of reporting period: August 1, 2009 — January 31, 2010 |
Item 1. Report to Stockholders:
The following is a copy of the report transmitted to stockholders pursuant to Rule 30e-1 under the Investment Company Act of 1940:


A BALANCED APPROACH
Since 1937, when George Putnam created a diverse mix of stocks and bonds in a single, professionally managed portfolio, Putnam has championed the balanced approach.
A WORLD OF INVESTING
Today, we offer investors a world of equity, fixed-income, multi-asset, and absolute-return portfolios to suit a range of financial goals.
A COMMITMENT TO EXCELLENCE
Our portfolio managers seek superior results over time, backed by original, fundamental research on a global scale. We believe in the value of experienced financial advice, in providing exemplary service, and in putting clients first in all we do.

Putnam
Tax-Free
High Yield Fund
Semiannual report
1 | 31 | 10
| |
| Message from the Trustees | 2 |
|
| About the fund | 4 |
|
| Performance snapshot | 6 |
|
| Interview with your fund’s portfolio manager | 7 |
|
| Your fund’s performance | 11 |
|
| Your fund’s expenses | 13 |
|
| Terms and definitions | 15 |
|
| Trustee approval of management contract | 16 |
|
| Other information for shareholders | 26 |
|
| Financial statements | 27 |
|
| Shareholder meeting results | 59 |
|
Message from the Trustees
Dear Fellow Shareholder:
Last year’s rally in both stocks and bonds helped investors recoup some of the losses in their portfolios, and Putnam’s shareholders were particularly well served. After such strong growth, we are not surprised that the markets paused at the start of 2010.
While no one believes that 2010 will be a repeat performance of 2009, we do feel that today’s markets — based on an optimistic earnings outlook and growing evidence of a global economic recovery — offer ample opportunities for active money management, which is something that Putnam does well.
If there is any lesson to be learned from the extraordinary volatility of the past year, it is the importance of positioning one’s portfolio to limit downside risk. It is our belief that the best way to achieve this is by diversifying across all asset classes and investment strategies, and by adhering to your plan in every type of market environment.
Lastly, we would like to thank all shareholders who took the time to vote by proxy on a number of issues, including shareholder-friendly management fee changes, presented at the Putnam Funds’ shareholder meetings. We would also like to
2
welcome new shareholders to the fund and thank all of our investors for your continued confidence in Putnam.
About the fund
Seeking high current income exempt from federal income tax
Two of the most significant challenges of fixed-income investing are low interest rates and taxes on income. Putnam Tax-Free High Yield Fund can help investors reduce the impact of both by investing in higher-yielding municipal bonds, which offer the potential for a greater stream of income along with tax advantages.
Municipal bonds are typically issued by states and local municipalities to raise funds for building and maintaining public facilities. The income from a municipal bond is generally exempt from federal income tax, and from state taxes for residents of the state in which the bond is issued. Municipal bonds are backed by either the issuing city or town or by revenues collected from usage fees, and, as a result, have varying degrees of credit risk (the risk that the issuer will not be able to repay the bond).
Many high-yield municipal bonds are not rated by independent rating agencies such as Standard & Poor’s and Moody’s. This is mainly because many issuers decide not to pursue a rating that might be below investment grade. As a result, investment managers must do additional research to determine whether these bonds are prudent investments.
Evaluating a bond’s credit risk is one area in which Putnam has particular expertise. Putnam’s municipal bond research team analyzes each issue in depth and assigns unrated bonds an agency-equivalent Putnam rating — instead of rating bonds on a pass/ fail basis, which is a common practice in the industry. This analysis helps the managers in their efforts to identify bonds with attractive risk/return profiles from among this group.
Once the fund has invested in a bond, the fund’s managers continue to monitor developments that affect the bond market, the sector, and the issuer of the bond.
The goal of the fund’s research and active management is to stay a step ahead of the industry and to pinpoint opportunities to adjust holdings for the benefit of investors.
Consider these risks before investing: Lower-rated bonds may offer higher yields in return for more risk. Capital gains, if any, are taxable for federal and, in most cases, state purposes. For some investors, investment income may be subject to the federal alternative minimum tax. Tax-free funds may not be suitable for IRAs and other non-taxable accounts. Please consult with your tax advisor for more information. Income from federally exempt funds may be subject to state and local taxes. Funds that invest in bonds are subject to certain risks including interest-rate risk, credit risk, and inflation risk. As interest rates rise, the prices of bonds fall. Long-term bonds are more exposed to interest-rate risk than short-term bonds. Unlike bonds, bond funds have ongoing fees and expenses.
Understanding
tax-equivalent yield
To understand the value of tax-free income, it is helpful to compare a municipal bond’s yield with the “tax-equivalent yield” — the before-tax yield that must be offered by a taxable bond in order to equal the municipal bond’s yield after taxes.
How to calculate tax-equivalent yield:
The tax-equivalent yield equals the municipal bond’s yield divided by “one minus the tax rate.” For example, if a municipal bond’s yield is 5%, then its tax-equivalent yield is 7.7%, assuming the maximum 35% federal tax rate for 2009.
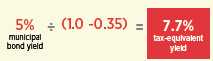
Results for investors subject to lower tax
rates would not be as advantageous.
Municipal bonds may finance a range of projects in your
community and thus play a key role in its development.

Performance
snapshot
Average annual total return (%) comparison as of 1/31/10
Current performance may be lower or higher than the quoted past performance, which cannot guarantee future results. Share price, principal value, and return will fluctuate, and you may have a gain or a loss when you sell your shares. Performance of class A shares assumes reinvestment of distributions and does not account for taxes. Fund returns in the bar chart do not reflect a sales charge of 4.00%; had they, returns would have been lower. See pages 7 and 11–13 for additional performance information. For a portion of the periods, this fund may have limited expenses, without which returns would have been lower. A 1% short-term trading fee may apply. To obtain the most recent month-end performance, visit putnam.com.
* Performance for class A shares before their inception (9/20/93) is derived from the historical performance of class B shares.
† Returns for the six-month period are not annualized, but cumulative.
6
Interview with your fund’s portfolio manager
Paul Drury
High-yield municipal bonds had a banner year in 2009. How did the fund perform over the semiannual period?
For the six months ended January 31, 2010, Putnam Tax-Free High Yield Fund’s class A shares at net asset value returned 13.13%, outperforming the 4.90% return of its benchmark, the Barclays Capital Municipal Bond Index, and the 12.53% average return of its peers in the Lipper High Yield Municipal Debt Funds category.
The six-month period, although strong in its entirety, was actually quite volatile. August and September were exceptional months for municipal bonds, as investors sought better returns than the near-zero yields offered by money market mutual funds and other short-term investments. In October, the municipal bond market sold off steeply after demand in August and September had pushed down yields [when bond prices rise, their yields fall] and investors sought to lock in profits. From the middle of November through the end of the period, however, stability had returned and the market resumed its upward trend.
What were some of the factors causing that volatility?
Since the end of 2008, we’ve seen periods of historically low valuations in the municipal bond market, especially in the lower-rated high-yield segment. These low prices and high yields relative to taxable bonds — U.S. Treasuries, in particular — created unusually high levels of demand during the period.
Broad market index and fund performance
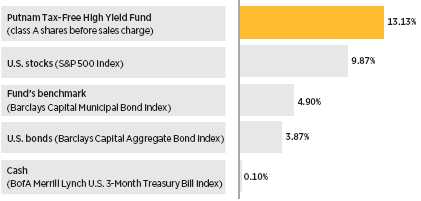
This comparison shows your fund’s performance in the context of broad market indexes for the six months ended 1/31/10. See pages 6 and 11–13 for additional fund performance information. Index descriptions can be found on page 15.
7
Given the limited supply of municipal bonds in the market — due in part to the introduction of Build America Bonds, or BABs — performance was more volatile than is typical for the asset class as investors moved in and out of positions.
Could you tell us a little more about Build America Bonds and the impact they’ve had on the municipal bond market?
Build America Bonds are taxable securities issued by state and local governments. The issuer, however, receives a subsidy direct from the U.S. Treasury to cover 35% of the interest payments. BABs have made a significant impact in reducing the supply of higher-quality issues in the municipal bond market. BABs are an affordable financing alternative that have been attractive to municipal issuers, allowing them access to a broader base of buyers for their bonds. At the same time, however, this popularity created concern about the future of tax-exempt supply, helping to strengthen their prices and foster the municipal bond rally.
What changes did you make to the portfolio’s positioning during the period?
Throughout the period, we found that the best investment opportunities continued to be in the BBB-rated segment of the bond market. As a result, our strategy hinged upon reallocating assets from higher-quality securities that performed well in the first half of 2009 into lower-quality, attractively valued issues. To give some perspective, at the beginning of the period, approximately 25% of the portfolio’s net assets were invested in securities rated A or better. By the end of the period, we had reduced that weighting to closer to 13% of net assets. It was a decision that proved beneficial, as lower-rated securities outperformed the broader municipal bond market during the period.
Credit quality overview
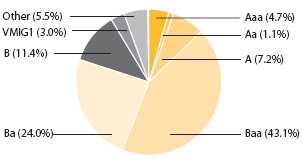
Credit qualities are shown as a percentage of net assets as of 1/31/10. A bond rated Baa or higher (MIG3/VMIG3 or higher, for short-term debt) is considered investment grade. The chart reflects Moody’s ratings; percentages may include bonds not rated by Moody’s but considered by Putnam Management to be of comparable quality. Ratings will vary over time.
8
“We found the best investment
opportunities continued to be
in the BBB-rated segment of the
bond market.”
Paul Drury
What were some specific holdings that helped fund returns?
Three separate tobacco settlement bonds —two from Ohio and one from Iowa — were among the strongest performers during the period. To give some background, state tobacco bonds are funded with revenue stemming from legal agreements that exempt tobacco companies from being targets of health-related lawsuits in exchange for annual payments, in perpetuity, to the states to cover tobacco-related health-care costs. These bonds often have higher yields than other issues of comparable quality and, in general, tobacco bonds are some of the largest and most liquid BBB-rated municipal bonds in the market. When investors sought out high-quality securities earlier in 2009, tobacco bonds were some of the easiest positions to exit, and sold off dramatically. We took the opportunity to add to our positions and, as the market recovered, the fund’s tobacco settlement bonds rallied sharply.
Another strong performer was the fund’s position in Allegheny County (Pennsylvania) Hospital Development Authority revenue bonds. Health-care securities, such as hospital bonds, are typically lower rated, as they are dependent upon generating income to make their interest payments. For this reason, careful analysis of the financial condition of the issuer is crucial in identifying investment opportunities. Our analysis pointed us toward a number of issues that performed well for the fund over the period, including the Allegheny County bonds.
Comparison of top sector weightings
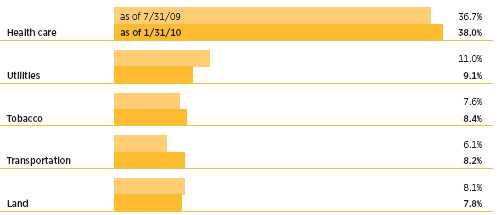
This chart shows how the fund’s top weightings have changed over the past six months. Weightings are shown as a percentage of net assets. Holdings will vary over time. Sector concentrations listed after the portfolio schedule in the Financial Statements section of this shareholder report are exclusive of insured or prerefunded status and may differ from the summary information above.
9
IN THE NEWS
Prices rose again in January, with the Consumer Price Index (CPI) climbing 0.2% for the month, but is deflation on its way? The surprise came in the “core” numbers that exclude more volatile food and energy prices. In January, the core numbers dropped for the first time in more than 25 years, due to falling home prices and high unemployment. This monthly dip is too isolated an incident to be deemed deflation, which can damage an economy as prices spiral downward, eroding companies’ profitability and their ability to retain workers. Economists agree that mild, stable inflation is generally the healthiest state for consumer prices.
Which holdings produced disappointing results?
Two waste management bonds, both issued by the Coconino County (Arizona) Pollution Authority, were among the top detractors from returns. As is sometimes the case, our purchase of these holdings was poorly timed. We bought these bonds shortly before the market sold off in September 2009, and although we found them fundamentally sound, we decided to sell our positions at a loss and invest the capital in more attractive opportunities that were created by the market dip.
What is your outlook for the municipal bond market and the fund?
We believe markets are likely to remain challenging in the short term. Traditionally, March and April are seasonally weak for tax-exempt bonds, because investors tend to use tax-exempt income to pay their taxes instead of reinvesting. When you add in the state revenue challenges, the uncertain future of bond insurers, and the potential for regulatory changes in health care, choppy times seem fairly certain.
However, we see some real positives for municipals over the longer term — the Bush administration’s tax cuts are likely to expire on January 1, 2011, supply of higher-grade issuance should remain light due to BABs, and we see continued demand in the marketplace. Despite the headlines that state budget woes will occasionally grab, the financial health of the asset class remains sound, and we believe municipal bonds remain an attractive option for tax-conscious investors.
Thanks, Paul, for speaking with us today.
The views expressed in this report are exclusively those of Putnam Management. They are not meant as investment advice.
Please note that the holdings discussed in this report may not have been held by the fund for the entire period. Portfolio composition is subject to review in accordance with the fund’s investment strategy and may vary in the future. Current and future portfolio holdings are subject to risk.

Portfolio Manager Paul Drury is a Tax Exempt Specialist at Putnam. He has a B.A. from Suffolk University. A CFA charterholder, Paul has been in the investment industry since he joined Putnam in 1989.
In addition to Paul, your fund’s portfolio managers are Susan McCormack and Thalia Meehan.
10
Your fund’s performance
This section shows your fund’s performance, price, and distribution information for periods ended January 31, 2010, the end of the first half of its current fiscal year. In accordance with regulatory requirements for mutual funds, we also include performance as of the most recent calendar quarter-end and expense information taken from the fund’s current prospectus. Performance should always be considered in light of a fund’s investment strategy. Data represents past performance. Past performance does not guarantee future results. More recent returns may be less or more than those shown. Investment return and principal value will fluctuate, and you may have a gain or a loss when you sell your shares. Performance information does not reflect any deduction for taxes a shareholder may owe on fund distributions or on the redemption of fund shares. For the most recent month-end performance, please visit the Individual Investors section at putn am.com or call Putnam at 1-800-225-1581. Class Y shares are generally only available to corporate and institutional clients and clients in other approved programs. See the Terms and Definitions section in this report for definitions of the share classes offered by your fund.
Fund performance Total return for periods ended 1/31/10
| | | | | | | | | |
| | Class A | Class B | Class C | Class M | Class Y |
| (inception dates) | (9/20/93) | (9/9/85) | (2/1/99) | (12/29/94) | (1/2/08) |
|
| | NAV | POP | NAV | CDSC | NAV | CDSC | NAV | POP | NAV |
|
| Annual average | | | | | | | | | |
| (life of fund) | 6.09% | 5.91% | 5.67% | 5.67% | 5.25% | 5.25% | 5.86% | 5.71% | 5.75% |
|
| 10 years | 49.67 | 43.67 | 41.03 | 41.03 | 38.46 | 38.46 | 45.29 | 40.63 | 43.81 |
| Annual average | 4.12 | 3.69 | 3.50 | 3.50 | 3.31 | 3.31 | 3.81 | 3.47 | 3.70 |
|
| 5 years | 14.86 | 10.30 | 11.27 | 9.50 | 10.58 | 10.58 | 13.23 | 9.61 | 13.49 |
| Annual average | 2.81 | 1.98 | 2.16 | 1.83 | 2.03 | 2.03 | 2.52 | 1.85 | 2.56 |
|
| 3 years | 3.33 | –0.74 | 1.45 | –1.17 | 1.15 | 1.15 | 2.48 | –0.92 | 3.44 |
| Annual average | 1.10 | –0.25 | 0.48 | –0.39 | 0.38 | 0.38 | 0.82 | –0.31 | 1.13 |
|
| 1 year | 28.49 | 23.40 | 27.64 | 22.64 | 27.61 | 26.61 | 28.13 | 23.97 | 28.90 |
|
| 6 months | 13.13 | 8.65 | 12.87 | 7.87 | 12.79 | 11.79 | 12.99 | 9.30 | 13.35 |
|
Current performance may be lower or higher than the quoted past performance, which cannot guarantee future results. After-sales-charge returns (public offering price, or POP) for class A and M shares reflect a maximum 4.00% and 3.25% load, respectively. Class B share returns reflect the applicable contingent deferred sales charge (CDSC), which is 5% in the first year, declining to 1% in the sixth year, and is eliminated thereafter. Class C shares reflect a 1% CDSC for the first year that is eliminated thereafter. Class Y shares have no initial sales charge or CDSC. Performance for class A, C, M, and Y shares before their inception is derived from the historical performance of class B shares, adjusted for the applicable sales charge (or CDSC) and, for class C shares, the higher operating expenses for such shares.
For a portion of the periods, this fund may have limited expenses, without which returns would have been lower.
A 1% short-term trading fee may be applied to shares exchanged or sold within 7 days of purchase.
11
Comparative index returns For periods ended 1/31/10
| | |
| | Barclays Capital Municipal | Lipper High Yield Municipal Debt Funds |
| | Bond Index | category average* |
|
| Annual average (life of fund) | 7.16% | 6.16% |
|
| 10 years | 76.58 | 49.08 |
| Annual average | 5.85 | 4.05 |
|
| 5 years | 23.02 | 8.14 |
| Annual average | 4.23 | 1.50 |
|
| 3 years | 14.71 | –3.96 |
| Annual average | 4.68 | –1.45 |
|
| 1 year | 9.49 | 25.07 |
|
| 6 months | 4.90 | 12.53 |
|
Index and Lipper results should be compared to fund performance at net asset value.
* Over the 6-month, 1-year, 3-year, 5-year, 10-year, and life-of-fund periods ended 1/31/10, there were 118, 112, 95, 79, 57, and 5 funds, respectively, in this Lipper category.
Fund price and distribution information For the six-month period ended 1/31/10
| | | | | | | |
| Distributions | Class A | Class B | Class C | Class M | Class Y |
|
| Number | 6 | 6 | 6 | 6 | 6 |
|
| Income 1 | $0.315883 | $0.281019 | $0.272593 | $0.300556 | $0.329315 |
|
| Capital gains 2 | — | — | — | | — | — |
|
| Total | $0.315883 | $0.281019 | $0.272593 | $0.300556 | $0.329315 |
|
| Share value | NAV | POP | NAV | NAV | NAV | POP | NAV |
|
| 7/31/09 | $10.39 | $10.82 | $10.40 | $10.40 | $10.39 | $10.74 | $10.40 |
|
| 1/31/10 | 11.43 | 11.91 | 11.45 | 11.45 | 11.43 | 11.81 | 11.45 |
|
| Current yield (end of period) | NAV | POP | NAV | NAV | NAV | POP | NAV |
|
| Current dividend rate 3 | 5.51% | 5.28% | 4.88% | 4.73% | 5.24% | 5.07% | 5.74% |
|
| Taxable equivalent 4 | 8.48 | 8.12 | 7.51 | 7.28 | 8.06 | 7.80 | 8.83 |
|
| Current 30-day SEC yield 5 | N/A | 5.28 | 4.88 | 4.72 | N/A | 5.06 | 5.76 |
|
| Taxable equivalent 4 | N/A | 8.12 | 7.51 | 7.26 | N/A | 7.78 | 8.86 |
|
The classification of distributions, if any, is an estimate. Final distribution information will appear on your year-end tax forms.
1 For some investors, investment income may be subject to the federal alternative minimum tax.
2 Capital gains, if any, are taxable for federal and, in most cases, state purposes.
3 Most recent distribution, excluding capital gains, are annualized and divided by NAV or POP at end of period.
4 Assumes maximum 35.00% federal tax rate for 2010. Results for investors subject to lower tax rates would not be as advantageous.
5 Based only on investment income and calculated using the maximum offering price for each share class, in accordance with SEC guidelines.
12
Fund performance as of most recent calendar quarter
Total return for periods ended 12/31/09
| | | | | | | | | |
| | Class A | Class B | Class C | Class M | Class Y |
| (inception dates) | (9/20/93) | (9/9/85) | (2/1/99) | (12/29/94) | (1/2/08) |
|
| | NAV | POP | NAV | CDSC | NAV | CDSC | NAV | POP | NAV |
|
| Annual average | | | | | | | | | |
| (life of fund) | 6.05% | 5.88% | 5.63% | 5.63% | 5.21% | 5.21% | 5.82% | 5.68% | 5.71% |
|
| 10 years | 46.45 | 40.56 | 38.01 | 38.01 | 35.52 | 35.52 | 42.28 | 37.64 | 40.54 |
| Annual average | 3.89 | 3.46 | 3.27 | 3.27 | 3.09 | 3.09 | 3.59 | 3.25 | 3.46 |
|
| 5 years | 14.69 | 10.14 | 11.15 | 9.38 | 10.31 | 10.31 | 13.02 | 9.40 | 13.26 |
| Annual average | 2.78 | 1.95 | 2.14 | 1.81 | 1.98 | 1.98 | 2.48 | 1.81 | 2.52 |
|
| 3 years | 1.97 | –2.11 | 0.12 | –2.47 | –0.26 | –0.26 | 1.12 | –2.21 | 2.01 |
| Annual average | 0.65 | –0.71 | 0.04 | –0.83 | –0.09 | –0.09 | 0.37 | –0.74 | 0.67 |
|
| 1 year | 35.10 | 29.76 | 34.17 | 29.17 | 34.03 | 33.03 | 34.73 | 30.34 | 35.47 |
|
| 6 months | 13.74 | 9.16 | 13.37 | 8.37 | 13.28 | 12.28 | 13.59 | 9.93 | 13.94 |
|
Your fund’s expenses
As a mutual fund investor, you pay ongoing expenses, such as management fees, distribution fees (12b-1 fees), and other expenses. In the most recent six-month period, your fund limited these expenses; had it not done so, expenses would have been higher. Using the following information, you can estimate how these expenses affect your investment and compare them with the expenses of other funds. You may also pay one-time transaction expenses, including sales charges (loads) and redemption fees, which are not shown in this section and would have resulted in higher total expenses. For more information, see your fund’s prospectus or talk to your financial representative.
Expense ratios
| | | | | |
| | Class A | Class B | Class C | Class M | Class Y |
|
| Total annual operating expenses for the fiscal year | | | | | |
| ended 7/31/09* | 0.82% | 1.45% | 1.60% | 1.10% | 0.60% |
|
| Annualized expense ratio for the six-month period | | | | | |
| ended 1/31/10 | 0.84% | 1.46% | 1.61% | 1.11% | 0.61% |
|
Fiscal-year expense information in this table is taken from the most recent prospectus, is subject to change, and may differ from that shown for the annualized expense ratio and in the financial highlights of this report. Expenses are shown as a percentage of average net assets.
* Reflect projected expenses based on a new expense arrangement and the fund’s recent (8/31/09) asset level.
13
Expenses per $1,000
The following table shows the expenses you would have paid on a $1,000 investment in Putnam Tax-Free High Yield Fund from August 1, 2009, to January 31, 2010. It also shows how much a $1,000 investment would be worth at the close of the period, assuming actual returns and expenses.
| | | | | |
| | Class A | Class B | Class C | Class M | Class Y |
|
| Expenses paid per $1,000 *† | $4.51 | $7.83 | $8.64 | $5.96 | $3.28 |
|
| Ending value (after expenses) | $1,131.30 | $1,128.70 | $1,127.90 | $1,129.90 | $1,133.50 |
|
* Expenses for each share class are calculated using the fund’s annualized expense ratio for each class, which represents the ongoing expenses as a percentage of average net assets for the six months ended 1/31/10. The expense ratio may differ for each share class.
† Expenses are calculated by multiplying the expense ratio by the average account value for the period; then multiplying the result by the number of days in the period; and then dividing that result by the number of days in the year.
Estimate the expenses you paid
To estimate the ongoing expenses you paid for the six months ended January 31, 2010, use the following calculation method. To find the value of your investment on August 1, 2009, call Putnam at 1-800-225-1581.
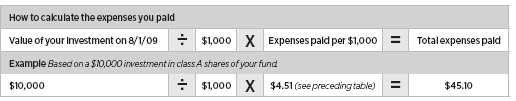
Compare expenses using the SEC’s method
The Securities and Exchange Commission (SEC) has established guidelines to help investors assess fund expenses. Per these guidelines, the following table shows your fund’s expenses based on a $1,000 investment, assuming a hypothetical 5% annualized return. You can use this information to compare the ongoing expenses (but not transaction expenses or total costs) of investing in the fund with those of other funds. All mutual fund shareholder reports will provide this information to help you make this comparison. Please note that you cannot use this information to estimate your actual ending account balance and expenses paid during the period.
| | | | | |
| | Class A | Class B | Class C | Class M | Class Y |
|
| Expenses paid per $1,000 *† | $4.28 | $7.43 | $8.19 | $5.65 | $3.11 |
|
| Ending value (after expenses) | $1,020.97 | $1,017.85 | $1,017.09 | $1,019.61 | $1,022.13 |
|
* Expenses for each share class are calculated using the fund’s annualized expense ratio for each class, which represents the ongoing expenses as a percentage of average net assets for the six months ended 1/31/10. The expense ratio may differ for each share class.
† Expenses are calculated by multiplying the expense ratio by the average account value for the period; then multiplying the result by the number of days in the period; and then dividing that result by the number of days in the year.
14
Terms and definitions
Important terms
Total return shows how the value of the fund’s shares changed over time, assuming you held the shares through the entire period and reinvested all distributions in the fund.
Net asset value (NAV) is the price, or value, of one share of a mutual fund, without a sales charge. NAVs fluctuate with market conditions. NAV is calculated by dividing the net assets of each class of shares by the number of outstanding shares in the class.
Public offering price (POP) is the price of a mutual fund share plus the maximum sales charge levied at the time of purchase. POP performance figures shown here assume the 4.00% maximum sales charge for class A shares and 3.25% for class M shares.
Contingent deferred sales charge (CDSC) is generally a charge applied at the time of the redemption of class B or C shares and assumes redemption at the end of the period. Your fund’s class B CDSC declines from a 5% maximum during the first year to 1% during the sixth year. After the sixth year, the CDSC no longer applies. The CDSC for class C shares is 1% for one year after purchase.
Current yield is the annual rate of return earned from dividends or interest of an investment. Current yield is expressed as a percentage of the price of a security, fund share, or principal investment.
Share classes
Class A shares are generally subject to an initial sales charge and no CDSC (except on certain redemptions of shares bought without an initial sales charge).
Class B shares are not subject to an initial sales charge. They may be subject to a CDSC.
Class C shares are not subject to an initial sales charge and are subject to a CDSC only if the shares are redeemed during the first year.
Class M shares have a lower initial sales charge and a higher 12b-1 fee than class A shares and no CDSC.
Class Y shares are not subject to an initial sales charge or CDSC, and carry no 12b-1 fee. They are generally only available to corporate and institutional clients and clients in other approved programs.
Comparative indexes
Barclays Capital Aggregate Bond Index is an unmanaged index of U.S. investment-grade fixed-income securities.
Barclays Capital Municipal Bond Index is an unmanaged index of long-term fixed-rate investment-grade tax-exempt bonds.
BofA Merrill Lynch U.S. 3-month Treasury Bill Index is an unmanaged index that seeks to measure the performance of U.S. Treasury bills available in the marketplace.
S&P 500 Index is an unmanaged index of common stock performance.
Indexes assume reinvestment of all distributions and do not account for fees. Securities and performance of a fund and an index will differ. You cannot invest directly in an index.
Lipper is a third-party industry-ranking entity that ranks mutual funds. Its rankings do not reflect sales charges. Lipper rankings are based on total return at net asset value relative to other funds that have similar current investment styles or objectives as determined by Lipper. Lipper may change a fund’s category assignment at its discretion. Lipper category averages reflect performance trends for funds within a category.
15
Trustee approval of management contract
General conclusions
The Board of Trustees of the Putnam funds oversees the management of each fund and, as required by law, determines annually whether to approve the continuance of your fund’s management contract with Putnam Investment Management (“Putnam Management”).
In this regard, the Board of Trustees, with the assistance of its Contract Committee consisting solely of Trustees who are not “interested persons” (as such term is defined in the Investment Company Act of 1940, as amended) of the Putnam funds (the “Independent Trustees”), requests and evaluates all information it deems reasonably necessary under the circumstances. Over the course of several months ending in June 2009, the Contract Committee met several times to consider the information provided by Putnam Management and other information developed with the assistance of the Board’s independent counsel and independent staff. The Contract Committee reviewed and discussed key aspects of this information with all of the Independent Trustees. At the Trustees’ June 12, 2009 meeting, the Contract Committee recommended, and the Independent Trustees approved, the continuance of your fund’s management contract, effective July 1, 2009.
The Independent Trustees’ approval was based on the following conclusions:
• That the fee schedule in effect for your fund represented reasonable compensation in light of the nature and quality of the services being provided to the fund, the fees paid by competitive funds and the costs incurred by Putnam Management in providing such services, and
• That such fee schedule represented an appropriate sharing between fund shareholders and Putnam Management of such economies of scale as may exist in the management of the fund at current asset levels.
These conclusions were based on a comprehensive consideration of all information provided to the Trustees, were subject to the continued application of certain expense reductions and waivers pending other considerations noted below, and were not the result of any single factor. Some of the factors that figured particularly in the Trustees’ deliberations and how the Trustees considered these factors are described below, although individual Trustees may have evaluated the information presented differently, giving different weights to various factors. It is also important to recognize that the fee arrangements for your fund and the other Putnam funds are the result of many years of review and discussion between the Independent Trustees and Putnam Management, that certain aspects of the arrangements may receive greater scrutiny in some years than others, and that the Trustees’ conclusions may be based, in part, on their consideration of these sam e arrangements in prior years.
Consideration of strategic
pricing proposal
The Trustees considered that the Contract Committee had been engaged in a detailed review of Putnam Management’s strategic pricing proposal that was first presented to the Committee at its May 2009 meeting. The proposal included proposed changes to the basic structure of the management fees in place for all open-end funds (except the Putnam RetirementReady® Funds and Putnam Money Market Liquidity Fund), including implementation of a breakpoint structure based on the aggregate net assets of all such funds in lieu of the individual breakpoint structures in place for each fund, as well as implementation of performance fees for certain funds. In addition, the proposal
16
recommended substituting separate expense limitations on investor servicing fees and on other expenses as a group in lieu of the total expense limitations in place for many funds.
While the Contract Committee noted the likelihood that the Trustees and Putnam Management would reach agreement on the strategic pricing matters in later months, the terms of the management contracts required that the Trustees approve the continuance of the contracts in order to prevent their expiration at June 30, 2009. The Contract Committee’s recommendations in June reflect its conclusion that the terms of the contractual arrangements for your fund continued to be appropriate for the upcoming term, absent any possible agreement with respect to the matters addressed in Putnam Management’s proposal.
The Trustees were mindful of the significant changes that had occurred at Putnam Management in the past two years, including a change of ownership, the installation of a new senior management team at Putnam Management, the substantial decline in assets under management resulting from extraordinary market forces as well as continued net redemptions in many funds, the introduction of new fund products representing novel investment strategies and the introduction of performance fees for certain new funds. The Trustees were also mindful that many other leading firms in the industry had also been experiencing significant challenges due to the changing financial and competitive environment. For these reasons, even though the Trustees believed that the current contractual arrangements in place between the funds and Putnam Management and its affiliates have served shareholders well and continued to be appropriate for the near term, the Trustees believed that i t was an appropriate time to reconsider the current structure of the funds’ contractual arrangements with Putnam Management with a view to possible changes that might better serve the interests of shareholders in this new environment. The Trustees concluded their review of Putnam Management’s strategic pricing proposal in July 2009, and their considerations regarding the proposal are discussed below under the heading “Subsequent approval of strategic pricing proposal.” With the exception of the discussion under this heading, the following discussion generally addresses only the Trustees’ reasons for recommending the continuance of the current contractual arrangements as, at the time the Trustees determined to make this recommendation, the Trustees had not yet reached any conclusions with respect to the strategic pricing proposal.
Management fee schedules and
categories; total expenses
The Trustees reviewed the management fee schedules in effect for all Putnam funds, including fee levels and breakpoints, and the assignment of funds to particular fee categories. The general fee structure has been carefully developed over the years and re-examined on many occasions and adjusted where appropriate. In this regard, the Trustees noted that shareholders of all funds voted by overwhelming majorities in 2007 to approve new management contracts containing identical fee schedules.
In reviewing fees and expenses, the Trustees generally focused their attention on material changes in circumstances — for example, changes in a fund’s size or investment style, changes in Putnam Management’s operating costs, or changes in competitive practices in the mutual fund industry — that suggest that consideration of fee changes might be warranted. The Trustees concluded that the circumstances did not warrant changes to the management fee structure of your fund at that time but, as indicated above, based on their detailed review of the current fee structure, were prepared to consider possible changes to this arrangement that might better serve the interests of shareholders in the future. The
17
Trustees focused on two areas of particular interest, as discussed further below:
• Competitiveness. The Trustees reviewed comparative fee and expense information for competitive funds, which indicated that, in a custom peer group of competitive funds selected by Lipper Inc., your fund ranked in the 38th percentile in management fees and in the 24th percentile in total expenses (less any applicable 12b-1 fees) as of December 31, 2008 (the first percentile being the least expensive funds and the 100th percentile being the most expensive funds).
The Trustees noted that expense ratios for a number of Putnam funds, which show the percentage of fund assets used to pay for management and administrative services, distribution (12b-1) fees and other expenses, had been increasing recently as a result of declining net assets and the natural operation of fee breakpoints. The Trustees expressed their intention to monitor the funds’ percentile rankings in management fees and in total expenses to ensure that fees and expenses of the funds continue to meet evolving competitive standards.
The Trustees noted that the expense ratio increases described above were being controlled by expense limitations initially implemented in January 2004. These expense limitations give effect to a commitment by Putnam Management that the expense ratio of each open-end fund would be no higher than the average expense ratio of the competitive funds included in the fund’s relevant Lipper universe (exclusive of any applicable 12b-1 charges in each case). The Trustees observed that this commitment to limit fund expenses has served shareholders well since its inception and, while the Contract Committee was reviewing proposed alternative expense limitation arrangements as noted above, the Trustees received a commitment from Putnam Management and its parent company to continue this program through at least June 30, 2010, or such earlier time as the Trustees and Putnam Management reach agreement on alternative arrangements .
In order to ensure that the expenses of the Putnam funds continue to meet evolving competitive standards, the Trustees requested, and Putnam Management agreed, to extend for the twelve months beginning July 1, 2009, or until such earlier time as the Trustees and Putnam Management reach agreement on alternative expense limitation arrangements, an additional expense limitation for certain funds at an amount equal to the average expense ratio (exclusive of 12b-1 charges) of a custom peer group of competitive funds selected by Lipper to correspond to the size of the fund. This additional expense limitation will be applied to those open-end funds that had above-average expense ratios (exclusive of 12b-1 charges) based on the custom peer group data for the period ended December 31, 2007. This additional expense limitation was not applied to your fund because it had a below-average expense ratio relative to its custom peer group.
• Economies of scale. Your fund currently has the benefit of breakpoints in its management fee that provide shareholders with significant economies of scale, which means that the effective management fee rate of the fund (as a percentage of fund assets) declines as the fund grows in size and crosses specified asset thresholds. Conversely, as the fund shrinks in size — as has been the case for many Putnam funds in recent years — these breakpoints result in increasing fee levels. In recent years, the Trustees have examined the operation of the existing breakpoint structure during periods of both growth and decline in asset levels. The Trustees concluded that the fee schedule in effect for your fund represented an appropriate sharing of economies of scale at that time but, as noted above, were in the process
18
of reviewing a proposal to eliminate individual fund breakpoints for all of the open-end funds (except for the Putnam RetirementReady® Funds and Putnam Money Market Liquidity Fund) in favor of a breakpoint structure based on the aggregate net assets of all such funds.
In connection with their review of the management fees and total expenses of the Putnam funds, the Trustees also reviewed the costs of the services provided and profits realized by Putnam Management and its affiliates from their contractual relationships with the funds. This information included trends in revenues, expenses and profitability of Putnam Management and its affiliates relating to the investment management and distribution services provided to the funds. In this regard, the Trustees also reviewed an analysis of Putnam Management’s revenues, expenses and profitability with respect to the funds’ management contracts, allocated on a fund-by-fund basis.
Investment performance
The quality of the investment process provided by Putnam Management represented a major factor in the Trustees’ evaluation of the quality of services provided by Putnam Management under your fund’s management contract. The Trustees were assisted in their review of the Putnam funds’ investment process and performance by the work of the Investment Oversight Coordinating Committee of the Trustees and the Investment Oversight Committees of the Trustees, which had met on a regular monthly basis with the funds’ portfolio teams throughout the year. The Trustees concluded that Putnam Management generally provides a high-quality investment process — as measured by the experience and skills of the individuals assigned to the management of fund portfolios, the resources made available to such personnel, and in general the ability of Putnam Management to attract and retain high-quality personnel — but also recognized that this does no t guarantee favorable investment results for every fund in every time period. The Trustees considered the investment performance of each fund over multiple time periods and considered information comparing each fund’s performance with various benchmarks and with the performance of competitive funds.
The Trustees noted the disappointing investment performance of many of the funds for periods ended March 31, 2009. They discussed with senior management of Putnam Management the factors contributing to such underperformance and the actions being taken to improve performance. The Trustees recognized that, in recent years, Putnam Management has taken steps to strengthen its investment personnel and processes to address areas of underperformance, including Putnam Management’s continuing efforts to strengthen the equity research function, recent changes in portfolio managers including increased accountability of individual managers rather than teams, recent changes in Putnam Management’s approach to incentive compensation, including emphasis on top quartile performance over a rolling three-year period, and the recent arrival of a new chief investment officer. The Trustees also recognized the substantial improvement in performance of many funds si nce the implementation of those changes. The Trustees indicated their intention to continue to monitor performance trends to assess the effectiveness of these efforts and to evaluate whether additional changes to address areas of underperformance are warranted.
In the case of your fund, the Trustees considered that your fund’s class A share cumulative total return performance at net asset value was in the following percentiles of its Lipper Inc. peer group (Lipper High Yield Municipal Debt Funds) (compared using tax-adjusted performance to recognize the different federal income tax treatment for capital gains distributions and exempt-interest distributions) for the one-year, three-year and five-year periods ended March 31, 2009 (the first percentile
19
being the best-performing funds and the 100th percentile being the worst-performing funds):
| | | |
| One-year period | 46th | | |
| | |
| Three-year period | 40th | | |
| | |
| Five-year period | 33rd | | |
| | |
Over the one-year, three-year and five-year periods ended March 31, 2009, there were 108, 84 and 77 funds, respectively, in your fund’s Lipper peer group. Past performance is no guarantee of future results.
As a general matter, the Trustees believe that cooperative efforts between the Trustees and Putnam Management represent the most effective way to address investment performance problems. The Trustees noted that investors in the Putnam funds have, in effect, placed their trust in the Putnam organization, under the oversight of the funds’ Trustees, to make appropriate decisions regarding the management of the funds. Based on the responsiveness of Putnam Management in the recent past to Trustee concerns about investment performance, the Trustees concluded that it is preferable to seek change within Putnam Management to address performance shortcomings. In the Trustees’ view, the alternative of engaging a new investment adviser for an underperforming fund would entail significant disruptions and would not provide any greater assurance of improved investment performance.
Brokerage and soft-dollar allocations;
other benefits
The Trustees considered various potential benefits that Putnam Management may receive in connection with the services it provides under the management contract with your fund. These include benefits related to brokerage and soft-dollar allocations, whereby a portion of the commissions paid by a fund for brokerage may be used to acquire research services that may be useful to Putnam Management in managing the assets of the fund and of other clients. The Trustees considered a change made, at Putnam Management’s request, to the Putnam funds’ brokerage allocation policy commencing in 2009, which increased the permitted soft dollar allocation to third-party services over what had been authorized in previous years. The Trustees noted that a portion of available soft dollars continue to be allocated to the payment of fund expenses, although the amount allocated for this purpose has declined in recent years. The Tr ustees indicated their continued intent to monitor regulatory developments in this area with the assistance of their Brokerage Committee and also indicated their continued intent to monitor the potential benefits associated with the allocation of fund brokerage and trends in industry practice to ensure that the principle of seeking best price and execution remains paramount in the portfolio trading process.
The Trustees’ annual review of your fund’s management contract also included the review of the investor servicing agreement with Putnam Investor Services, Inc. (“PSERV”), which agreement provides benefits to an affiliate of Putnam Management. The Trustees considered that effective January 1, 2009, the Trustees, PSERV and Putnam Fiduciary Trust Company (“PFTC”) entered into a new fee schedule that includes for the open-end funds (other than funds of Putnam Variable Trust and Putnam Money Market Liquidity Fund) an expense limitation but, as noted above, also considered that this expense limitation is subject to review as part of the Trustees’ pending review of Putnam’s strategic pricing proposal.
In the case of your fund, the Trustees’ annual review of the fund’s management contract also included the review of the fund’s distributor’s contract and distribution plans with Putnam Retail Management Limited Partnership, which contract and plans also provide benefits to an affiliate of Putnam Management.
20
Comparison of retail and institutional
fee schedules
The information examined by the Trustees as part of their annual contract review has included for many years information regarding fees charged by Putnam Management and its affiliates to institutional clients such as defined benefit pension plans, college endowments, etc. This information included comparisons of such fees with fees charged to the funds, as well as a detailed assessment of the differences in the services provided to these two types of clients. The Trustees observed, in this regard, that the differences in fee rates between institutional clients and mutual funds are by no means uniform when examined by individual asset sectors, suggesting that differences in the pricing of investment management services to these types of clients reflect to a substantial degree historical competitive forces operating in separate market places. The Trustees considered the fact that fee rates across different asset classes are typically higher on average fo r mutual funds than for institutional clients, as well as the differences between the services that Putnam Management provides to the Putnam funds and those that it provides to institutional clients of the firm, but did not rely on such comparisons to any significant extent in concluding that the management fees paid by your fund are reasonable.
Subsequent approval of strategic
pricing proposal
As mentioned above, at a series of meetings beginning in May 2009 and ending on July 10, 2009, the Contract Committee and the Trustees engaged in a detailed review of Putnam Management’s strategic pricing proposal. Following this review, the Trustees of each fund, including all of the Independent Trustees, voted unanimously on July 10, 2009 to approve proposed management contracts reflecting the proposal, as modified based on discussions between the Independent Trustees and Putnam Management, for each fund. In considering the proposed contracts, the Independent Trustees focused largely on the specific proposed changes described below relating to management fees. They also took into account the factors that they considered in connection with their most recent annual approval on June 12, 2009 of the continuance of the funds’ current management contracts and the extensive materials that they had reviewed in co nnection with that approval process, as described above.
At a meeting held on November 19, 2009, shareholders approved the proposed management contract for your fund. The new management contract was implemented on January 1, 2010.
• Considerations relating to Fund Family fee rate calculations. The Independent Trustees considered that the proposed management contracts would change the manner in which fund shareholders share in potential economies of scale associated with the management of the funds. Under the current management contracts, shareholders of a fund (other than Putnam Money Market Liquidity Fund and the Putnam RetirementReady® Funds, which do not pay management fees to Putnam Management) benefit from increased fund size through reductions in the effective management fee paid to Putnam Management once the fund’s net assets exceed the first breakpoint in the fund’s fee schedule ($500 million for most funds). Conversely, in the case of funds with net assets above the level of the first breakpoint, the effective management fee increases as the fund’s average net assets decline below a breakpoint. These breakpoints are measured solely by the net assets of each individual fund and are not affected by possible growth (or decline) of net assets of other funds in the Fund Family. (“Fund Family” for purposes of this discussion refers to all open-end mutual funds sponsored by Putnam Management, except for the Putnam RetirementReady® Funds and
21
Putnam Money Market Liquidity Fund.) Under the proposed management contracts, potential economies of scale would be shared ratably among shareholders of all funds, regardless of their size. The management fees paid by a fund (and indirectly by shareholders) would no longer be affected by the growth (or decline) of assets of the particular fund, but rather would be affected solely by the growth (or decline) of the aggregate net assets of all funds in the Fund Family, regardless of whether the net assets of the particular fund are growing or declining.
The table below shows the proposed effective management fee rate for your fund, based on June 30, 2009 net assets of the Fund Family ($52.3 billion). This table also shows the effective management fee rate payable by your fund under its current management contract, based on the net assets of the fund as of June 30, 2009. Finally, this table shows the difference in the effective management fees, based on net assets as of June 30, 2009, between the proposed management contract and the current contract.
| | | |
| | Proposed Effective | Current Effective | |
| Name of Fund | Contractual Rate | Contractual Rate | Difference |
|
| |
| Putnam Tax-Free High Yield Fund | 0.492% | 0.500% | (0.008%) |
As shown in the foregoing table, based on June 30, 2009 net asset levels, the proposed management contract would provide for payment of a management fee rate that is lower for your fund than the management fee rate payable under the current management contract. For a small number of funds (although not your fund), the management fee rate would be slightly higher under the proposed contract at these asset levels, but by only immaterial amounts. In the aggregate, the financial impact on Putnam Management of implementing this proposed change for all funds at June 30, 2009 net asset levels is a reduction in annual management fee revenue of approximately $24.0 million. (Putnam Management has already incurred a significant portion of this revenue reduction through the waiver of a portion of its current management fees for certain funds pending shareholder consideration of the proposed management contracts. Putnam is not obliged to continue such wa ivers beyond July 31, 2010 in the event that the proposed contracts are not approved by shareholders.) The Independent Trustees carefully considered the implications of this proposed change under a variety of economic circumstances. They considered the fact that at current asset levels the management fees paid by the funds under the proposed contract would be lower for almost all funds, and would not be materially higher for any fund. They considered the possibility that under some circumstances, the current management contract could result in a lower fee for a particular fund than the proposed management contract. Such circumstances might occur, for example, if the aggregate net assets of the Fund Family remain largely unchanged and the net assets of an individual fund grew substantially, or if the net assets of an individual fund remain largely unchanged and the aggregate net assets of the Fund Family declined substantially.
The Independent Trustees noted that future changes in the net assets of individual funds are inherently unpredictable and that experience has shown that funds often grow in size and decline in size over time depending on market conditions and the changing popularity of particular investment styles and asset classes. They noted that, while the aggregate net assets of the Fund Family have changed substantially over time, basing a management fee on the aggregate level of assets of the Fund Family would likely reduce fluctuations in costs paid by individual funds and lead to greater stability and predictability of fund operating costs over time.
22
The Independent Trustees considered that the proposed management contract would likely be advantageous for newly organized funds that have yet to attract significant assets and for funds in specialty asset classes that are unlikely to grow to a significant size. In each case, such funds would participate in the benefits of scale made possible by the aggregate size of the Fund Family to an extent that would not be possible based solely on their individual size.
The Independent Trustees also considered that for funds that have achieved or are likely to achieve considerable scale on their own, the proposed management contract could result in sharing of economies which might lead to slightly higher costs under some circumstances, but they noted that any such increases are immaterial at current asset levels and that over time such funds are likely to realize offsetting benefits from their opportunity to participate, both through the exchange privilege and through the Fund Family breakpoint fee structure, in the improved growth prospects of a diversified Fund Family able to offer competitively priced products.
The Independent Trustees noted that the implementation of the proposed management contracts would result in a reduction in aggregate fee revenues for Putnam Management at current asset levels. They also noted that applying various projections of growth equally to the aggregate net assets of the Fund Family and to the net assets of individual funds also showed revenue reductions for Putnam Management. They recognized, however, the possibility that under some scenarios Putnam Management might realize greater future revenues, with respect to certain funds, under the proposed contracts than under the current contracts, but considered such circumstances to be both less likely and inherently unpredictable.
The Independent Trustees considered the extent to which Putnam Management may realize economies of scale in connection with the management of the funds. In this regard, they considered the possibility that such economies of scale as may exist in the management of mutual funds may be associated more closely with the size of the aggregate assets of the mutual fund complex than with the size of any individual fund. In this regard the Independent Trustees considered the financial information provided to them by Putnam Management over a period of many years regarding the allocation of costs involved in calculating the profitability of its mutual fund business as a whole and the profitability of individual funds. The Independent Trustees noted that the methodologies for such cost allocations had been reviewed on a number of occasions in the past by independent financial consultants engaged by the Independent Trustees. The Independent Trustees noted that these methodologies support Putnam Management’s assertion that many of its operating costs and any associated economies of scale are related more to the aggregate net assets under management in various sectors of its business than to the size of individual funds. They noted that on a number of occasions in the past the Independent Trustees had separately considered the possibility of calculating management fees in whole or in part based on aggregate net assets of the Putnam funds.
The Independent Trustees considered the fact that the proposed contracts would result in a sharing among the affected funds of economies of scale that for the most part are now enjoyed by the larger funds, without materially increasing the current costs of any of the larger funds. They concluded that this sharing of economies among funds was appropriate in light of the diverse investment opportunities available to shareholders of all funds through the existence of the exchange privilege. They also considered that the proposed change in management fee structure would allow Putnam Management to introduce new investment products at more
23
attractive pricing levels than may be currently be the case.
After considering all of the foregoing, the Independent Trustees concluded that the proposed calculation of management fees based on the aggregate net assets of the Fund Family represented a fair and reasonable means of sharing possible economies of scale among the shareholders of all funds.
• Considerations relating to addition of fee rate adjustments based on investment performance for certain funds. The Independent Trustees considered that Putnam’s proposal to add fee rate adjustments based on investment performance to the management contracts of certain funds reflected a desire by Putnam Management to align its fee revenues more closely with investment performance in the case of certain funds. They noted that Putnam Management already has a significant financial interest in achieving good performance results for the funds it manages. Putnam Management’s fees are based on the assets under its management (whether calculated on an individual fund or complex-wide basis). Good performance results in higher asset levels and therefore higher revenues to Putnam Management. Moreover, good performance also tends to at tract additional investors to particular funds or the complex generally, also resulting in higher revenues. Nevertheless, the Independent Trustees concluded that adjusting management fees based on performance for certain selected funds could provide additional benefits to shareholders.
The Independent Trustees noted that Putnam Management proposed the addition of performance adjustments only for certain of the funds and considered whether similar adjustments might be appropriate for other funds. In this regard, they considered Putnam Management’s belief that the addition of performance adjustments would be most appropriate for shareholders of U.S. growth funds, international equity funds and Putnam Global Equity Fund. They also considered Putnam Management’s view that it would continue to monitor whether performance fees would be appropriate for other funds. Accordingly, the Independent Trustees concluded that it would be desirable to gain further experience with the operation of performance adjustments for certain funds and the market’s receptivity to such fee structures before giving further consideration to whether similar performance adjustments would be appropriate for other fun ds as well.
• Considerations relating to standardization of payment terms. The proposed management contracts for all funds provide that management fees will be computed and paid monthly within 15 days after the end of each month. The current contracts of the funds contain quarterly computation and payment terms in some cases. These differences largely reflect practices in place at earlier times when many of the funds were first organized. Under the proposed contract, certain funds would make payments to Putnam Management earlier than they do under their current contract. This would reduce a fund’s opportunity to earn income on accrued but unpaid management fees by a small amount, but would not have a material effect on a fund’s operating costs.
The Independent Trustees considered the fact that standardizing the payment terms for all funds would involve an acceleration in the timing of payments to Putnam Management for some funds and a corresponding loss of a potential opportunity for such funds to earn income on accrued but unpaid management fees. The Independent Trustees did not view this change as having a material impact on shareholders of any fund. In this regard, the Independent Trustees noted that the proposed contracts conform to the payment terms included in management contracts for all Putnam funds organized in recent years and
24
that standardizing payment terms across all funds would reduce administrative burdens for both the funds and Putnam Management.
• Considerations relating to comparisons with management fees and total expenses of competitive funds. As part of their evaluation of the proposed management contracts, the Independent Trustees also reviewed the general approach taken by Putnam Management and the Independent Trustees in recent years in imposing appropriate limits on total fund expenses. As part of the annual contract review process in recent years, Putnam Management agreed to waive fees as needed to limit total fund expenses to a maximum level equal to the average total expenses of comparable competitive funds in the mutual fund industry. In connection with its proposal to implement new management contracts, Putnam Management also proposed, and the Independent Trustees approved, certain changes in this approach that shift the focus from controlling total expenses to imposing separate limits on certain c ategories of expenses, as required. As a general matter, Putnam Management and the Independent Trustees concluded that management fees for the Putnam funds are competitive with the fees charged by comparable funds in the industry. Nevertheless, the Independent Trustees considered specific management fee waivers proposed to be implemented as of August 1, 2009 by Putnam Management with respect to the current management fees of certain funds, as well as projected reductions in management fees for almost all funds that would result under the proposed contracts. Putnam Management and the Independent Trustees also agreed to impose separate expense limitations of 37.5 basis points on the general category of shareholder servicing expenses and 20 basis points on the general category of other ordinary operating expenses.
These new expense limitations, as well as the fee waivers, were implemented for all funds effective as of August 1, 2009, replacing the expense limitation referred to above.
These changes resulted in lower total expenses for many funds, but in the case of some funds total expenses increased after application of the new waivers and expense limitations (as compared with the results obtained using the expense limitation method previously in place). In this regard, the Independent Trustees considered the likelihood that total expenses for most of these funds would have increased in any event in the normal course under the previous expense limitation arrangement, as the reported total expense levels of many competitive funds increased in response to the major decline in asset values that began in September 2008. These new waivers and expense limitations will continue in effect until at least July 31, 2010 and will be re-evaluated by the Independent Trustees as part of the annual contract review process prior to their scheduled expiration. However, the management fee waivers referred to above would largely become permanent reduc tions in fees as a result of the implementation of the proposed management contracts.
Under these new expense limitation arrangements effective August 1, 2009, the fixed income funds, including your fund, and asset allocation funds are subject to management fee waivers that reduce these funds’ management fees pending implementation of the proposed management contracts. In addition, your fund is subject to expense limitations of 37.5 basis points on the category of shareholder servicing fees and 20 basis points on the general category of other ordinary operating expenses.
25
Other information for shareholders
Important notice regarding delivery
of shareholder documents
In accordance with SEC regulations, Putnam sends a single copy of annual and semiannual shareholder reports, prospectuses, and proxy statements to Putnam shareholders who share the same address, unless a shareholder requests otherwise. If you prefer to receive your own copy of these documents, please call Putnam at 1-800-225-1581, and Putnam will begin sending individual copies within 30 days.
Proxy voting
Putnam is committed to managing our mutual funds in the best interests of our shareholders. The Putnam funds’ proxy voting guidelines and procedures, as well as information regarding how your fund voted proxies relating to portfolio securities during the 12-month period ended June 30, 2009, are available in the Individual Investors section of putnam.com, and on the SEC’s Web site, www.sec.gov. If you have questions about finding forms on the SEC’s Web site, you may call the SEC at 1-800-SEC-0330. You may also obtain the Putnam funds’ proxy voting guidelines and procedures at no charge by calling Putnam’s Shareholder Services at 1-800-225-1581.
Fund portfolio holdings
The fund will file a complete schedule of its portfolio holdings with the SEC for the first and third quarters of each fiscal year on Form N-Q. Shareholders may obtain the fund’s Forms N-Q on the SEC’s Web site at www.sec.gov. In addition, the fund’s Forms N-Q may be reviewed and copied at the SEC’s Public Reference Room in Washington, D.C. You may call the SEC at 1-800-SEC-0330 for information about the SEC’s Web site or the operation of the Public Reference Room.
Trustee and employee
fund ownership
Putnam employees and members of the Board of Trustees place their faith, confidence, and, most importantly, investment dollars in Putnam mutual funds. As of January 31, 2010, Putnam employees had approximately $294,000,000 and the Trustees had approximately $45,000,000 invested in Putnam mutual funds. These amounts include investments by the Trustees’ and employees’ immediate family members as well as investments through retirement and deferred compensation plans.
26
Financial statements
A guide to financial statements
These sections of the report, as well as the accompanying Notes, constitute the fund’s financial statements.
The fund’s portfolio lists all the fund’s investments and their values as of the last day of the reporting period. Holdings are organized by asset type and industry sector, country, or state to show areas of concentration and diversification.
Statement of assets and liabilities shows how the fund’s net assets and share price are determined. All investment and noninvestment assets are added together. Any unpaid expenses and other liabilities are subtracted from this total. The result is divided by the number of shares to determine the net asset value per share, which is calculated separately for each class of shares. (For funds with preferred shares, the amount subtracted from total assets includes the liquidation preference of preferred shares.)
Statement of operations shows the fund’s net investment gain or loss. This is done by first adding up all the fund’s earnings — from dividends and interest income — and subtracting its operating expenses to determine net investment income (or loss). Then, any net gain or loss the fund realized on the sales of its holdings — as well as any unrealized gains or losses over the period — is added to or subtracted from the net investment result to determine the fund’s net gain or loss for the fiscal period.
Statement of changes in net assets shows how the fund’s net assets were affected by the fund’s net investment gain or loss, by distributions to shareholders, and by changes in the number of the fund’s shares. It lists distributions and their sources (net investment income or realized capital gains) over the current reporting period and the most recent fiscal year-end. The distributions listed here may not match the sources listed in the Statement of operations because the distributions are determined on a tax basis and may be paid in a different period from the one in which they were earned. Dividend sources are estimated at the time of declaration. Actual results may vary. Any non-taxable return of capital cannot be determined until final tax calculations are completed after the end of the fund’s fiscal year.
Financial highlights provide an overview of the fund’s investment results, per-share distributions, expense ratios, net investment income ratios, and portfolio turnover in one summary table, reflecting the five most recent reporting periods. In a semiannual report, the highlights table also includes the current reporting period.
27
The fund’s portfolio 1/31/10 (Unaudited)
| |
| Key to holding’s abbreviations | |
| ABAG Association Of Bay Area Governments | FRN Floating Rate Notes |
| AGO Assured Guaranty, Ltd. | G.O. Bonds General Obligation Bonds |
| AMBAC AMBAC Indemnity Corporation | GNMA Coll. Government National Mortgage |
| COP Certificates of Participation | Association Collateralized |
| FNMA Coll. Federal National Mortgage | NATL National Public Finance Guarantee Corp. |
| Association Collateralized | Radian Insd. Radian Group Insured |
| FRB Floating Rate Bonds | VRDN Variable Rate Demand Notes |
| | | |
| MUNICIPAL BONDS AND NOTES (97.6%)* | Rating** | Principal amount | Value |
|
| Alabama (1.4%) | | | |
| Cullman Cnty., Hlth. Care Auth. Rev. Bonds | | | |
| (Cullman Regl. Med. Ctr.), Ser. A, 7s, 2/1/36 | Baa3 | $6,000,000 | $6,107,940 |
|
| Mobile, Special Care Fac. Fin. Auth. VRDN | | | |
| (Infirmary Hlth. Syst.), Ser. A, 0.17s, 2/1/40 | VMIG1 | 2,400,000 | 2,400,000 |
|
| Selma, Indl. Dev. Board Rev. Bonds (Gulf Opportunity | | | |
| Zone Intl. Paper Co.), Ser. A, 6 1/4s, 11/1/33 | BBB | 3,000,000 | 3,030,150 |
|
| Sylacauga, Hlth. Care Auth. Rev. Bonds (Coosa | | | |
| Valley Med. Ctr.), Ser. A | | | |
| 6s, 8/1/35 | B/P | 750,000 | 605,018 |
| 6s, 8/1/25 | B/P | 1,700,000 | 1,450,644 |
|
| | | | 13,593,752 |
| Arizona (3.5%) | | | |
| Calhoun Cnty., Sales & Use Tax Rev. Bonds | | | |
| (Georgia-Pacific Corp.), 6 3/8s, 11/1/26 | B2 | 2,000,000 | 1,964,460 |
|
| Casa Grande, Indl. Dev. Auth. Rev. Bonds (Casa | | | |
| Grande Regl. Med. Ctr.), Ser. A | | | |
| 7 5/8s, 12/1/29 | B+/P | 7,300,000 | 7,049,902 |
| 7 1/4s, 12/1/19 | B+/P | 500,000 | 492,360 |
|
| Cochise Cnty., Indl. Dev. Auth. Rev. Bonds | | | |
| (Sierra Vista Regl. Hlth. Ctr.), 7 3/4s, 12/1/30 | BBB–/P | 3,015,000 | 3,145,459 |
| (Sierra Vista Cmnty. Hosp.), 6.45s, 12/1/17 | BBB–/P | 1,900,000 | 1,965,189 |
| (Sierra Vista Regl. Hlth. Ctr.), Ser. A, 6.2s, | | | |
| 12/1/21 | BBB–/P | 885,000 | 903,505 |
|
| Coconino Cnty., Poll. Control Rev. Bonds (Tucson | | | |
| Elec. Pwr. Co. — Navajo), Ser. A, 5 1/8s, 10/1/32 | Baa3 | 4,000,000 | 3,791,840 |
|
| Glendale, Indl. Dev. Auth. Rev. Bonds (John C. | | | |
| Lincoln Hlth.), 5s, 12/1/42 | BBB | 1,000,000 | 859,720 |
|
| Maricopa Cnty., Poll. Control Rev. Bonds (El Paso | | | |
| Elec. Co.), Ser. A, 7 1/4s, 2/1/40 | Baa2 | 4,800,000 | 5,426,112 |
|
| Navajo Cnty., Indl. Dev. Rev. Bonds (Stone | | | |
| Container Corp.), 7.2s, 6/1/27 (In default) † | D/P | 2,180,000 | 1,744,000 |
|
| Phoenix, Indl. Dev. Auth. Ed. Rev. Bonds (Career | | | |
| Success Schools), 7 1/8s, 1/1/45 | BBB– | 500,000 | 492,675 |
|
| Pima Cnty., Indl. Dev. Auth. Rev. Bonds | | | |
| (Tucson Elec. Pwr.), Ser. A, 6 3/8s, 9/1/29 | Baa3 | 2,500,000 | 2,547,575 |
| (Tucson Elec. Pwr. Co.), 5 3/4s, 9/1/29 | Baa3 | 1,000,000 | 1,008,930 |
| (Horizon Cmnty. Learning Ctr.), 5.05s, 6/1/25 | BBB | 2,450,000 | 1,953,924 |
|
| Salt Verde, Fin. Corp. Gas Rev. Bonds, 5s, 12/1/37 | A | 1,430,000 | 1,219,704 |
|
| | | | 34,565,355 |
28
| | | |
| MUNICIPAL BONDS AND NOTES (97.6%)* cont. | Rating** | Principal amount | Value |
|
| Arkansas (0.3%) | | | |
| Arkadelphia, Pub. Ed. Fac. Board Rev. Bonds | | | |
| (Ouachita Baptist U.), 6s, 3/1/33 | BBB–/P | $2,000,000 | $2,073,640 |
|
| Little River Cnty., Rev. Bonds | | | |
| (Georgia-Pacific Corp.), 5.6s, 10/1/26 | B2 | 1,290,000 | 1,160,665 |
|
| | | | 3,234,305 |
| California (9.4%) | | | |
| ABAG Fin. Auth. COP (American Baptist Homes), | | | |
| Ser. A, 5.85s, 10/1/27 | BBB– | 3,000,000 | 2,799,600 |
|
| CA Rev. Bonds (Catholic Hlth. Care West), Ser. A, | | | |
| 6s, 7/1/39 | A2 | 5,000,000 | 5,290,650 |
|
| CA Edl. Fac. Auth. Rev. Bonds (Claremont Graduate | | | |
| U.), Ser. A, 5s, 3/1/42 | A3 | 1,580,000 | 1,442,050 |
|
| CA Infrastructure & Econ. Dev. Bank Rev. Bonds | | | |
| Ser. A, ACA, zero %, 12/1/24 | B/P | 2,000,000 | 218,720 |
| (Cap. Appn.), Ser. A, ACA, zero %, 12/1/23 | B/P | 2,000,000 | 232,180 |
|
| CA Muni. Fin. Auth. COP (Cmnty. Hosp. Central CA) | | | |
| 5 1/4s, 2/1/46 | Baa2 | 7,000,000 | 5,780,180 |
| 5 1/4s, 2/1/37 | Baa2 | 3,205,000 | 2,726,974 |
|
| CA Poll. Control Fin. Auth. Solid Waste Disp. | | | |
| Rev. Bonds (Waste Management, Inc.), Ser. A-2, | | | |
| 5.4s, 4/1/25 | BBB | 5,500,000 | 5,483,775 |
|
| CA State Pub. Wks. Board Rev. Bonds, Ser. I-1, | | | |
| 6 5/8s, 11/1/34 | BBB+ | 3,750,000 | 3,895,350 |
|
| CA Statewide Cmnty. Dev. Auth. 144A Rev. Bonds | | | |
| (Front Porch Cmntys. & Svcs.), Ser. A, 5 1/8s, 4/1/37 | BBB | 3,300,000 | 2,706,462 |
|
| CA Statewide Cmnty. Dev. Auth. Special Tax Rev. | | | |
| Bonds (Citrus Garden Apt. Project — D1), | | | |
| 5 1/4s, 7/1/22 | A | 1,000,000 | 994,640 |
|
| CA Statewide Cmnty. Dev. Auth. Rev. Bonds | | | |
| (Thomas Jefferson School of Law), Ser. A, | | | |
| 7 1/4s, 10/1/38 | BB+ | 2,025,000 | 2,058,514 |
| (Irvine LLC-UCI East Campus), 6s, 5/15/40 | Baa2 | 2,000,000 | 1,988,720 |
| (Sr. Living-Presbyterian Homes), Ser. A, | | | |
| 4 7/8s, 11/15/36 | BBB | 1,000,000 | 840,410 |
|
| Cathedral City, Impt. Board Act of 1915 Special | | | |
| Assmt. Bonds (Cove Impt. Dist.), Ser. 04-02 | | | |
| 5.05s, 9/2/35 | BBB–/P | 1,790,000 | 1,449,363 |
| 5s, 9/2/30 | BBB–/P | 1,695,000 | 1,463,751 |
|
| Chula Vista, Cmnty. Fac. Dist. Special Tax Rev. Bonds | | | |
| (No. 07-1 Otay Ranch Village Eleven), 5.8s, 9/1/28 | BB+/P | 1,890,000 | 1,684,878 |
| (No. 07-I Otay Ranch Village Eleven), 5.1s, 9/1/26 | BB+/P | 355,000 | 299,577 |
|
| Foothill/Eastern Corridor Agcy. Rev. Bonds | | | |
| (Toll Road), 5.85s, 1/15/23 | Baa3 | 1,500,000 | 1,517,940 |
| (CA Toll Roads), 5 3/4s, 1/15/40 | Baa3 | 3,200,000 | 3,021,504 |
| zero %, 1/15/38 | Baa3 | 9,000,000 | 1,203,390 |
| zero %, 1/15/37 | Baa3 | 5,000,000 | 720,300 |
| zero %, 1/15/30 | Baa3 | 6,000,000 | 1,547,280 |
|
| Golden State Tobacco Securitization Corp. | | | |
| Rev. Bonds | | | |
| Ser. A-1, 5s, 6/1/33 | BBB | 2,200,000 | 1,720,576 |
| Ser. A, AMBAC, zero %, 6/1/24 | Aa3 | 23,000,000 | 9,166,650 |
|
29
| | | |
| MUNICIPAL BONDS AND NOTES (97.6%)* cont. | Rating** | Principal amount | Value |
|
| California cont. | | | |
| Irvine, Impt. Board Act of 1915 Special Assmt. | | | |
| (Dist. No. 03-19) | | | |
| 5s, 9/2/29 | BB–/P | $1,775,000 | $1,436,845 |
| 5s, 9/2/25 | BB–/P | 1,350,000 | 1,153,386 |
|
| Irvine, Impt. Board Act of 1915 Ltd. Oblig. Special | | | |
| Assmt. Bonds (No. 03-19 Group 4), 5s, 9/2/29 | BB–/P | 705,000 | 604,086 |
|
| M-S-R Energy Auth. Rev. Bonds, Ser. A, | | | |
| 6 1/2s, 11/1/39 | A | 1,250,000 | 1,318,088 |
|
| North Natomas, Cmnty. Fac. Special Tax Bonds | | | |
| (Dist. No. 4), Ser. D, 5s, 9/1/33 | BBB–/P | 345,000 | 277,687 |
| Ser. D, 5s, 9/1/26 | BBB–/P | 1,090,000 | 959,244 |
|
| Oakley, Pub. Fin. Auth. Rev. Bonds, 5 7/8s, 9/2/24 | BB–/P | 1,345,000 | 1,245,013 |
|
| Orange Cnty., Cmnty. Fac. Dist. Special Tax Rev. | | | |
| Bonds (Ladera Ranch No. 02-1), Ser. A, | | | |
| 5.55s, 8/15/33 | BBB/P | 2,875,000 | 2,532,300 |
|
| Sacramento, Special Tax Rev. Bonds (North Natomas | | | |
| Cmnty. Fac.) | | | |
| Ser. 01-03, 6s, 9/1/28 | BBB/P | 700,000 | 686,000 |
| Ser. 97-01, 5.1s, 9/1/35 | BB+/P | 2,895,000 | 2,361,886 |
| Ser. 97-01, 5s, 9/1/29 | BB+/P | 1,355,000 | 1,169,270 |
|
| San Francisco, City & Cnty. Redev. Agcy. Cmnty. | | | |
| Fac. Dist. Special Tax (No. 6 Mission Bay | | | |
| South), Ser. A, 5.15s, 8/1/35 | BB–/P | 1,000,000 | 805,560 |
|
| San Francisco, City & Cnty. Redev. Fin. Auth. Tax | | | |
| Alloc. Bonds (Mission Bay South Redev.), Ser. D, | | | |
| 6 1/2s, 8/1/31 | BBB | 500,000 | 521,940 |
|
| San Joaquin Hills, Trans. Corridor Agcy. Toll Rd. | | | |
| Rev. Bonds, Ser. A, 5 1/2s, 1/15/28 | Ba2 | 1,500,000 | 1,305,120 |
|
| Santaluz, Cmnty. Facs. Dist. No. 2 Special Tax | | | |
| Rev. Bonds (Impt. Area No. 1), Ser. B, 6 3/8s, 9/1/30 | BBB/P | 6,365,000 | 6,364,491 |
|
| Selma, Unified School Dist. G.O. Bonds (Election | | | |
| of 2006), Ser. C, AGO, zero %, 8/1/37 | AAA | 2,400,000 | 357,192 |
|
| Southern CA Pub. Pwr. Auth. Rev. Bonds | | | |
| (Natural Gas), Ser. A, 5 1/4s, 11/1/21 | A | 1,500,000 | 1,534,230 |
|
| Sunnyvale, Special Tax Rev. Bonds (Cmnty. Fac. | | | |
| Dist. No. 1), 7 3/4s, 8/1/32 | B+/P | 3,780,000 | 3,736,417 |
|
| Thousand Oaks, Cmnty. Fac. Dist. Special Tax Rev. | | | |
| Bonds (Marketplace 94-1), zero %, 9/1/14 | B+/P | 4,820,000 | 3,370,481 |
|
| | | | 91,992,670 |
| Colorado (1.8%) | | | |
| CO Edl. & Cultural Fac. Auth. VRDN (National | | | |
| Jewish Federation Bond), Ser. C-2, 0.25s, 3/1/36 | VMIG1 | 600,000 | 600,000 |
|
| CO Hlth. Fac. Auth. Rev. Bonds | | | |
| (Christian Living Cmntys.), Ser. A, 9s, 1/1/34 | BB–/P | 750,000 | 805,410 |
| (Evangelical Lutheran), Ser. A, 6 1/8s, 6/1/38 | A3 | 4,810,000 | 4,813,992 |
| (Evangelical Lutheran), 5.9s, 10/1/27 | A3 | 5,000,000 | 4,999,550 |
| (Christian Living Cmntys.), Ser. A, 5 3/4s, 1/1/26 | BB–/P | 1,550,000 | 1,393,140 |
| (Valley View Assn.), 5 1/4s, 5/15/42 | BBB | 1,250,000 | 1,095,988 |
| (Valley View Assn.), 5 1/8s, 5/15/37 | BBB | 1,000,000 | 873,480 |
|
| CO Springs, Hosp. Rev. Bonds, 6 3/8s, 12/15/30 | A3 | 755,000 | 770,613 |
|
30
| | | |
| MUNICIPAL BONDS AND NOTES (97.6%)* cont. | Rating** | Principal amount | Value |
|
| Colorado cont. | | | |
| Denver, City & Cnty. Special Fac. Arpt. Rev. | | | |
| Bonds (United Airlines), Ser. A, 5 1/4s, 10/1/32 | B– | $675,000 | $484,859 |
|
| E-470 Pub. Hwy. Auth. Rev. Bonds, Ser. A, NATL, | | | |
| zero %, 9/1/34 | A | 12,000,000 | 2,136,720 |
|
| | | | 17,973,752 |
| Connecticut (0.8%) | | | |
| CT State Dev. Auth. 1st. Mtg. Gross Rev. Hlth. | | | |
| Care Rev. Bonds (Elim Street Park | | | |
| Baptist, Inc.), 5.85s, 12/1/33 | BBB+ | 2,000,000 | 1,818,660 |
|
| CT State Dev. Auth. Poll. Control Rev. Bonds | | | |
| (Western MA Electric Co.), Ser. A, 5.85s, 9/1/28 | Baa2 | 3,250,000 | 3,263,033 |
|
| Hamden, Fac. Rev. Bonds (Whitney Ctr.), Ser. A, | | | |
| 7 3/4s, 1/1/43 | BB/P | 2,800,000 | 2,855,524 |
|
| | | | 7,937,217 |
| District of Columbia (1.0%) | | | |
| DC Tobacco Settlement Fin. Corp. Rev. Bonds, | | | |
| Ser. A, zero %, 6/15/46 | BBB–/F | 94,730,000 | 3,196,190 |
|
| Metro. Washington, Arpt. Auth. Dulles Toll Rd. | | | |
| Rev. Bonds (2nd Sr. Lien), Ser. B | | | |
| zero %, 10/1/40 | Baa1 | 995,000 | 113,748 |
| zero %, 10/1/39 | Baa1 | 10,000,000 | 1,234,000 |
| zero %, 10/1/38 | Baa1 | 20,000,000 | 2,692,800 |
| zero %, 10/1/37 | Baa1 | 15,200,000 | 2,194,728 |
|
| | | | 9,431,466 |
| Florida (4.8%) | | | |
| Aberdeen, Cmnty. Dev. Dist. Special Assmt. Bonds, | | | |
| Ser. 1, 3.518s, 11/1/15 (In default)† | D/P | 1,210,000 | 588,943 |
|
| Cap. Region Cmnty., Dev. Dist. Special Assmt. | | | |
| Bonds, Ser. A, 7s, 5/1/39 | BB–/P | 1,000,000 | 930,900 |
|
| Escambia Cnty., Env. Impt. Rev. Bonds (Intl. | | | |
| Paper Co.), Ser. A, 5s, 8/1/26 | BBB | 1,500,000 | 1,299,735 |
|
| Escambia Cnty., Hlth. Fac. Auth. Rev. Bonds | | | |
| (Baptist Hosp. & Baptist Manor), 5 1/8s, 10/1/19 | Baa1 | 925,000 | 920,412 |
|
| Fishhawk, Cmnty. Dev. Dist. II Rev. Bonds, | | | |
| Ser. B, 5 1/8s, 11/1/14 | B–/P | 795,000 | 749,447 |
|
| Heritage Harbour Marketplace Cmnty., Dev. Dist. | | | |
| Special Assmt., 5.6s, 5/1/36 | BB–/P | 2,435,000 | 1,801,583 |
|
| Jacksonville, Econ. Dev. Comm. Hlth. Care Fac. Rev. | | | |
| Bonds (Proton Therapy Inst.), Class A, 6s, 9/1/17 | B/P | 1,225,000 | 1,213,203 |
|
| Jacksonville, Econ. Dev. Comm. Indl. Dev. Rev. | | | |
| Bonds (Gerdau Ameristeel US, Inc.), 5.3s, 5/1/37 | Ba1 | 5,250,000 | 3,803,363 |
|
| Lakeland, Retirement Cmnty. Rev. Bonds (1st | | | |
| Mtge. — Carpenters), 6 3/8s, 1/1/43 | BBB–/F | 1,820,000 | 1,623,331 |
|
| Lee Cnty., Indl. Dev. Auth. Hlth. Care Fac. Rev. Bonds | | | |
| (Shell Pt./Alliance Oblig. Group), 5 1/8s, 11/15/36 | BB+ | 2,925,000 | 2,303,438 |
| (Shell Pt./Alliance), 5s, 11/15/32 | BB+ | 3,210,000 | 2,538,917 |
| (Shell Pt./Alliance Cmnty.), 5s, 11/15/22 | BB+ | 2,000,000 | 1,732,600 |
|
| Main St. Cmnty., Dev. Dist. Special Assmt. Bonds, | | | |
| Ser. A, 6.8s, 5/1/38 | BB–/P | 740,000 | 573,411 |
|
| Miami Beach, Hlth. Fac. Auth. Hosp. Rev. Bonds | | | |
| (Mount Sinai Med. Ctr.), Ser. A, 6.7s, 11/15/19 | Ba2 | 2,000,000 | 1,974,400 |
|
31
| | | |
| MUNICIPAL BONDS AND NOTES (97.6%)* cont. | Rating** | Principal amount | Value |
|
| Florida cont. | | | |
| Miami-Dade Cnty., Aviation Rev. Bonds (Miami | | | |
| Intl. Arpt.), Ser. A-1, 5 3/8s, 10/1/41 | A2 | $1,000,000 | $990,160 |
|
| Middle Village Cmnty. Dev. Dist. Special Assmt., | | | |
| Ser. A, 6s, 5/1/35 | BB/P | 2,000,000 | 1,669,920 |
|
| Myrtle Creek, Impt. Dist. Special Assmt. Bonds, | | | |
| Ser. A, 5.2s, 5/1/37 | BB–/P | 2,175,000 | 1,257,150 |
|
| Palm Coast Pk. Cmnty. Dev. Dist. Special Assmt. | | | |
| Bonds, 5.7s, 5/1/37 (In default) † | D/P | 2,630,000 | 1,531,081 |
|
| Reunion West, Cmnty. Dev. Dist. Special Assmt. | | | |
| Bonds, 6 1/4s, 5/1/36 (In default) † | D/P | 4,030,000 | 1,703,924 |
|
| Sarasota Cnty., Hlth. Fac. Auth. Retirement Fac. | | | |
| Rev. Bonds (Village On The Isle), 5 1/2s, 1/1/27 | BBB/F | 1,850,000 | 1,535,667 |
|
| Six Mile Creek, Cmnty. Dev. Dist. Special Assmt., | | | |
| 5 7/8s, 5/1/38 | CCC/P | 2,000,000 | 803,600 |
|
| South Bay, Cmnty. Dev. Dist. Rev. Bonds, | | | |
| Ser. B-1, 5 1/8s, 11/1/10 (In default) † | D/P | 2,035,000 | 614,305 |
|
| South Village, Cmnty. Dev. Dist. Rev. Bonds, | | | |
| Ser. A, 5.7s, 5/1/35 | BB–/P | 2,870,000 | 1,864,639 |
|
| Split Pine, Cmnty. Dev. Dist. Special Assmt. | | | |
| Bonds, Ser. A, 5 1/4s, 5/1/39 | BB–/P | 4,750,000 | 2,904,673 |
|
| Tampa Bay, Cmnty. Dev. Dist. Special Assmt. Bonds | | | |
| (New Port), Ser. A, 5 7/8s, | | | |
| 5/1/38 (In default) † | D/P | 1,880,000 | 602,991 |
|
| Tolomato, Cmnty. Dev. Dist. Special Assmt. Bonds | | | |
| 6.55s, 5/1/27 | BB–/P | 1,300,000 | 1,074,554 |
| 5.4s, 5/1/37 | BB–/P | 2,380,000 | 1,599,693 |
|
| Town Ctr. at Palm Coast, Cmnty. Dev. Dist. | | | |
| Special Assmt., 6s, 5/1/36 | BB–/P | 1,920,000 | 1,184,794 |
|
| Verandah, West Cmnty. Dev. Dist. Rev. Bonds (Cap. | | | |
| Impt.), Ser. A, 6 5/8s, 5/1/33 | BBB–/P | 900,000 | 814,734 |
|
| Verano Ctr. Cmnty. Dev. Dist. Special Assmt. | | | |
| Bonds (Cmnty. Infrastructure) | | | |
| Ser. A, 5 3/8s, 5/1/37 | BB–/P | 1,000,000 | 560,000 |
| Ser. B, 5s, 11/1/13 | BB–/P | 2,920,000 | 1,810,400 |
|
| Wentworth Estates, Cmnty. Dev. Dist. Special | | | |
| Assmt. Bonds, Ser. A, 5 5/8s, | | | |
| 5/1/37 (In default) † | D/P | 1,940,000 | 958,961 |
|
| World Commerce Cmnty. Dev. Dist. Special Assmt., | | | |
| Ser. A-1 | | | |
| 6 1/2s, 5/1/36 (In default) † | D/P | 1,950,000 | 742,970 |
| 6 1/4s, 5/1/22 (In default) † | D/P | 1,665,000 | 636,729 |
|
| | | | 46,914,628 |
| Georgia (2.8%) | | | |
| Atlanta, Wtr. & Waste Wtr. Rev. Bonds, Ser. A, | | | |
| 6 1/4s, 11/1/39 | A | 5,000,000 | 5,267,900 |
|
| Clayton Cnty., Dev. Auth. Special Fac. Rev. Bonds | | | |
| (Delta Airlines), Ser. B, 9s, 6/1/35 | Caa1 | 4,000,000 | 4,044,360 |
|
| Effingham Cnty., Indl. Dev. Auth. Rev. Bonds | | | |
| (Georgia-Pacific Corp.), 6 1/2s, 6/1/31 | B2 | 3,400,000 | 3,436,788 |
|
32
| | | |
| MUNICIPAL BONDS AND NOTES (97.6%)* cont. | Rating** | Principal amount | Value |
|
| Georgia cont. | | | |
| Fulton Cnty., Res. Care Fac. Rev. Bonds | | | |
| (Canterbury Court), Class A, 6 1/8s, 2/15/34 | BB–/P | $1,800,000 | $1,569,240 |
| (First Mtge. — Lenbrook), Ser. A, 5 1/8s, 7/1/42 | B/P | 1,000,000 | 655,830 |
| (First Mtge. — Lenbrook), Ser. A, 5s, 7/1/17 | B/P | 2,240,000 | 1,961,792 |
|
| Gainesville & Hall Cnty., Devauth Retirement | | | |
| Cmnty. Rev. Bonds (Acts Retirement-Life Cmnty.), | | | |
| Ser. A-2, 6 5/8s, 11/15/39 | BBB+ | 1,200,000 | 1,249,704 |
|
| Main St. Natural Gas, Inc. Rev. Bonds (GA Gas), | | | |
| Ser. A, 5 1/2s, 9/15/21 | A+ | 1,255,000 | 1,274,302 |
|
| Marietta, Dev. Auth. Rev. Bonds (U. Fac. — Life | | | |
| U., Inc.), 7s, 6/15/39 | Ba3 | 4,150,000 | 3,813,228 |
|
| Med. Ctr. Hosp. Auth. Rev. Bonds (Spring Harbor | | | |
| Green Island), 5 1/4s, 7/1/27 | B+/P | 3,050,000 | 2,555,168 |
|
| Rockdale Cnty., Dev. Auth. Rev. Bonds | | | |
| (Visy Paper), Ser. A, 6 1/8s, 1/1/34 | B+/P | 1,400,000 | 1,138,480 |
|
| | | | 26,966,792 |
| Guam (0.1%) | | | |
| Territory of Guam Rev. Bonds, Ser. A, 5 3/8s, 12/1/24 | BBB– | 1,000,000 | 1,028,760 |
|
| | | | 1,028,760 |
| Hawaii (0.5%) | | | |
| HI State Dept. Budget & Fin. Rev. Bonds | | | |
| (Craigside), Ser. A, 9s, 11/15/44 | B/P | 1,350,000 | 1,473,660 |
|
| (Hawaiian Elec. Co. — Subsidary), 6 1/2s, 7/1/39 | Baa1 | 3,500,000 | 3,762,220 |
|
| | | | 5,235,880 |
| Illinois (3.8%) | | | |
| Chicago, Special Assmt. Bonds (Lake Shore East), | | | |
| 6 3/4s, 12/1/32 | BB/P | 3,250,000 | 2,962,050 |
|
| Du Page Cnty., Special Svc. Area No. 31 Special | | | |
| Tax Bonds (Monarch Landing), 5 5/8s, 3/1/36 | CCC/P | 900,000 | 668,853 |
|
| IL Fin. Auth. Rev. Bonds | | | |
| (Provena Hlth.), Ser. A, 7 3/4s, 8/15/34 | Baa1 | 3,500,000 | 3,969,630 |
| (Rush U. Med. Ctr.), Ser. A, 7 1/4s, 11/1/38 | A3 | 2,150,000 | 2,373,622 |
| (Silver Cross Hosp. & Med. Ctr.), 7s, 8/15/44 | BBB | 5,250,000 | 5,444,355 |
| (Monarch Landing, Inc.), Ser. A, 7s, | | | |
| 12/1/27 (In default) † | D/P | 2,350,000 | 587,500 |
| (IL Rush U. Med Ctr.), Ser. C, 6 5/8s, 11/1/39 | A3 | 1,425,000 | 1,516,428 |
| (Roosevelt U.), 6 1/2s, 4/1/44 | Baa2 | 245,000 | 249,366 |
| (Roosevelt U.), 6 1/2s, 4/1/39 | Baa2 | 4,000,000 | 4,129,800 |
| (Landing At Plymouth Place), Ser. A, 6s, 5/15/25 | B+/P | 1,550,000 | 1,350,577 |
| (Elmhurst Memorial), Ser. A, 5 5/8s, 1/1/37 | Baa1 | 2,000,000 | 1,847,800 |
|
| IL Fin. Auth. Solid Waste Disposal (Waste | | | |
| Mgmt., Inc.), Ser. A, 5.05s, 8/1/29 | BBB | 5,045,000 | 4,959,033 |
|
| IL Hlth. Fac. Auth. Rev. Bonds | | | |
| (Cmnty. Rehab. Providers Fac.), 8 1/4s, 8/1/12 | CCC/P | 143,414 | 115,056 |
| (Cmnty. Rehab. Providers Fac.), Ser. A, | | | |
| 7 7/8s, 7/1/20 | CCC/P | 632,654 | 489,700 |
| (St. Benedict), Ser. 03A-1, 6.9s, | | | |
| 11/15/33 (In default) † | D/P | 1,000,000 | 300,000 |
| (Elmhurst Memorial Hlth. Care), 5 5/8s, 1/1/28 | Baa1 | 6,000,000 | 5,844,540 |
|
| | | | 36,808,310 |
33
| | | |
| MUNICIPAL BONDS AND NOTES (97.6%)* cont. | Rating** | Principal amount | Value |
|
| Indiana (0.3%) | | | |
| Anderson, Econ. Dev. Rev. Bonds (Anderson U.), | | | |
| 5s, 10/1/32 | BBB–/F | $2,450,000 | $2,132,039 |
|
| IN State Fin. Auth. Edl. Fac. VRDN, Ser. A-1, | | | |
| 0.20s, 2/1/37 | VMIG1 | 1,200,000 | 1,200,000 |
|
| | | | 3,332,039 |
| Iowa (3.2%) | | | |
| IA Fin. Auth. Hlth. Care Fac. Rev. Bonds | | | |
| (Care Initiatives), 9 1/4s, 7/1/25 (Prerefunded) | AAA | 13,155,000 | 14,920,927 |
| (Dev. Care Initiatives), Ser. A, 5 1/2s, 7/1/25 | BB+ | 3,185,000 | 2,566,155 |
| (Care Initiatives), Ser. A, 5s, 7/1/20 | BB+ | 1,700,000 | 1,405,118 |
| (Care Initiatives), Ser. A, 5 1/4s, 7/1/18 | BB+ | 2,500,000 | 2,193,350 |
|
| IA Fin. Auth. Retirement Cmnty. Rev. Bonds | | | |
| (Friendship Haven), Ser. A, 6s, 11/15/24 | BB/P | 300,000 | 282,327 |
|
| Marion Hlth. Care Fac. Rev. Bonds (First Mtge.), | | | |
| Ser. IA, 6 1/2s, 1/1/29 | CCC | 45,000 | 43,222 |
|
| Tobacco Settlement Auth. of IA Rev. Bonds | | | |
| Ser. B, 5.6s, 6/1/34 | BBB | 9,000,000 | 7,809,120 |
| Ser. C, 5 3/8s, 6/1/38 | BBB | 3,000,000 | 2,295,000 |
|
| | | | 31,515,219 |
| Kansas (0.9%) | | | |
| KS State Dev. Fin. Auth. VRDN (Sisters | | | |
| of Charity), Ser. C, 0.23s, 12/1/19 | VMIG1 | 1,920,000 | 1,920,000 |
|
| Lenexa, Hlth. Care Fac. Rev. Bonds | | | |
| (LakeView Village), 7 1/4s, 5/15/39 | BB+/P | 1,500,000 | 1,519,950 |
| 5 1/2s, 5/15/39 | BB+/P | 2,500,000 | 2,022,325 |
| 5 3/8s, 5/15/27 | BB+/P | 3,400,000 | 2,902,206 |
|
| | | | 8,364,481 |
| Kentucky (0.9%) | | | |
| KY Econ. Dev. Fin. Auth. Rev. Bonds (First | | | |
| Mtge.), Ser. IA, 8s, 1/1/29 | B+/P | 247,000 | 237,239 |
|
| KY Econ. Dev. Fin. Auth. Hlth. Syst. Rev. Bonds | | | |
| (Norton Hlth. Care), Ser. A, 6 5/8s, 10/1/28 | A–/F | 1,365,000 | 1,395,658 |
|
| Louisville & Jefferson Cnty., Metro. Govt. Hlth. Syst. | | | |
| Rev. Bonds (Norton Hlth. Care, Inc.), 5s, 10/1/30 | A– | 4,000,000 | 3,759,840 |
|
| Louisville/Jefferson Cnty., Metro. Govt. College | | | |
| Rev. Bonds (Bellarmine U.), Ser. A, 6s, 5/1/38 | Baa2 | 855,000 | 846,869 |
|
| Owen Cnty., Wtr. Wks. Syst. Rev. Bonds (American | | | |
| Wtr. Co.), Ser. A, 6 1/4s, 6/1/39 | BBB+ | 2,000,000 | 2,136,720 |
|
| | | | 8,376,326 |
| Louisiana (1.2%) | | | |
| LA Hlth. Ed. Auth. Rev. Bonds (Lambeth House), | | | |
| Ser. A, 6.2s, 1/1/28 | B+/P | 3,000,000 | 2,602,920 |
|
| Rapides, Fin. Auth. FRB (Cleco Pwr.), AMBAC, | | | |
| 4.7s, 11/1/36 | Baa2 | 2,250,000 | 1,929,150 |
|
| Tobacco Settlement Fin. Corp. Rev. Bonds, | | | |
| Ser. 01-B, 5 7/8s, 5/15/39 | BBB | 5,350,000 | 5,006,637 |
|
| W. Feliciana Parish, Poll. Control Rev. Bonds | | | |
| (Entergy Gulf States), Ser. B, 6.6s, 9/1/28 | BBB | 2,170,000 | 2,169,848 |
|
| | | | 11,708,555 |
| Maine (0.4%) | | | |
| Rumford, Solid Waste Disp. Rev. Bonds (Boise | | | |
| Cascade Corp.), 6 7/8s, 10/1/26 | B2 | 5,000,000 | 3,744,000 |
|
| | | | 3,744,000 |
34
| | | |
| MUNICIPAL BONDS AND NOTES (97.6%)* cont. | Rating** | Principal amount | Value |
|
| Maryland (1.3%) | | | |
| MD Econ. Dev. Corp. Poll. Control Rev. Bonds | | | |
| (Potomac Electric Power Co.), 6.2s, 9/1/22 | A3 | $1,700,000 | $1,947,452 |
|
| MD State Hlth. & Higher Edl. Fac. Auth. Rev. | | | |
| Bonds (WA Cnty. Hosp.), 6s, 1/1/43 | BBB– | 4,760,000 | 4,752,908 |
|
| MD State Indl. Dev. Fin. Auth. Econ. Dev. Rev. | | | |
| Bonds (Our Lady of Good Counsel School), Ser. A, | | | |
| 6s, 5/1/35 | BB–/P | 600,000 | 549,792 |
|
| Westminster, Econ. Dev. Rev. Bonds (Carroll | | | |
| Lutheran Village), Ser. A | | | |
| 6 1/4s, 5/1/34 | BB/P | 4,800,000 | 4,021,824 |
| 6s, 5/1/24 | BB/P | 2,000,000 | 1,743,020 |
|
| | | | 13,014,996 |
| Massachusetts (6.4%) | | | |
| MA Dev. Fin. Agcy. Sr. Living Fac. Rev. Bonds | | | |
| (Groves-Lincoln), Ser. A, 7 3/4s, 6/1/39 | BB–/P | 2,000,000 | 1,981,380 |
|
| MA State Dev. Fin. Agcy. Rev. Bonds | | | |
| (Sabis Intl.), Ser. A, 8s, 4/15/39 | BBB | 1,840,000 | 1,963,685 |
| (Lasell College), 6 3/4s, 7/1/31 | BB+/P | 210,000 | 209,139 |
| (Linden Ponds, Inc. Fac.), Ser. A, 5 3/4s, 11/15/42 | BB/P | 3,690,000 | 2,637,723 |
| (Linden Ponds, Inc.), Ser. A, 5 3/4s, 11/15/35 | BB/P | 1,645,000 | 1,212,398 |
| (Eastern Nazarene College), 5 5/8s, 4/1/29 | BB+ | 2,000,000 | 1,557,600 |
| (Linden Ponds, Inc.), Ser. A, 5 1/2s, 11/15/27 | BB/P | 1,000,000 | 760,940 |
| (Wheelock College), Ser. C, 5 1/4s, 10/1/37 | BBB | 2,000,000 | 1,803,520 |
| (Wheelock College), Ser. C, 5 1/4s, 10/1/29 | BBB | 1,300,000 | 1,210,911 |
|
| MA State Dev. Fin. Agcy. Hlth. Care Fac. Rev. | | | |
| Bonds (Adventcare), Ser. A, 6.65s, 10/15/28 | B/P | 2,150,000 | 1,879,917 |
|
| MA State Hlth. & Edl. Fac. Auth. Rev. Bonds | | | |
| (Civic Investments/HPHC), Ser. A, 9s, | | | |
| 12/15/15 (Prerefunded) | AAA/P | 6,615,000 | 7,820,121 |
| (Jordan Hosp.), Ser. E, 6 3/4s, 10/1/33 | BB– | 6,035,000 | 5,450,390 |
| (UMass Memorial), Ser. C, 6 5/8s, 7/1/32 | Baa1 | 9,750,000 | 9,864,758 |
| (Quincy Med. Ctr.), Ser. A, 6 1/2s, 1/15/38 | BB–/P | 5,000,000 | 4,423,500 |
| (Berkshire Hlth. Syst.), Ser. E, 6 1/4s, 10/1/31 | BBB+ | 4,400,000 | 4,455,396 |
| (Hlth. Care Syst.-Covenant Hlth.), 6s, 7/1/31 | A/F | 5,685,000 | 5,779,485 |
| (Springfield College), 5 5/8s, 10/15/40 | Baa1 | 2,000,000 | 1,978,180 |
| (Milton Hosp.), Ser. D, 5 3/8s, 7/1/35 | BB– | 3,950,000 | 2,610,832 |
| (Fisher College), Ser. A, 5 1/8s, 4/1/37 | BBB– | 1,400,000 | 1,098,202 |
| (Milford Regl. Med.), Ser. E, 5s, 7/15/32 | Baa3 | 1,000,000 | 826,130 |
| (Milford Regl. Med.), Ser. E, 5s, 7/15/27 | Baa3 | 2,750,000 | 2,385,185 |
|
| MA State Indl. Fin. Agcy. Rev. Bonds (1st Mtge. | | | |
| Stone Institute & Newton Home), 7.9s, 1/1/24 | BB–/P | 750,000 | 724,830 |
|
| | | | 62,634,222 |
| Michigan (2.5%) | | | |
| Advanced Tech. Academy Pub. School Rev. Bonds, | | | |
| 6s, 11/1/28 | BBB– | 1,750,000 | 1,487,798 |
|
| Ann Arbor, Econ. Dev. Corp. Ltd. Oblig. Rev. | | | |
| Bonds (Glacier Hills, Inc.), State & Local Govt. | | | |
| Coll., 8 3/8s, 1/15/19 (Prerefunded) | AAA | 1,961,000 | 2,464,310 |
|
| Detroit, G.O. Bonds (Cap. Impt.), Ser. A-1, | | | |
| 5s, 4/1/15 | BB | 2,880,000 | 2,762,179 |
|
| Dickinson Cnty., Econ. Dev. Corp. Rev. Bonds, | | | |
| 5 3/4s, 6/1/16 | BBB | 4,000,000 | 4,091,280 |
|
35
| | | |
| MUNICIPAL BONDS AND NOTES (97.6%)* cont. | Rating** | Principal amount | Value |
|
| Michigan cont. | | | |
| Flint, Hosp. Bldg. Auth. Rev. Bonds (Hurley Med. | | | |
| Ctr.), 6s, 7/1/20 | Ba1 | $2,210,000 | $2,104,738 |
|
| Garden City, Hosp. Fin. Auth. Rev. Bonds (Garden | | | |
| City Hosp.), Ser. A | | | |
| 5 3/4s, 9/1/17 | Ba1 | 1,595,000 | 1,472,998 |
| 5 5/8s, 9/1/10 | Ba1 | 170,000 | 170,427 |
|
| MI Higher Ed. Fac. Auth. VRDN (U. of Detroit), | | | |
| 0.23s, 11/1/36 | VMIG1 | 300,000 | 300,000 |
|
| MI State Hosp. Fin. Auth. Rev. Bonds (Henry Ford | | | |
| Hlth.), 5 3/4s, 11/15/39 | A1 | 4,400,000 | 4,289,428 |
|
| MI State Strategic Fund Solid Waste Disp. Rev. | | | |
| Bonds (SD Warren Co.), Ser. C, 7 3/8s, 1/15/22 | BB/P | 5,000,000 | 4,246,950 |
|
| MI Tobacco Settlement Fin. Auth. Rev. Bonds, | | | |
| Ser. A, 6s, 6/1/34 | BBB | 425,000 | 367,226 |
|
| | | | 23,757,334 |
| Minnesota (2.3%) | | | |
| Arden Hills, Hsg. & Hlth. Care Facs. VRDN | | | |
| (Presbyterian Homes), Ser. A, 0.2s, 9/1/29 | A–1+ | 3,113,000 | 3,113,000 |
|
| Douglas Cnty., Gross Hlth. Care Fac. Rev. Bonds | | | |
| (Douglas Cnty. Hosp.), Ser. A, 6 1/4s, 7/1/34 | BBB– | 2,400,000 | 2,478,984 |
|
| Inver Grove Heights, Nursing Home Rev. Bonds | | | |
| (Presbyterian Homes Care) | | | |
| 5 1/2s, 10/1/41 | B/P | 1,000,000 | 837,350 |
| 5 3/8s, 10/1/26 | B/P | 250,000 | 222,545 |
|
| MN State Higher Ed. Fac. Auth. VRDN (St. Olaf | | | |
| College), Ser. 5-M1, 0.2s, 10/1/32 | VMIG1 | 1,400,000 | 1,400,000 |
|
| North Oaks, Sr. Hsg. Rev. Bonds (Presbyterian Homes) | | | |
| 6 1/8s, 10/1/39 | BB/P | 1,375,000 | 1,321,375 |
| 6s, 10/1/27 | BB/P | 1,250,000 | 1,227,213 |
|
| Northfield, Hosp. Rev. Bonds, 5 3/8s, 11/1/31 | BBB– | 1,500,000 | 1,400,250 |
|
| Sauk Rapids Hlth. Care & Hsg. Fac. Rev. Bonds | | | |
| (Good Shepherd Lutheran Home), 6s, 1/1/34 | B+/P | 800,000 | 701,024 |
|
| St. Paul, Hsg. & Redev. Auth. Hlth. Care Fac. Rev. | | | |
| Bonds (HealthPartners Oblig. Group), 5 1/4s, 5/15/36 | Baa1 | 5,035,000 | 4,618,958 |
|
| St. Paul, Hsg. & Redev. Auth. Hosp. Rev. Bonds | | | |
| (Healtheast), 6s, 11/15/35 | Ba1 | 1,250,000 | 1,122,050 |
|
| Washington Cnty., Hsg. & Redev. Auth. Rev. Bonds | | | |
| (Healtheast), 5 1/2s, 11/15/27 | Ba1 | 4,250,000 | 3,732,138 |
|
| | | | 22,174,887 |
| Mississippi (0.8%) | | | |
| Jackson Cnty., VRDN, 0.16s, 12/1/16 | VMIG1 | 400,000 | 400,000 |
|
| MS Bus. Fin. Corp. Poll. Control Rev. Bonds | | | |
| (Syst. Energy Resources, Inc.), 5 7/8s, 4/1/22 | BBB | 2,000,000 | 1,999,680 |
|
| Warren Cnty., Gulf Opportunity Zone (Intl. | | | |
| Paper Co.), Ser. A, 6 1/2s, 9/1/32 | BBB | 5,400,000 | 5,578,632 |
|
| | | | 7,978,312 |
| Missouri (0.3%) | | | |
| Carthage, Hosp. Rev. Bonds, 5 7/8s, 4/1/30 | B–/P | 1,100,000 | 866,855 |
|
| Kansas City, Indl. Dev. Auth. Hlth. Fac. Rev. Bonds | | | |
| (First Mtge. Bishop Spencer), Ser. A, 6 1/4s, 1/1/24 | BB–/P | 2,000,000 | 1,767,300 |
|
| MO State Hsg. Dev. Comm. Mtge. Rev. Bonds (Single | | | |
| Fam. Home Ownership Loan), Ser. A-1, GNMA Coll., | | | |
| FNMA Coll., 6 3/4s, 3/1/34 | AAA | 590,000 | 618,420 |
|
| | | | 3,252,575 |
36
| | | |
| MUNICIPAL BONDS AND NOTES (97.6%)* cont. | Rating** | Principal amount | Value |
|
| Montana (0.2%) | | | |
| MT Fac. Fin. Auth. Rev. Bonds (Sr. Living St. | | | |
| John’s Lutheran), Ser. A, 6s, 5/15/25 | B+/P | $750,000 | $615,495 |
|
| MT Fac. Fin. Auth. VRDN (Sisters of Charity), | | | |
| Ser. A, 0.23s, 12/1/25 | VMIG1 | 730,000 | 730,000 |
|
| MT State Board Inv. Exempt Fac. Rev. Bonds | | | |
| (Stillwater Mining), 8s, 7/1/20 | B | 750,000 | 654,203 |
|
| | | | 1,999,698 |
| Nebraska (0.4%) | | | |
| Central Plains, Energy Project Rev. Bonds (NE Gas | | | |
| No. 1), Ser. A, 5 1/4s, 12/1/18 | BB+ | 1,500,000 | 1,529,610 |
|
| Kearney, Indl. Dev. Rev. Bonds | | | |
| (Great Platte River), 8s, 9/1/12 (In default) † | D/P | 123,433 | 23,452 |
| (Brookhaven), zero %, 9/1/12 (In default) † | D/P | 1,582,934 | 23,744 |
|
| NE Edl. Fin. Auth. VRDN (Creighton U.), 0.2s, 7/1/35 | VMIG1 | 2,500,000 | 2,500,000 |
|
| | | | 4,076,806 |
| Nevada (1.6%) | | | |
| Clark Cnty., Impt. Dist. Special Assmt. Bonds | | | |
| (Summerlin No. 142), 6 3/8s, 8/1/23 | BB/P | 945,000 | 893,176 |
| (Summerlin No. 151), 5s, 8/1/25 | BB–/P | 300,000 | 198,135 |
| (Summerlin No. 151), 5s, 8/1/20 | BB–/P | 335,000 | 238,701 |
| (Summerlin No. 151), 5s, 8/1/19 | BB–/P | 1,140,000 | 831,778 |
| (Summerlin No. 151), 5s, 8/1/18 | BB–/P | 1,100,000 | 822,118 |
| (Summerlin No. 151), 5s, 8/1/17 | BB–/P | 1,300,000 | 988,078 |
|
| Clark Cnty., Indl. Dev. Rev. Bonds (NV Pwr. Co.) | | | |
| Ser. B, 5.9s, 10/1/30 | BB+ | 2,000,000 | 1,832,600 |
| Ser. C, 5 1/2s, 10/1/30 | BB+ | 2,500,000 | 2,384,125 |
|
| Henderson, Local Impt. Dist. Special Assmt. Bonds | | | |
| (No. T-16), 5 1/8s, 3/1/25 | B/P | 490,000 | 222,881 |
| (No. T-16), 5.1s, 3/1/21 | B/P | 1,215,000 | 555,741 |
| (No. T-17), 5s, 9/1/25 | BB/P | 805,000 | 577,274 |
| (No. T-16), 5s, 3/1/20 | B/P | 975,000 | 446,979 |
| (No. T-18), 5s, 9/1/16 | B/P | 375,000 | 174,131 |
| (No. T-18), 5s, 9/1/15 | B/P | 2,295,000 | 1,072,775 |
| (No. T-18), 5s, 9/1/14 | B/P | 2,330,000 | 1,099,434 |
| (No. T-16), 4.8s, 3/1/15 | B/P | 1,745,000 | 819,452 |
|
| Las Vegas, Local Impt. Board Special Assmt. | | | |
| (Special Impt. Dist. No. 607), 6s, 6/1/19 | BB/P | 970,000 | 834,307 |
| (Dist. No. 607), 5.9s, 6/1/18 | BB/P | 195,000 | 170,746 |
| (Dist. No. 607), 5.9s, 6/1/17 | BB/P | 1,450,000 | 1,304,203 |
|
| | | | 15,466,634 |
| New Hampshire (0.8%) | | | |
| NH Higher Edl. & Hlth. Fac. Auth. Rev. Bonds | | | |
| (Rivermead at Peterborough), 5 3/4s, 7/1/28 | BB+/P | 6,000,000 | 5,241,240 |
|
| NH Hlth. & Ed. Fac. Auth. Rev. Bonds (Huntington | | | |
| at Nashua), Ser. A, 6 7/8s, 5/1/33 | BB–/P | 2,400,000 | 2,402,760 |
|
| | | | 7,644,000 |
| New Jersey (3.6%) | | | |
| Burlington Cnty., Bridge Comm. Econ. Dev. Rev. | | | |
| Bonds (The Evergreens), 5 5/8s, 1/1/38 | BB+/P | 5,500,000 | 4,807,825 |
|
| NJ Econ. Dev. Auth. Rev. Bonds | | | |
| (Newark Arpt. Marriott Hotel), 7s, 10/1/14 | Ba1 | 4,000,000 | 4,006,320 |
| (First Mtge. Presbyterian Home), Ser. A, | | | |
| 6 3/8s, 11/1/31 | BB/P | 500,000 | 416,810 |
37
| | | |
| MUNICIPAL BONDS AND NOTES (97.6%)* cont. | Rating** | Principal amount | Value |
|
| New Jersey cont. | | | |
| NJ Econ. Dev. Auth. Rev. Bonds | | | |
| (United Methodist Homes), Ser. A-1, 6 1/4s, 7/1/33 | BB+ | $3,000,000 | $2,633,640 |
| (First Mtge. Presbyterian Home), Ser. A, | | | |
| 6 1/4s, 11/1/20 | BB/P | 500,000 | 452,320 |
| (Cranes Mill), Ser. A, 6s, 7/1/38 | BBB–/F | 1,750,000 | 1,556,800 |
| (First Mtge. Lions Gate), Ser. A, 5 7/8s, 1/1/37 | B/P | 800,000 | 630,648 |
| (Cigarette Tax), 5 1/2s, 6/15/24 | Baa2 | 5,000,000 | 4,931,350 |
|
| NJ Econ. Dev. Auth. Retirement Cmnty. Rev. Bonds | | | |
| (Seabrook Village, Inc.), 5 1/4s, 11/15/36 | BB–/P | 3,590,000 | 2,885,427 |
|
| NJ Hlth. Care Fac. Fin. Auth. Rev. Bonds | | | |
| (St. Joseph Hlth. Care Syst.), 6 5/8s, 7/1/38 | BBB– | 6,000,000 | 6,039,840 |
| (St. Peter’s U. Hosp.), 5 3/4s, 7/1/37 | Baa2 | 4,500,000 | 4,462,920 |
|
| Tobacco Settlement Fin. Corp. Rev. Bonds, | | | |
| Ser. 1A, 5s, 6/1/29 | BBB | 3,100,000 | 2,404,608 |
|
| | | | 35,228,508 |
| New Mexico (0.9%) | | | |
| Farmington, Poll. Control Rev. Bonds (San Juan) | | | |
| Ser. A, 4 7/8s, 4/1/33 | Baa3 | 7,660,000 | 6,639,994 |
| Ser. B, 4 7/8s, 4/1/33 | Baa3 | 2,750,000 | 2,383,205 |
|
| | | | 9,023,199 |
| New York (5.0%) | | | |
| Albany, Indl. Dev. Agcy. Rev. Bonds | | | |
| (Charitable Leadership), Ser. A, 5 3/4s, 7/1/26 | Caa1 | 2,000,000 | 1,503,460 |
|
| Brooklyn Arena Local Dev. Corp. Rev. Bonds | | | |
| (Barclays Ctr.), 6 3/8s, 7/15/43 | Baa3 | 3,000,000 | 3,064,950 |
|
| Broome Cnty., Indl. Dev. Agcy. Continuing Care | | | |
| Retirement Rev. Bonds (GoodShepherd Village), | | | |
| Ser. A, 6 7/8s, 7/1/40 | B/P | 715,000 | 571,163 |
|
| Huntington, Hsg. Auth. Sr. Hsg. Fac. Rev. Bonds | | | |
| (Gurwin Jewish Sr. Residence), Ser. A, 6s, 5/1/39 | B+/P | 1,250,000 | 938,775 |
|
| NY City, Indl. Dev. Agcy. Rev. Bonds | | | |
| (Yankee Stadium — Pilot), AGO, 7s, 3/1/49 | AAA | 1,000,000 | 1,158,710 |
| (Staten Island U. Hosp. Project), 6.45s, 7/1/32 | Ba2 | 1,435,000 | 1,338,611 |
| (Liberty-7 World Trade Ctr.), Ser. A, 6 1/4s, 3/1/15 | BB/P | 1,000,000 | 1,000,320 |
| (Brooklyn Navy Yard Cogen. Partners), | | | |
| 5.65s, 10/1/28 | BB | 3,250,000 | 2,417,188 |
|
| NY City, Indl. Dev. Agcy. Civic Fac. Rev. Bonds | | | |
| (Staten Island U. Hosp.), Ser. A, 6 3/8s, 7/1/31 | Ba2 | 605,000 | 560,793 |
| (Bronx Pkg. Dev. Co., LLC), 5 3/4s, 10/1/37 | BB/P | 3,500,000 | 2,854,145 |
|
| NY City, Indl. Dev. Agcy. Special Fac. Rev. Bonds | | | |
| (JFK Intl. Arpt.), Ser. A, 8s, 8/1/12 | B– | 4,500,000 | 4,563,495 |
| (American Airlines — JFK Intl. Arpt.), 7 1/2s, 8/1/16 | B– | 9,165,000 | 9,095,621 |
| (British Airways PLC), 5 1/4s, 12/1/32 | BB | 2,325,000 | 1,492,185 |
| (Jetblue Airways Corp.), 5 1/8s, 5/15/30 | B– | 3,680,000 | 2,769,752 |
| (Jetblue Airways Corp.), 5s, 5/15/20 | B– | 675,000 | 572,704 |
|
| NY State Dorm. Auth. Non-State Supported Debt | | | |
| Rev. Bonds (Orange Regl. Med. Ctr.), 6 1/4s, 12/1/37 | Ba1 | 1,700,000 | 1,533,043 |
|
| NY State Energy Research & Dev. Auth. Gas Fac. | | | |
| Rev. Bonds (Brooklyn Union Gas), 6.952s, 7/1/26 | A+ | 1,800,000 | 1,800,288 |
|
| Oneida Cnty., Indl. Dev. Agcy. Rev. Bonds (St. | | | |
| Elizabeth Med.), Ser. A, 5 7/8s, 12/1/29 | BB+/P | 1,500,000 | 1,313,115 |
|
38
| | | |
| MUNICIPAL BONDS AND NOTES (97.6%)* cont. | Rating** | Principal amount | Value |
|
| New York cont. | | | |
| Seneca Cnty., Indl. Dev. Agcy. Solid Waste Disp. | | | |
| Mandatory Put Bonds (Seneca Meadows, Inc.), | | | |
| 6 5/8s, 10/1/13 | BB– | $1,660,000 | $1,662,523 |
|
| Suffolk Cnty., Indl. Dev. Agcy. Rev. Bonds | | | |
| (Peconic Landings), Ser. A, 8s, 10/1/20 | BB–/P | 3,610,000 | 3,710,611 |
|
| Suffolk Cnty., Indl. Dev. Agcy. Civic Fac. Rev. Bonds | | | |
| (Southampton Hosp. Assn.), Ser. B, 7 5/8s, 1/1/30 | B–/P | 3,500,000 | 3,492,895 |
| (Gurwin Jewish-Phase II), 6.7s, 5/1/39 | B+/P | 990,000 | 819,463 |
|
| Yonkers, Indl. Dev. Agcy. Civic Fac. Rev. Bonds | | | |
| (St. John’s Riverside Hosp.), Ser. A, 7 1/8s, 7/1/31 | B– | 500,000 | 491,610 |
|
| | | | 48,725,420 |
| North Carolina (0.6%) | | | |
| NC Cap. Fin. Agcy. Edl. Fac. Rev. Bonds | | | |
| (Meredith College), 6s, 6/1/31 | BBB | 1,000,000 | 1,028,920 |
|
| NC Med. Care Cmnty. Hlth. Care Fac. Rev. Bonds | | | |
| (Deerfield), Ser. A, 6 1/8s, 11/1/38 | BBB+/F | 400,000 | 390,192 |
| (First Mtge. — Presbyterian Homes), 5 3/8s, 10/1/22 | BB/P | 750,000 | 739,455 |
|
| NC Med. Care Comm. Retirement Fac. Rev. Bonds | | | |
| (Carolina Village), 6s, 4/1/38 | BB/P | 2,500,000 | 1,890,000 |
| (First Mtge. United Methodist), Ser. C, | | | |
| 5 1/2s, 10/1/32 | BB+/P | 2,000,000 | 1,777,300 |
|
| | | | 5,825,867 |
| Ohio (4.8%) | | | |
| Allen Cnty., Hosp. Fac. VRDN (Catholic Hlth. | | | |
| Care), Ser. B, 0.20s, 10/1/31 | VMIG1 | 1,500,000 | 1,500,000 |
|
| Buckeye, Tobacco Settlement Fin. Auth. Rev. Bonds | | | |
| (Asset Backed Bonds), Ser. A-2, 6 1/2s, 6/1/47 | BBB | 2,335,000 | 1,955,773 |
| Ser. A-2, 5 7/8s, 6/1/30 | BBB | 5,000,000 | 4,288,250 |
| Ser. A-2, 5 3/4s, 6/1/34 | BBB | 24,800,000 | 20,403,208 |
| Ser. A-2, 5 1/8s, 6/1/24 | BBB | 855,000 | 792,217 |
| Ser. A-3, zero %, stepped-coupon (6.25%, | | | |
| 12/1/12) 6/1/37 †† | BBB | 13,800,000 | 9,271,116 |
|
| Hickory Chase, Cmnty. Auth. Infrastructure Impt. | | | |
| Rev. Bonds (Hickory Chase), 7s, 12/1/38 | BB–/P | 1,695,000 | 1,127,429 |
|
| Lake Cnty., Hosp. Fac. Rev. Bonds (Lake Hosp. | | | |
| Syst.), Ser. C, 6s, 8/15/43 | Baa1 | 1,550,000 | 1,530,191 |
|
| Montgomery Cnty., VRDN (Miami Valley Hosp.), | | | |
| Ser. B, 0.23s, 11/15/24 | VMIG1 | 3,400,000 | 3,400,000 |
|
| OH State Air Quality Dev. Auth. Rev. Bonds | | | |
| (Valley Elec. Corp.), Ser. E, 5 5/8s, 10/1/19 | Baa3 | 1,450,000 | 1,490,673 |
|
| OH State Env. Impt. Rev. Bonds (USX Corp.), | | | |
| 5 5/8s, 5/1/29 | Baa1 | 750,000 | 754,710 |
|
| | | | 46,513,567 |
| Oklahoma (0.4%) | | | |
| OK State Cap. Impt. Auth. State Facs. Auth. VRDN | | | |
| (Higher Ed.), Ser. D1, 0.2s, 7/1/31 | VMIG1 | 2,655,000 | 2,655,000 |
|
| OK State Tpk. Auth. VRDN, Ser. E, 0.2s, 1/1/28 | VMIG1 | 1,100,000 | 1,100,000 |
|
| | | | 3,755,000 |
39
| | | |
| MUNICIPAL BONDS AND NOTES (97.6%)* cont. | Rating** | Principal amount | Value |
|
| Oregon (0.9%) | | | |
| Multnomah Cnty., Hosp. Fac. Auth. Rev. Bonds | | | |
| (Terwilliger Plaza), 6 1/2s, 12/1/29 | BB–/P | $7,300,000 | $7,318,688 |
|
| OR State Hsg. & Cmnty. Svcs. Dept. Rev. Bonds | | | |
| (Single Fam. Mtge.), Ser. B, 5 3/8s, 7/1/34 | Aa2 | 2,000 | 2,010 |
|
| Warm Springs Reservation, Confederated Tribes | | | |
| Rev. Bonds (Pelton Round Butte Tribal), Ser. B, | | | |
| 6 3/8s, 11/1/33 | A3 | 1,800,000 | 1,787,796 |
|
| | | | 9,108,494 |
| Pennsylvania (5.5%) | | | |
| Allegheny Cnty., Hosp. Dev. Auth. Rev. Bonds | | | |
| (Hlth. Syst.), Ser. B, 9 1/4s, 11/15/15 (Prerefunded) | AAA | 5,070,000 | 5,427,080 |
| (Hlth. Syst.-West PA), Ser. A, 5 3/8s, 11/15/40 | BB | 15,615,000 | 11,401,292 |
|
| Allegheny Cnty., Indl. Dev. Auth. Rev. Bonds | | | |
| (Env. Impt. — USX Corp.), 6 7/8s, 5/1/30 | BB | 3,400,000 | 3,512,812 |
|
| Bucks Cnty., Indl. Dev. Auth. Retirement Cmnty. Rev. | | | |
| Bonds (Ann’s Choice, Inc.), Ser. A, 6 1/8s, 1/1/25 | BB/P | 3,840,000 | 3,565,248 |
|
| Chester Cnty., Hlth. & Ed. Fac. Auth. Rev. Bonds | | | |
| (Jenners Pond, Inc.) | | | |
| 7 5/8s, 7/1/34 (Prerefunded) | AAA/P | 1,700,000 | 1,991,822 |
| 7 1/4s, 7/1/24 (Prerefunded) | AAA/P | 1,725,000 | 2,005,778 |
|
| Cumberland Cnty., Muni. Auth. Rev. Bonds (Diakon | | | |
| Lutheran Ministries), 5s, 1/1/36 | BBB+/F | 1,790,000 | 1,451,744 |
|
| Lancaster Cnty., Hosp. Auth. Rev. Bonds | | | |
| (Brethren Village), Ser. A | | | |
| 6 1/2s, 7/1/40 | BB–/P | 3,000,000 | 2,804,790 |
| 6 3/8s, 7/1/30 | BB–/P | 1,375,000 | 1,283,673 |
|
| Lebanon Cnty., Hlth. Facs. Rev. Bonds (Pleasant | | | |
| View Retirement), Ser. A, 5 1/8s, 12/15/20 | BB/P | 1,000,000 | 914,360 |
|
| Montgomery Cnty., Indl. Auth. Resource Recvy. | | | |
| Rev. Bonds (Whitemarsh Cont. Care), 6 1/4s, 2/1/35 | B–/P | 2,400,000 | 1,810,392 |
|
| New Morgan, Indl. Dev. Auth. Solid Waste Disp. | | | |
| Rev. Bonds (New Morgan Landfill Co., Inc.), | | | |
| 6 1/2s, 4/1/19 | BBB | 2,830,000 | 2,834,302 |
|
| PA Econ. Dev. Fin. Auth. Exempt Fac. Rev. Bonds | | | |
| (Allegheny Energy Supply Co.), 7s, 7/15/39 | Baa3 | 4,000,000 | 4,403,360 |
| (Reliant Energy), Ser. B, 6 3/4s, 12/1/36 | B1 | 1,890,000 | 1,915,156 |
|
| PA State Higher Edl. Fac. Auth. Rev. Bonds | | | |
| (Edinboro U.), 5 7/8s, 7/1/38 | Baa3 | 1,000,000 | 951,650 |
| (Widener U.), 5.4s, 7/15/36 | BBB+ | 1,500,000 | 1,425,120 |
|
| Philadelphia, Hosp. & Higher Ed. Fac. Auth. Rev. | | | |
| Bonds (Graduate Hlth. Syst. Oblig. Group), | | | |
| 7 1/4s, 7/1/18 (In default) † | D/P | 5,515,765 | 1,655 |
|
| Philadelphia, Hosp. & Higher Edl. Fac. Auth. | | | |
| Hosp. Rev. Bonds (Graduate Hlth. Syst.), Ser. B, | | | |
| 6 1/4s, 7/1/13 (In default) † | D/P | 535,300 | 161 |
|
| Susquehanna, Area Regl. Arpt. Syst. Auth. Rev. | | | |
| Bonds, Ser. A, 6 1/2s, 1/1/38 | Baa3 | 2,675,000 | 2,562,169 |
|
| Washington Cnty., Indl. Dev. Auth. Hlth. Care | | | |
| Fac. Rev. Bonds (First Mtge. AHF/Central), | | | |
| 7 3/4s, 1/1/29 | B/P | 1,220,000 | 1,211,911 |
|
| West Shore, Area Hosp. Auth. Rev. Bonds (Holy | | | |
| Spirit Hosp.), 6 1/4s, 1/1/32 | BBB | 2,000,000 | 2,002,700 |
|
| | | | 53,477,175 |
40
| | | |
| MUNICIPAL BONDS AND NOTES (97.6%)* cont. | Rating** | Principal amount | Value |
|
| Puerto Rico (3.9%) | | | |
| Cmnwlth. of PR, G.O. Bonds, Ser. C, 6s, 7/1/39 | Baa3 | $2,515,000 | $2,543,671 |
|
| Cmnwlth. of PR, Aqueduct & Swr. Auth. Rev. Bonds, | | | |
| Ser. A, 6s, 7/1/44 | Baa3 | 14,500,000 | 14,796,235 |
|
| Cmnwlth. of PR, Indl. Tourist Edl. Med. & Env. | | | |
| Control Fac. Rev. Bonds (Cogen. Fac.-AES), | | | |
| 6 5/8s, 6/1/26 | Baa3 | 7,400,000 | 7,472,964 |
|
| Cmnwlth. of PR, Pub. Bldg. Auth. Rev. Bonds | | | |
| (Govt. Fac.), Ser. P, 6 3/4s, 7/1/36 | Baa3 | 5,000,000 | 5,359,200 |
|
| Cmnwlth. of PR, Sales Tax Fin. Corp. Rev. Bonds, | | | |
| Ser. A, zero %, 8/1/31 | A+ | 31,000,000 | 7,534,860 |
|
| | | | 37,706,930 |
| Rhode Island (0.3%) | | | |
| Tobacco Settlement Fin. Corp. Rev. Bonds, Ser. A | | | |
| 6 1/4s, 6/1/42 | BBB | 1,310,000 | 1,206,523 |
| 6 1/8s, 6/1/32 | BBB | 1,465,000 | 1,385,773 |
|
| | | | 2,592,296 |
| South Carolina (0.1%) | | | |
| Georgetown Cnty., Env. Impt. Rev. Bonds (Intl. | | | |
| Paper Co.), Ser. A, 5.3s, 3/1/28 | BBB | 500,000 | 436,325 |
|
| | | | 436,325 |
| South Dakota (0.4%) | | | |
| SD Edl. Enhancement Funding Corp. SD Tobacco Rev. | | | |
| Bonds, Ser. B, 6 1/2s, 6/1/32 | BBB | 3,615,000 | 3,547,833 |
|
| | | | 3,547,833 |
| Tennessee (1.1%) | | | |
| Chattanooga, Hlth. Edl. & Hsg. Fac. Board VRDN | | | |
| (Catholic Hlth. Initiatives), Ser. C, 0.2s, 5/1/39 | VMIG1 | 800,000 | 800,000 |
|
| Elizabethton, Hlth. & Edl. Fac. Board Rev. Bonds | | | |
| (Hosp. Ref. & Impt.), Ser. B, 8s, 7/1/33 | | | |
| (Prerefunded) | BBB/F | 4,000,000 | 4,629,720 |
|
| Johnson City, Hlth. & Edl. Fac. Board Hosp. Rev. | | | |
| Bonds (First Mtge. Mountain States Hlth.), Ser. A | | | |
| 7 1/2s, 7/1/25 (Prerefunded) | Baa1 | 3,000,000 | 3,437,370 |
| 5 1/2s, 7/1/36 | Baa1 | 1,900,000 | 1,840,777 |
|
| | | | 10,707,867 |
| Texas (9.2%) | | | |
| Abilene, Hlth. Fac. Dev. Corp. Rev. Bonds (Sears | | | |
| Methodist Retirement), Ser. A | | | |
| 7s, 11/15/33 | B+/P | 2,500,000 | 2,257,425 |
| 5.9s, 11/15/25 | B+/P | 6,850,000 | 5,739,204 |
|
| Alliance, Arpt. Auth. Rev. Bonds | | | |
| (American Airlines, Inc.), 5 1/4s, 12/1/29 | CCC+ | 2,520,000 | 1,588,734 |
| (Federal Express Corp.), 4.85s, 4/1/21 | Baa2 | 4,000,000 | 3,948,880 |
|
| Bexar Cnty., Hsg. Fin. Auth. Corp. Rev. Bonds | | | |
| (American Opty-Waterford), Ser. A1, 7s, 12/1/36 | Baa3 | 4,500,000 | 3,761,640 |
|
| Brazoria Cnty., Brazos River Harbor Naval Dist. | | | |
| Env. FRN (Dow Chemical Co.), Ser. A-4, | | | |
| 5.95s, 5/15/33 | BBB– | 1,150,000 | 1,138,443 |
|
| Brazos River, Auth. Poll. Control Rev. Bonds (TXU | | | |
| Energy Co., LLC) | | | |
| Ser. D-1, 8 1/4s, 5/1/33 | CCC | 3,000,000 | 2,115,030 |
| 5s, 3/1/41 | CCC | 1,000,000 | 459,570 |
|
41
| | | |
| MUNICIPAL BONDS AND NOTES (97.6%)* cont. | Rating** | Principal amount | Value |
|
| Texas cont. | | | |
| Brazos, Harbor Indl. Dev. Corp. Env. Fac. | | | |
| Mandatory Put Bonds (Dow Chemical), 5.9s, 5/1/28 | BBB– | $1,850,000 | $1,811,391 |
|
| Crawford Ed. Fac. Rev. Bonds (U. St. Thomas), | | | |
| 5 3/8s, 10/1/27 | BBB+ | 3,985,000 | 3,683,017 |
|
| Dallas-Fort Worth, Intl. Arpt. Fac. Impt. Rev. | | | |
| Bonds (American Airlines, Inc.) | | | |
| 6 3/8s, 5/1/35 | CCC+ | 2,515,000 | 1,786,656 |
| 5 1/2s, 11/1/30 | CCC+ | 1,500,000 | 970,965 |
|
| Houston, Arpt. Syst. Rev. Bonds | | | |
| (Continental Airlines, Inc.), Ser. E, 7s, 7/1/29 | B3 | 500,000 | 485,020 |
| (Continental Airlines, Inc.), Ser. E, 6 3/4s, | | | |
| 7/1/29 | B3 | 2,505,000 | 2,367,926 |
| (Special Fac. — Continental Airlines, Inc.), | | | |
| Ser. E, 6 3/4s, 7/1/21 | B3 | 8,400,000 | 8,102,136 |
| (Continental Airlines, Inc.), Ser. C, 5.7s, | | | |
| 7/15/29 | B3 | 4,985,000 | 3,996,325 |
|
| La Vernia, Higher Ed. Fin. Corp. Rev. Bonds | | | |
| (Kipp Inc.), Ser. A, 6 3/8s, 8/15/44 | BBB | 2,450,000 | 2,521,271 |
|
| Matagorda Cnty., Poll. Control Rev. Bonds | | | |
| (Cent Pwr. & Light Co.), Ser. A, 6.3s, 11/1/29 | Baa2 | 2,400,000 | 2,588,448 |
| (Dist. No. 1), Ser. A, AMBAC, 4.4s, 5/1/30 | Baa2 | 3,000,000 | 2,506,350 |
|
| Mission, Econ. Dev. Corp. Solid Waste Disp. Rev. | | | |
| Bonds (Allied Waste N.A. Inc.), Ser. A, 5.2s, 4/1/18 | BBB | 6,650,000 | 6,623,334 |
|
| North TX, Thruway Auth. Rev. Bonds (Toll 2nd | | | |
| Tier), Ser. F, 5 3/4s, 1/1/38 | A3 | 3,370,000 | 3,412,496 |
|
| North TX, Thruway Auth. stepped-coupon Rev. | | | |
| Bonds, zero %, (6 1/2s, 1/1/15), 2043 †† | A2 | 5,300,000 | 3,965,566 |
|
| San Antonio, Edl. Fac. Corp. VRDN (Trinity U.), | | | |
| 0.23s, 6/1/33 | A–1+ | 500,000 | 500,000 |
|
| Tarrant Cnty., Cultural Ed. Fac. Fin. Corp. | | | |
| Retirement Fac. Rev. Bonds | | | |
| (Sr. Living Ctr.), Ser. A, 8 1/4s, 11/15/44 | B+/P | 8,000,000 | 7,810,880 |
| (Sr. Living Ctr.), Ser. A, 8 1/4s, 11/15/39 | B+/P | 1,000,000 | 987,780 |
| (Air Force Village), 6 3/8s, 11/15/44 | BBB/F | 5,825,000 | 5,740,130 |
|
| Tomball, Hosp. Auth. Rev. Bonds (Tomball Regl. | | | |
| Hosp.), 6s, 7/1/25 | Baa3 | 4,945,000 | 4,757,337 |
|
| TX Private Activity Surface Trans. Corp. Rev. | | | |
| Bonds (NTE Mobility), 6 7/8s, 12/31/39 | Baa2 | 3,350,000 | 3,482,158 |
|
| Uptown, Dev. Auth. Tax Increment Contract Tax | | | |
| Alloc. (Infrastructure Impt. Fac.), 5 1/2s, | | | |
| 9/1/29 | BBB+ | 1,000,000 | 984,530 |
|
| | | | 90,092,642 |
| Utah (0.6%) | | | |
| Carbon Cnty., Solid Waste Disp. Rev. Bonds | | | |
| (Laidlaw Env.), Ser. A, 7.45s, 7/1/17 | B+/P | 600,000 | 603,222 |
|
| Murray City, Hosp. Rev. VRDN (IHC Hlth. | | | |
| Svcs., Inc.), Ser. A, 0.2s, 5/15/37 | VMIG1 | 2,500,000 | 2,500,000 |
|
| Tooele Cnty., Harbor & Term. Dist. Port Fac. Rev. | | | |
| Bonds (Union Pacific), Ser. A, 5.7s, 11/1/26 | Baa2 | 3,000,000 | 3,012,180 |
|
| | | | 6,115,402 |
42
| | | |
| MUNICIPAL BONDS AND NOTES (97.6%)* cont. | Rating** | Principal amount | Value |
|
| Virginia (2.7%) | | | |
| Albemarle Cnty., Indl. Dev. Auth. Res. Care Fac. | | | |
| Rev. Bonds (Westminster-Canterbury), 5s, 1/1/31 | B+/P | $1,100,000 | $955,702 |
|
| Chesterfield Cnty., Hlth. Ctr. Cmnty. Res. Care | | | |
| Fac. Rev. Bonds (Lucy Corr Village), Ser. A, | | | |
| 6 1/4s, 12/1/38 | BB–/P | 2,000,000 | 1,768,020 |
|
| Henrico Cnty., Econ. Dev. Auth. Res. Care Fac. | | | |
| Rev. Bonds (United Methodist), Ser. A | | | |
| 6.7s, 6/1/27 | BB+/P | 3,860,000 | 3,863,628 |
| 6 1/2s, 6/1/22 | BB+/P | 3,000,000 | 3,011,190 |
|
| James Cnty., Indl. Dev. Auth. Rev. Bonds | | | |
| (Williamsburg), Ser. A, 6 1/8s, 3/1/32 | BB–/P | 2,500,000 | 2,202,375 |
|
| Lexington, Indl. Dev. Auth. Res. Care Fac. Rev. | | | |
| Bonds (Kendal at Lexington), Ser. A, 5 1/2s, 1/1/37 | B+/P | 1,460,000 | 1,138,070 |
|
| Peninsula Ports Auth. Rev. Bonds (VA Baptist | | | |
| Homes), Ser. A, 7 3/8s, 12/1/32 (Prerefunded) | AAA | 4,000,000 | 4,854,240 |
|
| WA Cnty., Indl. Dev. Auth. Hosp. Fac. Rev. Bonds | | | |
| (Mountain States Hlth. Alliance), Ser. C, | | | |
| 7 3/4s, 7/1/38 | Baa1 | 5,100,000 | 5,810,736 |
|
| Winchester, Indl. Dev. Auth. Res. Care Fac. Rev. | | | |
| Bonds (Westminster-Canterbury), Ser. A | | | |
| 5.3s, 1/1/35 | BB/P | 2,000,000 | 1,779,940 |
| 5.2s, 1/1/27 | BB/P | 1,300,000 | 1,191,671 |
|
| | | | 26,575,572 |
| Washington (2.5%) | | | |
| Tobacco Settlement Auth. of WA Rev. Bonds | | | |
| 6 5/8s, 6/1/32 | BBB | 11,065,000 | 11,044,419 |
| 6 1/2s, 6/1/26 | BBB | 4,705,000 | 4,770,258 |
|
| WA State Higher Ed. Fac. Auth. Rev. Bonds | | | |
| (Whitworth U.), 5 5/8s, 10/1/40 | Baa1 | 1,600,000 | 1,566,688 |
|
| WA State Hlth. Care Fac. Auth. Rev. Bonds | | | |
| (WA Hlth. Svcs.), 7s, 7/1/39 | Baa2 | 3,000,000 | 3,195,360 |
| Ser. C, Radian Insd., 5 3/8s, 8/15/28 | Baa2 | 1,500,000 | 1,433,055 |
|
| WA State Hlth. Care Fac. Auth. Lease VRDN | | | |
| (National Hlth. Care Research & Ed.), 0.2s, 1/1/32 | VMIG1 | 800,000 | 800,000 |
|
| WA State Hsg. Fin. Comm. VRDN (Local 82 —JATC | | | |
| Edl. Dev. Trust), 0.23s, 11/1/25 | A–1+ | 1,200,000 | 1,200,000 |
|
| | | | 24,009,780 |
| West Virginia (0.6%) | | | |
| Princeton, Hosp. Rev. Bonds (Cmnty. Hosp. | | | |
| Assn., Inc.), 6.1s, 5/1/29 | Ba3 | 4,525,000 | 4,115,171 |
|
| WV State Hosp. Fin. Auth. Rev. Bonds (Thomas | | | |
| Hlth. Syst.), 6 3/4s, 10/1/43 | B/P | 2,330,000 | 2,205,951 |
|
| | | | 6,321,122 |
| Wisconsin (0.8%) | | | |
| Badger, Tobacco Settlement Asset | | | |
| Securitization Corp. Rev. Bonds, 7s, 6/1/28 | | | |
| (Prerefunded) | AAA | 2,280,000 | 2,593,933 |
|
| WI State Hlth. & Edl. Fac. Auth. Rev. Bonds | | | |
| (St. Johns Cmntys. Inc.), Ser. A, 7 5/8s, 9/15/39 | BB/P | 1,350,000 | 1,408,185 |
| (St. Johns Cmntys. Inc.), Ser. A, 7 1/4s, 9/15/29 | BB/P | 1,000,000 | 1,027,020 |
| (Prohealth Care, Inc.), 6 5/8s, 2/15/39 | A1 | 3,000,000 | 3,215,598 |
|
| | | | 8,244,736 |
| Total municipal bonds and notes (cost $1,003,434,984) | | | $952,730,706 |
43
| | |
| PREFERRED STOCKS (1.2%)* | Shares | Value |
|
| MuniMae Tax Exempt Bond Subsidiary, LLC 144A Ser. A, | | |
| 7.50% cum. pfd. | 5,922,300 | $5,635,601 |
|
| MuniMae Tax Exempt Bond Subsidiary, LLC 144A | | |
| Ser. A-2, 4.90% cum. pfd. | 2,000,000 | 1,503,460 |
|
| MuniMae Tax Exempt Bond Subsidiary, LLC 144A Ser. B, | | |
| 7 3/4s cum. pfd. | 6,000,000 | 4,921,200 |
|
| Total preferred stocks (cost $13,922,300) | | $12,060,261 |
|
| |
| COMMON STOCKS (—%)* | Shares | Value |
|
| Tembec, Inc. (Canada) † | 10,751 | $10,962 |
|
| Total common stocks (cost $8,077,612) | | $10,962 |
| | | |
| | | | |
| WARRANTS (—%)* † | Expiration | Strike | | |
| | date | Price | Warrants | Value |
|
| Tembec, Inc. (Canada) | 3/03/12 | CAD 0.00001 | 23,892 | $2,570 |
|
| Total warrants (cost $979,144) | | | | $2,570 |
| | | |
| | |
| SHORT-TERM INVESTMENTS (—%)* | | |
| | Principal Amount | Value |
|
| SSgA Prime Money Market Fund i | $20,000 | $20,000 |
|
| Total short-term investments (cost $20,000) | | $20,000 |
| |
| TOTAL INVESTMENTS | | |
|
| Total investments (cost $1,026,434,040) | | $964,824,499 |
|
| Key to holding’s abbreviations |
| CAD Canadian Dollar |
* Percentages indicated are based on net assets of $976,177,412.
** The Moody’s, Standard & Poor’s or Fitch ratings indicated are believed to be the most recent ratings available at January 31, 2010 for the securities listed. Ratings are generally ascribed to securities at the time of issuance. While the agencies may from time to time revise such ratings, they undertake no obligation to do so, and the ratings do not necessarily represent what the agencies would ascribe to these securities at January 31, 2010.
Securities rated by Putnam are indicated by “/P.” Securities rated by Fitch are indicated by “/F.” The rating of an insured security represents what is believed to be the most recent rating of the insurer’s claims-paying ability available at January 31, 2010 and does not reflect any subsequent changes. Security ratings are defined in the Statement of Additional Information.
† Non-income-producing security.
†† The interest rate and date shown parenthetically represent the new interest rate to be paid and the date the fund will begin accruing interest at this rate.
i Security purchased with cash or securities received, that was pledged to the fund for collateral on certain derivative contracts (Note 1).
At January 31, 2010, liquid assets totaling $36,490 have been segregated to cover certain derivative contracts.
144A after the name of an issuer represents securities exempt from registration under Rule 144A under the Securities Act of 1933, as amended. These securities may be resold in transactions exempt from registration, normally to qualified institutional buyers.
The rates shown on FRB, FRN, Mandatory Put Bonds and VRDN are the current interest rates at January 31, 2010. The dates shown on Mandatory Put Bonds are the next mandatory put dates.
The dates shown on debt obligations other than Mandatory Put Bonds are the original maturity dates.
The fund had the following sector concentration greater than 10% at January 31, 2010 (as a percentage of net assets):
Health care 39.4%
44
| | | | | | |
| TOTAL RETURN SWAP CONTRACTS OUTSTANDING at 1/31/10 (Unaudited) | |
|
| | Upfront | | | Fixed payments | Total return | |
| Swap counterparty/ | premium | Termination | | received (paid) by | received by | Unrealized |
| Notional amount | received (paid) | date | | fund per annum | or paid by fund | depreciation |
|
| Citibank, N.A. | | | | | | |
| $10,000,000 | $— | 3/1/10 | | — | Municipal Market | $(36,490) |
| | | | | | Data Index AAA | |
| | | | | | municipal yields | |
| | | | | | 20 Year rate | |
|
| Total | | | | | | $(36,490) |
ASC 820, Fair Value Measurements and Disclosures, establishes a three-level hierarchy for disclosure of fair value measurements. The valuation hierarchy is based upon the transparency of inputs to the valuation of the fund’s investments. The three levels are defined as follows:
Level 1 — Valuations based on quoted prices for identical securities in active markets.
Level 2 — Valuations based on quoted prices in markets that are not active or for which all significant inputs are observable, either directly or indirectly.
Level 3 — Valuations based on inputs that are unobservable and significant to the fair value measurement.
The following is a summary of the inputs used to value the fund’s net assets as of January 31, 2010:
| | | |
| | | Valuation inputs |
|
| Investments in securities: | Level 1 | Level 2 | Level 3 |
|
| Common stocks: | | | |
|
| Basic materials | $10,962 | $— | $— |
|
| Total common stocks | 10,962 | — | — |
| Municipal bonds and notes | — | 952,730,706 | — |
|
| Preferred stocks | — | 12,060,261 | — |
|
| Short-term investments | 20,000 | | |
|
| Warrants | 2,570 | — | — |
|
| Totals by level | $33,532 | $964,790,967 | $— |
| | Level 1 | Level 2 | Level 3 |
|
| Other financial instruments: | $— | $(36,490) | $— |
|
| Other financial instruments include swaps. | | | |
The accompanying notes are an integral part of these financial statements.
45
Statement of assets and liabilities 1/31/10 (Unaudited)
| | |
| ASSETS | | |
|
| Investment in securities, at value, (Note 1): | | |
| Unaffiliated issuers (identified cost $1,026,434,040) | | $964,824,499 |
|
| Cash | | 1,074,589 |
|
| Interest and other receivables | | 13,235,514 |
|
| Receivable for shares of the fund sold | | 1,192,418 |
|
| Receivable for investments sold | | 179,220 |
|
| Total assets | | 980,506,240 |
|
| |
| LIABILITIES | | |
|
| Distributions payable to shareholders | | 1,963,948 |
|
| Payable for shares of the fund repurchased | | 1,250,206 |
|
| Payable for compensation of Manager (Note 2) | | 399,837 |
|
| Payable for investor servicing fees (Note 2) | | 43,790 |
|
| Payable for custodian fees (Note 2) | | 3,076 |
|
| Payable for Trustee compensation and expenses (Note 2) | | 258,622 |
|
| Payable for administrative services (Note 2) | | 2,964 |
|
| Payable for distribution fees (Note 2) | | 222,179 |
|
| Unrealized depreciation on swap contracts (Note 1) | | 36,490 |
|
| Collateral on certain derivative contracts, at value (Note 1) | | 20,000 |
|
| Other accrued expenses | | 127,716 |
|
| Total liabilities | | 4,328,828 |
| |
| Net assets | | $976,177,412 |
|
| |
| REPRESENTED BY | | |
|
| Paid-in capital (Unlimited shares authorized) (Notes 1 and 4) | $1,243,720,478 |
|
| Undistributed net investment income (Note 1) | | 3,641,965 |
|
| Accumulated net realized loss on investments (Note 1) | | (209,539,000) |
|
| Net unrealized depreciation of investments | | (61,646,031) |
|
| Total — Representing net assets applicable to capital shares outstanding | | $976,177,412 |
|
| |
| COMPUTATION OF NET ASSET VALUE AND OFFERING PRICE | | |
|
| Net asset value and redemption price per class A share | | |
| ($881,253,827 divided by 77,085,775 shares) | | $11.43 |
|
| Offering price per class A share (100/96.00 of $11.43)* | | $11.91 |
|
| Net asset value and offering price per class B share ($28,385,350 divided by 2,479,228 shares)** | $11.45 |
|
| Net asset value and offering price per class C share ($28,473,139 divided by 2,487,768 shares)** | $11.45 |
|
| Net asset value and redemption price per class M share ($9,236,122 divided by 807,867 shares) | $11.43 |
|
| Offering price per class M share (100/96.75 of $11.43)*** | | $11.81 |
|
| Net asset value, offering price and redemption price per class Y share | | |
| ($28,828,974 divided by 2,517,207 shares) | | $11.45 |
|
* On single retail sales of less than $100,000. On sales of $100,000 or more the offering price is reduced.
** Redemption price per share is equal to net asset value less any applicable contingent deferred sales charge.
*** On single retail sales of less than $50,000. On sales of $50,000 or more the offering price is reduced.
The accompanying notes are an integral part of these financial statements.
46
Statement of operations Six months ended 1/31/10 (Unaudited)
| |
| INTEREST INCOME | $31,738,918 |
|
| |
| EXPENSES | |
|
| Compensation of Manager (Note 2) | $2,375,118 |
|
| Investor servicing fees (Note 2) | 260,448 |
|
| Custodian fees (Note 2) | 7,639 |
|
| Trustee compensation and expenses (Note 2) | 35,703 |
|
| Administrative services (Note 2) | 18,466 |
|
| Distribution fees — Class A (Note 2) | 1,001,927 |
|
| Distribution fees — Class B (Note 2) | 134,950 |
|
| Distribution fees — Class C (Note 2) | 126,412 |
|
| Distribution fees — Class M (Note 2) | 22,067 |
|
| Other | 220,699 |
|
| Total expenses | 4,203,429 |
| | |
| Expense reduction (Note 2) | (1,629) |
|
| Net expenses | 4,201,800 |
| |
| Net investment income | 27,537,118 |
|
| |
| Net realized loss on investments (Notes 1 and 3) | (1,515,974) |
|
| Net realized gain on swap contracts (Note 1) | 895,000 |
|
| Net unrealized appreciation of investments and swap contracts during the period | 87,846,384 |
|
| Net gain on investments | 87,225,410 |
| |
| Net increase in net assets resulting from operations | $114,762,528 |
|
The accompanying notes are an integral part of these financial statements.
47
Statement of changes in net assets
| | |
| INCREASE (DECREASE) IN NET ASSETS | Six months ended 1/31/10* | Year ended 7/31/09 |
|
| Operations: | | |
| Net investment income | $27,537,118 | $56,427,771 |
|
| Net realized loss on investments | (620,974) | (51,635,046) |
|
| Net unrealized appreciation (depreciation) of investments | 87,846,384 | (101,208,929) |
|
| Net increase (decrease) in net assets resulting from operations | 114,762,528 | (96,416,204) |
|
| Distributions to shareholders (Note 1): | | |
| From ordinary income | | |
| Taxable net investment income | | |
|
| Class A | (100,265) | (521,004) |
|
| Class B | (3,424) | (27,894) |
|
| Class C | (3,127) | (10,900) |
|
| Class M | (1,051) | (4,962) |
|
| Class Y | (2,828) | (232) |
|
| From tax-exempt net investment income | | |
| Class A | (24,407,647) | (51,731,735) |
|
| Class B | (787,792) | (2,391,207) |
|
| Class C | (603,162) | (967,552) |
|
| Class M | (233,303) | (476,965) |
|
| Class Y | (359,415) | (45,077) |
|
| Redemption fees (Note 1) | 6 | 9,909 |
|
| Increase (decrease) from capital share transactions (Note 4) | 15,021,911 | (117,437,226) |
|
| Total increase (decrease) in net assets | 103,282,431 | (270,021,049) |
|
| |
| NET ASSETS | | |
|
| Beginning of period | 872,894,981 | 1,142,916,030 |
|
| End of period (including undistributed net investment income | | |
| of $3,641,965 and $2,606,861, respectively) | $976,177,412 | $872,894,981 |
|
* Unaudited
The accompanying notes are an integral part of these financial statements.
48
|
| This page left blank intentionally. |
49
Financial highlights (For a common share outstanding throughout the period)
| | | | | | | | | | | | | |
| INVESTMENT OPERATIONS: | | LESS DISTRIBUTIONS: | | RATIOS AND SUPPLEMENTAL DATA: |
|
| | | | | | | | | | | | | Ratio of net | |
| | | | Net realized | | | | | | | | Ratio | investment | |
| | Net asset value, | | and unrealized | Total from | | | | Net asset | Total return | Net assets, | of expenses | income (loss) | |
| | beginning | Net investment | gain (loss) on | investment | From net | | Redemption value, | value, end of | at net asset | of period | to average | to average | Portfolio |
| Period ended | of period | income (loss) | investments | operations | investment income | Total distributions | fees | period | value (%) a | (in thousands) | net assets (%) b | net assets (%) | turnover (%) |
|
| Class A | | | | | | | | | | | | | |
| January 31, 2010 ** | $10.39 | .32 | 1.04 | 1.36 | (.32) | (.32) | — d | $11.43 | 13.13 * | $881,254 | .42 * | 2.93 * | 13.88 * |
| July 31, 2009 | 11.93 | .62 | (1.52) | (.90) | (.64) | (.64) | — d | 10.39 | (7.15) | 806,921 | .83 c | 6.31 c | 16.01 |
| July 31, 2008 | 12.88 | .64 | (.96) | (.32) | (.63) | (.63) | — d | 11.93 | (2.57) | 1,049,449 | .82 c | 5.14 c | 46.26 |
| July 31, 2007 | 12.95 | .62 | (.07) | .55 | (.62) | (.62) | — | 12.88 | 4.26 | 1,216,301 | .82 c | 4.72 c | 10.25 |
| July 31, 2006 | 13.02 | .62 | (.09) | .53 | (.60) | (.60) | — d | 12.95 | 4.21 | 1,293,442 | .82 c | 4.73 c | 16.97 |
| July 31, 2005 | 12.46 | .60 | .57 | 1.17 | (.61) | (.61) | — d | 13.02 | 9.59 | 1,375,968 | .85 c | 4.77 c | 21.33 |
|
| Class B | | | | | | | | | | | | | |
| January 31, 2010 ** | $10.40 | .29 | 1.04 | 1.33 | (.28) | (.28) | — d | $11.45 | 12.87 * | $28,385 | .74 * | 2.61 * | 13.88 * |
| July 31, 2009 | 11.94 | .56 | (1.52) | (.96) | (.58) | (.58) | — d | 10.40 | (7.76) | 32,843 | 1.46 c | 5.65 c | 16.01 |
| July 31, 2008 | 12.90 | .57 | (.98) | (.41) | (.55) | (.55) | — d | 11.94 | (3.25) | 64,075 | 1.45 c | 4.49 c | 46.26 |
| July 31, 2007 | 12.97 | .54 | (.07) | .47 | (.54) | (.54) | — | 12.90 | 3.67 | 103,765 | 1.45 c | 4.09 c | 10.25 |
| July 31, 2006 | 13.04 | .53 | (.08) | .45 | (.52) | (.52) | — d | 12.97 | 3.60 | 169,789 | 1.45 c | 4.09 c | 16.97 |
| July 31, 2005 | 12.48 | .52 | .57 | 1.09 | (.53) | (.53) | — d | 13.04 | 8.82 | 242,213 | 1.49 c | 4.15 c | 21.33 |
|
| Class C | | | | | | | | | | | | | |
| January 31, 2010 ** | $10.40 | .28 | 1.04 | 1.32 | (.27) | (.27) | — d | $11.45 | 12.79 * | $28,473 | .81 * | 2.54 * | 13.88 * |
| July 31, 2009 | 11.93 | .54 | (1.51) | (.97) | (.56) | (.56) | — d | 10.40 | (7.78) | 21,010 | 1.61 c | 5.56 c | 16.01 |
| July 31, 2008 | 12.88 | .55 | (.97) | (.42) | (.53) | (.53) | — d | 11.93 | (3.27) | 19,022 | 1.60 c | 4.36 c | 46.26 |
| July 31, 2007 | 12.96 | .52 | (.08) | .44 | (.52) | (.52) | — | 12.88 | 3.35 | 19,265 | 1.60 c | 3.95 c | 10.25 |
| July 31, 2006 | 13.02 | .51 | (.07) | .44 | (.50) | (.50) | — d | 12.96 | 3.44 | 21,381 | 1.60 c | 3.95 c | 16.97 |
| July 31, 2005 | 12.47 | .50 | .56 | 1.06 | (.51) | (.51) | — d | 13.02 | 8.64 | 23,054 | 1.64 c | 3.97 c | 21.33 |
|
| Class M | | | | | | | | | | | | | |
| January 31, 2010 ** | $10.39 | .31 | 1.03 | 1.34 | (.30) | (.30) | — d | $11.43 | 12.99 * | $9,236 | .56 * | 2.79 * | 13.88 * |
| July 31, 2009 | 11.92 | .59 | (1.51) | (.92) | (.61) | (.61) | — d | 10.39 | (7.35) | 7,781 | 1.11 c | 6.02 c | 16.01 |
| July 31, 2008 | 12.88 | .61 | (.98) | (.37) | (.59) | (.59) | — d | 11.92 | (2.89) | 10,204 | 1.10 c | 4.85 c | 46.26 |
| July 31, 2007 | 12.95 | .58 | (.07) | .51 | (.58) | (.58) | — | 12.88 | 4.01 | 10,816 | 1.10 c | 4.44 c | 10.25 |
| July 31, 2006 | 13.01 | .58 | (.07) | .51 | (.57) | (.57) | — d | 12.95 | 3.97 | 11,521 | 1.10 c | 4.45 c | 16.97 |
| July 31, 2005 | 12.46 | .56 | .56 | 1.12 | (.57) | (.57) | — d | 13.01 | 9.17 | 12,567 | 1.14 c | 4.47 c | 21.33 |
|
| Class Y | | | | | | | | | | | | | |
| January 31, 2010 ** | $10.40 | .34 | 1.04 | 1.38 | (.33) | (.33) | — d | $11.45 | 13.35 * | $28,829 | .31 * | 3.08 * | 13.88 * |
| July 31, 2009 | 11.93 | .64 | (1.50) | (.86) | (.67) | (.67) | — d | 10.40 | (6.88) | 4,340 | .61 c | 6.57 c | 16.01 |
| July 31, 2008 † | 12.49 | .40 | (.57) | (.17) | (.39) | (.39) | — d | 11.93 | (1.41) * | 167 | .35 *c | 3.21 *c | 46.26 |
|
See notes to financial highlights at the end of this section.
The accompanying notes are an integral part of these financial statements.
Financial highlights (Continued)
* Not annualized.
** Unaudited.
† For the period January 2, 2008 (commencement of operations) to July 31, 2008.
a Total return assumes dividend reinvestment and does not reflect the effect of sales charges.
b Includes amounts paid through expense offset arrangements (Note 2).
c Reflects an involuntary contractual expense limitation in effect during the period. As a result of such limitation, the expenses of each class reflect a reduction of the following amounts (Note 2):
| |
| | Percentage of |
| | average net assets |
|
| July 31, 2009 | 0.02% |
|
| July 31, 2008 | 0.01 |
|
| July 31, 2007 | <0.01 |
|
| July 31, 2006 | <0.01 |
|
| July 31, 2005 | 0.02 |
|
d Amount represents less than $0.01 per share.
The accompanying notes are an integral part of these financial statements.
52
Notes to financial statements 1/31/10 (Unaudited)
Note 1: Significant accounting policies
Putnam Tax-Free High Yield Fund (the “fund”) is a series of Putnam Tax-Free Income Trust (the “trust”) , a Massachusetts business trust, which is registered under the Investment Company Act of 1940, as amended, as a diversified, open end management investment company. The fund pursues its objective of seeking high current income exempt from federal income tax by investing primarily in high-yielding, lower-rated tax-exempt securities constituting a portfolio that Putnam Investment Management, LLC (“Putnam Management”), the fund’s manager, an indirect wholly-owned subsidiary of Putnam Investments, LLC, believes does not involve undue risk to income or principal. The fund invests in higher yielding, lower rated bonds that may have a higher rate of default.
The fund offers class A, class B, class C, class M and class Y shares. Class A and class M shares are sold with a maximum front-end sales charge of 4.00% and 3.25%, respectively, and generally do not pay a contingent deferred sales charge. Class B shares, which convert to class A shares after approximately eight years, do not pay a front-end sales charge and are subject to a contingent deferred sales charge, if those shares are redeemed within six years of purchase. Class C shares have a one-year 1.00% contingent deferred sales charge and do not convert to class A shares. The expenses for class A, class B, class C, and class M shares may differ based on the distribution fee of each class, which is identified in Note 2. Class Y shares, which are sold at net asset value, are generally subject to the same expenses as class A, class B, class C, and class M shares, but do not bear a distribution fee. Class Y shares are generally only available to corpo rate and institutional clients and clients in other approved programs.
A 1.00% redemption fee may apply on any shares that are redeemed (either by selling or exchanging into another fund) within 7 days of purchase. The redemption fee is accounted for as an addition to paid-in-capital.
Investment income, realized and unrealized gains and losses and expenses of the fund are borne pro-rata based on the relative net assets of each class to the total net assets of the fund, except that each class bears expenses unique to that class (including the distribution fees applicable to such classes). Each class votes as a class only with respect to its own distribution plan or other matters on which a class vote is required by law or determined by the Trustees. If the fund were liquidated, shares of each class would receive their pro-rata share of the net assets of the fund. In addition, the Trustees declare separate dividends on each class of shares.
In the normal course of business, the fund enters into contracts that may include agreements to indemnify another party under given circumstances. The fund’s maximum exposure under these arrangements is unknown as this would involve future claims that may be, but have not yet been, made against the fund. However, the fund’s management team expects the risk of material loss to be remote.
The following is a summary of significant accounting policies consistently followed by the fund in the preparation of its financial statements. The preparation of financial statements is in conformity with accounting principles generally accepted in the United States of America and requires management to make estimates and assumptions that affect the reported amounts of assets and liabilities in the financial statements and the reported amounts of increases and decreases in net assets from operations during the reporting period. Actual results could differ from those estimates. Subsequent events after the Statement of assets and liabilities date through the date that the financial statements were issued, March 11, 2010, have been evaluated in the preparation of the financial statements.
A) Security valuation Tax-exempt bonds and notes are generally valued on the basis of valuations provided by an independent pricing service approved by the Trustees. Such services use information with respect to transactions in bonds, quotations from bond dealers, market transactions in comparable securities and various relationships between securities in determining value. Certain investments, including certain restricted and illiquid securities and derivatives are also valued at fair value following procedures approved by the Trustees. Such valuations and procedures are reviewed periodically by the Trustees. The fair value of securities is generally determined as the amount that the fund could reasonably expect to realize from an orderly disposition of such securities over a reasonable period of time. By its nature, a fair value price is a good faith estimate of the value of a security in a current sale and does not reflect an actual market price, which may be different by a material amount.
Investments for which market quotations are readily available are valued at the last reported sales price on their principal exchange, or official closing price for certain markets. If no sales are reported — as in the case of some securities traded over-the-counter — a security is valued at its last reported bid price. Market quotations are not considered to be readily available for certain debt obligations; such investments are valued on the basis of valuations furnished by an independent pricing service approved by the Trustees
53
or dealers selected by Putnam Management. Such services or dealers determine valuations for normal institutional-size trading units of such securities using methods based on market transactions for comparable securities and various relationships, generally recognized by institutional traders, between securities (which considers such factors as security prices, yields, maturities and ratings). Many securities markets and exchanges outside the U.S. close prior to the close of the New York Stock Exchange and therefore the closing prices for securities in such markets or on such exchanges may not fully reflect events that occur after such close but before the close of the New York Stock Exchange. Accordingly, on certain days, the fund will fair value foreign equity securities taking into account multiple factors, including movements in the U.S. securities markets. The number of days on which fair value prices will be used will depend on market activity and it is possible that fair value prices will be used by the fund to a significant extent. Securities quoted in foreign currencies, if any, are translated into U.S. dollars at the current exchange rate. To the extent a pricing service or dealer is unable to value a security or provides a valuation that Putnam Management does not believe accurately reflects the security’s fair value, the security will be valued at fair value by Putnam Management.
B) Security transactions and related investment income Security transactions are recorded on the trade date (the date the order to buy or sell is executed). Gains or losses on securities sold are determined on the identified cost basis. Interest income is recorded on the accrual basis. Non-cash dividends, if any, are recorded at the fair market value of the securities received. Dividends representing a return of capital or capital gains, if any, are reflected as a reduction of cost and/or as a realized gain. All premiums/discounts are amortized/accreted on a yield-to-maturity basis. The premium in excess of the call price, if any, is amortized to the call date; thereafter, any remaining premium is amortized to maturity.
C) Total return swap contracts The fund may enter into total return swap contracts, which are arrangements to exchange a market linked return for a periodic payment, both based on a notional principal amount to help enhance the funds return and manage the fund’s exposure to credit risk. To the extent that the total return of the security, index or other financial measure underlying the transaction exceeds or falls short of the offsetting interest rate obligation, the fund will receive a payment from or make a payment to the counterparty. Total return swap contracts are marked to market daily based upon quotations from market makers and the change, if any, is recorded as an unrealized gain or loss. Payments received or made are recorded as realized gains or losses. Certain total return swap contracts may include extended effective dates. Payments related to these swap co ntracts are accrued based on the terms of the contract. The fund could be exposed to credit or market risk due to unfavorable changes in the fluctuation of interest rates or in the price of the underlying security or index, the possibility that there is no liquid market for these agreements or that the counterparty may default on its obligation to perform. The fund’s maximum risk of loss from counterparty risk is the fair value of the contract. This risk may be mitigated by having a master netting arrangement between the fund and the counterparty. Risk of loss may exceed amounts recognized on the Statement of assets and liabilities. Total return swap contracts outstanding at period end, if any, are listed after the fund’s portfolio. The fund had an average notional amount of approximately $15,700,000 on Total return swap contracts for the period ended January 31, 2010.
D) Master agreements The fund is a party to ISDA (International Swap and Derivatives Association, Inc.) Master Agreements (“Master Agreements”) with certain counterparties that govern over the counter derivative and foreign exchange contracts entered into from time to time. The Master Agreements may contain provisions regarding, among other things, the parties’ general obligations, representations, agreements, collateral requirements, events of default and early termination. With respect to certain counterparties, in accordance with the terms of the Master Agreements, collateral posted to the fund is held in a segregated account by the fund’s custodian and with respect to those amounts which can be sold or repledged, are presented in the fund’s portfolio. Collateral pledged by the fund is segregated by the fund’s custodian and identified in the fund’s portfolio. Collateral ca n be in the form of cash or debt securities issued by the U.S. Government or related agencies or other securities as agreed to by the fund and the applicable counterparty. Collateral requirements are determined based on the fund’s net position with each counterparty. Termination events applicable to the fund may occur upon a decline in the fund’s net assets below a specified threshold over a certain period of time. Termination events applicable to counterparties may occur upon a decline in the counterparty’s long-term and short-term credit ratings below a specified level. In each case, upon occurrence, the other party may elect to terminate early and cause settlement of all derivative and foreign exchange contracts outstanding, including the payment of any losses and costs resulting from such early termination, as reasonably determined by the terminating party. Any decision by one or more of the fund’s counterparties to elect early termination could impact the fund’s future derivativ e activity.
At January 31, 2010, the fund had net liability position of $36,490 on derivative contracts subject to the Master
54
Agreements. Collateral posted by the fund totaled no monies.
E) Federal taxes It is the policy of the fund to distribute all of its income within the prescribed time and otherwise comply with the provisions of the Internal Revenue Code of 1986, as amended (the “Code”), applicable to regulated investment companies. It is also the intention of the fund to distribute an amount sufficient to avoid imposition of any excise tax under Section 4982 of the Code. The fund is subject to the provisions of Accounting Standards Codification ASC 740 Income Taxes (“ASC 740”). ASC 740 sets forth a minimum threshold for financial statement recognition of the benefit of a tax position taken or expected to be taken in a tax return. The fund did not have any unrecognized tax benefits in the accompanying financial statements. No provision has been made for federal taxes on income, capital gains or unrealized appreciation on securities held nor for excise tax on income and capital gains. Each of the fund’s federal tax returns for the prior three fiscal years remains subject to examination by the Internal Revenue Service and state departments of revenue.
At July 31, 2009, the fund had a capital loss carryover of $172,316,983 available to the extent allowed by the Code to offset future net capital gain, if any. The amounts of the carryovers and the expiration dates are:
| | |
| Loss Carryover | Expiration | |
| |
| $1,466,587 | July 31, 2010 | |
| |
| 24,697,987 | July 31, 2011 | |
| |
| 87,799,907 | July 31, 2012 | |
| |
| 36,670,752 | July 31, 2013 | |
| |
| 4,270,473 | July 31, 2016 | |
| |
| 17,411,277 | July 31, 2017 | |
| |
Pursuant to federal income tax regulations applicable to regulated investment companies, the fund has elected to defer to its fiscal year ending July 31, 2010 approximately $37,177,511 of losses recognized during the period November 1, 2008 to July 31, 2009, a portion of which could be subject to limitations imposed by the Code.
The aggregate identified cost on a tax basis is $1,026,241,448, resulting in gross unrealized appreciation and depreciation of $37,504,984 and $98,921,933, respectively, or net unrealized depreciation of $61,416,949.
F) Distributions to shareholders Income dividends are recorded daily by the fund and are paid monthly. Distributions from capital gains, if any, are recorded on the ex-dividend date and paid at least annually. The amount and character of income and gains to be distributed are determined in accordance with income tax regulations which may differ from generally accepted accounting principles. Dividend sources are estimated at the time of declaration. Actual results may vary. Any non-taxable return of capital cannot be determined until final tax calculations are completed after the end of the fund’s fiscal year. Reclassifications are made to the fund’s capital accounts to reflect income and gains available for distribution (or available capital loss carryovers) under income tax regulations.
G) Expenses of the trust Expenses directly charged or attributable to any fund will be paid from the assets of that fund. Generally, expenses of the trust will be allocated among and charged to the assets of each fund on a basis that the Trustees deem fair and equitable, which may be based on the relative assets of each fund or the nature of the services performed and relative applicability to each fund.
Note 2: Management fee, administrative
services and other transactions
Effective January 1, 2010, the fund pays Putnam Management a management fee (based on the fund’s average net assets and computed and paid monthly) at annual rates that may vary based on the average of the aggregate net assets of most open-end funds, as defined in the fund’s management contract, sponsored by Putnam Management. Such annual rates may vary as follows: 0.63% of the first $5 billion of average net assets, 0.58% of the next $5 billion, 0.53% of the next $10 billion, 0.48% of the next $10 billion, 0.43% of the next $50 billion, 0.41% of the next $50 billion, and 0.40% of the next $100 billion and 0.395% thereafter.
Prior to January 1, 2010, the fund paid Putnam Management for management and investment advisory services monthly based on the average net assets of the fund. Such fee was based on the lesser of (i) an annual rate of 0.50% of the average net asset value of the fund or (ii) the following annual rates: 0.60% of the first $500 million of average net assets, 0.50% of the next $500 million, 0.45% of the next $500 million, 0.40% of the next $5 billion, 0.375% of the next $5 billion, 0.355% of the next $5 billion, and 0.34% of the next $5 billion and 0.33% thereafter.
Effective August 1, 2009 through July 31, 2010, Putnam Management has also contractually agreed to reimburse the fund’s expenses to the extent necessary to limit the cumulative expenses of the fund, exclusive of brokerage, interest, taxes, investment-related expenses, extraordinary expenses and payments under the fund’s investor servicing contract, investment management contract and distribution plans, on a fiscal year-to-date basis (or from August 1, 2009 through the fund’s next fiscal year end, as applicable), to an annual rate of 0.20% of the fund’s average net assets over such fiscal year-to-date period (or since August 1, 2009, as applicable). During the period
55
ended January 31, 2010, the fund’s expenses were not reduced as a result of this limit.
Putnam Management has contractually agreed, from August 1, 2009 through July 31, 2010, to limit the management fee for the fund to an annual rate of 0.50% of the fund’s average net assets. During the period ended January 31, 2010, the fund’s expenses were not reduced as a result of this limit.
Effective November 30, 2009, Putnam Investments Limited (“PIL”), an affiliate of Putnam Management, is authorized by the Trustees to manage a separate portion of the assets of the fund as determined by Putnam Management from time to time. Putnam Management pays a quarterly sub-management fee to PIL for its services at an annual rate of 0.40% of the average net assets of the portion of the fund managed by PIL.
The fund reimburses Putnam Management an allocated amount for the compensation and related expenses of certain officers of the fund and their staff who provide administrative services to the fund. The aggregate amount of all such reimbursements is determined annually by the Trustees.
Custodial functions for the fund’s assets are provided by State Street Bank and Trust Company (“State Street”). Custody fees are based on the fund’s asset level, the number of its security holdings and transaction volumes.
Putnam Investor Services, Inc., an affiliate of Putnam Management, provided investor servicing agent functions to the fund. Putnam Investor Services, Inc. received fees for investor servicing, subject to certain limitations, based on the fund’s retail asset level, the number of shareholder accounts in the fund and the level of defined contribution plan assets in the fund. The amounts incurred for investor servicing agent functions during the period ended January 31, 2010 are included in Investor servicing fees in the Statement of operations.
The fund has entered into expense offset arrangements with Putnam Investor Services, Inc. and State Street whereby Putnam Investor Services, Inc.’s and State Street’s fees are reduced by credits allowed on cash balances. For the six months ended January 31, 2010, the fund’s expenses were reduced by $1,629 under the expense offset arrangements.
Each independent Trustee of the fund receives an annual Trustee fee, of which $702, as a quarterly retainer, has been allocated to the fund, and an additional fee for each Trustees meeting attended. Trustees receive additional fees for attendance at certain committee meetings and industry seminars and for certain compliance-related matters. Trustees also are reimbursed for expenses they incur relating to their services as Trustees.
The fund has adopted a Trustee Fee Deferral Plan (the “Deferral Plan”) which allows the Trustees to defer the receipt of all or a portion of Trustees fees payable on or after July 1, 1995. The deferred fees remain invested in certain Putnam funds until distribution in accordance with the Deferral Plan.
The fund has adopted an unfunded noncontributory defined benefit pension plan (the “Pension Plan”) covering all Trustees of the fund who have served as a Trustee for at least five years and were first elected prior to 2004. Benefits under the Pension Plan are equal to 50% of the Trustee’s average annual attendance and retainer fees for the three years ended December 31, 2005. The retirement benefit is payable during a Trustee’s lifetime, beginning the year following retirement, for the number of years of service through December 31, 2006. Pension expense for the fund is included in Trustee compensation and expenses in the Statement of operations. Accrued pension liability is included in Payable for Trustee compensation and expenses in the Statement of assets and liabilities. The Trustees have terminated the Pension Plan with respect to any Trustee first elected after 2003.
The fund has adopted distribution plans (the “Plans”) with respect to its class A, class B, class C and class M shares pursuant to Rule 12b-1 under the Investment Company Act of 1940. The purpose of the Plans is to compensate Putnam Retail Management Limited Partnership, a wholly-owned subsidiary of Putnam Investments, LLC and Putnam Retail Management GP, Inc., for services provided and expenses incurred in distributing shares of the fund. The Plans provide for payments by the fund to Putnam Retail Management Limited Partnership at an annual rate of up to 0.35%, 1.00%, 1.00% and 1.00% of the average net assets attributable to class A, class B, class C and class M shares, respectively. The Trustees have approved payment by the fund at the annual rate of 0.85%, 1.00% and 0.50% of the average net assets for class B, class C and class M shares, respectively. For class A shares, the annual payment rate will equal the weighted average of (i) 0.20% on the net assets of the fund attributable to class A shares purchased and paid for prior to March 21, 2005 and (ii) 0.25% on all other net assets of the fund attributable to class A shares.
For the six months ended January 31, 2010, Putnam Retail Management Limited Partnership, acting as underwriter, received net commissions of $60,741 and $1,480 from the sale of class A and class M shares, respectively, and received $7,701 and $5,221 in contingent deferred sales charges from redemptions of class B and class C shares, respectively.
A deferred sales charge of up to 1.00% is assessed on certain redemptions of class A shares that were purchased without an initial sales charge as part of an investment of $1 million or more. For the period ended
56
January 31, 2010, Putnam Retail Management Limited Partnership, acting as underwriter, received no monies on class A redemptions.
Note 3: Purchases and sales of securities
During the period ended January 31, 2010, cost of purchases and proceeds from sales of investment securities other than short-term investments aggregated $134,071,105 and $125,562,725, respectively. There were no purchases or sales of U.S. government securities.
Note 4: Capital shares
At January 31, 2010, there was an unlimited number of shares of beneficial interest authorized. Transactions in capital shares were as follows:
| | | | |
| | Six months ended 1/31/10 | Year ended 7/31/09 |
|
| Class A | Shares | Amount | Shares | Amount |
|
| Shares sold | 3,380,212 | $37,840,436 | 5,967,236 | $60,913,928 |
|
| Shares issued in connection with | | | | |
| reinvestment of distributions | 1,363,785 | 15,364,006 | 3,289,454 | 33,141,995 |
|
| | 4,743,997 | 53,204,442 | 9,256,690 | 94,055,923 |
|
| Shares repurchased | (5,353,398) | (60,170,773) | (19,562,612) | (196,726,799) |
|
| Net decrease | (609,401) | $(6,966,331) | (10,305,922) | $(102,670,876) |
|
| |
| | Six months ended 1/31/10 | Year ended 7/31/09 |
|
| Class B | Shares | Amount | Shares | Amount |
|
| Shares sold | 135,734 | $1,516,918 | 200,129 | $2,007,978 |
|
| Shares issued in connection with | | | | |
| reinvestment of distributions | 38,075 | 429,380 | 131,211 | 1,325,397 |
|
| | 173,809 | 1,946,298 | 331,340 | 3,333,375 |
|
| Shares repurchased | (852,045) | (9,542,293) | (2,538,180) | (25,635,053) |
|
| Net decrease | (678,236) | $(7,595,995) | (2,206,840) | $(22,301,678) |
|
| |
| | Six months ended 1/31/10 | Year ended 7/31/09 |
|
| Class C | Shares | Amount | Shares | Amount |
|
| Shares sold | 644,210 | $7,286,912 | 795,795 | $8,059,770 |
|
| Shares issued in connection with | | | | |
| reinvestment of distributions | 29,598 | 334,186 | 51,935 | 523,196 |
|
| | 673,808 | 7,621,098 | 847,730 | 8,582,966 |
|
| Shares repurchased | (206,815) | (2,324,745) | (420,916) | (4,167,284) |
|
| Net increase | 466,993 | $5,296,353 | 426,814 | $4,415,682 |
|
| |
| | Six months ended 1/31/10 | Year ended 7/31/09 |
|
| Class M | Shares | Amount | Shares | Amount |
|
| Shares sold | 79,486 | $894,434 | 48,251 | $490,925 |
|
| Shares issued in connection with | | | | |
| reinvestment of distributions | 15,472 | 174,376 | 36,135 | 364,080 |
|
| | 94,958 | 1,068,810 | 84,386 | 855,005 |
|
| Shares repurchased | (36,239) | (405,901) | (190,957) | (1,861,739) |
|
| Net increase (decrease) | 58,719 | $662,909 | (106,571) | $(1,006,734) |
|
57
| | | | |
| | Six months ended 1/31/10 | Year ended 7/31/09 |
|
| Class Y | Shares | Amount | Shares | Amount |
|
| Shares sold | 4,049,928 | $45,946,730 | 425,074 | $4,348,236 |
|
| Shares issued in connection with | | | | |
| reinvestment of distributions | 5,122 | 57,140 | 4,146 | 41,866 |
|
| | 4,055,050 | 46,003,870 | 429,220 | 4,390,102 |
|
| Shares repurchased | (1,955,110) | (22,378,895) | (25,929) | (263,722) |
|
| Net increase | 2,099,940 | $23,624,975 | 403,291 | $4,126,380 |
|
Note 5: Summary of derivative activity
The following is a summary of the market values of derivative instruments as of January 31, 2010:
Market values of derivative instruments as of
January 31, 2010
| | | |
| | |
| | | Liability derivatives | |
|
| Derivatives not | Statement of | |
| accounted for as | assets and | |
| hedging instruments | liabilities | |
| under ASC 815 | location | Market value |
|
| Interest rate | | |
| contracts | Payables | $36,490 |
|
| Total | | $36,490 |
|
The following is a summary of realized and unrealized gains or losses of derivative instruments on the Statement of operations for the period ended January 31, 2010 (see Note 1):
Amount of Realized Gain or (Loss) on
Derivatives Recognized in Income
| | |
| Derivatives not | | |
| accounted for as | | |
| hedging instruments | | |
| under ASC 815 | Swaps | Total |
|
| Interest rate contracts | $895,000 | $895,000 |
|
| Total | $895,000 | $895,000 |
|
Change in Unrealized Appreciation or
(Depreciation) on Derivatives Recognized
in Income
| | |
| Derivatives not | | |
| accounted for as | | |
| hedging instruments | | |
| under ASC 815 | Swaps | Total |
|
| Interest rate contracts | $49,510 | $49,510 |
|
| Total | $49,510 | $49,510 |
|
Note 6: Regulatory matters and litigation
In late 2003 and 2004, Putnam Management settled charges brought by the Securities and Exchange Commission (the “SEC”) and the Massachusetts Securities Division in connection with excessive short-term trading in Putnam funds. Distribution of payments from Putnam Management to certain open-end Putnam funds and their shareholders is expected to be completed in the next several months. These allegations and related matters have served as the general basis for certain lawsuits, including purported class action lawsuits against Putnam Management and, in a limited number of cases, some Putnam funds. Putnam Management believes that these lawsuits will have no material adverse effect on the funds or on Putnam Management’s ability to provide investment management services. In addition, Putnam Management has agreed to bear any costs incurred by the Putnam funds as a result of these matters.
Note 7: Market and credit risk
In the normal course of business, the fund trades financial instruments and enters into financial transactions where risk of potential loss exists due to changes in the market (market risk) or failure of the contracting party to the transaction to perform (credit risk). The fund may be exposed to additional credit risk that an institution or other entity with which the fund has unsettled or open transactions will default.
58
Shareholder meeting results (Unaudited)
November 19, 2009 meeting
At the meeting, each of the nominees for Trustees was elected with all funds of the Trust voting together as a single class, as follows:
| | |
| | Votes for | Votes withheld |
|
| Ravi Akhoury | 87,629,571 | 3,211,141 |
|
| Jameson A. Baxter | 87,685,078 | 3,155,634 |
|
| Charles B. Curtis | 87,636,865 | 3,203,847 |
|
| Robert J. Darretta | 87,718,101 | 3,122,611 |
|
| Myra R. Drucker | 87,676,864 | 3,163,848 |
|
| John A. Hill | 87,663,405 | 3,177,307 |
|
| Paul L. Joskow | 87,703,115 | 3,137,597 |
|
| Elizabeth T. Kennan | 87,603,596 | 3,237,116 |
|
| Kenneth R. Leibler | 87,728,152 | 3,112,560 |
|
| Robert E. Patterson | 87,682,188 | 3,158,524 |
|
| George Putnam, III | 87,703,624 | 3,137,088 |
|
| Robert L. Reynolds | 87,732,364 | 3,108,348 |
|
| W. Thomas Stephens | 87,702,525 | 3,138,187 |
|
| Richard B. Worley | 87,699,031 | 3,141,681 |
|
A proposal to approve a new management contract between the fund and Putnam Management was approved as follows:
| | | |
| Votes | Votes | | Broker |
| for | against | Abstentions | non-votes |
|
| 43,068,086 | 1,899,351 | 2,000,378 | 23,189,980 |
|
All tabulations are rounded to the nearest whole number.
59
Services for shareholders
Investor services
Systematic investment plan Tell us how much you wish to invest regularly — weekly, semimonthly, or monthly — and the amount you choose will be transferred automatically from your checking or savings account. There’s no additional fee for this service, and you can suspend it at any time. This plan may be a great way to save for college expenses or to plan for your retirement.
Please note that regular investing does not guarantee a profit or protect against loss in a declining market. Before arranging a systematic investment plan, consider your financial ability to continue making purchases in periods when prices are low.
Systematic exchange You can make regular transfers from one Putnam fund to another Putnam fund. There are no additional fees for this service, and you can cancel or change your options at any time.
Dividends PLUS You can choose to have the dividend distributions from one of your Putnam funds automatically reinvested in another Putnam fund at no additional charge.
Free exchange privilege You can exchange money between Putnam funds free of charge, as long as they are the same class of shares. A signature guarantee is required if you are exchanging more than $500,000.
Reinstatement privilege If you’ve sold Putnam shares or received a check for a dividend or capital gain, you may reinvest the proceeds with Putnam within 90 days of the transaction and they will be reinvested at the fund’s current net asset value — with no sales charge. However, reinstatement of class B shares may have special tax consequences. Ask your financial or tax representative for details.
Check-writing service You have ready access to many Putnam accounts. It’s as simple as writing a check, and there are no special fees or service charges. For more information about the check-writing service, call Putnam or visit our Web site.
Dollar cost averaging When you’re investing for long-term goals, it’s time, not timing, that counts. Investing on a systematic basis is a better strategy than trying to figure out when the markets will go up or down. This means investing the same amount of money regularly over a long period. This method of investing is called dollar cost averaging. When a fund’s share price declines, your investment dollars buy more shares at lower prices. When it increases, they buy fewer shares. Over time, you will pay a lower average price per share.
For more information
Visit the Individual Investors section at putnam.com A secure section of our Web site contains complete information on your account, including balances and transactions, updated daily. You may also conduct transactions, such as exchanges, additional investments, and address changes. Log on today to get your password.
Call us toll free at 1-800-225-1581 Ask a helpful Putnam representative or your financial advisor for details about any of these or other services, or see your prospectus.
60
Fund information
Founded over 70 years ago, Putnam Investments was built around the concept that a balance between risk and reward is the hallmark of a well-rounded financial program. We manage over 100 funds across income, value, blend, growth, asset allocation, absolute return, and global sector categories.
| | |
| Investment Manager | Officers | Robert R. Leveille |
| Putnam Investment | Robert L. Reynolds | Vice President and |
| Management, LLC | President | Chief Compliance Officer |
| One Post Office Square | | |
| Boston, MA 02109 | Jonathan S. Horwitz | Mark C. Trenchard |
| | Executive Vice President, | Vice President and |
| Marketing Services | Principal Executive Officer, | BSA Compliance Officer |
| Putnam Retail Management | Treasurer and | |
| One Post Office Square | Compliance Liaison | Judith Cohen |
| Boston, MA 02109 | | Vice President, Clerk and |
| | Charles E. Porter | Assistant Treasurer |
| Custodian | Senior Advisor to the Trustees | |
| State Street Bank and Trust | | Wanda M. McManus |
| Company | Steven D. Krichmar | Vice President, Senior Associate |
| | Vice President and | Treasurer and Assistant Clerk |
| Legal Counsel | Principal Financial Officer | |
| Ropes & Gray LLP | | Nancy E. Florek |
| | Janet C. Smith | Vice President, Assistant Clerk, |
| Trustees | Vice President, Principal | Assistant Treasurer and |
| John A. Hill, Chairman | Accounting Officer and | Proxy Manager |
| Jameson A. Baxter, | Assistant Treasurer | |
| Vice Chairman | | |
| Ravi Akhoury | Susan G. Malloy | |
| Charles B. Curtis | Vice President and | |
| Robert J. Darretta | Assistant Treasurer | |
| Myra R. Drucker | | |
| Paul L. Joskow | Beth S. Mazor | |
| Elizabeth T. Kennan | Vice President | |
| Kenneth R. Leibler | | |
| Robert E. Patterson | James P. Pappas | |
| George Putnam, III | Vice President | |
| Robert L. Reynolds | | |
| W. Thomas Stephens | Francis J. McNamara, III | |
| Richard B. Worley | Vice President and | |
| Chief Legal Officer | |
This report is for the information of shareholders of Putnam Tax-Free High Yield Fund. It may also be used as sales literature when preceded or accompanied by the current prospectus, the most recent copy of Putnam’s Quarterly Performance Summary, and Putnam’s Quarterly Ranking Summary. For more recent performance, please visit putnam.com. Investors should carefully consider the investment objective, risks, charges, and expenses of a fund, which are described in its prospectus. For this and other information or to request a prospectus, or a summary prospectus if available, call 1-800-225-1581 toll free. Please read the prospectus carefully before investing. The fund’s Statement of Additional Information contains additional information about the fund’s Trustees and is available without charge upon request by calling 1-800-225-1581.

Item 2. Code of Ethics:
Not applicable
Item 3. Audit Committee Financial Expert:
Not applicable
Item 4. Principal Accountant Fees and Services:
Not applicable
Item 5. Audit Committee of Listed Registrants
Not applicable
Item 6. Schedule of Investments:
The registrant’s schedule of investments in unaffiliated issuers is included in the report to shareholders in Item 1 above.
Item 7. Disclosure of Proxy Voting Policies and Procedures For Closed-End Management
Investment Companies:
Not applicable
Item 8. Portfolio Managers of Closed-End Investment Companies
Not Applicable
Item 9. Purchases of Equity Securities by Closed-End Management Investment Companies and
Affiliated Purchasers:
Not applicable
Item 10. Submission of Matters to a Vote of Security Holders:
Not applicable
Item 11. Controls and Procedures:
(a) The registrant's principal executive officer and principal financial officer have concluded, based on their evaluation of the effectiveness of the design and operation of the registrant's disclosure controls and procedures as of a date within 90 days of the filing date of this report, that the design and operation of such procedures are generally effective to provide reasonable assurance that information required to be disclosed by the registrant in this report is recorded, processed, summarized and reported within the time periods specified in the Commission's rules and forms.
(b) Changes in internal control over financial reporting: Not applicable
Item 12. Exhibits:
(a)(1) Not applicable
(a)(2) Separate certifications for the principal executive officer and principal financial officer of the registrant as required by Rule 30a-2(a) under the Investment Company Act of 1940, as amended, are filed herewith.
(b) The certifications required by Rule 30a-2(b) under the Investment Company Act of 1940, as amended, are filed herewith.
Putnam Tax Free Income Trust
By (Signature and Title):
/s/Janet C. Smith
Janet C. Smith
Principal Accounting Officer
Date: March 31, 2010
Pursuant to the requirements of the Securities Exchange Act of 1934 and the Investment Company Act of 1940, this report has been signed below by the following persons on behalf of the registrant and in the capacities and on the dates indicated.
By (Signature and Title):
/s/Jonathan S. Horwitz
Jonathan S. Horwitz
Principal Executive Officer
Date: March 31, 2010
By (Signature and Title):
/s/Steven D. Krichmar
Steven D. Krichmar
Principal Financial Officer
Date: March 31, 2010