Exhibit 99.2
Management’s Discussion
and Analysis
FOR THE THREE MONTHS ENDED MARCH 31, 2020
| | | | | | | | |
| | Management Discussion and Analysis For the three months ended March 31, 2020 and 2019 |
| | | | | |
| TABLE OF CONTENTS | |
| |
| |
| |
| Highlights | |
| Operating Performance | |
| 2020 Annual Operating Outlook | |
| Project Development Update | |
| Overview of Financial Results | |
| |
| |
| |
| |
| |
| |
| Acquisition of Tahoe | |
| |
| |
| |
| |
| Disclosure Controls and Procedures and Technical Information | |
| Cautionary Note | |
| | | | | | | | |
| PAN AMERICAN SILVER CORP. | 2 |
| | | | | | | | |
| | Management Discussion and Analysis For the three months ended March 31, 2020 and 2019 |
MANAGEMENT’S DISCUSSION AND ANALYSIS OF FINANCIAL CONDITION AND RESULTS OF OPERATIONS
May 6, 2020
INTRODUCTION
This Management’s Discussion and Analysis (“MD&A”) is intended to help the reader understand the significant factors that influence the performance of Pan American Silver Corp. and its subsidiaries (collectively “Pan American”, “we”, “us”, “our” or the “Company”) and such factors that may affect its future performance. This MD&A should be read in conjunction with the Company’s audited consolidated financial statements for the year ended December 31, 2019 (the "2019 Financial Statements"), and the related notes contained therein, and the unaudited condensed interim consolidated financial statements for the three months ended March 31, 2020 (the “Q1 2020 Financial Statements”), and the related notes contained therein. All amounts in this MD&A, the 2019 Financial Statements, and the Q1 2020 Financial Statements are expressed in United States dollars (“USD”), unless identified otherwise. The Company reports its financial position, results of operations and cash flows in accordance with International Financial Reporting Standards (“IFRS”), as issued by the International Accounting Standards Board. Pan American’s significant accounting policies are set out in Note 3 of the 2019 Financial Statements.
This MD&A refers to various non-Generally Accepted Accounting Principles (“non-GAAP”) measures, such as “all-in sustaining costs per ounce sold", “cash costs per ounce sold”, “adjusted earnings” and “basic adjusted earnings per share”, "total debt", "capital", and “working capital", which are used by the Company to manage and evaluate operating performance at each of the Company’s mines and are widely reported in the mining industry as benchmarks for performance, but do not have standardized meaning under IFRS. To facilitate a better understanding of these non-GAAP measures as calculated by the Company, additional information has been provided in this MD&A. Please refer to the section of this MD&A entitled “Alternative Performance (Non-GAAP) Measures” for a detailed description of “all-in sustaining cost per ounce sold”, “cash costs per ounce sold”, “adjusted earnings“ and “basic adjusted earnings per share”, "total debt", "capital", and “working capital” as well as details of the Company’s by-product credits and a reconciliation, where appropriate, of these measures to the Q1 2020 Financial Statements.
Any reference to “Cash Costs” in this MD&A should be understood to mean cash costs per ounce of silver or gold sold, net of by-product credits. Any reference to “AISC” in this MD&A should be understood to mean all-in sustaining costs per silver or gold ounce sold, net of by-product credits.
Except for historical information contained in this MD&A, the following disclosures are forward-looking statements within the meaning of the U.S. Private Securities Litigation Reform Act of 1995 and forward-looking information within the meaning of applicable Canadian provincial securities laws or are future oriented financial information and as such are based on an assumed set of economic conditions and courses of action. Please refer to the cautionary note regarding forward-looking statements and information at the back of this MD&A and the “Risks Related to Pan American’s Business” contained in the Company’s most recent Annual Information Form on file with the Canadian provincial securities regulatory authorities and Form 40-F on file with the U.S. Securities and Exchange Commission (the “SEC”). Additional information about Pan American and its business activities, including its Annual Information Form, is available on SEDAR at www.sedar.com
| | | | | | | | |
| PAN AMERICAN SILVER CORP. | 3 |
| | | | | | | | |
| | Management Discussion and Analysis For the three months ended March 31, 2020 and 2019 |
CORE BUSINESS AND STRATEGY
Pan American engages in silver and gold mining and related activities, including exploration, mine development, extraction, processing, refining and reclamation. The Company owns and operates silver and gold mines located in Peru, Mexico, Argentina, Bolivia, and Canada. We also own the Escobal mine in Guatemala that is currently not operating. In addition, the Company is exploring for new silver deposits and opportunities throughout the Americas. The Company is listed on the Toronto Stock Exchange (Symbol: PAAS) and on the Nasdaq Global Select Market (“NASDAQ”) in New York (Symbol: PAAS).
Pan American’s vision is to be the world’s premier silver mining company, with a reputation for excellence in discovery, engineering, innovation and sustainable development. To achieve this vision, we base our business on the following strategy:
•Generate sustainable profits and superior returns on investments through the safe, efficient and environmentally sound development and operation of our assets.
•Constantly replace and grow our mineable reserves and resources through targeted near-mine exploration and global business development.
•Foster positive long-term relationships with our employees, shareholders, communities and local governments through open and honest communication and ethical and sustainable business practices.
•Continually search for opportunities to upgrade and improve the quality of our assets, both internally and through acquisition.
•Encourage our employees to be innovative, responsive and entrepreneurial throughout our entire organization.
To execute this strategy, Pan American has assembled a sector-leading team of mining professionals with a depth of knowledge and experience in all aspects of our business, which enables the Company to confidently advance early stage projects through construction and into operation.
Pan American is determined to conduct its business in a responsible and sustainable manner. Caring for the environment in which we operate, contributing to the long-term development of our host communities and ensuring that our employees can work in a safe and secure manner are core values at Pan American. We are committed to maintaining positive relations with our employees, the local communities and the government agencies, all of whom we view as partners in our enterprise.
| | | | | | | | |
| PAN AMERICAN SILVER CORP. | 4 |
| | | | | | | | |
| | Management Discussion and Analysis For the three months ended March 31, 2020 and 2019 |
Q1 2020 HIGHLIGHTS
Operations
•Coronavirus disease ("COVID-19") pandemic impact
Pan American suspended normal operations at its mines in Mexico, Peru, Argentina and Bolivia in the latter part of March, 2020 in order to comply with mandatory national quarantines imposed in response to the COVID-19 pandemic. At this time, we cannot determine when the quarantines will be lifted or what allowances may be made to allow operating activities to resume. The Company is conducting care and maintenance at the suspended operations to sustain strict safety and environmental systems, and to ensure operational readiness when the government restrictions are lifted and Pan American determines that it is safe to resume operations. In the meantime, our focus is on supporting our people and communities. In addition to our ongoing corporate social responsibility programs, to date, we have donated approximately $2.0 million in food and hygiene supplies, as well as provided health care support to our local communities. As the situation regarding the COVID-19 pandemic is uncertain, Pan American is unable to determine the impact on its 2020 operating guidance. Further discussion on the operational status of each mine, and the impact on 2020 annual guidance is included in the "Q1 2020 Operating Performance" section of this MD&A under the sub-heading "Impact of COVID-19". There are currently no confirmed cases of COVID-19 at any of Pan American's operations or offices.
•Silver production of 5.56 million ounces
Consolidated silver production for the three months ended March 31, 2020 (" Q1 2020") of 5.56 million ounces was 9% lower than the 6.13 million ounces produced in the three months ended March 31, 2019 ("Q1 2019"), primarily reflecting the suspension of the Huaron and Morococha operations in mid-March 2020 and encountering a failure of an underground ventilation circuit affecting high-grade ore mining rates at the La Colorada mine.
•Gold production of 156.1 thousand ounces
Consolidated gold production for Q1 2020 of 156.1 thousand ounces was 94% higher than the 80.5 thousand ounces produced in Q1 2019, primarily reflecting increased production over a full three-month period from the Shahuindo, La Arena, and Bell Creek and Timmins (together "Timmins") mines that were acquired on February 22, 2019 (the "Gold Segment mines").
•Base metal production
Zinc production in Q1 2020 was 13.1 thousand tonnes, 22% less than Q1 2019 production. Lead production of 5.3 thousand tonnes was 19% less than Q1 2019 production. Copper production of 1.9 thousand tonnes was comparable to Q1 2019 production.
Financial
•Revenue and net income
Revenue in Q1 2020 of $358.4 million was up 41% from Q1 2019, primarily due to increased gold sales from the Gold Segment mines, and higher realized gold prices.
A net loss of $77.2 million ($0.37 basic loss per share) was recorded for Q1 2020 compared with net earnings of $3.3 million ($0.02 basic earnings per share) in Q1 2019. The quarter-over-quarter decrease in earnings mainly reflects:
(i) a $34.3 million increase in mine operating earnings from the higher Gold Segment revenues, partially offset by an increase in the related Gold Segment cost of sales;
(ii) a $45.4 million increase in tax expense, primarily driven by non-cash devaluations of certain tax assets denominated in foreign currencies as a result of foreign currency exchange rate changes;
(iii) a $40.6 million increase in investment losses, reflecting non-cash unrealized losses recognized in the quarter on the fair-value of certain equity investments owned by the Company;
| | | | | | | | |
| PAN AMERICAN SILVER CORP. | 5 |
| | | | | | | | |
| | Management Discussion and Analysis For the three months ended March 31, 2020 and 2019 |
(iv) a $12.6 million increase in care and maintenance costs, attributable to the temporary suspension of operations in March, 2020 as a result of the COVID-19 pandemic; and
(v) a $9.2 million increase in losses on foreign currency contracts due to the devaluation of the Mexican peso, the Peruvian sole and the Canadian dollar.
Adjusted loss: of $7.6 million, ($0.04 adjusted loss per share) was recorded in Q1 2020 compared to the revised Q1 2019 adjusted earnings of $4.5 million, ($0.03 basic adjusted earnings per share). Included in Q1 2020 adjusted earnings are non-cash, unrealized, mark-to-market driven investment losses of $28.3 million, representing a $0.13 loss per share compared to an $11.3 million gain, representing $0.06 earnings per share in Q1 2019.
Cash flow from operations: in Q1 2020 totaled $114.1 million, $127.0 million more than the $12.9 million consumed in Q1 2019.
•Liquidity and working capital position
As at March 31, 2020, the Company had cash and short-term investment balances of $239.2 million, working capital of $488.0 million, and $240.0 million available under its $500.0 million revolving credit facility (the "Credit Facility"). Total debt of $299.2 million was related to the drawn portion of the Credit Facility ($260.0 million) and to the financing of lease liabilities.
•Q1 2020 Cash Costs per ounce sold
•Silver Segment Cash Costs were $8.18 per silver ounce sold.
•Gold Segment Cash Costs were $757 per gold ounce sold.
•Q1 2020 All-In Sustaining Costs per ounce sold (“AISC”)
•Silver Segment AISC were $15.26 per silver ounce sold.
•Gold Segment AISC were $969 per gold ounce sold.
•Consolidated AISC per silver ounce sold, including by-product credits from the Gold Segment gold production, were $3.49 per silver ounce sold.
Cash Costs and AISC are non-GAAP measure, please refer to the “Alternative Performance (Non-GAAP) Measures” section of this MD&A for a detailed reconciliation of these measure to the Q1 2020 Financial Statements.
OPERATING PERFORMANCE
Impact of COVID-19
•Operational Status
As a result of the COVID-19 pandemic, the Company has suspended or reduced normal operations in order to comply with mandatory national quarantines, and to protect the health and safety of our personnel and communities in a manner consistent with those recommended by the local health authorities, best management practices, and the World Health Organization.
The following section describes the current operating status of our mines in each of the countries where we operate.
Argentina
On March 20, 2020 the federal government of Argentina imposed mandatory social distancing on its population and stated that it would be in effect until April 12, 2020. The initial social distancing mandate included a suspension order for non-essential businesses including mining; however, mining was subsequently deemed an essential business by the federal government on April 3, 2020. In addition, the federal government subsequently extended the mandate to April 26, 2020 and then again to May 10, 2020, while mining continues to be classified as an essential business subject to strict sanitary protocols and restricted personnel deployments. The Company temporarily suspended its Manantial Espejo operations and assigned a work-from-home directive for its
| | | | | | | | |
| PAN AMERICAN SILVER CORP. | 6 |
| | | | | | | | |
| | Management Discussion and Analysis For the three months ended March 31, 2020 and 2019 |
administrative Argentine personnel on March 23, 2020 in order to comply with this mandatory social distancing measure. The Company is currently restarting the Manantial Espejo operation at reduced capacity and is developing plans for restarting the COSE and Joaquin operations in the second quarter of 2020 ("Q2 2020").
Bolivia
On March 22, 2020, the Bolivian government announced a national quarantine and stated that it would be in effect until March 31, 2020. The quarantine was subsequently extended to April 15, 2020, and then to April 30, 2020. The Company halted all supply deliveries and personnel transport to its San Vicente mine, and subsequently suspended operations in an orderly manner, assigning a work-from-home directive for its administrative personnel and support offices in compliance with the national quarantine. Following the Bolivian government’s stated intention for partially lifting of the National Quarantine on May 7, 2020 under certain return-to-work constraints, the Company is preparing detailed plans and sanitary protocols in accordance with the anticipated constraints that would enable a possible consideration for restarting of the San Vicente operation at reduced capacity rates with limited personnel during Q2-2020.
Canada
The Timmins mines continued to operate throughout Q1 2020 while adopting health and safety protocols consistent with those recommended by the local health authorities, best management practices and the World Health Organization. The Company also adopted a work-from-home initiative for its Ontario, Canada administrative personnel and began to voluntarily reduce mine and plant throughput by approximately 10% in order to further enhance physical distancing throughout the operations, offices, and personnel transport systems.
Mexico
On March 17, 2020, Mexico’s Senate announced the need to retire the vulnerable population from conducting activities that could increase the possibility of becoming infected from the COVID-19 virus. On March 19, 2020 the Company began to demobilize vulnerable workers, assigned a work-from-home directive for its administrative personnel and reduced the operational workforce at its mines in Mexico by approximately 30% in order to increase physical distancing throughout the operations, offices, and personnel transport systems. On March 31, 2020, Mexico's Ministry of Health issued a National Agreement for the immediate suspension of non-essential activities until April 30, 2020, which has since been extended to May 30, 2020 leaving open the possibility to restart non-essential businesses later in May 2020 at reduced capacity in municipalities where active COVID-19 infections are considered to be low or non-existent. The Company temporarily suspended its La Colorada and Dolores operations in order to comply with this National Agreement.
The Company continues to recirculate solutions through the Dolores heap in order to maintain full process solution containment and expects that gold and silver production will continue at a decreasing rate during the temporary suspension. The Company is closely monitoring the published COVID-19 infection rates in the municipalities surrounding our mine sites and is developing detailed plans and health and safety protocols for potentially restarting our Mexican mines during Q2-2020 at reduced capacities, pending local authorizations and acceptance.
| | | | | | | | |
| PAN AMERICAN SILVER CORP. | 7 |
| | | | | | | | |
| | Management Discussion and Analysis For the three months ended March 31, 2020 and 2019 |
Peru
On March 15, 2020, the government of Peru declared a National State of Emergency requiring a 15-day national quarantine, which was subsequently extended to April 13, 2020, then to April 26, 2020, and the latest extension to May 10, 2020. The Company assigned a work-from-home directive for its administrative personnel and temporarily suspended operations at its four Peruvian mines: Shahuindo, La Arena, Huaron and Morococha in order to comply with the State of Emergency declaration.
The Company continues to recirculate solutions at the Shahuindo and La Arena heaps in order to maintain appropriate process solution containment and expects that gold production will continue at a decreasing rate during the temporary suspension.
•2020 Annual Operating Outlook
Given the uncertainties regarding the progression of the COVID-19 pandemic in our operating jurisdictions and the resulting government measures and restrictions, particularly the duration of operating suspensions, the Company is currently unable to determine the impact on its 2020 annual production, Cash Costs, AISC and capital expenditure forecasts, as provided in the 2019 annual MD&A dated March 12, 2020 (collectively the "2020 Guidance"). The Company expects to update the 2020 Guidance once sufficient clarity on the operating circumstances becomes available.
•Financial Impact
Due to the dynamic nature of the pandemic, the financial impact of COVID-19 on the Company is indeterminable at this time, and the revenues and profit margins reflected in the Q1 2020 financial results will not be sustained in the near-term while normal course business is disrupted. However, as described in the "Liquidity and Capital Position" section of this MD&A, based on the Company's financial position, the results of a management performed COVID-19 disruption and liquidity analysis, and the Company's access to capital, management believes that the Company’s liquidity is sufficient to satisfy our anticipated 2020 working capital requirements, fund currently planned capital expenditures, and to discharge liabilities as they come due. In order to provide additional flexibility and liquidity, Pan American has deferred certain capital expenditures and exploration spending. As well, Pan American's senior management team has voluntarily agreed to a salary reduction until the situation normalizes, including a 20% reduction for the executive management team.
Financial and other COVID-19 related risks are further discussed in the "Risks and Uncertainties" section of this MD&A.
Silver and Gold Production
The following table provides silver and gold production at each of Pan American’s operations for Q1 2020 as compared to Q1 2019. Production in Q1 2019 for the Shahuindo, La Arena, and Timmins mines represent production subsequent to the February 22, 2019 closing date of the acquisition, as described in the "Acquisition of Tahoe" section of this MD&A. Each operation’s production variances are further discussed in the “Individual Mine Performance” section of this MD&A.
| | | | | | | | |
| PAN AMERICAN SILVER CORP. | 8 |
| | | | | | | | |
| | Management Discussion and Analysis For the three months ended March 31, 2020 and 2019 |
| | | | | | | | | | | | | | | | | | | | | | | | |
| | | | | Silver Production
(ounces ‘000s) | | | | | Gold Production
(ounces ‘000s) | |
| | | | | Three months ended
March 31, | | | | | Three months ended
March 31, | |
| | | | | 2020 | 2019 | | | | 2020 | 2019 |
| Operations: | | | | | | | | | | |
| La Colorada | | | | 1,593 | | 1,990 | | | | | 1.1 | | 1.0 | |
| Dolores | | | | 1,230 | | 1,112 | | | | | 27.1 | | 30.0 | |
| Huaron | | | | 771 | | 937 | | | | | 0.2 | | 0.2 | |
Morococha(1) | | | | 457 | | 697 | | | | | 0.3 | | 0.6 | |
San Vicente(2) | | | | 738 | | 851 | | | | | 0.1 | | 0.1 | |
| Manantial Espejo | | | | 695 | | 524 | | | | | 6.5 | | 4.9 | |
Shahuindo(3) | | | | 64 | | 10 | | | | | 48.9 | | 14.5 | |
La Arena(3) | | | | 8 | | 3 | | | | | 28.7 | | 14.7 | |
Timmins (3) | | | | 5 | | 2 | | | | | 43.3 | | 14.4 | |
Total (4) | | | | 5,561 | | 6,125 | | | | | 156.1 | | 80.5 | |
(1)Morococha data represents Pan American's 92.3% interest in the mine's production.
(2)San Vicente data represents Pan American's 95.0% interest in the mine's production.
(3)Reflects production results subsequent to the February 22, 2019 closing date of the Acquisition as described in the "Acquisition of Tahoe" section of this MD&A.
(4)Totals may not add due to rounding.
Silver Production
Consolidated silver production in Q1 2020 of 5.56 million ounces was 9% lower than the 6.13 million ounces produced in Q1 2019. La Colorada, Morococha, Huaron, and San Vicente drove the decrease, which was only partially offset by increased production at Dolores and Manantial Espejo.
Gold Production
Consolidated gold production in Q1 2020 of 156.1 thousand ounces was 94% higher than the 80.5 thousand ounces produced in Q1 2019. The increase was attributable to a full quarter of production from the Gold Segment mines, which together produced 120.9 thousand ounces in Q1 2020.
Base Metal Production
The following table provides the Company’s base metal production for Q1 2020 and Q1 2019:
| | | | | | | | | | |
| | | | Base Metal Production | |
| | | Three months ended
March 31, | |
| | | 2020 | 2019 |
| Zinc – kt | | | 13.1 | | 16.8 | |
| Lead – kt | | | 5.3 | | 6.5 | |
| Copper – kt | | | 1.9 | | 2.0 | |
Zinc, lead and copper production in Q1 2020 were each lower than Q1 2019 production, driven by a combination of lower grades and throughput, which were largely the result of the COVID-19 mine suspensions.
Cash Cost and AISC
The quantification of both Cash Costs and AISC measures is described in detail, and where appropriate reconciled to the Q1 2020 Financial Statements, in the "Alternative (Non-GAAP) Performance Measures" section of this MD&A.
The following table reflects the Cash Costs and AISC net of by-product credits at each of Pan American’s operations for Q1 2020 as compared to Q1 2019. Please note that cost measures for Q1 2019 for the Gold Segment mines represent results from February 22, 2019 to March 31, 2019:
| | | | | | | | |
| PAN AMERICAN SILVER CORP. | 9 |
| | | | | | | | |
| | Management Discussion and Analysis For the three months ended March 31, 2020 and 2019 |
| | | | | | | | | | | | | | | | | | | | | | |
| | | Cash Costs(1) ($ per ounce) | | | | AISC(1) ($ per ounce) | | | | | |
| | | Three months ended
March 31, | | | | Three months ended
March 31, | | | | | |
| | | 2020 | 2019 | | | 2020 | 2019 | | | | |
| La Colorada | | | 7.23 | | 2.16 | | | | 9.98 | | 3.37 | | | | | |
| Dolores | | | 0.07 | | 3.34 | | | | 23.29 | | 26.45 | | | | | |
| Huaron | | | 7.95 | | 4.38 | | | | 10.56 | | 8.54 | | | | | |
| Morococha | | | 12.29 | | (1.01) | | | | 20.23 | | 2.20 | | | | | |
| San Vicente | | | 14.71 | | 10.25 | | | | 17.08 | | 11.20 | | | | | |
| Manantial Espejo | | | 13.69 | | 27.53 | | | | 14.85 | | 27.94 | | | | | |
Silver Segment Consolidated (2) | | | 8.18 | | 5.46 | | | | 15.26 | | 10.83 | | | | | |
| Shahuindo | | | 617 | | 616 | | | | 775 | | 657 | | | | | |
| La Arena | | | 725 | | 642 | | | | 1,212 | | 1,263 | | | | | |
Timmins(3) | | | 945 | | 999 | | | | 1,051 | | 1,137 | | | | | |
Gold Segment Consolidated (2)(3) | | | 757 | | 777 | | | | 969 | | 1,091 | | | | | |
Consolidated metrics per silver ounce sold(3)(4): | | | | | | | | | | | | |
| All Operations | | | | | | | | | 3.49 | | 10.51 | | | | | |
| All Operations before NRV inventory adjustments | | | | | | | | | 1.41 | | 9.18 | | | | | |
(1)Cash Costs and AISC are non-GAAP measures. Please refer to the section “Alternative Performance (Non-GAAP) Measures” of this MD&A for a detailed description of these measures and where appropriate a reconciliation of the measure to the Q1 2020 Financial Statements.
(2)Silver segment Cash Costs and AISC are calculated net of credits for realized revenues from all metals other than silver ("silver segment by-product credits"), and are calculated per ounce of silver sold. Gold segment Cash Costs and AISC are calculated net of credits for realized silver revenues ("gold segment by-product credits"), and are calculated per ounce of gold sold. Consolidated AISC is based on total silver ounces sold and are net of by-product credits from all metals other than silver ("silver basis consolidated by-product credits").
(3)2019 Timmins, Gold Segment, and Consolidated AISC were adjusted to reflect amounts recast, and presented, for the three months ended March 31, 2019 as if Timmins had not been classified as held for sale.
(4)Consolidated silver basis total is calculated per silver ounce sold with total gold revenues included within by-product credits. G&A costs are included in the consolidated AISC, but not allocated in calculating AISC for each operation.
Cash Costs
Silver Segment Cash Costs per ounce in Q1 2020 were $8.18 per ounce, $2.72 higher than in Q1 2019. The increase is largely the result of: lower by-product credits, driven mainly by lower realized base metal prices; increased concentrate smelting and refining charges; and higher direct operating costs per ounce in part due to lower silver grades; partially offset by decreased royalty costs.
Gold Segment Cash Costs in Q1 2020 of $757 per ounce were comparable to those in Q1 2019.
AISC
Silver Segment AISC for Q1 2020 of $15.26 was $4.43 higher than Q1 2019 AISC. The quarter-over-quarter variance was largely due to the same factors impacting the Silver Segment Cash Costs described above as well as increased sustaining capital per ounce and higher cost-increasing net realizable value ("NRV") adjustments to inventories at Manantial Espejo, Morococha, and Dolores.
Gold Segment AISC for Q1 2020 of $969 was $122 lower than Q1 2019 AISC, largely reflecting heap leach sequencing leading to a higher ratio of ounces produced to ounces places, mainly at La Arena.
Consolidated AISC, based on total silver ounces sold net of by-product credits from all metals other than silver, for Q1 2020 were $3.49 per ounce, a $7.02 decrease from Q1 2019. The quarter-over-quarter variance was largely the result of increased gold by-product credits from increased gold production and prices, partially offset by increased negative NRV adjustments and higher silver segment direct operating costs per ounce.
Individual Mine Performance
An analysis of performance at each operation in Q1 2020 compared with Q1 2019 follows. The project capital amounts invested in Q1 2020 are further discussed in the "Project Development Update" section of this MD&A.
| | | | | | | | |
| PAN AMERICAN SILVER CORP. | 10 |
| | | | | | | | |
| | Management Discussion and Analysis For the three months ended March 31, 2020 and 2019 |
La Colorada mine
| | | | | | | | | | |
| | | | Three months ended
March 31, | |
| | | | 2020 | 2019 |
| Tonnes milled – kt | | | 174.2 | | 186.8 | |
| Average silver grade – grams per tonne | | | 312 | | 362 | |
| Average zinc grade - % | | | 2.70 | | 3.08 | |
| Average lead grade - % | | | 1.34 | | 1.60 | |
| Production: | | | | |
| Silver – koz | | | 1,593 | | 1,990 | |
| Gold – koz | | | 1.08 | | 1.01 | |
| Zinc – kt | | | 4.09 | | 5.10 | |
| Lead – kt | | | 1.98 | | 2.62 | |
| | | | |
Cash Costs - $ per ounce1) | | | 7.23 | | 2.16 | |
| | | | |
Sustaining capital - $ thousands(2) | | | 4,753 | | 2,212 | |
| | | | |
| Care and maintenance costs - $ thousands | | | — | | — | |
| | | | |
AISC - $ per ounce(1) | | | 9.98 | | 3.37 | |
| | | | |
| Payable silver sold - koz | | | 1,839 | | 2,047 | |
(1)Cash Costs and AISC are non-GAAP measures. Please refer to the “Alternative Performance (Non-GAAP) Measures” section of this MD&A for a detailed reconciliation of these measures to cost of sales.
(2)Sustaining capital expenditures exclude $3.6 million in investing activity cash outflows for Q1 2020 (Q1 2019: $1.6 million) related to investment capital incurred on the La Colorada projects, as disclosed in the “Project Development Update” section of this MD&A.
Q1 2020 vs. Q1 2019
Production:
•Silver: 20% decrease, primarily due to a collapse of one of the primary mine ventilation raises in the fourth quarter of 2019, which necessitated adjusting the short-term mine plan while we progress on the replacement and upgrade of the primary ventilation infrastructure in the eastern portion of the mine. In Q1 2020 these mine plan adjustments resulted in redeploying personnel and equipment away from the impacted area of the mine, which resulted in lower head grades. In addition, throughput was impacted by the COVID-19 mitigation measures that began on March 19, 2020.
•By-products: 20% and 24% decreases in zinc and lead production, respectively, also due to the lower throughput and grades described above.
Cash Costs: the $5.07 per ounce increase was the result of the lower production, resulting in higher unit operating costs per ounce, as well as lower by-product credits from lower base metal prices, and higher treatment and refining charges.
Sustaining Capital: primarily related to tailings storage facility expenditures, underground infrastructure investments, including developing short and long term ventilation raises, equipment replacements and rehabilitations, lease payments for equipment and near-mine exploration activities. Sustaining capital expenditures increased relative to the comparable quarter primary due to the tailings storage facility upgrade and increased investment in underground infrastructure to replace the failed ventilation raise. The work in progress on the primary ventilation circuit includes new raises that are being bored between the surface and the 345 and 528 levels. As there are areas of weak rock that resulted in the previous failure, the area is being pre-supported by grouting before the raises are bored. The interim circuit that will allow full operations to resume in the eastern part of the mine will be in place in Q3 2020, with the long term infrastructure being completed in the first half of 2021.
AISC: the increase was due to the same factors affecting Cash Costs, in addition to the higher sustaining capital.
| | | | | | | | |
| PAN AMERICAN SILVER CORP. | 11 |
| | | | | | | | |
| | Management Discussion and Analysis For the three months ended March 31, 2020 and 2019 |
Dolores mine
| | | | | | | | | | |
| | | | Three months ended
March 31, | |
| | | | 2020 | 2019 |
| Tonnes placed – kt | | | 1,905.0 | | 1,840.4 | |
| Average silver grade – grams per tonne | | | 38 | | 28 | |
| Average gold grade – grams per tonne | | | 0.60 | | 0.50 | |
| Production: | | | | |
| Silver – koz | | | 1,230 | | 1,112 | |
| Gold – koz | | | 27.1 | | 30.0 | |
| | | | |
Cash Costs - $ per ounce(1) | | | 0.07 | | 3.34 | |
| | | | |
Sustaining capital - $ thousands(2) | | | 15,124 | | 13,067 | |
| | | | |
| Care and maintenances costs - $ thousands | | | — | | — | |
| | | | |
AISC - $ per ounce(1) | | | 23.29 | | 26.45 | |
| | | | |
| Payable silver sold - koz | | | 1,150 | | 1,011 | |
(1)Cash Costs and AISC are non-GAAP measures. Please refer to the “Alternative Performance (Non-GAAP) Measures” section of this MD&A for a detailed reconciliation of these measures to cost of sales.
(2)Sustaining capital expenditures exclude $nil in investing activity cash outflows for Q1 2020 (Q1 2019: $0.4 million) related to investment capital incurred on the Mexico projects, as disclosed in the “Project Development Update” section of this MD&A.
Q1 2020 vs. Q1 2019
Production:
•Silver: 11% higher due to improved grades from mine sequencing and higher throughput. Higher throughput was achieved despite being partially impacted by the COVID-19 mitigation measures that began on March 19, 2020.
•Gold: 10% lower as higher throughput and grades were more than offset by a decrease in the ratio of ounces recovered to stacked, reflecting the extended timing required to pass leach solutions through deeper portions that exist in this stage of the heap in addition to benefits gained from the re-leaching of some partially leached pad 1 ores during Q1 2019.
Cash Costs: decreased $3.27 per ounce primarily due to lower operating costs partially offset by decreased by-product credits from lower gold production outweighing higher gold prices.
Sustaining Capital: comprised mainly of pre-stripping expenditures and leach pad expansions.
AISC: the decrease was due to the same factors affecting Cash Costs.
| | | | | | | | |
| PAN AMERICAN SILVER CORP. | 12 |
| | | | | | | | |
| | Management Discussion and Analysis For the three months ended March 31, 2020 and 2019 |
Huaron mine
| | | | | | | | | | |
| | | | Three months ended
March 31, | |
| | | | 2020 | 2019 |
| Tonnes milled - kt | | | 203.2 | | 240.0 | |
| Average silver grade – grams per tonne | | | 143 | | 144 | |
| Average zinc grade - % | | | 2.54 | | 2.27 | |
| Average lead grade - % | | | 1.28 | | 1.18 | |
| Average copper grade - % | | | 0.89 | | 0.72 | |
| Production: | | | | |
| Silver – koz | | | 771 | | 937 | |
| Gold – koz | | | 0.16 | | 0.24 | |
| Zinc – kt | | | 3.85 | | 4.13 | |
| Lead – kt | | | 1.96 | | 2.09 | |
| Copper – kt | | | 1.37 | | 1.29 | |
| | | | |
Cash Costs - $ per ounce(1) | | | 7.95 | | 4.38 | |
| | | | |
| Sustaining capital - $ thousands | | | 1,413 | | 3,218 | |
| | | | |
| Care and maintenance costs - $ thousands | | | 2,254 | | — | |
| | | | |
AISC-$ per ounce(1) | | | 10.56 | | 8.54 | |
| | | | |
| Payable silver sold – koz | | | 596 | | 819 | |
(1)Cash Costs and AISC are non-GAAP measures. Please refer to the “Alternative Performance (Non-GAAP) Measures” section of this MD&A for a detailed reconciliation of these measures to cost of sales.
Q1 2020 vs. Q1 2019
Production:
•Silver: 18% lower, primarily due to lower throughput related to COVID-19 mine suspensions that commenced on March 16, 2020.
•By-products: zinc and lead production were both 7% lower, while copper production was 6% higher, primarily as a result of mine sequencing into higher grade copper zones partially offset by the COVID-19 related mine suspension.
Cash Costs: which exclude care and maintenance costs during the COVID 19 suspension, increased $3.57 per ounce primarily due to higher direct unit operating costs per ounce and higher treatment and refining charges.
Sustaining Capital: related primarily to payments for equipment leases, near-mine exploration, and equipment replacements and refurbishments. The decrease from Q1 2019 was primarily related to the reduction in expenditures in the tailings storage facility construction project and the mine deepening project, both of which were effectively completed in 2019.
AISC: increased by $2.02 per ounce, as the same factors causing the increased cash costs were partially offset by lower sustaining capital expenditures.
| | | | | | | | |
| PAN AMERICAN SILVER CORP. | 13 |
| | | | | | | | |
| | Management Discussion and Analysis For the three months ended March 31, 2020 and 2019 |
Morococha mine(1)
| | | | | | | | | | |
| | | | Three months ended
March 31, | |
| | | | 2020 | 2019 |
| Tonnes milled – kt | | | 138.9 | | 169.4 | |
| Average silver grade – grams per tonne | | | 116 | | 145 | |
| Average zinc grade - % | | | 3.39 | | 4.01 | |
| Average lead grade - % | | | 1.19 | | 1.32 | |
| Average copper grade - % | | | 0.41 | | 0.50 | |
| Production: | | | | |
| Silver – koz | | | 457 | | 697 | |
| Gold – koz | | | 0.28 | | 0.63 | |
| Zinc – kt | | | 4.12 | | 5.78 | |
| Lead – kt | | | 1.33 | | 1.77 | |
| Copper – kt | | | 0.37 | | 0.56 | |
| | | | |
Cash Costs - $ per ounce(2) | | | 12.29 | | (1.01) | |
| | | | |
Sustaining capital (100%) - $ thousands(3) | | | 2,236 | | 1,935 | |
| | | | |
| Care and maintenance costs - $ thousands | | | 2,203 | | — | |
| | | | |
AISC - $ per ounce(2) | | | 20.23 | | 2.20 | |
| | | | |
| Payable silver sold (100%) - koz | | | 408 | | 691 | |
(1)Production figures are for Pan American’s 92.3% share only, unless otherwise noted.
(2)Cash Costs and AISC are non-GAAP measures. Please refer to the “Alternative Performance (Non-GAAP) Measures” section of this MD&A for a detailed reconciliation of these measures to cost of sales.
(3)Sustaining capital expenditures exclude $0.4 million of project capital cash outflows for Q1 2020 (Q1 2019: $0.1 million) related to Morococha plant studies, and is included in Other Projects as disclosed in the “Project Development Update” section of this MD&A.
Q1 2020 vs. Q1 2019
Production:
•Silver: 34% lower due to lower grades from mine sequencing and lower throughput related to COVID-19 mine suspension.
•By-products: zinc, lead and copper production decreased by 29%, 25% and 35%, respectively, for the same reasons described for silver production.
Cash Costs: which exclude care and maintenance costs during the COVID 19 suspension, were $13.30 per ounce higher, primarily due to the lower grades resulting in higher unit per ounce costs, as well as higher treatment and refining charges.
Sustaining Capital: primarily related to near-mine exploration, mine infrastructure upgrades, and equipment and facility leases.
AISC: $18.03 per ounce higher due to the same factors affecting quarter-over-quarter cash costs, together with higher sustaining capital and an NRV write-down in the current period.
| | | | | | | | |
| PAN AMERICAN SILVER CORP. | 14 |
| | | | | | | | |
| | Management Discussion and Analysis For the three months ended March 31, 2020 and 2019 |
San Vicente mine(1)
| | | | | | | | | | |
| | | | Three months ended
March 31, | |
| | | | 2020 | 2019 |
| Tonnes milled – kt | | | 82.6 | | 83.3 | |
| Average silver grade – grams per tonne | | | 302 | | 354 | |
| Average zinc grade - % | | | 1.59 | | 2.64 | |
| Average lead grade - % | | | — | | 0.07 | |
| Average copper grade - % | | | 0.26 | | 0.32 |
| Production: | | | | |
| Silver – koz | | | 738 | | 851 | |
| Gold – koz | | | 0.10 | | 0.09 | |
| Zinc – kt | | | 1.05 | | 1.79 | |
| Lead – kt | | | — | | 0.04 | |
| Copper – kt | | | 0.18 | | 0.19 | |
| | | | |
Cash Costs - $ per ounce (2) | | | 14.71 | | 10.25 | |
| | | | |
| Sustaining capital (100%) - $ thousands | | | 1,925 | | 990 | |
| | | | |
| Care and maintenance costs - $ thousands | | | — | | — | |
| | | | |
AISC - $ per ounce(2) | | | 17.08 | | 11.20 | |
| | | | |
| Payable silver sold (100%) - koz | | | 840 | | 1,121 | |
(1)Production figures are for Pan American’s 95.0% share only, unless otherwise noted.
(2)Cash Costs and AISC are non-GAAP measures. Please refer to the “Alternative Performance (Non-GAAP) Measures” section of this MD&A for a detailed reconciliation of these measures to cost of sales.
Q1 2020 vs. Q1 2019
Production:
•Silver: 13% lower primarily due to lower grades from mine sequencing, mining of narrower vein structures and reduced throughput related to the COVID-19 mine suspension that began on March 25, 2020.
•By-products: the 42% decrease in zinc production was the result of lower grades from mine sequencing, whereas copper production remained consistent with Q1 2019.
Cash Costs: $4.46 per ounce higher due to the lower production described above, lower base metal prices, and higher treatment and refining charges.
Sustaining Capital: Q1 2020 expenditures primarily related to mine equipment replacements and rehabilitation, and near-mine exploration.
AISC: the $5.88 per ounce increase was due primarily to the same factors that increased cash costs, in addition to higher sustaining capital in the period.
| | | | | | | | |
| PAN AMERICAN SILVER CORP. | 15 |
| | | | | | | | |
| | Management Discussion and Analysis For the three months ended March 31, 2020 and 2019 |
Manantial Espejo mine
| | | | | | | | | | |
| | | | Three months ended
March 31, | |
| | | | 2020 | 2019 |
| Tonnes milled - kt | | | 161.1 | | 188.6 | |
| Average silver grade – grams per tonne | | | 152 | | 103 | |
| Average gold grade – grams per tonne | | | 1.33 | | 0.92 | |
| Production: | | | | |
| Silver – koz | | | 695 | | 524 | |
| Gold – koz | | | 6.45 | | 4.93 | |
| | | | |
Cash Costs - $ per ounce(1) | | | 13.69 | | 27.53 | |
| | | | |
Sustaining capital - $ thousands(2) | | | 716 | | 721 | |
| | | | |
| Care and maintenance costs - $ thousands | | | 1,973 | | — | |
| | | | |
AISC - $ per ounce(1) | | | 14.85 | | 27.94 | |
| | | | |
| Payable silver sold - koz | | | 730 | | 402 | |
(1)Cash Costs and AISC are non-GAAP measures. Please refer to the “Alternative Performance (Non-GAAP) Measures” section of this MD&A for a detailed reconciliation of these measures to cost of sales.
(2)Sustaining capital expenditures exclude $3.5 million of project capital cash outflows for Q1 2020 (Q1 2019: $5.9 million) related to the development of the Joaquin and COSE projects as disclosed in the “Project Development Update” section of this MD&A.
Q1 2020 vs. Q1 2019
Production:
•Silver and Gold: increased 33% and 31%, respectively, primarily from better grades in the current mine sequence in addition to a modest contribution of ore from the Joaquin property as production from that operation started to ramp up. There was no ore production from COSE during the quarter. The grade increases were partially offset by reduced throughput caused due to the COVID-19 related mine suspension that began on March 23, 2020.
Cash Costs: which exclude care and maintenance costs during the COVID 19 suspension, were a decrease of $13.84 per ounce, primarily as a result of higher production combined with higher gold prices, more than offsetting the increased operating costs, which reflect inflationary pressures in the second half of 2019 and the unexpected stability in the Argentine Peso.
Sustaining Capital: Q1 2020 expenditures were primarily related to lease payments for diesel generators on site.
AISC: the $13.09 per ounce decrease was driven by the same factors affecting Cash Costs.
| | | | | | | | |
| PAN AMERICAN SILVER CORP. | 16 |
| | | | | | | | |
| | Management Discussion and Analysis For the three months ended March 31, 2020 and 2019 |
Shahuindo mine
| | | | | | | | | | |
| | | | Three months ended
March 31, | |
| | | | 2020 | 2019(1) |
| Tonnes milled - kt | | | 2,932.1 | | 1,237.9 | |
| Average silver grade – grams per tonne | | | 9 | | 8 | |
| Average gold grade – grams per tonne | | | 0.62 | | 0.68 | |
| Production: | | | | |
| Silver – koz | | | 64 | | 10 | |
| Gold – koz | | | 48.91 | | 14.46 | |
| | | | |
Cash Costs - $ per ounce(2) | | | 617 | | 616 | |
| | | | |
Sustaining capital - $ thousands(3) | | | 7,844 | | 230 | |
| | | | |
| Care and maintenance costs - $ thousands | | | 857 | | — | |
| | | | |
AISC $ per ounce(2) | | | 775 | | 657 | |
| | | | |
| Payable gold sold | | | 52,002 | | 8,600 | |
(1)The Shahuindo mine was acquired on February 22, 2019, and as such the Q1 2019 financial and operating results of the mine has only been reported, and included in the Company's consolidated results, from this date forward.
(2)Cash Costs and AISC are non-GAAP measures. Please refer to the “Alternative Performance (Non-GAAP) Measures” section of this MD&A for a detailed reconciliation of these measures to cost of sales.
(3)Sustaining capital expenditures exclude $0.1 million of project capital cash outflows for Q1 2020 (Q1 2019: $nil) related to the payment of final invoices for the crushing and agglomeration plant completed by Tahoe, and is included in Other Projects as disclosed in the “Project Development Update” section of this MD&A.
Q1 2020 vs. Q1 2019
Production:
•Gold: a 238% increase due to accounting for the full quarter of operations, less intense rain in northern Peru than the prior year, and improvements in the haulage of ore and waste from the pit, which enabled higher mining rates compared to Q1 2019, partially offset by the impact of the COVID-19 suspensions beginning on March 16, 2020. Leaching has continued on the pads subsequent to the COVID-19 suspension.
Cash Costs: which exclude care and maintenance costs during the COVID 19 suspension, were consistent with the comparable period.
Sustaining Capital: Q1 2020 expenditures primarily related to leach pad expansions, near-mine exploration activities, and payments for leased mining equipment.
AISC: increased by $118 per ounce, primarily as a result of the increased sustaining capital per ounce.
| | | | | | | | |
| PAN AMERICAN SILVER CORP. | 17 |
| | | | | | | | |
| | Management Discussion and Analysis For the three months ended March 31, 2020 and 2019 |
La Arena mine
| | | | | | | | | | |
| | | | Three months ended
March 31, | |
| | | | 2020 | 2019(1) |
| Tonnes milled - kt | | | 1,048.4 | | 619.3 | |
| Average silver grade – grams per tonne | | | 1 | | — | |
| Average gold grade – grams per tonne | | | 0.35 | | 0.50 | |
| Production: | | | | |
| Silver – koz | | | 8 | | 3 | |
| Gold – koz | | | 28.70 | | 14.72 | |
| | | | |
Cash Costs - $ per ounce(2) | | | 725 | | 642 | |
| | | | |
| Sustaining capital - $ thousands | | | 12,698 | | 10,456 | |
| | | | |
| Care and maintenance costs - $ thousands | | | 823 | | — | |
| | | | |
AISC - $ per ounce(2) | | | 1,212 | | 1,263 | |
| | | | |
| Payable gold sold | | | 26,662 | | 17,135 | |
(1)The La Arena mine was acquired on February 22, 2019, and as such, the Q1 2019 financial and operating results of the mine has only been reported, and included in the Company's consolidated results, from this date forward.
(2)Cash Costs and AISC are non-GAAP measures. Please refer to the “Alternative Performance (Non-GAAP) Measures” section of this MD&A for a detailed reconciliation of these measures to cost of sales.
Q1 2020 vs. Q1 2019
Production:
•Gold: 95% increase from a longer period of operations, as well as a higher ratio of ounces recovered to contained ounces stacked, primarily due to the timing of leach kinetics from the elevated stacking rates in Q4 2019. Higher throughput was partially offset by the aforementioned suspension of mining and stacking activities due to COVID-19, that commenced on March 16, 2020. Leaching has continued on the pads subsequent to the COVID-19 suspension.
Cash Costs: which exclude care and maintenance costs during the COVID 19 suspension, increased by $83 per ounce from higher operating costs related to a lower capitalization rate of deferred stripping activities on account of mine sequencing.
Sustaining Capital: Q1 2020 expenditures were primarily related to capitalized deferred stripping and the waste storage facility expansions.
AISC: decreased by $51 per ounce as higher cash costs were more than offset by lower sustaining capital per ounce, primarily from the completion of leach pad expansions in 2019.
| | | | | | | | |
| PAN AMERICAN SILVER CORP. | 18 |
| | | | | | | | |
| | Management Discussion and Analysis For the three months ended March 31, 2020 and 2019 |
Timmins mines
| | | | | | | | | | |
| | | | Three months ended
March 31, | |
| | | | 2020 | 2019(1) |
| Tonnes milled - kt | | | 444.6 | | 181.7 | |
| Average silver grade – grams per tonne | | | — | | — | |
| Average gold grade – grams per tonne | | | 3.00 | | 2.79 | |
| Production: | | | | |
| Silver – koz | | | 5 | | 2 | |
| Gold – koz | | | 43.31 | | 14.38 | |
| | | | |
Cash Costs - $ per ounce(2) | | | 945 | | 999 | |
| | | | |
Sustaining capital - $ thousands(3) | | | 3,498 | | 1,913 | |
| | | | |
| Care and maintenance costs - $ thousands | | | — | | — | |
| | | | |
AISC - $ per ounce(2) | | | 1,051 | | 1,137 | |
| | | | |
| Payable gold sold | | | 43,480 | | 16,700 | |
(1)The Timmins mines were acquired on February 22, 2019, and as such, the Q1 2019 financial and operating results of these mines have only been reported, and included in the Company's consolidated results, from this date forward.
(2)Cash Costs and AISC are non-GAAP measures. Please refer to the “Alternative Performance (Non-GAAP) Measures” section of this MD&A for a detailed reconciliation of these measures to cost of sales. 2019 Cash Costs and AISC were adjusted to reflect amounts recast, and presented, for the three months ended March 31, 2019 as if Timmins had not been classified as held for sale.
(3)Sustaining capital expenditures exclude $1.0 million of project capital cash outflows for Q1 2020 (Q1 2019: $1.3 million) related to investment capital incurred on the Timmins projects, as disclosed in the “Project Development Update” section of this MD&A.
Q1 2020 vs. Q1 2019
Production:
•Gold: a 201% increase as a result of a full quarter of operations, increased mining and milling rates from the shaft expansion completed in early 2019 and subsequent de-bottlenecking efforts, and higher grades from mine sequencing.
Cash Costs: a decrease of $54 per ounce, primarily as a result of throughput efficiencies and higher gold grades from mine sequencing.
Sustaining Capital: Q1 2020 expenditures were primarily related to mine equipment replacements and refurbishments, near-mine exploration, and lease payments for mining equipment.
AISC: the $86 per ounce decrease was the result of the same factors reducing cash costs as well as lower sustaining capital per ounce.
2020 ANNUAL OPERATING OUTLOOK
Given the uncertainties regarding the progression of the COVID-19 pandemic in our operating jurisdictions and the resulting government measures and restrictions, particularly the duration of operating suspensions, the Company is currently unable to determine the impact on its 2020 annual production, Cash Costs, AISC and capital expenditure forecasts, as provided in the 2019 annual MD&A dated March 12, 2020 (collectively the "2020 Guidance"). The Company expects to update the 2020 Guidance once sufficient clarity on the operating circumstances becomes available.
| | | | | | | | |
| PAN AMERICAN SILVER CORP. | 19 |
| | | | | | | | |
| | Management Discussion and Analysis For the three months ended March 31, 2020 and 2019 |
PROJECT DEVELOPMENT UPDATE
The following table reflects the amounts spent at each of Pan American’s major projects in Q1 2020 compared with Q1 2019:
| | | | | | | | | | |
Project Development Capital (1) | | | Three months ended
March 31, | |
| (thousands of USD) | | | | |
| | | | 2020 | 2019 |
| | | | |
| | | | |
| Mexico Projects | | | $ | 3,642 | | $ | 2,003 | |
| Joaquin and COSE projects | | | 3,545 | | 5,853 | |
| Timmins projects | | | 1,008 | | 1,261 | |
| Other | | | 477 | | 757 | |
| Total | | | $ | 8,672 | | $ | 9,874 | |
(1)Categorization of the Q1 2019 amounts have been changed from those reported in the Q1 2019 MD&A to conform to the current period categorizations.
During Q1 2020, the Company achieved the following progress on its projects:
Mexico Projects:
The Company spent $3.6 million on exploration drilling activities relating to the La Colorada skarn deposit.
COSE and Joaquin Projects:
The Company spent $3.5 million on COSE project development during Q1 2020. Project development activities were directed at revising ground control systems throughout the mine and further advancing underground developments in preparation for mining later this year given the COVID-19 driven suspension of operations that began on March 23, 2020.
Joaquin commenced ramp-up of production during the quarter with over 5,000 tonnes mined during Q1 2020 prior to the COVID-19 driven suspension of operations that began on March 23, 2020.
Timmins Projects:
The Company spent $1.0 million on projects at Timmins in Q1 2020, primarily related to equipment and material orders to expand the operation during 2020.
OVERVIEW OF Q1 2020 FINANCIAL RESULTS
Selected Annual and Quarterly Information
The following tables set out selected quarterly results for the past nine quarters as well as selected annual results for the past two years. The dominant factors affecting results in the quarters and years presented below are the volatility of realized metal prices and the timing of sales, which vary with the timing of shipments and impairment charges. The fourth quarter of both 2019 and 2018 included impairment charges to the Manantial Espejo mine and the COSE and Joaquin projects.
| | | | | | | | |
| PAN AMERICAN SILVER CORP. | 20 |
| | | | | | | | |
| | Management Discussion and Analysis For the three months ended March 31, 2020 and 2019 |
| | | | | | | | | | | | | | |
| 2020 | | | Quarter Ended | | | | | | | |
| (In thousands of USD, other than per share amounts) | | | March 31 | | | | | | | |
| Revenue | | | $ | 358,428 | | | | | | | | |
| Mine operating earnings | | | $ | 50,058 | | | | | | | | |
| Earnings for the period attributable to equity holders | | | $ | (76,807) | | | | | | | | |
| Basic earnings per share | | | $ | (0.37) | | | | | | | | |
| Diluted earnings per share | | | $ | (0.37) | | | | | | | | |
| Cash flow from operating activities | | | $ | 114,051 | | | | | | | | |
| Cash dividends paid per share | | | $ | 0.050 | | | | | | | | |
| Other financial information | | |
| | | | | | | |
| Total assets | | | $ | 3,366,044 | | | | | | | | |
Total long-term financial liabilities(1) | | | $ | 501,140 | | | | | | | | |
| Total attributable shareholders’ equity | | | $ | 2,378,776 | | | | | | | | |
(1)Total long-term financial liabilities are comprised of non-current liabilities excluding deferred tax liabilities, deferred revenue, and share purchase warrant liabilities.
| | | | | | | | | | | | | | | | | | | | | |
| 2019 | Quarter Ended | | | | Year
Ended | | | | |
| (In thousands of USD, other than per share amounts) | March 31(1) | June 30(1) | Sept 30(1) | Dec 31 | Dec 31 | | | | |
Revenue(2) | $ | 253,699 | | $ | 340,494 | | $ | 352,187 | | $ | 404,379 | | $ | 1,350,759 | | | | | |
Mine operating earnings(2) | $ | 15,770 | | $ | 37,740 | | $ | 77,168 | | $ | 98,610 | | $ | 229,288 | | | | | |
| Earnings for the period attributable to equity holders | $ | 2,783 | | $ | 5,053 | | $ | 50,975 | | $ | 51,927 | | $ | 110,738 | | | | | |
| Basic earnings per share | $ | 0.02 | | $ | 0.02 | | $ | 0.26 | | $ | 0.25 | | $ | 0.55 | | | | | |
| Diluted earnings per share | $ | 0.02 | | $ | 0.02 | | $ | 0.26 | | $ | 0.25 | | $ | 0.55 | | | | | |
| Cash flow from operating activities | $ | (12,911) | | $ | 83,518 | | $ | 81,948 | | $ | 129,473 | | $ | 282,028 | | | | | |
| Cash dividends paid per share | $ | 0.035 | | $ | 0.035 | | $ | 0.035 | | $ | 0.035 | | $ | 0.140 | | | | | |
| Other financial information | | | | | | | | | |
| Total assets | | | | | $ | 3,461,682 | | | | | |
Total long-term financial liabilities(3) | | | | | $ | 517,776 | | | | | |
| Total attributable shareholders’ equity | | | | | $ | 2,463,099 | | | | | |
(1)Amounts differ from those originally reported in the respective quarter due to: (1) the finalization of the purchase price allocation which was retrospectively applied, the most significant change being the removal of the previously recorded $30.5M bargain purchase gain; and, (2) amounts presented retrospectively as if Timmins had not been classified as held for sale.
(2)Concurrent with the Tahoe Acquisition, the Company classified the Timmins mines as a discontinued operation held for sale and, in the third quarter, reclassified to be a continuing operation after a change in management's intentions. As a result, the previously recorded first and second quarters have been recast to present the Timmins mines as continuing operations.
(3)Total long-term financial liabilities are comprised of non-current liabilities excluding deferred tax liabilities, deferred revenue, and share purchase warrant liabilities.
| | | | | | | | |
| PAN AMERICAN SILVER CORP. | 21 |
| | | | | | | | |
| | Management Discussion and Analysis For the three months ended March 31, 2020 and 2019 |
| | | | | | | | | | | | | | | | | | | | | |
| 2018 | Quarter Ended | | | | Year
Ended | | | | |
| (In thousands of USD, other than per share amounts) | March 31 | June 30 | Sept 30 | Dec 31 | Dec 31 | | | | |
| Revenue | $ | 206,961 | | $ | 216,460 | | $ | 187,717 | | $ | 173,357 | | $ | 784,495 | | | | | |
| Mine operating earnings (loss) | $ | 55,124 | | $ | 54,851 | | $ | (4,412) | | $ | (4,666) | | $ | 100,897 | | | | | |
| Earnings (loss) for the period attributable to equity holders | $ | 47,376 | | $ | 36,187 | | $ | (9,460) | | $ | (63,809) | | $ | 10,294 | | | | | |
| Basic earnings (loss) per share | $ | 0.31 | | $ | 0.24 | | $ | (0.06) | | $ | (0.42) | | $ | 0.07 | | | | | |
| Diluted earnings (loss) per share | $ | 0.31 | | $ | 0.24 | | $ | (0.06) | | $ | (0.42) | | $ | 0.07 | | | | | |
| Cash flow from operating activities | $ | 34,400 | | $ | 66,949 | | $ | 41,699 | | $ | 11,930 | | $ | 154,978 | | | | | |
| Cash dividends paid per share | $ | 0.035 | | $ | 0.035 | | $ | 0.035 | | $ | 0.035 | | $ | 0.140 | | | | | |
| Other financial information | | | | | | | | | |
| Total assets | | | | | $ | 1,937,476 | | | | | |
Total long-term financial liabilities(1) | | | | | $ | 96,828 | | | | | |
| Total attributable shareholders’ equity | | | | | $ | 1,508,212 | | | | | |
(1)Total long-term financial liabilities are comprised of non-current liabilities excluding deferred tax liabilities, deferred revenue, and share purchase warrant liabilities.
| | | | | | | | |
| PAN AMERICAN SILVER CORP. | 22 |
| | | | | | | | |
| | Management Discussion and Analysis For the three months ended March 31, 2020 and 2019 |
Income Statement: Q1 2020 vs. Q1 2019
A net loss of $77.2 million was recorded in Q1 2020 compared to net earnings of $3.3 million in Q1 2019, which corresponds to basic loss and earnings per share of $(0.37) and $0.02, respectively.
The following table highlights the differences between net earnings in Q1 2020 compared with Q1 2019:
| | | | | | | | | | | | | | | | | |
Net earnings, three months ended March 31, 2019
(in thousands of USD) | | | | $ | 3,320 | | Note |
| Revenue: | | | | | |
| Increased realized metal prices | | $ | 40,185 | | | | |
| Higher quantities of metal sold | | 77,848 | | | | |
| Increased direct selling costs | | (3,584) | | | | |
| Increased negative settlement adjustments | | (9,720) | | | | |
| Total increase in revenue | | | | 104,729 | | (1) |
| Cost of sales: | | | | | |
| Increased production costs and decreased royalty charges | | $ | (41,626) | | | | (2) |
| | | | | |
| Increased depreciation and amortization | | (28,815) | | | | (3) |
| Total increase in cost of sales | | | | (70,441) | | |
| Total increase in mine operating earnings | | | | 34,288 | | |
| Increased income tax expense | | | | (45,430) | | (4) |
| Decreased investment income and other expense | | | | (41,975) | | (5) |
| Increased care and maintenance costs | | | | (12,577) | | (6) |
| Increased net loss on commodity contracts, derivatives and asset sales | | | | (10,944) | | (7) |
| Decreased dilution gain, net of share of income from associate | | | | (3,540) | | (8) |
| Increased interest and finance expense | | | | (1,667) | | |
| Decreased transaction and integration costs | | | | 1,403 | | |
| Decreased foreign exchange loss | | | | 1,117 | | |
| Increased general and administrative expense | | | | (653) | | |
| Increased exploration and project development expense | | | | (577) | | |
| | | | | |
| | | | | |
| | | | | |
| | | | | |
| | | | | |
| Net loss, three months ended March 31, 2020 | | | | $ | (77,235) | | |
(1)Revenue for Q1 2020 was $104.7 million higher than in Q1 2019, as a result of increased quantities of metal sold and higher realized prices, partially offset by higher treatment and refining charges and negative settlement adjustments. The increased quantities of metal sold was the result of increased gold sales, partially offset by decreased quantities in other metals sold. The additional 75.9 thousand ounces of gold sold reflects a full three-month quarter of sales and increased production from the Gold Segment mines. The increased revenue from higher realized prices was largely due to the 21% increase in the gold price, as well as the 6% increase in the silver price partially offset by lower base metal prices.
| | | | | | | | |
| PAN AMERICAN SILVER CORP. | 23 |
| | | | | | | | |
| | Management Discussion and Analysis For the three months ended March 31, 2020 and 2019 |
The following table reflects the metal prices realized by the Company and the quantities of metal sold during each quarter:
| | | | | | | | | | | | | | | | | | | | | |
| | | Realized Metal Prices (1) | | | | Quantities of Metal Sold (2) | | | |
| | | Three months ended
March 31, | | | | Three months ended
March 31, | | | |
| | | 2020 | 2019 | | | 2020 | 2019 | | |
| Silver | | $ | 16.50 | | $ | 15.52 | | | | 5,647 | | 6,092 | | | |
| Gold | | $ | 1,580 | | $ | 1,302 | | | | 156.4 | | 80.5 | | | |
| Zinc | | $ | 2,125 | | $ | 2,750 | | | | 11.5 | | 14.9 | | | |
| Lead | | $ | 1,857 | | $ | 2,039 | | | | 5.9 | | 6.8 | | | |
| Copper | | $ | 5,801 | | $ | 6,207 | | | | 1.4 | | 1.9 | | | |
(1)Metal price stated as dollars per ounce for silver and gold, and dollars per tonne for zinc, lead and copper, inclusive of final settlement adjustments on concentrate sales.
(1)Metal quantities stated as koz for silver and gold and kt for zinc, lead and copper.
(2)Production and Royalty costs in Q1 2020 were $41.6 million higher than in Q1 2019. The increase was driven by a $42.4 million increase in production costs, partially offset by a $0.8 million decrease in royalty costs. The increased production costs reflects the increased costs related to higher production and sales quantities from the Gold Segment mines, particularly the Shahuindo and Timmins mines where quarter-over-quarter production costs increased by $27.2 million and $16.9 million, respectively, driven by increased gold sales volumes of 505% and 160%, respectively. Other factors increasing production costs were higher production costs at Manantial Espejo, due to increased sales volumes and a $3.6 million increase in negative NRV inventory adjustments. These increased production costs were partially offset by lower production costs at Huaron and Morococha, mainly from lower sales volumes due to the COVID-19 related mine suspensions in mid March 2020, and lower costs at Dolores due to lower gold sales volumes.
(3)Depreciation and amortization ("D&A") expense was $28.8 million higher than in Q1 2019, largely as a result of additional depreciation expense from the Gold Segment mines ($29.0 million) due to a full three-months of depreciation in Q1 2020 and the previously discussed higher sales volumes.
(4)Income tax expense of $52.7 million in Q1 2020 was $45.4 million higher than the $7.3 million income tax expense in Q1 2019. The increased expense was primarily due to the significant devaluation of the Mexican peso, and to a lesser extent, the Peruvian sol, which resulted in a decrease to the deductible tax basis of the assets in Mexico and Peru.
(5)Investment loss and other expense together was $42.0 million higher in Q1 2020 compared to Q1 2019, driven largely by changes in Investment losses which were $28.3 million in Q1 2020, a $40.6 million change from the $12.3 million investment income in Q1 2019. The loss and income in each period was driven by the fair value "mark-to-market" adjustment of certain of the Company's investments.
(6)Care and maintenance costs were $16.0 million in Q1 2020, a $12.6 million increase from Q1 2019, primarily the result of COVID-19 related suspensions at the Peruvian mines that began in mid-March 2020; and a full three-months of care and maintenance costs at the Escobal mine.
(7)Losses on commodity and foreign currency contracts were $8.8 million compared to gains of $0.3 million in Q1 2019, and drove the majority of the $10.9 million quarter-over-quarter increase in losses from commodity contracts, derivatives, and asset sales. The Q1 2020 commodity and foreign currency contract losses largely reflected losses related to the Company's foreign currency contracts due to the devaluation of the Mexican peso, the Peruvian sole and the Canadian dollar, which is further described in the "Foreign currency exchange rate" portion of the "Risks and Uncertainties" section of this MD&A.
(8)Share of loss from associate in Q1 2020 was $2.9 million loss compared to income of $0.6 million in Q1 2019, and related to the Company's investment in Maverix Metals Inc. ("Maverix"), which is accounted for using the equity method whereby the Company records its portion of Maverix's net income based on Pan
| | | | | | | | |
| PAN AMERICAN SILVER CORP. | 24 |
| | | | | | | | |
| | Management Discussion and Analysis For the three months ended March 31, 2020 and 2019 |
American's fully diluted ownership interest. In Q1 2020, the Company recorded its portion of a CAD $18.9 million royalty interest impairment charge recorded by Maverix in Q4 2019.
Statement of Cash Flows: Q1 2020 vs. Q1 2019
Cash flow from operations in Q1 2020 totaled $114.1 million, $127.0 million more than the $12.9 million consumed in Q1 2019. The increase was mainly attributable to a $76.1 million increase in cash from changes in non-cash operating working capital, a $50.9 million increase in operating cash flow before working capital changes, interest and tax payments, partially offset by a $2.7 million increase in tax payments.
Other than working capital changes, the increase in operating cash flow was the result of: increased cash based mine operating earnings, largely reflective of the increased cash flows from the Gold Segment mines; partially offset by the previously discussed increase in care and maintenance expenditures and tax payments in Q1 2020.
Working capital changes in Q1 2020 resulted in a $38.2 million source of cash compared with a $37.9 million use of cash in Q1 2019. The Q1 2020 source of cash was mainly driven by a $39.6 million draw-down in accounts receivable balances, largely due to trade receivable balances not being replenished as a result of the COVID-19 suspensions. The Q1 2019 use of cash from working capital changes was due largely to the settlement of transaction related accounts payables balances acquired through the Tahoe transaction and an increase in accounts receivables from concentrate sales.
Investing activities utilized $58.5 million in Q1 2020, which related primarily to $55.8 million spent on mineral properties, plant and equipment at the Company’s mines and projects, as previously described in the “Operating Performance” section of this MD&A. In Q1 2019, investing activities utilized $233.8 million inclusive of $247.5 million investment (net of cash acquired) related to the Tahoe acquisition, as described in the "Acquisition of Tahoe" section of this MD&A, and $40.9 million spent on mineral properties, plant and equipment, partially offset by $54.1 million sourced from the net sale of short-term investments.
Financing activities in Q1 2020 used $26.6 million compared to $198.7 million generated in Q1 2019. Cash used in Q1 2020 primarily consisted of a $15.0 million repayment of the Credit Facility, $10.5 million in dividends, and $4.1 million of lease repayments, partially offset by $2.9 million of proceeds from the issuance of shares on the exercise of stock options. Financing activities in Q1 2019 were primarily related to financing the Tahoe Acquisition. The net cash generated in Q1 2019 consisted of $335.0 million drawn on the Company's $500.0 million revolving credit facility, partially offset by $125.0 million used to settle Tahoe's previously drawn bank debt, $7.3 million paid as dividends to shareholders, and $4.0 million of lease payments.
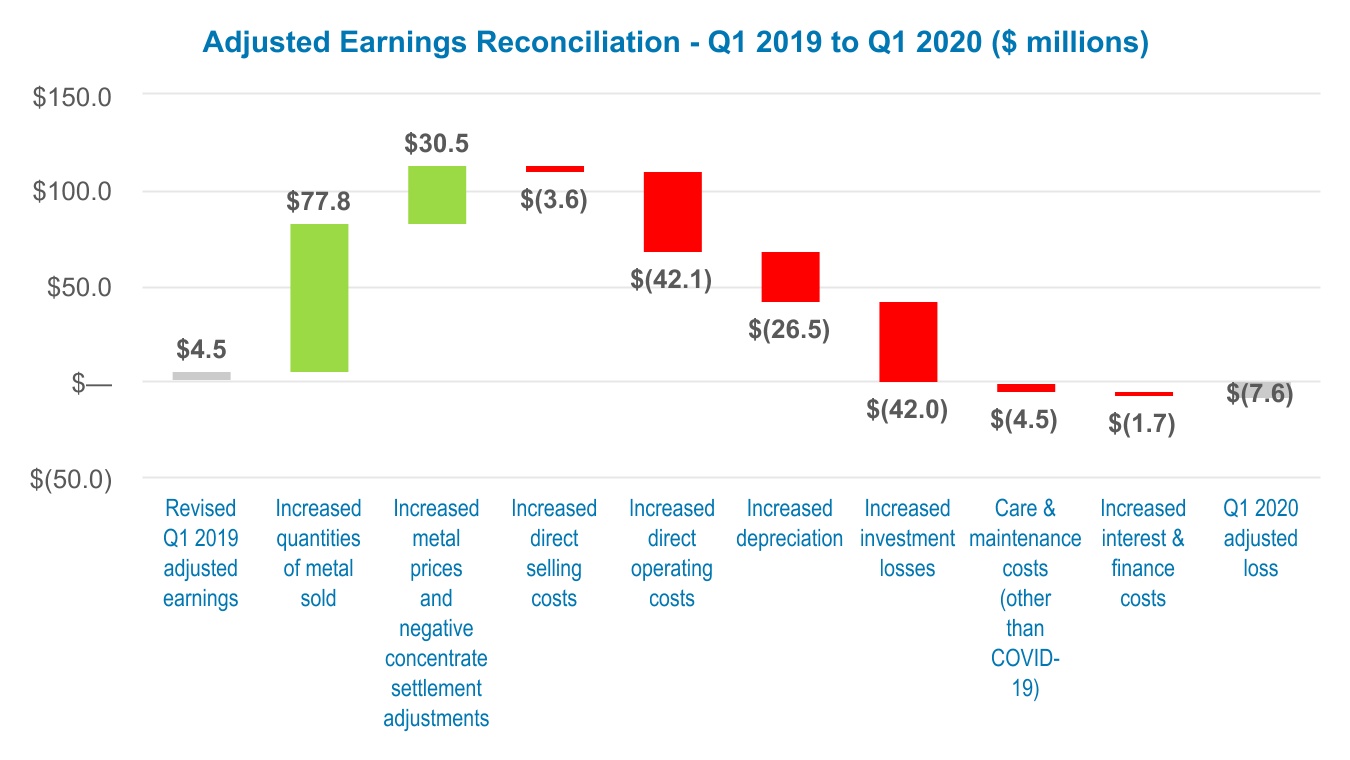
Adjusted Earnings: Q1 2020 vs Q1 2019
Adjusted earnings is a non-GAAP measure. Please refer to the section of this MD&A entitled “Alternative Performance (Non-GAAP) Measures” for a detailed description of “adjusted earnings”, and a reconciliation of these measures to the Q1 2020 Financial Statements.
Adjusted Loss in Q1 2020 was $7.6 million, representing basic adjusted loss per share of $0.04, compared to the revised Q1 2019 adjusted earnings of $4.5 million, and basic adjusted earnings per share of $0.03. Included in Q1 2020 adjusted earnings are non-cash, unrealized, mark-to-market driven investment losses of $28.8 million, representing a $(0.14) loss per share (Q1 2019 - $11.3 million gains, representing $0.06 earnings per share).
The Q1 2019 adjusted loss has been revised from that originally reported in the Q1 2019 to retrospectively include earnings from the Timmins operation. A description of these adjustments is included in the "Adjusted Earnings" portion of the “Alternative Performance (Non-GAAP) Measures” section of this MD&A.
| | | | | | | | |
| PAN AMERICAN SILVER CORP. | 25 |
| | | | | | | | |
| | Management Discussion and Analysis For the three months ended March 31, 2020 and 2019 |
The following chart illustrates the key factors leading to the change in adjusted earnings from Q1 2019 to Q1 2020:
LIQUIDITY AND CAPITAL POSITION
| | | | | | | | | | | | | | |
| Liquidity and Capital Measures (in $000s) | March 31, 2020 | December 31, 2019 | | Q1 2020
Change | | |
| Cash and cash equivalents ("Cash") | $ | 147,827 | | $ | 120,564 | | | $ | 27,263 | | | |
| Short-term Investments | $ | 91,346 | | $ | 117,776 | | | $ | (26,430) | | | |
| Cash and Short-term investments | $ | 239,173 | | $ | 238,340 | | | $ | 833 | | | |
| Working Capital | $ | 487,969 | | $ | 517,249 | | | $ | (29,280) | | | |
| Credit Facility committed amount | $ | 500,000 | | $ | 500,000 | | | $ | — | | | |
| Credit Facility amounts drawn | $ | 260,000 | | $ | 275,000 | | | $ | (15,000) | | | |
| | | | | | |
| Shareholders' equity | $ | 2,383,095 | | $ | 2,467,846 | | | $ | (84,751) | | | |
Total debt (1) | $ | 299,230 | | $ | 316,208 | | | $ | (16,978) | | | |
Capital (2) | $ | 2,443,152 | | $ | 2,545,714 | | | $ | (102,562) | | | |
(1)Total debt is a non-GAAP measure calculated as the total of amounts drawn on the Revolving Credit Facility, finance lease liabilities and loans payable. Please refer to the “Alternative Performance (Non-GAAP) Measures” section of this MD&A for a detailed description of the calculations.
(2)Capital is a non-GAAP measure and consists of shareholders’ equity and debt net of cash and cash equivalents and short term investments. Please refer to the “Alternative Performance (Non-GAAP) Measures” section of this MD&A for a detailed description of the calculations.
Liquidity and Capital Resources
The Company's cash and short term investments increased by $0.8 million during Q1 2020. Operating cash flows of $114.1 million, which included a $38.2 million source of cash from working capital changes offset by $36.5 million in tax payments, more than funded the Company's investing and financing activities in the quarter, including a $15.0 million repayment of the Credit Facility. The working capital changes primarily reflect the collection of trade receivables from concentrate and doré sales.
Pan American’s investment objectives for its cash balances are to preserve capital, to provide liquidity and to maximize returns. The Company’s strategy to achieve these objectives is to invest excess cash balances in a
| | | | | | | | |
| PAN AMERICAN SILVER CORP. | 26 |
| | | | | | | | |
| | Management Discussion and Analysis For the three months ended March 31, 2020 and 2019 |
portfolio of primarily fixed income instruments with specified credit rating targets established by the Board of Directors of the Company (the "Board of Directors"), and by diversifying the currencies in which it maintains its cash balances. The Company does not own any asset-backed commercial paper or other similar, known, at-risk investments in its investment portfolio.
Working capital of $488.0 million at March 31, 2020 was $29.3 million lower than working capital of $517.2 million at December 31, 2019. The working capital decrease primarily reflects trade accounts receivable collections and metals inventory draw-downs; partially offset by an increase in net income tax receivable balances and a decrease in current liabilities, largely reflecting accounts payable and accrued liability pay-downs.
During Q1 2020, the Company made a $15 million repayment of its four-year, $500 million Credit Facility, reducing the drawn amount at March 31, 2020, to $260 million. As a precautionary measure in response to the COVID-19 related suspensions, in April 2020 the Company increased its cash and cash equivalents holdings with an $80.0 million draw on the Credit Facility. Of the amount drawn, $70.0 million was invested into risk-free Canadian Guaranteed Investment Certificates yielding an annual interest rate of 0.935%. As of March 31, 2020, and as of the date of this MD&A, the Company was in compliance with all financial covenants under the Credit Facility.
The COVID-19 crisis, together with other dynamics in the marketplace, has significantly increased borrowing costs and, in certain cases, restricted the ability of borrowers to access the capital markets and other sources of financing. The borrowing costs under the Company's Credit Facility have not changed and are based on the Company's leverage ratio at either (i) LIBOR plus 1.875% to 2.750% or; (ii) The Bank of Nova Scotia's Base Rate on U.S. dollar denominated commercial loans plus 0.875% to 1.750%. Undrawn amounts under the Credit Facility are subject to a stand-by fee of 0.4219% to 0.6188% per annum, dependent on the Company's leverage ratio. The Company's Credit Facility matures on 1 February 2023.
The net cash generated from the sales of metal production provides our primary source of cash flows, and we do not currently expect to experience payment delinquencies from our metal sales counterparties during the COVID-19 crisis, though the impact of COVID-19 on the credit risk associated with our counterparties cannot be determined with any degree of certainty.
The Company’s financial position at March 31, 2020, and the operating cash flows that are expected over the next twelve months, lead Management to believe that the Company’s liquid assets are sufficient to satisfy our 2020 working capital requirements, fund currently planned capital expenditures, and to discharge liabilities as they come due during the crisis. The Company remains well positioned to take advantage of strategic opportunities as they become available. Liquidity risks are discussed further in the “Risks and Uncertainties” section of this MD&A.
In the normal course of business, the Company enters into contracts that give rise to commitments for future minimum payments, details of which are described in Note 8(f)(ii) of the 2019 Financial Statements, and in the Liquidity and Capital Position section of the Company's annual 2019 Management Discussion and Analysis (the "2019 Annual MD&A"). Since December 31, 2019, there have been no significant changes to these contractual obligations and commitments.
The impact of inflation on the Company’s financial position, operational performance, or cash flows over the next twelve months cannot be determined with any degree of certainty due to a number of uncertainties including those related to the COVID-19 business disruptions.
Outstanding Share Amounts
As at March 31, 2020, the Company had approximately 0.5 million stock options outstanding (each exercisable for one common share of the Company), with exercise prices in the range of CAD $9.76 to CAD $65.71 and a weighted average life of 46 months. Approximately 0.4 million of the stock options were vested and exercisable at March 31, 2020, with an average weighted exercise price of CAD $17.93 per share.
| | | | | | | | |
| PAN AMERICAN SILVER CORP. | 27 |
| | | | | | | | |
| | Management Discussion and Analysis For the three months ended March 31, 2020 and 2019 |
The following table sets out the common shares and options outstanding as at the date of this MD&A:
| | | | | |
| | Outstanding as at
May 6, 2020 |
| Common shares | 210,002,117 | |
| Options | 474,548 | |
| Total | 210,476,665 | |
As part of the consideration payable to Tahoe shareholders in connection with the Tahoe Acquisition, Tahoe shareholders received contingent consideration in the form of one contingent value right ("CVR") for each Tahoe share. Each CVR has a 10 year term and will be exchanged for 0.0497 of a Pan American share upon first commercial shipment of concentrate following restart of operations at the Escobal mine. The Company issued an aggregate of 313,887,490 CVRs.
CLOSURE AND DECOMMISSIONING COST PROVISION
The estimated future closure and decommissioning costs are based principally on the requirements of relevant authorities and the Company’s environmental policies. The provision is measured using management’s assumptions and estimates for future cash outflows. The Company accrues these costs, which are determined by discounting costs using rates specific to the underlying obligation. Upon recognition of a liability for the closure and decommissioning costs, the Company capitalizes these costs to the related mine and amortizes such amounts over the life of each mine on a unit-of-production basis except in the case of exploration projects for which the offset to the liability is expensed. The accretion of the discount due to the passage of time is recognized as an increase in the liability and a finance expense.
The total inflated and undiscounted amount of estimated cash flows required to settle the Company’s estimated future closure and decommissioning costs as of March 31, 2020 was $291.5 million (December 31, 2019 - $290.4 million) using inflation rates of between 0% and 5% (December 31, 2019 - between 0% and 5%). The inflated and discounted provision on the statement of financial position as at March 31, 2020 was $189.5 million (December 31, 2019 - $188.5 million), using discount rates between 0% and 9% (December 31, 2019 - between 2% and 9%). Spending with respect to decommissioning obligations at Alamo Dorado and Manantial Espejo began in 2016, while the remainder of the obligations are expected to be paid through 2043, or later if the mine lives are extended. Revisions made to the reclamation obligations in Q1 2020 were primarily a result of increased site disturbance from the ordinary course of operations at the mines, reclamation activities at Alamo Dorado, and revisions to the estimates based on periodic reviews of closure plans and related costs, actual expenditures incurred, and closure activities completed. These obligations will be funded from operating cash flows, reclamation deposits, and cash on hand.
The accretion of the discount charged in Q1 2020 as finance expense was $2.1 million (Q1 2019, $2.0 million). Reclamation expenditures incurred during Q1 2020 were $0.7 million,(Q1 2019, 0.9 million).
RELATED PARTY TRANSACTIONS
The Company’s related parties include its subsidiaries, associates over which it exercises significant influence, and key management personnel. During its normal course of operation, the Company enters into transactions with its related parties for goods and services.
Related party transactions with Maverix Metals Inc. have been disclosed in Note 9 of the Q1 2020 Financial Statements. These transactions are in the normal course of operations and are measured at fair value, which is the amount of consideration established and agreed to by the parties.
ACQUISITION OF TAHOE RESOURCES INC. ("Tahoe")
On February 22, 2019 (the "Closing Date"), the Company completed the acquisition all of the issued and outstanding shares of Tahoe Resources Inc. (the "Acquisition"). Tahoe was a mid-tier publicly traded precious
| | | | | | | | |
| PAN AMERICAN SILVER CORP. | 28 |
| | | | | | | | |
| | Management Discussion and Analysis For the three months ended March 31, 2020 and 2019 |
metals mining company with ownership interests in a diverse portfolio of mines and projects including the following principal mines: La Arena and Shahuindo in Peru; Timmins West and Bell Creek in Canada (together "Timmins"); and Escobal in Guatemala, where operations have been suspended since June 2017 (together the "Acquired Mines"). The Company now operates three gold mines as a result of the Acquisition. Consequently, the Company's operations have been divided into silver and gold segments for the purposes of reporting.
All 2019 production, operating and financial results of the Acquired Mines (including Cash Costs and AISC amounts) reported in this MD&A and included in the Company's consolidated results, reflect only the results from February 22, 2019 onwards.
Consolidation of Tahoe
As described in Note 8 of the 2019 Financial Statements, the Company determined that the Acquisition represented a business combination with Pan American identified as the acquirer. Based on the February 21, 2019, closing share price of Pan American's common shares on the NASDAQ, the total consideration of the acquisition was $1.14 billion.
The following table summarizes the consideration paid as part of the purchase price:
| | | | | | | | | | | | | | |
| Consideration: | | Shares Issued/Issuable | | Consideration |
Fair value estimate of the Pan American share consideration (1) | | 55,990,512 | | | $ | 795,626 | |
Fair value estimate of the CVRs (2) | | 15,600,208 | | | 71,916 | |
Cash (1) | | — | | | 275,008 | |
Fair value estimate of replacement options (3) | | 835,874 | | | 124 | |
| Total Consideration | | 72,426,594 | | | $ | 1,142,674 | |
(1)The Pan American share consideration value is based on an assumed value of $14.21 per Pan American common share (based on the NASDAQ closing price on February 21, 2019).
(2)Assumed fair value of the CVRs is based on the residual amount of the value of the Tahoe shares acquired (based on the NYSE closing price closing of $3.64 on February 21, 2019) after deducting the cash consideration of $275 million and the fair value of the Company's common share consideration paid (based on the February 21, 2019 NASDAQ closing price of $14.21).
(3)Assumed fair value of 3.5 million Tahoe options that upon the Acquisition vested and converted into 835.8 thousand Pan American stock options (the "Replacement options"). The fair value of the Replacement options was determined using the Black-Scholes option pricing model, as at the Acquisition Closing Date, the assumptions of which are described in the Company's Q3 2019 Financial Statements.
The following table summarizes the allocation of the purchase price to the identifiable assets and liabilities based on their estimated fair values at the Closing Date of the Acquisition:
| | | | | | | | |
| Allocation of consideration: | | |
| Cash and cash equivalents | | $ | 27,529 | |
| Accounts receivable | | 18,154 | |
| VAT Receivable | | 87,492 | |
| Inventory | | 148,209 | |
| Other current assets | | 1,381 | |
| Mineral properties, plant and equipment | | 1,239,402 | |
| Other assets | | 6,551 | |
| Deferred tax assets | | 30,728 | |
| Accounts payable and accrued liabilities | | (148,742) | |
| Debt | | (125,000) | |
| Provision for closure and decommissioning liabilities | | (77,320) | |
| Net current and deferred income tax liabilities | | (65,710) | |
| | $ | 1,142,674 | |
| | |
| | |
| | | | | | | | |
| PAN AMERICAN SILVER CORP. | 29 |
| | | | | | | | |
| | Management Discussion and Analysis For the three months ended March 31, 2020 and 2019 |
ALTERNATIVE PERFORMANCE (NON-GAAP) MEASURES
Per Ounce Measures
Cash Costs and AISC are non-GAAP financial measures that do not have any standardized meaning prescribed by IFRS and are therefore unlikely to be comparable to similar measures presented by other companies.
Pan American produces by-product metals incidentally to our silver and gold mining activities. We have adopted the practice of calculating a performance measure with the net cost of producing an ounce of silver and gold, our primary payable metals, after deducting revenues gained from incidental by-product production. This performance measurement has been commonly used in the mining industry for many years and was developed as a relatively simple way of comparing the net production costs of the primary metal for a specific period against the prevailing market price of that metal.
Silver segment Cash Costs and AISC are calculated net of credits for realized revenues from all metals other than silver ("silver segment by-product credits"), and are calculated per ounce of silver sold. Gold segment Cash Costs and AISC are calculated net of credits for realized silver revenues ("gold segment by-product credits"), and are calculated per ounce of gold sold. Consolidated Cash Costs and AISC are based on total silver ounces sold and are net of by-product credits from all metals other than silver ("silver basis consolidated by-product credits").
Cash costs per ounce metrics, net of by-product credits, is used extensively in our internal decision making processes. We believe the metric is also useful to investors because it facilitates comparison, on a mine-by-mine basis, notwithstanding the unique mix of incidental by-product production at each mine, of our operations’ relative performance on a period-by-period basis, and against the operations of our peers in the silver industry. Cash costs per ounce is conceptually understood and widely reported in the mining industry.
We believe that AISC, also calculated net of by-products, is a comprehensive measure of the full cost of operating our consolidated business, given it includes the cost of replacing silver and gold ounces through exploration, the cost of ongoing capital investments (sustaining capital), general and administrative expenses, as well as other items that affect the Company’s consolidated cash flow.
To facilitate a better understanding of these measure as calculated by the Company, the following table provides the detailed reconciliation of these measure to the applicable cost items, as reported in the consolidated financial statements for the respective periods. All 2019 operating results from the Gold Segment mines only include results from February 22, 2019 to March 31, 2019.
| | | | | | | | |
| PAN AMERICAN SILVER CORP. | 30 |
| | | | | | | | |
| | Management Discussion and Analysis For the three months ended March 31, 2020 and 2019 |
| | | | | | | | | | | | | | | | | | | | | | | | | | | | | | | | | | | | | | | | | | | | | | | |
| | Three months ended March 31, 2020 | | | | | | | | Three months ended March 31, 2019 | | | | | | |
| (In thousands of USD, except as noted) | Silver Segment | | Gold Segment | | Corporate | | Consolidated (silver basis)(2) | | Silver Segment | | Gold Segment(5) | | Corporate | | Consolidated (silver basis)(1) |
| Production costs | $ | 130,995 | | | $ | 93,322 | | | | | | $ | 224,317 | | | $ | 134,847 | | | $ | 47,083 | | | | | | $ | 181,930 | |
| Purchase Price Allocation Inventory Fair Value Adjustment | | | | (1,323) | | | | | | (1,323) | | | — | | | (14,504) | | | — | | | (14,504) | |
| NRV inventory adjustments | (11,720) | | | — | | | | | | (11,720) | | | (8,135) | | | — | | | | | | (8,135) | |
| On-site direct operating costs | 119,275 | | | 91,999 | | | — | | | 211,274 | | | 126,712 | | | 32,579 | | | — | | | 159,291 | |
| Royalties | 4,094 | | | 1,810 | | | | | | 5,904 | | | 6,262 | | | 403 | | | | | | 6,665 | |
Smelting, refining and direct selling charges(2) | 20,013 | | | 35 | | | | | | 20,048 | | | 16,454 | | | 10 | | | | | | 16,464 | |
Cash cost of sales before by-product credits (3) | 143,382 | | | 93,844 | | | — | | | 237,226 | | | 149,428 | | | 32,992 | | | — | | | 182,420 | |
Silver segment by-product credits(2) | (97,898) | | | — | | | | | | — | | | (116,177) | | | — | | | | | | — | |
Gold segment by-product credits(2) | — | | | (1,359) | | | | | | — | | | — | | | — | | | | | | — | |
Total Silver basis consolidated by-product credits(1)(2) | — | | | — | | | | | | (290,529) | | | — | | | — | | | | | | (171,073) | |
Cash Costs(4) | $ | 45,484 | | | $ | 92,485 | | | $ | — | | | $ | (53,303) | | | $ | 33,251 | | | $ | 32,992 | | | $ | — | | | $ | 11,347 | |
| | | | | | | | | | | | | | | | | | | | | | | |
| NRV inventory adjustments | 11,720 | | | — | | | | | | 11,720 | | | 8,135 | | | — | | | | | | 8,135 | |
| Sustaining capital | 26,167 | | | 24,040 | | | | | | 50,207 | | | 22,143 | | | 12,599 | | | | | | 34,742 | |
| Exploration and project development | 275 | | | 1,031 | | | 1,121 | | | 2,427 | | | 763 | | | 396 | | | 691 | | | 1,850 | |
| Reclamation cost accretion | 1,228 | | | 750 | | | 88 | | | 2,066 | | | 1,652 | | | 297 | | | 93 | | | 2,042 | |
| General and administrative expense | — | | | — | | | 6,588 | | | 6,588 | | | — | | | — | | | 5,935 | | | 5,935 | |
All-in sustaining costs(4) | $ | 84,874 | | | $ | 118,307 | | | $ | 7,797 | | | $ | 19,705 | | | $ | 65,944 | | | $ | 46,284 | | | $ | 6,719 | | | $ | 64,051 | |
| | | | | | | | | | | | | | | | | | | | | | | |
| Silver segment silver ounces sold (koz) | 5,563 | | | — | | | | | | — | | | 6,092 | | | — | | | | | | — | |
| Gold segment gold ounces sold (koz) | — | | | 122 | | | | | | — | | | — | | | 42 | | | | | | — | |
Total silver ounces sold (koz)(2) | — | | | — | | | | | | 5,647 | | | — | | | — | | | | | | 6,092 | |
Cash costs per ounce sold(4) | $ | 8.18 | | | $ | 757 | | | | | | | | | $ | 5.46 | | | $ | 777 | | | | | | | |
| AISC per ounce sold | $ | 15.26 | | | $ | 969 | | | | | | $ | 3.49 | | | $ | 10.83 | | | $ | 1,091 | | | | | | $ | 10.51 | |
| AISC per ounce sold (excluding NRV inventory adjustments) | $ | 13.15 | | | $ | 969 | | | | | | $ | 1.41 | | | $ | 9.49 | | | $ | 1,091 | | | | | | $ | 9.18 | |
(1)Consolidated silver basis calculated by treating all revenues from metals other than silver, including gold, as a by-product credit in Cash Costs. Total silver basis consolidated by-product credits include all silver segment by-product credits, as well as gold revenues from the Gold Segment mines as by-products. Total silver ounces sold likewise includes silver ounces sold from Gold Segment operations.
(2)Included in the revenue line of the consolidated income statements. By-product credits are reflective of realized metal prices for the applicable periods.
(3)Totals may not add due to rounding.
(4)2019 Gold Segment and Consolidated Cash Costs and AISC were adjusted to reflect amounts recast, and presented, for the three months ended March 31, 2019 as if Timmins had not been classified as held for sale.
(5)All operating results from the Gold Segment Mines, are only from the Closing Date to March 31, 2019, and do not represent a full three months of first quarter 2019 operations.
| | | | | | | | |
| PAN AMERICAN SILVER CORP. | 31 |
| | | | | | | | |
| | Management Discussion and Analysis For the three months ended March 31, 2020 and 2019 |
Sustaining capital is included in AISC, while capital related to growth projects or acquisitions (referred to by the Company as project or investment capital) is not. Inclusion of only sustaining capital in the AISC measure reflects the capital costs associated with current ounces sold as opposed to project capital, which is expected to increase future production. The project capital excluded in the reconciliation below is further described in the "Project Development Update" section of this MD&A.
| | | | | | | | | | | | | | | | | | | | |
Reconciliation of payments for mineral properties,
plant and equipment and sustaining capital | | | | | | Three months ended
March 31, | | |
| (in thousands of USD) | | | | | | 2020 | | 2019 |
Payments for mineral properties, plant and equipment(1) | | | | | | $ | 55,750 | | | $ | 40,878 | |
| Add/(Subtract) | | | | | | | | |
Lease Payments(1) | | | | | | 4,064 | | | 3,990 | |
| Investment (non-sustaining) capital | | | | | | (9,608) | | | (10,126) | |
Sustaining Capital(2) | | | | | | $ | 50,207 | | | $ | 34,742 | |
(1)As presented on the consolidated statements of cash flows.
(2)Totals may not add due to rounding
| | | | | | | | |
| PAN AMERICAN SILVER CORP. | 32 |
| | | | | | | | |
| | Management Discussion and Analysis For the three months ended March 31, 2020 and 2019 |
Silver Segment Cash Costs and AISC by mine:
| | | | | | | | | | | | | | | | | | | | | | | |
| SILVER SEGMENT | Three months ended March 31, 2020 | | | | | | |
| (In thousands of USD, except as noted) | La Colorada | Dolores | Huaron | Morococha | San
Vicente | Manantial
Espejo | Consolidated
Silver Segment |
| Production Costs | $ | 21,296 | | $ | 50,623 | | $ | 15,143 | | $ | 15,241 | | $ | 9,883 | | $ | 18,809 | | $ | 130,995 | |
| NRV inventory adjustments | — | | (10,833) | | — | | (879) | | — | | (7) | | (11,720) | |
| On-site direct operating costs | 21,296 | | 39,790 | | 15,143 | | 14,362 | | 9,883 | | 18,802 | | 119,275 | |
| Royalties | 135 | | 2,038 | | 76 | | — | | 1,398 | | 447 | | 4,094 | |
| Smelting, refining & direct selling costs | 5,370 | | 23 | | 5,401 | | 4,155 | | 3,611 | | 1,453 | | 20,013 | |
| Cash Costs before by-product credits | 26,801 | | 41,851 | | 20,620 | | 18,517 | | 14,892 | | 20,702 | | 143,382 | |
| Silver segment by-product credits | (13,503) | | (41,772) | | (15,881) | | (13,501) | | (2,540) | | (10,701) | | (97,898) | |
| Cash Costs | $ | 13,298 | | $ | 79 | | $ | 4,739 | | $ | 5,016 | | $ | 12,352 | | $ | 10,001 | | $ | 45,484 | |
| | | | | | | |
| NRV inventory adjustments | — | | 10,833 | | — | | 879 | | — | | 7 | | 11,720 | |
| Sustaining capital | 4,753 | | 15,124 | | 1,413 | | 2,236 | | 1,925 | | 716 | | 26,167 | |
| Exploration and project development | 161 | | 72 | | — | | 42 | | — | | — | | 275 | |
| Reclamation cost accretion | 143 | | 663 | | 144 | | 84 | | 71 | | 123 | | 1,228 | |
| All-in sustaining costs | $ | 18,355 | | $ | 26,771 | | $ | 6,296 | | $ | 8,257 | | $ | 14,348 | | $ | 10,847 | | $ | 84,874 | |
| | | | | | | |
| Silver segment silver ounces sold (koz) | 1,839 | | 1,150 | | 596 | | 408 | | 840 | | 730 | | 5,563 | |
| | | | | | | |
| Cash cost per ounce sold | $ | 7.23 | | $ | 0.07 | | $ | 7.95 | | $ | 12.29 | | $ | 14.71 | | $ | 13.69 | | $ | 8.18 | |
| AISC per ounce sold | $ | 9.98 | | $ | 23.29 | | $ | 10.56 | | $ | 20.23 | | $ | 17.08 | | $ | 14.85 | | $ | 15.26 | |
| AISC per ounce sold (excluding NRV inventory adjustments) | $ | 9.98 | | $ | 13.86 | | $ | 10.56 | | $ | 18.07 | | $ | 17.08 | | $ | 14.84 | | $ | 13.15 | |
| | | | | | | | | | | | | | | | | | | | | | | |
| SILVER SEGMENT | Three Months Ended March 31, 2019 | | | | | | |
| (In thousands of USD, except as noted) | La Colorada | Dolores | Huaron | Morococha | San
Vicente | Manantial
Espejo | Consolidated
Silver Segment |
| Production Costs | $ | 19,491 | | $ | 53,688 | | $ | 18,829 | | $ | 18,545 | | $ | 11,415 | | $ | 12,880 | | $ | 134,847 | |
| NRV inventory adjustments | — | | (9,455) | | — | | — | | — | | 1,321 | | (8,135) | |
| On-site direct operating costs | 19,491 | | 44,233 | | 18,829 | | 18,545 | | 11,415 | | 14,201 | | 126,712 | |
| Royalties | 79 | | 1,989 | | — | | — | | 3,929 | | 264 | | 6,262 | |
| Smelting, refining & direct selling costs | 3,809 | | 24 | | 4,345 | | 3,527 | | 3,024 | | 1,725 | | 16,454 | |
| Cash Costs before by-product credits | 23,379 | | 46,246 | | 23,174 | | 22,072 | | 18,368 | | 16,190 | | 149,428 | |
| Silver segment by-product credits | (18,949) | | (42,870) | | (19,588) | | (22,768) | | (6,882) | | (5,121) | | (116,177) | |
| Cash Costs | $ | 4,430 | | $ | 3,376 | | $ | 3,586 | | $ | (696) | | $ | 11,486 | | $ | 11,069 | | $ | 33,251 | |
| | | | | | | |
| NRV inventory adjustments | — | | 9,455 | | — | | — | | — | | (1,321) | | 8,135 | |
| Sustaining capital | 2,212 | | 13,067 | | 3,218 | | 1,935 | | 990 | | 721 | | 22,143 | |
| Exploration and project development | 106 | | 292 | | 8 | | 172 | | — | | 185 | | 763 | |
| Reclamation cost accretion | 144 | | 560 | | 181 | | 109 | | 78 | | 580 | | 1,652 | |
| All-in sustaining costs | $ | 6,892 | | $ | 26,750 | | $ | 6,993 | | $ | 1,520 | | $ | 12,554 | | $ | 11,234 | | $ | 65,944 | |
| | | | | | | |
| Silver segment silver ounces sold (koz) | 2,047 | | 1,011 | | 819 | | 691 | | 1,121 | | 402 | | 6,092 | |
| | | | | | | |
| Cash cost per ounce sold | $ | 2.16 | | $ | 3.34 | | $ | 4.38 | | $ | (1.01) | | $ | 10.25 | | $ | 27.53 | | $ | 5.46 | |
| AISC per ounce sold | $ | 3.37 | | $ | 26.45 | | $ | 8.54 | | $ | 2.20 | | $ | 11.20 | | $ | 27.94 | | $ | 10.83 | |
| AISC per ounce sold (excluding NRV inventory adjustments) | $ | 3.37 | | $ | 17.10 | | $ | 8.54 | | $ | 2.20 | | $ | 11.20 | | $ | 31.23 | | $ | 9.49 | |
| | | | | | | | |
| PAN AMERICAN SILVER CORP. | 33 |
| | | | | | | | |
| | Management Discussion and Analysis For the three months ended March 31, 2020 and 2019 |
Gold Segment Cash Costs and AISC by mine:
| | | | | | | | | | | | | | |
| GOLD SEGMENT | Three months ended March 31, 2020 | | | |
| (In thousands of USD, except as noted) | Shahuindo | La Arena | Timmins | Total |
| Production Costs | $ | 34,247 | | $ | 19,731 | | $ | 39,344 | | $ | 93,322 | |
| Purchase Price Allocation Inventory Fair Value Adjustment | (1,114) | | (207) | | (1) | | (1,323) | |
| NRV inventory adjustments | — | | — | | — | | — | |
| On-site direct operating costs | 33,133 | | 19,524 | | 39,343 | | 91,999 | |
| Royalties | — | | — | | 1,810 | | 1,810 | |
| Smelting, refining & direct selling costs | — | | — | | 35 | | 35 | |
| Cash Costs before by-product credits | 33,133 | | 19,524 | | 41,188 | | 93,844 | |
| Gold segment by-product credits | (1,068) | | (205) | | (86) | | (1,359) | |
| Cash Costs of Sales | $ | 32,065 | | $ | 19,319 | | $ | 41,102 | | $ | 92,485 | |
| | | | |
| NRV inventory adjustments | — | | — | | — | | — | |
| Sustaining capital | 7,844 | | 12,698 | | 3,498 | | 24,040 | |
| Exploration and project development | (5) | | — | | 1,036 | | 1,031 | |
| Reclamation cost accretion | 404 | | 295 | | 51 | | 750 | |
| All-in sustaining costs | $ | 40,308 | | $ | 32,312 | | $ | 45,687 | | $ | 118,307 | |
| | | | |
| Gold segment gold ounces sold | 52,002 | | 26,662 | | 43,480 | | 122,144 | |
| | | | |
| Cash cost per ounce sold | $ | 617 | | $ | 725 | | $ | 945 | | $ | 757 | |
| AISC per ounce sold | $ | 775 | | $ | 1,212 | | $ | 1,051 | | $ | 969 | |
| AISC per ounce sold (excluding NRV inventory adjustments) | $ | 775 | | $ | 1,212 | | $ | 1,051 | | $ | 969 | |
| | | | | | | | | | | | | | |
| GOLD SEGMENT | Three months ended March 31, 2019 | | | |
| (In thousands of USD, except as noted) | Shahuindo | La Arena | Timmins | Total |
| Production Costs | $ | 7,563 | | $ | 17,443 | | $ | 22,077 | | $ | 47,083 | |
| Purchase Price Allocation Inventory Fair Value Adjustment | (2,262) | | (6,438) | | (5,804) | | (14,504) | |
| NRV inventory adjustments | — | | — | | | | — | |
| On-site direct operating costs | 5,301 | | 11,005 | | 16,273 | | 32,579 | |
| Royalties | — | | — | | 403 | | 403 | |
| Smelting, refining & direct selling costs | — | | — | | 10 | | 10 | |
| Cash Costs before by-product credits | 5,301 | | 11,005 | | 16,686 | | 32,992 | |
| Gold segment by-product credits | — | | — | | — | | — | |
| Cash Costs of Sales | $ | 5,301 | | $ | 11,005 | | $ | 16,686 | | $ | 32,992 | |
| | | | | |
| NRV inventory adjustments | — | | — | | — | | — | |
| Sustaining capital | 230 | | 10,456 | | 1,913 | | 12,599 | |
| Exploration and project development | — | | — | | 396 | | 396 | |
| Reclamation cost accretion | 117 | | 180 | | — | | 297 | |
| All-in sustaining costs | $ | 5,648 | | $ | 21,641 | | $ | 18,994 | | $ | 46,284 | |
| | | | | |
| Gold segment gold ounces sold | 8,600 | | 17,135 | | 16,700 | | 42,435 | |
| | | | |
| Cash cost per ounce sold | $ | 616 | | $ | 642 | | $ | 999 | | $ | 777 | |
| AISC per ounce sold | $ | 657 | | $ | 1,263 | | $ | 1,137 | | $ | 1,091 | |
| AISC per ounce sold (excluding NRV inventory adjustments) | $ | 657 | | $ | 1,263 | | $ | 1,137 | | $ | 1,091 | |
(1)2019 Timmins and Gold Segment Cash Costs and AISC were adjusted to reflect amounts recast, and presented, for the three months ended March 31, 2019 as if Timmins had not been classified as held for sale.
| | | | | | | | |
| PAN AMERICAN SILVER CORP. | 34 |
| | | | | | | | |
| | Management Discussion and Analysis For the three months ended March 31, 2020 and 2019 |
Adjusted Earnings and Basic Adjusted Earnings Per Share
Adjusted earnings and basic adjusted earnings per share are non-GAAP measures that the Company considers to better reflect normalized earnings because it eliminates items that in management's judgment are subject to volatility as a result of factors which are unrelated to operations in the period, and/or relate to items that will settle in future periods. Certain items that become applicable in a period may be adjusted for, with the Company retroactively presenting comparable periods with an adjustment for such items and conversely, items no longer applicable may be removed from the calculation. The Company adjusts certain items in the periods that they occurred, but does not reverse or otherwise unwind the effect of such items in future periods. Neither adjusted earnings nor basic adjusted earnings per share have any standardized meaning prescribed by GAAP and are therefore unlikely to be comparable to similar measures presented by other companies.
The following table shows a reconciliation of adjusted earnings for the three months ended March 31, 2020 and 2019, to the net earnings for each period.
| | | | | | | | | | | | | | | | | | | | |
| | | | | | Three months ended
March 31, | | |
| (In thousands of USD, except as noted) | | | | | | 2020 | | 2019 |
| Net (loss) earnings for the period | | | | | | $ | (77,235) | | | $ | 3,320 | |
| Adjust for: | | | | | | | | |
| Derivative gains | | | | | | $ | — | | | | $ | (1,771) | |
| | | | | | | | |
| | | | | | | | |
| Unrealized foreign exchange losses | | | | | | 3,527 | | | | 2,495 | |
| Net realizable value adjustment of heap inventory | | | | | | 8,971 | | | | 9,399 | |
| Unrealized losses (gains) on commodity contracts | | | | | | 8,282 | | | | (341) | |
| Share of loss (income) from associate and dilution gain | | | | | | 2,929 | | | | (611) | |
| | | | | | | | |
| | | | | | | | |
| Gain on sale of assets | | | | | | (35) | | | | (40) | |
| | | | | | | | |
| COVID-19 related mine care and maintenance | | | | | | 8,111 | | | | — | |
| | | | | | | | |
| Transaction and integration costs | | | | | | — | | | | 1,403 | |
| Depreciation not taken on assets held for sale | | | | | | — | | | | (2,277) | |
| | | | | | | | |
| | | | | | | | |
| Effect of taxes on adjusting items | | | | | | (3,139) | | | | (3,298) | |
| Effect of foreign exchange on taxes | | | | | | 40,971 | | | | (3,780) | |
| Total adjustments | | | | | $ | 69,617 | | | $ | 1,179 | |
| Adjusted (loss) earnings for the period | | | | | | $ | (7,618) | | | $ | 4,499 | |
| Weighted average shares for the period | | | | | | $ | 209,779 | | | $ | 176,467 | |
| Adjusted (loss) earnings per share for the period | | | | | | $ | (0.04) | | | $ | 0.03 | |
Total Debt
Total debt is a non-GAAP measure calculated as the total current and non-current portions of: long-term debt (including amounts drawn on the Credit Facility), lease liabilities, and loans payable. Total debt does not have any standardized meaning prescribed by GAAP and is therefore unlikely to be comparable to similar measures presented by other companies. The Company and certain investors use this information to evaluate the financial debt leverage of the Company.
Capital
Capital is a non-GAAP measure and is calculated as total equity plus total debt less cash and cash equivalents and short term investments. Capital does not have any standardized meaning prescribed by GAAP and is therefore unlikely to be comparable to similar measures presented by other companies. The Company and certain investors use this information to evaluate the enterprise value of the Company.
Working Capital
Working capital is a non-GAAP measure calculated as current assets less current liabilities. Working capital does not have any standardized meaning prescribed by GAAP and is therefore unlikely to be comparable to similar
| | | | | | | | |
| PAN AMERICAN SILVER CORP. | 35 |
| | | | | | | | |
| | Management Discussion and Analysis For the three months ended March 31, 2020 and 2019 |
measures presented by other companies. The Company and certain investors use this information to evaluate whether the Company is able to meet its current obligations using its current assets.
RISKS AND UNCERTAINTIES
The Company is exposed to many risks in conducting its business, including but not limited to: metal price risk as the Company derives its revenue from the sale of silver, zinc, lead, copper, and gold; trading and credit risk in the normal course of dealing with other companies; foreign exchange risk as the Company reports its financial statements in USD whereas the Company operates in jurisdictions that utilize other currencies; the inherent risk of uncertainties in estimating mineral reserves and mineral resources; political, economic and social risks related to conducting business in foreign jurisdictions such as Canada, Peru, Mexico, Argentina, Bolivia and Guatemala; environmental risks; risks related to its relations with employees and local communities where we operate, and emerging risks relating to the spread of the novel coronavirus, which has to date resulted in profound health and economic impacts globally and which presents future risks and uncertainties that are largely unknown at this time. Certain of these risks are described below, and are more fully described in Pan American’s Annual Information Form (available on SEDAR at www.sedar.com) and Form 40-F filed with the United States Securities and Exchange Commission (the "SEC"), and in the Risks and Uncertainties section of the Company's 2019 Annual MD&A, and the 2019 Financial Statements. Readers are encouraged to refer to these documents for a more detailed description of some of the risks and uncertainties inherent to Pan American’s business.
Financial Instruments Risk Exposure
The Company is exposed to financial risks, including metal price risk, credit risk, interest rate risk, foreign currency exchange rate risk, and liquidity risk. The Company's exposures and management of each of those risks are described in Note 9(f) to the Company's 2019 Financial Statements. There were no significant changes to those risks or to the Company's management of exposure to those risks during the three months ended March 31, 2020 . The following provides an update to certain relevant financial instrument risks for the quarter:
Metal Price Risk
A decrease in the market price of silver, gold and other metals could affect our profitability, along with the commercial viability of our mines and production from some of our mining properties. From time to time, Pan American mitigates the price risk associated with its base metal production by committing some of its future production under forward sales or option contracts. However, decisions relating to hedging may have material adverse effects on our financial performance, financial position, and results of operations. The Board of Directors continually assesses Pan American’s strategy towards our base metal exposure. During Q1 2019, the Company recorded losses of $0.1 million on certain outstanding collars made up of put and call contracts on base metal production to manage the Company's financial exposure to these metals. No such base metal contracts were entered into or were outstanding during Q1 2020.
Trading Activities and Credit Risk
As at March 31, 2020, we had receivable balances associated with buyers of our concentrates of $23.3 million (December 31, 2019 - $48.8 million). The vast majority of the Company's concentrate is sold to a limited number of concentrate buyers.
As at March 31, 2020, we had approximately $29.0 million contained in precious metal inventory at refineries (December 31, 2019 - $58.2 million). Silver doré production is refined under long-term agreements with fixed refining terms at five separate refineries worldwide. We generally retain the risk and title to the precious metals throughout the process of refining and therefore are exposed to the risk that the refineries will not be able to perform in accordance with the refining contract and that we may not be able to fully recover our precious metals in such circumstances.
As at March 31, 2020, we had approximately $16.3 million contained in precious metal inventory at major commercial banks (December 31, 2019 - $nil).
| | | | | | | | |
| PAN AMERICAN SILVER CORP. | 36 |
| | | | | | | | |
| | Management Discussion and Analysis For the three months ended March 31, 2020 and 2019 |
Supplier advances for products and services yet to be provided are a common practice in some jurisdictions in which the Company operates. These advances represent a credit risk to the Company to the extent that suppliers do not deliver products or perform services as expected. As at March 31, 2020, the Company had made $5.3 million of supplier advances (December 31, 2019 - $3.4 million), which are reflected in “Trade and other receivables” on the Company’s balance sheet.
Foreign currency exchange rate risk
A part of the Company’s operating and capital expenditures is denominated in local currencies other than USD. These expenditures are exposed to fluctuations in USD exchange rates relative to the local currencies. From time to time, the Company mitigates part of this currency exposure by accumulating local currencies, entering into contracts designed to fix or limit the Company’s exposure to changes in the value of local currencies relative to the USD, or assuming liability positions to offset financial assets subject to currency risk. At March 31, 2020, the Company had outstanding positions on its foreign currency exposure of CAD, PEN, and MXN purchases. The CAD positions are collars with a notional amount of $45.0 million USD, with weighted average USD put and call exchange rates of $1.30 and $1.36, respectively. The PEN positions are collars with a notional amount of $67.5 million USD, with weighted average USD put and call exchange rates of $3.36 and $3.49, respectively. The MXN positions are collars with a notional amount of $36.0 million USD, with weighted average USD put and call exchange rates of $19.50 and $21.04, respectively. The Company recorded an $8.8 million loss on the foreign currency exchange contracts for the three months ended March 31, 2020 (Q1 2019 - $0.5 million). At March 31, 2020, the Company held cash and short-term investments of $96.8 million in Canadian dollars, $5.0 million in Argentine pesos, $4.0 million in Peruvian soles, $3.9 million in Bolivian bolivianos, and $2.1 million in Mexican pesos.
Taxation Risks
Pan American is exposed to tax related risks. The nature of these taxation risks and how the risks are managed are described in the Risks and Uncertainties section of the 2019 Annual MD&A, and in Note 29(c) to the Company's 2019 Financial Statements. There were no significant changes to those risks or to the Company's management of exposure to those risks during the three months ended March 31, 2020.
Claims and Legal Proceedings
Pan American is subject to various claims and legal proceedings covering a wide range of matters that arise in the ordinary course of business activities. The nature, assessment and management of such claims is described in the Risks and Uncertainties section of the 2019 Annual MD&A, and in Note 23 to the Company's Q1 2020 Financial Statements. There were no significant changes to those risks or to the Company's management of exposure to those risks during the three months ended March 31, 2020.
Foreign Operations and Government Regulations
Pan American currently conducts operations in Peru, Mexico, Argentina, Bolivia, Canada and Guatemala. Most of these jurisdictions are potentially subject to a number of political and economic risks, as well as civil and labour unrest, violence and the prevalence of criminal activity, including organized crime, theft and illegal mining. The nature of the foreign jurisdiction risks and the Company's exposures to and management of those risks are described in the Risks and Uncertainties section of the 2019 Annual MD&A. Other than the additional government regulations with respect to COVID-19, including those described in this MD&A, there were no significant changes to those risks or to the Company's management of exposure to those risks during the three months ended March 31, 2020.
Community Action
Communities and NGOs have become more vocal and active with respect to mining activities at or near their communities. Some communities and NGOs have taken actions that could have a material adverse effect on our operations, such as setting up road closures and commencing lawsuits. The nature of risks relating to such actions are described in the Risks and Uncertainties section of the 2019 Annual MD&A. There were no significant changes
| | | | | | | | |
| PAN AMERICAN SILVER CORP. | 37 |
| | | | | | | | |
| | Management Discussion and Analysis For the three months ended March 31, 2020 and 2019 |
to those risks or to the Company's management of exposure to those risks during the three months ended March 31, 2020.
Title to Assets
In many jurisdictions in which we operate, legal rights applicable to mining concessions are different and separate from legal rights applicable to surface lands. Accordingly, title holders of mining concessions in many jurisdictions must agree with surface landowners on compensation in respect of mining activities conducted on such land. We do not hold title to all of the surface lands at many of our operations and we rely on contracts or other similar rights to conduct surface activities. Related examples of such matters with regards to the Company's assets is described the Risks and Uncertainties section of the 2019 Annual MD&A. There have been no additional material examples nor were there significant changes to the examples, related risks, or to the Company's management of exposure to those risks, during the three months ended March 31, 2020.
General Economic Conditions
General economic conditions may adversely affect our growth, profitability and ability to obtain financing. Events in global financial markets in the past several years have had a profound impact on the global economy. Many industries, including the silver and gold mining industry, have been and continue to be impacted by these market conditions. Some of the key impacts of the current financial market turmoil include contraction in credit markets resulting in a widening of credit risk, devaluations, high volatility in global equity, commodity, foreign exchange and precious metal markets and a lack of market confidence and liquidity. A continued or worsened slowdown in the financial markets or other economic conditions, including but not limited to, consumer spending, employment rates, business conditions, inflation, fuel and energy costs, consumer debt levels, lack of available credit, the state of the financial markets, interest rates and tax rates, may adversely affect our growth, profitability and ability to obtain financing. A number of issues related to economic conditions could have a material adverse effect on our business, financial condition and results of operations, including:
•contraction in credit markets could impact the cost and availability of financing and our overall liquidity;
•the volatility of silver, gold and other metal prices would impact our revenues, profits, losses and cash flow;
•recessionary pressures could adversely impact demand for our production;
•volatile energy, commodity and consumables prices and currency exchange rates could impact our production costs; and
•the devaluation and volatility of global stock markets could impact the valuation of our equity and other securities.
Coronavirus (COVID-19)
The current outbreak of the novel coronavirus that was first reported from Wuhan, China on December 31, 2019, and any future emergence and spread of similar pathogens or the existence of pandemics could have a material adverse effect on our business and results of operations, as well as impacting global economic conditions. While initially the outbreak of the coronavirus was largely concentrated, it has now spread to many other countries and infections and COVID-19 related deaths have been reported globally. The coronavirus has spread into areas where we have operations and where our offices are located. Government efforts to curtail the spread of the coronavirus have resulted in temporary suspensions of our operations in Mexico, Peru, Argentina and Bolivia, and we have reduced throughput at our Canadian operations in Timmins in order to enhance physical distancing and protect our personnel and the community. The spread of the coronavirus has impacted our employees and contractors, not only as it relates to potential health concerns, but also in terms of limitations on movement, availability of food and other goods, and personal financial well-being, among others. Our suppliers and service providers have also been impacted. While the coronavirus has already had significant, direct impacts on our operations, our business, our workforce, and our production, the extent to which the coronavirus will continue to impact our operations will depend on future developments which are highly uncertain and cannot be predicted
| | | | | | | | |
| PAN AMERICAN SILVER CORP. | 38 |
| | | | | | | | |
| | Management Discussion and Analysis For the three months ended March 31, 2020 and 2019 |
with confidence. These future developments include, but are not limited to, the duration of the outbreak, new information that may emerge concerning the severity of the coronavirus, and the actions taken to contain the coronavirus or treat it. Our ability to continue with any operations in Canada, or to successfully maintain our other operations on care and maintenance, or to restart or ramp-up these operations efficiently or economically, or at all, is unknown. It is also uncertain whether we will be able to maintain an adequate financial condition and have sufficient capital, or have access to capital through our credit facility or otherwise, to sustain our business and operations.
Moreover, the actual and threatened spread of the coronavirus globally could also have a material adverse effect on the regional economies in which we operate, could continue to negatively impact stock markets, including the trading price of our shares, could adversely impact our ability to raise capital, could cause continued interest rate volatility and movements that could make obtaining financing or refinancing our debt obligations more challenging or more expensive (if such financing is available at all) and could result in any operations affected by coronavirus becoming subject to quarantine. Any of these developments, and others, could have a material adverse effect on our business and results of operations.
Please refer to "Impact of COVID 19" discussion included in the "Operating Performance" section of this MD&A, as well as Pan American’s new releases dated March 17, March 23, and April 1, 2020, for further information and updates related to the impact of COVID-19 on our operations.
SIGNIFICANT JUDGMENTS AND KEY SOURCES OF ESTIMATION UNCERTAINTY IN THE APPLICATION OF ACCOUNTING POLICIES
In preparing financial statements in accordance with IFRS, Management is required to make estimates and assumptions that affect the amounts reported in the consolidated financial statements. These critical accounting estimates represent Management's estimates and judgments that are uncertain and any changes in these could materially impact the Company’s financial statements. Management continuously reviews its estimates, judgments, and assumptions using the most current information available.
Readers should also refer to Note 3 of the 2019 Financial Statements, for the Company’s summary of significant accounting policies.
CHANGES IN ACCOUNTING STANDARDS
The accounting policies applied in the preparation of these unaudited condensed interim consolidated financial statements are consistent with those applied and disclosed in the Company’s audited consolidated financial statements for the year ended December 31, 2019.
Changes in accounting standards not yet effective
New accounting standards and interpretations have been published that are not mandatory for the current period and have not been early adopted. These standards are not expected to have a material impact on the Company in the current or future reporting periods. The Company has not early adopted any amendment, standard or interpretation that has been issued by the IASB but is not yet effective.
| | | | | | | | |
| PAN AMERICAN SILVER CORP. | 39 |
| | | | | | | | |
| | Management Discussion and Analysis For the three months ended March 31, 2020 and 2019 |
DISCLOSURE CONTROLS AND PROCEDURES
Management’s Report on Internal Control over Financial Reporting
Management of Pan American is responsible for establishing and maintaining an adequate system of internal control, including internal controls over financial reporting. Internal control over financial reporting is a process designed by, or under the supervision of, the President and Chief Executive Officer and the Chief Financial Officer and effected by the Board of Directors, Management and other personnel to provide reasonable assurance regarding the reliability of financial reporting and the preparation of financial statements for external purposes in accordance with International Financial Reporting Standards as issued by the International Accounting Standards Board. It includes those policies and procedures that:
a.pertain to the maintenance of records that in reasonable detail accurately and fairly reflect the transactions and dispositions of the assets of Pan American,
b.are designed to provide reasonable assurance that transactions are recorded as necessary to permit preparation of financial statements in accordance with International Financial Reporting Standards, and that receipts and expenditures of Pan American are being made only in accordance with authorizations of Management and Pan American’s directors, and
c.are designed to provide reasonable assurance regarding prevention or timely detection of unauthorized acquisition, use or disposition of Pan American’s assets that could have a material effect on the annual financial statements or interim financial reports.
The Company’s management, including its President and Chief Executive Officer and Chief Financial Officer, believe that due to its inherent limitations, internal control over financial reporting may not prevent or detect misstatements on a timely basis. In addition, projections of any evaluation of the effectiveness of internal control over financial reporting to future periods are subject to the risk that the controls may become inadequate because of changes in conditions, or that the degree of compliance with the policies or procedures may deteriorate.
Changes in Internal Controls over Financial Reporting
There has been no change in the Company’s internal control over financial reporting during the three month period ended March 31, 2020 that has materially affected or is reasonably likely to materially affect, its internal control over financial reporting.
TECHNICAL INFORMATION
Scientific and technical information contained in this MD&A has been reviewed and approved by Martin Wafforn, P.Eng., Senior Vice President Technical Services and Processing Optimization, and Christopher Emerson, FAusIMM, Vice President Business Development and Geology, each of whom is a Qualified Persons, as the term is defined in Canadian National Instrument 43-101 - Standards of Disclosure of Mineral Projects ("NI 43-101").
For more detailed information regarding the Company’s material mineral properties as at June 30, 2019 and technical information related thereto, including a complete list of current technical reports applicable to such properties, please refer to the Company’s Annual Information Form dated March 12, 2020, filed at www.sedar.com or the Company’s most recent Form 40-F filed with the SEC.
| | | | | | | | |
| PAN AMERICAN SILVER CORP. | 40 |
| | | | | | | | |
| | Management Discussion and Analysis For the three months ended March 31, 2020 and 2019 |
Cautionary Note Regarding Forward-Looking Statements and Information
Certain of the statements and information in this MD&A constitute “forward-looking statements” within the meaning of the United States Private Securities Litigation Reform Act of 1995 and “forward-looking information” within the meaning of applicable Canadian provincial securities laws relating to the Company and its operations. All statements, other than statements of historical fact, are forward-looking statements. When used in this MD&A, the words, “will”, “believes”, “expects”, “intents”, “plans”, “forecast”, “objective”, “guidance”, “outlook”, “potential”, “anticipated”, “budget”, and other similar words and expressions, identify forward-looking statements or information. These forward-looking statements or information relate to, among other things: the effect that any such reductions or suspensions may have on our operations and our financial and operational results; the ability of Pan American to continue with any operations in Canada, or to successfully maintain our other operations on care and maintenance, or to restart or ramp-up these operations efficiently or economically, or at all; whether Pan American is able to maintain a strong financial condition and have sufficient capital, or have access to capital through our credit facility or otherwise, to sustain our business and operations; the presence and impact of COVID-19 on our workforce, suppliers and other essential resources and the effect those impacts have on our business; future financial and operational performance; future production of silver, gold and other metals produced by the Company; future Cash Costs and AISC; the sufficiency of the Company’s current working capital, anticipated operating cash flow or its ability to raise necessary funds; the anticipated amount and timing of production at each of the Company’s properties and in the aggregate; our expectations with respect to future metal prices and exchange rates; the duration and effect of the license suspensions and any road blocks relating to the Escobal mine; the constitutional court-mandated ILO 169 consultation process in Guatemala, and the timing and completion thereof; the estimated cost of and availability of funding necessary for sustaining capital; forecast capital and non-operating spending; and the Company’s plans and expectations for its properties and operations.
These forward-looking statements and information reflect the Company’s current views with respect to future events and are necessarily based upon a number of assumptions and estimates that, while considered reasonable by the Company, are inherently subject to significant operational, business, economic, competitive, political, regulatory, and social uncertainties and contingencies. These assumptions include: the world-wide economic and social impact of COVID-19 is managed and the duration and extent of the coronavirus pandemic is minimized or not long-term; tonnage of ore to be mined and processed; ore grades and recoveries; prices for silver, gold and base metals remaining as estimated; currency exchange rates remaining as estimated; capital, decommissioning and reclamation estimates; our mineral reserve and mineral resource estimates and the assumptions upon which they are based; prices for energy inputs, labour, materials, supplies and services (including transportation); no labour-related disruptions at any of our operations; no unplanned delays or interruptions in scheduled production; all necessary permits, licenses and regulatory approvals for our operations are received in a timely manner and can be maintained; and our ability to comply with environmental, health and safety laws, particularly given the potential for modifications and expansion of such laws. The foregoing list of assumptions is not exhaustive.
The Company cautions the reader that forward-looking statements and information involve known and unknown risks, uncertainties and other factors that may cause actual results and developments to differ materially from those expressed or implied by such forward-looking statements or information contained in this MD&A and the Company has made assumptions and estimates based on or related to many of these factors. Such factors include, without limitation: the duration and effects of the coronavirus and COVID-19, and any other pandemics on our operations and workforce, and their effects on global economies and society; fluctuations in silver, gold, and base metal prices; fluctuations in prices for energy inputs; fluctuations in currency markets (such as the PEN, MXN, ARS, BOL, GTQ and CAD versus the USD); risks related to the technological and operational nature of the Company’s business; changes in national and local government, legislation, taxation, controls or regulations and political, legal or economic developments in Canada, the United States, Mexico, Peru, Argentina, Bolivia, Guatemala or other countries where the Company may carry on business, including the risk of expropriation related to certain of our operations, particularly in Argentina and Bolivia and risks related to the constitutional court-mandated ILO 169 consultation process in Guatemala; risks and hazards associated with the business of mineral exploration, development and mining (including environmental hazards, industrial accidents, unusual or unexpected geological or structural formations, pressures, cave-ins and flooding); risks relating to the credit worthiness or financial condition of suppliers, refiners and other parties with whom the Company does business; inadequate insurance, or inability to obtain insurance, to cover these risks and hazards; employee relations; relationships with and claims by
| | | | | | | | |
| PAN AMERICAN SILVER CORP. | 41 |
| | | | | | | | |
| | Management Discussion and Analysis For the three months ended March 31, 2020 and 2019 |
the local communities and indigenous populations; availability and increasing costs associated with mining inputs and labour; the Company’s ability to secure our mine sites or maintain access to our mine sites due to criminal activity, violence, or civil and labour unrest; the speculative nature of mineral exploration and development, including the risk of obtaining or retaining necessary licenses and permits and the presence of laws, regulations and other legal impediments that may impose restrictions on mining, including those currently in the province of Chubut, Argentina, or that might otherwise prevent or cause the suspension or discontinuation of mining activities; diminishing quantities or grades of mineral reserves as properties are mined; global financial conditions; the Company’s ability to complete and successfully integrate acquisitions and to mitigate other business combination risks; challenges to, or difficulty in maintaining, the Company’s title to properties and continued ownership thereof; the actual results of current exploration activities, conclusions of economic evaluations, and changes in project parameters to deal with unanticipated economic or other factors; increased competition in the mining industry for properties, equipment, qualified personnel, and their costs; having sufficient cash to pay obligations as they come due; and those factors identified under the caption “Risks Related to Pan American’s Business” in the Company’s most recent Form 40-F and Annual Information Form filed with the United States Securities and Exchange Commission and Canadian provincial securities regulatory authorities, respectively. Although the Company has attempted to identify important factors that could cause actual results to differ materially, there may be other factors that cause results not to be as anticipated, estimated, described, or intended. Investors are cautioned against attributing undue certainty or reliance on forward-looking statements or information. Forward-looking statements and information are designed to help readers understand Management's current views of our near and longer term prospects and may not be appropriate for other purposes. The Company does not intend, and does not assume any obligation, to update or revise forward-looking statements or information to reflect changes in assumptions or in circumstances or any other events affecting such statements or information, other than as required by applicable law.
Cautionary Note to U.S. Investors Concerning Estimates of Mineral Reserves and Mineral Resources
This MD&A has been prepared in accordance with the requirements of Canadian securities laws, which differ from the requirements of U.S. securities laws. Unless otherwise indicated, all mineral reserve and mineral resource estimates included in the MD&A have been disclosed in accordance with NI 43-101 and the Canadian Institute of Mining, Metallurgy, and Petroleum Definition Standards. NI 43-101 is a rule developed by the Canadian Securities Administrators that establishes standards for all public disclosure an issuer makes of scientific and technical information concerning mineral projects.
| | | | | | | | |
| PAN AMERICAN SILVER CORP. | 42 |