Management’s Discussion and Analysis
for the Year Ended December 31, 2010
TABLE OF CONTENTS
| Introduction | 1 |
| Core Business and Strategy | 2 |
| Highlights of 2010 | 4 |
| 2011 Project Development Objectives | 6 |
| 2011 Operating Outlook | 6 |
| 2010 Operating Performance | 11 |
| Overview of 2010 Financial Results | 22 |
| Liquidity Position | 26 |
| Investments and Investment Income | 27 |
| Capital Resources | 27 |
| Financial Instruments | 28 |
| Asset Retirement Obligations | 29 |
| Contractual Commitments and Contingencies | 29 |
| General and Administrative | 30 |
| Exploration and Project Development | 31 |
| Non-GAAP Measures | 32 |
| Governance and Corporate Social Responsibility | 32 |
| Risks and Uncertainties | 35 |
| Critical Accounting Policies and Estimates | 40 |
| Future Accounting Changes | 42 |
| Subsequent Events | 46 |
| Disclosure Controls and Procedures | 46 |
| Mineral Reserves and Resources | 49 |
MANAGEMENT’S DISCUSSION AND ANALYSIS OF FINANCIAL CONDITION AND RESULTS OF OPERATIONS
March 22, 2011
INTRODUCTION
Management’s discussion and analysis (“MD&A”) is intended to help the reader understand the significant factors that have affected Pan American Silver Corp.’s and its subsidiaries’ (“Pan American” or the “Company”) performance and such factors that may affect its future performance. The MD&A should be read in conjunction with the Company’s Audited Consolidated Financial Statements for the year ended December 31, 2010 and the related notes contained therein. All amounts in this MD&A and in the consolidated financial statements are expressed in United States dollars (“USD”), unless identified otherwise. The Company reports its financial position, results of operations and cash flows in accordance with Canadian generally accepted accounting principles (“Canadian GAAP”). Pan American’s significant accounting policies are set out in Note 2 of the Audited Consolidated Financial Statements. Differences between Canadian and United States generally accepted accounting principles (“US GAAP”) that would have affected the Company’s reported financial results are set out in Note 21 of the Audited Consolidated Financial Statements. This MD&A refers to various non-GAAP measures, such as “cash and total cost per ounce of silver”, which are used by the Company to manage and evaluate operating performance at each of the Company’s mines and are widely reported in the silver mining industry as benchmarks for performance, but do not have standardized meaning. To facilitate a better understanding of these measures as calculated by the Company, we have provided detailed descriptions and reconciliations where applicable.
Except for historical information contained in this MD&A, the following disclosures are forward-looking statements within the meaning of the Private Securities Litigation Reform Act of 1995 or are future oriented financial information and as such are based on an assumed set of economic conditions and courses of action. Please refer to the cautionary note regarding the risks associated with forward looking statements at the back of this MD&A and the “Risks Related to Pan American’s Business” contained in the Company’s most recent Form 40-F and Annual Information Form on file with the US Securities and Exchange Commission and the Canadian provincial securities regulatory authorities. Additional information about Pan American and its business activities, including its Annual Information Form, is available on SEDAR at www.sedar.com
The scientific or technical information in this MD&A, which includes reserve estimates for the Huaron, Morococha, Quiruvilca, Alamo Dorado, La Colorada, Manantial Espejo, and San Vicente properties were based upon information prepared by or under the supervision of Michael Steinmann, P.Geo., Executive Vice President Geology & Exploration and Martin G. Wafforn, P.Eng., Vice President Technical Services, who are “Qualified Persons” for purposes of National Instrument 43-101. Navidad Resource estimates were prepared by Pamela De Mark, P. Geo. Mineral Resource estimates for Hog Heaven and Waterloo are based on historical third party estimates.
The Company’s 2011 forecast and the resultant forecast numbers contained in this MD&A include estimates of future production rates for silver and other metals and future cash and total costs of production at each of the Company’s properties, which are forward-looking estimates. These forecasts are based on the following key assumptions: (i) silver: $20.65 per ounce, gold: $1,320 per ounce, zinc: $2,050 per tonne ($0.93 per lb), lead: $2,050 per tonne ($0.93 per lb), and copper: $7,000 per tonne ($3.18 per lb); (ii) that we are able to ship and sell all of our 2011 production in the 2011 financial year; (iii) the Company’s forecast production for each individual mine is achieved; (iv) there is no disruption in production, increase in costs or disruption due to, among other things: natural phenomena and hazards; technological, mechanical or operational disruptions; changes in local governments, legislation, taxation or the political or economic environment; fluctuations in the price of silver, gold or base metals; fluctuations in the local currencies of those countries in which the Company carries on business; unexpected work stoppages or labour disputes; fluctuations in the price for electricity, natural gas, fuel oil, and other key supplies; or transportation disruptions.
No assurance can be given that the indicated quantities of silver and other metals will be produced, or that projected cash costs or forecast capital costs will be achieved. Expected future production, cash costs and capital costs are inherently uncertain and could materially change over time. If actual results differ from the assumptions set out above, the Company’s mineral production and cash costs may differ materially from the forecasts in this MD&A. Readers should review those matters discussed herein under the heading “Risks and Uncertainties” and are advised to read the “Cautionary Note Regarding Forward Looking statements” contained herein.
CORE BUSINESS AND STRATEGY
Pan American engages in silver mining and related activities, including exploration, mine development, extraction, processing, refining and reclamation. The Company owns and operates silver mines located in Peru, Mexico, Argentina, and Bolivia. In addition, the Company is exploring for new silver deposits throughout South America and Mexico. The Company is listed on the Toronto Stock Exchange (Symbol: PAA) and on the NASDAQ Exchange in New York (Symbol: PAAS).
Pan American was founded in 1994 with the specific intention of providing investors with the best investment opportunity to gain real exposure to silver prices. The Company's mission is to be the largest and lowest cost primary silver mining company globally. To realize this mission, Pan American’s strategy is to focus on growing its base of low cost silver production and silver reserves by constantly optimizing its production methods, and developing new silver deposits through acquisition and exploration.
To execute this strategy, Pan American has assembled a sector leading team of mining professionals with a depth of exploration, construction, operating, and financing knowledge that allows the Company to confidently advance early stage projects through construction and into operation.
Pan American is determined to conduct its business in a responsible and sustainable manner.
Being responsible for the environment in which we operate, contributing to the long-term development of our host communities and ensuring that our employees can work in a safe and secure manner are core values at Pan American. We are committed to maintaining positive relations with our employees, the local communities and the government agencies, all of whom we view as partners in our enterprise.
Pan American Silver’s priority at every operation is the safety of our employees. We believe that comprehensive and continuous training is fundamental to the safety of our employees. With our comprehensive safety training and strictly enforced safety procedures, our goal is to continually improve our safety performance and remain industry leaders in the health and safety of our workers.
In addition, the Company is committed to operating our mines and developing new projects in an environmentally responsible manner. We have developed a comprehensive environmental policy, which all operations adhere to and apply to their short and long-term plans. This policy addresses topics that include water use and recycling, waste disposition, the research and use of alternative energies, compliance with required laws, closure requirements and education initiatives. Each operation runs unique environmental programs according to its location, needs, resources and processes. We have a proactive approach to minimizing and mitigating environmental impacts during all phases of the mining cycle from exploration through project development and into full mining operations. This is accomplished by applying prudent design and operating practices, continuous monitoring and by providing training and education for the employees and contractors who work at our facilities.
The Company recognizes that the skills and dedication of our employees and contractors are important drivers of our success. We also recognize the vital contribution they make to the economic prosperity of the communities in which we operate. As such, we offer leading career development opportunities, competitive remuneration, an engaging working environment and a supportive culture where fairness, respect, safety and diversity are valued and practiced.
Pan American’s operational track record and strong financial standing has positioned the Company to take full advantage of strategic opportunities in the silver market, when and if they arise. Pan American’s silver production has grown for 15 consecutive years. At the end of 2010, Pan American had seven operating mines and also owned the world class Navidad silver development project in Argentina, and is the operator of the La Preciosa project in Mexico - a considerable portfolio of quality silver assets providing diversification of political and operational risk. Pan American also produces significant quantities of gold and base metals as by-products to its silver mining activities. The following charts reflect the geographic diversity of our silver production and the breakdown of our revenue, by metal type, for 2010:
| 2010 Silver Production by Country | 2010 Revenue by Metal |
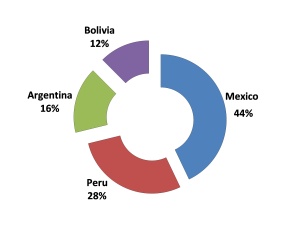 |  |
OPERATIONAL & PROJECT DEVELOPMENT
 | Record Silver Production |
Silver production was 24.3 million ounces in 2010, an increase of 5% over 2009. This new record is mainly attributable to exceptional silver production at Alamo Dorado, where 6.7 million ounces was produced compared to 5.3 million ounces in 2009.
| | Navidad Project Update |
The Company released the results of Navidad’s preliminary assessment, which defined a highly economic project that would produce an estimated average of 19.8 million ounces of silver over the first 5 years of operation, have a mine life of 17 years and generate an after-tax return of $1.2 billion at a 5% discount rate (assuming a $25 per ounce silver price).
| | La Preciosa Update |
The Company made good progress at the La Preciosa joint-venture project, where we invested in exploration and delineation drilling, metallurgical testing and engineering activities and are well on our way to producing a preliminary assessment by mid-year 2011.
| | Robust Proven and Probable Silver Reserves |
A successful exploration and resource conversion program in 2010 very nearly fully replaced reserves that were mined during the year. As at December 31, 2010, proven and probable reserves totaled 230.7 million ounces. For the complete breakdown of reserves and resources by property and category, refer to section “Mineral Reserves and Resources” contained herein.
FINANCIAL
Annual sales in 2010 were a record $632.0 million, an increase of 39% over 2009 sales, driven primarily by increased quantities of silver sold, combined with higher realized prices for all metals.
| Record Mine Operating Earnings |
Mine operating earnings in 2010 increased to $239.8 million, an increase of 90% over the prior year, as growth in sales noted above significantly outweighed increases in cost of sales and depreciation.
| Record Operating Cash Flow |
Cash flow from operations was at a record $242.3 million, a 109% increase from 2009. Operating cash flow before changes in non-cash working capital was $218.3 million in 2010, a $66.7 million improvement on the comparable cash flow from 2009. The additional operating cash flow was mainly attributable to increased cash flow from Alamo Dorado and Manantial Espejo, which combined to generate $150.9 million.
| Record Liquidity and Working Capital Position |
The Company had a record cash and short term investment balance of $360.5 million and a working capital position at a record $433.8 million at December 31, 2010, an increase of $167.4 million and $161.5 million, respectively, from a year ago. This was driven mostly by the record operating cash flows as described above.
| Pan American Starts Paying Dividends |
Pan American declared its first dividend in February 2010 and a second dividend in August 2010, both in the amount of $0.025 per common share. In November 2010 the Company announced a dividend in the amount of $0.025 per common share and increased the frequency of the Company’s dividend distributions from a semi-annual to a quarterly basis.
BUSINESS DEVELOPMENT
During January 2010, the Company issued further common shares and share purchase warrants (1.7 million and 0.7 million, respectively) to bring its ownership interest in Aquiline Resources Inc. from 93% to 100% by January 22, 2010. The final step of the acquisition was achieved through a Compulsory Acquisition. Please refer to Note 3 of the Audited Consolidated Financial Statements for further details.
2011 PROJECT DEVELOPMENT OBJECTIVES
On November 30, 2010, the Company released the results of Navidad’s Preliminary Assessment, which defined a highly economic project that would involve developing and mining the deposit through conventional surface mining methods. The Preliminary Assessment technical report was subsequently filed with the applicable regulatory authorities on January 14, 2011 and is available on SEDAR at www.sedar.com. The Company expects to complete an Environmental Impact Assessment (“EIA”) during the second quarter of 2011 and a full feasibility study in the fourth quarter. In 2011, the Company plans to invest over $40.0 million in Navidad’s continued development, including $16 million for exploration diamond drilling. The remainder will be directed towards preparation of the EIA, tailings site and geotechnical evaluation, metallurgical studies, basic engineering, preparation of the feasibility study, and community, media and government relations activities. Pan American Silver remains confident that an open and informed dialogue with the provincial government and local communities regarding open pit mining in the Central Meseta of Chubut will ultimately be resolved favorably and lead to the responsible development of Navidad. The Company intends to transform Navidad into a world-class silver mine.
During 2010 Pan American was also very active at the La Preciosa joint-venture with Orko Silver Corp. The Company is currently completing additional work to evaluate alternative extraction and development scenarios in order to maximize the project’s economics, in view of the improved metals price environment. During the first half of 2011, Pan American expects to invest $1 million at La Preciosa to complete a preliminary assessment.
Pan American’s Morococha Relocation Project will advance in 2011 with completion of the construction of the new Morococha site infrastructure, including a maintenance facility, warehouse, administration building, and employee residence. A total of $43 million is budgeted for this work in 2011, which will be partially offset by progress payments received from Minera Peru Chinalco (“Chinalco”). The purpose of this project is to move existing facilities to outside the area of Chinalco’s future Toromocho open pit mine. The processing plant relocation is currently scheduled for 2013/2014, as the current concentrator is located a safe distance from the first Toromocho open pit activity.
2011 OPERATING OUTLOOK
This section of the MD&A provides management’s production and costs forecasts for 2011. We also discuss the major capital projects planned for each of the operations in 2011. These are forward-looking estimates and subject to the cautionary note regarding the risks associated with forward looking statements at the end of this MD&A.
Silver production is expected to decline slightly from 2010’s production to between 23.0 and 24.0 million ounces. The expected decrease is primarily due to lower production at Alamo Dorado and Quiruvilca partially offset by planned increases at Manantial Espejo, Huaron, La Colorada and San Vicente.
The expected reductions in gold grades at Manantial Espejo and Alamo Dorado will likely result in lower gold production in 2011. Zinc, lead and copper production are expected to increase in 2011 as compared to 2010’s production, due to higher throughput at Huaron and La Colorada.
Precious metals are expected to contribute approximately 79% of our sales in 2011, similar to the distribution sales in 2010. Gold is still expected to be our most significant by-product in 2011, despite lower production levels. Our sales base will continue to be geographically diversified in 2011 with the Peruvian operations contributing 35% of sales, the Mexican operations 32%, Manantial Espejo 23% and San Vicente 10%.
Silver Production Forecast
| | Silver Production ounces (000s) | Cash Costs per ounce (1) | Total Costs per ounce (1) |
| Huaron | 3,100 - 3,200 | $11.10 - $13.00 | $12.65 - $14.60 |
| Morococha | 2,600 - 2,700 | $4.80 - $6.60 | $7.57 - $9.48 |
| Quiruvilca | 1,000 - 1,100 | $8.80 - $9.90 | $16.07 - $17.90 |
| Alamo Dorado | 4,800 - 5,100 | $5.30 - $5.70 | $9.32 - $9.98 |
| La Colorada | 4,100 - 4,200 | $7.60 - $8.50 | $9.08 - $10.02 |
| San Vicente | 3,200 - 3,300 | $7.60 - $8.60 | $11.32 - $12.44 |
| Manantial Espejo | 4,200 - 4,500 | $4.80 - $5.60 | $13.23 - $14.63 |
| Consolidated Total | 23,000 - 24,100 | $7.00 - $7.50 | $11.08 -$11.78 |
| (1) | Cash costs per ounce and total costs per ounce are non-GAAP measurements. Please refer to section Non-GAAP Measures for a detailed reconciliation of these measures to our cost of sales. The cash cost forecasts assume by-product credit prices of $2,050/tonne ($0.93/lb) for Zinc and Lead, $7,000/tonne ($3.17/lb) for Copper, and $1,320/oz for gold. |
By-product Production Forecast
| | Gold ounces | Zinc tonnes | Lead tonnes | Copper tonnes |
| Huaron | 1,300 - 1,500 | 9,900 - 11,800 | 4,400 - 4,500 | 1,700 - 2,000 |
| Morococha | 1,300 - 1,400 | 16,000 - 16,800 | 4,600 - 5,700 | 1,450 - 1,550 |
| Quiruvilca | 1,450 - 1,550 | 9,200 - 9,500 | 2,500 - 2,600 | 1,300 - 1,400 |
| Alamo Dorado | 14,800 - 15,400 | - | - | 95 - 105 |
| La Colorada | 4,300 - 4,800 | 3,300 - 3,600 | 1,500 - 2,400 | - |
| San Vicente | - | 5,000 - 5,800 | - | 500 - 600 |
| Manantial Espejo | 52,000 - 53,200 | - | - | - |
| Consolidated Total | 75,150 - 77,850 | 43,400 - 47,500 | 13,000 - 15,200 | 5,045 - 5,655 |
| Cash and Total Costs Forecasts |
Cash costs are expected to increase to approximately $7.00 to $7.50 per ounce of payable silver in 2011 compared to the 2010 cash costs of $5.69 per ounce. This is primarily due to increases in direct operating costs (mostly labour related), royalties, treatment charges, and reduced gold by-product credits. The non-cash component of our total cost per ounce is expected to increase relative to the $3.82 per ounce recorded in 2010 to approximately $4.21 per ounce in 2011.
| Capital Expenditure Forecasts |
We are planning to invest $54.0 million in sustaining capital and $67.2 on project development in 2011, as set out in the table below:
| | | Capital budget (in millions) |
| Huaron | $ | 9.9 | |
| Morococha | $ | 12.2 | |
| Quiruvilca | $ | 2.9 | |
| Alamo Dorado | $ | 2.0 | |
| La Colorada | $ | 10.8 | |
| San Vicente | $ | 4.6 | |
| Manantial Espejo | $ | 11.6 | |
| Mine Capital | $ | 54.0 | |
| Navidad | $ | 28.7 | |
| Morococha Project | $ | 37.2 | |
| Other | $ | 1.3 | |
| Project Development Capital | $ | 67.2 | |
| Total Capital | $ | 121.2 | |
Management’s forecast for each mine’s operating performance and capital requirements in 2011 follows.
In 2011, we expect to produce approximately 3.1 to 3.2 million ounces of silver at Huaron at a cash cost in the range of $11.10 to $13.00 per ounce. Huaron plans to increase mining and milling rates by around 4% from its 2010 levels by accessing additional higher grade ore zones deeper in the mine. The increased throughput along with an approximate 5% increase in silver grade is expected to result in an increase in silver production of approximately 10%. The expected increase in throughput rates is also expected to yield higher production of zinc, lead and copper. Costs per dry metric tonne (“DMT”) milled are forecasted to remain fairly stable as compared to 2010 primarily as a result of the effect of increases in throughput offsetting cost increases. Cash costs per ounce are expected to reduce from the 2010 cash costs due to the increased by-product credit production and partially offset by the increased operating costs.
Capital spending of $9.9 million at Huaron in 2011 will allow for mine development, exploration to replace reserves mined, equipment overhauls and equipment replacements.
In 2011, we expect to produce approximately 2.6 to 2.7 million ounces of silver at a cash cost in the range of $4.80 to $6.60 per ounce for Pan American’s 92.2% interest in Morococha. Tonnes milled, silver grades and recoveries at Morococha in 2011 are all expected to remain similar to 2010 levels. Zinc and lead production is expected to increase marginally with higher grades in the areas planned to be mined. Operating costs per tonne are expected to increase by approximately 8% over 2010. We anticipate cash cost per ounce in 2011 to increase compared to 2010’s cash cost of $4.43 due to the higher operating costs partially offset by increased zinc and lead production.
In total, Morococha’s capital budget for 2011 is $12.2 million, primarily for the long term multiple year mine development advances towards the Yacamina zones, exploration to replace reserves mined, and equipment overhauls and replacements.
In 2011, we expect to produce 1.0 to 1.1 million ounces of silver at a cash cost in the range of $8.80 to $9.90 per ounce.
The production profile is anticipated to decline slightly from that achieved in 2010 due to lower expected grades. A decrease in by-product credits is the main reason for the expected increase in cash costs per ounce, compared to the $5.87 per ounce cash costs recorded in 2010. Our forecast reflects management’s intention to operate the mine throughout the year while concurrently advancing the mine closure.
Management’s forecast for 2011 assumes that mine development continues throughout 2011, anticipating the continuation of operations beyond 2011. Our plan includes concurrent reclamation spending of approximately $1.5 million which will be recorded against the existing mine closure obligation on our balance sheet. In 2011 we plan to capitalize expenditures of $2.9 million and amortize these amounts over the production life primarily for equipment overhauls and replacements.
Our assumption is that the La Oroya smelter will not restart in 2011 and we are therefore not anticipating any silver production from our pyrite stockpile operation. As such, the remaining silver ounces contained in the pyrite stockpiles have been re-categorized from Reserves to Resources and in 2010 we wrote down the remaining carrying value of the stockpiles.
In 2011, we expect Alamo Dorado to be our largest producer with anticipated production of 4.8 to 5.1 million ounces of silver at a cash cost in the range of $5.30 to $5.70 per ounce. Silver and gold grades will decrease at Alamo Dorado during 2011, with silver and gold recoveries stable around 88%. The mine is expected to produce 14,800 to 15,400 ounces of gold compared to the 16,476 ounces produced in 2010.
The expected increase in cash costs per ounce compared to the $3.16 per ounce incurred in 2010 is due to lower silver grades, higher direct operating costs and lower by-product credits from gold revenues.
Capital expenditures are expected to be $2.0 million, primarily for exploration and for equipment replacements and upgrades.
In 2011, we expect to produce 4.1 to 4.2 million ounces of silver at a cash cost in the range of $7.60 to $8.50 per ounce. La Colorada will continue shifting production from the oxide zone and expand production from the sulphide zone. A 12% increase in throughput is expected to result in an approximately 8% increase in silver production during 2011, as well as increases in the production of gold, zinc and lead.
Operating costs per tonne in 2011 are expected to remain similar to the 2010 level. Cash costs per ounce are expected to decrease by approximately 2% from 2010’s cash costs per ounce of $8.59 due to the effect of increased production, which outweighs the impact of higher direct operating costs.
Capital expenditures at La Colorada in 2011 are expected to be $10.8 million, and are comprised mostly of expenditures related to constructing a new tailings dam, equipment overhauls, equipment replacements and exploration drilling.
In 2011, we expect to produce 3.2 to 3.3 million ounces of silver at a cash cost in the range of $7.60 to $8.60 per ounce for Pan American’s 95.0% interest in San Vicente. Our 2011 forecast for San Vicente contemplates operating the plant at 11% above the design capacity of 750 tonnes per day. The mine plan for 2011 is expected to deliver ore with slightly lower silver and zinc grades than in 2010. The higher throughput rates are expected to outweigh the decrease in grades, resulting in increased production of silver and zinc compared to 2010 levels.
For 2011 the increase in throughput rates is expected to result in a decrease in the unit operating costs per tonne, offsetting the impact of lower grades and as a consequence cash costs per ounce are expected to remain similar to 2010 levels.
The main projects making up the $4.6 million capital budget at San Vicente include equipment overhauls and repairs, infrastructure upgrades, and exploration drilling.
In 2011, we expect to produce 4.2 to 4.5 million ounces of silver at a cash cost in the range of $4.80 to $5.60 per ounce. The key objectives in 2011 for Manantial Espejo are to maintain design capacity throughput of 2,000 tonnes per day of ore and to improve silver grades and recoveries, thereby increasing silver production from 2010 levels.
The 2011 mine plan calls for a total of approximately 10.1 million tonnes to be mined from open pits, including 0.6 million tonnes of ore from the open pit and an additional 0.2 million ore tonnes to be mined from underground. The open pit mining rates will be expanded
from the average 604,000 tonnes per month achieved in 2010 to 1.0 million tonnes per month beginning in July 2011 with an investment of $5.5 million for additional open pit equipment. The increased open pit mining rates provides enhanced flexibility, reduced unit operating costs, enhanced grades in 2011 to 2014, and an overall increase in life-of-mine cash flows. Gold head grades are expected to decrease which will result in an approximately 17% decline in gold production from the 2010 level. The drop in gold production and the resultant decline in by-product credit is the principal reason for the sharp increase from the 2010 cash costs of $1.61 per ounce.
Included in cash flow from operations at Manantial Espejo is an amount of $20.1 million related to recovery of value added tax ("VAT”) receivable balances. Operating cash flow from Manantial (excluding working capital) is expected to make up approximately 35% of the consolidated operating cash flow in 2011.
The capital budget for 2011 totals $11.6 million with the majority of the capital to be spent on equipment acquisitions, increased housing projects in Gobernador Gregores, work on the tailings dam, as well as exploration drilling.
2010 OPERATING PERFORMANCE
The following table reflects silver production and cash costs at each of Pan American’s operations for 2010, as compared to 2009 and 2008.
| | | Silver Production (ounces ‘000s) | | | Cash Costs(1) ($ per ounce) | |
| | | 2010 | | | 2009 | | | 2008 | | | 2010 | | | 2009 | | | 2008 | |
| Huaron | | | 2,987 | | | | 3,563 | | | | 3,628 | | | $ | 12.35 | | | $ | 9.95 | | | $ | 8.06 | |
Morococha(2) | | | 2,633 | | | | 2,762 | | | | 2,476 | | | $ | 4.43 | | | $ | 5.86 | | | $ | 2.84 | |
| Quiruvilca | | | 1,245 | | | | 1,422 | | | | 1,383 | | | $ | 5.87 | | | $ | 8.64 | | | $ | 6.61 | |
| Pyrites Stockpiles | | | - | | | | 98 | | | | 284 | | | | - | | | $ | 3.78 | | | $ | 4.41 | |
| Alamo Dorado | | | 6,721 | | | | 5,321 | | | | 6,116 | | | $ | 3.16 | | | $ | 4.51 | | | $ | 4.38 | |
| La Colorada | | | 3,702 | | | | 3,468 | | | | 3,911 | | | $ | 8.59 | | | $ | 7.55 | | | $ | 8.06 | |
San Vicente(3) | | | 3,033 | | | | 2,627 | | | | 875 | | | $ | 8.21 | | | $ | 7.07 | | | $ | 7.57 | |
| Manantial Espejo | | | 3,965 | | | | 3,783 | | | | - | | | $ | 1.61 | | | $ | (0.84 | ) | | | - | |
| Consolidated Total | | | 24,286 | | | | 23,044 | | | | 18,673 | | | $ | 5.69 | | | $ | 5.53 | | | $ | 5.96 | |
| (1) | Cash costs per ounce and total costs per ounce are non-GAAP measurements. Please refer to section Non-GAAP Measures for a detailed reconciliation of these measures to our cost of sales. |
| (2) | Morococha data represents Pan American's 92.2% interest in the mine's production. |
| (3) | San Vicente data represents Pan American's 95.0% interest in the mine's production. |
The graph below pictorially presents silver production by mine in 2010 and highlights the diverse nature of Pan American’s silver production.
| Silver Production by Mine |
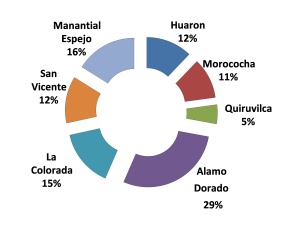 |
In 2010, Pan American’s silver production increased by 1.2 million ounces to a record 24.3 million ounces. This increase was primarily driven by record production at Alamo Dorado, increased silver production at San Vicente, which was in its first full year of commercial operation and higher silver production relative to 2009 at Manantial Espejo and La Colorada. These increases were partially offset by decreases at our Peruvian operations. Silver production in 2010 was 800,000 ounces higher than management’s forecast of 23.4 million ounces.
Consolidated cash costs per ounce of silver were $5.69 in 2010, a 3% increase from 2009’s cash costs per ounce of $5.53. The small increase in cash costs were primarily due to a 10% increase in unit operating costs per tonne which were driven by increases in mining royalties in Argentina due to higher metal prices, stronger local currencies and higher labour costs, partially offset by the increased by-product credits as a result of the improved gold and base metal prices in 2010.
The following table sets out the Company’s by-product production over the past three years:
| | | By-Product Production | |
| | | 2010 | | | 2009 | | | 2008 | |
| Gold ounces | | | 89,555 | | | | 100,704 | | | | 25,146 | |
| Zinc tonnes | | | 43,103 | | | | 44,246 | | | | 39,811 | |
| Lead tonnes | | | 13,629 | | | | 14,328 | | | | 15,974 | |
| Copper tonnes | | | 5,221 | | | | 6,446 | | | | 6,069 | |
In 2010, production of all by-product metals decreased in comparison to 2009 production. Gold, zinc, lead and copper production relative to 2009 declined by 11%, 3%, 5% and 19%, respectively. Actual production in 2010 fell short of management’s expectation for zinc, lead and copper by 6%, 14% and 28%, respectively. While gold production in 2010 did
exceed management’s initial forecast of 85,600 ounces, it fell short of our revised guidance of 95,000 in the Q1 2010 MD&A. The shortfall in gold was due to lower than anticipated gold grades and recoveries over the last 3 quarters of 2010, while the shortfall in the base metals was primarily due to lower than expected grades.
A description of each mine and an analysis of their 2010 operating performance, measured against 2009 operating performance and management’s forecasts for 2010 follows.
| | Twelve months ended | |
| | December 31, | |
| | 2010 | | | 2009 | |
| Tonnes milled | | | 704,094 | | | | 699,420 | |
| Average silver grade – grams per tonne | | | 171 | | | | 200 | |
| Average zinc grade | | | 2.43 | % | | | 2.48 | % |
| Average silver recovery | | | 77.3 | % | | | 79.2 | % |
| Silver – ounces | | | 2,987,280 | | | | 3,562,893 | |
| Gold – ounces | | | 1,525 | | | | 1,235 | |
| Zinc – tonnes | | | 10,216 | | | | 11,198 | |
| Lead – tonnes | | | 4,346 | | | | 4,372 | |
| Copper – tonnes | | | 1,654 | | | | 2,166 | |
| | | | | | | | | |
Cash costs per ounce (1) | | $ | 12.35 | | | $ | 9.95 | |
Total costs per ounce (1) | | $ | 13.98 | | | $ | 11.33 | |
| | | | | | | | | |
| Payable ounces of silver | | | 2,753,906 | | | | 3,225,928 | |
| | | | | | | |
| (1) | Cash costs per ounce and total costs per ounce are non-GAAP measurements. Please refer to section Non-GAAP Measures for a detailed reconciliation of these measures to our cost of sales. |
The Huaron silver-zinc underground polymetallic mine is located 320 highway km northeast of Lima in the heart of the Cerro de Pasco district. This is one of Peru's most important mining districts, accounting for more than half of the country's silver production. Since operations began in 1912, Huaron has produced more than 230 million ounces of silver.
Pan American acquired a majority interest in Huaron in March 2000 and re-opened the mine in April 2001 after completing a feasibility study, arranging financing and completing site rehabilitations.
In 2010, although mill tonnage at Huaron remained similar to 2009, silver production declined by 16% mainly due to lower silver grades and recoveries. Zinc and copper production was also hampered by lower grades and recoveries, while lead and gold production remained similar to 2009 levels. These declines were a result of less than expected ore tonnes and grades obtained from the 180 level mine deepening area.
Cash costs at Huaron increased by 24% in 2010 to $12.35 per ounce mainly due to the negative effect of fixed costs on lower production of silver ounces and increased costs associated with additional cost for dewatering and ventilation for the mine deepening to 180 level, additional underground mine development and ground support measures, general operating cost escalations and the strengthening local currency. Offsetting these factors were higher by-product credits resulting from stronger base metal prices in 2010.
Silver production in 2010 was 19% below management’s forecast of 3.7 million ounces and actual cash costs per ounce were 41% higher than our forecast of $8.75 per ounce. The reasons for the shortfall in production relative to management’s forecast were lower than planned throughput combined with lower grade silver ore. The latter was due to the shortfalls of high grade ore realized on the 180 level mine deepening. The actual cash costs in 2010 relative to forecasted cash costs were negatively impacted by (i) the negative effect of fixed costs on lower tonnage and lower production of silver; (ii) a six-day mine closure resulting from an illegal worker’s strike disputing the amount of the 2009 workers’ profit-sharing payment; (iii) additional underground mine development costs and increases in ground support measures; and (iv) the effect of strengthened local currency. Offsetting these factors were better realized by-product prices than expected.
Capital expenditures at Huaron during 2010 totalled $6.6 million and comprised mainly of mine development, exploration expenditures, process plant screening upgrades, mine equipment replacements, tailings dam improvements, and surface facility upgrades.
| | Twelve months ended | |
| | December 31, | |
| | 2010 | | 2009 | |
| | | | | |
| Tonnes milled | | 619,819 | | | 638,805 | |
| Average silver grade – grams per tonne | | 152 | | | 156 | |
| Average zinc grade | | 2.88 | % | | 3.24 | % |
| Average silver recovery | | 87.0 | % | | 86.1 | % |
| Silver – ounces | | 2,632,790 | | | 2,762,064 | |
| Gold – ounces | | 2,329 | | | 1,291 | |
| Zinc – tonnes | | 15,228 | | | 16,942 | |
| Lead – tonnes | | 4,927 | | | 5,520 | |
| Copper – tonnes | | 1,532 | | | 2,030 | |
| | | | | | | |
Cash costs per ounce (1) | $ | 4.43 | | $ | 5.86 | |
Total costs per ounce (1) | $ | 7.13 | | $ | 8.49 | |
| | | | | | | |
| Payable ounces of silver | | 2,338,121 | | | 2,469,949 | |
| | | | | | | |
| * | Production and cost figures are for Pan American’s 92.2% share only. |
| (1) | Cash costs per ounce and total costs per ounce are non-GAAP measurements. Please refer to section Non-GAAP Measures for a detailed reconciliation of these measures to our cost of sales. |
Pan American acquired the Morococha mine in Peru in August 2004. Morococha is a silver-zinc rich underground polymetallic vein mine located approximately 180 highway kilometres southwest of the Company's Huaron mine or 140 highway kilometers east of Lima.
The Morococha district has been mined continuously for more than 100 years and lies within one of the world's most prolific mineral belts for polymetallic vein systems. Morococha hosts a very large and productive network of veins, mantos, skarns, and other replacement ore bodies within a mineral rights package covering 110 square kilometres of concessions.
Morococha’s 2010 silver production decreased by 5% as compared to 2009 mainly due to a 3% decrease in throughput rates combined with slightly lower silver grades, partially offset by higher silver recoveries. Lower zinc, lead and copper grades resulted in lower production of those metals.
Cash costs at Morococha decreased by 24% primarily due to higher by-product credits resulting from stronger base metal prices partially offset by an increase in unit operating costs per tonne for 2010 compared to 2009.
Actual performance at Morococha in 2010 with respect to throughput rates, silver grades and recoveries were all roughly in-line with management’s forecasts, resulting in silver production which was within 2% of management’s expectations. Gold production was ahead of management’s expectation due to higher gold grades. Zinc, lead and copper fell short of management’s forecast by 5%, 13% and 34%, respectively, due mainly to lower grades of those metals. The actual cash costs were 4% higher than forecasted cash costs of $4.25 per ounce due to higher operating costs from general cost escalations and the strengthened currency partially offset by higher than expected by-product credits.
Capital expenditures at Morococha during 2010 totalled $16.7 million. The capital spending was primarily on long term mine development advances, exploration drilling, mine and plant equipment replacements, and initial preparation work for the central facility relocations to make way for Chinalco’s Toromocho Project development.
| | | Twelve months ended | |
| | | December 31, | |
| | | 2010 | | | 2009 | |
| Tonnes milled | | | 323,427 | | | | 330,030 | |
| Average silver grade – grams per tonne | | | 141 | | | | 155 | |
| Average zinc grade | | | 3.58 | % | | | 3.80 | % |
| Average silver recovery | | | 84.7 | % | | | 86.3 | % |
| Silver – ounces | | | 1,245,030 | | | | 1,421,897 | |
| Gold – ounces | | | 1,801 | | | | 1,522 | |
| Zinc – tonnes | | | 10,058 | | | | 10,993 | |
| Lead – tonnes | | | 2,989 | | | | 3,230 | |
| Copper – tonnes | | | 1,434 | | | | 1,643 | |
| | | | | | | | | |
Cash costs per ounce (1) | | $ | 5.87 | | | $ | 8.64 | |
Total costs per ounce (1) | | $ | 6.56 | | | $ | 9.25 | |
| | | | | | | | | |
| Payable ounces of silver | | | 1,128,557 | | | | 1,288,720 | |
| (1) | Cash costs per ounce and total costs per ounce are non-GAAP measurements. Please refer to section Non-GAAP Measures for a detailed reconciliation of these measures to our cost of sales. |
The Quiruvilca mine is located approximately 130 kilometres inland from the coastal city of Trujillo. Mineralization was first reported in the area in 1789, and the mine has been in continuous operation since 1926. The underground workings cover an area four kilometres long by three kilometres wide and extend more than 400 meters in depth. Pan American has operated Quiruvilca since acquiring the property from ASARCO in late 1995.
As reported previously, management has activated plans to place Quiruvilca on care and maintenance. Based on the improvement in the price environment for metals being sustained through 2010 and into 2011, our intention is to operate the Quiruvilca mine throughout 2011 while still continuing to prepare for mine closure should metal prices fall sharply.
In 2010, Quiruvilca’s silver production decreased by 12% in comparison to 2009. This decrease in silver production was due to a combination of lower tonnage and reduced silver grades and recoveries. Similarly, lower zinc, lead, and copper grades resulted in lower production of those metals in 2010.
Cash costs for 2010 were $5.87, a 32% decrease from $8.64 per ounce a year ago, primarily due to the increase in by-product credits resulting from stronger base metal prices in 2010 partially off-set by higher operating costs from general cost escalations and the strengthened currency. Cash costs in 2010 continue to reflect the fact that all expenditures in Quiruvilca were expensed (including items that would normally have been capitalized if the operation were not being prepared for care and maintenance).
Silver production during 2010 fell 11% short of management’s expectations, primarily due to the lower than expected silver grades and recoveries. Overall by-product production was reasonably within management’s forecast. Gold and zinc production were above management’s forecast by 15% and 3%, respectively, due to higher realized grades of those metals, while lead production was in-line with expectations, and copper production fell 10% short of forecast due to lower realized copper grades partially offset by higher than anticipated copper recoveries. Cash costs of $5.87 per ounce were 16% below management’s forecast of $7.00 per ounce primarily as a result of higher than expected base metal prices partially off-set by higher operating costs.
| | | Twelve months ended | |
| | | December 31, | |
| | | 2010 | | | 2009 | |
| Tonnes sold | | - | | | | 13,984 | |
| Average silver grade – grams per tonne | | - | | | | 218 | |
| Silver – ounces | | - | | | | 98,235 | |
| | | | | | | | |
Cash costs per ounce (1) | | $ | - | | | $ | 3.78 | |
Total costs per ounce (1) | | $ | - | | | $ | 3.78 | |
| | | | | | | | | |
| Payable ounces of silver | | | - | | | | 50,218 | |
| (1) | Cash costs per ounce and total costs per ounce are non-GAAP measurements. Please refer to section Non-GAAP Measures for a detailed reconciliation of these measures to our cost of sales. |
The silver-rich stockpiles are located in the Cerro de Pasco mining district of Peru. Volcan Compañía Minera, a Peruvian mining company, is the largest ore producer in this district. For many decades, Volcan's Cerro de Pasco mine accumulated silver-rich stockpiles from which the silver could not be extracted by standard metallurgical processes. In November 2002, Pan American acquired the stockpiles and entered into an agreement to mine and sell 600,000 tonnes of the highest grade silver stockpiles to the La Oroya smelter, where the ore is used as a process flux and consequently the silver is recovered.
In 2010, there was no production from the Pyrite Stockpile operation as a direct consequence of the closure of the La Oroya smelter, which is the only buyer of this material.
Management’s expectation that the La Oroya smelter would restart operations in the second quarter of 2010 was not realized. As a consequence, there was no production in 2010 from
the pyrite stockpiles compared to the forecasted 0.2 million ounces of silver at a cash cost of $4.00 per ounce.
In Q4 2010, the Company made the decision to write-off the remaining $1.5 million book value associated with the pyrite stockpiles. This decision was based on the uncertainty related to the future of the La Oroya smelter. As a consequence of this decision the remaining silver reserves in the pyrite stockpile have been re-categorized to measured and indicated resources.
| | | Twelve months ended | |
| | | December 31, | |
| | | 2010 | | | 2009 | |
| Tonnes milled | | | 1,675,952 | | | | 1,671,257 | |
| Average silver grade – grams per tonne | | | 147 | | | | 111 | |
| Average gold grade – grams per tonne | | | 0.38 | | | | 0.39 | |
| Average silver recovery | | | 88.4 | % | | | 87.7 | % |
| Silver – ounces | | | 6,721,258 | | | | 5,320,637 | |
| Gold – ounces | | | 16,746 | | | | 18,211 | |
| Copper – tonnes | | | 89 | | | | 206 | |
| | | | | | | | | |
Cash costs per ounce (1) | | $ | 3.16 | | | $ | 4.51 | |
Total costs per ounce (1) | | $ | 7.41 | | | $ | 9.12 | |
| | | | | | | | | |
| Payable ounces of silver | | | 6,693,134 | | | | 5,284,037 | |
| (1) | Cash costs per ounce and total costs per ounce are non-GAAP measurements. Please refer to section Non-GAAP Measures for a detailed reconciliation of these measures to our cost of sales. |
Alamo Dorado is an open-pit mine located in the Mexican state of Sonora, approximately 320 km from the state capital of Hermosillo. Corner Bay Silver Inc., a Toronto-listed exploration company, began grassroots reconnaissance of the area in 1997. Pan American acquired Corner Bay and the Alamo Dorado project in February 2003. The mine began commercial production on April 1, 2007 after the construction of the mine, plant and related infrastructure was completed substantially on schedule and on budget at the end of 2006.
Alamo Dorado was the Company’s largest silver producer in 2010, with record silver production of 6.7 million ounces. Silver production increased by 26% from the 2009 levels primarily due to significantly higher silver grades. The increased silver grades were a result of more mining than planned in the higher grade portions of the Phase I pit and encountering more tonnes and higher grades than anticipated in the Phase II pit. Gold production at approximately 17,000 ounces in 2010 was 8% lower than that in the comparable period of 2009 mainly as a result of lower gold grades.
Alamo Dorado’s cash costs per ounce were $3.16 in 2010, a 30% decrease from the 2009 cash costs of $4.51, due mainly to the positive effect of higher production of silver ounces on fixed costs and the higher gold price.
Alamo Dorado’s record silver production in 2010 was well above management’s forecast of 4.2 million ounces mainly due to higher than expected silver grades. Gold production was 23% ahead of the 13,700 ounce forecast as gold grades realized also exceeded expectations. Cash costs were 53% lower than our forecast of $6.75 per ounce as a result
of significantly higher silver production and higher realized gold by-product credits resulting from increased gold production and gold metal prices.
Capital expenditures at Alamo Dorado during 2010 totalled $2.1 million primarily for equipment replacements and infrastructure upgrades.
| | | Twelve months ended | |
| | | December 31, | |
| | | 2010 | | | 2009 | |
| Tonnes milled | | | 345,697 | | | | 324,916 | |
| Average silver grade – grams per tonne | | | 378 | | | | 384 | |
| Average silver recovery | | | 88.0 | % | | | 86.2 | % |
| Silver – ounces | | | 3,701,568 | | | | 3,467,856 | |
| Gold – ounces | | | 4,312 | | | | 6,554 | |
| Zinc – tonnes | | | 2,940 | | | | 2,311 | |
| Lead – tonnes | | | 1,366 | | | | 1,205 | |
| | | | | | | | | |
Cash costs per ounce (1) | | $ | 8.59 | | | $ | 7.55 | |
Total costs per ounce (1) | | $ | 9.73 | | | $ | 11.21 | |
| | | | | | | | | |
| Payable ounces of silver | | | 3,537,905 | | | | 3,333,170 | |
| (1) | Cash costs per ounce and total costs per ounce are non-GAAP measurements. Please refer to section Non-GAAP Measures for a detailed reconciliation of these measures to our cost of sales. |
Pan American acquired the La Colorada mine in 1998 and invested through 2003 to refurbish the mine and construct a 650 tonne per day silver and gold oxide ore processing plant with associated infrastructure. Following the commissioning of the oxide plant in 2003, the Company made additional investments to expand the mine and the pre-existing sulphide processing plant to produce silver, gold, lead, and zinc from an additional 550 tonne per day sulphide plant which was commissioned in 2006. The mine consists of six continuous blocks of exploration permits and exploitation claims totalling 2,230 hectares.
The project lies within one of Mexico’s geologic belts known as the "faja de plata" (silver belt) that extends for 800 km along the Sierra Madre Mountains and is defined by prolific silver deposits. The continued exploration success achieved at La Colorada reported over the last 5 years illustrates the excellent potential for extending reserves through discovery and additional development.
Silver production at the La Colorada mine in 2010 was 3.7 million ounces, a 7% increase compared to the previous year. This increase was due to higher throughput rates and improved silver recoveries as a result of benefits from previous investments in mine development, mine equipment purchases, ventilation and dewatering which are enabling higher productivities and efficiencies. Despite the higher throughput rates in 2010, lower gold grades led to a decrease in gold production while production of lead and zinc benefited from higher throughput.
Cash costs increased by 14% in 2010 compared to 2009 to $8.59 per ounce as a result of higher operating costs, partially offset by higher by-product credits.
Actual performance at La Colorada in 2010 with respect to silver production was 3% ahead of management’s expectation of 3.6 million ounces, resulting from higher realized silver
grades than expected. Gold grades were approximately 19% below expectations, whereas lead and zinc grades were in-line with expectations. Actual cash costs of $8.59 were in-line with management’s forecast for 2010 as higher operating costs were off-set by better than expected production and higher by-product metal prices.
Capital expenditures at La Colorada during 2010 totalled $9.1 million. The capital was spent mainly on a tailings dam expansion, additional underground mine equipment purchases, sulphide plant equipment upgrades, and exploration works.
| | | Twelve months ended | |
| | | December 31, | |
| | | 2010 | | | 2009 | |
| Tonnes milled | | | 271,483 | | | | 167,006 | |
| Average silver grade – grams per tonne | | | 389 | | | | 537 | |
| Average zinc grade | | | 2.29 | % | | | 2.26 | % |
| Average silver recovery | | | 89.1 | % | | | 91.0 | % |
| Silver – ounces | | | 3,033,046 | | | | 2,626,774 | |
| Zinc – tonnes | | | 4,661 | | | | 2,803 | |
| Copper – tonnes | | | 512 | | | | 401 | |
| | | | | | | | | |
Cash costs per ounce (1) | | $ | 8.21 | | | $ | 7.07 | |
Total costs per ounce (1) | | $ | 12.07 | | | $ | 9.51 | |
| | | | | | | | | |
| Payable ounces of silver | | | 2,823,869 | | | | 2,458,600 | |
| * | Production and interest figures are for Pan American’s 95.0% share only. |
| (1) | Cash costs per ounce and total costs per ounce are non-GAAP measurements. Please refer to section Non-GAAP Measures for a detailed reconciliation of these measures to our cost of sales. |
The San Vicente silver-zinc mine is located in the Bolivian Andes. More than 20 bonanza type silver-zinc veins are known to occur over an area of 1.5 kilometres on surface and extend to at least 200 meters in depth. The project consists of 15 mining concessions totalling 8,159 hectares.
San Vicente was operated from 1972 to 1993 by COMIBOL, the Bolivian state mining company. In 1999 Pan American optioned the project from COMIBOL under a joint venture agreement. Following acquisition, Pan American investigated several development alternatives for San Vicente with local partnerships and by May 2007 secured 95.0% interest in the operating company of the Joint Venture Project with COMIBOL. Under the Joint Venture agreement, COMIBOL retains the rights to collect 9.4% of the operating cash flow while the Company recovers its capital investment increasing to 37.5% thereafter. Between 2000 and 2007 the Company invested in exploration drilling, underground development drifting, and performing various feasibility and development studies while conducting limited mining and toll milling production at a nearby neighbouring processing facility. During this period, Pan American discovered the rich Litoral II vein which served to significantly increase the Proven and Probable reserves at the mine. Pan American decided in mid-2007 to invest in expanding the mine by developing a modern trackless long-hole mining operation for the Litoral II vein and constructing its own 750 tonne-per-day processing facility. Commissioning activities proceeded smoothly since the April 2009 start-up leading the Company to declare commercial production in the first month of operation.
In 2010, San Vicente’s silver production increased by 15% compared to its 2009 production, mainly due to a full year of production offset by lower silver grades and recoveries. Zinc and copper production levels were significantly higher by 66% and 28%, respectively, compared to the same period last year primarily due to the increased throughput rates.
Cash costs at San Vicente increased by 16% to $8.21 in 2010 as compared to the previous year. The higher cash costs in 2010 resulted from anticipated lower silver grades as high grade ore that had been stockpiled during the exploration and development years was processed in 2009. This was partially offset by higher zinc and copper by-product credits due to increased production and prices of those metals.
Actual silver production attributable to Pan American in 2010 was in-line with management’s forecast, as the lower than expected silver grades were offset by the higher than anticipated throughput rates. Zinc and copper production fell short of forecast by 7% and 27% respectively due to the lower than expected grades of those metals. Actual cash costs of $8.21 were 17% above management’s forecast due to processing more tonnes and lower silver grades as well as higher than expected operating costs.
Capital expenditures at San Vicente during 2010 totalled $6.0 million. This consisted mainly of spending on exploration, additional underground mine equipment, concentrate handling and reagent storage facility upgrades, tailings pond water recycle system enhancements and a tailings dam rise.
| | | Twelve months ended | |
| | | December 31, | |
| | | 2010 | | | 2009 | |
| Tonnes milled | | | 717,463 | | | | 632,949 | |
| Average silver grade – grams per tonne | | | 191 | | | | 209 | |
| Average gold grade – grams per tonne | | | 2.81 | | | | 3.79 | |
| Average silver recovery | | | 90.5 | % | | | 87.6 | % |
| Average gold recovery | | | 94.7 | % | | | 94.6 | % |
| Silver – ounces | | | 3,964,822 | | | | 3,783,183 | |
| Gold – ounces | | | 62,843 | | | | 71,892 | |
| | | | | | | | | |
Cash costs per ounce (1) | | $ | 1.61 | | | $ | (0.84 | ) |
Total costs per ounce (1) | | $ | 10.16 | | | $ | 8.19 | |
| | | | | | | | | |
| Payable ounces of silver | | | 3,958,874 | | | | 3,777,508 | |
| (1) | Cash costs per ounce and total costs per ounce are non-GAAP measurements. Please refer to section Non-GAAP Measures for a detailed reconciliation of these measures to our cost of sales. |
Reconnaissance exploration on the Manantial Espejo property was first carried out in the 1970s by the Argentinean government. In 2002, the Company acquired a 50% interest in the project and in March 2006, the Company negotiated and entered into a purchase agreement for the remaining 50% interest, thus becoming a 100% owner of the Manantial Espejo project.
In March 2006, Pan American completed a feasibility study and the 43-101 Technical Report for the Manantial Espejo Project, based upon a combination open pit and underground mine plan, and a conventional milling and leaching circuit with a design capacity of 2,000 tonnes per day. In the same month, the Company’s board of directors
approved a project to construct the Manantial Espejo mine, which was completed in December 2008. In 2009, its first full year of commercial production, the mine achieved an outstanding start-up performance and produced 3.8 million ounces of silver and over 70,000 ounces of gold at cash costs of negative $0.84 per ounce of silver. The 2010 silver production levels surpassed the previous year’s outstanding production.
Silver production at the Manantial Espejo mine in 2010 was 4.0 million ounces, a 5% increase from the production level in 2009. This increase was a result of the higher throughput rates and silver recoveries, partially offset by lower silver grades. Gold production decreased by 13% in 2010 due to lower gold grades that were expected as the operation normalized towards the average reserve gold grades of the deposit, which is expected to be approximately 2.2 grams per tonne.
In 2010, cash costs at Manantial Espejo increased to $1.61, significantly higher than 2009’s cash costs of negative $0.84 per ounce. The main drivers of the increase in cash costs were higher operating costs mainly due to an increase in labour costs and the effects from the high sustained inflation rates in Argentina. These were partially offset by higher by-product gold prices.
In 2010, Manantial Espejo’s actual silver grades were below management’s forecast, resulting in 14% lower silver production than expected due to variations to the mine sequencing. Gold recoveries and grades were in-line with forecasts, resulting in gold production within 1% of management’s expectations. The actual cash costs in 2010 of $1.61 per ounce were significantly lower than the $3.25 per ounce forecast by management as actual cash costs benefited from higher than anticipated gold prices.
Capital expenditures at Manantial Espejo during 2010 totalled $7.0 million. The capital expenditures consisted mainly of exploration drilling, acquisition of additional open pit mining equipment, and a tailings dam expansion.
OVERVIEW OF 2010 FINANCIAL RESULTS
The table below sets out highlights of Pan American’s quarterly results, expressed in thousands of US dollars (except for per share detail), for the past 12 quarters, together with select balance sheet information for the prior three years.
| | QUARTERS ENDED (UNAUDITED) | YEARS ENDED |
| | | |
| 2010 | MARCH 31 | JUNE 30 | SEPT. 30 | DEC. 31 | DEC. 31 |
| Net income for the period | $ | 19,113 | $ | 18,256 | $ | 28,815 | $ | 46,389 | $ | 112,573 |
| Net income per share - Basic | $ | 0.18 | $ | 0.17 | $ | 0.27 | $ | 0.43 | $ | 1.05 |
- Diluted | $ | 0.18 | $ | 0.17 | $ | 0.27 | $ | 0.43 | $ | 1.05 |
| Dividends declared per share | $ | 0.025 | $ | - | $ | 0.025 | $ | 0.025 | $ | 0.075 |
| Sales | $ | 132,375 | $ | 147,250 | $ | 161,262 | $ | 191,099 | $ | 631,986 |
| Mine operating earnings* | $ | 36,874 | $ | 51,144 | $ | 60,581 | $ | 91,208 | $ | 239,807 |
| Income tax provision | $ | (11,416) | $ | (18,757) | $ | (17,588) | $ | (43,226) | $ | (90,987) |
| Cash Flow from operations | $ | 48,916 | $ | 45,091 | $ | 64,620 | $ | 83,629 | $ | 242,256 |
Other financial information: | | | | | | |
| Total Assets | | | | | $ | 2,072,608 |
| Total long-term financial liabilities | | | | | $ | 429,305 |
| Total Shareholders’ Equity | | | | | $ | 1,520,288 |
| 2009 | MARCH 31 | JUNE 30 | SEPT. 30 | DEC. 31 | DEC. 31 |
| Net income for the period | $ | 6,610 | $ | 10,208 | $ | 17,375 | $ | 27,805 | $ | 61,998 |
| Net income per share - Basic | $ | 0.08 | $ | 0.12 | $ | 0.20 | $ | 0.31 | $ | 0.71 |
- Diluted | $ | 0.08 | $ | 0.12 | $ | 0.20 | $ | 0.31 | $ | 0.71 |
| Sales | $ | 70,406 | $ | 111,392 | $ | 118,608 | $ | 154,406 | $ | 454,812 |
| Mine operating earnings* | $ | 10,474 | $ | 23,490 | $ | 34,708 | $ | 57,334 | $ | 126,006 |
| Income tax provision | $ | (2,350) | $ | (2,694) | $ | (7,483) | $ | (15,229) | $ | (27,756) |
| Cash Flow from (used in) operations | $ | (5,375) | $ | 32,034 | $ | 37,099 | $ | 52,118 | $ | 115,876 |
Other financial information: | | | | | | |
| Total Assets | | | | | $ | 1,848,609 |
| Total long-term financial liabilities | | | | $ | 389,383 |
| Total Shareholders’ Equity | | | | | $ | 1,343,790 |
| |
| 2008 | MARCH 31 | JUNE 30 | SEPT. 30 | DEC. 31 | DEC. 31 |
| Net income (loss) for the period | $ | 30,157 | $ | 21,357 | $ | 6,404 | $ | (33,316) | $ | 24,602 |
| Net income (loss) per share - Basic | $ | 0.38 | $ | 0.26 | $ | 0.08 | $ | (0.41) | $ | 0.31 |
- Diluted | $ | 0.38 | $ | 0.26 | $ | 0.08 | $ | (0.41) | $ | 0.30 |
| Sales | $ | 108,750 | $ | 104,079 | $ | 79,493 | $ | 46,278 | $ | 338,600 |
| Mine operating earnings (losses)* | $ | 48,375 | $ | 39,259 | $ | 15,469 | $ | (9,884) | $ | 93,219 |
| Income tax (provision) recovery | $ | (14,497) | $ | (12,451) | $ | (5,988) | $ | 8,506 | $ | (24,430) |
| Cash Flow from (used in) operations | $ | 20,964 | $ | 52,654 | $ | 24,262 | $ | (4,352) | $ | 93,528 |
Other financial information: | | | | | | |
| Total Assets | | | | | $ | 873,383 |
| Total long-term financial liabilities | | | | $ | 102,715 |
| Total Shareholders’ Equity | | | | | $ | 685,641 |
| * | Mine operating earnings/(losses) are equal to sales less cost of sales less depreciation and amortization, which is considered to be substantially the same as gross margin. |
| | Note: The Company announced its first dividend on February 15, 2010. |
Net income for 2010 was $112.6 million, compared to net income of $62.0 million for 2009. Basic earnings per share for 2010 were $1.05 compared to $0.71 in 2009. The significant increase in net income was primarily attributable to improved metal prices and a 6% increase in the quantity of silver sold.
Earnings before taxes for 2010 were reduced by $24.5 million in exploration expenses and a non-cash doubtful provision of $4.8 million and the associated write-down of inventory related to Doe Run Peru ("DRP"). The exploration expenses were primarily incurred on drilling and prefeasibility work at the Navidad and La Preciosa projects and the non-cash doubtful provision of $4.8 million was due to the uncertainty in collecting a long-term receivable from Doe Run Peru and the associated write-down of pyrite stockpile inventories that were being sold to Doe Run Peru. Net income in 2010 benefited from $11.1 million in foreign exchange gain resulting primarily from the revaluation of the long-term future income tax liability denominated in Argentine pesos and gains on Canadian dollar bank balances.
Earnings before taxes for 2009 were reduced by the following items: (i) a non-cash, doubtful debt provision of $4.4 million due to the uncertainty in collecting a long-term receivable from Doe Run Peru; (ii) a non-cash fair value charge of $2.2 million for a delay in recovery of the long-term VAT receivable in Argentina; and (iii) a donation of $2.3 million to the University of British Columbia for the construction of an earth science building.
Sales in 2010 were a record $632.0 million, an increase of 39% over the 2009 sales. This increase was driven primarily by increased metal prices and silver quantities sold, with a partial offset from lower base metal quantities sold.
Mine operating earnings, defined as sales less cost of sales and depreciation and amortization, increased to $239.8 million in 2010, an increase of 90% over the prior year. This change was from the combined effect of an increase in sales, as described above, which outweighed increased cost of sales and depreciation charges.
Cost of sales for the year was $305.7 million, a 24% increase from the $245.6 million realized in the same period last year. This increase was primarily a result of greater quantities of silver sold and higher operating costs.
Depreciation and amortization charges of $86.5 million in 2010 were 4% higher than the $83.2 million recorded in 2009.
Income tax provisions for 2010 amounted to $91.0 million compared to $27.8 million in 2009. This increase was primarily a consequence of (i) higher taxable income generated at our operations; (ii) an additional Bolivian mining tax of 12.5% introduced in October 2009; and (iii) withholding taxes on both technical services and interest paid from our foreign subsidiaries to Pan American Silver Corp.
Operating activities generated $242.3 million in 2010, a new record for the Company, compared to $115.9 million generated by operations in 2009, which was the previous record for operating cash flow. The increase in cash flow from operations resulted from improved operating earnings due to higher quantities of silver sold and higher realized prices. Before changes in non-cash working capital items, which generated $23.9 million in 2010 (2009: used $35.8 million), cash flow from operations in 2010 was $218.3 million (2009: $151.7 million). The largest contributors to the operating cash flows, before changes in non-cash working capital items, were Alamo Dorado and Manantial Espejo at $77.4 million and $73.5 million, respectively.
Changes in non-cash working capital contributed $23.9 million in 2010 compared with non-cash working capital requirements of $35.8 million in 2009. The net non-cash working capital contributions in 2010 consisted primarily of an increase in income taxes payable of $37.1 million and an increase in accounts payable and other current liabilities of $5.7 million, which were offset by a $12.1 million increase in inventories. The higher accrued current income taxes resulted from the substantial increase in taxable income generated. The increase in accounts payable and other current liabilities was mainly due to the cash payments received for the Morococha relocation project and due to the timing of royalty and other payables. The increase in inventory levels is mainly attributable to an increase in both silver doré inventory due to timing of shipments and material and supplies inventory at Manantial Espejo. In 2009, the main movements in working capital accounts that required funding were a $26.8 million increase in accounts receivables and other current assets and an increase in inventories of $15.2 million offset by an increase in taxes payable of $4.0 million.
Investing activities used $166.1 million in 2010, inclusive of $80.2 million invested in short-term investments. The balance of investing activities consisted primarily of spending $28.0 million on the Navidad project and sustaining investments in property, plant and equipment primarily at Morococha, La Colorada, Manantial Espejo, Huaron, San Vicente and Alamo Dorado of $11.3 million, $9.1 million, $7.0 million, $6.6 million, $6.0 million and $2.1 million, respectively. In addition, $5.4 million was spent on the Morococha relocation project and $5.0 million was paid as refundable VAT tax in Argentina and Bolivia.
Investing activities used $146.3 million in 2009, inclusive of $80.1 million invested in short- term investments. The balance of investing activities was dominated by final construction related expenditures at Manantial Espejo of $13.5 million and $19.0 million spent to complete the expansion at San Vicente. Sustaining investments in property, plant, and equipment were made at Morococha, Huaron, and La Colorada where $8.1 million, $7.0 million and $3.1 million were spent, respectively. In addition, $12.4 million was paid as refundable VAT tax in Argentina and Bolivia.
Financing activities in 2010 generated $2.6 million, whereas financing activities in 2009 generated $104.1 million. Cash generated from financing activities in 2010 was a result of $11.9 million in proceeds from the exercising of warrants and options which was offset by $8.0 million in dividend payments to our shareholders.
In 2009, the $104.1 million in cash generated from financing activities consisted primarily of proceeds from the public offering of 6.37 million common shares in February 2009 at a
price of $16.25 per share, for proceeds of $98.3 million, net of underwriting fees and issue expenses, along with contributions from minority shareholders in the San Vicente project of $1.6 million. In addition, proceeds from short term concentrate advances provided $4.1 million.
| Statement of Operations: Q4 2010 |
Net income in the fourth quarter of 2010 (Q4 2010) was $46.4 million or $0.43 per share compared to $27.8 million or $0.31 per share for the comparable period in 2009. The 67% increase in net income was a result of significantly better operating results mainly attributable to higher metal prices and partially offset by lower quantities sold of all metals, with the exception of lead. Silver, gold, zinc and copper quantities sold in 2010 declined by 6%, 26%, 19% and 24% respectively, while lead quantities sold increased by 8% in comparison to 2009.
Earnings before taxes for the period were negatively impacted by higher general and administration costs due to the timing of the Company’s annual incentive plan and severance payments and a non-cash $1.5 million write-down of pyrite stockpile inventories that were being sold to the La Oroya smelter, which remains closed. Net income in Q4 2010 benefited from $1.9 million in foreign exchange gain resulting primarily from the revaluation of the long-term future income tax liability denominated in Argentine pesos and an insurance claim related to theft of doré at La Colorada for $1.7 million.
Earnings for the fourth quarter of 2009 (Q4 2009) were negatively impacted by: (i) a non-cash fair value charge of $2.2 million for a delay in recovery of the long-term VAT receivable in Argentina; (ii) a donation of $2.3 million to the University of British Columbia for the construction of an earth science building; and (iii) $4.6 million in exploration activities, mainly at La Preciosa.
Sales during Q4 2010 were a record $191.1 million, a significant increase from the $154.4 million of sales in the same period last year. This 24% increase in sales was driven primarily by higher realized prices for all metals partially offset by lower quantities sold of all metals, except lead as described above.
Mine operating earnings rose to $91.2 million in Q4 2010 from $57.3 million in the same quarter last year. This increase was attributable to increased sales in Q4 2010, as described above, and due to a reduction in depreciation charges, which outweighed the increase in cost of sales.
Cost of sales for Q4 2010 of $78.8 million was an increase of 8% from $72.7 million in the comparable period last year.
Depreciation and amortization charges for Q4 2010 decreased to $21.1 million from $24.4 million in Q4 2009. The reduction in depreciation was mainly a result of lower quantities of metals sold compared to the same period in 2009.
Income tax provision during Q4 2010 amounted to $43.2 million compared to $15.2 million in Q4 2009. The income tax expense resulted primarily from: (i) increased taxable income generated in all the jurisdictions the Company operates in; (ii) reduction of tax
assets in Bolivia; and (iii) withholding taxes on both technical services and interest paid from our foreign subsidiaries to Pan American Silver Corp.
Operating activities in Q4 2010 generated a record cash flow of $83.6 million, a 60% increase from the $52.1 million generated in Q4 2009. This operating cash flow record in Q4 2010 was mainly attributable to the significantly higher metal prices.
Cash flow generated from operating activities in Q4 of 2009 was $52.1 million compared to cash used in operating activities of $4.9 million in the comparable quarter of 2008. Operating cash flow in Q4 of 2009 was positively impacted by significantly higher metal prices and by operating cash flow from Manantial Espejo and San Vicente, both of which were in their first year of operation.
Cash flow from investing activities used $69.0 million in Q4 2010. This consisted primarily of $41.6 million in short term investments, $5.7 million spending on the Navidad project and an aggregate $29.6 million in sustaining capital investments at Morococha, La Colorada, San Vicente and Manantial Espejo.
Investing activities in Q4 of 2009 used $17.9 million, including the investment of $6.3 million in short-term investments. Aggregate sustaining capital expenditures of $7.6 million were spent during the quarter at all operations and an additional $1.9 million was paid as refundable VAT in Argentina and Bolivia. The Company also spent approximately $3.3 million on costs associated with closing the Aquiline transaction in the quarter.
Financing activities in Q4 2010 generated $10.2 million and consisted primarily of $8.7 million from the exercising of warrants and options offset by $2.7 million in dividend payment to our shareholders. In Q4 of 2009, cash generated by financing activities totalled $1.0 million and was comprised of advances against concentrate shipments.
LIQUIDITY POSITION
The Company’s cash balance at December 31, 2010 was $179.9 million, which was an increase of $79.4 million from the balance at December 31, 2009. The balance of the Company’s short-term investments at December 31, 2010 was $180.6 million, an increase of $88.0 million from a year ago. This increase in liquidity in 2010 resulted primarily from cash generated by operating activities of $242.3 million in addition to $11.9 million in proceeds from the exercising of warrants and options, partially offset by capital expenditures on property, plant and equipment of $87.3 million which includes $3.9 million in refundable VAT payments. The Company does not own any asset-backed commercial paper in its investment portfolio.
Working capital at December 31, 2010 was $433.8 million, an increase of $161.5 million from the prior year-end’s working capital of $272.3 million. The increase in working capital was mainly due to a $167.4 million increase in cash and short-term investments, plus an increase in inventory of $13.4 million, in addition to a decrease in accounts payable and other current liabilities of $14.9 million. These were partially offset by an increase in the current income tax liability of $30.0 million and a decrease in income taxes receivable of $12.0 million. The increase in income tax liability is primarily a result of the higher current
taxable income generated in 2010. The increase in inventory is mainly attributable to an increase in both silver doré inventory due to timing of shipments and material and supplies inventory at Manantial Espejo.
On October 10, 2008, Pan American entered into a $70 million revolving credit facility (“the Facility”) with Scotia Capital and Standard Bank Plc (“the Lenders”). The purpose of the Facility is for general corporate purposes, including acquisitions. The Facility, which is principally secured by a pledge of Pan American’s equity interests in its material subsidiaries, had a term of four years. On December 20, 2010 the Company renewed the Facility and extended the term to December 2014 and increased the amount of the Facility to $150 million by expanding the number of Lenders to include West LB, CIBC and BMO. The interest margin on the renewed Facility ranges from 3.00% to 4.00% over LIBOR, based on the Company’s net debt to EBITDA ratio. Pan American has agreed to pay a commitment fee of between 0.90% and 1.20% on undrawn amounts under the Facility, depending on the Company’s net debt to EBITDA ratio. To the date of this MD&A, the Company has not made any drawings under the Facility.
Alternatives for financing the Company’s future capital needs include our significant liquidity position, future operating cash flow, unutilized credit facility and the proceeds of exercised share options. In the opinion of management, based on the Company’s current liquidity position and the operating cash flows that are expected in 2011, the Company’s liquid assets will be sufficient to discharge liabilities as they come due and to fund planned project development and sustaining capital expenditures in 2011. Please refer to the “2011 Operating Outlook” section of this MD&A for a more detailed description of the sustaining capital expenditures planned for each mine in 2011.
The impact of inflation on the Company’s financial position, operational performance, or cash flows over the next twelve months cannot be determined with any degree of certainty.
INVESTMENTS AND INVESTMENT INCOME
Pan American’s investment objectives for its cash balances are to preserve capital, to provide liquidity and to maximize return. The Company’s strategy to achieve these objectives is to invest excess cash balances in a portfolio of primarily fixed income instruments. Market conditions are reviewed constantly and value is added through interest rate anticipation, sector allocation, and security specific valuation. Custody of securities and cash balances, as well as trading activities may be delegated to various financial institutions.
Investment income for 2010 totalled $1.0 million and was primarily made up of interest generated by the Company’s short-term investment portfolio. In comparison, 2009’s investment income of $6.8 million resulted mainly from a gain from the short-term investment in Aquiline when we acquired that Company.
CAPITAL RESOURCES
Shareholders’ equity at December 31, 2010 had a balance of $1,520.3 million (2009: $1,343.8 million). The Company issued 2.7 million shares during the year, 1.7 million of which were related to the Aquiline transaction which increased Shareholders’ equity by
$43.5 million. Shareholders’ equity further increased by the net income for the period of $112.6 million and by the issuance of warrants in connection with the Aquiline acquisition, which resulted in a $4.0 million increase in contributed surplus.
The following table sets out the common shares, warrants and options outstanding as at December 31, 2010:
| | | Outstanding as at December 31, 2010 (in thousands) | |
| Common shares | | | 107,791 | |
| Warrants | | | 7,955 | |
| Options | | | 1,448 | |
| Total | | | 117,194 | |
As at December 31, 2010, the Company had approximately 107.8 million common shares outstanding for a share capital of $1,272.9 million. The basic weighted average number of common shares outstanding was 107.6 million shares for the year and 108.0 million shares for the quarter ended December 31, 2010.
As of March 22, 2011, the total number of shares outstanding was 107,822,826.
Expiry dates on the warrants range from October 2011 to December 2014, and exercise prices range from CAD $10.02 to CAD $35.00. All outstanding warrants are exercisable at an average weighted exercise price of CAD $34.67 and the weighted average remaining life of the warrants was 47 months.
As at December 31, 2010, the Company had approximately 1.4 million stock options outstanding, with exercise prices in the range of $17.73 and $48.10. All vested stock options were exercisable at an average weighted exercise price of $41.53 per share and a weighted average life of 30 months.
FINANCIAL INSTRUMENTS
From time to time, Pan American mitigates the price risk associated with its base metal production by committing some of its forecasted production under forward sales or option contracts. At December 31, 2010, the Company had no outstanding base metal positions. During the first quarter of 2011, the Company entered into zinc option contracts for 10,725 tonnes, which have the effect of ensuring a price between $2,083 and $3,067 per tonne on that quantity of zinc, settling monthly during 2011. For the same period, the Company also entered into lead option contracts for 2,750 tonnes, which have the effect of ensuring a price between $2,050 and $3,300 per tonne on that quantity of lead, settling monthly during 2011. At the date of this MD&A, the positions had a negative mark-to-market valuation of approximately $0.1 million.
Approximately 65% of the Company’s operating and capital expenditures are denominated in local currencies other than the U.S. dollar. These expenditures are exposed to fluctuations in U.S. dollar exchange rates relative to the local currencies. From time to time, the Company mitigates part of this currency exposure by accumulating local currencies or by entering into contracts designed to fix or limit the Company’s exposure to changes in the
value of local currencies relative to US dollars. At December 31, 2010 and at the date of this MD&A, the Company had no outstanding foreign currency contracts.
The Company recorded a loss on commodity and currency contracts of $0.2 million in 2010, compared to a gain of $1.9 million in 2009.
ASSET RETIREMENT OBLIGATIONS
The estimated future reclamation and remediation costs are based principally on legal and regulatory requirements. The asset retirement obligation is measured using management’s assumptions and estimates for cash outflows. The Company accrues these costs initially at their fair value, which are determined by discounting costs using the credit adjusted risk-free interest rate. Upon recognition of a liability for an asset retirement obligation, the Company capitalizes these costs to the related mine and amortizes it over the life of each mine on a unit-of-production basis. Changes due to the passage of time are recognized as an increase in the liability and an accretion expense.
The total undiscounted amount of estimated cash flows required to settle the Company’s asset retirement obligations is $72.1 million (2009 - $67.1 million) which has been discounted using discount rates between 3% and 19%. Reclamation obligations at the Quiruvilca mine of $17.6 million are expected to be paid starting in two to five years while the remainder of the obligations are expected to be paid through 2028. Revisions made to the reclamation obligations in 2010 were primarily a result of increased site disturbance and from the ordinary course of operations at the mines. Reclamation obligations will be funded from operating cash flows, reclamation deposits and cash on hand.
Accretion charged to 2010 earnings was $2.9 million compared to $3.0 million in 2009. Reclamation expenditures during the current year were similar to the previous year at $1.0 million.
CONTRACTUAL COMMITMENTS AND CONTINGENCIES
The Company does not have any off-balance sheet arrangements or commitments that have a current or future effect on its financial condition, changes in financial condition, revenues or expenses, results of operations, liquidity, capital expenditures or capital resources, that are material, other than those disclosed in this MD&A and the Audited Consolidated Financial Statements and the related notes.
An outstanding convertible debenture with a fair value of $20.8 million was issued as part of the Aquiline transaction and could be converted into either (i) 363,854 common shares at a conversion price of CAD $48.10 per common share; or (ii) a contract granting the holder the right to purchase 12.5% of the life of the mine payable silver from the Loma de La Plata deposit of the Navidad property. The holder was required to make this election on February 28, 2010 and elected alternative (ii) above. The final contract for this alternative is being negotiated and pending the final resolution to this alternative, the Company continues to classify the fair value calculated at the acquisition of this alternative as a liability.
The Company had the following contractual obligations at the end of 2010:
PAYMENTS DUE BY PERIOD (IN THOUSANDS OF DOLLARS) | |
| | | | | | Less than | | | 1 - 3 | | | 4 - 5 | | | After | |
| | | Total | | | 1 year | | | years | | | years | | | 5 years | |
| Capital Lease Obligations | | $ | 158 | | | $ | 118 | | | $ | 40 | | | | - | | | | - | |
| Current Liabilities | | | 113,180 | | | | 113,180 | | | | - | | | | - | | | | - | |
Contribution Plan(1) | | | 4,902 | | | | 2,451 | | | | 2,451 | | | | - | | | | - | |
Total contractual obligations(2) | | $ | 118,240 | | | $ | 115,749 | | | $ | 2,491 | | | | - | | | | - | |
| (1) | In June 2008 the Company initiated a 4 year contractual retention plan for key officers and management, further discussed in Note 13 in the Consolidated Financial Statements. Contract commitments for the plan, payable in CAD, represent minimum payments expected to be paid out, presented above in USD at the year-end rate. |
| (2) | Amounts above do not include payments related to the Company’s anticipated asset retirement obligation (Note 11 in the Consolidated Financial Statements). |
GENERAL AND ADMINISTRATIVE
General and administrative costs, including stock based compensation, increased by 34% in 2010 to $17.1 million (2009: $12.8 million). This anticipated increase was primarily as a result of: (i) the timing of the Company’s annual incentive plan; (ii) the addition of several new positions in 2010; (iii) various expenses related to the integration of Aquiline, including increased travel; and (iv) a stronger CAD exchange rate against the USD (CAD to USD exchange of 1.03 average in 2010 versus 1.14 average in 2009).
Our general and administrative costs, including stock based compensation, are expected to remain similar to our 2010 level at approximately $17.0 million.
The following table compares our general and administrative forecast for 2011 against the general and administrative costs incurred over the previous three years, on a per ounce of silver produced basis.
| | | Actual | | | Forecast | |
| | | 2008 | | | 2009 | | | 2010 | | | 2011 | |
General and administrative costs (in ‘000s of US Dollars) | | $ | 10,435 | | | $ | 12,769 | | | $ | 17,109 | | | $ | 16,987 | |
| Silver production (in ‘000s of ounces) | | | 18,673 | | | | 23,044 | | | | 24,286 | | | | 23,500 | |
| General and administrative costs per silver ounce produced | | $ | 0.55 | | | $ | 0.55 | | | $ | 0.70 | | | $ | 0.72 | |
EXPLORATION AND PROJECT DEVELOPMENT
Exploration and project development expenses in 2010 were $24.5 million compared to $9.9 million incurred in 2009. The expenses recorded in 2010 primarily represented the exploration and project development expenses incurred for the advancement of the Navidad and La Preciosa projects.
During 2010, Pan American invested a total of $37.5 million in the Navidad silver development project of which $9.5 million was expensed. Activities were focused on diamond drilling to further define and raise confidence in the resources of the eight deposits that comprise the project, conducting preliminary engineering design work, and advancing an Environmental Impact Assessment (“EIA”). The Company also launched a comprehensive community and government relations program, to improve the public’s understanding of mining activity and to initiate an open dialogue for the amendment of the current mining law, which bans open pit mining in the province of Chubut where Navidad is located.
On November 30, 2010, the Company released the results of Navidad’s preliminary assessment, which defined a highly economic project that would involve developing and mining eight separate deposits through conventional surface mining methods. It is estimated that Navidad could produce an annual average of 19.8 million ounces of silver over the first 5 years of operation, have a mine life in excess of 17 years and generate an after-tax return of $1.2 billion at a 5% discount rate (assuming a $25 per ounce silver price). The construction of a 15,000 tonnes-per-day operation would require approximately $760 million in pre-production costs, excluding $133 million in recoverable VAT. The project would provide direct employment to approximately 1,500 individuals during the construction phase and up to 500 individuals during the operations phase. The preliminary assessment was subsequently filed with the applicable regulatory authorities on January 14, 2011 and is available on SEDAR at www.sedar.com.
During 2010 Pan American was also very active at the La Preciosa joint-venture, where the Company invested a total of $10 million in exploration and delineation drilling, metallurgical testing and engineering activities. The Company is currently completing additional work to evaluate alternative extraction and development scenarios to maximize the project’s economics, in view of the improved metals price environment.
The Company’s “brownfields” exploration program will continue to be very active in 2011 with approximately 108.0 km of drilling planned. The cost of these programs is included as part of each mine’s capital budget or included in its operating costs. The total amount expected to be spent on brownfield drilling in 2011 is approximately $10.9 million. The main objective of this program is to replace reserves and resources mined at our sites. The main targets for these resource and reserve replacements are the Candelaria oxide and sulphide zones at La Colorada, the Litoral extension at San Vicente, the Maria, Marta and Melissa veins at Manantial Espejo and multiple vein structures at Morococha and Huaron.
NON-GAAP MEASURES
| Cash and Total Costs per Ounce of Silver |
The non-GAAP measures of cash and total cost per ounce of silver are used by the Company to manage and evaluate operating performance at each of the Company’s mines and are widely reported in the silver mining industry as benchmarks for performance, but do not have standardized meaning. To facilitate a better understanding of these measures as calculated by the Company, we have provided a detailed reconciliation of these measures to our cost of sales, as reported in our audited Consolidated Statement of Operations for 2010, 2009 and 2008.
| Cash and Total Cost per Ounce Reconciliation | |
| (in thousands of U.S. dollars) | | | 2010 | | | 2009 | | | 2008 | |
| | | | | | | | | | | |
| Cost of Sales | | | | | $ | 305,696 | | | $ | 245,637 | | | $ | 199,032 | |
| Add / (Subtract) | | | | | | | | | | | | | | | |
| Smelting, refining, & transportation charges | | | | | | 66,441 | | | | 64,118 | | | | 58,378 | |
| By-product credits | | | | | | (253,925 | ) | | | (215,657 | ) | | | (160,276 | ) |
| Mining royalties | | | | | | 21,300 | | | | 11,867 | | | | 4,843 | |
| Worker’s participation and voluntary payments | | | | | | (6,230 | ) | | | (1,151 | ) | | | (1,700 | ) |
| Change in inventories | | | | | | 5,977 | | | | 15,068 | | | | 1,419 | |
| Other | | | | | | (5,092 | ) | | | 3,368 | | | | 3,980 | |
| Non-controlling interest adjustment | | | | | | (2,114 | ) | | | (2,144 | ) | | | (1,043 | ) |
| Cash Operating Costs | | | A | | | | 132,055 | | | | 121,106 | | | | 104,633 | |
| Add / (Subtract) | | | | | | | | | | | | | | | | |
| Depreciation & amortization | | | | | | | 86,483 | | | | 83,169 | | | | 46,349 | |
| Accretion of asset retirement obligation | | | | | | | 2,929 | | | | 2,998 | | | | 2,687 | |
| Change in inventories | | | | | | | 1,212 | | | | 3,388 | | | | 839 | |
| Other | | | | | | | (755 | ) | | | (271 | ) | | | (232 | ) |
| Non-controlling interest adjustment | | | | | | | (1,108 | ) | | | (867 | ) | | | (605 | ) |
| Total Costs | | | B | | | $ | 220,816 | | | $ | 209,523 | | | $ | 153,671 | |
| | | | | | | | | | | | | | | | | |
| Payable Silver Production (000’s ounces) | | | C | | | | 23,224 | | | | 21,888 | | | | 17,543 | |
| | | | | | | | | | | | | | | | | |
| Cash Costs per ounce | | | A/C | | | $ | 5.69 | | | $ | 5.53 | | | $ | 5.96 | |
| Total Costs per ounce | | | B/C | | | $ | 9.51 | | | $ | 9.57 | | | $ | 8.76 | |
GOVERNANCE AND CORPORATE SOCIAL RESPONSIBILITY
Pan American Silver adheres to the highest standards of corporate governance and closely follows the requirements established by both the Canadian Securities Administrators and the SEC (Securities and Exchange Commission) in the United States. We believe that our current corporate governance systems not only meet but exceed these requirements.
Our Board of Directors oversees the direction and strategy of the business and the affairs of the company. The Board is comprised of a non-executive chairman and eight other directors, six of whom are independent and are represented by a lead director. The Board’s wealth of experience allows it to effectively oversee the development of corporate strategies, provide management with long-term direction, consider and approve major decisions, oversee the business generally and evaluate corporate performance. The Health, Safety and Environment Committee, which is a sub committee appointed by the Board of Directors, provides oversight for the corporate social initiatives of the Company and reports directly to the Board.
We believe that good corporate governance is important to the effective performance of the Company and plays a significant role in protecting the interests of all stakeholders while helping to maximize value.
Pan American has intensified efforts to reduce the amount of waste generated by our operations with the ongoing improvement of waste management and disposal programs. Site wastes include oils, scrap steel, tires and construction wastes as well as those produced by our office, cafeteria and camp operations. In addition to investigating and applying alternative procedures and technologies to reduce waste where warranted, we are also working with local companies to increase the amount of waste that is reclaimed and reused. We produce about five thousand metric tonnes of total waste from our operations annually and we expect to reduce this number significantly by implementing a number of initiatives.
Cyanide is used for leaching silver at Manantial Espejo, in Argentina, and both of our operations in Mexico, Alamo Dorado and La Colorada. The water and tailings from this process are carefully managed so that the cyanide does not cause any negative impact to the environment. In order to ensure that the cyanide is handled correctly and that it is properly disposed of, the mine employees go through rigorous training provided by the International Institute of Cyanide (IIC).
Pan American recognizes that water is a finite resource, essential to the sustaining of life and a healthy environment. The Company is therefore committed to ensuring that sources of water are not negatively impacted by our operations. To achieve this we use water efficiently, including recycling as much as possible; maintain natural water courses as much as possible; and ensure that our discharges comply with or exceed regulated requirements.
At present, four of our seven mineral processing plants operate as closed circuits in which the water that is used in processing is not discharged from the plant to the environment, thereby minimizing fresh water usage. Fresh water is still needed, however, to make up for evaporation and exfiltration and for water retained in the product and tailings. All of our operations have strict and extensive water monitoring programs to ensure that water discharges comply with the local environmental laws and industry standards.
We are aware of the challenges and risks associated with climate change and are committed to reducing our Greenhouse Gas ("GHG") emissions through improvements in energy efficiency and the use of renewable energy. The main source of the Company’s GHG is through direct consumption of diesel fuel, gasoline, LPG (Liquefied Petroleum Gas) and natural gas. GHG emissions from indirect consumption are related mainly to electricity supplied by national grids.
The majority of Pan American Silver’s mines have been successful in maintaining a relatively low GHG emission rate. This is because the energy that they use to run the mines and processing plants is from their respective national electrical grids. Energy derived from national
grids is classified as Indirect Energy Consumption, which produces much less GHG emissions than Direct Energy Consumption, which is generally derived from fossil fuels.
We recognize that improved energy efficiency holds the greatest promise for significantly reducing our GHG emissions. While conservation efforts to date have been limited, we have begun to take a more serious look at opportunities to improve our performance, including creating an energy taskforce to explore possible renewable energy technologies and to reduce the overall energy consumption at our mines. In addition, in areas where the climatic conditions are favourable for the economic use of solar energy, the taskforce is reviewing the use of a photovoltaic system to generate electricity for part of the crushing and the refining process.
We are also doing our best to remind employees that individual efforts to conserve energy can make a big difference. All of our mines run educational campaigns to create awareness and encourage the reduction of energy consumption. These campaigns are focused on our workers and extend to the community through events such as the Earth Day Celebrations. Ongoing reforestation and restoration projects at most of our facilities are also playing a role in mitigating GHG emissions.
Pan American Silver is committed to creating sustainable value in the communities where we operate. We maintain offices with knowledgeable staff in each of these communities to make it easy for residents to ask questions and find out more about our operations. A strong local presence also ensures that we are better able to understand community issues and priorities. The community programs in which we participate are born out of the research conducted by our local offices and typically centre on education, health, environment, infrastructure and alternative economic activities.
Pan American derives its revenue from the sale of silver, zinc, lead, copper, and gold. The Company’s sales are directly dependent on metal prices that have shown extreme volatility and are beyond the Company’s control. The table below illustrates the effect of changes in silver and gold prices on anticipated sales for 2011. This analysis assumes that quantities of silver and gold produced and sold remain constant under all price scenarios presented.
Expected 2011 Sales (000’s USD)
| | Gold Price |
| Silver Price | | $1,200 | $1,320 | $1,400 | $1,450 | $1,500 |
| $14.00 | $473,388 | $481,589 | $487,056 | $490,473 | $493,890 |
| $18.00 | $561,256 | $569,456 | $574,924 | $578,341 | $581,758 |
| $22.00 | $649,115 | $657,316 | $662,783 | $666,200 | $669,617 |
| $26.00 | $736,967 | $745,167 | $750,634 | $754,051 | $757,468 |
| $30.00 | $824,855 | $833,055 | $838,522 | $841,939 | $845,356 |
| $34.00 | $912,743 | $920,943 | $926,410 | $929,827 | $933,244 |
Consistent with the Company’s mission to provide equity investors with exposure to changes in silver prices, our policy is not to hedge the price of silver.
From time to time, Pan American mitigates the price risk associated with its base metal production by committing some of its forecasted base metal production under forward sales and option contracts, as described under the “Financial Instruments” section of this MD&A. The Board of Directors continually assesses the Company’s strategy towards its base metal exposure, depending on market conditions.
Since base metal and gold sales are treated as a by-product credit for purposes of calculating cash costs per ounce of silver, this non-GAAP measure is highly sensitive to base metal and gold prices. The table below illustrates this point by plotting the expected cash cost per ounce according to the 2011 forecast against various price assumptions for the Company’s two main by-product credits, zinc and gold.
Cash Cost per Ounce of Silver Produced (USD/oz)
| | Gold Price |
Zinc Price | | $1,200 | $1,320 | $1,400 | $1,450 | $1,500 |
| $1,400 | $8.35 | $7.99 | $7.75 | $7.59 | $7.44 |
| $1,800 | $7.85 | $7.48 | $7.24 | $7.09 | $6.93 |
| $2,200 | $7.40 | $7.04 | $6.79 | $6.64 | $6.49 |
| $2,600 | $6.96 | $6.59 | $6.35 | $6.20 | $6.04 |
The Company has long-term contracts to sell the zinc, lead and copper concentrates produced by the Quiruvilca, Huaron, Morococha, San Vicente and La Colorada mines. These contracts include provisions for pricing the contained metals, including silver, based on average spot prices over defined 30-day periods that may differ from the month in which the concentrate was produced. Under these circumstances, the Company may, from time
to time, fix the price for a portion of the payable metal content during the month that the concentrates are produced.
The zinc, lead and copper concentrates produced by Pan American are sold through long-term supply arrangements to metal traders or integrated mining and smelting companies. The terms of the concentrate contracts may require the Company to deliver concentrate that has a value greater than the payment received at the time of delivery, thereby introducing the Company to credit risk of the buyers of our concentrates. Should any of these counterparties not honour supply arrangements, or should any of them become insolvent, Pan American may incur losses for products already shipped and be forced to sell its concentrates in the spot market or it may not have a market for its concentrates and therefore its future operating results may be materially adversely impacted.
For example, the DRP smelter, a significant buyer of Pan American’s production in Peru, experienced financial difficulties in the first quarter of 2009 and closed. Pan American continued to sell copper concentrates to other buyers but on inferior terms. At the end of 2010 and at the date of this MD&A, the DRP smelter remains closed and Pan American is owed approximately $8.8 million under the terms of its contract with DRP for deliveries of concentrates that occurred in early 2009. The Company has established a doubtful accounts receivable provision for the full amount receivable from DRP. In addition, during the fourth quarter of 2010, the Company wrote down $1.5 million of costs of certain pyrite stockpile inventories that were being sold to the La Oroya smelter after assessing that no other economically viable alternatives to realize upon these inventories could be found. The Company continues to pursue all legal and commercial avenues to collect the amount outstanding.
At December 31, 2010 the Company had receivable balances associated with buyers of our concentrates of $51.0 million (2009 - $54.0 million). Approximately 89% of this receivable balance is owed by six well known concentrate buyers and the vast majority of our concentrate is sold to those same counterparts.
Silver doré production is refined under long term agreements with fixed refining terms at three refineries worldwide. The Company generally retains the risk and title to the precious metals throughout the process of refining and therefore is exposed to the risk that the refineries will not be able to perform in accordance with the refining contract and that the Company may not be able to fully recover our precious metals in such circumstances. At December 31, 2010 the Company had approximately $50.4 million of value contained in precious metal inventory at refineries. The Company maintains insurance coverage against the loss of precious metal doré and base metal concentrates at our mine sites, in-transit to refineries and while at the refineries and smelters.
Refined silver and gold is sold in the spot market to various bullion traders and banks. Credit risk may arise from these activities if we are not paid for metal at the time it is delivered, as required by spot sale contracts.
The Company maintains trading facilities with several banks and bullion dealers for the purposes of transacting the Company’s trading activities. None of these facilities are subject to margin arrangements. The Company’s trading activities can expose us to the
credit risk of our counterparties to the extent that our trading positions have a positive mark-to-market value.
Management constantly monitors and assesses the credit risk resulting from its concentrate sales, refining arrangements and commodity contracts. Furthermore, management carefully considers credit risk when allocating prospective sales and refining business to counterparties. In making allocation decisions, management attempts to avoid unacceptable concentration of credit risk to any single counterparty.
Pan American reports its financial statements in USD; however the Company operates in jurisdictions that utilize other currencies. As a consequence, the financial results of the Company’s operations, as reported in USD, are subject to changes in the value of the USD relative to local currencies. Since the Company’s sales are denominated in USD and a portion of the Company’s operating costs and capital spending are in local currencies, the Company is negatively impacted by strengthening local currencies relative to the USD and positively impacted by the inverse. The local currencies that we have the most exposure to are the Peruvian soles (PEN), Mexican pesos (MXN) and Argentine pesos (ARS). The following table illustrates the effect of changes in the exchange rate of PEN and MXN against the USD on anticipated cost of sales for 2011, expressed in percentage terms:
| | MXN/USD |
| PEN/USD | | 10.50 | 11.50 | 12.50 | 13.50 | 14.50 |
| 2.40 | 107% | 105% | 104% | 102% | 101% |
| 2.60 | 105% | 103% | 102% | 100% | 99% |
| 2.80 | 103% | 102% | 100% | 99% | 98% |
| 3.00 | 102% | 100% | 99% | 97% | 96% |
| 3.20 | 101% | 99% | 97% | 96% | 95% |
Under this analysis, our cost of sales is reflected at 100% at our forecasted foreign exchange assumptions for the PEN and MXN of 2.80 and 12.50 per one USD, respectively. Devaluation of the USD relative to the PEN and MXN has the effect of increasing our anticipated cost of sales above 100%, and vice versa.
In order to mitigate this exposure, the Company maintains a portion of its cash balances in PEN, MXN and Canadian dollars and, from time to time, enters into forward currency positions to match anticipated spending. At December 31, 2010, the Company did not have any open currency forward positions, but was holding approximately 32% of its cash balances in currencies other than USD.
The Company’s balance sheet contains various monetary assets and liabilities, some of which are denominated in foreign currencies. Accounting convention dictates that these balances are fair valued at the end of each period, with resulting adjustments being reflected as foreign exchange gains or losses on the Company’s statement of operations. More specifically, under Canadian GAAP, the purchase price accounting related to the Aquiline acquisition required the Company to establish a future income tax liability of $276.3 million to reflect the difference between the tax values and the accounting book values of the assets purchased. As this balance is deemed to be a monetary liability,
denominated primarily in ARS, the Company is required to mark-to-market this liability for any movements in the exchange rate of that currency against the USD. Under Canadian GAAP, this requirement introduces large foreign exchange gains and losses to the Company’s earnings in the future. Gains are recognized to the extent the Argentine peso weakens relative to the USD and vice versa creates losses. In 2010, the Company recognized a $10.8 million gain on this future income tax liability. Under International Financial Reporting Standards, the preliminary purchase accounting related to the Aquiline acquisition will differ from the above described Canadian GAAP treatment. Please refer to the below section ‘Future Accounting Changes’ for further details.
Liquidity risk is the risk that the Company will not be able to meet its financial obligations as they come due. The volatility of the metals markets can impact the Company’s ability to forecast cash flow from operations.
The Company must maintain sufficient liquidity to meet its short-term business requirements, taking into account its anticipated cash flows from operations, its holdings of cash and cash equivalents and committed loan facilities.
The Company manages its liquidity risk by continuously monitoring forecasted and actual cash flows. The Company has in place a rigorous reporting, planning and budgeting process to help determine the funds required to support its normal operating requirements on an ongoing basis and its expansion plans. The Company continually evaluates and reviews capital and operating expenditures in order to identify, decrease and limit all non-essential expenditures. Pan American expects to generate positive free cash flow from operations in 2011 and to further strengthen its liquidity position.
| Political and Country Risk |
Pan American currently conducts operations in Peru, Mexico, Argentina and Bolivia. All of these jurisdictions are potentially subject to a number of political and economic risks. The Company is unable to determine the impact of these risks on its future financial position or results of operations and the Company’s exploration, development and production activities may be substantially affected by factors outside of Pan American’s control. These potential factors include, but are not limited to: royalty and tax increases or claims by governmental bodies, expropriation or nationalization, foreign exchange controls, import and export regulations, cancellation or renegotiation of contracts and environmental and permitting regulations. The Company currently has no political risk insurance coverage against these risks.
| Environmental and Health and Safety Risks |
Pan American’s activities are subject to extensive laws and regulations governing environmental protection and employee health and safety. Environmental laws and regulations are complex and have tended to become more stringent over time. Pan American is required to obtain governmental permits and in some instances provide bonding requirements under federal, state, or provincial air, water quality, and mine reclamation rules and permits. Although Pan American makes provisions for reclamation
costs, it cannot be assured that these provisions will be adequate to discharge its future obligations for these costs.
Failure to comply with applicable environmental and health and safety laws may result in injunctions, damages, suspension or revocation of permits and imposition of penalties. While the health and safety of our people and responsible environmental stewardship are our top priorities, there can be no assurance that Pan American has been or will be at all times in complete compliance with such laws, regulations and permits, or that the costs of complying with current and future environmental and health and safety laws and permits will not materially and adversely affect Pan American’s business, results of operations or financial condition.
Pan American’s business depends on good relations with its employees. At December 31, 2010 the Company had approximately 7,068 employees and employees of mining contractors, of which approximately 2,117 were represented by unions in Peru, 614 by a union in Argentina and a further 306 by a union in Bolivia. The Mexican mines do not have a union. The Company has experienced short-duration labour strikes and work stoppages in the past and may experience future labour related events.
The number of persons skilled in acquisition, exploration and development of mining properties is limited and competition for such persons is intense. As Pan American’s business activity grows, Pan American will require additional key mining personnel as well as additional financial and administrative staff. There can be no assurance that Pan American will be successful in attracting, training and retaining qualified personnel as competition for persons with these skill sets increases. If Pan American is not successful in this regard, the efficiency of its operations could be impaired, which could have an adverse impact on Pan American’s future cash flows, earnings, results of operations and financial condition.
| Claims and Legal Proceedings |
Pan American is subject to various claims and legal proceedings covering a wide range of matters that arise in the ordinary course of business activities, including claims relating to ex-employees. Each of these matters is subject to various uncertainties and it is possible that some of these matters may be resolved unfavourably to Pan American. The Company carries liability insurance coverage and establishes provisions for matters that are probable and can be reasonably estimated. In addition, Pan American may be involved in disputes with other parties in the future which may result in a material adverse impact on our financial condition, cash flow and results of operations. Please refer to Note 17 “Commitments and Contingencies” of the Audited Consolidated Financial Statements for further information.
| Corporate Development Activities |
An element of the Company’s business strategy is to make selected acquisitions. The Company expects to continue to evaluate acquisition opportunities on a regular basis and intends to pursue those opportunities that it believes are in its long-term best interests. The success of the Company’s acquisitions will depend upon the Company’s ability to
effectively manage the operations of entities it acquires and to realize other anticipated benefits. The process of managing acquired businesses may involve unforeseen difficulties and may require a disproportionate amount of management resources. There can be no assurance that the Company will be able to successfully manage the operations of businesses it acquires or that the anticipated benefits of its acquisitions will be realized.
CRITICAL ACCOUNTING POLICIES AND ESTIMATES
The preparation of financial statements in conformity with Canadian GAAP requires management to make estimates and assumptions that affect the reported amount of assets and liabilities and disclosure of contingent liabilities at the date of the financial statements, and the reported amounts of sales and expenditures during the reporting period. Management has identified: (i) Mineral property, plant, and equipment, Construction in progress and Investments in non-producing property; (ii) Future income tax provision; (iii) Provision for reclamation and closure; (iv) Stock based compensation; and (v) accounting for derivative instruments as the critical estimates for the following discussion. The Company did not make significant changes to its accounting policies in 2010. Please refer to Note 2 of the Company’s consolidated financial statements for a description of all of the significant accounting policies.
Mineral property, plant and equipment, Construction in progress, and Investment in non-producing properties are the most significant assets of the Company, representing assets in aggregate of $1.5 billion at December 31, 2010. This amount represents the capitalized expenditures related to the acquisition, exploration, construction and development of mineral deposits. Construction costs on development projects are capitalized until the mine is substantially complete and ready for production. Mineral exploration costs are expensed as incurred. Capitalization of evaluation expenditures commences when there is a high degree of confidence in the project’s viability and hence it is probable that future economic benefits will flow to the Company. Evaluation expenditures, other than that acquired from the purchase of another mining company, are carried forward as an asset provided that such costs are expected to be recouped in full through successful development and exploration of the area of interest or alternatively, by its sale. Evaluation expenditures include delineation drilling, metallurgical evaluations, and geotechnical evaluations amongst others.
The Company estimates its reserves and resources and the economic life of its mines and utilizes this information to calculate depletion and amortization expense. Annually, or more frequently as circumstances require, Pan American assesses the recoverability of the carrying values of its mining properties and investments by performing impairment evaluations. These evaluations consist of comparing each asset’s carrying value with the estimated undiscounted future net cash flows. Future cash flows are estimated based on production, metal prices, capital and operating costs. Where those estimated cash flows are less than the carrying value, the Company records a write-down of the asset to the estimated fair value.
No impairments were recorded in 2010, based on impairment analyses using a long-term silver price of $16.85 per ounce, which is based on analyst consensus prices. Other estimates incorporated in the impairment evaluations include processing and mining costs, mining tonnage, ore grades and recoveries, which are all subject to uncertainty. If the price
environment of silver deteriorates materially for a sustained period of time or some of the other assumptions prove inaccurate, material asset impairment charges may be required in the future.
The future income tax provision is based on the liability method. Future taxes arise from the recognition of the tax consequences of temporary differences by applying substantively enacted tax rates applicable to future years to differences between the financial statement carrying amounts and the tax bases of certain assets and liabilities. The Company records a valuation allowance against any portion of those future income tax assets that it estimates will, more likely than not, fail to be realized. The future income tax provision also incorporates management’s estimates regarding the utilization of tax loss carry forwards, which are dependent on future operating performance and transactions. Please refer to Note 19 of the Company’s consolidated financial statements for further details on our future income tax provision.
Reclamation and closure costs have been estimated based on the Company’s interpretation of current regulatory requirements, however, changes in regulatory requirements and new information may result in revisions to the estimates. The Company recognizes the present value of liabilities for reclamation and closure costs in the period in which they are incurred. A corresponding increase to the carrying amount of the related assets is generally recorded and depreciated over the life of the asset. Accordingly, at December 31, 2010 the expected present value of future site restoration costs for the Huaron, Morococha, Quiruvilca, La Colorada, Alamo Dorado, Manantial Espejo and San Vicente mines were estimated using discount rates between approximately 3% and 19% at $69.5 million (2008 - $62.8 million). This estimate was increased in 2010 primarily as a result of accretion of the liability of $2.9 million and the recognition of an additional $4.8 million from a combination of increased site disturbance and from the ordinary course of operations at our mines. The reclamation provision was reduced in 2010 by $1.0 million of closure expenditures.
Pan American estimates expenses related to employee stock-based compensation on the fair value method of accounting. Under this method, Pan American is required to recognize a charge to the income statement based on an option-pricing model for all stock options that were granted and vested in each period, with a corresponding credit to Contributed Surplus under the Shareholders’ Equity section of the balance sheet. In 2010, stock options were awarded in February and December. The fair value of these stock options was calculated using an option-pricing model based on the following assumptions – dividend yield of zero to 0.3 percent, a weighted average volatility of the Company’s share price in the range of 46% to 57%, a weighted average annual risk free rate in the range of 1.5% to 2.0% and an expected lives ranging from 1.5 to 3.0 years. The resulting weighted average option valuation was in the range of CAD $8.04 to CAD $11.12. The total expense related to the employee stock-based compensation in 2010 was $4.0 million (2009: $2.4 million). The charge to the Company’s income statement is incorporated as part of the general and administrative expenses.
The Company has considered CICA 3865 – Hedges, which specifies the conditions under which hedge accounting is appropriate and includes requirements for the identification, documentation and designation of hedging relationships, sets standards for determining hedge effectiveness, and establishes criteria for the discontinuance of hedge accounting.
Based on CICA 3865, the Company’s conclusion is that its forward contracts for the sale of base metals (lead and zinc), its forward contracts for purchasing PEN and MXN with US dollars, and its silver fixing contracts do not qualify for hedge accounting. As a result, Pan American is required to recognize mark-to-market valuations of its open forward contract positions through its income at the end of each period.
FUTURE ACCOUNTING CHANGES
The Accounting Standards Board (AcSB) adopted International Financial Reporting Standards (IFRS) as Canadian GAAP for publicly accountable enterprises for fiscal years beginning on or after January 1, 2011. The Company will report its first interim consolidated financial statements in accordance with IFRS for the three months ended March 31, 2011, with comparative figures for the corresponding period for 2010. In addition, the adoption date of January 1, 2011 will require the restatement, for comparative purposes, of amounts reported by the Company for its year ending December 31, 2010, and restatement of the opening balance sheet as at January 1, 2010, the transition date. This is discussed in detail in the following section.
| International Financial Reporting Standards |
The Company continues to advance through its IFRS transition project plan. The advancement made includes determining key accounting policies, progress in the developing of financial statements including note disclosures, implementing business requirements, continuously addressing internal controls and internal control over financial reporting requirements, implementing and monitoring system needs and preparing the Company’s opening balance sheet under IFRS.
The condensed preliminary consolidated opening IFRS balance sheet as at January 1, 2010 with reconciliations to the previously reported December 31, 2009 audited consolidated balance sheet prepared in accordance with Canadian GAAP is presented below. The preliminary amounts presented below are based on accounting policies the Company expects to apply in preparing its first consolidated IFRS financial statements. The amounts determined for the final consolidated opening IFRS balance sheet as at January 1, 2010 may differ from these preliminary amounts.
The Company’s unaudited condensed preliminary consolidated IFRS balance sheet as at January 1, 2010 is as follows:
As at January 1, 2010 | | Canadian GAAP | | | Income Taxes(1) | | | Closure and Decommis-sioning(2) | | | Warrants(3) | | | Other(4) | | | IFRS | |
| Current Assets | | $ | 372,455 | | | $ | (4,993 | ) | | $ | - | | | $ | - | | | $ | - | | | $ | 367,462 | |
| Non-current assets | | | 1,476,154 | | | | (272,461 | ) | | | (836 | ) | | | - | | | | - | | | | 1,202,857 | |
| Total assets | | $ | 1,848,609 | | | $ | (277,454 | ) | | $ | (836 | ) | | $ | - | | | | - | | | | 1,570, 319 | |
| | | | | | | | | | | | | | | | | | | | | | | | | |
| Current liabilities | | $ | 100,180 | | | $ | - | | | $ | - | | | $ | - | | | $ | - | | | $ | 100,180 | |
| Non-current liabilities | | | 389,383 | | | | (271,948 | ) | | | (5,502 | ) | | | 43,919 | | | | - | | | | 155,852 | |
| Total Liabilities | | | 489,563 | | | | (271,948 | ) | | | (5,502 | ) | | | 43,919 | | | | - | | | | 256,032 | |
| | | | | | | | | | | | | | | | | | | | | | | | | |
| Shareholders’ Equity | | | 1,343,790 | | | | (5,506 | ) | | | 4,666 | | | | (43,919 | ) | | | (708 | ) | | | 1,298,323 | |
| Non-controlling interest | | | 15,256 | | | | - | | | | - | | | | | | | | 708 | | | | 15,964 | |
| | | | 1,359,046 | | | | (5,506 | ) | | | 4,666 | | | | (43,919 | ) | | | - | | | | 1,314,287 | |
| Total Liabilities and Shareholders’ Equity | | $ | 1,848,609 | | | $ | (277,454 | ) | | $ | (836 | ) | | $ | - | | | $ | - | | | $ | 1,570,319 | |
Notes to Canadian GAAP to IFRS Reconciliation
| (1) | Income taxes |
| | |
| | The adjustments to deferred income tax assets and liabilities reflect the tax effects under IAS 12 Income Taxes: |
| | |
| | (a) | IAS 12 requires recognition of deferred taxes for differences that arise on translation of non-monetary assets denominated in currencies other than US dollars. The tax bases of these non-monetary items are re-measured from the local currency to the functional currency using current rates and the differences as a result of changes in exchange rates and indexing for the period creates a deferred tax adjustment. Under Canadian GAAP, the historical exchange rates were used. Since the Company has mining properties in Argentina, Peru, Mexico and Bolivia with costs denominated in local currencies, the movement between the US dollar and these local currencies gives rise to changes in deferred tax. |
| | | |
| | (b) | Unlike Canadian GAAP, IAS 12 prohibits the recognition of deferred taxes at the time of an acquisition where the transaction is not a business combination. Accordingly, in its opening balance sheet, the Company has reversed the deferred income tax liabilities recognized on acquisition of the assets of Aquiline, Manantial Espejo and Alamo Dorado. |
| | | |
| | (c) | The deferred tax expense booked on the deferred component of the employee profit-sharing arrangement at some of our sites is different under IFRS. Unlike Canadian GAAP, the deferred component of this employee benefit liability is not recognised under IAS 19 Employee benefits. |
| | | |
| | (d) | IAS 12 permits the presentation of foreign exchange gains or losses from translation of deferred income taxes in income taxes, as compared to presenting these in other income and expense under Canadian GAAP. |
| (2) | Closure and decommissioning |
| | |
| | Under IAS 37 Provisions, Contingent Liabilities and Contingent Assets, the closure provision is measured based on the best estimate of expenditure required to settle the obligation at the balance sheet date using current discount rate and inflation assumptions; thus simplifying the calculation by removing the ‘layering’ concept used for Canadian GAAP. In addition, IFRS requires that the liability be re-measured at each reporting date versus the passive requirement in Canadian GAAP to re-measure in the event of changes in the amount or timing of cash flows required to settle the obligation. |
| | |
| (3) | Share purchase warrants |
| | |
| | Share purchase warrants that were presented as equity instruments under Canadian GAAP are reclassified to derivative financial liability under IAS 39 Financial Instruments: Recognition and Measurement. Under IFRS, share purchase warrants with an exercise price denominated in a currency other than the Company's functional currency are classified and accounted for as financial liabilities and, as such, are measured at their fair values with changes in fair values included in net earnings. |
| | |
| (4) | Other |
| | |
| | (a) | Under IAS 39 Financial Instruments: Recognition and Measurement, the foreign exchange gains or losses on available for sale monetary securities are recognized in the profit for the period (to retained earnings on transition date), whereas in Canadian GAAP these were booked to other comprehensive income. |
| | | |
| | (b) | The Company made an adjustment to record the changes in non-controlling interests resulting from all the IFRS adjustments and non-controlling interests are presented as part of the equity section under IFRS. |
Outlook on Future Earnings
Future net earnings will be impacted by changes in fair values to the Company’s share purchase warrants, with an exercise price denominated in Canadian dollars. Changes in the fair value of the share purchase warrants is primarily influenced by the Company’s share price, the volatility of the Company’s share price and the Canadian to USD exchange rate. Generally, if either the share price or the volatility increase or the Canadian dollar strengthens against the USD, with other factors remaining constant, the fair value of the warrant liability will increase and the Company will record an expense in its future earnings.
Secondly, due to the change in the accounting methodology of recognizing deferred taxes that arise on foreign non-monetary assets, the company expects its foreign exchange gains or losses related to deferred income taxes to be less volatile.