UNITED STATES
SECURITIES AND EXCHANGE COMMISSION
Washington, D.C. 20549
FORM N-CSR
CERTIFIED SHAREHOLDER REPORT OF REGISTERED
MANAGEMENT INVESTMENT COMPANIES
Investment Company Act file number 811-04347
GMO Trust
(Exact name of the registrant as specified in charter)
53 State Street, 33rd Floor, Boston, MA 02109
(Address of principal executive offices) (Zip Code)
Tara Pari, Chief Executive Officer, 53 State Street, 33rd Floor, Boston, MA 02109
(Name and address of agent for services)
Registrant’s telephone number, including area code: 617-346-7646
Date of fiscal year end: 02/28/23
Date of reporting period: 02/28/23
Item 1. Reports to Stockholders.
The annual reports for each series of the registrant for the period ended February 28, 2023 are filed herewith.
GMO Trust
Annual Report
February 28, 2023
Climate Change Fund
Emerging Markets ex-China Fund
Emerging Markets Fund
Emerging Markets Select Equity Fund
(formerly Emerging Domestic Opportunities Fund)
International Equity Fund
Japan Value Creation Fund
Quality Cyclicals Fund
Quality Fund
Resource Transition Fund
Resources Fund
Small Cap Quality Fund
Tax-Managed International Equities Fund
U.S. Equity Fund
U.S. Opportunistic Value Fund
U.S. Small Cap Value Fund
For a free copy of the Funds’ proxy voting guidelines, shareholders may call 1-617-346-7646 (collect), visit GMO’s website at www.gmo.com or visit the Securities and Exchange Commission’s website at www.sec.gov. Information regarding how the Funds voted proxies relating to portfolio securities during the most recent 12-month period ended June 30 will be available without charge on GMO’s website at www.gmo.com and on the Securities and Exchange Commission’s website at www.sec.gov no later than August 31 of each year.
The Funds file their complete schedule of portfolio holdings with the Securities and Exchange Commission for the first and third quarter of each fiscal year on Form N-PORT, which is available on the Commission’s website at www.sec.gov. The Funds have a policy with respect to disclosure of portfolio holdings under which they may also make a complete schedule of portfolio holdings available on GMO’s website at www.gmo.com.
This report is prepared for the general information of shareholders. It is authorized for distribution to prospective investors only when preceded or accompanied by a prospectus for the GMO Trust, which contains a complete discussion of the risks associated with an investment in these Funds and other important information. The GMO Trust prospectus can be obtained at www.gmo.com. The GMO Trust Statement of Additional Information includes additional information about the Trustees of GMO Trust and is available without charge, upon request, by calling 1-617-346-7646 (collect).
An investment in the Funds is subject to risk, including the possible loss of principal amount invested. There can be no assurance that the Funds will achieve their stated investment objectives. Please see the Funds’ prospectus regarding specific principal risks for each Fund. General risks may include: market risk-equities, management and operational risk, non-U.S. investment risk, small company risk and derivatives risk.
The Funds are distributed by Funds Distributor LLC. Funds Distributor LLC is not affiliated with GMO.
| 3 | ||||
| 4 | ||||
| 5 | ||||
| 6 | ||||
| 9 | ||||
| 10 | ||||
| 11 | ||||
| 12 | ||||
| 17 | ||||
| 18 | ||||
| 19 | ||||
| 20 | ||||
Emerging Markets Select Equity Fund (formerly Emerging Domestic Opportunities Fund) | ||||
| 27 | ||||
| 28 | ||||
| 29 | ||||
| 30 | ||||
| 33 | ||||
| 34 | ||||
| 35 | ||||
| 36 | ||||
| 41 | ||||
| 42 | ||||
| 43 | ||||
| 44 | ||||
| 47 | ||||
| 48 | ||||
| 49 | ||||
| 50 | ||||
| 53 | ||||
| 54 | ||||
| 55 | ||||
| 56 | ||||
| 59 | ||||
| 60 | ||||
| 61 | ||||
| 62 | ||||
| 65 | ||||
| 66 | ||||
| 67 | ||||
| 68 |
| 71 | ||||
| 72 | ||||
| 73 | ||||
| 74 | ||||
| 77 | ||||
| 78 | ||||
| 79 | ||||
| 80 | ||||
| 85 | ||||
| 86 | ||||
| 87 | ||||
| 88 | ||||
| 93 | ||||
| 94 | ||||
| 95 | ||||
| 96 | ||||
| 99 | ||||
| 100 | ||||
| 101 | ||||
| 102 | ||||
| 106 | ||||
| 107 | ||||
| 113 | ||||
| 116 | ||||
| 124 | ||||
| 169 | ||||
| 216 | ||||
| 218 | ||||
| 221 | ||||
| 224 | ||||
| 226 |
This page has been left blank intentionally.
(A Series of GMO Trust)
Portfolio Management
Day-to-day management of the Fund’s portfolio is the responsibility of the Focused Equity team at Grantham, Mayo, Van Otterloo & Co. LLC.
Management Discussion and Analysis of Fund Performance
Although GMO does not manage the Fund to, or control the Fund’s risk relative to, any securities index or securities benchmark, a discussion of the Fund’s performance relative to the MSCI All Country World Index (“ACWI”) is included for comparative purposes.
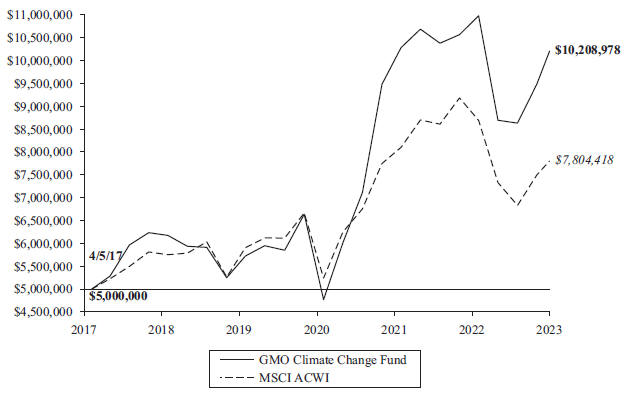
Class III shares of GMO Climate Change Fund returned -1.92% (net) for the fiscal year ended February 28, 2023, as compared with -8.26% for the MSCI ACWI.
The Fund’s clean energy holdings, approximately half of the portfolio by weight, returned -1.9% for the year. This helped drive strong relative performance versus both broad global equities and the broader clean energy sector. Solar companies and lithium producers were the standouts within clean energy, while wind and biofuel companies fell more than broader global markets. Canadian Solar and SolarEdge Technologies were the top contributing individual positions.
The Fund’s electric grid and water allocations, significantly smaller positions than clean energy, also added to absolute returns by finishing the year well above broad global equities.
The Fund’s agriculture holdings faced the most headwinds, returning around -5%. PhosAgro and Ros Agro were two of the biggest individual detractors.
The views expressed herein are exclusively those of Grantham, Mayo, Van Otterloo & Co. LLC as of the date of this report and are subject to change. GMO disclaims any responsibility to update such views. They are not meant as investment advice. References to specific securities are not recommendations of such securities and may not be representative of any GMO portfolio’s current or future investments. All information is unaudited.
3
GMO Climate Change Fund
(A Series of GMO Trust)
Comparison of Change in Value of a $5,000,000 Investment in
GMO Climate Change Fund Class III Shares and the MSCI ACWI
As of February 28, 2023
| Average Annual Total Returns | ||||||||||||
| 1 Year | 5 Year | Since Inception | ||||||||||
| Class III | -1.92% | 10.62% | 4/5/17 12.86% | |||||||||
| Class R6 | -1.90% | n/a | 1/16/20 14.01% | |||||||||
| Class I | -2.03% | n/a | 2/25/20 16.35% | |||||||||
Performance data quoted represents past performance and is not indicative of future results. The investment return and principal value of an investment will fluctuate so that an investor’s shares, when redeemed, may be worth more or less than their original cost. Current performance data may be lower or higher than the performance data provided herein. To obtain performance information up to the most recent month-end, visit www.gmo.com. Performance shown is net of all fees after reimbursement from GMO. Returns would have been lower had certain expenses not been reimbursed during the periods shown and do not include the effect of taxes on distributions and redemptions. The performance information shown above only includes purchase premiums and/or redemption fees in effect as of February 28, 2023. All information is unaudited. Performance for classes may vary due to different fees.
MSCI data may not be reproduced or used for any other purpose. MSCI provides no warranties, has not prepared or approved this report, and has no liability hereunder.
For Class III, R6 and I the gross expense ratio of 0.81%, 0.81% and 0.91%, respectively, is equal to the Fund’s Total Annual Operating Expenses set forth in the Fund’s most recent prospectus dated June 30, 2022. For the Classes listed above, the corresponding net expense ratio of 0.77%, 0.77% and 0.87% reflects the reduction of expenses from fee reimbursements. The fee reimbursements will continue until at least June 30, 2023. Elimination of this reimbursement will result in higher fees and lower performance.
4
GMO Climate Change Fund
(A Series of GMO Trust)
Investment Concentration Summary
February 28, 2023 (Unaudited)
Asset Class Summary& | % of Total Net Assets | |||
Common Stocks | 97.5 | % | ||
Mutual Funds | 2.9 | |||
Short-Term Investments | 0.2 | |||
Other | (0.6 | ) | ||
|
| |||
| 100.0 | % | |||
|
| |||
Country/Region Summary¤ | % of Investments | |||
United States | 47.8 | % | ||
Canada | 11.1 | |||
France | 6.3 | |||
South Korea | 5.7 | |||
Japan | 5.0 | |||
Germany | 3.2 | |||
Brazil | 3.2 | |||
Denmark | 2.8 | |||
China | 2.7 | |||
Mexico | 2.7 | |||
Other Developed | 2.6 | ‡ | ||
Spain | 1.9 | |||
Finland | 1.3 | |||
United Kingdom | 1.3 | |||
Chile | 1.3 | |||
Other Emerging | 1.1 | † | ||
|
| |||
| 100.0 | % | |||
|
| |||
Industry Group Summary | % of Equity Investments# | |||
Clean Energy | 48.5 | % | ||
Energy Efficiency | 20.3 | |||
Agriculture | 12.6 | |||
Copper | 8.3 | |||
Water | 6.1 | |||
Electric Grid | 3.8 | |||
Cash/Other | 0.4 | |||
|
| |||
| 100.0 | % | |||
|
| |||
| & | In the table, derivative financial instruments, if any, are based on market values, rather than the notional amounts of derivatives, except for forward currency contracts which are based on unrealized appreciation/(depreciation). |
| ¤ | The table shows country exposure in the Fund. The table excludes short-term investments. The table excludes exposure through forward currency contracts and includes exposure through other derivative financial instruments, if any. The table takes into account the market value of securities and options and the notional amounts of swap contracts and other derivative financial instruments, if any. |
| ‡ | “Other Developed” is comprised of developed countries that each represent between (1.0)% and 1.0% of Investments. |
| † | “Other Emerging” is comprised of emerging countries that each represent between (1.0)% and 1.0% of Investments. |
| # | Equity investments may consist of common stocks and other stock-related securities, such as preferred stocks, if any. This table excludes exposure to derivative contracts, short-term investments, mutual funds and investment funds, if any. For a summary of these exposures, if any, see the Schedule of Investments. |
5
GMO Climate Change Fund
(A Series of GMO Trust)
(showing percentage of total net assets)
February 28, 2023
| Shares | Description | Value ($) | ||||||
| COMMON STOCKS — 97.5% | ||||||||
| Argentina — 0.9% | ||||||||
| 991,915 | Adecoagro SA (a) | 8,054,350 | ||||||
|
| |||||||
| Australia — 0.3% | ||||||||
| 320,055 | Clean TeQ Water Ltd * (a) | 80,793 | ||||||
| 352,923 | Sandfire Resources Ltd | 1,389,660 | ||||||
| 1,399,037 | Sunrise Energy Metals Ltd * (a) | 1,504,678 | ||||||
|
| |||||||
| Total Australia | 2,975,131 | |||||||
|
| |||||||
| Belgium — 0.6% | ||||||||
| 173,060 | Umicore SA | 5,767,848 | ||||||
|
| |||||||
| Brazil — 3.2% | ||||||||
| 2,293,670 | Dexco SA | 2,856,436 | ||||||
| 1,948,167 | Sao Martinho SA | 10,121,411 | ||||||
| 723,320 | SLC Agricola SA | 6,807,051 | ||||||
| 1,124,400 | Suzano SA | 10,252,960 | ||||||
|
| |||||||
| Total Brazil | 30,037,858 | |||||||
|
| |||||||
| Canada — 11.1% | ||||||||
| 476,293 | Anaergia Inc * (a) | 1,532,375 | ||||||
| 837,710 | Canadian Solar Inc * | 33,298,973 | ||||||
| 708,464 | First Quantum Minerals Ltd | 15,477,693 | ||||||
| 1,925,700 | Greenlane Renewables Inc * (a) | 606,853 | ||||||
| 3,171,457 | Ivanhoe Mines Ltd – Class A * | 26,496,599 | ||||||
| 1,008,392 | Largo Inc * (a) | 6,451,640 | ||||||
| 1,333,508 | Li-Cycle Holdings Corp * (a) | 8,081,058 | ||||||
| 194,500 | Northland Power Inc | 4,725,302 | ||||||
| 90,860 | Nutrien Ltd | 7,079,689 | ||||||
|
| |||||||
| Total Canada | 103,750,182 | |||||||
|
| |||||||
| Chile — 1.3% | ||||||||
| 131,658 | Sociedad Quimica y Minera de Chile SA Sponsored ADR | 11,684,648 | ||||||
|
| |||||||
| China — 2.8% | ||||||||
| 1,031,000 | Canvest Environmental Protection Group Co Ltd | 508,135 | ||||||
| 8,528,114 | China High Speed Transmission Equipment Group Co Ltd * | 3,525,470 | ||||||
| 3,654,494 | China Water Affairs Group Ltd | 3,251,454 | ||||||
| 225,792 | Hollysys Automation Technologies Ltd | 4,152,315 | ||||||
| 742,500 | Ming Yang Smart Energy Group Ltd – Class A | 2,716,186 | ||||||
| 1,737,600 | Tianjin Capital Environmental Protection Group Co Ltd – Class A | 1,612,854 | ||||||
| 2,606,006 | Tianneng Power International Ltd (a) | 3,343,196 | ||||||
| 5,342,352 | Xinjiang Goldwind Science & Technology Co Ltd – Class H (a) | 4,819,047 | ||||||
| 1,226,576 | Yutong Bus Co Ltd – Class A | 1,765,673 | ||||||
|
| |||||||
| Total China | 25,694,330 | |||||||
|
| |||||||
Shares | Description | Value ($) | ||||||
| Denmark — 2.8% | ||||||||
| 915,363 | Vestas Wind Systems A/S | 26,119,829 | ||||||
|
| |||||||
| Finland — 1.3% | ||||||||
| 429,093 | Kemira Oyj | 8,218,626 | ||||||
| 62,677 | Neste Oyj | 3,022,989 | ||||||
| 44,979 | Uponor Oyj | 837,078 | ||||||
|
| |||||||
| Total Finland | 12,078,693 | |||||||
|
| |||||||
| France — 6.3% | ||||||||
| 141,314 | Nexans SA | 13,624,450 | ||||||
| 194,164 | STMicroelectronics NV | 9,301,452 | ||||||
| 644,103 | Valeo | 13,381,072 | ||||||
| 631,256 | Veolia Environnement SA | 18,839,396 | ||||||
| 2,944 | Vilmorin & Cie SA | 150,122 | ||||||
| 114,522 | Waga Energy SA * | 3,282,990 | ||||||
|
| |||||||
| Total France | 58,579,482 | |||||||
|
| |||||||
| Germany — 3.2% | ||||||||
| 359,049 | E.ON SE | 3,917,533 | ||||||
| 244,304 | Infineon Technologies AG | 8,642,591 | ||||||
| 97,550 | Knorr-Bremse AG | 6,629,976 | ||||||
| 72,789 | Siemens AG (Registered) | 11,092,446 | ||||||
|
| |||||||
| Total Germany | 30,282,546 | |||||||
|
| |||||||
| Israel — 0.2% | ||||||||
| 317,225 | ICL Group Ltd | 2,302,217 | ||||||
|
| |||||||
| Japan — 5.1% | ||||||||
| 263,700 | Ebara Corp | 11,206,503 | ||||||
| 240,700 | GS Yuasa Corp | 4,337,798 | ||||||
| 23,000 | Kurita Water Industries Ltd | 1,039,144 | ||||||
| 9,900 | METAWATER Co Ltd | 121,195 | ||||||
| 151,600 | Organo Corp | 3,782,536 | ||||||
| 815,300 | Panasonic Holdings Corp (a) | 7,119,219 | ||||||
| 995,100 | Renesas Electronics Corp * | 12,854,190 | ||||||
| 454,700 | Yokogawa Electric Corp | 6,791,068 | ||||||
|
| |||||||
| Total Japan | 47,251,653 | |||||||
|
| |||||||
| Mexico — 2.7% | ||||||||
| 4,295,205 | Grupo Mexico SAB de CV – Series B | 19,318,035 | ||||||
| 2,754,600 | Orbia Advance Corp SAB de CV | 5,722,534 | ||||||
|
| |||||||
| Total Mexico | 25,040,569 | |||||||
|
| |||||||
| Netherlands — 0.4% | ||||||||
| 86,187 | Arcadis NV | 3,563,965 | ||||||
|
| |||||||
| Norway — 0.7% | ||||||||
| 778,202 | Austevoll Seafood ASA | 6,649,499 | ||||||
|
| |||||||
| Russia — 0.0% | ||||||||
| 72,215 | MMC Norilsk Nickel PJSC (b) | 139,426 | ||||||
| 3 | MMC Norilsk Nickel PJSC ADR * (b) | 1 | ||||||
| 120,856 | PhosAgro PJSC (b) | 108,472 | ||||||
| See accompanying notes to the financial statements. | 6 |
GMO Climate Change Fund
(A Series of GMO Trust)
Schedule of Investments — (Continued)
(showing percentage of total net assets)
February 28, 2023
| Shares | Description | Value ($) | ||||||
| Russia — continued | ||||||||
| 2,335 | PhosAgro PJSC GDR * (b) (c) | 699 | ||||||
| 169,638 | Ros Agro Plc GDR (Registered) * (b) | 17,770 | ||||||
|
| |||||||
| Total Russia | 266,368 | |||||||
|
| |||||||
| South Korea — 5.8% | ||||||||
| 102,300 | LG Chem Ltd | 52,514,945 | ||||||
| 2,346 | Samsung SDI Co Ltd | 1,232,532 | ||||||
|
| |||||||
| Total South Korea | 53,747,477 | |||||||
|
| |||||||
| Spain — 1.9% | ||||||||
| 23,995 | Acciona SA | 4,520,781 | ||||||
| 239,948 | Endesa SA | 4,705,384 | ||||||
| 414,526 | Iberdrola SA | 4,751,885 | ||||||
| 221,863 | Red Electrica Corp SA | 3,680,395 | ||||||
|
| |||||||
| Total Spain | 17,658,445 | |||||||
|
| |||||||
| Sweden — 0.2% | ||||||||
| 244,125 | Munters Group AB | 2,355,205 | ||||||
|
| |||||||
| Switzerland — 0.1% | ||||||||
| 6,625 | Gurit Holding AG (a) | 689,199 | ||||||
|
| |||||||
| Thailand — 0.1% | ||||||||
| 2,418,500 | SPCG Pcl | 999,237 | ||||||
|
| |||||||
| Ukraine — 0.1% | ||||||||
| 219,994 | Kernel Holding SA * | 995,844 | ||||||
|
| |||||||
| United Kingdom — 1.3% | ||||||||
| 181,900 | Atlantica Sustainable Infrastructure Plc | 5,020,440 | ||||||
| 303,072 | National Grid Plc | 3,803,465 | ||||||
| 366,690 | Renewi Plc * | 3,030,201 | ||||||
|
| |||||||
| Total United Kingdom | 11,854,106 | |||||||
|
| |||||||
| United States — 45.1% | ||||||||
| 342,762 | Aemetis, Inc. * (a) | 1,223,660 | ||||||
| 107,492 | AGCO Corp. | 15,135,949 | ||||||
| 281,700 | Alcoa Corp. | 13,786,398 | ||||||
| 730,460 | Ameresco, Inc. – Class A * | 32,103,717 | ||||||
| 351,561 | BorgWarner, Inc. | 17,676,487 | ||||||
| 2,927,838 | Clean Energy Fuels Corp. * | 16,395,893 | ||||||
| 42,163 | Consolidated Edison, Inc. | 3,767,264 | ||||||
| 55,938 | Constellation Energy Corp. | 4,189,197 | ||||||
| 205,424 | Corteva, Inc. | 12,795,861 | ||||||
| 501,350 | Darling Ingredients, Inc. * | 31,720,414 | ||||||
| 17,622 | Deere & Co. | 7,387,847 | ||||||
| 56,866 | Edison International | 3,765,098 | ||||||
| 52,691 | EnerSys | 4,778,547 | ||||||
| 90,128 | Exelon Corp. | 3,640,270 | ||||||
| 307,122 | Freeport-McMoRan, Inc. | 12,582,788 | ||||||
| 1,171,395 | Gevo, Inc. * (a) | 2,167,081 | ||||||
| 5,292,084 | GrafTech International Ltd. | 29,900,275 | ||||||
| 725,731 | Green Plains, Inc. * | 25,161,094 | ||||||
| Shares | Description | Value ($) | ||||||
| United States — continued | ||||||||
| 859,990 | Livent Corp. * | 20,166,765 | ||||||
| 299,118 | Mosaic Co. (The) | 15,910,086 | ||||||
| 211,748 | Mueller Water Products, Inc. – Class A | 2,936,945 | ||||||
| 20,787 | MYR Group, Inc. * | 2,507,120 | ||||||
| 26,300 | NextEra Energy Partners LP | 1,742,638 | ||||||
| 78,265 | ON Semiconductor Corp. * | 6,058,494 | ||||||
| 47,209 | Owens Corning | 4,616,568 | ||||||
| 29,572 | Pentair Plc | 1,654,258 | ||||||
| 162,881 | PotlatchDeltic Corp. (REIT) | 7,518,587 | ||||||
| 142,123 | Sensata Technologies Holding Plc | 7,188,581 | ||||||
| 126,437 | SolarEdge Technologies, Inc. * | 40,196,851 | ||||||
| 2,240,487 | Sunrun, Inc. * | 53,861,307 | ||||||
| 72,253 | TE Connectivity Ltd. | 9,199,252 | ||||||
| 5,357 | Valmont Industries, Inc. | 1,699,937 | ||||||
| 68,658 | Westinghouse Air Brake Technologies Corp. | 7,163,089 | ||||||
|
| |||||||
| Total United States | 420,598,318 | |||||||
|
| |||||||
TOTAL COMMON STOCKS (COST $899,870,247) | 908,996,999 | |||||||
|
| |||||||
| MUTUAL FUNDS — 2.9% | ||||||||
| United States — 2.9% | ||||||||
| Affiliated Issuers — 2.9% | ||||||||
| 5,441,764 | GMO U.S. Treasury Fund (d) | 27,154,401 | ||||||
|
| |||||||
| Total United States | 27,154,401 | |||||||
|
| |||||||
TOTAL MUTUAL FUNDS (COST $27,142,335) | 27,154,401 | |||||||
|
| |||||||
| 7 | See accompanying notes to the financial statements. |
GMO Climate Change Fund
(A Series of GMO Trust)
Schedule of Investments — (Continued)
(showing percentage of total net assets)
February 28, 2023
| Shares | Description | Value ($) | ||||||
| SHORT-TERM INVESTMENTS — 0.2% |
| |||||||
| Money Market Funds — 0.2% | ||||||||
| 2,242,517 | State Street Institutional Treasury Money Market Fund – Premier Class, 4.42% (e) | 2,242,517 | ||||||
|
| |||||||
TOTAL SHORT-TERM INVESTMENTS (COST $2,242,517) | 2,242,517 | |||||||
|
| |||||||
TOTAL INVESTMENTS — 100.6% (Cost $929,255,099) | 938,393,917 | |||||||
| Other Assets and Liabilities (net) — (0.6)% | (5,534,744 | ) | ||||||
|
| |||||||
| TOTAL NET ASSETS — 100.0% | $932,859,173 | |||||||
|
| |||||||
Additional information on each restricted security is as follows:
Issuer Description | Acquisition Date | Acquisition Cost | Value as a Percentage of Fund’s Net Assets | Value as of February 28, 2023 | ||||||||||||
PhosAgro PJSC GDR | 08/09/19 | $ | 36,037 | 0.0 | % | $ | 699 | |||||||||
|
| |||||||||||||||
Notes to Schedule of Investments:
| * | Non-income producing security. |
| (a) | All or a portion of this security is out on loan (Note 2). |
| (b) | Investment valued at fair value using methods determined in good faith by the Trustees of GMO Trust or persons acting at their direction pursuant to procedures approved by the Trustees. Investment valued using significant unobservable inputs (Note 2). |
| (c) | The security is restricted as to resale. |
| (d) | All or a portion of this security is purchased with collateral from securities loaned (Note 2). |
| (e) | The rate disclosed is the 7 day net yield as of February 28, 2023. |
For a listing of definitions of acronyms, counterparty abbreviations and currency abbreviations used throughout the Schedule of Investments as well as the derivative tables, if any, please refer to page 106.
| See accompanying notes to the financial statements. | 8 |
GMO Emerging Markets ex-China Fund
(A Series of GMO Trust)
Portfolio Management
Day-to-day management of the Fund’s portfolio is the responsibility of the Systematic Equity team at Grantham, Mayo, Van Otterloo & Co. LLC.
Management Discussion and Analysis of fund Performance
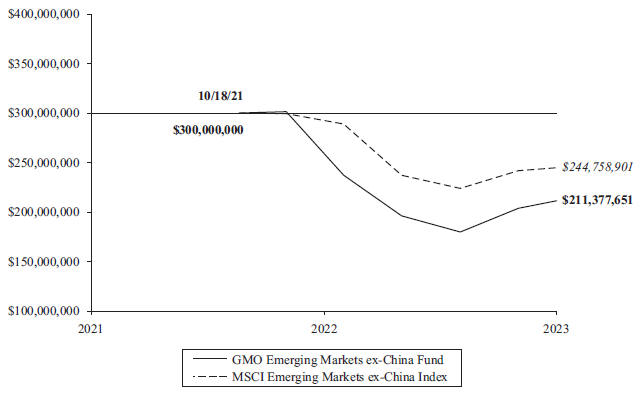
Class VI shares of GMO Emerging Markets ex-China Fund returned -15.97% (net) for the fiscal year ended February 28, 2023, as compared with -14.92% for the MSCI Emerging Markets ex-China Index.
Country-sector allocation detracted from the Fund’s relative returns for the fiscal year. In particular, the Fund’s overweight positions in Russian Materials and Russian Energy hurt relative performance.
Stock selection detracted from the Fund’s relative returns for the period. The Fund’s stock selection in Russian Materials, Russian Energy, and Taiwanese Industrials hurt relative performance.
The views expressed herein are exclusively those of Grantham, Mayo, Van Otterloo & Co. LLC as of the date of this report and are subject to change. GMO disclaims any responsibility to update such views. They are not meant as investment advice. References to specific securities are not recommendations of such securities and may not be representative of any GMO portfolio’s current or future investments. All information is unaudited.
| 9 |
GMO Emerging Markets ex-China Fund
(A Series of GMO Trust)
Comparison of Change in Value of a $300,000,000 Investment in
GMO Emerging Markets ex-China Fund Class VI Shares and the MSCI Emerging Markets
ex-China Index
As of February 28, 2023
| Average Annual Total Returns | ||||||||
| 1 Year | Since Inception | |||||||
| Class III | -16.04 | % | 11/17/21 -24.00 | % | ||||
| Class VI | -15.97 | % | 10/18/21 -22.65 | % | ||||
| Class I | -16.19 | % | 12/1/21 -22.71 | % | ||||
Performance data quoted represents past performance and is not indicative of future results. The investment return and principal value of an investment will fluctuate so that an investor’s shares, when redeemed, may be worth more or less than their original cost. Current performance data may be lower or higher than the performance data provided herein. To obtain performance information up to the most recent month-end, visit www.gmo.com. Performance shown is net of all fees after reimbursement from GMO. Returns would have been lower had certain expenses not been reimbursed during the periods shown and do not include the effect of taxes on distributions and redemptions. The performance information shown above only includes purchase premiums and/or redemption fees in effect as of February 28, 2023. All information is unaudited. Performance for classes may vary due to different fees.
MSCI data may not be reproduced or used for any other purpose. MSCI provides no warranties, has not prepared or approved this report, and has no liability hereunder.
For Class III, VI and I the gross expense ratio of 0.97%, 0.88% and 1.14%, respectively, is equal to the Fund’s Total Annual Operating Expenses set forth in the Fund’s most recent prospectus dated June 30, 2022. For the Classes listed above, the corresponding net expense ratio of 0.81%, 0.68% and 0.96% reflects the reduction of expenses from fee reimbursements. The fee reimbursements will continue until at least June 30, 2023. Elimination of this reimbursement will result in higher fees and lower performance.
| 10 |
GMO Emerging Markets ex-China Fund
(A Series of GMO Trust)
Investment Concentration Summary
February 28, 2023 (Unaudited)
Asset Class Summary& | % of Total Net Assets | |||
Common Stocks | 96.4 | % | ||
Preferred Stocks | 6.2 | |||
Mutual Funds | 0.1 | |||
Short-Term Investments | 0.0 | ^ | ||
Other | (2.7 | ) | ||
|
| |||
| 100.0 | % | |||
|
| |||
Country/Region Summary¤ | % of Investments | |||
Taiwan | 32.7 | % | ||
South Korea | 19.9 | |||
Brazil | 10.4 | |||
Mexico | 8.0 | |||
India | 6.7 | |||
South Africa | 6.4 | |||
Indonesia | 4.4 | |||
Vietnam | 2.4 | |||
Poland | 2.0 | |||
Hungary | 1.6 | |||
Chile | 1.5 | |||
Thailand | 0.8 | |||
United Kingdom | 0.7 | * | ||
Qatar | 0.6 | |||
Egypt | 0.5 | |||
Russia | 0.5 | |||
Turkey | 0.3 | |||
Philippines | 0.2 | |||
Czech Republic | 0.2 | |||
United States | 0.1 | * | ||
Malaysia | 0.1 | |||
Greece | 0.0 | ^ | ||
|
| |||
| 100.0 | % | |||
|
| |||
Industry Group Summary | % of Equity Investments# | |||
Technology Hardware & Equipment | 18.0 | % | ||
Banks | 14.6 | |||
Materials | 14.1 | |||
Energy | 11.4 | |||
Semiconductors & Semiconductor Equipment | 8.7 | |||
Transportation | 7.8 | |||
Food, Beverage & Tobacco | 6.8 | |||
Diversified Financials | 3.7 | |||
Insurance | 3.7 | |||
Automobiles & Components | 1.6 | |||
Utilities | 1.3 | |||
Food & Staples Retailing | 1.3 | |||
Telecommunication Services | 1.2 | |||
Capital Goods | 1.0 | |||
Software & Services | 1.0 | |||
Household & Personal Products | 0.8 | |||
Health Care Equipment & Services | 0.7 | |||
Media & Entertainment | 0.5 | |||
Retailing | 0.5 | |||
Pharmaceuticals, Biotechnology & Life Sciences | 0.4 | |||
Consumer Durables & Apparel | 0.3 | |||
Consumer Services | 0.3 | |||
Real Estate | 0.2 | |||
Commercial & Professional Services | 0.1 | |||
|
| |||
| 100.0 | % | |||
|
| |||
| & | In the table, derivative financial instruments, if any, are based on market values, rather than the notional amounts of derivatives, except for forward currency contracts which are based on unrealized appreciation/(depreciation). |
| ¤ | The table shows country exposure in the Fund. The table excludes short-term investments. The table excludes exposure through forward currency contracts and includes exposure through other derivative financial instruments, if any. The table takes into account the market value of securities and options and the notional amounts of swap contracts and other derivative financial instruments, if any. |
| * | Includes companies that derive more than 50% of their revenues or profits from emerging markets. |
| # | Equity investments may consist of common stocks and other stock-related securities, such as preferred stocks, if any. This table excludes exposure to derivative contracts, short-term investments, mutual funds and investment funds, if any. For a summary of these exposures, if any, see the Schedule of Investments. |
| ^ | Rounds to 0.0%. |
| 11 |
GMO Emerging Markets ex-China Fund
(A Series of GMO Trust)
(showing percentage of total net assets)
February 28, 2023
| Shares | Description | Value ($) | ||||||
| COMMON STOCKS — 96.4% | ||||||||
| Brazil — 4.6% | ||||||||
| 962,100 | Ambev SA | 2,460,633 | ||||||
| 19,200 | Banco do Brasil SA | 147,793 | ||||||
| 300 | Banco Santander Brasil SA ADR | 1,638 | ||||||
| 186,300 | BB Seguridade Participacoes SA | 1,217,340 | ||||||
| 7,200 | Cia Brasileira de Aluminio | 14,330 | ||||||
| 139,500 | CPFL Energia SA | 807,085 | ||||||
| 27,800 | EDP—Energias do Brasil SA | 104,234 | ||||||
| 159,527 | Enauta Participacoes SA | 419,884 | ||||||
| 12,400 | Engie Brasil Energia SA | 93,033 | ||||||
| 3,100 | Fleury SA | 8,402 | ||||||
| 65,303 | Localiza Rent a Car SA | 692,140 | ||||||
| 168,400 | Transmissora Alianca de Energia Eletrica SA | 1,141,548 | ||||||
| 35,000 | Ultrapar Participacoes SA | 88,111 | ||||||
| 11,600 | Vale SA | 189,041 | ||||||
| 259,002 | Vale SA Sponsored ADR – Class B | 4,232,093 | ||||||
|
| |||||||
| Total Brazil | 11,617,305 | |||||||
|
| |||||||
| Chile — 1.6% | ||||||||
| 6 | Banco de Chile | 0 | ||||||
| 35,530 | CAP SA | 295,371 | ||||||
| 9,835 | Cencosud SA | 18,590 | ||||||
| 44,531 | Cencosud Shopping SA | 63,445 | ||||||
| 19,200 | Cia Cervecerias Unidas SA Sponsored ADR | 291,456 | ||||||
| 3,353,198 | Colbun SA | 384,476 | ||||||
| 92,049 | Inversiones La Construccion SA | 401,402 | ||||||
| 28,500 | Sociedad Quimica y Minera de Chile SA | |||||||
| Sponsored ADR | 2,529,375 | |||||||
|
| |||||||
| Total Chile | 3,984,115 | |||||||
|
| |||||||
| Czech Republic — 0.2% | ||||||||
| 705 | Philip Morris CR AS | 546,098 | ||||||
|
| |||||||
| Egypt — 0.5% | ||||||||
| 32,022 | Abou Kir Fertilizers & Chemical Industries | 43,625 | ||||||
| 414,704 | Commercial International Bank Egypt SAE | 718,950 | ||||||
| 937,132 | Eastern Co SAE | 566,482 | ||||||
|
| |||||||
| Total Egypt | 1,329,057 | |||||||
|
| |||||||
| Greece — 0.0% | ||||||||
| 2,715 | Jumbo SA | 54,213 | ||||||
|
| |||||||
| Hungary — 1.6% | ||||||||
| 96,339 | MOL Hungarian Oil & Gas Plc | 731,567 | ||||||
| 98,163 | OTP Bank Nyrt | 2,973,639 | ||||||
| 19,080 | Richter Gedeon Nyrt | 399,949 | ||||||
|
| |||||||
| Total Hungary | 4,105,155 | |||||||
|
| |||||||
| India — 6.9% | ||||||||
| 27,073 | Aurobindo Pharma Ltd | 150,872 | ||||||
| 20,000 | Axis Bank Ltd GDR (Registered) | 1,012,638 | ||||||
| Shares | Description | Value ($) | ||||||
| India — continued | ||||||||
| 34,200 | Azure Power Global Ltd * | 113,544 | ||||||
| 59,181 | Castrol India Ltd | 82,234 | ||||||
| 9,038 | City Union Bank Ltd | 15,129 | ||||||
| 1,866,066 | Coal India Ltd | 4,845,398 | ||||||
| 28,954 | Cochin Shipyard Ltd | 158,600 | ||||||
| 7,909 | Colgate-Palmolive India Ltd | 141,333 | ||||||
| 15,065 | Coromandel International Ltd | 164,688 | ||||||
| 5,143 | Deepak Fertilisers & Petrochemicals Corp Ltd | 38,840 | ||||||
| 9,436 | EID Parry India Ltd | 56,944 | ||||||
| 48,991 | Engineers India Ltd | 42,553 | ||||||
| 31,711 | Exide Industries Ltd | 67,444 | ||||||
| 16,065 | GHCL Ltd | 100,372 | ||||||
| 9,524 | Godawari Power and Ispat Ltd | 39,238 | ||||||
| 12,975 | Great Eastern Shipping Co Ltd (The) | 86,161 | ||||||
| 49,593 | Gujarat Mineral Development Corp Ltd | 79,990 | ||||||
| 12,390 | Gujarat Narmada Valley Fertilizers & Chemicals Ltd | 78,893 | ||||||
| 122,392 | Gujarat State Fertilizers & Chemicals Ltd | 185,250 | ||||||
| 14,039 | HDFC Bank Ltd ADR | 949,598 | ||||||
| 80,000 | ICICI Bank Ltd Sponsored ADR | 1,654,400 | ||||||
| 131 | Indus Towers Ltd | 273 | ||||||
| 70,010 | Infosys Ltd Sponsored ADR | 1,255,979 | ||||||
| 483,091 | ITC Ltd | 2,199,162 | ||||||
| 38,128 | L&T Finance Holdings Ltd | 40,496 | ||||||
| 7,108 | Mahanagar Gas Ltd | 76,796 | ||||||
| 12,400 | MakeMyTrip Ltd * | 321,408 | ||||||
| 159,172 | Manappuram Finance Ltd | 198,132 | ||||||
| 334,008 | National Aluminium Co Ltd | 316,258 | ||||||
| 121,694 | NBCC India Ltd | 48,823 | ||||||
| 37,102 | NCC Ltd | 40,108 | ||||||
| 749,082 | Oil & Natural Gas Corp Ltd | 1,374,000 | ||||||
| 51,199 | Oil India Ltd | 152,338 | ||||||
| 4,087 | Oracle Financial Services Software Ltd | 155,923 | ||||||
| 138,148 | Petronet LNG Ltd | 370,645 | ||||||
| 13,840 | Redington Ltd | 28,505 | ||||||
| 13,907 | RITES Ltd | 54,780 | ||||||
| 44,092 | Sun TV Network Ltd | 229,409 | ||||||
| 28,656 | Welspun Corp Ltd | 63,736 | ||||||
| 6,400 | WNS Holdings Ltd ADR * | 556,288 | ||||||
| 12,551 | Zensar Technologies Ltd | 43,976 | ||||||
|
| |||||||
| Total India | 17,591,154 | |||||||
|
| |||||||
| Indonesia — 4.5% | ||||||||
| 16,037,800 | Adaro Energy Indonesia Tbk PT | 3,142,168 | ||||||
| 858,000 | AKR Corporindo Tbk PT | 77,873 | ||||||
| 5,745,200 | Bank Central Asia Tbk PT | 3,295,094 | ||||||
| 1,496,100 | Bank Mandiri Persero Tbk PT | 980,769 | ||||||
| 859,100 | Bank Negara Indonesia Persero Tbk PT | 494,091 | ||||||
| 3,008,900 | Bank Rakyat Indonesia Persero Tbk PT | 920,920 | ||||||
| 3,085,800 | Bukit Asam Tbk PT | 780,830 | ||||||
| 1,348,300 | Indika Energy Tbk PT | 203,269 | ||||||
| 313,500 | Indo Tambangraya Megah Tbk PT | 764,178 | ||||||
| See accompanying notes to the financial statements. | 12 |
GMO Emerging Markets ex-China Fund
(A Series of GMO Trust)
Schedule of Investments — (Continued)
(showing percentage of total net assets)
February 28, 2023
| Shares | Description | Value ($) | ||||||
| Indonesia — continued | ||||||||
| 452,700 | United Tractors Tbk PT | 828,011 | ||||||
|
| |||||||
| Total Indonesia | 11,487,203 | |||||||
|
| |||||||
| Malaysia — 0.1% | ||||||||
| 184,300 | Hartalega Holdings Bhd | 60,362 | ||||||
| 127,700 | Hibiscus Petroleum Bhd | 30,260 | ||||||
| 284,300 | Kossan Rubber Industries Bhd | 69,039 | ||||||
| 41,800 | Petronas Chemicals Group Bhd | 66,679 | ||||||
| 800 | RHB Bank Bhd | 1,013 | ||||||
|
| |||||||
| Total Malaysia | 227,353 | |||||||
|
| |||||||
| Mexico — 8.2% | ||||||||
| 726,778 | America Movil SAB de CV – Series L | 746,381 | ||||||
| 36,377 | America Movil SAB de CV – Class L Sponsored ADR | 748,639 | ||||||
| 130,900 | Arca Continental SAB de CV | 1,108,713 | ||||||
| 200,700 | Banco del Bajio SA | 766,864 | ||||||
| 7,300 | Coca-Cola Femsa SAB de CV Sponsored ADR | 525,673 | ||||||
| 539,400 | Credito Real SAB de CV SOFOM ER * (a) | — | ||||||
| 5,000 | Fomento Economico Mexicano SAB de CV Sponsored ADR | 459,600 | ||||||
| 600 | Grupo Aeroportuario del Centro Norte SAB de CV ADR | 46,794 | ||||||
| 19,900 | Grupo Aeroportuario del Centro Norte SAB de CV – Class B | 190,272 | ||||||
| 3,700 | Grupo Aeroportuario del Pacifico SAB de CV – Class B | 70,190 | ||||||
| 33,395 | Grupo Aeroportuario del Sureste SAB de CV – Class B | 956,156 | ||||||
| 240 | Grupo Aeroportuario del Sureste SAB de CV ADR | 68,683 | ||||||
| 1,215,867 | Grupo Financiero Banorte SAB de CV – Class O | 10,292,323 | ||||||
| 225,000 | Grupo Mexico SAB de CV – Series B | 1,011,956 | ||||||
| 107,100 | Qualitas Controladora SAB de CV | 666,196 | ||||||
| 77,300 | Regional SAB de CV | 641,332 | ||||||
| 631,037 | Wal-Mart de Mexico SAB de CV | 2,486,692 | ||||||
|
| |||||||
| Total Mexico | 20,786,464 | |||||||
|
| |||||||
| Philippines — 0.2% | ||||||||
| 35,350 | GT Capital Holdings Inc | 331,265 | ||||||
| 420,300 | Puregold Price Club Inc | 239,222 | ||||||
|
| |||||||
| Total Philippines | 570,487 | |||||||
|
| |||||||
| Poland — 2.1% | ||||||||
| 35,576 | Bank Polska Kasa Opieki SA | 715,902 | ||||||
| 10,768 | Jastrzebska Spolka Weglowa SA * | 132,304 | ||||||
| 193,748 | Polski Koncern Naftowy ORLEN SA | 2,893,736 | ||||||
| 183,005 | Powszechny Zaklad Ubezpieczen SA | 1,504,660 | ||||||
|
| |||||||
| Total Poland | 5,246,602 | |||||||
|
| |||||||
| Qatar — 0.6% | ||||||||
| 324,184 | Qatar National Bank QPSC | 1,500,132 | ||||||
|
| |||||||
| Shares | Description | Value ($) | ||||||
| Russia — 0.5% | ||||||||
| 4,036,000 | Alrosa PJSC * (a) (b) | 32,541 | ||||||
| 434,347 | Etalon Group Plc GDR (Registered) * (a) | 3,107 | ||||||
| 131,280 | Evraz Plc (a) | 3,232 | ||||||
| 236,860,000 | Federal Grid Co Unified Energy System PJSC * (a) | 2,796 | ||||||
| 102,255 | Gazprom Neft PJSC (a) | 5,802 | ||||||
| 897,812 | Gazprom PJSC (a) | 18,868 | ||||||
| 6,151,400 | Inter RAO UES PJSC (a) | 2,797 | ||||||
| 122,088 | LUKOIL PJSC (a) | 64,501 | ||||||
| 4,327,340 | Magnitogorsk Iron & Steel Works PJSC * (a) (b) | 22,597 | ||||||
| 7,832 | MMC Norilsk Nickel PJSC (a) | 15,121 | ||||||
| 5 | MMC Norilsk Nickel PJSC ADR * (a) | 1 | ||||||
| 172,200 | Mobile TeleSystems PJSC ADR* (a) | 11,931 | ||||||
| 88,090 | Moscow Exchange MICEX-RTS PJSC * (a) | 1,356 | ||||||
| 93,370 | Novatek PJSC (a) | 13,287 | ||||||
| 1,403,510 | Novolipetsk Steel PJSC * (a) | 23,391 | ||||||
| 4,917 | PhosAgro PJSC (a) | 4,413 | ||||||
| 95 | PhosAgro PJSC GDR * (a) (b) | 28 | ||||||
| 276,810 | Polymetal International Plc * | 815,037 | ||||||
| 11,902 | Polyus PJSC * (a) | 13,922 | ||||||
| 1 | Polyus PJSC GDR (Registered) * (a) | 1 | ||||||
| 4,917 | Ros Agro Plc GDR (Registered) * (a) | 515 | ||||||
| 50,074,400 | RusHydro PJSC (a) | 5,264 | ||||||
| 3,446,432 | Sberbank of Russia PJSC * (a) (b) | 78,021 | ||||||
| 140,607 | Severstal PJSC GDR (Registered) * (a) (b) | 19,873 | ||||||
| 2,387,800 | Surgutneftegas PJSC (a) | 7,267 | ||||||
| 657,084 | Tatneft PJSC (a) | 28,709 | ||||||
| 9,408 | TCS Group Holding Plc GDR (Registered) * (a) | 3,229 | ||||||
|
| |||||||
| Total Russia | 1,197,607 | |||||||
|
| |||||||
| South Africa — 6.6% | ||||||||
| 1 | Absa Group Ltd | 11 | ||||||
| 50,985 | Anglo American Platinum Ltd | 2,819,289 | ||||||
| 2,190 | Aspen Pharmacare Holdings Ltd | 16,911 | ||||||
| 61,129 | AVI Ltd | 253,086 | ||||||
| 6,221 | Capitec Bank Holdings Ltd | 593,510 | ||||||
| 2,833 | Clicks Group Ltd | 41,271 | ||||||
| 11,088 | Exxaro Resources Ltd | 121,362 | ||||||
| 915,141 | FirstRand Ltd | 3,264,090 | ||||||
| 72,127 | Foschini Group Ltd (The) | 398,389 | ||||||
| 145,618 | Impala Platinum Holdings Ltd | 1,359,619 | ||||||
| 15,943 | Investec Ltd | 102,003 | ||||||
| 59,968 | Kumba Iron Ore Ltd | 1,563,838 | ||||||
| 14,313 | Motus Holdings Ltd | 86,339 | ||||||
| 62,346 | Mr Price Group Ltd | 517,041 | ||||||
| 53,310 | MTN Group Ltd | 420,053 | ||||||
| 104,250 | Ninety One Ltd | 261,409 | ||||||
| 808,940 | Old Mutual Ltd | 524,714 | ||||||
| 15,057 | Omnia Holdings Ltd | 48,980 | ||||||
| 152 | Reinet Investments SCA | 3,009 | ||||||
| 74,593 | Sanlam Ltd | 242,754 | ||||||
| 240,447 | Sibanye Stillwater Ltd | 485,479 | ||||||
| 13 | See accompanying notes to the financial statements. |
GMO Emerging Markets ex-China Fund
(A Series of GMO Trust)
Schedule of Investments — (Continued)
(showing percentage of total net assets)
February 28, 2023
| Shares | Description | Value ($) | ||||||
| South Africa — continued | ||||||||
| 109,300 | Sibanye Stillwater Ltd ADR | 885,330 | ||||||
| 35,811 | Thungela Resources Ltd (c) | 413,333 | ||||||
| 42,885 | Thungela Resources Ltd (c) | 498,636 | ||||||
| 44,728 | Tiger Brands Ltd | 540,630 | ||||||
| 97,283 | Truworths International Ltd | 313,294 | ||||||
| 156,823 | Vodacom Group Ltd | 1,080,771 | ||||||
|
| |||||||
| Total South Africa | 16,855,151 | |||||||
|
| |||||||
| South Korea — 20.4% | ||||||||
| 2,327 | BGF retail Co Ltd | 318,273 | ||||||
| 13,337 | BH Co Ltd | 238,042 | ||||||
| 459 | Caregen Co Ltd | 61,167 | ||||||
| 23,514 | Cheil Worldwide Inc | 355,514 | ||||||
| 6 | CJ CheilJedang Corp | 1,456 | ||||||
| 3,515 | Coway Co Ltd | 141,816 | ||||||
| 6,472 | Daeduck Electronics Co Ltd | 102,462 | ||||||
| 20,419 | Daou Data Corp | 748,448 | ||||||
| 8,396 | DB HiTek Co Ltd | 286,834 | ||||||
| 5,155 | DB Insurance Co Ltd | 299,990 | ||||||
| 135,863 | Dongwon Development Co Ltd | 330,781 | ||||||
| 36 | GOLFZON Co Ltd * | 3,899 | ||||||
| 1,487 | GS Holdings Corp | 45,703 | ||||||
| 3,235 | HAESUNG DS Co Ltd | 98,078 | ||||||
| 22,097 | Hana Financial Group Inc | 757,866 | ||||||
| 1,507 | Handsome Co Ltd | 29,277 | ||||||
| 9,802 | Hankook Tire & Technology Co Ltd | 275,726 | ||||||
| 26,261 | HMM Co Ltd * | 446,781 | ||||||
| 7,286 | Huchems Fine Chemical Corp | 111,183 | ||||||
| 48,482 | Humasis Co Ltd * | 542,048 | ||||||
| 3,466 | Hyundai Glovis Co Ltd | 415,095 | ||||||
| 15,950 | Hyundai Marine & Fire Insurance Co Ltd | 424,416 | ||||||
| 10,145 | Hyundai Mobis Co Ltd | 1,629,529 | ||||||
| 1,098 | Industrial Bank of Korea | 8,610 | ||||||
| 7,380 | INTOPS Co Ltd | 156,290 | ||||||
| 1,775 | JB Financial Group Co Ltd | 12,394 | ||||||
| 36,734 | KB Financial Group Inc | 1,422,674 | ||||||
| 4,016 | KCC Glass Corp | 123,366 | ||||||
| 273 | KEPCO Plant Service & Engineering Co Ltd * | 6,679 | ||||||
| 39,898 | Kia Corp | 2,267,408 | ||||||
| 91,299 | Korea Real Estate Investment & Trust Co Ltd | 89,785 | ||||||
| 4,076 | Korea Zinc Co Ltd | 1,799,738 | ||||||
| 65,921 | KT Skylife Co Ltd | 399,269 | ||||||
| 101,135 | KT&G Corp | 6,786,562 | ||||||
| 10,983 | Kumho Petrochemical Co Ltd * | 1,305,939 | ||||||
| 6,054 | LOTTE Fine Chemical Co Ltd | 265,491 | ||||||
| 9,491 | LX Semicon Co Ltd | 662,134 | ||||||
| 2,570 | MegaStudyEdu Co Ltd | 134,195 | ||||||
| 59,200 | Meritz Securities Co Ltd | 314,146 | ||||||
| 9,703 | Mirae Asset Securities Co Ltd | 52,391 | ||||||
| 1,094 | NCSoft Corp | 358,955 | ||||||
| 16,618 | NH Investment & Securities Co Ltd * | 119,282 | ||||||
| 491 | NongShim Co Ltd | 135,871 | ||||||
| Shares | Description | Value ($) | ||||||
| South Korea — continued | ||||||||
| 6,312 | Orion Corp | 596,637 | ||||||
| 6,963 | POSCO Holdings Inc | 1,678,245 | ||||||
| 14,500 | POSCO Holdings Inc Sponsored ADR | 884,355 | ||||||
| 4,464 | PSK Inc | 59,735 | ||||||
| 2,482 | S-1 Corp | 105,818 | ||||||
| 365,132 | Samsung Electronics Co Ltd | 16,706,574 | ||||||
| 1,411 | Samsung Fire & Marine Insurance Co Ltd | 228,845 | ||||||
| 4,743 | Samsung SDS Co Ltd | 448,570 | ||||||
| 8,008 | Samsung Securities Co Ltd | 202,664 | ||||||
| 1,206 | Samyang Foods Co Ltd | 108,621 | ||||||
| 46,746 | SD Biosensor Inc | 811,704 | ||||||
| 28,240 | Seegene Inc | 519,684 | ||||||
| 1,992 | SFA Engineering Corp | 54,055 | ||||||
| 52,120 | Shinhan Financial Group Co Ltd | 1,530,505 | ||||||
| 287 | SK Chemicals Co Ltd | 16,972 | ||||||
| 656 | Soulbrain Co Ltd | 115,755 | ||||||
| 13,389 | Spigen Korea Co Ltd | 344,799 | ||||||
| 458 | Unid Co Ltd | 28,298 | ||||||
| 370,597 | Woori Financial Group Inc | 3,416,525 | ||||||
| 122 | Young Poong Corp * | 57,492 | ||||||
| 1,025 | Youngone Corp * | 33,003 | ||||||
|
| |||||||
| Total South Korea | 52,034,419 | |||||||
|
| |||||||
| Taiwan — 33.6% | ||||||||
| 447,000 | Acer Inc | 370,669 | ||||||
| 8,000 | Advanced Ceramic X Corp | 60,859 | ||||||
| 28,000 | Advantech Co Ltd | 324,801 | ||||||
| 1,011,850 | AmTRAN Technology Co Ltd | 353,952 | ||||||
| 126,000 | Asia Cement Corp | 184,734 | ||||||
| 155,000 | Asustek Computer Inc | 1,403,890 | ||||||
| 86,000 | Aten International Co Ltd | 229,781 | ||||||
| 20,000 | Aurora Corp | 52,750 | ||||||
| 954,000 | Catcher Technology Co Ltd | 5,765,055 | ||||||
| 1,383,319 | Cathay Financial Holding Co Ltd | 1,961,671 | ||||||
| 39,900 | Chailease Holding Co Ltd | 292,455 | ||||||
| 177,000 | Chicony Electronics Co Ltd | 531,659 | ||||||
| 161,176 | China Development Financial Holding Corp | 69,398 | ||||||
| 469,000 | China General Plastics Corp | 439,722 | ||||||
| 689,000 | China Steel Corp | 708,795 | ||||||
| 266,000 | Chipbond Technology Corp | 585,048 | ||||||
| 119,000 | ChipMOS Technologies Inc | 141,628 | ||||||
| 20,000 | Chroma ATE Inc | 120,432 | ||||||
| 34,000 | Chunghwa Telecom Co Ltd | 128,549 | ||||||
| 33,000 | Elan Microelectronics Corp | 116,822 | ||||||
| 1,109,600 | Evergreen Marine Corp Taiwan Ltd | 5,670,317 | ||||||
| 68,000 | Everlight Electronics Co Ltd | 85,595 | ||||||
| 91,000 | Far Eastern New Century Corp | 96,740 | ||||||
| 40,000 | Feng Hsin Steel Co Ltd | 93,665 | ||||||
| 269,000 | First Financial Holding Co Ltd | 235,733 | ||||||
| 21,000 | FLEXium Interconnect Inc * | 67,557 | ||||||
| 110,000 | Formosa Advanced Technologies Co Ltd | 154,837 | ||||||
| 49,000 | Formosa Chemicals & Fibre Corp | 113,712 | ||||||
| 19,000 | Formosa International Hotels Corp | 194,612 | ||||||
| See accompanying notes to the financial statements. | 14 |
GMO Emerging Markets ex-China Fund
(A Series of GMO Trust)
Schedule of Investments — (Continued)
(showing percentage of total net assets)
February 28, 2023
| Shares | Description | Value ($) | ||||||
| Taiwan — continued | ||||||||
| 1,000,000 | Formosa Plastics Corp | 2,968,568 | ||||||
| 430,897 | Foxconn Technology Co Ltd | 783,586 | ||||||
| 1,506,500 | Fubon Financial Holding Co Ltd | 2,945,831 | ||||||
| 34,000 | Getac Technology Corp | 54,668 | ||||||
| 132,000 | Gigabyte Technology Co Ltd | 511,141 | ||||||
| 24,000 | Global Mixed Mode Technology Inc | 136,915 | ||||||
| 449,000 | Grand Pacific Petrochemical | 291,904 | ||||||
| 85,000 | Greatek Electronics Inc | 148,246 | ||||||
| 1,384,000 | HannStar Display Corp * | 578,047 | ||||||
| 41,000 | Holtek Semiconductor Inc | 99,131 | ||||||
| 1,416,000 | Hon Hai Precision Industry Co Ltd | 4,684,130 | ||||||
| 2,000 | International Games System Co Ltd | 32,952 | ||||||
| 169,000 | Inventec Corp | 146,812 | ||||||
| 8,000 | King Slide Works Co Ltd | 109,103 | ||||||
| 391,000 | King’s Town Bank Co Ltd | 436,207 | ||||||
| 104,000 | Kung Long Batteries Industrial Co Ltd | 477,221 | ||||||
| 93,000 | Largan Precision Co Ltd | 6,685,774 | ||||||
| 843,000 | Lite-On Technology Corp | 1,918,271 | ||||||
| 18,000 | Makalot Industrial Co Ltd | 125,977 | ||||||
| 542,000 | Micro-Star International Co Ltd | 2,417,903 | ||||||
| 260,000 | Mitac Holdings Corp | 268,621 | ||||||
| 542,000 | Nan Ya Plastics Corp | 1,333,552 | ||||||
| 216,528 | Nantex Industry Co Ltd | 307,550 | ||||||
| 201,000 | Nanya Technology Corp | 382,606 | ||||||
| 8,000 | Nien Made Enterprise Co Ltd | 85,177 | ||||||
| 244,000 | Novatek Microelectronics Corp | 3,224,607 | ||||||
| 72,000 | Phison Electronics Corp | 819,850 | ||||||
| 32,000 | �� | Powertech Technology Inc | 92,530 | |||||
| 209,000 | Primax Electronics Ltd | 406,297 | ||||||
| 275,000 | Radiant Opto-Electronics Corp | 949,356 | ||||||
| 22,000 | Raydium Semiconductor Corp | 294,874 | ||||||
| 136,744 | Shanghai Commercial & Savings Bank Ltd (The) | 212,275 | ||||||
| 63,000 | Simplo Technology Co Ltd | 608,596 | ||||||
| 9,000 | Sinbon Electronics Co Ltd | 87,619 | ||||||
| 28,000 | Sonix Technology Co Ltd | 50,196 | ||||||
| 12,000 | Sporton International Inc | 104,331 | ||||||
| 69,000 | Synnex Technology International Corp | 140,788 | ||||||
| 55,000 | T3EX Global Holdings Corp | 124,520 | ||||||
| 50,000 | TaiDoc Technology Corp | 310,475 | ||||||
| 109,200 | Taita Chemical Co Ltd | 82,601 | ||||||
| 273,000 | Taiwan Glass Industry Corp | 208,722 | ||||||
| 30,000 | Taiwan Hon Chuan Enterprise Co Ltd | 94,760 | ||||||
| 283,000 | Taiwan PCB Techvest Co Ltd | 358,842 | ||||||
| 311,000 | Taiwan Semiconductor Manufacturing Co Ltd | 5,145,150 | ||||||
| 105,980 | Taiwan Semiconductor Manufacturing Co Ltd Sponsored ADR | 9,227,679 | ||||||
| 155,000 | Taiwan Union Technology Corp | 297,521 | ||||||
| 30,000 | TCI Co Ltd | 207,762 | ||||||
| 88,000 | Tripod Technology Corp | 301,381 | ||||||
| 45,000 | Tung Ho Steel Enterprise Corp | 87,710 | ||||||
| 23,000 | TXC Corp | 64,795 | ||||||
| 115,000 | United Integrated Services Co Ltd | 847,823 | ||||||
| Shares | Description | Value ($) | ||||||
| Taiwan — continued | ||||||||
| 97,000 | Universal Inc | 76,351 | ||||||
| 505,000 | USI Corp | 415,164 | ||||||
| 27,000 | Walsin Technology Corp | 88,078 | ||||||
| 1,164,250 | Wan Hai Lines Ltd | 3,013,105 | ||||||
| 60,000 | WPG Holdings Ltd | 96,985 | ||||||
| 3,996,000 | Yang Ming Marine Transport Corp | 8,410,657 | ||||||
| 824,580 | Yuanta Financial Holding Co Ltd | 613,117 | ||||||
|
| |||||||
| Total Taiwan | 85,549,848 | |||||||
|
| |||||||
| Thailand — 0.8% | ||||||||
| 116,300 | CP ALL Pcl NVDR | 203,977 | ||||||
| 28,200 | Kasikornbank Pcl NVDR | 109,289 | ||||||
| 377,000 | PTT Exploration & Production Pcl NVDR | 1,595,631 | ||||||
| 151,200 | Regional Container Lines Pcl NVDR | 133,632 | ||||||
| 365,900 | Sri Trang Gloves Thailand Pcl NVDR | 114,875 | ||||||
|
| |||||||
| Total Thailand | 2,157,404 | |||||||
|
| |||||||
| Turkey — 0.2% | ||||||||
| 2 | Turkiye Is Bankasi AS – Class C | 1 | ||||||
| 1,239,542 | Yapi ve Kredi Bankasi AS | 656,894 | ||||||
|
| |||||||
| Total Turkey | 656,895 | |||||||
|
| |||||||
| United Kingdom — 0.7% | ||||||||
| 35,882 | Unilever Plc | 1,786,474 | ||||||
|
| |||||||
| Vietnam — 2.5% | ||||||||
| 524,500 | Duc Giang Chemicals JSC | 1,105,613 | ||||||
| 123,800 | IDICO Corp JSC | 200,094 | ||||||
| 96,900 | PetroVietnam Ca Mau Fertilizer JSC | 95,809 | ||||||
| 87,200 | PetroVietnam Fertilizer & Chemicals JSC | 128,413 | ||||||
| 115,600 | PetroVietnam Technical Services Corp | 125,953 | ||||||
| 755,400 | SSI Securities Corp | 580,253 | ||||||
| 389,100 | Vietnam Dairy Products JSC | 1,236,623 | ||||||
| 709,200 | Vietnam Joint Stock Commercial Bank for Industry and Trade * | 817,709 | ||||||
| 3,555,900 | VNDirect Securities Corp | 2,012,991 | ||||||
|
| |||||||
| Total Vietnam | 6,303,458 | |||||||
|
| |||||||
TOTAL COMMON STOCKS (COST $339,867,613) | 245,586,594 | |||||||
|
| |||||||
| PREFERRED STOCKS (d) — 6.2% | ||||||||
| Brazil — 6.2% | ||||||||
| 26,600 | Banco do Estado do Rio Grande do Sul SA – Class B | 50,757 | ||||||
| 241,819 | Cia Energetica de Minas Gerais | 484,058 | ||||||
| 52,760 | Cia Energetica de Minas Gerais Sponsored ADR | 102,882 | ||||||
| 4,300 | Cia Ferro Ligas da Bahia | 47,185 | ||||||
| 533,200 | Gerdau SA | 2,915,798 | ||||||
| 87,300 | Gerdau SA Sponsored ADR | 477,531 | ||||||
| 512,500 | Itausa SA | 805,638 | ||||||
| 273,100 | Metalurgica Gerdau SA | 656,218 | ||||||
| 15 | See accompanying notes to the financial statements. |
GMO Emerging Markets ex-China Fund
(A Series of GMO Trust)
Schedule of Investments — (Continued)
(showing percentage of total net assets)
February 28, 2023
| Shares | Description | Value ($) | ||||||
| Brazil — continued | ||||||||
| 1,865,669 | Petroleo Brasileiro SA | 8,994,353 | ||||||
| 97,717 | Petroleo Brasileiro SA Sponsored ADR | 953,718 | ||||||
| 13,700 | Unipar Carbocloro SA – Class B | 207,484 | ||||||
|
| |||||||
| Total Brazil | 15,695,622 | |||||||
|
| |||||||
| Chile — 0.0% | ||||||||
| 14,812 | Embotelladora Andina SA – Class B | 36,423 | ||||||
|
| |||||||
| Russia — 0.0% | ||||||||
| 3,948,700 | Surgutneftegas PJSC (a) | 14,643 | ||||||
| 315 | Transneft PJSC (a) | 3,840 | ||||||
|
| |||||||
| Total Russia | 18,483 | |||||||
|
| |||||||
| Taiwan — 0.0% | ||||||||
| 224,635 | China Development Financial Holding Corp | 59,877 | ||||||
|
| |||||||
TOTAL PREFERRED STOCKS (COST $20,057,749) | 15,810,405 | |||||||
|
| |||||||
| MUTUAL FUNDS — 0.1% | ||||||||
| United States — 0.1% | ||||||||
| Affiliated Issuers — 0.1% | ||||||||
| 63,933 | GMO U.S. Treasury Fund | 319,023 | ||||||
|
| |||||||
| Total United States | 319,023 | |||||||
|
| |||||||
TOTAL MUTUAL FUNDS (COST $319,023) | 319,023 | |||||||
|
| |||||||
| SHORT-TERM INVESTMENTS — 0.0% |
| |||||||
| Money Market Funds — 0.0% | ||||||||
| 25,328 | State Street Institutional Treasury Money Market Fund – Premier Class, 4.42% (e) | 25,328 | ||||||
|
| |||||||
TOTAL SHORT-TERM INVESTMENTS (COST $25,328) | 25,328 | |||||||
|
| |||||||
TOTAL INVESTMENTS — 102.7% (Cost $360,269,713) | 261,741,350 | |||||||
| Other Assets and Liabilities (net) — (2.7)% | (6,947,223 | ) | ||||||
|
| |||||||
| TOTAL NET ASSETS — 100.0% | $254,794,127 | |||||||
|
| |||||||
Additional information on each restricted security is as follows:
Issuer | Acquisition Date | Acquisition Cost | Value as a Percentage of Fund’s Net Assets | Value as of February 28, 2023 | ||||||||||||
Alrosa PJSC | 10/18/21 | $ | 7,054,956 | 0.0 | % | $ | 32,541 | |||||||||
Issuer Description | Acquisition Date | Acquisition Cost | Value as a Percentage of Fund’s Net Assets | Value as of February 28, 2023 | ||||||||||||
Magnitogorsk Iron & Steel Works PJSC | 10/18/21 | $ | 4,011,995 | 0.0 | % | $ | 22,597 | |||||||||
PhosAgro PJSC GDR | 10/18/21 | 2,465 | 0.0 | % | 28 | |||||||||||
Sberbank of Russia PJSC | 10/18/21 | 16,614,391 | 0.0 | % | 78,021 | |||||||||||
Severstal PJSC GDR (Registered) | 10/18/21 | 3,190,235 | 0.0 | % | 19,873 | |||||||||||
|
| |||||||||||||||
| $ | 153,060 | |||||||||||||||
|
| |||||||||||||||
Notes to Schedule of Investments:
| * | Non-income producing security. |
| (a) | Investment valued at fair value using methods determined in good faith by the Trustees of GMO Trust or persons acting at their direction pursuant to procedures approved by the Trustees. Investment valued using significant unobservable inputs (Note 2). |
| (b) | The security is restricted as to resale. |
| (c) | Securities are traded on separate exchanges for the same entity. |
| (d) | Preferred dividend rates are disclosed to the extent that a stated rate exists. |
| (e) | The rate disclosed is the 7 day net yield as of February 28, 2023. |
For a listing of definitions of acronyms, counterparty abbreviations and currency abbreviations used throughout the Schedule of Investments as well as the derivative tables, if any, please refer to page 106.
| See accompanying notes to the financial statements. | 16 |
(A Series of GMO Trust)
Portfolio Management
Day-to-day management of the Fund’s portfolio is the responsibility of the Systematic Equity team at Grantham, Mayo, Van Otterloo & Co. LLC.
Management Discussion and Analysis of Fund Performance
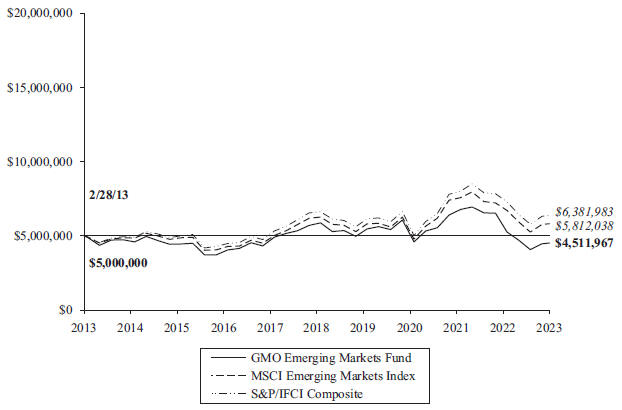
Class II shares of GMO Emerging Markets Fund returned -20.78% (net) for the fiscal year ended February 28, 2023, as compared with -15.28% for the MSCI Emerging Markets Index.
Country-sector allocation detracted from the Fund’s relative returns for the fiscal year. In particular, the Fund’s overweight positions in Russian Materials and Russian Energy hurt relative performance.
Stock selection detracted from the Fund’s relative returns for the fiscal year. The Fund’s stock selection in Russian Materials, Russian Energy, and Taiwanese Industrials hurt relative performance.
Because some of the securities and instruments held directly or indirectly by the Fund had positive fair value adjustments at the beginning or end of the fiscal year (and the performance of indices are not fair valued), the Fund’s absolute and relative performance is higher than it otherwise would have been in the absence of such fair value adjustments.
The views expressed herein are exclusively those of Grantham, Mayo, Van Otterloo & Co. LLC as of the date of this report and are subject to change. GMO disclaims any responsibility to update such views. They are not meant as investment advice. References to specific securities are not recommendations of such securities and may not be representative of any GMO portfolio’s current or future investments. All information is unaudited.
| 17 |
GMO Emerging Markets Fund
(A Series of GMO Trust)
Comparison of Change in Value of a $5,000,000 Investment in
GMO Emerging Markets Fund Class II Shares, the MSCI Emerging Markets Index and
the S&P/IFCI Composite
As of February 28, 2023
| Average Annual Total Returns | ||||||||||||||
| 1 Year | 5 Year | 10 Year | Since Inception | |||||||||||
| Class II | -20.78 | % | -5.32 | % | -1.02 | % | n/a | |||||||
| Class III | -20.73 | % | -5.27 | % | -0.97 | % | n/a | |||||||
| Class VI | -20.62 | % | -5.15 | % | -0.84 | % | n/a | |||||||
| Class R6 | -20.76 | % | n/a | n/a | 3/31/20 -0.57% | |||||||||
| Class I | -20.80 | % | n/a | n/a | 1/14/20 -9.79% | |||||||||
Performance data quoted represents past performance and is not indicative of future results. The investment return and principal value of an investment will fluctuate so that an investor’s shares, when redeemed, may be worth more or less than their original cost. Current performance data may be lower or higher than the performance data provided herein. To obtain performance information up to the most recent month-end, visit www.gmo.com. Performance shown is net of all fees after reimbursement from GMO. Returns would have been lower had certain expenses not been reimbursed during the periods shown and do not include the effect of taxes on distributions and redemptions. The performance information shown above only includes purchase premiums and/or redemption fees in effect as of February 28, 2023. All information is unaudited. Performance for classes may vary due to different fees.
For S&P disclaimers please visit https://www.gmo.com/north-america/benchmark-disclaimers/
MSCI data may not be reproduced or used for any other purpose. MSCI provides no warranties, has not prepared or approved this report, and has no liability hereunder.
For Class II, III, VI, R6 and I the gross expense ratio of 0.96%, 0.89%, 0.80%, 0.96% and 1.09%, respectively, is equal to the Fund’s Total Annual Operating Expenses set forth in the Fund’s most recent prospectus dated June 30, 2022. For the Classes listed above, the corresponding net expense ratio of 0.93%, 0.88%, 0.75%, 0.93% and 0.99% reflects the reduction of expenses from fee reimbursements. The fee reimbursements will continue until at least June 30, 2023. Elimination of this reimbursement will result in higher fees and lower performance.
| 18 |
GMO Emerging Markets Fund
(A Series of GMO Trust)
Investment Concentration Summary
February 28, 2023 (Unaudited)
Asset Class Summary& | % of Total Net Assets | |||
Common Stocks | 91.2 | % | ||
Preferred Stocks | 6.8 | |||
Mutual Funds | 1.8 | |||
Short-Term Investments | 0.4 | |||
Debt Obligations | 0.3 | |||
Futures Contracts | (0.1 | ) | ||
Other | (0.4 | ) | ||
|
| |||
| 100.0 | % | |||
|
| |||
Country/Region Summary¤ | % of Investments | |||
China | 25.7 | % | ||
Taiwan | 20.1 | |||
South Korea | 14.5 | |||
United States | 8.6 | * | ||
Brazil | 6.7 | |||
Mexico | 5.1 | |||
India | 4.7 | |||
South Africa | 4.1 | |||
Vietnam | 2.8 | |||
Indonesia | 1.6 | |||
United Kingdom | 1.2 | * | ||
Hungary | 1.1 | |||
Poland | 0.8 | |||
Russia | 0.5 | |||
Qatar | 0.5 | |||
Thailand | 0.4 | |||
Chile | 0.4 | |||
Czech Republic | 0.2 | |||
Malaysia | 0.2 | |||
Egypt | 0.2 | |||
Philippines | 0.2 | |||
Greece | 0.1 | |||
Kuwait | 0.1 | |||
Pakistan | 0.1 | |||
Turkey | 0.1 | |||
Sri Lanka | 0.0 | ^ | ||
Panama | 0.0 | ^ | ||
|
| |||
| 100.0 | % | |||
|
| |||
Industry Group Summary | % of Equity Investments# | |||
Technology Hardware & Equipment | 14.1 | % | ||
Materials | 11.8 | |||
Banks | 10.5 | |||
Energy | 10.5 | |||
Food, Beverage & Tobacco | 8.7 | |||
Transportation | 8.5 | |||
Media & Entertainment | 6.7 | |||
Semiconductors & Semiconductor Equipment | 5.7 | |||
Insurance | 4.1 | |||
Diversified Financials | 3.3 | |||
Retailing | 2.9 | |||
Automobiles & Components | 2.1 | |||
Consumer Durables & Apparel | 1.7 | |||
Household & Personal Products | 1.7 | |||
Capital Goods | 1.6 | |||
Health Care Equipment & Services | 1.2 | |||
Software & Services | 1.0 | |||
Real Estate | 0.9 | |||
Pharmaceuticals, Biotechnology & Life Sciences | 0.8 | |||
Food & Staples Retailing | 0.8 | |||
Telecommunication Services | 0.5 | |||
Utilities | 0.4 | |||
Consumer Services | 0.4 | |||
Commercial & Professional Services | 0.1 | |||
|
| |||
| 100.0 | % | |||
|
| |||
| & | In the table, derivative financial instruments, if any, are based on market values, rather than the notional amounts of derivatives, except for forward currency contracts which are based on unrealized appreciation/(depreciation). |
| ¤ | The table shows country exposure in the Fund. The table excludes short-term investments. The table excludes exposure through forward currency contracts and includes exposure through other derivative financial instruments, if any. The table takes into account the market value of securities and options and the notional amounts of swap contracts and other derivative financial instruments, if any. |
| * | Includes companies that derive more than 50% of their revenues or profits from emerging markets. |
| # | Equity investments may consist of common stocks and other stock-related securities, such as preferred stocks, if any. This table excludes exposure to derivative contracts, short-term investments, mutual funds and investment funds, if any. For a summary of these exposures, if any, see the Schedule of Investments. |
| ^ | Rounds to 0.0%. |
| 19 |
GMO Emerging Markets Fund
(A Series of GMO Trust)
(showing percentage of total net assets)
February 28, 2023
| Shares | Description | Value ($) | ||||||
| COMMON STOCKS — 91.2% | ||||||||
| Brazil — 2.9% | ||||||||
| 74,300 | Alupar Investimento SA | 385,305 | ||||||
| 768,800 | Ambev SA | 1,966,255 | ||||||
| 140,500 | BB Seguridade Participacoes SA | 918,069 | ||||||
| 423,800 | Cia Brasileira de Aluminio | 843,480 | ||||||
| 129,300 | CPFL Energia SA | 748,073 | ||||||
| 359,900 | EDP—Energias do Brasil SA | 1,349,423 | ||||||
| 520,986 | Enauta Participacoes SA | 1,371,265 | ||||||
| 291,000 | Fleury SA | 788,717 | ||||||
| 559,788 | Localiza Rent a Car SA | 5,933,136 | ||||||
| 106,400 | M Dias Branco SA | 682,243 | ||||||
| 238,400 | Petroreconcavo SA | 1,288,661 | ||||||
| 421,100 | Qualicorp Consultoria e Corretora de Seguros SA | 375,619 | ||||||
| 367,500 | Santos Brasil Participacoes SA | 562,258 | ||||||
| 119,200 | Sao Martinho SA | 619,286 | ||||||
| 432,643 | Vale SA Sponsored ADR – Class B | 7,069,387 | ||||||
|
| |||||||
| Total Brazil | 24,901,177 | |||||||
|
| |||||||
| Chile — 0.4% | ||||||||
| 35,198 | CAP SA | 292,611 | ||||||
| 8,542,519 | Colbun SA | 979,480 | ||||||
| 25,900 | Sociedad Quimica y Minera de Chile SA Sponsored ADR | 2,298,625 | ||||||
|
| |||||||
| Total Chile | 3,570,716 | |||||||
|
| |||||||
| China — 27.6% | ||||||||
| 2,476,000 | 361 Degrees International Ltd * | 1,187,523 | ||||||
| 585,500 | 3SBio Inc | 580,605 | ||||||
| 10,118,200 | Agricultural Bank of China Ltd – Class A | 4,271,785 | ||||||
| 36,705 | Alibaba Group Holding Ltd Sponsored ADR* | 3,222,332 | ||||||
| 248,600 | Anhui Expressway Co Ltd – Class A | 299,857 | ||||||
| 354,000 | Anhui Expressway Co Ltd – Class H | 330,845 | ||||||
| 134,200 | ANTA Sports Products Ltd | 1,772,142 | ||||||
| 284,800 | Autohome Inc – Class A (a) | 2,178,723 | ||||||
| 97,094 | Autohome Inc ADR | 2,961,367 | ||||||
| 2,662,600 | Bank of China Ltd – Class A | 1,239,394 | ||||||
| 646,000 | Bosideng International Holdings Ltd | 358,351 | ||||||
| 1,008,000 | China BlueChemical Ltd – Class H | 227,520 | ||||||
| 6,940,141 | China Coal Energy Co Ltd – Class A | 8,771,717 | ||||||
| 4,827,878 | China Communications Services Corp Ltd – Class H | 1,877,055 | ||||||
| 12,309,148 | China Construction Bank Corp – Class H | 7,524,304 | ||||||
| 947,000 | China Education Group Holdings Ltd | 1,087,632 | ||||||
| 19,367,000 | China Feihe Ltd | 15,522,798 | ||||||
| 1,259,000 | China Hongqiao Group Ltd | 1,346,630 | ||||||
| 1,216,000 | China Lesso Group Holdings Ltd | 1,282,618 | ||||||
| 917,000 | China Medical System Holdings Ltd | 1,380,500 | ||||||
| 639,800 | China Merchants Bank Co Ltd – Class A | 3,441,661 | ||||||
| 1,802,000 | China Oriental Group Co Ltd | 365,589 | ||||||
| 10,408,532 | China Petroleum & Chemical Corp – Class A | 6,983,389 | ||||||
| Shares | Description | Value ($) | ||||||
| China — continued | ||||||||
| 1,322,000 | China Petroleum & Chemical Corp – Class H | 674,454 | ||||||
| 3,845,631 | China Shenhua Energy Co Ltd – Class A | 15,519,556 | ||||||
| 177,481 | China Tourism Group Duty Free Corp Ltd – Class A | 5,055,973 | ||||||
| 732,000 | China Yuhua Education Corp Ltd – Class L * | 122,501 | ||||||
| 2,585,500 | COSCO Shipping Holdings Co Ltd – Class A | 4,015,589 | ||||||
| 1,065,000 | COSCO Shipping Holdings Co Ltd – Class H | 1,104,643 | ||||||
| 158,000 | CSPC Pharmaceutical Group Ltd | 169,739 | ||||||
| 1,209,000 | Dongyue Group Ltd | 1,369,176 | ||||||
| 177,122 | Hangzhou Robam Appliances Co Ltd – Class A | 784,951 | ||||||
| 250,000 | Hansoh Pharmaceutical Group Co Ltd | 449,434 | ||||||
| 253,900 | Hello Group Inc Sponsored ADR | 2,236,859 | ||||||
| 10,248,000 | Hua Han Health Industry Holdings Ltd (b) | 1 | ||||||
| 250,800 | Huayu Automotive Systems Co Ltd – Class A | 683,353 | ||||||
| 5,349,900 | Industrial & Commercial Bank of China Ltd – Class A | 3,314,701 | ||||||
| 5,250,824 | Inner Mongolia Eerduosi Resources Co Ltd – Class A | 12,667,171 | ||||||
| 1,098,200 | Inner Mongolia Yitai Coal Co Ltd – Class H | 1,397,115 | ||||||
| 293,800 | JOYY Inc ADR | 9,225,320 | ||||||
| 354,500 | Kingboard Laminates Holdings Ltd | 442,085 | ||||||
| 25,749 | Kweichow Moutai Co Ltd – Class A | 6,736,362 | ||||||
| 1,785,000 | Lonking Holdings Ltd | 323,139 | ||||||
| 57,016 | Meituan – Class B * | 989,508 | ||||||
| 128,800 | Midea Group Co Ltd – Class A | 972,332 | ||||||
| 361,900 | NetEase Inc | 5,624,088 | ||||||
| 901,000 | Orient Overseas International Ltd | 14,472,967 | ||||||
| 8,593,000 | PICC Property & Casualty Co Ltd – Class H | 7,547,668 | ||||||
| 1,509,009 | Ping An Insurance Group Co of China Ltd – Class A | 10,488,932 | ||||||
| 349,500 | Ping An Insurance Group Co of China Ltd – Class H | 2,385,874 | ||||||
| 812,100 | Postal Savings Bank of China Co Ltd – Class A | 529,035 | ||||||
| 4,274,400 | Qingling Motors Co Ltd – Class H | 555,095 | ||||||
| 462,400 | Shandong Weigao Group Medical Polymer Co Ltd – Class H | 746,390 | ||||||
| 1,201,681 | Shenzhen YUTO Packaging Technology Co Ltd – Class A | 5,307,110 | ||||||
| 2,058,500 | Sinopec Engineering Group Co Ltd – Class H | 1,031,313 | ||||||
| 467,100 | Sinotrans Ltd – Class A | 264,592 | ||||||
| 711,500 | Sinotruk Hong Kong Ltd | 1,121,410 | ||||||
| 1,489,000 | Sunac China Holdings Ltd * (c) | 868,808 | ||||||
| 261,800 | Sunny Optical Technology Group Co Ltd | 2,977,144 | ||||||
| 445,165 | Tencent Holdings Ltd | 19,555,383 | ||||||
| 155,300 | Tencent Holdings Ltd ADR | 6,826,988 | ||||||
| 252,000 | Tianneng Power International Ltd (a) | 323,286 | ||||||
| 417,000 | Topsports International Holdings Ltd | 364,736 | ||||||
| See accompanying notes to the financial statements. | 20 |
GMO Emerging Markets Fund
(A Series of GMO Trust)
Schedule of Investments — (Continued)
(showing percentage of total net assets)
February 28, 2023
| Shares | Description | Value ($) | ||||||
| China — continued | ||||||||
| 590,262 | Vipshop Holdings Ltd ADR * | 8,789,001 | ||||||
| 204,400 | Xinhua Winshare Publishing and Media Co Ltd – Class A | 309,189 | ||||||
| 58,000 | Yadea Group Holdings Ltd | 124,479 | ||||||
| 1,163,515 | Yankuang Energy Group Co Ltd – Class A | 5,981,777 | ||||||
| 1,252,000 | Zhejiang Expressway Co Ltd – Class H | 1,009,763 | ||||||
| 37,507 | Zhejiang Supor Co Ltd – Class A | 307,326 | ||||||
|
| |||||||
| Total China | 233,980,653 | |||||||
|
| |||||||
| Czech Republic — 0.3% | ||||||||
| 415,292 | Moneta Money Bank AS | 1,582,037 | ||||||
| 770 | Philip Morris CR AS | 596,448 | ||||||
|
| |||||||
| Total Czech Republic | 2,178,485 | |||||||
|
| |||||||
| Egypt — 0.2% | ||||||||
| 1,016,366 | Commercial International Bank Egypt SAE | 1,762,018 | ||||||
|
| |||||||
| Greece — 0.1% | ||||||||
| 19,893 | Jumbo SA | 397,222 | ||||||
| 27,371 | Motor Oil Hellas Corinth Refineries SA | 724,722 | ||||||
|
| |||||||
| Total Greece | 1,121,944 | |||||||
|
| |||||||
| Hungary — 1.2% | ||||||||
| 282,369 | MOL Hungarian Oil & Gas Plc | 2,144,219 | ||||||
| 217,827 | OTP Bank Nyrt | 6,598,605 | ||||||
| 54,615 | Richter Gedeon Nyrt | 1,144,821 | ||||||
|
| |||||||
| Total Hungary | 9,887,645 | |||||||
|
| |||||||
| India — 5.1% | ||||||||
| 126,719 | Asian Paints Ltd | 4,337,565 | ||||||
| 434,720 | Axis Bank Ltd | 4,438,384 | ||||||
| 976 | Clean Science & Technology Ltd | 16,215 | ||||||
| 94,679 | Cochin Shipyard Ltd | 518,619 | ||||||
| 29,266 | Colgate-Palmolive India Ltd | 522,981 | ||||||
| 46,178 | Coromandel International Ltd | 504,811 | ||||||
| 34,425 | Deepak Fertilisers & Petrochemicals Corp Ltd | 259,981 | ||||||
| 52,156 | GHCL Ltd | 325,863 | ||||||
| 49,752 | Great Eastern Shipping Co Ltd (The) | 330,379 | ||||||
| 349,170 | Gujarat State Fertilizers & Chemicals Ltd | 528,496 | ||||||
| 111,870 | HDFC Bank Ltd | 2,168,209 | ||||||
| 158,429 | Hindustan Zinc Ltd | 582,890 | ||||||
| 124,091 | Housing Development Finance Corp Ltd | 3,912,705 | ||||||
| 658,997 | ICICI Bank Ltd | 6,811,027 | ||||||
| 375,898 | Infosys Ltd Sponsored ADR | 6,743,610 | ||||||
| 423,027 | L&T Finance Holdings Ltd | 449,298 | ||||||
| 748,702 | Manappuram Finance Ltd | 931,961 | ||||||
| 506,884 | NCC Ltd | 547,947 | ||||||
| 138,040 | Oil India Ltd | 410,725 | ||||||
| 10,474 | Oracle Financial Services Software Ltd | 399,594 | ||||||
| 752,652 | Petronet LNG Ltd | 2,019,335 | ||||||
| 16,173 | PI Industries Ltd | 605,008 | ||||||
| 247,087 | Redington Ltd | 508,895 | ||||||
| Shares | Description | Value ($) | ||||||
| India — continued | ||||||||
| 151,715 | Sun TV Network Ltd | 789,367 | ||||||
| 153,710 | Titan Co Ltd | 4,403,421 | ||||||
|
| |||||||
| Total India | 43,067,286 | |||||||
|
| |||||||
| Indonesia — 1.7% | ||||||||
| 24,855,000 | Adaro Energy Indonesia Tbk PT | 4,869,657 | ||||||
| 825,400 | Bank Mandiri Persero Tbk PT | 541,091 | ||||||
| 3,763,500 | Bank Negara Indonesia Persero Tbk PT | 2,164,487 | ||||||
| 10,572,800 | Bank Pembangunan Daerah Jawa Timur Tbk PT | 512,979 | ||||||
| 7,987,800 | Bukit Asam Tbk PT | 2,021,230 | ||||||
| 914,291 | Indo Tambangraya Megah Tbk PT | 2,228,649 | ||||||
| 20,933,300 | Panin Financial Tbk PT | 546,313 | ||||||
| 907,700 | United Tractors Tbk PT | 1,660,230 | ||||||
|
| |||||||
| Total Indonesia | 14,544,636 | |||||||
|
| |||||||
| Kuwait — 0.1% | ||||||||
| 64,358 | Humansoft Holding Co KSC | 771,498 | ||||||
|
| |||||||
| Malaysia — 0.2% | ||||||||
| 1,590,900 | Hartalega Holdings Bhd | 521,056 | ||||||
| 1,909,600 | Hibiscus Petroleum Bhd | 452,498 | ||||||
| 1,505,800 | Kossan Rubber Industries Bhd | 365,666 | ||||||
| 377,900 | RHB Bank Bhd | 478,301 | ||||||
|
| |||||||
| Total Malaysia | 1,817,521 | |||||||
|
| |||||||
| Mexico — 5.4% | ||||||||
| 2,027,700 | America Movil SAB de CV – Series L | 2,082,392 | ||||||
| 97,800 | America Movil SAB de CV – Class L Sponsored ADR | 2,012,724 | ||||||
| 201,500 | Arca Continental SAB de CV | 1,706,690 | ||||||
| 473,900 | Banco del Bajio SA | 1,810,748 | ||||||
| 26,800 | Coca-Cola Femsa SAB de CV Sponsored ADR | 1,929,868 | ||||||
| 315,700 | Credito Real SAB de CV SOFOM ER * (a) (b) | — | ||||||
| 50,900 | Fomento Economico Mexicano SAB de CV Sponsored ADR | 4,678,728 | ||||||
| 5,500 | Grupo Aeroportuario del Centro Norte SAB de CV ADR | 428,945 | ||||||
| 63,200 | Grupo Aeroportuario del Centro Norte SAB de CV – Class B | 604,280 | ||||||
| 3,700 | Grupo Aeroportuario del Pacifico SAB de CV ADR | 703,296 | ||||||
| 59,300 | Grupo Aeroportuario del Pacifico SAB de CV – Class B | 1,124,938 | ||||||
| 42,365 | Grupo Aeroportuario del Sureste SAB de CV – Class B | 1,212,982 | ||||||
| 6,900 | Grupo Aeroportuario del Sureste SAB de CV ADR | 1,974,642 | ||||||
| 139,100 | Grupo Bimbo SAB de CV – Series A | 663,170 | ||||||
| 1,887,857 | Grupo Financiero Banorte SAB de CV – Class O | 15,980,723 | ||||||
| 697,600 | Grupo Mexico SAB de CV – Series B | 3,137,513 | ||||||
| 160,900 | Grupo Televisa SAB Sponsored ADR | 798,064 | ||||||
| 21 | See accompanying notes to the financial statements. |
GMO Emerging Markets Fund
(A Series of GMO Trust)
Schedule of Investments — (Continued)
(showing percentage of total net assets)
February 28, 2023
| Shares | Description | Value ($) | ||||||
| Mexico — continued | ||||||||
| 205,400 | Regional SAB de CV | 1,704,136 | ||||||
| 834,900 | Wal-Mart de Mexico SAB de CV | 3,290,044 | ||||||
|
| |||||||
| Total Mexico | 45,843,883 | |||||||
|
| |||||||
| Pakistan — 0.1% | ||||||||
| 1,789,759 | Pakistan Petroleum Ltd | 428,674 | ||||||
|
| |||||||
| Panama — 0.0% | ||||||||
| 1,591,142 | BAC Holding International Corp * | 64,701 | ||||||
|
| |||||||
| Philippines — 0.2% | ||||||||
| 54,680 | GT Capital Holdings Inc | 512,406 | ||||||
| 16,607,800 | Megaworld Corp | 605,746 | ||||||
| 887,200 | Puregold Price Club Inc | 504,968 | ||||||
|
| |||||||
| Total Philippines | 1,623,120 | |||||||
|
| |||||||
| Poland — 0.8% | ||||||||
| 4 | Bank Polska Kasa Opieki SA | 80 | ||||||
| 26,443 | Budimex SA | 1,672,769 | ||||||
| 67,976 | Pepco Group NV * | 673,336 | ||||||
| 288,647 | Polski Koncern Naftowy ORLEN SA | 4,311,107 | ||||||
| 5,549 | Santander Bank Polska SA | 372,364 | ||||||
|
| |||||||
| Total Poland | 7,029,656 | |||||||
|
| |||||||
| Qatar — 0.6% | ||||||||
| 905,604 | Qatar National Bank QPSC | 4,190,601 | ||||||
| 527,916 | Qatar National Cement Co QSC | 612,612 | ||||||
|
| |||||||
| Total Qatar | 4,803,213 | |||||||
|
| |||||||
| Russia — 0.5% | ||||||||
| 31,701,260 | Alrosa PJSC * (b) (d) | 255,595 | ||||||
| 380,350 | Detsky Mir PJSC * (b) | 3,522 | ||||||
| 39,977 | Evraz Plc (b) | 984 | ||||||
| 1,432,600,000 | Federal Grid Co Unified Energy System PJSC * (b) | 16,913 | ||||||
| 653,911 | Fix Price Group Plc GDR* (b) | 18,747 | ||||||
| 219,070 | Gazprom Neft PJSC (b) | 12,431 | ||||||
| 1,250,860 | Gazprom PJSC (b) | 26,287 | ||||||
| 575,658 | Globaltrans Investment Plc Sponsored GDR (Registered) * (b) | 24,787 | ||||||
| 78,536,400 | Inter RAO UES PJSC (b) | 35,716 | ||||||
| 239,440 | LSR Group PJSC – Class A * (b) | 15,365 | ||||||
| 3 | LSR Group PJSC GDR (Registered) (b) | — | ||||||
| 285,469 | LUKOIL PJSC (b) | 150,817 | ||||||
| 17,490,987 | Magnitogorsk Iron & Steel Works PJSC * (b) (d) | 91,335 | ||||||
| 474,800 | Mechel PJSC * (b) | 8,019 | ||||||
| 37,212 | MMC Norilsk Nickel PJSC (b) | 71,846 | ||||||
| 5 | MMC Norilsk Nickel PJSC ADR * (b) | 1 | ||||||
| 249,660 | Mobile TeleSystems PJSC (b) | 8,647 | ||||||
| 35,508 | Mobile TeleSystems PJSC ADR* (b) | 2,460 | ||||||
| 4,133,417 | Moscow Exchange MICEX-RTS PJSC * (b) | 63,612 | ||||||
| 10,015,560 | Novolipetsk Steel PJSC * (b) | 166,922 | ||||||
| Shares | Description | Value ($) | ||||||
| Russia — continued | ||||||||
| 11,924 | PhosAgro PJSC (b) | 10,702 | ||||||
| 230 | PhosAgro PJSC GDR * (b) (d) | 69 | ||||||
| 916,204 | Polymetal International Plc * | 2,697,664 | ||||||
| 80,094 | Polyus PJSC * (b) | 93,685 | ||||||
| 24,938,000 | RusHydro PJSC (b) | 2,621 | ||||||
| 13,125,612 | Sberbank of Russia PJSC * (b) (d) | 297,141 | ||||||
| 706,464 | Severstal PJSC GDR (Registered) * (b) (d) | 99,850 | ||||||
| 68,353 | SFI PJSC * (b) | 4,537 | ||||||
| 63,500,900 | Surgutneftegas PJSC (b) | 193,253 | ||||||
| 2,860,038 | Tatneft PJSC (b) | 124,958 | ||||||
| 8,118,000 | Unipro PJSC * (b) | 1,731 | ||||||
| 556,430 | United Co Rusal International PJSC (b) | 2,948 | ||||||
| 46,698 | X5 Retail Group NV GDR (Registered) * (b) | 6,215 | ||||||
|
| |||||||
| Total Russia | 4,509,380 | |||||||
|
| |||||||
| South Africa — 4.4% | ||||||||
| 26,521 | African Rainbow Minerals Ltd | 367,074 | ||||||
| 166,605 | Anglo American Platinum Ltd | 9,212,664 | ||||||
| 163,864 | AVI Ltd | 678,429 | ||||||
| 21,519 | Capitec Bank Holdings Ltd | 2,053,004 | ||||||
| 129,850 | Exxaro Resources Ltd | 1,421,248 | ||||||
| 286,591 | FirstRand Ltd | 1,022,202 | ||||||
| 198,098 | Foschini Group Ltd (The) | 1,094,183 | ||||||
| 299,598 | Impala Platinum Holdings Ltd | 2,797,313 | ||||||
| 230,191 | Investec Ltd | 1,472,755 | ||||||
| 342,992 | Kumba Iron Ore Ltd | 8,944,501 | ||||||
| 413,419 | Lewis Group Ltd | 938,362 | ||||||
| 46,942 | Motus Holdings Ltd | 283,165 | ||||||
| 84,272 | Mr Price Group Ltd | 698,875 | ||||||
| 368,345 | Ninety One Ltd | 923,632 | ||||||
| 674,681 | Pepkor Holdings Ltd | 689,127 | ||||||
| 98,900 | Sibanye Stillwater Ltd ADR (a) | 801,090 | ||||||
| 131,868 | SPAR Group Ltd (The) (a) | 1,034,081 | ||||||
| 15,943 | Thungela Resources Ltd | 185,374 | ||||||
| 142,839 | Tiger Brands Ltd | 1,726,504 | ||||||
| 244,704 | Truworths International Ltd | 788,055 | ||||||
|
| |||||||
| Total South Africa | 37,131,638 | |||||||
|
| |||||||
| South Korea — 13.1% | ||||||||
| 22,842 | AMOREPACIFIC Group | 690,872 | ||||||
| 5,910 | BGF retail Co Ltd | 808,334 | ||||||
| 66,262 | BH Co Ltd | 1,182,662 | ||||||
| 106,233 | BNK Financial Group Inc | 537,644 | ||||||
| 3,553 | Caregen Co Ltd | 473,479 | ||||||
| 56,234 | Cheil Worldwide Inc | 850,215 | ||||||
| 11,916 | Coway Co Ltd | 480,761 | ||||||
| 35,014 | Daou Data Corp (a) | 1,283,420 | ||||||
| 33,526 | DB Insurance Co Ltd | 1,951,011 | ||||||
| 8,276 | Dentium Co Ltd * | 755,857 | ||||||
| 492,446 | Dongwon Development Co Ltd | 1,198,940 | ||||||
| 15,690 | Fila Holdings Corp | 462,250 | ||||||
| 15,455 | HAESUNG DS Co Ltd | 468,563 | ||||||
| See accompanying notes to the financial statements. | 22 |
GMO Emerging Markets Fund
(A Series of GMO Trust)
Schedule of Investments — (Continued)
(showing percentage of total net assets)
February 28, 2023
| Shares | Description | Value ($) | ||||||
| South Korea — continued | ||||||||
| 28,258 | Hankook Tire & Technology Co Ltd | 794,885 | ||||||
| 13,006 | HD Hyundai Co Ltd | 584,118 | ||||||
| 111,481 | HDC Hyundai Development Co-Engineering & Construction * (a) | 872,125 | ||||||
| 237,663 | Humasis Co Ltd * | 2,657,167 | ||||||
| 47,351 | Hyundai Marine & Fire Insurance Co Ltd | 1,259,969 | ||||||
| 52,241 | Hyundai Mobis Co Ltd | 8,391,149 | ||||||
| 79,319 | Industrial Bank of Korea | 621,989 | ||||||
| 39,287 | INTOPS Co Ltd | 832,001 | ||||||
| 137,248 | JB Financial Group Co Ltd | 958,360 | ||||||
| 102,134 | Kia Corp | 5,804,287 | ||||||
| 4,621 | KIWOOM Securities Co Ltd * | 360,113 | ||||||
| 390,080 | KT&G Corp (a) | 26,175,924 | ||||||
| 63,425 | Kumho Petrochemical Co Ltd * | 7,541,580 | ||||||
| 10,179 | LOTTE Fine Chemical Co Ltd (a) | 446,388 | ||||||
| 8,432 | LX Semicon Co Ltd | 588,253 | ||||||
| 23,324 | Meritz Financial Group Inc | 792,917 | ||||||
| 156,225 | Meritz Securities Co Ltd | 829,011 | ||||||
| 11,883 | NCSoft Corp | 3,898,966 | ||||||
| 21,937 | Neowiz * | 775,595 | ||||||
| 58,047 | NH Investment & Securities Co Ltd * | 416,654 | ||||||
| 2,203 | NongShim Co Ltd | 609,621 | ||||||
| 17,305 | Orion Corp | 1,635,741 | ||||||
| 449,983 | Samsung Electronics Co Ltd | 20,588,922 | ||||||
| 8,628 | Samsung SDS Co Ltd | 815,995 | ||||||
| 34,333 | Samsung Securities Co Ltd | 868,889 | ||||||
| 5,036 | Samyang Foods Co Ltd | 453,580 | ||||||
| 147,090 | SD Biosensor Inc | 2,554,091 | ||||||
| 89,823 | Seegene Inc | 1,652,959 | ||||||
| 4,240 | Unid Co Ltd | 261,970 | ||||||
| 440,568 | Woori Financial Group Inc | 4,061,586 | ||||||
| 393,848 | Woori Technology Investment Co Ltd * | 1,412,683 | ||||||
| 13,586 | Yuhan Corp | 541,085 | ||||||
|
| |||||||
| Total South Korea | 111,202,581 | |||||||
|
| |||||||
| Sri Lanka — 0.0% | ||||||||
| 103,983,101 | Anilana Hotels & Properties Ltd * (c) (e) | 258,636 | ||||||
|
| |||||||
| Taiwan — 21.5% | ||||||||
| 64,000 | Advantech Co Ltd | 742,402 | ||||||
| 60,000 | Allied Supreme Corp | 686,773 | ||||||
| 231,000 | Asia Cement Corp | 338,678 | ||||||
| 176,000 | ASROCK Inc | 910,986 | ||||||
| 323,689 | Asustek Computer Inc | 2,931,766 | ||||||
| 350,000 | Aten International Co Ltd | 935,156 | ||||||
| 100,200 | Aurora Corp | 264,280 | ||||||
| 2,134,000 | Catcher Technology Co Ltd | 12,895,835 | ||||||
| 78,948 | Chailease Holding Co Ltd | 578,665 | ||||||
| 236,000 | Chicony Electronics Co Ltd | 708,879 | ||||||
| 244,000 | Chipbond Technology Corp | 536,661 | ||||||
| 328,000 | ChipMOS Technologies Inc | 390,368 | ||||||
| 39,000 | Chlitina Holding Ltd | 272,841 | ||||||
| 462,000 | Chong Hong Construction Co Ltd | 1,153,137 | ||||||
| 102,000 | Chroma ATE Inc | 614,206 | ||||||
| Shares | Description | Value ($) | ||||||
| Taiwan — continued | ||||||||
| 941,400 | Coretronic Corp | 1,983,579 | ||||||
| 868,000 | Co-Tech Development Corp | 1,774,784 | ||||||
| 136,000 | Elan Microelectronics Corp | 481,448 | ||||||
| 2,076,200 | Evergreen Marine Corp Taiwan Ltd | 10,609,871 | ||||||
| 234,000 | Far Eastern New Century Corp | 248,761 | ||||||
| 769,000 | Farglory Land Development Co Ltd | 1,486,000 | ||||||
| 65,000 | Feng TAY Enterprise Co Ltd | 391,560 | ||||||
| 653,000 | First Financial Holding Co Ltd | 572,244 | ||||||
| 206,000 | FLEXium Interconnect Inc * | 662,700 | ||||||
| 78,000 | Formosa International Hotels Corp | 798,932 | ||||||
| 716,778 | Foxconn Technology Co Ltd | 1,303,460 | ||||||
| 4,285,489 | Fubon Financial Holding Co Ltd | 8,379,904 | ||||||
| 86,000 | Gourmet Master Co Ltd | 443,784 | ||||||
| 1,608,000 | Grand Pacific Petrochemical | 1,045,394 | ||||||
| 55,000 | Grape King Bio Ltd | 326,700 | ||||||
| 146,000 | Holtek Semiconductor Inc | 353,004 | ||||||
| 204,532 | Hon Hai Precision Industry Co Ltd | 676,592 | ||||||
| 480,000 | Huaku Development Co Ltd | 1,450,264 | ||||||
| 596,000 | Inventec Corp | 517,752 | ||||||
| 37,000 | King Slide Works Co Ltd | 504,601 | ||||||
| 208,000 | Kung Long Batteries Industrial Co Ltd | 954,443 | ||||||
| 229,000 | Largan Precision Co Ltd | 16,462,819 | ||||||
| 1,752,000 | Lite-On Technology Corp | 3,986,727 | ||||||
| 45,000 | Makalot Industrial Co Ltd | 314,943 | ||||||
| 2,596,000 | Micro-Star International Co Ltd | 11,580,952 | ||||||
| 565,000 | Mitac Holdings Corp | 583,733 | ||||||
| 392,000 | Nantex Industry Co Ltd | 556,785 | ||||||
| 1,101,000 | Nanya Technology Corp | 2,095,770 | ||||||
| 27,000 | Nien Made Enterprise Co Ltd | 287,473 | ||||||
| 556,810 | Novatek Microelectronics Corp | 7,358,579 | ||||||
| 715,000 | Phison Electronics Corp | 8,141,563 | ||||||
| 427,000 | Pou Chen Corp | 467,883 | ||||||
| 82,000 | Powertech Technology Inc | 237,109 | ||||||
| 715,000 | Primax Electronics Ltd | 1,389,963 | ||||||
| 670,936 | Radiant Opto-Electronics Corp | 2,316,207 | ||||||
| 84,000 | Raydium Semiconductor Corp | 1,125,884 | ||||||
| 320,488 | Shanghai Commercial & Savings Bank Ltd (The) | 497,510 | ||||||
| 406,000 | Shinkong Insurance Co Ltd | 671,198 | ||||||
| 210,468 | Simplo Technology Co Ltd | 2,033,176 | ||||||
| 33,000 | Sinbon Electronics Co Ltd | 321,269 | ||||||
| 40,000 | Sporton International Inc | 347,771 | ||||||
| 685,250 | Syncmold Enterprise Corp | 1,381,593 | ||||||
| 120,000 | Synnex Technology International Corp | 244,848 | ||||||
| 192,000 | T3EX Global Holdings Corp | 434,688 | ||||||
| 88,024 | Tah Hsin Industrial Corp | 207,193 | ||||||
| 108,000 | TaiDoc Technology Corp | 670,625 | ||||||
| 110,000 | Taiwan Hon Chuan Enterprise Co Ltd | 347,454 | ||||||
| 1,125,000 | Taiwan Semiconductor Manufacturing Co Ltd | 18,611,879 | ||||||
| 56,730 | Taiwan Semiconductor Manufacturing Co Ltd Sponsored ADR | 4,939,481 | ||||||
| 558,000 | Taiwan Union Technology Corp | 1,071,076 | ||||||
| 116,000 | TCI Co Ltd | 803,348 | ||||||
| 23 | See accompanying notes to the financial statements. |
GMO Emerging Markets Fund
(A Series of GMO Trust)
Schedule of Investments — (Continued)
(showing percentage of total net assets)
February 28, 2023
| Shares | Description | Value ($) | ||||||
| Taiwan — continued | ||||||||
| 69,000 | Topkey Corp | 498,268 | ||||||
| 636,000 | Transcend Information Inc | 1,461,592 | ||||||
| 424,160 | Tripod Technology Corp | 1,452,657 | ||||||
| 115,000 | TTY Biopharm Co Ltd | 295,256 | ||||||
| 115,000 | TXC Corp | 323,974 | ||||||
| 335,224 | United Integrated Services Co Ltd | 2,471,396 | ||||||
| 585,000 | Universal Inc | 460,466 | ||||||
| 98,000 | Walsin Technology Corp | 319,690 | ||||||
| 2,735,750 | Wan Hai Lines Ltd | 7,080,182 | ||||||
| 261,000 | Wistron Corp | 282,788 | ||||||
| 8,302,000 | Yang Ming Marine Transport Corp | 17,473,793 | ||||||
| 78,000 | Yulon Nissan Motor Co Ltd | 520,777 | ||||||
| 234,725 | Zeng Hsing Industrial Co Ltd | 939,828 | ||||||
|
| |||||||
| Total Taiwan | 181,996,576 | |||||||
|
| |||||||
| Thailand — 0.5% | ||||||||
| 345,700 | CP ALL Pcl (Foreign Registered) | 606,320 | ||||||
| 185,900 | Kasikornbank Pcl (Foreign Registered) | 720,454 | ||||||
| 2,630,100 | Pruksa Holding Pcl (Foreign Registered) | 1,004,545 | ||||||
| 546,200 | Regional Container Lines Pcl | 482,736 | ||||||
| 1,387,200 | Sri Trang Gloves Thailand Pcl (Foreign Registered) | 435,514 | ||||||
| 259,300 | Tisco Financial Group Pcl | 755,583 | ||||||
|
| |||||||
| Total Thailand | 4,005,152 | |||||||
|
| |||||||
| Turkey — 0.0% | ||||||||
| 79,882 | Is Yatirim Menkul Degerler AS | 211,277 | ||||||
| 14,453 | Mavi Giyim Sanayi Ve Ticaret AS – Class B | 80,037 | ||||||
| 137,201 | Vestel Beyaz Esya Sanayi ve Ticaret AS | 89,625 | ||||||
|
| |||||||
| Total Turkey | 380,939 | |||||||
|
| |||||||
| United Kingdom — 1.3% | ||||||||
| 226,263 | Unilever Plc | 11,265,064 | ||||||
|
| |||||||
| Vietnam — 3.0% | ||||||||
| 2,406,500 | Duc Giang Chemicals JSC | 5,072,749 | ||||||
| 205,500 | PetroVietnam Fertilizer & Chemicals JSC | 302,624 | ||||||
| 753,900 | PetroVietnam Technical Services Corp | 821,415 | ||||||
| 173,000 | Pha Lai Thermal Power JSC | 107,785 | ||||||
| 2,813,800 | SSI Securities Corp | 2,161,392 | ||||||
| 1,780,300 | Vietnam Dairy Products JSC | 5,658,082 | ||||||
| 1,898,900 | Vietnam Joint Stock Commercial Bank for Industry and Trade * | 2,189,437 | ||||||
| 15,882,100 | VNDirect Securities Corp | 8,990,840 | ||||||
|
| |||||||
| Total Vietnam | 25,304,324 | |||||||
|
| |||||||
TOTAL COMMON STOCKS (COST $1,269,183,912) | 773,451,116 | |||||||
|
| |||||||
| Shares / Par Value† | Description | Value ($) | ||||||
| PREFERRED STOCKS (f) — 6.8% | ||||||||
| Brazil — 4.2% | ||||||||
| 274,500 | Banco do Estado do Rio Grande do Sul SA – Class B | 523,786 | ||||||
| 1,099,200 | Gerdau SA | 6,010,963 | ||||||
| 781,200 | Gerdau SA Sponsored ADR | 4,273,164 | ||||||
| 1,238,400 | Itausa SA | 1,946,735 | ||||||
| 964,600 | Metalurgica Gerdau SA | 2,317,789 | ||||||
| 4,074,643 | Petroleo Brasileiro SA | 19,643,772 | ||||||
| 52,800 | Unipar Carbocloro SA – Class B | 799,647 | ||||||
|
| |||||||
| Total Brazil | 35,515,856 | |||||||
|
| |||||||
| Russia — 0.1% | ||||||||
| 194,570 | Nizhnekamskneftekhim PJSC (b) | 2,216 | ||||||
| 79,676,700 | Surgutneftegas PJSC (b) | 295,456 | ||||||
| 869 | Transneft PJSC (b) | 10,595 | ||||||
|
| |||||||
| Total Russia | 308,267 | |||||||
|
| |||||||
| South Korea — 2.4% | ||||||||
| 508,242 | Samsung Electronics Co Ltd | 20,494,366 | ||||||
|
| |||||||
| Taiwan — 0.1% | ||||||||
| 256,798 | Chailease Holding Co Ltd | 838,900 | ||||||
|
| |||||||
TOTAL PREFERRED STOCKS (COST $105,453,783) | 57,157,389 | |||||||
|
| |||||||
| DEBT OBLIGATIONS — 0.3% | ||||||||
| United States — 0.3% | ||||||||
| 2,800,000 | U.S. Treasury Note, Variable Rate, USBM + 0.03%, 4.84%, due 04/30/23 (g) | 2,800,624 | ||||||
|
| |||||||
TOTAL DEBT OBLIGATIONS (COST $2,800,953) | 2,800,624 | |||||||
|
| |||||||
| MUTUAL FUNDS — 1.8% | ||||||||
| United States — 1.8% | ||||||||
| Affiliated Issuers — 1.8% | ||||||||
| 3,075,349 | GMO U.S. Treasury Fund | 15,345,992 | ||||||
|
| |||||||
| Total United States | 15,345,992 | |||||||
|
| |||||||
TOTAL MUTUAL FUNDS (COST $15,345,992) | 15,345,992 | |||||||
|
| |||||||
| See accompanying notes to the financial statements. | 24 |
GMO Emerging Markets Fund
(A Series of GMO Trust)
Schedule of Investments — (Continued)
(showing percentage of total net assets)
February 28, 2023
| Shares | Description | Value ($) | ||||||
| SHORT-TERM INVESTMENTS — 0.4% |
| |||||||
| Money Market Funds — 0.4% | ||||||||
| 3,659,489 | State Street Institutional Treasury Money Market Fund – Premier Class, 4.42% (h) | 3,659,489 | ||||||
|
| |||||||
TOTAL SHORT-TERM INVESTMENTS (COST $3,659,489) | 3,659,489 | |||||||
|
| |||||||
TOTAL INVESTMENTS — 100.5% (Cost $1,396,444,129) | 852,414,610 | |||||||
| Other Assets and Liabilities (net) — (0.5)% | (4,607,809 | ) | ||||||
|
| |||||||
| TOTAL NET ASSETS — 100.0% | $ | 847,806,801 | ||||||
|
| |||||||
Additional information on each restricted security is as follows:
Issuer | Acquisition Date | Acquisition Cost | Value as a Percentage of Fund’s Net Assets | Value as of February 28, 2023 | ||||||||||||
Alrosa PJSC | 09/14/17 | $ | 46,779,239 | 0.0 | % | $ | 255,595 | |||||||||
Issuer | Acquisition Date | Acquisition Cost | Value as a Percentage of Fund’s Net Assets | Value as of February 28, 2023 | ||||||||||||
Magnitogorsk Iron & Steel Works PJSC | 03/26/18 | $ | 14,388,116 | 0.0 | % | $ | 91,335 | |||||||||
PhosAgro PJSC GDR | 02/09/22 | 5,151 | 0.0 | % | 69 | |||||||||||
Sberbank of Russia PJSC | 11/10/17 | 51,393,929 | 0.0 | % | 297,141 | |||||||||||
Severstal PJSC GDR (Registered) | 10/12/17 | 13,249,420 | 0.0 | % | 99,850 | |||||||||||
|
| |||||||||||||||
| $ | 743,990 | |||||||||||||||
|
| |||||||||||||||
A summary of outstanding financial instruments at February 28, 2023 is as follows:
Futures Contracts
Number of | Type | Expiration Date | Notional Amount ($) | Value/Net Unrealized Appreciation (Depreciation) ($) | ||||||||||
| Buys | ||||||||||||||
| 1,253 | Mini MSCI Emerging Markets | March 2023 | $ | 60,325,685 | $ | (1,021,894 | ) | |||||||
|
|
|
| |||||||||||
| + | Buys - Fund is long the futures contract. |
Sales - Fund is short the futures contract.
As of February 28, 2023, for the above contracts and/or agreements, the Fund had sufficient cash and/or securities to cover commitments or collateral requirements, if any, of the relevant broker or exchange.
Notes to Schedule of Investments:
| † | Denominated in U.S. Dollar, unless otherwise indicated. |
| * | Non-income producing security. |
| (a) | All or a portion of this security is out on loan (Note 2). |
| (b) | Investment valued at fair value using methods determined in good faith by the Trustees of GMO Trust or persons acting at their direction pursuant to procedures approved by the Trustees. Investment valued using significant unobservable inputs (Note 2). |
| (c) | Investment valued using significant unobservable inputs (Note 2). |
| (d) | The security is restricted as to resale. |
| (e) | Affiliated company (Note 10). |
| (f) | Preferred dividend rates are disclosed to the extent that a stated rate exists. |
| (g) | All or a portion of this security has been pledged to cover margin requirements on futures and/or cleared swap contracts, collateral on OTC swap contracts, forward currency contracts, and/or written options, if any (Note 4). |
| (h) | The rate disclosed is the 7 day net yield as of February 28, 2023. |
For a listing of definitions of acronyms, counterparty abbreviations and currency abbreviations used throughout the Schedule of Investments as well as the derivative tables, if any, please refer to page 106.
| 25 | See accompanying notes to the financial statements. |
This page has been left blank intentionally.
GMO Emerging Markets Select Equity Fund (formerly GMO Emerging Domestic Opportunities Fund)
(A Series of GMO Trust)
Portfolio Management
Day-to-day management of the Fund’s portfolio is the responsibility of the Emerging Markets Equity team at Grantham, Mayo, Van Otterloo & Co. LLC and GMO Singapore Pte. Limited.
Management Discussion and Analysis of Fund Performance
Class II shares of GMO Emerging Markets Select Equity Fund returned -15.97% (net) for the fiscal year ended February 28, 2023, as compared with -15.28% for the MSCI Emerging Markets Index.
Country-sector allocation contributed to the Fund’s relative returns for the fiscal year. The Fund’s overweight position in Mexico Financials and overweight position in Taiwan Information Technology helped relative performance.
Stock selection detracted from the Fund’s relative returns for the fiscal year. The Fund’s stock selection in China Consumer Discretionary and India Financials hurt relative performance.
The views expressed herein are exclusively those of Grantham, Mayo, Van Otterloo & Co. LLC as of the date of this report and are subject to change. GMO disclaims any responsibility to update such views. They are not meant as investment advice. References to specific securities are not recommendations of such securities and may not be representative of any GMO portfolio’s current or future investments. All information is unaudited.
| 27 |
GMO Emerging Markets Select Equity Fund (formerly GMO Emerging Domestic Opportunities Fund)
(A Series of GMO Trust)
Comparison of Change in Value of a $5,000,000 Investment in
GMO Emerging Markets Select Equity Fund (formerly GMO Emerging Domestic Opportunities Fund)
Class II Shares and the MSCI Emerging Markets Index
As of February 28, 2023
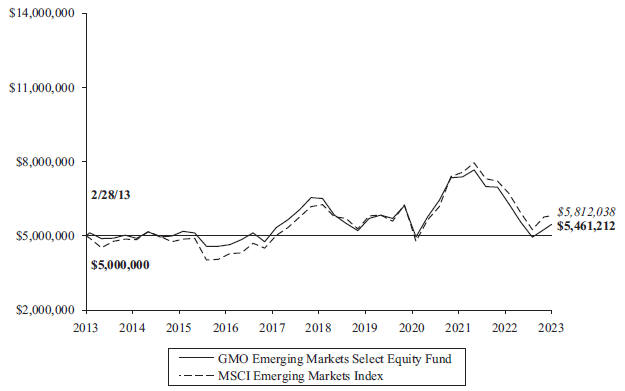
| Average Annual Total Returns | ||||||||
| 1 Year | 5 Year | 10 Year | Since Inception | |||||
| Class II | -15.97% | -3.82% | 0.89% | n/a | ||||
| Class V* | -15.90% | -3.70% | 1.01% | n/a | ||||
| Class I | -16.04% | n/a | n/a | 1/22/21-16.15% | ||||
Performance data quoted represents past performance and is not indicative of future results. The investment return and principal value of an investment will fluctuate so that an investor’s shares, when redeemed, may be worth more or less than their original cost. Current performance data may be lower or higher than the performance data provided herein. To obtain performance information up to the most recent month-end, visit www.gmo.com. Performance shown is net of all fees after reimbursement from GMO. Returns would have been lower had certain expenses not been reimbursed during the periods shown and do not include the effect of taxes on distributions and redemptions. The performance information shown above only includes purchase premiums and/or redemption fees in effect as of February 28, 2023. All information is unaudited. Performance for classes may vary due to different fees.
| * | For the period from October 27, 2011 to November 29, 2013, no Class V shares were outstanding. Performance for that period is that of Class II, which has higher expenses. Therefore, the performance shown is lower than it would have been if Class V expenses had been applied throughout. |
MSCI data may not be reproduced or used for any other purpose. MSCI provides no warranties, has not prepared or approved this report, and has no liability hereunder.
For Class II, V and I the gross expense ratio of 0.94%, 0.80% and 1.04%, respectively, is equal to the Fund’s Total Annual Operating Expenses set forth in the Fund’s most recent supplement to the prospectus dated October 26, 2022. For the Classes listed above, the corresponding net expense ratio of 0.81%, 0.70% and 0.91% reflects the reduction of expenses from fee reimbursements. The fee reimbursements will continue until at least October 26, 2023. Elimination of this reimbursement will result in higher fees and lower performance.
| 28 |
GMO Emerging Markets Select Equity Fund (formerly GMO Emerging Domestic Opportunities Fund)
(A Series of GMO Trust)
Investment Concentration Summary
February 28, 2023 (Unaudited)
Asset Class Summary& | % of Total Net Assets | |||
Common Stocks | 94.2 | % | ||
Short-Term Investments | 1.0 | |||
Mutual Funds | 0.6 | |||
Preferred Stocks | 0.4 | |||
Investment Funds | 0.0 | ^ | ||
Other | 3.8 | |||
|
| |||
| 100.0 | % | |||
|
| |||
Country/Region Summary¤ | % of Investments | |||
China | 30.7 | % | ||
Taiwan | 17.7 | |||
India | 17.0 | |||
South Korea | 6.3 | |||
Indonesia | 6.2 | |||
Mexico | 6.0 | |||
Thailand | 2.6 | |||
Vietnam | 2.5 | |||
Brazil | 2.4 | |||
United States | 2.3 | |||
United Kingdom | 1.6 | |||
Switzerland | 1.1 | |||
Hong Kong | 1.0 | |||
France | 1.0 | |||
Japan | 0.7 | |||
South Africa | 0.5 | |||
Philippines | 0.3 | |||
Russia | 0.1 | |||
|
| |||
| 100.0 | % | |||
|
| |||
Industry Group Summary | % of Equity Investments# | |||
Banks | 15.2 | % | ||
Semiconductors & Semiconductor Equipment | 13.1 | |||
Technology Hardware & Equipment | 11.9 | |||
Food, Beverage & Tobacco | 9.5 | |||
Retailing | 8.1 | |||
Household & Personal Products | 5.1 | |||
Capital Goods | 5.1 | |||
Media & Entertainment | 4.0 | |||
Consumer Services | 3.8 | |||
Consumer Durables & Apparel | 3.7 | |||
Automobiles & Components | 2.8 | |||
Food & Staples Retailing | 2.6 | |||
Transportation | 2.5 | |||
Software & Services | 2.5 | |||
Insurance | 2.4 | |||
Telecommunication Services | 2.0 | |||
Diversified Financials | 1.8 | |||
Pharmaceuticals, Biotechnology & Life Sciences | 1.5 | |||
Materials | 1.4 | |||
Real Estate | 0.7 | |||
Utilities | 0.3 | |||
|
| |||
| 100.0 | % | |||
|
| |||
| & | In the table, derivative financial instruments, if any, are based on market values, rather than the notional amounts of derivatives, except for forward currency contracts which are based on unrealized appreciation/(depreciation). |
| ¤ | The table shows country exposure in the Fund. The table excludes short-term investments. The table excludes exposure through forward currency contracts and includes exposure through other derivative financial instruments, if any. The table takes into account the market value of securities and options and the notional amounts of swap contracts and other derivative financial instruments, if any. |
| # | Equity investments may consist of common stocks and other stock-related securities, such as preferred stocks, if any. This table excludes exposure to derivative contracts, short-term investments, mutual funds and investment funds, if any. For a summary of these exposures, if any, see the Schedule of Investments. |
| ^ | Rounds to 0.0%. |
| 29 |
GMO Emerging Markets Select Equity Fund (formerly GMO Emerging Domestic Opportunities Fund)
(A Series of GMO Trust)
(showing percentage of total net assets)
February 28, 2023
| Shares | Description | Value ($) | ||||||
| COMMON STOCKS — 94.2% | ||||||||
| Brazil — 1.9% | ||||||||
| 122,100 | Ambev SA | 312,279 | ||||||
| 157,000 | B3 SA - Brasil Bolsa Balcao | 316,372 | ||||||
| 126 | Localiza Rent a Car SA * (a) | 1,335 | ||||||
| 28,912 | Localiza Rent a Car SA (a) | 306,435 | ||||||
| 561 | MercadoLibre Inc * | 684,420 | ||||||
| 80,600 | Raia Drogasil SA | 349,160 | ||||||
| 54,700 | WEG SA | 409,144 | ||||||
|
| |||||||
| Total Brazil | 2,379,145 | |||||||
|
| |||||||
| China — 29.2% | ||||||||
| 451,888 | Alibaba Group Holding Ltd * | 4,966,901 | ||||||
| 34,450 | Baidu Inc – Class A * | 592,310 | ||||||
| 19,000 | BYD Co Ltd – Class H | 510,800 | ||||||
| 13,100 | Changzhou Xingyu Automotive Lighting Systems Co Ltd – Class A | 284,811 | ||||||
| 712,000 | China International Capital Corp Ltd – Class H | 1,532,989 | ||||||
| 159,000 | China Mengniu Dairy Co Ltd * | 699,866 | ||||||
| 290,502 | China Merchants Bank Co Ltd – Class H | 1,576,409 | ||||||
| 188,000 | China Resources Land Ltd | 835,334 | ||||||
| 114,000 | China Yangtze Power Co Ltd – Class A | 347,744 | ||||||
| 10,400 | Contemporary Amperex Technology Co Ltd – Class A | 603,467 | ||||||
| 20,115 | H World Group Ltd ADR | 952,848 | ||||||
| 358,855 | Haier Smart Home Co Ltd – Class A | 1,361,178 | ||||||
| 97,176 | Jiangsu Hengli Hydraulic Co Ltd – Class A | 965,061 | ||||||
| 58,900 | Kuaishou Technology * | 394,716 | ||||||
| 12,886 | Kweichow Moutai Co Ltd – Class A | 3,371,190 | ||||||
| 61,658 | Meituan – Class B * | 1,070,070 | ||||||
| 69,598 | Montage Technology Co Ltd – Class A | 578,996 | ||||||
| 184,285 | NARI Technology Co Ltd – Class A | 697,258 | ||||||
| 85,500 | Ping An Insurance Group Co of China Ltd – Class H | 583,669 | ||||||
| 62,172 | Proya Cosmetics Co Ltd – Class A | 1,635,037 | ||||||
| 114,900 | SF Holding Co Ltd – Class A | 891,122 | ||||||
| 42,458 | Shanghai Baosight Software Co Ltd – Class A | 302,764 | ||||||
| 102,372 | Shenzhen Inovance Technology Co Ltd – Class A | 1,080,088 | ||||||
| 22,800 | Sunny Optical Technology Group Co Ltd | 259,278 | ||||||
| 78,184 | Tencent Holdings Ltd | 3,434,497 | ||||||
| 24,248 | Trip.com Group Ltd ADR* | 862,016 | ||||||
| 156,000 | Tsingtao Brewery Co Ltd – Class H | 1,539,685 | ||||||
| 87,585 | Wuliangye Yibin Co Ltd – Class A | 2,574,106 | ||||||
| 71,000 | Wuxi Lead Intelligent Equipment Co Ltd – Class A | 443,709 | ||||||
| 32,030 | Yum China Holdings Inc | 1,881,122 | ||||||
|
| |||||||
| Total China | 36,829,041 | |||||||
|
| |||||||
| France — 1.0% | ||||||||
| 3,148 | L’Oreal SA * (b) | 1,244,319 | ||||||
|
| |||||||
| Shares | Description | Value ($) | ||||||
| Hong Kong — 1.0% | ||||||||
| 118,800 | AIA Group Ltd | 1,262,608 | ||||||
|
| |||||||
| India — 16.2% | ||||||||
| 28,202 | Asian Paints Ltd | 965,349 | ||||||
| 57,159 | Axis Bank Ltd | 583,579 | ||||||
| 23,116 | Bajaj Auto Ltd | 1,019,578 | ||||||
| 158,703 | Campus Activewear Ltd * | 776,988 | ||||||
| 52,030 | Cipla Ltd | 569,670 | ||||||
| 31,730 | Cyient Ltd | 362,460 | ||||||
| 114,593 | Dabur India Ltd | 738,910 | ||||||
| 124,386 | Godrej Consumer Products Ltd * | 1,389,870 | ||||||
| 101,672 | HDFC Bank Ltd | 1,970,557 | ||||||
| 178,092 | ICICI Bank Ltd | 1,840,660 | ||||||
| 227,741 | Indian Hotels Co Ltd | 853,763 | ||||||
| 129,484 | Infosys Ltd | 2,329,735 | ||||||
| 26,987 | JB Chemicals & Pharmaceuticals Ltd | 636,240 | ||||||
| 39,469 | Kajaria Ceramics Ltd | 510,448 | ||||||
| 85,598 | LA Opala RG Ltd | 373,616 | ||||||
| 64,673 | Laxmi Organic Industries Ltd | 204,734 | ||||||
| 6,681 | Maruti Suzuki India Ltd | 698,662 | ||||||
| 94,753 | Metro Brands Ltd | 937,727 | ||||||
| 30,790 | SBI Cards & Payment Services Ltd | 279,477 | ||||||
| 77,283 | SBI Life Insurance Co Ltd | 1,042,613 | ||||||
| 20,429 | SRF Ltd | 534,952 | ||||||
| 47,632 | Sun Pharmaceutical Industries Ltd | 551,893 | ||||||
| 66,186 | Sundram Fasteners Ltd | 785,010 | ||||||
| 15,138 | Titan Co Ltd | 433,667 | ||||||
|
| |||||||
| Total India | 20,390,158 | |||||||
|
| |||||||
| Indonesia — 5.9% | ||||||||
| 3,359,300 | Bank Central Asia Tbk PT | 1,926,688 | ||||||
| 3,058,000 | Bank Mandiri Persero Tbk PT | 2,004,672 | ||||||
| 2,217,100 | Cisarua Mountain Dairy Tbk PT | 646,995 | ||||||
| 13,421,100 | Mitra Adiperkasa Tbk PT * | 1,328,916 | ||||||
| 5,944,400 | Telkom Indonesia Persero Tbk PT | 1,514,252 | ||||||
|
| |||||||
| Total Indonesia | 7,421,523 | |||||||
|
| |||||||
| Japan — 0.6% | ||||||||
| 4,700 | Daikin Industries Ltd | 803,675 | ||||||
|
| |||||||
| Mexico — 5.7% | ||||||||
| 402,623 | Banco del Bajio SA | 1,538,402 | ||||||
| 64,638 | Grupo Aeroportuario del Pacifico SAB de CV – Class B | 1,226,202 | ||||||
| 204,498 | Regional SAB de CV | 1,696,652 | ||||||
| 703,711 | Wal-Mart de Mexico SAB de CV | 2,773,075 | ||||||
|
| |||||||
| Total Mexico | 7,234,331 | |||||||
|
| |||||||
| Philippines — 0.3% | ||||||||
| 174,820 | Bank of the Philippine Islands | 346,651 | ||||||
|
| |||||||
| Russia — 0.1% | ||||||||
| 34,988 | Magnit PJSC * (c) | 21,342 | ||||||
| 546,960 | Mobile TeleSystems PJSC (c) | 18,945 | ||||||
| See accompanying notes to the financial statements. | 30 |
GMO Emerging Markets Select Equity Fund (formerly GMO Emerging Domestic Opportunities Fund)
(A Series of GMO Trust)
Schedule of Investments — (Continued)
(showing percentage of total net assets)
February 28, 2023
| Shares | Description | Value ($) | ||||||
| Russia — continued | ||||||||
| 530,016 | Sberbank of Russia PJSC * (c) (d) | 11,999 | ||||||
| 46,548 | TCS Group Holding Plc GDR (Registered) * (c) | 18,477 | ||||||
| 69,200 | Yandex NV – Class A * (c) | 13,107 | ||||||
|
| |||||||
| Total Russia | 83,870 | |||||||
|
| |||||||
| South Africa — 0.5% | ||||||||
| 56,996 | Absa Group Ltd | 615,363 | ||||||
|
| |||||||
| South Korea — 6.0% | ||||||||
| 1,321 | LG Energy Solution Ltd * | 521,812 | ||||||
| 2,037 | NAVER Corp | 320,220 | ||||||
| 142,811 | Samsung Electronics Co Ltd | 6,534,301 | ||||||
| 2,977 | SK Hynix Inc | 201,200 | ||||||
|
| |||||||
| Total South Korea | 7,577,533 | |||||||
|
| |||||||
| Switzerland — 1.0% | ||||||||
| 11,612 | Nestle SA (Registered) | 1,308,331 | ||||||
|
| |||||||
| Taiwan — 16.9% | ||||||||
| 271,000 | Delta Electronics Inc | 2,535,400 | ||||||
| 321,000 | E Ink Holdings Inc | 2,031,261 | ||||||
| 31,000 | eMemory Technology Inc | 1,863,075 | ||||||
| 58,000 | MediaTek Inc | 1,361,783 | ||||||
| 189,000 | Sinbon Electronics Co Ltd | 1,839,992 | ||||||
| 705,800 | Taiwan Semiconductor Manufacturing Co Ltd | 11,676,679 | ||||||
|
| |||||||
| Total Taiwan | 21,308,190 | |||||||
|
| |||||||
| Thailand — 2.4% | ||||||||
| 144,200 | Advanced Info Service Pcl (Foreign Registered) | 823,999 | ||||||
| 298,600 | Airports of Thailand Pcl (Foreign Registered) * | 614,512 | ||||||
| 201,700 | Bangkok Bank Pcl (Foreign Registered) | 932,938 | ||||||
| 568,600 | Central Retail Corp Pcl (Foreign Registered) | 719,451 | ||||||
|
| |||||||
| Total Thailand | 3,090,900 | |||||||
|
| |||||||
| United Kingdom — 1.6% | ||||||||
| 20,907 | Diageo Plc | 887,218 | ||||||
| 22,066 | Unilever Plc | 1,098,611 | ||||||
|
| |||||||
| Total United Kingdom | 1,985,829 | |||||||
|
| |||||||
| United States — 1.6% | ||||||||
| 6,438 | Apple, Inc. | 949,026 | ||||||
| 376,200 | Samsonite International SA * | 1,055,777 | ||||||
|
| |||||||
| Total United States | 2,004,803 | |||||||
|
| |||||||
| Vietnam — 2.3% | ||||||||
| 644,300 | Bank for Foreign Trade of Vietnam JSC * | 2,535,156 | ||||||
| Shares | Description | Value ($) | ||||||
| Vietnam — continued | ||||||||
| 134,133 | Phu Nhuan Jewelry JSC | 433,968 | ||||||
|
| |||||||
| Total Vietnam | 2,969,124 | |||||||
|
| |||||||
TOTAL COMMON STOCKS (COST $148,385,220) | 118,855,394 | |||||||
|
| |||||||
| PREFERRED STOCKS (e) — 0.4% | ||||||||
| Brazil — 0.4% | ||||||||
| 108,900 | Itau Unibanco Holding SA | 528,957 | ||||||
|
| |||||||
TOTAL PREFERRED STOCKS (COST $524,415) | 528,957 | |||||||
|
| |||||||
| INVESTMENT FUNDS — 0.0% | ||||||||
| Russia — 0.0% | ||||||||
| 61,600 | VanEck Russia ETF (c) | 9,610 | ||||||
|
| |||||||
TOTAL INVESTMENT FUNDS (COST $1,563,306) | 9,610 | |||||||
|
| |||||||
| MUTUAL FUNDS — 0.6% | ||||||||
| United States — 0.6% | ||||||||
| Affiliated Issuers — 0.6% | ||||||||
| 142,775 | GMO U.S. Treasury Fund | 712,446 | ||||||
|
| |||||||
| Total United States | 712,446 | |||||||
|
| |||||||
TOTAL MUTUAL FUNDS (COST $712,446) | 712,446 | |||||||
|
| |||||||
| 31 | See accompanying notes to the financial statements. |
GMO Emerging Markets Select Equity Fund (formerly GMO Emerging Domestic Opportunities Fund)
(A Series of GMO Trust)
Schedule of Investments — (Continued)
(showing percentage of total net assets)
February 28, 2023
| Shares | Description | Value ($) | ||||||
| SHORT-TERM INVESTMENTS — 1.0% |
| |||||||
| Money Market Funds — 1.0% | ||||||||
| 1,241,862 | State Street Institutional Treasury Money Market Fund – Premier Class, 4.42% (f) | 1,241,862 | ||||||
|
| |||||||
TOTAL SHORT-TERM INVESTMENTS (COST $1,241,862) | 1,241,862 | |||||||
|
| |||||||
TOTAL INVESTMENTS — 96.2% (Cost $152,427,249) | 121,348,269 | |||||||
| Other Assets and Liabilities (net) — 3.8% | 4,839,858 | |||||||
|
| |||||||
| TOTAL NET ASSETS — 100.0% | $ | 126,188,127 | ||||||
|
| |||||||
Additional information on each restricted security is as follows:
Issuer Description | Acquisition Date | Acquisition Cost | Value as a Percentage of Fund’s Net Assets | Value as of February 28, 2023 | ||||||||||||
Sberbank of Russia PJSC | 03/03/21 | $ | 2,059,161 | 0.0 | % | $ | 11,999 | |||||||||
|
| |||||||||||||||
Notes to Schedule of Investments:
| * | Non-income producing security. |
| (a) | Securities are traded on separate exchanges for the same entity. |
| (b) | Investment valued using significant unobservable inputs (Note 2). |
| (c) | Investment valued at fair value using methods determined in good faith by the Trustees of GMO Trust or persons acting at their direction pursuant to procedures approved by the Trustees. Investment valued using significant unobservable inputs (Note 2). |
| (d) | The security is restricted as to resale. |
| (e) | Preferred dividend rates are disclosed to the extent that a stated rate exists. |
| (f) | The rate disclosed is the 7 day net yield as of February 28, 2023. |
For a listing of definitions of acronyms, counterparty abbreviations and currency abbreviations used throughout the Schedule of Investments as well as the derivative tables, if any, please refer to page 106.
| See accompanying notes to the financial statements. | 32 |
(A Series of GMO Trust)
Portfolio Management
Day-to-day management of the Fund’s portfolio is the responsibility of the Systematic Equity team at Grantham, Mayo, Van Otterloo & Co. LLC.
Management Discussion and Analysis of Fund Performance
Although the Fund is not managed relative to any securities market index or benchmark, a discussion of the Fund’s performance relative to the MSCI EAFE Index is included for comparative purposes.
Class II shares of GMO International Equity Fund returned -1.93% (net) for the fiscal year ended February 28, 2023, as compared with -3.14% for the MSCI EAFE Index.
Stock selection drove outperformance for the period with notable contributions from Japan, Singapore, Consumer Staples, Industrials, and Spanish Financials.
Decisions which detracted from performance included stock selection in the United Kingdom, Health Care, and Consumer Discretionary. Aggregate country and sector allocation decisions were also modest detractors.
The views expressed herein are exclusively those of Grantham, Mayo, Van Otterloo & Co. LLC as of the date of this report and are subject to change. GMO disclaims any responsibility to update such views. They are not meant as investment advice. References to specific securities are not recommendations of such securities and may not be representative of any GMO portfolio’s current or future investments. All information is unaudited.
| 33 |
GMO International Equity Fund
(A Series of GMO Trust)
Comparison of Change in Value of a $5,000,000 Investment in
GMO International Equity Fund Class II Shares and the MSCI EAFE Index
As of February 28, 2023
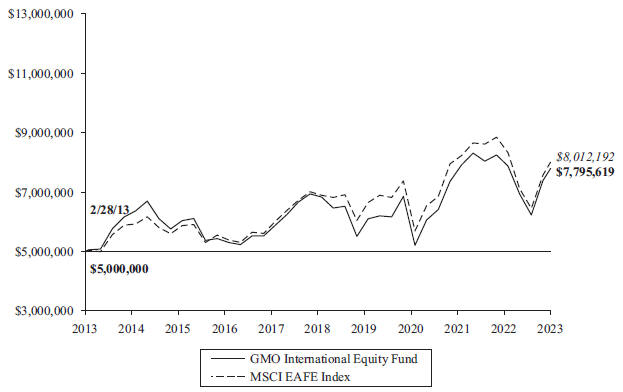
| Average Annual Total Returns | ||||||||
| 1 Year | 5 Year | 10 Year | Since Inception | |||||
| Class II | -1.93% | 2.38% | 4.54% | n/a | ||||
| Class III | -1.87% | 2.45% | 4.61% | n/a | ||||
| Class IV | -1.82% | 2.52% | 4.68% | n/a | ||||
| Class I | -2.03% | n/a | n/a | 5/24/21 -4.71% | ||||
Performance data quoted represents past performance and is not indicative of future results. The investment return and principal value of an investment will fluctuate so that an investor’s shares, when redeemed, may be worth more or less than their original cost. Current performance data may be lower or higher than the performance data provided herein. To obtain performance information up to the most recent month-end, visit www.gmo.com. Performance shown is net of all fees after reimbursement from GMO. Returns would have been lower had certain expenses not been reimbursed during the periods shown and do not include the effect of taxes on distributions and redemptions. The performance information shown above only includes purchase premiums and/or redemption fees in effect as of February 28, 2023. All information is unaudited. Performance for classes may vary due to different fees.
MSCI data may not be reproduced or used for any other purpose. MSCI provides no warranties, has not prepared or approved this report, and has no liability hereunder.
For Class II, III, IV and I the gross expense ratio of 0.77%, 0.70%, 0.64% and 0.92%, respectively, is equal to the Fund’s Total Annual Operating Expenses set forth in the Fund’s most recent prospectus dated June 30, 2022. For the Classes listed above, the corresponding net expense ratio of 0.75%, 0.68%, 0.62% and 0.90% reflects the reduction of expenses from fee reimbursements. The fee reimbursements will continue until at least June 30, 2023. Elimination of this reimbursement will result in higher fees and lower performance.
| 34 |
GMO International Equity Fund
(A Series of GMO Trust)
Investment Concentration Summary
February 28, 2023 (Unaudited)
Asset Class Summary& | % of Total Net Assets | |||
Common Stocks | 97.1 | % | ||
Mutual Funds | 5.6 | |||
Preferred Stocks | 0.9 | |||
Debt Obligations | 0.3 | |||
Short-Term Investments | 0.0 | ^ | ||
Futures Contracts | (0.0 | )^ | ||
Other | (3.9 | ) | ||
|
| |||
| 100.0 | % | |||
|
| |||
Country/Region Summary¤ | % of Investments | |||
Japan | 22.8 | % | ||
United Kingdom | 14.5 | |||
France | 14.3 | |||
Netherlands | 7.0 | |||
United States | 7.0 | |||
Spain | 6.3 | |||
Switzerland | 5.5 | |||
Germany | 4.4 | |||
Singapore | 4.4 | |||
Australia | 3.8 | |||
Other Developed | 2.7 | ‡ | ||
Norway | 2.3 | |||
Finland | 1.8 | |||
Hong Kong | 1.7 | |||
Italy | 1.5 | |||
|
| |||
| 100.0 | % | |||
|
| |||
Industry Group Summary | % of Equity Investments# | |||
Capital Goods | 15.0 | % | ||
Banks | 10.3 | |||
Pharmaceuticals, Biotechnology & Life Sciences | 9.7 | |||
Food, Beverage & Tobacco | 9.2 | |||
Energy | 7.9 | |||
Consumer Durables & Apparel | 6.8 | |||
Materials | 6.3 | |||
Diversified Financials | 4.9 | |||
Technology Hardware & Equipment | 4.8 | |||
Telecommunication Services | 4.3 | |||
Commercial & Professional Services | 3.6 | |||
Food & Staples Retailing | 3.4 | |||
Semiconductors & Semiconductor Equipment | 3.1 | |||
Automobiles & Components | 2.9 | |||
Retailing | 2.5 | |||
Media & Entertainment | 1.7 | |||
Insurance | 1.6 | |||
Household & Personal Products | 0.6 | |||
Real Estate | 0.6 | |||
Utilities | 0.4 | |||
Transportation | 0.2 | |||
Health Care Equipment & Services | 0.1 | |||
Consumer Services | 0.1 | |||
Software & Services | 0.0 | ^ | ||
|
| |||
| 100.0 | % | |||
|
| |||
| & | In the table, derivative financial instruments, if any, are based on market values, rather than the notional amounts of derivatives, except for forward currency contracts which are based on unrealized appreciation/(depreciation). |
| ¤ | The table shows country exposure in the Fund. The table excludes short-term investments. The table excludes exposure through forward currency contracts and includes exposure through other derivative financial instruments, if any. The table takes into account the market value of securities and options and the notional amounts of swap contracts and other derivative financial instruments, if any. |
| ‡ | “Other Developed” is comprised of developed countries that each represent between (1.0)% and 1.0% of Investments. |
| # | Equity investments may consist of common stocks and other stock-related securities, such as preferred stocks, if any. This table excludes exposure to derivative contracts, short-term investments, mutual funds and investment funds, if any. For a summary of these exposures, if any, see the Schedule of Investments. |
| ^ | Rounds to 0.0%. |
| 35 |
GMO International Equity Fund
(A Series of GMO Trust)
(showing percentage of total net assets)
February 28, 2023
| Shares | Description | Value ($) | ||||||
| COMMON STOCKS — 97.1% | ||||||||
| Australia — 4.0% | ||||||||
| 102,604 | BHP Group Ltd | 3,105,314 | ||||||
| 359,836 | BlueScope Steel Ltd | 4,603,991 | ||||||
| 329,961 | Brambles Ltd | 2,851,092 | ||||||
| 182,571 | Fortescue Metals Group Ltd | 2,616,227 | ||||||
| 441,709 | GrainCorp Ltd – Class A | 2,329,206 | ||||||
| 80,670 | JB Hi-Fi Ltd | 2,264,271 | ||||||
| 89,611 | Pact Group Holdings Ltd | 76,444 | ||||||
| 426,099 | Rio Tinto Ltd | 33,301,379 | ||||||
| 69,396 | Sims Ltd | 741,219 | ||||||
| 35,889 | Super Retail Group Ltd | 312,151 | ||||||
|
| |||||||
| Total Australia | 52,201,294 | |||||||
|
| |||||||
| Belgium — 0.2% | ||||||||
| 91,042 | AGFA-Gevaert NV * | 269,079 | ||||||
| 46,282 | Bekaert SA | 2,042,106 | ||||||
| 8,002 | Melexis NV | 865,540 | ||||||
|
| |||||||
| Total Belgium | 3,176,725 | |||||||
|
| |||||||
| Denmark — 0.1% | ||||||||
| 9,627 | Per Aarsleff Holding A/S | 417,384 | ||||||
| 6,605 | Schouw & Co A/S | 525,158 | ||||||
|
| |||||||
| Total Denmark | 942,542 | |||||||
|
| |||||||
| Finland — 1.8% | ||||||||
| 3,632,148 | Nokia Oyj | 16,804,309 | ||||||
| 195,835 | UPM-Kymmene Oyj | 7,096,363 | ||||||
|
| |||||||
| Total Finland | 23,900,672 | |||||||
|
| |||||||
| France — 15.0% | ||||||||
| 4,049 | Alten SA | 631,913 | ||||||
| 465 | Christian Dior SE | 386,133 | ||||||
| 571,522 | Cie de Saint-Gobain | 33,961,341 | ||||||
| 158,037 | Coface SA * | 2,329,200 | ||||||
| 191,402 | Derichebourg SA | 1,230,829 | ||||||
| 71,765 | Ipsen SA * | 8,199,765 | ||||||
| 48,472 | IPSOS * | 2,973,523 | ||||||
| 399 | Kering SA | 233,942 | ||||||
| 59,766 | Metropole Television SA | 892,045 | ||||||
| 169,927 | Publicis Groupe SA * | 13,490,019 | ||||||
| 49,316 | Renault SA * | 2,207,229 | ||||||
| 360,248 | Sanofi | 33,682,555 | ||||||
| 36,013 | Societe BIC SA | 2,329,561 | ||||||
| 630,747 | Societe Generale SA | 18,177,843 | ||||||
| 692,600 | STMicroelectronics NV | 33,355,616 | ||||||
| 188,405 | Television Francaise 1 | 1,501,378 | ||||||
| 14,666 | TotalEnergies SE (a) | 906,786 | ||||||
| 616,046 | TotalEnergies SE (a) | 38,012,593 | ||||||
|
| |||||||
| Total France | 194,502,271 | |||||||
|
| |||||||
| Germany — 3.8% | ||||||||
| 34,331 | Bayer AG (Registered) | 2,038,616 | ||||||
| Shares | Description | Value ($) | ||||||
| Germany — continued | ||||||||
| 36,494 | Bayerische Motoren Werke AG | 3,764,917 | ||||||
| 8,708 | Hannover Rueck SE | 1,691,081 | ||||||
| 42,521 | Henkel AG & Co KGaA | 2,940,110 | ||||||
| 9,437 | Hornbach Holding AG & Co KGaA | 783,751 | ||||||
| 6,128 | HUGO BOSS AG | 419,120 | ||||||
| 5,326 | Indus Holding AG | 129,061 | ||||||
| 195,123 | Kloeckner & Co SE | 2,111,964 | ||||||
| 3,557 | Krones AG | 433,181 | ||||||
| 74,142 | Mercedes-Benz Group AG | 5,682,443 | ||||||
| 135,930 | Merck KGaA | 25,757,781 | ||||||
| 23,043 | RTL Group SA | 1,110,793 | ||||||
| 38,944 | Salzgitter AG | 1,634,166 | ||||||
| 5,745 | Volkswagen AG | 1,020,657 | ||||||
|
| |||||||
| Total Germany | 49,517,641 | |||||||
|
| |||||||
| Hong Kong — 1.8% | ||||||||
| 404,500 | ASMPT Ltd | 3,451,351 | ||||||
| 149,500 | BOC Hong Kong Holdings Ltd | 505,960 | ||||||
| 553,487 | Champion (REIT) | 248,108 | ||||||
| 915,000 | CK Asset Holdings Ltd | 5,738,909 | ||||||
| 354,500 | CK Hutchison Holdings Ltd | 2,116,807 | ||||||
| 202,800 | Dah Sing Banking Group Ltd | 164,605 | ||||||
| 120,869 | Dah Sing Financial Holdings Ltd | 326,562 | ||||||
| 1,107,707 | Esprit Holdings Ltd * | 104,508 | ||||||
| 1,617,585 | IGG Inc * | 592,753 | ||||||
| 286,401 | Johnson Electric Holdings Ltd | 328,534 | ||||||
| 281,140 | Kerry Logistics Network Ltd | 464,635 | ||||||
| 164,326 | Luk Fook Holdings International Ltd | 524,600 | ||||||
| 1,132,331 | Pacific Textiles Holdings Ltd | 379,480 | ||||||
| 1,161,023 | Shun Tak Holdings Ltd * | 235,198 | ||||||
| 289,526 | SmarTone Telecommunications Holdings Ltd | 193,415 | ||||||
| 192,500 | Swire Pacific Ltd – Class A | 1,570,936 | ||||||
| 313,588 | Television Broadcasts Ltd * | 148,189 | ||||||
| 832,000 | VSTECS Holdings Ltd | 480,303 | ||||||
| 81,800 | VTech Holdings Ltd | 449,388 | ||||||
| 8,889,015 | WH Group Ltd | 5,172,775 | ||||||
|
| |||||||
| Total Hong Kong | 23,197,016 | |||||||
|
| |||||||
| Ireland — 0.9% | ||||||||
| 832,780 | Bank of Ireland Group Plc | 9,174,831 | ||||||
| 44,742 | Kingspan Group Plc | 2,904,116 | ||||||
|
| |||||||
| Total Ireland | 12,078,947 | |||||||
|
| |||||||
| Italy — 1.6% | ||||||||
| 241,297 | Anima Holding SPA | 1,042,391 | ||||||
| 74,458 | Banca IFIS SPA | 1,222,227 | ||||||
| 96,935 | Banco BPM SPA | 422,555 | ||||||
| 207,810 | BPER Banca | 590,281 | ||||||
| 832,410 | Eni SPA | 11,756,978 | ||||||
| 74,493 | Esprinet SPA | 568,527 | ||||||
| 1,265,259 | MFE-MediaForEurope NV – Class A | 555,895 | ||||||
| 2,362 | Sesa SPA | 304,649 | ||||||
| See accompanying notes to the financial statements. | 36 |
GMO International Equity Fund
(A Series of GMO Trust)
Schedule of Investments — (Continued)
(showing percentage of total net assets)
February 28, 2023
| Shares | Description | Value ($) | ||||||
| Italy — continued | ||||||||
| 155,065 | Snam SPA | 761,830 | ||||||
| 33,183 | Unieuro SPA | 393,522 | ||||||
| 490,558 | Unipol Gruppo SPA * | 2,594,997 | ||||||
|
| |||||||
| Total Italy | 20,213,852 | |||||||
|
| |||||||
| Japan — 24.0% | ||||||||
| 400 | Advantest Corp | 31,708 | ||||||
| 63,520 | AOKI Holdings Inc | 382,824 | ||||||
| 122,600 | Bandai Namco Holdings Inc | 7,575,596 | ||||||
| 329,196 | Brother Industries Ltd | 4,842,124 | ||||||
| 1,153,600 | Canon Inc | 24,828,061 | ||||||
| 5,300 | Canon Inc Sponsored ADR | 113,791 | ||||||
| 13,800 | Canon Marketing Japan Inc | 304,967 | ||||||
| 169,000 | Citizen Watch Co Ltd | 1,022,970 | ||||||
| 89,990 | Daiwabo Holdings Co Ltd | 1,390,672 | ||||||
| 5,474 | Dexerials Corp | 107,251 | ||||||
| 53,448 | Doutor Nichires Holdings Co Ltd | 732,858 | ||||||
| 20,506 | Fuyo General Lease Co Ltd | 1,412,558 | ||||||
| 58,936 | Geo Holdings Corp | 700,212 | ||||||
| 17,453 | Gunze Ltd | 571,716 | ||||||
| 88,200 | Haseko Corp | 1,012,116 | ||||||
| 972,254 | ITOCHU Corp | 29,061,329 | ||||||
| 1,509,004 | Japan Tobacco Inc | 30,686,197 | ||||||
| 112,244 | Kanematsu Corp | 1,344,955 | ||||||
| 866,096 | KDDI Corp | 25,340,119 | ||||||
| 41,693 | Komeri Co Ltd | 811,353 | ||||||
| 2,208,900 | Marubeni Corp | 28,198,944 | ||||||
| 58,357 | MCJ Co Ltd | 411,288 | ||||||
| 1,239,700 | Mitsubishi Motors Corp * | 4,888,798 | ||||||
| 1,002,538 | Mitsui & Co Ltd | 28,137,097 | ||||||
| 39,684 | Modec Inc * | 438,954 | ||||||
| 406,500 | NGK Spark Plug Co Ltd | 8,174,371 | ||||||
| 53,926 | Nichias Corp | 1,063,386 | ||||||
| 47,731 | Nippon Signal Company Ltd | 362,769 | ||||||
| 734,595 | Nippon Telegraph & Telephone Corp | 21,286,224 | ||||||
| 66,466 | Okinawa Electric Power Co (The) | 502,652 | ||||||
| 67,700 | Ono Pharmaceutical Co Ltd | 1,378,911 | ||||||
| 82,324 | Press Kogyo Co Ltd | 290,134 | ||||||
| 37,219 | Prima Meat Packers Ltd | 585,156 | ||||||
| 5,983 | San-A Co Ltd | 184,407 | ||||||
| 318,000 | Seiko Epson Corp | 4,384,485 | ||||||
| 64,995 | Seiko Group Corp | 1,376,992 | ||||||
| 389,512 | Sekisui Chemical Co Ltd | 5,221,876 | ||||||
| 941,200 | Sekisui House Ltd | 17,819,959 | ||||||
| 29,600 | Shimamura Co Ltd | 2,765,206 | ||||||
| 526,381 | Sojitz Corp | 10,105,319 | ||||||
| 1,699,641 | Sumitomo Chemical Co Ltd | 5,955,532 | ||||||
| 72,900 | Sumitomo Corp | 1,242,418 | ||||||
| 417,700 | Sumitomo Forestry Co Ltd | 8,015,262 | ||||||
| 20,638 | T-Gaia Corp | 248,548 | ||||||
| 30,200 | Tokyo Gas Co Ltd | 582,481 | ||||||
| 14,177 | Tokyo Seimitsu Co Ltd | 517,579 | ||||||
| 101,975 | Tokyu Construction Co Ltd | 517,915 | ||||||
| Shares | Description | Value ($) | ||||||
| Japan — continued | ||||||||
| 12,428 | Towa Pharmaceutical Co Ltd | 174,670 | ||||||
| 363,455 | Toyota Tsusho Corp | 14,822,968 | ||||||
| 24,269 | TPR Co Ltd | 248,488 | ||||||
| 44,669 | Valor Holdings Co Ltd | 643,509 | ||||||
| 20,256 | Warabeya Nichiyo Holdings Co Ltd | 276,385 | ||||||
| 39,800 | Yakult Honsha Co Ltd | 2,713,011 | ||||||
| 199,200 | Yamaha Motor Co Ltd | 5,096,573 | ||||||
| 18,900 | Yokogawa Electric Corp | 282,277 | ||||||
|
| |||||||
| Total Japan | 311,187,921 | |||||||
|
| |||||||
| Netherlands — 7.4% | ||||||||
| 512,984 | ABN AMRO Bank NV CVA | 9,052,202 | ||||||
| 82,037 | ASR Nederland NV | 3,733,573 | ||||||
| 134,049 | EXOR NV * | 11,060,964 | ||||||
| 946,547 | Koninklijke Ahold Delhaize NV | 30,054,637 | ||||||
| 86,425 | NN Group NV | 3,498,186 | ||||||
| 409,608 | Randstad NV | 25,133,617 | ||||||
| 16,416 | Signify NV | 568,815 | ||||||
| 110,770 | Wolters Kluwer NV | 12,823,570 | ||||||
|
| |||||||
| Total Netherlands | 95,925,564 | |||||||
|
| |||||||
| Norway — 2.4% | ||||||||
| 351,958 | Elkem ASA * | 1,324,991 | ||||||
| 923,574 | Equinor ASA | 28,273,687 | ||||||
| 183,405 | Europris ASA | 1,292,990 | ||||||
|
| |||||||
| Total Norway | 30,891,668 | |||||||
|
| |||||||
| Portugal — 0.9% | ||||||||
| 252,518 | CTT - Correios de Portugal SA | 1,002,047 | ||||||
| 241,180 | Jeronimo Martins SGPS SA | 4,950,447 | ||||||
| 614,791 | Navigator Co SA (The) * | 2,162,237 | ||||||
| 336,099 | REN - Redes Energeticas Nacionais SGPS | |||||||
| SA | 903,654 | |||||||
| 2,020,716 | Sonae SGPS SA | 2,214,004 | ||||||
|
| |||||||
| Total Portugal | 11,232,389 | |||||||
|
| |||||||
| Singapore — 4.6% | ||||||||
| 1,014,225 | DBS Group Holdings Ltd | 25,732,024 | ||||||
| 841,100 | First Resources Ltd | 958,996 | ||||||
| 182,387 | Jardine Cycle & Carriage Ltd | 4,020,753 | ||||||
| 1,426,700 | Keppel Corp Ltd | 5,793,561 | ||||||
| 27,228,617 | Sembcorp Marine Ltd * | 2,562,412 | ||||||
| 428,300 | Sheng Siong Group Ltd | 517,873 | ||||||
| 222,800 | Venture Corp Ltd | 2,837,272 | ||||||
| 1,693,139 | Wilmar International Ltd | 4,946,766 | ||||||
| 5,034,522 | Yangzijiang Financial Holding Ltd * | 1,306,250 | ||||||
| 11,050,422 | Yangzijiang Shipbuilding Holdings Ltd * | 10,573,036 | ||||||
|
| |||||||
| Total Singapore | 59,248,943 | |||||||
|
| |||||||
| Spain — 6.7% | ||||||||
| 544,478 | Acerinox SA | 5,978,795 | ||||||
| 4,683,692 | Banco Bilbao Vizcaya Argentaria SA | 36,406,465 | ||||||
| 37 | See accompanying notes to the financial statements. |
GMO International Equity Fund
(A Series of GMO Trust)
Schedule of Investments — (Continued)
(showing percentage of total net assets)
February 28, 2023
| Shares | Description | Value ($) | ||||||
| Spain — continued | ||||||||
| 22,694,144 | Banco de Sabadell SA * | 29,642,991 | ||||||
| 21,873 | Cia de Distribucion Integral Logista Holdings SA | 528,045 | ||||||
| 26,651 | Ebro Foods SA | 457,560 | ||||||
| 88,803 | Ence Energia y Celulosa SA | 338,896 | ||||||
| 12,628 | Grupo Catalana Occidente SA * | 412,332 | ||||||
| 301,612 | Industria de Diseno Textil SA * | 9,291,678 | ||||||
| 201,732 | Repsol SA * | 3,190,359 | ||||||
|
| |||||||
| Total Spain | 86,247,121 | |||||||
|
| |||||||
| Sweden — 0.8% | ||||||||
| 73,546 | Investor AB – A Shares | 1,507,609 | ||||||
| 48,402 | New Wave Group AB – B Shares | 849,096 | ||||||
| 1,067,441 | SSAB AB – A Shares | 7,760,174 | ||||||
|
| |||||||
| Total Sweden | 10,116,879 | |||||||
|
| |||||||
| Switzerland — 5.8% | ||||||||
| 40,548 | Ascom Holding AG (Registered) | 387,869 | ||||||
| 16,945 | Cie Financiere Richemont SA – Class A | |||||||
| (Registered) | 2,560,327 | |||||||
| 14,677 | DKSH Holding AG | 1,194,300 | ||||||
| 209 | Forbo Holding AG (Registered) | 274,056 | ||||||
| 50,911 | Novartis AG (Registered) | 4,284,676 | ||||||
| 146,841 | Roche Holding AG – Genusschein | 42,339,967 | ||||||
| 4,535 | Swatch Group AG (The) | 1,578,156 | ||||||
| 4,590 | Swatch Group AG (The) (Registered) | 292,390 | ||||||
| 10,851 | u-blox Holding AG * | 1,164,644 | ||||||
| 675,798 | UBS Group AG (Registered) | 14,688,627 | ||||||
| 3,995 | Zehnder Group AG – Class RG | 309,853 | ||||||
| 11,918 | Zurich Insurance Group AG | 5,653,342 | ||||||
|
| |||||||
| Total Switzerland | 74,728,207 | |||||||
|
| |||||||
| United Kingdom — 15.2% | ||||||||
| 1,043,111 | 3i Group Plc | 20,407,674 | ||||||
| 858,041 | BAE Systems Plc | 9,267,012 | ||||||
| 2,872,071 | Barratt Developments Plc | 16,148,147 | ||||||
| 190,125 | Bellway Plc | 5,068,779 | ||||||
| 442,500 | BP Plc Sponsored ADR | 17,523,000 | ||||||
| 844,068 | British American Tobacco Plc | 31,944,399 | ||||||
| 4,840,664 | BT Group Plc | 8,115,156 | ||||||
| 285,653 | Burberry Group Plc | 8,482,337 | ||||||
| 1,790,825 | Centrica Plc | 2,259,905 | ||||||
| 460,642 | Coca-Cola HBC AG * | 11,796,768 | ||||||
| 83,864 | Crest Nicholson Holdings Plc | 246,453 | ||||||
| 4,626 | Ferguson Plc | 665,963 | ||||||
| 600,747 | Ferrexpo Plc | 1,064,524 | ||||||
| 57,044 | Galliford Try Holdings Plc | 120,540 | ||||||
| 343,770 | GSK Plc | 5,889,095 | ||||||
| 103,137 | Halfords Group Plc | 260,858 | ||||||
| 313,831 | IG Group Holdings Plc | 3,029,629 | ||||||
| 1,092,360 | Imperial Brands Plc | 26,316,329 | ||||||
| 592,466 | Investec Plc | 3,773,446 | ||||||
| 321,026 | Kingfisher Plc | 1,110,223 | ||||||
| Shares / Par Value† | Description | Value ($) | ||||||
| United Kingdom — continued | ||||||||
| 120,309 | Next Plc | 9,896,843 | ||||||
| 251,694 | Persimmon Plc | 4,389,208 | ||||||
| 155,235 | Plus500 Ltd | 3,348,686 | ||||||
| 588,452 | Redrow Plc | 3,616,224 | ||||||
| 277,447 | Spirent Communications Plc | 709,805 | ||||||
| 248,506 | Vesuvius Plc | 1,233,004 | ||||||
| 13,161 | WPP Plc | 161,869 | ||||||
|
| |||||||
| Total United Kingdom | 196,845,876 | |||||||
|
| |||||||
| United States — 0.1% | ||||||||
| 79,531 | ADTRAN Holdings, Inc. | 1,387,816 | ||||||
| 164,100 | Samsonite International SA * | 460,534 | ||||||
|
| |||||||
| Total United States | 1,848,350 | |||||||
|
| |||||||
TOTAL COMMON STOCKS (COST $1,289,809,935) | 1,258,003,878 | |||||||
|
| |||||||
| PREFERRED STOCKS (b) — 0.9% | ||||||||
| Germany — 0.9% | ||||||||
| 60,669 | Bayerische Motoren Werke AG | 5,746,319 | ||||||
| 4,226 | Draegerwerk AG & Co KGaA | 184,292 | ||||||
| 69,322 | Henkel AG & Co KGaA | 5,043,058 | ||||||
|
| |||||||
| Total Germany | 10,973,669 | |||||||
|
| |||||||
TOTAL PREFERRED STOCKS (COST $9,831,263) | 10,973,669 | |||||||
|
| |||||||
| DEBT OBLIGATIONS — 0.3% | ||||||||
| United States — 0.3% | ||||||||
| 4,000,000 | U.S. Treasury Note, Variable Rate, USBM + 0.04%, 4.84%, due 07/31/24 (c) | 3,998,630 | ||||||
|
| |||||||
TOTAL DEBT OBLIGATIONS (COST $3,997,437) | 3,998,630 | |||||||
|
| |||||||
| MUTUAL FUNDS — 5.6% | ||||||||
| United States — 5.6% | ||||||||
| Affiliated Issuers — 5.6% | ||||||||
| 14,551,191 | GMO U.S. Treasury Fund | 72,610,442 | ||||||
|
| |||||||
| Total United States | 72,610,442 | |||||||
|
| |||||||
TOTAL MUTUAL FUNDS (COST $72,590,181) | 72,610,442 | |||||||
|
| |||||||
| See accompanying notes to the financial statements. | 38 |
GMO International Equity Fund
(A Series of GMO Trust)
Schedule of Investments — (Continued)
(showing percentage of total net assets)
February 28, 2023
| Shares | Description | Value ($) | ||||||
| SHORT-TERM INVESTMENTS — 0.0% |
| |||||||
| Money Market Funds — 0.0% | ||||||||
| 169,848 | State Street Institutional Treasury Money Market Fund – Premier Class, 4.42% (d) | 169,848 | ||||||
|
| |||||||
TOTAL SHORT-TERM INVESTMENTS (COST $169,848) | 169,848 | |||||||
|
| |||||||
TOTAL INVESTMENTS — 103.9% (Cost $1,376,398,664) | 1,345,756,467 | |||||||
| Other Assets and Liabilities (net) — (3.9)% | (50,212,917 | ) | ||||||
|
| |||||||
| TOTAL NET ASSETS — 100.0% | $ | 1,295,543,550 | ||||||
|
| |||||||
A summary of outstanding financial instruments at February 28, 2023 is as follows:
Futures Contracts
Number of | Type | Expiration Date | Notional Amount ($) | Value/Net Unrealized Appreciation (Depreciation) ($) | ||||||||||||
Buys | ||||||||||||||||
164 | MSCI EAFE | March 2023 | $ | 16,782,120 | $ | (352,111 | ) | |||||||||
|
|
|
| |||||||||||||
| + | Buys - Fund is long the futures contract. |
Sales - Fund is short the futures contract.
As of February 28, 2023, for the above contracts and/or agreements, the Fund had sufficient cash and/or securities to cover commitments or collateral requirements, if any, of the relevant broker or exchange.
Notes to Schedule of Investments:
| † | Denominated in U.S. Dollar, unless otherwise indicated. |
| * | Non-income producing security. |
| (a) | Securities are traded on separate exchanges for the same entity. |
| (b) | Preferred dividend rates are disclosed to the extent that a stated rate exists. |
| (c) | All or a portion of this security has been pledged to cover margin requirements on futures and/or cleared swap contracts, collateral on OTC swap contracts, forward currency contracts, and/or written options, if any (Note 4). |
| (d) | The rate disclosed is the 7 day net yield as of February 28, 2023. |
For a listing of definitions of acronyms, counterparty abbreviations and currency abbreviations used throughout the Schedule of Investments as well as the derivative tables, if any, please refer to page 106.
| 39 | See accompanying notes to the financial statements. |
This page has been left blank intentionally.
GMO-Usonian Japan Value Creation Fund
(A Series of GMO Trust)
Portfolio Management
Day-to-day management of the Fund’s portfolio is the responsibility of the Usonian Japan Equity team at Grantham, Mayo, Van Otterloo & Co. LLC.
Management Discussion and Analysis of Fund Performance
Although the Fund is not managed relative to any securities market index or benchmark, a discussion of the Fund’s performance relative to the Tokyo Stock Price Index (TR) (“TOPIX”) is included for comparative purposes.
Class VI shares of GMO-Usonian Japan Value Creation Fund (the “Fund”) returned -9.11% (net) for the fiscal year ended February 28, 2023, as compared with -8.62% for TOPIX.
Persistent inflation pressures in 2022 forced most central banks (Japan being a notable laggard) to raise interest rates, which in turn led to significant equity market declines. Japan’s 2.9% (JPY) decline in 2022, as measured by the TOPIX, compared favorably to other developed markets as measured by the MSCI World ex-Japan Index, which was down 16.7% in local currency terms.
Relative to TOPIX, sector allocation contributed to returns this period. An overweight in Financials and underweight in Consumer Discretionary contributed to the returns, while security selection in Consumer Staples and Health Care detracted.
The views expressed herein are exclusively those of Grantham, Mayo, Van Otterloo & Co. LLC as of the date of this report and are subject to change. GMO disclaims any responsibility to update such views. They are not meant as investment advice. References to specific securities are not recommendations of such securities and may not be representative of any GMO portfolio’s current or future investments. All information is unaudited.
| 41 |
GMO-Usonian Japan Value Creation Fund
(A Series of GMO Trust)
Comparison of Change in Value of a $300,000,000 Investment in
GMO-Usonian Japan Value Creation Fund Class VI Shares and the Tokyo Stock Price Index (TR)
As of February 28, 2023
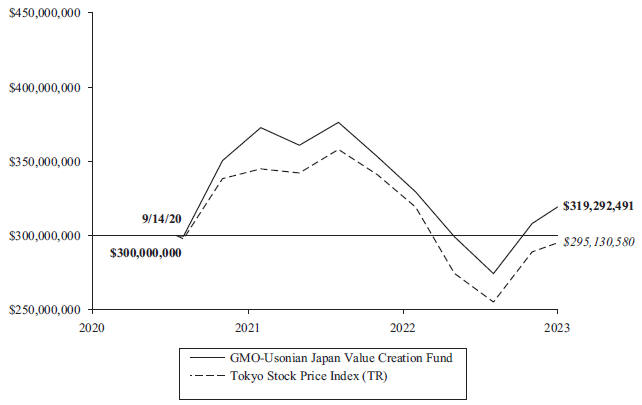
| Average Annual Total Returns | ||||||
| 1 Year | Since Inception | |||||
| Class III | -9.21 | % | 12/30/21 -8.37% | |||
| Class VI | -9.11 | % | 9/14/20 2.57% | |||
| Class I | -9.32 | % | 6/7/21 -9.63% | |||
Performance data quoted represents past performance and is not indicative of future results. The investment return and principal value of an investment will fluctuate so that an investor’s shares, when redeemed, may be worth more or less than their original cost. Current performance data may be lower or higher than the performance data provided herein. To obtain performance information up to the most recent month-end, visit www.gmo.com. Performance shown is net of all fees after reimbursement from GMO. Returns would have been lower had certain expenses not been reimbursed during the periods shown and do not include the effect of taxes on distributions and redemptions. The performance information shown above only includes purchase premiums and/or redemption fees in effect as of February 28, 2023. All information is unaudited. Performance for classes may vary due to different fees.
For Class III, VI and I the gross expense ratio of 0.74%, 0.65% and 0.89%, respectively. is equal to the Fund’s Total Annual Operating Expenses set forth in the Fund’s most recent prospectus dated June 30, 2022. For the Classes listed above, the corresponding net expense ratio of 0.67%, 0.58%, 0.78% reflects the reduction of expenses from fee reimbursements. The fee reimbursements will continue until at least June 30, 2023. Elimination of this reimbursement will result in higher fees and lower performance.
| 42 |
GMO-Usonian Japan Value Creation Fund
(A Series of GMO Trust)
Investment Concentration Summary
February 28, 2023 (Unaudited)
Asset Class Summary& | % of Total Net Assets | |||
Common Stocks | 98.5 | % | ||
Short-Term Investments | 4.3 | |||
Other | (2.8 | ) | ||
|
| |||
| 100.0 | % | |||
|
| |||
Industry Group Summary | % of Equity Investments# | |||
Capital Goods | 21.4 | % | ||
Food, Beverage & Tobacco | 9.9 | |||
Materials | 9.8 | |||
Semiconductors & Semiconductor Equipment | 7.9 | |||
Technology Hardware & Equipment | 7.6 | |||
Banks | 7.0 | |||
Insurance | 6.4 | |||
Commercial & Professional Services | 6.1 | |||
Diversified Financials | 4.0 | |||
Automobiles & Components | 3.6 | |||
Transportation | 3.3 | |||
Software & Services | 3.1 | |||
Health Care Equipment & Services | 2.8 | |||
Telecommunication Services | 2.5 | |||
Retailing | 2.0 | |||
Consumer Durables & Apparel | 2.0 | |||
Pharmaceuticals, Biotechnology & Life Sciences | 0.6 | |||
|
| |||
| 100.0 | % | |||
|
| |||
| & | In the table, derivative financial instruments, if any, are based on market values, rather than the notional amounts of derivatives, except for forward currency contracts which are based on unrealized appreciation/(depreciation). |
| # | Equity investments may consist of common stocks and other stock-related securities, such as preferred stocks, if any. This table excludes exposure to derivative contracts, short-term investments, mutual funds and investment funds, if any. For a summary of these exposures, if any, see the Schedule of Investments. |
| 43 |
GMO-Usonian Japan Value Creation Fund
(A Series of GMO Trust)
(showing percentage of total net assets)
February 28, 2023
| Shares | Description | Value ($) | ||||||
| COMMON STOCKS — 98.5% | ||||||||
| Automobiles & Components — 3.5% | ||||||||
| 181,300 | Stanley Electric Co Ltd | 3,780,708 | ||||||
|
| |||||||
| Banks — 6.9% | ||||||||
| 99,400 | Sumitomo Mitsui Financial Group Inc | 4,341,178 | ||||||
| 81,700 | Sumitomo Mitsui Trust Holdings Inc | 3,026,987 | ||||||
|
| |||||||
| Total Banks | 7,368,165 | |||||||
|
| |||||||
| Capital Goods — 21.0% | ||||||||
| 198,200 | EXEO Group Inc | 3,477,757 | ||||||
| 178,600 | Fuji Corp | 2,704,911 | ||||||
| 128,100 | Kyudenko Corp | 3,235,540 | ||||||
| 213,500 | Mitsubishi Electric Corp | 2,399,145 | ||||||
| 502,000 | Penta-Ocean Construction Co Ltd | 2,392,387 | ||||||
| 213,500 | Takuma Co Ltd | 2,149,767 | ||||||
| 120,500 | THK Co Ltd | 2,698,684 | ||||||
| 60,600 | Toyota Industries Corp | 3,555,411 | ||||||
|
| |||||||
| Total Capital Goods | 22,613,602 | |||||||
|
| |||||||
| Commercial & Professional Services — 6.0% |
| |||||||
| 46,400 | Secom Co Ltd | 2,698,366 | ||||||
| 206,000 | Toppan Inc | 3,725,396 | ||||||
|
| |||||||
| Total Commercial & Professional Services | 6,423,762 | |||||||
|
| |||||||
| Consumer Durables & Apparel — 2.0% |
| |||||||
| 185,900 | Haseko Corp | 2,133,246 | ||||||
|
| |||||||
| Diversified Financials — 4.0% | ||||||||
| 157,800 | Credit Saison Co Ltd | 2,150,706 | ||||||
| 55,900 | Zenkoku Hosho Co Ltd | 2,129,704 | ||||||
|
| |||||||
| Total Diversified Financials | 4,280,410 | |||||||
|
| |||||||
| Food, Beverage & Tobacco — 9.7% | ||||||||
| 85,200 | Ezaki Glico Co Ltd | 2,139,140 | ||||||
| 217,300 | Kirin Holdings Co Ltd | 3,252,651 | ||||||
| 74,400 | Morinaga & Co Ltd | 2,145,935 | ||||||
| 105,400 | NH Foods Ltd | 2,910,330 | ||||||
|
| |||||||
| Total Food, Beverage & Tobacco | 10,448,056 | |||||||
|
| |||||||
| Health Care Equipment & Services — 2.8% |
| |||||||
| 150,100 | H.U. Group Holdings Inc | 2,953,901 | ||||||
|
| |||||||
| Insurance — 6.3% | ||||||||
| 81,600 | MS&AD Insurance Group Holdings Inc | 2,670,288 | ||||||
| 269,300 | T&D Holdings Inc | 4,078,333 | ||||||
|
| |||||||
| Total Insurance | 6,748,621 | |||||||
|
| |||||||
| Materials — 9.7% | ||||||||
| 126,500 | Denka Co Ltd | 2,671,361 | ||||||
| 98,800 | Maruichi Steel Tube Ltd | 2,146,626 | ||||||
| 227,400 | Teijin Ltd | 2,362,819 | ||||||
| Shares | Description | Value ($) | ||||||
| Materials — continued | ||||||||
| 329,000 | Tokai Carbon Co Ltd | 3,212,439 | ||||||
|
| |||||||
| Total Materials | 10,393,245 | |||||||
|
| |||||||
| Pharmaceuticals, Biotechnology & Life Sciences — 0.6% |
| |||||||
| 13,300 | Sawai Group Holdings Co Ltd | 368,238 | ||||||
| 15,200 | Tsumura & Co | 289,041 | ||||||
|
| |||||||
| Total Pharmaceuticals, Biotechnology & Life Sciences | 657,279 | |||||||
|
| |||||||
| Retailing — 2.0% | ||||||||
| 248,800 | K’s Holdings Corp | 2,143,693 | ||||||
|
| |||||||
| Semiconductors & Semiconductor Equipment — 7.7% |
| |||||||
| 34,900 | Rohm Co Ltd | 2,687,742 | ||||||
| 215,700 | SUMCO Corp | 2,976,319 | ||||||
| 72,800 | Tokyo Seimitsu Co Ltd | 2,657,806 | ||||||
|
| |||||||
| Total Semiconductors & Semiconductor Equipment | 8,321,867 | |||||||
|
| |||||||
| Software & Services — 3.1% | ||||||||
| 92,100 | NEC Corp | 3,296,100 | ||||||
|
| |||||||
| Technology Hardware & Equipment — 7.5% |
| |||||||
| 131,800 | Amano Corp | 2,437,406 | ||||||
| 174,400 | Daiwabo Holdings Co Ltd | 2,695,112 | ||||||
| 63,300 | FUJIFILM Holdings Corp | 2,953,063 | ||||||
|
| |||||||
| Total Technology Hardware & Equipment | 8,085,581 | |||||||
|
| |||||||
| Telecommunication Services — 2.5% | ||||||||
| 91,700 | KDDI Corp | 2,682,946 | ||||||
|
| |||||||
| Transportation — 3.2% | ||||||||
| 94,800 | Sankyu Inc | 3,487,745 | ||||||
|
| |||||||
TOTAL COMMON STOCKS (COST $122,632,182) | 105,818,927 | |||||||
|
| |||||||
| See accompanying notes to the financial statements. | 44 |
GMO-Usonian Japan Value Creation Fund
(A Series of GMO Trust)
Schedule of Investments — (Continued)
(showing percentage of total net assets)
February 28, 2023
| Shares | Description | Value ($) | ||||||
| SHORT-TERM INVESTMENTS — 4.3% |
| |||||||
| Money Market Funds — 4.3% | ||||||||
| 4,654,152 | State Street Institutional Treasury Money Market Fund – Premier Class, 4.42% (a) | 4,654,152 | ||||||
|
| |||||||
TOTAL SHORT-TERM INVESTMENTS (COST $4,654,152) | 4,654,152 | |||||||
|
| |||||||
TOTAL INVESTMENTS — 102.8% (Cost $127,286,334) | 110,473,079 | |||||||
| Other Assets and Liabilities (net) — (2.8)% | (2,967,305 | ) | ||||||
|
| |||||||
| TOTAL NET ASSETS — 100.0% | $107,505,774 | |||||||
|
| |||||||
Notes to Schedule of Investments:
(a) The rate disclosed is the 7 day net yield as of February 28, 2023.
For a listing of definitions of acronyms, counterparty abbreviations and currency abbreviations used throughout the Schedule of Investments as well as the derivative tables, if any, please refer to page 106.
| 45 | See accompanying notes to the financial statements. |
This page has been left blank intentionally.
(A Series of GMO Trust)
Portfolio Management
Day-to-day management of the Fund’s portfolio is the responsibility of the Focused Equity team at Grantham, Mayo, Van Otterloo & Co. LLC.
Management Discussion and Analysis of Fund Performance
Although GMO does not manage the Fund to, or control the Fund’s risk relative to, any securities index or securities benchmark, a discussion of the Fund’s performance relative to the MSCI All Country World Index (“ACWI”) is included for comparative purposes.
Class VI shares of GMO Quality Cyclicals Fund returned -3.67% (net) for the fiscal year ended February 28, 2023, as compared with -8.26% for the MSCI ACWI.
Relative to the MSCI ACWI, sector allocation added value this period. The Energy (overweight) and Communication Services (underweight) allocations helped returns while Consumer Discretionary (overweight) and Health Care (underweight) reduced returns. Security selection within sector added value. Selection results in Consumer Discretionary and Consumer Staples helped returns. Industrials and Financials detracted from returns. Sector allocation had a comparable effect to stock selection within sector.
The U.S./non-U.S. regional allocation contributed to returns.
Las Vegas Sands, FEMSA and BorgWarner made the largest positive impact while Lyft, Persimmon and V.F. Corporation detracted.
Because some of the securities and instruments held directly or indirectly by the Fund had positive fair value adjustments at the beginning or end of the fiscal year (and the performance of indices are not fair valued), the Fund’s absolute and relative performance is higher than it otherwise would have been in the absence of such fair value adjustments.
The views expressed herein are exclusively those of Grantham, Mayo, Van Otterloo & Co. LLC as of the date of this report and are subject to change. GMO disclaims any responsibility to update such views. They are not meant as investment advice. References to specific securities are not recommendations of such securities and may not be representative of any GMO portfolio’s current or future investments. All information is unaudited.
47
GMO Quality Cyclicals Fund
(A Series of GMO Trust)
Comparison of Change in Value of a $300,000,000 Investment in
GMO Quality Cyclicals Fund Class VI Shares and the MSCI ACWI
As of February 28, 2023
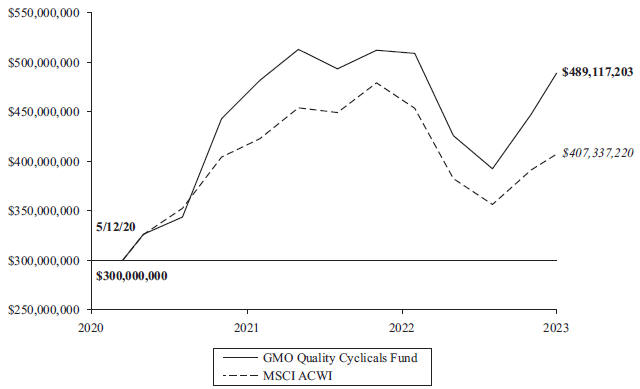
| Average Annual Total Returns | ||||||||
| 1 Year | Since Inception | |||||||
| Class VI | -3.67 | % | 5/12/20 19.09 | % | ||||
| Class I | -3.84 | % | 7/16/21 -1.53 | % | ||||
Performance data quoted represents past performance and is not indicative of future results. The investment return and principal value of an investment will fluctuate so that an investor’s shares, when redeemed, may be worth more or less than their original cost. Current performance data may be lower or higher than the performance data provided herein. To obtain performance information up to the most recent month-end, visit www.gmo.com. Performance shown is net of all fees after reimbursement from GMO. Returns would have been lower had certain expenses not been reimbursed during the periods shown and do not include the effect of taxes on distributions and redemptions. The performance information shown above only includes purchase premiums and/or redemption fees in effect as of February 28, 2023. All information is unaudited. Performance for classes may vary due to different fees.
MSCI data may not be reproduced or used for any other purpose. MSCI provides no warranties, has not prepared or approved this report, and has no liability hereunder.
For Class VI and I the gross expense ratio of 0.48% and 0.67%, respectively, is equal to the Fund’s Total Annual Operating Expenses set forth in the Fund’s most recent prospectus dated June 30, 2022. For the Classes listed above, the corresponding net expense ratio of 0.41% and 0.60% reflects the reduction of expenses from fee reimbursements. The fee reimbursements will continue until at least June 30, 2023. Elimination of this reimbursement will result in higher fees and lower performance.
| 48 |
GMO Quality Cyclicals Fund
(A Series of GMO Trust)
Investment Concentration Summary
February 28, 2023 (Unaudited)
Asset Class Summary& | % of Total Net Assets | |||
Common Stocks | 97.2 | % | ||
Preferred Stocks | 2.0 | |||
Mutual Funds | 1.0 | |||
Short-Term Investments | 0.2 | |||
Other | (0.4 | ) | ||
|
| |||
| 100.0 | % | |||
|
| |||
Country/Region Summary¤ | % of Investments | |||
United States | 49.4 | % | ||
United Kingdom | 10.4 | |||
France | 9.3 | |||
Mexico | 6.6 | |||
Canada | 5.3 | |||
Spain | 5.1 | |||
China | 3.3 | |||
Ireland | 2.7 | |||
Germany | 2.2 | |||
Brazil | 2.2 | |||
Finland | 2.0 | |||
Hong Kong | 1.5 | |||
Other Emerging | 0.0 | †^ | ||
|
| |||
| 100.0 | % | |||
|
| |||
Industry Group Summary | % of Equity Investments# | |||
Consumer Services | 14.4 | % | ||
Energy | 11.2 | |||
Capital Goods | 8.9 | |||
Diversified Financials | 8.6 | |||
Consumer Durables & Apparel | 8.4 | |||
Materials | 7.9 | |||
Food, Beverage & Tobacco | 6.6 | |||
Banks | 5.8 | |||
Retailing | 5.2 | |||
Media & Entertainment | 4.9 | |||
Semiconductors & Semiconductor Equipment | 3.2 | |||
Automobiles & Components | 3.1 | |||
Software & Services | 2.8 | |||
Transportation | 2.7 | |||
Insurance | 2.6 | |||
Household & Personal Products | 2.3 | |||
Technology Hardware & Equipment | 1.4 | |||
|
| |||
| 100.0 | % | |||
|
| |||
| & | In the table, derivative financial instruments, if any, are based on market values, rather than the notional amounts of derivatives, except for forward currency contracts which are based on unrealized appreciation/(depreciation). |
| ¤ | The table shows country exposure in the Fund. The table excludes short-term investments. The table excludes exposure through forward currency contracts and includes exposure through other derivative financial instruments, if any. The table takes into account the market value of securities and options and the notional amounts of swap contracts and other derivative financial instruments, if any. |
| † | “Other Emerging” is comprised of emerging countries that each represent between (1.0)% and 1.0% of Investments. |
| # | Equity investments may consist of common stocks and other stock-related securities, such as preferred stocks, if any. This table excludes exposure to derivative contracts, short-term investments, mutual funds and investment funds, if any. For a summary of these exposures, if any, see the Schedule of Investments. |
| ^ | Rounds to 0.0%. |
| 49 |
GMO Quality Cyclicals Fund
(A Series of GMO Trust)
(showing percentage of total net assets)
February 28, 2023
| Shares | Description | Value ($) | ||||||
| COMMON STOCKS — 97.2% | ||||||||
| Brazil — 0.2% | ||||||||
| 9,602 | Vale SA | 156,480 | ||||||
|
| |||||||
| Canada — 5.3% | ||||||||
| 9,933 | Brookfield Asset Management Ltd – Class A | 333,947 | ||||||
| 41,367 | Brookfield Corp – Class A | 1,375,453 | ||||||
| 25,173 | Nutrien Ltd | 1,957,956 | ||||||
|
| |||||||
| Total Canada | 3,667,356 | |||||||
|
| |||||||
| China — 3.3% | ||||||||
| 138,407 | Alibaba Group Holding Ltd * | 1,521,293 | ||||||
| 2,762 | Meituan – Class B * | 47,934 | ||||||
| 17,023 | Tencent Holdings Ltd | 747,793 | ||||||
|
| |||||||
| Total China | 2,317,020 | |||||||
|
| |||||||
| Finland — 2.0% | ||||||||
| 28,731 | Neste Oyj | 1,385,732 | ||||||
|
| |||||||
| France — 9.4% | ||||||||
| 2,200 | Kering SA | 1,289,905 | ||||||
| 2,957 | LVMH Moet Hennessy Louis Vuitton SE | 2,458,232 | ||||||
| 19,589 | Safran SA | 2,765,993 | ||||||
|
| |||||||
| Total France | 6,514,130 | |||||||
|
| |||||||
| Germany — 2.2% | ||||||||
| 13,059 | Beiersdorf AG | 1,558,534 | ||||||
|
| |||||||
| Hong Kong — 1.5% | ||||||||
| 156,502 | Galaxy Entertainment Group Ltd | 1,041,934 | ||||||
|
| |||||||
| Ireland — 2.7% | ||||||||
| 88,793 | Ryanair Holdings Plc * | 1,382,755 | ||||||
| 5,482 | Ryanair Holdings Plc Sponsored ADR * | 508,565 | ||||||
|
| |||||||
| Total Ireland | 1,891,320 | |||||||
|
| |||||||
| Mexico — 6.6% | ||||||||
| 289,770 | Fomento Economico Mexicano SAB de CV | 2,668,611 | ||||||
| 433,845 | Grupo Mexico SAB de CV – Series B | 1,951,253 | ||||||
|
| |||||||
| Total Mexico | 4,619,864 | |||||||
|
| |||||||
| Russia — 0.0% | ||||||||
| 33,541 | LUKOIL PJSC (a) | 17,720 | ||||||
| 72,920 | Novatek PJSC (a) | 10,377 | ||||||
|
| |||||||
| Total Russia | 28,097 | |||||||
|
| |||||||
| Spain — 5.1% | ||||||||
| 30,477 | Amadeus IT Group SA * | 1,916,480 | ||||||
| 52,333 | Industria de Diseno Textil SA | 1,612,209 | ||||||
|
| |||||||
| Total Spain | 3,528,689 | |||||||
|
| |||||||
| Shares | Description | Value ($) | ||||||
| United Kingdom — 10.4% | ||||||||
| 24,526 | Berkeley Group Holdings Plc (The) | 1,234,605 | ||||||
| 126,321 | Compass Group Plc | 2,918,240 | ||||||
| 48,923 | Persimmon Plc | 853,152 | ||||||
| 139,110 | S4 Capital Plc * | 342,903 | ||||||
| 62,728 | Shell Plc | 1,899,929 | ||||||
|
| |||||||
| Total United Kingdom | 7,248,829 | |||||||
|
| |||||||
| United States — 48.5% | ||||||||
| 13,909 | Alphabet, Inc. – Class A * | 1,252,645 | ||||||
| 12,363 | American Express Co. | 2,151,038 | ||||||
| 953 | Booking Holdings, Inc. * | 2,405,372 | ||||||
| 42,893 | BorgWarner, Inc. | 2,156,660 | ||||||
| 6,212 | CarMax, Inc. * | 428,876 | ||||||
| 10,239 | Chevron Corp. | 1,646,124 | ||||||
| 29,604 | Darling Ingredients, Inc. * | 1,873,045 | ||||||
| 18,271 | EOG Resources, Inc. | 2,064,988 | ||||||
| 21,337 | Green Plains, Inc. * | 739,754 | ||||||
| 12,219 | Hilton Worldwide Holdings, Inc. | 1,765,768 | ||||||
| 20,110 | Intercontinental Exchange, Inc. | 2,047,198 | ||||||
| 2,262 | Lam Research Corp. | 1,099,355 | ||||||
| 31,684 | Las Vegas Sands Corp. * | 1,820,880 | ||||||
| 1,357 | Markel Corp. * | 1,804,620 | ||||||
| 6,059 | Meta Platforms, Inc. – Class A * | 1,059,961 | ||||||
| 19,791 | Micron Technology, Inc. | 1,144,316 | ||||||
| 13,296 | Otis Worldwide Corp. | 1,125,108 | ||||||
| 23,003 | Raytheon Technologies Corp. | 2,256,364 | ||||||
| 18,545 | Sensata Technologies Holding Plc | 938,006 | ||||||
| 39,236 | US Bancorp | 1,872,734 | ||||||
| 45,764 | Wells Fargo & Co. | 2,140,382 | ||||||
|
| |||||||
| Total United States | 33,793,194 | |||||||
|
| |||||||
TOTAL COMMON STOCKS (COST $54,960,839) | 67,751,179 | |||||||
|
| |||||||
| PREFERRED STOCKS (b) — 2.0% | ||||||||
| Brazil — 2.0% | ||||||||
| 261,075 | Bradespar SA | 1,379,315 | ||||||
|
| |||||||
TOTAL PREFERRED STOCKS (COST $1,172,269) | 1,379,315 | |||||||
|
| |||||||
| MUTUAL FUNDS — 1.0% | ||||||||
| United States — 1.0% | ||||||||
| Affiliated Issuers — 1.0% | ||||||||
| 136,445 | GMO U.S. Treasury Fund | 680,863 | ||||||
|
| |||||||
| Total United States | 680,863 | |||||||
|
| |||||||
TOTAL MUTUAL FUNDS (COST $680,863) | 680,863 | |||||||
|
| |||||||
| See accompanying notes to the financial statements. | 50 |
GMO Quality Cyclicals Fund
(A Series of GMO Trust)
Schedule of Investments — (Continued)
(showing percentage of total net assets)
February 28, 2023
| Shares | Description | Value ($) | ||||||
| SHORT-TERM INVESTMENTS — 0.2% |
| |||||||
| Money Market Funds — 0.2% | ||||||||
| 149,116 | State Street Institutional Treasury Money Market Fund – Premier Class, 4.42% (c) | 149,116 | ||||||
|
| |||||||
TOTAL SHORT-TERM INVESTMENTS (COST $149,116) | 149,116 | |||||||
|
| |||||||
TOTAL INVESTMENTS — 100.4% (Cost $56,963,087) | 69,960,473 | |||||||
| Other Assets and Liabilities (net) — (0.4)% | (286,414 | ) | ||||||
|
| |||||||
| TOTAL NET ASSETS — 100.0% | $ | 69,674,059 | ||||||
|
| |||||||
Notes to Schedule of Investments:
| * | Non-income producing security. |
| (a) | Investment valued at fair value using methods determined in good faith by the Trustees of GMO Trust or persons acting at their direction pursuant to procedures approved by the Trustees. Investment valued using significant unobservable inputs (Note 2). |
| (b) | Preferred dividend rates are disclosed to the extent that a stated rate exists. |
| (c) | The rate disclosed is the 7 day net yield as of February 28, 2023. |
For a listing of definitions of acronyms, counterparty abbreviations and currency abbreviations used throughout the Schedule of Investments as well as the derivative tables, if any, please refer to page 106.
| 51 | See accompanying notes to the financial statements. |
This page has been left blank intentionally.
(A Series of GMO Trust)
Portfolio Management
Day-to-day management of the Fund’s portfolio is the responsibility of the Focused Equity team at Grantham, Mayo, Van Otterloo & Co. LLC.
Management Discussion and Analysis of Fund Performance
Although GMO does not manage the Fund to, or control the Fund’s risk relative to, any securities index or securities benchmark, a discussion of the Fund’s performance relative to the S&P 500 Index is included for comparative purposes.
Class III shares of GMO Quality Fund returned -5.30% (net) for the fiscal year ended February 28, 2023, as compared with -7.69% for the S&P 500 Index.
Relative to the S&P 500, sector allocation generated incremental returns this period. The Health Care (overweight) and Communication Services (underweight) allocations made a positive contribution while Energy (underweight) and Industrials (underweight) had a negative impact. Security selection within sector generated incremental returns. Selection results in IT, Consumer Discretionary and Health Care made a positive contribution. Financials and Industrials detracted. Stock selection within sector had a larger impact than sector allocation.
The allocation to non-U.S. stocks helped.
Merck, Safran and TJX added to returns while Exxon (underweight), Lyft and Taiwan Semi detracted from returns.
Because some of the securities and instruments held directly or indirectly by the Fund had positive fair value adjustments at the beginning or end of the fiscal year (and the performance of indices are not fair valued), the Fund’s absolute and relative performance is higher than it otherwise would have been in the absence of such fair value adjustments.
The views expressed herein are exclusively those of Grantham, Mayo, Van Otterloo & Co. LLC as of the date of this report and are subject to change. GMO disclaims any responsibility to update such views. They are not meant as investment advice. References to specific securities are not recommendations of such securities and may not be representative of any GMO portfolio’s current or future investments. All information is unaudited.
| 53 |
GMO Quality Fund
(A Series of GMO Trust)
Comparison of Change in Value of a $5,000,000 Investment in
GMO Quality Fund Class III Shares and the S&P 500 Index
As of February 28, 2023
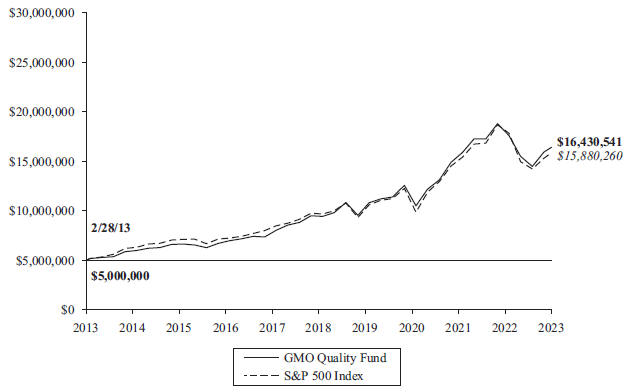
| Average Annual Total Returns | ||||||||||
| 1 Year | 5 Year | 10 Year | Since Inception | |||||||
| Class III | -5.30 | % | 10.94% | 12.64% | n/a | |||||
| Class IV | -5.23 | % | 11.00% | 12.69% | n/a | |||||
| Class VI | -5.24 | % | 11.04% | 12.74% | n/a | |||||
| Class R6 | -5.29 | % | n/a | n/a | 11/12/19 10.10% | |||||
| Class I | -5.40 | % | n/a | n/a | 9/26/19 11.23% | |||||
Performance data quoted represents past performance and is not indicative of future results. The investment return and principal value of an investment will fluctuate so that an investor’s shares, when redeemed, may be worth more or less than their original cost. Current performance data may be lower or higher than the performance data provided herein. To obtain performance information up to the most recent month-end, visit www.gmo.com. Performance shown is net of all fees after reimbursement from GMO. Returns would have been lower had certain expenses not been reimbursed during the periods shown and do not include the effect of taxes on distributions and redemptions. The performance information shown above only includes purchase premiums and/or redemption fees in effect as of February 28, 2023. All information is unaudited. Performance for classes may vary due to different fees.
For S&P disclaimers please visit https://www.gmo.com/north-america/benchmark-disclaimers/
For Class III, IV, VI, R6 and I the gross expense ratio of 0.50%, 0.46%, 0.41%, 0.50% and 0.62%, respectively, is equal to the Fund’s Total Annual Operating Expenses set forth in the Fund’s most recent prospectus dated June 30, 2022. For the Classes listed above, the corresponding net expense ratio of 0.49%, 0.45%, 0.40%, 0.48% and 0.58% reflects the reduction of expenses from fee reimbursements. The fee reimbursements will continue until at least June 30, 2023. Elimination of this reimbursement will result in higher fees and lower performance.
| 54 |
GMO Quality Fund
(A Series of GMO Trust)
Investment Concentration Summary
February 28, 2023 (Unaudited)
Asset Class Summary& | % of Total Net Assets | |||
Common Stocks | 98.2 | % | ||
Mutual Funds | 1.7 | |||
Short-Term Investments | 0.1 | |||
Other | 0.0 | ^ | ||
|
| |||
| 100.0 | % | |||
|
| |||
Country/Region Summary¤ | % of Investments | |||
United States | 78.6 | % | ||
France | 4.9 | |||
United Kingdom | 4.9 | |||
Germany | 3.6 | |||
Taiwan | 3.0 | |||
Switzerland | 3.0 | |||
China | 1.2 | |||
Other Developed | 0.8 | ‡ | ||
|
| |||
| 100.0 | % | |||
|
| |||
Industry Group Summary | % of Equity Investments# | |||
Software & Services | 22.8 | % | ||
Health Care Equipment & Services | 13.8 | |||
Semiconductors & Semiconductor Equipment | 10.8 | |||
Pharmaceuticals, Biotechnology & Life Sciences | 9.8 | |||
Retailing | 7.8 | |||
Capital Goods | 6.3 | |||
Media & Entertainment | 6.2 | |||
Banks | 5.8 | |||
Food, Beverage & Tobacco | 5.2 | |||
Technology Hardware & Equipment | 3.7 | |||
Consumer Services | 2.7 | |||
Household & Personal Products | 2.3 | |||
Consumer Durables & Apparel | 1.5 | |||
Diversified Financials | 1.3 | |||
|
| |||
| 100.0 | % | |||
|
| |||
| & | In the table, derivative financial instruments, if any, are based on market values, rather than the notional amounts of derivatives, except for forward currency contracts which are based on unrealized appreciation/(depreciation). |
| ¤ | The table shows country exposure in the Fund. The table excludes short-term investments. The table excludes exposure through forward currency contracts and includes exposure through other derivative financial instruments, if any. The table takes into account the market value of securities and options and the notional amounts of swap contracts and other derivative financial instruments, if any. |
| ‡ | “Other Developed” is comprised of developed countries that each represent between (1.0)% and 1.0% of Investments. |
| # | Equity investments may consist of common stocks and other stock-related securities, such as preferred stocks, if any. This table excludes exposure to derivative contracts, short-term investments, mutual funds and investment funds, if any. For a summary of these exposures, if any, see the Schedule of Investments. |
| ^ | Rounds to 0.0%. |
| 55 |
GMO Quality Fund
(A Series of GMO Trust)
(showing percentage of total net assets)
February 28, 2023
| Shares | Description | Value ($) | ||||||
| COMMON STOCKS — 98.2% | ||||||||
| Banks — 5.6% | ||||||||
| 4,531,787 | US Bancorp | 216,302,194 | ||||||
| 3,561,717 | Wells Fargo & Co. | 166,581,504 | ||||||
|
| |||||||
| Total Banks | 382,883,698 | |||||||
|
| |||||||
| Capital Goods — 6.2% | ||||||||
| 480,068 | Knorr-Bremse AG | 32,627,772 | ||||||
| 1,823,758 | Otis Worldwide Corp. | 154,326,402 | ||||||
| 1,665,821 | Safran SA | 235,216,126 | ||||||
|
| |||||||
| Total Capital Goods | 422,170,300 | |||||||
|
| |||||||
| Consumer Durables & Apparel — 1.5% |
| |||||||
| 120,331 | LVMH Moet Hennessy Louis Vuitton SE | 100,034,322 | ||||||
|
| |||||||
| Consumer Services — 2.7% | ||||||||
| 7,878,697 | Compass Group Plc | 182,011,946 | ||||||
|
| |||||||
| Diversified Financials — 1.3% | ||||||||
| 495,377 | American Express Co. | 86,190,644 | ||||||
|
| |||||||
| Food, Beverage & Tobacco — 5.1% | ||||||||
| 2,926,465 | Coca-Cola Co. (The) | 174,153,932 | ||||||
| 383,637 | Constellation Brands, Inc. – Class A | 85,819,597 | ||||||
| 754,097 | Nestle SA (Registered) | 84,964,578 | ||||||
|
| |||||||
| Total Food, Beverage & Tobacco | 344,938,107 | |||||||
|
| |||||||
| Health Care Equipment & Services — 13.6% |
| |||||||
| 906,275 | Abbott Laboratories | 92,186,293 | ||||||
| 228,877 | Cigna Group (The) | 66,854,972 | ||||||
| 369,173 | Elevance Health, Inc. | 173,389,483 | ||||||
| 335,018 | Intuitive Surgical, Inc.* | 76,849,779 | ||||||
| 1,441,951 | Medtronic Plc | 119,393,543 | ||||||
| 831,699 | Quest Diagnostics, Inc. | 115,073,873 | ||||||
| 584,385 | UnitedHealth Group, Inc. | 278,132,197 | ||||||
| �� |
|
| ||||||
| Total Health Care Equipment & Services | 921,880,140 | |||||||
|
| |||||||
| Household & Personal Products — 2.2% |
| |||||||
| 3,045,538 | Unilever Plc | 151,629,656 | ||||||
|
| |||||||
| Media & Entertainment — 6.0% | ||||||||
| 2,310,850 | Alphabet, Inc. – Class A* | 208,115,151 | ||||||
| 1,155,495 | Meta Platforms, Inc. – Class A* | 202,142,295 | ||||||
|
| |||||||
| Total Media & Entertainment | 410,257,446 | |||||||
|
| |||||||
| Pharmaceuticals, Biotechnology & Life Sciences — 9.7% |
| |||||||
| 442,096 | Eli Lilly & Co. | 137,589,117 | ||||||
| 1,572,089 | Johnson & Johnson | 240,938,360 | ||||||
| 1,511,540 | Merck & Co., Inc. | 160,586,010 | ||||||
| 403,768 | Roche Holding AG – Genusschein | 116,422,006 | ||||||
|
| |||||||
| Total Pharmaceuticals, Biotechnology & Life Sciences | 655,535,493 | |||||||
|
| |||||||
| Shares | Description | Value ($) | ||||||
| Retailing — 7.6% | ||||||||
| 7,678,765 | Alibaba Group Holding Ltd* | 84,400,699 | ||||||
| 2,476,206 | Amazon.com, Inc.* | 233,332,892 | ||||||
| 2,604,667 | TJX Cos, Inc. (The) | 199,517,492 | ||||||
|
| |||||||
| Total Retailing | 517,251,083 | |||||||
|
| |||||||
| Semiconductors & Semiconductor Equipment — 10.6% |
| |||||||
| 288,314 | KLA Corp. | 109,380,565 | ||||||
| 426,262 | Lam Research Corp. | 207,167,595 | ||||||
| 12,285,790 | Taiwan Semiconductor Manufacturing Co Ltd | 203,254,787 | ||||||
| 1,175,016 | Texas Instruments, Inc. | 201,456,493 | ||||||
|
| |||||||
| Total Semiconductors & Semiconductor Equipment | 721,259,440 | |||||||
|
| |||||||
| Software & Services — 22.4% | ||||||||
| 698,948 | Accenture Plc – Class A | 185,605,641 | ||||||
| 394,286 | Adobe, Inc.* | 127,728,950 | ||||||
| 817,054 | Amadeus IT Group SA* | 51,378,671 | ||||||
| 1,835,584 | Microsoft Corp. | 457,831,361 | ||||||
| 2,431,421 | Oracle Corp. | 212,506,195 | ||||||
| 809,873 | salesforce.com, Inc.* | 132,503,322 | ||||||
| 1,835,197 | SAP SE | 208,498,284 | ||||||
| 641,249 | Visa, Inc. – Class A | 141,036,305 | ||||||
|
| |||||||
| Total Software & Services | 1,517,088,729 | |||||||
|
| |||||||
| Technology Hardware & Equipment — 3.7% |
| |||||||
| 1,692,441 | Apple, Inc. | 249,482,728 | ||||||
|
| |||||||
TOTAL COMMON STOCKS (COST $4,246,389,689) | 6,662,613,732 | |||||||
|
| |||||||
| MUTUAL FUNDS — 1.7% | ||||||||
| Affiliated Issuers — 1.7% | ||||||||
| 23,294,255 | GMO U.S. Treasury Fund | 116,238,335 | ||||||
|
| |||||||
TOTAL MUTUAL FUNDS (COST $116,151,685) | 116,238,335 | |||||||
|
| |||||||
| See accompanying notes to the financial statements. | 56 |
GMO Quality Fund
(A Series of GMO Trust)
Schedule of Investments — (Continued)
(showing percentage of total net assets)
February 28, 2023
| Shares | Description | Value ($) | ||||||
| SHORT-TERM INVESTMENTS — 0.1% |
| |||||||
| Money Market Funds — 0.1% | ||||||||
| 3,826,774 | State Street Institutional Treasury Money Market Fund – Premier Class, 4.42% (a) | 3,826,774 | ||||||
|
| |||||||
TOTAL SHORT-TERM INVESTMENTS (COST $3,826,774) | 3,826,774 | |||||||
|
| |||||||
TOTAL INVESTMENTS — 100.0% (Cost $4,366,368,148) | 6,782,678,841 | |||||||
| Other Assets and Liabilities (net) — 0.0% | 2,725,342 | |||||||
|
| |||||||
| TOTAL NET ASSETS — 100.0% | $ | 6,785,404,183 | ||||||
|
| |||||||
Notes to Schedule of Investments:
| * | Non-income producing security. |
| (a) | The rate disclosed is the 7 day net yield as of February 28, 2023. |
For a listing of definitions of acronyms, counterparty abbreviations and currency abbreviations used throughout the Schedule of Investments as well as the derivative tables, if any, please refer to page 106.
| 57 | See accompanying notes to the financial statements. |
This page has been left blank intentionally.
(A Series of GMO Trust)
Portfolio Management
Day-to-day management of the Fund’s portfolio is the responsibility of the Focused Equity team at Grantham, Mayo, Van Otterloo & Co. LLC.
Management Discussion and Analysis of Fund Performance
Although the Fund is not managed relative to any securities market index or benchmark, a discussion of the Fund’s performance relative to the MSCI All Country World Index (“ACWI”) Commodity Producers ex-Energy is included for comparative purposes.
Class VI shares of GMO Resource Transition Fund returned -5.10% (net) for the period from the Fund’s inception on February 15, 2023 until the end of the fiscal year ended February 28, 2023, as compared with -3.68% for the MSCI ACWI Commodity Producers ex-Energy.
The Fund’s industrial metals portfolio, the largest segment by weight, performed in line with the benchmark. Copper producers were the strongest performer in the metals portfolio for the period.
The Fund’s energy portfolio, which is primarily an off-benchmark position, detracted as the clean energy portfolio was down about 9% for the period.
The Fund agriculture portfolio delivered strong returns for the period; agricultural productivity and precision agriculture companies had positive returns in an otherwise down market.
The views expressed herein are exclusively those of Grantham, Mayo, Van Otterloo & Co. LLC as of the date of this report and are subject to change. GMO disclaims any responsibility to update such views. They are not meant as investment advice. References to specific securities are not recommendations of such securities and may not be representative of any GMO portfolio’s current or future investments. All information is unaudited.
| 59 |
GMO Resource Transition Fund
(A Series of GMO Trust)
Comparison of Change in Value of a $350,000,000 Investment in
GMO Resource Transition Fund Class VI Shares and the MSCI ACWI Commodity Producers ex-Energy
As of February 28, 2023
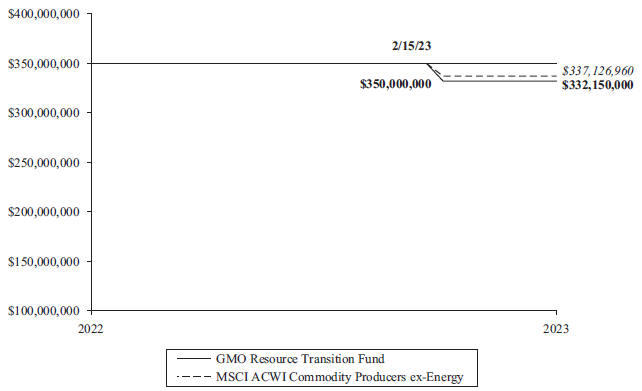
| Average Annual Total Returns | ||
| Since Inception | ||
| Class VI | 2/15/23 -5.10% |
Performance data quoted represents past performance and is not indicative of future results. The investment return and principal value of an investment will fluctuate so that an investor’s shares, when redeemed, may be worth more or less than their original cost. Current performance data may be lower or higher than the performance data provided herein. To obtain performance information up to the most recent month-end, visit www.gmo.com. Performance shown is net of all fees after reimbursement from GMO. Returns would have been lower had certain expenses not been reimbursed during the periods shown and do not include the effect of taxes on distributions and redemptions. The performance information shown above only includes purchase premiums and/or redemption fees in effect as of February 28, 2023. All information is unaudited.
MSCI data may not be reproduced or used for any other purpose. MSCI provides no warranties, has not prepared or approved this report, and has no liability hereunder.
For Class VI the gross expense ratio of 0.93% is equal to the Fund’s Total Annual Operating Expenses set forth in the Fund’s most recent prospectus dated February 11, 2023. For the Class listed above, the net expense ratio of 0.86% reflects the reduction of expenses from fee reimbursements. The fee reimbursements will continue until at least June 30, 2024. Elimination of this reimbursement will result in higher fees and lower performance
| 60 |
GMO Resource Transition Fund
(A Series of GMO Trust)
Investment Concentration Summary
February 28, 2023 (Unaudited)
Asset Class Summary& | % of Total Net Assets | |||
Common Stocks | 94.4 | % | ||
Preferred Stocks | 4.7 | |||
Mutual Funds | 0.8 | |||
Short-Term Investments | 0.1 | |||
Other | 0.0 | ^ | ||
|
| |||
| 100.0 | % | |||
|
| |||
Country/Region Summary¤ | % of Investments | |||
United States | 33.2 | % | ||
Canada | 17.7 | |||
Brazil | 12.7 | |||
United Kingdom | 12.2 | |||
France | 4.2 | |||
South Africa | 4.0 | |||
Mexico | 3.6 | |||
Chile | 2.5 | |||
Japan | 1.7 | |||
Denmark | 1.7 | |||
Australia | 1.6 | |||
Argentina | 1.5 | |||
Norway | 1.3 | |||
China | 1.2 | |||
Other Developed | 0.9 | ‡ | ||
|
| |||
| 100.0 | % | |||
|
| |||
Industry Group Summary | % of Equity Investments# | |||
Industrial Metals | 54.8 | % | ||
Energy | 25.9 | |||
Agriculture | 15.0 | |||
Water | 4.3 | |||
|
| |||
| 100.0 | % | |||
|
| |||
| & | In the table, derivative financial instruments, if any, are based on market values, rather than the notional amounts of derivatives, except for forward currency contracts which are based on unrealized appreciation/(depreciation). |
| ¤ | The table shows country exposure in the Fund. The table excludes short-term investments. The table excludes exposure through forward currency contracts and includes exposure through other derivative financial instruments, if any. The table takes into account the market value of securities and options and the notional amounts of swap contracts and other derivative financial instruments, if any. |
| ‡ | “Other Developed” is comprised of developed countries that each represent between (1.0)% and 1.0% of Investments. |
| # | Equity investments may consist of common stocks and other stock-related securities, such as preferred stocks, if any. This table excludes exposure to derivative contracts, short-term investments, mutual funds and investment funds, if any. For a summary of these exposures, if any, see the Schedule of Investments. |
| ^ | Rounds to 0.0%. |
| 61 |
GMO Resource Transition Fund
(A Series of GMO Trust)
(showing percentage of total net assets)
February 28, 2023
| Shares | Description | Value ($) | ||||||
| COMMON STOCKS — 94.4% |
| |||||||
| Argentina — 1.5% | ||||||||
| 859,100 | Adecoagro SA | 6,975,892 | ||||||
|
| |||||||
| Australia — 1.5% | ||||||||
| 253,522 | Fortescue Metals Group Ltd | 3,632,949 | ||||||
| 1,992,788 | Jupiter Mines Ltd | 315,018 | ||||||
| 2,149,903 | Perenti Ltd * | 1,532,143 | ||||||
| 270,056 | Sandfire Resources Ltd | 1,063,365 | ||||||
| 578,245 | Sunrise Energy Metals Ltd * | 621,909 | ||||||
|
| |||||||
| Total Australia | 7,165,384 | |||||||
|
| |||||||
| Brazil — 8.0% | ||||||||
| 958,900 | Dexco SA | 1,194,172 | ||||||
| 880,600 | Sao Martinho SA | 4,575,026 | ||||||
| 431,700 | SLC Agricola SA | 4,062,661 | ||||||
| 871,000 | Suzano SA | 7,942,305 | ||||||
| 1,185,600 | Vale SA | 19,321,241 | ||||||
|
| |||||||
| Total Brazil | 37,095,405 | |||||||
|
| |||||||
| Canada — 17.7% | ||||||||
| 273,200 | Anaergia Inc * | 878,965 | ||||||
| 260,200 | Canadian Solar Inc * | 10,342,950 | ||||||
| 240,200 | Enerflex Ltd | 1,593,118 | ||||||
| 768,100 | First Quantum Minerals Ltd | 16,780,550 | ||||||
| 520,000 | Greenlane Renewables Inc * | 163,870 | ||||||
| 3,649,800 | Ivanhoe Mines Ltd – Class A * | 30,493,016 | ||||||
| 531,300 | Largo Inc * | 3,399,230 | ||||||
| 725,900 | Li-Cycle Holdings Corp * | 4,398,954 | ||||||
| 73,500 | Nutrien Ltd | 5,716,830 | ||||||
| 95,000 | Teck Resources Ltd – Class B (a) | 3,792,400 | ||||||
| 96,200 | Teck Resources Ltd – Class B (a) | 3,840,245 | ||||||
|
| |||||||
| Total Canada | 81,400,128 | |||||||
|
| |||||||
| Chile — 2.5% | ||||||||
| 129,800 | Sociedad Quimica y Minera de Chile SA Sponsored ADR | 11,519,750 | ||||||
|
| |||||||
| China — 1.2% | ||||||||
| 3,340,000 | China High Speed Transmission Equipment Group Co Ltd * | 1,380,736 | ||||||
| 1,858,000 | China Water Affairs Group Ltd | 1,653,088 | ||||||
| 2,752,000 | Xinjiang Goldwind Science & Technology Co Ltd – Class H | 2,482,431 | ||||||
|
| |||||||
| Total China | 5,516,255 | |||||||
|
| |||||||
| Denmark — 1.7% | ||||||||
| 269,614 | Vestas Wind Systems A/S | 7,693,419 | ||||||
|
| |||||||
| Finland — 0.9% | ||||||||
| 123,342 | Kemira Oyj | 2,362,429 | ||||||
| 40,894 | Neste Oyj | 1,972,368 | ||||||
|
| |||||||
| Total Finland | 4,334,797 | |||||||
|
| |||||||
| Shares | Description | Value ($) | ||||||
| France — 4.2% | ||||||||
| 28,022 | Eramet SA | 3,007,071 | ||||||
| 241,114 | Technip Energies NV | 4,668,050 | ||||||
| 388,439 | Veolia Environnement SA | 11,592,691 | ||||||
|
| |||||||
| Total France | 19,267,812 | |||||||
|
| |||||||
| Japan — 1.7% | ||||||||
| 91,800 | Ebara Corp | 3,901,240 | ||||||
| 246,700 | Mitsubishi Materials Corp | 3,840,387 | ||||||
|
| |||||||
| Total Japan | 7,741,627 | |||||||
|
| |||||||
| Mexico — 3.6% | ||||||||
| 3,651,600 | Grupo Mexico SAB de CV – Series B | 16,423,369 | ||||||
|
| |||||||
| Norway — 1.3% | ||||||||
| 446,020 | Austevoll Seafood ASA | 3,811,105 | ||||||
| 114,992 | TGS ASA | 2,069,932 | ||||||
|
| |||||||
| Total Norway | 5,881,037 | |||||||
|
| |||||||
| South Africa — 4.0% | ||||||||
| 290,598 | African Rainbow Minerals Ltd | 4,022,128 | ||||||
| 19,348 | Anglo American Platinum Ltd | 1,069,876 | ||||||
| 684,736 | Impala Platinum Holdings Ltd | 6,393,302 | ||||||
| 3,486,218 | Sibanye Stillwater Ltd | 7,038,907 | ||||||
|
| |||||||
| Total South Africa | 18,524,213 | |||||||
|
| |||||||
| United Kingdom — 12.2% | ||||||||
| 610,009 | Anglo American Plc | 21,078,685 | ||||||
| 1,420,802 | Ferrexpo Plc | 2,517,662 | ||||||
| 5,444,126 | Glencore Plc | 32,457,124 | ||||||
|
| |||||||
| Total United Kingdom | 56,053,471 | |||||||
|
| |||||||
| United States — 32.4% | ||||||||
| 319,200 | Aemetis, Inc. * | 1,139,544 | ||||||
| 82,400 | AGCO Corp. | 11,602,744 | ||||||
| 63,000 | Alcoa Corp. | 3,083,220 | ||||||
| 313,600 | Ameresco, Inc. – Class A * | 13,782,720 | ||||||
| 1,200,800 | Clean Energy Fuels Corp. * | 6,724,480 | ||||||
| 251,600 | Darling Ingredients, Inc. * | 15,918,732 | ||||||
| 13,100 | Deere & Co. | 5,492,044 | ||||||
| 273,300 | Freeport-McMoRan, Inc. | 11,197,101 | ||||||
| 1,056,700 | GrafTech International Ltd. | 5,970,355 | ||||||
| 355,400 | Green Plains, Inc. * | 12,321,718 | ||||||
| 672,100 | Livent Corp. * | 15,760,745 | ||||||
| 263,300 | Mosaic Co. (The) | 14,004,927 | ||||||
| 64,300 | PotlatchDeltic Corp. (REIT) | 2,968,088 | ||||||
| 24,200 | SolarEdge Technologies, Inc. * | 7,693,664 | ||||||
| 885,400 | Sunrun, Inc. * | 21,285,016 | ||||||
|
| |||||||
| Total United States | 148,945,098 | |||||||
|
| |||||||
TOTAL COMMON STOCKS (COST $458,303,414) | 434,537,657 | |||||||
|
| |||||||
| See accompanying notes to the financial statements. | 62 |
GMO Resource Transition Fund
(A Series of GMO Trust)
Schedule of Investments — (Continued)
(showing percentage of total net assets)
February 28, 2023
| Shares | Description | Value ($) | ||||||
| PREFERRED STOCKS (b) — 4.7% | ||||||||
| Brazil — 4.7% | ||||||||
| 4,063,200 | Bradespar SA | 21,466,753 | ||||||
|
| |||||||
TOTAL PREFERRED STOCKS (COST $22,675,279) | 21,466,753 | |||||||
|
| |||||||
| MUTUAL FUNDS — 0.8% | ||||||||
| United States — 0.8% | ||||||||
| Affiliated Issuers — 0.8% | ||||||||
| 703,815 | GMO U.S. Treasury Fund | 3,512,040 | ||||||
|
| |||||||
| Total United States | 3,512,040 | |||||||
|
| |||||||
TOTAL MUTUAL FUNDS (COST $3,512,040) | 3,512,040 | |||||||
|
| |||||||
| SHORT-TERM INVESTMENTS — 0.1% |
| |||||||
| Money Market Funds — 0.1% | ||||||||
| 466,627 | State Street Institutional Treasury Money Market Fund – Premier Class, 4.42% (c) | 466,627 | ||||||
|
| |||||||
TOTAL SHORT-TERM INVESTMENTS (COST $466,627) | 466,627 | |||||||
|
| |||||||
TOTAL INVESTMENTS — 100.0% (Cost $484,957,360) | 459,983,077 | |||||||
| Other Assets and Liabilities (net) — 0.0% | 225,676 | |||||||
|
| |||||||
| TOTAL NET ASSETS — 100.0% | $ | 460,208,753 | ||||||
|
| |||||||
Notes to Schedule of Investments:
| * | Non-income producing security. |
| (a) | Securities are traded on separate exchanges for the same entity. |
| (b) | Preferred dividend rates are disclosed to the extent that a stated rate exists. |
| (c) | The rate disclosed is the 7 day net yield as of February 28, 2023. |
For a listing of definitions of acronyms, counterparty abbreviations and currency abbreviations used throughout the Schedule of Investments as well as the derivative tables, if any, please refer to page 106.
| 63 | See accompanying notes to the financial statements. |
This page has been left blank intentionally.
(A Series of GMO Trust)
Portfolio Management
Day-to-day management of the Fund’s portfolio is the responsibility of the Focused Equity team at Grantham, Mayo, Van Otterloo & Co. LLC.
Management Discussion and Analysis of Fund Performance
Although GMO does not manage the Fund to, or control the Fund’s risk relative to, any securities index or securities benchmark, a discussion of the Fund’s performance relative to the MSCI All Country World Index (“ACWI”) Commodity Producers Index is included for comparative purposes.
Class III shares of GMO Resources Fund returned -1.47% (net) for the fiscal year ended February 28, 2023, as compared with 5.35% for the MSCI ACWI Commodity Producers Index.
The Fund’s energy portfolio delivered strong absolute returns but the underweight to fossil fuel producers and off-benchmark position in clean energy led to underperformance versus the benchmark. Fossil fuel producers delivered close to 20% for the year; two of the top five individual contributors, Kosmos Energy and Galp Energia, were from this segment.
The Fund’s industrial metals portfolio, the second largest segment by weight, underperformed. Lithium producers delivered positive returns, although this was balanced out by drawdowns across copper and platinum group metals producers. Norilsk Nickel was one of the largest individual detractors for the year.
The Fund’s agriculture segment, at roughly twice the weight of that in the benchmark, detracted relative value as the segment was down 4.4% in the Fund. Precision agriculture companies went against that trend, delivering a 21% return.
Because some of the securities and instruments held directly or indirectly by the Fund had positive fair value adjustments at the beginning or end of the fiscal year (and the performance of indices are not fair valued), the Fund’s absolute and relative performance is higher than it otherwise would have been in the absence of such fair value adjustments.
The views expressed herein are exclusively those of Grantham, Mayo, Van Otterloo & Co. LLC as of the date of this report and are subject to change. GMO disclaims any responsibility to update such views. They are not meant as investment advice. References to specific securities are not recommendations of such securities and may not be representative of any GMO portfolio’s current or future investments. All information is unaudited.
65
GMO Resources Fund
(A Series of GMO Trust)
Comparison of Change in Value of a $5,000,000 Investment in
GMO Resources Fund Class III Shares, the MSCI ACWI Commodity Producers and the MSCI ACWI
As of February 28, 2023
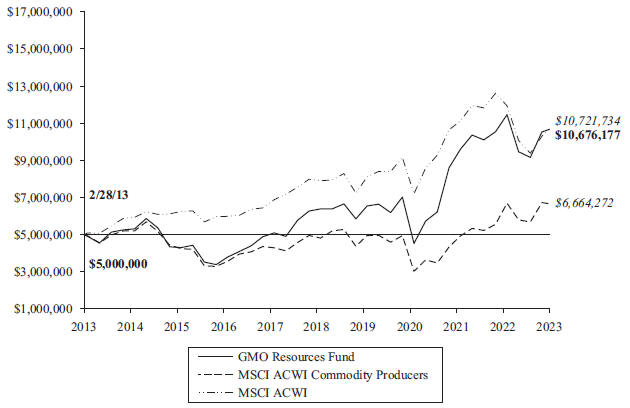
| Average Annual Total Returns | ||||||||||||||||
| 1 Year | 5 Year | 10 Year | Since Inception | |||||||||||||
| Class III | -1.47 | % | 10.54 | % | 7.88 | % | n/a | |||||||||
| Class IV | -1.40 | % | 10.59 | % | n/a | 3/20/13 8.07 | % | |||||||||
| Class VI | -1.39 | % | n/a | n/a | 2/8/22 -3.93 | % | ||||||||||
| Class R6 | -1.43 | % | n/a | n/a | 1/22/21 6.06 | % | ||||||||||
| Class I | -1.55 | % | n/a | n/a | 1/22/21 5.97 | % | ||||||||||
Performance data quoted represents past performance and is not indicative of future results. The investment return and principal value of an investment will fluctuate so that an investor’s shares, when redeemed, may be worth more or less than their original cost. Current performance data may be lower or higher than the performance data provided herein. To obtain performance information up to the most recent month-end, visit www.gmo.com. Performance shown is net of all fees after reimbursement from GMO. Returns would have been lower had certain expenses not been reimbursed during the periods shown and do not include the effect of taxes on distributions and redemptions. The performance information shown above only includes purchase premiums and/or redemption fees in effect as of February 28, 2023. All information is unaudited. Performance for classes may vary due to different fees.
MSCI data may not be reproduced or used for any other purpose. MSCI provides no warranties, has not prepared or approved this report, and has no liability hereunder.
For Class III, IV, VI, R6 and I the gross expense ratio of 0.71%, 0.65%, 0.61%, 0.74% and 0.83%, respectively, is equal to the Fund’s Total Annual Operating Expenses set forth in the Fund’s most recent prospectus dated June 30, 2022. For the Classes listed above, the corresponding net expense ratio of 0.71%, 0.65%, 0.61%, 0.74% and 0.81% reflects the reduction of expenses from fee reimbursements. The fee reimbursements will continue until at least June 30, 2023. Elimination of this reimbursement will result in higher fees and lower performance.
66
GMO Resources Fund
(A Series of GMO Trust)
Investment Concentration Summary
February 28, 2023 (Unaudited)
Asset Class Summary& | % of Total Net Assets | |||
Common Stocks | 90.4 | % | ||
Preferred Stocks | 8.2 | |||
Mutual Funds | 2.2 | |||
Short-Term Investments | 0.2 | |||
Rights/Warrants | 0.0 | ^ | ||
Other | (1.0 | ) | ||
|
| |||
| 100.0 | % | |||
|
| |||
Country/Region Summary¤ | % of Investments | |||
United States | 32.7 | % | ||
United Kingdom | 14.6 | |||
Brazil | 11.6 | |||
Canada | 11.0 | |||
Portugal | 3.5 | |||
South Africa | 2.7 | |||
Norway | 2.7 | |||
France | 2.6 | |||
Other Emerging | 2.5 | † | ||
Mexico | 2.2 | |||
Spain | 2.0 | |||
China | 1.8 | |||
Australia | 1.7 | |||
Chile | 1.5 | |||
Austria | 1.4 | |||
India | 1.4 | |||
Italy | 1.2 | |||
Japan | 1.0 | |||
Denmark | 1.0 | |||
Other Developed | 0.9 | ‡ | ||
|
| |||
| 100.0 | % | |||
|
| |||
Industry Group Summary | % of Equity Investments# | |||
Energy | 53.6 | % | ||
Industrial Metals | 34.2 | |||
Agriculture | 9.5 | |||
Water | 2.7 | |||
Cash/Other | 0.0 | ^ | ||
|
| |||
| 100.0 | % | |||
|
| |||
| & | In the table, derivative financial instruments, if any, are based on market values, rather than the notional amounts of derivatives, except for forward currency contracts which are based on unrealized appreciation/(depreciation). |
| ¤ | The table shows country exposure in the Fund. The table excludes short-term investments. The table excludes exposure through forward currency contracts and includes exposure through other derivative financial instruments, if any. The table takes into account the market value of securities and options and the notional amounts of swap contracts and other derivative financial instruments, if any. |
| † | “Other Emerging” is comprised of emerging countries that each represent between (1.0)% and 1.0% of Investments. |
| ‡ | “Other Developed” is comprised of developed countries that each represent between (1.0)% and 1.0% of Investments. |
| # | Equity investments may consist of common stocks and other stock-related securities, such as preferred stocks, if any. This table excludes exposure to derivative contracts, short-term investments, mutual funds and investment funds, if any. For a summary of these exposures, if any, see the Schedule of Investments. |
| ^ | Rounds to 0.0%. |
| 67 |
GMO Resources Fund
(A Series of GMO Trust)
(showing percentage of total net assets)
February 28, 2023
| Shares | Description | Value ($) | ||||||
| COMMON STOCKS — 90.4% | ||||||||
| Argentina — 0.9% | ||||||||
| 2,059,375 | Adecoagro SA (a) | 16,722,125 | ||||||
|
| |||||||
| Australia — 1.7% | ||||||||
| 13,006,288 | Beach Energy Ltd | 12,266,452 | ||||||
| 735,000 | Clean TeQ Water Ltd * | 185,540 | ||||||
| 607,823 | Fortescue Metals Group Ltd | 8,710,053 | ||||||
| 4,776,947 | Jupiter Mines Ltd (a) | 755,135 | ||||||
| 5,153,570 | Perenti Ltd * | 3,672,727 | ||||||
| 647,464 | Sandfire Resources Ltd (a) | 2,549,437 | ||||||
| 1,938,657 | Sunrise Energy Metals Ltd * | 2,085,045 | ||||||
|
| |||||||
| Total Australia | 30,224,389 | |||||||
|
| |||||||
| Austria — 1.4% | ||||||||
| 504,933 | OMV AG (a) | 24,594,008 | ||||||
|
| |||||||
| Brazil — 3.5% | ||||||||
| 2,298,590 | Dexco SA | 2,862,563 | ||||||
| 1,411,600 | Enauta Participacoes SA | 3,715,411 | ||||||
| 2,110,878 | Sao Martinho SA | 10,966,752 | ||||||
| 1,034,820 | SLC Agricola SA | 9,738,529 | ||||||
| 2,082,000 | Suzano SA | 18,984,936 | ||||||
| 1,025,968 | Vale SA | 16,719,783 | ||||||
|
| |||||||
| Total Brazil | 62,987,974 | |||||||
|
| |||||||
| Canada — 11.1% | ||||||||
| 654,900 | Anaergia Inc * (a) | 2,107,007 | ||||||
| 545,800 | Birchcliff Energy Ltd (a) | 3,356,000 | ||||||
| 623,860 | Canadian Solar Inc * (a) | 24,798,435 | ||||||
| 798,100 | Crescent Point Energy Corp | 5,451,023 | ||||||
| 575,852 | Enerflex Ltd | 3,819,319 | ||||||
| 1,841,500 | First Quantum Minerals Ltd | 40,230,938 | ||||||
| 1,246,100 | Greenlane Renewables Inc * (a) | 392,688 | ||||||
| 6,348,000 | Ivanhoe Mines Ltd – Class A * (a) | 53,035,691 | ||||||
| 1,273,509 | Largo Inc * | 8,147,844 | ||||||
| 1,740,100 | Li-Cycle Holdings Corp * (a) | 10,545,006 | ||||||
| 176,300 | Nutrien Ltd | 13,712,614 | ||||||
| 851,600 | Tamarack Valley Energy Ltd (a) | 2,708,643 | ||||||
| 227,800 | Teck Resources Ltd – Class B (b) | 9,093,776 | ||||||
| 230,700 | Teck Resources Ltd – Class B (a) (b) | 9,209,402 | ||||||
| 609,000 | Vermilion Energy Inc (a) | 8,160,600 | ||||||
| 420,000 | Whitecap Resources Inc (a) | 3,219,641 | ||||||
|
| |||||||
| Total Canada | 197,988,627 | |||||||
|
| |||||||
| Chile — 1.6% | ||||||||
| 311,295 | Sociedad Quimica y Minera de Chile SA | |||||||
| Sponsored ADR | 27,627,431 | |||||||
|
| |||||||
| China — 1.8% | ||||||||
| 8,006,000 | China High Speed Transmission Equipment | |||||||
| Group Co Ltd * (a) | 3,309,631 | |||||||
| 4,454,000 | China Water Affairs Group Ltd | 3,962,785 | ||||||
| Shares | Description | Value ($) | ||||||
| China — continued | ||||||||
| 2,516,300 | Henan Shenhuo Coal & Power Co Ltd – Class A | 6,770,864 | ||||||
| 1,829,284 | Inner Mongolia Eerduosi Resources Co Ltd – Class A | 4,412,994 | ||||||
| 4,999,845 | Western Mining Co Ltd – Class A | 8,275,520 | ||||||
| 6,597,000 | Xinjiang Goldwind Science & Technology Co Ltd – Class H | 5,950,798 | ||||||
|
| |||||||
| Total China | 32,682,592 | |||||||
|
| |||||||
| Denmark — 1.0% | ||||||||
| 646,403 | Vestas Wind Systems A/S | 18,445,071 | ||||||
|
| |||||||
| Finland — 0.6% | ||||||||
| 295,665 | Kemira Oyj | 5,663,015 | ||||||
| 98,029 | Neste Oyj | 4,728,060 | ||||||
|
| |||||||
| Total Finland | 10,391,075 | |||||||
|
| |||||||
| France — 2.6% | ||||||||
| 67,171 | Eramet SA | 7,208,192 | ||||||
| 577,978 | Technip Energies NV | 11,189,853 | ||||||
| 931,289 | Veolia Environnement SA | 27,793,671 | ||||||
| 10,058 | Vilmorin & Cie SA | 512,882 | ||||||
|
| |||||||
| Total France | 46,704,598 | |||||||
|
| |||||||
| Hungary — 0.9% | ||||||||
| 2,087,807 | MOL Hungarian Oil & Gas Plc | 15,854,133 | ||||||
|
| |||||||
| India — 1.4% | ||||||||
| 2,021,714 | Oil India Ltd | 6,015,416 | ||||||
| 5,717,817 | Vedanta Ltd | 18,541,595 | ||||||
|
| |||||||
| Total India | 24,557,011 | |||||||
|
| |||||||
| Israel — 0.3% | ||||||||
| 63,210 | Delek Group Ltd * | 5,908,700 | ||||||
|
| |||||||
| Italy — 1.2% | ||||||||
| 1,499,266 | Eni SPA | 21,175,667 | ||||||
|
| |||||||
| Japan — 1.1% | ||||||||
| 220,100 | Ebara Corp | 9,353,626 | ||||||
| 591,300 | Mitsubishi Materials Corp | 9,204,787 | ||||||
|
| |||||||
| Total Japan | 18,558,413 | |||||||
|
| |||||||
| Mexico — 2.2% | ||||||||
| 8,754,740 | Grupo Mexico SAB de CV – Series B | 39,375,157 | ||||||
|
| |||||||
| Norway — 2.7% | ||||||||
| 1,069,161 | Austevoll Seafood ASA | 9,135,655 | ||||||
| 3,149,846 | DNO ASA | 3,609,194 | ||||||
| 1,001,352 | Equinor ASA | 30,654,731 | ||||||
| 275,650 | TGS ASA | 4,961,882 | ||||||
|
| |||||||
| Total Norway | 48,361,462 | |||||||
|
| |||||||
| See accompanying notes to the financial statements. | 68 |
GMO Resources Fund
(A Series of GMO Trust)
Schedule of Investments — (Continued)
(showing percentage of total net assets)
February 28, 2023
| Shares | Description | Value ($) | ||||||
| Pakistan — 0.1% | ||||||||
| 459,459 | Pakistan Oilfields Ltd | 752,015 | ||||||
|
| |||||||
| Portugal — 3.5% | ||||||||
| 5,154,089 | Galp Energia SGPS SA | 62,877,418 | ||||||
|
| |||||||
| Russia — 0.1% | ||||||||
| 3,574,704 | Gazprom Neft PJSC (c) | 202,836 | ||||||
| 14,145,410 | Gazprom PJSC (c) | 297,270 | ||||||
| 248,399 | LUKOIL PJSC (c) | 131,233 | ||||||
| 232,917 | MMC Norilsk Nickel PJSC (c) | 449,696 | ||||||
| 338,098 | PhosAgro PJSC (c) | 303,455 | ||||||
| 6,533 | PhosAgro PJSC GDR * (c) (d) | 1,955 | ||||||
| 2 | PhosAgro PJSC GDR (Registered) * (c) | — | ||||||
| 601,778 | Ros Agro Plc GDR (Registered) * (c) | 63,037 | ||||||
| 3,476,399 | Tatneft PJSC (c) | 151,887 | ||||||
|
| |||||||
| Total Russia | 1,601,369 | |||||||
|
| |||||||
| Singapore — 0.0% | ||||||||
| 2,725,600 | Ezra Holdings Ltd * (a) (c) | — | ||||||
|
| |||||||
| South Africa — 2.7% | ||||||||
| 696,598 | African Rainbow Minerals Ltd | 9,641,520 | ||||||
| 46,379 | Anglo American Platinum Ltd | 2,564,594 | ||||||
| 1,641,392 | Impala Platinum Holdings Ltd | 15,325,491 | ||||||
| 291,076 | Sasol Ltd | 4,268,175 | ||||||
| 8,356,871 | Sibanye Stillwater Ltd | 16,873,081 | ||||||
|
| |||||||
| Total South Africa | 48,672,861 | |||||||
|
| |||||||
| South Korea — 0.1% | ||||||||
| 1,872 | Young Poong Corp * | 882,178 | ||||||
|
| |||||||
| Spain — 2.0% | ||||||||
| 2,282,140 | Repsol SA | 36,091,675 | ||||||
|
| |||||||
| Switzerland — 0.0% | ||||||||
| 6,630 | Gurit Holding AG (a) | 689,719 | ||||||
|
| |||||||
| Turkey — 0.3% | ||||||||
| 2,231,200 | Koza Anadolu Metal Madencilik | |||||||
| Isletmeleri AS * | 5,381,727 | |||||||
|
| |||||||
| Ukraine — 0.1% | ||||||||
| 501,341 | Kernel Holding SA * | 2,269,414 | ||||||
|
| |||||||
| United Kingdom — 14.7% | ||||||||
| 1,139,322 | Anglo American Plc | 39,368,942 | ||||||
| 11,208,541 | BP Plc | 73,657,242 | ||||||
| 3,520,763 | Ferrexpo Plc | 6,238,796 | ||||||
| 11,210,476 | Glencore Plc | 66,835,302 | ||||||
| 845,161 | Harbour Energy Plc | 2,948,880 | ||||||
| 760,605 | Serica Energy Plc | 2,369,001 | ||||||
| 2,357,728 | Shell Plc | 71,411,749 | ||||||
|
| |||||||
| Total United Kingdom | 262,829,912 | |||||||
|
| |||||||
| Shares | Description | Value ($) | ||||||
| United States — 30.8% | ||||||||
| 765,224 | Aemetis, Inc. * | 2,731,850 | ||||||
| 197,600 | AGCO Corp. | 27,824,056 | ||||||
| 151,100 | Alcoa Corp. | 7,394,834 | ||||||
| 751,801 | Ameresco, Inc. – Class A * | 33,041,654 | ||||||
| 159,100 | California Resources Corp. | 6,714,020 | ||||||
| 2,878,466 | Clean Energy Fuels Corp. * | 16,119,410 | ||||||
| 603,300 | Darling Ingredients, Inc. * | 38,170,791 | ||||||
| 31,500 | Deere & Co. | 13,206,060 | ||||||
| 655,182 | Freeport-McMoRan, Inc. | 26,842,806 | ||||||
| 2,533,082 | GrafTech International Ltd. | 14,311,913 | ||||||
| 851,993 | Green Plains, Inc. * | 29,538,597 | ||||||
| 485,300 | Hess Corp. | 65,369,910 | ||||||
| 13,951,301 | Kosmos Energy Ltd. * | 109,796,739 | ||||||
| 1,611,246 | Livent Corp. * | 37,783,719 | ||||||
| 286,500 | Marathon Oil Corp. | 7,205,475 | ||||||
| 631,221 | Mosaic Co. (The) | 33,574,645 | ||||||
| 154,100 | PotlatchDeltic Corp. (REIT) | 7,113,256 | ||||||
| 114,500 | Sitio Royalties Corp. – Class A | 2,691,895 | ||||||
| 58,024 | SolarEdge Technologies, Inc. * | 18,446,990 | ||||||
| 2,122,866 | Sunrun, Inc. * | 51,033,699 | ||||||
|
| |||||||
| Total United States | 548,912,319 | |||||||
|
| |||||||
| TOTAL COMMON STOCKS (COST $1,608,673,321) | 1,613,119,040 | |||||||
|
| |||||||
| PREFERRED STOCKS (e) — 8.2% | ||||||||
| Brazil — 8.2% | ||||||||
| 15,176,026 | Bradespar SA | 80,178,185 | ||||||
| 13,576,981 | Petroleo Brasileiro SA | 65,454,354 | ||||||
|
| |||||||
| Total Brazil | 145,632,539 | |||||||
|
| |||||||
| Russia — 0.0% | ||||||||
| 20,237,584 | Surgutneftegas PJSC (c) | 75,045 | ||||||
| 7,494,797 | Tatneft PJSC (c) | 332,947 | ||||||
|
| |||||||
| Total Russia | 407,992 | |||||||
|
| |||||||
| TOTAL PREFERRED STOCKS (COST $199,442,442) | 146,040,531 | |||||||
|
| |||||||
| MUTUAL FUNDS — 2.2% | ||||||||
| United States — 2.2% | ||||||||
| Affiliated Issuers — 2.2% | ||||||||
| 7,868,642 | GMO U.S. Treasury Fund | 39,264,526 | ||||||
|
| |||||||
| Total United States | 39,264,526 | |||||||
|
| |||||||
| TOTAL MUTUAL FUNDS (COST $39,249,466) | 39,264,526 | |||||||
|
| |||||||
| 69 | See accompanying notes to the financial statements. |
GMO Resources Fund
(A Series of GMO Trust)
Schedule of Investments — (Continued)
(showing percentage of total net assets)
February 28, 2023
| Shares | Description | Value ($) | ||||||
| RIGHTS/WARRANTS — 0.0% | ||||||||
| Singapore — 0.0% | ||||||||
| 2,117,812 | Ezion Holdings Ltd, expires 04/16/23* (a) (c) | 2 | ||||||
|
| |||||||
| Total Singapore | 2 | |||||||
|
| |||||||
TOTAL RIGHTS/WARRANTS (COST $0) | 2 | |||||||
|
| |||||||
| SHORT-TERM INVESTMENTS — 0.2% |
| |||||||
| Money Market Funds — 0.2% | ||||||||
| 3,375,156 | State Street Institutional Treasury Money Market Fund – Premier Class, 4.42% (f) | 3,375,156 | ||||||
|
| |||||||
TOTAL SHORT-TERM INVESTMENTS (COST $3,375,156) | 3,375,156 | |||||||
|
| |||||||
TOTAL INVESTMENTS — 101.0% (Cost $1,850,740,385) | 1,801,799,255 | |||||||
| Other Assets and Liabilities (net) — (1.0)% | (17,522,059 | ) | ||||||
|
| |||||||
| TOTAL NET ASSETS — 100.0% | $ | 1,784,277,196 | ||||||
|
| |||||||
Additional information on each restricted security is as follows:
| Value as a | ||||||||||||||||
| Percentage | Value as of | |||||||||||||||
| Issuer | Acquisition | Acquisition | of Fund’s | February 28, | ||||||||||||
Description | Date | Cost | Net Assets | 2023 | ||||||||||||
PhosAgro PJSC GDR | 08/26/16 | $ | 93,496 | 0.0 | % | $ | 1,955 | |||||||||
|
| |||||||||||||||
Notes to Schedule of Investments:
| * | Non-income producing security. |
| (a) | All or a portion of this security is out on loan (Note 2). |
| (b) | Securities are traded on separate exchanges for the same entity. |
| (c) | Investment valued at fair value using methods determined in good faith by the Trustees of GMO Trust or persons acting at their direction pursuant to procedures approved by the Trustees. Investment valued using significant unobservable inputs (Note 2). |
| (d) | The security is restricted as to resale. |
| (e) | Preferred dividend rates are disclosed to the extent that a stated rate exists. |
| (f) | The rate disclosed is the 7 day net yield as of February 28, 2023. |
For a listing of definitions of acronyms, counterparty abbreviations and currency abbreviations used throughout the Schedule of Investments as well as the derivative tables, if any, please refer to page 106.
| See accompanying notes to the financial statements. | 70 |
(A Series of GMO Trust)
Portfolio Management
Day-to-day management of the Fund’s portfolio is the responsibility of the Focused Equity team at Grantham, Mayo, Van Otterloo & Co. LLC.
Management Discussion and Analysis of the Fund Performance
Although the Fund is not managed relative to any securities market index or benchmark, a discussion of the Fund’s performance relative to S&P 600 Index is included for comparative purposes.
Class VI shares of GMO Small Cap Quality Fund returned 20.10% (net) for the period from the Fund’s inception on September 20, 2022 until the end of fiscal year ended February 28, 2023, as compared with 10.20% for the S&P 600 Index.
Relative to the S&P 600, sector allocation added value during the period. The Industrials (overweight) and Financials (underweight) allocations helped returns while Energy (underweight) reduced returns. Security selection with sector added value. Selection results in IT and Financials helped returns. Consumer Staples and Materials detracted from returns. Sector allocation had a comparable effect to stock selection within sector.
Axcelis, SAIA and TopBuild made the largest positive impact while Ollie’s Bargain Outlet, Globus Medical and Booz Allen Hamilton detracted.
The views expressed herein are exclusively those of Grantham, Mayo, Van Otterloo & Co. LLC as of the date of this report and are subject to change. GMO disclaims any responsibility to update such views. They are not meant as investment advice. References to specific securities are not recommendations of such securities and may not be representative of any GMO portfolio’s current or future investments. All information is unaudited.
71
GMO Small Cap Quality Fund
(A Series of GMO Trust)
Comparison of Change in Value of a $350,000,000 Investment in
GMO Small Cap Quality Fund Class VI Shares and the S&P 600 Index
As of February 28, 2023
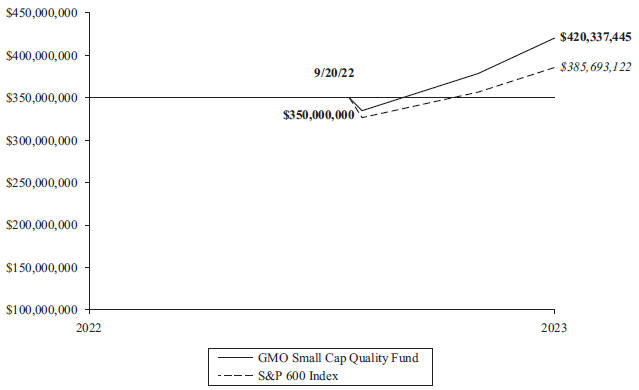
| Average Annual Total Returns | ||
| Since Inception | ||
| Class III | 11/15/22 4.57% | |
| Class VI | 9/20/22 20.10% | |
| Class I | 11/15/22 4.51% |
Performance data quoted represents past performance and is not indicative of future results. The investment return and principal value of an investment will fluctuate so that an investor’s shares, when redeemed, may be worth more or less than their original cost. Current performance data may be lower or higher than the performance data provided herein. To obtain performance information up to the most recent month-end, visit www.gmo.com. Performance shown is net of all fees after reimbursement from GMO. Returns would have been lower had certain expenses not been reimbursed during the periods shown and do not include the effect of taxes on distributions and redemptions. The performance information shown above only includes purchase premiums and/or redemption fees in effect as of February 28, 2023. All information is unaudited. Performance for classes may vary due to different fees.
For S&P disclaimers please visit https://www.gmo.com/north-america/benchmark-disclaimers/
For Class III, VI and I the gross expense ratio of 0.91%, 0.82% and 1.01%, respectively, is equal to the Fund’s Total Annual Operating Expenses set forth in the Fund’s most recent prospectus dated September 20, 2022. For the Classes listed above, the net expense ratio of 0.75%, 0.66% and 0.75% reflects the reduction of expenses from fee reimbursements. The fee reimbursements will continue until at least October 1, 2023. Elimination of this reimbursement will result in higher fees and lower performance.
72
GMO Small Cap Quality Fund
(A Series of GMO Trust)
Investment Concentration Summary
February 28, 2023 (Unaudited)
Asset Class Summary& | % of Total Net Assets | |||
Common Stocks | 98.0 | % | ||
Mutual Funds | 0.9 | |||
Short-Term Investments | 0.4 | |||
Other | 0.7 | |||
|
| |||
| 100.0 | % | |||
|
| |||
Industry Group Summary | % of Equity Investments# | |||
Capital Goods | 23.7 | % | ||
Semiconductors & Semiconductor Equipment | 8.1 | |||
Consumer Durables & Apparel | 7.6 | |||
Food, Beverage & Tobacco | 7.1 | |||
Automobiles & Components | 6.7 | |||
Transportation | 6.7 | |||
Technology Hardware & Equipment | 5.8 | |||
Commercial & Professional Services | 5.6 | |||
Materials | 5.3 | |||
Diversified Financials | 4.8 | |||
Software & Services | �� | 4.5 | ||
Media & Entertainment | 3.3 | |||
Banks | 3.0 | |||
Retailing | 2.9 | |||
Health Care Equipment & Services | 2.9 | |||
Pharmaceuticals, Biotechnology & Life Sciences | 2.0 | |||
|
| |||
| 100.0 | % | |||
|
| |||
| & | In the table, derivative financial instruments, if any, are based on market values, rather than the notional amounts of derivatives, except for forward currency contracts which are based on unrealized appreciation/(depreciation). |
| # | Equity investments may consist of common stocks and other stock-related securities, such as preferred stocks, if any. This table excludes exposure to derivative contracts, short-term investments, mutual funds and investment funds, if any. For a summary of these exposures, if any, see the Schedule of Investments. |
| 73 |
GMO Small Cap Quality Fund
(A Series of GMO Trust)
(showing percentage of total net assets)
February 28, 2023
| Shares | Description | Value ($) | ||||||
| COMMON STOCKS — 98.0% | ||||||||
| Automobiles & Components — 6.6% | ||||||||
| 18,427 | Fox Factory Holding Corp.* | 2,165,172 | ||||||
| 74,805 | Gentex Corp. | 2,135,683 | ||||||
|
| |||||||
| Total Automobiles & Components | 4,300,855 | |||||||
|
| |||||||
| Banks — 2.9% | ||||||||
| 43,836 | Essent Group Ltd. | 1,882,756 | ||||||
|
| |||||||
| Capital Goods — 23.2% | ||||||||
| 20,381 | A O Smith Corp. | 1,337,605 | ||||||
| 14,839 | AAON, Inc. | 1,349,755 | ||||||
| 12,614 | Allegion PLC | 1,421,724 | ||||||
| 12,091 | Curtiss-Wright Corp. | 2,113,386 | ||||||
| 20,334 | Graco, Inc. | 1,414,026 | ||||||
| 5,610 | Kadant, Inc. | 1,204,243 | ||||||
| 9,139 | RBC Bearings, Inc.* | 2,100,234 | ||||||
| 39,676 | Trex Co., Inc.* | 2,028,634 | ||||||
| 21,267 | Woodward, Inc. | 2,105,433 | ||||||
|
| |||||||
| Total Capital Goods | 15,075,040 | |||||||
|
| |||||||
| Commercial & Professional Services — 5.5% | ||||||||
| 14,939 | Booz Allen Hamilton Holding Corp. | 1,415,171 | ||||||
| 11,577 | FTI Consulting, Inc.* | 2,126,811 | ||||||
|
| |||||||
| Total Commercial & Professional Services | 3,541,982 | |||||||
|
| |||||||
| Consumer Durables & Apparel — 7.5% | ||||||||
| 35,905 | Acushnet Holdings Corp. | 1,732,775 | ||||||
| 17,016 | Malibu Boats, Inc. – Class A* | 1,016,876 | ||||||
| 10,211 | TopBuild Corp.* | 2,119,702 | ||||||
|
| |||||||
| Total Consumer Durables & Apparel | 4,869,353 | |||||||
|
| |||||||
| Diversified Financials — 4.7% | ||||||||
| 12,532 | Cohen & Steers, Inc. | 906,815 | ||||||
| 22,514 | Houlihan Lokey, Inc. | 2,154,590 | ||||||
|
| |||||||
| Total Diversified Financials | 3,061,405 | |||||||
|
| |||||||
| Food, Beverage & Tobacco — 7.0% | ||||||||
| 4,649 | Boston Beer Co., Inc. (The) – Class A* | 1,505,346 | ||||||
| 7,294 | J & J Snack Foods Corp. | 1,029,986 | ||||||
| 10,519 | Lancaster Colony Corp. | 2,019,438 | ||||||
|
| |||||||
| Total Food, Beverage & Tobacco | 4,554,770 | |||||||
|
| |||||||
| Health Care Equipment & Services — 2.8% | ||||||||
| 31,168 | Globus Medical, Inc. – Class A* | 1,818,341 | ||||||
|
| |||||||
| Materials — 5.2% | ||||||||
| 18,270 | AptarGroup, Inc. | 2,132,474 | ||||||
| 9,651 | Balchem Corp. | 1,254,630 | ||||||
|
| |||||||
| Total Materials | 3,387,104 | |||||||
|
| |||||||
| Shares | Description | Value ($) | ||||||
| Media & Entertainment — 3.3% |
| |||||||
| 55,044 | New York Times Co. (The) – Class A | 2,119,194 | ||||||
| Pharmaceuticals, Biotechnology & Life Sciences — 1.9% |
| |||||||
| 18,227 | Bruker Corp. | 1,256,205 | ||||||
| Retailing — 2.8% |
| |||||||
| 26,367 | Ollie’s Bargain Outlet Holdings, Inc.* | 1,517,157 | ||||||
| 1,116 | Winmark Corp. | 325,872 | ||||||
| Total Retailing | 1,843,029 | |||||||
| Semiconductors & Semiconductor Equipment — 7.9% |
| |||||||
| 17,031 | Axcelis Technologies, Inc.* | 2,189,165 | ||||||
| 23,944 | Power Integrations, Inc. | 1,969,394 | ||||||
| 7,144 | Universal Display Corp. | 970,512 | ||||||
| Total Semiconductors & Semiconductor Equipment | 5,129,071 | |||||||
| Software & Services — 4.4% |
| |||||||
| 17,312 | Dolby Laboratories, Inc. – Class A | 1,424,432 | ||||||
| 29,733 | Genpact Ltd. | 1,419,156 | ||||||
| Total Software & Services | 2,843,588 | |||||||
| Technology Hardware & Equipment — 5.7% |
| |||||||
| 35,101 | Ciena Corp.* | 1,692,570 | ||||||
| 16,703 | Fabrinet* | 2,035,595 | ||||||
| Total Technology Hardware & Equipment | 3,728,165 | |||||||
| Transportation — 6.6% |
| |||||||
| 11,735 | Landstar System, Inc. | 2,121,571 | ||||||
| 7,883 | Saia, Inc.* | 2,135,267 | ||||||
| Total Transportation | 4,256,838 | |||||||
TOTAL COMMON STOCKS (COST $52,997,114) | 63,667,696 | |||||||
| MUTUAL FUNDS — 0.9% |
| |||||||
| Affiliated Issuers — 0.9% |
| |||||||
| 122,595 | GMO U.S. Treasury Fund | 611,750 | ||||||
TOTAL MUTUAL FUNDS (COST $611,333) | 611,750 | |||||||
| See accompanying notes to the financial statements. | 74 |
GMO Small Cap Quality Fund
(A Series of GMO Trust)
Schedule of Investments — (Continued)
(showing percentage of total net assets)
February 28, 2023
| Shares | Description | Value ($) | ||||||
| SHORT-TERM INVESTMENTS — 0.4% |
| |||||||
| Money Market Funds — 0.4% | ||||||||
| 254,109 | State Street Institutional Treasury Money Market Fund – Premier Class, 4.42% (a) | 254,109 | ||||||
|
| |||||||
TOTAL SHORT-TERM INVESTMENTS (COST $254,109) | 254,109 | |||||||
|
| |||||||
TOTAL INVESTMENTS — 99.3% (Cost $53,862,556) | 64,533,555 | |||||||
| Other Assets and Liabilities (net) — 0.7% | 444,380 | |||||||
|
| |||||||
| TOTAL NET ASSETS — 100.0% | $ | 64,977,935 | ||||||
|
| |||||||
Notes to Schedule of Investments:
| * | Non-income producing security. |
| (a) | The rate disclosed is the 7 day net yield as of February 28, 2023. |
For a listing of definitions of acronyms, counterparty abbreviations and currency abbreviations used throughout the Schedule of Investments as well as the derivative tables, if any, please refer to page 106.
| 75 | See accompanying notes to the financial statements. |
This page has been left blank intentionally.
GMO Tax-Managed International Equities Fund
(A Series of GMO Trust)
Portfolio Management
Day-to-day management of the Fund’s portfolio is the responsibility of the Systematic Equity team at Grantham, Mayo, Van Otterloo & Co. LLC.
Management Discussion and Analysis of Fund Performance
Although the Fund is not managed relative to any securities market index or benchmark, a discussion of the Fund’s performance relative to the MSCI EAFE Index is included for comparative purposes.
Class III shares of GMO Tax-Managed International Equities Fund returned -2.42% (net) for the fiscal year ended February 28, 2023, as compared with -3.14% for the MSCI EAFE Index.
Stock selection drove outperformance for the period with notable contributions from Japan, Emerging Markets, Singapore, Consumer Staples, Industrials, and Spanish Financials.
Decisions which detracted from performance included stock selection in the United Kingdom, Health Care, and Consumer Discretionary. Aggregate country and sector allocation decisions were also detractors.
The views expressed herein are exclusively those of Grantham, Mayo, Van Otterloo & Co. LLC as of the date of this report and are subject to change. GMO disclaims any responsibility to update such views. They are not meant as investment advice. References to specific securities are not recommendations of such securities and may not be representative of any GMO portfolio’s current or future investments. All information is unaudited.
| 77 |
GMO Tax-Managed International Equities Fund
(A Series of GMO Trust)
Comparison of Change in Value of a $5,000,000 Investment in
GMO Tax-Managed International Equities Fund Class III Shares, the MSCI EAFE Index and
the MSCI EAFE Index (After Tax) As of February 28, 2023
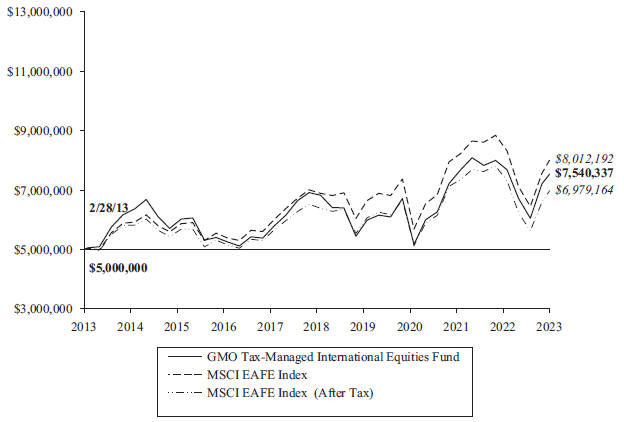
| Average Annual Total Returns | ||||||||||||
| 1 Year | 5 Year | 10 Year | ||||||||||
| Class III | -2.42 | % | 1.75 | % | 4.19 | % | ||||||
Performance data quoted represents past performance and is not indicative of future results. The investment return and principal value of an investment will fluctuate so that an investor’s shares, when redeemed, may be worth more or less than their original cost. Current performance data may be lower or higher than the performance data provided herein. To obtain performance information up to the most recent month-end, visit www.gmo.com. Performance shown is net of all fees after reimbursement from GMO. Returns would have been lower had certain expenses not been reimbursed during the periods shown and do not include the effect of taxes on distributions and redemptions. The performance information shown above only includes purchase premiums and/or redemption fees in effect as of February 28, 2023. All information is unaudited.
MSCI data may not be reproduced or used for any other purpose. MSCI provides no warranties, has not prepared or approved this report, and has no liability hereunder.
For Class III the gross expense ratio of 1.44% is equal to the Fund’s Total Annual Operating Expenses set forth in the Fund’s most recent prospectus dated June 30, 2022. For the Class listed above, the net expense ratio of 0.85% reflects the reduction of expenses from fee reimbursements. The fee reimbursements will continue until at least June 30, 2023. Elimination of this reimbursement will result in higher fees and lower performance.
| 78 |
GMO Tax-Managed International Equities Fund
(A Series of GMO Trust)
Investment Concentration Summary
February 28, 2023 (Unaudited)
Asset Class Summary& | % of Total Net Assets | |||
Common Stocks | 95.8 | % | ||
Mutual Funds | 3.8 | |||
Preferred Stocks | 1.8 | |||
Short-Term Investments | 0.1 | |||
Futures Contracts | 0.0 | ^ | ||
Other | (1.5 | ) | ||
|
| |||
| 100.0 | % | |||
|
| |||
Country/Region Summary¤ | % of Investments | |||
Japan | 21.8 | % | ||
France | 13.9 | |||
United Kingdom | 13.2 | |||
Netherlands | 7.0 | |||
Spain | 6.5 | |||
Switzerland | 5.7 | |||
Germany | 4.4 | |||
Australia | 4.1 | |||
United States | 4.1 | |||
Singapore | 3.7 | |||
Turkey | 2.0 | |||
Norway | 2.0 | |||
Brazil | 1.9 | |||
Other Developed | 1.8 | ‡ | ||
South Korea | 1.7 | |||
Thailand | 1.7 | |||
Finland | 1.4 | |||
Other Emerging | 1.1 | † | ||
Hong Kong | 1.0 | |||
Italy | 1.0 | |||
|
| |||
| 100.0 | % | |||
|
| |||
Industry Group Summary | % of Equity Investments# | |||
Capital Goods | 14.4 | % | ||
Banks | 11.7 | |||
Pharmaceuticals, Biotechnology & Life Sciences | 10.1 | |||
Food, Beverage & Tobacco | 9.6 | |||
Energy | 7.9 | |||
Consumer Durables & Apparel | 6.3 | |||
Materials | 5.7 | |||
Diversified Financials | 4.9 | |||
Telecommunication Services | 4.7 | |||
Technology Hardware & Equipment | 4.1 | |||
Commercial & Professional Services | 3.5 | |||
Food & Staples Retailing | 3.1 | |||
Semiconductors & Semiconductor Equipment | 3.1 | |||
Automobiles & Components | 2.8 | |||
Retailing | 2.4 | |||
Insurance | 1.6 | |||
Media & Entertainment | 1.1 | |||
Household & Personal Products | 0.7 | |||
Real Estate | 0.7 | |||
Utilities | 0.5 | |||
Health Care Equipment & Services | 0.5 | |||
Software & Services | 0.4 | |||
Transportation | 0.2 | |||
|
| |||
| 100.0 | % | |||
|
| |||
| & | In the table, derivative financial instruments, if any, are based on market values, rather than the notional amounts of derivatives, except for forward currency contracts which are based on unrealized appreciation/(depreciation). |
| ¤ | The table shows country exposure in the Fund. The table excludes short-term investments. The table excludes exposure through forward currency contracts and includes exposure through other derivative financial instruments, if any. The table takes into account the market value of securities and options and the notional amounts of swap contracts and other derivative financial instruments, if any. |
| ‡ | “Other Developed” is comprised of developed countries that each represent between (1.0)% and 1.0% of Investments. |
| † | “Other Emerging” is comprised of emerging countries that each represent between (1.0)% and 1.0% of Investments. |
| # | Equity investments may consist of common stocks and other stock-related securities, such as preferred stocks, if any. This table excludes exposure to derivative contracts, short-term investments, mutual funds and investment funds, if any. For a summary of these exposures, if any, see the Schedule of Investments. |
| ^ | Rounds to 0.0%. |
| 79 |
GMO Tax-Managed International Equities Fund
(A Series of GMO Trust)
(showing percentage of total net assets)
February 28, 2023
| Shares | Description | Value ($) | ||||||
| COMMON STOCKS — 95.8% |
| |||||||
| Australia — 4.2% |
| |||||||
| 3,324 | BHP Group Ltd | 100,601 | ||||||
| 7,015 | BlueScope Steel Ltd | 89,755 | ||||||
| 7,666 | Brambles Ltd | 66,239 | ||||||
| 4,574 | Fortescue Metals Group Ltd | 65,545 | ||||||
| 9,989 | GrainCorp Ltd – Class A | 52,673 | ||||||
| 2,367 | JB Hi-Fi Ltd | 66,438 | ||||||
| 10,142 | Rio Tinto Ltd | 792,639 | ||||||
| 4,330 | Sims Ltd | 46,249 | ||||||
|
| |||||||
| Total Australia | 1,280,139 | |||||||
|
| |||||||
| Belgium — 0.1% |
| |||||||
| 605 | Bekaert SA | 26,694 | ||||||
|
| |||||||
| Brazil — 1.2% |
| |||||||
| 600 | Arezzo Industria e Comercio SA | 8,549 | ||||||
| 4,400 | Banco do Brasil SA | 33,869 | ||||||
| 10,200 | BB Seguridade Participacoes SA | 66,650 | ||||||
| 71,500 | Cielo SA | 65,553 | ||||||
| 12,100 | JBS SA | 44,351 | ||||||
| 5,100 | Petroleo Brasileiro SA Sponsored ADR | 56,559 | ||||||
| 27,700 | TIM SA | 64,866 | ||||||
| 5,200 | Vibra Energia SA | 14,690 | ||||||
|
| |||||||
| Total Brazil | 355,087 | |||||||
|
| |||||||
| Finland — 1.4% |
| |||||||
| 68,365 | Nokia Oyj | 316,294 | ||||||
| 3,563 | UPM-Kymmene Oyj | 129,110 | ||||||
|
| |||||||
| Total Finland | 445,404 | |||||||
|
| |||||||
| France — 14.1% |
| |||||||
| 338 | Alten SA | 52,750 | ||||||
| 12,683 | Cie de Saint-Gobain | 753,657 | ||||||
| 1,448 | Coface SA | 21,341 | ||||||
| 1,551 | Ipsen SA | 177,215 | ||||||
| 1,111 | IPSOS | 68,155 | ||||||
| 125 | Kering SA | 73,290 | ||||||
| 27 | LVMH Moet Hennessy Louis Vuitton SE | 22,446 | ||||||
| 3,231 | Publicis Groupe SA | 256,500 | ||||||
| 805 | Renault SA * | 36,029 | ||||||
| 8,720 | Sanofi | 815,305 | ||||||
| 390 | Societe BIC SA | 25,228 | ||||||
| 10,871 | Societe Generale SA | 313,297 | ||||||
| 16,700 | STMicroelectronics NV | 804,272 | ||||||
| 14,783 | TotalEnergies SE | 912,172 | ||||||
|
| |||||||
| Total France | 4,331,657 | |||||||
|
| |||||||
| Germany — 3.5% |
| |||||||
| 1,871 | Bayer AG (Registered) | 111,102 | ||||||
| 1,208 | Bayerische Motoren Werke AG | 124,624 | ||||||
| 253 | Hannover Rueck SE | 49,132 | ||||||
| 207 | Henkel AG & Co KGaA | 14,313 | ||||||
| Shares | Description | Value ($) | ||||||
| Germany — continued | ||||||||
| 84 | Hornbach Holding AG & Co KGaA | 6,976 | ||||||
| 3,298 | Kloeckner & Co SE | 35,697 | ||||||
| 1,644 | Mercedes-Benz Group AG | 126,001 | ||||||
| 2,923 | Merck KGaA | 553,888 | ||||||
| 117 | RTL Group SA | 5,640 | ||||||
| 268 | Volkswagen AG | 47,613 | ||||||
|
| |||||||
| Total Germany | 1,074,986 | |||||||
|
| |||||||
| Hong Kong — 1.1% | ||||||||
| 9,100 | ASMPT Ltd | 77,645 | ||||||
| 20,500 | CK Asset Holdings Ltd | 128,577 | ||||||
| 4,000 | Johnson Electric Holdings Ltd | 4,588 | ||||||
| 1,800 | VTech Holdings Ltd | 9,889 | ||||||
| 181,500 | WH Group Ltd | 105,620 | ||||||
|
| |||||||
| Total Hong Kong | 326,319 | |||||||
|
| |||||||
| India — 1.0% | ||||||||
| 3,359 | Cipla Ltd | 36,777 | ||||||
| 39,788 | GAIL India Ltd | 49,463 | ||||||
| 34 | Hero MotoCorp Ltd | 997 | ||||||
| 644 | Hindustan Aeronautics Ltd | 20,058 | ||||||
| 16,760 | ITC Ltd | 76,296 | ||||||
| 1,169 | Rajesh Exports Ltd | 9,179 | ||||||
| 67,001 | REC Ltd | 92,742 | ||||||
| 742 | Sun Pharmaceutical Industries Ltd | 8,597 | ||||||
|
| |||||||
| Total India | 294,109 | |||||||
|
| |||||||
| Ireland — 0.6% | ||||||||
| 10,544 | Bank of Ireland Group Plc | 116,164 | ||||||
| 908 | Kingspan Group Plc | 58,937 | ||||||
|
| |||||||
| Total Ireland | 175,101 | |||||||
|
| |||||||
| Italy — 1.0% | ||||||||
| 675 | Banca IFIS SPA | 11,080 | ||||||
| 15,234 | Eni SPA | 215,166 | ||||||
| 1,005 | Esprinet SPA | 7,670 | ||||||
| 128 | Sesa SPA | 16,509 | ||||||
| 13,409 | Unipol Gruppo SPA | 70,932 | ||||||
|
| |||||||
| Total Italy | 321,357 | |||||||
|
| |||||||
| Japan — 22.2% | ||||||||
| 500 | Advantest Corp | 39,634 | ||||||
| 2,300 | Asahi Kasei Corp | 16,020 | ||||||
| 2,800 | Bandai Namco Holdings Inc | 173,015 | ||||||
| 7,500 | Brother Industries Ltd | 110,317 | ||||||
| 28,500 | Canon Inc | 613,384 | ||||||
| 1,600 | Daiwabo Holdings Co Ltd | 24,726 | ||||||
| 400 | FUJIFILM Holdings Corp | 18,661 | ||||||
| 3,100 | Haseko Corp | 35,573 | ||||||
| 23,100 | ITOCHU Corp | 690,475 | ||||||
| 35,500 | Japan Tobacco Inc | 721,907 | ||||||
| 22,300 | KDDI Corp | 652,450 | ||||||
| See accompanying notes to the financial statements. | 80 |
GMO Tax-Managed International Equities Fund
(A Series of GMO Trust)
Schedule of Investments — (Continued)
(showing percentage of total net assets)
February 28, 2023
| Shares | Description | Value ($) | ||||||
| Japan — continued | ||||||||
| 51,600 | Marubeni Corp | 658,729 | ||||||
| 17,300 | Mitsubishi Motors Corp * | 68,223 | ||||||
| 23,200 | Mitsui & Co Ltd | 651,128 | ||||||
| 8,900 | NGK Spark Plug Co Ltd | 178,971 | ||||||
| 1,000 | Nichias Corp | 19,719 | ||||||
| 18,700 | Nippon Telegraph & Telephone Corp | 541,866 | ||||||
| 2,600 | Ono Pharmaceutical Co Ltd | 52,957 | ||||||
| 6,500 | Seiko Epson Corp | 89,620 | ||||||
| 6,900 | Sekisui Chemical Co Ltd | 92,503 | ||||||
| 19,300 | Sekisui House Ltd | 365,411 | ||||||
| 600 | Shimamura Co Ltd | 56,051 | ||||||
| 12,120 | Sojitz Corp | 232,676 | ||||||
| 23,500 | Sumitomo Chemical Co Ltd | 82,344 | ||||||
| 2,000 | Sumitomo Corp | 34,086 | ||||||
| 8,000 | Sumitomo Forestry Co Ltd | 153,512 | ||||||
| 7,000 | Toyota Tsusho Corp | 285,485 | ||||||
| 900 | Yakult Honsha Co Ltd | 61,350 | ||||||
| 3,400 | Yamaha Motor Co Ltd | 86,990 | ||||||
|
| |||||||
| Total Japan | 6,807,783 | |||||||
|
| |||||||
| Netherlands — 7.1% | ||||||||
| 9,795 | ABN AMRO Bank NV CVA | 172,844 | ||||||
| 1,130 | ASR Nederland NV | 51,427 | ||||||
| 2,955 | EXOR NV * | 243,830 | ||||||
| 22,005 | Koninklijke Ahold Delhaize NV | 698,700 | ||||||
| 1,838 | NN Group NV | 74,396 | ||||||
| 8,239 | Randstad NV | 505,547 | ||||||
| 1,309 | Signify NV | 45,357 | ||||||
| 3,480 | Wolters Kluwer NV | 402,871 | ||||||
|
| |||||||
| Total Netherlands | 2,194,972 | |||||||
|
| |||||||
| Norway — 2.0% | ||||||||
| 20,091 | Equinor ASA | 615,053 | ||||||
|
| |||||||
| Poland — 0.1% | ||||||||
| 233 | Asseco Poland SA | 4,178 | ||||||
| 1,259 | Polski Koncern Naftowy ORLEN SA | 18,804 | ||||||
|
| |||||||
| Total Poland | 22,982 | |||||||
|
| |||||||
| Portugal — 0.7% | ||||||||
| 7,022 | Jeronimo Martins SGPS SA | 144,133 | ||||||
| 8,084 | Navigator Co SA (The) | 28,432 | ||||||
| 34,225 | Sonae SGPS SA | 37,499 | ||||||
|
| |||||||
| Total Portugal | 210,064 | |||||||
|
| |||||||
| Russia — 0.0% | ||||||||
| 9,800 | Surgutneftegas PJSC (a) | 30 | ||||||
|
| |||||||
| Singapore — 3.7% | ||||||||
| 24,099 | DBS Group Holdings Ltd | 611,419 | ||||||
| 3,900 | Jardine Cycle & Carriage Ltd | 85,976 | ||||||
| 26,900 | Keppel Corp Ltd | 109,236 | ||||||
| 513,387 | Sembcorp Marine Ltd * | 48,313 | ||||||
| Shares | Description | Value ($) | ||||||
| Singapore — continued | ||||||||
| 25,700 | Wilmar International Ltd | 75,086 | ||||||
| 221,300 | Yangzijiang Shipbuilding Holdings Ltd | 211,740 | ||||||
|
| |||||||
| Total Singapore | 1,141,770 | |||||||
|
| |||||||
| South Africa — 0.1% | ||||||||
| 2,596 | Aspen Pharmacare Holdings Ltd | 20,046 | ||||||
| 11,423 | Netcare Ltd | 9,467 | ||||||
| 2,988 | Truworths International Ltd | 9,623 | ||||||
|
| |||||||
| Total South Africa | 39,136 | |||||||
|
| |||||||
| South Korea — 1.7% | ||||||||
| 9,988 | BNK Financial Group Inc | 50,549 | ||||||
| 4,624 | DGB Financial Group Inc | 27,604 | ||||||
| 885 | GS Holdings Corp | 27,201 | ||||||
| 6,606 | Hanwha Life Insurance Co Ltd * | 14,844 | ||||||
| 611 | Hyundai Glovis Co Ltd | 73,175 | ||||||
| 396 | Hyundai Mobis Co Ltd | 63,607 | ||||||
| 2,832 | KT&G Corp | 190,038 | ||||||
| 5 | LG Electronics Inc | 419 | ||||||
| 656 | LOTTE Fine Chemical Co Ltd | 28,768 | ||||||
| 464 | LX International Corp | 10,977 | ||||||
| 494 | SL Corp * | 10,179 | ||||||
| 1,041 | Youngone Corp * | 33,518 | ||||||
|
| |||||||
| Total South Korea | 530,879 | |||||||
|
| |||||||
| Spain — 6.6% | ||||||||
| 11,908 | Acerinox SA | 130,759 | ||||||
| 110,934 | Banco Bilbao Vizcaya Argentaria SA | 862,293 | ||||||
| 500,668 | Banco de Sabadell SA | 653,971 | ||||||
| 7,967 | Industria de Diseno Textil SA | 245,437 | ||||||
| 7,652 | Repsol SA | 121,015 | ||||||
|
| |||||||
| Total Spain | 2,013,475 | |||||||
|
| |||||||
| Sweden — 0.4% | ||||||||
| 1,395 | Investor AB – A Shares | 28,596 | ||||||
| 554 | Investor AB – B Shares | 10,701 | ||||||
| 4,822 | SSAB AB – A Shares | 35,055 | ||||||
| 9,319 | SSAB AB – B Shares | 63,746 | ||||||
|
| |||||||
| Total Sweden | 138,098 | |||||||
|
| |||||||
| Switzerland — 5.8% | ||||||||
| 403 | Cie Financiere Richemont SA – Class A (Registered) | 60,892 | ||||||
| 446 | DKSH Holding AG | 36,292 | ||||||
| 1,484 | Novartis AG (Registered) | 124,894 | ||||||
| 100 | Novartis AG Sponsored ADR | 8,412 | ||||||
| 3,239 | Roche Holding AG – Genusschein | 933,929 | ||||||
| 95 | Swatch Group AG (The) | 33,059 | ||||||
| 1,700 | UBS Group AG (Registered) (b) | 37,026 | ||||||
| 19,697 | UBS Group AG (Registered) (b) | 428,119 | ||||||
| 263 | Zurich Insurance Group AG | 124,755 | ||||||
|
| |||||||
| Total Switzerland | 1,787,378 | |||||||
|
| |||||||
| 81 | See accompanying notes to the financial statements. |
GMO Tax-Managed International Equities Fund
(A Series of GMO Trust)
Schedule of Investments — (Continued)
(showing percentage of total net assets)
February 28, 2023
| Shares | Description | Value ($) | ||||||
| Thailand — 1.7% | ||||||||
| 93,200 | AP Thailand Pcl NVDR | 32,687 | ||||||
| 164,500 | Bangkok Dusit Medical Services Pcl NVDR | 130,299 | ||||||
| 529,900 | Krung Thai Bank Pcl NVDR | 259,363 | ||||||
| 92,900 | PTT Oil & Retail Business Pcl NVDR | 57,567 | ||||||
| 649,600 | Sansiri Pcl NVDR | 35,097 | ||||||
|
| |||||||
| Total Thailand | 515,013 | |||||||
|
| |||||||
| Turkey — 2.1% | ||||||||
| 330,568 | Akbank TAS | 305,668 | ||||||
| 11,564 | Arcelik AS | 72,997 | ||||||
| 15,186 | Aselsan Elektronik Sanayi Ve Ticaret AS | 44,330 | ||||||
| 3,483 | Dogus Otomotiv Servis ve Ticaret AS | 31,157 | ||||||
| 12,020 | KOC Holding AS | 49,234 | ||||||
| 58,101 | Turkiye Garanti Bankasi AS | 71,504 | ||||||
| 50,705 | Turkiye Is Bankasi AS – Class C | 30,430 | ||||||
| 104,432 | Turkiye Sinai Kalkinma Bankasi AS * | 21,903 | ||||||
| 2,975 | Vestel Elektronik Sanayi ve Ticaret AS * | 8,811 | ||||||
|
| |||||||
| Total Turkey | 636,034 | |||||||
|
| |||||||
| United Kingdom — 13.4% | ||||||||
| 21,176 | 3i Group Plc | 414,292 | ||||||
| 19,339 | BAE Systems Plc | 208,865 | ||||||
| 49,520 | Barratt Developments Plc | 278,425 | ||||||
| 4,024 | Bellway Plc | 107,281 | ||||||
| 9,500 | BP Plc Sponsored ADR | 376,200 | ||||||
| 3,830 | British American Tobacco Plc | 144,949 | ||||||
| 16,100 | British American Tobacco Plc Sponsored ADR | 612,766 | ||||||
| 82,656 | BT Group Plc | 138,569 | ||||||
| 5,664 | Burberry Group Plc | 168,190 | ||||||
| 8,393 | Coca-Cola HBC AG * | 214,940 | ||||||
| 152 | Ferguson Plc | 21,882 | ||||||
| 5,490 | GSK Plc Sponsored ADR | 188,142 | ||||||
| 7,596 | IG Group Holdings Plc | 73,330 | ||||||
| 26,017 | Imperial Brands Plc | 626,782 | ||||||
| 4,134 | Investec Plc | 26,330 | ||||||
| 8,500 | Kingfisher Plc | 29,396 | ||||||
| 2,568 | Next Plc | 211,248 | ||||||
| 5,740 | Persimmon Plc | 100,098 | ||||||
| 3,503 | Plus500 Ltd | 75,566 | ||||||
| 13,515 | Redrow Plc | 83,054 | ||||||
| 6,565 | Spirent Communications Plc | 16,796 | ||||||
|
| |||||||
| Total United Kingdom | 4,117,101 | |||||||
|
| |||||||
TOTAL COMMON STOCKS (COST $25,690,239) | 29,400,621 | |||||||
|
| |||||||
| PREFERRED STOCKS (c) — 1.8% | ||||||||
| Brazil — 0.8% | ||||||||
| 8,700 | Cia Energetica de Minas Gerais | 17,415 | ||||||
| 70,200 | Cia Paranaense de Energia – Class B | 94,531 | ||||||
| 13,000 | Gerdau SA Sponsored ADR | 71,110 | ||||||
| Shares | Description | Value ($) | ||||||
| Brazil — continued | ||||||||
| 4,500 | Petroleo Brasileiro SA Sponsored ADR | 43,920 | ||||||
|
| |||||||
| Total Brazil | 226,976 | |||||||
|
| |||||||
| Germany — 1.0% | ||||||||
| 1,061 | Bayerische Motoren Werke AG | 100,494 | ||||||
| 186 | Draegerwerk AG & Co KGaA | 8,111 | ||||||
| 2,718 | Henkel AG & Co KGaA | 197,730 | ||||||
|
| |||||||
| Total Germany | 306,335 | |||||||
|
| |||||||
| South Korea — 0.0% | ||||||||
| 302 | LG Electronics Inc | 10,828 | ||||||
|
| |||||||
TOTAL PREFERRED STOCKS (COST $506,167) | 544,139 | |||||||
|
| |||||||
| MUTUAL FUNDS — 3.8% | ||||||||
| United States — 3.8% | ||||||||
| Affiliated Issuers — 3.8% | ||||||||
| 232,525 | GMO U.S. Treasury Fund | 1,160,296 | ||||||
|
| |||||||
| Total United States | 1,160,296 | |||||||
|
| |||||||
TOTAL MUTUAL FUNDS (COST $1,158,722) | 1,160,296 | |||||||
|
| |||||||
| SHORT-TERM INVESTMENTS — 0.1% |
| |||||||
| Money Market Funds — 0.1% | ||||||||
| 43,531 | State Street Institutional Treasury Money Market Fund – Premier Class, 4.42% (d) | 43,531 | ||||||
|
| |||||||
TOTAL SHORT-TERM INVESTMENTS (COST $43,531) | 43,531 | |||||||
|
| |||||||
TOTAL INVESTMENTS — 101.5% (Cost $27,398,659) | 31,148,587 | |||||||
| Other Assets and Liabilities (net) — (1.5)% | (462,391 | ) | ||||||
|
| |||||||
| TOTAL NET ASSETS — 100.0% | $30,686,196 | |||||||
|
| |||||||
| See accompanying notes to the financial statements. | 82 |
GMO Tax-Managed International Equities Fund
(A Series of GMO Trust)
Schedule of Investments — (Continued)
February 28, 2023
A summary of outstanding financial instruments at February 28, 2023 is as follows:
Futures Contracts
Number of | Type | Expiration Date | Notional Amount ($) | Value/Net Unrealized Appreciation (Depreciation) ($) | ||||||||||||
Buys | ||||||||||||||||
1 | MSCI EAFE | March 2023 | $ | 102,330 | $ | 2,645 | ||||||||||
|
|
|
| |||||||||||||
| + | Buys - Fund is long the futures contract. |
Sales - Fund is short the futures contract.
As of February 28, 2023, for the above contracts and/or agreements, the Fund had sufficient cash and/or securities to cover commitments or collateral requirements, if any, of the relevant broker or exchange.
Notes to Schedule of Investments:
| * | Non-income producing security. |
| (a) | Investment valued at fair value using methods determined in good faith by the Trustees of GMO Trust or persons acting at their direction pursuant to procedures approved by the Trustees. Investment valued using significant unobservable inputs (Note 2). |
| (b) | Securities are traded on separate exchanges for the same entity. |
| (c) | Preferred dividend rates are disclosed to the extent that a stated rate exists. |
| (d) | The rate disclosed is the 7 day net yield as of February 28, 2023. |
For a listing of definitions of acronyms, counterparty abbreviations and currency abbreviations used throughout the Schedule of Investments as well as the derivative tables, if any, please refer to page 106.
| 83 | See accompanying notes to the financial statements. |
This page has been left blank intentionally.
(A Series of GMO Trust)
Portfolio Management
Day-to-day management of the Fund’s portfolio is the responsibility of the Systematic Equity team at Grantham, Mayo, Van Otterloo & Co. LLC.
Management Discussion and Analysis of Fund Performance
Although the Fund is not managed relative to any securities market index or benchmark, a discussion of the Fund’s performance relative to the S&P Composite 1500 Index is included for comparative purposes.
Class III shares of GMO U.S. Equity Fund returned -1.63% (net) for the fiscal year ended February 28, 2023, as compared with -7.19% for the S&P Composite 1500 Index.
Stock selection drove outperformance for the period with notable contributions from Consumer Discretionary, Health Care, and Financials. Top contributors included overweight positioning in Merck (Health Care) and Genuine Parts Company (Consumer Discretionary). Underweight positioning toward Amazon and Tesla in Consumer Discretionary also contributed to performance.
Top detractors included stock selection in Real Estate and an underweight toward Financials.
The views expressed herein are exclusively those of Grantham, Mayo, Van Otterloo & Co. LLC as of the date of this report and are subject to change. GMO disclaims any responsibility to update such views. They are not meant as investment advice. References to specific securities are not recommendations of such securities and may not be representative of any GMO portfolio’s current or future investments. All information is unaudited.
| 85 |
GMO U.S. Equity Fund
(A Series of GMO Trust)
Comparison of Change in Value of a $5,000,000 Investment in
GMO U.S. Equity Fund Class III Shares and the S&P Composite 1500 Index
As of February 28, 2023
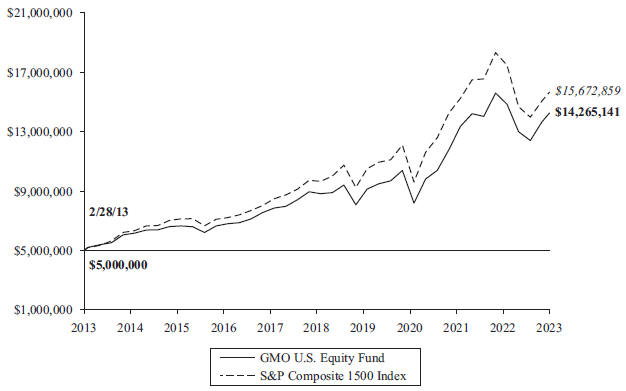
| Average Annual Total Returns | ||||||||||||
| 1 Year | 5 Year | 10 Year | ||||||||||
| Class III | -1.63 | % | 9.75 | % | 11.05 | % | ||||||
| Class VI | -1.47 | % | 9.86 | % | 11.16 | % | ||||||
Performance data quoted represents past performance and is not indicative of future results. The investment return and principal value of an investment will fluctuate so that an investor’s shares, when redeemed, may be worth more or less than their original cost. Current performance data may be lower or higher than the performance data provided herein. To obtain performance information up to the most recent month-end, visit www.gmo.com. Performance shown is net of all fees after reimbursement from GMO. Returns would have been lower had certain expenses not been reimbursed during the periods shown and do not include the effect of taxes on distributions and redemptions. The performance information shown above only includes purchase premiums and/or redemption fees in effect as of February 28, 2023. All information is unaudited. Performance for classes may vary due to different fees.
For S&P disclaimers please visit https://www.gmo.com/north-america/benchmark-disclaimers/
For Class III and VI the gross expense ratio of 0.50% and 0.41%, respectively, is equal to the Fund’s Total Annual Operating Expenses set forth in the Fund’s most recent prospectus dated June 30, 2022. For the Classes listed above, the corresponding Net Expense Ratio of 0.47% and 0.38% reflects the reduction of expenses from fee reimbursements. The fee reimbursements will continue until at least June 30, 2023. Elimination of this reimbursement will result in higher fees and lower performance.
| 86 |
GMO U.S. Equity Fund
(A Series of GMO Trust)
Investment Concentration Summary
February 28, 2023 (Unaudited)
Asset Class Summary& | % of Total Net Assets | |||
Common Stocks | 98.0 | % | ||
Mutual Funds | 1.2 | |||
Short-Term Investments | 0.3 | |||
Futures Contracts | 0.0 | ^ | ||
Other | 0.5 | |||
|
| |||
| 100.0 | % | |||
|
| |||
Industry Group Summary | % of Equity Investments# | |||
Technology Hardware & Equipment | 11.7 | % | ||
Retailing | 9.3 | |||
Capital Goods | 8.7 | |||
Software & Services | 8.7 | |||
Energy | 7.2 | |||
Semiconductors & Semiconductor Equipment | 7.2 | |||
Diversified Financials | 6.5 | |||
Pharmaceuticals, Biotechnology & Life Sciences | 6.0 | |||
Consumer Durables & Apparel | 5.2 | |||
Health Care Equipment & Services | 4.7 | |||
Materials | 4.7 | |||
Media & Entertainment | 4.6 | |||
Banks | 4.4 | |||
Food, Beverage & Tobacco | 4.1 | |||
Food & Staples Retailing | 3.4 | |||
Commercial & Professional Services | 1.2 | |||
Insurance | 1.2 | |||
Consumer Services | 0.6 | |||
Transportation | 0.4 | |||
Automobiles & Components | 0.1 | |||
Real Estate | 0.1 | |||
|
| |||
| 100.0 | % | |||
|
| |||
| & | In the table, derivative financial instruments, if any, are based on market values, rather than the notional amounts of derivatives, except for forward currency contracts which are based on unrealized appreciation/(depreciation). |
| # | Equity investments may consist of common stocks and other stock-related securities, such as preferred stocks, if any. This table excludes exposure to derivative contracts, short-term investments, mutual funds and investment funds, if any. For a summary of these exposures, if any, see the Schedule of Investments. |
| ^ | Rounds to 0.0%. |
| 87 |
GMO U.S. Equity Fund
(A Series of GMO Trust)
(showing percentage of total net assets)
February 28, 2023
| Shares | Description | Value ($) | ||||||
| COMMON STOCKS — 98.0% | ||||||||
| Automobiles & Components — 0.1% | ||||||||
| 9,300 | Modine Manufacturing Co.* | 227,013 | ||||||
| 2,400 | Standard Motor Products, Inc. | 93,528 | ||||||
|
| |||||||
| Total Automobiles & Components | 320,541 | |||||||
|
| |||||||
| Banks — 4.3% | ||||||||
| 1,800 | 1st Source Corp. | 89,676 | ||||||
| 3,400 | Amalgamated Financial Corp. | 80,070 | ||||||
| 28,392 | Associated Banc-Corp. | 657,275 | ||||||
| 4,100 | Atlantic Union Bankshares Corp. | 153,586 | ||||||
| 900 | Banner Corp. | 56,682 | ||||||
| 1,900 | Capital City Bank Group, Inc. | 67,773 | ||||||
| 5,800 | Citizens Financial Group, Inc. | 242,208 | ||||||
| 2,000 | Community Trust Bancorp, Inc. | 85,500 | ||||||
| 1,800 | Enterprise Financial Services Corp. | 98,028 | ||||||
| 9,000 | Farmers National Banc Corp. | 128,250 | ||||||
| 12,800 | Fifth Third Bancorp | 464,640 | ||||||
| 6,200 | First BanCorp | 89,962 | ||||||
| 9,400 | First Financial Bancorp | 231,616 | ||||||
| 1,500 | First Financial Corp. | 65,925 | ||||||
| 8,900 | Hanmi Financial Corp. | 210,218 | ||||||
| 6,400 | Huntington Bancshares, Inc. | 98,048 | ||||||
| 4,100 | Independent Bank Corp. | 90,405 | ||||||
| 38,800 | MGIC Investment Corp. | 533,888 | ||||||
| 5,000 | PNC Financial Services Group, Inc. | 789,600 | ||||||
| 31,600 | Radian Group, Inc. | 674,660 | ||||||
| 105,300 | Regions Financial Corp. | 2,455,596 | ||||||
| 300 | Synovus Financial Corp. | 12,543 | ||||||
| 17,900 | Truist Financial Corp. | 840,405 | ||||||
| 7,000 | Trustmark Corp. | 205,800 | ||||||
| 43,200 | US Bancorp | 2,061,936 | ||||||
| 3,300 | Washington Federal, Inc. | 115,731 | ||||||
|
| |||||||
| Total Banks | 10,600,021 | |||||||
|
| |||||||
| Capital Goods — 8.6% | ||||||||
| 2,000 | Apogee Enterprises, Inc. | 91,520 | ||||||
| 116,253 | Carrier Global Corp. | 5,234,873 | ||||||
| 1,800 | Cummins, Inc. | 437,544 | ||||||
| 1,800 | Eaton Corp. Plc | 314,874 | ||||||
| 11,000 | Fortune Brands Innovations, Inc. | 681,450 | ||||||
| 5,800 | Griffon Corp. | 211,526 | ||||||
| 3,400 | Moog, Inc. – Class A | 335,308 | ||||||
| 45,400 | MRC Global, Inc.* | 508,480 | ||||||
| 8,683 | Mueller Industries, Inc. | 642,281 | ||||||
| 65,250 | PACCAR, Inc. | 4,711,050 | ||||||
| 5,300 | Timken Co. (The) | 452,885 | ||||||
| 27,448 | Trane Technologies Plc | 5,077,057 | ||||||
| 3,315 | WW Grainger, Inc. | 2,215,845 | ||||||
|
| |||||||
| Total Capital Goods | 20,914,693 | |||||||
|
| |||||||
| Commercial & Professional Services — 1.2% | ||||||||
| 95,700 | ACCO Brands Corp. | 542,619 | ||||||
| Shares | Description | Value ($) | ||||||
| Commercial & Professional Services — continued |
| |||||||
| 600 | Barrett Business Services, Inc. | 57,588 | ||||||
| 2,400 | Brady Corp. – Class A | 132,384 | ||||||
| 7,400 | CBIZ, Inc.* | 370,666 | ||||||
| 9,600 | Deluxe Corp. | 177,024 | ||||||
| 2,700 | Heidrick & Struggles International, Inc. | 92,691 | ||||||
| 7,900 | ICF International, Inc. | 785,971 | ||||||
| 3,400 | Kforce, Inc. | 212,466 | ||||||
| 9,200 | Kimball International, Inc. – Class B | 63,572 | ||||||
| 1,200 | Republic Services, Inc. – Class A | 154,716 | ||||||
| 12,800 | Resources Connection, Inc. | 231,168 | ||||||
| 3,000 | TrueBlue, Inc.* | 56,100 | ||||||
|
| |||||||
| Total Commercial & Professional Services | 2,876,965 | |||||||
|
| |||||||
| Consumer Durables & Apparel — 5.1% | ||||||||
| 11,300 | Acushnet Holdings Corp. | 545,338 | ||||||
| 800 | Carter’s, Inc. | 60,312 | ||||||
| 22,200 | Ethan Allen Interiors, Inc. | 656,010 | ||||||
| 43,741 | Garmin Ltd. | 4,292,304 | ||||||
| 38,981 | La-Z-Boy, Inc. | 1,262,205 | ||||||
| 1,700 | Lululemon Athletica, Inc.* | 525,640 | ||||||
| 1,400 | M/I Homes, Inc.* | 80,976 | ||||||
| 6,200 | MasterCraft Boat Holdings, Inc.* | 209,374 | ||||||
| 6,500 | Meritage Homes Corp.* | 709,995 | ||||||
| 5,300 | Movado Group, Inc. | 183,486 | ||||||
| 5,700 | Oxford Industries, Inc. | 670,377 | ||||||
| 10,400 | PVH Corp. | 834,496 | ||||||
| 31,800 | Taylor Morrison Home Corp. – Class A* | 1,139,394 | ||||||
| 58,052 | TRI Pointe Homes, Inc.* | 1,383,960 | ||||||
|
| |||||||
| Total Consumer Durables & Apparel | 12,553,867 | |||||||
|
| |||||||
| Consumer Services — 0.6% | ||||||||
| 6,300 | Adtalem Global Education, Inc.* | 246,456 | ||||||
| 1,300 | Graham Holdings Co. – Class B | 814,658 | ||||||
| 31,275 | Perdoceo Education Corp.* | 431,126 | ||||||
|
| |||||||
| Total Consumer Services | 1,492,240 | |||||||
|
| |||||||
| Diversified Financials — 6.4% | ||||||||
| 29,100 | American Express Co. | 5,063,109 | ||||||
| 7,000 | Ameriprise Financial, Inc. | 2,400,090 | ||||||
| 45,400 | Bank of New York Mellon Corp. (The) | 2,309,952 | ||||||
| 3,800 | Berkshire Hathaway, Inc. – Class B* | 1,159,684 | ||||||
| 6,500 | Discover Financial Services | 728,000 | ||||||
| 10,100 | Donnelley Financial Solutions, Inc.* | 427,331 | ||||||
| 25,043 | Enova International, Inc.* | 1,220,846 | ||||||
| 3,100 | Jackson Financial, Inc. – Class A | 140,678 | ||||||
| 53,000 | Janus Henderson Group Plc | 1,455,380 | ||||||
| 2,100 | Nelnet, Inc. – Class A | 197,127 | ||||||
| 2,200 | Oppenheimer Holdings, Inc. – Class A | 96,998 | ||||||
| 3,247 | PROG Holdings, Inc.* | 80,266 | ||||||
| 3,223 | State Street Corp. | 285,816 | ||||||
|
| |||||||
| Total Diversified Financials | 15,565,277 | |||||||
|
| |||||||
| See accompanying notes to the financial statements. | 88 |
GMO U.S. Equity Fund
(A Series of GMO Trust)
Schedule of Investments — (Continued)
(showing percentage of total net assets)
February 28, 2023
| Shares | Description | Value ($) | ||||||
| Energy — 7.1% | ||||||||
| 41,200 | Chevron Corp. | 6,623,724 | ||||||
| 2,100 | Dril-Quip, Inc.* | 71,925 | ||||||
| 12,200 | EOG Resources, Inc. | 1,378,844 | ||||||
| 70,200 | Exxon Mobil Corp. | 7,715,682 | ||||||
| 4,300 | Marathon Petroleum Corp. | 531,480 | ||||||
| 7,700 | Phillips 66 | 789,712 | ||||||
| 6,400 | World Fuel Services Corp. | 175,680 | ||||||
|
| |||||||
| Total Energy | 17,287,047 | |||||||
|
| |||||||
| Food & Staples Retailing — 3.3% | ||||||||
| 6,800 | Costco Wholesale Corp. | 3,292,424 | ||||||
| 111,945 | Kroger Co. (The) | 4,829,307 | ||||||
|
| |||||||
| Total Food & Staples Retailing | 8,121,731 | |||||||
|
| |||||||
| Food, Beverage & Tobacco — 4.0% | ||||||||
| 39,800 | General Mills, Inc. | 3,164,498 | ||||||
| 5,200 | Hershey Co. (The) | 1,239,264 | ||||||
| 22,800 | PepsiCo, Inc. | 3,956,484 | ||||||
| 4,200 | Philip Morris International, Inc. | 408,660 | ||||||
| 22,065 | Universal Corp. | 1,116,268 | ||||||
|
| |||||||
| Total Food, Beverage & Tobacco | 9,885,174 | |||||||
|
| |||||||
| Health Care Equipment & Services — 4.7% |
| |||||||
| 1,841 | AmerisourceBergen Corp. | 286,386 | ||||||
| 10,900 | Cigna Group (The) | 3,183,890 | ||||||
| 4,700 | Elevance Health, Inc. | 2,207,449 | ||||||
| 4,700 | Humana, Inc. | 2,326,594 | ||||||
| 4,300 | UnitedHealth Group, Inc. | 2,046,542 | ||||||
| 10,700 | Zimmer Biomet Holdings, Inc. | 1,325,409 | ||||||
|
| |||||||
| Total Health Care Equipment & Services | 11,376,270 | |||||||
|
| |||||||
| Insurance — 1.1% |
| |||||||
| 15,300 | Progressive Corp. (The) | 2,195,856 | ||||||
| 13,063 | Stewart Information Services Corp. | 555,047 | ||||||
|
| |||||||
| Total Insurance | 2,750,903 | |||||||
|
| |||||||
| Materials — 4.6% |
| |||||||
| 10,900 | AdvanSix, Inc. | 448,535 | ||||||
| 1,900 | Air Products & Chemicals, Inc. | 543,362 | ||||||
| 55,100 | Corteva, Inc. | 3,432,179 | ||||||
| 8,900 | Ecolab, Inc. | 1,418,393 | ||||||
| 8,800 | Huntsman Corp. | 258,192 | ||||||
| 3,100 | Ingevity Corp.* | 255,936 | ||||||
| 500 | Martin Marietta Materials, Inc. | 179,935 | ||||||
| 9,600 | Mercer International, Inc. | 103,488 | ||||||
| 2,973 | NewMarket Corp. | 1,021,225 | ||||||
| 3,200 | Newmont Corp. | 139,552 | ||||||
| 10,100 | O-I Glass, Inc.* | 224,422 | ||||||
| 3,596 | Reliance Steel & Aluminum Co. | 891,233 | ||||||
| 9,700 | Ryerson Holding Corp. | 348,521 | ||||||
| 12,874 | Stepan Co. | 1,340,055 | ||||||
| 1,700 | Sylvamo Corp. | 83,861 | ||||||
| Shares | Description | Value ($) | ||||||
| Materials — continued | ||||||||
| 10,500 | Valvoline, Inc. | 369,600 | ||||||
| 6,400 | Warrior Met Coal, Inc. | 244,928 | ||||||
|
| |||||||
| Total Materials | 11,303,417 | |||||||
|
| |||||||
| Media & Entertainment — 4.5% |
| |||||||
| 18,260 | Alphabet, Inc. – Class C* | 1,648,878 | ||||||
| 17,500 | Alphabet, Inc. – Class A* | 1,576,050 | ||||||
| 12,300 | AMC Networks, Inc. – Class A* | 275,028 | ||||||
| 103,533 | Comcast Corp. – Class A | 3,848,322 | ||||||
| 27,742 | Electronic Arts, Inc. | 3,077,697 | ||||||
| 6,600 | Fox Corp. – Class B | 212,850 | ||||||
| 1,300 | News Corp. – Class B | 22,438 | ||||||
| 2,400 | Scholastic Corp. | 109,464 | ||||||
| 17,018 | TEGNA, Inc. | 296,113 | ||||||
|
| |||||||
| Total Media & Entertainment | 11,066,840 | |||||||
|
| |||||||
| Pharmaceuticals, Biotechnology & Life Sciences — 5.9% |
| |||||||
| 6,900 | Agilent Technologies, Inc. | 979,593 | ||||||
| 2,200 | Biogen, Inc.* | 593,692 | ||||||
| 35,441 | Bristol-Myers Squibb Co. | 2,444,011 | ||||||
| 17,900 | Johnson & Johnson | 2,743,354 | ||||||
| 67,150 | Merck & Co., Inc. | 7,134,016 | ||||||
| 7,595 | Prestige Consumer Healthcare, Inc.* | 457,599 | ||||||
|
| |||||||
| Total Pharmaceuticals, Biotechnology & Life Sciences | 14,352,265 | |||||||
|
| |||||||
| Real Estate — 0.1% |
| |||||||
| 3,400 | CBRE Group, Inc. – Class A* | 289,476 | ||||||
|
| |||||||
| Retailing — 9.1% |
| |||||||
| 4,900 | 1-800-Flowers.com, Inc. – Class A* | 48,510 | ||||||
| 8,400 | Aaron’s Co., Inc. (The) | 120,540 | ||||||
| 20,680 | Amazon.com, Inc.* | 1,948,676 | ||||||
| 14,300 | Best Buy Co., Inc. | 1,188,473 | ||||||
| 11,400 | Caleres, Inc. | 297,654 | ||||||
| 14,000 | Chico’s FAS, Inc.* | 80,500 | ||||||
| 16,000 | Container Store Group , Inc. (The)* | 69,600 | ||||||
| 4,700 | Designer Brands, Inc. – Class A | 46,013 | ||||||
| 9,000 | Dollar General Corp. | 1,946,700 | ||||||
| 91,500 | eBay, Inc. | 4,199,850 | ||||||
| 2,600 | Foot Locker, Inc. | 113,672 | ||||||
| 32,500 | Gap, Inc. (The) | 422,825 | ||||||
| 200 | Genesco, Inc.* | 8,994 | ||||||
| 8,054 | Group 1 Automotive, Inc. | 1,780,498 | ||||||
| 8,700 | Haverty Furniture Cos., Inc. | 328,338 | ||||||
| 11,700 | Home Depot, Inc. (The) | 3,469,518 | ||||||
| 8,300 | ODP Corp. (The)* | 375,824 | ||||||
| 8,100 | Shoe Carnival, Inc. | 213,435 | ||||||
| 17,400 | Signet Jewelers Ltd. | 1,246,188 | ||||||
| 9,800 | Tractor Supply Co. | 2,285,948 | ||||||
| 3,900 | Ulta Beauty, Inc.* | 2,023,320 | ||||||
|
| |||||||
| Total Retailing | 22,215,076 | |||||||
|
| |||||||
| 89 | See accompanying notes to the financial statements. |
GMO U.S. Equity Fund
(A Series of GMO Trust)
Schedule of Investments — (Continued)
(showing percentage of total net assets)
February 28, 2023
| Shares | Description | Value ($) | ||||||
| Semiconductors & Semiconductor Equipment — 7.0% |
| |||||||
| 5,492 | Cirrus Logic, Inc.* | 564,303 | ||||||
| 174,943 | Intel Corp. | 4,361,329 | ||||||
| 22,900 | Kulicke & Soffa Industries, Inc. | 1,220,570 | ||||||
| 23,300 | Microchip Technology, Inc. | 1,887,999 | ||||||
| 20,100 | NXP Semiconductors NV | 3,587,448 | ||||||
| 45,400 | QUALCOMM, Inc. | 5,608,262 | ||||||
|
| |||||||
| Total Semiconductors & Semiconductor Equipment | 17,229,911 | |||||||
|
| |||||||
| Software & Services — 8.5% | ||||||||
| 6,800 | Automatic Data Processing, Inc. | 1,494,776 | ||||||
| 25,222 | Cadence Design Systems, Inc.* | 4,866,333 | ||||||
| 7,900 | CSG Systems International, Inc. | 443,980 | ||||||
| 1,900 | International Business Machines Corp. | 245,670 | ||||||
| 29,519 | Microsoft Corp. | 7,362,629 | ||||||
| 100 | Oracle Corp. | 8,740 | ||||||
| 2,800 | Roper Technologies, Inc. | 1,204,560 | ||||||
| 14,174 | Synopsys, Inc.* | 5,155,934 | ||||||
|
| |||||||
| Total Software & Services | 20,782,622 | |||||||
|
| |||||||
| Technology Hardware & Equipment — 11.4% | ||||||||
| 81,924 | Apple, Inc. | 12,076,417 | ||||||
| 8,900 | Arista Networks, Inc.* | 1,234,430 | ||||||
| 1,037 | Arrow Electronics, Inc.* | 122,356 | ||||||
| 3,522 | Avnet, Inc. | 157,468 | ||||||
| 4,700 | Bel Fuse, Inc. – Class B | 166,944 | ||||||
| 3,700 | Belden, Inc. | 312,206 | ||||||
| 17,500 | Dell Technologies, Inc. – Class C | 711,200 | ||||||
| 214,000 | Hewlett Packard Enterprise Co. | 3,340,540 | ||||||
| 126,844 | HP, Inc. | 3,744,435 | ||||||
| 2,800 | Juniper Networks, Inc. | 86,184 | ||||||
| 18,400 | Keysight Technologies, Inc.* | 2,943,264 | ||||||
| 4,300 | Motorola Solutions, Inc. | 1,130,083 | ||||||
| 6,700 | Sanmina Corp.* | 405,082 | ||||||
| Shares | Description | Value ($) | ||||||
| Technology Hardware & Equipment — continued |
| |||||||
| 9,500 | Super Micro Computer, Inc.* | 930,715 | ||||||
| 200 | TTM Technologies, Inc.* | 2,658 | ||||||
| 10,700 | Vontier Corp. | 280,019 | ||||||
| 19,995 | Xerox Holdings Corp. | 329,717 | ||||||
|
| |||||||
| Total Technology Hardware & Equipment | 27,973,718 | |||||||
|
| |||||||
| Transportation — 0.4% | ||||||||
| 7,500 | Hub Group, Inc. – Class A* | 687,975 | ||||||
| 10,400 | Schneider National, Inc. – Class B | 291,824 | ||||||
|
| |||||||
| Total Transportation | 979,799 | |||||||
|
| |||||||
TOTAL COMMON STOCKS (COST $235,225,833) | 239,937,853 | |||||||
|
| |||||||
| MUTUAL FUNDS — 1.2% | ||||||||
| Affiliated Issuers — 1.2% | ||||||||
| 612,832 | GMO U.S. Treasury Fund | 3,058,032 | ||||||
|
| |||||||
TOTAL MUTUAL FUNDS (COST $3,058,032) | 3,058,032 | |||||||
|
| |||||||
| SHORT-TERM INVESTMENTS — 0.3% | ||||||||
| Money Market Funds — 0.3% | ||||||||
| 717,880 | State Street Institutional Treasury Money Market Fund – Premier Class, 4.42% (a) | 717,880 | ||||||
|
| |||||||
TOTAL SHORT-TERM INVESTMENTS (COST $717,880) | 717,880 | |||||||
|
| |||||||
TOTAL INVESTMENTS — 99.5% (Cost $239,001,745) | 243,713,765 | |||||||
| Other Assets and Liabilities (net) — 0.5% | 1,246,620 | |||||||
|
| |||||||
| TOTAL NET ASSETS — 100.0% | $ | 244,960,385 | ||||||
|
| |||||||
A summary of outstanding financial instruments at February 28, 2023 is as follows:
Futures Contracts
Number of Contracts + | Type | Expiration Date | Notional Amount ($) | Value/Net Unrealized Appreciation (Depreciation) ($) | ||||||||||
Buys | ||||||||||||||
8 | S&P 500 E-Mini | March 2023 | $ | 1,590,200 | $ | 49,914 | ||||||||
|
|
|
| |||||||||||
| + | Buys - Fund is long the futures contract. |
Sales - Fund is short the futures contract.
As of February 28, 2023, for the above contracts and/or agreements, the Fund had sufficient cash and/or securities to cover commitments or collateral requirements, if any, of the relevant broker or exchange.
| See accompanying notes to the financial statements. | 90 |
GMO U.S. Equity Fund
(A Series of GMO Trust)
Schedule of Investments — (Continued)
February 28, 2023
Notes to Schedule of Investments:
| * | Non-income producing security. |
| (a) | The rate disclosed is the 7 day net yield as of February 28, 2023. |
For a listing of definitions of acronyms, counterparty abbreviations and currency abbreviations used throughout the Schedule of Investments as well as the derivative tables, if any, please refer to page 106.
| 91 | See accompanying notes to the financial statements. |
This page has been left blank intentionally.
GMO U.S. Opportunistic Value Fund
(A Series of GMO Trust)
Portfolio Management
Day-to-day management of the Fund’s portfolio is the responsibility of the Systematic Equity team at Grantham, Mayo, Van Otterloo & Co. LLC.
Management Discussion and Analysis of Fund Performance
Although the Fund is not managed relative to any securities market index or benchmark, a discussion of the Fund’s performance relative to the S&P Composite 1500 Index is included for comparative purposes.
Class VI shares of GMO U.S. Opportunistic Value Fund returned 1.10% (net) for the period from the Fund’s inception on December 13, 2022, until the end of the fiscal year on February 28, 2023, as compared with -0.46% for the S&P Composite 1500 Index.
Stock selection was the largest contributor to outperformance for the period with notable contributions from Communications Services and Financials. Sector allocation also contributed, including overweight positioning toward Financials and not holding Utilities.
Top detractors included stock selection in Health Care and Information Technology.
The views expressed herein are exclusively those of Grantham, Mayo, Van Otterloo & Co. LLC as of the date of this report and are subject to change. GMO disclaims any responsibility to update such views. They are not meant as investment advice. References to specific securities are not recommendations of such securities and may not be representative of any GMO portfolio’s current or future investments. All information is unaudited.
| 93 |
GMO U.S. Opportunistic Value Fund
(A Series of GMO Trust)
Comparison of Change in Value of a $350,000,000 Investment in
GMO U.S. Opportunistic Value Fund Class VI Shares and the S&P Composite 1500 Index
As of February 28, 2023
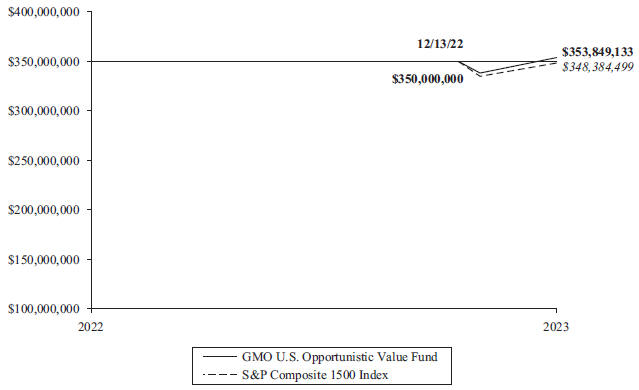
| Average Annual Total Returns | ||
| Since Inception | ||
| Class III | 2/15/23 -4.13% | |
| Class IV | 2/15/23 -4.13% | |
| Class VI | 12/13/22 1.10% | |
| Class I | 2/15/23 -4.13% |
Performance data quoted represents past performance and is not indicative of future results. The investment return and principal value of an investment will fluctuate so that an investor’s shares, when redeemed, may be worth more or less than their original cost. Current performance data may be lower or higher than the performance data provided herein. To obtain performance information up to the most recent month-end, visit www.gmo.com. Performance shown is net of all fees after reimbursement from GMO. Returns would have been lower had certain expenses not been reimbursed during the periods shown and do not include the effect of taxes on distributions and redemptions. The performance information shown above only includes purchase premiums and/or redemption fees in effect as of February 28, 2023. All information is unaudited. Performance for classes may vary due to different fees.
For S&P disclaimers please visit https://www.gmo.com/north-america/benchmark-disclaimers/
For Class III, IV, VI and I the gross expense ratio of 0.54%, 0.49%, 0.45% and 0.64%, respectively, is equal to the Fund’s Total Annual Operating Expenses set forth in the Fund’s most recent prospectus dated February 11, 2023. For the Classes listed above, the net expense ratio of 0.47%, 0.42%, 0.38% and 0.57% reflects the reduction of expenses from fee reimbursements. The fee reimbursements will continue until at least June 30, 2024. Elimination of this reimbursement will result in higher fees and lower performance.
94
GMO U.S. Opportunistic Value Fund
(A Series of GMO Trust)
Investment Concentration Summary
February 28, 2023 (Unaudited)
Asset Class Summary& | % of Total Net Assets | |||
Common Stocks | 98.2 | % | ||
Mutual Funds | 2.1 | |||
Short-Term Investments | 0.1 | |||
Other | (0.4 | ) | ||
|
| |||
| 100.0 | % | |||
|
| |||
Industry Group Summary | % of Equity Investments# | |||
Banks | 12.8 | % | ||
Pharmaceuticals, Biotechnology & Life Sciences | 11.7 | |||
Media & Entertainment | 8.6 | |||
Diversified Financials | 8.3 | |||
Energy | 7.6 | |||
Health Care Equipment & Services | 6.5 | |||
Semiconductors & Semiconductor Equipment | 6.4 | |||
Technology Hardware & Equipment | 5.8 | |||
Telecommunication Services | 4.7 | |||
Consumer Durables & Apparel | 4.2 | |||
Insurance | 4.1 | |||
Capital Goods | 3.9 | |||
Retailing | 3.6 | |||
Software & Services | 2.9 | |||
Automobiles & Components | 2.9 | |||
Food, Beverage & Tobacco | 1.7 | |||
Food & Staples Retailing | 1.1 | |||
Materials | 1.0 | |||
Real Estate | 0.8 | |||
Consumer Services | 0.6 | |||
Commercial & Professional Services | 0.6 | |||
Transportation | 0.2 | |||
Household & Personal Products | 0.0 | ^ | ||
|
| |||
| 100.0 | % | |||
|
| |||
| & | In the table, derivative financial instruments, if any, are based on market values, rather than the notional amounts of derivatives, except for forward currency contracts which are based on unrealized appreciation/(depreciation). |
| # | Equity investments may consist of common stocks and other stock-related securities, such as preferred stocks, if any. This table excludes exposure to derivative contracts, short-term investments, mutual funds and investment funds, if any. For a summary of these exposures, if any, see the Schedule of Investments. |
| ^ | Rounds to 0.0%. |
| 95 |
GMO U.S. Opportunistic Value Fund
(A Series of GMO Trust)
(showing percentage of total net assets)
February 28, 2023
| Shares | Description | Value ($) | ||||||
| COMMON STOCKS — 98.2% | ||||||||
| Automobiles & Components — 2.8% | ||||||||
| 32,632 | BorgWarner, Inc. | 1,640,737 | ||||||
| 237,916 | Ford Motor Co. | 2,871,646 | ||||||
| 69,752 | General Motors Co. | 2,702,192 | ||||||
| 11,900 | Goodyear Tire & Rubber Co.* | 135,184 | ||||||
| 1,700 | Harley-Davidson, Inc. | 80,835 | ||||||
| 3,444 | Lear Corp. | 480,955 | ||||||
|
| |||||||
| Total Automobiles & Components | 7,911,549 | |||||||
|
| |||||||
| Banks — 12.5% | ||||||||
| 221,146 | Bank of America Corp. | 7,585,308 | ||||||
| 78,258 | Citigroup, Inc. | 3,966,898 | ||||||
| 21,958 | Citizens Financial Group, Inc. | 916,966 | ||||||
| 139,772 | Huntington Bancshares, Inc. | 2,141,307 | ||||||
| 64,390 | JPMorgan Chase & Co. | 9,230,306 | ||||||
| 20,514 | KeyCorp. | 375,201 | ||||||
| 5,200 | M&T Bank Corp. | 807,508 | ||||||
| 13,628 | PNC Financial Services Group, Inc. | 2,152,134 | ||||||
| 50,538 | Radian Group, Inc. | 1,078,986 | ||||||
| 92,126 | Regions Financial Corp. | 2,148,378 | ||||||
| 34,778 | Truist Financial Corp. | 1,632,827 | ||||||
| 16,060 | US Bancorp | 766,544 | ||||||
| 33,528 | Wells Fargo & Co. | 1,568,105 | ||||||
| 10,140 | Zions Bancorp NA | 513,287 | ||||||
|
| |||||||
| Total Banks | 34,883,755 | |||||||
|
| |||||||
| Capital Goods — 3.9% | ||||||||
| 36,434 | 3M Co. | 3,925,399 | ||||||
| 2,700 | AGCO Corp. | 380,187 | ||||||
| 1,666 | Allison Transmission Holdings, Inc. | 79,135 | ||||||
| 5,194 | Atkore, Inc.* | 758,428 | ||||||
| 5,352 | Cummins, Inc. | 1,300,964 | ||||||
| 4,428 | Encore Wire Corp. | 854,648 | ||||||
| 12,300 | Ferguson Plc | 1,772,430 | ||||||
| 17,370 | Owens Corning | 1,698,613 | ||||||
|
| |||||||
| Total Capital Goods | 10,769,804 | |||||||
|
| |||||||
| Commercial & Professional Services — 0.6% | ||||||||
| 2,156 | HNI Corp. | 67,375 | ||||||
| 17,740 | ManpowerGroup, Inc. | 1,505,771 | ||||||
|
| |||||||
| Total Commercial & Professional Services | 1,573,146 | |||||||
|
| |||||||
| Consumer Durables & Apparel — 4.1% | ||||||||
| 7,760 | Brunswick Corp. | 678,379 | ||||||
| 4,866 | Carter’s, Inc. | 366,848 | ||||||
| 9,538 | DR Horton, Inc. | 882,074 | ||||||
| 10,512 | Garmin Ltd. | 1,031,543 | ||||||
| 161,752 | Hanesbrands, Inc. | 918,751 | ||||||
| 21,150 | Hasbro, Inc. | 1,163,462 | ||||||
| 8,526 | La-Z-Boy, Inc. | 276,072 | ||||||
| 10,202 | Lennar Corp. – Class A | 986,941 | ||||||
| 4,482 | PulteGroup, Inc. | 245,031 | ||||||
| Shares | Description | Value ($) | ||||||
| Consumer Durables & Apparel — continued |
| |||||||
| 23,928 | PVH Corp. | 1,919,983 | ||||||
| 284 | Ralph Lauren Corp. | 33,566 | ||||||
| 5,816 | Tapestry, Inc. | 253,054 | ||||||
| 21,946 | Taylor Morrison Home Corp. – Class A* | 786,325 | ||||||
| 4,410 | TRI Pointe Homes, Inc.* | 105,134 | ||||||
| 7,200 | VF Corp. | 178,704 | ||||||
| 11,806 | Whirlpool Corp. | 1,628,992 | ||||||
| 5,400 | Wolverine World Wide, Inc. | 90,450 | ||||||
|
| |||||||
| Total Consumer Durables & Apparel | 11,545,309 | |||||||
|
| |||||||
| Consumer Services — 0.6% | ||||||||
| 4,974 | Adtalem Global Education, Inc.* | 194,583 | ||||||
| 490 | Graham Holdings Co. – Class B | 307,063 | ||||||
| 32,390 | H&R Block, Inc. | 1,191,952 | ||||||
|
| |||||||
| Total Consumer Services | 1,693,598 | |||||||
|
| |||||||
| Diversified Financials — 8.1% | ||||||||
| 2,940 | Alliance Data Systems Corp. | 120,746 | ||||||
| 38,136 | Ally Financial, Inc. | 1,145,987 | ||||||
| 60,092 | Bank of New York Mellon Corp. (The) | 3,057,481 | ||||||
| 11,900 | Capital One Financial Corp. | 1,298,052 | ||||||
| 20,436 | Discover Financial Services | 2,288,832 | ||||||
| 5,100 | Franklin Resources, Inc. | 150,297 | ||||||
| 15,416 | Goldman Sachs Group, Inc. (The) | 5,421,036 | ||||||
| 49,544 | Invesco Ltd. | 874,947 | ||||||
| 62,624 | Janus Henderson Group Plc | 1,719,655 | ||||||
| 5,300 | Jefferies Financial Group, Inc. | 200,287 | ||||||
| 16,758 | Northern Trust Corp. | 1,596,535 | ||||||
| 30,242 | State Street Corp. | 2,681,860 | ||||||
| 57,184 | Synchrony Financial | 2,042,041 | ||||||
|
| |||||||
| Total Diversified Financials | 22,597,756 | |||||||
|
| |||||||
| Energy — 7.5% | ||||||||
| 24,200 | Cabot Oil & Gas Corp. | 604,274 | ||||||
| 23,220 | Chevron Corp. | 3,733,079 | ||||||
| 31,850 | ConocoPhillips | 3,291,698 | ||||||
| 21,904 | EOG Resources, Inc. | 2,475,590 | ||||||
| 89,864 | Exxon Mobil Corp. | 9,876,952 | ||||||
| 4,300 | Ovintiv, Inc. | 183,911 | ||||||
| 6,300 | Phillips 66 | 646,128 | ||||||
|
| |||||||
| Total Energy | 20,811,632 | |||||||
|
| |||||||
| Food & Staples Retailing — 1.1% | ||||||||
| 25,356 | Kroger Co. (The) | 1,093,858 | ||||||
| 55,026 | Walgreens Boots Alliance, Inc. | 1,955,074 | ||||||
|
| |||||||
| Total Food & Staples Retailing | 3,048,932 | |||||||
|
| |||||||
| Food, Beverage & Tobacco — 1.6% | ||||||||
| 14,800 | Archer-Daniels-Midland Co. | 1,178,080 | ||||||
| 21,700 | Kraft Heinz Co. (The) | 844,998 | ||||||
| 6,978 | Molson Coors Brewing Co. – Class B | 371,160 | ||||||
| 34,068 | Tyson Foods, Inc. – Class A | 2,018,188 | ||||||
| See accompanying notes to the financial statements. | 96 |
GMO U.S. Opportunistic Value Fund
(A Series of GMO Trust)
Schedule of Investments — (Continued)
(showing percentage of total net assets)
February 28, 2023
| Shares | Description | Value ($) | ||||||
| Food, Beverage & Tobacco — continued |
| |||||||
| 3,074 | Universal Corp. | 155,514 | ||||||
|
| |||||||
| Total Food, Beverage & Tobacco | 4,567,940 | |||||||
|
| |||||||
| Health Care Equipment & Services — 6.4% |
| |||||||
| 26,502 | Centene Corp.* | 1,812,737 | ||||||
| 15,174 | Cigna Group (The) | 4,432,325 | ||||||
| 60,088 | CVS Health Corp. | 5,019,752 | ||||||
| 5,778 | Elevance Health, Inc. | 2,713,753 | ||||||
| 18,484 | Henry Schein, Inc.* | 1,447,482 | ||||||
| 2,164 | Laboratory Corp. of America Holdings | 517,975 | ||||||
| 23,236 | Medtronic Plc | 1,923,941 | ||||||
|
| |||||||
| Total Health Care Equipment & Services | 17,867,965 | |||||||
|
| |||||||
| Household & Personal Products — 0.0% |
| |||||||
| 784 | USANA Health Sciences, Inc.* | 47,652 | ||||||
|
| |||||||
| Insurance — 4.1% | ||||||||
| 42,790 | Fidelity National Financial, Inc. | 1,705,609 | ||||||
| 6,916 | Hartford Financial Services Group, Inc. (The) | 541,385 | ||||||
| 45,416 | MetLife, Inc. | 3,257,690 | ||||||
| 18,452 | Principal Financial Group, Inc. | 1,652,561 | ||||||
| 31,992 | Prudential Financial, Inc. | 3,199,200 | ||||||
| 600 | Reinsurance Group of America, Inc. | 86,682 | ||||||
| 8,592 | Stewart Information Services Corp. | 365,074 | ||||||
| 11,948 | Unum Group | 532,283 | ||||||
|
| |||||||
| Total Insurance | 11,340,484 | |||||||
|
| |||||||
| Materials — 1.0% | ||||||||
| 15,196 | Huntsman Corp. | 445,851 | ||||||
| 1,428 | Nucor Corp. | 239,104 | ||||||
| 7,670 | Reliance Steel & Aluminum Co. | 1,900,933 | ||||||
| 1,700 | Schnitzer Steel Industries, Inc. – Class A | 55,573 | ||||||
|
| |||||||
| Total Materials | 2,641,461 | |||||||
|
| |||||||
| Media & Entertainment — 8.4% | ||||||||
| 27,300 | Alphabet, Inc. – Class A* | 2,458,638 | ||||||
| 112,654 | Comcast Corp. – Class A | 4,187,349 | ||||||
| 16,800 | Fox Corp. – Class A | 588,336 | ||||||
| 4,500 | Fox Corp. – Class B | 145,125 | ||||||
| 71,762 | Meta Platforms, Inc. – Class A* | 12,554,044 | ||||||
| 56,326 | Paramount Global – Class B | 1,206,503 | ||||||
| 149,098 | Warner Bros Discovery, Inc.* | 2,328,911 | ||||||
|
| |||||||
| Total Media & Entertainment | 23,468,906 | |||||||
|
| |||||||
| Pharmaceuticals, Biotechnology & Life Sciences — 11.5% |
| |||||||
| 9,502 | Biogen, Inc.* | 2,564,210 | ||||||
| 71,100 | Bristol-Myers Squibb Co. | 4,903,056 | ||||||
| 57,184 | Gilead Sciences, Inc. | 4,605,027 | ||||||
| 25,692 | Johnson & Johnson | 3,937,556 | ||||||
| 39,520 | Merck & Co., Inc. | 4,198,605 | ||||||
| 176,530 | Pfizer, Inc. | 7,161,822 | ||||||
| Shares | Description | Value ($) | ||||||
| Pharmaceuticals, Biotechnology & Life Sciences — continued |
| |||||||
| 3,742 | Regeneron Pharmaceuticals, Inc.* | 2,845,492 | ||||||
| 160,394 | Viatris, Inc. | 1,828,491 | ||||||
|
| |||||||
| Total Pharmaceuticals, Biotechnology & Life Sciences | 32,044,259 | |||||||
|
| |||||||
| Real Estate — 0.8% | ||||||||
| 26,038 | CBRE Group, Inc. – Class A* | 2,216,875 | ||||||
| 2,548 | Marcus & Millichap, Inc. | 87,575 | ||||||
|
| |||||||
| Total Real Estate | 2,304,450 | |||||||
|
| |||||||
| Retailing — 3.6% | ||||||||
| 3,400 | Academy Sports & Outdoors, Inc. | 201,110 | ||||||
| 2,992 | AutoNation, Inc.* | 408,438 | ||||||
| 26,388 | Best Buy Co., Inc. | 2,193,107 | ||||||
| 57,070 | eBay, Inc. | 2,619,513 | ||||||
| 24,296 | Foot Locker, Inc. | 1,062,221 | ||||||
| 31,380 | Gap, Inc. (The) | 408,254 | ||||||
| 2,084 | Group 1 Automotive, Inc. | 460,710 | ||||||
| 38,228 | Kohl’s Corp. | 1,071,913 | ||||||
| 1,372 | Lithia Motors, Inc. | 350,107 | ||||||
| 50,376 | Macy’s, Inc. | 1,030,693 | ||||||
| 4,912 | Nordstrom, Inc. | 95,686 | ||||||
| 58 | Williams-Sonoma, Inc. | 7,245 | ||||||
|
| |||||||
| Total Retailing | 9,908,997 | |||||||
|
| |||||||
| Semiconductors & Semiconductor Equipment — 6.3% |
| |||||||
| 18,674 | Applied Materials, Inc. | 2,168,985 | ||||||
| 221,860 | Intel Corp. | 5,530,970 | ||||||
| 19,310 | Kulicke & Soffa Industries, Inc. | 1,029,223 | ||||||
| 48,838 | Micron Technology, Inc. | 2,823,813 | ||||||
| 47,364 | QUALCOMM, Inc. | 5,850,875 | ||||||
|
| |||||||
| Total Semiconductors & Semiconductor Equipment | 17,403,866 | |||||||
|
| |||||||
| Software & Services — 2.8% | ||||||||
| 27,218 | Cognizant Technology Solutions Corp. – Class A | 1,704,663 | ||||||
| 17,100 | DXC Technology Co.* | 474,354 | ||||||
| 39,094 | International Business Machines Corp. | 5,054,854 | ||||||
| 52,538 | Western Union Co. (The) | 680,893 | ||||||
|
| |||||||
| Total Software & Services | 7,914,764 | |||||||
|
| |||||||
| Technology Hardware & Equipment — 5.7% |
| |||||||
| 12,760 | Arrow Electronics, Inc.* | 1,505,553 | ||||||
| 8,444 | Avnet, Inc. | 377,531 | ||||||
| 119,552 | Cisco Systems, Inc. | 5,788,708 | ||||||
| 42,554 | Dell Technologies, Inc. – Class C | 1,729,395 | ||||||
| 60,528 | Flex Ltd.* | 1,377,617 | ||||||
| 128,566 | Hewlett Packard Enterprise Co. | 2,006,915 | ||||||
| 102,154 | HP, Inc. | 3,015,586 | ||||||
| 97 | See accompanying notes to the financial statements. |
GMO U.S. Opportunistic Value Fund
(A Series of GMO Trust)
Schedule of Investments — (Continued)
(showing percentage of total net assets)
February 28, 2023
| Shares | Description | Value ($) | ||||||
| Technology Hardware & Equipment — continued |
| |||||||
| 10,290 | Xerox Holdings Corp. | 169,682 | ||||||
|
| |||||||
| Total Technology Hardware & Equipment | 15,970,987 | |||||||
|
| |||||||
| Telecommunication Services — 4.6% | ||||||||
| 309,250 | AT&T, Inc. | 5,847,917 | ||||||
| 180,032 | Verizon Communications, Inc. | 6,987,042 | ||||||
|
| |||||||
| Total Telecommunication Services | 12,834,959 | |||||||
|
| |||||||
| Transportation — 0.2% | ||||||||
| 2,868 | Matson, Inc. | 190,751 | ||||||
| 10,406 | Schneider National, Inc. – Class B | 291,992 | ||||||
|
| |||||||
| Total Transportation | 482,743 | |||||||
|
| |||||||
TOTAL COMMON STOCKS (COST $274,425,438) | 273,634,914 | |||||||
|
| |||||||
| MUTUAL FUNDS — 2.1% | ||||||||
| Affiliated Issuers — 2.1% | ||||||||
| 1,166,679 | GMO U.S. Treasury Fund | 5,821,730 | ||||||
|
| |||||||
TOTAL MUTUAL FUNDS (COST $5,821,730) | 5,821,730 | |||||||
|
| |||||||
| SHORT-TERM INVESTMENTS — 0.1% |
| |||||||
| Money Market Funds — 0.1% | ||||||||
| 225,815 | State Street Institutional Treasury Money Market Fund – Premier Class, 4.42% (a) | 225,815 | ||||||
|
| |||||||
TOTAL SHORT-TERM INVESTMENTS (COST $225,815) | 225,815 | |||||||
|
| |||||||
TOTAL INVESTMENTS — 100.4% (Cost $280,472,983) | 279,682,459 | |||||||
| Other Assets and Liabilities (net) — (0.4)% | (1,215,744 | ) | ||||||
|
| |||||||
| TOTAL NET ASSETS — 100.0% | $ | 278,466,715 | ||||||
|
| |||||||
Notes to Schedule of Investments:
| * | Non-income producing security. |
| (a) | The rate disclosed is the 7 day net yield as of February 28, 2023. |
For a listing of definitions of acronyms, counterparty abbreviations and currency abbreviations used throughout the Schedule of Investments as well as the derivative tables, if any, please refer to page 106.
| See accompanying notes to the financial statements. | 98 |
(A Series of GMO Trust)
Portfolio Management
Day-to-day management of the Fund’s portfolio is the responsibility of the Systematic Equity team at Grantham, Mayo, Van Otterloo & Co. LLC.
Management Discussion and Analysis of Fund Performance
Class VI shares of GMO U.S. Small Cap Value Fund returned -2.86% (net) for the fiscal year ended February 28, 2023, as compared with +0.02% for the S&P SmallCap 600 Value Index.
Stock selection drove underperformance for the period, with notable challenges in Real Estate, Industrials, Financials, and Energy.
In contrast sector allocation added value. The portfolio benefited from underweight positioning toward Real Estate and Health Care, and overweight positioning toward Materials.
The views expressed herein are exclusively those of Grantham, Mayo, Van Otterloo & Co. LLC as of the date of this report and are subject to change. GMO disclaims any responsibility to update such views. They are not meant as investment advice. References to specific securities are not recommendations of such securities and may not be representative of any GMO portfolio’s current or future investments. All information is unaudited.
| 99 |
GMO U.S. Small Cap Value Fund
(A Series of GMO Trust)
Comparison of Change in Value of a $300,000,000 Investment in
GMO U.S. Small Cap Value Fund Class VI Shares and the S&P SmallCap 600 Value Index
As of February 28, 2023
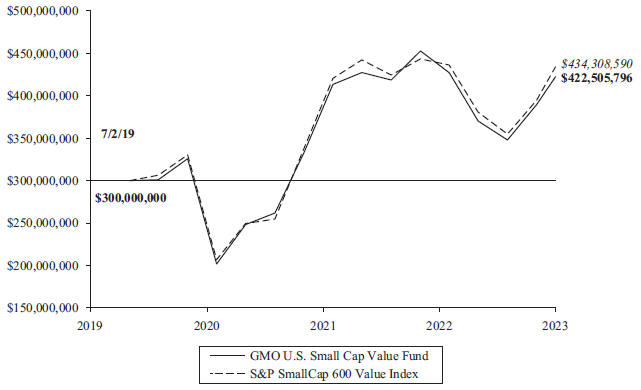
Average Annual Total Returns | ||||||||
| 1 Year | Since Inception | |||||||
| Class VI | -2.86 | % | 7/2/19 9.81 | % | ||||
Performance data quoted represents past performance and is not indicative of future results. The investment return and principal value of an investment will fluctuate so that an investor’s shares, when redeemed, may be worth more or less than their original cost. Current performance data may be lower or higher than the performance data provided herein. To obtain performance information up to the most recent month-end, visit www.gmo.com. Performance shown is net of all fees after reimbursement from GMO. Returns would have been lower had certain expenses not been reimbursed during the periods shown and do not include the effect of taxes on distributions and redemptions. The performance information shown above only includes purchase premiums and/or redemption fees in effect as of February 28, 2023. All information is unaudited.
For S&P disclaimers please visit https://www.gmo.com/north-america/benchmark-disclaimers/
For Class VI the gross expense ratio of 0.42% is equal to the Fund’s Total Annual Operating Expenses set forth in the Fund’s most recent prospectus dated June 30, 2022. For the Class listed above, the net expense ratio of 0.42% reflects the reduction of expenses from fee reimbursements. The fee reimbursements will continue until at least June 30, 2023. Elimination of this reimbursement will result in higher fees and lower performance.
| 100 |
GMO U.S. Small Cap Value Fund
(A Series of GMO Trust)
Investment Concentration Summary
February 28, 2023 (Unaudited)
Asset Class Summary& | % of Total Net Assets | |||
Common Stocks | 98.8 | % | ||
Mutual Funds | 1.2 | |||
Short-Term Investments | 0.3 | |||
Rights/Warrants | 0.1 | |||
Futures Contracts | 0.0 | ^ | ||
Other | (0.4 | ) | ||
|
| |||
| 100.0 | % | |||
|
| |||
Industry Group Summary | % of Equity Investments# | |||
Capital Goods | 10.8 | % | ||
Retailing | 10.4 | |||
Consumer Durables & Apparel | 10.0 | |||
Materials | 9.2 | |||
Technology Hardware & Equipment | 7.8 | |||
Real Estate | 7.7 | |||
Banks | 7.2 | |||
Commercial & Professional Services | 5.4 | |||
Diversified Financials | 5.3 | |||
Media & Entertainment | 4.1 | |||
Energy | 3.6 | |||
Semiconductors & Semiconductor Equipment | 3.6 | |||
Insurance | 3.4 | |||
Health Care Equipment & Services | 2.5 | |||
Pharmaceuticals, Biotechnology & Life Sciences | 2.3 | |||
Transportation | 1.9 | |||
Food, Beverage & Tobacco | 1.7 | |||
Consumer Services | 1.5 | |||
Food & Staples Retailing | 0.7 | |||
Automobiles & Components | 0.5 | |||
Telecommunication Services | 0.4 | |||
|
| |||
| 100.0 | % | |||
|
| |||
| & | In the table, derivative financial instruments, if any, are based on market values, rather than the notional amounts of derivatives, except for forward currency contracts which are based on unrealized appreciation/(depreciation). |
| # | Equity investments may consist of common stocks and other stock-related securities, such as preferred stocks, if any. This table excludes exposure to derivative contracts, short-term investments, mutual funds and investment funds, if any. For a summary of these exposures, if any, see the Schedule of Investments. |
| ^ | Rounds to 0.0%. |
| 101 |
GMO U.S. Small Cap Value Fund
(A Series of GMO Trust)
(showing percentage of total net assets)
February 28, 2023
Shares | Description | Value ($) | ||||||
| COMMON STOCKS — 98.8% | ||||||||
| Automobiles & Components — 0.4% | ||||||||
| 5,400 | Modine Manufacturing Co.* | 131,814 | ||||||
|
| |||||||
| Banks — 7.2% | ||||||||
| 2,706 | 1st Source Corp. | 134,813 | ||||||
| 7,025 | Amalgamated Financial Corp. | 165,439 | ||||||
| 1,327 | Arrow Financial Corp. | 40,447 | ||||||
| 11,699 | Associated Banc-Corp. | 270,832 | ||||||
| 600 | Capital City Bank Group, Inc. | 21,402 | ||||||
| 900 | Central Valley Community Bancorp | 22,959 | ||||||
| 470 | Civista Bancshares, Inc. | 10,025 | ||||||
| 2,696 | Community Trust Bancorp, Inc. | 115,254 | ||||||
| 1,004 | Financial Institutions, Inc. | 25,060 | ||||||
| 1,605 | First Community Bankshares, Inc. | 50,108 | ||||||
| 698 | First Financial Bancorp | 17,199 | ||||||
| 2,400 | First Financial Corp. | 105,480 | ||||||
| 400 | Great Southern Bancorp, Inc. | 23,276 | ||||||
| 8,589 | Hanmi Financial Corp. | 202,872 | ||||||
| 4,391 | Independent Bank Corp. | 96,821 | ||||||
| 3,400 | Midland States Bancorp, Inc. | 88,536 | ||||||
| 1,200 | MidWestOne Financial Group, Inc. | 36,048 | ||||||
| 19,900 | Radian Group, Inc. | 424,865 | ||||||
| 613 | Republic Bancorp, Inc. – Class A | 27,278 | ||||||
| 6,196 | Towne Bank | 187,925 | ||||||
| 2,367 | Waterstone Financial, Inc. | 38,109 | ||||||
|
| |||||||
| Total Banks | 2,104,748 | |||||||
|
| |||||||
| Capital Goods — 10.7% | ||||||||
| 6,700 | Allison Transmission Holdings, Inc. | 318,250 | ||||||
| 5,100 | Apogee Enterprises, Inc. | 233,376 | ||||||
| 12,700 | Griffon Corp. | 463,169 | ||||||
| 2,570 | Hyster-Yale Materials Handling, Inc. | 99,999 | ||||||
| 1,468 | Miller Industries, Inc. | 40,825 | ||||||
| 5,519 | Moog, Inc. – Class A | 544,284 | ||||||
| 33,300 | MRC Global, Inc.* | 372,960 | ||||||
| 7,855 | Mueller Industries, Inc. | 581,034 | ||||||
| 12,000 | NOW, Inc.* | 154,200 | ||||||
| 1,152 | Park-Ohio Holdings Corp. | 15,333 | ||||||
| 596 | Preformed Line Products Co. | 53,142 | ||||||
| 1,200 | Quanex Building Products Corp. | 31,140 | ||||||
| 3,135 | Resideo Technologies, Inc.* | 57,496 | ||||||
| 200 | Rush Enterprises, Inc. – Class B | 11,996 | ||||||
| 600 | Tennant Co. | 42,492 | ||||||
| 2,948 | V2X, Inc.* | 136,699 | ||||||
|
| |||||||
| Total Capital Goods | 3,156,395 | |||||||
|
| |||||||
| Commercial & Professional Services — 5.4% |
| |||||||
| 36,749 | ACCO Brands Corp. | 208,367 | ||||||
| 800 | Barrett Business Services, Inc. | 76,784 | ||||||
| 3,400 | CBIZ, Inc.* | 170,306 | ||||||
| 12,679 | Deluxe Corp. | 233,801 | ||||||
| 4,971 | Heidrick & Struggles International, Inc. | 170,655 | ||||||
| 2,500 | ICF International, Inc. | 248,725 | ||||||
| Shares | Description | Value ($) | ||||||
| Commercial & Professional Services — continued |
| |||||||
| 9,100 | Kelly Services, Inc. – Class A | 152,243 | ||||||
| 7,273 | Kimball International, Inc. – Class B | 50,256 | ||||||
| 10,690 | Resources Connection, Inc. | 193,061 | ||||||
| 9,593 | Steelcase, Inc. – Class A | 75,497 | ||||||
|
| |||||||
| Total Commercial & Professional Services | 1,579,695 | |||||||
|
| |||||||
| Consumer Durables & Apparel — 9.8% |
| |||||||
| 3,000 | Acushnet Holdings Corp. | 144,780 | ||||||
| 2,100 | Bassett Furniture Industries, Inc. | 38,955 | ||||||
| 2,652 | Clarus Corp. | 26,255 | ||||||
| 13,277 | Ethan Allen Interiors, Inc. | 392,335 | ||||||
| 10,500 | G-III Apparel Group Ltd.* | 174,457 | ||||||
| 2,546 | Hooker Furniture Corp. | 55,974 | ||||||
| 1,622 | Johnson Outdoors, Inc. – Class A | 105,203 | ||||||
| 14,891 | La-Z-Boy, Inc. | 482,171 | ||||||
| 100 | Malibu Boats, Inc. – Class A* | 5,976 | ||||||
| 3,200 | MasterCraft Boat Holdings, Inc.* | 108,064 | ||||||
| 7,335 | Movado Group, Inc. | 253,938 | ||||||
| 3,000 | Oxford Industries, Inc. | 352,830 | ||||||
| 9,800 | Taylor Morrison Home Corp. – Class A* | 351,134 | ||||||
| 11,892 | TRI Pointe Homes, Inc.* | 283,505 | ||||||
| 3,569 | Universal Electronics, Inc.* | 45,398 | ||||||
| 11,651 | Vera Bradley, Inc.* | 61,750 | ||||||
| 1,300 | VOXX International Corp.* | 14,859 | ||||||
|
| |||||||
| Total Consumer Durables & Apparel | 2,897,584 | |||||||
|
| |||||||
| Consumer Services — 1.4% | ||||||||
| 252 | Graham Holdings Co. – Class B | 157,918 | ||||||
| 19,500 | Perdoceo Education Corp.* | 268,808 | ||||||
|
| |||||||
| Total Consumer Services | 426,726 | |||||||
|
| |||||||
| Diversified Financials — 5.2% | ||||||||
| 6,600 | A-Mark Precious Metals, Inc. | 193,446 | ||||||
| 8,971 | Curo Group Holdings Corp. | 26,195 | ||||||
| 308 | Diamond Hill Investment Group, Inc. | 53,777 | ||||||
| 11,004 | Donnelley Financial Solutions, Inc.* | 465,579 | ||||||
| 9,509 | Enova International, Inc.* | 463,564 | ||||||
| 1,200 | LendingTree, Inc.* | 39,516 | ||||||
| 800 | Nelnet, Inc. – Class A | 75,096 | ||||||
| 3,400 | Oppenheimer Holdings, Inc. – Class A | 149,906 | ||||||
| 1,900 | Regional Management Corp. | 59,888 | ||||||
| 914 | Westwood Holdings Group, Inc. | 11,745 | ||||||
|
| |||||||
| Total Diversified Financials | 1,538,712 | |||||||
|
| |||||||
| Energy — 3.6% | ||||||||
| 100 | Dril-Quip, Inc.* | 3,425 | ||||||
| 7,260 | Evolution Petroleum Corp. | 47,262 | ||||||
| 2,400 | Gulfport Energy Corp.* | 158,688 | ||||||
| 26,100 | Oil States International, Inc.* | 238,293 | ||||||
| 22,197 | World Fuel Services Corp. | 609,308 | ||||||
|
| |||||||
| Total Energy | 1,056,976 | |||||||
|
| |||||||
| See accompanying notes to the financial statements. | 102 |
GMO U.S. Small Cap Value Fund
(A Series of GMO Trust)
Schedule of Investments — (Continued)
(showing percentage of total net assets)
February 28, 2023
| Shares | Description | Value ($) | ||||||
| Food & Staples Retailing — 0.7% | ||||||||
| 4,309 | SpartanNash Co. | 115,309 | ||||||
| 1,500 | Village Super Market, Inc. – Class A | 33,495 | ||||||
| 600 | Weis Markets, Inc. | 45,864 | ||||||
|
| |||||||
| Total Food & Staples Retailing | 194,668 | |||||||
|
| |||||||
| Food, Beverage & Tobacco — 1.7% | ||||||||
| 2,444 | Seneca Foods Corp. – Class A* | 135,886 | ||||||
| 7,159 | Universal Corp. | 362,174 | ||||||
|
| |||||||
| Total Food, Beverage & Tobacco | 498,060 | |||||||
|
| |||||||
| Health Care Equipment & Services — 2.5% |
| |||||||
| 735 | Eargo, Inc.* | 4,447 | ||||||
| 4,900 | HealthStream, Inc.* | 125,685 | ||||||
| 20,700 | Patterson Cos., Inc. | 548,964 | ||||||
| 100 | Tactile Systems Technology, Inc.* | 1,445 | ||||||
| 4,000 | Zimvie, Inc.* | 45,520 | ||||||
|
| |||||||
| Total Health Care Equipment & Services | 726,061 | |||||||
|
| |||||||
| Insurance — 3.4% | ||||||||
| 18,300 | CNO Financial Group, Inc. | 468,846 | ||||||
| 2,080 | GoHealth, Inc. – Class A* | 33,717 | ||||||
| 10,690 | Stewart Information Services Corp. | 454,218 | ||||||
| 2,000 | Universal Insurance Holdings, Inc. | 38,660 | ||||||
|
| |||||||
| Total Insurance | 995,441 | |||||||
|
| |||||||
| Materials — 9.1% | ||||||||
| 5,348 | AdvanSix, Inc. | 220,070 | ||||||
| 1,808 | American Vanguard Corp. | 37,733 | ||||||
| 300 | Innospec, Inc. | 32,838 | ||||||
| 3,519 | Koppers Holdings, Inc. | 126,297 | ||||||
| 11,113 | Mativ Holdings, Inc. | 287,938 | ||||||
| 4,480 | Mercer International, Inc. | 48,294 | ||||||
| 1,200 | NewMarket Corp. | 412,200 | ||||||
| 9,800 | Pactiv Evergreen, Inc. | 105,938 | ||||||
| 9,300 | Ryerson Holding Corp. | 334,149 | ||||||
| 3,700 | Stepan Co. | 385,133 | ||||||
| 1,200 | Sylvamo Corp. | 59,196 | ||||||
| 16,800 | Warrior Met Coal, Inc. | 642,936 | ||||||
|
| |||||||
| Total Materials | 2,692,722 | |||||||
|
| |||||||
| Media & Entertainment — 4.1% | ||||||||
| 16,400 | AMC Networks, Inc. – Class A* | 366,704 | ||||||
| 400 | EverQuote, Inc. – Class A* | 5,460 | ||||||
| 700 | Lee Enterprises, Inc.* | 13,160 | ||||||
| 8,300 | Scholastic Corp. | 378,563 | ||||||
| 6,890 | TEGNA, Inc. | 119,886 | ||||||
| 10,400 | Yelp, Inc.* | 312,208 | ||||||
|
| |||||||
| Total Media & Entertainment | 1,195,981 | |||||||
|
| |||||||
| Pharmaceuticals, Biotechnology & Life Sciences — 2.1% |
| |||||||
| 1,200 | NGM Biopharmaceuticals, Inc.* | 5,688 | ||||||
| Shares | Description | Value ($) | ||||||
| Pharmaceuticals, Biotechnology & Life Sciences — continued |
| |||||||
| 900 | Pliant Therapeutics, Inc.* | 28,674 | ||||||
| 9,920 | Prestige Consumer Healthcare, Inc.* | 597,680 | ||||||
|
| |||||||
| Total Pharmaceuticals, Biotechnology & Life Sciences | 632,042 | |||||||
|
| |||||||
| Real Estate — 7.6% | ||||||||
| 66,382 | Anywhere Real Estate, Inc.* | 384,352 | ||||||
| 8,200 | Apple Hospitality REIT, Inc. | 135,382 | ||||||
| 138,800 | Diversified Healthcare Trust (REIT) | 136,024 | ||||||
| 6,600 | Douglas Elliman, Inc. | 27,852 | ||||||
| 6,881 | Five Point Holdings LLC – Class A* | 15,069 | ||||||
| 3,170 | Forestar Group, Inc.* | 45,236 | ||||||
| 7,600 | Hersha Hospitality Trust (REIT) | 63,536 | ||||||
| 16,300 | Industrial Logistics Properties Trust (REIT) | 66,830 | ||||||
| 600 | Lamar Advertising Co. (REIT) – Class A | 62,736 | ||||||
| 7,400 | Marcus & Millichap, Inc. | 254,338 | ||||||
| 27,400 | Piedmont Office Realty Trust, Inc. – Class A (REIT) | 250,710 | ||||||
| 8,000 | PotlatchDeltic Corp. (REIT) | 369,280 | ||||||
| 500 | RE/MAX Holdings, Inc. – Class A | 9,245 | ||||||
| 3,200 | RMR Group, Inc. (The) – Class A | 90,048 | ||||||
| 4,000 | RPT Realty (REIT) | 42,880 | ||||||
| 23,300 | Service Properties Trust (REIT) | 255,834 | ||||||
| 800 | Urstadt Biddle Properties, Inc. – Class A (REIT) | 13,840 | ||||||
| 1,900 | Whitestone REIT | 17,955 | ||||||
| 700 | Xenia Hotels & Resorts, Inc. (REIT) | 9,828 | ||||||
|
| |||||||
| Total Real Estate | 2,250,975 | |||||||
|
| |||||||
| Retailing — 10.3% | ||||||||
| 12,500 | Aaron’s Co., Inc. (The) | 179,375 | ||||||
| 2,100 | Caleres, Inc. | 54,831 | ||||||
| 3,820 | Cato Corp. (The) – Class A | 35,335 | ||||||
| 45,000 | Chico’s FAS, Inc.* | 258,750 | ||||||
| 900 | Children’s Place, Inc. (The)* | 37,683 | ||||||
| 100 | Citi Trends, Inc.* | 2,804 | ||||||
| 19,400 | Container Store Group , Inc. (The)* | 84,390 | ||||||
| 24,800 | Designer Brands, Inc. – Class A | 242,792 | ||||||
| 7,587 | Genesco, Inc.* | 341,187 | ||||||
| 3,594 | Group 1 Automotive, Inc. | 794,526 | ||||||
| 6,194 | Haverty Furniture Cos., Inc. | 233,761 | ||||||
| 7,800 | Lands’ End, Inc.* | 59,280 | ||||||
| 10,396 | Shoe Carnival, Inc. | 273,935 | ||||||
| 5,700 | Signet Jewelers Ltd. | 408,234 | ||||||
| 494 | Weyco Group, Inc. | 13,091 | ||||||
|
| |||||||
| Total Retailing | 3,019,974 | |||||||
|
| |||||||
| Semiconductors & Semiconductor Equipment — 3.6% |
| |||||||
| 16,900 | Amkor Technology, Inc. | 435,344 | ||||||
| 600 | Cirrus Logic, Inc.* | 61,650 | ||||||
| 103 | See accompanying notes to the financial statements. |
GMO U.S. Small Cap Value Fund
(A Series of GMO Trust)
Schedule of Investments — (Continued)
(showing percentage of total net assets)
February 28, 2023
| Shares | Description | Value ($) | ||||||
| Semiconductors & Semiconductor Equipment — continued |
| |||||||
| 10,300 | Kulicke & Soffa Industries, Inc. | 548,990 | ||||||
|
| |||||||
| Total Semiconductors & Semiconductor Equipment | 1,045,984 | |||||||
|
| |||||||
| Technology Hardware & Equipment — 7.7% |
| |||||||
| 12,513 | Avnet, Inc. | 559,456 | ||||||
| 2,900 | Bel Fuse, Inc. – Class B | 103,008 | ||||||
| 8,619 | Benchmark Electronics, Inc. | 205,046 | ||||||
| 3,161 | CTS Corp. | 136,903 | ||||||
| 9,700 | Daktronics, Inc.* | 39,382 | ||||||
| 2,978 | Kimball Electronics, Inc.* | 74,480 | ||||||
| 700 | PC Connection, Inc. | 30,660 | ||||||
| 9,745 | Sanmina Corp.* | 589,183 | ||||||
| 3,353 | ScanSource, Inc.* | 104,546 | ||||||
| 244 | Super Micro Computer, Inc.* | 23,904 | ||||||
| 100 | Vishay Precision Group Inc.* | 4,360 | ||||||
| 23,922 | Xerox Holdings Corp. | 394,474 | ||||||
|
| |||||||
| Total Technology Hardware & Equipment | 2,265,402 | |||||||
|
| |||||||
| Telecommunication Services — 0.4% | ||||||||
| 600 | ATN International, Inc. | 25,230 | ||||||
| 7,821 | Spok Holdings, Inc. | 78,132 | ||||||
|
| |||||||
| Total Telecommunication Services | 103,362 | |||||||
|
| |||||||
| Transportation — 1.9% | ||||||||
| 3,100 | Hub Group, Inc. – Class A* | 284,363 | ||||||
| 10,000 | Schneider National, Inc. – Class B | 280,600 | ||||||
|
| |||||||
| Total Transportation | 564,963 | |||||||
|
| |||||||
TOTAL COMMON STOCKS (COST $28,891,909) | 29,078,285 | |||||||
|
| |||||||
| Shares | Description | Value ($) | ||||||
| MUTUAL FUNDS — 1.2% | ||||||||
| Affiliated Issuers — 1.2% | ||||||||
| 69,122 | GMO U.S. Treasury Fund | 344,916 | ||||||
|
| |||||||
TOTAL MUTUAL FUNDS (COST $344,916) | 344,916 | |||||||
|
| |||||||
| RIGHTS/WARRANTS — 0.1% | ||||||||
| Pharmaceuticals, Biotechnology & Life Sciences — 0.1% |
| |||||||
| 72,700 | Achillion Pharmaceuticals, Inc. CVR* (a) | 36,350 | ||||||
|
| |||||||
TOTAL RIGHTS/WARRANTS (COST $33,442) | 36,350 | |||||||
|
| |||||||
| SHORT-TERM INVESTMENTS — 0.3% |
| |||||||
| Money Market Funds — 0.3% | ||||||||
| 90,522 | State Street Institutional Treasury Money Market Fund – Premier Class, 4.42% (b) | 90,522 | ||||||
|
| |||||||
TOTAL SHORT-TERM INVESTMENTS (COST $90,522) | 90,522 | |||||||
|
| |||||||
TOTAL INVESTMENTS — 100.4% (Cost $29,360,789) | 29,550,073 | |||||||
| Other Assets and Liabilities (net) — (0.4)% | (122,558 | ) | ||||||
|
| |||||||
| TOTAL NET ASSETS — 100.0% | $29,427,515 | |||||||
|
| |||||||
A summary of outstanding financial instruments at February 28, 2023 is as follows:
Futures Contracts
| Value/Net | ||||||||||||||
| Unrealized | ||||||||||||||
Number of | Type | Expiration Date | Notional Amount ($) | Appreciation (Depreciation) ($) | ||||||||||
| Buys | ||||||||||||||
| 2 | E-mini Russell 2000 Index | March 2023 | $ | 189,910 | $ | 14,011 | ||||||||
|
|
|
| |||||||||||
| + | Buys - Fund is long the futures contract. |
Sales - Fund is short the futures contract. |
As of February 28, 2023, for the above contracts and/or agreements, the Fund had sufficient cash and/or securities to cover commitments or collateral requirements, if any, of the relevant broker or exchange.
| See accompanying notes to the financial statements. | 104 |
GMO U.S. Small Cap Value Fund
(A Series of GMO Trust)
Schedule of Investments — (Continued)
February 28, 2023
Notes to Schedule of Investments:
| * | Non-income producing security. |
| (a) | Investment valued using significant unobservable inputs (Note 2). |
| (b) | The rate disclosed is the 7 day net yield as of February 28, 2023. |
For a listing of definitions of acronyms, counterparty abbreviations and currency abbreviations used throughout the Schedule of Investments as well as the derivative tables, if any, please refer to page 106.
| 105 | See accompanying notes to the financial statements. |
GMO Trust Funds
February 28, 2023
ADR - American Depositary Receipt
CVA - Certificaaten van aandelen (Share Certificates)
CVR - Contingent Value Right
ETF - Exchange-Traded Fund
Foreign Registered - Shares issued to foreign investors in markets that have foreign ownership limits.
GDR - Global Depositary Receipt
JSC - Joint-Stock Company
NVDR - Non-Voting Depositary Receipt
PJSC - Private Joint-Stock Company
QPSC - Qatar Private Stock Company
QSC - Qatari Shareholding Company
REIT - Real Estate Investment Trust
SOFOM - Sociedades Financieras de Objeto Multi (Multi-purpose Financial Company)
USBM - U.S. Treasury 3 Month Bill Money Market Yield
The rates shown on variable rate notes are the current interest rates at February 28, 2023, which are subject to change based on the terms of the security.
| See accompanying notes to the financial statements. | 106 |
Statements of Assets and Liabilities — February 28, 2023
| Emerging | ||||||||||||||||||||
| Markets | ||||||||||||||||||||
| Select | ||||||||||||||||||||
| Equity | ||||||||||||||||||||
| Fund | ||||||||||||||||||||
| (formerly | ||||||||||||||||||||
| Emerging | Emerging | |||||||||||||||||||
| Markets | Domestic | |||||||||||||||||||
| Climate | ex-China | Emerging | Opportunities | International | ||||||||||||||||
| Change Fund | Fund | Markets Fund | Fund) | Equity Fund | ||||||||||||||||
Assets: | ||||||||||||||||||||
Investments in affiliated issuers, at value (Notes 2 and 10)(a) | $ | 27,154,401 | $ | 319,023 | $ | 15,604,628 | $ | 712,446 | $ | 72,610,442 | ||||||||||
Investments in unaffiliated issuers, at value | 911,239,516 | 261,422,327 | 836,809,982 | 120,635,823 | 1,273,146,025 | |||||||||||||||
Foreign currency, at value (Note 2)(d) | 6,831 | 3,621,902 | 3,491,212 | 71,738 | 25,800 | |||||||||||||||
Cash | 7 | 267 | 3,714 | — | — | |||||||||||||||
Receivable for investments sold | 44,412 | 45,118,803 | 48,823,591 | — | 162,991,208 | |||||||||||||||
Receivable for Fund shares sold | 310,547 | 156,000 | 272,954 | — | 201,592 | |||||||||||||||
Dividends and interest receivable | 1,539,744 | 1,761,224 | 5,954,759 | 360,661 | 4,282,692 | |||||||||||||||
Dividend withholding tax receivable | 20,941 | 7,584 | 28,889 | 76,824 | 1,490,258 | |||||||||||||||
Foreign capital gains tax refund receivable | — | — | 3,679,284 | 5,190,179 | — | |||||||||||||||
EU tax reclaims receivable (Note 2) | — | — | — | — | 1,792,749 | |||||||||||||||
Due from broker (Note 2) | — | — | 139,972 | 11,025 | 4,371 | |||||||||||||||
Receivable for expenses reimbursed and/or waived by GMO (Note 5) | 123,519 | 69,055 | 75,410 | 28,919 | 49,070 | |||||||||||||||
|
|
|
|
|
|
|
|
|
| |||||||||||
Total assets | 940,439,918 | 312,476,185 | 914,884,395 | 127,087,615 | 1,516,594,207 | |||||||||||||||
|
|
|
|
|
|
|
|
|
| |||||||||||
Liabilities: | ||||||||||||||||||||
Payable for cash collateral from securities loaned (Note 2) | 5,704,463 | — | — | — | — | |||||||||||||||
Payable for investments purchased | 930,228 | 4,478,145 | 1,835,654 | 275,442 | — | |||||||||||||||
Payable for Fund shares repurchased | 150,437 | 52,795,000 | 61,355,542 | — | 166,797,552 | |||||||||||||||
Accrued foreign capital gains tax payable (Note 2) | — | 759 | 1,585,801 | 384,323 | — | |||||||||||||||
Payable for IRS closing agreement fees (Note 2) | — | — | — | — | 53,077,926 | |||||||||||||||
Payable to affiliate for (Note 5): | ||||||||||||||||||||
Management fee | 432,852 | 133,769 | 505,620 | 54,150 | 567,342 | |||||||||||||||
Shareholder service fee | 108,213 | 15,551 | 81,238 | 20,209 | 118,345 | |||||||||||||||
Payable for variation margin on open futures contracts (Note 4) | — | — | 413,490 | — | 132,020 | |||||||||||||||
Payable to Trustees and related expenses | 2,568 | 847 | 5,796 | 2,673 | 5,330 | |||||||||||||||
Miscellaneous payable | — | — | 794,750 | — | — | |||||||||||||||
Accrued expenses | 251,984 | 257,987 | 499,703 | 162,691 | 352,142 | |||||||||||||||
|
|
|
|
|
|
|
|
|
| |||||||||||
Total liabilities | 7,580,745 | 57,682,058 | 67,077,594 | 899,488 | 221,050,657 | |||||||||||||||
|
|
|
|
|
|
|
|
|
| |||||||||||
Net assets | $ | 932,859,173 | $ | 254,794,127 | $ | 847,806,801 | $ | 126,188,127 | $ | 1,295,543,550 | ||||||||||
|
|
|
|
|
|
|
|
|
| |||||||||||
(a) Cost of investments – affiliated issuers: | $ | 27,142,335 | $ | 319,023 | $ | 21,319,238 | $ | 712,446 | $ | 72,590,181 | ||||||||||
(b) Cost of investments – unaffiliated issuers: | $ | 902,112,764 | $ | 359,950,690 | $ | 1,375,124,891 | $ | 151,714,803 | $ | 1,303,808,483 | ||||||||||
(c) Includes securities on loan at value (Note 2): | $ | 15,478,407 | $ | — | $ | 3,789,662 | $ | — | $ | — | ||||||||||
(d) Cost of foreign currency: | $ | 6,885 | $ | 3,634,817 | $ | 3,486,618 | $ | 72,076 | $ | 25,947 | ||||||||||
| 107 | See accompanying notes to the financial statements. |
GMO Trust Funds
Statements of Assets and Liabilities — February 28, 2023 — (Continued)
| Emerging | ||||||||||||||||||||
| Markets | ||||||||||||||||||||
| Select | ||||||||||||||||||||
| Equity | ||||||||||||||||||||
| Fund | ||||||||||||||||||||
| (formerly | ||||||||||||||||||||
| Emerging | Emerging | |||||||||||||||||||
| Markets | Domestic | |||||||||||||||||||
| Climate | ex-China | Emerging | Opportunities | International | ||||||||||||||||
| Change Fund | Fund | Markets Fund | Fund) | Equity Fund | ||||||||||||||||
Net assets consist of: | ||||||||||||||||||||
Paid-in capital | $ | 952,024,456 | $ | 374,927,207 | $ | 2,722,691,955 | $ | 306,110,430 | $ | 2,296,531,707 | ||||||||||
Distributable earnings (accumulated loss) | (19,165,283 | ) | (120,133,080 | ) | (1,874,885,154 | ) | (179,922,303 | ) | (1,000,988,157 | ) | ||||||||||
|
|
|
|
|
|
|
|
|
| |||||||||||
| $ | 932,859,173 | $ | 254,794,127 | $ | 847,806,801 | $ | 126,188,127 | $ | 1,295,543,550 | |||||||||||
|
|
|
|
|
|
|
|
|
| |||||||||||
Net assets attributable to: | ||||||||||||||||||||
Class II | $ | — | $ | — | $ | 151,666,217 | $ | 113,488,066 | $ | 4,623,307 | ||||||||||
|
|
|
|
|
|
|
|
|
| |||||||||||
Class III | $ | 330,217,908 | $ | 28,548,471 | $ | 72,071 | $ | — | $ | 366,630,413 | ||||||||||
|
|
|
|
|
|
|
|
|
| |||||||||||
Class IV | $ | — | $ | — | $ | — | $ | — | $ | 921,486,246 | ||||||||||
|
|
|
|
|
|
|
|
|
| |||||||||||
Class V | $ | — | $ | — | $ | — | $ | 6,830,235 | $ | — | ||||||||||
|
|
|
|
|
|
|
|
|
| |||||||||||
Class VI | $ | — | $ | 226,245,293 | $ | 598,337,065 | $ | — | $ | — | ||||||||||
|
|
|
|
|
|
|
|
|
| |||||||||||
Class R6 | $ | 183,089,429 | $ | — | $ | 11,042,024 | $ | — | $ | — | ||||||||||
|
|
|
|
|
|
|
|
|
| |||||||||||
Class I | $ | 419,551,836 | $ | 363 | $ | 86,689,424 | $ | 5,869,826 | $ | 2,803,584 | ||||||||||
|
|
|
|
|
|
|
|
|
| |||||||||||
Shares outstanding: | ||||||||||||||||||||
Class II | — | — | 6,935,257 | 6,323,595 | 216,579 | |||||||||||||||
|
|
|
|
|
|
|
|
|
| |||||||||||
Class III | 11,422,048 | 2,142,444 | 3,283 | — | 16,939,034 | |||||||||||||||
|
|
|
|
|
|
|
|
|
| |||||||||||
Class IV | — | — | — | — | 42,655,385 | |||||||||||||||
|
|
|
|
|
|
|
|
|
| |||||||||||
Class V | — | — | — | 381,752 | — | |||||||||||||||
|
|
|
|
|
|
|
|
|
| |||||||||||
Class VI | — | 16,966,080 | 27,614,301 | — | — | |||||||||||||||
|
|
|
|
|
|
|
|
|
| |||||||||||
Class R6 | 6,346,682 | — | 504,765 | — | — | |||||||||||||||
|
|
|
|
|
|
|
|
|
| |||||||||||
Class I | 14,552,070 | 27 | 3,971,743 | 327,366 | 129,087 | |||||||||||||||
|
|
|
|
|
|
|
|
|
| |||||||||||
Net asset value per share: | ||||||||||||||||||||
Class II | $ | — | $ | — | $ | 21.87 | $ | 17.95 | $ | 21.35 | ||||||||||
|
|
|
|
|
|
|
|
|
| |||||||||||
Class III | $ | 28.91 | $ | 13.33 | $ | 21.96 | $ | — | $ | 21.64 | ||||||||||
|
|
|
|
|
|
|
|
|
| |||||||||||
Class IV | $ | — | $ | — | $ | — | $ | — | $ | 21.60 | ||||||||||
|
|
|
|
|
|
|
|
|
| |||||||||||
Class V | $ | — | $ | — | $ | — | $ | 17.89 | $ | — | ||||||||||
|
|
|
|
|
|
|
|
|
| |||||||||||
Class VI | $ | — | $ | 13.34 | $ | 21.67 | $ | — | $ | — | ||||||||||
|
|
|
|
|
|
|
|
|
| |||||||||||
Class R6 | $ | 28.85 | $ | — | $ | 21.88 | $ | — | $ | — | ||||||||||
|
|
|
|
|
|
|
|
|
| |||||||||||
Class I | $ | 28.83 | $ | 13.34 | $ | 21.83 | $ | 17.93 | $ | 21.72 | ||||||||||
|
|
|
|
|
|
|
|
|
| |||||||||||
| See accompanying notes to the financial statements. | 108 |
GMO Trust Funds
Statements of Assets and Liabilities — February 28, 2023 — (Continued)
| Quality | ||||||||||||||||||||
| Japan Value | Cyclicals | Quality | Resource | Resources | ||||||||||||||||
| Creation Fund | Fund | Fund | Transition Fund | Fund | ||||||||||||||||
Assets: | ||||||||||||||||||||
Investments in affiliated issuers, at value (Notes 2 and 10)(a) | $ | — | $ | 680,863 | $ | 116,238,335 | $ | 3,512,040 | $ | 39,264,526 | ||||||||||
Investments in unaffiliated issuers, at value | 110,473,079 | 69,279,610 | 6,666,440,506 | 456,471,037 | 1,762,534,729 | |||||||||||||||
Foreign currency, at value (Note 2)(d) | 3,194 | 553 | 72 | 5,487 | 79,895 | |||||||||||||||
Cash | — | — | — | 1,826 | 14 | |||||||||||||||
Receivable for investments sold | 19,516,928 | 26,504,133 | 40,968,528 | — | 83,511 | |||||||||||||||
Receivable for Fund shares sold | 25,000 | — | 9,091,726 | — | 135,583,546 | |||||||||||||||
Dividends and interest receivable | 248,340 | 274,281 | 10,594,438 | 373,435 | 4,481,632 | |||||||||||||||
Dividend withholding tax receivable | 5,949 | — | 2,363,539 | — | 380,690 | |||||||||||||||
Foreign capital gains tax refund receivable (Note 2) | — | — | — | — | 1,012 | |||||||||||||||
EU tax reclaims receivable (Note 2) | — | — | 254,969 | — | — | |||||||||||||||
Receivable for expenses reimbursed and/or waived by GMO (Note 5) | 29,069 | 31,056 | 278,035 | 121,391 | — | |||||||||||||||
|
|
|
|
|
|
|
|
|
| |||||||||||
Total assets | 130,301,559 | 96,770,496 | 6,846,230,148 | 460,485,216 | 1,942,409,555 | |||||||||||||||
|
|
|
|
|
|
|
|
|
| |||||||||||
Liabilities: | ||||||||||||||||||||
Payable for investments purchased | 76,796 | 36,446 | — | 12,040 | 228,988 | |||||||||||||||
Payable for Fund shares repurchased | 22,545,000 | 26,935,000 | 57,830,514 | — | 156,284,955 | |||||||||||||||
Accrued foreign capital gains tax payable (Note 2) | — | — | — | — | 34,726 | |||||||||||||||
Payable to affiliate for (Note 5): | ||||||||||||||||||||
Management fee | 50,159 | 25,184 | 1,791,159 | 133,612 | 824,350 | |||||||||||||||
Shareholder service fee | 7,499 | 4,202 | 612,702 | 9,186 | 192,785 | |||||||||||||||
Payable to Trustees and related expenses | 441 | 371 | 25,195 | 434 | 7,585 | |||||||||||||||
Accrued expenses | 115,890 | 95,234 | 566,395 | 121,191 | 558,970 | |||||||||||||||
|
|
|
|
|
|
|
|
|
| |||||||||||
Total liabilities | 22,795,785 | 27,096,437 | 60,825,965 | 276,463 | 158,132,359 | |||||||||||||||
|
|
|
|
|
|
|
|
|
| |||||||||||
Net assets | $ | 107,505,774 | $ | 69,674,059 | $ | 6,785,404,183 | $ | 460,208,753 | $ | 1,784,277,196 | ||||||||||
|
|
|
|
|
|
|
|
|
| |||||||||||
(a) Cost of investments – affiliated issuers: | $ | — | $ | 680,863 | $ | 116,151,685 | $ | 3,512,040 | $ | 39,249,466 | ||||||||||
(b) Cost of investments – unaffiliated issuers: | $ | 127,286,334 | $ | 56,282,224 | $ | 4,250,216,463 | $ | 481,445,320 | $ | 1,811,490,919 | ||||||||||
(c) Includes securities on loan at value (Note 2): | $ | — | $ | — | $ | — | $ | — | $ | 44,042,029 | ||||||||||
(d) Cost of foreign currency: | $ | 3,192 | $ | 561 | $ | 76 | $ | 5,487 | $ | 80,455 | ||||||||||
| 109 | See accompanying notes to the financial statements. |
GMO Trust Funds
Statements of Assets and Liabilities — February 28, 2023 — (Continued)
| Quality | ||||||||||||||||||||
| Japan Value | Cyclicals | Quality | Resource | Resources | ||||||||||||||||
| Creation Fund | Fund | Fund | Transition Fund | Fund | ||||||||||||||||
Net assets consist of: | ||||||||||||||||||||
Paid-in capital | $ | 130,026,471 | $ | 53,729,684 | $ | 4,423,490,799 | $ | 485,000,000 | $ | 1,809,552,573 | ||||||||||
Distributable earnings (accumulated loss) | (22,520,697 | ) | 15,944,375 | 2,361,913,384 | (24,791,247 | ) | (25,275,377 | ) | ||||||||||||
|
|
|
|
|
|
|
|
|
| |||||||||||
| $ | 107,505,774 | $ | 69,674,059 | $ | 6,785,404,183 | $ | 460,208,753 | $ | 1,784,277,196 | |||||||||||
|
|
|
|
|
|
|
|
|
| |||||||||||
Net assets attributable to: | ||||||||||||||||||||
Class III | $ | 24,808,432 | $ | — | $ | 2,885,806,701 | $ | — | $ | 322,034,544 | ||||||||||
|
|
|
|
|
|
|
|
|
| |||||||||||
Class IV | $ | — | $ | — | $ | 418,403,151 | $ | — | $ | 343,999,910 | ||||||||||
|
|
|
|
|
|
|
|
|
| |||||||||||
Class VI | $ | 81,148,197 | $ | 69,604,514 | $ | 2,224,690,677 | $ | 460,208,753 | $ | 65,869,098 | ||||||||||
|
|
|
|
|
|
|
|
|
| |||||||||||
Class R6 | $ | — | $ | — | $ | 769,960,029 | $ | — | $ | 315,904,004 | ||||||||||
|
|
|
|
|
|
|
|
|
| |||||||||||
Class I | $ | 1,549,145 | $ | 69,545 | $ | 486,543,625 | $ | — | $ | 736,469,640 | ||||||||||
|
|
|
|
|
|
|
|
|
| |||||||||||
Shares outstanding: | ||||||||||||||||||||
Class III | 1,471,010 | — | 121,443,948 | — | 12,848,578 | |||||||||||||||
|
|
|
|
|
|
|
|
|
| |||||||||||
Class IV | — | — | 17,552,618 | — | 13,771,977 | |||||||||||||||
|
|
|
|
|
|
|
|
|
| |||||||||||
Class VI | 4,811,272 | 3,164,759 | 93,613,681 | 24,250,000 | 2,639,401 | |||||||||||||||
|
|
|
|
|
|
|
|
|
| |||||||||||
Class R6 | — | — | 32,447,370 | — | 12,616,061 | |||||||||||||||
|
|
|
|
|
|
|
|
|
| |||||||||||
Class I | 91,928 | 3,162 | 20,527,065 | — | 29,389,205 | |||||||||||||||
|
|
|
|
|
|
|
|
|
| |||||||||||
Net asset value per share: | ||||||||||||||||||||
Class III | $ | 16.86 | $ | — | $ | 23.76 | $ | — | $ | 25.06 | ||||||||||
|
|
|
|
|
|
|
|
|
| |||||||||||
Class IV | $ | — | $ | — | $ | 23.84 | $ | — | $ | 24.98 | ||||||||||
|
|
|
|
|
|
|
|
|
| |||||||||||
Class VI | $ | 16.87 | $ | 21.99 | $ | 23.76 | $ | 18.98 | $ | 24.96 | ||||||||||
|
|
|
|
|
|
|
|
|
| |||||||||||
Class R6 | $ | — | $ | — | $ | 23.73 | $ | — | $ | 25.04 | ||||||||||
|
|
|
|
|
|
|
|
|
| |||||||||||
Class I | $ | 16.85 | $ | 21.99 | $ | 23.70 | $ | — | $ | 25.06 | ||||||||||
|
|
|
|
|
|
|
|
|
| |||||||||||
| See accompanying notes to the financial statements. | 110 |
GMO Trust Funds
Statements of Assets and Liabilities — February 28, 2023 — (Continued)
| Tax-Managed | U.S. | |||||||||||||||||||
| Small Cap | International | Opportunistic | U.S. Small | |||||||||||||||||
| Quality | Equities | U.S. Equity | Value | Cap Value | ||||||||||||||||
| Fund | Fund | Fund | Fund | Fund | ||||||||||||||||
Assets: |
| |||||||||||||||||||
Investments in affiliated issuers, at value | $ | 611,750 | $ | 1,160,296 | $ | 3,058,032 | $ | 5,821,730 | $ | 344,916 | ||||||||||
Investments in unaffiliated issuers, at value (Note 2)(b) | 63,921,805 | 29,988,291 | 240,655,733 | 273,860,729 | 29,205,157 | |||||||||||||||
Foreign currency, at value (Note 2)(c) | — | 20,090 | — | — | — | |||||||||||||||
Receivable for investments sold | 25,987,633 | — | 27,561,341 | 60,715,714 | 16,392,009 | |||||||||||||||
Dividends and interest receivable | 33,820 | 112,204 | 444,932 | 891,435 | 76,563 | |||||||||||||||
Dividend withholding tax receivable | — | 25,553 | — | — | — | |||||||||||||||
Foreign capital gains tax refund receivable (Note 2) | — | 2,032 | — | — | — | |||||||||||||||
Due from broker (Note 2) | — | 24,131 | 102,954 | — | 13,010 | |||||||||||||||
Receivable for variation margin on open futures contracts (Note 4) | — | — | — | — | 20 | |||||||||||||||
Receivable for expenses reimbursed and/or waived by GMO (Note 5) | 81,456 | 25,492 | 33,407 | 73,855 | — | |||||||||||||||
|
|
|
|
|
|
|
|
|
| |||||||||||
Total assets | 90,636,464 | 31,358,089 | 271,856,399 | 341,363,463 | 46,031,675 | |||||||||||||||
|
|
|
|
|
|
|
|
|
| |||||||||||
Liabilities: | ||||||||||||||||||||
Payable for investments purchased | 1,557 | — | — | 16,263 | — | |||||||||||||||
Payable for Fund shares repurchased | 25,500,000 | 1,000 | 26,700,000 | 62,675,000 | 16,500,000 | |||||||||||||||
Accrued foreign capital gains tax payable (Note 2) | — | 5,383 | — | — | — | |||||||||||||||
Payable for IRS closing agreement fees (Note 2) | — | 508,467 | — | — | — | |||||||||||||||
Payable to affiliate for (Note 5): | ||||||||||||||||||||
Management fee | 42,666 | 11,888 | 67,175 | 75,060 | 11,310 | |||||||||||||||
Shareholder service fee | 4,246 | 3,566 | 15,994 | 14,342 | 2,006 | |||||||||||||||
Payable for variation margin on open futures contracts (Note 4) | — | 805 | 5,000 | — | — | |||||||||||||||
Payable to Trustees and related expenses | 274 | 146 | 1,588 | 854 | 1,036 | |||||||||||||||
Accrued expenses | 109,786 | 140,638 | 106,257 | 115,229 | 89,808 | |||||||||||||||
|
|
|
|
|
|
|
|
|
| |||||||||||
Total liabilities | 25,658,529 | 671,893 | 26,896,014 | 62,896,748 | 16,604,160 | |||||||||||||||
|
|
|
|
|
|
|
|
|
| |||||||||||
Net assets | $ | 64,977,935 | $ | 30,686,196 | $ | 244,960,385 | $ | 278,466,715 | $ | 29,427,515 | ||||||||||
|
|
|
|
|
|
|
|
|
| |||||||||||
(a) Cost of investments – affiliated issuers: | $ | 611,333 | $ | 1,158,722 | $ | 3,058,032 | $ | 5,821,730 | $ | 344,916 | ||||||||||
(b) Cost of investments – unaffiliated issuers: | $ | 53,251,223 | $ | 26,239,937 | $ | 235,943,713 | $ | 274,651,253 | $ | 29,015,873 | ||||||||||
(c) Cost of foreign currency: | $ | — | $ | 20,302 | $ | — | $ | — | $ | — | ||||||||||
| 111 | See accompanying notes to the financial statements. |
GMO Trust Funds
Statements of Assets and Liabilities — February 28, 2023 — (Continued)
| Tax-Managed | U.S. | |||||||||||||||||||
| Small Cap | International | Opportunistic | U.S. Small | |||||||||||||||||
| Quality | Equities | U.S. Equity | Value | Cap Value | ||||||||||||||||
| Fund | Fund | Fund | Fund | Fund | ||||||||||||||||
Net assets consist of: | ||||||||||||||||||||
Paid-in capital | $ | 52,233,302 | $ | 30,520,055 | $ | 226,665,808 | $ | 276,034,854 | $ | 34,600,206 | ||||||||||
Distributable earnings (accumulated loss) | 12,744,633 | 166,141 | 18,294,577 | 2,431,861 | (5,172,691 | ) | ||||||||||||||
|
|
|
|
|
|
|
|
|
| |||||||||||
| $ | 64,977,935 | $ | 30,686,196 | $ | 244,960,385 | $ | 278,466,715 | $ | 29,427,515 | |||||||||||
|
|
|
|
|
|
|
|
|
| |||||||||||
Net assets attributable to: | ||||||||||||||||||||
Class III | $ | 13,391,406 | $ | 30,686,196 | $ | 50,114,234 | $ | 9,585 | $ | — | ||||||||||
|
|
|
|
|
|
|
|
|
| |||||||||||
Class IV | $ | — | $ | — | $ | — | $ | 62,784,375 | $ | — | ||||||||||
|
|
|
|
|
|
|
|
|
| |||||||||||
Class VI | $ | 51,565,627 | $ | — | $ | 194,846,151 | $ | 215,667,963 | $ | 29,427,515 | ||||||||||
|
|
|
|
|
|
|
|
|
| |||||||||||
Class I | $ | 20,902 | $ | — | $ | — | $ | 4,792 | $ | — | ||||||||||
|
|
|
|
|
|
|
|
|
| |||||||||||
Shares outstanding: | ||||||||||||||||||||
Class III | 605,451 | 2,330,380 | 3,995,720 | 475 | — | |||||||||||||||
|
|
|
|
|
|
|
|
|
| |||||||||||
Class IV | — | — | — | 3,108,685 | — | |||||||||||||||
|
|
|
|
|
|
|
|
|
| |||||||||||
Class VI | 2,330,557 | — | 15,744,850 | 10,679,452 | 1,711,511 | |||||||||||||||
|
|
|
|
|
|
|
|
|
| |||||||||||
Class I | 945 | — | — | 237 | — | |||||||||||||||
|
|
|
|
|
|
|
|
|
| |||||||||||
Net asset value per share: | ||||||||||||||||||||
Class III | $ | 22.12 | $ | 13.17 | $ | 12.54 | $ | 20.20 | $ | — | ||||||||||
|
|
|
|
|
|
|
|
|
| |||||||||||
Class IV | $ | — | $ | — | $ | — | $ | 20.20 | $ | — | ||||||||||
|
|
|
|
|
|
|
|
|
| |||||||||||
Class VI | $ | 22.13 | $ | — | $ | 12.38 | $ | 20.19 | $ | 17.19 | ||||||||||
|
|
|
|
|
|
|
|
|
| |||||||||||
Class I | $ | 22.11 | $ | — | $ | — | $ | 20.20 | $ | — | ||||||||||
|
|
|
|
|
|
|
|
|
| |||||||||||
| See accompanying notes to the financial statements. | 112 |
GMO Trust Funds
Statements of Operations — Year Ended February 28, 2023
| Emerging | ||||||||||||||||||||
| Markets | ||||||||||||||||||||
| Select | ||||||||||||||||||||
| Equity | ||||||||||||||||||||
| Fund | ||||||||||||||||||||
| (formerly | ||||||||||||||||||||
| Emerging | Emerging | |||||||||||||||||||
| Markets | Domestic | |||||||||||||||||||
| Climate | ex-China | Emerging | Opportunities | International | ||||||||||||||||
| Change Fund | Fund | Markets Fund | Fund) | Equity Fund | ||||||||||||||||
Investment Income: | ||||||||||||||||||||
Dividends from unaffiliated issuers (Net of withholding tax) (Note 2)(a) | $ | 11,933,819 | $ | 17,136,947 | $ | 77,451,748 | $ | 9,404,810 | $ | 75,703,713 | ||||||||||
Dividends from affiliated issuers (Note 10) | 347,948 | 112,318 | 154,052 | 49,028 | 701,608 | |||||||||||||||
Interest | 546 | 21,584 | 453,104 | 89,573 | 1,106,943 | |||||||||||||||
Securities lending income from affiliated issuers (net) | 889,085 | — | — | — | — | |||||||||||||||
Securities lending income (net) | 487,278 | — | 636,864 | — | — | |||||||||||||||
Other income (Note 2) | 2,042 | 345 | — | — | 2,434,726 | |||||||||||||||
Less: IRS closing agreement fees (Note 2) | — | — | — | — | (2,463,808 | ) | ||||||||||||||
|
|
|
|
|
|
|
|
|
| |||||||||||
Total investment income | 13,660,718 | 17,271,194 | 78,695,768 | 9,543,411 | 77,483,182 | |||||||||||||||
|
|
|
|
|
|
|
|
|
| |||||||||||
Expenses: | ||||||||||||||||||||
Management fee (Note 5) | 4,904,430 | 1,565,603 | 9,225,954 | 2,529,540 | 7,736,927 | |||||||||||||||
Shareholder service fee – Class II (Note 5) | — | — | 411,941 | 334,201 | 10,765 | |||||||||||||||
Shareholder service fee – Class III (Note 5) | 458,180 | 23,759 | 261,179 | — | 481,799 | |||||||||||||||
Shareholder service fee – Class IV (Note 5) | — | — | — | — | 1,096,795 | |||||||||||||||
Shareholder service fee – Class V (Note 5) | — | — | — | 160,629 | — | |||||||||||||||
Shareholder service fee – Class VI (Note 5) | — | 147,848 | 505,718 | — | — | |||||||||||||||
Shareholder service fee – Class R6 (Note 5) | 202,311 | — | 68,440 | — | — | |||||||||||||||
Shareholder service fee – Class I (Note 5) | 565,617 | 1 | 236,316 | 19,169 | 5,791 | |||||||||||||||
Audit and tax fees | 110,115 | 82,272 | 135,064 | 149,594 | 121,526 | |||||||||||||||
Custodian, fund accounting agent and transfer agent fees | 679,958 | 386,552 | 1,530,859 | 453,440 | 432,497 | |||||||||||||||
Legal fees | 31,784 | 7,137 | 52,911 | 13,217 | 54,768 | |||||||||||||||
Registration fees | 70,688 | 4,288 | 62,948 | 34,277 | 44,610 | |||||||||||||||
Trustees’ fees and related expenses (Note 5) | 38,299 | 10,273 | 74,926 | 19,855 | 74,379 | |||||||||||||||
Miscellaneous | 24,343 | 36,156 | 57,658 | 24,037 | 28,187 | |||||||||||||||
|
|
|
|
|
|
|
|
|
| |||||||||||
Total expenses | 7,085,725 | 2,263,889 | 12,623,914 | 3,737,959 | 10,088,044 | |||||||||||||||
Fees and expenses reimbursed and/or waived by GMO (Note 5) | (376,330 | ) | (325,594 | ) | (832,105 | ) | (344,754 | ) | (555,459 | ) | ||||||||||
|
|
|
|
|
|
|
|
|
| |||||||||||
Net expenses | 6,709,395 | 1,938,295 | 11,791,809 | 3,393,205 | 9,532,585 | |||||||||||||||
|
|
|
|
|
|
|
|
|
| |||||||||||
Net investment income (loss) | 6,951,323 | 15,332,899 | 66,903,959 | 6,150,206 | 67,950,597 | |||||||||||||||
|
|
|
|
|
|
|
|
|
| |||||||||||
Realized and unrealized gain (loss): | ||||||||||||||||||||
Net realized gain (loss) on: | ||||||||||||||||||||
Investments in unaffiliated issuers (net of foreign capital gains tax) (Note 2)(b) | (19,652,317 | ) | (21,897,543 | ) | (156,355,224 | ) | (88,345,323 | ) | (93,134,028 | ) | ||||||||||
Investments in affiliated issuers | (478,069 | ) | 10,103 | (6,104,262 | ) | (20,588 | ) | 90,181 | ||||||||||||
Futures contracts | — | — | (34,669,130 | ) | (1,774,049 | ) | (2,353,493 | ) | ||||||||||||
Foreign currency and foreign currency related transactions | (165,813 | ) | (1,326,487 | ) | (4,203,924 | ) | (1,429,802 | ) | (2,053,697 | ) | ||||||||||
|
|
|
|
|
|
|
|
|
| |||||||||||
Net realized gain (loss) | (20,296,199 | ) | (23,213,927 | ) | (201,332,540 | ) | (91,569,762 | ) | (97,451,037 | ) | ||||||||||
|
|
|
|
|
|
|
|
|
| |||||||||||
Change in net unrealized appreciation (depreciation) on: | ||||||||||||||||||||
Investments in unaffiliated issuers (net of foreign capital gains tax) (Note 2)(c) | (4,939,364 | ) | (38,600,089 | ) | (272,938,720 | ) | (38,614,606 | ) | (12,806,489 | ) | ||||||||||
Investments in affiliated issuers | 57,275 | 17 | 3,167,062 | 9,304 | 20,261 | |||||||||||||||
Futures contracts | — | — | 4,470,024 | — | (352,111 | ) | ||||||||||||||
Foreign currency and foreign currency related transactions | (29,020 | ) | (70,376 | ) | (448,661 | ) | (452,064 | ) | (60,192 | ) | ||||||||||
|
|
|
|
|
|
|
|
|
| |||||||||||
Net change in unrealized appreciation (depreciation) | (4,911,109 | ) | (38,670,448 | ) | (265,750,295 | ) | (39,057,366 | ) | (13,198,531 | ) | ||||||||||
|
|
|
|
|
|
|
|
|
| |||||||||||
Net realized and unrealized gain (loss) | (25,207,308 | ) | (61,884,375 | ) | (467,082,835 | ) | (130,627,128 | ) | (110,649,568 | ) | ||||||||||
|
|
|
|
|
|
|
|
|
| |||||||||||
Net increase (decrease) in net assets resulting from operations | $ | (18,255,985 | ) | $ | (46,551,476 | ) | $ | (400,178,876 | ) | $ | (124,476,922 | ) | $ | (42,698,971 | ) | |||||
|
|
|
|
|
|
|
|
|
| |||||||||||
(a) Withholding tax: | $ | 884,502 | �� | $ | 2,519,869 | $ | 9,867,551 | $ | 1,444,881 | $ | 6,269,460 | |||||||||
(b) Foreign capital gains tax (benefit) on net realized | $ | — | $ | 74,909 | $ | 775,373 | $ | 36,786 | $ | — | ||||||||||
(c) Foreign capital gains tax (benefit) on change in | $ | — | $ | 759 | $ | (1,765,497 | ) | $ | (820,484 | ) | $ | — | ||||||||
| 113 | See accompanying notes to the financial statements. |
GMO Trust Funds
Statements of Operations — Year Ended February 28, 2023 — (Continued)
| Quality | ||||||||||||||||||||
| Japan Value | Cyclicals | Quality | Resource | Resources | ||||||||||||||||
| Creation Fund | Fund | Fund | Transition Fund* | Fund | ||||||||||||||||
Investment Income: | ||||||||||||||||||||
Dividends from unaffiliated issuers (Net of withholding tax) (Note 2)(a) | $ | 3,935,950 | $ | 2,485,100 | $ | 114,337,971 | $ | 368,452 | $ | 109,320,383 | ||||||||||
Dividends from affiliated issuers (Note 10) | — | 19,551 | 1,904,895 | 4,867 | 235,030 | |||||||||||||||
Interest | — | 25 | 1,463,785 | 1,826 | 331,123 | |||||||||||||||
Securities lending income (net) | — | — | — | — | 869,760 | |||||||||||||||
Other income | — | — | — | — | 7,863 | |||||||||||||||
|
|
|
|
|
|
|
|
|
| |||||||||||
Total investment income | 3,935,950 | 2,504,676 | 117,706,651 | 375,145 | 110,764,159 | |||||||||||||||
|
|
|
|
|
|
|
|
|
| |||||||||||
Expenses: | ||||||||||||||||||||
Management fee (Note 5) | 645,023 | 359,464 | 23,767,302 | 133,612 | 11,270,463 | |||||||||||||||
Shareholder service fee – Class III (Note 5) | 33,272 | — | 3,920,245 | — | 368,880 | |||||||||||||||
Shareholder service fee – Class IV (Note 5) | — | — | 888,438 | — | 402,094 | |||||||||||||||
Shareholder service fee – Class VI (Note 5) | 57,421 | 59,872 | 1,485,699 | 9,186 | 394,306 | |||||||||||||||
Shareholder service fee – Class R6 (Note 5) | — | — | 838,809 | — | 239,640 | |||||||||||||||
Shareholder service fee – Class I (Note 5) | 3,632 | 106 | 723,163 | — | 1,094,099 | |||||||||||||||
Organizational expenses | — | — | — | 51,125 | — | |||||||||||||||
Audit and tax fees | 81,928 | 82,126 | 133,883 | 62,901 | 137,812 | |||||||||||||||
Custodian, fund accounting agent and transfer agent fees | 76,500 | 52,202 | 1,867,157 | 4,580 | 1,975,203 | |||||||||||||||
Legal fees | 6,415 | 6,376 | 244,035 | 458 | 85,154 | |||||||||||||||
Registration fees | 22,355 | 21,913 | 123,538 | 1,864 | 89,291 | |||||||||||||||
Trustees’ fees and related expenses (Note 5) | 6,146 | 5,275 | 342,242 | 434 | 107,950 | |||||||||||||||
Miscellaneous | 13,303 | 8,760 | 45,508 | 462 | 44,913 | |||||||||||||||
|
|
|
|
|
|
|
|
|
| |||||||||||
Total expenses | 945,995 | 596,094 | 34,380,019 | 264,622 | 16,209,805 | |||||||||||||||
Fees and expenses reimbursed and/or waived by GMO (Note 5) | (184,095 | ) | (160,399 | ) | (1,525,611 | ) | (121,391 | ) | (201,274 | ) | ||||||||||
|
|
|
|
|
|
|
|
|
| |||||||||||
Net expenses | 761,900 | 435,695 | 32,854,408 | 143,231 | 16,008,531 | |||||||||||||||
|
|
|
|
|
|
|
|
|
| |||||||||||
Net investment income (loss) | 3,174,050 | 2,068,981 | 84,852,243 | 231,914 | 94,755,628 | |||||||||||||||
|
|
|
|
|
|
|
|
|
| |||||||||||
Realized and unrealized gain (loss): | ||||||||||||||||||||
Net realized gain (loss) on: | ||||||||||||||||||||
Investments in unaffiliated issuers (net of foreign capital gains tax) | (5,314,875 | ) | 10,494,333 | 474,478,789 | — | 206,365,455 | ||||||||||||||
Investments in affiliated issuers | — | (7,909 | ) | (124,273 | ) | — | 33,266 | |||||||||||||
Foreign currency and foreign currency related transactions | (215,933 | ) | (9,681 | ) | (562,508 | ) | (48,994 | ) | (2,537,429 | ) | ||||||||||
|
|
|
|
|
|
|
|
|
| |||||||||||
Net realized gain (loss) | (5,530,808 | ) | 10,476,743 | 473,792,008 | ** | (48,994 | ) | 203,861,292 | ** | |||||||||||
|
|
|
|
|
|
|
|
|
| |||||||||||
Change in net unrealized appreciation (depreciation) on: | ||||||||||||||||||||
Investments in unaffiliated issuers (net of foreign capital gains tax) | (11,578,281 | ) | (17,678,866 | ) | (1,004,989,139 | ) | (24,974,283 | ) | (297,193,808 | ) | ||||||||||
Investments in affiliated issuers | — | 1,737 | 75,060 | — | 15,060 | |||||||||||||||
Foreign currency and foreign currency related transactions | (76,085 | ) | (5,694 | ) | (216,376 | ) | 116 | 15,039 | ||||||||||||
|
|
|
|
|
|
|
|
|
| |||||||||||
Net change in unrealized appreciation (depreciation) | (11,654,366 | ) | (17,682,823 | ) | (1,005,130,455 | ) | (24,974,167 | ) | (297,163,709 | ) | ||||||||||
|
|
|
|
|
|
|
|
|
| |||||||||||
Net realized and unrealized gain (loss) | (17,185,174 | ) | (7,206,080 | ) | (531,338,447 | ) | (25,023,161 | ) | (93,302,417 | ) | ||||||||||
|
|
|
|
|
|
|
|
|
| |||||||||||
Net increase (decrease) in net assets resulting from operations | $ | (14,011,124 | ) | $ | (5,137,099 | ) | $ | (446,486,204 | ) | $ | (24,791,247 | ) | $ | 1,453,211 | ||||||
|
|
|
|
|
|
|
|
|
| |||||||||||
(a) Withholding tax: | $ | 424,775 | $ | 94,829 | $ | 3,075,651 | $ | 24,020 | $ | 4,967,871 | ||||||||||
(b) Foreign capital gains tax (benefit) on net | $ | — | $ | — | $ | — | $ | — | $ | 377,694 | ||||||||||
(c) Foreign capital gains tax (benefit) on change | $ | — | $ | — | $ | — | $ | — | $ | (1,261,402 | ) | |||||||||
| * | Period from February 15, 2023 (commencement of operations) through February 28, 2023. |
| ** | For the details related to in-kind redemption realized gain (loss) please refer to Note 6. |
| See accompanying notes to the financial statements. | 114 |
GMO Trust Funds
Statements of Operations — Year Ended February 28, 2023 — (Continued)
| Tax-Managed | U.S. | |||||||||||||||||||
| Small Cap | International | Opportunistic | U.S. Small | |||||||||||||||||
| Quality | Equities | U.S. Equity | Value | Cap Value | ||||||||||||||||
| Fund* | Fund | Fund | Fund** | Fund | ||||||||||||||||
Investment Income: | ||||||||||||||||||||
Dividends from unaffiliated issuers (Net of withholding tax) (Note 2)(a) | $ | 378,827 | $ | 1,665,412 | $ | 7,005,768 | $ | 1,787,045 | $ | 3,262,804 | ||||||||||
Dividends from affiliated issuers (Note 10) | 10,447 | 21,911 | 110,095 | 61,571 | 46,154 | |||||||||||||||
Interest | 15 | 491 | 3,759 | 5,365 | 3,570 | |||||||||||||||
Other income | — | 76 | — | — | — | |||||||||||||||
Less: IRS closing agreement fees (Note 2) | — | (22,602 | ) | — | — | — | ||||||||||||||
|
|
|
|
|
|
|
|
|
| |||||||||||
Total investment income | 389,289 | 1,665,288 | 7,119,622 | 1,853,981 | 3,312,528 | |||||||||||||||
|
|
|
|
|
|
|
|
|
| |||||||||||
Expenses: | ||||||||||||||||||||
Management fee (Note 5) | 257,252 | 175,683 | 1,194,424 | 183,083 | 475,487 | |||||||||||||||
Shareholder service fee – Class III (Note 5) | 1,419 | *** | 52,705 | 108,255 | 1 | **** | — | |||||||||||||
Shareholder service fee – Class IV (Note 5) | — | — | — | 2,277 | **** | — | ||||||||||||||
Shareholder service fee – Class VI (Note 5) | 23,058 | — | 172,220 | 31,230 | 84,360 | |||||||||||||||
Shareholder service fee – Class I (Note 5) | 9 | *** | — | — | — | **** | — | |||||||||||||
Organizational expenses | 58,375 | — | — | 51,125 | �� | |||||||||||||||
Audit and tax fees | 46,222 | 101,311 | 81,789 | 56,221 | 77,121 | |||||||||||||||
Custodian, fund accounting agent and transfer agent fees | 15,907 | 116,534 | 89,276 | 11,194 | 28,000 | |||||||||||||||
Legal fees | 4,097 | 3,564 | 14,934 | 1,118 | 7,102 | |||||||||||||||
Registration fees | 41,612 | 2,306 | 17,881 | 54,274 | 736 | |||||||||||||||
Trustees’ fees and related expenses (Note 5) | 1,445 | 1,735 | 19,274 | 1,688 | 8,420 | |||||||||||||||
Miscellaneous | 4,151 | 30,904 | ***** | 8,444 | 1,266 | 6,722 | ||||||||||||||
|
|
|
|
|
|
|
|
|
| |||||||||||
Total expenses | 453,547 | 484,742 | 1,706,497 | 393,477 | 687,948 | |||||||||||||||
Fees and expenses reimbursed and/or waived by GMO (Note 5) | (170,358 | ) | (244,695 | ) | (184,333 | ) | (169,229 | ) | — | |||||||||||
|
|
|
|
|
|
|
|
|
| |||||||||||
Net expenses | 283,189 | 240,047 | 1,522,164 | 224,248 | 687,948 | |||||||||||||||
|
|
|
|
|
|
|
|
|
| |||||||||||
Net investment income (loss) | 106,100 | 1,425,241 | 5,597,458 | 1,629,733 | 2,624,580 | |||||||||||||||
|
|
|
|
|
|
|
|
|
| |||||||||||
Realized and unrealized gain (loss): | ||||||||||||||||||||
Net realized gain (loss) on: | ||||||||||||||||||||
Investments in unaffiliated issuers (net of foreign capital gains tax) | 9,117,118 | (2,704,516 | ) | 14,679,322 | 1,883,873 | (4,107,889 | ) | |||||||||||||
Investments in affiliated issuers | 1,002 | (5,875 | ) | (58,281 | ) | 8,993 | (17,237 | ) | ||||||||||||
Futures contracts | — | (79,891 | ) | (655,705 | ) | — | (552,891 | ) | ||||||||||||
Foreign currency and foreign currency related transactions | — | (20,813 | ) | — | — | — | ||||||||||||||
|
|
|
|
|
|
|
|
|
| |||||||||||
Net realized gain (loss) | 9,118,120 | (2,811,095 | ) | 13,965,336 | 1,892,866 | (4,678,017 | ) | |||||||||||||
|
|
|
|
|
|
|
|
|
| |||||||||||
Change in net unrealized appreciation (depreciation) on: | ||||||||||||||||||||
Investments in unaffiliated issuers (net of foreign capital gains tax) | 10,670,582 | (658,420 | ) | (28,578,720 | ) | (790,524 | ) | (23,600,482 | ) | |||||||||||
Investments in affiliated issuers | 417 | 4,538 | 26,176 | — | 3,629 | |||||||||||||||
Futures contracts | — | 16,918 | 376,842 | — | 14,011 | |||||||||||||||
Foreign currency and foreign currency related transactions | — | (13,571 | ) | — | — | — | ||||||||||||||
|
|
|
|
|
|
|
|
|
| |||||||||||
Net change in unrealized appreciation (depreciation) | 10,670,999 | (650,535 | ) | (28,175,702 | ) | (790,524 | ) | (23,582,842 | ) | |||||||||||
|
|
|
|
|
|
|
|
|
| |||||||||||
Net realized and unrealized gain (loss) | 19,789,119 | (3,461,630 | ) | (14,210,366 | ) | 1,102,342 | (28,260,859 | ) | ||||||||||||
|
|
|
|
|
|
|
|
|
| |||||||||||
Net increase (decrease) in net assets resulting from operations | $ | 19,895,219 | $ | (2,036,389 | ) | $ | (8,612,908 | ) | $ | 2,732,075 | $ | (25,636,279 | ) | |||||||
|
|
|
|
|
|
|
|
|
| |||||||||||
(a) Withholding tax: | $ | — | $ | 236,869 | $ | 6,334 | $ | — | $ | 2,110 | ||||||||||
(b) Foreign capital gains tax (benefit) on net realized gain (loss): | $ | — | $ | 3,266 | $ | — | $ | — | $ | — | ||||||||||
(c) Foreign capital gains tax (benefit) on change in net unrealized appreciation (depreciation): | $ | — | $ | 5,274 | $ | — | $ | — | $ | — | ||||||||||
| * | Period from September 20, 2022 (commencement of operations) through February 28, 2023. |
| ** | Period from December 13, 2022 (commencement of operations) through February 28, 2023. |
| *** | Period from November 15, 2022 (commencement of operations) through February 28, 2023. |
| **** | Period from February 15, 2023 (commencement of operations) through February 28, 2023. |
| ***** | Includes $24,043 of pricing related fees. |
| 115 | See accompanying notes to the financial statements. |
GMO Trust Funds
Statements of Changes in Net Assets
| Emerging | ||||||||||||||||
| Markets | ||||||||||||||||
| Climate | ex-China | |||||||||||||||
| Change Fund | Fund | |||||||||||||||
| Period from | ||||||||||||||||
| October 18, 2021 | ||||||||||||||||
| (commencement | ||||||||||||||||
| of operations) | ||||||||||||||||
| Year Ended | Year Ended | through | ||||||||||||||
| February 28, | February 28, | February 28, | ||||||||||||||
| 2023 | 2022 | 2023 | 2022 | |||||||||||||
Increase (decrease) in net assets: | ||||||||||||||||
Operations: | ||||||||||||||||
Net investment income (loss) | $ | 6,951,323 | $ | 4,209,151 | $ | 15,332,899 | $ | 2,920,797 | ||||||||
Net realized gain (loss) | (20,296,199 | ) | 63,585,403 | (23,213,927 | ) | 227,472 | ||||||||||
Change in net unrealized appreciation (depreciation) | (4,911,109 | ) | (58,326,785 | ) | (38,670,448 | ) | (59,947,593 | ) | ||||||||
|
|
|
|
|
|
|
| |||||||||
Net increase (decrease) in net assets from operations | (18,255,985 | ) | 9,467,769 | (46,551,476 | ) | (56,799,324 | ) | |||||||||
|
|
|
|
|
|
|
| |||||||||
Distributions to shareholders: | ||||||||||||||||
Class III | (6,826,624 | ) | (39,431,752 | ) | (759,928 | ) | (23,270 | )* | ||||||||
Class VI | — | — | (13,701,355 | ) | (2,297,709 | ) | ||||||||||
Class R6 | (3,035,164 | ) | (13,530,453 | ) | — | — | ||||||||||
Class I | (8,159,916 | ) | (30,161,491 | ) | (15 | ) | (3 | )** | ||||||||
|
|
|
|
|
|
|
| |||||||||
Total distributions | (18,021,704 | ) | (83,123,696 | ) | (14,461,298 | ) | (2,320,982 | ) | ||||||||
|
|
|
|
|
|
|
| |||||||||
Net share transactions (Note 9): | ||||||||||||||||
Class III | 34,383,090 | 165,751,876 | 17,239,928 | 16,365,827 | * | |||||||||||
Class VI | — | — | 1,469,698 | 339,851,236 | ||||||||||||
Class R6 | 71,379,478 | 50,189,598 | — | — | ||||||||||||
Class I | 133,221,424 | 235,985,857 | 15 | 503 | ** | |||||||||||
|
|
|
|
|
|
|
| |||||||||
Increase (decrease) in net assets resulting from net share transactions | 238,983,992 | 451,927,331 | 18,709,641 | 356,217,566 | ||||||||||||
|
|
|
|
|
|
|
| |||||||||
Total increase (decrease) in net assets | 202,706,303 | 378,271,404 | (42,303,133 | ) | 297,097,260 | |||||||||||
Net assets: | ||||||||||||||||
Beginning of period | 730,152,870 | 351,881,466 | 297,097,260 | — | ||||||||||||
|
|
|
|
|
|
|
| |||||||||
End of period | $ | 932,859,173 | $ | 730,152,870 | $ | 254,794,127 | $ | 297,097,260 | ||||||||
|
|
|
|
|
|
|
| |||||||||
| * | Period from November 17, 2021 (commencement of operations) through February 28, 2022. |
| ** | Period from December 1, 2021 (commencement of operations) through February 28, 2022. |
| See accompanying notes to the financial statements. | 116 |
GMO Trust Funds
Statements of Changes in Net Assets — (Continued)
| Emerging | ||||||||||||||||
| Markets | ||||||||||||||||
| Select | ||||||||||||||||
| Equity | ||||||||||||||||
| Fund | ||||||||||||||||
| (formerly | ||||||||||||||||
| Emerging | ||||||||||||||||
| Domestic | ||||||||||||||||
| Emerging | Opportunities | |||||||||||||||
| Markets Fund | Fund) | |||||||||||||||
| Year Ended | Year Ended | |||||||||||||||
| February 28, | February 28, | |||||||||||||||
| 2023 | 2022 | 2023 | 2022 | |||||||||||||
Increase (decrease) in net assets: | ||||||||||||||||
Operations: | ||||||||||||||||
Net investment income (loss) | $ | 66,903,959 | $ | 94,644,152 | $ | 6,150,206 | $ | 5,959,918 | ||||||||
Net realized gain (loss) | (201,332,540 | ) | 134,355,921 | (91,569,762 | ) | 6,464,490 | ||||||||||
Change in net unrealized appreciation (depreciation) | (265,750,295 | ) | (572,946,926 | ) | (39,057,366 | ) | (140,829,482 | ) | ||||||||
|
|
|
|
|
|
|
| |||||||||
Net increase (decrease) in net assets from operations | (400,178,876 | ) | (343,946,853 | ) | (124,476,922 | ) | (128,405,074 | ) | ||||||||
|
|
|
|
|
|
|
| |||||||||
Distributions to shareholders: | ||||||||||||||||
Class II | (13,357,178 | ) | (10,877,340 | ) | (3,229,489 | ) | (19,585,057 | ) | ||||||||
Class III | (10,406,493 | ) | (15,036,779 | ) | — | — | ||||||||||
Class V | — | — | * | (3,512,029 | ) | (40,195,516 | ) | |||||||||
Class VI | (59,450,292 | ) | (65,952,879 | ) | — | — | ||||||||||
Class R6 | (1,501,438 | ) | (1,932,217 | ) | — | — | ||||||||||
Class I | (7,549,670 | ) | (6,142,292 | ) | (181,455 | ) | (1,037,354 | ) | ||||||||
|
|
|
|
|
|
|
| |||||||||
Total distributions | (92,265,071 | ) | (99,941,507 | ) | (6,922,973 | ) | (60,817,927 | ) | ||||||||
|
|
|
|
|
|
|
| |||||||||
Net share transactions (Note 9): | ||||||||||||||||
Class II | (47,692,845 | ) | 24,140,732 | (85,145,643 | ) | (10,423,150 | ) | |||||||||
Class III | (200,996,603 | ) | (166,371,558 | ) | — | — | ||||||||||
Class V | — | (315,869,299 | )* | (414,461,166 | ) | (62,497,493 | ) | |||||||||
Class VI | (325,897,850 | ) | (249,450,634 | ) | — | — | ||||||||||
Class R6 | (18,867,256 | ) | 5,685,636 | — | — | |||||||||||
Class I | (1,027,086 | ) | 67,945,520 | (3,325,970 | ) | (3,642,128 | ) | |||||||||
|
|
|
|
|
|
|
| |||||||||
Increase (decrease) in net assets resulting from net share transactions | (594,481,640 | ) | (633,919,603 | ) | (502,932,779 | ) | (76,562,771 | ) | ||||||||
|
|
|
|
|
|
|
| |||||||||
Total increase (decrease) in net assets | (1,086,925,587 | ) | (1,077,807,963 | ) | (634,332,674 | ) | (265,785,772 | ) | ||||||||
Net assets: | ||||||||||||||||
Beginning of period | 1,934,732,388 | 3,012,540,351 | 760,520,801 | 1,026,306,573 | ||||||||||||
|
|
|
|
|
|
|
| |||||||||
End of period | $ | 847,806,801 | $ | 1,934,732,388 | $ | 126,188,127 | $ | 760,520,801 | ||||||||
|
|
|
|
|
|
|
| |||||||||
| * | Class V liquidated on April 29, 2021. |
| 117 | See accompanying notes to the financial statements. |
GMO Trust Funds
Statements of Changes in Net Assets — (Continued)
| International | Japan Value | |||||||||||||||
| Equity Fund | Creation Fund | |||||||||||||||
| Year Ended | Year Ended | |||||||||||||||
| February 28, | February 28, | |||||||||||||||
| 2023 | 2022 | 2023 | 2022 | |||||||||||||
Increase (decrease) in net assets: | ||||||||||||||||
Operations: | ||||||||||||||||
Net investment income (loss) | $ | 67,950,597 | $ | 84,376,014 | $ | 3,174,050 | $ | 3,126,596 | ||||||||
Net realized gain (loss) | (97,451,037 | ) | 211,671,131 | (5,530,808 | ) | 20,528,456 | ||||||||||
Change in net unrealized appreciation (depreciation) | (13,198,531 | ) | (177,873,927 | ) | (11,654,366 | ) | (25,642,038 | ) | ||||||||
|
|
|
|
|
|
|
| |||||||||
Net increase (decrease) in net assets from operations | (42,698,971 | ) | 118,173,218 | (14,011,124 | ) | (1,986,986 | ) | |||||||||
|
|
|
|
|
|
|
| |||||||||
Distributions to shareholders: | ||||||||||||||||
Class II | (187,750 | ) | (366,324 | ) | — | — | ||||||||||
Class III | (13,506,456 | ) | (24,543,676 | ) | (1,377,552 | ) | — | ** | ||||||||
Class IV | (51,620,967 | ) | (103,725,040 | ) | — | — | ||||||||||
Class VI | — | — | (6,098,598 | ) | (24,444,217 | ) | ||||||||||
Class I | (105,835 | ) | (143,501 | )* | (140,999 | ) | (312,047 | )*** | ||||||||
|
|
|
|
|
|
|
| |||||||||
Total distributions | (65,421,008 | ) | (128,778,541 | ) | (7,617,149 | ) | (24,756,264 | ) | ||||||||
|
|
|
|
|
|
|
| |||||||||
Net share transactions (Note 9): | ||||||||||||||||
Class II | (636,611 | ) | 154,410 | — | — | |||||||||||
Class III | 29,494,140 | (64,863,064 | ) | 4,240,268 | 23,595,006 | ** | ||||||||||
Class IV | (526,895,189 | ) | (220,799,835 | ) | — | — | ||||||||||
Class VI | — | — | (33,856,529 | ) | (4,444,830 | ) | ||||||||||
Class I | (49,180 | ) | 3,300,506 | * | (1,063,960 | ) | 3,535,322 | *** | ||||||||
|
|
|
|
|
|
|
| |||||||||
Increase (decrease) in net assets resulting from net share transactions | (498,086,840 | ) | (282,207,983 | ) | (30,680,221 | ) | 22,685,498 | |||||||||
|
|
|
|
|
|
|
| |||||||||
Total increase (decrease) in net assets | (606,206,819 | ) | (292,813,306 | ) | (52,308,494 | ) | (4,057,752 | ) | ||||||||
Net assets: | ||||||||||||||||
Beginning of period | 1,901,750,369 | 2,194,563,675 | 159,814,268 | 163,872,020 | ||||||||||||
|
|
|
|
|
|
|
| |||||||||
End of period | $ | 1,295,543,550 | $ | 1,901,750,369 | $ | 107,505,774 | $ | 159,814,268 | ||||||||
|
|
|
|
|
|
|
| |||||||||
| * | Period from May 24, 2021 (commencement of operations) through February 28, 2022. |
| ** | Period from December 30, 2021 (commencement of operations) through February 28, 2022. |
| *** | Period from June 7, 2021 (commencement of operations) through February 28, 2022. |
| See accompanying notes to the financial statements. | 118 |
GMO Trust Funds
Statements of Changes in Net Assets — (Continued)
| Quality | ||||||||||||||||
| Cyclicals | Quality | |||||||||||||||
| Fund | Fund | |||||||||||||||
| Year Ended | Year Ended | |||||||||||||||
| February 28, | February 28, | |||||||||||||||
| 2023 | 2022 | 2023 | 2022 | |||||||||||||
Increase (decrease) in net assets: | ||||||||||||||||
Operations: | ||||||||||||||||
Net investment income (loss) | $ | 2,068,981 | $ | 3,195,501 | $ | 84,852,243 | $ | 97,006,929 | ||||||||
Net realized gain (loss) | 10,476,743 | 16,586,147 | 473,792,008 | 511,445,075 | ||||||||||||
Change in net unrealized appreciation (depreciation) | (17,682,823 | ) | (5,437,374 | ) | (1,005,130,455 | ) | 497,845,399 | |||||||||
|
|
|
|
|
|
|
| |||||||||
Net increase (decrease) in net assets from operations | (5,137,099 | ) | 14,344,274 | (446,486,204 | ) | 1,106,297,403 | ||||||||||
|
|
|
|
|
|
|
| |||||||||
Distributions to shareholders: | ||||||||||||||||
Class III | — | — | (273,729,638 | ) | (208,459,284 | ) | ||||||||||
Class IV | — | — | (87,058,631 | ) | (50,525,221 | ) | ||||||||||
Class VI | (12,448,036 | ) | (29,159,128 | ) | (283,709,474 | ) | (211,183,341 | ) | ||||||||
Class R6 | — | — | (61,977,061 | ) | (30,631,216 | ) | ||||||||||
Class I | (8,044 | ) | (9,434 | )* | (52,650,146 | ) | (28,062,487 | ) | ||||||||
|
|
|
|
|
|
|
| |||||||||
Total distributions | (12,456,080 | ) | (29,168,562 | ) | (759,124,950 | ) | (528,861,549 | ) | ||||||||
|
|
|
|
|
|
|
| |||||||||
Net share transactions (Note 9):** | ||||||||||||||||
Class III | — | — | 320,666,228 | (857,439,954 | ) | |||||||||||
Class IV | — | — | (353,772,936 | ) | 111,734,620 | |||||||||||
Class VI | (54,278,965 | ) | 14,291,719 | (765,638,839 | ) | 839,898,152 | ||||||||||
Class R6 | — | — | 346,761,814 | 157,998,340 | ||||||||||||
Class I | — | 89,975 | * | 83,829,487 | 160,637,473 | |||||||||||
|
|
|
|
|
|
|
| |||||||||
Increase (decrease) in net assets resulting from net share transactions | (54,278,965 | ) | 14,381,694 | (368,154,246 | ) | 412,828,631 | ||||||||||
|
|
|
|
|
|
|
| |||||||||
Total increase (decrease) in net assets | (71,872,144 | ) | (442,594 | ) | (1,573,765,400 | ) | 990,264,485 | |||||||||
Net assets: | ||||||||||||||||
Beginning of period | 141,546,203 | 141,988,797 | 8,359,169,583 | 7,368,905,098 | ||||||||||||
|
|
|
|
|
|
|
| |||||||||
End of period | $ | 69,674,059 | $ | 141,546,203 | $ | 6,785,404,183 | $ | 8,359,169,583 | ||||||||
|
|
|
|
|
|
|
| |||||||||
| * | Period from July 16, 2021 (commencement of operations) through February 28, 2022. |
| ** | For details related to in-kind share transactions please refer to Note 6, as applicable. |
| 119 | See accompanying notes to the financial statements. |
GMO Trust Funds
Statements of Changes in Net Assets — (Continued)
| Resource | Resources | |||||||||||
| Transition Fund | Fund | |||||||||||
| Period from | ||||||||||||
| February 15, 2023 | ||||||||||||
| (commencement | ||||||||||||
| of operations) | ||||||||||||
| through | Year Ended | |||||||||||
| February 28, | February 28, | |||||||||||
| 2023 | 2023 | 2022 | ||||||||||
Increase (decrease) in net assets: | ||||||||||||
Operations: | ||||||||||||
Net investment income (loss) | $ | 231,914 | $ | 94,755,628 | $ | 69,825,573 | ||||||
Net realized gain (loss) | (48,994 | ) | 203,861,292 | 135,596,926 | ||||||||
Change in net unrealized appreciation (depreciation) | (24,974,167 | ) | (297,163,709 | ) | (17,199,595 | ) | ||||||
|
|
|
|
|
| |||||||
Net increase (decrease) in net assets from operations | (24,791,247 | ) | 1,453,211 | 188,222,904 | ||||||||
|
|
|
|
|
| |||||||
Distributions to shareholders: | ||||||||||||
Class III | — | (24,568,037 | ) | (29,937,354 | ) | |||||||
Class IV | — | (39,706,418 | ) | (94,223,444 | ) | |||||||
Class VI | — | (78,893,459 | ) | — | * | |||||||
Class R6 | — | (17,754,677 | ) | (3,478,525 | ) | |||||||
Class I | — | (75,407,234 | ) | (55,077,833 | ) | |||||||
|
|
|
|
|
| |||||||
Total distributions | — | (236,329,825 | ) | (182,717,156 | ) | |||||||
|
|
|
|
|
| |||||||
Net share transactions (Note 9):** | ||||||||||||
Class III | — | 110,861,393 | 138,203,591 | |||||||||
Class IV | — | 13,307,997 | (167,410,013 | ) | ||||||||
Class VI | 485,000,000 | (733,868,214 | ) | 866,735,067 | * | |||||||
Class R6 | — | 229,450,639 | 103,708,055 | |||||||||
Class I | — | 195,850,083 | 257,993,206 | |||||||||
|
|
|
|
|
| |||||||
Increase (decrease) in net assets resulting from net share transactions | 485,000,000 | (184,398,102 | ) | 1,199,229,906 | ||||||||
|
|
|
|
|
| |||||||
Total increase (decrease) in net assets | 460,208,753 | (419,274,716 | ) | 1,204,735,654 | ||||||||
Net assets: | ||||||||||||
Beginning of period | — | 2,203,551,912 | 998,816,258 | |||||||||
|
|
|
|
|
| |||||||
End of period | $ | 460,208,753 | $ | 1,784,277,196 | $ | 2,203,551,912 | ||||||
|
|
|
|
|
| |||||||
| * | Period from February 8, 2022 (commencement of operations) through February 28, 2022. |
| ** | For details related to in-kind share transactions please refer to Note 6, as applicable. |
| See accompanying notes to the financial statements. | 120 |
GMO Trust Funds
Statements of Changes in Net Assets — (Continued)
| Tax-Managed | ||||||||||||
| Small Cap | International | |||||||||||
| Quality | Equities | |||||||||||
| Fund | Fund | |||||||||||
| Period from | ||||||||||||
| September 20, 2022 | ||||||||||||
| (commencement | ||||||||||||
| of operations) | ||||||||||||
| through | Year Ended | |||||||||||
| February 28, | February 28, | |||||||||||
| 2023 | 2023 | 2022 | ||||||||||
Increase (decrease) in net assets: | ||||||||||||
Operations: | ||||||||||||
Net investment income (loss) | $ | 106,100 | $ | 1,425,241 | $ | 1,475,736 | ||||||
Net realized gain (loss) | 9,118,120 | (2,811,095 | ) | 6,723,726 | ||||||||
Change in net unrealized appreciation (depreciation) | 10,670,999 | (650,535 | ) | (6,159,271 | ) | |||||||
|
|
|
|
|
| |||||||
Net increase (decrease) in net assets from operations | 19,895,219 | (2,036,389 | ) | 2,040,191 | ||||||||
|
|
|
|
|
| |||||||
Distributions to shareholders: | ||||||||||||
Class III | (1,078,895 | )* | (2,115,226 | ) | (5,390,526 | ) | ||||||
Class VI | (6,070,048 | ) | — | — | ||||||||
Class I | (1,643 | )* | — | — | ||||||||
|
|
|
|
|
| |||||||
Total distributions | (7,150,586 | ) | (2,115,226 | ) | (5,390,526 | ) | ||||||
|
|
|
|
|
| |||||||
Net share transactions (Note 9): | ||||||||||||
Class III | 14,292,658 | * | 3,056,537 | (3,827,951 | ) | |||||||
Class VI | 37,919,001 | — | — | |||||||||
Class I | 21,643 | * | — | — | ||||||||
|
|
|
|
|
| |||||||
Increase (decrease) in net assets resulting from net share transactions | 52,233,302 | 3,056,537 | (3,827,951 | ) | ||||||||
|
|
|
|
|
| |||||||
Total increase (decrease) in net assets | 64,977,935 | (1,095,078 | ) | (7,178,286 | ) | |||||||
Net assets: | ||||||||||||
Beginning of period | — | 31,781,274 | 38,959,560 | |||||||||
|
|
|
|
|
| |||||||
End of period | $ | 64,977,935 | $ | 30,686,196 | $ | 31,781,274 | ||||||
|
|
|
|
|
| |||||||
| * | Period from November 15, 2022 (commencement of operations) through February 28, 2023. |
| 121 | See accompanying notes to the financial statements. |
GMO Trust Funds
Statements of Changes in Net Assets — (Continued)
| U.S. | ||||||||||||
| Opportunistic | ||||||||||||
| U.S. Equity | Value | |||||||||||
| Fund | Fund | |||||||||||
| Period from | ||||||||||||
| December 13, 2022 | ||||||||||||
| (commencement | ||||||||||||
| of operations) | ||||||||||||
| Year Ended | through | |||||||||||
| February 28, | February 28, | |||||||||||
| 2023 | 2022 | 2023 | ||||||||||
Increase (decrease) in net assets: | ||||||||||||
Operations: | ||||||||||||
Net investment income (loss) | $ | 5,597,458 | $ | 5,844,954 | $ | 1,629,733 | ||||||
Net realized gain (loss) | 13,965,336 | 79,406,685 | 1,892,866 | |||||||||
Change in net unrealized appreciation (depreciation) | (28,175,702 | ) | (33,300,126 | ) | (790,524 | ) | ||||||
|
|
|
|
|
| |||||||
Net increase (decrease) in net assets from operations | (8,612,908 | ) | 51,951,513 | 2,732,075 | ||||||||
|
|
|
|
|
| |||||||
Distributions to shareholders: | ||||||||||||
Class III | (5,157,645 | ) | (17,687,300 | ) | — | |||||||
Class VI | (23,167,342 | ) | (66,498,945 | ) | (300,214 | ) | ||||||
|
|
|
|
|
| |||||||
Total distributions | (28,324,987 | ) | (84,186,245 | ) | (300,214 | ) | ||||||
|
|
|
|
|
| |||||||
Net share transactions (Note 9): | ||||||||||||
Class III | (24,293,425 | ) | (24,924,349 | ) | 10,000 | * | ||||||
Class IV | — | — | 65,500,000 | * | ||||||||
Class VI | (159,286,298 | ) | 171,434,661 | 210,519,854 | ||||||||
Class I | — | — | 5,000 | * | ||||||||
|
|
|
|
|
| |||||||
Increase (decrease) in net assets resulting from net share transactions | (183,579,723 | ) | 146,510,312 | 276,034,854 | ||||||||
|
|
|
|
|
| |||||||
Total increase (decrease) in net assets | (220,517,618 | ) | 114,275,580 | 278,466,715 | ||||||||
Net assets: | ||||||||||||
Beginning of period | 465,478,003 | 351,202,423 | — | |||||||||
|
|
|
|
|
| |||||||
End of period | $ | 244,960,385 | $ | 465,478,003 | $ | 278,466,715 | ||||||
|
|
|
|
|
| |||||||
| * | Period from February 15, 2023 (commencement of operations) through February 28, 2023. |
| See accompanying notes to the financial statements. | 122 |
GMO Trust Funds
Statements of Changes in Net Assets — (Continued)
| U.S. Small | ||||||||
| Cap Value | ||||||||
| Fund | ||||||||
| Year Ended | ||||||||
| February 28, | ||||||||
| 2023 | 2022 | |||||||
Increase (decrease) in net assets: | ||||||||
Operations: | ||||||||
Net investment income (loss) | $ | 2,624,580 | $ | 3,936,416 | ||||
Net realized gain (loss) | (4,678,017 | ) | 76,979,623 | |||||
Change in net unrealized appreciation (depreciation) | (23,582,842 | ) | (31,906,411 | ) | ||||
|
|
|
| |||||
Net increase (decrease) in net assets from operations | (25,636,279 | ) | 49,009,628 | |||||
|
|
|
| |||||
Distributions to shareholders: | ||||||||
Class VI | (18,256,190 | ) | (83,549,717 | ) | ||||
|
|
|
| |||||
Total distributions | (18,256,190 | ) | (83,549,717 | ) | ||||
|
|
|
| |||||
Net share transactions (Note 9): | ||||||||
Class VI | (180,490,250 | ) | (84,147,317 | ) | ||||
|
|
|
| |||||
Increase (decrease) in net assets resulting from net share transactions | (180,490,250 | ) | (84,147,317 | ) | ||||
|
|
|
| |||||
Total increase (decrease) in net assets | (224,382,719 | ) | (118,687,406 | ) | ||||
Net assets: | ||||||||
Beginning of period | 253,810,234 | 372,497,640 | ||||||
|
|
|
| |||||
End of period | $ | 29,427,515 | $ | 253,810,234 | ||||
|
|
|
| |||||
| 123 | See accompanying notes to the financial statements. |
GMO Trust Funds
(For a share outstanding throughout each period)
CLIMATE CHANGE FUND
| Class III Shares | ||||||||||||||||||||
| Year Ended February 28/29, | ||||||||||||||||||||
| 2023 | 2022 | 2021 | 2020 | 2019 | ||||||||||||||||
Net asset value, beginning of period | $ | 30.23 | $ | 34.39 | $ | 22.36 | $ | 22.04 | $ | 23.81 | ||||||||||
|
|
|
|
|
|
|
|
|
| |||||||||||
Income (loss) from investment operations: | ||||||||||||||||||||
Net investment income (loss)(a)† | 0.25 | 0.28 | 0.35 | 0.41 | 0.36 | |||||||||||||||
Net realized and unrealized gain (loss) | (0.93 | ) | 0.72 | 13.43 | 0.87 | (1.61 | ) | |||||||||||||
|
|
|
|
|
|
|
|
|
| |||||||||||
Total from investment operations | (0.68 | ) | 1.00 | 13.78 | 1.28 | (1.25 | ) | |||||||||||||
|
|
|
|
|
|
|
|
|
| |||||||||||
Less distributions to shareholders: | ||||||||||||||||||||
From net investment income | (0.16 | ) | (0.57 | ) | (0.30 | ) | (0.45 | ) | (0.26 | ) | ||||||||||
From net realized gains | (0.48 | ) | (4.59 | ) | (1.45 | ) | (0.51 | ) | (0.26 | ) | ||||||||||
|
|
|
|
|
|
|
|
|
| |||||||||||
Total distributions | (0.64 | ) | (5.16 | ) | (1.75 | ) | (0.96 | ) | (0.52 | ) | ||||||||||
|
|
|
|
|
|
|
|
|
| |||||||||||
Net asset value, end of period | $ | 28.91 | $ | 30.23 | $ | 34.39 | $ | 22.36 | $ | 22.04 | ||||||||||
|
|
|
|
|
|
|
|
|
| |||||||||||
Total Return(b) | (1.92 | )% | 2.91 | % | 63.84 | % | 5.66 | % | (5.22 | )% | ||||||||||
Ratios/Supplemental Data: | ||||||||||||||||||||
Net assets, end of period (000’s) | $ | 330,218 | $ | 306,996 | $ | 178,223 | $ | 121,062 | $ | 113,000 | ||||||||||
Net expenses to average daily net assets(c) | 0.77 | % | 0.77 | % | 0.77 | % | 0.77 | % | 0.75 | % | ||||||||||
Net investment income (loss) to average daily net assets(a) | 0.90 | % | 0.84 | % | 1.39 | % | 1.84 | % | 1.61 | % | ||||||||||
Portfolio turnover rate(d) | 57 | % | 63 | % | 84 | % | 62 | % | 29 | % | ||||||||||
Fees and expenses reimbursed and/or waived by GMO to average daily net assets: | 0.05 | % | 0.04 | %(e) | 0.13 | %(e) | 0.16 | %(e) | 0.26 | % | ||||||||||
| (a) | Net investment income is affected by the timing of the declaration of dividends by the other GMO Funds and/or other investment companies in which the Fund invests, if any. |
| (b) | The total returns would have been lower had certain expenses not been reimbursed and/or waived during the periods shown, if applicable, and assumes the effect of reinvested distributions, if any. Calculation excludes purchase premiums and redemption fees which are borne by the shareholder purchasing or redeeming Fund shares, if any. |
| (c) | Net expenses exclude expenses incurred indirectly through investment in the underlying funds, if any (Note 5). |
| (d) | The portfolio turnover rate excludes investments in GMO U.S. Treasury Fund (“USTF”) which is used as a short-term investment vehicle for cash management. The Fund’s portfolio turnover rate including transactions in USTF during the period and/or year ended: |
| February 28, 2023 | February 28, 2022 | February 28, 2021 | February 29, 2020 | February 28, 2019 | ||||||||||||||||
Portfolio turnover rate including transactions in USTF | 124 | % | 140 | % | 145 | % | 173 | % | 121 | % | ||||||||||
| (e) | Ratio includes indirect fees waived or borne by GMO. |
| † | Calculated using average shares outstanding throughout the period. |
| See accompanying notes to the financial statements. | 124 |
GMO Trust Funds
Financial Highlights — (Continued)
(For a share outstanding throughout each period)
CLIMATE CHANGE FUND (continued)
| Class R6 Shares | ||||||||||||||||
| Year Ended February 28, | Period from January 16, 2020 (commencement of operations) through February 29, | |||||||||||||||
| 2023 | 2022 | 2021 | 2020 | |||||||||||||
Net asset value, beginning of period | $ | 30.17 | $ | 34.33 | $ | 22.36 | $ | 24.55 | ||||||||
|
|
|
|
|
|
|
| |||||||||
Income (loss) from investment operations: | ||||||||||||||||
Net investment income (loss)(a)† | 0.25 | 0.28 | 0.31 | 0.01 | ||||||||||||
Net realized and unrealized gain (loss) | (0.92 | ) | 0.72 | 13.43 | (2.20 | ) | ||||||||||
|
|
|
|
|
|
|
| |||||||||
Total from investment operations | (0.67 | ) | 1.00 | 13.74 | (2.19 | ) | ||||||||||
|
|
|
|
|
|
|
| |||||||||
Less distributions to shareholders: | ||||||||||||||||
From net investment income | (0.17 | ) | (0.57 | ) | (0.32 | ) | — | |||||||||
From net realized gains | (0.48 | ) | (4.59 | ) | (1.45 | ) | — | |||||||||
|
|
|
|
|
|
|
| |||||||||
Total distributions | (0.65 | ) | (5.16 | ) | (1.77 | ) | — | |||||||||
|
|
|
|
|
|
|
| |||||||||
Net asset value, end of period | $ | 28.85 | $ | 30.17 | $ | 34.33 | $ | 22.36 | ||||||||
|
|
|
|
|
|
|
| |||||||||
Total Return(b) | (1.90 | )% | 2.90 | % | 63.71 | % | (8.92 | )%** | ||||||||
Ratios/Supplemental Data: | ||||||||||||||||
Net assets, end of period (000’s) | $ | 183,089 | $ | 115,014 | $ | 74,961 | $ | 1,129 | ||||||||
Net expenses to average daily net assets(c) | 0.77 | % | 0.77 | % | 0.77 | % | 0.77 | %* | ||||||||
Net investment income (loss) to average daily net assets(a) | 0.90 | % | 0.84 | % | 1.04 | % | 0.40 | %* | ||||||||
Portfolio turnover rate(d) | 57 | % | 63 | % | 84 | % | 62 | %** | ||||||||
Fees and expenses reimbursed and/or waived by GMO to average daily net assets: | 0.05 | % | 0.04 | %(e) | 0.11 | %(e) | 0.23 | %(e)* | ||||||||
| (a) | Net investment income is affected by the timing of the declaration of dividends by the other GMO Funds and/or other investment companies in which the Fund invests, if any. |
| (b) | The total returns would have been lower had certain expenses not been reimbursed and/or waived during the periods shown, if applicable, and assumes the effect of reinvested distributions, if any. Calculation excludes purchase premiums and redemption fees which are borne by the shareholder purchasing or redeeming Fund shares, if any. |
| (c) | Net expenses exclude expenses incurred indirectly through investment in the underlying funds, if any (Note 5). |
| (d) | The portfolio turnover rate excludes investments in GMO U.S. Treasury Fund (“USTF”) which is used as a short-term investment vehicle for cash management. The Fund’s portfolio turnover rate including transactions in USTF during the period and/or year ended: |
| February 28, 2023 | February 28, 2022 | February 28, 2021 | February 29, 2020 | |||||||||||||
Portfolio turnover rate including transactions in USTF | 124 | % | 140 | % | 145 | % | 173 | % | ||||||||
| (e) | Ratio includes indirect fees waived or borne by GMO. |
| † | Calculated using average shares outstanding throughout the period. |
| * | Annualized. |
| ** | Not annualized. |
| 125 | See accompanying notes to the financial statements. |
GMO Trust Funds
Financial Highlights — (Continued)
(For a share outstanding throughout each period)
CLIMATE CHANGE FUND (continued)
| Class I Shares | ||||||||||||||||
| Year Ended February 28, | Period from February 25, 2020 (commencement of operations) through February 29, | |||||||||||||||
| 2023 | 2022 | 2021 | 2020 | |||||||||||||
Net asset value, beginning of period | $ | 30.16 | $ | 34.33 | $ | 22.36 | $ | 23.37 | ||||||||
|
|
|
|
|
|
|
| |||||||||
Income (loss) from investment operations: | ||||||||||||||||
Net investment income (loss)(a)† | 0.22 | 0.24 | 0.21 | 0.01 | ||||||||||||
Net realized and unrealized gain (loss) | (0.93 | ) | 0.73 | 13.53 | (1.02 | ) | ||||||||||
|
|
|
|
|
|
|
| |||||||||
Total from investment operations | (0.71 | ) | 0.97 | 13.74 | (1.01 | ) | ||||||||||
|
|
|
|
|
|
|
| |||||||||
Less distributions to shareholders: | ||||||||||||||||
From net investment income | (0.14 | ) | (0.55 | ) | (0.32 | ) | — | |||||||||
From net realized gains | (0.48 | ) | (4.59 | ) | (1.45 | ) | — | |||||||||
|
|
|
|
|
|
|
| |||||||||
Total distributions | (0.62 | ) | (5.14 | ) | (1.77 | ) | — | |||||||||
|
|
|
|
|
|
|
| |||||||||
Net asset value, end of period | $ | 28.83 | $ | 30.16 | $ | 34.33 | $ | 22.36 | ||||||||
|
|
|
|
|
|
|
| |||||||||
Total Return(b) | (2.03 | )% | 2.81 | % | 63.67 | % | (4.32 | )%** | ||||||||
Ratios/Supplemental Data: | ||||||||||||||||
Net assets, end of period (000’s) | $ | 419,552 | $ | 308,143 | $ | 98,697 | $ | 962 | ||||||||
Net expenses to average daily net assets(c) | 0.87 | % | 0.87 | % | 0.87 | % | 0.87 | %* | ||||||||
Net investment income (loss) to average daily net assets(a) | 0.79 | % | 0.72 | % | 0.66 | % | 1.93 | %* | ||||||||
Portfolio turnover rate(d) | 57 | % | 63 | % | 84 | % | 62 | %** | ||||||||
Fees and expenses reimbursed and/or waived by GMO to average daily net assets: | 0.05 | % | 0.04 | %(e) | 0.11 | %(e) | 0.43 | %(e)* | ||||||||
| (a) | Net investment income is affected by the timing of the declaration of dividends by the other GMO Funds and/or other investment companies in which the Fund invests, if any. |
| (b) | The total returns would have been lower had certain expenses not been reimbursed and/or waived during the periods shown, if applicable, and assumes the effect of reinvested distributions, if any. Calculation excludes purchase premiums and redemption fees which are borne by the shareholder purchasing or redeeming Fund shares, if any. |
| (c) | Net expenses exclude expenses incurred indirectly through investment in the underlying funds, if any (Note 5). |
| (d) | The portfolio turnover rate excludes investments in GMO U.S. Treasury Fund (“USTF”) which is used as a short-term investment vehicle for cash management. The Fund’s portfolio turnover rate including transactions in USTF during the period and/or year ended: |
| February 28, 2023 | February 28, 2022 | February 28, 2021 | February 29, 2020 | |||||||||||||
Portfolio turnover rate including transactions in USTF | 124 | % | 140 | % | 145 | % | 173 | % | ||||||||
| (e) | Ratio includes indirect fees waived or borne by GMO. |
| † | Calculated using average shares outstanding throughout the period. |
| * | Annualized. |
| ** | Not annualized. |
| See accompanying notes to the financial statements. | 126 |
GMO Trust Funds
Financial Highlights — (Continued)
(For a share outstanding throughout each period)
EMERGING MARKETS EX-CHINA FUND
| Class III Shares | ||||||||
| Year Ended February 28, | Period from November 17, 2021 (commencement of operations) through February 28, | |||||||
| 2023 | 2022 | |||||||
Net asset value, beginning of period | $ | 16.65 | $ | 20.00 | ||||
|
|
|
| |||||
Income (loss) from investment operations: | ||||||||
Net investment income (loss)(a)† | 0.72 | 0.15 | ||||||
Net realized and unrealized gain (loss) | (3.42 | ) | (3.37 | ) | ||||
|
|
|
| |||||
Total from investment operations | (2.70 | ) | (3.22 | ) | ||||
|
|
|
| |||||
Less distributions to shareholders: | ||||||||
From net investment income | (0.56 | ) | (0.13 | ) | ||||
From net realized gains | (0.06 | ) | — | |||||
|
|
|
| |||||
Total distributions | (0.62 | ) | (0.13 | ) | ||||
|
|
|
| |||||
Net asset value, end of period | $ | 13.33 | $ | 16.65 | ||||
|
|
|
| |||||
Total Return(b) | (16.04 | )% | (16.20 | )%** | ||||
Ratios/Supplemental Data: | ||||||||
Net assets, end of period (000’s) | $ | 28,548 | $ | 14,810 | ||||
Net expenses to average daily net assets(c) | 0.80 | % | 0.80 | %* | ||||
Net investment income (loss) to average daily net assets(a) | 5.26 | % | 2.52 | %* | ||||
Portfolio turnover rate(d) | 126 | % | 43 | %** | ||||
Fees and expenses reimbursed and/or waived by GMO to average daily net assets: | 0.08 | % | 0.16 | %* | ||||
| (a) | Net investment income is affected by the timing of the declaration of dividends by the other GMO Funds and/or other investment companies in which the Fund invests, if any. |
| (b) | The total returns would have been lower had certain expenses not been reimbursed and/or waived during the periods shown, if applicable, and assumes the effect of reinvested distributions, if any. Calculation excludes purchase premiums and redemption fees which are borne by the shareholder purchasing or redeeming Fund shares, if any. |
| (c) | Net expenses exclude expenses incurred indirectly through investment in the underlying funds, if any (Note 5). |
| (d) | The portfolio turnover rate excludes investments in GMO U.S. Treasury Fund (“USTF”) which is used as a short-term investment vehicle for cash management. The Fund’s portfolio turnover rate including transactions in USTF during the period and/or year ended: |
| February 28, | February 28, | |||||||
| 2023 | 2022 | |||||||
Portfolio turnover rate including transactions in USTF | 140 | % | 43 | % | ||||
| † | Calculated using average shares outstanding throughout the period. |
| * | Annualized. |
| ** | Not annualized. |
| 127 | See accompanying notes to the financial statements. |
GMO Trust Funds
Financial Highlights — (Continued)
(For a share outstanding throughout each period)
EMERGING MARKETS EX-CHINA FUND (continued)
| Class VI Shares | ||||||||
| Year Ended February 28, | Period from October 18, 2021 (commencement of operations) through February 28, | |||||||
| 2023 | 2022 | |||||||
Net asset value, beginning of period | $ | 16.66 | $ | 20.00 | ||||
|
|
|
| |||||
Income (loss) from investment operations: | ||||||||
Net investment income (loss)(a)† | 0.74 | 0.17 | ||||||
Net realized and unrealized gain (loss) | (3.43 | ) | (3.38 | ) | ||||
|
|
|
| |||||
Total from investment operations | (2.69 | ) | (3.21 | ) | ||||
|
|
|
| |||||
Less distributions to shareholders: | ||||||||
From net investment income | (0.57 | ) | (0.13 | ) | ||||
From net realized gains | (0.06 | ) | — | |||||
|
|
|
| |||||
Total distributions | (0.63 | ) | (0.13 | ) | ||||
|
|
|
| |||||
Net asset value, end of period | $ | 13.34 | $ | 16.66 | ||||
|
|
|
| |||||
Total Return(b) | (15.97 | )% | (16.15 | )%** | ||||
Ratios/Supplemental Data: | ||||||||
Net assets, end of period (000’s) | $ | 226,245 | $ | 282,287 | ||||
Net expenses to average daily net assets(c) | 0.67 | % | 0.67 | %* | ||||
Net investment income (loss) to average daily net assets(a) | 5.39 | % | 2.36 | %* | ||||
Portfolio turnover rate(d) | 126 | % | 43 | %** | ||||
Fees and expenses reimbursed and/or waived by GMO to average daily net assets: | 0.12 | % | 0.20 | %* | ||||
| (a) | Net investment income is affected by the timing of the declaration of dividends by the other GMO Funds and/or other investment companies in which the Fund invests, if any. |
| (b) | The total returns would have been lower had certain expenses not been reimbursed and/or waived during the periods shown, if applicable, and assumes the effect of reinvested distributions, if any. Calculation excludes purchase premiums and redemption fees which are borne by the shareholder purchasing or redeeming Fund shares, if any. |
| (c) | Net expenses exclude expenses incurred indirectly through investment in the underlying funds, if any (Note 5). |
| (d) | The portfolio turnover rate excludes investments in GMO U.S. Treasury Fund (“USTF”) which is used as a short-term investment vehicle for cash management. The Fund’s portfolio turnover rate including transactions in USTF during the period and/or year ended: |
| February 28, | February 28, | |||||||
| 2023 | 2022 | |||||||
Portfolio turnover rate including transactions in USTF | 140 | % | 43 | % | ||||
| † | Calculated using average shares outstanding throughout the period. |
| * | Annualized. |
| ** | Not annualized. |
| See accompanying notes to the financial statements. | 128 |
GMO Trust Funds
Financial Highlights — (Continued)
(For a share outstanding throughout each period)
EMERGING MARKETS EX-CHINA FUND (continued)
| Class I Shares | ||||||||
| Year Ended February 28, | Period from December 1, 2021 (commencement of operations) through February 28, | |||||||
| 2023 | 2022 | |||||||
Net asset value, beginning of period | $ | 16.64 | $ | 19.34 | ||||
|
|
|
| |||||
Income (loss) from investment operations: | ||||||||
Net investment income (loss)(a)† | 0.70 | 0.12 | ||||||
Net realized and unrealized gain (loss) | (3.42 | ) | (2.69 | ) | ||||
|
|
|
| |||||
Total from investment operations | (2.72 | ) | (2.57 | ) | ||||
|
|
|
| |||||
Less distributions to shareholders: | ||||||||
From net investment income | (0.52 | ) | (0.13 | ) | ||||
From net realized gains | (0.06 | ) | — | |||||
|
|
|
| |||||
Total distributions | (0.58 | ) | (0.13 | ) | ||||
|
|
|
| |||||
Net asset value, end of period | $ | 13.34 | $ | 16.64 | ||||
|
|
|
| |||||
Total Return(b) | (16.19 | )% | (13.38 | )%** | ||||
Ratios/Supplemental Data: | ||||||||
Net assets, end of period (000’s) | $ | 0 | (c) | $ | 0 | (c) | ||
Net expenses to average daily net assets(d) | 0.95 | % | 0.93 | %* | ||||
Net investment income (loss) to average daily net assets(a) | 5.13 | % | 2.54 | %* | ||||
Portfolio turnover rate(e) | 126 | % | 43 | %** | ||||
Fees and expenses reimbursed and/or waived by GMO to average daily net assets: | 0.10 | % | 0.19 | %* | ||||
| (a) | Net investment income is affected by the timing of the declaration of dividends by the other GMO Funds and/or other investment companies in which the Fund invests, if any. |
| (b) | The total returns would have been lower had certain expenses not been reimbursed and/or waived during the periods shown, if applicable, and assumes the effect of reinvested distributions, if any. Calculation excludes purchase premiums and redemption fees which are borne by the shareholder purchasing or redeeming Fund shares, if any. |
| (c) | Rounds to less than $1,000. |
| (d) | Net expenses exclude expenses incurred indirectly through investment in the underlying funds, if any (Note 5). |
| (e) | The portfolio turnover rate excludes investments in GMO U.S. Treasury Fund (“USTF”) which is used as a short-term investment vehicle for cash management. The Fund’s portfolio turnover rate including transactions in USTF during the period and/or year ended: |
| February 28, | February 28, | |||||||
| 2023 | 2022 | |||||||
Portfolio turnover rate including transactions in USTF | 140 | % | 43 | % | ||||
| † | Calculated using average shares outstanding throughout the period. |
| * | Annualized. |
| ** | Not annualized. |
| 129 | See accompanying notes to the financial statements. |
GMO Trust Funds
Financial Highlights — (Continued)
(For a share outstanding throughout each period)
EMERGING MARKETS FUND
| Class II Shares | ||||||||||||||||||||
| Year Ended February 28/29, | ||||||||||||||||||||
| 2023 | 2022 | 2021 | 2020 | 2019 | ||||||||||||||||
Net asset value, beginning of period | $ | 29.81 | $ | 36.70 | $ | 30.75 | $ | 32.23 | $ | 36.42 | ||||||||||
|
|
|
|
|
|
|
|
|
| |||||||||||
Income (loss) from investment operations: | ||||||||||||||||||||
Net investment income (loss)(a)† | 1.04 | 1.21 | 0.86 | 1.13 | 1.01 | |||||||||||||||
Net realized and unrealized gain (loss) | (7.23 | ) | (6.58 | ) | 6.36 | (1.02 | ) | (4.22 | ) | |||||||||||
|
|
|
|
|
|
|
|
|
| |||||||||||
Total from investment operations | (6.19 | ) | (5.37 | ) | 7.22 | 0.11 | (3.21 | ) | ||||||||||||
|
|
|
|
|
|
|
|
|
| |||||||||||
Less distributions to shareholders: | ||||||||||||||||||||
From net investment income | (1.75 | ) | (1.52 | ) | (1.27 | ) | (1.59 | ) | (0.98 | ) | ||||||||||
|
|
|
|
|
|
|
|
|
| |||||||||||
Total distributions | (1.75 | ) | (1.52 | ) | (1.27 | ) | (1.59 | ) | (0.98 | ) | ||||||||||
|
|
|
|
|
|
|
|
|
| |||||||||||
Net asset value, end of period | $ | 21.87 | $ | 29.81 | $ | 36.70 | $ | 30.75 | $ | 32.23 | ||||||||||
|
|
|
|
|
|
|
|
|
| |||||||||||
Total Return(b) | (20.78 | )% | (15.13 | )% | 23.89 | % | (0.11 | )% | (8.57 | )% | ||||||||||
Ratios/Supplemental Data: | ||||||||||||||||||||
Net assets, end of period (000’s) | $ | 151,666 | $ | 262,449 | $ | 291,833 | $ | 397,798 | $ | 451,720 | ||||||||||
Net expenses to average daily net assets(c) | 0.95 | % | 0.92 | % | 0.93 | % | 0.93 | % | 0.93 | % | ||||||||||
Net investment income (loss) to average daily net assets(a) | 4.32 | % | 3.34 | % | 2.73 | % | 3.44 | % | 3.09 | % | ||||||||||
Portfolio turnover rate | 128 | %(d) | 102 | % | 102 | % | 100 | %(d) | 98 | %(d) | ||||||||||
Fees and expenses reimbursed and/or waived by GMO to average daily net assets: | 0.05 | % | 0.03 | % | 0.07 | %(e) | 0.13 | %(e) | 0.13 | % | ||||||||||
Purchase premiums and redemption fees consisted of the following per share amounts (Note 2):† | $ | — | $ | — | $ | — | $ | 0.02 | $ | 0.08 | ||||||||||
| (a) | Net investment income is affected by the timing of the declaration of dividends by the other GMO Funds and/or other investment companies in which the Fund invests, if any. |
| (b) | The total returns would have been lower had certain expenses not been reimbursed and/or waived during the periods shown, if applicable, and assumes the effect of reinvested distributions, if any. Calculation excludes purchase premiums and redemption fees which are borne by the shareholder purchasing or redeeming Fund shares, if any. |
| (c) | Net expenses exclude expenses incurred indirectly through investment in the underlying funds, if any (Note 5). |
| (d) | The portfolio turnover rate excludes investments in GMO U.S. Treasury Fund (“USTF”) which is used as a short-term investment vehicle for cash management. The Fund’s portfolio turnover rate including transactions in USTF during the period and/or year ended: |
| February 28, | February 28, | February 28, | February 29, | February 28, | ||||||||||||||||
| 2023 | 2022 | 2021 | 2020 | 2019 | ||||||||||||||||
Portfolio turnover rate including transactions in USTF | 138 | % | N/A | N/A | 123 | % | 128 | % | ||||||||||||
| (e) | Ratio includes indirect fees waived or borne by GMO. |
| † | Calculated using average shares outstanding throughout the period. |
| See accompanying notes to the financial statements. | 130 |
GMO Trust Funds
Financial Highlights — (Continued)
(For a share outstanding throughout each period)
EMERGING MARKETS FUND (continued)
| Class III Shares | ||||||||||||||||||||
| Year Ended February 28/29, | ||||||||||||||||||||
| 2023 | 2022 | 2021 | 2020 | 2019 | ||||||||||||||||
Net asset value, beginning of period | $ | 29.91 | $ | 36.81 | $ | 30.84 | $ | 32.32 | $ | 36.51 | ||||||||||
|
|
|
|
|
|
|
|
|
| |||||||||||
Income (loss) from investment operations: | ||||||||||||||||||||
Net investment income (loss)(a)† | 1.22 | 1.27 | 0.76 | 1.21 | 1.01 | |||||||||||||||
Net realized and unrealized gain (loss) | (7.42 | ) | (6.64 | ) | 6.51 | (1.09 | ) | (4.21 | ) | |||||||||||
|
|
|
|
|
|
|
|
|
| |||||||||||
Total from investment operations | (6.20 | ) | (5.37 | ) | 7.27 | 0.12 | (3.20 | ) | ||||||||||||
|
|
|
|
|
|
|
|
|
| |||||||||||
Less distributions to shareholders: | ||||||||||||||||||||
From net investment income | (1.75 | ) | (1.53 | ) | (1.30 | ) | (1.60 | ) | (0.99 | ) | ||||||||||
|
|
|
|
|
|
|
|
|
| |||||||||||
Total distributions | (1.75 | ) | (1.53 | ) | (1.30 | ) | (1.60 | ) | (0.99 | ) | ||||||||||
|
|
|
|
|
|
|
|
|
| |||||||||||
Net asset value, end of period | $ | 21.96 | $ | 29.91 | $ | 36.81 | $ | 30.84 | $ | 32.32 | ||||||||||
|
|
|
|
|
|
|
|
|
| |||||||||||
Total Return(b) | (20.73 | )% | (15.08 | )% | 23.99 | % | (0.08 | )% | (8.51 | )% | ||||||||||
Ratios/Supplemental Data: | ||||||||||||||||||||
Net assets, end of period (000’s) | $ | 72 | $ | 267,177 | $ | 501,907 | $ | 333,779 | $ | 277,824 | ||||||||||
Net expenses to average daily net assets(c) | 0.90 | % | 0.87 | % | 0.88 | % | 0.88 | % | 0.88 | % | ||||||||||
Net investment income (loss) to average daily net assets(a) | 5.01 | % | 3.47 | % | 2.36 | % | 3.68 | % | 3.08 | % | ||||||||||
Portfolio turnover rate | 128 | %(d) | 102 | % | 102 | % | 100 | %(d) | 98 | %(d) | ||||||||||
Fees and expenses reimbursed and/or waived by GMO to average daily net assets: | 0.02 | % | 0.01 | % | 0.04 | %(e) | 0.11 | %(e) | 0.11 | % | ||||||||||
Purchase premiums and redemption fees consisted of the following per share amounts (Note 2):† | $ | — | $ | — | $ | — | $ | 0.02 | $ | 0.08 | ||||||||||
| (a) | Net investment income is affected by the timing of the declaration of dividends by the other GMO Funds and/or other investment companies in which the Fund invests, if any. |
| (b) | The total returns would have been lower had certain expenses not been reimbursed and/or waived during the periods shown, if applicable, and assumes the effect of reinvested distributions, if any. Calculation excludes purchase premiums and redemption fees which are borne by the shareholder purchasing or redeeming Fund shares, if any. |
| (c) | Net expenses exclude expenses incurred indirectly through investment in the underlying funds, if any (Note 5). |
| (d) | The portfolio turnover rate excludes investments in GMO U.S. Treasury Fund (“USTF”) which is used as a short-term investment vehicle for cash management. The Fund’s portfolio turnover rate including transactions in USTF during the period and/or year ended: |
| February 28, | February 28, | February 28, | February 29, | February 28, | ||||||||||||||||
| 2023 | 2022 | 2021 | 2020 | 2019 | ||||||||||||||||
Portfolio turnover rate including transactions in USTF | 138 | % | N/A | N/A | 123 | % | 128 | % | ||||||||||||
| (e) | Ratio includes indirect fees waived or borne by GMO. |
| † | Calculated using average shares outstanding throughout the period. |
| 131 | See accompanying notes to the financial statements. |
GMO Trust Funds
Financial Highlights — (Continued)
(For a share outstanding throughout each period)
EMERGING MARKETS FUND (continued)
| Class VI Shares | ||||||||||||||||||||
| Year Ended February 28/29, | ||||||||||||||||||||
| 2023 | 2022 | 2021 | 2020 | 2019 | ||||||||||||||||
Net asset value, beginning of period | $ | 29.56 | $ | 36.41 | $ | 30.52 | $ | 32.00 | $ | 36.16 | ||||||||||
|
|
|
|
|
|
|
|
|
| |||||||||||
Income (loss) from investment operations: | ||||||||||||||||||||
Net investment income (loss)(a)† | 1.14 | 1.33 | 0.87 | 1.23 | 1.06 | |||||||||||||||
Net realized and unrealized gain (loss) | (7.24 | ) | (6.59 | ) | 6.36 | (1.07 | ) | (4.19 | ) | |||||||||||
|
|
|
|
|
|
|
|
|
| |||||||||||
Total from investment operations | (6.10 | ) | (5.26 | ) | 7.23 | 0.16 | (3.13 | ) | ||||||||||||
|
|
|
|
|
|
|
|
|
| |||||||||||
Less distributions to shareholders: | ||||||||||||||||||||
From net investment income | (1.79 | ) | (1.59 | ) | (1.34 | ) | (1.64 | ) | (1.03 | ) | ||||||||||
|
|
|
|
|
|
|
|
|
| |||||||||||
Total distributions | (1.79 | ) | (1.59 | ) | (1.34 | ) | (1.64 | ) | (1.03 | ) | ||||||||||
|
|
|
|
|
|
|
|
|
| |||||||||||
Net asset value, end of period | $ | 21.67 | $ | 29.56 | $ | 36.41 | $ | 30.52 | $ | 32.00 | ||||||||||
|
|
|
|
|
|
|
|
|
| |||||||||||
Total Return(b) | (20.62 | )% | (14.98 | )% | 24.11 | % | 0.05 | % | (8.39 | )% | ||||||||||
Ratios/Supplemental Data: | ||||||||||||||||||||
Net assets, end of period (000’s) | $ | 598,337 | $ | 1,244,914 | $ | 1,787,607 | $ | 2,182,893 | $ | 2,685,798 | ||||||||||
Net expenses to average daily net assets(c) | 0.77 | % | 0.74 | % | 0.75 | % | 0.75 | % | 0.75 | % | ||||||||||
Net investment income (loss) to average daily net assets(a) | 4.77 | % | 3.69 | % | 2.75 | % | 3.76 | % | 3.25 | % | ||||||||||
Portfolio turnover rate | 128 | %(d) | 102 | % | 102 | % | 100 | %(d) | 98 | %(d) | ||||||||||
Fees and expenses reimbursed and/or waived by GMO to average daily net assets: | 0.06 | % | 0.05 | % | 0.08 | %(e) | 0.15 | %(e) | 0.14 | % | ||||||||||
Purchase premiums and redemption fees consisted of the following per share amounts (Note 2):† | $ | — | $ | — | $ | — | $ | 0.02 | $ | 0.08 | ||||||||||
| (a) | Net investment income is affected by the timing of the declaration of dividends by the other GMO Funds and/or other investment companies in which the Fund invests, if any. |
| (b) | The total returns would have been lower had certain expenses not been reimbursed and/or waived during the periods shown, if applicable, and assumes the effect of reinvested distributions, if any. Calculation excludes purchase premiums and redemption fees which are borne by the shareholder purchasing or redeeming Fund shares, if any. |
| (c) | Net expenses exclude expenses incurred indirectly through investment in the underlying funds, if any (Note 5). |
| (d) | The portfolio turnover rate excludes investments in GMO U.S. Treasury Fund (“USTF”) which is used as a short-term investment vehicle for cash management. The Fund’s portfolio turnover rate including transactions in USTF during the period and/or year ended: |
| February 28, | February 28, | February 28, | February 29, | February 28, | ||||||||||||||||
| 2023 | 2022 | 2021 | 2020 | 2019 | ||||||||||||||||
Portfolio turnover rate including transactions in USTF | 138 | % | N/A | N/A | 123 | % | 128 | % | ||||||||||||
| (e) | Ratio includes indirect fees waived or borne by GMO. |
| † | Calculated using average shares outstanding throughout the period. |
| See accompanying notes to the financial statements. | 132 |
GMO Trust Funds
Financial Highlights — (Continued)
(For a share outstanding throughout each period)
EMERGING MARKETS FUND (continued)
| Class R6 Shares | ||||||||||||
| Year Ended February 28, | Period from March 31, 2020 (commencement of operations) through February 28, | |||||||||||
| 2023 | 2022 | 2021 | ||||||||||
Net asset value, beginning of period | $ | 29.78 | $ | 36.67 | $ | 26.05 | ||||||
|
|
|
|
|
| |||||||
Income (loss) from investment operations: | ||||||||||||
Net investment income (loss)(a)† | 1.14 | 1.15 | 0.72 | |||||||||
Net realized and unrealized gain (loss) | (7.32 | ) | (6.51 | ) | 11.20 | |||||||
|
|
|
|
|
| |||||||
Total from investment operations | (6.18 | ) | (5.36 | ) | 11.92 | |||||||
|
|
|
|
|
| |||||||
Less distributions to shareholders: | ||||||||||||
From net investment income | (1.72 | ) | (1.53 | ) | (1.30 | ) | ||||||
|
|
|
|
|
| |||||||
Total distributions | (1.72 | ) | (1.53 | ) | (1.30 | ) | ||||||
|
|
|
|
|
| |||||||
Net asset value, end of period | $ | 21.88 | $ | 29.78 | $ | 36.67 | ||||||
|
|
|
|
|
| |||||||
Total Return(b) | (20.76 | )% | (15.13 | )% | 46.24 | %** | ||||||
Ratios/Supplemental Data: | ||||||||||||
Net assets, end of period (000’s) | $ | 11,042 | $ | 40,197 | $ | 43,664 | ||||||
Net expenses to average daily net assets(c) | 0.95 | % | 0.93 | % | 0.93 | %* | ||||||
Net investment income (loss) to average daily net assets(a) | 4.74 | % | 3.18 | % | 2.39 | %* | ||||||
Portfolio turnover rate | 128 | %(d) | 102 | % | 102 | %** | ||||||
Fees and expenses reimbursed and/or waived by GMO to average daily net assets: | 0.04 | % | 0.03 | % | 0.05 | %(e)* | ||||||
| (a) | Net investment income is affected by the timing of the declaration of dividends by the other GMO Funds and/or other investment companies in which the Fund invests, if any. |
| (b) | The total returns would have been lower had certain expenses not been reimbursed and/or waived during the periods shown, if applicable, and assumes the effect of reinvested distributions, if any. Calculation excludes purchase premiums and redemption fees which are borne by the shareholder purchasing or redeeming Fund shares, if any. |
| (c) | Net expenses exclude expenses incurred indirectly through investment in the underlying funds, if any (Note 5). |
| (d) | The portfolio turnover rate excludes investments in GMO U.S. Treasury Fund (“USTF”) which is used as a short-term investment vehicle for cash management. The Fund’s portfolio turnover rate including transactions in USTF during the period and/or year ended: |
| February 28, | February 28, | February 28, | ||||||||||
| 2023 | 2022 | 2021 | ||||||||||
Portfolio turnover rate including transactions in USTF | 138 | % | N/A | N/A | ||||||||
| (e) | Ratio includes indirect fees waived or borne by GMO. |
| † | Calculated using average shares outstanding throughout the period. |
| * | Annualized. |
| ** | Not annualized. |
| 133 | See accompanying notes to the financial statements. |
GMO Trust Funds
Financial Highlights — (Continued)
(For a share outstanding throughout each period)
EMERGING MARKETS FUND (continued)
| Class I Shares | ||||||||||||||||
| Year Ended February 28, | Period from January 14, 2020 (commencement of operations) through February 29, | |||||||||||||||
| 2023 | 2022 | 2021 | 2020 | |||||||||||||
Net asset value, beginning of period | $ | 29.75 | $ | 36.66 | $ | 30.75 | $ | 35.29 | ||||||||
|
|
|
|
|
|
|
| |||||||||
Income (loss) from investment operations: | ||||||||||||||||
Net investment income (loss)(a)† | 1.06 | 1.13 | 0.52 | 0.00 | (b) | |||||||||||
Net realized and unrealized gain (loss) | (7.24 | ) | (6.52 | ) | 6.68 | (4.54 | ) | |||||||||
|
|
|
|
|
|
|
| |||||||||
Total from investment operations | (6.18 | ) | (5.39 | ) | 7.20 | (4.54 | ) | |||||||||
|
|
|
|
|
|
|
| |||||||||
Less distributions to shareholders: | ||||||||||||||||
From net investment income | (1.74 | ) | (1.52 | ) | (1.29 | ) | — | |||||||||
|
|
|
|
|
|
|
| |||||||||
Total distributions | (1.74 | ) | (1.52 | ) | (1.29 | ) | — | |||||||||
|
|
|
|
|
|
|
| |||||||||
Net asset value, end of period | $ | 21.83 | $ | 29.75 | $ | 36.66 | $ | 30.75 | ||||||||
|
|
|
|
|
|
|
| |||||||||
Total Return(c) | (20.80 | )% | (15.20 | )% | 23.83 | % | (12.86 | )%** | ||||||||
Ratios/Supplemental Data: | ||||||||||||||||
Net assets, end of period (000’s) | $ | 86,689 | $ | 119,995 | $ | 79,824 | $ | 16,158 | ||||||||
Net expenses to average daily net assets(d) | 1.00 | % | 0.98 | % | 0.98 | % | 0.94 | %* | ||||||||
Net investment income (loss) to average daily net assets(a) | 4.42 | % | 3.14 | % | 1.55 | % | (0.05 | )%* | ||||||||
Portfolio turnover rate | 128 | %(e) | 102 | % | 102 | % | 100 | %(e)** | ||||||||
Fees and expenses reimbursed and/or waived by GMO to average daily net assets: | 0.12 | % | 0.10 | % | 0.10 | %(f) | 0.19 | %(f)* | ||||||||
| (a) | Net investment income is affected by the timing of the declaration of dividends by the other GMO Funds and/or other investment companies in which the Fund invests, if any. |
| (b) | Rounds to less than $0.01. |
| (c) | The total returns would have been lower had certain expenses not been reimbursed and/or waived during the periods shown, if applicable, and assumes the effect of reinvested distributions, if any. Calculation excludes purchase premiums and redemption fees which are borne by the shareholder purchasing or redeeming Fund shares, if any. |
| (d) | Net expenses exclude expenses incurred indirectly through investment in the underlying funds, if any (Note 5). |
| (e) | The portfolio turnover rate excludes investments in GMO U.S. Treasury Fund (“USTF”) which is used as a short-term investment vehicle for cash management. The Fund’s portfolio turnover rate including transactions in USTF during the period and/or year ended: |
| February 28, | February 28, | February 28, | February 29, | |||||||||||||
| 2023 | 2022 | 2021 | 2020 | |||||||||||||
Portfolio turnover rate including transactions in USTF | 138 | % | N/A | N/A | 123 | % | ||||||||||
| (f) | Ratio includes indirect fees waived or borne by GMO. |
| † | Calculated using average shares outstanding throughout the period. |
| * | Annualized. |
| ** | Not annualized. |
| See accompanying notes to the financial statements. | 134 |
GMO Trust Funds
Financial Highlights — (Continued)
(For a share outstanding throughout each period)
EMERGING MARKETS SELECT EQUITY FUND (FORMERLY EMERGING DOMESTIC OPPORTUNITIES FUND)
| Class II Shares | ||||||||||||||||||||
| Year Ended February 28/29, | ||||||||||||||||||||
| 2023 | 2022 | 2021 | 2020 | 2019 | ||||||||||||||||
Net asset value, beginning of period | $ | 21.96 | $ | 27.68 | $ | 21.14 | $ | 21.61 | $ | 28.86 | ||||||||||
|
|
|
|
|
|
|
|
|
| |||||||||||
Income (loss) from investment operations: | ||||||||||||||||||||
Net investment income (loss)(a)† | 0.22 | 0.15 | 0.17 | 0.40 | 0.24 | |||||||||||||||
Net realized and unrealized gain (loss) | (3.74 | ) | (3.95 | ) | 6.53 | 0.18 | (4.58 | ) | ||||||||||||
|
|
|
|
|
|
|
|
|
| |||||||||||
Total from investment operations | (3.52 | ) | (3.80 | ) | 6.70 | 0.58 | (4.34 | ) | ||||||||||||
|
|
|
|
|
|
|
|
|
| |||||||||||
Less distributions to shareholders: | ||||||||||||||||||||
From net investment income | (0.49 | ) | (0.06 | ) | (0.16 | ) | (1.05 | ) | (0.17 | ) | ||||||||||
From net realized gains | — | (1.86 | ) | — | — | (2.74 | ) | |||||||||||||
|
|
|
|
|
|
|
|
|
| |||||||||||
Total distributions | (0.49 | ) | (1.92 | ) | (0.16 | ) | (1.05 | ) | (2.91 | ) | ||||||||||
|
|
|
|
|
|
|
|
|
| |||||||||||
Net asset value, end of period | $ | 17.95 | $ | 21.96 | $ | 27.68 | $ | 21.14 | $ | 21.61 | ||||||||||
|
|
|
|
|
|
|
|
|
| |||||||||||
Total Return(b) | (15.97 | )% | (14.13 | )% | 31.76 | % | 2.39 | % | (15.48 | )% | ||||||||||
Ratios/Supplemental Data: | ||||||||||||||||||||
Net assets, end of period (000’s) | $ | 113,488 | $ | 238,702 | $ | 309,966 | $ | 292,418 | $ | 467,336 | ||||||||||
Net expenses to average daily net assets(c) | 1.00 | % | 1.06 | % | 1.03 | % | 1.03 | % | 1.04 | % | ||||||||||
Net investment income (loss) to average daily net assets(a) | 1.18 | % | 0.56 | % | 0.73 | % | 1.81 | % | 1.00 | % | ||||||||||
Portfolio turnover rate(d) | 131 | % | 190 | % | 216 | % | 186 | % | 238 | % | ||||||||||
Fees and expenses reimbursed and/or waived by GMO to average daily net assets: | 0.13 | % | 0.02 | %(e) | 0.02 | %(e) | 0.02 | %(e) | 0.01 | % | ||||||||||
Purchase premiums and redemption fees consisted of the following per share amounts (Note 2):† | $ | — | $ | — | $ | — | $ | 0.05 | $ | 0.05 | ||||||||||
| (a) | Net investment income is affected by the timing of the declaration of dividends by the other GMO Funds and/or other investment companies in which the Fund invests, if any. |
| (b) | The total returns would have been lower had certain expenses not been reimbursed and/or waived during the periods shown, if applicable, and assumes the effect of reinvested distributions, if any. Calculation excludes purchase premiums and redemption fees which are borne by the shareholder purchasing or redeeming Fund shares, if any. |
| (c) | Net expenses exclude expenses incurred indirectly through investment in the underlying funds, if any (Note 5). |
| (d) | The portfolio turnover rate excludes investments in GMO U.S. Treasury Fund (“USTF”) which is used as a short-term investment vehicle for cash management. The Fund’s portfolio turnover rate including transactions in USTF during the period and/or year ended: |
| February 28, | February 28, | February 28, | February 29, | February 28, | ||||||||||||||||
| 2023 | 2022 | 2021 | 2020 | 2019 | ||||||||||||||||
Portfolio turnover rate including transactions in USTF | 143 | % | 215 | % | 236 | % | 235 | % | 254 | % | ||||||||||
| (e) | Ratio includes indirect fees waived or borne by GMO. |
| † | Calculated using average shares outstanding throughout the period. |
| 135 | See accompanying notes to the financial statements. |
GMO Trust Funds
Financial Highlights — (Continued)
(For a share outstanding throughout each period)
EMERGING MARKETS SELECT EQUITY FUND (FORMERLY EMERGING DOMESTIC OPPORTUNITIES FUND) (continued)
| Class V Shares | ||||||||||||||||||||
| Year Ended February 28/29, | ||||||||||||||||||||
| 2023 | 2022 | 2021 | 2020 | 2019 | ||||||||||||||||
Net asset value, beginning of period | $ | 21.97 | $ | 27.66 | $ | 21.12 | $ | 21.60 | $ | 28.85 | ||||||||||
|
|
|
|
|
|
|
|
|
| |||||||||||
Income (loss) from investment operations: | ||||||||||||||||||||
Net investment income (loss)(a)† | 0.45 | 0.18 | 0.20 | 0.43 | 0.28 | |||||||||||||||
Net realized and unrealized gain (loss) | (3.96 | ) | (3.93 | ) | 6.53 | 0.17 | (4.60 | ) | ||||||||||||
|
|
|
|
|
|
|
|
|
| |||||||||||
Total from investment operations | (3.51 | ) | (3.75 | ) | 6.73 | 0.60 | (4.32 | ) | ||||||||||||
|
|
|
|
|
|
|
|
|
| |||||||||||
Less distributions to shareholders: | ||||||||||||||||||||
From net investment income | (0.57 | ) | (0.08 | ) | (0.19 | ) | (1.08 | ) | (0.19 | ) | ||||||||||
From net realized gains | — | (1.86 | ) | — | — | (2.74 | ) | |||||||||||||
|
|
|
|
|
|
|
|
|
| |||||||||||
Total distributions | (0.57 | ) | (1.94 | ) | (0.19 | ) | (1.08 | ) | (2.93 | ) | ||||||||||
|
|
|
|
|
|
|
|
|
| |||||||||||
Net asset value, end of period | $ | 17.89 | $ | 21.97 | $ | 27.66 | $ | 21.12 | $ | 21.60 | ||||||||||
|
|
|
|
|
|
|
|
|
| |||||||||||
Total Return(b) | (15.90 | )% | (13.98 | )% | 31.95 | % | 2.50 | % | (15.37 | )% | ||||||||||
Ratios/Supplemental Data: | ||||||||||||||||||||
Net assets, end of period (000’s) | $ | 6,830 | $ | 510,307 | $ | 697,864 | $ | 565,384 | $ | 755,613 | ||||||||||
Net expenses to average daily net assets(c) | 0.94 | % | 0.92 | % | 0.90 | % | 0.89 | % | 0.90 | % | ||||||||||
Net investment income (loss) to average daily net assets(a) | 2.25 | % | 0.70 | % | 0.87 | % | 1.94 | % | 1.19 | % | ||||||||||
Portfolio turnover rate(d) | 131 | % | 190 | % | 216 | % | 186 | % | 238 | % | ||||||||||
Fees and expenses reimbursed and/or waived by GMO to average daily net assets: | 0.07 | % | 0.02 | %(e) | 0.02 | %(e) | 0.02 | %(e) | 0.01 | % | ||||||||||
Purchase premiums and redemption fees consisted of the following per share amounts (Note 2):† | $ | — | $ | — | $ | — | $ | 0.04 | $ | 0.05 | ||||||||||
| (a) | Net investment income is affected by the timing of the declaration of dividends by the other GMO Funds and/or other investment companies in which the Fund invests, if any. |
| (b) | The total returns would have been lower had certain expenses not been reimbursed and/or waived during the periods shown, if applicable, and assumes the effect of reinvested distributions, if any. Calculation excludes purchase premiums and redemption fees which are borne by the shareholder purchasing or redeeming Fund shares, if any. |
| (c) | Net expenses exclude expenses incurred indirectly through investment in the underlying funds, if any (Note 5). |
| (d) | The portfolio turnover rate excludes investments in GMO U.S. Treasury Fund (“USTF”) which is used as a short-term investment vehicle for cash management. The Fund’s portfolio turnover rate including transactions in USTF during the period and/or year ended: |
| February 28, | February 28, | February 28, | February 29, | February 28, | ||||||||||||||||
| 2023 | 2022 | 2021 | 2020 | 2019 | ||||||||||||||||
Portfolio turnover rate including transactions in USTF | 143 | % | 215 | % | 236 | % | 235 | % | 254 | % | ||||||||||
| (e) | Ratio includes indirect fees waived or borne by GMO. |
| † | Calculated using average shares outstanding throughout the period. |
| See accompanying notes to the financial statements. | 136 |
GMO Trust Funds
Financial Highlights — (Continued)
(For a share outstanding throughout each period)
EMERGING MARKETS SELECT EQUITY FUND (FORMERLY EMERGING DOMESTIC OPPORTUNITIES FUND) (continued)
| Class I Shares | ||||||||||||
| Year Ended February 28, | Period from January 22, 2021 (commencement of operations) through February 28, | |||||||||||
| 2023 | 2022 | 2021 | ||||||||||
Net asset value, beginning of period | $ | 21.95 | $ | 27.67 | $ | 28.88 | ||||||
|
|
|
|
|
| |||||||
Income (loss) from investment operations: | ||||||||||||
Net investment income (loss)(a)† | 0.22 | 0.15 | 0.02 | |||||||||
Net realized and unrealized gain (loss) | (3.75 | ) | (3.94 | ) | (1.23 | ) | ||||||
|
|
|
|
|
| |||||||
Total from investment operations | (3.53 | ) | (3.79 | ) | (1.21 | ) | ||||||
|
|
|
|
|
| |||||||
Less distributions to shareholders: | ||||||||||||
From net investment income | (0.49 | ) | (0.07 | ) | — | |||||||
From net realized gains | — | (1.86 | ) | — | ||||||||
|
|
|
|
|
| |||||||
Total distributions | (0.49 | ) | (1.93 | ) | — | |||||||
|
|
|
|
|
| |||||||
Net asset value, end of period | $ | 17.93 | $ | 21.95 | $ | 27.67 | ||||||
|
|
|
|
|
| |||||||
Total Return(b) | (16.04 | )% | (14.12 | )% | (4.19 | )%** | ||||||
Ratios/Supplemental Data: | ||||||||||||
Net assets, end of period (000’s) | $ | 5,870 | $ | 11,512 | $ | 18,476 | ||||||
Net expenses to average daily net assets(c) | 1.06 | % | 1.09 | % | 1.04 | %* | ||||||
Net investment income (loss) to average daily net assets(a) | 1.19 | % | 0.57 | % | 0.82 | %* | ||||||
Portfolio turnover rate(d) | 131 | % | 190 | % | 216 | %** | ||||||
Fees and expenses reimbursed and/or waived by GMO to average daily net assets: | 0.17 | % | 0.09 | %(e) | 0.08 | %(e)* | ||||||
| (a) | Net investment income is affected by the timing of the declaration of dividends by the other GMO Funds and/or other investment companies in which the Fund invests, if any. |
| (b) | The total returns would have been lower had certain expenses not been reimbursed and/or waived during the periods shown, if applicable, and assumes the effect of reinvested distributions, if any. Calculation excludes purchase premiums and redemption fees which are borne by the shareholder purchasing or redeeming Fund shares, if any. |
| (c) | Net expenses exclude expenses incurred indirectly through investment in the underlying funds, if any (Note 5). |
| (d) | The portfolio turnover rate excludes investments in GMO U.S. Treasury Fund (“USTF”) which is used as a short-term investment vehicle for cash management. The Fund’s portfolio turnover rate including transactions in USTF during the period and/or year ended: |
| February 28, | February 28, | February 28, | ||||||||||
| 2023 | 2022 | 2021 | ||||||||||
Portfolio turnover rate including transactions in USTF | 143 | % | 215 | % | 236 | % | ||||||
| (e) | Ratio includes indirect fees waived or borne by GMO. |
| † | Calculated using average shares outstanding throughout the period. |
| * | Annualized. |
| ** | Not annualized. |
| 137 | See accompanying notes to the financial statements. |
GMO Trust Funds
Financial Highlights — (Continued)
(For a share outstanding throughout each period)
INTERNATIONAL EQUITY FUND
| Class II Shares | ||||||||||||||||||||
| Year Ended February 28/29, | ||||||||||||||||||||
| 2023 | 2022 | 2021 | 2020 | 2019 | ||||||||||||||||
Net asset value, beginning of period | $ | 22.70 | $ | 23.04 | $ | 19.83 | $ | 20.08 | $ | 23.63 | ||||||||||
|
|
|
|
|
|
|
|
|
| |||||||||||
Income (loss) from investment operations: | ||||||||||||||||||||
Net investment income (loss)(a)† | 0.88 | 0.91 | (b) | 0.75 | (b) | 0.72 | 0.57 | |||||||||||||
Net realized and unrealized gain (loss) | (1.36 | ) | 0.26 | 3.46 | (0.22 | ) | (3.45 | ) | ||||||||||||
|
|
|
|
|
|
|
|
|
| |||||||||||
Total from investment operations | (0.48 | ) | 1.17 | 4.21 | 0.50 | (2.88 | ) | |||||||||||||
|
|
|
|
|
|
|
|
|
| |||||||||||
Less distributions to shareholders: | ||||||||||||||||||||
From net investment income | (0.87 | ) | (1.51 | ) | (1.00 | ) | (0.75 | ) | (0.67 | ) | ||||||||||
|
|
|
|
|
|
|
|
|
| |||||||||||
Total distributions | (0.87 | ) | (1.51 | ) | (1.00 | ) | (0.75 | ) | (0.67 | ) | ||||||||||
|
|
|
|
|
|
|
|
|
| |||||||||||
Net asset value, end of period | $ | 21.35 | $ | 22.70 | $ | 23.04 | $ | 19.83 | $ | 20.08 | ||||||||||
|
|
|
|
|
|
|
|
|
| |||||||||||
Total Return(c) | (1.93 | )% | 5.00 | %(d) | 21.58 | %(e) | 2.19 | % | (12.07 | )% | ||||||||||
Ratios/Supplemental Data: | ||||||||||||||||||||
Net assets, end of period (000’s) | $ | 4,623 | $ | 5,615 | $ | 5,546 | $ | 10,802 | $ | 18,202 | ||||||||||
Net expenses to average daily net assets(f) | 0.73 | % | 0.74 | % | 0.73 | % | 0.73 | % | 0.73 | % | ||||||||||
Net investment income (loss) to average daily net assets(a) | 4.30 | % | 3.69 | %(b) | 3.82 | %(b) | 3.52 | % | 2.64 | % | ||||||||||
Portfolio turnover rate(g) | 51 | % | 64 | % | 48 | % | 46 | % | 41 | % | ||||||||||
Fees and expenses reimbursed and/or waived by GMO to average daily net assets: | 0.04 | % | 0.03 | % | 0.03 | % | 0.03 | %(h) | 0.02 | % | ||||||||||
| (a) | Net investment income is affected by the timing of the declaration of dividends by the other GMO Funds and/or other investment companies in which the Fund invests, if any. |
| (b) | Net investment income per share includes income received for EU reclaims, net of IRS closing agreement fees and non-recurring contingent legal fees attributed to EU tax reclaims, if any, in connection with certain Fund holdings (Note 2). Excluding the net EU reclaim amount below, the net investment income to average daily net assets ratio would have been: |
February 28, 2022 | February 28, 2021 | |||
$12,515 | $ | 69,807 | ||
3.48% | 2.62 | % | ||
| (c) | The total returns would have been lower had certain expenses not been reimbursed and/or waived during the periods shown, if applicable, and assumes the effect of reinvested distributions, if any. Calculation excludes purchase premiums and redemption fees which are borne by the shareholder purchasing or redeeming Fund shares, if any. |
| (d) | EU tax reclaim payments and related interest received during the year, net of IRS closing agreement fees and non-recurring contingent legal fees attributed to EU tax reclaims, had a positive impact to total return, adding below respectively, to each class’s total return (Note 2): |
February 28, 2022 |
0.21% |
| (e) | EU tax reclaim payments and related interest received during the year, net of IRS closing agreement fees, had a positive impact to total return, adding 1.58% to each class’s total return (Note 2). |
| (f) | Net expenses exclude expenses incurred indirectly through investment in the underlying funds, if any (Note 5). |
| (g) | The portfolio turnover rate excludes investments in GMO U.S. Treasury Fund (“USTF”) which is used as a short-term investment vehicle for cash management. The Fund’s portfolio turnover rate including transactions in USTF during the period and/or year ended: |
| February 28, | February 28, | February 28, | February 29, | February 28, | ||||||||||||||||
| 2023 | 2022 | 2021 | 2020 | 2019 | ||||||||||||||||
Portfolio turnover rate including transactions in USTF | 60 | % | N/A | N/A | 65 | % | 54 | % | ||||||||||||
| (h) | Ratio includes indirect fees waived or borne by GMO. |
| † | Calculated using average shares outstanding throughout the period. |
| See accompanying notes to the financial statements. | 138 |
GMO Trust Funds
Financial Highlights — (Continued)
(For a share outstanding throughout each period)
INTERNATIONAL EQUITY FUND (continued)
| Class III Shares | ||||||||||||||||||||
| Year Ended February 28/29, | ||||||||||||||||||||
| 2023 | 2022 | 2021 | 2020 | 2019 | ||||||||||||||||
Net asset value, beginning of period | $ | 23.00 | $ | 23.32 | $ | 20.09 | $ | 20.33 | $ | 23.92 | ||||||||||
|
|
|
|
|
|
|
|
|
| |||||||||||
Income (loss) from investment operations: | ||||||||||||||||||||
Net investment income (loss)(a)† | 0.89 | 0.96 | (b) | 0.75 | (b) | 0.70 | 0.57 | |||||||||||||
Net realized and unrealized gain (loss) | (1.36 | ) | 0.25 | 3.51 | (0.17 | ) | (3.47 | ) | ||||||||||||
|
|
|
|
|
|
|
|
|
| |||||||||||
Total from investment operations | (0.47 | ) | 1.21 | 4.26 | 0.53 | (2.90 | ) | |||||||||||||
|
|
|
|
|
|
|
|
|
| |||||||||||
Less distributions to shareholders: | ||||||||||||||||||||
From net investment income | (0.89 | ) | (1.53 | ) | (1.03 | ) | (0.77 | ) | (0.69 | ) | ||||||||||
|
|
|
|
|
|
|
|
|
| |||||||||||
Total distributions | (0.89 | ) | (1.53 | ) | (1.03 | ) | (0.77 | ) | (0.69 | ) | ||||||||||
|
|
|
|
|
|
|
|
|
| |||||||||||
Net asset value, end of period | $ | 21.64 | $ | 23.00 | $ | 23.32 | $ | 20.09 | $ | 20.33 | ||||||||||
|
|
|
|
|
|
|
|
|
| |||||||||||
Total Return(c) | (1.87 | )% | 5.08 | %(d) | 21.60 | %(e) | 2.29 | % | (12.02 | )% | ||||||||||
Ratios/Supplemental Data: | ||||||||||||||||||||
Net assets, end of period (000’s) | $ | 366,630 | $ | 358,775 | $ | 423,332 | $ | 452,165 | $ | 507,195 | ||||||||||
Net expenses to average daily net assets(f) | 0.66 | % | 0.67 | % | 0.66 | % | 0.66 | % | 0.66 | % | ||||||||||
Net investment income (loss) to average daily net assets(a) | 4.28 | % | 3.84 | %(b) | 3.70 | %(b) | 3.36 | % | 2.64 | % | ||||||||||
Portfolio turnover rate(g) | 51 | % | 64 | % | 48 | % | 46 | % | 41 | % | ||||||||||
Fees and expenses reimbursed and/or waived by GMO to average daily net assets: | 0.04 | % | 0.03 | % | 0.03 | % | 0.03 | %(h) | 0.02 | % | ||||||||||
| (a) | Net investment income is affected by the timing of the declaration of dividends by the other GMO Funds and/or other investment companies in which the Fund invests, if any. |
| (b) | Net investment income per share includes income received for EU reclaims, net of IRS closing agreement fees and non-recurring contingent legal fees attributed to EU tax reclaims, if any, in connection with certain Fund holdings (Note 2). Excluding the net EU reclaim amount below, the net investment income to average daily net assets ratio would have been: |
February 28, 2022 | February 28, 2021 | |||
$861,919 | $ | 6,194,610 | ||
3.63% | 2.30 | % | ||
| (c) | The total returns would have been lower had certain expenses not been reimbursed and/or waived during the periods shown, if applicable, and assumes the effect of reinvested distributions, if any. Calculation excludes purchase premiums and redemption fees which are borne by the shareholder purchasing or redeeming Fund shares, if any. |
| (d) | EU tax reclaim payments and related interest received during the year, net of IRS closing agreement fees and non-recurring contingent legal fees attributed to EU tax reclaims, had a positive impact to total return, adding below respectively, to each class’s total return (Note 2): |
February 28, 2022 |
0.21% |
| (e) | EU tax reclaim payments and related interest received during the year, net of IRS closing agreement fees, had a positive impact to total return, adding 1.58% to each class’s total return (Note 2). |
| (f) | Net expenses exclude expenses incurred indirectly through investment in the underlying funds, if any (Note 5). |
| (g) | The portfolio turnover rate excludes investments in GMO U.S. Treasury Fund (“USTF”) which is used as a short-term investment vehicle for cash management. The Fund’s portfolio turnover rate including transactions in USTF during the period and/or year ended: |
| February 28, | February 28, | February 28, | February 29, | February 28, | ||||||||||||||||
| 2023 | 2022 | 2021 | 2020 | 2019 | ||||||||||||||||
Portfolio turnover rate including transactions in USTF | 60 | % | N/A | N/A | 65 | % | 54 | % | ||||||||||||
| (h) | Ratio includes indirect fees waived or borne by GMO. |
| † | Calculated using average shares outstanding throughout the period. |
| 139 | See accompanying notes to the financial statements. |
GMO Trust Funds
Financial Highlights — (Continued)
(For a share outstanding throughout each period)
INTERNATIONAL EQUITY FUND (continued)
| Class IV Shares | ||||||||||||||||||||
| Year Ended February 28/29, | ||||||||||||||||||||
| 2023 | 2022 | 2021 | 2020 | 2019 | ||||||||||||||||
Net asset value, beginning of period | $ | 22.96 | $ | 23.28 | $ | 20.05 | $ | 20.29 | $ | 23.87 | ||||||||||
|
|
|
|
|
|
|
|
|
| |||||||||||
Income (loss) from investment operations: | ||||||||||||||||||||
Net investment income (loss)(a)† | 0.92 | 0.96 | (b) | 0.77 | (b) | 0.74 | 0.63 | |||||||||||||
Net realized and unrealized gain (loss) | (1.38 | ) | 0.26 | 3.50 | (0.20 | ) | (3.51 | ) | ||||||||||||
|
|
|
|
|
|
|
|
|
| |||||||||||
Total from investment operations | (0.46 | ) | 1.22 | 4.27 | 0.54 | (2.88 | ) | |||||||||||||
|
|
|
|
|
|
|
|
|
| |||||||||||
Less distributions to shareholders: | ||||||||||||||||||||
From net investment income | (0.90 | ) | (1.54 | ) | (1.04 | ) | (0.78 | ) | (0.70 | ) | ||||||||||
|
|
|
|
|
|
|
|
|
| |||||||||||
Total distributions | (0.90 | ) | (1.54 | ) | (1.04 | ) | (0.78 | ) | (0.70 | ) | ||||||||||
|
|
|
|
|
|
|
|
|
| |||||||||||
Net asset value, end of period | $ | 21.60 | $ | 22.96 | $ | 23.28 | $ | 20.05 | $ | 20.29 | ||||||||||
|
|
|
|
|
|
|
|
|
| |||||||||||
Total Return(c) | (1.82 | )% | 5.16 | %(d) | 21.71 | %(e) | 2.34 | % | (11.95 | )% | ||||||||||
Ratios/Supplemental Data: | ||||||||||||||||||||
Net assets, end of period (000’s) | $ | 921,486 | $ | 1,534,339 | $ | 1,765,686 | $ | 2,584,648 | $ | 3,156,760 | ||||||||||
Net expenses to average daily net assets(f) | 0.60 | % | 0.61 | % | 0.60 | % | 0.60 | % | 0.60 | % | ||||||||||
Net investment income (loss) to average daily net assets(a) | 4.42 | % | 3.88 | %(b) | 3.81 | %(b) | 3.53 | % | 2.89 | % | ||||||||||
Portfolio turnover rate(g) | 51 | % | 64 | % | 48 | % | 46 | % | 41 | % | ||||||||||
Fees and expenses reimbursed and/or waived by GMO to average daily net assets: | 0.04 | % | 0.03 | % | 0.03 | % | 0.03 | %(h) | 0.02 | % | ||||||||||
| (a) | Net investment income is affected by the timing of the declaration of dividends by the other GMO Funds and/or other investment companies in which the Fund invests, if any. |
| (b) | Net investment income per share includes income received for EU reclaims, net of IRS closing agreement fees and non-recurring contingent legal fees attributed to EU tax reclaims, if any, in connection with certain Fund holdings (Note 2). Excluding the net EU reclaim amount below, the net investment income to average daily net assets ratio would have been: |
February 28, 2022 | February 28, 2021 | |||
$3,699,861 | $ | 27,980,578 | ||
3.67% | 2.49 | % | ||
| (c) | The total returns would have been lower had certain expenses not been reimbursed and/or waived during the periods shown, if applicable, and assumes the effect of reinvested distributions, if any. Calculation excludes purchase premiums and redemption fees which are borne by the shareholder purchasing or redeeming Fund shares, if any. |
| (d) | EU tax reclaim payments and related interest received during the year, net of IRS closing agreement fees and non-recurring contingent legal fees attributed to EU tax reclaims, had a positive impact to total return, adding below respectively, to each class’s total return (Note 2): |
February 28, 2022 |
0.21% |
| (e) | EU tax reclaim payments and related interest received during the year, net of IRS closing agreement fees, had a positive impact to total return, adding 1.58% to each class’s total return (Note 2). |
| (f) | Net expenses exclude expenses incurred indirectly through investment in the underlying funds, if any (Note 5). |
| (g) | The portfolio turnover rate excludes investments in GMO U.S. Treasury Fund (“USTF”) which is used as a short-term investment vehicle for cash management. The Fund’s portfolio turnover rate including transactions in USTF during the period and/or year ended: |
| February 28, 2023 | February 28, 2022 | February 28, 2021 | February 29, 2020 | February 28, 2019 | ||||||||||||||||
Portfolio turnover rate including transactions in USTF | 60 | % | N/A | N/A | 65 | % | 54 | % | ||||||||||||
| (h) | Ratio includes indirect fees waived or borne by GMO. |
| † | Calculated using average shares outstanding throughout the period. |
| See accompanying notes to the financial statements. | 140 |
GMO Trust Funds
Financial Highlights — (Continued)
(For a share outstanding throughout each period)
INTERNATIONAL EQUITY FUND (continued)
| Class I Shares | ||||||||
| Year Ended February 28, | Period from May 24, 2021 (commencement of operations) through February 28, | |||||||
| 2023 | 2022 | |||||||
Net asset value, beginning of period | $ | 23.08 | $ | 25.79 | ||||
|
|
|
| |||||
Income (loss) from investment operations: | ||||||||
Net investment income (loss)(a)† | 0.85 | 0.44 | (b) | |||||
Net realized and unrealized gain (loss) | (1.36 | ) | (2.05 | ) | ||||
|
|
|
| |||||
Total from investment operations | (0.51 | ) | (1.61 | ) | ||||
|
|
|
| |||||
Less distributions to shareholders: | ||||||||
From net investment income | (0.85 | ) | (1.10 | ) | ||||
|
|
|
| |||||
Total distributions | (0.85 | ) | (1.10 | ) | ||||
|
|
|
| |||||
Net asset value, end of period | $ | 21.72 | $ | 23.08 | ||||
|
|
|
| |||||
Total Return(c) | (2.03 | )% | (6.27 | )%(d)** | ||||
Ratios/Supplemental Data: | ||||||||
Net assets, end of period (000’s) | $ | 2,804 | $ | 3,021 | ||||
Net expenses to average daily net assets(e) | 0.83 | % | 0.89 | %* | ||||
Net investment income (loss) to average daily net assets(a) | 4.08 | % | 2.35 | %(b)* | ||||
Portfolio turnover rate(f) | 51 | % | 64 | %** | ||||
Fees and expenses reimbursed and/or waived by GMO to average daily net assets: | 0.04 | % | 0.03 | %* | ||||
| (a) | Net investment income is affected by the timing of the declaration of dividends by the other GMO Funds and/or other investment companies in which the Fund invests, if any. |
| (b) | Net investment income per share includes income received for EU reclaims, net of IRS closing agreement fees and non-recurring contingent legal fees attributed to EU tax reclaims, if any, in connection with certain Fund holdings (Note 2). Excluding the net EU reclaim amount below, the net investment income to average daily net assets ratio would have been: |
February 28, 2022 |
$2,264 |
| 1.63% |
| (c) | The total returns would have been lower had certain expenses not been reimbursed and/or waived during the periods shown, if applicable, and assumes the effect of reinvested distributions, if any. Calculation excludes purchase premiums and redemption fees which are borne by the shareholder purchasing or redeeming Fund shares, if any. |
| (d) | EU tax reclaim payments and related interest received during the period, net of IRS closing agreement fees and non-recurring contingent legal fees attributed to EU tax reclaims, had a positive impact to total return, adding 0.16% to Class I’s total return (Note 2). Class I commenced operations on May 24, 2021. |
| (e) | Net expenses exclude expenses incurred indirectly through investment in the underlying funds, if any (Note 5). |
| (f) | The portfolio turnover rate excludes investments in GMO U.S. Treasury Fund (“USTF”) which is used as a short-term investment vehicle for cash management. The Fund’s portfolio turnover rate including transactions in USTF during the period and/or year ended: |
| February 28, | February 28, | |||||||
| 2023 | 2022 | |||||||
Portfolio turnover rate including transactions in USTF | 60 | % | N/A | |||||
| † | Calculated using average shares outstanding throughout the period. |
| * | Annualized. |
| ** | Not annualized. |
| 141 | See accompanying notes to the financial statements. |
GMO Trust Funds
Financial Highlights — (Continued)
(For a share outstanding throughout each period)
JAPAN VALUE CREATION FUND
| Class III Shares | ||||||||
| Year Ended February 28, | Period from of operations) through | |||||||
| 2023 | 2022 | |||||||
Net asset value, beginning of period | $ | 19.71 | $ | 19.81 | ||||
|
|
|
| |||||
Income (loss) from investment operations: | ||||||||
Net investment income (loss)(a)† | 0.39 | (0.03 | ) | |||||
Net realized and unrealized gain (loss) | (2.27 | ) | (0.07 | ) | ||||
|
|
|
| |||||
Total from investment operations | (1.88 | ) | (0.10 | ) | ||||
|
|
|
| |||||
Less distributions to shareholders: | ||||||||
From net investment income | (0.16 | ) | — | |||||
From net realized gains | (0.81 | ) | — | |||||
|
|
|
| |||||
Total distributions | (0.97 | ) | — | |||||
|
|
|
| |||||
Net asset value, end of period | $ | 16.86 | $ | 19.71 | ||||
|
|
|
| |||||
Total Return(b) | (9.21 | )% | (0.50 | )%** | ||||
Ratios/Supplemental Data: | ||||||||
Net assets, end of period (000’s) | $ | 24,808 | $ | 23,673 | ||||
Net expenses to average daily net assets(c) | 0.67 | % | 0.66 | %* | ||||
Net investment income (loss) to average daily net assets(a) | 2.37 | % | (0.55 | )%* | ||||
Portfolio turnover rate | 39 | % | 47 | %** | ||||
Fees and expenses reimbursed and/or waived by GMO to average daily net assets: | 0.15 | % | 0.15 | %* | ||||
| (a) | Net investment income is affected by the timing of the declaration of dividends by the other GMO Funds and/or other investment companies in which the Fund invests, if any. |
| (b) | The total returns would have been lower had certain expenses not been reimbursed and/or waived during the periods shown, if applicable, and assumes the effect of reinvested distributions, if any. Calculation excludes purchase premiums and redemption fees which are borne by the shareholder purchasing or redeeming Fund shares, if any. |
| (c) | Net expenses exclude expenses incurred indirectly through investment in the underlying funds, if any (Note 5). |
| † | Calculated using average shares outstanding throughout the period. |
| * | Annualized. |
| ** | Not annualized. |
| See accompanying notes to the financial statements. | 142 |
GMO Trust Funds
Financial Highlights — (Continued)
(For a share outstanding throughout each period)
JAPAN VALUE CREATION FUND (continued)
| Class VI Shares | ||||||||||||
| Year Ended February 28, | Period from of operations) through | |||||||||||
| 2023 | 2022 | 2021 | ||||||||||
Net asset value, beginning of period | $ | 19.71 | $ | 23.47 | $ | 20.00 | ||||||
|
|
|
|
|
| |||||||
Income (loss) from investment operations: | ||||||||||||
Net investment income (loss)(a)† | 0.41 | 0.43 | 0.17 | |||||||||
Net realized and unrealized gain (loss) | (2.27 | ) | (0.71 | ) | 3.59 | |||||||
|
|
|
|
|
| |||||||
Total from investment operations | (1.86 | ) | (0.28 | ) | 3.76 | |||||||
|
|
|
|
|
| |||||||
Less distributions to shareholders: | ||||||||||||
From net investment income | (0.17 | ) | (1.50 | ) | (0.28 | ) | ||||||
From net realized gains | (0.81 | ) | (1.98 | ) | (0.01 | ) | ||||||
|
|
|
|
|
| |||||||
Total distributions | (0.98 | ) | (3.48 | ) | (0.29 | ) | ||||||
|
|
|
|
|
| |||||||
Net asset value, end of period | $ | 16.87 | $ | 19.71 | $ | 23.47 | ||||||
|
|
|
|
|
| |||||||
Total Return(b) | (9.11 | )% | (1.45 | )% | 18.82 | %** | ||||||
Ratios/Supplemental Data: | ||||||||||||
Net assets, end of period (000’s) | $ | 81,148 | $ | 133,035 | $ | 163,872 | ||||||
Net expenses to average daily net assets(c) | 0.57 | % | 0.57 | % | 0.56 | %* | ||||||
Net investment income (loss) to average daily net assets(a) | 2.48 | % | 1.90 | % | 1.68 | %* | ||||||
Portfolio turnover rate | 39 | % | 47 | % | 28 | %** | ||||||
Fees and expenses reimbursed and/or waived by GMO to average daily net assets: | 0.14 | % | 0.08 | % | 0.23 | %* | ||||||
| (a) | Net investment income is affected by the timing of the declaration of dividends by the other GMO Funds and/or other investment companies in which the Fund invests, if any. |
| (b) | The total returns would have been lower had certain expenses not been reimbursed and/or waived during the periods shown, if applicable, and assumes the effect of reinvested distributions, if any. Calculation excludes purchase premiums and redemption fees which are borne by the shareholder purchasing or redeeming Fund shares, if any. |
| (c) | Net expenses exclude expenses incurred indirectly through investment in the underlying funds, if any (Note 5). |
| † | Calculated using average shares outstanding throughout the period. |
| * | Annualized. |
| ** | Not annualized. |
| 143 | See accompanying notes to the financial statements. |
GMO Trust Funds
Financial Highlights — (Continued)
(For a share outstanding throughout each period)
JAPAN VALUE CREATION FUND (continued)
| Class I Shares | ||||||||
| Period from | ||||||||
| June 7, 2021 | ||||||||
| (commencement | ||||||||
| of operations) | ||||||||
| Year Ended | through | |||||||
| February 28, | February 28, | |||||||
| 2023 | 2022 | |||||||
Net asset value, beginning of period | $ | 19.69 | $ | 24.95 | ||||
|
|
|
| |||||
Income (loss) from investment operations: | ||||||||
Net investment income (loss)(a)† | 0.42 | 0.12 | ||||||
Net realized and unrealized gain (loss) | (2.32 | ) | (1.91 | )(b) | ||||
|
|
|
| |||||
Total from investment operations | (1.90 | ) | (1.79 | ) | ||||
|
|
|
| |||||
Less distributions to shareholders: | ||||||||
From net investment income | (0.13 | ) | (1.49 | ) | ||||
From net realized gains | (0.81 | ) | (1.98 | ) | ||||
|
|
|
| |||||
Total distributions | (0.94 | ) | (3.47 | ) | ||||
|
|
|
| |||||
Net asset value, end of period | $ | 16.85 | $ | 19.69 | ||||
|
|
|
| |||||
Total Return(c) | (9.32 | )% | (7.43 | )%** | ||||
Ratios/Supplemental Data: | ||||||||
Net assets, end of period (000’s) | $ | 1,549 | $ | 3,107 | ||||
Net expenses to average daily net assets(d) | 0.77 | % | 0.77 | %* | ||||
Net investment income (loss) to average daily net assets(a) | 2.54 | % | 0.79 | %* | ||||
Portfolio turnover rate | 39 | % | 47 | %** | ||||
Fees and expenses reimbursed and/or waived by GMO to average daily net assets: | 0.19 | % | 0.12 | %* | ||||
| (a) | Net investment income is affected by the timing of the declaration of dividends by the other GMO Funds and/or other investment companies in which the Fund invests, if any. |
| (b) | The amount shown for a share outstanding does not correspond with the aggregate net realized and unrealized gain (loss) on investments due to the timing of purchases and redemptions of the Fund shares in relation to fluctuating market values of the investments of the Fund. |
| (c) | The total returns would have been lower had certain expenses not been reimbursed and/or waived during the periods shown, if applicable, and assumes the effect of reinvested distributions, if any. Calculation excludes purchase premiums and redemption fees which are borne by the shareholder purchasing or redeeming Fund shares, if any. |
| (d) | Net expenses exclude expenses incurred indirectly through investment in the underlying funds, if any (Note 5). |
| † | Calculated using average shares outstanding throughout the period. |
| * | Annualized. |
| ** | Not annualized. |
| See accompanying notes to the financial statements. | 144 |
GMO Trust Funds
Financial Highlights — (Continued)
(For a share outstanding throughout each period)
QUALITY CYCLICALS FUND
| Class VI Shares | ||||||||||||
| Period from | ||||||||||||
| May 12, 2020 | ||||||||||||
| (commencement | ||||||||||||
| of operations) | ||||||||||||
| Year Ended February 28, | through February 28, | |||||||||||
| 2023 | 2022 | 2021 | ||||||||||
Net asset value, beginning of period | $ | 25.77 | $ | 29.06 | $ | 20.00 | ||||||
|
|
|
|
|
| |||||||
Income (loss) from investment operations: | ||||||||||||
Net investment income (loss)(a)† | 0.42 | 0.64 | 0.38 | |||||||||
Net realized and unrealized gain (loss) | (1.61 | ) | 2.24 | 10.23 | ||||||||
|
|
|
|
|
| |||||||
Total from investment operations | (1.19 | ) | 2.88 | 10.61 | ||||||||
|
|
|
|
|
| |||||||
Less distributions to shareholders: | ||||||||||||
From net investment income | (0.59 | ) | (0.84 | ) | (0.60 | ) | ||||||
From net realized gains | (2.00 | ) | (5.33 | ) | (0.95 | ) | ||||||
|
|
|
|
|
| |||||||
Total distributions | (2.59 | ) | (6.17 | ) | (1.55 | ) | ||||||
|
|
|
|
|
| |||||||
Net asset value, end of period | $ | 21.99 | $ | 25.77 | $ | 29.06 | ||||||
|
|
|
|
|
| |||||||
Total Return(b) | (3.67 | )% | 10.22 | % | 53.56 | %** | ||||||
Ratios/Supplemental Data: | ||||||||||||
Net assets, end of period (000’s) | $ | 69,605 | $ | 141,465 | $ | 141,989 | ||||||
Net expenses to average daily net assets(c) | 0.40 | % | 0.40 | % | 0.40 | %* | ||||||
Net investment income (loss) to average daily net assets(a) | 1.90 | % | 2.20 | % | 1.92 | %* | ||||||
Portfolio turnover rate(d) | 17 | % | 22 | % | 65 | %** | ||||||
Fees and expenses reimbursed and/or waived by GMO to average daily net assets: | 0.15 | % | 0.08 | % | 0.20 | %* | ||||||
| (a) | Net investment income is affected by the timing of the declaration of dividends by the other GMO Funds and/or other investment companies in which the Fund invests, if any. |
| (b) | The total returns would have been lower had certain expenses not been reimbursed and/or waived during the periods shown, if applicable, and assumes the effect of reinvested distributions, if any. Calculation excludes purchase premiums and redemption fees which are borne by the shareholder purchasing or redeeming Fund shares, if any. |
| (c) | Net expenses exclude expenses incurred indirectly through investment in the underlying funds, if any (Note 5). |
| (d) | The portfolio turnover rate excludes investments in GMO U.S. Treasury Fund (“USTF”) which is used as a short-term investment vehicle for cash management. The Fund’s portfolio turnover rate including transactions in USTF during the period and/or year ended: |
| February 28, | February 28, | February 28, | ||||||||||
| 2023 | 2022 | 2021 | ||||||||||
Portfolio turnover rate including transactions in USTF | 29 | % | 27 | % | 70 | % | ||||||
| † | Calculated using average shares outstanding throughout the period. |
| * | Annualized. |
| ** | Not annualized. |
| 145 | See accompanying notes to the financial statements. |
GMO Trust Funds
Financial Highlights — (Continued)
(For a share outstanding throughout each period)
QUALITY CYCLICALS FUND (continued)
| Class I Shares | ||||||||
| Period from | ||||||||
| July 16, 2021 | ||||||||
| (commencement | ||||||||
| of operations) | ||||||||
| Year Ended | through | |||||||
| February 28, | February 28, | |||||||
| 2023 | 2022 | |||||||
Net asset value, beginning of period | $ | 25.76 | $ | 28.45 | ||||
|
|
|
| |||||
Income (loss) from investment operations: | ||||||||
Net investment income (loss)(a)† | 0.38 | 0.34 | ||||||
Net realized and unrealized gain (loss) | (1.60 | ) | (0.05 | )(b) | ||||
|
|
|
| |||||
Total from investment operations | (1.22 | ) | 0.29 | |||||
|
|
|
| |||||
Less distributions to shareholders: | ||||||||
From net investment income | (0.55 | ) | (0.47 | ) | ||||
From net realized gains | (2.00 | ) | (2.51 | ) | ||||
|
|
|
| |||||
Total distributions | (2.55 | ) | (2.98 | ) | ||||
|
|
|
| |||||
Net asset value, end of period | $ | 21.99 | $ | 25.76 | ||||
|
|
|
| |||||
Total Return(c) | (3.84 | )% | 1.42 | %** | ||||
Ratios/Supplemental Data: | ||||||||
Net assets, end of period (000’s) | $ | 70 | $ | 81 | ||||
Net expenses to average daily net assets(d) | 0.60 | % | 0.59 | %* | ||||
Net investment income (loss) to average daily net assets(a) | 1.70 | % | 1.92 | %* | ||||
Portfolio turnover rate(e) | 17 | % | 22 | %** | ||||
Fees and expenses reimbursed and/or waived by GMO to average daily net assets: | 0.15 | % | 0.08 | %* | ||||
| (a) | Net investment income is affected by the timing of the declaration of dividends by the other GMO Funds and/or other investment companies in which the Fund invests, if any. |
| (b) | The amount shown for a share outstanding does not correspond with the aggregate net realized and unrealized gain (loss) on investments due to the timing of purchases and redemptions of the Fund shares in relation to fluctuating market values of the investments of the Fund. |
| (c) | The total returns would have been lower had certain expenses not been reimbursed and/or waived during the periods shown, if applicable, and assumes the effect of reinvested distributions, if any. Calculation excludes purchase premiums and redemption fees which are borne by the shareholder purchasing or redeeming Fund shares, if any. |
| (d) | Net expenses exclude expenses incurred indirectly through investment in the underlying funds, if any (Note 5). |
| (e) | The portfolio turnover rate excludes investments in GMO U.S. Treasury Fund (“USTF”) which is used as a short-term investment vehicle for cash management. The Fund’s portfolio turnover rate including transactions in USTF during the period and/or year ended: |
| February 28, | February 28, | |||||||
| 2023 | 2022 | |||||||
Portfolio turnover rate including transactions in USTF | 29 | % | 27 | % | ||||
| † | Calculated using average shares outstanding throughout the period. |
| * | Annualized. |
| ** | Not annualized. |
| See accompanying notes to the financial statements. | 146 |
GMO Trust Funds
Financial Highlights — (Continued)
(For a share outstanding throughout each period)
QUALITY FUND
| Class III Shares | ||||||||||||||||||||
| Year Ended February 28/29, | ||||||||||||||||||||
| 2023 | 2022 | 2021 | 2020 | 2019 | ||||||||||||||||
Net asset value, beginning of period | $ | 28.05 | $ | 25.98 | $ | 22.77 | $ | 22.28 | $ | 25.13 | ||||||||||
|
|
|
|
|
|
|
|
|
| |||||||||||
Income (loss) from investment operations: | ||||||||||||||||||||
Net investment income (loss)(a)† | 0.29 | 0.33 | (b) | 0.32 | 0.35 | 0.35 | ||||||||||||||
Net realized and unrealized gain (loss) | (1.80 | ) | 3.56 | 6.37 | 2.15 | 1.21 | ||||||||||||||
|
|
|
|
|
|
|
|
|
| |||||||||||
Total from investment operations | �� | (1.51 | ) | 3.89 | 6.69 | 2.50 | 1.56 | |||||||||||||
|
|
|
|
|
|
|
|
|
| |||||||||||
Less distributions to shareholders: | ||||||||||||||||||||
From net investment income | (0.30 | ) | (0.32 | ) | (0.35 | ) | (0.36 | ) | (0.39 | ) | ||||||||||
From net realized gains | (2.48 | ) | (1.50 | ) | (3.13 | ) | (1.65 | ) | (4.02 | ) | ||||||||||
|
|
|
|
|
|
|
|
|
| |||||||||||
Total distributions | (2.78 | ) | (1.82 | ) | (3.48 | ) | (2.01 | ) | (4.41 | ) | ||||||||||
|
|
|
|
|
|
|
|
|
| |||||||||||
Net asset value, end of period | $ | 23.76 | $ | 28.05 | $ | 25.98 | $ | 22.77 | $ | 22.28 | ||||||||||
|
|
|
|
|
|
|
|
|
| |||||||||||
Total Return(c) | (5.30 | )% | 14.71 | %(d) | 30.83 | % | 10.64 | % | 6.86 | % | ||||||||||
Ratios/Supplemental Data: | ||||||||||||||||||||
Net assets, end of period (000’s) | $ | 2,885,807 | $ | 2,996,330 | $ | 3,519,473 | $ | 3,195,240 | $ | 3,065,461 | ||||||||||
Net expenses to average daily net assets(e) | 0.49 | % | 0.48 | % | 0.48 | % | 0.48 | % | 0.48 | % | ||||||||||
Net investment income (loss) to average daily net assets(a) | 1.14 | % | 1.12 | %(b) | 1.33 | % | 1.44 | % | 1.42 | % | ||||||||||
Portfolio turnover rate(f) | 15 | % | 18 | % | 28 | % | 17 | % | 18 | % | ||||||||||
Fees and expenses reimbursed and/or waived by GMO to average daily net assets: | 0.02 | % | 0.02 | %(g) | 0.02 | %(g) | 0.02 | %(g) | 0.02 | % | ||||||||||
| (a) | Net investment income is affected by the timing of the declaration of dividends by the other GMO Funds and/or other investment companies in which the Fund invests, if any. |
| (b) | Net investment income per share includes income received for EU reclaims, net of IRS closing agreement fees and non-recurring contingent legal fees attributed to EU tax reclaims, if any, in connection with certain Fund holdings (Note 2). Excluding the net EU reclaim amount below, the net investment income to average daily net assets ratio would have been: |
February 28, 2022 |
$6,233,641 |
0.94% |
| (c) | The total returns would have been lower had certain expenses not been reimbursed and/or waived during the periods shown, if applicable, and assumes the effect of reinvested distributions, if any. Calculation excludes purchase premiums and redemption fees which are borne by the shareholder purchasing or redeeming Fund shares, if any. |
| (d) | EU tax reclaim payments and related interest received during the year, net of IRS closing agreement fees and non-recurring contingent legal fees attributed to EU tax reclaims, had a positive impact to total return, adding below respectively, to each class’s total return (Note 2): |
February 28, 2022 |
0.20% |
| (e) | Net expenses exclude expenses incurred indirectly through investment in the underlying funds, if any (Note 5). |
| (f) | The portfolio turnover rate excludes investments in GMO U.S. Treasury Fund (“USTF”) which is used as a short-term investment vehicle for cash management. The Fund’s portfolio turnover rate including transactions in USTF during the period and/or year ended: |
| February 28, | February 28, | February 28, | February 29, | February 28, | ||||||||||||||||
| 2023 | 2022 | 2021 | 2020 | 2019 | ||||||||||||||||
Portfolio turnover rate including transactions in USTF | 24 | % | 18 | % | 28 | % | 17 | % | 20 | % | ||||||||||
| (g) | Ratio includes indirect fees waived or borne by GMO. |
| † | Calculated using average shares outstanding throughout the period. |
| 147 | See accompanying notes to the financial statements. |
GMO Trust Funds
Financial Highlights — (Continued)
(For a share outstanding throughout each period)
QUALITY FUND (continued)
| Class IV Shares | ||||||||||||||||||||
| Year Ended February 28/29, | ||||||||||||||||||||
| 2023 | 2022 | 2021 | 2020 | 2019 | ||||||||||||||||
Net asset value, beginning of period | $ | 28.13 | $ | 26.04 | $ | 22.82 | $ | 22.32 | $ | 25.17 | ||||||||||
|
|
|
|
|
|
|
|
|
| |||||||||||
Income (loss) from investment operations: | ||||||||||||||||||||
Net investment income (loss)(a)† | 0.30 | 0.32 | (b) | 0.34 | 0.37 | 0.36 | ||||||||||||||
Net realized and unrealized gain (loss) | (1.80 | ) | 3.60 | 6.37 | 2.14 | 1.22 | ||||||||||||||
|
|
|
|
|
|
|
|
|
| |||||||||||
Total from investment operations | (1.50 | ) | 3.92 | 6.71 | 2.51 | 1.58 | ||||||||||||||
|
|
|
|
|
|
|
|
|
| |||||||||||
Less distributions to shareholders: | ||||||||||||||||||||
From net investment income | (0.31 | ) | (0.33 | ) | (0.36 | ) | (0.36 | ) | (0.41 | ) | ||||||||||
From net realized gains | (2.48 | ) | (1.50 | ) | (3.13 | ) | (1.65 | ) | (4.02 | ) | ||||||||||
|
|
|
|
|
|
|
|
|
| |||||||||||
Total distributions | (2.79 | ) | (1.83 | ) | (3.49 | ) | (2.01 | ) | (4.43 | ) | ||||||||||
|
|
|
|
|
|
|
|
|
| |||||||||||
Net asset value, end of period | $ | 23.84 | $ | 28.13 | $ | 26.04 | $ | 22.82 | $ | 22.32 | ||||||||||
|
|
|
|
|
|
|
|
|
| |||||||||||
Total Return(c) | (5.23 | )% | 14.79 | %(d) | 30.86 | % | 10.70 | % | 6.91 | % | ||||||||||
Ratios/Supplemental Data: | ||||||||||||||||||||
Net assets, end of period (000’s) | $ | 418,403 | $ | 912,163 | $ | 750,632 | $ | 852,866 | $ | 1,139,024 | ||||||||||
Net expenses to average daily net assets(e) | 0.45 | % | 0.44 | % | 0.44 | % | 0.44 | % | 0.44 | % | ||||||||||
Net investment income (loss) to average daily net assets(a) | 1.19 | % | 1.08 | %(b) | 1.37 | % | 1.52 | % | 1.46 | % | ||||||||||
Portfolio turnover rate(f) | 15 | % | 18 | % | 28 | % | 17 | % | 18 | % | ||||||||||
Fees and expenses reimbursed and/or waived by GMO to average daily net assets: | 0.02 | % | 0.02 | %(g) | 0.02 | %(g) | 0.02 | %(g) | 0.02 | % | ||||||||||
| (a) | Net investment income is affected by the timing of the declaration of dividends by the other GMO Funds and/or other investment companies in which the Fund invests, if any. |
| (b) | Net investment income per share includes income received for EU reclaims, net of IRS closing agreement fees and non-recurring contingent legal fees attributed to EU tax reclaims, if any, in connection with certain Fund holdings (Note 2). Excluding the net EU reclaim amount below, the net investment income to average daily net assets ratio would have been: |
February 28, 2022 |
$1,577,219 |
0.91% |
| (c) | The total returns would have been lower had certain expenses not been reimbursed and/or waived during the periods shown, if applicable, and assumes the effect of reinvested distributions, if any. Calculation excludes purchase premiums and redemption fees which are borne by the shareholder purchasing or redeeming Fund shares, if any. |
| (d) | EU tax reclaim payments and related interest received during the year, net of IRS closing agreement fees and non-recurring contingent legal fees attributed to EU tax reclaims, had a positive impact to total return, adding below respectively, to each class’s total return (Note 2): |
February 28, 2022 |
0.20% |
| (e) | Net expenses exclude expenses incurred indirectly through investment in the underlying funds, if any (Note 5). |
| (f) | The portfolio turnover rate excludes investments in GMO U.S. Treasury Fund (“USTF”) which is used as a short-term investment vehicle for cash management. The Fund’s portfolio turnover rate including transactions in USTF during the period and/or year ended: |
| February 28, | February 28, | February 28, | February 29, | February 28, | ||||||||||||||||
| 2023 | 2022 | 2021 | 2020 | 2019 | ||||||||||||||||
Portfolio turnover rate including transactions in USTF | 24 | % | 18 | % | 28 | % | 17 | % | 20 | % | ||||||||||
| (g) | Ratio includes indirect fees waived or borne by GMO. |
| † | Calculated using average shares outstanding throughout the period. |
| See accompanying notes to the financial statements. | 148 |
GMO Trust Funds
Financial Highlights — (Continued)
(For a share outstanding throughout each period)
QUALITY FUND (continued)
| Class VI Shares | ||||||||||||||||||||
| Year Ended February 28/29, | ||||||||||||||||||||
| 2023 | 2022 | 2021 | 2020 | 2019 | ||||||||||||||||
Net asset value, beginning of period | $ | 28.06 | $ | 25.98 | $ | 22.77 | $ | 22.28 | $ | 25.13 | ||||||||||
|
|
|
|
|
|
|
|
|
| |||||||||||
Income (loss) from investment operations: | ||||||||||||||||||||
Net investment income (loss)(a)† | 0.32 | 0.34 | (b) | 0.35 | 0.37 | 0.38 | ||||||||||||||
Net realized and unrealized gain (loss) | (1.82 | ) | 3.60 | 6.37 | 2.15 | 1.21 | ||||||||||||||
|
|
|
|
|
|
|
|
|
| |||||||||||
Total from investment operations | (1.50 | ) | 3.94 | 6.72 | 2.52 | 1.59 | ||||||||||||||
|
|
|
|
|
|
|
|
|
| |||||||||||
Less distributions to shareholders: | ||||||||||||||||||||
From net investment income | (0.32 | ) | (0.36 | ) | (0.38 | ) | (0.38 | ) | (0.42 | ) | ||||||||||
From net realized gains | (2.48 | ) | (1.50 | ) | (3.13 | ) | (1.65 | ) | (4.02 | ) | ||||||||||
|
|
|
|
|
|
|
|
|
| |||||||||||
Total distributions | (2.80 | ) | (1.86 | ) | (3.51 | ) | (2.03 | ) | (4.44 | ) | ||||||||||
|
|
|
|
|
|
|
|
|
| |||||||||||
Net asset value, end of period | $ | 23.76 | $ | 28.06 | $ | 25.98 | $ | 22.77 | $ | 22.28 | ||||||||||
|
|
|
|
|
|
|
|
|
| |||||||||||
Total Return(c) | (5.24 | )% | 14.86 | %(d) | 30.95 | % | 10.73 | % | 6.96 | % | ||||||||||
Ratios/Supplemental Data: | ||||||||||||||||||||
Net assets, end of period (000’s) | $ | 2,224,691 | $ | 3,461,580 | $ | 2,465,066 | $ | 2,077,277 | $ | 2,227,287 | ||||||||||
Net expenses to average daily net assets(e) | 0.40 | % | 0.39 | % | 0.39 | % | 0.39 | % | 0.39 | % | ||||||||||
Net investment income (loss) to average daily net assets(a) | 1.24 | % | 1.16 | %(b) | 1.41 | % | 1.55 | % | 1.54 | % | ||||||||||
Portfolio turnover rate(f) | 15 | % | 18 | % | 28 | % | 17 | % | 18 | % | ||||||||||
Fees and expenses reimbursed and/or waived by GMO to average daily net assets: | 0.02 | % | 0.02 | %(g) | 0.02 | %(g) | 0.02 | %(g) | 0.02 | % | ||||||||||
| (a) | Net investment income is affected by the timing of the declaration of dividends by the other GMO Funds and/or other investment companies in which the Fund invests, if any. |
| (b) | Net investment income per share includes income received for EU reclaims, net of IRS closing agreement fees and non-recurring contingent legal fees attributed to EU tax reclaims, if any, in connection with certain Fund holdings (Note 2). Excluding the net EU reclaim amount below, the net investment income to average daily net assets ratio would have been: |
February 28, 2022 |
$5,862,655 |
0.99% |
| (c) | The total returns would have been lower had certain expenses not been reimbursed and/or waived during the periods shown, if applicable, and assumes the effect of reinvested distributions, if any. Calculation excludes purchase premiums and redemption fees which are borne by the shareholder purchasing or redeeming Fund shares, if any. |
| (d) | EU tax reclaim payments and related interest received during the year, net of IRS closing agreement fees and non-recurring contingent legal fees attributed to EU tax reclaims, had a positive impact to total return, adding below respectively, to each class’s total return (Note 2): |
February 28, 2022 |
0.20% |
| (e) | Net expenses exclude expenses incurred indirectly through investment in the underlying funds, if any (Note 5). |
| (f) | The portfolio turnover rate excludes investments in GMO U.S. Treasury Fund (“USTF”) which is used as a short-term investment vehicle for cash management. The Fund’s portfolio turnover rate including transactions in USTF during the period and/or year ended: |
| February 28, | February 28, | February 28, | February 29, | February 28, | ||||||||||||||||
| 2023 | 2022 | 2021 | 2020 | 2019 | ||||||||||||||||
Portfolio turnover rate including transactions in USTF | 24 | % | 18 | % | 28 | % | 17 | % | 20 | % | ||||||||||
| (g) | Ratio includes indirect fees waived or borne by GMO. |
| † | Calculated using average shares outstanding throughout the period. |
| 149 | See accompanying notes to the financial statements. |
GMO Trust Funds
Financial Highlights — (Continued)
(For a share outstanding throughout each period)
QUALITY FUND (continued)
| Class R6 Shares | ||||||||||||||||
| Period from | ||||||||||||||||
| November 12, 2019 | ||||||||||||||||
| (commencement | ||||||||||||||||
| of operations) | ||||||||||||||||
| Year Ended | through | |||||||||||||||
| February 28, | February 29, | |||||||||||||||
| 2023 | 2022 | 2021 | 2020 | |||||||||||||
Net asset value, beginning of period | $ | 28.02 | $ | 25.96 | $ | 22.76 | $ | 25.21 | ||||||||
|
|
|
|
|
|
|
| |||||||||
Income (loss) from investment operations: | ||||||||||||||||
Net investment income (loss)(a)† | 0.28 | 0.32 | (b) | 0.30 | 0.10 | |||||||||||
Net realized and unrealized gain (loss) | (1.79 | ) | 3.57 | 6.39 | (0.83 | ) | ||||||||||
|
|
|
|
|
|
|
| |||||||||
Total from investment operations | (1.51 | ) | 3.89 | 6.69 | (0.73 | ) | ||||||||||
|
|
|
|
|
|
|
| |||||||||
Less distributions to shareholders: | ||||||||||||||||
From net investment income | (0.30 | ) | (0.33 | ) | (0.36 | ) | (0.32 | ) | ||||||||
From net realized gains | (2.48 | ) | (1.50 | ) | (3.13 | ) | (1.40 | ) | ||||||||
|
|
|
|
|
|
|
| |||||||||
Total distributions | (2.78 | ) | (1.83 | ) | (3.49 | ) | (1.72 | ) | ||||||||
|
|
|
|
|
|
|
| |||||||||
Net asset value, end of period | $ | 23.73 | $ | 28.02 | $ | 25.96 | $ | 22.76 | ||||||||
|
|
|
|
|
|
|
| |||||||||
Total Return(c) | (5.29 | )% | 14.71 | %(d) | 30.81 | % | (3.39 | )%** | ||||||||
Ratios/Supplemental Data: | ||||||||||||||||
Net assets, end of period (000’s) | $ | 769,960 | $ | 507,232 | $ | 330,287 | $ | 77,375 | ||||||||
Net expenses to average daily net assets(e) | 0.48 | % | 0.48 | % | 0.48 | % | 0.49 | %* | ||||||||
Net investment income (loss) to average daily net assets(a) | 1.12 | % | 1.07 | %(b) | 1.22 | % | 1.31 | %* | ||||||||
Portfolio turnover rate(f) | 15 | % | 18 | % | 28 | % | 17 | %** | ||||||||
Fees and expenses reimbursed and/or waived by GMO to average daily net assets: | 0.03 | % | 0.02 | %(g) | 0.02 | %(g) | 0.02 | %(g)* | ||||||||
| (a) | Net investment income is affected by the timing of the declaration of dividends by the other GMO Funds and/or other investment companies in which the Fund invests, if any. |
| (b) | Net investment income per share includes income received for EU reclaims, net of IRS closing agreement fees and non-recurring contingent legal fees attributed to EU tax reclaims, if any, in connection with certain Fund holdings (Note 2). Excluding the net EU reclaim amount below, the net investment income to average daily net assets ratio would have been: |
February 28, 2022 |
$822,832 |
0.89% |
| (c) | The total returns would have been lower had certain expenses not been reimbursed and/or waived during the periods shown, if applicable, and assumes the effect of reinvested distributions, if any. Calculation excludes purchase premiums and redemption fees which are borne by the shareholder purchasing or redeeming Fund shares, if any. |
| (d) | EU tax reclaim payments and related interest received during the year, net of IRS closing agreement fees and non-recurring contingent legal fees attributed to EU tax reclaims, had a positive impact to total return, adding below respectively, to each class’s total return (Note 2): |
February 28, 2022 |
0.20% |
| (e) | Net expenses exclude expenses incurred indirectly through investment in the underlying funds, if any (Note 5). |
| (f) | The portfolio turnover rate excludes investments in GMO U.S. Treasury Fund (“USTF”) which is used as a short-term investment vehicle for cash management. The Fund’s portfolio turnover rate including transactions in USTF during the period and/or year ended: |
| February 28, | February 28, | February 28, | February 29, | |||||||||||||
| 2023 | 2022 | 2021 | 2020 | |||||||||||||
Portfolio turnover rate including transactions in USTF | 24 | % | 18 | % | 28 | % | 17 | % | ||||||||
| (g) | Ratio includes indirect fees waived or borne by GMO. |
| † | Calculated using average shares outstanding throughout the period. |
| * | Annualized. |
| ** | Not annualized. |
| See accompanying notes to the financial statements. | 150 |
GMO Trust Funds
Financial Highlights — (Continued)
(For a share outstanding throughout each period)
QUALITY FUND (continued)
| Class I Shares | ||||||||||||||||
| Period from | ||||||||||||||||
| September 26, 2019 | ||||||||||||||||
| (commencement | ||||||||||||||||
| of operations) | ||||||||||||||||
| Year Ended | through | |||||||||||||||
| February 28, | February 29, | |||||||||||||||
| 2023 | 2022 | 2021 | 2020 | |||||||||||||
Net asset value, beginning of period | $ | 27.99 | $ | 25.93 | $ | 22.75 | $ | 23.95 | ||||||||
|
|
|
|
|
|
|
| |||||||||
Income (loss) from investment operations: | ||||||||||||||||
Net investment income (loss)(a)† | 0.26 | 0.28 | (b) | 0.28 | 0.12 | |||||||||||
Net realized and unrealized gain (loss) | (1.80 | ) | 3.58 | 6.37 | 0.39 | |||||||||||
|
|
|
|
|
|
|
| |||||||||
Total from investment operations | (1.54 | ) | 3.86 | 6.65 | 0.51 | |||||||||||
|
|
|
|
|
|
|
| |||||||||
Less distributions to shareholders: | ||||||||||||||||
From net investment income | (0.27 | ) | (0.30 | ) | (0.34 | ) | (0.31 | ) | ||||||||
From net realized gains | (2.48 | ) | (1.50 | ) | (3.13 | ) | (1.40 | ) | ||||||||
|
|
|
|
|
|
|
| |||||||||
Total distributions | (2.75 | ) | (1.80 | ) | (3.47 | ) | (1.71 | ) | ||||||||
|
|
|
|
|
|
|
| |||||||||
Net asset value, end of period | $ | 23.70 | $ | 27.99 | $ | 25.93 | $ | 22.75 | ||||||||
|
|
|
|
|
|
|
| |||||||||
Total Return(c) | (5.40 | )% | 14.62 | %(d) | 30.66 | % | 1.62 | %** | ||||||||
Ratios/Supplemental Data: | ||||||||||||||||
Net assets, end of period (000’s) | $ | 486,544 | $ | 481,865 | $ | 303,447 | $ | 80,110 | ||||||||
Net expenses to average daily net assets(e) | 0.58 | % | 0.58 | % | 0.58 | % | 0.57 | %* | ||||||||
Net investment income (loss) to average daily net assets(a) | 1.04 | % | 0.96 | %(b) | 1.12 | % | 1.13 | %* | ||||||||
Portfolio turnover rate(f) | 15 | % | 18 | % | 28 | % | 17 | %** | ||||||||
Fees and expenses reimbursed and/or waived by GMO to average daily net assets: | 0.04 | % | 0.04 | %(g) | 0.02 | %(g) | 0.02 | %(g)* | ||||||||
| (a) | Net investment income is affected by the timing of the declaration of dividends by the other GMO Funds and/or other investment companies in which the Fund invests, if any. |
| (b) | Net investment income per share includes income received for EU reclaims, net of IRS closing agreement fees and non-recurring contingent legal fees attributed to EU tax reclaims, if any, in connection with certain Fund holdings (Note 2). Excluding the net EU reclaim amount below, the net investment income to average daily net assets ratio would have been: |
February 28, 2022 |
$779,657 |
0.79% |
| (c) | The total returns would have been lower had certain expenses not been reimbursed and/or waived during the periods shown, if applicable, and assumes the effect of reinvested distributions, if any. Calculation excludes purchase premiums and redemption fees which are borne by the shareholder purchasing or redeeming Fund shares, if any. |
| (d) | EU tax reclaim payments and related interest received during the year, net of IRS closing agreement fees and non-recurring contingent legal fees attributed to EU tax reclaims, had a positive impact to total return, adding below respectively, to each class’s total return (Note 2): |
February 28, 2022 |
0.20% |
| (e) | Net expenses exclude expenses incurred indirectly through investment in the underlying funds, if any (Note 5). |
| (f) | The portfolio turnover rate excludes investments in GMO U.S. Treasury Fund (“USTF”) which is used as a short-term investment vehicle for cash management. The Fund’s portfolio turnover rate including transactions in USTF during the period and/or year ended: |
| February 28, | February 28, | February 28, | February 29, | |||||||||||||
| 2023 | 2022 | 2021 | 2020 | |||||||||||||
Portfolio turnover rate including transactions in USTF | 24 | % | 18 | % | 28 | % | 17 | % | ||||||||
| (g) | Ratio includes indirect fees waived or borne by GMO. |
| † | Calculated using average shares outstanding throughout the period. |
| * | Annualized. |
| ** | Not annualized. |
| 151 | See accompanying notes to the financial statements. |
GMO Trust Funds
Financial Highlights — (Continued)
(For a share outstanding throughout the period)
RESOURCE TRANSITION FUND
| Class VI Shares | ||||
| Period from | ||||
| February 15, 2023 | ||||
| (commencement | ||||
| of operations) | ||||
| through | ||||
| February 28, | ||||
| 2023 | ||||
Net asset value, beginning of period | $ | 20.00 | ||
|
| |||
Income (loss) from investment operations: | ||||
Net investment income (loss)(a)† | 0.01 | |||
Net realized and unrealized gain (loss) | (1.03 | ) | ||
Total from investment operations | (1.02 | ) | ||
|
| |||
Net asset value, end of period | $ | 18.98 | ||
|
| |||
Total Return(b) | (5.10 | )%** | ||
|
| |||
Ratios/Supplemental Data: | ||||
Net assets, end of period (000’s) | $ | 460,209 | ||
Net expenses to average daily net assets(c) | 0.86 | %* | ||
Net investment income (loss) to average daily net assets(a) | 1.39 | %* | ||
Portfolio turnover rate(d) | 0 | %** | ||
Fees and expenses reimbursed and/or waived by GMO to average daily net assets: | 0.73 | %* | ||
| (a) | Net investment income is affected by the timing of the declaration of dividends by the other GMO Funds and/or other investment companies in which the Fund invests, if any. |
| (b) | The total returns would have been lower had certain expenses not been reimbursed and/or waived during the periods shown, if applicable, and assumes the effect of reinvested distributions, if any. Calculation excludes purchase premiums and redemption fees which are borne by the shareholder purchasing or redeeming Fund shares, if any. |
| (c) | Net expenses exclude expenses incurred indirectly through investment in the underlying funds, if any (Note 5). |
| (d) | The portfolio turnover rate excludes investments in GMO U.S. Treasury Fund (“USTF”) which is used as a short-term investment vehicle for cash management. The Fund’s portfolio turnover rate including transactions in USTF during the period and/or year ended: |
| February 28, 2023 | ||||
Portfolio turnover rate including transactions in USTF | 2 | % | ||
| † | Calculated using average shares outstanding throughout the period. |
| * | Annualized. |
| ** | Not annualized. |
| See accompanying notes to the financial statements. | 152 |
GMO Trust Funds
Financial Highlights — (Continued)
(For a share outstanding throughout each period)
RESOURCES FUND
| Class III Shares | ||||||||||||||||||||
| Year Ended February 28/29, | ||||||||||||||||||||
| 2023 | 2022 | 2021 | 2020 | 2019 | ||||||||||||||||
Net asset value, beginning of period | $ | 28.39 | $ | 27.81 | $ | 18.11 | $ | 20.31 | $ | 20.88 | ||||||||||
|
|
|
|
|
|
|
|
|
| |||||||||||
Income (loss) from investment operations: | ||||||||||||||||||||
Net investment income (loss)(a)† | 1.13 | 1.54 | 0.48 | 0.65 | 0.54 | |||||||||||||||
Net realized and unrealized gain (loss) | (1.74 | ) | 2.00 | 10.13 | (2.22 | ) | (0.37 | ) | ||||||||||||
|
|
|
|
|
|
|
|
|
| |||||||||||
Total from investment operations | (0.61 | ) | 3.54 | 10.61 | (1.57 | ) | 0.17 | |||||||||||||
|
|
|
|
|
|
|
|
|
| |||||||||||
Less distributions to shareholders: | ||||||||||||||||||||
From net investment income | (1.10 | ) | (1.35 | ) | (0.47 | ) | (0.63 | ) | (0.74 | ) | ||||||||||
From net realized gains | (1.62 | ) | (1.61 | ) | (0.44 | ) | — | — | ||||||||||||
|
|
|
|
|
|
|
|
|
| |||||||||||
Total distributions | (2.72 | ) | (2.96 | ) | (0.91 | ) | (0.63 | ) | (0.74 | ) | ||||||||||
|
|
|
|
|
|
|
|
|
| |||||||||||
Net asset value, end of period | $ | 25.06 | $ | 28.39 | $ | 27.81 | $ | 18.11 | $ | 20.31 | ||||||||||
|
|
|
|
|
|
|
|
|
| |||||||||||
Total Return(b) | (1.47 | )% | 13.29 | % | 59.36 | % | (8.14 | )% | 0.99 | % | ||||||||||
Ratios/Supplemental Data: | ||||||||||||||||||||
Net assets, end of period (000’s) | $ | 322,035 | $ | 239,225 | $ | 96,091 | $ | 201,320 | $ | 169,523 | ||||||||||
Net expenses to average daily net assets(c) | 0.72 | % | 0.71 | % | 0.72 | % | 0.73 | % | 0.74 | %(d) | ||||||||||
Net investment income (loss) to average daily net assets(a) | 4.26 | % | 5.32 | % | 2.44 | % | 3.24 | % | 2.68 | % | ||||||||||
Portfolio turnover rate(e) | 65 | % | 60 | % | 86 | % | 37 | % | 35 | % | ||||||||||
Fees and expenses reimbursed and/or waived by GMO to average daily net assets: | — | — | 0.00 | %(f)(g) | 0.00 | %(f)(g) | — | |||||||||||||
Purchase premiums and redemption fees consisted of the following per share amounts (Note 2):† | $ | — | $ | — | $ | — | $ | 0.01 | $ | 0.02 | ||||||||||
| (a) | Net investment income is affected by the timing of the declaration of dividends by the other GMO Funds and/or other investment companies in which the Fund invests, if any. |
| (b) | The total returns would have been lower had certain expenses not been reimbursed and/or waived during the periods shown, if applicable, and assumes the effect of reinvested distributions, if any. Calculation excludes purchase premiums and redemption fees which are borne by the shareholder purchasing or redeeming Fund shares, if any. |
| (c) | Net expenses exclude expenses incurred indirectly through investment in the underlying funds, if any (Note 5). |
| (d) | Includes recoupment of past reimbursed and/or waived fees (Note 5). |
| (e) | The portfolio turnover rate excludes investments in GMO U.S. Treasury Fund (“USTF”) which is used as a short-term investment vehicle for cash management. The Fund’s portfolio turnover rate including transactions in USTF during the period and/or year ended: |
| February 28, | February 28, | February 28, | February 29, | February 28, | ||||||||||||||||
| 2023 | 2022 | 2021 | 2020 | 2019 | ||||||||||||||||
Portfolio turnover rate including transactions in USTF | 72 | % | 60 | % | 89 | % | 101 | % | 69 | % | ||||||||||
| (f) | Ratio includes indirect fees waived or borne by GMO. |
| (g) | Rounds to less than 0.01%. |
| † | Calculated using average shares outstanding throughout the period. |
| 153 | See accompanying notes to the financial statements. |
GMO Trust Funds
Financial Highlights — (Continued)
(For a share outstanding throughout each period)
RESOURCES FUND (continued)
| Class IV Shares | ||||||||||||||||||||
| Year Ended February 28/29, | ||||||||||||||||||||
| 2023 | 2022 | 2021 | 2020 | 2019 | ||||||||||||||||
Net asset value, beginning of period | $ | 28.30 | $ | 27.73 | $ | 18.06 | $ | 20.24 | $ | 20.81 | ||||||||||
|
|
|
|
|
|
|
|
|
| |||||||||||
Income (loss) from investment operations: | ||||||||||||||||||||
Net investment income (loss)(a) † | 1.13 | 1.79 | 0.47 | 0.68 | 0.62 | |||||||||||||||
Net realized and unrealized gain (loss) | (1.72 | ) | 1.76 | 10.12 | (2.22 | ) | (0.46 | ) | ||||||||||||
|
|
|
|
|
|
|
|
|
| |||||||||||
Total from investment operations | (0.59 | ) | 3.55 | 10.59 | (1.54 | ) | 0.16 | |||||||||||||
|
|
|
|
|
|
|
|
|
| |||||||||||
Less distributions to shareholders: | ||||||||||||||||||||
From net investment income | (1.11 | ) | (1.37 | ) | (0.48 | ) | (0.64 | ) | (0.73 | ) | ||||||||||
From net realized gains | (1.62 | ) | (1.61 | ) | (0.44 | ) | — | — | ||||||||||||
|
|
|
|
|
|
|
|
|
| |||||||||||
Total distributions | (2.73 | ) | (2.98 | ) | (0.92 | ) | (0.64 | ) | (0.73 | ) | ||||||||||
|
|
|
|
|
|
|
|
|
| |||||||||||
Net asset value, end of period | $ | 24.98 | $ | 28.30 | $ | 27.73 | $ | 18.06 | $ | 20.24 | ||||||||||
|
|
|
|
|
|
|
|
|
| |||||||||||
Total Return(b) | (1.40 | )% | 13.34 | % | 59.42 | % | (8.03 | )% | 0.98 | % | ||||||||||
Ratios/Supplemental Data: | ||||||||||||||||||||
Net assets, end of period (000’s) | $ | 344,000 | $ | 383,353 | $ | 531,006 | $ | 311,515 | $ | 336,954 | ||||||||||
Net expenses to average daily net assets(c) | 0.67 | % | 0.65 | % | 0.67 | % | 0.68 | % | 0.70 | %(d) | ||||||||||
Net investment income (loss) to average daily net assets(a) | 4.32 | % | 6.21 | % | 2.33 | % | 3.40 | % | 3.06 | % | ||||||||||
Portfolio turnover rate(e) | 65 | % | 60 | % | 86 | % | 37 | % | 35 | % | ||||||||||
Fees and expenses reimbursed and/or waived by GMO to average daily net assets: | — | — | 0.00 | %(f)(g) | 0.00 | %(f)(g) | — | |||||||||||||
Purchase premiums and redemption fees consisted of the following per share amounts (Note 2):† | $ | — | $ | — | $ | — | $ | 0.01 | $ | 0.02 | ||||||||||
| (a) | Net investment income is affected by the timing of the declaration of dividends by the other GMO Funds and/or other investment companies in which the Fund invests, if any. |
| (b) | The total returns would have been lower had certain expenses not been reimbursed and/or waived during the periods shown, if applicable, and assumes the effect of reinvested distributions, if any. Calculation excludes purchase premiums and redemption fees which are borne by the shareholder purchasing or redeeming Fund shares, if any. |
| (c) | Net expenses exclude expenses incurred indirectly through investment in the underlying funds, if any (Note 5). |
| (d) | Includes recoupment of past reimbursed and/or waived fees (Note 5). |
| (e) | The portfolio turnover rate excludes investments in GMO U.S. Treasury Fund (“USTF”) which is used as a short-term investment vehicle for cash management. The Fund’s portfolio turnover rate including transactions in USTF during the period and/or year ended: |
| February 28, | February 28, | February 28, | February 29, | February 28, | ||||||||||||||||
| 2023 | 2022 | 2021 | 2020 | 2019 | ||||||||||||||||
Portfolio turnover rate including transactions in USTF | 72 | % | 60 | % | 89 | % | 101 | % | 69 | % | ||||||||||
| (f) | Ratio includes indirect fees waived or borne by GMO. |
| (g) | Rounds to less than 0.01%. |
| † | Calculated using average shares outstanding throughout the period. |
| See accompanying notes to the financial statements. | 154 |
GMO Trust Funds
Financial Highlights — (Continued)
(For a share outstanding throughout each period)
RESOURCES FUND (continued)
| Class VI Shares | ||||||||
| Period from | ||||||||
| February 8, 2022 | ||||||||
| (commencement | ||||||||
| of operations) | ||||||||
| Year Ended | through | |||||||
| February 28, | February 28, | |||||||
| 2023 | 2022 | |||||||
Net asset value, beginning of period | $ | 28.30 | $ | 29.11 | ||||
|
|
|
| |||||
Income (loss) from investment operations: | ||||||||
Net investment income (loss)(a)† | 1.10 | (0.57 | ) | |||||
Net realized and unrealized gain (loss) | (1.69 | ) | (0.24 | )(b) | ||||
|
|
|
| |||||
Total from investment operations | (0.59 | ) | (0.81 | ) | ||||
|
|
|
| |||||
Less distributions to shareholders: | ||||||||
From net investment income | (1.13 | ) | — | |||||
From net realized gains | (1.62 | ) | — | |||||
|
|
|
| |||||
Total distributions | (2.75 | ) | — | |||||
|
|
|
| |||||
Net asset value, end of period | $ | 24.96 | $ | 28.30 | ||||
|
|
|
| |||||
Total Return(c) | (1.39 | )% | (2.78 | )%** | ||||
Ratios/Supplemental Data: | ||||||||
Net assets, end of period (000’s) | $ | 65,869 | $ | 842,698 | ||||
Net expenses to average daily net assets(d) | 0.62 | % | 0.74 | %* | ||||
Net investment income (loss) to average daily net assets(a) | 4.21 | % | (35.65 | )%* | ||||
Portfolio turnover rate(e) | 65 | % | 60 | %** | ||||
| (a) | Net investment income is affected by the timing of the declaration of dividends by the other GMO Funds and/or other investment companies in which the Fund invests, if any. |
| (b) | The amount shown for a share outstanding does not correspond with the aggregate net realized and unrealized gain (loss) on investments due to the timing of purchases and redemptions of Fund shares in relation to fluctuating market values of the investments of the Fund. |
| (c) | The total returns would have been lower had certain expenses not been reimbursed and/or waived during the periods shown, if applicable, and assumes the effect of reinvested distributions, if any. Calculation excludes purchase premiums and redemption fees which are borne by the shareholder purchasing or redeeming Fund shares, if any. |
| (d) | Net expenses exclude expenses incurred indirectly through investment in the underlying funds, if any (Note 5). |
| (e) | The portfolio turnover rate excludes investments in GMO U.S. Treasury Fund (“USTF”) which is used as a short-term investment vehicle for cash management. The Fund’s portfolio turnover rate including transactions in USTF during the period and/or year ended: |
| February 28, | February 28, | |||||||
| 2023 | 2022 | |||||||
Portfolio turnover rate including transactions in USTF | 72 | % | 60 | % | ||||
| † | Calculated using average shares outstanding throughout the period. |
| * | Annualized. |
| ** | Not annualized. |
| 155 | See accompanying notes to the financial statements. |
GMO Trust Funds
Financial Highlights — (Continued)
(For a share outstanding throughout each period)
RESOURCES FUND (continued)
| Class R6 Shares | ||||||||||||
| Period from | ||||||||||||
| January 22, 2021 | ||||||||||||
| (commencement | ||||||||||||
| of operations) | ||||||||||||
| Year Ended | through | |||||||||||
| February 28, | February 28, | |||||||||||
| 2023 | 2022 | 2021 | ||||||||||
Net asset value, beginning of period | $ | 28.37 | $ | 27.82 | $ | 27.44 | ||||||
|
|
|
|
|
| |||||||
Income (loss) from investment operations: | ||||||||||||
Net investment income (loss)(a)† | 1.10 | (0.06 | ) | 0.03 | ||||||||
Net realized and unrealized gain (loss) | (1.71 | ) | 3.59 | 0.35 | ||||||||
|
|
|
|
|
| |||||||
Total from investment operations | (0.61 | ) | 3.53 | 0.38 | ||||||||
|
|
|
|
|
| |||||||
Less distributions to shareholders: | ||||||||||||
From net investment income | (1.10 | ) | (1.37 | ) | — | |||||||
From net realized gains | (1.62 | ) | (1.61 | ) | — | |||||||
|
|
|
|
|
| |||||||
Total distributions | (2.72 | ) | (2.98 | ) | — | |||||||
|
|
|
|
|
| |||||||
Net asset value, end of period | $ | 25.04 | $ | 28.37 | $ | 27.82 | ||||||
|
|
|
|
|
| |||||||
Total Return(b) | (1.43 | )% | 13.25 | % | 1.38 | %** | ||||||
Ratios/Supplemental Data: | ||||||||||||
Net assets, end of period (000’s) | $ | 315,904 | $ | 105,086 | $ | 2,617 | ||||||
Net expenses to average daily net assets(c) | 0.72 | % | 0.74 | % | 0.71 | %* | ||||||
Net investment income (loss) to average daily net assets(a) | 4.21 | % | (0.20 | )% | 0.98 | %* | ||||||
Portfolio turnover rate(d) | 65 | % | 60 | % | 86 | %** | ||||||
| (a) | Net investment income is affected by the timing of the declaration of dividends by the other GMO Funds and/or other investment companies in which the Fund invests, if any. |
| (b) | The total returns would have been lower had certain expenses not been reimbursed and/or waived during the periods shown, if applicable, and assumes the effect of reinvested distributions, if any. Calculation excludes purchase premiums and redemption fees which are borne by the shareholder purchasing or redeeming Fund shares, if any. |
| (c) | Net expenses exclude expenses incurred indirectly through investment in the underlying funds, if any (Note 5). |
| (d) | The portfolio turnover rate excludes investments in GMO U.S. Treasury Fund (“USTF”) which is used as a short-term investment vehicle for cash management. The Fund’s portfolio turnover rate including transactions in USTF during the period and/or year ended: |
| February 28, | February 28, | February 28, | ||||||||||
| 2023 | 2022 | 2021 | ||||||||||
Portfolio turnover rate including transactions in USTF | 72 | % | 60 | % | 89 | % | ||||||
| † | Calculated using average shares outstanding throughout the period. |
| * | Annualized. |
| ** | Not annualized. |
| See accompanying notes to the financial statements. | 156 |
GMO Trust Funds
Financial Highlights — (Continued)
(For a share outstanding throughout each period)
RESOURCES FUND (continued)
| Class I Shares | ||||||||||||
| Period from | ||||||||||||
| January 22, 2021 | ||||||||||||
| (commencement | ||||||||||||
| of operations) | ||||||||||||
| Year Ended | through | |||||||||||
| February 28, | February 28, | |||||||||||
| 2023 | 2022 | 2021 | ||||||||||
Net asset value, beginning of period | $ | 28.39 | $ | 27.81 | $ | 27.44 | ||||||
|
|
|
|
|
| |||||||
Income (loss) from investment operations: | ||||||||||||
Net investment income (loss)(a) † | 1.08 | 1.25 | 0.02 | |||||||||
Net realized and unrealized gain (loss) | (1.72 | ) | 2.27 | 0.35 | ||||||||
|
|
|
|
|
| |||||||
Total from investment operations | (0.64 | ) | 3.52 | 0.37 | ||||||||
|
|
|
|
|
| |||||||
Less distributions to shareholders: | ||||||||||||
From net investment income | (1.07 | ) | (1.33 | ) | — | |||||||
From net realized gains | (1.62 | ) | (1.61 | ) | — | |||||||
|
|
|
|
|
| |||||||
Total distributions | (2.69 | ) | (2.94 | ) | — | |||||||
|
|
|
|
|
| |||||||
Net asset value, end of period | $ | 25.06 | $ | 28.39 | $ | 27.81 | ||||||
|
|
|
|
|
| |||||||
Total Return(b) | (1.55 | )% | 13.19 | % | 1.35 | %** | ||||||
Ratios/Supplemental Data: | ||||||||||||
Net assets, end of period (000’s) | $ | 736,470 | $ | 633,189 | $ | 369,102 | ||||||
Net expenses to average daily net assets(c) | 0.82 | % | 0.81 | % | 0.81 | %* | ||||||
Net investment income (loss) to average daily net assets(a) | 4.11 | % | 4.32 | % | 0.74 | %* | ||||||
Portfolio turnover rate(d) | 65 | % | 60 | % | 86 | %** | ||||||
Fees and expenses reimbursed and/or waived by GMO to average daily net assets: | 0.03 | % | — | — | ||||||||
| (a) | Net investment income is affected by the timing of the declaration of dividends by the other GMO Funds and/or other investment companies in which the Fund invests, if any. |
| (b) | The total returns would have been lower had certain expenses not been reimbursed and/or waived during the periods shown, if applicable, and assumes the effect of reinvested distributions, if any. Calculation excludes purchase premiums and redemption fees which are borne by the shareholder purchasing or redeeming Fund shares, if any. |
| (c) | Net expenses exclude expenses incurred indirectly through investment in the underlying funds, if any (Note 5). |
| (d) | The portfolio turnover rate excludes investments in GMO U.S. Treasury Fund (“USTF”) which is used as a short-term investment vehicle for cash management. The Fund’s portfolio turnover rate including transactions in USTF during the period and/or year ended: |
| February 28, | February 28, | February 28, | ||||||||||
| 2023 | 2022 | 2021 | ||||||||||
Portfolio turnover rate including transactions in USTF | 72 | % | 60 | % | 89 | % | ||||||
| † | Calculated using average shares outstanding throughout the period. |
| * | Annualized. |
| ** | Not annualized. |
| 157 | See accompanying notes to the financial statements. |
GMO Trust Funds
Financial Highlights — (Continued)
(For a share outstanding throughout the period)
SMALL CAP QUALITY FUND
| Class III Shares | ||||
| Period from | ||||
| November 15, 2022 | ||||
| (commencement | ||||
| of operations) | ||||
| through | ||||
| February 28, | ||||
| 2023 | ||||
Net asset value, beginning of period | $ | 22.96 | ||
|
| |||
Income (loss) from investment operations: | ||||
Net investment income (loss)(a)† | 0.01 | |||
Net realized and unrealized gain (loss) | 1.03 | |||
|
| |||
Total from investment operations | 1.04 | |||
|
| |||
Less distributions to shareholders: | ||||
From net investment income | (0.01 | ) | ||
From net realized gains | (1.87 | ) | ||
|
| |||
Total distributions | (1.88 | ) | ||
|
| |||
Net asset value, end of period | $ | 22.12 | ||
|
| |||
Total Return(b) | 4.57 | %** | ||
Ratios/Supplemental Data: | ||||
Net assets, end of period (000’s) | $ | 13,391 | ||
Net expenses to average daily net assets(c) | 0.75 | %* | ||
Net investment income (loss) to average daily net assets(a) | 0.19 | %* | ||
Portfolio turnover rate(d) | 77 | %** | ||
Fees and expenses reimbursed and/or waived by GMO to average daily net assets: | 0.85 | %* | ||
| (a) | Net investment income is affected by the timing of the declaration of dividends by the other GMO Funds and/or other investment companies in which the Fund invests, if any. |
| (b) | The total returns would have been lower had certain expenses not been reimbursed and/or waived during the periods shown, if applicable, and assumes the effect of reinvested distributions, if any. Calculation excludes purchase premiums and redemption fees which are borne by the shareholder purchasing or redeeming Fund shares, if any. |
| (c) | Net expenses exclude expenses incurred indirectly through investment in the underlying funds, if any (Note 5). |
| (d) | The portfolio turnover rate excludes investments in GMO U.S. Treasury Fund (“USTF”) which is used as a short-term investment vehicle for cash management. The Fund’s portfolio turnover rate including transactions in USTF during the period and/or year ended: |
| February 28, 2023 | ||||
Portfolio turnover rate including transactions in USTF | 78 | % | ||
| † | Calculated using average shares outstanding throughout the period. |
| * | Annualized. |
| ** | Not annualized. |
| See accompanying notes to the financial statements. | 158 |
GMO Trust Funds
Financial Highlights — (Continued)
(For a share outstanding throughout the period)
SMALL CAP QUALITY FUND (continued)
| Class VI Shares | ||||
| Period from | ||||
| September 20, 2022 | ||||
| (commencement | ||||
| of operations) | ||||
| through | ||||
| February 28, | ||||
| 2023 | ||||
Net asset value, beginning of period | $ | 20.00 | ||
|
| |||
Income (loss) from investment operations: | ||||
Net investment income (loss)(a)† | 0.02 | |||
Net realized and unrealized gain (loss) | 4.00 | |||
|
| |||
Total from investment operations | 4.02 | |||
|
| |||
Less distributions to shareholders: | ||||
From net investment income | (0.02 | ) | ||
From net realized gains | (1.87 | ) | ||
|
| |||
Total distributions | (1.89 | ) | ||
|
| |||
Net asset value, end of period | $ | 22.13 | ||
|
| |||
Total Return(b) | 20.10 | %** | ||
Ratios/Supplemental Data: | ||||
Net assets, end of period (000’s) | $ | 51,566 | ||
Net expenses to average daily net assets(c) | 0.66 | %* | ||
Net investment income (loss) to average daily net assets(a) | 0.25 | %* | ||
Portfolio turnover rate(d) | 77 | %** | ||
Fees and expenses reimbursed and/or waived by GMO to average daily net assets: | 0.39 | %* | ||
| (a) | Net investment income is affected by the timing of the declaration of dividends by the other GMO Funds and/or other investment companies in which the Fund invests, if any. |
| (b) | The total returns would have been lower had certain expenses not been reimbursed and/or waived during the periods shown, if applicable, and assumes the effect of reinvested distributions, if any. Calculation excludes purchase premiums and redemption fees which are borne by the shareholder purchasing or redeeming Fund shares, if any. |
| (c) | Net expenses exclude expenses incurred indirectly through investment in the underlying funds, if any (Note 5). |
| (d) | The portfolio turnover rate excludes investments in GMO U.S. Treasury Fund (“USTF”) which is used as a short-term investment vehicle for cash management. The Fund’s portfolio turnover rate including transactions in USTF during the period and/or year ended: |
| February 28, | ||||
| 2023 | ||||
Portfolio turnover rate including transactions in USTF | 78 | % | ||
| † | Calculated using average shares outstanding throughout the period. |
| * | Annualized. |
| ** | Not annualized. |
| 159 | See accompanying notes to the financial statements. |
GMO Trust Funds
Financial Highlights — (Continued)
(For a share outstanding throughout the period)
SMALL CAP QUALITY FUND (continued)
| Class I Shares | ||||
| Period from | ||||
| November 15, 2022 | ||||
| (commencement | ||||
| of operations) | ||||
| through | ||||
| February 28, | ||||
| 2023 | ||||
Net asset value, beginning of period | $ | 22.96 | ||
|
| |||
Income (loss) from investment operations: | ||||
Net investment income (loss)(a)† | 0.01 | |||
Net realized and unrealized gain (loss) | 1.02 | |||
|
| |||
Total from investment operations | 1.03 | |||
|
| |||
Less distributions to shareholders: | ||||
From net investment income | (0.01 | ) | ||
From net realized gains | (1.87 | ) | ||
|
| |||
Total distributions | (1.88 | ) | ||
|
| |||
Net asset value, end of period | $ | 22.11 | ||
|
| |||
Total Return(b) | 4.51 | %** | ||
Ratios/Supplemental Data: | ||||
Net assets, end of period (000’s) | $ | 21 | ||
Net expenses to average daily net assets(c) | 0.75 | %* | ||
Net investment income (loss) to average daily net assets(a) | 0.09 | %* | ||
Portfolio turnover rate(d) | 77 | %** | ||
Fees and expenses reimbursed and/or waived by GMO to average daily net assets: | 0.61 | %* | ||
| (a) | Net investment income is affected by the timing of the declaration of dividends by the other GMO Funds and/or other investment companies in which the Fund invests, if any. |
| (b) | The total returns would have been lower had certain expenses not been reimbursed and/or waived during the periods shown, if applicable, and assumes the effect of reinvested distributions, if any. Calculation excludes purchase premiums and redemption fees which are borne by the shareholder purchasing or redeeming Fund shares, if any. |
| (c) | Net expenses exclude expenses incurred indirectly through investment in the underlying funds, if any (Note 5). |
| (d) | The portfolio turnover rate excludes investments in GMO U.S. Treasury Fund (“USTF”) which is used as a short-term investment vehicle for cash management. The Fund’s portfolio turnover rate including transactions in USTF during the period and/or year ended: |
| February 28, | ||||
| 2023 | ||||
Portfolio turnover rate including transactions in USTF | 78 | % | ||
| † | Calculated using average shares outstanding throughout the period. |
| * | Annualized. |
| ** | Not annualized. |
| See accompanying notes to the financial statements. | 160 |
GMO Trust Funds
Financial Highlights — (Continued)
(For a share outstanding throughout each period)
TAX-MANAGED INTERNATIONAL EQUITIES FUND
| Class III Shares | ||||||||||||||||||||
| Year Ended February 28/29, | ||||||||||||||||||||
| 2023 | 2022 | 2021 | 2020 | 2019 | ||||||||||||||||
Net asset value, beginning of period | $ | 14.30 | $ | 15.98 | $ | 13.57 | $ | 13.82 | $ | 17.00 | ||||||||||
|
|
|
|
|
|
|
|
|
| |||||||||||
Income (loss) from investment operations: | ||||||||||||||||||||
Net investment income (loss)(a)† | 0.52 | 0.63 | (b) | 0.34 | 0.46 | 0.37 | ||||||||||||||
Net realized and unrealized gain (loss) | (0.93 | ) | 0.14 | 2.42 | (0.10 | ) | (2.63 | ) | ||||||||||||
|
|
|
|
|
|
|
|
|
| |||||||||||
Total from investment operations | (0.41 | ) | 0.77 | 2.76 | 0.36 | (2.26 | ) | |||||||||||||
|
|
|
|
|
|
|
|
|
| |||||||||||
Less distributions to shareholders: | ||||||||||||||||||||
From net investment income | (0.48 | ) | (0.76 | ) | (0.35 | ) | (0.61 | ) | (0.39 | ) | ||||||||||
From net realized gains | (0.24 | ) | (1.69 | ) | — | — | (0.53 | ) | ||||||||||||
|
|
|
|
|
|
|
|
|
| |||||||||||
Total distributions | (0.72 | ) | (2.45 | ) | (0.35 | ) | (0.61 | ) | (0.92 | ) | ||||||||||
|
|
|
|
|
|
|
|
|
| |||||||||||
Net asset value, end of period | $ | 13.17 | $ | 14.30 | $ | 15.98 | $ | 13.57 | $ | 13.82 | ||||||||||
|
|
|
|
|
|
|
|
|
| |||||||||||
Total Return(c) | (2.42 | )% | 4.77 | %(d) | 20.53 | % | 2.31 | % | (13.50 | )% | ||||||||||
Ratios/Supplemental Data: | ||||||||||||||||||||
Net assets, end of period (000’s) | $ | 30,686 | $ | 31,781 | $ | 38,960 | $ | 36,228 | $ | 48,739 | ||||||||||
Net expenses to average daily net assets(e) | 0.68 | % | 0.84 | %(f) | 0.73 | % | 0.80 | % | 0.79 | % | ||||||||||
Net investment income (loss) to average daily net assets(a) | 4.06 | % | 3.78 | %(b) | 2.47 | % | 3.28 | % | 2.47 | % | ||||||||||
Portfolio turnover rate(g) | 93 | % | 86 | % | 75 | % | 52 | % | 63 | % | ||||||||||
Fees and expenses reimbursed and/or waived by GMO to average daily net assets: | 0.70 | % | 0.60 | %(h) | 0.54 | %(h) | 0.54 | %(h) | 0.54 | % | ||||||||||
| (a) | Net investment income is affected by the timing of the declaration of dividends by the other GMO Funds and/or other investment companies in which the Fund invests, if any. |
| (b) | Net investment income per share includes income received for EU reclaims, net of IRS closing agreement fees and non-recurring contingent legal fees attributed to EU tax reclaims, if any, in connection with certain Fund holdings (Note 2). Excluding the net EU reclaim amount below, the net investment income to average daily net assets ratio would have been: |
February 28, 2022 |
$61,519 |
3.62% |
| (c) | The total returns would have been lower had certain expenses not been reimbursed and/or waived during the periods shown, if applicable, and assumes the effect of reinvested distributions, if any. Calculation excludes purchase premiums and redemption fees which are borne by the shareholder purchasing or redeeming Fund shares, if any. |
| (d) | EU tax reclaim payments and related interest received during the year, net of IRS closing agreement fees and non-recurring contingent legal fees attributed to EU tax reclaims, had a positive impact to total return, adding below respectively, to each class’s total return (Note 2): |
February 28, 2022 |
0.14% |
| (e) | Net expenses exclude expenses incurred indirectly through investment in the underlying funds, if any (Note 5). |
| (f) | Net expenses include non-recurring contingent legal fees attributed to EU tax reclaims. The net expense ratio excluding these legal fees is 0.73% (Note 2). |
| (g) | The portfolio turnover rate excludes investments in GMO U.S. Treasury Fund (“USTF”) which is used as a short-term investment vehicle for cash management. The Fund’s portfolio turnover rate including transactions in USTF during the period and/or year ended: |
| February 28, | February 28, | February 28, | February 29, | February 28, | ||||||||||||||||
| 2023 | 2022 | 2021 | 2020 | 2019 | ||||||||||||||||
Portfolio turnover rate including transactions in USTF | 134 | % | 107 | % | 77 | % | 65 | % | 117 | % | ||||||||||
| (h) | Ratio includes indirect fees waived or borne by GMO. |
| † | Calculated using average shares outstanding throughout the period. |
| 161 | See accompanying notes to the financial statements. |
GMO Trust Funds
Financial Highlights — (Continued)
(For a share outstanding throughout each period)
U.S. EQUITY FUND
| Class III Shares | ||||||||||||||||||||
| Year Ended February 28/29, | ||||||||||||||||||||
| 2023 | 2022 | 2021 | 2020 | 2019 | ||||||||||||||||
Net asset value, beginning of period | $ | 13.69 | $ | 14.39 | $ | 11.89 | $ | 13.07 | $ | 15.41 | ||||||||||
|
|
|
|
|
|
|
|
|
| |||||||||||
Income (loss) from investment operations: | ||||||||||||||||||||
Net investment income (loss)(a)† | 0.17 | 0.21 | 0.18 | 0.22 | 0.23 | |||||||||||||||
Net realized and unrealized gain (loss) | (0.45 | ) | 2.13 | 3.56 | 0.21 | (0.04 | )(b) | |||||||||||||
|
|
|
|
|
|
|
|
|
| |||||||||||
Total from investment operations | (0.28 | ) | 2.34 | 3.74 | 0.43 | 0.19 | ||||||||||||||
|
|
|
|
|
|
|
|
|
| |||||||||||
Less distributions to shareholders: | ||||||||||||||||||||
From net investment income | (0.17 | ) | (0.19 | ) | (0.21 | ) | (0.32 | ) | (0.26 | ) | ||||||||||
From net realized gains | (0.70 | ) | (2.85 | ) | (1.03 | ) | (1.29 | ) | (2.27 | ) | ||||||||||
|
|
|
|
|
|
|
|
|
| |||||||||||
Total distributions | (0.87 | ) | (3.04 | ) | (1.24 | ) | (1.61 | ) | (2.53 | ) | ||||||||||
|
|
|
|
|
|
|
|
|
| |||||||||||
Net asset value, end of period | $ | 12.54 | $ | 13.69 | $ | 14.39 | $ | 11.89 | $ | 13.07 | ||||||||||
|
|
|
|
|
|
|
|
|
| |||||||||||
Total Return(c) | (1.63 | )% | 15.80 | % | 33.74 | % | 2.51 | % | 1.94 | % | ||||||||||
Ratios/Supplemental Data: | ||||||||||||||||||||
Net assets, end of period (000’s) | $ | 50,114 | $ | 80,646 | $ | 105,656 | $ | 83,738 | $ | 131,198 | ||||||||||
Net expenses to average daily net assets(d) | 0.47 | % | 0.46 | % | 0.47 | % | 0.46 | % | 0.46 | % | ||||||||||
Net investment income (loss) to average daily net assets(a) | 1.38 | % | 1.34 | % | 1.47 | % | 1.64 | % | 1.62 | % | ||||||||||
Portfolio turnover rate(e) | 81 | % | 94 | % | 66 | % | 72 | % | 89 | % | ||||||||||
Fees and expenses reimbursed and/or waived by GMO to average daily net assets: | 0.05 | % | 0.04 | %(f) | 0.04 | %(f) | 0.03 | %(f) | 0.03 | % | ||||||||||
| (a) | Net investment income is affected by the timing of the declaration of dividends by the other GMO Funds and/or other investment companies in which the Fund invests, if any. |
| (b) | The amount shown for a share outstanding does not correspond with the aggregate net realized and unrealized gain (loss) on investments due to the timing of purchases and redemptions of the Fund shares in relation to fluctuating market values of the investments of the Fund. |
| (c) | The total returns would have been lower had certain expenses not been reimbursed and/or waived during the periods shown, if applicable, and assumes the effect of reinvested distributions, if any. Calculation excludes purchase premiums and redemption fees which are borne by the shareholder purchasing or redeeming Fund shares, if any. |
| (d) | Net expenses exclude expenses incurred indirectly through investment in the underlying funds, if any (Note 5). |
| (e) | The portfolio turnover rate excludes investments in GMO U.S. Treasury Fund (“USTF”) which is used as a short-term investment vehicle for cash management. The Fund’s portfolio turnover rate including transactions in USTF during the period and/or year ended: |
| February 28, | February 28, | February 28, | February 29, | February 28, | ||||||||||||||||
| 2023 | 2022 | 2021 | 2020 | 2019 | ||||||||||||||||
Portfolio turnover rate including transactions in USTF | 91 | % | 115 | % | 81 | % | 88 | % | 105 | % | ||||||||||
| (f) | Ratio includes indirect fees waived or borne by GMO. |
| † | Calculated using average shares outstanding throughout the period. |
| See accompanying notes to the financial statements. | 162 |
GMO Trust Funds
Financial Highlights — (Continued)
(For a share outstanding throughout each period)
U.S. EQUITY FUND (continued)
| Class VI Shares | ||||||||||||||||||||
| Year Ended February 28/29, | ||||||||||||||||||||
| 2023 | 2022 | 2021 | 2020 | 2019 | ||||||||||||||||
Net asset value, beginning of period | $ | 13.52 | $ | 14.25 | $ | 11.78 | $ | 12.97 | $ | 15.31 | ||||||||||
|
|
|
|
|
|
|
|
|
| |||||||||||
Income (loss) from investment operations: | ||||||||||||||||||||
Net investment income (loss)(a)† | 0.18 | 0.22 | 0.19 | 0.23 | 0.24 | |||||||||||||||
Net realized and unrealized gain (loss) | (0.44 | ) | 2.11 | 3.53 | 0.20 | (0.04 | )(b) | |||||||||||||
|
|
|
|
|
|
|
|
|
| |||||||||||
Total from investment operations | (0.26 | ) | 2.33 | 3.72 | 0.43 | 0.20 | ||||||||||||||
|
|
|
|
|
|
|
|
|
| |||||||||||
Less distributions to shareholders: | ||||||||||||||||||||
From net investment income | (0.18 | ) | (0.21 | ) | (0.22 | ) | (0.33 | ) | (0.27 | ) | ||||||||||
From net realized gains | (0.70 | ) | (2.85 | ) | (1.03 | ) | (1.29 | ) | (2.27 | ) | ||||||||||
|
|
|
|
|
|
|
|
|
| |||||||||||
Total distributions | (0.88 | ) | (3.06 | ) | (1.25 | ) | (1.62 | ) | (2.54 | ) | ||||||||||
|
|
|
|
|
|
|
|
|
| |||||||||||
Net asset value, end of period | $ | 12.38 | $ | 13.52 | $ | 14.25 | $ | 11.78 | $ | 12.97 | ||||||||||
Total Return(c) | (1.47 | )% | 15.89 | % | 33.92 | % | 2.53 | % | 2.05 | % | ||||||||||
Ratios/Supplemental Data: | ||||||||||||||||||||
Net assets, end of period (000’s) | $ | 194,846 | $ | 384,832 | $ | 245,547 | $ | 365,693 | $ | 758,714 | ||||||||||
Net expenses to average daily net assets(d) | 0.38 | % | 0.37 | % | 0.37 | % | 0.37 | % | 0.37 | % | ||||||||||
Net investment income (loss) to average daily net assets(a) | 1.47 | % | 1.42 | % | 1.56 | % | 1.75 | % | 1.68 | % | ||||||||||
Portfolio turnover rate(e) | 81 | % | 94 | % | 66 | % | 72 | % | 89 | % | ||||||||||
Fees and expenses reimbursed and/or waived by GMO to average daily net assets: | 0.05 | % | 0.04 | %(f) | 0.04 | %(f) | 0.03 | %(f) | 0.03 | % | ||||||||||
| (a) | Net investment income is affected by the timing of the declaration of dividends by the other GMO Funds and/or other investment companies in which the Fund invests, if any. |
| (b) | The amount shown for a share outstanding does not correspond with the aggregate net realized and unrealized gain (loss) on investments due to the timing of purchases and redemptions of the Fund shares in relation to fluctuating market values of the investments of the Fund. |
| (c) | The total returns would have been lower had certain expenses not been reimbursed and/or waived during the periods shown, if applicable, and assumes the effect of reinvested distributions, if any. Calculation excludes purchase premiums and redemption fees which are borne by the shareholder purchasing or redeeming Fund shares, if any. |
| (d) | Net expenses exclude expenses incurred indirectly through investment in the underlying funds, if any (Note 5). |
| (e) | The portfolio turnover rate excludes investments in GMO U.S. Treasury Fund (“USTF”) which is used as a short-term investment vehicle for cash management. The Fund’s portfolio turnover rate including transactions in USTF during the period and/or year ended: |
| February 28, | February 28, | February 28, | February 29, | February 28, | ||||||||||||||||
| 2023 | 2022 | 2021 | 2020 | 2019 | ||||||||||||||||
Portfolio turnover rate including transactions in USTF | 91 | % | 115 | % | 81 | % | 88 | % | 105 | % | ||||||||||
| (f) | Ratio includes indirect fees waived or borne by GMO. |
| † | Calculated using average shares outstanding throughout the period. |
| 163 | See accompanying notes to the financial statements. |
GMO Trust Funds
Financial Highlights — (Continued)
(For a share outstanding throughout the period)
U.S. OPPORTUNISTIC VALUE FUND
| Class III Shares | ||||
| Period from February 15, 2023 (commencement of operations) through February 28, 2023 | ||||
Net asset value, beginning of period | $ | 21.07 | ||
|
| |||
Income (loss) from investment operations: | ||||
Net investment income (loss)(a)† | 0.02 | |||
Net realized and unrealized gain (loss) | (0.89 | )(b) | ||
|
| |||
Total from investment operations | (0.87 | ) | ||
|
| |||
Net asset value, end of period | $ | 20.20 | ||
|
| |||
Total Return(c) | (4.13 | )%** | ||
Ratios/Supplemental Data: | ||||
Net assets, end of period (000’s) | $ | 10 | ||
Net expenses to average daily net assets(d) | 0.47 | %* | ||
Net investment income (loss) to average daily net assets(a) | 2.30 | %* | ||
Portfolio turnover rate(e) | 47 | %** | ||
Fees and expenses reimbursed and/or waived by GMO to average daily net assets: | 0.48 | %* | ||
| (a) | Net investment income is affected by the timing of the declaration of dividends by the other GMO Funds and/or other investment companies in which the Fund invests, if any. |
| (b) | The amount shown for a share outstanding does not correspond with the aggregate net realized and unrealized gain (loss) on investments due to the timing of purchases and redemptions of Fund shares in relation to fluctuating market values of the investments of the Fund. |
| (c) | The total returns would have been lower had certain expenses not been reimbursed and/or waived during the periods shown, if applicable, and assumes the effect of reinvested distributions, if any. Calculation excludes purchase premiums and redemption fees which are borne by the shareholder purchasing or redeeming Fund shares, if any. |
| (d) | Net expenses exclude expenses incurred indirectly through investment in the underlying funds, if any (Note 5). |
| (e) | The portfolio turnover rate excludes investments in GMO U.S. Treasury Fund (“USTF”) which is used as a short-term investment vehicle for cash management. The Fund’s portfolio turnover rate including transactions in USTF during the period and/or year ended: |
| February 28, 2023 | ||||
Portfolio turnover rate including transactions in USTF | 77 | % | ||
| † | Calculated using average shares outstanding throughout the period. |
| * | Annualized. |
| ** | Not annualized. |
| See accompanying notes to the financial statements. | 164 |
GMO Trust Funds
Financial Highlights — (Continued)
(For a share outstanding throughout the period)
U.S. OPPORTUNISTIC VALUE FUND (continued)
| Class IV Shares | ||||
| Period from February 15, 2023 (commencement of operations) through February 28, 2023 | ||||
Net asset value, beginning of period | $ | 21.07 | ||
|
| |||
Income (loss) from investment operations: | ||||
Net investment income (loss)(a)† | 0.01 | |||
Net realized and unrealized gain (loss) | (0.88 | )(b) | ||
|
| |||
Total from investment operations | (0.87 | ) | ||
|
| |||
Net asset value, end of period | $ | 20.20 | ||
|
| |||
Total Return(c) | (4.13 | )%** | ||
Ratios/Supplemental Data: | ||||
Net assets, end of period (000’s) | $ | 62,784 | ||
Net expenses to average daily net assets(d) | 0.42 | %* | ||
Net investment income (loss) to average daily net assets(a) | 1.94 | %* | ||
Portfolio turnover rate(e) | 47 | %** | ||
Fees and expenses reimbursed and/or waived by GMO to average daily net assets: | 0.49 | %* | ||
| (a) | Net investment income is affected by the timing of the declaration of dividends by the other GMO Funds and/or other investment companies in which the Fund invests, if any. |
| (b) | The amount shown for a share outstanding does not correspond with the aggregate net realized and unrealized gain (loss) on investments due to the timing of purchases and redemptions of Fund shares in relation to fluctuating market values of the investments of the Fund. |
| (c) | The total returns would have been lower had certain expenses not been reimbursed and/or waived during the periods shown, if applicable, and assumes the effect of reinvested distributions, if any. Calculation excludes purchase premiums and redemption fees which are borne by the shareholder purchasing or redeeming Fund shares, if any. |
| (d) | Net expenses exclude expenses incurred indirectly through investment in the underlying funds, if any (Note 5). |
| (e) | The portfolio turnover rate excludes investments in GMO U.S. Treasury Fund (“USTF”) which is used as a short-term investment vehicle for cash management. The Fund’s portfolio turnover rate including transactions in USTF during the period and/or year ended: |
| February 28, 2023 | ||||
Portfolio turnover rate including transactions in USTF | 77 | % | ||
| † | Calculated using average shares outstanding throughout the period. |
| * | Annualized. |
| ** | Not annualized. |
| 165 | See accompanying notes to the financial statements. |
GMO Trust Funds
Financial Highlights — (Continued)
(For a share outstanding throughout the period)
U.S. OPPORTUNISTIC VALUE FUND (continued)
| Class VI Shares | ||||
| Period from December 13, 2022 (commencement of operations) through February 28, 2023 | ||||
Net asset value, beginning of period | $ | 20.00 | ||
|
| |||
Income (loss) from investment operations: | ||||
Net investment income (loss)(a)† | 0.12 | |||
Net realized and unrealized gain (loss) | 0.10 | |||
|
| |||
Total from investment operations | 0.22 | |||
|
| |||
Less distributions to shareholders: | ||||
From net investment income | (0.03 | ) | ||
|
| |||
Total distributions | (0.03 | ) | ||
|
| |||
Net asset value, end of period | $ | 20.19 | ||
|
| |||
Total Return(b) | 1.10 | %** | ||
Ratios/Supplemental Data: | ||||
Net assets, end of period (000’s) | $ | 215,668 | ||
Net expenses to average daily net assets(c) | 0.38 | %* | ||
Net investment income (loss) to average daily net assets(a) | 2.79 | %* | ||
Portfolio turnover rate(d) | 47 | %** | ||
Fees and expenses reimbursed and/or waived by GMO to average daily net assets: | 0.28 | %* | ||
| (a) | Net investment income is affected by the timing of the declaration of dividends by the other GMO Funds and/or other investment companies in which the Fund invests, if any. |
| (b) | The total returns would have been lower had certain expenses not been reimbursed and/or waived during the periods shown, if applicable, and assumes the effect of reinvested distributions, if any. Calculation excludes purchase premiums and redemption fees which are borne by the shareholder purchasing or redeeming Fund shares, if any. |
| (c) | Net expenses exclude expenses incurred indirectly through investment in the underlying funds, if any (Note 5). |
| (d) | The portfolio turnover rate excludes investments in GMO U.S. Treasury Fund (“USTF”) which is used as a short-term investment vehicle for cash management. The Fund’s portfolio turnover rate including transactions in USTF during the period and/or year ended: |
| February 28, 2023 | ||||
Portfolio turnover rate including transactions in USTF | 77 | % | ||
| † | Calculated using average shares outstanding throughout the period. |
| * | Annualized. |
| ** | Not annualized. |
| See accompanying notes to the financial statements. | 166 |
GMO Trust Funds
Financial Highlights — (Continued)
(For a share outstanding throughout the period)
U.S. OPPORTUNISTIC VALUE FUND (continued)
| Class I Shares | ||||
| Period from February 15, 2023 (commencement of operations) through February 28, 2023 | ||||
Net asset value, beginning of period | $ | 21.07 | ||
|
| |||
Income (loss) from investment operations: | ||||
Net investment income (loss)(a)† | 0.01 | |||
Net realized and unrealized gain (loss) | (0.88 | )(b) | ||
|
| |||
Total from investment operations | (0.87 | ) | ||
|
| |||
Net asset value, end of period | $ | 20.20 | ||
|
| |||
Total Return(c) | (4.13 | )%** | ||
Ratios/Supplemental Data: | ||||
Net assets, end of period (000’s) | $ | 5 | ||
Net expenses to average daily net assets(d) | 0.57 | %* | ||
Net investment income (loss) to average daily net assets(a) | 1.73 | %* | ||
Portfolio turnover rate(e) | 47 | %** | ||
Fees and expenses reimbursed and/or waived by GMO to average daily net assets: | 0.47 | %* | ||
| (a) | Net investment income is affected by the timing of the declaration of dividends by the other GMO Funds and/or other investment companies in which the Fund invests, if any. |
| (b) | The amount shown for a share outstanding does not correspond with the aggregate net realized and unrealized gain (loss) on investments due to the timing of purchases and redemptions of Fund shares in relation to fluctuating market values of the investments of the Fund. |
| (c) | The total returns would have been lower had certain expenses not been reimbursed and/or waived during the periods shown, if applicable, and assumes the effect of reinvested distributions, if any. Calculation excludes purchase premiums and redemption fees which are borne by the shareholder purchasing or redeeming Fund shares, if any. |
| (d) | Net expenses exclude expenses incurred indirectly through investment in the underlying funds, if any (Note 5). |
| (e) | The portfolio turnover rate excludes investments in GMO U.S. Treasury Fund (“USTF”) which is used as a short-term investment vehicle for cash management. The Fund’s portfolio turnover rate including transactions in USTF during the period and/or year ended: |
| February 28, 2023 | ||||
Portfolio turnover rate including transactions in USTF | 77 | % | ||
| † | Calculated using average shares outstanding throughout the period. |
| * | Annualized. |
| ** | Not annualized. |
| 167 | See accompanying notes to the financial statements. |
GMO Trust Funds
Financial Highlights — (Continued)
(For a share outstanding throughout each period)
U.S. SMALL CAP VALUE FUND
| Class VI Shares | ||||||||||||||||
| Year Ended February 28, | Period from July 2, 2019 (commencement of operations) through February 29, | |||||||||||||||
| 2023 | 2022 | 2021 | 2020 | |||||||||||||
Net asset value, beginning of period | $ | 19.74 | $ | 24.99 | $ | 18.06 | $ | 20.00 | ||||||||
|
|
|
|
|
|
|
| |||||||||
Income (loss) from investment operations: | ||||||||||||||||
Net investment income (loss)(a)† | 0.30 | 0.33 | 0.30 | 0.23 | ||||||||||||
Net realized and unrealized gain (loss) | (1.08 | ) | 2.89 | 6.96 | (1.99 | ) | ||||||||||
|
|
|
|
|
|
|
| |||||||||
Total from investment operations | (0.78 | ) | 3.22 | 7.26 | (1.76 | ) | ||||||||||
|
|
|
|
|
|
|
| |||||||||
Less distributions to shareholders: | ||||||||||||||||
From net investment income | (0.45 | ) | (0.39 | ) | (0.33 | ) | (0.18 | ) | ||||||||
From net realized gains | (1.32 | ) | (8.08 | ) | — | — | ||||||||||
|
|
|
|
|
|
|
| |||||||||
Total distributions | (1.77 | ) | (8.47 | ) | (0.33 | ) | (0.18 | ) | ||||||||
|
|
|
|
|
|
|
| |||||||||
Net asset value, end of period | $ | 17.19 | $ | 19.74 | $ | 24.99 | $ | 18.06 | ||||||||
|
|
|
|
|
|
|
| |||||||||
Total Return(b) | (2.86 | )% | 13.21 | % | 40.64 | % | (8.95 | )%** | ||||||||
Ratios/Supplemental Data: | ||||||||||||||||
Net assets, end of period (000’s) | $ | 29,428 | $ | 253,810 | $ | 372,498 | $ | 415,508 | ||||||||
Net expenses to average daily net assets(c) | 0.45 | % | 0.42 | % | 0.41 | % | 0.44 | %* | ||||||||
Net investment income (loss) to average daily net assets(a) | 1.71 | % | 1.32 | % | 1.67 | % | 1.69 | %* | ||||||||
Portfolio turnover rate(d) | 60 | % | 62 | % | 86 | % | 56 | %** | ||||||||
Fees and expenses reimbursed and/or waived by GMO to average daily net assets: | — | 0.00 | %(e) (f) | 0.00 | %(e) (f) | 0.00 | %(e) (f) * | |||||||||
| (a) | Net investment income is affected by the timing of the declaration of dividends by the other GMO Funds and/or other investment companies in which the Fund invests, if any. |
| (b) | The total returns would have been lower had certain expenses not been reimbursed and/or waived during the periods shown, if applicable, and assumes the effect of reinvested distributions, if any. Calculation excludes purchase premiums and redemption fees which are borne by the shareholder purchasing or redeeming Fund shares, if any. |
| (c) | Net expenses exclude expenses incurred indirectly through investment in the underlying funds, if any (Note 5). |
| (d) | The portfolio turnover rate excludes investments in GMO U.S. Treasury Fund (“USTF”) which is used as a short-term investment vehicle for cash management. The Fund’s portfolio turnover rate including transactions in USTF during the period and/or year ended: |
| February 28, 2023 | February 28, 2022 | February 28, 2021 | February 29, 2020 | |||||||||||||
Portfolio turnover rate including transactions in USTF | 69 | % | 71 | % | 98 | % | 69 | % | ||||||||
| (e) | Ratio includes indirect fees waived or borne by GMO. |
| (f) | Rounds to less than 0.01%. |
| † | Calculated using average shares outstanding throughout the period. |
| * | Annualized. |
| ** | Not annualized. |
| See accompanying notes to the financial statements. | 168 |
GMO Trust Funds
February 28, 2023
| 1. | Organization |
Each of Climate Change Fund, Emerging Markets ex-China Fund, Emerging Markets Fund, Emerging Markets Select Equity Fund (formerly Emerging Domestic Opportunities Fund), International Equity Fund, Japan Value Creation Fund, Quality Cyclicals Fund, Quality Fund, Resource Transition Fund (commenced operations on February 15, 2023), Resources Fund, Small Cap Quality Fund (commenced operations on September 20, 2022), Tax-Managed International Equities Fund, U.S. Equity Fund, U.S. Opportunistic Value Fund (commenced operations on December 13, 2022) and U.S. Small Cap Value Fund (each a “Fund” and collectively the “Funds”) is a series of GMO Trust (the “Trust”). The Trust is registered under the Investment Company Act of 1940, as amended (the “1940 Act”), as an open-end management investment company. The Trust was established as a Massachusetts business trust under the laws of The Commonwealth of Massachusetts on June 24, 1985. The Declaration of Trust permits the Trustees of the Trust (“Trustees”) to create an unlimited number of series of shares (Funds) and to subdivide Funds into classes. The Funds are advised and managed by Grantham, Mayo, Van Otterloo & Co. LLC (“GMO”).
The Funds may invest in GMO U.S. Treasury Fund and in money market funds unaffiliated with GMO. The Funds may also invest in other GMO Funds (“underlying funds”). The financial statements of the underlying funds should be read in conjunction with the Funds’ financial statements. The financial statements are available without charge on the Securities and Exchange Commission’s (“SEC”) website at www.sec.gov or on GMO’s website at www.gmo.com.
The following table provides information about the Funds’ principal investment objectives and benchmarks (if any):
| Fund Name | Benchmark | Investment Objective | ||
| Climate Change Fund | Not Applicable | High total return | ||
| Emerging Markets ex-China Fund | MSCI Emerging Markets ex-China Index | Total return in excess of benchmark | ||
| Emerging Markets Fund | MSCI Emerging Markets Index | Total return in excess of benchmark | ||
| Emerging Markets Select Equity Fund (formerly Emerging Domestic Opportunities Fund) | MSCI Emerging Markets Index | Total return in excess of benchmark | ||
| International Equity Fund | Not Applicable | High total return | ||
| Japan Value Creation Fund | Not Applicable | Total return | ||
| Quality Cyclicals Fund | Not Applicable | Total return | ||
| Quality Fund | Not Applicable | Total return | ||
| Resource Transition Fund | Not Applicable | Total return | ||
| Resources Fund | Not Applicable | Total return | ||
| Small Cap Quality Fund | Not Applicable | Total return | ||
| Tax-Managed International Equities Fund | Not Applicable | High after-tax total return | ||
| U.S. Equity Fund | Not Applicable | High total return | ||
| U.S. Opportunistic Value Fund | Not Applicable | Total return | ||
| U.S. Small Cap Value Fund | S&P SmallCap 600 Value Index | Total return in excess of its benchmark |
Tax-Managed International Equities Fund currently limits subscriptions.
| 2. | Significant accounting policies |
The following is a summary of significant accounting policies followed by each Fund in the preparation of its financial statements. These policies are in conformity with accounting principles generally accepted in the United States of America (“U.S. GAAP”) and have been consistently followed by the Funds in preparing these financial statements. The preparation of financial statements in accordance with U.S. GAAP requires management to make estimates and assumptions that affect the reported amounts and disclosures in the financial statements. Actual results could differ from those estimates. The accounting records of the Funds are maintained in U.S. dollars.
169
GMO Trust Funds
Notes to Financial Statements — (Continued)
February 28, 2023
Portfolio valuation
Exchange-traded securities (other than exchange-traded options) for which market quotations are readily available are valued at (i) the last sale price or (ii) official closing price or (iii) most recent quoted price published by the exchange (if no reported last sale or official closing price) or (iv) the quoted price provided by a pricing source (in the event GMO deems the private market to be a more reliable indicator of market value than the exchange). Exchange-traded options are valued at the last sale price, provided that price is between the closing bid and ask prices. If the last sale price is not within that range, then they will be valued at the closing bid price for long positions and the closing ask price for short positions. Cleared derivatives are valued using the price quoted (which may be based on a model) by the relevant clearing house. If an updated quote for a cleared derivative is not available when a Fund calculates its net asset value, the derivative will generally be valued using an industry standard model, which may differ from the model used by the relevant clearing house. Over-the-counter (“OTC”) derivatives are generally valued at the price determined by an industry standard model. Unlisted securities for which market quotations are readily available are generally valued at the most recent quoted price. Shares of the underlying funds and other open-end registered investment companies are valued at their most recent net asset value.
The foregoing valuation methodologies are modified for equities that trade in non-U.S. securities markets that close before the close of the New York Stock Exchange (“NYSE”) due to time zone differences, including the value of equities that underlie futures, options and other derivatives (to the extent the market for those derivatives closes prior to the close of the NYSE). In those cases, the price will generally be adjusted, to the extent practicable and available, based on inputs from an independent pricing service approved by the Trustees that are intended to reflect valuation changes through the NYSE close. These securities listed on foreign exchanges (including the value of equity securities that underlie futures, options and other derivatives (to the extent the market for such instruments closes prior to the close of the NYSE)) are classified as Level 2 (levels defined below).
Typically, the Funds and the underlying funds value fixed income securities at the most recent price supplied by a pricing source determined by GMO. GMO evaluates pricing sources on an ongoing basis and may change a pricing source at any time. GMO monitors erratic or unusual movements (including unusual inactivity) in the prices supplied for a security and has discretion to override a price supplied by a source (e.g., by taking a price supplied by another source) when it believes that the price supplied is not reliable. Alternative pricing sources are often but not always available for securities held by the Funds and the underlying funds.
“Quoted price” typically means the bid price for securities held long and the ask price for securities sold short. If a market quotation for a security does not involve a bid or an ask, the “quoted price” may be the price provided by a market participant or other third-party pricing source in accordance with the market practice for that security. If an updated quoted price for a security is not available when a Fund calculates its net asset value, the Fund will generally use the last quoted price so long as GMO believes that the last quoted price continues to represent that security’s fair value.
In the case of derivatives, prices determined by a model may reflect an estimate of the average of bid and ask prices, regardless of whether a Fund has a long position or a short position.
If quotations are not readily available or circumstances make an existing valuation methodology or procedure unreliable, derivatives and other securities are valued at fair value as determined in good faith by the Trustees or persons acting at their direction pursuant to procedures approved by the Trustees. Because of the uncertainty inherent in fair value pricing, the price determined for a particular security may be materially different from the value realized upon its sale. The Funds and/or the underlying funds classify such securities as Level 3 (levels defined below). For the year ended February 28, 2023, the Funds did not reduce the value of any of their OTC derivatives contracts, if any, based on the creditworthiness of their counterparties. See Note 4 “Derivative financial instruments” for a further discussion on valuation of derivatives.
U.S. GAAP requires the Funds to disclose the fair value of their investments in a three-level hierarchy (Levels 1, 2 and 3). The valuation hierarchy is based upon the relative observability of inputs to the valuation of the Funds’ investments. The inputs or methodologies used for valuing securities are not necessarily an indication of the risk associated with investing in those securities.
Changes in valuation techniques may result in transfers into or out of an investment’s assigned level within the fair value hierarchy. In addition, in periods of market dislocation, the observability of prices and inputs may be reduced for many instruments. This condition, as well as changes related to the liquidity of investments, could cause a security to be reclassified between levels.
The three levels are defined as follows:
Level 1 – Valuations based on quoted prices for identical securities in active markets.
170
GMO Trust Funds
Notes to Financial Statements — (Continued)
February 28, 2023
The types of assets and liabilities categorized in Level 1 generally include actively traded domestic and certain foreign equity securities; certain U.S. government obligations; derivatives actively traded on a national securities exchange (such as some futures and options); and shares of open-end mutual funds (even if their investments are valued using Level 2 or Level 3 inputs).
Level 2 – Valuations determined using other significant direct or indirect observable inputs.
The types of assets and liabilities categorized in Level 2 generally include cleared derivatives and certain OTC derivatives such as swaps, options, swaptions, and forward currency contracts valued using industry standard models; certain restricted securities valued at the most recent available market or quoted price; certain securities that are valued at the local price; and certain foreign equity securities that are adjusted based on inputs from an independent pricing service approved by the Trustees, including the value of equity securities that underlie futures, options and other derivatives (to the extent the market for such instruments closes prior to the close of the NYSE) to reflect estimated valuation changes through the NYSE close.
Level 3 – Valuations based primarily on inputs that are unobservable and significant.
The types of assets and liabilities categorized in Level 3 generally include, but are not limited to, securities whose trading has been suspended or that have been de-listed from their current primary trading exchange valued at the most recent available market or quoted price; securities in default or bankruptcy proceedings for which there is no current market quotation valued at the most recent available market or quoted price; certain equity securities that are valued based on the last traded exchange price adjusted for the movement in a relevant index and/or a security type conversion discount; certain securities that are valued using a price from a comparable security related to the same issuer; and certain recently acquired equity securities that have yet to begin trading that are valued at cost.
The following is a summary of the respective levels assigned to the Funds’ direct securities and derivatives, if any, as of February 28, 2023:
| Description | Level 1 | Level 2 | Level 3 | Total | ||||||||||||
Climate Change Fund | ||||||||||||||||
Asset Valuation Inputs | ||||||||||||||||
Common Stocks | ||||||||||||||||
Argentina | $ | 8,054,350 | $ | — | $ | — | $ | 8,054,350 | ||||||||
Australia | — | 2,975,131 | — | 2,975,131 | ||||||||||||
Belgium | — | 5,767,848 | — | 5,767,848 | ||||||||||||
Brazil | — | 30,037,858 | — | 30,037,858 | ||||||||||||
Canada | 103,750,182 | — | — | 103,750,182 | ||||||||||||
Chile | 11,684,648 | — | — | 11,684,648 | ||||||||||||
China | 4,152,315 | 21,542,015 | — | 25,694,330 | ||||||||||||
Denmark | — | 26,119,829 | — | 26,119,829 | ||||||||||||
Finland | — | 12,078,693 | — | 12,078,693 | ||||||||||||
France | — | 58,579,482 | — | 58,579,482 | ||||||||||||
Germany | — | 30,282,546 | — | 30,282,546 | ||||||||||||
Israel | — | 2,302,217 | — | 2,302,217 | ||||||||||||
Japan | — | 47,251,653 | — | 47,251,653 | ||||||||||||
Mexico | 25,040,569 | — | — | 25,040,569 | ||||||||||||
Netherlands | — | 3,563,965 | — | 3,563,965 | ||||||||||||
Norway | — | 6,649,499 | — | 6,649,499 | ||||||||||||
Russia | — | — | 266,368 | 266,368 | ||||||||||||
South Korea | — | 53,747,477 | — | 53,747,477 | ||||||||||||
Spain | — | 17,658,445 | — | 17,658,445 | ||||||||||||
Sweden | — | 2,355,205 | — | 2,355,205 | ||||||||||||
Switzerland | — | 689,199 | — | 689,199 | ||||||||||||
Thailand | — | 999,237 | — | 999,237 | ||||||||||||
Ukraine | — | 995,844 | — | 995,844 | ||||||||||||
United Kingdom | 5,020,440 | 6,833,666 | — | 11,854,106 | ||||||||||||
171
GMO Trust Funds
Notes to Financial Statements — (Continued)
February 28, 2023
| Description | Level 1 | Level 2 | Level 3 | Total | ||||||||||||
Climate Change Fund (continued) | ||||||||||||||||
Asset Valuation Inputs (continued) | ||||||||||||||||
Common Stocks (continued) | ||||||||||||||||
United States | $ | 420,598,318 | $ | — | $ | — | $ | 420,598,318 | ||||||||
|
|
|
|
|
|
|
| |||||||||
TOTAL COMMON STOCKS | 578,300,822 | 330,429,809 | 266,368 | 908,996,999 | ||||||||||||
|
|
|
|
|
|
|
| |||||||||
Mutual Funds | ||||||||||||||||
United States | 27,154,401 | — | — | 27,154,401 | ||||||||||||
|
|
|
|
|
|
|
| |||||||||
TOTAL MUTUAL FUNDS | 27,154,401 | — | — | 27,154,401 | ||||||||||||
|
|
|
|
|
|
|
| |||||||||
Short-Term Investments | 2,242,517 | — | — | 2,242,517 | ||||||||||||
|
|
|
|
|
|
|
| |||||||||
Total Investments | 607,697,740 | 330,429,809 | 266,368 | 938,393,917 | ||||||||||||
|
|
|
|
|
|
|
| |||||||||
Total | $ | 607,697,740 | $ | 330,429,809 | $ | 266,368 | $ | 938,393,917 | ||||||||
|
|
|
|
|
|
|
| |||||||||
Emerging Markets ex-China Fund | ||||||||||||||||
Asset Valuation Inputs | ||||||||||||||||
Common Stocks | ||||||||||||||||
Brazil | $ | 4,233,731 | $ | 7,383,574 | $ | — | $ | 11,617,305 | ||||||||
Chile | 2,820,831 | 1,163,284 | — | 3,984,115 | ||||||||||||
Czech Republic | — | 546,098 | — | 546,098 | ||||||||||||
Egypt | — | 1,329,057 | — | 1,329,057 | ||||||||||||
Greece | — | 54,213 | — | 54,213 | ||||||||||||
Hungary | — | 4,105,155 | — | 4,105,155 | ||||||||||||
India | 4,851,217 | 12,739,937 | — | 17,591,154 | ||||||||||||
Indonesia | — | 11,487,203 | — | 11,487,203 | ||||||||||||
Malaysia | — | 227,353 | — | 227,353 | ||||||||||||
Mexico | 20,786,464 | — | 0§ | 20,786,464 | ||||||||||||
Philippines | — | 570,487 | — | 570,487 | ||||||||||||
Poland | — | 5,246,602 | — | 5,246,602 | ||||||||||||
Qatar | — | 1,500,132 | — | 1,500,132 | ||||||||||||
Russia | — | 815,037 | 382,570 | 1,197,607 | ||||||||||||
South Africa | 885,330 | 15,969,821 | — | 16,855,151 | ||||||||||||
South Korea | 884,355 | 51,150,064 | — | 52,034,419 | ||||||||||||
Taiwan | 9,227,679 | 76,322,169 | — | 85,549,848 | ||||||||||||
Thailand | — | 2,157,404 | — | 2,157,404 | ||||||||||||
Turkey | — | 656,895 | — | 656,895 | ||||||||||||
United Kingdom | — | 1,786,474 | — | 1,786,474 | ||||||||||||
Vietnam | — | 6,303,458 | — | 6,303,458 | ||||||||||||
|
|
|
|
|
|
|
| |||||||||
TOTAL COMMON STOCKS | 43,689,607 | 201,514,417 | 382,570 | 245,586,594 | ||||||||||||
|
|
|
|
|
|
|
| |||||||||
Preferred Stocks | ||||||||||||||||
Brazil | 1,534,131 | 14,161,491 | — | 15,695,622 | ||||||||||||
Chile | — | 36,423 | — | 36,423 | ||||||||||||
Russia | — | — | 18,483 | 18,483 | ||||||||||||
Taiwan | — | 59,877 | — | 59,877 | ||||||||||||
|
|
|
|
|
|
|
| |||||||||
TOTAL PREFERRED STOCKS | 1,534,131 | 14,257,791 | 18,483 | 15,810,405 | ||||||||||||
|
|
|
|
|
|
|
| |||||||||
Mutual Funds | ||||||||||||||||
United States | 319,023 | — | — | 319,023 | ||||||||||||
|
|
|
|
|
|
|
| |||||||||
TOTAL MUTUAL FUNDS | 319,023 | — | — | 319,023 | ||||||||||||
|
|
|
|
|
|
|
| |||||||||
172
GMO Trust Funds
Notes to Financial Statements — (Continued)
February 28, 2023
| Description | Level 1 | Level 2 | Level 3 | Total | ||||||||||||
Emerging Markets ex-China Fund (continued) | ||||||||||||||||
Asset Valuation Inputs (continued) | ||||||||||||||||
Short-Term Investments | $ | 25,328 | $ | — | $ | — | $ | 25,328 | ||||||||
|
|
|
|
|
|
|
| |||||||||
Total Investments | 45,568,089 | 215,772,208 | 401,053 | 261,741,350 | ||||||||||||
|
|
|
|
|
|
|
| |||||||||
Total | $ | 45,568,089 | $ | 215,772,208 | $ | 401,053 | $ | 261,741,350 | ||||||||
|
|
|
|
|
|
|
| |||||||||
Emerging Markets Fund | ||||||||||||||||
Asset Valuation Inputs | ||||||||||||||||
Common Stocks | ||||||||||||||||
Brazil | $ | 7,069,387 | $ | 17,831,790 | $ | — | $ | 24,901,177 | ||||||||
Chile | 2,298,625 | 1,272,091 | — | 3,570,716 | ||||||||||||
China | 33,261,867 | 199,849,977 | 868,809 | 233,980,653 | ||||||||||||
Czech Republic | — | 2,178,485 | — | 2,178,485 | ||||||||||||
Egypt | — | 1,762,018 | — | 1,762,018 | ||||||||||||
Greece | — | 1,121,944 | — | 1,121,944 | ||||||||||||
Hungary | — | 9,887,645 | — | 9,887,645 | ||||||||||||
India | 6,743,610 | 36,323,676 | — | 43,067,286 | ||||||||||||
Indonesia | — | 14,544,636 | — | 14,544,636 | ||||||||||||
Kuwait | — | 771,498 | — | 771,498 | ||||||||||||
Malaysia | — | 1,817,521 | — | 1,817,521 | ||||||||||||
Mexico | 45,843,883 | — | 0§ | 45,843,883 | ||||||||||||
Pakistan | — | 428,674 | — | 428,674 | ||||||||||||
Panama | 64,701 | — | — | 64,701 | ||||||||||||
Philippines | — | 1,623,120 | — | 1,623,120 | ||||||||||||
Poland | — | 7,029,656 | — | 7,029,656 | ||||||||||||
Qatar | — | 4,803,213 | — | 4,803,213 | ||||||||||||
Russia | — | 2,697,664 | 1,811,716 | 4,509,380 | ||||||||||||
South Africa | 801,090 | 36,330,548 | — | 37,131,638 | ||||||||||||
South Korea | — | 111,202,581 | — | 111,202,581 | ||||||||||||
Sri Lanka | — | — | 258,636 | 258,636 | ||||||||||||
Taiwan | 4,939,481 | 177,057,095 | — | 181,996,576 | ||||||||||||
Thailand | — | 4,005,152 | — | 4,005,152 | ||||||||||||
Turkey | — | 380,939 | — | 380,939 | ||||||||||||
United Kingdom | — | 11,265,064 | — | 11,265,064 | ||||||||||||
Vietnam | — | 25,304,324 | — | 25,304,324 | ||||||||||||
|
|
|
|
|
|
|
| |||||||||
TOTAL COMMON STOCKS | 101,022,644 | 669,489,311 | 2,939,161 | 773,451,116 | ||||||||||||
|
|
|
|
|
|
|
| |||||||||
Preferred Stocks | ||||||||||||||||
Brazil | 4,273,164 | 31,242,692 | — | 35,515,856 | ||||||||||||
Russia | — | — | 308,267 | 308,267 | ||||||||||||
South Korea | — | 20,494,366 | — | 20,494,366 | ||||||||||||
Taiwan | — | 838,900 | — | 838,900 | ||||||||||||
|
|
|
|
|
|
|
| |||||||||
TOTAL PREFERRED STOCKS | 4,273,164 | 52,575,958 | 308,267 | 57,157,389 | ||||||||||||
|
|
|
|
|
|
|
| |||||||||
Debt Obligations | ||||||||||||||||
United States | 2,800,624 | — | — | 2,800,624 | ||||||||||||
|
|
|
|
|
|
|
| |||||||||
TOTAL DEBT OBLIGATIONS | 2,800,624 | — | — | 2,800,624 | ||||||||||||
|
|
|
|
|
|
|
| |||||||||
173
GMO Trust Funds
Notes to Financial Statements — (Continued)
February 28, 2023
| Description | Level 1 | Level 2 | Level 3 | Total | ||||||||||||
Emerging Markets Fund (continued) | ||||||||||||||||
Asset Valuation Inputs (continued) | ||||||||||||||||
Mutual Funds | ||||||||||||||||
United States | $ | 15,345,992 | $ | — | $ | — | $ | 15,345,992 | ||||||||
|
|
|
|
|
|
|
| |||||||||
TOTAL MUTUAL FUNDS | 15,345,992 | — | — | 15,345,992 | ||||||||||||
|
|
|
|
|
|
|
| |||||||||
Short-Term Investments | 3,659,489 | — | — | 3,659,489 | ||||||||||||
|
|
|
|
|
|
|
| |||||||||
Total Investments | 127,101,913 | 722,065,269 | 3,247,428 | 852,414,610 | ||||||||||||
|
|
|
|
|
|
|
| |||||||||
Total | $ | 127,101,913 | $ | 722,065,269 | $ | 3,247,428 | $ | 852,414,610 | ||||||||
|
|
|
|
|
|
|
| |||||||||
Liability Valuation Inputs | ||||||||||||||||
Derivatives^ | ||||||||||||||||
Futures Contracts | ||||||||||||||||
Equity Risk | $ | (1,021,894 | ) | $ | — | $ | — | $ | (1,021,894 | ) | ||||||
|
|
|
|
|
|
|
| |||||||||
Total | $ | (1,021,894 | ) | $ | — | $ | — | $ | (1,021,894 | ) | ||||||
|
|
|
|
|
|
|
| |||||||||
Emerging Markets Select Equity Fund (formerly Emerging Domestic Opportunities Fund) | ||||||||||||||||
Asset Valuation Inputs | ||||||||||||||||
Common Stocks | ||||||||||||||||
Brazil | $ | 685,755 | $ | 1,693,390 | $ | — | $ | 2,379,145 | ||||||||
China | 3,695,986 | 33,133,055 | — | 36,829,041 | ||||||||||||
France | — | — | 1,244,319 | 1,244,319 | ||||||||||||
Hong Kong | — | 1,262,608 | — | 1,262,608 | ||||||||||||
India | — | 20,390,158 | — | 20,390,158 | ||||||||||||
Indonesia | — | 7,421,523 | — | 7,421,523 | ||||||||||||
Japan | — | 803,675 | — | 803,675 | ||||||||||||
Mexico | 7,234,331 | — | — | 7,234,331 | ||||||||||||
Philippines | — | 346,651 | — | 346,651 | ||||||||||||
Russia | — | — | 83,870 | 83,870 | ||||||||||||
South Africa | — | 615,363 | — | 615,363 | ||||||||||||
South Korea | — | 7,577,533 | — | 7,577,533 | ||||||||||||
Switzerland | — | 1,308,331 | — | 1,308,331 | ||||||||||||
Taiwan | — | 21,308,190 | — | 21,308,190 | ||||||||||||
Thailand | — | 3,090,900 | — | 3,090,900 | ||||||||||||
United Kingdom | — | 1,985,829 | — | 1,985,829 | ||||||||||||
United States | 949,026 | 1,055,777 | — | 2,004,803 | ||||||||||||
Vietnam | — | 2,969,124 | — | 2,969,124 | ||||||||||||
|
|
|
|
|
|
|
| |||||||||
TOTAL COMMON STOCKS | 12,565,098 | 104,962,107 | 1,328,189 | 118,855,394 | ||||||||||||
|
|
|
|
|
|
|
| |||||||||
Preferred Stocks | ||||||||||||||||
Brazil | — | 528,957 | — | 528,957 | ||||||||||||
|
|
|
|
|
|
|
| |||||||||
TOTAL PREFERRED STOCKS | — | 528,957 | — | 528,957 | ||||||||||||
|
|
|
|
|
|
|
| |||||||||
Investment Funds | ||||||||||||||||
Russia | — | — | 9,610 | 9,610 | ||||||||||||
|
|
|
|
|
|
|
| |||||||||
TOTAL INVESTMENT FUNDS | — | — | 9,610 | 9,610 | ||||||||||||
|
|
|
|
|
|
|
| |||||||||
Mutual Funds | ||||||||||||||||
United States | 712,446 | — | — | 712,446 | ||||||||||||
|
|
|
|
|
|
|
| |||||||||
TOTAL MUTUAL FUNDS | 712,446 | — | — | 712,446 | ||||||||||||
|
|
|
|
|
|
|
| |||||||||
174
GMO Trust Funds
Notes to Financial Statements — (Continued)
February 28, 2023
| Description | Level 1 | Level 2 | Level 3 | Total | ||||||||||||
Emerging Markets Select Equity Fund (formerly Emerging Domestic Opportunities Fund) (continued) | ||||||||||||||||
Asset Valuation Inputs (continued) | ||||||||||||||||
Short-Term Investments | $ | 1,241,862 | $ | — | $ | — | $ | 1,241,862 | ||||||||
|
|
|
|
|
|
|
| |||||||||
Total Investments | 14,519,406 | 105,491,064 | 1,337,799 | 121,348,269 | ||||||||||||
|
|
|
|
|
|
|
| |||||||||
Total | $ | 14,519,406 | $ | 105,491,064 | $ | 1,337,799 | $ | 121,348,269 | ||||||||
|
|
|
|
|
|
|
| |||||||||
International Equity Fund | ||||||||||||||||
Asset Valuation Inputs | ||||||||||||||||
Common Stocks | ||||||||||||||||
Australia | $ | — | $ | 52,201,294 | $ | — | $ | 52,201,294 | ||||||||
Belgium | — | 3,176,725 | — | 3,176,725 | ||||||||||||
Denmark | — | 942,542 | — | 942,542 | ||||||||||||
Finland | — | 23,900,672 | — | 23,900,672 | ||||||||||||
France | 33,355,616 | 161,146,655 | — | 194,502,271 | ||||||||||||
Germany | — | 49,517,641 | — | 49,517,641 | ||||||||||||
Hong Kong | — | 23,197,016 | — | 23,197,016 | ||||||||||||
Ireland | — | 12,078,947 | — | 12,078,947 | ||||||||||||
Italy | — | 20,213,852 | — | 20,213,852 | ||||||||||||
Japan | 113,791 | 311,074,130 | — | 311,187,921 | ||||||||||||
Netherlands | — | 95,925,564 | — | 95,925,564 | ||||||||||||
Norway | — | 30,891,668 | — | 30,891,668 | ||||||||||||
Portugal | — | 11,232,389 | — | 11,232,389 | ||||||||||||
Singapore | — | 59,248,943 | — | 59,248,943 | ||||||||||||
Spain | — | 86,247,121 | — | 86,247,121 | ||||||||||||
Sweden | — | 10,116,879 | — | 10,116,879 | ||||||||||||
Switzerland | — | 74,728,207 | — | 74,728,207 | ||||||||||||
United Kingdom | 17,523,000 | 179,322,876 | — | 196,845,876 | ||||||||||||
United States | 1,387,816 | 460,534 | — | 1,848,350 | ||||||||||||
|
|
|
|
|
|
|
| |||||||||
TOTAL COMMON STOCKS | 52,380,223 | 1,205,623,655 | — | 1,258,003,878 | ||||||||||||
|
|
|
|
|
|
|
| |||||||||
Preferred Stocks | ||||||||||||||||
Germany | — | 10,973,669 | — | 10,973,669 | ||||||||||||
|
|
|
|
|
|
|
| |||||||||
TOTAL PREFERRED STOCKS | — | 10,973,669 | — | 10,973,669 | ||||||||||||
|
|
|
|
|
|
|
| |||||||||
Debt Obligations | ||||||||||||||||
United States | 3,998,630 | — | — | 3,998,630 | ||||||||||||
|
|
|
|
|
|
|
| |||||||||
TOTAL DEBT OBLIGATIONS | 3,998,630 | — | — | 3,998,630 | ||||||||||||
|
|
|
|
|
|
|
| |||||||||
Mutual Funds | ||||||||||||||||
United States | 72,610,442 | — | — | 72,610,442 | ||||||||||||
|
|
|
|
|
|
|
| |||||||||
TOTAL MUTUAL FUNDS | 72,610,442 | — | — | 72,610,442 | ||||||||||||
|
|
|
|
|
|
|
| |||||||||
Short-Term Investments | 169,848 | — | — | 169,848 | ||||||||||||
|
|
|
|
|
|
|
| |||||||||
Total Investments | 129,159,143 | 1,216,597,324 | — | 1,345,756,467 | ||||||||||||
|
|
|
|
|
|
|
| |||||||||
Total | $ | 129,159,143 | $ | 1,216,597,324 | $ | — | $ | 1,345,756,467 | ||||||||
|
|
|
|
|
|
|
| |||||||||
175
GMO Trust Funds
Notes to Financial Statements — (Continued)
February 28, 2023
| Description | Level 1 | Level 2 | Level 3 | Total | ||||||||||||
International Equity Fund (continued) | ||||||||||||||||
Liability Valuation Inputs | ||||||||||||||||
Derivatives^ | ||||||||||||||||
Futures Contracts | ||||||||||||||||
Equity Risk | $ | (352,111 | ) | $ | — | $ | — | $ | (352,111 | ) | ||||||
|
|
|
|
|
|
|
| |||||||||
Total | $ | (352,111 | ) | $ | — | $ | — | $ | (352,111 | ) | ||||||
|
|
|
|
|
|
|
| |||||||||
Japan Value Creation Fund | ||||||||||||||||
Asset Valuation Inputs | ||||||||||||||||
Common Stocks | $ | — | $ | 105,818,927 | $ | — | $ | 105,818,927 | ||||||||
Short-Term Investments | 4,654,152 | — | — | 4,654,152 | ||||||||||||
|
|
|
|
|
|
|
| |||||||||
Total Investments | 4,654,152 | 105,818,927 | — | 110,473,079 | ||||||||||||
|
|
|
|
|
|
|
| |||||||||
Total | $ | 4,654,152 | $ | 105,818,927 | $ | — | $ | 110,473,079 | ||||||||
|
|
|
|
|
|
|
| |||||||||
Quality Cyclicals Fund | ||||||||||||||||
Asset Valuation Inputs | ||||||||||||||||
Common Stocks | ||||||||||||||||
Brazil | $ | — | $ | 156,480 | $ | — | $ | 156,480 | ||||||||
Canada | 3,667,356 | — | — | 3,667,356 | ||||||||||||
China | — | 2,317,020 | — | 2,317,020 | ||||||||||||
Finland | — | 1,385,732 | — | 1,385,732 | ||||||||||||
France | — | 6,514,130 | — | 6,514,130 | ||||||||||||
Germany | — | 1,558,534 | — | 1,558,534 | ||||||||||||
Hong Kong | — | 1,041,934 | — | 1,041,934 | ||||||||||||
Ireland | 508,565 | 1,382,755 | — | 1,891,320 | ||||||||||||
Mexico | 4,619,864 | — | — | 4,619,864 | ||||||||||||
Russia | — | — | 28,097 | 28,097 | ||||||||||||
Spain | — | 3,528,689 | — | 3,528,689 | ||||||||||||
United Kingdom | — | 7,248,829 | — | 7,248,829 | ||||||||||||
United States | 33,793,194 | — | — | 33,793,194 | ||||||||||||
|
|
|
|
|
|
|
| |||||||||
TOTAL COMMON STOCKS | 42,588,979 | 25,134,103 | 28,097 | 67,751,179 | ||||||||||||
|
|
|
|
|
|
|
| |||||||||
Preferred Stocks | ||||||||||||||||
Brazil | — | 1,379,315 | — | 1,379,315 | ||||||||||||
|
|
|
|
|
|
|
| |||||||||
TOTAL PREFERRED STOCKS | — | 1,379,315 | — | 1,379,315 | ||||||||||||
|
|
|
|
|
|
|
| |||||||||
Mutual Funds | ||||||||||||||||
United States | 680,863 | — | — | 680,863 | ||||||||||||
|
|
|
|
|
|
|
| |||||||||
TOTAL MUTUAL FUNDS | 680,863 | — | — | 680,863 | ||||||||||||
|
|
|
|
|
|
|
| |||||||||
Short-Term Investments | 149,116 | — | — | 149,116 | ||||||||||||
|
|
|
|
|
|
|
| |||||||||
Total Investments | 43,418,958 | 26,513,418 | 28,097 | 69,960,473 | ||||||||||||
|
|
|
|
|
|
|
| |||||||||
Total | $ | 43,418,958 | $ | 26,513,418 | $ | 28,097 | $ | 69,960,473 | ||||||||
|
|
|
|
|
|
|
| |||||||||
Quality Fund | ||||||||||||||||
Asset Valuation Inputs | ||||||||||||||||
Common Stocks | ||||||||||||||||
China | $ | — | $ | 84,400,699 | $ | — | $ | 84,400,699 | ||||||||
France | — | 335,250,448 | — | 335,250,448 | ||||||||||||
176
GMO Trust Funds
Notes to Financial Statements — (Continued)
February 28, 2023
| Description | Level 1 | Level 2 | Level 3 | Total | ||||||||||||
Quality Fund (continued) | ||||||||||||||||
Asset Valuation Inputs (continued) | ||||||||||||||||
Common Stocks (continued) | ||||||||||||||||
Germany | $ | — | $ | 241,126,056 | $ | — | $ | 241,126,056 | ||||||||
Spain | — | 51,378,671 | — | 51,378,671 | ||||||||||||
Switzerland | — | 201,386,584 | — | 201,386,584 | ||||||||||||
Taiwan | — | 203,254,787 | — | 203,254,787 | ||||||||||||
United Kingdom | — | 333,641,602 | — | 333,641,602 | ||||||||||||
United States | 5,212,174,885 | — | — | 5,212,174,885 | ||||||||||||
|
|
|
|
|
|
|
| |||||||||
TOTAL COMMON STOCKS | 5,212,174,885 | 1,450,438,847 | — | 6,662,613,732 | ||||||||||||
|
|
|
|
|
|
|
| |||||||||
Mutual Funds | ||||||||||||||||
United States | 116,238,335 | — | — | 116,238,335 | ||||||||||||
|
|
|
|
|
|
|
| |||||||||
TOTAL MUTUAL FUNDS | 116,238,335 | — | — | 116,238,335 | ||||||||||||
|
|
|
|
|
|
|
| |||||||||
Short-Term Investments | 3,826,774 | — | — | 3,826,774 | ||||||||||||
|
|
|
|
|
|
|
| |||||||||
Total Investments | 5,332,239,994 | 1,450,438,847 | — | 6,782,678,841 | ||||||||||||
|
|
|
|
|
|
|
| |||||||||
Total | $ | 5,332,239,994 | $ | 1,450,438,847 | $ | — | $ | 6,782,678,841 | ||||||||
|
|
|
|
|
|
|
| |||||||||
Resource Transition Fund | ||||||||||||||||
Asset Valuation Inputs | ||||||||||||||||
Common Stocks | ||||||||||||||||
Argentina | $ | 6,975,892 | $ | — | $ | — | $ | 6,975,892 | ||||||||
Australia | — | 7,165,384 | — | 7,165,384 | ||||||||||||
Brazil | — | 37,095,405 | — | 37,095,405 | ||||||||||||
Canada | 81,400,128 | — | — | 81,400,128 | ||||||||||||
Chile | 11,519,750 | — | — | 11,519,750 | ||||||||||||
China | — | 5,516,255 | — | 5,516,255 | ||||||||||||
Denmark | — | 7,693,419 | — | 7,693,419 | ||||||||||||
Finland | — | 4,334,797 | — | 4,334,797 | ||||||||||||
France | — | 19,267,812 | — | 19,267,812 | ||||||||||||
Japan | — | 7,741,627 | — | 7,741,627 | ||||||||||||
Mexico | 16,423,369 | — | — | 16,423,369 | ||||||||||||
Norway | — | 5,881,037 | — | 5,881,037 | ||||||||||||
South Africa | — | 18,524,213 | — | 18,524,213 | ||||||||||||
United Kingdom | — | 56,053,471 | — | 56,053,471 | ||||||||||||
United States | 148,945,098 | — | — | 148,945,098 | ||||||||||||
|
|
|
|
|
|
|
| |||||||||
TOTAL COMMON STOCKS | 265,264,237 | 169,273,420 | — | 434,537,657 | ||||||||||||
|
|
|
|
|
|
|
| |||||||||
Preferred Stocks | ||||||||||||||||
Brazil | — | 21,466,753 | — | 21,466,753 | ||||||||||||
|
|
|
|
|
|
|
| |||||||||
TOTAL PREFERRED STOCKS | — | 21,466,753 | — | 21,466,753 | ||||||||||||
|
|
|
|
|
|
|
| |||||||||
Mutual Funds | ||||||||||||||||
United States | 3,512,040 | — | — | 3,512,040 | ||||||||||||
|
|
|
|
|
|
|
| |||||||||
TOTAL MUTUAL FUNDS | 3,512,040 | — | — | 3,512,040 | ||||||||||||
|
|
|
|
|
|
|
| |||||||||
Short-Term Investments | 466,627 | — | — | 466,627 | ||||||||||||
|
|
|
|
|
|
|
| |||||||||
Total Investments | 269,242,904 | 190,740,173 | — | 459,983,077 | ||||||||||||
|
|
|
|
|
|
|
| |||||||||
Total | $ | 269,242,904 | $ | 190,740,173 | $ | — | $ | 459,983,077 | ||||||||
|
|
|
|
|
|
|
| |||||||||
177
GMO Trust Funds
Notes to Financial Statements — (Continued)
February 28, 2023
| Description | Level 1 | Level 2 | Level 3 | Total | ||||||||||||
Resources Fund | ||||||||||||||||
Asset Valuation Inputs | ||||||||||||||||
Common Stocks | ||||||||||||||||
Argentina | $ | 16,722,125 | $ | — | $ | — | $ | 16,722,125 | ||||||||
Australia | — | 30,224,389 | — | 30,224,389 | ||||||||||||
Austria | — | 24,594,008 | — | 24,594,008 | ||||||||||||
Brazil | — | 62,987,974 | — | 62,987,974 | ||||||||||||
Canada | 197,988,627 | — | — | 197,988,627 | ||||||||||||
Chile | 27,627,431 | — | — | 27,627,431 | ||||||||||||
China | — | 32,682,592 | — | 32,682,592 | ||||||||||||
Denmark | — | 18,445,071 | — | 18,445,071 | ||||||||||||
Finland | — | 10,391,075 | — | 10,391,075 | ||||||||||||
France | — | 46,704,598 | — | 46,704,598 | ||||||||||||
Hungary | — | 15,854,133 | — | 15,854,133 | ||||||||||||
India | — | 24,557,011 | — | 24,557,011 | ||||||||||||
Israel | — | 5,908,700 | — | 5,908,700 | ||||||||||||
Italy | — | 21,175,667 | — | 21,175,667 | ||||||||||||
Japan | — | 18,558,413 | — | 18,558,413 | ||||||||||||
Mexico | 39,375,157 | — | — | 39,375,157 | ||||||||||||
Norway | — | 48,361,462 | — | 48,361,462 | ||||||||||||
Pakistan | — | 752,015 | — | 752,015 | ||||||||||||
Portugal | — | 62,877,418 | — | 62,877,418 | ||||||||||||
Russia | — | — | 1,601,369 | 1,601,369 | ||||||||||||
Singapore | — | — | 0§ | 0§ | ||||||||||||
South Africa | — | 48,672,861 | — | 48,672,861 | ||||||||||||
South Korea | — | 882,178 | — | 882,178 | ||||||||||||
Spain | — | 36,091,675 | — | 36,091,675 | ||||||||||||
Switzerland | — | 689,719 | — | 689,719 | ||||||||||||
Turkey | — | 5,381,727 | — | 5,381,727 | ||||||||||||
Ukraine | — | 2,269,414 | — | 2,269,414 | ||||||||||||
United Kingdom | — | 262,829,912 | — | 262,829,912 | ||||||||||||
United States | 548,912,319 | — | — | 548,912,319 | ||||||||||||
|
|
|
|
|
|
|
| |||||||||
TOTAL COMMON STOCKS | 830,625,659 | 780,892,012 | 1,601,369 | 1,613,119,040 | ||||||||||||
|
|
|
|
|
|
|
| |||||||||
Preferred Stocks | ||||||||||||||||
Brazil | — | 145,632,539 | — | 145,632,539 | ||||||||||||
Russia | — | — | 407,992 | 407,992 | ||||||||||||
|
|
|
|
|
|
|
| |||||||||
TOTAL PREFERRED STOCKS | — | 145,632,539 | 407,992 | 146,040,531 | ||||||||||||
|
|
|
|
|
|
|
| |||||||||
Rights/Warrants | ||||||||||||||||
Singapore | — | — | 2 | 2 | ||||||||||||
|
|
|
|
|
|
|
| |||||||||
TOTAL RIGHTS/WARRANTS | — | — | 2 | 2 | ||||||||||||
|
|
|
|
|
|
|
| |||||||||
Mutual Funds | ||||||||||||||||
United States | 39,264,526 | — | — | 39,264,526 | ||||||||||||
|
|
|
|
|
|
|
| |||||||||
TOTAL MUTUAL FUNDS | 39,264,526 | — | — | 39,264,526 | ||||||||||||
|
|
|
|
|
|
|
| |||||||||
Short-Term Investments | 3,375,156 | — | — | 3,375,156 | ||||||||||||
|
|
|
|
|
|
|
| |||||||||
Total Investments | 873,265,341 | 926,524,551 | 2,009,363 | 1,801,799,255 | ||||||||||||
|
|
|
|
|
|
|
| |||||||||
Total | $ | 873,265,341 | $ | 926,524,551 | $ | 2,009,363 | $ | 1,801,799,255 | ||||||||
|
|
|
|
|
|
|
| |||||||||
178
GMO Trust Funds
Notes to Financial Statements — (Continued)
February 28, 2023
| Description | Level 1 | Level 2 | Level 3 | Total | ||||||||||||
Small Cap Quality Fund | ||||||||||||||||
Asset Valuation Inputs | ||||||||||||||||
Common Stocks | $ | 63,667,696 | $ | — | $ | — | $ | 63,667,696 | ||||||||
Mutual Funds | 611,750 | — | — | 611,750 | ||||||||||||
Short-Term Investments | 254,109 | — | — | 254,109 | ||||||||||||
|
|
|
|
|
|
|
| |||||||||
Total Investments | 64,533,555 | — | — | 64,533,555 | ||||||||||||
|
|
|
|
|
|
|
| |||||||||
Total | $ | 64,533,555 | $ | — | $ | — | $ | 64,533,555 | ||||||||
|
|
|
|
|
|
|
| |||||||||
Tax-Managed International Equities Fund | ||||||||||||||||
Asset Valuation Inputs | ||||||||||||||||
Common Stocks | ||||||||||||||||
Australia | $ | — | $ | 1,280,139 | $ | — | $ | 1,280,139 | ||||||||
Belgium | — | 26,694 | — | 26,694 | ||||||||||||
Brazil | 56,559 | 298,528 | — | 355,087 | ||||||||||||
Finland | — | 445,404 | — | 445,404 | ||||||||||||
France | 804,272 | 3,527,385 | — | 4,331,657 | ||||||||||||
Germany | — | 1,074,986 | — | 1,074,986 | ||||||||||||
Hong Kong | — | 326,319 | — | 326,319 | ||||||||||||
India | — | 294,109 | — | 294,109 | ||||||||||||
Ireland | — | 175,101 | — | 175,101 | ||||||||||||
Italy | — | 321,357 | — | 321,357 | ||||||||||||
Japan | — | 6,807,783 | — | 6,807,783 | ||||||||||||
Netherlands | — | 2,194,972 | — | 2,194,972 | ||||||||||||
Norway | — | 615,053 | — | 615,053 | ||||||||||||
Poland | — | 22,982 | — | 22,982 | ||||||||||||
Portugal | — | 210,064 | — | 210,064 | ||||||||||||
Russia | — | — | 30 | 30 | ||||||||||||
Singapore | — | 1,141,770 | — | 1,141,770 | ||||||||||||
South Africa | — | 39,136 | — | 39,136 | ||||||||||||
South Korea | — | 530,879 | — | 530,879 | ||||||||||||
Spain | — | 2,013,475 | — | 2,013,475 | ||||||||||||
Sweden | — | 138,098 | — | 138,098 | ||||||||||||
Switzerland | 45,438 | 1,741,940 | — | 1,787,378 | ||||||||||||
Thailand | — | 515,013 | — | 515,013 | ||||||||||||
Turkey | — | 636,034 | — | 636,034 | ||||||||||||
United Kingdom | 1,177,108 | 2,939,993 | — | 4,117,101 | ||||||||||||
|
|
|
|
|
|
|
| |||||||||
TOTAL COMMON STOCKS | 2,083,377 | 27,317,214 | 30 | 29,400,621 | ||||||||||||
|
|
|
|
|
|
|
| |||||||||
Preferred Stocks | ||||||||||||||||
Brazil | 115,030 | 111,946 | — | 226,976 | ||||||||||||
Germany | — | 306,335 | — | 306,335 | ||||||||||||
South Korea | — | 10,828 | — | 10,828 | ||||||||||||
|
|
|
|
|
|
|
| |||||||||
TOTAL PREFERRED STOCKS | 115,030 | 429,109 | — | 544,139 | ||||||||||||
|
|
|
|
|
|
|
| |||||||||
Mutual Funds | ||||||||||||||||
United States | 1,160,296 | — | — | 1,160,296 | ||||||||||||
|
|
|
|
|
|
|
| |||||||||
TOTAL MUTUAL FUNDS | 1,160,296 | — | — | 1,160,296 | ||||||||||||
|
|
|
|
|
|
|
| |||||||||
Short-Term Investments | 43,531 | — | — | 43,531 | ||||||||||||
|
|
|
|
|
|
|
| |||||||||
Total Investments | 3,402,234 | 27,746,323 | 30 | 31,148,587 | ||||||||||||
|
|
|
|
|
|
|
| |||||||||
179
GMO Trust Funds
Notes to Financial Statements — (Continued)
February 28, 2023
| Description | Level 1 | Level 2 | Level 3 | Total | ||||||||||||
Tax-Managed International Equities Fund (continued) | ||||||||||||||||
Asset Valuation Inputs (continued) | ||||||||||||||||
Derivatives^ | ||||||||||||||||
Futures Contracts | ||||||||||||||||
Equity Risk | $ | 2,645 | $ | — | $ | — | $ | 2,645 | ||||||||
|
|
|
|
|
|
|
| |||||||||
Total | $ | 3,404,879 | $ | 27,746,323 | $ | 30 | $ | 31,151,232 | ||||||||
|
|
|
|
|
|
|
| |||||||||
U.S. Equity Fund | ||||||||||||||||
Asset Valuation Inputs | ||||||||||||||||
Common Stocks | $ | 239,937,853 | $ | — | $ | — | $ | 239,937,853 | ||||||||
Mutual Funds | 3,058,032 | — | — | 3,058,032 | ||||||||||||
Short-Term Investments | 717,880 | — | — | 717,880 | ||||||||||||
|
|
|
|
|
|
|
| |||||||||
Total Investments | 243,713,765 | — | — | 243,713,765 | ||||||||||||
|
|
|
|
|
|
|
| |||||||||
Derivatives^ | ||||||||||||||||
Futures Contracts | ||||||||||||||||
Equity Risk | 49,914 | — | — | 49,914 | ||||||||||||
|
|
|
|
|
|
|
| |||||||||
Total | $ | 243,763,679 | $ | — | $ | — | $ | 243,763,679 | ||||||||
|
|
|
|
|
|
|
| |||||||||
U.S. Opportunistic Value Fund | ||||||||||||||||
Asset Valuation Inputs | ||||||||||||||||
Common Stocks | $ | 273,634,914 | $ | — | $ | — | $ | 273,634,914 | ||||||||
Mutual Funds | 5,821,730 | — | — | 5,821,730 | ||||||||||||
Short-Term Investments | 225,815 | — | — | 225,815 | ||||||||||||
|
|
|
|
|
|
|
| |||||||||
Total Investments | 279,682,459 | — | — | 279,682,459 | ||||||||||||
|
|
|
|
|
|
|
| |||||||||
Total | $ | 279,682,459 | $ | — | $ | — | $ | 279,682,459 | ||||||||
|
|
|
|
|
|
|
| |||||||||
U.S. Small Cap Value Fund | ||||||||||||||||
Asset Valuation Inputs | ||||||||||||||||
Common Stocks | $ | 29,078,285 | $ | — | $ | — | $ | 29,078,285 | ||||||||
Mutual Funds | 344,916 | — | — | 344,916 | ||||||||||||
Rights/Warrants | — | — | 36,350 | 36,350 | ||||||||||||
Short-Term Investments | 90,522 | — | — | 90,522 | ||||||||||||
|
|
|
|
|
|
|
| |||||||||
Total Investments | 29,513,723 | — | 36,350 | 29,550,073 | ||||||||||||
|
|
|
|
|
|
|
| |||||||||
Derivatives^ | ||||||||||||||||
Futures Contracts | ||||||||||||||||
Equity Risk | 14,011 | — | — | 14,011 | ||||||||||||
|
|
|
|
|
|
|
| |||||||||
Total | $ | 29,527,734 | $ | — | $ | 36,350 | $ | 29,564,084 | ||||||||
|
|
|
|
|
|
|
| |||||||||
The risks referenced in the tables above are not intended to be inclusive of all risks. Please see the “Investment and other risks” and “Derivative financial instruments” sections below for a further discussion of risks.
| ^ | In the tables above derivatives are based on market values, rather than the notional amounts of derivatives, except for forward currency contracts which are based on unrealized appreciation/(depreciation). Excludes purchased options, if any, which are included in investments. |
| § | Represents the interest in securities that were determined to have a value of zero at February 28, 2023. |
180
GMO Trust Funds
Notes to Financial Statements — (Continued)
February 28, 2023
The underlying funds held at year end are classified above as Level 1. Certain underlying funds invest in securities and/or derivatives which may have been fair valued using methods determined in good faith by or at the direction of the Trustees or which may have been valued using significant unobservable inputs. For a summary of the levels assigned to the underlying funds’ direct securities and derivatives, if any, please refer to the underlying funds’ Notes to Financial Statements which are available on the SEC’s website at www.sec.gov or on GMO’s website at www.gmo.com.
U.S. GAAP requires additional disclosures about fair value measurements for material Level 3 securities and derivatives, if any (determined by each category of asset or liability as compared to a Fund’s total net assets). Level 3 holdings include investments valued using unadjusted prices supplied by a third-party pricing source (e.g., broker quotes, vendor). The below Funds held classes of investments or derivatives with direct material Level 3 holdings at February 28, 2023:
| Investment Type | Number of Investments | Valuation Methodology | ||||
Emerging Markets ex-China Fund | ||||||
Common and/or Preferred Stock | 11 | Valued off the last traded price with a 99% discount | ||||
Emerging Markets Fund | ||||||
Common and/or Preferred Stock | 11 | Valued off the last traded price with a 99% discount | ||||
Common and/or Preferred Stock | 2 | Valued at the last price prior to trading being suspended | ||||
Emerging Markets Select Equity Fund (formerly Emerging Domestic Opportunities Fund) | ||||||
Common and/or Preferred Stock | 3 | Valued off the last traded price with a 99% discount | ||||
Common and/or Preferred Stock | 1 | Valued off the parent security | ||||
Resources Fund | ||||||
Common and/or Preferred Stock | 4 | Valued off the last traded price with a 99% discount | ||||
For Funds with material total Level 3 assets and/or liabilities, the following is a reconciliation of securities and derivatives, if any, in which significant unobservable inputs (Level 3) were used in determining value:
Balances as of February 28, | Purchases | Sales | Accrued Discounts/ Premiums | Total Realized Gain/ (Loss) | Change in Unrealized Appreciation (Depreciation) | Transfer into Level 3 | Transfer out of Level 3 | Balances as of February 28, 2023 | Net Change in February 28, 2023 |
| ||||||||||||||||||||||||||||||||||||
Emerging Markets ex-China Fund | ||||||||||||||||||||||||||||||||||||||||||||||
Common Stocks | ||||||||||||||||||||||||||||||||||||||||||||||
Russia | $ | 949,755 | $ | — | $ | (184,500 | ) | $ | — | $ | (445,565 | ) | $ | (307,759 | ) | $ | 370,639 | ‡ | $ | — | $ | 382,570 | $ | (646,790 | ) | |||||||||||||||||||||
Preferred Stocks | ||||||||||||||||||||||||||||||||||||||||||||||
Russia | — | — | — | — | — | — | 18,483 | ‡ | — | 18,483 | — | |||||||||||||||||||||||||||||||||||
|
|
|
|
|
|
|
|
|
|
|
|
|
|
|
|
|
|
|
| |||||||||||||||||||||||||||
Total Investments | $ | 949,755 | $ | — | $ | (184,500 | ) | $ | — | $ | (445,565 | ) | $ | (307,759 | ) | $ | 389,122 | $ | — | $ | 401,053 | $ | (646,790 | ) | ||||||||||||||||||||||
|
|
|
|
|
|
|
|
|
|
|
|
|
|
|
|
|
|
|
| |||||||||||||||||||||||||||
Emerging Markets Fund | ||||||||||||||||||||||||||||||||||||||||||||||
Common Stocks | ||||||||||||||||||||||||||||||||||||||||||||||
China | $ | 358,312 | $ | — | $ | (124,467 | ) | $ | — | $ | (219,172 | ) | $ | (14,672 | ) | $ | 868,808 | ‡ | $ | — | $ | 868,809 | $ | — | ||||||||||||||||||||||
Russia | 2,870,861 | — | (1,248,787 | ) | — | (5,573,985 | ) | 3,973,118 | 1,790,509 | ‡ | — | 1,811,716 | (508,280 | ) | ||||||||||||||||||||||||||||||||
181
GMO Trust Funds
Notes to Financial Statements — (Continued)
February 28, 2023
Balances as of | Purchases | Sales | Accrued Discounts/ Premiums | Total (Loss) | Change in Unrealized (Depreciation) | Transfer Level 3 | Transfer Level 3 | Balances as of February 28, | Net Change in February 28, |
| ||||||||||||||||||||||||||||||||||||
Emerging Markets Fund (continued) | ||||||||||||||||||||||||||||||||||||||||||||||
Common Stocks (continued) | ||||||||||||||||||||||||||||||||||||||||||||||
Sri Lanka | $ | — | $ | — | $ | — | $ | — | $ | — | $ | — | $ | 258,636 | ‡ | $ | — | $ | 258,636 | $ | — | |||||||||||||||||||||||||
Preferred Stocks | ||||||||||||||||||||||||||||||||||||||||||||||
Russia | — | — | — | — | — | — | 308,267 | ‡ | — | 308,267 | — | |||||||||||||||||||||||||||||||||||
|
|
|
|
|
|
|
|
|
|
|
|
|
|
|
|
|
|
|
| |||||||||||||||||||||||||||
Total Investments | $ | 3,229,173 | $ | — | $ | (1,373,254 | ) | $ | — | $ | (5,793,157 | ) | $ | 3,958,446 | $ | 3,226,220 | $ | — | $ | 3,247,428 | $ | (508,280 | ) | |||||||||||||||||||||||
|
|
|
|
|
|
|
|
|
|
|
|
|
|
|
|
|
|
|
| |||||||||||||||||||||||||||
Emerging Markets Select Equity Fund (formerly Emerging Domestic Opportunities Fund) | ||||||||||||||||||||||||||||||||||||||||||||||
Common Stocks | ||||||||||||||||||||||||||||||||||||||||||||||
France | $ | — | $ | 1,135,998 | $ | — | $ | — | $ | — | $ | 108,321 | $ | — | $ | — | $ | 1,244,319 | $ | 108,321 | ||||||||||||||||||||||||||
India | 5,986,759 | — | (3,882,186 | ) | — | 2,071,788 | (3,971,627 | ) | — | (204,734 | )‡ | — | — | |||||||||||||||||||||||||||||||||
Russia | 911,572 | — | — | — | — | (898,465 | ) | 70,763 | ‡ | — | 83,870 | (898,465 | ) | |||||||||||||||||||||||||||||||||
Investment Funds | ||||||||||||||||||||||||||||||||||||||||||||||
Russia | — | — | — | — | — | — | 9,610 | ‡ | — | 9,610 | — | |||||||||||||||||||||||||||||||||||
|
|
|
|
|
|
|
|
|
|
|
|
|
|
|
|
|
|
|
| |||||||||||||||||||||||||||
Total Investments | $ | 6,898,331 | $ | 1,135,998 | $ | (3,882,186 | ) | $ | — | $ | 2,071,788 | $ | (4,761,771 | ) | $ | 80,373 | $ | (204,734 | ) | $ | 1,337,799 | $ | (790,144 | ) | ||||||||||||||||||||||
|
|
|
|
|
|
|
|
|
|
|
|
|
|
|
|
|
|
|
| |||||||||||||||||||||||||||
Resources Fund | ||||||||||||||||||||||||||||||||||||||||||||||
Common Stocks | ||||||||||||||||||||||||||||||||||||||||||||||
Russia | $ | — | $ | — | $ | — | $ | — | $ | — | $ | — | 1,601,369 | ‡ | $ | — | $ | 1,601,369 | $ | — | ||||||||||||||||||||||||||
United States | 4,539,029 | — | (4,410,991 | ) | — | — | (128,038 | ) | — | — | — | — | ||||||||||||||||||||||||||||||||||
Preferred Stocks | ||||||||||||||||||||||||||||||||||||||||||||||
Russia | — | — | — | — | — | — | 407,992 | ‡ | — | 407,992 | — | |||||||||||||||||||||||||||||||||||
Rights/Warrants | ||||||||||||||||||||||||||||||||||||||||||||||
Singapore | 2 | — | — | — | — | — | — | — | 2 | — | ||||||||||||||||||||||||||||||||||||
|
|
|
|
|
|
|
|
|
|
|
|
|
|
|
|
|
|
|
| |||||||||||||||||||||||||||
Total Investments | $ | 4,539,031 | $ | — | $ | (4,410,991 | ) | $ | — | $ | — | $ | (128,038 | ) | $ | 2,009,361 | $ | — | $ | 2,009,363 | $ | — | ||||||||||||||||||||||||
|
|
|
|
|
|
|
|
|
|
|
|
|
|
|
|
|
|
|
| |||||||||||||||||||||||||||
U.S. Small Cap Value Fund | ||||||||||||||||||||||||||||||||||||||||||||||
Rights/Warrants | ||||||||||||||||||||||||||||||||||||||||||||||
United States | $ | 36,350 | $ | — | $ | — | $ | — | $ | — | $ | — | $ | — | $ | — | $ | 36,350 | $ | — | ||||||||||||||||||||||||||
|
|
|
|
|
|
|
|
|
|
|
|
|
|
|
|
|
|
|
| |||||||||||||||||||||||||||
Total Investments | $ | 36,350 | $ | — | $ | — | $ | — | $ | — | $ | — | $ | — | $ | — | $ | 36,350 | $ | — | ||||||||||||||||||||||||||
|
|
|
|
|
|
|
|
|
|
|
|
|
|
|
|
|
|
|
| |||||||||||||||||||||||||||
| ‡ | Financial assets transferred between levels were due to a change in observable and/or unobservable inputs as well as the impact of the Russian invasion of Ukraine on local and global markets, as applicable. |
182
GMO Trust Funds
Notes to Financial Statements — (Continued)
February 28, 2023
The following table summarizes the quantitative inputs used in the valuation of investments classified within Level 3 of the fair value hierarchy for the year ended February 28, 2023 for Funds with material Level 3 investments.
Quantitative information about Level 3 Fair Value Measurements*
| Investment Type | Total Fair Value ($) | Valuation Methodology | Unobservable Inputs | Range (Weighted Average) | ||||||
Emerging Markets ex-China Fund | ||||||||||
Common Stock | 343,885 | Fair Value | Price of comparable equity/Discount for liquidity | 99%/(N/A) | ||||||
Common Stock | — | Fair Value | Discount for lack of liquidity/marketability | $0 (N/A) | ||||||
Common Stock (American Depositary Receipt) | 11,932 | Fair Value | Price of comparable equity/Discount for liquidity | 99%/(N/A) | ||||||
Common Stock (Global Depositary Receipt) | 26,753 | Fair Value | Price of comparable equity/Discount for liquidity | 99%/(N/A) | ||||||
Preferred Stock | 18,483 | Fair Value | Price of comparable equity/Discount for liquidity | 99%/(N/A) | ||||||
Emerging Markets Fund | ||||||||||
Common Stock | 1,659,587 | Fair Value | Price of comparable equity/Discount for liquidity | 99%/(N/A) | ||||||
Common Stock | 1 | Fair Value | Discount for lack of liquidity/marketability | $0 (N/A) | ||||||
Common Stock (American Depositary Receipt) | 2,461 | Fair Value | Price of comparable equity/Discount for liquidity | 99%/(N/A) | ||||||
Common Stock (Global Depositary Receipt) | 149,668 | Fair Value | Price of comparable equity/Discount for liquidity | 99%/(N/A) | ||||||
Preferred Stock | 308,267 | Fair Value | Price of comparable equity/Discount for liquidity | 99%/(N/A) | ||||||
Emerging Markets Select Equity Fund (formerly Emerging Domestic Opportunities Fund) | ||||||||||
Common Stock | 65,393 | Fair Value | Price of comparable equity/Discount for liquidity | 99%/(N/A) | ||||||
Common Stock (Global Depositary Receipt) | 18,477 | Fair Value | Price of comparable equity/Discount for liquidity | 99%/(N/A) | ||||||
Investment Fund | 9,610 | Fair Value | Price of comparable equity/Discount for liquidity | 99%/(N/A) | ||||||
Resources Fund | ||||||||||
Common Stock | — | Fair Value | Discount for lack of liquidity/marketability | $0 (N/A) | ||||||
Common Stock | 1,536,377 | Fair Value | Price of comparable equity/Discount for liquidity | 99%/(N/A) | ||||||
Common Stock (Global Depositary Receipt) | 64,992 | Fair Value | Price of comparable equity/Discount for liquidity | 99%/(N/A) | ||||||
Preferred Stock | 407,992 | Fair Value | Price of comparable equity/Discount for liquidity | 99%/(N/A) | ||||||
Warrant | 2 | Fair Value | Discount for lack of liquidity/marketability | $0 (N/A) | ||||||
U.S. Small Cap Value Fund | — | N/A | N/A | N/A | ||||||
| * | The table does not include Level 3 securities or derivatives that are valued by pricing vendors or brokers. As of February 28, 2023, the value of these securities and/or derivatives for Emerging Markets Fund, Emerging Markets Select Equity Fund (formerly Emerging Domestic Opportunities Fund) and U.S. Small Cap Value Fund was $1,127,444, $1,244,319 and $36,350, respectively. The inputs for these investments are not readily available or cannot be reasonably estimated. |
Cash
Cash and foreign currency, if any, in the Statements of Assets and Liabilities consist of cash balances held with the custodian.
Due to/from broker
Due to/from broker in the Statements of Assets and Liabilities includes collateral on swap contracts, futures contracts, option contracts and forward currency contracts, if any, and may include marked-to-market amounts related to foreign currency or cash owed.
183
GMO Trust Funds
Notes to Financial Statements — (Continued)
February 28, 2023
Foreign currency translation
The market values of foreign securities, currency holdings and related assets and liabilities are typically translated into U.S. dollars at the close of regular trading on the NYSE, generally at 4:00 pm Eastern time. Income and expenses denominated in foreign currencies are typically translated into U.S. dollars at the close of regular trading on the NYSE. Fluctuations in the value of currency holdings and other assets and liabilities resulting from changes in exchange rates are recorded as unrealized foreign currency gains or losses. Realized gains or losses and unrealized appreciation or depreciation on investment securities and income and expenses are translated on the respective dates of such transactions. The effects of changes in foreign currency exchange rates on investments in securities are not separated in the Statements of Operations from the effects of changes in market prices of those securities, but are included with the net realized and unrealized gain or loss on investment securities.
Rights and warrants
The Funds may purchase or otherwise receive warrants or rights. Warrants and rights generally give the holder the right to receive, upon exercise, a security of the issuer at a set price. Funds typically use warrants and rights in a manner similar to their use of purchased options on securities. Risks associated with the use of warrants and rights are generally similar to risks associated with the use of purchased options. However, warrants and rights often do not have standardized terms, and may have longer maturities and may be less liquid than exchange-traded options. In addition, the terms of warrants or rights may limit a Fund’s ability to exercise the warrants or rights at such times and in such quantities as the Fund would otherwise wish. Rights and/or warrants outstanding at the end of the year, if any, are listed in each applicable Fund’s Schedule of Investments.
Securities lending
The Funds may make secured loans of their portfolio securities amounting to not more than one-third of their total assets. Securities loans are required to be collateralized by cash or securities in an amount equal to the securities loaned (marked to market daily). Daily market fluctuations could cause the value of loaned securities to be more or less than the value of the collateral received. When this occurs, the collateral is adjusted and settled on the following business day. Funds participating in securities lending receive compensation for lending their securities and/or net investment income earned on the investment of cash collateral, net of fee rebates paid to the borrower and fees paid to the lending agent. Cash collateral received is generally invested in GMO U.S. Treasury Fund. State Street Bank and Trust Company serves as the Funds’ lending agent.
A Fund that lends its portfolio securities bears the risk of delay in the recovery of loaned securities, including possible impairment of the Fund’s ability to vote the securities, the inability to invest proceeds from the sales of such securities and of loss of rights in the collateral should the borrower fail financially. A Fund also bears the risk that the value of investments made with collateral may decline and bears the risk of total loss with respect to the investment of collateral.
At February 28, 2023, securities on loan at value and collateral from securities on loan are listed below:
| Fund Name | Value of securities on loan ($) | Cash collateral ($) | Non-cash collateral ($)* | Total collateral ($) | ||||||||||||
Climate Change Fund | 15,478,407 | 5,704,463 | 10,803,402 | 16,507,865 | ||||||||||||
Emerging Markets Fund | 3,789,662 | — | 4,044,292 | 4,044,292 | ||||||||||||
Resources Fund | 44,042,029 | — | 46,549,072 | 46,549,072 | ||||||||||||
| * | Non-cash collateral is comprised of U.S. Treasuries and Agencies. The Fund cannot repledge non-cash collateral; therefore, they are excluded from the Statements of Assets and Liabilities. |
Information regarding the value of the securities loaned and the value of cash collateral at year end is included in the Statements of Assets and Liabilities.
Taxes and distributions
Each Fund has elected to be treated or intends to elect to be treated and intends to qualify each tax year as a regulated investment company under Subchapter M of the Internal Revenue Code of 1986, as amended (the “Code”). Each Fund intends to distribute its net investment income, if any, and its net realized short-term and long-term capital gains, if any, after giving effect to any available capital loss carryforwards for U.S. federal income tax purposes. Therefore, each Fund makes no provision for U.S. federal income or excise taxes.
184
GMO Trust Funds
Notes to Financial Statements — (Continued)
February 28, 2023
The policy of each Fund is to declare and pay dividends of its net investment income, if any, at least annually, although the Funds are permitted to, and will from time to time, declare and pay dividends of net investment income, if any, more frequently. Each Fund also intends to distribute net realized short-term and long-term capital gains, if any, at least annually. In addition, each Fund may, from time to time at their discretion, make unscheduled distributions in advance of large redemptions by shareholders or as otherwise deemed appropriate by a Fund. Typically, all distributions are reinvested in additional shares of each Fund at net asset value, unless GMO or its agents receive and process a shareholder election to receive cash distributions. Distributions to shareholders are recorded by each Fund on the ex-dividend date.
Taxes on foreign interest and dividend income are generally withheld in accordance with the applicable country’s tax treaty with the United States. The foreign withholding rates applicable to a Fund’s investments in certain jurisdictions may be higher if a significant portion of the Fund is held by non-U.S. shareholders.
As a result of court cases involving several countries across the European Union, certain Funds have filed tax reclaims in addition to treaty-based claims, in respect of previously withheld taxes on dividends earned (“EU tax reclaims”). These filings are subject to various administrative proceedings by each local jurisdiction’s tax authority, as well as judicial proceedings. EU tax reclaim and associated interest entitlements that have been recognized, if any, are reflected as Other income in the Statements of Operations. As a result of its entitlements to EU tax reclaims and related interest amounts, a Fund may incur contingent legal fees. Such fees are presented within Legal fees in the Statements of Operations. Related receivables, if any, are reflected as EU tax reclaims receivable in the Statements of Assets and Liabilities. Generally, unless GMO believes that recovery amounts are collectible and free from significant contingencies, recoveries will not be reflected in a Fund’s net asset value. EU tax reclaims and related interest entitlements recognized by a Fund, if any, reduce the amount of foreign taxes, if any, that a Fund may elect to pass-through to its shareholders from a U.S. federal tax perspective. In certain circumstances and to the extent that EU tax reclaims recognized by a Fund were previously passed-through as foreign tax credits to its U.S. taxable shareholders, a Fund may enter into a closing agreement with the U.S. Internal Revenue Service (the “IRS”). Doing so will enable a Fund to quantify and remit its tax liability related to any recoveries (on behalf of its shareholders). Based on current guidance from the IRS, it is expected that International Equity Fund and Tax-Managed International Equities Fund will enter into a closing agreement with the IRS. Accordingly, estimated charges related to International Equity Fund and Tax-Managed International Equities Fund’s closing agreement liabilities are presented as a reduction of Investment Income in the Statements of Operations and their estimated closing agreement liabilities are presented as Payable for IRS closing agreement fees in the Statements of Assets and Liabilities.
Each Fund may be subject to taxation on realized capital gains, repatriation proceeds and other transaction-based charges imposed by certain countries in which it invests. Transaction-based charges are generally calculated as a percentage of the transaction amount. Taxes related to capital gains realized during the year ended February 28, 2023, if any, are reflected as part of Net realized gain (loss) in the Statements of Operations. Changes in tax liabilities related to capital gain taxes on unrealized investment gains, if any, are reflected as part of Change in net unrealized appreciation (depreciation) in the Statements of Operations.
Foreign taxes paid by each Fund may be treated, to the extent permissible by the Code (and other applicable U.S. federal tax guidance) and if that Fund so elects, as if paid by U.S. shareholders of that Fund.
Income and capital gain distributions are determined in accordance with U.S. federal income tax regulations, which may differ from U.S. GAAP. Certain capital accounts in the financial statements are periodically adjusted for permanent differences in order to reflect their tax character. These adjustments have no impact on net assets or net asset value per share. Temporary differences that arise from recognizing certain items of income, expense, gain or loss in different periods for financial statement and tax purposes will likely reverse at some time in the future.
185
GMO Trust Funds
Notes to Financial Statements — (Continued)
February 28, 2023
Differences in distributable earnings on a U.S. GAAP and tax accounting basis primarily relate to the following:
| Differences related to: | Climate Change Fund | Emerging Markets ex-China | Emerging Markets Fund | Emerging Select Equity | International Equity Fund | Japan Value Creation Fund | Quality Cyclicals Fund | Quality Fund | Resource Transition Fund | Resources Fund | Small Cap Quality Fund | Tax-Managed International Equities Fund | U.S. Equity Fund | U.S. Opportunistic Value Fund | U.S. Small Cap Value Fund |
| ||||||||||||||||
Capital loss carryforwards | X | X | X | X | X | X | X | X | ||||||||||||||||||||||||
Derivative contract transactions | X | |||||||||||||||||||||||||||||||
Dividend income and withholding tax reclaim reserves | X | X | X | X | X | X | X | |||||||||||||||||||||||||
Dividends received from underlying investments | X | X | X | X | X | |||||||||||||||||||||||||||
EU tax reclaims, associated interest entitlements and IRS closing agreement matters | X | |||||||||||||||||||||||||||||||
Foreign capital gains taxes | X | X | ||||||||||||||||||||||||||||||
Foreign currency transactions | X | X | X | X | X | X | X | |||||||||||||||||||||||||
Losses on wash sale transactions | X | X | X | X | X | X | X | X | X | X | X | X | X | X | ||||||||||||||||||
Passive foreign investment company transactions | X | X | X | X | X | X | X | X | X | |||||||||||||||||||||||
Post-October capital losses | X | X | X | X | X | X | ||||||||||||||||||||||||||
Real estate investment trust transactions | X | |||||||||||||||||||||||||||||||
Redemption in-kind transactions | X | X | ||||||||||||||||||||||||||||||
U.S. federal tax equalization utilized | X | |||||||||||||||||||||||||||||||
There are no significant differences | X |
186
GMO Trust Funds
Notes to Financial Statements — (Continued)
February 28, 2023
The tax character of distributions declared by each Fund to shareholders is as follows:
| Tax year ended February 28, 2023 | Tax year ended February 28, 2022 | |||||||||||||||||||||||
| Fund Name | Ordinary Income (including any net short-term capital gain) ($) | Net Long-Term Gain ($) | Total Distributions ($) | Ordinary short-term | Net Long-Term Gain ($) | Total Distributions ($) | ||||||||||||||||||
Climate Change Fund | 12,075,146 | 5,946,558 | 18,021,704 | 58,947,090 | 24,176,606 | 83,123,696 | ||||||||||||||||||
Emerging Markets ex-China Fund | 14,461,298 | — | 14,461,298 | 2,320,982 | — | 2,320,982 | ||||||||||||||||||
Emerging Markets Fund | 92,265,071 | — | 92,265,071 | 99,941,507 | — | 99,941,507 | ||||||||||||||||||
Emerging Markets Select Equity Fund (formerly Emerging Domestic Opportunities Fund) | 6,922,973 | — | 6,922,973 | 2,585,729 | 58,232,198 | 60,817,927 | ||||||||||||||||||
International Equity Fund | 65,421,008 | — | 65,421,008 | 128,778,541 | — | 128,778,541 | ||||||||||||||||||
Japan Value Creation Fund | 1,700,312 | 5,916,837 | 7,617,149 | 23,620,607 | 1,135,657 | 24,756,264 | ||||||||||||||||||
Quality Cyclicals Fund | 3,135,963 | 9,320,117 | 12,456,080 | 23,763,294 | 5,405,268 | 29,168,562 | ||||||||||||||||||
Quality Fund | 92,208,707 | 666,916,243 | 759,124,950 | 216,653,021 | 312,208,528 | 528,861,549 | ||||||||||||||||||
Resource Transition Fund | — | — | — | N/A | N/A | N/A | ||||||||||||||||||
Resources Fund | 185,045,976 | 51,283,849 | 236,329,825 | 155,301,803 | 27,415,353 | 182,717,156 | ||||||||||||||||||
Small Cap Quality Fund | 7,150,586 | — | 7,150,586 | N/A | N/A | N/A | ||||||||||||||||||
Tax-Managed International Equities Fund | 1,390,528 | 724,698 | 2,115,226 | 1,685,418 | 3,705,108 | 5,390,526 | ||||||||||||||||||
U.S. Equity Fund | 11,550,123 | 16,774,864 | 28,324,987 | 26,259,224 | 57,927,021 | 84,186,245 | ||||||||||||||||||
U.S. Opportunistic Value Fund | 300,214 | — | 300,214 | N/A | N/A | N/A | ||||||||||||||||||
U.S. Small Cap Value Fund | 9,957,158 | 8,299,032 | 18,256,190 | 55,774,484 | 27,775,233 | 83,549,717 | ||||||||||||||||||
Distributions in excess of a Fund’s tax basis earnings and profits, if significant, are reported in the Funds’ financial statements as a return of capital.
As of February 28, 2023, the components of distributable earnings on a tax basis and certain tax attributes for the Funds consisted of the following:
| Fund Name | Undistributed Income capital gain) ($) | Undistributed Net Long-Term Capital Gain ($) | Late-Year Ordinary Loss Deferral ($) | Capital Loss Carryforwards ($) | Post-October Capital Losses Deferral ($) | |||||||||||||||
Climate Change Fund | — | — | — | (2,818,070 | ) | — | ||||||||||||||
Emerging Markets ex-China Fund | 2,707,865 | — | — | (13,036,850 | ) | (1,600,297 | ) | |||||||||||||
Emerging Markets Fund | 7,265,505 | — | — | (1,297,849,423 | ) | (16,286,704 | ) | |||||||||||||
Emerging Markets Select Equity Fund (formerly Emerging Domestic Opportunities Fund) | 139,941 | — | — | (124,573,395 | ) | (16,310,162 | ) | |||||||||||||
International Equity Fund | 19,202,753 | — | — | (898,889,462 | ) | (12,365,740 | ) | |||||||||||||
Japan Value Creation Fund | 1,250,986 | — | — | (3,679,991 | ) | (1,723,625 | ) | |||||||||||||
Quality Cyclicals Fund | 601,342 | 3,186,255 | — | — | — | |||||||||||||||
Quality Fund | 10,440,160 | — | — | — | (43,083,480 | ) | ||||||||||||||
Resource Transition Fund | 182,920 | — | — | — | — | |||||||||||||||
Resources Fund | 36,189,962 | 15,124,241 | — | — | — | |||||||||||||||
187
GMO Trust Funds
Notes to Financial Statements — (Continued)
February 28, 2023
| Fund Name | Undistributed Income | Undistributed Net Long-Term Capital Gain ($) | Late-Year Ordinary Loss Deferral ($) | Capital Loss Carryforwards ($) | Post-October Capital Losses Deferral ($) | |||||||||||||||
Small Cap Quality Fund | 2,203,813 | — | — | — | — | |||||||||||||||
Tax-Managed International Equities Fund | 385,111 | — | — | (2,758,138 | ) | — | ||||||||||||||
U.S. Equity Fund | 565,905 | 14,050,030 | — | — | — | |||||||||||||||
U.S. Opportunistic Value Fund | 6,709,161 | 1,117 | — | — | — | |||||||||||||||
U.S. Small Cap Value Fund | 95,452 | — | — | (5,302,487 | ) | — | ||||||||||||||
As of February 28, 2023, certain Funds had capital loss carryforwards available to offset future realized gains, if any, to the extent permitted by the Code. Net capital losses are carried forward without expiration and generally retain their short-term and/or long-term tax character, as applicable. Utilization of the capital loss carryforwards, post-October capital losses, late-year ordinary losses, and losses realized subsequent to February 28, 2023, if any, could be subject to further limitations imposed by the Code related to share ownership activity. The Funds’ capital loss carryforwards are as follows:
| Fund Name | Short-Term ($) | Long-Term ($) | ||||||
Climate Change Fund | (503,543 | ) | (2,314,527 | ) | ||||
Emerging Markets ex-China Fund | (13,036,850 | ) | — | |||||
Emerging Markets Fund | (185,574,143 | ) | (1,112,275,280 | ) | ||||
Emerging Markets Select Equity Fund (formerly Emerging Domestic Opportunities Fund) | (97,432,541 | ) | (27,140,854 | ) | ||||
International Equity Fund | (800,218,525 | ) | (98,670,937 | ) | ||||
Japan Value Creation Fund | (51,479 | ) | (3,628,512 | ) | ||||
Quality Cyclicals Fund | — | — | ||||||
Quality Fund | — | — | ||||||
Resource Transition Fund | — | — | ||||||
Resources Fund | — | — | ||||||
Small Cap Quality Fund | — | — | ||||||
Tax-Managed International Equities Fund | (2,758,138 | ) | — | |||||
U.S. Equity Fund | — | — | ||||||
U.S. Opportunistic Value Fund | — | — | ||||||
U.S. Small Cap Value Fund | (5,302,487 | ) | — | |||||
188
GMO Trust Funds
Notes to Financial Statements — (Continued)
February 28, 2023
As of February 28, 2023, the approximate total cost, aggregate investment-level gross/net unrealized appreciation (depreciation) in the value of total investments (including total securities sold short, if any), and the net unrealized appreciation (depreciation) of outstanding financial instruments, for U.S. federal income tax purposes were as follows:
| Total Investments | Outstanding Financial Instruments | |||||||||||||||||||
| Fund Name | Aggregate Cost ($) | Gross Unrealized Appreciation ($) | Gross Unrealized (Depreciation) ($) | Net Unrealized Appreciation (Depreciation) ($) | Net Unrealized Appreciation (Depreciation) ($) | |||||||||||||||
Climate Change Fund | 954,064,966 | 75,007,788 | (90,678,838 | ) | (15,671,050 | ) | — | |||||||||||||
Emerging Markets ex-China Fund | 369,833,240 | 8,530,777 | (116,622,667 | ) | (108,091,890 | ) | — | |||||||||||||
Emerging Markets Fund | 1,415,064,934 | 28,272,824 | (590,923,148 | ) | (562,650,324 | ) | — | |||||||||||||
Emerging Markets Select Equity Fund (formerly Emerging Domestic Opportunities Fund) | 158,940,086 | 4,253,808 | (41,845,625 | ) | (37,591,817 | ) | — | |||||||||||||
International Equity Fund | 1,397,143,369 | 93,277,696 | (144,664,598 | ) | (51,386,902 | ) | — | |||||||||||||
Japan Value Creation Fund | 128,764,846 | 2,881,288 | (21,173,055 | ) | (18,291,767 | ) | — | |||||||||||||
Quality Cyclicals Fund | 57,695,279 | 17,016,531 | (4,751,337 | ) | 12,265,194 | — | ||||||||||||||
Quality Fund | 4,386,694,055 | 2,583,731,558 | (187,746,772 | ) | 2,395,984,786 | — | ||||||||||||||
Resource Transition Fund | 484,957,360 | 3,383,868 | (28,358,151 | ) | (24,974,283 | ) | — | |||||||||||||
Resources Fund | 1,876,676,731 | 326,637,610 | (401,515,086 | ) | (74,877,476 | ) | — | |||||||||||||
Small Cap Quality Fund | 53,992,737 | 10,561,186 | (20,367 | ) | 10,540,819 | — | ||||||||||||||
Tax-Managed International Equities Fund | 28,290,294 | 3,660,428 | (802,135 | ) | 2,858,293 | — | ||||||||||||||
U.S. Equity Fund | 240,035,123 | 17,184,416 | (13,505,774 | ) | 3,678,642 | — | ||||||||||||||
U.S. Opportunistic Value Fund | 283,960,875 | 8,941,879 | (13,220,295 | ) | (4,278,416 | ) | — | |||||||||||||
U.S. Small Cap Value Fund | 29,515,730 | 3,952,929 | (3,918,585 | ) | 34,344 | — | ||||||||||||||
The Funds are subject to authoritative guidance related to the accounting and disclosure of uncertain tax positions under U.S. GAAP. A Fund may recognize an income tax liability related to an uncertain tax position under U.S. GAAP when the uncertain tax position has a less than 50% probability that it would be sustained upon examination by the tax authorities, based on technical merits. United States and non-U.S. tax rules (including the interpretation and application of tax laws) are subject to change. The Funds file tax returns and/or adopt certain tax positions in various jurisdictions. Non-U.S. taxes are provided for based on the Funds’ understanding of the prevailing tax rules of the non-U.S. markets in which they invest. Recently enacted tax rules, including interpretations of tax laws and tax legislation/initiatives currently under consideration in various jurisdictions, including the U.S., might affect the way the Funds and their investors are taxed prospectively and/or retroactively. Prior to the expiration of the relevant statutes of limitations, if any, the Funds are subject to examination by U.S. federal, state, local and non-U.S. jurisdictions with respect to the tax returns they have filed and the tax positions they have adopted. The Funds’ U.S. federal income tax returns are generally subject to examination by the Internal Revenue Service for a period of three years after they are filed. State, local and/or non-U.S. tax returns and/or other filings may be subject to examination for different periods, depending upon the tax rules of each applicable jurisdiction. As of February 28, 2023, each Fund has determined that no tax liability is required to be accrued in its financial statements related to uncertain tax positions for any tax years which are subject to examination.
Security transactions and related investment income
Security transactions are accounted for in the financial statements on trade date. For purposes of daily net asset value calculations, the Funds’ policy is that security transactions are generally accounted for on the following business day. GMO may override that policy and a Fund may account for security transactions on trade date if it experiences significant purchases or redemptions or engages in significant portfolio transactions. Dividend income, net of applicable foreign withholding taxes, if any, is recorded on the ex-dividend date or, if later, when a Fund is informed of the ex-dividend date. Income dividends and capital gain distributions from underlying funds, if any, are recorded on the ex-dividend date. Interest income is recorded on the accrual basis and is adjusted for the amortization of premiums and accretion of discounts. Principal on inflation-indexed securities is adjusted for inflation/deflation and any increase or decrease is recorded as interest income or investment loss. Coupon income is not recognized on securities for which collection is not expected. Paydown gains and losses on mortgage-related and other asset-backed securities, if any, are recorded as components of interest income in the Statements of Operations. Non-cash dividends, if any, are recorded at the fair market value of the asset received. In determining the net gain or loss on securities sold, the Funds use the identified cost basis.
189
GMO Trust Funds
Notes to Financial Statements — (Continued)
February 28, 2023
During the year ended February 28, 2023, the Funds did not recognize dividends or foreign withholding on local Russian shares, if any, due to restrictions imposed by the Russian government on dividend payments received by foreign shareholders like the Funds. At this time, no assurance can be given regarding the future payment of outstanding dividends by Russian issuers, the time period during which such Russia’s restrictions will remain in place or on the future ability of foreign shareholders to claim or otherwise gain control over or access to dividends paid.
Expenses and class allocations
Most of the expenses of the Trust are directly attributable to an individual Fund. Generally, common expenses are allocated among the Funds based on, among other things, the nature and type of expense and the relative size of the Funds. Investment income, common expenses, purchase premiums and redemption fees, if any, and realized and unrealized gains and losses are allocated among the classes of shares of the Funds, if applicable, based on the relative net assets of each class. Shareholder service fees, if any, which are directly attributable to a class of shares, are charged to that class’s operations. In addition, the Funds may incur fees and expenses indirectly as a shareholder in the underlying funds. Because the underlying funds have different expense and fee levels and the Funds may own different proportions of the underlying funds at different times, the amount of fees and expenses indirectly incurred by a Fund will vary (see Note 5).
Custodian, Fund Accounting Agent and Transfer Agent
State Street Bank and Trust Company (“State Street”) serves as the Funds’ custodian, fund accounting agent and transfer agent. Cash balances maintained at the custodian and transfer agent are held in a Demand Deposit Account and interest income earned, if any, is shown as interest income in the Statements of Operations.
Purchases and redemptions of Fund shares
Purchase premiums and redemption fees (if applicable) are paid to and retained by a Fund to help offset estimated portfolio transaction costs and other related costs (e.g., bid to ask spreads, stamp duties and transfer fees) incurred by the Fund directly or indirectly (e.g., through investments in underlying funds) as a result of an investor’s purchase or redemption by allocating estimated transaction costs to the purchasing or redeeming shareholder. Such fees are recorded as a component of the Funds’ net share transactions. A Fund may impose a new purchase premium and redemption fee or increase or decrease an existing fee at any time.
Purchase premiums are not charged on reinvestments of dividends or other distributions. Redemption fees apply to all shares of a Fund regardless of how the shares were acquired (e.g., by direct purchase or by reinvestment of dividends or other distributions).
If GMO determines that any portion of a cash purchase or redemption, as applicable, is offset by a corresponding cash redemption or purchase occurring on the same day, it ordinarily will waive or reduce the purchase premium or redemption fee with respect to that portion.
GMO also may waive or reduce the purchase premium or redemption fee for a purchase or redemption of a Fund’s shares if the Fund will not incur transaction costs or will incur reduced transaction costs. For example, GMO may reduce the purchase premium to the extent that securities are used to purchase a Fund’s shares (taking into account transaction costs, stamp duties or transfer fees), and GMO may reduce redemption fees to the extent a Fund uses portfolio securities to redeem its shares (taking into account transaction costs, stamp duties or transfer fees).
As of February 28, 2023, none of the Funds charge a purchase premium or redemption fee. Historical information on purchase premiums and redemption fees are provided in the table below.
190
GMO Trust Funds
Notes to Financial Statements — (Continued)
February 28, 2023
| Emerging Markets Fund | For the period from December 1, 2018 to November 22, 2019, the premium on cash purchases and the fee on cash redemptions were each 0.40% of the amount invested or redeemed. Prior to December 1, 2018, the premium on cash purchases and the fee on cash redemptions were each 0.80% of the amount invested or redeemed. | |
Emerging Markets Select Equity Fund (formerly Emerging Domestic Opportunities Fund) | For the period from December 1, 2018 to November 22, 2019, the premium on cash purchases and the fee on cash redemptions were each 0.40% of the amount invested or redeemed. Prior to December 1, 2018, the premium on cash purchases and the fee on cash redemptions were each 0.80% of the amount invested or redeemed. | |
| Resources Fund | Prior to March 9, 2020, the premium on cash purchases and the fee on cash redemptions were each 0.30% of the amount invested or redeemed. |
Other matters — Emerging Markets Fund (“EMF”)
Indian regulators alleged in 2002 that EMF violated some conditions under which it was granted permission to operate in India and have restricted some of EMF’s locally held assets pending resolution of the dispute. Although these locally held assets remain the property of EMF, a portion of the assets are not permitted to be withdrawn from EMF’s local custodial account located in India. The amount of restricted assets is small relative to the size of EMF, representing approximately 0.37% of the Fund’s total net assets as of February 28, 2023, though in recognition of the potential liability, a portion of that amount is included as a Miscellaneous payable within the Statements of Assets and Liabilities. The effect of this claim on the value of the restricted assets, and all matters relating to EMF’s response to these allegations, are subject to the supervision and control of GMO Trust’s Board of Trustees. Any costs in respect of this matter will be borne by EMF.
Recently-issued accounting guidance
In June 2022, the Financial Accounting Standards Board (“FASB”) issued a new Accounting Standards Update 2022-03, “Fair Value Measurement (Topic 820) – Fair Value Measurement of Equity Securities Subject to Contractual Sale Restrictions” (“ASU 2022-03”). The amendments in ASU 2022-03 apply to all entities that have investments in equity securities measured at fair value that are subject to a contractual sale restriction. The amendments in ASU 2022-03 clarify guidance for fair value measurement of an equity security subject to a contractual sale restriction and establish new disclosure requirements for such equity securities. The amendments in ASU 2022-03 are effective for fiscal years, and interim periods within those fiscal years, beginning after December 15, 2023 with early adoption permitted. GMO is currently evaluating the impact, if any, of the new disclosure requirements on the financial statements.
191
GMO Trust Funds
Notes to Financial Statements — (Continued)
February 28, 2023
| 3. | Investment and other risks |
The following chart identifies selected risks associated with each Fund. Risks not marked for a particular Fund may, however, still apply to some extent to that Fund at various times.
| Climate Change Fund | Emerging Markets ex-China Fund | Emerging Markets Fund | Emerging Markets Select Equity Fund (formerly Emerging Domestic Opportunities Fund) | International Equity Fund | Japan Value Creation Fund | Quality Cyclicals Fund | Quality Fund | Resource Transition Fund | Resources Fund | Small Cap Quality Fund | Tax-Managed International Equities Fund | U.S. Equity Fund | U.S. Opportunistic Value Fund | U.S. Small Cap Value Fund | ||||||||||||||||||
Market Risk – Equities | X | X | X | X | X | X | X | X | X | X | X | X | X | X | X | |||||||||||||||||
Management and Operational Risk | X | X | X | X | X | X | X | X | X | X | X | X | X | X | X | |||||||||||||||||
Focused Investment Risk | X | X | X | X | X | X | X | X | X | X | X | X | X | X | X | |||||||||||||||||
Commodities Risk | X | X | X | X | ||||||||||||||||||||||||||||
Non-U.S. Investment Risk | X | X | X | X | X | X | X | X | X | X | X | X | ||||||||||||||||||||
Currency Risk | X | X | X | X | X | X | X | X | X | X | X | |||||||||||||||||||||
Illiquidity Risk | X | X | X | X | X | X | X | X | X | X | X | X | X | X | ||||||||||||||||||
Smaller Company Risk | X | X | X | X | X | X | X | X | X | X | X | X | X | X | ||||||||||||||||||
Market Disruption and Geopolitical Risk | X | X | X | X | X | X | X | X | X | X | X | X | X | X | X | |||||||||||||||||
Derivatives and Short Sales Risk | X | X | X | X | X | X | X | X | X | X | X | X | X | X | ||||||||||||||||||
Counterparty Risk | X | X | X | X | X | X | X | X | X | X | X | X | X | X | ||||||||||||||||||
Leveraging Risk | X | X | X | X | X | X | X | X | X | X | X | X | X | X | ||||||||||||||||||
Fund of Funds Risk | X | X | X | |||||||||||||||||||||||||||||
Large Shareholder Risk | X | X | X | X | X | X | X | X | X | X | X | X | X | X | ||||||||||||||||||
Event-Driven Risk | X | X | X | X | X | X | ||||||||||||||||||||||||||
Credit Risk | X | |||||||||||||||||||||||||||||||
Non-Diversified Funds | X | X | X | X | X | X | X |
192
GMO Trust Funds
Notes to Financial Statements — (Continued)
February 28, 2023
Investing in mutual funds involves many risks. The risks of investing in a particular Fund depend on the types of investments in its portfolio and the investment strategies GMO employs on its behalf. This section does not describe every possible risk of investing in the Funds. Particular Funds could be subject to additional risks because of the types of investments they make and market conditions, which can change over time. Please see the Funds’ prospectus for more information regarding the risks of investing in the Funds.
Funds that invest in other GMO Funds or other investment companies (collectively, “Underlying Funds”) are exposed to the risks to which the Underlying Funds in which it invests are exposed, as well as the risk that the Underlying Funds will not perform as expected. Therefore, unless otherwise noted, the selected risks summarized below include both direct and indirect risks, and references in this section to investments made by a Fund include those made both directly and indirectly by the Fund.
An investment in a Fund is not a bank deposit and, therefore, is not insured or guaranteed by the Federal Deposit Insurance Corporation or any other government agency.
• MARKET RISK — EQUITIES. The market price of an equity may decline due to factors affecting the issuer or its industry or the economy and equity markets generally. Equities that are characterized as relatively cyclical often are especially sensitive to economic cycles, which means they typically underperform non-cyclical equities during economic downturns. Cyclical equities may include investments in companies in any industry, including industries generally thought of as cyclical (e.g., consumer discretionary, financials, energy, real estate, materials and industrials) and industries not typically viewed as cyclical (e.g., healthcare, technology). If a Fund purchases an equity for less than its fundamental fair (or intrinsic) value as assessed by GMO and GMO’s assessment proves to be incorrect, the Fund runs the risk that the market price of the equity will not appreciate or will decline. A Fund also may purchase equities that typically trade at higher multiples of current earnings than other securities, and the market prices of these equities often are more sensitive to changes in future earnings expectations than the market prices of equities trading at lower multiples. Declines in stock market prices generally are likely to reduce the net asset value of the Fund’s shares.
• MANAGEMENT AND OPERATIONAL RISK. Each Fund runs the risk that GMO’s investment techniques will fail to produce desired results. For many Funds, GMO uses quantitative models as part of its investment process. GMO’s models may not accurately predict future market movements. In addition, GMO’s models rely on assumptions and data that are subject to limitations (e.g., inaccuracies, staleness) that could adversely affect their predictive value. The Funds also run the risk that GMO’s assessment of an investment (including a security’s fundamental fair (or intrinsic) value) is wrong or that deficiencies in GMO’s or another service provider’s internal systems or controls will cause losses for the Funds or impair Fund operations.
• FOCUSED INVESTMENT RISK. Investments focused in countries, regions, asset classes, sectors, industries, currencies or issuers that are subject to the same or similar risk factors and investments whose market prices are closely correlated are subject to higher overall risk than investments that are more diversified or whose market prices are not as closely correlated. A Fund that invests in the securities of a limited number of issuers has greater exposure to a decline in the market price of a particular security held by the Fund than if the Fund invested in the securities of a larger number of issuers.
For Resource Transition Fund, because the Fund concentrates its investments in the resource transition sector, it is particularly exposed to adverse developments, including adverse price movements, affecting issuers in the resource transition sector and is subject to higher risks than a fund that invests in a wider range of industries. In addition, the market prices of securities of companies in the resource transition sector are often more volatile (particularly in the short term) than those of securities of companies in other industries. Some of the commodities used as raw materials or produced by these companies are subject to broad price fluctuations as a result of industry-wide supply and demand factors. Companies in the resource transition sector often have limited pricing power over the supplies they purchase and the products they sell, which can affect their profitability, and are often capital-intensive and use significant amounts of leverage. Projects in the resource transition sector may take extended periods of time to complete, and companies cannot ensure that the market will be favorable at the time the project begins production. Companies in the resource transition sector also may be subject to special risks associated with natural or man-made disasters. In addition, companies in the resource transition sector can be especially affected by political and economic developments, government regulations including changes in tax law or interpretations of law, energy conservation, and the success of exploration projects. Specifically, companies in the resource transition sector can be significantly affected by import controls, worldwide competition and cartels, and changes in consumer sentiment and spending and can be subject to liability for, among other things, environmental damage, depletion of resources, and mandated expenditures for safety and pollution control. The Fund’s concentration in the securities of companies in the resource transition sector exposes it to the price movements of natural resources to a greater extent than if it were more broadly diversified. For example, the Fund’s lack of exposure
193
GMO Trust Funds
Notes to Financial Statements — (Continued)
February 28, 2023
to companies that own fossil fuel reserves or that focus on oil and gas exploration and production may have an adverse effect on Fund performance relative to a fund that invested more broadly across the natural resources sector. Because the Fund invests primarily in the resource transition sector, it runs the risk of performing poorly during an economic downturn or a decline in demand for natural resources.
• COMMODITIES RISK. Commodity prices can be extremely volatile, and exposure to commodities can cause the value of a Fund’s shares to decline or fluctuate in a rapid and unpredictable manner.
• NON-U.S. INVESTMENT RISK. The market prices of many non-U.S. securities (particularly of companies tied economically to emerging countries) fluctuate more than those of U.S. securities. Many non-U.S. securities markets (particularly emerging markets) are less stable, smaller, less liquid, and less regulated than U.S. securities markets, and the cost of trading in those markets often is higher than in U.S. securities markets. In addition, issuers of non-U.S. securities (particularly those tied economically to emerging countries) often are not subject to as much regulation as U.S. issuers, and the reporting, recordkeeping, accounting, custody, and auditing standards to which those issuers are subject often are not as rigorous as U.S. standards. In addition, a Fund may be subject to non-U.S. taxes, potentially on a retroactive basis, on (i) capital gains it realizes or dividends, interest, or other amounts it realizes or accrues in respect of non-U.S. investments; (ii) transactions in those investments; and (iii) repatriation of proceeds generated from the sale or other disposition of those investments. Also, the Funds need a license to invest directly in securities traded in many non-U.S. securities markets, and a Fund is subject to the risk that its license is terminated or suspended. In some non-U.S. securities markets, prevailing custody and trade settlement practices (e.g., the requirement to pay for securities prior to receipt) expose a Fund to credit and other risks. Further, adverse changes in investment regulations, capital requirements or exchange controls could adversely affect the value of a Fund’s investments. These and other risks (e.g., nationalization, expropriation or other confiscation of assets of non-U.S. issuers, difficulties enforcing legal judgments or contractual rights and geopolitical risks) tend to be higher for investments in the securities of companies tied economically to emerging countries. The economies of emerging countries often depend predominantly on only a few industries or revenues from particular commodities, and often are more volatile than the economies of developed countries.
• CURRENCY RISK. Fluctuations in exchange rates can adversely affect the market value of a Fund’s foreign currency holdings and investments denominated in foreign currencies.
• ILLIQUIDITY RISK. Low trading volume, lack of a market maker, large position size or legal restrictions may limit or prevent a Fund or an underlying fund from selling particular securities or closing derivative positions at desirable prices.
• SMALLER COMPANY RISK. Smaller companies may have limited product lines, markets, or financial resources, lack the competitive strength of larger companies, have less experienced managers or depend on a few key employees. The securities of companies with smaller market capitalizations often are less widely held and trade less frequently and in lesser quantities, and their market prices often fluctuate more, than the securities of companies with larger market capitalizations.
• MARKET DISRUPTION AND GEOPOLITICAL RISK. Geopolitical and other events (e.g., wars, pandemics, sanctions, terrorism) may disrupt securities markets and adversely affect particular economies and markets as well as global economies and markets. Those events, as well as other changes in non-U.S. and U.S. economic and political conditions, could exacerbate other risks or otherwise reduce the value of the Funds’ investments.
Russia’s invasion of Ukraine beginning in February 2022 has had, and could continue to have, severe adverse effects on regional and global economic markets for securities and commodities. For example, in response to Russia’s actions, various governments, including the United States, issued a series of broad-ranging economic sanctions against Russia that, among other things (i) prohibit doing business with certain Russian companies, financial institutions and individuals (e.g., officials); (ii) the removal of Russian banks from the Society for Worldwide Interbank Financial Telecommunications (commonly referred to as “SWIFT”), the electronic banking network that connects banks globally; and (iii) restrict the Russian Central Bank from undermining the impact of the sanctions. In retaliation for the sanctions and other actions by the U.S. and other countries, Russia has imposed strict capital controls limiting the ability of foreigners to trade on the Moscow Stock Exchange and to sell, receive or deliver assets held in the custody of local Russian banks (such as equities of Russian companies and Rubles). These actions by the United States and other countries have adversely affected (and similar actions in the future could adversely affect) the Russian economy and the value and liquidity of Russian securities. In particular, where a Fund holds securities of a Russian issuer that is subject to blocking sanctions imposed by the U.S. Department of the Treasury’s Office of Foreign Assets Control, those securities will be frozen and consequently unable to be sold
194
GMO Trust Funds
Notes to Financial Statements — (Continued)
February 28, 2023
or transferred. Moreover, the Russia/Ukraine conflict and related actions (such as those described above) have, and could continue to have, an adverse effect on global markets and liquidity, thereby negatively affecting the value of a Fund’s investments beyond any direct exposure to Russian issuers.
• DERIVATIVES AND SHORT SALES RISK. The use of derivatives involves the risk that their value may not change as expected relative to changes in the value of the underlying assets, pools of assets, rates, currencies or indices. Derivatives also present other risks, including market risk, illiquidity risk, currency risk, credit risk, and counterparty risk. The market price of an option is affected by many factors, including changes in the market prices or dividend rates of underlying securities (or in the case of indices, the securities in such indices); the time remaining before expiration; changes in interest rates or exchange rates; and changes in the actual or perceived volatility of the relevant index or underlying securities. A Fund may create short investment exposure by selling securities short or by taking a derivative position in which the value of the derivative moves in the opposite direction from the price of an underlying asset, pool of assets, rate, currency or index. The risks of loss associated with derivatives that provide short investment exposure and short sales of securities are theoretically unlimited.
• COUNTERPARTY RISK. A Fund runs the risk that the counterparty to a derivatives contract, a clearing member used by the Fund to hold a cleared derivatives contract, or a borrower of the Fund’s securities is unable or unwilling to make timely settlement payments, return the Fund’s margin or collateral or otherwise honor its obligations.
• LEVERAGING RISK. The use of derivatives, short sales and securities lending can create leverage. Leverage increases a Fund’s losses when the value of its investments (including derivatives) declines. In addition, a Fund’s portfolio will be leveraged if it exercises its right to delay payment on a redemption, and losses will result if the value of the Fund’s assets declines between the time a redemption request is deemed to be received by a Fund and the time the Fund liquidates assets to meet that request.
• FUND OF FUNDS RISK. A Fund is indirectly exposed to all of the risks of an investment in the underlying funds in which it invests (including ETFs), including the risk that those underlying funds will not perform as expected. Because a Fund bears the fees and expenses of the underlying funds in which it invests, an increase in fees and expenses of an underlying fund or a reallocation of the Fund’s investments to underlying funds with higher fees or expenses will increase the Fund’s total expenses.
• LARGE SHAREHOLDER RISK. To the extent that a large number of shares of a Fund is held by a single shareholder (e.g., an institutional investor or another GMO Fund) or a group of shareholders with a common investment strategy (e.g., GMO asset allocation accounts), the Fund is subject to the risk that a redemption by that shareholder or group of all or a large portion of their Fund shares will require the Fund to sell securities at disadvantageous prices, disrupt the Fund’s operations, or force the Fund’s liquidation.
• EVENT-DRIVEN RISK. If a Fund purchases securities in anticipation of a proposed merger, acquisition, exchange offer, tender offer, or other similar transaction and that transaction later appears likely to be delayed or unlikely to be consummated or, in fact, is not consummated or is delayed, the market price of the securities purchased by the Fund may decline sharply, resulting in losses to the Fund. The risk/reward payout of event-driven strategies (such as merger arbitrage) typically is asymmetric, with the losses in failed transactions often far exceeding the gains in successful transactions. Event-driven strategies are subject to the risk of overall market movements, and a Fund may experience losses even if a transaction is consummated.
• CREDIT RISK. A Fund runs the risk that the issuer or guarantor of a fixed income investment (including a sovereign or quasi-sovereign debt issuer) or the obligors of obligations underlying an asset-backed security will be unable or unwilling to satisfy their obligations to pay principal and interest or otherwise to honor their obligations in a timely manner. The market price of a fixed income investment will normally decline as a result of the failure of an issuer, guarantor, or obligor to meet its payment obligations or in anticipation of such failure. In addition, investments in emerging country sovereign or quasi-sovereign debt involve a heightened risk that the issuer responsible for repayment of the debt may be unable or unwilling to pay interest and repay principal when due, and a Fund may lack recourse against the issuer in the event of default. Investments in quasi-sovereign debt also are subject to the risk that the issuer will default independently of its sovereign. Below investment grade investments have speculative characteristics, and negative changes in economic conditions or other circumstances are more likely to impair the ability of issuers of those investments to make principal and interest payments than issuers of investment grade investments.
195
GMO Trust Funds
Notes to Financial Statements — (Continued)
February 28, 2023
• NON-DIVERSIFIED FUNDS. The following Funds are non-diversified investment companies under the 1940 Act and therefore a decline in the market price of a particular security held by the Funds may affect the Funds’ performance more than if the Funds were a diversified investment company.
| • | Emerging Markets ex-China Fund |
| • | Emerging Markets Select Equity Fund (formerly Emerging Domestic Opportunities Fund) |
| • | Japan Value Creation Fund |
| • | Quality Cyclicals Fund |
| • | Quality Fund |
| • | Resource Transition Fund |
| • | Small Cap Quality Fund |
| 4. | Derivative financial instruments |
Derivatives are financial contracts whose value depends on, or is derived from, the value of underlying assets, reference rates, or indices that are used to increase, decrease or adjust elements of the investment exposures of a Fund’s portfolio. Derivatives may relate to securities, interest rates, currencies, currency exchange rates, inflation rates, commodities and indices, and include foreign currency contracts, swap contracts, reverse repurchase agreements, and other exchange-traded and OTC contracts.
The Funds may use derivatives to gain long investment exposure to securities or other assets. For example, a Fund may use derivatives instead of investing directly in equity securities, including using equity derivatives to maintain equity exposure when it holds cash by “equitizing” its cash balances using futures contracts or other types of derivatives. The Funds also may use currency derivatives (including forward currency contracts, futures contracts, swap contracts and options) to gain exposure to a given currency.
The Funds may use derivatives in an attempt to reduce their investment exposures (which may result in a reduction below zero). A Fund also may use currency derivatives in an attempt to reduce some aspect of the currency exposure in its portfolio. For these purposes, the Fund may use an instrument denominated in a different currency that GMO believes is highly correlated with the relevant currency.
The Funds may use derivatives in an attempt to adjust elements of their investment exposures to various securities, sectors, markets, indices, and currencies without actually having to sell existing investments or make new direct investments. For example, if a Fund holds a large proportion of stocks of companies in a particular sector and GMO believes that stocks of companies in another sector will outperform those stocks, the Fund might use a short futures contract on an appropriate index (to synthetically “sell” a portion of the Fund’s portfolio) in combination with a long futures contract on another index (to synthetically “buy” exposure to that index). In adjusting its investment exposures, a Fund also may use currency derivatives in an attempt to adjust its currency exposure, seeking currency exposure that is different (in some cases, significantly different) from the currencies in which its equities are traded.
The Funds may use derivatives to effect transactions intended as substitutes for securities lending.
Each of the Funds may have investment exposures in excess of its net assets (i.e. the Fund may be leveraged).
A Fund’s foreign currency exposure may differ significantly from the currencies in which its equities are traded.
Certain derivatives transactions that may be used by the Funds, including certain interest rate swaps and certain credit default index swaps, are required to be transacted through a central clearing organization. The Funds hold cleared derivatives transactions, if any, through clearing members, who are members of derivatives clearing houses. Certain other derivatives, including futures and certain options, are transacted on exchanges. The Funds hold exchange-traded derivatives through clearing brokers that are typically members of the exchanges. In contrast to bilateral derivatives transactions, following a period of advance notice to the Fund, clearing brokers generally can require termination of existing cleared or exchange-traded derivatives transactions at any time and increases in margin above the margin that it required at the beginning of a transaction. Clearing houses and exchanges also have broad rights to increase margin requirements for existing transactions and to terminate transactions. Any such increase or termination could interfere with the ability of a Fund to pursue its investment strategy. Also, a Fund is subject to execution risk if it enters into a derivatives transaction that is required to be cleared (or that GMO expects to be cleared), and no clearing member is willing or able to clear the transaction on the Fund’s behalf. In that case, the transaction might have to be terminated, and the Fund could lose some or all of the benefit of any increase in the value of the transaction after the time of the transaction.
196
GMO Trust Funds
Notes to Financial Statements — (Continued)
February 28, 2023
The use of derivatives involves risks that are in addition to, and potentially greater than, the risks associated with investing directly in securities and other more traditional assets. See “Investment and other risks” above for further information.
For Funds that held derivatives during the year ended February 28, 2023, the following table shows how the Fund used these derivatives (marked with an X):
| Type of Derivative and Objective for Use | Emerging Markets | Emerging Markets Select Equity Fund (formerly Emerging Domestic Opportunities Fund) | International Equity Fund | Tax-Managed International Equities Fund | U.S. Equity Fund | U.S. Small Cap Value Fund | ||||||||||||||||||
Futures contracts | ||||||||||||||||||||||||
Adjust exposure to certain securities markets | X | X | X | X | X | X | ||||||||||||||||||
Maintain the diversity and liquidity of the portfolio | X | X | X | X | ||||||||||||||||||||
Futures contracts
The Funds may purchase and sell futures contracts. A futures contract is a contract that obligates the holder to buy or sell an asset at a predetermined delivery price at a specified time in the future. Some futures contracts are net (cash) settled. Upon entering into a futures contract, a Fund is required to deposit cash, U.S. government and agency obligations or other liquid assets with the futures clearing broker in accordance with the initial margin requirements of the broker or exchange. Futures contracts are generally valued at the settlement price established at the close of business each day by the board of trade or exchange on which they are traded (and if the futures are traded outside the U.S. and the market for such futures is closed prior to the close of the NYSE due to time zone differences, the values will be adjusted, to the extent practicable and available, based on inputs from an independent pricing service approved by the Trustees to reflect estimated valuation changes through the NYSE close). The value of each of the Fund’s futures contracts is marked-to-market daily and an appropriate payable or receivable for the change in value (“variation margin”) is recorded by each Fund. The payable or receivable is settled on the following business day. Gains or losses are recognized but not accounted for as realized until the contracts expire or are closed. Futures contracts involve, to varying degrees, risk of loss in excess of the variation margin as recorded in the Statements of Assets and Liabilities. Under some circumstances, futures exchanges may establish daily limits on the amount that the price of a futures contract can vary from the previous day’s settlement price, thereby effectively preventing liquidation of unfavorable positions. Futures contracts expose the Funds to the risk that they may not be able to enter into a closing transaction due to an illiquid market. Futures contracts outstanding at the end of the year, if any, are listed in each applicable Fund’s Schedule of Investments.
****
As provided by U.S. GAAP, the table below is based on market values or unrealized appreciation/(depreciation) rather than the notional amounts of derivatives. Changes to market values of reference asset(s) will tend to have a greater impact on the Funds (with correspondingly greater risk) the greater the notional amount. For further information on notional amounts, see the Schedule of Investments.
The following is a summary of the valuations of derivative instruments categorized by risk exposure.
197
GMO Trust Funds
Notes to Financial Statements — (Continued)
February 28, 2023
The Effect of Derivative Instruments on the Statements of Assets and Liabilities as of February 28, 2023 and the Statements of Operations for the year ended February 28, 2023^:
The risks referenced in the tables below are not intended to be inclusive of all risks. Please see the “Investment and other risks” and “Portfolio valuation” sections for a further discussion of risks.
| Equity | ||||
| Contracts | ||||
Emerging Markets Fund | ||||
Liability Derivatives | ||||
Unrealized Depreciation on Futures Contracts¤ | $ | (1,021,894 | ) | |
|
| |||
Total | $ | (1,021,894 | ) | |
|
| |||
Net Realized Gain (Loss) on | ||||
Futures Contracts | $ | (34,669,130 | ) | |
|
| |||
Total | $ | (34,669,130 | ) | |
|
| |||
Change in Net Appreciation (Depreciation) on | ||||
Futures Contracts | $ | 4,470,024 | ||
|
| |||
Total | $ | 4,470,024 | ||
|
| |||
Emerging Markets Select Equity Fund (formerly Emerging Domestic Opportunities Fund) | ||||
Net Realized Gain (Loss) on | ||||
Futures Contracts | $ | (1,774,049 | ) | |
|
| |||
Total | $ | (1,774,049 | ) | |
|
| |||
International Equity Fund | ||||
Liability Derivatives | ||||
Unrealized Depreciation on Futures Contracts¤ | $ | (352,111 | ) | |
|
| |||
Total | $ | (352,111 | ) | |
|
| |||
Net Realized Gain (Loss) on | ||||
Futures Contracts | $ | (2,353,493 | ) | |
|
| |||
Total | $ | (2,353,493 | ) | |
|
| |||
Change in Net Appreciation (Depreciation) on | ||||
Futures Contracts | $ | (352,111 | ) | |
|
| |||
Total | $ | (352,111 | ) | |
|
| |||
Tax-Managed International Equities Fund | ||||
Asset Derivatives | ||||
Unrealized Appreciation on Futures Contracts¤ | $ | 2,645 | ||
|
| |||
Total | $ | 2,645 | ||
|
| |||
Net Realized Gain (Loss) on | ||||
Futures Contracts | $ | (79,891 | ) | |
|
| |||
Total | $ | (79,891 | ) | |
|
| |||
Change in Net Appreciation (Depreciation) on | ||||
Futures Contracts | $ | 16,918 | ||
|
| |||
Total | $ | 16,918 | ||
|
| |||
198
GMO Trust Funds
Notes to Financial Statements — (Continued)
February 28, 2023
| Equity | ||||
| Contracts | ||||
U.S. Equity Fund | ||||
Asset Derivatives | ||||
Unrealized Appreciation on Futures Contracts¤ | $ | 49,914 | ||
|
| |||
Total | $ | 49,914 | ||
|
| |||
Net Realized Gain (Loss) on | ||||
Futures Contracts | $ | (655,705 | ) | |
|
| |||
Total | $ | (655,705 | ) | |
|
| |||
Change in Net Appreciation (Depreciation) on | ||||
Futures Contracts | $ | 376,842 | ||
|
| |||
Total | $ | 376,842 | ||
|
| |||
U.S. Small Cap Value Fund | ||||
Asset Derivatives | ||||
Unrealized Appreciation on Futures Contracts¤ | $ | 14,011 | ||
|
| |||
Total | $ | 14,011 | ||
|
| |||
Net Realized Gain (Loss) on | ||||
Futures Contracts | $ | (552,891 | ) | |
|
| |||
Total | $ | (552,891 | ) | |
|
| |||
Change in Net Appreciation (Depreciation) on | ||||
Futures Contracts | $ | 14,011 | ||
|
| |||
Total | $ | 14,011 | ||
|
| |||
| ^ | Because the Funds recognize changes in value through the Statements of Operations, they do not qualify for hedge accounting under authoritative guidance for derivative instruments. The Funds’ investments in derivatives may represent an economic hedge; however, they are considered to be non-hedge transactions for the purpose of these tables. |
| ¤ | The table includes cumulative unrealized appreciation/depreciation of futures and value of cleared swap contracts, if any, as reported in the Schedule of Investments. Year end variation margin on open futures and cleared swap contracts, if any, is reported within the Statements of Assets and Liabilities. |
Certain Funds are party to International Swaps and Derivatives Association, Inc. Master Agreements, Global Master Repurchase Agreements, Master Securities Loan Agreements or other similar types of agreements (collectively, “Master Agreements”) that generally govern the terms of OTC derivative transactions, repurchase agreements, reverse repurchase agreements and securities loans. The Master Agreements may include collateral posting terms and set-off provisions that apply in the event of a default and/or termination event. Upon the occurrence of such an event, including the bankruptcy or insolvency of the counterparty, the Master Agreements may permit the non-defaulting party to calculate a single net payment to close out applicable transactions. However, there is no guarantee that the terms of a Master Agreement will be enforceable; for example, when bankruptcy or insolvency laws impose restrictions on or prohibitions against the right of offset. Additionally, the set-off and netting provisions of a Master Agreement may not extend to the obligations of the counterparty’s affiliates or across varying types of transactions. Because no such event has occurred, the Funds do not presently have a legally enforceable right of set-off and these amounts have not been offset in the Statements of Assets and Liabilities. Termination events may also include a decline in the net assets of a Fund below a certain level over a specified period of time and may entitle a counterparty to elect an early termination of all the transactions under the Master Agreement with that counterparty. Such an election by one or more of the counterparties could have a material adverse impact on a Fund’s operations. For more information about other uncertainties and risks, see “Investments and other risks” above.
For financial reporting purposes, in the Statements of Assets and Liabilities any cash collateral that has been pledged to cover obligations of the Funds is reported as Due from broker and any cash collateral received from the counterparty is reported as Due to broker. Any non-cash collateral pledged by the Funds is noted in the Schedules of Investments. For financial reporting purposes, the Funds’ Statements of Assets and Liabilities generally show derivative assets and derivative liabilities (regardless of whether they are subject to netting arrangements) on a gross basis, which reflects the full risks and exposures of the Fund prior to netting. See Note 2 for information on repurchase agreements, reverse repurchase agreements and securities loans held by the Funds at February 28, 2023, if any.
199
GMO Trust Funds
Notes to Financial Statements — (Continued)
February 28, 2023
The average derivative activity of notional amounts (futures contracts), based on absolute values, at each month-end, was as follows for the year ended February 28, 2023:
| Fund Name | Futures Contracts ($) | |||
Emerging Markets Fund | 121,253,994 | |||
Emerging Markets Select Equity Fund (formerly Emerging Domestic Opportunities Fund) | 2,067,420 | |||
International Equity Fund | 13,864,240 | |||
Tax-Managed International Equities Fund | 377,475 | |||
U.S. Equity Fund | 4,839,358 | |||
U.S. Small Cap Value Fund | 2,041,687 | |||
| 5. | Fees and other transactions with affiliates |
GMO receives a management fee for the services it provides to each Fund. Management fees are paid monthly at the annual rate equal to the percentage of each Fund’s average daily net assets set forth in the table below:
| Climate Change Fund | Emerging Markets ex-China Fund | Emerging Markets Fund | Emerging Markets Select Equity Fund (formerly Emerging Domestic Opportunities Fund) | International Equity Fund | Japan Value Creation Fund | Quality Cyclicals Fund | Quality Fund | Resource Transition Fund | Resources Fund | Small Cap Quality Fund | Tax-Managed International Equities Fund | U.S. Equity Fund | U.S. Opportunistic Value Fund | U.S. Small Cap Value Fund | ||||||||||||||||||||||||||||||||||||||||||||||||
Management Fee | 0.60 | %(a) | 0.55 | % | 0.65 | %(b) | 0.55 | %(c) | 0.50 | % | 0.50 | % | 0.33 | % | 0.33 | % | 0.80 | % | 0.50 | % | 0.60 | % | 0.50 | % | 0.31 | % | 0.31 | % | 0.31 | % | ||||||||||||||||||||||||||||||||
| (a) | Prior to December 31, 2018, GMO voluntarily agreed to reduce its annual management fee by 0.15%. |
| (b) | Prior to June 30, 2020, GMO contractually agreed to reduce its annual management fee from 0.75% to 0.65%. |
| (c) | Prior to October 26, 2022, Emerging Markets Select Equity Fund’s (formerly Emerging Domestic Opportunities Fund) management fee was 0.75%. |
200
GMO Trust Funds
Notes to Financial Statements — (Continued)
February 28, 2023
In addition, each class of shares of certain Funds pays GMO directly or indirectly a shareholder service fee for providing client services and reporting, such as performance information, client account information, personal and electronic access to Fund information, access to analysis and explanations of Fund reports, and assistance in maintaining and correcting client-related information. Shareholder service fees are paid monthly at the annual rate equal to the percentage of each applicable Class’s average daily net assets set forth in the table below:
| Fund Name | Class II | Class III | Class IV | Class V | Class VI | Class R6 | Class I | |||||||||||||||||||||
Climate Change Fund | 0.15 | % | 0.10 | %* | 0.085 | %* | 0.055 | %* | 0.15 | % | 0.15 | % | ||||||||||||||||
Emerging Markets ex-China Fund | 0.22 | %* | 0.15 | % | 0.105 | %* | 0.085 | %* | 0.055 | % | 0.22 | %* | 0.22 | % | ||||||||||||||
Emerging Markets Fund | 0.22 | % | 0.15 | % | 0.105 | %* | 0.085 | %* | 0.055 | % | 0.22 | % | 0.22 | % | ||||||||||||||
Emerging Markets Select Equity Fund (formerly Emerging Domestic Opportunities Fund) | 0.22 | % | 0.15 | %* | 0.105 | %* | 0.085 | % | 0.055 | %* | 0.22 | %* | 0.22 | % | ||||||||||||||
International Equity Fund | 0.22 | % | 0.15 | % | 0.09 | % | 0.22 | %* | 0.22 | % | ||||||||||||||||||
Japan Value Creation Fund | 0.15 | % | 0.10 | %* | 0.085 | %* | 0.055 | % | 0.15 | %* | 0.15 | % | ||||||||||||||||
Quality Cyclicals Fund | 0.15 | %* | 0.105 | %* | 0.085 | %* | 0.055 | % | 0.15 | %* | 0.15 | % | ||||||||||||||||
Quality Fund | 0.15 | % | 0.105 | % | 0.085 | %* | 0.055 | % | 0.15 | % | 0.15 | % | ||||||||||||||||
Resource Transition Fund | 0.15 | %* | 0.10 | %* | 0.085 | %* | 0.055 | % | 0.15 | %* | 0.15 | %* | ||||||||||||||||
Resources Fund | 0.15 | % | 0.10 | % | 0.085 | %* | 0.055 | % | 0.15 | % | 0.15 | % | ||||||||||||||||
Small Cap Quality Fund | 0.15 | % | 0.10 | %* | 0.085 | %* | 0.055 | % | 0.15 | %* | 0.15 | % | ||||||||||||||||
Tax-Managed International Equities Fund | 0.15 | % | 0.15 | %* | 0.15 | %* | ||||||||||||||||||||||
U.S. Equity Fund | 0.15 | % | 0.10 | %* | 0.085 | %* | 0.055 | % | 0.15 | %* | 0.15 | %* | ||||||||||||||||
U.S. Opportunistic Value Fund | 0.15 | % | 0.10 | % | 0.085 | %* | 0.055 | % | 0.15 | %* | 0.15 | % | ||||||||||||||||
U.S. Small Cap Value Fund | 0.15 | %* | 0.10 | %* | 0.085 | %* | 0.055 | % | 0.15 | %* | 0.15 | %* | ||||||||||||||||
| * | Class is offered but has no shareholders as of February 28, 2023. |
Prior to June 30, 2022, GMO contractually agreed to reimburse Emerging Markets Fund, Emerging Markets Select Equity Fund (formerly Emerging Domestic Opportunities Fund), International Equity Fund, Japan Value Creation Fund, Quality Cyclicals Fund, Tax-Managed International Equities Fund, and U.S. Equity Fund for “Specified Operating Expenses” (as defined below). For U.S. Opportunistic Value Fund and for the period starting June 30, 2022 for International Equity Fund, Japan Value Creation Fund, Quality Cyclicals Fund, Tax-Managed International Equities Fund, and U.S. Equity Fund, GMO has contractually agreed to reimburse the Fund for the portion of its “Specified Operating Expenses” (as defined below) that exceeds 0.01% of the Fund’s average daily net assets. Any such reimbursements are paid to a Fund concurrently with the Fund’s payment of management fees to GMO.
Subject to the exclusions noted below, “Specified Operating Expenses” means: audit expenses, fund accounting expenses, pricing service expenses, expenses of non-investment related tax services, transfer agency expenses (excluding, in the case of Class I shares, any amounts paid for sub-transfer agency, recordkeeping and other administrative services provided by financial intermediaries for the benefit of Class I shareholders), expenses of non-investment related legal services provided to the Funds by or at the direction of GMO, organizational and start-up expenses, federal securities law filing expenses, printing expenses, state and federal registration fees and custody expenses. In the case of Emerging Markets Fund, “Specified Operating Expenses” does not include custody expenses, and in the case of Emerging Markets Select Equity Fund (formerly Emerging Domestic Opportunities Fund) (for the period prior to October 26, 2022), “Specified Operating Expenses” only includes custody expenses to the extent that they exceed 0.10% of the Fund’s average daily net assets.
For Climate Change Fund (prior to September 25, 2018), Resources Fund and U.S. Small Cap Value Fund, GMO has contractually agreed to reimburse the Fund for the portion of its “Specified Operating Expenses” (as defined above) that exceeds 0.10% of the Fund’s average daily net assets. GMO is permitted to recover from the Fund, on a class-by-class basis the “Specified Operating Expenses” GMO has borne or reimbursed (whether through reduction of its fees or otherwise) to the extent that the Funds’ “Specified Operating Expenses” later fall below the annualized rate of 0.10% per year or any lower expense limit in effect when GMO seeks to
201
GMO Trust Funds
Notes to Financial Statements — (Continued)
February 28, 2023
recover the expenses. A Fund, however, is not obligated to pay any such amount more than three years after GMO bore or reimbursed an expense. Any such recovery will not cause a Fund to exceed the annual limitation rate set forth above or any lower expense limit in effect when GMO seeks to recover the expenses.
With respect to Climate Change Fund (for the period starting September 25, 2018), Emerging Markets ex-China Fund, Quality Fund (for the period starting June 30, 2022), Emerging Markets Select Equity (for the period starting October 26, 2022), Resource Transition Fund and Small Cap Quality Fund, GMO has contractually agreed to waive its fees with respect to and/or reimburse each Fund to the extent that the Fund’s total annual fund operating expenses (after applying all other contractual and voluntary expense limitation arrangements in effect at the time) exceed the following amounts for each class of shares, in each case representing the average daily net assets for the indicated class of shares (each, an “Expense Cap”). The Expense Cap for Climate Change Fund is 0.77% for Class III shares; 0.72% for Class IV shares; 0.705% for Class V shares; 0.675% for Class VI shares; 0.77% for Class R6 shares; and 0.77% for Class I shares. The Expense Cap for Emerging Markets ex-China Fund is 0.85% for Class II shares; 0.80% for Class III shares; 0.75%for Class IV shares; 0.70% for Class V shares; 0.67% for Class VI shares; 0.85% for Class R6 shares; and 0.85% for Class I shares. The Expense Cap for Quality Fund is 0.49% for Class III shares; 0.445% for Class IV shares; 0.425% for Class V shares; 0.395% for Class VI shares; 0.48% for Class R6 shares; and 0.48% for Class I shares. The Expense Cap for Emerging Markets Select Equity Fund (formerly Emerging Domestic Opportunities Fund) is 0.75% for Class II shares; 0.70% for Class III shares; 0.65% for Class IV shares; 0.635% for Class V shares; 0.605% for Class VI shares; 0.75% for Class R6 shares; and 0.75% for Class I shares. The Expense Cap for Resource Transition Fund is 0.95% for Class III shares; 0.90% for Class IV shares; 0.885% for Class V shares; 0.855% for Class VI shares; 0.95% for Class R6 shares; and 0.95% for Class I shares. The Expense Cap for Small Cap Quality Fund is 0.75% for Class III shares; 0.70% for Class IV shares; 0.685% for Class V shares; 0.655% for Class VI shares; 0.75% for Class R6 shares; and 0.75% for Class I shares. Fees and expenses of the “non-interested” Trustees and legal counsel to the “non-interested” Trustees, investment-related costs (such as brokerage commissions, interest, and acquired fund fees and expenses), payments out of assets attributable to Class I shares for sub-transfer agency, recordkeeping and other administrative services provided by financial intermediaries, taxes, litigation and indemnification expenses, judgments, and other extraordinary or non-recurring expenses not incurred in the ordinary course of the Fund’s business (“Excluded Expenses”), are excluded from the Expense Cap. GMO is permitted to recover from Emerging Markets ex-China Fund, Climate Change Fund (for the period starting September 25, 2018), and Emerging Markets Select Equity Fund (formerly Emerging Domestic Opportunities Fund) (for the period starting October 26, 2022), on a class-by-class basis, expenses it has borne or reimbursed pursuant to an Expense Cap (whether through reduction of its fees or otherwise) to the extent that the Fund’s total annual fund operating expenses (excluding Excluded Expenses) later fall below that Expense Cap or any lower expense limit in effect when GMO seeks to recover the expenses. The Fund, however, is not obligated to pay any such amount more than three years after GMO bore or reimbursed an expense. Any such recovery will not cause the Fund to exceed the Expense Caps set forth above or any lower expense limits as is in effect at the time GMO seeks to recover expenses.
For the year ended February 28, 2023, GMO did not recoup any previously recorded waivers and/or reimbursements.
202
GMO Trust Funds
Notes to Financial Statements — (Continued)
February 28, 2023
On February 28, 2023, the waivers and/or reimbursements subject to possible future recoupment are as follows:
| Expiring the year ending February 29, 2024 | Expiring the year ending February 28, 2025 | Expiring the year ending February 28, 2026 | ||||||||||
Climate Change Fund, Class III | $ | 168,599 | $ | 105,427 | $ | 138,441 | ||||||
Climate Change Fund, Class R6 | $ | 31,954 | $ | 37,789 | $ | 65,464 | ||||||
Climate Change Fund, Class I | $ | 23,165 | $ | 84,286 | $ | 172,425 | ||||||
Emerging Markets ex-China Fund, Class III | — | $ | 1,152 | $ | 12,927 | |||||||
Emerging Markets ex-China Fund, Class VI | — | $ | 240,690 | $ | 312,667 | |||||||
Emerging Markets ex-China Fund, Class I | — | $ | 0 | * | $ | 0 | * | |||||
Emerging Markets Select Equity Fund (formerly Emerging Domestic Opportunities Fund), Class II | — | — | $ | 107,572 | ||||||||
Emerging Markets Select Equity Fund (formerly Emerging Domestic Opportunities Fund), Class V | — | — | $ | 5,863 | ||||||||
Emerging Markets Select Equity Fund (formerly Emerging Domestic Opportunities Fund), Class I | — | — | $ | 5,659 | ||||||||
| * | Amount is less than $1. |
For each Fund that pays GMO a management fee and shareholder service fee, GMO has contractually agreed to waive or reduce the Fund’s management fee and shareholder service fee, to the extent necessary to offset the management fees and shareholder service fees paid to GMO that are directly or indirectly borne by the Fund or a class of shares of the Fund as a result of the Fund’s direct or indirect investments in other series of GMO Trust (“GMO Funds”). Management fees and shareholder service fees will not be waived below zero.
In addition, for Emerging Markets Fund only, GMO has contractually agreed to waive the shareholder service fees charged to holders of each class of shares of the Fund to the extent necessary to prevent the shareholder service fees borne by each class of shares of the Fund from exceeding the percentage of the class’s average daily net assets as follows: 0.20% for Class II shares, 0.15% for Class III shares, 0.10% for Class IV shares, 0.05% for Class V shares, 0.02% for Class VI shares, 0.20% for Class R6 shares and 0.20% for Class I shares.
These contractual waivers and reimbursements will continue through at least June 30, 2023 for each Fund unless the Funds’ Board of Trustees authorizes their modification or termination or reduces the fee rates paid to GMO under the Fund’s management contract or servicing and supplemental support agreement.
GMO has contractually agreed to reimburse Class I assets of each Fund (or waive its fees) except Small Cap Quality Fund, Emerging Markets Fund (for the period prior to January 27, 2020) and Emerging Markets Select Equity Fund (formerly Emerging Domestic Opportunities Fund) (for the period prior to January 27, 2020) to the extent that payments for sub-transfer agency, recordkeeping and other administrative services provided by financial intermediaries from Class I assets exceed 0.10% of such Fund’s average daily net assets attributable to Class I assets. Effective January 27 2020, GMO has contractually agreed to reimburse Class I assets for Emerging Markets Fund and Emerging Markets Select Equity Fund (formerly Emerging Domestic Opportunities Fund) (for the period prior to October 26, 2022) to the extent payments for sub-transfer agency, recordkeeping and other administrative services from Class I assets exceed 0.05% and 0.03%, respectively, of such Fund’s average daily net assets attributable to Class I assets.
For Small Cap Quality Fund, GMO has contractually agreed to waive its fees with respect to and/or reimburse Class I shares for the amounts paid by the Fund out of the net assets attributable to Class I shares for sub-transfer agency, recordkeeping and other administrative services provided by financial intermediaries with respect to Class I shareholders. This reimbursement will continue through at least October 1, 2023 and may not be terminated prior to this date without the action or consent of the Trust’s Board of Trustees.
203
GMO Trust Funds
Notes to Financial Statements — (Continued)
February 28, 2023
Sub-Transfer Agent/Recordkeeping Payments
Class II, III, IV, V, VI and R6 shares are not subject to payments to third parties for sub-transfer agent, recordkeeping and other administrative services. GMO may, on a case-by-case basis, make payments for sub-transfer agent, recordkeeping and other administrative services provided by financial intermediaries for the benefit of shareholders of these classes. Any such payments are made by GMO out of its own resources and are not an additional charge to a Fund or the holders of Class II, III, IV, V, VI or Class R6 shares. These payments may create a conflict of interest by influencing a financial intermediary to recommend a Fund over another investment.
Class I shares are subject to payments for sub-transfer agency, recordkeeping and other administrative services provided by financial intermediaries for the benefit of holders of Class I shares through an account maintained by a third party platform or intermediary. These services are not primarily intended to result in the sale of Fund shares but instead to provide ongoing services with respect to holders of Class I shares through a third-party platform or intermediary. Because payments for sub-transfer agency, recordkeeping and other administrative services are paid out of a Fund’s Class I assets on an ongoing basis, over time they will increase the cost of an investment in Class I shares. In addition, GMO may, on a case-by-case basis, make payments for sub-transfer agency, recordkeeping and other administrative services provided by financial intermediaries with respect to shareholders of Class I shares. Any such payments will be made by GMO out of its own resources and will not be an additional charge to a Fund or the holders of Class I shares. Any such payments will create a conflict of interest by influencing a financial intermediary to recommend a Fund over another investment.
The Funds’ portion of the fees paid by the Trust to the Trust’s independent Trustees and their legal counsel and any agents unaffiliated with GMO during the year ended February 28, 2023 is shown in the table below and is included in the Statements of Operations.
| Fund Name | Independent Trustees and their legal counsel ($) | |||
Climate Change Fund | 38,299 | |||
Emerging Markets ex-China Fund | 10,273 | |||
Emerging Markets Fund | 74,926 | |||
Emerging Markets Select Equity Fund (formerly Emerging Domestic Opportunities Fund) | 19,855 | |||
International Equity Fund | 74,379 | |||
Japan Value Creation Fund | 6,146 | |||
Quality Cyclicals Fund | 5,275 | |||
Quality Fund | 342,242 | |||
Resource Transition Fund | 434 | |||
Resources Fund | 107,950 | |||
Small Cap Quality Fund | 1,445 | |||
Tax-Managed International Equities Fund | 1,735 | |||
U.S. Equity Fund | 19,274 | |||
U.S. Opportunistic Value Fund | 1,688 | |||
U.S. Small Cap Value Fund | 8,420 | |||
Certain Funds incur fees and expenses indirectly as a shareholder in the underlying funds. For the year ended February 28, 2023, none of the Funds had annualized indirect fees and expenses greater than 0.01% of the Fund’s average daily net assets.
The Funds are permitted to purchase or sell securities from or to other GMO Trust funds under specified conditions outlined in procedures adopted by the Trustees. The procedures have been designed to ensure that any purchase or sale of securities by a Fund from or to another GMO Trust fund complies with rule 17a-7 of the 1940 Act. Further, as defined under the procedures, each transaction is effectuated at the current market price. During the year ended February 28, 2023, Japan Value Creation Fund engaged in cross trade purchases in the amount of $8,936,387.
204
GMO Trust Funds
Notes to Financial Statements — (Continued)
February 28, 2023
| 6. | Purchases and sales of securities |
Cost of purchases and proceeds from sales of securities, excluding short-term investments and including GMO U.S. Treasury Fund, if applicable, for the year ended February 28, 2023 are noted in the table below:
| Purchases ($) | Purchases ($) | Sales ($) | Sales ($) | |||||||||||||
| Fund Name | U.S. Government Securities | Investments (Non-U.S. Government Securities) | U.S. Government Securities | Investments (Non-U.S. Government Securities) | ||||||||||||
Climate Change Fund | — | 1,248,348,793 | — | 1,073,578,109 | ||||||||||||
Emerging Markets ex-China Fund | — | 418,104,183 | — | 388,488,242 | ||||||||||||
Emerging Markets Fund | — | 1,928,789,103 | 5,363,442 | 2,532,915,074 | ||||||||||||
Emerging Markets Select Equity Fund (formerly Emerging Domestic Opportunities Fund) | — | 473,265,013 | — | 940,001,216 | ||||||||||||
International Equity Fund | 44,957,551 | 875,620,053 | 40,943,511 | 1,322,330,149 | ||||||||||||
Japan Value Creation Fund | — | 48,232,418 | — | 78,790,604 | ||||||||||||
Quality Cyclicals Fund | — | 30,770,739 | — | 94,348,969 | ||||||||||||
Quality Fund | 39,998,092 | 1,702,527,450 | 39,959,902 | 2,669,092,629 | ||||||||||||
Resource Transition Fund | — | 494,925,156 | — | 10,500,000 | ||||||||||||
Resources Fund | — | 1,590,035,503 | — | 1,855,761,340 | ||||||||||||
Small Cap Quality Fund | — | 110,503,998 | — | 66,013,669 | ||||||||||||
Tax-Managed International Equities Fund | — | 50,806,541 | — | 48,377,150 | ||||||||||||
U.S. Equity Fund | — | 346,140,485 | — | 554,279,139 | ||||||||||||
U.S. Opportunistic Value Fund | — | 482,935,948 | — | 204,581,647 | ||||||||||||
U.S. Small Cap Value Fund | — | 103,445,379 | — | 300,199,369 | ||||||||||||
Included in the table above are cost of purchases and proceeds from sales of securities for in-kind transactions, excluding short-term investments, if any, in accordance with U.S. GAAP for the year ended February 28, 2023. In-kind purchases and sales of securities, including short-term investments, if any, and net realized gains/(losses) attributed to redemption in-kind transactions, if any, are noted in the table below:
| Fund Name | In-Kind Purchases ($) | In-Kind Sales ($) | Net realized gains/(losses) attributed to redemption in-kind transactions ($) | |||||||||
Quality Fund | — | 97,279,466 | ** | 42,108,472 | ||||||||
Resource Transition Fund | 262,495,845 | * | — | — | ||||||||
Resources Fund | — | 262,495,845 | ** | 91,712,369 | ||||||||
| * | The purchase in-kind was made by an affiliate. |
| ** | The redemption in-kind was redeemed by an affiliate. |
| 7. | Guarantees |
In the normal course of business the Funds enter into contracts with third-party service providers that contain a variety of representations and warranties and that provide general indemnifications. The Funds’ maximum exposure under these arrangements is unknown, as it involves possible future claims that may or may not be made against the Funds. Based on experience, GMO is of the view that the risk of loss to the Funds in connection with the Funds’ indemnification obligations is remote; however, there can be no assurance that such obligations will not result in material liabilities that adversely affect the Funds.
205
GMO Trust Funds
Notes to Financial Statements — (Continued)
February 28, 2023
| 8. | Principal shareholders as of February 28, 2023 |
| Percentage of | ||||||||
| outstanding shares of | ||||||||
| Number of | the Fund held by those | |||||||
| shareholders that held | shareholders owning | |||||||
| more than 10% of the | greater than 10% of the | |||||||
| outstanding shares of | outstanding shares of | |||||||
| Fund Name | the Fund | the Fund | ||||||
Climate Change Fund | 2 | 27.34 | % | |||||
Emerging Markets ex-China Fund* | 3 | # | 61.64 | % | ||||
Emerging Markets Fund* | 2 | ‡ | 42.48 | % | ||||
Emerging Markets Select Equity Fund (formerly Emerging Domestic Opportunities Fund)* | 4 | 72.14 | % | |||||
International Equity Fund | 4 | § | 76.01 | % | ||||
Japan Value Creation Fund | 4 | § | 65.98 | % | ||||
Quality Cyclicals Fund | 3 | # | 79.58 | % | ||||
Quality Fund | — | — | ||||||
Resource Transition Fund | 1 | 100.00 | % | |||||
Resources Fund | 1 | 22.24 | % | |||||
Small Cap Quality Fund | 4 | § | 84.23 | % | ||||
Tax-Managed International Equities Fund | 1 | 88.05 | % | |||||
U.S. Equity Fund | 3 | ‡ | 78.64 | % | ||||
U.S. Opportunistic Value Fund | 3 | ‡ | 66.90 | % | ||||
U.S. Small Cap Value Fund | 3 | # | 93.17 | % | ||||
| * | The Fund’s outstanding shares were owned by 10 or more shareholders as of February 28, 2023. |
| # | Two of the shareholders are other funds of the Trust. |
| ‡ | One of the shareholders is another fund of the Trust. |
| § | Three of the shareholders are other funds of the Trust. |
| 9. | Share transactions |
The Declaration of Trust permits each Fund to issue an unlimited number of shares of beneficial interest (without par value). Transactions in the Funds’ shares were as follows:
| Year Ended | Year Ended | |||||||||||||||
| February 28, 2023 | February 28, 2022 | |||||||||||||||
| Shares | Amount | Shares | Amount | |||||||||||||
Climate Change Fund | ||||||||||||||||
Class III: | ||||||||||||||||
Shares sold | 2,293,579 | $ | 63,698,181 | 4,396,243 | $ | 149,142,682 | ||||||||||
Shares issued to shareholders in reinvestment of distributions | 270,003 | 6,770,829 | 1,249,982 | 39,118,226 | ||||||||||||
Shares repurchased | (1,296,895 | ) | (36,085,920 | ) | (672,638 | ) | (22,509,032 | ) | ||||||||
|
|
|
|
|
|
|
| |||||||||
Net increase (decrease) | 1,266,687 | $ | 34,383,090 | 4,973,587 | $ | 165,751,876 | ||||||||||
|
|
|
|
|
|
|
| |||||||||
Class R6: | ||||||||||||||||
Shares sold | 2,750,968 | $ | 77,763,896 | 1,285,070 | $ | 39,436,952 | ||||||||||
Shares issued to shareholders in reinvestment of distributions | 119,945 | 3,035,164 | 432,217 | 13,530,454 | ||||||||||||
Shares repurchased | (335,884 | ) | (9,419,582 | ) | (88,861 | ) | (2,777,808 | ) | ||||||||
|
|
|
|
|
|
|
| |||||||||
Net increase (decrease) | 2,535,029 | $ | 71,379,478 | 1,628,426 | $ | 50,189,598 | ||||||||||
|
|
|
|
|
|
|
| |||||||||
206
GMO Trust Funds
Notes to Financial Statements — (Continued)
February 28, 2023
| Year Ended | Year Ended | |||||||||||||||
| February 28, 2023 | February 28, 2022 | |||||||||||||||
| Shares | Amount | Shares | Amount | |||||||||||||
Climate Change Fund (continued) | ||||||||||||||||
Class I: | ||||||||||||||||
Shares sold | 8,677,070 | $ | 250,563,272 | 7,873,871 | $ | 255,196,026 | ||||||||||
Shares issued to shareholders in reinvestment of distributions | 306,421 | 7,654,596 | 906,464 | 28,189,754 | ||||||||||||
Shares repurchased | (4,649,309 | ) | (124,996,444 | ) | (1,437,226 | ) | (47,399,923 | ) | ||||||||
|
|
|
|
|
|
|
| |||||||||
Net increase (decrease) | 4,334,182 | $ | 133,221,424 | 7,343,109 | $ | 235,985,857 | ||||||||||
|
|
|
|
|
|
|
| |||||||||
Emerging Markets ex-China Fund | ||||||||||||||||
Class III:(a) | ||||||||||||||||
Shares sold | 1,226,028 | $ | 16,900,000 | 897,980 | $ | 16,532,557 | ||||||||||
Shares issued to shareholders in reinvestment of distributions | 58,596 | 759,928 | 1,172 | 23,270 | ||||||||||||
Shares repurchased | (31,508 | ) | (420,000 | ) | (9,824 | ) | (190,000 | ) | ||||||||
|
|
|
|
|
|
|
| |||||||||
Net increase (decrease) | 1,253,116 | $ | 17,239,928 | 889,328 | $ | 16,365,827 | ||||||||||
|
|
|
|
|
|
|
| |||||||||
Class VI:(b) | ||||||||||||||||
Shares sold | 7,082,596 | $ | 99,117,301 | 17,827,432 | $ | 355,913,395 | ||||||||||
Shares issued to shareholders in reinvestment of distributions | 1,038,893 | 13,467,979 | 115,695 | 2,297,709 | ||||||||||||
Shares repurchased | (8,104,086 | ) | (111,115,582 | ) | (994,450 | ) | (18,359,868 | ) | ||||||||
|
|
|
|
|
|
|
| |||||||||
Net increase (decrease) | 17,403 | $ | 1,469,698 | 16,948,677 | $ | 339,851,236 | ||||||||||
|
|
|
|
|
|
|
| |||||||||
Class I:(c) | ||||||||||||||||
Shares sold | — | $ | — | 26 | $ | 500 | ||||||||||
Shares issued to shareholders in reinvestment of distributions | 1 | 15 | — | 3 | ||||||||||||
|
|
|
|
|
|
|
| |||||||||
Net increase (decrease) | 1 | $ | 15 | 26 | $ | 503 | ||||||||||
|
|
|
|
|
|
|
| |||||||||
Emerging Markets Fund | ||||||||||||||||
Class II: | ||||||||||||||||
Shares sold | 1,277,650 | $ | 30,440,000 | 2,606,322 | $ | 88,755,053 | ||||||||||
Shares issued to shareholders in reinvestment of distributions | 291,417 | 6,477,785 | 206,838 | 7,025,529 | ||||||||||||
Shares repurchased | (3,438,032 | ) | (84,610,630 | ) | (1,960,353 | ) | (71,639,850 | ) | ||||||||
|
|
|
|
|
|
|
| |||||||||
Net increase (decrease) | (1,868,965 | ) | $ | (47,692,845 | ) | 852,807 | $ | 24,140,732 | ||||||||
|
|
|
|
|
|
|
| |||||||||
Class III: | ||||||||||||||||
Shares sold | 390,168 | $ | 10,000,000 | 90,991 | $ | 3,125,000 | ||||||||||
Shares issued to shareholders in reinvestment of distributions | 162,785 | 3,655,845 | 200,077 | 6,847,588 | ||||||||||||
Shares repurchased | (9,483,449 | ) | (214,652,448 | ) | (4,992,075 | ) | (176,344,146 | ) | ||||||||
|
|
|
|
|
|
|
| |||||||||
Net increase (decrease) | (8,930,496 | ) | $ | (200,996,603 | ) | (4,701,007 | ) | $ | (166,371,558 | ) | ||||||
|
|
|
|
|
|
|
| |||||||||
Class V:(d) | ||||||||||||||||
Shares repurchased | — | $ | — | (8,449,876 | ) | $ | (315,869,299 | ) | ||||||||
|
|
|
|
|
|
|
| |||||||||
Net increase (decrease) | — | $ | — | (8,449,876 | ) | $ | (315,869,299 | ) | ||||||||
|
|
|
|
|
|
|
| |||||||||
Class VI: | ||||||||||||||||
Shares sold | 5,482,286 | $ | 139,068,333 | 13,464,812 | $ | 499,344,486 | ||||||||||
Shares issued to shareholders in reinvestment of distributions | 2,643,339 | 58,261,285 | 1,923,723 | 64,976,185 | ||||||||||||
Shares repurchased | (22,625,062 | ) | (523,227,468 | ) | (22,366,927 | ) | (813,771,305 | ) | ||||||||
|
|
|
|
|
|
|
| |||||||||
Net increase (decrease) | (14,499,437 | ) | $ | (325,897,850 | ) | (6,978,392 | ) | $ | (249,450,634 | ) | ||||||
|
|
|
|
|
|
|
| |||||||||
207
GMO Trust Funds
Notes to Financial Statements — (Continued)
February 28, 2023
| Year Ended | Year Ended | |||||||||||||||
| February 28, 2023 | February 28, 2022 | |||||||||||||||
| Shares | Amount | Shares | Amount | |||||||||||||
Emerging Markets Fund (continued) | ||||||||||||||||
Class R6: | ||||||||||||||||
Shares sold | 330,449 | $ | 8,182,854 | 253,043 | $ | 9,226,510 | ||||||||||
Shares issued to shareholders in reinvestment of distributions | 67,172 | 1,501,438 | 57,004 | 1,932,218 | ||||||||||||
Shares repurchased | (1,242,779 | ) | (28,551,548 | ) | (150,830 | ) | (5,473,092 | ) | ||||||||
|
|
|
|
|
|
|
| |||||||||
Net increase (decrease) | (845,158 | ) | $ | (18,867,256 | ) | 159,217 | $ | 5,685,636 | ||||||||
|
|
|
|
|
|
|
| |||||||||
Class I: | ||||||||||||||||
Shares sold | 4,488,230 | $ | 101,205,649 | 2,589,594 | $ | 93,382,590 | ||||||||||
Shares issued to shareholders in reinvestment of distributions | 305,559 | 6,768,479 | 158,470 | 5,361,706 | ||||||||||||
Shares repurchased | (4,854,907 | ) | (109,001,214 | ) | (892,702 | ) | (30,798,776 | ) | ||||||||
|
|
|
|
|
|
|
| |||||||||
Net increase (decrease) | (61,118 | ) | $ | (1,027,086 | ) | 1,855,362 | $ | 67,945,520 | ||||||||
|
|
|
|
|
|
|
| |||||||||
Emerging Markets Select Equity Fund (formerly Emerging Domestic Opportunities Fund) | ||||||||||||||||
Class II: | ||||||||||||||||
Shares sold | 70,922 | $ | 1,500,000 | 407,827 | $ | 10,609,510 | ||||||||||
Shares issued to shareholders in reinvestment of distributions | 160,512 | 2,821,893 | 833,460 | 19,536,789 | ||||||||||||
Shares repurchased | (4,777,771 | ) | (89,467,536 | ) | (1,571,408 | ) | (40,569,449 | ) | ||||||||
|
|
|
|
|
|
|
| |||||||||
Net increase (decrease) | (4,546,337 | ) | $ | (85,145,643 | ) | (330,121 | ) | $ | (10,423,150 | ) | ||||||
|
|
|
|
|
|
|
| |||||||||
Class V: | ||||||||||||||||
Shares sold | 1,879,699 | $ | 40,000,000 | 1,027,838 | $ | 24,000,001 | ||||||||||
Shares issued to shareholders in reinvestment of distributions | 193,914 | 3,512,029 | 1,710,648 | 40,195,448 | ||||||||||||
Shares repurchased | (24,921,887 | ) | (457,973,195 | ) | (4,735,609 | ) | (126,692,942 | ) | ||||||||
|
|
|
|
|
|
|
| |||||||||
Net increase (decrease) | (22,848,274 | ) | $ | (414,461,166 | ) | (1,997,123 | ) | $ | (62,497,493 | ) | ||||||
|
|
|
|
|
|
|
| |||||||||
Class I: | ||||||||||||||||
Shares sold | 50,310 | $ | 943,106 | 205,682 | $ | 5,688,566 | ||||||||||
Shares issued to shareholders in reinvestment of distributions | 10,306 | 181,455 | 44,186 | 1,037,354 | ||||||||||||
Shares repurchased | (257,747 | ) | (4,450,531 | ) | (393,002 | ) | (10,368,048 | ) | ||||||||
|
|
|
|
|
|
|
| |||||||||
Net increase (decrease) | (197,131 | ) | $ | (3,325,970 | ) | (143,134 | ) | $ | (3,642,128 | ) | ||||||
|
|
|
|
|
|
|
| |||||||||
International Equity Fund | ||||||||||||||||
Class II: | ||||||||||||||||
Shares sold | — | $ | — | 67 | $ | 1,543 | ||||||||||
Shares issued to shareholders in reinvestment of distributions | 3,425 | 69,812 | 6,894 | 160,857 | ||||||||||||
Shares repurchased | (34,224 | ) | (706,423 | ) | (328 | ) | (7,990 | ) | ||||||||
|
|
|
|
|
|
|
| |||||||||
Net increase (decrease) | (30,799 | ) | $ | (636,611 | ) | 6,633 | $ | 154,410 | ||||||||
|
|
|
|
|
|
|
| |||||||||
Class III: | ||||||||||||||||
Shares sold | 2,704,405 | $ | 57,352,993 | 902,391 | $ | 22,300,898 | ||||||||||
Shares issued to shareholders in reinvestment of distributions | 652,563 | 13,506,456 | 1,036,029 | 24,543,676 | ||||||||||||
Shares repurchased | (2,014,765 | ) | (41,365,309 | ) | (4,491,351 | ) | (111,707,638 | ) | ||||||||
|
|
|
|
|
|
|
| |||||||||
Net increase (decrease) | 1,342,203 | $ | 29,494,140 | (2,552,931 | ) | $ | (64,863,064 | ) | ||||||||
|
|
|
|
|
|
|
| |||||||||
208
GMO Trust Funds
Notes to Financial Statements — (Continued)
February 28, 2023
| Year Ended | Year Ended | |||||||||||||||
| February 28, 2023 | February 28, 2022 | |||||||||||||||
| Shares | Amount | Shares | Amount | |||||||||||||
International Equity Fund (continued) | ||||||||||||||||
Class IV: | ||||||||||||||||
Shares sold | 2,432,877 | $ | 47,902,468 | 6,293,011 | $ | 158,848,803 | ||||||||||
Shares issued to shareholders in reinvestment of distributions | 2,465,511 | 50,894,941 | 4,392,308 | 103,725,041 | ||||||||||||
Shares repurchased | (29,069,183 | ) | (625,692,598 | ) | (19,692,831 | ) | (483,373,679 | ) | ||||||||
|
|
|
|
|
|
|
| |||||||||
Net increase (decrease) | (24,170,795 | ) | $ | (526,895,189 | ) | (9,007,512 | ) | $ | (220,799,835 | ) | ||||||
|
|
|
|
|
|
|
| |||||||||
Class I:(e) | ||||||||||||||||
Shares sold | — | $ | — | 130,919 | $ | 3,300,485 | ||||||||||
Shares issued to shareholders in reinvestment of distributions | 5,087 | 105,835 | 6,199 | 143,501 | ||||||||||||
Shares repurchased | (6,920 | ) | (155,015 | ) | (6,198 | ) | (143,480 | ) | ||||||||
|
|
|
|
|
|
|
| |||||||||
Net increase (decrease) | (1,833 | ) | $ | (49,180 | ) | 130,920 | $ | 3,300,506 | ||||||||
|
|
|
|
|
|
|
| |||||||||
Japan Value Creation Fund | ||||||||||||||||
Class III:(f) | ||||||||||||||||
Shares sold | 619,507 | $ | 11,000,000 | 1,201,005 | $ | 23,595,006 | ||||||||||
Shares issued to shareholders in reinvestment of distributions | 86,864 | 1,377,552 | — | — | ||||||||||||
Shares repurchased | (436,366 | ) | (8,137,284 | ) | — | — | ||||||||||
|
|
|
|
|
|
|
| |||||||||
Net increase (decrease) | 270,005 | $ | 4,240,268 | 1,201,005 | $ | 23,595,006 | ||||||||||
|
|
|
|
|
|
|
| |||||||||
Class VI: | ||||||||||||||||
Shares sold | 959,693 | $ | 15,667,481 | 711,481 | (g) | $ | 16,519,323 | (g) | ||||||||
Shares issued to shareholders in reinvestment of distributions | 384,538 | 6,098,598 | 1,165,547 | 24,281,578 | ||||||||||||
Shares repurchased | (3,282,287 | ) | (55,622,608 | ) | (2,110,286 | ) | (45,245,731 | ) | ||||||||
|
|
|
|
|
|
|
| |||||||||
Net increase (decrease) | (1,938,056 | ) | $ | (33,856,529 | ) | (233,258 | ) | $ | (4,444,830 | ) | ||||||
|
|
|
|
|
|
|
| |||||||||
Class I:(h) | ||||||||||||||||
Shares sold | 50,299 | $ | 859,951 | 150,076 | $ | 3,372,125 | ||||||||||
Shares issued to shareholders in reinvestment of distributions | 7,979 | 126,318 | 14,815 | 306,209 | ||||||||||||
Shares repurchased | (124,158 | ) | (2,050,229 | ) | (7,083 | ) | (143,012 | ) | ||||||||
|
|
|
|
|
|
|
| |||||||||
Net increase (decrease) | (65,880 | ) | $ | (1,063,960 | ) | 157,808 | $ | 3,535,322 | ||||||||
|
|
|
|
|
|
|
| |||||||||
Quality Cyclicals Fund | ||||||||||||||||
Class VI: | ||||||||||||||||
Shares sold | 67,181 | $ | 1,423,995 | 4,504 | $ | 133,246 | ||||||||||
Shares issued to shareholders in reinvestment of distributions | 603,708 | 12,448,036 | 1,088,936 | 29,159,128 | ||||||||||||
Shares repurchased | (2,996,166 | ) | (68,150,996 | ) | (489,406 | ) | (15,000,655 | ) | ||||||||
|
|
|
|
|
|
|
| |||||||||
Net increase (decrease) | (2,325,277 | ) | $ | (54,278,965 | ) | 604,034 | $ | 14,291,719 | ||||||||
|
|
|
|
|
|
|
| |||||||||
Class I:(i) | ||||||||||||||||
Shares sold | — | $ | — | 3,162 | $ | 89,975 | ||||||||||
Shares issued to shareholders in reinvestment of distributions | 390 | 8,044 | 380 | 9,434 | ||||||||||||
Shares repurchased | (390 | ) | (8,044 | ) | (380 | ) | (9,434 | ) | ||||||||
|
|
|
|
|
|
|
| |||||||||
Net increase (decrease) | — | $ | — | 3,162 | $ | 89,975 | ||||||||||
|
|
|
|
|
|
|
| |||||||||
209
GMO Trust Funds
Notes to Financial Statements — (Continued)
February 28, 2023
| Year Ended | Year Ended | |||||||||||||||
| February 28, 2023 | February 28, 2022 | |||||||||||||||
| Shares | Amount | Shares | Amount | |||||||||||||
Quality Fund | ||||||||||||||||
Class III: | ||||||||||||||||
Shares sold | 29,027,931 | $ | 707,656,996 | 10,762,535 | $ | 311,185,638 | ||||||||||
Shares issued to shareholders in reinvestment of distributions | 10,035,515 | 241,386,991 | 6,211,089 | 184,230,822 | ||||||||||||
Shares repurchased | (24,430,061 | ) | (628,377,759 | ) | (45,655,713 | ) | (1,352,856,414 | ) | ||||||||
|
|
|
|
|
|
|
| |||||||||
Net increase (decrease) | 14,633,385 | $ | 320,666,228 | (28,682,089 | ) | $ | (857,439,954 | ) | ||||||||
|
|
|
|
|
|
|
| |||||||||
Class IV: | ||||||||||||||||
Shares sold | 8,731,142 | $ | 219,481,613 | 24,890,734 | $ | 743,002,525 | ||||||||||
Shares issued to shareholders in reinvestment of distributions | 3,610,473 | 87,058,631 | 1,698,410 | 50,525,221 | ||||||||||||
Shares repurchased | (27,218,142 | ) | (660,313,180 | ) | (22,990,583 | ) | (681,793,126 | ) | ||||||||
|
|
|
|
|
|
|
| |||||||||
Net increase (decrease) | (14,876,527 | ) | $ | (353,772,936 | ) | 3,598,561 | $ | 111,734,620 | ||||||||
|
|
|
|
|
|
|
| |||||||||
Class VI: | ||||||||||||||||
Shares sold | 16,844,643 | $ | 424,865,852 | 33,411,262 | $ | 985,954,280 | ||||||||||
Shares issued to shareholders in reinvestment of distributions | 11,765,228 | 282,951,395 | 7,098,478 | 210,592,163 | ||||||||||||
Shares repurchased | (58,380,318 | )(j) | (1,473,456,086 | )(j) | (12,013,379 | ) | (356,648,291 | ) | ||||||||
|
|
|
|
|
|
|
| |||||||||
Net increase (decrease) | (29,770,447 | ) | $ | (765,638,839 | ) | 28,496,361 | $ | 839,898,152 | ||||||||
|
|
|
|
|
|
|
| |||||||||
Class R6: | ||||||||||||||||
Shares sold | 17,754,787 | $ | 434,999,443 | 6,146,062 | $ | 180,898,983 | ||||||||||
Shares issued to shareholders in reinvestment of distributions | 2,148,260 | 51,549,418 | 827,128 | 24,514,251 | ||||||||||||
Shares repurchased | (5,557,361 | ) | (139,787,047 | ) | (1,596,874 | ) | (47,414,894 | ) | ||||||||
|
|
|
|
|
|
|
| |||||||||
Net increase (decrease) | 14,345,686 | $ | 346,761,814 | 5,376,316 | $ | 157,998,340 | ||||||||||
|
|
|
|
|
|
|
| |||||||||
Class I: | ||||||||||||||||
Shares sold | 7,697,744 | $ | 194,255,441 | 7,086,571 | $ | 206,735,852 | ||||||||||
Shares issued to shareholders in reinvestment of distributions | 1,845,669 | 44,276,266 | 803,359 | 23,785,537 | ||||||||||||
Shares repurchased | (6,232,234 | ) | (154,702,220 | ) | (2,376,575 | ) | (69,883,916 | ) | ||||||||
|
|
|
|
|
|
|
| |||||||||
Net increase (decrease) | 3,311,179 | $ | 83,829,487 | 5,513,355 | $ | 160,637,473 | ||||||||||
|
|
|
|
|
|
|
| |||||||||
Resource Transition Fund | ||||||||||||||||
Class VI:(k) | ||||||||||||||||
Shares sold | 24,250,000 | (l) | $ | 485,000,000 | (l) | |||||||||||
|
|
|
| |||||||||||||
Net increase (decrease) | 24,250,000 | $ | 485,000,000 | |||||||||||||
|
|
|
| |||||||||||||
Resources Fund | ||||||||||||||||
Class III: | ||||||||||||||||
Shares sold | 5,838,113 | $ | 150,228,136 | 8,981,611 | $ | 257,064,425 | ||||||||||
Shares issued to shareholders in reinvestment of distributions | 977,612 | 23,410,659 | 1,052,726 | 29,016,330 | ||||||||||||
Shares repurchased | (2,393,374 | ) | (62,777,402 | ) | (5,062,843 | ) | (147,877,164 | ) | ||||||||
|
|
|
|
|
|
|
| |||||||||
Net increase (decrease) | 4,422,351 | $ | 110,861,393 | 4,971,494 | $ | 138,203,591 | ||||||||||
|
|
|
|
|
|
|
| |||||||||
210
GMO Trust Funds
Notes to Financial Statements — (Continued)
February 28, 2023
| Year Ended | Year Ended | |||||||||||||||
| February 28, 2023 | February 28, 2022 | |||||||||||||||
| Shares | Amount | Shares | Amount | |||||||||||||
Resources Fund (continued) | ||||||||||||||||
Class IV: | ||||||||||||||||
Shares sold | 4,970,697 | $ | 138,669,163 | 20,735,965 | $ | 604,670,278 | ||||||||||
Shares issued to shareholders in reinvestment of distributions | 1,402,172 | 33,474,027 | 3,423,141 | 94,223,444 | ||||||||||||
Shares repurchased | (6,146,566 | ) | (158,835,193 | ) | (29,760,042 | ) | (866,303,735 | ) | ||||||||
|
|
|
|
|
|
|
| |||||||||
Net increase (decrease) | 226,303 | $ | 13,307,997 | (5,600,936 | ) | $ | (167,410,013 | ) | ||||||||
|
|
|
|
|
|
|
| |||||||||
Class VI:(m) | ||||||||||||||||
Shares sold | 5,144,338 | $ | 137,190,816 | 29,775,768 | $ | 866,735,067 | ||||||||||
Shares issued to shareholders in reinvestment of distributions | 3,298,787 | 78,893,459 | — | — | ||||||||||||
Shares repurchased | (35,579,492 | )(n) | (949,952,489 | )(n) | — | — | ||||||||||
|
|
|
|
|
|
|
| |||||||||
Net increase (decrease) | (27,136,367 | ) | $ | (733,868,214 | ) | 29,775,768 | $ | 866,735,067 | ||||||||
|
|
|
|
|
|
|
| |||||||||
Class R6: | ||||||||||||||||
Shares sold | 10,952,827 | $ | 284,224,101 | 3,927,986 | $ | 112,964,982 | ||||||||||
Shares issued to shareholders in reinvestment of distributions | 525,919 | 12,572,025 | 121,620 | 3,313,878 | ||||||||||||
Shares repurchased | (2,566,399 | ) | (67,345,487 | ) | (439,984 | ) | (12,570,805 | ) | ||||||||
|
|
|
|
|
|
|
| |||||||||
Net increase (decrease) | 8,912,347 | $ | 229,450,639 | 3,609,622 | $ | 103,708,055 | ||||||||||
|
|
|
|
|
|
|
| |||||||||
Class I: | ||||||||||||||||
Shares sold | 14,656,338 | $ | 394,486,306 | 12,802,341 | $ | 367,878,139 | ||||||||||
Shares issued to shareholders in reinvestment of distributions | 1,436,534 | 34,315,888 | 942,416 | 25,987,421 | ||||||||||||
Shares repurchased | (9,009,983 | ) | (232,952,111 | ) | (4,708,721 | ) | (135,872,354 | ) | ||||||||
|
|
|
|
|
|
|
| |||||||||
Net increase (decrease) | 7,082,889 | $ | 195,850,083 | 9,036,036 | $ | 257,993,206 | ||||||||||
|
|
|
|
|
|
|
| |||||||||
Small Cap Quality Fund | ||||||||||||||||
Class III:(o) | ||||||||||||||||
Shares sold | 579,284 | $ | 13,713,763 | |||||||||||||
Shares issued to shareholders in reinvestment of distributions | 48,771 | 1,078,895 | ||||||||||||||
Shares repurchased | (22,604 | ) | (500,000 | ) | ||||||||||||
|
|
|
| |||||||||||||
Net increase (decrease) | 605,451 | $ | 14,292,658 | |||||||||||||
|
|
|
| |||||||||||||
Class VI:(p) | ||||||||||||||||
Shares sold | 4,834,315 | $ | 95,350,175 | |||||||||||||
Shares issued to shareholders in reinvestment of distributions | 274,277 | 6,070,048 | ||||||||||||||
Shares repurchased | (2,778,035 | ) | (63,501,222 | ) | ||||||||||||
|
|
|
| |||||||||||||
Net increase (decrease) | 2,330,557 | $ | 37,919,001 | |||||||||||||
|
|
|
| |||||||||||||
Class I:(o) | ||||||||||||||||
Shares sold | 871 | $ | 20,000 | |||||||||||||
Shares issued to shareholders in reinvestment of distributions | 74 | 1,643 | ||||||||||||||
|
|
|
| |||||||||||||
Net increase (decrease) | 945 | $ | 21,643 | |||||||||||||
|
|
|
| |||||||||||||
211
GMO Trust Funds
Notes to Financial Statements — (Continued)
February 28, 2023
| Year Ended | Year Ended | |||||||||||||||
| February 28, 2023 | February 28, 2022 | |||||||||||||||
| Shares | Amount | Shares | Amount | |||||||||||||
Tax-Managed International Equities Fund | ||||||||||||||||
Class III: | ||||||||||||||||
Shares sold | 1,278,438 | $ | 17,610,421 | 18,656 | $ | 275,619 | ||||||||||
Shares issued to shareholders in reinvestment of distributions | 19,213 | 234,924 | 63,193 | 910,792 | ||||||||||||
Shares repurchased | (1,189,473 | ) | (14,788,808 | ) | (297,762 | ) | (5,014,362 | ) | ||||||||
|
|
|
|
|
|
|
| |||||||||
Net increase (decrease) | 108,178 | $ | 3,056,537 | (215,913 | ) | $ | (3,827,951 | ) | ||||||||
|
|
|
|
|
|
|
| |||||||||
U.S. Equity Fund | ||||||||||||||||
Class III: | ||||||||||||||||
Shares sold | 780,199 | $ | 9,542,163 | — | $ | — | ||||||||||
Shares issued to shareholders in reinvestment of distributions | 434,605 | 5,152,616 | 1,201,808 | 17,671,434 | ||||||||||||
Shares repurchased | (3,111,887 | ) | (38,988,204 | ) | (2,649,751 | ) | (42,595,783 | ) | ||||||||
|
|
|
|
|
|
|
| |||||||||
Net increase (decrease) | (1,897,083 | ) | $ | (24,293,425 | ) | (1,447,943 | ) | $ | (24,924,349 | ) | ||||||
|
|
|
|
|
|
|
| |||||||||
Class VI: | ||||||||||||||||
Shares sold | 3,361,946 | $ | 42,023,521 | 11,888,253 | $ | 185,874,969 | ||||||||||
Shares issued to shareholders in reinvestment of distributions | 1,952,253 | 22,833,817 | 4,617,810 | 66,354,537 | ||||||||||||
Shares repurchased | (18,043,098 | ) | (224,143,636 | ) | (5,260,335 | ) | (80,794,845 | ) | ||||||||
|
|
|
|
|
|
|
| |||||||||
Net increase (decrease) | (12,728,899 | ) | $ | (159,286,298 | ) | 11,245,728 | $ | 171,434,661 | ||||||||
|
|
|
|
|
|
|
| |||||||||
U.S. Opportunistic Value Fund | ||||||||||||||||
Class III:(q) | ||||||||||||||||
Shares sold | 475 | $ | 10,000 | |||||||||||||
|
|
|
| |||||||||||||
Net increase (decrease) | 475 | $ | 10,000 | |||||||||||||
|
|
|
| |||||||||||||
Class IV:(q) | ||||||||||||||||
Shares sold | 3,108,685 | $ | 65,500,000 | |||||||||||||
|
|
|
| |||||||||||||
Net increase (decrease) | 3,108,685 | $ | 65,500,000 | |||||||||||||
|
|
|
| |||||||||||||
Class VI:(r) | ||||||||||||||||
Shares sold | 15,518,520 | $ | 308,964,640 | |||||||||||||
Shares issued to shareholders in reinvestment of distributions | 15,792 | 300,214 | ||||||||||||||
Shares repurchased | (4,854,860 | ) | (98,745,000 | ) | ||||||||||||
|
|
|
| |||||||||||||
Net increase (decrease) | 10,679,452 | $ | 210,519,854 | |||||||||||||
|
|
|
| |||||||||||||
Class I:(q) | ||||||||||||||||
Shares sold | 237 | $ | 5,000 | |||||||||||||
|
|
|
| |||||||||||||
Net increase (decrease) | 237 | $ | 5,000 | |||||||||||||
|
|
|
| |||||||||||||
212
GMO Trust Funds
Notes to Financial Statements — (Continued)
February 28, 2023
| Year Ended | Year Ended | |||||||||||||||
| February 28, 2023 | February 28, 2022 | |||||||||||||||
| Shares | Amount | Shares | Amount | |||||||||||||
U.S. Small Cap Value Fund | ||||||||||||||||
Class VI: | ||||||||||||||||
Shares sold | 434,736 | $ | 7,112,560 | 119,271 | $ | 3,183,172 | ||||||||||
Shares issued to shareholders in reinvestment of distributions | 1,174,542 | 18,256,190 | 4,036,257 | 83,549,717 | ||||||||||||
Shares repurchased | (12,753,368 | ) | (205,859,000 | ) | (6,207,447 | ) | (170,880,206 | ) | ||||||||
|
|
|
|
|
|
|
| |||||||||
Net increase (decrease) | (11,144,090 | ) | $ | (180,490,250 | ) | (2,051,919 | ) | $ | (84,147,317 | ) | ||||||
|
|
|
|
|
|
|
| |||||||||
| (a) | The period under the heading “Year Ended February 28, 2022” represents the period from November 17, 2021 (commencement of operations) through February 28, 2022. |
| (b) | The period under the heading “Year Ended February 28, 2022” represents the period from October 18, 2021 (commencement of operations) through February 28, 2022. |
| (c) | The period under the heading “Year Ended February 28, 2022” represents the period from December 1, 2021 (commencement of operations) through February 28, 2022. |
| (d) | Class V liquidated on April 29, 2021. |
| (e) | The period under the heading “Year Ended February 28, 2022” represents the period from May 24, 2021 (commencement of operations) through February 28, 2022. |
| (f) | The period under the heading “Year Ended February 28, 2022” represents the period from December 30, 2021 (commencement of operations) through February 28, 2022. |
| (g) | 343,975 shares and $5,174,438 were purchased in-kind. |
| (h) | The period under the heading “Year Ended February 28, 2022” represents the period from June 7, 2021 (commencement of operations) through February 28, 2022. |
| (i) | The period under the heading “Year Ended February 28, 2022” represents the period from July 16, 2021 (commencement of operations) through February 28, 2022. |
| (j) | 4,031,474 shares and $97,279,466 were redeemed in-kind by an affiliate. |
| (k) | The period under the heading “Year Ended February 28, 2023” represents the period from February 15, 2023 (commencement of operations) through February 28, 2023. |
| (l) | 13,124,792 shares and $262,495,845 were purchased in-kind by an affiliate. |
| (m) | The period under the heading “Year Ended February 28, 2022” represents the period from February 8, 2022 (commencement of operations) through February 28, 2022. |
| (n) | 9,969,459 shares and $262,495,845 were redeemed in-kind by an affiliate. |
| (o) | The period under the heading “Year Ended February 28, 2023” represents the period from November 15, 2022 (commencement of operations) through February 28, 2023. |
| (p) | The period under the heading “Year Ended February 28, 2023” represents the period from September 20, 2022 (commencement of operations) through February 28, 2023. |
| (q) | The period under the heading “Year Ended February 28, 2023” represents the period from February 15, 2023 (commencement of operations) through February 28, 2023. |
| (r) | The period under the heading “Year Ended February 28, 2023” represents the period from December 13, 2022 (commencement of operations) through February 28, 2023. |
| 10. | Investments in affiliated companies and other Funds of the Trust |
An affiliated company for the purposes of this disclosure is a company in which a Fund has or had direct ownership of at least 5% of the issuer’s voting securities or an investment in other funds of GMO Trust. A summary of the Funds’ transactions involving companies that are or were affiliates during the year ended February 28, 2023 is set forth below:
| Affiliate | Value, beginning of period | Purchases | Sales Proceeds | Dividend Income | Distributions of Realized Gains | Net Realized Gain (Loss) | Net Increase/ Decrease in Unrealized Appreciation/ Depreciation | Value, end of period | ||||||||||||||||||||||||
Climate Change Fund | ||||||||||||||||||||||||||||||||
GMO U.S. Treasury Fund | $ | 58,977,551 | $ | 583,764,531 | $ | 615,166,887 | $ | 347,948 | * | $ | — | $ | (478,069 | ) | $ | 57,275 | $ | 27,154,401 | ||||||||||||||
|
|
|
|
|
|
|
|
|
|
|
|
|
|
|
| |||||||||||||||||
213
GMO Trust Funds
Notes to Financial Statements — (Continued)
February 28, 2023
| Affiliate | Value, beginning of period | Purchases | Sales Proceeds | Dividend Income | Distributions of Realized Gains | Net Realized | Net Increase/ Decrease in Unrealized Appreciation/ Depreciation | Value, end of period | ||||||||||||||||||||||||
Emerging Markets ex-China Fund | ||||||||||||||||||||||||||||||||
GMO U.S. Treasury Fund | $ | 4,374 | $ | 42,708,903 | $ | 42,404,374 | $ | 112,318 | $ | — | $ | 10,103 | $ | 17 | $ | 319,023 | ||||||||||||||||
|
|
|
|
|
|
|
|
|
|
|
|
|
|
|
| |||||||||||||||||
Emerging Markets Fund | ||||||||||||||||||||||||||||||||
Anilana Hotels & Properties Ltd | $ | 712,685 | $ | — | $ | — | $ | — | $ | — | $ | — | $ | (454,049 | ) | $ | 258,636 | |||||||||||||||
Gayatri Projects Ltd | 3,763,980 | — | 1,255,563 | — | — | (6,129,528 | ) | 3,621,111 | — | # | ||||||||||||||||||||||
GMO U.S. Treasury Fund | — | 147,160,726 | 131,840,000 | 154,052 | — | 25,266 | — | 15,345,992 | ||||||||||||||||||||||||
|
|
|
|
|
|
|
|
|
|
|
|
|
|
|
| |||||||||||||||||
Totals | $ | 4,476,665 | $ | 147,160,726 | $ | 133,095,563 | $ | 154,052 | $ | — | $ | (6,104,262 | ) | $ | 3,167,062 | $ | 15,604,628 | |||||||||||||||
|
|
|
|
|
|
|
|
|
|
|
|
|
|
|
| |||||||||||||||||
Emerging Markets Select Equity Fund (formerly Emerging Domestic Opportunities Fund) | ||||||||||||||||||||||||||||||||
GMO U.S. Treasury Fund | $ | 2,331,522 | $ | 40,369,604 | $ | 41,977,396 | $ | 49,028 | $ | — | $ | (20,588 | ) | $ | 9,304 | $ | 712,446 | |||||||||||||||
|
|
|
|
|
|
|
|
|
|
|
|
|
|
|
| |||||||||||||||||
International Equity Fund | ||||||||||||||||||||||||||||||||
GMO U.S. Treasury Fund | $ | — | $ | 143,000,000 | $ | 70,500,000 | $ | 701,608 | $ | — | $ | 90,181 | $ | 20,261 | $ | 72,610,442 | ||||||||||||||||
|
|
|
|
|
|
|
|
|
|
|
|
|
|
|
| |||||||||||||||||
Quality Cyclicals Fund | ||||||||||||||||||||||||||||||||
GMO U.S. Treasury Fund | $ | 434,957 | $ | 12,357,078 | $ | 12,105,000 | $ | 19,551 | $ | — | $ | (7,909 | ) | $ | 1,737 | $ | 680,863 | |||||||||||||||
|
|
|
|
|
|
|
|
|
|
|
|
|
|
|
| |||||||||||||||||
Quality Fund | ||||||||||||||||||||||||||||||||
GMO U.S. Treasury Fund | $ | 5,788,348 | $ | 706,499,200 | $ | 596,000,000 | 1,904,895 | $ | — | $ | (124,273 | ) | $ | 75,060 | $ | 116,238,335 | ||||||||||||||||
|
|
|
|
|
|
|
|
|
|
|
|
|
|
|
| |||||||||||||||||
Resource Transition Fund | ||||||||||||||||||||||||||||||||
GMO U.S. Treasury Fund | $ | — | $ | 14,012,040 | $ | 10,500,000 | $ | 4,867 | $ | — | $ | — | $ | — | $ | 3,512,040 | ||||||||||||||||
|
|
|
|
|
|
|
|
|
|
|
|
|
|
|
| |||||||||||||||||
Resources Fund | ||||||||||||||||||||||||||||||||
GMO U.S. Treasury Fund | $ | — | $ | 154,450,000 | $ | 115,233,800 | $ | 235,030 | $ | — | $ | 33,266 | $ | 15,060 | $ | 39,264,526 | ||||||||||||||||
|
|
|
|
|
|
|
|
|
|
|
|
|
|
|
| |||||||||||||||||
Small Cap Quality Fund | ||||||||||||||||||||||||||||||||
GMO U.S. Treasury Fund | $ | — | $ | 2,410,331 | $ | 1,800,000 | $ | 10,447 | $ | — | $ | 1,002 | $ | 417 | $ | 611,750 | ||||||||||||||||
|
|
|
|
|
|
|
|
|
|
|
|
|
|
|
| |||||||||||||||||
Tax-Managed International Equities Fund | ||||||||||||||||||||||||||||||||
GMO U.S. Treasury Fund | $ | 999,833 | $ | 16,770,000 | $ | 16,608,200 | $ | 21,911 | $ | — | $ | (5,875 | ) | $ | 4,538 | $ | 1,160,296 | |||||||||||||||
|
|
|
|
|
|
|
|
|
|
|
|
|
|
|
| |||||||||||||||||
U.S. Equity Fund | ||||||||||||||||||||||||||||||||
GMO U.S. Treasury Fund | $ | 10,402,263 | $ | 41,460,000 | $ | 48,772,126 | $ | 110,095 | $ | — | $ | (58,281 | ) | $ | 26,176 | $ | 3,058,032 | |||||||||||||||
|
|
|
|
|
|
|
|
|
|
|
|
|
|
|
| |||||||||||||||||
U.S. Opportunistic Value Fund | ||||||||||||||||||||||||||||||||
GMO U.S. Treasury Fund | $ | — | $ | 91,312,737 | $ | 85,500,000 | $ | 61,571 | $ | — | $ | 8,993 | $ | — | $ | 5,821,730 | ||||||||||||||||
|
|
|
|
|
|
|
|
|
|
|
|
|
|
|
| |||||||||||||||||
214
GMO Trust Funds
Notes to Financial Statements — (Continued)
February 28, 2023
| Affiliate | Value, beginning of period | Purchases | Sales Proceeds | Dividend Income | Distributions of Realized Gains | Net Realized | Net Increase/ Decrease in Unrealized Appreciation/ Depreciation | Value, end of period | ||||||||||||||||||||||||
U.S. Small Cap Value Fund | ||||||||||||||||||||||||||||||||
GMO U.S. Treasury Fund | $ | 1,158,524 | $ | 15,100,000 | $ | 15,900,000 | $ | 46,154 | $ | — | $ | (17,237 | ) | $ | 3,629 | $ | 344,916 | |||||||||||||||
|
|
|
|
|
|
|
|
|
|
|
|
|
|
|
| |||||||||||||||||
| * | Excludes income from investment of cash collateral from securities lending in GMO U.S. Treasury Fund. Income (net of fee rebates paid to the borrower and fees paid to the lending agent) from investment of cash collateral from securities lending in GMO U.S. Treasury Fund was $889,085 in Climate Change Fund during the year. |
| # | Security is no longer an affiliate at year end. |
| 11. | Subsequent events |
Subsequent to February 28, 2023, GMO Emerging Markets Select Equity Fund (formerly Emerging Domestic Opportunities Fund) received redemption requests in the amount of $79,324,769.
215
Report of Independent Registered Public Accounting Firm
To the Board of Trustees of GMO Trust and Shareholders of GMO Climate Change Fund, GMO Emerging Markets Select Equity Fund (formerly GMO Emerging Domestic Opportunities Fund), GMO Emerging Markets ex-China Fund, GMO Emerging Markets Fund, GMO International Equity Fund, GMO-Usonian Japan Value Creation Fund, GMO Quality Cyclicals Fund, GMO Quality Fund, GMO Resource Transition Fund, GMO Resources Fund, GMO Small Cap Quality Fund, GMO Tax-Managed International Equities Fund, GMO U.S. Equity Fund, GMO U.S. Opportunistic Value Fund and GMO U.S. Small Cap Value Fund
Opinions on the Financial Statements
We have audited the accompanying statements of assets and liabilities, including the schedules of investments, of GMO Climate Change Fund, GMO Emerging Markets Select Equity Fund (formerly GMO Emerging Domestic Opportunities Fund), GMO Emerging Markets ex-China Fund, GMO Emerging Markets Fund, GMO International Equity Fund, GMO-Usonian Japan Value Creation Fund, GMO Quality Cyclicals Fund, GMO Quality Fund, GMO Resource Transition Fund, GMO Resources Fund, GMO Small Cap Quality Fund, GMO Tax-Managed International Equities Fund, GMO U.S. Equity Fund, GMO U.S. Opportunistic Value Fund and GMO U.S. Small Cap Value Fund (fifteen of the funds constituting GMO Trust, hereafter collectively referred to as the “Funds”) as of February 28, 2023, the related statements of operations and the statements of changes in net assets for each of the periods indicated in the table below, including the related notes, and the financial highlights for each of the periods indicated therein (collectively referred to as the “financial statements”). In our opinion, the financial statements present fairly, in all material respects, the financial position of each of the Funds as of February 28, 2023, the results of each of their operations and the changes in each of their net assets for each of the periods indicated in the table below and each of the financial highlights for each of the periods indicated therein in conformity with accounting principles generally accepted in the United States of America.
| GMO Climate Change Fund, GMO Emerging Markets Select Equity Fund (formerly GMO Emerging Domestic Opportunities Fund), GMO Emerging Markets Fund, GMO International Equity Fund, GMO Quality Fund, GMO Resources Fund, GMO Tax-Managed International Equities Fund, GMO U.S. Equity Fund, GMO U.S. Small Cap Value Fund, GMO Quality Cyclicals Fund, GMO-Usonian Japan Value Creation Fund | Statements of operations for the year ended February 28, 2023 and the statements of changes in net assets for each of the two years in the period ended February 28, 2023 | |
| GMO Emerging Markets ex-China Fund | Statement of operations for the year ended February 28, 2023 and statements of changes in net assets for the year ended February 28, 2023 and for the period October 18, 2021 (commencement of operations) through February 28, 2022 | |
| GMO Small Cap Quality Fund | Statements of operations and changes in net assets for the period September 20, 2022 (commencement of operations) through February 28, 2023 | |
| GMO U.S. Opportunistic Value Fund | Statements of operations and changes in net assets for the period December 13, 2022 (commencement of operations) through February 28, 2023 | |
| GMO Resource Transition Fund | Statements of operations and changes in net assets for the period February 15, 2023 (commencement of operations) through February 28, 2023 |
Basis for Opinions
These financial statements are the responsibility of the Funds’ management. Our responsibility is to express an opinion on the Funds’ financial statements based on our audits. We are a public accounting firm registered with the Public Company Accounting Oversight Board (United States) (PCAOB) and are required to be independent with respect to the Funds in accordance with the U.S. federal securities laws and the applicable rules and regulations of the Securities and Exchange Commission and the PCAOB.
We conducted our audits of these financial statements in accordance with the standards of the PCAOB. Those standards require that we plan and perform the audit to obtain reasonable assurance about whether the financial statements are free of material misstatement, whether due to error or fraud.
| 216 |
Report of Independent Registered Public Accounting Firm - (Continued)
Our audits included performing procedures to assess the risks of material misstatement of the financial statements, whether due to error or fraud, and performing procedures that respond to those risks. Such procedures included examining, on a test basis, evidence regarding the amounts and disclosures in the financial statements. Our audits also included evaluating the accounting principles used and significant estimates made by management, as well as evaluating the overall presentation of the financial statements. Our procedures included confirmation of securities owned as of February 28, 2023 by correspondence with the custodian, transfer agent and brokers; when replies were not received from brokers, we performed other auditing procedures. We believe that our audits provide a reasonable basis for our opinions.
| /s/ PricewaterhouseCoopers LLP |
| Boston, MA |
| April 27, 2023 |
We have served as the auditor of one or more investment companies in the GMO mutual funds complex since 1985.
| 217 |
GMO Trust Funds
Board Review of Investment Management Agreements
February 28, 2023 (Unaudited)
GMO Resource Transition Fund
Approval of initial management agreement for GMO Resource Transition Fund (the “Fund”). At a meeting on November 16, 2022, the Trustees of GMO Trust (the “Trust”) approved for an initial two-year term commencing November 22, 2022 the management agreement between Grantham, Mayo, Van Otterloo & Co. LLC (“GMO”) and the Trust, on behalf of the Fund. In approving the initial management agreement, the Trustees considered information they believed to be relevant, including information relating specifically to the Fund as well as to the Trust generally and the other series of the Trust (collectively, the “GMO funds”).
At a meeting on November 16, 2022, the Trustees considered a proposal by GMO that they establish the Fund as a new series of the Trust, that they approve a management agreement between the Trust, on behalf of the Fund, and GMO, and that they approve arrangements for GMO’s provision of shareholder servicing and supplemental support to classes of the Fund. During that meeting, the Trustees met with representatives from GMO’s Focused Equity Team, GMO’s Product Development Team, and GMO’s Legal Group and asked questions relating to the Fund and the materials GMO provided the Trustees in advance of the meeting.
Since the Fund had not yet commenced operations, the Trustees were unable to consider its investment performance. The Trustees, therefore, considered the performance of the other GMO funds whose investments were managed by GMO’s Focused Equity Team, the GMO division that would be managing the Fund’s investments, and in particular GMO Resources Fund.
The Trustees considered the Fund’s estimated expenses and expense ratio (annual operating expenses per share as a percentage of average annual net asset value per share) as compared to the expense ratios of other funds in peer groups determined by GMO to have similar investment characteristics. In considering the Fund’s estimated expense ratio, the Trustees took into account GMO’s undertaking to reimburse a portion of the Fund’s operating expenses.
The Trustees also considered the fees to be paid to GMO under the Fund’s management and shareholder servicing and supplemental support agreements. The Trustees reviewed information provided by GMO comparing the management fee to be paid by the Fund to the management fee of GMO Resources Fund, whose investments are managed by GMO’s Focused Equity Team, as well as funds managed by other managers determined by GMO to have similar investment characteristics. The Trustees also considered the shareholder servicing fees to be charged by GMO to different share classes of the Fund in light of the services to be provided to each class by GMO.
The Trustees considered that the non-investment management services to be provided by GMO to the Fund, including but not limited to valuation, legal and compliance, board support, accounting, operational, operational risk management, and technology services, were the same as the services provided by GMO under its current management agreements with other GMO funds.
Since the Fund had not yet commenced operations, no information regarding GMO’s profitability with respect to the Fund was available to the Trustees. The Trustees did, however, consider information previously provided them by GMO regarding its profits from managing the Trust overall. The Trustees also considered how the proposed fees compared to fees paid by other GMO funds and took note of “fallout benefits” that could be realized by GMO from its management of the Fund. As the Fund had not yet commenced operations, the Trustees did not consider economies of scale that might be realized by GMO as a result of its managing the Fund.
The Trustees also considered the experience and sophistication of GMO and its personnel (including, among others, management and investment-management personnel, and legal, compliance, accounting and risk-management personnel). In addition, the Trustees considered the resources GMO would employ in managing the Fund, GMO’s organization, its reputation, its risk-management policies, its proxy voting policies, and other aspects of GMO’s business relevant to the nature and quality of the services GMO would be providing the Fund.
After reviewing these and other factors, the Trustees concluded, in the context of their overall review of the Fund’s initial management agreement, that the nature, extent and quality of services to be provided supported their approval of the Fund’s management agreement and that the fee to be charged under that agreement was reasonable.
In the Trustees’ deliberations, each Trustee gave specific factors the weight that Trustee thought appropriate. Following their deliberations, the Trustees who are not “interested persons” of the Trust voting separately, and then all Trustees voting together, approved the Fund’s initial management agreement.
| 218 |
GMO Trust Funds
Board Review of Investment Management Agreements — (Continued)
February 28, 2023 (Unaudited)
GMO Small Cap Quality Fund
Approval of initial management agreement for GMO Small Cap Quality Fund (the “Fund”). At a meeting on August 30, 2022, the Trustees of GMO Trust (the “Trust”) approved for an initial two-year term commencing September 20, 2022 the management agreement between Grantham, Mayo, Van Otterloo & Co. LLC (“GMO”) and the Trust, on behalf of the Fund. In approving the initial management agreement, the Trustees considered information they believed, in light of the legal advice furnished to them, to be relevant, including information relating specifically to the Fund as well as to the Trust generally and the other series of the Trust (collectively, the “GMO funds”).
At a meeting on August 30, 2022, the Trustees discussed materials provided by GMO for purposes of considering GMO’s proposal to establish the Fund as a new series of the Trust and a proposed management agreement between the Trust, on behalf of the Fund, and GMO. During this meeting, the Trustees met with a representative from GMO’s Legal Group.
Since the Fund had not yet commenced operations, the Trustees were unable to consider its investment performance. The Trustees therefore considered the performance of the other GMO funds whose investments were managed by the investment division of GMO that would be managing the Fund’s investments.
The Trustees considered the Fund’s estimated expenses and estimated expense ratio (annual operating expenses per share as a percentage of average annual net asset value per share) as compared to the expense ratios of other funds in peer groups determined by GMO to have similar investment characteristics. In considering the Fund’s estimated expense ratio, the Trustees took into account GMO’s undertaking to reimburse a portion of the Fund’s operating expenses.
The Trustees also considered the fees to be paid to GMO under the Fund’s management and shareholder servicing and supplemental support agreements. The Trustees reviewed information provided by GMO comparing the management fee to be paid by the Fund to the management fee of two GMO funds, each with an investment strategy similar to that of the Fund, including one whose investments were managed by the investment division of GMO that would manage the Fund’s investments, as well as funds managed by other managers determined by GMO to have similar investment characteristics. The Trustees also considered the shareholder servicing fees to be charged by GMO to different share classes of the Fund in light of the services to be provided to each class by GMO.
The Trustees also considered that the non-investment management services to be provided by GMO to the Fund, including but not limited to valuation, legal and compliance, board support, accounting, operational, operational risk management, and technology services, were the same as the services provided by GMO under its current management agreements with other GMO funds. In addition, the Trustees observed that GMO had successfully transitioned to a remote/hybrid work environment without interrupting or reducing the quality of its services to the other GMO funds.
Since the Fund had not yet commenced operations, no information regarding GMO’s profitability with respect to the Fund was available to the Trustees. The Trustees did, however, consider information provided to them by GMO regarding its profits from managing the Trust overall. The Trustees also considered how the proposed fees compared to fees paid by other GMO funds and took note of “fallout benefits” realized by GMO that would result from its management of the Fund and the other GMO funds. As the Fund had not yet commenced operations, the Trustees did not consider possible economies of scale to GMO associated with managing the Fund.
The Trustees also considered the experience and sophistication of GMO and its personnel (including, among others, management and investment-management personnel, and legal, compliance, accounting and risk-management personnel). In addition, the Trustees considered the resources GMO would employ in managing the Fund, GMO’s organization, its reputation, its risk-management policies, its proxy voting policies, and other aspects of GMO’s business relevant to the nature and quality of its services to be provided to the Fund.
After reviewing these and other factors, the Trustees concluded, in the context of their overall review of the Fund’s initial management agreement, that the nature, extent and quality of services to be provided supported their approval of the Fund’s management agreement and that the fee to be charged under that agreement was reasonable.
In the Trustees’ deliberations, each Trustee weighted specific factors as that Trustee thought appropriate. Following their deliberations, the Trustees who are not “interested persons” of the Trust voting separately, and then all Trustees voting together, approved the Fund’s initial management agreement.
| 219 |
GMO Trust Funds
Board Review of Investment Management Agreements — (Continued)
February 28, 2023 (Unaudited)
GMO U.S. Opportunistic Value Fund
Approval of initial management agreement for GMO U.S. Opportunistic Value Fund (the “Fund”). At a meeting on November 16, 2022, the Trustees of GMO Trust (the “Trust”) approved for an initial two-year term commencing November 22, 2022 the management agreement between Grantham, Mayo, Van Otterloo & Co. LLC (“GMO”) and the Trust, on behalf of the Fund. In approving the initial management agreement, the Trustees considered information they believed to be relevant, including information relating specifically to the Fund as well as to the Trust generally and the other series of the Trust (collectively, the “GMO funds”).
At a meeting on November 16, 2022, the Trustees considered a proposal by GMO that they establish the Fund as a new series of the Trust, that they approve a management agreement between the Trust, on behalf of the Fund, and GMO, and that they approve arrangements for GMO’s provision of shareholder servicing and supplemental support to classes of the Fund. During that meeting, the Trustees met with representatives from GMO’s Asset Allocation and Systematic Equity Teams and GMO’s Legal Group and asked questions relating to the Fund and the materials GMO provided the Trustees in advance of the meeting.
Since the Fund had not yet commenced operations, the Trustees were unable to consider its investment performance. The Trustees therefore considered the performance of the other GMO funds whose investments were managed by GMO’s Systematic Equity Team, the GMO division that would be primarily responsible for managing the Fund’s investments.
The Trustees considered the Fund’s estimated expenses and expense ratio (annual operating expenses per share as a percentage of average annual net asset value per share) as compared to the expense ratios of other funds in peer groups determined by GMO to have similar investment characteristics. In considering the Fund’s estimated expense ratio, the Trustees took into account GMO’s undertaking to reimburse a portion of the Fund’s operating expenses.
The Trustees also considered the fees to be paid to GMO under the Fund’s management and shareholder servicing and supplemental support agreements. The Trustees reviewed information provided by GMO comparing the management fee to be paid by the Fund to the management fee of GMO U.S. Equity Fund, whose investments are managed by GMO’s Systematic Equity Team, as well as funds managed by other managers determined by GMO to have similar investment characteristics. The Trustees also considered the shareholder servicing fees to be charged by GMO to different share classes of the Fund in light of the services to be provided to each class by GMO.
The Trustees considered that the non-investment management services to be provided by GMO to the Fund, including but not limited to valuation, legal and compliance, board support, accounting, operational, operational risk management, and technology services, were the same as the services provided by GMO under its current management agreements with other GMO funds.
Since the Fund had not yet commenced operations, no information regarding GMO’s profitability with respect to the Fund was available to the Trustees. The Trustees did, however, consider information previously provided them by GMO regarding its profits from managing the Trust overall. The Trustees also considered how the proposed fees compared to fees paid by other GMO funds and took note of “fallout benefits” that could be realized by GMO from its management of the Fund. As the Fund had not yet commenced operations, the Trustees did not consider economies of scale that might be realized by GMO as a result of its managing the Fund.
The Trustees also considered the experience and sophistication of GMO and its personnel (including, among others, management and investment-management personnel, and legal, compliance, accounting and risk-management personnel). In addition, the Trustees considered the resources GMO would employ in managing the Fund, GMO’s organization, its reputation, its risk-management policies, its proxy voting policies, and other aspects of GMO’s business relevant to the nature and quality of the services GMO would be providing the Fund.
After reviewing these and other factors, the Trustees concluded, in the context of their overall review of the Fund’s initial management agreement, that the nature, extent and quality of services to be provided supported their approval of the Fund’s management agreement and that the fee to be charged under that agreement was reasonable.
In the Trustees’ deliberations, each Trustee gave specific factors the weight that Trustee thought appropriate. Following their deliberations, the Trustees who are not “interested persons” of the Trust voting separately, and then all Trustees voting together, approved the Fund’s initial management agreement.
| 220 |
GMO Trust Funds
February 28, 2023 (Unaudited)
Expense Examples: The following information is in relation to expenses for the six month period ended February 28, 2023.
As a shareholder of the Funds, you may incur two types of costs: (1) transaction cost, if applicable; and (2) ongoing costs, including direct and/or indirect management fees, direct and/or indirect shareholder services fees, and other Fund expenses. This example is intended to help you understand your ongoing costs (in dollars) of investing in the Funds and to compare these costs with the ongoing costs of investing in other mutual funds.
These examples are based on an investment of $1,000 invested at the beginning of the period and held for the entire period, September 1, 2022 through February 28, 2023.
Actual Expenses
This section of the table for each class below provides information about actual account values and actual expenses. You may use the information in this section, together with the amount you invested, to estimate the expenses that you paid over the period. Simply divide your account value by $1,000 (for example, a $10,000,000 account value divided by $1,000 = 10,000), then multiply the result by the number under the heading entitled “Expenses Paid During the Period” to estimate the expenses you paid on your account during this period.
Hypothetical Example for Comparison Purposes
This section of the table for each class below provides information about hypothetical account values and hypothetical expenses based on the Funds’ actual expense ratio and an assumed rate of return of 5% per year before expenses, which is not the Funds’ actual return. The hypothetical account values and expenses may not be used to estimate the actual ending account balance or expenses you paid for the period. You may use this information to compare the ongoing costs of investing in the Funds with other funds. To do so, compare this 5% hypothetical example with the 5% hypothetical examples that appear in the shareholder reports of other funds.
Please note that the expenses shown in the table are meant to highlight your ongoing costs only and do not reflect any transactional costs. Therefore, this section of the table is useful in comparing ongoing costs only, and will not help you determine the relative total costs of owning different funds. In addition, if these transactional costs were included, your costs would have been higher.
| Actual | Hypothetical |
| ||||||||||||||||||||||||||
| Beginning Account Value September 1, 2022 | Ending Account Value February 28, 2023 | Expenses Paid During the Period* | Beginning Account Value September 1, 2022 | Ending Account Value February 28, 2023 | Expenses Paid During the Period* | Annualized Expense Ratio | ||||||||||||||||||||||
Climate Change Fund |
| |||||||||||||||||||||||||||
Class III | $ | 1,000.00 | $ | 1,023.40 | $ | 3.91 | $ | 1,000.00 | $ | 1,020.93 | $ | 3.91 | 0.78 | % | ||||||||||||||
Class R6 | $ | 1,000.00 | $ | 1,023.30 | $ | 3.91 | $ | 1,000.00 | $ | 1,020.93 | $ | 3.91 | 0.78 | % | ||||||||||||||
Class I | $ | 1,000.00 | $ | 1,022.60 | $ | 4.36 | $ | 1,000.00 | $ | 1,020.48 | $ | 4.36 | 0.87 | % | ||||||||||||||
Emerging Markets ex-China Fund |
| |||||||||||||||||||||||||||
Class III | $ | 1,000.00 | $ | 1,046.50 | $ | 4.06 | $ | 1,000.00 | $ | 1,020.83 | $ | 4.01 | 0.80 | % | ||||||||||||||
Class VI | $ | 1,000.00 | $ | 1,046.90 | $ | 3.40 | $ | 1,000.00 | $ | 1,021.47 | $ | 3.36 | 0.67 | % | ||||||||||||||
Class I | $ | 1,000.00 | $ | 1,044.50 | $ | 4.77 | $ | 1,000.00 | $ | 1,020.13 | $ | 4.71 | 0.94 | % | ||||||||||||||
Emerging Markets Fund |
| |||||||||||||||||||||||||||
Class II | $ | 1,000.00 | $ | 981.70 | $ | 4.42 | $ | 1,000.00 | $ | 1,020.33 | $ | 4.51 | 0.90 | % | ||||||||||||||
Class III | $ | 1,000.00 | $ | 982.10 | $ | 4.18 | $ | 1,000.00 | $ | 1,020.58 | $ | 4.26 | 0.85 | % | ||||||||||||||
Class VI | $ | 1,000.00 | $ | 982.60 | $ | 3.54 | $ | 1,000.00 | $ | 1,021.22 | $ | 3.61 | 0.72 | % | ||||||||||||||
Class R6 | $ | 1,000.00 | $ | 981.70 | $ | 4.42 | $ | 1,000.00 | $ | 1,020.33 | $ | 4.51 | 0.90 | % | ||||||||||||||
Class I | $ | 1,000.00 | $ | 981.30 | $ | 4.67 | $ | 1,000.00 | $ | 1,020.08 | $ | 4.76 | 0.95 | % | ||||||||||||||
Emerging Markets Select Equity Fund |
| |||||||||||||||||||||||||||
Class II | $ | 1,000.00 | $ | 1,001.50 | $ | 4.32 | $ | 1,000.00 | $ | 1,020.48 | $ | 4.36 | 0.87 | % | ||||||||||||||
Class V | $ | 1,000.00 | $ | 1,001.90 | $ | 3.72 | $ | 1,000.00 | $ | 1,021.08 | $ | 3.76 | 0.75 | % | ||||||||||||||
Class I | $ | 1,000.00 | $ | 1,000.90 | $ | 4.81 | $ | 1,000.00 | $ | 1,019.98 | $ | 4.86 | 0.97 | % | ||||||||||||||
| 221 |
GMO Trust Funds
Fund Expenses — (Continued)
February 28, 2023 (Unaudited)
| Actual | Hypothetical |
| ||||||||||||||||||||||||||
| Beginning Account Value September 1, 2022 | Ending Account Value February 28, 2023 | Expenses Paid During the Period* | Beginning Account Value September 1, 2022 | Ending Account Value February 28, 2023 | Expenses Paid During the Period* | Annualized Expense Ratio | ||||||||||||||||||||||
International Equity Fund |
| |||||||||||||||||||||||||||
Class II | $ | 1,000.00 | $ | 1,150.30 | $ | 3.89 | $ | 1,000.00 | $ | 1,021.18 | $ | 3.66 | 0.73 | % | ||||||||||||||
Class III | $ | 1,000.00 | $ | 1,150.40 | $ | 3.52 | $ | 1,000.00 | $ | 1,021.52 | $ | 3.31 | 0.66 | % | ||||||||||||||
Class IV | $ | 1,000.00 | $ | 1,151.10 | $ | 3.25 | $ | 1,000.00 | $ | 1,021.77 | $ | 3.06 | 0.61 | % | ||||||||||||||
Class I | $ | 1,000.00 | $ | 1,149.40 | $ | 4.48 | $ | 1,000.00 | $ | 1,020.63 | $ | 4.21 | 0.84 | % | ||||||||||||||
Japan Value Creation Fund |
| |||||||||||||||||||||||||||
Class III | $ | 1,000.00 | $ | 1,071.20 | $ | 3.44 | $ | 1,000.00 | $ | 1,021.47 | $ | 3.36 | 0.67 | % | ||||||||||||||
Class VI | $ | 1,000.00 | $ | 1,072.40 | $ | 2.93 | $ | 1,000.00 | $ | 1,021.97 | $ | 2.86 | 0.57 | % | ||||||||||||||
Class I | $ | 1,000.00 | $ | 1,071.10 | $ | 3.95 | $ | 1,000.00 | $ | 1,020.98 | $ | 3.86 | 0.77 | % | ||||||||||||||
Quality Cyclicals Fund |
| |||||||||||||||||||||||||||
Class VI | $ | 1,000.00 | $ | 1,125.20 | $ | 2.11 | $ | 1,000.00 | $ | 1,022.81 | $ | 2.01 | 0.40 | % | ||||||||||||||
Class I | $ | 1,000.00 | $ | 1,124.50 | $ | 3.16 | $ | 1,000.00 | $ | 1,021.82 | $ | 3.01 | 0.60 | % | ||||||||||||||
Quality Fund |
| |||||||||||||||||||||||||||
Class III | $ | 1,000.00 | $ | 1,039.10 | $ | 2.53 | $ | 1,000.00 | $ | 1,022.32 | $ | 2.51 | 0.50 | % | ||||||||||||||
Class IV | $ | 1,000.00 | $ | 1,039.60 | $ | 2.28 | $ | 1,000.00 | $ | 1,022.56 | $ | 2.26 | 0.45 | % | ||||||||||||||
Class VI | $ | 1,000.00 | $ | 1,039.60 | $ | 2.02 | $ | 1,000.00 | $ | 1,022.81 | $ | 2.01 | 0.40 | % | ||||||||||||||
Class R6 | $ | 1,000.00 | $ | 1,039.20 | $ | 2.48 | $ | 1,000.00 | $ | 1,022.37 | $ | 2.46 | 0.49 | % | ||||||||||||||
Class I | $ | 1,000.00 | $ | 1,038.60 | $ | 2.98 | $ | 1,000.00 | $ | 1,021.87 | $ | 2.96 | 0.59 | % | ||||||||||||||
Resource Transition Fund |
| |||||||||||||||||||||||||||
Class VI(a) | $ | 1,000.00 | $ | 949.00 | $ | 0.30 | $ | 1,000.00 | $ | 1,020.53 | $ | 4.31 | 0.86 | % | ||||||||||||||
Resources Fund |
| |||||||||||||||||||||||||||
Class III | $ | 1,000.00 | $ | 1,035.10 | $ | 3.73 | $ | 1,000.00 | $ | 1,021.13 | $ | 3.71 | 0.74 | % | ||||||||||||||
Class IV | $ | 1,000.00 | $ | 1,035.50 | $ | 3.48 | $ | 1,000.00 | $ | 1,021.37 | $ | 3.46 | 0.69 | % | ||||||||||||||
Class VI | $ | 1,000.00 | $ | 1,035.50 | $ | 3.23 | $ | 1,000.00 | $ | 1,021.62 | $ | 3.21 | 0.64 | % | ||||||||||||||
Class R6 | $ | 1,000.00 | $ | 1,035.20 | $ | 3.73 | $ | 1,000.00 | $ | 1,021.13 | $ | 3.71 | 0.74 | % | ||||||||||||||
Class I | $ | 1,000.00 | $ | 1,034.90 | $ | 4.24 | $ | 1,000.00 | $ | 1,020.63 | $ | 4.21 | 0.84 | % | ||||||||||||||
Small Cap Quality Fund |
| |||||||||||||||||||||||||||
Class III(b) | $ | 1,000.00 | $ | 1,045.70 | $ | 2.21 | $ | 1,000.00 | $ | 1,021.08 | $ | 3.76 | 0.75 | % | ||||||||||||||
Class VI(c) | $ | 1,000.00 | $ | 1,201.00 | $ | 3.20 | $ | 1,000.00 | $ | 1,021.52 | $ | 3.31 | 0.66 | % | ||||||||||||||
Class I(b) | $ | 1,000.00 | $ | 1,045.10 | $ | 2.21 | $ | 1,000.00 | $ | 1,021.08 | $ | 3.76 | 0.75 | % | ||||||||||||||
Tax-Managed International Equities Fund |
| |||||||||||||||||||||||||||
Class III | $ | 1,000.00 | $ | 1,145.00 | $ | 3.62 | $ | 1,000.00 | $ | 1,021.42 | $ | 3.41 | 0.68 | % | ||||||||||||||
U.S. Equity Fund |
| |||||||||||||||||||||||||||
Class III | $ | 1,000.00 | $ | 1,050.20 | $ | 2.44 | $ | 1,000.00 | $ | 1,022.41 | $ | 2.41 | 0.48 | % | ||||||||||||||
Class VI | $ | 1,000.00 | $ | 1,051.50 | $ | 1.93 | $ | 1,000.00 | $ | 1,022.91 | $ | 1.91 | 0.38 | % | ||||||||||||||
U.S. Opportunistic Value Fund |
| |||||||||||||||||||||||||||
Class III(d) | $ | 1,000.00 | $ | 958.70 | $ | 0.16 | $ | 1,000.00 | $ | 1,022.46 | $ | 2.36 | 0.47 | % | ||||||||||||||
Class IV(d) | $ | 1,000.00 | $ | 958.70 | $ | 0.15 | $ | 1,000.00 | $ | 1,022.71 | $ | 2.11 | 0.42 | % | ||||||||||||||
Class VI(e) | $ | 1,000.00 | $ | 1,011.00 | $ | 0.81 | $ | 1,000.00 | $ | 1,022.91 | $ | 1.91 | 0.38 | % | ||||||||||||||
Class I(d) | $ | 1,000.00 | $ | 958.70 | $ | 0.20 | $ | 1,000.00 | $ | 1,021.97 | $ | 2.86 | 0.57 | % | ||||||||||||||
U.S. Small Cap Value Fund |
| |||||||||||||||||||||||||||
Class VI | $ | 1,000.00 | $ | 1,075.70 | $ | 2.62 | $ | 1,000.00 | $ | 1,022.27 | $ | 2.56 | 0.51 | % | ||||||||||||||
| * | Expenses are calculated using each class’s annualized net expense ratio (including indirect expenses incurred) for the six months ended February 28, 2023, multiplied by the average account value over the period, multiplied by 181 days in the period, divided by 365 days in the year. |
| (a) | For the period February 15, 2023 (commencement of operations) through February 28, 2023, expenses were calculated using the class’s annualized net expense ratio (including indirect expenses incurred) for the period ended February 28, 2023, multiplied by the average account value over the period, multiplied by 13 days in the period, divided by 365 days in the year. |
| (b) | For the period November 15, 2022 (commencement of operations) through February 28, 2023, expenses were calculated using the class’s annualized net expense ratio (including indirect expenses incurred) for the period ended February 28, 2023, multiplied by the average account value over the period, multiplied by 105 days in the period, divided by 365 days in the year. |
| 222 |
GMO Trust Funds
Fund Expenses — (Continued)
February 28, 2023 (Unaudited)
| * | Expenses are calculated using each class’s annualized net expense ratio (including indirect expenses incurred) for the six months ended February 28, 2023, multiplied by the average account value over the period, multiplied by 181 days in the period, divided by 365 days in the year. |
| (c) | For the period September 20, 2022 (commencement of operations) through February 28, 2023, expenses were calculated using the class’s annualized net expense ratio (including indirect expenses incurred) for the period ended February 28, 2023, multiplied by the average account value over the period, multiplied by 161 days in the period, divided by 365 days in the year. |
| (d) | For the period February 15, 2023 (commencement of operations) through February 28, 2023, expenses were calculated using the class’s annualized net expense ratio (including indirect expenses incurred) for the period ended February 28, 2023, multiplied by the average account value over the period, multiplied by 13 days in the period, divided by 365 days in the year. |
| (e) | For the period December 13, 2022 (commencement of operations) through February 28, 2023, expenses were calculated using the class’s annualized net expense ratio (including indirect expenses incurred) for the period ended February 28, 2023, multiplied by the average account value over the period, multiplied by 77 days in the period, divided by 365 days in the year. |
| 223 |
GMO Trust Funds
Tax Information for the Tax Year Ended February 28, 2023 (Unaudited)
The following information is being provided in order to meet reporting requirements set forth by the Code and/or to meet state specific requirements. Shareholders should consult their tax advisors.
With respect to distributions paid, the Fund designates the following amounts (or, if subsequently determined to be different, the maximum amount allowable) for the fiscal year ended February 28, 2023:
| Fund Name | Dividend Received Deduction (corporate shareholders)(1) | Qualified Dividend Income (non-corporate shareholders)(1) | U.S. Government Obligation Income(1)(2) | Interest- Related Dividend Income ($)(3) | Short-Term Capital Gain Dividends ($)(3) | Long-Term Capital Gain Distributions ($) | Foreign Taxes Paid ($)(4) | Foreign Source Income ($)(4) | Section 199A Dividend Income (non-corporate shareholders) ($)(5) | |||||||||||||||||||||||||||
Climate Change Fund | 19.22 | % | 73.39 | % | — | — | 7,373,420 | 5,946,557 | — | — | — | |||||||||||||||||||||||||
Emerging Markets ex-China Fund | — | 69.32 | % | — | — | 1,227,646 | — | 2,256,811 | 15,943,458 | — | ||||||||||||||||||||||||||
Emerging Markets Fund | — | 45.83 | % | — | — | — | — | 9,526,303 | 99,350,032 | — | ||||||||||||||||||||||||||
Emerging Markets Select Equity Fund (formerly Emerging Domestic Opportunities Fund) | 2.50 | % | 85.89 | % | — | — | — | — | 1,383,054 | 7,062,914 | — | |||||||||||||||||||||||||
International Equity Fund | — | 100.00 | % | — | — | — | — | 3,370,011 | 84,623,761 | — | ||||||||||||||||||||||||||
Japan Value Creation Fund | — | 100.00 | % | — | — | 393,360 | 5,916,837 | 421,015 | 2,558,374 | — | ||||||||||||||||||||||||||
Quality Cyclicals Fund | 32.00 | % | 70.22 | % | — | — | 274,150 | 9,320,117 | — | — | — | |||||||||||||||||||||||||
Quality Fund | 88.58 | % | 100.00 | % | — | — | 8,841,744 | 680,905,238 | — | — | — | |||||||||||||||||||||||||
Resource Transition Fund | — | — | — | — | — | — | — | — | — | |||||||||||||||||||||||||||
Resources Fund | 2.21 | % | 25.35 | % | — | — | 89,614,667 | 51,283,849 | 5,007,236 | 110,868,573 | — | |||||||||||||||||||||||||
Small Cap Quality Fund | 100.00 | % | 100.00 | % | — | — | 80,175 | — | — | — | — | |||||||||||||||||||||||||
Tax-Managed International Equities Fund | — | 100.00 | % | — | — | — | 724,698 | 191,161 | 1,775,639 | — | ||||||||||||||||||||||||||
U.S. Equity Fund | 61.27 | % | 64.36 | % | — | — | 5,755,100 | 16,774,864 | — | — | — | |||||||||||||||||||||||||
U.S. Opportunistic Value Fund | 71.40 | % | 78.49 | % | — | — | — | — | — | — | — | |||||||||||||||||||||||||
U.S. Small Cap Value Fund | 35.31 | % | 35.80 | % | — | — | 7,120,083 | 8,299,032 | — | — | 10,473 | |||||||||||||||||||||||||
| (1) | Presented as a percentage of net investment income and short-term capital gain distributions paid, if any. |
| (2) | All or a portion of these amounts may be exempt from taxation at the state level. |
| (3) | These amounts are generally exempt from U.S. withholding taxes for non-U.S. shareholders, provided certain conditions are satisfied by both the Funds and the Funds’ shareholders. If applicable, interest-related dividend amounts may include short-term capital gain distributions received from underlying funds. |
| (4) | The Funds expect to elect to treat foreign taxes attributed to foreign source income from certain of its investments, as if incurred directly by the Funds’ shareholders. All amounts presented above are based upon net investment income earned. |
| (5) | The Funds hereby designate the above qualified business income under Section 199A of the Code. |
| 224 |
GMO Trust Funds
Tax Information for the Tax Year Ended February 28, 2023 (Unaudited) — (Continued)
In early 2024, the Funds will notify applicable shareholders of amounts for use in preparing 2023 U.S. federal income tax forms.
| 225 |
Trustees and Officers (Unaudited)
The following tables present information regarding each Trustee and officer of the Trust as of February 28, 2023. Each Trustee’s and officer’s year of birth (“YOB”) is set forth after his or her name. Unless otherwise noted, (i) each Trustee and officer has engaged in the principal occupation(s) noted in the table for at least the most recent five years, although not necessarily in the same capacity, and (ii) the address of each Trustee and officer is c/o GMO Trust, 53 State Street, Suite 3300, Boston, MA 02109. Each Trustee serves in office until the earlier of (a) the election and qualification of a successor at the next meeting of shareholders called to elect Trustees or (b) the Trustee dies, resigns, or is removed as provided in the Trust’s governing documents. Each of the Trustees of the Trust, other than Ms. Santoro, is not an “interested person” of the Trust, as such term is used in the 1940 Act (each, an “Independent Trustee”). Because the Funds do not hold annual meetings of shareholders, each Trustee will hold office for an indeterminate period. Each officer serves in office until his or her successor is elected and determined to be qualified to carry out the duties and responsibilities of the office, or until the officer resigns or is removed from office.
Independent Trustees
Name and | Position(s) | Length of | Principal Occupation(s) | Number of | Other | |||||
| Donald W. Glazer YOB: 1944 | Chairman of the Board of Trustees | Chairman of the Board of Trustees since March 2005; Lead Independent Trustee (September 2004 – March 2005); Trustee since December 2000. | Consultant – Law and Business; Author of Legal Treatises. | 33 | Director, BeiGene Ltd. (biotech). | |||||
Peter Tufano YOB: 1957 | Trustee | Since December 2008. | Peter Moores Professor of Finance (Since July 1, 2011) and Peter Moores Dean and Professor of Finance (July 1, 2011 – June 30, 2022) University of Oxford, Said Business School; Baker Foundation Professor, Harvard Business School (Since July 1, 2022). | 33 | None. | |||||
| Paul Braverman YOB: 1949 | Trustee | Since March 2010. | Retired | 33 | Trustee HIMCO Variable Insurance Trust (27 Portfolios) April 2014 – April 2019). | |||||
226 |
| Interested Trustee and Officer | ||||||||||
Dina Santoro2 YOB: 1973 | Trustee; President of the Trust | Trustee and President of the Trust since February 2023. | Chief Operating Officer, Grantham, Mayo, Van Otterloo & Co. LLC (February 2023 – Present); President, Chief Executive Officer, and Director, Voya Investments, LLC, Voya Capital, LLC, and Voya Funds Services, LLC (September 2022 – December 2022); Director and Senior Vice President, Voya Investments Distributor, LLC (April 2018 –December 2022); Chief Operating Officer, Voya Investment Management (January 2022 –December 2022); Senior Managing Director, Head of Product and Marketing Strategy, Voya Investment Management (September 2017-December 2022). Formerly, President and Director, Voya Investments, LLC and Voya Capital, LLC (March 2018-September 2022); Director, Voya Funds Services, LLC (March 2018-September 2022). | 33 | Voya Separate Portfolios Trust (July 2018 – December 2022). | |||||
| 1 | The Fund Complex includes series of each of GMO Trust. |
| 2 | Ms. Santoro is an “interested person” of the Trust, as such term is used in the 1940 Act (as “Interested Trustee”), by virtue of her positions with the Trust and GMO indicated in the table above. |
Officers
Name and | Position(s) | Length of Time Served | Principal Occupation(s) | |||
Dina Santoro YOB: 1973 | Trustee; President of the Trust | Trustee and President since February 2023. | Chief Operating Officer, Grantham, Mayo, Van Otterloo & Co. LLC (February 2023 – Present); Chief Operating Officer, Grantham, Mayo, Van Otterloo & Co. LLC (February 2023 – Present); President, Chief Executive Officer, and Director, Voya Investments, LLC, Voya Capital, LLC, and Voya Funds Services, LLC (September 2022 – February 2023); Director and Senior Vice President, Voya Investments Distributor, LLC (April 2018 –February 2023); Chief Operating Officer, Voya Investment Management (January 2022 –February 2023); Senior Managing Director, Head of Product and Marketing Strategy, Voya Investment Management (September 2017-February 2023); Formerly, President and Director, Voya Investments, LLC and Voya Capital, LLC (March 2018-September 2022); Director, Voya Funds Services, LLC (March 2018-September 2022). | |||
Tara Pari YOB: 1976 | Chief Executive Officer | Chief Executive Officer since November 2020. | Risk and Controls, Grantham, Mayo, Van Otterloo & Co. LLC (September 2004 – November 2020); Head of Fund Reporting and Risk and Controls, Grantham, Mayo, Van Otterloo & Co. LLC (November 2020 to present). | |||
| Betty Maganzini YOB: 1972 | Treasurer, Chief Accounting Officer and Chief Financial Officer | Treasurer, Chief Accounting Officer and Chief Financial Officer since September 2018; Assistant Treasurer, September 2013 – September 2018. | Fund Administrator, Grantham, Mayo, Van Otterloo & Co. LLC (July 2010 – present). | |||
| 227 |
Name and | Position(s) | Length of Time Served | Principal Occupation(s) | |||
Susan Saw YOB: 1981 | Assistant Treasurer | Since September 2019. | Fund Administrator, Grantham, Mayo, Van Otterloo & Co. LLC (March 2011 – present). | |||
John L. Nasrah YOB: 1977 | Assistant Treasurer and Chief Tax Officer | Since March 2007. | Head of Tax, Grantham, Mayo, Van Otterloo & Co. LLC (November 2020 - present); Head of Fund Tax, Grantham, Mayo, Van Otterloo & Co. LLC (2018 - 2020). | |||
Cathy Tao YOB: 1974 | Assistant Treasurer | Since September 2016. | Fund Administrator, Grantham, Mayo, Van Otterloo & Co. LLC (October 2007 – present). | |||
Devin Kelly YOB: 1984 | Assistant Treasurer | Since June 2020. | Fund Administrator, Grantham, Mayo, Van Otterloo & Co. LLC (October 2012 – present). | |||
Brian Kadehjian YOB: 1974 | Assistant Treasurer and Treasury Officer | Assistant Treasurer since February 2015; Treasury Officer since September 2013. | Fund Administrator, Grantham, Mayo, Van Otterloo & Co. LLC (April 2002 – present). | |||
Douglas Y. Charton YOB: 1982 | Chief Legal Officer, Vice President and Clerk | Since August 2015. | Legal Counsel, Grantham, Mayo, Van Otterloo & Co. LLC (July 2015 – present); Associate, K&L Gates LLP (September 2007 – July 2015). | |||
Megan Bunting YOB: 1978 | Vice President and Assistant Clerk | Since September 2013. | Legal Counsel, Grantham, Mayo, Van Otterloo & Co. LLC (September 2006 – present). | |||
Kevin O’Brien YOB: 1985 | Vice President and Assistant Clerk | Since March 2016. | Legal Counsel, Grantham, Mayo, Van Otterloo & Co. LLC (February 2015 – present). | |||
Gregory L. Pottle YOB: 1971 | Chief Compliance Officer | Chief Compliance Officer since May 2015; Vice President and Assistant Clerk, November 2006 – November 2015. | Chief Compliance Officer, Grantham, Mayo, Van Otterloo & Co. LLC (May 2015 – present). | |||
Kelly Butler YOB: 1974 | Anti-Money Laundering Officer | Since March 2020. | Compliance Manager (March 2016 – present); Compliance Specialist, Grantham, Mayo, Van Otterloo & Co. LLC (November 2007 – March 2016). | |||
| * | Each officer of the Trust may also serve as an officer and/or director of certain pooled investment vehicles of which GMO or an affiliate of GMO serves as the investment adviser. |
| 228 |
AR-022823-EQ
GMO Trust
Annual Report
February 28, 2023
Asset Allocation Bond Fund
Emerging Country Debt Fund
High Yield Fund
Multi-Sector Fixed Income Fund
Opportunistic Income Fund
U.S. Treasury Fund
For a free copy of the Funds’ proxy voting guidelines, shareholders may call 1-617-346-7646 (collect), visit GMO’s website at www.gmo.com or visit the Securities and Exchange Commission’s website at www.sec.gov. Information regarding how the Funds voted proxies relating to portfolio securities during the most recent 12-month period ended June 30 will be available without charge on GMO’s website at www.gmo.com and on the Securities and Exchange Commission’s website at www.sec.gov no later than August 31 of each year.
The Funds file their complete schedule of portfolio holdings with the Securities and Exchange Commission for the first and third quarter of each fiscal year on Form N-PORT which is available on the Commission’s website at www.sec.gov. The Funds have a policy with respect to disclosure of portfolio holdings under which they may also make a complete schedule of portfolio holdings available on GMO’s website at www.gmo.com.
This report is prepared for the general information of shareholders. It is authorized for distribution to prospective investors only when preceded or accompanied by a prospectus for the GMO Trust, which contains a complete discussion of the risks associated with an investment in these Funds and other important information. The GMO Trust prospectus can be obtained at www.gmo.com. The GMO Trust Statement of Additional Information includes additional information about the Trustees of GMO Trust and is available without charge, upon request, by calling 1-617-346-7646 (collect).
An investment in the Funds is subject to risk, including the possible loss of principal amount invested. There can be no assurance that the Funds will achieve their stated investment objectives. Please see the Funds’ prospectus regarding specific principal risks for each Fund. General risks may include: market risk-fixed income investments, management and operational risk, market risk-asset backed securities, credit risk and derivatives risk.
The Funds are distributed by Funds Distributor LLC. Funds Distributor LLC is not affiliated with GMO.
TABLE OF CONTENTS
| 1 | ||||
| 2 | ||||
| 3 | ||||
| 4 | ||||
| 7 | ||||
| 8 | ||||
| 9 | ||||
| 10 | ||||
| 23 | ||||
| 24 | ||||
| 25 | ||||
| 26 | ||||
| 31 | ||||
| 32 | ||||
| 33 | ||||
| 34 | ||||
| 43 | ||||
| 44 | ||||
| 46 | ||||
| 47 | ||||
| 59 | ||||
| 60 | ||||
| 61 | ||||
| 62 | ||||
| 63 | ||||
| 64 | ||||
| 68 | ||||
| 70 | ||||
| 73 | ||||
| 74 | ||||
| 87 | ||||
| 124 | ||||
| 125 | ||||
| 127 | ||||
| 128 |
GMO Asset Allocation Bond Fund
(A Series of GMO Trust)
Portfolio Management
Day-to-day management of the Fund’s portfolio is the responsibility of the Developed Rates & FX team and the Asset Allocation team at Grantham, Mayo, Van Otterloo & Co. LLC.
Management Discussion and Analysis of Fund Performance
Class III shares of GMO Asset Allocation Bond Fund returned -12.86% (net) for the fiscal year ended February 28, 2023, as compared with a +2.22% return for the FTSE 3-Month Treasury Bill Index.
For most of the period, the Fund was invested in U.S. nominal government bonds. At the start of the period the 10-year nominal yield was 1.83%, but this has climbed all the way to 3.92% by the end of February 2023. Against this challenging backdrop for bonds, the Fund did better than, for example, the FTSE 10-Year Treasury Benchmark On-the-Run Index, which returned -13.98%.
In order to increase exposure to the significantly improved yields, the duration of the Fund was materially increased toward the very end of the period. This was implemented by selling the physical bonds that were held and instead entering a series of futures contracts. This was done to maintain an interest rate exposure that was not dissimilar in shape to the Bloomberg U.S. Aggregate Index while increasing the overall exposure to bonds. (We did not want to simply increase duration by taking a position in longer dated bonds given the inverted slope of the yield curve).
The views expressed herein are exclusively those of Grantham, Mayo, Van Otterloo & Co. LLC as of the date of this report and are subject to change. GMO disclaims any responsibility to update such views. They are not meant as investment advice. References to specific securities are not recommendations of such securities and may not be representative of any GMO portfolio’s current or future investments. All information is unaudited.
1
GMO Asset Allocation Bond Fund
(A Series of GMO Trust)
Comparison of Change in Value of a $5,000,000 Investment in
GMO Asset Allocation Bond Fund Class III Shares and the FTSE 3-Month Treasury Bill Index
As of February 28, 2023
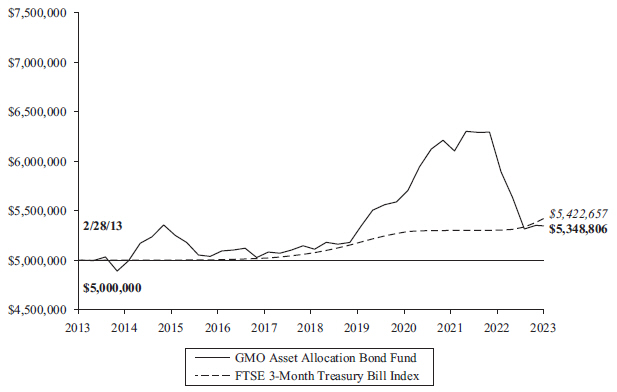
| Average Annual Total Returns | ||||||||||||
| 1 Year | 5 Year | 10 Year | ||||||||||
| Class III | -12.86 | % | 1.03 | % | 0.68 | % | ||||||
| Class VI | -12.81 | % | 1.12 | % | 0.76 | % | ||||||
Performance data quoted represents past performance and is not indicative of future results. The investment return and principal value of an investment will fluctuate so that an investor’s shares, when redeemed, may be worth more or less than their original cost. Current performance data may be lower or higher than the performance data provided herein. To obtain performance information up to the most recent month-end, visit www.gmo.com. Performance shown is net of all fees after reimbursement from GMO. Returns would have been lower had certain expenses not been reimbursed during the periods shown and do not include the effect of taxes on distributions and redemptions. The performance information shown above only includes purchase premiums and/or redemption fees in effect as of February 28, 2023. All information is unaudited. Performance for classes may vary due to different fees.
For Class III and VI the gross expense ratio of 0.57% and 0.48%, respectively, is equal to the Fund’s Total Annual Operating Expenses set forth in the Fund’s most recent prospectus dated June 30, 2022. For the Classes listed above, the corresponding net expense ratio of 0.42% and 0.32% reflects the reduction of expenses from fee reimbursements. The fee reimbursements will continue until at least June 30, 2023. Elimination of this reimbursement will result in higher fees and lower performance.
2
GMO Asset Allocation Bond Fund
(A Series of GMO Trust)
Investment Concentration Summary
February 28, 2023 (Unaudited)
Asset Class Summary& | % of Total Net Assets | |||
Short-Term Investments | 75.4 | % | ||
Debt Obligations | 24.9 | |||
Forward Currency Contracts | 0.0 | ^ | ||
Futures Contracts | (0.1 | ) | ||
Other | (0.2 | ) | ||
|
| |||
| 100.0 | % | |||
|
| |||
| & | In the table, derivative financial instruments, if any, are based on market values, rather than the notional amounts of derivatives, except for forward currency contracts which are based on unrealized appreciation/(depreciation). |
| ^ | Rounds to 0.0%. |
3
GMO Asset Allocation Bond Fund
(A Series of GMO Trust)
(showing percentage of total net assets)
February 28, 2023
Par Value† | Description | Value ($) | ||||||||
| DEBT OBLIGATIONS — 24.9% | ||||||||||
| U.S. Government — 24.9% | ||||||||||
| 5,000,000 | U.S. Treasury Note, Variable Rate, SOFR + 0.20%, 5.01%, due 01/31/25 (a) | 5,005,241 | ||||||||
|
| |||||||||
| TOTAL DEBT OBLIGATIONS (COST $5,002,173) | 5,005,241 | |||||||||
|
| |||||||||
| SHORT-TERM INVESTMENTS — 75.4% |
| |||||||||
| Sovereign and Sovereign Agency Issuers — 9.8% |
| |||||||||
| JPY | 270,000,000 | Japan Treasury Discount Bill, Zero Coupon, due 06/05/23 | 1,983,756 | |||||||
|
| |||||||||
| U.S. Government Agency — 14.9% | ||||||||||
| 3,000,000 | Federal Home Loan Banks, Variable Rate, SOFR + 0.03%, 4.58%, due 06/07/23 | 2,999,995 | ||||||||
|
| |||||||||
| Repurchase Agreements — 49.6% | ||||||||||
| 9,999,814 | Nomura Securities International, Inc. Repurchase Agreement, dated, 02/28/23 maturing on 03/01/23 with a maturity value of $10,001,067 and an effective yield of 4.51%, collateralized by a U.S. Treasury Note with maturity date 12/31/29 and a market value of $10,203,893. | 9,999,814 | ||||||||
|
| |||||||||
Shares | Description | Value ($) | ||||||
| Money Market Funds — 1.1% | ||||||||
| 216,301 | State Street Institutional Treasury Money Market Fund – Premier Class, 4.42% (b) | 216,301 | ||||||
|
| |||||||
| TOTAL SHORT-TERM INVESTMENTS (COST $15,196,426) | 15,199,866 | |||||||
|
| |||||||
| TOTAL INVESTMENTS — 100.3% (Cost $20,198,599) | 20,205,107 | |||||||
|
| |||||||
| Other Assets and Liabilities (net) — (0.3)% | (54,675 | ) | ||||||
|
| |||||||
| TOTAL NET ASSETS — 100.0% | $ | 20,150,432 | ||||||
|
| |||||||
A summary of outstanding financial instruments at February 28, 2023 is as follows:
Forward Currency Contracts
Settlement | Counterparty | Currency Sold | Currency Purchased | Net Unrealized Appreciation (Depreciation)($) | ||||||||||||
06/05/2023 | CITI | JPY 270,000,000 | USD 2,018,072 | $ | 7,690 | |||||||||||
|
| |||||||||||||||
Futures Contracts
Number of Contracts + | Type | Expiration Date | Notional Amount ($) | Value/Net Unrealized Appreciation (Depreciation) ($) | ||||||||||
| Buys | ||||||||||||||
| 43 | U.S. Long Bond (CBT) | June 2023 | 5,384,406 | (5,066 | ) | |||||||||
| 45 | U.S. Treasury Note 10 Yr. (CBT) | June 2023 | 5,024,531 | 2,050 | ||||||||||
| 33 | U.S. Treasury Note 2 Yr. (CBT) | June 2023 | 6,722,977 | (17,279 | ) | |||||||||
| 91 | U.S. Treasury Note 5 Yr. (CBT) | June 2023 | 9,741,977 | (17,176 | ) | |||||||||
| 33 | U.S. Treasury Ultra 10 Yr. (CBT) | June 2023 | 3,867,187 | 9,238 | ||||||||||
| 28 | U.S. Ultra Bond (CBT) | June 2023 | 3,781,750 | 13,084 | ||||||||||
|
|
|
| |||||||||||
| $ | 34,522,828 | $ | (15,149 | ) | ||||||||||
|
|
|
| |||||||||||
| + | Buys - Fund is long the futures contract. |
Sales - Fund is short the futures contract.
| See accompanying notes to the financial statements. | 4 |
GMO Asset Allocation Bond Fund
(A Series of GMO Trust)
Schedule of Investments — (Continued)
February 28, 2023
As of February 28, 2023, for the above contracts and/or agreements, the Fund had sufficient cash and/or securities to cover commitments or collateral requirements, if any, of the relevant broker or exchange.
Notes to Schedule of Investments:
| † | Denominated in U.S. Dollar, unless otherwise indicated. |
| (a) | All or a portion of this security has been pledged to cover margin requirements on futures and/or cleared swap contracts, collateral on OTC swap contracts, forward currency contracts, and/or written options, if any (Note 4). |
| (b) | The rate disclosed is the 7 day net yield as of February 28, 2023. |
For a listing of definitions of acronyms, counterparty abbreviations and currency abbreviations used throughout the Schedule of Investments as well as the derivative tables, if any, please refer to page 63.
| 5 | See accompanying notes to the financial statements. |
This page has been left blank intentionally.
GMO Emerging Country Debt Fund
(A Series of GMO Trust)
Portfolio Management
Day-to-day management of the Fund’s portfolio is the responsibility of the Emerging Country Debt team at Grantham, Mayo, Van Otterloo & Co. LLC.
Management Discussion and Analysis of Fund Performance
Class III shares of GMO Emerging Country Debt Fund returned -5.52% (net) for the fiscal year ended February 28, 2023, as compared with -8.64% for the J.P. Morgan EMBI Global Diversified + (EMBIGD).
EMBIGD’s spread over U.S. Treasuries tightened by 23 basis points to 447 basis points during the fiscal year, and the yield on the 10-year U.S. Treasury bond rose by 210 basis points to 3.92%.
The Fund had a small negative alpha from country selection during the fiscal year, as losses from overweights in Ecuador, Ukraine, Sri Lanka, and Zambia were mostly offset by the Fund’s overweights in Oman, Tunisia, Jordan, and Argentina, and underweight in Pakistan.
In terms of security selection, positive alpha was driven by the holding of bonds in off-benchmark countries. The most notable countries in this category were Russia and Venezuela, followed by Belarus, Republic of Congo, and the Bahamas. Security selection in on-benchmark countries such as Ukraine, Ghana, and South Africa also contributed positive alpha during the fiscal year, though negative alpha from security selection in Tunisia, Brazil, and Mexico partly offset these gains. Within quasi-sovereign security selection, the portfolio had positive alpha from Brazil and India, while Mexico and China were notable detractors.
The views expressed herein are exclusively those of Grantham, Mayo, Van Otterloo & Co. LLC as of the date of this report and are subject to change. GMO disclaims any responsibility to update such views. They are not meant as investment advice. References to specific securities are not recommendations of such securities and may not be representative of any GMO portfolio’s current or future investments. All information is unaudited.
7
GMO Emerging Country Debt Fund
(A Series of GMO Trust)
Comparison of Change in Value of a $5,000,000 Investment in
GMO Emerging Country Debt Fund Class III Shares, the J.P. Morgan EMBI Global Diversified +*
and the J.P. Morgan EMBI Global
As of February 28, 2023
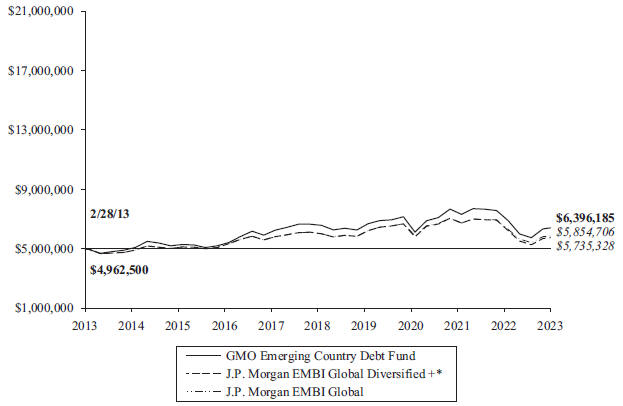
| Average Annual Total Returns | ||||||||
| 1 Year | 5 Year | 10 Year | Since Inception | |||||
| Class III | -6.93% | -0.63% | 2.49% | n/a | ||||
| Class IV | -6.89% | -0.58% | 2.54% | n/a | ||||
| Class VI | -6.90% | n/a | n/a | 7/29/21 -11.59% | ||||
Performance data quoted represents past performance and is not indicative of future results. The investment return and principal value of an investment will fluctuate so that an investor’s shares, when redeemed, may be worth more or less than their original cost. Current performance data may be lower or higher than the performance data provided herein. To obtain performance information up to the most recent month-end, visit www.gmo.com. Performance shown is net of all fees after reimbursement from GMO. Each performance figure assumes a purchase at the beginning and redemption at the end of the stated period and reflects a transaction fee of 0.75% on the purchase and 0.75% on the redemption. Transaction fees are retained by the Fund to cover trading costs. Returns would have been lower had certain expenses not been reimbursed during the periods shown and do not include the effect of taxes on distributions and redemptions. All information is unaudited. Performance for classes may vary due to different fees.
For J.P. Morgan disclaimers please visit https://www.gmo.com/north-america/benchmark-disclaimers/
| * | The J.P. Morgan Emerging Markets Bond Index Global Diversified + (composite index) reflects the performance of the J.P. Morgan Emerging Markets Bond Index Global through 2/29/2020 and the J.P. Morgan EMBI Global Diversified thereafter. |
For Class III, IV, and VI the gross expense ratio of 0.53%, 0.48%, and 0.43%, respectively, is equal to the Fund’s Total Annual Operating Expenses set forth in the Fund’s most recent prospectus dated June 30, 2022. For the Classes listed above, the corresponding net expense ratio of 0.53%, 0.48% and 0.43% reflects the reduction of expenses from fee reimbursements. The fee reimbursements will continue until at least June 30, 2023. Elimination of this reimbursement will result in higher fees and lower performance.
8
GMO Emerging Country Debt Fund
(A Series of GMO Trust)
Investment Concentration Summary
February 28, 2023 (Unaudited)
Asset Class Summary& | % of Total Net Assets | |||
Debt Obligations | 90.2 | % | ||
Short-Term Investments | 3.9 | |||
Loan Assignments | 1.2 | |||
Swap Contracts | 1.0 | |||
Loan Participations | 0.8 | |||
Rights/Warrants | 0.3 | |||
Investment Funds | 0.3 | |||
Forward Currency Contracts | 0.1 | |||
Written Options/Credit Linked Options | 0.0 | ^ | ||
Bond Forward Contracts | (0.0 | )^ | ||
Other | 2.2 | |||
|
| |||
| 100.0 | % | |||
|
| |||
Country/Region Summary¤ | % of Investments | |||
Turkey | 8.0 | % | ||
Mexico | 6.4 | |||
Saudi Arabia | 6.2 | |||
Oman | 5.6 | |||
Bahrain | 5.4 | |||
Dominican Republic | 5.2 | |||
Indonesia | 4.6 | |||
Colombia | 4.5 | |||
South Africa | 4.1 | |||
Argentina | 3.8 | |||
Egypt | 3.5 | |||
Tunisia | 3.5 | |||
Jordan | 3.2 | |||
Peru | 3.0 | |||
United Arab Emirates | 2.9 | |||
Panama | 2.7 | |||
Kenya | 2.5 | |||
Chile | 2.4 | |||
Ecuador | 2.4 | |||
Romania | 2.3 | |||
Philippines | 2.1 | |||
Kazakhstan | 2.0 | |||
Vietnam | 1.8 | |||
Nigeria | 1.7 | |||
Other Emerging | 1.6 | † | ||
India | 1.5 | |||
Ghana | 1.4 | |||
Israel | 1.4 | |||
Brazil | 1.1 | |||
Costa Rica | 1.1 | |||
Sri Lanka | 1.1 | |||
Uruguay | 1.0 | |||
|
| |||
| 100.0 | % | |||
|
| |||
| & | The table incorporates aggregate indirect asset class exposure associated with investments in other funds of GMO Trust (“underlying funds”). Derivative financial instruments, if any, are based on market values, rather than the notional amounts of derivatives, except for forward currency contracts which are based on unrealized appreciation/(depreciation). |
| ¤ | The table incorporates aggregate indirect country exposure associated with investments in the underlying funds. The table excludes short-term investments. The table includes exposure through the use of certain derivative financial instruments and excludes exposure through certain currency linked derivatives such as forward currency contracts and currency options. The table is based on duration adjusted net exposures (both investments and derivatives), taking into account the market value of securities and the notional amounts of swaps and other derivative financial instruments. Duration is based on GMO’s models. The greater the duration of a bond, the greater its contribution to the concentration percentage. Credit default swap exposures are factored into the duration adjusted exposure using a reference security and applying the same methodology to that security. |
| † | “Other Emerging” is comprised of emerging countries that each represent between (1.0)% and 1.0% of Investments. |
| ^ | Rounds to 0.0%. |
9
GMO Emerging Country Debt Fund
(A Series of GMO Trust)
(showing percentage of total net assets)
February 28, 2023
Par Value† | Description | Value ($) | ||||||||
| DEBT OBLIGATIONS — 90.2% | ||||||||||
| Albania — 1.5% | ||||||||||
| Sovereign and Sovereign Agency Issuers — 1.5% |
| |||||||||
| 40,349,849 | Republic of Albania Par Bond, Zero Coupon, due 08/31/25 (a) (b) | 34,834,893 | ||||||||
| EUR | 7,400,000 | Republic of Albania Par Bond, Reg S, 3.50%, due 11/23/31 | 6,375,562 | |||||||
|
| |||||||||
| Total Albania | 41,210,455 | |||||||||
|
| |||||||||
| Angola — 0.6% | ||||||||||
| Sovereign and Sovereign Agency Issuers — 0.6% |
| |||||||||
| 20,600,000 | Angolan Government International Bond, Reg S, 9.38%, due 05/08/48 | 17,613,000 | ||||||||
|
| |||||||||
| Argentina — 3.2% | ||||||||||
| Sovereign and Sovereign Agency Issuers — 3.2% |
| |||||||||
| 23,590,713 | Republic of Argentina, 1.00%, due 07/09/29 | 7,296,680 | ||||||||
| 28,633,493 | Republic of Argentina, Step Up, 0.50%, due 07/09/30 | 9,277,251 | ||||||||
| JPY | 330,767,207 | Republic of Argentina, Variable Rate, 4.33%, due 12/31/33 (c) | 609,765 | |||||||
| 45,947,942 | Republic of Argentina, Step Up, 1.50%, due 07/09/35 | 13,072,190 | ||||||||
| EUR | 25,230,000 | Republic of Argentina, Step Up, 3.00%, due 01/09/38 | 7,285,213 | |||||||
| 56,798,994 | Republic of Argentina, Step Up, 3.88%, due 01/09/38 | 19,435,656 | ||||||||
| JPY | 271,173,000 | Republic of Argentina, 0.67%, due 12/31/38 (c) | 343,559 | |||||||
| EUR | 6,660,000 | Republic of Argentina, Step Up, 2.75%, due 07/09/41 | 1,754,026 | |||||||
| 56,601,240 | Republic of Argentina, Step Up, 3.50%, due 07/09/41 | 17,772,789 | ||||||||
| 46,247,000 | Republic of Argentina, Step Up, 1.50%, due 07/09/46 | 13,348,040 | ||||||||
|
| |||||||||
| Total Argentina | 90,195,169 | |||||||||
|
| |||||||||
| Armenia — 0.0% | ||||||||||
| Corporate Debt | ||||||||||
| 1,150,000 | Ardshinbank CJSC Via Dilijan Finance BV, Reg S, 6.50%, due 01/28/25 | 1,085,658 | ||||||||
|
| |||||||||
| Azerbaijan — 0.5% | ||||||||||
| Sovereign and Sovereign Agency Issuers — 0.5% |
| |||||||||
| 14,400,000 | Republic of Azerbaijan International Bond, Reg S, 5.13%, due 09/01/29 | 13,700,700 | ||||||||
|
| |||||||||
| Bahamas — 1.0% | ||||||||||
| Sovereign and Sovereign Agency Issuers — 1.0% |
| |||||||||
| 8,840,000 | Bahamas Government International Bond, Reg S, 6.00%, due 11/21/28 | 7,204,600 | ||||||||
| 4,400,000 | Bahamas Government International Bond, 144A, 9.00%, due 06/16/29 | 3,985,575 | ||||||||
| 14,800,000 | Bahamas Government International Bond, Reg S, 8.95%, due 10/15/32 | 13,040,650 | ||||||||
Par Value† | Description | Value ($) | ||||||||
| Bahamas — continued | ||||||||||
| Sovereign and Sovereign Agency Issuers — continued |
| |||||||||
| 4,300,000 | Bahamas Government International Bond, Reg S, 7.13%, due 04/02/38 | 3,310,462 | ||||||||
|
| |||||||||
| Total Bahamas | 27,541,287 | |||||||||
|
| |||||||||
| Bahrain — 2.3% | ||||||||||
| Sovereign and Sovereign Agency Issuers — 2.3% |
| |||||||||
| 68,390,000 | Bahrain Government International Bond, Reg S, 7.50%, due 09/20/47 | 63,602,700 | ||||||||
|
| |||||||||
| Barbados — 0.6% | ||||||||||
| Sovereign and Sovereign Agency Issuers — 0.6% |
| |||||||||
| 17,520,000 | Barbados Government International Bond, Reg S, 6.50%, due 10/01/29 | 16,116,210 | ||||||||
|
| |||||||||
| Belarus — 0.3% | ||||||||||
| Sovereign and Sovereign Agency Issuers — 0.3% |
| |||||||||
| 8,304,000 | Development Bank of the Republic of Belarus JSC, Reg S, 6.75%, due 05/02/24 (c) (d) | 2,906,400 | ||||||||
| 20,300,000 | Republic of Belarus International Bond, Reg S, 6.20%, due 02/28/30 (c) (d) | 6,394,500 | ||||||||
|
| |||||||||
| Total Belarus | 9,300,900 | |||||||||
|
| |||||||||
| Bermuda — 0.2% | ||||||||||
| Sovereign and Sovereign Agency Issuers — 0.2% |
| |||||||||
| 5,690,000 | Bermuda Government International Bond, Reg S, 4.75%, due 02/15/29 | 5,531,036 | ||||||||
|
| |||||||||
| Bolivia — 0.2% | ||||||||||
| Sovereign and Sovereign Agency Issuers — 0.2% |
| |||||||||
| 7,500,000 | Bolivia Government International Bond, Reg S, 4.50%, due 03/20/28 | 5,287,500 | ||||||||
|
| |||||||||
| Brazil — 1.7% | ||||||||||
| Corporate Debt — 0.8% | ||||||||||
| 23,331,060 | MV24 Capital BV, Reg S, 6.75%, due 06/01/34 | 20,936,710 | ||||||||
|
| |||||||||
| Sovereign and Sovereign Agency Issuers — 0.9% |
| |||||||||
| 4,000,000 | Petrobras Global Finance BV, 6.85%, due 06/05/2115 | 3,326,500 | ||||||||
| 14,400,000 | Republic of Brazil, 4.75%, due 01/14/50 | 10,325,700 | ||||||||
| BRL | 61,000,000 | Rio Smart Lighting Sarl, Reg S, 12.25%, due 09/20/32 (e) | 11,531,184 | |||||||
|
| |||||||||
| 25,183,384 | ||||||||||
|
| |||||||||
| Total Brazil | 46,120,094 | |||||||||
|
| |||||||||
| Bulgaria — 0.1% | ||||||||||
| Sovereign and Sovereign Agency Issuers — 0.1% |
| |||||||||
| EUR | 2,800,000 | Bulgarian Energy Holding EAD, Reg S, 2.45%, due 07/22/28 | 2,422,555 | |||||||
|
| |||||||||
| See accompanying notes to the financial statements. | 10 |
GMO Emerging Country Debt Fund
(A Series of GMO Trust)
Schedule of Investments — (Continued)
(showing percentage of total net assets)
February 28, 2023
Par Value† | Description | Value ($) | ||||||||
| Cameroon — 0.2% | ||||||||||
| Sovereign and Sovereign Agency Issuers — 0.2% |
| |||||||||
| EUR | 6,100,000 | Republic of Cameroon International Bond, Reg S, 5.95%, due 07/07/32 | 4,820,023 | |||||||
|
| |||||||||
| Chile — 2.2% | ||||||||||
| Corporate Debt — 0.9% | ||||||||||
| 16,611,000 | Enel Generacion Chile SA, 8.13%, due 02/01/97 (a) | 15,471,486 | ||||||||
| 23,601,659 | Inversiones Latin America Power Ltda, Reg S, 5.13%, due 06/15/33 | 10,396,531 | ||||||||
|
| |||||||||
| 25,868,017 | ||||||||||
|
| |||||||||
| Sovereign and Sovereign Agency Issuers — 1.3% |
| |||||||||
| 6,100,000 | Chile Government International Bond, 3.10%, due 05/07/41 | 4,427,456 | ||||||||
| 3,000,000 | Chile Government International Bond, 4.00%, due 01/31/52 | 2,325,563 | ||||||||
| 6,600,000 | Empresa Nacional del Petroleo, Reg S, 5.25%, due 11/06/29 | 6,246,487 | ||||||||
| 4,300,000 | Empresa Nacional del Petroleo, Reg S, 3.45%, due 09/16/31 | 3,533,525 | ||||||||
| 24,950,000 | Empresa Nacional del Petroleo, Reg S, 4.50%, due 09/14/47 | 18,974,475 | ||||||||
|
| |||||||||
| 35,507,506 | ||||||||||
|
| |||||||||
| Total Chile | 61,375,523 | |||||||||
|
| |||||||||
| China — 0.2% | ||||||||||
| Corporate Debt | ||||||||||
| 11,200,000 | China Evergrande Group, Reg S, 11.50%, due 01/22/23 (d) | 971,600 | ||||||||
| 14,300,000 | China Evergrande Group, Reg S, 12.00%, due 01/22/24 (d) | 1,161,875 | ||||||||
| 7,500,000 | China Evergrande Group, Reg S, 10.50%, due 04/11/24 (d) | 628,125 | ||||||||
| 2,900,000 | Huarong Finance Co., Ltd., Reg S, 4.75%, due 04/27/27 | 2,502,700 | ||||||||
| 6,100,000 | Scenery Journey Ltd., Reg S, 11.50%, due 10/24/22 (d) | 335,500 | ||||||||
| 2,100,000 | Scenery Journey Ltd., Reg S, 13.00%, due 11/06/22 (d) | 115,500 | ||||||||
| 3,600,000 | Scenery Journey Ltd., Reg S, 12.00%, due 10/24/23 (d) | 198,000 | ||||||||
| 4,100,000 | Scenery Journey Ltd., Reg S, 13.75%, due 11/06/23 (d) | 225,500 | ||||||||
|
| |||||||||
| Total China | 6,138,800 | |||||||||
|
| |||||||||
| Colombia — 4.0% | ||||||||||
| Corporate Debt — 0.1% | ||||||||||
| COP | 21,060,796,766 | PA Autopista Rio Magdalena, Reg S, 6.05%, due 06/15/36 | 3,142,154 | |||||||
|
| |||||||||
| Sovereign and Sovereign Agency Issuers — 3.9% |
| |||||||||
| 1,092,000 | Colombia Government International Bond, 8.38%, due 02/15/27 (a) | 1,088,401 | ||||||||
| 3,100,000 | Colombia Government International Bond, 11.85%, due 03/09/28 (a) | 3,507,344 | ||||||||
Par Value† | Description | Value ($) | ||||||||
| Colombia — continued | ||||||||||
| Sovereign and Sovereign Agency Issuers — continued |
| |||||||||
| 10,300,000 | Colombia Government International Bond, 8.00%, due 04/20/33 | 10,169,963 | ||||||||
| 3,500,000 | Colombia Government International Bond, 7.50%, due 02/02/34 | 3,312,750 | ||||||||
| 77,700,000 | Colombia Government International Bond, 5.63%, due 02/26/44 | 55,749,750 | ||||||||
| 14,000,000 | Colombia Government International Bond, 5.20%, due 05/15/49 | 9,255,750 | ||||||||
| 5,300,000 | Ecopetrol SA, 8.88%, due 01/13/33 | 5,180,750 | ||||||||
| 20,900,000 | Ecopetrol SA, 5.88%, due 11/02/51 | 13,297,625 | ||||||||
| COP | 41,560,000,000 | Empresas Publicas de Medellin ESP, Reg S, 8.38%, due 11/08/27 | 6,449,077 | |||||||
|
| |||||||||
| 108,011,410 | ||||||||||
|
| |||||||||
| Total Colombia | 111,153,564 | |||||||||
|
| |||||||||
| Congo Republic (Brazzaville) — 1.2% | ||||||||||
| Sovereign and Sovereign Agency Issuers — 1.2% |
| |||||||||
| 40,766,789 | Republic of Congo, Reg S, Step Up, 6.00%, due 06/30/29 (c) | 34,723,113 | ||||||||
|
| |||||||||
| Costa Rica — 0.8% | ||||||||||
| Sovereign and Sovereign Agency Issuers — 0.8% |
| |||||||||
| 17,031,000 | Costa Rica Government International Bond, Reg S, 7.16%, due 03/12/45 | 16,459,397 | ||||||||
| 8,298,000 | Instituto Costarricense de Electricidad, Reg S, 6.38%, due 05/15/43 | 6,578,758 | ||||||||
|
| |||||||||
| Total Costa Rica | 23,038,155 | |||||||||
|
| |||||||||
| Czech Republic — 0.1% | ||||||||||
| Sovereign and Sovereign Agency Issuers — 0.1% |
| |||||||||
| 4,458,000 | CEZ AS, Reg S, 5.63%, due 04/03/42 | 4,111,038 | ||||||||
|
| |||||||||
| Dominican Republic — 3.0% | ||||||||||
| Sovereign and Sovereign Agency Issuers — 3.0% |
| |||||||||
| 9,100,000 | Dominican Republic International Bond, 144A, 6.00%, due 02/22/33 | 8,231,519 | ||||||||
| 7,600,000 | Dominican Republic International Bond, Reg S, 6.50%, due 02/15/48 | 6,425,800 | ||||||||
| 90,829,000 | Dominican Republic International Bond, Reg S, 5.88%, due 01/30/60 | 67,769,787 | ||||||||
|
| |||||||||
| Total Dominican Republic | 82,427,106 | |||||||||
|
| |||||||||
| Ecuador — 2.1% | ||||||||||
| Sovereign and Sovereign Agency Issuers — 2.1% |
| |||||||||
| 1,300,000 | Ecuador Government International Bond, 5.00%, due 02/28/25 (c) | 1,196,000 | ||||||||
| 6,646,892 | Ecuador Government International Bond, Reg S, Zero Coupon, due 07/31/30 | 2,053,474 | ||||||||
| 15,076,250 | Ecuador Government International Bond, Reg S, Step Up, 5.50%, due 07/31/30 | 7,295,963 | ||||||||
| 96,987,125 | Ecuador Government International Bond, Reg S, Step Up, 2.50%, due 07/31/35 | 33,963,679 | ||||||||
| 11 | See accompanying notes to the financial statements. |
GMO Emerging Country Debt Fund
(A Series of GMO Trust)
Schedule of Investments — (Continued)
(showing percentage of total net assets)
February 28, 2023
Par Value† | Description | Value ($) | ||||||||
| Ecuador — continued | ||||||||||
| Sovereign and Sovereign Agency Issuers — continued |
| |||||||||
| 29,703,750 | Ecuador Government International Bond, Reg S, Step Up, 1.50%, due 07/31/40 | 9,232,297 | ||||||||
| 7,597,817 | Ecuador Social Bond Sarl, Reg S, Zero Coupon, due 01/30/35 | 5,741,100 | ||||||||
|
| |||||||||
| Total Ecuador | 59,482,513 | |||||||||
|
| |||||||||
| Egypt — 2.2% | ||||||||||
| Sovereign and Sovereign Agency Issuers — 2.2% |
| |||||||||
| 24,500,000 | Egypt Government International Bond, Reg S, 8.70%, due 03/01/49 | 15,649,375 | ||||||||
| 48,700,000 | Egypt Government International Bond, Reg S, 8.88%, due 05/29/50 | 31,168,000 | ||||||||
| 22,764,000 | Egypt Government International Bond, Reg S, 8.15%, due 11/20/59 | 13,886,040 | ||||||||
|
| |||||||||
| Total Egypt | 60,703,415 | |||||||||
|
| |||||||||
| El Salvador — 0.6% | ||||||||||
| Sovereign and Sovereign Agency Issuers — 0.6% |
| |||||||||
| 6,200,000 | El Salvador Government International Bond, Reg S, 8.25%, due 04/10/32 | 3,079,850 | ||||||||
| 6,275,000 | El Salvador Government International Bond, Reg S, 7.65%, due 06/15/35 | 2,891,598 | ||||||||
| 26,700,000 | El Salvador Government International Bond, Reg S, 7.12%, due 01/20/50 | 11,861,475 | ||||||||
|
| |||||||||
| Total El Salvador | 17,832,923 | |||||||||
|
| |||||||||
| Ethiopia — 0.1% | ||||||||||
| Sovereign and Sovereign Agency Issuers — 0.1% |
| |||||||||
| 3,290,000 | Ethiopia International Bond, Reg S, 6.63%, due 12/11/24 | 2,234,733 | ||||||||
|
| |||||||||
| Gabon — 0.5% | ||||||||||
| Sovereign and Sovereign Agency Issuers — 0.5% |
| |||||||||
| 5,600,000 | Gabon Government International Bond, Reg S, 6.63%, due 02/06/31 | 4,533,550 | ||||||||
| 10,600,000 | Gabon Government International Bond, Reg S, 7.00%, due 11/24/31 | 8,586,000 | ||||||||
|
| |||||||||
| Total Gabon | 13,119,550 | |||||||||
|
| |||||||||
| Ghana — 1.3% | ||||||||||
| Sovereign and Sovereign Agency Issuers — 1.3% |
| |||||||||
| 5,800,000 | Republic of Ghana, Reg S, 8.13%, due 03/26/32 (d) | 2,138,750 | ||||||||
| 9,000,000 | Republic of Ghana, Reg S, 8.88%, due 05/07/42 (d) | 3,296,250 | ||||||||
| 14,800,000 | Republic of Ghana, Reg S, 8.63%, due 06/16/49 (d) | 5,383,500 | ||||||||
| 32,500,000 | Republic of Ghana, Reg S, 8.95%, due 03/26/51 (d) | 11,903,125 | ||||||||
| 27,800,000 | Republic of Ghana, Reg S, 8.75%, due 03/11/61 (d) |
| 10,112,250 |
| ||||||
Par Value† | Description | Value ($) | ||||||||
| Ghana — continued | ||||||||||
| Sovereign and Sovereign Agency Issuers — continued |
| |||||||||
| 7,121,144 | Saderea DAC, Reg S, 12.50%, due 11/30/26 | 3,119,951 | ||||||||
|
| |||||||||
| Total Ghana | 35,953,826 | |||||||||
|
| |||||||||
| Grenada — 0.2% | ||||||||||
| Sovereign and Sovereign Agency Issuers — 0.2% |
| |||||||||
| 7,005,938 | Grenada Government International Bond, Reg S, 7.00%, due 05/12/30 | 5,814,928 | ||||||||
|
| |||||||||
| Guatemala — 0.9% | ||||||||||
| Sovereign and Sovereign Agency Issuers — 0.9% |
| |||||||||
| 3,915,000 | Republic of Guatemala, Reg S, 8.13%, due 10/06/34 | 4,354,948 | ||||||||
| 5,100,000 | Republic of Guatemala, Reg S, 4.65%, due 10/07/41 | 4,111,237 | ||||||||
| 16,700,000 | Republic of Guatemala, Reg S, 6.13%, due 06/01/50 | 15,815,944 | ||||||||
|
| |||||||||
| Total Guatemala | 24,282,129 | |||||||||
|
| |||||||||
| Honduras — 0.2% | ||||||||||
| Sovereign and Sovereign Agency Issuers — 0.2% |
| |||||||||
| 7,150,000 | Honduras Government International Bond, Reg S, 5.63%, due 06/24/30 | 5,696,763 | ||||||||
|
| |||||||||
| Hungary — 1.7% | ||||||||||
| Sovereign and Sovereign Agency Issuers — 1.7% |
| |||||||||
| 10,200,000 | Hungary Government International Bond, 144A, 6.25%, due 09/22/32 | 10,314,750 | ||||||||
| 23,900,000 | Hungary Government International Bond, 144A, 5.50%, due 06/16/34 | 22,854,375 | ||||||||
| 16,400,000 | Hungary Government International Bond, Reg S, 3.13%, due 09/21/51 | 9,963,000 | ||||||||
| 4,600,000 | Hungary Government International Bond, 144A, 6.75%, due 09/25/52 | 4,715,000 | ||||||||
|
| |||||||||
| Total Hungary | 47,847,125 | |||||||||
|
| |||||||||
| India — 1.7% | ||||||||||
| Corporate Debt | ||||||||||
| 24,100,000 | Delhi International Airport Ltd., Reg S, 6.45%, due 06/04/29 | 22,191,581 | ||||||||
| 800,000 | GMR Hyderabad International Airport Ltd., Reg S, 4.75%, due 02/02/26 | 745,650 | ||||||||
| 17,140,000 | GMR Hyderabad International Airport Ltd., Reg S, 4.25%, due 10/27/27 | 14,904,301 | ||||||||
| 11,150,000 | India Airport Infra, Reg S, 6.25%, due 10/25/25 | 10,564,625 | ||||||||
|
| |||||||||
| Total India | 48,406,157 | |||||||||
|
| |||||||||
| Indonesia — 3.9% | ||||||||||
| Sovereign and Sovereign Agency Issuers — 3.9% |
| |||||||||
| 3,750,000 | Freeport Indonesia PT, Reg S, 6.20%, due 04/14/52 | 3,298,359 | ||||||||
| See accompanying notes to the financial statements. | 12 |
GMO Emerging Country Debt Fund
(A Series of GMO Trust)
Schedule of Investments — (Continued)
(showing percentage of total net assets)
February 28, 2023
Par Value† | Description | Value ($) | ||||||||
| Indonesia — continued | ||||||||||
| Sovereign and Sovereign Agency Issuers — continued |
| |||||||||
| 7,500,000 | Hutama Karya Persero PT, Reg S, 3.75%, due 05/11/30 | 6,690,469 | ||||||||
| 17,000,000 | Indonesia Asahan Aluminium Persero PT, Reg S, 5.80%, due 05/15/50 | 14,867,563 | ||||||||
| 3,100,000 | Indonesia Government International Bond, 4.85%, due 01/11/33 | 3,038,341 | ||||||||
| 10,191,000 | Indonesia Government International Bond, 5.45%, due 09/20/52 | 10,090,211 | ||||||||
| 1,500,000 | Indonesia Government International Bond, 5.65%, due 01/11/53 | 1,518,915 | ||||||||
| 16,600,000 | Minejesa Capital BV, Reg S, 5.63%, due 08/10/37 | 13,237,255 | ||||||||
| 9,200,000 | Pertamina Persero PT, Reg S, 6.50%, due 05/27/41 | 9,305,225 | ||||||||
| 6,700,000 | Pertamina Persero PT, Reg S, 4.15%, due 02/25/60 | 4,769,060 | ||||||||
| 14,800,000 | Perusahaan Listrik Negara PT, Reg S, 6.25%, due 01/25/49 | 14,226,500 | ||||||||
| 7,200,000 | Perusahaan Penerbit SBSN Indonesia III, 144A, 4.70%, due 06/06/32 | 7,065,792 | ||||||||
| 20,849,000 | Saka Energi Indonesia PT, Reg S, 4.45%, due 05/05/24 | 19,910,795 | ||||||||
|
| |||||||||
| Total Indonesia | 108,018,485 | |||||||||
|
| |||||||||
| Israel — 0.6% | ||||||||||
| Sovereign and Sovereign Agency Issuers — 0.6% |
| |||||||||
| 15,783,000 | Israel Electric Corp., Ltd., Reg S, 8.10%, due 12/15/96 | 17,601,675 | ||||||||
|
| |||||||||
| Ivory Coast — 0.8% | ||||||||||
| Sovereign and Sovereign Agency Issuers — 0.8% |
| |||||||||
| EUR | 1,500,000 | Ivory Coast Government International Bond, Reg S, 6.88%, due 10/17/40 | 1,166,114 | |||||||
| EUR | 27,800,000 | Ivory Coast Government International Bond, Reg S, 6.63%, due 03/22/48 | 20,362,304 | |||||||
|
| |||||||||
| Total Ivory Coast | 21,528,418 | |||||||||
|
| |||||||||
| Jamaica — 0.8% | ||||||||||
| Corporate Debt — 0.2% | ||||||||||
| 7,401,452 | TransJamaican Highway Ltd., Reg S, 5.75%, due 10/10/36 | 6,202,417 | ||||||||
|
| |||||||||
| Sovereign and Sovereign Agency Issuers — 0.6% |
| |||||||||
| 4,375,000 | Jamaica Government International Bond, 7.88%, due 07/28/45 | 5,097,695 | ||||||||
| 9,300,000 | National Road Operating & Construction Co., Ltd., Reg S, 9.38%, due 11/10/24 (c) | 9,579,000 | ||||||||
|
| |||||||||
| 14,676,695 | ||||||||||
|
| |||||||||
| Total Jamaica | 20,879,112 | |||||||||
|
| |||||||||
| Jordan — 1.4% | ||||||||||
| Sovereign and Sovereign Agency Issuers — 1.4% |
| |||||||||
| 44,195,000 | Jordan Government International Bond, Reg S, 7.38%, due 10/10/47 | 38,678,912 | ||||||||
|
| |||||||||
Par Value† | Description | Value ($) | ||||||||
| Kazakhstan — 0.8% | ||||||||||
| Sovereign and Sovereign Agency Issuers — 0.8% |
| |||||||||
| 1,600,000 | KazMunayGas National Co. JSC, Reg S, 5.75%, due 04/19/47 | 1,276,800 | ||||||||
| 26,000,000 | KazMunayGas National Co. JSC, Reg S, 6.38%, due 10/24/48 | 21,775,000 | ||||||||
|
| |||||||||
| Total Kazakhstan | 23,051,800 | |||||||||
|
| |||||||||
| Kenya — 1.1% | ||||||||||
| Sovereign and Sovereign Agency Issuers — 1.1% |
| |||||||||
| 40,694,000 | Kenya Government International Bond, Reg S, 8.25%, due 02/28/48 | 31,029,175 | ||||||||
|
| |||||||||
| Kuwait — 0.1% | ||||||||||
| Corporate Debt | ||||||||||
| 3,300,000 | Equate Petrochemical BV, Reg S, 2.63%, due 04/28/28 | 2,878,838 | ||||||||
|
| |||||||||
| Lebanon — 0.4% | ||||||||||
| Sovereign and Sovereign Agency Issuers — 0.4% |
| |||||||||
| 20,400,000 | Lebanon Government International Bond, Reg S, 6.85%, due 03/23/27 (d) | 1,377,000 | ||||||||
| 5,547,000 | Lebanon Government International Bond, Reg S, 7.00%, due 03/20/28 (d) | 368,529 | ||||||||
| 60,605,000 | Lebanon Government International Bond, Reg S, 7.15%, due 11/20/31 (d) | 4,140,079 | ||||||||
| 21,000,000 | Lebanon Government International Bond, 8.20%, due 05/17/33 (d) | 1,414,875 | ||||||||
| 56,914,000 | Lebanon Government International Bond, 8.25%, due 05/17/34 (d) | 3,905,723 | ||||||||
|
| |||||||||
| Total Lebanon | 11,206,206 | |||||||||
|
| |||||||||
| Malaysia — 1.0% | ||||||||||
| Sovereign and Sovereign Agency Issuers — 1.0% |
| |||||||||
| 18,300,000 | 1MDB Global Investments Ltd., Reg S, 4.40%, due 03/09/23 | 18,157,260 | ||||||||
| 4,900,000 | Dua Capital Ltd., Reg S, 2.78%, due 05/11/31 | 4,000,164 | ||||||||
| 6,800,000 | Petronas Capital Ltd., Reg S, 4.80%, due 04/21/60 | 6,282,775 | ||||||||
|
| |||||||||
| Total Malaysia | 28,440,199 | |||||||||
|
| |||||||||
| Mexico — 5.9% | ||||||||||
| Sovereign and Sovereign Agency Issuers — 5.9% |
| |||||||||
| 5,940,000 | Comision Federal de Electricidad, Reg S, 5.00%, due 07/30/49 | 4,633,200 | ||||||||
| 152,000,000 | Petroleos Mexicanos, 7.69%, due 01/23/50 | 106,567,200 | ||||||||
| 5,200,000 | Petroleos Mexicanos, Reg S, 6.63%, due 12/28/2170 | 3,250,000 | ||||||||
| GBP | 53,506,000 | United Mexican States, 5.63%, due 03/19/2114 | 49,295,493 | |||||||
|
| |||||||||
| Total Mexico | 163,745,893 | |||||||||
|
| |||||||||
| 13 | See accompanying notes to the financial statements. |
GMO Emerging Country Debt Fund
(A Series of GMO Trust)
Schedule of Investments — (Continued)
(showing percentage of total net assets)
February 28, 2023
Par Value† | Description | Value ($) | ||||||||
| Mongolia — 0.1% | ||||||||||
| Sovereign and Sovereign Agency Issuers — 0.1% |
| |||||||||
| 3,000,000 | Mongolia Government International Bond, Reg S, 4.45%, due 07/07/31 | 2,400,330 | ||||||||
|
| |||||||||
| Montenegro — 0.2% | ||||||||||
| Sovereign and Sovereign Agency Issuers — 0.2% |
| |||||||||
| EUR | 6,600,000 | Montenegro Government International Bond, Reg S, 2.88%, due 12/16/27 | 5,507,429 | |||||||
|
| |||||||||
| Morocco — 0.4% | ||||||||||
| Sovereign and Sovereign Agency Issuers — 0.4% |
| |||||||||
| 5,400,000 | OCP SA, Reg S, 5.13%, due 06/23/51 | 3,888,000 | ||||||||
| 9,200,000 | Office Cherifien des Phosphates SA, Reg S, 6.88%, due 04/25/44 | 8,360,500 | ||||||||
|
| |||||||||
| Total Morocco | 12,248,500 | |||||||||
|
| |||||||||
| Mozambique — 0.2% | ||||||||||
| Sovereign and Sovereign Agency Issuers — 0.2% |
| |||||||||
| 7,576,000 | Mozambique International Bond, Reg S, Step Up, 5.00%, due 09/15/31 | 5,744,976 | ||||||||
|
| |||||||||
| Nigeria — 1.1% | ||||||||||
| Sovereign and Sovereign Agency Issuers — 1.1% |
| |||||||||
| 43,050,000 | Nigeria Government International Bond, Reg S, 8.25%, due 09/28/51 | 29,704,500 | ||||||||
|
| |||||||||
| Oman — 2.9% | ||||||||||
| Sovereign and Sovereign Agency Issuers — 2.9% |
| |||||||||
| 11,500,000 | Lamar Funding Ltd., Reg S, 3.96%, due 05/07/25 | 10,862,469 | ||||||||
| 67,000,000 | Oman Government International Bond, Reg S, 6.75%, due 01/17/48 | 64,236,250 | ||||||||
| 5,900,000 | Oryx Funding Ltd., Reg S, 5.80%, due 02/03/31 | 5,707,512 | ||||||||
|
| |||||||||
| Total Oman | 80,806,231 | |||||||||
|
| |||||||||
| Pakistan — 0.3% | ||||||||||
| Sovereign and Sovereign Agency Issuers — 0.3% |
| |||||||||
| 14,700,000 | Islamic Republic of Pakistan, Reg S, 7.88%, due 03/31/36 | 6,107,850 | ||||||||
| 4,826,000 | Pakistan Water & Power Development Authority, Reg S, 7.50%, due 06/04/31 | 1,496,591 | ||||||||
|
| |||||||||
| Total Pakistan | 7,604,441 | |||||||||
|
| |||||||||
| Panama — 1.9% | ||||||||||
| Sovereign and Sovereign Agency Issuers — 1.9% |
| |||||||||
| 16,061,000 | Aeropuerto Internacional de Tocumen SA, Reg S, 5.13%, due 08/11/61 | 12,595,839 | ||||||||
| 2,900,000 | AES Panama Generation Holdings SRL, Reg S, 4.38%, due 05/31/30 | 2,534,600 | ||||||||
| 9,837,000 | Panama Government International Bond, 8.13%, due 04/28/34 | 11,540,031 | ||||||||
| 25,100,000 | Panama Government International Bond, 4.50%, due 04/01/56 | 18,304,175 | ||||||||
Par Value† | Description | Value ($) | ||||||||
| Panama — continued | ||||||||||
| Sovereign and Sovereign Agency Issuers — continued |
| |||||||||
| 12,000,000 | Panama Government International Bond, 4.50%, due 01/19/63 | 8,541,000 | ||||||||
|
| |||||||||
| Total Panama | 53,515,645 | |||||||||
|
| |||||||||
| Papua New Guinea — 0.0% | ||||||||||
| Sovereign and Sovereign Agency Issuers — 0.0% |
| |||||||||
| 1,100,000 | Papua New Guinea Government International Bond, Reg S, 8.38%, due 10/04/28 | 989,863 | ||||||||
|
| |||||||||
| Peru — 2.1% | ||||||||||
| Sovereign and Sovereign Agency Issuers — 2.1% |
| |||||||||
| PEN | 42,800,000 | Peru Government Bond, 6.15%, due 08/12/32 | 9,919,357 | |||||||
| 29,100,000 | Peruvian Government International Bond, 3.60%, due 01/15/72 | 18,802,238 | ||||||||
| 45,195,000 | Petroleos del Peru SA, Reg S, 5.63%, due 06/19/47 | 30,149,584 | ||||||||
|
| |||||||||
| Total Peru | 58,871,179 | |||||||||
|
| |||||||||
| Philippines — 2.1% | ||||||||||
| Sovereign and Sovereign Agency Issuers — 2.1% |
| |||||||||
| 3,800,000 | Bangko Sentral ng Pilipinas Bond, 8.60%, due 06/15/97 (c) | 5,130,000 | ||||||||
| 3,200,000 | Philippine Government International Bond, 3.20%, due 07/06/46 | 2,288,352 | ||||||||
| 8,700,000 | Philippine Government International Bond, 5.95%, due 10/13/47 | 9,288,207 | ||||||||
| 3,500,000 | Philippine Government International Bond, 5.50%, due 01/17/48 | 3,544,135 | ||||||||
| 32,512,000 | Power Sector Assets & Liabilities Management Corp., 9.63%, due 05/15/28 | 37,571,680 | ||||||||
|
| |||||||||
| Total Philippines | 57,822,374 | |||||||||
|
| |||||||||
| Poland — 0.4% | ||||||||||
| Sovereign and Sovereign Agency Issuers — 0.4% |
| |||||||||
| 11,400,000 | Republic of Poland Government International Bond, 5.75%, due 11/16/32 | 11,929,872 | ||||||||
|
| |||||||||
| Qatar — 0.4% | ||||||||||
| Sovereign and Sovereign Agency Issuers — 0.4% |
| |||||||||
| 10,878,000 | QNB Finansbank AS, Reg S, 6.88%, due 09/07/24 | 10,869,841 | ||||||||
|
| |||||||||
| Republic of North Macedonia — 0.2% | ||||||||||
| Sovereign and Sovereign Agency Issuers — 0.2% |
| |||||||||
| EUR | 7,800,000 | North Macedonia Government International Bond, Reg S, 1.63%, due 03/10/28 | 6,359,247 | |||||||
|
| |||||||||
| Romania — 1.8% | ||||||||||
| Sovereign and Sovereign Agency Issuers — 1.8% |
| |||||||||
| EUR | 16,200,000 | Romanian Government International Bond, 144A, 6.63%, due 09/27/29 | 17,327,500 | |||||||
| See accompanying notes to the financial statements. | 14 |
GMO Emerging Country Debt Fund
(A Series of GMO Trust)
Schedule of Investments — (Continued)
(showing percentage of total net assets)
February 28, 2023
Par Value† | Description | Value ($) | ||||||||
| Romania — continued | ||||||||||
| Sovereign and Sovereign Agency Issuers — continued |
| |||||||||
| 10,900,000 | Romanian Government International Bond, Reg S, 6.00%, due 05/25/34 | 10,573,000 | ||||||||
| EUR | 7,300,000 | Romanian Government International Bond, Reg S, 2.88%, due 04/13/42 | 4,439,694 | |||||||
| EUR | 5,600,000 | Romanian Government International Bond, Reg S, 4.63%, due 04/03/49 | 4,316,472 | |||||||
| EUR | 14,900,000 | Romanian Government International Bond, Reg S, 3.38%, due 01/28/50 | 9,219,439 | |||||||
| 4,000,000 | Romanian Government International Bond, 144A, 7.63%, due 01/17/53 | 4,317,500 | ||||||||
|
| |||||||||
| Total Romania | 50,193,605 | |||||||||
|
| |||||||||
| Russia — 0.1% | ||||||||||
| Sovereign and Sovereign Agency Issuers — 0.1% |
| |||||||||
| 6,870,000 | GTLK Europe Capital DAC, Reg S, 4.65%, due 03/10/27 (c) (d) (f) | 343,500 | ||||||||
| 5,200,000 | GTLK Europe Capital DAC, Reg S, 4.80%, due 02/26/28 (c) (d) (f) | 260,000 | ||||||||
| 6,800,000 | GTLK Europe Capital DAC, Reg S, 4.35%, due 02/27/29 (c) (d) (f) | 340,000 | ||||||||
| 6,400,000 | Russian Foreign Bond, Reg S, 5.10%, due 03/28/35 (c) (d) | 320,000 | ||||||||
| 34,000,000 | Russian Foreign Bond, 144A, 5.10%, due 03/28/35 (c) (d) | 1,700,000 | ||||||||
|
| |||||||||
| Total Russia | 2,963,500 | |||||||||
|
| |||||||||
| Rwanda — 0.1% | ||||||||||
| Sovereign and Sovereign Agency Issuers — 0.1% |
| |||||||||
| 4,500,000 | Rwanda International Government Bond, Reg S, 5.50%, due 08/09/31 | 3,382,875 | ||||||||
|
| |||||||||
| Saudi Arabia — 3.5% | ||||||||||
| Corporate Debt — 1.3% | ||||||||||
| 29,989,900 | ACWA Power Management And Investments One Ltd., Reg S, 5.95%, due 12/15/39 | 27,671,306 | ||||||||
| 11,900,000 | EIG Pearl Holdings Sarl, 144A, 4.39%, due 11/30/46 | 9,046,975 | ||||||||
|
| |||||||||
| 36,718,281 | ||||||||||
|
| |||||||||
| Sovereign and Sovereign Agency Issuers — 2.2% |
| |||||||||
| 9,000,000 | Saudi Government International Bond, 144A, 5.00%, due 01/18/53 | 8,212,500 | ||||||||
| 75,500,000 | Saudi Government International Bond, Reg S, 3.45%, due 02/02/61 | 51,944,000 | ||||||||
|
| |||||||||
| 60,156,500 | ||||||||||
|
| |||||||||
| Total Saudi Arabia | 96,874,781 | |||||||||
|
| |||||||||
| Senegal — 0.2% | ||||||||||
| Sovereign and Sovereign Agency Issuers — 0.2% |
| |||||||||
| 7,100,000 | Senegal Government International Bond, Reg S, 6.75%, due 03/13/48 | 4,978,875 | ||||||||
|
| |||||||||
Par Value† | Description | Value ($) | ||||||||
| Serbia — 0.6% | ||||||||||
| Sovereign and Sovereign Agency Issuers — 0.6% |
| |||||||||
| 9,700,000 | Serbia International Bond, 144A, 6.50%, due 09/26/33 | 9,433,250 | ||||||||
| EUR | 13,600,000 | Serbia International Bond, Reg S, 2.05%, due 09/23/36 | 8,377,298 | |||||||
|
| |||||||||
| Total Serbia | 17,810,548 | |||||||||
|
| |||||||||
| South Africa — 4.0% | ||||||||||
| Sovereign and Sovereign Agency Issuers — 4.0% |
| |||||||||
| 9,520,000 | Eskom Holdings SOC, Ltd., Reg S, 7.13%, due 02/11/25 | 9,349,592 | ||||||||
| 19,700,000 | Eskom Holdings SOC, Ltd., Reg S, 8.45%, due 08/10/28 | 19,281,375 | ||||||||
| ZAR | 165,550,000 | Eskom Holdings SOC, Ltd., Zero Coupon, due 12/31/32 | 1,904,749 | |||||||
| ZAR | 441,200,000 | Republic of South Africa Government International Bond, 6.50%, due 02/28/41 | 15,119,130 | |||||||
| 54,400,000 | Republic of South Africa Government International Bond, 5.75%, due 09/30/49 | 39,508,000 | ||||||||
| 23,100,000 | Republic of South Africa Government International Bond, 7.30%, due 04/20/52 | 19,866,000 | ||||||||
| 5,700,000 | Transnet SOC, Ltd., 144A, 8.25%, due 02/06/28 | 5,714,250 | ||||||||
| ZAR | 22,200,000 | Transnet SOC, Ltd., 13.50%, due 04/18/28 | 1,333,136 | |||||||
|
| |||||||||
| Total South Africa | 112,076,232 | |||||||||
|
| |||||||||
| Sri Lanka — 1.0% | ||||||||||
| Sovereign and Sovereign Agency Issuers — 1.0% |
| |||||||||
| 5,880,000 | Sri Lanka Government International Bond, Reg S, 6.83%, due 07/18/26 (d) | 2,200,590 | ||||||||
| 9,444,000 | Sri Lanka Government International Bond, Reg S, 6.20%, due 05/11/27 (d) | 3,380,952 | ||||||||
| 28,000,000 | Sri Lanka Government International Bond, Reg S, 6.75%, due 04/18/28 (d) | 10,153,080 | ||||||||
| 7,100,000 | Sri Lanka Government International Bond, Reg S, 7.85%, due 03/14/29 (d) | 2,574,531 | ||||||||
| 24,400,000 | Sri Lanka Government International Bond, Reg S, 7.55%, due 03/28/30 (d) | 8,796,200 | ||||||||
|
| |||||||||
| Total Sri Lanka | 27,105,353 | |||||||||
|
| |||||||||
| SupraNational — 0.1% | ||||||||||
| Sovereign and Sovereign Agency Issuers — 0.1% |
| |||||||||
| TRY | 213,500,000 | International Finance Corp., Reg S, Zero Coupon, due 02/15/29 | 3,551,663 | |||||||
|
| |||||||||
| Suriname — 0.7% | ||||||||||
| Sovereign and Sovereign Agency Issuers — 0.7% |
| |||||||||
| 13,600,000 | Republic of Suriname, Reg S, 12.88%, due 12/30/23 (d) | 10,756,750 | ||||||||
| 14,259,000 | Republic of Suriname, Reg S, 9.25%, due 10/26/26 (d) | 9,596,307 | ||||||||
|
| |||||||||
| Total Suriname | 20,353,057 | |||||||||
|
| |||||||||
| 15 | See accompanying notes to the financial statements. |
GMO Emerging Country Debt Fund
(A Series of GMO Trust)
Schedule of Investments — (Continued)
(showing percentage of total net assets)
February 28, 2023
Par Value† | Description | Value ($) | ||||||||
| Tajikistan — 0.3% | ||||||||||
| Sovereign and Sovereign Agency Issuers — 0.3% |
| |||||||||
| 9,274,000 | Republic of Tajikistan International Bond, Reg S, 7.13%, due 09/14/27 | 7,139,821 | ||||||||
|
| |||||||||
| Trinidad And Tobago — 1.1% | ||||||||||
| Sovereign and Sovereign Agency Issuers — 1.1% |
| |||||||||
| 21,100,000 | Heritage Petroleum Co., Ltd., 144A, 9.00%, due 08/12/29 | 22,102,250 | ||||||||
| 9,900,000 | Telecommunications Services of Trinidad & Tobago Ltd., Reg S, 8.88%, due 10/18/29 | 8,712,000 | ||||||||
|
| |||||||||
| Total Trinidad And Tobago | 30,814,250 | |||||||||
|
| |||||||||
| Tunisia — 0.9% | ||||||||||
| Sovereign and Sovereign Agency Issuers — 0.9% |
| |||||||||
| JPY | 5,960,000,000 | Banque Centrale de Tunisie SA, 4.30%, due 08/02/30 (c) | 18,384,929 | |||||||
| JPY | 2,030,000,000 | Banque Centrale de Tunisie SA, 4.20%, due 03/17/31 (c) | 5,963,791 | |||||||
| JPY | 730,000,000 | Banque Centrale de Tunisie SA, 3.50%, due 02/03/33 | 2,090,999 | |||||||
|
| |||||||||
| Total Tunisia | 26,439,719 | |||||||||
|
| |||||||||
| Turkey — 3.9% | ||||||||||
| Sovereign and Sovereign Agency Issuers — 3.9% |
| |||||||||
| 13,709,000 | Istanbul Metropolitan Municipality, Reg S, 6.38%, due 12/09/25 | 12,156,456 | ||||||||
| 18,702,000 | Republic of Turkey, 6.00%, due 01/14/41 | 13,301,797 | ||||||||
| 123,313,000 | Republic of Turkey, 5.75%, due 05/11/47 | 82,465,569 | ||||||||
|
| |||||||||
| Total Turkey | 107,923,822 | |||||||||
|
| |||||||||
| Ukraine — 0.7% | ||||||||||
| Sovereign and Sovereign Agency Issuers — 0.7% |
| |||||||||
| 5,500,000 | NPC Ukrenergo, Reg S, 6.88%, due 11/09/28 (c) (d) | 922,281 | ||||||||
| 13,900,000 | State Agency of Roads of Ukraine, Reg S, 6.25%, due 06/24/30 (c) (d) | 2,396,013 | ||||||||
| 7,919,000 | Ukraine Government International Bond, Reg S, 7.75%, due 09/01/28 (c) (d) | 1,478,873 | ||||||||
| 4,769,000 | Ukraine Government International Bond, Reg S, 7.75%, due 09/01/29 (c) (d) | 892,101 | ||||||||
| 19,400,000 | Ukraine Government International Bond, Reg S, 9.75%, due 11/01/30 (c) (d) | 3,598,700 | ||||||||
| 30,500,000 | Ukraine Government International Bond, Reg S, 7.38%, due 09/25/34 (c) (d) | 5,230,750 | ||||||||
| 24,300,000 | Ukraine Government International Bond, Reg S, 7.25%, due 03/15/35 (c) (d) | 4,127,962 | ||||||||
| 200,000 | Ukraine Railways Via Rail Capital Markets Plc, Reg S, 7.88%, due 07/15/28 (c) (d) | 38,163 | ||||||||
|
| |||||||||
| Total Ukraine | 18,684,843 | |||||||||
|
| |||||||||
| United Arab Emirates — 1.7% | ||||||||||
| Sovereign and Sovereign Agency Issuers — 1.7% |
| |||||||||
| 3,700,000 | Abu Dhabi Crude Oil Pipeline LLC, Reg S, 4.60%, due 11/02/47 | 3,361,913 | ||||||||
Par Value† | Description | Value ($) | ||||||||
| United Arab Emirates — continued | ||||||||||
| Sovereign and Sovereign Agency Issuers — continued |
| |||||||||
| 6,700,000 | Abu Dhabi Government International Bond, Reg S, 3.13%, due 09/30/49 | 4,824,000 | ||||||||
| 7,400,000 | Abu Dhabi Government International Bond, Reg S, 2.70%, due 09/02/70 | 4,440,000 | ||||||||
| 6,200,000 | DAE Funding LLC, Reg S, 3.38%, due 03/20/28 | 5,518,000 | ||||||||
| 15,900,000 | Finance Department Government of Sharjah, Reg S, 4.00%, due 07/28/50 | 10,074,637 | ||||||||
| 23,000,000 | Finance Department Government of Sharjah, Reg S, 4.38%, due 03/10/51 | 15,525,000 | ||||||||
| 2,700,000 | MDGH GMTN (RSC) Ltd., 144A, 5.50%, due 04/28/33 | 2,796,390 | ||||||||
|
| |||||||||
| Total United Arab Emirates | 46,539,940 | |||||||||
|
| |||||||||
| United States — 1.0% | ||||||||||
| Asset-Backed Securities — 0.2% | ||||||||||
| 779,899 | CWHEQ Revolving Home Equity Loan Trust, Series 05-F, Class 2A, AMBAC, Variable Rate, 1 mo. LIBOR + 0.24%, 4.83%, due 12/15/35 | 747,624 | ||||||||
| 250,470 | CWHEQ Revolving Home Equity Loan Trust, Series 05-H, Class 2A, FGIC, Variable Rate, 1 mo. LIBOR + 0.24%, 4.83%, due 12/15/35 | 246,258 | ||||||||
| 565,949 | CWHEQ Revolving Home Equity Loan Trust, Series 06-D, Class 2A, XLCA, Variable Rate, 1 mo. LIBOR + 0.20%, 4.79%, due 05/15/36 | 535,306 | ||||||||
| 6,596,745 | Morgan Stanley IXIS Real Estate Capital Trust, Series 06-2, Class A3, Variable Rate, 1 mo. LIBOR + 0.15%, 4.77%, due 11/25/36 | 2,205,021 | ||||||||
| 6,650,816 | Morgan Stanley IXIS Real Estate Capital Trust, Series 06-2, Class A4, Variable Rate, 1 mo. LIBOR + 0.22%, 4.84%, due 11/25/36 | 2,223,281 | ||||||||
| 3,436,411 | Wamu Asset-Backed Certificates, Series 07-HE2, Class 2A4, Variable Rate, 1 mo. LIBOR + 0.36%, 4.98%, due 04/25/37 | 1,312,952 | ||||||||
|
| |||||||||
| 7,270,442 | ||||||||||
|
| |||||||||
| U.S. Government — 0.8% | ||||||||||
| 9,100,000 | U.S. Treasury Note, 3.88%, due 11/30/27 | 8,970,254 | ||||||||
| 14,000,000 | U.S. Treasury Note, 3.38%, due 08/15/42 (g) | 12,604,375 | ||||||||
|
| |||||||||
| 21,574,629 | ||||||||||
|
| |||||||||
| Total United States | 28,845,071 | |||||||||
|
| |||||||||
| Uruguay — 0.6% | ||||||||||
| Sovereign and Sovereign Agency Issuers — 0.6% |
| |||||||||
| 17,018,000 | Uruguay Government International Bond, 5.10%, due 06/18/50 | 16,660,622 | ||||||||
|
| |||||||||
| See accompanying notes to the financial statements. | 16 |
GMO Emerging Country Debt Fund
(A Series of GMO Trust)
Schedule of Investments — (Continued)
(showing percentage of total net assets)
February 28, 2023
Par Value† | Description | Value ($) | ||||||||
| Uzbekistan — 0.5% | ||||||||||
| Sovereign and Sovereign Agency Issuers — 0.5% |
| |||||||||
| 6,200,000 | Republic of Uzbekistan International Bond, Reg S, 3.70%, due 11/25/30 | 4,968,912 | ||||||||
| 1,037,000 | Uzbek Industrial & Construction Bank ATB, Reg S, 5.75%, due 12/02/24 | 971,151 | ||||||||
| 8,100,000 | Uzbekneftegaz JSC, Reg S, 4.75%, due 11/16/28 | 6,662,250 | ||||||||
|
| |||||||||
| Total Uzbekistan | 12,602,313 | |||||||||
|
| |||||||||
| Venezuela — 1.6% | ||||||||||
| Sovereign and Sovereign Agency Issuers — 1.6% |
| |||||||||
| 111,465,000 | Electricidad de Caracas Finance BV, Reg S, 8.50%, due 04/10/18 (c) (d) | 835,988 | ||||||||
| 176,000,000 | Petroleos de Venezuela SA, Reg S, 6.00%, due 05/16/24 (c) (d) | 7,920,000 | ||||||||
| 61,967,000 | Petroleos de Venezuela SA, Reg S, 6.00%, due 11/15/26 (c) (d) | 2,788,515 | ||||||||
| 19,028,000 | Venezuela Government International Bond, Reg S, 7.75%, due 10/13/19 (c) (d) | 1,855,230 | ||||||||
| 36,600,000 | Venezuela Government International Bond, Reg S, 6.00%, due 12/09/20 (c) (d) | 3,568,500 | ||||||||
| 23,750,000 | Venezuela Government International Bond, Reg S, 12.75%, due 08/23/22 (c) (d) | 2,315,625 | ||||||||
| 172,793,000 | Venezuela Government International Bond, Reg S, 9.00%, due 05/07/23 (c) (d) | 16,847,317 | ||||||||
| 68,700,000 | Venezuela Government International Bond, Reg S, 11.95%, due 08/05/31 (c) (d) | 6,698,250 | ||||||||
| 7,000,000 | Venezuela Government International Bond, 9.38%, due 01/13/34 (c) (d) | 682,500 | ||||||||
|
| |||||||||
| Total Venezuela | 43,511,925 | |||||||||
|
| |||||||||
| Vietnam — 0.8% | ||||||||||
| Sovereign and Sovereign Agency Issuers — 0.8% |
| |||||||||
| 18,358,000 | Debt and Asset Trading Corp., Reg S, 1.00%, due 10/10/25 | 15,573,321 | ||||||||
| 8,018,000 | Socialist Republic of Vietnam, Series 30 Yr, Variable Rate, 6 mo. LIBOR + 0.81%, 6.08%, due 03/13/28 (c) | 7,376,560 | ||||||||
|
| |||||||||
| Total Vietnam | 22,949,881 | |||||||||
|
| |||||||||
| Zambia — 0.5% | ||||||||||
| Sovereign and Sovereign Agency Issuers — 0.5% |
| |||||||||
| 2,900,000 | Zambia Government International Bond, Reg S, 5.38%, due 09/20/22 (d) | 1,230,325 | ||||||||
| 26,072,000 | Zambia Government International Bond, Reg S, 8.97%, due 07/30/27 (d) | 11,602,040 | ||||||||
|
| |||||||||
| Total Zambia | 12,832,365 | |||||||||
|
| |||||||||
| TOTAL DEBT OBLIGATIONS (COST $3,648,682,706) | 2,514,556,850 | |||||||||
|
| |||||||||
Par Value† | Description | Value ($) | ||||||||
| LOAN ASSIGNMENTS — 1.2% | ||||||||||
| Chad — 0.4% | ||||||||||
| 2,460,117 | Glencore UK (Chad) Loan Agreement, Tranche A, Variable Rate, 3 mo. LIBOR + 2.00%, 6.97%, due 09/30/25 (c) | 2,017,295 | ||||||||
| 13,122,676 | Glencore UK (Chad) Loan Agreement, Tranche B, Variable Rate, 3 mo. LIBOR + 2.25%, 7.22%, due 12/31/27 (c) | 8,857,807 | ||||||||
|
| |||||||||
| Total Chad | 10,875,102 | |||||||||
|
| |||||||||
| Kenya — 0.1% | ||||||||||
| 2,458,335 | Republic of Kenya Loan Agreement, 6 mo. LIBOR + 6.70%, 11.96%, due 04/10/25 (a) | 2,286,718 | ||||||||
|
| |||||||||
| Turkey — 0.7% | ||||||||||
| 20,192,857 | Meridiam Eastern Europe Investment S.à.r.l. Loan Agreement, 8.85%, due 06/23/28 (a) | 19,649,339 | ||||||||
|
| |||||||||
| TOTAL LOAN ASSIGNMENTS (COST $37,052,058) | 32,811,159 | |||||||||
|
| |||||||||
| LOAN PARTICIPATIONS — 0.8% | ||||||||||
| Angola — 0.4% | ||||||||||
| 194,000 | Republic of Angola Loan Agreement (Participation via Avenir II BV), Reg S, 6 mo. LIBOR + 4.50%, 9.76%, due 12/07/23 (c) | 194,000 | ||||||||
| 7,771,429 | Republic of Angola Loan Agreement (Participation via Avenir Issuer II Ireland DAC), Reg S, 6.93%, due 02/19/27 (c) | 7,421,714 | ||||||||
| 5,133,333 | Republic of Angola Loan Agreement (Participation with GE Capital EFS Financing, Inc), 7.50%, due 08/30/24 (c) | 4,928,000 | ||||||||
|
| |||||||||
| Total Angola | 12,543,714 | |||||||||
|
| |||||||||
| Egypt — 0.0% | ||||||||||
| CHF | 237 | Paris Club Loan Agreement (Participation with Standard Chartered Bank), Zero Coupon, due 01/03/24 (a) | 218 | |||||||
|
| |||||||||
| Iraq — 0.3% | ||||||||||
| EUR | 559,895 | Republic of Iraq Paris Club Loan Agreement (Participation with Credit Suisse), 4.50%, due 12/30/27 (c) | 467,838 | |||||||
| JPY | 891,873,600 | Republic of Iraq Paris Club Loan Agreement (Participation with Deutsche Bank), 2.57%, due 01/01/28 (c) | 5,142,087 | |||||||
| JPY | 189,322,071 | Republic of Iraq Paris Club Loan Agreement (Participation with Deutsche Bank), 2.57%, due 01/01/28 (c) | 1,091,534 | |||||||
| JPY | 80,472,432 | Republic of Iraq Paris Club Loan Agreement (Participation with Deutsche Bank), 2.57%, due 01/01/28 (c) | 463,963 | |||||||
|
| |||||||||
| Total Iraq | 7,165,422 | |||||||||
|
| |||||||||
| 17 | See accompanying notes to the financial statements. |
GMO Emerging Country Debt Fund
(A Series of GMO Trust)
Schedule of Investments — (Continued)
(showing percentage of total net assets)
February 28, 2023
Par Value† / Shares | Description | Value ($) | ||||||||
| Russia — 0.0% | ||||||||||
| EUR | 76,893,500 | Russian Foreign Trade Obligations (Participation with GML International Ltd.) (c) (d) | 2 | |||||||
|
| |||||||||
| Sudan — 0.1% | ||||||||||
| CHF | 11,833,578 | Republic of Sudan Loan Agreement, Tranche A (Participation via Abu Dhabi Investment Company) (c) (d) | 1,256,419 | |||||||
| CHF | 5,155,077 | Republic of Sudan Loan Agreement, Tranche B (Participation via Abu Dhabi Investment Company) (c) (d) | 547,335 | |||||||
|
| |||||||||
| Total Sudan | 1,803,754 | |||||||||
|
| |||||||||
| TOTAL LOAN PARTICIPATIONS (COST $42,059,370) | 21,513,110 | |||||||||
|
| |||||||||
| INVESTMENT FUNDS — 0.3% | ||||||||||
| Colombia — 0.3% | ||||||||||
| 6,371,845 | Bona Fide Investments Feeder LLC (a) (h) | 7,035,403 | ||||||||
|
| |||||||||
| TOTAL INVESTMENT FUNDS (COST $6,371,845) | 7,035,403 | |||||||||
|
| |||||||||
| MUTUAL FUNDS — 2.4% | ||||||||||
| United States — 2.4% | ||||||||||
| Affiliated Issuers — 2.4% | ||||||||||
| 13,532,923 | GMO U.S. Treasury Fund | 67,529,288 | ||||||||
|
| |||||||||
| TOTAL MUTUAL FUNDS (COST $67,761,027) | 67,529,288 | |||||||||
|
| |||||||||
| RIGHTS/WARRANTS — 0.3% | ||||||||||
| Argentina — 0.2% | ||||||||||
| EUR | 271,989,676 | Republic of Argentina GDP Linked, Variable Rate, Expires 12/15/35 (i) | 5,088,400 | |||||||
Shares |
Description | Value ($) | ||||||||
| Argentina — continued | ||||||||||
| JPY | 600,789,000 | Republic of Argentina GDP Linked, Variable Rate, Expires 12/15/35 (a) (i) | 39,023 | |||||||
|
| |||||||||
| Total Argentina | 5,127,423 | |||||||||
|
| |||||||||
| Ukraine — 0.1% | ||||||||||
| 11,746,000 | Government of Ukraine GDP Linked, Variable Rate, Reg S, Expires 08/01/41 (c) (d) (i) | 3,177,293 | ||||||||
|
| |||||||||
| TOTAL RIGHTS/WARRANTS (COST $44,800,544) | 8,304,716 | |||||||||
|
| |||||||||
| SHORT-TERM INVESTMENTS — 1.5% |
| |||||||||
| Money Market Funds — 0.2% | ||||||||||
| 5,308,770 | State Street Institutional Treasury Money Market Fund – Premier Class, 4.42% (j) | 5,308,770 | ||||||||
|
| |||||||||
| Repurchase Agreements — 1.3% | ||||||||||
| 35,999,722 | Nomura Securities International, Inc. Repurchase Agreement, dated, 02/28/23 maturing on 3/01/23 with a maturity value of $36,004,232 and an effective yield of 4.51%, collateralized by a U.S. Treasury Note with maturity date 12/31/29 and a market value of $36,734,410. | 35,999,722 | ||||||||
|
| |||||||||
| TOTAL SHORT-TERM INVESTMENTS (COST $41,308,492) | 41,308,492 | |||||||||
|
| |||||||||
| TOTAL INVESTMENTS — 96.7% (Cost $3,888,036,042) | 2,693,059,018 | |||||||||
| Other Assets and Liabilities (net) — 3.3% | 93,302,321 | |||||||||
|
| |||||||||
| TOTAL NET ASSETS — 100.0% | $ | 2,786,361,339 | ||||||||
|
| |||||||||
Additional information on each restricted security is as follows:
| Value as a | ||||||||||||||||
| Percentage | Value as of | |||||||||||||||
| Issuer | Acquisition | Acquisition | of Fund’s | February 28, | ||||||||||||
Description | Date | Cost | Net Assets | 2023 | ||||||||||||
Bona Fide Investments Feeder LLC | 12/31/21 | $ | 6,371,845 | 0.3 | % | $ | 7,035,403 | |||||||||
GTLK Europe Capital DAC, Reg S, 4.65%, due 03/10/27 | 04/30/20 | 6,683,240 | 0.0 | % | 343,500 | |||||||||||
GTLK Europe Capital DAC, Reg S, 4.80%, due 02/26/28 | 03/12/21 | 5,331,091 | 0.0 | % | 260,000 | |||||||||||
GTLK Europe Capital DAC, Reg S, 4.35%, due 02/27/29 | 01/26/22 | 5,890,814 | 0.0 | % | 340,000 | |||||||||||
|
| |||||||||||||||
| $ | 7,978,903 | |||||||||||||||
|
| |||||||||||||||
| See accompanying notes to the financial statements. | 18 |
GMO Emerging Country Debt Fund
(A Series of GMO Trust)
Schedule of Investments — (Continued)
February 28, 2023
A summary of outstanding financial instruments at February 28, 2023 is as follows:
Bond Forward Contracts
Reference Entity | Counterparty | Notional Amount | Expiration Date | Net Unrealized Appreciation/ (Depreciation)($) | ||||||||||||||||
Colombian TES | CITI | COP | 101,950,000,000 | 03/16/23 | (779,711 | ) | ||||||||||||||
Colombian TES | CITI | COP | 59,980,000,000 | 03/21/23 | 50,594 | |||||||||||||||
Colombian TES | CITI | COP | 78,000,000,000 | 03/23/23 | (131,990 | ) | ||||||||||||||
|
| |||||||||||||||||||
| $ | (861,107 | ) | ||||||||||||||||||
|
| |||||||||||||||||||
Forward Currency Contracts
Settlement | Counterparty | Currency Sold | Currency Purchased | Net Unrealized Appreciation (Depreciation)($) | Settlement Date | Counterparty | Currency Sold | Currency Purchased | Net Unrealized Appreciation (Depreciation)($) | |||||||||||||||||||||||||||||||||||||
05/03/2023 | SSB | BRL | 28,700,000 | USD | 5,525,287 | 102,823 | 04/11/2023 | JPM | COP 67,220,000,000 | USD | 13,515,633 | (207,948 | ) | |||||||||||||||||||||||||||||||||
03/21/2023 | MSCI | EUR | 120,100,000 | USD | 128,662,890 | 1,488,341 | 05/10/2023 | MSCI | PEN 36,200,000 | USD | 9,322,208 | (171,070 | ) | |||||||||||||||||||||||||||||||||
|
| |||||||||||||||||||||||||||||||||||||||||||||
03/21/2023 | SSB | GBP | 45,900,000 | USD | 55,282,832 | 53,268 | $ | 2,217,237 | ||||||||||||||||||||||||||||||||||||||
|
| |||||||||||||||||||||||||||||||||||||||||||||
03/17/2023 | MSCI | JPY | 4,861,900,000 | USD | 36,506,095 | 723,580 | ||||||||||||||||||||||||||||||||||||||||
05/31/2023 | MSCI | ZAR | 289,300,000 | USD | 15,863,656 | 228,243 | ||||||||||||||||||||||||||||||||||||||||
Reverse Repurchase Agreements
Average balance outstanding | $ | (4,305,840 | ) | |
Average interest rate (net) | 1.04 | % | ||
Maximum balance outstanding | $ | (12,778,500 | ) |
Average balance outstanding was calculated based on daily face value balances outstanding during the period that the Fund had entered into reverse repurchase agreements. Average interest rate was calculated based on interest received and/or paid during the period that the Fund had entered into the reverse repurchase agreements.
Credit Linked Options
Principal / Notional | Expiration Date | Description | Premiums Paid/ (Received) ($) | Value ($) | ||||||||||
Put Sold USD 7,946,000 | 01/24/2024 | Republic of Philippines Credit Linked Put Option, Fund receives premium of 0.25% (OTC) (CP-DB) (a) | (157,475 | ) | 19,539 | |||||||||
Put Sold USD 41,197,000 | 04/15/2024 | Banco do Brasil Credit Linked Put Option, Fund receives premium of 0.30% (OTC) (CP-DB) (a) | (1,450,009 | ) | 135,667 | |||||||||
Put Sold USD 81,200,000 | 04/15/2024 | Banco do Brasil Credit Linked Put Option, Fund receives premium of 0.44% (OTC) (CP-DB) (a) | (4,508,450 | ) | 146,469 | |||||||||
|
|
|
| |||||||||||
| $ | (6,115,934 | ) | $ | 301,675 | ||||||||||
|
|
|
| |||||||||||
| 19 | See accompanying notes to the financial statements. |
GMO Emerging Country Debt Fund
(A Series of GMO Trust)
Schedule of Investments — (Continued)
February 28, 2023
Swap Contracts
Centrally Cleared Credit Default Swaps
Reference Entity | Notional Amount | Annual Premium | Implied Credit Spread (1) | Maximum Potential Amount of Future Payments by the Fund Under the Contract (2) | Expiration Date | Periodic Payment Frequency | Premiums Paid/ (Received) ($) | Value ($) | Net Unrealized Appreciation/ (Depreciation) ($) | |||||||||||||||||||||||||||||||
Buy Protection^: | ||||||||||||||||||||||||||||||||||||||||
CDX.EM.38.V1 | USD | 116,100,000 | 1.00 | % | 2.41 | % | N/A | 12/20/2027 | Quarterly | $ | 11,377,800 | $ | 6,636,276 | $ | (4,741,524 | ) | ||||||||||||||||||||||||
|
|
|
|
|
| |||||||||||||||||||||||||||||||||||
OTC Credit Default Swaps
Reference Entity | Counterparty | Notional Amount | Annual Premium | Implied Credit Spread (1) | Maximum Potential Amount of Future Payments by the Fund Under the Contract (2) | Expiration Date | Periodic Payment Frequency | Premiums Paid/ (Received) ($) | Value ($) | Net Unrealized Appreciation/ (Depreciation) ($) | ||||||||||||||||||||||||||||||||||
Buy Protection^: | ||||||||||||||||||||||||||||||||||||||||||||
Republic of Nigeria | JPM | USD | 9,100,000 | 5.00 | % | 4.94 | % | N/A | 12/20/2023 | Quarterly | 182,831 | (3,898 | ) | (186,729 | ) | |||||||||||||||||||||||||||||
Petrobras Global Finance BV | CITI | USD | 40,600,000 | 1.00 | % | 1.31 | % | N/A | 12/20/2024 | Quarterly | 644,565 | 218,504 | (426,061 | ) | ||||||||||||||||||||||||||||||
Republic of Brazil | CITI | USD | 14,000,000 | 1.00 | % | 1.00 | % | N/A | 12/20/2024 | Quarterly | 128,035 | (813 | ) | (128,848 | ) | |||||||||||||||||||||||||||||
Republic of Colombia | CITI | USD | 45,000,000 | 1.00 | % | 1.47 | % | N/A | 12/20/2024 | Quarterly | 667,284 | 361,752 | (305,532 | ) | ||||||||||||||||||||||||||||||
Republic of South Africa | BCLY | USD | 37,800,000 | 1.00 | % | 1.36 | % | N/A | 12/20/2024 | Quarterly | 718,543 | 233,187 | (485,356 | ) | ||||||||||||||||||||||||||||||
Republic of Turkey | BCLY | USD | 14,000,000 | 1.00 | % | 4.80 | % | N/A | 12/20/2024 | Quarterly | 1,744,254 | 881,158 | (863,096 | ) | ||||||||||||||||||||||||||||||
Republic of Turkey | CITI | USD | 19,700,000 | 1.00 | % | 4.80 | % | N/A | 12/20/2024 | Quarterly | 1,335,735 | 1,239,915 | (95,820 | ) | ||||||||||||||||||||||||||||||
Commonwealth of Bahamas | DB | EUR | 23,501,331 | 1.00 | % | 5.04 | % | N/A | 06/20/2025 | Quarterly | 2,918,259 | 1,149,429 | (1,768,830 | ) | ||||||||||||||||||||||||||||||
Kingdom of Bahrain | MORD | USD | 6,000,000 | 1.00 | % | 2.39 | % | N/A | 12/20/2027 | Quarterly | 546,195 | 342,886 | (203,309 | ) | ||||||||||||||||||||||||||||||
Republic of Colombia | CITI | USD | 4,900,000 | 1.00 | % | 2.83 | % | N/A | 12/20/2027 | Quarterly | 395,462 | 367,073 | (28,389 | ) | ||||||||||||||||||||||||||||||
Republic of Egypt | CITI | USD | 2,500,000 | 1.00 | % | 10.45 | % | N/A | 12/20/2027 | Quarterly | 712,500 | 757,945 | 45,445 | |||||||||||||||||||||||||||||||
Republic of Egypt | JPM | USD | 2,800,000 | 1.00 | % | 10.45 | % | N/A | 12/20/2027 | Quarterly | 772,800 | 848,899 | 76,099 | |||||||||||||||||||||||||||||||
Republic of Egypt | JPM | USD | 2,800,000 | 1.00 | % | 10.45 | % | N/A | 12/20/2027 | Quarterly | 812,000 | 848,899 | 36,899 | |||||||||||||||||||||||||||||||
Republic of South Africa | GS | USD | 41,600,000 | 1.00 | % | 2.55 | % | N/A | 12/20/2027 | Quarterly | 3,589,670 | 2,657,729 | (931,941 | ) | ||||||||||||||||||||||||||||||
Republic of Turkey | MORD | USD | 10,400,000 | 1.00 | % | 5.58 | % | N/A | 12/20/2027 | Quarterly | 2,530,009 | 1,780,230 | (749,779 | ) | ||||||||||||||||||||||||||||||
United States of Mexico | MORD | USD | 16,200,000 | 1.00 | % | 1.16 | % | N/A | 12/20/2027 | Quarterly | 497,689 | 108,575 | (389,114 | ) | ||||||||||||||||||||||||||||||
United States of Mexico | GS | USD | 16,200,000 | 1.00 | % | 1.51 | % | N/A | 06/20/2029 | Quarterly | 1,287,609 | 445,806 | (841,803 | ) | ||||||||||||||||||||||||||||||
United States of Mexico | GS | USD | 16,200,000 | 1.00 | % | 1.82 | % | N/A | 09/20/2031 | Quarterly | 2,138,931 | 905,656 | (1,233,275 | ) | ||||||||||||||||||||||||||||||
Sell Protection^: | ||||||||||||||||||||||||||||||||||||||||||||
Commonwealth of Bahamas | DB | USD | 2,787,000 | 1.00 | % | 5.50 | % | 2,787,000 USD | 06/20/2023 | Quarterly | (508,122 | ) | (25,419 | ) | 482,703 | |||||||||||||||||||||||||||||
Commonwealth of Bahamas | DB | USD | 5,675,000 | 1.00 | % | 5.50 | % | 5,675,000 USD | 06/20/2023 | Quarterly | (1,017,200 | ) | (51,760 | ) | 965,440 | |||||||||||||||||||||||||||||
| See accompanying notes to the financial statements. | 20 |
GMO Emerging Country Debt Fund
(A Series of GMO Trust)
Schedule of Investments — (Continued)
February 28, 2023
Swap Contracts — continued
OTC Credit Default Swaps — continued
Reference | Counterparty | Notional Amount | Annual Premium | Implied Credit Spread (1) | Maximum Potential Amount of Future Payments by the Fund Under the Contract (2) | Expiration Date | Periodic Payment Frequency | Premiums Paid/ (Received) ($) | Value ($) | Net Unrealized Appreciation/ (Depreciation) ($) | ||||||||||||||||||||||||||||||||||
Commonwealth of Bahamas | DB | USD | 31,567,771 | 1.00 | % | 5.04 | % | 31,567,771 USD | 06/20/2025 | Quarterly | (3,380,251 | ) | (1,429,578 | ) | 1,950,673 | |||||||||||||||||||||||||||||
|
|
|
|
|
| |||||||||||||||||||||||||||||||||||||||
| $ | 16,716,798 | $ | 11,636,175 | $ | (5,080,623 | ) | ||||||||||||||||||||||||||||||||||||||
|
|
|
|
|
| |||||||||||||||||||||||||||||||||||||||
| ^ | Buy Protection - Fund pays a premium and buys credit protection. If a credit event occurs the Fund will, depending on the terms of the particular swap contract, either (i) receive from the seller of protection an amount equal to the notional amount of the swap and deliver the referenced obligation or underlying securities comprising the referenced index or (ii) receive a net settlement amount in the form of cash or securities equal to the notional amount of the swap less the recovery value of the referenced obligation or underlying securities comprising the referenced index. |
Sell Protection - Fund receives a premium and sells credit protection. If a credit event occurs the Fund will, depending on the terms of the particular swap contract, either (i) pay to the buyer of protection an amount equal to the notional amount of the swap and take delivery of the referenced obligation or underlying securities comprising the referenced index or (ii) pay a net settlement amount in the form of cash or securities equal to the notional amount of the swap less the recovery value of the referenced obligation or underlying securities comprising the referenced index.
| (1) | As of February 28, 2023, implied credit spreads in absolute terms, calculated using a model, and utilized in determining the market value of credit default swap contracts on the reference security, serve as an indicator of the current status of the payment/performance risk and reflect the likelihood or risk of default for the reference entity. |
The implied credit spread of a particular referenced entity reflects the cost of buying/selling protection. Wider (i.e. higher) credit spreads represent a deterioration of the referenced entity’s credit soundness and a greater likelihood or risk of default or other credit event occurring as defined under the terms of the contract.
| (2) | The maximum potential amount the Fund could be required to pay as a seller of credit protection if a credit event occurs as defined under the terms of that particular swap contract. |
Centrally Cleared Interest Rate Swaps
Fund Pays | Fund Receives | Notional Amount | Expiration Date | Periodic Payment Frequency | Premiums Paid/ (Received) ($) | Value ($) | Net Unrealized Appreciation/ (Depreciation) ($) | |||||||||||||||||||||||||
BRL-CDI | 12.70% | BRL | 1,780,364,487 | 01/02/2025 | At Maturity | — | 19,902 | 19,902 | ||||||||||||||||||||||||
0.30% | JPY-TONA-OIS-COMPOUND | JPY | 9,270,000,000 | 12/21/2027 | Annually | (67,598 | ) | 433,714 | 501,312 | |||||||||||||||||||||||
USD - SOFR - COMPOUND | 4.01% | USD | 50,400,000 | 12/21/2027 | Annually | 643,722 | (22,276 | ) | (665,998 | ) | ||||||||||||||||||||||
0.58% | JPY-TONA-OIS-COMPOUND | JPY | 4,710,000,000 | 12/21/2032 | Annually | (108,339 | ) | 832,645 | 940,984 | |||||||||||||||||||||||
2.80% | 6 Month EURIBOR | EUR | 22,600,000 | 03/16/2033 | Semi-Annually | 86,566 | 884,703 | 798,137 | ||||||||||||||||||||||||
2.85% | GBP - SONIA - COMPOUND | GBP | 24,900,000 | 03/15/2053 | Annually | 298,148 | 3,637,299 | 3,339,151 | ||||||||||||||||||||||||
2.30% | 6 Month EURIBOR | EUR | 30,200,000 | 03/19/2053 | Semi-Annually | (91,667 | ) | 2,632,278 | 2,723,945 | |||||||||||||||||||||||
|
|
|
|
|
| |||||||||||||||||||||||||||
| $ | 760,832 | $ | 8,418,265 | $ | 7,657,433 | |||||||||||||||||||||||||||
|
|
|
|
|
| |||||||||||||||||||||||||||
| 21 | See accompanying notes to the financial statements. |
GMO Emerging Country Debt Fund
(A Series of GMO Trust)
Schedule of Investments — (Continued)
February 28, 2023
As of February 28, 2023, for the above contracts and/or agreements, the Fund had sufficient cash and/or securities to cover commitments or collateral requirements, if any, of the relevant broker or exchange.
Notes to Schedule of Investments:
| † | Denominated in U.S. Dollar, unless otherwise indicated. |
| (a) | Investment valued at fair value using methods determined in good faith by the Trustees of GMO Trust or persons acting at their direction pursuant to procedures approved by the Trustees. Investment valued using significant unobservable inputs (Note 2). |
| (b) | Security is backed by U.S. Treasury Bonds. |
| (c) | Investment valued using significant unobservable inputs (Note 2). |
| (d) | Security is in default. |
| (e) | Security is backed by the United States International Development Finance Corporation. |
| (f) | The security is restricted as to resale. |
| (g) | All or a portion of this security has been pledged to cover margin requirements on futures and/or cleared swap contracts, collateral on OTC swap contracts, forward currency contracts, and/or written options, if any (Note 4). |
| (h) | Private placement security; restricted as to resale. Represents investment in a pool of constitutional obligations of the Colombian government owed to individuals. |
| (i) | Indexed security in which price and/or coupon is linked to the price of a specific instrument or financial statistic. |
| (j) | The rate disclosed is the 7 day net yield as of February 28, 2023. |
For a listing of definitions of acronyms, counterparty abbreviations and currency abbreviations used throughout the Schedule of Investments as well as the derivative tables, if any, please refer to page 63.
| See accompanying notes to the financial statements. | 22 |
(A Series of GMO Trust)
Portfolio Management
Day-to-day management of the Fund’s portfolio is the responsibility of the Structured Products team at Grantham, Mayo, Van Otterloo & Co. LLC.
Management Discussion and Analysis of Fund Performance
Class VI shares of GMO High Yield Fund returned -2.90% (net) for the fiscal year ended February 28, 2023, as compared with -5.36% for the Markit iBoxx USD Liquid High Yield Index.
The Fund was invested in a mix of index portfolio products as well as cash high yield bonds. During the fiscal year, the Fund moved exposures between different products based on changes in the model’s alpha signals as well as other factors.
The Fund’s allocation to portfolio products, including standardized total return swaps and credit default swap indices, contributed positively towards outperformance over the benchmark, as did the short volatility overlay, while the high-quality BB bonds in the Fund underperformed the benchmark.
The views expressed herein are exclusively those of Grantham, Mayo, Van Otterloo & Co. LLC as of the date of this report and are subject to change. GMO disclaims any responsibility to update such views. They are not meant as investment advice. References to specific securities are not recommendations of such securities and may not be representative of any GMO portfolio’s current or future investments. All information is unaudited.
23
GMO High Yield Fund
(A Series of GMO Trust)
Comparison of Change in Value of a $300,000,000 Investment in
GMO High Yield Fund Class VI Shares and the Markit iBoxx USD Liquid High Yield Index
As of February 28, 2023
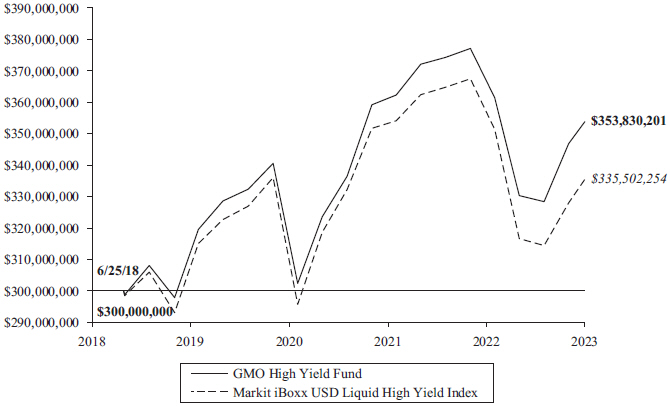
Average Annual Total Returns | ||||
| 1 Year | Since Inception | |||
| Class VI | -2.90% | 6/25/18 3.59% | ||
Performance data quoted represents past performance and is not indicative of future results. The investment return and principal value of an investment will fluctuate so that an investor’s shares, when redeemed, may be worth more or less than their original cost. Current performance data may be lower or higher than the performance data provided herein. To obtain performance information up to the most recent month-end, visit www.gmo.com. Performance shown is net of all fees after reimbursement from GMO. Returns would have been lower had certain expenses not been reimbursed during the periods shown and do not include the effect of taxes on distributions and redemptions. The performance information shown above only includes purchase premiums and/or redemption fees in effect as of February 28, 2023. All information is unaudited.
For Class VI the gross expense ratio of 0.55% is equal to the Fund’s Total Annual Operating Expenses set forth in the Fund’s most recent prospectus dated June 30, 2022. For the Class listed above, the net expense ratio of 0.46% reflects the reduction of expenses from fee reimbursements. The fee reimbursements will continue until at least June 30, 2023. Elimination of this reimbursement will result in higher fees and lower performance.
24
GMO High Yield Fund
(A Series of GMO Trust)
Investment Concentration Summary
February 28, 2023 (Unaudited)
Asset Class Summary& | % of Total Net Assets | |||
Short-Term Investments | 52.1 | % | ||
Debt Obligations | 46.8 | |||
Swap Contracts | 1.4 | |||
Futures Contracts | (0.0 | )^ | ||
Written Options | (0.0 | )^ | ||
Other | (0.3 | ) | ||
|
| |||
| 100.0 | % | |||
|
| |||
Industry Group Summary¤ | % of Investments | |||
Consumer Cyclical | 21.7 | % | ||
Communications | 15.4 | |||
Consumer Non-Cyclical | 11.4 | |||
Energy | 10.9 | |||
Communications | 8.8 | |||
Technology | 5.9 | |||
Basic Industry | 5.0 | |||
Transportation | 4.9 | |||
Electric | 4.0 | |||
Finance Companies | 3.0 | |||
REITS | 2.4 | |||
Other Financial | 2.1 | |||
Insurance | 1.8 | |||
Banking | 1.0 | |||
Cash/Cash Equivalents | 0.8 | |||
Brokerage/Asset Managers/Exchanges | 0.5 | |||
Other Industrial | 0.4 | |||
|
| |||
| 100.0 | % | |||
|
| |||
| & | In the table, derivative financial instruments, if any, are based on market values, rather than the notional amounts of derivatives, except for forward currency contracts which are based on unrealized appreciation/(depreciation). |
| ¤ | The table excludes short-term investments and mutual funds, if any. The table includes exposure through the use of certain derivative financial instruments and excludes exposures through certain currency linked derivatives such as forward currency contracts. The table takes in account the market values of securities and the notional amounts of swaps. The table is not normalized, thus the table may not total to 100%. |
| ^ | Rounds to 0.0%. |
25
GMO High Yield Fund
(A Series of GMO Trust)
(showing percentage of total net assets)
February 28, 2023
Par Value† | Description | Value ($) | ||||||||
| DEBT OBLIGATIONS — 46.8% | ||||||||||
| Corporate Debt — 19.5% | ||||||||||
| Australia — 1.6% | ||||||||||
| 2,625,000 | FMG Resources August 2006 Pty. Ltd., 144A, 4.38%, due 04/01/31 | 2,214,715 | ||||||||
| 1,950,000 | Mineral Resources Ltd, 144A, 8.00%, due 11/01/27 | 1,940,250 | ||||||||
|
| |||||||||
| Total Australia | 4,154,965 | |||||||||
|
| |||||||||
| Canada — 0.5% | ||||||||||
| 190,000 | Air Canada, 144A, 3.88%, due 08/15/26 | 171,158 | ||||||||
| 1,200,000 | Methanex Corp, 5.25%, due 12/15/29 | 1,099,500 | ||||||||
|
| |||||||||
| Total Canada | 1,270,658 | |||||||||
|
| |||||||||
| Cayman Islands — 1.2% | ||||||||||
| 950,000 | Melco Resorts Finance Ltd, 144A, 5.75%, due 07/21/28 | 816,402 | ||||||||
| 1,500,000 | Melco Resorts Finance Ltd, 144A, 5.38%, due 12/04/29 | 1,239,765 | ||||||||
| 981,000 | Sands China Ltd, 5.90%, due 08/08/28 | 928,993 | ||||||||
|
| |||||||||
| Total Cayman Islands | 2,985,160 | |||||||||
|
| |||||||||
| United Kingdom — 0.7% | ||||||||||
| 1,020,000 | Virgin Media Secured Finance Plc, 144A, 5.50%, due 05/15/29 | 924,283 | ||||||||
| 1,000,000 | Virgin Media Secured Finance Plc, 144A, 4.50%, due 08/15/30 | 823,233 | ||||||||
|
| |||||||||
| Total United Kingdom | 1,747,516 | |||||||||
|
| |||||||||
| United States — 15.5% | ||||||||||
| 650,000 | American Airlines, Inc. / AAdvantage Loyalty IP Ltd., 144A, 5.50%, due 04/20/26 | 632,611 | ||||||||
| 1,950,000 | American Airlines, Inc. / AAdvantage Loyalty IP Ltd., 144A, 5.75%, due 04/20/29 | 1,854,675 | ||||||||
| 325,000 | Apache Corp., 5.35%, due 07/01/49 | 257,429 | ||||||||
| 125,000 | Bath & Body Works, Inc., 6.88%, due 11/01/35 | 110,324 | ||||||||
| 3,750,000 | CCO Holdings LLC / CCO Holdings Capital Corp., 144A, 4.75%, due 03/01/30 | 3,153,637 | ||||||||
| 250,000 | Cogent Communications Group, Inc., 144A, 3.50%, due 05/01/26 | 227,065 | ||||||||
| 748,000 | CoreCivic, Inc., 8.25%, due 04/15/26 | 757,253 | ||||||||
| 1,500,000 | Crown Americas LLC, 5.25%, due 04/01/30 | 1,395,557 | ||||||||
| 500,000 | Delta Air Lines, Inc., 7.38%, due 01/15/26 | 514,500 | ||||||||
| 400,000 | Enact Holdings, Inc., 144A, 6.50%, due 08/15/25 | 393,100 | ||||||||
| 1,125,000 | FirstEnergy Corp., 4.15%, due 07/15/27 | 1,049,400 | ||||||||
| 125,000 | Fluor Corp., 4.25%, due 09/15/28 | 112,787 | ||||||||
| 1,000,000 | Gap, Inc. (The), 144A, 3.88%, due 10/01/31 | 717,460 | ||||||||
| 1,100,000 | Howard Hughes Corp. (The), 144A, 5.38%, due 08/01/28 | 996,875 | ||||||||
Par Value† | Description | Value ($) | ||||||||
| Corporate Debt — continued | ||||||||||
| United States — continued | ||||||||||
| 1,050,000 | Icahn Enterprises LP / Icahn Enterprises Finance Corp., 5.25%, due 05/15/27 | 971,300 | ||||||||
| 1,625,000 | Icahn Enterprises LP / Icahn Enterprises Finance Corp., 4.38%, due 02/01/29 | 1,403,517 | ||||||||
| 1,975,000 | Iron Mountain Information Management Services, Inc., 144A, 5.00%, due 07/15/32 | 1,628,861 | ||||||||
| 500,000 | KB Home, 4.80%, due 11/15/29 | 436,250 | ||||||||
| 2,650,000 | Kohl’s Corp., 3.63%, due 05/01/31 | 1,863,215 | ||||||||
| 625,000 | Ladder Capital Finance Holdings LLLP / Ladder Capital Finance Corp., 144A, 4.25%, due 02/01/27 | 531,290 | ||||||||
| 1,500,000 | Ladder Capital Finance Holdings LLLP / Ladder Capital Finance Corp., 144A, 4.75%, due 06/15/29 | 1,219,760 | ||||||||
| 700,000 | Las Vegas Sands Corp., 3.50%, due 08/18/26 | 640,434 | ||||||||
| 1,800,000 | Las Vegas Sands Corp., 3.90%, due 08/08/29 | 1,569,464 | ||||||||
| 1,625,000 | Mattel, Inc., 144A, 3.38%, due 04/01/26 | 1,490,937 | ||||||||
| 750,000 | Molina Healthcare, Inc., 144A, 3.88%, due 05/15/32 | 615,757 | ||||||||
| 625,000 | Murphy Oil USA, Inc., 144A, 3.75%, due 02/15/31 | 505,694 | ||||||||
| 262,000 | New Fortress Energy, Inc., 144A, 6.75%, due 09/15/25 | 245,667 | ||||||||
| 1,500,000 | New Fortress Energy, Inc., 144A, 6.50%, due 09/30/26 | 1,372,500 | ||||||||
| 1,125,000 | Newell Brands, Inc., 5.63%, due 04/01/36 | 952,814 | ||||||||
| 316,000 | NextEra Energy Operating Partners LP, 144A, 4.50%, due 09/15/27 | 289,930 | ||||||||
| 812,000 | Occidental Petroleum Corp., 8.50%, due 07/15/27 | 871,187 | ||||||||
| 850,000 | OneMain Finance Corp., 6.13%, due 03/15/24 | 838,084 | ||||||||
| 250,000 | OneMain Finance Corp., 6.88%, due 03/15/25 | 244,058 | ||||||||
| 875,000 | OneMain Finance Corp., 7.13%, due 03/15/26 | 850,596 | ||||||||
| 375,000 | OneMain Finance Corp., 6.63%, due 01/15/28 | 349,203 | ||||||||
| 1,750,000 | PDC Energy, Inc., 5.75%, due 05/15/26 | 1,671,226 | ||||||||
| 836,000 | PG&E Corp., 5.00%, due 07/01/28 | 763,310 | ||||||||
| 750,000 | PG&E Corp., 5.25%, due 07/01/30 | 669,375 | ||||||||
| 375,000 | Prime Security Services Borrower LLC / Prime Finance, Inc., 144A, 5.75%, due 04/15/26 | 362,344 | ||||||||
| 800,000 | Spirit AeroSystems, Inc., 3.85%, due 06/15/26 | 743,998 | ||||||||
| 171,875 | Spirit Loyalty Cayman Ltd. / Spirit IP Cayman Ltd., 144A, 8.00%, due 09/20/25 | 172,519 | ||||||||
| 378,125 | Spirit Loyalty Cayman Ltd. / Spirit IP Cayman Ltd., 144A, 8.00%, due 09/20/25 | 379,543 | ||||||||
| 400,000 | Topaz Solar Farms LLC, 144A, 5.75%, due 09/30/39 | 370,628 | ||||||||
| 1,350,000 | United Airlines, Inc., 144A, 4.38%, due 04/15/26 | 1,270,592 | ||||||||
| See accompanying notes to the financial statements. | 26 |
GMO High Yield Fund
(A Series of GMO Trust)
Schedule of Investments — (Continued)
(showing percentage of total net assets)
February 28, 2023
Par Value† / Shares | Description | Value ($) | ||||||||
| Corporate Debt — continued | ||||||||||
| United States — continued | ||||||||||
| 748,000 | United Airlines, Inc., 144A, 4.63%, due 04/15/29 | 663,129 | ||||||||
| 565,000 | Western Midstream Operating LP, 3.35%, due 02/01/25 | 535,487 | ||||||||
| 1,375,000 | Western Midstream Operating LP, 3.95%, due 06/01/25 | 1,306,250 | ||||||||
|
| |||||||||
| Total United States | 39,971,592 | |||||||||
|
| |||||||||
| Total Corporate Debt | 50,129,891 | |||||||||
|
| |||||||||
| U.S. Government — 27.3% | ||||||||||
| 3,480,000 | U.S. Treasury Note, Variable Rate, USBM + 0.03%, 4.84%, due 07/31/23 (a) | 3,479,128 | ||||||||
| 54,000,000 | U.S. Treasury Note, Variable Rate, USBM - 0.08%, 4.73%, due 04/30/24 (a) | 53,918,206 | ||||||||
| 6,000,000 | U.S. Treasury Note, Variable Rate, USBM + 0.04%, 4.84%, due 07/31/24 (a) | 5,997,945 | ||||||||
| 6,700,000 | U.S. Treasury Note, Variable Rate, SOFR + 0.20%, 5.01%, due 01/31/25 (a) | 6,707,023 | ||||||||
|
| |||||||||
| Total U.S. Government | 70,102,302 | |||||||||
|
| |||||||||
TOTAL DEBT OBLIGATIONS (COST $122,744,232) | 120,232,193 | |||||||||
|
| |||||||||
| SHORT-TERM INVESTMENTS — 52.1% |
| |||||||||
| Repurchase Agreements — 41.2% | ||||||||||
| 105,999,397 | Nomura Securities International, Inc. Repurchase Ageement, dated 02/28/23, maturing on 03/01/23 with a maturity value of $106,012,676 and an effective yield of 4.51%, collateralized by a U.S. Treasury Note with maturity date 12/31/29 and a market value of $108,162,650. | 105,999,397 | ||||||||
|
| |||||||||
| U.S. Government Agency — 9.7% | ||||||||||
| 25,000,000 | Federal Home Loan Banks, Variable Rate, SOFR + 0.07%, 4.62%, due 04/06/23 | 25,000,732 | ||||||||
|
| |||||||||
| Money Market Funds — 1.2% | ||||||||||
| 3,093,108 | State Street Institutional Treasury Money Market Fund – Premier Class, 4.42% (b) | 3,093,108 | ||||||||
|
| |||||||||
TOTAL SHORT-TERM INVESTMENTS (COST $134,092,505) | 134,093,237 | |||||||||
|
| |||||||||
TOTAL INVESTMENTS — 98.9% (Cost $256,836,737) | 254,325,430 | |||||||||
| Other Assets and Liabilities (net) — 1.1% | 2,889,641 | |||||||||
|
| |||||||||
| TOTAL NET ASSETS — 100.0% | $ | 257,215,071 | ||||||||
|
| |||||||||
| 27 | See accompanying notes to the financial statements. |
GMO High Yield Fund
(A Series of GMO Trust)
Schedule of Investments — (Continued)
February 28, 2023
A summary of outstanding financial instruments at February 28, 2023 is as follows:
Futures Contracts
Number of Contracts + | Type | Expiration | Notional Amount ($) | Value/Net Unrealized Appreciation (Depreciation) ($) | ||||||||
| Buys | ||||||||||||
| 68 | U.S. Treasury Note 10 Yr. (CBT) | June 2023 | 7,592,625 | 11,751 | ||||||||
| 55 | U.S. Treasury Note 2 Yr. (CBT) | June 2023 | 11,204,961 | (7,164 | ) | |||||||
| 163 | U.S. Treasury Note 5 Yr. (CBT) | June 2023 | 17,449,914 | (6,497 | ) | |||||||
|
|
|
| |||||||||
| $ | 36,247,500 | $ | (1,910 | ) | ||||||||
|
|
|
| |||||||||
Number of Contracts + | Type | Expiration | Notional Amount ($) | Value/Net Unrealized Appreciation (Depreciation) ($) | ||||||||
| Sales | ||||||||||||
| 4 | U.S. Long Bond (CBT) | June 2023 | 500,875 | 119 | ||||||||
| 1 | U.S. Ultra Bond (CBT) | June 2023 | 135,062 | 22 | ||||||||
|
|
|
| |||||||||
| $ | 635,937 | $ | 141 | |||||||||
|
|
|
| |||||||||
| + | Buys - Fund is long the futures contract. |
Sales - Fund is short the futures contract.
Written Options
Description | Counterparty | Exercise Rate | Expiration Date | Principal/ Notional Amount | Floating Rate Index | Pay/Receive Floating Rate | Value ($) | |||||||||||||||||||
| Written Options on Credit Default Swaps – Puts | ||||||||||||||||||||||||||
| CDX.NA.HYS.39 | DB | 99.00% | 03/15/23 | USD (50,188,000) | Fixed Spread | Pay | (64,112 | ) | ||||||||||||||||||
|
| |||||||||||||||||||||||||
| TOTAL WRITTEN OPTIONS | ||||||||||||||||||||||||||
| (Premiums $612,795) | $ | (64,112 | ) | |||||||||||||||||||||||
|
| |||||||||||||||||||||||||
Swap Contracts
Centrally Cleared Credit Default Swaps
Reference Entity | Notional Amount | Annual Premium | Implied Credit Spread (1) | Maximum Potential Amount of Future Payments by the Fund Under the Contract (2) | Expiration Date | Periodic Payment Frequency | Premiums Paid/ (Received) ($) | Value ($) | Net Unrealized Appreciation/ (Depreciation) ($) | |||||||||||||||||||||||||||
| Sell Protection^: | ||||||||||||||||||||||||||||||||||||
CDX.NA.HYS.39.V1 | USD 42,408,000 | 5.00 | % | 4.63 | % | 42,408,000 USD | 12/20/2027 | Quarterly | $ | 840,336 | $ | 587,139 | $ | (253,197 | ) | |||||||||||||||||||||
|
|
|
|
|
| |||||||||||||||||||||||||||||||
| ^ | Buy Protection - Fund pays a premium and buys credit protection. If a credit event occurs the Fund will, depending on the terms of the particular swap contract, either (i) receive from the seller of protection an amount equal to the notional amount of the swap and deliver the referenced obligation or underlying securities comprising the referenced index or (ii) receive a net settlement amount in the form of cash or securities equal to the notional amount of the swap less the recovery value of the referenced obligation or underlying securities comprising the referenced index. |
Sell Protection - Fund receives a premium and sells credit protection. If a credit event occurs the Fund will, depending on the terms of the particular swap contract, either (i) pay to the buyer of protection an amount equal to the notional amount of the swap and take delivery of the referenced obligation or underlying securities comprising the referenced index or (ii) pay a net settlement amount in the form of cash or securities equal to the notional amount of the swap less the recovery value of the referenced obligation or underlying securities comprising the referenced index.
| (1) | As of February 28, 2023, implied credit spreads in absolute terms, calculated using a model, and utilized in determining the market value of credit default swap contracts on the reference security, serve as an indicator of the current status of the payment/performance risk and reflect the likelihood or risk of default for the reference entity. The implied credit spread of a particular referenced entity reflects the cost of buying/selling protection. Wider (i.e. higher) credit spreads represent a deterioration of the referenced entity’s credit soundness and a greater likelihood or risk of default or other credit event occurring as defined under the terms of the contract. |
| (2) | The maximum potential amount the Fund could be required to pay as a seller of credit protection if a credit event occurs as defined under the terms of that particular swap contract. |
| See accompanying notes to the financial statements. | 28 |
GMO High Yield Fund
(A Series of GMO Trust)
Schedule of Investments — (Continued)
February 28, 2023
Swap Contracts — continued
OTC Total Return Swaps
Fund Pays | Fund Receives | Counterparty | Notional Amount | Expiration Date | Periodic Payment Frequency | Premiums Paid/ (Received) ($) | Value ($) | Net Unrealized Appreciation/ (Depreciation) ($) | ||||||||||||||
| SOFR | Total Return on iBoxx USD Liquid High Yield Index | BCLY | USD 29,740,000 | 03/20/2023 | Quarterly | 628 | 858,739 | 858,111 | ||||||||||||||
| SOFR | Total Return on iBoxx USD Liquid High Yield Index | MSCI | USD 73,200,000 | 03/20/2023 | Quarterly | (2,739 | ) | 2,386,902 | 2,389,641 | |||||||||||||
| SOFR | Total Return on iBoxx USD Liquid High Yield Index | MSCI | USD 24,730,000 | 03/20/2023 | Quarterly | (654 | ) | 172,227 | 172,881 | |||||||||||||
| SOFR | Total Return on iBoxx USD Liquid High Yield Index | JPM | USD 22,440,000 | 03/20/2023 | Quarterly | (593 | ) | 177,318 | 177,911 | |||||||||||||
| Total Return on iShares iBoxx High Yield Corporate Bond ETF | SOFR | MORD | USD 29,510,000 | 03/20/2023 | At Maturity | (593,691 | ) | (852,098 | ) | (258,407 | ) | |||||||||||
| 1 Month Federal Funds Rate minus 1.85% | Total Return on iShares iBoxx High Yield Corporate Bond ETF | GS | USD 30,004,039 | 03/22/2023 | Monthly | — | 239,416 | 239,416 | ||||||||||||||
|
|
|
|
|
| |||||||||||||||||
| $ | (597,049 | ) | $ | 2,982,504 | $ | 3,579,553 | ||||||||||||||||
|
|
|
|
|
| |||||||||||||||||
As of February 28, 2023, for the above contracts and/or agreements, the Fund had sufficient cash and/or securities to cover commitments or collateral requirements, if any, of the relevant broker or exchange.
Notes to Schedule of Investments:
| † | Denominated in U.S. Dollar, unless otherwise indicated. |
| (a) | All or a portion of this security has been pledged to cover margin requirements on futures and/or cleared swap contracts, collateral on OTC swap contracts, forward currency contracts, and/or written options, if any (Note 4). |
| (b) | The rate disclosed is the 7 day net yield as of February 28, 2023. |
For a listing of definitions of acronyms, counterparty abbreviations and currency abbreviations used throughout the Schedule of Investments as well as the derivative tables, if any, please refer to page 63.
| 29 | See accompanying notes to the financial statements. |
This page has been left blank intentionally.
GMO Multi-Sector Fixed Income Fund
(A Series of GMO Trust)
Portfolio Management
Day-to-day management of the Fund’s portfolio is the responsibility of the Developed Rates & FX team at Grantham, Mayo, Van Otterloo & Co. LLC.
Management Discussion and Analysis of Fund Performance
Class III shares of GMO Multi-Sector Fixed Income Fund returned –10.54% (net) for the fiscal year ended February 28, 2023, as compared with -9.72% for the Bloomberg U.S. Aggregate Index.
The Fund’s investment exposure was implemented through global interest rate and currency derivatives, as well as indirect (through other GMO Funds, including GMO Opportunistic Income Fund and GMO Emerging Country Debt Fund) and direct fixed income investments.
The Fund’s overweight positioning to off-benchmark securitized products and emerging country debt added relative returns, while security selection from investment grade corporate bonds also provided support. Active rates and currencies strategies drew down during the period.
Developed markets interest rate performance was near flat, as gains from active duration positions in Switzerland and the U.S. washed with losses from European and UK exposure. Slope positioning (2-year vs. 10-year) added value, namely from trading European and Canadian interest rate curves.
Developed market currency positioning hurt the portfolio, most notably because of U.S. dollar strength, but market selection also contributed to the drawdown. Currency selection was negative in Japanese yen and Norwegian krone, but positive in Canadian dollar. Exposure to emerging currencies outperformed, as cross-market selection was strong in LatAm and Asia.
The views expressed herein are exclusively those of Grantham, Mayo, Van Otterloo & Co. LLC as of the date of this report and are subject to change. GMO disclaims any responsibility to update such views. They are not meant as investment advice. References to specific securities are not recommendations of such securities and may not be representative of any GMO portfolio’s current or future investments. All information is unaudited.
31
GMO Multi-Sector Fixed Income Fund
(A Series of GMO Trust)
Comparison of Change in Value of a $5,000,000 Investment in
GMO Multi-Sector Fixed Income Fund Class III Shares and the
Bloomberg U.S. Aggregate Index
As of February 28, 2023
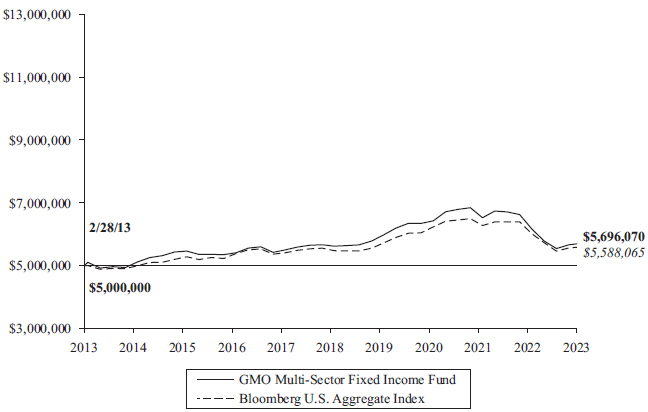
| Average Annual Total Returns | ||||||
| 1 Year | 5 Year | 10 Year | ||||
| Class III | -10.54% | 0.42% | 1.31% | |||
| Class IV | -10.56% | 0.45% | 1.36% | |||
Performance data quoted represents past performance and is not indicative of future results. The investment return and principal value of an investment will fluctuate so that an investor’s shares, when redeemed, may be worth more or less than their original cost. Current performance data may be lower or higher than the performance data provided herein. To obtain performance information up to the most recent month-end, visit www.gmo.com. Performance shown is net of all fees after reimbursement from GMO. Returns would have been lower had certain expenses not been reimbursed during the periods shown and do not include the effect of taxes on distributions and redemptions. The performance information shown above only includes purchase premiums and/or redemption fees in effect as of February 28, 2023. All information is unaudited. Performance for classes may vary due to different fees.
For Class III and IV the gross expense ratio of 0.68% and 0.64%, respectively, is equal to the Fund’s Total Annual Operating Expenses set forth in the Fund’s most recent prospectus dated June 30, 2022. For the Classes listed above, the corresponding net expense ratio of 0.45% and 0.40% reflects the reduction of expenses from fee reimbursements. The fee reimbursements will continue until at least June 30, 2023. Elimination of this reimbursement will result in higher fees and lower performance.
32
GMO Multi-Sector Fixed Income Fund
(A Series of GMO Trust)
Investment Concentration Summary
February 28, 2023 (Unaudited)
Asset Class Summary& | % of Total Net Assets | |||
Debt Obligations | 76.0 | % | ||
Short-Term Investments | 37.2 | |||
Swap Contracts | 0.5 | |||
Forward Currency Contracts | 0.4 | |||
Loan Assignments | 0.1 | |||
Loan Participations | 0.0^ | |||
Rights/Warrants | 0.0^ | |||
Investment Funds | 0.0^ | |||
Purchased Options | 0.0^ | |||
Bond Forward Contracts | (0.0 | )^ | ||
Written Options/Credit Linked Options | (0.0 | )^ | ||
Futures Contracts | (0.0 | )^ | ||
Other | (14.2 | ) | ||
|
| |||
| 100.0 | % | |||
|
| |||
Country/Region Summary¤ | % of Investments | |||
United States | 95.3 | % | ||
Australia | 11.2 | |||
Switzerland | 5.9 | |||
Other Developed | 0.6 | ‡ | ||
New Zealand | (1.7 | ) | ||
Sweden | (3.9 | ) | ||
Euro Region | (7.4 | )§ | ||
|
| |||
| 100.0 | % | |||
|
| |||
| & | The table incorporates aggregate indirect asset class exposure associated with investments in other funds of GMO Trust (“underlying funds”). Derivative financial instruments, if any, are based on market values, rather than the notional amounts of derivatives, except for forward currency contracts which are based on unrealized appreciation/(depreciation). |
| ¤ | The table incorporates aggregate indirect country exposure associated with investments in the underlying funds. The table excludes short-term investments. The table includes exposure through the use of certain derivative financial instruments and excludes exposure through certain currency linked derivatives such as forward currency contracts and currency options. The table is based on duration adjusted net exposures (both investments and derivatives), taking into account the market value of securities and the notional amounts of swaps and other derivative financial instruments. Duration is based on GMO’s models. The greater the duration of a bond, the greater its contribution to the concentration percentage. Credit default swap exposures are factored into the duration adjusted exposure using a reference security and applying the same methodology to that security. The table is normalized to 100%, therefore the absolute exposure presented for each country may not be representative of the true exposure of the Fund. |
| ‡ | “Other Developed” is comprised of developed countries that each represent between (1.0)% and 1.0% of Investments. |
| § | “Euro Region” is comprised of derivative financial instruments attributed to the Eurozone and not a particular country. |
| ^ | Rounds to 0.0%. |
33
GMO Multi-Sector Fixed Income Fund
(A Series of GMO Trust)
Schedule of Investments
(showing percentage of total net assets)
February 28, 2023
Par Value† | Description | Value ($) | ||||||||
| DEBT OBLIGATIONS — 54.1% | ||||||||||
| Canada — 0.5% | ||||||||||
| Corporate Debt | ||||||||||
| 150,000 | Fairfax Financial Holdings Ltd, 144A, 5.63%, due 08/16/32 | 142,593 | ||||||||
| 150,000 | Rogers Communications Inc, 5.00%, due 03/15/44 | 130,227 | ||||||||
| 150,000 | Rogers Communications Inc, 144A, 4.50%, due 03/15/42 | 122,970 | ||||||||
| 150,000 | Rogers Communications Inc, 144A, 4.55%, due 03/15/52 | 119,632 | ||||||||
|
| |||||||||
| Total Canada | 515,422 | |||||||||
|
| |||||||||
| Germany — 0.7% | ||||||||||
| Corporate Debt | ||||||||||
| 400,000 | Deutsche Bank AG, Variable Rate, 3.96%, due 11/26/25 | 383,681 | ||||||||
| 200,000 | Deutsche Bank AG, Variable Rate, 6.72%, due 01/18/29 | 202,118 | ||||||||
| 200,000 | Deutsche Bank AG, Variable Rate, 3.55%, due 09/18/31 | 166,916 | ||||||||
|
| |||||||||
| Total Germany | 752,715 | |||||||||
|
| |||||||||
| Ireland — 0.4% | ||||||||||
| Corporate Debt | ||||||||||
| 250,000 | AerCap Ireland Capital DAC / AerCap Global Aviation Trust, 3.65%, due 07/21/27 | 226,423 | ||||||||
| 200,000 | AerCap Ireland Capital DAC / AerCap Global Aviation Trust, 3.30%, due 01/30/32 | 160,048 | ||||||||
|
| |||||||||
| Total Ireland | 386,471 | |||||||||
|
| |||||||||
| Japan — 1.7% | ||||||||||
| Corporate Debt | ||||||||||
| 300,000 | Mitsubishi UFJ Financial Group, Inc., Variable Rate, 4.08%, due 04/19/28 | 284,745 | ||||||||
| 200,000 | Mitsubishi UFJ Financial Group, Inc., Variable Rate, 4.32%, due 04/19/33 | 181,858 | ||||||||
| 200,000 | Mizuho Financial Group Inc, 5.75%, due 05/27/34 | 199,011 | ||||||||
| 200,000 | Mizuho Financial Group, Inc., 4.02%, due 03/05/28 | 188,288 | ||||||||
| 250,000 | Mizuho Financial Group, Inc., 4.25%, due 09/11/29 | 233,219 | ||||||||
| 200,000 | Sumitomo Mitsui Financial Group Inc, 5.46%, due 01/13/26 | 199,561 | ||||||||
| 200,000 | Sumitomo Mitsui Financial Group Inc, 5.77%, due 01/13/33 | 201,626 | ||||||||
| 250,000 | Takeda Pharmaceutical Co. Ltd., 5.00%, due 11/26/28 | 246,836 | ||||||||
|
| |||||||||
| Total Japan | 1,735,144 | |||||||||
|
| |||||||||
Par Value† | Description | Value ($) | ||||||||
| Netherlands — 0.4% | ||||||||||
| Corporate Debt | ||||||||||
| 200,000 | ING Groep NV, Variable Rate, 4.02%, due 03/28/28 | 187,822 | ||||||||
| 350,000 | ING Groep NV, Variable Rate, 2.73%, due 04/01/32 | 282,344 | ||||||||
|
| |||||||||
| Total Netherlands | 470,166 | |||||||||
|
| |||||||||
| Spain — 0.6% | ||||||||||
| Corporate Debt | ||||||||||
| 200,000 | Banco Bilbao Vizcaya Argentaria SA, 1.13%, due 09/18/25 | 179,095 | ||||||||
| 200,000 | Banco Bilbao Vizcaya Argentaria SA, Variable Rate, 5.86%, due 09/14/26 | 198,557 | ||||||||
| 200,000 | Banco Bilbao Vizcaya Argentaria SA, Variable Rate, 6.14%, due 09/14/28 | 202,618 | ||||||||
|
| |||||||||
| Total Spain | 580,270 | |||||||||
|
| |||||||||
| United Kingdom — 3.7% | ||||||||||
| Corporate Debt | ||||||||||
| 200,000 | Barclays Plc, Variable Rate, 5.50%, due 08/09/28 | 195,988 | ||||||||
| 200,000 | Barclays Plc, Variable Rate, 4.97%, due 05/16/29 | 190,458 | ||||||||
| 300,000 | Barclays Plc, Variable Rate, 2.89%, due 11/24/32 | 232,929 | ||||||||
| 300,000 | BAT Capital Corp., 4.39%, due 08/15/37 | 232,865 | ||||||||
| 200,000 | HSBC Holdings Plc, Variable Rate, 2.25%, due 11/22/27 | 175,928 | ||||||||
| 200,000 | HSBC Holdings Plc, Variable Rate, 4.58%, due 06/19/29 | 187,927 | ||||||||
| 500,000 | HSBC Holdings Plc, Variable Rate, 3.97%, due 05/22/30 | 447,997 | ||||||||
| 250,000 | Lloyds Banking Group Plc, Variable Rate, 3.75%, due 03/18/28 | 231,346 | ||||||||
| 200,000 | Lloyds Banking Group Plc, 4.55%, due 08/16/28 | 189,443 | ||||||||
| 250,000 | Mead Johnson Nutrition Co., 4.13%, due 11/15/25 | 242,810 | ||||||||
| 250,000 | Natwest Group Plc, Variable Rate, 3.07%, due 05/22/28 | 225,562 | ||||||||
| 200,000 | Natwest Group Plc, Variable Rate, 4.89%, due 05/18/29 | 191,176 | ||||||||
| 200,000 | NatWest Group Plc, Variable Rate, 4.52%, due 06/25/24 | 198,921 | ||||||||
| 250,000 | Prudential Plc, 3.13%, due 04/14/30 | 220,029 | ||||||||
| 150,000 | RELX Capital Inc, 4.00%, due 03/18/29 | 138,872 | ||||||||
| 300,000 | Reynolds American, Inc., 5.70%, due 08/15/35 | 272,781 | ||||||||
| 250,000 | Reynolds American, Inc., 6.15%, due 09/15/43 | 229,166 | ||||||||
|
| |||||||||
| Total United Kingdom | 3,804,198 | |||||||||
|
| |||||||||
| United States — 46.1% | ||||||||||
| Asset-Backed Securities — 3.2% | ||||||||||
| 3,380,000 | Citigroup Commercial Mortgage Trust, 144A, 3.90%, due 05/10/36 | 3,338,035 | ||||||||
|
| |||||||||
| See accompanying notes to the financial statements. | 34 |
GMO Multi-Sector Fixed Income Fund
(A Series of GMO Trust)
Schedule of Investments — (Continued)
(showing percentage of total net assets)
February 28, 2023
Par Value† | Description | Value ($) | ||||||||
| United States — continued | ||||||||||
| Corporate Debt — 16.8% | ||||||||||
| 300,000 | AbbVie, Inc., 4.50%, due 05/14/35 | 278,459 | ||||||||
| 250,000 | AES Corp. (The), 1.38%, due 01/15/26 | 221,241 | ||||||||
| 150,000 | AES Corp. (The), 2.45%, due 01/15/31 | 119,150 | ||||||||
| 250,000 | Aircastle Ltd., 4.13%, due 05/01/24 | 244,160 | ||||||||
| 200,000 | Aircastle Ltd., 4.25%, due 06/15/26 | 189,840 | ||||||||
| 250,000 | Altria Group, Inc., 5.80%, due 02/14/39 | 230,395 | ||||||||
| 150,000 | Altria Group, Inc., 5.95%, due 02/14/49 | 134,312 | ||||||||
| 350,000 | Altria Group, Inc., 4.00%, due 02/04/61 | 231,370 | ||||||||
| 150,000 | Amcor Finance USA, Inc., 3.63%, due 04/28/26 | 141,577 | ||||||||
| 200,000 | American Financial Group, Inc., 4.50%, due 06/15/47 | 165,202 | ||||||||
| 250,000 | Amgen, Inc., 4.40%, due 02/22/62 | 200,173 | ||||||||
| 150,000 | Arch Capital Group US, Inc., 5.14%, due 11/01/43 | 136,355 | ||||||||
| 250,000 | Athene Holding Ltd., 4.13%, due 01/12/28 | 233,754 | ||||||||
| 200,000 | Athene Holding Ltd., 6.15%, due 04/03/30 | 201,907 | ||||||||
| 150,000 | AutoZone, Inc., 4.00%, due 04/15/30 | 137,843 | ||||||||
| 100,000 | Baxalta, Inc., 5.25%, due 06/23/45 | 94,720 | ||||||||
| 200,000 | Biogen, Inc., 4.05%, due 09/15/25 | 193,629 | ||||||||
| 150,000 | Biogen, Inc., 2.25%, due 05/01/30 | 121,442 | ||||||||
| 200,000 | Boeing Co. (The), 5.71%, due 05/01/40 | 190,404 | ||||||||
| 200,000 | Boeing Co. (The), 5.81%, due 05/01/50 | 190,245 | ||||||||
| 250,000 | Boeing Co. (The), 5.93%, due 05/01/60 | 233,455 | ||||||||
| 150,000 | Booking Holdings, Inc., 3.60%, due 06/01/26 | 142,982 | ||||||||
| 300,000 | Broadcom, Inc., 144A, 3.42%, due 04/15/33 | 241,529 | ||||||||
| 150,000 | Broadcom, Inc., 144A, 4.93%, due 05/15/37 | 130,474 | ||||||||
| 200,000 | Cardinal Health, Inc., 3.08%, due 06/15/24 | 193,673 | ||||||||
| 300,000 | Cardinal Health, Inc., 4.37%, due 06/15/47 | 239,530 | ||||||||
| 400,000 | Carrier Global Corp., 2.72%, due 02/15/30 | 337,543 | ||||||||
| 150,000 | CDW LLC / CDW Finance Corp., 4.25%, due 04/01/28 | 136,456 | ||||||||
| 200,000 | Charter Communications Operating LLC / Charter Communications Operating Capital, 5.38%, due 04/01/38 | 167,320 | ||||||||
| 100,000 | Charter Communications Operating LLC / Charter Communications Operating Capital, 6.83%, due 10/23/55 | 94,051 | ||||||||
| 400,000 | Cheniere Corpus Christi Holdings LLC, 5.13%, due 06/30/27 | 394,642 | ||||||||
| 200,000 | Cheniere Energy Partners LP, 5.38%, due 07/15/25 | 197,533 | ||||||||
| 250,000 | Cheniere Energy Partners LP, 4.50%, due 10/01/29 | 226,877 | ||||||||
| 200,000 | Cheniere Energy Partners LP, 4.00%, due 03/01/31 | 172,330 | ||||||||
| 250,000 | Cigna Group (The), 3.88%, due 10/15/47 | 191,045 | ||||||||
| 150,000 | Cigna Group (The), 4.90%, due 12/15/48 | 134,910 | ||||||||
| 150,000 | Continental Resources, Inc., 4.90%, due 06/01/44 | 112,251 | ||||||||
| 350,000 | Corning, Inc., 5.45%, due 11/15/79 | 310,127 | ||||||||
| 200,000 | DCP Midstream Operating LP, 5.63%, due 07/15/27 | 197,993 | ||||||||
Par Value† | Description | Value ($) | ||||||||
| United States — continued | ||||||||||
| Corporate Debt — continued | ||||||||||
| 200,000 | Dick’s Sporting Goods, Inc., 3.15%, due 01/15/32 | 157,967 | ||||||||
| 200,000 | Dick’s Sporting Goods, Inc., 4.10%, due 01/15/52 | 132,782 | ||||||||
| 500,000 | Elevance Health, Inc., 2.38%, due 01/15/25 | 473,342 | ||||||||
| 100,000 | Eli Lilly & Co., 3.38%, due 03/15/29 | 92,826 | ||||||||
| 150,000 | Eli Lilly & Co., 4.15%, due 03/15/59 | 131,284 | ||||||||
| 200,000 | F&G Annuities & Life, Inc., 7.40%, due 01/13/28 | 200,078 | ||||||||
| 150,000 | Gilead Sciences, Inc., 4.00%, due 09/01/36 | 132,078 | ||||||||
| 250,000 | GLP Capital LP / GLP Financing II, Inc., 5.38%, due 04/15/26 | 243,807 | ||||||||
| 150,000 | GLP Capital LP / GLP Financing II, Inc., 5.75%, due 06/01/28 | 146,696 | ||||||||
| 250,000 | GLP Capital LP / GLP Financing II, Inc., 4.00%, due 01/15/31 | 214,375 | ||||||||
| 200,000 | HCA, Inc., 5.25%, due 06/15/49 | 172,500 | ||||||||
| 150,000 | Host Hotels & Resorts LP, 3.50%, due 09/15/30 | 124,688 | ||||||||
| 150,000 | International Business Machines Corp., 4.15%, due 05/15/39 | 127,199 | ||||||||
| 150,000 | International Business Machines Corp., 3.43%, due 02/09/52 | 105,158 | ||||||||
| 150,000 | Interpublic Group of Cos., Inc. (The), 4.75%, due 03/30/30 | 143,050 | ||||||||
| 150,000 | Kirby Corp., 4.20%, due 03/01/28 | 140,031 | ||||||||
| 300,000 | Kyndryl Holdings, Inc., 3.15%, due 10/15/31 | 223,976 | ||||||||
| 350,000 | Las Vegas Sands Corp., 3.50%, due 08/18/26 | 320,217 | ||||||||
| 250,000 | Lowe’s Cos., Inc., 5.80%, due 09/15/62 | 241,519 | ||||||||
| 100,000 | Marathon Oil Corp., 5.20%, due 06/01/45 | 84,252 | ||||||||
| 150,000 | McDonald’s Corp., (MTN), 4.70%, due 12/09/35 | 141,982 | ||||||||
| 150,000 | McDonald’s Corp., (MTN), 4.45%, due 03/01/47 | 129,523 | ||||||||
| 150,000 | Morgan Stanley, Variable Rate, 3.62%, due 04/01/31 | 132,821 | ||||||||
| 150,000 | Motorola Solutions, Inc., 2.30%, due 11/15/30 | 117,332 | ||||||||
| 150,000 | Motorola Solutions, Inc., 2.75%, due 05/24/31 | 119,223 | ||||||||
| 150,000 | Motorola Solutions, Inc., 5.60%, due 06/01/32 | 146,831 | ||||||||
| 300,000 | Mylan, Inc., 5.20%, due 04/15/48 | 229,119 | ||||||||
| 150,000 | Northrop Grumman Corp., 5.15%, due 05/01/40 | 145,478 | ||||||||
| 200,000 | NVIDIA Corp., 3.50%, due 04/01/50 | 155,097 | ||||||||
| 200,000 | Omega Healthcare Investors, Inc., 3.38%, due 02/01/31 | 157,603 | ||||||||
| 150,000 | Omega Healthcare Investors, Inc., 3.25%, due 04/15/33 | 107,221 | ||||||||
| 250,000 | O’Reilly Automotive, Inc., 4.20%, due 04/01/30 | 234,369 | ||||||||
| 200,000 | O’Reilly Automotive, Inc., 4.70%, due 06/15/32 | 190,568 | ||||||||
| 35 | See accompanying notes to the financial statements. |
GMO Multi-Sector Fixed Income Fund
(A Series of GMO Trust)
Schedule of Investments — (Continued)
(showing percentage of total net assets)
February 28, 2023
Par Value† |
Description | Value ($) | ||||||||
| United States — continued | ||||||||||
| Corporate Debt — continued | ||||||||||
| 200,000 | Otis Worldwide Corp., 2.06%, due 04/05/25 | 186,572 | ||||||||
| 250,000 | Pacific Gas & Electric Co., 3.75%, due 07/01/28 | 224,659 | ||||||||
| 250,000 | Pacific Gas & Electric Co., 5.90%, due 06/15/32 | 241,606 | ||||||||
| 150,000 | Pacific Gas & Electric Co., 4.75%, due 02/15/44 | 117,464 | ||||||||
| 200,000 | Philip Morris International, Inc., 4.13%, due 03/04/43 | 157,941 | ||||||||
| 250,000 | Philip Morris International, Inc., 4.88%, due 11/15/43 | 217,671 | ||||||||
| 150,000 | Philip Morris International, Inc., 4.25%, due 11/10/44 | 119,655 | ||||||||
| 150,000 | Reinsurance Group of America, Inc., 3.90%, due 05/15/29 | 137,333 | ||||||||
| 250,000 | Reinsurance Group of America, Inc., 3.15%, due 06/15/30 | 213,751 | ||||||||
| 200,000 | Ross Stores, Inc., 4.60%, due 04/15/25 | 196,912 | ||||||||
| 200,000 | Southern Copper Corp, 5.88%, due 04/23/45 | 201,163 | ||||||||
| 150,000 | State Street Corp., Variable Rate, 4.82%, due 01/26/34 | 144,611 | ||||||||
| 150,000 | Synchrony Financial, 4.25%, due 08/15/24 | 146,377 | ||||||||
| 150,000 | T-Mobile USA, Inc., 2.05%, due 02/15/28 | 128,738 | ||||||||
| 250,000 | T-Mobile USA, Inc., 5.80%, due 09/15/62 | 245,125 | ||||||||
| 150,000 | Trane Technologies Luxembourg Finance SA, 3.80%, due 03/21/29 | 138,125 | ||||||||
| 350,000 | Union Pacific Corp., 4.10%, due 09/15/67 | 274,502 | ||||||||
| 350,000 | Union Pacific Corp., 3.80%, due 04/06/71 | 255,973 | ||||||||
| 50,000 | UnitedHealth Group, Inc., 4.95%, due 05/15/62 | 47,059 | ||||||||
| 300,000 | Utah Acquisition Sub, Inc., 5.25%, due 06/15/46 | 233,430 | ||||||||
| 150,000 | VeriSign, Inc., 2.70%, due 06/15/31 | 121,112 | ||||||||
| 350,000 | Viatris, Inc., 4.00%, due 06/22/50 | 225,756 | ||||||||
| 200,000 | Williams Cos, Inc. (The), 5.10%, due 09/15/45 | 175,803 | ||||||||
| 150,000 | Willis North America, Inc., 4.50%, due 09/15/28 | 142,241 | ||||||||
|
| |||||||||
| 17,419,470 | ||||||||||
|
| |||||||||
| U.S. Government — 11.1% | ||||||||||
| 11,500,000 | U.S. Treasury Bonds, 1.13%, due 08/15/40 (a) | 7,242,754 | ||||||||
| 3,900,000 | U.S. Treasury Note, Variable Rate, USBM - 0.08%, 4.73%, due 04/30/24 (a) | 3,894,093 | ||||||||
| 450,000 | U.S. Treasury Note, Variable Rate, USBM + 0.04%, 4.84%, due 07/31/24 | 449,846 | ||||||||
|
| |||||||||
| 11,586,693 | ||||||||||
|
| |||||||||
| U.S. Government Agency — 15.0% | ||||||||||
| 400,000 | Federal National Mortgage Association, TBA, 2.00%, due 03/13/53 | 325,742 | ||||||||
Par Value† / Shares | Description | Value ($) | ||||||||
| United States — continued | ||||||||||
| U.S. Government Agency — continued | ||||||||||
| 6,200,000 | Federal National Mortgage Association, TBA, 2.50%, due 03/16/38 | 5,653,625 | ||||||||
| 5,800,000 | Federal National Mortgage Association, TBA, 3.00%, due 03/13/53 | 5,100,941 | ||||||||
| 2,100,000 | Federal National Mortgage Association, TBA, 2.50%, due 03/13/53 | 1,778,684 | ||||||||
| 3,000,000 | Federal National Mortgage Association, TBA, 3.00%, due 03/21/53 | 2,677,793 | ||||||||
|
| |||||||||
| 15,536,785 | ||||||||||
|
| |||||||||
| Total United States | 47,880,983 | |||||||||
|
| |||||||||
TOTAL DEBT OBLIGATIONS (COST $59,468,788) | 56,125,369 | |||||||||
|
| |||||||||
| MUTUAL FUNDS — 26.8% | ||||||||||
| United States — 26.8% | ||||||||||
| Affiliated Issuers | ||||||||||
| 247,731 | GMO Emerging Country Debt Fund, Class VI | 4,374,928 | ||||||||
| 974,867 | GMO Opportunistic Income Fund, Class VI | 23,494,304 | ||||||||
|
| |||||||||
TOTAL MUTUAL FUNDS (COST $32,367,720) | 27,869,232 | |||||||||
|
| |||||||||
| SHORT-TERM INVESTMENTS — 33.2% |
| |||||||||
| Repurchase Agreements — 3.4% | ||||||||||
| 3,499,595 | Nomura Securities International, Inc. Repurchase Agreement, dated, 02/28/23 maturing on 03/01/23 with a maturity value of $3,500,033 and an effective yield of 4.51%, collateralized by a U.S. Treasury Note with maturity date 12/31/29 and a market value of $3,571,015. | 3,499,595 | ||||||||
|
| |||||||||
| Money Market Funds — 0.3% | ||||||||||
| 282,880 | State Street Institutional Treasury Money Market Fund – Premier Class, 4.42% (b) | 282,880 | ||||||||
|
| |||||||||
| Sovereign and Sovereign Agency Issuers — 19.9% |
| |||||||||
| JPY | 1,920,000,000 | Japan Treasury Discount Bill, Zero Coupon, due 03/27/23 | 14,103,003 | |||||||
| JPY | 902,200,000 | Japan Treasury Discount Bill, Zero Coupon, due 05/15/23 | 6,628,210 | |||||||
|
| |||||||||
| Total Sovereign and Sovereign Agency Issuers | 20,731,213 | |||||||||
|
| |||||||||
| See accompanying notes to the financial statements. | 36 |
GMO Multi-Sector Fixed Income Fund
(A Series of GMO Trust)
Schedule of Investments — (Continued)
(showing percentage of total net assets)
February 28, 2023
Par Value† | Description | Value ($) | ||||||||
| U.S. Government Agency — 9.6% | ||||||||||
| 10,000,000 | Federal Home Loan Banks, Variable Rate, SOFR + 0.04%, 4.59%, due 06/05/23 | 9,999,941 | ||||||||
|
| |||||||||
| TOTAL SHORT-TERM INVESTMENTS (COST $34,680,315) | 34,513,629 | |||||||||
|
| |||||||||
TOTAL INVESTMENTS — 114.1% (Cost $126,516,823) | 118,508,230 | |||||||||
| Other Assets and Liabilities (net) —(14.1%) | (14,638,919 | ) | ||||||||
|
| |||||||||
| TOTAL NET ASSETS — 100.0% | $ | 103,869,311 | ||||||||
|
| |||||||||
A summary of outstanding financial instruments at February 28, 2023 is as follows:
Forward Currency Contracts
Settlement | Counterparty | Currency Sold | Currency Purchased | Net Unrealized Appreciation (Depreciation)($) | ||||||||||||||||||
05/09/2023 | BOA | AUD | 670,000 | USD | 452,174 | 260 | ||||||||||||||||
05/09/2023 | BCLY | AUD | 2,350,000 | USD | 1,624,574 | 39,504 | ||||||||||||||||
05/09/2023 | MSCI | AUD | 540,000 | USD | 374,178 | 9,949 | ||||||||||||||||
05/03/2023 | GS | BRL | 350,000 | USD | 67,080 | 952 | ||||||||||||||||
05/03/2023 | JPM | BRL | 400,000 | USD | 75,912 | 338 | ||||||||||||||||
04/03/2023 | BCLY | CAD | 570,000 | USD | 425,659 | 7,805 | ||||||||||||||||
04/03/2023 | GS | CAD | 810,000 | USD | 600,457 | 6,664 | ||||||||||||||||
04/03/2023 | SSB | CAD | 600,000 | USD | 446,956 | 7,110 | ||||||||||||||||
05/16/2023 | BCLY | CHF | 5,293,976 | USD | 5,825,911 | 159,980 | ||||||||||||||||
04/11/2023 | MSCI | COP | 960,000,000 | USD | 199,456 | 3,464 | ||||||||||||||||
03/21/2023 | SSB | GBP | 1,260,000 | USD | 1,517,568 | 1,462 | ||||||||||||||||
05/16/2023 | MSCI | HUF | 35,000,000 | USD | 96,238 | 664 | ||||||||||||||||
05/08/2023 | GS | IDR | 2,200,000,000 | USD | 145,541 | 1,468 | ||||||||||||||||
03/31/2023 | DB | ILS | 1,536,203 | USD | 432,941 | 12,081 | ||||||||||||||||
05/31/2023 | MSCI | ILS | 350,000 | USD | 96,951 | 806 | ||||||||||||||||
03/27/2023 | BOA | JPY | 1,920,000,000 | USD | 14,231,587 | 80,744 | ||||||||||||||||
05/15/2023 | CITI | JPY | 902,200,000 | USD | 7,121,934 | 425,355 | ||||||||||||||||
05/08/2023 | CITI | KRW | 140,000,000 | USD | 106,427 | 138 | ||||||||||||||||
05/08/2023 | GS | KRW | 160,000,000 | USD | 122,063 | 589 | ||||||||||||||||
05/31/2023 | MSCI | NZD | 1,820,000 | USD | 1,130,484 | 5,212 | ||||||||||||||||
05/31/2023 | SSB | NZD | 950,000 | USD | 592,159 | 4,792 | ||||||||||||||||
04/28/2023 | CITI | PHP | 15,500,000 | USD | 282,375 | 3,425 | ||||||||||||||||
05/22/2023 | GS | PLN | 1,050,000 | USD | 235,165 | 412 | ||||||||||||||||
04/27/2023 | BCLY | RON | 2,981,041 | USD | 642,855 | 4,174 | ||||||||||||||||
05/22/2023 | MSCI | SGD | 870,686 | USD | 652,757 | 5,625 | ||||||||||||||||
05/22/2023 | BCLY | THB | 16,222,300 | USD | 473,920 | 11,229 | ||||||||||||||||
03/08/2023 | MSCI | TWD | 23,445,600 | USD | 785,468 | 21,322 | ||||||||||||||||
05/03/2023 | GS | USD | 112,910 | BRL | 600,000 | 452 | ||||||||||||||||
04/10/2023 | JPM | USD | 144,014 | CLP | 120,000,000 | 236 | ||||||||||||||||
04/10/2023 | MSCI | USD | 304,841 | CLP | 260,271,500 | 8,029 | ||||||||||||||||
04/11/2023 | JPM | USD | 605,943 | COP | 3,013,658,000 | 9,323 | ||||||||||||||||
05/22/2023 | BCLY | USD | 197,069 | INR | 16,420,556 | 512 | ||||||||||||||||
Settlement | Counterparty | Currency Sold | Currency Purchased | Net Unrealized Appreciation (Depreciation)($) | ||||||||||||||||||
04/20/2023 | MSCI | USD | 824,806 | MXN | 15,619,101 | 20,962 | ||||||||||||||||
05/10/2023 | MSCI | USD | 72,105 | PEN | 280,000 | 1,323 | ||||||||||||||||
05/31/2023 | MSCI | ZAR | 1,400,000 | USD | 76,536 | 872 | ||||||||||||||||
04/11/2023 | MSCI | COP | 1,280,000,000 | USD | 258,354 | (2,969 | ) | |||||||||||||||
04/17/2023 | MSCI | CZK | 15,642,868 | USD | 702,022 | (289 | ) | |||||||||||||||
05/10/2023 | MSCI | PEN | 280,000 | USD | 72,558 | (871 | ) | |||||||||||||||
05/22/2023 | MSCI | PLN | 300,000 | USD | 66,637 | (435 | ) | |||||||||||||||
05/08/2023 | BCLY | SEK | 12,397,350 | USD | 1,177,459 | (11,061 | ) | |||||||||||||||
05/03/2023 | CITI | USD | 96,641 | BRL | 500,000 | (2,173 | ) | |||||||||||||||
05/03/2023 | GS | USD | 87,521 | BRL | 450,000 | (2,500 | ) | |||||||||||||||
05/03/2023 | SSB | USD | 455,050 | BRL | 2,363,667 | (8,468 | ) | |||||||||||||||
04/03/2023 | BCLY | USD | 3,865,345 | CAD | 5,187,182 | (62,741 | ) | |||||||||||||||
04/10/2023 | MSCI | USD | 341,139 | CLP | 280,000,000 | (4,553 | ) | |||||||||||||||
04/17/2023 | CITI | USD | 226,654 | CZK | 5,000,000 | (2,171 | ) | |||||||||||||||
04/17/2023 | GS | USD | 108,325 | CZK | 2,400,000 | (573 | ) | |||||||||||||||
04/17/2023 | MSCI | USD | 71,878 | CZK | 1,600,000 | (44 | ) | |||||||||||||||
03/31/2023 | GS | USD | 1,081,259 | EUR | 1,010,000 | (11,127 | ) | |||||||||||||||
03/31/2023 | JPM | USD | 4,773,781 | EUR | 4,470,000 | (37,651 | ) | |||||||||||||||
05/16/2023 | JPM | USD | 602,605 | HUF | 219,769,900 | (2,485 | ) | |||||||||||||||
05/08/2023 | JPM | USD | 179,939 | IDR | 2,694,041,000 | (3,511 | ) | |||||||||||||||
03/17/2023 | MSCI | USD | 5,037,540 | JPY | 670,902,084 | (99,848 | ) | |||||||||||||||
05/08/2023 | BCLY | USD | 12,886 | KRW | 15,778,325 | (907 | ) | |||||||||||||||
05/08/2023 | GS | USD | 64,944 | KRW | 80,000,000 | (4,207 | ) | |||||||||||||||
04/17/2023 | BOA | USD | 416,095 | NOK | 4,100,000 | (20,352 | ) | |||||||||||||||
04/17/2023 | MSCI | USD | 3,662,886 | NOK | 36,385,429 | (150,863 | ) | |||||||||||||||
05/31/2023 | SSB | USD | 329,211 | NZD | 530,000 | (1,522 | ) | |||||||||||||||
04/28/2023 | JPM | USD | 136,225 | PHP | 7,500,000 | (1,250 | ) | |||||||||||||||
05/08/2023 | BCLY | USD | 760,343 | SEK | 7,900,000 | (2,979 | ) | |||||||||||||||
05/22/2023 | BCLY | USD | 131,261 | THB | 4,500,000 | (2,912 | ) | |||||||||||||||
05/31/2023 | MSCI | USD | 274,173 | ZAR | 5,000,000 | (3,945 | ) | |||||||||||||||
|
| |||||||||||||||||||||
| $ | 414,826 | |||||||||||||||||||||
|
| |||||||||||||||||||||
| 37 | See accompanying notes to the financial statements. |
GMO Multi-Sector Fixed Income Fund
(A Series of GMO Trust)
Schedule of Investments — (Continued)
February 28, 2023
Futures Contracts
| Number of Contracts + | Type | Expiration Date | Notional Amount ($) | Value/Net Unrealized Appreciation (Depreciation) ($) | ||||||||||||||
| Buys | ||||||||||||||||||
| 24 | U.S. Long Bond (CBT) | June 2023 | 3,005,250 | (1,533 | ) | |||||||||||||
| 57 | U.S. Treasury Note 10 Yr. (CBT) | June 2023 | 6,364,406 | 6,216 | ||||||||||||||
| 28 | U.S. Treasury Note 2 Yr. (CBT) | June 2023 | 5,704,344 | (11,384 | ) | |||||||||||||
| 133 | U.S. Treasury Note 5 Yr. (CBT) | June 2023 | 14,238,273 | (14,704 | ) | |||||||||||||
| 36 | U.S. Treasury Ultra 10 Yr. (CBT) | June 2023 | 4,218,750 | (10,097 | ) | |||||||||||||
|
|
|
| |||||||||||||||
| $ | 33,531,023 | $ | (31,502 | ) | ||||||||||||||
|
|
|
| |||||||||||||||
| + | Buys - Fund is long the futures contract. |
Sales - Fund is short the futures contract.
Swap Contracts
Centrally Cleared Interest Rate Swaps
Fund Pays | Fund Receives | Notional Amount | Expiration Date | Periodic Payment Frequency | Premiums Paid/ (Received) ($) | Value ($) | Net Unrealized Appreciation/ (Depreciation) ($) | |||||||||||||||||||||||
3.56% | 3 Month AUD BBSW | AUD | 3,000,000 | 03/15/2025 | Quarterly | — | 24,204 | 24,204 | ||||||||||||||||||||||
3.66% | 3 Month AUD BBSW | AUD | 4,500,000 | 03/15/2025 | Quarterly | — | 30,598 | 30,598 | ||||||||||||||||||||||
3.70% | 3 Month AUD BBSW | AUD | 14,859,000 | 03/15/2025 | Quarterly | 2,836 | 93,284 | 90,448 | ||||||||||||||||||||||
3 Month AUD BBSW | 3.63% | AUD | 3,500,000 | 03/15/2025 | Quarterly | — | (25,308 | ) | (25,308 | ) | ||||||||||||||||||||
3 Month AUD BBSW | 3.73% | AUD | 3,000,000 | 03/15/2025 | Quarterly | — | (17,636 | ) | (17,636 | ) | ||||||||||||||||||||
3 Month AUD BBSW | 3.85% | AUD | 5,000,000 | 03/15/2025 | Quarterly | — | (21,988 | ) | (21,988 | ) | ||||||||||||||||||||
3 Month AUD BBSW | 3.92% | AUD | 4,000,000 | 03/15/2025 | Quarterly | — | (13,882 | ) | (13,882 | ) | ||||||||||||||||||||
3.99% | 3 Month CAD CDOR | CAD | 12,828,000 | 03/15/2025 | Semi-Annually | 5,996 | 123,947 | 117,951 | ||||||||||||||||||||||
3.83% | 3 Month CAD CDOR | CAD | 5,000,000 | 03/15/2025 | Semi-Annually | — | 59,628 | 59,628 | ||||||||||||||||||||||
3 Month CAD CDOR | 4.00% | CAD | 2,500,000 | 03/15/2025 | Semi-Annually | — | (23,801 | ) | (23,801 | ) | ||||||||||||||||||||
3 Month CAD CDOR | 4.75% | CAD | 1,500,000 | 03/15/2025 | Semi-Annually | — | 1,371 | 1,371 | ||||||||||||||||||||||
CHF - SARON - OIS - COMPOUND | 1.36% | CHF | 2,500,000 | 03/15/2025 | Annually | — | (24,231 | ) | (24,231 | ) | ||||||||||||||||||||
CHF - SARON - OIS - COMPOUND | 1.57% | CHF | 1,500,000 | 03/15/2025 | Annually | — | (7,930 | ) | (7,930 | ) | ||||||||||||||||||||
1.18% | CHF - SARON - OIS - COMPOUND | CHF | 7,988,000 | 03/15/2025 | Annually | 907 | 106,584 | 105,677 | ||||||||||||||||||||||
EUR - EuroSTR - COMPOUND | 2.93% | EUR | 1,500,000 | 03/15/2025 | Annually | — | (19,755 | ) | (19,755 | ) | ||||||||||||||||||||
EUR - EuroSTR - COMPOUND | 2.97% | EUR | 5,500,000 | 03/15/2025 | Annually | — | (68,791 | ) | (68,791 | ) | ||||||||||||||||||||
3.19% | EUR - EuroSTR - COMPOUND | EUR | 2,500,000 | 03/15/2025 | Annually | — | 19,773 | 19,773 | ||||||||||||||||||||||
GBP - SONIA - COMPOUND | 4.27% | GBP | 5,436,000 | 03/15/2025 | Annually | (2,696 | ) | (37,863 | ) | (35,167 | ) | |||||||||||||||||||
4.45% | GBP - SONIA - COMPOUND | GBP | 2,000,000 | 03/15/2025 | Annually | — | 6,141 | 6,141 | ||||||||||||||||||||||
4.17% | GBP - SONIA - COMPOUND | GBP | 3,000,000 | 03/15/2025 | Annually | — | 27,874 | 27,874 | ||||||||||||||||||||||
4.05% | GBP - SONIA - COMPOUND | GBP | 2,000,000 | 03/15/2025 | Annually | — | 24,059 | 24,059 | ||||||||||||||||||||||
4.87% | 3 Month NZD Bank Bill Rate | NZD | 2,500,000 | 03/15/2025 | Quarterly | 2,008 | 14,649 | 12,641 | ||||||||||||||||||||||
3.20% | 3 Month SEK STIBOR | SEK | 20,000,000 | 03/15/2025 | Quarterly | — | 24,992 | 24,992 | ||||||||||||||||||||||
2.97% | 3 Month SEK STIBOR | SEK | 25,000,000 | 03/15/2025 | Quarterly | — | 41,480 | 41,480 | ||||||||||||||||||||||
3 Month SEK STIBOR | 3.10% | SEK | 163,396,000 | 03/15/2025 | Quarterly | 1,677 | (231,720 | ) | (233,397 | ) | ||||||||||||||||||||
3 Month SEK STIBOR | 3.13% | SEK | 20,000,000 | 03/15/2025 | Quarterly | — | (27,330 | ) | (27,330 | ) | ||||||||||||||||||||
USD - SOFR - COMPOUND | 4.19% | USD | 2,000,000 | 03/15/2025 | Annually | — | (26,196 | ) | (26,196 | ) | ||||||||||||||||||||
USD - SOFR - COMPOUND | 4.54% | USD | 3,000,000 | 03/15/2025 | Annually | — | (19,690 | ) | (19,690 | ) | ||||||||||||||||||||
4.14% | USD - SOFR - COMPOUND | USD | 4,958,000 | 03/15/2025 | Annually | 3,653 | 70,166 | 66,513 | ||||||||||||||||||||||
| See accompanying notes to the financial statements. | 38 |
GMO Multi-Sector Fixed Income Fund
(A Series of GMO Trust)
Schedule of Investments — (Continued)
February 28, 2023
Swap Contracts — continued
Centrally Cleared Interest Rate Swaps — continued
Fund Pays | Fund Receives | Notional Amount | Expiration Date | Periodic Payment Frequency | Premiums Paid/ (Received) ($) | Value ($) | Net Unrealized Appreciation/ (Depreciation) ($) | |||||||||||||||||||
4.24% | 3 Month AUD BBSW | AUD | 5,000,000 | 06/21/2025 | Quarterly | — | (1,300 | ) | (1,300 | ) | ||||||||||||||||
EUR - EuroSTR - COMPOUND | 3.61% | EUR | 1,500,000 | 06/21/2025 | Annually | — | 747 | 747 | ||||||||||||||||||
6 Month AUD BBSW | 3.99% | AUD | 3,406,000 | 03/15/2033 | Semi-Annually | (1,080 | ) | (89,210 | ) | (88,130 | ) | |||||||||||||||
6 Month AUD BBSW | 4.03% | AUD | 1,200,000 | 03/15/2033 | Semi-Annually | — | (28,866 | ) | (28,866 | ) | ||||||||||||||||
6 Month AUD BBSW | 4.03% | AUD | 1,000,000 | 03/15/2033 | Semi-Annually | — | (24,109 | ) | (24,109 | ) | ||||||||||||||||
6 Month AUD BBSW | 4.04% | AUD | 2,600,000 | 03/15/2033 | Semi-Annually | — | (60,924 | ) | (60,924 | ) | ||||||||||||||||
6 Month AUD BBSW | 4.07% | AUD | 700,000 | 03/15/2033 | Semi-Annually | — | (15,607 | ) | (15,607 | ) | ||||||||||||||||
6 Month AUD BBSW | 4.19% | AUD | 1,100,000 | 03/15/2033 | Semi-Annually | — | (16,937 | ) | (16,937 | ) | ||||||||||||||||
6 Month AUD BBSW | 4.24% | AUD | 1,600,000 | 03/15/2033 | Semi-Annually | — | (20,782 | ) | (20,782 | ) | ||||||||||||||||
6 Month AUD BBSW | 4.45% | AUD | 12,158,000 | 03/15/2033 | Semi-Annually | (4,115 | ) | (21,015 | ) | (16,900 | ) | |||||||||||||||
4.22% | 6 Month AUD BBSW | AUD | 1,200,000 | 03/15/2033 | Semi-Annually | — | 16,398 | 16,398 | ||||||||||||||||||
4.35% | 6 Month AUD BBSW | AUD | 1,700,000 | 03/15/2033 | Semi-Annually | — | 11,503 | 11,503 | ||||||||||||||||||
4.32% | 6 Month AUD BBSW | AUD | 900,000 | 03/15/2033 | Semi-Annually | — | 7,624 | 7,624 | ||||||||||||||||||
4.17% | 6 Month AUD BBSW | AUD | 700,000 | 03/15/2033 | Semi-Annually | — | 11,535 | 11,535 | ||||||||||||||||||
4.05% | 6 Month AUD BBSW | AUD | 800,000 | 03/15/2033 | Semi-Annually | — | 18,573 | 18,573 | ||||||||||||||||||
3.24% | 3 Month CAD CDOR | CAD | 1,128,000 | 03/15/2033 | Semi-Annually | (2,241 | ) | 35,635 | 37,876 | |||||||||||||||||
3.17% | 3 Month CAD CDOR | CAD | 1,700,000 | 03/15/2033 | Semi-Annually | — | 60,701 | 60,701 | ||||||||||||||||||
3.23% | 3 Month CAD CDOR | CAD | 600,000 | 03/15/2033 | Semi-Annually | — | 19,400 | 19,400 | ||||||||||||||||||
3.42% | 3 Month CAD CDOR | CAD | 800,000 | 03/15/2033 | Semi-Annually | — | 16,275 | 16,275 | ||||||||||||||||||
3.62% | 3 Month CAD CDOR | CAD | 800,000 | 03/15/2033 | Semi-Annually | — | 6,684 | 6,684 | ||||||||||||||||||
3.82% | 3 Month CAD CDOR | CAD | 300,000 | 03/15/2033 | Semi-Annually | — | (1,256 | ) | (1,256 | ) | ||||||||||||||||
3 Month CAD CDOR | 3.18% | CAD | 2,844,000 | 03/15/2033 | Semi-Annually | (5,696 | ) | (100,993 | ) | (95,297 | ) | |||||||||||||||
3 Month CAD CDOR | 3.28% | CAD | 1,100,000 | 03/15/2033 | Semi-Annually | — | (32,093 | ) | (32,093 | ) | ||||||||||||||||
3 Month CAD CDOR | 3.30% | CAD | 1,100,000 | 03/15/2033 | Semi-Annually | — | (30,373 | ) | (30,373 | ) | ||||||||||||||||
3 Month CAD CDOR | 3.32% | CAD | 1,700,000 | 03/15/2033 | Semi-Annually | — | (45,063 | ) | (45,063 | ) | ||||||||||||||||
3 Month CAD CDOR | 3.44% | CAD | 800,000 | 03/15/2033 | Semi-Annually | — | (15,417 | ) | (15,417 | ) | ||||||||||||||||
3 Month CAD CDOR | 3.45% | CAD | 700,000 | 03/15/2033 | Semi-Annually | — | (12,867 | ) | (12,867 | ) | ||||||||||||||||
3 Month CAD CDOR | 3.56% | CAD | 800,000 | 03/15/2033 | Semi-Annually | — | (9,775 | ) | (9,775 | ) | ||||||||||||||||
CHF - SARON - OIS - COMPOUND | 1.50% | CHF | 1,707,000 | 03/15/2033 | Annually | (1,218 | ) | (74,552 | ) | (73,334 | ) | |||||||||||||||
CHF - SARON - OIS - COMPOUND | 1.55% | CHF | 900,000 | 03/15/2033 | Annually | — | (35,014 | ) | (35,014 | ) | ||||||||||||||||
CHF - SARON - OIS - COMPOUND | 1.60% | CHF | 6,479,000 | 03/15/2033 | Annually | — | (221,216 | ) | (221,216 | ) | ||||||||||||||||
CHF - SARON - OIS - COMPOUND | 1.73% | CHF | 1,000,000 | 03/15/2033 | Annually | — | (21,951 | ) | (21,951 | ) | ||||||||||||||||
1.99% | CHF - SARON - OIS - COMPOUND | CHF | 500,000 | 03/15/2033 | Annually | — | (1,727 | ) | (1,727 | ) | ||||||||||||||||
1.58% | CHF - SARON - OIS - COMPOUND | CHF | 500,000 | 03/15/2033 | Annually | — | 18,213 | 18,213 | ||||||||||||||||||
1.91% | CHF - SARON - OIS - COMPOUND | CHF | 1,000,000 | 03/15/2033 | Annually | — | 3,734 | 3,734 | ||||||||||||||||||
1.81% | CHF - SARON - OIS - COMPOUND | CHF | 400,000 | 03/15/2033 | Annually | — | 5,574 | 5,574 | ||||||||||||||||||
1.97% | CHF - SARON - OIS - COMPOUND | CHF | 1,200,000 | 03/15/2033 | Annually | — | (2,047 | ) | (2,047 | ) | ||||||||||||||||
EUR - EuroSTR - COMPOUND | 2.68% | EUR | 600,000 | 03/15/2033 | Annually | — | (17,386 | ) | (17,386 | ) | ||||||||||||||||
2.59% | EUR - EuroSTR - COMPOUND | EUR | 2,000,000 | 03/15/2033 | Annually | — | 74,395 | 74,395 | ||||||||||||||||||
2.59% | EUR - EuroSTR - COMPOUND | EUR | 1,200,000 | 03/15/2033 | Annually | — | 44,800 | 44,800 | ||||||||||||||||||
2.45% | EUR - EuroSTR - COMPOUND | EUR | 400,000 | 03/15/2033 | Annually | — | 20,184 | 20,184 | ||||||||||||||||||
2.69% | EUR - EuroSTR - COMPOUND | EUR | 700,000 | 03/15/2033 | Annually | — | 19,680 | 19,680 | ||||||||||||||||||
2.88% | EUR - EuroSTR - COMPOUND | EUR | 1,400,000 | 03/15/2033 | Annually | — | 15,197 | 15,197 | ||||||||||||||||||
| 39 | See accompanying notes to the financial statements. |
GMO Multi-Sector Fixed Income Fund
(A Series of GMO Trust)
Schedule of Investments — (Continued)
February 28, 2023
Swap Contracts — continued
Centrally Cleared Interest Rate Swaps — continued
Fund Pays | Fund Receives | Notional Amount | Expiration Date | Periodic Payment Frequency | Premiums Paid/ (Received) ($) | Value ($) | Net Unrealized Appreciation/ (Depreciation) ($) | |||||||||||||||||||
2.82% | EUR - EuroSTR - COMPOUND | EUR | 900,000 | 03/15/2033 | Annually | — | 15,002 | 15,002 | ||||||||||||||||||
2.87% | EUR - EuroSTR - COMPOUND | EUR | 1,100,000 | 03/15/2033 | Annually | — | 13,489 | 13,489 | ||||||||||||||||||
2.90% | EUR - EuroSTR - COMPOUND | EUR | 900,000 | 03/15/2033 | Annually | — | 8,788 | 8,788 | ||||||||||||||||||
GBP - SONIA - COMPOUND | 3.34% | GBP | 1,100,000 | 03/15/2033 | Annually | — | (43,753 | ) | (43,753 | ) | ||||||||||||||||
GBP - SONIA - COMPOUND | 3.39% | GBP | 500,000 | 03/15/2033 | Annually | — | (17,564 | ) | (17,564 | ) | ||||||||||||||||
GBP - SONIA - COMPOUND | 3.41% | GBP | 700,000 | 03/15/2033 | Annually | — | (23,049 | ) | (23,049 | ) | ||||||||||||||||
GBP - SONIA - COMPOUND | 3.44% | GBP | 700,000 | 03/15/2033 | Annually | — | (20,857 | ) | (20,857 | ) | ||||||||||||||||
GBP - SONIA - COMPOUND | 3.48% | GBP | 1,600,000 | 03/15/2033 | Annually | — | (41,099 | ) | (41,099 | ) | ||||||||||||||||
GBP - SONIA - COMPOUND | 3.56% | GBP | 500,000 | 03/15/2033 | Annually | — | (8,930 | ) | (8,930 | ) | ||||||||||||||||
3.22% | GBP - SONIA - COMPOUND | GBP | 1,214,000 | 03/15/2033 | Annually | 2,933 | 61,922 | 58,989 | ||||||||||||||||||
3.77% | GBP - SONIA - COMPOUND | GBP | 700,000 | 03/15/2033 | Annually | — | (1,709 | ) | (1,709 | ) | ||||||||||||||||
3.36% | GBP - SONIA - COMPOUND | GBP | 900,000 | 03/15/2033 | Annually | — | 33,729 | 33,729 | ||||||||||||||||||
3.16% | GBP - SONIA - COMPOUND | GBP | 600,000 | 03/15/2033 | Annually | — | 34,080 | 34,080 | ||||||||||||||||||
3.48% | GBP - SONIA - COMPOUND | GBP | 700,000 | 03/15/2033 | Annually | — | 18,426 | 18,426 | ||||||||||||||||||
3.54% | GBP - SONIA - COMPOUND | GBP | 600,000 | 03/15/2033 | Annually | — | 11,978 | 11,978 | ||||||||||||||||||
4.22% | 3 Month NZD Bank Bill Rate | NZD | 1,900,000 | 03/15/2033 | Quarterly | 3,125 | 44,700 | 41,575 | ||||||||||||||||||
4.27% | 3 Month NZD Bank Bill Rate | NZD | 1,000,000 | 03/15/2033 | Quarterly | — | 20,836 | 20,836 | ||||||||||||||||||
4.14% | 3 Month NZD Bank Bill Rate | NZD | 1,700,000 | 03/15/2033 | Quarterly | — | 46,690 | 46,690 | ||||||||||||||||||
4.47% | 3 Month NZD Bank Bill Rate | NZD | 1,400,000 | 03/15/2033 | Quarterly | — | 15,249 | 15,249 | ||||||||||||||||||
3 Month NZD Bank Bill Rate | 4.22% | NZD | 600,000 | 03/15/2033 | Quarterly | (378 | ) | (13,974 | ) | (13,596 | ) | |||||||||||||||
3 Month NZD Bank Bill Rate | 4.26% | NZD | 1,100,000 | 03/15/2033 | Quarterly | (227 | ) | (23,281 | ) | (23,054 | ) | |||||||||||||||
3 Month NZD Bank Bill Rate | 4.59% | NZD | 2,200,000 | 03/15/2033 | Quarterly | — | (11,540 | ) | (11,540 | ) | ||||||||||||||||
3 Month SEK STIBOR | 2.47% | SEK | 7,000,000 | 03/15/2033 | Quarterly | — | (45,706 | ) | (45,706 | ) | ||||||||||||||||
3 Month SEK STIBOR | 2.54% | SEK | 11,000,000 | 03/15/2033 | Quarterly | — | (65,735 | ) | (65,735 | ) | ||||||||||||||||
3 Month SEK STIBOR | 2.59% | SEK | 6,000,000 | 03/15/2033 | Quarterly | — | (33,521 | ) | (33,521 | ) | ||||||||||||||||
3 Month SEK STIBOR | 2.63% | SEK | 5,000,000 | 03/15/2033 | Quarterly | — | (26,350 | ) | (26,350 | ) | ||||||||||||||||
3 Month SEK STIBOR | 2.81% | SEK | 8,000,000 | 03/15/2033 | Quarterly | — | (30,416 | ) | (30,416 | ) | ||||||||||||||||
2.51% | 3 Month SEK STIBOR | SEK | 35,729,000 | 03/15/2033 | Quarterly | 2,229 | 221,138 | 218,909 | ||||||||||||||||||
2.62% | 3 Month SEK STIBOR | SEK | 4,000,000 | 03/15/2033 | Quarterly | — | 21,305 | 21,305 | ||||||||||||||||||
3.00% | 3 Month SEK STIBOR | SEK | 91,793,000 | 03/15/2033 | Quarterly | (706 | ) | 209,828 | 210,534 | |||||||||||||||||
3 Month SEK STIBOR | 3.22% | SEK | 9,000,000 | 03/15/2033 | Quarterly | — | (4,870 | ) | (4,870 | ) | ||||||||||||||||
3 Month SEK STIBOR | 3.28% | SEK | 14,000,000 | 03/15/2033 | Quarterly | — | (51 | ) | (51 | ) | ||||||||||||||||
USD - SOFR - COMPOUND | 3.05% | USD | 1,230,000 | 03/15/2033 | Annually | — | (59,836 | ) | (59,836 | ) | ||||||||||||||||
USD - SOFR - COMPOUND | 3.07% | USD | 1,900,000 | 03/15/2033 | Annually | — | (89,139 | ) | (89,139 | ) | ||||||||||||||||
USD - SOFR - COMPOUND | 3.13% | USD | 1,109,000 | 03/15/2033 | Annually | (5,044 | ) | (46,927 | ) | (41,883 | ) | |||||||||||||||
USD - SOFR - COMPOUND | 3.16% | USD | 1,100,000 | 03/15/2033 | Annually | — | (43,805 | ) | (43,805 | ) | ||||||||||||||||
USD - SOFR - COMPOUND | 3.19% | USD | 800,000 | 03/15/2033 | Annually | — | (29,681 | ) | (29,681 | ) | ||||||||||||||||
3.16% | USD - SOFR - COMPOUND | USD | 1,304,000 | 03/15/2033 | Annually | 2,395 | 51,692 | 49,297 | ||||||||||||||||||
3.23% | USD - SOFR - COMPOUND | USD | 700,000 | 03/15/2033 | Annually | — | 23,720 | 23,720 | ||||||||||||||||||
3.29% | USD - SOFR - COMPOUND | USD | 1,000,000 | 03/15/2033 | Annually | — | 29,349 | 29,349 | ||||||||||||||||||
3.33% | USD - SOFR - COMPOUND | USD | 700,000 | 03/15/2033 | Annually | — | 18,178 | 18,178 | ||||||||||||||||||
3.47% | USD - SOFR - COMPOUND | USD | 600,000 | 03/15/2033 | Annually | — | 8,629 | 8,629 | ||||||||||||||||||
3.30% | USD - SOFR - COMPOUND | USD | 1,100,000 | 03/15/2033 | Annually | — | 30,697 | 30,697 | ||||||||||||||||||
3.22% | USD - SOFR - COMPOUND | USD | 1,200,000 | 03/15/2033 | Annually | — | 41,602 | 41,602 | ||||||||||||||||||
3.22% | USD - SOFR - COMPOUND | USD | 500,000 | 03/15/2033 | Annually | — | 17,375 | 17,375 | ||||||||||||||||||
3.40% | USD - SOFR - COMPOUND | USD | 900,000 | 03/15/2033 | Annually | — | 18,324 | 18,324 | ||||||||||||||||||
3.44% | USD - SOFR - COMPOUND | USD | 600,000 | 03/15/2033 | Annually | — | 10,138 | 10,138 | ||||||||||||||||||
3.46% | USD - SOFR - COMPOUND | �� | USD | 700,000 | 03/15/2033 | Annually | — | 10,442 | 10,442 | |||||||||||||||||
3.59% | USD - SOFR - COMPOUND | USD | 2,000,000 | 03/15/2033 | Annually | — | 8,392 | 8,392 | ||||||||||||||||||
3.63% | USD - SOFR - COMPOUND | USD | 600,000 | 03/15/2033 | Annually | — | 489 | 489 | ||||||||||||||||||
6 Month AUD BBSW | 4.51% | AUD | 1,100,000 | 06/21/2033 | | Semi- Annually | — | 338 | 338 | |||||||||||||||||
| See accompanying notes to the financial statements. | 40 |
GMO Multi-Sector Fixed Income Fund
(A Series of GMO Trust)
Schedule of Investments — (Continued)
February 28, 2023
Swap Contracts — continued
Centrally Cleared Interest Rate Swaps — continued
Fund Pays | Fund Receives | Notional Amount | Expiration Date | Periodic Payment Frequency | Premiums Paid/ (Received) ($) | Value ($) | Net Unrealized Appreciation/ (Depreciation) ($) | |||||||||||||||||||||||
3.04% | EUR - EuroSTR - COMPOUND | EUR | 300,000 | 06/21/2033 | Annually | — | (992 | ) | (992 | ) | ||||||||||||||||||||
3.61% | USD - SOFR - COMPOUND | USD | 800,000 | 06/21/2033 | Annually | — | (1,481 | ) | (1,481 | ) | ||||||||||||||||||||
|
|
|
|
|
| |||||||||||||||||||||||||
| $ | 4,358 | $ | (28,740 | ) | $ | (33,098 | ) | |||||||||||||||||||||||
|
|
|
|
|
| |||||||||||||||||||||||||
As of February 28, 2023, for the above contracts and/or agreements, the Fund had sufficient cash and/or securities to cover commitments or collateral requirements, if any, of the relevant broker or exchange.
Notes to Schedule of Investments:
| † | Denominated in U.S. Dollar, unless otherwise indicated. |
| (a) | All or a portion of this security has been pledged to cover margin requirements on futures and/or cleared swap contracts, collateral on OTC swap contracts, forward currency contracts, and/or written options, if any (Note 4). |
| (b) | The rate disclosed is the 7 day net yield as of February 28, 2023. |
For a listing of definitions of acronyms, counterparty abbreviations and currency abbreviations used throughout the Schedule of Investments as well as the derivative tables, if any, please refer to page 63.
| 41 | See accompanying notes to the financial statements. |
This page has been left blank intentionally.
(A Series of GMO Trust)
Portfolio Management
Day-to-day management of the Fund’s portfolio is the responsibility of the Structured Products team at Grantham, Mayo, Van Otterloo & Co. LLC.
Management Discussion and Analysis of Fund Performance
Although the Fund is not managed relative to any securities market index or benchmark, a discussion of the Fund’s performance relative to the Bloomberg U.S. Securitized + Index* is included for comparative purposes.
Class VI shares of GMO Opportunistic Income Fund returned -0.58% (net) for the fiscal year ended February 28, 2023, as compared with -8.94% for the Bloomberg U.S. Securitized + Index.
Absolute performance was driven by losses from the portfolio’s Duration Management positions. Partly offsetting losses, gains from the portfolio’s Collateralized Loan Obligation (CLO), Commercial Mortgage-Backed Securities (CMBS), and Student Loan sectors contributed positively. The Fund’s Credit Relative Value positions also posted gains during the fiscal year, while the portfolio’s Residential Mortgage-Backed Securities (RMBS) sector posted losses.
| * | The Bloomberg U.S. Securitized + Index is an internally maintained benchmark computed by GMO, comprised of the J.P. Morgan U.S. 3-Month Cash Index through 12/30/2016 and the Bloomberg U.S. Securitized: MBS, ABS, CMBS Index thereafter. |
The views expressed herein are exclusively those of Grantham, Mayo, Van Otterloo & Co. LLC as of the date of this report and are subject to change. GMO disclaims any responsibility to update such views. They are not meant as investment advice. References to specific securities are not recommendations of such securities and may not be representative of any GMO portfolio’s current or future investments. All information is unaudited.
43
GMO Opportunistic Income Fund
(A Series of GMO Trust)
Comparison of Change in Value of a $300,000,000 Investment in
GMO Opportunistic Income Fund^ Class VI Shares, the Bloomberg U.S. Securitized + Index**
and the Bloomberg U.S. Securitized Index
As of February 28, 2023
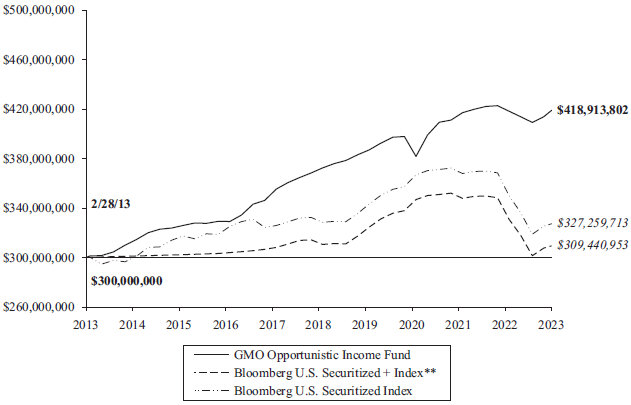
| Average Annual Total Returns | ||||||||
| 1 Year | 5 Year | 10 Year | Since Inception *** | |||||
| Class III* | -0.66% | n/a | n/a | 7/21/21 -0.58% | ||||
| Class VI | -0.58% | 2.46% | 3.40% | n/a | ||||
| Class R6 | -0.68% | n/a | n/a | 5/19/21 -0.03% | ||||
| Class I | -0.73% | n/a | n/a | 11/5/19 1.39% | ||||
Performance data quoted represents past performance and is not indicative of future results. The investment return and principal value of an investment will fluctuate so that an investor’s shares, when redeemed, may be worth more or less than their original cost. Current performance data may be lower or higher than the performance data provided herein. To obtain performance information up to the most recent month-end, visit www.gmo.com. Performance shown is net of all fees after reimbursement from GMO. Transaction fees are retained by the Fund to cover trading costs. Returns would have been lower had certain expenses not been reimbursed during the periods shown and do not include the effect of taxes on distributions and redemptions. The performance information shown above only includes purchase premiums and/or redemption fees in effect as of February 28, 2023. All information is unaudited. Performance for classes may vary due to different fees.
| ^ | Effective February 12, 2014, GMO Opportunistic Income Fund (the “Acquired Fund”) merged into GMO Short-Duration Collateral Fund and the surviving entity was renamed GMO Opportunistic Income Fund. For accounting and financial reporting purposes, the Acquired Fund is the surviving entity, meaning that the combined entity adopted the historical financial reporting and performance history of the Acquired Fund. The information shown prior to February 12, 2014 is that of the Acquired Fund and reflects the Acquired Fund’s performance. |
| * | For the period December 28, 2021 to February 1, 2022, no Class III shares were outstanding. Performance for that period is that of Class I shares, which have higher expenses. Therefore, the performance shown is lower than it would have been if Class III expenses had been applied throughout. |
| ** | The Bloomberg U.S. Securitized + Index is a composite benchmark computed by GMO and comprised of the J.P. Morgan U.S. 3 Month Cash Index through December 30, 2016 and the Bloomberg U.S. Securitized Index thereafter. |
44
GMO Opportunistic Income Fund
(A Series of GMO Trust)
| *** | Beginning December 21, 2015 the pricing source for certain fixed income assets of the Fund changed, which may have had a material impact on the Fund’s performance for the period shown. |
For J.P. Morgan disclaimers please visit https://www.gmo.com/north-america/benchmark-disclaimers/
For Class III, VI, R6 and I the gross expense ratio of 0.62%, 0.52%, 0.63% and 0.72%, respectively, is equal to the Fund’s Total Annual Operating Expenses set forth in the Fund’s most recent prospectus dated June 30, 2022. For the Classes listed above, the corresponding net expense ratio of 0.59%, 0.48%, 0.59%, and 0.68% reflects the reduction of expenses from fee reimbursements. The fee reimbursements will continue until at least June 30, 2023. Elimination of this reimbursement will result in higher fees and lower performance.
45
GMO Opportunistic Income Fund
(A Series of GMO Trust)
Investment Concentration Summary
February 28, 2023 (Unaudited)
Asset Class Summary& | % of Total Net Assets | |||
Debt Obligations | 80.3 | % | ||
Short-Term Investments | 15.8 | |||
Swap Contracts | 2.3 | |||
Mutual Funds | 1.0 | |||
Purchased Options | 0.0 | ^ | ||
Forward Currency Contracts | 0.0 | ^ | ||
Written Options | (0.0 | )^ | ||
Futures Contracts | (0.0 | )^ | ||
Other | 0.6 | |||
|
| |||
| 100.0 | % | |||
|
| |||
Industry Sector Summary | % of Debt Obligations | |||
Commercial Mortgage-Backed Securities | 27.5 | % | ||
Collateralized Loan Obligations | 21.3 | |||
Student Loans - Private | 14.0 | |||
Residential Mortgage-Backed Securities — Other | 7.3 | |||
Small Balance Commercial Mortgages | 6.3 | |||
U.S. Government | 5.5 | |||
Student Loans - Federal Family Education Loan Program | 4.9 | |||
Residential Mortgage-Backed Securities — Alt-A | 3.9 | |||
Residential Mortgage-Backed Securities — Prime | 3.8 | |||
Residential Mortgage-Backed Securities — Subprime | 2.0 | |||
Residential Mortgage-Backed Securities — Performing Loans | 1.5 | |||
U.S. Government Agency | 1.4 | |||
Corporate Debt | 0.4 | |||
CMBS Collateralized Debt Obligations | 0.2 | |||
|
| |||
| 100.0 | % | |||
|
| |||
| & | In the table, derivative financial instruments, if any, are based on market values, rather than the notional amounts of derivatives, except for forward currency contracts which are based on unrealized appreciation/(depreciation). |
| ^ | Rounds to 0.0%. |
46
GMO Opportunistic Income Fund
(A Series of GMO Trust)
(showing percentage of total net assets)
February 28, 2023
Par Value† | Description | Value ($) | ||||||
| DEBT OBLIGATIONS — 80.3% | ||||||||
| Asset-Backed Securities — 74.5% | ||||||||
| CMBS Collateralized Debt Obligations — 0.2% | ||||||||
| 8,586,000 | ARCap Resecuritization Trust, Series 05-1A, Class B, 144A, 5.55%, due 12/21/42 | 1,502,550 | ||||||
| 543,333 | GS Mortgage Securities Corp. Trust, Series 06-CC1, Class A, 144A, Variable Rate, 5.33%, due 03/21/46 | 408,858 | ||||||
|
| |||||||
| Total CMBS Collateralized Debt Obligations | 1,911,408 | |||||||
|
| |||||||
| Collateralized Loan Obligations — 17.1% |
| |||||||
| 4,000,000 | AMMC CLO 24 Ltd., Series 21-24A, Class A, 144A, Variable Rate, 3 mo. LIBOR + 1.19%, 6.00%, due 01/20/35 | 3,918,196 | ||||||
| 10,000,000 | Ballyrock CLO 15 Ltd., Series 21-1A, Class A1, 144A, Variable Rate, 3 mo. LIBOR + 1.06%, 5.85%, due 04/15/34 | 9,786,810 | ||||||
| 6,593,000 | Crestline Denali CLO XVI Ltd., Series 18-1A, Class A, 144A, Variable Rate, 3 mo. LIBOR + 1.12%, 5.93%, due 01/20/30 | 6,517,088 | ||||||
| 4,075,000 | Crown City CLO III, Series 21-1A, Class A1A, 144A, Variable Rate, 3 mo. LIBOR + 1.17%, 5.98%, due 07/20/34 | 3,982,155 | ||||||
| 4,550,000 | Fort Washington CLO Ltd., Series 21-2A, Class A, 144A, Variable Rate, 3 mo. LIBOR + 1.22%, 6.03%, due 10/20/34 | 4,467,322 | ||||||
| 4,921,494 | Gallatin CLO IX Ltd., Series 18-1A, Class A, 144A, Variable Rate, 3 mo. LIBOR + 1.05%, 5.87%, due 01/21/28 | 4,909,958 | ||||||
| 613,851 | Halcyon Loan Advisors Funding CLO Ltd., Series 14-2A, Class C, 144A, Variable Rate, 3 mo. LIBOR + 3.50%, 8.30%, due 04/28/25 | 598,600 | ||||||
| 5,718,682 | JFIN CLO Ltd., Series 15-2A, Class DR, 144A, Variable Rate, 3 mo. LIBOR + 3.20%, 7.99%, due 10/17/26 | 5,629,734 | ||||||
| 4,320,000 | JFIN CLO Ltd., Series 12-1A, Class BR, 144A, Variable Rate, 3 mo. LIBOR + 2.35%, 7.16%, due 07/20/28 | 4,231,872 | ||||||
| 3,000,000 | JFIN CLO Ltd., Series 16-1A, Class DR, 144A, Variable Rate, 3 mo. LIBOR + 3.40%, 8.21%, due 10/27/28 | 2,945,211 | ||||||
| 924,441 | JMP Credit Advisors CLO IV Ltd., Series 17-1A, Class AR, 144A, Variable Rate, 3 mo. LIBOR + 1.28%, 6.07%, due 07/17/29 | 919,174 | ||||||
| 14,000,000 | Man GLG US CLO, Series 18-1A, Class A1R, 144A, Variable Rate, 3 mo. LIBOR + 1.14%, 5.95%, due 04/22/30 | 13,825,924 | ||||||
| 4,000,000 | Mountain View CLO Ltd., Series 13-1A, Class BRR , 144A, Variable Rate, 3 mo. LIBOR + 1.67%, 6.48%, due 10/12/30 | 3,886,020 | ||||||
| 6,086,000 | Northwoods Capital CLO XVII Ltd., Series 18-17A, Class A, 144A, Variable Rate, 3 mo. LIBOR + 1.06%, 5.88%, due 04/22/31 | 6,012,408 | ||||||
| 7,000,000 | OFSI BSL CLO VIII Ltd., Series 17-1A, Class BR, 144A, Variable Rate, 3 mo. LIBOR + 1.50%, 6.29%, due 08/16/29 | 6,844,894 | ||||||
Par Value† | Description | Value ($) | ||||||
| Asset-Backed Securities — continued | ||||||||
| Collateralized Loan Obligations — continued | ||||||||
| 1,083,456 | OZLM CLO VII Ltd., Series 14-7A, Class SUB, 144A, Variable Rate, 0.00, due 07/17/26 | 15,126 | ||||||
| 7,260,552 | OZLM CLO VII Ltd., Series 14-7RA, Class A1R, 144A, Variable Rate, 3 mo. LIBOR + 1.01%, 5.80%, due 07/17/29 | 7,212,487 | ||||||
| 13,830,000 | OZLM CLO XVIII Ltd, Series 18-18A, Class A, 144A, Variable Rate, 3 mo. LIBOR + 1.02%, 5.85%, due 04/15/31 | 13,610,573 | ||||||
| 2,190,000 | OZLM CLO XXII Ltd, Series 18-22A, Class A2, 144A, Variable Rate, 3 mo. LIBOR + 1.50%, 6.29%, due 01/17/31 | 2,105,346 | ||||||
| 1,797,044 | Saranac CLO III Ltd., Series 14-3A, Class ALR, 144A, Variable Rate, 3 mo. LIBOR + 1.60%, 6.35%, due 06/22/30 | 1,791,338 | ||||||
| 4,000,000 | Shackleton CLO Ltd, Series 14-5RA, Class A, 144A, Variable Rate, 3 mo. LIBOR + 1.10%, 5.93%, due 05/07/31 | 3,949,664 | ||||||
| 1,262,000 | Signal Peak CLO 2 LLC, Series 15-1A, Class BR2, 144A, Variable Rate, 3 mo. LIBOR + 1.50%, 6.31%, due 04/20/29 | 1,251,127 | ||||||
| 3,417,000 | SOUND POINT CLO XIX Ltd., Series 18-1A, Class A, 144A, Variable Rate, 3 mo. LIBOR + 1.00%, 5.79%, due 04/15/31 | 3,366,910 | ||||||
| 1,439,500 | Sounds Point CLO IV-R Ltd., Series 13-3RA, Class A, 144A, Variable Rate, 3 mo. LIBOR + 1.15%, 5.94%, due 04/18/31 | 1,418,912 | ||||||
| 8,688,000 | Steele Creek CLO Ltd., Series 16-1A, Class AR, 144A, Variable Rate, 3 mo. LIBOR + 1.12%, 5.89%, due 06/15/31 | 8,573,935 | ||||||
| 1,672,347 | Telos CLO Ltd., Series 13-3A, Class CR, 144A, Variable Rate, 3 mo. LIBOR + 2.60%, 7.39%, due 07/17/26 | 1,669,528 | ||||||
| 7,737,500 | Telos CLO Ltd., Series 14-5A, Class BR, 144A, Variable Rate, 3 mo. LIBOR + 1.48%, 6.27%, due 04/17/28 | 7,676,877 | ||||||
| 4,335,500 | Telos CLO Ltd., Series 14-5A, Class CR, 144A, Variable Rate, 3 mo. LIBOR + 2.15%, 6.94%, due 04/17/28 | 4,195,238 | ||||||
| 7,000,000 | THL Credit Wind River CLO Ltd., Series 17-1A, Class ARR, 144A, Variable Rate, 3 mo. LIBOR + 1.06%, 5.85%, due 04/18/36 | 6,802,236 | ||||||
| 4,993,200 | Venture 32 CLO Ltd., Series 18-32A, Class A1, 144A, Variable Rate, 3 mo. LIBOR + 1.10%, 5.89%, due 07/18/31 | 4,914,148 | ||||||
| 5,431,200 | Venture 34 CLO Ltd., Series 18-34A, Class A, 144A, Variable Rate, 3 mo. LIBOR + 1.23%, 6.02%, due 10/15/31 | 5,344,866 | ||||||
| 2,999,335 | Venture XVIII CLO Ltd., Series 14-18A, Class AR, 144A, Variable Rate, 3 mo. LIBOR + 1.22%, 6.01%, due 10/15/29 | 2,977,653 | ||||||
| 9,000,000 | Venture XXIV CLO Ltd., Series 16-24A, Class BRR, 144A, Variable Rate, 3 mo. LIBOR + 1.50%, 6.31%, due 10/20/28 | 8,838,423 | ||||||
| 9,916,063 | Wellfleet CLO Ltd., Series 17-2A, Class A1R, 144A, Variable Rate, 3 mo. LIBOR + 1.06%, 5.87%, due 10/20/29 | 9,832,798 | ||||||
| 1,360,000 | Whitebox CLO II Ltd., Series 20-2A, Class A1R, 144A, Variable Rate, 3 mo. LIBOR + 1.22%, 6.04%, due 10/24/34 | 1,338,343 | ||||||
| 47 | See accompanying notes to the financial statements. |
GMO Opportunistic Income Fund
(A Series of GMO Trust)
Schedule of Investments — (Continued)
(showing percentage of total net assets)
February 28, 2023
Par Value† | Description | Value ($) | ||||||||
| Asset-Backed Securities — continued | ||||||||||
| Collateralized Loan Obligations — continued |
| |||||||||
| 302,756 | WhiteHorse CLO VIII Ltd., Series 14-1A, Class DR, 144A, Variable Rate, 3 mo. LIBOR + 3.45%, 8.26%, due 05/01/26 | 301,275 | ||||||||
| 3,897,573 | WhiteHorse CLO X Ltd., Series 15-10A, Class DR, 144A, Variable Rate, 3 mo. LIBOR + 3.00%, 7.79%, due 04/17/27 | 3,844,742 | ||||||||
| 4,453,900 | Whitehorse CLO XII Ltd., Series 18-12A, Class A, 144A, Variable Rate, 3 mo. LIBOR + 1.25%, 6.04%, due 10/15/31 | 4,397,295 | ||||||||
| 4,141,884 | Zais CLO 7 Ltd., Series 17-2A, Class A, 144A, Variable Rate, 3 mo. LIBOR + 1.29%, 6.08%, due 04/15/30 | 4,099,715 | ||||||||
| 719,614 | Zais CLO 8 Ltd., Series 18-1A, Class A, 144A, Variable Rate, 3 mo. LIBOR + 0.95%, 5.74%, due 04/15/29 | 714,830 | ||||||||
| 4,470,500 | Zais CLO 8 Ltd., Series 18-1A, Class B, 144A, Variable Rate, 3 mo. LIBOR + 1.45%, 6.24%, due 04/15/29 | 4,377,129 | ||||||||
|
| |||||||||
| Total Collateralized Loan Obligations | 193,095,880 | |||||||||
|
| |||||||||
| Commercial Mortgage-Backed Securities — 22.1% |
| |||||||||
| 10,000,000 | BAMLL Commercial Mortgage Securities Trust, Series 19-BPR, Class ANM, 144A, 3.11%, due 11/05/32 | 9,126,753 | ||||||||
| 11,857,600 | Barclays Commercial Mortgage Trust, Series 18-TALL, Class A, 144A, Variable Rate, 1 mo. LIBOR + 0.72%, 5.31%, due 03/15/37 | 11,045,371 | ||||||||
| 8,448,000 | Barclays Commercial Mortgage Trust, Series 18-CHRS, Class E, 144A, Variable Rate, 4.27%, due 08/05/38 | 5,408,845 | ||||||||
| 9,180,000 | BBCMS Mortgage Trust, Series 18-C2, Class A5, 4.31%, due 12/15/51 | 8,770,749 | ||||||||
| 6,060,427 | Bear Stearns Mortgage Funding Trust, Series 06-AR1, Class 1A1, Variable Rate, 1 mo. LIBOR + 0.42%, 5.04%, due 07/25/36 | 5,313,769 | ||||||||
| 6,240,722 | Benchmark Mortgage Trust, Series 19-B11, Class A5, 3.54%, due 05/15/52 | 5,669,999 | ||||||||
| 7,000,000 | Benchmark Mortgage Trust, Series 19-B12, Class A5, 3.12%, due 08/15/52 | 6,195,431 | ||||||||
| 1,000,000 | Benchmark Mortgage Trust, Series 18-B7, Class A4, Variable Rate, 4.51%, due 05/15/53 | 963,183 | ||||||||
| 19,000,000 | Benchmark Mortgage Trust, Series 19-B15, Class A5, 2.93%, due 12/15/72 | 16,447,945 | ||||||||
| 6,550,000 | BX Commercial Mortgage Trust, Series 21-VINO, Class A, 144A, Variable Rate, 1 mo. LIBOR + 0.65%, 5.24%, due 05/15/38 | 6,410,453 | ||||||||
| 6,400,000 | BX Commercial Mortgage Trust, Series 21-ACNT, Class A, 144A, Variable Rate, 1 mo. LIBOR + 0.85%, 5.44%, due 11/15/38 | 6,291,818 | ||||||||
| 8,000,000 | BX Commercial Mortgage Trust, Series 20-VIV4, Class A, 144A, 2.84%, due 03/09/44 | 6,703,246 | ||||||||
| 8,000,000 | BX Commercial Mortgage Trust, Series 20-VIVA, Class D, 144A, Variable Rate, 3.55%, due 03/11/44 | 6,373,270 | ||||||||
Par Value† | Description | Value ($) | ||||||||
| Asset-Backed Securities — continued | ||||||||||
| Commercial Mortgage-Backed Securities — continued |
| |||||||||
| 8,000,000 | BX Trust, Series 19-OC11, Class A, 144A, 3.20%, due 12/09/41 | 6,892,674 | ||||||||
| 4,895,000 | BX Trust, Series 19-OC11, Class C, 144A, 3.86%, due 12/09/41 | 4,163,853 | ||||||||
| 9,000,000 | BX Trust, Series 19-OC11, Class E, 144A, Variable Rate, 3.94%, due 12/09/41 | 7,182,121 | ||||||||
| 4,446,000 | Citigroup Commercial Mortgage Trust, Series 2014-GC23, Class B, Variable Rate, 4.18%, due 07/10/47 | 4,249,170 | ||||||||
| 3,031,837 | Commercial Mortgage Trust, Series 15-PC1, Class B, Variable Rate, 4.29%, due 07/10/50 | 2,844,944 | ||||||||
| 13,183,852 | Commercial Mortgage Trust, Series 18-COR3, Class A3, 4.23%, due 05/10/51 | 12,445,352 | ||||||||
| 93,511 | Credit Suisse First Boston Mortgage Securities Corp., Series 05-C2, Class AMFL, Variable Rate, 1 mo. LIBOR + 0.25%, 4.85%, due 04/15/37 | 93,509 | ||||||||
| 74,802 | Credit Suisse First Boston Mortgage Securities Corp., Series 05-C2, Class AMFX, 4.88%, due 04/15/37 | 74,675 | ||||||||
| 5,570,000 | ELP Commercial Mortgage Trust, Series 21-ELP, Class A, 144A, Variable Rate, 1 mo. LIBOR + 0.70%, 5.29%, due 11/15/38 | 5,423,444 | ||||||||
| 2,000,000 | Grace Trust, Series 20-GRCE, Class A, 144A, 2.35%, due 12/10/40 | 1,551,660 | ||||||||
| 7,000,000 | GS Mortgage Securities Corp. Trust, Series 22-SHIP, Class A, 144A, Variable Rate, SOFR + 0.73%, 5.29%, due 08/15/36 | 6,944,992 | ||||||||
| 10,000,000 | GS Mortgage Securities Trust, Series 21-GSA3, Class A5, 2.62%, due 12/15/54 | 8,184,983 | ||||||||
| 5,500,000 | ILPT Commercial Mortgage Trust, Series 22-LPFX, Class A, 144A, 3.38%, due 03/15/32 | 4,655,731 | ||||||||
| 4,108,246 | MHC Commercial Mortgage Trust, Series 21-MHC, Class A, 144A, Variable Rate, 1 mo. LIBOR + 0.80%, 5.39%, due 04/15/38 | 4,053,407 | ||||||||
| 10,000,000 | MKT Mortgage Trust, Series 20-525M, Class A, 144A, 2.69%, due 02/12/40 | 7,833,334 | ||||||||
| 2,971,000 | Morgan Stanley Capital I Trust, Series 19-H6, Class A4, 3.42%, due 06/15/52 | 2,654,280 | ||||||||
| 11,545,000 | SMRT Commercial Mortgage Trust, Series 2022-MINI, Class A, 144A, Variable Rate, SOFR + 1.00%, 5.56%, due 01/15/39 | 11,306,446 | ||||||||
| 7,130,000 | Taubman Centers Commercial Mortgage Trust, Series 22-DPM, Class A, 144A, Variable Rate, SOFR + 2.19%, 6.75%, due 05/15/37 | 7,034,817 | ||||||||
| 5,268,100 | UBS Commercial Mortgage Trust, Series 18-C9, Class A4, Variable Rate, 4.12%, due 03/15/51 | 4,968,232 | ||||||||
| 7,933,000 | UBS Commercial Mortgage Trust, Series 18-C12, Class A5, 4.30%, due 08/15/51 | 7,484,545 | ||||||||
| 1,821,935 | Velocity Commercial Capital Loan Trust, Series 22-1, Class A, 144A, Variable Rate, 3.38%, due 02/25/52 | 1,676,315 | ||||||||
| See accompanying notes to the financial statements. | 48 |
GMO Opportunistic Income Fund
(A Series of GMO Trust)
Schedule of Investments — (Continued)
(showing percentage of total net assets)
February 28, 2023
Par Value† | Description | Value ($) | ||||||||
| Asset-Backed Securities — continued | ||||||||||
| Commercial Mortgage-Backed Securities — continued |
| |||||||||
| 4,550,000 | WaMu Commercial Mortgage Securities Trust, Series 06-SL1, Class E, 144A, Variable Rate, 2.98%, due 11/23/43 | 4,485,158 | ||||||||
| 1,583,453 | WaMu Commercial Mortgage Securities Trust, Series 07-SL3, Class G, 144A, Variable Rate, 3.78%, due 03/23/45 | 1,576,009 | ||||||||
| 11,594,960 | WaMu Commercial Mortgage Securities Trust, Series 07-SL3, Class J, 144A, Variable Rate, 3.78%, due 03/23/45 | 9,817,119 | ||||||||
| 3,162,000 | Wells Fargo Commercial Mortgage Trust, Series 13-BTC, Class A, 144A, 3.54%, due 04/16/35 | 3,094,615 | ||||||||
| 4,317,000 | Wells Fargo Commercial Mortgage Trust, Series 13-BTC, Class D, 144A, Variable Rate, 3.55%, due 04/16/35 | 4,173,582 | ||||||||
| 8,733,000 | Wells Fargo Commercial Mortgage Trust, Series 13-BTC, Class F, 144A, Variable Rate, 3.55%, due 04/16/35 | 8,373,876 | ||||||||
| 2,704,000 | Wells Fargo Commercial Mortgage Trust, Series 19-C50, Class C, 4.35%, due 05/15/52 | 2,208,870 | ||||||||
| 2,030,000 | Wells Fargo Commercial Mortgage Trust, Series 19-C51, Class A4, 3.31%, due 06/15/52 | 1,809,744 | ||||||||
| 7,000,000 | Wells Fargo Commercial Mortgage Trust, Series 21-C59, Class A5, 2.63%, due 04/15/54 | 5,794,604 | ||||||||
| 1,395,022 | Wells Fargo Commercial Mortgage Trust, Series 18-C47, Class A4, 4.44%, due 09/15/61 | 1,337,048 | ||||||||
|
| |||||||||
| Total Commercial Mortgage-Backed Securities | 249,109,941 | |||||||||
|
| |||||||||
| Residential Mortgage-Backed Securities — Other —5.9% |
| |||||||||
| 800,117 | ACE Securities Corp. Home Equity Loan Trust, Series 06-ASL1, Class A, Variable Rate, 1 mo. LIBOR + 0.28%, 4.90%, due 02/25/36 | 109,448 | ||||||||
| 17,663,707 | American Home Mortgage Investment Trust, Series 06-2, Class 4A, Variable Rate, 1 mo. LIBOR + 0.36%, 4.98%, due 02/25/36 | 361,235 | ||||||||
| 6,000,000 | AMSR Trust, Series 20-SFR5, Class A, 144A, 1.38%, due 11/17/37 | 5,382,073 | ||||||||
| 13,743,281 | BankAmerica Manufactured Housing Contract Trust, Series 98-1, Class B2, Variable Rate, 8.00%, due 08/10/25 | 3,577,072 | ||||||||
| 4,753,124 | BCMSC Trust, Series 99-A, Class M1, Variable Rate, 6.79%, due 03/15/29 | 4,410,954 | ||||||||
| 8,834,023 | BCMSC Trust, Series 99-B, Class A4, Variable Rate, 7.30%, due 12/15/29 | 1,202,549 | ||||||||
| 2,928,137 | BCMSC Trust, Series 00-A, Class A4, Variable Rate, 8.29%, due 06/15/30 | 431,267 | ||||||||
| 151,577 | Bear Stearns Mortgage Funding Trust, Series 07-SL2, Class 1A, Variable Rate, 1 mo. LIBOR + 0.32%, 4.94%, due 02/25/37 | 148,987 | ||||||||
Par Value† | Description | Value ($) | ||||||||
| Asset-Backed Securities — continued | ||||||||||
| Residential Mortgage-Backed Securities — Other — continued |
| |||||||||
| 2,747,771 | Conseco Finance Corp., Series 97-6, Class M1, Variable Rate, 7.21%, due 01/15/29 | 2,548,946 | ||||||||
| 2,057,377 | Conseco Finance Corp., Series 98-6, Class M1, Variable Rate, 6.63%, due 06/01/30 | 1,912,594 | ||||||||
| 5,516,593 | Conseco Finance Securitizations Corp., Series 01-3, Class M1, Variable Rate, 7.15%, due 05/01/33 | 4,865,466 | ||||||||
| 1,030,571 | Corevest American Finance Trust, Series 21-1, Class A, 144A, 1.57%, due 04/15/53 | 907,045 | ||||||||
| 8,487,631 | FirstKey Homes Trust, Series 21-SFR3, Class A, 144A, 2.14%, due 12/17/38 | 7,556,597 | ||||||||
| 618,069 | GMACM Home Equity Loan Trust, Series 04-HE3, Class A3, FSA, Variable Rate, 1 mo. LIBOR + 0.50%, 5.12%, due 10/25/34 | 588,947 | ||||||||
| 2,236,237 | GMACM Home Equity Loan Trust, Series 07-HE3, Class 2A1, Variable Rate, 7.00%, due 09/25/37 | 1,950,088 | ||||||||
| 4,332,782 | Home Equity Loan Trust, Series 05-HS1, Class AI4, Step Up, 5.60%, due 09/25/35 | 267,534 | ||||||||
| 28,540,347 | Home Equity Mortgage Loan Asset-Backed Trust, Series 06-A, Class A, Variable Rate, 1 mo. LIBOR + 0.26%, 4.88%, due 06/25/36 | 607,384 | ||||||||
| 8,799,444 | Home Loan Trust, Series 06-HI4, Class A4, Step Up, 6.22%, due 09/25/36 | 3,104,906 | ||||||||
| 9,222,661 | Home Loan Trust, Series 07-HI1, Class A4, Step Up, 0.00, due 03/25/37 | 1,697,012 | ||||||||
| 3,644,115 | Master Second Lien Trust, Series 06-1, Class A, Variable Rate, 1 mo. LIBOR + 0.32%, 4.94%, due 03/25/36 | 289,396 | ||||||||
| 211,675 | Mellon Re-REMIC Pass-Through Trust, Series 04-TBC1, Class A, 144A, Variable Rate, 1 mo.LIBOR + 0.25%, 4.87%, due 02/26/34 | 187,242 | ||||||||
| 1,195,925 | New Century Home Equity Loan Trust, Series 03-B, Class M1, Variable Rate, 1 mo. LIBOR + 0.98%, 5.59%, due 10/25/33 | 1,144,770 | ||||||||
| 13,629,963 | New Century Home Equity Loan Trust, Series 06-S1, Class A2A, Variable Rate, 1 mo. LIBOR + 0.20%, 4.82%, due 03/25/36 | 410,321 | ||||||||
| 7,774,810 | New Century Home Equity Loan Trust, Series 06-S1, Class A1, Variable Rate, 1 mo. LIBOR + 0.34%, 4.96%, due 03/25/36 | 234,025 | ||||||||
| 20,728,500 | New Century Home Equity Loan Trust, Series 06-S1, Class A2B, Variable Rate, 1 mo. LIBOR + 0.40%, 5.02%, due 03/25/36 | 623,903 | ||||||||
| 52,544 | Nomura Asset Acceptance Corp. Alternative Loan Trust, Series 05-S3, Class M1, Variable Rate, 1 mo. LIBOR + 0.90%, 5.52%, due 08/25/35 | 325,538 | ||||||||
| 880,997 | Oakwood Mortgage Investors, Inc., Series 98-A, Class B1, Variable Rate, 7.50%, due 05/15/28 | 824,473 | ||||||||
| 1,069,233 | Oakwood Mortgage Investors, Inc., Series 98-D, Class M1, 144A, 7.42%, due 01/15/29 | 1,011,769 | ||||||||
| 49 | See accompanying notes to the financial statements. |
GMO Opportunistic Income Fund
(A Series of GMO Trust)
Schedule of Investments — (Continued)
(showing percentage of total net assets)
February 28, 2023
Par Value† | Description | Value ($) | ||||||||
| Asset-Backed Securities — continued | ||||||||||
| Residential Mortgage-Backed Securities — Other — continued |
| |||||||||
| 3,466,623 | Oakwood Mortgage Investors, Inc., Series 99-E, Class A1, Variable Rate, 7.61%, due 03/15/30 | 2,178,658 | ||||||||
| 11,780,230 | Oakwood Mortgage Investors, Inc., Series 00-D, Class A4, Variable Rate, 7.40%, due 07/15/30 | 2,863,603 | ||||||||
| 905,486 | Oakwood Mortgage Investors, Inc., Series 01-D, Class A4, Variable Rate, 6.93%, due 09/15/31 | 517,609 | ||||||||
| 485,200 | Oakwood Mortgage Investors, Inc., Series 01-E, Class A3, 5.69%, due 12/15/31 | 464,000 | ||||||||
| 1,348,758 | Progress Residential Trust, Series 21-SFR10, Class A, 144A, 2.39%, due 12/17/40 | 1,154,244 | ||||||||
| 4,597,258 | Tricon American Homes Trust, Series 19-SFR1, Class A, 144A, 2.75%, due 03/17/38 | 4,235,730 | ||||||||
| 3,411,098 | Tricon American Homes Trust, Series 20-SFR2, Class A, 144A, 1.48%, due 11/17/39 | 2,885,342 | ||||||||
| 5,720,134 | Verus Securitization Trust, Series 22-5, Class A1, 144A, Step Up, 3.80%, due 04/25/67 | 5,242,237 | ||||||||
|
| |||||||||
| Total Residential Mortgage-Backed Securities — Other | 66,222,964 | |||||||||
|
| |||||||||
| Residential Mortgage-Backed Securities — Performing Loans — 1.2% |
| |||||||||
| 2,813,092 | Ajax Mortgage Loan Trust, Series 21-A, Class A1, 144A, Variable Rate, 1.07%, due 09/25/65 | 2,453,679 | ||||||||
| 7,033,286 | CSMC Trust, Series 22-NQM1, Class A1, 144A, Variable Rate, 2.27%, due 11/25/66 | 6,023,738 | ||||||||
| 5,656,817 | Verus Securitization Trust, Series 21-8, Class A, 144A, Variable Rate, 1.82%, due 11/25/66 | 4,818,872 | ||||||||
|
| |||||||||
| Total Residential Mortgage-Backed Securities — Performing Loans | 13,296,289 | |||||||||
|
| |||||||||
| Residential Mortgage-Backed Securities — Prime —3.1% |
| |||||||||
| 7,230,107 | American Home Mortgage Assets Trust, Series 06-4, Class 1A12, Variable Rate, 1 mo. LIBOR + 0.21%, 4.83%, due 10/25/46 | 3,877,297 | ||||||||
| 497,719 | Bear Stearns ARM Trust, Series 05-9, Class A1, Variable Rate, U.S. Treasury Yield 1 Year CMT + 2.30%, 5.23%, due 10/25/35 | 461,439 | ||||||||
| 3,862,942 | CSMC Mortgage-Backed Trust, Series 07-4, Class 2A1, 6.00%, due 06/25/37 | 2,258,705 | ||||||||
| 1,271,711 | IndyMac INDA Mortgage Loan Trust, Series 06-AR3, Class 1A1, Variable Rate, 3.69%, due 12/25/36 | 1,068,680 | ||||||||
| 875,752 | IndyMac INDA Mortgage Loan Trust, Series 07-AR1, Class 1A1, Variable Rate, 3.27%, due 03/25/37 | 715,593 | ||||||||
Par Value† | Description | Value ($) | ||||||||
| Asset-Backed Securities — continued | ||||||||||
| Residential Mortgage-Backed Securities — Prime — continued |
| |||||||||
| 7,511,198 | IndyMac INDX Mortgage Loan Trust, Series 06-AR2, Class 1A1A, Variable Rate, 1 mo. LIBOR + 0.44%, 5.06%, due 04/25/46 | 6,206,811 | ||||||||
| 1,614,875 | Morgan Stanley Mortgage Loan Trust, Series 06-2, Class 6A, 6.50%, due 02/25/36 | 808,886 | ||||||||
| 31,756 | Residential Funding Mtg Sec I Trust, Series 05-SA4, Class 2A2, Variable Rate, 4.20%, due 09/25/35 | 30,665 | ||||||||
| 4,638,537 | Structured Adjustable Rate Mortgage Loan Trust, Series 05-9, Class 2A2A, Variable Rate, 12 MTA + 1.40%, 4.19%, due 05/25/35 | 3,540,974 | ||||||||
| 746,597 | WaMu Mortgage Pass-Through Certificates Trust, Series 05-AR10, Class 1A3, Variable Rate, 3.85%, due 09/25/35 | 660,662 | ||||||||
| 898,376 | WaMu Mortgage Pass-Through Certificates Trust, Series 06-AR19, Class 2A, Variable Rate, 12 MTA + 1.25%, 4.04%, due 01/25/47 | 794,266 | ||||||||
| 2,175,015 | Washington Mutual Mortgage Pass-Through Certificates, Series 05-4, Class CB3, Variable Rate, 1 mo. LIBOR + 0.45%, 5.07%, due 06/25/35 | 1,830,239 | ||||||||
| 2,236,284 | Washington Mutual Mortgage Pass-Through Certificates, Series 05-10, Class 4CB3, Variable Rate, 1 mo. LIBOR + 0.60%, 5.22%, due 12/25/35 | 1,948,204 | ||||||||
| 4,205,432 | Washington Mutual Mortgage Pass-Through Certificates, Series 06-8, Class A5, Variable Rate, 4.18%, due 10/25/36 | 1,727,610 | ||||||||
| 8,961,945 | Washington Mutual Mortgage Pass-Through Certificates, Series 07-5, Class A6, 6.00%, due 06/25/37 | 8,821,895 | ||||||||
|
| |||||||||
| Total Residential Mortgage-Backed Securities — Prime | 34,751,926 | |||||||||
|
| |||||||||
| Residential Mortgage-Backed Securities — Subprime — 1.6% |
| |||||||||
| 1,178,565 | Asset Backed Funding Certificates Trust, Series 05-AQ1, Class A5, Step Up, 4.35%, due 06/25/35 | 1,109,852 | ||||||||
| 1,285,764 | BCAP LLC, Series 14-RR2, Class 11A3, 144A, Variable Rate, 2.67%, due 05/26/37 | 1,238,214 | ||||||||
| 9,477,803 | Bravo Mortgage Asset Trust, Series 06-1A, Class M1, 144A, Variable Rate, 1 mo. LIBOR + 0.60%, 5.22%, due 07/25/36 | 8,065,923 | ||||||||
| 580,786 | Carrington Mortgage Loan Trust, Series 07-RFC1, Class A3, Variable Rate, 1 mo. LIBOR + 0.14%, 4.76%, due 12/25/36 | 551,685 | ||||||||
| 1,014,442 | CHL Mortgage Pass-Through Trust, Series 04-HYB6, Class A2, Variable Rate, 3.90%, due 11/20/34 | 931,956 | ||||||||
| 2,694,703 | First Franklin Mortgage Loan Trust, Series 06-FF12, Class A1, Variable Rate, 1 mo. LIBOR + 0.11%, 4.72%, due 09/25/36 | 2,425,163 | ||||||||
| See accompanying notes to the financial statements. | 50 |
GMO Opportunistic Income Fund
(A Series of GMO Trust)
Schedule of Investments — (Continued)
(showing percentage of total net assets)
February 28, 2023
Par Value† | Description | Value ($) | ||||||||
| Asset-Backed Securities — continued | ||||||||||
| Residential Mortgage-Backed Securities — Subprime — continued |
| |||||||||
| 856,919 | Lehman XS Trust, Series 07-15N, Class 2A1, Variable Rate, 1 mo. LIBOR + 0.50%, 5.12%, due 08/25/37 | 769,118 | ||||||||
| 3,214,734 | Residential Asset Mortgage Products Trust, Series 05-RS1, Class MII2, Variable Rate, 1 mo. LIBOR + 0.80%, 5.82%, due 01/25/35 | 2,917,037 | ||||||||
|
| |||||||||
| Total Residential Mortgage-Backed Securities — Subprime | 18,008,948 | |||||||||
|
| |||||||||
| Residential Mortgage-Backed Securities — Alt-A —3.2% |
| |||||||||
| 304,707 | Alternative Loan Trust, Series 04-J11, Class 1CB1, 5.50%, due 11/25/34 | 292,679 | ||||||||
| 2,464,185 | Alternative Loan Trust, Series 05-18CB, Class A8, 5.50%, due 05/25/35 | 2,314,708 | ||||||||
| 1,577,285 | Alternative Loan Trust, Series 06-7CB, Class 1A1, Variable Rate, 1 mo. LIBOR + 0.70%, 5.32%, due 05/25/36 | 729,374 | ||||||||
| 1,615,988 | Alternative Loan Trust, Series 06-28CB, Class A1, Variable Rate, 1 mo. LIBOR + 0.70%, 5.32%, due 10/25/36 | 665,146 | ||||||||
| 1,222,308 | Bear Stearns ALT-A Trust, Series 04-11, Class 1M1, Variable Rate, 1 mo. LIBOR + 0.90%, 5.52%, due 11/25/34 | 1,193,134 | ||||||||
| 2,132,183 | Bear Stearns ALT-A Trust, Series 07-1, Class 1A1, Variable Rate, 1 mo. LIBOR + 0.32%, 4.94%, due 01/25/47 | 1,674,199 | ||||||||
| 1,916,789 | Bear Stearns Asset Backed Securities I Trust, Series 04-AC5, Class A1, Step Up, 5.75%, due 10/25/34 | 1,778,659 | ||||||||
| 3,870,170 | Citigroup Mortgage Loan Trust, Inc., Series 06-AR5, Class 2A2A, Variable Rate, 3.57%, due 07/25/36 | 2,237,030 | ||||||||
| 4,750,000 | Fieldstone Mortgage Investment Trust, Series 04-4, Class M4, Variable Rate, 1 mo. LIBOR + 2.55%, 7.17%, due 10/25/35 | 3,032,356 | ||||||||
| 11,049,573 | GSAA Home Equity Trust, Series 06-9, Class A3, Variable Rate, 1 mo. LIBOR + 0.32%, 4.94%, due 06/25/36 | 2,430,688 | ||||||||
| 12,458,326 | GSR Mortgage Loan Trust, Series 07-OA2, Class 1A1, Variable Rate, 2.98%, due 06/25/47 | 7,822,104 | ||||||||
| 6,875,262 | HarborView Mortgage Loan Trust, Series 07-4, Class 2A1, Variable Rate, 1 mo. LIBOR + 0.44%, 4.81%, due 07/19/47 | 6,291,494 | ||||||||
| 156,587 | JP Morgan Resecuritization Trust, Series 09-10, Class 7A1, 144A, Variable Rate, 6.05%, due 02/26/37 | 152,352 | ||||||||
| 1,504,982 | Merrill Lynch First Franklin Mortgage Loan Trust, Series 07-H1, Class 2A1, Variable Rate, 1 mo. LIBOR + 3.00%, 7.62%, due 10/25/37 | 1,412,540 | ||||||||
| 8,288,795 | Terwin Mortgage Trust, Series 06-7, Class 2A3, 144A, Variable Rate, 1 mo. LIBOR + 0.54%, 5.16%, due 08/25/37 | 3,566,444 | ||||||||
|
| |||||||||
| Total Residential Mortgage-Backed Securities — Alt-A | 35,592,907 | |||||||||
|
| |||||||||
Par Value† | Description | Value ($) | ||||||||
| Asset-Backed Securities — continued | ||||||||||
| Small Balance Commercial Mortgages — 5.0% |
| |||||||||
| 2,947,980 | Bayview Commercial Asset Trust, Series 05-2A, Class A1, 144A, Variable Rate, 1 mo. LIBOR + 0.47%, 5.08%, due 08/25/35 | 2,725,048 | ||||||||
| 1,563,660 | Bayview Commercial Asset Trust, Series 05-4A, Class A2, 144A, Variable Rate, 1 mo. LIBOR + 0.59%, 5.20%, due 01/25/36 | 1,436,215 | ||||||||
| 2,000,188 | Bayview Commercial Asset Trust, Series 06-1A, Class A2, 144A, Variable Rate, 1 mo. LIBOR + 0.54%, 5.16%, due 04/25/36 | 1,813,566 | ||||||||
| 804,031 | Bayview Commercial Asset Trust, Series 06-1A, Class M1, 144A, Variable Rate, 1 mo. LIBOR + 0.57%, 5.19%, due 04/25/36 | 722,551 | ||||||||
| 1,132,850 | Bayview Commercial Asset Trust, Series 06-2A, Class A1, 144A, Variable Rate, 1 mo. LIBOR + 0.35%, 4.96%, due 07/25/36 | 1,036,929 | ||||||||
| 2,317,259 | Bayview Commercial Asset Trust, Series 06-2A, Class A2, 144A, Variable Rate, 1 mo. LIBOR + 0.42%, 5.04%, due 07/25/36 | 2,126,909 | ||||||||
| 2,784,200 | Bayview Commercial Asset Trust, Series 06-3A, Class A1, 144A, Variable Rate, 1 mo. LIBOR + 0.38%, 4.99%, due 10/25/36 | 2,606,922 | ||||||||
| 8,716,000 | Bayview Commercial Asset Trust, Series 06-SP2, Class A, 144A, Variable Rate, 1 mo. LIBOR + 0.42%, 5.04%, due 01/25/37 | 7,981,127 | ||||||||
| 1,733,431 | Bayview Commercial Asset Trust, Series 07-1, Class A1, 144A, Variable Rate, 1 mo. LIBOR + 0.33%, 4.95%, due 03/25/37 | 1,567,620 | ||||||||
| 2,571,059 | Bayview Commercial Asset Trust, Series 07-3, Class A1, 144A, Variable Rate, 1 mo. LIBOR + 0.24%, 4.86%, due 07/25/37 | 2,297,998 | ||||||||
| 5,497,735 | Bayview Commercial Asset Trust, Series 07-2A, Class A1, 144A, Variable Rate, 1 mo. LIBOR + 0.27%, 4.89%, due 07/25/37 | 4,897,636 | ||||||||
| 1,827,194 | Bayview Commercial Asset Trust, Series 08-1, Class A4, 144A, Variable Rate, 1 mo. LIBOR + 1.50%, 6.12%, due 01/25/38 | 1,770,234 | ||||||||
| 88,189,882 | FRESB Mortgage Trust, Series 20-SB76, Class X1, IO, Variable Rate, 1.18%, due 05/25/30 | 3,555,816 | ||||||||
| 20,431,378 | FRESB Mortgage Trust, Series 20-SB74, Class X1, Variable Rate, 1.12%, due 03/25/40 | 734,913 | ||||||||
| 70,360,881 | FRESB Mortgage Trust, Series 20-SB77, Class X1, IO, Variable Rate, 0.89%, due 06/25/40 | 2,308,899 | ||||||||
| 1,572,535 | Lehman Brothers Small Balance Commercial Mortgage Trust, Series 06-1A, Class B, 144A, Variable Rate, 1 mo. LIBOR + 1.00%, 5.62%, due 04/25/31 | 1,555,925 | ||||||||
| 3,568,448 | Lehman Brothers Small Balance Commercial Mortgage Trust, Series 07-2A, Class M1, 144A, Variable Rate, 1 mo. LIBOR + 0.40%, 5.02%, due 06/25/37 | 3,429,434 | ||||||||
| 5,488,658 | Lehman Brothers Small Balance Commercial Mortgage Trust, Series 07-3A, Class M1, 144A, Variable Rate, 4.84%, due 10/25/37 | 5,200,292 | ||||||||
| 6,563,503 | Velocity Commercial Capital Loan Trust, Series 21-4, Class A, 144A, Variable Rate, 2.52%, due 12/26/51 | 5,566,385 | ||||||||
| 51 | See accompanying notes to the financial statements. |
GMO Opportunistic Income Fund
(A Series of GMO Trust)
Schedule of Investments — (Continued)
(showing percentage of total net assets)
February 28, 2023
Par Value† | Description | Value ($) | ||||||||
| Asset-Backed Securities — continued | ||||||||||
| Small Balance Commercial Mortgages — continued |
| |||||||||
| 1,736,334 | Velocity Commercial Capital Loan Trust, Series 21-4, Class M3, 144A, Variable Rate, 3.81%, due 12/26/51 | 1,338,243 | ||||||||
| 2,311,475 | WaMu Commercial Mortgage Securities Trust, Series 07-SL2, Class E, 144A, Variable Rate, 4.03%, due 12/27/49 | 2,248,622 | ||||||||
|
| |||||||||
| Total Small Balance Commercial Mortgages | 56,921,284 | |||||||||
|
| |||||||||
| Student Loans - Federal Family Education Loan Program — 3.9% |
| |||||||||
| 4,934,252 | AccessLex Institute, Series 04-2, Class B, Variable Rate, 3 mo. LIBOR + 0.70%, 5.52%, due 01/25/43 | 4,543,982 | ||||||||
| 2,701,926 | Collegiate Funding Services Education Loan Trust, Series 05-B, Class B, Variable Rate, 3 mo. LIBOR + 0.32%, 5.04%, due 03/28/35 | 2,423,758 | ||||||||
| 7,095,739 | SLC Student Loan Trust, Series 08-2, Class A4, Variable Rate, 3 mo. LIBOR + 0.90%, 5.67%, due 06/15/21 | 6,914,885 | ||||||||
| 15,378,425 | SLM Student Loan Trust, Series 08-9, Class A, Variable Rate, 3 mo. LIBOR + 1.50%, 6.32%, due 04/25/23 | 15,326,837 | ||||||||
| 6,559,495 | SLM Student Loan Trust, Series 08-5, Class A4, Variable Rate, 3 mo. LIBOR + 1.70%, 6.52%, due 07/25/23 | 6,521,573 | ||||||||
| 8,250,621 | SLM Student Loan Trust, Series 08-4, Class A4, Variable Rate, 3 mo. LIBOR + 1.65%, 6.47%, due 07/25/25 | 8,213,473 | ||||||||
|
| |||||||||
| Total Student Loans - Federal Family Education Loan Program | 43,944,508 | |||||||||
|
| |||||||||
| Student Loans - Private — 11.2% | ||||||||||
| 1,642,275 | Access Group, Inc., Series 05-A, Class B, Variable Rate, 3 mo. LIBOR + 0.80%, 5.62%, due 07/25/34 | 1,593,273 | ||||||||
| 6,931,133 | KeyCorp Student Loan Trust, Series 05-A, Class 2C, Variable Rate, 3 mo. LIBOR + 1.30%, 6.02%, due 12/27/38 | 6,375,324 | ||||||||
| 2,944,935 | KeyCorp Student Loan Trust, Series 06-A, Class 2B, Variable Rate, 3 mo. LIBOR + 0.48%, 5.20%, due 12/27/41 | 2,927,422 | ||||||||
| 309,291 | KeyCorp Student Loan Trust, Series 04-A, Class 2C, Variable Rate, 3 mo. LIBOR + 0.80%, 5.61%, due 04/28/42 | 309,022 | ||||||||
| 5,622,500 | KeyCorp Student Loan Trust, Series 04-A, Class 2D, Variable Rate, 3 mo. LIBOR + 1.25%, 6.06%, due 07/28/42 | 5,248,187 | ||||||||
| 8,775,000 | National Collegiate Commutation Trust, Series 07-3, Class A3R4, 144A, Variable Rate, 7-DayAuct + 0.00%, 3.60%, due 03/31/38 (a) | 2,500,875 | ||||||||
| 3,275,000 | National Collegiate II Commutation Trust, Series 07-4, Class A3R6, Variable Rate, 28-DayAuct + 0.00%, 5.28%, due 03/25/38 (a) | 900,625 | ||||||||
Par Value† | Description | Value ($) | ||||||||
| Asset-Backed Securities — continued | ||||||||||
| Student Loans - Private — continued | ||||||||||
| 7,625,000 | National Collegiate II Commutation Trust, Series 07-4, Class A3R7, Variable Rate, 28-DayAuct + 0.00%, 8.07%, due 03/25/38 (a) | 2,096,875 | ||||||||
| 4,601,971 | National Collegiate Student Loan Trust, Series 06-4, Class A4, Variable Rate, 1 mo. LIBOR + 0.31%, 4.93%, due 05/25/32 | 4,346,877 | ||||||||
| 3,025,423 | National Collegiate Student Loan Trust, Series 07-2, Class A4, Variable Rate, 1 mo. LIBOR + 0.29%, 4.91%, due 01/25/33 | 2,781,126 | ||||||||
| 10,245,076 | National Collegiate Student Loan Trust, Series 06-1, Class A5, Variable Rate, 1 mo. LIBOR + 0.35%, 4.97%, due 03/25/33 | 9,557,318 | ||||||||
| 4,001,711 | National Collegiate Student Loan Trust, Series 05-2, Class A51, Variable Rate, 1 mo. LIBOR + 0.37%, 4.99%, due 06/25/33 | 3,763,781 | ||||||||
| 14,255,544 | National Collegiate Student Loan Trust, Series 07-1, Class A4, Variable Rate, 1 mo. LIBOR + 0.31%, 4.92%, due 10/25/33 | 13,277,554 | ||||||||
| 4,621,034 | National Collegiate Student Loan Trust, Series 04-2, Class B, Variable Rate, 1 mo. LIBOR + 0.54%, 5.16%, due 12/26/33 | 4,428,023 | ||||||||
| 75,000 | National Collegiate Student Loan Trust, Series 07-4, Class A3A7, Variable Rate, 8.07%, due 03/25/38 (b) | 59,250 | ||||||||
| 25,000 | National Collegiate Student Loan Trust, Series 07-3, Class A3A4, Variable Rate, 8.09%, due 03/25/38 (b) | 19,750 | ||||||||
| 3,877,008 | Navient Student Loan Trust, Series 22-A, Class A, 144A, 2.23%, due 07/15/70 | 3,401,759 | ||||||||
| 3,199,397 | Nelnet Student Loan Trust, Series 21-A, Class APT1, 144A, 1.36%, due 04/20/62 | 2,864,221 | ||||||||
| 3,546,000 | SLM Private Credit Student Loan Trust, Series 03-A, Class A3, Variable Rate, 7.91%, due 06/15/32 (a) | 3,528,270 | ||||||||
| 5,400,349 | SLM Private Credit Student Loan Trust, Series 03-C, Class C, Variable Rate, 3 mo. LIBOR + 1.60%, 6.37%, due 09/15/32 | 1,553,398 | ||||||||
| 1,750,000 | SLM Private Credit Student Loan Trust, Series 03-C, Class A3, Variable Rate, 8.07%, due 09/15/32 (a) | 1,741,250 | ||||||||
| 5,263,195 | SLM Private Credit Student Loan Trust, Series 04-A, Class A3, Variable Rate, 3 mo. LIBOR + 0.40%, 5.17%, due 06/15/33 | 5,119,700 | ||||||||
| 9,440,000 | SLM Private Credit Student Loan Trust, Series 04-B, Class A4, Variable Rate, 3 mo. LIBOR + 0.43%, 5.20%, due 09/15/33 | 9,072,608 | ||||||||
| 7,130,759 | SLM Private Credit Student Loan Trust, Series 06-A, Class A5, Variable Rate, 3 mo. LIBOR + 0.29%, 5.06%, due 06/15/39 | 6,714,657 | ||||||||
| 10,629,838 | SLM Private Credit Student Loan Trust, Series 05-B, Class A4, Variable Rate, 3 mo. LIBOR + 0.33%, 5.10%, due 06/15/39 | 10,156,492 | ||||||||
| 1,804,858 | SLM Private Credit Student Loan Trust, Series 06-BW, Class A5, Variable Rate, 3 mo. LIBOR + 0.20%, 4.97%, due 12/15/39 | 1,687,561 | ||||||||
| 10,147,708 | SLM Private Credit Student Loan Trust, Series 06-B, Class A5, Variable Rate, 3 mo. LIBOR + 0.27%, 5.04%, due 12/15/39 | 9,510,911 | ||||||||
| See accompanying notes to the financial statements. | 52 |
GMO Opportunistic Income Fund
(A Series of GMO Trust)
Schedule of Investments — (Continued)
(showing percentage of total net assets)
February 28, 2023
Par Value† |
Description | Value ($) | ||||||||
| Asset-Backed Securities — continued | ||||||||||
| Student Loans - Private — continued | ||||||||||
| 2,672,291 | SLM Private Credit Student Loan Trust, Series 06-C, Class C, Variable Rate, 3 mo. LIBOR + 0.39%, 5.16%, due 12/15/39 | 2,426,643 | ||||||||
| 2,236,827 | SLM Private Credit Student Loan Trust, Series 07-A, Class A4A, Variable Rate, 3 mo. LIBOR + 0.24%, 5.01%, due 12/16/41 | 2,139,655 | ||||||||
| 6,989,400 | Towd Point Asset Trust, Series 18-SL1, Class B, 144A, Variable Rate, 1 mo. LIBOR + 1.05%, 5.56%, due 01/25/46 | 6,728,071 | ||||||||
|
| |||||||||
| Total Student Loans - Private | 126,830,478 | |||||||||
|
| |||||||||
| Total Asset-Backed Securities | 839,686,533 | |||||||||
|
| |||||||||
| Corporate Debt — 0.3% | ||||||||||
| Airlines — 0.3% | ||||||||||
| 2,485,000 | American Airlines Class AA Pass-Through Certificates, 3.65%, due 02/15/29 | 2,244,723 | ||||||||
| 1,406,997 | American Airlines Class AA Pass-Through Certificates, 3.35%, due 04/15/31 | 1,254,737 | ||||||||
|
| |||||||||
| Total Airlines | 3,499,460 | |||||||||
|
| |||||||||
| Total Corporate Debt | 3,499,460 | |||||||||
|
| |||||||||
| U.S. Government — 4.4% | ||||||||||
| 1,000,000 | U.S. Treasury Note, Variable Rate, USBM + 0.04%, 4.84%, due 10/31/23 | 999,715 | ||||||||
| 1,900,000 | U.S. Treasury Note, Variable Rate, USBM - 0.08%, 4.73%, due 04/30/24 | 1,897,122 | ||||||||
| 47,000,000 | U.S. Treasury Note, Variable Rate, USBM + 0.04%, 4.84%, due 07/31/24 (c) | 46,983,905 | ||||||||
|
| |||||||||
| Total U.S. Government | 49,880,742 | |||||||||
|
| |||||||||
| U.S. Government Agency — 1.1% | ||||||||||
| 352,500 | Agency for International Development Floater (Support of Tunisia), Variable Rate, 6 mo. LIBOR + 0.00%, 5.19%, due 07/01/23 (a) | 351,366 | ||||||||
| 1,975,000 | Agency for International Development Floater (Support of Morocco), Variable Rate, 6 mo. LIBOR - 0.02%, 5.23%, due 02/01/25 (a) | 1,955,250 | ||||||||
| 3,000,000 | Agency for International Development Floater (Support of Morocco), Variable Rate, 6 mo. LIBOR + 0.15%, 5.41%, due 10/29/26 (a) | 2,956,417 | ||||||||
Par Value† / Shares | Description | Value ($) | ||||||||
| U.S. Government Agency — continued | ||||||||||
| 7,500,000 | Federal Home Loan Banks, Variable Rate, SOFR + 0.10%, 4.65%, due 09/04/24 | 7,500,000 | ||||||||
|
| |||||||||
| Total U.S. Government Agency | 12,763,033 | |||||||||
|
| |||||||||
| TOTAL DEBT OBLIGATIONS (COST $1,005,734,152) | 905,829,768 | |||||||||
|
| |||||||||
| MUTUAL FUNDS — 1.0% | ||||||||||
| United States — 1.0% | ||||||||||
| Affiliated Issuers — 1.0% | ||||||||||
| 2,183,242 | GMO U.S. Treasury Fund | 10,894,378 | ||||||||
|
| |||||||||
| TOTAL MUTUAL FUNDS (COST $11,003,541) | 10,894,378 | |||||||||
|
| |||||||||
| SHORT-TERM INVESTMENTS — 15.8% |
| |||||||||
| U.S. Government Agency — 3.6% | ||||||||||
| 10,000,000 | Federal Home Loan Banks, Variable Rate, SOFR + 0.07%, 4.62%, due 04/06/23 | 10,000,293 | ||||||||
| 30,000,000 | Federal Home Loan Banks, Variable Rate, SOFR + 0.04%, 4.59%, due 06/05/23 | 29,999,824 | ||||||||
|
| |||||||||
| Total U.S. Government Agency | 40,000,117 | |||||||||
|
| |||||||||
| Repurchase Agreements — 11.9% | ||||||||||
| 134,028,353 | Daiwa Capital Markets America, Inc. Repurchase Agreement, dated, 02/28/23 maturing on 03/01/23 with a maturity value of $134,045,181 and an effective yield of 4.52%, collateralized by a U.S. Treasury Note with maturity date 4/30/29 and a market value of $136,763,625. | 134,028,353 | ||||||||
|
| |||||||||
| Money Market Funds — 0.3% | ||||||||||
| 3,695,283 | State Street Institutional Treasury Money Market Fund – Premier Class, 4.42% (d) | 3,695,283 | ||||||||
|
| |||||||||
| TOTAL SHORT-TERM INVESTMENTS (COST $177,723,635) | 177,723,753 | |||||||||
|
| |||||||||
| PURCHASED OPTIONS — 0.0% | ||||||||||||||||||||||||||||
Description | Counterparty | Exercise Rate | Expiration Date | Principal/ Notional Amount | Floating Rate Index | Pay/Receive Floating Rate | Value ($) | |||||||||||||||||||||
Options on Credit Default Swaps - Puts — 0.0% | ||||||||||||||||||||||||||||
CDX.NA.HY.39 | BCLY | 103.00 | % | 04/19/23 | USD 14,747,000 | Fixed Spread | Pay | 359,673 | ||||||||||||||||||||
|
| |||||||||||||||||||||||||||
TOTAL PURCHASED OPTIONS |
| 359,673 | ||||||||||||||||||||||||||
|
| |||||||||||||||||||||||||||
TOTAL INVESTMENTS — 97.1% |
| 1,094,807,572 | ||||||||||||||||||||||||||
|
| |||||||||||||||||||||||||||
Other Assets and Liabilities (net) — 2.9% |
| 32,348,932 | ||||||||||||||||||||||||||
|
| |||||||||||||||||||||||||||
TOTAL NET ASSETS — 100.0% |
| $ | 1,127,156,504 | |||||||||||||||||||||||||
|
| |||||||||||||||||||||||||||
| 53 | See accompanying notes to the financial statements. |
GMO Opportunistic Income Fund
(A Series of GMO Trust)
Schedule of Investments — (Continued)
(showing percentage of total net assets)
February 28, 2023
A summary of outstanding financial instruments at February 28, 2023 is as follows:
Forward Currency Contracts
Settlement Date | Counterparty | Currency Sold | Currency Purchased | Net Unrealized Appreciation (Depreciation)($) | ||||||||||||
04/17/2023 | BOA | EUR 5,459,200 | USD 5,931,551 | 141,678 | ||||||||||||
04/17/2023 | SSB | EUR 291,000 | USD 309,207 | 581 | ||||||||||||
04/17/2023 | MSCI | USD 222,399 | EUR 207,000 | (2,861 | ) | |||||||||||
|
| |||||||||||||||
| $ | 139,398 | |||||||||||||||
|
| |||||||||||||||
Futures Contracts
Number of Contracts + | Type | Expiration Date | Notional Amount ($) | Value/Net Unrealized Appreciation (Depreciation) ($) | ||||||||||
| Buys | ||||||||||||||
| 19 | U.S. Long Bond (CBT) | June 2023 | 2,379,156 | (1,214 | ) | |||||||||
| 1,083 | U.S. Treasury Note 2 Yr. (CBT) | June 2023 | 220,635,867 | (432,863 | ) | |||||||||
| 840 | U.S. Treasury Note 5 Yr. (CBT) | June 2023 | 89,925,938 | (10,343 | ) | |||||||||
| 74 | U.S. Treasury Ultra 10 Yr. (CBT) | June 2023 | 8,671,875 | (20,754 | ) | |||||||||
| 17 | U.S. Ultra Bond (CBT) | June 2023 | 2,296,062 | (15,102 | ) | |||||||||
|
|
|
| |||||||||||
| $ | 323,908,898 | $ | (480,276 | ) | ||||||||||
|
|
|
| |||||||||||
Number of | Type | Expiration Date | Notional Amount ($) | Value/Net Unrealized Appreciation (Depreciation) ($) | ||||||||||
| Sales | ||||||||||||||
| 45 | U.S. Treasury Note 10 Yr. (CBT) | June 2023 | $ | 5,024,531 | $ | (6,049 | ) | |||||||
|
|
|
| |||||||||||
| + | Buys - Fund is long the futures contract. |
Sales - Fund is short the futures contract. |
Written Options
Description | Counterparty | Exercise Rate | Expiration Date | Principal/ Notional Amount | Floating | Pay/Receive Floating Rate | Value ($) | |||||||||||||||||
Written Options on Credit Default Swaps - Puts |
| |||||||||||||||||||||||
CDX.NA.IGS.39 | MSCI | 77.50 | % | 03/15/23 | USD (110,139,000) | Fixed Spread | Pay | (126,132 | ) | |||||||||||||||
CDX.NA.IGS.39 | MSCI | 85.00 | % | 04/19/23 | USD (49,879,000) | Fixed Spread | Pay | (77,127 | ) | |||||||||||||||
CDX.NA.HY.39 | BCLY | 99.50 | % | 04/19/23 | USD (22,120,000) | Fixed Spread | Pay | (170,774 | ) | |||||||||||||||
CDX.NA.IG.39 | BCLY | 95.00 | % | 05/17/23 | USD (49,890,000) | Fixed Spread | Pay | (73,840 | ) | |||||||||||||||
|
| |||||||||||||||||||||||
| Total Written Options On Credit Default Swaps — Puts |
| (447,873 | ) | |||||||||||||||||||||
|
| |||||||||||||||||||||||
| TOTAL WRITTEN OPTIONS |
| |||||||||||||||||||||||
| (Premiums $546,765) |
| $ | (447,873 | ) | ||||||||||||||||||||
|
| |||||||||||||||||||||||
| See accompanying notes to the financial statements. | 54 |
GMO Opportunistic Income Fund
(A Series of GMO Trust)
Schedule of Investments — (Continued)
February 28, 2023
Swap Contracts
Centrally Cleared Credit Default Swaps
Reference Entity | Notional Amount | Annual Premium | Implied Credit Spread (1) | Maximum Potential Amount of Future Payments by the Fund Under the Contract (2) | Expiration Date | Periodic Payment Frequency | Premiums Paid/ (Received) ($) | Value ($) | Net Unrealized Appreciation/ (Depreciation) ($) | |||||||||||||||||||||||||||
Buy Protection^: | ||||||||||||||||||||||||||||||||||||
CDX.NA.HY.S37.V2 | USD 13,355,100 | 5.00 | % | 3.95 | % | N/A | 12/20/2026 | Quarterly | (741,208 | ) | (446,661 | ) | 294,547 | |||||||||||||||||||||||
ITRAXX.XO.36.V1 | EUR 16,780,000 | 5.00 | % | 3.56 | % | N/A | 12/20/2026 | Quarterly | (597,455 | ) | (825,930 | ) | (228,475 | ) | ||||||||||||||||||||||
CDX.NA.IG.S39 | USD 173,195,000 | 1.00 | % | 0.76 | % | N/A | 12/20/2027 | Quarterly | (1,259,898 | ) | (1,738,531 | ) | (478,633 | ) | ||||||||||||||||||||||
ITRAXX.XO.38.V1 | EUR 14,400,000 | 5.00 | % | 4.13 | % | N/A | 12/20/2027 | Quarterly | (294,353 | ) | (511,666 | ) | (217,313 | ) | ||||||||||||||||||||||
|
|
|
|
|
| |||||||||||||||||||||||||||||||
| $ | (2,892,914 | ) | $ | (3,522,788 | ) | $ | (629,874 | ) | ||||||||||||||||||||||||||||
|
|
|
|
|
| |||||||||||||||||||||||||||||||
OTC Credit Default Swaps
Reference Entity | Counterparty | Notional Amount | Annual Premium | Implied Credit Spread (1) | Maximum Potential Amount of Future Payments by the Fund Under the Contract (2) | Expiration Date | Periodic Payment Frequency | Premiums Paid/ (Received) ($) | Value ($) | Net Unrealized Appreciation/ (Depreciation) ($) | ||||||||||||||||||||||||||||||||
Buy Protection^: | ||||||||||||||||||||||||||||||||||||||||||
CDX.NA.HYS.31 | CITI | USD | 3,941,000 | 5.00 | % | 0.89 | % | N/A | 12/20/2023 | Quarterly | (15,370 | ) | (128,770 | ) | (113,400 | ) | ||||||||||||||||||||||||||
CDX.NA.HYS.31 | CITI | USD | 4,025,000 | 5.00 | % | 0.89 | % | N/A | 12/20/2023 | Quarterly | 41,458 | (131,513 | ) | (172,971 | ) | |||||||||||||||||||||||||||
CDX.NA.HYS.31 | CITI | USD | 7,055,000 | 5.00 | % | 0.89 | % | N/A | 12/20/2023 | Quarterly | 44,878 | (230,516 | ) | (275,394 | ) | |||||||||||||||||||||||||||
ITRAXX.EUR.38 12 | JPM | EUR | 91,775,000 | 1.00 | % | 0.34 | % | N/A | 12/20/2027 | Quarterly | (2,972,877 | ) | (2,814,602 | ) | 158,275 | |||||||||||||||||||||||||||
CMBX.NA.A.7 | CGMI | USD | 1,420,000 | 2.00 | % | 12.92 | % | N/A | 01/17/2047 | Monthly | 89,177 | 88,991 | (186 | ) | ||||||||||||||||||||||||||||
CMBX.NA.A.7 | CGMI | USD | 10,000,000 | 2.00 | % | 12.92 | % | N/A | 01/17/2047 | Monthly | 593,750 | 626,699 | 32,949 | |||||||||||||||||||||||||||||
CMBX.NA.A.7 | GS | USD | 2,840,000 | 2.00 | % | 12.92 | % | N/A | 01/17/2047 | Monthly | 156,358 | 177,982 | 21,624 | |||||||||||||||||||||||||||||
CMBX.NA.AS.7 | BOA | USD | 4,505,000 | 1.00 | % | 1.53 | % | N/A | 01/17/2047 | Monthly | 47,352 | 13,641 | (33,711 | ) | ||||||||||||||||||||||||||||
CMBX.NA.AS.7 | DB | USD | 7,608,000 | 1.00 | % | 1.53 | % | N/A | 01/17/2047 | Monthly | (119,899 | ) | 23,037 | 142,936 | ||||||||||||||||||||||||||||
CMBX.NA.AS.7 | DB | USD | 16,677,794 | 1.00 | % | 1.53 | % | N/A | 01/17/2047 | Monthly | 197,705 | 50,499 | (147,206 | ) | ||||||||||||||||||||||||||||
CMBX.NA.AS.7 | GS | USD | 4,400,000 | 1.00 | % | 1.53 | % | N/A | 01/17/2047 | Monthly | 112,812 | 13,323 | (99,489 | ) | ||||||||||||||||||||||||||||
CMBX.NA.AS.7 | MORD | USD | 13,270,000 | 1.00 | % | 1.53 | % | N/A | 01/17/2047 | Monthly | 205,782 | 40,181 | (165,601 | ) | ||||||||||||||||||||||||||||
CMBX.NA.AA.11 | CGMI | USD | 4,000,000 | 1.50 | % | 2.1 | % | N/A | 11/18/2054 | Monthly | (6,041 | ) | 95,132 | 101,173 | ||||||||||||||||||||||||||||
CMBX.NA.AA.11 | CGMI | USD | 4,626,000 | 1.50 | % | 2.10 | % | N/A | 11/18/2054 | Monthly | (63,740 | ) | 110,020 | 173,760 | ||||||||||||||||||||||||||||
CMBX.NA.AA.11 | MORD | USD | 4,624,500 | 1.50 | % | 2.10 | % | N/A | 11/18/2054 | Monthly | (67,279 | ) | 109,984 | 177,263 | ||||||||||||||||||||||||||||
CMBX.NA.AA.11 | MORD | USD | 4,624,500 | 1.50 | % | 2.10 | % | N/A | 11/18/2054 | Monthly | (61,371 | ) | 109,984 | 171,355 | ||||||||||||||||||||||||||||
CMBX.NA.A.8 | GS | USD | 8,892,000 | 2.00 | % | 3.51 | % | N/A | 10/17/2057 | Monthly | 150,185 | 199,357 | 49,172 | |||||||||||||||||||||||||||||
CMBX.NA.AS.8 | CGMI | USD | 8,892,000 | 1.00 | % | 1.05 | % | N/A | 10/17/2057 | Monthly | 73,095 | 5,977 | (67,118 | ) | ||||||||||||||||||||||||||||
CMBX.NA.AS.8 | MORD | USD | 3,384,000 | 1.00 | % | 1.05 | % | N/A | 10/17/2057 | Monthly | 140,432 | 2,274 | (138,158 | ) | ||||||||||||||||||||||||||||
CMBX.NA.BBB-.8 | GS | USD | 1,444,000 | 3.00 | % | 15.18 | % | N/A | 10/17/2057 | Monthly | 216,864 | 239,596 | 22,732 | |||||||||||||||||||||||||||||
CMBX.NA.BBB-.8 | GS | USD | 4,224,000 | 3.00 | % | 15.18 | % | N/A | 10/17/2057 | Monthly | 400,908 | 700,867 | 299,959 | |||||||||||||||||||||||||||||
CMBX.NA.BBB-.9 | DB | USD | 2,936,200 | 3.00 | % | 11.84 | % | N/A | 09/17/2058 | Monthly | 356,201 | 545,950 | 189,749 | |||||||||||||||||||||||||||||
CMBX.NA.BBB-.9 | MORD | USD | 5,116,800 | 3.00 | % | 11.84 | % | N/A | 09/17/2058 | Monthly | 584,727 | 951,405 | 366,678 | |||||||||||||||||||||||||||||
CMBX.NA.BBB-.10 | GS | USD | 1,752,000 | 3.00 | % | 10.36 | % | N/A | 11/17/2059 | Monthly | 326,310 | 360,207 | 33,897 | |||||||||||||||||||||||||||||
CMBX.NA.BBB-.10 | GS | USD | 4,000,000 | 3.00 | % | 10.36 | % | N/A | 11/17/2059 | Monthly | 745,000 | 822,390 | 77,390 | |||||||||||||||||||||||||||||
CMBX.NA.AA.12 | GS | USD | 6,974,000 | 1.50 | % | 2.24 | % | N/A | 08/17/2061 | Monthly | (61,732 | ) | 237,664 | 299,396 | ||||||||||||||||||||||||||||
CMBX.NA.AA.6 | GS | USD | 4,703,648 | 1.50 | % | 34.7 | % | N/A | 05/11/2063 | Monthly | 34,885 | 305,983 | 271,098 | |||||||||||||||||||||||||||||
CMBX.NA.BBB-.6 | CGMI | USD | 4,274,000 | 3.00 | % | 76.09 | % | N/A | 05/11/2063 | Monthly | 1,357,351 | 477,969 | (879,382 | ) | ||||||||||||||||||||||||||||
| 55 | See accompanying notes to the financial statements. |
GMO Opportunistic Income Fund
(A Series of GMO Trust)
Schedule of Investments — (Continued)
February 28, 2023
Swap Contracts — continued
OTC Credit Default Swaps — continued
Reference Entity | Counterparty | Notional Amount | Annual Premium | Implied Credit Spread (1) | Maximum Potential Amount of Future Payments by the Fund Under the Contract (2) | Expiration Date | Periodic Payment Frequency | Premiums Paid/ (Received) ($) | Value ($) | Net Unrealized Appreciation/ (Depreciation) ($) | ||||||||||||||||||||||||||||
CMBX.NA.BB.14 | GS | USD | 1,360,000 | 5.00 | % | 11.75 | % | N/A | 12/16/2072 | Monthly | 75,915 | 396,916 | 321,001 | |||||||||||||||||||||||||
CMBX.NA.BB.14 | GS | USD | 3,140,000 | 5.00 | % | 11.75 | % | N/A | 12/16/2072 | Monthly | 175,274 | 916,410 | 741,136 | |||||||||||||||||||||||||
CMBX.NA.BB.14 | MSCI | USD | 4,235,000 | 5.00 | % | 11.75 | % | N/A | 12/16/2072 | Monthly | 427,602 | 1,235,985 | 808,383 | |||||||||||||||||||||||||
CMBX.NA.BBB-.13 | CGMI | USD | 2,000,000 | 3.00 | % | 8.17 | % | N/A | 12/16/2072 | Monthly | 286,083 | 465,375 | 179,292 | |||||||||||||||||||||||||
CMBX.NA.BBB-.13 | GS | USD | 273,500 | 3.00 | % | 8.17 | % | N/A | 12/16/2072 | Monthly | 16,840 | 63,640 | 46,800 | |||||||||||||||||||||||||
CMBX.NA.BBB-.13 | GS | USD | 1,800,000 | 3.00 | % | 8.17 | % | N/A | 12/16/2072 | Monthly | 66,662 | 418,837 | 352,175 | |||||||||||||||||||||||||
CMBX.NA.BBB-.13 | GS | USD | 1,860,000 | 3.00 | % | 8.17 | % | N/A | 12/16/2072 | Monthly | 360,375 | 432,798 | 72,423 | |||||||||||||||||||||||||
Sell Protection^: | ||||||||||||||||||||||||||||||||||||||
CDX.NA.HYS.31.V14-5Y | CITI | USD | 2,866,000 | 5.00 | % | 0.28 | % | 2,866,000 USD | 12/20/2023 | Quarterly | 293,765 | 107,635 | (186,130 | ) | ||||||||||||||||||||||||
CDX.NA.HYS.31.V14-5Y | CITI | USD | 4,657,000 | 5.00 | % | 0.28 | % | 4,657,000 USD | 12/20/2023 | Quarterly | 492,478 | 174,897 | (317,581 | ) | ||||||||||||||||||||||||
CDX.NA.HYS.31.V14-5Y | CITI | USD | 8,050,000 | 5.00 | % | 0.28 | % | 8,050,000 USD | 12/20/2023 | Quarterly | 539,350 | 302,324 | (237,026 | ) | ||||||||||||||||||||||||
CDX.NA.HYS.33.V12-5Y | CITI | USD | 10,598,036 | 5.00 | % | 0.22 | % | 10,598,036 USD | 12/20/2024 | Quarterly | 1,827,631 | 869,785 | (957,846 | ) | ||||||||||||||||||||||||
CDX.NA.HYS.33.V12-5Y | JPM | USD | 10,394,872 | 5.00 | % | 0.22 | % | 10,394,872 USD | 12/20/2024 | Quarterly | 1,704,759 | 853,112 | (851,647 | ) | ||||||||||||||||||||||||
CDX.NA.HYS.33.V12-5Y | MORD | USD | 2,800,896 | 5.00 | % | 0.22 | % | 2,800,896 USD | 12/20/2024 | Quarterly | 482,034 | 229,871 | (252,163 | ) | ||||||||||||||||||||||||
CDX.NA.HYS.33.V1-5Y | GS | USD | 25,937,869 | 5.00 | % | 0.22 | % | 25,937,869 USD | 12/20/2024 | Quarterly | 5,736,853 | 2,128,732 | (3,608,121 | ) | ||||||||||||||||||||||||
CDX.NA.HYS.33.V3-5Y | CITI | USD | 4,201,343 | 5.00 | % | 0.22 | % | 4,201,343 USD | 12/20/2024 | Quarterly | 444,572 | 344,806 | (99,766 | ) | ||||||||||||||||||||||||
CDX.NA.HYS.37 | GS | USD | 33,720,000 | 5.00 | % | 0.47 | % | 33,720,000 USD | 12/20/2026 | Quarterly | 6,308,637 | 5,148,080 | (1,160,557 | ) | ||||||||||||||||||||||||
ITRAXX.XO.36 35 | MSCI | EUR | 33,560,000 | 5.00 | % | 0.56 | % | 33,560,000 EUR | 12/20/2026 | Quarterly | 5,830,388 | 5,327,133 | (503,255 | ) | ||||||||||||||||||||||||
CDX.NA.IG.39 15 | MSCI | USD | 91,775,000 | 1.00 | % | 0.25 | % | 91,775,000 USD | 12/20/2027 | Quarterly | 3,115,557 | 2,972,523 | (143,034 | ) | ||||||||||||||||||||||||
ITRAXX.XO.38 35 | JPM | EUR | 25,920,000 | 5.00 | % | 0.98 | % | 25,920,000 EUR | 12/20/2027 | Quarterly | 4,389,263 | 4,480,739 | 91,476 | |||||||||||||||||||||||||
CMBX.NA.AA.7 | CGMI | USD | 5,000,000 | 1.50 | % | 7.93 | % | 5,000,000 USD | 01/17/2047 | Monthly | (125,000 | ) | (185,695 | ) | (60,695 | ) | ||||||||||||||||||||||
CMBX.NA.A.9 | CGMI | USD | 2,500,000 | 2.00 | % | 4.51 | % | 2,500,000 USD | 09/17/2058 | Monthly | (74,374 | ) | (144,785 | ) | (70,411 | ) | ||||||||||||||||||||||
CMBX.NA.A.9 | GS | USD | 4,158,800 | 2.00 | % | 4.51 | % | 4,158,800 USD | 09/17/2058 | Monthly | 54,550 | (240,852 | ) | (295,402 | ) | |||||||||||||||||||||||
CMBX.NA.AAA.10 | GS | USD | 7,540,000 | 0.50 | % | 0.63 | % | 7,540,000 USD | 11/17/2059 | Monthly | 68,960 | (32,049 | ) | (101,009 | ) | |||||||||||||||||||||||
CMBX.NA.15.AAA | GS | USD | 2,825,000 | 0.50 | % | 0.91 | % | 2,825,000 USD | 11/18/2064 | Monthly | (43,465 | ) | (78,268 | ) | (34,803 | ) | ||||||||||||||||||||||
|
|
|
|
|
| |||||||||||||||||||||||||||||||||
| $ | 34,961,630 | $ | 29,191,660 | $ | (5,769,970 | ) | ||||||||||||||||||||||||||||||||
|
|
|
|
|
| |||||||||||||||||||||||||||||||||
| ^ | Buy Protection - Fund pays a premium and buys credit protection. If a credit event occurs the Fund will, depending on the terms of the particular swap contract, either (i) receive from the seller of protection an amount equal to the notional amount of the swap and deliver the referenced obligation or underlying securities comprising the referenced index or (ii) receive a net settlement amount in the form of cash or securities equal to the notional amount of the swap less the recovery value of the referenced obligation or underlying securities comprising the referenced index. |
Sell Protection - Fund receives a premium and sells credit protection. If a credit event occurs the Fund will, depending on the terms of the particular swap contract, either (i) pay to the buyer of protection an amount equal to the notional amount of the swap and take delivery of the referenced obligation or underlying securities comprising the referenced index or (ii) pay a net settlement amount in the form of cash or securities equal to the notional amount of the swap less the recovery value of the referenced obligation or underlying securities comprising the referenced index.
| (1) | As of February 28, 2023, implied credit spreads in absolute terms, calculated using a model, and utilized in determining the market value of credit default swap contracts on the reference security, serve as an indicator of the current status of the payment/performance risk and reflect the likelihood or risk of default for the reference entity. The implied credit spread of a particular referenced entity reflects the cost of buying/selling protection. Wider (i.e. higher) credit spreads represent a deterioration of the referenced entity’s credit soundness and a greater likelihood or risk of default or other credit event occurring as defined under the terms of the contract. |
| (2) | The maximum potential amount the Fund could be required to pay as a seller of credit protection if a credit event occurs as defined under the terms of that particular swap contract. |
| See accompanying notes to the financial statements. | 56 |
GMO Opportunistic Income Fund
(A Series of GMO Trust)
Schedule of Investments — (Continued)
February 28, 2023
Swap Contracts — continued
OTC Total Return Swaps
Fund Pays | Fund Receives | Counterparty | Notional Amount | Expiration Date | Periodic Payment Frequency | Premiums Paid/ (Received) ($) | Value ($) | Net Unrealized Appreciation/ (Depreciation) ($) | ||||||||||||||||||||||||
Total Return on iBoxx USD Liquid Investment Grade Index | SOFR | MSCI | USD 12,478,000 | 03/20/2023 | Quarterly | $ | 2,992 | $ | 94,565 | $ | 91,573 | |||||||||||||||||||||
|
|
|
|
|
| |||||||||||||||||||||||||||
As of February 28, 2023, for the above contracts and/or agreements, the Fund had sufficient cash and/or securities to cover commitments or collateral requirements, if any, of the relevant broker or exchange.
Notes to Schedule of Investments:
† Denominated in U.S. Dollar, unless otherwise indicated. (a) Investment valued at fair value using methods determined in good faith by the Trustees of GMO Trust or persons acting at their direction pursuant to procedures approved by the Trustees. Investment valued using significant unobservable inputs (Note 2). (b) Investment valued using significant unobservable inputs (Note 2). (c) All or a portion of this security has been pledged to cover margin requirements on futures and/or cleared swap contracts, collateral on OTC swap contracts, forward currency contracts, and/or written options, if any (Note 4). (d) The rate disclosed is the 7 day net yield as of February 28, 2023. | For a listing of definitions of acronyms, counterparty abbreviations and currency abbreviations used throughout the Schedule of Investments as well as the derivative tables, if any, please refer to page 63. |
| 57 | See accompanying notes to the financial statements. |
This page has been left blank intentionally.
(A Series of GMO Trust)
Portfolio Management
Day-to-day management of the Fund’s portfolio is the responsibility of the Short Duration Strategies team at Grantham, Mayo, Van Otterloo & Co. LLC.
Management Discussion and Analysis of Fund Performance
Although the Fund is not managed relative to any securities market index or benchmark, a discussion of the Fund’s performance relative to the FTSE 3-Month Treasury Bill Index is included for comparative purposes.
GMO U.S. Treasury Fund returned +2.00% (net) for the fiscal year ended February 28, 2023, as compared with +2.22% for the FTSE 3-Month Treasury Bill Index.
Security selection in U.S. Treasury Notes drove underperformance during the year, partly offset by gains from Floating Rate U.S. Treasury Notes.
The views expressed herein are exclusively those of Grantham, Mayo, Van Otterloo & Co. LLC as of the date of this report and are subject to change. GMO disclaims any responsibility to update such views. They are not meant as investment advice. References to specific securities are not recommendations of such securities and may not be representative of any GMO portfolio’s current or future investments. All information is unaudited.
59
GMO U.S. Treasury Fund
(A Series of GMO Trust)
Comparison of Change in Value of a $5,000,000 Investment in
GMO U.S. Treasury Fund and the FTSE 3-Month Treasury Bill Index
As of February 28, 2023
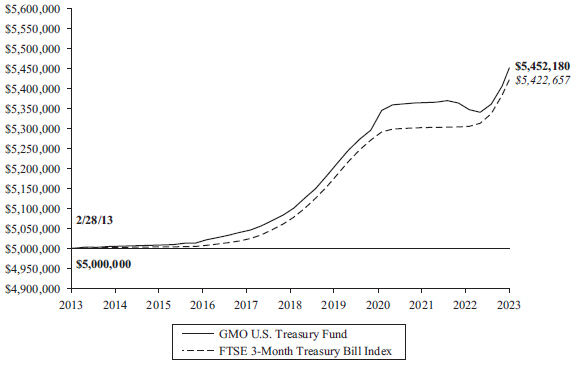
| Average Annual Total Returns | ||||||||||||
| 1 Year | 5 Year | 10 Year | ||||||||||
| Core Class | 2.00 | % | 1.37 | % | 0.87 | % | ||||||
Performance data quoted represents past performance and is not indicative of future results. The investment return and principal value of an investment will fluctuate so that an investor’s shares, when redeemed, may be worth more or less than their original cost. Current performance data may be lower or higher than the performance data provided herein. To obtain performance information up to the most recent month-end, visit www.gmo.com. Performance shown is net of all fees after reimbursement from GMO. Returns would have been lower had certain expenses not been reimbursed during the periods shown and do not include the effect of taxes on distributions and redemptions. The performance information shown above only includes purchase premiums and/or redemption fees in effect as of February 28, 2023. All information is unaudited.
The gross expense ratio of 0.12% is equal to the Fund’s Total Annual Operating Expenses set forth in the Fund’s most recent prospectus dated June 30, 2022. The corresponding net expense ratio of 0.09% reflects the reduction of expenses from fee reimbursements. The fee reimbursements will continue until at least June 30, 2023. Elimination of this reimbursement will result in higher fees and lower performance.
60
GMO U.S. Treasury Fund
(A Series of GMO Trust)
Investment Concentration Summary
February 28, 2023 (Unaudited)
Asset Class Summary | % of Total Net Assets | |||
Short-Term Investments | 101.0 | % | ||
Other | (1.0 | ) | ||
|
| |||
| 100.0 | % | |||
|
| |||
61
GMO U.S. Treasury Fund
(A Series of GMO Trust)
(showing percentage of total net assets)
February 28, 2023
Par Value† | Description | Value ($) | ||||||||
| SHORT-TERM INVESTMENTS — 101.0% |
| |||||||||
| U.S. Government — 67.3% | ||||||||||
| 47,000,000 | U.S. Treasury Note, 0.25%, due 06/15/23 | 46,366,602 | ||||||||
| 50,000,000 | U.S. Treasury Note, 0.13%, due 08/15/23 | 48,884,765 | ||||||||
| 40,000,000 | U.S. Treasury Note, 0.38%, due 10/31/23 | 38,771,875 | ||||||||
| 55,000,000 | U.S. Treasury Note, Variable Rate, USBM - 0.08%, 4.73%, due 04/30/24 | 54,916,691 | ||||||||
| 26,000,000 | U.S. Treasury Note, Variable Rate, USBM + 0.04%, 4.84%, due 07/31/24 | 25,991,097 | ||||||||
| 60,000,000 | U.S. Treasury Note, Variable Rate, SOFR + 0.20%, 5.01%, due 01/31/25 | 60,062,889 | ||||||||
|
| |||||||||
| Total U.S. Government | 274,993,919 | |||||||||
|
| |||||||||
| U.S. Government Agency — 19.4% | ||||||||||
| 5,000,000 | Federal Home Loan Banks, Variable Rate, SOFR + 0.02%, 4.57%, due 03/15/23 | 5,000,031 | ||||||||
| 10,000,000 | Federal Home Loan Banks, Variable Rate, SOFR + 0.07%, 4.62%, due 04/06/23 | 10,000,293 | ||||||||
| 20,000,000 | Federal Home Loan Banks, Variable Rate, SOFR + 0.07%, 4.62%, due 05/08/23 | 20,000,870 | ||||||||
| 10,000,000 | Federal Home Loan Banks, Variable Rate, SOFR + 0.04%, 4.59%, due 06/05/23 | 9,999,941 | ||||||||
| 5,000,000 | Federal Home Loan Banks, Variable Rate, SOFR + 0.03%, 4.58%, due 06/07/23 | 4,999,811 | ||||||||
| 15,000,000 | Federal Home Loan Banks, Variable Rate, SOFR + 0.06%, 4.61%, due 09/19/23 | 14,999,738 | ||||||||
| 10,000,000 | Federal Home Loan Banks, 5.23%, due 03/22/24 | 10,004,527 | ||||||||
| 4,000,000 | Federal Home Loan Banks, Variable Rate, SOFR + 0.10%, 4.65%, due 09/04/24 | 4,000,000 | ||||||||
|
| |||||||||
| Total U.S. Government Agency | 79,005,211 | |||||||||
|
| |||||||||
| Repurchase Agreements — 14.2% | ||||||||||
| 28,029,225 | Daiwa Capital Markets America, Inc. Repurchase Agreement, dated, 02/28/23 maturing on 03/01/23 with a maturity value of $28,032,690 and an effective yield of 4.45%, collateralized by a U.S. Treasury Note with maturity date 07/31/23 and a market value of $28,601,250. | 28,029,225 | ||||||||
| 30,071,055 | Daiwa Capital Markets America, Inc. Repurchase Agreement, dated, 02/28/23 maturing on 03/01/23 with a maturity value of $30,074,831 and an effective yield of 4.52%, collateralized by a U.S. Treasury Note with maturity date 04/30/29 and a market value of $30,684,750. | 30,071,055 | ||||||||
|
| |||||||||
| Total Repurchase Agreements | 58,100,280 | |||||||||
|
| |||||||||
Shares | Description | Value ($) | ||||||||
| Money Market Funds — 0.1% | ||||||||||
| 394,675 | State Street Institutional Treasury Plus Money Market Fund – Premier Class, 4.47% (a) | 394,675 | ||||||||
|
| |||||||||
| TOTAL SHORT-TERM INVESTMENTS (COST $413,185,830) | 412,494,085 | |||||||||
|
| |||||||||
| TOTAL INVESTMENTS — 101.0% (Cost $413,185,830) | 412,494,085 | |||||||||
|
| |||||||||
| Other Assets and Liabilities (net) — (1.0)% | (4,036,971 | ) | ||||||||
|
| |||||||||
| TOTAL NET ASSETS — 100.0% | $ | 408,457,114 | ||||||||
|
| |||||||||
Notes to Schedule of Investments:
| † | Denominated in U.S. Dollar, unless otherwise indicated. |
| (a) | The rate disclosed is the 7 day net yield as of February 28, 2023. |
For a listing of definitions of acronyms, counterparty abbreviations and currency abbreviations used throughout the Schedule of Investments as well as the derivative tables, if any, please refer to page 63.
| See accompanying notes to the financial statements. | 62 |
GMO Trust Funds
February 28, 2023
144A - Securities exempt from registration under Rule 144A of the Securities Act of 1933. These securities may be resold in transactions exempt from registration, normally to qualified institutional investors.
AMBAC - Insured as to the payment of principal and interest by AMBAC Assurance Corporation.
AUD BBSW - Bank Bill Swap Reference Rate denominated in Australian Dollar.
CDI - Certificado de Deposito Interbancario
CDOR - Canadian Dollar Offering Rate
CJSC - Closed Joint-Stock Company
CLO - Collateralized Loan Obligation
CMBS - Commercial Mortgage Backed Security
CMT - Constant Maturity Treasury
ETF - Exchange-Traded Fund
EURIBOR - Euro Interbank Offered Rate
EuroSTR - Euro Short-Term Rate
FGIC - Insured as to the payment of principal and interest by Financial Guaranty Insurance Corporation.
FSA - Insured as to the payment of principal and interest by Financial Security Assurance.
GDP - Gross Domestic Product
GMTN - Global Medium Term Note
IO - Interest Only
JSC - Joint-Stock Company
LIBOR - London Interbank Offered Rate
MTA - Monthly Treasury Average Index
MTN - Medium Term Note
NZD Bank Bill Rate - Bank Bill Rate denominated in New Zealand Dollar.
OIS - Overnight Indexed Swaps
OTC - Over-the-Counter
Reg S - Security exempt from registration under Regulation S of the Securities Act of 1933, which exempts from registration securities offered and sold outside the United States. Security may not be offered or sold in the United States except pursuant to an exemption from, or in a transaction not subject to, the registration requirements of the Securities Act of 1933.
SARON - Swiss Average Rate Overnight
SEK STIBOR - Stockholm Interbank Offered Rate denominated in Swedish Krona.
SOFR - Secured Overnight Financing Rate
SONIA - Sterling Overnight Interbank Average Rate
TBA - To Be Announced - Delayed Delivery Security
TONA - Tokyo Overnight Average Rate
USBM - U.S. Treasury 3 Month Bill Money Market Yield
XLCA - Insured as to the payment of principal and interest by XL Capital Assurance.
The rates shown on variable rate notes are the current interest rates at February 28, 2023, which are subject to change based on the terms of the security.
| Counterparty Abbreviations: | ||
| BCLY - Barclays Bank PLC | MORD - Morgan Stanley Capital Services LLC | |
| BOA - Bank of America, N.A. | ||
| CGMI - Citigroup Global Markets Inc. | MSCI - Morgan Stanley & Co. International PLC | |
| CITI - Citibank N.A. | ||
| DB - Deutsche Bank AG | SSB - State Street Bank and Trust Company | |
| GS - Goldman Sachs International | ||
| JPM - JPMorgan Chase Bank, N.A. | ||
| Currency Abbreviations: | ||
| AUD - Australian Dollar | MXN - Mexican Peso | |
| BRL - Brazilian Real | NOK - Norwegian Krone | |
| CAD - Canadian Dollar | NZD - New Zealand Dollar | |
| CHF - Swiss Franc | PEN - Peruvian Sol | |
| CLP - Chilean Peso | PHP - Philippines Peso | |
| COP - Colombian Peso | PLN - Polish Zloty | |
| CZK - Czech Republic Koruna | RON - Romanian New Leu | |
| EUR - Euro | SEK - Swedish Krona | |
| GBP - British Pound | SGD - Singapore Dollar | |
| HUF - Hungarian Forint | THB - Thai Baht | |
| IDR - Indonesian Rupiah | TRY - Turkish Lira | |
| ILS - Israeli Shekel | TWD - Taiwan New Dollar | |
| INR - Indian Rupee | USD - United States Dollar | |
| JPY - Japanese Yen | ZAR - South African Rand | |
| KRW - South Korean Won | ||
| 63 | See accompanying notes to the financial statements. |
Statements of Assets and Liabilities — February 28, 2023
| Asset Allocation Bond Fund | Emerging Country Debt Fund | High Yield Fund | ||||||||||
Assets: | ||||||||||||
Investments in affiliated issuers, at value (Notes 2 and 10)(a) | $ | — | $ | 67,529,288 | $ | — | ||||||
Investments in unaffiliated issuers, at value (Note 2)(b) | 10,205,293 | 2,589,530,008 | 148,326,033 | |||||||||
Repurchase agreements, at value (Note 2)(c) | 9,999,814 | 35,999,722 | 105,999,397 | |||||||||
Foreign currency, at value (Note 2)(d) | — | 790,094 | — | |||||||||
Cash | 406 | — | 12,653 | |||||||||
Receivable for investments sold | — | 13,306,929 | — | |||||||||
Dividends and interest receivable | 21,797 | 48,044,086 | 1,281,946 | |||||||||
Unrealized appreciation on open forward currency contracts (Note 4) | 7,690 | 2,596,255 | — | |||||||||
Due from broker (Note 2) | — | 31,304,982 | 4,249,420 | |||||||||
Receivable for variation margin on open futures contracts (Note 4) | — | — | 14,400 | |||||||||
Unrealized appreciation on open bond forward contracts (Note 4) | — | 50,594 | — | |||||||||
Receivable for open OTC swap contracts (Note 4) | — | 13,147,643 | 3,834,602 | |||||||||
Interest receivable for open OTC swap contracts (Note 4) | — | 180,788 | 256,186 | |||||||||
Receivable for expenses reimbursed and/or waived by GMO (Note 5) | 27,955 | — | 19,624 | |||||||||
Receivable for options (Note 4)(e) | — | 301,675 | — | |||||||||
Miscellaneous receivable | — | 1,974 | — | |||||||||
|
|
|
|
|
| |||||||
Total assets | 20,262,955 | 2,802,784,038 | 263,994,261 | |||||||||
|
|
|
|
|
| |||||||
Liabilities: | ||||||||||||
Due to custodian | — | 38,848 | — | |||||||||
Payable for investments purchased | — | 10,392,424 | — | |||||||||
Payable for Fund shares repurchased | — | 28,478 | — | |||||||||
Payable to affiliate for (Note 5): | ||||||||||||
Management fee | 3,932 | 755,625 | 69,612 | |||||||||
Shareholder service fee | 866 | 227,093 | 10,939 | |||||||||
Payable for variation margin on open futures contracts (Note 4) | 2,938 | — | — | |||||||||
Payable for variation margin on open cleared swap contracts (Note 4) | — | 326,119 | 3,729,643 | |||||||||
Payable for closed swap contracts (Note 4) | — | 806,556 | 639,357 | |||||||||
Unrealized depreciation on open forward currency contracts (Note 4) | — | 379,018 | — | |||||||||
Interest payable for open OTC swap contracts (Note 4) | — | 712,739 | 1,313,140 | |||||||||
Unrealized depreciation on open bond forward contracts (Note 4) | — | 911,701 | — | |||||||||
Payable for open OTC swap contracts (Note 4) | — | 1,511,468 | 852,098 | |||||||||
Payable to Trustees and related expenses | 107 | 11,699 | 880 | |||||||||
Written options outstanding, at value (Note 4) | — | — | 64,112 | |||||||||
Accrued expenses | 104,680 | * | 320,931 | 99,409 | ||||||||
|
|
|
|
|
| |||||||
Total liabilities | 112,523 | 16,422,699 | 6,779,190 | |||||||||
|
|
|
|
|
| |||||||
Net assets | $ | 20,150,432 | $ | 2,786,361,339 | $ | 257,215,071 | ||||||
|
|
|
|
|
| |||||||
(a) Cost of investments – affiliated issuers: | $ | — | $ | 67,761,027 | $ | — | ||||||
(b) Cost of investments – unaffiliated issuers: | $ | 10,198,785 | $ | 3,784,275,293 | $ | 150,837,340 | ||||||
(c) Cost of investments – repurchase agreements: | $ | 9,999,814 | $ | 35,999,722 | $ | 105,999,397 | ||||||
(d) Cost of foreign currency: | $ | — | $ | 792,605 | $ | — | ||||||
(e) Premiums on options: | $ | — | $ | 6,115,934 | $ | 612,795 | ||||||
* Includes audit and tax fees payable of $78,135.
| See accompanying notes to the financial statements. | 64 |
GMO Trust Funds
Statements of Assets and Liabilities — February 28, 2023 — (Continued)
| Asset Allocation Bond Fund | Emerging Country Debt Fund | High Yield Fund | ||||||||||
| Net assets consist of: | ||||||||||||
Paid-in capital | $ | 71,149,112 | $ | 4,522,442,966 | $ | 273,945,215 | ||||||
Distributable earnings (accumulated loss) | (50,998,680 | ) | (1,736,081,627 | ) | (16,730,144 | ) | ||||||
|
|
|
|
|
| |||||||
| $ | 20,150,432 | $ | 2,786,361,339 | $ | 257,215,071 | |||||||
|
|
|
|
|
| |||||||
Net assets attributable to: | ||||||||||||
Class III | $ | 19,159 | $ | 1,222,989,082 | $ | — | ||||||
|
|
|
|
|
| |||||||
Class IV | $ | — | $ | 1,170,559,249 | $ | — | ||||||
|
|
|
|
|
| |||||||
Class VI | $ | 20,131,273 | $ | 392,813,008 | $ | 257,215,071 | ||||||
|
|
|
|
|
| |||||||
Shares outstanding: | ||||||||||||
Class III | 937 | 69,059,027 | — | |||||||||
|
|
|
|
|
| |||||||
Class IV | — | 66,229,041 | — | |||||||||
|
|
|
|
|
| |||||||
Class VI | 988,344 | 22,237,873 | 15,378,484 | |||||||||
|
|
|
|
|
| |||||||
Net asset value per share: | ||||||||||||
Class III | $ | 20.46 | $ | 17.71 | $ | — | ||||||
|
|
|
|
|
| |||||||
Class IV | $ | — | $ | 17.67 | $ | — | ||||||
|
|
|
|
|
| |||||||
Class VI | $ | 20.37 | $ | 17.66 | $ | 16.73 | ||||||
|
|
|
|
|
| |||||||
| 65 | See accompanying notes to the financial statements. |
GMO Trust Funds
Statements of Assets and Liabilities — February 28, 2023 — (Continued)
| Multi-Sector | Opportunistic | |||||||||||
| Fixed Income | Income | U.S. Treasury | ||||||||||
| Fund | Fund | Fund | ||||||||||
Assets: | ||||||||||||
Investments in affiliated issuers, at value (Notes 2 and 10)(a) | $ | 27,869,232 | $ | 10,894,378 | $ | — | ||||||
Investments in unaffiliated issuers, at value (Note 2)(b) | 87,139,403 | 949,884,841 | 354,393,805 | |||||||||
Repurchase agreements, at value (Note 2)(c) | 3,499,595 | 134,028,353 | 58,100,280 | |||||||||
Foreign currency, at value (Note 2) | — | 651 | — | |||||||||
Cash | 632 | 690,468 | 8 | |||||||||
Receivable for investments sold | 1,670,491 | 56,667,921 | — | |||||||||
Receivable for Fund shares sold | — | 304,278 | 75,000 | |||||||||
Dividends and interest receivable | 463,869 | 5,097,387 | 1,020,628 | |||||||||
Unrealized appreciation on open forward currency contracts (Note 4) | 857,233 | 142,259 | — | |||||||||
Receivable for variation margin on open cleared swap contracts (Note 4) | — | 94,968 | — | |||||||||
Due from broker (Note 2) | 928,999 | 5,378,242 | — | |||||||||
Receivable for variation margin on open futures contracts (Note 4) | 2,102 | — | — | |||||||||
Receivable for open OTC swap contracts (Note 4) | — | 33,273,275 | — | |||||||||
Interest receivable for open OTC swap contracts (Note 4) | — | 1,934,003 | — | |||||||||
Receivable for expenses reimbursed and/or waived by GMO (Note 5) | 35,655 | 104,491 | 34,833 | |||||||||
|
|
|
|
|
| |||||||
Total assets | 122,467,211 | 1,198,495,515 | 413,624,554 | |||||||||
|
|
|
|
|
| |||||||
Liabilities: | ||||||||||||
Foreign currency due to custodian | 60 | — | — | |||||||||
Payable for investments purchased | 17,983,027 | 65,600,803 | 4,000,000 | |||||||||
Payable for Fund shares repurchased | — | 262,411 | 27,762 | |||||||||
Payable to affiliate for (Note 5): | ||||||||||||
Management fee | 20,161 | 343,237 | 660 | |||||||||
Shareholder service fee | 8,410 | 98,850 | — | |||||||||
Payable for variation margin on open futures contracts (Note 4) | — | 30,493 | — | |||||||||
Payable for variation margin on open cleared swap contracts (Note 4) | 18,474 | — | — | |||||||||
Dividends payable | — | — | 1,069,138 | |||||||||
Unrealized depreciation on open forward currency contracts (Note 4) | 442,407 | 2,861 | — | |||||||||
Interest payable for open OTC swap contracts (Note 4) | — | 374,058 | — | |||||||||
Payable for open OTC swap contracts (Note 4) | — | 3,987,050 | — | |||||||||
Payable to Trustees and related expenses | 385 | 3,154 | 802 | |||||||||
Written options outstanding, at value (Note 4)(d) | — | 447,873 | — | |||||||||
Accrued expenses | 124,976 | 188,221 | 69,078 | |||||||||
|
|
|
|
|
| |||||||
Total liabilities | 18,597,900 | 71,339,011 | 5,167,440 | |||||||||
|
|
|
|
|
| |||||||
Net assets | $ | 103,869,311 | $ | 1,127,156,504 | $ | 408,457,114 | ||||||
|
|
|
|
|
| |||||||
(a) Cost of investments – affiliated issuers: | $ | 32,367,720 | $ | 11,003,541 | $ | — | ||||||
(b) Cost of investments – unaffiliated issuers: | $ | 90,649,508 | $ | 1,049,642,897 | $ | 355,085,550 | ||||||
(c) Cost of investments – repurchase agreements: | $ | 3,499,595 | $ | 134,028,353 | $ | 58,100,280 | ||||||
(d) Premiums on written options: | $ | — | $ | 546,765 | $ | — | ||||||
| See accompanying notes to the financial statements. | 66 |
GMO Trust Funds
Statements of Assets and Liabilities — February 28, 2023 — (Continued)
| Multi-Sector Fixed Income Fund | Opportunistic Income Fund | U.S. Treasury Fund | ||||||||||
Net assets consist of: | ||||||||||||
Paid-in capital | $ | 152,818,280 | $ | 1,288,540,705 | $ | 410,943,868 | ||||||
Distributable earnings (accumulated loss) | (48,948,969 | ) | (161,384,201 | ) | (2,486,754 | ) | ||||||
|
|
|
|
|
| |||||||
| $ | 103,869,311 | $ | 1,127,156,504 | $ | 408,457,114 | |||||||
|
|
|
|
|
| |||||||
Net assets attributable to: | ||||||||||||
Core Class | $ | — | $ | — | $ | 408,457,114 | ||||||
|
|
|
|
|
| |||||||
Class III | $ | 14,756,717 | $ | 48,100,799 | $ | — | ||||||
|
|
|
|
|
| |||||||
Class IV | $ | 89,112,594 | $ | — | $ | — | ||||||
|
|
|
|
|
| |||||||
Class VI | $ | — | $ | 389,294,729 | $ | — | ||||||
|
|
|
|
|
| |||||||
Class R6 | $ | — | $ | 186,229,637 | $ | — | ||||||
|
|
|
|
|
| |||||||
Class I | $ | — | $ | 503,531,339 | $ | — | ||||||
|
|
|
|
|
| |||||||
Shares outstanding: | ||||||||||||
Core Class | — | — | 81,858,201 | |||||||||
|
|
|
|
|
| |||||||
Class III | 892,436 | 1,995,391 | — | |||||||||
|
|
|
|
|
| |||||||
Class IV | 5,363,472 | — | — | |||||||||
|
|
|
|
|
| |||||||
Class VI | — | 16,151,804 | — | |||||||||
|
|
|
|
|
| |||||||
Class R6 | — | 7,753,521 | — | |||||||||
|
|
|
|
|
| |||||||
Class I | — | 20,932,460 | — | |||||||||
|
|
|
|
|
| |||||||
Net asset value per share: | ||||||||||||
Core Class | $ | — | $ | — | $ | 4.99 | ||||||
|
|
|
|
|
| |||||||
Class III | $ | 16.54 | $ | 24.11 | $ | — | ||||||
|
|
|
|
|
| |||||||
Class IV | $ | 16.61 | $ | — | $ | — | ||||||
|
|
|
|
|
| |||||||
Class VI | $ | — | $ | 24.10 | $ | — | ||||||
|
|
|
|
|
| |||||||
Class R6 | $ | — | $ | 24.02 | $ | — | ||||||
|
|
|
|
|
| |||||||
Class I | $ | — | $ | 24.06 | $ | — | ||||||
|
|
|
|
|
| |||||||
| 67 | See accompanying notes to the financial statements. |
GMO Trust Funds
Statements of Operations —Year Ended February 28, 2023
| Asset | Emerging | |||||||||||
| Allocation | Country | High Yield | ||||||||||
| Bond Fund | Debt Fund | Fund | ||||||||||
Investment Income: | ||||||||||||
Interest | $ | 512,951 | $ | 223,507,504 | $ | 5,869,465 | ||||||
Dividends from unaffiliated issuers | 2,984 | 185,363 | 76,976 | |||||||||
Dividends from affiliated issuers (Note 10) | 460 | 1,693,152 | — | |||||||||
|
|
|
|
|
| |||||||
Total investment income | 516,395 | 225,386,019 | 5,946,441 | |||||||||
|
|
|
|
|
| |||||||
Expenses: | ||||||||||||
Management fee (Note 5) | 58,603 | 10,909,853 | 895,814 | |||||||||
Shareholder service fee – Class III (Note 5) | 30 | 1,217,685 | — | |||||||||
Shareholder service fee – Class IV (Note 5) | — | 1,369,059 | — | |||||||||
Shareholder service fee – Class VI (Note 5) | 12,882 | 514,938 | 140,771 | |||||||||
Audit and tax fees | 102,316 | 159,700 | 88,368 | |||||||||
Custodian, fund accounting agent and transfer agent fees | 30,128 | 565,739 | 65,247 | |||||||||
Legal fees | 1,731 | 217,657 | 10,490 | |||||||||
Registration fees | 5,472 | 6,624 | 460 | |||||||||
Trustees’ fees and related expenses (Note 5) | 828 | 151,093 | 12,432 | |||||||||
Interest expense (Note 2) | — | 10,009 | 30 | |||||||||
Miscellaneous | 6,941 | 57,255 | 9,380 | |||||||||
|
|
|
|
|
| |||||||
Total expenses | 218,931 | 15,179,612 | 1,222,992 | |||||||||
Fees and expenses reimbursed and/or waived by GMO (Note 5) | (143,701 | ) | — | (33,421 | ) | |||||||
|
|
|
|
|
| |||||||
Net expenses | 75,230 | 15,179,612 | 1,189,571 | |||||||||
|
|
|
|
|
| |||||||
Net investment income (loss) | 441,165 | 210,206,407 | 4,756,870 | |||||||||
|
|
|
|
|
| |||||||
Realized and unrealized gain (loss): | ||||||||||||
Net realized gain (loss) on: | ||||||||||||
Investments in unaffiliated issuers | (4,980,801 | ) | (301,854,204 | ) | (8,672,358 | ) | ||||||
Investments in affiliated issuers | (93 | ) | (35,403 | ) | — | |||||||
Bond forward contracts | — | (3,321,127 | ) | — | ||||||||
Futures contracts | — | — | (3,490,787 | ) | ||||||||
Options | — | (582,636 | ) | (813,785 | ) | |||||||
Swap contracts | — | 20,775,483 | (855,932 | ) | ||||||||
Forward currency contracts | — | 45,389,317 | 8,623,955 | |||||||||
Foreign currency and foreign currency related transactions | (10,611 | ) | (999,738 | ) | 851,136 | |||||||
|
|
|
|
|
| |||||||
Net realized gain (loss) | (4,991,505 | ) | (240,628,308 | )* | (4,357,771 | ) | ||||||
|
|
|
|
|
| |||||||
Change in net unrealized appreciation (depreciation) on: | ||||||||||||
Investments in unaffiliated issuers | 638,673 | (249,693,545 | ) | (1,904,604 | ) | |||||||
Investments in affiliated issuers | 47 | (274,412 | ) | — | ||||||||
Bond forward contracts | — | (861,107 | ) | — | ||||||||
Futures contracts | (15,149 | ) | — | (170,929 | ) | |||||||
Options | — | 558,200 | 466,086 | |||||||||
Swap contracts | — | (1,188,018 | ) | 5,318,510 | ||||||||
Forward currency contracts | 7,690 | (2,024,259 | ) | (218,399 | ) | |||||||
Foreign currency and foreign currency related transactions | — | 202,605 | — | |||||||||
|
|
|
|
|
| |||||||
Net change in unrealized appreciation (depreciation) | 631,261 | (253,280,536 | ) | 3,490,664 | ||||||||
|
|
|
|
|
| |||||||
Net realized and unrealized gain (loss) | (4,360,244 | ) | (493,908,844 | ) | (867,107 | ) | ||||||
|
|
|
|
|
| |||||||
Net increase (decrease) in net assets resulting from operations | $ | (3,919,079 | ) | $ | (283,702,437 | ) | $ | 3,889,763 | ||||
|
|
|
|
|
| |||||||
| * | For the details related to in-kind redemption realized gain (loss) please refer to Note 6. |
| See accompanying notes to the financial statements. | 68 |
GMO Trust Funds
Statements of Operations —Year Ended February 28, 2023 — (Continued)
| Multi-Sector | Opportunistic | |||||||||||
| Fixed Income | Income | U.S. Treasury | ||||||||||
| Fund | Fund | Fund | ||||||||||
Investment Income: | ||||||||||||
Interest | $ | 1,722,130 | $ | 48,862,553 | $ | 8,737,083 | ||||||
Dividends from affiliated issuers (Note 10) | 1,500,541 | 259,013 | — | |||||||||
Dividends from unaffiliated issuers | 21,951 | 94,940 | 14,570 | |||||||||
|
|
|
|
|
| |||||||
Total investment income | 3,244,622 | 49,216,506 | 8,751,653 | |||||||||
|
|
|
|
|
| |||||||
Expenses: | ||||||||||||
Management fee (Note 5) | 274,890 | 3,946,095 | 268,590 | |||||||||
Shareholder service fee – Class III (Note 5) | 12,183 | 13,604 | — | |||||||||
Shareholder service fee – Class IV (Note 5) | 101,834 | — | — | |||||||||
Shareholder service fee – Class VI (Note 5) | — | 198,332 | — | |||||||||
Shareholder service fee – Class R6 (Note 5) | — | 281,085 | — | |||||||||
Shareholder service fee – Class I (Note 5) | — | 644,191 | — | |||||||||
Audit and tax fees | 102,051 | 135,862 | 55,617 | |||||||||
Custodian, fund accounting agent and transfer agent fees | 114,822 | 710,204 | 51,785 | |||||||||
Legal fees | 3,278 | 50,895 | 15,705 | |||||||||
Registration fees | 5,690 | 76,323 | 2,282 | |||||||||
Trustees’ fees and related expenses (Note 5) | 4,275 | 45,941 | 14,721 | |||||||||
Interest expense (Note 2) | 200 | 479 | — | |||||||||
Miscellaneous | 14,163 | 46,489 | 7,204 | |||||||||
|
|
|
|
|
| |||||||
Total expenses | 633,386 | 6,149,500 | 415,904 | |||||||||
Fees and expenses reimbursed and/or waived by GMO (Note 5) | (231,455 | ) | (506,623 | ) | (396,707 | ) | ||||||
Indirectly incurred management fees waived or borne by GMO (Note 5) | (112,898 | ) | — | — | ||||||||
Indirectly incurred shareholder service fees waived or borne by GMO (Note 5) | (15,850 | ) | — | — | ||||||||
|
|
|
|
|
| |||||||
Net expenses | 273,183 | 5,642,877 | 19,197 | |||||||||
|
|
|
|
|
| |||||||
Net investment income (loss) | 2,971,439 | 43,573,629 | 8,732,456 | |||||||||
|
|
|
|
|
| |||||||
Realized and unrealized gain (loss): | ||||||||||||
Net realized gain (loss) on: | ||||||||||||
Investments in unaffiliated issuers | (10,109,652 | ) | (6,939,209 | ) | (1,062,384 | ) | ||||||
Investments in affiliated issuers | (454,191 | ) | — | — | ||||||||
Investments in securities sold short | — | 467,445 | — | |||||||||
Realized gain distributions from affiliated issuers (Note 10) | 357,581 | — | — | |||||||||
Futures contracts | (5,844,922 | ) | (2,378,481 | ) | — | |||||||
Written options | — | 2,660,303 | — | |||||||||
Swap contracts | (41,891 | ) | 3,389,890 | — | ||||||||
Forward currency contracts | 3,010,113 | 415,402 | — | |||||||||
Foreign currency and foreign currency related transactions | (387,862 | ) | 42,494 | — | ||||||||
|
|
|
|
|
| |||||||
Net realized gain (loss) | (13,470,824 | ) | (2,342,156 | ) | (1,062,384 | ) | ||||||
|
|
|
|
|
| |||||||
Change in net unrealized appreciation (depreciation) on: | ||||||||||||
Investments in unaffiliated issuers | (1,197,311 | ) | (46,521,961 | ) | (298,759 | ) | ||||||
Investments in affiliated issuers | (1,892,716 | ) | (43,665 | ) | — | |||||||
Futures contracts | (440,253 | ) | (204,141 | ) | — | |||||||
Written options | — | 132,109 | — | |||||||||
Swap contracts | 265,954 | (706,166 | ) | — | ||||||||
Forward currency contracts | 948,216 | 65,902 | — | |||||||||
Foreign currency and foreign currency related transactions | (1,400 | ) | 28,453 | — | ||||||||
|
|
|
|
|
| |||||||
Net change in unrealized appreciation (depreciation) | (2,317,510 | ) | (47,249,469 | ) | (298,759 | ) | ||||||
|
|
|
|
|
| |||||||
Net realized and unrealized gain (loss) | (15,788,334 | ) | (49,591,625 | ) | (1,361,143 | ) | ||||||
|
|
|
|
|
| |||||||
Net increase (decrease) in net assets resulting from operations | $ | (12,816,895 | ) | $ | (6,017,996 | ) | $ | 7,371,313 | ||||
|
|
|
|
|
| |||||||
| 69 | See accompanying notes to the financial statements. |
GMO Trust Funds
Statements of Changes in Net Assets
| Asset | Emerging | |||||||||||||||
| Allocation | Country | |||||||||||||||
| Bond Fund | Debt Fund | |||||||||||||||
| Year Ended | Year Ended | |||||||||||||||
| February 28, | February 28, | |||||||||||||||
| 2023 | 2022 | 2023 | 2022 | |||||||||||||
Increase (decrease) in net assets: | ||||||||||||||||
Operations: | ||||||||||||||||
Net investment income (loss) | $ | 441,165 | $ | 1,103,782 | $ | 210,206,407 | $ | 238,557,153 | ||||||||
Net realized gain (loss) | (4,991,505 | ) | 9,714,027 | (240,628,308 | ) | 42,391,923 | ||||||||||
Change in net unrealized appreciation (depreciation) | 631,261 | (10,233,591 | ) | (253,280,536 | ) | (598,650,728 | ) | |||||||||
|
|
|
|
|
|
|
| |||||||||
Net increase (decrease) in net assets from operations | (3,919,079 | ) | 584,218 | (283,702,437 | ) | (317,701,652 | ) | |||||||||
|
|
|
|
|
|
|
| |||||||||
Distributions to shareholders: | ||||||||||||||||
Class III | — | (300,707 | ) | (99,791,566 | ) | (100,344,029 | ) | |||||||||
Class IV | — | — | (167,952,272 | ) | (220,289,705 | ) | ||||||||||
Class VI | (157,978 | ) | (699,355 | ) | (94,556,130 | ) | (98,169,031 | )* | ||||||||
|
|
|
|
|
|
|
| |||||||||
Total distributions | (157,978 | ) | (1,000,062 | ) | (362,299,968 | ) | (418,802,765 | ) | ||||||||
|
|
|
|
|
|
|
| |||||||||
Net share transactions (Note 9):** | ||||||||||||||||
Class III | — | (62,140,074 | ) | 433,276,064 | 113,189,447 | |||||||||||
Class IV | — | — | (104,836,068 | ) | (1,395,160,087 | ) | ||||||||||
Class VI | (13,791,287 | ) | (19,881,378 | ) | (628,940,069 | ) | 1,516,676,054 | * | ||||||||
|
|
|
|
|
|
|
| |||||||||
Increase (decrease) in net assets resulting from net share transactions | (13,791,287 | ) | (82,021,452 | ) | (300,500,073 | ) | 234,705,414 | |||||||||
|
|
|
|
|
|
|
| |||||||||
Purchase premiums and redemption fees (Notes 2 and 9): | ||||||||||||||||
Class III | — | — | 1,008,898 | 678,088 | ||||||||||||
Class IV | — | — | 1,719,233 | 1,511,015 | ||||||||||||
Class VI | — | — | 919,077 | 605,125 | * | |||||||||||
|
|
|
|
|
|
|
| |||||||||
Increase (decrease) in net assets resulting from purchase premiums and redemption fees | — | — | 3,647,208 | 2,794,228 | ||||||||||||
|
|
|
|
|
|
|
| |||||||||
Total increase (decrease) in net assets resulting from net share transactions,purchase premiums and redemption fees | (13,791,287 | ) | (82,021,452 | ) | (296,852,865 | ) | 237,499,642 | |||||||||
|
|
|
|
|
|
|
| |||||||||
Total increase (decrease) in net assets | (17,868,344 | ) | (82,437,296 | ) | (942,855,270 | ) | (499,004,775 | ) | ||||||||
Net assets: | ||||||||||||||||
Beginning of period | 38,018,776 | 120,456,072 | 3,729,216,609 | 4,228,221,384 | ||||||||||||
|
|
|
|
|
|
|
| |||||||||
End of period | $ | 20,150,432 | $ | 38,018,776 | $ | 2,786,361,339 | $ | 3,729,216,609 | ||||||||
|
|
|
|
|
|
|
| |||||||||
| * | Period from July 29, 2021 (commencement of operations) through February 28, 2022. |
| ** | For the details related to in-kind redemption realized gain (loss) please refer to Note 6. |
| See accompanying notes to the financial statements. | 70 |
GMO Trust Funds
Statements of Changes in Net Assets — (Continued)
| Multi-Sector | ||||||||||||||||
| High Yield | Fixed Income | |||||||||||||||
| Fund | Fund | |||||||||||||||
| Year Ended | Year Ended | |||||||||||||||
| February 28, | February 28, | |||||||||||||||
| 2023 | 2022 | 2023 | 2022 | |||||||||||||
Increase (decrease) in net assets: | ||||||||||||||||
Operations: | ||||||||||||||||
Net investment income (loss) | $ | 4,756,870 | $ | 986,956 | $ | 2,971,439 | $ | 2,405,102 | ||||||||
Net realized gain (loss) | (4,357,771 | ) | 4,454,786 | (13,470,824 | ) | (1,528,423 | ) | |||||||||
Change in net unrealized appreciation (depreciation) | 3,490,664 | (3,881,686 | ) | (2,317,510 | ) | (5,325,792 | ) | |||||||||
|
|
|
|
|
|
|
| |||||||||
Net increase (decrease) in net assets from operations | 3,889,763 | 1,560,056 | (12,816,895 | ) | (4,449,113 | ) | ||||||||||
|
|
|
|
|
|
|
| |||||||||
Distributions to shareholders: | ||||||||||||||||
Class III | — | — | (149,319 | ) | (771,747 | ) | ||||||||||
Class IV | — | — | (1,851,259 | ) | (4,376,860 | ) | ||||||||||
Class VI | (18,971,313 | ) | (11,979,726 | ) | — | — | ||||||||||
|
|
|
|
|
|
|
| |||||||||
Total distributions | (18,971,313 | ) | (11,979,726 | ) | (2,000,578 | ) | (5,148,607 | ) | ||||||||
|
|
|
|
|
|
|
| |||||||||
Net share transactions (Note 9): | ||||||||||||||||
Class III | — | — | 7,014,922 | (22,088,583 | ) | |||||||||||
Class IV | — | — | (13,308,297 | ) | (8,797,990 | ) | ||||||||||
Class VI | 187,710,400 | 460,560 | — | — | ||||||||||||
|
|
|
|
|
|
|
| |||||||||
Increase (decrease) in net assets resulting from net share transactions | 187,710,400 | 460,560 | (6,293,375 | ) | (30,886,573 | ) | ||||||||||
|
|
|
|
|
|
|
| |||||||||
Total increase (decrease) in net assets | 172,628,850 | (9,959,110 | ) | (21,110,848 | ) | (40,484,293 | ) | |||||||||
Net assets: | ||||||||||||||||
Beginning of period | 84,586,221 | 94,545,331 | 124,980,159 | 165,464,452 | ||||||||||||
|
|
|
|
|
|
|
| |||||||||
End of period | $ | 257,215,071 | $ | 84,586,221 | $ | 103,869,311 | $ | 124,980,159 | ||||||||
|
|
|
|
|
|
|
| |||||||||
| 71 | See accompanying notes to the financial statements. |
GMO Trust Funds
Statements of Changes in Net Assets — (Continued)
| Opportunistic | ||||||||||||||||
| Income | U.S. Treasury | |||||||||||||||
| Fund | Fund | |||||||||||||||
| Year Ended | Year Ended | |||||||||||||||
| February 28, | February 28, | |||||||||||||||
| 2023 | 2022 | 2023 | 2022 | |||||||||||||
Increase (decrease) in net assets: | ||||||||||||||||
Operations: | ||||||||||||||||
Net investment income (loss) | $ | 43,573,629 | $ | 30,121,595 | $ | 8,732,456 | $ | 400,559 | ||||||||
Net realized gain (loss) | (2,342,156 | ) | 7,063,562 | (1,062,384 | ) | (591,117 | ) | |||||||||
Change in net unrealized appreciation (depreciation) | (47,249,469 | ) | (28,564,681 | ) | (298,759 | ) | (560,101 | ) | ||||||||
|
|
|
|
|
|
|
| |||||||||
Net increase (decrease) in net assets from operations | (6,017,996 | ) | 8,620,476 | 7,371,313 | (750,659 | ) | ||||||||||
|
|
|
|
|
|
|
| |||||||||
Distributions to shareholders: | ||||||||||||||||
Core Class | — | — | (8,732,859 | ) | (700,751 | ) | ||||||||||
Class III | (353,815 | ) | (224,578 | )* | — | — | ||||||||||
Class VI | (19,571,131 | ) | (8,572,000 | ) | — | — | ||||||||||
Class R6 | (9,882,307 | ) | (2,592,002 | )** | — | — | ||||||||||
Class I | (20,733,424 | ) | (8,435,870 | ) | — | — | ||||||||||
|
|
|
|
|
|
|
| |||||||||
Total distributions | (50,540,677 | ) | (19,824,450 | ) | (8,732,859 | ) | (700,751 | ) | ||||||||
|
|
|
|
|
|
|
| |||||||||
Net share transactions (Note 9): | ||||||||||||||||
Core Class | — | — | 152,052,342 | (123,236,970 | ) | |||||||||||
Class III | 36,408,292 | 12,503,177 | * | — | — | |||||||||||
Class VI | 35,260,297 | (98,588,215 | ) | — | — | |||||||||||
Class R6 | 44,469,462 | 155,415,258 | ** | — | — | |||||||||||
Class I | 83,699,966 | 31,143,682 | — | — | ||||||||||||
|
|
|
|
|
|
|
| |||||||||
Increase (decrease) in net assets resulting from net share transactions | 199,838,017 | 100,473,902 | 152,052,342 | (123,236,970 | ) | |||||||||||
|
|
|
|
|
|
|
| |||||||||
Total increase (decrease) in net assets | 143,279,344 | 89,269,928 | 150,690,796 | (124,688,380 | ) | |||||||||||
Net assets: | ||||||||||||||||
Beginning of period | 983,877,160 | 894,607,232 | 257,766,318 | 382,454,698 | ||||||||||||
|
|
|
|
|
|
|
| |||||||||
End of period | $ | 1,127,156,504 | $ | 983,877,160 | $ | 408,457,114 | $ | 257,766,318 | ||||||||
|
|
|
|
|
|
|
| |||||||||
| * | Period from July 21, 2021 (commencement of operations) through December 28, 2021, when all outstanding shares of the class were redeemed, and February 1, 2022, when the class recommenced operations, to February 28, 2022. |
| ** | Period from May 19, 2021 (commencement of operations) through February 28, 2022. |
| See accompanying notes to the financial statements. | 72 |
GMO Trust Funds
Statement of Cash Flows —Year Ended February 28, 2023
| Emerging | ||||
| Country | ||||
| Debt Fund | ||||
Cash flows from operating activities: | ||||
Net increase (decrease) in net assets resulting from operations | $ | (283,702,437 | ) | |
|
| |||
Adjustments to reconcile net increase (decrease) in net assets resulting from operations to net cash provided by (used in) operating activities: | ||||
Net change in unrealized (appreciation) depreciation | 253,280,536 | |||
Net realized (gain) loss | 240,628,308 | |||
Cost of purchase of investments held long | (1,038,838,432 | ) | ||
Proceeds from sale of investments held long | 926,328,233 | |||
Net accretion of discount and amortization of premium | (28,730,783 | ) | ||
Short-term investments, net | 22,541,575 | |||
Cash flows related to derivative transactions: | ||||
Option contracts | (10,054 | ) | ||
Bond forward contracts | (3,321,127 | ) | ||
Swap contracts | 11,722,630 | |||
Forward currency contracts | 45,389,317 | |||
Foreign currency and foreign currency related transactions | (797,133 | ) | ||
Change in assets and liabilities: | ||||
(Increase) decrease in due from broker | 7,885,334 | |||
(Increase) decrease in dividends and interest receivable | 16,191,136 | |||
(Increase) decrease in interest receivable for open OTC swap contracts | (60,424 | ) | ||
(Increase) decrease in miscellaneous receivable | 165,193 | |||
Increase (decrease) in payable to affiliate for: | ||||
Management fee | (312,673 | ) | ||
Shareholder service fee | (69,786 | ) | ||
Increase (decrease) in due to custodian | 38,848 | |||
Increase (decrease) in payable for closed swap contracts | 806,556 | |||
Increase (decrease) in payable to Trustees and related expenses | (3,126 | ) | ||
Increase (decrease) in interest payable for OTC swap contracts | (38,516 | ) | ||
Increase (decrease) in accrued expenses | (257,531 | ) | ||
|
| |||
Net cash provided by (used in) operating activities | 168,835,644 | |||
|
| |||
Cash flows from financing activities: | ||||
Proceeds from shares sold | 967,995,763 | |||
Shares repurchased | (1,094,133,971 | ) | ||
Cash distributions paid | (42,306,220 | ) | ||
Purchase premiums and redemption fees | 3,647,208 | |||
Increase (decrease) in payable for reverse repurchase agreements | (6,346,002 | ) | ||
|
| |||
Net cash provided by (used in) financing activities | (171,143,222 | ) | ||
|
| |||
Net increase (decrease) in cash | (2,307,578 | ) | ||
Cash, beginning of period | 3,097,672 | |||
|
| |||
Cash, end of period | $ | 790,094 | ||
|
| |||
Supplemental information (non-cash financing activities): | ||||
Redemptions in-kind | $ | 515,977,959 | ||
| 73 | See accompanying notes to the financial statements. |
GMO Trust Funds
(For a share outstanding throughout each period)
ASSET ALLOCATION BOND FUND
| Class III Shares | ||||||||||||||||||||
| Year Ended February 28/29, | ||||||||||||||||||||
| 2023 | 2022 | 2021 | 2020 | 2019 | ||||||||||||||||
Net asset value, beginning of period | $ | 23.48 | $ | 23.82 | $ | 22.66 | $ | 21.61 | $ | 21.95 | ||||||||||
|
|
|
|
|
|
|
|
|
| |||||||||||
Income (loss) from investment operations: | ||||||||||||||||||||
Net investment income (loss)(a)† | 0.39 | 0.41 | 0.26 | 0.55 | 0.54 | |||||||||||||||
Net realized and unrealized gain (loss) | (3.41 | ) | (0.36 | ) | 1.18 | 1.52 | 0.18 | |||||||||||||
|
|
|
|
|
|
|
|
|
| |||||||||||
Total from investment operations | (3.02 | ) | 0.05 | 1.44 | 2.07 | 0.72 | ||||||||||||||
|
|
|
|
|
|
|
|
|
| |||||||||||
Less distributions to shareholders: | ||||||||||||||||||||
From net investment income | — | (0.39 | ) | (0.28 | ) | (1.02 | ) | (1.06 | ) | |||||||||||
|
|
|
|
|
|
|
|
|
| |||||||||||
Total distributions | — | (0.39 | ) | (0.28 | ) | (1.02 | ) | (1.06 | ) | |||||||||||
|
|
|
|
|
|
|
|
|
| |||||||||||
Net asset value, end of period | $ | 20.46 | $ | 23.48 | $ | 23.82 | $ | 22.66 | $ | 21.61 | ||||||||||
|
|
|
|
|
|
|
|
|
| |||||||||||
Total Return(b) | (12.86 | )% | 0.16 | % | 6.33 | % | 9.74 | % | 3.37 | % | ||||||||||
Ratios/Supplemental Data: | ||||||||||||||||||||
Net assets, end of period (000’s) | $ | 19 | $ | 22 | $ | 61,836 | $ | 41,124 | $ | 82,801 | ||||||||||
Net operating expenses to average daily net assets | 0.41 | %(c) | 0.41 | %(c) | 0.41 | %(c) | 0.40 | %(c) | 0.41 | %(c) | ||||||||||
Interest and/or dividend expenses and/or borrowing costs to average daily net assets(d) | — | — | — | 0.00 | %(e) | 0.00 | %(e) | |||||||||||||
Total net expenses to average daily net assets | 0.41 | %(c) | 0.41 | %(c) | 0.41 | %(c) | 0.40 | %(c) | 0.41 | %(c) | ||||||||||
Net investment income (loss) to average daily net assets(a) | 1.82 | % | 1.68 | % | 1.11 | % | 2.49 | % | 2.48 | % | ||||||||||
Portfolio turnover rate(f) | 95 | % | 209 | % | 30 | % | 16 | % | 59 | % | ||||||||||
Fees and expenses reimbursed and/or waived by GMO to average daily net assets: | 0.64 | % | 0.16 | %(g) | 0.08 | %(g) | 0.06 | %(g) | 0.04 | % | ||||||||||
| (a) | Net investment income is affected by the timing of the declaration of dividends by the other GMO Funds and/or other investment companies in which the Fund invests, if any. |
| (b) | The total returns would have been lower had certain expenses not been reimbursed and/or waived during the periods shown, if applicable, and assumes the effect of reinvested distributions, if any. Calculation excludes purchase premiums and redemption fees which are borne by the shareholder purchasing or redeeming Fund shares, if any. |
| (c) | Net expenses exclude expenses incurred indirectly through investment in the underlying funds, if any (Note 5). |
| (d) | Interest and dividend expense and/or borrowing costs incurred as a result of cash collateral on derivatives, entering into reverse repurchase agreements, securities sold short or margin on cleared swap contracts, if any, is included in the Fund’s net expenses. Income earned on investing proceeds from reverse repurchase agreements, if any, is included in interest income. |
| (e) | Rounds to less than 0.01%. |
| (f) | The portfolio turnover rate excludes investments in GMO U.S. Treasury Fund (“USTF”) which is used as a short-term investment vehicle for cash management. The Fund’s portfolio turnover rate including transactions in USTF during the period and/or year ended: |
| February 28, | February 28, | February 28, | February 29, | February 28, | ||||||||||||||||
| 2023 | 2022 | 2021 | 2020 | 2019 | ||||||||||||||||
Portfolio turnover rate including transactions in USTF | 96 | % | 206 | % | 39 | % | 37 | % | 88 | % | ||||||||||
| (g) | Ratio includes indirect fees waived or borne by GMO. |
| † | Calculated using average shares outstanding throughout the period. |
| See accompanying notes to the financial statements. | 74 |
GMO Trust Funds
Financial Highlights — (Continued)
(For a share outstanding throughout each period)
ASSET ALLOCATION BOND FUND (continued)
| Class VI Shares | ||||||||||||||||||||
| Year Ended February 28/29, | ||||||||||||||||||||
| 2023 | 2022 | 2021 | 2020 | 2019 | ||||||||||||||||
Net asset value, beginning of period | $ | 23.52 | $ | 23.88 | $ | 22.72 | $ | 21.67 | $ | 22.02 | ||||||||||
|
|
|
|
|
|
|
|
|
| |||||||||||
Income (loss) from investment operations: | ||||||||||||||||||||
Net investment income (loss)(a)† | 0.40 | 0.39 | 0.27 | 0.56 | 0.57 | |||||||||||||||
Net realized and unrealized gain (loss) | (3.40 | ) | (0.31 | ) | 1.18 | 1.53 | 0.18 | |||||||||||||
|
|
|
|
|
|
|
|
|
| |||||||||||
Total from investment operations | (3.00 | ) | 0.08 | 1.45 | 2.09 | 0.75 | ||||||||||||||
|
|
|
|
|
|
|
|
|
| |||||||||||
Less distributions to shareholders: | ||||||||||||||||||||
From net investment income | (0.15 | ) | (0.44 | ) | (0.29 | ) | (1.04 | ) | (1.10 | ) | ||||||||||
|
|
|
|
|
|
|
|
|
| |||||||||||
Total distributions | (0.15 | ) | (0.44 | ) | (0.29 | ) | (1.04 | ) | (1.10 | ) | ||||||||||
|
|
|
|
|
|
|
|
|
| |||||||||||
Net asset value, end of period | $ | 20.37 | $ | 23.52 | $ | 23.88 | $ | 22.72 | $ | 21.67 | ||||||||||
|
|
|
|
|
|
|
|
|
| |||||||||||
Total Return(b) | (12.81 | )% | 0.26 | % | 6.39 | % | 9.83 | % | 3.48 | % | ||||||||||
Ratios/Supplemental Data: | ||||||||||||||||||||
Net assets, end of period (000’s) | $ | 20,131 | $ | 37,997 | $ | 58,621 | $ | 192,410 | $ | 305,842 | ||||||||||
Net operating expenses to average daily net assets | 0.32 | %(c) | 0.31 | %(c) | 0.31 | %(c) | 0.31 | %(c) | 0.31 | %(c) | ||||||||||
Interest and/or dividend expenses and/or borrowing costs to average daily net assets(d) | — | — | — | 0.00 | %(e) | 0.00 | %(e) | |||||||||||||
Total net expenses to average daily net assets | 0.32 | %(c) | 0.31 | %(c) | 0.31 | %(c) | 0.31 | %(c) | 0.31 | %(c) | ||||||||||
Net investment income (loss) to average daily net assets(a) | 1.88 | % | 1.60 | % | 1.15 | % | 2.49 | % | 2.57 | % | ||||||||||
Portfolio turnover rate(f) | 95 | % | 209 | % | 30 | % | 16 | % | 59 | % | ||||||||||
Fees and expenses reimbursed and/or waived by GMO to average daily net assets: | 0.61 | % | 0.17 | %(g) | 0.08 | %(g) | 0.06 | %(g) | 0.04 | % | ||||||||||
| (a) | Net investment income is affected by the timing of the declaration of dividends by the other GMO Funds and/or other investment companies in which the Fund invests, if any. |
| (b) | The total returns would have been lower had certain expenses not been reimbursed and/or waived during the periods shown, if applicable, and assumes the effect of reinvested distributions, if any. Calculation excludes purchase premiums and redemption fees which are borne by the shareholder purchasing or redeeming Fund shares, if any. |
| (c) | Net expenses exclude expenses incurred indirectly through investment in the underlying funds, if any (Note 5). |
| (d) | Interest and dividend expense and/or borrowing costs incurred as a result of cash collateral on derivatives, entering into reverse repurchase agreements, securities sold short or margin on cleared swap contracts, if any, is included in the Fund’s net expenses. Income earned on investing proceeds from reverse repurchase agreements, if any, is included in interest income. |
| (e) | Rounds to less than 0.01%. |
| (f) | The portfolio turnover rate excludes investments in GMO U.S. Treasury Fund (“USTF”) which is used as a short-term investment vehicle for cash management. The Fund’s portfolio turnover rate including transactions in USTF during the period and/or year ended: |
| February 28, | February 28, | February 28, | February 29, | February 28, | ||||||||||||||||
| 2023 | 2022 | 2021 | 2020 | 2019 | ||||||||||||||||
Portfolio turnover rate including transactions in USTF | 96 | % | 206 | % | 39 | % | 37 | % | 88 | % | ||||||||||
| (g) | Ratio includes indirect fees waived or borne by GMO. |
| † | Calculated using average shares outstanding throughout the period. |
| 75 | See accompanying notes to the financial statements. |
GMO Trust Funds
Financial Highlights — (Continued)
(For a share outstanding throughout each period)
EMERGING COUNTRY DEBT FUND
| Class III Shares | ||||||||||||||||||||
| Year Ended February 28/29, | ||||||||||||||||||||
| 2023 | 2022 | 2021 | 2020 | 2019 | ||||||||||||||||
Net asset value, beginning of period | $ | 21.34 | $ | 25.54 | $ | 27.38 | $ | 26.82 | $ | 28.62 | ||||||||||
|
|
|
|
|
|
|
|
|
| |||||||||||
Income (loss) from investment operations: | ||||||||||||||||||||
Net investment income (loss)(a)† | 1.28 | 1.42 | 1.56 | 1.44 | 1.36 | |||||||||||||||
Net realized and unrealized gain (loss) | (2.52 | ) | (3.16 | ) | (0.85 | ) | 0.91 | (1.19 | ) | |||||||||||
|
|
|
|
|
|
|
|
|
| |||||||||||
Total from investment operations | (1.24 | ) | (1.74 | ) | 0.71 | 2.35 | 0.17 | |||||||||||||
|
|
|
|
|
|
|
|
|
| |||||||||||
Less distributions to shareholders: | ||||||||||||||||||||
From net investment income | (2.39 | ) | (1.82 | ) | (1.93 | ) | (1.79 | ) | (1.97 | ) | ||||||||||
From net realized gains | — | (0.64 | ) | (0.62 | ) | — | — | |||||||||||||
|
|
|
|
|
|
|
|
|
| |||||||||||
Total distributions | (2.39 | ) | (2.46 | ) | (2.55 | ) | (1.79 | ) | (1.97 | ) | ||||||||||
|
|
|
|
|
|
|
|
|
| |||||||||||
Net asset value, end of period | $ | 17.71 | $ | 21.34 | $ | 25.54 | $ | 27.38 | $ | 26.82 | ||||||||||
|
|
|
|
|
|
|
|
|
| |||||||||||
Total Return(b) | (5.52 | )% | (7.83 | )% | 2.67 | % | 8.97 | % | 0.97 | % | ||||||||||
Ratios/Supplemental Data: | ||||||||||||||||||||
Net assets, end of period (000’s) | $ | 1,222,989 | $ | 942,565 | $ | 1,010,106 | $ | 1,133,945 | $ | 1,294,577 | ||||||||||
Net operating expenses to average daily net assets(c) | 0.54 | % | 0.53 | % | 0.54 | % | 0.53 | % | 0.52 | % | ||||||||||
Interest and/or dividend expenses and/or borrowing costs to average daily net assets(d) | 0.00 | %(e) | — | 0.00 | %(e) | 0.01 | % | 0.02 | % | |||||||||||
Total net expenses to average daily net assets(c) | 0.54 | % | 0.53 | % | 0.54 | % | 0.54 | % | 0.54 | % | ||||||||||
Net investment income (loss) to average daily net assets(a) | 6.75 | % | 5.62 | % | 6.02 | % | 5.23 | % | 4.99 | % | ||||||||||
Portfolio turnover rate(f) | 32 | % | 34 | % | 56 | % | 41 | % | 15 | % | ||||||||||
Fees and expenses reimbursed and/or waived by GMO to average daily net assets: | — | 0.00 | %(e) (g) | 0.00 | %(e) (g) | 0.00 | %(e) (g) | 0.00 | %(e) (g) | |||||||||||
Purchase premiums and redemption fees consisted of the following per share amounts (Note 2):† | $ | 0.02 | $ | 0.02 | $ | 0.03 | $ | 0.03 | $ | 0.03 | ||||||||||
| (a) | Net investment income is affected by the timing of the declaration of dividends by the other GMO Funds and/or other investment companies in which the Fund invests, if any. |
| (b) | The total returns would have been lower had certain expenses not been reimbursed and/or waived during the periods shown, if applicable, and assumes the effect of reinvested distributions, if any. Calculation excludes purchase premiums and redemption fees which are borne by the shareholder purchasing or redeeming Fund shares, if any. |
| (c) | Net expenses exclude expenses incurred indirectly through investment in the underlying funds, if any (Note 5). |
| (d) | Interest and dividend expense and/or borrowing costs incurred as a result of cash collateral on derivatives, entering into reverse repurchase agreements, securities sold short or margin on cleared swap contracts, if any, is included in the Fund’s net expenses. Income earned on investing proceeds from reverse repurchase agreements, if any, is included in interest income. |
| (e) | Rounds to less than 0.01%. |
| (f) | The portfolio turnover rate excludes investments in GMO U.S. Treasury Fund (“USTF”) which is used as a short-term investment vehicle for cash management. The Fund’s portfolio turnover rate including transactions in USTF during the period and/or year ended: |
| February 28, | February 28, | February 28, | February 29, | February 28, | ||||||||||||||||
| 2023 | 2022 | 2021 | 2020 | 2019 | ||||||||||||||||
Portfolio turnover rate including transactions in USTF | 32 | % | 33 | % | 55 | % | 40 | % | 15 | % | ||||||||||
| (g) | Ratio includes indirect fees waived or borne by GMO. |
| † | Calculated using average shares outstanding throughout the period. |
| See accompanying notes to the financial statements. | 76 |
GMO Trust Funds
Financial Highlights — (Continued)
(For a share outstanding throughout each period)
EMERGING COUNTRY DEBT FUND (continued)
| Class IV Shares | ||||||||||||||||||||
| Year Ended February 28/29, | ||||||||||||||||||||
| 2023 | 2022 | 2021 | 2020 | 2019 | ||||||||||||||||
Net asset value, beginning of period | $ | 21.30 | $ | 25.50 | $ | 27.34 | $ | 26.77 | $ | 28.57 | ||||||||||
|
|
|
|
|
|
|
|
|
| |||||||||||
Income (loss) from investment operations: | ||||||||||||||||||||
Net investment income (loss)(a)† | 1.28 | 1.41 | 1.39 | 1.43 | 1.37 | |||||||||||||||
Net realized and unrealized gain (loss) | (2.51 | ) | (3.14 | ) | (0.66 | ) | 0.94 | (1.19 | ) | |||||||||||
|
|
|
|
|
|
|
|
|
| |||||||||||
Total from investment operations | (1.23 | ) | (1.73 | ) | 0.73 | 2.37 | 0.18 | |||||||||||||
|
|
|
|
|
|
|
|
|
| |||||||||||
Less distributions to shareholders: | ||||||||||||||||||||
From net investment income | (2.40 | ) | (1.83 | ) | (1.95 | ) | (1.80 | ) | (1.98 | ) | ||||||||||
From net realized gains | — | (0.64 | ) | (0.62 | ) | — | — | |||||||||||||
|
|
|
|
|
|
|
|
|
| |||||||||||
Total distributions | (2.40 | ) | (2.47 | ) | (2.57 | ) | (1.80 | ) | (1.98 | ) | ||||||||||
|
|
|
|
|
|
|
|
|
| |||||||||||
Net asset value, end of period | $ | 17.67 | $ | 21.30 | $ | 25.50 | $ | 27.34 | $ | 26.77 | ||||||||||
|
|
|
|
|
|
|
|
|
| |||||||||||
Total Return(b) | (5.48 | )% | (7.82 | )% | 2.73 | % | 9.08 | % | 1.02 | % | ||||||||||
Ratios/Supplemental Data: | ||||||||||||||||||||
Net assets, end of period (000’s) | $ | 1,170,559 | $ | 1,531,528 | $ | 3,218,116 | $ | 3,219,098 | $ | 2,849,316 | ||||||||||
Net operating expenses to average daily net assets(c) | 0.49 | % | 0.48 | % | 0.49 | % | 0.48 | % | 0.47 | % | ||||||||||
Interest and/or dividend expenses and/or borrowing costs to average daily net assets(d) | 0.00 | %(e) | — | 0.00 | %(e) | 0.01 | % | 0.02 | % | |||||||||||
Total net expenses to average daily net assets(c) | 0.49 | % | 0.48 | % | 0.49 | % | 0.49 | % | 0.49 | % | ||||||||||
Net investment income (loss) to average daily net assets(a) | 6.78 | % | 5.56 | % | 5.38 | % | 5.22 | % | 5.04 | % | ||||||||||
Portfolio turnover rate(f) | 32 | % | 34 | % | 56 | % | 41 | % | 15 | % | ||||||||||
Fees and expenses reimbursed and/or waived by GMO to average daily net assets: | — | 0.00 | %(e) (g) | 0.00 | %(e) (g) | 0.00 | %(e) (g) | 0.00 | %(e) (g) | |||||||||||
Purchase premiums and redemption fees consisted of the following per share amounts (Note 2):† | $ | 0.02 | $ | 0.02 | $ | 0.03 | $ | 0.03 | $ | 0.03 | ||||||||||
| (a) | Net investment income is affected by the timing of the declaration of dividends by the other GMO Funds and/or other investment companies in which the Fund invests, if any. |
| (b) | The total returns would have been lower had certain expenses not been reimbursed and/or waived during the periods shown, if applicable, and assumes the effect of reinvested distributions, if any. Calculation excludes purchase premiums and redemption fees which are borne by the shareholder purchasing or redeeming Fund shares, if any. |
| (c) | Net expenses exclude expenses incurred indirectly through investment in the underlying funds, if any (Note 5). |
| (d) | Interest and dividend expense and/or borrowing costs incurred as a result of cash collateral on derivatives, entering into reverse repurchase agreements, securities sold short or margin on cleared swap contracts, if any, is included in the Fund’s net expenses. Income earned on investing proceeds from reverse repurchase agreements, if any, is included in interest income. |
| (e) | Rounds to less than 0.01%. |
| (f) | The portfolio turnover rate excludes investments in GMO U.S. Treasury Fund (“USTF”) which is used as a short-term investment vehicle for cash management. The Fund’s portfolio turnover rate including transactions in USTF during the period and/or year ended: |
| February 28, | February 28, | February 28, | February 29, | February 28, | ||||||||||||||||
| 2023 | 2022 | 2021 | 2020 | 2019 | ||||||||||||||||
Portfolio turnover rate including transactions in USTF | 32 | % | 33 | % | 55 | % | 40 | % | 15 | % | ||||||||||
| (g) | Ratio includes indirect fees waived or borne by GMO. |
| † | Calculated using average shares outstanding throughout the period. |
| 77 | See accompanying notes to the financial statements. |
GMO Trust Funds
Financial Highlights — (Continued)
(For a share outstanding throughout each period)
EMERGING COUNTRY DEBT FUND (continued)
| Class VI Shares | ||||||||
| Period from | ||||||||
| July 29, 2021 | ||||||||
| (commencement | ||||||||
| of operations) | ||||||||
| Year Ended | through | |||||||
| February 28, | February 28, | |||||||
| 2023 | 2022 | |||||||
Net asset value, beginning of period | $ | 21.30 | $ | 25.89 | ||||
|
|
|
| |||||
Income (loss) from investment operations: | ||||||||
Net investment income (loss)(a)† | 1.27 | 0.77 | ||||||
Net realized and unrealized gain (loss) | (2.51 | ) | (3.60 | ) | ||||
|
|
|
| |||||
Total from investment operations | (1.24 | ) | (2.83 | ) | ||||
|
|
|
| |||||
Less distributions to shareholders: | ||||||||
From net investment income | (2.40 | ) | (1.55 | ) | ||||
From net realized gains | — | (0.21 | ) | |||||
|
|
|
| |||||
Total distributions | (2.40 | ) | (1.76 | ) | ||||
|
|
|
| |||||
Net asset value, end of period | $ | 17.66 | $ | 21.30 | ||||
|
|
|
| |||||
Total Return(b) | (5.49 | )% | (11.63 | )%** | ||||
Ratios/Supplemental Data: | ||||||||
Net assets, end of period (000’s) | $ | 392,813 | $ | 1,255,123 | ||||
Net operating expenses to average daily net assets(c) | 0.44 | % | 0.43 | %* | ||||
Interest and/or dividend expenses and/or borrowing costs to average daily net assets(d) | 0.00 | %(e) | — | |||||
Total net expenses to average daily net assets(c) | 0.44 | % | 0.43 | %* | ||||
Net investment income (loss) to average daily net assets(a) | 6.68 | % | 5.35 | %* | ||||
Portfolio turnover rate(f) | 32 | % | 34 | %** | ||||
Fees and expenses reimbursed and/or waived by GMO to average daily net assets: | — | 0.00 | %(e)(g)* | |||||
Purchase premiums and redemption fees consisted of the following per share amounts (Note 2):† | $ | 0.02 | $ | 0.01 | ||||
| (a) | Net investment income is affected by the timing of the declaration of dividends by the other GMO Funds and/or other investment companies in which the Fund invests, if any. |
| (b) | The total returns would have been lower had certain expenses not been reimbursed and/or waived during the periods shown, if applicable, and assumes the effect of reinvested distributions, if any. Calculation excludes purchase premiums and redemption fees which are borne by the shareholder purchasing or redeeming Fund shares, if any. |
| (c) | Net expenses exclude expenses incurred indirectly through investment in the underlying funds, if any (Note 5). |
| (d) | Interest and dividend expense and/or borrowing costs incurred as a result of cash collateral on derivatives, entering into reverse repurchase agreements, securities sold short or margin on cleared swap contracts, if any, is included in the Fund’s net expenses. Income earned on investing proceeds from reverse repurchase agreements, if any, is included in interest income. |
| (e) | Rounds to less than 0.01%. |
| (f) | The portfolio turnover rate excludes investments in GMO U.S. Treasury Fund (“USTF”) which is used as a short-term investment vehicle for cash management. The Fund’s portfolio turnover rate including transactions in USTF during the period and/or year ended: |
| February 28, | February 28, | |||||||
| 2023 | 2022 | |||||||
Portfolio turnover rate including transactions in USTF | 32 | % | 33 | % | ||||
| (g) | Ratio includes indirect fees waived or borne by GMO. |
| † | Calculated using average shares outstanding throughout the period. |
| * | Annualized. |
| ** | Not annualized. |
| See accompanying notes to the financial statements. | 78 |
GMO Trust Funds
Financial Highlights — (Continued)
(For a share outstanding throughout each period)
HIGH YIELD FUND
| Class VI Shares | ||||||||||||||||||||
Period from June 25, 2018 (commencement of operations) through | ||||||||||||||||||||
| Year Ended February 28/29, | February 28, | |||||||||||||||||||
| 2023 | 2022 | 2021 | 2020 | 2019 | ||||||||||||||||
Net asset value, beginning of period | $ | 18.61 | $ | 20.90 | $ | 19.94 | $ | 20.21 | $ | 20.00 | ||||||||||
|
|
|
|
|
|
|
|
|
| |||||||||||
Income (loss) from investment operations: | ||||||||||||||||||||
Net investment income (loss)(a)† | 0.32 | 0.21 | 0.64 | 0.48 | 0.27 | |||||||||||||||
Net realized and unrealized gain (loss) | (0.87 | ) | 0.13 | 0.77 | 0.82 | 0.71 | ||||||||||||||
|
|
|
|
|
|
|
|
|
| |||||||||||
Total from investment operations | (0.55 | ) | 0.34 | 1.41 | 1.30 | 0.98 | ||||||||||||||
|
|
|
|
|
|
|
|
|
| |||||||||||
Less distributions to shareholders: | ||||||||||||||||||||
From net investment income | (1.30 | ) | (0.68 | ) | (0.40 | ) | (1.57 | ) | (0.61 | ) | ||||||||||
From net realized gains | (0.03 | ) | (1.95 | ) | (0.05 | ) | — | (0.16 | ) | |||||||||||
|
|
|
|
|
|
|
|
|
| |||||||||||
Total distributions | (1.33 | ) | (2.63 | ) | (0.45 | ) | (1.57 | ) | (0.77 | ) | ||||||||||
|
|
|
|
|
|
|
|
|
| |||||||||||
Net asset value, end of period | $ | 16.73 | $ | 18.61 | $ | 20.90 | $ | 19.94 | $ | 20.21 | ||||||||||
|
|
|
|
|
|
|
|
|
| |||||||||||
Total Return(b) | (2.90 | )% | 1.35 | % | 7.21 | % | 6.40 | % | 5.07 | %** | ||||||||||
Ratios/Supplemental Data: | ||||||||||||||||||||
Net assets, end of period (000’s) | $ | 257,215 | $ | 84,586 | $ | 94,545 | $ | 161,449 | $ | 212,762 | ||||||||||
Net operating expenses to average daily net assets(c) | 0.46 | % | 0.51 | % | 0.52 | %(d) | 0.52 | %(d) | 0.51 | %(d)* | ||||||||||
Interest and/or dividend expenses and/or borrowing costs to average daily net assets(e) | 0.00 | %(f) | 0.00 | %(f) | 0.00 | %(f) | 0.03 | % | 0.04 | %* | ||||||||||
Total net expenses to average daily net assets(c) | 0.46 | % | 0.51 | % | 0.52 | %(d) | 0.55 | %(d) | 0.55 | %(d)* | ||||||||||
Net investment income (loss) to average daily net assets(a) | 1.86 | % | 1.05 | % | 3.23 | % | 2.34 | % | 2.00 | %* | ||||||||||
Portfolio turnover rate(g) | 31 | % | 98 | % | 288 | % | 105 | % | 81 | %** | ||||||||||
Fees and expenses reimbursed and/or waived by GMO to average daily net assets: | 0.01 | % | 0.03 | % | 0.00 | %(f)(h) | 0.00 | %(f)(h) | 0.12 | %* | ||||||||||
| (a) | Net investment income is affected by the timing of the declaration of dividends by the other GMO Funds and/or other investment companies in which the Fund invests, if any. |
| (b) | The total returns would have been lower had certain expenses not been reimbursed and/or waived during the periods shown, if applicable, and assumes the effect of reinvested distributions, if any. Calculation excludes purchase premiums and redemption fees which are borne by the shareholder purchasing or redeeming Fund shares, if any. |
| (c) | Net expenses exclude expenses incurred indirectly through investment in the underlying funds, if any (Note 5). |
| (d) | Includes recoupment of past reimbursed and/or waived fees (Note 5). |
| (e) | Interest expense incurred as a result of entering into reverse repurchase agreements, securities sold short or margin on cleared swap contracts, if any, is included in the Fund’s net expenses. Income earned on investing proceeds from reverse repurchase agreements, if any, is included in interest income. |
| (f) | Rounds to less than 0.01%. |
| (g) | The portfolio turnover rate excludes investments in GMO U.S. Treasury Fund (“USTF”) which is used as a short-term investment vehicle for cash management. The Fund’s portfolio turnover rate including transactions in USTF during the period and/or year ended: |
| February 28, 2023 | February 28, 2022 | February 28, 2021 | February 29, 2020 | February 28, 2019 | ||||||||||||||||
Portfolio turnover rate including transactions in USTF | N/A | N/A | 317 | % | 214 | % | 159 | % | ||||||||||||
| (h) | Ratio includes indirect fees waived or borne by GMO. |
| † | Calculated using average shares outstanding throughout the period. |
| * | Annualized. |
| ** | Not annualized. |
| 79 | See accompanying notes to the financial statements. |
GMO Trust Funds
Financial Highlights — (Continued)
(For a share outstanding throughout each period)
MULTI-SECTOR FIXED INCOME FUND
| Class III Shares | ||||||||||||||||||||
| Year Ended February 28/29, | ||||||||||||||||||||
| 2023 | 2022 | 2021 | 2020 | 2019 | ||||||||||||||||
Net asset value, beginning of period | $ | 18.84 | $ | 20.13 | $ | 22.19 | $ | 20.88 | $ | 20.93 | ||||||||||
|
|
|
|
|
|
|
|
|
| |||||||||||
Income (loss) from investment operations: | ||||||||||||||||||||
Net investment income (loss)(a)† | 0.47 | 0.27 | 0.43 | 0.53 | 0.51 | |||||||||||||||
Net realized and unrealized gain (loss) | (2.45 | ) | (0.99 | ) | (0.24 | )(b) | 2.01 | 0.49 | ||||||||||||
|
|
|
|
|
|
|
|
|
| |||||||||||
Total from investment operations | (1.98 | ) | (0.72 | ) | 0.19 | 2.54 | 1.00 | |||||||||||||
|
|
|
|
|
|
|
|
|
| |||||||||||
Less distributions to shareholders: | ||||||||||||||||||||
From net investment income | (0.32 | ) | — | (0.93 | ) | (0.64 | ) | (1.05 | ) | |||||||||||
From net realized gains | — | (0.57 | ) | (1.32 | ) | (0.59 | ) | — | ||||||||||||
|
|
|
|
|
|
|
|
|
| |||||||||||
Total distributions | (0.32 | ) | (0.57 | ) | (2.25 | ) | (1.23 | ) | (1.05 | ) | ||||||||||
|
|
|
|
|
|
|
|
|
| |||||||||||
Net asset value, end of period | $ | 16.54 | $ | 18.84 | $ | 20.13 | $ | 22.19 | $ | 20.88 | ||||||||||
|
|
|
|
|
|
|
|
|
| |||||||||||
Total Return(c) | (10.54 | )% | (3.74 | )% | 0.59 | % | 12.38 | % | 4.88 | % | ||||||||||
Ratios/Supplemental Data: | ||||||||||||||||||||
Net assets, end of period (000’s) | $ | 14,757 | $ | 8,803 | $ | 31,602 | $ | 80,639 | $ | 84,163 | ||||||||||
Net operating expenses to average daily net assets(d) | 0.29 | % | 0.31 | % | 0.30 | % | 0.29 | % | 0.29 | % | ||||||||||
Interest and/or dividend expenses and/or borrowing costs to average daily net assets(e) | 0.00 | %(f) | 0.00 | %(f) | 0.00 | %(f) | 0.00 | %(f) | 0.00 | %(f) | ||||||||||
Total net expenses to average daily net assets(d) | 0.29 | % | 0.31 | % | 0.30 | % | 0.29 | % | 0.29 | % | ||||||||||
Net investment income (loss) to average daily net assets(a) | 2.70 | % | 1.33 | % | 1.98 | % | 2.43 | % | 2.41 | % | ||||||||||
Portfolio turnover rate(g) | 326 | % | 256 | % | 262 | % | 215 | % | 201 | % | ||||||||||
Fees and expenses reimbursed and/or waived by GMO to average daily net assets:(h) | 0.33 | % | 0.24 | % | 0.19 | % | 0.16 | % | 0.16 | % | ||||||||||
| (a) | Net investment income is affected by the timing of the declaration of dividends by the other GMO Funds and/or other investment companies in which the Fund invests, if any. |
| (b) | The amount shown for a share outstanding does not correspond with the aggregate net realized and unrealized gain (loss) on investments due to the timing of purchases and redemptions of Fund shares in relation to fluctuating market values of the investments of the Fund. |
| (c) | The total returns would have been lower had certain expenses not been reimbursed and/or waived during the periods shown, if applicable, and assumes the effect of reinvested distributions, if any. Calculation excludes purchase premiums and redemption fees which are borne by the shareholder purchasing or redeeming Fund shares, if any. |
| (d) | Net expenses exclude expenses incurred indirectly through investment in the underlying funds, if any (Note 5). |
| (e) | Interest expense incurred as a result of entering into reverse repurchase agreements, securities sold short or margin on cleared swap contracts, if any, is included in the Fund’s net expenses. Income earned on investing proceeds from reverse repurchase agreements, if any, is included in interest income. |
| (f) | Rounds to less than 0.01%. |
| (g) | The portfolio turnover rate excludes investments in GMO U.S. Treasury Fund (“USTF”) which is used as a short-term investment vehicle for cash management. The Fund’s portfolio turnover rate including transactions in USTF during the period and/or year ended: |
| February 28, 2023 | February 28, 2022 | February 28, 2021 | February 29, 2020 | February 28, 2019 | ||||||||||||||||
Portfolio turnover rate including transactions in USTF | 329 | % | 263 | % | 335 | % | 285 | % | 250 | % | ||||||||||
| (h) | Ratio includes indirect fees waived or borne by GMO. |
| † | Calculated using average shares outstanding throughout the period. |
| See accompanying notes to the financial statements. | 80 |
GMO Trust Funds
Financial Highlights — (Continued)
(For a share outstanding throughout each period)
MULTI-SECTOR FIXED INCOME FUND (continued)
| Class IV Shares | ||||||||||||||||||||
| Year Ended February 28/29, | ||||||||||||||||||||
| 2023 | 2022 | 2021 | 2020 | 2019 | ||||||||||||||||
Net asset value, beginning of period | $ | 18.93 | $ | 20.20 | $ | 22.26 | $ | 20.94 | $ | 20.98 | ||||||||||
|
|
|
|
|
|
|
|
|
| |||||||||||
Income (loss) from investment operations: | ||||||||||||||||||||
Net investment income (loss)(a)† | 0.47 | 0.28 | 0.35 | 0.54 | 0.48 | |||||||||||||||
Net realized and unrealized gain (loss) | (2.46 | ) | (0.98 | ) | (0.16 | )(b) | 2.02 | 0.53 | ||||||||||||
|
|
|
|
|
|
|
|
|
| |||||||||||
Total from investment operations | (1.99 | ) | (0.70 | ) | 0.19 | 2.56 | 1.01 | |||||||||||||
|
|
|
|
|
|
|
|
|
| |||||||||||
Less distributions to shareholders: | ||||||||||||||||||||
From net investment income | (0.33 | ) | — | (0.93 | ) | (0.65 | ) | (1.05 | ) | |||||||||||
From net realized gains | — | (0.57 | ) | (1.32 | ) | (0.59 | ) | — | ||||||||||||
|
|
|
|
|
|
|
|
|
| |||||||||||
Total distributions | (0.33 | ) | (0.57 | ) | (2.25 | ) | (1.24 | ) | (1.05 | ) | ||||||||||
|
|
|
|
|
|
|
|
|
| |||||||||||
Net asset value, end of period | $ | 16.61 | $ | 18.93 | $ | 20.20 | $ | 22.26 | $ | 20.94 | ||||||||||
|
|
|
|
|
|
|
|
|
| |||||||||||
Total Return(c) | (10.56 | )% | (3.63 | )% | 0.59 | % | 12.44 | % | 4.93 | % | ||||||||||
Ratios/Supplemental Data: | ||||||||||||||||||||
Net assets, end of period (000’s) | $ | 89,113 | $ | 116,178 | $ | 133,862 | $ | 449,655 | $ | 580,456 | ||||||||||
Net operating expenses to average daily net assets(d) | 0.24 | % | 0.25 | % | 0.24 | % | 0.24 | % | 0.24 | % | ||||||||||
Interest and/or dividend expenses and/or borrowing costs to average daily net assets(e) | 0.00 | %(f) | 0.00 | %(f) | 0.00 | %(f) | 0.00 | %(f) | 0.00 | %(f) | ||||||||||
Total net expenses to average daily net assets(d) | 0.24 | % | 0.25 | % | 0.24 | % | 0.24 | % | 0.24 | % | ||||||||||
Net investment income (loss) to average daily net assets(a) | 2.70 | % | 1.39 | % | 1.57 | % | 2.47 | % | 2.29 | % | ||||||||||
Portfolio turnover rate(g) | 326 | % | 256 | % | 262 | % | 215 | % | 201 | % | ||||||||||
Fees and expenses reimbursed and/or waived by GMO to average daily net assets:(h) | 0.33 | % | 0.25 | % | 0.19 | % | 0.16 | % | 0.15 | % | ||||||||||
| (a) | Net investment income is affected by the timing of the declaration of dividends by the other GMO Funds and/or other investment companies in which the Fund invests, if any. |
| (b) | The amount shown for a share outstanding does not correspond with the aggregate net realized and unrealized gain (loss) on investments due to the timing of purchases and redemptions of Fund shares in relation to fluctuating market values of the investments of the Fund. |
| (c) | The total returns would have been lower had certain expenses not been reimbursed and/or waived during the periods shown, if applicable, and assumes the effect of reinvested distributions, if any. Calculation excludes purchase premiums and redemption fees which are borne by the shareholder purchasing or redeeming Fund shares, if any. |
| (d) | Net expenses exclude expenses incurred indirectly through investment in the underlying funds, if any (Note 5). |
| (e) | Interest expense incurred as a result of entering into reverse repurchase agreements, securities sold short or margin on cleared swap contracts, if any, is included in the Fund’s net expenses. Income earned on investing proceeds from reverse repurchase agreements, if any, is included in interest income. |
| (f) | Rounds to less than 0.01%. |
| (g) | The portfolio turnover rate excludes investments in GMO U.S. Treasury Fund (“USTF”) which is used as a short-term investment vehicle for cash management. The Fund’s portfolio turnover rate including transactions in USTF during the period and/or year ended: |
| February 28, 2023 | February 28, 2022 | February 28, 2021 | February 29, 2020 | February 28, 2019 | ||||||||||||||||
Portfolio turnover rate including transactions in USTF | 329 | % | 263 | % | 335 | % | 285 | % | 250 | % | ||||||||||
| (h) | Ratio includes indirect fees waived or borne by GMO. |
| † | Calculated using average shares outstanding throughout the period. |
| 81 | See accompanying notes to the financial statements. |
GMO Trust Funds
Financial Highlights — (Continued)
(For a share outstanding throughout each period)
OPPORTUNISTIC INCOME FUND
| Class III Shares | ||||||||||||
| Year Ended February 28 | Period from February 1, 2022 (commencement of operations) through February 28, | Period from July 21, 2021 (commencement of operations) through December 28, | ||||||||||
| 2023 | 2022 | 2021 | ||||||||||
Net asset value, beginning of period | $ | 25.56 | $ | 25.66 | $ | 25.88 | ||||||
|
|
|
|
|
| |||||||
Income (loss) from investment operations: | ||||||||||||
Net investment income (loss)(a)† | 1.05 | 0.07 | 0.44 | |||||||||
Net realized and unrealized gain (loss) | (1.23 | ) | (0.17 | ) | (0.33 | ) | ||||||
|
|
|
|
|
| |||||||
Total from investment operations | (0.18 | ) | (0.10 | ) | 0.11 | |||||||
|
|
|
|
|
| |||||||
Less distributions to shareholders: | ||||||||||||
From net investment income | (0.90 | ) | — | (0.42 | ) | |||||||
From net realized gains | (0.37 | ) | — | — | ||||||||
|
|
|
|
|
| |||||||
Total distributions | (1.27 | ) | — | (0.42 | ) | |||||||
|
|
|
|
|
| |||||||
Net asset value, end of period | $ | 24.11 | $ | 25.56 | $ | 25.57 | ||||||
|
|
|
|
|
| |||||||
Total Return(b) | (0.66 | )% | (0.39 | )%** | 0.43 | %** | ||||||
Ratios/Supplemental Data: | ||||||||||||
Net assets, end of period (000’s) | $ | 48,101 | $ | 12,281 | $ | 13,847 | ||||||
Net operating expenses to average daily net assets(c) | 0.56 | % | 0.70 | %* | 0.56 | %* | ||||||
Interest and/or dividend expenses to average daily net assets(d) | 0.00 | %(e) | 0.00 | %(e)* | 0.00 | %(e)* | ||||||
Total net expenses to average daily net assets(c) | 0.56 | % | 0.70 | %* | 0.56 | %* | ||||||
Net investment income (loss) to average daily net assets(a) | 4.19 | % | 3.92 | %* | 3.84 | %* | ||||||
Portfolio turnover rate(f) | 73 | % | 95 | %** | 95 | %** | ||||||
Fees and expenses reimbursed and/or waived by GMO to average daily net assets: | 0.06 | % | 0.08 | %* | 0.04 | %* | ||||||
| (a) | Net investment income is affected by the timing of the declaration of dividends by the other GMO Funds and/or other investment companies in which the Fund invests, if any. |
| (b) | The total returns would have been lower had certain expenses not been reimbursed and/or waived during the periods shown, if applicable, and assumes the effect of reinvested distributions, if any. Calculation excludes purchase premiums and redemption fees which are borne by the shareholder purchasing or redeeming Fund shares, if any. |
| (c) | Net expenses exclude expenses incurred indirectly through investment in the underlying funds, if any (Note 5). |
| (d) | Interest and dividend expense and/or borrowing costs incurred as a result of cash collateral on derivatives, entering into reverse repurchase agreements, securities sold short or margin on cleared swap contracts, if any, is included in the Fund’s net expenses. Income earned on investing proceeds from reverse repurchase agreements, if any, is included in interest income. |
| (e) | Rounds to less than 0.01%. |
| (f) | The portfolio turnover rate excludes investments in GMO U.S. Treasury Fund (“USTF”) which is used as a short-term investment vehicle for cash management. The Fund’s portfolio turnover rate including transactions in USTF during the period and/or year ended: |
| February 28, 2023 | February 28, 2022 | February 28, 2021 | ||||||||||
Portfolio turnover rate including transactions in USTF | 72 | % | 94 | % | 45 | % | ||||||
| † | Calculated using average shares outstanding throughout the period. |
| * | Annualized. |
| ** | Not annualized. |
| See accompanying notes to the financial statements. | 82 |
GMO Trust Funds
Financial Highlights — (Continued)
(For a share outstanding throughout each period)
OPPORTUNISTIC INCOME FUND (continued)
| Class VI Shares | ||||||||||||||||||||
| Year Ended February 28/29, | ||||||||||||||||||||
| 2023 | 2022 | 2021 | 2020 | 2019 | ||||||||||||||||
Net asset value, beginning of period | $ | 25.56 | $ | 25.84 | $ | 26.15 | $ | 26.21 | $ | 26.41 | ||||||||||
|
|
|
|
|
|
|
|
|
| |||||||||||
Income (loss) from investment operations: | ||||||||||||||||||||
Net investment income (loss)(a)† | 1.11 | 0.81 | 1.06 | 1.46 | 1.32 | |||||||||||||||
Net realized and unrealized gain (loss) | (1.27 | ) | (0.55 | ) | (0.31 | ) | (0.06 | ) | (0.38 | ) | ||||||||||
|
|
|
|
|
|
|
|
|
| |||||||||||
Total from investment operations | (0.16 | ) | 0.26 | 0.75 | 1.40 | 0.94 | ||||||||||||||
|
|
|
|
|
|
|
|
|
| |||||||||||
Less distributions to shareholders: | ||||||||||||||||||||
From net investment income | (0.93 | ) | (0.54 | ) | (1.06 | ) | (1.46 | ) | (1.14 | ) | ||||||||||
From net realized gains | (0.37 | ) | — | — | — | — | ||||||||||||||
|
|
|
|
|
|
|
|
|
| |||||||||||
Total distributions | (1.30 | ) | (0.54 | ) | (1.06 | ) | (1.46 | ) | (1.14 | ) | ||||||||||
|
|
|
|
|
|
|
|
|
| |||||||||||
Net asset value, end of period | $ | 24.10 | $ | 25.56 | $ | 25.84 | $ | 26.15 | $ | 26.21 | ||||||||||
|
|
|
|
|
|
|
|
|
| |||||||||||
Total Return(b) | (0.58 | )% | 1.00 | % | 2.95 | % | 5.45 | % | 3.58 | % | ||||||||||
Ratios/Supplemental Data: | ||||||||||||||||||||
Net assets, end of period (000’s) | $ | 389,295 | $ | 375,117 | $ | 477,457 | $ | 825,876 | $ | 1,001,146 | ||||||||||
Net operating expenses to average daily net assets(c) | 0.47 | % | 0.47 | % | 0.47 | % | 0.47 | % | 0.49 | % | ||||||||||
Interest and/or dividend expenses and/or borrowing costs to average daily net assets(d) | 0.00 | %(e) | 0.00 | %(e) | 0.00 | %(e) | 0.00 | %(e) | 0.00 | %(e) | ||||||||||
Total net expenses to average daily net assets(c) | 0.47 | % | 0.47 | % | 0.47 | % | 0.47 | % | 0.49 | % | ||||||||||
Net investment income (loss) to average daily net assets(a) | 4.52 | % | 3.13 | % | 4.12 | % | 5.50 | % | 4.99 | % | ||||||||||
Portfolio turnover rate(f) | 73 | % | 95 | % | 43 | % | 47 | % | 75 | % | ||||||||||
Fees and expenses reimbursed and/or waived by GMO to average daily net assets: | 0.05 | % | 0.05 | %(g) | 0.05 | %(g) | 0.04 | %(g) | 0.04 | % | ||||||||||
Purchase premiums and redemption fees consisted of the following per share amounts (Note 2):† | $ | — | $ | — | $ | — | $ | 0.01 | $ | 0.05 | ||||||||||
| (a) | Net investment income is affected by the timing of the declaration of dividends by the other GMO Funds and/or other investment companies in which the Fund invests, if any. |
| (b) | The total returns would have been lower had certain expenses not been reimbursed and/or waived during the periods shown, if applicable, and assumes the effect of reinvested distributions, if any. Calculation excludes purchase premiums and redemption fees which are borne by the shareholder purchasing or redeeming Fund shares, if any. |
| (c) | Net expenses exclude expenses incurred indirectly through investment in the underlying funds, if any (Note 5). |
| (d) | Interest and dividend expense and/or borrowing costs incurred as a result of cash collateral on derivatives, entering into reverse repurchase agreements, securities sold short or margin on cleared swap contracts, if any, is included in the Fund’s net expenses. Income earned on investing proceeds from reverse repurchase agreements, if any, is included in interest income. |
| (e) | Rounds to less than 0.01%. |
| (f) | The portfolio turnover rate excludes investments in GMO U.S. Treasury Fund (“USTF”) which is used as a short-term investment vehicle for cash management. The Fund’s portfolio turnover rate including transactions in USTF during the period and/or year ended: |
| February 28, 2023 | February 28, 2022 | February 28, 2021 | February 29, 2020 | February 28, 2019 | ||||||||||||||||
Portfolio turnover rate including transactions in USTF | 72 | % | 94 | % | 45 | % | 48 | % | 83 | % | ||||||||||
| (g) | Ratio includes indirect fees waived or borne by GMO. |
| † | Calculated using average shares outstanding throughout the period. |
| 83 | See accompanying notes to the financial statements. |
GMO Trust Funds
Financial Highlights — (Continued)
(For a share outstanding throughout each period)
OPPORTUNISTIC INCOME FUND (continued)
| Class R6 Shares | ||||||||
| Year Ended February 28, 2023 | Period from May 19, 2021 (commencement of operations) through February 28, 2022 | |||||||
Net asset value, beginning of period | $ | 25.48 | $ | 25.86 | ||||
|
|
|
| |||||
Income (loss) from investment operations: | ||||||||
Net investment income (loss)(a)† | 1.08 | 0.67 | ||||||
Net realized and unrealized gain (loss) | (1.27 | ) | (0.51 | ) | ||||
|
|
|
| |||||
Total from investment operations | (0.19 | ) | 0.16 | |||||
|
|
|
| |||||
Less distributions to shareholders: | ||||||||
From net investment income | (0.90 | ) | (0.54 | ) | ||||
From net realized gains | (0.37 | ) | — | |||||
|
|
|
| |||||
Total distributions | (1.27 | ) | (0.54 | ) | ||||
|
|
|
| |||||
Net asset value, end of period | $ | 24.02 | $ | 25.48 | ||||
|
|
|
| |||||
Total Return(b) | (0.68 | )% | 0.62 | %** | ||||
Ratios/Supplemental Data: | ||||||||
Net assets, end of period (000’s) | $ | 186,230 | $ | 152,877 | ||||
Net operating expenses to average daily net assets(c) | 0.56 | % | 0.58 | %* | ||||
Interest and/or dividend expenses and/or borrowing costs to average daily net assets(d) | 0.00 | %(e) | 0.00 | %(e)* | ||||
Total net expenses to average daily net assets(c) | 0.56 | % | 0.58 | %* | ||||
Net investment income (loss) to average daily net assets(a) | 4.42 | % | 3.29 | %* | ||||
Portfolio turnover rate(f) | 73 | % | 95 | %** | ||||
Fees and expenses reimbursed and/or waived by GMO to average daily net assets: | 0.05 | % | 0.05 | %* | ||||
| (a) | Net investment income is affected by the timing of the declaration of dividends by the other GMO Funds and/or other investment companies in which the Fund invests, if any. |
| (b) | The total returns would have been lower had certain expenses not been reimbursed and/or waived during the periods shown, if applicable, and assumes the effect of reinvested distributions, if any. Calculation excludes purchase premiums and redemption fees which are borne by the shareholder purchasing or redeeming Fund shares, if any. |
| (c) | Net expenses exclude expenses incurred indirectly through investment in the underlying funds, if any (Note 5). |
| (d) | Interest and dividend expense and/or borrowing costs incurred as a result of cash collateral on derivatives, entering into reverse repurchase agreements, securities sold short or margin on cleared swap contracts, if any, is included in the Fund’s net expenses. Income earned on investing proceeds from reverse repurchase agreements, if any, is included in interest income. |
| (e) | Rounds to less than 0.01%. |
| (f) | The portfolio turnover rate excludes investments in GMO U.S. Treasury Fund (“USTF”) which is used as a short-term investment vehicle for cash management. The Fund’s portfolio turnover rate including transactions in USTF during the period and/or year ended: |
| February 28, 2023 | February 28, 2022 | |||||||
Portfolio turnover rate including transactions in USTF | 72 | % | 94 | % | ||||
| † | Calculated using average shares outstanding throughout the period. |
| * | Annualized. |
| ** | Not annualized. |
| See accompanying notes to the financial statements. | 84 |
GMO Trust Funds
Financial Highlights — (Continued)
(For a share outstanding throughout each period)
OPPORTUNISTIC INCOME FUND (continued)
| Class I Shares | ||||||||||||||||
| Year Ended February 28, | Period from November 5, 2019 (commencement of operations) through February 29, | |||||||||||||||
| 2023 | 2022 | 2021 | 2020 | |||||||||||||
Net asset value, beginning of period | $ | 25.51 | $ | 25.80 | $ | 26.12 | $ | 26.85 | ||||||||
|
|
|
|
|
|
|
| |||||||||
Income (loss) from investment operations: | ||||||||||||||||
Net investment income (loss)(a)† | 1.06 | 0.77 | 0.89 | 0.54 | ||||||||||||
Net realized and unrealized gain (loss) | (1.26 | ) | (0.57 | ) | (0.18 | ) | (0.08 | ) | ||||||||
|
|
|
|
|
|
|
| |||||||||
Total from investment operations | (0.20 | ) | 0.20 | 0.71 | 0.46 | |||||||||||
|
|
|
|
|
|
|
| |||||||||
Less distributions to shareholders: | ||||||||||||||||
From net investment income | (0.88 | ) | (0.49 | ) | (1.03 | ) | (1.19 | ) | ||||||||
From net realized gains | (0.37 | ) | — | — | — | |||||||||||
|
|
|
|
|
|
|
| |||||||||
Total distributions | (1.25 | ) | (0.49 | ) | (1.03 | ) | (1.19 | ) | ||||||||
|
|
|
|
|
|
|
| |||||||||
Net asset value, end of period | $ | 24.06 | $ | 25.51 | $ | 25.80 | $ | 26.12 | ||||||||
|
|
|
|
|
|
|
| |||||||||
Total Return(b) | (0.73 | )% | 0.77 | % | 2.79 | % | 1.80 | %** | ||||||||
Ratios/Supplemental Data: | ||||||||||||||||
Net assets, end of period (000’s) | $ | 503,531 | $ | 443,602 | $ | 417,150 | $ | 22,684 | ||||||||
Net operating expenses to average daily net assets(c) | 0.66 | % | 0.67 | % | 0.68 | % | 0.66 | %* | ||||||||
Interest and/or dividend expenses and/or borrowing costs to average daily net assets(d) | 0.00 | %(e) | 0.00 | %(e) | 0.00 | %(e) | 0.00 | %(e)* | ||||||||
Total net expenses to average daily net assets(c) | 0.66 | % | 0.67 | % | 0.68 | % | 0.66 | %* | ||||||||
Net investment income (loss) to average daily net assets(a) | 4.33 | % | 2.97 | % | 3.47 | % | 6.55 | %* | ||||||||
Portfolio turnover rate(f) | 73 | % | 95 | % | 43 | % | 47 | %** | ||||||||
Fees and expenses reimbursed and/or waived by GMO to average daily net assets: | 0.05 | % | 0.05 | %(g) | 0.07 | %(g) | 0.07 | %(g)* | ||||||||
| (a) | Net investment income is affected by the timing of the declaration of dividends by the other GMO Funds and/or other investment companies in which the Fund invests, if any. |
| (b) | The total returns would have been lower had certain expenses not been reimbursed and/or waived during the periods shown, if applicable, and assumes the effect of reinvested distributions, if any. Calculation excludes purchase premiums and redemption fees which are borne by the shareholder purchasing or redeeming Fund shares, if any. |
| (c) | Net expenses exclude expenses incurred indirectly through investment in the underlying funds, if any (Note 5). |
| (d) | Interest and dividend expense and/or borrowing costs incurred as a result of cash collateral on derivatives, entering into reverse repurchase agreements, securities sold short or margin on cleared swap contracts, if any, is included in the Fund’s net expenses. Income earned on investing proceeds from reverse repurchase agreements, if any, is included in interest income. |
| (e) | Rounds to less than 0.01%. |
| (f) | The portfolio turnover rate excludes investments in GMO U.S. Treasury Fund (“USTF”) which is used as a short-term investment vehicle for cash management. The Fund’s portfolio turnover rate including transactions in USTF during the period and/or year ended: |
| February 28, 2023 | February 28, 2022 | February 28, 2021 | February 29, 2020 | |||||||||||||
Portfolio turnover rate including transactions in USTF | 72 | % | 94 | % | 45 | % | 48 | % | ||||||||
| (g) | Ratio includes indirect fees waived or borne by GMO. |
| † | Calculated using average shares outstanding throughout the period. |
| * | Annualized. |
| ** | Not annualized. |
| 85 | See accompanying notes to the financial statements. |
GMO Trust Funds
Financial Highlights — (Continued)
(For a share outstanding throughout each period)
U.S. TREASURY FUND
| Core Shares | ||||||||||||||||||||
| Year Ended February 28/29, | ||||||||||||||||||||
| 2023 | 2022 | 2021 | 2020 | 2019(a) | ||||||||||||||||
Net asset value, beginning of period | $ | 5.01 | $ | 5.04 | $ | 5.02 | $ | 5.00 | $ | 5.00 | ||||||||||
|
|
|
|
|
|
|
|
|
| |||||||||||
Income (loss) from investment operations: | ||||||||||||||||||||
Net investment income (loss)† | 0.13 | 0.01 | 0.01 | 0.10 | 0.10 | |||||||||||||||
Net realized and unrealized gain (loss) | (0.03 | ) | (0.04 | ) | 0.02 | 0.02 | 0.01 | |||||||||||||
|
|
|
|
|
|
|
|
|
| |||||||||||
Total from investment operations | 0.10 | (0.03 | ) | 0.03 | 0.12 | 0.11 | ||||||||||||||
|
|
|
|
|
|
|
|
|
| |||||||||||
Less distributions to shareholders: | ||||||||||||||||||||
From net investment income | (0.12 | ) | (0.00 | )(b) | (0.01 | ) | (0.10 | ) | (0.11 | ) | ||||||||||
From net realized gains | — | (0.00 | )(b) | (0.00 | )(b) | — | — | |||||||||||||
|
|
|
|
|
|
|
|
|
| |||||||||||
Total distributions | (0.12 | ) | (0.00 | )(b) | (0.01 | ) | (0.10 | ) | (0.11 | ) | ||||||||||
|
|
|
|
|
|
|
|
|
| |||||||||||
Net asset value, end of period | $ | 4.99 | $ | 5.01 | $ | 5.04 | $ | 5.02 | $ | 5.00 | ||||||||||
|
|
|
|
|
|
|
|
|
| |||||||||||
Total Return(c) | 2.00 | % | (0.37 | )% | 0.63 | % | 2.47 | % | 2.16 | % | ||||||||||
Ratios/Supplemental Data: | ||||||||||||||||||||
Net assets, end of period (000’s) | $ | 408,457 | $ | 257,766 | $ | 382,455 | $ | 222,762 | $ | 635,777 | ||||||||||
Net expenses to average daily net assets | 0.01 | % | 0.02 | % | 0.08 | % | 0.06 | % | 0.00 | %(d) | ||||||||||
Net investment income (loss) to average daily net assets | 2.60 | % | 0.13 | % | 0.20 | % | 2.03 | % | 1.97 | % | ||||||||||
Portfolio turnover rate(e) | 0 | % | 0 | % | 0 | % | 0 | % | 0 | % | ||||||||||
Fees and expenses reimbursed and/or waived by GMO to average daily net assets: | 0.12 | % | 0.10 | % | 0.03 | % | 0.05 | % | 0.10 | % | ||||||||||
| (a) | Per share amounts were adjusted to reflect an approximate 5 for 1 stock split effective December 6, 2018. |
| (b) | Rounds to less than $0.01. |
| (c) | The total returns would have been lower had certain expenses not been reimbursed and/or waived during the periods shown, if applicable, and assumes the effect of reinvested distributions, if any. Calculation excludes purchase premiums and redemption fees which are borne by the shareholder purchasing or redeeming Fund shares, if any. |
| (d) | Rounds to less than 0.01%. |
| (e) | Portfolio turnover rate calculation excludes short-term investments. |
| † | Calculated using average shares outstanding throughout the period. |
| See accompanying notes to the financial statements. | 86 |
GMO Trust Funds
February 28, 2023
| 1. | Organization |
Each of Asset Allocation Bond Fund, Emerging Country Debt Fund, High Yield Fund, Multi-Sector Fixed Income Fund, Opportunistic Income Fund and U.S. Treasury Fund (each a “Fund” and collectively the “Funds”) is a series of GMO Trust (the “Trust”). The Trust is registered under the Investment Company Act of 1940, as amended (the “1940 Act”), as an open-end management investment company. The Trust was established as a Massachusetts business trust under the laws of The Commonwealth of Massachusetts on June 24, 1985. The Declaration of Trust permits the Trustees of the Trust (“Trustees”) to create an unlimited number of series of shares (Funds) and to subdivide Funds into classes. The Funds are advised and managed by Grantham, Mayo, Van Otterloo & Co. LLC (“GMO”).
The Funds may invest in GMO U.S. Treasury Fund and in money market funds unaffiliated with GMO.
Many of the Funds may invest without limitation in other GMO Funds (“underlying funds”). In particular, pursuant to an exemptive order granted by the Securities and Exchange Commission (“SEC”), some of the Funds may invest in Emerging Country Debt Fund, Opportunistic Income Fund and U.S. Treasury Fund. The financial statements of the underlying funds should be read in conjunction with the Funds’ financial statements. The financial statements are available without charge on the SEC’s website at www.sec.gov or on GMO’s website at www.gmo.com.
The following table provides information about the Funds’ principal investment objectives and benchmarks (if any):
| Fund Name | Benchmark | Investment Objective | ||
| Asset Allocation Bond Fund | FTSE 3-Month Treasury Bill Index | Total return in excess of benchmark | ||
| Emerging Country Debt Fund | J.P. Morgan EMBI Global Diversified | Total return in excess of benchmark | ||
| High Yield Fund | Markit iBoxx USD Liquid High Yield Index | Total return in excess of benchmark | ||
| Multi-Sector Fixed Income Fund | Bloomberg U.S. Aggregate Index | Total return in excess of benchmark | ||
| Opportunistic Income Fund | Not Applicable | Capital appreciation and current income | ||
| U.S. Treasury Fund | Not Applicable | Liquidity and safety of principal with current income as a secondary objective |
Asset Allocation Bond Fund currently limits subscriptions.
| 2. | Significant accounting policies |
The following is a summary of significant accounting policies followed by each Fund in the preparation of its financial statements. These policies are in conformity with accounting principles generally accepted in the United States of America (“U.S. GAAP”) and have been consistently followed by the Funds in preparing these financial statements. The preparation of financial statements in accordance with U.S. GAAP requires management to make estimates and assumptions that affect the reported amounts and disclosures in the financial statements. Actual results could differ from those estimates. The accounting records of the Funds are maintained in U.S. dollars.
Portfolio valuation
Typically, the Funds and the underlying funds value fixed income securities at the most recent price supplied by a pricing source determined by GMO. GMO evaluates pricing sources on an ongoing basis and may change a pricing source at any time. GMO monitors erratic or unusual movements (including unusual inactivity) in the prices supplied for a security and has discretion to override a price supplied by a source (e.g., by taking a price supplied by another source) when it believes that the price supplied is not reliable. Alternative pricing sources are often but not always available for securities held by the Funds and the underlying funds.
Exchange-traded securities (other than exchange-traded options) for which market quotations are readily available are valued at (i) the last sale price or (ii) official closing price or (iii) most recent quoted price published by the exchange (if no reported last sale or official closing price) or (iv) the quoted price provided by a pricing source (in the event GMO deems the private market to be a more reliable indicator of market value than the exchange). Exchange-traded options are valued at the last sale price, provided that price is between the closing bid and ask prices. If the last sale price is not within that range, then they will be valued at the closing bid price for long positions and the closing ask price for short positions. Cleared derivatives are valued using the price quoted (which may be based on a model) by the relevant clearing house. If an updated quote for a cleared derivative is not available when a Fund calculates its net asset
87
GMO Trust Funds
Notes to Financial Statements — (Continued)
February 28, 2023
value, the derivative will generally be valued using an industry standard model, which may differ from the model used by the relevant clearing house. Over-the-counter (“OTC”) derivatives are generally valued at the price determined by an industry standard model. Unlisted securities for which market quotations are readily available are generally valued at the most recent quoted price. Shares of the underlying funds and other open-end registered investment companies are valued at their most recent net asset value.
The foregoing valuation methodologies are modified for equities that trade in non-U.S. securities markets that close before the close of the New York Stock Exchange (“NYSE”) due to time zone differences, including the value of equities that underlie futures, options and other derivatives (to the extent the market for those derivatives closes prior to the close of the NYSE). In those cases, the price will generally be adjusted, to the extent practicable and available, based on inputs from an independent pricing service approved by the Trustees that are intended to reflect valuation changes through the NYSE close. These securities listed on foreign exchanges (including the value of equity securities that underlie futures, options and other derivatives (to the extent the market for such instruments closes prior to the close of the NYSE)) are classified as Level 2 (levels defined below).
“Quoted price” typically means the bid price for securities held long and the ask price for securities sold short. If a market quotation for a security does not involve a bid or an ask, the “quoted price” may be the price provided by a market participant or other third-party pricing source in accordance with the market practice for that security. If an updated quoted price for a security is not available when a Fund calculates its net asset value, the Fund will generally use the last quoted price so long as GMO believes that the last quoted price continues to represent that security’s fair value.
In the case of derivatives, prices determined by a model may reflect an estimate of the average of bid and ask prices, regardless of whether a Fund has a long position or a short position.
If quotations are not readily available or circumstances make an existing valuation methodology or procedure unreliable, derivatives and other securities are valued at fair value as determined in good faith by the Trustees or persons acting at their direction pursuant to procedures approved by the Trustees. Because of the uncertainty inherent in fair value pricing, the price determined for a particular security may be materially different from the value realized upon its sale. The Funds and/or the underlying funds classify such securities as Level 3 (levels defined below). For the year ended February 28, 2023, the Funds did not reduce the value of any of their OTC derivatives contracts, if any, based on the creditworthiness of their counterparties. See Note 4 “Derivative financial instruments” for a further discussion on valuation of derivatives.
U.S. GAAP requires the Funds to disclose the fair value of their investments in a three-level hierarchy (Levels 1, 2 and 3). The valuation hierarchy is based upon the relative observability of inputs to the valuation of the Funds’ investments. The inputs or methodologies used for valuing securities are not necessarily an indication of the risk associated with investing in those securities.
Changes in valuation techniques may result in transfers into or out of an investment’s assigned level within the fair value hierarchy. In addition, in periods of market dislocation, the observability of prices and inputs may be reduced for many instruments. This condition, as well as changes related to the liquidity of investments, could cause a security to be reclassified between levels.
The three levels are defined as follows:
Level 1 – Valuations based on quoted prices for identical securities in active markets.
The types of assets and liabilities categorized in Level 1 generally include actively traded domestic and certain foreign equity securities; certain U.S. government obligations; derivatives actively traded on a national securities exchange (such as some futures and options); and shares of open-end mutual funds (even if their investments are valued using Level 2 or Level 3 inputs).
Level 2 – Valuations determined using other significant direct or indirect observable inputs.
The types of assets and liabilities categorized in Level 2 generally include certain U.S. government agency securities, mortgage-backed securities, asset-backed securities, certain sovereign debt obligations, and corporate bonds valued using vendor prices or broker quotes; cleared derivatives and certain OTC derivatives such as swaps, options, swaptions, and forward currency contracts valued using industry standard models; certain restricted securities valued at the most recent available market or quoted price; certain debt obligations, such as collateralized loan obligations, that have yet to begin trading that are valued at cost; and certain foreign equity securities that are adjusted based on inputs from an independent pricing service approved by the Trustees, including the value of equity securities that underlie futures, options and other derivatives (to the extent the market for such instruments closes prior to the close of the NYSE) to reflect estimated valuation changes through the NYSE close.
88
GMO Trust Funds
Notes to Financial Statements — (Continued)
February 28, 2023
Level 3 – Valuations based primarily on inputs that are unobservable and significant.
The types of assets and liabilities categorized in Level 3 generally include, but are not limited to, certain debt securities (such as asset-backed, mortgage-backed, loans and sovereign debt) and derivatives even though they may be valued using broker quotes; certain debt securities and derivatives adjusted by a specified discount for liquidity or other considerations; certain sovereign debt securities valued using comparable securities issued by the sovereign adjusted by a specified spread; securities whose trading has been suspended or that have been de-listed from their current primary trading exchange valued at the most recent available market or quoted price; certain investment funds whose valuations are based on monthly net asset value statements; securities in default or bankruptcy proceedings for which there is no current market quotation valued at the most recent available market or quoted price and potential litigation recoveries and interests related to bankruptcy proceedings.
The following is a summary of the respective levels assigned to the Funds’ direct securities and derivatives, if any, as of February 28, 2023:
| Description | Level 1 | Level 2 | Level 3 | Total | ||||||||||||
Asset Allocation Bond Fund | ||||||||||||||||
Asset Valuation Inputs | ||||||||||||||||
Debt Obligations | ||||||||||||||||
U.S. Government | $ | 5,005,241 | $ | — | $ | — | $ | 5,005,241 | ||||||||
|
|
|
|
|
|
|
| |||||||||
TOTAL DEBT OBLIGATIONS | 5,005,241 | — | — | 5,005,241 | ||||||||||||
|
|
|
|
|
|
|
| |||||||||
Short-Term Investments | 3,216,296 | 11,983,570 | — | 15,199,866 | ||||||||||||
|
|
|
|
|
|
|
| |||||||||
Total Investments | 8,221,537 | 11,983,570 | — | 20,205,107 | ||||||||||||
|
|
|
|
|
|
|
| |||||||||
Derivatives^ | ||||||||||||||||
Forward Currency Contracts | ||||||||||||||||
Foreign Currency Risk | — | 7,690 | — | 7,690 | ||||||||||||
Futures Contracts | ||||||||||||||||
Interest Rate Risk | 24,372 | — | — | 24,372 | ||||||||||||
|
|
|
|
|
|
|
| |||||||||
Total | $ | 8,245,909 | $ | 11,991,260 | $ | — | $ | 20,237,169 | ||||||||
|
|
|
|
|
|
|
| |||||||||
Liability Valuation Inputs | ||||||||||||||||
Derivatives^ | ||||||||||||||||
Futures Contracts | ||||||||||||||||
Interest Rate Risk | $ | (39,521 | ) | $ | — | $ | — | $ | (39,521 | ) | ||||||
|
|
|
|
|
|
|
| |||||||||
Total | $ | (39,521 | ) | $ | — | $ | — | $ | (39,521 | ) | ||||||
|
|
|
|
|
|
|
| |||||||||
Emerging Country Debt Fund | ||||||||||||||||
Asset Valuation Inputs | ||||||||||||||||
Debt Obligations | ||||||||||||||||
Asset-Backed Securities | $ | — | $ | 7,270,442 | $ | — | $ | 7,270,442 | ||||||||
Corporate Debt | — | 135,905,546 | 15,471,486 | 151,377,032 | ||||||||||||
Sovereign and Sovereign Agency Issuers | — | 2,137,136,224 | 197,198,523 | 2,334,334,747 | ||||||||||||
U.S. Government | 21,574,629 | — | — | 21,574,629 | ||||||||||||
|
|
|
|
|
|
|
| |||||||||
TOTAL DEBT OBLIGATIONS | 21,574,629 | 2,280,312,212 | 212,670,009 | 2,514,556,850 | ||||||||||||
|
|
|
|
|
|
|
| |||||||||
89
GMO Trust Funds
Notes to Financial Statements — (Continued)
February 28, 2023
| Description | Level 1 | Level 2 | Level 3 | Total | ||||||||||||
Emerging Country Debt Fund (continued) | ||||||||||||||||
Asset Valuation Inputs (continued) | ||||||||||||||||
Loan Assignments | $ | — | $ | — | $ | 32,811,159 | $ | 32,811,159 | ||||||||
Loan Participations | — | — | 21,513,110 | 21,513,110 | ||||||||||||
Investment Funds | — | — | 7,035,403 | 7,035,403 | ||||||||||||
Mutual Funds | 67,529,288 | — | — | 67,529,288 | ||||||||||||
Rights/Warrants | — | 5,088,400 | 3,216,316 | 8,304,716 | ||||||||||||
Short-Term Investments | 5,308,770 | 35,999,722 | — | 41,308,492 | ||||||||||||
|
|
|
|
|
|
|
| |||||||||
Total Investments | 94,412,687 | 2,321,400,334 | 277,245,997 | 2,693,059,018 | ||||||||||||
|
|
|
|
|
|
|
| |||||||||
Derivatives^ | ||||||||||||||||
Bond Forward Contracts | ||||||||||||||||
Interest Rate Risk | — | 50,594 | — | 50,594 | ||||||||||||
Forward Currency Contracts | ||||||||||||||||
Foreign Currency Risk | — | 2,596,255 | — | 2,596,255 | ||||||||||||
Options | ||||||||||||||||
Credit Risk | — | — | 301,675 | 301,675 | ||||||||||||
Swap Contracts | ||||||||||||||||
Credit Risk | — | 19,783,919 | — | 19,783,919 | ||||||||||||
Interest Rate Risk | — | 8,440,541 | — | 8,440,541 | ||||||||||||
|
|
|
|
|
|
|
| |||||||||
Total | $ | 94,412,687 | $ | 2,352,271,643 | $ | 277,547,672 | $ | 2,724,232,002 | ||||||||
|
|
|
|
|
|
|
| |||||||||
Liability Valuation Inputs | ||||||||||||||||
Derivatives^ | ||||||||||||||||
Bond Forward Contracts | ||||||||||||||||
Interest Rate Risk | $ | — | $ | (911,701 | ) | $ | — | $ | (911,701 | ) | ||||||
Forward Currency Contracts | ||||||||||||||||
Foreign Currency Risk | — | (379,018 | ) | — | (379,018 | ) | ||||||||||
Swap Contracts | ||||||||||||||||
Credit Risk | — | (1,511,468 | ) | — | (1,511,468 | ) | ||||||||||
Interest Rate Risk | — | (22,276 | ) | — | (22,276 | ) | ||||||||||
|
|
|
|
|
|
|
| |||||||||
Total | $ | — | $ | (2,824,463 | ) | $ | — | $ | (2,824,463 | ) | ||||||
|
|
|
|
|
|
|
| |||||||||
High Yield Fund | ||||||||||||||||
Asset Valuation Inputs | ||||||||||||||||
Debt Obligations | ||||||||||||||||
Corporate Debt | $ | — | $ | 50,129,891 | $ | — | $ | 50,129,891 | ||||||||
U.S. Government | 70,102,302 | — | — | 70,102,302 | ||||||||||||
|
|
|
|
|
|
|
| |||||||||
TOTAL DEBT OBLIGATIONS | 70,102,302 | 50,129,891 | — | 120,232,193 | ||||||||||||
|
|
|
|
|
|
|
| |||||||||
Short-Term Investments | 28,093,840 | 105,999,397 | — | 134,093,237 | ||||||||||||
|
|
|
|
|
|
|
| |||||||||
Total Investments | 98,196,142 | 156,129,288 | — | 254,325,430 | ||||||||||||
|
|
|
|
|
|
|
| |||||||||
Derivatives^ | ||||||||||||||||
Futures Contracts | ||||||||||||||||
Interest Rate Risk | 11,892 | — | — | 11,892 | ||||||||||||
Swap Contracts | ||||||||||||||||
Credit Risk | — | 587,139 | — | 587,139 | ||||||||||||
Interest Rate Risk | — | 3,834,602 | — | 3,834,602 | ||||||||||||
|
|
|
|
|
|
|
| |||||||||
Total | $ | 98,208,034 | $ | 160,551,029 | $ | — | $ | 258,759,063 | ||||||||
|
|
|
|
|
|
|
| |||||||||
90
GMO Trust Funds
Notes to Financial Statements — (Continued)
February 28, 2023
| Description | Level 1 | Level 2 | Level 3 | Total | ||||||||||||
High Yield Fund (continued) | ||||||||||||||||
Liability Valuation Inputs | ||||||||||||||||
Derivatives^ | ||||||||||||||||
Futures Contracts | ||||||||||||||||
Interest Rate Risk | $ | (13,661 | ) | $ | — | $ | — | $ | (13,661 | ) | ||||||
Written Options | ||||||||||||||||
Credit Risk | — | (64,112 | ) | — | (64,112 | ) | ||||||||||
Swap Contracts | ||||||||||||||||
Interest Rate Risk | (852,098 | ) | — | — | (852,098 | ) | ||||||||||
|
|
|
|
|
|
|
| |||||||||
Total | $ | (865,759 | ) | $ | (64,112 | ) | $ | — | $ | (929,871 | ) | |||||
|
|
|
|
|
|
|
| |||||||||
Multi-Sector Fixed Income Fund | ||||||||||||||||
Asset Valuation Inputs | ||||||||||||||||
Debt Obligations | ||||||||||||||||
Asset-Backed Securities | $ | — | $ | 3,338,035 | $ | — | $ | 3,338,035 | ||||||||
Corporate Debt | — | 25,663,856 | — | 25,663,856 | ||||||||||||
U.S. Government | 11,586,693 | — | — | 11,586,693 | ||||||||||||
U.S. Government Agency | — | 15,536,785 | — | 15,536,785 | ||||||||||||
|
|
|
|
|
|
|
| |||||||||
TOTAL DEBT OBLIGATIONS | 11,586,693 | 44,538,676 | — | 56,125,369 | ||||||||||||
|
|
|
|
|
|
|
| |||||||||
Mutual Funds | 27,869,232 | — | — | 27,869,232 | ||||||||||||
Short-Term Investments | 10,282,821 | 24,230,808 | — | 34,513,629 | ||||||||||||
|
|
|
|
|
|
|
| |||||||||
Total Investments | 49,738,746 | 68,769,484 | — | 118,508,230 | ||||||||||||
|
|
|
|
|
|
|
| |||||||||
Derivatives^ | ||||||||||||||||
Forward Currency Contracts | ||||||||||||||||
Foreign Currency Risk | — | 857,233 | — | 857,233 | ||||||||||||
Futures Contracts | ||||||||||||||||
Interest Rate Risk | 6,216 | — | — | 6,216 | ||||||||||||
Swap Contracts | ||||||||||||||||
Interest Rate Risk | — | 2,122,127 | — | 2,122,127 | ||||||||||||
|
|
|
|
|
|
|
| |||||||||
Total | $ | 49,744,962 | $ | 71,748,844 | $ | — | $ | 121,493,806 | ||||||||
|
|
|
|
|
|
|
| |||||||||
Liability Valuation Inputs | ||||||||||||||||
Derivatives^ | ||||||||||||||||
Forward Currency Contracts | ||||||||||||||||
Foreign Currency Risk | $ | — | $ | (442,407 | ) | $ | — | $ | (442,407 | ) | ||||||
Futures Contracts | ||||||||||||||||
Interest Rate Risk | (37,718 | ) | — | — | (37,718 | ) | ||||||||||
Swap Contracts | ||||||||||||||||
Interest Rate Risk | — | (2,150,867 | ) | — | (2,150,867 | ) | ||||||||||
|
|
|
|
|
|
|
| |||||||||
Total | $ | (37,718 | ) | $ | (2,593,274 | ) | $ | — | $ | (2,630,992 | ) | |||||
|
|
|
|
|
|
|
| |||||||||
Opportunistic Income Fund | ||||||||||||||||
Asset Valuation Inputs | ||||||||||||||||
Debt Obligations | ||||||||||||||||
Asset-Backed Securities | $ | — | $ | 828,839,638 | $ | 10,846,895 | $ | 839,686,533 | ||||||||
Corporate Debt | — | 3,499,460 | — | 3,499,460 | ||||||||||||
U.S. Government | 49,880,742 | — | — | 49,880,742 | ||||||||||||
91
GMO Trust Funds
Notes to Financial Statements — (Continued)
February 28, 2023
| Description | Level 1 | Level 2 | Level 3 | Total | ||||||||||||
Opportunistic Income Fund (continued) | ||||||||||||||||
Asset Valuation Inputs (continued) | ||||||||||||||||
Debt Obligations (continued) | ||||||||||||||||
U.S. Government Agency | $ | — | $ | 7,500,000 | $ | 5,263,033 | $ | 12,763,033 | ||||||||
|
|
|
|
|
|
|
| |||||||||
TOTAL DEBT OBLIGATIONS | 49,880,742 | 839,839,098 | 16,109,928 | 905,829,768 | ||||||||||||
|
|
|
|
|
|
|
| |||||||||
Mutual Funds | 10,894,378 | — | — | 10,894,378 | ||||||||||||
Short-Term Investments | 43,695,400 | 134,028,353 | — | 177,723,753 | ||||||||||||
Purchased Options | — | 359,673 | — | 359,673 | ||||||||||||
|
|
|
|
|
|
|
| |||||||||
Total Investments | 104,470,520 | 974,227,124 | 16,109,928 | 1,094,807,572 | ||||||||||||
|
|
|
|
|
|
|
| |||||||||
Derivatives^ | ||||||||||||||||
Forward Currency Contracts | ||||||||||||||||
Foreign Currency Risk | — | 142,259 | — | 142,259 | ||||||||||||
Swap Contracts | ||||||||||||||||
Credit Risk | — | 33,178,710 | — | 33,178,710 | ||||||||||||
Interest Rate Risk | — | 94,565 | — | 94,565 | ||||||||||||
|
|
|
|
|
|
|
| |||||||||
Total | $ | 104,470,520 | $ | 1,007,642,658 | $ | 16,109,928 | $ | 1,128,223,106 | ||||||||
|
|
|
|
|
|
|
| |||||||||
Liability Valuation Inputs | ||||||||||||||||
Derivatives^ | ||||||||||||||||
Forward Currency Contracts | ||||||||||||||||
Foreign Currency Risk | $ | — | $ | (2,861 | ) | $ | — | $ | (2,861 | ) | ||||||
Futures Contracts | ||||||||||||||||
Interest Rate Risk | (486,325 | ) | — | — | (486,325 | ) | ||||||||||
Written Options | ||||||||||||||||
Credit Risk | — | (447,873 | ) | — | (447,873 | ) | ||||||||||
Swap Contracts | ||||||||||||||||
Credit Risk | — | (7,509,838 | ) | — | (7,509,838 | ) | ||||||||||
|
|
|
|
|
|
|
| |||||||||
Total | $ | (486,325 | ) | $ | (7,960,572 | ) | $ | — | $ | (8,446,897 | ) | |||||
|
|
|
|
|
|
|
| |||||||||
U.S. Treasury Fund | ||||||||||||||||
Asset Valuation Inputs | ||||||||||||||||
Short-Term Investments | $ | 350,393,805 | $ | 62,100,280 | $ | — | $ | 412,494,085 | ||||||||
|
|
|
|
|
|
|
| |||||||||
Total Investments | 350,393,805 | 62,100,280 | — | 412,494,085 | ||||||||||||
|
|
|
|
|
|
|
| |||||||||
Total | $ | 350,393,805 | $ | 62,100,280 | $ | — | $ | 412,494,085 | ||||||||
|
|
|
|
|
|
|
| |||||||||
The risks referenced in the tables above are not intended to be inclusive of all risks. Please see the “Investment and other risks” and “Derivative financial instruments” sections below for a further discussion of risks.
| ^ | In the tables above derivatives are based on market values, rather than the notional amounts of derivatives, except for bond forward contracts and forward currency contracts which are based on unrealized appreciation/(depreciation). Excludes purchased options, if any, which are included in investments. |
Emerging Country Debt Fund has committed an additional $6,231,337 to its investment in Bona Fide Investments Feeder LLC, a private investment in a pool of constitutional obligations of the Colombian government owed to individuals.
92
GMO Trust Funds
Notes to Financial Statements — (Continued)
February 28, 2023
The underlying funds held at year end are classified above as Level 1. Certain underlying funds invest in securities and/or derivatives which may have been fair valued using methods determined in good faith by or at the direction of the Trustees or which may have been valued using significant unobservable inputs. For a summary of the levels assigned to the underlying funds’ direct securities and derivatives, if any, please refer to the underlying funds’ Notes to Financial Statements which are available on the SEC’s website at www.sec.gov or on GMO’s website at www.gmo.com.
U.S. GAAP requires additional disclosures about fair value measurements for material Level 3 securities and derivatives, if any (determined by each category of asset or liability as compared to a Fund’s total net assets). Level 3 holdings include investments valued using unadjusted prices supplied by a third-party pricing source (e.g., broker quotes, vendor). Emerging Country Debt Fund’s Level 3 holdings also include the Republic of Albania Par Bond, due 8/31/25, which is valued by applying a 140 basis point spread to the yield of the U.S. Treasury Strip Principal, due 8/15/25, one Colombia Government International Bond, due 2/15/27 which is valued by applying a 150 basis point spread to the yield of the Colombia Government International Bond, due 4/25/27, one Colombia Government International Bond, due 3/09/28 which is valued by applying a 160 basis point spread to the yield of the Colombia Government International Bond, due 4/25/27, Empresa Nacional de Electricidad SA, due 2/01/97 which is valued based on the average of a selection of comparable bonds and applying a 200 basis point discount for liquidity considerations, Meridiam Eastern Europe Investment S.à.r.l. Loan Agreement, due 6/23/28, which is valued based on a more liquid loan participation’s price discounted by 2 points, a Republic of Kenya loan agreement, which is valued by applying 500 basis point yield spread to a comparable bond and an investment fund valued based on a monthly net asset value statement. Opportunistic Income Fund’s Level 3 holdings also consists of three U.S. Agency for International Development Floater Bonds which were valued using current LIBOR yield and adjusted by 125 basis points for liquidity considerations, three asset-backed securities that were valued in line with general movement of spreads, interest rates or a comparable bond and two asset-backed securities priced based on market trades. There were no other Funds with classes of investments or derivatives with direct material Level 3 holdings at February 28, 2023.
For Funds with material total Level 3 assets and/or liabilities, the following is a reconciliation of securities and derivatives, if any, in which significant unobservable inputs (Level 3) were used in determining value:
Balances as of February 28, | Purchases | Sales | Accrued Discounts/ Premiums | Total Realized Gain/ (Loss) | Change in Unrealized Appreciation (Depreciation) | Transfer into Level 3 | Transfer out of Level 3 | Balances as of February 28, 2023 | Net Change in of February 28, 2023 | |||||||||||||||||||||||||||||||
Emerging Country Debt Fund | ||||||||||||||||||||||||||||||||||||||||
Debt Obligations | ||||||||||||||||||||||||||||||||||||||||
Corporate Debt | $ | 20,629,398 | $ | — | $ | (2,912,700 | ) | $ | (1,754 | ) | $ | (1,455,716 | ) | $ | (787,742 | ) | $ | — | $ | — | $ | 15,471,486 | $ | (787,742 | ) | |||||||||||||||
Sovereign and Sovereign Agency Issuers | 272,728,861 | 7,661,450 | (68,955,225 | ) | 5,996,693 | (69,022,235 | ) | 48,788,979 | — | — | 197,198,523 | 2,861,768 | ||||||||||||||||||||||||||||
Investment Funds | 7,850,000 | — | (1,506,392 | ) | — | 28,237 | 663,558 | — | — | 7,035,403 | 663,558 | |||||||||||||||||||||||||||||
Loan Assignments | 53,869,474 | — | (19,536,810 | ) | 2,133,803 | (1,912,414 | ) | (1,742,894 | ) | — | — | 32,811,159 | (1,742,894 | ) | ||||||||||||||||||||||||||
Loan Participation | 43,258,898 | — | (20,205,025 | ) | 1,523,604 | 531,225 | (3,595,592 | ) | — | — | 21,513,110 | (2,576,088 | ) | |||||||||||||||||||||||||||
Rights/Warrants | 2,194,666 | — | (726,254 | ) | — | (508,860 | ) | 2,256,764 | — | — | 3,216,316 | 2,256,764 | ||||||||||||||||||||||||||||
|
|
|
|
|
|
|
|
|
|
|
|
|
|
|
|
|
|
|
| |||||||||||||||||||||
Total Investments | 400,531,297 | 7,661,450 | (113,842,406 | ) | 9,652,346 | (72,339,763 | ) | 45,583,073 | — | — | 277,245,997 | 675,366 | ||||||||||||||||||||||||||||
|
|
|
|
|
|
|
|
|
|
|
|
|
|
|
|
|
|
|
| |||||||||||||||||||||
Derivatives | ||||||||||||||||||||||||||||||||||||||||
Options | 326,111 | — | — | — | (582,636 | ) | 558,200 | — | — | 301,675 | 558,200 | |||||||||||||||||||||||||||||
|
|
|
|
|
|
|
|
|
|
|
|
|
|
|
|
|
|
|
| |||||||||||||||||||||
Total | $ | 400,857,408 | $ | 7,661,450 | $ | (113,842,406 | )# | $ | 9,652,346 | $ | (72,922,399 | ) | $ | 46,141,273 | $ | — | $ | — | $ | 277,547,672 | $ | 1,233,566 | ||||||||||||||||||
|
|
|
|
|
|
|
|
|
|
|
|
|
|
|
|
|
|
|
| |||||||||||||||||||||
Opportunistic Income Fund | ||||||||||||||||||||||||||||||||||||||||
Debt Obligations | ||||||||||||||||||||||||||||||||||||||||
Asset-Backed Securities | $ | 12,356,438 | $ | — | $ | (1,417,000 | ) | $ | 275,077 | $ | — | $ | (367,620 | ) | $ | — | $ | — | $ | 10,846,895 | $ | (367,620 | ) | |||||||||||||||||
93
GMO Trust Funds
Notes to Financial Statements — (Continued)
February 28, 2023
Balances as of February | Purchases | Sales | Accrued Discounts/ Premiums | Total Realized Gain/ (Loss) | Change in Unrealized Appreciation (Depreciation) | Transfer into Level 3 | Transfer out of Level 3 | Balances as of February 28, 2023 | Net Change in of February 28, 2023 | |||||||||||||||||||||||||||||||
Opportunistic Income Fund (continued) |
| |||||||||||||||||||||||||||||||||||||||
Debt Obligations (continued) | ||||||||||||||||||||||||||||||||||||||||
U.S. Government Agency | $ | 7,640,437 | $ | — | $ | (2,439,179 | ) | $ | 32,745 | $ | — | $ | 29,030 | $ | — | $ | — | $ | 5,263,033 | $ | 29,030 | |||||||||||||||||||
|
|
|
|
|
|
|
|
|
|
|
|
|
|
|
|
|
|
|
| |||||||||||||||||||||
Total | $ | 19,996,875 | $ | — | $ | (3,856,179 | )## | $ | 307,822 | $ | — | $ | (338,590 | ) | $ | — | $ | — | $ | 16,109,928 | $ | (338,590 | ) | |||||||||||||||||
|
|
|
|
|
|
|
|
|
|
|
|
|
|
|
|
|
|
|
| |||||||||||||||||||||
| # | Includes $26,121,271 of proceeds received from partial calls and/or principal paydowns as applicable. |
| ## | Includes $2,439,179 of proceeds received from partial calls and/or principal paydowns as applicable. |
The following table summarizes the quantitative inputs used in the valuation of investments classified within Level 3 of the fair value hierarchy for the year ended February 28, 2023 for Funds with material Level 3 investments.
Quantitative information about Level 3 Fair Value Measurements*
| Investment Type | Total Fair Value ($) | Valuation Methodology | Unobservable Inputs | Range (Weighted Average) | ||||||||
Emerging Country Debt Fund | ||||||||||||
Sovereign and Sovereign Agency Issuers | 39,430,638 | Fair Value | Discount for lack of liquidity/marketability | 1.40% - 1.60%(1.42%) | ||||||||
Corporate Debt | 15,471,486 | Fair Value | Discount for lack of liquidity/marketability | 2.00% (N/A) | ||||||||
Loan Assignments and Participations | 2,286,936 | Fair Value | Discount for lack of liquidity/marketability | 5.00%-6.00%(5.00%) | ||||||||
Loan Assignments and Participations | 19,649,339 | Fair Value | Discount for lack of liquidity/marketability | $2.00 (N/A) | ||||||||
Warrants | 39,023 | Fair Value | Discount for lack of liquidity/marketability | 50% (N/A) | ||||||||
Options | 301,675 | Fair Value | Probability of CDS threshold event | <5% (N/A) | ||||||||
Investment Funds | 7,035,403 | Fair Value | Net asset value statement | (N/A) | ||||||||
Opportunistic Income Fund | ||||||||||||
Asset-Backed Securities | 10,767,895 | Fair Value | Broker mark of comparable bond | N/A | ||||||||
Government Agency | 5,263,033 | Fair Value | Discount for lack of liquidity/marketability | 1.25% (N/A) | ||||||||
| * | The table does not include Level 3 securities or derivatives that are valued by pricing vendors or brokers. As of February 28, 2023, the value of these securities and/or derivatives for Emerging Country Debt Fund and Opportunistic Income Fund was $193,333,172 and $79,000, respectively. The inputs for these investments are not readily available or cannot be reasonably estimated. |
Cash
Cash and foreign currency, if any, in the Statements of Assets and Liabilities consist of cash balances held with the custodian.
Due to/from broker
Due to/from broker in the Statements of Assets and Liabilities includes collateral on swap contracts, futures contracts, option contracts and forward currency contracts, if any, and may include marked-to-market amounts related to foreign currency or cash owed.
Foreign currency translation
The market values of foreign securities, currency holdings and related assets and liabilities are typically translated into U.S. dollars at the close of regular trading on the NYSE, generally at 4:00 pm Eastern time. Income and expenses denominated in foreign currencies are typically translated into U.S. dollars at the close of regular trading on the NYSE. Fluctuations in the value of currency holdings and other assets and liabilities resulting from changes in exchange rates are recorded as unrealized foreign currency gains or losses. Realized gains or losses and unrealized appreciation or depreciation on investment securities and income and expenses are translated
94
GMO Trust Funds
Notes to Financial Statements — (Continued)
February 28, 2023
on the respective dates of such transactions. The effects of changes in foreign currency exchange rates on investments in securities are not separated in the Statements of Operations from the effects of changes in market prices of those securities, but are included with the net realized and unrealized gain or loss on investment securities.
Indexed investments
Each Fund may invest in various transactions and instruments that are designed to track the performance of an index (including, but not limited to, securities indices and credit default indices). Indexed securities are securities the redemption values and/or coupons of which are indexed to a specific instrument, group of instruments, index, or other statistic. Indexed securities typically, but not always, are debt securities or deposits whose value at maturity or coupon rate is determined by reference to other securities, securities or inflation indices, currencies, precious metals or other commodities, or other financial indicators. For example, the maturity value of gold-indexed securities depends on the price of gold and, therefore, their price tends to rise and fall with gold prices.
Loan assignments and participations
The Funds (except U.S. Treasury Fund) may invest in direct debt instruments, which are interests in amounts owed to lenders or lending syndicates, to suppliers of goods or services, or to other parties by corporate, governmental or other borrower. Such “loans” may include bank loans, promissory notes, and loan participations, or in the case of suppliers of goods or services, trade claims or other receivables. A loan is often administered by a bank or other financial institution that acts as agent for all holders. The agent administers the terms of the loan, as specified in the loan agreement. Unless, under the terms of the loan or other indebtedness a Fund has direct recourse against the borrower, it may have to rely on the agent to enforce its rights against the borrower. When investing in a loan participation, (i) a Fund has the right to receive payments of principal, interest and any fees to which it is entitled only from the party from whom the Fund has purchased the participation and only upon receipt by that party of payments from the borrower and (ii) a Fund generally has no right to enforce compliance by the borrower with the terms of the loan agreement or to vote on matters arising under the loan agreement. Thus, a Fund may be subject to credit risk both of the party from whom it purchased the loan participation and the borrower and that Fund may have minimal control over the terms of any loan modification. Loan assignments and participations outstanding at the end of the year, if any, are listed in each applicable Fund’s Schedule of Investments.
Rights and warrants
The Funds may purchase or otherwise receive warrants or rights. Warrants and rights generally give the holder the right to receive, upon exercise, a security of the issuer at a set price. Funds typically use warrants and rights in a manner similar to their use of purchased options on securities, as described in the section entitled “Options” in Note 4 “Derivative financial instruments”. Risks associated with the use of warrants and rights are generally similar to risks associated with the use of purchased options. However, warrants and rights often do not have standardized terms, and may have longer maturities and may be less liquid than exchange-traded options. In addition, the terms of warrants or rights may limit a Fund’s ability to exercise the warrants or rights at such times and in such quantities as the Fund would otherwise wish. Rights and/or warrants outstanding at the end of the year, if any, are listed in each applicable Fund’s Schedule of Investments.
Repurchase agreements
The Funds may enter into repurchase agreements with banks and brokers. Under a repurchase agreement a Fund acquires a security for a relatively short period for cash and obtains a simultaneous commitment from the seller to repurchase the security at an agreed upon price and date. The Fund, through its custodian, takes possession of securities it acquired under the repurchase agreement. The value of the securities acquired may be less than the amount owed to the Fund by the seller. If the seller in a repurchase agreement transaction defaults or enters into insolvency proceedings and the value of the securities subject to the repurchase agreement is insufficient, the Fund’s recovery of cash from the seller may be delayed and, even if the Fund is able to dispose of the securities, the Fund may incur a loss equal to the difference between the cash it paid and the value of the securities.
As of February 28, 2023, the Funds listed below had entered into repurchase agreements. The value of related collateral for each broker listed below exceeds the value of the repurchase agreements at year end. Repurchase agreements outstanding at the end of the year, if any, are listed in each applicable Fund’s Schedule of Investments.
95
GMO Trust Funds
Notes to Financial Statements — (Continued)
February 28, 2023
| Fund Name | Counterparty | Value ($) | Value (with associated collateral) ($) | Weighted Average Maturity (days) | ||||||||||
Asset Allocation Bond Fund | Nomura Securities International, Inc. | 9,999,814 | 10,203,893 | 1.0 | ||||||||||
Emerging Country Debt Fund | Nomura Securities International, Inc. | 35,999,722 | 36,734,410 | 1.0 | ||||||||||
High Yield Fund | Nomura Securities International, Inc. | 105,999,397 | 108,162,650 | 1.0 | ||||||||||
Multi-Sector Fixed Income Fund | Nomura Securities International, Inc. | 3,499,595 | 3,571,015 | 1.0 | ||||||||||
Opportunistic Income Fund | Daiwa Capital Markets America, Inc. | 134,028,353 | 136,763,625 | 1.0 | ||||||||||
U.S. Treasury Fund | Daiwa Capital Markets America, Inc. | 58,100,280 | 59,286,000 | 1.0 | ||||||||||
Reverse repurchase agreements
The Funds may enter into reverse repurchase agreements with banks and brokers to enhance return. Under a reverse repurchase agreement a Fund sells portfolio assets subject to an agreement by that Fund to repurchase the same assets at an agreed upon price and date. A Fund can use the proceeds received from entering into a reverse repurchase agreement to make additional investments, which generally causes the Fund’s portfolio to behave as if it were leveraged. If the buyer in a reverse repurchase agreement files for bankruptcy or becomes insolvent, the Fund may be unable to recover the securities it sold and as a result may realize a loss on the transaction if the securities it sold are worth more than the purchase price it originally received from the buyer. Reverse repurchase agreements outstanding at the end of the year, if any, are listed in each applicable Fund’s Schedule of Investments.
Inflation-indexed bonds
The Funds may invest in inflation-indexed bonds. Inflation-indexed bonds are fixed income securities whose principal value is adjusted periodically according to the rate of inflation/deflation. Two structures are common. The U.S. Treasury and some other issuers use a structure that accrues inflation/deflation into the principal value of the bond. Many other issuers adjust the coupon accruals for inflation related changes.
The market price of inflation-indexed bonds normally changes when real interest rates change. Real interest rates, in turn, are tied to the relationship between nominal interest rates (i.e. stated interest rates) and the rate of inflation. Therefore, if the rate of inflation rises at a faster rate than nominal interest rates, real interest rates (i.e. nominal interest rate minus inflation) might decline, leading to an increase in value of inflation-indexed bonds. In contrast, if nominal interest rates increase at a faster rate than inflation, real interest rates might rise, leading to a decrease in value of inflation-indexed bonds. Coupon payments received by a Fund from inflation-indexed bonds are generally included in the Fund’s gross income for the period in which they accrue. In addition, any increase/decrease in the principal amount of an inflation-indexed bond is generally included in the Fund’s gross income even though principal is not paid until maturity. Inflation-indexed bonds outstanding at the end of the year, if any, are listed in each applicable Fund’s Schedule of Investments.
Delayed delivery commitments and when-issued securities
The Funds (except U.S. Treasury Fund) may purchase or sell securities on a when-issued or forward commitment basis. Payment and delivery may take place a month or more after the date of the transaction. The price of the underlying securities and the date when the securities will be delivered and paid for are fixed at the time the transaction is negotiated. The purchase of when-issued or delayed delivery securities can cause a Fund’s portfolio to be leveraged. Investments in when-issued securities also present the risk that the security will not be issued or delivered. Delayed delivery commitments outstanding at the end of the year, if any, are listed in each applicable Fund’s Schedule of Investments.
Short sales
Certain Funds may enter into short sales transactions. A short sale is a transaction in which a Fund sells securities it may not own in anticipation of a decline in the fair market value of the securities. Securities sold in short sale transactions and the dividend and/or interest payable on such securities, if any, are reflected as a liability in the Statements of Assets and Liabilities. A Fund is obligated to deliver securities at the trade price at the time the short position is closed. Possible losses from short sales may be unlimited, whereas losses from purchases cannot exceed the total amount invested. Short sales outstanding at the end of the year, if any, are listed in each applicable Fund’s Schedule of Investments.
96
GMO Trust Funds
Notes to Financial Statements — (Continued)
February 28, 2023
Taxes and distributions
Each Fund has elected to be treated or intends to elect to be treated and intends to qualify each tax year as a regulated investment company under Subchapter M of the Internal Revenue Code of 1986, as amended (the “Code”). Each Fund intends to distribute its net investment income, if any, and its net realized short-term and long-term capital gains, if any, after giving effect to any available capital loss carryforwards for U.S. federal income tax purposes. Therefore, each Fund makes no provision for U.S. federal income or excise taxes.
With the exception of U.S. Treasury Fund, the policy of each Fund is to declare and pay dividends of its net investment income, if any, at least annually, although the Funds are permitted to, and will from time to time, declare and pay dividends of net investment income, if any, more frequently. The policy of U.S. Treasury Fund is to declare dividends daily, to the extent net investment income is available. U.S. Treasury Fund will generally pay dividends on the first business day following the end of each month in which dividends were declared. Accrued dividends in respect of a shareholder’s partial redemption of U.S. Treasury Fund shares redeemed between monthly payment dates will be paid on the first business day following the end of the month in which redemptions are made. Accrued dividends in respect of a shareholder’s complete redemption of U.S. Treasury Fund shares between monthly payment dates will be paid with the redemption proceeds. Each Fund also intends to distribute net realized short-term and long-term capital gains, if any, at least annually. In addition, each Fund may, from time to time at their discretion, make unscheduled distributions in advance of large redemptions by shareholders or as otherwise deemed appropriate by a Fund. Typically, all distributions are reinvested in additional shares of each Fund, at net asset value, unless GMO or its agents receive and process a shareholder election to receive cash distributions. Distributions to shareholders are recorded by each Fund on the ex-dividend date.
Taxes on foreign interest and dividend income are generally withheld in accordance with the applicable country’s tax treaty with the United States. The foreign withholding rates applicable to a Fund’s investments in certain jurisdictions may be higher if a significant portion of the Fund is held by non-U.S. shareholders. Each Fund may be subject to taxation on realized capital gains, repatriation proceeds and other transaction-based charges imposed by certain countries in which it invests. Transaction-based charges are generally calculated as a percentage of the transaction amount. Taxes related to capital gains realized during the year ended February 28, 2023, if any, are reflected as part of Net realized gain (loss) in the Statements of Operations. Changes in tax liabilities related to capital gain taxes on unrealized investment gains, if any, are reflected as part of Change in net unrealized appreciation (depreciation) in the Statements of Operations.
Income and capital gain distributions are determined in accordance with U.S. federal income tax regulations, which may differ from U.S. GAAP. Certain capital accounts in the financial statements are periodically adjusted for permanent differences in order to reflect their tax character. These adjustments have no impact on net assets or net asset value per share. Temporary differences that arise from recognizing certain items of income, expense, gain or loss in different periods for financial statement and tax purposes will likely reverse at some time in the future.
Differences in distributable earnings on a U.S. GAAP and tax accounting basis primarily relate to the following:
| Differences related to: | Asset Allocation Bond Fund | Emerging Country Debt Fund | High Yield Fund | Multi- Sector Fixed Income Fund | Opportunistic Income Fund | U.S. Treasury Fund | ||||||
Capital loss carryforwards | X | X | X | X | X | X | ||||||
Defaulted bonds | X | |||||||||||
Derivative contract transactions | X | X | X | X | X | |||||||
Foreign currency transactions | X | X | X | X | X | |||||||
Interest, accretion, and amortization | X | X | ||||||||||
Late year ordinary losses | X | X |
97
GMO Trust Funds
Notes to Financial Statements — (Continued)
February 28, 2023
| Differences related to: | Asset Allocation Bond Fund | Emerging Country Debt Fund | High Yield Fund | Multi- Sector Fixed Income Fund | Opportunistic Income Fund | U.S. Treasury Fund | ||||||
Losses on wash sale transactions | X | X | X | |||||||||
Losses related to debt obligations | X | |||||||||||
Mutual fund distributions received | X | |||||||||||
Paydown gain/losses | X | |||||||||||
Post-October capital losses | X | X | X | X | ||||||||
Redemption in-kind transactions | X | |||||||||||
Straddle loss deferrals | X |
The tax character of distributions declared by each Fund to shareholders is as follows:
| Tax year ended February 28, 2023 | Tax year ended February 28, 2022 | |||||||||||||||||||||||
| Fund Name | Ordinary Income (including any net short-term capital gain) ($) | Net Long-Term Capital Gain ($) | Total Distributions ($) | Ordinary Income (including any net short-term capital gain) ($) | Net Long- Gain ($) | Total Distributions ($) | ||||||||||||||||||
Asset Allocation Bond Fund | 157,978 | — | 157,978 | 1,000,062 | — | 1,000,062 | ||||||||||||||||||
Emerging Country Debt Fund | 362,299,968 | — | 362,299,968 | 344,849,612 | 73,953,153 | 418,802,765 | ||||||||||||||||||
High Yield Fund | 18,803,003 | 168,310 | 18,971,313 | 11,531,519 | 448,207 | 11,979,726 | ||||||||||||||||||
Multi-Sector Fixed Income Fund | 2,000,578 | — | 2,000,578 | — | 5,148,607 | 5,148,607 | ||||||||||||||||||
Opportunistic Income Fund | 40,558,234 | 9,982,443 | 50,540,677 | 19,824,450 | — | 19,824,450 | ||||||||||||||||||
U.S. Treasury Fund | 8,732,859 | — | 8,732,859 | 564,398 | 136,353 | 700,751 | ||||||||||||||||||
Distributions in excess of a Fund’s tax basis earnings and profits, if significant, are reported in the Funds’ financial statements as a return of capital.
As of February 28, 2023, the components of distributable earnings on a tax basis and certain tax attributes for the Funds consisted of the following:
| Fund Name | Undistributed Ordinary Income (including any net short-term capital gain) ($) | Late-Year Ordinary Loss Deferral ($) | Capital Loss Carryforwards ($) | Post-October Capital Losses Deferral ($) | ||||||||||||
Asset Allocation Bond Fund | 428,198 | — | (48,013,799 | ) | (3,419,578 | ) | ||||||||||
Emerging Country Debt Fund | 15,086,827 | — | (88,337,038 | ) | (29,465,764 | ) | ||||||||||
High Yield Fund | — | (1,676,312 | ) | (9,017,045 | ) | — | ||||||||||
Multi-Sector Fixed Income Fund | — | (3,435,086 | ) | (35,362,111 | ) | (873,980 | ) | |||||||||
Opportunistic Income Fund | 12,632,243 | — | (55,222,241 | ) | — | |||||||||||
U.S. Treasury Fund | — | — | (1,588,005 | ) | (207,004 | ) | ||||||||||
98
GMO Trust Funds
Notes to Financial Statements — (Continued)
February 28, 2023
As of February 28, 2023, certain Funds had capital loss carryforwards available to offset future realized gains, if any, to the extent permitted by the Code. Net capital losses are carried forward without expiration and generally retain their short-term and/or long-term tax character, as applicable. Utilization of the capital loss carryforwards, post-October capital losses, late-year ordinary losses, and losses realized subsequent to February 28, 2023, if any, could be subject to further limitations imposed by the Code related to share ownership activity. The Funds’ capital loss carryforwards are as follows:
| Fund Name | Short-Term ($) | Long-Term ($) | ||||||
Asset Allocation Bond Fund | (27,614,560 | ) | (20,399,239 | ) | ||||
Emerging Country Debt Fund | (14,075,236 | ) | (74,261,802 | ) | ||||
High Yield Fund | (6,436,296 | ) | (2,580,749 | ) | ||||
Multi-Sector Fixed Income Fund | (5,818,749 | ) | (29,543,362 | ) | ||||
Opportunistic Income Fund | — | (55,222,241 | ) | |||||
U.S. Treasury Fund | (1,588,005 | ) | — | |||||
As of February 28, 2023, the approximate total cost, aggregate investment-level gross/net unrealized appreciation (depreciation) in the value of total investments (including total securities sold short, if any), and the net unrealized appreciation (depreciation) of outstanding financial instruments, for U.S. federal income tax purposes were as follows:
| Total Investments | Outstanding Financial Instruments | |||||||||||||||||||
| Fund Name | Aggregate Cost ($) | Gross Unrealized Appreciation ($) | Gross Unrealized (Depreciation) ($) | Net Unrealized Appreciation (Depreciation) ($) | Net Unrealized (Depreciation)($) | |||||||||||||||
Asset Allocation Bond Fund | 20,198,599 | 6,514 | (6 | ) | 6,508 | — | ||||||||||||||
Emerging Country Debt Fund | 4,118,949,611 | 21,874,718 | (1,447,765,311 | ) | (1,425,890,593 | ) | (1,334,238 | ) | ||||||||||||
High Yield Fund | 260,862,521 | 24,047 | (6,561,138 | ) | (6,537,091 | ) | 500,304 | |||||||||||||
Multi-Sector Fixed Income Fund | 127,753,688 | 230,203 | (9,475,661 | ) | (9,245,458 | ) | (41,175 | ) | ||||||||||||
Opportunistic Income Fund | 1,202,026,420 | 9,576,744 | (116,795,592 | ) | (107,218,848 | ) | (6,368,213 | ) | ||||||||||||
U.S. Treasury Fund | 413,185,830 | 33,274 | (725,019 | ) | (691,745 | ) | — | |||||||||||||
The Funds are subject to authoritative guidance related to the accounting and disclosure of uncertain tax positions under U.S. GAAP. A Fund may recognize an income tax liability related to an uncertain tax position under U.S. GAAP when the uncertain tax position has a less than 50% probability that it would be sustained upon examination by the tax authorities, based on technical merits. United States and non-U.S. tax rules (including the interpretation and application of tax laws) are subject to change. The Funds file tax returns and/or adopt certain tax positions in various jurisdictions. Non-U.S. taxes are provided for based on the Funds’ understanding of the prevailing tax rules of the non-U.S. markets in which they invest. Recently enacted tax rules, including interpretations of tax laws and tax legislation/initiatives currently under consideration in various jurisdictions, including the U.S., might affect the way the Funds and their investors are taxed prospectively and/or retroactively. Prior to the expiration of the relevant statutes of limitations, if any, the Funds are subject to examination by U.S. federal, state, local and non-U.S. jurisdictions with respect to the tax returns they have filed and the tax positions they have adopted. The Funds’ U.S. federal income tax returns are generally subject to examination by the Internal Revenue Service for a period of three years after they are filed. State, local and/or non-U.S. tax returns and/or other filings may be subject to examination for different periods, depending upon the tax rules of each applicable jurisdiction. As of February 28, 2023, each Fund has determined that no tax liability is required to be accrued in its financial statements related to uncertain tax positions for any tax years which are subject to examination.
Security transactions and related investment income
Security transactions are accounted for in the financial statements on trade date. For purposes of daily net asset value calculations, the Funds’ policy is that security transactions are generally accounted for on the following business day. GMO may override that policy and a Fund may account for security transactions on trade date if it experiences significant purchases or redemptions or engages in significant portfolio transactions. Dividend income, net of applicable foreign withholding taxes, if any, is recorded on the ex-dividend date or, if later, when a Fund is informed of the ex-dividend date. Income dividends and capital gain distributions from underlying
99
GMO Trust Funds
Notes to Financial Statements — (Continued)
February 28, 2023
funds, if any, are recorded on the ex-dividend date. Interest income is recorded on the accrual basis and is adjusted for the amortization of premiums and accretion of discounts. Principal on inflation-indexed securities is adjusted for inflation/deflation and any increase or decrease is recorded as interest income or investment loss. Coupon income is not recognized on securities for which collection is not expected. Paydown gains and losses on mortgage-related and other asset-backed securities, if any, are recorded as components of interest income in the Statements of Operations. Non-cash dividends, if any, are recorded at the fair market value of the asset received. In determining the net gain or loss on securities sold, the Funds use the identified cost basis.
Expenses and class allocations
Most of the expenses of the Trust are directly attributable to an individual Fund. Generally, common expenses are allocated among the Funds based on, among other things, the nature and type of expense and the relative size of the Funds. Investment income, common expenses, purchase premiums and redemption fees, if any, and realized and unrealized gains and losses are allocated among the classes of shares of the Funds, if applicable, based on the relative net assets of each class. Shareholder service fees, if any, which are directly attributable to a class of shares, are charged to that class’s operations. In addition, the Funds may incur fees and expenses indirectly as a shareholder in the underlying funds. Because the underlying funds have different expense and fee levels and the Funds may own different proportions of the underlying funds at different times, the amount of fees and expenses indirectly incurred by a Fund will vary (see Note 5).
Custodian, Fund Accounting Agent and Transfer Agent
State Street Bank and Trust Company (“State Street”) serves as the Funds’ custodian, fund accounting agent and transfer agent. Cash balances maintained at the custodian and transfer agent are held in a Demand Deposit Account and interest income earned, if any, is shown as interest income in the Statements of Operations.
Purchases and redemptions of Fund shares
Purchase premiums and redemption fees (if applicable) are paid to and retained by a Fund to help offset estimated portfolio transaction costs and other related costs (e.g., bid to ask spreads, stamp duties, and transfer fees) incurred by the Fund directly or indirectly (e.g., through investments in underlying funds) as a result of an investor’s purchase or redemption by allocating estimated transaction costs to the purchasing or redeeming shareholder. Such fees are recorded as a component of the Funds’ net share transactions. A Fund may impose a new purchase premium and redemption fee or increase or decrease an existing fee at any time.
Purchase premiums are not charged on reinvestments of dividends or other distributions. Redemption fees apply to all shares of a Fund regardless of how the shares were acquired (e.g., by direct purchase or by reinvestment of dividends or other distributions).
If GMO determines that any portion of a cash purchase or redemption, as applicable, is offset by a corresponding cash redemption or purchase occurring on the same day, it ordinarily will waive or reduce the purchase premium or redemption fee with respect to that portion.
GMO also may waive or reduce the purchase premium or redemption fee for a purchase or redemption of a Fund’s shares if the Fund will not incur transaction costs or will incur reduced transaction costs. For example, GMO may reduce the purchase premium to the extent that securities are used to purchase a Fund’s shares (taking into account transaction costs, stamp duties or transfer fees), and GMO may reduce redemption fees to the extent a Fund uses portfolio securities to redeem its shares (taking into account transaction costs, stamp duties or transfer fees).
100
GMO Trust Funds
Notes to Financial Statements — (Continued)
February 28, 2023
As of February 28, 2023, the premium on cash purchases and the fee on cash redemptions were as follows:
Asset Allocation Bond Fund | Emerging Debt Fund(1) | High Yield Fund | Multi-Sector Fixed Income Fund | Opportunistic Income Fund(2) | U.S. Treasury Fund | |||||||||||||||||||
Purchase Premium | — | 0.75 | % | — | — | — | — | |||||||||||||||||
Redemption Fee | — | 0.75 | % | — | — | — | — | |||||||||||||||||
| (1) | For the periods from July 31, 2020 to May 18, 2021, May 8, 2020 to July 31, 2020, March 25, 2020 to May 8, 2020, March 16, 2020 to March 25, 2020, February 1, 2016 to March 16, 2020 the premiums on purchases and the fee on redemptions were each 1.00%, 1.50%, 2.00%, 1.15% and 0.75%, respectively, of the amount invested or redeemed. |
| (2) | Prior to June 30, 2019, the premiums on purchases and the fee on redemptions were each 0.40% of the amount invested or redeemed. |
Recently-issued accounting guidance
In June 2022, the Financial Accounting Standards Board (“FASB”) issued a new Accounting Standards Update 2022-03, “Fair Value Measurement (Topic 820) – Fair Value Measurement of Equity Securities Subject to Contractual Sale Restrictions” (“ASU 2022-03”). The amendments in ASU 2022-03 apply to all entities that have investments in equity securities measured at fair value that are subject to a contractual sale restriction. The amendments in ASU 2022-03 clarify guidance for fair value measurement of an equity security subject to a contractual sale restriction and establish new disclosure requirements for such equity securities. The amendments in ASU 2022-03 are effective for fiscal years, and interim periods within those fiscal years, beginning after December 15, 2023 with early adoption permitted. GMO is currently evaluating the impact, if any, of the new disclosure requirements on the financial statements.
| 3. | Investment and other risks |
The following chart identifies selected risks associated with each Fund. Risks not marked for a particular Fund may, however, still apply to some extent to that Fund at various times.
Asset Allocation Bond Fund | Emerging Country Debt Fund | High Yield Fund | Multi-Sector Fixed Income Fund | Opportunistic Income Fund | U.S. Treasury Fund | |||||||
Credit Risk | X | X | X | X | X | X | ||||||
Market Risk – Fixed Income | X | X | X | X | X | X | ||||||
Illiquidity Risk | X | X | X | X | X | |||||||
Derivatives and Short Sales Risk | X | X | X | X | X | |||||||
Market Risk – Asset-Backed Securities | X | X | X | |||||||||
Counterparty Risk | X | X | X | X | X | X | ||||||
Management and Operational Risk | X | X | X | X | X | X | ||||||
Focused Investment Risk | X | X | X | X | X | |||||||
Currency Risk | X | X | X | X | X |
101
GMO Trust Funds
Notes to Financial Statements — (Continued)
February 28, 2023
Asset Bond | Emerging Country Debt Fund | High Yield Fund | Multi-Sector Fixed Income Fund | Opportunistic Income Fund | U.S. Treasury Fund | |||||||
Futures Contracts Risk | X | X | X | |||||||||
Fund of Funds Risk | X | X | X | |||||||||
Non-U.S. Investment Risk | X | X | X | X | X | |||||||
Commodities Risk | X | |||||||||||
Market Disruption and Geopolitical Risk | X | X | X | X | X | X | ||||||
Large Shareholder Risk | X | X | X | X | X | X | ||||||
Leveraging Risk | X | X | X | X | X | |||||||
Market Risk – Equities | X | X | ||||||||||
Smaller Company Risk | X | X | X | |||||||||
Non-Diversified Funds | X | X |
Investing in mutual funds involves many risks. The risks of investing in a particular Fund depend on the types of investments in its portfolio and the investment strategies GMO employs on its behalf. This section does not describe every possible risk of investing in the Funds. Particular Funds could be subject to additional risks because of the types of investments they make and market conditions, which can change over time. Please see the Funds’ prospectus for more information regarding the risks of investing in the Funds.
Funds that invest in other GMO Funds or other investment companies (collectively, “Underlying Funds”) are exposed to the risks to which the Underlying Funds in which it invests are exposed, as well as the risk that the Underlying Funds will not perform as expected. Therefore, unless otherwise noted, the selected risks summarized below include both direct and indirect risks, and references in this section to investments made by a Fund include those made both directly and indirectly by the Fund.
An investment in a Fund is not a bank deposit and, therefore, is not insured or guaranteed by the Federal Deposit Insurance Corporation or any other government agency.
• CREDIT RISK. A Fund runs the risk that the issuer or guarantor of a fixed income investment (including a sovereign or quasi-sovereign debt issuer) or the obligors of obligations underlying an asset-backed security will be unable or unwilling to satisfy their obligations to pay principal and interest or otherwise to honor their obligations in a timely manner. The market price of a fixed income investment will normally decline as a result of the failure of an issuer, guarantor, or obligor to meet its payment obligations or in anticipation of such failure. In addition, investments in emerging country sovereign or quasi-sovereign debt involve a heightened risk that the issuer responsible for repayment of the debt may be unable or unwilling to pay interest and repay principal when due, and the Fund may lack recourse against the issuer in the event of default. Investments in quasi-sovereign debt also are subject to the risk that the issuer will default independently of its sovereign. Securities issued by the U.S. Treasury historically have presented minimal credit risk. However, events in 2011 led to a downgrade in the long-term credit rating of U.S. bonds by several major rating agencies and introduced greater uncertainty about the repayment by the United States of its obligations. A further credit rating downgrade could decrease, and a U.S. credit default would decrease, the value of a Fund’s investments and increase the volatility of a Fund’s portfolio. Below investment grade investments have speculative characteristics, and negative changes in economic conditions or other circumstances are more likely to impair the ability of issuers of those investments to make principal and interest payments than issuers of investment grade investments. Investments in distressed or defaulted or other low quality debt investments generally are considered speculative and may involve substantial risks not normally associated with investments in higher quality securities, including adverse business, financial or economic conditions that lead to their issuers’ payment defaults and insolvency proceedings. In particular, distressed or defaulted obligations might be repaid, if at all, only after lengthy workout or bankruptcy proceedings, during which the
102
GMO Trust Funds
Notes to Financial Statements — (Continued)
February 28, 2023
issuer might not make any interest or other payments, and the Fund may incur additional expenses to seek recovery. If GMO’s assessment of the eventual recovery value of a distressed or defaulted debt investment proves incorrect, the Fund may lose a substantial portion or all of its investment or may be required to accept cash or instruments worth less than its original investment.
• MARKET RISK — FIXED INCOME. The market price of a fixed income investment can decline due to market-related factors, including rising interest rates and widening credit spreads, or decreased liquidity due, for example, to market uncertainty about the value of a fixed income investment (or class of fixed income investments). In addition, the market prices of emerging country sovereign and quasi-sovereign debt investments can decline due to uncertainty about their credit quality and the reliability of their payment streams.
• ILLIQUIDITY RISK. Low trading volume, lack of a market maker, large position size, or legal restrictions may limit or prevent a Fund or an underlying fund from selling particular securities or closing derivative positions at desirable prices.
• DERIVATIVES AND SHORT SALES RISK. The use of derivatives involves the risk that their value may not change as expected relative to changes in the value of the underlying assets, pools of assets, rates, currencies or indices. Derivatives also present other risks, including market risk, illiquidity risk, currency risk, credit risk, and counterparty risk. The market price of an option is affected by many factors, including changes in the market prices or dividend rates of underlying securities (or in the case of indices, the securities in such indices); the time remaining before expiration; changes in interest rates or exchange rates; and changes in the actual or perceived volatility of the relevant index or underlying securities. A Fund may create short investment exposure by selling securities short or taking a derivative position in which the value of the derivative moves in the opposite direction from the price of an underlying asset, pool of assets, rate, currency or index. The risks of loss associated with derivatives that provide short investment exposure and short sales of securities are theoretically unlimited.
• MARKET RISK— ASSET BACKED SECURITIES. The market price of asset-backed securities, like that of other fixed income investments with complex structures, can decline for a variety of reasons, including market uncertainty about their credit quality and the reliability of their payment streams. Payment streams associated with asset-backed securities held by a Fund depend on many factors (e.g., the cash flow generated by the assets backing the securities, deal structure, creditworthiness of any credit-support provider, and reliability of various other service providers with access to the payment stream), and a problem in any of these factors can lead to a reduction in the payment stream GMO expected a Fund to receive when the Fund purchased the asset-backed security. The liquidity of asset-backed securities (particularly below investment grade asset-backed securities) may change over time. During periods of deteriorating economic conditions, such as recessions or periods of rising unemployment, delinquencies and losses generally increase, sometimes dramatically, with respect to securitizations involving loans, sales contracts, receivables and other obligations underlying asset-backed securities. The effects of the COVID-19 virus, and governmental responses to the effects of the virus, have resulted, and may continue to result, in delinquencies and losses and have other, potentially unanticipated, adverse effects on such investments and the markets for those investments.
• COUNTERPARTY RISK. A Fund runs the risk that the counterparty to a derivatives contract, a clearing member used by the Fund to hold a cleared derivatives contract, or a borrower of the Fund’s securities is unable or unwilling to make timely settlement payments, return the Fund’s collateral or otherwise honor its obligations.
• MANAGEMENT AND OPERATIONAL RISK. A Fund runs the risk that GMO’s investment techniques will fail to produce desired results. For many funds, GMO uses quantitative models as part of its investment process. GMO’s models may not accurately predict future market movements. In addition, GMO’s models rely on assumptions and data that are subject to limitations (e.g., inaccuracies, staleness) that could adversely affect their predictive value. A Fund also runs the risk that GMO’s assessment of an investment (including a security’s fundamental fair (or intrinsic) value) is wrong or that deficiencies in GMO’s or another service provider’s internal systems or controls will cause losses for the Fund or impair Fund operations.
• FOCUSED INVESTMENT RISK. Investments focused in countries, regions, asset classes, sectors, industries, currencies, or issuers that are subject to the same or similar risk factors and investments whose market prices are closely correlated are subject to higher overall risk than investments that are more diversified or whose market prices are not as closely correlated.
• CURRENCY RISK. Fluctuations in exchange rates can adversely affect the market value of a Fund’s foreign currency holdings and investments denominated in foreign currencies.
103
GMO Trust Funds
Notes to Financial Statements — (Continued)
February 28, 2023
• FUTURES CONTRACTS RISK. The loss to a Fund resulting from its use of futures contracts is potentially unlimited. Futures markets are highly volatile, and the use of futures contracts increases the volatility of the Fund’s net asset value. A liquid secondary market may not exist for any particular futures contract at any particular time, and a Fund may be unable when it wishes to effect closing transactions to terminate its exposure under that contract. When a Fund uses futures contracts for hedging purposes, it runs the risk that changes in the prices of the contracts will not correlate perfectly with changes in the securities, index, or other asset underlying the contracts or movements in the prices of the Fund’s investments that are subject to the hedge. In addition, a Fund may be unable to recover or may be delayed in recovering margin or other amounts deposited with a futures commission merchant or futures clearinghouse. Foreign futures contracts are often less liquid and more volatile than U.S. futures contracts.
• FUND OF FUNDS RISK. A Fund is indirectly exposed to all of the risks of an investment in the underlying funds (including underlying GMO Funds and ETFs) in which it invests, including the risk that those underlying funds will not perform as expected. Because a Fund bears the fees and expenses of the underlying funds in which it invests, an increase in fees and expenses of an underlying fund or a reallocation of the Fund’s investments to underlying funds with higher fees or expenses will increase the Fund’s total expenses.
• NON-U.S. INVESTMENT RISK. The market prices of many non-U.S. securities (particularly of companies tied economically to emerging countries) fluctuate more than those of U.S. securities. Many non-U.S. securities markets (particularly emerging markets) are less stable, smaller, less liquid, and less regulated than U.S. securities markets, and the cost of trading in those markets often is higher than in U.S. securities markets. In addition, issuers of non-U.S. securities (particularly those tied economically to emerging countries) often are not subject to as much regulation as U.S. issuers, and the reporting, recordkeeping, accounting, custody, and auditing standards to which those issuers are subject often are not as rigorous as U.S. standards. In addition, a Fund may be subject to non-U.S. taxes, potentially on a retroactive basis, on (i) capital gains it realizes or dividends, interest, or other amounts it realizes or accrues in respect of non-U.S. investments; (ii) transactions in those investments; and (iii) repatriation of proceeds generated from the sale or other disposition of those investments. Also, the Fund needs a license to invest directly in securities traded in many non-U.S. securities markets, and a Fund is subject to the risk that its license is terminated or suspended. In some non-U.S. securities markets, prevailing custody and trade settlement practices (e.g., the requirement to pay for securities prior to receipt) expose a Fund to credit and other risks. Further, adverse changes in investment regulations, capital requirements or exchange controls could adversely affect the value of the Fund’s investments. These and other risks (e.g., nationalization, expropriation or other confiscation of assets of non-U.S. issuers, difficulties enforcing legal judgments or contractual rights and other geopolitical risks) tend to be higher for investments in the securities of companies tied economically to emerging countries. The economies of emerging countries often depend predominantly on only a few industries or revenues from particular commodities, and often are more volatile than the economies of developed countries.
• COMMODITIES RISK. Commodity prices can be extremely volatile, and exposure to commodities can cause the value of a Fund’s shares to decline or fluctuate in a rapid and unpredictable manner.
• MARKET DISRUPTION AND GEOPOLITICAL RISK. Geopolitical and other events (e.g., wars, pandemics, sanctions, terrorism) may disrupt securities markets and adversely affect particular economies and markets as well as global economies and markets. Those events, as well as other changes in non U.S. and U.S. economic and political conditions, could exacerbate other risks or otherwise reduce the value of the Funds’ investments.
Russia’s invasion of Ukraine beginning in February 2022 has had, and could continue to have, severe adverse effects on regional and global economic markets for securities and commodities. For example, in response to Russia’s actions, various governments, including the United States, issued a series of broad-ranging economic sanctions against Russia that, among other things (i) prohibit doing business with certain Russian companies, financial institutions and individuals (e.g., officials); (ii) the removal of Russian banks from the Society for Worldwide Interbank Financial Telecommunications (commonly referred to as “SWIFT”), the electronic banking network that connects banks globally; and (iii) restrict the Russian Central Bank from undermining the impact of the sanctions. In retaliation for the sanctions and other actions by the U.S. and other countries, Russia has imposed strict capital controls limiting the ability of foreigners to trade on the Moscow Stock Exchange and to sell, receive or deliver assets held in the custody of local Russian banks (such as equities of Russian companies and Rubles). These actions by the United States and other countries have adversely affected (and similar actions in the future could adversely affect) the Russian economy and the value and liquidity of Russian securities. In particular, where a Fund holds securities of a Russian issuer that is subject to blocking sanctions imposed by the U.S. Department of the Treasury’s Office of Foreign Assets Control, those securities will be frozen and consequently unable to be sold
104
GMO Trust Funds
Notes to Financial Statements — (Continued)
February 28, 2023
or transferred. Moreover, the Russia/Ukraine conflict and related actions (such as those described above) have, and could continue to have, an adverse effect on global markets and liquidity, thereby negatively affecting the value of a Fund’s investments beyond any direct exposure to Russian issuers.
• LARGE SHAREHOLDER RISK. To the extent that a large number of shares of a Fund is held by a single shareholder (e.g., an institutional investor or another GMO Fund) or a group of shareholders with a common investment strategy (e.g., GMO asset allocation accounts), the Fund is subject to the risk that a redemption by those shareholders of all or a large portion of their Fund shares will require the Fund to sell securities at disadvantageous prices, disrupt the Fund’s operations, or force the Fund’s liquidation.
• LEVERAGING RISK. The use of derivatives, short sales and securities lending can create leverage. Leverage increases a Fund’s losses when the value of its investments (including derivatives) declines. In addition, a Fund’s portfolio will be leveraged if it exercises its right to delay payment on a redemption, and losses will result if the value of the Fund’s assets declines between the time a redemption request is deemed to be received by a Fund and the time the Fund liquidates assets to meet that request.
• MARKET RISK—EQUITIES. The market price of an equity may decline due to factors affecting the issuer or its industry or the economy and equity markets generally. If a Fund purchases an equity for less than its fundamental fair (or intrinsic) value as assessed by GMO and GMO’s assessment proves to be incorrect, the Fund runs the risk that the market price of the equity will not appreciate or will decline. A Fund also may purchase equities that typically trade at higher multiples of current earnings than other securities, and the market prices of these equities often are more sensitive to changes in future earnings expectations than the market prices of equities trading at lower multiples. Declines in stock market prices generally are likely to reduce the net asset value of the Fund’s shares.
• SMALLER COMPANY RISK. Smaller companies may have limited product lines, markets, or financial resources, lack the competitive strength of larger companies, have less experienced managers or depend on a few key employees. The securities of companies with smaller market capitalizations often are less widely held and trade less frequently and in lesser quantities, and their market prices often fluctuate more, than the securities of companies with larger market capitalizations.
• NON-DIVERSIFIED FUNDS. High Yield Fund and Multi-Sector Fixed Income Fund are non-diversified investment companies under the 1940 Act and therefore a decline in the market price of a particular security held by the Funds may affect the Funds’ performance more than if the Funds were a diversified investment company.
| 4. | Derivative financial instruments |
Derivatives are financial contracts whose value depends on, or is derived from, the value of underlying assets, reference rates, or indices that are used to increase, decrease or adjust elements of the investment exposures of a Fund’s portfolio. Derivatives may relate to securities, interest rates, currencies, currency exchange rates, inflation rates, commodities and indices, and include foreign currency contracts, swap contracts, reverse repurchase agreements, and other exchange-traded and OTC contracts.
The Funds may use derivatives to gain long investment exposure to securities or other assets. In particular, the Funds may use swaps, options, or other derivatives on an index, an ETF, a single security, or a basket of securities to gain investment exposures (e.g., by selling protection under a credit default swap). The Funds also may use currency derivatives (including forward currency contracts, futures contracts, swap contracts and options) to gain exposure to a given currency.
The Funds may use derivatives in an attempt to reduce their investment exposures (which may result in a reduction below zero). For example, a Fund may use credit default swaps to take a short position with respect to the likelihood of default by an issuer or may use a bond futures contract to short the bond market of a particular country. A Fund also may use currency derivatives in an attempt to reduce (which may result in a reduction below zero) some aspect of the currency exposure in its portfolio. For these purposes, the Fund may use an instrument denominated in a different currency that GMO believes is highly correlated with the relevant currency. The Funds may use derivatives in an attempt to adjust elements of their investment exposures to various securities, sectors, markets, indices, ETFs, and currencies without actually having to sell existing investments or make new direct investments. For instance, GMO may alter the interest rate exposure of debt instruments by employing interest rate swaps. Such a strategy is designed to maintain the Fund’s exposure to the credit of an issuer through the debt instrument but adjust the Fund’s interest rate exposure through the swap. With these swaps, the Fund and its counterparties exchange interest rate exposure, such as fixed versus variable rates and shorter duration versus longer duration exposure. In adjusting its investment exposures, a Fund also may use currency derivatives in an attempt to adjust its currency exposure, seeking currency exposure that is different (in some cases, significantly different) from the currency exposure represented by its portfolio investments.
105
GMO Trust Funds
Notes to Financial Statements — (Continued)
February 28, 2023
Each of the Funds is not limited in its use of derivatives or in the total notional value of its derivative positions. As a result of their derivative positions, a Fund may have gross investment exposures in excess of its net assets (i.e., the Fund may be leveraged) and therefore are subject to heightened risk of loss. Each Fund’s (other than U.S. Treasury Fund) performance can depend substantially, if not primarily, on the performance of assets or indices underlying its derivatives even though it does not own those assets or indices.
Certain derivatives transactions that may be used by the Funds, including certain interest rate swaps and certain credit default index swaps, are required to be transacted through a central clearing organization. The Funds hold cleared derivatives transactions, if any, through clearing members, who are members of derivatives clearing houses. Certain other derivatives, including futures and certain options, are transacted on exchanges. The Funds hold exchange-traded derivatives through clearing brokers that are typically members of the exchanges. In contrast to bilateral derivatives transactions, following a period of advance notice to the Fund, clearing brokers generally can require termination of existing cleared or exchange-traded derivatives transactions at any time and increases in margin above the margin that it required at the beginning of a transaction. Clearing houses and exchanges also have broad rights to increase margin requirements for existing transactions and to terminate transactions. Any such increase or termination could interfere with the ability of a Fund to pursue its investment strategy. Also, a Fund is subject to execution risk if it enters into a derivatives transaction that is required to be cleared (or that GMO expects to be cleared), and no clearing member is willing or able to clear the transaction on the Fund’s behalf. In that case, the transaction might have to be terminated, and the Fund could lose some or all of the benefit of any increase in the value of the transaction after the time of the transaction.
The use of derivatives involves risks that are in addition to, and potentially greater than, the risks associated with investing directly in securities and other more traditional assets. See “Investment and other risks” above for further information.
For Funds that held derivatives during the year ended February 28, 2023, the following table shows how the Fund used these derivatives (marked with an X):
| Type of Derivative and Objective for Use | Asset Allocation | Emerging Country Debt Fund | High Yield Fund | Multi-Sector Fixed Income | Opportunistic Income Fund | |||||
Bond forward contracts | ||||||||||
Substitute for direct investment in securities | X | |||||||||
Forward currency contracts | ||||||||||
Adjust currency exchange rate risk | X | X | X | X | ||||||
Adjust exposure to foreign currencies | X | X | X | |||||||
Futures contracts | ||||||||||
Adjust interest rate exposure | X | X | X | X | ||||||
Maintain the diversity and liquidity of the portfolio | X | X | X | |||||||
Options (Purchased) | ||||||||||
Achieve exposure to a reference entity’s credit | X | |||||||||
Adjust exposure to foreign currencies | X | |||||||||
Provide a measure of protection against default loss | X | |||||||||
Options (Written) | ||||||||||
Achieve exposure to a reference entity’s credit | X | X | ||||||||
Provide a measure of protection against default loss | X | |||||||||
Options (Credit linked) | ||||||||||
Achieve exposure to a reference entity’s credit | X | |||||||||
Swap contracts | ||||||||||
Achieve exposure to a reference entity’s credit | X | X | X | |||||||
Adjust exposure to certain markets | X | X | ||||||||
Adjust interest rate exposure | X | X | X | |||||||
Adjust portfolio beta | X |
106
GMO Trust Funds
Notes to Financial Statements — (Continued)
February 28, 2023
| Type of Derivative and Objective for Use (continued) | Asset Allocation Bond Fund | Emerging Country Debt Fund | High Yield Fund | Multi-Sector Fixed Income Fund | Opportunistic Fund | |||||
Generate long risk exposure to an index | X | |||||||||
Provide a measure of protection against default loss | X | X | X | |||||||
Provide exposure to the Fund’s benchmark | X | X |
Bond forward contracts
The Funds may enter into bond forward contracts. A bond forward may be a contractual agreement between the Fund and another party to cash settle the difference between the final price of an underlying asset and the forward price, calculated at inception of the contract. In a bond forward transaction, no cash premium is paid when the parties enter into the bond forward. If the transaction is collateralized, an exchange of margin collateral will take place according to an agreed-upon schedule. Otherwise, no asset of any kind changes hands until the bond forward matures (typically in 30 days) or is rolled over for another agreed upon period. Generally, the value of the bond forward will change based on changes in the value of the underlying asset. Bond forwards are subject to market risk (the risk that the market value of the underlying bond may change), non-correlation risk (the risk that the market value of the bond forward might move independently of the market value of the underlying bond) and counterparty credit risk (the risk that a counterparty will be unable to meet its obligation under the contract). If there is no cash exchanged at the time the Fund enters into the bond forward, counterparty risk may be limited to the loss of any marked-to market profit on the contract and any delays or limitations on the Fund’s ability to sell or otherwise use the investments posted as collateral for the bond forward. Bond forward contracts outstanding at the end of the year, if any, are listed in each applicable Fund’s Schedule of Investments.
Forward currency contracts
The Funds (except U.S. Treasury Fund) may enter into forward currency contracts, including forward cross currency contracts. A forward currency contract is an agreement between two parties to buy and sell a currency at a set price on a future date (or to pay or receive the amount of the change in relative values of the two currencies). The market price of a forward currency contract fluctuates with changes in forward currency exchange rates. The value of each of the Fund’s forward currency contracts is marked-to-market daily using rates supplied by a quotation service and changes in value are recorded by each Fund as unrealized gains or losses. Realized gains or losses on the contracts are equal to the difference between the value of the contract at the time it was opened and the value at the time it was settled.
These contracts involve market risk in excess of the unrealized gain or loss. Forward currency contracts expose a Fund to the market risk of unfavorable movements in currency values and the risk that the counterparty will be unable or unwilling to meet the terms of the contracts. Most forward currency contracts are collateralized. Forward currency contracts outstanding at the end of the year, if any, are listed in each applicable Fund’s Schedule of Investments.
Futures contracts
The Funds may purchase and sell futures contracts. A futures contract is a contract that obligates the holder to buy or sell an asset at a predetermined delivery price at a specified time in the future. Some futures contracts are net (cash) settled. Upon entering into a futures contract, a Fund is required to deposit cash, U.S. government and agency obligations or other liquid assets with the futures clearing broker in accordance with the initial margin requirements of the broker or exchange. Futures contracts are generally valued at the settlement price established at the close of business each day by the board of trade or exchange on which they are traded (and if the futures are traded outside the U.S. and the market for such futures is closed prior to the close of the NYSE due to time zone differences, the values will be adjusted, to the extent practicable and available, based on inputs from an independent pricing service approved by the Trustees to reflect estimated valuation changes through the NYSE close). The value of each of the Fund’s futures contracts is marked-to-market daily and an appropriate payable or receivable for the change in value (“variation margin”) is recorded by each Fund. The payable or receivable is settled on the following business day. Gains or losses are recognized but not accounted for as realized until the contracts expire or are closed. Futures contracts involve, to varying degrees, risk of loss in excess of the variation margin as recorded in the Statements of Assets and Liabilities. Under some circumstances, futures exchanges may establish daily limits on the amount that the price of a futures contract can vary from the previous day’s settlement price, thereby effectively preventing liquidation of unfavorable positions. Futures contracts expose the Funds to the risk that they may not be able to enter into a closing transaction due to an illiquid market. Futures contracts outstanding at the end of the year, if any, are listed in each applicable Fund’s Schedule of Investments.
107
GMO Trust Funds
Notes to Financial Statements — (Continued)
February 28, 2023
Options
The Funds may purchase call and put options. A call option gives the holder the right to buy an asset; a put option gives the holder the right to sell an asset. “Quanto” options are cash-settled options in which the underlying asset (often an index) is denominated in a currency other than the currency in which the option is settled. By purchasing options a Fund alters its exposure to the underlying asset by, in the case of a call option, entitling it to purchase the underlying asset at a set price from the writer of the option and, in the case of a put option, entitling it to sell the underlying asset at a set price to the writer of the option. A Fund pays a premium for a purchased option. That premium, if any, which is disclosed in the Schedule of Investments, is subsequently reflected in the marked-to-market value of the option. The potential loss associated with purchasing put and call options is limited to the premium paid. Purchased option contracts outstanding at the end of the year, if any, are listed in each applicable Fund’s Schedule of Investments.
The Funds may write (i.e. sell) call and put options on futures, swaps (“swaptions”), securities or currencies they own or in which they may invest. Writing options alters a Fund’s exposure to the underlying asset by, in the case of a call option, obligating that Fund to sell the underlying asset at a set price to the option-holder and, in the case of a put option, obligating that Fund to purchase the underlying asset at a set price from the option-holder. In some cases (e.g., index options), settlement will be in cash, based on a formula price. When a Fund writes a call or put option, an amount equal to the premium received is recorded as a liability and is subsequently included in the marked-to-market value of the option. As a writer of an option, a Fund has no control over whether it will be required to sell (call) or purchase (put) the underlying asset and as a result bears the risk of an unfavorable change in the price of the asset underlying the option. In the event that a Fund writes call options without an offsetting exposure (e.g., call options on an asset that the Fund does not own), it bears an unlimited risk of loss if the price of the underlying asset increases during the term of the option. OTC options expose a Fund to the risk the Fund may not be able to enter into a closing transaction because of an illiquid market. Written option contracts outstanding at the end of the year, if any, are listed in each applicable Fund’s Schedule of Investments.
When an option contract is closed, the Fund records a realized gain or loss equal to the difference between the value of the contract at the time it was opened and the value at the time it was closed. Realized gains and losses on purchased options are included in realized gains and losses on investment securities. If a written call option is exercised, the premium originally received is recorded as an addition to sales proceeds. If a written put option is exercised, the premium originally received is recorded as a reduction in the cost of investments purchased. Gains and losses from the expiration or closing of written option contracts are separately disclosed in the Statements of Operations.
In a credit linked option contract, one party makes payments to another party in exchange for the option to exercise a contract where the buyer has the right to receive a specified return if a credit event (e.g., default or similar event) occurs with respect to a reference entity or entities and a specified decrease in the value of the related collateral occurs. A writer of a credit linked option receives periodic payments in return for its obligation to pay an agreed-upon value to the other party if they exercise their option in the case of a credit event. If no credit event occurs, the seller has no payment obligation and will keep the premiums received.
Swap contracts
The Funds may directly or indirectly use various swap contracts, including, without limitation, swaps on securities and securities indices, total return swaps, interest rate swaps, basis swaps, currency swaps, credit default swaps, variance swaps, commodity swaps, inflation swaps, municipal swaps, dividend swaps, volatility swaps, correlation swaps and other types of available swaps. A swap contract is an agreement to exchange the return generated by one asset for the return generated by another asset. Some swap contracts are net settled. When entering into a swap contract and during the term of the transaction, a Fund and/or the swap counterparty may post or receive cash or securities as collateral.
Initial upfront payments received or made upon entering into a swap contract are included in the fair market value of the swap. The Funds do not amortize upfront payments. Net periodic payments made or received to compensate for differences between the stated terms of the swap contract and prevailing market conditions (credit spreads, currency exchange rates, interest rates, and other relevant factors) are recorded as realized gains or losses in the Statements of Operations. A liquidation payment received or made at the termination of the swap contract is recorded as realized gain or loss in the Statements of Operations. The periodic frequency of payments received may differ from periodic payment frequencies made and their frequencies could be monthly, quarterly, semiannually, annually or at maturity.
108
GMO Trust Funds
Notes to Financial Statements — (Continued)
February 28, 2023
Interest rate swap contracts involve an exchange by the parties of their respective commitments to pay or rights to receive interest (e.g., an exchange of floating rate interest payments for fixed rate interest payments with respect to the notional amount of principal). Basis swaps are interest rate swaps that involve the exchange of two floating interest rate payments and may involve the exchange of two different currencies.
Inflation swaps involve the exchange of a floating rate linked to an index for a fixed rate interest payment with respect to a notional amount or principal.
Total return swap contracts involve a commitment by one party to pay interest to the other party in exchange for a payment to it from the other party based on the return of a reference asset (e.g., a security, basket of securities, or futures contract), both based on notional amounts. To the extent the return of the reference asset exceeds or falls short of the interest payments, one party is entitled to receive a payment from or obligated to make a payment to the other party.
In a credit default swap contract, one party makes payments to another party in exchange for the right to receive a specified return (or to put a security) if a credit event (e.g., default or similar event) occurs with respect to a reference entity or entities. A seller of credit default protection receives periodic payments in return for its obligation to pay the principal amount of a debt security (or other agreed-upon value) to the other party upon the occurrence of a credit event. If no credit event occurs, the seller has no payment obligations so long as there is no early termination.
For credit default swap contracts on asset-backed securities, a credit event may be triggered by various occurrences, which may include an issuer’s failure to pay interest or principal on a reference security, a breach of a material representation or covenant, an agreement by the holders of an asset-backed security to a maturity extension, or a write-down on the collateral underlying the security. For credit default swap contracts on corporate or sovereign issuers, a credit event may be triggered by such occurrences as the issuer’s bankruptcy, failure to pay interest or principal, repudiation/moratorium and/or restructuring.
Correlation swaps involve receiving a stream of payments based on the actual average correlation between or among the price movements of two or more underlying variables over a period of time, in exchange for making a regular stream of payments based on a fixed “strike” correlation level (or vice versa), where both payment streams are based on a notional amount. The underlying variables may include, without limitation, commodity prices, exchange rates, interest rates and stock indices.
Variance swap contracts involve an agreement by two parties to exchange cash flows based on the measured variance (or square of volatility) of a specified underlying asset. One party agrees to exchange a “fixed rate” or strike price payment for the “floating rate” or realized price variance on the underlying asset with respect to the notional amount. At inception, the strike price chosen is generally fixed at a level such that the fair value of the swap is zero. As a result, no money changes hands at the initiation of the contract. At the expiration date, the amount payable by one party to the other is the difference between the realized price variance of the underlying asset and the strike price multiplied by the notional amount. A receiver of the realized price variance would be entitled to receive a payment when the realized price variance of the underlying asset is greater than the strike price and would be obligated to make a payment when that variance is less than the strike price. A payer of the realized price variance would be obligated to make a payment when the realized price variance of the underlying asset is greater than the strike price and would be entitled to receive a payment when that variance is less than the strike price. This type of agreement is essentially a forward contract on the future realized price variance of the underlying asset.
Generally, the Funds price their OTC swap contracts daily using industry standard models that may incorporate quotations from market makers or pricing vendors and record the change in value, if any, as unrealized gain or loss in the Statements of Operations. Gains or losses are realized upon the termination of the swap contracts or reset dates, as appropriate. Cleared swap contracts are valued using the quote (which may be based on a model) published by the relevant clearing house. If an updated quote for a cleared swap contract is not available by the time that a Fund calculates its net asset value on any business day, then that swap contract will generally be valued using an industry standard model, which may differ from the model used by the relevant clearing house.
The values assigned to swap contracts may differ significantly from the values realized upon termination, and the differences could be material. Entering into swap contracts involves counterparty credit, legal, and documentation risk that is generally not reflected in the value assigned to the swap contract. Such risks include the possibility that the counterparty defaults on its obligations to perform or disagrees as to the meaning of contractual terms, that a Fund has amounts on deposit in excess of amounts owed by that Fund, or that any collateral the other party posts is insufficient or not timely received by a Fund. Credit risk is particularly acute in economic environments in which financial services firms are exposed to systemic risks of the type evidenced by the insolvency of Lehman Brothers in 2008 and subsequent market disruptions. Swap contracts outstanding at the end of the year, if any, are listed in each applicable Fund’s Schedule of Investments.
109
GMO Trust Funds
Notes to Financial Statements — (Continued)
February 28, 2023
****
As provided by U.S. GAAP, the table below is based on market values or unrealized appreciation/(depreciation) rather than the notional amounts of derivatives. Changes to market values of reference asset(s) will tend to have a greater impact on the Funds (with correspondingly greater risk) the greater the notional amount. For further information on notional amounts, see the Schedule of Investments.
The following is a summary of the valuations of derivative instruments categorized by risk exposure.
The Effect of Derivative Instruments on the Statements of Assets and Liabilities as of February 28, 2023 and the Statements of Operations for the year ended February 28, 2023^:
The risks referenced in the tables below are not intended to be inclusive of all risks. Please see the “Investment and other risks” and “Portfolio valuation” sections for a further discussion of risks.
| Credit Contracts | Foreign Currency Contracts | Interest Rate Contracts | Total | |||||||||||||
Asset Allocation Bond Fund | ||||||||||||||||
Asset Derivatives | ||||||||||||||||
Unrealized Appreciation on Forward Currency Contracts | $ | — | $ | 7,690 | $ | — | $ | 7,690 | ||||||||
Unrealized Appreciation on Futures Contracts¤ | — | — | 24,372 | 24,372 | ||||||||||||
|
|
|
|
|
|
|
| |||||||||
Total | $ | — | $ | 7,690 | $ | 24,372 | $ | 32,062 | ||||||||
|
|
|
|
|
|
|
| |||||||||
Liability Derivatives | ||||||||||||||||
Unrealized Depreciation on Futures Contracts¤ | $ | — | $ | — | $ | (39,521 | ) | $ | (39,521 | ) | ||||||
|
|
|
|
|
|
|
| |||||||||
Total | $ | — | $ | — | $ | (39,521 | ) | $ | (39,521 | ) | ||||||
|
|
|
|
|
|
|
| |||||||||
Change in Net Appreciation (Depreciation) on | ||||||||||||||||
Futures Contracts | $ | — | $ | — | $ | (15,149 | ) | $ | (15,149 | ) | ||||||
Forward Currency Contracts | — | 7,690 | — | 7,690 | ||||||||||||
|
|
|
|
|
|
|
| |||||||||
Total | $ | — | $ | 7,690 | $ | (15,149 | ) | $ | (7,459 | ) | ||||||
|
|
|
|
|
|
|
| |||||||||
110
GMO Trust Funds
Notes to Financial Statements — (Continued)
February 28, 2023
| Foreign | Interest | |||||||||||||||
| Credit | Currency | Rate | ||||||||||||||
| Contracts | Contracts | Contracts | Total | |||||||||||||
Emerging Country Debt Fund | ||||||||||||||||
Asset Derivatives | ||||||||||||||||
Unrealized Appreciation on Bond Forward Contracts | $ | — | $ | — | $ | 50,594 | $ | 50,594 | ||||||||
Unrealized Appreciation on Forward Currency Contracts | — | 2,596,255 | — | 2,596,255 | ||||||||||||
Options, at value | 301,675 | — | — | 301,675 | ||||||||||||
Swap Contracts, at value¤ | 19,783,919 | — | 8,440,541 | 28,224,460 | ||||||||||||
|
|
|
|
|
|
|
| |||||||||
Total | $ | 20,085,594 | $ | 2,596,255 | $ | 8,491,135 | $ | 31,172,984 | ||||||||
|
|
|
|
|
|
|
| |||||||||
Liability Derivatives | ||||||||||||||||
Unrealized Depreciation on Bond Forwards Contracts | $ | — | $ | — | $ | (911,701 | ) | $ | (911,701 | ) | ||||||
Unrealized Depreciation on Forward Currency Contracts | — | (379,018 | ) | — | (379,018 | ) | ||||||||||
Swap Contracts, at value¤ | (1,511,468 | ) | — | (22,276 | ) | (1,533,744 | ) | |||||||||
|
|
|
|
|
|
|
| |||||||||
Total | $ | (1,511,468 | ) | $ | (379,018 | ) | $ | (933,977 | ) | $ | (2,824,463 | ) | ||||
|
|
|
|
|
|
|
| |||||||||
Net Realized Gain (Loss) on | ||||||||||||||||
Investments (purchased options) | $ | — | $ | (377,508 | ) | $ | — | $ | (377,508 | ) | ||||||
Bond forward contracts | — | — | (3,321,127 | ) | (3,321,127 | ) | ||||||||||
Options | (582,636 | ) | — | — | (582,636 | ) | ||||||||||
Swap Contracts | 14,267,458 | — | 6,508,025 | 20,775,483 | ||||||||||||
Forward Currency Contracts | — | 45,389,317 | — | 45,389,317 | ||||||||||||
|
|
|
|
|
|
|
| |||||||||
Total | $ | 13,684,822 | $ | 45,011,809 | $ | 3,186,898 | $ | 61,883,529 | ||||||||
|
|
|
|
|
|
|
| |||||||||
Change in Net Appreciation (Depreciation) on | ||||||||||||||||
Investments (purchased options) | $ | — | $ | 1,064,064 | $ | — | $ | 1,064,064 | ||||||||
Bond forward contracts | — | — | (861,107 | ) | (861,107 | ) | ||||||||||
Options | 558,200 | — | — | 558,200 | ||||||||||||
Swap Contracts | (12,322,098 | ) | — | 11,134,080 | (1,188,018 | ) | ||||||||||
Forward Currency Contracts | — | (2,024,259 | ) | — | (2,024,259 | ) | ||||||||||
|
|
|
|
|
|
|
| |||||||||
Total | $ | (11,763,898 | ) | $ | (960,195 | ) | $ | 10,272,973 | $ | (2,451,120 | ) | |||||
|
|
|
|
|
|
|
| |||||||||
High Yield Fund | ||||||||||||||||
Asset Derivatives | ||||||||||||||||
Unrealized Appreciation on Futures Contracts¤ | $ | — | $ | — | $ | 11,892 | $ | 11,892 | ||||||||
Swap Contracts, at value¤ | 587,139 | — | 3,834,602 | 4,421,741 | ||||||||||||
|
|
|
|
|
|
|
| |||||||||
Total | $ | 587,139 | $ | — | $ | 3,846,494 | $ | 4,433,633 | ||||||||
|
|
|
|
|
|
|
| |||||||||
Liability Derivatives | ||||||||||||||||
Unrealized Depreciation on Futures Contracts¤ | $ | — | $ | — | $ | (13,661 | ) | $ | (13,661 | ) | ||||||
Written Options, at value | (64,112 | ) | — | — | (64,112 | ) | ||||||||||
Swap Contracts, at value¤ | — | — | (852,098 | ) | (852,098 | ) | ||||||||||
|
|
|
|
|
|
|
| |||||||||
Total | $ | (64,112 | ) | $ | — | $ | (865,759 | ) | $ | (929,871 | ) | |||||
|
|
|
|
|
|
|
| |||||||||
Net Realized Gain (Loss) on | ||||||||||||||||
Futures Contracts | $ | — | $ | — | $ | (3,490,787 | ) | $ | (3,490,787 | ) | ||||||
Written Options | (813,785 | ) | — | — | (813,785 | ) | ||||||||||
Swap Contracts | (78,052 | ) | — | (777,880 | ) | (855,932 | ) | |||||||||
Forward Currency Contracts | — | 8,623,955 | — | 8,623,955 | ||||||||||||
|
|
|
|
|
|
|
| |||||||||
Total | $ | (891,837 | ) | $ | 8,623,955 | $ | (4,268,667 | ) | $ | 3,463,451 | ||||||
|
|
|
|
|
|
|
| |||||||||
Change in Net Appreciation (Depreciation) on | ||||||||||||||||
Futures Contracts | $ | — | $ | — | $ | (170,929 | ) | $ | (170,929 | ) | ||||||
Written Options | 466,086 | — | — | 466,086 | ||||||||||||
Swap Contracts | 924,075 | — | 4,394,435 | 5,318,510 | ||||||||||||
Forward Currency Contracts | — | (218,399 | ) | — | (218,399 | ) | ||||||||||
|
|
|
|
|
|
|
| |||||||||
Total | $ | 1,390,161 | $ | (218,399 | ) | $ | 4,223,506 | $ | 5,395,268 | |||||||
|
|
|
|
|
|
|
| |||||||||
111
GMO Trust Funds
Notes to Financial Statements — (Continued)
February 28, 2023
| Foreign | Interest | |||||||||||||||
| Credit | Currency | Rate | ||||||||||||||
| Contracts | Contracts | Contracts | Total | |||||||||||||
Multi-Sector Fixed Income Fund | ||||||||||||||||
Asset Derivatives | ||||||||||||||||
Unrealized Appreciation on Forward Currency Contracts | $ | — | $ | 857,233 | $ | — | $ | 857,233 | ||||||||
Unrealized Appreciation on Futures Contracts¤ | — | — | 6,216 | 6,216 | ||||||||||||
Swap Contracts, at value¤ | — | — | 2,122,127 | 2,122,127 | ||||||||||||
|
|
|
|
|
|
|
| |||||||||
Total | $ | — | $ | 857,233 | $ | 2,128,343 | $ | 2,985,576 | ||||||||
|
|
|
|
|
|
|
| |||||||||
Liability Derivatives | ||||||||||||||||
Unrealized Depreciation on Forward Currency Contracts | $ | — | $ | (442,407 | ) | $ | — | $ | (442,407 | ) | ||||||
Unrealized Depreciation on Futures Contracts¤ | — | — | (37,718 | ) | (37,718 | ) | ||||||||||
Swap Contracts, at value¤ | — | — | (2,150,867 | ) | (2,150,867 | ) | ||||||||||
|
|
|
|
|
|
|
| |||||||||
Total | $ | — | $ | (442,407 | ) | $ | (2,188,585 | ) | $ | (2,630,992 | ) | |||||
|
|
|
|
|
|
|
| |||||||||
Net Realized Gain (Loss) on | ||||||||||||||||
Futures Contracts | $ | — | $ | — | $ | (5,844,922 | ) | $ | (5,844,922 | ) | ||||||
Swap Contracts | — | — | (41,891 | ) | (41,891 | ) | ||||||||||
Forward Currency Contracts | — | 3,010,113 | — | 3,010,113 | ||||||||||||
|
|
|
|
|
|
|
| |||||||||
Total | $ | — | $ | 3,010,113 | $ | (5,886,813 | ) | $ | (2,876,700 | ) | ||||||
|
|
|
|
|
|
|
| |||||||||
Change in Net Appreciation (Depreciation) on | ||||||||||||||||
Futures Contracts | $ | — | $ | — | $ | (440,253 | ) | $ | (440,253 | ) | ||||||
Swap Contracts | — | — | 265,954 | 265,954 | ||||||||||||
Forward Currency Contracts | — | 948,216 | — | 948,216 | ||||||||||||
|
|
|
|
|
|
|
| |||||||||
Total | $ | — | $ | 948,216 | $ | (174,299 | ) | $ | 773,917 | |||||||
|
|
|
|
|
|
|
| |||||||||
112
GMO Trust Funds
Notes to Financial Statements — (Continued)
February 28, 2023
| Foreign | Interest | |||||||||||||||
| Credit | Currency | Rate | ||||||||||||||
| Contracts | Contracts | Contracts | Total | |||||||||||||
Opportunistic Income Fund | ||||||||||||||||
Asset Derivatives | ||||||||||||||||
Investments, at value (purchased options) | $ | 359,673 | $ | — | $ | — | $ | 359,673 | ||||||||
Unrealized Appreciation on Forward Currency Contracts | — | 142,259 | — | 142,259 | ||||||||||||
Swap Contracts, at value¤ | 33,178,710 | — | 94,565 | 33,273,275 | ||||||||||||
|
|
|
|
|
|
|
| |||||||||
Total | $ | 33,538,383 | $ | 142,259 | $ | 94,565 | $ | 33,775,207 | ||||||||
|
|
|
|
|
|
|
| |||||||||
Liability Derivatives | ||||||||||||||||
Unrealized Depreciation on Forward Currency Contracts | $ | — | $ | (2,861 | ) | $ | — | $ | (2,861 | ) | ||||||
Unrealized Depreciation on Futures Contracts¤ | — | — | (486,325 | ) | (486,325 | ) | ||||||||||
Written Options, at value | (447,873 | ) | — | — | (447,873 | ) | ||||||||||
Swap Contracts, at value¤ | (7,509,838 | ) | — | — | (7,509,838 | ) | ||||||||||
|
|
|
|
|
|
|
| |||||||||
Total | $ | (7,957,711 | ) | $ | (2,861 | ) | $ | (486,325 | ) | $ | (8,446,897 | ) | ||||
|
|
|
|
|
|
|
| |||||||||
Net Realized Gain (Loss) on | ||||||||||||||||
Investments (purchased options) | $ | (722,628 | ) | $ | — | $ | — | $ | (722,628 | ) | ||||||
Futures Contracts | — | — | (2,378,481 | ) | (2,378,481 | ) | ||||||||||
Written Options | 2,660,303 | — | — | 2,660,303 | ||||||||||||
Swap Contracts | 2,844,742 | — | 545,148 | 3,389,890 | ||||||||||||
Forward Currency Contracts | — | 415,402 | — | 415,402 | ||||||||||||
|
|
|
|
|
|
|
| |||||||||
Total | $ | 4,782,417 | $ | 415,402 | $ | (1,833,333 | ) | $ | 3,364,486 | |||||||
|
|
|
|
|
|
|
| |||||||||
Change in Net Appreciation (Depreciation) on | ||||||||||||||||
Investments (purchased options) | $ | 76,361 | $ | — | $ | — | $ | 76,361 | ||||||||
Futures Contracts | — | — | (204,141 | ) | (204,141 | ) | ||||||||||
Written Options | 132,109 | — | — | 132,109 | ||||||||||||
Swap Contracts | (662,155 | ) | — | (44,011 | ) | (706,166 | ) | |||||||||
Forward Currency Contracts | — | 65,902 | — | 65,902 | ||||||||||||
|
|
|
|
|
|
|
| |||||||||
Total | $ | (453,685 | ) | $ | 65,902 | $ | (248,152 | ) | $ | (635,935 | ) | |||||
|
|
|
|
|
|
|
| |||||||||
| ^ | Because the Funds recognize changes in value through the Statements of Operations, they do not qualify for hedge accounting under authoritative guidance for derivative instruments. The Funds’ investments in derivatives may represent an economic hedge; however, they are considered to be non-hedge transactions for the purpose of these tables. |
| ¤ | The table includes cumulative unrealized appreciation/depreciation of futures and value of cleared swap contracts, if any, as reported in the Schedule of Investments. Year end variation margin on open futures and cleared swap contracts, if any, is reported within the Statements of Assets and Liabilities. |
Certain Funds are party to International Swaps and Derivatives Association, Inc. Master Agreements, Global Master Repurchase Agreements or other similar types of agreements (collectively, “Master Agreements”) that generally govern the terms of OTC derivative transactions, repurchase agreements and reverse repurchase agreements. The Master Agreements may include collateral posting terms and set-off provisions that apply in the event of a default and/or termination event. Upon the occurrence of such an event, including the bankruptcy or insolvency of the counterparty, the Master Agreements may permit the non-defaulting party to calculate a single net payment to close out applicable transactions. However, there is no guarantee that the terms of a Master Agreement will be enforceable; for example, when bankruptcy or insolvency laws impose restrictions on or prohibitions against the right of offset. Additionally, the set-off and netting provisions of a Master Agreement may not extend to the obligations of the counterparty’s affiliates or across varying types of transactions. Because no such event has occurred, the Funds do not presently have a legally enforceable right of set-off and these amounts have not been offset in the Statements of Assets and Liabilities, but have been presented separately in the table below. Termination events may also include a decline in the net assets of a Fund below a certain level over a specified period of time and may entitle a counterparty to elect an early termination of all the transactions under the Master Agreement with that counterparty. Such an election by one or more of the counterparties could have a material adverse impact on a Fund’s operations. An estimate of the aggregate net payment, if any, that may need to be paid by a Fund (or may be received by a Fund) in such an event is represented by the Net Amounts in the tables below. For more information about other uncertainties and risks, see “Investments and other risks” above.
113
GMO Trust Funds
Notes to Financial Statements — (Continued)
February 28, 2023
For financial reporting purposes, in the Statements of Assets and Liabilities any cash collateral that has been pledged to cover obligations of the Funds is reported as Due from broker and any cash collateral received from the counterparty is reported as Due to broker. Any non-cash collateral pledged by the Funds is noted in the Schedules of Investments. The tables below show the potential effect of netting arrangements made available by the Master Agreements on the financial position of the Funds. For financial reporting purposes, the Funds’ Statements of Assets and Liabilities generally show derivative assets and derivative liabilities (regardless of whether they are subject to netting arrangements) on a gross basis, which reflects the full risks and exposures of the Fund prior to netting. See Note 2 for information on repurchase agreements and reverse repurchase agreements held by the Funds at February 28, 2023, if any.
The tables above present the Funds’ derivative assets and liabilities by type of financial instrument. The following tables present the Funds’ OTC and/or exchange-traded derivative assets and liabilities by counterparty net of amounts that may be available for offset under the Master Agreements by the terms of the agreement and net of the related collateral received or pledged by the Funds as of February 28, 2023:
Asset Allocation Bond Fund
| Gross Derivative | Derivative | Net Amount | ||||||||||||||
| Assets Subject to | Collateral | Assets/Liabilities | of Derivative | |||||||||||||
| Counterparty | Master Agreements | Received | Available for Offset | Assets | ||||||||||||
Citibank N.A. | $ | 7,690 | $ | — | $ | — | $ | 7,690 | ||||||||
|
|
|
|
|
|
|
| |||||||||
Total | $ | 7,690 | $ | — | $ | — | $ | 7,690 | ||||||||
|
|
|
|
|
|
|
| |||||||||
Emerging Country Debt Fund
| Gross Derivative | Derivative | Net Amount | ||||||||||||||
| Assets Subject to | Collateral | Assets/Liabilities | of Derivative | |||||||||||||
| Counterparty | Master Agreements | Received | Available for Offset | Assets | ||||||||||||
Barclays Bank PLC | $ | 1,114,345 | $ | (972,317 | ) | $ | — | $ | 142,028 | |||||||
Citibank N.A. | 2,995,783 | (1,880,000 | ) | (912,514 | ) | 203,269 | ||||||||||
Deutsche Bank AG | 1,451,104 | — | (1,451,104 | ) | — | |||||||||||
Goldman Sachs International | 4,009,191 | (3,839,231 | ) | — | 169,960 | |||||||||||
JPMorgan Chase Bank, N.A. | 1,697,798 | — | (211,846 | ) | 1,485,952 | |||||||||||
Morgan Stanley & Co. International PLC | 2,440,164 | (2,269,094 | ) | (171,070 | ) | — | * | |||||||||
Morgan Stanley Capital Services LLC | 2,231,691 | (2,231,691 | ) | — | — | * | ||||||||||
State Street Bank and Trust Company | 156,091 | (156,091 | ) | — | — | * | ||||||||||
|
|
|
|
|
|
|
| |||||||||
Total | $ | 16,096,167 | $ | (11,348,424 | ) | $ | (2,746,534 | ) | $ | 2,001,209 | ||||||
|
|
|
|
|
|
|
| |||||||||
| Gross Derivative | Derivative | Net Amount | ||||||||||||||
| Liabilities Subject to | Collateral | Assets/Liabilities | of Derivative | |||||||||||||
| Counterparty | Master Agreement | Pledged | Available for Offset | Liabilities | ||||||||||||
Citibank N.A. | $ | (912,514 | ) | $ | — | $ | 912,514 | $ | — | |||||||
Deutsche Bank AG | (1,506,757 | ) | 55,653 | 1,451,104 | — | * | ||||||||||
JPMorgan Chase Bank, N.A. | (211,846 | ) | — | 211,846 | — | |||||||||||
Morgan Stanley & Co. International PLC | (171,070 | ) | — | 171,070 | — | |||||||||||
|
|
|
|
|
|
|
| |||||||||
Total | $ | (2,802,187 | ) | $ | 55,653 | $ | 2,746,534 | $ | — | |||||||
|
|
|
|
|
|
|
| |||||||||
114
GMO Trust Funds
Notes to Financial Statements — (Continued)
February 28, 2023
High Yield Fund
| Gross Derivative | Derivative | Net Amount | ||||||||||||||
| Assets Subject to | Collateral | Assets/Liabilities | of Derivative | |||||||||||||
| Counterparty | Master Agreements | Received | Available for Offset | Assets | ||||||||||||
Barclays Bank PLC | $ | 858,739 | $ | (260,761 | ) | $ | — | $ | 597,978 | |||||||
Goldman Sachs International | 239,416 | (239,416 | ) | — | — | * | ||||||||||
JPMorgan Chase Bank, N.A. | 177,318 | — | — | 177,318 | ||||||||||||
Morgan Stanley & Co. International PLC | 2,559,129 | (1,990,000 | ) | — | 569,129 | |||||||||||
|
|
|
|
|
|
|
| |||||||||
Total | $ | 3,834,602 | $ | (2,490,177 | ) | $ | — | $ | 1,344,425 | |||||||
|
|
|
|
|
|
|
| |||||||||
| Gross Derivative | Derivative | Net Amount | ||||||||||||||
| Liabilities Subject to | Collateral | Assets/Liabilities | of Derivative | |||||||||||||
| Counterparty | Master Agreement | Pledged | Available for Offset | Liabilities | ||||||||||||
Deutsche Bank AG | $ | (64,112 | ) | $ | 64,112 | $ | — | $ | — | * | ||||||
Morgan Stanley & Co. LLC | (852,098 | ) | — | — | (852,098 | ) | ||||||||||
|
|
|
|
|
|
|
| |||||||||
Total | $ | (916,210 | ) | $ | 64,112 | $ | — | $ | (852,098 | ) | ||||||
|
|
|
|
|
|
|
| |||||||||
Multi-Sector Fixed Income Fund
| Gross Derivative | Derivative | Net Amount | ||||||||||||||
| Assets Subject to | Collateral | Assets/Liabilities | of Derivative | |||||||||||||
| Counterparty | Master Agreements | Received | Available for Offset | Assets | ||||||||||||
Bank of America, N.A. | $ | 81,004 | $ | — | $ | (20,352 | ) | $ | 60,652 | |||||||
Barclays Bank PLC | 223,204 | — | (80,600 | ) | 142,604 | |||||||||||
Citibank N.A. | 428,918 | (250,000 | ) | (4,344 | ) | 174,574 | ||||||||||
Deutsche Bank AG | 12,081 | — | — | 12,081 | ||||||||||||
Goldman Sachs | 10,537 | — | (10,537 | ) | — | |||||||||||
JPMorgan Chase Bank, N.A. | 9,897 | — | (9,897 | ) | — | |||||||||||
Morgan Stanley & Co. International PLC | 78,228 | — | (78,228 | ) | — | |||||||||||
State Street Bank and Trust Company | 13,364 | — | (9,990 | ) | 3,374 | |||||||||||
|
|
|
|
|
|
|
| |||||||||
Total | $ | 857,233 | $ | (250,000 | ) | $ | (213,948 | ) | $ | 393,285 | ||||||
|
|
|
|
|
|
|
| |||||||||
| Gross Derivative | Derivative | Net Amount | ||||||||||||||
| Liabilities Subject to | Collateral | Assets/Liabilities | of Derivative | |||||||||||||
| Counterparty | Master Agreement | Pledged | Available for Offset | Liabilities | ||||||||||||
Bank of America, N.A. | $ | (20,352 | ) | $ | — | $ | 20,352 | $ | — | |||||||
Barclays Bank PLC | (80,600 | ) | — | 80,600 | — | |||||||||||
Citibank N.A. | (4,344 | ) | — | 4,344 | — | |||||||||||
Goldman Sachs | (18,407 | ) | — | 10,537 | (7,870 | ) | ||||||||||
JPMorgan Chase Bank, N.A. | (44,897 | ) | — | 9,897 | (35,000 | ) | ||||||||||
Morgan Stanley & Co. International PLC | (263,817 | ) | 172,863 | 78,228 | (12,726 | ) | ||||||||||
State Street Bank and Trust Company | (9,990 | ) | — | 9,990 | — | |||||||||||
|
|
|
|
|
|
|
| |||||||||
Total | $ | (442,407 | ) | $ | 172,863 | $ | 213,948 | $ | (55,596 | ) | ||||||
|
|
|
|
|
|
|
| |||||||||
115
GMO Trust Funds
Notes to Financial Statements — (Continued)
February 28, 2023
Opportunistic Income Fund
| Gross Derivative | Derivative | Net Amount | ||||||||||||||
| Assets Subject to | Collateral | Assets/Liabilities | of Derivative | |||||||||||||
| Counterparty | Master Agreements | Received | Available for Offset | Assets | ||||||||||||
Bank of America, N.A. | $ | 155,319 | $ | (104,063 | ) | $ | — | $ | 51,256 | |||||||
Barclays Bank PLC | 359,673 | — | (244,614 | ) | 115,059 | |||||||||||
Citibank N.A. | 1,799,447 | (1,308,648 | ) | (490,799 | ) | — | * | |||||||||
Citigroup Global Markets Inc. | 1,870,163 | (1,539,683 | ) | (330,480 | ) | — | * | |||||||||
Deutsche Bank AG | 619,486 | (619,486 | ) | — | — | * | ||||||||||
Goldman Sachs International | 12,562,782 | (12,182,600 | ) | (351,169 | ) | 29,013 | ||||||||||
JPMorgan Chase Bank, N.A. | 5,333,851 | (2,519,249 | ) | (2,814,602 | ) | — | * | |||||||||
Morgan Stanley & Co. International PLC | 9,630,206 | (9,424,086 | ) | (206,120 | ) | — | * | |||||||||
Morgan Stanley Capital Services LLC | 1,443,699 | (1,443,699 | ) | — | — | * | ||||||||||
State Street Bank and Trust Company | 581 | — | — | 581 | ||||||||||||
|
|
|
|
|
|
|
| |||||||||
Total | $ | 33,775,207 | $ | (29,141,514 | ) | $ | (4,437,784 | ) | $ | 195,909 | ||||||
|
|
|
|
|
|
|
| |||||||||
| Gross Derivative | Derivative | Net Amount | ||||||||||||||
| Liabilities Subject to | Collateral | Assets/Liabilities | of Derivative | |||||||||||||
| Counterparty | Master Agreement | Pledged | Available for Offset | Liabilities | ||||||||||||
Barclays Bank PLC | $ | (244,614 | ) | $ | — | $ | 244,614 | $ | — | |||||||
Citibank N.A. | (490,799 | ) | — | 490,799 | — | |||||||||||
Citigroup Global Markets Inc. | (330,480 | ) | — | 330,480 | — | |||||||||||
Goldman Sachs International | (351,169 | ) | — | 351,169 | — | |||||||||||
JPMorgan Chase Bank, N.A. | (2,814,602 | ) | — | 2,814,602 | — | |||||||||||
Morgan Stanley & Co. International PLC | (206,120 | ) | — | 206,120 | — | |||||||||||
|
|
|
|
|
|
|
| |||||||||
Total | $ | (4,437,784 | ) | $ | — | $ | 4,437,784 | $ | — | |||||||
|
|
|
|
|
|
|
| |||||||||
| * | The actual collateral received and/or pledged is more than the amount shown. |
The average derivative activity of notional amounts (bond forward contracts, forward currency contracts, futures contracts and swap contracts) and principal amounts (options) outstanding, based on absolute values, at each month-end, was as follows for the year ended February 28, 2023:
| Fund Name | Bond Forward Contracts ($) | Forward Currency Contracts ($) | Futures Contracts ($) | Options (Principal) | Swap Contracts ($) | |||||||||||||||
Asset Allocation Bond Fund | — | 167,532 | 2,876,902 | — | — | |||||||||||||||
Emerging Country Debt Fund | 62,582,418 | 355,576,096 | — | 147,959,667 | 1,180,833,365 | |||||||||||||||
High Yield Fund | — | 62,782,591 | 47,942,061 | 15,730,000 | 223,682,065 | |||||||||||||||
Multi-Sector Fixed Income Fund | — | 91,548,726 | 42,343,335 | — | 316,468,574 | |||||||||||||||
Opportunistic Income Fund | — | 6,742,982 | 604,169,387 | 191,170,167 | 615,320,632 | |||||||||||||||
116
GMO Trust Funds
Notes to Financial Statements — (Continued)
February 28, 2023
| 5. | Fees and other transactions with affiliates |
GMO receives a management fee for the services it provides to each Fund. Management fees are paid monthly at the annual rate equal to the percentage of each Fund’s average daily net assets set forth in the table below:
| Asset Allocation Bond Fund | Emerging Country Debt Fund | High Yield Fund | Multi- Sector Fixed Income Fund | Opportunistic Income Fund | U.S. Treasury Fund | |||||||||||||||||||
Management Fee | 0.25 | % | 0.35 | % | 0.35 | % | 0.25 | % | 0.40 | % | 0.08 | %(a) | ||||||||||||
| (a) | Since April 9, 2021 and prior to June 30, 2019, GMO voluntarily waived the Fund’s entire management fee. |
In addition, each class of shares of certain Funds pays GMO directly or indirectly a shareholder service fee for providing client services and reporting, such as performance information, client account information, personal and electronic access to Fund information, access to analysis and explanations of Fund reports, and assistance in maintaining and correcting client-related information. Shareholder service fees are paid monthly at the annual rate equal to the percentage of each applicable Class’s average daily net assets set forth in the table below:
| Fund Name | Class III | Class IV | Class V | Class VI | Class R6 | Class I | ||||||||||||||||||
Asset Allocation Bond Fund | 0.15 | % | 0.055 | % | ||||||||||||||||||||
Emerging Country Debt Fund | 0.15 | % | 0.10 | % | 0.055 | % | ||||||||||||||||||
High Yield Fund | 0.15 | %* | 0.10 | %* | 0.085 | %* | 0.055 | % | 0.15 | %* | 0.15 | %* | ||||||||||||
Multi-Sector Fixed Income Fund | 0.15 | % | 0.10 | % | 0.15 | %* | 0.15 | %* | ||||||||||||||||
Opportunistic Income Fund | 0.15 | % | 0.055 | % | 0.15 | % | 0.15 | % | ||||||||||||||||
| * | Class is offered but has no shareholders as of February 28, 2023. |
For each Fund (prior to June 30, 2022), other than Emerging Country Debt Fund and High Yield Fund, GMO has contractually agreed to reimburse the Fund for its “Specified Operating Expenses” (as defined below). For the period starting June 30, 2022, Asset Allocation Bond Fund, Multi-Sector Fixed Income Fund and Opportunistic Income Fund, GMO has contractually agreed to reimburse the Fund for the portion of its “Specified Operating Expenses” (as defined below) that exceeds 0.01% of the Fund’s average daily net assets. Any such reimbursements are paid to a Fund concurrently with the Fund’s payment of management fees to GMO.
“Specified Operating Expenses” means: audit expenses, fund accounting expenses, pricing service expenses, expenses of non-investment related tax services, transfer agency expenses (excluding, in the case of Class I shares, any amounts paid for sub-transfer agency, recordkeeping and other administrative services provided by financial intermediaries for the benefit of Class I shareholders), expenses of non-investment related legal services provided to the Funds by or at the direction of GMO, federal securities law filing expenses, printing expenses, state and federal registration fees and custody expenses.
With respect to High Yield Fund, GMO has contractually agreed to waive its fees with respect to and/or reimburse the Fund to the extent that the Fund’s total annual fund operating expenses (after applying all other contractual and voluntary expense limitation arrangements in effect at the time) exceed the following amounts for each class of shares, in each case representing the average daily net assets for the indicated class of shares: 0.55% for Class III shares; 0.50% for Class IV shares; 0.485% for Class V shares; 0.455% for Class VI shares; 0.55% for Class R6 shares; and 0.55% for Class I shares (each, an “Expense Cap”). Fees and expenses of the “non-interested” Trustees and legal counsel to the “non-interested” Trustees, investment-related costs (such as brokerage commissions, interest, and acquired fund fees and expenses), payments out of assets attributable to Class I shares for sub-transfer agency,
117
GMO Trust Funds
Notes to Financial Statements — (Continued)
February 28, 2023
recordkeeping and other administrative services provided by financial intermediaries, taxes, litigation and indemnification expenses, judgments, and other extraordinary or non-recurring expenses not incurred in the ordinary course of the Fund’s business (“Excluded Expenses”), are excluded from the Expense Cap. GMO is permitted to recover from the Fund, on a class-by-class basis, expenses it has borne or reimbursed pursuant to an Expense Cap (whether through reduction of its fees or otherwise) to the extent that the Fund’s total annual fund operating expenses (excluding Excluded Expenses) later fall below that Expense Cap or any lower expense limit in effect when GMO seeks to recover the expenses. The Fund, however, is not obligated to pay any such amount more than three years after GMO bore or reimbursed an expense. Any such recovery will not cause the Fund to exceed the Expense Caps set forth above or any lower expense limits in effect at the time GMO seeks to recover expenses.
For the year ended February 28, 2023, GMO did not recoup any previously recorded waivers and/or reimbursements.
On February 28, 2023, the waivers and/or reimbursements subject to possible future recoupment are as follows:
| Expiring the year ending February 29, 2024 | Expiring the year ending February 28, 2025 | Expiring the year ending February 28, 2026 | ||||||||||
High Yield Fund, Class VI | — | — | $ | 30,232 | ||||||||
GMO has contractually agreed to waive or reduce the Fund’s management fees and shareholder service fees to the extent necessary to offset the management fees and shareholder service fees paid to GMO that are directly or indirectly borne by the Fund or a class of shares of the Fund as a result of the Fund’s direct or indirect investments in other series of GMO Trust (“GMO Funds”). Management fees and shareholder service fees will not be waived below zero.
These contractual waivers and reimbursements will continue through at least June 30, 2023 for each Fund unless the Funds’ Board of Trustees authorizes their modification or termination or reduces the fee rates paid to GMO under the Fund’s management contract or servicing and supplemental support agreement.
For each Fund, other than High Yield Fund, GMO has contractually agreed to reimburse Class I shares of each Fund (or waive its fees) to the extent that payments for sub-transfer agency, recordkeeping and other administrative services provided by financial intermediaries from Class I assets exceed 0.10% of such Fund’s average daily net assets attributable to Class I assets.
For High Yield Fund prior to June 30, 2022, GMO has contractually agreed to reimburse Class I assets to the extent payments for sub-transfer agency, recordkeeping and other administrative services from Class I assets exceed 0.10% of such Fund’s average daily net assets attributable to Class I assets. For the period starting June 30, 2022, GMO has contractually agreed to reimburse Class I assets to the extent payments for sub-transfer agency, recordkeeping and other administrative services from Class I assets exceed 0.04% of such Fund’s average daily net assets attributable to Class I assets.
Sub-Transfer Agent/Recordkeeping Payments
Class III, IV, V, VI, and R6 shares are not subject to payments to third parties for sub-transfer agent, recordkeeping and other administrative services. GMO may, on a case-by-case basis, make payments for sub-transfer agent, recordkeeping and other administrative services provided by financial intermediaries for the benefit of shareholders of these classes. Any such payments are made by GMO out of its own resources and are not an additional charge to a Fund or the holders of Class III, IV, V, VI, or Class R6 shares. These payments may create a conflict of interest by influencing a financial intermediary to recommend a Fund over another investment.
Class I shares are subject to payments for sub-transfer agency, recordkeeping and other administrative services provided by financial intermediaries for the benefit of holders of Class I shares through an account maintained by a third-party platform or intermediary. These services are not primarily intended to result in the sale of Fund shares but instead to provide ongoing services with respect to holders of Class I shares through a third-party platform or intermediary. Because payments for sub-transfer agency, recordkeeping and other administrative services are paid out of a Fund’s Class I assets on an ongoing basis, over time they will increase the cost of an investment in Class I shares. In addition, GMO may, on a case-by-case basis, make payments for sub-transfer agency, recordkeeping and other administrative services provided by financial intermediaries with respect to shareholders of Class I shares. Any such payments will be made by GMO out of its own resources and will not be an additional charge to a Fund or the holders of Class I shares. Any such payments will create a conflict of interest by influencing a financial intermediary to recommend a Fund over another investment.
118
GMO Trust Funds
Notes to Financial Statements — (Continued)
February 28, 2023
The Funds’ portion of the fees paid by the Trust to the Trust’s independent Trustees and their legal counsel and any agents unaffiliated with GMO during the year ended February 28, 2023 is shown in the table below and is included in the Statements of Operations.
| Fund Name | Independent Trustees and their legal counsel ($) | |||
Asset Allocation Bond Fund | 828 | |||
Emerging Country Debt Fund | 151,093 | |||
High Yield Fund | 12,432 | |||
Multi-Sector Fixed Income Fund | 4,275 | |||
Opportunistic Income Fund | 45,941 | |||
U.S. Treasury Fund | 14,721 | |||
Certain Funds incur fees and expenses indirectly as a shareholder in the underlying funds. For the Year ended February 28, 2023, the Funds below had indirect fees and expenses greater than 0.01% of the Fund’s average daily net assets.
| Fund Name | Total Indirect Expense | |||
Multi-Sector Fixed Income Fund | 0.121 | % | ||
The Funds are permitted to purchase or sell securities from or to other GMO Trust funds under specified conditions outlined in procedures adopted by the Trustees. The procedures have been designed to ensure that any purchase or sale of securities by a Fund from or to another GMO Trust fund complies with rule 17a-7 of the 1940 Act. Further, as defined under the procedures, each transaction is effectuated at the current market price. During the year ended February 28, 2023, the funds did not engage in these transactions.
| 6. | Purchases and sales of securities |
Cost of purchases and proceeds from sales of securities, excluding short-term investments and including GMO U.S. Treasury Fund, if applicable, for the year ended February 28, 2023 are noted in the table below:
| Purchases ($) | Purchases ($) | Sales ($) | Sales ($) | |||||||||||||
| Fund Name | U.S. Government Securities | Investments (Non-U.S. Government Securities) | U.S. Government Securities | Investments (Non-U.S. Government Securities) | ||||||||||||
Asset Allocation Bond Fund | 21,472,245 | 165,056 | 50,087,828 | 176,635 | ||||||||||||
Emerging Country Debt Fund | 221,257,491 | 723,294,480 | 302,125,171 | 1,044,602,778 | ||||||||||||
High Yield Fund | 68,696,356 | 53,053,697 | 2,147,192 | 23,644,937 | ||||||||||||
Multi-Sector Fixed Income Fund | 260,169,580 | 32,627,031 | 248,619,393 | 40,053,254 | ||||||||||||
Opportunistic Income Fund | 308,812,644 | 408,390,773 | 425,038,810 | 226,474,353 | ||||||||||||
U.S. Treasury Fund | — | — | — | — | ||||||||||||
119
GMO Trust Funds
Notes to Financial Statements — (Continued)
February 28, 2023
Included in the table above are cost of purchases and proceeds from sales of securities for in-kind transactions, excluding short-term investments, if any, in accordance with U.S. GAAP for the year ended February 28, 2023. In-kind purchases and sales of securities, including short-term investments, if any, and net realized gains/(losses) attributed to redemption in-kind transactions, if any, are noted in the table below:
| Fund Name | In-Kind Purchases ($) | In-Kind Sales ($) | Net realized gains/ (losses) attributed to redemption in- kind transactions ($) | |||||||||
Emerging Country Debt Fund | — | 515,977,959 | * | (168,375,123 | ) | |||||||
| * | The redemption in-kind was redeemed by an affiliate. |
| 7. | Guarantees |
In the normal course of business the Funds enter into contracts with third-party service providers that contain a variety of representations and warranties and that provide general indemnifications. The Funds’ maximum exposure under these arrangements is unknown, as it involves possible future claims that may or may not be made against the Funds. Based on experience, GMO is of the view that the risk of loss to the Funds in connection with the Funds’ indemnification obligations is remote; however, there can be no assurance that such obligations will not result in material liabilities that adversely affect the Funds.
| 8. | Principal shareholders as of February 28, 2023 |
| Fund Name | Number of the Fund | Percentage of outstanding shares of the Fund held by those shareholders owning greater than 10% of the outstanding shares of the Fund | ||||||
Asset Allocation Bond Fund | 1 | ‡ | 99.81 | % | ||||
Emerging Country Debt Fund | — | — | ||||||
High Yield Fund | 3 | # | 94.37 | % | ||||
Multi-Sector Fixed Income Fund | 4 | # | 85.58 | % | ||||
Opportunistic Income Fund | 3 | ‡ | 61.28 | % | ||||
U.S. Treasury Fund | 3 | § | 62.77 | % | ||||
| ‡ | One of the shareholders is another fund of the Trust. |
| # | Two of the shareholders are other funds of the Trust. |
| § | Three of the shareholders are other funds of the Trust. |
120
GMO Trust Funds
Notes to Financial Statements — (Continued)
February 28, 2023
| 9. | Share transactions |
The Declaration of Trust permits each Fund to issue an unlimited number of shares of beneficial interest (without par value). Transactions in the Funds’ shares were as follows:
| Year Ended February 28, 2023 | Year Ended February 28, 2022 | |||||||||||||||
| Shares | Amount | Shares | Amount | |||||||||||||
Asset Allocation Bond Fund | ||||||||||||||||
Class III: | ||||||||||||||||
Shares sold | — | $ | — | 231,090 | $ | 5,615,500 | ||||||||||
Shares issued to shareholders in reinvestment of distributions | — | — | 15 | 359 | ||||||||||||
Shares repurchased | — | — | (2,826,353 | ) | (67,755,933 | ) | ||||||||||
Net increase (decrease) | — | $ | — | (2,595,248 | ) | $ | (62,140,074 | ) | ||||||||
|
|
|
|
|
|
|
| |||||||||
Class VI: | ||||||||||||||||
Shares sold | 155,762 | $ | 3,316,859 | 685,291 | $ | 16,677,005 | ||||||||||
Shares issued to shareholders in reinvestment of distributions | 7,321 | 157,978 | 28,792 | 699,355 | ||||||||||||
Shares repurchased | (790,590 | ) | (17,266,124 | ) | (1,552,611 | ) | (37,257,738 | ) | ||||||||
|
|
|
|
|
|
|
| |||||||||
Net increase (decrease) | (627,507 | ) | $ | (13,791,287 | ) | (838,528 | ) | $ | (19,881,378 | ) | ||||||
|
|
|
|
|
|
|
| |||||||||
Emerging Country Debt Fund | ||||||||||||||||
Class III: | ||||||||||||||||
Shares sold | 27,396,992 | $ | 489,332,221 | 7,338,675 | $ | 177,081,443 | ||||||||||
Shares issued to shareholders in reinvestment of distributions | 5,278,003 | 92,976,565 | 3,749,384 | 91,061,066 | ||||||||||||
Shares repurchased | (7,788,631 | ) | (149,032,722 | ) | (6,465,058 | ) | (154,953,062 | ) | ||||||||
Purchase premiums | — | 197,867 | — | 262,799 | ||||||||||||
Redemption fees | — | 811,031 | — | 415,289 | ||||||||||||
|
|
|
|
|
|
|
| |||||||||
Net increase (decrease) | 24,886,364 | $ | 434,284,962 | 4,623,001 | $ | 113,867,535 | ||||||||||
|
|
|
|
|
|
|
| |||||||||
Class IV: | ||||||||||||||||
Shares sold | 18,090,621 | $ | 327,661,582 | 19,770,838 | $ | 511,809,366 | ||||||||||
Shares issued to shareholders in reinvestment of distributions | 7,663,996 | 134,759,630 | 7,567,539 | 186,159,290 | ||||||||||||
Shares repurchased | (31,422,672 | ) | (567,257,280 | ) | (81,664,417 | ) | (2,093,128,743 | ) | ||||||||
Purchase premiums | — | 329,215 | — | 676,346 | ||||||||||||
Redemption fees | — | 1,390,018 | — | 834,669 | ||||||||||||
|
|
|
|
|
|
|
| |||||||||
Net increase (decrease) | (5,668,055 | ) | $ | (103,116,835 | ) | (54,326,040 | ) | $ | (1,393,649,072 | ) | ||||||
|
|
|
|
|
|
|
| |||||||||
Class VI:(a) | ||||||||||||||||
Shares sold | 7,804,106 | $ | 150,598,679 | 57,276,130 | $ | 1,479,762,322 | ||||||||||
Shares issued to shareholders in reinvestment of distributions | 5,224,631 | 92,257,553 | 4,061,385 | 96,336,051 | ||||||||||||
Shares repurchased | (49,730,237 | )(b) | (871,796,301 | )(b) | (2,398,142 | ) | (59,422,319 | ) | ||||||||
Purchase premiums | — | 145,763 | — | 151,434 | ||||||||||||
Redemption fees | — | 773,314 | — | 453,691 | ||||||||||||
|
|
|
|
|
|
|
| |||||||||
Net increase (decrease) | (36,701,500 | ) | $ | (628,020,992 | ) | 58,939,373 | $ | 1,517,281,179 | ||||||||
|
|
|
|
|
|
|
| |||||||||
121
GMO Trust Funds
Notes to Financial Statements — (Continued)
February 28, 2023
| Year Ended February 28, 2023 | Year Ended February 28, 2022 | |||||||||||||||
| Shares | Amount | Shares | Amount | |||||||||||||
High Yield Fund | ||||||||||||||||
Class VI: | ||||||||||||||||
Shares sold | 15,284,882 | $ | 267,516,111 | — | $ | — | ||||||||||
Shares issued to shareholders in reinvestment of distributions | 1,134,916 | 18,886,074 | 607,965 | 11,960,560 | ||||||||||||
Shares repurchased | (5,586,053 | ) | (98,691,785 | ) | (585,873 | ) | (11,500,000 | ) | ||||||||
|
|
|
|
|
|
|
| |||||||||
Net increase (decrease) | 10,833,745 | $ | 187,710,400 | 22,092 | $ | 460,560 | ||||||||||
|
|
|
|
|
|
|
| |||||||||
Multi-Sector Fixed Income Fund | ||||||||||||||||
Class III: | ||||||||||||||||
Shares sold | 416,640 | $ | 6,870,403 | 198,808 | $ | 4,000,000 | ||||||||||
Shares issued to shareholders in reinvestment of distributions | 8,883 | 149,319 | 38,703 | 771,747 | ||||||||||||
Shares repurchased | (280 | ) | (4,800 | ) | (1,340,616 | ) | (26,860,330 | ) | ||||||||
|
|
|
|
|
|
|
| |||||||||
Net increase (decrease) | 425,243 | $ | 7,014,922 | (1,103,105 | ) | $ | (22,088,583 | ) | ||||||||
|
|
|
|
|
|
|
| |||||||||
Class IV: | ||||||||||||||||
Shares sold | 1,483,036 | $ | 26,065,009 | 2,988,268 | $ | 60,053,854 | ||||||||||
Shares issued to shareholders in reinvestment of distributions | 92,314 | 1,559,194 | 193,216 | 3,868,186 | ||||||||||||
Shares repurchased | (2,350,022 | ) | (40,932,500 | ) | (3,669,201 | ) | (72,720,030 | ) | ||||||||
|
|
|
|
|
|
|
| |||||||||
Net increase (decrease) | (774,672 | ) | $ | (13,308,297 | ) | (487,717 | ) | $ | (8,797,990 | ) | ||||||
|
|
|
|
|
|
|
| |||||||||
Opportunistic Income Fund | ||||||||||||||||
Class III:(c) | ||||||||||||||||
Shares sold | 1,794,231 | $ | 43,302,785 | 1,013,442 | $ | 26,129,885 | ||||||||||
Shares issued to shareholders in reinvestment of distributions | 14,595 | 353,815 | 8,790 | 224,578 | ||||||||||||
Shares repurchased | (293,945 | ) | (7,248,308 | ) | (541,722 | ) | (13,851,286 | ) | ||||||||
|
|
|
|
|
|
|
| |||||||||
Net increase (decrease) | 1,514,881 | $ | 36,408,292 | 480,510 | $ | 12,503,177 | ||||||||||
|
|
|
|
|
|
|
| |||||||||
Class VI: | ||||||||||||||||
Shares sold | 5,356,095 | $ | 131,084,685 | 1,201,167 | $ | 30,987,689 | ||||||||||
Shares issued to shareholders in reinvestment of distributions | 621,773 | 15,001,411 | 294,328 | 7,561,416 | ||||||||||||
Shares repurchased | (4,501,883 | ) | (110,825,799 | ) | (5,293,597 | ) | (137,137,320 | ) | ||||||||
|
|
|
|
|
|
|
| |||||||||
Net increase (decrease) | 1,475,985 | $ | 35,260,297 | (3,798,102 | ) | $ | (98,588,215 | ) | ||||||||
|
|
|
|
|
|
|
| |||||||||
Class R6:(d) | ||||||||||||||||
Shares sold | 3,049,542 | $ | 76,297,993 | 6,348,670 | $ | 164,336,615 | ||||||||||
Shares issued to shareholders in reinvestment of distributions | 171,371 | 4,129,997 | 26,344 | 673,318 | ||||||||||||
Shares repurchased | (1,468,340 | ) | (35,958,528 | ) | (374,066 | ) | (9,594,675 | ) | ||||||||
|
|
|
|
|
|
|
| |||||||||
Net increase (decrease) | 1,752,573 | $ | 44,469,462 | 6,000,948 | $ | 155,415,258 | ||||||||||
|
|
|
|
|
|
|
| |||||||||
Class I: | ||||||||||||||||
Shares sold | 8,137,722 | $ | 196,826,521 | 5,654,035 | $ | 146,238,616 | ||||||||||
Shares issued to shareholders in reinvestment of distributions | 628,046 | 15,108,991 | 234,350 | 6,009,933 | ||||||||||||
Shares repurchased | (5,221,139 | ) | (128,235,546 | ) | (4,671,231 | ) | (121,104,867 | ) | ||||||||
|
|
|
|
|
|
|
| |||||||||
Net increase (decrease) | 3,544,629 | $ | 83,699,966 | 1,217,154 | $ | 31,143,682 | ||||||||||
|
|
|
|
|
|
|
| |||||||||
122
GMO Trust Funds
Notes to Financial Statements — (Continued)
February 28, 2023
| Year Ended February 28, 2023 | Year Ended February 28, 2022 | |||||||||||||||
| Shares | Amount | Shares | Amount | |||||||||||||
U.S. Treasury Fund | ||||||||||||||||
Core Class: | ||||||||||||||||
Shares sold | 498,976,199 | $ | 2,489,337,437 | 304,783,797 | $ | 1,534,292,585 | ||||||||||
Shares issued to shareholders in reinvestment of distributions | 426,512 | 2,126,219 | 63,726 | 320,558 | ||||||||||||
Shares repurchased | (468,958,957 | ) | (2,339,411,314 | ) | (329,360,932 | ) | (1,657,850,113 | ) | ||||||||
|
|
|
|
|
|
|
| |||||||||
Net increase (decrease) | 30,443,754 | $ | 152,052,342 | (24,513,409 | ) | $ | (123,236,970 | ) | ||||||||
|
|
|
|
|
|
|
| |||||||||
| (a) | The period under the heading “Year Ended February 28, 2022” represents the period from July 29, 2021 (commencement of operations) through February 28, 2022. |
| (b) | 29,602,866 shares and $515,977,959 were redeemed in-kind by an affiliate. |
| (c) | The period under the heading “Year Ended February 28, 2022” represents the period from July 21, 2021 (commencement of operations) through December 28, 2021 and the period under the heading “Year Ended February 28, 2022” represents the period from February 1, 2022 (commencement of operations) through February 28, 2022. |
| (d) | The period under the heading “Year Ended February 28, 2022” represents the period from May 19, 2021 (commencement of operations) through February 28, 2022. |
| 10. | Investments in affiliated companies and other Funds of the Trust |
An affiliated company for the purposes of this disclosure is a company in which a Fund has or had direct ownership of at least 5% of the issuer’s voting securities or an investment in other funds of GMO Trust. A summary of the Funds’ transactions involving companies that are or were affiliates during the year ended February 28, 2023 is set forth below:
| Affiliate | Value, beginning of period | Purchases | Sales Proceeds | Dividend Income | Distributions of Realized Gains | Net Realized Gain (Loss) | Net Increase/ Appreciation/ Depreciation | Value, end of period | ||||||||||||||||||||||||
Asset Allocation Bond Fund | ||||||||||||||||||||||||||||||||
GMO U.S. Treasury Fund | $ | 11,626 | $ | 165,055 | $ | 176,635 | $ | 460 | $ | — | $ | (93 | ) | $ | 47 | $ | — | |||||||||||||||
|
|
|
|
|
|
|
|
|
|
|
|
|
|
|
| |||||||||||||||||
Emerging Country Debt Fund | ||||||||||||||||||||||||||||||||
GMO U.S. Treasury Fund | $ | 74,339,103 | $ | — | $ | 6,500,000 | $ | 1,693,152 | $ | — | $ | (35,403 | ) | $ | (274,412 | ) | $ | 67,529,288 | ||||||||||||||
|
|
|
|
|
|
|
|
|
|
|
|
|
|
|
| |||||||||||||||||
Multi-Sector Fixed Income Fund | ||||||||||||||||||||||||||||||||
GMO Emerging Country Debt Fund, Class VI | $ | 6,291,438 | $ | — | $ | 1,000,001 | $ | 595,595 | $ | — | $ | (409,719 | ) | $ | (506,790 | ) | $ | 4,374,928 | ||||||||||||||
GMO Opportunistic Income Fund, Class VI | 25,924,702 | — | 1,000,000 | 904,092 | 357,581 | (34,894 | ) | (1,395,504 | ) | 23,494,304 | ||||||||||||||||||||||
GMO U.S. Treasury Fund | 2,399,326 | — | 2,399,326 | 854 | — | (9,578 | ) | 9,578 | — | |||||||||||||||||||||||
|
|
|
|
|
|
|
|
|
|
|
|
|
|
|
| |||||||||||||||||
Totals | $ | 34,615,466 | $ | — | $ | 4,399,327 | $ | 1,500,541 | $ | 357,581 | $ | (454,191 | ) | $ | (1,892,716 | ) | $ | 27,869,232 | ||||||||||||||
|
|
|
|
|
|
|
|
|
|
|
|
|
|
|
| |||||||||||||||||
Opportunistic Income Fund | ||||||||||||||||||||||||||||||||
GMO U.S. Treasury Fund | $ | 10,938,043 | $ | — | $ | — | $ | 259,013 | $ | — | $ | — | $ | (43,665 | ) | $ | 10,894,378 | |||||||||||||||
|
|
|
|
|
|
|
|
|
|
|
|
|
|
|
| |||||||||||||||||
| 11. | Subsequent events |
Subsequent to February 28, 2023, GMO High Yield Fund received redemption requests in the amount of $84,500,000.
123
Report of Independent Registered Public Accounting Firm
To the Board of Trustees of GMO Trust and Shareholders of
GMO Asset Allocation Bond Fund, GMO Emerging Country Debt Fund, GMO High Yield Fund, GMO Multi-Sector Fixed Income Fund, GMO Opportunistic Income Fund, and GMO U.S. Treasury Fund
Opinions on the Financial Statements
We have audited the accompanying statements of assets and liabilities, including the schedules of investments, of GMO Asset Allocation Bond Fund, GMO Emerging Country Debt Fund, GMO High Yield Fund, GMO Multi-Sector Fixed Income Fund, GMO Opportunistic Income Fund, and GMO U.S. Treasury Fund (six of the funds constituting GMO Trust, hereafter collectively referred to as the “Funds”) as of February 28, 2023, the related statements of operations for the year ended February 28, 2023, the statements of changes in net assets for each of the two years in the period ended February 28, 2023, the statement of cash flows for GMO Emerging Country Debt Fund for the year ended February 28, 2023, including the related notes, and the financial highlights for each of the periods indicated therein (collectively referred to as the “financial statements”). In our opinion, the financial statements present fairly, in all material respects, the financial position of each of the Funds as of February 28, 2023, the results of each of their operations for the year then ended, the changes in each of their net assets for each of the two years in the period ended February 28, 2023, the statement of cash flows of GMO Emerging Country Debt Fund for the year ended February 28, 2023 and each of the financial highlights for each of the periods indicated therein in conformity with accounting principles generally accepted in the United States of America.
Basis for Opinions
These financial statements are the responsibility of the Funds’ management. Our responsibility is to express an opinion on the Funds’ financial statements based on our audits. We are a public accounting firm registered with the Public Company Accounting Oversight Board (United States) (PCAOB) and are required to be independent with respect to the Funds in accordance with the U.S. federal securities laws and the applicable rules and regulations of the Securities and Exchange Commission and the PCAOB.
We conducted our audits of these financial statements in accordance with the standards of the PCAOB. Those standards require that we plan and perform the audit to obtain reasonable assurance about whether the financial statements are free of material misstatement, whether due to error or fraud.
Our audits included performing procedures to assess the risks of material misstatement of the financial statements, whether due to error or fraud, and performing procedures that respond to those risks. Such procedures included examining, on a test basis, evidence regarding the amounts and disclosures in the financial statements. Our audits also included evaluating the accounting principles used and significant estimates made by management, as well as evaluating the overall presentation of the financial statements. Our procedures included confirmation of securities owned as of February 28, 2023 by correspondence with the custodian, transfer agent and brokers; when replies were not received from brokers, we performed other auditing procedures. We believe that our audits provide a reasonable basis for our opinions.
| /s/ PricewaterhouseCoopers LLP |
| Boston, MA |
| April 27, 2023 |
We have served as the auditor of one or more investment companies in the GMO mutual funds complex since 1985.
124
GMO Trust Funds
February 28, 2023 (Unaudited)
Expense Examples: The following information is in relation to expenses for the six month period ended February 28, 2023.
As a shareholder of the Funds, you may incur two types of costs: (1) transaction costs, including purchase premium and redemption fees, if applicable; and (2) ongoing costs, including direct and/or indirect management fees, direct and/or indirect shareholder services fees, and other Fund expenses. This example is intended to help you understand your ongoing costs (in dollars) of investing in the Funds and to compare these costs with the ongoing costs of investing in other mutual funds.
These examples are based on an investment of $1,000 invested at the beginning of the period and held for the entire period, September 1, 2022 through February 28, 2023.
Actual Expenses
This section of the table for each class below provides information about actual account values and actual expenses. You may use the information in this section, together with the amount you invested, to estimate the expenses that you paid over the period. Simply divide your account value by $1,000 (for example, a $10,000,000 account value divided by $1,000 = 10,000), then multiply the result by the number under the heading entitled “Expenses Paid During the Period” to estimate the expenses you paid on your account during this period.
Hypothetical Example for Comparison Purposes
This section of the table for each class below provides information about hypothetical account values and hypothetical expenses based on the Funds’ actual expense ratio and an assumed rate of return of 5% per year before expenses, which is not the Funds’ actual return. The hypothetical account values and expenses may not be used to estimate the actual ending account balance or expenses you paid for the period. You may use this information to compare the ongoing costs of investing in the Funds with other funds. To do so, compare this 5% hypothetical example with the 5% hypothetical examples that appear in the shareholder reports of other funds.
Please note that the expenses shown in the table are meant to highlight your ongoing costs only and do not reflect any transactional costs, such as purchase premium and redemption fees. Therefore, this section of the table is useful in comparing ongoing costs only, and will not help you determine the relative total costs of owning different funds. In addition, if these transactional costs were included, your costs would have been higher.
| Actual | Hypothetical |
| ||||||||||||||||||||||||||
| Beginning Account Value September 1, 2022 | Ending Account Value February 28, 2023 | Expenses Paid During the Period* | Beginning Account Value September 1, 2022 | Ending Account Value February 28, 2023 | Expenses Paid During the Period* | Annualized Expense Ratio | ||||||||||||||||||||||
Asset Allocation Bond Fund |
| |||||||||||||||||||||||||||
Class III | $ | 1,000.00 | $ | 959.20 | $ | 1.94 | $ | 1,000.00 | $ | 1,022.81 | $ | 2.01 | 0.40 | % | ||||||||||||||
Class VI | $ | 1,000.00 | $ | 959.00 | $ | 1.55 | $ | 1,000.00 | $ | 1,023.21 | $ | 1.61 | 0.32 | % | ||||||||||||||
Emerging Country Debt Fund |
| |||||||||||||||||||||||||||
Class III | $ | 1,000.00 | $ | 1,055.10 | $ | 2.75 | $ | 1,000.00 | $ | 1,022.12 | $ | 2.71 | 0.54 | % | ||||||||||||||
Class IV | $ | 1,000.00 | $ | 1,055.50 | $ | 2.50 | $ | 1,000.00 | $ | 1,022.37 | $ | 2.46 | 0.49 | % | ||||||||||||||
Class VI | $ | 1,000.00 | $ | 1,055.10 | $ | 2.24 | $ | 1,000.00 | $ | 1,022.61 | $ | 2.21 | 0.44 | % | ||||||||||||||
High Yield Fund |
| |||||||||||||||||||||||||||
Class VI | $ | 1,000.00 | $ | 1,041.90 | $ | 2.38 | $ | 1,000.00 | $ | 1,022.46 | $ | 2.36 | 0.47 | % | ||||||||||||||
Multi-Sector Fixed Income Fund |
| |||||||||||||||||||||||||||
Class III | $ | 1,000.00 | $ | 978.80 | $ | 2.06 | $ | 1,000.00 | $ | 1,022.71 | $ | 2.11 | 0.42 | % | ||||||||||||||
Class IV | $ | 1,000.00 | $ | 978.10 | $ | 1.81 | $ | 1,000.00 | $ | 1,022.96 | $ | 1.86 | 0.37 | % | ||||||||||||||
Opportunistic Income Fund |
| |||||||||||||||||||||||||||
Class III | $ | 1,000.00 | $ | 1,010.60 | $ | 2.84 | $ | 1,000.00 | $ | 1,021.97 | $ | 2.86 | 0.57 | % | ||||||||||||||
Class VI | $ | 1,000.00 | $ | 1,010.50 | $ | 2.34 | $ | 1,000.00 | $ | 1,022.46 | $ | 2.36 | 0.47 | % | ||||||||||||||
Class R6 | $ | 1,000.00 | $ | 1,010.40 | $ | 2.84 | $ | 1,000.00 | $ | 1,021.97 | $ | 2.86 | 0.57 | % | ||||||||||||||
Class I | $ | 1,000.00 | $ | 1,009.80 | $ | 3.39 | $ | 1,000.00 | $ | 1,021.42 | $ | 3.41 | 0.68 | % | ||||||||||||||
125
GMO Trust Funds
Fund Expenses — (Continued)
February 28, 2023 (Unaudited)
| Actual | Hypothetical |
| ||||||||||||||||||||||||||
| Beginning Account Value September 1, 2022 | Ending Account Value February 28, 2023 | Expenses Paid During the Period* | Beginning Account Value September 1, 2022 | Ending Account Value February 28, 2023 | Expenses Paid During the Period* | Annualized Expense Ratio | ||||||||||||||||||||||
U.S. Treasury Fund | ||||||||||||||||||||||||||||
Core Class | $ | 1,000.00 | $ | 1,017.20 | $ | 0.05 | $ | 1,000.00 | $ | 1,024.75 | $ | 0.05 | 0.01 | % | ||||||||||||||
| * | Expenses are calculated using each class’s annualized net expense ratio (including indirect expenses incurred) for the six months ended February 28, 2023, multiplied by the average account value over the period, multiplied by 181 days in the period, divided by 365 days in the year. |
126
GMO Trust Funds
Tax Information for the Tax Year Ended February 28, 2023 (Unaudited)
The following information is being provided in order to meet reporting requirements set forth by the Code and/or to meet state-specific requirements. Shareholders should consult their tax advisors.
With respect to distributions paid, the Funds designate the following amounts (or, if subsequently determined to be different, the maximum amount allowable) for the fiscal year-ended February 28, 2023:
| Fund Name | U.S. Government Obligation Income(1)(2) | Interest- Dividend | Short-Term Capital Gain Dividends | Long-Term Capital Gain Distributions ($) | Code Interest-Related Dividend ($)(4) | |||||||||||||||
Asset Allocation Bond Fund | 100.00 | % | 140,605 | — | — | — | ||||||||||||||
Emerging Country Debt Fund | — | — | — | — | — | |||||||||||||||
High Yield Fund | 12.35 | % | 3,211,933 | 451,107 | 168,925 | — | ||||||||||||||
Multi-Sector Fixed Income Fund | 20.30 | % | 1,314,494 | — | — | — | ||||||||||||||
Opportunistic Income Fund | 5.86 | % | 26,718,186 | 4,491,689 | 9,982,443 | — | ||||||||||||||
U.S. Treasury Fund | 75.80 | % | 8,732,859 | — | — | 8,732,859 | ||||||||||||||
| (1) | Presented as a percentage of net investment income and short-term capital gain distributions paid, if any. |
| (2) | All or a portion of these amounts may be exempt from taxation at the state level. |
| (3) | These amounts are generally exempt from U.S. withholding taxes for non-U.S. shareholders, provided certain conditions are satisfied by both the Funds and the Funds’ shareholders. If applicable, interest-related dividend amounts may include short-term capital gain distributions received from underlying funds. |
| (4) | The Funds hereby designate the above business interest-related dividend income pursuant to Section 163(j) of the Code and the regulations. |
In early 2024, the Funds will notify applicable shareholders of amounts for use in preparing 2023 U.S. federal income tax forms.
127
Trustees and Officers (Unaudited)
The following tables present information regarding each Trustee and officer of the Trust as of February 28, 2023. Each Trustee’s and officer’s year of birth (“YOB”) is set forth after his or her name. Unless otherwise noted, (i) each Trustee and officer has engaged in the principal occupation(s) noted in the table for at least the most recent five years, although not necessarily in the same capacity, and (ii) the address of each Trustee and officer is c/o GMO Trust, 53 State Street, Suite 3300, Boston, MA 02109. Each Trustee serves in office until the earlier of (a) the election and qualification of a successor at the next meeting of shareholders called to elect Trustees or (b) the Trustee dies, resigns, or is removed as provided in the Trust’s governing documents. Each of the Trustees of the Trust, other than Ms. Santoro, is not an “interested person” of the Trust, as such term is used in the 1940 Act (each, an “Independent Trustee”). Because the Funds do not hold annual meetings of shareholders, each Trustee will hold office for an indeterminate period. Each officer serves in office until his or her successor is elected and determined to be qualified to carry out the duties and responsibilities of the office, or until the officer resigns or is removed from office.
Independent Trustees
Name and Year of Birth | Position(s) Held with the Trust | Length of Time Served | Principal Occupation(s) 5 Years | Number of | Other Directorships Held in the Past Five Years | |||||
Donald W. Glazer YOB: 1944 | Chairman of the Board of Trustees | Chairman of the Board of Trustees since March 2005; Lead Independent Trustee (September 2004 – March 2005); Trustee since December 2000. | Consultant – Law and Business; Author of Legal Treatises. | 33 | Director, BeiGene Ltd. (biotech). | |||||
Peter Tufano YOB: 1957 | Trustee | Since December 2008. | Peter Moores Professor of Finance (Since July 1, 2011) and Peter Moores Dean and Professor of Finance (July 1, 2011 – June 30, 2022) University of Oxford, Said Business School; Baker Foundation Professor, Harvard Business School (Since July 1, 2022). | 33 | None. | |||||
Paul Braverman YOB: 1949 | Trustee | Since March 2010. | Retired | 33 | Trustee HIMCO Variable Insurance Trust (27 Portfolios) April 2014 – April 2019). | |||||
128
| Interested Trustee and Officer | ||||||||||
Dina Santoro2 YOB: 1973 | Trustee; President of the Trust | Trustee and President of the Trust since February 2023. | Chief Operating Officer, Grantham, Mayo, Van Otterloo & Co. LLC (February 2023 – Present); President, Chief Executive Officer, and Director, Voya Investments, LLC, Voya Capital, LLC, and Voya Funds Services, LLC (September 2022 – December 2022); Director and Senior Vice President, Voya Investments Distributor, LLC (April 2018 –December 2022); Chief Operating Officer, Voya Investment Management (January 2022 –December 2022); Senior Managing Director, Head of Product and Marketing Strategy, Voya Investment Management (September 2017-December 2022). Formerly, President and Director, Voya Investments, LLC and Voya Capital, LLC (March 2018-September 2022); Director, Voya Funds Services, LLC (March 2018-September 2022). | 33 | Voya Separate Portfolios Trust (July 2018 – December 2022). | |||||
| 1 | The Fund Complex includes series of each of GMO Trust. |
| 2 | Ms. Santoro is an “interested person” of the Trust, as such term is used in the 1940 Act (as “Interested Trustee”), by virtue of her positions with the Trust and GMO indicated in the table above. |
Officers
Name and Year of Birth | Position(s) Held with Trust | Length of Time Served | Principal Occupation(s) During Past Five Years* | |||
| Dina Santoro YOB: 1973 | Trustee; President of the Trust | Trustee and President since February 2023. | Chief Operating Officer, Grantham, Mayo, Van Otterloo & Co. LLC (February 2023 – Present); Chief Operating Officer, Grantham, Mayo, Van Otterloo & Co. LLC (February 2023 – Present); President, Chief Executive Officer, and Director, Voya Investments, LLC, Voya Capital, LLC, and Voya Funds Services, LLC (September 2022 – February 2023); Director and Senior Vice President, Voya Investments Distributor, LLC (April 2018 –February 2023); Chief Operating Officer, Voya Investment Management (January 2022 –February 2023); Senior Managing Director, Head of Product and Marketing Strategy, Voya Investment Management (September 2017-February 2023); Formerly, President and Director, Voya Investments, LLC and Voya Capital, LLC (March 2018-September 2022); Director, Voya Funds Services, LLC (March 2018-September 2022). | |||
Tara Pari YOB: 1976 | Chief Executive Officer | Chief Executive Officer since November 2020. | Risk and Controls, Grantham, Mayo, Van Otterloo & Co. LLC (September 2004 – November 2020); Head of Fund Reporting and Risk and Controls, Grantham, Mayo, Van Otterloo & Co. LLC (November 2020 to present). | |||
Betty Maganzini YOB: 1972 | Treasurer, Chief Accounting Officer and Chief Financial Officer | �� | Treasurer, Chief Accounting Officer and Chief Financial Officer since September 2018; Assistant Treasurer, September 2013 – September 2018. | Fund Administrator, Grantham, Mayo, Van Otterloo & Co. LLC (July 2010 – present). | ||
129
Name and Year of Birth | Position(s) Held with Trust | Length of Time Served | Principal Occupation(s) During Past Five Years* | |||
Susan Saw YOB: 1981 | Assistant Treasurer | Since September 2019. | Fund Administrator, Grantham, Mayo, Van Otterloo & Co. LLC (March 2011 – present). | |||
John L. Nasrah YOB: 1977 | Since March 2007. | Head of Tax, Grantham, Mayo, Van Otterloo & Co. LLC (November 2020 - present); Head of Fund Tax, Grantham, Mayo, Van Otterloo & Co. LLC (2018 - 2020). | ||||
Cathy Tao YOB: 1974 | Assistant Treasurer | Since September 2016. | Fund Administrator, Grantham, Mayo, Van Otterloo & Co. LLC (October 2007 – present). | |||
Devin Kelly YOB: 1984 | Assistant Treasurer | Since June 2020. | Fund Administrator, Grantham, Mayo, Van Otterloo & Co. LLC (October 2012 – present). | |||
Brian Kadehjian YOB: 1974 | Assistant Treasurer and Treasury Officer | Assistant Treasurer since February 2015; Treasury Officer since September 2013. | Fund Administrator, Grantham, Mayo, Van Otterloo & Co. LLC (April 2002 – present). | |||
Douglas Y. Charton YOB: 1982 | Chief Legal Officer, Vice President and Clerk | Since August 2015. | Legal Counsel, Grantham, Mayo, Van Otterloo & Co. LLC (July 2015 – present); Associate, K&L Gates LLP (September 2007 – July 2015). | |||
Megan Bunting YOB: 1978 | Vice President and Assistant Clerk | Since September 2013. | Legal Counsel, Grantham, Mayo, Van Otterloo & Co. LLC (September 2006 – present). | |||
Kevin O’Brien YOB: 1985 | Vice President and Assistant Clerk | Since March 2016. | Legal Counsel, Grantham, Mayo, Van Otterloo & Co. LLC (February 2015 – present). | |||
Gregory L. Pottle YOB: 1971 | Chief Compliance Officer | Chief Compliance Officer since May 2015; Vice President and Assistant Clerk, November 2006 – November 2015. | Chief Compliance Officer, Grantham, Mayo, Van Otterloo & Co. LLC (May 2015 – present). | |||
| Kelly Butler YOB: 1974 | Anti-Money Laundering Officer | Since March 2020. | Compliance Manager (March 2016 – present); Compliance Specialist, Grantham, Mayo, Van Otterloo & Co. LLC (November 2007 – March 2016). | |||
| * | Each officer of the Trust may also serve as an officer and/or director of certain pooled investment vehicles of which GMO or an affiliate of GMO serves as the investment adviser. |
130
AR-022823-FI
GMO Trust
Annual Report
February 28, 2023
Alternative Allocation Fund
Benchmark-Free Allocation Fund
Benchmark-Free Fund
Global Asset Allocation Fund
Global Developed Equity Allocation Fund
Global Equity Allocation Fund
Implementation Fund
International Developed Equity Allocation Fund
International Equity Allocation Fund
SGM Major Markets Fund
Strategic Opportunities Allocation Fund
For a free copy of the Funds’ proxy voting guidelines, shareholders may call 1-617-346-7646 (collect), visit GMO’s website at www.gmo.com or visit the Securities and Exchange Commission’s website at www.sec.gov. Information regarding how the Funds voted proxies relating to portfolio securities during the most recent 12-month period ended June 30 will be available without charge on GMO’s website at www.gmo.com and on the Securities and Exchange Commission’s website at www.sec.gov no later than August 31 of each year.
The Funds file their complete schedule of portfolio holdings with the Securities and Exchange Commission for the first and third quarter of each fiscal year on Form N-PORT which is available on the Commission’s website at www.sec.gov. The Funds have a policy with respect to disclosure of portfolio holdings under which they may also make a complete schedule of portfolio holdings available on GMO’s website at www.gmo.com.
This report is prepared for the general information of shareholders. It is authorized for distribution to prospective investors only when preceded or accompanied by a prospectus for the GMO Trust, which contains a complete discussion of the risks associated with an investment in these Funds and other important information. The GMO Trust prospectus can be obtained at www.gmo.com. The GMO Trust Statement of Additional Information includes additional information about the Trustees of GMO Trust and is available without charge, upon request, by calling 1-617-346-7646 (collect).
An investment in the Funds is subject to risk, including the possible loss of principal amount invested. There can be no assurance that the Funds will achieve their stated investment objectives. Please see the Funds’ prospectus regarding specific principal risks for each Fund. General risks may include: market risk-equities, management and operational risk, market risk-asset backed securities, credit risk, non-U.S. investment risk, small company risk and derivatives risk.
The Funds are distributed by Funds Distributor LLC. Funds Distributor LLC is not affiliated with GMO.
TABLE OF CONTENTS
| 3 | ||||
| 4 | ||||
| 5 | ||||
| 6 | ||||
| 23 | ||||
| 24 | ||||
| 25 | ||||
| 26 | ||||
| 27 | ||||
| 28 | ||||
| 29 | ||||
| 30 | ||||
| 53 | ||||
| 54 | ||||
| 55 | ||||
| 56 | ||||
| 57 | ||||
| 58 | ||||
| 59 | ||||
| 60 | ||||
| 61 | ||||
| 62 | ||||
| 63 | ||||
| 64 | ||||
| 65 | ||||
| 66 | ||||
| 67 | ||||
| 68 | ||||
| 97 | ||||
| 98 | ||||
| 99 | ||||
| 100 | ||||
| 101 | ||||
| 102 | ||||
| 103 | ||||
| 104 | ||||
| 105 | ||||
| 106 | ||||
| 107 | ||||
| 108 |
| 111 | ||||
| 112 | ||||
| 113 | ||||
| 114 | ||||
| 125 | ||||
| 126 | ||||
| 132 | ||||
| 135 | ||||
| 141 | ||||
| 142 | ||||
| 168 | ||||
| 224 | ||||
| 226 | ||||
| 228 | ||||
| 229 |
This page has been left blank intentionally.
GMO Alternative Allocation Fund
(A Series of GMO Trust)
Portfolio Management
Day-to-day management of the Fund’s portfolio is the responsibility of the Asset Allocation team at Grantham, Mayo, Van Otterloo & Co. LLC.
Management Discussion and Analysis of Fund Performance
Although GMO does not manage the Fund to, or control the Fund’s risk relative to, any securities index or securities benchmark, a discussion of the Fund’s performance relative to the FTSE 3-Month Treasury Bill Index is included for comparative purposes only.
Class VI shares of GMO Alternative Allocation Fund returned +3.25% (net) for the fiscal year ended February 28, 2023, as compared with +2.22% for the FTSE-3 Month Treasury Bill Index.
Equity Dislocation, which is long cheap Value stocks and short expensive Growth stocks, had a very strong year and, as a sizeable allocation, was the biggest contributor to total Fund returns with a 2.52% contribution. Other strategies that had a meaningful positive impact included Event-Driven, Systematic Global Macro, and the Credit strategies. Unfortunately, one of the larger exposures, Fixed Income Absolute Return, had a disappointing 12 months and detracted -1.84%. The Asset Allocation Long/Short strategy and Put Selling also modestly detracted.
Because some of the securities and instruments held directly or indirectly by the Fund had positive fair value adjustments at the beginning or end of the fiscal year (and the performance of indices are not fair valued), the Fund’s absolute and relative performance is higher than it otherwise would have been in the absence of such fair value adjustments.
The views expressed herein are exclusively those of Grantham, Mayo, Van Otterloo & Co. LLC as of the date of this report and are subject to change. GMO disclaims any responsibility to update such views. They are not meant as investment advice. References to specific securities are not recommendations of such securities and may not be representative of any GMO portfolio’s current or future investments. All information is unaudited.
3
GMO Alternative Allocation Fund
(A Series of GMO Trust)
Comparison of Change in Value of a $300,000,000 Investment in
GMO Alternative Allocation Fund Class VI Shares and the FTSE 3-Month Treasury Bill Index
As of February 28, 2023
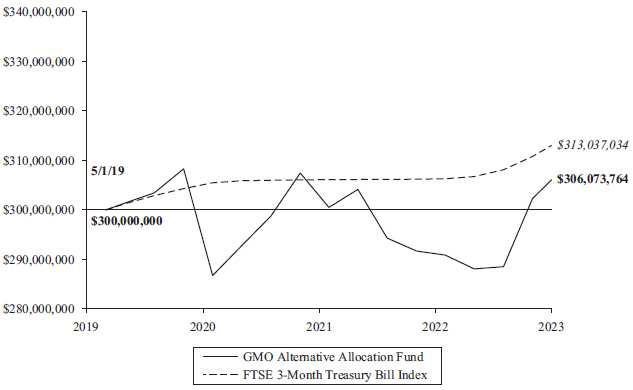
| Average Annual Total Returns | ||||||||||||
| 1 Year | Since Inception | |||||||||||
| Class VI | 3.25 | % | 5/1/19 | 0.52 | % | |||||||
| Class R6 | 3.17 | % | 7/31/20 | 1.19 | % | |||||||
| Class I | 2.98 | % | 9/4/19 | 0.06 | % | |||||||
Performance data quoted represents past performance and is not indicative of future results. The investment return and principal value of an investment will fluctuate so that an investor’s shares, when redeemed, may be worth more or less than their original cost. Current performance data may be lower or higher than the performance data provided herein. To obtain performance information up to the most recent month-end, visit www.gmo.com. Performance shown is net of all fees after reimbursement from GMO. Returns would have been lower had certain expenses not been reimbursed during the periods shown and do not include the effect of taxes on distributions and redemptions. The performance information shown above only includes purchase premiums and/or redemption fees in effect as of February 28, 2023. All information is unaudited. Performance for classes may vary due to different fees.
For Class VI, R6 and I the gross expense ratio of 1.51%, 1.71% and 1.79%, respectively, is equal to the Fund’s Total Annual Operating Expenses set forth in the Fund’s most recent prospectus dated June 30, 2022. For the Classes listed above, the corresponding net expense ratio of 1.34%, 1.58% and 1.60% reflects the reduction of expenses from fee reimbursements. The fee reimbursements will continue until at least June 30, 2023. Elimination of this reimbursement will result in higher fees and lower performance.
4
GMO Alternative Allocation Fund
(A Series of GMO Trust)
Consolidated Investment Concentration Summary(a)
February 28, 2023 (Unaudited)
Asset Class Summary& | % of Total Net Assets | |||
Common Stocks | 63.3 | % | ||
Short-Term Investments | 33.9 | |||
Debt Obligations | 32.6 | |||
Swap Contracts | 3.1 | |||
Investment Funds | 1.2 | |||
Preferred Stocks | 0.5 | |||
Forward Currency Contracts | 0.2 | |||
Rights/Warrants | 0.2 | |||
Purchased Options | 0.1 | |||
Futures Contracts | 0.0^ | |||
Written Options | (0.6 | ) | ||
Securities Sold Short | (36.4 | ) | ||
Other | 1.9 | |||
|
| |||
| 100.0 | % | |||
|
| |||
| Debt Obligations as a % | ||||
Country/Region Summary¤ | of Total Net Assets | |||
Australia | 4.1 | % | ||
Switzerland | 2.7 | |||
Canada | (1.6 | ) | ||
Germany | (1.8 | ) | ||
Other Developed | (1.8 | )‡ | ||
Sweden | (1.8 | ) | ||
Euro Region | (3.2 | )§ | ||
|
| |||
| (3.4 | )% | |||
|
| |||
| Equity Investments as a % | ||||
Country/Region Summary¤ | of Total Net Assets | |||
United States | 15.9 | % | ||
Japan | 5.1 | |||
Other Emerging | 3.2 | † | ||
Taiwan | 2.6 | |||
South Korea | 1.0 | |||
Other Developed | 0.4 | ‡ | ||
|
| |||
| 28.2 | % | |||
|
| |||
| (a) | GMO Alternative Allocation SPC Ltd. is a 100% owned subsidiary of GMO Alternative Allocation Fund. As such, the holdings of GMO Alternative Allocation SPC Ltd. have been included with GMO Alternative Allocation Fund. |
| & | The table incorporates aggregate indirect asset class exposure associated with investments in other funds of GMO Trust (“underlying funds”). Derivative financial instruments, if any, are based on market values, rather than the notional amounts of derivatives, except for forward currency contracts which are based on unrealized appreciation/(depreciation). |
| ¤ | The table incorporates aggregate indirect country exposure associated with investments in the underlying funds. The table excludes short-term investments. The table includes exposure through the use of certain derivative financial instruments and excludes exposure through certain currency linked derivatives such as forward currency contracts and currency options. The table is based on duration adjusted net exposures (both investments and derivatives), taking into account the market value of securities and the notional amounts of swaps and other derivative financial instruments. Duration is based on GMO’s models. The greater the duration of a bond, the greater its contribution to the concentration percentage. Credit default swap exposures are factored into the duration-adjusted exposure using the reference security and applying the same methodology to that security. The table is not normalized, thus, due to the exclusions listed above and negative exposures, which may be attributable to derivatives or short sales, if any, the tables may not total to 100%. |
| ‡ | “Other Developed” is comprised of developed countries that each represent between (1.0)% and 1.0% of Total Net Assets. |
| § | “Euro Region” is comprised of derivative financial instruments attributed to the Eurozone and not a particular country. |
| † | “Other Emerging” is comprised of emerging countries that each represent between (1.0)% and 1.0% of Total Net Assets. |
| ^ | Rounds to 0.0%. |
5
GMO Alternative Allocation Fund
(A Series of GMO Trust)
Consolidated Schedule of Investments
(showing percentage of total net assets)
February 28, 2023
| Shares | Description | Value ($) | ||||||
| COMMON STOCKS — 60.5% | ||||||||
| Australia — 0.8% | ||||||||
| 38,052 | Aurizon Holdings Ltd (a) | 84,557 | ||||||
| 26,238 | BlueScope Steel Ltd (a) | 335,707 | ||||||
| 32,748 | Brambles Ltd (a) | 282,965 | ||||||
| 13,595 | Fortescue Metals Group Ltd (a) | 194,815 | ||||||
| 47,960 | GPT Group (The) (REIT) (a) | 151,396 | ||||||
| 128,580 | Mirvac Group (REIT) (a) | 195,773 | ||||||
| 71,129 | Scentre Group (REIT) (a) | 142,063 | ||||||
| 75,217 | Stockland (REIT) (a) | 193,755 | ||||||
|
| |||||||
| Total Australia | 1,581,031 | |||||||
|
| |||||||
| Belgium — 0.5% | ||||||||
| 7,337 | Ageas SA/NV (a) | 331,112 | ||||||
| 730 | Sofina SA (a) | 181,861 | ||||||
| 4,348 | UCB SA | 373,790 | ||||||
|
| |||||||
| Total Belgium | 886,763 | |||||||
|
| |||||||
| Brazil — 0.2% | ||||||||
| 9,500 | Banco do Brasil SA | 73,126 | ||||||
| 15,700 | Petroleo Brasileiro SA Sponsored ADR (a) | 174,113 | ||||||
| 11,200 | Telefonica Brasil SA ADR (a) | 83,440 | ||||||
|
| |||||||
| Total Brazil | 330,679 | |||||||
|
| |||||||
| Canada — 1.8% | ||||||||
| 3,200 | Alimentation Couche-Tard Inc (a) | 150,115 | ||||||
| 135,793 | Canaccord Genuity Group Inc (a) | 1,147,448 | ||||||
| 1,000 | Canadian Apartment Properties (REIT) (a) | 36,218 | ||||||
| 2,700 | Canadian Tire Corp Ltd – Class A (a) | 336,565 | ||||||
| 800 | iA Financial Corp Inc (a) | 53,705 | ||||||
| 3,700 | Magna International Inc (a) | 206,218 | ||||||
| 12,100 | Manulife Financial Corp (a) (b) | 239,096 | ||||||
| 10,600 | Manulife Financial Corp (a) (b) | 209,592 | ||||||
| 3,200 | Onex Corp (a) | 171,104 | ||||||
| 9,800 | Quebecor Inc – Class B (a) | 231,839 | ||||||
| 7,900 | Teck Resources Ltd – Class B (a) (b) | 315,363 | ||||||
| 3,000 | Teck Resources Ltd – Class B (a) (b) | 119,760 | ||||||
| 3,900 | West Fraser Timber Co Ltd (a) (b) | 292,965 | ||||||
| 900 | West Fraser Timber Co Ltd (a) (b) | 67,554 | ||||||
|
| |||||||
| Total Canada | 3,577,542 | |||||||
|
| |||||||
| China — 0.6% | ||||||||
| 111,000 | Bank of Communications Co Ltd – Class H | 65,630 | ||||||
| 21,500 | Beijing Enterprises Holdings Ltd | 70,427 | ||||||
| 22,500 | China Conch Venture Holdings Ltd | 45,281 | ||||||
| 43,500 | China Overseas Land & Investment Ltd | 107,988 | ||||||
| 212,000 | China Railway Group Ltd – Class H | 110,492 | ||||||
| 308,000 | China Zhongwang Holdings Ltd * (c) | 65,922 | ||||||
| 146,000 | CITIC Ltd | 161,090 | ||||||
| 80,000 | Dongfeng Motor Group Co Ltd – Class H | 40,869 | ||||||
| 13,000 | Kingboard Holdings Ltd | 46,412 | ||||||
| 8,500 | Shanghai Pharmaceuticals Holding Co Ltd – Class H | 14,990 | ||||||
| Shares | Description | Value ($) | ||||||
| China — continued | ||||||||
| 239,500 | Shimao Group Holdings Ltd * (c) | 134,862 | ||||||
| 6,000 | Sinopharm Group Co Ltd – Class H | 16,069 | ||||||
| 374,000 | Sunac China Holdings Ltd * (c) | 218,223 | ||||||
| 400 | Vipshop Holdings Ltd ADR * (a) | 5,956 | ||||||
|
| |||||||
| Total China | 1,104,211 | |||||||
|
| |||||||
| Denmark — 0.6% | ||||||||
| 84 | AP Moller – Maersk A/S – Class A (a) | 191,998 | ||||||
| 90 | AP Moller – Maersk A/S – Class B (a) | 209,641 | ||||||
| 17,918 | Danske Bank A/S (a) | 416,114 | ||||||
| 4,547 | Pandora A/S (a) | 430,709 | ||||||
| 72 | Rockwool A/S – B Shares (a) | 16,347 | ||||||
|
| |||||||
| Total Denmark | 1,264,809 | |||||||
|
| |||||||
| Finland — 0.2% | ||||||||
| 71,627 | Nokia Oyj (a) | 331,386 | ||||||
|
| |||||||
| France — 0.7% | ||||||||
| 13,281 | ArcelorMittal SA | 398,555 | ||||||
| 4,396 | BNP Paribas SA (a) | 307,329 | ||||||
| 496 | Cie de Saint-Gobain (a) | 29,474 | ||||||
| 2,770 | Publicis Groupe SA (a) | 219,902 | ||||||
| 11,937 | Societe Generale SA | 344,019 | ||||||
|
| |||||||
| Total France | 1,299,279 | |||||||
|
| |||||||
| Germany — 0.5% | ||||||||
| 2,582 | Bayerische Motoren Werke AG (a) | 266,373 | ||||||
| 3,106 | Fresenius SE & Co KGaA (a) | 85,469 | ||||||
| 1,654 | HeidelbergCement AG (a) | 113,551 | ||||||
| 5,466 | Mercedes-Benz Group AG (a) | 418,929 | ||||||
|
| |||||||
| Total Germany | 884,322 | |||||||
|
| |||||||
| India — 0.5% | ||||||||
| 98,843 | GAIL India Ltd | 122,879 | ||||||
| 5,934 | Hindalco Industries Ltd | 28,643 | ||||||
| 30,419 | Hindustan Petroleum Corp Ltd | 79,324 | ||||||
| 56,680 | Indian Oil Corp Ltd | 52,113 | ||||||
| 76,693 | NTPC Ltd | 157,722 | ||||||
| 189,372 | Oil & Natural Gas Corp Ltd | 347,355 | ||||||
| 212,038 | Tata Steel Ltd | 267,058 | ||||||
|
| |||||||
| Total India | 1,055,094 | |||||||
|
| |||||||
| Israel — 1.1% | ||||||||
| 36,500 | Teva Pharmaceutical Industries Ltd Sponsored ADR * (a) | 361,715 | ||||||
| 38,086 | Tower Semiconductor Ltd * | 1,544,768 | ||||||
| 11,100 | ZIM Integrated Shipping Services Ltd | 262,626 | ||||||
|
| |||||||
| Total Israel | 2,169,109 | |||||||
|
| |||||||
| Italy — 0.4% | ||||||||
| 23,538 | Stellantis NV (a) | 411,780 | ||||||
| See accompanying notes to the financial statements. | 6 |
GMO Alternative Allocation Fund
(A Series of GMO Trust)
Consolidated Schedule of Investments — (Continued)
(showing percentage of total net assets)
February 28, 2023
| Shares | Description | Value ($) | ||||||
| Italy — continued | ||||||||
| 1,101,972 | Telecom Italia SPA * (a) | 359,819 | ||||||
|
| |||||||
| Total Italy | 771,599 | |||||||
|
| |||||||
| Japan — 7.6% | ||||||||
| 1,700 | AGC Inc (a) | 62,894 | ||||||
| 1,700 | Aisin Corp | 46,586 | ||||||
| 12,200 | Amano Corp | 225,617 | ||||||
| 29,600 | Asahi Kasei Corp (a) | 206,164 | ||||||
| 15,000 | Credit Saison Co Ltd (a) | 204,440 | ||||||
| 16,200 | Daiwabo Holdings Co Ltd | 250,349 | ||||||
| 11,900 | Denka Co Ltd (a) | 251,298 | ||||||
| 18,400 | EXEO Group Inc | 322,859 | ||||||
| 7,200 | Ezaki Glico Co Ltd (a) | 180,772 | ||||||
| 16,000 | Fuji Corp | 242,321 | ||||||
| 6,100 | FUJIFILM Holdings Corp (a) | 284,576 | ||||||
| 13,000 | H.U. Group Holdings Inc (a) | 255,834 | ||||||
| 17,500 | Haseko Corp (a) | 200,817 | ||||||
| 15,100 | Honda Motor Co Ltd (a) | 392,648 | ||||||
| 2,100 | Honda Motor Co Ltd Sponsored ADR (a) | 54,537 | ||||||
| 5,200 | Idemitsu Kosan Co Ltd (a) | 115,084 | ||||||
| 34,800 | Inpex Corp (a) | 364,857 | ||||||
| 12,300 | ITOCHU Corp (a) | 367,655 | ||||||
| 8,400 | KDDI Corp (a) | 245,766 | ||||||
| 18,500 | Kirin Holdings Co Ltd (a) | 276,917 | ||||||
| 22,600 | K’s Holdings Corp (a) | 194,725 | ||||||
| 11,200 | Kyudenko Corp | 282,889 | ||||||
| 9,300 | Maruichi Steel Tube Ltd (a) | 202,061 | ||||||
| 8,600 | Mitsubishi Corp (a) | 292,151 | ||||||
| 22,300 | Mitsubishi Electric Corp (a) | 250,590 | ||||||
| 14,000 | Mitsui OSK Lines Ltd (a) | 365,681 | ||||||
| 7,100 | Morinaga & Co Ltd (a) | 204,787 | ||||||
| 7,600 | MS&AD Insurance Group Holdings Inc (a) | 248,703 | ||||||
| 8,300 | NEC Corp (a) | 297,043 | ||||||
| 9,700 | NH Foods Ltd (a) | 267,839 | ||||||
| 6,500 | Nippon Telegraph & Telephone Corp (a) | 188,349 | ||||||
| 15,200 | Nippon Yusen KK (a) | 395,093 | ||||||
| 42,200 | Obayashi Corp (a) | 312,154 | ||||||
| 46,000 | Penta-Ocean Construction Co Ltd (a) | 219,223 | ||||||
| 3,900 | Renesas Electronics Corp * (a) | 50,378 | ||||||
| 3,100 | Rohm Co Ltd (a) | 238,739 | ||||||
| 8,600 | Sankyu Inc (a) | 316,399 | ||||||
| 1,500 | Sawai Group Holdings Co Ltd | 41,531 | ||||||
| 4,300 | Secom Co Ltd (a) | 250,064 | ||||||
| 21,100 | Sekisui House Ltd (a) | 399,491 | ||||||
| 33,900 | Shimizu Corp (a) | 182,988 | ||||||
| 16,700 | Stanley Electric Co Ltd | 348,251 | ||||||
| 8,000 | Subaru Corp | 128,170 | ||||||
| 17,600 | SUMCO Corp (a) | 242,852 | ||||||
| 60,300 | Sumitomo Chemical Co Ltd (a) | 211,291 | ||||||
| 20,600 | Sumitomo Corp (a) | 351,081 | ||||||
| 9,100 | Sumitomo Mitsui Financial Group Inc (a) | 397,432 | ||||||
| 7,300 | Sumitomo Mitsui Trust Holdings Inc (a) | 270,465 | ||||||
| 24,300 | T&D Holdings Inc (a) | 368,004 | ||||||
| Shares | Description | Value ($) | ||||||
| Japan — continued | ||||||||
| 9,500 | Taisei Corp (a) | 309,730 | ||||||
| 18,400 | Takuma Co Ltd | 185,273 | ||||||
| 22,800 | Teijin Ltd (a) | 236,905 | ||||||
| 12,500 | THK Co Ltd (a) | 279,947 | ||||||
| 30,000 | Tokai Carbon Co Ltd (a) | 292,928 | ||||||
| 7,400 | Tokyo Seimitsu Co Ltd (a) | 270,162 | ||||||
| 17,700 | Toppan Inc (a) | 320,095 | ||||||
| 14,600 | Tosoh Corp (a) | 198,694 | ||||||
| 5,600 | Toyota Industries Corp (a) | 328,553 | ||||||
| 2,100 | Tsumura & Co | 39,933 | ||||||
| 6,200 | Yamaha Motor Co Ltd | 158,628 | ||||||
| 5,300 | Zenkoku Hosho Co Ltd (a) | 201,922 | ||||||
|
| |||||||
| Total Japan | 14,893,185 | |||||||
|
| |||||||
| Mexico — 0.0% | ||||||||
| 3,300 | Grupo Televisa SAB Sponsored ADR | 16,368 | ||||||
|
| |||||||
| Netherlands — 1.1% | ||||||||
| 72,184 | Aegon NV (a) | 375,590 | ||||||
| 3,938 | EXOR NV * (a) | 324,942 | ||||||
| 9,170 | JDE Peet’s NV (a) | 269,938 | ||||||
| 12,074 | Koninklijke Ahold Delhaize NV (a) | 383,372 | ||||||
| 22,377 | Koninklijke Philips NV (a) | 365,344 | ||||||
| 8,649 | NN Group NV (a) | 350,082 | ||||||
|
| |||||||
| Total Netherlands | 2,069,268 | |||||||
|
| |||||||
| New Zealand — 0.1% | ||||||||
| 15,249 | Auckland International Airport Ltd * (a) | 82,398 | ||||||
| 19,591 | Meridian Energy Ltd (a) | 64,304 | ||||||
|
| |||||||
| Total New Zealand | 146,702 | |||||||
|
| |||||||
| Poland — 0.0% | ||||||||
| 6,301 | Polski Koncern Naftowy ORLEN SA | 94,109 | ||||||
|
| |||||||
| Portugal — 0.1% | ||||||||
| 38,712 | EDP – Energias de Portugal SA | 194,943 | ||||||
|
| |||||||
| South Africa — 0.1% | ||||||||
| 12,999 | Bidvest Group Ltd (The) | 165,761 | ||||||
|
| |||||||
| South Korea — 0.4% | ||||||||
| 313 | E-MART Inc | 26,476 | ||||||
| 4,407 | Kia Corp | 250,450 | ||||||
| 1,343 | LG Corp | 83,559 | ||||||
| 766 | LG Electronics Inc | 64,249 | ||||||
| 162 | POSCO Holdings Inc | 39,046 | ||||||
| 3,900 | POSCO Holdings Inc Sponsored ADR (a) | 237,861 | ||||||
| 4,827 | SK Square Co Ltd * | 139,765 | ||||||
|
| |||||||
| Total South Korea | 841,406 | |||||||
|
| |||||||
| Spain — 0.5% | ||||||||
| 60,712 | Banco Bilbao Vizcaya Argentaria SA (a) | 471,916 | ||||||
| 7 | See accompanying notes to the financial statements. |
GMO Alternative Allocation Fund
(A Series of GMO Trust)
Consolidated Schedule of Investments — (Continued)
(showing percentage of total net assets)
February 28, 2023
| Shares | Description | Value ($) | ||||||
| Spain — continued | ||||||||
| 125,048 | Banco Santander SA (a) | 492,365 | ||||||
|
| |||||||
| Total Spain | 964,281 | |||||||
|
| |||||||
| Sweden — 0.4% | ||||||||
| 30,792 | Fastighets AB Balder – B Shares* (a) | 152,324 | ||||||
| 1,251 | Industrivarden AB – A Shares (a) | 34,387 | ||||||
| 6,997 | Industrivarden AB – C Shares (a) | 191,834 | ||||||
| 7,324 | Investor AB – A Shares (a) | 150,134 | ||||||
| 11,059 | Kinnevik AB – Class B* (a) | 164,468 | ||||||
| 5,073 | Skanska AB – B Shares (a) | 92,197 | ||||||
| 3,739 | Svenska Cellulosa AB SCA – Class B (a) | 52,179 | ||||||
|
| |||||||
| Total Sweden | 837,523 | |||||||
|
| |||||||
| Switzerland — 0.5% | ||||||||
| 9,748 | Adecco Group AG (Registered) (a) | 347,577 | ||||||
| 6,071 | Logitech International SA (Registered) (a) | 331,601 | ||||||
| 1,316 | Roche Holding AG – Genusschein (a) | 379,454 | ||||||
|
| |||||||
| Total Switzerland | 1,058,632 | |||||||
|
| |||||||
| Taiwan — 1.7% | ||||||||
| 49,343 | Silicon Motion Technology Corp ADR (a) | 3,316,836 | ||||||
|
| |||||||
| Thailand — 0.2% | ||||||||
| 28,500 | Kasikornbank Pcl NVDR | 110,451 | ||||||
| 359,400 | Krung Thai Bank Pcl NVDR | 175,911 | ||||||
| 7,600 | Thai Oil Pcl NVDR | 10,838 | ||||||
|
| |||||||
| Total Thailand | 297,200 | |||||||
|
| |||||||
| Turkey — 0.3% | ||||||||
| 140,271 | Haci Omer Sabanci Holding AS | 323,645 | ||||||
| 620,190 | Yapi ve Kredi Bankasi AS | 328,669 | ||||||
|
| |||||||
| Total Turkey | 652,314 | |||||||
|
| |||||||
| United Kingdom — 0.8% | ||||||||
| 1,686 | 3i Group Plc (a) | 32,985 | ||||||
| 6,320 | Berkeley Group Holdings Plc (The) | 318,140 | ||||||
| 174,016 | BT Group Plc (a) | 291,730 | ||||||
| 4,965 | Coca-Cola HBC AG * (a) | 127,151 | ||||||
| 10,700 | Haleon Plc ADR * (a) | 84,316 | ||||||
| 77,864 | Kingfisher Plc (a) | 269,282 | ||||||
| 95,202 | Taylor Wimpey Plc (a) | 140,826 | ||||||
| 32,400 | Vodafone Group Plc Sponsored ADR (a) | 387,828 | ||||||
|
| |||||||
| Total United Kingdom | 1,652,258 | |||||||
|
| |||||||
| United States — 38.8% | ||||||||
| 1,300 | 3M Co. (a) | 140,062 | ||||||
| 62,605 | Activision Blizzard, Inc. (a) | 4,773,631 | ||||||
| 39,425 | Aerojet Rocketdyne Holdings, Inc. * (a) | 2,221,204 | ||||||
| 147,903 | Albertsons Cos., Inc. – Class A (a) | 2,940,312 | ||||||
| 11,100 | Ally Financial, Inc. (a) | 333,555 | ||||||
| 3,000 | Arrow Electronics, Inc. * (a) | 353,970 | ||||||
| 200 | Aspen Technology, Inc. * (a) | 42,402 | ||||||
| Shares | Description | Value ($) | ||||||
| United States — continued | ||||||||
| 5,000 | AT&T, Inc. (a) | 94,550 | ||||||
| 2,900 | Best Buy Co., Inc. (a) | 241,019 | ||||||
| 900 | Biogen, Inc. * (a) | 242,874 | ||||||
| 700 | Bio-Rad Laboratories, Inc. – Class A* | 334,488 | ||||||
| 33,900 | Black Knight, Inc. * (a) | 2,020,440 | ||||||
| 7,600 | BorgWarner, Inc. | 382,128 | ||||||
| 3,600 | Capital One Financial Corp. (a) | 392,688 | ||||||
| 9,200 | Carrier Global Corp. (a) | 414,276 | ||||||
| 2,900 | CBRE Group, Inc. – Class A* (a) | 246,906 | ||||||
| 5,400 | Centene Corp. * (a) | 369,360 | ||||||
| 8,300 | Citigroup, Inc. (a) | 420,727 | ||||||
| 20,200 | Cleveland-Cliffs, Inc. * (a) | 430,866 | ||||||
| 5,100 | Cognizant Technology Solutions Corp. – Class A (a) | 319,413 | ||||||
| 10,200 | Comcast Corp. – Class A (a) | 379,134 | ||||||
| 8,182 | Coupa Software, Inc. * (a) | 662,497 | ||||||
| 2,300 | Crowdstrike Holdings, Inc. – Class A* (a) | 277,587 | ||||||
| 42,928 | CSX Corp. (a) | 1,308,875 | ||||||
| 3,400 | CVS Health Corp. (a) | 284,036 | ||||||
| 6,700 | Dell Technologies, Inc. – Class C (a) | 272,288 | ||||||
| 1,400 | Discover Financial Services (a) | 156,800 | ||||||
| 24,400 | DISH Network Corp. – Class A* (a) | 278,404 | ||||||
| 4,300 | DR Horton, Inc. (a) | 397,664 | ||||||
| 8,100 | eBay, Inc. (a) | 371,790 | ||||||
| 44,496 | Evoqua Water Technologies Corp. * (a) | 2,160,726 | ||||||
| 1,500 | FedEx Corp. (a) | 304,830 | ||||||
| 8,900 | Fidelity National Financial, Inc. (a) | 354,754 | ||||||
| 61,863 | First Horizon Corp. (a) | 1,532,347 | ||||||
| 32,700 | Ford Motor Co. (a) | 394,689 | ||||||
| 5,200 | Fortune Brands Innovations, Inc. (a) | 322,140 | ||||||
| 38,865 | Fox Corp. – Class B (a) | 1,253,396 | ||||||
| 10,600 | Franklin Resources, Inc. (a) | 312,382 | ||||||
| 600 | Generac Holdings, Inc. * (a) | 72,006 | ||||||
| 11,300 | General Motors Co. (a) | 437,762 | ||||||
| 60,845 | Globus Medical, Inc. – Class A* (a) | 3,549,697 | ||||||
| 7,008 | HEICO Corp. – Class A (a) | 912,091 | ||||||
| 26,118 | Horizon Therapeutics Plc * (a) | 2,859,660 | ||||||
| 13,100 | HP, Inc. (a) | 386,712 | ||||||
| 62,843 | IAA, Inc. * (a) | 2,570,907 | ||||||
| 4,700 | Incyte Corp. * (a) | 361,806 | ||||||
| 15,700 | Intel Corp. (a) | 391,401 | ||||||
| 3,000 | International Business Machines Corp. (a) | 387,900 | ||||||
| 8,500 | Invesco Ltd. (a) | 150,110 | ||||||
| 2,500 | Jazz Pharmaceuticals Plc * | 351,000 | ||||||
| 22,000 | Kinder Morgan, Inc. (a) | 375,320 | ||||||
| 3,600 | Knight-Swift Transportation Holdings, Inc. (a) | 204,624 | ||||||
| 9,200 | Kraft Heinz Co. (The) (a) | 358,248 | ||||||
| 1,600 | Laboratory Corp. of America Holdings (a) | 382,976 | ||||||
| 4,200 | Lennar Corp. – Class A (a) | 406,308 | ||||||
| 43,138 | Liberty Broadband Corp. – Class C* (a) | 3,738,770 | ||||||
| 130,155 | Liberty Global Plc – Class A* (a) | 2,666,876 | ||||||
| 3,200 | Liberty Global Plc – Class C* | 68,000 | ||||||
| See accompanying notes to the financial statements. | 8 |
GMO Alternative Allocation Fund
(A Series of GMO Trust)
Consolidated Schedule of Investments — (Continued)
(showing percentage of total net assets)
February 28, 2023
| Shares |
Description | Value ($) | ||||||
| United States — continued | ||||||||
| 7,919 | Liberty Media Corp.-Liberty Formula One – Class A* (a) | 481,158 | ||||||
| 7,800 | Lincoln National Corp. | 247,416 | ||||||
| 91,000 | Lumen Technologies, Inc. (a) | 309,400 | ||||||
| 3,800 | LyondellBasell Industries NV – Class A (a) | 364,762 | ||||||
| 1,300 | Match Group, Inc. * (a) | 53,846 | ||||||
| 2,546 | Meta Platforms, Inc. – Class A* (a) | 445,397 | ||||||
| 6,600 | Micron Technology, Inc. (a) | 381,612 | ||||||
| 2,800 | Mohawk Industries, Inc. * | 287,980 | ||||||
| 6,800 | Molson Coors Brewing Co. – Class B (a) | 361,692 | ||||||
| 7,100 | Mosaic Co. (The) (a) | 377,649 | ||||||
| 90,440 | New York Community Bancorp, Inc. | 803,107 | ||||||
| 9,300 | NRG Energy, Inc. (a) | 304,947 | ||||||
| 2,100 | Nucor Corp. (a) | 351,624 | ||||||
| 10 | NVR, Inc. * (a) | 51,736 | ||||||
| 6,600 | Occidental Petroleum Corp. (a) | 386,496 | ||||||
| 600 | Oracle Corp. (a) | 52,440 | ||||||
| 4,700 | Ovintiv, Inc. (a) | 201,019 | ||||||
| 16,500 | Paramount Global – Class B (a) | 353,430 | ||||||
| 5,100 | PayPal Holdings, Inc. * (a) | 375,360 | ||||||
| 153,945 | Pershing Square Tontine Holdings Ltd. * (c) | 15,395 | ||||||
| 79,655 | PNM Resources, Inc. (a) | 3,903,095 | ||||||
| 3,900 | Prudential Financial, Inc. (a) | 390,000 | ||||||
| 7,400 | PulteGroup, Inc. (a) | 404,558 | ||||||
| 500 | Regeneron Pharmaceuticals, Inc. * (a) | 380,210 | ||||||
| 176,256 | Resolute Forest Products, Inc. * | 3,863,532 | ||||||
| 1,900 | Skyworks Solutions, Inc. (a) | 211,983 | ||||||
| 24,198 | Sportsman’s Warehouse Holdings, Inc. * | 217,540 | ||||||
| 1,200 | SS&C Technologies Holdings, Inc. (a) | 70,440 | ||||||
| 3,500 | Steel Dynamics, Inc. (a) | 441,385 | ||||||
| 10,400 | Synchrony Financial (a) | 371,384 | ||||||
| 122,810 | TEGNA, Inc. (a) | 2,136,894 | ||||||
| 2,900 | Textron, Inc. (a) | 210,337 | ||||||
| 5,700 | Tyson Foods, Inc. – Class A (a) | 337,668 | ||||||
| 79,438 | Umpqua Holdings Corp. | 1,402,875 | ||||||
| 6,692 | Union Pacific Corp. (a) | 1,387,118 | ||||||
| 2,300 | Universal Health Services, Inc. – Class B (a) | 307,211 | ||||||
| 10,400 | Verizon Communications, Inc. (a) | 403,624 | ||||||
| 1,100 | Vertex Pharmaceuticals, Inc. * (a) | 319,319 | ||||||
| 31,800 | Viatris, Inc. (a) | 362,520 | ||||||
| 20,077 | VMware, Inc. – Class A* (a) | 2,211,080 | ||||||
| 6,600 | Walgreens Boots Alliance, Inc. (a) | 234,498 | ||||||
| 3,943 | Warner Bros Discovery, Inc. * (a) | 61,590 | ||||||
| 25,800 | Western Union Co. (The) (a) | 334,368 | ||||||
| 7,800 | Western Digital Corp. * (a) | 300,144 | ||||||
| 2,600 | Westlake Corp. (a) | 309,764 | ||||||
| 2,200 | Whirlpool Corp. (a) | 303,556 | ||||||
| 5,400 | Zoom Video Communications, Inc. – Class A* (a) | 402,786 | ||||||
|
| |||||||
| Total United States | 75,857,329 | |||||||
|
| |||||||
TOTAL COMMON STOCKS (COST $123,971,258) | 118,313,939 | |||||||
|
| |||||||
| Shares / Par Value† | Description | Value ($) | ||||||
| PREFERRED STOCKS (d) —0.3% | ||||||||
| Brazil — 0.1% | ||||||||
| 19,700 | Petroleo Brasileiro SA Sponsored ADR (a) | 192,272 | ||||||
|
| |||||||
| Germany — 0.2% | ||||||||
| 2,200 | Bayerische Motoren Werke AG (a) | 208,375 | ||||||
| 1,817 | Volkswagen AG (a) | 247,340 | ||||||
|
| |||||||
| Total Germany | 455,715 | |||||||
|
| |||||||
| TOTAL PREFERRED STOCKS (COST $624,154) | 647,987 | |||||||
|
| |||||||
| RIGHTS/WARRANTS — 0.2% | ||||||||
| United States — 0.2% | ||||||||
| 195,149 | Bristol-Myers Squibb Co. CVR * (c) | 361,026 | ||||||
| 13,635 | Contra Abiomed, Inc. * (c) | 23,861 | ||||||
|
| |||||||
| TOTAL RIGHTS/WARRANTS (COST $298,336) | 384,887 | |||||||
|
| |||||||
| INVESTMENT FUNDS — 1.2% | ||||||||
| United States — 1.2% | ||||||||
| 1,000,824 | Altaba, Inc. (c) | 2,331,920 | ||||||
|
| |||||||
| TOTAL INVESTMENT FUNDS (COST $1,660,089) | 2,331,920 | |||||||
|
| |||||||
| DEBT OBLIGATIONS — 32.6% | ||||||||
| United States — 32.6% | ||||||||
| Asset-Backed Securities — 2.7% | ||||||||
| 5,418,616 | OZLM VI Ltd, Series 14-6A, Class A1S, 144A, Variable Rate, 3 mo. LIBOR + 1.08%, 5.87%, due 04/17/31 | 5,344,575 | ||||||
|
| |||||||
| U.S. Government — 18.1% | ||||||||
| 6,025,000 | U.S. Treasury Note, 0.13%, due 04/30/23 (a) | 5,978,066 | ||||||
| 5,050,000 | U.S. Treasury Note, 0.13%, due 06/30/23 (a) | 4,969,910 | ||||||
| 400,000 | U.S. Treasury Note, 0.13%, due 07/31/23 | 391,953 | ||||||
| 3,500,000 | U.S. Treasury Note, Variable Rate, USBM + 0.04%, 4.84%, due 10/31/23 | 3,499,001 | ||||||
| 10,650,000 | U.S. Treasury Note, Variable Rate, USBM + 0.04%, 4.84%, due 07/31/24 (a) | 10,646,353 | ||||||
| 10,000,000 | U.S. Treasury Note, Variable Rate, SOFR + 0.20%, 5.01%, due 01/31/25 | 10,010,482 | ||||||
|
| |||||||
| Total U.S. Government | 35,495,765 | |||||||
|
| |||||||
| U.S. Government Agency — 11.8% | ||||||||
| 13,000,000 | Federal Home Loan Banks, Variable Rate, SOFR + 0.03%, 4.58%, due 03/02/23 | 12,999,990 | ||||||
| 5,000,000 | Federal Home Loan Banks, Variable Rate, SOFR + 0.07%, 4.62%, due 12/14/23 | 4,999,439 | ||||||
| 9 | See accompanying notes to the financial statements. |
GMO Alternative Allocation Fund
(A Series of GMO Trust)
Consolidated Schedule of Investments — (Continued)
(showing percentage of total net assets)
February 28, 2023
| Par Value† / Shares | Description | Value ($) | ||||||
| United States — continued | ||||||||
| U.S. Government Agency — continued | ||||||||
| 5,000,000 | Federal Home Loan Banks, 5.23%, due 03/22/24 | 5,002,263 | ||||||
|
| |||||||
| Total U.S. Government Agency | 23,001,692 | |||||||
|
| |||||||
| Total United States | 63,842,032 | |||||||
|
| |||||||
TOTAL DEBT OBLIGATIONS (COST $63,905,305) | 63,842,032 | |||||||
|
| |||||||
| MUTUAL FUNDS — 2.9% | ||||||||
| United States — 2.9% | ||||||||
| Affiliated Issuers — 2.9% | ||||||||
| 431,379 | GMO Emerging Markets ex-China Fund, Class VI | 5,754,599 | ||||||
|
| |||||||
TOTAL MUTUAL FUNDS (COST $6,060,878) | 5,754,599 | |||||||
|
| |||||||
| Par Value† / Shares | Description | Value ($) | ||||||
| SHORT-TERM INVESTMENTS — 33.9% | ||||||||
| Sovereign and Sovereign Agency Issuers — 7.5% |
| |||||||
| JPY | 2,000,000,000 | Japan Treasury Discount Bill, Zero Coupon, due 04/10/23 | 14,691,527 | |||||
|
| |||||||
| Money Market Funds — 0.3% | ||||||||
| 640,891 | State Street Institutional Treasury Money Market Fund – Premier Class, 4.42% (e) | 640,891 | ||||||
|
| |||||||
| Repurchase Agreements — 26.1% | ||||||||
| 51,010,102 | Daiwa Capital Markets America, Inc. Repurchase Agreement, dated 02/28/23, maturing on 03/01/23 with a maturity value of $51,016,507 and an effective yield of 4.52%, collateralized by a U.S. Treasury Note with maturity date 04/30/29 and a market value of $52,051,125. | 51,010,102 | ||||||
|
| |||||||
TOTAL SHORT-TERM INVESTMENTS (COST $66,744,760) | 66,342,520 | |||||||
|
| |||||||
PURCHASED OPTIONS — 0.1%
Description | Counterparty | Exercise Rate | Expiration Date | Principal/ Notional Amount | Floating Rate Index | Pay/Receive Floating Rate | Value ($) | |||||||||||||||||||||
Options on Credit Default Swaps - Puts — 0.1% | ||||||||||||||||||||||||||||
CDX.NA.HY.39 | BCLY | 103.00 | % | 04/19/23 | USD 4,446,000 | Fixed Spread | Pay | 108,436 | ||||||||||||||||||||
|
| |||||||||||||||||||||||||||
TOTAL PURCHASED OPTIONS | 108,436 | |||||||||||||||||||||||||||
|
| |||||||||||||||||||||||||||
TOTAL INVESTMENTS — 131.7% | 257,726,320 | |||||||||||||||||||||||||||
|
| |||||||||||||||||||||||||||
| Shares | Description | Value ($) | ||||||
| SECURITIES SOLD SHORT — (36.4)% |
| |||||||
| Common Stocks — (36.2)% | ||||||||
| Australia — (0.7)% | ||||||||
| (5,304) | ASX Ltd | (242,267 | ) | |||||
| (1,304) | Cochlear Ltd | (194,459 | ) | |||||
| (7,891) | IDP Education Ltd | (151,753 | ) | |||||
| (216) | Macquarie Group Ltd | (27,428 | ) | |||||
| (116,925) | Pilbara Minerals Ltd* | (325,819 | ) | |||||
| (36,705) | Qantas Airways Ltd* | (157,868 | ) | |||||
| (3,704) | Ramsay Health Care Ltd | (167,928 | ) | |||||
| (610) | WiseTech Global Ltd | (25,778 | ) | |||||
|
| |||||||
| Total Australia | (1,293,300 | ) | ||||||
|
| |||||||
| Austria — (0.2)% | ||||||||
| (3,788) | Verbund AG | (327,595 | ) | |||||
|
| |||||||
| Belgium — (0.2)% | ||||||||
| (6,382) | Anheuser-Busch InBev SA/NV | (387,123 | ) | |||||
|
| |||||||
| Shares | Description | Value ($) | ||||||
| Canada — (2.4)% | ||||||||
| (5,600) | Agnico Eagle Mines Ltd | (257,768 | ) | |||||
| (8,700) | Algonquin Power & Utilities Corp | (66,381 | ) | |||||
| (15,200) | AltaGas Ltd | (260,890 | ) | |||||
| (8,200) | Brookfield Renewable Corp – Class A | (228,370 | ) | |||||
| (10,800) | Enbridge Inc | (405,216 | ) | |||||
| (2,900) | Franco-Nevada Corp | (369,953 | ) | |||||
| (22,200) | Pan American Silver Corp | (329,892 | ) | |||||
| (10,800) | Pembina Pipeline Corp | (354,672 | ) | |||||
| (5,600) | Restaurant Brands International Inc | (361,144 | ) | |||||
| (34,306) | Ritchie Bros Auctioneers Inc | (2,098,498 | ) | |||||
|
| |||||||
| Total Canada | (4,732,784 | ) | ||||||
|
| |||||||
| Denmark — (0.1)% | ||||||||
| (323) | Coloplast A/S – Class B | (37,321 | ) | |||||
| (7,832) | Tryg A/S | (173,506 | ) | |||||
|
| |||||||
| Total Denmark | (210,827 | ) | ||||||
|
| |||||||
| Finland — (0.1)% | ||||||||
| (1,954) | Elisa Oyj | (110,964 | ) | |||||
|
| |||||||
| See accompanying notes to the financial statements. | 10 |
GMO Alternative Allocation Fund
(A Series of GMO Trust)
Consolidated Schedule of Investments — (Continued)
(showing percentage of total net assets)
February 28, 2023
| Shares | Description | Value ($) | ||||||
| France — (0.8)% | ||||||||
| (10,681) | Accor SA* | (354,495 | ) | |||||
| (1,851) | Aeroports de Paris* | (268,194 | ) | |||||
| (52) | Euronext NV | (3,793 | ) | |||||
| (20,306) | Getlink SE | (341,036 | ) | |||||
| (242) | Hermes International | (438,052 | ) | |||||
| (248) | Sartorius Stedim Biotech | (80,773 | ) | |||||
| (1,409) | Ubisoft Entertainment SA* | (30,892 | ) | |||||
|
| |||||||
| Total France | (1,517,235 | ) | ||||||
|
| |||||||
| Germany — (1.0)% | ||||||||
| (8,208) | Delivery Hero SE* | (329,844 | ) | |||||
| (1,586) | Deutsche Boerse AG | (276,557 | ) | |||||
| (1,385) | MTU Aero Engines AG | (334,232 | ) | |||||
| (2,473) | Puma SE | (157,417 | ) | |||||
| (257) | QIAGEN NV* | (11,830 | ) | |||||
| (274) | Rational AG | (181,742 | ) | |||||
| (3,502) | Symrise AG – Class A | (357,797 | ) | |||||
| (98,860) | Telefonica Deutschland Holding AG | (299,886 | ) | |||||
| (1,871) | Zalando SE* | (74,129 | ) | |||||
|
| |||||||
| Total Germany | (2,023,434 | ) | ||||||
|
| |||||||
| Ireland — (0.0)% | ||||||||
| (594) | Flutter Entertainment Plc* | (94,928 | ) | |||||
|
| |||||||
| Israel — (0.2)% | ||||||||
| (2,500) | CyberArk Software Ltd* | (361,925 | ) | |||||
| (1,200) | Wix.com Ltd* | (108,636 | ) | |||||
|
| |||||||
| Total Israel | (470,561 | ) | ||||||
|
| |||||||
| Italy — (0.7)% | ||||||||
| (9,432) | Amplifon SPA | (272,727 | ) | |||||
| (1,278) | Ferrari NV (b) | (331,572 | ) | |||||
| (400) | Ferrari NV (b) | (104,148 | ) | |||||
| (22,728) | FinecoBank Banca Fineco SPA | (392,751 | ) | |||||
| (26,970) | Infrastrutture Wireless Italiane SPA | (296,834 | ) | |||||
|
| |||||||
| Total Italy | (1,398,032 | ) | ||||||
|
| |||||||
| Japan — (2.5)% | ||||||||
| (8,000) | Aeon Co Ltd | (149,215 | ) | |||||
| (15,700) | ANA Holdings Inc* | (318,530 | ) | |||||
| (11,000) | Asahi Intecc Co Ltd | (187,286 | ) | |||||
| (3,500) | GMO Payment Gateway Inc | (287,475 | ) | |||||
| (17,200) | Japan Airlines Co Ltd* | (323,875 | ) | |||||
| (9,600) | Japan Exchange Group Inc | (143,180 | ) | |||||
| (4,900) | Keio Corp | (170,727 | ) | |||||
| (2,700) | Keisei Electric Railway Co Ltd | (78,047 | ) | |||||
| (2,200) | Lasertec Corp | (357,710 | ) | |||||
| (11,800) | M3 Inc | (281,397 | ) | |||||
| (20,300) | MonotaRO Co Ltd | (276,108 | ) | |||||
| (1,000) | Nidec Corp | (50,749 | ) | |||||
| (15,600) | Nihon M&A Center Holdings Inc | (130,067 | ) | |||||
| (22,700) | Nippon Paint Holdings Co Ltd | (198,364 | ) | |||||
| (14,100) | Odakyu Electric Railway Co Ltd | (170,932 | ) | |||||
| Shares | Description | Value ($) | ||||||
| Japan — continued | ||||||||
| (2,700) | Oriental Land Co Ltd | (431,149 | ) | |||||
| (66,000) | Rakuten Group Inc | (325,326 | ) | |||||
| (4,600) | Shiseido Co Ltd | (211,957 | ) | |||||
| (32,400) | SoftBank Corp | (365,503 | ) | |||||
| (5,000) | Tobu Railway Co Ltd | (111,630 | ) | |||||
| (13,700) | Tokyu Corp | (165,044 | ) | |||||
| (5,300) | West Japan Railway Co | (205,709 | ) | |||||
|
| |||||||
| Total Japan | (4,939,980 | ) | ||||||
|
| |||||||
| Netherlands — (0.6)% | ||||||||
| (269) | Adyen NV* | (381,289 | ) | |||||
| (1,822) | IMCD NV | (288,406 | ) | |||||
| (8,366) | Just Eat Takeaway.com NV* | (181,963 | ) | |||||
| (97) | OCI NV | (3,222 | ) | |||||
| (15,547) | Universal Music Group NV | (366,308 | ) | |||||
|
| |||||||
| Total Netherlands | (1,221,188 | ) | ||||||
|
| |||||||
| New Zealand — (0.1)% | ||||||||
| (5,433) | Xero Ltd* | (282,971 | ) | |||||
|
| |||||||
| Norway — (0.2)% | ||||||||
| (12,916) | Aker BP ASA | (346,674 | ) | |||||
|
| |||||||
| Peru — (0.2)% | ||||||||
| (4,900) | Southern Copper Corp | (361,081 | ) | |||||
|
| |||||||
| Singapore — (0.2)% | ||||||||
| (55,738) | Grab Holdings Ltd – Class A* | (178,919 | ) | |||||
| (28,300) | Singapore Exchange Ltd | (182,771 | ) | |||||
|
| |||||||
| Total Singapore | (361,690 | ) | ||||||
|
| |||||||
| Spain — (0.4)% | ||||||||
| (10,930) | Cellnex Telecom SA | (410,080 | ) | |||||
| (13,863) | Ferrovial SA | (384,779 | ) | |||||
|
| |||||||
| Total Spain | (794,859 | ) | ||||||
|
| |||||||
| Sweden — (0.2)% | ||||||||
| (2,989) | Evolution AB | (360,673 | ) | |||||
|
| |||||||
| Switzerland — (0.4)% | ||||||||
| (6) | Chocoladefabriken Lindt & Spruengli AG | (65,734 | ) | |||||
| (260) | Partners Group Holding AG | (246,203 | ) | |||||
| (421) | Sika AG (Registered) | (118,059 | ) | |||||
| (2,239) | Straumann Holding AG (Registered) | (296,837 | ) | |||||
|
| |||||||
| Total Switzerland | (726,833 | ) | ||||||
|
| |||||||
| United Kingdom — (1.3)% | ||||||||
| (2,364) | Admiral Group Plc | (62,556 | ) | |||||
| (36,828) | Auto Trader Group Plc | (263,397 | ) | |||||
| (3,047) | Halma Plc | (79,303 | ) | |||||
| (18,955) | Hargreaves Lansdown Plc | (188,867 | ) | |||||
| (49,816) | Informa Plc | (400,174 | ) | |||||
| 11 | See accompanying notes to the financial statements. |
GMO Alternative Allocation Fund
(A Series of GMO Trust)
Consolidated Schedule of Investments — (Continued)
(showing percentage of total net assets)
February 28, 2023
| Shares | Description | Value ($) | ||||||
| United Kingdom — continued | ||||||||
| (5,268) | InterContinental Hotels Group Plc | (355,122 | ) | |||||
| (4,395) | London Stock Exchange Group Plc | (392,130 | ) | |||||
| (3,061) | M&G Plc | (7,884 | ) | |||||
| (33,185) | Ocado Group Plc* | (219,287 | ) | |||||
| (1,284) | Prudential Plc | (19,623 | ) | |||||
| (283,133) | Rolls-Royce Holdings Plc* | (493,302 | ) | |||||
| (793) | Spirax-Sarco Engineering Plc | (111,370 | ) | |||||
|
| |||||||
| Total United Kingdom | (2,593,015 | ) | ||||||
|
| |||||||
| United States — (23.7)% | ||||||||
| (13,800) | AES Corp. (The) | (340,584 | ) | |||||
| (2,000) | Alnylam Pharmaceuticals, Inc.* | (382,900 | ) | |||||
| (8,500) | Altria Group, Inc. | (394,655 | ) | |||||
| (1,000) | American Tower Corp. (REIT) | (198,010 | ) | |||||
| (700) | Aon Plc – Class A | (212,835 | ) | |||||
| (3,500) | Aramark | (128,800 | ) | |||||
| (4,500) | Ares Management Corp. – Class A | (362,835 | ) | |||||
| (2,100) | Arthur J Gallagher & Co. | (393,435 | ) | |||||
| (100) | Autodesk, Inc.* | (19,869 | ) | |||||
| (4,000) | Bills Holdings, Inc.* | (338,520 | ) | |||||
| (3,400) | Bio-Techne Corp. | (246,976 | ) | |||||
| (2,100) | Boeing Co. (The)* | (423,255 | ) | |||||
| (2,326) | Broadcom, Inc. | (1,382,319 | ) | |||||
| (1,900) | Burlington Stores, Inc.* | (407,075 | ) | |||||
| (7,700) | Caesars Entertainment, Inc.* | (390,852 | ) | |||||
| (5,500) | Ceridian HCM Holding, Inc.* | (401,115 | ) | |||||
| (10,309) | Charter Communications, Inc. – Class A* | (3,789,691 | ) | |||||
| (300) | Chipotle Mexican Grill, Inc. – Class A* | (447,324 | ) | |||||
| (15,747) | Clarivate Plc* | (159,517 | ) | |||||
| (6,700) | Cloudflare, Inc. – Class A* | (402,067 | ) | |||||
| (47,332) | Columbia Banking System, Inc. | (1,407,180 | ) | |||||
| (800) | Crown Castle, Inc. (REIT) | (104,600 | ) | |||||
| (9,800) | Delta Air Lines, Inc.* | (375,732 | ) | |||||
| (3,300) | Dexcom, Inc.* | (366,333 | ) | |||||
| (2,900) | Diamondback Energy, Inc. | (407,682 | ) | |||||
| (2,500) | Equity LifeStyle Properties, Inc. (REIT) | (171,275 | ) | |||||
| (100) | Erie Indemnity Co. – Class A | (23,539 | ) | |||||
| (2,500) | Essential Utilities, Inc. | (106,950 | ) | |||||
| (5,600) | Exact Sciences Corp.* | (349,048 | ) | |||||
| (4,400) | Fastenal Co. | (226,864 | ) | |||||
| (6,300) | Fortinet, Inc.* | (374,472 | ) | |||||
| (23,972) | Fox Corp. – Class A | (839,499 | ) | |||||
| (1,100) | Gartner, Inc.* | (360,591 | ) | |||||
| (5,649) | HEICO Corp. | (935,305 | ) | |||||
| (1,800) | Hess Corp. | (242,460 | ) | |||||
| (1,100) | HubSpot, Inc.* | (425,546 | ) | |||||
| (900) | IDEXX Laboratories, Inc.* | (425,916 | ) | |||||
| (100) | Illumina, Inc.* | (19,920 | ) | |||||
| (4,000) | Ingersoll Rand, Inc. | (232,280 | ) | |||||
| (1,300) | Insulet Corp.* | (359,268 | ) | |||||
| (1,900) | IQVIA Holdings, Inc.* | (396,093 | ) | |||||
| (3,700) | Iron Mountain, Inc. (REIT) | (195,175 | ) | |||||
| (2,400) | Lamb Weston Holdings, Inc. | (241,536 | ) | |||||
| Shares | Description | Value ($) | ||||||
| United States — continued | ||||||||
| (120,416) | Liberty Global Plc – Class C* | (2,558,840 | ) | |||||
| (13,379) | Liberty Media Corp.-Liberty Formula One – Class C* | (908,033 | ) | |||||
| (1,200) | Linde Plc | (418,044 | ) | |||||
| (5,000) | Live Nation Entertainment, Inc.* | (360,300 | ) | |||||
| (1,200) | MarketAxess Holdings, Inc. | (409,740 | ) | |||||
| (100) | Marriott International, Inc. – Class A | (16,924 | ) | |||||
| (10,099) | MaxLinear, Inc.* | (345,487 | ) | |||||
| (1,800) | MongoDB, Inc. – Class A* | (377,136 | ) | |||||
| (500) | Monolithic Power Systems, Inc. | (242,145 | ) | |||||
| (600) | Moody’s Corp. | (174,090 | ) | |||||
| (100) | Motorola Solutions, Inc. | (26,281 | ) | |||||
| (800) | MSCI, Inc. – Class A | (417,720 | ) | |||||
| (90,436) | New York Community Bancorp, Inc. | (803,072 | ) | |||||
| (7,100) | Newmont Corp. | (309,631 | ) | |||||
| (13,100) | NiSource, Inc. | (359,333 | ) | |||||
| (11,675) | Norfolk Southern Corp. | (2,624,773 | ) | |||||
| (4,134) | Novocure Ltd.* | (318,194 | ) | |||||
| (60,194) | NuVasive, Inc.* | (2,602,187 | ) | |||||
| (5,200) | Okta, Inc.* | (370,708 | ) | |||||
| (5,900) | ONEOK, Inc. | (386,155 | ) | |||||
| (29,400) | Palantir Technologies, Inc. – Class A* | (230,496 | ) | |||||
| (3,100) | Paychex, Inc. | (342,240 | ) | |||||
| (3,900) | Philip Morris International, Inc. | (379,470 | ) | |||||
| (400) | PTC, Inc.* | (50,132 | ) | |||||
| (100) | Public Storage (REIT) | (29,895 | ) | |||||
| (10,600) | ROBLOX Corp. – Class A* | (388,384 | ) | |||||
| (4,700) | Roku, Inc.* | (304,043 | ) | |||||
| (9,800) | Rollins, Inc. | (344,960 | ) | |||||
| (6,200) | Royal Caribbean Cruises Ltd.* | (437,968 | ) | |||||
| (2,200) | Seagen, Inc.* | (395,318 | ) | |||||
| (900) | ServiceNow, Inc.* | (388,953 | ) | |||||
| (1,400) | Sherwin-Williams Co. (The) | (309,890 | ) | |||||
| (75,999) | Signify Health, Inc. – Class A* | (2,188,011 | ) | |||||
| (1,600) | Simon Property Group, Inc. (REIT) | (195,344 | ) | |||||
| (1,700) | Snowflake, Inc. – Class A* | (262,446 | ) | |||||
| (3,700) | Starbucks Corp. | (377,733 | ) | |||||
| (1,300) | Sysco Corp. | (96,941 | ) | |||||
| (2,314) | Tesla, Inc.* | (476,013 | ) | |||||
| (9,800) | Toast, Inc. – Class A* | (185,416 | ) | |||||
| (5,800) | Trade Desk, Inc. (The) – Class A* | (324,568 | ) | |||||
| (500) | TransDigm Group, Inc. | (371,935 | ) | |||||
| (5,800) | Twilio, Inc. – Class A* | (389,818 | ) | |||||
| (12,962) | Uber Technologies, Inc.* | (431,116 | ) | |||||
| (4,200) | UDR, Inc. (REIT) | (179,928 | ) | |||||
| (1,300) | Vail Resorts, Inc. | (303,537 | ) | |||||
| (300) | Vulcan Materials Co. | (54,273 | ) | |||||
| (12,000) | Williams Cos., Inc. (The) | (361,200 | ) | |||||
| (4,900) | Wolfspeed, Inc.* | (362,502 | ) | |||||
| (21,360) | Xylem, Inc. | (2,192,604 | ) | |||||
| (2,888) | Zillow Group, Inc. – Class C* | (121,296 | ) | |||||
| See accompanying notes to the financial statements. | 12 |
GMO Alternative Allocation Fund
(A Series of GMO Trust)
Consolidated Schedule of Investments — (Continued)
(showing percentage of total net assets)
February 28, 2023
| Shares | Description | Value ($) | ||||||
| United States — continued | ||||||||
| (3,100) | Zscaler, Inc.* | (406,565 | ) | |||||
|
| |||||||
| Total United States | (46,321,686 | ) | ||||||
|
| |||||||
| TOTAL COMMON STOCKS (PROCEEDS $75,349,695) | (70,877,433 | ) | ||||||
|
| |||||||
| PREFERRED STOCKS (d) — (0.2)% | ||||||||
| Germany — (0.2)% | ||||||||
| (761) | Sartorius AG | (323,248 | ) | |||||
|
| |||||||
TOTAL PREFERRED STOCKS (PROCEEDS $351,736) | (323,248 | ) | ||||||
|
| |||||||
| TOTAL SECURITIES SOLD SHORT (PROCEEDS $75,701,431) | (71,200,681 | ) | ||||||
|
| |||||||
| Other Assets and Liabilities (net) — 4.7% | 9,146,371 | |||||||
|
| |||||||
| TOTAL NET ASSETS — 100.0% | $ | 195,672,010 | ||||||
|
| |||||||
A summary of outstanding financial instruments at February 28, 2023 is as follows:
Forward Currency Contracts
Settlement Date | Counter- party | Currency Sold | Currency Purchased | Net Unrealized Appreciation (Depreciation)($) | ||||||||||||||||||
05/09/2023 | BOA | AUD | 620,000 | USD | 418,429 | 241 | ||||||||||||||||
03/24/2023 | BCLY | AUD | 58,463 | USD | 40,378 | 1,007 | ||||||||||||||||
05/09/2023 | BCLY | AUD | 2,000,000 | USD | 1,382,616 | 33,621 | ||||||||||||||||
03/24/2023 | DB | AUD | 1,092,009 | USD | 756,036 | 20,630 | ||||||||||||||||
03/24/2023 | MSCI | AUD | 2,012,799 | USD | 1,425,978 | 70,472 | ||||||||||||||||
05/09/2023 | MSCI | AUD | 460,000 | USD | 318,744 | 8,475 | ||||||||||||||||
03/24/2023 | SSB | AUD | 831,466 | USD | 581,447 | 21,501 | ||||||||||||||||
05/03/2023 | GS | BRL | 250,000 | USD | 47,914 | 680 | ||||||||||||||||
05/03/2023 | JPM | BRL | 350,000 | USD | 66,423 | 296 | ||||||||||||||||
05/08/2023 | BOA | CAD | 3,745,085 | USD | 2,789,762 | 43,032 | ||||||||||||||||
04/03/2023 | BCLY | CAD | 580,000 | USD | 433,127 | 7,942 | ||||||||||||||||
04/03/2023 | GS | CAD | 700,000 | USD | 518,913 | 5,759 | ||||||||||||||||
05/08/2023 | MSCI | CAD | 481,259 | USD | 355,974 | 3,007 | ||||||||||||||||
04/03/2023 | SSB | CAD | 470,000 | USD | 350,116 | 5,570 | ||||||||||||||||
05/16/2023 | BCLY | CHF | 4,577,275 | USD | 5,037,196 | 138,322 | ||||||||||||||||
03/31/2023 | JPM | CHF | 6,541,545 | USD | 7,139,476 | 171,874 | ||||||||||||||||
04/11/2023 | MSCI | COP | 920,000,000 | USD | 191,177 | 3,351 | ||||||||||||||||
04/17/2023 | BOA | EUR | 1,927,800 | USD | 2,094,601 | 50,031 | ||||||||||||||||
04/17/2023 | SSB | EUR | 104,000 | USD | 110,507 | 208 | ||||||||||||||||
03/21/2023 | SSB | GBP | 1,070,000 | USD | 1,288,728 | 1,242 | ||||||||||||||||
05/16/2023 | MSCI | HUF | 30,000,000 | USD | 82,490 | 569 | ||||||||||||||||
05/08/2023 | GS | IDR | 1,800,000,000 | USD | 119,079 | 1,201 | ||||||||||||||||
03/31/2023 | DB | ILS | 1,317,605 | USD | 371,334 | 10,362 | ||||||||||||||||
05/31/2023 | MSCI | ILS | 300,000 | USD | 83,101 | 691 | ||||||||||||||||
04/13/2023 | BCLY | JPY | 56,610,620 | USD | 427,893 | 9,648 | ||||||||||||||||
04/13/2023 | GS | JPY | 48,074,805 | USD | 358,721 | 3,540 | ||||||||||||||||
04/13/2023 | MSCI | JPY | 240,086,965 | USD | 1,830,586 | 56,802 | ||||||||||||||||
Settlement Date | Counter- party | Currency Sold | Currency Purchased | Net Unrealized Appreciation (Depreciation)($) | ||||||||||||||||||
04/10/2023 | SSB | JPY | 2,000,000,000 | USD | 15,264,548 | 494,689 | ||||||||||||||||
04/13/2023 | SSB | JPY | 78,470,078 | USD | 602,185 | 22,441 | ||||||||||||||||
05/08/2023 | CITI | KRW | 120,000,000 | USD | 91,224 | 118 | ||||||||||||||||
05/08/2023 | GS | KRW | 140,000,000 | USD | 106,805 | 515 | ||||||||||||||||
03/27/2023 | MSCI | NZD | 828,856 | USD | 530,645 | 18,148 | ||||||||||||||||
05/31/2023 | MSCI | NZD | 1,560,000 | USD | 968,986 | 4,467 | ||||||||||||||||
05/31/2023 | SSB | NZD | 810,000 | USD | 504,893 | 4,086 | ||||||||||||||||
04/28/2023 | CITI | PHP | 13,500,000 | USD | 245,932 | 2,976 | ||||||||||||||||
05/22/2023 | GS | PLN | 900,000 | USD | 201,548 | 331 | ||||||||||||||||
04/27/2023 | BCLY | RON | 2,491,896 | USD | 537,372 | 3,489 | ||||||||||||||||
05/22/2023 | MSCI | SGD | 755,848 | USD | 566,662 | 4,884 | ||||||||||||||||
05/22/2023 | BCLY | THB | 13,552,251 | USD | 395,917 | 9,381 | ||||||||||||||||
03/08/2023 | MSCI | TWD | 21,043,349 | USD | 704,989 | 19,137 | ||||||||||||||||
05/03/2023 | GS | USD | 94,091 | BRL | 500,000 | 377 | ||||||||||||||||
04/10/2023 | JPM | USD | 120,012 | CLP | 100,000,000 | 197 | ||||||||||||||||
04/10/2023 | MSCI | USD | 262,480 | CLP | 224,096,500 | 6,904 | ||||||||||||||||
04/11/2023 | JPM | USD | 533,850 | COP | 2,655,101,500 | 8,214 | ||||||||||||||||
05/22/2023 | BCLY | USD | 156,894 | INR | 13,073,064 | 407 | ||||||||||||||||
04/20/2023 | MSCI | USD | 719,171 | MXN | 13,618,725 | 18,277 | ||||||||||||||||
05/10/2023 | MSCI | USD | 61,805 | PEN | 240,000 | 1,134 | ||||||||||||||||
05/31/2023 | MSCI | ZAR | 1,000,000 | USD | 54,669 | 623 | ||||||||||||||||
05/08/2023 | BOA | CAD | 393,274 | USD | 288,405 | (31 | ) | |||||||||||||||
04/11/2023 | MSCI | COP | 1,080,000,000 | USD | 217,934 | (2,558 | ) | |||||||||||||||
04/17/2023 | MSCI | CZK | 13,570,976 | USD | 609,039 | (250 | ) | |||||||||||||||
05/10/2023 | MSCI | PEN | 240,000 | USD | 62,192 | (747 | ) | |||||||||||||||
05/22/2023 | MSCI | PLN | 250,000 | USD | 55,531 | (363 | ) | |||||||||||||||
05/08/2023 | BCLY | SEK | 10,444,479 | USD | 991,982 | (9,319 | ) | |||||||||||||||
| 13 | See accompanying notes to the financial statements. |
GMO Alternative Allocation Fund
(A Series of GMO Trust)
Consolidated Schedule of Investments — (Continued)
February 28, 2023
Forward Currency Contracts — continued
Settlement Date | Counter- party | Currency Sold | Currency Purchased | Net Unrealized Appreciation (Depreciation)($) | ||||||||||||||||||
03/24/2023 | BCLY | USD | 141,146 | AUD | 204,095 | (3,700 | ) | |||||||||||||||
05/03/2023 | CITI | USD | 67,649 | BRL | 350,000 | (1,521 | ) | |||||||||||||||
05/03/2023 | GS | USD | 77,796 | BRL | 400,000 | (2,222 | ) | |||||||||||||||
05/03/2023 | SSB | USD | 402,195 | BRL | 2,089,119 | (7,485 | ) | |||||||||||||||
05/08/2023 | BOA | USD | 1,104,044 | CAD | 1,482,257 | (16,923 | ) | |||||||||||||||
04/03/2023 | BCLY | USD | 3,369,560 | CAD | 4,522,285 | (54,377 | ) | |||||||||||||||
03/17/2023 | DB | USD | 2,101,795 | CAD | 2,806,254 | (44,927 | ) | |||||||||||||||
03/17/2023 | GS | USD | 299,618 | CAD | 400,362 | (6,169 | ) | |||||||||||||||
05/08/2023 | MSCI | USD | 1,179,552 | CAD | 1,572,903 | (25,949 | ) | |||||||||||||||
03/31/2023 | BCLY | USD | 8,326 | CHF | 7,574 | (259 | ) | |||||||||||||||
03/31/2023 | DB | USD | 172,181 | CHF | 157,843 | (4,058 | ) | |||||||||||||||
03/31/2023 | GS | USD | 218,338 | CHF | 200,419 | (4,866 | ) | |||||||||||||||
03/31/2023 | MSCI | USD | 168,979 | CHF | 154,489 | (4,428 | ) | |||||||||||||||
04/10/2023 | MSCI | USD | 304,534 | CLP | 250,000,000 | (4,011 | ) | |||||||||||||||
04/17/2023 | CITI | USD | 199,453 | CZK | 4,400,000 | (1,909 | ) | |||||||||||||||
04/17/2023 | GS | USD | 81,244 | CZK | 1,800,000 | (430 | ) | |||||||||||||||
04/17/2023 | MSCI | USD | 71,878 | CZK | 1,600,000 | (44 | ) | |||||||||||||||
03/31/2023 | BCLY | USD | 689,622 | EUR | 639,784 | (11,747 | ) | |||||||||||||||
03/31/2023 | DB | USD | 152,244 | EUR | 142,577 | (1,178 | ) | |||||||||||||||
03/31/2023 | GS | USD | 1,238,775 | EUR | 1,156,967 | (12,925 | ) | |||||||||||||||
Settlement Date | Counter- party | Currency Sold | Currency Purchased | Net Unrealized Appreciation (Depreciation)($) | ||||||||||||||||||
03/31/2023 | JPM | USD | 4,735,354 | EUR | 4,421,079 | (51,057 | ) | |||||||||||||||
03/31/2023 | MSCI | USD | 8,980,006 | EUR | 8,227,227 | (262,954 | ) | |||||||||||||||
04/17/2023 | MSCI | USD | 79,505 | EUR | 74,000 | (1,023 | ) | |||||||||||||||
03/24/2023 | BCLY | USD | 355,308 | GBP | 291,383 | (4,680 | ) | |||||||||||||||
03/24/2023 | MSCI | USD | 212,354 | GBP | 176,038 | (524 | ) | |||||||||||||||
03/24/2023 | SSB | USD | 834,104 | GBP | 675,341 | (21,449 | ) | |||||||||||||||
05/16/2023 | JPM | USD | 519,661 | HUF | 189,520,539 | (2,143 | ) | |||||||||||||||
05/08/2023 | JPM | USD | 147,886 | IDR | 2,214,143,000 | (2,886 | ) | |||||||||||||||
03/17/2023 | MSCI | USD | 4,354,355 | JPY | 579,915,155 | (86,307 | ) | |||||||||||||||
05/08/2023 | BCLY | USD | 7,212 | KRW | 8,830,175 | (508 | ) | |||||||||||||||
05/08/2023 | GS | USD | 56,826 | KRW | 70,000,000 | (3,681 | ) | |||||||||||||||
04/17/2023 | BOA | USD | 334,906 | NOK | 3,300,000 | (16,381 | ) | |||||||||||||||
04/17/2023 | MSCI | USD | 3,203,964 | NOK | 31,827,768 | (131,860 | ) | |||||||||||||||
05/31/2023 | SSB | USD | 279,519 | NZD | 450,000 | (1,292 | ) | |||||||||||||||
04/28/2023 | JPM | USD | 127,143 | PHP | 7,000,000 | (1,166 | ) | |||||||||||||||
05/08/2023 | BCLY | USD | 635,223 | SEK | 6,600,000 | (2,488 | ) | |||||||||||||||
05/22/2023 | BCLY | USD | 105,009 | THB | 3,600,000 | (2,330 | ) | |||||||||||||||
05/31/2023 | MSCI | USD | 230,305 | ZAR | 4,200,000 | (3,314 | ) | |||||||||||||||
|
| |||||||||||||||||||||
| $ | 472,430 | |||||||||||||||||||||
|
| |||||||||||||||||||||
Futures Contracts
Number of Contracts + | Type | Expiration Date | Notional Amount ($) | Value/Net Unrealized Appreciation (Depreciation) ($) | ||||||||||
Buys | ||||||||||||||
34 | CAC40 10 Euro | March 2023 | 2,609,369 | 4,747 | ||||||||||
26 | Corn(f) | May 2023 | 819,325 | (57,571 | ) | |||||||||
7 | DAX Index | March 2023 | 2,845,999 | 129,114 | ||||||||||
89 | FTSE 100 Index | March 2023 | 8,404,223 | 243,154 | ||||||||||
335 | Mini MSCI Emerging Markets | March 2023 | 16,128,575 | (345,517 | ) | |||||||||
123 | MSCI Singapore | March 2023 | 2,678,959 | (53,650 | ) | |||||||||
22 | Soybean(f) | May 2023 | 1,626,900 | (42,645 | ) | |||||||||
9 | SPI 200 Futures | March 2023 | 1,086,518 | (41,272 | ) | |||||||||
6 | U.S. Long Bond (CBT) | June 2023 | 751,312 | (383 | ) | |||||||||
5 | U.S. Treasury Note 5 Yr. (CBT) | June 2023 | 535,273 | (39 | ) | |||||||||
5 | U.S. Ultra Bond (CBT) | June 2023 | 675,313 | (2,089 | ) | |||||||||
|
|
|
| |||||||||||
| $ | 38,161,766 | $ | (166,151 | ) | ||||||||||
|
|
|
| |||||||||||
Number of Contracts + | Type | Expiration Date | Notional Amount ($) | Value/Net Unrealized Appreciation (Depreciation) ($) | ||||||||
Sales | ||||||||||||
12 | Australian Government Bond 10 Yr. | March 2023 | 950,083 | 22,418 | ||||||||
46 | Canadian Government Bond 10 Yr. | June 2023 | 4,095,332 | (10,888 | ) | |||||||
5 | E-mini Russell 2000 Index | March 2023 | 474,775 | (5,082 | ) | |||||||
19 | Euro Bund | March 2023 | 2,670,998 | 112,654 | ||||||||
8 | Euro Bund | June 2023 | 1,116,508 | (2,660 | ) | |||||||
11 | FTSE Taiwan Index | March 2023 | 589,857 | 9,389 | ||||||||
3 | Gold 100 OZ(f) | April 2023 | 551,010 | 28,933 | ||||||||
3 | Hang Seng Index | March 2023 | 377,677 | 11,993 | ||||||||
94 | S&P 500 E-Mini | March 2023 | 18,684,850 | (10,297 | ) | |||||||
12 | S&P/TSX 60 | March 2023 | 2,139,861 | (1,461 | ) | |||||||
23 | Silver(f) | May 2023 | 2,423,165 | 136,601 | ||||||||
34 | TOPIX Index | March 2023 | 4,974,485 | (100,395 | ) | |||||||
86 | U.S. Treasury Note 10 Yr. (CBT) | June 2023 | 9,602,438 | 7,954 | ||||||||
4 | UK Gilt Long Bond | June 2023 | 480,947 | 3,702 | ||||||||
1 | WTI Crude(f) | March 2023 | 77,050 | (2,893 | ) | |||||||
|
|
|
| |||||||||
| $ | 49,209,036 | $ | 199,968 | |||||||||
|
|
|
| |||||||||
| + | Buys - Fund is long the futures contract. |
Sales - Fund is short the futures contract.
| See accompanying notes to the financial statements. | 14 |
GMO Alternative Allocation Fund
(A Series of GMO Trust)
Consolidated Schedule of Investments — (Continued)
February 28, 2023
Written Options
Description | Exercise Price | Expiration Date | Number of Contracts | Notional Amount | Value ($) | |||||||||||||||||||
Equity Options – Calls | ||||||||||||||||||||||||
Black Knight, Inc. | 60.00 | 04/21/23 | (339 | ) | USD | (2,020,440 | ) | (237,300 | ) | |||||||||||||||
Albertsons Cos., Inc.(g) | 21.00 | 07/21/23 | (1,272 | ) | USD | (2,528,736 | ) | (69,960 | ) | |||||||||||||||
Globus Medical, Inc. | 62.50 | 09/15/23 | (142 | ) | USD | (828,428 | ) | (88,040 | ) | |||||||||||||||
Globus Medical, Inc. | 60.00 | 09/15/23 | (15 | ) | USD | (87,510 | ) | (7,845 | ) | |||||||||||||||
Activision Blizzard, Inc. | 77.50 | 01/19/24 | (222 | ) | USD | (1,692,750 | ) | (187,590 | ) | |||||||||||||||
Activision Blizzard, Inc. | 80.00 | 01/19/24 | (104 | ) | USD | (793,000 | ) | (76,440 | ) | |||||||||||||||
VMware, Inc. | 120.00 | 01/19/24 | (68 | ) | USD | (748,884 | ) | (61,200 | ) | |||||||||||||||
|
| |||||||||||||||||||||||
| Total Equity Options –Calls | (728,375 | ) | ||||||||||||||||||||||
|
| |||||||||||||||||||||||
Index Options – Puts | ||||||||||||||||||||||||
S&P 500 Index | 4,135.00 | 03/03/23 | (8 | ) | USD | (3,176,120 | ) | (139,360 | ) | |||||||||||||||
S&P 500 Index | 4,090.00 | 03/10/23 | (9 | ) | USD | (3,573,135 | ) | (119,970 | ) | |||||||||||||||
S&P 500 Index | 4,080.00 | 03/17/23 | (9 | ) | USD | (3,573,135 | ) | (120,150 | ) | |||||||||||||||
S&P 500 Index | 3,970.00 | 03/24/23 | (9 | ) | USD | (3,573,135 | ) | (72,459 | ) | |||||||||||||||
|
| |||||||||||||||||||||||
| Total Index Options –Puts | (451,939 | ) | ||||||||||||||||||||||
|
| |||||||||||||||||||||||
Description | Counterparty | Exercise Rate | Expiration Date | Principal/ Notional Amount | Floating Rate Index | Pay/Receive Floating Rate | Value ($) | |||||||||||||||||||||||||
Written Options on Credit Default Swaps - Puts |
| |||||||||||||||||||||||||||||||
CDX.NA.IGS.39 | MSCI | 85.00 | % | 04/19/23 | USD | (12,890,000 | ) | Fixed Spread | Pay | (19,931 | ) | |||||||||||||||||||||
CDX.NA.HY.39 | BCLY | 99.50 | % | 04/19/23 | USD | (6,669,000 | ) | Fixed Spread | Pay | (51,487 | ) | |||||||||||||||||||||
CDX.NA.IG.39 | BCLY | 95.00 | % | 05/17/23 | USD | (13,340,000 | ) | Fixed Spread | Pay | (19,744 | ) | |||||||||||||||||||||
|
| |||||||||||||||||||||||||||||||
| Total Written Options On Credit Default Swaps —Puts | (91,162 | ) | ||||||||||||||||||||||||||||||
|
| |||||||||||||||||||||||||||||||
| TOTAL WRITTEN OPTIONS | ||||||||||||||||||||||||||||||||
| (Premiums $1,226,737) | $ | (1,271,476 | ) | |||||||||||||||||||||||||||||
|
| |||||||||||||||||||||||||||||||
Swap Contracts
Centrally Cleared Credit Default Swaps
Reference Entity | Notional Amount | Annual Premium | Implied Credit Spread (1) | Maximum Potential Amount of Future Payments by the Fund Under the Contract (2) | Expiration Date | Periodic Payment Frequency | Premiums Paid/ (Received) ($) | Value ($) | Net Unrealized Appreciation/ (Depreciation) ($) | |||||||||||||||||||||||||||
Buy Protection^: | ||||||||||||||||||||||||||||||||||||
CDX.NA.HY.S37.V2 | USD | 4,405,500 | 5.00 | % | 3.95 | % | N/A | 12/20/2026 | Quarterly | (244,505 | ) | (147,342 | ) | 97,163 | ||||||||||||||||||||||
ITRAXX.XO.36.V1 | EUR | 6,675,000 | 5.00 | % | 3.56 | % | N/A | 12/20/2026 | Quarterly | (237,664 | ) | (328,551 | ) | (90,887 | ) | |||||||||||||||||||||
CDX.NA.IG.S39 | USD | 26,230,000 | 1.00 | % | 0.76 | % | N/A | 12/20/2027 | Quarterly | (104,595 | ) | (263,297 | ) | (158,702 | ) | |||||||||||||||||||||
ITRAXX.XO.38.V1 | EUR | 4,455,000 | 5.00 | % | 4.13 | % | N/A | 12/20/2027 | Quarterly | (91,065 | ) | (158,294 | ) | (67,229 | ) | |||||||||||||||||||||
|
|
|
|
|
| |||||||||||||||||||||||||||||||
| $ | (677,829 | ) | $ | (897,484 | ) | $ | (219,655 | ) | ||||||||||||||||||||||||||||
|
|
|
|
|
| |||||||||||||||||||||||||||||||
| 15 | See accompanying notes to the financial statements. |
GMO Alternative Allocation Fund
(A Series of GMO Trust)
Consolidated Schedule of Investments — (Continued)
February 28, 2023
Swap Contracts — continued
OTC Credit Default Swaps
Reference Entity | Counter- party | Notional Amount | Annual Premium | Implied Credit Spread (1) | Maximum Potential Amount of Future Payments by the Fund Under the Contract (2) | Expiration Date | Periodic Payment Frequency | Premiums Paid/ (Received) ($) | Value ($) | Net Unrealized Appreciation/ (Depreciation) ($) | ||||||||||||||||||||||||||||||||
Buy Protection^: | ||||||||||||||||||||||||||||||||||||||||||
CDX.NA.HYS.31 | CITI | USD | 1,631,000 | 5.00 | % | 0.89 | % | N/A | 12/20/2023 | Quarterly | (6,361 | ) | (53,291 | ) | (46,930 | ) | ||||||||||||||||||||||||||
CDX.NA.HYS.31 | CITI | USD | 1,780,000 | 5.00 | % | 0.89 | % | N/A | 12/20/2023 | Quarterly | 18,334 | (58,160 | ) | (76,494 | ) | |||||||||||||||||||||||||||
ITRAXX.EUR.38 12 | JPM | EUR | 33,337,000 | 1.00 | % | 0.34 | % | N/A | 12/20/2027 | Quarterly | (1,079,889 | ) | (1,022,396 | ) | 57,493 | |||||||||||||||||||||||||||
CMBX.NA.BBB-.9 | MLCS | USD | 2,640,000 | 3.00 | % | 11.84 | % | N/A | 09/17/2058 | Monthly | 212,244 | 490,875 | 278,631 | |||||||||||||||||||||||||||||
CMBX.NA.BBB-.10 | GS | USD | 1,886,000 | 3.00 | % | 10.36 | % | N/A | 11/17/2059 | Monthly | 351,268 | 387,757 | 36,489 | |||||||||||||||||||||||||||||
CMBX.NA.BBB-.13 | GS | USD | 576,500 | 3.00 | % | 8.17 | % | N/A | 12/16/2072 | Monthly | 35,496 | 134,144 | 98,648 | |||||||||||||||||||||||||||||
Sell Protection^: | ||||||||||||||||||||||||||||||||||||||||||
CDX.NA.HYS.31.V14-5Y | CITI | USD | 1,187,000 | 5.00 | % | 0.28 | % | 1,187,000 USD | 12/20/2023 | Quarterly | 121,668 | 44,579 | (77,089 | ) | ||||||||||||||||||||||||||||
CDX.NA.HYS.31.V14-5Y | CITI | USD | 1,928,000 | 5.00 | % | 0.28 | % | 1,928,000 USD | 12/20/2023 | Quarterly | 203,886 | 72,407 | (131,479 | ) | ||||||||||||||||||||||||||||
CDX.NA.HYS.31.V14-5Y | CITI | USD | 3,560,000 | 5.00 | % | 0.28 | % | 3,560,000 USD | 12/20/2023 | Quarterly | 238,520 | 133,698 | (104,822 | ) | ||||||||||||||||||||||||||||
CDX.NA.HYS.33.V12-5Y | CITI | USD | 4,388,727 | 5.00 | % | 0.22 | % | 4,388,727 USD | 12/20/2024 | Quarterly | 756,836 | 360,185 | (396,651 | ) | ||||||||||||||||||||||||||||
CDX.NA.HYS.37 | GS | USD | 11,125,000 | 5.00 | % | 0.47 | % | 11,125,000 USD | 12/20/2026 | Quarterly | 2,081,364 | 1,698,470 | (382,894 | ) | ||||||||||||||||||||||||||||
ITRAXX.XO.36 35 | MSCI | EUR | 13,350,000 | 5.00 | % | 0.56 | % | 13,350,000 EUR | 12/20/2026 | Quarterly | 2,319,299 | 2,119,107 | (200,192 | ) | ||||||||||||||||||||||||||||
CDX.NA.IG.39 15 | MSCI | USD | 33,337,000 | 1.00 | % | 0.25 | % | 33,337,000 USD | 12/20/2027 | Quarterly | 1,131,717 | 1,079,760 | (51,957 | ) | ||||||||||||||||||||||||||||
ITRAXX.XO.38 35 | JPM | EUR | 8,019,000 | 5.00 | % | 0.98 | % | 8,019,000 EUR | 12/20/2027 | Quarterly | 1,357,928 | 1,386,229 | 28,301 | |||||||||||||||||||||||||||||
CMBX.NA.A.9 | CGMI | USD | 1,112,500 | 2.00 | % | 4.51 | % | 1,112,500 USD | 09/17/2058 | Monthly | (33,096 | ) | (64,429 | ) | (31,333 | ) | ||||||||||||||||||||||||||
CMBX.NA.A.9 | CGMI | USD | 1,780,000 | 2.00 | % | 4.51 | % | 1,780,000 USD | 09/17/2058 | Monthly | (44,602 | ) | (103,087 | ) | (58,485 | ) | ||||||||||||||||||||||||||
CMBX.NA.A.9 | MLCS | USD | 4,750,000 | 2.00 | % | 4.51 | % | 4,750,000 USD | 09/17/2058 | Monthly | 9,294 | (275,091 | ) | (284,385 | ) | |||||||||||||||||||||||||||
CMBX.NA.AAA.10 | GS | USD | 4,610,000 | 0.50 | % | 0.63 | % | 4,610,000 USD | 11/17/2059 | Monthly | 42,163 | (19,595 | ) | (61,758 | ) | |||||||||||||||||||||||||||
CMBX.NA.15.AAA | GS | USD | 1,730,000 | 0.50 | % | 0.91 | % | 1,730,000 USD | 11/18/2064 | Monthly | (26,617 | ) | (47,931 | ) | (21,314 | ) | ||||||||||||||||||||||||||
|
|
|
|
|
| |||||||||||||||||||||||||||||||||||||
| $ | 7,689,452 | $ | 6,263,231 | $ | (1,426,221 | ) | ||||||||||||||||||||||||||||||||||||
|
|
|
|
|
| |||||||||||||||||||||||||||||||||||||
| ^ | Buy Protection - Fund pays a premium and buys credit protection. If a credit event occurs the Fund will, depending on the terms of the particular swap contract, either (i) receive from the seller of protection an amount equal to the notional amount of the swap and deliver the referenced obligation or underlying securities comprising the referenced index or (ii) receive a net settlement amount in the form of cash or securities equal to the notional amount of the swap less the recovery value of the referenced obligation or underlying securities comprising the referenced index. |
Sell Protection - Fund receives a premium and sells credit protection. If a credit event occurs the Fund will, depending on the terms of the particular swap contract, either (i) pay to the buyer of protection an amount equal to the notional amount of the swap and take delivery of the referenced obligation or underlying securities comprising the referenced index or (ii) pay a net settlement amount in the form of cash or securities equal to the notional amount of the swap less the recovery value of the referenced obligation or underlying securities comprising the referenced index. |
| (1) | As of February 28, 2023, implied credit spreads in absolute terms, calculated using a model, and utilized in determining the market value of credit default swap contracts on the reference security, serve as an indicator of the current status of the payment/performance risk and reflect the likelihood or risk of default for the reference entity. The implied credit spread of a particular referenced entity reflects the cost of buying/selling protection. Wider (i.e. higher) credit spreads represent a deterioration of the referenced entity’s credit soundness and a greater likelihood or risk of default or other credit event occurring as defined under the terms of the contract. |
| (2) | The maximum potential amount the Fund could be required to pay as a seller of credit protection if a credit event occurs as defined under the terms of that particular swap contract. |
Centrally Cleared Interest Rate Swaps
Fund Pays | Fund Receives | Notional Amount | Expiration Date | Periodic Payment Frequency | Premiums Paid/ (Received) ($) | Value ($) | Net Unrealized Appreciation/ (Depreciation) ($) | |||||||||||||||||||||
3.56% | 3 Month AUD BBSW | AUD | 2,500,000 | 03/15/2025 | Quarterly | — | 20,170 | 20,170 | ||||||||||||||||||||
3.66% | 3 Month AUD BBSW | AUD | 3,500,000 | 03/15/2025 | Quarterly | — | 23,798 | 23,798 | ||||||||||||||||||||
3.70% | 3 Month AUD BBSW | AUD | 12,818,000 | 03/15/2025 | Quarterly | 2,446 | 80,470 | 78,024 | ||||||||||||||||||||
| See accompanying notes to the financial statements. | 16 |
GMO Alternative Allocation Fund
(A Series of GMO Trust)
Consolidated Schedule of Investments — (Continued)
February 28, 2023
Swap Contracts — continued
Centrally Cleared Interest Rate Swaps — continued
Fund Pays | Fund Receives | Notional Amount | Expiration Date | Periodic Payment Frequency | Premiums Paid/ (Received) ($) | Value ($) | Net Unrealized Appreciation/ (Depreciation) ($) | |||||||||||||||||||||
3 Month AUD BBSW | 3.63% | AUD | 3,000,000 | 03/15/2025 | Quarterly | — | (21,693 | ) | (21,693 | ) | ||||||||||||||||||
3 Month AUD BBSW | 3.73% | AUD | 2,500,000 | 03/15/2025 | Quarterly | — | (14,697 | ) | (14,697 | ) | ||||||||||||||||||
3 Month AUD BBSW | 3.85% | AUD | 4,500,000 | 03/15/2025 | Quarterly | — | (19,789 | ) | (19,789 | ) | ||||||||||||||||||
3 Month AUD BBSW | 3.92% | AUD | 3,500,000 | 03/15/2025 | Quarterly | — | (12,146 | ) | (12,146 | ) | ||||||||||||||||||
3.99% | 3 Month CAD CDOR | CAD | 11,066,000 | 03/15/2025 | Semi-Annually | 5,172 | 106,922 | 101,750 | ||||||||||||||||||||
3.83% | 3 Month CAD CDOR | CAD | 4,500,000 | 03/15/2025 | Semi-Annually | — | 53,665 | 53,665 | ||||||||||||||||||||
3 Month CAD CDOR | 4.00% | CAD | 2,500,000 | 03/15/2025 | Semi-Annually | — | (23,801 | ) | (23,801 | ) | ||||||||||||||||||
3 Month CAD CDOR | 4.75% | CAD | 1,500,000 | 03/15/2025 | Semi-Annually | — | 1,371 | 1,371 | ||||||||||||||||||||
CHF - SARON - OIS - COMPOUND | 1.36% | CHF | 2,000,000 | 03/15/2025 | Annually | — | (19,385 | ) | (19,385 | ) | ||||||||||||||||||
CHF - SARON - OIS - COMPOUND | 1.57% | CHF | 1,500,000 | 03/15/2025 | Annually | — | (7,930 | ) | (7,930 | ) | ||||||||||||||||||
1.18% | CHF - SARON - OIS - COMPOUND | CHF | 6,891,000 | 03/15/2025 | Annually | 783 | 91,947 | 91,164 | ||||||||||||||||||||
EUR - EuroSTR - COMPOUND | 2.93% | EUR | 1,500,000 | 03/15/2025 | Annually | — | (19,755 | ) | (19,755 | ) | ||||||||||||||||||
EUR - EuroSTR - COMPOUND | 2.97% | EUR | 4,500,000 | 03/15/2025 | Annually | — | (56,284 | ) | (56,284 | ) | ||||||||||||||||||
3.19% | EUR -EuroSTR - COMPOUND | EUR | 2,000,000 | 03/15/2025 | Annually | — | 15,819 | 15,819 | ||||||||||||||||||||
GBP - SONIA - COMPOUND | 4.27% | GBP | 4,689,000 | 03/15/2025 | Annually | (2,325 | ) | (32,660 | ) | (30,335 | ) | |||||||||||||||||
4.45% | GBP - SONIA - COMPOUND | GBP | 2,000,000 | 03/15/2025 | Annually | — | 6,141 | 6,141 | ||||||||||||||||||||
4.17% | GBP - SONIA - COMPOUND | GBP | 2,500,000 | 03/15/2025 | Annually | — | 23,228 | 23,228 | ||||||||||||||||||||
4.05% | GBP - SONIA - COMPOUND | GBP | 2,000,000 | 03/15/2025 | Annually | — | 24,059 | 24,059 | ||||||||||||||||||||
4.87% | 3 Month NZD Bank Bill Rate | NZD | 2,500,000 | 03/15/2025 | Quarterly | 2,008 | 14,649 | 12,641 | ||||||||||||||||||||
3.20% | 3 Month SEK STIBOR | SEK | 20,000,000 | 03/15/2025 | Quarterly | — | 24,992 | 24,992 | ||||||||||||||||||||
2.97% | 3 Month SEK STIBOR | SEK | 30,000,000 | 03/15/2025 | Quarterly | — | 49,775 | 49,775 | ||||||||||||||||||||
3 Month SEK STIBOR | 3.10% | SEK | 140,956,000 | 03/15/2025 | Quarterly | 1,446 | (199,896 | ) | (201,342 | ) | ||||||||||||||||||
3 Month SEK STIBOR | 3.13% | SEK | 15,000,000 | 03/15/2025 | Quarterly | — | (20,497 | ) | (20,497 | ) | ||||||||||||||||||
USD - SOFR - COMPOUND | 4.19% | USD | 2,000,000 | 03/15/2025 | Annually | — | (26,196 | ) | (26,196 | ) | ||||||||||||||||||
USD - SOFR - COMPOUND | 4.54% | USD | 2,500,000 | 03/15/2025 | Annually | — | (16,408 | ) | (16,408 | ) | ||||||||||||||||||
4.14% | USD - SOFR - COMPOUND | USD | 4,298,000 | 03/15/2025 | Annually | 3,167 | 60,826 | 57,659 | ||||||||||||||||||||
4.24% | 3 Month AUD BBSW | AUD | 4,000,000 | 06/21/2025 | Quarterly | — | (1,040 | ) | (1,040 | ) | ||||||||||||||||||
EUR - EuroSTR - COMPOUND | 3.61% | EUR | 1,000,000 | 06/21/2025 | Annually | — | 498 | 498 | ||||||||||||||||||||
6 Month AUD BBSW | 3.99% | AUD | 2,939,000 | 03/15/2033 | Semi-Annually | (933 | ) | (76,978 | ) | (76,045 | ) | |||||||||||||||||
6 Month AUD BBSW | 4.03% | AUD | 1,000,000 | 03/15/2033 | Semi-Annually | — | (24,055 | ) | (24,055 | ) | ||||||||||||||||||
6 Month AUD BBSW | 4.03% | AUD | 900,000 | 03/15/2033 | Semi-Annually | — | (21,698 | ) | (21,698 | ) | ||||||||||||||||||
6 Month AUD BBSW | 4.04% | AUD | 2,200,000 | 03/15/2033 | Semi-Annually | — | (51,551 | ) | (51,551 | ) | ||||||||||||||||||
6 Month AUD BBSW | 4.07% | AUD | 600,000 | 03/15/2033 | Semi-Annually | — | (13,378 | ) | (13,378 | ) | ||||||||||||||||||
6 Month AUD BBSW | 4.19% | AUD | 700,000 | 03/15/2033 | Semi-Annually | — | (10,778 | ) | (10,778 | ) | ||||||||||||||||||
6 Month AUD BBSW | 4.24% | AUD | 1,200,000 | 03/15/2033 | Semi-Annually | — | (15,587 | ) | (15,587 | ) | ||||||||||||||||||
6 Month AUD BBSW | 4.45% | AUD | 10,602,000 | 03/15/2033 | Semi-Annually | (3,588 | ) | (18,325 | ) | (14,737 | ) | |||||||||||||||||
4.22% | 6 Month AUD BBSW | AUD | 1,000,000 | 03/15/2033 | Semi-Annually | — | 13,665 | 13,665 | ||||||||||||||||||||
4.35% | 6 Month AUD BBSW | AUD | 1,300,000 | 03/15/2033 | Semi-Annually | — | 8,796 | 8,796 | ||||||||||||||||||||
4.32% | 6 Month AUD BBSW | AUD | 800,000 | 03/15/2033 | Semi-Annually | — | 6,777 | 6,777 | ||||||||||||||||||||
4.17% | 6 Month AUD BBSW | AUD | 600,000 | 03/15/2033 | Semi-Annually | — | 9,887 | 9,887 | ||||||||||||||||||||
4.05% | 6 Month AUD BBSW | AUD | 700,000 | 03/15/2033 | Semi-Annually | — | 16,251 | 16,251 | ||||||||||||||||||||
3.24% | 3 Month CAD CDOR | CAD | 964,000 | 03/15/2033 | Semi-Annually | (1,915 | ) | 30,454 | 32,369 | |||||||||||||||||||
3.17% | 3 Month CAD CDOR | CAD | 1,500,000 | 03/15/2033 | Semi-Annually | — | 53,560 | 53,560 | ||||||||||||||||||||
3.23% | 3 Month CAD CDOR | CAD | 500,000 | 03/15/2033 | Semi-Annually | — | 16,167 | 16,167 | ||||||||||||||||||||
3.42% | 3 Month CAD CDOR | CAD | 800,000 | 03/15/2033 | Semi-Annually | — | 16,275 | 16,275 | ||||||||||||||||||||
3.62% | 3 Month CAD CDOR | CAD | 600,000 | 03/15/2033 | Semi-Annually | — | 5,013 | 5,013 | ||||||||||||||||||||
3.82% | 3 Month CAD CDOR | CAD | 300,000 | 03/15/2033 | Semi-Annually | — | (1,256 | ) | (1,256 | ) | ||||||||||||||||||
3 Month CAD CDOR | 3.18% | CAD | 2,454,000 | 03/15/2033 | Semi-Annually | (4,915 | ) | (87,143 | ) | (82,228 | ) | |||||||||||||||||
| 17 | See accompanying notes to the financial statements. |
GMO Alternative Allocation Fund
(A Series of GMO Trust)
Consolidated Schedule of Investments — (Continued)
February 28, 2023
Swap Contracts — continued
Centrally Cleared Interest Rate Swaps — continued
Fund Pays | Fund Receives | Notional Amount | Expiration Date | Periodic Payment Frequency | Premiums Paid/ (Received) ($) | Value ($) | Net Unrealized Appreciation/ (Depreciation) ($) | |||||||||||||||||||||
3 Month CAD CDOR | 3.28% | CAD | 1,000,000 | 03/15/2033 | Semi-Annually | — | (29,175 | ) | (29,175 | ) | ||||||||||||||||||
3 Month CAD CDOR | 3.30% | CAD | 1,000,000 | 03/15/2033 | Semi-Annually | — | (27,612 | ) | (27,612 | ) | ||||||||||||||||||
3 Month CAD CDOR | 3.32% | CAD | 1,400,000 | 03/15/2033 | Semi-Annually | — | (37,111 | ) | (37,111 | ) | ||||||||||||||||||
3 Month CAD CDOR | 3.44% | CAD | 700,000 | 03/15/2033 | Semi-Annually | — | (13,490 | ) | (13,490 | ) | ||||||||||||||||||
3 Month CAD CDOR | 3.45% | CAD | 600,000 | 03/15/2033 | Semi-Annually | — | (11,029 | ) | (11,029 | ) | ||||||||||||||||||
3 Month CAD CDOR | 3.56% | CAD | 800,000 | 03/15/2033 | Semi-Annually | — | (9,775 | ) | (9,775 | ) | ||||||||||||||||||
CHF - SARON - OIS - COMPOUND | 1.50% | CHF | 1,472,000 | 03/15/2033 | Annually | (1,051 | ) | (64,289 | ) | (63,238 | ) | |||||||||||||||||
CHF - SARON - OIS - COMPOUND | 1.55% | CHF | 600,000 | 03/15/2033 | Annually | — | (23,342 | ) | (23,342 | ) | ||||||||||||||||||
CHF - SARON - OIS - COMPOUND | 1.60% | CHF | 5,988,000 | 03/15/2033 | Annually | — | (204,452 | ) | (204,452 | ) | ||||||||||||||||||
CHF - SARON - OIS - COMPOUND | 1.73% | CHF | 800,000 | 03/15/2033 | Annually | — | (17,561 | ) | (17,561 | ) | ||||||||||||||||||
1.99% | CHF - SARON - OIS - COMPOUND | CHF | 700,000 | 03/15/2033 | Annually | — | (2,418 | ) | (2,418 | ) | ||||||||||||||||||
1.58% | CHF - SARON - OIS - COMPOUND | CHF | 400,000 | 03/15/2033 | Annually | — | 14,571 | 14,571 | ||||||||||||||||||||
1.91% | CHF - SARON - OIS - COMPOUND | CHF | 900,000 | 03/15/2033 | Annually | — | 3,361 | 3,361 | ||||||||||||||||||||
1.81% | CHF - SARON - OIS - COMPOUND | CHF | 400,000 | 03/15/2033 | Annually | — | 5,574 | 5,574 | ||||||||||||||||||||
1.97% | CHF - SARON - OIS - COMPOUND | CHF | 800,000 | 03/15/2033 | Annually | — | (1,365 | ) | (1,365 | ) | ||||||||||||||||||
EUR - EuroSTR - COMPOUND | 2.68% | EUR | 500,000 | 03/15/2033 | Annually | — | (14,488 | ) | (14,488 | ) | ||||||||||||||||||
2.59% | EUR - EuroSTR - COMPOUND | EUR | 1,700,000 | 03/15/2033 | Annually | — | 63,235 | 63,235 | ||||||||||||||||||||
2.59% | EUR - EuroSTR - COMPOUND | EUR | 1,000,000 | 03/15/2033 | Annually | — | 37,334 | 37,334 | ||||||||||||||||||||
2.45% | EUR - EuroSTR - COMPOUND | EUR | 400,000 | 03/15/2033 | Annually | — | 20,184 | 20,184 | ||||||||||||||||||||
2.69% | EUR - EuroSTR - COMPOUND | EUR | 600,000 | 03/15/2033 | Annually | — | 16,868 | 16,868 | ||||||||||||||||||||
2.88% | EUR - EuroSTR - COMPOUND | EUR | 1,300,000 | 03/15/2033 | Annually | — | 14,111 | 14,111 | ||||||||||||||||||||
2.82% | EUR - EuroSTR - COMPOUND | EUR | 600,000 | 03/15/2033 | Annually | — | 10,001 | 10,001 | ||||||||||||||||||||
2.87% | EUR -EuroSTR - COMPOUND | EUR | 1,000,000 | 03/15/2033 | Annually | — | 12,263 | 12,263 | ||||||||||||||||||||
2.90% | EUR - EuroSTR - COMPOUND | EUR | 800,000 | 03/15/2033 | Annually | — | 7,812 | 7,812 | ||||||||||||||||||||
GBP - SONIA - COMPOUND | 3.34% | GBP | 1,000,000 | 03/15/2033 | Annually | — | (39,775 | ) | (39,775 | ) | ||||||||||||||||||
GBP - SONIA - COMPOUND | 3.39% | GBP | 400,000 | 03/15/2033 | Annually | — | (14,051 | ) | (14,051 | ) | ||||||||||||||||||
GBP - SONIA - COMPOUND | 3.41% | GBP | 600,000 | 03/15/2033 | Annually | — | (19,756 | ) | (19,756 | ) | ||||||||||||||||||
GBP - SONIA - COMPOUND | 3.44% | GBP | 600,000 | 03/15/2033 | Annually | — | (17,878 | ) | (17,878 | ) | ||||||||||||||||||
GBP - SONIA - COMPOUND | 3.48% | GBP | 1,300,000 | 03/15/2033 | Annually | — | (33,393 | ) | (33,393 | ) | ||||||||||||||||||
GBP - SONIA - COMPOUND | 3.56% | GBP | 400,000 | 03/15/2033 | Annually | — | (7,144 | ) | (7,144 | ) | ||||||||||||||||||
3.22% | GBP - SONIA - COMPOUND | GBP | 1,047,000 | 03/15/2033 | Annually | 2,529 | 53,405 | 50,876 | ||||||||||||||||||||
3.77% | GBP - SONIA - COMPOUND | GBP | 500,000 | 03/15/2033 | Annually | — | (1,221 | ) | (1,221 | ) | ||||||||||||||||||
3.36% | GBP - SONIA - COMPOUND | GBP | 900,000 | 03/15/2033 | Annually | — | 33,729 | 33,729 | ||||||||||||||||||||
3.16% | GBP - SONIA - COMPOUND | GBP | 500,000 | 03/15/2033 | Annually | — | 28,400 | 28,400 | ||||||||||||||||||||
3.48% | GBP - SONIA - COMPOUND | GBP | 600,000 | 03/15/2033 | Annually | — | 15,794 | 15,794 | ||||||||||||||||||||
3.54% | GBP - SONIA - COMPOUND | GBP | 500,000 | 03/15/2033 | Annually | — | 9,982 | 9,982 | ||||||||||||||||||||
4.22% | 3 Month NZD Bank Bill Rate | NZD | 1,700,000 | 03/15/2033 | Quarterly | 2,796 | 39,995 | 37,199 | ||||||||||||||||||||
4.27% | 3 Month NZD Bank Bill Rate | NZD | 870,000 | 03/15/2033 | Quarterly | — | 18,127 | 18,127 | ||||||||||||||||||||
4.14% | 3 Month NZD Bank Bill Rate | NZD | 1,400,000 | 03/15/2033 | Quarterly | — | 38,450 | 38,450 | ||||||||||||||||||||
4.47% | 3 Month NZD Bank Bill Rate | NZD | 1,300,000 | 03/15/2033 | Quarterly | — | 14,160 | 14,160 | ||||||||||||||||||||
3 Month NZD Bank Bill Rate | 4.22% | NZD | 500,000 | 03/15/2033 | Quarterly | (315 | ) | (11,645 | ) | (11,330 | ) | |||||||||||||||||
3 Month NZD Bank Bill Rate | 4.26% | NZD | 1,000,000 | 03/15/2033 | Quarterly | (206 | ) | (21,165 | ) | (20,959 | ) | |||||||||||||||||
3 Month NZD Bank Bill Rate | 4.59% | NZD | 1,900,000 | 03/15/2033 | Quarterly | — | (9,966 | ) | (9,966 | ) | ||||||||||||||||||
| See accompanying notes to the financial statements. | 18 |
GMO Alternative Allocation Fund
(A Series of GMO Trust)
Consolidated Schedule of Investments — (Continued)
February 28, 2023
Swap Contracts — continued
Centrally Cleared Interest Rate Swaps — continued
Fund Pays | Fund Receives | Notional Amount | Expiration Date | Periodic Payment Frequency | Premiums Paid/ (Received) ($) | Value ($) | Net Unrealized Appreciation/ (Depreciation) ($) | |||||||||||||||||||||||
3 Month SEK STIBOR | 2.47% | SEK | 7,000,000 | 03/15/2033 | Quarterly | — | (45,706 | ) | (45,706 | ) | ||||||||||||||||||||
3 Month SEK STIBOR | 2.54% | SEK | 9,000,000 | 03/15/2033 | Quarterly | — | (53,784 | ) | (53,784 | ) | ||||||||||||||||||||
3 Month SEK STIBOR | 2.59% | SEK | 6,000,000 | 03/15/2033 | Quarterly | — | (33,521 | ) | (33,521 | ) | ||||||||||||||||||||
3 Month SEK STIBOR | 2.63% | SEK | 4,000,000 | 03/15/2033 | Quarterly | — | (21,080 | ) | (21,080 | ) | ||||||||||||||||||||
3 Month SEK STIBOR | 2.81% | SEK | 9,000,000 | 03/15/2033 | Quarterly | — | (34,218 | ) | (34,218 | ) | ||||||||||||||||||||
2.51% | 3 Month SEK STIBOR | SEK | 30,822,000 | 03/15/2033 | Quarterly | 1,923 | 190,767 | 188,844 | ||||||||||||||||||||||
2.62% | 3 Month SEK STIBOR | SEK | 4,000,000 | 03/15/2033 | Quarterly | — | 21,305 | 21,305 | ||||||||||||||||||||||
3.00% | 3 Month SEK STIBOR | SEK | 80,731,000 | 03/15/2033 | Quarterly | (621 | ) | 184,541 | 185,162 | |||||||||||||||||||||
3 Month SEK STIBOR | 3.22% | SEK | 7,000,000 | 03/15/2033 | Quarterly | — | (3,788 | ) | (3,788 | ) | ||||||||||||||||||||
3 Month SEK STIBOR | 3.28% | SEK | 11,000,000 | 03/15/2033 | Quarterly | — | (40 | ) | (40 | ) | ||||||||||||||||||||
USD - SOFR - COMPOUND | 3.05% | USD | 1,050,000 | 03/15/2033 | Annually | — | (51,079 | ) | (51,079 | ) | ||||||||||||||||||||
USD - SOFR - COMPOUND | 3.07% | USD | 1,700,000 | 03/15/2033 | Annually | — | (79,756 | ) | (79,756 | ) | ||||||||||||||||||||
USD - SOFR - COMPOUND | 3.13% | USD | 962,000 | 03/15/2033 | Annually | (4,376 | ) | (40,705 | ) | (36,329 | ) | |||||||||||||||||||
USD - SOFR - COMPOUND | 3.16% | USD | 1,100,000 | 03/15/2033 | Annually | — | (43,805 | ) | (43,805 | ) | ||||||||||||||||||||
USD - SOFR - COMPOUND | 3.19% | USD | 700,000 | 03/15/2033 | Annually | — | (25,971 | ) | (25,971 | ) | ||||||||||||||||||||
3.16% | USD - SOFR - COMPOUND | USD | 1,131,000 | 03/15/2033 | Annually | 2,078 | 44,834 | 42,756 | ||||||||||||||||||||||
3.23% | USD - SOFR - COMPOUND | USD | 600,000 | 03/15/2033 | Annually | — | 20,331 | 20,331 | ||||||||||||||||||||||
3.29% | USD - SOFR - COMPOUND | USD | 900,000 | 03/15/2033 | Annually | — | 26,414 | 26,414 | ||||||||||||||||||||||
3.33% | USD - SOFR - COMPOUND | USD | 600,000 | 03/15/2033 | Annually | — | 15,581 | 15,581 | ||||||||||||||||||||||
3.47% | USD - SOFR - COMPOUND | USD | 500,000 | 03/15/2033 | Annually | — | 7,190 | 7,190 | ||||||||||||||||||||||
3.30% | USD - SOFR - COMPOUND | USD | 1,100,000 | 03/15/2033 | Annually | — | 30,697 | 30,697 | ||||||||||||||||||||||
3.22% | USD - SOFR - COMPOUND | USD | 1,100,000 | 03/15/2033 | Annually | — | 38,135 | 38,135 | ||||||||||||||||||||||
3.22% | USD - SOFR - COMPOUND | USD | 400,000 | 03/15/2033 | Annually | — | 13,900 | 13,900 | ||||||||||||||||||||||
3.40% | USD - SOFR - COMPOUND | USD | 700,000 | 03/15/2033 | Annually | — | 14,252 | 14,252 | ||||||||||||||||||||||
3.44% | USD - SOFR - COMPOUND | USD | 600,000 | 03/15/2033 | Annually | — | 10,138 | 10,138 | ||||||||||||||||||||||
3.46% | USD - SOFR - COMPOUND | USD | 600,000 | 03/15/2033 | Annually | — | 8,950 | 8,950 | ||||||||||||||||||||||
3.59% | USD - SOFR - COMPOUND | USD | 1,700,000 | 03/15/2033 | Annually | — | 7,133 | 7,133 | ||||||||||||||||||||||
3.63% | USD - SOFR - COMPOUND | USD | 600,000 | 03/15/2033 | Annually | — | 489 | 489 | ||||||||||||||||||||||
6 Month AUD BBSW | 4.51% | AUD | 900,000 | 06/21/2033 | Semi-Annually | — | 276 | 276 | ||||||||||||||||||||||
3.04% | EUR - EuroSTR - COMPOUND | EUR | 200,000 | 06/21/2033 | Annually | — | (662 | ) | (662 | ) | ||||||||||||||||||||
3.61% | USD - SOFR - COMPOUND | USD | 700,000 | 06/21/2033 | Annually | — | (1,296 | ) | (1,296 | ) | ||||||||||||||||||||
|
|
|
|
|
| |||||||||||||||||||||||||
| $ | 4,103 | $ | (12,974 | ) | $ | (17,077 | ) | |||||||||||||||||||||||
|
|
|
|
|
| |||||||||||||||||||||||||
OTC Total Return Swaps
Fund Pays | Fund Receives | Counterparty | Notional Amount | Expiration Date | Periodic Payment Frequency | Premiums Paid/ (Received) ($) | Value ($) | Net Unrealized Appreciation/ (Depreciation) ($) | ||||||||||||||||
SOFR | Total Return on iShares iBoxx High Yield Corporate Bond ETF | MSCI | USD | 5,000,000 | 03/20/2023 | Quarterly | (187 | ) | 170,173 | 170,360 | ||||||||||||||
SOFR | Total Return on iShares iBoxx High Yield Corporate Bond ETF | MSCI | USD | 10,000,000 | 03/20/2023 | Quarterly | (368 | ) | 260,537 | 260,905 | ||||||||||||||
Total Return on iBoxx USD Liquid Investment Grade Index | SOFR | MSCI | USD | 3,560,000 | 03/20/2023 | Quarterly | 853 | 26,980 | 26,127 | |||||||||||||||
| 19 | See accompanying notes to the financial statements. |
GMO Alternative Allocation Fund
(A Series of GMO Trust)
Consolidated Schedule of Investments — (Continued)
February 28, 2023
Swap Contracts — continued
OTC Total Return Swaps — continued
Fund Pays | Fund Receives | Counterparty | Notional Amount | Expiration Date | Periodic Payment Frequency | Premiums Paid/ (Received) ($) | Value ($) | Net Unrealized Appreciation/ (Depreciation) ($) | ||||||||||||||||||||
1 Month Federal Funds Rate plus 0.09% | Total Return on MSCI World Daily Total Return Net Value Index | GS | USD | 3,351,714 | 05/09/2023 | Monthly | — | (59,844 | ) | (59,844 | ) | |||||||||||||||||
Total Return on MSCI World Daily Total Return Net Growth Index | 1 Month Federal Funds Rate minus 0.08% | GS | USD | 2,993,560 | 05/09/2023 | Monthly | — | 106,694 | 106,694 | |||||||||||||||||||
Total Return on MSCI World Daily Total Return Net Value Index | 1 Month Federal Funds Rate minus 0.08% | GS | USD | 305,465 | 05/09/2023 | Monthly | — | 10,887 | 10,887 | |||||||||||||||||||
1 Month Federal Funds Rate plus 0.01% | Total Return on MSCI World Daily Total Return Net Value Index | UBSA | USD | 3,877,483 | 05/12/2023 | Monthly | — | (42,610 | ) | (42,610 | ) | |||||||||||||||||
Total Return on MSCI World Daily Total Return Net Growth Index | 1 Month Federal Funds Rate plus 0.02% | UBSA | USD | 3,887,988 | 05/12/2023 | Monthly | — | 105,141 | 105,141 | |||||||||||||||||||
1 Month Federal Funds Rate plus 0.05% | Total Return on MSCI World Daily Total Return Net Value Index | UBSA | USD | 1,036,058 | 05/22/2023 | Monthly | — | (2,576 | ) | (2,576 | ) | |||||||||||||||||
Total Return on MSCI World Daily Total Return Net Growth Index | 1 Month Federal Funds Rate plus 0.06% | UBSA | USD | 842,717 | 05/22/2023 | Monthly | — | 9,565 | 9,565 | |||||||||||||||||||
1 Month Federal Funds Rate plus 0.01% | Total Return on MSCI World Daily Total Return Net Value Index | UBSA | USD | 504,333 | 08/09/2023 | Monthly | — | (9,005 | ) | (9,005 | ) | |||||||||||||||||
Total Return on MSCI World Daily Total Return Net Growth Index | 1 Month Federal Funds Rate minus 0.01% | UBSA | USD | 274,919 | 08/09/2023 | Monthly | — | 9,798 | 9,798 | |||||||||||||||||||
1 Month Federal Funds Rate minus 0.02% | Total Return on MSCI World Daily Total Return Net Value Index | JPM | USD | 1,289,576 | 12/15/2023 | Monthly | — | (9,978 | ) | (9,978 | ) | |||||||||||||||||
Total Return on MSCI World Daily Total Return Net Growth Index | 1 Month Federal Funds Rate minus 0.07% | JPM | USD | 1,513,731 | 12/15/2023 | Monthly | — | 36,632 | 36,632 | |||||||||||||||||||
Total Return on Equity Basket (h) | 1 Month Federal Funds Rate minus 0.40% | GS | USD | 1,135,015 | 06/24/2024 | Monthly | — | 13,227 | 13,227 | |||||||||||||||||||
Total Return on Equity Basket (i) | 1 Month Federal Funds Rate minus 0.40% | MORD | USD | 2,576,661 | 06/18/2024 | Monthly | — | 115,102 | 115,102 | |||||||||||||||||||
|
|
|
|
|
| |||||||||||||||||||||||
| $ | 298 | $ | 740,723 | $ | 740,425 | |||||||||||||||||||||||
|
|
|
|
|
| |||||||||||||||||||||||
As of February 28, 2023, for the above contracts and/or agreements, the Fund had sufficient cash and/or securities to cover commitments or collateral requirements, if any, of the relevant broker or exchange.
| See accompanying notes to the financial statements. | 20 |
GMO Alternative Allocation Fund
(A Series of GMO Trust)
Consolidated Schedule of Investments — (Continued)
February 28, 2023
Notes to Schedule of Investments:
| † | Denominated in U.S. Dollar, unless otherwise indicated. |
| * | Non-income producing security. |
| (a) | All or a portion of this security has been pledged to cover margin requirements on futures and/or cleared swap contracts, collateral on securities sold short, OTC swap contracts, forward currency contracts, and/or written options, if any (Note 4). |
| (b) | Securities are traded on separate exchanges for the same entity. |
| (c) | Investment valued using significant unobservable inputs (Note 2). |
| (d) | Preferred dividend rates are disclosed to the extent that a stated rate exists. |
| (e) | The rate disclosed is the 7 day net yield as of February 28, 2023. |
| (f) | All or a portion of this security or derivative is owned by GMO Alternative Allocation SPC Ltd., which is a 100% owned subsidiary of GMO Alternative Allocation Fund. |
| (g) | Investment valued at fair value using methods determined in good faith by the Trustees of GMO Trust or persons acting at their direction pursuant to procedures approved by the Trustees. Investment valued using significant unobservable inputs (Note 2). |
| (h) | Periodic payments made/received are based on the total return of the referenced entity. Custom equity basket swap which has a notional amount of less than 1% of the Fund’s total net assets. |
| (i) | The following table represents the individual long and/or short positions within the custom equity basket swap as of February 28, 2023: |
| Shares | Description | % of Equity Basket | Value ($) | |||||||||
| (164,000) | Air China Ltd – Class H | 6.1 | % | (151,213 | ) | |||||||
| (46,000) | Alibaba Health Information Technology Ltd | 1.3 | % | (32,937 | ) | |||||||
| (132,000) | China Molybdenum Co Ltd – Class H | 3.0 | % | (74,329 | ) | |||||||
| (48,000) | Genscript Biotech Corp | 5.4 | % | (131,385 | ) | |||||||
| (190,300) | Gulf Energy Development Pcl NVDR | 11.5 | % | (282,802 | ) | |||||||
| (376) | Hanmi Pharm Co Ltd | 3.0 | % | (73,578 | ) | |||||||
| (3,653) | Hotel Shilla Co Ltd | 9.0 | % | (221,201 | ) | |||||||
| (2,341) | Kakao Corp | 4.5 | % | (110,196 | ) | |||||||
| (124,000) | Kingdee International Software Group Co Ltd | 9.4 | % | (231,690 | ) | |||||||
| (12,100) | Klabin SA | 1.8 | % | (44,975 | ) | |||||||
| (7,405) | Korea Aerospace Industries Ltd | 10.2 | % | (252,136 | ) | |||||||
| (343) | LG Energy Solution | 5.5 | % | (135,489 | ) | |||||||
| (336) | POSCO Chemical Co Ltd | 2.3 | % | (56,061 | ) | |||||||
| (571) | Samsung Biologics Co Ltd | 13.6 | % | (333,600 | ) | |||||||
| (40,355) | Samsung Heavy Industries Co Ltd | 6.8 | % | (167,571 | ) | |||||||
| (426) | Yuhan Corp | 0.7 | % | (16,966 | ) | |||||||
| (96,000) | Zijin Mining Group Co Ltd – Class H | 5.9 | % | (145,283 | ) | |||||||
|
| |||||||||||
| TOTAL COMMON STOCKS | $ | (2,461,412 | ) | |||||||||
|
| |||||||||||
For a listing of definitions of acronyms, counterparty abbreviations and currency abbreviations used throughout the Schedule of Investments as well as the derivative tables, if any, please refer to page 125.
| 21 | See accompanying notes to the financial statements. |
This page has been left blank intentionally.
GMO Benchmark-Free Allocation Fund
(A Series of GMO Trust)
Portfolio Management
Day-to-day management of the Fund’s portfolio is the responsibility of the Asset Allocation team at Grantham, Mayo, Van Otterloo & Co. LLC.
Management Discussion and Analysis of Fund Performance
Although GMO does not manage the Fund to, or control the Fund’s risk relative to, any securities index or securities benchmark, a discussion of the Fund’s performance relative to the Consumer Price Index (“CPI”) is included for comparative purposes only.
Class III shares of GMO Benchmark-Free Allocation Fund returned +0.50% (net) for the fiscal year ended February 28, 2023, as compared with +6.15% for the CPI.
This was a fairly lackluster 12 months for absolute performance, but it was very solid in relation to the majority of risk assets. Over the same period, global equities, as measured by the MSCI All Country World Index (“ACWI”), were down -8.26%, while bonds, as measured by the Bloomberg U.S. Aggregate index, were down -9.72%.
The Fund had an average equity exposure of about 35%, and this had a moderately worse return than MSCI ACWI. We had a significant investment in emerging markets as we believed that they were trading at very preferential valuations, but China’s pursuit of a zero-COVID policy until very late in 2022 really hampered their economy and weighed heavily on emerging market equity performance. There was a broadly 49% average exposure to equity long/short positions and alternatives and these delivered a welcome positive return, ensuring that the Fund was not down in absolute terms for the period. The best performer, up some 8.07%, was the Equity Dislocation Strategy, which is long cheap Value stocks and short expensive Growth stocks. Fixed income assets accounted for an average 15% of the Fund, and these were down -1.60% for the 12 months. Our decision to emphasize credit over duration was a key driver of the outperformance over the Bloomberg U.S. Aggregate index, although each of the underlying components of the fixed income exposure also beat their respective reference benchmark index. There was an average 1% exposure to cash/cash plus and this had little impact on returns.
The views expressed herein are exclusively those of Grantham, Mayo, Van Otterloo & Co. LLC as of the date of this report and are subject to change. GMO disclaims any responsibility to update such views. They are not meant as investment advice. References to specific securities are not recommendations of such securities and may not be representative of any GMO portfolio’s current or future investments. All information is unaudited.
23
GMO Benchmark-Free Allocation Fund
(A Series of GMO Trust)
Comparison of Change in Value of a $5,000,000 Investment in
GMO Benchmark-Free Allocation Fund Class III Shares, the Consumer Price Index and the Bloomberg
U.S. Treasury Inflation Notes: 1-10 Year Index
As of February 28, 2023
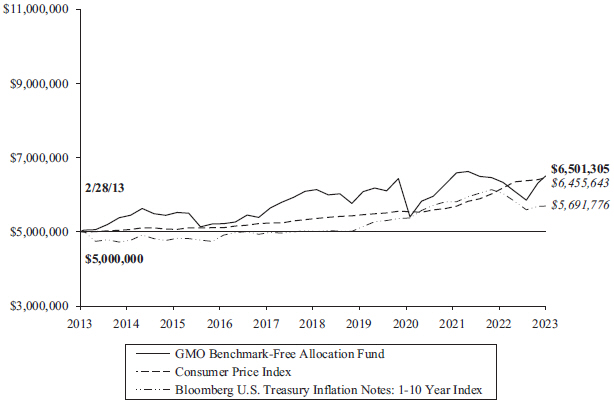
| Average Annual Total Returns | ||||||||||||||||
| 1 Year | 5 Year | 10 Year | Since Inception | |||||||||||||
| Class III | 0.50% | 1.08% | 2.66% | n/a | ||||||||||||
| Class IV | 0.55% | 1.13% | 2.71% | n/a | ||||||||||||
| Class MF | 0.54% | 1.13% | 2.72% | n/a | ||||||||||||
| Class R6 | 0.51% | n/a | n/a | 5/1/20 4.77% | ||||||||||||
| Class I | 0.38% | n/a | n/a | 8/8/19 1.97% | ||||||||||||
Performance data quoted represents past performance and is not indicative of future results. The investment return and principal value of an investment will fluctuate so that an investor’s shares, when redeemed, may be worth more or less than their original cost. Current performance data may be lower or higher than the performance data provided herein. To obtain performance information up to the most recent month-end, visit www.gmo.com. Performance shown is net of all fees after reimbursement from GMO. Returns would have been lower had certain expenses not been reimbursed during the periods shown and do not include the effect of taxes on distributions and redemptions. The performance information shown above only includes purchase premiums and/or redemption fees in effect as of February 28, 2023. All information is unaudited. Performance for classes may vary due to different fees.
For Class III, IV, MF, R6 and I the gross expense ratio of 1.17%, 1.12%, 1.12%, 1.17% and 1.28%, respectively, is equal to the Fund’s Total Annual Operating Expenses set forth in the Fund’s most recent prospectus dated June 30, 2022. For the Classes listed above, the corresponding net expense ratio of 1.11%, 1.06%, 1.06%, 1.11% and 1.21% reflects the reduction of expenses from fee reimbursements. The fee reimbursements will continue until at least June 30, 2023. Elimination of this reimbursement will result in higher fees and lower performance.
24
GMO Benchmark-Free Allocation Fund
(A Series of GMO Trust)
Investment Concentration Summary
February 28, 2023 (Unaudited)
Asset Class Summary& | % of Total Net Assets | |||
Common Stocks | 67.9 | % | ||
Debt Obligations | 38.5 | |||
Short-Term Investments | 9.3 | |||
Preferred Stocks | 1.6 | |||
Swap Contracts | 0.3 | |||
Investment Funds | 0.3 | |||
Loan Assignments | 0.1 | |||
Loan Participations | 0.0 | ^ | ||
Rights/Warrants | 0.0 | ^ | ||
Futures Contracts | 0.0 | ^ | ||
Purchased Options | 0.0 | ^ | ||
Forward Currency Contracts | (0.0 | )^ | ||
Written Options/Credit Linked Options | (0.1 | ) | ||
Securities Sold Short | (20.6 | ) | ||
Other | 2.7 | |||
|
| |||
| 100.0 | % | |||
|
| |||
Country/Region Summary¤ | Debt Obligations as a % of Total Net Assets | |||
Other Emerging | 4.2 | %† | ||
Australia | 2.0 | |||
Switzerland | 1.2 | |||
Other Developed | (1.5 | )‡ | ||
Euro Region | (1.6 | )§ | ||
|
| |||
| 4.3 | % | |||
|
| |||
Country/Region Summary¤ | Equity Investments as a % of Total Net Assets | |||
United States | 10.0 | % | ||
Japan | 9.2 | |||
Other Emerging | 4.7 | † | ||
Other Developed | 4.5 | ‡ | ||
China | 3.0 | |||
Taiwan | 3.0 | |||
South Korea | 2.7 | |||
United Kingdom | 2.4 | |||
Brazil | 2.0 | |||
India | 2.0 | |||
France | 1.7 | |||
Canada | 1.1 | |||
Netherlands | 1.1 | |||
Spain | 1.1 | |||
|
| |||
| 48.5 | % | |||
|
| |||
| & | The table incorporates aggregate indirect asset class exposure associated with investments in other funds of GMO Trust (“underlying funds”). Derivative financial instruments, if any, are based on market values, rather than the notional amounts of derivatives, except for forward currency contracts which are based on unrealized appreciation/(depreciation). |
| ¤ | The table incorporates aggregate indirect country exposure associated with investments in the underlying funds. The table excludes short-term investments. The table includes exposure through the use of certain derivative financial instruments and excludes exposure through certain currency linked derivatives such as forward currency contracts and currency options. The table is based on duration adjusted net exposures (both investments and derivatives), taking into account the market value of securities and the notional amounts of swaps and other derivative financial instruments. Duration is based on GMO’s models. The greater the duration of a bond, the greater its contribution to the concentration percentage. Credit default swap exposures are factored into the duration-adjusted exposure using the reference security and applying the same methodology to that security. The table is not normalized, thus, due to the exclusions listed above and negative exposures, which may be attributable to derivatives or short sales, if any, the tables may not total to 100%. |
| † | “Other Emerging” is comprised of emerging countries that each represent between (1.0)% and 1.0% of Total Net Assets. |
| ‡ | “Other Developed” is comprised of developed countries that each represent between (1.0)% and 1.0% of Total Net Assets. |
| § | “Euro Region” is comprised of derivative financial instruments attributed to the Eurozone and not a particular country. |
| ^ | Rounds to 0.0%. |
25
GMO Benchmark-Free Allocation Fund
(A Series of GMO Trust)
(showing percentage of total net assets)
February 28, 2023
| Shares | Description | Value ($) | ||||||
| MUTUAL FUNDS — 100.0% | ||||||||
| Affiliated Issuers — 100.0% | ||||||||
| 12,765,527 | GMO Emerging Country Debt Fund, Class VI | 225,439,211 | ||||||
| 5,419,607 | GMO High Yield Fund, Class VI | 90,670,017 | ||||||
| 304,108,537 | GMO Implementation Fund | 3,734,452,836 | ||||||
| 10,931,076 | GMO Opportunistic Income Fund, Class VI | 263,438,935 | ||||||
|
| |||||||
| 3,119,257 | GMO SGM Major Markets Fund, Class VI | 88,586,880 | ||||||
|
| |||||||
| TOTAL MUTUAL FUNDS (COST $4,711,541,495) | 4,402,587,879 | |||||||
| SHORT-TERM INVESTMENTS — 0.0% |
| |||||||
| Money Market Funds — 0.0% | ||||||||
| 2,836,801 | State Street Institutional Treasury Money Market Fund – Premier Class, 4.42% (a) | 2,836,801 | ||||||
|
| |||||||
| TOTAL SHORT-TERM INVESTMENTS (COST $2,836,801) | 2,836,801 | |||||||
|
| |||||||
| TOTAL INVESTMENTS — 100.0% (Cost $4,714,378,296) | 4,405,424,680 | |||||||
| Other Assets and Liabilities (net) — (0.0%) | (1,758,737 | ) | ||||||
|
| |||||||
| TOTAL NET ASSETS — 100.0% | $ | 4,403,665,943 | ||||||
|
| |||||||
Notes to Schedule of Investments:
| (a) | The rate disclosed is the 7 day net yield as of February 28, 2023. |
For a listing of definitions of acronyms, counterparty abbreviations and currency abbreviations used throughout the Schedule of Investments as well as the derivative tables, if any, please refer to page 125.
| See accompanying notes to the financial statements. | 26 |
(A Series of GMO Trust)
Portfolio Management
Day-to-day management of the Fund’s portfolio is the responsibility of the Asset Allocation team at Grantham, Mayo, Van Otterloo & Co. LLC.
Management Discussion and Analysis of Fund Performance
Although GMO does not manage the Fund to, or control the Fund’s risk relative to, any index or benchmark, a discussion of the Fund’s performance relative to the Consumer Price Index (“CPI”) is included for comparative purposes only.
Class III shares of GMO Benchmark-Free Fund returned -0.40% (net) for the fiscal year ended February 28, 2023, as compared with +6.15% for the CPI.
This was a fairly lackluster 12 months for absolute performance, but it was very solid in relation to the majority of risk assets. Over the same period, global equities as measured by the MSCI All Country World Index (“ACWI”) were down -8.26%, while bonds as measured by the Bloomberg U.S. Aggregate Index were down -9.72%.
The Fund had an average equity exposure of about 44%, and this had a moderately worse return than MSCI ACWI. We had a significant investment in emerging markets as we believed that they were trading at very preferential valuations, but China’s pursuit of a zero-COVID policy until very late in 2022 really hampered their economy and weighed heavily on emerging market equity performance. There was a broadly 38% average exposure to equity long/short positions and alternatives and these delivered a welcome positive return. The best performer, up some 8.03%, was the Equity Dislocation Strategy, which is long cheap Value stocks and short expensive Growth stocks. Fixed income assets accounted for an average 14% of the Fund over the period, and these were very slightly down for the 12 months. The decision to emphasize credit over duration was a key driver of the outperformance over the Bloomberg U.S. Aggregate Index. There was an average 3% exposure to cash/cash plus and this had little impact on returns.
Because some of the securities and instruments held directly or indirectly by the Fund had positive fair value adjustments at the beginning or end of the fiscal year (and the performance of indices are not fair valued), the Fund’s absolute and relative performance is higher than it otherwise would have been in the absence of such fair value adjustments.
The views expressed herein are exclusively those of Grantham, Mayo, Van Otterloo & Co. LLC as of the date of this report and are subject to change. GMO disclaims any responsibility to update such views. They are not meant as investment advice. References to specific securities are not recommendations of such securities and may not be representative of any GMO portfolio’s current or future investments. All information is unaudited.
27
GMO Benchmark-Free Fund
(A Series of GMO Trust)
Comparison of Change in Value of a $5,000,000 Investment in
GMO Benchmark-Free Fund Class III Shares, the Consumer Price Index and the
Bloomberg U.S. Treasury Inflation Notes: 1-10 Year Index
As of February 28, 2023
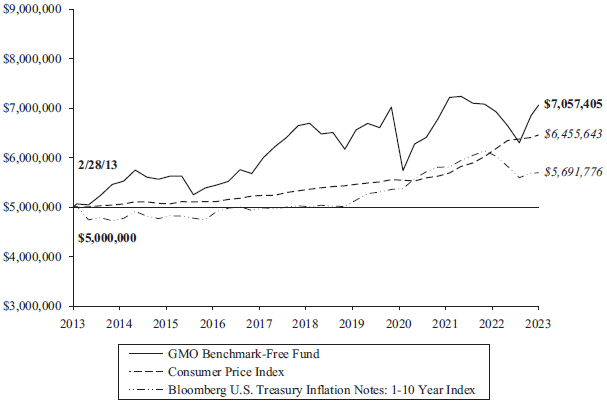
| Average Annual Total Returns | ||||||||||||
| 1 Year | 5 Year | 10 Year | ||||||||||
| Class III | -0.40 | % | 0.96 | % | 3.51 | % | ||||||
Performance data quoted represents past performance and is not indicative of future results. The investment return and principal value of an investment will fluctuate so that an investor’s shares, when redeemed, may be worth more or less than their original cost. Current performance data may be lower or higher than the performance data provided herein. To obtain performance information up to the most recent month-end, visit www.gmo.com. Performance shown is net of all fees after reimbursement from GMO. Returns would have been lower had certain expenses not been reimbursed during the periods shown and do not include the effect of taxes on distributions and redemptions. The performance information shown above only includes purchase premiums and/or redemption fees in effect as of February 28, 2023. All information is unaudited.
For Class III the gross expense ratio of 0.46% is equal to the Fund’s Total Annual Operating Expenses set forth in the Fund’s most recent prospectus dated June 30, 2022. For the Class listed above, the net expense ratio of 0.39% reflects the reduction of expenses from fee reimbursements. The fee reimbursements will continue until at least June 30, 2023. Elimination of this reimbursement will result in higher fees and lower performance.
28
GMO Benchmark-Free Fund
(A Series of GMO Trust)
Investment Concentration Summary
February 28, 2023 (Unaudited)
Asset Class Summary& | % of Total Net Assets | |||
Common Stocks | 74.0 | % | ||
Debt Obligations | 37.0 | |||
Short-Term Investments | 12.6 | |||
Preferred Stocks | 1.9 | |||
Swap Contracts | 0.3 | |||
Loan Assignments | 0.1 | |||
Loan Participations | 0.1 | |||
Rights/Warrants | 0.0 | ^ | ||
Investment Funds | 0.0 | ^ | ||
Purchased Options | 0.0 | ^ | ||
Futures Contracts | 0.0 | ^ | ||
Written Options/Credit Linked Options | (0.0 | )^ | ||
Forward Currency Contracts | (0.0 | )^ | ||
Securities Sold Short | (20.3 | ) | ||
Other | (5.7 | ) | ||
|
| |||
| 100.0 | % | |||
|
| |||
Country/Region Summary¤ | Debt Obligations as a % of Total Net Assets | |||
Other Emerging | 5.8 | %† | ||
United States | 3.0 | |||
Australia | 1.1 | |||
Other Developed | (0.3 | )‡ | ||
Euro Region | (1.0 | )§ | ||
|
| |||
| 8.6 | % | |||
|
| |||
Country/Region Summary¤ | Equity Investments as a % of Total Net Assets | |||
Japan | 11.1 | % | ||
United States | 8.2 | |||
Other Developed | 5.4 | ‡ | ||
Taiwan | 3.8 | |||
China | 3.6 | |||
Other Emerging | 3.4 | † | ||
South Korea | 3.2 | |||
United Kingdom | 2.9 | |||
Brazil | 2.5 | |||
India | 2.4 | |||
France | 2.1 | |||
Canada | 1.5 | |||
Spain | 1.4 | |||
Netherlands | 1.3 | |||
Mexico | 1.2 | |||
South Africa | 1.2 | |||
|
| |||
| 55.2 | % | |||
|
| |||
| & | The table incorporates aggregate indirect asset class exposure associated with investments in other funds of GMO Trust (“underlying funds”). Derivative financial instruments, if any, are based on market values, rather than the notional amounts of derivatives, except for forward currency contracts which are based on unrealized appreciation/(depreciation). |
| ¤ | The table incorporates aggregate indirect country exposure associated with investments in the underlying funds. The table excludes short-term investments. The table includes exposure through the use of certain derivative financial instruments and excludes exposure through certain currency linked derivatives such as forward currency contracts and currency options. The table is based on duration adjusted net exposures (both investments and derivatives), taking into account the market value of securities and the notional amounts of swaps and other derivative financial instruments. Duration is based on GMO’s models. The greater the duration of a bond, the greater its contribution to the concentration percentage. Credit default swap exposures are factored into the duration-adjusted exposure using the reference security and applying the same methodology to that security. The table is not normalized, thus, due to the exclusions listed above and negative exposures, which may be attributable to derivatives or short sales, if any, the tables may not total to 100%. |
| † | “Other Emerging” is comprised of emerging countries that each represent between (1.0)% and 1.0% of Investments. |
| ‡ | “Other Developed” is comprised of developed countries that each represent between (1.0)% and 1.0% of Investments. |
| § | “Euro Region” is comprised of derivative financial instruments attributed to the Eurozone and not a particular country. |
| ^ | Rounds to 0.0%. |
29
GMO Benchmark-Free Fund
(A Series of GMO Trust)
(showing percentage of total net assets)
February 28, 2023
| Shares | Description | Value ($) | ||||||
| COMMON STOCKS — 70.8% | ||||||||
| Australia — 1.2% | ||||||||
| 13,589 | Accent Group Ltd | 20,230 | ||||||
| 25,394 | AMP Ltd * | 17,627 | ||||||
| 132,841 | Aurizon Holdings Ltd (a) | 295,192 | ||||||
| 33,572 | Austal Ltd | 40,811 | ||||||
| 332,873 | Beach Energy Ltd | 313,938 | ||||||
| 875 | BHP Group Ltd (a) | 26,482 | ||||||
| 175,708 | BlueScope Steel Ltd | 2,248,130 | ||||||
| 157,077 | Brambles Ltd (a) | 1,357,254 | ||||||
| 8,890 | Challenger Ltd | 44,606 | ||||||
| 98,647 | Fortescue Metals Group Ltd (a) | 1,413,603 | ||||||
| 271,875 | GPT Group (The) (REIT) (a) | 858,229 | ||||||
| 122,820 | GrainCorp Ltd – Class A | 647,650 | ||||||
| 151,638 | Grange Resources Ltd | 96,557 | ||||||
| 92,272 | Helia Group Ltd | 213,641 | ||||||
| 43,009 | HomeCo Daily Needs (REIT) | 37,912 | ||||||
| 9,926 | JB Hi-Fi Ltd | 278,606 | ||||||
| 8,334 | McMillan Shakespeare Ltd | 80,163 | ||||||
| 61,540 | Metcash Ltd (b) | 168,242 | ||||||
| 601,068 | Mirvac Group (REIT) (a) | 915,173 | ||||||
| 5,860 | Monadelphous Group Ltd | 47,180 | ||||||
| 49,803 | Nufarm Ltd | 193,913 | ||||||
| 24,122 | Perenti Ltd * | 17,191 | ||||||
| 33,896 | Rio Tinto Ltd (a) | 2,649,111 | ||||||
| 304,181 | Scentre Group (REIT) (a) | 607,527 | ||||||
| 24,820 | Southern Cross Media Group Ltd | 17,665 | ||||||
| 304,567 | Stockland (REIT) (a) | 784,549 | ||||||
| 9,332 | Super Retail Group Ltd | 81,167 | ||||||
| 8,117 | Viva Energy Group Ltd | 16,349 | ||||||
|
| |||||||
| Total Australia | 13,488,698 | |||||||
|
| |||||||
| Austria — 0.0% | ||||||||
| 6,452 | Raiffeisen Bank International AG * | 107,719 | ||||||
| 737 | Strabag SE | 29,193 | ||||||
| 1,513 | Vienna Insurance Group AG Wiener | |||||||
| Versicherung Gruppe | 42,298 | |||||||
|
| |||||||
| Total Austria | 179,210 | |||||||
|
| |||||||
| Belgium — 0.5% | ||||||||
| 38,335 | Ageas SA/NV | 1,730,023 | ||||||
| 9,220 | Bekaert SA | 406,815 | ||||||
| 1,235 | Cie d’Entreprises CFE * | 12,436 | ||||||
| 963 | Orange Belgium SA * | 16,276 | ||||||
| 3,076 | Sofina SA | 766,306 | ||||||
| 7,150 | Solvay SA (a) | 816,729 | ||||||
| 8,208 | Telenet Group Holding NV | 126,872 | ||||||
| 21,009 | UCB SA | 1,806,107 | ||||||
|
| |||||||
| Total Belgium | 5,681,564 | |||||||
|
| |||||||
| Brazil — 1.0% | ||||||||
| 1,800 | Alupar Investimento SA | 9,334 | ||||||
| 291,400 | Ambev SA | 745,274 | ||||||
| Shares | Description | Value ($) | ||||||
| Brazil — continued | ||||||||
| 15,900 | B3 SA - Brasil Bolsa Balcao | 32,040 | ||||||
| 103,100 | Banco do Brasil SA | 793,615 | ||||||
| 57,400 | BB Seguridade Participacoes SA | 375,069 | ||||||
| 6,700 | Cia Brasileira de Aluminio | 13,335 | ||||||
| 7,700 | Companhia Energetica de Minas Gerais | 22,796 | ||||||
| 37,600 | CPFL Energia SA | 217,537 | ||||||
| 9,800 | EDP - Energias do Brasil SA | 36,744 | ||||||
| 70,027 | Enauta Participacoes SA | 184,315 | ||||||
| 2,400 | Engie Brasil Energia SA | 18,006 | ||||||
| 7,100 | Fleury SA | 19,244 | ||||||
| 41,800 | Itau Unibanco Holding SA | 173,413 | ||||||
| 116,100 | JBS SA | 425,553 | ||||||
| 67,014 | Localiza Rent a Car SA | 710,275 | ||||||
| 79,900 | Marfrig Global Foods SA | 97,215 | ||||||
| 1,500 | Odontoprev SA | 3,306 | ||||||
| 225,900 | Petroleo Brasileiro SA Sponsored ADR | 2,505,231 | ||||||
| 47,300 | Ser Educacional SA * | 33,789 | ||||||
| 44,300 | Telefonica Brasil SA ADR (a) | 330,035 | ||||||
| 753,600 | TIM SA | 1,764,726 | ||||||
| 8,800 | TIM SA ADR | 103,224 | ||||||
| 49,800 | Transmissora Alianca de Energia Eletrica SA | 337,584 | ||||||
| 4,300 | Ultrapar Participacoes SA | 10,825 | ||||||
| 7,852 | Vale SA | 127,961 | ||||||
| 145,600 | Vale SA Sponsored ADR – Class B (a) | 2,379,104 | ||||||
| 169,540 | Vibra Energia SA | 478,946 | ||||||
|
| |||||||
| Total Brazil | 11,948,496 | |||||||
|
| |||||||
| Canada — 2.2% | ||||||||
| 600 | ADENTRA Inc | 14,291 | ||||||
| 9,100 | Algoma Steel Group Inc (b) | 73,093 | ||||||
| 31,500 | Alimentation Couche-Tard Inc (a) | 1,477,695 | ||||||
| 3,000 | Atco Ltd – Class I (a) | 93,023 | ||||||
| 8,126 | Brookfield Asset Management Ltd – Class A (a) | 273,196 | ||||||
| 33,733 | Brookfield Corp – Class A (a) | 1,121,622 | ||||||
| 6,700 | Canaccord Genuity Group Inc | 56,615 | ||||||
| 3,409 | Canadian Apartment Properties (REIT) (a) | 123,469 | ||||||
| 1,700 | Canadian Solar Inc * | 67,575 | ||||||
| 13,500 | Canadian Tire Corp Ltd – Class A (a) | 1,682,825 | ||||||
| 25,100 | Canfor Corp * | 428,236 | ||||||
| 42,900 | Celestica Inc * (b) (c) | 554,289 | ||||||
| 16,200 | Celestica Inc * (c) | 209,790 | ||||||
| 4,003 | Cogeco Inc | 177,487 | ||||||
| 2,900 | DREAM UnLtd Corp – Class A (b) | 56,682 | ||||||
| 4,400 | Element Fleet Management Corp | 62,848 | ||||||
| 100 | Fairfax Financial Holdings Ltd (a) | 69,914 | ||||||
| 14,800 | Finning International Inc | 375,396 | ||||||
| 22,700 | Hydro One Ltd (a) | 589,085 | ||||||
| 4,600 | iA Financial Corp Inc | 308,802 | ||||||
| 20,100 | Imperial Oil Ltd (c) | 992,136 | ||||||
| 1,100 | Imperial Oil Ltd (a) (c) | 54,408 | ||||||
| 36,600 | Interfor Corp * | 616,125 | ||||||
| 12,838 | International Petroleum Corp * | 129,026 | ||||||
| See accompanying notes to the financial statements. | 30 |
GMO Benchmark-Free Fund
(A Series of GMO Trust)
Schedule of Investments — (Continued)
(showing percentage of total net assets)
February 28, 2023
| Shares | Description | Value ($) | ||||||
| Canada — continued | ||||||||
| 4,300 | Loblaw Cos Ltd (a) | 367,477 | ||||||
| 17,400 | Magna International Inc | 969,784 | ||||||
| 62,800 | Manulife Financial Corp (a) (c) | 1,240,928 | ||||||
| 51,900 | Manulife Financial Corp (a) (c) | 1,026,209 | ||||||
| 4,900 | Martinrea International Inc | 50,203 | ||||||
| 10,600 | Mullen Group Ltd (a) | 110,622 | ||||||
| 1,000 | National Bank of Canada | 73,448 | ||||||
| 20,489 | Nutrien Ltd (a) | 1,593,634 | ||||||
| 14,400 | OceanaGold Corp * | 29,338 | ||||||
| 16,800 | Onex Corp | 898,298 | ||||||
| 8,300 | Parex Resources Inc | 135,282 | ||||||
| 49,400 | Quebecor Inc – Class B | 1,168,657 | ||||||
| 4,600 | Rogers Sugar Inc | 20,935 | ||||||
| 14,200 | Russel Metals Inc | 370,168 | ||||||
| 7,300 | Sleep Country Canada Holdings Inc | 139,099 | ||||||
| 2,600 | Spin Master Corp | 70,464 | ||||||
| 2,800 | Stella-Jones Inc | 101,329 | ||||||
| 2,100 | Suncor Energy Inc (a) | 70,580 | ||||||
| 70,900 | Teck Resources Ltd – Class B (c) | 2,830,284 | ||||||
| 45,800 | Teck Resources Ltd – Class B (a) (c) | 1,828,336 | ||||||
| 16,100 | Uni-Select Inc * | 559,046 | ||||||
| 1,500 | Wajax Corp | 26,713 | ||||||
| 19,600 | West Fraser Timber Co Ltd (c) | 1,472,334 | ||||||
| 5,000 | West Fraser Timber Co Ltd (c) | 375,300 | ||||||
|
| |||||||
| Total Canada | 25,136,096 | |||||||
|
| |||||||
| Chile — 0.1% | ||||||||
| 281,457 | Cencosud SA | 532,009 | ||||||
| 37,376 | Cencosud Shopping SA | 53,251 | ||||||
| 3,200 | Cia Cervecerias Unidas SA Sponsored ADR | 48,576 | ||||||
| 1,696,576 | Colbun SA | 194,528 | ||||||
| 31,876 | Empresas CMPC SA | 52,955 | ||||||
| 302,270 | Falabella SA | 665,181 | ||||||
| 28,643 | Inversiones La Construccion SA | 124,905 | ||||||
|
| |||||||
| Total Chile | 1,671,405 | |||||||
|
| |||||||
| China — 3.6% | ||||||||
| 116,000 | 361 Degrees International Ltd * | 55,634 | ||||||
| 441,000 | 3SBio Inc | 437,313 | ||||||
| 6,762,000 | Agricultural Bank of China Ltd – Class H | 2,344,367 | ||||||
| 112,769 | Alibaba Group Holding Ltd * | 1,239,494 | ||||||
| 449,000 | BAIC Motor Corp Ltd – Class H | 121,985 | ||||||
| 3,938,000 | Bank of China Ltd – Class H | 1,444,268 | ||||||
| 1,273,091 | Bank of Communications Co Ltd – Class H | 752,725 | ||||||
| 103,500 | Beijing Enterprises Holdings Ltd | 339,032 | ||||||
| 214,000 | China BlueChemical Ltd – Class H | 48,303 | ||||||
| 2,998,000 | China Cinda Asset Management Co Ltd – Class H | 389,660 | ||||||
| 628,000 | China Communications Services Corp Ltd – Class H | 244,163 | ||||||
| 116,500 | China Conch Venture Holdings Ltd | 234,454 | ||||||
| 3,828,000 | China Construction Bank Corp – Class H | 2,339,970 | ||||||
| 683,000 | China Dongxiang Group Co Ltd | 30,044 | ||||||
| Shares | Description | Value ($) | ||||||
| China — continued | ||||||||
| 1,376,000 | China Energy Engineering Corp Ltd – Class H (b) | 161,336 | ||||||
| 888,000 | China Everbright Environment Group Ltd | 360,143 | ||||||
| 1,058,000 | China Greenfresh Group Co Ltd (d) | — | ||||||
| 1,149,500 | China Hongqiao Group Ltd | 1,229,508 | ||||||
| 235,000 | China Lesso Group Holdings Ltd | 247,874 | ||||||
| 52,000 | China Lilang Ltd | 26,498 | ||||||
| 252,645 | China Medical System Holdings Ltd | 380,345 | ||||||
| 255,000 | China Overseas Grand Oceans Group Ltd | 99,202 | ||||||
| 938,000 | China Overseas Land & Investment Ltd | 2,328,573 | ||||||
| 5,730,000 | China Petroleum & Chemical Corp – Class H | 2,923,313 | ||||||
| 2,289,042 | China Railway Group Ltd – Class H | 1,193,018 | ||||||
| 693,000 | China Reinsurance Group Corp – Class H | 49,483 | ||||||
| 805,000 | China Resources Pharmaceutical Group Ltd | 662,092 | ||||||
| 56,000 | China Shineway Pharmaceutical Group Ltd | 48,932 | ||||||
| 336,000 | China South City Holdings Ltd * (b) | 22,274 | ||||||
| 552,000 | China State Construction International Holdings Ltd | 628,655 | ||||||
| 762,000 | China Traditional Chinese Medicine Holdings Co Ltd | 395,369 | ||||||
| 1,776,400 | China Zhongwang Holdings Ltd * (e) | 380,201 | ||||||
| 1,389,000 | CITIC Ltd | 1,532,566 | ||||||
| 1,892,000 | CSPC Pharmaceutical Group Ltd | 2,032,572 | ||||||
| 980,000 | Dongfeng Motor Group Co Ltd – Class H | 500,650 | ||||||
| 195,000 | Fufeng Group Ltd | 125,048 | ||||||
| 52,000 | Guangzhou Baiyunshan Pharmaceutical Holdings Co Ltd – Class H | 153,125 | ||||||
| 309,600 | Haier Smart Home Co Ltd – Class H | 1,095,697 | ||||||
| 22,500 | Hengan International Group Co Ltd | 103,484 | ||||||
| 60,000 | Hisense Home Appliances Group Co Ltd – Class H | 90,165 | ||||||
| 132,750 | Kingboard Holdings Ltd | 473,935 | ||||||
| 120,200 | Legend Holdings Corp – Class H | 132,846 | ||||||
| 2,330,000 | Lenovo Group Ltd | 2,096,771 | ||||||
| 30,281 | Livzon Pharmaceutical Group Inc – Class H | 105,249 | ||||||
| 249,000 | Lonking Holdings Ltd | 45,077 | ||||||
| 3,912 | Meituan – Class B* | 67,893 | ||||||
| 610,000 | Metallurgical Corp of China Ltd – Class H | 132,998 | ||||||
| 23,500 | NetDragon Websoft Holdings Ltd | 53,487 | ||||||
| 232,000 | Nexteer Automotive Group Ltd | 147,385 | ||||||
| 3,098,000 | PetroChina Co Ltd – Class H | 1,580,408 | ||||||
| 2,502,000 | PICC Property & Casualty Co Ltd – Class H | 2,197,634 | ||||||
| 245,000 | Poly Property Group Co Ltd | 58,776 | ||||||
| 12,000 | Road King Infrastructure Ltd | 5,941 | ||||||
| 287,800 | Shanghai Pharmaceuticals Holding Co Ltd – Class H | 507,531 | ||||||
| 1,294,500 | Shimao Group Holdings Ltd * (e) | 728,933 | ||||||
| 242,000 | Shougang Fushan Resources Group Ltd | 77,739 | ||||||
| 616,000 | Sino-Ocean Group Holding Ltd | 77,831 | ||||||
| 265,500 | Sinopec Engineering Group Co Ltd – Class H | 133,016 | ||||||
| 409,200 | Sinopharm Group Co Ltd – Class H | 1,095,965 | ||||||
| 31 | See accompanying notes to the financial statements. |
GMO Benchmark-Free Fund
(A Series of GMO Trust)
Schedule of Investments — (Continued)
(showing percentage of total net assets)
February 28, 2023
| Shares | Description | Value ($) | ||||||
| China — continued | ||||||||
| 324,000 | Sinotruk Hong Kong Ltd | 510,663 | ||||||
| 606,000 | Skyworth Group Ltd | 332,461 | ||||||
| 58,000 | SSY Group Ltd | 34,778 | ||||||
| 1,768,000 | Sunac China Holdings Ltd * (b) (e) | 1,031,601 | ||||||
| 253,000 | TCL Electronics Holdings Ltd * | 109,341 | ||||||
| 39,720 | Tencent Holdings Ltd | 1,744,836 | ||||||
| 100,000 | Tianjin Port Development Holdings Ltd | 7,650 | ||||||
| 250,000 | Tianneng Power International Ltd (b) | 320,720 | ||||||
| 208,000 | Yadea Group Holdings Ltd | 446,408 | ||||||
| 500 | Zhongsheng Group Holdings Ltd | 2,498 | ||||||
| 7,800 | ZTE Corp – Class H | 23,175 | ||||||
|
| |||||||
| Total China | 41,075,081 | |||||||
|
| |||||||
| Czech Republic — 0.0% | ||||||||
| 55,773 | Moneta Money Bank AS | 212,465 | ||||||
| 212 | Philip Morris CR AS | 164,217 | ||||||
|
| |||||||
| Total Czech Republic | 376,682 | |||||||
|
| |||||||
| Denmark — 0.5% | ||||||||
| 465 | AP Moller – Maersk A/S – Class A (a) | 1,062,846 | ||||||
| 371 | AP Moller – Maersk A/S – Class B (a) | 864,188 | ||||||
| 91,530 | Danske Bank A/S | 2,125,624 | ||||||
| 3,288 | Matas A/S | 38,234 | ||||||
| 21,953 | Pandora A/S | 2,079,468 | ||||||
| 432 | Rockwool A/S – B Shares | 98,081 | ||||||
| 2,359 | Scandinavian Tobacco Group A/S | 40,958 | ||||||
|
| |||||||
| Total Denmark | 6,309,399 | |||||||
|
| |||||||
| Egypt — 0.0% | ||||||||
| 19,325 | Abou Kir Fertilizers & Chemical Industries | 26,328 | ||||||
| 99,520 | Commercial International Bank Egypt SAE | 172,533 | ||||||
| 249,818 | Eastern Co SAE | 151,011 | ||||||
| 24,934 | Misr Fertilizers Production Co SAE | 116,230 | ||||||
|
| |||||||
| Total Egypt | 466,102 | |||||||
|
| |||||||
| Finland — 0.5% | ||||||||
| 1,849 | Kemira Oyj | 35,415 | ||||||
| 24,014 | Metsa Board Oyj – Class B | 210,091 | ||||||
| 23,410 | Neste Oyj | 1,129,093 | ||||||
| 532,952 | Nokia Oyj (a) | 2,465,728 | ||||||
| 74,371 | Outokumpu Oyj | 445,259 | ||||||
| 53,980 | UPM-Kymmene Oyj (a) | 1,956,043 | ||||||
|
| |||||||
| Total Finland | 6,241,629 | |||||||
|
| |||||||
| France — 2.7% | ||||||||
| 16,165 | ALD SA (a) | 214,131 | ||||||
| 608 | APERAM SA | 23,644 | ||||||
| 64,637 | ArcelorMittal SA | 1,939,717 | ||||||
| 10,682 | Arkema SA | 1,082,931 | ||||||
| 470 | Axway Software SA (a) | 11,178 | ||||||
| 20,115 | BNP Paribas SA | 1,406,262 | ||||||
| 599 | Boiron SA | 26,747 | ||||||
| Shares | Description | Value ($) | ||||||
| France — continued | ||||||||
| 43,937 | Cie de Saint-Gobain (a) | 2,610,852 | ||||||
| 44,207 | Coface SA | 651,537 | ||||||
| 16,197 | Derichebourg SA | 104,156 | ||||||
| 691 | Eiffage SA (a) | 75,837 | ||||||
| 50 | Eramet SA | 5,366 | ||||||
| 389 | HEXAOM | 7,813 | ||||||
| 14,297 | Ipsen SA | 1,633,555 | ||||||
| 11,848 | IPSOS | 726,818 | ||||||
| 1,792 | Kering SA (a) | 1,050,687 | ||||||
| 2,409 | LVMH Moet Hennessy Louis Vuitton SE (a) | 2,002,665 | ||||||
| 948 | Mersen SA | 44,725 | ||||||
| 4,330 | Metropole Television SA | 64,628 | ||||||
| 34,242 | Publicis Groupe SA (a) | 2,718,374 | ||||||
| 9,401 | Quadient SA | 163,166 | ||||||
| 3,372 | Rexel SA | 83,820 | ||||||
| 1,465 | Rothschild & Co | 73,359 | ||||||
| 15,961 | Safran SA (a) | 2,253,714 | ||||||
| 23,103 | Sanofi (a) | 2,160,090 | ||||||
| 3,971 | SMCP SA * | 30,997 | ||||||
| 5,738 | Societe BIC SA | 371,172 | ||||||
| 119,741 | Societe Generale SA | 3,450,881 | ||||||
| 42,100 | STMicroelectronics NV | 2,027,536 | ||||||
| 577 | Synergie SE | 20,529 | ||||||
| 23,077 | Technip Energies NV | 446,779 | ||||||
| 50,241 | Television Francaise 1 | 400,365 | ||||||
| 54,022 | TotalEnergies SE (a) | 3,333,381 | ||||||
|
| |||||||
| Total France | 31,217,412 | |||||||
|
| |||||||
| Germany — 1.0% | ||||||||
| 4,034 | 1&1 AG | 48,335 | ||||||
| 188 | Amadeus Fire AG | 24,423 | ||||||
| 2,658 | Aurubis AG | 259,975 | ||||||
| 14,358 | Bayer AG (Registered) (a) | 852,595 | ||||||
| 13,938 | Bayerische Motoren Werke AG (a) | 1,437,919 | ||||||
| 10,640 | Beiersdorf AG (a) | 1,269,837 | ||||||
| 20,037 | Commerzbank AG * | 244,161 | ||||||
| 425 | Deutsche Boerse AG | 74,109 | ||||||
| 307 | Draegerwerk AG & Co KGaA (a) | 11,937 | ||||||
| 1,126 | Elmos Semiconductor SE | 91,371 | ||||||
| 15,772 | Fresenius SE & Co KGaA (a) | 434,001 | ||||||
| 2,270 | Hamburger Hafen und Logistik AG (a) | 30,030 | ||||||
| 707 | Hannover Rueck SE (a) | 137,298 | ||||||
| 6,088 | HeidelbergCement AG (a) | 417,956 | ||||||
| 2,255 | Hornbach Holding AG & Co KGaA | 187,280 | ||||||
| 1,282 | HUGO BOSS AG | 87,682 | ||||||
| 55,620 | Kloeckner & Co SE | 602,018 | ||||||
| 1,367 | Krones AG | 166,477 | ||||||
| 29,462 | Mercedes-Benz Group AG (a) | 2,258,047 | ||||||
| 9,492 | Merck KGaA (a) | 1,798,667 | ||||||
| 2,121 | RTL Group SA | 102,243 | ||||||
| 7,564 | Salzgitter AG | 317,400 | ||||||
| 1,370 | Siltronic AG | 99,762 | ||||||
| 610 | Talanx AG (a) | 29,132 | ||||||
| See accompanying notes to the financial statements. | 32 |
GMO Benchmark-Free Fund
(A Series of GMO Trust)
Schedule of Investments — (Continued)
(showing percentage of total net assets)
February 28, 2023
| Shares | Description | Value ($) | ||||||
| Germany — continued | ||||||||
| 2,038 | Volkswagen AG (a) | 362,071 | ||||||
|
| |||||||
| Total Germany | 11,344,726 | |||||||
|
| |||||||
| Greece — 0.1% | ||||||||
| 12,055 | FF Group * (d) | — | ||||||
| 12,411 | Jumbo SA | 247,822 | ||||||
| 12,571 | Mytilineos SA | 339,169 | ||||||
|
| |||||||
| Total Greece | 586,991 | |||||||
|
| |||||||
| Hong Kong — 0.6% | ||||||||
| 107,300 | ASMPT Ltd | 915,525 | ||||||
| 45,400 | Bank of East Asia Ltd (The) | 64,131 | ||||||
| 86,000 | BOC Hong Kong Holdings Ltd | 291,054 | ||||||
| 71,400 | Champion (REIT) | 32,006 | ||||||
| 29,000 | Chow Sang Sang Holdings International Ltd | 37,347 | ||||||
| 272,000 | CITIC Telecom International Holdings Ltd | 99,112 | ||||||
| 65,500 | CK Asset Holdings Ltd (a) | 410,818 | ||||||
| 49,500 | CK Hutchison Holdings Ltd (a) | 295,577 | ||||||
| 550,000 | CSI Properties Ltd | 10,387 | ||||||
| 65,300 | Dah Sing Banking Group Ltd | 53,001 | ||||||
| 22,400 | Dah Sing Financial Holdings Ltd | 60,520 | ||||||
| 108,000 | E-Commodities Holdings Ltd | 18,864 | ||||||
| 272,000 | First Pacific Co Ltd | 91,206 | ||||||
| 127,573 | Galaxy Entertainment Group Ltd | 849,335 | ||||||
| 104,000 | Giordano International Ltd | 25,329 | ||||||
| 34,500 | Health & Happiness H&H International Holdings Ltd | 58,233 | ||||||
| 190,000 | HKT Trust & HKT Ltd – Class SS | 247,019 | ||||||
| 298,000 | IGG Inc * | 109,200 | ||||||
| 70,500 | Johnson Electric Holdings Ltd | 80,871 | ||||||
| 69,000 | K Wah International Holdings Ltd | 23,837 | ||||||
| 29,500 | Kerry Logistics Network Ltd | 48,754 | ||||||
| 68,500 | Kerry Properties Ltd (a) | 171,519 | ||||||
| 41,800 | Luk Fook Holdings International Ltd | 133,444 | ||||||
| 64,000 | NWS Holdings Ltd | 56,353 | ||||||
| 4,000 | Orient Overseas International Ltd (a) | 64,253 | ||||||
| 172,000 | Pacific Textiles Holdings Ltd | 57,643 | ||||||
| 48,500 | Power Assets Holdings Ltd (a) | 259,416 | ||||||
| 234,000 | Shun Tak Holdings Ltd * | 47,403 | ||||||
| 149,000 | SITC International Holdings Co Ltd | 311,700 | ||||||
| 50,000 | SmarTone Telecommunications Holdings Ltd | 33,402 | ||||||
| 93,000 | Sun Hung Kai & Co Ltd | 37,701 | ||||||
| 72,500 | Swire Pacific Ltd – Class A (a) | 591,651 | ||||||
| 56,500 | Texhong International Group Ltd | 48,464 | ||||||
| 46,000 | Texwinca Holdings Ltd | 7,738 | ||||||
| 200,000 | VSTECS Holdings Ltd | 115,457 | ||||||
| 29,800 | VTech Holdings Ltd | 163,713 | ||||||
| 1,756,000 | WH Group Ltd | 1,021,867 | ||||||
| 71,000 | Yue Yuen Industrial Holdings Ltd | 105,044 | ||||||
|
| |||||||
| Total Hong Kong | 7,048,894 | |||||||
|
| |||||||
| Shares | Description | Value ($) | ||||||
| Hungary — 0.2% | ||||||||
| 30,443 | MOL Hungarian Oil & Gas Plc | 231,174 | ||||||
| 55,727 | OTP Bank Nyrt | 1,688,131 | ||||||
| 12,280 | Richter Gedeon Nyrt | 257,409 | ||||||
|
| |||||||
| Total Hungary | 2,176,714 | |||||||
|
| |||||||
| India — 2.4% | ||||||||
| 3 | ACC Ltd | 63 | ||||||
| 42,762 | Arvind Ltd * | 42,773 | ||||||
| 19,526 | Asian Paints Ltd | 668,371 | ||||||
| 15,616 | Aurobindo Pharma Ltd | 87,025 | ||||||
| 60,206 | Axis Bank Ltd | 614,688 | ||||||
| 21,023 | Cipla Ltd | 230,178 | ||||||
| 857,350 | Coal India Ltd | 2,226,182 | ||||||
| 22,546 | Cochin Shipyard Ltd | 123,499 | ||||||
| 2,218 | Colgate-Palmolive India Ltd | 39,635 | ||||||
| 10,094 | Coromandel International Ltd | 110,346 | ||||||
| 191 | Cummins India Ltd | 3,619 | ||||||
| 2,077 | Deepak Fertilisers & Petrochemicals Corp Ltd | 15,686 | ||||||
| 23,833 | Dhampur Bio Organics Ltd * | 42,406 | ||||||
| 25,437 | Engineers India Ltd | 22,094 | ||||||
| 92,023 | Exide Industries Ltd | 195,718 | ||||||
| 1,687,041 | GAIL India Ltd | 2,097,281 | ||||||
| 4,013 | GHCL Ltd | 25,073 | ||||||
| 32,270 | Glenmark Pharmaceuticals Ltd | 167,640 | ||||||
| 4,212 | Great Eastern Shipping Co Ltd (The) | 27,970 | ||||||
| 718 | Gujarat Narmada Valley Fertilizers & Chemicals Ltd | 4,572 | ||||||
| 176,367 | Gujarat State Fertilizers & Chemicals Ltd | 266,945 | ||||||
| 22,249 | HDFC Bank Ltd | 431,219 | ||||||
| 93,260 | Hindalco Industries Ltd | 450,166 | ||||||
| 11,770 | Hindustan Aeronautics Ltd | 366,581 | ||||||
| 76,634 | Hindustan Petroleum Corp Ltd | 199,841 | ||||||
| 1,793 | Hindustan Unilever Ltd | 53,273 | ||||||
| 17,007 | Hindustan Zinc Ltd | 62,572 | ||||||
| 18,492 | Housing Development Finance Corp Ltd | 583,070 | ||||||
| 96,682 | ICICI Bank Ltd | 999,251 | ||||||
| 8,355 | Indiabulls Housing Finance Ltd * | 10,175 | ||||||
| 202,318 | Indian Oil Corp Ltd | 186,017 | ||||||
| 75 | Indus Towers Ltd | 156 | ||||||
| 13,117 | Infosys Ltd | 236,007 | ||||||
| 28,200 | Infosys Ltd Sponsored ADR (a) | 505,908 | ||||||
| 754,959 | ITC Ltd | 3,436,779 | ||||||
| 83,713 | Karnataka Bank Ltd (The) | 146,901 | ||||||
| 4,676 | L&T Finance Holdings Ltd | 4,966 | ||||||
| 48,296 | Mahindra & Mahindra Ltd | 744,364 | ||||||
| 41,809 | Manappuram Finance Ltd | 52,043 | ||||||
| 67,371 | National Aluminium Co Ltd | 63,791 | ||||||
| 61,090 | NBCC India Ltd | 24,509 | ||||||
| 26,883 | NCC Ltd | 29,061 | ||||||
| 420,940 | NMDC Ltd | 564,155 | ||||||
| 457,826 | NMDC Steel Ltd * | 185,251 | ||||||
| 324,679 | NTPC Ltd | 667,713 | ||||||
| 2,220,940 | Oil & Natural Gas Corp Ltd | 4,073,748 | ||||||
| 33 | See accompanying notes to the financial statements. |
GMO Benchmark-Free Fund
(A Series of GMO Trust)
Schedule of Investments — (Continued)
(showing percentage of total net assets)
February 28, 2023
| Shares | Description | Value ($) | ||||||
| India — continued | ||||||||
| 15,851 | Oil India Ltd | 47,163 | ||||||
| 869 | Oracle Financial Services Software Ltd | 33,153 | ||||||
| 87,442 | Petronet LNG Ltd | 234,603 | ||||||
| 499,412 | Power Finance Corp Ltd | 874,098 | ||||||
| 15,658 | Rajesh Exports Ltd | 122,949 | ||||||
| 24,064 | Rashtriya Chemicals & Fertilizers Ltd | 28,331 | ||||||
| 667,446 | REC Ltd | 923,865 | ||||||
| 87,830 | Redington Ltd | 180,893 | ||||||
| 6,490 | RITES Ltd | 25,564 | ||||||
| 145,188 | Sun Pharmaceutical Industries Ltd | 1,682,236 | ||||||
| 21,574 | Sun TV Network Ltd | 112,249 | ||||||
| 1,138,191 | Tata Steel Ltd | 1,433,531 | ||||||
| 24,037 | Titan Co Ltd | 688,602 | ||||||
| 25,850 | Vardhman Textiles Ltd * | 96,793 | ||||||
|
| |||||||
| Total India | 27,573,311 | |||||||
|
| |||||||
| Indonesia — 0.5% | ||||||||
| 4,123,400 | Adaro Energy Indonesia Tbk PT | 807,867 | ||||||
| 1,312,400 | Astra International Tbk PT | 524,970 | ||||||
| 2,650,100 | Bank Central Asia Tbk PT | 1,519,935 | ||||||
| 626,196 | Bank Mandiri Persero Tbk PT | 410,503 | ||||||
| 235,400 | Bank Negara Indonesia Persero Tbk PT | 135,385 | ||||||
| 2,588,500 | Bank Pembangunan Daerah Jawa Timur Tbk PT | 125,591 | ||||||
| 1,609,600 | Bank Rakyat Indonesia Persero Tbk PT | 492,643 | ||||||
| 975,100 | Bukit Asam Tbk PT | 246,739 | ||||||
| 1,134,100 | Global Mediacom Tbk PT * | 21,265 | ||||||
| 99,100 | Indo Tambangraya Megah Tbk PT | 241,563 | ||||||
| 572,600 | Indofood Sukses Makmur Tbk PT | 243,102 | ||||||
| 2,681,400 | Kalbe Farma Tbk PT | 370,933 | ||||||
| 2,116,700 | Media Nusantara Citra Tbk PT * | 90,189 | ||||||
| 1,562,700 | Perusahaan Gas Negara Tbk PT | 160,302 | ||||||
| 133,148 | United Tractors Tbk PT | 243,534 | ||||||
|
| |||||||
| Total Indonesia | 5,634,521 | |||||||
|
| |||||||
| Ireland — 0.5% | ||||||||
| 9,210 | AIB Group Plc | 39,339 | ||||||
| 203,821 | Bank of Ireland Group Plc | 2,245,519 | ||||||
| 12,774 | Glanbia Plc | 157,742 | ||||||
| 3,477 | Kingspan Group Plc | 225,685 | ||||||
| 15,644 | Origin Enterprises Plc | 70,006 | ||||||
| 9,611 | Permanent TSB Group Holdings Plc * | 26,447 | ||||||
| 10,319 | Ryanair Holdings Plc * | 160,696 | ||||||
| 14,919 | Ryanair Holdings Plc Sponsored ADR * (a) | 1,384,035 | ||||||
| 28,383 | Smurfit Kappa Group Plc | 1,058,877 | ||||||
|
| |||||||
| Total Ireland | 5,368,346 | |||||||
|
| |||||||
| Israel — 0.3% | ||||||||
| 220,793 | Oil Refineries Ltd | 66,620 | ||||||
| 174,200 | Teva Pharmaceutical Industries Ltd Sponsored ADR * | 1,726,322 | ||||||
| 53,700 | ZIM Integrated Shipping Services Ltd | 1,270,542 | ||||||
|
| |||||||
| Total Israel | 3,063,484 | |||||||
|
| |||||||
| Shares | Description | Value ($) | ||||||
| Italy — 0.7% | ||||||||
| 13,898 | Anima Holding SPA | 60,039 | ||||||
| 19,133 | Banca IFIS SPA | 314,068 | ||||||
| 18,249 | Banco BPM SPA | 79,550 | ||||||
| 17,609 | BPER Banca | 50,018 | ||||||
| 15,729 | CIR SpA-Compagnie Industriali * | 7,241 | ||||||
| 22,116 | Credito Emiliano SPA | 190,040 | ||||||
| 58,014 | Eni SPA (a) | 819,391 | ||||||
| 900 | Eni SPA Sponsored ADR | 25,524 | ||||||
| 6,234 | Esprinet SPA | 47,578 | ||||||
| 59,732 | Italgas SPA (a) | 339,310 | ||||||
| 107,971 | Leonardo SPA | 1,211,360 | ||||||
| 72,418 | MFE-MediaForEurope NV – Class A | 31,817 | ||||||
| 115,097 | Stellantis NV (a) | 2,013,539 | ||||||
| 5,364,637 | Telecom Italia SPA * (b) | 1,751,674 | ||||||
| 6,681 | UniCredit SPA | 136,683 | ||||||
| 2,778 | Unieuro SPA (b) | 32,945 | ||||||
| 168,846 | Unipol Gruppo SPA | 893,176 | ||||||
|
| |||||||
| Total Italy | 8,003,953 | |||||||
|
| |||||||
| Japan — 13.3% | ||||||||
| 5,600 | AGC Inc | 207,181 | ||||||
| 5,100 | Aichi Corp | 29,540 | ||||||
| 4,900 | Aisin Corp | 134,277 | ||||||
| 83,900 | Amano Corp | 1,551,581 | ||||||
| 3,400 | AOKI Holdings Inc | 20,491 | ||||||
| 35,400 | Arcs Co Ltd (b) | 563,472 | ||||||
| 146,600 | Asahi Kasei Corp | 1,021,071 | ||||||
| 5,700 | Bandai Namco Holdings Inc (a) | 352,210 | ||||||
| 3,600 | Bando Chemical Industries Ltd | 27,711 | ||||||
| 43,100 | Brother Industries Ltd | 633,955 | ||||||
| 90,700 | Canon Inc (a) | 1,952,068 | ||||||
| 6,500 | Canon Marketing Japan Inc | 143,644 | ||||||
| 5,400 | Central Glass Co Ltd | 132,702 | ||||||
| 1,600 | Chiyoda Integre Co Ltd | 26,567 | ||||||
| 106,000 | Chugoku Marine Paints Ltd | 872,532 | ||||||
| 80,600 | Citizen Watch Co Ltd (b) | 487,878 | ||||||
| 132,200 | Credit Saison Co Ltd (b) | 1,801,795 | ||||||
| 24,600 | Dai Nippon Printing Co Ltd | 659,520 | ||||||
| 1,100 | Dai Nippon Toryo Co Ltd | 6,866 | ||||||
| 34,000 | Daicel Corp | 236,064 | ||||||
| 1,500 | Dai-Dan Co Ltd | 26,227 | ||||||
| 1,400 | Daiichi Jitsugyo Co Ltd | 54,494 | ||||||
| 173,300 | Daiwabo Holdings Co Ltd | 2,678,113 | ||||||
| 96,400 | Denka Co Ltd | 2,035,725 | ||||||
| 18,400 | Dentsu Group Inc (a) | 590,061 | ||||||
| 3,700 | DTS Corp (a) | 85,987 | ||||||
| 2,400 | Ehime Bank Ltd (The) | 17,284 | ||||||
| 141,000 | EXEO Group Inc | 2,474,085 | ||||||
| 64,600 | Ezaki Glico Co Ltd | 1,621,930 | ||||||
| 133,600 | Fuji Corp | 2,023,383 | ||||||
| 8,400 | Fuji Electric Co Ltd | 324,323 | ||||||
| 52,300 | FUJIFILM Holdings Corp | 2,439,892 | ||||||
| 3,400 | Fukuoka Financial Group Inc | 75,900 | ||||||
| See accompanying notes to the financial statements. | 34 |
GMO Benchmark-Free Fund
(A Series of GMO Trust)
Schedule of Investments — (Continued)
(showing percentage of total net assets)
February 28, 2023
| Shares | Description | Value ($) | ||||||
| Japan — continued | ||||||||
| 2,100 | Furuno Electric Co Ltd | 14,976 | ||||||
| 2,100 | G-7 Holdings Inc | 22,151 | ||||||
| 101,300 | H.U. Group Holdings Inc (a) | 1,993,539 | ||||||
| 5,600 | Hachijuni Bank Ltd (The) | 25,342 | ||||||
| 6,900 | Hanwa Co Ltd | 200,754 | ||||||
| 206,200 | Haseko Corp | 2,366,194 | ||||||
| 2,500 | Heiwado Co Ltd | 39,134 | ||||||
| 52,100 | Hogy Medical Co Ltd | 1,231,016 | ||||||
| 80,300 | Honda Motor Co Ltd (a) | 2,088,055 | ||||||
| 3,400 | Honda Motor Co Ltd Sponsored ADR (a) | 88,298 | ||||||
| 13,000 | Hosiden Corp | 159,130 | ||||||
| 30,400 | Idemitsu Kosan Co Ltd | 672,798 | ||||||
| 12,300 | Inabata & Co Ltd | 242,451 | ||||||
| 193,200 | Inpex Corp | 2,025,583 | ||||||
| 126,700 | ITOCHU Corp (a) | 3,787,149 | ||||||
| 500 | Itochu-Shokuhin Co Ltd | 18,247 | ||||||
| 17,600 | Itoham Yonekyu Holdings Inc | 92,279 | ||||||
| 8,000 | Itoki Corp | 46,292 | ||||||
| 5,800 | Jaccs Co Ltd | 188,883 | ||||||
| 7,800 | Japan Aviation Electronics Industry Ltd | 129,486 | ||||||
| 4,500 | Japan Petroleum Exploration Co Ltd | 162,138 | ||||||
| 107,600 | Japan Tobacco Inc (a) | 2,188,089 | ||||||
| 5,100 | Kaga Electronics Co Ltd | 182,938 | ||||||
| 45,300 | Kajima Corp | 541,381 | ||||||
| 3,500 | Kamei Corp | 39,138 | ||||||
| 7,600 | Kandenko Co Ltd | 49,867 | ||||||
| 2,500 | Kaneka Corp | 62,819 | ||||||
| 106,300 | Kanematsu Corp | 1,273,731 | ||||||
| 114,200 | KDDI Corp (a) | 3,341,248 | ||||||
| 149,900 | Kirin Holdings Co Ltd | 2,243,775 | ||||||
| 1,897 | Kohnan Shoji Co Ltd (b) | 44,133 | ||||||
| 10,901 | Komeri Co Ltd | 212,135 | ||||||
| 61,000 | Konoike Transport Co Ltd (a) | 670,320 | ||||||
| 155,800 | K’s Holdings Corp | 1,342,393 | ||||||
| 3,000 | Kyokuto Kaihatsu Kogyo Co Ltd | 32,230 | ||||||
| 83,900 | Kyudenko Corp | 2,119,139 | ||||||
| 8,700 | Macnica Holdings Inc | 240,684 | ||||||
| 88,900 | Macromill Inc | 663,006 | ||||||
| 100 | Makino Milling Machine Co Ltd | 3,621 | ||||||
| 98,800 | Mandom Corp | 1,041,987 | ||||||
| 141,300 | Marubeni Corp (a) | 1,803,844 | ||||||
| 88,900 | Maruichi Steel Tube Ltd | 1,931,529 | ||||||
| 1,000 | Maruzen Showa Unyu Co Ltd | 22,909 | ||||||
| 1,300 | Matsuda Sangyo Co Ltd | 21,913 | ||||||
| 95,200 | Maxell Ltd | 1,015,471 | ||||||
| 31,900 | Mazda Motor Corp | 285,411 | ||||||
| 5,800 | MCJ Co Ltd | 40,877 | ||||||
| 94,800 | Mebuki Financial Group Inc | 254,840 | ||||||
| 1,100 | Melco Holdings Inc | 27,257 | ||||||
| 30,200 | Mirarth Holdings Inc | 84,021 | ||||||
| 42,100 | Mitsubishi Corp (a) | 1,430,181 | ||||||
| 173,800 | Mitsubishi Electric Corp | 1,953,028 | ||||||
| 207,900 | Mitsubishi Motors Corp * | 819,861 | ||||||
| 2,200 | Mitsubishi Research Institute Inc (a) | 83,720 | ||||||
| Shares | Description | Value ($) | ||||||
| Japan — continued | ||||||||
| 219,000 | Mitsubishi UFJ Financial Group Inc (a) | 1,552,599 | ||||||
| 44,900 | Mitsui & Co Ltd (a) | 1,260,157 | ||||||
| 3,100 | Mitsui DM Sugar Holdings Co Ltd | 47,392 | ||||||
| 71,600 | Mitsui OSK Lines Ltd (a) | 1,870,200 | ||||||
| 4,300 | Mitsui-Soko Holdings Co Ltd (a) | 124,506 | ||||||
| 4,100 | MIXI Inc | 80,575 | ||||||
| 57,000 | Morinaga & Co Ltd | 1,644,063 | ||||||
| 52,700 | MS&AD Insurance Group Holdings Inc (a) | 1,724,561 | ||||||
| 2,900 | Nagase & Co Ltd | 43,083 | ||||||
| 63,100 | NEC Corp (a) | 2,258,240 | ||||||
| 78,000 | NGK Spark Plug Co Ltd | 1,568,514 | ||||||
| 79,200 | NH Foods Ltd | 2,186,890 | ||||||
| 8,600 | Nichias Corp | 169,586 | ||||||
| 4,400 | Nichiha Corp | 84,991 | ||||||
| 5,200 | Nichireki Co Ltd | 56,557 | ||||||
| 47,800 | Nikon Corp | 473,443 | ||||||
| 4,100 | Nippn Corp | 48,746 | ||||||
| 2,000 | Nippon Densetsu Kogyo Co Ltd | 22,365 | ||||||
| 6,100 | Nippon Soda Co Ltd | 206,919 | ||||||
| 1,500 | Nippon Steel Trading Corp | 102,077 | ||||||
| 90,300 | Nippon Telegraph & Telephone Corp (a) | 2,616,606 | ||||||
| 18,900 | Nippon Television Holdings Inc | 155,580 | ||||||
| 75,200 | Nippon Yusen KK (a) | 1,954,672 | ||||||
| 1,500 | Nissin Corp | 23,271 | ||||||
| 1,100 | Nitto Kogyo Corp | 21,402 | ||||||
| 11,600 | Nojima Corp | 115,461 | ||||||
| 1,600 | Noritake Co Ltd | 53,216 | ||||||
| 197,600 | Obayashi Corp | 1,461,651 | ||||||
| 500 | Ono Pharmaceutical Co Ltd | 10,184 | ||||||
| 5,200 | Osaka Soda Co Ltd | 164,353 | ||||||
| 104,400 | Pacific Industrial Co Ltd | 891,423 | ||||||
| 7,200 | PAL GROUP Holdings Co Ltd | 147,071 | ||||||
| 328,800 | Penta-Ocean Construction Co Ltd | 1,566,966 | ||||||
| 2,500 | Prima Meat Packers Ltd | 39,305 | ||||||
| 5,700 | Proto Corp | 51,065 | ||||||
| 18,500 | Renesas Electronics Corp * (a) | 238,973 | ||||||
| 500 | Restar Holdings Corp | 8,517 | ||||||
| 23,200 | Rohm Co Ltd | 1,786,694 | ||||||
| 2,100 | Roland DG Corp | 48,955 | ||||||
| 1,800 | Ryobi Ltd | 20,035 | ||||||
| 15,600 | San-A Co Ltd (b) | 480,822 | ||||||
| 8,800 | Sanki Engineering Co Ltd | 98,732 | ||||||
| 69,600 | Sankyu Inc (a) | 2,560,623 | ||||||
| 19,900 | Sanwa Holdings Corp | 209,769 | ||||||
| 500 | Sanyo Denki Co Ltd | 20,767 | ||||||
| 13,900 | Sawai Group Holdings Co Ltd | 384,851 | ||||||
| 34,600 | Secom Co Ltd (a) | 2,012,143 | ||||||
| 69,500 | Seiko Epson Corp | 958,244 | ||||||
| 4,800 | Seiko Group Corp | 101,693 | ||||||
| 14,500 | Sekisui Chemical Co Ltd | 194,390 | ||||||
| 146,100 | Sekisui House Ltd | 2,766,145 | ||||||
| 2,900 | Sekisui Jushi Corp | 42,075 | ||||||
| 10,900 | Shimamura Co Ltd | 1,018,268 | ||||||
| 163,700 | Shimizu Corp | 883,633 | ||||||
| 35 | See accompanying notes to the financial statements. |
GMO Benchmark-Free Fund
(A Series of GMO Trust)
Schedule of Investments — (Continued)
(showing percentage of total net assets)
February 28, 2023
| Shares | Description | Value ($) | ||||||
| Japan — continued | ||||||||
| 2,900 | Shinmaywa Industries Ltd | 23,933 | ||||||
| 4,800 | Shizuoka Gas Co Ltd (a) | 39,781 | ||||||
| 800 | Sinanen Holdings Co Ltd | 20,473 | ||||||
| 1,500 | Sinko Industries Ltd | 17,362 | ||||||
| 21,500 | SKY Perfect JSAT Holdings Inc | 81,599 | ||||||
| 113,260 | Sojitz Corp | 2,174,335 | ||||||
| 147,600 | Stanley Electric Co Ltd | 3,077,951 | ||||||
| 5,700 | Star Micronics Co Ltd | 72,302 | ||||||
| 47,400 | Subaru Corp | 759,406 | ||||||
| 145,100 | SUMCO Corp | 2,002,151 | ||||||
| 460,600 | Sumitomo Chemical Co Ltd | 1,613,940 | ||||||
| 107,900 | Sumitomo Corp (a) | 1,838,915 | ||||||
| 63,200 | Sumitomo Forestry Co Ltd | 1,212,747 | ||||||
| 75,200 | Sumitomo Mitsui Financial Group Inc | 3,284,272 | ||||||
| 67,700 | Sumitomo Mitsui Trust Holdings Inc | 2,508,287 | ||||||
| 1,500 | Sumitomo Seika Chemicals Co Ltd | 48,248 | ||||||
| 210,900 | T&D Holdings Inc | 3,193,912 | ||||||
| 17,000 | Tachi-S Co Ltd | 155,497 | ||||||
| 46,000 | Taisei Corp | 1,499,746 | ||||||
| 2,000 | Takeuchi Manufacturing Co Ltd (b) | 42,722 | ||||||
| 146,500 | Takuma Co Ltd | 1,475,133 | ||||||
| 3,000 | Tamron Co Ltd | 71,455 | ||||||
| 174,500 | Teijin Ltd | 1,813,157 | ||||||
| 2,900 | T-Gaia Corp (b) | 34,925 | ||||||
| 90,700 | THK Co Ltd | 2,031,292 | ||||||
| 64,600 | Toho Holdings Co Ltd | 1,044,569 | ||||||
| 233,100 | Tokai Carbon Co Ltd | 2,276,047 | ||||||
| 79,100 | Tokyo Gas Co Ltd (a) | 1,525,637 | ||||||
| 55,300 | Tokyo Seimitsu Co Ltd | 2,018,910 | ||||||
| 155,400 | Toppan Inc | 2,810,323 | ||||||
| 92,200 | Tosei Corp | 997,829 | ||||||
| 61,900 | Tosoh Corp | 842,409 | ||||||
| 3,000 | Towa Pharmaceutical Co Ltd | 42,164 | ||||||
| 13,800 | Toyo Construction Co Ltd | 89,836 | ||||||
| 43,400 | Toyota Industries Corp | 2,546,284 | ||||||
| 15,900 | Toyota Tsusho Corp (a) | 648,458 | ||||||
| 3,000 | TPR Co Ltd | 30,717 | ||||||
| 6,600 | Tsumura & Co | 125,505 | ||||||
| 1,900 | TV Asahi Holdings Corp | 20,269 | ||||||
| 5,500 | Wacoal Holdings Corp | 98,963 | ||||||
| 13,100 | YAMABIKO Corp | 121,479 | ||||||
| 39,000 | Yamaha Motor Co Ltd | 997,823 | ||||||
| 5,300 | Yamazen Corp | 40,746 | ||||||
| 4,400 | Yellow Hat Ltd | 57,462 | ||||||
| 39,900 | Yokogawa Bridge Holdings Corp | 601,663 | ||||||
| 5,100 | Yokogawa Electric Corp | 76,170 | ||||||
| 3,200 | Yuasa Trading Co Ltd | 85,960 | ||||||
| 43,700 | Zenkoku Hosho Co Ltd | 1,664,903 | ||||||
|
| |||||||
| Total Japan | 153,460,606 | |||||||
|
| |||||||
| Kuwait — 0.0% | ||||||||
| 12,211 | Humansoft Holding Co KSC | 146,381 | ||||||
|
| |||||||
| Shares | Description | Value ($) | ||||||
| Malaysia — 0.1% | ||||||||
| 41,100 | AMMB Holdings Bhd | 36,717 | ||||||
| 40,100 | Hartalega Holdings Bhd | 13,134 | ||||||
| 39,400 | IOI Corp Bhd | 33,627 | ||||||
| 116,300 | Kossan Rubber Industries Bhd | 28,242 | ||||||
| 4,000 | Kuala Lumpur Kepong Bhd | 18,534 | ||||||
| 304,500 | Petronas Chemicals Group Bhd | 485,738 | ||||||
| 22,500 | PPB Group Bhd | 87,728 | ||||||
| 181,700 | Telekom Malaysia Bhd | 203,663 | ||||||
|
| |||||||
| Total Malaysia | 907,383 | |||||||
|
| |||||||
| Mexico — 1.1% | ||||||||
| 18,800 | Alpek SAB de CV | 22,944 | ||||||
| 439,337 | America Movil SAB de CV – Series L | 451,187 | ||||||
| 9,539 | America Movil SAB de CV – Class L Sponsored ADR | 196,313 | ||||||
| 87,512 | Arca Continental SAB de CV | 741,220 | ||||||
| 63,400 | Banco del Bajio SA | 242,248 | ||||||
| 1,676 | Coca-Cola Femsa SAB de CV Sponsored ADR | 120,689 | ||||||
| 495,200 | Credito Real SAB de CV SOFOM ER * (d) | — | ||||||
| 33,792 | El Puerto de Liverpool SAB de CV – Class C1 | 205,339 | ||||||
| 236,088 | Fomento Economico Mexicano SAB de CV | 2,174,232 | ||||||
| 1,313 | Fomento Economico Mexicano SAB de CV Sponsored ADR | 120,691 | ||||||
| 71,600 | Gentera SAB de CV | 77,601 | ||||||
| 400 | Grupo Aeroportuario del Centro Norte SAB de CV ADR | 31,196 | ||||||
| 2,739 | Grupo Aeroportuario del Centro Norte SAB de CV – Class B | 26,189 | ||||||
| 1,655 | Grupo Aeroportuario del Pacifico SAB de CV – Class B | 31,396 | ||||||
| 13,291 | Grupo Aeroportuario del Sureste SAB de CV – Class B | 380,544 | ||||||
| 124 | Grupo Aeroportuario del Sureste SAB de CV ADR | 35,486 | ||||||
| 473,725 | Grupo Financiero Banorte SAB de CV – Class O | 4,010,085 | ||||||
| 425,128 | Grupo Mexico SAB de CV – Series B | 1,912,048 | ||||||
| 18,900 | Grupo Televisa SAB Sponsored ADR | 93,744 | ||||||
| 7,156 | Kimberly-Clark de Mexico SAB de CV – Class A | 14,315 | ||||||
| 36,600 | Qualitas Controladora SAB de CV | 227,663 | ||||||
| 19,300 | Regional SAB de CV | 160,126 | ||||||
| 8,151 | Unifin Financiera SAB de CV SOFOM | |||||||
| ENR * (d) | — | |||||||
| 377,368 | Wal-Mart de Mexico SAB de CV | 1,487,073 | ||||||
|
| |||||||
| Total Mexico | 12,762,329 | |||||||
|
| |||||||
| Netherlands — 1.8% | ||||||||
| 100,351 | ABN AMRO Bank NV CVA | 1,770,810 | ||||||
| 359,241 | Aegon NV | 1,869,216 | ||||||
| 39,074 | ASR Nederland NV | 1,778,291 | ||||||
| 50,825 | EXOR NV * | 4,193,791 | ||||||
| 9,049 | ForFarmers NV (b) | 31,456 | ||||||
| See accompanying notes to the financial statements. | 36 |
GMO Benchmark-Free Fund
(A Series of GMO Trust)
Schedule of Investments — (Continued)
(showing percentage of total net assets)
February 28, 2023
| Shares | Description | Value ($) | ||||||
| Netherlands — continued | ||||||||
| 48,043 | JDE Peet’s NV | 1,414,244 | ||||||
| 135,398 | Koninklijke Ahold Delhaize NV (a) | 4,299,140 | ||||||
| 105,584 | Koninklijke Philips NV (a) | 1,723,847 | ||||||
| 40,194 | NN Group NV | 1,626,915 | ||||||
| 34,169 | Randstad NV (a) | 2,096,616 | ||||||
|
| |||||||
| Total Netherlands | 20,804,326 | |||||||
|
| |||||||
| New Zealand — 0.1% | ||||||||
| 59,921 | Auckland International Airport Ltd * (c) | 323,782 | ||||||
| 74 | Auckland International Airport Ltd * (a) (c) | 399 | ||||||
| 128,894 | Meridian Energy Ltd (a) | 423,075 | ||||||
| 18,409 | Spark New Zealand Ltd | 56,839 | ||||||
|
| |||||||
| Total New Zealand | 804,095 | |||||||
|
| |||||||
| Norway — 0.3% | ||||||||
| 7,086 | BW LPG Ltd | 61,987 | ||||||
| 7,513 | DNO ASA | 8,609 | ||||||
| 113,879 | Elkem ASA | 428,712 | ||||||
| 71,147 | Equinor ASA (a) | 2,178,047 | ||||||
| 47,115 | Europris ASA | 332,157 | ||||||
| 12,773 | Hoegh Autoliners ASA (a) | 83,737 | ||||||
| 21,557 | Norske Skog ASA * | 138,969 | ||||||
| 3,159 | Selvaag Bolig ASA | 10,498 | ||||||
| 4,756 | SpareBank 1 Nord Norge | 47,189 | ||||||
| 3,527 | Stolt-Nielsen Ltd (a) | 109,031 | ||||||
| 4,008 | Subsea 7 SA | 52,061 | ||||||
| 30,841 | Wallenius Wilhelmsen ASA (a) | 269,622 | ||||||
|
| |||||||
| Total Norway | 3,720,619 | |||||||
|
| |||||||
| Pakistan — 0.0% | ||||||||
| 48,525 | Oil & Gas Development Co Ltd | 15,227 | ||||||
| 108,203 | Pakistan Petroleum Ltd | 25,916 | ||||||
|
| |||||||
| Total Pakistan | 41,143 | |||||||
|
| |||||||
| Panama — 0.0% | ||||||||
| 297,879 | BAC Holding International Corp * | 12,113 | ||||||
|
| |||||||
| Philippines — 0.0% | ||||||||
| 10,800 | GT Capital Holdings Inc | 101,207 | ||||||
| 233,080 | Megaworld Corp | 8,501 | ||||||
| 33,900 | Puregold Price Club Inc | 19,295 | ||||||
|
| |||||||
| Total Philippines | 129,003 | |||||||
|
| |||||||
| Poland — 0.3% | ||||||||
| 5,274 | Asseco Poland SA | 94,580 | ||||||
| 59,399 | Bank Polska Kasa Opieki SA | 1,195,296 | ||||||
| 3,461 | Budimex SA | 218,941 | ||||||
| 32,437 | Cyfrowy Polsat SA | 125,648 | ||||||
| 3,970 | Jastrzebska Spolka Weglowa SA * | 48,778 | ||||||
| 22 | LPP SA | 46,469 | ||||||
| 104,881 | Polski Koncern Naftowy ORLEN SA | 1,566,457 | ||||||
| Shares | Description | Value ($) | ||||||
| Poland — continued | ||||||||
| 49,735 | Powszechny Zaklad Ubezpieczen SA | 408,919 | ||||||
|
| |||||||
| Total Poland | 3,705,088 | |||||||
|
| |||||||
| Portugal — 0.2% | ||||||||
| 195,500 | EDP – Energias de Portugal SA | 984,483 | ||||||
| 53,872 | Galp Energia SGPS SA | 657,213 | ||||||
| 1,688 | Jeronimo Martins SGPS SA | 34,648 | ||||||
| 112,720 | Navigator Co SA (The) | 396,439 | ||||||
| 34,941 | NOS SGPS SA | 154,395 | ||||||
| 518,655 | Sonae SGPS SA | 568,266 | ||||||
|
| |||||||
| Total Portugal | 2,795,444 | |||||||
|
| |||||||
| Qatar — 0.1% | ||||||||
| 76,290 | Ooredoo QPSC | 192,791 | ||||||
| 3,634 | Qatar Gas Transport Co Ltd | 3,641 | ||||||
| 147,319 | Qatar National Bank QPSC | 681,705 | ||||||
| 14,520 | Qatar National Cement Co QSC | 16,850 | ||||||
|
| |||||||
| Total Qatar | 894,987 | |||||||
|
| |||||||
| Russia — 0.1% | ||||||||
| 3,038,020 | Alrosa PJSC * (d) (f) | 24,494 | ||||||
| 10,190 | Detsky Mir PJSC * (d) | 94 | ||||||
| 148,200,000 | Federal Grid Co Unified Energy System PJSC * (d) | 1,750 | ||||||
| 68,395 | Fix Price Group Plc GDR* (d) | 1,961 | ||||||
| 180,610 | Gazprom Neft PJSC (d) | 10,248 | ||||||
| 2,050,858 | Gazprom PJSC (d) | 43,100 | ||||||
| 7,736 | Globaltrans Investment Plc Sponsored GDR (Registered) * (d) | 333 | ||||||
| 6,310,100 | Inter RAO UES PJSC (d) | 2,870 | ||||||
| 19,776 | LSR Group PJSC – Class A* (d) | 1,269 | ||||||
| 1 | LSR Group PJSC GDR (Registered) * (d) | — | ||||||
| 74,944 | LUKOIL PJSC (d) | 39,594 | ||||||
| 1,561 | Magnit PJSC * (d) | 952 | ||||||
| 1,863,335 | Magnitogorsk Iron & Steel Works PJSC * (d) (f) | 9,730 | ||||||
| 25,400 | Mechel PJSC * (d) | 429 | ||||||
| 4,554 | MMC Norilsk Nickel PJSC (d) | 8,793 | ||||||
| 1 | MMC Norilsk Nickel PJSC ADR * (d) | — | ||||||
| 16,770 | Mobile TeleSystems PJSC (d) | 581 | ||||||
| 20,400 | Mobile TeleSystems PJSC ADR* (d) | 1,413 | ||||||
| 361,420 | Moscow Exchange MICEX-RTS PJSC * (d) | 5,562 | ||||||
| 3,294,000 | Mosenergo PJSC (d) | 881 | ||||||
| 75,720 | Novatek PJSC (d) | 10,775 | ||||||
| 1,212,010 | Novolipetsk Steel PJSC * (d) | 20,200 | ||||||
| 3,466 | PhosAgro PJSC (d) | 3,111 | ||||||
| 67 | PhosAgro PJSC GDR * (d) (f) | 20 | ||||||
| 130,264 | Polymetal International Plc * | 383,548 | ||||||
| 10,215 | Polyus PJSC * (d) | 11,948 | ||||||
| 1 | Polyus PJSC GDR (Registered) * (d) | 1 | ||||||
| 5,248 | Ros Agro Plc GDR (Registered) * (d) | 490 | ||||||
| 12,592,062 | ROSSETI PJSC * (d) | 140 | ||||||
| 24,471,200 | RusHydro PJSC (d) | 2,572 | ||||||
| 37 | See accompanying notes to the financial statements. |
GMO Benchmark-Free Fund
(A Series of GMO Trust)
Schedule of Investments — (Continued)
(showing percentage of total net assets)
February 28, 2023
| Shares | Description | Value ($) | ||||||
| Russia — continued | ||||||||
| 3,677,652 | Sberbank of Russia PJSC * (d) (f) | 83,256 | ||||||
| 425 | Severstal PAO * (d) (f) | 60 | ||||||
| 91,185 | Severstal PJSC GDR (Registered) * (d) (f) | 12,888 | ||||||
| 11,580 | SFI PJSC * (d) | 769 | ||||||
| 5,940,620 | Surgutneftegas PJSC (d) | 18,079 | ||||||
| 332,388 | Tatneft PJSC (d) | 14,522 | ||||||
| 1,300,440 | Unipro PJSC * (d) | 277 | ||||||
| 50,950 | United Co Rusal International PJSC (d) | 270 | ||||||
| 8,456 | X5 Retail Group NV GDR (Registered) * (d) | 1,125 | ||||||
|
| |||||||
| Total Russia | 718,105 | |||||||
|
| |||||||
| Saudi Arabia — 0.2% | ||||||||
| 15,086 | Almarai Co JSC | 210,807 | ||||||
| 90,067 | Saudi Arabian Oil Co | 760,867 | ||||||
| 33,130 | Saudi Basic Industries Corp | 780,717 | ||||||
| 57,564 | Saudi Telecom Co | 538,670 | ||||||
|
| |||||||
| Total Saudi Arabia | 2,291,061 | |||||||
|
| |||||||
| Singapore — 0.7% | ||||||||
| 51,300 | AIMS APAC (REIT) | 52,517 | ||||||
| 39,000 | Bumitama Agri Ltd | 18,640 | ||||||
| 1,500 | City Developments Ltd | 8,581 | ||||||
| 156,200 | ComfortDelGro Corp Ltd | 140,259 | ||||||
| 87,435 | DBS Group Holdings Ltd | 2,218,324 | ||||||
| 35,500 | First Real Estate Investment Trust (b) | 6,852 | ||||||
| 84,500 | First Resources Ltd | 96,344 | ||||||
| 1,318,100 | Golden Agri-Resources Ltd | 249,426 | ||||||
| 159,400 | Japfa Ltd | 35,492 | ||||||
| 42,716 | Jardine Cycle & Carriage Ltd | 941,682 | ||||||
| 253,400 | Keppel Corp Ltd | 1,029,010 | ||||||
| 12,900 | Oversea-Chinese Banking Corp Ltd | 121,241 | ||||||
| 40,900 | Sasseur Real Estate Investment Trust | 23,064 | ||||||
| 5,063,259 | Sembcorp Marine Ltd * | 476,490 | ||||||
| 37,700 | Sheng Siong Group Ltd | 45,584 | ||||||
| 122,500 | Silverlake Axis Ltd | 30,456 | ||||||
| 114,700 | StarHub Ltd | 90,208 | ||||||
| 300 | United Overseas Bank Ltd | 6,650 | ||||||
| 15,200 | Venture Corp Ltd | 193,566 | ||||||
| 29,300 | Wilmar International Ltd | 85,604 | ||||||
| 785,699 | Yangzijiang Financial Holding Ltd * (b) | 203,856 | ||||||
| 2,097,399 | Yangzijiang Shipbuilding Holdings Ltd | 2,006,790 | ||||||
| 134,400 | Yanlord Land Group Ltd | 108,782 | ||||||
|
| |||||||
| Total Singapore | 8,189,418 | |||||||
|
| |||||||
| South Africa — 1.1% | ||||||||
| 213,899 | Absa Group Ltd | 2,309,382 | ||||||
| 9,865 | African Rainbow Minerals Ltd | 136,540 | ||||||
| 20,826 | Anglo American Platinum Ltd | 1,151,604 | ||||||
| 2,455 | Aspen Pharmacare Holdings Ltd | 18,957 | ||||||
| 10,455 | Astral Foods Ltd | 93,042 | ||||||
| 11,974 | AVI Ltd | 49,575 | ||||||
| 28,451 | Barloworld Ltd | 141,794 | ||||||
| Shares | Description | Value ($) | ||||||
| South Africa — continued | ||||||||
| 56,237 | Bidvest Group Ltd (The) | 717,126 | ||||||
| 77,272 | Blue Label Telecoms Ltd * | 19,096 | ||||||
| 3,237 | Capitec Bank Holdings Ltd | 308,824 | ||||||
| 653 | Clicks Group Ltd | 9,513 | ||||||
| 329,955 | FirstRand Ltd | 1,176,871 | ||||||
| 37,663 | Foschini Group Ltd (The) | 208,029 | ||||||
| 57,219 | Impala Platinum Holdings Ltd | 534,247 | ||||||
| 27,974 | Investec Ltd | 178,977 | ||||||
| 52,940 | Kumba Iron Ore Ltd | 1,380,562 | ||||||
| 17,129 | Lewis Group Ltd | 38,879 | ||||||
| 15,058 | Metair Investments Ltd | 19,686 | ||||||
| 25,008 | Motus Holdings Ltd | 150,854 | ||||||
| 32,824 | Mr Price Group Ltd | 272,212 | ||||||
| 65,823 | MTN Group Ltd | 518,649 | ||||||
| 566 | Naspers Ltd | 99,527 | ||||||
| 14,456 | Ninety One Ltd | 36,249 | ||||||
| 222,976 | Old Mutual Ltd | 144,632 | ||||||
| 366,428 | Pepkor Holdings Ltd | 374,274 | ||||||
| 8,062 | Raubex Group Ltd | 12,489 | ||||||
| 75 | Reinet Investments SCA | 1,485 | ||||||
| 20,426 | Reunert Ltd | 65,979 | ||||||
| 257,788 | RMB Holdings Ltd | 7,303 | ||||||
| 19,233 | Sanlam Ltd | 62,591 | ||||||
| 70,941 | Sappi Ltd | 188,759 | ||||||
| 86,672 | Sibanye Stillwater Ltd | 174,996 | ||||||
| 29,700 | Sibanye Stillwater Ltd ADR | 240,570 | ||||||
| 8,741 | Telkom SA SOC Ltd * | 18,237 | ||||||
| 11,682 | Thungela Resources Ltd (c) | 135,830 | ||||||
| 10,735 | Thungela Resources Ltd (c) | 123,904 | ||||||
| 19,261 | Tiger Brands Ltd | 232,809 | ||||||
| 170,369 | Truworths International Ltd | 548,664 | ||||||
| 45,534 | Vodacom Group Ltd | 313,805 | ||||||
| 149,069 | Woolworths Holdings Ltd | 625,054 | ||||||
| 37,545 | Zeda Ltd * | 24,655 | ||||||
|
| |||||||
| Total South Africa | 12,866,231 | |||||||
|
| |||||||
| South Korea — 3.0% | ||||||||
| 407 | BGF retail Co Ltd | 55,667 | ||||||
| 4,153 | BH Co Ltd | 74,124 | ||||||
| 92,333 | BNK Financial Group Inc | 467,296 | ||||||
| 2,778 | Cheil Worldwide Inc | 42,001 | ||||||
| 2,887 | Coway Co Ltd | 116,478 | ||||||
| 889 | Daihan Pharmaceutical Co Ltd | 19,771 | ||||||
| 6,452 | Daou Data Corp | 236,495 | ||||||
| 2,378 | DB HiTek Co Ltd | 81,240 | ||||||
| 3,404 | DB Insurance Co Ltd | 198,092 | ||||||
| 4,220 | DGB Financial Group Inc | 25,192 | ||||||
| 49,509 | Dongwon Development Co Ltd | 120,538 | ||||||
| 4,705 | E-MART Inc | 397,995 | ||||||
| 13,118 | GS Holdings Corp | 403,185 | ||||||
| 1,832 | GS Retail Co Ltd | 39,923 | ||||||
| 35,576 | Hana Financial Group Inc | 1,220,159 | ||||||
| 1,994 | Handsome Co Ltd | 38,738 | ||||||
| See accompanying notes to the financial statements. | 38 |
GMO Benchmark-Free Fund
(A Series of GMO Trust)
Schedule of Investments — (Continued)
(showing percentage of total net assets)
February 28, 2023
| Shares | Description | Value ($) | ||||||
| South Korea — continued | ||||||||
| 25,658 | Hankook Tire & Technology Co Ltd | 721,748 | ||||||
| 25,723 | HDC Hyundai Development Co-Engineering & Construction * | 201,233 | ||||||
| 5,348 | HMM Co Ltd * | 90,986 | ||||||
| 13,286 | Humasis Co Ltd * | 148,543 | ||||||
| 3,444 | Hyundai Department Store Co Ltd | 141,261 | ||||||
| 7,747 | Hyundai Engineering & Construction Co Ltd | 212,893 | ||||||
| 5,226 | Hyundai Glovis Co Ltd | 625,877 | ||||||
| 1,022 | Hyundai Home Shopping Network Corp | 39,790 | ||||||
| 10,517 | Hyundai Mobis Co Ltd | 1,689,281 | ||||||
| 1,388 | INTOPS Co Ltd | 29,394 | ||||||
| 16,762 | JB Financial Group Co Ltd | 117,044 | ||||||
| 9,622 | KB Financial Group Inc | 372,651 | ||||||
| 1,500 | KB Financial Group Inc ADR | 57,795 | ||||||
| 3,100 | KC Co Ltd | 47,251 | ||||||
| 75 | KCC Corp | 13,885 | ||||||
| 1,095 | KCC Glass Corp | 33,637 | ||||||
| 87,604 | Kia Corp | 4,978,546 | ||||||
| 564 | KIWOOM Securities Co Ltd * | 43,952 | ||||||
| 187 | Korea Investment Holdings Co Ltd * | 8,754 | ||||||
| 955 | Korea Zinc Co Ltd | 421,675 | ||||||
| 20,967 | KT Skylife Co Ltd | 126,992 | ||||||
| 75,898 | KT&G Corp | 5,093,058 | ||||||
| 5,061 | Kumho Petrochemical Co Ltd * | 601,781 | ||||||
| 2,360 | LF Corp | 30,935 | ||||||
| 7,870 | LG Corp | 489,657 | ||||||
| 28,830 | LG Electronics Inc | 2,418,138 | ||||||
| 7,063 | LOTTE Fine Chemical Co Ltd | 309,739 | ||||||
| 12,827 | LX International Corp | 303,467 | ||||||
| 2,374 | LX Semicon Co Ltd | 165,621 | ||||||
| 289 | NCSoft Corp | 94,825 | ||||||
| 687 | NH Investment & Securities Co Ltd * | 4,931 | ||||||
| 80 | NongShim Co Ltd | 22,138 | ||||||
| 1,396 | Orion Corp | 131,956 | ||||||
| 3,385 | POSCO Holdings Inc | 815,864 | ||||||
| 33,746 | POSCO Holdings Inc Sponsored ADR | 2,058,169 | ||||||
| 2,741 | PSK Inc | 36,679 | ||||||
| 84,701 | Samsung Electronics Co Ltd | 3,875,485 | ||||||
| 1,151 | Samsung Electronics Co Ltd GDR (Registered) (a) | 1,317,223 | ||||||
| 21 | Samsung Fire & Marine Insurance Co Ltd | 3,406 | ||||||
| 1,213 | Samsung SDS Co Ltd | 114,720 | ||||||
| 49 | Samyang Foods Co Ltd | 4,413 | ||||||
| 12,731 | SD Biosensor Inc | 221,063 | ||||||
| 123 | Sebang Global Battery Co Ltd | 4,818 | ||||||
| 5,394 | Seegene Inc | 99,263 | ||||||
| 23,286 | Shinhan Financial Group Co Ltd | 683,794 | ||||||
| 25,209 | SK Square Co Ltd * | 729,921 | ||||||
| 4,311 | SL Corp * | 88,831 | ||||||
| 127,275 | Woori Financial Group Inc | 1,173,345 | ||||||
| 12,429 | Woori Technology Investment Co Ltd * | 44,581 | ||||||
| 7,522 | Youngone Corp * | 242,192 | ||||||
|
| |||||||
| Total South Korea | 34,840,095 | |||||||
|
| |||||||
| Shares | Description | Value ($) | ||||||
| Spain — 1.7% | ||||||||
| 165,630 | Acerinox SA | 1,818,747 | ||||||
| 3,445 | ACS Actividades de Construccion y Servicios SA | 104,437 | ||||||
| 24,836 | Amadeus IT Group SA * (a) | 1,561,758 | ||||||
| 685,638 | Banco Bilbao Vizcaya Argentaria SA | 5,329,483 | ||||||
| 2,512,627 | Banco de Sabadell SA | 3,281,982 | ||||||
| 613,555 | Banco Santander SA | 2,415,814 | ||||||
| 69,863 | Bankinter SA | 491,436 | ||||||
| 22,565 | CaixaBank SA | 96,891 | ||||||
| 20,409 | Cia de Distribucion Integral Logista Holdings SA (a) | 492,703 | ||||||
| 50,669 | Ence Energia y Celulosa SA | 193,367 | ||||||
| 2,938 | Faes Farma SA | 10,731 | ||||||
| 1,233 | Grupo Catalana Occidente SA | 40,260 | ||||||
| 44,686 | Industria de Diseno Textil SA (a) | 1,376,629 | ||||||
| 3,881 | Mediaset Espana Comunicacion SA * | 13,520 | ||||||
| 118,951 | Repsol SA | 1,881,191 | ||||||
| 7,215 | Unicaja Banco SA | 9,243 | ||||||
|
| |||||||
| Total Spain | 19,118,192 | |||||||
|
| |||||||
| Sweden — 0.6% | ||||||||
| 14,856 | Betsson AB – Class B* (a) | 133,410 | ||||||
| 147,567 | Fastighets AB Balder – B Shares* | 729,994 | ||||||
| 5,356 | Industrivarden AB – A Shares (a) | 147,223 | ||||||
| 31,008 | Industrivarden AB – C Shares (a) | 850,136 | ||||||
| 40,752 | Investor AB – A Shares | 835,369 | ||||||
| 3,643 | Investor AB – B Shares (a) | 70,370 | ||||||
| 8,047 | Inwido AB | 89,248 | ||||||
| 65,231 | Kinnevik AB – Class B* | 970,107 | ||||||
| 14,504 | New Wave Group AB – B Shares | 254,438 | ||||||
| 25,714 | Skanska AB – B Shares | 467,326 | ||||||
| 212,730 | SSAB AB – A Shares | 1,546,523 | ||||||
| 31,417 | SSAB AB – B Shares | 214,905 | ||||||
| 19,790 | Svenska Cellulosa AB SCA – Class B | 276,177 | ||||||
|
| |||||||
| Total Sweden | 6,585,226 | |||||||
|
| |||||||
| Switzerland — 0.8% | ||||||||
| 48,472 | Adecco Group AG (Registered) | 1,728,331 | ||||||
| 393 | Bobst Group SA (Registered) | 28,791 | ||||||
| 243 | Cie Financiere Richemont SA – Class A (Registered) (a) | 36,716 | ||||||
| 956 | DKSH Holding AG | 77,792 | ||||||
| 30,350 | Logitech International SA (Registered) | 1,657,731 | ||||||
| 2,157 | Mobilezone Holding AG (Registered) | 39,796 | ||||||
| 574 | Roche Holding AG (a) | 177,814 | ||||||
| 8,204 | Roche Holding AG – Genusschein (a) | 2,365,532 | ||||||
| 28 | Swatch Group AG (The) (a) | 9,744 | ||||||
| 1,980 | u-blox Holding AG * | 212,515 | ||||||
| 103,745 | UBS Group AG (Registered) (a) | 2,254,922 | ||||||
| 1,841 | Zurich Insurance Group AG (a) | 873,284 | ||||||
|
| |||||||
| Total Switzerland | 9,462,968 | |||||||
|
| |||||||
| 39 | See accompanying notes to the financial statements. |
GMO Benchmark-Free Fund
(A Series of GMO Trust)
Schedule of Investments — (Continued)
(showing percentage of total net assets)
February 28, 2023
| Shares | Description | Value ($) | ||||||
| Taiwan — 3.9% | ||||||||
| 54,560 | Acer Inc | 45,243 | ||||||
| 14,414 | Acter Group Corp Ltd | 56,590 | ||||||
| 3,000 | Advantech Co Ltd | 34,800 | ||||||
| 5,000 | Allied Supreme Corp | 57,231 | ||||||
| 328,650 | AmTRAN Technology Co Ltd | 114,964 | ||||||
| 95,100 | ASE Technology Holding Co Ltd ADR (a) | 681,867 | ||||||
| 11,000 | ASROCK Inc | 56,937 | ||||||
| 268,035 | Asustek Computer Inc | 2,427,688 | ||||||
| 19,000 | Aten International Co Ltd | 50,766 | ||||||
| 8,400 | Aurora Corp | 22,155 | ||||||
| 411,000 | Catcher Technology Co Ltd | 2,483,687 | ||||||
| 546,972 | Cathay Financial Holding Co Ltd | 775,656 | ||||||
| 25,367 | Chailease Holding Co Ltd | 185,932 | ||||||
| 205,000 | Chicony Electronics Co Ltd | 615,763 | ||||||
| 170,000 | Chipbond Technology Corp | 373,903 | ||||||
| 24,000 | ChipMOS Technologies Inc | 28,564 | ||||||
| 4,000 | Chlitina Holding Ltd | 27,984 | ||||||
| 9,280 | Chong Hong Construction Co Ltd | 23,163 | ||||||
| 6,000 | Chroma ATE Inc | 36,130 | ||||||
| 427,000 | Compal Electronics Inc | 337,693 | ||||||
| 63,440 | Coretronic Corp | 133,671 | ||||||
| 50,000 | Co-Tech Development Corp | 102,234 | ||||||
| 3,000 | Delta Electronics Inc | 28,067 | ||||||
| 24,640 | Elan Microelectronics Corp | 87,227 | ||||||
| 397,200 | Evergreen Marine Corp Taiwan Ltd | 2,029,786 | ||||||
| 183,000 | Far EasTone Telecommunications Co Ltd | 412,930 | ||||||
| 91,000 | Farglory Land Development Co Ltd | 175,847 | ||||||
| 6,000 | Feng TAY Enterprise Co Ltd | 36,144 | ||||||
| 22,600 | First Financial Holding Co Ltd | 19,805 | ||||||
| 50,701 | FLEXium Interconnect Inc * | 163,105 | ||||||
| 7,000 | Formosa International Hotels Corp | 71,699 | ||||||
| 176,000 | Formosa Plastics Corp | 522,468 | ||||||
| 147,821 | Foxconn Technology Co Ltd | 268,812 | ||||||
| 828,765 | Fubon Financial Holding Co Ltd | 1,620,579 | ||||||
| 13,080 | Fusheng Precision Co Ltd | 106,368 | ||||||
| 11,560 | Getac Technology Corp | 18,587 | ||||||
| 12,000 | Gigabyte Technology Co Ltd | 46,467 | ||||||
| 4,000 | Global Mixed Mode Technology Inc | 22,819 | ||||||
| 7,000 | Gourmet Master Co Ltd | 36,122 | ||||||
| 265,000 | Grand Pacific Petrochemical | 172,282 | ||||||
| 5,000 | Grape King Bio Ltd | 29,700 | ||||||
| 17,000 | Holtek Semiconductor Inc | 41,103 | ||||||
| 1,640,318 | Hon Hai Precision Industry Co Ltd | 5,426,174 | ||||||
| 69,000 | Huaku Development Co Ltd | 208,475 | ||||||
| 33,687 | Innodisk Corp | 247,367 | ||||||
| 16,109 | International Games System Co Ltd | 265,415 | ||||||
| 34,000 | Inventec Corp | 29,536 | ||||||
| 2,000 | King Slide Works Co Ltd | 27,276 | ||||||
| 63,000 | King’s Town Bank Co Ltd | 70,284 | ||||||
| 31,000 | Kung Long Batteries Industrial Co Ltd | 142,249 | ||||||
| 22,000 | Largan Precision Co Ltd | 1,581,581 | ||||||
| 410,000 | Lite-On Technology Corp | 932,967 | ||||||
| 4,807 | Makalot Industrial Co Ltd | 33,643 | ||||||
| 86,000 | MediaTek Inc | 2,019,196 | ||||||
| Shares | Description | Value ($) | ||||||
| Taiwan — continued | ||||||||
| 5,408 | Merry Electronics Co Ltd | 15,052 | ||||||
| 217,000 | Micro-Star International Co Ltd | 968,053 | ||||||
| 113,000 | Mitac Holdings Corp | 116,747 | ||||||
| 132,280 | Nan Ya Plastics Corp | 325,465 | ||||||
| 77,903 | Nantex Industry Co Ltd | 110,651 | ||||||
| 76,000 | Nanya Technology Corp | 144,667 | ||||||
| 26,000 | Nichidenbo Corp | 47,893 | ||||||
| 6,800 | Nien Made Enterprise Co Ltd | 72,401 | ||||||
| 105,000 | Novatek Microelectronics Corp | 1,387,638 | ||||||
| 45,000 | Phison Electronics Corp | 512,406 | ||||||
| 664,000 | Pou Chen Corp | 727,575 | ||||||
| 14,000 | Powertech Technology Inc | 40,482 | ||||||
| 2,000 | Poya International Co Ltd | 38,674 | ||||||
| 82,000 | Primax Electronics Ltd | 159,408 | ||||||
| 21,000 | Quanta Computer Inc | 54,967 | ||||||
| 207,472 | Radiant Opto-Electronics Corp | 716,235 | ||||||
| 7,000 | Raydium Semiconductor Corp | 93,824 | ||||||
| 235,400 | Ruentex Industries Ltd | 519,518 | ||||||
| 31,760 | Shin Zu Shing Co Ltd | 92,563 | ||||||
| 68,000 | Shinkong Insurance Co Ltd | 112,417 | ||||||
| 31,900 | Simplo Technology Co Ltd | 308,162 | ||||||
| 6,945 | Sinmag Equipment Corp | 21,906 | ||||||
| 28,080 | Syncmold Enterprise Corp | 56,615 | ||||||
| 11,000 | T3EX Global Holdings Corp | 24,904 | ||||||
| 19,000 | TaiDoc Technology Corp | 117,980 | ||||||
| 205,000 | Taiwan Semiconductor Manufacturing Co Ltd | 3,391,498 | ||||||
| 23,742 | Taiwan Semiconductor Manufacturing Co Ltd Sponsored ADR (a) | 2,067,216 | ||||||
| 31,000 | Taiwan Union Technology Corp | 59,504 | ||||||
| 10,000 | TCI Co Ltd | 69,254 | ||||||
| 22,400 | Teco Electric and Machinery Co Ltd | 22,475 | ||||||
| 7,360 | Test Research Inc | 15,288 | ||||||
| 4,000 | Thinking Electronic Industrial Co Ltd | 18,509 | ||||||
| 36,681 | TOPBI International Holdings Ltd * | 19,606 | ||||||
| 4,000 | Topkey Corp | 28,885 | ||||||
| 40,000 | Transcend Information Inc | 91,924 | ||||||
| 59,000 | Tripod Technology Corp | 202,062 | ||||||
| 12,000 | TTY Biopharm Co Ltd | 30,809 | ||||||
| 20,000 | Tung Ho Steel Enterprise Corp | 38,982 | ||||||
| 43,624 | United Integrated Services Co Ltd | 321,612 | ||||||
| 148,000 | Universal Inc | 116,494 | ||||||
| 345,850 | Wan Hai Lines Ltd | 895,068 | ||||||
| 130,000 | Winbond Electronics Corp | 97,324 | ||||||
| 635,000 | Wistron Corp | 688,008 | ||||||
| 116,000 | WPG Holdings Ltd | 187,504 | ||||||
| 1,186,000 | Yang Ming Marine Transport Corp | 2,496,256 | ||||||
| 1,416,000 | Yuanta Financial Holding Co Ltd | 1,052,869 | ||||||
| 6,000 | Yulon Nissan Motor Co Ltd | 40,060 | ||||||
| 9,669 | Zeng Hsing Industrial Co Ltd | 38,714 | ||||||
| 79,000 | Zhen Ding Technology Holding Ltd | 289,195 | ||||||
|
| |||||||
| Total Taiwan | 44,632,020 | |||||||
|
| |||||||
| See accompanying notes to the financial statements. | 40 |
GMO Benchmark-Free Fund
(A Series of GMO Trust)
Schedule of Investments — (Continued)
(showing percentage of total net assets)
February 28, 2023
| Shares | Description | Value ($) | ||||||
| Thailand — 0.8% | ||||||||
| 2,229,700 | AP Thailand Pcl NVDR | 782,002 | ||||||
| 432,400 | Bangkok Bank Pcl NVDR | 2,000,012 | ||||||
| 105,200 | Bangkok Dusit Medical Services Pcl NVDR | 83,328 | ||||||
| 81,300 | Central Retail Corp Pcl NVDR | 102,869 | ||||||
| 32,300 | CP ALL Pcl (Foreign Registered) | 56,651 | ||||||
| 34,600 | CP ALL Pcl NVDR | 60,685 | ||||||
| 69,100 | GFPT Pcl NVDR | 23,854 | ||||||
| 10,300 | Kasikornbank Pcl (Foreign Registered) | 39,918 | ||||||
| 317,700 | Kasikornbank Pcl NVDR | 1,231,243 | ||||||
| 6,513,600 | Krung Thai Bank Pcl NVDR | 3,188,125 | ||||||
| 53,632 | Pruksa Holding Pcl NVDR | 20,484 | ||||||
| 73,000 | PTG Energy Pcl NVDR | 28,911 | ||||||
| 167,100 | PTT Exploration & Production Pcl NVDR | 707,241 | ||||||
| 36,600 | Regional Container Lines Pcl NVDR | 32,347 | ||||||
| 3,163,500 | Sansiri Pcl NVDR | 170,918 | ||||||
| 141,300 | Somboon Advance Technology Pcl NVDR | 82,351 | ||||||
| 154,700 | Sri Trang Gloves Thailand Pcl NVDR | 48,568 | ||||||
| 23,760 | Supalai Pcl (Foreign Registered) | 15,325 | ||||||
| 91,100 | Thai Oil Pcl NVDR | 129,914 | ||||||
| 88,000 | Thai Vegetable Oil Pcl NVDR | 69,722 | ||||||
|
| |||||||
| Total Thailand | 8,874,468 | |||||||
|
| |||||||
| Turkey — 0.7% | ||||||||
| 2,366,101 | Akbank TAS | 2,187,876 | ||||||
| 7,422 | Arcelik AS | 46,851 | ||||||
| 234,134 | Aselsan Elektronik Sanayi Ve Ticaret AS | 683,462 | ||||||
| 15,360 | Dogus Otomotiv Servis ve Ticaret AS | 137,402 | ||||||
| 11,131 | Enerjisa Enerji AS | 18,951 | ||||||
| 629,490 | Haci Omer Sabanci Holding AS | 1,452,412 | ||||||
| 158,444 | KOC Holding AS | 648,992 | ||||||
| 88,740 | Turkcell Iletisim Hizmetleri AS | 149,593 | ||||||
| 291,727 | Turkiye Garanti Bankasi AS | 359,025 | ||||||
| 83,462 | Turkiye Is Bankasi AS – Class C | 50,089 | ||||||
| 249,998 | Turkiye Sinai Kalkinma Bankasi AS * | 52,432 | ||||||
| 213,634 | Vestel Beyaz Esya Sanayi ve Ticaret AS | 139,553 | ||||||
| 3,628,983 | Yapi ve Kredi Bankasi AS | 1,923,176 | ||||||
|
| |||||||
| Total Turkey | 7,849,814 | |||||||
|
| |||||||
| United Arab Emirates — 0.0% | ||||||||
| 481,607 | Abu Dhabi National Oil Co for Distribution PJSC | 565,875 | ||||||
|
| |||||||
| United Kingdom — 3.5% | ||||||||
| 143,519 | 3i Group Plc (a) | 2,807,840 | ||||||
| 3,173 | AG Barr Plc | 21,219 | ||||||
| 26,016 | BAE Systems Plc (a) | 280,978 | ||||||
| 91,851 | Balfour Beatty Plc | 403,236 | ||||||
| 4,859 | Bank of Georgia Group Plc | 163,620 | ||||||
| 42,912 | Barclays Plc | 90,055 | ||||||
| 416,276 | Barratt Developments Plc | 2,340,501 | ||||||
| 33,313 | Bellway Plc | 888,133 | ||||||
| 51,469 | Berkeley Group Holdings Plc (The) | 2,590,879 | ||||||
| 66,900 | BP Plc Sponsored ADR (a) | 2,649,240 | ||||||
| Shares | Description | Value ($) | ||||||
| United Kingdom — continued | ||||||||
| 46,744 | British American Tobacco Plc (a) | 1,769,062 | ||||||
| 23,400 | British American Tobacco Plc Sponsored ADR (a) | 890,604 | ||||||
| 1,572,312 | BT Group Plc (a) | 2,635,910 | ||||||
| 10,720 | Bunzl Plc | 381,963 | ||||||
| 11,572 | Burberry Group Plc | 343,625 | ||||||
| 550,572 | Centrica Plc (a) | 694,786 | ||||||
| 394 | Clarkson Plc (a) | 15,647 | ||||||
| 8,058 | Coats Group Plc | 7,098 | ||||||
| 75,906 | Coca-Cola HBC AG * | 1,943,908 | ||||||
| 102,927 | Compass Group Plc (a) | 2,377,797 | ||||||
| 26,649 | Crest Nicholson Holdings Plc | 78,314 | ||||||
| 829 | EMIS Group Plc (a) | 18,662 | ||||||
| 23,265 | Evraz Plc (d) | 573 | ||||||
| 182,942 | Ferrexpo Plc | 324,173 | ||||||
| 1,720 | Galliford Try Holdings Plc | 3,635 | ||||||
| 47,800 | Haleon Plc ADR * (a) | 376,664 | ||||||
| 26,552 | Halfords Group Plc | 67,156 | ||||||
| 3,700 | HSBC Holdings Plc Sponsored ADR (a) | 141,747 | ||||||
| 87,165 | IG Group Holdings Plc | 841,464 | ||||||
| 79,804 | Imperial Brands Plc (a) | 1,922,579 | ||||||
| 20,749 | International Personal Finance Plc | 24,076 | ||||||
| 99,947 | Investec Plc | 636,568 | ||||||
| 4,789 | Keller Group Plc | 46,556 | ||||||
| 381,188 | Kingfisher Plc | 1,318,284 | ||||||
| 118,259 | Legal & General Group Plc (a) | 364,013 | ||||||
| 72,896 | Lloyds Banking Group Plc | 46,036 | ||||||
| 167,481 | M&G Plc | 431,359 | ||||||
| 13,089 | Morgan Advanced Materials Plc | 48,720 | ||||||
| 6,762 | Morgan Sindall Group Plc | 145,985 | ||||||
| 81,997 | OSB Group Plc | 550,181 | ||||||
| 9,042 | Paragon Banking Group Plc | 64,836 | ||||||
| 51,109 | Persimmon Plc | 891,273 | ||||||
| 53,747 | Plus500 Ltd | 1,159,415 | ||||||
| 35,451 | Redde Northgate Plc (a) | 172,466 | ||||||
| 84,758 | Redrow Plc | 520,865 | ||||||
| 113,387 | S4 Capital Plc * | 279,496 | ||||||
| 35,708 | Serica Energy Plc | 111,217 | ||||||
| 51,111 | Shell Plc (a) | 1,548,069 | ||||||
| 36,063 | Spirent Communications Plc | 92,262 | ||||||
| 18,260 | Standard Chartered Plc | 172,780 | ||||||
| 470,165 | Taylor Wimpey Plc | 695,486 | ||||||
| 3,340 | TBC Bank Group Plc | 99,660 | ||||||
| 19,589 | Unilever Plc (a) | 975,287 | ||||||
| 11,263 | Vesuvius Plc | 55,883 | ||||||
| 146,247 | Vodafone Group Plc Sponsored ADR (a) | 1,750,577 | ||||||
| 63,748 | WPP Plc (a) | 784,048 | ||||||
|
| |||||||
| Total United Kingdom | 40,056,466 | |||||||
|
| |||||||
| United States — 17.6% | ||||||||
| 12,800 | 3M Co. (a) | 1,379,072 | ||||||
| 600 | Adtalem Global Education, Inc. * (a) | 23,472 | ||||||
| 6,669 | ADTRAN Holdings, Inc. | 116,374 | ||||||
| 500 | AGCO Corp. (a) | 70,405 | ||||||
| 41 | See accompanying notes to the financial statements. |
GMO Benchmark-Free Fund
(A Series of GMO Trust)
Schedule of Investments — (Continued)
(showing percentage of total net assets)
February 28, 2023
| Shares | Description | Value ($) | ||||||
| United States — continued | ||||||||
| 700 | Alliance Data Systems Corp. | 28,749 | ||||||
| 200 | Allison Transmission Holdings, Inc. | 9,500 | ||||||
| 60,800 | Ally Financial, Inc. | 1,827,040 | ||||||
| 14,483 | Alphabet, Inc. – Class A* (a) | 1,304,339 | ||||||
| 2,600 | Alphabet, Inc. – Class C* (a) | 234,780 | ||||||
| 10,042 | American Express Co. (a) | 1,747,208 | ||||||
| 4,000 | Applied Materials, Inc. (a) | 464,600 | ||||||
| 18,700 | Arrow Electronics, Inc. * | 2,206,413 | ||||||
| 900 | Aspen Technology, Inc. * (a) | 190,809 | ||||||
| 92,100 | AT&T, Inc. (a) | 1,741,611 | ||||||
| 1,100 | Atkore, Inc. * | 160,622 | ||||||
| 400 | AutoNation, Inc. * | 54,604 | ||||||
| 1,800 | Avnet, Inc. | 80,478 | ||||||
| 45,500 | Bank of America Corp. (a) | 1,560,650 | ||||||
| 11,800 | Bank of New York Mellon Corp. (The) (a) | 600,384 | ||||||
| 19,300 | Best Buy Co., Inc. (a) | 1,604,023 | ||||||
| 5,800 | Biogen, Inc. * | 1,565,188 | ||||||
| 3,700 | Bio-Rad Laboratories, Inc. – Class A* | 1,768,008 | ||||||
| 738 | Booking Holdings, Inc. * (a) | 1,862,712 | ||||||
| 80,723 | BorgWarner, Inc. | 4,058,752 | ||||||
| 14,200 | Bristol-Myers Squibb Co. (a) | 979,232 | ||||||
| 1,800 | Brunswick Corp. | 157,356 | ||||||
| 6,100 | Cabot Oil & Gas Corp. | 152,317 | ||||||
| 19,600 | Capital One Financial Corp. (a) | 2,137,968 | ||||||
| 5,110 | CarMax, Inc. * (a) | 352,794 | ||||||
| 44,000 | Carrier Global Corp. (a) | 1,981,320 | ||||||
| 1,500 | Carter’s, Inc. | 113,085 | ||||||
| 19,300 | CBRE Group, Inc. – Class A* (a) | 1,643,202 | ||||||
| 30,700 | Centene Corp. * (a) | 2,099,880 | ||||||
| 13,188 | Chevron Corp. (a) | 2,120,235 | ||||||
| 3,000 | Cigna Group (The) (a) | 876,300 | ||||||
| 24,100 | Cisco Systems, Inc. (a) | 1,166,922 | ||||||
| 54,900 | Citigroup, Inc. (a) | 2,782,881 | ||||||
| 4,900 | Citizens Financial Group, Inc. | 204,624 | ||||||
| 96,500 | Cleveland-Cliffs, Inc. * (a) | 2,058,345 | ||||||
| 28,400 | Cognizant Technology Solutions Corp. – Class A (a) | 1,778,692 | ||||||
| 71,700 | Comcast Corp. – Class A (a) | 2,665,089 | ||||||
| 6,800 | ConocoPhillips (a) | 702,780 | ||||||
| 11,500 | Crowdstrike Holdings, Inc. – Class A* (a) | 1,387,935 | ||||||
| 600 | Cummins, Inc. (a) | 145,848 | ||||||
| 26,800 | CVS Health Corp. (a) | 2,238,872 | ||||||
| 24,104 | Darling Ingredients, Inc. * | 1,525,060 | ||||||
| 38,000 | Dell Technologies, Inc. – Class C (a) | 1,544,320 | ||||||
| 10,300 | Discover Financial Services (a) | 1,153,600 | ||||||
| 123,300 | DISH Network Corp. – Class A* | 1,406,853 | ||||||
| 24,700 | DR Horton, Inc. (a) | 2,284,256 | ||||||
| 2,300 | DXC Technology Co. * (a) | 63,802 | ||||||
| 50,600 | eBay, Inc. (a) | 2,322,540 | ||||||
| 1,200 | Elevance Health, Inc. (a) | 563,604 | ||||||
| 900 | Encore Wire Corp. | 173,709 | ||||||
| 19,349 | EOG Resources, Inc. | 2,186,824 | ||||||
| 18,600 | Exxon Mobil Corp. (a) | 2,044,326 | ||||||
| 7,200 | FedEx Corp. (a) | 1,463,184 | ||||||
| Shares | Description | Value ($) | ||||||
| United States — continued | ||||||||
| 2,400 | Ferguson Plc (a) | 345,840 | ||||||
| 54,300 | Fidelity National Financial, Inc. | 2,164,398 | ||||||
| 13,900 | Flex Ltd. * | 316,364 | ||||||
| 5,300 | Foot Locker, Inc. | 231,716 | ||||||
| 210,300 | Ford Motor Co. (a) | 2,538,321 | ||||||
| 26,194 | Fortune Brands Innovations, Inc. | 1,622,718 | ||||||
| 5,900 | Fox Corp. – Class A (a) | 206,618 | ||||||
| 59,000 | Fox Corp. – Class B (a) | 1,902,750 | ||||||
| 55,000 | Franklin Resources, Inc. (a) | 1,620,850 | ||||||
| 7,600 | Gap, Inc. (The) | 98,876 | ||||||
| 2,300 | Garmin Ltd. | 225,699 | ||||||
| 3,041 | Generac Holdings, Inc. * | 364,950 | ||||||
| 67,700 | General Motors Co. | 2,622,698 | ||||||
| 11,400 | Gilead Sciences, Inc. (a) | 918,042 | ||||||
| 3,000 | Goldman Sachs Group, Inc. (The) (a) | 1,054,950 | ||||||
| 100 | Graham Holdings Co. – Class B (a) | 62,666 | ||||||
| 17,379 | Green Plains, Inc. * | 602,530 | ||||||
| 200 | Group 1 Automotive, Inc. | 44,214 | ||||||
| 6,800 | H&R Block, Inc. (a) | 250,240 | ||||||
| 28,600 | Hanesbrands, Inc. | 162,448 | ||||||
| 1,700 | Hartford Financial Services Group, Inc. (The) (a) | 133,076 | ||||||
| 2,100 | Hasbro, Inc. | 115,521 | ||||||
| 1,200 | Henry Schein, Inc. * (a) | 93,972 | ||||||
| 26,800 | Hewlett Packard Enterprise Co. | 418,348 | ||||||
| 9,949 | Hilton Worldwide Holdings, Inc. (a) | 1,437,730 | ||||||
| 700 | HNI Corp. | 21,875 | ||||||
| 82,700 | HP, Inc. | 2,441,304 | ||||||
| 28,400 | Huntington Bancshares, Inc. | 435,088 | ||||||
| 4,200 | Huntsman Corp. | 123,228 | ||||||
| 22,300 | Incyte Corp. * | 1,716,654 | ||||||
| 123,800 | Intel Corp. (a) | 3,086,334 | ||||||
| 16,392 | Intercontinental Exchange, Inc. (a) | 1,668,706 | ||||||
| 22,500 | International Business Machines Corp. (a) | 2,909,250 | ||||||
| 45,500 | Invesco Ltd. | 803,530 | ||||||
| 12,700 | Janus Henderson Group Plc | 348,742 | ||||||
| 11,800 | Jazz Pharmaceuticals Plc * | 1,656,720 | ||||||
| 1,300 | Jefferies Financial Group, Inc. | 49,127 | ||||||
| 5,600 | Johnson & Johnson (a) | 858,256 | ||||||
| 13,200 | JPMorgan Chase & Co. (a) | 1,892,220 | ||||||
| 4,400 | KeyCorp. | 80,476 | ||||||
| 105,600 | Kinder Morgan, Inc. (a) | 1,801,536 | ||||||
| 18,500 | Knight-Swift Transportation Holdings, Inc. (a) | 1,051,540 | ||||||
| 8,900 | Kohl’s Corp. | 249,556 | ||||||
| 50,900 | Kraft Heinz Co. (The) (a) | 1,982,046 | ||||||
| 4,800 | Kroger Co. (The) (a) | 207,072 | ||||||
| 4,400 | Kulicke & Soffa Industries, Inc. | 234,520 | ||||||
| 8,800 | Laboratory Corp. of America Holdings (a) | 2,106,368 | ||||||
| 1,870 | Lam Research Corp. (a) | 908,839 | ||||||
| 25,773 | Las Vegas Sands Corp. * (a) | 1,481,174 | ||||||
| 2,700 | La-Z-Boy, Inc. | 87,426 | ||||||
| 900 | Lear Corp. | 125,685 | ||||||
| 22,300 | Lennar Corp. – Class A (a) | 2,157,302 | ||||||
| See accompanying notes to the financial statements. | 42 |
GMO Benchmark-Free Fund
(A Series of GMO Trust)
Schedule of Investments — (Continued)
(showing percentage of total net assets)
February 28, 2023
| Shares | Description | Value ($) | ||||||
| United States — continued | ||||||||
| 2,300 | Liberty Global Plc – Class A* | 47,127 | ||||||
| 14,300 | Liberty Global Plc – Class C* | 303,875 | ||||||
| 33,700 | Lincoln National Corp. | 1,068,964 | ||||||
| 400 | Lithia Motors, Inc. | 102,072 | ||||||
| 442,028 | Lumen Technologies, Inc. | 1,502,895 | ||||||
| 19,100 | LyondellBasell Industries NV – Class A (a) | 1,833,409 | ||||||
| 11,100 | Macy’s, Inc. | 227,106 | ||||||
| 3,600 | ManpowerGroup, Inc. | 305,568 | ||||||
| 800 | Marcus & Millichap, Inc. | 27,496 | ||||||
| 1,100 | Markel Corp. * (a) | 1,462,846 | ||||||
| 5,700 | Match Group, Inc. * (a) | 236,094 | ||||||
| 500 | Matson, Inc. (a) | 33,255 | ||||||
| 6,300 | Medtronic Plc (a) | 521,640 | ||||||
| 8,500 | Merck & Co., Inc. (a) | 903,040 | ||||||
| 32,367 | Meta Platforms, Inc. – Class A* (a) | 5,662,283 | ||||||
| 8,900 | MetLife, Inc. (a) | 638,397 | ||||||
| 60,793 | Micron Technology, Inc. (a) | 3,515,051 | ||||||
| 14,100 | Mohawk Industries, Inc. * | 1,450,185 | ||||||
| 36,700 | Molson Coors Brewing Co. – Class B (a) | 1,952,073 | ||||||
| 32,517 | Mosaic Co. (The) (a) | 1,729,579 | ||||||
| 1,400 | Nordstrom, Inc. | 27,272 | ||||||
| 3,600 | Northern Trust Corp. (a) | 342,972 | ||||||
| 42,100 | NRG Energy, Inc. (a) | 1,380,459 | ||||||
| 10,900 | Nucor Corp. (a) | 1,825,096 | ||||||
| 34,100 | Occidental Petroleum Corp. | 1,996,896 | ||||||
| 3,300 | Oracle Corp. (a) | 288,420 | ||||||
| 10,795 | Otis Worldwide Corp. (a) | 913,473 | ||||||
| 20,386 | Ovintiv, Inc. | 871,909 | ||||||
| 3,700 | Owens Corning | 361,823 | ||||||
| 98,400 | Paramount Global – Class B (a) | 2,107,728 | ||||||
| 25,200 | PayPal Holdings, Inc. * (a) | 1,854,720 | ||||||
| 35,400 | Pfizer, Inc. (a) | 1,436,178 | ||||||
| 1,600 | Phillips 66 | 164,096 | ||||||
| 3,000 | PNC Financial Services Group, Inc. | 473,760 | ||||||
| 3,700 | Principal Financial Group, Inc. (a) | 331,372 | ||||||
| 25,200 | Prudential Financial, Inc. (a) | 2,520,000 | ||||||
| 37,000 | PulteGroup, Inc. (a) | 2,022,790 | ||||||
| 4,800 | PVH Corp. | 385,152 | ||||||
| 9,700 | QUALCOMM, Inc. (a) | 1,198,241 | ||||||
| 11,100 | Radian Group, Inc. | 236,985 | ||||||
| 200 | Ralph Lauren Corp. | 23,638 | ||||||
| 18,787 | Raytheon Technologies Corp. (a) | 1,842,817 | ||||||
| 3,500 | Regeneron Pharmaceuticals, Inc. * (a) | 2,661,470 | ||||||
| 18,600 | Regions Financial Corp. | 433,752 | ||||||
| 1,500 | Reliance Steel & Aluminum Co. (a) | 371,760 | ||||||
| 7,900 | Resolute Forest Products, Inc. * | 173,285 | ||||||
| 14,100 | Samsonite International SA * | 39,571 | ||||||
| 2,200 | Schneider National, Inc. – Class B (a) | 61,732 | ||||||
| 15,105 | Sensata Technologies Holding Plc | 764,011 | ||||||
| 7,900 | Skyworks Solutions, Inc. | 881,403 | ||||||
| 6,000 | SS&C Technologies Holdings, Inc. (a) | 352,200 | ||||||
| 700 | Stanley Black & Decker, Inc. | 59,927 | ||||||
| 6,000 | State Street Corp. (a) | 532,080 | ||||||
| 17,000 | Steel Dynamics, Inc. (a) | 2,143,870 | ||||||
| Shares | Description | Value ($) | ||||||
| United States — continued | ||||||||
| 1,700 | Stewart Information Services Corp. | 72,233 | ||||||
| 62,400 | Synchrony Financial (a) | 2,228,304 | ||||||
| 2,000 | Tapestry, Inc. | 87,020 | ||||||
| 4,500 | Taylor Morrison Home Corp. – Class A* | 161,235 | ||||||
| 13,400 | Textron, Inc. (a) | 971,902 | ||||||
| 1,400 | TRI Pointe Homes, Inc. * | 33,376 | ||||||
| 7,400 | Truist Financial Corp. | 347,430 | ||||||
| 35,900 | Tyson Foods, Inc. – Class A (a) | 2,126,716 | ||||||
| 400 | Universal Corp. | 20,236 | ||||||
| 12,100 | �� | Universal Health Services, Inc. – Class B (a) | 1,616,197 | |||||
| 2,400 | Unum Group | 106,920 | ||||||
| 35,423 | US Bancorp | 1,690,740 | ||||||
| 200 | USANA Health Sciences, Inc. * | 12,156 | ||||||
| 89,200 | Verizon Communications, Inc. (a) | 3,461,852 | ||||||
| 4,800 | Vertex Pharmaceuticals, Inc. * (a) | 1,393,392 | ||||||
| 2,100 | VF Corp. | 52,122 | ||||||
| 189,900 | Viatris, Inc. | 2,164,860 | ||||||
| 45,100 | Walgreens Boots Alliance, Inc. (a) | 1,602,403 | ||||||
| 48,048 | Warner Bros Discovery, Inc. * (a) | 750,510 | ||||||
| 44,200 | Wells Fargo & Co. (a) | 2,067,234 | ||||||
| 141,200 | Western Union Co. (The) (a) | 1,829,952 | ||||||
| 35,300 | Western Digital Corp. * | 1,358,344 | ||||||
| 13,100 | Westlake Corp. | 1,560,734 | ||||||
| 11,700 | Whirlpool Corp. | 1,614,366 | ||||||
| 200 | Williams-Sonoma, Inc. | 24,984 | ||||||
| 3,200 | Xerox Holdings Corp. | 52,768 | ||||||
| 2,700 | Zions Bancorp NA | 136,674 | ||||||
| 26,100 | Zoom Video Communications, Inc. – Class A* (a) | 1,946,799 | ||||||
|
| |||||||
| Total United States | 203,272,929 | |||||||
|
| |||||||
| Vietnam — 0.2% | ||||||||
| 229,000 | Duc Giang Chemicals JSC | 482,718 | ||||||
| 21,900 | IDICO Corp JSC | 35,396 | ||||||
| 237,500 | SSI Securities Corp | 182,433 | ||||||
| 172,600 | Vietnam Dairy Products JSC | 548,551 | ||||||
| 368,700 | Vietnam Joint Stock Commercial Bank for Industry and Trade * | 425,112 | ||||||
| 1,233,600 | VNDirect Securities Corp | 698,340 | ||||||
|
| |||||||
| Total Vietnam | 2,372,550 | |||||||
|
| |||||||
TOTAL COMMON STOCKS (COST $905,796,269) | 816,471,649 | |||||||
|
| |||||||
| PREFERRED STOCKS (g) — 1.6% | ||||||||
| Brazil — 1.1% | ||||||||
| 100 | Banco do Estado do Rio Grande do Sul SA – Class B | 191 | ||||||
| 212,717 | Bradespar SA | 1,123,829 | ||||||
| 266,099 | Cia Energetica de Minas Gerais | 532,661 | ||||||
| 52,100 | Cia Energetica de Minas Gerais Sponsored ADR (a) | 101,595 | ||||||
| 2,200 | Cia Ferro Ligas da Bahia | 24,141 | ||||||
| 569,300 | Cia Paranaense de Energia – Class B | 766,613 | ||||||
| 43 | See accompanying notes to the financial statements. |
GMO Benchmark-Free Fund
(A Series of GMO Trust)
Schedule of Investments — (Continued)
(showing percentage of total net assets)
February 28, 2023
| Shares / Par Value† | Description | Value ($) | ||||||
| Brazil — continued | ||||||||
| 229,000 | Gerdau SA | 1,252,284 | ||||||
| 261,667 | Gerdau SA Sponsored ADR | 1,431,318 | ||||||
| 164,700 | Itau Unibanco Holding SA Sponsored ADR | 792,207 | ||||||
| 156,300 | Itausa SA | 245,700 | ||||||
| 93,200 | Metalurgica Gerdau SA | 223,946 | ||||||
| 524,500 | Petroleo Brasileiro SA | 2,528,604 | ||||||
| 291,100 | Petroleo Brasileiro SA Sponsored ADR | 2,841,136 | ||||||
| 4,000 | Unipar Carbocloro SA – Class B | 60,579 | ||||||
|
| |||||||
| Total Brazil | 11,924,804 | |||||||
|
| |||||||
| Chile — 0.1% | ||||||||
| 11,600 | Sociedad Quimica y Minera de Chile SA | |||||||
| Sponsored ADR | 1,029,500 | |||||||
|
| |||||||
| Colombia — 0.0% | ||||||||
| 297,879 | Grupo Aval Acciones y Valores SA | 33,101 | ||||||
|
| |||||||
| Germany — 0.2% | ||||||||
| 13,833 | Bayerische Motoren Werke AG | 1,310,205 | ||||||
| 2,245 | Draegerwerk AG & Co KGaA (a) | 97,903 | ||||||
| 512 | Villeroy & Boch AG | 10,747 | ||||||
| 8,751 | Volkswagen AG (a) | 1,191,235 | ||||||
|
| |||||||
| Total Germany | 2,610,090 | |||||||
|
| |||||||
| Russia — 0.0% | ||||||||
| 12,924 | Bashneft PJSC (d) | 1,390 | ||||||
| 56,000 | Nizhnekamskneftekhim PJSC (d) | 637 | ||||||
| 20,810 | Sberbank of Russia PJSC * (d) (f) | 464 | ||||||
| 9,254,300 | Surgutneftegas PJSC (d) | 34,317 | ||||||
| 161 | Transneft PJSC (d) | 1,963 | ||||||
|
| |||||||
| Total Russia | 38,771 | |||||||
|
| |||||||
| South Korea — 0.2% | ||||||||
| 2,160 | Hyundai Motor Co GDR (Registered) | 75,608 | ||||||
| 2,725 | LG Electronics Inc | 97,705 | ||||||
| 55,756 | Samsung Electronics Co Ltd | 2,248,307 | ||||||
| 89 | Samsung Electronics Co Ltd GDR (Registered) | 90,331 | ||||||
|
| |||||||
| Total South Korea | 2,511,951 | |||||||
|
| |||||||
| Taiwan — 0.0% | ||||||||
| 10,589 | Chailease Holding Co Ltd | 34,592 | ||||||
|
| |||||||
TOTAL PREFERRED STOCKS (COST $24,093,609) | 18,182,809 | |||||||
|
| |||||||
| DEBT OBLIGATIONS — 20.6% | ||||||||
| United States — 20.6% | ||||||||
| U.S. Government — 17.7% | ||||||||
| 77,400,000 | U.S. Treasury Note, 0.13%, due 04/30/23 | 76,797,065 | ||||||
| 7,000,000 | U.S. Treasury Note, 0.13%, due 05/31/23 | 6,917,159 | ||||||
| 13,700,000 | U.S. Treasury Note, 0.13%, due 06/30/23 | 13,482,726 | ||||||
| Par Value† / Shares | Description | Value ($) | ||||||
| United States — continued | ||||||||
| U.S. Government — continued | ||||||||
| 1,000,000 | U.S. Treasury Note, 0.13%, due 07/31/23 | 979,883 | ||||||
| 43,725,000 | U.S. Treasury Note, Variable Rate, USBM + 0.04%, 4.84%, due 10/31/23 | 43,712,517 | ||||||
| 32,000,000 | U.S. Treasury Note, Variable Rate, USBM - 0.08%, 4.73%, due 04/30/24 | 31,951,530 | ||||||
| 30,000,000 | U.S. Treasury Note, Variable Rate, USBM + 0.04%, 4.84%, due 07/31/24 (a) | 29,989,727 | ||||||
|
| |||||||
| Total U.S. Government | 203,830,607 | |||||||
|
| |||||||
| U.S. Government Agency — 2.9% | ||||||||
| 16,000,000 | Federal Home Loan Banks, 5.23%, due 03/22/24 | 16,007,243 | ||||||
| 9,500,000 | Federal Home Loan Banks, Variable Rate, SOFR + 0.10%, 4.65%, due 09/04/24 | 9,500,000 | ||||||
| 8,000,000 | Federal Home Loan Banks, SOFR + 0.03%, 4.58%, due 06/07/23 | 7,999,986 | ||||||
|
| |||||||
| Total U.S. Government Agency | 33,507,229 | |||||||
|
| |||||||
| Total United States | 237,337,836 | |||||||
|
| |||||||
TOTAL DEBT OBLIGATIONS (COST $238,084,846) | 237,337,836 | |||||||
|
| |||||||
| MUTUAL FUNDS — 24.9% | ||||||||
| United States — 24.9% | ||||||||
| Affiliated Issuers — 24.9% | ||||||||
| 4,706,698 | GMO Emerging Country Debt Fund, Class VI | 83,120,284 | ||||||
| 3,809,610 | GMO High Yield Fund, Class VI | 63,734,779 | ||||||
| 2,847,952 | GMO Opportunistic Income Fund, Class VI | 68,635,629 | ||||||
| 1,645,883 | GMO Resources Fund | 41,081,249 | ||||||
| 1,023,784 | GMO SGM Major Markets Fund, Class VI | 29,075,472 | ||||||
| 246,586 | GMO U.S. Treasury Fund (h) | 1,230,461 | ||||||
|
| |||||||
| Total Affiliated Issuers | 286,877,874 | |||||||
|
| |||||||
| TOTAL MUTUAL FUNDS (COST $325,645,034) | 286,877,874 | |||||||
|
| |||||||
| SHORT-TERM INVESTMENTS — 8.2% |
| |||||||
| Money Market Funds — 0.2% | ||||||||
| 2,997,967 | State Street Institutional Treasury Money Market Fund – Premier Class, 4.42% (i) | 2,997,967 | ||||||
|
| |||||||
| See accompanying notes to the financial statements. | 44 |
GMO Benchmark-Free Fund
(A Series of GMO Trust)
Schedule of Investments — (Continued)
(showing percentage of total net assets)
February 28, 2023
| Shares | Description | Value ($) | ||||||
| Repurchase Agreements — 8.0% | ||||||||
| 91,999,073 | Nomura Securities International, Inc. Repurchase Agreement, dated 02/28/23, maturing on 03/01/23 with a maturity value of $92,010,598 and an effective yield of 4.51%, collateralized by a U.S. Treasury Note with maturity date 12/31/29 and a market value of $93,876,605. | 91,999,073 | ||||||
|
| |||||||
TOTAL SHORT-TERM INVESTMENTS (COST $94,997,040) | 94,997,040 | |||||||
|
| |||||||
TOTAL INVESTMENTS — 126.1% (Cost $1,588,616,798) | 1,453,867,208 | |||||||
|
| |||||||
| SECURITIES SOLD SHORT — (20.3)% |
| |||||||
| Common Stocks — (20.2)% | ||||||||
| Australia — (0.5)% | ||||||||
| (29,801) | ASX Ltd | (1,361,199 | ) | |||||
| (6,255) | Cochlear Ltd | (932,775 | ) | |||||
| (36,815) | IDP Education Ltd | (707,996 | ) | |||||
| (590,364) | Pilbara Minerals Ltd* | (1,645,089 | ) | |||||
| (166,314) | Qantas Airways Ltd* | (715,317 | ) | |||||
| (18,702) | Ramsay Health Care Ltd | (847,890 | ) | |||||
|
| |||||||
| Total Australia | (6,210,266 | ) | ||||||
|
| |||||||
| Austria — (0.1)% | ||||||||
| (18,499) | Verbund AG | (1,599,838 | ) | |||||
|
| �� | ||||||
| Belgium — (0.2)% | ||||||||
| (33,223) | Anheuser-Busch InBev SA/NV | (2,015,259 | ) | |||||
|
| |||||||
| Canada — (1.2)% | ||||||||
| (25,742) | Agnico Eagle Mines Ltd | (1,184,904 | ) | |||||
| (19,500) | Algonquin Power & Utilities Corp | (148,785 | ) | |||||
| (83,200) | AltaGas Ltd | (1,428,028 | ) | |||||
| (43,400) | Brookfield Renewable Corp – Class A | (1,208,690 | ) | |||||
| (50,034) | Enbridge Inc | (1,877,276 | ) | |||||
| (14,602) | Franco-Nevada Corp | (1,862,777 | ) | |||||
| (104,930) | Pan American Silver Corp | (1,559,260 | ) | |||||
| (57,400) | Pembina Pipeline Corp | (1,885,016 | ) | |||||
| (28,600) | Restaurant Brands International Inc | (1,844,414 | ) | |||||
| (7,200) | Ritchie Bros Auctioneers Inc | (440,424 | ) | |||||
|
| |||||||
| Total Canada | (13,439,574 | ) | ||||||
|
| |||||||
| Denmark — (0.1)% | ||||||||
| (1,368) | Coloplast A/S – Class B | (158,067 | ) | |||||
| (38,136) | Tryg A/S | (844,844 | ) | |||||
|
| |||||||
| Total Denmark | (1,002,911 | ) | ||||||
|
| |||||||
| Finland — (0.0)% | ||||||||
| (9,105) | Elisa Oyj | (517,056 | ) | |||||
|
| |||||||
| Shares | Description | Value ($) | ||||||
| France — (0.7)% | ||||||||
| (54,333) | Accor SA* | (1,803,274 | ) | |||||
| (10,110) | Aeroports de Paris* | (1,464,853 | ) | |||||
| (291) | Euronext NV | (21,226 | ) | |||||
| (101,611) | Getlink SE | (1,706,540 | ) | |||||
| (1,217) | Hermes International | (2,202,931 | ) | |||||
| (1,109) | Sartorius Stedim Biotech | (361,198 | ) | |||||
| (2,638) | Ubisoft Entertainment SA* | (57,838 | ) | |||||
|
| |||||||
| Total France | (7,617,860 | ) | ||||||
|
| |||||||
| Germany — (0.9)% | ||||||||
| (42,487) | Delivery Hero SE* | (1,707,367 | ) | |||||
| (7,713) | Deutsche Boerse AG | (1,344,946 | ) | |||||
| (6,440) | MTU Aero Engines AG | (1,554,120 | ) | |||||
| (11,244) | Puma SE | (715,731 | ) | |||||
| (1,440) | Rational AG | (955,141 | ) | |||||
| (16,386) | Symrise AG – Class A | (1,674,146 | ) | |||||
| (483,048) | Telefonica Deutschland Holding AG | (1,465,295 | ) | |||||
| (8,430) | Zalando SE* | (333,997 | ) | |||||
|
| |||||||
| Total Germany | (9,750,743 | ) | ||||||
|
| |||||||
| Ireland — (0.0)% | ||||||||
| (2,893) | Flutter Entertainment Plc* | (462,335 | ) | |||||
|
| |||||||
| Israel — (0.2)% | ||||||||
| (12,800) | CyberArk Software Ltd* | (1,853,056 | ) | |||||
| (4,400) | Wix.com Ltd* | (398,332 | ) | |||||
|
| |||||||
| Total Israel | (2,251,388 | ) | ||||||
|
| |||||||
| Italy — (0.6)% | ||||||||
| (46,681) | Amplifon SPA | (1,349,784 | ) | |||||
| (6,763) | Ferrari NV (c) | (1,754,635 | ) | |||||
| (1,800) | Ferrari NV (c) | (468,666 | ) | |||||
| (118,456) | FinecoBank Banca Fineco SPA | (2,046,975 | ) | |||||
| (148,767) | Infrastrutture Wireless Italiane SPA | (1,637,341 | ) | |||||
|
| |||||||
| Total Italy | (7,257,401 | ) | ||||||
|
| |||||||
| Japan — (2.1)% | ||||||||
| (43,500) | Aeon Co Ltd | (811,356 | ) | |||||
| (78,900) | ANA Holdings Inc* | (1,600,768 | ) | |||||
| (57,400) | Asahi Intecc Co Ltd | (977,295 | ) | |||||
| (16,800) | GMO Payment Gateway Inc | (1,379,880 | ) | |||||
| (77,300) | Japan Airlines Co Ltd* | (1,455,552 | ) | |||||
| (46,900) | Japan Exchange Group Inc | (699,495 | ) | |||||
| (25,400) | Keio Corp | (884,992 | ) | |||||
| (17,800) | Keisei Electric Railway Co Ltd | (514,530 | ) | |||||
| (10,600) | Lasertec Corp | (1,723,511 | ) | |||||
| (7,500) | LIXIL Corp | (119,567 | ) | |||||
| (58,500) | M3 Inc | (1,395,062 | ) | |||||
| (105,600) | MonotaRO Co Ltd | (1,436,303 | ) | |||||
| (2,100) | Nidec Corp | (106,574 | ) | |||||
| (73,200) | Nihon M&A Center Holdings Inc | (610,314 | ) | |||||
| (100,700) | Nippon Paint Holdings Co Ltd | (879,968 | ) | |||||
| (78,100) | Odakyu Electric Railway Co Ltd | (946,792 | ) | |||||
| 45 | See accompanying notes to the financial statements. |
GMO Benchmark-Free Fund
(A Series of GMO Trust)
Schedule of Investments — (Continued)
(showing percentage of total net assets)
February 28, 2023
| Shares | Description | Value ($) | ||||||
| Japan — continued | ||||||||
| (13,100) | Oriental Land Co Ltd | (2,091,873 | ) | |||||
| (323,600) | Rakuten Group Inc | (1,595,083 | ) | |||||
| (22,400) | Shiseido Co Ltd | (1,032,137 | ) | |||||
| (167,500) | SoftBank Corp | (1,889,561 | ) | |||||
| (27,100) | Tobu Railway Co Ltd | (605,035 | ) | |||||
| (71,800) | Tokyu Corp | (864,973 | ) | |||||
| (21,600) | West Japan Railway Co | (838,362 | ) | |||||
|
| |||||||
| Total Japan | (24,458,983 | ) | ||||||
|
| |||||||
| Netherlands — (0.5)% | ||||||||
| (1,302) | Adyen NV* | (1,845,493 | ) | |||||
| (8,869) | IMCD NV | (1,403,883 | ) | |||||
| (48,387) | Just Eat Takeaway.com NV* | (1,052,432 | ) | |||||
| (544) | OCI NV | (18,070 | ) | |||||
| (80,195) | Universal Music Group NV | (1,889,502 | ) | |||||
|
| |||||||
| Total Netherlands | (6,209,380 | ) | ||||||
|
| |||||||
| New Zealand — (0.1)% | ||||||||
| (30,206) | Xero Ltd* | (1,573,242 | ) | |||||
|
| |||||||
| Norway — (0.2)% | ||||||||
| (63,486) | Aker BP ASA | (1,704,004 | ) | |||||
|
| |||||||
| Peru — (0.2)% | ||||||||
| (25,120) | Southern Copper Corp | (1,851,093 | ) | |||||
|
| |||||||
| Russia — (0.0)% | ||||||||
| (1,138) | Magnit PJSC* (d) | (694 | ) | |||||
|
| |||||||
| Singapore — (0.2)% | ||||||||
| (281,196) | Grab Holdings Ltd – Class A* | (902,639 | ) | |||||
| (161,700) | Singapore Exchange Ltd | (1,044,316 | ) | |||||
|
| |||||||
| Total Singapore | (1,946,955 | ) | ||||||
|
| |||||||
| Spain — (0.3)% | ||||||||
| (53,528) | Cellnex Telecom SA | (2,008,303 | ) | |||||
| (69,506) | Ferrovial SA | (1,929,199 | ) | |||||
|
| |||||||
| Total Spain | (3,937,502 | ) | ||||||
|
| |||||||
| Sweden — (0.2)% | ||||||||
| (14,159) | Evolution AB | (1,708,519 | ) | |||||
|
| |||||||
| Switzerland — (0.3)% | ||||||||
| (8) | Chocoladefabriken Lindt & Spruengli AG | (87,645 | ) | |||||
| (2) | Chocoladefabriken Lindt & Spruengli AG (Registered) | (221,544 | ) | |||||
| (1,248) | Partners Group Holding AG | (1,181,773 | ) | |||||
| (2,048) | Sika AG (Registered) | (574,310 | ) | |||||
| (10,413) | Straumann Holding AG (Registered) | (1,380,511 | ) | |||||
|
| |||||||
| Total Switzerland | (3,445,783 | ) | ||||||
|
| |||||||
| United Kingdom — (1.1)% | ||||||||
| (10,994) | Admiral Group Plc | (290,923 | ) | |||||
| Shares | Description | Value ($) | ||||||
| United Kingdom — continued | ||||||||
| (177,676) | Auto Trader Group Plc | (1,270,753 | ) | |||||
| (13,939) | Halma Plc | (362,783 | ) | |||||
| (104,068) | Hargreaves Lansdown Plc | (1,036,930 | ) | |||||
| (258,928) | Informa Plc | (2,079,980 | ) | |||||
| (25,638) | InterContinental Hotels Group Plc | (1,728,290 | ) | |||||
| (21,401) | London Stock Exchange Group Plc | (1,909,434 | ) | |||||
| (180,555) | Ocado Group Plc* | (1,193,110 | ) | |||||
| (4,042) | Prudential Plc | (61,774 | ) | |||||
| (1,292,469) | Rolls-Royce Holdings Plc* | (2,251,866 | ) | |||||
| (3,857) | Spirax-Sarco Engineering Plc | (541,681 | ) | |||||
|
| |||||||
| Total United Kingdom | (12,727,524 | ) | ||||||
|
| |||||||
| United States — (10.5)% | ||||||||
| (75,100) | AES Corp. (The) | (1,853,468 | ) | |||||
| (10,200) | Alnylam Pharmaceuticals, Inc.* | (1,952,790 | ) | |||||
| (41,900) | Altria Group, Inc. | (1,945,417 | ) | |||||
| (5,400) | American Tower Corp. (REIT) | (1,069,254 | ) | |||||
| (3,300) | Aon Plc – Class A | (1,003,365 | ) | |||||
| (14,300) | Aramark | (526,240 | ) | |||||
| (22,776) | Ares Management Corp. – Class A | (1,836,429 | ) | |||||
| (10,700) | Arthur J Gallagher & Co. | (2,004,645 | ) | |||||
| (300) | Autodesk, Inc.* | (59,607 | ) | |||||
| (18,196) | Bills Holdings, Inc.* | (1,539,927 | ) | |||||
| (16,000) | Bio-Techne Corp. | (1,162,240 | ) | |||||
| (10,600) | Boeing Co. (The)* | (2,136,430 | ) | |||||
| (3,000) | Broadcom, Inc. | (1,782,870 | ) | |||||
| (9,000) | Burlington Stores, Inc.* | (1,928,250 | ) | |||||
| (41,300) | Caesars Entertainment, Inc.* | (2,096,388 | ) | |||||
| (27,900) | Ceridian HCM Holding, Inc.* | (2,034,747 | ) | |||||
| (1,300) | Chipotle Mexican Grill, Inc. – Class A* | (1,938,404 | ) | |||||
| (96,150) | Clarivate Plc* | (974,000 | ) | |||||
| (33,400) | Cloudflare, Inc. – Class A* | (2,004,334 | ) | |||||
| (2,900) | Crown Castle, Inc. (REIT) | (379,175 | ) | |||||
| (48,200) | Delta Air Lines, Inc.* | (1,847,988 | ) | |||||
| (16,600) | Dexcom, Inc.* | (1,842,766 | ) | |||||
| (14,000) | Diamondback Energy, Inc. | (1,968,120 | ) | |||||
| (13,000) | Equity LifeStyle Properties, Inc. (REIT) | (890,630 | ) | |||||
| (500) | Erie Indemnity Co. – Class A | (117,695 | ) | |||||
| (11,000) | Essential Utilities, Inc. | (470,580 | ) | |||||
| (30,400) | Exact Sciences Corp.* | (1,894,832 | ) | |||||
| (21,200) | Fastenal Co. | (1,093,072 | ) | |||||
| (30,900) | Fortinet, Inc.* | (1,836,696 | ) | |||||
| (5,200) | Gartner, Inc.* | (1,704,612 | ) | |||||
| (8,900) | Hess Corp. | (1,198,830 | ) | |||||
| (5,500) | HubSpot, Inc.* | (2,127,730 | ) | |||||
| (4,200) | IDEXX Laboratories, Inc.* | (1,987,608 | ) | |||||
| (19,200) | Ingersoll Rand, Inc. | (1,114,944 | ) | |||||
| (6,900) | Insulet Corp.* | (1,906,884 | ) | |||||
| (8,700) | IQVIA Holdings, Inc.* | (1,813,689 | ) | |||||
| (20,500) | Iron Mountain, Inc. (REIT) | (1,081,375 | ) | |||||
| (11,405) | Lamb Weston Holdings, Inc. | (1,147,799 | ) | |||||
| (30,400) | Liberty Media Corp.-Liberty Formula One – Class C* | (2,063,248 | ) | |||||
| (6,100) | Linde Plc | (2,125,057 | ) | |||||
| See accompanying notes to the financial statements. | 46 |
GMO Benchmark-Free Fund
(A Series of GMO Trust)
Schedule of Investments — (Continued)
(showing percentage of total net assets)
February 28, 2023
| Shares | Description | Value ($) | ||||||
| United States — continued | ||||||||
| (27,800) | Live Nation Entertainment, Inc.* | (2,003,268 | ) | |||||
| (5,700) | MarketAxess Holdings, Inc. | (1,946,265 | ) | |||||
| (9,600) | MongoDB, Inc. – Class A* | (2,011,392 | ) | |||||
| (2,200) | Monolithic Power Systems, Inc. | (1,065,438 | ) | |||||
| (2,800) | Moody’s Corp. | (812,420 | ) | |||||
| (3,800) | MSCI, Inc. – Class A | (1,984,170 | ) | |||||
| (34,826) | Newmont Corp. | (1,518,762 | ) | |||||
| (61,100) | NiSource, Inc. | (1,675,973 | ) | |||||
| (21,535) | Novocure Ltd.* | (1,657,549 | ) | |||||
| (28,600) | Okta, Inc.* | (2,038,894 | ) | |||||
| (26,700) | ONEOK, Inc. | (1,747,515 | ) | |||||
| (144,900) | Palantir Technologies, Inc. – Class A* | (1,136,016 | ) | |||||
| (13,300) | Paychex, Inc. | (1,468,320 | ) | |||||
| (600) | Paylocity Holding Corp.* | (115,566 | ) | |||||
| (19,300) | Philip Morris International, Inc. | (1,877,890 | ) | |||||
| (1,500) | PTC, Inc.* | (187,995 | ) | |||||
| (100) | Repligen Corp.* | (17,437 | ) | |||||
| (54,800) | ROBLOX Corp. – Class A* | (2,007,872 | ) | |||||
| (24,300) | Roku, Inc.* | (1,571,967 | ) | |||||
| (48,279) | Rollins, Inc. | (1,699,421 | ) | |||||
| (30,200) | Royal Caribbean Cruises Ltd.* | (2,133,328 | ) | |||||
| (10,100) | Seagen, Inc.* | (1,814,869 | ) | |||||
| (4,300) | ServiceNow, Inc.* | (1,858,331 | ) | |||||
| (6,300) | Sherwin-Williams Co. (The) | (1,394,505 | ) | |||||
| (8,200) | Simon Property Group, Inc. (REIT) | (1,001,138 | ) | |||||
| (8,400) | Snowflake, Inc. – Class A* | (1,296,792 | ) | |||||
| (18,300) | Starbucks Corp. | (1,868,247 | ) | |||||
| (5,400) | Sysco Corp. | (402,678 | ) | |||||
| (11,449) | Tesla, Inc.* | (2,355,174 | ) | |||||
| (39,303) | Toast, Inc. – Class A* | (743,613 | ) | |||||
| (29,000) | Trade Desk, Inc. (The) – Class A* | (1,622,840 | ) | |||||
| (2,700) | TransDigm Group, Inc. | (2,008,449 | ) | |||||
| (29,500) | Twilio, Inc. – Class A* | (1,982,695 | ) | |||||
| (61,644) | Uber Technologies, Inc.* | (2,050,279 | ) | |||||
| (19,800) | UDR, Inc. (REIT) | (848,232 | ) | |||||
| (6,700) | Vail Resorts, Inc. | (1,564,383 | ) | |||||
| (1,900) | Vulcan Materials Co. | (343,729 | ) | |||||
| (64,800) | Williams Cos., Inc. (The) | (1,950,480 | ) | |||||
| (27,400) | Wolfspeed, Inc.* | (2,027,052 | ) | |||||
| (14,956) | Zillow Group, Inc. – Class C* | (628,152 | ) | |||||
| (15,800) | Zscaler, Inc.* | (2,072,170 | ) | |||||
|
| |||||||
| Total United States | (120,973,401 | ) | ||||||
|
| |||||||
TOTAL COMMON STOCKS (PROCEEDS $238,775,577) | (232,661,711 | ) | ||||||
|
| |||||||
| Shares | Description | Value ($) | ||||||
| PREFERRED STOCKS (g) — (0.1)% |
| |||||||
| Germany — (0.1)% | ||||||||
| (3,871) | Sartorius AG | (1,644,276 | ) | |||||
|
| |||||||
TOTAL PREFERRED STOCKS (PROCEEDS $1,577,400) | (1,644,276 | ) | ||||||
|
| |||||||
| TOTAL SECURITIES SOLD SHORT (PROCEEDS $240,352,977) | (234,305,987 | ) | ||||||
|
| |||||||
| Other Assets and Liabilities (net) — (5.8%) | (66,848,620 | ) | ||||||
|
| |||||||
| TOTAL NET ASSETS — 100.0% | $ | 1,152,712,601 | ||||||
|
| |||||||
Additional information on each restricted security is as follows:
| Value as a | ||||||||||||||||
| Percentage | Value as of | |||||||||||||||
| Issuer | Acquisition | Acquisition | of Fund’s | February 28, | ||||||||||||
Description | Date | Cost | Net Assets | 2023 | ||||||||||||
Alrosa PJSC | 12/06/17 | $ | 4,239,436 | 0.0 | % | $ | 24,494 | |||||||||
Magnitogorsk Iron & Steel Works PJSC | 09/08/17 | 1,550,653 | 0.0 | % | 9,730 | |||||||||||
PhosAgro PJSC GDR | 12/03/20 | 1,365 | 0.0 | % | 20 | |||||||||||
Sberbank of Russia PJSC | 09/09/20 | 12,774,954 | 0.0 | % | 83,256 | |||||||||||
Sberbank of Russia PJSC | 01/10/22 | 77,024 | 0.0 | % | 464 | |||||||||||
Severstal PAO | 02/02/21 | 7,249 | 0.0 | % | 60 | |||||||||||
Severstal PJSC GDR (Registered) | 03/16/20 | 1,679,360 | 0.0 | % | 12,888 | |||||||||||
|
| |||||||||||||||
| $ | 130,912 | |||||||||||||||
|
| |||||||||||||||
| 47 | See accompanying notes to the financial statements. |
GMO Benchmark-Free Fund
(A Series of GMO Trust)
Schedule of Investments — (Continued)
February 28, 2023
A summary of outstanding financial instruments at February 28, 2023 is as follows:
Forward Currency Contracts
Settlement Date | Counter- party | Currency Sold | Currency Purchased | Net Unrealized Appreciation (Depreciation)($) | ||||||||||||||||||
05/09/2023 | BOA | AUD | 920,000 | USD | 620,895 | 357 | ||||||||||||||||
05/09/2023 | BCLY | AUD | 2,960,000 | USD | 2,046,253 | 49,740 | ||||||||||||||||
05/09/2023 | MSCI | AUD | 670,000 | USD | 464,258 | 12,345 | ||||||||||||||||
05/03/2023 | GS | BRL | 400,000 | USD | 76,662 | 1,088 | ||||||||||||||||
05/03/2023 | JPM | BRL | 500,000 | USD | 94,890 | 422 | ||||||||||||||||
04/03/2023 | BCLY | CAD | 860,000 | USD | 642,223 | 11,777 | ||||||||||||||||
04/03/2023 | GS | CAD | 1,020,000 | USD | 756,131 | 8,392 | ||||||||||||||||
04/03/2023 | SSB | CAD | 700,000 | USD | 521,449 | 8,295 | ||||||||||||||||
05/16/2023 | BCLY | CHF | 6,752,004 | USD | 7,430,440 | 204,040 | ||||||||||||||||
04/11/2023 | MSCI | COP | 1,320,000,000 | USD | 274,317 | 4,827 | ||||||||||||||||
03/21/2023 | SSB | GBP | 1,570,000 | USD | 1,890,938 | 1,822 | ||||||||||||||||
05/16/2023 | MSCI | HUF | 45,000,000 | USD | 123,735 | 854 | ||||||||||||||||
05/08/2023 | GS | IDR | 2,800,000,000 | USD | 185,234 | 1,868 | ||||||||||||||||
03/31/2023 | DB | ILS | 1,933,563 | USD | 544,927 | 15,206 | ||||||||||||||||
05/31/2023 | MSCI | ILS | 450,000 | USD | 124,651 | 1,037 | ||||||||||||||||
05/08/2023 | CITI | KRW | 180,000,000 | USD | 136,835 | 177 | ||||||||||||||||
05/08/2023 | GS | KRW | 200,000,000 | USD | 152,579 | 736 | ||||||||||||||||
05/31/2023 | MSCI | NZD | 2,290,000 | USD | 1,422,422 | 6,558 | ||||||||||||||||
05/31/2023 | SSB | NZD | 1,200,000 | USD | 747,990 | 6,053 | ||||||||||||||||
04/28/2023 | CITI | PHP | 19,500,000 | USD | 355,260 | 4,324 | ||||||||||||||||
05/22/2023 | GS | PLN | 1,300,000 | USD | 291,141 | 495 | ||||||||||||||||
04/27/2023 | BCLY | RON | 3,684,153 | USD | 794,480 | 5,158 | ||||||||||||||||
05/22/2023 | MSCI | SGD | 1,111,598 | USD | 833,369 | 7,182 | ||||||||||||||||
05/22/2023 | BCLY | THB | 20,039,025 | USD | 585,423 | 13,871 | ||||||||||||||||
03/08/2023 | MSCI | TWD | 31,326,001 | USD | 1,049,475 | 28,488 | ||||||||||||||||
05/03/2023 | GS | USD | 141,137 | BRL | 750,000 | 565 | ||||||||||||||||
04/10/2023 | JPM | USD | 180,018 | CLP | 150,000,000 | 296 | ||||||||||||||||
04/10/2023 | MSCI | USD | 391,384 | CLP | 334,112,500 | 10,249 | ||||||||||||||||
04/11/2023 | JPM | USD | 784,549 | COP | 3,901,955,400 | 12,071 | ||||||||||||||||
05/22/2023 | BCLY | USD | 239,434 | INR | 19,950,616 | 622 | ||||||||||||||||
04/20/2023 | MSCI | USD | 1,054,576 | MXN | 19,970,191 | 26,802 | ||||||||||||||||
05/10/2023 | MSCI | USD | 92,707 | PEN | 360,000 | 1,701 | ||||||||||||||||
05/31/2023 | MSCI | ZAR | 1,800,000 | USD | 98,404 | 1,122 | ||||||||||||||||
04/11/2023 | MSCI | COP | 1,600,000,000 | USD | 322,906 | (3,751 | ) | |||||||||||||||
04/17/2023 | MSCI | CZK | 20,105,948 | USD | 902,316 | (371 | ) | |||||||||||||||
05/10/2023 | MSCI | PEN | 360,000 | USD | 93,289 | (1,120 | ) | |||||||||||||||
05/22/2023 | MSCI | PLN | 400,000 | USD | 88,850 | (580 | ) | |||||||||||||||
05/08/2023 | BCLY | SEK | 15,493,154 | USD | 1,471,488 | (13,823 | ) | |||||||||||||||
05/03/2023 | CITI | USD | 106,305 | BRL | 550,000 | (2,390 | ) | |||||||||||||||
05/03/2023 | GS | USD | 106,970 | BRL | 550,000 | (3,055 | ) | |||||||||||||||
05/03/2023 | SSB | USD | 591,655 | BRL | 3,073,234 | (11,011 | ) | |||||||||||||||
04/03/2023 | BCLY | USD | 4,969,290 | CAD | 6,669,172 | (80,273 | ) | |||||||||||||||
04/10/2023 | MSCI | USD | 438,451 | CLP | 360,000,000 | (5,698 | ) | |||||||||||||||
04/17/2023 | CITI | USD | 308,247 | CZK | 6,800,000 | (2,950 | ) | |||||||||||||||
04/17/2023 | GS | USD | 135,406 | CZK | 3,000,000 | (717 | ) | |||||||||||||||
04/17/2023 | MSCI | USD | 89,848 | CZK | 2,000,000 | (55 | ) | |||||||||||||||
03/31/2023 | GS | USD | 1,423,836 | EUR | 1,330,000 | (14,652 | ) | |||||||||||||||
03/31/2023 | JPM | USD | 5,959,217 | EUR | 5,580,000 | (47,000 | ) | |||||||||||||||
05/16/2023 | JPM | USD | 765,361 | HUF | 279,127,316 | (3,156 | ) | |||||||||||||||
Settlement Date | Counter- party | Currency Sold | Currency Purchased | Net Unrealized Appreciation (Depreciation)($) | ||||||||||||||||||
05/08/2023 | JPM | USD | 217,696 | IDR | 3,259,337,000 | (4,248 | ) | |||||||||||||||
03/17/2023 | MSCI | USD | 6,420,994 | JPY | 855,151,183 | (127,269 | ) | |||||||||||||||
05/08/2023 | BCLY | USD | 18,780 | KRW | 22,994,101 | (1,323 | ) | |||||||||||||||
05/08/2023 | GS | USD | 73,062 | KRW | 90,000,000 | (4,733 | ) | |||||||||||||||
04/17/2023 | BOA | USD | 487,136 | NOK | 4,800,000 | (23,826 | ) | |||||||||||||||
04/17/2023 | MSCI | USD | 4,730,581 | NOK | 46,990,448 | (194,933 | ) | |||||||||||||||
05/31/2023 | SSB | USD | 409,961 | NZD | 660,000 | (1,895 | ) | |||||||||||||||
04/28/2023 | JPM | USD | 172,552 | PHP | 9,500,000 | (1,583 | ) | |||||||||||||||
05/08/2023 | BCLY | USD | 943,210 | SEK | 9,800,000 | (3,695 | ) | |||||||||||||||
05/22/2023 | BCLY | USD | 157,513 | THB | 5,400,000 | (3,495 | ) | |||||||||||||||
05/31/2023 | MSCI | USD | 350,942 | ZAR | 6,400,000 | (5,049 | ) | |||||||||||||||
|
| |||||||||||||||||||||
| $ | (114,111 | ) | ||||||||||||||||||||
|
| |||||||||||||||||||||
| See accompanying notes to the financial statements. | 48 |
GMO Benchmark-Free Fund
(A Series of GMO Trust)
Schedule of Investments — (Continued)
February 28, 2023
Swap Contracts
Centrally Cleared Interest Rate Swaps
Fund Pays | Fund Receives | Notional Amount | Expiration Date | Periodic Payment Frequency | Premiums Paid/ (Received) ($) | Value ($) | Net Unrealized Appreciation/ (Depreciation) ($) | |||||||||||||||||||||||
3.56% | 3 Month AUD BBSW | AUD | 4,000,000 | 03/15/2025 | Quarterly | — | 32,272 | 32,272 | ||||||||||||||||||||||
3.66% | 3 Month AUD BBSW | AUD | 5,000,000 | 03/15/2025 | Quarterly | — | 33,998 | 33,998 | ||||||||||||||||||||||
3.70% | 3 Month AUD BBSW | AUD | 18,933,000 | 03/15/2025 | Quarterly | 3,614 | 118,860 | 115,246 | ||||||||||||||||||||||
3 Month AUD BBSW | 3.63% | AUD | 4,500,000 | 03/15/2025 | Quarterly | — | (32,539 | ) | (32,539 | ) | ||||||||||||||||||||
3 Month AUD BBSW | 3.73% | AUD | 4,000,000 | 03/15/2025 | Quarterly | — | (23,515 | ) | (23,515 | ) | ||||||||||||||||||||
3 Month AUD BBSW | 3.85% | AUD | 6,500,000 | 03/15/2025 | Quarterly | — | (28,585 | ) | (28,585 | ) | ||||||||||||||||||||
3 Month AUD BBSW | 3.92% | AUD | 5,000,000 | 03/15/2025 | Quarterly | — | (17,352 | ) | (17,352 | ) | ||||||||||||||||||||
3.99% | 3 Month CAD CDOR | CAD | 16,345,000 | 03/15/2025 | Semi-Annually | 7,639 | 157,929 | 150,290 | ||||||||||||||||||||||
3.83% | 3 Month CAD CDOR | CAD | 6,500,000 | 03/15/2025 | Semi-Annually | — | 77,515 | 77,515 | ||||||||||||||||||||||
3 Month CAD CDOR | 4.00% | CAD | 3,000,000 | 03/15/2025 | Semi-Annually | — | (28,561 | ) | (28,561 | ) | ||||||||||||||||||||
3 Month CAD CDOR | 4.75% | CAD | 2,000,000 | 03/15/2025 | Semi-Annually | — | 1,827 | 1,827 | ||||||||||||||||||||||
CHF - SARON - OIS - | ||||||||||||||||||||||||||||||
COMPOUND | 1.36% | CHF | 3,000,000 | 03/15/2025 | Annually | — | (29,077 | ) | (29,077 | ) | ||||||||||||||||||||
CHF - SARON - OIS - | ||||||||||||||||||||||||||||||
COMPOUND | 1.57% | CHF | 2,500,000 | 03/15/2025 | Annually | — | (13,217 | ) | (13,217 | ) | ||||||||||||||||||||
| CHF -SARON -OIS - | ||||||||||||||||||||||||||||||
1.18% | COMPOUND | CHF | 10,178,000 | 03/15/2025 | Annually | 1,156 | 135,805 | 134,649 | ||||||||||||||||||||||
EUR - EuroSTR - COMPOUND | 2.93% | EUR | 2,500,000 | 03/15/2025 | Annually | — | (32,926 | ) | (32,926 | ) | ||||||||||||||||||||
EUR - EuroSTR - COMPOUND | 2.97% | EUR | 7,000,000 | 03/15/2025 | Annually | — | (87,553 | ) | (87,553 | ) | ||||||||||||||||||||
3.19% | EUR - EuroSTR - COMPOUND EUR | 3,500,000 | 03/15/2025 | Annually | — | 27,682 | 27,682 | |||||||||||||||||||||||
GBP - SONIA - COMPOUND | 4.27% | GBP | 6,926,000 | 03/15/2025 | Annually | (3,434 | ) | (48,241 | ) | (44,807 | ) | |||||||||||||||||||
4.45% | GBP - SONIA - COMPOUND | GBP | 3,000,000 | 03/15/2025 | Annually | — | 9,212 | 9,212 | ||||||||||||||||||||||
4.17% | GBP - SONIA - COMPOUND | GBP | 4,000,000 | 03/15/2025 | Annually | — | 37,165 | 37,165 | ||||||||||||||||||||||
4.05% | GBP - SONIA - COMPOUND | GBP | 2,500,000 | 03/15/2025 | Annually | — | 30,074 | 30,074 | ||||||||||||||||||||||
4.87% | 3 Month NZD Bank Bill Rate | NZD | 3,500,000 | 03/15/2025 | Quarterly | 2,811 | 20,509 | 17,698 | ||||||||||||||||||||||
3.20% | 3 Month SEK STIBOR | SEK | 25,000,000 | 03/15/2025 | Quarterly | — | 31,240 | 31,240 | ||||||||||||||||||||||
2.97% | 3 Month SEK STIBOR | SEK | 40,000,000 | 03/15/2025 | Quarterly | — | 66,367 | 66,367 | ||||||||||||||||||||||
3 Month SEK STIBOR | 3.10% | SEK | 208,193,000 | 03/15/2025 | Quarterly | 2,136 | (295,248 | ) | (297,384 | ) | ||||||||||||||||||||
3 Month SEK STIBOR | 3.13% | SEK | 25,000,000 | 03/15/2025 | Quarterly | — | (34,162 | ) | (34,162 | ) | ||||||||||||||||||||
USD - SOFR - COMPOUND | 4.19% | USD | 3,000,000 | 03/15/2025 | Annually | — | (39,294 | ) | (39,294 | ) | ||||||||||||||||||||
USD - SOFR - COMPOUND | 4.54% | USD | 3,500,000 | 03/15/2025 | Annually | — | (22,972 | ) | (22,972 | ) | ||||||||||||||||||||
4.14% | USD -SOFR -COMPOUND | USD | 6,348,000 | 03/15/2025 | Annually | 4,678 | 89,837 | 85,159 | ||||||||||||||||||||||
4.24% | 3 Month AUD BBSW | AUD | 6,000,000 | 06/21/2025 | Quarterly | — | (1,559 | ) | (1,559 | ) | ||||||||||||||||||||
EUR - EuroSTR - COMPOUND | 3.61% | EUR | 1,500,000 | 06/21/2025 | Annually | — | 747 | 747 | ||||||||||||||||||||||
6 Month AUD BBSW | 3.99% | AUD | 4,340,000 | 03/15/2033 | Semi-Annually | (1,377 | ) | (113,673 | ) | (112,296 | ) | |||||||||||||||||||
6 Month AUD BBSW | 4.03% | AUD | 1,500,000 | 03/15/2033 | Semi-Annually | — | (36,082 | ) | (36,082 | ) | ||||||||||||||||||||
6 Month AUD BBSW | 4.03% | AUD | 1,200,000 | 03/15/2033 | Semi-Annually | — | (28,930 | ) | (28,930 | ) | ||||||||||||||||||||
6 Month AUD BBSW | 4.04% | AUD | 3,100,000 | 03/15/2033 | Semi-Annually | — | (72,640 | ) | (72,640 | ) | ||||||||||||||||||||
6 Month AUD BBSW | 4.07% | AUD | 900,000 | 03/15/2033 | Semi-Annually | — | (20,066 | ) | (20,066 | ) | ||||||||||||||||||||
6 Month AUD BBSW | 4.19% | AUD | 1,000,000 | 03/15/2033 | Semi-Annually | — | (15,397 | ) | (15,397 | ) | ||||||||||||||||||||
6 Month AUD BBSW | 4.24% | AUD | 1,900,000 | 03/15/2033 | Semi-Annually | — | (24,679 | ) | (24,679 | ) | ||||||||||||||||||||
6 Month AUD BBSW | 4.45% | AUD | 15,670,000 | 03/15/2033 | Semi-Annually | (5,303 | ) | (27,085 | ) | (21,782 | ) | |||||||||||||||||||
4.22% | 6 Month AUD BBSW | AUD | 1,500,000 | 03/15/2033 | Semi-Annually | — | 20,498 | 20,498 | ||||||||||||||||||||||
4.35% | 6 Month AUD BBSW | AUD | 2,000,000 | 03/15/2033 | Semi-Annually | — | 13,532 | 13,532 | ||||||||||||||||||||||
4.32% | 6 Month AUD BBSW | AUD | 1,100,000 | 03/15/2033 | Semi-Annually | — | 9,318 | 9,318 | ||||||||||||||||||||||
4.17% | 6 Month AUD BBSW | AUD | 900,000 | 03/15/2033 | Semi-Annually | — | 14,831 | 14,831 | ||||||||||||||||||||||
4.05% | 6 Month AUD BBSW | AUD | 1,000,000 | 03/15/2033 | Semi-Annually | — | 23,216 | 23,216 | ||||||||||||||||||||||
3.24% | 3 Month CAD CDOR | CAD | 1,378,000 | 03/15/2033 | Semi-Annually | (2,737 | ) | 43,533 | 46,270 | |||||||||||||||||||||
3.17% | 3 Month CAD CDOR | CAD | 2,200,000 | 03/15/2033 | Semi-Annually | — | 78,555 | 78,555 | ||||||||||||||||||||||
| 49 | See accompanying notes to the financial statements. |
GMO Benchmark-Free Fund
(A Series of GMO Trust)
Schedule of Investments — (Continued)
February 28, 2023
Swap Contracts — continued
Centrally Cleared Interest Rate Swaps — continued
Fund Pays | Fund Receives | Notional Amount | Expiration Date | Periodic Payment Frequency | Premiums Paid/ (Received) ($) | Value ($) | Net Unrealized Appreciation/ (Depreciation) ($) | |||||||||||||||||||||||
3.23% | 3 Month CAD CDOR | CAD | 700,000 | 03/15/2033 | Semi-Annually | — | 22,634 | 22,634 | ||||||||||||||||||||||
3.42% | 3 Month CAD CDOR | CAD | 1,100,000 | 03/15/2033 | Semi-Annually | — | 22,379 | 22,379 | ||||||||||||||||||||||
3.62% | 3 Month CAD CDOR | CAD | 900,000 | 03/15/2033 | Semi-Annually | — | 7,519 | 7,519 | ||||||||||||||||||||||
3.82% | 3 Month CAD CDOR | CAD | 500,000 | 03/15/2033 | Semi-Annually | — | (2,093 | ) | (2,093 | ) | ||||||||||||||||||||
3 Month CAD CDOR | 3.18% | CAD | 3,624,000 | 03/15/2033 | Semi-Annually | (7,258 | ) | (128,690 | ) | (121,432 | ) | |||||||||||||||||||
3 Month CAD CDOR | 3.28% | CAD | 1,400,000 | 03/15/2033 | Semi-Annually | — | (40,846 | ) | (40,846 | ) | ||||||||||||||||||||
3 Month CAD CDOR | 3.30% | CAD | 1,400,000 | 03/15/2033 | Semi-Annually | — | (38,656 | ) | (38,656 | ) | ||||||||||||||||||||
3 Month CAD CDOR | 3.32% | CAD | 2,200,000 | 03/15/2033 | Semi-Annually | — | (58,317 | ) | (58,317 | ) | ||||||||||||||||||||
3 Month CAD CDOR | 3.44% | CAD | 1,000,000 | 03/15/2033 | Semi-Annually | — | (19,271 | ) | (19,271 | ) | ||||||||||||||||||||
3 Month CAD CDOR | 3.45% | CAD | 800,000 | 03/15/2033 | Semi-Annually | — | (14,705 | ) | (14,705 | ) | ||||||||||||||||||||
3 Month CAD CDOR | 3.56% | CAD | 1,100,000 | 03/15/2033 | Semi-Annually | — | (13,440 | ) | (13,440 | ) | ||||||||||||||||||||
CHF - SARON - OIS - | ||||||||||||||||||||||||||||||
COMPOUND | 1.50% | CHF | 2,174,000 | 03/15/2033 | Annually | (1,552 | ) | (94,949 | ) | (93,397 | ) | |||||||||||||||||||
CHF - SARON - OIS - | ||||||||||||||||||||||||||||||
COMPOUND | 1.55% | CHF | 900,000 | 03/15/2033 | Annually | — | (35,014 | ) | (35,014 | ) | ||||||||||||||||||||
CHF - SARON - OIS - | ||||||||||||||||||||||||||||||
COMPOUND | 1.60% | CHF | 8,816,000 | 03/15/2033 | Annually | — | (301,010 | ) | (301,010 | ) | ||||||||||||||||||||
CHF - SARON - OIS - | ||||||||||||||||||||||||||||||
COMPOUND | 1.73% | CHF | 1,200,000 | 03/15/2033 | Annually | — | (26,341 | ) | (26,341 | ) | ||||||||||||||||||||
| CHF -SARON -OIS - | ||||||||||||||||||||||||||||||
1.99% | COMPOUND | CHF | 1,100,000 | 03/15/2033 | Annually | — | (3,800 | ) | (3,800 | ) | ||||||||||||||||||||
| CHF - SARON - OIS - | ||||||||||||||||||||||||||||||
1.58% | COMPOUND | CHF | 600,000 | 03/15/2033 | Annually | — | 21,856 | 21,856 | ||||||||||||||||||||||
| CHF - SARON - OIS - | ||||||||||||||||||||||||||||||
1.91% | COMPOUND | CHF | 1,300,000 | 03/15/2033 | Annually | — | 4,855 | 4,855 | ||||||||||||||||||||||
| CHF - SARON - OIS - | ||||||||||||||||||||||||||||||
1.81% | COMPOUND | CHF | 500,000 | 03/15/2033 | Annually | — | 6,968 | 6,968 | ||||||||||||||||||||||
| CHF - SARON - OIS - | ||||||||||||||||||||||||||||||
1.97% | COMPOUND | CHF | 1,200,000 | 03/15/2033 | Annually | — | (2,047 | ) | (2,047 | ) | ||||||||||||||||||||
EUR - EuroSTR - COMPOUND | 2.68% | EUR | 700,000 | 03/15/2033 | Annually | — | (20,284 | ) | (20,284 | ) | ||||||||||||||||||||
2.59% | EUR -EuroSTR -COMPOUND | EUR | 2,600,000 | 03/15/2033 | Annually | — | 96,713 | 96,713 | ||||||||||||||||||||||
2.59% | EUR - EuroSTR - COMPOUND | EUR | 1,500,000 | 03/15/2033 | Annually | — | 56,000 | 56,000 | ||||||||||||||||||||||
2.45% | EUR - EuroSTR - COMPOUND | EUR | 500,000 | 03/15/2033 | Annually | — | 25,230 | 25,230 | ||||||||||||||||||||||
2.69% | EUR - EuroSTR - COMPOUND | EUR | 800,000 | 03/15/2033 | Annually | — | 22,491 | 22,491 | ||||||||||||||||||||||
2.88% | EUR - EuroSTR - COMPOUND | EUR | 2,000,000 | 03/15/2033 | Annually | — | 21,710 | 21,710 | ||||||||||||||||||||||
2.82% | EUR - EuroSTR - COMPOUND | EUR | 900,000 | 03/15/2033 | Annually | — | 15,002 | 15,002 | ||||||||||||||||||||||
2.87% | EUR - EuroSTR - COMPOUND | EUR | 1,400,000 | 03/15/2033 | Annually | — | 17,168 | 17,168 | ||||||||||||||||||||||
2.90% | EUR - EuroSTR - COMPOUND | EUR | 1,200,000 | 03/15/2033 | Annually | — | 11,718 | 11,718 | ||||||||||||||||||||||
GBP - SONIA - COMPOUND | 3.34% | GBP | 1,400,000 | 03/15/2033 | Annually | — | (55,686 | ) | (55,686 | ) | ||||||||||||||||||||
GBP - SONIA - COMPOUND | 3.39% | GBP | 600,000 | 03/15/2033 | Annually | — | (21,077 | ) | (21,077 | ) | ||||||||||||||||||||
GBP - SONIA - COMPOUND | 3.41% | GBP | 900,000 | 03/15/2033 | Annually | — | (29,634 | ) | (29,634 | ) | ||||||||||||||||||||
GBP - SONIA - COMPOUND | 3.44% | GBP | 1,000,000 | 03/15/2033 | Annually | — | (29,796 | ) | (29,796 | ) | ||||||||||||||||||||
GBP - SONIA - COMPOUND | 3.48% | GBP | 2,000,000 | 03/15/2033 | Annually | — | (51,373 | ) | (51,373 | ) | ||||||||||||||||||||
GBP - SONIA - COMPOUND | 3.56% | GBP | 600,000 | 03/15/2033 | Annually | — | (10,717 | ) | (10,717 | ) | ||||||||||||||||||||
3.22% | GBP - SONIA - COMPOUND | GBP | 1,547,000 | 03/15/2033 | Annually | 3,737 | 78,908 | 75,171 | ||||||||||||||||||||||
3.77% | GBP - SONIA - COMPOUND | GBP | 900,000 | 03/15/2033 | Annually | — | (2,198 | ) | (2,198 | ) | ||||||||||||||||||||
3.36% | GBP - SONIA - COMPOUND | GBP | 1,200,000 | 03/15/2033 | Annually | — | 44,971 | 44,971 | ||||||||||||||||||||||
3.16% | GBP - SONIA - COMPOUND | GBP | 800,000 | 03/15/2033 | Annually | — | 45,440 | 45,440 | ||||||||||||||||||||||
3.48% | GBP - SONIA - COMPOUND | GBP | 900,000 | 03/15/2033 | Annually | — | 23,690 | 23,690 | ||||||||||||||||||||||
3.54% | GBP - SONIA - COMPOUND | GBP | 700,000 | 03/15/2033 | Annually | — | 13,974 | 13,974 | ||||||||||||||||||||||
4.22% | 3 Month NZD Bank Bill Rate | NZD | 2,600,000 | 03/15/2033 | Quarterly | 4,277 | 61,169 | 56,892 | ||||||||||||||||||||||
4.27% | 3 Month NZD Bank Bill Rate | NZD | 1,280,000 | 03/15/2033 | Quarterly | — | 26,670 | 26,670 | ||||||||||||||||||||||
| See accompanying notes to the financial statements. | 50 |
GMO Benchmark-Free Fund
(A Series of GMO Trust)
Schedule of Investments — (Continued)
February 28, 2023
Swap Contracts — continued
Centrally Cleared Interest Rate Swaps — continued
Fund Pays | Fund Receives | Notional Amount | Expiration Date | Periodic Payment Frequency | Premiums Paid/ (Received) ($) | Value ($) | Net Unrealized Appreciation/ (Depreciation) ($) | |||||||||||||||||||||||
4.14% | 3 Month NZD Bank Bill Rate | NZD | 2,000,000 | 03/15/2033 | Quarterly | — | 54,929 | 54,929 | ||||||||||||||||||||||
4.47% | 3 Month NZD Bank Bill Rate | NZD | 1,900,000 | 03/15/2033 | Quarterly | — | 20,695 | 20,695 | ||||||||||||||||||||||
3 Month NZD Bank Bill Rate | 4.22% | NZD | 800,000 | 03/15/2033 | Quarterly | (505 | ) | (18,633 | ) | (18,128 | ) | |||||||||||||||||||
3 Month NZD Bank Bill Rate | 4.26% | NZD | 1,500,000 | 03/15/2033 | Quarterly | (310 | ) | (31,747 | ) | (31,437 | ) | |||||||||||||||||||
3 Month NZD Bank Bill Rate | 4.59% | NZD | 2,800,000 | 03/15/2033 | Quarterly | — | (14,687 | ) | (14,687 | ) | ||||||||||||||||||||
3 Month SEK STIBOR | 2.47% | SEK | 11,000,000 | 03/15/2033 | Quarterly | — | (71,824 | ) | (71,824 | ) | ||||||||||||||||||||
3 Month SEK STIBOR | 2.54% | SEK | 13,000,000 | 03/15/2033 | Quarterly | — | (77,687 | ) | (77,687 | ) | ||||||||||||||||||||
3 Month SEK STIBOR | 2.59% | SEK | 8,000,000 | 03/15/2033 | Quarterly | — | (44,695 | ) | (44,695 | ) | ||||||||||||||||||||
3 Month SEK STIBOR | 2.63% | SEK | 6,000,000 | 03/15/2033 | Quarterly | — | (31,620 | ) | (31,620 | ) | ||||||||||||||||||||
3 Month SEK STIBOR | 2.81% | SEK | 13,000,000 | 03/15/2033 | Quarterly | — | (49,426 | ) | (49,426 | ) | ||||||||||||||||||||
2.51% | 3 Month SEK STIBOR | SEK | 45,525,000 | 03/15/2033 | Quarterly | 2,840 | 281,769 | 278,929 | ||||||||||||||||||||||
2.62% | 3 Month SEK STIBOR | SEK | 5,000,000 | 03/15/2033 | Quarterly | — | 26,631 | 26,631 | ||||||||||||||||||||||
3.00% | 3 Month SEK STIBOR | SEK | 119,168,000 | 03/15/2033 | Quarterly | (916 | ) | 272,404 | 273,320 | |||||||||||||||||||||
3 Month SEK STIBOR | 3.22% | SEK | 10,000,000 | 03/15/2033 | Quarterly | — | (5,411 | ) | (5,411 | ) | ||||||||||||||||||||
3 Month SEK STIBOR | 3.28% | SEK | 17,000,000 | 03/15/2033 | Quarterly | — | (62 | ) | (62 | ) | ||||||||||||||||||||
USD - SOFR - COMPOUND | 3.05% | USD | 1,540,000 | 03/15/2033 | Annually | — | (74,916 | ) | (74,916 | ) | ||||||||||||||||||||
USD - SOFR - COMPOUND | 3.07% | USD | 2,600,000 | 03/15/2033 | Annually | — | (121,980 | ) | (121,980 | ) | ||||||||||||||||||||
USD - SOFR - COMPOUND | 3.13% | USD | 1,420,000 | 03/15/2033 | Annually | (6,459 | ) | (60,085 | ) | (53,626 | ) | |||||||||||||||||||
USD - SOFR - COMPOUND | 3.16% | USD | 1,500,000 | 03/15/2033 | Annually | — | (59,734 | ) | (59,734 | ) | ||||||||||||||||||||
USD - SOFR - COMPOUND | 3.19% | USD | 1,000,000 | 03/15/2033 | Annually | — | (37,101 | ) | (37,101 | ) | ||||||||||||||||||||
3.16% | USD -SOFR - COMPOUND | USD | 1,670,000 | 03/15/2033 | Annually | 3,068 | 66,201 | 63,133 | ||||||||||||||||||||||
3.23% | USD - SOFR -COMPOUND | USD | 800,000 | 03/15/2033 | Annually | — | 27,108 | 27,108 | ||||||||||||||||||||||
3.29% | USD - SOFR - COMPOUND | USD | 1,300,000 | 03/15/2033 | Annually | — | 38,154 | 38,154 | ||||||||||||||||||||||
3.33% | USD - SOFR - COMPOUND | USD | 1,000,000 | 03/15/2033 | Annually | — | 25,968 | 25,968 | ||||||||||||||||||||||
3.47% | USD - SOFR - COMPOUND | USD | 800,000 | 03/15/2033 | Annually | — | 11,505 | 11,505 | ||||||||||||||||||||||
3.30% | USD - SOFR - COMPOUND | USD | 1,500,000 | 03/15/2033 | Annually | — | 41,859 | 41,859 | ||||||||||||||||||||||
3.22% | USD - SOFR - COMPOUND | USD | 1,600,000 | 03/15/2033 | Annually | — | 55,470 | 55,470 | ||||||||||||||||||||||
3.22% | USD - SOFR - COMPOUND | USD | 600,000 | 03/15/2033 | Annually | — | 20,851 | 20,851 | ||||||||||||||||||||||
3.40% | USD - SOFR - COMPOUND | USD | 1,100,000 | 03/15/2033 | Annually | — | 22,396 | 22,396 | ||||||||||||||||||||||
3.44% | USD - SOFR - COMPOUND | USD | 800,000 | 03/15/2033 | Annually | — | 13,517 | 13,517 | ||||||||||||||||||||||
3.46% | USD - SOFR - COMPOUND | USD | 900,000 | 03/15/2033 | Annually | — | 13,425 | 13,425 | ||||||||||||||||||||||
3.59% | USD - SOFR - COMPOUND | USD | 2,500,000 | 03/15/2033 | Annually | — | 10,490 | 10,490 | ||||||||||||||||||||||
3.63% | USD - SOFR - COMPOUND | USD | 800,000 | 03/15/2033 | Annually | — | 652 | 652 | ||||||||||||||||||||||
6 Month AUD BBSW | 4.51% | AUD | 1,400,000 | 06/21/2033 | Semi-Annually | — | 430 | 430 | ||||||||||||||||||||||
3.04% | EUR - EuroSTR - COMPOUND | EUR | 400,000 | 06/21/2033 | Annually | — | (1,323 | ) | (1,323 | ) | ||||||||||||||||||||
3.61% | USD - SOFR - COMPOUND | USD | 1,100,000 | 06/21/2033 | Annually | — | (2,037 | ) | (2,037 | ) | ||||||||||||||||||||
|
|
|
|
|
| |||||||||||||||||||||||||
| $ | 6,105 | $ | (50,224 | ) | $ | (56,329 | ) | |||||||||||||||||||||||
|
|
|
|
|
| |||||||||||||||||||||||||
| 51 | See accompanying notes to the financial statements. |
GMO Benchmark-Free Fund
(A Series of GMO Trust)
Schedule of Investments — (Continued)
February 28, 2023
Swap Contracts — continued
OTC Total Return Swaps
Fund Pays | Fund Receives | Counterparty | Notional Amount | Expiration Date | Periodic Payment Frequency | Premiums Paid/ (Received) ($) | Value ($) | Net Unrealized Appreciation/ (Depreciation) ($) | ||||||||||||||||||||||||||||
Total Return on Equity Basket (j) | | 1 Month Federal Funds Rate minus 0.40% | | GS | USD | 5,366,507 | 06/24/2024 | Monthly | — | 61,707 | 61,707 | |||||||||||||||||||||||||
Total Return on Equity Basket (k) | | 1 Month Federal Funds Rate minus 0.40% | | MORD | USD | 13,571,872 | 06/18/2024 | Monthly | — | 668,582 | 668,582 | |||||||||||||||||||||||||
|
|
|
|
|
| |||||||||||||||||||||||||||||||
| $ | — | $ | 730,289 | $ | 730,289 | |||||||||||||||||||||||||||||||
|
|
|
|
|
| |||||||||||||||||||||||||||||||
As of February 28, 2023, for the above contracts and/or agreements, the Fund had sufficient cash and/or securities to cover commitmentsor collateral requirements, if any, of the relevant broker or exchange.
Notes to Schedule of Investments:
| † | Denominated in U.S. Dollar, unless otherwise indicated. |
| * | Non-income producing security. |
| (a) | All or a portion of this security has been pledged to cover margin requirements on futures and/or cleared swap contracts, collateral on securities sold short, OTC swap contracts, forward currency contracts, and/or written options, if any (Note 4). |
| (b) | All or a portion of this security is out on loan (Note 2). |
| (c) | Securities are traded on separate exchanges for the same entity. |
| (d) | Investment valued at fair value using methods determined in good faith by the Trustees of GMO Trust or persons acting at their direction pursuant to procedures approved by the Trustees. Investment valued using significant unobservable inputs (Note 2). |
| (e) | Investment valued using significant unobservable inputs (Note 2). |
| (f) | The security is restricted as to resale. |
| (g) | Preferred dividend rates are disclosed to the extent that a stated rate exists. |
| (h) | All or a portion of this security is purchased with collateral from securities loaned (Note 2). |
| (i) | The rate disclosed is the 7 day net yield as of February 28, 2023. |
| (j) | Periodic payments made/received are based on the total return of the referenced entity. Custom equity basket swap which has a notional amount of less than 1% of the Fund’s total net assets. |
| (k) | The following table represents the individual long and/or short positions within the custom equity basket swap as of February 28, 2023: |
| Shares | Description | % of Equity Basket | Value ($) | |||||||||
| (786,000) | Air China Ltd – Class H | 5.6 | % | (724,718 | ) | |||||||
| (146,000) | Alibaba Health Information Technology Ltd | 0.8 | % | (104,540 | ) | |||||||
| (560) | BGF Retail Co Ltd | 0.6 | % | (76,593 | ) | |||||||
| (504,000) | China Molybdenum Co Ltd – Class H | 2.2 | % | (283,801 | ) | |||||||
| (1,692) | Elisa Oyj | 0.7 | % | (96,085 | ) | |||||||
| (258,000) | Genscript Biotech Corp | 5.5 | % | (706,197 | ) | |||||||
| (1,002,700) | Gulf Energy Development Pcl NVDR | 11.5 | % | (1,490,095 | ) | |||||||
| (2,386) | Hanmi Pharm Co Ltd | 3.6 | % | (466,908 | ) | |||||||
| (1,800) | Hapvida Participacoes e Investimentos SA | 0.0 | % | (1,544 | ) | |||||||
| (19,103) | Hotel Shilla Co Ltd | 8.9 | % | (1,156,746 | ) | |||||||
| (9,536) | Kakao Corp | 3.5 | % | (448,881 | ) | |||||||
| (650,000) | Kingdee International Software Group Co Ltd | 9.5 | % | (1,214,501 | ) | |||||||
| (75,000) | Klabin SA | 2.1 | % | (278,772 | ) | |||||||
| (38,839) | Korea Aerospace Industries Ltd | 10.2 | % | (1,322,448 | ) | |||||||
| (1,249) | LG Energy Solution | 3.8 | % | (493,371 | ) | |||||||
| (400) | Lojas Renner SA | 0.0 | % | (1,425 | ) | |||||||
| (83,100) | Microport Scientific Corp | 1.8 | % | (235,758 | ) | |||||||
| 4,262 | Nokia Oyj | (0.2 | %) | 19,718 | ||||||||
| (1,695) | POSCO Chemical Co Ltd | 2.2 | % | (282,806 | ) | |||||||
| (2,924) | Samsung Biologics Co Ltd | 13.2 | % | (1,708,313 | ) | |||||||
| (212,948) | Samsung Heavy Industries Co Ltd | 6.8 | % | (884,247 | ) | |||||||
| (8,918) | Yuhan Corp | 2.7 | % | (355,174 | ) | |||||||
| (432,000) | Zijin Mining Group Co Ltd – Class H | 5.0 | % | (653,772 | ) | |||||||
|
| |||||||||||
| TOTAL COMMON STOCKS | $ | (12,966,977 | ) | |||||||||
|
| |||||||||||
For a listing of definitions of acronyms, counterparty abbreviations and currency abbreviations used throughout the Schedule of Investments as well as the derivative tables, if any, please refer to page 125.
| See accompanying notes to the financial statements. | 52 |
GMO Global Asset Allocation Fund
(A Series of GMO Trust)
Portfolio Management
Day-to-day management of the Fund’s portfolio is the responsibility of the Asset Allocation team at Grantham, Mayo, Van Otterloo & Co. LLC.
Management Discussion and Analysis of Fund Performance
Class III shares of GMO Global Asset Allocation Fund returned -5.48% (net) for the fiscal year ended February 28, 2023, as compared with -8.52% for the Fund’s benchmark, the GMO Global Asset Allocation Index (65% MSCI All Country World Index (“ACWI”) and 35% Bloomberg U.S. Aggregate Index).
The Fund’s circa 16% off-benchmark position in alternatives had the most significant beneficial impact on relative performance, as it delivered a decent positive return while both equities and bonds struggled. The Fund held an average 59% in equities over the period, and the return of -6.90% beat the MSCI ACWI return of -8.26%. The regional bias of being underweight to the U.S. market and overweight to developed ex-U.S. and emerging markets had only modest impact on performance relative to the benchmark. In particular, the benefits gained from being overweight developed ex-U.S. equities compensated for the detriment caused by being overweight emerging market equities. Security selection in developed markets was strong, helped by outperformance of the Value style. The Fund held an average of 25% in fixed income, and the emphasis on credit over duration, coupled with good relative performance within the credit exposures, ensured outperformance of the benchmark. The Fund’s fixed income exposures posted -8.20%, nicely ahead of the -9.72% return from the Bloomberg U.S. Aggregate Index.
Because some of the securities and instruments held directly or indirectly by the Fund had positive fair value adjustments at the beginning or end of the fiscal year (and the performance of indices are not fair valued), the Fund’s absolute and relative performance is higher than it otherwise would have been in the absence of such fair value adjustments.
The views expressed herein are exclusively those of Grantham, Mayo, Van Otterloo & Co. LLC as of the date of this report and are subject to change. GMO disclaims any responsibility to update such views. They are not meant as investment advice. References to specific securities are not recommendations of such securities and may not be representative of any GMO portfolio’s current or future investments. All information is unaudited.
| 53 |
GMO Global Asset Allocation Fund
(A Series of GMO Trust)
Comparison of Change in Value of a $5,000,000 Investment in
GMO Global Asset Allocation Fund Class III Shares, the GMO Global Asset Allocation Index*,
the MSCI ACWI and the Bloomberg U.S. Aggregate Index
As of February 28, 2023
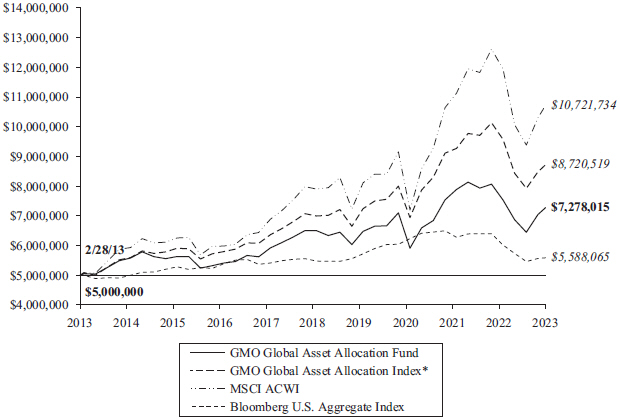
| Average Annual Total Returns | ||||||||
| 1 Year | 5 Year | 10 Year | Since Inception | |||||
| Class III | -5.48% | 2.15% | 3.83% | n/a | ||||
| Class R6 | -5.48% | n/a | n/a | 9/30/19 2.59% | ||||
| Class I | -5.60% | n/a | n/a | 1/6/21 -2.46% | ||||
Performance data quoted represents past performance and is not indicative of future results. The investment return and principal value of an investment will fluctuate so that an investor’s shares, when redeemed, may be worth more or less than their original cost. Current performance data may be lower or higher than the performance data provided herein. To obtain performance information up to the most recent month-end, visit www.gmo.com. Performance shown is net of all fees after reimbursement from GMO. Returns would have been lower had certain expenses not been reimbursed during the periods shown and do not include the effect of taxes on distributions and redemptions. The performance information shown above only includes purchase premiums and/or redemption fees in effect as of February 28, 2023. All information is unaudited. Performance for classes may vary due to different fees.
| * | The GMO Global Asset Allocation Index is comprised of 65% MSCI ACWI (All Country World Index) and 35% Bloomberg U.S. Aggregate Index. |
MSCI data may not be reproduced or used for any other purpose. MSCI provides no warranties, has not prepared or approved this report, and has no liability hereunder.
For Class III, R6 and I the gross expense ratio of 0.73%, 0.72% and 0.83%, respectively, is equal to the Fund’s Total Annual Operating Expenses set forth in the Fund’s most recent prospectus dated June 30, 2022. For the Classes listed above, the corresponding net expense ratio of 0.70%, 0.70% and 0.80% reflects the reduction of expenses from fee reimbursements. The fee reimbursements will continue until at least June 30, 2023. Elimination of this reimbursement will result in higher fees and lower performance.
54
GMO Global Asset Allocation Fund
(A Series of GMO Trust)
Investment Concentration Summary
February 28, 2023 (Unaudited)
Asset Class Summary& | % of Total Net Assets | |||
Common Stocks | 66.5 | % | ||
Debt Obligations | 21.5 | |||
Short-Term Investments | 17.4 | |||
Preferred Stocks | 1.2 | |||
Swap Contracts | 0.6 | |||
Investment Funds | 0.2 | |||
Forward Currency Contracts | 0.1 | |||
Loan Assignments | 0.1 | |||
Rights/Warrants | 0.0 | ^ | ||
Loan Participations | 0.0 | ^ | ||
Purchased Options | 0.0 | ^ | ||
Futures Contracts | (0.0 | )^ | ||
Written Options/Credit Linked Options | (0.1 | ) | ||
Securities Sold Short | (5.2 | ) | ||
Other | (2.3 | ) | ||
|
| |||
| 100.0 | % | |||
|
| |||
Country/Region Summary¤ | Debt Obligations as a % of Total Net Assets | |||
United States | 16.3 | % | ||
Other Emerging | 2.7 | † | ||
Australia | 1.8 | |||
Switzerland | 1.1 | |||
Other Developed | (0.9 | )‡ | ||
Euro Region | (1.4 | )§ | ||
|
| |||
| 19.6 | % | |||
|
| |||
Country/Region Summary¤ | Equity Investments as a % of Total Net Assets | |||
United States | 22.1 | % | ||
Japan | 9.0 | |||
Taiwan | 4.2 | |||
Other Developed | 4.0 | ‡ | ||
Other Emerging | 3.5 | † | ||
United Kingdom | 3.3 | |||
France | 3.2 | |||
South Korea | 2.7 | |||
China | 2.2 | |||
Netherlands | 1.5 | |||
Brazil | 1.4 | |||
Spain | 1.4 | |||
Mexico | 1.2 | |||
Switzerland | 1.2 | |||
Germany | 1.0 | |||
|
| |||
| 61.9 | % | |||
|
| |||
| & | The table incorporates aggregate indirect asset class exposure associated with investments in other funds of GMO Trust (“underlying funds”). Derivative financial instruments, if any, are based on market values, rather than the notional amounts of derivatives, except for forward currency contracts which are based on unrealized appreciation/(depreciation). |
| ¤ | The table incorporates aggregate indirect country exposure associated with investments in the underlying funds. The table excludes short-term investments. The table includes exposure through the use of certain derivative financial instruments and excludes exposure through certain currency linked derivatives such as forward currency contracts and currency options. The table is based on duration adjusted net exposures (both investments and derivatives), taking into account the market value of securities and the notional amounts of swaps and other derivative financial instruments. Duration is based on GMO’s models. The greater the duration of a bond, the greater its contribution to the concentration percentage. Credit default swap exposures are factored into the duration-adjusted exposure using the reference security and applying the same methodology to that security. The table is not normalized, thus, due to the exclusions listed above and negative exposures, which may be attributable to derivatives or short sales, if any, the tables may not total to 100%. |
| † | “Other Emerging” is comprised of emerging countries that each represent between (1.0)% and 1.0% of Total Net Assets. |
| ‡ | “Other Developed” is comprised of developed countries that each represent between (1.0)% and 1.0% of Total Net Assets. |
| § | “Euro Region” is comprised of derivative financial instruments attributed to the Eurozone and not a particular country. |
| ^ | Rounds to 0.0%. |
55
GMO Global Asset Allocation Fund
(A Series of GMO Trust)
(showing percentage of total net assets)
February 28, 2023
| Shares | Description | Value ($) | ||||||
| MUTUAL FUNDS — 99.7% | ||||||||
| Affiliated Issuers — 99.7% | ||||||||
| 2,618,254 | GMO Alternative Allocation Fund, Class VI | 48,411,511 | ||||||
| 987,416 | GMO Asset Allocation Bond Fund, Class VI | 20,113,672 | ||||||
| 592,803 | GMO Emerging Country Debt Fund, Class VI | 10,468,900 | ||||||
| 1,750,681 | GMO Emerging Markets ex-China Fund, Class VI | 23,354,081 | ||||||
| 1,199,709 | GMO Emerging Markets Fund, Class VI | 25,997,689 | ||||||
| 410,552 | GMO High Yield Fund, Class VI | 6,868,538 | ||||||
| 2,859,015 | GMO International Equity Fund, Class IV | 61,754,726 | ||||||
| 817,727 | GMO-Usonian Japan Value Creation Fund, Class VI | 13,795,046 | ||||||
| 2,447,916 | GMO Multi-Sector Fixed Income Fund, Class IV | 40,659,884 | ||||||
| 431,680 | GMO Opportunistic Income Fund, Class VI | 10,403,498 | ||||||
| 471,523 | GMO Quality Cyclicals Fund, Class VI | 10,368,785 | ||||||
| 402,976 | GMO Quality Fund, Class VI | 9,574,699 | ||||||
| 481,464 | GMO Small Cap Quality Fund, Class VI | 10,654,800 | ||||||
| 1,346,622 | GMO U.S. Equity Fund, Class VI | 16,671,178 | ||||||
| 1,139,577 | GMO U.S. Opportunistic Value Fund, Class VI | 23,008,064 | ||||||
| 410,809 | GMO U.S. Small Cap Value Fund, Class VI | 7,061,808 | ||||||
| 1,610 | GMO U.S. Treasury Fund | 8,036 | ||||||
|
| |||||||
TOTAL MUTUAL FUNDS (COST $392,022,548) | 339,174,915 | |||||||
|
| |||||||
| SHORT-TERM INVESTMENTS — 0.2% |
| |||||||
| Money Market Funds — 0.2% | ||||||||
| 559,158 | State Street Institutional Treasury Money Market Fund – Premier Class, 4.42% (a) | 559,158 | ||||||
|
| |||||||
TOTAL SHORT-TERM INVESTMENTS (COST $559,158) | 559,158 | |||||||
|
| |||||||
TOTAL INVESTMENTS — 99.9% (Cost $392,581,706) | 339,734,073 | |||||||
| Other Assets and Liabilities (net) — 0.1% | 385,464 | |||||||
|
| |||||||
| TOTAL NET ASSETS — 100.0% | $ | 340,119,537 | ||||||
|
| |||||||
Notes to Schedule of Investments:
| (a) | The rate disclosed is the 7 day net yield as of February 28, 2023. |
For a listing of definitions of acronyms, counterparty abbreviations and currency abbreviations used throughout the Schedule of Investments as well as the derivative tables, if any, please refer to page 125.
| See accompanying notes to the financial statements. | 56 |
GMO Global Developed Equity Allocation Fund
(A Series of GMO Trust)
Portfolio Management
Day-to-day management of the Fund’s portfolio is the responsibility of the Asset Allocation team at Grantham, Mayo, Van Otterloo & Co. LLC.
Management Discussion and Analysis of Fund Performance
Class III shares of GMO Global Developed Equity Allocation Fund returned -3.94% (net) for the fiscal year ended February 28, 2023, as compared with -7.33% for the Fund’s benchmark, the MSCI World Index.
The Fund’s underweight to the U.S. market and overweight to developed ex-U.S. added to performance relative to the benchmark. We also believed that emerging markets were trading at very preferential valuations, and therefore held an “off-benchmark” position here. Unfortunately, pursuit of a zero-COVID policy until near the very end of 2022 really hampered the Chinese economy and weighed heavily on emerging market performance. Security selection in developed markets was strong, helped by strong outperformance of the Value style.
The views expressed herein are exclusively those of Grantham, Mayo, Van Otterloo & Co. LLC as of the date of this report and are subject to change. GMO disclaims any responsibility to update such views. They are not meant as investment advice. References to specific securities are not recommendations of such securities and may not be representative of any GMO portfolio’s current or future investments. All information is unaudited.
57
GMO Global Developed Equity Allocation Fund
(A Series of GMO Trust)
Comparison of Change in Value of a $5,000,000 Investment in
GMO Global Developed Equity Allocation Fund Class III Shares and the MSCI World Index
As of February 28, 2023
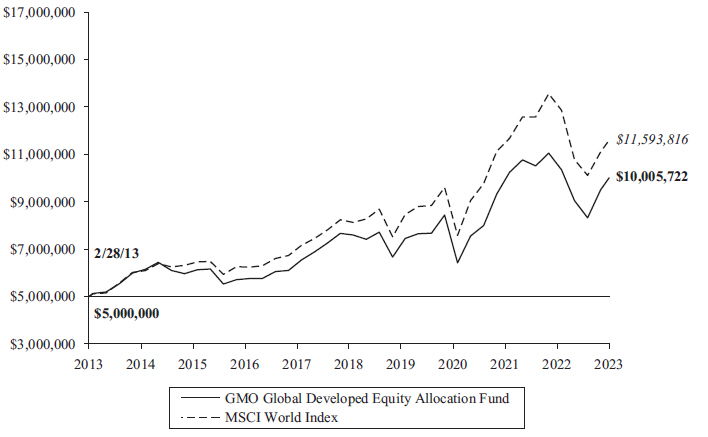
| Average Annual Total Returns | ||||||||||||
| 1 Year | 5 Year | 10 Year | ||||||||||
| Class III | -3.94 | % | 5.28 | % | 7.18 | % | ||||||
Performance data quoted represents past performance and is not indicative of future results. The investment return and principal value of an investment will fluctuate so that an investor’s shares, when redeemed, may be worth more or less than their original cost. Current performance data may be lower or higher than the performance data provided herein. To obtain performance information up to the most recent month-end, visit www.gmo.com. Performance shown is net of all fees after reimbursement from GMO. Returns would have been lower had certain expenses not been reimbursed during the periods shown and do not include the effect of taxes on distributions and redemptions. The performance information shown above only includes purchase premiums and/or redemption fees in effect as of February 28, 2023. All information is unaudited.
MSCI data may not be reproduced or used for any other purpose. MSCI provides no warranties, has not prepared or approved this report, and has no liability hereunder.
For Class III the gross expense ratio of 0.58% is equal to the Fund’s Total Annual Operating Expenses set forth in the Fund’s most recent prospectus dated June 30, 2022. For the Class listed above, the net expense ratio of 0.53% reflects the reduction of expenses from fee reimbursements. The fee reimbursements will continue until at least June 30, 2023. Elimination of this reimbursement will result in higher fees and lower performance.
58
GMO Global Developed Equity Allocation Fund
(A Series of GMO Trust)
Investment Concentration Summary
February 28, 2023 (Unaudited)
Asset Class Summary& | % of Total Net Assets | |||
Common Stocks | 97.6 | % | ||
Short-Term Investments | 3.3 | |||
Preferred Stocks | 0.9 | |||
Debt Obligations | 0.1 | |||
Rights/Warrants | 0.0 | ^ | ||
Futures Contracts | (0.0 | )^ | ||
Other | (1.9 | ) | ||
|
| |||
| 100.0 | % | |||
|
| |||
Country/Region Summary¤ | % of Investments | |||
United States | 43.4 | % | ||
Japan | 13.5 | |||
United Kingdom | 7.5 | |||
France | 7.3 | |||
Other Developed | 3.9 | ‡ | ||
Other Emerging | 3.2 | † | ||
Netherlands | 3.0 | |||
Spain | 3.0 | |||
Taiwan | 3.0 | |||
Switzerland | 2.7 | |||
Germany | 2.5 | |||
Singapore | 1.8 | |||
Australia | 1.6 | |||
South Korea | 1.6 | |||
Brazil | 1.0 | |||
Mexico | 1.0 | |||
|
| |||
| 100.0 | % | |||
|
| |||
| & | The table incorporates aggregate indirect asset class exposure associated with investments in other funds of GMO Trust (“underlying funds”). Derivative financial instruments, if any, are based on market values, rather than the notional amounts of derivatives, except for forward currency contracts which are based on unrealized appreciation/(depreciation). |
| ¤ | The table incorporates aggregate indirect country exposure associated with investments in the underlying funds. The table excludes short-term investments and includes exposure through the use of derivative financial instruments, if any. The table excludes exposure through forward currency contracts, if any. |
| ‡ | “Other Developed” is comprised of developed countries that each represent between (1.0)% and 1.0% of Investments. |
| † | “Other Emerging” is comprised of emerging countries that each represent between (1.0)% and 1.0% of Investments. |
| ^ | Rounds to 0.0%. |
59
GMO Global Developed Equity Allocation Fund
(A Series of GMO Trust)
(showing percentage of total net assets)
February 28, 2023
| Shares | Description | Value ($) | ||||||
| MUTUAL FUNDS — 100.0% | ||||||||
| Affiliated Issuers — 100.0% | ||||||||
| 390,430 | GMO Emerging Markets ex-China Fund, Class VI | 5,208,340 | ||||||
| 1,205,807 | GMO International Equity Fund, Class IV | 26,045,425 | ||||||
| 157,276 | GMO-Usonian Japan Value Creation Fund, Class VI | 2,653,243 | ||||||
| 175,205 | GMO Quality Cyclicals Fund, Class VI | 3,852,762 | ||||||
| 398,516 | GMO Quality Fund, Class VI | 9,468,743 | ||||||
| 173,366 | GMO Small Cap Quality Fund, Class VI | 3,836,577 | ||||||
| 328,549 | GMO U.S. Equity Fund, Class VI | 4,067,439 | ||||||
| 497,317 | GMO U.S. Opportunistic Value Fund, Class VI | 10,040,826 | ||||||
| 105,382 | GMO U.S. Small Cap Value Fund, Class VI | 1,811,524 | ||||||
|
| |||||||
| TOTAL MUTUAL FUNDS (COST $68,566,962) | 66,984,879 | |||||||
|
| |||||||
| SHORT-TERM INVESTMENTS — 0.0% |
| |||||||
| Money Market Funds — 0.0% | ||||||||
| 30,817 | State Street Institutional Treasury Money Market Fund – Premier Class, 4.42% (a) | 30,817 | ||||||
|
| |||||||
| TOTAL SHORT-TERM INVESTMENTS (COST $30,817) | 30,817 | |||||||
|
| |||||||
TOTAL INVESTMENTS — 100.0% (Cost $68,597,779) | 67,015,696 | |||||||
| Other Assets and Liabilities (net) — (0.0%) | (23,242 | ) | ||||||
|
| |||||||
| TOTAL NET ASSETS — 100.0% | $ | 66,992,454 | ||||||
|
| |||||||
Notes to Schedule of Investments:
| (a) | The rate disclosed is the 7 day net yield as of February 28, 2023. |
For a listing of definitions of acronyms, counterparty abbreviations and currency abbreviations used throughout the Schedule of Investments as well as the derivative tables, if any, please refer to page 125.
| See accompanying notes to the financial statements. | 60 |
GMO Global Equity Allocation Fund
(A Series of GMO Trust)
Portfolio Management
Day-to-day management of the Fund’s portfolio is the responsibility of the Asset Allocation team at Grantham, Mayo, Van Otterloo & Co. LLC. Specific security selection is primarily handled by other GMO investment teams in collaboration with the Asset Allocation team.
Management Discussion and Analysis of Fund Performance
Class III shares of GMO Global Equity Allocation Fund returned -6.66% (net) for the fiscal year ended February 28, 2023, as compared with -8.26% for the Fund’s benchmark, the MSCI All Country World Index (“ACWI”).
The Fund’s regional bias of being underweight to the U.S. market and overweight to developed ex-U.S. and emerging markets had only a modest impact on performance relative to the benchmark. In particular, the benefits gained from being overweight developed ex-U.S. equities compensated for the detriment caused by being overweight emerging market equities. For the period, the MSCI World ex-U.S. Index performed relatively strongly and was down just -3.75%, while the MSCI Emerging Markets Index fell -15.28%. The MSCI USA Index sat right in the middle with a -8.95% return. We had believed that emerging markets were trading at very preferential valuations, but pursuit of a zero-COVID policy until near the very end of 2022 really hampered the Chinese economy and weighed heavily on emerging market performance. Most of the outperformance relative to the benchmark was, therefore, down to stock selection. The Fund enjoyed strong relative results in the U.S., and indeed in developed markets generally, while the emerging market exposure modestly lagged the reference benchmark.
Because some of the securities and instruments held directly or indirectly by the Fund had positive fair value adjustments at the beginning or end of the fiscal year (and the performance of indices are not fair valued), the Fund’s absolute and relative performance is higher than it otherwise would have been in the absence of such fair value adjustments.
The views expressed herein are exclusively those of Grantham, Mayo, Van Otterloo & Co. LLC as of the date of this report and are subject to change. GMO disclaims any responsibility to update such views. They are not meant as investment advice. References to specific securities are not recommendations of such securities and may not be representative of any GMO portfolio’s current or future investments. All information is unaudited.
61
GMO Global Equity Allocation Fund
(A Series of GMO Trust)
Comparison of Change in Value of a $5,000,000 Investment in
GMO Global Equity Allocation Fund Class III Shares and the MSCI ACWI
As of February 28, 2023
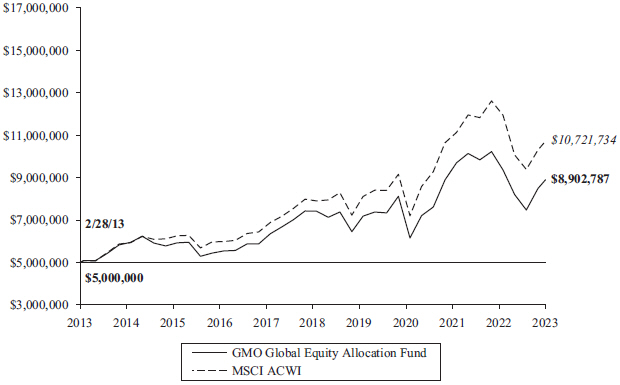
| Average Annual Total Returns | ||||||||||||||||||||
| 1 Year | 5 Year | 10 Year | Since Inception | |||||||||||||||||
| Class III | -6.66 | % | 3.38 | % | 5.94 | % | n/a | |||||||||||||
| Class R6 | -6.69 | % | n/a | n/a | 7/15/20 | 6.45 | % | |||||||||||||
| Class I | -6.74 | % | n/a | n/a | 8/17/20 | 5.04 | % | |||||||||||||
Performance data quoted represents past performance and is not indicative of future results. The investment return and principal value of an investment will fluctuate so that an investor’s shares, when redeemed, may be worth more or less than their original cost. Current performance data may be lower or higher than the performance data provided herein. To obtain performance information up to the most recent month-end, visit www.gmo.com. Performance shown is net of all fees after reimbursement from GMO. Returns would have been lower had certain expenses not been reimbursed during the periods shown and do not include the effect of taxes on distributions and redemptions. The performance information shown above only includes purchase premiums and/or redemption fees in effect as of February 28, 2023. All information is unaudited. Performance for classes may vary due to different fees.
MSCI data may not be reproduced or used for any other purpose. MSCI provides no warranties, has not prepared or approved this report, and has no liability hereunder.
For Class III, R6 and I the gross expense ratio of 0.60%, 0.60% and 0.70%, respectively, is equal to the Fund’s Total Annual Operating Expenses set forth in the Fund’s most recent prospectus dated June 30, 2022. For the Classes listed above, the corresponding net expense ratio of 0.59%, 0.59% and 0.69% reflects the reduction of expenses from fee reimbursements. The fee reimbursements will continue until at least June 30, 2023. Elimination of this reimbursement will result in higher fees and lower performance.
62
GMO Global Equity Allocation Fund
(A Series of GMO Trust)
Investment Concentration Summary
February 28, 2023 (Unaudited)
Asset Class Summary& | % of Total Net Assets | |||
Common Stocks | 95.2 | % | ||
Short-Term Investments | 3.1 | |||
Preferred Stocks | 1.7 | |||
Debt Obligations | 0.1 | |||
Rights/Warrants | 0.0 | ^ | ||
Futures Contracts | (0.0 | )^ | ||
Other | (0.1 | ) | ||
|
| |||
| 100.0 | % | |||
|
| |||
Country/Region Summary¤ | % of Investments | |||
United States | 36.5 | % | ||
Japan | 11.9 | |||
United Kingdom | 6.4 | |||
Taiwan | 6.2 | |||
France | 6.1 | |||
South Korea | 3.9 | |||
Other Emerging | 3.6 | † | ||
China | 3.5 | |||
Other Developed | 3.5 | ‡ | ||
Netherlands | 2.5 | |||
Spain | 2.5 | |||
Switzerland | 2.3 | |||
Germany | 2.1 | |||
Brazil | 2.0 | |||
Mexico | 1.7 | |||
Singapore | 1.5 | |||
Australia | 1.3 | |||
India | 1.3 | |||
South Africa | 1.2 | |||
|
| |||
| 100.0 | % | |||
|
| |||
| & | The table incorporates aggregate indirect asset class exposure associated with investments in other funds of GMO Trust (“underlying funds”). Derivative financial instruments, if any, are based on market values, rather than the notional amounts of derivatives, except for forward currency contracts which are based on unrealized appreciation/(depreciation). |
| ¤ | The table incorporates aggregate indirect country exposure associated with investments in the underlying funds. The table excludes short-term investments and includes exposure through the use of derivative financial instruments, if any. The table excludes exposure through forward currency contracts, if any. |
| † | “Other Emerging” is comprised of emerging countries that each represent between (1.0)% and 1.0% of Investments. |
| ‡ | “Other Developed” is comprised of developed countries that each represent between (1.0)% and 1.0% of Investments. |
| ^ | Rounds to 0.0%. |
63
GMO Global Equity Allocation Fund
(A Series of GMO Trust)
(showing percentage of total net assets)
February 28, 2023
| Shares | Description | Value ($) | ||||||
| MUTUAL FUNDS — 98.3% | ||||||||
| Affiliated Issuers — 98.3% | ||||||||
| 4,315,772 | GMO Emerging Markets ex-China Fund, Class VI | 57,572,405 | ||||||
| 3,085,568 | GMO Emerging Markets Fund, Class VI | 66,864,262 | ||||||
| 8,968,521 | GMO International Equity Fund, Class IV | 193,720,044 | ||||||
| 1,395,668 | GMO-Usonian Japan Value Creation Fund, Class VI | 23,544,917 | ||||||
| 1,308,330 | GMO Quality Cyclicals Fund, Class VI | 28,770,184 | ||||||
| 3,010,838 | GMO Quality Fund, Class VI | 71,537,500 | ||||||
| 1,344,374 | GMO Small Cap Quality Fund, Class VI | 29,750,989 | ||||||
| 2,398,986 | GMO U.S. Equity Fund, Class VI | 29,699,442 | ||||||
| 3,507,749 | GMO U.S. Opportunistic Value Fund, Class VI | 70,821,461 | ||||||
| 994,923 | GMO U.S. Small Cap Value Fund, Class VI | 17,102,735 | ||||||
|
| |||||||
| TOTAL MUTUAL FUNDS (COST $701,748,053) | 589,383,939 | |||||||
|
| |||||||
| SHORT-TERM INVESTMENTS — 0.1% |
| |||||||
| Money Market Funds — 0.1% | ||||||||
| 582,993 | State Street Institutional Treasury Money Market Fund – Premier Class, 4.42% (a) | 582,993 | ||||||
|
| |||||||
| TOTAL SHORT-TERM INVESTMENTS (COST $582,993) | 582,993 | |||||||
|
| |||||||
| TOTAL INVESTMENTS — 98.4% (Cost $702,331,046) | 589,966,932 | |||||||
| Other Assets and Liabilities (net) — 1.6% | 9,601,604 | |||||||
|
| |||||||
| TOTAL NET ASSETS — 100.0% | $ | 599,568,536 | ||||||
|
| |||||||
Notes to Schedule of Investments:
| (a) | The rate disclosed is the 7 day net yield as of February 28, 2023. |
For a listing of definitions of acronyms, counterparty abbreviations and currency abbreviations used throughout the Schedule of Investments as well as the derivative tables, if any, please refer to page 125.
| See accompanying notes to the financial statements. | 64 |
(A Series of GMO Trust)
Portfolio Management
Day-to-day management of the Fund’s portfolio is the responsibility of the Asset Allocation team at Grantham, Mayo, Van Otterloo & Co. LLC. Allocations among asset classes are made by the Asset Allocation team and specific security selection is primarily handled by other GMO investment teams in collaboration with the Asset Allocation team.
Management Discussion and Analysis of Fund Performance
Although GMO does not manage the Fund to, or control the Fund’s risk relative to, any securities index or securities benchmark, a discussion of the Fund’s performance relative to the Consumer Price Index (“CPI”) is included for comparative purposes only.
GMO Implementation Fund returned +1.52% (net) for the fiscal year ended February 28, 2023, as compared with +6.15% for the CPI.
This was a fairly lackluster 12 months for absolute performance, but it was very solid in relation to the majority of risk assets. Over the same period, global equities as measured by the MSCI All Country World Index (“ACWI”) were down -8.26%, while bonds as measured by the Bloomberg U.S. Aggregate Index were down -9.72%.
The Fund had an average equity exposure of about 40%, and this had a moderately worse return than MSCI ACWI. We had a significant investment in emerging markets as we believed that they were trading at very preferential valuations, but China’s pursuit of a zero-COVID policy until very late in 2022 really hampered their economy and weighed heavily on emerging market equity performance. There was a broadly 53% average exposure to equity long/short positions and alternatives and these delivered a welcome positive return, ensuring that the Fund was not down in absolute terms for the period. The best performer, up some 8.03%, was the Equity Dislocation Strategy, which is long cheap Value stocks and short expensive Growth stocks. Fixed income assets accounted for an average of 7% of the Fund, and these were down -3.01% for the 12 months, as the decision to emphasize credit over duration was a key driver of the outperformance over the Bloomberg U.S. Aggregate Index.
The views expressed herein are exclusively those of Grantham, Mayo, Van Otterloo & Co. LLC as of the date of this report and are subject to change. GMO disclaims any responsibility to update such views. They are not meant as investment advice. References to specific securities are not recommendations of such securities and may not be representative of any GMO portfolio’s current or future investments. All information is unaudited.
65
GMO Implementation Fund
(A Series of GMO Trust)
Comparison of Change in Value of a $5,000,000 Investment in
GMO Implementation Fund, the Consumer Price Index and the Bloomberg U.S. Treasury
Inflation Notes: 1-10 Year Index
As of February 28, 2023
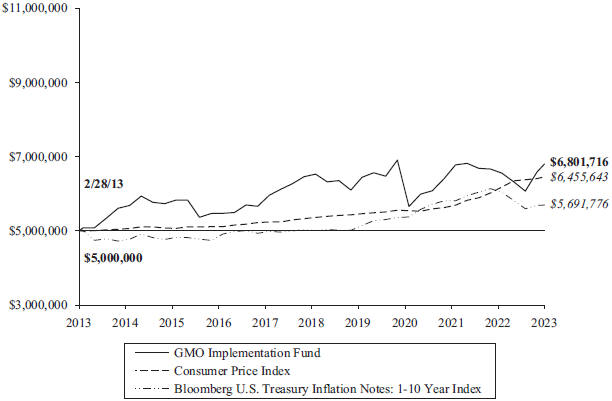
| Average Annual Total Returns | ||||||||||||
| 1 Year | 5 Year | 10 Year | ||||||||||
| Core Class | 1.52 | % | 0.76 | % | 3.13 | % | ||||||
Performance data quoted represents past performance and is not indicative of future results. The investment return and principal value of an investment will fluctuate so that an investor’s shares, when redeemed, may be worth more or less than their original cost. Current performance data may be lower or higher than the performance data provided herein. To obtain performance information up to the most recent month-end, visit www.gmo.com. Performance shown is net of all fees after reimbursement from GMO. Returns would have been lower had certain expenses not been reimbursed during the periods shown and do not include the effect of taxes on distributions and redemptions. The performance information shown above only includes purchase premiums and/or redemption fees in effect as of February 28, 2023. All information is unaudited.
The gross expense ratio of 0.38% is equal to the Fund’s Total Annual Operating Expenses set forth in the Fund’s most recent prospectus dated June 30, 2022. The net expense ratio of 0.33% reflects the reduction of expenses from fee reimbursements. The fee reimbursements will continue until at least June 30, 2023. Elimination of this reimbursement will result in higher fees and lower performance.
66
GMO Implementation Fund
(A Series of GMO Trust)
Consolidated Investment Concentration Summary(a)
February 28, 2023 (Unaudited)
Asset Class Summary& | % of Total Net Assets | |||
Common Stocks | 80.1 | % | ||
Debt Obligations | 30.8 | |||
Short-Term Investments | 8.1 | |||
Preferred Stocks | 1.9 | |||
Investment Funds | 0.3 | |||
Swap Contracts | 0.1 | |||
Mutual Funds | 0.0 | ^ | ||
Rights/Warrants | 0.0 | ^ | ||
Futures Contracts | 0.0 | ^ | ||
Forward Currency Contracts | (0.0 | )^ | ||
Written Options | (0.1 | ) | ||
Securities Sold Short | (24.3 | ) | ||
Other | 3.1 | |||
|
| |||
| 100.0 | % | |||
|
| |||
| Debt Obligations as a % | ||||
Country/Region Summary¤ | of Total Net Assets | |||
Australia | 2.4 | % | ||
Switzerland | 1.5 | |||
Sweden | (1.0 | ) | ||
Other Developed | (1.2 | )‡ | ||
Euro Region | (1.7 | )§ | ||
United States | (1.7 | ) | ||
|
| |||
| (1.7 | )% | |||
|
| |||
| Equity Investments as a % | ||||
Country/Region Summary¤ | of Total Net Assets | |||
United States | 11.8 | % | ||
Japan | 10.5 | |||
Other Developed | 5.4 | ‡ | ||
China | 3.6 | |||
Taiwan | 3.5 | |||
Other Emerging | 3.3 | † | ||
South Korea | 3.1 | |||
United Kingdom | 2.8 | |||
Brazil | 2.4 | |||
India | 2.3 | |||
France | 2.1 | |||
Spain | 1.4 | |||
Canada | 1.3 | |||
Netherlands | 1.3 | |||
Mexico | 1.1 | |||
South Africa | 1.1 | |||
|
| |||
| 57.0 | % | |||
|
| |||
Industry Group Summary | % of Equity Investments# | |||
Banks | 13.6 | % | ||
Materials | 12.8 | |||
Capital Goods | 9.4 | |||
Energy | 9.2 | |||
Technology Hardware & Equipment | 8.1 | |||
Consumer Durables & Apparel | 5.7 | |||
Automobiles & Components | 5.5 | |||
Food, Beverage & Tobacco | 5.4 | |||
Pharmaceuticals, Biotechnology & Life Sciences | 4.8 | |||
Diversified Financials | 4.6 | |||
Semiconductors & Semiconductor Equipment | 4.5 | |||
Insurance | 4.1 | |||
Media & Entertainment | 3.1 | |||
Telecommunication Services | 2.7 | |||
Food & Staples Retailing | 2.4 | |||
Retailing | 2.2 | |||
Commercial & Professional Services | 1.4 | |||
Utilities | 1.3 | |||
Real Estate | 1.3 | |||
Transportation | 1.0 | |||
Household & Personal Products | 0.4 | |||
Health Care Equipment & Services | 0.3 | |||
Software & Services | (1.7 | ) | ||
Consumer Services | (2.1 | ) | ||
|
| |||
| 100.0 | % | |||
|
| |||
| (a) | GMO Implementation SPC Ltd. is a 100% owned subsidiary of GMO Implementation Fund. As such, the holdings of GMO Implementation SPC Ltd. have been included with GMO Implementation Fund. |
| & | In the table, derivative financial instruments, if any, are based on market values, rather than the notional amounts of derivatives, except for forward currency contracts which are based on unrealized appreciation/(depreciation). |
| ¤ | The table incorporates aggregate indirect country exposure associated with investments in the underlying funds. The table excludes short-term investments. The table includes exposure through the use of certain derivative financial instruments and excludes exposure through certain currency linked derivatives such as forward currency contracts and currency options. The table is based on duration adjusted net exposures (both investments and derivatives), taking into account the market value of securities and the notional amounts of swaps and other derivative financial instruments. Duration is based on GMO’s models. The greater the duration of a bond, the greater its contribution to the concentration percentage. Credit default swap exposures are factored into the duration-adjusted exposure using the reference security and applying the same methodology to that security. The table is not normalized, thus, due to the exclusions listed above and negative exposures, which may be attributable to derivatives or short sales, if any, the tables may not total to 100%. |
| ‡ | “Other Developed” is comprised of developed countries that each represent between (1.0)% and 1.0% of Total Net Assets. |
| § | “Euro Region” is comprised of derivative financial instruments attributed to the Eurozone and not a particular country. |
| † | “Other Emerging” is comprised of emerging countries that each represent between (1.0)% and 1.0% of Total Net Assets. |
| # | Equity investments may consist of common stocks and other stock-related securities, such as preferred stocks, if any. This table excludes exposure to derivative contracts, short-term investments, mutual funds and investment funds, if any. For a summary of these exposures, if any, see the Schedule of Investments. |
| ^ | Rounds to 0.0%. |
67
GMO Implementation Fund
(A Series of GMO Trust)
Consolidated Schedule of Investments
(showing percentage of total net assets)
February 28, 2023
| Shares | Description | Value ($) | ||||||
| COMMON STOCKS — 80.1% | ||||||||
| Argentina — 0.0% | ||||||||
| 154,985 | Adecoagro SA | 1,258,478 | ||||||
|
| |||||||
| Australia — 1.3% | ||||||||
| 49,016 | Accent Group Ltd | 72,970 | ||||||
| 102,333 | AMP Ltd * | 71,035 | ||||||
| 591,817 | Aurizon Holdings Ltd (a) | 1,315,102 | ||||||
| 96,471 | Austal Ltd | 117,272 | ||||||
| 2,003,099 | Beach Energy Ltd | 1,889,157 | ||||||
| 2,005 | BHP Group Ltd (a) | 60,681 | ||||||
| 580,618 | BlueScope Steel Ltd | 7,428,829 | ||||||
| 558,921 | Brambles Ltd (a) | 4,829,465 | ||||||
| 10,360 | Challenger Ltd | 51,981 | ||||||
| 403,443 | Fortescue Metals Group Ltd (a) | 5,781,304 | ||||||
| 969,024 | GPT Group (The) (REIT) (a) | 3,058,921 | ||||||
| 339,577 | GrainCorp Ltd – Class A | 1,790,646 | ||||||
| 391,714 | Grange Resources Ltd | 249,429 | ||||||
| 307,463 | Helia Group Ltd | 711,883 | ||||||
| 66,858 | HomeCo Daily Needs (REIT) | 58,934 | ||||||
| 35,190 | JB Hi-Fi Ltd (b) | 987,724 | ||||||
| 449,614 | Jupiter Mines Ltd | 71,075 | ||||||
| 22,644 | McMillan Shakespeare Ltd | 217,808 | ||||||
| 220,360 | Metcash Ltd (b) | 602,434 | ||||||
| 1,984,009 | Mirvac Group (REIT) (a) | 3,020,809 | ||||||
| 9,087 | Monadelphous Group Ltd | 73,161 | ||||||
| 96,512 | Mount Gibson Iron Ltd * (b) | 36,634 | ||||||
| 26,347 | NRW Holdings Ltd | 44,722 | ||||||
| 142,179 | Nufarm Ltd | 553,588 | ||||||
| 556,495 | Perenti Ltd * | 396,590 | ||||||
| 38,247 | Regis Resources Ltd | 44,689 | ||||||
| 106,226 | Rio Tinto Ltd (a) | 8,301,996 | ||||||
| 54,450 | Sandfire Resources Ltd | 214,401 | ||||||
| 1,133,073 | Scentre Group (REIT) (a) | 2,263,035 | ||||||
| 79,010 | Southern Cross Media Group Ltd | 56,233 | ||||||
| 1,131,646 | Stockland (REIT) (a) | 2,915,062 | ||||||
| 154,510 | Sunrise Energy Metals Ltd * | 166,177 | ||||||
| 21,255 | Super Retail Group Ltd | 184,869 | ||||||
| 58,090 | Viva Energy Group Ltd | 117,007 | ||||||
|
| |||||||
| Total Australia | 47,755,623 | |||||||
|
| |||||||
| Austria — 0.1% | ||||||||
| 38,015 | OMV AG | 1,851,614 | ||||||
| 13,375 | Raiffeisen Bank International AG * | 223,302 | ||||||
| 3,216 | Strabag SE | 127,385 | ||||||
|
| |||||||
| Total Austria | 2,202,301 | |||||||
|
| |||||||
| Belgium — 0.5% | ||||||||
| 133,639 | Ageas SA/NV | 6,031,003 | ||||||
| 20,043 | AGFA-Gevaert NV * | 59,238 | ||||||
| 32,991 | Bekaert SA | 1,455,666 | ||||||
| 3,217 | Cie d’Entreprises CFE * | 32,395 | ||||||
| 11,958 | Econocom Group SA (a) | 38,718 | ||||||
| 1,544 | Orange Belgium SA * | 26,097 | ||||||
| Shares | Description | Value ($) | ||||||
| Belgium — continued | ||||||||
| 10,949 | Sofina SA (b) | 2,727,659 | ||||||
| 22,702 | Solvay SA (a) | 2,593,200 | ||||||
| 19,121 | Telenet Group Holding NV | 295,554 | ||||||
| 74,769 | UCB SA | 6,427,761 | ||||||
|
| |||||||
| Total Belgium | 19,687,291 | |||||||
|
| |||||||
| Brazil — 1.1% | ||||||||
| 775,100 | Ambev SA | 1,982,368 | ||||||
| 358,100 | Banco do Brasil SA | 2,756,483 | ||||||
| 145,800 | BB Seguridade Participacoes SA | 952,701 | ||||||
| 128,000 | CPFL Energia SA | 740,551 | ||||||
| 176,340 | Dexco SA | 219,606 | ||||||
| 14,400 | EDP - Energias do Brasil SA | 53,992 | ||||||
| 298,335 | Enauta Participacoes SA | 785,235 | ||||||
| 6,000 | Engie Brasil Energia SA | 45,016 | ||||||
| 111,200 | Itau Unibanco Holding SA | 461,329 | ||||||
| 312,100 | JBS SA | 1,143,970 | ||||||
| 178,624 | Localiza Rent a Car SA | 1,893,218 | ||||||
| 169,900 | Marfrig Global Foods SA | 206,718 | ||||||
| 865,200 | Petroleo Brasileiro SA Sponsored ADR | 9,595,068 | ||||||
| 170,526 | Sao Martinho SA | 885,942 | ||||||
| 134,800 | Ser Educacional SA * | 96,296 | ||||||
| 79,400 | SLC Agricola SA | 747,221 | ||||||
| 159,900 | Suzano SA | 1,458,065 | ||||||
| 157,800 | Telefonica Brasil SA ADR (a) | 1,175,610 | ||||||
| 2,396,100 | TIM SA | 5,611,014 | ||||||
| 29,600 | TIM SA ADR | 347,208 | ||||||
| 158,800 | Transmissora Alianca de Energia Eletrica SA | 1,076,471 | ||||||
| 15,400 | Ultrapar Participacoes SA | 38,769 | ||||||
| 104,344 | Vale SA | 1,700,452 | ||||||
| 375,800 | Vale SA Sponsored ADR – Class B (a) | 6,140,572 | ||||||
| 588,600 | Vibra Energia SA | 1,662,779 | ||||||
|
| |||||||
| Total Brazil | 41,776,654 | |||||||
|
| |||||||
| Canada — 2.7% | ||||||||
| 4,900 | ADENTRA Inc (b) | 116,709 | ||||||
| 26,400 | Algoma Steel Group Inc (b) | 212,051 | ||||||
| 102,200 | Alimentation Couche-Tard Inc (a) | 4,794,300 | ||||||
| 58,000 | Anaergia Inc * | 186,603 | ||||||
| 6,500 | Atco Ltd – Class I (a) | 201,550 | ||||||
| 41,900 | Birchcliff Energy Ltd | 257,634 | ||||||
| 24,407 | Brookfield Asset Management Ltd – Class A (a) | 820,563 | ||||||
| 104,873 | Brookfield Corp – Class A (a) | 3,487,027 | ||||||
| 511,741 | Canaccord Genuity Group Inc (b) | 4,324,202 | ||||||
| 10,574 | Canadian Apartment Properties (REIT) (a) | 382,973 | ||||||
| 52,020 | Canadian Solar Inc * | 2,067,795 | ||||||
| 48,100 | Canadian Tire Corp Ltd – Class A (a) | 5,995,844 | ||||||
| 74,100 | Canfor Corp * | 1,264,235 | ||||||
| 124,200 | Celestica Inc * (b) (c) | 1,604,724 | ||||||
| 43,900 | Celestica Inc * (c) | 568,505 | ||||||
| 10,500 | Cogeco Inc | 465,555 | ||||||
| See accompanying notes to the financial statements. | 68 |
GMO Implementation Fund
(A Series of GMO Trust)
Consolidated Schedule of Investments — (Continued)
(showing percentage of total net assets)
February 28, 2023
| Shares | Description | Value ($) | ||||||
| Canada — continued | ||||||||
| 60,100 | Crescent Point Energy Corp | 410,483 | ||||||
| 1,500 | Dollarama Inc (a) | 86,647 | ||||||
| 12,000 | DREAM UnLtd Corp – Class A (b) | 234,547 | ||||||
| 9,200 | Element Fleet Management Corp | 131,409 | ||||||
| 43,366 | Enerflex Ltd | 287,624 | ||||||
| 600 | Fairfax Financial Holdings Ltd (a) | 419,481 | ||||||
| 46,300 | Finning International Inc | 1,174,381 | ||||||
| 141,300 | First Quantum Minerals Ltd | 3,086,957 | ||||||
| 68,100 | Hydro One Ltd (a) | 1,767,256 | ||||||
| 12,100 | iA Financial Corp Inc | 812,283 | ||||||
| 51,600 | Imperial Oil Ltd (c) | 2,546,976 | ||||||
| 13,900 | Imperial Oil Ltd (c) | 687,513 | ||||||
| 117,800 | Interfor Corp * | 1,983,046 | ||||||
| 40,595 | International Petroleum Corp * | 407,992 | ||||||
| 486,900 | Ivanhoe Mines Ltd – Class A* | 4,067,908 | ||||||
| 110,972 | Largo Inc * (b) | 709,993 | ||||||
| 133,500 | Li-Cycle Holdings Corp * | 809,010 | ||||||
| 14,500 | Loblaw Cos Ltd (a) | 1,239,168 | ||||||
| 61,900 | Magna International Inc (b) | 3,449,978 | ||||||
| 311,700 | Manulife Financial Corp (a) (c) | 6,163,185 | ||||||
| 106,600 | Manulife Financial Corp (a) (c) | 2,106,416 | ||||||
| 13,700 | Martinrea International Inc | 140,364 | ||||||
| 46,300 | Mullen Group Ltd (a) | 483,190 | ||||||
| 1,500 | National Bank of Canada | 110,172 | ||||||
| 77,242 | Nutrien Ltd (a) | 6,007,883 | ||||||
| 26,500 | OceanaGold Corp * | 53,991 | ||||||
| 61,800 | Onex Corp | 3,304,454 | ||||||
| 16,800 | Parex Resources Inc | 273,823 | ||||||
| 169,900 | Quebecor Inc – Class B | 4,019,327 | ||||||
| 11,200 | Rogers Sugar Inc | 50,973 | ||||||
| 41,500 | Russel Metals Inc | 1,081,829 | ||||||
| 24,600 | Sleep Country Canada Holdings Inc | 468,743 | ||||||
| 9,800 | Spin Master Corp | 265,595 | ||||||
| 7,500 | Stella-Jones Inc | 271,418 | ||||||
| 2,800 | Suncor Energy Inc | 94,106 | ||||||
| 72,000 | Tamarack Valley Energy Ltd (b) | 229,007 | ||||||
| 261,000 | Teck Resources Ltd – Class B (c) | 10,418,959 | ||||||
| 173,100 | Teck Resources Ltd – Class B (c) | 6,910,152 | ||||||
| 45,100 | Uni-Select Inc * | 1,566,023 | ||||||
| 46,700 | Vermilion Energy Inc | 625,780 | ||||||
| 4,000 | Wajax Corp | 71,235 | ||||||
| 69,200 | West Fraser Timber Co Ltd (c) | 5,198,241 | ||||||
| 16,500 | West Fraser Timber Co Ltd (c) | 1,238,490 | ||||||
| 32,200 | Whitecap Resources Inc | 246,839 | ||||||
|
| |||||||
| Total Canada | 102,463,117 | |||||||
|
| |||||||
| Chile — 0.2% | ||||||||
| 17,924 | CAP SA | 149,007 | ||||||
| 827,785 | Cencosud SA | 1,564,678 | ||||||
| 100,764 | Cencosud Shopping SA | 143,562 | ||||||
| 19,400 | Cia Cervecerias Unidas SA Sponsored ADR | 294,492 | ||||||
| 5,951,896 | Colbun SA | 682,441 | ||||||
| 86,442 | Empresas CMPC SA | 143,603 | ||||||
| Shares | Description | Value ($) | ||||||
| Chile — continued | ||||||||
| 3,849,027 | Enel Chile SA | 173,276 | ||||||
| 945,241 | Falabella SA | 2,080,115 | ||||||
| 62,938 | Inversiones La Construccion SA | 274,456 | ||||||
|
| |||||||
| Total Chile | 5,505,630 | |||||||
|
| |||||||
| China — 3.6% | ||||||||
| 282,000 | 361 Degrees International Ltd * | 135,251 | ||||||
| 1,436,000 | 3SBio Inc | 1,423,995 | ||||||
| 21,392,000 | Agricultural Bank of China Ltd – Class H | 7,416,547 | ||||||
| 350,681 | Alibaba Group Holding Ltd * | 3,854,490 | ||||||
| 69,500 | Anhui Conch Cement Co Ltd – Class H | 255,156 | ||||||
| 93,040 | AustAsia Group Ltd * | 48,361 | ||||||
| 2,446,000 | BAIC Motor Corp Ltd – Class H | 664,531 | ||||||
| 13,065,000 | Bank of China Ltd – Class H | 4,791,611 | ||||||
| 4,235,871 | Bank of Communications Co Ltd – Class H | 2,504,492 | ||||||
| 338,000 | Beijing Enterprises Holdings Ltd | 1,107,177 | ||||||
| 684,000 | China BlueChemical Ltd – Class H | 154,388 | ||||||
| 9,392,000 | China Cinda Asset Management Co Ltd – Class H | 1,220,710 | ||||||
| 1,764,000 | China Communications Services Corp Ltd – Class H | 685,835 | ||||||
| 404,500 | China Conch Venture Holdings Ltd | 814,047 | ||||||
| 12,591,000 | China Construction Bank Corp – Class H | 7,696,594 | ||||||
| 1,741,000 | China Dongxiang Group Co Ltd | 76,584 | ||||||
| 3,862,000 | China Energy Engineering Corp Ltd – Class H (b) | 452,818 | ||||||
| 2,717,000 | China Everbright Environment Group Ltd | 1,101,925 | ||||||
| 3,659,000 | China Greenfresh Group Co Ltd (d) | — | ||||||
| 835,000 | China High Speed Transmission Equipment Group Co Ltd * | 345,184 | ||||||
| 3,691,500 | China Hongqiao Group Ltd | 3,948,438 | ||||||
| 759,000 | China Lesso Group Holdings Ltd | 800,582 | ||||||
| 207,000 | China Lilang Ltd | 105,482 | ||||||
| 825,925 | China Medical System Holdings Ltd | 1,243,391 | ||||||
| 715,000 | China Overseas Grand Oceans Group Ltd | 278,155 | ||||||
| 3,130,500 | China Overseas Land & Investment Ltd | 7,771,427 | ||||||
| 18,792,000 | China Petroleum & Chemical Corp – Class H | 9,587,243 | ||||||
| 7,450,000 | China Railway Group Ltd – Class H | 3,882,840 | ||||||
| 629,000 | China Railway Signal & Communication Corp Ltd – Class H | 229,247 | ||||||
| 2,139,000 | China Reinsurance Group Corp – Class H | 152,733 | ||||||
| 3,229,500 | China Resources Pharmaceutical Group Ltd | 2,656,180 | ||||||
| 138,000 | China Shineway Pharmaceutical Group Ltd | 120,581 | ||||||
| 2,324,000 | China South City Holdings Ltd * (b) | 154,063 | ||||||
| 1,488,000 | China State Construction International Holdings Ltd | 1,694,634 | ||||||
| 2,642,000 | China Traditional Chinese Medicine Holdings Co Ltd | 1,370,820 | ||||||
| 336,000 | China Water Affairs Group Ltd | 298,944 | ||||||
| 4,237,600 | China Zhongwang Holdings Ltd * (b) (e) | 906,970 | ||||||
| 5,139,158 | CITIC Ltd | 5,670,339 | ||||||
| 6,040,000 | CSPC Pharmaceutical Group Ltd | 6,488,761 | ||||||
| 3,266,313 | Dongfeng Motor Group Co Ltd – Class H | 1,668,652 | ||||||
| 32,000 | Far East Horizon Ltd | 28,306 | ||||||
| 69 | See accompanying notes to the financial statements. |
GMO Implementation Fund
(A Series of GMO Trust)
Consolidated Schedule of Investments — (Continued)
(showing percentage of total net assets)
February 28, 2023
| Shares | Description | Value ($) | ||||||
| China — continued | ||||||||
| 512,000 | Fufeng Group Ltd | 328,330 | ||||||
| 168,000 | Guangzhou Baiyunshan Pharmaceutical Holdings Co Ltd – Class H | 494,714 | ||||||
| 974,600 | Haier Smart Home Co Ltd – Class H | 3,449,182 | ||||||
| 193,000 | Henan Shenhuo Coal & Power Co Ltd – Class A | 519,325 | ||||||
| 96,000 | Hengan International Group Co Ltd | 441,531 | ||||||
| 114,000 | Hisense Home Appliances Group Co Ltd – Class H | 171,314 | ||||||
| 137,600 | Inner Mongolia Eerduosi Resources Co Ltd – Class A | 331,948 | ||||||
| 376,788 | Kingboard Holdings Ltd | 1,345,184 | ||||||
| 370,400 | Legend Holdings Corp – Class H | 409,369 | ||||||
| 7,388,000 | Lenovo Group Ltd | 6,648,474 | ||||||
| 110,900 | Livzon Pharmaceutical Group Inc – Class H | 385,461 | ||||||
| 760,000 | Lonking Holdings Ltd | 137,583 | ||||||
| 10,546 | Meituan – Class B* | 183,025 | ||||||
| 1,784,000 | Metallurgical Corp of China Ltd – Class H | 388,964 | ||||||
| 184,000 | MMG Ltd * | 51,897 | ||||||
| 55,000 | NetDragon Websoft Holdings Ltd | 125,182 | ||||||
| 743,000 | Nexteer Automotive Group Ltd | 472,014 | ||||||
| 11,544,000 | PetroChina Co Ltd – Class H | 5,889,033 | ||||||
| 7,148,000 | PICC Property & Casualty Co Ltd – Class H | 6,278,451 | ||||||
| 712,000 | Poly Property Group Co Ltd | 170,810 | ||||||
| 98,000 | Road King Infrastructure Ltd | 48,518 | ||||||
| 851,900 | Shanghai Pharmaceuticals Holding Co Ltd – Class H | 1,502,314 | ||||||
| 3,118,000 | Shimao Group Holdings Ltd * (e) | 1,755,747 | ||||||
| 314,000 | Shougang Fushan Resources Group Ltd | 100,868 | ||||||
| 1,787,500 | Sino-Ocean Group Holding Ltd | 225,849 | ||||||
| 720,000 | Sinopec Engineering Group Co Ltd – Class H | 360,722 | ||||||
| 1,215,600 | Sinopharm Group Co Ltd – Class H | 3,255,756 | ||||||
| 959,000 | Sinotruk Hong Kong Ltd | 1,511,500 | ||||||
| 1,768,000 | Skyworth Group Ltd | 969,953 | ||||||
| 166,000 | SSY Group Ltd | 99,537 | ||||||
| 5,905,000 | Sunac China Holdings Ltd * (b) (e) | 3,445,474 | ||||||
| 684,000 | TCL Electronics Holdings Ltd * | 295,610 | ||||||
| 124,460 | Tencent Holdings Ltd | 5,467,328 | ||||||
| 844,000 | Tianjin Port Development Holdings Ltd | 64,561 | ||||||
| 674,000 | Tianneng Power International Ltd (b) | 864,662 | ||||||
| 1,500 | Vipshop Holdings Ltd ADR * | 22,335 | ||||||
| 382,800 | Western Mining Co Ltd – Class A | 633,593 | ||||||
| 497,200 | Xinjiang Goldwind Science & Technology Co Ltd – Class H | 448,497 | ||||||
| 714,000 | Yadea Group Holdings Ltd | 1,532,381 | ||||||
| 22,500 | Zhongsheng Group Holdings Ltd | 112,393 | ||||||
| 50,800 | ZTE Corp – Class H | 150,932 | ||||||
|
| |||||||
| Total China | 134,897,805 | |||||||
|
| |||||||
| Czech Republic — 0.0% | ||||||||
| 176,806 | Moneta Money Bank AS | 673,535 | ||||||
| Shares | Description | Value ($) | ||||||
| Czech Republic — continued | ||||||||
| 627 | Philip Morris CR AS | 485,679 | ||||||
|
| |||||||
| Total Czech Republic | 1,159,214 | |||||||
|
| |||||||
| Denmark — 0.6% | ||||||||
| 1,484 | AP Moller – Maersk A/S – Class A (a) | 3,391,965 | ||||||
| 1,486 | AP Moller – Maersk A/S – Class B (a) | 3,461,410 | ||||||
| 325,748 | Danske Bank A/S | 7,564,928 | ||||||
| 9,656 | Matas A/S | 112,284 | ||||||
| 78,130 | Pandora A/S | 7,400,759 | ||||||
| 1,341 | Rockwool A/S – B Shares | 304,459 | ||||||
| 53,305 | Vestas Wind Systems A/S (a) | 1,521,055 | ||||||
|
| |||||||
| Total Denmark | 23,756,860 | |||||||
|
| |||||||
| Egypt — 0.0% | ||||||||
| 551,207 | Commercial International Bank Egypt SAE | 955,597 | ||||||
| 713,067 | Eastern Co SAE | 431,038 | ||||||
| 34,352 | Misr Fertilizers Production Co SAE | 160,133 | ||||||
|
| |||||||
| Total Egypt | 1,546,768 | |||||||
|
| |||||||
| Finland — 0.6% | ||||||||
| 26,260 | Kemira Oyj | 502,971 | ||||||
| 72,610 | Metsa Board Oyj – Class B | 635,241 | ||||||
| 80,200 | Neste Oyj | 3,868,145 | ||||||
| 1,784,682 | Nokia Oyj (a) | 8,256,918 | ||||||
| 226,312 | Outokumpu Oyj | 1,354,929 | ||||||
| 2,910 | Sanoma Oyj | 27,064 | ||||||
| 166,464 | UPM-Kymmene Oyj (a) | 6,032,062 | ||||||
|
| |||||||
| Total Finland | 20,677,330 | |||||||
|
| |||||||
| France — 2.8% | ||||||||
| 46,601 | ALD SA (a) | 617,305 | ||||||
| 3,646 | APERAM SA | 141,786 | ||||||
| 230,041 | ArcelorMittal SA | 6,903,391 | ||||||
| 33,470 | Arkema SA | 3,393,157 | ||||||
| 1,542 | Axway Software SA (a) | 36,674 | ||||||
| 75,573 | BNP Paribas SA | 5,283,394 | ||||||
| 1,626 | Boiron SA | 72,606 | ||||||
| 764 | Caisse Regionale de Credit Agricole Mutuel Nord de France | 12,972 | ||||||
| 138,208 | Cie de Saint-Gobain (a) | 8,212,683 | ||||||
| 126,880 | Coface SA | 1,869,998 | ||||||
| 67,952 | Derichebourg SA | 436,972 | ||||||
| 1,170 | Eiffage SA (a) | 128,406 | ||||||
| 6,203 | Eramet SA | 665,651 | ||||||
| 989 | HEXAOM | 19,863 | ||||||
| 45,941 | Ipsen SA | 5,249,152 | ||||||
| 34,929 | IPSOS | 2,142,726 | ||||||
| 5,574 | Kering SA (a) | 3,268,151 | ||||||
| 7,494 | LVMH Moet Hennessy Louis Vuitton SE (a) | 6,229,959 | ||||||
| 4,919 | Mersen SA | 232,068 | ||||||
| 12,291 | Metropole Television SA | 183,451 | ||||||
| 115,771 | Publicis Groupe SA (a) | 9,190,729 | ||||||
| See accompanying notes to the financial statements. | 70 |
GMO Implementation Fund
(A Series of GMO Trust)
Consolidated Schedule of Investments — (Continued)
(showing percentage of total net assets)
February 28, 2023
| Shares | Description | Value ($) | ||||||
| France — continued | ||||||||
| 26,267 | Quadient SA | 455,897 | ||||||
| 5,563 | Rexel SA | 138,283 | ||||||
| 2,607 | Rothschild & Co | 130,544 | ||||||
| 49,644 | Safran SA (a) | 7,009,798 | ||||||
| 75,904 | Sanofi (a) | 7,096,891 | ||||||
| 1,354 | SMCP SA * | 10,569 | ||||||
| 17,570 | Societe BIC SA | 1,136,545 | ||||||
| 390,917 | Societe Generale SA | 11,266,051 | ||||||
| 131,500 | STMicroelectronics NV | 6,333,040 | ||||||
| 1,570 | Synergie SE | 55,858 | ||||||
| 113,753 | Technip Energies NV | 2,202,297 | ||||||
| 134,947 | Television Francaise 1 | 1,075,378 | ||||||
| 170,220 | TotalEnergies SE (a) (c) | 10,503,280 | ||||||
| 2,651 | TotalEnergies SE (c) | 163,909 | ||||||
| 70,565 | Veolia Environnement SA (a) | 2,105,963 | ||||||
|
| |||||||
| Total France | 103,975,397 | |||||||
|
| |||||||
| Germany — 1.0% | ||||||||
| 11,635 | 1&1 AG | 139,410 | ||||||
| 369 | Amadeus Fire AG | 47,937 | ||||||
| 5,444 | Aurubis AG | 532,470 | ||||||
| 43,999 | Bayer AG (Registered) (a) | 2,612,714 | ||||||
| 44,384 | Bayerische Motoren Werke AG (a) | 4,578,892 | ||||||
| 33,094 | Beiersdorf AG (a) | 3,949,622 | ||||||
| 69,524 | Commerzbank AG * | 847,184 | ||||||
| 1,247 | Deutsche Boerse AG | 217,444 | ||||||
| 1,359 | Deutsche Telekom AG (a) | 30,500 | ||||||
| 561 | Draegerwerk AG & Co KGaA | 21,814 | ||||||
| 4,253 | Elmos Semiconductor SE | 345,115 | ||||||
| 56,131 | Fresenius SE & Co KGaA (a) | 1,544,567 | ||||||
| 5,683 | Hamburger Hafen und Logistik AG (a) | 75,180 | ||||||
| 2,725 | Hannover Rueck SE (a) | 529,191 | ||||||
| 25,638 | HeidelbergCement AG (a) | 1,760,111 | ||||||
| 5,330 | Hornbach Holding AG & Co KGaA | 442,661 | ||||||
| 1,945 | HUGO BOSS AG | 133,027 | ||||||
| 159,245 | Kloeckner & Co SE | 1,723,630 | ||||||
| 3,813 | Krones AG | 464,357 | ||||||
| 108,310 | Mercedes-Benz Group AG (a) | 8,301,171 | ||||||
| 29,591 | Merck KGaA (a) | 5,607,287 | ||||||
| 5,222 | RTL Group SA | 251,728 | ||||||
| 27,171 | Salzgitter AG | 1,140,148 | ||||||
| 3,459 | Siltronic AG | 251,880 | ||||||
| 1,907 | Talanx AG (a) | 91,073 | ||||||
| 4,711 | Traton SE | 76,945 | ||||||
| 7,646 | Volkswagen AG | 1,358,389 | ||||||
| 1,076 | Wuestenrot & Wuerttembergische AG | 19,545 | ||||||
|
| |||||||
| Total Germany | 37,093,992 | |||||||
|
| |||||||
| Greece — 0.1% | ||||||||
| 2,291 | Hellenic Telecommunications Organization SA | 35,144 | ||||||
| 35,752 | Jumbo SA | 713,894 | ||||||
| Shares | Description | Value ($) | ||||||
| Greece — continued | ||||||||
| 40,970 | Mytilineos SA | 1,105,382 | ||||||
|
| |||||||
| Total Greece | 1,854,420 | |||||||
|
| |||||||
| Hong Kong — 0.6% | ||||||||
| 335,300 | ASMPT Ltd | 2,860,910 | ||||||
| 197,000 | Bank of East Asia Ltd (The) | 278,275 | ||||||
| 238,000 | BOC Hong Kong Holdings Ltd | 805,474 | ||||||
| 71,000 | Chow Sang Sang Holdings International Ltd | 91,437 | ||||||
| 904,000 | CITIC Telecom International Holdings Ltd | 329,401 | ||||||
| 219,500 | CK Asset Holdings Ltd (a) | 1,376,711 | ||||||
| 173,000 | CK Hutchison Holdings Ltd (a) | 1,033,026 | ||||||
| 1,170,000 | CSI Properties Ltd | 22,095 | ||||||
| 220,400 | Dah Sing Banking Group Ltd | 178,890 | ||||||
| 59,200 | Dah Sing Financial Holdings Ltd | 159,946 | ||||||
| 500,000 | E-Commodities Holdings Ltd | 87,332 | ||||||
| 944,000 | First Pacific Co Ltd | 316,537 | ||||||
| 398,827 | Galaxy Entertainment Group Ltd | 2,655,246 | ||||||
| 254,000 | Giordano International Ltd | 61,862 | ||||||
| 30,000 | Hang Lung Group Ltd | 54,509 | ||||||
| 93,000 | Health & Happiness H&H International Holdings Ltd | 156,977 | ||||||
| 631,000 | HKT Trust & HKT Ltd – Class SS | 820,362 | ||||||
| 907,000 | IGG Inc * | 332,364 | ||||||
| 211,500 | Johnson Electric Holdings Ltd | 242,614 | ||||||
| 290,000 | K Wah International Holdings Ltd | 100,182 | ||||||
| 98,000 | Kerry Logistics Network Ltd | 161,963 | ||||||
| 240,000 | Kerry Properties Ltd (a) | 600,943 | ||||||
| 65,000 | Luk Fook Holdings International Ltd | 207,508 | ||||||
| 221,000 | NWS Holdings Ltd | 194,594 | ||||||
| 4,500 | Orient Overseas International Ltd (a) | 72,285 | ||||||
| 518,000 | Pacific Textiles Holdings Ltd | 173,598 | ||||||
| 264,000 | PAX Global Technology Ltd | 230,875 | ||||||
| 103,000 | PCCW Ltd | 51,201 | ||||||
| 166,500 | Power Assets Holdings Ltd (a) | 890,571 | ||||||
| 636,000 | Shun Tak Holdings Ltd * | 128,840 | ||||||
| 460,000 | Singamas Container Holdings Ltd | 39,846 | ||||||
| 508,000 | SITC International Holdings Co Ltd | 1,062,709 | ||||||
| 108,500 | SmarTone Telecommunications Holdings Ltd | 72,483 | ||||||
| 217,000 | Sun Hung Kai & Co Ltd | 87,969 | ||||||
| 221,000 | Swire Pacific Ltd – Class A (a) | 1,803,516 | ||||||
| 40,000 | TAI Cheung Holdings Ltd | 21,513 | ||||||
| 137,500 | Texhong International Group Ltd | 117,943 | ||||||
| 414,000 | VPower Group International Holdings Ltd – Class H* (b) | 22,445 | ||||||
| 568,000 | VSTECS Holdings Ltd | 327,899 | ||||||
| 103,600 | VTech Holdings Ltd | 569,151 | ||||||
| 5,522,000 | WH Group Ltd | 3,213,412 | ||||||
| 237,500 | Yue Yuen Industrial Holdings Ltd | 351,378 | ||||||
|
| |||||||
| Total Hong Kong | 22,366,792 | |||||||
|
| |||||||
| Hungary — 0.2% | ||||||||
| 278,008 | MOL Hungarian Oil & Gas Plc | 2,111,103 | ||||||
| 71 | See accompanying notes to the financial statements. |
GMO Implementation Fund
(A Series of GMO Trust)
Consolidated Schedule of Investments — (Continued)
(showing percentage of total net assets)
February 28, 2023
| Shares | Description | Value ($) | ||||||
| Hungary — continued | ||||||||
| 158,172 | OTP Bank Nyrt | 4,791,484 | ||||||
| 40,842 | Richter Gedeon Nyrt | 856,116 | ||||||
|
| |||||||
| Total Hungary | 7,758,703 | |||||||
|
| |||||||
| India — 2.4% | ||||||||
| 64,791 | Arvind Ltd * | 64,808 | ||||||
| 45,479 | Asian Paints Ltd | 1,556,737 | ||||||
| 55,851 | Aurobindo Pharma Ltd | 311,246 | ||||||
| 156,814 | Axis Bank Ltd | 1,601,032 | ||||||
| 15,336 | Bajaj Consumer Care Ltd | 30,234 | ||||||
| 53,522 | Castrol India Ltd | 74,370 | ||||||
| 68,022 | Cipla Ltd | 744,764 | ||||||
| 39,687 | City Union Bank Ltd | 66,432 | ||||||
| 2,294,935 | Coal India Ltd | 5,958,993 | ||||||
| 67,849 | Cochin Shipyard Ltd | 371,653 | ||||||
| 8,616 | Colgate-Palmolive India Ltd | 153,967 | ||||||
| 37,217 | Coromandel International Ltd | 406,851 | ||||||
| 7,819 | Deepak Fertilisers & Petrochemicals Corp Ltd | 59,050 | ||||||
| 65,110 | Dhampur Bio Organics Ltd * | 115,851 | ||||||
| 17,305 | Dhampur Sugar Mills Ltd | 43,509 | ||||||
| 3,200 | Dr Reddy’s Laboratories Ltd ADR | 167,200 | ||||||
| 6,542 | EID Parry India Ltd | 39,480 | ||||||
| 66,384 | Engineers India Ltd | 57,660 | ||||||
| 331,612 | Exide Industries Ltd | 705,286 | ||||||
| 1,840 | Finolex Cables Ltd | 15,658 | ||||||
| 5,577,768 | GAIL India Ltd | 6,934,122 | ||||||
| 16,487 | GHCL Ltd | 103,008 | ||||||
| 93,684 | Glenmark Pharmaceuticals Ltd | 486,680 | ||||||
| 7,222 | Godawari Power and Ispat Ltd | 29,754 | ||||||
| 726 | Godfrey Phillips India Ltd | 15,600 | ||||||
| 14,756 | Great Eastern Shipping Co Ltd (The) | 97,988 | ||||||
| 38,845 | Gujarat Mineral Development Corp Ltd | 62,654 | ||||||
| 12,142 | Gujarat Narmada Valley Fertilizers & Chemicals Ltd | 77,314 | ||||||
| 22,374 | Gujarat Pipavav Port Ltd | 28,606 | ||||||
| 535,930 | Gujarat State Fertilizers & Chemicals Ltd | 811,171 | ||||||
| 66,314 | HDFC Bank Ltd | 1,285,265 | ||||||
| 1,145 | Hero MotoCorp Ltd | 33,566 | ||||||
| 478,026 | Hindalco Industries Ltd | 2,307,430 | ||||||
| 27,950 | Hindustan Aeronautics Ltd | 870,513 | ||||||
| 346,207 | Hindustan Petroleum Corp Ltd | 902,814 | ||||||
| 7,830 | Hindustan Unilever Ltd | 232,642 | ||||||
| 58,692 | Hindustan Zinc Ltd | 215,939 | ||||||
| 44,011 | Housing Development Finance Corp Ltd | 1,387,708 | ||||||
| 207,147 | ICICI Bank Ltd | 2,140,956 | ||||||
| 9,886 | Indiabulls Housing Finance Ltd * | 12,039 | ||||||
| 742,129 | Indian Oil Corp Ltd | 682,334 | ||||||
| 21,755 | Indus Towers Ltd | 45,357 | ||||||
| 12,186 | Infosys Ltd | 219,256 | ||||||
| 100,253 | Infosys Ltd Sponsored ADR (a) | 1,798,539 | ||||||
| 2,552,543 | ITC Ltd | 11,619,869 | ||||||
| 228,690 | Karnataka Bank Ltd (The) | 401,311 | ||||||
| 3,237 | KRBL Ltd | 13,269 | ||||||
| Shares | Description | Value ($) | ||||||
| India — continued | ||||||||
| 27,845 | L&T Finance Holdings Ltd | 29,574 | ||||||
| 9,992 | Mahanagar Gas Ltd | 107,955 | ||||||
| 149,640 | Mahindra & Mahindra Ltd | 2,306,331 | ||||||
| 92,059 | Manappuram Finance Ltd | 114,592 | ||||||
| 250,629 | National Aluminium Co Ltd | 237,310 | ||||||
| 88,089 | NBCC India Ltd | 35,341 | ||||||
| 90,708 | NCC Ltd | 98,056 | ||||||
| 1,349,056 | NMDC Ltd | 1,808,040 | ||||||
| 1,429,048 | NMDC Steel Ltd * | 578,240 | ||||||
| 1,183,130 | NTPC Ltd | 2,433,147 | ||||||
| 7,269,934 | Oil & Natural Gas Corp Ltd | 13,334,842 | ||||||
| 195,691 | Oil India Ltd | 582,260 | ||||||
| 3,389 | Oracle Financial Services Software Ltd | 129,294 | ||||||
| 275,162 | Petronet LNG Ltd | 738,248 | ||||||
| 3,861 | PI Industries Ltd | 144,434 | ||||||
| 1,364,896 | Power Finance Corp Ltd | 2,388,916 | ||||||
| 97,251 | PTC India Ltd | 104,004 | ||||||
| 7,227 | Rain Industries Ltd | 13,387 | ||||||
| 45,714 | Rajesh Exports Ltd | 358,952 | ||||||
| 18,556 | Rashtriya Chemicals & Fertilizers Ltd | 21,847 | ||||||
| 1,825,764 | REC Ltd | 2,527,184 | ||||||
| 266,653 | Redington Ltd | 549,193 | ||||||
| 11,036 | RITES Ltd | 43,472 | ||||||
| 461,623 | Sun Pharmaceutical Industries Ltd | 5,348,642 | ||||||
| 53,227 | Sun TV Network Ltd | 276,938 | ||||||
| 487 | Tata Chemicals Ltd | 5,750 | ||||||
| 4,099,245 | Tata Steel Ltd | 5,162,925 | ||||||
| 60,302 | Titan Co Ltd | 1,727,507 | ||||||
| 76,800 | Vardhman Textiles Ltd * | 287,571 | ||||||
| 438,784 | Vedanta Ltd | 1,422,878 | ||||||
| 61,767 | Welspun Corp Ltd | 137,381 | ||||||
| 1,830 | West Coast Paper Mills Ltd | 10,570 | ||||||
| 18,250 | Zensar Technologies Ltd | 63,944 | ||||||
| 20,268 | Zydus Lifesciences Ltd | 113,673 | ||||||
|
| |||||||
| Total India | 88,602,883 | |||||||
|
| |||||||
| Indonesia — 0.5% | ||||||||
| 12,198,900 | Adaro Energy Indonesia Tbk PT | 2,390,041 | ||||||
| 594,100 | Aneka Tambang Tbk | 77,526 | ||||||
| 3,422,800 | Astra International Tbk PT | 1,369,146 | ||||||
| 7,792,100 | Bank Central Asia Tbk PT | 4,469,071 | ||||||
| 2,522,192 | Bank Mandiri Persero Tbk PT | 1,653,423 | ||||||
| 981,500 | Bank Negara Indonesia Persero Tbk PT | 564,486 | ||||||
| 3,007,300 | Bank Pembangunan Daerah Jawa Timur Tbk PT | 145,910 | ||||||
| 5,468,200 | Bank Rakyat Indonesia Persero Tbk PT | 1,673,627 | ||||||
| 3,614,400 | Bukit Asam Tbk PT | 914,586 | ||||||
| 3,326,300 | Global Mediacom Tbk PT * | 62,371 | ||||||
| 847,100 | Indika Energy Tbk PT | 127,708 | ||||||
| 361,500 | Indo Tambangraya Megah Tbk PT | 881,182 | ||||||
| 1,641,700 | Indofood Sukses Makmur Tbk PT | 696,998 | ||||||
| 7,260,800 | Kalbe Farma Tbk PT | 1,004,426 | ||||||
| 5,089,000 | Media Nusantara Citra Tbk PT * | 216,835 | ||||||
| 15,752,600 | Panin Financial Tbk PT | 411,108 | ||||||
| See accompanying notes to the financial statements. | 72 |
GMO Implementation Fund
(A Series of GMO Trust)
Consolidated Schedule of Investments — (Continued)
(showing percentage of total net assets)
February 28, 2023
| Shares | Description | Value ($) | ||||||
| Indonesia — continued | ||||||||
| 3,986,400 | Perusahaan Gas Negara Tbk PT | 408,924 | ||||||
| 477,600 | United Tractors Tbk PT | 873,555 | ||||||
|
| |||||||
| Total Indonesia | 17,940,923 | |||||||
|
| |||||||
| Ireland — 0.5% | ||||||||
| 49,187 | AIB Group Plc | 210,093 | ||||||
| 634,169 | Bank of Ireland Group Plc | 6,986,711 | ||||||
| 43,417 | Glanbia Plc | 536,142 | ||||||
| 8,927 | Kingspan Group Plc | 579,434 | ||||||
| 38,104 | Origin Enterprises Plc | 170,514 | ||||||
| 24,839 | Permanent TSB Group Holdings Plc * | 68,351 | ||||||
| 52,951 | Ryanair Holdings Plc Sponsored ADR * (a) | 4,912,264 | ||||||
| 88,883 | Smurfit Kappa Group Plc | 3,315,933 | ||||||
|
| |||||||
| Total Ireland | 16,779,442 | |||||||
|
| |||||||
| Israel — 0.5% | ||||||||
| 4,764 | Delek Group Ltd * | 445,326 | ||||||
| 541,530 | Oil Refineries Ltd | 163,395 | ||||||
| 620,500 | Teva Pharmaceutical Industries Ltd Sponsored ADR * | 6,149,155 | ||||||
| 143,446 | Tower Semiconductor Ltd * | 5,818,170 | ||||||
| 195,900 | ZIM Integrated Shipping Services Ltd | 4,634,994 | ||||||
|
| |||||||
| Total Israel | 17,211,040 | |||||||
|
| |||||||
| Italy — 0.8% | ||||||||
| 58,641 | Anima Holding SPA | 253,326 | ||||||
| 24,111 | Arnoldo Mondadori Editore SPA | 46,664 | ||||||
| 54,052 | Banca IFIS SPA | 887,263 | ||||||
| 79,933 | Banco BPM SPA | 348,441 | ||||||
| 33,385 | BPER Banca | 94,830 | ||||||
| 60,809 | Credito Emiliano SPA | 522,525 | ||||||
| 297,689 | Eni SPA | 4,204,566 | ||||||
| 20,711 | Esprinet SPA | 158,065 | ||||||
| 133,568 | IMMSI SPA | 73,963 | ||||||
| 185,740 | Italgas SPA (a) | 1,055,103 | ||||||
| 350,908 | Leonardo SPA | 3,936,945 | ||||||
| 246,850 | MFE-MediaForEurope NV – Class A | 108,454 | ||||||
| 1,452 | Prima Industrie SPA | 38,365 | ||||||
| 2,198 | Sabaf SPA | 39,480 | ||||||
| 409,629 | Stellantis NV (a) | 7,166,163 | ||||||
| 18,494,345 | Telecom Italia SPA * | 6,038,819 | ||||||
| 26,013 | UniCredit SPA | 532,187 | ||||||
| 6,329 | Unieuro SPA (b) | 75,056 | ||||||
| 533,274 | Unipol Gruppo SPA | 2,820,960 | ||||||
|
| |||||||
| Total Italy | 28,401,175 | |||||||
|
| |||||||
| Japan — 13.0% | ||||||||
| 27,234 | AGC Inc | 1,007,568 | ||||||
| 13,100 | Aichi Corp | 75,879 | ||||||
| 27,100 | Aisin Corp | 742,635 | ||||||
| 266,800 | Amano Corp | 4,933,990 | ||||||
| 5,900 | AOKI Holdings Inc | 35,558 | ||||||
| 100,300 | Arcs Co Ltd (b) | 1,596,503 | ||||||
| Shares | Description | Value ($) | ||||||
| Japan — continued | ||||||||
| 560,900 | Asahi Kasei Corp | 3,906,675 | ||||||
| 14,800 | Bandai Namco Holdings Inc | 914,509 | ||||||
| 9,100 | Bando Chemical Industries Ltd | 70,048 | ||||||
| 138,600 | Brother Industries Ltd | 2,038,659 | ||||||
| 5,600 | Canon Electronics Inc | 72,655 | ||||||
| 288,000 | Canon Inc (a) | 6,198,406 | ||||||
| 100 | Canon Inc Sponsored ADR (a) | 2,147 | ||||||
| 23,600 | Canon Marketing Japan Inc | 521,538 | ||||||
| 16,600 | Central Glass Co Ltd | 407,936 | ||||||
| 4,000 | Chiyoda Integre Co Ltd | 66,416 | ||||||
| 276,100 | Chugoku Marine Paints Ltd | 2,272,699 | ||||||
| 242,000 | Citizen Watch Co Ltd (b) | 1,464,845 | ||||||
| 416,500 | Credit Saison Co Ltd | 5,676,610 | ||||||
| 76,100 | Dai Nippon Printing Co Ltd (a) | 2,040,224 | ||||||
| 13,700 | Dai Nippon Toryo Co Ltd | 85,514 | ||||||
| 92,000 | Daicel Corp | 638,760 | ||||||
| 4,000 | Dai-Dan Co Ltd | 69,939 | ||||||
| 4,800 | Daiichi Jitsugyo Co Ltd | 186,837 | ||||||
| 4,100 | Daiken Corp | 66,657 | ||||||
| 3,000 | Daito Pharmaceutical Co Ltd | 54,213 | ||||||
| 562,700 | Daiwabo Holdings Co Ltd | 8,695,755 | ||||||
| 305,200 | Denka Co Ltd | 6,445,054 | ||||||
| 56,800 | Dentsu Group Inc | 1,821,494 | ||||||
| 16,600 | Ebara Corp | 705,453 | ||||||
| 450,600 | EXEO Group Inc | 7,906,545 | ||||||
| 194,400 | Ezaki Glico Co Ltd | 4,880,855 | ||||||
| 2,400 | FJ Next Co Ltd (b) | 17,803 | ||||||
| 415,800 | Fuji Corp | 6,297,324 | ||||||
| 28,500 | Fuji Electric Co Ltd | 1,100,380 | ||||||
| 5,000 | Fuji Pharma Co Ltd | 38,911 | ||||||
| 159,400 | FUJIFILM Holdings Corp | 7,436,307 | ||||||
| 13,700 | Fukuoka Financial Group Inc | 305,830 | ||||||
| 9,000 | Furuno Electric Co Ltd | 64,182 | ||||||
| 1,600 | Furyu Corp | 14,108 | ||||||
| 3,400 | G-7 Holdings Inc | 35,863 | ||||||
| 306,200 | H.U. Group Holdings Inc | 6,025,879 | ||||||
| 26,400 | Hachijuni Bank Ltd (The) | 119,468 | ||||||
| 19,000 | Hanwa Co Ltd | 552,801 | ||||||
| 649,994 | Haseko Corp | 7,458,835 | ||||||
| 7,800 | Heiwado Co Ltd | 122,097 | ||||||
| 3,200 | Hochiki Corp | 34,667 | ||||||
| 123,500 | Hogy Medical Co Ltd | 2,918,052 | ||||||
| 269,800 | Honda Motor Co Ltd (a) | 7,015,658 | ||||||
| 29,500 | Honda Motor Co Ltd Sponsored ADR (a) | 766,115 | ||||||
| 36,200 | Hosiden Corp | 443,116 | ||||||
| 4,000 | Hosokawa Micron Corp | 80,960 | ||||||
| 2,300 | Hyakujushi Bank Ltd (The) | 33,879 | ||||||
| 99,400 | Idemitsu Kosan Co Ltd | 2,199,871 | ||||||
| 39,600 | Inabata & Co Ltd | 780,574 | ||||||
| 702,000 | Inpex Corp | 7,360,039 | ||||||
| 441,100 | ITOCHU Corp (a) | 13,184,777 | ||||||
| 1,300 | Itochu-Shokuhin Co Ltd | 47,442 | ||||||
| 44,600 | Itoham Yonekyu Holdings Inc | 233,844 | ||||||
| 25,000 | Itoki Corp | 144,663 | ||||||
| 73 | See accompanying notes to the financial statements. |
GMO Implementation Fund
(A Series of GMO Trust)
Consolidated Schedule of Investments — (Continued)
(showing percentage of total net assets)
February 28, 2023
| Shares | Description | Value ($) | ||||||
| Japan — continued | ||||||||
| 15,500 | Jaccs Co Ltd | 504,774 | ||||||
| 29,000 | Japan Aviation Electronics Industry Ltd | 481,421 | ||||||
| 12,700 | Japan Petroleum Exploration Co Ltd | 457,589 | ||||||
| 338,600 | Japan Tobacco Inc (a) | 6,885,566 | ||||||
| 13,900 | Kaga Electronics Co Ltd | 498,595 | ||||||
| 146,900 | Kajima Corp | 1,755,604 | ||||||
| 14,900 | Kamei Corp | 166,618 | ||||||
| 22,500 | Kandenko Co Ltd | 147,632 | ||||||
| 9,400 | Kaneka Corp | 236,201 | ||||||
| 290,500 | Kanematsu Corp | 3,480,893 | ||||||
| 362,700 | KDDI Corp (a) | 10,611,827 | ||||||
| 459,700 | Kirin Holdings Co Ltd (a) | 6,881,011 | ||||||
| 18,300 | Kitz Corp | 118,949 | ||||||
| 5,179 | Kohnan Shoji Co Ltd (b) | 120,487 | ||||||
| 32,200 | Komeri Co Ltd | 626,618 | ||||||
| 193,800 | Konoike Transport Co Ltd | 2,129,639 | ||||||
| 400 | Krosaki Harima Corp | 18,551 | ||||||
| 474,800 | K’s Holdings Corp | 4,090,938 | ||||||
| 8,000 | Kyosan Electric Manufacturing Co Ltd | 24,375 | ||||||
| 274,300 | Kyudenko Corp | 6,928,247 | ||||||
| 28,400 | Macnica Holdings Inc | 785,680 | ||||||
| 251,300 | Macromill Inc | 1,874,168 | ||||||
| 2,300 | Makino Milling Machine Co Ltd | 83,282 | ||||||
| 271,500 | Mandom Corp | 2,863,354 | ||||||
| 440,800 | Marubeni Corp (a) | 5,627,278 | ||||||
| 275,600 | Maruichi Steel Tube Ltd | 5,987,957 | ||||||
| 5,400 | Maruzen Showa Unyu Co Ltd | 123,709 | ||||||
| 6,100 | Matsuda Sangyo Co Ltd | 102,823 | ||||||
| 256,100 | Maxell Ltd | 2,731,746 | ||||||
| 94,500 | Mazda Motor Corp | 845,496 | ||||||
| 22,400 | MCJ Co Ltd | 157,871 | ||||||
| 327,700 | Mebuki Financial Group Inc | 880,918 | ||||||
| 1,600 | Melco Holdings Inc | 39,646 | ||||||
| 75,800 | Mirarth Holdings Inc | 210,887 | ||||||
| 157,600 | Mitsubishi Corp (a) | 5,353,839 | ||||||
| 518,600 | Mitsubishi Electric Corp | 5,827,620 | ||||||
| 3,500 | Mitsubishi Gas Chemical Co Inc | 49,583 | ||||||
| 44,500 | Mitsubishi Materials Corp | 692,733 | ||||||
| 604,500 | Mitsubishi Motors Corp * | 2,383,866 | ||||||
| 3,500 | Mitsubishi Research Institute Inc (a) | 133,191 | ||||||
| 900 | Mitsubishi Shokuhin Co Ltd | 21,423 | ||||||
| 707,700 | Mitsubishi UFJ Financial Group Inc (a) | 5,017,234 | ||||||
| 137,400 | Mitsui & Co Ltd (a) | 3,856,250 | ||||||
| 2,800 | Mitsui Chemicals Inc | 67,550 | ||||||
| 10,600 | Mitsui DM Sugar Holdings Co Ltd | 162,049 | ||||||
| 256,500 | Mitsui OSK Lines Ltd (a) | 6,699,807 | ||||||
| 11,200 | Mitsui-Soko Holdings Co Ltd (a) | 324,295 | ||||||
| 7,500 | MIXI Inc | 147,392 | ||||||
| 16,500 | Modec Inc * | 182,511 | ||||||
| 177,100 | Morinaga & Co Ltd | 5,108,132 | ||||||
| 169,600 | MS&AD Insurance Group Holdings Inc | 5,550,011 | ||||||
| 18,200 | MTI Ltd | 72,487 | ||||||
| 3,700 | Nagase & Co Ltd | 54,968 | ||||||
| 189,400 | NEC Corp (a) | 6,778,299 | ||||||
| Shares | Description | Value ($) | ||||||
| Japan — continued | ||||||||
| 247,800 | NGK Spark Plug Co Ltd (b) | 4,983,048 | ||||||
| 241,800 | NH Foods Ltd | 6,676,641 | ||||||
| 34,700 | Nichias Corp | 684,261 | ||||||
| 12,900 | Nichiha Corp | 249,178 | ||||||
| 8,400 | Nichireki Co Ltd | 91,362 | ||||||
| 159,700 | Nikon Corp | 1,581,776 | ||||||
| 7,000 | Nippn Corp | 83,225 | ||||||
| 4,200 | Nippon Densetsu Kogyo Co Ltd | 46,966 | ||||||
| 10,400 | Nippon Soda Co Ltd | 352,780 | ||||||
| 3,100 | Nippon Steel Trading Corp | 210,960 | ||||||
| 300,900 | Nippon Telegraph & Telephone Corp (a) | 8,719,124 | ||||||
| 68,300 | Nippon Television Holdings Inc | 562,228 | ||||||
| 269,100 | Nippon Yusen KK (a) (b) | 6,994,712 | ||||||
| 8,300 | Nisshin Oillio Group Ltd (The) | 202,957 | ||||||
| 3,800 | Nissin Corp | 58,954 | ||||||
| 4,300 | Nitto Kogyo Corp | 83,661 | ||||||
| 41,000 | Nojima Corp | 408,095 | ||||||
| 680,800 | Obayashi Corp | 5,035,890 | ||||||
| 6,000 | Ono Pharmaceutical Co Ltd | 122,208 | ||||||
| 14,300 | Osaka Soda Co Ltd | 451,971 | ||||||
| 10,200 | Osaki Electric Co Ltd | 40,072 | ||||||
| 274,100 | Pacific Industrial Co Ltd | 2,340,412 | ||||||
| 21,000 | PAL GROUP Holdings Co Ltd | 428,958 | ||||||
| 1,036,300 | Penta-Ocean Construction Co Ltd | 4,938,706 | ||||||
| 10,800 | Prima Meat Packers Ltd | 169,797 | ||||||
| 8,000 | Proto Corp | 71,670 | ||||||
| 66,000 | Renesas Electronics Corp * | 852,554 | ||||||
| 72,900 | Rohm Co Ltd | 5,614,223 | ||||||
| 43,000 | San-A Co Ltd (b) | 1,325,342 | ||||||
| 21,600 | Sanki Engineering Co Ltd | 242,343 | ||||||
| 210,900 | Sankyu Inc (a) | 7,759,129 | ||||||
| 53,500 | Sanwa Holdings Corp | 563,952 | ||||||
| 1,000 | Sanyo Denki Co Ltd | 41,534 | ||||||
| 56,200 | Sawai Group Holdings Co Ltd | 1,556,015 | ||||||
| 107,200 | Secom Co Ltd (a) | 6,234,155 | ||||||
| 202,600 | Seiko Epson Corp | 2,793,386 | ||||||
| 39,000 | Sekisui Chemical Co Ltd | 522,842 | ||||||
| 504,100 | Sekisui House Ltd | 9,544,243 | ||||||
| 7,500 | Sekisui Jushi Corp | 108,815 | ||||||
| 35,400 | Shimamura Co Ltd | 3,307,036 | ||||||
| 543,300 | Shimizu Corp | 2,932,669 | ||||||
| 9,100 | Shin-Etsu Polymer Co Ltd | 90,386 | ||||||
| 10,500 | Shinmaywa Industries Ltd | 86,653 | ||||||
| 6,200 | Shinnihon Corp | 42,014 | ||||||
| 2,000 | Sinanen Holdings Co Ltd | 51,183 | ||||||
| 9,300 | Sinko Industries Ltd | 107,646 | ||||||
| 84,900 | SKY Perfect JSAT Holdings Inc | 322,220 | ||||||
| 346,020 | Sojitz Corp | 6,642,798 | ||||||
| 458,200 | Stanley Electric Co Ltd | 9,554,993 | ||||||
| 21,500 | Star Micronics Co Ltd | 272,718 | ||||||
| 166,900 | Subaru Corp | 2,673,943 | ||||||
| 431,500 | SUMCO Corp | 5,954,018 | ||||||
| 1,564,400 | Sumitomo Chemical Co Ltd | 5,481,649 | ||||||
| 368,900 | Sumitomo Corp (a) | 6,287,079 | ||||||
| See accompanying notes to the financial statements. | 74 |
GMO Implementation Fund
(A Series of GMO Trust)
Consolidated Schedule of Investments — (Continued)
(showing percentage of total net assets)
February 28, 2023
| Shares | Description | Value ($) | ||||||
| Japan — continued | ||||||||
| 182,100 | Sumitomo Forestry Co Ltd | 3,494,324 | ||||||
| 236,800 | Sumitomo Mitsui Financial Group Inc | 10,341,962 | ||||||
| 208,600 | Sumitomo Mitsui Trust Holdings Inc | 7,728,635 | ||||||
| 1,500 | Sumitomo Seika Chemicals Co Ltd | 48,248 | ||||||
| 2,600 | Sumitomo Warehouse Co Ltd (The) (a) | 40,650 | ||||||
| 646,900 | T&D Holdings Inc | 9,796,782 | ||||||
| 39,300 | Tachi-S Co Ltd | 359,472 | ||||||
| 168,500 | Taisei Corp | 5,493,635 | ||||||
| 5,500 | Takeuchi Manufacturing Co Ltd (b) | 117,484 | ||||||
| 423,500 | Takuma Co Ltd | 4,264,291 | ||||||
| 10,000 | Tamron Co Ltd | 238,185 | ||||||
| 563,200 | Teijin Ltd | 5,851,976 | ||||||
| 300,400 | THK Co Ltd | 6,727,674 | ||||||
| 182,500 | Toho Holdings Co Ltd | 2,950,989 | ||||||
| 766,200 | Tokai Carbon Co Ltd (b) | 7,481,371 | ||||||
| 1,500 | Token Corp | 85,179 | ||||||
| 253,600 | Tokyo Gas Co Ltd (a) | 4,891,295 | ||||||
| 181,000 | Tokyo Seimitsu Co Ltd | 6,608,007 | ||||||
| 471,400 | Toppan Inc | 8,525,009 | ||||||
| 255,800 | Tosei Corp | 2,768,381 | ||||||
| 224,700 | Tosoh Corp | 3,057,985 | ||||||
| 7,000 | Towa Pharmaceutical Co Ltd | 98,382 | ||||||
| 48,300 | Toyo Construction Co Ltd | 314,427 | ||||||
| 3,300 | Toyo Ink SC Holdings Co Ltd | 46,869 | ||||||
| 133,900 | Toyota Industries Corp | 7,855,933 | ||||||
| 48,100 | Toyota Tsusho Corp (a) | 1,961,686 | ||||||
| 35,700 | Tsumura & Co | 678,865 | ||||||
| 6,500 | TV Asahi Holdings Corp | 69,341 | ||||||
| 14,000 | Unipres Corp | 82,864 | ||||||
| 11,700 | Wacoal Holdings Corp | 210,522 | ||||||
| 4,600 | Warabeya Nichiyo Holdings Co Ltd (b) | 62,765 | ||||||
| 23,800 | YAMABIKO Corp | 220,703 | ||||||
| 117,200 | Yamaha Motor Co Ltd | 2,998,586 | ||||||
| 400 | Yamato Kogyo Co Ltd | 16,034 | ||||||
| 23,300 | Yamazen Corp | 179,131 | ||||||
| 16,800 | Yellow Hat Ltd | 219,400 | ||||||
| 106,000 | Yokogawa Bridge Holdings Corp | 1,598,403 | ||||||
| 8,800 | Yokogawa Electric Corp | 131,430 | ||||||
| 7,200 | Yuasa Trading Co Ltd | 193,411 | ||||||
| 136,900 | Zenkoku Hosho Co Ltd | 5,215,679 | ||||||
|
| |||||||
| Total Japan | 486,980,726 | |||||||
|
| |||||||
| Kuwait — 0.0% | ||||||||
| 13,649 | Humansoft Holding Co KSC | 163,619 | ||||||
|
| |||||||
| Malaysia — 0.1% | ||||||||
| 144,700 | AMMB Holdings Bhd | 129,269 | ||||||
| 330,500 | Hartalega Holdings Bhd | 108,246 | ||||||
| 293,600 | Hibiscus Petroleum Bhd | 69,571 | ||||||
| 208,300 | IOI Corp Bhd | 177,778 | ||||||
| 369,700 | Kossan Rubber Industries Bhd | 89,777 | ||||||
| 12,300 | Kuala Lumpur Kepong Bhd | 56,994 | ||||||
| 1,036,700 | Petronas Chemicals Group Bhd | 1,653,744 | ||||||
| Shares | Description | Value ($) | ||||||
| Malaysia — continued | ||||||||
| 11,100 | Petronas Gas Bhd | 41,203 | ||||||
| 62,400 | PPB Group Bhd | 243,298 | ||||||
| 53,900 | RHB Bank Bhd | 68,220 | ||||||
| 486,000 | Telekom Malaysia Bhd | 544,745 | ||||||
| 38,200 | TIME dotCom Bhd | 45,538 | ||||||
|
| |||||||
| Total Malaysia | 3,228,383 | |||||||
|
| |||||||
| Mexico — 1.1% | ||||||||
| 56,500 | Alpek SAB de CV | 68,956 | ||||||
| 1,357,510 | America Movil SAB de CV – Series L | 1,394,125 | ||||||
| 40,709 | America Movil SAB de CV – Class L Sponsored ADR | 837,791 | ||||||
| 239,215 | Arca Continental SAB de CV | 2,026,133 | ||||||
| 240,702 | Banco del Bajio SA | 919,710 | ||||||
| 2,296 | Coca-Cola Femsa SAB de CV Sponsored ADR | 165,335 | ||||||
| 1,136,700 | Credito Real SAB de CV SOFOM ER * (d) | — | ||||||
| 91,100 | El Puerto de Liverpool SAB de CV – Class C1 | 553,576 | ||||||
| 734,310 | Fomento Economico Mexicano SAB de CV | 6,762,563 | ||||||
| 3,954 | Fomento Economico Mexicano SAB de CV Sponsored ADR | 363,452 | ||||||
| 178,200 | Gentera SAB de CV | 193,136 | ||||||
| 19,660 | Grupo Aeroportuario del Centro Norte SAB de CV – Class B | 187,977 | ||||||
| 19,340 | Grupo Aeroportuario del Pacifico SAB de CV – Class B | 366,885 | ||||||
| 40,007 | Grupo Aeroportuario del Sureste SAB de CV – Class B | 1,145,469 | ||||||
| 288 | Grupo Aeroportuario del Sureste SAB de CV ADR | 82,420 | ||||||
| 1,418,669 | Grupo Financiero Banorte SAB de CV – Class O | 12,009,043 | ||||||
| 29,255 | Grupo Herdez SAB de CV – Series * | 69,394 | ||||||
| 1,968,840 | Grupo Mexico SAB de CV – Series B | 8,855,018 | ||||||
| 60,500 | Grupo Televisa SAB Sponsored ADR | 300,080 | ||||||
| 81,551 | Qualitas Controladora SAB de CV | 507,273 | ||||||
| 105,700 | Regional SAB de CV | 876,958 | ||||||
| 196,849 | Unifin Financiera SAB de CV SOFOM ENR * (d) | — | ||||||
| 994,472 | Wal-Mart de Mexico SAB de CV | 3,918,860 | ||||||
|
| |||||||
| Total Mexico | 41,604,154 | |||||||
|
| |||||||
| Netherlands — 1.9% | ||||||||
| 321,383 | ABN AMRO Bank NV CVA | 5,671,178 | ||||||
| 1,225,748 | Aegon NV | 6,377,856 | ||||||
| 123,888 | ASR Nederland NV | 5,638,247 | ||||||
| 9,661 | Brunel International NV | 119,443 | ||||||
| 16,510 | Evander Gold Mines Ltd (e) | 175 | ||||||
| 163,209 | EXOR NV * | 13,467,082 | ||||||
| 64,477 | ForFarmers NV (b) | 224,137 | ||||||
| 173,045 | JDE Peet’s NV | 5,093,935 | ||||||
| 455,573 | Koninklijke Ahold Delhaize NV (a) | 14,465,295 | ||||||
| 375,771 | Koninklijke Philips NV (a) | 6,135,132 | ||||||
| 153,766 | NN Group NV | 6,223,918 | ||||||
| 75 | See accompanying notes to the financial statements. |
GMO Implementation Fund
(A Series of GMO Trust)
Consolidated Schedule of Investments — (Continued)
(showing percentage of total net assets)
February 28, 2023
| Shares | Description | Value ($) | ||||||
| Netherlands — continued | ||||||||
| 107,562 | Randstad NV | 6,600,022 | ||||||
| 974 | Signify NV | 33,749 | ||||||
|
| |||||||
| Total Netherlands | 70,050,169 | |||||||
|
| |||||||
| New Zealand — 0.1% | ||||||||
| 208,690 | Auckland International Airport Ltd * (a) | 1,127,651 | ||||||
| 403,006 | Meridian Energy Ltd (a) | 1,322,805 | ||||||
| 67,374 | Spark New Zealand Ltd | 208,022 | ||||||
|
| |||||||
| Total New Zealand | 2,658,478 | |||||||
|
| |||||||
| Norway — 0.4% | ||||||||
| 80,560 | Austevoll Seafood ASA | 688,361 | ||||||
| 6,391 | BW LPG Ltd | 55,907 | ||||||
| 319,811 | DNO ASA | 366,450 | ||||||
| 366,766 | Elkem ASA | 1,380,738 | ||||||
| 301,631 | Equinor ASA (a) | 9,233,933 | ||||||
| 139,926 | Europris ASA | 986,466 | ||||||
| 31,285 | Hoegh Autoliners ASA (a) | 205,098 | ||||||
| 52,913 | Norske Skog ASA * | 341,108 | ||||||
| 10,799 | SpareBank 1 Nord Norge | 107,146 | ||||||
| 9,566 | Stolt-Nielsen Ltd (a) | 295,717 | ||||||
| 5,268 | Subsea 7 SA | 68,428 | ||||||
| 20,920 | TGS ASA | 376,574 | ||||||
| 109,148 | Wallenius Wilhelmsen ASA (a) | 954,206 | ||||||
|
| |||||||
| Total Norway | 15,060,132 | |||||||
|
| |||||||
| Pakistan — 0.0% | ||||||||
| 100,507 | Oil & Gas Development Co Ltd | 31,539 | ||||||
| 43,862 | Pakistan Oilfields Ltd | 71,791 | ||||||
| 169,206 | Pakistan Petroleum Ltd | 40,527 | ||||||
|
| |||||||
| Total Pakistan | 143,857 | |||||||
|
| |||||||
| Panama — 0.0% | ||||||||
| 494,873 | BAC Holding International Corp * | 20,123 | ||||||
|
| |||||||
| Philippines — 0.0% | ||||||||
| 30,470 | GT Capital Holdings Inc | 285,534 | ||||||
| 63,200 | Manila Electric Co | 362,816 | ||||||
| 5,097,024 | Megaworld Corp | 185,907 | ||||||
| 199,300 | Puregold Price Club Inc | 113,436 | ||||||
|
| |||||||
| Total Philippines | 947,693 | |||||||
|
| |||||||
| Poland — 0.3% | ||||||||
| 17,571 | Asseco Poland SA | 315,104 | ||||||
| 194,129 | Bank Polska Kasa Opieki SA | 3,906,491 | ||||||
| 13,963 | Budimex SA | 883,291 | ||||||
| 75,238 | Cyfrowy Polsat SA | 291,441 | ||||||
| 7,021 | Jastrzebska Spolka Weglowa SA * | 86,265 | ||||||
| 60,313 | Orange Polska SA | 91,074 | ||||||
| 309,662 | Polski Koncern Naftowy ORLEN SA | 4,624,978 | ||||||
| 165,854 | Powszechny Zaklad Ubezpieczen SA | 1,363,645 | ||||||
| Shares | Description | Value ($) | ||||||
| Poland — continued | ||||||||
| 1,397 | Santander Bank Polska SA | 93,745 | ||||||
|
| |||||||
| Total Poland | 11,656,034 | |||||||
|
| |||||||
| Portugal — 0.4% | ||||||||
| 695,781 | EDP – Energias de Portugal SA | 3,503,759 | ||||||
| 573,086 | Galp Energia SGPS SA | 6,991,375 | ||||||
| 8,810 | Jeronimo Martins SGPS SA | 180,834 | ||||||
| 317,312 | Navigator Co SA (The) | 1,115,995 | ||||||
| 106,341 | NOS SGPS SA | 469,892 | ||||||
| 23,211 | REN - Redes Energeticas Nacionais SGPS SA | 62,406 | ||||||
| 1,533,704 | Sonae SGPS SA | 1,680,407 | ||||||
|
| |||||||
| Total Portugal | 14,004,668 | |||||||
|
| |||||||
| Qatar — 0.1% | ||||||||
| 209,477 | Ooredoo QPSC | 529,365 | ||||||
| 356,559 | Qatar National Bank QPSC | 1,649,945 | ||||||
| 160,925 | Qatar National Cement Co QSC | 186,743 | ||||||
|
| |||||||
| Total Qatar | 2,366,053 | |||||||
|
| |||||||
| Russia — 0.0% | ||||||||
| 10,221,010 | Alrosa PJSC * (d) (f) | 82,408 | ||||||
| 376,870,000 | Federal Grid Co Unified Energy System PJSC * (d) | 4,449 | ||||||
| 214,678 | Fix Price Group Plc GDR* (d) | 6,155 | ||||||
| 415,363 | Gazprom Neft PJSC (d) | 23,569 | ||||||
| 4,924,596 | Gazprom PJSC (d) | 103,492 | ||||||
| 75,924 | Globaltrans Investment Plc Sponsored GDR (Registered) * (d) | 3,269 | ||||||
| 18,204,300 | Inter RAO UES PJSC (d) | 8,279 | ||||||
| 88,304 | LSR Group PJSC – Class A* (d) | 5,666 | ||||||
| 4 | LSR Group PJSC GDR (Registered) * (d) | — | ||||||
| 192,855 | LUKOIL PJSC (d) | 101,888 | ||||||
| 5,760,219 | Magnitogorsk Iron & Steel Works PJSC * (d) (f) | 30,079 | ||||||
| 71,800 | Mechel PJSC * (d) | 1,213 | ||||||
| 12,797 | MMC Norilsk Nickel PJSC (d) | 24,707 | ||||||
| 8 | MMC Norilsk Nickel PJSC ADR * (d) | 2 | ||||||
| 23,942 | Mobile TeleSystems PJSC (d) | 829 | ||||||
| 37,065 | Mobile TeleSystems PJSC ADR* (d) | 2,568 | ||||||
| 1,472,470 | Moscow Exchange MICEX-RTS PJSC * (d) | 22,661 | ||||||
| 7,545,000 | Mosenergo PJSC (d) | 2,018 | ||||||
| 191,960 | Novatek PJSC (d) | 27,317 | ||||||
| 3,493,400 | Novolipetsk Steel PJSC * (d) | 58,222 | ||||||
| 6,115 | PhosAgro PJSC (d) | 5,488 | ||||||
| 118 | PhosAgro PJSC GDR * (d) (f) | 35 | ||||||
| 254,956 | Polymetal International Plc * | 750,690 | ||||||
| 25,552 | Polyus PJSC * (d) | 29,888 | ||||||
| 1 | Polyus PJSC GDR (Registered) * (d) | 1 | ||||||
| 1,493 | Ros Agro Plc GDR (Registered) * (c) (d) | 139 | ||||||
| 1,208 | Ros Agro Plc GDR (Registered) * (c) (d) | 127 | ||||||
| 49,974,140 | RusHydro PJSC (d) | 5,253 | ||||||
| 8,073,970 | Sberbank of Russia PJSC * (d) (f) | 182,780 | ||||||
| 7,395 | Severstal PAO * (d) (f) | 1,045 | ||||||
| See accompanying notes to the financial statements. | 76 |
GMO Implementation Fund
(A Series of GMO Trust)
Consolidated Schedule of Investments — (Continued)
(showing percentage of total net assets)
February 28, 2023
| Shares | Description | Value ($) | ||||||
| Russia — continued | ||||||||
| 261,549 | Severstal PJSC GDR (Registered) * (d) (f) | 36,967 | ||||||
| 29,090 | SFI PJSC * (d) | 1,931 | ||||||
| 27,770,670 | Surgutneftegas PJSC (d) | 84,515 | ||||||
| 986,916 | Tatneft PJSC (d) | 43,119 | ||||||
| 725,480 | Unipro PJSC * (d) | 155 | ||||||
| 55,470 | United Co Rusal International PJSC (d) | 294 | ||||||
| 752,312,000 | VTB Bank PJSC * (d) (f) | 1,654 | ||||||
|
| |||||||
| Total Russia | 1,652,872 | |||||||
|
| |||||||
| Saudi Arabia — 0.2% | ||||||||
| 40,577 | Almarai Co JSC | 567,012 | ||||||
| 279,140 | Saudi Arabian Oil Co | 2,358,117 | ||||||
| 102,973 | Saudi Basic Industries Corp | 2,426,584 | ||||||
| 165,801 | Saudi Telecom Co | 1,551,524 | ||||||
|
| |||||||
| Total Saudi Arabia | 6,903,237 | |||||||
|
| |||||||
| Singapore — 0.7% | ||||||||
| 4,700 | AIMS APAC (REIT) | 4,812 | ||||||
| 621,000 | Asian Pay Television Trust | 52,071 | ||||||
| 102,600 | Bumitama Agri Ltd | 49,036 | ||||||
| 16,300 | City Developments Ltd | 93,242 | ||||||
| 494,100 | ComfortDelGro Corp Ltd | 443,676 | ||||||
| 285,024 | DBS Group Holdings Ltd | 7,231,378 | ||||||
| 122,400 | First Real Estate Investment Trust (b) | 23,626 | ||||||
| 291,200 | First Resources Ltd | 332,017 | ||||||
| 3,955,300 | Golden Agri-Resources Ltd | 748,467 | ||||||
| 465,199 | Japfa Ltd | 103,582 | ||||||
| 134,100 | Jardine Cycle & Carriage Ltd | 2,956,258 | ||||||
| 747,600 | Keppel Corp Ltd | 3,035,863 | ||||||
| 41,100 | Oversea-Chinese Banking Corp Ltd | 386,278 | ||||||
| 242,500 | Sasseur Real Estate Investment Trust | 136,747 | ||||||
| 14,267,971 | Sembcorp Marine Ltd * | 1,342,720 | ||||||
| 76,000 | Sheng Siong Group Ltd | 91,894 | ||||||
| 241,100 | Silverlake Axis Ltd | 59,943 | ||||||
| 1,500 | Singapore Exchange Ltd | 9,687 | ||||||
| 279,000 | StarHub Ltd | 219,425 | ||||||
| 1,600 | United Overseas Bank Ltd | 35,465 | ||||||
| 50,400 | Venture Corp Ltd | 641,825 | ||||||
| 130,000 | Wilmar International Ltd | 379,815 | ||||||
| 3,538,977 | Yangzijiang Financial Holding Ltd * | 918,218 | ||||||
| 6,663,077 | Yangzijiang Shipbuilding Holdings Ltd | 6,375,227 | ||||||
| 463,600 | Yanlord Land Group Ltd | 375,234 | ||||||
|
| |||||||
| Total Singapore | 26,046,506 | |||||||
|
| |||||||
| South Africa — 1.1% | ||||||||
| 699,139 | Absa Group Ltd | 7,548,323 | ||||||
| 39,872 | AECI Ltd | 202,507 | ||||||
| 86,854 | African Rainbow Minerals Ltd | 1,202,135 | ||||||
| 58,694 | Anglo American Platinum Ltd | 3,245,569 | ||||||
| 3,954 | Aspen Pharmacare Holdings Ltd | 30,532 | ||||||
| 25,568 | Astral Foods Ltd | 227,536 | ||||||
| 38,186 | AVI Ltd | 158,098 | ||||||
| 79,908 | Barloworld Ltd | 398,245 | ||||||
| Shares | Description | Value ($) | ||||||
| South Africa — continued | ||||||||
| 200,108 | Bidvest Group Ltd (The) | 2,551,748 | ||||||
| 270,454 | Blue Label Telecoms Ltd * | 66,838 | ||||||
| 8,098 | Capitec Bank Holdings Ltd | 772,584 | ||||||
| 3,737 | Clicks Group Ltd | 54,441 | ||||||
| 1,800 | Drdgold Ltd ADR Sponsored ADR | 13,176 | ||||||
| 4,274 | Exxaro Resources Ltd | 46,780 | ||||||
| 845,143 | FirstRand Ltd | 3,014,424 | ||||||
| 79,173 | Foschini Group Ltd (The) | 437,307 | ||||||
| 263,953 | Impala Platinum Holdings Ltd | 2,464,499 | ||||||
| 24,044 | Investec Ltd | 153,833 | ||||||
| 161,073 | Kumba Iron Ore Ltd | 4,200,441 | ||||||
| 120,662 | Lewis Group Ltd | 273,874 | ||||||
| 74,229 | Motus Holdings Ltd | 447,766 | ||||||
| 115,175 | Mr Price Group Ltd | 955,157 | ||||||
| 197,199 | MTN Group Ltd | 1,553,819 | ||||||
| 1,908 | Naspers Ltd | 335,510 | ||||||
| 78,892 | Ninety One Ltd | 197,823 | ||||||
| 714,975 | Old Mutual Ltd | 463,764 | ||||||
| 10,559 | Omnia Holdings Ltd | 34,348 | ||||||
| 1,081,361 | Pepkor Holdings Ltd | 1,104,515 | ||||||
| 65,074 | Reunert Ltd | 210,198 | ||||||
| 91,876 | Sanlam Ltd | 298,999 | ||||||
| 3,420 | Santam Ltd | 55,046 | ||||||
| 246,480 | Sappi Ltd | 655,830 | ||||||
| 21,903 | Sasol Ltd | 321,173 | ||||||
| 2,402 | Shoprite Holdings Ltd | 29,086 | ||||||
| 862,723 | Sibanye Stillwater Ltd | 1,741,895 | ||||||
| 89,800 | Sibanye Stillwater Ltd ADR | 727,380 | ||||||
| 21,584 | Telkom SA SOC Ltd * | 45,033 | ||||||
| 32,468 | Thungela Resources Ltd (c) | 377,514 | ||||||
| 22,802 | Thungela Resources Ltd (c) | 263,183 | ||||||
| 51,308 | Tiger Brands Ltd | 620,163 | ||||||
| 478,516 | Truworths International Ltd | 1,541,033 | ||||||
| 80,115 | Tsogo Sun Gaming Ltd | 51,951 | ||||||
| 131,583 | Vodacom Group Ltd | 906,826 | ||||||
| 457,819 | Woolworths Holdings Ltd | 1,919,659 | ||||||
| 101,898 | Zeda Ltd * | 66,915 | ||||||
|
| |||||||
| Total South Africa | 41,987,476 | |||||||
|
| |||||||
| South Korea — 2.9% | ||||||||
| 1,902 | BGF retail Co Ltd | 260,144 | ||||||
| 23,701 | BH Co Ltd | 423,022 | ||||||
| 269,005 | BNK Financial Group Inc | 1,361,431 | ||||||
| 483 | Caregen Co Ltd | 64,365 | ||||||
| 27,528 | Cheil Worldwide Inc | 416,202 | ||||||
| 15,424 | Coway Co Ltd | 622,294 | ||||||
| 4,096 | Daeduck Electronics Co Ltd | 64,846 | ||||||
| 2,765 | Daihan Pharmaceutical Co Ltd | 61,493 | ||||||
| 6,562 | Daou Data Corp | 240,527 | ||||||
| 5,655 | DB HiTek Co Ltd | 193,192 | ||||||
| 6,618 | DB Insurance Co Ltd | 385,128 | ||||||
| 483 | Dentium Co Ltd * | 44,113 | ||||||
| 26,994 | DGB Financial Group Inc | 161,145 | ||||||
| 77 | See accompanying notes to the financial statements. |
GMO Implementation Fund
(A Series of GMO Trust)
Consolidated Schedule of Investments — (Continued)
(showing percentage of total net assets)
February 28, 2023
| Shares | Description | Value ($) | ||||||
| South Korea — continued | ||||||||
| 274,760 | Dongwon Development Co Ltd | 668,948 | ||||||
| 12,170 | E-MART Inc | 1,029,459 | ||||||
| 4,584 | Fila Holdings Corp | 135,051 | ||||||
| 41,751 | GS Holdings Corp | 1,283,228 | ||||||
| 1,646 | HAESUNG DS Co Ltd | 49,903 | ||||||
| 121,451 | Hana Financial Group Inc | 4,165,435 | ||||||
| 11,389 | Handsome Co Ltd | 221,258 | ||||||
| 80,851 | Hankook Tire & Technology Co Ltd | 2,274,303 | ||||||
| 69,615 | HDC Hyundai Development Co-Engineering & Construction * | 544,604 | ||||||
| 10,446 | HMM Co Ltd * | 177,719 | ||||||
| 7,232 | Huchems Fine Chemical Corp | 110,359 | ||||||
| 26,812 | Humasis Co Ltd * | 299,769 | ||||||
| 9,236 | Hyundai Department Store Co Ltd | 378,828 | ||||||
| 22,554 | Hyundai Engineering & Construction Co Ltd | 619,801 | ||||||
| 16,950 | Hyundai Glovis Co Ltd | 2,029,967 | ||||||
| 2,982 | Hyundai Home Shopping Network Corp | 116,099 | ||||||
| 17,812 | Hyundai Marine & Fire Insurance Co Ltd | 473,962 | ||||||
| 32,764 | Hyundai Mobis Co Ltd | 5,262,679 | ||||||
| 5,444 | Industrial Bank of Korea | 42,690 | ||||||
| 1,070 | Innox Advanced Materials Co Ltd | 31,461 | ||||||
| 14,726 | INTOPS Co Ltd | 311,860 | ||||||
| 64,794 | JB Financial Group Co Ltd | 452,436 | ||||||
| 19,162 | KB Financial Group Inc | 742,126 | ||||||
| 13,500 | KB Financial Group Inc ADR | 520,155 | ||||||
| 8,906 | KC Co Ltd | 135,747 | ||||||
| 3,229 | KC Tech Co Ltd | 43,340 | ||||||
| 2,072 | KCC Glass Corp | 63,649 | ||||||
| 286,240 | Kia Corp | 16,267,053 | ||||||
| 1,243 | KIWOOM Securities Co Ltd * | 96,866 | ||||||
| 3,450 | Korea Petrochemical Ind Co Ltd * | 453,098 | ||||||
| 3,065 | Korea Zinc Co Ltd | 1,353,336 | ||||||
| 54,413 | KT Skylife Co Ltd | 329,568 | ||||||
| 209,520 | KT&G Corp | 14,059,628 | ||||||
| 17,465 | Kumho Petrochemical Co Ltd * | 2,076,684 | ||||||
| 23,897 | LG Corp | 1,486,826 | ||||||
| 96,594 | LG Electronics Inc | 8,101,896 | ||||||
| 26,313 | LOTTE Fine Chemical Co Ltd | 1,153,925 | ||||||
| 5,172 | LOTTE Himart Co Ltd | 51,877 | ||||||
| 34,592 | LX International Corp | 818,393 | ||||||
| 11,323 | LX Semicon Co Ltd | 789,942 | ||||||
| 2,694 | MegaStudyEdu Co Ltd | 140,670 | ||||||
| 43,615 | Meritz Securities Co Ltd | 231,444 | ||||||
| 400 | NCSoft Corp | 131,245 | ||||||
| 6,196 | NH Investment & Securities Co Ltd * | 44,474 | ||||||
| 373 | NongShim Co Ltd | 103,218 | ||||||
| 5,544 | Orion Corp | 524,042 | ||||||
| 11,034 | POSCO Holdings Inc | 2,659,450 | ||||||
| 114,100 | POSCO Holdings Inc Sponsored ADR | 6,958,959 | ||||||
| 5,021 | PSK Inc | 67,188 | ||||||
| 971 | S-1 Corp | 41,398 | ||||||
| 189,052 | Samsung Electronics Co Ltd | 8,650,053 | ||||||
| Shares | Description | Value ($) | ||||||
| South Korea — continued | ||||||||
| 3,408 | Samsung Electronics Co Ltd GDR (Registered) | 3,900,170 | ||||||
| 310 | Samsung Fire & Marine Insurance Co Ltd | 50,278 | ||||||
| 6,155 | Samsung SDS Co Ltd | 582,110 | ||||||
| 6,658 | Samsung Securities Co Ltd | 168,499 | ||||||
| 562 | Samyang Foods Co Ltd | 50,618 | ||||||
| 38,626 | SD Biosensor Inc | 670,707 | ||||||
| 21,431 | Seegene Inc | 394,382 | ||||||
| 2,649 | SFA Engineering Corp | 71,883 | ||||||
| 100,683 | Shinhan Financial Group Co Ltd | 2,956,558 | ||||||
| 583 | Shinsegae Inc | 89,839 | ||||||
| 81,274 | SK Square Co Ltd * | 2,353,271 | ||||||
| 11,728 | SL Corp * | 241,664 | ||||||
| 1,507 | SNT Motiv Co Ltd | 54,932 | ||||||
| 548 | Soulbrain Co Ltd | 96,698 | ||||||
| 162 | Taekwang Industrial Co Ltd * | 95,727 | ||||||
| 664 | Unid Btplus Co Ltd * | 4,802 | ||||||
| 1,120 | Unid Co Ltd | 69,200 | ||||||
| 370,368 | Woori Financial Group Inc | 3,414,414 | ||||||
| 122,515 | Woori Technology Investment Co Ltd * | 439,446 | ||||||
| 193 | Young Poong Corp * | 90,951 | ||||||
| 24,451 | Youngone Corp * | 787,267 | ||||||
|
| |||||||
| Total South Korea | 109,657,387 | |||||||
|
| |||||||
| Spain — 1.7% | ||||||||
| 515,004 | Acerinox SA | 5,655,147 | ||||||
| 7,068 | ACS Actividades de Construccion y Servicios SA | 214,270 | ||||||
| 77,248 | Amadeus IT Group SA * (a) | 4,857,573 | ||||||
| 3,111 | Atresmedia Corp de Medios de Comunicacion SA | 11,326 | ||||||
| 2,313,705 | Banco Bilbao Vizcaya Argentaria SA | 17,984,492 | ||||||
| 8,108,420 | Banco de Sabadell SA | 10,591,182 | ||||||
| 2,176,685 | Banco Santander SA | 8,570,489 | ||||||
| 207,700 | Bankinter SA | 1,461,021 | ||||||
| 39,573 | CaixaBank SA | 169,921 | ||||||
| 63,435 | Cia de Distribucion Integral Logista Holdings SA (a) | 1,531,412 | ||||||
| 163,425 | Ence Energia y Celulosa SA | 623,674 | ||||||
| 17,207 | Faes Farma SA | 62,849 | ||||||
| 2,936 | Grupo Catalana Occidente SA | 95,867 | ||||||
| 8,503 | Iberdrola SA (a) | 97,473 | ||||||
| 141,572 | Industria de Diseno Textil SA (a) | 4,361,370 | ||||||
| 16,471 | Mediaset Espana Comunicacion SA * | 57,381 | ||||||
| 552,904 | Repsol SA | 8,744,087 | ||||||
| 98,304 | Unicaja Banco SA | 125,933 | ||||||
|
| |||||||
| Total Spain | 65,215,467 | |||||||
|
| |||||||
| Sweden — 0.6% | ||||||||
| 40,186 | Betsson AB – Class B* (a) | 360,877 | ||||||
| 526,235 | Fastighets AB Balder – B Shares* | 2,603,213 | ||||||
| 26,971 | Industrivarden AB – A Shares (a) | 741,366 | ||||||
| 112,639 | Industrivarden AB – C Shares | 3,088,184 | ||||||
| 139,259 | Investor AB – A Shares | 2,854,651 | ||||||
| See accompanying notes to the financial statements. | 78 |
GMO Implementation Fund
(A Series of GMO Trust)
Consolidated Schedule of Investments — (Continued)
(showing percentage of total net assets)
February 28, 2023
| Shares | Description | Value ($) | ||||||
| Sweden — continued | ||||||||
| 16,636 | Investor AB – B Shares (a) | 321,347 | ||||||
| 25,683 | Inwido AB | 284,847 | ||||||
| 211,613 | Kinnevik AB – Class B* | 3,147,081 | ||||||
| 39,072 | New Wave Group AB – B Shares | 685,424 | ||||||
| 91,699 | Skanska AB – B Shares | 1,666,538 | ||||||
| 698,932 | SSAB AB – A Shares | 5,081,156 | ||||||
| 75,229 | SSAB AB – B Shares | 514,597 | ||||||
| 72,473 | Svenska Cellulosa AB SCA – Class B | 1,011,390 | ||||||
|
| |||||||
| Total Sweden | 22,360,671 | |||||||
|
| |||||||
| Switzerland — 0.9% | ||||||||
| 172,810 | Adecco Group AG (Registered) | 6,161,761 | ||||||
| 1,396 | Cie Financiere Richemont SA – Class A (Registered) (a) | 210,930 | ||||||
| 1,926 | DKSH Holding AG | 156,723 | ||||||
| 483 | Gurit Holding AG | 50,246 | ||||||
| 108,204 | Logitech International SA (Registered) | 5,910,151 | ||||||
| 6,653 | Mobilezone Holding AG (Registered) | 122,747 | ||||||
| 30,661 | Roche Holding AG – Genusschein (a) | 8,840,758 | ||||||
| 363 | Swatch Group AG (The) | 126,322 | ||||||
| 7,554 | u-blox Holding AG * | 810,775 | ||||||
| 328,044 | UBS Group AG (Registered) (a) | 7,130,113 | ||||||
| 2,982 | Zehnder Group AG – Class RG | 231,285 | ||||||
| 5,189 | Zurich Insurance Group AG (a) | 2,461,419 | ||||||
|
| |||||||
| Total Switzerland | 32,213,230 | |||||||
|
| |||||||
| Taiwan — 3.6% | ||||||||
| 30,000 | Acer Inc | 24,877 | ||||||
| 3,774 | Acter Group Corp Ltd | 14,817 | ||||||
| 7,000 | Advantech Co Ltd | 81,200 | ||||||
| 748,235 | AmTRAN Technology Co Ltd | 261,737 | ||||||
| 293,100 | ASE Technology Holding Co Ltd ADR | 2,101,527 | ||||||
| 71,000 | Asia Cement Corp | 104,096 | ||||||
| 698,672 | Asustek Computer Inc | 6,328,121 | ||||||
| 58,000 | Aten International Co Ltd | 154,969 | ||||||
| 1,119,000 | Catcher Technology Co Ltd | 6,762,155 | ||||||
| 1,080,019 | Cathay Financial Holding Co Ltd | 1,531,564 | ||||||
| 106,673 | Chailease Holding Co Ltd | 781,880 | ||||||
| 502,490 | Chicony Electronics Co Ltd | 1,509,341 | ||||||
| 502,000 | Chipbond Technology Corp | 1,104,114 | ||||||
| 134,000 | ChipMOS Technologies Inc | 159,480 | ||||||
| 113,540 | Chong Hong Construction Co Ltd | 283,392 | ||||||
| 5,000 | Chroma ATE Inc | 30,108 | ||||||
| 1,015,000 | Compal Electronics Inc | 802,712 | ||||||
| 145,080 | Coretronic Corp | 305,691 | ||||||
| 12,000 | Delta Electronics Inc | 112,269 | ||||||
| 13,000 | Elan Microelectronics Corp | 46,021 | ||||||
| 1,057,000 | Evergreen Marine Corp Taiwan Ltd | 5,401,519 | ||||||
| 535,000 | Far EasTone Telecommunications Co Ltd | 1,207,200 | ||||||
| 271,000 | Farglory Land Development Co Ltd | 523,675 | ||||||
| 170,340 | First Financial Holding Co Ltd | 149,274 | ||||||
| 100,709 | FLEXium Interconnect Inc * | 323,980 | ||||||
| 35,000 | Formosa Advanced Technologies Co Ltd | 49,266 | ||||||
| Shares | Description | Value ($) | ||||||
| Taiwan — continued | ||||||||
| 6,000 | Formosa International Hotels Corp | 61,456 | ||||||
| 615,000 | Formosa Plastics Corp | 1,825,669 | ||||||
| 356,000 | Foxconn Technology Co Ltd | 647,386 | ||||||
| 1,868,148 | Fubon Financial Holding Co Ltd | 3,653,002 | ||||||
| 12,000 | Fusheng Precision Co Ltd | 97,585 | ||||||
| 26,000 | Getac Technology Corp | 41,805 | ||||||
| 792,000 | Grand Pacific Petrochemical | 514,896 | ||||||
| 700,160 | HannStar Display Corp * | 292,431 | ||||||
| 16,000 | Holtek Semiconductor Inc | 38,685 | ||||||
| 4,439,406 | Hon Hai Precision Industry Co Ltd | 14,685,562 | ||||||
| 207,000 | Huaku Development Co Ltd | 625,426 | ||||||
| 26,941 | International Games System Co Ltd | 443,886 | ||||||
| 3,000 | King Slide Works Co Ltd | 40,914 | ||||||
| 217,000 | King’s Town Bank Co Ltd | 242,089 | ||||||
| 148,000 | Kung Long Batteries Industrial Co Ltd | 679,123 | ||||||
| 63,000 | Largan Precision Co Ltd | 4,529,073 | ||||||
| 1,084,000 | Lite-On Technology Corp | 2,466,674 | ||||||
| 11,000 | Makalot Industrial Co Ltd | 76,986 | ||||||
| 237,000 | MediaTek Inc | 5,564,528 | ||||||
| 58,039 | Mercuries Life Insurance Co Ltd * | 10,220 | ||||||
| 559,000 | Micro-Star International Co Ltd | 2,493,741 | ||||||
| 489,000 | Mitac Holdings Corp | 505,214 | ||||||
| 322,000 | Nan Ya Plastics Corp | 792,257 | ||||||
| 276,502 | Nantex Industry Co Ltd | 392,735 | ||||||
| 330,000 | Nanya Technology Corp | 628,160 | ||||||
| 6,000 | Nien Made Enterprise Co Ltd | 63,883 | ||||||
| 236,000 | Novatek Microelectronics Corp | 3,118,882 | ||||||
| 81,000 | Phison Electronics Corp | 922,331 | ||||||
| 1,709,566 | Pou Chen Corp | 1,873,249 | ||||||
| 32,000 | Powertech Technology Inc | 92,530 | ||||||
| 321,000 | Primax Electronics Ltd | 624,025 | ||||||
| 4,880 | Quanta Computer Inc | 12,773 | ||||||
| 595,263 | Radiant Opto-Electronics Corp | 2,054,968 | ||||||
| 15,000 | Raydium Semiconductor Corp | 201,051 | ||||||
| 11,000 | Realtek Semiconductor Corp | 135,608 | ||||||
| 635,000 | Ruentex Industries Ltd | 1,401,419 | ||||||
| 19,031 | Shanghai Commercial & Savings Bank Ltd (The) | 29,543 | ||||||
| 132,280 | Shin Zu Shing Co Ltd | 385,524 | ||||||
| 128,000 | Shinkong Insurance Co Ltd | 211,609 | ||||||
| 211,133 | Silicon Motion Technology Corp ADR | 14,192,360 | ||||||
| 99,000 | Simplo Technology Co Ltd | 956,366 | ||||||
| 10,000 | Soft-World International Corp | 26,357 | ||||||
| 292,000 | Syncmold Enterprise Corp | 588,727 | ||||||
| 43,000 | Synnex Technology International Corp | 87,737 | ||||||
| 13,000 | T3EX Global Holdings Corp | 29,432 | ||||||
| 24,311 | Tah Hsin Industrial Corp | 57,224 | ||||||
| 49,000 | TaiDoc Technology Corp | 304,265 | ||||||
| 10,000 | Taiwan Hon Chuan Enterprise Co Ltd | 31,587 | ||||||
| 187,000 | Taiwan Semiconductor Manufacturing Co Ltd | 3,093,708 | ||||||
| 151,125 | Taiwan Semiconductor Manufacturing Co Ltd Sponsored ADR (a) | 13,158,454 | ||||||
| 96,000 | Taiwan Union Technology Corp | 184,271 | ||||||
| 79 | See accompanying notes to the financial statements. |
GMO Implementation Fund
(A Series of GMO Trust)
Consolidated Schedule of Investments — (Continued)
(showing percentage of total net assets)
February 28, 2023
| Shares | Description | Value ($) | ||||||
| Taiwan — continued | ||||||||
| 5,000 | Thinking Electronic Industrial Co Ltd | 23,136 | ||||||
| 122,699 | TOPBI International Holdings Ltd * | 65,583 | ||||||
| 289,000 | Transcend Information Inc | 664,151 | ||||||
| 223,000 | Tripod Technology Corp | 763,727 | ||||||
| 16,000 | Tung Ho Steel Enterprise Corp | 31,186 | ||||||
| 121,681 | United Integrated Services Co Ltd | 897,078 | ||||||
| 304,000 | Universal Inc | 239,285 | ||||||
| 840,400 | Wan Hai Lines Ltd | 2,174,974 | ||||||
| 445,000 | Winbond Electronics Corp | 333,146 | ||||||
| 1,669,000 | Wistron Corp | 1,808,324 | ||||||
| 389,000 | WPG Holdings Ltd | 628,786 | ||||||
| 14,000 | WT Microelectronics Co Ltd | 29,738 | ||||||
| 3,232,000 | Yang Ming Marine Transport Corp | 6,802,614 | ||||||
| 239,000 | Youngtek Electronics Corp | 495,272 | ||||||
| 4,082,290 | Yuanta Financial Holding Co Ltd | 3,035,392 | ||||||
| 194,000 | Zhen Ding Technology Holding Ltd | 710,174 | ||||||
|
| |||||||
| Total Taiwan | 134,044,937 | |||||||
|
| |||||||
| Thailand — 0.8% | ||||||||
| 5,829,700 | AP Thailand Pcl NVDR | 2,044,596 | ||||||
| 1,424,900 | Bangkok Bank Pcl NVDR | 6,590,695 | ||||||
| 159,400 | Bangkok Dusit Medical Services Pcl NVDR | 126,260 | ||||||
| 275,400 | Central Retail Corp Pcl NVDR | 348,464 | ||||||
| 131,900 | CP ALL Pcl (Foreign Registered) | 231,338 | ||||||
| 42,300 | CP ALL Pcl NVDR | 74,190 | ||||||
| 226,000 | GFPT Pcl NVDR | 78,016 | ||||||
| 46,700 | Kasikornbank Pcl (Foreign Registered) | 180,985 | ||||||
| 1,491,400 | Kasikornbank Pcl NVDR | 5,779,905 | ||||||
| 20,727,800 | Krung Thai Bank Pcl NVDR | 10,145,360 | ||||||
| 159,808 | Pruksa Holding Pcl (Foreign Registered) | 61,037 | ||||||
| 565,380 | Pruksa Holding Pcl NVDR | 215,942 | ||||||
| 236,200 | PTG Energy Pcl NVDR | 93,545 | ||||||
| 390,700 | PTT Exploration & Production Pcl NVDR | 1,653,616 | ||||||
| 122,800 | Regional Container Lines Pcl NVDR | 108,532 | ||||||
| 8,706,500 | Sansiri Pcl NVDR | 470,397 | ||||||
| 849,700 | SC Asset Corp Pcl (Foreign Registered) | 111,532 | ||||||
| 207,800 | Somboon Advance Technology Pcl NVDR | 121,107 | ||||||
| 811,300 | Sri Trang Gloves Thailand Pcl NVDR | 254,709 | ||||||
| 272,400 | Thai Oil Pcl NVDR | 388,459 | ||||||
| 208,230 | Thai Vegetable Oil Pcl NVDR | 164,980 | ||||||
|
| |||||||
| Total Thailand | 29,243,665 | |||||||
|
| |||||||
| Turkey — 0.7% | ||||||||
| 8,381,194 | Akbank TAS | 7,749,885 | ||||||
| 41,621 | Arcelik AS | 262,730 | ||||||
| 720,844 | Aselsan Elektronik Sanayi Ve Ticaret AS | 2,104,219 | ||||||
| 44,546 | Dogus Otomotiv Servis ve Ticaret AS | 398,483 | ||||||
| 63,456 | Enerjisa Enerji AS | 108,036 | ||||||
| 2,366,456 | Haci Omer Sabanci Holding AS | 5,460,087 | ||||||
| 430,205 | KOC Holding AS | 1,762,135 | ||||||
| 181,208 | Koza Anadolu Metal Madencilik Isletmeleri AS * | 437,080 | ||||||
| Shares | Description | Value ($) | ||||||
| Turkey — continued | ||||||||
| 15,811 | Mavi Giyim Sanayi Ve Ticaret AS – Class B | 87,558 | ||||||
| 309,451 | Turkcell Iletisim Hizmetleri AS | 521,656 | ||||||
| 1,331,180 | Turkiye Garanti Bankasi AS | 1,638,267 | ||||||
| 518,983 | Turkiye Is Bankasi AS – Class C | 311,461 | ||||||
| 345,703 | Turkiye Sinai Kalkinma Bankasi AS * | 72,505 | ||||||
| 810,760 | Vestel Beyaz Esya Sanayi ve Ticaret AS | 529,617 | ||||||
| 11,791,916 | Yapi ve Kredi Bankasi AS | 6,249,115 | ||||||
|
| |||||||
| Total Turkey | 27,692,834 | |||||||
|
| |||||||
| Ukraine — 0.0% | ||||||||
| 36,516 | Kernel Holding SA * | 165,297 | ||||||
|
| |||||||
| United Arab Emirates — 0.0% | ||||||||
| 1,468,209 | Abu Dhabi National Oil Co for Distribution PJSC | 1,725,105 | ||||||
| 21,065 | Emaar Development PJSC * | 27,104 | ||||||
|
| |||||||
| Total United Arab Emirates | 1,752,209 | |||||||
|
| |||||||
| United Kingdom — 4.0% | ||||||||
| 438,869 | 3i Group Plc | 8,586,138 | ||||||
| 8,019 | AG Barr Plc | 53,627 | ||||||
| 87,261 | Anglo American Plc | 3,015,279 | ||||||
| 74,042 | BAE Systems Plc (a) | 799,668 | ||||||
| 278,407 | Balfour Beatty Plc | 1,222,238 | ||||||
| 16,420 | Bank of Georgia Group Plc | 552,920 | ||||||
| 118,531 | Barclays Plc | 248,748 | ||||||
| 15,600 | Barclays Plc Sponsored ADR | 131,976 | ||||||
| 1,307,597 | Barratt Developments Plc | 7,351,931 | ||||||
| 112,297 | Bellway Plc | 2,993,866 | ||||||
| 181,035 | Berkeley Group Holdings Plc (The) | 9,113,055 | ||||||
| 858,496 | BP Plc (a) | 5,641,631 | ||||||
| 217,500 | BP Plc Sponsored ADR (a) | 8,613,000 | ||||||
| 77,094 | British American Tobacco Plc (a) | 2,917,681 | ||||||
| 145,600 | British American Tobacco Plc Sponsored ADR (a) | 5,541,536 | ||||||
| 5,230,676 | BT Group Plc | 8,768,993 | ||||||
| 34,762 | Bunzl Plc (a) | 1,238,601 | ||||||
| 33,473 | Burberry Group Plc | 993,966 | ||||||
| 1,772,005 | Centrica Plc (a) | 2,236,155 | ||||||
| 1,567 | Clarkson Plc (a) | 62,231 | ||||||
| 254,637 | Coca-Cola HBC AG * | 6,521,102 | ||||||
| 320,119 | Compass Group Plc (a) | 7,395,320 | ||||||
| 77,759 | Crest Nicholson Holdings Plc | 228,512 | ||||||
| 6,596 | EMIS Group Plc | 148,484 | ||||||
| 30,601 | Evraz Plc (d) | 753 | ||||||
| 833,847 | Ferrexpo Plc | 1,477,578 | ||||||
| 858,538 | Glencore Plc (a) | 5,118,484 | ||||||
| 170,300 | Haleon Plc ADR * (a) | 1,341,964 | ||||||
| 107,355 | Halfords Group Plc | 271,527 | ||||||
| 64,838 | Harbour Energy Plc | 226,228 | ||||||
| 12,700 | HSBC Holdings Plc Sponsored ADR (a) | 486,537 | ||||||
| 243,050 | IG Group Holdings Plc | 2,346,331 | ||||||
| 249,209 | Imperial Brands Plc (a) | 6,003,759 | ||||||
| See accompanying notes to the financial statements. | 80 |
GMO Implementation Fund
(A Series of GMO Trust)
Consolidated Schedule of Investments — (Continued)
(showing percentage of total net assets)
February 28, 2023
| Shares | Description | Value ($) | ||||||
| United Kingdom — continued | ||||||||
| 915 | Indivior Plc * | 16,764 | ||||||
| 27,836 | International Personal Finance Plc | 32,299 | ||||||
| 322,374 | Investec Plc | 2,053,216 | ||||||
| 11,440 | Keller Group Plc | 111,214 | ||||||
| 1,377,808 | Kingfisher Plc | 4,764,952 | ||||||
| 405,455 | Legal & General Group Plc (a) | 1,248,030 | ||||||
| 382,150 | Lloyds Banking Group Plc | 241,339 | ||||||
| 561,363 | M&G Plc | 1,445,831 | ||||||
| 29,999 | Morgan Sindall Group Plc | 647,650 | ||||||
| 28,652 | NatWest Group Plc | 100,653 | ||||||
| 265,891 | OSB Group Plc | 1,784,067 | ||||||
| 12,499 | Paragon Banking Group Plc | 89,624 | ||||||
| 154,226 | Persimmon Plc | 2,689,496 | ||||||
| 163,212 | Plus500 Ltd | 3,520,764 | ||||||
| 102,635 | Redde Northgate Plc (a) | 499,310 | ||||||
| 291,855 | Redrow Plc | 1,793,542 | ||||||
| 340,816 | S4 Capital Plc * | 840,103 | ||||||
| 169,799 | Serica Energy Plc | 528,860 | ||||||
| 339,545 | Shell Plc (a) | 10,284,266 | ||||||
| 104,869 | Spirent Communications Plc | 268,291 | ||||||
| 61,535 | Standard Chartered Plc | 582,256 | ||||||
| 1,496,695 | Taylor Wimpey Plc | 2,213,967 | ||||||
| 10,766 | TBC Bank Group Plc | 321,241 | ||||||
| 54,111 | Unilever Plc (a) | 2,694,050 | ||||||
| 53,102 | Vesuvius Plc | 263,474 | ||||||
| 543,900 | Vodafone Group Plc Sponsored ADR (a) | 6,510,483 | ||||||
| 26,057 | Wincanton Plc | 98,033 | ||||||
| 205,906 | WPP Plc (a) | 2,532,474 | ||||||
|
| |||||||
| Total United Kingdom | 149,826,068 | |||||||
|
| |||||||
| United States — 25.2% | ||||||||
| 44,900 | 3M Co. (a) | 4,837,526 | ||||||
| 252,059 | Activision Blizzard, Inc. (a) | 19,219,499 | ||||||
| 2,500 | Adtalem Global Education, Inc. * (a) | 97,800 | ||||||
| 17,805 | ADTRAN Holdings, Inc. | 310,697 | ||||||
| 61,232 | Aemetis, Inc. * | 218,598 | ||||||
| 148,490 | Aerojet Rocketdyne Holdings, Inc. * | 8,365,927 | ||||||
| 16,600 | AGCO Corp. (a) | 2,337,446 | ||||||
| 561,275 | Albertsons Cos., Inc. – Class A | 11,158,147 | ||||||
| 14,100 | Alcoa Corp. | 690,054 | ||||||
| 2,500 | Alliance Data Systems Corp. | 102,675 | ||||||
| 201,600 | Ally Financial, Inc. | 6,058,080 | ||||||
| 43,719 | Alphabet, Inc. – Class A* (a) | 3,937,333 | ||||||
| 11,200 | Alphabet, Inc. – Class C* (a) | 1,011,360 | ||||||
| 57,600 | Ameresco, Inc. – Class A* | 2,531,520 | ||||||
| 31,427 | American Express Co. (a) | 5,467,984 | ||||||
| 1,888,723 | Anchor Hocking Holdings, Inc. (d) | 1,548,753 | ||||||
| 4,600 | Apollo Commercial Real Estate Finance, Inc. (REIT) | 52,854 | ||||||
| 19,700 | Applied Materials, Inc. (a) | 2,288,155 | ||||||
| 63,400 | Arrow Electronics, Inc. * | 7,480,566 | ||||||
| 2,000 | Aspen Technology, Inc. * (a) | 424,020 | ||||||
| 304,600 | AT&T, Inc. (a) | 5,759,986 | ||||||
| 3,100 | Atkore, Inc. * | 452,662 | ||||||
| Shares | Description | Value ($) | ||||||
| United States — continued | ||||||||
| 1,000 | AutoNation, Inc. * | 136,510 | ||||||
| 4,800 | Avnet, Inc. | 214,608 | ||||||
| 155,100 | Bank of America Corp. (a) | 5,319,930 | ||||||
| 37,800 | Bank of New York Mellon Corp. (The) (a) | 1,923,264 | ||||||
| 69,800 | Best Buy Co., Inc. (a) | 5,801,078 | ||||||
| 20,500 | Biogen, Inc. * (a) | 5,532,130 | ||||||
| 12,700 | Bio-Rad Laboratories, Inc. – Class A* | 6,068,568 | ||||||
| 136,400 | Black Knight, Inc. * (a) | 8,129,440 | ||||||
| 2,178 | Booking Holdings, Inc. * (a) | 5,497,272 | ||||||
| 274,745 | BorgWarner, Inc. | 13,814,179 | ||||||
| 45,700 | Bristol-Myers Squibb Co. (a) | 3,151,472 | ||||||
| 99,576 | Bruin Blocker LLC (e) | 57,226 | ||||||
| 5,900 | Brunswick Corp. | 515,778 | ||||||
| 15,600 | Cabot Oil & Gas Corp. | 389,532 | ||||||
| 12,200 | California Resources Corp. | 514,840 | ||||||
| 66,000 | Capital One Financial Corp. (a) | 7,199,280 | ||||||
| 15,233 | CarMax, Inc. * (a) | 1,051,686 | ||||||
| 150,700 | Carrier Global Corp. (a) | 6,786,021 | ||||||
| 3,800 | Carter’s, Inc. | 286,482 | ||||||
| 66,900 | CBRE Group, Inc. – Class A* (a) | 5,695,866 | ||||||
| 105,000 | Centene Corp. * (a) | 7,182,000 | ||||||
| 40,097 | Chevron Corp. (a) | 6,446,395 | ||||||
| 9,600 | Cigna Group (The) (a) | 2,804,160 | ||||||
| 77,000 | Cisco Systems, Inc. (a) | 3,728,340 | ||||||
| 192,400 | Citigroup, Inc. (a) | 9,752,756 | ||||||
| 15,100 | Citizens Financial Group, Inc. | 630,576 | ||||||
| 216,800 | Clean Energy Fuels Corp. * | 1,214,080 | ||||||
| 330,100 | Cleveland-Cliffs, Inc. * (a) | 7,041,033 | ||||||
| 100,600 | Cognizant Technology Solutions Corp. – Class A (a) | 6,300,578 | ||||||
| 241,600 | Comcast Corp. – Class A (a) | 8,980,272 | ||||||
| 24,500 | ConocoPhillips (a) | 2,532,075 | ||||||
| 31,209 | Coupa Software, Inc. * (a) | 2,526,993 | ||||||
| 39,200 | Crowdstrike Holdings, Inc. – Class A* (a) | 4,731,048 | ||||||
| 161,682 | CSX Corp. (a) | 4,929,684 | ||||||
| 1,600 | Cummins, Inc. (a) | 388,928 | ||||||
| 94,100 | CVS Health Corp. (a) | 7,861,114 | ||||||
| 121,170 | Darling Ingredients, Inc. * | 7,666,426 | ||||||
| 2,400 | Deere & Co. (a) | 1,006,176 | ||||||
| 139,700 | Dell Technologies, Inc. – Class C (a) | 5,677,408 | ||||||
| 38,100 | Discover Financial Services (a) | 4,267,200 | ||||||
| 405,100 | DISH Network Corp. – Class A* | 4,622,191 | ||||||
| 85,800 | DR Horton, Inc. (a) | 7,934,784 | ||||||
| 6,100 | DXC Technology Co. * (a) | 169,214 | ||||||
| 170,000 | eBay, Inc. (a) | 7,803,000 | ||||||
| 3,800 | Elevance Health, Inc. (a) | 1,784,746 | ||||||
| 2,400 | Encore Wire Corp. | 463,224 | ||||||
| 60,449 | EOG Resources, Inc. | 6,831,946 | ||||||
| 167,587 | Evoqua Water Technologies Corp. * | 8,138,025 | ||||||
| 59,500 | Exxon Mobil Corp. (a) | 6,539,645 | ||||||
| 26,800 | FedEx Corp. (a) | 5,446,296 | ||||||
| 7,900 | Ferguson Plc (a) | 1,138,390 | ||||||
| 182,400 | Fidelity National Financial, Inc. (a) | 7,270,464 | ||||||
| 235,960 | First Horizon Corp. | 5,844,729 | ||||||
| 81 | See accompanying notes to the financial statements. |
GMO Implementation Fund
(A Series of GMO Trust)
Consolidated Schedule of Investments — (Continued)
(showing percentage of total net assets)
February 28, 2023
| Shares | Description | Value ($) | ||||||
| United States — continued | ||||||||
| 37,300 | Flex Ltd. * | 848,948 | ||||||
| 16,900 | Foot Locker, Inc. | 738,868 | ||||||
| 706,400 | Ford Motor Co. (a) | 8,526,248 | ||||||
| 90,100 | Fortune Brands Innovations, Inc. | 5,581,695 | ||||||
| 54,300 | Fox Corp. – Class A (a) | 1,901,586 | ||||||
| 279,894 | Fox Corp. – Class B | 9,026,581 | ||||||
| 211,500 | Franklin Resources, Inc. (a) | 6,232,905 | ||||||
| 50,400 | Freeport-McMoRan, Inc. (a) | 2,064,888 | ||||||
| 24,900 | Gap, Inc. (The) | 323,949 | ||||||
| 6,500 | Garmin Ltd. | 637,845 | ||||||
| 8,800 | Generac Holdings, Inc. * | 1,056,088 | ||||||
| 229,600 | General Motors Co. | 8,894,704 | ||||||
| 33,500 | Gilead Sciences, Inc. (a) | 2,697,755 | ||||||
| 229,518 | Globus Medical, Inc. – Class A* (a) | 13,390,080 | ||||||
| 9,800 | Goldman Sachs Group, Inc. (The) (a) | 3,446,170 | ||||||
| 194,344 | GrafTech International Ltd. | 1,098,044 | ||||||
| 400 | Graham Holdings Co. – Class B (a) | 250,664 | ||||||
| 118,065 | Green Plains, Inc. * | 4,093,313 | ||||||
| 700 | Group 1 Automotive, Inc. | 154,749 | ||||||
| 18,200 | H&R Block, Inc. (a) | 669,760 | ||||||
| 76,000 | Hanesbrands, Inc. | 431,680 | ||||||
| 4,500 | Hartford Financial Services Group, Inc. (The) (a) | 352,260 | ||||||
| 5,600 | Hasbro, Inc. | 308,056 | ||||||
| 36,178 | HEICO Corp. – Class A | 4,708,567 | ||||||
| 3,600 | Henry Schein, Inc. * (a) | 281,916 | ||||||
| 37,200 | Hess Corp. | 5,010,840 | ||||||
| 85,300 | Hewlett Packard Enterprise Co. | 1,331,533 | ||||||
| 30,972 | Hilton Worldwide Holdings, Inc. (a) | 4,475,764 | ||||||
| 1,800 | HNI Corp. | 56,250 | ||||||
| 98,370 | Horizon Therapeutics Plc * | 10,770,531 | ||||||
| 291,300 | HP, Inc. | 8,599,176 | ||||||
| 76,200 | Huntington Bancshares, Inc. | 1,167,384 | ||||||
| 11,200 | Huntsman Corp. | 328,608 | ||||||
| 240,135 | IAA, Inc. * | 9,823,923 | ||||||
| 79,500 | Incyte Corp. * | 6,119,910 | ||||||
| 412,200 | Intel Corp. (a) | 10,276,146 | ||||||
| 50,932 | Intercontinental Exchange, Inc. (a) | 5,184,878 | ||||||
| 78,300 | International Business Machines Corp. (a) | 10,124,190 | ||||||
| 167,900 | Invesco Ltd. | 2,965,114 | ||||||
| 40,700 | Janus Henderson Group Plc | 1,117,622 | ||||||
| 44,000 | Jazz Pharmaceuticals Plc * | 6,177,600 | ||||||
| 4,000 | Jefferies Financial Group, Inc. | 151,160 | ||||||
| 17,700 | Johnson & Johnson (a) | 2,712,702 | ||||||
| 43,300 | JPMorgan Chase & Co. (a) | 6,207,055 | ||||||
| 11,700 | KeyCorp. | 213,993 | ||||||
| 376,100 | Kinder Morgan, Inc. | 6,416,266 | ||||||
| 61,100 | Knight-Swift Transportation Holdings, Inc. (a) | 3,472,924 | ||||||
| 25,600 | Kohl’s Corp. | 717,824 | ||||||
| 800 | Korn Ferry | 44,712 | ||||||
| 1,070,100 | Kosmos Energy Ltd. * | 8,421,687 | ||||||
| 183,200 | Kraft Heinz Co. (The) (a) | 7,133,808 | ||||||
| 12,600 | Kroger Co. (The) (a) | 543,564 | ||||||
| Shares | Description | Value ($) | ||||||
| United States — continued | ||||||||
| 13,700 | Kulicke & Soffa Industries, Inc. | 730,210 | ||||||
| 31,600 | Laboratory Corp. of America Holdings (a) | 7,563,776 | ||||||
| 5,767 | Lam Research Corp. (a) | 2,802,820 | ||||||
| 80,171 | Las Vegas Sands Corp. * (a) | 4,607,427 | ||||||
| 7,200 | La-Z-Boy, Inc. | 233,136 | ||||||
| 3,100 | Lear Corp. | 432,915 | ||||||
| 76,300 | Lennar Corp. – Class A (a) | 7,381,262 | ||||||
| 173,815 | Liberty Broadband Corp. – Class C* | 15,064,546 | ||||||
| 511,537 | Liberty Global Plc – Class A* | 10,481,393 | ||||||
| 71,800 | Liberty Global Plc – Class C* | 1,525,750 | ||||||
| 41,543 | Liberty Media Corp.-Liberty Formula One – Class A* | 2,524,153 | ||||||
| 120,000 | Lincoln National Corp. | 3,806,400 | ||||||
| 1,100 | Lithia Motors, Inc. | 280,698 | ||||||
| 125,209 | Livent Corp. * | 2,936,151 | ||||||
| 1,531,800 | Lumen Technologies, Inc. | 5,208,120 | ||||||
| 70,700 | LyondellBasell Industries NV – Class A (a) | 6,786,493 | ||||||
| 38,500 | Macy’s, Inc. | 787,710 | ||||||
| 11,300 | ManpowerGroup, Inc. | 959,144 | ||||||
| 22,000 | Marathon Oil Corp. | 553,300 | ||||||
| 2,100 | Marcus & Millichap, Inc. | 72,177 | ||||||
| 3,438 | Markel Corp. * (a) | 4,572,059 | ||||||
| 22,600 | Match Group, Inc. * (a) | 936,092 | ||||||
| 1,400 | Matson, Inc. (a) | 93,114 | ||||||
| 17,100 | Medtronic Plc (a) | 1,415,880 | ||||||
| 30,500 | Merck & Co., Inc. (a) | 3,240,320 | ||||||
| 105,998 | Meta Platforms, Inc. – Class A* (a) | 18,543,290 | ||||||
| 28,500 | MetLife, Inc. (a) | 2,044,305 | ||||||
| 205,957 | Micron Technology, Inc. (a) | 11,908,434 | ||||||
| 48,100 | Mohawk Industries, Inc. * | 4,947,085 | ||||||
| 126,500 | Molson Coors Brewing Co. – Class B (a) | 6,728,535 | ||||||
| 165,100 | Mosaic Co. (The) (a) | 8,781,669 | ||||||
| 1,288,200 | NII Holdings, Inc. (e) | 450,870 | ||||||
| 3,600 | Nordstrom, Inc. | 70,128 | ||||||
| 10,500 | Northern Trust Corp. (a) | 1,000,335 | ||||||
| 150,100 | NRG Energy, Inc. (a) | 4,921,779 | ||||||
| 41,200 | Nucor Corp. (a) | 6,898,528 | ||||||
| 100 | NVR, Inc. * | 517,362 | ||||||
| 117,000 | Occidental Petroleum Corp. | 6,851,520 | ||||||
| 14,700 | Oracle Corp. (a) | 1,284,780 | ||||||
| 33,615 | Otis Worldwide Corp. (a) | 2,844,501 | ||||||
| 81,000 | Ovintiv, Inc. | 3,464,370 | ||||||
| 11,800 | Owens Corning | 1,153,922 | ||||||
| 335,000 | Paramount Global – Class B (a) | 7,175,700 | ||||||
| 91,900 | PayPal Holdings, Inc. * (a) | 6,763,840 | ||||||
| 755,227 | Pershing Square Tontine Holdings Ltd. * (e) | 75,523 | ||||||
| 113,100 | Pfizer, Inc. (a) | 4,588,467 | ||||||
| 4,500 | Phillips 66 | 461,520 | ||||||
| 8,100 | PNC Financial Services Group, Inc. | 1,279,152 | ||||||
| 305,744 | PNM Resources, Inc. (a) | 14,981,456 | ||||||
| 12,400 | PotlatchDeltic Corp. (REIT) (a) | 572,384 | ||||||
| 13,000 | Principal Financial Group, Inc. (a) | 1,164,280 | ||||||
| 90,200 | Prudential Financial, Inc. (a) | 9,020,000 | ||||||
| 129,600 | PulteGroup, Inc. | 7,085,232 | ||||||
| See accompanying notes to the financial statements. | 82 |
GMO Implementation Fund
(A Series of GMO Trust)
Consolidated Schedule of Investments — (Continued)
(showing percentage of total net assets)
February 28, 2023
| Shares | Description | Value ($) | ||||||
| United States — continued | ||||||||
| 15,500 | PVH Corp. | 1,243,720 | ||||||
| 30,800 | QUALCOMM, Inc. (a) | 3,804,724 | ||||||
| 35,300 | Radian Group, Inc. | 753,655 | ||||||
| 2,300 | Ralph Lauren Corp. | 271,837 | ||||||
| 58,280 | Raytheon Technologies Corp. (a) | 5,716,685 | ||||||
| 11,800 | Regeneron Pharmaceuticals, Inc. * (a) | 8,972,956 | ||||||
| 59,200 | Regions Financial Corp. | 1,380,544 | ||||||
| 5,000 | Reliance Steel & Aluminum Co. (a) | 1,239,200 | ||||||
| 704,283 | Resolute Forest Products, Inc. * (c) | 15,437,883 | ||||||
| 20,500 | Resolute Forest Products, Inc. * (c) | 449,663 | ||||||
| 500 | Robert Half International, Inc. (a) | 40,310 | ||||||
| 33,000 | Samsonite International SA * | 92,612 | ||||||
| 5,800 | Schneider National, Inc. – Class B (a) | 162,748 | ||||||
| 46,937 | Sensata Technologies Holding Plc | 2,374,073 | ||||||
| 8,800 | Sitio Royalties Corp. – Class A | 206,888 | ||||||
| 30,600 | Skyworks Solutions, Inc. | 3,414,042 | ||||||
| 5,500 | SolarEdge Technologies, Inc. * | 1,748,560 | ||||||
| 298,457 | Southeastern Grocers, Inc. * (d) | 6,640,668 | ||||||
| 116,593 | Sportsman’s Warehouse Holdings, Inc. * | 1,048,171 | ||||||
| 25,700 | SS&C Technologies Holdings, Inc. (a) | 1,508,590 | ||||||
| 4,400 | Stanley Black & Decker, Inc. | 376,684 | ||||||
| 19,100 | State Street Corp. (a) | 1,693,788 | ||||||
| 62,800 | Steel Dynamics, Inc. (a) | 7,919,708 | ||||||
| 4,500 | Stewart Information Services Corp. | 191,205 | ||||||
| 162,852 | Sunrun, Inc. * | 3,914,962 | ||||||
| 210,500 | Synchrony Financial (a) | 7,516,955 | ||||||
| 13,500 | Tapestry, Inc. | 587,385 | ||||||
| 12,300 | Taylor Morrison Home Corp. – Class A* | 440,709 | ||||||
| 460,393 | TEGNA, Inc. | 8,010,838 | ||||||
| 51,400 | Textron, Inc. (a) | 3,728,042 | ||||||
| 3,700 | TRI Pointe Homes, Inc. * | 88,208 | ||||||
| 5,869 | TRU TAJ Liquidation Unit Trust/TRU TAJ Finance, Inc. (d) | 59 | ||||||
| 160,204 | TRU TAJ LLC/TRU TAJ Finance, Inc. (d) | 780,994 | ||||||
| 26,300 | Truist Financial Corp. | 1,234,785 | ||||||
| 126,200 | Tyson Foods, Inc. – Class A (a) | 7,476,088 | ||||||
| 320,078 | Umpqua Holdings Corp. | 5,652,577 | ||||||
| 25,208 | Union Pacific Corp. (a) | 5,225,114 | ||||||
| 1,100 | Universal Corp. | 55,649 | ||||||
| 43,300 | Universal Health Services, Inc. – Class B (a) | 5,783,581 | ||||||
| 6,600 | Unum Group | 294,030 | ||||||
| 108,653 | US Bancorp | 5,186,008 | ||||||
| 700 | USANA Health Sciences, Inc. * | 42,546 | ||||||
| 297,200 | Verizon Communications, Inc. (a) | 11,534,332 | ||||||
| 18,100 | Vertex Pharmaceuticals, Inc. * (a) | 5,254,249 | ||||||
| 9,500 | VF Corp. | 235,790 | ||||||
| 641,200 | Viatris, Inc. | 7,309,680 | ||||||
| 79,989 | VMware, Inc. – Class A* (a) | 8,809,189 | ||||||
| 163,400 | Walgreens Boots Alliance, Inc. (a) | 5,805,602 | ||||||
| 193,377 | Warner Bros Discovery, Inc. * (a) | 3,020,549 | ||||||
| 134,607 | Wells Fargo & Co. (a) | 6,295,569 | ||||||
| 473,600 | Western Union Co. (The) (a) | 6,137,856 | ||||||
| 126,300 | Western Digital Corp. * | 4,860,024 | ||||||
| 44,300 | Westlake Corp. | 5,277,902 | ||||||
| Shares | Description | Value ($) | ||||||
| United States — continued | ||||||||
| 107,060 | Westmoreland Mining Holdings (e) | 321,180 | ||||||
| 42,100 | Whirlpool Corp. | 5,808,958 | ||||||
| 2,200 | Williams-Sonoma, Inc. | 274,824 | ||||||
| 8,700 | Xerox Holdings Corp. | 143,463 | ||||||
| 7,200 | Zions Bancorp NA | 364,464 | ||||||
| 88,200 | Zoom Video Communications, Inc. – Class A* (a) | 6,578,838 | ||||||
|
| |||||||
| Total United States | 940,687,109 | |||||||
|
| |||||||
| Vietnam — 0.2% | ||||||||
| 562,800 | Duc Giang Chemicals JSC | 1,186,347 | ||||||
| 143,300 | IDICO Corp JSC | 231,611 | ||||||
| 41,500 | PetroVietnam Ca Mau Fertilizer JSC | 41,033 | ||||||
| 42,900 | PetroVietnam Fertilizer & Chemicals JSC | 63,176 | ||||||
| 111,100 | PetroVietnam Technical Services Corp | 121,049 | ||||||
| 35,000 | Pha Lai Thermal Power JSC | 21,806 | ||||||
| 1,038,200 | SSI Securities Corp | 797,483 | ||||||
| 385,200 | Vietnam Dairy Products JSC | 1,224,228 | ||||||
| 1,238,400 | Vietnam Joint Stock Commercial Bank for Industry and Trade * | 1,427,878 | ||||||
| 3,669,600 | VNDirect Securities Corp | 2,077,357 | ||||||
|
| |||||||
| Total Vietnam | 7,191,968 | |||||||
|
| |||||||
| TOTAL COMMON STOCKS (COST $3,400,429,416) | 2,990,196,860 | |||||||
|
| |||||||
| PREFERRED STOCKS (g) — 1.9% | ||||||||
| Brazil — 1.3% | ||||||||
| 1,828,478 | Bradespar SA | 9,660,240 | ||||||
| 785,419 | Cia Energetica de Minas Gerais | 1,572,203 | ||||||
| 49,150 | Cia Energetica de Minas Gerais Sponsored ADR (a) | 95,842 | ||||||
| 2,300 | Cia Ferro Ligas da Bahia | 25,239 | ||||||
| 1,797,700 | Cia Paranaense de Energia – Class B | 2,420,763 | ||||||
| 551,000 | Gerdau SA | 3,013,137 | ||||||
| 863,804 | Gerdau SA Sponsored ADR | 4,725,008 | ||||||
| 21,600 | Itau Unibanco Holding SA | 104,917 | ||||||
| 653,900 | Itau Unibanco Holding SA Sponsored ADR | 3,145,259 | ||||||
| 300,800 | Itausa SA | 472,850 | ||||||
| 237,200 | Metalurgica Gerdau SA | 569,956 | ||||||
| 2,726,200 | Petroleo Brasileiro SA | 13,142,956 | ||||||
| 920,480 | Petroleo Brasileiro SA Sponsored ADR | 8,983,885 | ||||||
| 9,900 | Unipar Carbocloro SA – Class B | 149,934 | ||||||
|
| |||||||
| Total Brazil | 48,082,189 | |||||||
|
| |||||||
| Chile — 0.1% | ||||||||
| 34,984 | Embotelladora Andina SA – Class B | 86,026 | ||||||
| 45,100 | Sociedad Quimica y Minera de Chile SA Sponsored ADR | 4,002,625 | ||||||
|
| |||||||
| Total Chile | 4,088,651 | |||||||
|
| |||||||
| 83 | See accompanying notes to the financial statements. |
GMO Implementation Fund
(A Series of GMO Trust)
Consolidated Schedule of Investments — (Continued)
(showing percentage of total net assets)
February 28, 2023
| Shares | Description | Value ($) | ||||||
| Germany — 0.2% | ||||||||
| 48,969 | Bayerische Motoren Werke AG | 4,638,143 | ||||||
| 4,088 | Draegerwerk AG & Co KGaA | 178,274 | ||||||
| 3,461 | Villeroy & Boch AG | 72,649 | ||||||
| 29,854 | Volkswagen AG (a) | 4,063,893 | ||||||
|
| |||||||
| Total Germany | 8,952,959 | |||||||
|
| |||||||
| Russia — 0.0% | ||||||||
| 15,222 | Bashneft PJSC (d) | 1,637 | ||||||
| 79,750 | Nizhnekamskneftekhim PJSC (d) | 908 | ||||||
| 49,530 | Sberbank of Russia PJSC * (d) (f) | 1,105 | ||||||
| 20,862,000 | Surgutneftegas PJSC (d) | 77,360 | ||||||
| 12,313 | Tatneft PJSC (d) | 547 | ||||||
| 337 | Transneft PJSC (d) | 4,109 | ||||||
|
| |||||||
| Total Russia | 85,666 | |||||||
|
| |||||||
| South Korea — 0.3% | ||||||||
| 5,895 | Hyundai Motor Co GDR (Registered) | 206,348 | ||||||
| 6,750 | LG Electronics Inc | 242,021 | ||||||
| 216,689 | Samsung Electronics Co Ltd | 8,737,774 | ||||||
| 1,358 | Samsung Electronics Co Ltd GDR (Registered) | 1,378,304 | ||||||
|
| |||||||
| Total South Korea | 10,564,447 | |||||||
|
| |||||||
| Taiwan — 0.0% | ||||||||
| 68,864 | Chailease Holding Co Ltd | 224,963 | ||||||
|
| |||||||
| United States — 0.0% | ||||||||
| 39 | Gulfport Energy Corp. (e) | 183,300 | ||||||
|
| |||||||
| TOTAL PREFERRED STOCKS (COST $90,596,661) | 72,182,175 | |||||||
|
| |||||||
| RIGHTS/WARRANTS — 0.0% | ||||||||
| Canada — 0.0% | ||||||||
| 222,285 | Clementia Pharmaceuticals Inc * (e) | 222 | ||||||
|
| |||||||
| United States — 0.0% | ||||||||
| 408,963 | Bristol-Myers Squibb Co. CVR * (e) | 756,582 | ||||||
| 50,914 | Contra Abiomed, Inc. * (e) | 89,099 | ||||||
|
| |||||||
| Total United States | 845,681 | |||||||
|
| |||||||
| TOTAL RIGHTS/WARRANTS (COST $1,235,833) | 845,903 | |||||||
|
| |||||||
| INVESTMENT FUNDS — 0.3% | ||||||||
| United States — 0.3% | ||||||||
| 4,418,828 | Altaba, Inc. (e) | 10,295,869 | ||||||
|
| |||||||
| TOTAL INVESTMENT FUNDS (COST $5,265,822) | 10,295,869 | |||||||
|
| |||||||
| Par Value† | Description | Value ($) | ||||||
| DEBT OBLIGATIONS — 30.8% | ||||||||
| Austria — 0.1% | ||||||||
| Corporate Debt — 0.1% | ||||||||
| EUR 1,600,000 | ams-OSRAM AG, Reg S, 2.13%, due 11/03/27 | 1,220,162 | ||||||
|
| |||||||
| China — 0.0% | ||||||||
| Corporate Debt — 0.0% | ||||||||
| 6,630,000 | Scenery Journey Ltd., Reg S, 11.50%, due 10/24/22 (h) | 364,650 | ||||||
| 2,130,000 | Scenery Journey Ltd., Reg S, 12.00%, due 10/24/23 (h) | 117,150 | ||||||
|
| |||||||
| Total China | 481,800 | |||||||
|
| |||||||
| Israel — 0.1% | ||||||||
| Corporate Debt — 0.1% | ||||||||
| 3,452,000 | Teva Pharmaceutical Finance Co LLC, 6.15%, due 02/01/36 | 3,087,383 | ||||||
|
| |||||||
| Netherlands — 0.0% | ||||||||
| Corporate Debt — 0.0% | ||||||||
| EUR 539,716 | Evander Gold Mines Ltd, Variable Rate, 10.00%, due 04/19/26 (d) (h) | 57 | ||||||
|
| |||||||
| United States — 30.6% | ||||||||
| Bank Loans — 0.5% | ||||||||
| 255,202 | American Consolidated Natural Resources, Inc., 2020 Exit Term Loan, Variable Rate, 3 mo. LIBOR plus 13.00%, 17.82%, due 09/16/25 (e) | 255,202 | ||||||
| 640,205 | Envision Healthcare Corp., 2018 1st Lien Term Loan, Variable Rate, 1 mo. LIBOR plus 3.75%, 7.82%, due 10/10/25 (e) | 153,649 | ||||||
| 839,688 | Envision Healthcare Corp., 2022 Third Out Term Loan, Variable Rate, 3 mo. SOFR plus 3.75%, 8.33%, due 03/31/27 (e) | 156,745 | ||||||
| 343,221 | Envision Healthcare Corp., 2022 Second Out Term Loan, Variable Rate, 3 mo. SOFR plus 4.25%, 8.83%, due 03/31/27 (e) | 129,851 | ||||||
| 13,889,232 | Gibson Brands, Inc., 2021 Term Loan, Variable Rate, 3 mo. LIBOR plus 5.00%, 9.92%, due 08/11/28 (e) | 11,082,982 | ||||||
| 6,484,971 | Peloton Interactive, Inc, Term Loan, Variable Rate, 3 mo. SOFR plus 6.50%, 11.37%, due 05/25/27 (e) | 6,493,077 | ||||||
| 2,872,049 | TGP Holdings III LLC, 2021 Term Loan, Variable Rate, 3 mo. LIBOR plus 3.25%, 8.08%, due 06/29/28 (e) | 2,290,459 | ||||||
|
| |||||||
| Total Bank Loans | 20,561,965 | |||||||
|
| |||||||
| Corporate Debt — 0.5% | ||||||||
| 15,121 | Alaska Airlines Pass-Through Trust – Class B, 144A, 8.00%, due 02/15/27 | 15,448 | ||||||
| 4,755,168 | American Airlines Pass-Through Trust – Class B, 4.95%, due 08/15/26 | 4,612,733 | ||||||
| 1,759,876 | American Airlines Pass-Through Trust – Class B, 3.70%, due 04/15/27 | 1,646,153 | ||||||
| See accompanying notes to the financial statements. | 84 |
GMO Implementation Fund
(A Series of GMO Trust)
Consolidated Schedule of Investments — (Continued)
(showing percentage of total net assets)
February 28, 2023
| Par Value† / Shares | Description | Value ($) | ||||||
| United States — continued | ||||||||
| Corporate Debt — continued | ||||||||
| 2,499,205 | American Airlines Pass-Through Trust – Class B, 3.75%, due 04/15/27 | 2,339,557 | ||||||
| 2,293,797 | American Airlines Pass-Through Trust – Class B, 3.85%, due 08/15/29 | 2,060,877 | ||||||
| 1,603,100 | American Airlines Pass-Through Trust – Class B, 144A, 4.38%, due 12/15/25 | 1,549,032 | ||||||
| 1,400,000 | Esc Cb Gulfport Energy, 6.38%, due 01/15/26 (e) | 140 | ||||||
| 1,877,000 | GPS Hospitality Holding Co. LLC / GPS Finco, Inc., 144A, 7.00%, due 08/15/28 | 1,182,510 | ||||||
| 432,458 | JetBlue Pass-Through Trust, Series 1B – Class B, 7.75%, due 05/15/30 | 424,536 | ||||||
| 3,291,000 | Royal Caribbean Cruises Ltd., 7.50%, due 10/15/27 | 3,089,788 | ||||||
|
| |||||||
| Total Corporate Debt | 16,920,774 | |||||||
|
| |||||||
| U.S. Government — 26.0% | ||||||||
| 100,000,000 | U.S. Treasury Floating Rate Notes, Variable Rate, USBM + 0.14%, 4.95%, due 10/31/24 | 100,074,659 | ||||||
| 247,000,000 | U.S. Treasury Note, 0.13%, due 04/30/23 (i) | 245,075,905 | ||||||
| 205,000,000 | U.S. Treasury Note, 0.13%, due 06/30/23 (a) | 201,748,827 | ||||||
| 100,000,000 | U.S. Treasury Note, 0.13%, due 07/31/23 | 97,988,281 | ||||||
| 50,000,000 | U.S. Treasury Note, Variable Rate, USBM + 0.04%, 4.84%, due 10/31/23 | 49,985,726 | ||||||
| 175,000,000 | U.S. Treasury Note, Variable Rate, USBM - 0.08%, 4.73%, due 04/30/24 | 174,734,927 | ||||||
| 52,105,000 | U.S. Treasury Note, Variable Rate, USBM + 0.04%, 4.84%, due 07/31/24 (a) | 52,087,157 | ||||||
| 50,000,000 | U.S. Treasury Note, Variable Rate, SOFR + 0.20%, 5.01%, due 01/31/25 | 50,052,408 | ||||||
|
| |||||||
| Total U.S. Government | 971,747,890 | |||||||
|
| |||||||
| U.S. Government Agency — 3.6% | ||||||||
| 62,500,000 | Federal Home Loan Banks, 5.23%, due 03/22/24 | 62,528,292 | ||||||
| 40,500,000 | Federal Home Loan Banks, Variable Rate, SOFR + 0.10%, 4.65%, due 09/04/24 | 40,500,000 | ||||||
| 32,000,000 | Federal Home Loan Banks, SOFR + 0.03%, 4.58%, due 06/07/23 | 31,999,943 | ||||||
|
| |||||||
| Total U.S. Government Agency | 135,028,235 | |||||||
|
| |||||||
| Total United States | 1,144,258,864 | |||||||
|
| |||||||
| TOTAL DEBT OBLIGATIONS (COST $1,160,290,349) | 1,149,048,266 | |||||||
|
| |||||||
| MUTUAL FUNDS — 0.0% | ||||||||
| United States — 0.0% | ||||||||
| Affiliated Issuers — 0.0% | ||||||||
| 224,382 | GMO U.S. Treasury Fund | 1,119,668 | ||||||
|
| |||||||
| TOTAL MUTUAL FUNDS (COST $1,122,183) | 1,119,668 | |||||||
|
| |||||||
| Shares / Par Value† | Description | Value ($) | ||||||
| SHORT-TERM INVESTMENTS — 8.1% | ||||||||
| Money Market Funds — 0.2% | ||||||||
| 8,274,886 | State Street Institutional Treasury Money Market Fund – Premier Class, 4.42% (j) | 8,274,886 | ||||||
| 237,554 | State Street U.S. Treasury Liquidity Fund – Class D Shares, 4.48% (i) | 237,554 | ||||||
|
| |||||||
| Total Money Market Funds | 8,512,440 | |||||||
|
| |||||||
| Repurchase Agreements — 7.5% | ||||||||
| 280,048,230 | Daiwa Capital Markets America, Inc. Repurchase Agreement, dated 02/28/23, maturing on 03/01/23 with a maturity value of $280,083,392 and an effective yield of 4.52%, collateralized by a U.S. Treasury Note with maturity date 04/30/29 and a market value of $285,763,500. | 280,048,230 | ||||||
|
| |||||||
| U.S. Government — 0.4% | ||||||||
| 15,880,000 | U.S. Treasury Bill, 4.72%, due 05/18/23 (i) (k) | 15,719,579 | ||||||
|
| |||||||
| TOTAL SHORT-TERM INVESTMENTS (COST $304,346,667) | 304,280,249 | |||||||
|
| |||||||
| TOTAL INVESTMENTS — 121.2% (Cost $4,963,286,931) | 4,527,968,990 | |||||||
|
| |||||||
| SECURITIES SOLD SHORT — (24.3)% | ||||||||
| Common Stocks — (24.1)% | ||||||||
| Australia — (0.6)% | ||||||||
| (103,960) | ASX Ltd | (4,748,507 | ) | |||||
| (22,371) | Cochlear Ltd | (3,336,068 | ) | |||||
| (128,427) | IDP Education Ltd | (2,469,804 | ) | |||||
| (1,973,097) | Pilbara Minerals Ltd* | (5,498,167 | ) | |||||
| (643,700) | Qantas Airways Ltd* | (2,768,557 | ) | |||||
| (63,409) | Ramsay Health Care Ltd | (2,874,764 | ) | |||||
|
| |||||||
| Total Australia | (21,695,867 | ) | ||||||
|
| |||||||
| Austria — (0.1)% | ||||||||
| (66,290) | Verbund AG | (5,732,919 | ) | |||||
|
| |||||||
| Belgium — (0.2)% | ||||||||
| (115,920) | Anheuser-Busch InBev SA/NV | (7,031,538 | ) | |||||
|
| |||||||
| Canada — (1.4)% | ||||||||
| (92,900) | Agnico Eagle Mines Ltd | (4,276,187 | ) | |||||
| (135,300) | Algonquin Power & Utilities Corp | (1,032,339 | ) | |||||
| (274,700) | AltaGas Ltd | (4,714,895 | ) | |||||
| (140,500) | Brookfield Renewable Corp – Class A | (3,912,925 | ) | |||||
| (181,800) | Enbridge Inc | (6,821,136 | ) | |||||
| (49,600) | Franco-Nevada Corp | (6,327,472 | ) | |||||
| (375,300) | Pan American Silver Corp | (5,576,958 | ) | |||||
| (192,300) | Pembina Pipeline Corp | (6,315,132 | ) | |||||
| (99,900) | Restaurant Brands International Inc | (6,442,551 | ) | |||||
| (148,419) | Ritchie Bros Auctioneers Inc | (9,078,790 | ) | |||||
|
| |||||||
| Total Canada | (54,498,385 | ) | ||||||
|
| |||||||
| 85 | See accompanying notes to the financial statements. |
GMO Implementation Fund
(A Series of GMO Trust)
Consolidated Schedule of Investments — (Continued)
(showing percentage of total net assets)
February 28, 2023
| Shares | Description | Value ($) | ||||||
| Denmark — (0.1)% | ||||||||
| (5,502) | Coloplast A/S – Class B | (635,735 | ) | |||||
| (133,060) | Tryg A/S | (2,947,738 | ) | |||||
|
| |||||||
| Total Denmark | (3,583,473 | ) | ||||||
|
| |||||||
| Finland — (0.0)% | ||||||||
| (33,193) | Elisa Oyj | (1,884,969 | ) | |||||
|
| |||||||
| France — (0.7)% | ||||||||
| (189,578) | Accor SA* | (6,291,962 | ) | |||||
| (34,991) | Aeroports de Paris* | (5,069,897 | ) | |||||
| (900) | Euronext NV | (65,646 | ) | |||||
| (356,931) | Getlink SE | (5,994,597 | ) | |||||
| (4,247) | Hermes International | (7,687,633 | ) | |||||
| (3,869) | Sartorius Stedim Biotech | (1,260,120 | ) | |||||
| (9,204) | Ubisoft Entertainment SA* | (201,798 | ) | |||||
|
| |||||||
| Total France | (26,571,653 | ) | ||||||
|
| |||||||
| Germany — (0.9)% | ||||||||
| (140,515) | Delivery Hero SE* | (5,646,686 | ) | |||||
| (28,189) | Deutsche Boerse AG | (4,915,424 | ) | |||||
| (23,292) | MTU Aero Engines AG | (5,620,897 | ) | |||||
| (41,571) | Puma SE | (2,646,178 | ) | |||||
| (4,703) | Rational AG | (3,119,463 | ) | |||||
| (59,767) | Symrise AG – Class A | (6,106,352 | ) | |||||
| (1,685,441) | Telefonica Deutschland Holding AG | (5,112,677 | ) | |||||
| (37,021) | Zalando SE* | (1,466,774 | ) | |||||
|
| |||||||
| Total Germany | (34,634,451 | ) | ||||||
|
| |||||||
| Ireland — (0.0)% | ||||||||
| (10,097) | Flutter Entertainment Plc* | (1,613,618 | ) | |||||
|
| |||||||
| Israel — (0.2)% | ||||||||
| (42,900) | CyberArk Software Ltd* | (6,210,633 | ) | |||||
| (18,400) | Wix.com Ltd* | (1,665,752 | ) | |||||
|
| |||||||
| Total Israel | (7,876,385 | ) | ||||||
|
| |||||||
| Italy — (0.7)% | ||||||||
| (162,877) | Amplifon SPA | (4,709,600 | ) | |||||
| (22,944) | Ferrari NV (c) | (5,952,734 | ) | |||||
| (6,900) | Ferrari NV (c) | (1,796,553 | ) | |||||
| (397,526) | FinecoBank Banca Fineco SPA | (6,869,436 | ) | |||||
| (500,561) | Infrastrutture Wireless Italiane SPA | (5,509,212 | ) | |||||
|
| |||||||
| Total Italy | (24,837,535 | ) | ||||||
|
| |||||||
| Japan — (2.3)% | ||||||||
| (151,900) | Aeon Co Ltd | (2,833,219 | ) | |||||
| (266,600) | ANA Holdings Inc* | (5,408,930 | ) | |||||
| (185,100) | Asahi Intecc Co Ltd | (3,151,521 | ) | |||||
| Shares | Description | Value ($) | ||||||
| Japan — continued | ||||||||
| (58,000) | GMO Payment Gateway Inc | (4,763,870 | ) | |||||
| (282,600) | Japan Airlines Co Ltd* | (5,321,334 | ) | |||||
| (163,800) | Japan Exchange Group Inc | (2,443,012 | ) | |||||
| (80,900) | Keio Corp | (2,818,735 | ) | |||||
| (52,700) | Keisei Electric Railway Co Ltd | (1,523,357 | ) | |||||
| (37,100) | Lasertec Corp | (6,032,288 | ) | |||||
| (212,300) | M3 Inc | (5,062,763 | ) | |||||
| (368,500) | MonotaRO Co Ltd | (5,012,100 | ) | |||||
| (12,400) | Nidec Corp | (629,293 | ) | |||||
| (255,600) | Nihon M&A Center Holdings Inc | (2,131,097 | ) | |||||
| (368,400) | Nippon Paint Holdings Co Ltd | (3,219,267 | ) | |||||
| (251,600) | Odakyu Electric Railway Co Ltd | (3,050,101 | ) | |||||
| (44,000) | Oriental Land Co Ltd | (7,026,138 | ) | |||||
| (1,130,100) | Rakuten Group Inc | (5,570,466 | ) | |||||
| (78,300) | Shiseido Co Ltd | (3,607,873 | ) | |||||
| (584,900) | SoftBank Corp | (6,598,235 | ) | |||||
| (106,600) | Tobu Railway Co Ltd | (2,379,951 | ) | |||||
| (252,300) | Tokyu Corp | (3,039,452 | ) | |||||
| (82,400) | West Japan Railway Co | (3,198,196 | ) | |||||
|
| |||||||
| Total Japan | (84,821,198 | ) | ||||||
|
| |||||||
| Netherlands — (0.6)% | ||||||||
| (4,543) | Adyen NV* | (6,439,381 | ) | |||||
| (30,947) | IMCD NV | (4,898,633 | ) | |||||
| (163,292) | Just Eat Takeaway.com NV* | (3,551,649 | ) | |||||
| (1,684) | OCI NV | (55,939 | ) | |||||
| (279,814) | Universal Music Group NV | (6,592,793 | ) | |||||
|
| |||||||
| Total Netherlands | (21,538,395 | ) | ||||||
|
| |||||||
| New Zealand — (0.1)% | ||||||||
| (100,332) | Xero Ltd* | (5,225,668 | ) | |||||
|
| |||||||
| Norway — (0.2)% | ||||||||
| (221,109) | Aker BP ASA | (5,934,704 | ) | |||||
|
| |||||||
| Peru — (0.2)% | ||||||||
| (87,655) | Southern Copper Corp | (6,459,297 | ) | |||||
|
| |||||||
| Singapore — (0.2)% | ||||||||
| (935,154) | Grab Holdings Ltd – Class A* | (3,001,844 | ) | |||||
| (554,600) | Singapore Exchange Ltd | (3,581,805 | ) | |||||
|
| |||||||
| Total Singapore | (6,583,649 | ) | ||||||
|
| |||||||
| Spain — (0.4)% | ||||||||
| (179,816) | Cellnex Telecom SA | (6,746,471 | ) | |||||
| (242,518) | Ferrovial SA | (6,731,296 | ) | |||||
|
| |||||||
| Total Spain | (13,477,767 | ) | ||||||
|
| |||||||
| Sweden — (0.2)% | ||||||||
| (51,164) | Evolution AB | (6,173,788 | ) | |||||
|
| |||||||
| See accompanying notes to the financial statements. | 86 |
GMO Implementation Fund
(A Series of GMO Trust)
Consolidated Schedule of Investments — (Continued)
(showing percentage of total net assets)
February 28, 2023
| Shares | Description | Value ($) | ||||||
| Switzerland — (0.3)% | ||||||||
| (9) | Chocoladefabriken Lindt & Spruengli AG (Registered) | (996,945 | ) | |||||
| (4,363) | Partners Group Holding AG | (4,131,470 | ) | |||||
| (7,159) | Sika AG (Registered) | (2,007,562 | ) | |||||
| (36,397) | Straumann Holding AG (Registered) | (4,825,360 | ) | |||||
|
| |||||||
| Total Switzerland | (11,961,337 | ) | ||||||
|
| |||||||
| United Kingdom — (1.2)% | ||||||||
| (48,413) | Admiral Group Plc | (1,281,106 | ) | |||||
| (657,099) | Auto Trader Group Plc | (4,699,623 | ) | |||||
| (53,442) | Halma Plc | (1,390,908 | ) | |||||
| (359,518) | Hargreaves Lansdown Plc | (3,582,224 | ) | |||||
| (870,715) | Informa Plc | (6,994,493 | ) | |||||
| (89,486) | InterContinental Hotels Group Plc | (6,032,364 | ) | |||||
| (73,682) | London Stock Exchange Group Plc | (6,574,036 | ) | |||||
| (588,926) | Ocado Group Plc* | (3,891,630 | ) | |||||
| (4,777,542) | Rolls-Royce Holdings Plc* | (8,323,901 | ) | |||||
| (14,404) | Spirax-Sarco Engineering Plc | (2,022,914 | ) | |||||
|
| |||||||
| Total United Kingdom | (44,793,199 | ) | ||||||
|
| |||||||
| United States — (13.5)% | ||||||||
| (251,700) | AES Corp. (The) | (6,211,956 | ) | |||||
| (33,300) | Alnylam Pharmaceuticals, Inc.* | (6,375,285 | ) | |||||
| (140,600) | Altria Group, Inc. | (6,528,058 | ) | |||||
| (17,600) | American Tower Corp. (REIT) | (3,484,976 | ) | |||||
| (12,300) | Aon Plc – Class A | (3,739,815 | ) | |||||
| (57,000) | Aramark | (2,097,600 | ) | |||||
| (76,200) | Ares Management Corp. – Class A | (6,144,006 | ) | |||||
| (36,500) | Arthur J Gallagher & Co. | (6,838,275 | ) | |||||
| (2,300) | Autodesk, Inc.* | (456,987 | ) | |||||
| (65,400) | Bills Holdings, Inc.* | (5,534,802 | ) | |||||
| (59,600) | Bio-Techne Corp. | (4,329,344 | ) | |||||
| (35,600) | Boeing Co. (The)* | (7,175,180 | ) | |||||
| (18,406) | Broadcom, Inc. | (10,938,502 | ) | |||||
| (31,500) | Burlington Stores, Inc.* | (6,748,875 | ) | |||||
| (131,400) | Caesars Entertainment, Inc.* | (6,669,864 | ) | |||||
| (93,700) | Ceridian HCM Holding, Inc.* | (6,833,541 | ) | |||||
| (41,814) | Charter Communications, Inc. – Class A* | (15,371,244 | ) | |||||
| (4,500) | Chipotle Mexican Grill, Inc. – Class A* | (6,709,860 | ) | |||||
| (249,330) | Clarivate Plc* | (2,525,713 | ) | |||||
| (112,100) | Cloudflare, Inc. – Class A* | (6,727,121 | ) | |||||
| (190,705) | Columbia Banking System, Inc. | (5,669,660 | ) | |||||
| (12,000) | Crown Castle, Inc. (REIT) | (1,569,000 | ) | |||||
| (161,200) | Delta Air Lines, Inc.* | (6,180,408 | ) | |||||
| (60,300) | Dexcom, Inc.* | (6,693,903 | ) | |||||
| (47,100) | Diamondback Energy, Inc. | (6,621,318 | ) | |||||
| (43,800) | Equity LifeStyle Properties, Inc. (REIT) | (3,000,738 | ) | |||||
| (1,200) | Erie Indemnity Co. – Class A | (282,468 | ) | |||||
| (44,300) | Essential Utilities, Inc. | (1,895,154 | ) | |||||
| (101,600) | Exact Sciences Corp.* | (6,332,728 | ) | |||||
| (79,000) | Fastenal Co. | (4,073,240 | ) | |||||
| (112,200) | Fortinet, Inc.* | (6,669,168 | ) | |||||
| (90,286) | Fox Corp. – Class A | (3,161,816 | ) | |||||
| Shares | Description | Value ($) | ||||||
| United States — continued | ||||||||
| (19,100) | Gartner, Inc.* | (6,261,171 | ) | |||||
| (29,158) | HEICO Corp. | (4,827,690 | ) | |||||
| (33,100) | Hess Corp. | (4,458,570 | ) | |||||
| (19,000) | HubSpot, Inc.* | (7,350,340 | ) | |||||
| (15,100) | IDEXX Laboratories, Inc.* | (7,145,924 | ) | |||||
| (71,600) | Ingersoll Rand, Inc. | (4,157,812 | ) | |||||
| (22,000) | Insulet Corp.* | (6,079,920 | ) | |||||
| (31,800) | IQVIA Holdings, Inc.* | (6,629,346 | ) | |||||
| (63,300) | Iron Mountain, Inc. (REIT) | (3,339,075 | ) | |||||
| (42,300) | Lamb Weston Holdings, Inc. | (4,257,072 | ) | |||||
| (482,275) | Liberty Global Plc – Class C* | (10,248,344 | ) | |||||
| (142,233) | Liberty Media Corp.-Liberty Formula One – Class C* | (9,653,354 | ) | |||||
| (20,400) | Linde Plc | (7,106,748 | ) | |||||
| (82,800) | Live Nation Entertainment, Inc.* | (5,966,568 | ) | |||||
| (19,600) | MarketAxess Holdings, Inc. | (6,692,420 | ) | |||||
| (43,398) | MaxLinear, Inc.* | (1,484,645 | ) | |||||
| (30,600) | MongoDB, Inc. – Class A* | (6,411,312 | ) | |||||
| (8,300) | Monolithic Power Systems, Inc. | (4,019,607 | ) | |||||
| (10,600) | Moody’s Corp. | (3,075,590 | ) | |||||
| (500) | Motorola Solutions, Inc. | (131,405 | ) | |||||
| (13,500) | MSCI, Inc. – Class A | (7,049,025 | ) | |||||
| (3) | New York Community Bancorp, Inc. | (26 | ) | |||||
| (119,600) | Newmont Corp. | (5,215,756 | ) | |||||
| (213,300) | NiSource, Inc. | (5,850,819 | ) | |||||
| (43,968) | Norfolk Southern Corp. | (9,884,886 | ) | |||||
| (71,510) | Novocure Ltd.* | (5,504,125 | ) | |||||
| (226,692) | NuVasive, Inc.* | (9,799,895 | ) | |||||
| (90,700) | Okta, Inc.* | (6,466,003 | ) | |||||
| (97,200) | ONEOK, Inc. | (6,361,740 | ) | |||||
| (536,400) | Palantir Technologies, Inc. – Class A* | (4,205,376 | ) | |||||
| (48,900) | Paychex, Inc. | (5,398,560 | ) | |||||
| (68,900) | Philip Morris International, Inc. | (6,703,970 | ) | |||||
| (7,400) | PTC, Inc.* | (927,442 | ) | |||||
| (184,200) | ROBLOX Corp. – Class A* | (6,749,088 | ) | |||||
| (89,200) | Roku, Inc.* | (5,770,348 | ) | |||||
| (168,750) | Rollins, Inc. | (5,940,000 | ) | |||||
| (108,300) | Royal Caribbean Cruises Ltd.* | (7,647,877 | ) | |||||
| (36,800) | Seagen, Inc.* | (6,612,592 | ) | |||||
| (15,600) | ServiceNow, Inc.* | (6,741,852 | ) | |||||
| (23,100) | Sherwin-Williams Co. (The) | (5,113,185 | ) | |||||
| (289,239) | Signify Health, Inc. – Class A* | (8,327,191 | ) | |||||
| (27,800) | Simon Property Group, Inc. (REIT) | (3,394,102 | ) | |||||
| (31,100) | Snowflake, Inc. – Class A* | (4,801,218 | ) | |||||
| (66,500) | Starbucks Corp. | (6,788,985 | ) | |||||
| (22,300) | Sysco Corp. | (1,662,911 | ) | |||||
| (39,806) | Tesla, Inc.* | (8,188,492 | ) | |||||
| (150,900) | Toast, Inc. – Class A* | (2,855,028 | ) | |||||
| (106,400) | Trade Desk, Inc. (The) – Class A* | (5,954,144 | ) | |||||
| (9,100) | TransDigm Group, Inc. | (6,769,217 | ) | |||||
| (107,200) | Twilio, Inc. – Class A* | (7,204,912 | ) | |||||
| (222,996) | Uber Technologies, Inc.* | (7,416,847 | ) | |||||
| (71,400) | UDR, Inc. (REIT) | (3,058,776 | ) | |||||
| (23,800) | Vail Resorts, Inc. | (5,557,062 | ) | |||||
| 87 | See accompanying notes to the financial statements. |
GMO Implementation Fund
(A Series of GMO Trust)
Consolidated Schedule of Investments — (Continued)
(showing percentage of total net assets)
February 28, 2023
Shares | Description | Value ($) | ||||||
| United States — continued | ||||||||
| (7,300) | Vulcan Materials Co. | (1,320,643 | ) | |||||
| (217,800) | Williams Cos., Inc. (The) | (6,555,780 | ) | |||||
| (81,600) | Wolfspeed, Inc.* | (6,036,768 | ) | |||||
| (80,443) | Xylem, Inc. | (8,257,474 | ) | |||||
| (67,749) | Zillow Group, Inc. – Class C* | (2,845,458 | ) | |||||
| (51,600) | Zscaler, Inc.* | (6,767,340 | ) | |||||
|
| |||||||
| Total United States | (504,592,431 | ) | ||||||
|
| |||||||
| TOTAL COMMON STOCKS (PROCEEDS $952,424,360) | (901,522,226 | ) | ||||||
|
| |||||||
| PREFERRED STOCKS (g) — (0.2)% |
| |||||||
| Germany — (0.2)% | ||||||||
| (13,508) | Sartorius AG | (5,737,764 | ) | |||||
|
| |||||||
TOTAL PREFERRED STOCKS (PROCEEDS $5,481,633) |
| (5,737,764 | ) | |||||
|
| |||||||
TOTAL SECURITIES SOLD SHORT (PROCEEDS $957,905,993) |
| (907,259,990 | ) | |||||
|
| |||||||
| Other Assets and Liabilities (net) — 3.1% | 115,174,192 | |||||||
|
| |||||||
| TOTAL NET ASSETS — 100.0% | $ | 3,735,883,192 | ||||||
|
| |||||||
Additional information on each restricted security is as follows:
Issuer Description | Acquisition Date | Acquisition Cost | Value as a Percentage of Fund’s Net Assets | Value as of February 28, 2023 | ||||||||||||
Alrosa PJSC | 12/06/17 | $ | 15,372,968 | 0.0 | % | $ | 82,408 | |||||||||
Magnitogorsk Iron & Steel Works PJSC | 06/16/21 | 4,815,566 | 0.0 | % | 30,079 | |||||||||||
PhosAgro PJSC GDR | 10/15/21 | 2,792 | 0.0 | % | 35 | |||||||||||
Sberbank of Russia PJSC | 09/09/20 | 29,636,901 | 0.0 | % | 182,780 | |||||||||||
Sberbank of Russia PJSC | 01/10/22 | 183,324 | 0.0 | % | 1,105 | |||||||||||
Severstal PAO | 02/02/21 | 126,125 | 0.0 | % | 1,045 | |||||||||||
Severstal PJSC GDR (Registered) | 10/23/17 | 5,003,828 | 0.0 | % | 36,967 | |||||||||||
VTB Bank PJSC | 01/09/20 | 587,690 | 0.0 | % | 1,654 | |||||||||||
|
| |||||||||||||||
| $ | 336,073 | |||||||||||||||
|
| |||||||||||||||
| See accompanying notes to the financial statements. | 88 |
GMO Implementation Fund
(A Series of GMO Trust)
Consolidated Schedule of Investments — (Continued)
February 28, 2023
A summary of outstanding financial instruments at February 28, 2023 is as follows:
Forward Currency Contracts
Settlement | Counter- party | Currency Sold | Currency Purchased | Net Unrealized Appreciation (Depreciation)($) | Settlement Date | Counter- party | Currency Sold | Currency Purchased | Net Unrealized Appreciation (Depreciation)($) | |||||||||||||||||||||||||||||||||||||||
05/09/2023 | BOA | AUD | 6,610,000 | USD | 4,460,996 | 2,567 | 05/31/2023 | MSCI | ZAR | 12,200,000 | USD | 666,959 | 7,602 | |||||||||||||||||||||||||||||||||||
03/24/2023 | BCLY | AUD | 280,374 | USD | 193,645 | 4,829 | 05/08/2023 | BOA | CAD | 1,446,150 | USD | 1,060,524 | (115 | ) | ||||||||||||||||||||||||||||||||||
05/09/2023 | BCLY | AUD | 21,440,000 | USD | 14,821,477 | 360,247 | 04/11/2023 | MSCI | COP | 11,400,000,000 | USD | 2,300,450 | (26,965 | ) | ||||||||||||||||||||||||||||||||||
03/24/2023 | DB | AUD | 5,249,873 | USD | 3,634,671 | 99,177 | 04/17/2023 | MSCI | CZK | 145,511,617 | USD | 6,530,280 | (2,685 | ) | ||||||||||||||||||||||||||||||||||
03/24/2023 | MSCI | AUD | 8,962,824 | USD | 6,350,593 | 314,636 | 05/10/2023 | MSCI | PEN | 2,640,000 | USD | 684,115 | (8,212 | ) | ||||||||||||||||||||||||||||||||||
05/09/2023 | MSCI | AUD | 4,870,000 | USD | 3,374,532 | 89,728 | 05/22/2023 | MSCI | PLN | 2,700,000 | USD | 599,734 | (3,917 | ) | ||||||||||||||||||||||||||||||||||
03/24/2023 | SSB | AUD | 3,995,288 | USD | 2,793,916 | 103,315 | 05/08/2023 | BCLY | SEK | 111,872,704 | USD | 10,625,298 | (99,815 | ) | ||||||||||||||||||||||||||||||||||
05/03/2023 | GS | BRL | 3,050,000 | USD | 584,551 | 8,296 | 03/24/2023 | BCLY | USD | 649,944 | AUD | 939,806 | (17,038 | ) | ||||||||||||||||||||||||||||||||||
05/03/2023 | JPM | BRL | 3,400,000 | USD | 645,254 | 2,872 | 05/03/2023 | CITI | USD | 792,456 | BRL | 4,100,000 | (17,818 | ) | ||||||||||||||||||||||||||||||||||
05/08/2023 | BOA | CAD | 14,540,426 | USD | 10,831,736 | 167,461 | 05/03/2023 | GS | USD | 777,963 | BRL | 4,000,000 | (22,219 | ) | ||||||||||||||||||||||||||||||||||
04/03/2023 | BCLY | CAD | 6,180,000 | USD | 4,615,043 | 84,627 | 05/03/2023 | SSB | USD | 4,269,441 | BRL | 22,176,756 | (79,453 | ) | ||||||||||||||||||||||||||||||||||
04/03/2023 | GS | CAD | 7,390,000 | USD | 5,478,240 | 60,801 | 05/08/2023 | BOA | USD | 4,306,803 | CAD | 5,782,207 | (66,003 | ) | ||||||||||||||||||||||||||||||||||
05/08/2023 | MSCI | CAD | 1,827,973 | USD | 1,352,097 | 11,420 | 04/03/2023 | BCLY | USD | 35,996,106 | CAD | 48,310,042 | (581,121 | ) | ||||||||||||||||||||||||||||||||||
04/03/2023 | SSB | CAD | 5,100,000 | USD | 3,799,130 | 60,437 | 03/17/2023 | DB | USD | 10,110,589 | CAD | 13,499,356 | (216,118 | ) | ||||||||||||||||||||||||||||||||||
05/16/2023 | BCLY | CHF | 48,892,875 | USD | 53,805,595 | 1,477,504 | 03/17/2023 | GS | USD | 998,638 | CAD | 1,334,420 | (20,563 | ) | ||||||||||||||||||||||||||||||||||
03/31/2023 | JPM | CHF | 31,436,297 | USD | 34,309,737 | 825,963 | 05/08/2023 | MSCI | USD | 4,601,953 | CAD | 6,136,722 | (101,143 | ) | ||||||||||||||||||||||||||||||||||
04/11/2023 | MSCI | COP | 9,840,000,000 | USD | 2,044,989 | 36,063 | 03/31/2023 | BCLY | USD | 1,288,109 | CHF | 1,171,748 | (40,044 | ) | ||||||||||||||||||||||||||||||||||
04/17/2023 | BOA | EUR | 1,104,900 | USD | 1,200,500 | 28,675 | 03/31/2023 | DB | USD | 822,471 | CHF | 753,980 | (19,384 | ) | ||||||||||||||||||||||||||||||||||
04/17/2023 | MSCI | EUR | 95,000 | USD | 103,612 | 2,858 | 03/31/2023 | GS | USD | 1,003,799 | CHF | 921,416 | (22,369 | ) | ||||||||||||||||||||||||||||||||||
03/21/2023 | SSB | GBP | 11,400,000 | USD | 13,730,377 | 13,230 | 03/31/2023 | MSCI | USD | 782,195 | CHF | 715,120 | (20,498 | ) | ||||||||||||||||||||||||||||||||||
05/16/2023 | MSCI | HUF | 335,000,000 | USD | 921,135 | 6,359 | 04/10/2023 | MSCI | USD | 3,153,587 | CLP | 2,590,000,000 | (40,172 | ) | ||||||||||||||||||||||||||||||||||
05/08/2023 | GS | IDR | 20,200,000,000 | USD | 1,336,332 | 13,476 | 04/17/2023 | CITI | USD | 2,203,057 | CZK | 48,600,000 | (21,086 | ) | ||||||||||||||||||||||||||||||||||
03/31/2023 | DB | ILS | 13,887,392 | USD | 3,913,816 | 109,215 | 04/17/2023 | GS | USD | 956,869 | CZK | 21,200,000 | (5,063 | ) | ||||||||||||||||||||||||||||||||||
05/31/2023 | MSCI | ILS | 3,350,000 | USD | 927,959 | 7,719 | 04/17/2023 | MSCI | USD | 673,857 | CZK | 15,000,000 | (410 | ) | ||||||||||||||||||||||||||||||||||
04/13/2023 | BCLY | JPY | 261,864,766 | USD | 1,979,311 | 44,630 | 03/31/2023 | BCLY | USD | 3,246,696 | EUR | 3,011,405 | (56,001 | ) | ||||||||||||||||||||||||||||||||||
04/13/2023 | GS | JPY | 222,158,077 | USD | 1,657,682 | 16,358 | 03/31/2023 | DB | USD | 711,053 | EUR | 665,907 | (5,500 | ) | ||||||||||||||||||||||||||||||||||
04/13/2023 | MSCI | JPY | 1,111,992,814 | USD | 8,478,484 | 262,979 | 03/31/2023 | GS | USD | 11,607,131 | EUR | 10,841,385 | (120,282 | ) | ||||||||||||||||||||||||||||||||||
04/13/2023 | SSB | JPY | 363,302,981 | USD | 2,788,014 | 103,898 | 03/31/2023 | JPM | USD | 44,680,043 | EUR | 41,813,324 | (377,278 | ) | ||||||||||||||||||||||||||||||||||
05/08/2023 | CITI | KRW | 1,310,000,000 | USD | 995,857 | 1,288 | 03/31/2023 | MSCI | USD | 43,161,236 | EUR | 39,543,102 | (1,263,856 | ) | ||||||||||||||||||||||||||||||||||
05/08/2023 | GS | KRW | 1,470,000,000 | USD | 1,121,453 | 5,410 | 03/24/2023 | BCLY | USD | 1,503,695 | GBP | 1,231,420 | (21,895 | ) | ||||||||||||||||||||||||||||||||||
03/27/2023 | MSCI | NZD | 3,997,131 | USD | 2,559,019 | 87,520 | 03/24/2023 | MSCI | USD | 983,156 | GBP | 815,017 | (2,425 | ) | ||||||||||||||||||||||||||||||||||
05/31/2023 | MSCI | NZD | 16,610,000 | USD | 10,317,218 | 47,564 | 03/24/2023 | SSB | USD | 4,007,856 | GBP | 3,245,002 | (103,062 | ) | ||||||||||||||||||||||||||||||||||
05/31/2023 | SSB | NZD | 8,650,000 | USD | 5,391,764 | 43,630 | 05/16/2023 | JPM | USD | 5,564,440 | HUF | 2,029,351,113 | (22,946 | ) | ||||||||||||||||||||||||||||||||||
04/28/2023 | CITI | PHP | 141,500,000 | USD | 2,577,911 | 31,375 | 05/08/2023 | JPM | USD | 1,611,476 | IDR | 24,127,015,400 | (31,447 | ) | ||||||||||||||||||||||||||||||||||
05/22/2023 | GS | PLN | 9,550,000 | USD | 2,138,723 | 3,587 | 03/17/2023 | MSCI | USD | 46,517,395 | JPY | 6,195,209,971 | (922,011 | ) | ||||||||||||||||||||||||||||||||||
04/27/2023 | BCLY | RON | 26,723,094 | USD | 5,762,779 | 37,417 | 05/08/2023 | BCLY | USD | 122,167 | KRW | 149,581,441 | (8,603 | ) | ||||||||||||||||||||||||||||||||||
05/22/2023 | MSCI | SGD | 8,056,457 | USD | 6,039,957 | 52,053 | 05/08/2023 | GS | USD | 568,263 | KRW | 700,000,000 | (36,814 | ) | ||||||||||||||||||||||||||||||||||
05/22/2023 | BCLY | THB | 145,198,956 | USD | 4,241,863 | 100,506 | 04/17/2023 | BOA | USD | 3,552,029 | NOK | 35,000,000 | (173,733 | ) | ||||||||||||||||||||||||||||||||||
03/08/2023 | MSCI | TWD | 226,515,523 | USD | 7,588,663 | 205,996 | 04/17/2023 | MSCI | USD | 34,241,225 | NOK | 340,122,042 | (1,411,705 | ) | ||||||||||||||||||||||||||||||||||
05/03/2023 | GS | USD | 987,960 | BRL | 5,250,000 | 3,954 | 05/31/2023 | SSB | USD | 2,981,533 | NZD | 4,800,000 | (13,783 | ) | ||||||||||||||||||||||||||||||||||
04/10/2023 | JPM | USD | 1,320,132 | CLP | 1,100,000,000 | 2,168 | 04/28/2023 | JPM | USD | 1,271,433 | PHP | 70,000,000 | (11,662 | ) | ||||||||||||||||||||||||||||||||||
04/10/2023 | MSCI | USD | 2,799,148 | CLP | 2,389,726,000 | 73,520 | 05/08/2023 | BCLY | USD | 6,794,963 | SEK | 70,600,000 | (26,618 | ) | ||||||||||||||||||||||||||||||||||
04/11/2023 | JPM | USD | 5,702,529 | COP | 28,361,529,900 | 87,737 | 05/22/2023 | BCLY | USD | 1,128,846 | THB | 38,700,000 | (25,047 | ) | ||||||||||||||||||||||||||||||||||
05/22/2023 | BCLY | USD | 1,725,872 | INR | 143,806,560 | 4,481 | 05/31/2023 | MSCI | USD | 2,500,459 | ZAR | 45,600,000 | (35,976 | ) | ||||||||||||||||||||||||||||||||||
|
| |||||||||||||||||||||||||||||||||||||||||||||||
04/20/2023 | MSCI | USD | 7,645,536 | MXN | 144,781,232 | 194,308 | $ | (780,923 | ) | |||||||||||||||||||||||||||||||||||||||
|
| |||||||||||||||||||||||||||||||||||||||||||||||
05/10/2023 | MSCI | USD | 679,852 | PEN | 2,640,000 | 12,476 | ||||||||||||||||||||||||||||||||||||||||||
| 89 | See accompanying notes to the financial statements. |
GMO Implementation Fund
(A Series of GMO Trust)
Consolidated Schedule of Investments — (Continued)
February 28, 2023
Futures Contracts
Number of | Type | Expiration Date | Notional Amount ($) | Value/Net Unrealized Appreciation (Depreciation) ($) | ||||||||||||
| Buys | ||||||||||||||||
| 158 | CAC40 10 Euro | March 2023 | 12,125,892 | 22,059 | ||||||||||||
| 121 | Corn(i) | May 2023 | 3,813,012 | (267,909 | ) | |||||||||||
| 31 | DAX Index | March 2023 | 12,603,708 | 596,730 | ||||||||||||
| 410 | FTSE 100 Index | March 2023 | 38,716,083 | 1,155,073 | ||||||||||||
| 1,553 | Mini MSCI Emerging Markets | March 2023 | 74,769,185 | (1,447,971 | ) | |||||||||||
| 572 | MSCI Singapore | March 2023 | 12,458,249 | (249,108 | ) | |||||||||||
| 104 | Soybean(i) | May 2023 | 7,690,800 | (198,933 | ) | |||||||||||
| 41 | SPI 200 Futures | March 2023 | 4,949,692 | (181,849 | ) | |||||||||||
|
|
|
| |||||||||||||
| $ | 167,126,621 | $ | (571,908 | ) | ||||||||||||
|
|
|
| |||||||||||||
Number of Contracts + | Type | Expiration Date | Notional Amount ($) | Value/Net Unrealized Appreciation (Depreciation) ($) | ||||||||||||
| Sales | ||||||||||||||||
| 55 | Australian Government Bond 10 Yr. | March 2023 | 4,354,546 | 114,250 | ||||||||||||
| 215 | Canadian Government Bond 10 Yr. | June 2023 | 19,141,224 | (49,072 | ) | |||||||||||
| 23 | E-mini Russell 2000 Index | March 2023 | 2,183,965 | (29,071 | ) | |||||||||||
| 88 | Euro Bund | March 2023 | 12,370,939 | 493,560 | ||||||||||||
| 38 | Euro Bund | June 2023 | 5,303,412 | (13,151 | ) | |||||||||||
| 52 | FTSE Taiwan Index | March 2023 | 2,788,415 | 44,384 | ||||||||||||
| 14 | Gold 100 OZ(i) | April 2023 | 2,571,380 | 130,390 | ||||||||||||
| 12 | Hang Seng Index | March 2023 | 1,510,709 | 47,983 | ||||||||||||
| 300 | S&P 500 E-Mini | March 2023 | 59,632,500 | (68,289 | ) | |||||||||||
| 54 | S&P/TSX 60 | March 2023 | 9,629,373 | (21,193 | ) | |||||||||||
| 107 | Silver(i) | May 2023 | 11,272,985 | 631,892 | ||||||||||||
| 159 | TOPIX Index | March 2023 | 23,263,035 | (488,406 | ) | |||||||||||
| 456 | U.S. Treasury Note 10 Yr. (CBT) | June 2023 | 50,915,250 | 30,061 | ||||||||||||
| 17 | UK Gilt Long Bond | June 2023 | 2,044,027 | 15,755 | ||||||||||||
| 4 | WTI Crude(i) | March 2023 | 308,200 | (11,574 | ) | |||||||||||
|
|
|
| |||||||||||||
| $ | 207,289,960 | $ | 827,519 | |||||||||||||
|
|
|
| |||||||||||||
| + | Buys - Fund is long the futures contract. |
Sales - Fund is short the futures contract.
Written Options
Description | Exercise Price | Expiration Date | Number of Contracts | Notional Amount | Value ($) | |||||||||||||
Equity Options – Calls | ||||||||||||||||||
Black Knight, Inc. | 60.00 | 04/21/23 | (1,364 | ) | USD (8,129,440) | (954,800 | ) | |||||||||||
Albertsons Cos., Inc.(d) | 21.00 | 07/21/23 | (4,835 | ) | USD (9,611,980) | (265,925 | ) | |||||||||||
Globus Medical, Inc. | 62.50 | 09/15/23 | (541 | ) | USD (3,156,194) | (335,420 | ) | |||||||||||
Globus Medical, Inc. | 60.00 | 09/15/23 | (54 | ) | USD (315,036) | (28,242 | ) | |||||||||||
Activision Blizzard, Inc. | 77.50 | 01/19/24 | (840 | ) | USD (6,405,000) | (709,800 | ) | |||||||||||
Activision Blizzard, Inc. | 80.00 | 01/19/24 | (420 | ) | USD (3,202,500) | (308,700 | ) | |||||||||||
VMware, Inc. | 120.00 | 01/19/24 | (262 | ) | USD (2,885,406) | (235,800 | ) | |||||||||||
|
| |||||||||||||||||
| Total Equity Options – Calls | (2,838,687 | ) | ||||||||||||||||
|
| |||||||||||||||||
| | TOTAL WRITTEN OPTIONS (Premiums $3,378,358) | $ | (2,838,687 | ) | ||||||||||||||
|
| |||||||||||||||||
| See accompanying notes to the financial statements. | 90 |
GMO Implementation Fund
(A Series of GMO Trust)
Consolidated Schedule of Investments — (Continued)
February 28, 2023
Swap Contracts
Centrally Cleared Credit Default Swaps
Reference Entity | Notional Amount | Annual Premium | Implied Credit Spread (1) | Maximum Potential Amount of Future Payments by the Fund Under the Contract (2) | Expiration Date | Periodic Payment Frequency | Premiums Paid/ (Received) ($) | Value ($) | Net Unrealized Appreciation/ (Depreciation) ($) | |||||||||||||||||||||||||||
Buy Protection^: | ||||||||||||||||||||||||||||||||||||
United Rentals North America, Inc. | USD 2,280,000 | 5.00 | % | 0.59 | % | N/A | 12/20/2024 | Quarterly | $ | 5,700 | $ | (173,770 | ) | $ | (179,470 | ) | ||||||||||||||||||||
|
|
|
|
|
| |||||||||||||||||||||||||||||||
OTC Credit Default Swaps
Reference Entity | Counter- party | Notional Amount | Annual Premium | Implied Credit Spread (1) | Maximum Potential Amount of Future Payments by the Fund Under the Contract (2) | Expiration Date | Periodic Payment Frequency | Premiums Paid/ (Received) ($) | Value ($) | Net Unrealized Appreciation/ (Depreciation) ($) | ||||||||||||||||||||||||||||||
Buy Protection^: | ||||||||||||||||||||||||||||||||||||||||
Halliburton Co. | BOA | USD | 1,140,000 | 1.00 | % | 0.38 | % | N/A | 12/20/2024 | Quarterly | 96,638 | (12,257 | ) | (108,895 | ) | |||||||||||||||||||||||||
HCA, Inc. | BCLY | USD | 1,140,000 | 5.00 | % | 0.54 | % | N/A | 12/20/2024 | Quarterly | (139,584 | ) | (88,051 | ) | 51,533 | |||||||||||||||||||||||||
Tenet Healthcare Corp. | JPM | USD | 570,000 | 5.00 | % | 1.23 | % | N/A | 12/20/2024 | Quarterly | 14,842 | (36,918 | ) | (51,760 | ) | |||||||||||||||||||||||||
Tenet Healthcare Corp. | JPM | USD | 1,140,000 | 5.00 | % | 1.23 | % | N/A | 12/20/2024 | Quarterly | 142,500 | (73,836 | ) | (216,336 | ) | |||||||||||||||||||||||||
American Airlines Group, Inc. | BCLY | USD | 2,970,000 | 5.00 | % | 6.89 | % | N/A | 06/20/2026 | Quarterly | 564,300 | 148,682 | (415,618 | ) | ||||||||||||||||||||||||||
Sell Protection^: | ||||||||||||||||||||||||||||||||||||||||
American Airlines Group, Inc. | BCLY | USD | 2,970,000 | 5.00 | % | 4.82 | % | 2,970,000 USD | 06/20/2024 | Quarterly | (222,750 | ) | 6,638 | 229,388 | ||||||||||||||||||||||||||
|
|
|
|
|
| |||||||||||||||||||||||||||||||||||
| $ | 455,946 | $ | (55,742 | ) | $ | (511,688 | ) | |||||||||||||||||||||||||||||||||
|
|
|
|
|
| |||||||||||||||||||||||||||||||||||
| ^ | Buy Protection - Fund pays a premium and buys credit protection. If a credit event occurs the Fund will, depending on the terms of the particular swap contract, either (i) receive from the seller of protection an amount equal to the notional amount of the swap and deliver the referenced obligation or underlying securities comprising the referenced index or (ii) receive a net settlement amount in the form of cash or securities equal to the notional amount of the swap less the recovery value of the referenced obligation or underlying securities comprising the referenced index. |
Sell Protection - Fund receives a premium and sells credit protection. If a credit event occurs the Fund will, depending on the terms of the particular swap contract, either (i) pay to the buyer of protection an amount equal to the notional amount of the swap and take delivery of the referenced obligation or underlying securities comprising the referenced index or (ii) pay a net settlement amount in the form of cash or securities equal to the notional amount of the swap less the recovery value of the referenced obligation or underlying securities comprising the referenced index.
| (1) | As of February 28, 2023, implied credit spreads in absolute terms, calculated using a model, and utilized in determining the market value of credit default swap contracts on the reference security, serve as an indicator of the current status of the payment/performance risk and reflect the likelihood or risk of default for the reference entity. |
The implied credit spread of a particular referenced entity reflects the cost of buying/selling protection. Wider (i.e. higher) credit spreads represent a deterioration of the referenced entity’s credit soundness and a greater likelihood or risk of default or other credit event occurring as defined under the terms of the contract.
| (2) | The maximum potential amount the Fund could be required to pay as a seller of credit protection if a credit event occurs as defined under the terms of that particular swap contract. |
Centrally Cleared Interest Rate Swaps
Fund Pays | Fund Receives | Notional Amount | Expiration Date | Periodic Payment Frequency | Premiums Paid/ (Received) ($) | Value ($) | Net Unrealized Appreciation/ (Depreciation) ($) | |||||||||||||||||||||
3.56%3 | Month AUD BBSW | AUD | 28,000,000 | 03/15/2025 | Quarterly | — | 225,906 | 225,906 | ||||||||||||||||||||
3.66%3 | Month AUD BBSW | AUD | 38,500,000 | 03/15/2025 | Quarterly | — | 261,781 | 261,781 | ||||||||||||||||||||
3.70%3 | Month AUD BBSW | AUD | 137,122,000 | 03/15/2025 | Quarterly | 26,171 | 860,842 | 834,671 | ||||||||||||||||||||
3 Month AUD BBSW | 3.63% | AUD | 32,500,000 | 03/15/2025 | Quarterly | — | (235,006 | ) | (235,006 | ) | ||||||||||||||||||
| 91 | See accompanying notes to the financial statements. |
GMO Implementation Fund
(A Series of GMO Trust)
Consolidated Schedule of Investments — (Continued)
February 28, 2023
Swap Contracts — continued
Centrally Cleared Interest Rate Swaps — continued
Fund Pays | Fund Receives | Notional Amount | Expiration Date | Periodic Payment Frequency | Premiums Paid/ (Received) ($) | Value ($) | Net Unrealized Appreciation/ (Depreciation) ($) | |||||||||||||||||||||||
3 Month AUD BBSW | 3.73% | AUD | 27,000,000 | 03/15/2025 | Quarterly | — | (158,725 | ) | (158,725 | ) | ||||||||||||||||||||
3 Month AUD BBSW | 3.85% | AUD | 48,000,000 | 03/15/2025 | Quarterly | — | (211,087 | ) | (211,087 | ) | ||||||||||||||||||||
3 Month AUD BBSW | 3.92% | AUD | 34,500,000 | 03/15/2025 | Quarterly | — | (119,728 | ) | (119,728 | ) | ||||||||||||||||||||
3.99% | 3 Month CAD CDOR | CAD | 118,382,000 | 03/15/2025 | Semi-Annually | 55,329 | 1,143,832 | 1,088,503 | ||||||||||||||||||||||
3.83% | 3 Month CAD CDOR | CAD | 47,000,000 | 03/15/2025 | Semi-Annually | — | 560,503 | 560,503 | ||||||||||||||||||||||
3 Month CAD CDOR | 4.00% | CAD | 24,000,000 | 03/15/2025 | Semi-Annually | — | (228,490 | ) | (228,490 | ) | ||||||||||||||||||||
3 Month CAD CDOR | 4.75% | CAD | 15,000,000 | 03/15/2025 | Semi-Annually | — | 13,706 | 13,706 | ||||||||||||||||||||||
CHF - SARON - OIS - COMPOUND | 1.36% | CHF | 21,000,000 | 03/15/2025 | Annually | — | (203,540 | ) | (203,540 | ) | ||||||||||||||||||||
CHF - SARON - OIS - COMPOUND | 1.57% | CHF | 16,500,000 | 03/15/2025 | Annually | — | (87,233 | ) | (87,233 | ) | ||||||||||||||||||||
1.18% | CHF - SARON - OIS - COMPOUND | CHF | 73,714,000 | 03/15/2025 | Annually | 8,372 | 983,565 | 975,193 | ||||||||||||||||||||||
EUR - EuroSTR - COMPOUND | 2.93% | EUR | 16,000,000 | 03/15/2025 | Annually | — | (210,724 | ) | (210,724 | ) | ||||||||||||||||||||
EUR - EuroSTR - COMPOUND | 2.97% | EUR | 50,500,000 | 03/15/2025 | Annually | — | (631,630 | ) | (631,630 | ) | ||||||||||||||||||||
3.19% | EUR - EuroSTR - COMPOUND | EUR | 24,500,000 | 03/15/2025 | Annually | — | 193,777 | 193,777 | ||||||||||||||||||||||
GBP - SONIA - COMPOUND | 4.27% | GBP | 50,162,000 | 03/15/2025 | Annually | (24,875 | ) | (349,389 | ) | (324,514 | ) | |||||||||||||||||||
4.45% | GBP - SONIA - COMPOUND | GBP | 20,500,000 | 03/15/2025 | Annually | — | 62,947 | 62,947 | ||||||||||||||||||||||
4.17% | GBP - SONIA - COMPOUND | GBP | 27,500,000 | 03/15/2025 | Annually | — | 255,507 | 255,507 | ||||||||||||||||||||||
4.05% | GBP - SONIA - COMPOUND | GBP | 19,000,000 | 03/15/2025 | Annually | — | 228,562 | 228,562 | ||||||||||||||||||||||
4.87% | 3 Month NZD Bank Bill Rate | NZD | 25,000,000 | 03/15/2025 | Quarterly | 20,078 | 146,492 | 126,414 | ||||||||||||||||||||||
3.20% | 3 Month SEK STIBOR | SEK | 190,000,000 | 03/15/2025 | Quarterly | — | 237,424 | 237,424 | ||||||||||||||||||||||
2.97% | 3 Month SEK STIBOR | SEK | 290,000,000 | 03/15/2025 | Quarterly | — | 481,162 | 481,162 | ||||||||||||||||||||||
3 Month SEK STIBOR | 3.10% | SEK | 1,507,855,000 | 03/15/2025 | Quarterly | 15,472 | (2,138,358 | ) | (2,153,830 | ) | ||||||||||||||||||||
3 Month SEK STIBOR | 3.13% | SEK | 165,000,000 | 03/15/2025 | Quarterly | — | (225,472 | ) | (225,472 | ) | ||||||||||||||||||||
USD - SOFR - COMPOUND | 4.19% | USD | 20,000,000 | 03/15/2025 | Annually | — | (261,958 | ) | (261,958 | ) | ||||||||||||||||||||
USD - SOFR - COMPOUND | 4.54% | USD | 26,000,000 | 03/15/2025 | Annually | — | (170,647 | ) | (170,647 | ) | ||||||||||||||||||||
4.14% | USD - SOFR - COMPOUND | USD | 45,975,000 | 03/15/2025 | Annually | 33,878 | 650,644 | 616,766 | ||||||||||||||||||||||
4.24% | 3 Month AUD BBSW | AUD | 44,500,000 | 06/21/2025 | Quarterly | — | (11,566 | ) | (11,566 | ) | ||||||||||||||||||||
EUR - EuroSTR - COMPOUND | 3.61% | EUR | 12,500,000 | 06/21/2025 | Annually | — | 6,228 | 6,228 | ||||||||||||||||||||||
6 Month AUD BBSW | 3.99% | AUD | 31,435,000 | 03/15/2033 | Semi-Annually | (9,977 | ) | (823,344 | ) | (813,367 | ) | |||||||||||||||||||
6 Month AUD BBSW | 4.03% | AUD | 11,000,000 | 03/15/2033 | Semi-Annually | — | (264,600 | ) | (264,600 | ) | ||||||||||||||||||||
6 Month AUD BBSW | 4.03% | AUD | 8,900,000 | 03/15/2033 | Semi-Annually | — | (214,567 | ) | (214,567 | ) | ||||||||||||||||||||
6 Month AUD BBSW | 4.04% | AUD | 22,800,000 | 03/15/2033 | Semi-Annually | — | (534,257 | ) | (534,257 | ) | ||||||||||||||||||||
6 Month AUD BBSW | 4.07% | AUD | 6,400,000 | 03/15/2033 | Semi-Annually | — | (142,694 | ) | (142,694 | ) | ||||||||||||||||||||
6 Month AUD BBSW | 4.19% | AUD | 7,200,000 | 03/15/2033 | Semi-Annually | — | (110,857 | ) | (110,857 | ) | ||||||||||||||||||||
6 Month AUD BBSW | 4.24% | AUD | 13,300,000 | 03/15/2033 | Semi-Annually | — | (172,753 | ) | (172,753 | ) | ||||||||||||||||||||
6 Month AUD BBSW | 4.45% | AUD | 113,330,000 | 03/15/2033 | Semi-Annually | (38,353 | ) | (195,886 | ) | (157,533 | ) | |||||||||||||||||||
4.22% | 6 Month AUD BBSW | AUD | 11,100,000 | 03/15/2033 | Semi-Annually | — | 151,685 | 151,685 | ||||||||||||||||||||||
4.35% | 6 Month AUD BBSW | AUD | 14,100,000 | 03/15/2033 | Semi-Annually | — | 95,403 | 95,403 | ||||||||||||||||||||||
4.32% | 6 Month AUD BBSW | AUD | 8,000,000 | 03/15/2033 | Semi-Annually | — | 67,765 | 67,765 | ||||||||||||||||||||||
4.17% | 6 Month AUD BBSW | AUD | 6,300,000 | 03/15/2033 | Semi-Annually | — | 103,818 | 103,818 | ||||||||||||||||||||||
4.05% | 6 Month AUD BBSW | AUD | 7,500,000 | 03/15/2033 | Semi-Annually | — | 174,119 | 174,119 | ||||||||||||||||||||||
3.24% | 3 Month CAD CDOR | CAD | 10,217,000 | 03/15/2033 | Semi-Annually | (20,295 | ) | 322,772 | 343,067 | |||||||||||||||||||||
3.17% | 3 Month CAD CDOR | CAD | 15,900,000 | 03/15/2033 | Semi-Annually | — | 567,737 | 567,737 | ||||||||||||||||||||||
3.23% | 3 Month CAD CDOR | CAD | 5,300,000 | 03/15/2033 | Semi-Annually | — | 171,369 | 171,369 | ||||||||||||||||||||||
3.42% | 3 Month CAD CDOR | CAD | 7,800,000 | 03/15/2033 | Semi-Annually | — | 158,685 | 158,685 | ||||||||||||||||||||||
3.62% | 3 Month CAD CDOR | CAD | 6,700,000 | 03/15/2033 | Semi-Annually | — | 55,977 | 55,977 | ||||||||||||||||||||||
3.82% | 3 Month CAD CDOR | CAD | 3,400,000 | 03/15/2033 | Semi-Annually | — | (14,234 | ) | (14,234 | ) | ||||||||||||||||||||
3 Month CAD CDOR | 3.18% | CAD | 26,248,000 | 03/15/2033 | Semi-Annually | (52,569 | ) | (932,079 | ) | (879,510 | ) | |||||||||||||||||||
3 Month CAD CDOR | 3.28% | CAD | 10,400,000 | 03/15/2033 | Semi-Annually | — | (303,424 | ) | (303,424 | ) | ||||||||||||||||||||
| See accompanying notes to the financial statements. | 92 |
GMO Implementation Fund
(A Series of GMO Trust)
Consolidated Schedule of Investments — (Continued)
February 28, 2023
Swap Contracts — continued
Centrally Cleared Interest Rate Swaps — continued
Fund Pays | Fund Receives | Notional Amount | Expiration Date | Periodic Payment Frequency | Premiums Paid/ (Received) ($) | Value ($) | Net Unrealized Appreciation/ (Depreciation) ($) | |||||||||||||||||||||||
3 Month CAD CDOR | 3.30% | CAD | 10,200,000 | 03/15/2033 | Semi-Annually | — | (281,638 | ) | (281,638 | ) | ||||||||||||||||||||
3 Month CAD CDOR | 3.32% | CAD | 15,800,000 | 03/15/2033 | Semi-Annually | — | (418,821 | ) | (418,821 | ) | ||||||||||||||||||||
3 Month CAD CDOR | 3.44% | CAD | 7,200,000 | 03/15/2033 | Semi-Annually | — | (138,752 | ) | (138,752 | ) | ||||||||||||||||||||
3 Month CAD CDOR | 3.45% | CAD | 6,000,000 | 03/15/2033 | Semi-Annually | — | (110,291 | ) | (110,291 | ) | ||||||||||||||||||||
3 Month CAD CDOR | 3.56% | CAD | 7,800,000 | 03/15/2033 | Semi-Annually | — | (95,304 | ) | (95,304 | ) | ||||||||||||||||||||
CHF - SARON - OIS - COMPOUND | 1.50% | CHF | 15,748,000 | 03/15/2033 | Annually | (11,239 | ) | (687,784 | ) | (676,545 | ) | |||||||||||||||||||
CHF - SARON - OIS - COMPOUND | 1.55% | CHF | 6,700,000 | 03/15/2033 | Annually | — | (260,658 | ) | (260,658 | ) | ||||||||||||||||||||
CHF - SARON - OIS - COMPOUND | 1.60% | CHF | 63,650,000 | 03/15/2033 | Annually | — | (2,173,239 | ) | (2,173,239 | ) | ||||||||||||||||||||
CHF - SARON - OIS - COMPOUND | 1.73% | CHF | 8,600,000 | 03/15/2033 | Annually | — | (188,777 | ) | (188,777 | ) | ||||||||||||||||||||
1.99% | CHF - SARON - OIS - COMPOUND | CHF | 7,500,000 | 03/15/2033 | Annually | — | (25,912 | ) | (25,912 | ) | ||||||||||||||||||||
1.58% | CHF - SARON - OIS - COMPOUND | CHF | 4,500,000 | 03/15/2033 | Annually | — | 163,920 | 163,920 | ||||||||||||||||||||||
1.91% | CHF - SARON - OIS - COMPOUND | CHF | 9,500,000 | 03/15/2033 | Annually | — | 35,477 | 35,477 | ||||||||||||||||||||||
1.81% | CHF - SARON - OIS - COMPOUND | CHF | 3,600,000 | 03/15/2033 | Annually | — | 50,168 | 50,168 | ||||||||||||||||||||||
1.97% | CHF - SARON - OIS - COMPOUND | CHF | 9,000,000 | 03/15/2033 | Annually | — | (15,355 | ) | (15,355 | ) | ||||||||||||||||||||
EUR - EuroSTR - COMPOUND | 2.68% | EUR | 5,300,000 | 03/15/2033 | Annually | — | (153,576 | ) | (153,576 | ) | ||||||||||||||||||||
2.59% | EUR - EuroSTR - COMPOUND | EUR | 18,600,000 | 03/15/2033 | Annually | — | 691,870 | 691,870 | ||||||||||||||||||||||
2.59% | EUR - EuroSTR - COMPOUND | EUR | 11,100,000 | 03/15/2033 | Annually | — | 414,402 | 414,402 | ||||||||||||||||||||||
2.45% | EUR - EuroSTR - COMPOUND | EUR | 3,500,000 | 03/15/2033 | Annually | — | 176,608 | 176,608 | ||||||||||||||||||||||
2.69% | EUR - EuroSTR - COMPOUND | EUR | 6,200,000 | 03/15/2033 | Annually | — | 174,305 | 174,305 | ||||||||||||||||||||||
2.88% | EUR - EuroSTR - COMPOUND | EUR | 14,100,000 | 03/15/2033 | Annually | — | 153,055 | 153,055 | ||||||||||||||||||||||
2.82% | EUR - EuroSTR - COMPOUND | EUR | 6,400,000 | 03/15/2033 | Annually | — | 106,678 | 106,678 | ||||||||||||||||||||||
2.87% | EUR - EuroSTR - COMPOUND | EUR | 10,700,000 | 03/15/2033 | Annually | — | 131,213 | 131,213 | ||||||||||||||||||||||
2.90% | EUR - EuroSTR - COMPOUND | EUR | 8,400,000 | 03/15/2033 | Annually | — | 82,025 | 82,025 | ||||||||||||||||||||||
GBP - SONIA - COMPOUND | 3.34% | GBP | 9,900,000 | 03/15/2033 | Annually | — | (393,776 | ) | (393,776 | ) | ||||||||||||||||||||
GBP - SONIA - COMPOUND | 3.39% | GBP | 4,400,000 | 03/15/2033 | Annually | — | (154,563 | ) | (154,563 | ) | ||||||||||||||||||||
GBP - SONIA - COMPOUND | 3.41% | GBP | 6,200,000 | 03/15/2033 | Annually | — | (204,145 | ) | (204,145 | ) | ||||||||||||||||||||
GBP - SONIA - COMPOUND | 3.44% | GBP | 6,900,000 | 03/15/2033 | Annually | — | (205,591 | ) | (205,591 | ) | ||||||||||||||||||||
GBP - SONIA - COMPOUND | 3.48% | GBP | 14,200,000 | 03/15/2033 | Annually | — | (364,749 | ) | (364,749 | ) | ||||||||||||||||||||
GBP - SONIA - COMPOUND | 3.56% | GBP | 4,700,000 | 03/15/2033 | Annually | — | (83,939 | ) | (83,939 | ) | ||||||||||||||||||||
3.22% | GBP - SONIA - COMPOUND | GBP | 11,203,000 | 03/15/2033 | Annually | 27,063 | 571,435 | 544,372 | ||||||||||||||||||||||
3.77% | GBP - SONIA - COMPOUND | GBP | 5,900,000 | 03/15/2033 | Annually | — | (14,409 | ) | (14,409 | ) | ||||||||||||||||||||
3.36% | GBP - SONIA - COMPOUND | GBP | 8,500,000 | 03/15/2033 | Annually | — | 318,548 | 318,548 | ||||||||||||||||||||||
3.16% | GBP - SONIA - COMPOUND | GBP | 6,000,000 | 03/15/2033 | Annually | — | 340,796 | 340,796 | ||||||||||||||||||||||
3.48% | GBP - SONIA - COMPOUND | GBP | 5,900,000 | 03/15/2033 | Annually | — | 155,303 | 155,303 | ||||||||||||||||||||||
3.54% | GBP - SONIA - COMPOUND | GBP | 5,600,000 | 03/15/2033 | Annually | — | 111,793 | 111,793 | ||||||||||||||||||||||
4.22% 3 Month NZD Bank Bill Rate | NZD | 18,400,000 | 03/15/2033 | Quarterly | 30,267 | 432,887 | 402,620 | |||||||||||||||||||||||
4.27% 3 Month NZD Bank Bill Rate | NZD | 9,250,000 | 03/15/2033 | Quarterly | — | 192,729 | 192,729 | |||||||||||||||||||||||
4.14% 3 Month NZD Bank Bill Rate | NZD | 14,700,000 | 03/15/2033 | Quarterly | — | 403,728 | 403,728 | |||||||||||||||||||||||
4.47% 3 Month NZD Bank Bill Rate | NZD | 13,600,000 | 03/15/2033 | Quarterly | — | 148,135 | 148,135 | |||||||||||||||||||||||
3 Month NZD Bank Bill Rate | 4.22% | NZD | 5,900,000 | 03/15/2033 | Quarterly | (3,721 | ) | (137,415 | ) | (133,694 | ) | |||||||||||||||||||
3 Month NZD Bank Bill Rate | 4.26% | NZD | 10,600,000 | 03/15/2033 | Quarterly | (2,188 | ) | (224,345 | ) | (222,157 | ) | |||||||||||||||||||
3 Month NZD Bank Bill Rate | 4.59% | NZD | 20,300,000 | 03/15/2033 | Quarterly | — | (106,482 | ) | (106,482 | ) | ||||||||||||||||||||
3 Month SEK STIBOR | 2.47% | SEK | 80,000,000 | 03/15/2033 | Quarterly | — | (522,356 | ) | (522,356 | ) | ||||||||||||||||||||
| 93 | See accompanying notes to the financial statements. |
GMO Implementation Fund
(A Series of GMO Trust)
Consolidated Schedule of Investments — (Continued)
February 28, 2023
Swap Contracts — continued
Centrally Cleared Interest Rate Swaps — continued
Fund Pays | Fund Receives | Notional Amount | Expiration Date | Periodic Payment Frequency | Premiums Paid/ (Received) ($) | Value ($) | Net Unrealized Appreciation/ (Depreciation) ($) | |||||||||||||||||||||||||
3 Month SEK STIBOR | 2.54% | SEK | 100,000,000 | 03/15/2033 | Quarterly | — | (597,594 | ) | (597,594 | ) | ||||||||||||||||||||||
3 Month SEK STIBOR | 2.59% | SEK | 63,000,000 | 03/15/2033 | Quarterly | — | (351,974 | ) | (351,974 | ) | ||||||||||||||||||||||
3 Month SEK STIBOR | 2.63% | SEK | 42,000,000 | 03/15/2033 | Quarterly | — | (221,341 | ) | (221,341 | ) | ||||||||||||||||||||||
3 Month SEK STIBOR | 2.81% | SEK | 94,000,000 | 03/15/2033 | Quarterly | — | (357,389 | ) | (357,389 | ) | ||||||||||||||||||||||
2.51% 3 Month SEK STIBOR | SEK | 329,715,000 | 03/15/2033 | Quarterly | 20,571 | 2,040,713 | 2,020,142 | |||||||||||||||||||||||||
2.62% 3 Month SEK STIBOR | SEK | 37,000,000 | 03/15/2033 | Quarterly | — | 197,068 | 197,068 | |||||||||||||||||||||||||
3.00% 3 Month SEK STIBOR | SEK | 866,375,000 | 03/15/2033 | Quarterly | (6,659 | ) | 1,980,429 | 1,987,088 | ||||||||||||||||||||||||
3 Month SEK STIBOR | 3.22% | SEK | 68,000,000 | 03/15/2033 | Quarterly | — | (36,796 | ) | (36,796 | ) | ||||||||||||||||||||||
3 Month SEK STIBOR | 3.28% | SEK | 125,000,000 | 03/15/2033 | Quarterly | — | (457 | ) | (457 | ) | ||||||||||||||||||||||
USD - SOFR - COMPOUND | 3.05% | USD | 11,180,000 | 03/15/2033 | Annually | — | (543,874 | ) | (543,874 | ) | ||||||||||||||||||||||
USD - SOFR - COMPOUND | 3.07% | USD | 18,500,000 | 03/15/2033 | Annually | — | (867,931 | ) | (867,931 | ) | ||||||||||||||||||||||
USD - SOFR - COMPOUND | 3.13% | USD | 10,286,000 | 03/15/2033 | Annually | (46,786 | ) | (435,236 | ) | (388,450 | ) | |||||||||||||||||||||
USD - SOFR - COMPOUND | 3.16% | USD | 11,100,000 | 03/15/2033 | Annually | — | (442,033 | ) | (442,033 | ) | ||||||||||||||||||||||
USD - SOFR - COMPOUND | 3.19% | USD | 7,300,000 | 03/15/2033 | Annually | — | (270,840 | ) | (270,840 | ) | ||||||||||||||||||||||
3.16% | USD - SOFR - COMPOUND | USD | 12,094,000 | 03/15/2033 | Annually | 22,217 | 479,423 | 457,206 | ||||||||||||||||||||||||
3.23% | USD - SOFR - COMPOUND | USD | 6,100,000 | 03/15/2033 | Annually | — | 206,698 | 206,698 | ||||||||||||||||||||||||
3.29% | USD - SOFR - COMPOUND | USD | 9,400,000 | 03/15/2033 | Annually | — | 275,882 | 275,882 | ||||||||||||||||||||||||
3.33% | USD - SOFR - COMPOUND | USD | 6,900,000 | 03/15/2033 | Annually | — | 179,179 | 179,179 | ||||||||||||||||||||||||
3.47% | USD - SOFR - COMPOUND | USD | 5,800,000 | 03/15/2033 | Annually | — | 83,409 | 83,409 | ||||||||||||||||||||||||
3.30% | USD - SOFR - COMPOUND | USD | 11,100,000 | 03/15/2033 | Annually | — | 309,756 | 309,756 | ||||||||||||||||||||||||
3.22% | USD - SOFR - COMPOUND | USD | 11,100,000 | 03/15/2033 | Annually | — | 384,820 | 384,820 | ||||||||||||||||||||||||
3.22% | USD - SOFR - COMPOUND | USD | 4,500,000 | 03/15/2033 | Annually | — | 156,379 | 156,379 | ||||||||||||||||||||||||
3.40% | USD - SOFR - COMPOUND | USD | 8,000,000 | 03/15/2033 | Annually | — | 162,880 | 162,880 | ||||||||||||||||||||||||
3.44% | USD - SOFR - COMPOUND | USD | 5,700,000 | 03/15/2033 | Annually | — | 96,309 | 96,309 | ||||||||||||||||||||||||
3.46% | USD - SOFR - COMPOUND | USD | 6,800,000 | 03/15/2033 | Annually | — | 101,435 | 101,435 | ||||||||||||||||||||||||
3.59% | USD - SOFR - COMPOUND | USD | 18,100,000 | 03/15/2033 | Annually | — | 75,946 | 75,946 | ||||||||||||||||||||||||
3.63% | USD - SOFR - COMPOUND | USD | 6,100,000 | 03/15/2033 | Annually | — | 4,970 | 4,970 | ||||||||||||||||||||||||
6 Month AUD BBSW | 4.51% | AUD | 10,400,000 | 06/21/2033 | Semi-Annually | — | 3,193 | 3,193 | ||||||||||||||||||||||||
3.04% | EUR - EuroSTR - COMPOUND | EUR | 2,800,000 | 06/21/2033 | Annually | — | (9,262 | ) | (9,262 | ) | ||||||||||||||||||||||
3.61% | USD - SOFR - COMPOUND | USD | 7,300,000 | 06/21/2033 | Annually | — | (13,517 | ) | (13,517 | ) | ||||||||||||||||||||||
|
|
|
|
|
| |||||||||||||||||||||||||||
| $ | 42,756 | $ | (286,597 | ) | $ | (329,353 | ) | |||||||||||||||||||||||||
|
|
|
|
|
| |||||||||||||||||||||||||||
OTC Total Return Swaps
Fund Pays | Fund Receives | Counterparty | Notional Amount | Expiration Date | Periodic Payment Frequency | Premiums Paid/ (Received) ($) | Value ($) | Net Unrealized Appreciation/ (Depreciation) ($) | ||||||||||||||||||||||
1 Month Federal Funds Rate plus 0.09% | Total Return on MSCI World Daily Total Return Net Value Index | GS | USD | 10,612,010 | 05/09/2023 | Monthly | — | (189,476 | ) | (189,476 | ) | |||||||||||||||||||
Total Return on MSCI World Daily Total Return Net Growth Index | 1 Month Federal Funds Rate minus 0.08% | GS | USD | 9,473,788 | 05/09/2023 | Monthly | — | 337,655 | 337,655 | |||||||||||||||||||||
Total Return on MSCI World Daily Total Return Net Value Index | 1 Month Federal Funds Rate minus 0.08% | GS | USD | 968,761 | 05/09/2023 | Monthly | — | 34,528 | 34,528 | |||||||||||||||||||||
| See accompanying notes to the financial statements. | 94 |
GMO Implementation Fund
(A Series of GMO Trust)
Consolidated Schedule of Investments — (Continued)
February 28, 2023
Swap Contracts — continued
OTC Total Return Swaps — continued
Fund Pays | Fund Receives | Counterparty | Notional Amount | Expiration Date | Periodic Payment Frequency | Premiums Paid/ (Received) ($) | Value ($) | Net Unrealized Appreciation/ (Depreciation) ($) | ||||||||||||||||||||||||||
1 Month Federal Funds Rate plus 0.01% | Total Return on MSCI World Daily Total Return Net Value Index | UBSA | USD | 12,286,765 | 05/12/2023 | Monthly | — | (135,020 | ) | (135,020 | ) | |||||||||||||||||||||||
Total Return on MSCI World Daily Total Return Net Growth Index | 1 Month Federal Funds Rate plus 0.02% | UBSA | USD | 12,320,101 | 05/12/2023 | Monthly | — | 333,167 | 333,167 | |||||||||||||||||||||||||
1 Month Federal Funds Rate plus 0.05% | Total Return on MSCI World Daily Total Return Net Value Index | UBSA | USD | 11,379,256 | 05/22/2023 | Monthly | — | (28,291 | ) | (28,291 | ) | |||||||||||||||||||||||
Total Return on MSCI World Daily Total Return Net Growth Index | 1 Month Federal Funds Rate plus 0.06% | UBSA | USD | 11,398,126 | 05/22/2023 | Monthly | — | 129,374 | 129,374 | |||||||||||||||||||||||||
1 Month Federal Funds Rate plus 0.01% | Total Return on MSCI World Daily Total Return Net Value Index | UBSA | USD | 11,704,731 | 08/09/2023 | Monthly | — | (208,986 | ) | (208,986 | ) | |||||||||||||||||||||||
Total Return on MSCI World Daily Total Return Net Growth Index | 1 Month Federal Funds Rate minus 0.01% | UBSA | USD | 9,329,783 | 08/09/2023 | Monthly | — | 332,523 | 332,523 | |||||||||||||||||||||||||
1 Month Federal Funds Rate minus 0.02% | Total Return on MSCI World Daily Total Return Net Value Index | JPM | USD | 2,308,758 | 12/15/2023 | Monthly | — | (17,864 | ) | (17,864 | ) | |||||||||||||||||||||||
Total Return on MSCI World Daily Total Return Net Growth Index | 1 Month Federal Funds Rate minus 0.07% | JPM | USD | 3,601,041 | 12/15/2023 | Monthly | — | 87,144 | 87,144 | |||||||||||||||||||||||||
Total Return on Equity Basket (l) | 1 Month Federal Funds Rate minus 0.40% | GS | USD | 15,872,352 | 06/24/2024 | Monthly | — | 133,869 | 133,869 | |||||||||||||||||||||||||
Total Return on Equity Basket (m) | 1 Month Federal Funds Rate minus 0.40% | MORD | USD | 48,500,566 | 06/18/2024 | Monthly | — | 2,125,796 | 2,125,796 | |||||||||||||||||||||||||
|
|
|
|
|
| |||||||||||||||||||||||||||||
| $ | — | $ | 2,934,419 | $ | 2,934,419 | |||||||||||||||||||||||||||||
|
|
|
|
|
| |||||||||||||||||||||||||||||
| 95 | See accompanying notes to the financial statements. |
GMO Implementation Fund
(A Series of GMO Trust)
Consolidated Schedule of Investments — (Continued)
February 28, 2023
As of February 28, 2023, for the above contracts and/or agreements, the Fund had sufficient cash and/or securities to cover commitments or collateral requirements, if any, of the relevant broker or exchange.
Notes to Schedule of Investments:
| † | Denominated in U.S. Dollar, unless otherwise indicated. |
| * | Non-income producing security. |
| (a) | All or a portion of this security has been pledged to cover margin requirements on futures and/or cleared swap contracts, collateral on securities sold short, OTC swap contracts, forward currency contracts, and/or written options, if any (Note 4). |
| (b) | All or a portion of this security is out on loan (Note 2). |
| (c) | Securities are traded on separate exchanges for the same entity. |
| (d) | Investment valued at fair value using methods determined in good faith by the Trustees of GMO Trust or persons acting at their direction pursuant to procedures approved by the Trustees. Investment valued using significant unobservable inputs (Note 2). |
| (e) | Investment valued using significant unobservable inputs (Note 2). |
| (f) | The security is restricted as to resale. |
| (g) | Preferred dividend rates are disclosed to the extent that a stated rate exists. |
| (h) | Security is in default. |
| (i) | All or a portion of this security or derivative is owned by GMO Implementation SPC Ltd., which is a 100% owned subsidiary of GMO Implementation Fund. |
| (j) | The rate disclosed is the 7 day net yield as of February 28, 2023. |
| (k) | The rate shown represents yield-to-maturity. |
| (l) | Periodic payments made/received are based on the total return of the referenced entity. Custom equity basket swap which has a notional amount of less than 1% of the Fund’s total net assets. |
| (m) | The following table represents the individual long and/or short positions within the custom equity basket swap as of February 28, 2023: |
Shares | Description | %of Equity Basket | Value ($) | |||||||||
| (2,744,000) | Air China Ltd – Class H | 5.5 | % | (2,530,058 | ) | |||||||
| (754,000) | Alibaba Health Information Technology Ltd | 1.2 | % | (539,885 | ) | |||||||
| (1,761,000) | China Molybdenum Co Ltd – Class H | 2.1 | % | (991,615 | ) | |||||||
| (900,000) | Genscript Biotech Corp | 5.3 | % | (2,463,477 | ) | |||||||
| (3,421,600) | Gulf Energy Development Pcl NVDR | 11.0 | % | (5,084,779 | ) | |||||||
| (6,832) | Hanmi Pharm Co Ltd | 2.9 | % | (1,336,929 | ) | |||||||
| (6,000) | Hapvida Participacoes e Investimentos SA | 0.0 | % | (5,146 | ) | |||||||
| (64,874) | Hotel Shilla Co Ltd | 8.5 | % | (3,928,324 | ) | |||||||
| (38,852) | Kakao Corp | 3.9 | % | (1,828,851 | ) | |||||||
| (2,271,000) | Kingdee International Software Group Co Ltd | 9.1 | % | (4,243,280 | ) | |||||||
| (232,300) | Klabin SA | 1.9 | % | (863,452 | ) | |||||||
| (147,262) | Korea Aerospace Industries Ltd | 10.8 | % | (5,014,195 | ) | |||||||
| (6,386) | LG Energy Solution | 5.4 | % | (2,522,550 | ) | |||||||
| (900) | Lojas Renner SA | 0.0 | % | (3,206 | ) | |||||||
| (327,700) | Microport Scientific Corp | 2.0 | % | (929,697 | ) | |||||||
| 7,652 | Nokia Oyj | (0.1 | %) | 35,402 | ||||||||
| (6,539) | POSCO Chemical Co Ltd | 2.4 | % | (1,091,014 | ) | |||||||
| (9,769) | Samsung Biologics Co Ltd | 12.3 | % | (5,707,425 | ) | |||||||
| (767,926) | Samsung Heavy Industries Co Ltd | 6.9 | % | (3,188,743 | ) | |||||||
| (39,720) | Yuhan Corp | 3.4 | % | (1,581,913 | ) | |||||||
| (1,680,000) | Zijin Mining Group Co Ltd – Class H | 5.5 | % | (2,542,447 | ) | |||||||
|
| |||||||||||
| TOTAL COMMON STOCKS | $ | (46,361,584 | ) | |||||||||
|
| |||||||||||
For a listing of definitions of acronyms, counterparty abbreviations and currency abbreviations used throughout the Schedule of Investments as well as the derivative tables, if any, please refer to page 125.
| See accompanying notes to the financial statements. | 96 |
GMO International Developed Equity Allocation Fund
(A Series of GMO Trust)
Portfolio Management
Day-to-day management of the Fund’s portfolio is the responsibility of the Asset Allocation team at Grantham, Mayo, Van Otterloo & Co. LLC.
Management Discussion and Analysis of Fund Performance
Class III shares of GMO International Developed Equity Allocation Fund returned -3.23% (net) for the fiscal year ended February 28, 2023, as compared with -3.14% for the Fund’s benchmark, the MSCI EAFE Index.
The Fund’s decision to hold a broadly 8% average off-benchmark position in emerging markets, managed ex-China, detracted from performance relative to the benchmark as the MSCI Emerging Markets ex-China Index stumbled to a -14.92% return. We believed that emerging markets were trading at very preferential valuations but, unfortunately, pursuit of a zero-COVID policy until near the very end of 2022 really hampered the Chinese economy and weighed heavily on all emerging market performance. Selection in developed markets was strong. Outperformance of the Value style undoubtedly provided a decent tailwind, although this was partly offset by being overweight to Japan, which lagged the MSCI EAFE Index. The performance challenge from being overweight emerging markets was exacerbated by security selection within emerging markets, where we lagged the reference benchmark.
The views expressed herein are exclusively those of Grantham, Mayo, Van Otterloo & Co. LLC as of the date of this report and are subject to change. GMO disclaims any responsibility to update such views. They are not meant as investment advice. References to specific securities are not recommendations of such securities and may not be representative of any GMO portfolio’s current or future investments. All information is unaudited.
97
GMO International Developed Equity Allocation Fund
(A Series of GMO Trust)
��
Comparison of Change in Value of a $5,000,000 Investment in
GMO International Developed Equity Allocation Fund Class III Shares and the MSCI EAFE Index
As of February 28, 2023

| Average Annual Total Returns | ||||||||||||||||
| 1 Year | 5 Year | 10 Year | Since Inception | |||||||||||||
Class III | -3.23 | % | 1.87 | % | 4.37 | % | n/a | |||||||||
Class R6 | -3.23 | % | n/a | n/a | 1/22/21 -0.58 | % | ||||||||||
Performance data quoted represents past performance and is not indicative of future results. The investment return and principal value of an investment will fluctuate so that an investor’s shares, when redeemed, may be worth more or less than their original cost. Current performance data may be lower or higher than the performance data provided herein. To obtain performance information up to the most recent month-end, visit www.gmo.com. Performance shown is net of all fees after reimbursement from GMO. Returns would have been lower had certain expenses not been reimbursed during the periods shown and do not include the effect of taxes on distributions and redemptions. The performance information shown above only includes purchase premiums and/or redemption fees in effect as of February 28, 2023. All information is unaudited. Performance for classes may vary due to different fees.
MSCI data may not be reproduced or used for any other purpose. MSCI provides no warranties, has not prepared or approved this report, and has no liability hereunder.
For Class III and R6 the gross expense ratio of 0.68% and 0.68%, respectively, is equal to the Fund’s Total Annual Operating Expenses set forth in the Fund’s most recent prospectus dated June 30, 2022. For the Classes listed above, the corresponding net expense ratio of 0.63% and 0.63% reflects the reduction of expenses from fee reimbursements. The fee reimbursements will continue until at least June 30, 2023. Elimination of this reimbursement will result in higher fees and lower performance.
98
GMO International Developed Equity Allocation Fund
(A Series of GMO Trust)
Investment Concentration Summary
February 28, 2023 (Unaudited)
Asset Class Summary | % of Total Net Assets | |||
Common Stocks | 97.1 | % | ||
Short-Term Investments | 5.2 | |||
Preferred Stocks | 1.2 | |||
Debt Obligations | 0.3 | |||
Futures Contracts | (0.0 | )^ | ||
Other | (3.8 | ) | ||
|
| |||
| 100.0 | % | |||
|
| |||
Country/Region Summary¤ | % of Investments | |||
Japan | 25.8 | % | ||
United Kingdom | 13.8 | |||
France | 13.5 | |||
Netherlands | 6.7 | |||
Spain | 6.0 | |||
Switzerland | 5.3 | |||
Germany | 4.2 | |||
Singapore | 4.0 | |||
Australia | 3.6 | |||
Other Emerging | 3.5 | † | ||
Taiwan | 2.7 | |||
Other Developed | 2.6 | ‡ | ||
Norway | 2.1 | |||
Finland | 1.6 | |||
Hong Kong | 1.6 | |||
South Korea | 1.6 | |||
Italy | 1.4 | |||
|
| |||
| 100.0 | % | |||
|
| |||
| & | The table incorporates aggregate indirect asset class exposure associated with investments in other funds of GMO Trust (“underlying funds”). Derivative financial instruments, if any, are based on market values, rather than the notional amounts of derivatives, except for forward currency contracts which are based on unrealized appreciation/(depreciation). |
| ¤ | The table incorporates aggregate indirect country exposure associated with investments in the underlying funds. The table excludes short-term investments and includes exposure through the use of derivative financial instruments, if any. The table excludes exposure through forward currency contracts, if any. |
| † | “Other Emerging” is comprised of emerging countries that each represent between (1.0)% and 1.0% of Investments. |
| ‡ | “Other Developed” is comprised of developed countries that each represent between (1.0)% and 1.0% of Investments. |
| ^ | Rounds to 0.0%. |
99
GMO International Developed Equity Allocation Fund
(A Series of GMO Trust)
(showing percentage of total net assets)
February 28, 2023
| Shares | Description | Value ($) | ||||||
| MUTUAL FUNDS — 100.0% | ||||||||
| Affiliated Issuers — 100.0% | ||||||||
| 1,350,537 | GMO Emerging Markets ex-China Fund, Class VI | 18,016,158 | ||||||
| 9,256,575 | GMO International Equity Fund, Class IV | 199,942,022 | ||||||
| 543,730 | GMO-Usonian Japan Value Creation Fund, Class VI | 9,172,729 | ||||||
|
| |||||||
| TOTAL MUTUAL FUNDS (COST $245,440,120) | 227,130,909 | |||||||
|
| |||||||
| SHORT-TERM INVESTMENTS — 0.0% |
| |||||||
| Money Market Funds — 0.0% | ||||||||
| 100,556 | State Street Institutional Treasury Money Market Fund – Premier Class, 4.42% (a) | 100,556 | ||||||
|
| |||||||
| TOTAL SHORT-TERM INVESTMENTS (COST $100,556) | 100,556 | |||||||
|
| |||||||
| TOTAL INVESTMENTS — 100.0% | ||||||||
| (Cost $245,540,676) | 227,231,465 | |||||||
| Other Assets and Liabilities (net) — (0.0%) | (31,622 | ) | ||||||
|
| |||||||
| TOTAL NET ASSETS — 100.0% | $ | 227,199,843 | ||||||
|
| |||||||
Notes to Schedule of Investments:
| (a) | The rate disclosed is the 7 day net yield as of February 28, 2023. |
For a listing of definitions of acronyms, counterparty abbreviations and currency abbreviations used throughout the Schedule of Investments as well as the derivative tables, if any, please refer to page 125.
| See accompanying notes to the financial statements. | 100 |
GMO International Equity Allocation Fund
(A Series of GMO Trust)
Portfolio Management
Day-to-day management of the Fund’s portfolio is the responsibility of the Asset Allocation team at Grantham, Mayo, Van Otterloo & Co. LLC.
Management Discussion and Analysis of Fund Performance
Class III shares of GMO International Equity Allocation Fund returned -9.05% (net) for the fiscal year ended February 28, 2023, compared to -7.19% for the MSCI All Country World Index (“ACWI”) ex USA.
The Fund’s overweight to emerging markets detracted from performance relative to the benchmark as the MSCI Emerging Markets Index stumbled to a -15.28% return. We believed that emerging markets were trading at very preferential valuations but, unfortunately, pursuit of a zero-COVID policy until near the very end of 2022 really hampered the Chinese economy and weighed heavily on emerging market performance. Security selection in developed markets was strong, with outperformance of the Value style undoubtedly providing a decent tailwind. The performance challenge from being overweight emerging markets was exacerbated by security selection within emerging markets, where we lagged the reference benchmark.
The views expressed herein are exclusively those of Grantham, Mayo, Van Otterloo & Co. LLC as of the date of this report and are subject to change. GMO disclaims any responsibility to update such views. They are not meant as investment advice. References to specific securities are not recommendations of such securities and may not be representative of any GMO portfolio’s current or future investments. All information is unaudited.
101
GMO International Equity Allocation Fund
(A Series of GMO Trust)
Comparison of Change in Value of a $5,000,000 Investment in
GMO International Equity Allocation Fund Class III Shares and the MSCI ACWI ex USA
As of February 28, 2023
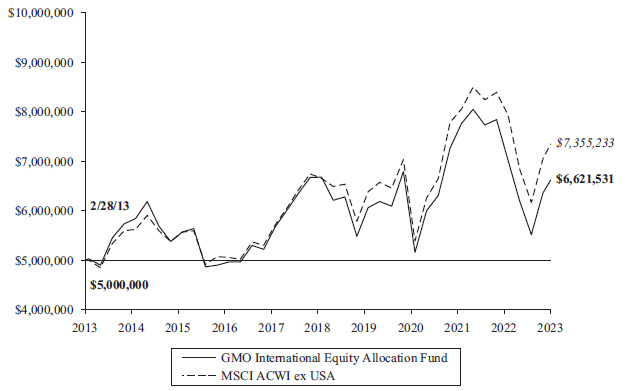
| Average Annual Total Returns | ||||||||||||||||
| 1 Year | 5 Year | 10 Year | Since Inception | |||||||||||||
| Class III | -9.05 | % | -0.43 | % | 2.85 | % | n/a | |||||||||
| Class R6 | -9.05 | % | n/a | n/a | 8/30/19 3.62 | % | ||||||||||
Performance data quoted represents past performance and is not indicative of future results. The investment return and principal value of an investment will fluctuate so that an investor’s shares, when redeemed, may be worth more or less than their original cost. Current performance data may be lower or higher than the performance data provided herein. To obtain performance information up to the most recent month-end, visit www.gmo.com. Performance shown is net of all fees after reimbursement from GMO. Returns would have been lower had certain expenses not been reimbursed during the periods shown and do not include the effect of taxes on distributions and redemptions. The performance information shown above only includes purchase premiums and/or redemption fees in effect as of February 28, 2023. All information is unaudited. Performance for classes may vary due to different fees.
MSCI data may not be reproduced or used for any other purpose. MSCI provides no warranties, has not prepared or approved this report, and has no liability hereunder.
For Class III and R6 the gross expense ratio of 0.69% and 0.69%, respectively, is equal to the Fund’s Total Annual Operating Expenses set forth in the Fund’s most recent prospectus dated June 30, 2022. For the Classes listed above, the corresponding net expense ratio of 0.67% and 0.67% reflects the reduction of expenses from fee reimbursements. The fee reimbursements will continue until at least June 30, 2023. Elimination of this reimbursement will result in higher fees and lower performance.
102
GMO International Equity Allocation Fund
(A Series of GMO Trust)
Investment Concentration Summary
February 28, 2023 (Unaudited)
Asset Class Summary | % of Total Net Assets | |||
Common Stocks | 95.4 | % | ||
Short-Term Investments | 4.3 | |||
Preferred Stocks | 2.9 | |||
Debt Obligations | 0.3 | |||
Futures Contracts | (0.1 | ) | ||
Other | (2.8 | ) | ||
|
| |||
| 100.0 | % | |||
|
| |||
Country/Region Summary¤ | % of Investments | |||
Japan | 18.0 | % | ||
United Kingdom | 9.4 | |||
Taiwan | 9.0 | |||
France | 8.8 | |||
China | 8.0 | |||
South Korea | 6.2 | |||
Netherlands | 4.3 | |||
Other Emerging | 4.1 | † | ||
Spain | 4.0 | |||
Switzerland | 3.5 | |||
Brazil | 3.0 | |||
Germany | 2.8 | |||
Singapore | 2.7 | |||
Australia | 2.5 | |||
India | 2.3 | |||
Mexico | 2.3 | |||
Other Developed | 2.0 | ‡ | ||
South Africa | 1.9 | |||
Hong Kong | 1.6 | |||
Norway | 1.4 | |||
Finland | 1.1 | |||
Viet Nam | 1.1 | |||
|
| |||
| 100.0 | % | |||
|
| |||
| & | The table incorporates aggregate indirect asset class exposure associated with investments in other funds of GMO Trust (“underlying funds”). Derivative financial instruments, if any, are based on market values, rather than the notional amounts of derivatives, except for forward currency contracts which are based on unrealized appreciation/(depreciation). |
| ¤ | The table incorporates aggregate indirect country exposure associated with investments in the underlying funds. The table excludes short-term investments and includes exposure through the use of derivative financial instruments, if any. The table excludes exposure through forward currency contracts, if any. |
| † | “Other Emerging” is comprised of emerging countries that each represent between (1.0)% and 1.0% of Investments. |
| ‡ | “Other Developed” is comprised of developed countries that each represent between (1.0)% and 1.0% of Investments. |
103
GMO International Equity Allocation Fund
(A Series of GMO Trust)
(showing percentage of total net assets)
February 28, 2023
| Shares | Description | Value ($) | ||||||
| MUTUAL FUNDS — 99.9% | ||||||||
| Affiliated Issuers — 99.9% | ||||||||
| 2,969,187 | GMO Emerging Markets ex-China Fund, Class VI | 39,608,956 | ||||||
| 6,502,864 | GMO Emerging Markets Fund, Class VI | 140,917,055 | ||||||
| 13,499,667 | GMO International Equity Fund, Class IV | 291,592,810 | ||||||
| 1,167,135 | GMO-Usonian Japan Value Creation Fund, Class VI | 19,689,572 | ||||||
|
| |||||||
| TOTAL MUTUAL FUNDS (COST $579,205,507) | 491,808,393 | |||||||
|
| |||||||
| SHORT-TERM INVESTMENTS — 0.1% |
| |||||||
| Money Market Funds — 0.1% | ||||||||
| 365,390 | State Street Institutional Treasury Money Market Fund – Premier Class, 4.42% (a) | 365,390 | ||||||
|
| |||||||
| TOTAL SHORT-TERM INVESTMENTS (COST $365,390) | 365,390 | |||||||
|
| |||||||
| TOTAL INVESTMENTS — 100.0% | ||||||||
| (Cost $579,570,897) | 492,173,783 | |||||||
| Other Assets and Liabilities (net) — (0.0%) | (31,591 | ) | ||||||
|
| |||||||
| TOTAL NET ASSETS — 100.0% | $ | 492,142,192 | ||||||
|
| |||||||
Notes to Schedule of Investments:
| (a) | The rate disclosed is the 7 day net yield as of February 28, 2023. |
For a listing of definitions of acronyms, counterparty abbreviations and currency abbreviations used throughout the Schedule of Investments as well as the derivative tables, if any, please refer to page 125.
| See accompanying notes to the financial statements. | 104 |
(A Series of GMO Trust)
Portfolio Management
Day-to-day management of the Fund’s portfolio is the responsibility of the Systematic Global Macro team at Grantham, Mayo, Van Otterloo & Co. LLC.
Management Discussion and Analysis of Fund Performance
Although GMO does not manage the Fund to, or control the Fund’s risk relative to, any securities index or securities benchmark, a discussion of the Fund’s performance relative to the FTSE 3-Month Treasury Bill Index is included for comparative purposes only.
Class III shares of GMO SGM Major Markets Fund returned +3.86% (net) for the fiscal year ended February 28, 2023, as compared with +2.22% for the FTSE 3-Month Treasury Bill Index.
The Fund added value from equity, fixed income, and commodity positions while currencies detracted value over the period. It was a difficult year for most assets as inflation soared throughout most major global economies which forced central banks around the world to lift interest rates dramatically, which in turn resulted in dramatic sell-offs in both equities and bonds. Throughout this turmoil, the Fund was able to take positions in some key assets where prices had become strongly dislocated to fundamental values.
Within equities, the portfolio generated returns by taking positions where there were significant relative valuation differentials. This was generally around the theme of being short the U.S. while being long cheaper European markets. This positioning was particularly well rewarded in the later part of the year, as concerns in Europe over the impact of energy prices from the war in Ukraine dissipated.
As inflation concerns accelerated throughout the year, combined with central bank rate rises, bond markets sold off globally. Within fixed income, the portfolio held bonds net short, mainly through short U.S. bond positions. Within commodities, a variety of contracts across agriculture, energy, and precious metals contributed to the positive returns. Currencies detracted over the period. The main contributor to the underperformance was long Japanese yen positions. While our models viewed the yen as being fundamentally cheap, markets heavily rewarded the carry trade. Our positions in the yen were eventually reduced as the direction of yen turned more favorable.
Because some of the securities and instruments held directly or indirectly by the Fund had positive fair value adjustments at the beginning or end of the fiscal year (and the performance of indices are not fair valued), the Fund’s absolute and relative performance is higher than it otherwise would have been in the absence of such fair value adjustments.
The views expressed herein are exclusively those of Grantham, Mayo, Van Otterloo & Co. LLC as of the date of this report and are subject to change. GMO disclaims any responsibility to update such views. They are not meant as investment advice. References to specific securities are not recommendations of such securities and may not be representative of any GMO portfolio’s current or future investments. All information is unaudited.
105
GMO SGM Major Markets Fund
(A Series of GMO Trust)
Comparison of Change in Value of a $5,000,000 Investment in
GMO SGM Major Markets Fund Class III Shares, the FTSE 3-Month Treasury Bill +++ Index* and the
FTSE 3-Month Treasury Bill Index
As of February 28, 2023
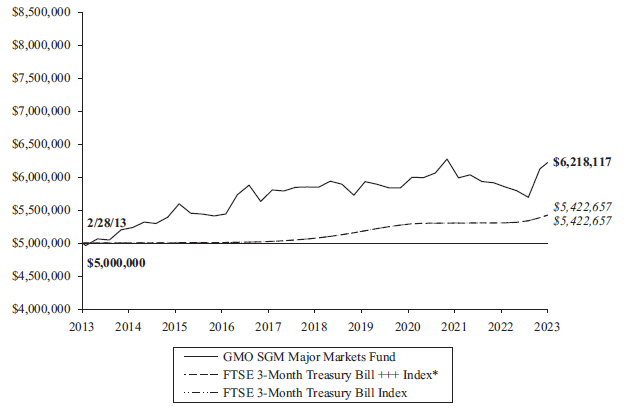
| Average Annual Total Returns | ||||||||||||
| 1 Year | 5 Year | 10 Year | Since Inception | |||||||||
| Class III | 3.86% | 1.34% | 2.20% | n/a | ||||||||
| Class VI | 3.96% | 1.44% | n/a | 12/1/15 1.99% | ||||||||
| Class I | 3.76% | n/a | n/a | 9/23/20 1.16% | ||||||||
Performance data quoted represents past performance and is not indicative of future results. The investment return and principal value of an investment will fluctuate so that an investor’s shares, when redeemed, may be worth more or less than their original cost. Current performance data may be lower or higher than the performance data provided herein. To obtain performance information up to the most recent month-end, visit www.gmo.com. Performance shown is net of all fees after reimbursement from GMO. Returns would have been lower had certain expenses not been reimbursed during the periods shown and do not include the effect of taxes on distributions and redemptions. The performance information shown above only includes purchase premiums and/or redemption fees in effect as of February 28, 2023. All information is unaudited. Performance for classes may vary due to different fees.
| * | The FTSE 3-Month Treasury Bill +++ Index is a composite benchmark computed by GMO and comprised of 50% Bloomberg Commodity Total Return Index and 50% J.P. Morgan U.S. 3 Month Cash Index through October 3, 2011 and the FTSE 3-Month Treasury Bill Index thereafter. |
For Class III, VI and I the gross expense ratio of 1.10%, 1.00% and 1.25%, respectively, is equal to the Fund’s Total Annual Operating Expenses set forth in the Fund’s most recent prospectus dated June 30, 2022. For the Classes listed above, the corresponding net expense ratio of 1.01%, 0.92% and 1.11% reflects the reduction of expenses from fee reimbursements. The fee reimbursements will continue until at least June 30, 2023. Elimination of this reimbursement will result in higher fees and lower performance.
106
GMO SGM Major Markets Fund
(A Series of GMO Trust)
Consolidated Investment Concentration Summary(a)
February 28, 2023 (Unaudited)
Asset Class Summary& | % of Total Net Assets | |||
Debt Obligations | 99.9 | % | ||
Short-Term Investments | 0.6 | |||
Swap Contracts | 0.3 | |||
Futures Contracts | 0.1 | # | ||
Forward Currency Contracts | 0.0 | ^ | ||
Other | (0.9 | ) | ||
|
| |||
| 100.0 | % | |||
|
| |||
| (a) | GMO Alternative Asset SPC Ltd. is a 100% owned subsidiary of GMO SGM Major Markets Fund. As such, the holdings of GMO Alternative Asset SPC Ltd. have been included with GMO SGM Major Markets Fund. |
| & | In the table, derivative financial instruments, if any, are based on market values, rather than the notional amounts of derivatives, except for forward currency contracts which are based on unrealized appreciation/(depreciation). The exposure the Fund has to futures contracts based on notional amounts is 13.4% of net assets. |
| # | Some or all is comprised of commodity exposure. See the Consolidated Schedule of Investments. |
| ^ | Rounds to 0.0%. |
107
GMO SGM Major Markets Fund
(A Series of GMO Trust)
Consolidated Schedule of Investments
(showing percentage of total net assets)
February 28, 2023
Par Value† / | Description | Value ($) | ||||||
| DEBT OBLIGATIONS — 99.9% | ||||||||
| United States — 99.9% | ||||||||
| U.S. Government — 89.8% | ||||||||
| 20,000,000 | U.S. Treasury Floating Rate Notes, Variable Rate, USBM + 0.14%, 4.95%, due 10/31/24 (a) (b) | 20,014,932 | ||||||
| 47,030,000 | U.S. Treasury Note, 0.13%, due 06/30/23 | 46,284,134 | ||||||
| 8,000,000 | U.S. Treasury Note, Variable Rate, USBM + 0.04%, 4.84%, due 10/31/23 (b) | 7,997,716 | ||||||
| 35,600,000 | U.S. Treasury Note, Variable Rate, USBM - 0.08%, 4.73%, due 04/30/24 (a) (b) | 35,546,077 | ||||||
| 6,000,000 | U.S. Treasury Note, Variable Rate, USBM + 0.04%, 4.84%, due 07/31/24 (a) | 5,997,945 | ||||||
|
| |||||||
| Total U.S. Government | 115,840,804 | |||||||
|
| |||||||
| U.S. Government Agency — 10.1% | ||||||||
| 7,000,000 | Federal Home Loan Banks, Variable Rate, SOFR + 0.03%, 4.58%, due 03/02/23 | 6,999,994 | ||||||
| 3,000,000 | Federal Home Loan Banks, Variable Rate, SOFR + 0.05%, 4.60%, due 07/06/23 | 2,999,968 | ||||||
| 3,000,000 | Federal Home Loan Banks, Variable Rate, SOFR + 0.07%, 4.62%, due 12/14/23 | 2,999,663 | ||||||
|
| |||||||
| Total U.S. Government Agency | 12,999,625 | |||||||
|
| |||||||
| Total United States | 128,840,429 | |||||||
|
| |||||||
| TOTAL DEBT OBLIGATIONS (COST $129,297,616) | 128,840,429 | |||||||
|
| |||||||
| SHORT-TERM INVESTMENTS — 0.6% |
| |||||||
| Money Market Funds — 0.6% | ||||||||
| 349,412 | State Street Global Advisors Liquidity Plc - U.S. Treasury Liquidity Fund, 4.48% (a) | 349,412 | ||||||
| 455,267 | State Street Institutional Treasury Money Market Fund – Premier Class, 4.42% (c) | 455,267 | ||||||
|
| |||||||
| TOTAL SHORT-TERM INVESTMENTS (COST $804,679) | 804,679 | |||||||
|
| |||||||
TOTAL INVESTMENTS — 100.5% (Cost $130,102,295) | 129,645,108 | |||||||
|
| |||||||
| Other Assets and Liabilities (net) — (0.5%) | (700,891 | ) | ||||||
|
| |||||||
| TOTAL NET ASSETS — 100.0% | $ | 128,944,217 | ||||||
|
| |||||||
| See accompanying notes to the financial statements. | 108 |
GMO SGM Major Markets Fund
(A Series of GMO Trust)
Consolidated Schedule of Investments — (Continued)
February 28, 2023
A summary of outstanding financial instruments at February 28, 2023 is as follows:
Forward Currency Contracts
Settlement Date | Counter- party | Currency Sold | Currency Purchased | Net Unrealized Appreciation (Depreciation) ($) | ||||||||||
03/24/2023 | BCLY | AUD | 104,706 | USD | 72,317 | 1,803 | ||||||||
03/24/2023 | DB | AUD | 2,305,947 | USD | 1,596,488 | 43,562 | ||||||||
03/24/2023 | MSCI | AUD | 3,840,695 | USD | 2,721,292 | 134,800 | ||||||||
03/24/2023 | SSB | AUD | 1,744,541 | USD | 1,219,963 | 45,112 | ||||||||
03/31/2023 | JPM | CHF | 13,718,585 | USD | 14,972,535 | 360,444 | ||||||||
04/13/2023 | BCLY | JPY | 104,540,041 | USD | 790,168 | 17,817 | ||||||||
04/13/2023 | GS | JPY | 94,793,316 | USD | 707,322 | 6,980 | ||||||||
04/13/2023 | MSCI | JPY | 480,902,472 | USD | 3,666,729 | 113,778 | ||||||||
04/13/2023 | SSB | JPY | 157,109,735 | USD | 1,205,672 | 44,931 | ||||||||
03/27/2023 | MSCI | NZD | 1,741,294 | USD | 1,114,801 | 38,127 | ||||||||
03/24/2023 | BCLY | USD | 345,311 | AUD | 499,313 | (9,052 | ) | |||||||
03/17/2023 | DB | USD | 4,408,029 | CAD | 5,885,469 | (94,224 | ) | |||||||
03/17/2023 | GS | USD | 399,707 | CAD | 534,104 | (8,230 | ) | |||||||
03/31/2023 | BCLY | USD | 561,910 | CHF | 511,150 | (17,468 | ) | |||||||
Settlement Date | Counter- party | Currency Sold | Currency Purchased | Net Unrealized Appreciation (Depreciation) ($) | ||||||||||||
03/31/2023 | DB | USD | 484,751 | CHF | 444,383 | (11,425 | ) | |||||||||
03/31/2023 | GS | USD | 426,041 | CHF | 391,076 | (9,494 | ) | |||||||||
03/31/2023 | MSCI | USD | 340,457 | CHF | 311,262 | (8,922 | ) | |||||||||
03/31/2023 | BCLY | USD | 1,017,632 | EUR | 944,557 | (16,838 | ) | |||||||||
03/31/2023 | DB | USD | 268,444 | EUR | 251,400 | (2,076 | ) | |||||||||
03/31/2023 | GS | USD | 572,081 | EUR | 534,030 | (6,256 | ) | |||||||||
03/31/2023 | JPM | USD | 666,934 | EUR | 614,402 | (15,951 | ) | |||||||||
03/31/2023 | MSCI | USD | 18,832,482 | EUR | 17,253,786 | (551,457 | ) | |||||||||
03/24/2023 | BCLY | USD | 620,837 | GBP | 508,450 | (9,005 | ) | |||||||||
03/24/2023 | MSCI | USD | 407,375 | GBP | 337,706 | (1,005 | ) | |||||||||
03/24/2023 | SSB | USD | 1,748,090 | GBP | 1,415,359 | (44,952 | ) | |||||||||
|
| |||||||||||||||
| $ | 999 | |||||||||||||||
|
| |||||||||||||||
Futures Contracts
| Value/Net | ||||||||||||
| Unrealized | ||||||||||||
| Number of | Expiration | Notional | Appreciation | |||||||||
Contracts + | Type | Date | Amount ($) | (Depreciation) ($) | ||||||||
| Buys | ||||||||||||
| 68 | CAC40 10 Euro | March 2023 | 5,218,739 | 9,494 | ||||||||
| 52 | Corn(a) | May 2023 | 1,638,650 | (115,142 | ) | |||||||
| 13 | DAX Index | March 2023 | 5,285,426 | 263,879 | ||||||||
| 175 | FTSE 100 Index | March 2023 | 16,525,157 | 495,908 | ||||||||
| 663 | Mini MSCI Emerging Markets | March 2023 | 31,920,135 | (589,166 | ) | |||||||
| 249 | MSCI Singapore | March 2023 | 5,423,259 | (108,485 | ) | |||||||
| 45 | Soybean(a) | May 2023 | 3,327,750 | (86,348 | ) | |||||||
| 17 | SPI 200 Futures | March 2023 | 2,052,311 | (75,136 | ) | |||||||
|
|
|
| |||||||||
| $ | 71,391,427 | $ | (204,996 | ) | ||||||||
|
|
|
| |||||||||
| Value/Net | ||||||||||||||||
| Unrealized | ||||||||||||||||
| Number of | Expiration | Notional | Appreciation | |||||||||||||
Contracts + | Type | Date | Amount ($) | (Depreciation) ($) | ||||||||||||
| Sales | ||||||||||||||||
| 24 | Australian Government Bond 10 Yr. | March 2023 | 1,900,166 | 52,182 | ||||||||||||
| 92 | Canadian Government Bond 10 Yr. | June 2023 | 8,190,663 | (20,962 | ) | |||||||||||
| 10 | E-mini Russell 2000 Index | March 2023 | 949,550 | (11,674 | ) | |||||||||||
| 38 | Euro Bund | March 2023 | 5,341,997 | 222,822 | ||||||||||||
| 16 | Euro Bund | June 2023 | 2,233,015 | (5,733 | ) | |||||||||||
| 22 | FTSE Taiwan Index | March 2023 | 1,179,714 | 18,778 | ||||||||||||
| 6 | Gold 100 OZ(a) | April 2023 | 1,102,020 | 55,550 | ||||||||||||
| 5 | Hang Seng Index | March 2023 | 629,462 | 19,992 | ||||||||||||
| 128 | S&P 500 E-Mini | March 2023 | 25,443,200 | (35,601 | ) | |||||||||||
| 23 | S&P/TSX 60 | March 2023 | 4,101,400 | (13,490 | ) | |||||||||||
| 46 | Silver(a) | May 2023 | 4,846,330 | 274,251 | ||||||||||||
| 68 | TOPIX Index | March 2023 | 9,948,971 | (208,805 | ) | |||||||||||
| 195 | U.S. Treasury Note 10 Yr. (CBT) | June 2023 | 21,772,969 | 13,055 | ||||||||||||
| 7 | UK Gilt Long Bond | June 2023 | 841,658 | 6,454 | ||||||||||||
| 2 | WTI Crude(a) | March 2023 | 154,100 | (5,787 | ) | |||||||||||
|
|
|
| |||||||||||||
| $ | 88,635,215 | $ | 361,032 | |||||||||||||
|
|
|
| |||||||||||||
| + | Buys - Fund is long the futures contract. |
Sales - Fund is short the futures contract. |
| 109 | See accompanying notes to the financial statements. |
GMO SGM Major Markets Fund
(A Series of GMO Trust)
Consolidated Schedule of Investments — (Continued)
February 28, 2023
Swap Contracts
OTC Total Return Swaps
| Periodic | Premiums | Net Unrealized | ||||||||||||||||||||||||||||
| Notional | Expiration | Payment | Paid/ | Appreciation/ | ||||||||||||||||||||||||||
Fund Pays | Fund Receives | Counterparty | Amount | Date | Frequency | (Received) ($) | Value ($) | (Depreciation) ($) | ||||||||||||||||||||||
1 Month Federal Funds Rate plus 0.09% | Total Return on MSCI World Daily Total Return Net Value Index | GS | USD | 8,983,434 | 05/09/2023 | Monthly | — | (160,398 | ) | (160,398 | ) | |||||||||||||||||||
Total Return on MSCI World Daily Total Return Net Growth Index | 1 Month Federal Funds Rate minus 0.08% | GS | USD | 8,011,918 | 05/09/2023 | Monthly | — | 285,553 | 285,553 | |||||||||||||||||||||
Total Return on MSCI World Daily Total Return Net Value Index | 1 Month Federal Funds Rate minus 0.08% | GS | USD | 820,393 | 05/09/2023 | Monthly | — | 29,240 | 29,240 | |||||||||||||||||||||
1 Month Federal Funds Rate plus 0.01% | Total Return on MSCI World Daily Total Return Net Value Index | UBSA | USD | 10,396,542 | 05/12/2023 | Monthly | — | (114,248 | ) | (114,248 | ) | |||||||||||||||||||
Total Return on MSCI World Daily Total Return Net Growth Index | 1 Month Federal Funds Rate plus 0.02% | UBSA | USD | 10,424,614 | 05/12/2023 | Monthly | — | 281,908 | 281,908 | |||||||||||||||||||||
1 Month Federal Funds Rate plus 0.05% | Total Return on MSCI World Daily Total Return Net Value Index | UBSA | USD | 7,798,830 | 05/22/2023 | Monthly | — | (19,390 | ) | (19,390 | ) | |||||||||||||||||||
Total Return on MSCI World Daily Total Return Net Growth Index | 1 Month Federal Funds Rate plus 0.06% | UBSA | USD | 7,577,808 | 05/22/2023 | Monthly | — | 86,011 | 86,011 | |||||||||||||||||||||
|
|
|
|
|
| |||||||||||||||||||||||||
| $ | — | $ | 388,676 | $ | 388,676 | |||||||||||||||||||||||||
|
|
|
|
|
| |||||||||||||||||||||||||
As of February 28, 2023, for the above contracts and/or agreements, the Fund had sufficient cash and/or securities to cover commitments or collateral requirements, if any, of the relevant broker or exchange.
Notes to Schedule of Investments:
| † | Denominated in U.S. Dollar, unless otherwise indicated. |
| (a) | All or a portion of this security or derivative is owned by GMO Alternative Asset SPC Ltd., which is a 100% owned subsidiary of GMO SGM Major Markets Fund. |
| (b) | All or a portion of this security has been pledged to cover margin requirements on futures and/or cleared swap contracts, collateral on OTC swap contracts, forward currency contracts, and/or written options, if any (Note 4). |
| (c) | The rate disclosed is the 7 day net yield as of February 28, 2023. |
For a listing of definitions of acronyms, counterparty abbreviations and currency abbreviations used throughout the Schedule of Investments as well as the derivative tables, if any, please refer to page 125.
| See accompanying notes to the financial statements. | 110 |
GMO Strategic Opportunities Allocation Fund
(A Series of GMO Trust)
Portfolio Management
Day-to-day management of the Fund’s portfolio is the responsibility of the Asset Allocation team at Grantham, Mayo, Van Otterloo & Co. LLC.
Management Discussion and Analysis of Fund Performance
Class III shares of GMO Strategic Opportunities Allocation Fund returned -4.08% (net) for the fiscal year ended February 28, 2023, as compared with -7.70% for the GMO Strategic Opportunities Allocation Index (75% MSCI World Index (MSCI Standard Index Series) and 25% Bloomberg U.S. Aggregate Index).
The Fund’s circa 20% off-benchmark position in alternatives had the most significant beneficial impact on relative performance. It is invested in the Equity Dislocation Strategy, which is long cheap Value stocks and short expensive Growth stocks, and enjoyed an excellent year, up some 7.87%. The Fund held an average 71% in equities over the period, and the return of -7.33% was in line with the MSCI World Index return. In terms of regional biases, the benefits gained from being overweight developed ex-U.S. equities largely compensated for the detriment caused by being overweight emerging market equities. Security selection in developed markets was strong, helped by outperformance of the Value style. The Fund held an average of 9% in fixed income, with an increased emphasis on credit due to a sizeable allocation to Emerging Market Debt. The Fund’s fixed income exposures posted -7.38%, nicely ahead of the -9.72% return from the Bloomberg U.S. Aggregate Index, with the outperformance largely driven by an excellent return from the Emerging Debt exposure, which was well ahead of its reference benchmark.
The views expressed herein are exclusively those of Grantham, Mayo, Van Otterloo & Co. LLC as of the date of this report and are subject to change. GMO disclaims any responsibility to update such views. They are not meant as investment advice. References to specific securities are not recommendations of such securities and may not be representative of any GMO portfolio’s current or future investments. All information is unaudited.
111
GMO Strategic Opportunities Allocation Fund
(A Series of GMO Trust)
Comparison of Change in Value of a $5,000,000 Investment in
GMO Strategic Opportunities Allocation Fund Class III Shares, the
GMO Strategic Opportunities Allocation Index*, the MSCI World Index and the Bloomberg
U.S. Aggregate Index
As of February 28, 2023
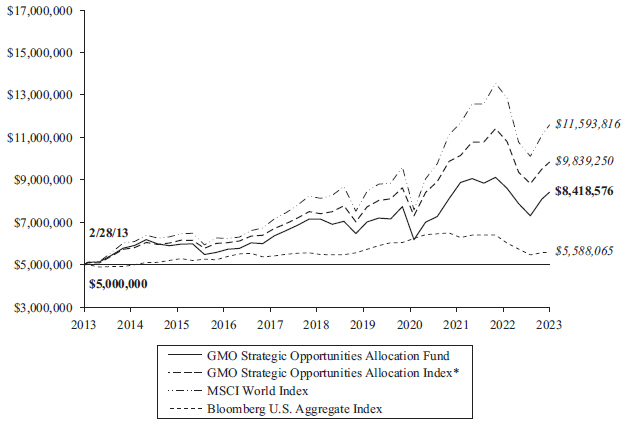
| Average Annual Total Returns | ||||||||||||
| 1 Year | 5 Year | 10 Year | ||||||||||
| Class III | -4.08 | % | 3.15 | % | 5.35 | % | ||||||
Performance data quoted represents past performance and is not indicative of future results. The investment return and principal value of an investment will fluctuate so that an investor’s shares, when redeemed, may be worth more or less than their original cost. Current performance data may be lower or higher than the performance data provided herein. To obtain performance information up to the most recent month-end, visit www.gmo.com. Performance shown is net of all fees after reimbursement from GMO. Returns would have been lower had certain expenses not been reimbursed during the periods shown and do not include the effect of taxes on distributions and redemptions. The performance information shown above only includes purchase premiums and/or redemption fees in effect as of February 28, 2023. All information is unaudited.
| * | The GMO Strategic Opportunities Allocation Index is a composite benchmark computed by GMO and comprised of 75% MSCI World Index and 25% Bloomberg U.S. Aggregate Index. |
MSCI data may not be reproduced or used for any other purpose. MSCI provides no warranties, has not prepared or approved this report, and has no liability hereunder.
For Class III the gross expense ratio of 0.76% is equal to the Fund’s Total Annual Operating Expenses set forth in the Fund’s most recent prospectus dated June 30, 2022. For the Class listed above, the net expense ratio of 0.62% reflects the reduction of expenses from fee reimbursements. The fee reimbursements will continue until at least June 30, 2023. Elimination of this reimbursement will result in higher fees and lower performance.
112
GMO Strategic Opportunities Allocation Fund
(A Series of GMO Trust)
Investment Concentration Summary
February 28, 2023 (Unaudited)
Asset Class Summary& | % of Total Net Assets | |||
Common Stocks | 88.8 | % | ||
Short-Term Investments | 17.0 | |||
Debt Obligations | 11.7 | |||
Preferred Stocks | 1.6 | |||
Swap Contracts | 0.1 | |||
Loan Assignments | 0.0 | ^ | ||
Loan Participations | 0.0 | ^ | ||
Forward Currency Contracts | 0.0 | ^ | ||
Rights/Warrants | 0.0 | ^ | ||
Investment Funds | 0.0 | ^ | ||
Purchased Options | 0.0 | ^ | ||
Written Options/Credit Linked Options | (0.0 | )^ | ||
Futures Contracts | (0.0 | )^ | ||
Securities Sold Short | (18.1 | ) | ||
Other | (1.1 | ) | ||
|
| |||
| 100.0 | % | |||
|
| |||
Country/Region Summary¤ | Debt Obligations as a % of Total Net Assets | |||
United States | 3.5 | % | ||
Other Emerging | 2.8 | † | ||
Other Developed | 0.8 | ‡ | ||
Euro Region | (0.5 | )§ | ||
|
| |||
| 6.6 | % | |||
|
| |||
Country/Region Summary¤ | Equity Investments as a % of Total Net Assets | |||
United States | 22.2 | % | ||
Japan | 10.9 | |||
Other Developed | 5.5 | ‡ | ||
Taiwan | 4.9 | |||
United Kingdom | 3.9 | |||
South Korea | 3.4 | |||
France | 3.3 | |||
China | 2.8 | |||
Other Emerging | 2.4 | † | ||
Netherlands | 1.9 | |||
Brazil | 1.8 | |||
Spain | 1.7 | |||
India | 1.5 | |||
Mexico | 1.5 | |||
Australia | 1.0 | |||
Singapore | 1.0 | |||
Switzerland | 1.0 | |||
South Africa | 1.0 | |||
Euro Region | 0.0 | §^ | ||
|
| |||
| 71.7 | % | |||
|
| |||
| & | The table incorporates aggregate indirect asset class exposure associated with investments in other funds of GMO Trust (“underlying funds”). Derivative financial instruments, if any, are based on market values, rather than the notional amounts of derivatives, except for forward currency contracts which are based on unrealized appreciation/(depreciation). |
| ¤ | The table incorporates aggregate indirect country exposure associated with investments in the underlying funds. The table excludes short-term investments. The table includes exposure through the use of certain derivative financial instruments and excludes exposure through certain currency linked derivatives such as forward currency contracts and currency options. The table is based on duration adjusted net exposures (both investments and derivatives), taking into account the market value of securities and the notional amounts of swaps and other derivative financial instruments. Duration is based on GMO’s models. The greater the duration of a bond, the greater its contribution to the concentration percentage. Credit default swap exposures are factored into the duration-adjusted exposure using the reference security and applying the same methodology to that security. The table is not normalized, thus, due to the exclusions listed above and negative exposures, which may be attributable to derivatives or short sales, if any, the tables may not total to 100%. |
| † | “Other Emerging” is comprised of emerging countries that each represent between (1.0)% and 1.0% of Total Net Assets. |
| ‡ | “Other Developed” is comprised of developed countries that each represent between (1.0)% and 1.0% of Total Net Assets. |
| § | “Euro Region” is comprised of derivative financial instruments attributed to the Eurozone and not a particular country. |
| ^ | Rounds to 0.0%. |
113
GMO Strategic Opportunities Allocation Fund
(A Series of GMO Trust)
(showing percentage of total net assets)
February 28, 2023
| Shares | Description | Value ($) | ||||||
| COMMON STOCKS — 32.9% | ||||||||
| Australia — 0.9% | ||||||||
| 13,796 | AMP Ltd * | 9,577 | ||||||
| 28,066 | Aurizon Holdings Ltd (a) | 62,367 | ||||||
| 3,376 | Austal Ltd | 4,104 | ||||||
| 81,259 | Beach Energy Ltd | 76,637 | ||||||
| 21,106 | BlueScope Steel Ltd | 270,045 | ||||||
| 21,839 | Brambles Ltd (a) | 188,704 | ||||||
| 19,437 | Fortescue Metals Group Ltd (a) | 278,531 | ||||||
| 44,850 | GPT Group (The) (REIT) (a) | 141,578 | ||||||
| 16,654 | GrainCorp Ltd – Class A | 87,819 | ||||||
| 13,508 | Grange Resources Ltd | 8,601 | ||||||
| 22,136 | Helia Group Ltd | 51,252 | ||||||
| 1,598 | JB Hi-Fi Ltd (a) | 44,853 | ||||||
| 3,518 | McMillan Shakespeare Ltd | 33,839 | ||||||
| 20,607 | Metcash Ltd (a) | 56,337 | ||||||
| 98,347 | Mirvac Group (REIT) (a) | 149,741 | ||||||
| 1,296 | Monadelphous Group Ltd | 10,434 | ||||||
| 13,540 | Nufarm Ltd | 52,719 | ||||||
| 6,326 | Perenti Ltd * | 4,508 | ||||||
| 6,946 | Regis Resources Ltd | 8,116 | ||||||
| 44,089 | Scentre Group (REIT) (a) | 88,057 | ||||||
| 42,562 | Stockland (REIT) (a) | 109,638 | ||||||
| 2,346 | Super Retail Group Ltd (a) | 20,405 | ||||||
| 2,143 | Viva Energy Group Ltd (a) | 4,316 | ||||||
|
| |||||||
| Total Australia | 1,762,178 | |||||||
|
| |||||||
| Austria — 0.0% | ||||||||
| 3,792 | Raiffeisen Bank International AG * | 63,309 | ||||||
|
| |||||||
| Belgium — 0.5% | ||||||||
| 5,649 | Ageas SA/NV (a) | 254,934 | ||||||
| 1,493 | Bekaert SA | 65,876 | ||||||
| 569 | Sofina SA (a) | 141,752 | ||||||
| 1,670 | Solvay SA (a) | 190,760 | ||||||
| 2,247 | Telenet Group Holding NV (a) | 34,732 | ||||||
| 3,202 | UCB SA (a) | 275,270 | ||||||
|
| |||||||
| Total Belgium | 963,324 | |||||||
|
| |||||||
| Brazil — 0.1% | ||||||||
| 7,200 | Banco do Brasil SA | 55,422 | ||||||
| 7,400 | Petroleo Brasileiro SA Sponsored ADR (a) | 82,066 | ||||||
| 8,200 | Telefonica Brasil SA ADR (a) | 61,090 | ||||||
| 1,107 | Vale SA | 18,041 | ||||||
|
| |||||||
| Total Brazil | 216,619 | |||||||
|
| |||||||
| Canada — 1.6% | ||||||||
| 300 | ADENTRA Inc | 7,146 | ||||||
| 900 | Algoma Steel Group Inc | 7,229 | ||||||
| 2,200 | Alimentation Couche-Tard Inc (a) | 103,204 | ||||||
| 1,167 | Brookfield Asset Management Ltd – Class A (a) | 39,235 | ||||||
| 5,065 | Brookfield Corp – Class A (a) | 168,411 | ||||||
| Shares | Description | Value ($) | ||||||
| Canada — continued | ||||||||
| 733 | Canadian Apartment Properties (REIT) (a) | 26,548 | ||||||
| 2,000 | Canadian Tire Corp Ltd – Class A (a) | 249,307 | ||||||
| 3,900 | Canfor Corp * | 66,539 | ||||||
| 8,358 | Celestica Inc * | 107,989 | ||||||
| 700 | Cogeco Inc | 31,037 | ||||||
| 600 | DREAM UnLtd Corp – Class A | 11,727 | ||||||
| 3,200 | Finning International Inc (a) | 81,167 | ||||||
| 700 | iA Financial Corp Inc | 46,992 | ||||||
| 5,200 | Interfor Corp * | 87,537 | ||||||
| 2,700 | Magna International Inc | 150,484 | ||||||
| 9,200 | Manulife Financial Corp (a) (b) | 181,910 | ||||||
| 7,400 | Manulife Financial Corp (a) (b) | 146,224 | ||||||
| 1,200 | Martinrea International Inc | 12,295 | ||||||
| 3,300 | Mullen Group Ltd (a) | 34,439 | ||||||
| 3,067 | Nutrien Ltd (a) | 238,551 | ||||||
| 5,000 | OceanaGold Corp * | 10,187 | ||||||
| 2,300 | Onex Corp | 122,981 | ||||||
| 7,300 | Quebecor Inc – Class B (a) | 172,696 | ||||||
| 2,600 | Russel Metals Inc | 67,777 | ||||||
| 1,900 | Sleep Country Canada Holdings Inc | 36,204 | ||||||
| 7,800 | Teck Resources Ltd – Class B (a) (b) | 311,371 | ||||||
| 2,000 | Teck Resources Ltd – Class B (a) (b) | 79,840 | ||||||
| 1,800 | Uni-Select Inc * (a) | 62,502 | ||||||
| 3,200 | West Fraser Timber Co Ltd (b) | 240,381 | ||||||
| 400 | West Fraser Timber Co Ltd (b) | 30,024 | ||||||
|
| |||||||
| Total Canada | 2,931,934 | |||||||
|
| |||||||
| China — 0.6% | ||||||||
| 16,893 | Alibaba Group Holding Ltd * | 185,678 | ||||||
| 110,000 | Bank of Communications Co Ltd – Class H | 65,038 | ||||||
| 15,000 | Beijing Enterprises Holdings Ltd | 49,135 | ||||||
| 12,500 | China Conch Venture Holdings Ltd | 25,156 | ||||||
| 33,000 | China Overseas Land & Investment Ltd | 81,922 | ||||||
| 152,000 | China Railway Group Ltd – Class H | 79,220 | ||||||
| 286,000 | China Zhongwang Holdings Ltd * (c) | 61,212 | ||||||
| 110,000 | CITIC Ltd | 121,370 | ||||||
| 60,000 | Dongfeng Motor Group Co Ltd – Class H | 30,652 | ||||||
| 9,000 | Kingboard Holdings Ltd | 32,131 | ||||||
| 209 | Meituan – Class B* | 3,627 | ||||||
| 9,900 | Shanghai Pharmaceuticals Holding Co Ltd – Class H | 17,459 | ||||||
| 154,000 | Shimao Group Holdings Ltd * (c) | 86,718 | ||||||
| 15,600 | Sinopharm Group Co Ltd – Class H | 41,782 | ||||||
| 271,000 | Sunac China Holdings Ltd * (c) | 158,124 | ||||||
| 2,099 | Tencent Holdings Ltd | 92,206 | ||||||
|
| |||||||
| Total China | 1,131,430 | |||||||
|
| |||||||
| Denmark — 0.5% | ||||||||
| 62 | AP Moller – Maersk A/S – Class A (a) | 141,713 | ||||||
| 66 | AP Moller – Maersk A/S – Class B (a) | 153,737 | ||||||
| 13,427 | Danske Bank A/S | 311,818 | ||||||
| 3,304 | Pandora A/S | 312,967 | ||||||
| See accompanying notes to the financial statements. | 114 |
GMO Strategic Opportunities Allocation Fund
(A Series of GMO Trust)
Schedule of Investments — (Continued)
(showing percentage of total net assets)
February 28, 2023
| Shares | Description | Value ($) | ||||||
| Denmark — continued | ||||||||
| 54 | Rockwool A/S – B Shares (a) | 12,260 | ||||||
|
| |||||||
| Total Denmark | 932,495 | |||||||
|
| |||||||
| Finland — 0.5% | ||||||||
| 640 | Kemira Oyj | 12,258 | ||||||
| 5,138 | Metsa Board Oyj – Class B | 44,951 | ||||||
| 3,575 | Neste Oyj (a) | 172,426 | ||||||
| 50,896 | Nokia Oyj (a) | 235,473 | ||||||
| 18,831 | Outokumpu Oyj | 112,741 | ||||||
| 8,953 | UPM-Kymmene Oyj (a) | 324,425 | ||||||
|
| |||||||
| Total Finland | 902,274 | |||||||
|
| |||||||
| France — 1.7% | ||||||||
| 3,743 | ALD SA (a) | 49,582 | ||||||
| 260 | APERAM SA | 10,111 | ||||||
| 9,781 | ArcelorMittal SA | 293,522 | ||||||
| 2,368 | Arkema SA | 240,066 | ||||||
| 3,193 | BNP Paribas SA (a) | 223,226 | ||||||
| 580 | Cie de Saint-Gobain (a) | 34,465 | ||||||
| 7,301 | Coface SA | 107,604 | ||||||
| 3,297 | Derichebourg SA (a) | 21,202 | ||||||
| 96 | Eiffage SA (a) | 10,536 | ||||||
| 2,369 | Ipsen SA (a) | 270,678 | ||||||
| 1,905 | IPSOS (a) | 116,863 | ||||||
| 272 | Kering SA (a) | 159,479 | ||||||
| 368 | LVMH Moet Hennessy Louis Vuitton SE (a) | 305,928 | ||||||
| 122 | Mersen SA | 5,756 | ||||||
| 6,865 | Publicis Groupe SA (a) | 544,993 | ||||||
| 1,773 | Quadient SA | 30,773 | ||||||
| 1,094 | Rexel SA (a) | 27,194 | ||||||
| 2,438 | Safran SA (a) | 344,249 | ||||||
| 989 | Societe BIC SA (a) | 63,975 | ||||||
| 9,024 | Societe Generale SA | 260,068 | ||||||
| 6,023 | Technip Energies NV (a) | 116,607 | ||||||
| 8,502 | Television Francaise 1 | 67,751 | ||||||
|
| |||||||
| Total France | 3,304,628 | |||||||
|
| |||||||
| Germany — 0.6% | ||||||||
| 502 | 1&1 AG (a) | 6,015 | ||||||
| 497 | Aurubis AG | 48,611 | ||||||
| 1,847 | Bayerische Motoren Werke AG (a) | 190,546 | ||||||
| 1,625 | Beiersdorf AG (a) | 193,937 | ||||||
| 44 | Draegerwerk AG & Co KGaA (a) | 1,711 | ||||||
| 2,702 | Fresenius SE & Co KGaA (a) | 74,351 | ||||||
| 1,233 | HeidelbergCement AG (a) | 84,648 | ||||||
| 368 | Hornbach Holding AG & Co KGaA (a) | 30,563 | ||||||
| 9,298 | Kloeckner & Co SE | 100,639 | ||||||
| 399 | Krones AG | 48,591 | ||||||
| 4,143 | Mercedes-Benz Group AG (a) | 317,531 | ||||||
| 355 | Siltronic AG (a) | 25,851 | ||||||
|
| |||||||
| Total Germany | 1,122,994 | |||||||
|
| |||||||
| Shares | Description | Value ($) | ||||||
| Hong Kong — 0.6% | ||||||||
| 15,300 | ASMPT Ltd (a) | 130,545 | ||||||
| 13,200 | Bank of East Asia Ltd (The) | 18,646 | ||||||
| 7,000 | Chow Sang Sang Holdings International Ltd | 9,015 | ||||||
| 69,000 | CITIC Telecom International Holdings Ltd | 25,142 | ||||||
| 4,800 | Dah Sing Financial Holdings Ltd | 12,969 | ||||||
| 86,000 | First Pacific Co Ltd | 28,837 | ||||||
| 19,230 | Galaxy Entertainment Group Ltd | 128,026 | ||||||
| 54,000 | HKT Trust & HKT Ltd – Class SS (a) | 70,205 | ||||||
| 31,000 | IGG Inc * | 11,360 | ||||||
| 18,500 | Johnson Electric Holdings Ltd | 21,221 | ||||||
| 23,000 | K Wah International Holdings Ltd (a) | 7,945 | ||||||
| 20,000 | Kerry Properties Ltd (a) | 50,079 | ||||||
| 9,000 | NWS Holdings Ltd (a) | 7,925 | ||||||
| 41,000 | Pacific Textiles Holdings Ltd | 13,740 | ||||||
| 35,000 | PCCW Ltd (a) | 17,399 | ||||||
| 15,000 | Power Assets Holdings Ltd (a) | 80,232 | ||||||
| 60,000 | Shun Tak Holdings Ltd * | 12,155 | ||||||
| 37,000 | SITC International Holdings Co Ltd | 77,402 | ||||||
| 17,000 | Sun Hung Kai & Co Ltd | 6,892 | ||||||
| 14,000 | Swire Pacific Ltd – Class A (a) | 114,250 | ||||||
| 44,000 | VSTECS Holdings Ltd | 25,401 | ||||||
| 6,800 | VTech Holdings Ltd | 37,357 | ||||||
| 289,500 | WH Group Ltd (a) | 168,468 | ||||||
| 18,000 | Yue Yuen Industrial Holdings Ltd | 26,631 | ||||||
|
| |||||||
| Total Hong Kong | 1,101,842 | |||||||
|
| |||||||
| India — 0.4% | ||||||||
| 75,186 | GAIL India Ltd | 93,469 | ||||||
| 5,777 | Hindalco Industries Ltd | 27,886 | ||||||
| 17,130 | Hindustan Petroleum Corp Ltd | 44,670 | ||||||
| 25,377 | Indian Oil Corp Ltd | 23,332 | ||||||
| 55,721 | NTPC Ltd | 114,592 | ||||||
| 148,376 | Oil & Natural Gas Corp Ltd | 272,158 | ||||||
| 161,092 | Tata Steel Ltd | 202,893 | ||||||
|
| |||||||
| Total India | 779,000 | |||||||
|
| |||||||
| Ireland — 0.5% | ||||||||
| 30,142 | Bank of Ireland Group Plc | 332,078 | ||||||
| 3,918 | Glanbia Plc | 48,382 | ||||||
| 4,209 | Origin Enterprises Plc | 18,835 | ||||||
| 12,511 | Ryanair Holdings Plc * | 194,831 | ||||||
| 412 | Ryanair Holdings Plc Sponsored ADR * (a) | 38,221 | ||||||
| 7,081 | Smurfit Kappa Group Plc | 264,169 | ||||||
|
| |||||||
| Total Ireland | 896,516 | |||||||
|
| |||||||
| Israel — 0.2% | ||||||||
| 2,836 | Isracard Ltd | 10,050 | ||||||
| 26,900 | Teva Pharmaceutical Industries Ltd Sponsored ADR * (a) | 266,579 | ||||||
| 7,600 | ZIM Integrated Shipping Services Ltd | 179,816 | ||||||
|
| |||||||
| Total Israel | 456,445 | |||||||
|
| |||||||
| 115 | See accompanying notes to the financial statements. |
GMO Strategic Opportunities Allocation Fund
(A Series of GMO Trust)
Schedule of Investments — (Continued)
(showing percentage of total net assets)
February 28, 2023
| Shares | Description | Value ($) | ||||||
| Italy — 0.6% | ||||||||
| 2,745 | Ascopiave SPA (a) | 7,845 | ||||||
| 2,511 | Banca IFIS SPA | 41,218 | ||||||
| 3,249 | Credito Emiliano SPA | 27,918 | ||||||
| 13,603 | Italgas SPA (a) | 77,272 | ||||||
| 23,592 | Leonardo SPA (a) | 264,686 | ||||||
| 27,999 | MFE-MediaForEurope NV – Class A (a) | 12,301 | ||||||
| 13,773 | Stellantis NV (a) | 240,949 | ||||||
| 826,069 | Telecom Italia SPA * (a) | 269,730 | ||||||
| 27,203 | Unipol Gruppo SPA | 143,901 | ||||||
|
| |||||||
| Total Italy | 1,085,820 | |||||||
|
| |||||||
| Japan — 4.5% | ||||||||
| 1,621 | AGC Inc (a) | 59,972 | ||||||
| 600 | Aisin Corp | 16,442 | ||||||
| 400 | Arata Corp | 11,862 | ||||||
| 500 | Arcs Co Ltd | 7,959 | ||||||
| 22,000 | Asahi Kasei Corp | 153,230 | ||||||
| 6,100 | Brother Industries Ltd | 89,725 | ||||||
| 1,900 | Canon Marketing Japan Inc | 41,988 | ||||||
| 600 | Central Glass Co Ltd | 14,745 | ||||||
| 16,300 | Citizen Watch Co Ltd | 98,665 | ||||||
| 5,300 | Dai Nippon Printing Co Ltd (a) | 142,092 | ||||||
| 200 | Dai Nippon Toryo Co Ltd | 1,248 | ||||||
| 7,400 | Daicel Corp | 51,379 | ||||||
| 300 | Daiichi Jitsugyo Co Ltd | 11,677 | ||||||
| 5,700 | Daiwabo Holdings Co Ltd | 88,086 | ||||||
| 5,000 | Dentsu Group Inc (a) | 160,343 | ||||||
| 200 | Eizo Corp | 5,600 | ||||||
| 700 | ESPEC Corp | 10,434 | ||||||
| 2,600 | Fuji Electric Co Ltd (a) | 100,386 | ||||||
| 500 | FUJIFILM Holdings Corp (a) | 23,326 | ||||||
| 1,400 | Fukuoka Financial Group Inc | 31,253 | ||||||
| 3,300 | Hachijuni Bank Ltd (The) | 14,934 | ||||||
| 1,700 | Hanwa Co Ltd | 49,461 | ||||||
| 7,900 | Haseko Corp | 90,654 | ||||||
| 8,600 | Hogy Medical Co Ltd (a) | 203,200 | ||||||
| 12,200 | Honda Motor Co Ltd (a) | 317,239 | ||||||
| 2,800 | Hosiden Corp | 34,274 | ||||||
| 2,900 | Idemitsu Kosan Co Ltd (a) | 64,181 | ||||||
| 1,800 | Inabata & Co Ltd | 35,481 | ||||||
| 33,300 | Inpex Corp (a) | 349,130 | ||||||
| 8,800 | ITOCHU Corp (a) | 263,038 | ||||||
| 2,100 | Itochu Enex Co Ltd | 17,135 | ||||||
| 5,300 | Itoham Yonekyu Holdings Inc (a) | 27,789 | ||||||
| 1,500 | Jaccs Co Ltd | 48,849 | ||||||
| 1,100 | Japan Aviation Electronics Industry Ltd | 18,261 | ||||||
| 1,300 | Japan Petroleum Exploration Co Ltd (a) | 46,840 | ||||||
| 1,300 | Juroku Financial Group Inc | 30,695 | ||||||
| 1,100 | Kaga Electronics Co Ltd | 39,457 | ||||||
| 12,900 | Kajima Corp (a) | 154,168 | ||||||
| 2,400 | Kandenko Co Ltd | 15,747 | ||||||
| 800 | Kaneka Corp | 20,102 | ||||||
| 2,900 | Kanematsu Corp | 34,749 | ||||||
| Shares | Description | Value ($) | ||||||
| Japan — continued | ||||||||
| 500 | Kanematsu Electronics Ltd (a) | 22,721 | ||||||
| 300 | Kissei Pharmaceutical Co Ltd | 5,395 | ||||||
| 800 | Kohnan Shoji Co Ltd | 18,612 | ||||||
| 2,200 | Komeri Co Ltd (a) | 42,812 | ||||||
| 1,700 | Macnica Holdings Inc | 47,030 | ||||||
| 300 | Makino Milling Machine Co Ltd | 10,863 | ||||||
| 1,400 | Maruichi Steel Tube Ltd | 30,418 | ||||||
| 400 | Maruzen Showa Unyu Co Ltd | 9,164 | ||||||
| 8,800 | Mazda Motor Corp | 78,734 | ||||||
| 27,900 | Mebuki Financial Group Inc | 75,000 | ||||||
| 5,700 | Mirarth Holdings Inc | 15,858 | ||||||
| 5,500 | Mitsubishi Corp (a) | 186,841 | ||||||
| 3,400 | Mitsubishi Electric Corp (a) | 38,207 | ||||||
| 600 | Mitsubishi Gas Chemical Co Inc | 8,500 | ||||||
| 34,000 | Mitsubishi Motors Corp * | 134,080 | ||||||
| 200 | Mitsubishi Shokuhin Co Ltd (a) | 4,761 | ||||||
| 700 | Mitsui DM Sugar Holdings Co Ltd | 10,701 | ||||||
| 10,900 | Mitsui OSK Lines Ltd (a) | 284,709 | ||||||
| 800 | Mitsui-Soko Holdings Co Ltd (a) | 23,164 | ||||||
| 600 | MIXI Inc (a) | 11,791 | ||||||
| 500 | Nagase & Co Ltd | 7,428 | ||||||
| 13,500 | NGK Spark Plug Co Ltd | 271,474 | ||||||
| 1,200 | Nichias Corp | 23,663 | ||||||
| 800 | Nichiha Corp | 15,453 | ||||||
| 9,400 | Nikon Corp | 93,104 | ||||||
| 1,100 | Nippon Soda Co Ltd | 37,313 | ||||||
| 200 | Nippon Steel Trading Corp | 13,610 | ||||||
| 4,200 | Nippon Telegraph & Telephone Corp (a) | 121,703 | ||||||
| 7,600 | Nippon Television Holdings Inc (a) | 62,561 | ||||||
| 11,800 | Nippon Yusen KK (a) | 306,717 | ||||||
| 200 | Nisshin Oillio Group Ltd (The) | 4,891 | ||||||
| 800 | Nitto Kogyo Corp | 15,565 | ||||||
| 3,800 | Nojima Corp (a) | 37,823 | ||||||
| 27,700 | Obayashi Corp | 204,897 | ||||||
| 1,300 | Okamura Corp (a) | 13,090 | ||||||
| 1,000 | Osaka Soda Co Ltd | 31,606 | ||||||
| 1,800 | PAL GROUP Holdings Co Ltd | 36,768 | ||||||
| 1,400 | Proto Corp | 12,542 | ||||||
| 1,200 | Raiznext Corp | 12,145 | ||||||
| 2,600 | Renesas Electronics Corp * (a) | 33,585 | ||||||
| 1,000 | San-Ai Oil Co Ltd | 10,252 | ||||||
| 2,500 | Sanki Engineering Co Ltd | 28,049 | ||||||
| 4,600 | Sanwa Holdings Corp | 48,489 | ||||||
| 13,200 | Seiko Epson Corp | 181,998 | ||||||
| 14,700 | Sekisui House Ltd (a) | 278,319 | ||||||
| 400 | Sekisui Jushi Corp | 5,803 | ||||||
| 2,300 | Shimamura Co Ltd (a) | 214,864 | ||||||
| 24,400 | Shimizu Corp | 131,708 | ||||||
| 1,100 | Shizuoka Gas Co Ltd (a) | 9,116 | ||||||
| 500 | Sinko Industries Ltd | 5,787 | ||||||
| 4,200 | SKY Perfect JSAT Holdings Inc (a) | 15,940 | ||||||
| 15,740 | Sojitz Corp | 302,172 | ||||||
| 1,100 | Star Micronics Co Ltd | 13,953 | ||||||
| 7,600 | Subaru Corp | 121,761 | ||||||
| See accompanying notes to the financial statements. | 116 |
GMO Strategic Opportunities Allocation Fund
(A Series of GMO Trust)
Schedule of Investments — (Continued)
(showing percentage of total net assets)
February 28, 2023
| Shares | Description | Value ($) | ||||||
| Japan — continued | ||||||||
| 71,500 | Sumitomo Chemical Co Ltd | 250,536 | ||||||
| 15,400 | Sumitomo Corp (a) | 262,459 | ||||||
| 10,800 | Sumitomo Forestry Co Ltd | 207,242 | ||||||
| 400 | Sumitomo Seika Chemicals Co Ltd | 12,866 | ||||||
| 1,100 | Sumitomo Warehouse Co Ltd (The) (a) | 17,198 | ||||||
| 6,100 | Taisei Corp (a) | 198,879 | ||||||
| 400 | Takeuchi Manufacturing Co Ltd | 8,544 | ||||||
| 1,000 | Tamron Co Ltd | 23,819 | ||||||
| 1,400 | Toho Holdings Co Ltd (a) | 22,638 | ||||||
| 14,900 | Tokyo Gas Co Ltd (a) | 287,383 | ||||||
| 3,900 | Tokyu Construction Co Ltd | 19,808 | ||||||
| 10,700 | Tosoh Corp | 145,618 | ||||||
| 600 | Totetsu Kogyo Co Ltd | 12,083 | ||||||
| 3,300 | Toyo Construction Co Ltd | 21,483 | ||||||
| 1,500 | TV Asahi Holdings Corp (a) | 16,002 | ||||||
| 2,000 | YAMABIKO Corp | 18,546 | ||||||
| 4,900 | Yamaha Motor Co Ltd | 125,368 | ||||||
| 1,200 | Yamazen Corp | 9,226 | ||||||
| 2,200 | Yellow Hat Ltd | 28,731 | ||||||
| 600 | Yuasa Trading Co Ltd | 16,118 | ||||||
|
| |||||||
| Total Japan | 8,483,853 | |||||||
|
| |||||||
| Mexico — 0.3% | ||||||||
| 36,102 | Fomento Economico Mexicano SAB de CV | 332,478 | ||||||
| 52,975 | Grupo Mexico SAB de CV – Series B | 238,260 | ||||||
|
| |||||||
| Total Mexico | 570,738 | |||||||
|
| |||||||
| Netherlands — 1.3% | ||||||||
| 14,935 | ABN AMRO Bank NV CVA | 263,545 | ||||||
| 52,055 | Aegon NV (a) | 270,854 | ||||||
| 5,652 | ASR Nederland NV | 257,227 | ||||||
| 7,939 | EXOR NV * (a) | 655,081 | ||||||
| 7,104 | JDE Peet’s NV (a) | 209,121 | ||||||
| 8,892 | Koninklijke Ahold Delhaize NV (a) | 282,338 | ||||||
| 16,481 | Koninklijke Philips NV (a) | 269,082 | ||||||
| 5,953 | NN Group NV (a) | 240,957 | ||||||
| 1,135 | Randstad NV (a) | 69,644 | ||||||
|
| |||||||
| Total Netherlands | 2,517,849 | |||||||
|
| |||||||
| New Zealand — 0.1% | ||||||||
| 7,740 | Auckland International Airport Ltd * (a) | 41,823 | ||||||
| 20,533 | Meridian Energy Ltd (a) | 67,397 | ||||||
| 8,374 | Spark New Zealand Ltd (a) | 25,855 | ||||||
|
| |||||||
| Total New Zealand | 135,075 | |||||||
|
| |||||||
| Norway — 0.2% | ||||||||
| 11,769 | DNO ASA | 13,485 | ||||||
| 15,845 | Elkem ASA | 59,650 | ||||||
| 10,372 | Europris ASA (a) | 73,122 | ||||||
| 1,204 | Hoegh Autoliners ASA (a) | 7,893 | ||||||
| 5,347 | Norske Skog ASA * | 34,470 | ||||||
| 1,637 | SpareBank 1 Nord Norge | 16,242 | ||||||
| 765 | Stolt-Nielsen Ltd (a) | 23,649 | ||||||
| Shares | Description | Value ($) | ||||||
| Norway — continued | ||||||||
| 1,330 | Subsea 7 SA (a) | 17,276 | ||||||
| 7,121 | Wallenius Wilhelmsen ASA (a) | 62,254 | ||||||
|
| |||||||
| Total Norway | 308,041 | |||||||
|
| |||||||
| Poland — 0.0% | ||||||||
| 3,946 | Polski Koncern Naftowy ORLEN SA | 58,936 | ||||||
|
| |||||||
| Portugal — 0.2% | ||||||||
| 5,839 | CTT - Correios de Portugal SA | 23,170 | ||||||
| 28,679 | EDP – Energias de Portugal SA | 144,419 | ||||||
| 14,937 | Navigator Co SA (The) | 52,534 | ||||||
| 11,973 | NOS SGPS SA | 52,906 | ||||||
| 98,476 | Sonae SGPS SA | 107,896 | ||||||
|
| |||||||
| Total Portugal | 380,925 | |||||||
|
| |||||||
| Russia — 0.0% | ||||||||
| 2,505 | LUKOIL PJSC (d) | 1,323 | ||||||
| 5,410 | Novatek PJSC (d) | 770 | ||||||
|
| |||||||
| Total Russia | 2,093 | |||||||
|
| |||||||
| Singapore — 0.5% | ||||||||
| 4,700 | City Developments Ltd | 26,886 | ||||||
| 33,600 | ComfortDelGro Corp Ltd | 30,171 | ||||||
| 19,000 | First Resources Ltd | 21,663 | ||||||
| 222,800 | Golden Agri-Resources Ltd | 42,161 | ||||||
| 27,900 | Japfa Ltd | 6,212 | ||||||
| 8,100 | Jardine Cycle & Carriage Ltd | 178,566 | ||||||
| 33,900 | Keppel Corp Ltd | 137,662 | ||||||
| 646,982 | Sembcorp Marine Ltd * | 60,886 | ||||||
| 26,800 | StarHub Ltd | 21,077 | ||||||
| 2,100 | Venture Corp Ltd | 26,743 | ||||||
| 184,300 | Yangzijiang Financial Holding Ltd * | 47,818 | ||||||
| 348,200 | Yangzijiang Shipbuilding Holdings Ltd | 333,157 | ||||||
| 24,600 | Yanlord Land Group Ltd | 19,911 | ||||||
|
| |||||||
| Total Singapore | 952,913 | |||||||
|
| |||||||
| South Africa — 0.1% | ||||||||
| 7,025 | Bidvest Group Ltd (The) | 89,582 | ||||||
|
| |||||||
| South Korea — 0.3% | ||||||||
| 331 | E-MART Inc | 27,999 | ||||||
| 2,677 | Kia Corp | 152,134 | ||||||
| 1,223 | LG Corp | 76,093 | ||||||
| 606 | LG Electronics Inc | 50,829 | ||||||
| 137 | POSCO Holdings Inc | 33,020 | ||||||
| 2,400 | POSCO Holdings Inc Sponsored ADR (a) | 146,376 | ||||||
| 2,735 | SK Square Co Ltd * | 79,191 | ||||||
|
| |||||||
| Total South Korea | 565,642 | |||||||
|
| |||||||
| Spain — 1.1% | ||||||||
| 21,374 | Acerinox SA | 234,703 | ||||||
| 370 | ACS Actividades de Construccion y Servicios SA (a) | 11,217 | ||||||
| 117 | See accompanying notes to the financial statements. |
GMO Strategic Opportunities Allocation Fund
(A Series of GMO Trust)
Schedule of Investments — (Continued)
(showing percentage of total net assets)
February 28, 2023
| Shares | Description | Value ($) | ||||||
| Spain — continued | ||||||||
| 3,721 | Amadeus IT Group SA * (a) | 233,987 | ||||||
| 46,898 | Banco Bilbao Vizcaya Argentaria SA (a) | 364,539 | ||||||
| 189,043 | Banco de Sabadell SA | 246,927 | ||||||
| 85,453 | Banco Santander SA (a) | 336,463 | ||||||
| 4,037 | Cia de Distribucion Integral Logista Holdings SA (a) | 97,459 | ||||||
| 9,308 | Ence Energia y Celulosa SA | 35,522 | ||||||
| 2,413 | Faes Farma SA | 8,814 | ||||||
| 6,390 | Industria de Diseno Textil SA (a) | 196,855 | ||||||
| 21,520 | Repsol SA (a) | 340,335 | ||||||
|
| |||||||
| Total Spain | 2,106,821 | |||||||
|
| |||||||
| Sweden — 0.5% | ||||||||
| 3,624 | Betsson AB – Class B* (a) | 32,544 | ||||||
| 21,811 | Fastighets AB Balder – B Shares* (a) | 107,896 | ||||||
| 1,822 | Industrivarden AB – A Shares (a) | 50,082 | ||||||
| 4,611 | Industrivarden AB – C Shares (a) | 126,418 | ||||||
| 4,424 | Investor AB – A Shares (a) | 90,687 | ||||||
| 3,356 | Inwido AB | 37,221 | ||||||
| 8,673 | Kinnevik AB – Class B* | 128,984 | ||||||
| 1,919 | New Wave Group AB – B Shares | 33,664 | ||||||
| 3,780 | Skanska AB – B Shares (a) | 68,698 | ||||||
| 37,851 | SSAB AB – A Shares | 275,173 | ||||||
| 2,358 | SSAB AB – B Shares (a) | 16,130 | ||||||
| 2,725 | Svenska Cellulosa AB SCA – Class B | 38,028 | ||||||
|
| |||||||
| Total Sweden | 1,005,525 | |||||||
|
| |||||||
| Switzerland — 0.4% | ||||||||
| 6,670 | Adecco Group AG (Registered) (a) | 237,827 | ||||||
| 500 | Logitech International SA (a) | 27,275 | ||||||
| 3,677 | Logitech International SA (Registered) (a) | 200,840 | ||||||
| 53 | Roche Holding AG (a) | 16,418 | ||||||
| 942 | Roche Holding AG – Genusschein (a) | 271,615 | ||||||
| 27 | Schindler Holding AG (Registered) (a) | 5,819 | ||||||
| 315 | u-blox Holding AG * | 33,809 | ||||||
|
| |||||||
| Total Switzerland | 793,603 | |||||||
|
| |||||||
| Thailand — 0.1% | ||||||||
| 21,200 | Kasikornbank Pcl NVDR | 82,160 | ||||||
| 263,800 | Krung Thai Bank Pcl NVDR | 129,119 | ||||||
|
| |||||||
| Total Thailand | 211,279 | |||||||
|
| |||||||
| Turkey — 0.2% | ||||||||
| 99,302 | Haci Omer Sabanci Holding AS | 229,118 | ||||||
| 420,212 | Yapi ve Kredi Bankasi AS | 222,691 | ||||||
|
| |||||||
| Total Turkey | 451,809 | |||||||
|
| |||||||
| United Kingdom — 2.5% | ||||||||
| 18,728 | 3i Group Plc (a) | 366,399 | ||||||
| 23,675 | Balfour Beatty Plc | 103,936 | ||||||
| 1,088 | Bank of Georgia Group Plc | 36,637 | ||||||
| 53,965 | Barratt Developments Plc | 303,417 | ||||||
| Shares | Description | Value ($) | ||||||
| United Kingdom — continued | ||||||||
| 5,914 | Bellway Plc | 157,669 | ||||||
| 7,761 | Berkeley Group Holdings Plc (The) | 390,678 | ||||||
| 129,122 | BT Group Plc (a) | 216,467 | ||||||
| 1,426 | Bunzl Plc (a) | 50,810 | ||||||
| 101,227 | Centrica Plc (a) | 127,742 | ||||||
| 200 | Clarkson Plc (a) | 7,943 | ||||||
| 14,928 | Coca-Cola HBC AG * (a) | 382,297 | ||||||
| 15,721 | Compass Group Plc (a) | 363,183 | ||||||
| 9,585 | Crest Nicholson Holdings Plc | 28,168 | ||||||
| 34,999 | Ferrexpo Plc | 62,018 | ||||||
| 9,400 | Haleon Plc ADR * (a) | 74,072 | ||||||
| 9,848 | Halfords Group Plc | 24,908 | ||||||
| 12,590 | IG Group Holdings Plc | 121,540 | ||||||
| 323 | Indivior Plc * | 5,918 | ||||||
| 14,144 | Investec Plc | 90,084 | ||||||
| 52,595 | Kingfisher Plc (a) | 181,892 | ||||||
| 31,230 | M&G Plc | 80,435 | ||||||
| 1,972 | Morgan Sindall Group Plc | 42,574 | ||||||
| 18,562 | OSB Group Plc | 124,547 | ||||||
| 1,901 | Paragon Banking Group Plc | 13,631 | ||||||
| 6,089 | Persimmon Plc | 106,184 | ||||||
| 10,466 | Plus500 Ltd | 225,770 | ||||||
| 19,590 | Premier Foods Plc (a) | 26,817 | ||||||
| 9,276 | Redde Northgate Plc (a) | 45,127 | ||||||
| 14,847 | Redrow Plc | 91,239 | ||||||
| 16,236 | S4 Capital Plc * (a) | 40,021 | ||||||
| 12,021 | Serica Energy Plc | 37,441 | ||||||
| 7,807 | Shell Plc (a) | 236,461 | ||||||
| 72,474 | Taylor Wimpey Plc | 107,206 | ||||||
| 850 | TBC Bank Group Plc | 25,363 | ||||||
| 22,729 | Vodafone Group Plc Sponsored ADR (a) | 272,066 | ||||||
| 13,798 | WPP Plc (a) | 169,704 | ||||||
|
| |||||||
| Total United Kingdom | 4,740,364 | |||||||
|
| |||||||
| United States — 11.3% | ||||||||
| 1,000 | 3M Co. (a) | 107,740 | ||||||
| 1,183 | ADTRAN Holdings, Inc. | 20,643 | ||||||
| 8,100 | Ally Financial, Inc. (a) | 243,405 | ||||||
| 1,717 | Alphabet, Inc. – Class A* (a) | 154,633 | ||||||
| 1,533 | American Express Co. (a) | 266,727 | ||||||
| 2,400 | Arrow Electronics, Inc. * (a) | 283,176 | ||||||
| 200 | Aspen Technology, Inc. * (a) | 42,402 | ||||||
| 3,800 | AT&T, Inc. (a) | 71,858 | ||||||
| 2,200 | Best Buy Co., Inc. (a) | 182,842 | ||||||
| 500 | Biogen, Inc. * (a) | 134,930 | ||||||
| 500 | Bio-Rad Laboratories, Inc. – Class A* (a) | 238,920 | ||||||
| 105 | Booking Holdings, Inc. * (a) | 265,020 | ||||||
| 9,913 | BorgWarner, Inc. | 498,426 | ||||||
| 2,700 | Capital One Financial Corp. (a) | 294,516 | ||||||
| 724 | CarMax, Inc. * (a) | 49,985 | ||||||
| 6,300 | Carrier Global Corp. (a) | 283,689 | ||||||
| 1,700 | CBRE Group, Inc. – Class A* (a) | 144,738 | ||||||
| 4,100 | Centene Corp. * (a) | 280,440 | ||||||
| See accompanying notes to the financial statements. | 118 |
GMO Strategic Opportunities Allocation Fund
(A Series of GMO Trust)
Schedule of Investments — (Continued)
(showing percentage of total net assets)
February 28, 2023
| Shares | Description | Value ($) | ||||||
| United States — continued | ||||||||
| 1,265 | Chevron Corp. (a) | 203,374 | ||||||
| 4,600 | Citigroup, Inc. (a) | 233,174 | ||||||
| 14,000 | Cleveland-Cliffs, Inc. * (a) | 298,620 | ||||||
| 3,500 | Cognizant Technology Solutions Corp. – Class A (a) | 219,205 | ||||||
| 5,800 | Comcast Corp. – Class A (a) | 215,586 | ||||||
| 1,564 | Crowdstrike Holdings, Inc. – Class A* (a) | 188,759 | ||||||
| 1,700 | CVS Health Corp. (a) | 142,018 | ||||||
| 3,615 | Darling Ingredients, Inc. * (a) | 228,721 | ||||||
| 4,300 | Dell Technologies, Inc. – Class C (a) | 174,752 | ||||||
| 900 | Discover Financial Services (a) | 100,800 | ||||||
| 18,500 | DISH Network Corp. – Class A* (a) | 211,085 | ||||||
| 3,200 | DR Horton, Inc. (a) | 295,936 | ||||||
| 5,300 | eBay, Inc. (a) | 243,270 | ||||||
| 2,257 | EOG Resources, Inc. (a) | 255,086 | ||||||
| 1,100 | FedEx Corp. (a) | 223,542 | ||||||
| 6,700 | Fidelity National Financial, Inc. (a) | 267,062 | ||||||
| 24,100 | Ford Motor Co. (a) | 290,887 | ||||||
| 3,600 | Fortune Brands Innovations, Inc. (a) | 223,020 | ||||||
| 200 | Fox Corp. – Class A (a) | 7,004 | ||||||
| 7,200 | Fox Corp. – Class B (a) | 232,200 | ||||||
| 8,400 | Franklin Resources, Inc. (a) | 247,548 | ||||||
| 314 | Generac Holdings, Inc. * (a) | 37,683 | ||||||
| 8,300 | General Motors Co. (a) | 321,542 | ||||||
| 2,572 | Green Plains, Inc. * (a) | 89,171 | ||||||
| 1,496 | Hilton Worldwide Holdings, Inc. (a) | 216,187 | ||||||
| 9,000 | HP, Inc. (a) | 265,680 | ||||||
| 3,600 | Incyte Corp. * (a) | 277,128 | ||||||
| 11,900 | Intel Corp. (a) | 296,667 | ||||||
| 2,492 | Intercontinental Exchange, Inc. (a) | 253,686 | ||||||
| 2,100 | International Business Machines Corp. (a) | 271,530 | ||||||
| 5,100 | Invesco Ltd. (a) | 90,066 | ||||||
| 1,800 | Jazz Pharmaceuticals Plc * (a) | 252,720 | ||||||
| 12,900 | Kinder Morgan, Inc. (a) | 220,074 | ||||||
| 2,700 | Knight-Swift Transportation Holdings, Inc. (a) | 153,468 | ||||||
| 7,000 | Kraft Heinz Co. (The) (a) | 272,580 | ||||||
| 1,100 | Laboratory Corp. of America Holdings (a) | 263,296 | ||||||
| 288 | Lam Research Corp. (a) | 139,971 | ||||||
| 3,912 | Las Vegas Sands Corp. * (a) | 224,823 | ||||||
| 2,900 | Lennar Corp. – Class A (a) | 280,546 | ||||||
| 1,288 | Liberty Global Plc – Class A* (a) | 26,391 | ||||||
| 2,099 | Liberty Global Plc – Class C* (a) | 44,604 | ||||||
| 5,400 | Lincoln National Corp. | 171,288 | ||||||
| 54,410 | Lumen Technologies, Inc. (a) | 184,994 | ||||||
| 3,000 | LyondellBasell Industries NV – Class A (a) | 287,970 | ||||||
| 166 | Markel Corp. * (a) | 220,757 | ||||||
| 900 | Match Group, Inc. * (a) | 37,278 | ||||||
| 2,616 | Meta Platforms, Inc. – Class A* (a) | 457,643 | ||||||
| 7,429 | Micron Technology, Inc. (a) | 429,545 | ||||||
| 2,100 | Mohawk Industries, Inc. * | 215,985 | ||||||
| 5,000 | Molson Coors Brewing Co. – Class B (a) | 265,950 | ||||||
| 4,485 | Mosaic Co. (The) (a) | 238,557 | ||||||
| 5,000 | NRG Energy, Inc. (a) | 163,950 | ||||||
| Shares | Description | Value ($) | ||||||
| United States — continued | ||||||||
| 1,600 | Nucor Corp. (a) | 267,904 | ||||||
| 5,000 | Occidental Petroleum Corp. (a) | 292,800 | ||||||
| 500 | Oracle Corp. (a) | 43,700 | ||||||
| 1,620 | Otis Worldwide Corp. (a) | 137,084 | ||||||
| 2,396 | Ovintiv, Inc. (a) | 102,477 | ||||||
| 12,300 | Paramount Global – Class B (a) | 263,466 | ||||||
| 3,700 | PayPal Holdings, Inc. * (a) | 272,320 | ||||||
| 2,200 | Prudential Financial, Inc. (a) | 220,000 | ||||||
| 5,000 | PulteGroup, Inc. (a) | 273,350 | ||||||
| 2,906 | Raytheon Technologies Corp. (a) | 285,049 | ||||||
| 400 | Regeneron Pharmaceuticals, Inc. * (a) | 304,168 | ||||||
| 2,255 | Sensata Technologies Holding Plc (a) | 114,058 | ||||||
| 1,000 | Skyworks Solutions, Inc. (a) | 111,570 | ||||||
| 1,200 | SS&C Technologies Holdings, Inc. (a) | 70,440 | ||||||
| 2,700 | Steel Dynamics, Inc. (a) | 340,497 | ||||||
| 7,600 | Synchrony Financial (a) | 271,396 | ||||||
| 2,200 | Textron, Inc. (a) | 159,566 | ||||||
| 4,200 | Tyson Foods, Inc. – Class A (a) | 248,808 | ||||||
| 1,900 | Universal Health Services, Inc. – Class B (a) | 253,783 | ||||||
| 4,853 | US Bancorp (a) | 231,634 | ||||||
| 7,900 | Verizon Communications, Inc. (a) | 306,599 | ||||||
| 600 | Vertex Pharmaceuticals, Inc. * (a) | 174,174 | ||||||
| 24,200 | Viatris, Inc. (a) | 275,880 | ||||||
| 5,000 | Walgreens Boots Alliance, Inc. (a) | 177,650 | ||||||
| 3,023 | Warner Bros Discovery, Inc. * (a) | 47,219 | ||||||
| 5,598 | Wells Fargo & Co. (a) | 261,818 | ||||||
| 19,600 | Western Union Co. (The) (a) | 254,016 | ||||||
| 4,500 | Western Digital Corp. * (a) | 173,160 | ||||||
| 1,800 | Westlake Corp. (a) | 214,452 | ||||||
| 1,300 | Whirlpool Corp. | 179,374 | ||||||
| 4,000 | Zoom Video Communications, Inc. – Class A* (a) | 298,360 | ||||||
|
| |||||||
| Total United States | 21,364,241 | |||||||
|
| |||||||
| TOTAL COMMON STOCKS (COST $61,203,780) | 62,390,097 | |||||||
|
| |||||||
| PREFERRED STOCKS (e) —0.3% | ||||||||
| Brazil — 0.2% | ||||||||
| 31,790 | Bradespar SA | 167,953 | ||||||
| 4,000 | Petroleo Brasileiro SA | 19,284 | ||||||
| 14,400 | Petroleo Brasileiro SA Sponsored ADR (a) | 140,544 | ||||||
|
| |||||||
| Total Brazil | 327,781 | |||||||
|
| |||||||
| Germany — 0.1% | ||||||||
| 1,572 | Bayerische Motoren Werke AG (a) | 148,893 | ||||||
| 507 | Draegerwerk AG & Co KGaA (a) | 22,110 | ||||||
| 1,142 | Volkswagen AG (a) | 155,456 | ||||||
|
| |||||||
| Total Germany | 326,459 | |||||||
|
| |||||||
| TOTAL PREFERRED STOCKS (COST $631,951) | 654,240 | |||||||
|
| |||||||
| 119 | See accompanying notes to the financial statements. |
GMO Strategic Opportunities Allocation Fund
(A Series of GMO Trust)
Schedule of Investments — (Continued)
(showing percentage of total net assets)
February 28, 2023
| Par Value† / Shares | Description | Value ($) | ||||||
| DEBT OBLIGATIONS — 4.3% | ||||||||
| United States — 4.3% | ||||||||
| U.S. Government — 2.7% | ||||||||
| 51,000 | U.S. Treasury Note, 0.13%, due 04/30/23 (a) | 50,603 | ||||||
| 5,000,000 | U.S. Treasury Note, Variable Rate, SOFR + 0.20%, 5.01%, due 01/31/25 (a) | 5,005,241 | ||||||
|
| |||||||
| Total U.S. Government | 5,055,844 | |||||||
|
| |||||||
| U.S. Government Agency — 1.6% | ||||||||
| 1,500,000 | Federal Home Loan Banks, 5.23%, due 03/22/24 | 1,500,679 | ||||||
| 1,500,000 | Federal Home Loan Banks, SOFR + 0.03%, 4.58%, due 06/07/23 | 1,499,997 | ||||||
|
| |||||||
| Total U.S. Government Agency | 3,000,676 | |||||||
|
| |||||||
| Total United States | 8,056,520 | |||||||
|
| |||||||
| TOTAL DEBT OBLIGATIONS (COST $8,054,406) | 8,056,520 | |||||||
|
| |||||||
| MUTUAL FUNDS — 69.0% | ||||||||
| United States — 69.0% | ||||||||
| Affiliated Issuers — 69.0% | ||||||||
| 361,645 | GMO Emerging Country Debt Fund, Class VI | 6,386,651 | ||||||
| 1,264,729 | GMO Emerging Markets ex-China Fund, Class VI | 16,871,485 | ||||||
| 769,179 | GMO Emerging Markets Fund, Class VI | 16,668,100 | ||||||
| 1,138,493 | GMO International Equity Fund, Class IV | 24,591,450 | ||||||
| 597,246 | GMO-Usonian Japan Value Creation Fund, Class VI | 10,075,534 | ||||||
| 648,113 | GMO Multi-Sector Fixed Income Fund, Class IV | 10,765,156 | ||||||
| 311,817 | GMO Quality Fund, Class VI | 7,408,770 | ||||||
| 331,353 | GMO Small Cap Quality Fund, Class VI | 7,332,851 | ||||||
| 789,237 | GMO U.S. Equity Fund, Class VI | 9,770,751 | ||||||
| 832,133 | GMO U.S. Opportunistic Value Fund, Class VI | 16,800,764 | ||||||
| 820,696 | GMO U.S. Treasury Fund | 4,095,276 | ||||||
|
| |||||||
| Total Affiliated Issuers | 130,766,788 | |||||||
|
| |||||||
| TOTAL MUTUAL FUNDS (COST $143,983,532) | 130,766,788 | |||||||
|
| |||||||
| SHORT-TERM INVESTMENTS — 11.0% |
| |||||||
| Money Market Funds — 0.4% | ||||||||
| 782,924 | State Street Institutional Treasury Money Market Fund – Premier Class, 4.42% (f) | 782,924 | ||||||
|
| |||||||
| Shares | Description | Value ($) | ||||||
| Repurchase Agreements — 10.6% | ||||||||
| 19,999,629 | Nomura Securities International, Inc. Repurchase Agreement, dated 02/28/23, maturing on 03/01/23 with a maturity value of $20,002,135 and an effective yield of 4.51%, collateralized by a U.S. Treasury Note with maturity date 12/31/29 and a market value of $20,407,785. | 19,999,629 | ||||||
|
| |||||||
| TOTAL SHORT-TERM INVESTMENTS (COST $20,782,553) | 20,782,553 | |||||||
|
| |||||||
| TOTAL INVESTMENTS — 117.5% | ||||||||
| (Cost $234,656,222) | 222,650,198 | |||||||
|
| |||||||
| SECURITIES SOLD SHORT — (18.1)% |
| |||||||
| Common Stocks — (18.0)% | ||||||||
| Australia — (0.5)% | ||||||||
| (4,131) | ASX Ltd | (188,689 | ) | |||||
| (876) | Cochlear Ltd | (130,633 | ) | |||||
| (4,940) | IDP Education Ltd | (95,002 | ) | |||||
| (199) | Macquarie Group Ltd | (25,269 | ) | |||||
| (78,626) | Pilbara Minerals Ltd* | (219,097 | ) | |||||
| (27,002) | Qantas Airways Ltd* | (116,136 | ) | |||||
| (2,517) | Ramsay Health Care Ltd | (114,113 | ) | |||||
|
| |||||||
| Total Australia | (888,939 | ) | ||||||
|
| |||||||
| Austria — (0.1)% | ||||||||
| (2,362) | Verbund AG | (204,271 | ) | |||||
|
| |||||||
| Belgium — (0.2)% | ||||||||
| (4,837) | Anheuser-Busch InBev SA/NV | (293,405 | ) | |||||
|
| |||||||
| Canada — (1.0)% | ||||||||
| (3,700) | Agnico Eagle Mines Ltd | (170,311 | ) | |||||
| (5,200) | Algonquin Power & Utilities Corp | (39,676 | ) | |||||
| (12,100) | AltaGas Ltd | (207,682 | ) | |||||
| (5,700) | Brookfield Renewable Corp – Class A | (158,745 | ) | |||||
| (7,373) | Enbridge Inc | (276,635 | ) | |||||
| (1,984) | Franco-Nevada Corp | (253,099 | ) | |||||
| (13,582) | Pan American Silver Corp | (201,828 | ) | |||||
| (8,100) | Pembina Pipeline Corp | (266,004 | ) | |||||
| (4,000) | Restaurant Brands International Inc | (257,960 | ) | |||||
| (900) | Ritchie Bros Auctioneers Inc | (55,053 | ) | |||||
|
| |||||||
| Total Canada | (1,886,993 | ) | ||||||
|
| |||||||
| Denmark — (0.1)% | ||||||||
| (232) | Coloplast A/S – Class B | (26,807 | ) | |||||
| (5,884) | Tryg A/S | (130,351 | ) | |||||
|
| |||||||
| Total Denmark | (157,158 | ) | ||||||
|
| |||||||
| Finland — (0.0)% | ||||||||
| (1,468) | Elisa Oyj | (83,365 | ) | |||||
|
| |||||||
| See accompanying notes to the financial statements. | 120 |
GMO Strategic Opportunities Allocation Fund
(A Series of GMO Trust)
Schedule of Investments — (Continued)
(showing percentage of total net assets)
February 28, 2023
| Shares | Description | Value ($) | ||||||
| France — (0.6)% | ||||||||
| (7,842) | Accor SA* | (260,271 | ) | |||||
| (1,525) | Aeroports de Paris* | (220,959 | ) | |||||
| (38) | Euronext NV | (2,772 | ) | |||||
| (13,476) | Getlink SE | (226,327 | ) | |||||
| (179) | Hermes International | (324,014 | ) | |||||
| (185) | Sartorius Stedim Biotech | (60,254 | ) | |||||
| (904) | Ubisoft Entertainment SA* | (19,820 | ) | |||||
|
| |||||||
| Total France | (1,114,417 | ) | ||||||
|
| |||||||
| Germany — (0.8)% | ||||||||
| (6,166) | Delivery Hero SE* | (247,785 | ) | |||||
| (1,023) | Deutsche Boerse AG | (178,385 | ) | |||||
| (1,001) | MTU Aero Engines AG | (241,564 | ) | |||||
| (1,773) | Puma SE | (112,859 | ) | |||||
| (189) | Rational AG | (125,362 | ) | |||||
| (2,657) | Symrise AG – Class A | (271,464 | ) | |||||
| (70,965) | Telefonica Deutschland Holding AG | (215,268 | ) | |||||
| (1,286) | Zalando SE* | (50,951 | ) | |||||
|
| |||||||
| Total Germany | (1,443,638 | ) | ||||||
|
| |||||||
| Ireland — (0.0)% | ||||||||
| (447) | Flutter Entertainment Plc* | (71,436 | ) | |||||
|
| |||||||
| Israel — (0.2)% | ||||||||
| (1,800) | CyberArk Software Ltd* | (260,586 | ) | |||||
| (800) | Wix.com Ltd* | (72,424 | ) | |||||
|
| |||||||
| Total Israel | (333,010 | ) | ||||||
|
| |||||||
| Italy — (0.6)% | ||||||||
| (6,384) | Amplifon SPA | (184,594 | ) | |||||
| (986) | Ferrari NV (b) | (255,814 | ) | |||||
| (300) | Ferrari NV (b) | (78,111 | ) | |||||
| (15,620) | FinecoBank Banca Fineco SPA | (269,921 | ) | |||||
| (22,515) | Infrastrutture Wireless Italiane SPA | (247,802 | ) | |||||
|
| |||||||
| Total Italy | (1,036,242 | ) | ||||||
|
| |||||||
| Japan — (1.9)% | ||||||||
| (5,900) | Aeon Co Ltd | (110,046 | ) | |||||
| (11,300) | ANA Holdings Inc* | (229,261 | ) | |||||
| (9,500) | Asahi Intecc Co Ltd | (161,747 | ) | |||||
| (2,400) | GMO Payment Gateway Inc | (197,126 | ) | |||||
| (12,900) | Japan Airlines Co Ltd* | (242,906 | ) | |||||
| (5,900) | Japan Exchange Group Inc | (87,996 | ) | |||||
| (3,700) | Keio Corp | (128,916 | ) | |||||
| (1,800) | Keisei Electric Railway Co Ltd | (52,031 | ) | |||||
| (700) | Kintetsu Group Holdings Co Ltd | (21,206 | ) | |||||
| (1,600) | Lasertec Corp | (260,153 | ) | |||||
| (8,000) | M3 Inc | (190,778 | ) | |||||
| (15,200) | MonotaRO Co Ltd | (206,741 | ) | |||||
| (700) | Nidec Corp | (35,525 | ) | |||||
| (10,600) | Nihon M&A Center Holdings Inc | (88,379 | ) | |||||
| (16,700) | Nippon Paint Holdings Co Ltd | (145,933 | ) | |||||
| (10,700) | Odakyu Electric Railway Co Ltd | (129,714 | ) | |||||
| Shares | Description | Value ($) | ||||||
| Japan — continued | ||||||||
| (2,000) | Oriental Land Co Ltd | (319,370 | ) | |||||
| (49,600) | Rakuten Group Inc | (244,487 | ) | |||||
| (3,500) | Shiseido Co Ltd | (161,271 | ) | |||||
| (23,900) | SoftBank Corp | (269,615 | ) | |||||
| (3,400) | Tobu Railway Co Ltd | (75,908 | ) | |||||
| (10,200) | Tokyu Corp | (122,879 | ) | |||||
| (4,000) | West Japan Railway Co | (155,252 | ) | |||||
|
| |||||||
| Total Japan | (3,637,240 | ) | ||||||
|
| |||||||
| Netherlands — (0.5)% | ||||||||
| (187) | Adyen NV* | (265,059 | ) | |||||
| (1,223) | IMCD NV | (193,590 | ) | |||||
| (6,105) | Just Eat Takeaway.com NV* | (132,786 | ) | |||||
| (71) | OCI NV | (2,358 | ) | |||||
| (10,847) | Universal Music Group NV | (255,570 | ) | |||||
|
| |||||||
| Total Netherlands | (849,363 | ) | ||||||
|
| |||||||
| New Zealand — (0.1)% | ||||||||
| (4,074) | Xero Ltd* | (212,189 | ) | |||||
|
| |||||||
| Norway — (0.1)% | ||||||||
| (9,016) | Aker BP ASA | (241,995 | ) | |||||
|
| |||||||
| Peru — (0.1)% | ||||||||
| (3,500) | Southern Copper Corp | (257,915 | ) | |||||
|
| |||||||
| Singapore — (0.1)% | ||||||||
| (35,028) | Grab Holdings Ltd – Class A* | (112,440 | ) | |||||
| (22,100) | Singapore Exchange Ltd | (142,730 | ) | |||||
|
| |||||||
| Total Singapore | (255,170 | ) | ||||||
|
| |||||||
| Spain — (0.3)% | ||||||||
| (8,306) | Cellnex Telecom SA | (311,631 | ) | |||||
| (10,986) | Ferrovial SA | (304,926 | ) | |||||
|
| |||||||
| Total Spain | (616,557 | ) | ||||||
|
| |||||||
| Sweden — (0.1)% | ||||||||
| (2,043) | Evolution AB | (246,522 | ) | |||||
|
| |||||||
| Switzerland — (0.3)% | ||||||||
| (5) | Chocoladefabriken Lindt & Spruengli AG | (54,778 | ) | |||||
| (186) | Partners Group Holding AG | (176,130 | ) | |||||
| (26) | Schindler Holding AG | (5,848 | ) | |||||
| (252) | Sika AG (Registered) | (70,667 | ) | |||||
| (1,550) | Straumann Holding AG (Registered) | (205,492 | ) | |||||
|
| |||||||
| Total Switzerland | (512,915 | ) | ||||||
|
| |||||||
| United Kingdom — (1.0)% | ||||||||
| (2,205) | Admiral Group Plc | (58,349 | ) | |||||
| (25,277) | Auto Trader Group Plc | (180,783 | ) | |||||
| (2,894) | Halma Plc | (75,321 | ) | |||||
| (14,090) | Hargreaves Lansdown Plc | (140,392 | ) | |||||
| 121 | See accompanying notes to the financial statements. |
GMO Strategic Opportunities Allocation Fund
(A Series of GMO Trust)
Schedule of Investments — (Continued)
(showing percentage of total net assets)
February 28, 2023
| Shares | Description | Value ($) | ||||||
| United Kingdom — continued | ||||||||
| (37,618) | Informa Plc | (302,187 | ) | |||||
| (3,957) | InterContinental Hotels Group Plc | (266,746 | ) | |||||
| (2,983) | London Stock Exchange Group Plc | (266,148 | ) | |||||
| (9,993) | M&G Plc | (25,738 | ) | |||||
| (25,187) | Ocado Group Plc* | (166,436 | ) | |||||
| (797) | Prudential Plc | (12,180 | ) | |||||
| (181,389) | Rolls-Royce Holdings Plc* | (316,034 | ) | |||||
| (605) | Spirax-Sarco Engineering Plc | (84,967 | ) | |||||
|
| |||||||
| Total United Kingdom | (1,895,281 | ) | ||||||
|
| |||||||
| United States — (9.4)% | ||||||||
| (11,200) | AES Corp. (The) | (276,416 | ) | |||||
| (1,500) | Alnylam Pharmaceuticals, Inc.* | (287,175 | ) | |||||
| (5,900) | Altria Group, Inc. | (273,937 | ) | |||||
| (700) | American Tower Corp. (REIT) | (138,607 | ) | |||||
| (500) | Aon Plc – Class A | (152,025 | ) | |||||
| (2,200) | Aramark | (80,960 | ) | |||||
| (3,144) | Ares Management Corp. – Class A | (253,501 | ) | |||||
| (1,500) | Arthur J Gallagher & Co. | (281,025 | ) | |||||
| (100) | Autodesk, Inc.* | (19,869 | ) | |||||
| (2,604) | Bills Holdings, Inc.* | (220,376 | ) | |||||
| (2,400) | Bio-Techne Corp. | (174,336 | ) | |||||
| (1,500) | Boeing Co. (The)* | (302,325 | ) | |||||
| (500) | Broadcom, Inc. | (297,145 | ) | |||||
| (1,200) | Burlington Stores, Inc.* | (257,100 | ) | |||||
| (5,400) | Caesars Entertainment, Inc.* | (274,104 | ) | |||||
| (4,200) | Ceridian HCM Holding, Inc.* | (306,306 | ) | |||||
| (200) | Chipotle Mexican Grill, Inc. – Class A* | (298,216 | ) | |||||
| (14,540) | Clarivate Plc* | (147,290 | ) | |||||
| (4,500) | Cloudflare, Inc. – Class A* | (270,045 | ) | |||||
| (600) | Crown Castle, Inc. (REIT) | (78,450 | ) | |||||
| (7,400) | Delta Air Lines, Inc.* | (283,716 | ) | |||||
| (2,700) | Dexcom, Inc.* | (299,727 | ) | |||||
| (2,000) | Diamondback Energy, Inc. | (281,160 | ) | |||||
| (1,800) | Equity LifeStyle Properties, Inc. (REIT) | (123,318 | ) | |||||
| (100) | Erie Indemnity Co. – Class A | (23,539 | ) | |||||
| (2,000) | Essential Utilities, Inc. | (85,560 | ) | |||||
| (4,000) | Exact Sciences Corp.* | (249,320 | ) | |||||
| (100) | Fair Isaac Corp.* | (67,739 | ) | |||||
| (3,300) | Fastenal Co. | (170,148 | ) | |||||
| (4,300) | Fortinet, Inc.* | (255,592 | ) | |||||
| (800) | Gartner, Inc.* | (262,248 | ) | |||||
| (1,200) | Hess Corp. | (161,640 | ) | |||||
| (800) | HubSpot, Inc.* | (309,488 | ) | |||||
| (600) | IDEXX Laboratories, Inc.* | (283,944 | ) | |||||
| (3,200) | Ingersoll Rand, Inc. | (185,824 | ) | |||||
| (900) | Insulet Corp.* | (248,724 | ) | |||||
| (1,300) | IQVIA Holdings, Inc.* | (271,011 | ) | |||||
| (2,700) | Iron Mountain, Inc. (REIT) | (142,425 | ) | |||||
| (1,551) | Lamb Weston Holdings, Inc. | (156,093 | ) | |||||
| (4,100) | Liberty Media Corp.-Liberty Formula One – Class C* | (278,267 | ) | |||||
| (900) | Linde Plc | (313,533 | ) | |||||
| (3,800) | Live Nation Entertainment, Inc.* | (273,828 | ) | |||||
| Shares | Description | Value ($) | ||||||
| United States — continued | ||||||||
| (900) | MarketAxess Holdings, Inc. | (307,305 | ) | |||||
| (1,300) | MongoDB, Inc. – Class A* | (272,376 | ) | |||||
| (300) | Monolithic Power Systems, Inc. | (145,287 | ) | |||||
| (400) | Moody’s Corp. | (116,060 | ) | |||||
| (600) | MSCI, Inc. – Class A | (313,290 | ) | |||||
| (4,511) | Newmont Corp. | (196,725 | ) | |||||
| (8,600) | NiSource, Inc. | (235,898 | ) | |||||
| (2,878) | Novocure Ltd.* | (221,520 | ) | |||||
| (4,100) | Okta, Inc.* | (292,289 | ) | |||||
| (4,500) | ONEOK, Inc. | (294,525 | ) | |||||
| (22,500) | Palantir Technologies, Inc. – Class A* | (176,400 | ) | |||||
| (1,900) | Paychex, Inc. | (209,760 | ) | |||||
| (200) | Paylocity Holding Corp.* | (38,522 | ) | |||||
| (2,900) | Philip Morris International, Inc. | (282,170 | ) | |||||
| (200) | PTC, Inc.* | (25,066 | ) | |||||
| (200) | Repligen Corp.* | (34,874 | ) | |||||
| (7,800) | ROBLOX Corp. – Class A* | (285,792 | ) | |||||
| (4,000) | Roku, Inc.* | (258,760 | ) | |||||
| (6,604) | Rollins, Inc. | (232,461 | ) | |||||
| (4,600) | Royal Caribbean Cruises Ltd.* | (324,944 | ) | |||||
| (1,500) | Seagen, Inc.* | (269,535 | ) | |||||
| (700) | ServiceNow, Inc.* | (302,519 | ) | |||||
| (900) | Sherwin-Williams Co. (The) | (199,215 | ) | |||||
| (1,200) | Simon Property Group, Inc. (REIT) | (146,508 | ) | |||||
| (1,200) | Snowflake, Inc. – Class A* | (185,256 | ) | |||||
| (2,800) | Starbucks Corp. | (285,852 | ) | |||||
| (100) | STERIS Plc | (18,803 | ) | |||||
| (800) | Sysco Corp. | (59,656 | ) | |||||
| (200) | Teladoc Health, Inc.* | (5,298 | ) | |||||
| (1,713) | Tesla, Inc.* | (352,381 | ) | |||||
| (5,493) | Toast, Inc. – Class A* | (103,927 | ) | |||||
| (4,400) | Trade Desk, Inc. (The) – Class A* | (246,224 | ) | |||||
| (400) | TransDigm Group, Inc. | (297,548 | ) | |||||
| (4,300) | Twilio, Inc. – Class A* | (289,003 | ) | |||||
| (9,594) | Uber Technologies, Inc.* | (319,096 | ) | |||||
| (3,200) | UDR, Inc. (REIT) | (137,088 | ) | |||||
| (1,000) | Vail Resorts, Inc. | (233,490 | ) | |||||
| (300) | Vulcan Materials Co. | (54,273 | ) | |||||
| (9,700) | Williams Cos., Inc. (The) | (291,970 | ) | |||||
| (3,800) | Wolfspeed, Inc.* | (281,124 | ) | |||||
| (2,242) | Zillow Group, Inc. – Class C* | (94,164 | ) | |||||
| (2,200) | Zscaler, Inc.* | (288,530 | ) | |||||
|
| |||||||
| Total United States | (17,841,536 | ) | ||||||
|
| |||||||
| TOTAL COMMON STOCKS (PROCEEDS $37,548,033) | (34,079,557 | ) | ||||||
|
| |||||||
| See accompanying notes to the financial statements. | 122 |
GMO Strategic Opportunities Allocation Fund
(A Series of GMO Trust)
Schedule of Investments — (Continued)
(showing percentage of total net assets)
February 28, 2023
| Shares | Description | Value ($) | ||||||
| PREFERRED STOCKS (e) — (0.1)% |
| |||||||
| Germany — (0.1)% |
| |||||||
| (561) | Sartorius AG | (238,295 | ) | |||||
|
| |||||||
TOTAL PREFERRED STOCKS (PROCEEDS $236,085) | (238,295 | ) | ||||||
|
| |||||||
| TOTAL SECURITIES SOLD SHORT | ||||||||
| (PROCEEDS $37,784,118) | (34,317,852 | ) | ||||||
|
| |||||||
| Other Assets and Liabilities (net) — 0.6% | 1,171,231 | |||||||
|
| |||||||
| TOTAL NET ASSETS — 100.0% | $ | 189,503,577 | ||||||
|
| |||||||
A summary of outstanding financial instruments at February 28, 2023 is as follows:
Swap Contracts
OTC Total Return Swaps
Fund Pays | Fund Receives | Counterparty | Notional Amount | Expiration Date | Periodic Payment Frequency | Premiums Paid/ (Received) ($) | Value ($) | Net Unrealized Appreciation/ (Depreciation) ($) | ||||||||||||||||||||||||
Total Return on Equity Basket (g) | | 1 Month Federal Funds Rate minus 0.40% | | GS | USD | 758,113 | 06/24/2024 | Monthly | — | 9,259 | 9,259 | |||||||||||||||||||||
Total Return on Equity Basket (h) | | 1 Month Federal Funds Rate minus 0.40% | | MORD | USD | 1,950,966 | 06/18/2024 | Monthly | — | 90,004 | 90,004 | |||||||||||||||||||||
|
|
|
|
|
| |||||||||||||||||||||||||||
| $ | — | $ | 99,263 | $ | 99,263 | |||||||||||||||||||||||||||
|
|
|
|
|
| |||||||||||||||||||||||||||
As of February 28, 2023, for the above contracts and/or agreements, the Fund had sufficient cash and/or securities to cover commitments or collateral requirements, if any, of the relevant broker or exchange.
Notes to Schedule of Investments:
| † | Denominated in U.S. Dollar, unless otherwise indicated. |
| * | Non-income producing security. |
| (a) | All or a portion of this security has been pledged to cover margin requirements on futures and/or cleared swap contracts, collateral on securities sold short, OTC swap contracts, forward currency contracts, and/or written options, if any (Note 4). |
| (b) | Securities are traded on separate exchanges for the same entity. |
| (c) | Investment valued using significant unobservable inputs (Note 2). |
| (d) | Investment valued at fair value using methods determined in good faith by the Trustees of GMO Trust or persons acting at their direction pursuant to procedures approved by the Trustees. Investment valued using significant unobservable inputs (Note 2). |
| (e) | Preferred dividend rates are disclosed to the extent that a stated rate exists. |
| (f) | The rate disclosed is the 7 day net yield as of February 28, 2023. |
| (g) | Periodic payments made/received are based on the total return of the referenced entity. Custom equity basket swap which has a notional amount of less than 1% of the Fund’s total net assets. |
| 123 | See accompanying notes to the financial statements. |
GMO Strategic Opportunities Allocation Fund
(A Series of GMO Trust)
Schedule of Investments — (Continued)
February 28, 2023
| (h) | The following table represents the individual long and/or short positions within the custom equity basket swap as of February 28, 2023: |
Shares | Description | % of Equity Basket | Value ($) | |||||||||
| (100,000) | Air China Ltd – Class H | 5.0 | % | (92,203 | ) | |||||||
| (40,000) | Alibaba Health Information Technology Ltd | 1.5 | % | (28,641 | ) | |||||||
| (108,000) | China Molybdenum Co Ltd – Class H | 3.3 | % | (60,814 | ) | |||||||
| (36,000) | Genscript Biotech Corp | 5.3 | % | (98,539 | ) | |||||||
| (163,300) | Gulf Energy Development Pcl NVDR | 13.0 | % | (242,677 | ) | |||||||
| (353) | Hanmi Pharm Co Ltd | 3.7 | % | (69,077 | ) | |||||||
| (2,364) | Hotel Shilla Co Ltd | 7.7 | % | (143,148 | ) | |||||||
| (1,795) | Kakao Corp | 4.5 | % | (84,495 | ) | |||||||
| (88,000) | Kingdee International Software Group Co Ltd | 8.8 | % | (164,425 | ) | |||||||
| (9,400) | Klabin SA | 1.9 | % | (34,940 | ) | |||||||
| (5,080) | Korea Aerospace Industries Ltd | 9.3 | % | (172,971 | ) | |||||||
| (229) | LG Energy Solution | 4.9 | % | (90,458 | ) | |||||||
| (17,600) | Microport Scientific Corp | 2.7 | % | (49,932 | ) | |||||||
| (281) | POSCO Chemical Co Ltd | 2.5 | % | (46,884 | ) | |||||||
| (429) | Samsung Biologics Co Ltd | 13.5 | % | (250,638 | ) | |||||||
| (27,568) | Samsung Heavy Industries Co Ltd | 6.1 | % | (114,474 | ) | |||||||
| (513) | Yuhan Corp | 1.1 | % | (20,431 | ) | |||||||
| (64,000) | Zijin Mining Group Co Ltd – Class H | 5.2 | % | (96,855 | ) | |||||||
|
| |||||||||||
| TOTAL COMMON STOCKS | $ | (1,861,602 | ) | |||||||||
|
| |||||||||||
For a listing of definitions of acronyms, counterparty abbreviations and currency abbreviations used throughout the Schedule of Investments as well as the derivative tables, if any, please refer to page 125.
| See accompanying notes to the financial statements. | 124 |
GMO Trust Funds
February 28, 2023
144A - Securities exempt from registration under Rule 144A of the Securities Act of 1933. These securities may be resold in transactions exempt from registration, normally to qualified institutional investors.
ADR - American Depositary Receipt
AUD BBSW - Bank Bill Swap Reference Rate denominated in Australian Dollar.
CDOR - Canadian Dollar Offering Rate
CVA - Certificaaten van aandelen (Share Certificates)
CVR - Contingent Value Right
ETF - Exchange-Traded Fund
EuroSTR - Euro Short-Term Rate
Foreign Registered - Shares issued to foreign investors in markets that have foreign ownership limits.
GDR - Global Depositary Receipt
JSC - Joint-Stock Company
LIBOR - London Interbank Offered Rate
NVDR - Non-Voting Depositary Receipt
NZD Bank Bill Rate - Bank Bill Rate denominated in New Zealand Dollar.
OIS - Overnight Indexed Swaps
PJSC - Private Joint-Stock Company
QPSC - Qatar Private Stock Company
QSC - Qatari Shareholding Company
Reg S - Security exempt from registration under Regulation S of the Securities Act of 1933, which exempts from registration securities offered and sold outside the United States. Security may not be offered or sold in the United States except pursuant to an exemption from, or in a transaction not subject to, the registration requirements of the Securities Act of 1933.
REIT - Real Estate Investment Trust
SARON - Swiss Average Rate Overnight
SEK STIBOR - Stockholm Interbank Offered Rate denominated in Swedish Krona.
SOFOM - Sociedades Financieras de Objeto Multi (Multi-purpose Financial Company)
SOFR - Secured Overnight Financing Rate
SONIA - Sterling Overnight Interbank Average Rate
USBM - U.S. Treasury 3 Month Bill Money Market Yield
The rates shown on variable rate notes are the current interest rates at February 28, 2023, which are subject to change based on the terms of the security.
| Counterparty Abbreviations: | ||
BCLY - Barclays Bank PLC BOA - Bank of America, N.A. | MORD - Morgan Stanley Capital Services LLC | |
CGMI - Citigroup Global Markets Inc. CITI - Citibank N.A. | MSCI - Morgan Stanley & Co. International PLC | |
| DB - Deutsche Bank AG | SSB - State Street Bank and Trust Company | |
| GS - Goldman Sachs International | UBSA - UBS AG | |
| JPM - JPMorgan Chase Bank, N.A. | ||
| MLCS - Merrill Lynch Capital Services, Inc. | ||
| Currency Abbreviations: | ||
| AUD - Australian Dollar | KRW - South Korean Won | |
| BRL - Brazilian Real | MXN - Mexican Peso | |
| CAD - Canadian Dollar | NOK - Norwegian Krone | |
| CHF - Swiss Franc | NZD - New Zealand Dollar | |
| CLP - Chilean Peso | PEN - Peruvian Sol | |
| COP - Colombian Peso | PHP - Philippines Peso | |
| CZK - Czech Republic Koruna | PLN - Polish Zloty | |
| EUR - Euro | RON - Romanian New Leu | |
| GBP - British Pound | SEK - Swedish Krona | |
| HUF - Hungarian Forint | SGD - Singapore Dollar | |
| IDR - Indonesian Rupiah | THB - Thai Baht | |
| ILS - Israeli Shekel | TWD - Taiwan New Dollar | |
| INR - Indian Rupee | USD - United States Dollar | |
| JPY - Japanese Yen | ZAR - South African Rand | |
| 125 | See accompanying notes to the financial statements. |
Statements of Assets and Liabilities — February 28, 2023
| Consolidated | Benchmark- | Global | ||||||||||||||
| Alternative | Free | Benchmark- | Asset | |||||||||||||
| Allocation | Allocation | Free | Allocation | |||||||||||||
| Fund | Fund | Fund | Fund | |||||||||||||
Assets: | ||||||||||||||||
Investments in affiliated issuers, at value (Notes 2 and 10)(a) | $ | 5,754,599 | $ | 4,402,587,879 | $ | 286,877,874 | $ | 339,174,915 | ||||||||
Investments in unaffiliated issuers, at value (Note 2)(b)(c) | 200,961,619 | 2,836,801 | 1,074,990,261 | 559,158 | ||||||||||||
Repurchase agreements, at value (Note 2)(d) | 51,010,102 | — | 91,999,073 | — | ||||||||||||
Foreign currency, at value (Note 2)(e) | 165,086 | — | 485,910 | — | ||||||||||||
Cash | 3,067,105 | — | 163,505 | 36 | ||||||||||||
Receivable for investments sold | 52,708,181 | 3,445,000 | 143,519,300 | 233,000 | ||||||||||||
Receivable for Fund shares sold | 116,115 | 1,197,517 | — | 351,866 | ||||||||||||
Receivable for closed swap contracts (Note 4) | 470 | — | 2,960 | — | ||||||||||||
Dividends and interest receivable | 940,264 | 10,200 | 3,597,651 | 826,355 | ||||||||||||
Dividend withholding tax receivable | 26,725 | — | 225,078 | — | ||||||||||||
Foreign capital gains tax refund receivable (Note 2) | — | — | 102,764 | — | ||||||||||||
Unrealized appreciation on open forward currency contracts (Note 4) | 1,290,869 | — | 448,540 | — | ||||||||||||
Receivable from liquidated underlying funds (Note 2) | 420,641 | — | — | 274,174 | ||||||||||||
Receivable for variation margin on open cleared swap contracts (Note 4) | 6,082 | — | — | — | ||||||||||||
Due from broker (Note 2) | 455,741 | — | 1,191,181 | — | ||||||||||||
Receivable for open OTC swap contracts (Note 4) | 8,771,947 | — | 730,289 | — | ||||||||||||
Interest receivable for open OTC swap contracts (Note 4) | 773,424 | — | — | — | ||||||||||||
Receivable for expenses reimbursed and/or waived by GMO (Note 5) | 101,965 | 395,918 | 79,229 | 32,884 | ||||||||||||
|
|
|
|
|
|
|
| |||||||||
Total assets | 326,570,935 | 4,410,473,315 | 1,604,413,615 | 341,452,388 | ||||||||||||
|
|
|
|
|
|
|
| |||||||||
Liabilities: | ||||||||||||||||
Investments sold short, at value (Note 2)(f) | 71,200,681 | — | 234,305,987 | — | ||||||||||||
Payable for cash collateral from securities loaned (Note 2) | — | — | 1,333,256 | — | ||||||||||||
Payable for investments purchased | 54,291,724 | — | 41,432,475 | 824,222 | ||||||||||||
Payable for Fund shares repurchased | 426,399 | 3,926,964 | 172,870,000 | 426,861 | ||||||||||||
Accrued foreign capital gains tax payable (Note 2) | 7,492 | — | 425,394 | — | ||||||||||||
Payable to affiliate for (Note 5): | ||||||||||||||||
Management fee | 109,593 | 2,216,243 | — | — | ||||||||||||
Supplemental support fee – Class MF | — | 84,108 | — | — | ||||||||||||
Shareholder service fee | 26,753 | 336,889 | — | — | ||||||||||||
Payable for variation margin on open futures contracts (Note 4) | 219,364 | — | — | — | ||||||||||||
Payable for variation margin on open cleared swap contracts (Note 4) | — | — | 23,971 | — | ||||||||||||
Payable for closed swap contracts (Note 4) | — | — | 1,785 | — | ||||||||||||
Unrealized depreciation on open forward currency contracts (Note 4) | 818,439 | — | 562,651 | — | ||||||||||||
Interest payable for open OTC swap contracts (Note 4) | 467,492 | — | — | — | ||||||||||||
Payable for open OTC swap contracts (Note 4) | 1,767,993 | — | — | — | ||||||||||||
Payable to Trustees and related expenses | 735 | 16,622 | 4,752 | 1,564 | ||||||||||||
Interest and dividend payable for short sales | 73,297 | — | 238,449 | — | ||||||||||||
Written options outstanding, at value (Note 4)(g) | 1,271,475 | — | — | — | ||||||||||||
Accrued expenses | 217,488 | 226,546 | 502,294 | 80,204 | ||||||||||||
|
|
|
|
|
|
|
| |||||||||
Total liabilities | 130,898,925 | 6,807,372 | 451,701,014 | 1,332,851 | ||||||||||||
|
|
|
|
|
|
|
| |||||||||
Net assets | $ | 195,672,010 | $ | 4,403,665,943 | $ | 1,152,712,601 | $ | 340,119,537 | ||||||||
|
|
|
|
|
|
|
| |||||||||
(a) Cost of investments – affiliated issuers: | $ | 6,060,878 | $ | 4,711,541,495 | $ | 325,645,034 | $ | 392,022,548 | ||||||||
(b) Cost of investments – unaffiliated issuers: | $ | 206,258,156 | $ | 2,836,801 | $ | 1,170,972,691 | $ | 559,158 | ||||||||
(c) Includes securities on loan at value (Note 2): | $ | — | $ | — | $ | 4,361,144 | $ | — | ||||||||
(d) Cost of investments – repurchase agreements: | $ | 51,010,102 | $ | — | $ | 91,999,073 | $ | — | ||||||||
(e) Cost of foreign currency: | $ | 157,710 | $ | — | $ | 496,430 | $ | — | ||||||||
(f) Proceeds from securities sold short: | $ | 75,701,431 | $ | — | $ | 240,352,977 | $ | — | ||||||||
(g) Premiums on written options: | $ | 1,226,737 | $ | — | $ | — | $ | — | ||||||||
| See accompanying notes to the financial statements. | 126 |
GMO Trust Funds
Statements of Assets and Liabilities — February 28, 2023 — (Continued)
| Consolidated | Benchmark- | Global | ||||||||||||||
| Alternative | Free | Benchmark- | Asset | |||||||||||||
| Allocation | Allocation | Free | Allocation | |||||||||||||
| Fund | Fund | Fund | Fund | |||||||||||||
Net assets consist of: | ||||||||||||||||
Paid-in capital | $ | 208,506,109 | $ | 4,988,977,141 | $ | 1,536,831,053 | $ | 612,053,314 | ||||||||
Distributable earnings (accumulated loss) | (12,834,099 | ) | (585,311,198 | ) | (384,118,452 | ) | (271,933,777 | ) | ||||||||
|
|
|
|
|
|
|
| |||||||||
| $ | 195,672,010 | $ | 4,403,665,943 | $ | 1,152,712,601 | $ | 340,119,537 | |||||||||
|
|
|
|
|
|
|
| |||||||||
Net assets attributable to: | ||||||||||||||||
Class III | $ | — | $ | 1,546,716,654 | $ | 1,152,712,601 | $ | 306,276,116 | ||||||||
|
|
|
|
|
|
|
| |||||||||
Class IV | $ | — | $ | 1,182,069,452 | $ | — | $ | — | ||||||||
|
|
|
|
|
|
|
| |||||||||
Class VI | $ | 49,257,361 | $ | — | $ | — | $ | — | ||||||||
|
|
|
|
|
|
|
| |||||||||
Class MF | $ | — | $ | 1,079,756,452 | $ | — | $ | — | ||||||||
|
|
|
|
|
|
|
| |||||||||
Class R6 | $ | 4,493 | $ | 281,801,868 | $ | — | $ | 20,440,106 | ||||||||
|
|
|
|
|
|
|
| |||||||||
Class I | $ | 146,410,156 | $ | 313,321,517 | $ | — | $ | 13,403,315 | ||||||||
|
|
|
|
|
|
|
| |||||||||
Shares outstanding: | ||||||||||||||||
Class III | — | 62,146,426 | 64,803,516 | 10,237,503 | ||||||||||||
|
|
|
|
|
|
|
| |||||||||
Class IV | — | 47,494,203 | — | — | ||||||||||||
|
|
|
|
|
|
|
| |||||||||
Class VI | 2,664,127 | — | — | — | ||||||||||||
|
|
|
|
|
|
|
| |||||||||
Class MF | — | 43,342,502 | — | — | ||||||||||||
|
|
|
|
|
|
|
| |||||||||
Class R6 | 242 | 11,332,161 | — | 683,658 | ||||||||||||
|
|
|
|
|
|
|
| |||||||||
Class I | 7,970,223 | 12,602,122 | — | 448,022 | ||||||||||||
|
|
|
|
|
|
|
| |||||||||
Net asset value per share: | ||||||||||||||||
Class III | $ | — | $ | 24.89 | $ | 17.79 | $ | 29.92 | ||||||||
|
|
|
|
|
|
|
| |||||||||
Class IV | $ | — | $ | 24.89 | $ | — | $ | — | ||||||||
|
|
|
|
|
|
|
| |||||||||
Class VI | $ | 18.49 | $ | — | $ | — | $ | — | ||||||||
|
|
|
|
|
|
|
| |||||||||
Class MF | $ | — | $ | 24.91 | $ | — | $ | — | ||||||||
|
|
|
|
|
|
|
| |||||||||
Class R6 | $ | 18.58 | $ | 24.87 | $ | — | $ | 29.90 | ||||||||
|
|
|
|
|
|
|
| |||||||||
Class I | $ | 18.37 | $ | 24.86 | $ | — | $ | 29.92 | ||||||||
|
|
|
|
|
|
|
| |||||||||
| 127 | See accompanying notes to the financial statements. |
GMO Trust Funds
Statements of Assets and Liabilities — February 28, 2023 — (Continued)
| Global | International | |||||||||||||||
| Developed | Global | Developed | ||||||||||||||
| Equity | Equity | Consolidated | Equity | |||||||||||||
| Allocation | Allocation | Implementation | Allocation | |||||||||||||
| Fund | Fund | Fund | Fund | |||||||||||||
Assets: | ||||||||||||||||
Investments in affiliated issuers, at value (Notes 2 and 10)(a) | $ | 66,984,879 | $ | 589,383,939 | $ | 1,119,668 | $ | 227,130,909 | ||||||||
Investments in unaffiliated issuers, at value (Note 2)(b)(c) | 30,817 | 582,993 | 4,246,801,092 | 100,556 | ||||||||||||
Repurchase agreements, at value (Note 2)(d) | — | — | 280,048,230 | — | ||||||||||||
Foreign currency, at value (Note 2)(e) | — | — | 2,177,014 | — | ||||||||||||
Receivable for investments sold | — | 505,850,000 | 70,855,661 | — | ||||||||||||
Receivable for Fund shares sold | — | 19,950 | — | 167,398 | ||||||||||||
Receivable for closed swap contracts (Note 4) | — | — | 9,181 | — | ||||||||||||
Dividends and interest receivable | 296,869 | 4,237,302 | 16,465,032 | 377 | ||||||||||||
Dividend withholding tax receivable | — | — | 612,868 | — | ||||||||||||
Foreign capital gains tax refund receivable (Note 2) | — | — | 3,952 | — | ||||||||||||
EU tax reclaims receivable (Note 2) | — | — | 1,428,922 | — | ||||||||||||
Unrealized appreciation on open forward currency contracts (Note 4) | — | — | 5,321,932 | — | ||||||||||||
Due from broker (Note 2) | — | — | 101,500,659 | — | ||||||||||||
Receivable for open OTC swap contracts (Note 4) | — | — | 3,669,376 | — | ||||||||||||
Interest receivable for open OTC swap contracts (Note 4) | — | — | 128,011 | — | ||||||||||||
Receivable for expenses reimbursed and/or waived by GMO (Note 5) | 21,918 | 46,766 | 247,809 | 32,714 | ||||||||||||
|
|
|
|
|
|
|
| |||||||||
Total assets | 67,334,483 | 1,100,120,950 | 4,730,389,407 | 227,431,954 | ||||||||||||
|
|
|
|
|
|
|
| |||||||||
Liabilities: | ||||||||||||||||
Investments sold short, at value (Note 2)(f) | — | — | 907,259,990 | — | ||||||||||||
Due to custodian | — | — | 844,333 | — | ||||||||||||
Due to broker (Note 2) | — | — | 285 | — | ||||||||||||
Payable for cash collateral from securities loaned (Note 2) | — | — | 1,324,193 | — | ||||||||||||
Payable for investments purchased | 296,740 | 4,235,589 | 67,287,579 | 156,000 | ||||||||||||
Payable for Fund shares repurchased | — | 496,191,231 | 3,445,000 | 1,199 | ||||||||||||
Accrued foreign capital gains tax payable (Note 2) | — | — | 1,158,030 | — | ||||||||||||
Payable for variation margin on open futures contracts (Note 4) | — | — | 1,104,268 | — | ||||||||||||
Payable for variation margin on open cleared swap contracts (Note 4) | — | — | 166,088 | — | ||||||||||||
Unrealized depreciation on open forward currency contracts (Note 4) | — | — | 6,102,855 | — | ||||||||||||
Interest payable for open OTC swap contracts (Note 4) | — | — | 162,387 | — | ||||||||||||
Payable for open OTC swap contracts (Note 4) | — | — | 790,699 | — | ||||||||||||
Payable to Trustees and related expenses | 280 | 4,452 | 14,960 | 674 | ||||||||||||
Interest and dividend payable for short sales | — | — | 931,218 | — | ||||||||||||
Written options outstanding, at value (Note 4)(g) | — | — | 2,838,687 | — | ||||||||||||
Accrued expenses | 45,009 | 121,142 | 1,075,643 | 74,238 | ||||||||||||
|
|
|
|
|
|
|
| |||||||||
Total liabilities | 342,029 | 500,552,414 | 994,506,215 | 232,111 | ||||||||||||
|
|
|
|
|
|
|
| |||||||||
Net assets | $ | 66,992,454 | $ | 599,568,536 | $ | 3,735,883,192 | $ | 227,199,843 | ||||||||
|
|
|
|
|
|
|
| |||||||||
(a) Cost of investments – affiliated issuers: | $ | 68,566,962 | $ | 701,748,053 | $ | 1,122,183 | $ | 245,440,120 | ||||||||
(b) Cost of investments – unaffiliated issuers: | $ | 30,817 | $ | 582,993 | $ | 4,682,116,518 | $ | 100,556 | ||||||||
(c) Includes securities on loan at value (Note 2): | $ | — | $ | — | $ | 18,231,045 | $ | — | ||||||||
(d) Cost of investments – repurchase agreements: | $ | — | $ | — | $ | 280,048,230 | $ | — | ||||||||
(e) Cost of foreign currency: | $ | — | $ | — | $ | 2,226,331 | $ | — | ||||||||
(f) Proceeds from securities sold short: | $ | — | $ | — | $ | 957,905,993 | $ | — | ||||||||
(g) Premiums on written options: | $ | — | $ | — | $ | 3,378,358 | $ | — | ||||||||
| See accompanying notes to the financial statements. | 128 |
GMO Trust Funds
Statements of Assets and Liabilities — February 28, 2023 — (Continued)
| Global | International | |||||||||||||||
| Developed | Global | Developed | ||||||||||||||
| Equity | Equity | Consolidated | Equity | |||||||||||||
| Allocation | Allocation | Implementation | Allocation | |||||||||||||
| Fund | Fund | Fund | Fund | |||||||||||||
Net assets consist of: | ||||||||||||||||
Paid-in capital | $ | 141,983,627 | $ | 838,573,587 | $ | 4,919,900,615 | $ | 411,244,205 | ||||||||
Distributable earnings (accumulated loss) | (74,991,173 | ) | (239,005,051 | ) | (1,184,017,423 | ) | (184,044,362 | ) | ||||||||
|
|
|
|
|
|
|
| |||||||||
| $ | 66,992,454 | $ | 599,568,536 | $ | 3,735,883,192 | $ | 227,199,843 | |||||||||
|
|
|
|
|
|
|
| |||||||||
Net assets attributable to: | ||||||||||||||||
Core Class | $ | — | $ | — | $ | 3,735,883,192 | $ | — | ||||||||
|
|
|
|
|
|
|
| |||||||||
Class III | $ | 66,992,454 | $ | 560,287,173 | $ | — | $ | 219,167,238 | ||||||||
|
|
|
|
|
|
|
| |||||||||
Class R6 | $ | — | $ | 34,288,955 | $ | — | $ | 8,032,605 | ||||||||
|
|
|
|
|
|
|
| |||||||||
Class I | $ | — | $ | 4,992,408 | $ | — | $ | — | ||||||||
|
|
|
|
|
|
|
| |||||||||
Shares outstanding: | ||||||||||||||||
Core Class | — | — | 304,108,537 | — | ||||||||||||
|
|
|
|
|
|
|
| |||||||||
Class III | 3,073,404 | 22,799,831 | — | 14,477,055 | ||||||||||||
|
|
|
|
|
|
|
| |||||||||
Class R6 | — | 1,395,537 | — | 530,660 | ||||||||||||
|
|
|
|
|
|
|
| |||||||||
Class I | — | 203,303 | — | — | ||||||||||||
|
|
|
|
|
|
|
| |||||||||
Net asset value per share: | ||||||||||||||||
Core Class | $ | — | $ | — | $ | 12.28 | $ | — | ||||||||
|
|
|
|
|
|
|
| |||||||||
Class III | $ | 21.80 | $ | 24.57 | $ | — | $ | 15.14 | ||||||||
|
|
|
|
|
|
|
| |||||||||
Class R6 | $ | — | $ | 24.57 | $ | — | $ | 15.14 | ||||||||
|
|
|
|
|
|
|
| |||||||||
Class I | $ | — | $ | 24.56 | $ | — | $ | — | ||||||||
|
|
|
|
|
|
|
| |||||||||
| 129 | See accompanying notes to the financial statements. |
GMO Trust Funds
Statements of Assets and Liabilities — February 28, 2023 — (Continued)
| Consolidated | ||||||||||||
| International | SGM | Strategic | ||||||||||
| Equity | Major | Opportunities | ||||||||||
| Allocation | Markets | Allocation | ||||||||||
| Fund | Fund | Fund | ||||||||||
Assets: | ||||||||||||
Investments in affiliated issuers, at value (Notes 2 and 10)(a) | $ | 491,808,393 | $ | — | $ | 130,766,788 | ||||||
Investments in unaffiliated issuers, at value (Note 2)(b) | 365,390 | 129,645,108 | 71,883,781 | |||||||||
Repurchase agreements, at value (Note 2)(c) | — | — | 19,999,629 | |||||||||
Foreign currency, at value (Note 2)(d) | — | 38 | 33,405 | |||||||||
Cash | — | 3,225,183 | 29,693 | |||||||||
Receivable for investments sold | — | 500,987 | 8,907,919 | |||||||||
Receivable for Fund shares sold | 79 | — | — | |||||||||
Receivable for closed swap contracts (Note 4) | — | — | 395 | |||||||||
Dividends and interest receivable | 1,182 | 418,315 | 783,847 | |||||||||
Dividend withholding tax receivable | — | — | 27,033 | |||||||||
Foreign capital gains tax refund receivable (Note 2) | — | — | 2,409 | |||||||||
Unrealized appreciation on open forward currency contracts (Note 4) | — | 807,354 | — | |||||||||
Due from broker (Note 2) | — | 1,043,101 | — | |||||||||
Receivable for open OTC swap contracts (Note 4) | — | 682,712 | 99,263 | |||||||||
Interest receivable for open OTC swap contracts (Note 4) | — | 42,547 | — | |||||||||
Receivable for expenses reimbursed and/or waived by GMO (Note 5) | 39,565 | 36,218 | 40,791 | |||||||||
|
|
|
|
|
| |||||||
Total assets | 492,214,609 | 136,401,563 | 232,574,953 | |||||||||
|
|
|
|
|
| |||||||
Liabilities: | ||||||||||||
Investments sold short, at value (Note 2)(e) | — | — | 34,317,852 | |||||||||
Due to broker (Note 2) | — | 60 | — | |||||||||
Payable for investments purchased | — | — | 1,318,932 | |||||||||
Payable for Fund shares repurchased | 1,442 | 5,576,070 | 7,265,000 | |||||||||
Accrued foreign capital gains tax payable (Note 2) | — | — | 14,382 | |||||||||
Payable to affiliate for (Note 5): | ||||||||||||
Management fee | — | 88,074 | — | |||||||||
Shareholder service fee | — | 6,294 | — | |||||||||
Payable for variation margin on open futures contracts (Note 4) | — | 474,385 | — | |||||||||
Unrealized depreciation on open forward currency contracts (Note 4) | — | 806,355 | — | |||||||||
Interest payable for open OTC swap contracts (Note 4) | — | 43,562 | — | |||||||||
Payable for open OTC swap contracts (Note 4) | — | 294,036 | — | |||||||||
Payable to Trustees and related expenses | 1,800 | 946 | 738 | |||||||||
Interest and dividend payable for short sales | — | — | 31,898 | |||||||||
Accrued expenses | 69,175 | 167,564 | 122,574 | |||||||||
|
|
|
|
|
| |||||||
Total liabilities | 72,417 | 7,457,346 | 43,071,376 | |||||||||
|
|
|
|
|
| |||||||
Net assets | $ | 492,142,192 | $ | 128,944,217 | $ | 189,503,577 | ||||||
|
|
|
|
|
| |||||||
(a) Cost of investments – affiliated issuers: | $ | 579,205,507 | $ | — | $ | 143,983,532 | ||||||
(b) Cost of investments – unaffiliated issuers: | $ | 365,390 | $ | 130,102,295 | $ | 70,673,061 | ||||||
(c) Cost of investments – repurchase agreements: | $ | — | $ | — | $ | 19,999,629 | ||||||
(d) Cost of foreign currency: | $ | — | $ | 38 | $ | 33,675 | ||||||
(e) Proceeds from securities sold short: | $ | — | $ | — | $ | 37,784,118 | ||||||
| See accompanying notes to the financial statements. | 130 |
GMO Trust Funds
Statements of Assets and Liabilities — February 28, 2023 — (Continued)
| Consolidated | ||||||||||||
| International | SGM | Strategic | ||||||||||
| Equity | Major | Opportunities | ||||||||||
| Allocation | Markets | Allocation | ||||||||||
| Fund | Fund | Fund | ||||||||||
Net assets consist of: | ||||||||||||
Paid-in capital | $ | 723,115,984 | $ | 211,160,501 | $ | 206,599,534 | ||||||
Distributable earnings (accumulated loss) | (230,973,792 | ) | (82,216,284 | ) | (17,095,957 | ) | ||||||
|
|
|
|
|
| |||||||
| $ | 492,142,192 | $ | 128,944,217 | $ | 189,503,577 | |||||||
|
|
|
|
|
| |||||||
Net assets attributable to: | ||||||||||||
Class III | $ | 286,725,268 | $ | 3,366,098 | $ | 189,503,577 | ||||||
|
|
|
|
|
| |||||||
Class VI | $ | — | $ | 120,827,221 | $ | — | ||||||
|
|
|
|
|
| |||||||
Class R6 | $ | 205,416,924 | $ | — | $ | — | ||||||
|
|
|
|
|
| |||||||
Class I | $ | — | $ | 4,750,898 | $ | — | ||||||
|
|
|
|
|
| |||||||
Shares outstanding: | ||||||||||||
Class III | 11,254,252 | 117,994 | 12,170,396 | |||||||||
|
|
|
|
|
| |||||||
Class VI | — | 4,254,842 | — | |||||||||
|
|
|
|
|
| |||||||
Class R6 | 8,065,679 | — | — | |||||||||
|
|
|
|
|
| |||||||
Class I | — | 166,825 | — | |||||||||
|
|
|
|
|
| |||||||
Net asset value per share: | ||||||||||||
Class III | $ | 25.48 | $ | 28.53 | $ | 15.57 | ||||||
|
|
|
|
|
| |||||||
Class VI | $ | — | $ | 28.40 | $ | — | ||||||
|
|
|
|
|
| |||||||
Class R6 | $ | 25.47 | $ | — | $ | — | ||||||
|
|
|
|
|
| |||||||
Class I | $ | — | $ | 28.48 | $ | — | ||||||
|
|
|
|
|
| |||||||
| 131 | See accompanying notes to the financial statements. |
GMO Trust Funds
Statements of Operations — Year Ended February 28, 2023
| Consolidated | Benchmark- | Global | ||||||||||||||
| Alternative | Free | Benchmark- | Asset | |||||||||||||
| Allocation | Allocation | Free | Allocation | |||||||||||||
| Fund | Fund | Fund | Fund | |||||||||||||
Investment Income: | ||||||||||||||||
Dividends from unaffiliated issuers (Net of withholding tax) (Note 2)(a) | $ | 3,608,779 | $ | 62,039 | $ | 43,120,760 | $ | 39,190 | ||||||||
Dividends from affiliated issuers (Note 10) | 338,155 | 175,422,512 | 20,142,592 | 10,843,641 | ||||||||||||
Interest | 2,032,900 | — | 7,160,831 | — | ||||||||||||
Securities lending income from affiliated issuers (net) | — | — | 225,412 | — | ||||||||||||
Other income (Note 2) | 23,073 | — | 466,152 | 15,039 | ||||||||||||
|
|
|
|
|
|
|
| |||||||||
Total investment income | 6,002,907 | 175,484,551 | 71,115,747 | 10,897,870 | ||||||||||||
|
|
|
|
|
|
|
| |||||||||
Expenses: | ||||||||||||||||
Management fee (Note 5) | 1,486,103 | 29,995,667 | — | — | ||||||||||||
Shareholder service fee – Class III (Note 5) | — | 2,339,359 | — | — | ||||||||||||
Shareholder service fee – Class IV (Note 5) | — | 1,253,219 | — | — | ||||||||||||
Shareholder service fee – Class VI (Note 5) | 35,289 | — | — | — | ||||||||||||
Shareholder service fee – Class R6 (Note 5) | 27 | 411,912 | — | — | ||||||||||||
Shareholder service fee – Class I (Note 5) | 306,682 | 505,624 | — | — | ||||||||||||
Supplemental support fee – Class MF (Note 5) | — | 1,190,235 | — | — | ||||||||||||
Audit and tax fees | 160,010 | 45,206 | 161,017 | 52,140 | ||||||||||||
Custodian, fund accounting agent and transfer agent fees | 646,145 | 559,145 | 1,227,909 | 103,822 | ||||||||||||
Dividend expense on short sales | 993,621 | — | 3,773,854 | — | ||||||||||||
Legal fees | 12,196 | 171,355 | 47,880 | 11,438 | ||||||||||||
Registration fees | 50,209 | 91,945 | 1,619 | 44,859 | ||||||||||||
Trustees’ fees and related expenses (Note 5) | 9,524 | 221,637 | 64,683 | 17,230 | ||||||||||||
Interest expense and borrowing costs for investments sold short (Note 2) | 242,476 | — | 991,863 | — | ||||||||||||
Miscellaneous | 56,277 | 37,207 | 121,017 | 10,659 | ||||||||||||
|
|
|
|
|
|
|
| |||||||||
Total expenses | 3,998,559 | 36,822,511 | 6,389,842 | 240,148 | ||||||||||||
Fees and expenses reimbursed and/or waived by GMO (Note 5) | (704,003 | ) | (552,357 | ) | (832,961 | ) | (207,778 | ) | ||||||||
Indirectly incurred management fees waived or borne by GMO (Note 5) | (39,527 | ) | (2,699,800 | ) | — | — | ||||||||||
Indirectly incurred shareholder service fees waived or borne by GMO (Note 5) | (1,760 | ) | (314,282 | ) | — | — | ||||||||||
|
|
|
|
|
|
|
| |||||||||
Net expenses | 3,253,269 | 33,256,072 | 5,556,881 | 32,370 | ||||||||||||
|
|
|
|
|
|
|
| |||||||||
Net investment income (loss) | 2,749,638 | 142,228,479 | 65,558,866 | 10,865,500 | ||||||||||||
|
|
|
|
|
|
|
| |||||||||
Realized and unrealized gain (loss): | ||||||||||||||||
Net realized gain (loss) on: | ||||||||||||||||
Investments in unaffiliated issuers (net of foreign capital gains tax) (Note 2)(b) | (8,238,417 | ) | — | (56,900,399 | ) | — | ||||||||||
Investments in affiliated issuers | (3,146,257 | ) | (79,603,818 | ) | (17,200,274 | ) | (50,287,550 | ) | ||||||||
Investments in securities sold short | 15,405,392 | — | 61,647,517 | — | ||||||||||||
Realized gain distributions from affiliated issuers (Note 10) | — | 8,712,522 | 7,223,264 | 8,578,145 | ||||||||||||
Futures contracts | 2,387,595 | — | 46,020,438 | — | ||||||||||||
Written options | 344,166 | — | — | — | ||||||||||||
Swap contracts | 544,588 | — | 2,003,063 | — | ||||||||||||
Forward currency contracts | (5,993,187 | ) | — | 715,353 | — | |||||||||||
Foreign currency and foreign currency related transactions | 49,420 | — | (635,371 | ) | — | |||||||||||
|
|
|
|
|
|
|
| |||||||||
Net realized gain (loss) | 1,353,300 | (70,891,296 | ) | 42,873,591 | (41,709,405 | ) | ||||||||||
|
|
|
|
|
|
|
| |||||||||
Change in net unrealized appreciation (depreciation) on: | ||||||||||||||||
Investments in unaffiliated issuers (net of foreign capital gains tax) (Note 2)(c) | (1,934,610 | ) | — | (67,780,782 | ) | — | ||||||||||
Investments in affiliated issuers | 1,173,984 | (86,441,325 | ) | (14,483,090 | ) | (3,797,081 | ) | |||||||||
Investments in securities sold short | (1,647,529 | ) | — | (20,197,766 | ) | — | ||||||||||
Futures contracts | 427,164 | — | (20,222,689 | ) | — | |||||||||||
Written options | (135,411 | ) | — | — | — | |||||||||||
Swap contracts | 620,892 | — | 467,020 | — | ||||||||||||
Forward currency contracts | 1,904,162 | — | 434,285 | — | ||||||||||||
Foreign currency and foreign currency related transactions | (48,124 | ) | — | (96,607 | ) | — | ||||||||||
|
|
|
|
|
|
|
| |||||||||
Net change in unrealized appreciation (depreciation) | 360,528 | (86,441,325 | ) | (121,879,629 | ) | (3,797,081 | ) | |||||||||
|
|
|
|
|
|
|
| |||||||||
Net realized and unrealized gain (loss) | 1,713,828 | (157,332,621 | ) | (79,006,038 | ) | (45,506,486 | ) | |||||||||
|
|
|
|
|
|
|
| |||||||||
Net increase (decrease) in net assets resulting from operations | $ | 4,463,466 | $ | (15,104,142 | ) | $ | (13,447,172 | ) | $ | (34,640,986 | ) | |||||
|
|
|
|
|
|
|
| |||||||||
(a) Withholding tax: | $ | 229,262 | $ | — | $ | 3,983,406 | $ | — | ||||||||
(b) Foreign capital gains tax (benefit) on net realized gain (loss): | $ | 8,577 | $ | — | $ | 72,131 | $ | — | ||||||||
(c) Foreign capital gains tax (benefit) on change in net unrealized appreciation (depreciation): | $ | (8,502 | ) | $ | — | $ | 124,387 | $ | — | |||||||
| See accompanying notes to the financial statements. | 132 |
GMO Trust Funds
Statements of Operations — Year Ended February 28, 2023 — (Continued)
| Global | International | |||||||||||||||
| Developed | Global | Developed | ||||||||||||||
| Equity | Equity | Consolidated | Equity | |||||||||||||
| Allocation | Allocation | Implementation | Allocation | |||||||||||||
| Fund | Fund | Fund | Fund | |||||||||||||
Investment Income: | ||||||||||||||||
Dividends from affiliated issuers (Note 10) | $ | 2,306,198 | $ | 47,322,078 | $ | — | $ | 8,558,973 | ||||||||
Dividends from unaffiliated issuers (Net of withholding tax) (Note 2)(a) | 862 | 8,292 | 132,654,853 | 1,845 | ||||||||||||
Interest | 21 | — | 34,493,537 | — | ||||||||||||
Securities lending income from affiliated issuers (net) | — | — | 548,886 | — | ||||||||||||
Other income (Note 2) | — | — | 15,327,185 | — | ||||||||||||
|
|
|
|
|
|
|
| |||||||||
Total investment income | 2,307,081 | 47,330,370 | 183,024,461 | 8,560,818 | ||||||||||||
|
|
|
|
|
|
|
| |||||||||
Expenses: | ||||||||||||||||
Audit and tax fees | 46,698 | 43,220 | 291,486 | 47,618 | ||||||||||||
Custodian, fund accounting agent and transfer agent fees | 18,448 | 96,753 | 2,153,948 | 54,719 | ||||||||||||
Dividend expense on short sales | — | — | 13,142,206 | — | ||||||||||||
Legal fees | 2,755 | 46,826 | 168,827 | 7,296 | ||||||||||||
Registration fees | 3,428 | 58,540 | — | 51,471 | ||||||||||||
Trustees’ fees and related expenses (Note 5) | 3,747 | 65,284 | 194,127 | 9,752 | ||||||||||||
Interest expense and borrowing costs for investments sold short (Note 2) | — | — | 1,566,994 | — | ||||||||||||
Miscellaneous | 6,446 | 13,321 | 163,798 | 7,730 | ||||||||||||
|
|
|
|
|
|
|
| |||||||||
Total expenses | 81,522 | 323,944 | 17,681,386 | 178,586 | ||||||||||||
Fees and expenses reimbursed and/or waived by GMO (Note 5) | (77,534 | ) | (250,431 | ) | (2,326,202 | ) | (168,594 | ) | ||||||||
|
|
|
|
|
|
|
| |||||||||
Net expenses | 3,988 | 73,513 | 15,355,184 | 9,992 | ||||||||||||
|
|
|
|
|
|
|
| |||||||||
Net investment income (loss) | 2,303,093 | 47,256,857 | 167,669,277 | 8,550,826 | ||||||||||||
|
|
|
|
|
|
|
| |||||||||
Realized and unrealized gain (loss): | ||||||||||||||||
Net realized gain (loss) on: | ||||||||||||||||
Investments in unaffiliated issuers (net of foreign capital gains tax) (Note 2)(b) | — | — | (145,544,552 | ) | — | |||||||||||
Investments in affiliated issuers | (3,345,279 | ) | (130,216,105 | ) | (218,844 | ) | (1,664,657 | ) | ||||||||
Investments in securities sold short | — | — | 174,616,325 | — | ||||||||||||
Realized gain distributions from affiliated issuers (Note 10) | 3,172,905 | 48,371,491 | — | 467,684 | ||||||||||||
Futures contracts | — | — | 140,890,139 | — | ||||||||||||
Written options | — | — | 1,061,715 | — | ||||||||||||
Swap contracts | — | — | 3,138,245 | — | ||||||||||||
Forward currency contracts | — | — | (20,013,196 | ) | — | |||||||||||
Foreign currency and foreign currency related transactions | — | — | 1,813,814 | — | ||||||||||||
|
|
|
|
|
|
|
| |||||||||
Net realized gain (loss) | (172,374 | ) | (81,844,614 | ) | 155,743,646 | (1,196,973 | ) | |||||||||
|
|
|
|
|
|
|
| |||||||||
Change in net unrealized appreciation (depreciation) on: | ||||||||||||||||
Investments in unaffiliated issuers (net of foreign capital gains tax) (Note 2)(c) | — | — | (252,001,598 | ) | — | |||||||||||
Investments in affiliated issuers | (6,335,293 | ) | (72,183,025 | ) | 60,867 | (13,717,635 | ) | |||||||||
Investments in securities sold short | — | — | (17,401,964 | ) | — | |||||||||||
Futures contracts | — | — | (47,219,444 | ) | — | |||||||||||
Written options | — | — | 278,514 | — | ||||||||||||
Swap contracts | — | — | 5,453,594 | — | ||||||||||||
Forward currency contracts | — | — | 5,235,136 | — | ||||||||||||
Foreign currency and foreign currency related transactions | — | — | (563,342 | ) | — | |||||||||||
|
|
|
|
|
|
|
| |||||||||
Net change in unrealized appreciation (depreciation) | (6,335,293 | ) | (72,183,025 | ) | (306,158,237 | ) | (13,717,635 | ) | ||||||||
|
|
|
|
|
|
|
| |||||||||
Net realized and unrealized gain (loss) | (6,507,667 | ) | (154,027,639 | ) | (150,414,591 | ) | (14,914,608 | ) | ||||||||
|
|
|
|
|
|
|
| |||||||||
Net increase (decrease) in net assets resulting from operations | $ | (4,204,574 | ) | $ | (106,770,782 | ) | $ | 17,254,686 | $ | (6,363,782 | ) | |||||
|
|
|
|
|
|
|
| |||||||||
(a) ���Withholding tax: | $ | — | $ | — | $ | 11,804,931 | $ | — | ||||||||
(b) Foreign capital gains tax (benefit) on net realized gain (loss): | $ | — | $ | — | $ | 698,515 | $ | — | ||||||||
(c) Foreign capital gains tax (benefit) on change in net unrealized appreciation (depreciation): | $ | — | $ | — | $ | 2,362 | $ | — | ||||||||
| 133 | See accompanying notes to the financial statements. |
GMO Trust Funds
Statements of Operations — Year Ended February 28, 2023 — (Continued)
| Consolidated | ||||||||||||
| International | SGM | Strategic | ||||||||||
| Equity | Major | Opportunities | ||||||||||
| Allocation | Markets | Allocation | ||||||||||
| Fund | Fund | Fund | ||||||||||
Investment Income: | ||||||||||||
Dividends from affiliated issuers (Note 10) | $ | 24,980,178 | $ | — | $ | 5,183,375 | ||||||
Dividends from unaffiliated issuers (Net of withholding tax) (Note 2)(a) | 6,855 | 56,589 | 2,997,552 | |||||||||
Interest | — | 3,660,432 | 442,959 | |||||||||
|
|
|
|
|
| |||||||
Total investment income | 24,987,033 | 3,717,021 | 8,623,886 | |||||||||
|
|
|
|
|
| |||||||
Expenses: | ||||||||||||
Management fee (Note 5) | — | 1,753,568 | — | |||||||||
Shareholder service fee – Class III (Note 5) | — | 31,546 | — | |||||||||
Shareholder service fee – Class VI (Note 5) | — | 95,199 | — | |||||||||
Shareholder service fee – Class I (Note 5) | — | 18,272 | — | |||||||||
Audit and tax fees | 45,455 | 113,576 | 87,130 | |||||||||
Custodian, fund accounting agent and transfer agent fees | 78,863 | 153,224 | 197,487 | |||||||||
Dividend expense on short sales | — | — | 517,881 | |||||||||
Legal fees | 18,426 | 9,759 | 6,181 | |||||||||
Registration fees | 19,345 | 49,698 | 3,704 | |||||||||
Trustees’ fees and related expenses (Note 5) | 24,303 | 10,321 | 7,499 | |||||||||
Interest expense and borrowing costs for investments sold short (Note 2) | — | — | 134,807 | |||||||||
Miscellaneous | 9,386 | 12,743 | 53,564 | |||||||||
|
|
|
|
|
| |||||||
Total expenses | 195,778 | 2,247,906 | 1,008,253 | |||||||||
Fees and expenses reimbursed and/or waived by GMO (Note 5) | (169,477 | ) | (311,647 | ) | (312,831 | ) | ||||||
|
|
|
|
|
| |||||||
Net expenses | 26,301 | 1,936,259 | 695,422 | |||||||||
|
|
|
|
|
| |||||||
Net investment income (loss) | 24,960,732 | 1,780,762 | 7,928,464 | |||||||||
|
|
|
|
|
| |||||||
Realized and unrealized gain (loss): | ||||||||||||
Net realized gain (loss) on: | ||||||||||||
Investments in unaffiliated issuers (net of foreign capital gains tax) (Note 2)(b) | — | (1,415,607 | ) | (3,687,950 | ) | |||||||
Investments in affiliated issuers | (13,617,510 | ) | — | (7,401,998 | ) | |||||||
Investments in securities sold short | — | — | 8,087,779 | |||||||||
Realized gain distributions from affiliated issuers (Note 10) | 1,154,154 | — | 3,584,990 | |||||||||
Futures contracts | — | 4,202,158 | — | |||||||||
Swap contracts | — | 827,298 | 582,171 | |||||||||
Forward currency contracts | — | (6,858,168 | ) | — | ||||||||
Foreign currency and foreign currency related transactions | — | 97,810 | (58,613 | ) | ||||||||
|
|
|
|
|
| |||||||
Net realized gain (loss) | (12,463,356 | ) | (3,146,509 | ) | 1,106,379 | |||||||
|
|
|
|
|
| |||||||
Change in net unrealized appreciation (depreciation) on: | ||||||||||||
Investments in unaffiliated issuers (net of foreign capital gains tax) (Note 2)(c) | — | 719,957 | (4,238,092 | ) | ||||||||
Investments in affiliated issuers | (69,591,970 | ) | — | (13,489,006 | ) | |||||||
Investments in securities sold short | — | — | (1,821,363 | ) | ||||||||
Futures contracts | — | 1,801,657 | — | |||||||||
Swap contracts | — | 1,120,017 | (46,249 | ) | ||||||||
Forward currency contracts | — | 300,089 | — | |||||||||
Foreign currency and foreign currency related transactions | — | (15,478 | ) | 242 | ||||||||
|
|
|
|
|
| |||||||
Net change in unrealized appreciation (depreciation) | (69,591,970 | ) | 3,926,242 | (19,594,468 | ) | |||||||
|
|
|
|
|
| |||||||
Net realized and unrealized gain (loss) | (82,055,326 | ) | 779,733 | (18,488,089 | ) | |||||||
|
|
|
|
|
| |||||||
Net increase (decrease) in net assets resulting from operations | $ | (57,094,594 | ) | $ | 2,560,495 | $ | (10,559,625 | ) | ||||
|
|
|
|
|
| |||||||
(a) Withholding tax: | $ | — | $ | — | $ | 256,244 | ||||||
(b) Foreign capital gains tax (benefit) on net realized gain (loss): | $ | — | $ | — | $ | 366 | ||||||
(c) Foreign capital gains tax (benefit) on change in net unrealized appreciation (depreciation): | $ | — | $ | — | $ | (118 | ) | |||||
| See accompanying notes to the financial statements. | 134 |
GMO Trust Funds
Statements of Changes in Net Assets
| Consolidated | Benchmark- | |||||||||||||||
| Alternative | Free | |||||||||||||||
| Allocation | Allocation | |||||||||||||||
| Fund | Fund | |||||||||||||||
| Year Ended | Year Ended | |||||||||||||||
| February 28, | February 28, | |||||||||||||||
| 2023 | 2022 | 2023 | 2022 | |||||||||||||
Increase (decrease) in net assets: | ||||||||||||||||
Operations: | ||||||||||||||||
Net investment income (loss) | $ | 2,749,638 | $ | 604,065 | $ | 142,228,479 | $ | 125,445,340 | ||||||||
Net realized gain (loss) | 1,353,300 | 1,862,748 | (70,891,296 | ) | (51,783,321 | ) | ||||||||||
Change in net unrealized appreciation (depreciation) | 360,528 | (3,368,084 | ) | (86,441,325 | ) | (9,001,883 | ) | |||||||||
|
|
|
|
|
|
|
| |||||||||
Net increase (decrease) in net assets from operations | 4,463,466 | (901,271 | ) | (15,104,142 | ) | 64,660,136 | ||||||||||
|
|
|
|
|
|
|
| |||||||||
Distributions to shareholders: | ||||||||||||||||
Class III | — | — | (44,436,242 | ) | (40,126,356 | ) | ||||||||||
Class IV | — | — | (39,436,017 | ) | (36,148,761 | ) | ||||||||||
Class VI | (566,438 | ) | (6,442,811 | ) | — | — | ||||||||||
Class MF | — | — | (34,154,940 | ) | (34,695,369 | ) | ||||||||||
Class R6 | (239 | ) | (15,298 | ) | (8,404,776 | ) | (5,897,575 | ) | ||||||||
Class I | (1,316,125 | ) | (6,161,945 | ) | (8,571,449 | ) | (8,143,311 | ) | ||||||||
|
|
|
|
|
|
|
| |||||||||
Total distributions | (1,882,802 | ) | (12,620,054 | ) | (135,003,424 | ) | (125,011,372 | ) | ||||||||
|
|
|
|
|
|
|
| |||||||||
Net share transactions (Note 9): | ||||||||||||||||
Class III | — | — | (129,056,156 | ) | (488,898,874 | ) | ||||||||||
Class IV | — | — | (169,185,506 | ) | (553,716,829 | ) | ||||||||||
Class VI | (81,621,079 | ) | (91,476,207 | ) | — | — | ||||||||||
Class MF | — | — | (248,623,598 | ) | (330,119,921 | ) | ||||||||||
Class R6 | (17,370 | ) | (445,328 | ) | 16,445,267 | (35,040,180 | ) | |||||||||
Class I | (4,435,177 | ) | (114,729,175 | ) | (39,451,537 | ) | 46,774,244 | |||||||||
|
|
|
|
|
|
|
| |||||||||
Increase (decrease) in net assets resulting from net share transactions | (86,073,626 | ) | (206,650,710 | ) | (569,871,530 | ) | (1,361,001,560 | ) | ||||||||
|
|
|
|
|
|
|
| |||||||||
Total increase (decrease) in net assets | (83,492,962 | ) | (220,172,035 | ) | (719,979,096 | ) | (1,421,352,796 | ) | ||||||||
Net assets: | ||||||||||||||||
Beginning of period | 279,164,972 | 499,337,007 | 5,123,645,039 | 6,544,997,835 | ||||||||||||
|
|
|
|
|
|
|
| |||||||||
End of period | $ | 195,672,010 | $ | 279,164,972 | $ | 4,403,665,943 | $ | 5,123,645,039 | ||||||||
|
|
|
|
|
|
|
| |||||||||
| 135 | See accompanying notes to the financial statements. |
GMO Trust Funds
Statements of Changes in Net Assets — (Continued)
| Global | ||||||||||||||||
| Benchmark- | Asset | |||||||||||||||
| Free | Allocation | |||||||||||||||
| Fund | Fund | |||||||||||||||
| Year Ended | Year Ended | |||||||||||||||
| February 28, | February 28, | |||||||||||||||
| 2023 | 2022 | 2023 | 2022 | |||||||||||||
Increase (decrease) in net assets: | ||||||||||||||||
Operations: | ||||||||||||||||
Net investment income (loss) | $ | 65,558,866 | $ | 65,016,102 | $ | 10,865,500 | $ | 17,733,383 | ||||||||
Net realized gain (loss) | 42,873,591 | 147,007,130 | (41,709,405 | ) | 68,360,369 | |||||||||||
Change in net unrealized appreciation (depreciation) | (121,879,629 | ) | (190,582,429 | ) | (3,797,081 | ) | (76,899,817 | ) | ||||||||
|
|
|
|
|
|
|
| |||||||||
Net increase (decrease) in net assets from operations | (13,447,172 | ) | 21,440,803 | (34,640,986 | ) | 9,193,935 | ||||||||||
|
|
|
|
|
|
|
| |||||||||
Distributions to shareholders: | ||||||||||||||||
Class III | (68,892,922 | ) | (78,012,250 | ) | (11,238,011 | ) | (36,020,211 | ) | ||||||||
Class R6 | — | — | (752,848 | ) | (1,757,031 | ) | ||||||||||
Class I | — | — | (538,596 | ) | (758,336 | ) | ||||||||||
|
|
|
|
|
|
|
| |||||||||
Total distributions | (68,892,922 | ) | (78,012,250 | ) | (12,529,455 | ) | (38,535,578 | ) | ||||||||
|
|
|
|
|
|
|
| |||||||||
Net share transactions (Note 9): | ||||||||||||||||
Class III | (378,801,075 | ) | (488,070,825 | ) | (234,701,495 | ) | (73,648,726 | ) | ||||||||
Class R6 | — | — | (3,363,652 | ) | (161,766,780 | ) | ||||||||||
Class I | — | — | 1,374,379 | (7,391,714 | ) | |||||||||||
|
|
|
|
|
|
|
| |||||||||
Increase (decrease) in net assets resulting from net share transactions | (378,801,075 | ) | (488,070,825 | ) | (236,690,768 | ) | (242,807,220 | ) | ||||||||
|
|
|
|
|
|
|
| |||||||||
Total increase (decrease) in net assets | (461,141,169 | ) | (544,642,272 | ) | (283,861,209 | ) | (272,148,863 | ) | ||||||||
Net assets: | ||||||||||||||||
Beginning of period | 1,613,853,770 | 2,158,496,042 | 623,980,746 | 896,129,609 | ||||||||||||
|
|
|
|
|
|
|
| |||||||||
End of period | $ | 1,152,712,601 | $ | 1,613,853,770 | $ | 340,119,537 | $ | 623,980,746 | ||||||||
|
|
|
|
|
|
|
| |||||||||
| See accompanying notes to the financial statements. | 136 |
GMO Trust Funds
Statements of Changes in Net Assets — (Continued)
Global Developed | Global | |||||||||||||||
| Equity | Equity | |||||||||||||||
| Allocation | Allocation | |||||||||||||||
| Fund | Fund | |||||||||||||||
| Year Ended | Year Ended | |||||||||||||||
| February 28, | February 28, | |||||||||||||||
| 2023 | 2022 | 2023 | 2022 | |||||||||||||
Increase (decrease) in net assets: | ||||||||||||||||
Operations: | ||||||||||||||||
Net investment income (loss) | $ | 2,303,093 | $ | 3,386,302 | $ | 47,256,857 | $ | 62,828,244 | ||||||||
Net realized gain (loss) | (172,374 | ) | 12,253,128 | (81,844,614 | ) | 174,474,499 | ||||||||||
Change in net unrealized appreciation (depreciation) | (6,335,293 | ) | (9,298,594 | ) | (72,183,025 | ) | (190,742,470 | ) | ||||||||
|
|
|
|
|
|
|
| |||||||||
Net increase (decrease) in net assets from operations | (4,204,574 | ) | 6,340,836 | (106,770,782 | ) | 46,560,273 | ||||||||||
|
|
|
|
|
|
|
| |||||||||
Distributions to shareholders: | ||||||||||||||||
Class III | (5,431,769 | ) | (10,659,337 | ) | (97,936,959 | ) | (122,025,655 | ) | ||||||||
Class R6 | — | — | (441,589 | ) | (541,431 | ) | ||||||||||
Class I | — | — | (388,226 | ) | (191,269 | ) | ||||||||||
|
|
|
|
|
|
|
| |||||||||
Total distributions | (5,431,769 | ) | (10,659,337 | ) | (98,766,774 | ) | (122,758,355 | ) | ||||||||
|
|
|
|
|
|
|
| |||||||||
Net share transactions (Note 9): | ||||||||||||||||
Class III | (10,181,077 | ) | 2,974,852 | (807,493,688 | ) | 7,964,576 | ||||||||||
Class R6 | — | — | 28,794,936 | 649,789 | ||||||||||||
Class I | — | — | 2,971,667 | 535,784 | ||||||||||||
|
|
|
|
|
|
|
| |||||||||
Increase (decrease) in net assets resulting from net share transactions | (10,181,077 | ) | 2,974,852 | (775,727,085 | ) | 9,150,149 | ||||||||||
|
|
|
|
|
|
|
| |||||||||
Total increase (decrease) in net assets | (19,817,420 | ) | (1,343,649 | ) | (981,264,641 | ) | (67,047,933 | ) | ||||||||
Net assets: | ||||||||||||||||
Beginning of period | 86,809,874 | 88,153,523 | 1,580,833,177 | 1,647,881,110 | ||||||||||||
|
|
|
|
|
|
|
| |||||||||
End of period | $ | 66,992,454 | $ | 86,809,874 | $ | 599,568,536 | $ | 1,580,833,177 | ||||||||
|
|
|
|
|
|
|
| |||||||||
| 137 | See accompanying notes to the financial statements. |
GMO Trust Funds
Statements of Changes in Net Assets — (Continued)
International Developed | ||||||||||||||||
| Consolidated | Equity | |||||||||||||||
| Implementation | Allocation | |||||||||||||||
| Fund | Fund | |||||||||||||||
| Year Ended | Year Ended | |||||||||||||||
| February 28, | February 28, | |||||||||||||||
| 2023 | 2022 | 2023 | 2022 | |||||||||||||
Increase (decrease) in net assets: | ||||||||||||||||
Operations: | ||||||||||||||||
Net investment income (loss) | $ | 167,669,277 | $ | 161,653,705 | $ | 8,550,826 | $ | 14,383,762 | ||||||||
Net realized gain (loss) | 155,743,646 | 208,144,198 | (1,196,973 | ) | 3,380,347 | |||||||||||
Change in net unrealized appreciation (depreciation) | (306,158,237 | ) | (253,804,818 | ) | (13,717,635 | ) | (10,962,253 | ) | ||||||||
|
|
|
|
|
|
|
| |||||||||
Net increase (decrease) in net assets from operations | 17,254,686 | 115,993,085 | (6,363,782 | ) | 6,801,856 | |||||||||||
|
|
|
|
|
|
|
| |||||||||
Distributions to shareholders: | ||||||||||||||||
Core Class | (132,069,652 | ) | (150,035,453 | ) | — | — | ||||||||||
Class III | — | — | (8,863,788 | ) | (15,331,043 | ) | ||||||||||
Class R6 | — | — | (323,823 | ) | (544,452 | ) | ||||||||||
|
|
|
|
|
|
|
| |||||||||
Total distributions | (132,069,652 | ) | (150,035,453 | ) | (9,187,611 | ) | (15,875,495 | ) | ||||||||
|
|
|
|
|
|
|
| |||||||||
Net share transactions (Note 9): | ||||||||||||||||
Core Class | (830,527,741 | ) | (1,255,098,954 | ) | — | — | ||||||||||
Class III | — | — | 11,806,790 | 13,953,404 | ||||||||||||
Class R6 | — | — | 368,329 | 313,408 | ||||||||||||
|
|
|
|
|
|
|
| |||||||||
Increase (decrease) in net assets resulting from net share transactions | (830,527,741 | ) | (1,255,098,954 | ) | 12,175,119 | 14,266,812 | ||||||||||
|
|
|
|
|
|
|
| |||||||||
Total increase (decrease) in net assets | (945,342,707 | ) | (1,289,141,322 | ) | (3,376,274 | ) | 5,193,173 | |||||||||
Net assets: | ||||||||||||||||
Beginning of period | 4,681,225,899 | 5,970,367,221 | 230,576,117 | 225,382,944 | ||||||||||||
|
|
|
|
|
|
|
| |||||||||
End of period | $ | 3,735,883,192 | $ | 4,681,225,899 | $ | 227,199,843 | $ | 230,576,117 | ||||||||
|
|
|
|
|
|
|
| |||||||||
| See accompanying notes to the financial statements. | 138 |
GMO Trust Funds
Statements of Changes in Net Assets — (Continued)
| International | Consolidated SGM | |||||||||||||||
| Equity | Major | |||||||||||||||
| Allocation | Markets | |||||||||||||||
| Fund | Fund | |||||||||||||||
| Year Ended | Year Ended | |||||||||||||||
| February 28, | February 28, | |||||||||||||||
| 2023 | 2022 | 2023 | 2022 | |||||||||||||
Increase (decrease) in net assets: | ||||||||||||||||
Operations: | ||||||||||||||||
Net investment income (loss) | $ | 24,960,732 | $ | 41,077,456 | $ | 1,780,762 | $ | (2,449,340 | ) | |||||||
Net realized gain (loss) | (12,463,356 | ) | 19,415,944 | (3,146,509 | ) | (6,698,606 | ) | |||||||||
Change in net unrealized appreciation (depreciation) | (69,591,970 | ) | (81,975,337 | ) | 3,926,242 | 1,094,883 | ||||||||||
|
|
|
|
|
|
|
| |||||||||
Net increase (decrease) in net assets from operations | (57,094,594 | ) | (21,481,937 | ) | 2,560,495 | (8,053,063 | ) | |||||||||
|
|
|
|
|
|
|
| |||||||||
Distributions to shareholders: | ||||||||||||||||
Class III | (13,246,154 | ) | (29,164,941 | ) | (1,493,076 | ) | (2,188,743 | ) | ||||||||
Class VI | — | — | (12,535,348 | ) | (23,082,080 | ) | ||||||||||
Class R6 | (10,107,910 | ) | (15,335,754 | ) | — | — | ||||||||||
Class I | — | — | (1,088,498 | ) | (1,575,727 | ) | ||||||||||
|
|
|
|
|
|
|
| |||||||||
Total distributions | (23,354,064 | ) | (44,500,695 | ) | (15,116,922 | ) | (26,846,550 | ) | ||||||||
|
|
|
|
|
|
|
| |||||||||
Net share transactions (Note 9): | ||||||||||||||||
Class III | (103,571,918 | ) | (119,007,367 | ) | (27,325,604 | ) | 5,866,671 | |||||||||
Class VI | — | — | (77,087,194 | ) | (77,631,000 | ) | ||||||||||
Class R6 | (3,154,572 | ) | 2,753,167 | — | — | |||||||||||
Class I | — | — | (14,477,458 | ) | 8,999,513 | |||||||||||
|
|
|
|
|
|
|
| |||||||||
Increase (decrease) in net assets resulting from net share transactions | (106,726,490 | ) | (116,254,200 | ) | (118,890,256 | ) | (62,764,816 | ) | ||||||||
|
|
|
|
|
|
|
| |||||||||
Total increase (decrease) in net assets | (187,175,148 | ) | (182,236,832 | ) | (131,446,683 | ) | (97,664,429 | ) | ||||||||
Net assets: | ||||||||||||||||
Beginning of period | 679,317,340 | 861,554,172 | 260,390,900 | 358,055,329 | ||||||||||||
|
|
|
|
|
|
|
| |||||||||
End of period | $ | 492,142,192 | $ | 679,317,340 | $ | 128,944,217 | $ | 260,390,900 | ||||||||
|
|
|
|
|
|
|
| |||||||||
| 139 | See accompanying notes to the financial statements. |
GMO Trust Funds
Statements of Changes in Net Assets — (Continued)
| Strategic | ||||||||
| Opportunities | ||||||||
| Allocation | ||||||||
| Fund | ||||||||
| Year Ended | ||||||||
| February 28, | ||||||||
| 2023 | 2022 | |||||||
Increase (decrease) in net assets: | ||||||||
Operations: | ||||||||
Net investment income (loss) | $ | 7,928,464 | $ | 10,033,100 | ||||
Net realized gain (loss) | 1,106,379 | 64,829,890 | ||||||
Change in net unrealized appreciation (depreciation) | (19,594,468 | ) | (48,805,216 | ) | ||||
|
|
|
| |||||
Net increase (decrease) in net assets from operations | (10,559,625 | ) | 26,057,774 | |||||
|
|
|
| |||||
Distributions to shareholders: | ||||||||
Class III | (18,348,413 | ) | (67,555,650 | ) | ||||
|
|
|
| |||||
Total distributions | (18,348,413 | ) | (67,555,650 | ) | ||||
|
|
|
| |||||
Net share transactions (Note 9): | ||||||||
Class III | (18,040,407 | ) | (301,846,406 | ) | ||||
|
|
|
| |||||
Increase (decrease) in net assets resulting from net share transactions | (18,040,407 | ) | (301,846,406 | ) | ||||
|
|
|
| |||||
Total increase (decrease) in net assets | (46,948,445 | ) | (343,344,282 | ) | ||||
Net assets: | ||||||||
Beginning of period | 236,452,022 | 579,796,304 | ||||||
|
|
|
| |||||
End of period | $ | 189,503,577 | $ | 236,452,022 | ||||
|
|
|
| |||||
| See accompanying notes to the financial statements. | 140 |
GMO Trust Funds
Statements of Cash Flows — Year Ended February 28, 2023
| Consolidated | Strategic | |||||||||||||||
| Alternative | Benchmark- | Consolidated | Opportunities | |||||||||||||
| Allocation | Free | Implementation | Allocation | |||||||||||||
| Fund | Fund | Fund | Fund | |||||||||||||
Cash flows from operating activities: | ||||||||||||||||
Net increase (decrease) in net assets resulting from operations | $ | 4,463,466 | $ | (13,447,172 | ) | $ | 17,254,686 | $ | (10,559,625 | ) | ||||||
|
|
|
|
|
|
|
| |||||||||
Adjustments to reconcile net increase (decrease) in net assets resulting from operations to net cash provided by (used in) operating activities: | ||||||||||||||||
Net change in unrealized (appreciation) depreciation | (360,528 | ) | 121,879,629 | 306,158,237 | 19,594,468 | |||||||||||
Net realized (gain) loss | (1,353,300 | ) | (42,873,591 | ) | (155,743,646 | ) | (1,106,379 | ) | ||||||||
Cost of purchase of investments held long | (363,276,150 | ) | (1,236,549,803 | ) | (3,850,288,882 | ) | (111,243,252 | ) | ||||||||
Cost of purchase of investments held short | (153,546,125 | ) | (273,084,221 | ) | (831,826,943 | ) | (29,795,539 | ) | ||||||||
Proceeds from sale of investments held long | 441,555,005 | 1,452,028,608 | 4,269,076,763 | 151,007,919 | ||||||||||||
Proceeds of sales to securities sold short | 136,105,994 | 216,646,442 | 820,915,668 | 25,032,389 | ||||||||||||
Net accretion of discount and amortization of premium | (77,197 | ) | (585,836 | ) | (6,763,892 | ) | 91,959 | |||||||||
Short-term investments, net | 24,684,381 | 145,777,954 | 238,814,680 | 2,437,822 | ||||||||||||
Realized gain distributions from affiliated issuers | — | 7,223,264 | — | 3,584,990 | ||||||||||||
Cash flows related to derivative transactions: | ||||||||||||||||
Futures contracts | 2,577,492 | 27,827,801 | 98,590,155 | — | ||||||||||||
Written option contracts | 164,176 | — | 3,484,850 | — | ||||||||||||
Swap contracts | (1,433,068 | ) | 2,434,192 | 5,144,118 | 582,171 | |||||||||||
Forward currency contracts | (5,993,187 | ) | 715,353 | (20,013,196 | ) | — | ||||||||||
Foreign currency and foreign currency related transactions | 1,296 | (731,978 | ) | 1,250,472 | (58,371 | ) | ||||||||||
Change in assets and liabilities: | ||||||||||||||||
(Increase) decrease in due from broker | 4,563,035 | 2,993,900 | 77,666,222 | 85 | ||||||||||||
(Increase) decrease in dividends and interest receivable | (726,793 | ) | (30,992 | ) | (4,039,365 | ) | (590,575 | ) | ||||||||
(Increase) decrease in dividend tax withholding | (12,204 | ) | 113,252 | 267,883 | 12,660 | |||||||||||
(Increase) decrease in receivable for expenses reimbursed and/or waived by GMO | 60,354 | (66,041 | ) | (226,221 | ) | (34,778 | ) | |||||||||
(Increase) decrease in interest receivable for open OTC swap contracts | (470,952 | ) | — | (128,011 | ) | — | ||||||||||
(Increase) decrease in receivable for closed swap contracts | 7,224 | 40,063 | 94,156 | 4,362 | ||||||||||||
(Increase) decrease in foreign capital gains tax refund receivable | — | 18,053 | 3,143 | (1,157 | ) | |||||||||||
(Increase) decrease in receivable from liquidated underlying funds | (23,073 | ) | — | — | — | |||||||||||
(Increase) decrease in EU tax reclaims receivable | — | — | (1,428,922 | ) | — | |||||||||||
Increase (decrease) in payable to affiliate for: | ||||||||||||||||
Management fee | (51,311 | ) | — | — | — | |||||||||||
Shareholder service fee | (4,736 | ) | — | — | — | |||||||||||
Increase (decrease) in due to custodian | — | — | 688,162 | (844 | ) | |||||||||||
Increase (decrease) in due to broker | — | (649 | ) | 9 | — | |||||||||||
Increase (decrease) in dividends and interest payable | 6,174 | 69,940 | 327,488 | 8,942 | ||||||||||||
Increase (decrease) in payable for closed swap contracts | (18,691 | ) | (114,304 | ) | (235,003 | ) | (10,843 | ) | ||||||||
Increase (decrease) in payable to Trustees and related expenses | (532 | ) | (1,847 | ) | (3,085 | ) | (2,524 | ) | ||||||||
Increase (decrease) in interest payable for OTC swap contracts^ | 448,440 | — | 109,551 | — | ||||||||||||
Increase (decrease) in accrued expenses | (26,566 | ) | (642,859 | ) | (1,036,393 | ) | (133,572 | ) | ||||||||
Increase (decrease) in accrued foreign capital gains tax payable | — | 85,795 | (104,584 | ) | — | |||||||||||
Increase (decrease) in payable for cash collateral from securities loaned | — | (8,776,785 | ) | (11,231,443 | ) | — | ||||||||||
|
|
|
|
|
|
|
| |||||||||
Net cash provided by (used in) operating activities | 87,262,624 | 400,948,168 | 956,776,657 | 48,820,308 | ||||||||||||
|
|
|
|
|
|
|
| |||||||||
Cash flows from financing activities: | ||||||||||||||||
Proceeds from shares sold | 52,061,627 | 24,689,894 | 333,116,017 | 16,819,874 | ||||||||||||
Shares repurchased | (139,007,645 | ) | (424,614,200 | ) | (1,289,752,003 | ) | (59,538,159 | ) | ||||||||
Cash distributions paid | (611,373 | ) | (1,515,872 | ) | — | (6,085,535 | ) | |||||||||
|
|
|
|
|
|
|
| |||||||||
Net cash provided by (used in) financing activities | (87,557,391 | ) | (401,440,178 | ) | (956,635,986 | ) | (48,803,820 | ) | ||||||||
|
|
|
|
|
|
|
| |||||||||
Net increase (decrease) in cash | (294,767 | ) | (492,010 | ) | 140,671 | 16,488 | ||||||||||
Cash, beginning of period | 3,526,958 | 1,141,425 | 2,036,343 | 46,610 | ||||||||||||
|
|
|
|
|
|
|
| |||||||||
Cash, end of period | $ | 3,232,191 | $ | 649,415 | $ | 2,177,014 | $ | 63,098 | ||||||||
|
|
|
|
|
|
|
| |||||||||
Cash paid during the period for: | ||||||||||||||||
^ Interest on swap contracts | $ | 540,703 | $ | — | $ | — | $ | — | ||||||||
| 141 | See accompanying notes to the financial statements. |
GMO Trust Funds
(For a share outstanding throughout each period)
CONSOLIDATED ALTERNATIVE ALLOCATION FUND
| Class VI Shares | ||||||||||||||||
| Period from | ||||||||||||||||
| May 1, 2019 | ||||||||||||||||
| (commencement | ||||||||||||||||
| of operations) | ||||||||||||||||
| Year Ended | through | |||||||||||||||
| February 28, | February 29, | |||||||||||||||
| 2023 | 2022 | 2021 | 2020 | |||||||||||||
Net asset value, beginning of period | $ | 18.08 | $ | 18.99 | $ | 19.45 | $ | 20.00 | ||||||||
|
|
|
|
|
|
|
| |||||||||
Income (loss) from investment operations: | ||||||||||||||||
Net investment income (loss)(a)† | 0.26 | 0.05 | (0.02 | ) | 0.15 | |||||||||||
Net realized and unrealized gain (loss) | 0.32 | (0.23 | ) | 0.03 | (b) | (0.18 | ) | |||||||||
|
|
|
|
|
|
|
| |||||||||
Total from investment operations | 0.58 | (0.18 | ) | 0.01 | (0.03 | ) | ||||||||||
|
|
|
|
|
|
|
| |||||||||
Less distributions to shareholders: | ||||||||||||||||
From net investment income | — | — | (0.47 | ) | (0.06 | ) | ||||||||||
From net realized gains | (0.17 | ) | (0.73 | ) | — | (0.46 | ) | |||||||||
|
|
|
|
|
|
|
| |||||||||
Total distributions | (0.17 | ) | (0.73 | ) | (0.47 | ) | (0.52 | ) | ||||||||
|
|
|
|
|
|
|
| |||||||||
Net asset value, end of period | $ | 18.49 | $ | 18.08 | $ | 18.99 | $ | 19.45 | ||||||||
|
|
|
|
|
|
|
| |||||||||
Total Return(c) | 3.25 | % | (0.99 | )% | 0.01 | % | (0.21 | )%** | ||||||||
Ratios/Supplemental Data: | ||||||||||||||||
Net assets, end of period (000’s) | $ | 49,257 | $ | 130,896 | $ | 230,386 | $ | 200,812 | ||||||||
Net operating expenses to average daily net assets(d) | 0.81 | % | 0.80 | % | 0.76 | % | 0.77 | %* | ||||||||
Interest and/or dividend expenses and/or borrowing costs to average daily net assets(e) | 0.61 | % | 0.51 | % | 0.49 | % | 0.29 | %* | ||||||||
Total net expenses to average daily net assets(d) | 1.42 | % | 1.31 | % | 1.25 | % | 1.05 | %* | ||||||||
Net investment income (loss) to average daily net assets(a) | 1.44 | % | 0.29 | % | (0.10 | )% | 0.88 | %* | ||||||||
Portfolio turnover rate(f) | 337 | % | 572 | % | 410 | % | 243 | %** | ||||||||
Fees and expenses reimbursed and/or waived by GMO to average daily net assets:(g) | 0.35 | % | 0.17 | % | 0.15 | % | 0.27 | %* | ||||||||
| (a) | Net investment income is affected by the timing of the declaration of dividends by the other GMO Funds and/or other investment companies in which the Fund invests, if any. |
| (b) | The amount shown for a share outstanding does not correspond with the aggregate net realized and unrealized gain (loss) on investments due to the timing of purchases and redemptions of the Fund shares in relation to fluctuating market values of the investments of the Fund. |
| (c) | The total returns would have been lower had certain expenses not been reimbursed and/or waived during the periods shown, if applicable, and assumes the effect of reinvested distributions, if any. Calculation excludes purchase premiums and redemption fees which are borne by the shareholder purchasing or redeeming Fund shares, if any. |
| (d) | Net expenses exclude expenses incurred indirectly through investment in the underlying funds, if any (Note 5). |
| (e) | Interest and dividend expense and/or borrowing costs incurred as a result of cash collateral on derivatives, entering into reverse repurchase agreements, securities sold short or margin on cleared swap contracts, if any, is included in the Fund’s net expenses. Income earned on investing proceeds from reverse repurchase agreements, if any, is included in interest income. |
| (f) | The portfolio turnover rate excludes investments in GMO U.S. Treasury Fund (“USTF”) which is used as a short-term investment vehicle for cash management. The Fund’s portfolio turnover rate including transactions in USTF during the period and/or year ended: |
| February 28, | February 28, | February 28, | February 29, | |||||||||||||
| 2023 | 2022 | 2021 | 2020 | |||||||||||||
Portfolio turnover rate including transactions in USTF | N/A | 572 | % | 411 | % | 250 | % | |||||||||
| (g) | Ratio includes indirect fees waived or borne by GMO. |
| † | Calculated using average shares outstanding throughout the period. |
| * | Annualized. |
| ** | Not annualized. |
| See accompanying notes to the financial statements. | 142 |
GMO Trust Funds
Financial Highlights — (Continued)
(For a share outstanding throughout each period)
CONSOLIDATED ALTERNATIVE ALLOCATION FUND (continued)
| Class R6 Shares | ||||||||||||
| Period from | ||||||||||||
| July 31, 2020 | ||||||||||||
| (commencement | ||||||||||||
| of operations) | ||||||||||||
| Year Ended | through | |||||||||||
| February 28, | February 28, | |||||||||||
| 2023 | 2022 | 2021 | ||||||||||
Net asset value, beginning of period | $ | 18.18 | $ | 18.95 | $ | 19.33 | ||||||
|
|
|
|
|
| |||||||
Income (loss) from investment operations: | ||||||||||||
Net investment income (loss)(a)† | 0.23 | (0.00 | )(b) | (0.03 | ) | |||||||
Net realized and unrealized gain (loss) | 0.34 | (0.04 | ) | 0.07 | (c) | |||||||
|
|
|
|
|
| |||||||
Total from investment operations | 0.57 | (0.04 | ) | 0.04 | ||||||||
|
|
|
|
|
| |||||||
Less distributions to shareholders: | ||||||||||||
From net investment income | — | — | (0.42 | ) | ||||||||
From net realized gains | (0.17 | ) | (0.73 | ) | — | |||||||
|
|
|
|
|
| |||||||
Total distributions | (0.17 | ) | (0.73 | ) | (0.42 | ) | ||||||
|
|
|
|
|
| |||||||
Net asset value, end of period | $ | 18.58 | $ | 18.18 | $ | 18.95 | ||||||
|
|
|
|
|
| |||||||
Total Return(d) | 3.17 | % | (0.23 | )% | 0.16 | %** | ||||||
Ratios/Supplemental Data: | ||||||||||||
Net assets, end of period (000’s) | $ | 4 | $ | 22 | $ | 478 | ||||||
Net operating expenses to average daily net assets(e) | 0.98 | % | 0.97 | % | 0.93 | %* | ||||||
Interest and/or dividend expenses and/or borrowing costs to average daily net assets(f) | 0.61 | % | 0.58 | % | 0.53 | %* | ||||||
Total net expenses to average daily net assets(e) | 1.59 | % | 1.55 | % | 1.46 | %* | ||||||
Net investment income (loss) to average daily net assets(a) | 1.27 | % | 0.01 | % | (0.26 | )%* | ||||||
Portfolio turnover rate(g) | 337 | % | 572 | % | 410 | %** | ||||||
Fees and expenses reimbursed and/or waived by GMO to average daily net assets:(h) | 0.35 | % | 0.13 | % | 0.16 | %* | ||||||
| (a) | Net investment income is affected by the timing of the declaration of dividends by the other GMO Funds and/or other investment companies in which the Fund invests, if any. |
| (b) | Rounds to less than $0.01. |
| (c) | The amount shown for a share outstanding does not correspond with the aggregate net realized and unrealized gain (loss) on investments due to the timing of purchases and redemptions of the Fund shares in relation to fluctuating market values of the investments of the Fund. |
| (d) | The total returns would have been lower had certain expenses not been reimbursed and/or waived during the periods shown, if applicable, and assumes the effect of reinvested distributions, if any. Calculation excludes purchase premiums and redemption fees which are borne by the shareholder purchasing or redeeming Fund shares, if any. |
| (e) | Net expenses exclude expenses incurred indirectly through investment in the underlying funds, if any (Note 5). |
| (f) | Interest and dividend expense and/or borrowing costs incurred as a result of cash collateral on derivatives, entering into reverse repurchase agreements, securities sold short or margin on cleared swap contracts, if any, is included in the Fund’s net expenses. Income earned on investing proceeds from reverse repurchase agreements, if any, is included in interest income. |
| (g) | The portfolio turnover rate excludes investments in GMO U.S. Treasury Fund (“USTF”) which is used as a short-term investment vehicle for cash management. The Fund’s portfolio turnover rate including transactions in USTF during the period and/or year ended: |
| February 28, | February 28, | February 28, | ||||||||||
| 2023 | 2022 | 2021 | ||||||||||
Portfolio turnover rate including transactions in USTF | N/A | 572 | % | 411 | % | |||||||
| (h) | Ratio includes indirect fees waived or borne by GMO. |
| † | Calculated using average shares outstanding throughout the period. |
| * | Annualized. |
| ** | Not annualized. |
| 143 | See accompanying notes to the financial statements. |
GMO Trust Funds
Financial Highlights — (Continued)
(For a share outstanding throughout each period)
CONSOLIDATED ALTERNATIVE ALLOCATION FUND (continued)
| Class I Shares | ||||||||||||||||
| Period from | ||||||||||||||||
| September 4, 2019 | ||||||||||||||||
| (commencement | ||||||||||||||||
| of operations) | ||||||||||||||||
| Year Ended | through | |||||||||||||||
| February 28, | February 29, | |||||||||||||||
| 2023 | 2022 | 2021 | 2020 | |||||||||||||
Net asset value, beginning of period | $ | 18.01 | $ | 18.96 | $ | 19.44 | $ | 20.18 | ||||||||
|
|
|
|
|
|
|
| |||||||||
Income (loss) from investment operations: | ||||||||||||||||
Net investment income (loss)(a)† | 0.23 | 0.01 | (0.09 | ) | 0.10 | |||||||||||
Net realized and unrealized gain (loss) | 0.30 | (0.23 | ) | 0.04 | (b) | (0.33 | ) | |||||||||
|
|
|
|
|
|
|
| |||||||||
Total from investment operations | 0.53 | (0.22 | ) | (0.05 | ) | (0.23 | ) | |||||||||
|
|
|
|
|
|
|
| |||||||||
Less distributions to shareholders: | ||||||||||||||||
From net investment income | — | — | (0.43 | ) | (0.05 | ) | ||||||||||
From net realized gains | (0.17 | ) | (0.73 | ) | — | (0.46 | ) | |||||||||
|
|
|
|
|
|
|
| |||||||||
Total distributions | (0.17 | ) | (0.73 | ) | (0.43 | ) | (0.51 | ) | ||||||||
|
|
|
|
|
|
|
| |||||||||
Net asset value, end of period | $ | 18.37 | $ | 18.01 | $ | 18.96 | $ | 19.44 | ||||||||
|
|
|
|
|
|
|
| |||||||||
Total Return(c) | 2.98 | % | (1.21 | )% | (0.30 | )% | (1.20 | )%** | ||||||||
Ratios/Supplemental Data: | ||||||||||||||||
Net assets, end of period (000’s) | $ | 146,410 | $ | 148,247 | $ | 268,473 | $ | 34,229 | ||||||||
Net operating expenses to average daily net assets(d) | 1.08 | % | 1.07 | % | 1.02 | % | 1.02 | %* | ||||||||
Interest and/or dividend expenses and/or borrowing costs to average daily net assets(e) | 0.60 | % | 0.50 | % | 0.51 | % | 0.23 | %* | ||||||||
Total net expenses to average daily net assets(d) | 1.68 | % | 1.57 | % | 1.53 | % | 1.25 | %* | ||||||||
Net investment income (loss) to average daily net assets(a) | 1.31 | % | 0.06 | % | (0.44 | )% | 0.98 | %* | ||||||||
Portfolio turnover rate(f) | 337 | % | 572 | % | 410 | % | 243 | %** | ||||||||
Fees and expenses reimbursed and/or waived by GMO to average daily net assets:(g) | 0.37 | % | 0.19 | % | 0.15 | % | 0.24 | %* | ||||||||
| (a) | Net investment income is affected by the timing of the declaration of dividends by the other GMO Funds and/or other investment companies in which the Fund invests, if any. |
| (b) | The amount shown for a share outstanding does not correspond with the aggregate net realized and unrealized gain (loss) on investments due to the timing of purchases and redemptions of the Fund shares in relation to fluctuating market values of the investments of the Fund. |
| (c) | The total returns would have been lower had certain expenses not been reimbursed and/or waived during the periods shown, if applicable, and assumes the effect of reinvested distributions, if any. Calculation excludes purchase premiums and redemption fees which are borne by the shareholder purchasing or redeeming Fund shares, if any. |
| (d) | Net expenses exclude expenses incurred indirectly through investment in the underlying funds, if any (Note 5). |
| (e) | Interest and dividend expense and/or borrowing costs incurred as a result of cash collateral on derivatives, entering into reverse repurchase agreements, securities sold short or margin on cleared swap contracts, if any, is included in the Fund’s net expenses. Income earned on investing proceeds from reverse repurchase agreements, if any, is included in interest income. |
| (f) | The portfolio turnover rate excludes investments in GMO U.S. Treasury Fund (“USTF”) which is used as a short-term investment vehicle for cash management. The Fund’s portfolio turnover rate including transactions in USTF during the period and/or year ended: |
| February 28, | February 28, | February 28, | February 29, | |||||||||||||
| 2023 | 2022 | 2021 | 2020 | |||||||||||||
Portfolio turnover rate including transactions in USTF | N/A | 572 | % | 411 | % | 250 | % | |||||||||
| (g) | Ratio includes indirect fees waived or borne by GMO. |
| † | Calculated using average shares outstanding throughout the period. |
| * | Annualized. |
| ** | Not annualized. |
| See accompanying notes to the financial statements. | 144 |
GMO Trust Funds
Financial Highlights — (Continued)
(For a share outstanding throughout each period)
BENCHMARK-FREE ALLOCATION FUND
| Class III Shares | ||||||||||||||||||||
| Year Ended February 28/29, | ||||||||||||||||||||
| 2023 | 2022 | 2021 | 2020 | 2019 | ||||||||||||||||
Net asset value, beginning of period | $ | 25.56 | $ | 25.97 | $ | 25.53 | $ | 26.36 | $ | 27.76 | ||||||||||
|
|
|
|
|
|
|
|
|
| |||||||||||
Income (loss) from investment operations: | ||||||||||||||||||||
Net investment income (loss)(a)† | 0.73 | 0.57 | 0.40 | 0.83 | 0.82 | |||||||||||||||
Net realized and unrealized gain (loss) | (0.63 | ) | (0.35 | ) | 0.98 | (0.75 | ) | (1.30 | ) | |||||||||||
|
|
|
|
|
|
|
|
|
| |||||||||||
Total from investment operations | 0.10 | 0.22 | 1.38 | 0.08 | (0.48 | ) | ||||||||||||||
|
|
|
|
|
|
|
|
|
| |||||||||||
Less distributions to shareholders: | ||||||||||||||||||||
From net investment income | (0.77 | ) | (0.63 | ) | (0.78 | ) | (0.90 | ) | (0.90 | ) | ||||||||||
From net realized gains | — | — | (0.16 | ) | (0.01 | ) | (0.02 | ) | ||||||||||||
|
|
|
|
|
|
|
|
|
| |||||||||||
Total distributions | (0.77 | ) | (0.63 | ) | (0.94 | ) | (0.91 | ) | (0.92 | ) | ||||||||||
|
|
|
|
|
|
|
|
|
| |||||||||||
Net asset value, end of period | $ | 24.89 | $ | 25.56 | $ | 25.97 | $ | 25.53 | $ | 26.36 | ||||||||||
|
|
|
|
|
|
|
|
|
| |||||||||||
Total Return(b) | 0.50 | % | 0.86 | % | 5.60 | % | 0.11 | % | (1.55 | )% | ||||||||||
Ratios/Supplemental Data: | ||||||||||||||||||||
Net assets, end of period (000’s) | $ | 1,546,717 | $ | 1,726,440 | $ | 2,227,712 | $ | 3,785,568 | $ | 4,642,211 | ||||||||||
Net expenses to average daily net assets(c) | 0.74 | % | 0.75 | % | 0.70 | % | 0.66 | % | 0.65 | % | ||||||||||
Net investment income (loss) to average daily net assets(a) | 3.00 | % | 2.15 | % | 1.59 | % | 3.12 | % | 3.07 | % | ||||||||||
Portfolio turnover rate | 19 | % | 7 | % | 20 | % | 10 | % | 18 | % | ||||||||||
Fees and expenses reimbursed and/or waived by GMO to average daily net assets:(d) | 0.08 | % | 0.06 | % | 0.11 | % | 0.15 | % | 0.15 | % | ||||||||||
Purchase premiums and redemption fees consisted of the following per share amounts (Note 2):† | $ | — | $ | — | $ | — | $ | — | $ | 0.00 | (e) | |||||||||
| (a) | Net investment income is affected by the timing of the declaration of dividends by the other GMO Funds and/or other investment companies in which the Fund invests, if any. |
| (b) | The total returns would have been lower had certain expenses not been reimbursed and/or waived during the periods shown, if applicable, and assumes the effect of reinvested distributions, if any. Calculation excludes purchase premiums and redemption fees which are borne by the shareholder purchasing or redeeming Fund shares, if any. |
| (c) | Net expenses exclude expenses incurred indirectly through investment in the underlying funds, if any (Note 5). |
| (d) | Ratio includes indirect fees waived or borne by GMO. |
| (e) | Rounds to less than $0.01. |
| † | Calculated using average shares outstanding throughout the period. |
| 145 | See accompanying notes to the financial statements. |
GMO Trust Funds
Financial Highlights — (Continued)
(For a share outstanding throughout each period)
BENCHMARK-FREE ALLOCATION FUND (continued)
| Class IV Shares | ||||||||||||||||||||
| Year Ended February 28/29, | ||||||||||||||||||||
| 2023 | 2022 | 2021 | 2020 | 2019 | ||||||||||||||||
Net asset value, beginning of period | $ | 25.56 | $ | 25.96 | $ | 25.53 | $ | 26.35 | $ | 27.75 | ||||||||||
|
|
|
|
|
|
|
|
|
| |||||||||||
Income (loss) from investment operations: | ||||||||||||||||||||
Net investment income (loss)(a)† | 0.80 | 0.49 | 0.43 | 0.83 | 0.88 | |||||||||||||||
Net realized and unrealized gain (loss) | (0.68 | ) | (0.25 | ) | 0.96 | (0.73 | ) | (1.35 | ) | |||||||||||
|
|
|
|
|
|
|
|
|
| |||||||||||
Total from investment operations | 0.12 | 0.24 | 1.39 | 0.10 | (0.47 | ) | ||||||||||||||
|
|
|
|
|
|
|
|
|
| |||||||||||
Less distributions to shareholders: | ||||||||||||||||||||
From net investment income | (0.79 | ) | (0.64 | ) | (0.80 | ) | (0.91 | ) | (0.91 | ) | ||||||||||
From net realized gains | — | — | (0.16 | ) | (0.01 | ) | (0.02 | ) | ||||||||||||
|
|
|
|
|
|
|
|
|
| |||||||||||
Total distributions | (0.79 | ) | (0.64 | ) | (0.96 | ) | (0.92 | ) | (0.93 | ) | ||||||||||
|
|
|
|
|
|
|
|
|
| |||||||||||
Net asset value, end of period | $ | 24.89 | $ | 25.56 | $ | 25.96 | $ | 25.53 | $ | 26.35 | ||||||||||
|
|
|
|
|
|
|
|
|
| |||||||||||
Total Return(b) | 0.55 | % | 0.93 | % | 5.61 | % | 0.21 | % | (1.50 | )% | ||||||||||
Ratios/Supplemental Data: | ||||||||||||||||||||
Net assets, end of period (000’s) | $ | 1,182,069 | $ | 1,388,080 | $ | 1,965,528 | $ | 2,085,324 | $ | 2,737,619 | ||||||||||
Net expenses to average daily net assets(c) | 0.69 | % | 0.70 | % | 0.66 | % | 0.61 | % | 0.60 | % | ||||||||||
Net investment income (loss) to average daily net assets(a) | 3.26 | % | 1.85 | % | 1.73 | % | 3.12 | % | 3.29 | % | ||||||||||
Portfolio turnover rate | 19 | % | 7 | % | 20 | % | 10 | % | 18 | % | ||||||||||
Fees and expenses reimbursed and/or waived by GMO to average daily net assets:(d) | 0.08 | % | 0.06 | % | 0.10 | % | 0.15 | % | 0.15 | % | ||||||||||
Purchase premiums and redemption fees consisted of the following per share amounts (Note 2):† | $ | — | $ | — | $ | — | $ | — | $ | 0.00 | (e) | |||||||||
| (a) | Net investment income is affected by the timing of the declaration of dividends by the other GMO Funds and/or other investment companies in which the Fund invests, if any. |
| (b) | The total returns would have been lower had certain expenses not been reimbursed and/or waived during the periods shown, if applicable, and assumes the effect of reinvested distributions, if any. Calculation excludes purchase premiums and redemption fees which are borne by the shareholder purchasing or redeeming Fund shares, if any. |
| (c) | Net expenses exclude expenses incurred indirectly through investment in the underlying funds, if any (Note 5). |
| (d) | Ratio includes indirect fees waived or borne by GMO. |
| (e) | Rounds to less than $0.01. |
| † | Calculated using average shares outstanding throughout the period. |
| See accompanying notes to the financial statements. | 146 |
GMO Trust Funds
Financial Highlights — (Continued)
(For a share outstanding throughout each period)
BENCHMARK-FREE ALLOCATION FUND (continued)
| Class MF Shares | ||||||||||||||||||||
| Year Ended February 28/29, | ||||||||||||||||||||
| 2023 | 2022 | 2021 | 2020 | 2019 | ||||||||||||||||
Net asset value, beginning of period | $ | 25.58 | $ | 25.99 | $ | 25.55 | $ | 26.38 | $ | 27.77 | ||||||||||
|
|
|
|
|
|
|
|
|
| |||||||||||
Income (loss) from investment operations: | ||||||||||||||||||||
Net investment income (loss)(a)† | 0.75 | 0.60 | 0.38 | 0.83 | 0.77 | |||||||||||||||
Net realized and unrealized gain (loss) | (0.64 | ) | (0.37 | ) | 1.01 | (0.74 | ) | (1.23 | ) | |||||||||||
|
|
|
|
|
|
|
|
|
| |||||||||||
Total from investment operations | 0.11 | 0.23 | 1.39 | 0.09 | (0.46 | ) | ||||||||||||||
|
|
|
|
|
|
|
|
|
| |||||||||||
Less distributions to shareholders: | ||||||||||||||||||||
From net investment income | (0.78 | ) | (0.64 | ) | (0.79 | ) | (0.91 | ) | (0.91 | ) | ||||||||||
From net realized gains | — | — | (0.16 | ) | (0.01 | ) | (0.02 | ) | ||||||||||||
|
|
|
|
|
|
|
|
|
| |||||||||||
Total distributions | (0.78 | ) | (0.64 | ) | (0.95 | ) | (0.92 | ) | (0.93 | ) | ||||||||||
|
|
|
|
|
|
|
|
|
| |||||||||||
Net asset value, end of period | $ | 24.91 | $ | 25.58 | $ | 25.99 | $ | 25.55 | $ | 26.38 | ||||||||||
|
|
|
|
|
|
|
|
|
| |||||||||||
Total Return(b) | 0.54 | % | 0.91 | % | 5.64 | % | 0.16 | % | (1.47 | )% | ||||||||||
Ratios/Supplemental Data: | ||||||||||||||||||||
Net assets, end of period (000’s) | $ | 1,079,756 | $ | 1,370,527 | $ | 1,716,252 | $ | 2,827,442 | $ | 3,926,518 | ||||||||||
Net expenses to average daily net assets(c) | 0.69 | % | 0.70 | % | 0.65 | % | 0.61 | % | 0.60 | % | ||||||||||
Net investment income (loss) to average daily net assets(a) | 3.05 | % | 2.25 | % | 1.54 | % | 3.12 | % | 2.88 | % | ||||||||||
Portfolio turnover rate | 19 | % | 7 | % | 20 | % | 10 | % | 18 | % | ||||||||||
Fees and expenses reimbursed and/or waived by GMO to average daily net assets:(d) | 0.08 | % | 0.06 | % | 0.11 | % | 0.15 | % | 0.15 | % | ||||||||||
Purchase premiums and redemption fees consisted of the following per share amounts (Note 2):† | $ | — | $ | — | $ | — | $ | — | $ | 0.00 | (e) | |||||||||
| (a) | Net investment income is affected by the timing of the declaration of dividends by the other GMO Funds and/or other investment companies in which the Fund invests, if any. |
| (b) | The total returns would have been lower had certain expenses not been reimbursed and/or waived during the periods shown, if applicable, and assumes the effect of reinvested distributions, if any. Calculation excludes purchase premiums and redemption fees which are borne by the shareholder purchasing or redeeming Fund shares, if any. |
| (c) | Net expenses exclude expenses incurred indirectly through investment in the underlying funds, if any (Note 5). |
| (d) | Ratio includes indirect fees waived or borne by GMO. |
| (e) | Rounds to less than $0.01. |
| † | Calculated using average shares outstanding throughout the period. |
| 147 | See accompanying notes to the financial statements. |
GMO Trust Funds
Financial Highlights — (Continued)
(For a share outstanding throughout each period)
BENCHMARK-FREE ALLOCATION FUND (continued)
| Class R6 Shares | ||||||||||||
| Period from | ||||||||||||
| May 1, 2020 | ||||||||||||
| (commencement | ||||||||||||
| of operations) | ||||||||||||
| Year Ended | through | |||||||||||
| February 28, | February 28, | |||||||||||
| 2023 | 2022 | 2021 | ||||||||||
Net asset value, beginning of period | $ | 25.54 | $ | 25.95 | $ | 23.95 | ||||||
|
|
|
|
|
| |||||||
Income (loss) from investment operations: | ||||||||||||
Net investment income (loss)(a)† | 0.77 | 0.55 | 0.24 | |||||||||
Net realized and unrealized gain (loss) | (0.66 | ) | (0.33 | ) | 2.72 | |||||||
|
|
|
|
|
| |||||||
Total from investment operations | 0.11 | 0.22 | 2.96 | |||||||||
|
|
|
|
|
| |||||||
Less distributions to shareholders: | ||||||||||||
From net investment income | (0.78 | ) | (0.63 | ) | (0.80 | ) | ||||||
From net realized gains | — | — | (0.16 | ) | ||||||||
|
|
|
|
|
| |||||||
Total distributions | (0.78 | ) | (0.63 | ) | (0.96 | ) | ||||||
|
|
|
|
|
| |||||||
Net asset value, end of period | $ | 24.87 | $ | 25.54 | $ | 25.95 | ||||||
|
|
|
|
|
| |||||||
Total Return(b) | 0.51 | % | 0.86 | % | 12.55 | %** | ||||||
Ratios/Supplemental Data: | ||||||||||||
Net assets, end of period (000’s) | $ | 281,802 | $ | 273,491 | $ | 310,687 | ||||||
Net expenses to average daily net assets(c) | 0.74 | % | 0.75 | % | 0.74 | %* | ||||||
Net investment income (loss) to average daily net assets(a) | 3.16 | % | 2.06 | % | 1.16 | %* | ||||||
Portfolio turnover rate | 19 | % | 7 | % | 20 | %** | ||||||
Fees and expenses reimbursed and/or waived by GMO to average daily net assets:(d) | 0.08 | % | 0.06 | % | 0.08 | %* | ||||||
| (a) | Net investment income is affected by the timing of the declaration of dividends by the other GMO Funds and/or other investment companies in which the Fund invests, if any. |
| (b) | The total returns would have been lower had certain expenses not been reimbursed and/or waived during the periods shown, if applicable, and assumes the effect of reinvested distributions, if any. Calculation excludes purchase premiums and redemption fees which are borne by the shareholder purchasing or redeeming Fund shares, if any. |
| (c) | Net expenses exclude expenses incurred indirectly through investment in the underlying funds, if any (Note 5). |
| (d) | Ratio includes indirect fees waived or borne by GMO. |
| † | Calculated using average shares outstanding throughout the period. |
| * | Annualized. |
| ** | Not annualized. |
| See accompanying notes to the financial statements. | 148 |
GMO Trust Funds
Financial Highlights — (Continued)
(For a share outstanding throughout each period)
BENCHMARK-FREE ALLOCATION FUND (continued)
| Class I Shares | ||||||||||||||||
| Period from | ||||||||||||||||
| August 8, 2019 | ||||||||||||||||
| (commencement | ||||||||||||||||
| of operations) | ||||||||||||||||
| Year Ended | through | |||||||||||||||
| February 28, | February 29, | |||||||||||||||
| 2023 | 2022 | 2021 | 2020 | |||||||||||||
Net asset value, beginning of period | $ | 25.53 | $ | 25.95 | $ | 25.52 | $ | 26.24 | ||||||||
|
|
|
|
|
|
|
| |||||||||
Income (loss) from investment operations: | ||||||||||||||||
Net investment income (loss)(a)† | 0.70 | 0.63 | 0.33 | 1.10 | ||||||||||||
Net realized and unrealized gain (loss) | (0.62 | ) | (0.44 | ) | 1.02 | (0.93 | ) | |||||||||
|
|
|
|
|
|
|
| |||||||||
Total from investment operations | 0.08 | 0.19 | 1.35 | 0.17 | ||||||||||||
|
|
|
|
|
|
|
| |||||||||
Less distributions to shareholders: | ||||||||||||||||
From net investment income | (0.75 | ) | (0.61 | ) | (0.76 | ) | (0.89 | ) | ||||||||
From net realized gains | — | — | (0.16 | ) | — | |||||||||||
|
|
|
|
|
|
|
| |||||||||
Total distributions | (0.75 | ) | (0.61 | ) | (0.92 | ) | (0.89 | ) | ||||||||
|
|
|
|
|
|
|
| |||||||||
Net asset value, end of period | $ | 24.86 | $ | 25.53 | $ | 25.95 | $ | 25.52 | ||||||||
|
|
|
|
|
|
|
| |||||||||
Total Return(b) | 0.38 | % | 0.77 | % | 5.47 | % | 0.48 | %** | ||||||||
Ratios/Supplemental Data: | ||||||||||||||||
Net assets, end of period (000’s) | $ | 313,322 | $ | 365,107 | $ | 324,819 | $ | 98,453 | ||||||||
Net expenses to average daily net assets(c) | 0.84 | % | 0.85 | % | 0.81 | % | 0.74 | %* | ||||||||
Net investment income (loss) to average daily net assets(a) | 2.85 | % | 2.38 | % | 1.30 | % | 7.22 | %* | ||||||||
Portfolio turnover rate | 19 | % | 7 | % | 20 | % | 10 | %** | ||||||||
Fees and expenses reimbursed and/or waived by GMO to average daily net assets:(d) | 0.09 | % | 0.07 | % | 0.10 | % | 0.15 | %* | ||||||||
| (a) | Net investment income is affected by the timing of the declaration of dividends by the other GMO Funds and/or other investment companies in which the Fund invests, if any. |
| (b) | The total returns would have been lower had certain expenses not been reimbursed and/or waived during the periods shown, if applicable, and assumes the effect of reinvested distributions, if any. Calculation excludes purchase premiums and redemption fees which are borne by the shareholder purchasing or redeeming Fund shares, if any. |
| (c) | Net expenses exclude expenses incurred indirectly through investment in the underlying funds, if any (Note 5). |
| (d) | Ratio includes indirect fees waived or borne by GMO. |
| † | Calculated using average shares outstanding throughout the period. |
| * | Annualized. |
| ** | Not annualized. |
| 149 | See accompanying notes to the financial statements. |
GMO Trust Funds
Financial Highlights — (Continued)
(For a share outstanding throughout each period)
BENCHMARK-FREE FUND
| Class III Shares | ||||||||||||||||||||
| Year Ended February 28/29, | ||||||||||||||||||||
| 2023 | 2022 | 2021 | 2020 | 2019 | ||||||||||||||||
Net asset value, beginning of period | $ | 18.85 | $ | 19.48 | $ | 18.88 | $ | 19.56 | $ | 20.91 | ||||||||||
|
|
|
|
|
|
|
|
|
| |||||||||||
Income (loss) from investment operations: | ||||||||||||||||||||
Net investment income (loss)(a)† | 0.86 | 0.63 | 0.52 | 0.72 | 0.58 | |||||||||||||||
Net realized and unrealized gain (loss) | (0.98 | ) | (0.39 | ) | 0.71 | (0.59 | ) | (1.21 | ) | |||||||||||
|
|
|
|
|
|
|
|
|
| |||||||||||
Total from investment operations | (0.12 | ) | 0.24 | 1.23 | 0.13 | (0.63 | ) | |||||||||||||
|
|
|
|
|
|
|
|
|
| |||||||||||
Less distributions to shareholders: | ||||||||||||||||||||
From net investment income | (0.94 | ) | (0.87 | ) | (0.63 | ) | (0.81 | ) | (0.72 | ) | ||||||||||
|
|
|
|
|
|
|
|
|
| |||||||||||
Total distributions | (0.94 | ) | (0.87 | ) | (0.63 | ) | (0.81 | ) | (0.72 | ) | ||||||||||
|
|
|
|
|
|
|
|
|
| |||||||||||
Net asset value, end of period | $ | 17.79 | $ | 18.85 | $ | 19.48 | $ | 18.88 | $ | 19.56 | ||||||||||
|
|
|
|
|
|
|
|
|
| |||||||||||
Total Return(b) | (0.40 | )% | 1.21 | % | 6.64 | % | 0.41 | % | (2.80 | )% | ||||||||||
Ratios/Supplemental Data: | ||||||||||||||||||||
Net assets, end of period (000’s) | $ | 1,152,713 | $ | 1,613,854 | $ | 2,158,496 | $ | 2,583,930 | $ | 3,165,731 | ||||||||||
Net operating expenses to average daily net assets(c) | 0.06 | % | 0.03 | % | 0.04 | % | 0.02 | % | 0.02 | % | ||||||||||
Interest and/or dividend expenses and/or borrowing costs to average daily net assets(d) | 0.35 | % | 0.26 | % | 0.08 | % | 0.03 | % | 0.04 | % | ||||||||||
Total net expenses to average daily net assets(c) | 0.41 | % | 0.29 | % | 0.12 | % | 0.05 | % | 0.06 | % | ||||||||||
Net investment income (loss) to average daily net assets(a) | 4.85 | % | 3.19 | % | 2.86 | % | 3.64 | % | 2.92 | % | ||||||||||
Portfolio turnover rate(e) | 107 | % | 138 | % | 145 | % | 50 | % | 59 | % | ||||||||||
Fees and expenses reimbursed and/or waived by GMO to average daily net assets: | 0.06 | % | 0.07 | % | 0.05 | % | 0.04 | % | 0.03 | % | ||||||||||
Purchase premiums and redemption fees consisted of the following per share amounts (Note 2):† | $ | — | $ | — | $ | — | $ | — | $ | 0.00 | (f) | |||||||||
| (a) | Net investment income is affected by the timing of the declaration of dividends by the other GMO Funds and/or other investment companies in which the Fund invests, if any. |
| (b) | The total returns would have been lower had certain expenses not been reimbursed and/or waived during the periods shown, if applicable, and assumes the effect of reinvested distributions, if any. Calculation excludes purchase premiums and redemption fees which are borne by the shareholder purchasing or redeeming Fund shares, if any. |
| (c) | Net expenses exclude expenses incurred indirectly through investment in the underlying funds, if any (Note 5). |
| (d) | Interest and dividend expense and/or borrowing costs incurred as a result of cash collateral on derivatives, entering into reverse repurchase agreements, securities sold short or margin on cleared swap contracts, if any, is included in the Fund’s net expenses. Income earned on investing proceeds from reverse repurchase agreements, if any, is included in interest income. |
| (e) | The portfolio turnover rate excludes investments in GMO U.S. Treasury Fund (“USTF”) which is used as a short-term investment vehicle for cash management. The Fund’s portfolio turnover rate including transactions in USTF during the period and/or year ended: |
| February 28, | February 28, | February 28, | February 29, | February 28, | ||||||||||||||||
| 2023 | 2022 | 2021 | 2020 | 2019 | ||||||||||||||||
Portfolio turnover rate including transactions in USTF | 114 | % | 145 | % | 151 | % | 52 | % | 59 | % | ||||||||||
| (f) | Rounds to less than $0.01. |
| † | Calculated using average shares outstanding throughout the period. |
| See accompanying notes to the financial statements. | 150 |
GMO Trust Funds
Financial Highlights — (Continued)
(For a share outstanding throughout each period)
GLOBAL ASSET ALLOCATION FUND
| Class III Shares | ||||||||||||||||||||
| Year Ended February 28/29, | ||||||||||||||||||||
| 2023 | 2022 | 2021 | 2020 | 2019 | ||||||||||||||||
Net asset value, beginning of period | $ | 32.86 | $ | 34.92 | $ | 31.50 | $ | 31.47 | $ | 33.31 | ||||||||||
|
|
|
|
|
|
|
|
|
| |||||||||||
Income (loss) from investment operations: | ||||||||||||||||||||
Net investment income (loss)(a)† | 0.82 | 0.96 | 0.88 | 1.08 | 1.02 | |||||||||||||||
Net realized and unrealized gain (loss) | (2.67 | ) | (0.90 | ) | 3.91 | 0.29 | (1.74 | ) | ||||||||||||
|
|
|
|
|
|
|
|
|
| |||||||||||
Total from investment operations | (1.85 | ) | 0.06 | 4.79 | 1.37 | (0.72 | ) | |||||||||||||
|
|
|
|
|
|
|
|
|
| |||||||||||
Less distributions to shareholders: | ||||||||||||||||||||
From net investment income | (1.09 | ) | (2.12 | ) | (1.37 | ) | (1.34 | ) | (1.12 | ) | ||||||||||
|
|
|
|
|
|
|
|
|
| |||||||||||
Total distributions | (1.09 | ) | (2.12 | ) | (1.37 | ) | (1.34 | ) | (1.12 | ) | ||||||||||
|
|
|
|
|
|
|
|
|
| |||||||||||
Net asset value, end of period | $ | 29.92 | $ | 32.86 | $ | 34.92 | $ | 31.50 | $ | 31.47 | ||||||||||
|
|
|
|
|
|
|
|
|
| |||||||||||
Total Return(b) | (5.48 | )% | (0.10 | )% | 15.39 | % | 4.12 | % | (1.96 | )% | ||||||||||
Ratios/Supplemental Data: | ||||||||||||||||||||
Net assets, end of period (000’s) | $ | 306,276 | $ | 585,212 | $ | 692,580 | $ | 1,539,522 | $ | 1,909,728 | ||||||||||
Net expenses to average daily net assets(c) | 0.00 | %(d) | 0.00 | %(d) | 0.00 | %(d) | 0.00 | %(d) | 0.00 | %(d) | ||||||||||
Net investment income (loss) to average daily net assets(a) | 2.72 | % | 2.68 | % | 2.78 | % | 3.32 | % | 3.17 | % | ||||||||||
Portfolio turnover rate(e) | 31 | % | 27 | % | 30 | % | 27 | % | 21 | % | ||||||||||
Fees and expenses reimbursed and/or waived by GMO to average daily net assets: | 0.05 | % | 0.03 | % | 0.01 | % | 0.01 | % | 0.01 | % | ||||||||||
Purchase premiums and redemption fees consisted of the following per share amounts (Note 2):† | $ | — | $ | — | $ | — | $ | — | $ | 0.00 | (f) | |||||||||
| (a) | Net investment income is affected by the timing of the declaration of dividends by the other GMO Funds and/or other investment companies in which the Fund invests, if any. |
| (b) | The total returns would have been lower had certain expenses not been reimbursed and/or waived during the periods shown, if applicable, and assumes the effect of reinvested distributions, if any. Calculation excludes purchase premiums and redemption fees which are borne by the shareholder purchasing or redeeming Fund shares, if any. |
| (c) | Net expenses exclude expenses incurred indirectly through investment in the underlying funds, if any (Note 5). |
| (d) | Rounds to less than 0.01%. |
| (e) | The portfolio turnover rate excludes investments in GMO U.S. Treasury Fund (“USTF”) which is used as a short-term investment vehicle for cash management. The Fund’s portfolio turnover rate including transactions in USTF during the period and/or year ended: |
| February 28, | February 28, | February 28, | February 29, | February 28, | ||||||||||||||||
| 2023 | 2022 | 2021 | 2020 | 2019 | ||||||||||||||||
Portfolio turnover rate including transactions in USTF | 32 | % | 31 | % | 41 | % | 28 | % | 24 | % | ||||||||||
| (f) | Rounds to less than $0.01. |
| † | Calculated using average shares outstanding throughout the period. |
| 151 | See accompanying notes to the financial statements. |
GMO Trust Funds
Financial Highlights — (Continued)
(For a share outstanding throughout each period)
GLOBAL ASSET ALLOCATION FUND (continued)
| Class R6 Shares | ||||||||||||||||
| Year Ended February 28, | Period from September 30, 2019 (commencement of operations) through February 29, | |||||||||||||||
| 2023 | 2022 | 2021 | 2020 | |||||||||||||
Net asset value, beginning of period | $ | 32.84 | $ | 34.93 | $ | 31.50 | $ | 32.56 | ||||||||
|
|
|
|
|
|
|
| |||||||||
Income (loss) from investment operations: | ||||||||||||||||
Net investment income (loss)(a)† | 0.84 | 0.51 | 0.93 | 0.86 | ||||||||||||
Net realized and unrealized gain (loss) | (2.69 | ) | (0.48 | ) | 3.87 | (0.71 | ) | |||||||||
|
|
|
|
|
|
|
| |||||||||
Total from investment operations | (1.85 | ) | 0.03 | 4.80 | 0.15 | |||||||||||
|
|
|
|
|
|
|
| |||||||||
Less distributions to shareholders: | ||||||||||||||||
From net investment income | (1.09 | ) | (2.12 | ) | (1.37 | ) | (1.21 | ) | ||||||||
|
|
|
|
|
|
|
| |||||||||
Total distributions | (1.09 | ) | (2.12 | ) | (1.37 | ) | (1.21 | ) | ||||||||
|
|
|
|
|
|
|
| |||||||||
Net asset value, end of period | $ | 29.90 | $ | 32.84 | $ | 34.93 | $ | 31.50 | ||||||||
|
|
|
|
|
|
|
| |||||||||
Total Return(b) | (5.48 | )% | (0.19 | )% | 15.42 | % | 0.22 | %** | ||||||||
Ratios/Supplemental Data: | ||||||||||||||||
Net assets, end of period (000’s) | $ | 20,440 | $ | 26,148 | $ | 183,052 | $ | 17,888 | ||||||||
Net expenses to average daily net assets(c) | 0.00 | %(d) | 0.00 | %(d) | 0.01 | % | 0.00 | %(d) | ||||||||
Net investment income (loss) to average daily net assets(a) | 2.80 | % | 1.44 | % | 2.78 | % | 6.23 | %* | ||||||||
Portfolio turnover rate(e) | 31 | % | 27 | % | 30 | % | 27 | %** | ||||||||
Fees and expenses reimbursed and/or waived by GMO to average daily net assets: | 0.05 | % | 0.02 | % | 0.02 | % | 0.01 | %* | ||||||||
| (a) | Net investment income is affected by the timing of the declaration of dividends by the other GMO Funds and/or other investment companies in which the Fund invests, if any. |
| (b) | The total returns would have been lower had certain expenses not been reimbursed and/or waived during the periods shown, if applicable, and assumes the effect of reinvested distributions, if any. Calculation excludes purchase premiums and redemption fees which are borne by the shareholder purchasing or redeeming Fund shares, if any. |
| (c) | Net expenses exclude expenses incurred indirectly through investment in the underlying funds, if any (Note 5). |
| (d) | Rounds to less than 0.01%. |
| (e) | The portfolio turnover rate excludes investments in GMO U.S. Treasury Fund (“USTF”) which is used as a short-term investment vehicle for cash management. The Fund’s portfolio turnover rate including transactions in USTF during the period and/or year ended: |
| February 28, 2023 | February 28, 2022 | February 28, 2021 | February 29, 2020 | |||||||||||||
Portfolio turnover rate including transactions in USTF | 32 | % | 31 | % | 41 | % | 28 | % | ||||||||
| † | Calculated using average shares outstanding throughout the period. |
| * | Annualized. |
| ** | Not annualized. |
| See accompanying notes to the financial statements. | 152 |
GMO Trust Funds
Financial Highlights — (Continued)
(For a share outstanding throughout each period)
GLOBAL ASSET ALLOCATION FUND (continued)
| Class I Shares | ||||||||||||
| Year Ended February 28, | Period from January 6, 2021 (commencement of operations) through February 28, | |||||||||||
| 2023 | 2022 | 2021 | ||||||||||
Net asset value, beginning of period | $ | 32.87 | $ | 34.92 | $ | 34.71 | ||||||
|
|
|
|
|
| |||||||
Income (loss) from investment operations: | ||||||||||||
Net investment income (loss)(a)† | 1.07 | 0.87 | (0.01 | ) | ||||||||
Net realized and unrealized gain (loss) | (2.96 | ) | (0.84 | ) | 0.22 | |||||||
|
|
|
|
|
| |||||||
Total from investment operations | (1.89 | ) | 0.03 | 0.21 | ||||||||
|
|
|
|
|
| |||||||
Less distributions to shareholders: | ||||||||||||
From net investment income | (1.06 | ) | (2.08 | ) | — | |||||||
|
|
|
|
|
| |||||||
Total distributions | (1.06 | ) | (2.08 | ) | — | |||||||
|
|
|
|
|
| |||||||
Net asset value, end of period | $ | 29.92 | $ | 32.87 | $ | 34.92 | ||||||
|
|
|
|
|
| |||||||
Total Return(b) | (5.60 | )% | (0.18 | )% | 0.61 | %** | ||||||
Ratios/Supplemental Data: | ||||||||||||
Net assets, end of period (000’s) | $ | 13,403 | $ | 12,621 | $ | 20,497 | ||||||
Net expenses to average daily net assets(c) | 0.10 | % | 0.10 | % | 0.11 | % | ||||||
Net investment income (loss) to average daily net assets(a) | 3.59 | % | 2.41 | % | (0.10 | )%* | ||||||
Portfolio turnover rate(d) | 31 | % | 27 | % | 30 | %** | ||||||
Fees and expenses reimbursed and/or waived by GMO to average daily net assets: | 0.08 | % | 0.03 | % | 0.02 | %* | ||||||
| (a) | Net investment income is affected by the timing of the declaration of dividends by the other GMO Funds and/or other investment companies in which the Fund invests, if any. |
| (b) | The total returns would have been lower had certain expenses not been reimbursed and/or waived during the periods shown, if applicable, and assumes the effect of reinvested distributions, if any. Calculation excludes purchase premiums and redemption fees which are borne by the shareholder purchasing or redeeming Fund shares, if any. |
| (c) | Net expenses exclude expenses incurred indirectly through investment in the underlying funds, if any (Note 5). |
| (d) | The portfolio turnover rate excludes investments in GMO U.S. Treasury Fund (“USTF”) which is used as a short-term investment vehicle for cash management. The Fund’s portfolio turnover rate including transactions in USTF during the period and/or year ended: |
| February 28, 2023 | February 28, 2022 | February 28, 2021 | ||||||||||
Portfolio turnover rate including transactions in USTF | 32 | % | 31 | % | 41 | % | ||||||
| † | Calculated using average shares outstanding throughout the period. |
| * | Annualized. |
| ** | Not annualized. |
| 153 | See accompanying notes to the financial statements. |
GMO Trust Funds
Financial Highlights — (Continued)
(For a share outstanding throughout each period)
GLOBAL DEVELOPED EQUITY ALLOCATION FUND
| Class III Shares | ||||||||||||||||||||
| Year Ended February 28/29, | ||||||||||||||||||||
| 2023 | 2022 | 2021 | 2020 | 2019 | ||||||||||||||||
Net asset value, beginning of period | $ | 24.43 | $ | 25.79 | $ | 20.87 | $ | 21.20 | $ | 22.88 | ||||||||||
|
|
|
|
|
|
|
|
|
| |||||||||||
Income (loss) from investment operations: | ||||||||||||||||||||
Net investment income (loss)(a)† | 0.65 | 1.00 | 0.75 | 0.25 | 0.57 | |||||||||||||||
Net realized and unrealized gain (loss) | (1.78 | ) | 0.94 | 5.12 | 0.42 | (1.67 | ) | |||||||||||||
|
|
|
|
|
|
|
|
|
| |||||||||||
Total from investment operations | (1.13 | ) | 1.94 | 5.87 | 0.67 | (1.10 | ) | |||||||||||||
|
|
|
|
|
|
|
|
|
| |||||||||||
Less distributions to shareholders: | ||||||||||||||||||||
From net investment income | (0.66 | ) | (2.08 | ) | (0.95 | ) | (0.74 | ) | (0.58 | ) | ||||||||||
From net realized gains | (0.84 | ) | (1.22 | ) | — | (0.26 | ) | — | ||||||||||||
|
|
|
|
|
|
|
|
|
| |||||||||||
Total distributions | (1.50 | ) | (3.30 | ) | (0.95 | ) | (1.00 | ) | (0.58 | ) | ||||||||||
|
|
|
|
|
|
|
|
|
| |||||||||||
Net asset value, end of period | $ | 21.80 | $ | 24.43 | $ | 25.79 | $ | 20.87 | $ | 21.20 | ||||||||||
|
|
|
|
|
|
|
|
|
| |||||||||||
Total Return(b) | (3.94 | )% | 6.80 | % | 28.41 | % | 2.87 | % | (4.58 | )% | ||||||||||
Ratios/Supplemental Data: | ||||||||||||||||||||
Net assets, end of period (000’s) | $ | 66,992 | $ | 86,810 | $ | 88,154 | $ | 73,383 | $ | 447,874 | ||||||||||
Net expenses to average daily net assets(c) | 0.01 | % | 0.00 | %(d) | 0.00 | %(d) | 0.00 | %(d) | 0.00 | %(d) | ||||||||||
Net investment income (loss) to average daily net assets(a) | 3.00 | % | 3.61 | % | 3.39 | % | 1.16 | % | 2.62 | % | ||||||||||
Portfolio turnover rate | 37 | % | 19 | % | 25 | % | 21 | % | 6 | % | ||||||||||
Fees and expenses reimbursed and/or waived by GMO to average daily net assets: | 0.10 | % | 0.05 | % | 0.06 | % | 0.03 | % | 0.02 | % | ||||||||||
Purchase premiums and redemption fees consisted of the following per share amounts (Note 2):† | $ | — | $ | — | $ | — | $ | — | $ | 0.00 | (e) | |||||||||
| (a) | Net investment income is affected by the timing of the declaration of dividends by the other GMO Funds and/or other investment companies in which the Fund invests, if any. |
| (b) | The total returns would have been lower had certain expenses not been reimbursed and/or waived during the periods shown, if applicable, and assumes the effect of reinvested distributions, if any. Calculation excludes purchase premiums and redemption fees which are borne by the shareholder purchasing or redeeming Fund shares, if any. |
| (c) | Net expenses exclude expenses incurred indirectly through investment in the underlying funds, if any (Note 5). |
| (d) | Rounds to less than 0.01%. |
| (e) | Rounds to less than $0.01. |
| † | Calculated using average shares outstanding throughout the period. |
| See accompanying notes to the financial statements. | 154 |
GMO Trust Funds
Financial Highlights — (Continued)
(For a share outstanding throughout each period)
GLOBAL EQUITY ALLOCATION FUND
| Class III Shares | ||||||||||||||||||||
| Year Ended February 28/29, | ||||||||||||||||||||
| 2023 | 2022 | 2021 | 2020 | 2019 | ||||||||||||||||
Net asset value, beginning of period | $ | 28.45 | $ | 29.91 | $ | 24.37 | $ | 24.63 | $ | 26.86 | ||||||||||
|
|
|
|
|
|
|
|
|
| |||||||||||
Income (loss) from investment operations: | ||||||||||||||||||||
Net investment income (loss)(a)† | 0.87 | 1.18 | 0.88 | 0.83 | 0.65 | |||||||||||||||
Net realized and unrealized gain (loss) | (2.92 | ) | (0.28 | ) | 5.75 | (0.16 | ) | (2.18 | ) | |||||||||||
|
|
|
|
|
|
|
|
|
| |||||||||||
Total from investment operations | (2.05 | ) | 0.90 | 6.63 | 0.67 | (1.53 | ) | |||||||||||||
|
|
|
|
|
|
|
|
|
| |||||||||||
Less distributions to shareholders: | ||||||||||||||||||||
From net investment income | (1.01 | ) | (2.35 | ) | (1.09 | ) | (0.93 | ) | (0.70 | ) | ||||||||||
From net realized gains | (0.82 | ) | (0.01 | ) | — | — | — | |||||||||||||
|
|
|
|
|
|
|
|
|
| |||||||||||
Total distributions | (1.83 | ) | (2.36 | ) | (1.09 | ) | (0.93 | ) | (0.70 | ) | ||||||||||
|
|
|
|
|
|
|
|
|
| |||||||||||
Net asset value, end of period | $ | 24.57 | $ | 28.45 | $ | 29.91 | $ | 24.37 | $ | 24.63 | ||||||||||
|
|
|
|
|
|
|
|
|
| |||||||||||
Total Return(b) | (6.66 | )% | 2.49 | % | 27.51 | % | 2.36 | % | (5.43 | )% | ||||||||||
Ratios/Supplemental Data: | ||||||||||||||||||||
Net assets, end of period (000’s) | $ | 560,287 | $ | 1,571,153 | $ | 1,638,868 | $ | 1,456,064 | $ | 1,637,744 | ||||||||||
Net expenses to average daily net assets(c) | 0.01 | % | 0.00 | %(d) | 0.00 | %(d) | 0.00 | %(d) | 0.00 | %(d) | ||||||||||
Net investment income (loss) to average daily net assets(a) | 3.51 | % | 3.69 | % | 3.44 | % | 3.26 | % | 2.56 | % | ||||||||||
Portfolio turnover rate | 35 | % | 20 | % | 20 | % | 20 | % | 11 | % | ||||||||||
Fees and expenses reimbursed and/or waived by GMO to average daily net assets: | 0.02 | % | 0.01 | % | 0.01 | % | 0.01 | % | 0.01 | % | ||||||||||
Purchase premiums and redemption fees consisted of the following per share amounts (Note 2):† | $ | — | $ | — | $ | — | $ | — | $ | 0.00 | (e) | |||||||||
| (a) | Net investment income is affected by the timing of the declaration of dividends by the other GMO Funds and/or other investment companies in which the Fund invests, if any. |
| (b) | The total returns would have been lower had certain expenses not been reimbursed and/or waived during the periods shown, if applicable, and assumes the effect of reinvested distributions, if any. Calculation excludes purchase premiums and redemption fees which are borne by the shareholder purchasing or redeeming Fund shares, if any. |
| (c) | Net expenses exclude expenses incurred indirectly through investment in the underlying funds, if any (Note 5). |
| (d) | Rounds to less than 0.01%. |
| (e) | Rounds to less than $0.01. |
| † | Calculated using average shares outstanding throughout the period. |
| 155 | See accompanying notes to the financial statements. |
GMO Trust Funds
Financial Highlights — (Continued)
(For a share outstanding throughout each period)
GLOBAL EQUITY ALLOCATION FUND (continued)
| Class R6 Shares | ||||||||||||
| Year Ended February 28, | Period from July 15, 2020 (commencement of operations) through February 28, | |||||||||||
| 2023 | 2022 | 2021 | ||||||||||
Net asset value, beginning of period | $ | 28.46 | $ | 29.91 | $ | 25.19 | ||||||
|
|
|
|
|
| |||||||
Income (loss) from investment operations: | ||||||||||||
Net investment income (loss)(a)† | 0.69 | 1.19 | 0.81 | |||||||||
Net realized and unrealized gain (loss) | (2.75 | ) | (0.28 | ) | 4.96 | |||||||
|
|
|
|
|
| |||||||
Total from investment operations | (2.06 | ) | 0.91 | 5.77 | ||||||||
|
|
|
|
|
| |||||||
Less distributions to shareholders: | ||||||||||||
From net investment income | (1.01 | ) | (2.35 | ) | (1.05 | ) | ||||||
From net realized gains | (0.82 | ) | (0.01 | ) | — | |||||||
|
|
|
|
|
| |||||||
Total distributions | (1.83 | ) | (2.36 | ) | (1.05 | ) | ||||||
|
|
|
|
|
| |||||||
Net asset value, end of period | $ | 24.57 | $ | 28.46 | $ | 29.91 | ||||||
|
|
|
|
|
| |||||||
Total Return(b) | (6.69 | )% | 2.52 | % | 23.14 | %** | ||||||
Ratios/Supplemental Data: | ||||||||||||
Net assets, end of period (000’s) | $ | 34,289 | $ | 7,065 | $ | 6,781 | ||||||
Net expenses to average daily net assets(c) | 0.01 | % | 0.00 | %(d) | 0.00 | %(d)* | ||||||
Net investment income (loss) to average daily net assets(a) | 2.77 | % | 3.74 | % | 4.70 | %* | ||||||
Portfolio turnover rate | 35 | % | 20 | % | 20 | %** | ||||||
Fees and expenses reimbursed and/or waived by GMO to average daily net assets: | 0.03 | % | 0.01 | % | 0.01 | %* | ||||||
| (a) | Net investment income is affected by the timing of the declaration of dividends by the other GMO Funds and/or other investment companies in which the Fund invests, if any. |
| (b) | The total returns would have been lower had certain expenses not been reimbursed and/or waived during the periods shown, if applicable, and assumes the effect of reinvested distributions, if any. Calculation excludes purchase premiums and redemption fees which are borne by the shareholder purchasing or redeeming Fund shares, if any. |
| (c) | Net expenses exclude expenses incurred indirectly through investment in the underlying funds, if any (Note 5). |
| (d) | Rounds to less than 0.01%. |
| † | Calculated using average shares outstanding throughout the period. |
| * | Annualized. |
| ** | Not annualized. |
| See accompanying notes to the financial statements. | 156 |
GMO Trust Funds
Financial Highlights — (Continued)
(For a share outstanding throughout each period)
GLOBAL EQUITY ALLOCATION FUND (continued)
| Class I Shares | ||||||||||||
| Year Ended February 28, | Period from August 17, 2020 (commencement of operations) through February 28, | |||||||||||
| 2023 | 2022 | 2021 | ||||||||||
Net asset value, beginning of period | $ | 28.44 | $ | 29.91 | $ | 26.14 | ||||||
|
|
|
|
|
| |||||||
Income (loss) from investment operations: | ||||||||||||
Net investment income (loss)(a)† | 0.90 | 1.17 | 0.90 | |||||||||
Net realized and unrealized gain (loss) | (2.97 | ) | (0.31 | ) | 3.91 | |||||||
|
|
|
|
|
| |||||||
Total from investment operations | (2.07 | ) | 0.86 | 4.81 | ||||||||
|
|
|
|
|
| |||||||
Less distributions to shareholders: | ||||||||||||
From net investment income | (0.99 | ) | (2.32 | ) | (1.04 | ) | ||||||
From net realized gains | (0.82 | ) | (0.01 | ) | — | |||||||
|
|
|
|
|
| |||||||
Total distributions | (1.81 | ) | (2.33 | ) | (1.04 | ) | ||||||
|
|
|
|
|
| |||||||
Net asset value, end of period | $ | 24.56 | $ | 28.44 | $ | 29.91 | ||||||
|
|
|
|
|
| |||||||
Total Return(b) | (6.74 | )% | 2.37 | % | 18.64 | %** | ||||||
Ratios/Supplemental Data: | ||||||||||||
Net assets, end of period (000’s) | $ | 4,992 | $ | 2,615 | $ | 2,233 | ||||||
Net expenses to average daily net assets(c) | 0.11 | % | 0.10 | % | 0.10 | %* | ||||||
Net investment income (loss) to average daily net assets(a) | 3.66 | % | 3.67 | % | 5.95 | %* | ||||||
Portfolio turnover rate | 35 | % | 20 | % | 20 | %** | ||||||
Fees and expenses reimbursed and/or waived by GMO to average daily net assets: | 0.02 | % | 0.01 | % | 0.01 | %* | ||||||
| (a) | Net investment income is affected by the timing of the declaration of dividends by the other GMO Funds and/or other investment companies in which the Fund invests, if any. |
| (b) | The total returns would have been lower had certain expenses not been reimbursed and/or waived during the periods shown, if applicable, and assumes the effect of reinvested distributions, if any. Calculation excludes purchase premiums and redemption fees which are borne by the shareholder purchasing or redeeming Fund shares, if any. |
| (c) | Net expenses exclude expenses incurred indirectly through investment in the underlying funds, if any (Note 5). |
| † | Calculated using average shares outstanding throughout the period. |
| * | Annualized. |
| ** | Not annualized. |
| 157 | See accompanying notes to the financial statements. |
GMO Trust Funds
Financial Highlights — (Continued)
(For a share outstanding throughout each period)
CONSOLIDATED IMPLEMENTATION FUND
| Core Shares | ||||||||||||||||||||
| Year Ended February 28/29, | ||||||||||||||||||||
| 2023 | 2022 | 2021 | 2020 | 2019 | ||||||||||||||||
Net asset value, beginning of period | $ | 12.54 | $ | 12.70 | $ | 12.74 | $ | 13.22 | $ | 14.09 | ||||||||||
|
|
|
|
|
|
|
|
|
| |||||||||||
Income (loss) from investment operations: | ||||||||||||||||||||
Net investment income (loss)† | 0.50 | (a)(b) | 0.38 | (b) | 0.35 | (b) | 0.49 | (b) | 0.40 | |||||||||||
Net realized and unrealized gain (loss) | (0.33 | ) | (0.13 | ) | (0.11 | ) | (0.43 | ) | (0.69 | ) | ||||||||||
|
|
|
|
|
|
|
|
|
| |||||||||||
Total from investment operations | 0.17 | 0.25 | 0.24 | 0.06 | (0.29 | ) | ||||||||||||||
|
|
|
|
|
|
|
|
|
| |||||||||||
Less distributions to shareholders: | ||||||||||||||||||||
From net investment income | (0.43 | ) | (0.41 | ) | (0.28 | ) | (0.54 | ) | (0.58 | ) | ||||||||||
|
|
|
|
|
|
|
|
|
| |||||||||||
Total distributions | (0.43 | ) | (0.41 | ) | (0.28 | ) | (0.54 | ) | (0.58 | ) | ||||||||||
|
|
|
|
|
|
|
|
|
| |||||||||||
Net asset value, end of period | $ | 12.28 | $ | 12.54 | $ | 12.70 | $ | 12.74 | $ | 13.22 | ||||||||||
|
|
|
|
|
|
|
|
|
| |||||||||||
Total Return(c) | 1.52 | %(d) | 2.02 | % | 1.95 | % | 0.25 | % | (1.88 | )% | ||||||||||
Ratios/Supplemental Data: | ||||||||||||||||||||
Net assets, end of period (000’s) | $ | 3,735,883 | $ | 4,681,226 | $ | 5,970,367 | $ | 7,114,306 | $ | 8,965,578 | ||||||||||
Net operating expenses to average daily net assets | 0.02 | %(e) | 0.00 | %(e)(f) | 0.01 | %(e) | 0.00 | %(e)(f) | 0.00 | %(f) | ||||||||||
Interest and/or dividend expenses to average daily net assets(g) | 0.36 | % | 0.32 | % | 0.15 | % | 0.06 | % | 0.10 | % | ||||||||||
Total net expenses to average daily net assets | 0.38 | %(e) | 0.32 | %(e) | 0.16 | %(e) | 0.06 | %(e) | 0.10 | % | ||||||||||
Net investment income (loss) to average daily net assets | 4.15 | %(b) | 2.95 | %(b) | 2.89 | %(b) | 3.65 | %(b) | 2.95 | % | ||||||||||
Portfolio turnover rate | 118 | %(h) | 194 | %(h) | 189 | %(h) | 97 | %(h) | 112 | % | ||||||||||
Fees and expenses reimbursed and/or waived by GMO to average daily net assets: | 0.06 | % | 0.06 | %(i) | 0.06 | %(i) | 0.05 | %(i) | 0.04 | % | ||||||||||
Purchase premiums and redemption fees consisted of the following per share amounts: (Note 2)† | $ | — | $ | — | $ | — | $ | — | $ | 0.00 | (j) | |||||||||
| (a) | Net investment income per share includes income received for EU reclaims, net of IRS closing agreement fees and non-recurring contingent legal fees attributed to EU tax reclaims, if any, in connection with certain Fund holdings (Note 2). Excluding the net EU reclaim amount below, the net investment income to average daily net assets ratio would have been: |
| February 28, 2023 | ||||
| $ | 15,309,005 | |||
| 3.77 | % | |||
| (b) | Net investment income is affected by the timing of the declaration of dividends by the other GMO Funds and/or other investment companies in which the Fund invests, if any. |
| (c) | The total returns would have been lower had certain expenses not been reimbursed and/or waived during the periods shown, if applicable, and assumes the effect of reinvested distributions, if any. Calculation excludes purchase premiums and redemption fees which are borne by the shareholder purchasing or redeeming Fund shares, if any. |
| (d) | EU tax reclaim payments and related interest received during the year, net of IRS closing agreement fees and non-recurring contingent legal fees attributed to EU tax reclaims, had a positive impact to total return, adding the below to the class’s total return (Note 2): |
| February 28, 2023 | ||||
| 0.39 | % | |||
| (e) | Net expenses exclude expenses incurred indirectly through investment in the underlying funds, if any (Note 5). |
| (f) | Rounds to less than 0.01%. |
| (g) | Interest and dividend expense and/or borrowing costs incurred as a result of cash collateral on derivatives, entering into reverse repurchase agreements, securities sold short or margin on cleared swap contracts, if any, is included in the Fund’s net expenses. Income earned on investing proceeds from reverse repurchase agreements, if any, is included in interest income. |
| (h) | The portfolio turnover rate excludes investments in GMO U.S. Treasury Fund (“USTF”) which is used as a short-term investment vehicle for cash management. The Fund’s portfolio turnover rate including transactions in USTF during the period and/or year ended: |
| February 28, 2023 | February 28, 2022 | February 28, 2021 | February 29, 2020 | February 28, 2019 | ||||||||||||||||
Portfolio turnover rate including transactions in USTF | 125 | % | 200 | % | 196 | % | 100 | % | N/A | |||||||||||
| See accompanying notes to the financial statements. | 158 |
GMO Trust Funds
Financial Highlights — (Continued)
(For a share outstanding throughout each period)
CONSOLIDATED IMPLEMENTATION FUND (continued)
| (i) | Ratio includes indirect fees waived or borne by GMO. |
| (j) | Rounds to less than $0.01. |
| † | Calculated using average shares outstanding throughout the period. |
| 159 | See accompanying notes to the financial statements. |
GMO Trust Funds
Financial Highlights — (Continued)
(For a share outstanding throughout each period)
INTERNATIONAL DEVELOPED EQUITY ALLOCATION FUND
| Class III Shares | ||||||||||||||||||||
| Year Ended February 28/29, | ||||||||||||||||||||
| 2023 | 2022 | 2021 | 2020 | 2019 | ||||||||||||||||
Net asset value, beginning of period | $ | 16.35 | $ | 16.95 | $ | 14.52 | $ | 14.75 | $ | 17.32 | ||||||||||
|
|
|
|
|
|
|
|
|
| |||||||||||
Income (loss) from investment operations: | ||||||||||||||||||||
Net investment income (loss)(a)† | 0.61 | 1.05 | 0.61 | 0.49 | 0.51 | |||||||||||||||
Net realized and unrealized gain (loss) | (1.18 | ) | (0.51 | ) | 2.56 | (0.12 | ) | (2.56 | ) | |||||||||||
|
|
|
|
|
|
|
|
|
| |||||||||||
Total from investment operations | (0.57 | ) | 0.54 | 3.17 | 0.37 | (2.05 | ) | |||||||||||||
|
|
|
|
|
|
|
|
|
| |||||||||||
Less distributions to shareholders: | ||||||||||||||||||||
From net investment income | (0.60 | ) | (1.09 | ) | (0.74 | ) | (0.60 | ) | (0.52 | ) | ||||||||||
From net realized gains | (0.04 | ) | (0.05 | ) | 0.00 | 0.00 | 0.00 | |||||||||||||
|
|
|
|
|
|
|
|
|
| |||||||||||
Total distributions | (0.64 | ) | (1.14 | ) | (0.74 | ) | (0.60 | ) | (0.52 | ) | ||||||||||
|
|
|
|
|
|
|
|
|
| |||||||||||
Net asset value, end of period | $ | 15.14 | $ | 16.35 | $ | 16.95 | $ | 14.52 | $ | 14.75 | ||||||||||
|
|
|
|
|
|
|
|
|
| |||||||||||
Total Return(b) | (3.23 | )% | 2.88 | % | 22.02 | % | 2.14 | % | (11.57 | )% | ||||||||||
Ratios/Supplemental Data: | ||||||||||||||||||||
Net assets, end of period (000’s) | $ | 219,167 | $ | 222,308 | $ | 217,129 | $ | 297,463 | $ | 572,830 | ||||||||||
Net expenses to average daily net assets(c) | 0.00 | %(d) | 0.00 | %(d) | 0.00 | %(d) | 0.00 | %(d) | 0.00 | %(d) | ||||||||||
Net investment income (loss) to average daily net assets(a) | 4.14 | % | 5.82 | % | 4.20 | % | 3.25 | % | 3.25 | % | ||||||||||
Portfolio turnover rate | 9 | % | 18 | % | 17 | % | 11 | % | 8 | % | ||||||||||
Fees and expenses reimbursed and/or waived by GMO to average daily net assets: | 0.08 | % | 0.05 | % | 0.03 | % | 0.02 | % | 0.02 | % | ||||||||||
Purchase premiums and redemption fees consisted of the following per share amounts (Note 2):† | $ | — | $ | — | $ | — | $ | — | $ | 0.00 | (e) | |||||||||
| (a) | Net investment income is affected by the timing of the declaration of dividends by the other GMO Funds and/or other investment companies in which the Fund invests, if any. |
| (b) | The total returns would have been lower had certain expenses not been reimbursed and/or waived during the periods shown, if applicable, and assumes the effect of reinvested distributions, if any. Calculation excludes purchase premiums and redemption fees which are borne by the shareholder purchasing or redeeming Fund shares, if any. |
| (c) | Net expenses exclude expenses incurred indirectly through investment in the underlying funds, if any (Note 5). |
| (d) | Rounds to less than 0.01%. |
| (e) | Rounds to less than $0.01. |
| † | Calculated using average shares outstanding throughout the period. |
| See accompanying notes to the financial statements. | 160 |
GMO Trust Funds
Financial Highlights — (Continued)
(For a share outstanding throughout each period)
INTERNATIONAL DEVELOPED EQUITY ALLOCATION FUND (continued)
| Class R6 Shares | ||||||||||||
| Year Ended February 28, | Period from January 22, 2021 (commencement of operations) through February 28, | |||||||||||
| 2023 | 2022 | 2021 | ||||||||||
Net asset value, beginning of period | $ | 16.35 | $ | 16.95 | $ | 17.08 | ||||||
|
|
|
|
|
| |||||||
Income (loss) from investment operations: | ||||||||||||
Net investment income (loss)(a)† | 0.61 | 1.02 | (0.00 | )(b) | ||||||||
Net realized and unrealized gain (loss) | (1.18 | ) | (0.48 | ) | (0.13 | ) | ||||||
|
|
|
|
|
| |||||||
Total from investment operations | (0.57 | ) | 0.54 | (0.13 | ) | |||||||
|
|
|
|
|
| |||||||
Less distributions to shareholders: | ||||||||||||
From net investment income | (0.60 | ) | (1.09 | ) | — | |||||||
From net realized gains | (0.04 | ) | (0.05 | ) | — | |||||||
|
|
|
|
|
| |||||||
Total distributions | (0.64 | ) | (1.14 | ) | — | |||||||
|
|
|
|
|
| |||||||
Net asset value, end of period | $ | 15.14 | $ | 16.35 | $ | 16.95 | ||||||
|
|
|
|
|
| |||||||
Total Return(c) | (3.23 | )% | 2.88 | % | (0.76 | )%** | ||||||
Ratios/Supplemental Data: | ||||||||||||
Net assets, end of period (000’s) | $ | 8,033 | $ | 8,268 | $ | 8,254 | ||||||
Net expenses to average daily net assets(d) | 0.00 | %(e) | 0.00 | %(e) | 0.01 | %* | ||||||
Net investment income (loss) to average daily net assets(a) | 4.13 | % | 5.66 | % | (0.01 | )%* | ||||||
Portfolio turnover rate | 9 | % | 18 | % | 17 | %** | ||||||
Fees and expenses reimbursed and/or waived by GMO to average daily net assets: | 0.08 | % | 0.05 | % | 0.05 | %* | ||||||
| (a) | Net investment income is affected by the timing of the declaration of dividends by the other GMO Funds and/or other investment companies in which the Fund invests, if any. |
| (b) | Rounds to less than $0.01. |
| (c) | The total returns would have been lower had certain expenses not been reimbursed and/or waived during the periods shown, if applicable, and assumes the effect of reinvested distributions, if any. Calculation excludes purchase premiums and redemption fees which are borne by the shareholder purchasing or redeeming Fund shares, if any. |
| (d) | Net expenses exclude expenses incurred indirectly through investment in the underlying funds, if any (Note 5). |
| (e) | Rounds to less than 0.01%. |
| † | Calculated using average shares outstanding throughout the period. |
| * | Annualized. |
| ** | Not annualized. |
| 161 | See accompanying notes to the financial statements. |
GMO Trust Funds
Financial Highlights — (Continued)
(For a share outstanding throughout each period)
INTERNATIONAL EQUITY ALLOCATION FUND
| Class III Shares | ||||||||||||||||||||
| Year Ended February 28/29, | ||||||||||||||||||||
| 2023 | 2022 | 2021 | 2020 | 2019 | ||||||||||||||||
Net asset value, beginning of period | $ | 29.43 | $ | 32.31 | $ | 27.45 | $ | 28.09 | $ | 32.62 | ||||||||||
|
|
|
|
|
|
|
|
|
| |||||||||||
Income (loss) from investment operations: | ||||||||||||||||||||
Net investment income (loss)(a)† | 1.24 | 1.64 | 1.24 | 1.02 | 0.91 | |||||||||||||||
Net realized and unrealized gain (loss) | (3.96 | ) | (2.59 | ) | 4.91 | (0.46 | ) | (4.47 | ) | |||||||||||
|
|
|
|
|
|
|
|
|
| |||||||||||
Total from investment operations | (2.72 | ) | (0.95 | ) | 6.15 | 0.56 | (3.56 | ) | ||||||||||||
|
|
|
|
|
|
|
| �� |
|
| ||||||||||
Less distributions to shareholders: | ||||||||||||||||||||
From net investment income | (1.23 | ) | (1.93 | ) | (1.29 | ) | (1.20 | ) | (0.97 | ) | ||||||||||
|
|
|
|
|
|
|
|
|
| |||||||||||
Total distributions | (1.23 | ) | (1.93 | ) | (1.29 | ) | (1.20 | ) | (0.97 | ) | ||||||||||
|
|
|
|
|
|
|
|
|
| |||||||||||
Net asset value, end of period | $ | 25.48 | $ | 29.43 | $ | 32.31 | $ | 27.45 | $ | 28.09 | ||||||||||
|
|
|
|
|
|
|
|
|
| |||||||||||
Total Return(b) | (9.05 | )% | (3.37 | )% | 22.67 | % | 1.62 | % | (10.69 | )% | ||||||||||
Ratios/Supplemental Data: | ||||||||||||||||||||
Net assets, end of period (000’s) | $ | 286,725 | $ | 437,139 | $ | 598,701 | $ | 646,622 | $ | 929,967 | ||||||||||
Net expenses to average daily net assets(c) | 0.01 | % | 0.00 | %(d) | 0.00 | %(d) | 0.00 | %(d) | 0.00 | %(d) | ||||||||||
Net investment income (loss) to average daily net assets(a) | 4.81 | % | 4.90 | % | 4.40 | % | 3.55 | % | 3.09 | % | ||||||||||
Portfolio turnover rate | 11 | % | 18 | % | 16 | % | 7 | % | 8 | % | ||||||||||
Fees and expenses reimbursed and/or waived by GMO to average daily net assets: | 0.03 | % | 0.02 | % | 0.02 | % | 0.01 | % | 0.01 | % | ||||||||||
Purchase premiums and redemption fees consisted of the following per share amounts (Note 2):† | $ | — | $ | — | $ | — | $ | — | $ | 0.00 | (e) | |||||||||
| (a) | Net investment income is affected by the timing of the declaration of dividends by the other GMO Funds and/or other investment companies in which the Fund invests, if any. |
| (b) | The total returns would have been lower had certain expenses not been reimbursed and/or waived during the periods shown, if applicable, and assumes the effect of reinvested distributions, if any. Calculation excludes purchase premiums and redemption fees which are borne by the shareholder purchasing or redeeming Fund shares, if any. |
| (c) | Net expenses exclude expenses incurred indirectly through investment in the underlying funds, if any (Note 5). |
| (d) | Rounds to less than 0.01%. |
| (e) | Rounds to less than $0.01. |
| † | Calculated using average shares outstanding throughout the period. |
| See accompanying notes to the financial statements. | 162 |
GMO Trust Funds
Financial Highlights — (Continued)
(For a share outstanding throughout each period)
INTERNATIONAL EQUITY ALLOCATION FUND (continued)
| Class R6 Shares | ||||||||||||||||
| Period from August 30, 2019 (commencement of operations) through February 29, 2020 | ||||||||||||||||
| Year Ended February 28, | ||||||||||||||||
| 2023 | 2022 | 2021 | ||||||||||||||
Net asset value, beginning of period | $ | 29.42 | $ | 32.30 | $ | 27.44 | $ | 27.07 | ||||||||
|
|
|
|
|
|
|
| |||||||||
Income (loss) from investment operations: | ||||||||||||||||
Net investment income (loss)(a)† | 1.30 | 1.74 | 1.29 | 1.14 | ||||||||||||
Net realized and unrealized gain (loss) | (4.02 | ) | (2.69 | ) | 4.86 | 0.33 | ||||||||||
|
|
|
|
|
|
|
| |||||||||
Total from investment operations | (2.72 | ) | (0.95 | ) | 6.15 | 1.47 | ||||||||||
|
|
|
|
|
|
|
| |||||||||
Less distributions to shareholders: | ||||||||||||||||
From net investment income | (1.23 | ) | (1.93 | ) | (1.29 | ) | (1.10 | ) | ||||||||
|
|
|
|
|
|
|
| |||||||||
Total distributions | (1.23 | ) | (1.93 | ) | (1.29 | ) | (1.10 | ) | ||||||||
|
|
|
|
|
|
|
| |||||||||
Net asset value, end of period | $ | 25.47 | $ | 29.42 | $ | 32.30 | $ | 27.44 | ||||||||
|
|
|
|
|
|
|
| |||||||||
Total Return(b) | (9.05 | )% | (3.37 | )% | 22.68 | % | 5.04 | %** | ||||||||
Ratios/Supplemental Data: | ||||||||||||||||
Net assets, end of period (000’s) | $ | 205,417 | $ | 242,178 | $ | 262,853 | $ | 210,223 | ||||||||
Net expenses to average daily net assets(c) | 0.01 | % | 0.00 | %(d) | 0.00 | %(d) | 0.00 | %(d)* | ||||||||
Net investment income (loss) to average daily net assets(a) | 5.08 | % | 5.20 | % | 4.56 | % | 7.83 | %* | ||||||||
Portfolio turnover rate | 11 | % | 18 | % | 16 | % | 7 | %** | ||||||||
Fees and expenses reimbursed and/or waived by GMO to average daily net assets: | 0.03 | % | 0.02 | % | 0.02 | % | 0.02 | %* | ||||||||
| (a) | Net investment income is affected by the timing of the declaration of dividends by the other GMO Funds and/or other investment companies in which the Fund invests, if any. |
| (b) | The total returns would have been lower had certain expenses not been reimbursed and/or waived during the periods shown, if applicable, and assumes the effect of reinvested distributions, if any. Calculation excludes purchase premiums and redemption fees which are borne by the shareholder purchasing or redeeming Fund shares, if any. |
| (c) | Net expenses exclude expenses incurred indirectly through investment in the underlying funds, if any (Note 5). |
| (d) | Rounds to less than 0.01%. |
| † | Calculated using average shares outstanding throughout the period. |
| * | Annualized. |
| ** | Not annualized. |
| 163 | See accompanying notes to the financial statements. |
GMO Trust Funds
Financial Highlights — (Continued)
(For a share outstanding throughout each period)
CONSOLIDATED SGM MAJOR MARKETS FUND
| Class III Shares | ||||||||||||||||||||
| Year Ended February 28/29, | ||||||||||||||||||||
| 2023 | 2022 | 2021 | 2020 | 2019 | ||||||||||||||||
Net asset value, beginning of period | $ | 29.30 | $ | 32.07 | $ | 31.13 | $ | 32.17 | $ | 31.87 | ||||||||||
|
|
|
|
|
|
|
|
|
| |||||||||||
Income (loss) from investment operations: | ||||||||||||||||||||
Net investment income (loss)(a)† | (0.18 | ) | (0.24 | ) | (0.09 | ) | 0.27 | 0.31 | ||||||||||||
Net realized and unrealized gain (loss) | 1.16 | (0.39 | ) | 1.81 | (0.83 | ) | 0.11 | (b) | ||||||||||||
|
|
|
|
|
|
|
|
|
| |||||||||||
Total from investment operations | 0.98 | (0.63 | ) | 1.72 | (0.56 | ) | 0.42 | |||||||||||||
|
|
|
|
|
|
|
|
|
| |||||||||||
Less distributions to shareholders: | ||||||||||||||||||||
From net investment income | (0.49 | ) | (0.71 | ) | (0.03 | ) | (0.48 | ) | (0.12 | ) | ||||||||||
From net realized gains | (1.26 | ) | (1.43 | ) | (0.75 | ) | — | — | ||||||||||||
|
|
|
|
|
|
|
|
|
| |||||||||||
Total distributions | (1.75 | ) | (2.14 | ) | (0.78 | ) | (0.48 | ) | (0.12 | ) | ||||||||||
|
|
|
|
|
|
|
|
|
| |||||||||||
Net asset value, end of period | $ | 28.53 | $ | 29.30 | $ | 32.07 | $ | 31.13 | $ | 32.17 | ||||||||||
|
|
|
|
|
|
|
|
|
| |||||||||||
Total Return(c) | 3.86 | % | (2.00 | )% | 5.48 | % | (1.74 | )% | 1.32 | % | ||||||||||
Ratios/Supplemental Data: | ||||||||||||||||||||
Net assets, end of period (000’s) | $ | 3,366 | $ | 32,796 | $ | 30,126 | $ | 18,527 | $ | 45,409 | ||||||||||
Net expenses to average daily net assets(d) | 1.01 | % | 1.00 | % | 1.01 | % | 1.01 | % | 1.00 | % | ||||||||||
Net investment income (loss) to average daily net assets(a) | (0.67 | )% | (0.81 | )% | (0.27 | )% | 0.85 | % | 0.97 | % | ||||||||||
Portfolio turnover rate | 69 | % | 81 | % | 76 | % | 46 | % | 49 | %(e) | ||||||||||
Fees and expenses reimbursed and/or waived by GMO to average daily net assets: | 0.13 | % | 0.10 | % | 0.07 | % | 0.05 | % | 0.04 | % | ||||||||||
| (a) | Net investment income is affected by the timing of the declaration of dividends by the other GMO Funds and/or other investment companies in which the Fund invests, if any. |
| (b) | The amount shown for a share outstanding does not correspond with the aggregate net realized and unrealized gain (loss) on investments due to the timing of purchases and redemptions of Fund shares in relation to fluctuating market values of the investments of the Fund. |
| (c) | The total returns would have been lower had certain expenses not been reimbursed and/or waived during the periods shown, if applicable, and assumes the effect of reinvested distributions, if any. Calculation excludes purchase premiums and redemption fees which are borne by the shareholder purchasing or redeeming Fund shares, if any. |
| (d) | Net expenses exclude expenses incurred indirectly through investment in the underlying funds, if any (Note 5). |
| (e) | The portfolio turnover rate excludes investments in GMO U.S. Treasury Fund (“USTF”) which is used as a short-term investment vehicle for cash management. The Fund’s portfolio turnover rate including transactions in USTF during the period and/or year ended: |
| February 28, 2023 | February 28, 2022 | February 28, 2021 | February 29, 2020 | February 28, 2019 | ||||||||||||||||
Portfolio turnover rate including transactions in USTF | N/A | N/A | N/A | N/A | 75 | % | ||||||||||||||
| † | Calculated using average shares outstanding throughout the period. |
| See accompanying notes to the financial statements. | 164 |
GMO Trust Funds
Financial Highlights — (Continued)
(For a share outstanding throughout each period)
CONSOLIDATED SGM MAJOR MARKETS FUND (continued)
| Class VI Shares | ||||||||||||||||||||
| Year Ended February 28/29, | ||||||||||||||||||||
| 2023 | 2022 | 2021 | 2020 | 2019 | ||||||||||||||||
Net asset value, beginning of period | $ | 29.27 | $ | 32.03 | $ | 31.07 | $ | 32.11 | $ | 31.78 | ||||||||||
|
|
|
|
|
|
|
|
|
| |||||||||||
Income (loss) from investment operations: | ||||||||||||||||||||
Net investment income (loss)(a)† | 0.31 | (0.22 | ) | (0.06 | ) | 0.25 | 0.33 | |||||||||||||
Net realized and unrealized gain (loss) | 0.69 | (0.38 | ) | 1.80 | (0.77 | ) | 0.13 | (b) | ||||||||||||
|
|
|
|
|
|
|
|
|
| |||||||||||
Total from investment operations | 1.00 | (0.60 | ) | 1.74 | (0.52 | ) | 0.46 | |||||||||||||
|
|
|
|
|
|
|
|
|
| |||||||||||
Less distributions to shareholders: | ||||||||||||||||||||
From net investment income | (0.61 | ) | (0.73 | ) | (0.03 | ) | (0.52 | ) | (0.13 | ) | ||||||||||
From net realized gains | (1.26 | ) | (1.43 | ) | (0.75 | ) | — | — | ||||||||||||
|
|
|
|
|
|
|
|
|
| |||||||||||
Total distributions | (1.87 | ) | (2.16 | ) | (0.78 | ) | (0.52 | ) | (0.13 | ) | ||||||||||
|
|
|
|
|
|
|
|
|
| |||||||||||
Net asset value, end of period | $ | 28.40 | $ | 29.27 | $ | 32.03 | $ | 31.07 | $ | 32.11 | ||||||||||
|
|
|
|
|
|
|
|
|
| |||||||||||
Total Return(c) | 3.96 | % | (1.92 | )% | 5.56 | % | (1.65 | )% | 1.47 | % | ||||||||||
Ratios/Supplemental Data: | ||||||||||||||||||||
Net assets, end of period (000’s) | $ | 120,827 | $ | 206,841 | $ | 314,087 | $ | 831,870 | $ | 1,161,238 | ||||||||||
Net expenses to average daily net assets(d) | 0.92 | % | 0.91 | % | 0.91 | % | 0.91 | % | 0.91 | % | ||||||||||
Net investment income (loss) to average daily net assets(a) | 1.13 | % | (0.71 | )% | (0.17 | )% | 0.79 | % | 1.04 | % | ||||||||||
Portfolio turnover rate | 69 | % | 81 | % | 76 | % | 46 | % | 49 | %(e) | ||||||||||
Fees and expenses reimbursed and/or waived by GMO to average daily net assets: | 0.15 | % | 0.09 | % | 0.07 | % | 0.04 | % | 0.04 | % | ||||||||||
| (a) | Net investment income is affected by the timing of the declaration of dividends by the other GMO Funds and/or other investment companies in which the Fund invests, if any. |
| (b) | The amount shown for a share outstanding does not correspond with the aggregate net realized and unrealized gain (loss) on investments due to the timing of purchases and redemptions of Fund shares in relation to fluctuating market values of the investments of the Fund. |
| (c) | The total returns would have been lower had certain expenses not been reimbursed and/or waived during the periods shown, if applicable, and assumes the effect of reinvested distributions, if any. Calculation excludes purchase premiums and redemption fees which are borne by the shareholder purchasing or redeeming Fund shares, if any. |
| (d) | Net expenses exclude expenses incurred indirectly through investment in the underlying funds, if any (Note 5). |
| (e) | The portfolio turnover rate excludes investments in GMO U.S. Treasury Fund (“USTF”) which is used as a short-term investment vehicle for cash management. The Fund’s portfolio turnover rate including transactions in USTF during the period and/or year ended: |
| February 28, 2023 | February 28, 2022 | February 28, 2021 | February 29, 2020 | February 28, 2019 | ||||||||||||||||
Portfolio turnover rate including transactions in USTF | N/A | N/A | N/A | N/A | 75 | % | ||||||||||||||
| † | Calculated using average shares outstanding throughout the period. |
| 165 | See accompanying notes to the financial statements. |
GMO Trust Funds
Financial Highlights — (Continued)
(For a share outstanding throughout each period)
CONSOLIDATED SGM MAJOR MARKETS FUND (continued)
| Class I Shares | ||||||||||||
| Year Ended February 28, | Period from September 23, 2020 (commencement through February 28, | |||||||||||
| 2023 | 2022 | 2021 | ||||||||||
Net asset value, beginning of period | $ | 29.23 | $ | 32.06 | $ | 32.37 | ||||||
|
|
|
|
|
| |||||||
Income (loss) from investment operations: | ||||||||||||
Net investment income (loss)(a)† | (0.07 | ) | (0.28 | ) | (0.04 | ) | ||||||
Net realized and unrealized gain (loss) | 1.02 | (0.40 | ) | 0.48 | ||||||||
|
|
|
|
|
| |||||||
Total from investment operations | 0.95 | (0.68 | ) | 0.44 | ||||||||
|
|
|
|
|
| |||||||
Less distributions to shareholders: | ||||||||||||
From net investment income | (0.44 | ) | (0.72 | ) | — | |||||||
From net realized gains | (1.26 | ) | (1.43 | ) | (0.75 | ) | ||||||
|
|
|
|
|
| |||||||
Total distributions | (1.70 | ) | (2.15 | ) | (0.75 | ) | ||||||
|
|
|
|
|
| |||||||
Net asset value, end of period | $ | 28.48 | $ | 29.23 | $ | 32.06 | ||||||
|
|
|
|
|
| |||||||
Total Return(b) | 3.76 | % | (2.16 | )% | 1.30 | %** | ||||||
Ratios/Supplemental Data: | ||||||||||||
Net assets, end of period (000’s) | $ | 4,751 | $ | 20,753 | $ | 13,842 | ||||||
Net expenses to average daily net assets(c) | 1.11 | % | 1.10 | % | 1.11 | %* | ||||||
Net investment income (loss) to average daily net assets(a) | (0.25 | )% | (0.93 | )% | (0.28 | )%* | ||||||
Portfolio turnover rate | 69 | % | 81 | % | 76 | %** | ||||||
Fees and expenses reimbursed and/or waived by GMO to average daily net assets: | 0.19 | % | 0.15 | % | 0.14 | %* | ||||||
| (a) | Net investment income is affected by the timing of the declaration of dividends by the other GMO Funds and/or other investment companies in which the Fund invests, if any. |
| (b) | The total returns would have been lower had certain expenses not been reimbursed and/or waived during the periods shown, if applicable, and assumes the effect of reinvested distributions, if any. Calculation excludes purchase premiums and redemption fees which are borne by the shareholder purchasing or redeeming Fund shares, if any. |
| (c) | Net expenses exclude expenses incurred indirectly through investment in the underlying funds, if any (Note 5). |
| † | Calculated using average shares outstanding throughout the period. |
| * | Annualized. |
| ** | Not annualized. |
| See accompanying notes to the financial statements. | 166 |
GMO Trust Funds
Financial Highlights — (Continued)
(For a share outstanding throughout each period)
STRATEGIC OPPORTUNITIES ALLOCATION FUND
| Class III Shares | ||||||||||||||||||||
| Year Ended February 28/29, | ||||||||||||||||||||
| 2023 | 2022 | 2021 | 2020 | 2019 | ||||||||||||||||
Net asset value, beginning of period | $ | 17.91 | $ | 21.56 | $ | 18.98 | $ | 19.48 | $ | 22.08 | ||||||||||
|
|
|
|
|
|
|
|
|
| |||||||||||
Income (loss) from investment operations: | ||||||||||||||||||||
Net investment income (loss)(a)† | 0.63 | 0.59 | 0.54 | 0.67 | 0.62 | |||||||||||||||
Net realized and unrealized gain (loss) | (1.46 | ) | 0.32 | 2.93 | (0.11 | ) | (1.45 | ) | ||||||||||||
|
|
|
|
|
|
|
|
|
| |||||||||||
Total from investment operations | (0.83 | ) | 0.91 | 3.47 | 0.56 | (0.83 | ) | |||||||||||||
|
|
|
|
|
|
|
|
|
| |||||||||||
Less distributions to shareholders: | ||||||||||||||||||||
From net investment income | (0.85 | ) | (1.22 | ) | (0.71 | ) | (0.77 | ) | (0.67 | ) | ||||||||||
From net realized gains | (0.66 | ) | (3.34 | ) | (0.18 | ) | (0.29 | ) | (1.10 | ) | ||||||||||
|
|
|
|
|
|
|
|
|
| |||||||||||
Total distributions | (1.51 | ) | (4.56 | ) | (0.89 | ) | (1.06 | ) | (1.77 | ) | ||||||||||
|
|
|
|
|
|
|
|
|
| |||||||||||
Net asset value, end of period | $ | 15.57 | $ | 17.91 | $ | 21.56 | $ | 18.98 | $ | 19.48 | ||||||||||
|
|
|
|
|
|
|
|
|
| |||||||||||
Total Return(b) | (4.08 | )% | 3.57 | % | 18.66 | % | 2.57 | % | (3.45 | )% | ||||||||||
Ratios/Supplemental Data: | ||||||||||||||||||||
Net assets, end of period (000’s) | $ | 189,504 | $ | 236,452 | $ | 579,796 | $ | 773,438 | $ | 915,148 | ||||||||||
Net operating expenses to average daily net assets(c) | 0.02 | % | 0.01 | % | 0.01 | % | 0.01 | % | 0.01 | % | ||||||||||
Interest and/or dividend expenses and/or borrowing costs to average daily net assets(d) | 0.32 | % | 0.26 | % | 0.07 | % | 0.03 | % | 0.03 | % | ||||||||||
Total net expenses to average daily net assets(c) | 0.34 | % | 0.27 | % | 0.08 | % | 0.04 | % | 0.04 | % | ||||||||||
Net investment income (loss) to average daily net assets(a) | 3.91 | % | 2.71 | % | 2.85 | % | 3.35 | % | 3.01 | % | ||||||||||
Portfolio turnover rate(e) | 74 | % | 95 | % | 61 | % | 36 | % | 35 | % | ||||||||||
Fees and expenses reimbursed and/or waived by GMO to average daily net assets: | 0.15 | % | 0.14 | % | 0.07 | % | 0.03 | % | 0.03 | % | ||||||||||
Purchase premiums and redemption fees consisted of the following per share amounts (Note 2):† | $ | — | $ | — | $ | — | $ | — | $ | 0.00 | (f) | |||||||||
| (a) | Net investment income is affected by the timing of the declaration of dividends by the other GMO Funds and/or other investment companies in which the Fund invests, if any. |
| (b) | The total returns would have been lower had certain expenses not been reimbursed and/or waived during the periods shown, if applicable, and assumes the effect of reinvested distributions, if any. Calculation excludes purchase premiums and redemption fees which are borne by the shareholder purchasing or redeeming Fund shares, if any. |
| (c) | Net expenses exclude expenses incurred indirectly through investment in the underlying funds, if any (Note 5). |
| (d) | Interest and dividend expense and/or borrowing costs incurred as a result of cash collateral on derivatives, entering into reverse repurchase agreements, securities sold short or margin on cleared swap contracts, if any, is included in the Fund’s net expenses. Income earned on investing proceeds from reverse repurchase agreements, if any, is included in interest income. |
| (e) | The portfolio turnover rate excludes investments in GMO U.S. Treasury Fund (“USTF”) which is used as a short-term investment vehicle for cash management. The Fund’s portfolio turnover rate including transactions in USTF during the period and/or year ended: |
| February 28, 2023 | February 28, 2022 | February 28, 2021 | February 29, 2020 | February 28, 2019 | ||||||||||||||||
Portfolio turnover rate including transactions in USTF | 72 | % | 122 | % | 80 | % | 41 | % | 38 | % | ||||||||||
| (f) | Rounds to less than $0.01. |
| † | Calculated using average shares outstanding throughout the period. |
| 167 | See accompanying notes to the financial statements. |
GMO Trust Funds
February 28, 2023
| 1. | Organization |
Each of Alternative Allocation Fund, Benchmark-Free Allocation Fund, Benchmark-Free Fund, Global Asset Allocation Fund, Global Developed Equity Allocation Fund, Global Equity Allocation Fund, Implementation Fund, International Developed Equity Allocation Fund, International Equity Allocation Fund, SGM Major Markets Fund and Strategic Opportunities Allocation Fund (each a “Fund” and collectively the “Funds”) is a series of GMO Trust (the “Trust”). The Trust is registered under the Investment Company Act of 1940, as amended (the “1940 Act”), as an open-end management investment company. The Trust was established as a Massachusetts business trust under the laws of The Commonwealth of Massachusetts on June 24, 1985. The Declaration of Trust permits the Trustees of the Trust (“Trustees”) to create an unlimited number of series of shares (Funds) and to subdivide Funds into classes. The Funds are advised and managed by Grantham, Mayo, Van Otterloo & Co. LLC (“GMO”).
The Funds may invest in GMO U.S. Treasury Fund and in money market funds unaffiliated with GMO.
Many of the Funds may invest primarily in other GMO Funds and Alternative Allocation Fund, Implementation Fund and SGM Major Markets Fund may also invest in GMO Alternative Allocation SPC Ltd., GMO Implementation SPC Ltd. and GMO Alternative Asset SPC Ltd. (each a “wholly-owned subsidiary”), respectively. These GMO Funds and wholly-owned subsidiaries are referenced herein as “underlying funds”. As a result, the Funds are exposed to all of the risks of the underlying funds in which they invest. Several of the underlying funds themselves invest a substantial portion of their assets in other GMO Funds. The financial statements of the underlying funds should be read in conjunction with the Funds’ financial statements. The financial statements are available without charge on the Securities and Exchange Commission’s (“SEC”) website at www.sec.gov or on GMO’s website at www.gmo.com.
The following table provides information about the Funds’ principal investment objectives and benchmarks (if any):
| Fund Name | Benchmark | Investment Objective | ||
| Alternative Allocation Fund | Not Applicable | Positive total return | ||
| Benchmark-Free Allocation Fund | Not Applicable | Positive total return | ||
| Benchmark-Free Fund | Not Applicable | Positive total return | ||
| Global Asset Allocation Fund | GMO Global Asset Allocation Index (65% MSCI ACWI, 35% Bloomberg U.S. Aggregate Index) | Total return greater than benchmark | ||
| Global Developed Equity Allocation Fund | MSCI World Index | Total return greater than benchmark | ||
| Global Equity Allocation Fund | MSCI ACWI | Total return greater than benchmark | ||
| Implementation Fund | Not Applicable | Positive total return, not relative return | ||
| International Developed Equity Allocation Fund | MSCI EAFE Index | Total return greater than benchmark | ||
| International Equity Allocation Fund | MSCI ACWI ex USA | Total return greater than benchmark | ||
| SGM Major Markets Fund | Not Applicable | Long-term total return | ||
| Strategic Opportunities Allocation Fund | GMO Strategic Opportunities Allocation Index (75% MSCI World Index (MSCI Standard Index Series), 25% Bloomberg U.S. Aggregate Index) | Total return greater than benchmark |
Benchmark-Free Fund, Implementation Fund and Strategic Opportunities Allocation Fund currently limit subscriptions.
| 2. | Significant accounting policies |
The following is a summary of significant accounting policies followed by each Fund in the preparation of its financial statements. These policies are in conformity with accounting principles generally accepted in the United States of America (“U.S. GAAP”) and have been consistently followed by the Funds in preparing these financial statements. The preparation of financial statements in accordance with U.S. GAAP requires management to make estimates and assumptions that affect the reported amounts and disclosures in the financial statements. Actual results could differ from those estimates. The accounting records of the Funds are maintained in U.S. dollars.
168
GMO Trust Funds
Notes to Financial Statements — (Continued)
February 28, 2023
Basis of presentation and principles of consolidation: Alternative Allocation Fund, Implementation Fund and SGM Major Markets Fund
Alternative Allocation Fund, Implementation Fund and SGM Major Markets Fund include the accounts of their wholly-owned subsidiaries and the accompanying financial statements have been consolidated for those accounts. The consolidated financial statements include all of the assets and liabilities of each wholly-owned subsidiary. All interfund accounts and transactions have been eliminated in consolidation.
Portfolio valuation
Shares of the underlying funds and other open-end registered investment companies are valued at their most recent net asset value. Direct investments held by the Funds and underlying funds are valued as follows: Exchange-traded securities (other than exchange-traded options) for which market quotations are readily available are valued at (i) the last sale price or (ii) official closing price or (iii) most recent quoted price published by the exchange (if no reported last sale or official closing price) or (iv) the quoted price provided by a pricing source (in the event GMO deems the private market to be a more reliable indicator of market value than the exchange). Exchange-traded options are valued at the last sale price, provided that price is between the closing bid and ask prices. If the last sale price is not within that range, then they will be valued at the closing bid price for long positions and the closing ask price for short positions. Cleared derivatives are valued using the price quoted (which may be based on a model) by the relevant clearing house. If an updated quote for a cleared derivative is not available when a Fund calculates its net asset value, the derivative will generally be valued using an industry standard model, which may differ from the model used by the relevant clearing house.
Over-the-counter (“OTC”) derivatives are generally valued at the price determined by an industry standard model. Unlisted securities for which market quotations are readily available are generally valued at the most recent quoted price.
The foregoing valuation methodologies are modified for equities that trade in non-U.S. securities markets that close before the close of the New York Stock Exchange (“NYSE”) due to time zone differences, including the value of equities that underlie futures, options and other derivatives (to the extent the market for those derivatives closes prior to the close of the NYSE). In those cases, the price will generally be adjusted, to the extent practicable and available, based on inputs from an independent pricing service approved by the Trustees that are intended to reflect valuation changes through the NYSE close. These securities listed on foreign exchanges (including the value of equity securities that underlie futures, options and other derivatives (to the extent the market for such instruments closes prior to the close of the NYSE)) are classified as Level 2 (levels defined below) and are described in the disclosures of the underlying funds.
Typically, the Funds and the underlying funds value fixed income securities at the most recent price supplied by a pricing source determined by GMO. GMO evaluates pricing sources on an ongoing basis and may change a pricing source at any time. GMO monitors erratic or unusual movements (including unusual inactivity) in the prices supplied for a security and has discretion to override a price supplied by a source (e.g., by taking a price supplied by another source) when it believes that the price supplied is not reliable. Alternative pricing sources are often but not always available for securities held by the Funds and the underlying funds.
“Quoted price” typically means the bid price for securities held long and the ask price for securities sold short. If a market quotation for a security does not involve a bid or an ask, the “quoted price” may be the price provided by a market participant or other third-party pricing source in accordance with the market practice for that security. If an updated quoted price for a security is not available when a Fund calculates its net asset value, the Fund will generally use the last quoted price so long as GMO believes that the last quoted price continues to represent that security’s fair value.
In the case of derivatives, prices determined by a model may reflect an estimate of the average of bid and ask prices, regardless of whether a Fund has a long position or a short position.
If quotations are not readily available or circumstances make an existing valuation methodology or procedure unreliable, derivatives and other securities are valued at fair value as determined in good faith by the Trustees or persons acting at their direction pursuant to procedures approved by the Trustees. Because of the uncertainty inherent in fair value pricing, the price determined for a particular security may be materially different from the value realized upon its sale. The Funds and/or the underlying funds classify such securities as Level 3 (levels defined below). For the year ended February 28, 2023, the Funds did not reduce the value of any of their OTC derivatives contracts, if any, based on the creditworthiness of their counterparties. See Note 4 “Derivative financial instruments” for a further discussion on valuation of derivatives.
169
GMO Trust Funds
Notes to Financial Statements — (Continued)
February 28, 2023
U.S. GAAP requires the Funds to disclose the fair value of their investments in a three-level hierarchy (Levels 1, 2 and 3). The valuation hierarchy is based upon the relative observability of inputs to the valuation of the Funds’ investments. The inputs or methodologies used for valuing securities are not necessarily an indication of the risk associated with investing in those securities.
Changes in valuation techniques may result in transfers into or out of an investment’s assigned level within the fair value hierarchy. In addition, in periods of market dislocation, the observability of prices and inputs may be reduced for many instruments. This condition, as well as changes related to the liquidity of investments, could cause a security to be reclassified between levels.
The three levels are defined as follows:
Level 1 – Valuations based on quoted prices for identical securities in active markets.
The types of assets and liabilities categorized in Level 1 generally include actively traded domestic and certain foreign equity securities; certain U.S. government obligations; derivatives actively traded on a national securities exchange (such as some futures and options); and shares of open-end mutual funds (even if their investments are valued using Level 2 or Level 3 inputs).
Level 2 – Valuations determined using other significant direct or indirect observable inputs.
The types of assets and liabilities categorized in Level 2 generally include certain U.S. government agency securities, mortgage-backed securities, asset-backed securities, certain sovereign debt obligations, and corporate bonds valued using vendor prices or broker quotes; cleared derivatives and certain OTC derivatives such as swaps, options, swaptions, and forward currency contracts valued using industry standard models; certain restricted securities valued at the most recent available market or quoted price; certain securities that are valued at the local price; certain debt obligations, such as collateralized loan obligations, that have yet to begin trading that are valued at cost; and certain foreign equity securities that are adjusted based on inputs from an independent pricing service approved by the Trustees, including the value of equity securities that underlie futures, options and other derivatives (to the extent the market for such instruments closes prior to the close of the NYSE) to reflect estimated valuation changes through the NYSE close.
Level 3 – Valuations based primarily on inputs that are unobservable and significant.
The types of assets and liabilities categorized in Level 3 generally include, but are not limited to, certain debt securities (such as asset-backed, mortgage-backed, loans and sovereign debt) and derivatives even though they may be valued using broker quotes; certain debt securities and derivatives adjusted by a specified discount for liquidity or other considerations; securities whose trading has been suspended or that have been de-listed from their current primary trading exchange valued at the most recent available market or quoted price; securities in default or bankruptcy proceedings for which there is no current market quotation valued at the most recent available market or quoted price; potential litigation recoveries and interests related to bankruptcy proceedings; certain equity securities that are valued based on the last traded exchange price adjusted for the movement in a relevant index; certain securities that are valued using a price from a comparable security related to the same issuer; and certain recently acquired equity securities that have yet to begin trading that are valued at cost.
The following is a summary of the respective levels assigned to the Funds’ direct securities and derivatives, if any, as of February 28, 2023:
| Description | Level 1 | Level 2 | Level 3 | Total | ||||||||||||
Consolidated Alternative Allocation Fund | ||||||||||||||||
Asset Valuation Inputs | ||||||||||||||||
Common Stocks | ||||||||||||||||
Australia | $ | — | $ | 1,581,031 | $ | — | $ | 1,581,031 | ||||||||
Belgium | — | 886,763 | — | 886,763 | ||||||||||||
Brazil | 257,553 | 73,126 | — | 330,679 | ||||||||||||
Canada | 3,577,542 | — | — | 3,577,542 | ||||||||||||
China | 5,956 | 679,248 | 419,007 | 1,104,211 | ||||||||||||
Denmark | — | 1,264,809 | — | 1,264,809 | ||||||||||||
Finland | — | 331,386 | — | 331,386 | ||||||||||||
France | — | 1,299,279 | — | 1,299,279 | ||||||||||||
170
GMO Trust Funds
Notes to Financial Statements — (Continued)
February 28, 2023
| Description | Level 1 | Level 2 | Level 3 | Total | ||||||||||||
Consolidated Alternative Allocation Fund (continued) |
| |||||||||||||||
Asset Valuation Inputs (continued) | ||||||||||||||||
Common Stocks (continued) | ||||||||||||||||
Germany | $ | — | $ | 884,322 | $ | — | $ | 884,322 | ||||||||
India | — | 1,055,094 | — | 1,055,094 | ||||||||||||
Israel | 2,169,109 | — | — | 2,169,109 | ||||||||||||
Italy | — | 771,599 | — | 771,599 | ||||||||||||
Japan | 54,537 | 14,838,648 | — | 14,893,185 | ||||||||||||
Mexico | 16,368 | — | — | 16,368 | ||||||||||||
Netherlands | — | 2,069,268 | — | 2,069,268 | ||||||||||||
New Zealand | — | 146,702 | — | 146,702 | ||||||||||||
Poland | — | 94,109 | — | 94,109 | ||||||||||||
Portugal | — | 194,943 | — | 194,943 | ||||||||||||
South Africa | — | 165,761 | — | 165,761 | ||||||||||||
South Korea | 237,861 | 603,545 | — | 841,406 | ||||||||||||
Spain | — | 964,281 | — | 964,281 | ||||||||||||
Sweden | — | 837,523 | — | 837,523 | ||||||||||||
Switzerland | — | 1,058,632 | — | 1,058,632 | ||||||||||||
Taiwan | 3,316,836 | — | — | 3,316,836 | ||||||||||||
Thailand | — | 297,200 | — | 297,200 | ||||||||||||
Turkey | — | 652,314 | — | 652,314 | ||||||||||||
United Kingdom | 472,144 | 1,180,114 | — | 1,652,258 | ||||||||||||
United States | 75,841,934 | — | 15,395 | 75,857,329 | ||||||||||||
|
|
|
|
|
|
|
| |||||||||
TOTAL COMMON STOCKS | 85,949,840 | 31,929,697 | 434,402 | 118,313,939 | ||||||||||||
|
|
|
|
|
|
|
| |||||||||
Preferred Stocks | ||||||||||||||||
Brazil | 192,272 | — | — | 192,272 | ||||||||||||
Germany | — | 455,715 | — | 455,715 | ||||||||||||
|
|
|
|
|
|
|
| |||||||||
TOTAL PREFERRED STOCKS | 192,272 | 455,715 | — | 647,987 | ||||||||||||
|
|
|
|
|
|
|
| |||||||||
Rights/Warrants | ||||||||||||||||
United States | — | — | 384,887 | 384,887 | ||||||||||||
|
|
|
|
|
|
|
| |||||||||
TOTAL RIGHTS/WARRANTS | — | — | 384,887 | 384,887 | ||||||||||||
|
|
|
|
|
|
|
| |||||||||
Investment Funds | ||||||||||||||||
United States | — | — | 2,331,920 | 2,331,920 | ||||||||||||
|
|
|
|
|
|
|
| |||||||||
TOTAL INVESTMENT FUNDS | — | — | 2,331,920 | 2,331,920 | ||||||||||||
|
|
|
|
|
|
|
| |||||||||
Debt Obligations | ||||||||||||||||
United States | 58,497,457 | 5,344,575 | — | 63,842,032 | ||||||||||||
|
|
|
|
|
|
|
| |||||||||
TOTAL DEBT OBLIGATIONS | 58,497,457 | 5,344,575 | — | 63,842,032 | ||||||||||||
|
|
|
|
|
|
|
| |||||||||
Mutual Funds | ||||||||||||||||
United States | 5,754,599 | — | — | 5,754,599 | ||||||||||||
|
|
|
|
|
|
|
| |||||||||
TOTAL MUTUAL FUNDS | 5,754,599 | — | — | 5,754,599 | ||||||||||||
|
|
|
|
|
|
|
| |||||||||
Short-Term Investments | 640,891 | 65,701,629 | — | 66,342,520 | ||||||||||||
Purchased Options | — | 108,436 | — | 108,436 | ||||||||||||
|
|
|
|
|
|
|
| |||||||||
Total Investments | 151,035,059 | 103,540,052 | 3,151,209 | 257,726,320 | ||||||||||||
|
|
|
|
|
|
|
| |||||||||
171
GMO Trust Funds
Notes to Financial Statements — (Continued)
February 28, 2023
| Description | Level 1 | Level 2 | Level 3 | Total | ||||||||||||
Consolidated Alternative Allocation Fund (continued) |
| |||||||||||||||
Asset Valuation Inputs (continued) | ||||||||||||||||
Derivatives^ | ||||||||||||||||
Forward Currency Contracts | ||||||||||||||||
Foreign Currency Risk | $ | — | $ | 1,290,869 | $ | — | $ | 1,290,869 | ||||||||
Futures Contracts | ||||||||||||||||
Equity Risk | — | 398,397 | — | 398,397 | ||||||||||||
Interest Rate Risk | 146,728 | — | — | 146,728 | ||||||||||||
Physical Commodity Contract Risk | 165,534 | — | — | 165,534 | ||||||||||||
Swap Contracts | ||||||||||||||||
Credit Risk | — | 7,907,211 | — | 7,907,211 | ||||||||||||
Equity Risk | — | 407,046 | — | 407,046 | ||||||||||||
Interest Rate Risk | — | 2,325,154 | — | 2,325,154 | ||||||||||||
|
|
|
|
|
|
|
| |||||||||
Total | $ | 151,347,321 | $ | 115,868,729 | $ | 3,151,209 | $ | 270,367,259 | ||||||||
|
|
|
|
|
|
|
| |||||||||
Liability Valuation Inputs | ||||||||||||||||
Common Stocks | ||||||||||||||||
Australia | $ | (25,778 | ) | $ | (1,267,522 | ) | $ | — | $ | (1,293,300 | ) | |||||
Austria | — | (327,595 | ) | — | (327,595 | ) | ||||||||||
Belgium | — | (387,123 | ) | — | (387,123 | ) | ||||||||||
Canada | (4,732,784 | ) | — | — | (4,732,784 | ) | ||||||||||
Denmark | — | (210,827 | ) | — | (210,827 | ) | ||||||||||
Finland | — | (110,964 | ) | — | (110,964 | ) | ||||||||||
France | — | (1,517,235 | ) | — | (1,517,235 | ) | ||||||||||
Germany | — | (2,023,434 | ) | — | (2,023,434 | ) | ||||||||||
Ireland | — | (94,928 | ) | — | (94,928 | ) | ||||||||||
Israel | (470,561 | ) | — | — | (470,561 | ) | ||||||||||
Italy | (104,148 | ) | (1,293,884 | ) | — | (1,398,032 | ) | |||||||||
Japan | — | (4,939,980 | ) | — | (4,939,980 | ) | ||||||||||
Netherlands | — | (1,221,188 | ) | — | (1,221,188 | ) | ||||||||||
New Zealand | — | (282,971 | ) | — | (282,971 | ) | ||||||||||
Norway | — | (346,674 | ) | — | (346,674 | ) | ||||||||||
Peru | (361,081 | ) | — | — | (361,081 | ) | ||||||||||
Singapore | (178,919 | ) | (182,771 | ) | — | (361,690 | ) | |||||||||
Spain | — | (794,859 | ) | — | (794,859 | ) | ||||||||||
Sweden | — | (360,673 | ) | — | (360,673 | ) | ||||||||||
Switzerland | — | (726,833 | ) | — | (726,833 | ) | ||||||||||
United Kingdom | — | (2,593,015 | ) | — | (2,593,015 | ) | ||||||||||
United States | (46,321,686 | ) | — | — | (46,321,686 | ) | ||||||||||
|
|
|
|
|
|
|
| |||||||||
TOTAL COMMON STOCKS | (52,194,957 | ) | (18,682,476 | ) | — | (70,877,433 | ) | |||||||||
|
|
|
|
|
|
|
| |||||||||
Preferred Stocks | ||||||||||||||||
Germany | — | (323,248 | ) | — | (323,248 | ) | ||||||||||
|
|
|
|
|
|
|
| |||||||||
TOTAL PREFERRED STOCKS | — | (323,248 | ) | — | (323,248 | ) | ||||||||||
|
|
|
|
|
|
|
| |||||||||
Derivatives^ | ||||||||||||||||
Forward Currency Contracts | ||||||||||||||||
Foreign Currency Risk | — | (818,439 | ) | — | (818,439 | ) | ||||||||||
Futures Contracts | ||||||||||||||||
Equity Risk | (362,357 | ) | (195,317 | ) | — | (557,674 | ) | |||||||||
Interest Rate Risk | (16,059 | ) | — | — | (16,059 | ) | ||||||||||
Physical Commodity Contract Risk | (103,109 | ) | — | — | (103,109 | ) | ||||||||||
172
GMO Trust Funds
Notes to Financial Statements — (Continued)
February 28, 2023
| Description | Level 1 | Level 2 | Level 3 | Total | ||||||||||||
Consolidated Alternative Allocation Fund (continued) |
| |||||||||||||||
Liability Valuation Inputs (continued) | ||||||||||||||||
Derivatives^ (continued) | ||||||||||||||||
Written Options | ||||||||||||||||
Credit Risk | $ | — | $ | (91,162 | ) | $ | — | $ | (91,162 | ) | ||||||
Equity Risk | (1,110,354 | ) | — | (69,960 | ) | (1,180,314 | ) | |||||||||
Swap Contacts | ||||||||||||||||
Credit Risk | — | (2,541,464 | ) | — | (2,541,464 | ) | ||||||||||
Equity Risk | — | (124,013 | ) | — | (124,013 | ) | ||||||||||
Interest Rate Risk | — | (1,880,438 | ) | — | (1,880,438 | ) | ||||||||||
|
|
|
|
|
|
|
| |||||||||
Total | $ | (53,786,836 | ) | $ | (24,656,557 | ) | $ | (69,960 | ) | $ | (78,513,353 | ) | ||||
|
|
|
|
|
|
|
| |||||||||
Benchmark-Free Allocation Fund | ||||||||||||||||
Asset Valuation Inputs | ||||||||||||||||
Mutual Funds | $ | 4,402,587,879 | $ | — | $ | — | $ | 4,402,587,879 | ||||||||
Short-Term Investments | 2,836,801 | — | — | 2,836,801 | ||||||||||||
|
|
|
|
|
|
|
| |||||||||
Total Investments | 4,405,424,680 | — | — | 4,405,424,680 | ||||||||||||
|
|
|
|
|
|
|
| |||||||||
Total | $ | 4,405,424,680 | $ | — | $ | — | $ | 4,405,424,680 | ||||||||
|
|
|
|
|
|
|
| |||||||||
Benchmark-Free Fund | ||||||||||||||||
Asset Valuation Inputs | ||||||||||||||||
Common Stocks | ||||||||||||||||
Australia | $ | — | $ | 13,488,698 | $ | — | $ | 13,488,698 | ||||||||
Austria | — | 179,210 | — | 179,210 | ||||||||||||
Belgium | — | 5,681,564 | — | 5,681,564 | ||||||||||||
Brazil | 5,320,900 | 6,627,596 | — | 11,948,496 | ||||||||||||
Canada | 25,007,070 | 129,026 | — | 25,136,096 | ||||||||||||
Chile | 48,576 | 1,622,829 | — | 1,671,405 | ||||||||||||
China | — | 38,934,346 | 2,140,735 | 41,075,081 | ||||||||||||
Czech Republic | — | 376,682 | — | 376,682 | ||||||||||||
Denmark | — | 6,309,399 | — | 6,309,399 | ||||||||||||
Egypt | — | 466,102 | — | 466,102 | ||||||||||||
Finland | — | 6,241,629 | — | 6,241,629 | ||||||||||||
France | 2,027,536 | 29,189,876 | — | 31,217,412 | ||||||||||||
Germany | — | 11,344,726 | — | 11,344,726 | ||||||||||||
Greece | — | 586,991 | — | 586,991 | ||||||||||||
Hong Kong | — | 7,048,894 | — | 7,048,894 | ||||||||||||
Hungary | — | 2,176,714 | — | 2,176,714 | ||||||||||||
India | 505,908 | 27,067,403 | — | 27,573,311 | ||||||||||||
Indonesia | — | 5,634,521 | — | 5,634,521 | ||||||||||||
Ireland | 1,384,035 | 3,984,311 | — | 5,368,346 | ||||||||||||
Israel | 2,996,864 | 66,620 | — | 3,063,484 | ||||||||||||
Italy | 25,524 | 7,978,429 | — | 8,003,953 | ||||||||||||
Japan | 88,298 | 153,372,308 | — | 153,460,606 | ||||||||||||
Kuwait | — | 146,381 | — | 146,381 | ||||||||||||
Malaysia | — | 907,383 | — | 907,383 | ||||||||||||
Mexico | 12,762,329 | — | — | 12,762,329 | ||||||||||||
Netherlands | — | 20,804,326 | — | 20,804,326 | ||||||||||||
New Zealand | 399 | 803,696 | — | 804,095 | ||||||||||||
173
GMO Trust Funds
Notes to Financial Statements — (Continued)
February 28, 2023
| Description | Level 1 | Level 2 | Level 3 | Total | ||||||||||||
Benchmark-Free Fund (continued) | ||||||||||||||||
Asset Valuation Inputs (continued) | ||||||||||||||||
Common Stocks (continued) | ||||||||||||||||
Norway | $ | — | $ | 3,720,619 | $ | — | $ | 3,720,619 | ||||||||
Pakistan | — | 41,143 | — | 41,143 | ||||||||||||
Panama | 12,113 | — | — | 12,113 | ||||||||||||
Philippines | — | 129,003 | — | 129,003 | ||||||||||||
Poland | — | 3,705,088 | — | 3,705,088 | ||||||||||||
Portugal | — | 2,795,444 | — | 2,795,444 | ||||||||||||
Qatar | — | 894,987 | — | 894,987 | ||||||||||||
Russia | — | 383,548 | 334,557 | 718,105 | ||||||||||||
Saudi Arabia | — | 2,291,061 | — | 2,291,061 | ||||||||||||
Singapore | — | 8,189,418 | — | 8,189,418 | ||||||||||||
South Africa | 240,570 | 12,625,661 | — | 12,866,231 | ||||||||||||
South Korea | 2,115,964 | 32,724,131 | — | 34,840,095 | ||||||||||||
Spain | — | 19,118,192 | — | 19,118,192 | ||||||||||||
Sweden | — | 6,585,226 | — | 6,585,226 | ||||||||||||
Switzerland | — | 9,462,968 | — | 9,462,968 | ||||||||||||
Taiwan | 2,787,757 | 41,844,263 | — | 44,632,020 | ||||||||||||
Thailand | — | 8,874,468 | — | 8,874,468 | ||||||||||||
Turkey | — | 7,849,814 | — | 7,849,814 | ||||||||||||
United Arab Emirates | — | 565,875 | — | 565,875 | ||||||||||||
United Kingdom | 5,808,832 | 34,247,061 | 573 | 40,056,466 | ||||||||||||
United States | 203,233,358 | 39,571 | — | 203,272,929 | ||||||||||||
Vietnam | — | 2,372,550 | — | 2,372,550 | ||||||||||||
|
|
|
|
|
|
|
| |||||||||
TOTAL COMMON STOCKS | 264,366,033 | 549,629,751 | 2,475,865 | 816,471,649 | ||||||||||||
|
|
|
|
|
|
|
| |||||||||
Preferred Stocks | ||||||||||||||||
Brazil | 5,166,256 | 6,758,548 | — | 11,924,804 | ||||||||||||
Chile | 1,029,500 | — | — | 1,029,500 | ||||||||||||
Colombia | 33,101 | — | — | 33,101 | ||||||||||||
Germany | — | 2,610,090 | — | 2,610,090 | ||||||||||||
Russia | — | — | 38,771 | 38,771 | ||||||||||||
South Korea | — | 2,511,951 | — | 2,511,951 | ||||||||||||
Taiwan | — | 34,592 | — | 34,592 | ||||||||||||
|
|
|
|
|
|
|
| |||||||||
TOTAL PREFERRED STOCKS | 6,228,857 | 11,915,181 | 38,771 | 18,182,809 | ||||||||||||
|
|
|
|
|
|
|
| |||||||||
Debt Obligations | ||||||||||||||||
United States | 227,837,836 | 9,500,000 | — | 237,337,836 | ||||||||||||
|
|
|
|
|
|
|
| |||||||||
TOTAL DEBT OBLIGATIONS | 227,837,836 | 9,500,000 | — | 237,337,836 | ||||||||||||
|
|
|
|
|
|
|
| |||||||||
Mutual Funds | ||||||||||||||||
United States | 286,877,874 | — | — | 286,877,874 | ||||||||||||
|
|
|
|
|
|
|
| |||||||||
TOTAL MUTUAL FUNDS | 286,877,874 | — | — | 286,877,874 | ||||||||||||
|
|
|
|
|
|
|
| |||||||||
Short-Term Investments | 2,997,967 | 91,999,073 | — | 94,997,040 | ||||||||||||
|
|
|
|
|
|
|
| |||||||||
Total Investments | 788,308,567 | 663,044,005 | 2,514,636 | 1,453,867,208 | ||||||||||||
|
|
|
|
|
|
|
| |||||||||
174
GMO Trust Funds
Notes to Financial Statements — (Continued)
February 28, 2023
| Description | Level 1 | Level 2 | Level 3 | Total | ||||||||||||
Benchmark-Free Fund (continued) | ||||||||||||||||
Asset Valuation Inputs (continued) | ||||||||||||||||
Derivatives^ | ||||||||||||||||
Forward Currency Contracts | ||||||||||||||||
Foreign Currency Risk | $ | — | $ | 448,540 | $ | — | $ | 448,540 | ||||||||
Swap Contracts | ||||||||||||||||
Equity Risk | — | 730,289 | — | 730,289 | ||||||||||||
Interest Rate Risk | — | 2,726,041 | — | 2,726,041 | ||||||||||||
|
|
|
|
|
|
|
| |||||||||
Total | $ | 788,308,567 | $ | 666,948,875 | $ | 2,514,636 | $ | 1,457,772,078 | ||||||||
|
|
|
|
|
|
|
| |||||||||
Liability Valuation Inputs | ||||||||||||||||
Common Stocks | ||||||||||||||||
Australia | $ | — | $ | (6,210,266 | ) | $ | — | $ | (6,210,266 | ) | ||||||
Austria | — | (1,599,838 | ) | — | (1,599,838 | ) | ||||||||||
Belgium | — | (2,015,259 | ) | — | (2,015,259 | ) | ||||||||||
Canada | (13,439,574 | ) | — | — | (13,439,574 | ) | ||||||||||
Denmark | — | (1,002,911 | ) | — | (1,002,911 | ) | ||||||||||
Finland | — | (517,056 | ) | — | (517,056 | ) | ||||||||||
France | — | (7,617,860 | ) | — | (7,617,860 | ) | ||||||||||
Germany | — | (9,750,743 | ) | — | (9,750,743 | ) | ||||||||||
Ireland | — | (462,335 | ) | — | (462,335 | ) | ||||||||||
Israel | (2,251,388 | ) | — | — | (2,251,388 | ) | ||||||||||
Italy | (468,666 | ) | (6,788,735 | ) | — | (7,257,401 | ) | |||||||||
Japan | — | (24,458,983 | ) | — | (24,458,983 | ) | ||||||||||
Netherlands | — | (6,209,380 | ) | — | (6,209,380 | ) | ||||||||||
New Zealand | — | (1,573,242 | ) | — | (1,573,242 | ) | ||||||||||
Norway | — | (1,704,004 | ) | — | (1,704,004 | ) | ||||||||||
Peru | (1,851,093 | ) | — | — | (1,851,093 | ) | ||||||||||
Russia | — | — | (694 | ) | (694 | ) | ||||||||||
Singapore | (902,639 | ) | (1,044,316 | ) | — | (1,946,955 | ) | |||||||||
Spain | — | (3,937,502 | ) | — | (3,937,502 | ) | ||||||||||
Sweden | — | (1,708,519 | ) | — | (1,708,519 | ) | ||||||||||
Switzerland | — | (3,445,783 | ) | — | (3,445,783 | ) | ||||||||||
United Kingdom | — | (12,727,524 | ) | — | (12,727,524 | ) | ||||||||||
United States | (120,973,401 | ) | — | — | (120,973,401 | ) | ||||||||||
|
|
|
|
|
|
|
| |||||||||
TOTAL COMMON STOCKS | (139,886,761 | ) | (92,774,256 | ) | (694 | ) | (232,661,711 | ) | ||||||||
|
|
|
|
|
|
|
| |||||||||
Preferred Stocks | ||||||||||||||||
Germany | — | (1,644,276 | ) | — | (1,644,276 | ) | ||||||||||
|
|
|
|
|
|
|
| |||||||||
TOTAL PREFERRED STOCKS | — | (1,644,276 | ) | — | (1,644,276 | ) | ||||||||||
|
|
|
|
|
|
|
| |||||||||
Derivatives^ | ||||||||||||||||
Forward Currency Contracts | ||||||||||||||||
Foreign Currency Risk | — | (562,651 | ) | — | (562,651 | ) | ||||||||||
Swap Contacts | ||||||||||||||||
Interest Rate Risk | — | (2,776,265 | ) | — | (2,776,265 | ) | ||||||||||
|
|
|
|
|
|
|
| |||||||||
Total | $ | (139,886,761 | ) | $ | (97,757,448 | ) | $ | (694 | ) | $ | (237,644,903 | ) | ||||
|
|
|
|
|
|
|
| |||||||||
175
GMO Trust Funds
Notes to Financial Statements — (Continued)
February 28, 2023
| Description | Level 1 | Level 2 | Level 3 | Total | ||||||||||||
Global Asset Allocation Fund | ||||||||||||||||
Asset Valuation Inputs | ||||||||||||||||
Mutual Funds | $ | 339,174,915 | $ | — | $ | — | $ | 339,174,915 | ||||||||
Short-Term Investments | 559,158 | — | — | 559,158 | ||||||||||||
|
|
|
|
|
|
|
| |||||||||
Total Investments | 339,734,073 | — | — | 339,734,073 | ||||||||||||
|
|
|
|
|
|
|
| |||||||||
Total | $ | 339,734,073 | $ | — | $ | — | $ | 339,734,073 | ||||||||
|
|
|
|
|
|
|
| |||||||||
Global Developed Equity Allocation Fund | ||||||||||||||||
Asset Valuation Inputs | ||||||||||||||||
Mutual Funds | $ | 66,984,879 | $ | — | $ | — | $ | 66,984,879 | ||||||||
Short-Term Investments | 30,817 | — | — | 30,817 | ||||||||||||
|
|
|
|
|
|
|
| |||||||||
Total Investments | 67,015,696 | — | — | 67,015,696 | ||||||||||||
|
|
|
|
|
|
|
| |||||||||
Total | $ | 67,015,696 | $ | — | $ | — | $ | 67,015,696 | ||||||||
|
|
|
|
|
|
|
| |||||||||
Global Equity Allocation Fund | ||||||||||||||||
Asset Valuation Inputs | ||||||||||||||||
Mutual Funds | $ | 589,383,939 | $ | — | $ | — | $ | 589,383,939 | ||||||||
Short-Term Investments | 582,993 | — | — | 582,993 | ||||||||||||
|
|
|
|
|
|
|
| |||||||||
Total Investments | 589,966,932 | — | — | 589,966,932 | ||||||||||||
|
|
|
|
|
|
|
| |||||||||
Total | $ | 589,966,932 | $ | — | $ | — | $ | 589,966,932 | ||||||||
|
|
|
|
|
|
|
| |||||||||
Consolidated Implementation Fund | ||||||||||||||||
Asset Valuation Inputs | ||||||||||||||||
Common Stocks | ||||||||||||||||
Argentina | $ | 1,258,478 | $ | — | $ | — | $ | 1,258,478 | ||||||||
Australia | — | 47,755,623 | — | 47,755,623 | ||||||||||||
Austria | — | 2,202,301 | — | 2,202,301 | ||||||||||||
Belgium | — | 19,687,291 | — | 19,687,291 | ||||||||||||
Brazil | 17,258,458 | 24,518,196 | — | 41,776,654 | ||||||||||||
Canada | 102,055,125 | 407,992 | — | 102,463,117 | ||||||||||||
Chile | 294,492 | 5,211,138 | — | 5,505,630 | ||||||||||||
China | 22,335 | 128,767,279 | 6,108,191 | 134,897,805 | ||||||||||||
Czech Republic | — | 1,159,214 | — | 1,159,214 | ||||||||||||
Denmark | — | 23,756,860 | — | 23,756,860 | ||||||||||||
Egypt | — | 1,546,768 | — | 1,546,768 | ||||||||||||
Finland | — | 20,677,330 | — | 20,677,330 | ||||||||||||
France | 6,333,040 | 97,642,357 | — | 103,975,397 | ||||||||||||
Germany | — | 37,093,992 | — | 37,093,992 | ||||||||||||
Greece | — | 1,854,420 | — | 1,854,420 | ||||||||||||
Hong Kong | — | 22,366,792 | — | 22,366,792 | ||||||||||||
Hungary | — | 7,758,703 | — | 7,758,703 | ||||||||||||
India | 1,965,739 | 86,637,144 | — | 88,602,883 | ||||||||||||
Indonesia | — | 17,940,923 | — | 17,940,923 | ||||||||||||
Ireland | 4,912,264 | 11,867,178 | — | 16,779,442 | ||||||||||||
Israel | 16,602,319 | 608,721 | — | 17,211,040 | ||||||||||||
Italy | — | 28,401,175 | — | 28,401,175 | ||||||||||||
Japan | 768,262 | 486,212,464 | — | 486,980,726 | ||||||||||||
176
GMO Trust Funds
Notes to Financial Statements — (Continued)
February 28, 2023
| Description | Level 1 | Level 2 | Level 3 | Total | ||||||||||||
Consolidated Implementation Fund (continued) | ||||||||||||||||
Asset Valuation Inputs (continued) | ||||||||||||||||
Common Stocks (continued) | ||||||||||||||||
Kuwait | $ | — | $ | 163,619 | $ | — | $ | 163,619 | ||||||||
Malaysia | — | 3,228,383 | — | 3,228,383 | ||||||||||||
Mexico | 41,604,154 | — | 0§ | 41,604,154 | ||||||||||||
Netherlands | — | 70,049,994 | 175 | 70,050,169 | ||||||||||||
New Zealand | — | 2,658,478 | — | 2,658,478 | ||||||||||||
Norway | — | 15,060,132 | — | 15,060,132 | ||||||||||||
Pakistan | — | 143,857 | — | 143,857 | ||||||||||||
Panama | 20,123 | — | — | 20,123 | ||||||||||||
Philippines | — | 947,693 | — | 947,693 | ||||||||||||
Poland | — | 11,656,034 | — | 11,656,034 | ||||||||||||
Portugal | — | 14,004,668 | — | 14,004,668 | ||||||||||||
Qatar | — | 2,366,053 | — | 2,366,053 | ||||||||||||
Russia | — | 750,690 | 902,182 | 1,652,872 | ||||||||||||
Saudi Arabia | — | 6,903,237 | — | 6,903,237 | ||||||||||||
Singapore | — | 26,046,506 | — | 26,046,506 | ||||||||||||
South Africa | 740,556 | 41,246,920 | — | 41,987,476 | ||||||||||||
South Korea | 7,479,114 | 102,178,273 | — | 109,657,387 | ||||||||||||
Spain | — | 65,215,467 | — | 65,215,467 | ||||||||||||
Sweden | — | 22,360,671 | — | 22,360,671 | ||||||||||||
Switzerland | — | 32,213,230 | — | 32,213,230 | ||||||||||||
Taiwan | 29,452,341 | 104,592,596 | — | 134,044,937 | ||||||||||||
Thailand | — | 29,243,665 | — | 29,243,665 | ||||||||||||
Turkey | — | 27,692,834 | — | 27,692,834 | ||||||||||||
Ukraine | — | 165,297 | — | 165,297 | ||||||||||||
United Arab Emirates | — | 1,752,209 | — | 1,752,209 | ||||||||||||
United Kingdom | 22,625,496 | 127,199,819 | 753 | 149,826,068 | ||||||||||||
United States | 930,719,224 | 92,612 | 9,875,273 | 940,687,109 | ||||||||||||
Vietnam | — | 7,191,968 | — | 7,191,968 | ||||||||||||
|
|
|
|
|
|
|
| |||||||||
TOTAL COMMON STOCKS | 1,184,111,520 | 1,789,198,766 | 16,886,574 | 2,990,196,860 | ||||||||||||
|
|
|
|
|
|
|
| |||||||||
Preferred Stocks | ||||||||||||||||
Brazil | 16,949,994 | 31,132,195 | — | 48,082,189 | ||||||||||||
Chile | 4,002,625 | 86,026 | — | 4,088,651 | ||||||||||||
Germany | — | 8,952,959 | — | 8,952,959 | ||||||||||||
Russia | — | — | 85,666 | 85,666 | ||||||||||||
South Korea | — | 10,564,447 | — | 10,564,447 | ||||||||||||
Taiwan | — | 224,963 | — | 224,963 | ||||||||||||
United States | — | — | 183,300 | 183,300 | ||||||||||||
|
|
|
|
|
|
|
| |||||||||
TOTAL PREFERRED STOCKS | 20,952,619 | 50,960,590 | 268,966 | 72,182,175 | ||||||||||||
|
|
|
|
|
|
|
| |||||||||
Rights/Warrants | ||||||||||||||||
Canada | — | — | 222 | 222 | ||||||||||||
United States | — | — | 845,681 | 845,681 | ||||||||||||
|
|
|
|
|
|
|
| |||||||||
TOTAL RIGHTS/WARRANTS | — | — | 845,903 | 845,903 | ||||||||||||
|
|
|
|
|
|
|
| |||||||||
Investment Funds | ||||||||||||||||
United States | — | — | 10,295,869 | 10,295,869 | ||||||||||||
|
|
|
|
|
|
|
| |||||||||
TOTAL INVESTMENT FUNDS | — | — | 10,295,869 | 10,295,869 | ||||||||||||
|
|
|
|
|
|
|
| |||||||||
177
GMO Trust Funds
Notes to Financial Statements — (Continued)
February 28, 2023
| Description | Level 1 | Level 2 | Level 3 | Total | ||||||||||||
Consolidated Implementation Fund (continued) | ||||||||||||||||
Asset Valuation Inputs (continued) | ||||||||||||||||
Debt Obligations | ||||||||||||||||
Austria | $ | — | $ | 1,220,162 | $ | — | $ | 1,220,162 | ||||||||
China | — | 481,800 | — | 481,800 | ||||||||||||
Israel | — | 3,087,383 | — | 3,087,383 | ||||||||||||
Netherlands | — | — | 57 | 57 | ||||||||||||
United States | 1,066,276,125 | 57,420,634 | 20,562,105 | 1,144,258,864 | ||||||||||||
|
|
|
|
|
|
|
| |||||||||
TOTAL DEBT OBLIGATIONS | 1,066,276,125 | 62,209,979 | 20,562,162 | 1,149,048,266 | ||||||||||||
|
|
|
|
|
|
|
| |||||||||
Mutual Funds | ||||||||||||||||
United States | 1,119,668 | — | — | 1,119,668 | ||||||||||||
|
|
|
|
|
|
|
| |||||||||
TOTAL MUTUAL FUNDS | 1,119,668 | — | — | 1,119,668 | ||||||||||||
|
|
|
|
|
|
|
| |||||||||
Short-Term Investments | 23,994,465 | 280,285,784 | — | 304,280,249 | ||||||||||||
|
|
|
|
|
|
|
| |||||||||
Total Investments | 2,296,454,397 | 2,182,655,119 | 48,859,474 | 4,527,968,990 | ||||||||||||
|
|
|
|
|
|
|
| |||||||||
Derivatives^ | ||||||||||||||||
Forward Currency Contracts | ||||||||||||||||
Foreign Currency Risk | — | 5,321,932 | — | 5,321,932 | ||||||||||||
Futures Contracts | ||||||||||||||||
Equity Risk | — | 1,866,229 | — | 1,866,229 | ||||||||||||
Interest Rate Risk | 653,626 | — | — | 653,626 | ||||||||||||
Physical Commodity Contract Risk | 762,282 | — | — | 762,282 | ||||||||||||
Swap Contracts | ||||||||||||||||
Credit Risk | — | 155,320 | — | 155,320 | ||||||||||||
Equity Risk | — | 3,514,056 | — | 3,514,056 | ||||||||||||
Interest Rate Risk | — | 19,775,772 | — | 19,775,772 | ||||||||||||
|
|
|
|
|
|
|
| |||||||||
Total | $ | 2,297,870,305 | $ | 2,213,288,428 | $ | 48,859,474 | $ | 4,560,018,207 | ||||||||
|
|
|
|
|
|
|
| |||||||||
Liability Valuation Inputs | ||||||||||||||||
Common Stocks | ||||||||||||||||
Australia | $ | — | $ | (21,695,867 | ) | $ | — | $ | (21,695,867 | ) | ||||||
Austria | — | (5,732,919 | ) | — | (5,732,919 | ) | ||||||||||
Belgium | — | (7,031,538 | ) | — | (7,031,538 | ) | ||||||||||
Canada | (54,498,385 | ) | — | — | (54,498,385 | ) | ||||||||||
Denmark | — | (3,583,473 | ) | — | (3,583,473 | ) | ||||||||||
Finland | — | (1,884,969 | ) | — | (1,884,969 | ) | ||||||||||
France | — | (26,571,653 | ) | — | (26,571,653 | ) | ||||||||||
Germany | — | (34,634,451 | ) | — | (34,634,451 | ) | ||||||||||
Ireland | — | (1,613,618 | ) | — | (1,613,618 | ) | ||||||||||
Israel | (7,876,385 | ) | — | — | (7,876,385 | ) | ||||||||||
Italy | (1,796,553 | ) | (23,040,982 | ) | — | (24,837,535 | ) | |||||||||
Japan | — | (84,821,198 | ) | — | (84,821,198 | ) | ||||||||||
Netherlands | — | (21,538,395 | ) | — | (21,538,395 | ) | ||||||||||
New Zealand | — | (5,225,668 | ) | — | (5,225,668 | ) | ||||||||||
Norway | — | (5,934,704 | ) | — | (5,934,704 | ) | ||||||||||
Peru | (6,459,297 | ) | — | — | (6,459,297 | ) | ||||||||||
Singapore | (3,001,844 | ) | (3,581,805 | ) | — | (6,583,649 | ) | |||||||||
Spain | — | (13,477,767 | ) | — | (13,477,767 | ) | ||||||||||
Sweden | — | (6,173,788 | ) | — | (6,173,788 | ) | ||||||||||
Switzerland | — | (11,961,337 | ) | — | (11,961,337 | ) | ||||||||||
178
GMO Trust Funds
Notes to Financial Statements — (Continued)
February 28, 2023
| Description | Level 1 | Level 2 | Level 3 | Total | ||||||||||||
Consolidated Implementation Fund (continued) | ||||||||||||||||
Liability Valuation Inputs (continued) | ||||||||||||||||
Common Stocks (continued) | ||||||||||||||||
United Kingdom | $ | — | $ | (44,793,199 | ) | $ | — | $ | (44,793,199 | ) | ||||||
United States | (504,592,431 | ) | — | — | (504,592,431 | ) | ||||||||||
|
|
|
|
|
|
|
| |||||||||
TOTAL COMMON STOCKS | (578,224,895 | ) | (323,297,331 | ) | — | (901,522,226 | ) | |||||||||
|
|
|
|
|
|
|
| |||||||||
Preferred Stocks | ||||||||||||||||
Germany | — | (5,737,764 | ) | — | (5,737,764 | ) | ||||||||||
|
|
|
|
|
|
|
| |||||||||
TOTAL PREFERRED STOCKS | — | (5,737,764 | ) | — | (5,737,764 | ) | ||||||||||
|
|
|
|
|
|
|
| |||||||||
Derivatives^ | ||||||||||||||||
Forward Currency Contracts | ||||||||||||||||
Foreign Currency Risk | — | (6,102,855 | ) | — | (6,102,855 | ) | ||||||||||
Futures Contracts | ||||||||||||||||
Equity Risk | (1,566,524 | ) | (919,363 | ) | — | (2,485,887 | ) | |||||||||
Interest Rate Risk | (62,223 | ) | — | — | (62,223 | ) | ||||||||||
Physical Commodity Contract Risk | (478,416 | ) | — | — | (478,416 | ) | ||||||||||
Written Options | ||||||||||||||||
Equity Risk | (2,572,762 | ) | — | (265,925 | ) | (2,838,687 | ) | |||||||||
Swap Contacts | ||||||||||||||||
Credit Risk | — | (384,832 | ) | — | (384,832 | ) | ||||||||||
Equity Risk | — | (579,637 | ) | — | (579,637 | ) | ||||||||||
Interest Rate Risk | — | (20,062,369 | ) | — | (20,062,369 | ) | ||||||||||
|
|
|
|
|
|
|
| |||||||||
Total | $ | (582,904,820 | ) | $ | (357,084,151 | ) | $ | (265,925 | ) | $ | (940,254,896 | ) | ||||
|
|
|
|
|
|
|
| |||||||||
International Developed Equity Allocation Fund | ||||||||||||||||
Asset Valuation Inputs | ||||||||||||||||
Mutual Funds | $ | 227,130,909 | $ | — | $ | — | $ | 227,130,909 | ||||||||
Short-Term Investments | 100,556 | — | — | 100,556 | ||||||||||||
|
|
|
|
|
|
|
| |||||||||
Total Investments | 227,231,465 | — | — | 227,231,465 | ||||||||||||
|
|
|
|
|
|
|
| |||||||||
Total | $ | 227,231,465 | $ | — | $ | — | $ | 227,231,465 | ||||||||
|
|
|
|
|
|
|
| |||||||||
International Equity Allocation Fund | ||||||||||||||||
Asset Valuation Inputs | ||||||||||||||||
Mutual Funds | $ | 491,808,393 | $ | — | $ | — | $ | 491,808,393 | ||||||||
Short-Term Investments | 365,390 | — | — | 365,390 | ||||||||||||
|
|
|
|
|
|
|
| |||||||||
Total Investments | 492,173,783 | — | — | 492,173,783 | ||||||||||||
|
|
|
|
|
|
|
| |||||||||
Total | $ | 492,173,783 | $ | — | $ | — | $ | 492,173,783 | ||||||||
|
|
|
|
|
|
|
| |||||||||
Consolidated SGM Major Markets Fund | ||||||||||||||||
Asset Valuation Inputs | ||||||||||||||||
Debt Obligations | ||||||||||||||||
United States | $ | 128,840,429 | $ | — | $ | — | $ | 128,840,429 | ||||||||
|
|
|
|
|
|
|
| |||||||||
TOTAL DEBT OBLIGATIONS | 128,840,429 | — | — | 128,840,429 | ||||||||||||
|
|
|
|
|
|
|
| |||||||||
Short-Term Investments | 455,267 | 349,412 | — | 804,679 | ||||||||||||
|
|
|
|
|
|
|
| |||||||||
Total Investments | 129,295,696 | 349,412 | — | 129,645,108 | ||||||||||||
|
|
|
|
|
|
|
| |||||||||
179
GMO Trust Funds
Notes to Financial Statements — (Continued)
February 28, 2023
| Description | Level 1 | Level 2 | Level 3 | Total | ||||||||||||
Consolidated SGM Major Markets Fund (continued) | ||||||||||||||||
Asset Valuation Inputs (continued) | ||||||||||||||||
Derivatives^ | ||||||||||||||||
Forward Currency Contracts | ||||||||||||||||
Foreign Currency Risk | $ | — | $ | 807,354 | $ | — | $ | 807,354 | ||||||||
Futures Contracts | ||||||||||||||||
Equity Risk | — | 808,051 | — | 808,051 | ||||||||||||
Interest Rate Risk | 294,513 | — | — | 294,513 | ||||||||||||
Physical Commodity Contract Risk | 329,801 | — | — | 329,801 | ||||||||||||
Swap Contracts | ||||||||||||||||
Equity Risk | — | 682,712 | — | 682,712 | ||||||||||||
|
|
|
|
|
|
|
| |||||||||
Total | $ | 129,920,010 | $ | 2,647,529 | $ | — | $ | 132,567,539 | ||||||||
|
|
|
|
|
|
|
| |||||||||
Liability Valuation Inputs | ||||||||||||||||
Derivatives^ | ||||||||||||||||
Forward Currency Contracts | ||||||||||||||||
Foreign Currency Risk | $ | — | $ | (806,355 | ) | $ | — | $ | (806,355 | ) | ||||||
Futures Contracts | ||||||||||||||||
Equity Risk | (649,931 | ) | (392,426 | ) | — | (1,042,357 | ) | |||||||||
Interest Rate Risk | (26,695 | ) | — | — | (26,695 | ) | ||||||||||
Physical Commodity Contract Risk | (207,277 | ) | — | — | (207,277 | ) | ||||||||||
Swap Contacts | ||||||||||||||||
Equity Risk | — | (294,036 | ) | — | (294,036 | ) | ||||||||||
|
|
|
|
|
|
|
| |||||||||
Total | $ | (883,903 | ) | $ | (1,492,817 | ) | $ | — | $ | (2,376,720 | ) | |||||
|
|
|
|
|
|
|
| |||||||||
Strategic Opportunities Allocation Fund | ||||||||||||||||
Asset Valuation Inputs | ||||||||||||||||
Common Stocks | ||||||||||||||||
Australia | $ | — | $ | 1,762,178 | $ | — | $ | 1,762,178 | ||||||||
Austria | — | 63,309 | — | 63,309 | ||||||||||||
Belgium | — | 963,324 | — | 963,324 | ||||||||||||
Brazil | 143,156 | 73,463 | — | 216,619 | ||||||||||||
Canada | 2,931,934 | — | — | 2,931,934 | ||||||||||||
China | — | 825,376 | 306,054 | 1,131,430 | ||||||||||||
Denmark | — | 932,495 | — | 932,495 | ||||||||||||
Finland | — | 902,274 | — | 902,274 | ||||||||||||
France | — | 3,304,628 | — | 3,304,628 | ||||||||||||
Germany | — | 1,122,994 | — | 1,122,994 | ||||||||||||
Hong Kong | — | 1,101,842 | — | 1,101,842 | ||||||||||||
India | — | 779,000 | — | 779,000 | ||||||||||||
Ireland | 38,221 | 858,295 | — | 896,516 | ||||||||||||
Israel | 446,395 | 10,050 | — | 456,445 | ||||||||||||
Italy | — | 1,085,820 | — | 1,085,820 | ||||||||||||
Japan | — | 8,483,853 | — | 8,483,853 | ||||||||||||
Mexico | 570,738 | — | — | 570,738 | ||||||||||||
Netherlands | — | 2,517,849 | — | 2,517,849 | ||||||||||||
New Zealand | — | 135,075 | — | 135,075 | ||||||||||||
Norway | — | 308,041 | — | 308,041 | ||||||||||||
Poland | — | 58,936 | — | 58,936 | ||||||||||||
Portugal | — | 380,925 | — | 380,925 | ||||||||||||
180
GMO Trust Funds
Notes to Financial Statements — (Continued)
February 28, 2023
| Description | Level 1 | Level 2 | Level 3 | Total | ||||||||||||
Strategic Opportunities Allocation Fund (continued) | ||||||||||||||||
Asset Valuation Inputs (continued) | ||||||||||||||||
Common Stocks (continued) | ||||||||||||||||
Russia | $ | — | $ | — | $ | 2,093 | $ | 2,093 | ||||||||
Singapore | — | 952,913 | — | 952,913 | ||||||||||||
South Africa | — | 89,582 | — | 89,582 | ||||||||||||
South Korea | 146,376 | 419,266 | — | 565,642 | ||||||||||||
Spain | — | 2,106,821 | — | 2,106,821 | ||||||||||||
Sweden | — | 1,005,525 | — | 1,005,525 | ||||||||||||
Switzerland | 27,275 | 766,328 | — | 793,603 | ||||||||||||
Thailand | — | 211,279 | — | 211,279 | ||||||||||||
Turkey | — | 451,809 | — | 451,809 | ||||||||||||
United Kingdom | 346,138 | 4,394,226 | — | 4,740,364 | ||||||||||||
United States | 21,364,241 | — | — | 21,364,241 | ||||||||||||
|
|
|
|
|
|
|
| |||||||||
TOTAL COMMON STOCKS | 26,014,474 | 36,067,476 | 308,147 | 62,390,097 | ||||||||||||
|
|
|
|
|
|
|
| |||||||||
Preferred Stocks | ||||||||||||||||
Brazil | 140,544 | 187,237 | — | 327,781 | ||||||||||||
Germany | — | 326,459 | — | 326,459 | ||||||||||||
|
|
|
|
|
|
|
| |||||||||
TOTAL PREFERRED STOCKS | 140,544 | 513,696 | — | 654,240 | ||||||||||||
|
|
|
|
|
|
|
| |||||||||
Debt Obligations | ||||||||||||||||
United States | 8,056,520 | — | — | 8,056,520 | ||||||||||||
|
|
|
|
|
|
|
| |||||||||
TOTAL DEBT OBLIGATIONS | 8,056,520 | — | — | 8,056,520 | ||||||||||||
|
|
|
|
|
|
|
| |||||||||
Mutual Funds | ||||||||||||||||
United States | 130,766,788 | — | — | 130,766,788 | ||||||||||||
|
|
|
|
|
|
|
| |||||||||
TOTAL MUTUAL FUNDS | 130,766,788 | — | — | 130,766,788 | ||||||||||||
|
|
|
|
|
|
|
| |||||||||
Short-Term Investments | 782,924 | 19,999,629 | — | 20,782,553 | ||||||||||||
|
|
|
|
|
|
|
| |||||||||
Total Investments | 165,761,250 | 56,580,801 | 308,147 | 222,650,198 | ||||||||||||
|
|
|
|
|
|
|
| |||||||||
Derivatives^ | ||||||||||||||||
Swap Contracts | �� | |||||||||||||||
Equity Risk | — | 99,263 | — | 99,263 | ||||||||||||
|
|
|
|
|
|
|
| |||||||||
Total | $ | 165,761,250 | $ | 56,680,064 | $ | 308,147 | $ | 222,749,461 | ||||||||
|
|
|
|
|
|
|
| |||||||||
Liability Valuation Inputs | ||||||||||||||||
Common Stocks | ||||||||||||||||
Australia | $ | — | $ | (888,939 | ) | $ | — | $ | (888,939 | ) | ||||||
Austria | — | (204,271 | ) | — | (204,271 | ) | ||||||||||
Belgium | — | (293,405 | ) | — | (293,405 | ) | ||||||||||
Canada | (1,886,993 | ) | — | — | (1,886,993 | ) | ||||||||||
Denmark | — | (157,158 | ) | — | (157,158 | ) | ||||||||||
Finland | — | (83,365 | ) | — | (83,365 | ) | ||||||||||
France | — | (1,114,417 | ) | — | (1,114,417 | ) | ||||||||||
Germany | — | (1,443,638 | ) | — | (1,443,638 | ) | ||||||||||
Ireland | — | (71,436 | ) | — | (71,436 | ) | ||||||||||
Israel | (333,010 | ) | — | — | (333,010 | ) | ||||||||||
Italy | (78,111 | ) | (958,131 | ) | — | (1,036,242 | ) | |||||||||
Japan | — | (3,637,240 | ) | — | (3,637,240 | ) | ||||||||||
Netherlands | — | (849,363 | ) | — | (849,363 | ) | ||||||||||
New Zealand | — | (212,189 | ) | — | (212,189 | ) | ||||||||||
181
GMO Trust Funds
Notes to Financial Statements — (Continued)
February 28, 2023
| Description | Level 1 | Level 2 | Level 3 | Total | ||||||||||||
Strategic Opportunities Allocation Fund (continued) | ||||||||||||||||
Liability Valuation Inputs (continued) | ||||||||||||||||
Common Stocks (continued) | ||||||||||||||||
Norway | $ | — | $ | (241,995 | ) | $ | — | $ | (241,995 | ) | ||||||
Peru | (257,915 | ) | — | — | (257,915 | ) | ||||||||||
Singapore | (112,440 | ) | (142,730 | ) | — | (255,170 | ) | |||||||||
Spain | — | (616,557 | ) | — | (616,557 | ) | ||||||||||
Sweden | — | (246,522 | ) | — | (246,522 | ) | ||||||||||
Switzerland | — | (512,915 | ) | — | (512,915 | ) | ||||||||||
United Kingdom | — | (1,895,281 | ) | — | (1,895,281 | ) | ||||||||||
United States | (17,841,536 | ) | — | — | (17,841,536 | ) | ||||||||||
|
|
|
|
|
|
|
| |||||||||
TOTAL COMMON STOCKS | (20,510,005 | ) | (13,569,552 | ) | — | (34,079,557 | ) | |||||||||
|
|
|
|
|
|
|
| |||||||||
Preferred Stocks | ||||||||||||||||
Germany | — | (238,295 | ) | — | (238,295 | ) | ||||||||||
|
|
|
|
|
|
|
| |||||||||
TOTAL PREFERRED STOCKS | — | (238,295 | ) | — | (238,295 | ) | ||||||||||
|
|
|
|
|
|
|
| |||||||||
Total | $ | (20,510,005 | ) | $ | (13,807,847 | ) | $ | — | $ | (34,317,852 | ) | |||||
|
|
|
|
|
|
|
| |||||||||
The risks referenced in the tables above are not intended to be inclusive of all risks. Please see the “Investment and other risks” and “Derivative financial instruments” sections below for a further discussion of risks.
| ^ | In the tables above derivatives are based on market values, rather than the notional amounts of derivatives, except for forward currency contracts which are based on unrealized appreciation/(depreciation). Excludes purchased options, if any, which are included in investments. |
| § | Represents the interest in securities that were determined to have a value of zero at February 28, 2023. |
The underlying funds held at year end are classified above as Level 1. Certain underlying funds invest in securities and/or derivatives which may have been fair valued using methods determined in good faith by or at the direction of the Trustees or which may have been valued using significant unobservable inputs. For a summary of the levels assigned to the underlying funds’ direct securities and derivatives, if any, please refer to the underlying funds’ Notes to Financial Statements which are available on the SEC’s website at www.sec.gov or on GMO’s website at www.gmo.com.
U.S. GAAP requires additional disclosures about fair value measurements for material Level 3 securities and derivatives, if any (determined by each category of asset or liability as compared to a Fund’s total net assets). Level 3 holdings include investments valued using unadjusted prices supplied by a third-party pricing source (e.g., broker quotes, vendor). Alternative Allocation Fund, Benchmark-Free Fund, Implementation Fund and Strategic Opportunities Allocation Fund’s Level 3 holdings each include three common stocks valued at their last price prior to trading being suspended. Implementation Fund’s Level 3 holdings also include a common stock that is priced at the average of broker bids and a common stock priced with a 20% discount to a comparable stock and an additional 10% discount for liquidity considerations. Other than described above, there were no other Funds with classes of investments or derivatives with direct material Level 3 holdings at February 28, 2023.
182
GMO Trust Funds
Notes to Financial Statements — (Continued)
February 28, 2023
For Funds with material total Level 3 assets and/or liabilities, the following is a reconciliation of securities and derivatives, if any, in which significant unobservable inputs (Level 3) were used in determining value:
Balances as of February 28, 2022 | Purchases/ Closing of Options | Sales/ Writing of Options | Accrued Discounts/ Premiums | Total Realized Gain/ (Loss) | Change in Unrealized Appreciation (Depreciation) | Transfer into Level 3 | Transfer out of Level 3 | Balances as of February 28, 2023 | Net Change in Unrealized Appreciation (Depreciation) from Investments Still Held as of February 28, 2023 |
| ||||||||||||||||||||||||||||||||
Consolidated Alternative Allocation Fund | ||||||||||||||||||||||||||||||||||||||||||
Common Stocks | ||||||||||||||||||||||||||||||||||||||||||
China | $ | 66,215 | $ | — | $ | — | $ | — | $ | — | $ | (294 | ) | $ | 353,086 | ‡ | $ | — | $ | 419,007 | $ | (294 | ) | |||||||||||||||||||
United States | — | — | — | — | — | 15,395 | — | — | 15,395 | — | ||||||||||||||||||||||||||||||||
Rights/Warrants | ||||||||||||||||||||||||||||||||||||||||||
United States | 263,451 | 13,908 | — | — | — | 107,528 | — | — | 384,887 | 107,528 | ||||||||||||||||||||||||||||||||
Investment Funds | ||||||||||||||||||||||||||||||||||||||||||
United States | 5,607,602 | 301,290 | (4,063,345 | ) | — | — | 486,373 | — | — | 2,331,920 | 486,373 | |||||||||||||||||||||||||||||||
|
|
|
|
|
|
|
|
|
|
|
|
|
|
|
|
|
|
|
| |||||||||||||||||||||||
Total Investments | 5,937,268 | 315,198 | (4,063,345 | ) | — | — | 609,002 | 353,086 | — | 3,151,209 | 593,607 | |||||||||||||||||||||||||||||||
|
|
|
|
|
|
|
|
|
|
|
|
|
|
|
|
|
|
|
| |||||||||||||||||||||||
Derivatives | ||||||||||||||||||||||||||||||||||||||||||
Written Options | — | — | (159,497 | ) | — | — | 89,537 | — | — | (69,960 | ) | 89,537 | ||||||||||||||||||||||||||||||
|
|
|
|
|
|
|
|
|
|
|
|
|
|
|
|
|
|
|
| |||||||||||||||||||||||
Total | $ | 5,937,268 | $ | 315,198 | $ | (4,222,842 | ) | $ | — | $ | — | $ | 698,539 | $ | 353,086 | $ | — | $ | 3,081,249 | $ | 683,144 | |||||||||||||||||||||
|
|
|
|
|
|
|
|
|
|
|
|
|
|
|
|
|
|
|
| |||||||||||||||||||||||
Benchmark-Free Fund | ||||||||||||||||||||||||||||||||||||||||||
Common Stocks | ||||||||||||||||||||||||||||||||||||||||||
China | $ | 381,895 | $ | 251,324 | $ | (251,324 | ) | $ | — | $ | — | $ | (1,693 | ) | $ | 1,760,533 | ‡ | $ | — | $ | 2,140,735 | $ | (253,017 | ) | ||||||||||||||||||
Russia | 965,229 | — | (162,079 | ) | — | (474,978 | ) | (324,797 | ) | 331,182 | ‡ | — | 334,557 | (115,837 | ) | |||||||||||||||||||||||||||
United Kingdom | — | — | — | — | — | — | 573 | ‡ | — | 573 | — | |||||||||||||||||||||||||||||||
Preferred Stocks | ||||||||||||||||||||||||||||||||||||||||||
Russia | — | — | — | — | — | — | 38,771 | ‡ | — | 38,771 | — | |||||||||||||||||||||||||||||||
Securities Sold Short | ||||||||||||||||||||||||||||||||||||||||||
Russia | — | — | (78,267 | ) | — | — | 77,573 | — | — | (694 | ) | 77,573 | ||||||||||||||||||||||||||||||
|
|
|
|
|
|
|
|
|
|
|
|
|
|
|
|
|
|
|
| |||||||||||||||||||||||
Total Investments | $ | 1,347,124 | $ | 251,324 | $ | (491,670 | ) | $ | — | $ | (474,978 | ) | $ | (248,917 | ) | $ | 2,131,059 | $ | — | $ | 2,513,942 | $ | (291,281 | ) | ||||||||||||||||||
|
|
|
|
|
|
|
|
|
|
|
|
|
|
|
|
|
|
|
| |||||||||||||||||||||||
Consolidated Implementation Fund | ||||||||||||||||||||||||||||||||||||||||||
Common Stocks | ||||||||||||||||||||||||||||||||||||||||||
China | $ | 965,024 | $ | 879,828 | $ | (898,220 | ) | $ | — | $ | (33,595 | ) | $ | (6,066 | ) | $ | 5,201,220 | ‡ | $ | — | $ | 6,108,191 | $ | (883,866 | ) | |||||||||||||||||
Netherlands | 185 | — | — | — | — | (10 | ) | — | — | 175 | (10 | ) | ||||||||||||||||||||||||||||||
Russia | 1,248,215 | — | (479,875 | ) | — | (1,653,109 | ) | 893,492 | 893,459 | ‡ | — | 902,182 | (262,303 | ) | ||||||||||||||||||||||||||||
United Kingdom | — | — | — | — | — | — | 753 | ‡ | — | 753 | — | |||||||||||||||||||||||||||||||
United States | 8,961,199 | 1,460,086 | (95,454 | ) | — | 4,718 | (455,276 | ) | — | — | 9,875,273 | (272,696 | ) | |||||||||||||||||||||||||||||
Preferred Stocks | ||||||||||||||||||||||||||||||||||||||||||
Russia | — | — | — | — | — | — | 85,666 | ‡ | — | 85,666 | — | |||||||||||||||||||||||||||||||
United States | 875,250 | — | (1,341,586 | ) | — | 1,317,575 | (667,939 | ) | — | — | 183,300 | 2,831 | ||||||||||||||||||||||||||||||
Rights/Warrants | ||||||||||||||||||||||||||||||||||||||||||
Canada | 300,085 | — | — | — | — | (299,863 | ) | — | — | 222 | (299,863 | ) | ||||||||||||||||||||||||||||||
United States | 682,940 | 51,933 | (277,922 | ) | — | 277,922 | 110,808 | — | — | 845,681 | 241,649 | |||||||||||||||||||||||||||||||
183
GMO Trust Funds
Notes to Financial Statements — (Continued)
February 28, 2023
Balances as of February 28, 2022 | Purchases/ Closing of Options | Sales/ of Options | Accrued | Total Realized Gain/ (Loss) | Change in Unrealized Appreciation (Depreciation) | Transfer into Level 3 | Transfer Level 3 | Balances as of February 28, 2023 | Net Change in Unrealized Appreciation (Depreciation) from Investments Still Held as of February 28, 2023 |
| ||||||||||||||||||||||||||||||||
Consolidated Implementation Fund (continued) | ||||||||||||||||||||||||||||||||||||||||||
Investment Funds |
| |||||||||||||||||||||||||||||||||||||||||
United States | $ | 22,156,919 | $ | 2,904,671 | (16,751,806 | ) | $ | — | $ | — | $ | 1,986,085 | $ | — | $ | — | $ | 10,295,869 | $ | 1,986,085 | ||||||||||||||||||||||
Debt Obligations | ||||||||||||||||||||||||||||||||||||||||||
Bank Loans | ||||||||||||||||||||||||||||||||||||||||||
Luxembourg | 2,436,433 | — | (2,429,250 | ) | 695 | (21,290 | ) | 13,412 | — | — | — | — | ||||||||||||||||||||||||||||||
United States | 18,428,534 | 23,316,579 | (18,648,208 | ) | 604,874 | (1,880,423 | ) | (1,259,391 | ) | — | — | 20,561,965 | (1,354,975 | ) | ||||||||||||||||||||||||||||
Corporate Debt | ||||||||||||||||||||||||||||||||||||||||||
Netherlands | 55 | — | — | — | — | 2 | — | — | 57 | 2 | ||||||||||||||||||||||||||||||||
United States | 140 | — | — | — | — | — | — | — | 140 | — | ||||||||||||||||||||||||||||||||
|
|
|
|
|
|
|
|
|
|
|
|
|
|
|
|
|
|
|
| |||||||||||||||||||||||
Total Investments | 56,054,979 | 28,613,097 | (40,922,321 | )# | 605,569 | (1,988,202 | ) | 315,254 | 6,181,098 | — | 48,859,474 | (843,146 | ) | |||||||||||||||||||||||||||||
|
|
|
|
|
|
|
|
|
|
|
|
|
|
|
|
|
|
|
| |||||||||||||||||||||||
Derivatives | ||||||||||||||||||||||||||||||||||||||||||
Written Options | — | — | (605,123 | ) | — | — | 339,198 | — | — | (265,925 | ) | 339,198 | ||||||||||||||||||||||||||||||
|
|
|
|
|
|
|
|
|
|
|
|
|
|
|
|
|
|
|
| |||||||||||||||||||||||
Total | $ | 56,054,979 | $ | 28,613,097 | $ | (41,527,444 | ) | $ | 605,569 | $ | (1,988,202 | ) | $ | 654,452 | $ | 6,181,098 | $ | — | $ | 48,593,549 | $ | (503,948 | ) | |||||||||||||||||||
|
|
|
|
|
|
|
|
|
|
|
|
|
|
|
|
|
|
|
| |||||||||||||||||||||||
Strategic Opportunities Allocation Fund | ||||||||||||||||||||||||||||||||||||||||||
Common Stocks | ||||||||||||||||||||||||||||||||||||||||||
China | $ | 61,485 | $ | — | $ | — | $ | — | $ | — | $ | (273 | ) | $ | 244,842 | ‡ | $ | — | $ | 306,054 | $ | (273 | ) | |||||||||||||||||||
Russia | — | — | — | — | — | — | 2,093 | ‡ | — | 2,093 | — | |||||||||||||||||||||||||||||||
|
|
|
|
|
|
|
|
|
|
|
|
|
|
|
|
|
|
|
| |||||||||||||||||||||||
Total Investments | $ | 61,485 | $ | — | $ | — | $ | — | $ | — | $ | (273 | ) | $ | 246,935 | $ | — | $ | 308,147 | $ | (273 | ) | ||||||||||||||||||||
|
|
|
|
|
|
|
|
|
|
|
|
|
|
|
|
|
|
|
| |||||||||||||||||||||||
| ‡ | Financial assets transferred between levels were due to a change in observable and/or unobservable inputs as well as the impact of the Russian invasion of Ukraine on local and global markets, as applicable. |
| # | Includes $1,994,673 of proceeds received from partial calls and/or principal paydowns as applicable. |
184
GMO Trust Funds
Notes to Financial Statements — (Continued)
February 28, 2023
The following table summarizes the quantitative inputs used in the valuation of investments classified within Level 3 of the fair value hierarchy for the year ended February 28, 2023 for Funds with material Level 3 investments.
Quantitative information about Level 3 Fair Value Measurements*
| Investment Type | Total Fair Value ($) | Valuation Methodology | Unobservable Inputs | Range (Weighted Average) | ||||||||||
Consolidated Alternative Allocation Fund | ||||||||||||||
Options | (69,960 | ) | Fair Value | N/A** | N/A | |||||||||
Benchmark-Free Fund | ||||||||||||||
Common Stock | — | Fair Value | Discount for lack of liquidity/marketability | $0 (N/A) | ||||||||||
Common Stock | 316,899 | Fair Value | Price of comparable equity/Discount for liquidity | 99%/(N/A) | ||||||||||
Common Stock (American Depositary Receipt) | 1,413 | Fair Value | Price of comparable equity/Discount for liquidity | 99%/(N/A) | ||||||||||
Common Stock (Global Depositary Receipt) | 16,818 | Fair Value | Price of comparable equity/Discount for liquidity | 99%/(N/A) | ||||||||||
Preferred Stock | 38,771 | Fair Value | Price of comparable equity/Discount for liquidity | 99%/(N/A) | ||||||||||
Consolidated Implementation Fund | ||||||||||||||
Common Stock | 7,421,662 | Fair Value | Average of broker quotes | N/A | ||||||||||
Common Stock | 59 | Fair Value | Discount for lack of liquidity/marketability | $0 (N/A) | ||||||||||
Corporate Debt | 57 | Fair Value | Discount for lack of liquidity/marketability | $0 (N/A) | ||||||||||
Common Stock | 853,672 | Fair Value | Price of comparable equity/Discount for liquidity | 99%/(N/A) | ||||||||||
Common Stock (American Depositary Receipt) | 2,570 | Fair Value | Price of comparable equity/Discount for liquidity | 99%/(N/A) | ||||||||||
Common Stock (Global Depositary Receipt) | 46,693 | Fair Value | Price of comparable equity/Discount for liquidity | 99%/(N/A) | ||||||||||
Preferred Stock | 85,666 | Fair Value | Price of comparable equity/Discount for liquidity | 99%/(N/A) | ||||||||||
Options | (265,925 | ) | Fair Value | N/A** | N/A | |||||||||
Strategic Opportunities Allocation Fund | ||||||||||||||
Common Stock | 2,093 | Fair Value | Price of comparable equity/Discount for liquidity | 99%/(N/A) | ||||||||||
| * | The table does not include Level 3 securities or derivatives that are valued by pricing vendors or brokers. As of February 28, 2023, the value of these securities and/or derivatives for Consolidated Alternative Allocation Fund, Benchmark-Free Fund, Consolidated Implementation Fund and Strategic Opportunities Allocation Fund was $3,151,209, $2,140,041, $40,449,095 and $306,054, respectively. The inputs for these investments are not readily available or cannot be reasonably estimated. |
| ** | Fair valued using the last traded price provided it is within the closing bid/ask; otherwise, the mid-price is used. |
Cash
Cash and foreign currency, if any, in the Statements of Assets and Liabilities consist of cash balances held with the custodian.
Due to/from broker
Due to/from broker in the Statements of Assets and Liabilities includes collateral on swap contracts, futures contracts, option contracts and forward currency contracts, if any, and may include marked-to-market amounts related to foreign currency or cash owed.
Foreign currency translation
The market values of foreign securities, currency holdings and related assets and liabilities are typically translated into U.S. dollars at the close of regular trading on the NYSE, generally at 4:00 pm Eastern time. Income and expenses denominated in foreign currencies are typically translated into U.S. dollars at the close of regular trading on the NYSE. Fluctuations in the value of currency holdings and other assets and liabilities resulting from changes in exchange rates are recorded as unrealized foreign currency gains or losses. Realized gains or losses and unrealized appreciation or depreciation on investment securities and income and expenses are translated
185
GMO Trust Funds
Notes to Financial Statements — (Continued)
February 28, 2023
on the respective dates of such transactions. The effects of changes in foreign currency exchange rates on investments in securities are not separated in the Statements of Operations from the effects of changes in market prices of those securities, but are included with the net realized and unrealized gain or loss on investment securities.
Loan assignments and participations
Certain Funds may invest in direct debt instruments, which are interests in amounts owed to lenders or lending syndicates, to suppliers of goods or services, or to other parties by corporate, governmental or other borrower. Such “loans” may include bank loans, promissory notes, and loan participations, or in the case of suppliers of goods or services, trade claims or other receivables. A loan is often administered by a bank or other financial institution that acts as agent for all holders. The agent administers the terms of the loan, as specified in the loan agreement. Unless, under the terms of the loan or other indebtedness a Fund has direct recourse against the borrower, it may have to rely on the agent to enforce its rights against the borrower. When investing in a loan participation, (i) a Fund has the right to receive payments of principal, interest and any fees to which it is entitled only from the party from whom the Fund has purchased the participation and only upon receipt by that party of payments from the borrower and (ii) a Fund generally has no right to enforce compliance by the borrower with the terms of the loan agreement or to vote on matters arising under the loan agreement. Thus, a Fund may be subject to credit risk both of the party from whom it purchased the loan participation and the borrower and that Fund may have minimal control over the terms of any loan modification. Loan assignments and participations outstanding at the end of the year, if any, are listed in each applicable Fund’s Schedule of Investments.
Rights and warrants
The Funds may purchase or otherwise receive warrants or rights. Warrants and rights generally give the holder the right to receive, upon exercise, a security of the issuer at a set price. Funds typically use warrants and rights in a manner similar to their use of purchased options on securities, as described in the section entitled “Options” in Note 4 “Derivative financial instruments”. Risks associated with the use of warrants and rights are generally similar to risks associated with the use of purchased options. However, warrants and rights often do not have standardized terms, and may have longer maturities and may be less liquid than exchange-traded options. In addition, the terms of warrants or rights may limit a Fund’s ability to exercise the warrants or rights at such times and in such quantities as the Fund would otherwise wish. Rights and/or warrants outstanding at the end of the year, if any, are listed in each applicable Fund’s Schedule of Investments.
Repurchase agreements
The Funds may enter into repurchase agreements with banks and brokers. Under a repurchase agreement a Fund acquires a security for a relatively short period for cash and obtains a simultaneous commitment from the seller to repurchase the security at an agreed upon price and date. The Fund, through its custodian, takes possession of securities it acquired under the repurchase agreement. The value of the securities acquired may be less than the amount owed to the Fund by the seller. If the seller in a repurchase agreement transaction defaults or enters into insolvency proceedings and the value of the securities subject to the repurchase agreement is insufficient, the Fund’s recovery of cash from the seller may be delayed and, even if the Fund is able to dispose of the securities, the Fund may incur a loss equal to the difference between the cash it paid and the value of the securities. Repurchase agreements outstanding at the end of the year, if any, are listed in each applicable Fund’s Schedule of Investments.
| Value (with | Weighted Average | |||||||||||||
| Fund Name | Counterparty | Value ($) | associated collateral) ($) | Maturity (days) | ||||||||||
Consolidated Alternative Allocation Fund | Daiwa Capital Markets America, Inc. | 51,010,102 | 52,051,125 | 1.0 | ||||||||||
Benchmark-Free Fund | Nomura Securities International, Inc. | 91,999,073 | 93,876,605 | 1.0 | ||||||||||
Consolidated Implementation Fund | Daiwa Capital Markets America, Inc. | 280,048,230 | 285,763,500 | 1.0 | ||||||||||
Strategic Opportunities Allocation Fund | Nomura Securities International, Inc. | 19,999,629 | 20,407,785 | 1.0 | ||||||||||
Reverse repurchase agreements
The Funds may enter into reverse repurchase agreements with banks and brokers to enhance return. Under a reverse repurchase agreement a Fund sells portfolio assets subject to an agreement by that Fund to repurchase the same assets at an agreed upon price and date. A Fund can use the proceeds received from entering into a reverse repurchase agreement to make additional investments, which generally causes the Fund’s portfolio to behave as if it were leveraged. If the buyer in a reverse repurchase agreement files for
186
GMO Trust Funds
Notes to Financial Statements — (Continued)
February 28, 2023
bankruptcy or becomes insolvent, the Fund may be unable to recover the securities it sold and as a result may realize a loss on the transaction if the securities it sold are worth more than the purchase price it originally received from the buyer. Reverse repurchase agreements outstanding at the end of the year, if any, are listed in each applicable Fund’s Schedule of Investments.
Inflation-indexed bonds
Certain Funds may invest in inflation-indexed bonds. Inflation-indexed bonds are fixed income securities whose principal value is adjusted periodically according to the rate of inflation/deflation. Two structures are common. The U.S. Treasury and some other issuers use a structure that accrues inflation/deflation into the principal value of the bond. Many other issuers adjust the coupon accruals for inflation related changes.
The market price of inflation-indexed bonds normally changes when real interest rates change. Real interest rates, in turn, are tied to the relationship between nominal interest rates (i.e. stated interest rates) and the rate of inflation. Therefore, if the rate of inflation rises at a faster rate than nominal interest rates, real interest rates (i.e. nominal interest rate minus inflation) might decline, leading to an increase in value of inflation-indexed bonds. In contrast, if nominal interest rates increase at a faster rate than inflation, real interest rates might rise, leading to a decrease in value of inflation-indexed bonds. Coupon payments received by a Fund from inflation-indexed bonds are generally included in the Fund’s gross income for the period in which they accrue. In addition, any increase/decrease in the principal amount of an inflation-indexed bond is generally included in the Fund’s gross income even though principal is not paid until maturity. Inflation-indexed bonds outstanding at the end of the year, if any, are listed in each applicable Fund’s Schedule of Investments.
Securities lending
The Funds may make secured loans of their portfolio securities amounting to not more than one-third of their total assets. Securities loans are required to be collateralized by cash or securities in an amount equal to the securities loaned (marked to market daily). Daily market fluctuations could cause the value of loaned securities to be more or less than the value of the collateral received. When this occurs, the collateral is adjusted and settled on the following business day. Funds participating in securities lending receive compensation for lending their securities and/or net investment income earned on the investment of cash collateral, net of fee rebates paid to the borrower and fees paid to the lending agent. Cash collateral received is generally invested in GMO U.S. Treasury Fund. State Street Bank and Trust Company serves as the Funds’ lending agent.
A Fund that lends its portfolio securities bears the risk of delay in the recovery of loaned securities, including possible impairment of the Fund’s ability to vote the securities, the inability to invest proceeds from the sales of such securities and of loss of rights in the collateral should the borrower fail financially. A Fund also bears the risk that the value of investments made with collateral may decline and bears the risk of total loss with respect to the investment of collateral.
At February 28, 2023, securities on loan at value and collateral from securities on loan are listed below:
| Value of securities | Cash | Non-cash | Total | |||||||||||||
| Fund Name | on loan ($) | collateral ($) | collateral ($)* | collateral ($) | ||||||||||||
Benchmark-Free Fund | 4,361,144 | 1,333,256 | 3,267,358 | 4,600,614 | ||||||||||||
Consolidated Implementation Fund | 18,231,045 | 1,324,193 | 18,062,828 | 19,387,021 | ||||||||||||
| * | Non-cash collateral is comprised of U.S. Treasuries and Agencies. The Fund cannot repledge non-cash collateral; therefore, they are excluded from the Statements of Assets and Liabilities. |
In addition, some Funds may loan their portfolio securities through an “enhanced custody” program offered by the Funds’ custodian to facilitate the borrowing of securities for the Funds’ short sales. Under the program, a Fund borrows securities from the custodian and sells short those borrowed securities. The Fund may utilize various ways of collateralizing its obligation to return the borrowed securities, including by pledging securities held in the Fund’s custodial account to the custodian. For its participation in the enhanced custody program, the Fund will pay the custodian a securities borrow fee and a financing charge.
Information regarding the value of the securities loaned and the value of cash collateral at year end is included in the Statements of Assets and Liabilities.
187
GMO Trust Funds
Notes to Financial Statements — (Continued)
February 28, 2023
Short sales
Certain Funds may enter into short sales transactions. A short sale is a transaction in which a Fund sells securities it may not own in anticipation of a decline in the fair market value of the securities. Securities sold in short sale transactions and the dividend and/or interest payable on such securities, if any, are reflected as a liability in the Statements of Assets and Liabilities. A Fund is obligated to deliver securities at the trade price at the time the short position is closed. Possible losses from short sales may be unlimited, whereas losses from purchases cannot exceed the total amount invested. Some Funds may also loan their portfolio securities through an enhanced custody program offered by the Funds’ custodian to facilitate the borrowing of securities for the Funds’ short sales (see Securities lending above). Short sales outstanding at the end of the year, if any, are listed in each applicable Fund’s Schedule of Investments.
Municipal obligations
Municipal obligations are issued by or on behalf of states, territories and possessions of the United States and their political subdivisions, agencies and instrumentalities and the District of Columbia to obtain funds for various public purposes. Municipal notes are generally used to provide for short-term capital needs, such as to finance working capital needs of municipalities or to provide various interim or construction financing, and generally have maturities of one year or less. Municipal bonds, which meet longer-term capital needs and generally have maturities of more than one year when issued, have two principal classifications: “general obligation” bonds and “revenue” bonds. Issuers of general obligation bonds include states, counties, cities, towns and regional districts. The basic security behind general obligation bonds is the issuer’s pledge of its full faith, credit, and taxing power for the payment of principal and interest. Revenue bonds have been issued to fund a wide variety of capital projects. The principal security for a revenue bond is generally the net revenues derived from a particular facility or group of facilities or, in some cases, from the proceeds of a special excise or other specific revenue source. Although the principal security behind these bonds varies widely, many provide additional security in the form of a debt service reserve fund whose monies also may be used to make principal and interest payments on the issuer’s obligations. Municipal obligations at the end of the year, if any, are listed in each applicable Fund’s Schedule of Investments.
Trade claims
Certain Funds may purchase trade claims against companies, including companies in bankruptcy or reorganization proceedings. Trade claims generally include claims of suppliers for goods delivered and not paid, claims for unpaid services rendered, claims for contract rejection damages and claims related to litigation. Trade claims are illiquid instruments which generally do not pay interest and there can be no guarantee that the debtor will ever be able to satisfy the obligation on the trade claim. Such claims are typically unsecured and may be subordinated to other unsecured obligations of a debtor, and generally are subject to defenses of the debtor with respect to the underlying transaction giving rise to the trade claim. Trade claims outstanding at the end of the year, if any, are listed in each applicable Fund’s Schedule of Investments.
Taxes and distributions
Each Fund has elected to be treated or intends to elect to be treated and intends to qualify each tax year as a regulated investment company under Subchapter M of the Internal Revenue Code of 1986, as amended (the “Code”). Each Fund intends to distribute its net investment income, if any, and its net realized short-term and long-term capital gains, if any, after giving effect to any available capital loss carryforwards for U.S. federal income tax purposes. Therefore, each Fund makes no provision for U.S. federal income or excise taxes.
Alternative Allocation SPC Ltd., Alternative Asset SPC Ltd. and Implementation SPC Ltd. are wholly-owned subsidiaries of Alternative Allocation Fund, SGM Major Markets Fund and Implementation Fund, respectively, and each has elected to be treated as a (non-U.S.) corporation for U.S. federal income tax purposes.
The policy of each Fund is to declare and pay dividends of its net investment income, if any, at least annually, although the Funds are permitted to, and will from time to time, declare and pay dividends of net investment income, if any, more frequently. Each Fund also intends to distribute net realized short-term and long-term capital gains, if any, at least annually. In addition, each Fund may, from time to time at their discretion, make unscheduled distributions in advance of large redemptions by shareholders or as otherwise deemed appropriate by a Fund. Typically, all distributions are reinvested in additional shares of each Fund, at net asset value, unless GMO or its agents receive and process a shareholder election to receive cash distributions. Distributions to shareholders are recorded by each Fund on the ex-dividend date.
188
GMO Trust Funds
Notes to Financial Statements — (Continued)
February 28, 2023
Taxes on foreign interest and dividend income are generally withheld in accordance with the applicable country’s tax treaty with the United States. The foreign withholding rates applicable to a Fund’s investments in certain jurisdictions may be higher if a significant portion of the Fund is held by non-U.S. shareholders and/or if certain investments are made by a Fund’s wholly-owned subsidiary. Certain Funds have previously filed for and/or may file for additional tax refunds with respect to certain taxes withheld by certain countries. Generally, the amount of such refunds that a Fund reasonably determines are collectible and free from significant contingencies are reflected in a Fund’s net asset value and are reflected as Dividends from unaffiliated issuers in the Statements of Operations. In certain circumstances, a Fund’s receipt of such refunds may cause the Fund and/or its shareholders to be liable for U.S. federal income taxes, interest charges and related fees.
As a result of court cases involving several countries across the European Union, certain Funds and/or underlying funds have filed tax reclaims in addition to treaty-based claims, in respect of previously withheld taxes on dividends earned (“EU tax reclaims”). These filings are subject to various administrative proceedings by each local jurisdiction’s tax authority, as well as judicial proceedings. EU tax reclaim and associated interest entitlements that have been recognized, if any, are reflected as Other income in the Statements of Operations. As a result of its entitlements to EU tax reclaims and related interest amounts, a Fund may incur contingent legal fees. Such fees are presented within Legal fees in the Statements of Operations. Related receivables, if any, are reflected as EU tax reclaims receivable in the Statements of Assets and Liabilities. Receivables resulting from EU tax reclaims pursued by liquidated underlying funds, if any, are reflected as Receivable from liquidated underlying funds in the Statements of Assets and Liabilities. Generally, unless GMO believes that recovery amounts are collectible and free from significant contingencies, recoveries will not be reflected in a Fund’s net asset value. EU tax reclaims and related interest entitlements recognized by a Fund, if any, reduce the amount of foreign taxes, if any, that a Fund may elect to pass-through to its shareholders from a U.S. federal tax perspective. In certain circumstances and to the extent that EU tax reclaims recognized by a Fund were previously passed-through as foreign tax credits to its U.S. taxable shareholders, a Fund may enter into a closing agreement with the U.S. Internal Revenue Service. Doing so will enable a Fund to quantify and remit its tax liability related to any recoveries (on behalf of its shareholders).
Each Fund may be subject to taxation on realized capital gains, repatriation proceeds and other transaction-based charges imposed by certain countries in which it invests. Transaction-based charges are generally calculated as a percentage of the transaction amount. Taxes related to capital gains realized during the year ended February 28, 2023, if any, are reflected as part of Net realized gain (loss) in the Statements of Operations. Changes in tax liabilities related to capital gain taxes on unrealized investment gains, if any, are reflected as part of Change in net unrealized appreciation (depreciation) in the Statements of Operations.
Foreign taxes paid by each Fund may be treated, to the extent permissible by the Code (and other applicable U.S. federal tax guidance) and if that Fund so elects, as if paid by U.S. shareholders of that Fund.
Income and capital gain distributions are determined in accordance with U.S. federal income tax regulations, which may differ from U.S. GAAP. Certain capital accounts in the financial statements are periodically adjusted for permanent differences in order to reflect their tax character. These adjustments have no impact on net assets or net asset value per share. Temporary differences that arise from recognizing certain items of income, expense, gain or loss in different periods for financial statement and tax purposes will likely reverse at some time in the future.
189
GMO Trust Funds
Notes to Financial Statements — (Continued)
February 28, 2023
Differences in distributable earnings on a U.S. GAAP and tax accounting basis primarily relate to the following:
| Differences related to: | Consolidated Alternative Allocation Fund | Benchmark- Free Allocation Fund | Benchmark- Free Fund | Global Asset Allocation Fund | Global Developed Equity Allocation Fund | Global Equity Allocation Fund | Consolidated Implementation Fund | International Developed Equity Allocation Fund | International Equity Allocation Fund | Consolidated SGM Major Markets Fund | Strategic Opportunities Allocation Fund | |||||||||||
Capital loss carryforwards | X | X | X | X | X | X | X | X | ||||||||||||||
Constructive sale gains | X | X | ||||||||||||||||||||
Controlled foreign corporation transactions | X | X | X | |||||||||||||||||||
Defaulted bonds | X | X | ||||||||||||||||||||
Derivative contract transactions | X | X | X | X | X | |||||||||||||||||
Dividend income and withholding tax reclaim reserves | X | X | X | |||||||||||||||||||
Dividends received from underlying investments | X | X | X | |||||||||||||||||||
EU tax reclaims, associated interest entitlements and IRS closing agreement matters | X | X | ||||||||||||||||||||
Foreign currency transactions | X | X | X | X | ||||||||||||||||||
Interest, accretion, and amortization | X | |||||||||||||||||||||
Late year ordinary losses | X | |||||||||||||||||||||
Losses on wash sale transactions | X | X | X | X | X | X | X | X | X | X | X | |||||||||||
Mutual fund distributions received | X | X | X | X | X | |||||||||||||||||
Net operating losses | X | |||||||||||||||||||||
Passive foreign investment company transactions | X | X | X | |||||||||||||||||||
Post-October capital losses | X | X | X | X | X | X | X | X | ||||||||||||||
Real estate investment trust transactions | X | |||||||||||||||||||||
Securities sold short | X | X | ||||||||||||||||||||
Straddle loss deferrals | X | |||||||||||||||||||||
U.S. federal tax equalization utilized | X |
The tax character of distributions declared by each Fund to shareholders is as follows:
| Tax year ended February 28, 2023 | Tax year ended February 28, 2022 | |||||||||||||||||||||||
| Fund Name | Ordinary Income (including any net short-term capital gain) ($) | Net Long-Term Capital Gain ($) | Total Distributions ($) | Ordinary Income (including any net short-term capital gain) ($) | Net Long-Term Capital Gain ($) | Total Distributions ($) | ||||||||||||||||||
Consolidated Alternative Allocation Fund | — | 1,882,802 | 1,882,802 | 10,917,959 | 1,702,095 | 12,620,054 | ||||||||||||||||||
Benchmark-Free Allocation Fund | 135,003,424 | — | 135,003,424 | 125,011,372 | — | 125,011,372 | ||||||||||||||||||
Benchmark-Free Fund | 68,892,922 | — | 68,892,922 | 78,012,250 | — | 78,012,250 | ||||||||||||||||||
Global Asset Allocation Fund | 12,529,455 | — | 12,529,455 | 38,535,578 | — | 38,535,578 | ||||||||||||||||||
190
GMO Trust Funds
Notes to Financial Statements — (Continued)
February 28, 2023
| Tax year ended February 28, 2023 | Tax year ended February 28, 2022 | |||||||||||||||||||||||
| Ordinary | Ordinary | |||||||||||||||||||||||
| Income | Income | |||||||||||||||||||||||
| (including | (including | |||||||||||||||||||||||
| any net | Net Long-Term | any net | Net Long-Term | |||||||||||||||||||||
| short-term | Capital | Total | short-term | Capital | Total | |||||||||||||||||||
| Fund Name | capital gain) ($) | Gain ($) | Distributions ($) | capital gain) ($) | Gain ($) | Distributions ($) | ||||||||||||||||||
Global Developed Equity Allocation Fund | 2,450,037 | 2,981,732 | 5,431,769 | 6,882,171 | 3,777,166 | 10,659,337 | ||||||||||||||||||
Global Equity Allocation Fund | 54,826,953 | 43,939,821 | 98,766,774 | 122,244,648 | 513,707 | 122,758,355 | ||||||||||||||||||
Consolidated Implementation Fund | 132,069,652 | — | 132,069,652 | 150,035,453 | — | 150,035,453 | ||||||||||||||||||
International Developed Equity Allocation Fund | 8,665,535 | 522,076 | 9,187,611 | 15,376,326 | 499,169 | 15,875,495 | ||||||||||||||||||
International Equity Allocation Fund | 23,354,064 | — | 23,354,064 | 44,500,695 | — | 44,500,695 | ||||||||||||||||||
Consolidated SGM Major Markets Fund | 4,727,778 | 10,389,144 | 15,116,922 | 9,313,520 | 17,533,030 | 26,846,550 | ||||||||||||||||||
Strategic Opportunities Allocation Fund | 11,870,561 | 6,477,852 | 18,348,413 | 37,102,686 | 30,452,964 | 67,555,650 | ||||||||||||||||||
Distributions in excess of a Fund’s tax basis earnings and profits, if significant, are reported in the Funds’ financial statements as a return of capital.
As of February 28, 2023, the components of distributable earnings on a tax basis and certain tax attributes for the Funds consisted of the following:
| Fund Name | Undistributed Ordinary Income (including any net short-term capital gain) ($) | Undistributed Net Long-Term Capital Gain ($) | Late-Year Ordinary Loss Deferral ($) | Capital Loss Carryforwards ($) | Post-October Capital Losses Deferral ($) | |||||||||||||||
Consolidated Alternative Allocation Fund | — | — | — | — | (1,148,688 | ) | ||||||||||||||
Benchmark-Free Allocation Fund | 10,509,520 | — | (5,083,479 | ) | (134,493,219 | ) | (35,232,984 | ) | ||||||||||||
Benchmark-Free Fund | 7,669,669 | — | — | (214,979,398 | ) | (14,766,029 | ) | |||||||||||||
Global Asset Allocation Fund | 2,184,376 | — | — | (193,303,061 | ) | (14,650,740 | ) | |||||||||||||
Global Developed Equity Allocation Fund | 1,092,876 | — | — | (68,273,826 | ) | (3,432,919 | ) | |||||||||||||
Global Equity Allocation Fund | 5,442,493 | — | — | (16,072,032 | ) | (93,686,841 | ) | |||||||||||||
Consolidated Implementation Fund | 27,685,258 | — | — | (735,922,019 | ) | — | ||||||||||||||
International Developed Equity Allocation Fund | 57,058 | — | (1,435 | ) | (134,339,489 | ) | — | |||||||||||||
International Equity Allocation Fund | 2,947,922 | — | (2,780 | ) | (119,884,822 | ) | (1,680,583 | ) | ||||||||||||
Consolidated SGM Major Markets Fund | 6,482,229 | 14,836,779 | — | — | — | |||||||||||||||
Strategic Opportunities Allocation Fund | 949,316 | — | — | — | (6,082,865 | ) | ||||||||||||||
As of February 28, 2023, certain Funds had capital loss carryforwards available to offset future realized gains, if any, to the extent permitted by the Code. Net capital losses are carried forward without expiration and generally retain their short-term and/or long-term tax character, as applicable. Utilization of the capital loss carryforwards, post-October capital losses, late-year ordinary losses, and losses realized subsequent to February 28, 2023, if any, could be subject to further limitations imposed by the Code related to share ownership activity. The Funds’ capital loss carryforwards are as follows:
191
GMO Trust Funds
Notes to Financial Statements — (Continued)
February 28, 2023
| Fund Name | Short-Term ($) | Long-Term ($) | ||||||
Consolidated Alternative Allocation Fund | — | — | ||||||
Benchmark-Free Allocation Fund | (1,503,482 | ) | (132,989,737 | ) | ||||
Benchmark-Free Fund | (86,270,326 | ) | (128,709,072 | ) | ||||
Global Asset Allocation Fund | (2,005,315 | ) | (191,297,746 | ) | ||||
Global Developed Equity Allocation Fund | — | (68,273,826 | ) | |||||
Global Equity Allocation Fund | (1,252,771 | ) | (14,819,261 | ) | ||||
Consolidated Implementation Fund | (427,965,003 | ) | (307,957,016 | ) | ||||
International Developed Equity Allocation Fund | — | (134,339,489 | ) | |||||
International Equity Allocation Fund | (1,541,558 | ) | (118,343,264 | ) | ||||
Consolidated SGM Major Markets Fund | — | — | ||||||
Strategic Opportunities Allocation Fund | — | — | ||||||
As of February 28, 2023, the approximate total cost, aggregate investment-level gross/net unrealized appreciation (depreciation) in the value of total investments (including total securities sold short, if any), and the net unrealized appreciation (depreciation) of outstanding financial instruments for U.S. federal income tax purposes were as follows:
| Total Investments | Outstanding Financial Instruments | |||||||||||||||||||
| Fund Name | Aggregate Cost ($) | Gross Unrealized Appreciation ($) | Gross Unrealized (Depreciation) ($) | Net Unrealized Appreciation (Depreciation) ($) | Net Unrealized Appreciation (Depreciation) ($) | |||||||||||||||
Consolidated Alternative Allocation Fund | 196,939,742 | 12,566,021 | (22,980,123 | ) | (10,414,102 | ) | (1,715,319 | ) | ||||||||||||
Benchmark-Free Allocation Fund | 4,826,435,714 | — | (421,011,034 | ) | (421,011,034 | ) | — | |||||||||||||
Benchmark-Free Fund | 1,379,015,327 | 77,561,445 | (237,015,551 | ) | (159,454,106 | ) | (65,657 | ) | ||||||||||||
Global Asset Allocation Fund | 406,090,197 | 1,355,283 | (67,711,407 | ) | (66,356,124 | ) | — | |||||||||||||
Global Developed Equity Allocation Fund | 71,393,002 | 1,418,193 | (5,795,499 | ) | (4,377,306 | ) | — | |||||||||||||
Global Equity Allocation Fund | 724,655,604 | 3,088,525 | (137,777,197 | ) | (134,688,672 | ) | — | |||||||||||||
Consolidated Implementation Fund | 4,080,796,294 | 289,213,474 | (749,300,768 | ) | (460,087,294 | ) | (1,119,561 | ) | ||||||||||||
International Developed Equity Allocation Fund | 276,991,962 | — | (49,760,497 | ) | (49,760,497 | ) | — | |||||||||||||
International Equity Allocation Fund | 604,527,311 | — | (112,353,528 | ) | (112,353,528 | ) | — | |||||||||||||
Consolidated SGM Major Markets Fund* | 232,825,333 | 40,549 | (103,220,774 | ) | (103,180,225 | ) | (482,201 | ) | ||||||||||||
Strategic Opportunities Allocation Fund | 200,156,897 | 15,155,145 | (26,979,695 | ) | (11,824,550 | ) | — | |||||||||||||
| * | $124,058,622, ($101,900,670) and ($101,900,670) of the Fund’s Aggregate Cost ($), Gross Unrealized (Depreciation) ($) and Net Unrealized Appreciation (Depreciation) ($), respectively, relate to the Fund’s wholly-owned subsidiary. |
The Funds are subject to authoritative guidance related to the accounting and disclosure of uncertain tax positions under U.S. GAAP. A Fund may recognize an income tax liability related to an uncertain tax position under U.S. GAAP when the uncertain tax position has a less than 50% probability that it would be sustained upon examination by the tax authorities, based on technical merits. United States and non-U.S. tax rules (including the interpretation and application of tax laws) are subject to change. The Funds file tax returns and/or adopt certain tax positions in various jurisdictions. Non-U.S. taxes are provided for based on the Funds’ understanding of the prevailing tax rules of the non-U.S. markets in which they invest. Recently enacted tax rules, including interpretations of tax laws and tax legislation/initiatives currently under consideration in various jurisdictions, including the U.S., might affect the way the Funds and their investors are taxed prospectively and/or retroactively. Prior to the expiration of the relevant statutes of limitations, if any, the Funds are subject to examination by U.S. federal, state, local and non-U.S. jurisdictions with respect to the tax returns they have filed and the tax positions they have adopted. The Funds’ U.S. federal income tax returns are generally subject to examination by the Internal Revenue Service for a period of three years after they are filed. State, local and/or non-U.S. tax returns and/or other filings
192
GMO Trust Funds
Notes to Financial Statements — (Continued)
February 28, 2023
may be subject to examination for different periods, depending upon the tax rules of each applicable jurisdiction. As of February 28, 2023, each Fund has determined that no tax liability is required to be accrued in its financial statements related to uncertain tax positions for any tax years which are subject to examination.
Security transactions and related investment income
Security transactions are accounted for in the financial statements on trade date. For purposes of daily net asset value calculations, the Funds’ policy is that security transactions are generally accounted for on the following business day. GMO may override that policy and a Fund may account for security transactions on trade date if it experiences significant purchases or redemptions or engages in significant portfolio transactions. Dividend income, net of applicable foreign withholding taxes, if any, is recorded on the ex-dividend date or, if later, when a Fund is informed of the ex-dividend date. Income dividends and capital gain distributions from underlying funds, if any, are recorded on the ex-dividend date. Interest income is recorded on the accrual basis and is adjusted for the amortization of premiums and accretion of discounts. Principal on inflation-indexed securities is adjusted for inflation/deflation and any increase or decrease is recorded as interest income or investment loss. Coupon income is not recognized on securities for which collection is not expected. Paydown gains and losses on mortgage-related and other asset-backed securities, if any, are recorded as components of interest income in the Statements of Operations. Non-cash dividends, if any, are recorded at the fair market value of the asset received. In determining the net gain or loss on securities sold, the Funds use the identified cost basis.
During the year ended February 28, 2023, the Funds did not recognize dividends or foreign withholding taxes on local Russian shares, if any, due to restrictions imposed by the Russian government on dividend payments received by foreign shareholders like the Funds. At this time, no assurance can be given regarding the future payment of outstanding dividends by Russian issuers, the time period during which such Russia’s restrictions will remain in place or on the future ability of foreign shareholders to claim or otherwise gain control over or access to dividends paid.
Expenses and class allocations
Most of the expenses of the Trust are directly attributable to an individual Fund. Generally, common expenses are allocated among the Funds based on, among other things, the nature and type of expense and the relative size of the Funds. Investment income, common expenses, purchase premiums and redemption fees, if any, and realized and unrealized gains and losses are allocated among the classes of shares of the Funds, if applicable, based on the relative net assets of each class. Shareholder service fees and supplemental support fees, if any, which are directly attributable to a class of shares, are charged to that class’s operations. In addition, the Funds may incur fees and expenses indirectly as a shareholder in the underlying funds. Because the underlying funds have different expense and fee levels and the Funds may own different proportions of the underlying funds at different times, the amount of fees and expenses indirectly incurred by a Fund will vary (see Note 5).
Custodian, Fund Accounting Agent and Transfer Agent
State Street Bank and Trust Company (“State Street”) serves as the Funds’ custodian, fund accounting agent and transfer agent. Cash balances maintained at the custodian and transfer agent are held in a Demand Deposit Account and interest income earned, if any, is shown as interest income in the Statements of Operations.
Purchases and redemptions of Fund shares
Purchase premiums and redemption fees (if applicable) are paid to and retained by a Fund to help offset estimated portfolio transaction costs and other related costs (e.g., bid to ask spreads, stamp duties, and transfer fees) incurred by the Fund (directly or indirectly through investments in underlying funds or a wholly-owned subsidiary) as a result of an investor’s purchase or redemption by allocating estimated transaction costs to the purchasing or redeeming shareholder. Such fees are recorded as a component of the Funds’ net share transactions. A Fund may impose a new purchase premium and redemption fee or increase or decrease an existing fee at any time.
Purchase premiums are not charged on reinvestments of dividends or other distributions. Redemption fees apply to all shares of a Fund regardless of how the shares were acquired (e.g., by direct purchase or by reinvestment of dividends or other distributions).
If GMO determines that any portion of a cash purchase or redemption, as applicable, is offset by a corresponding cash redemption or purchase occurring on the same day, it ordinarily will waive or reduce the purchase premium or redemption fee with respect to that portion.
193
GMO Trust Funds
Notes to Financial Statements — (Continued)
February 28, 2023
GMO also may waive or reduce the purchase premium or redemption fee for a purchase or redemption of a Fund’s shares if the Fund will not incur transaction costs or will incur reduced transaction costs. For example, GMO may reduce the purchase premium to the extent that securities are used to purchase a Fund’s shares (taking into account transaction costs, stamp duties or transfer fees), and GMO may reduce redemption fees to the extent a Fund uses portfolio securities to redeem its shares (taking into account transaction costs, stamp duties or transfer fees).
As of February 28, 2023, none of the Funds charge a purchase premium or redemption fee. Historical information on purchase premiums and redemption fees are provided in the table below.
| Benchmark-Free Allocation Fund | For the period from June 30, 2016 to June 30, 2018, the premium on cash purchases and the fee on cash redemptions were each 0.20% of the amount invested or redeemed. | |
| Benchmark-Free Fund | For the period from June 30, 2016 to June 30, 2018, the premium on cash purchases and the fee on cash redemptions were each 0.25% of the amount invested or redeemed. | |
| Global Asset Allocation Fund | For the period from June 30, 2016 to June 30, 2018, the premium on cash purchases and the fee on cash redemptions were each 0.15% of the amount invested or redeemed. | |
| Global Developed Equity Allocation Fund | For the period from March 10, 2014 to June 30, 2018, the premium on cash purchases and the fee on cash redemptions were each 0.08% of the amount invested or redeemed. | |
| Global Equity Allocation Fund | For the period from June 30, 2016 to June 30, 2018, the premium on cash purchases and the fee on cash redemptions were each 0.18% of the amount invested or redeemed. | |
| Implementation Fund | For the period from June 30, 2015 to June 30, 2018, the premium on cash purchases and the fee on cash redemptions were each 0.20% of the amount invested or redeemed. | |
| International Developed Equity Allocation Fund | For the period from March 10, 2014 to June 30, 2018, the premium on cash purchases and the fee on cash redemptions were each 0.08% of the amount invested or redeemed. | |
| International Equity Allocation Fund | For the period from June 30, 2016 to June 30, 2018, the premium on cash purchases and the fee on cash redemptions were each 0.25% of the amount invested or redeemed. | |
| Strategic Opportunities Allocation Fund | For the period from June 30, 2016 to June 30, 2018, the premium on cash purchases and the fee on cash redemptions were each 0.20% of the amount invested or redeemed. |
Recently-issued accounting guidance
In June 2022, the Financial Accounting Standards Board (“FASB”) issued a new Accounting Standards Update 2022-03, “Fair Value Measurement (Topic 820) – Fair Value Measurement of Equity Securities Subject to Contractual Sale Restrictions”(“ASU 2022-03”). The amendments in ASU 2022-03 apply to all entities that have investments in equity securities measured at fair value that are subject to a contractual sale restriction. The amendments in ASU 2022-03 clarify guidance for fair value measurement of an equity security subject to a contractual sale restriction and establish new disclosure requirements for such equity securities. The amendments in ASU 2022-03 are effective for fiscal years, and interim periods within those fiscal years, beginning after December 15, 2023 with early adoption permitted. GMO is currently evaluating the impact, if any, of the new disclosure requirements on the financial statements.
194
GMO Trust Funds
Notes to Financial Statements — (Continued)
February 28, 2023
| 3. | Investment and other risks |
The following chart identifies selected risks associated with each Fund. Risks not marked for a particular Fund may, however, still apply to some extent to that Fund at various times.
Alternative Allocation | Benchmark- Free Allocation Fund | Benchmark- Free Fund | Global Asset Allocation Fund | Global Developed Equity Allocation Fund | Global Equity Allocation Fund | Implementation Fund | International Developed Equity Allocation Fund | International Equity Allocation Fund | SGM Major Markets Fund | Strategic Opportunities Allocation Fund | ||||||||||||
Market Risk – Equities | X | X | X | X | X | X | X | X | X | X | X | |||||||||||
Management and Operational Risk | X | X | X | X | X | X | X | X | X | X | X | |||||||||||
Non-U.S. Investment Risk | X | X | X | X | X | X | X | X | X | X | X | |||||||||||
Derivatives and Short Sales Risk | X | X | X | X | X | X | X | X | X | X | X | |||||||||||
Futures Contracts Risk | X | X | X | X | X | X | ||||||||||||||||
Currency Risk | X | X | X | X | X | X | X | X | X | X | X | |||||||||||
Market Risk – Fixed Income | X | X | X | X | X | X | X | X | X | X | X | |||||||||||
Fund of Funds Risk | X | X | X | X | X | X | X | X | X | X | X | |||||||||||
Leveraging Risk | X | X | X | X | X | X | X | X | X | X | X | |||||||||||
Commodities Risk | X | X | X | X | X | X | X | |||||||||||||||
Smaller Company Risk | X | X | X | X | X | X | X | X | X | X | ||||||||||||
Credit Risk | X | X | X | X | X | X | X | X | X | X | X | |||||||||||
Counterparty Risk | X | X | X | X | X | X | X | X | X | X | X | |||||||||||
Event-Driven Risk | X | X | X | X | ||||||||||||||||||
Illiquidity Risk | X | X | X | X | X | X | X | X | X | X | X | |||||||||||
Market Disruption and Geopolitical Risk | X | X | X | X | X | X | X | X | X | X | X | |||||||||||
Focused Investment Risk | X | X | X | X | X | X | X | X | X | X | X | |||||||||||
Market Risk – Asset-Backed Securities | X | X | X | X | X | X | ||||||||||||||||
Large Shareholder Risk | X | X | X | X | X | X | X | X | X | X | X | |||||||||||
Non-Diversified Funds | X | X | X | X | X | X | X | X | X | X |
Investing in mutual funds involves many risks. The risks of investing in a particular Fund depend on the types of investments in its portfolio and the investment strategies GMO employs on its behalf. This section does not describe every possible risk of investing in the Funds. Particular Funds could be subject to additional risks because of the types of investments they make and market conditions, which can change over time. Please see the Funds’ prospectus for more information regarding the risks of investing in the Funds.
Funds that invest in other GMO Funds, other investment companies or in a wholly-owned subsidiary (collectively, “Underlying Funds”) are exposed to the risks to which the Underlying Funds in which it invests are exposed, as well as the risk that the Underlying Funds will not perform as expected. Therefore, unless otherwise noted, the selected risks summarized below include both direct and indirect risks, and references in this section to investments made by a Fund include those made both directly and indirectly by the Fund.
195
GMO Trust Funds
Notes to Financial Statements — (Continued)
February 28, 2023
An investment in a Fund is not a bank deposit and, therefore, is not insured or guaranteed by the Federal Deposit Insurance Corporation or any other government agency.
| • | MARKET RISK — EQUITIES. The market price of an equity may decline due to factors affecting the issuer or its industry or the economy and equity markets generally. If the Fund purchases an equity for less than its fundamental fair (or intrinsic) value as assessed by GMO and GMO’s assessment proves to be incorrect, a Fund runs the risk that the market price of the equity will not appreciate or will decline. A Fund also may purchase equities that typically trade at higher multiples of current earnings than other securities, and the market prices of these equities often are more sensitive to changes in future earnings expectations than the market prices of equities trading at lower multiples. Declines in stock market prices generally are likely to reduce the net asset value of the Fund’s shares. |
| • | MANAGEMENT AND OPERATIONAL RISK. A Fund runs the risk that GMO’s investment techniques will fail to produce desired results. GMO uses quantitative models as part of its investment process. GMO’s models may not accurately predict future market movements. In addition, GMO’s models rely on assumptions and data that are subject to limitations (e.g., inaccuracies, staleness) that could adversely affect their predictive value. A Fund also runs the risk that GMO’s assessment of an investment (including a security’s fundamental fair (or intrinsic) value) is wrong or that deficiencies in GMO’s or another service provider’s internal systems or controls will cause losses for the Fund or impair Fund operations. |
| • | NON-U.S. INVESTMENT RISK. The market prices of many non-U.S. securities (particularly of companies tied economically to emerging countries) fluctuate more than those of U.S. securities. Many non-U.S. securities markets (particularly emerging markets) are less stable, smaller, less liquid, and less regulated than U.S. securities markets, and the cost of trading in those markets often is higher than in U.S. securities markets. In addition, issuers of non-U.S. securities (particularly those tied economically to emerging countries) often are not subject to as much regulation as U.S. issuers, and the reporting, recordkeeping, accounting, custody, and auditing standards to which those issuers are subject often are not as rigorous as U.S. standards. In addition, a Fund may be subject to non-U.S. taxes, potentially on a retroactive basis, on (i) capital gains it realizes or dividends, interest, or other amounts it realizes or accrues in respect of non-U.S. investments; (ii) transactions in those investments; and (iii) repatriation of proceeds generated from the sale or other disposition of those investments. Also, the Funds need a license to invest directly in securities traded in many non-U.S. securities markets, and a Fund is subject to the risk that its license is terminated or suspended. In some non-U.S. securities markets, prevailing custody and trade settlement practices (e.g., the requirement to pay for securities prior to receipt) expose a Fund to credit and other risks. Further, adverse changes in investment regulations, capital requirements or exchange controls could adversely affect the value of the Fund’s investments. These and other risks (e.g., nationalization, expropriation or other confiscation of assets of non-U.S. issuers, difficulties enforcing legal judgments or contractual rights and geopolitical risks) tend to be higher for investments in the securities of companies tied economically to emerging countries. The economies of emerging countries often depend predominantly on only a few industries or revenues from particular commodities and often are more volatile than the economies of developed countries. |
| • | DERIVATIVES AND SHORT SALES RISK. The use of derivatives involves the risk that their value may not change as expected relative to changes in the value of the underlying assets, pools of assets, rates, currencies or indices. Derivatives also present other risks, including market risk, illiquidity risk, currency risk, credit risk, and counterparty risk. The market price of an option is affected by many factors, including changes in the market prices or dividend rates of underlying securities (or in the case of indices, the securities in such indices); the time remaining before expiration; changes in interest rates or exchange rates; and changes in the actual or perceived volatility of the relevant index or underlying securities. A Fund may create short investment exposure selling securities short or by taking a derivative position in which the value of the derivative moves in the opposite direction from the price of an underlying asset, pool of assets, rate, currency or index. The risks of loss associated with derivatives that provide short investment exposure and short sales of securities are theoretically unlimited. |
| • | FUTURES CONTRACTS RISK. The loss to a Fund resulting from its use of futures contracts is potentially unlimited. Futures markets are highly volatile, and the use of futures contracts increases the volatility of the Fund’s net asset value. A liquid secondary market may not exist for any particular futures contract at any particular time, and a Fund may be unable when it wishes to effect closing transactions to terminate its exposure under that contract. When a Fund uses futures contracts for hedging purposes, it runs the risk that changes in the prices of the contracts will not correlate perfectly with changes in the securities, index, or other asset underlying the contracts or movements in the prices of the Fund’s investments that are subject to the hedge. In addition, a Fund may be unable to recover or may be delayed in recovering margin or other amounts deposited with a futures commission merchant or futures clearinghouse. Foreign futures contracts are often less liquid and more volatile than U.S. futures contracts. |
196
GMO Trust Funds
Notes to Financial Statements — (Continued)
February 28, 2023
| • | CURRENCY RISK. Fluctuations in exchange rates can adversely affect the market value of a Fund’s foreign currency holdings and investments denominated in foreign currencies. |
| • | MARKET RISK – FIXED INCOME. The market price of a fixed income investment can decline due to market-related factors, including rising interest rates and widening credit spreads, or decreased liquidity due, for example, to market uncertainty about the value of a fixed income investment (or class of fixed income investments). |
| • | FUND OF FUNDS RISK. A Fund is indirectly exposed to all of the risks of an investment (if any) in its wholly-owned subsidiary and the underlying funds (including underlying GMO Funds and ETFs) in which it invests, including the risk that its wholly-owned subsidiary (if any) and those underlying funds will not perform as expected. Because a Fund bears the fees and expenses of the underlying funds in which it invests, an increase in fees and expenses of an underlying fund or a reallocation of the Fund’s investments to underlying funds with higher fees or expenses will increase the Fund’s total expenses. |
| • | LEVERAGING RISK. The use of derivatives, short sales and securities lending can create leverage. Leverage increases a Fund’s losses when the value of its investments (including derivatives) declines. In addition, the Fund’s portfolio will be leveraged if it exercises its right to delay payment on a redemption, and losses will result if the value of the Fund’s assets declines between the time a redemption request is deemed to be received by the Fund and the time the Fund liquidates assets to meet that request. |
| • | COMMODITIES RISK. Commodity prices can be extremely volatile, and exposure to commodities can cause the value of a Fund’s shares to decline or fluctuate in a rapid and unpredictable manner. |
| • | SMALLER COMPANY RISK. Smaller companies may have limited product lines, markets, or financial resources, lack the competitive strength of larger companies, have less experienced managers or depend on a few key employees. The securities of companies with smaller market capitalizations often are less widely held and trade less frequently and in lesser quantities, and their market prices often fluctuate more, than the securities of companies with larger market capitalizations. |
| • | CREDIT RISK. A Fund runs the risk that the issuer or guarantor of a fixed income investment (including a sovereign or quasi-sovereign debt issuer) or the obligors of obligations underlying an asset-backed security will be unable or unwilling to satisfy their obligations to pay principal and interest or otherwise to honor their obligations in a timely manner. The market price of a fixed income investment will normally decline as a result of the failure of an issuer, guarantor, or obligor to meet its payment obligations or in anticipation of such failure. In addition, investments in emerging country sovereign or quasi-sovereign debt are subject to the risk that a Fund may lack recourse against the issuer in the event of default. Investments in quasi-sovereign debt also are subject to the risk that the issuer will default independently of its sovereign. Below investment grade investments have speculative characteristics, and negative changes in economic conditions or other circumstances are more likely to impair the ability of issuers of those investments to make principal and interest payments than issuers of investment grade investments. Investments in distressed or defaulted or other low quality debt investments generally are considered speculative and may involve substantial risks not normally associated with investments in higher quality securities, including adverse business, financial or economic conditions that lead to their issuers’ payment defaults and insolvency proceedings. In particular, distressed or defaulted obligations might be repaid, if at all, only after lengthy workout or bankruptcy proceedings, during which the issuer might not make any interest or other payments, and the Fund may incur additional expenses to seek recovery. If GMO’s assessment of the eventual recovery value of a distressed or defaulted debt investment proves incorrect, the Fund may lose a substantial portion or all of its investment or may be required to accept cash or instruments worth less than its original investment. |
| • | COUNTERPARTY RISK. A Fund runs the risk that the counterparty to a derivatives contract, a clearing member used by the Fund to hold a cleared derivatives contract, or a borrower of the Fund’s securities is unable or unwilling to make timely settlement payments, return the Fund’s margin or collateral or otherwise honor its obligations. |
| • | EVENT-DRIVEN RISK. If a Fund purchases securities in anticipation of a proposed merger, acquisition, exchange offer, tender offer, or other similar transaction and that transaction later appears likely to be delayed or unlikely to be consummated or, in fact, is not consummated or is delayed, the market price of the securities purchased by the Fund may decline sharply, resulting in losses to the Fund. The risk/reward payout of event-driven strategies (such as merger arbitrage) typically is asymmetric, with the losses in failed transactions often far exceeding the gains in successful transactions. Event-driven strategies are subject to the risk of overall market movements, and a Fund may experience losses even if a transaction is consummated. |
197
GMO Trust Funds
Notes to Financial Statements — (Continued)
February 28, 2023
| • | ILLIQUIDITY RISK. Low trading volume, lack of a market maker, large position size or legal restrictions may limit or prevent a Fund or an underlying fund from selling particular securities or closing derivative positions at desirable prices. |
| • | MARKET DISRUPTION AND GEOPOLITICAL RISK. Geopolitical and other events (e.g., wars, pandemics, sanctions, terrorism) may disrupt securities markets and adversely affect particular economies and markets as well as global economies and markets. Those events, as well as other changes in non-U.S. and U.S. economic and political conditions, could exacerbate other risks or otherwise reduce the value of the Fund’s investments. |
Russia’s invasion of Ukraine beginning in February 2022 has had, and could continue to have, severe adverse effects on regional and global economic markets for securities and commodities. For example, in response to Russia’s actions, various governments, including the United States, issued a series of broad-ranging economic sanctions against Russia that, among other things (i) prohibit doing business with certain Russian companies, financial institutions and individuals (e.g., officials); (ii) the removal of Russian banks from the Society for Worldwide Interbank Financial Telecommunications (commonly referred to as “SWIFT”), the electronic banking network that connects banks globally; and (iii) restrict the Russian Central Bank from undermining the impact of the sanctions. In retaliation for the sanctions and other actions by the U.S. and other countries, Russia has imposed strict capital controls limiting the ability of foreigners to trade on the Moscow Stock Exchange and to sell, receive or deliver assets held in the custody of local Russian banks (such as equities of Russian companies and Rubles). These actions by the United States and other countries have adversely affected (and similar actions in the future could adversely affect) the Russian economy and the value and liquidity of Russian securities. In particular, where a Fund holds securities of a Russian issuer that is subject to blocking sanctions imposed by the U.S. Department of the Treasury’s Office of Foreign Assets Control, those securities will be frozen and consequently unable to be sold or transferred. Moreover, the Russia/Ukraine conflict and related actions (such as those described above) have, and could continue to have, an adverse effect on global markets and liquidity, thereby negatively affecting the value of a Fund’s investments beyond any direct exposure to Russian issuers.
| • | FOCUSED INVESTMENT RISK. Investments focused in countries, regions, asset classes, sectors, industries, currencies, or issuers that are subject to the same or similar risk factors and investments whose market prices are closely correlated are subject to higher overall risk than investments that are more diversified or whose market prices are not as closely correlated. |
| • | MARKET RISK — ASSET BACKED SECURITIES. The market price of asset-backed securities, like that of other fixed income investments with complex structures, can decline for a variety of reasons, including market uncertainty about their credit quality and the reliability of their payment streams. Payment streams associated with asset-backed securities held by a Fund depend on many factors (e.g., the cash flow generated by the assets backing the securities, deal structure, creditworthiness of any credit-support provider, and reliability of various other service providers with access to the payment stream), and a problem in any of these factors can lead to a reduction in the payment stream GMO expected a Fund to receive when the Fund purchased the asset-backed security. |
| • | LARGE SHAREHOLDER RISK. To the extent that a large number of shares of a Fund is held by a single shareholder (e.g., an institutional investor or another GMO Fund) or a group of shareholders with a common investment strategy (e.g., GMO asset allocation accounts), the Fund is subject to the risk that a redemption by that shareholder or group of all or a large portion of their Fund shares will require the Fund to sell securities at disadvantageous prices, disrupt the Fund’s operations, or force the Fund’s liquidation. |
| • | NON-DIVERSIFIED FUNDS. Alternative Allocation Fund and SGM Major Markets Fund are non-diversified investment companies under the 1940 Act and therefore a decline in the market price of a particular security held by the Funds may affect the Funds’ performance more than if the Funds were a diversified investment company. |
| 4. | Derivative financial instruments |
During the year ended February 28, 2023, only Consolidated Alternative Allocation Fund, Benchmark-Free Fund, Implementation Fund, Consolidated SGM Major Markets Fund, and Strategic Opportunities Allocation Fund held derivative financial instruments directly. For a listing of derivative financial instruments, if any, held by the underlying funds, please refer to the underlying funds’ Schedule of Investments. The derivative information provided below only pertains to direct investments made by Alternative Allocation Fund, Benchmark-Free Fund, Implementation Fund, SGM Major Markets Fund and Strategic Opportunities Allocation Fund (or their respective wholly-owned subsidiary, if any).
198
GMO Trust Funds
Notes to Financial Statements — (Continued)
February 28, 2023
Derivatives are financial contracts whose value depends on, or is derived from, the value of underlying assets, reference rates, or indices, that are used to increase, decrease or adjust elements of the investment exposures of a Fund’s portfolio. Derivatives may relate to securities, interest rates, currencies, currency exchange rates, inflation rates, commodities and indices, and include foreign currency contracts, swap contracts, reverse repurchase agreements, and other exchange-traded and OTC contracts.
Consolidated Alternative Allocation Fund may use derivatives in some or all of the ways described below.
Use of Derivatives by Benchmark-Free Fund, Consolidated Implementation Fund and Strategic Opportunities Allocation Fund
The Funds may use derivatives to gain long or short investment exposure to securities, commodities or other assets. For example, a Fund may use derivatives instead of investing directly in equity securities, including using equity derivatives to maintain equity exposure when it holds cash by “equitizing” its cash balances using futures contracts or other types of derivatives. The Funds also may use exchange-traded futures and forward foreign exchange contracts to gain exposure to a range of global equity, bond, currency, and commodity markets and may use currency derivatives (including forward currency contracts, futures contracts, swap contracts and options) to gain exposure to a given currency.
The Funds may use derivatives such as futures, options, and swap contracts, in an attempt to reduce their investment exposures (which may result in a reduction below zero). A Fund also may use currency derivatives in an attempt to reduce (which may result in a reduction below zero) some aspect of the currency exposure in its portfolio. For these purposes, the Funds may use an instrument denominated in a different currency that GMO believes is highly correlated with the relevant currency. Implementation Fund uses exchange-traded futures and forward contracts as an integral part of its investment program.
The Funds may use derivatives in an attempt to adjust elements of their investment exposures to individual commodities, various securities, sectors, markets, indices and currencies without actually having to sell existing investments or make new direct investments. For example, if a Fund holds a large proportion of a certain type of security or commodity and GMO believes that another security or commodity will outperform such security or commodity, the Fund might use a short futures contract on an appropriate index (to synthetically “sell” a portion of the Fund’s portfolio) in combination with a long futures contract on another index (to synthetically “buy” exposure to that index). Long and short swap contracts and contracts for differences also may be used for these purposes. Derivatives used to effect synthetic sales and purchases will generally be unwound as actual portfolio securities are sold and purchased. In adjusting investment exposures, each Fund also may use currency derivatives, seeking currency exposure that is different (in some cases, significantly different) from the currency exposure represented by its portfolio. Each Fund’s foreign currency exposure may differ significantly from the currency exposure represented by its investments.
The Funds may use derivatives to effect transactions intended as substitutes for securities lending.
Each of the Funds is not limited in its use of derivatives or in the total notional value of its derivative positions. As a result of their derivative positions, the Funds may have gross investment exposures in excess of their net assets (i.e. the Funds may be leveraged) and therefore are subject to heightened risk of loss. Each Fund’s performance can depend substantially, if not primarily, on the performance of assets or indices underlying its derivatives even though it does not own those assets or indices.
Use of Derivatives by Consolidated SGM Major Markets Fund
The Fund may use derivatives to gain long and/or short investment exposure to securities, currencies, commodities, or other assets. In particular, the Fund may use exchange traded futures and forward foreign exchange contracts to gain exposure to a range of global equity, bond, currency, and commodity markets. The Fund also may use currency derivatives (including forward currency contracts, futures contracts, swap contracts and options) to gain exposure to a given currency.
The Fund may use derivatives in an attempt to adjust its investment exposures. For example, the Fund may use credit default swaps to take a short position with respect to the likelihood of default by an issuer. The Fund also may use currency derivatives in an attempt to reduce (which may result in a reduction below zero) some aspect of the currency exposure in its portfolio. For these purposes, the Fund may use an instrument denominated in a different currency that GMO believes is highly correlated with the relevant currency.
The Fund may use derivatives, such as futures, options, and swap contracts, in an attempt to adjust elements of its investment exposures to individual commodities, various securities, sectors, markets, indices and currencies without actually having to sell existing investments or make new direct investments. For example, if the Fund holds a large proportion of a certain type of security or commodity and GMO believes that another security or commodity will outperform such security or commodity, the Fund might use a short futures contract on an appropriate index (to synthetically “sell” a portion of the Fund’s portfolio) in combination with a long
199
GMO Trust Funds
Notes to Financial Statements — (Continued)
February 28, 2023
futures contract on another index (to synthetically “buy” exposure to that index). Long and short swap contracts and contracts for differences also may be used for these purposes. Derivatives used to effect synthetic sales and purchases will generally be unwound as actual portfolio securities are sold and purchased. In addition, GMO may alter the interest rate exposure of debt instruments by employing interest rate swaps. Such a strategy is designed to maintain the Fund’s exposure to the credit of an issuer through the debt instrument but adjust the Fund’s interest rate exposure through the swap. With these swaps, the Fund and its counterparties exchange interest rate exposure, such as fixed versus variable rates and shorter duration versus longer duration exposure. In adjusting its investment exposure, the Fund also may use currency derivatives in an attempt to adjust its currency exposure, seeking currency exposure that is different (in some cases, significantly different) from the currencies in which their equities are traded.
The Fund is not limited in its use of derivatives or in the total notional value of its derivative positions. As a result of its derivative positions, the Fund will typically have gross investment exposures in excess of its net assets (i.e. the Fund will be leveraged) and therefore is subject to heightened risk of loss. The Fund’s performance can depend substantially, if not primarily, on the performance of assets or indices underlying its derivatives even though it does not own those assets or indices.
***
Certain derivatives transactions that may be used by the Funds, including certain interest rate swaps and certain credit default index swaps, are required to be transacted through a central clearing organization. The Funds hold cleared derivatives transactions, if any, through clearing members, who are members of derivatives clearing houses. Certain other derivatives, including futures and certain options, are transacted on exchanges. The Funds hold exchange-traded derivatives through clearing brokers that are typically members of the exchanges. In contrast to bilateral derivatives transactions, following a period of advance notice to the Fund, clearing brokers generally can require termination of existing cleared or exchange-traded derivatives transactions at any time and increases in margin above the margin that it required at the beginning of a transaction. Clearing houses and exchanges also have broad rights to increase margin requirements for existing transactions and to terminate transactions. Any such increase or termination could interfere with the ability of a Fund to pursue its investment strategy. Also, a Fund is subject to execution risk if it enters into a derivatives transaction that is required to be cleared (or that GMO expects to be cleared), and no clearing member is willing or able to clear the transaction on the Fund’s behalf. In that case, the transaction might have to be terminated, and the Fund could lose some or all of the benefit of any increase in the value of the transaction after the time of the transaction.
The use of derivatives involves risks that are in addition to, and potentially greater than, the risks associated with investing directly in securities and other more traditional assets. See “Investment and other risks” above for further information.
For Funds that held derivatives during the year ended February 28, 2023, the following table shows how the Fund used these derivatives (marked with an X):
| Type of Derivative and Objective for Use | Consolidated Alternative Allocation Fund | Benchmark- Fund | Consolidated Implementation Fund | Consolidated Major | Strategic Opportunities Allocation Fund | |||||
Forward currency contracts | ||||||||||
Adjust currency exchange rate risk | X | |||||||||
Adjust exposure to foreign currencies | X | X | X | X | ||||||
Manage against anticipated currency exchange rate changes | X | X | ||||||||
Futures contracts | ||||||||||
Adjust exposure to certain securities markets | X | X | X | X | ||||||
Adjust interest rate exposure | X | X | ||||||||
Maintain the diversity and liquidity of the portfolio | X | X | X | X | ||||||
Substitute for direct investment | X |
200
GMO Trust Funds
Notes to Financial Statements — (Continued)
February 28, 2023
| Consolidated | ||||||||||
| Consolidated | SGM | Strategic | ||||||||
| Alternative | Benchmark- | Consolidated | Major | Opportunities | ||||||
| Allocation | Free | Implementation | Markets | Allocation | ||||||
| Type of Derivative and Objective for Use (continued) | Fund | Fund | Fund | Fund | Fund | |||||
Options (Purchased) | ||||||||||
Substitute for direct equity investment | X | X | ||||||||
Options (Written) | ||||||||||
Substitute for direct equity investment | X | X | ||||||||
Swap contracts | ||||||||||
Achieve exposure to a reference entity’s credit | X | X | ||||||||
Adjust exposure to certain markets | X | |||||||||
Adjust interest rate exposure | X | X | X | X | ||||||
Substitute for direct investment in securities | X | X | X | X |
Forward currency contracts
The Funds may enter into forward currency contracts, including forward cross currency contracts. A forward currency contract is an agreement between two parties to buy and sell a currency at a set price on a future date (or to pay or receive the amount of the change in relative values of the two currencies). The market price of a forward currency contract fluctuates with changes in forward currency exchange rates. The value of each of the Fund’s forward currency contracts is marked-to-market daily using rates supplied by a quotation service and changes in value are recorded by each Fund as unrealized gains or losses. Realized gains or losses on the contracts are equal to the difference between the value of the contract at the time it was opened and the value at the time it was settled.
These contracts involve market risk in excess of the unrealized gain or loss. Forward currency contracts expose a Fund to the market risk of unfavorable movements in currency values and the risk that the counterparty will be unable or unwilling to meet the terms of the contracts. Most forward currency contracts are collateralized. Forward currency contracts outstanding at the end of the year, if any, are listed in each applicable Fund’s Schedule of Investments.
Futures contracts
The Funds may purchase and sell futures contracts. A futures contract is a contract that obligates the holder to buy or sell an asset at a predetermined delivery price at a specified time in the future. Some futures contracts are net (cash) settled. Upon entering into a futures contract, a Fund is required to deposit cash, U.S. government and agency obligations or other liquid assets with the futures clearing broker in accordance with the initial margin requirements of the broker or exchange. Futures contracts are generally valued at the settlement price established at the close of business each day by the board of trade or exchange on which they are traded (and if the futures are traded outside the U.S. and the market for such futures is closed prior to the close of the NYSE due to time zone differences, the values will be adjusted, to the extent practicable and available, based on inputs from an independent pricing service approved by the Trustees to reflect estimated valuation changes through the NYSE close). The value of each of the Fund’s futures contracts is marked-to-market daily and an appropriate payable or receivable for the change in value (“variation margin”) is recorded by each Fund. The payable or receivable is settled on the following business day. Gains or losses are recognized but not accounted for as realized until the contracts expire or are closed. Futures contracts involve, to varying degrees, risk of loss in excess of the variation margin as recorded in the Statements of Assets and Liabilities. Under some circumstances, futures exchanges may establish daily limits on the amount that the price of a futures contract can vary from the previous day’s settlement price, thereby effectively preventing liquidation of unfavorable positions. Futures contracts expose the Funds to the risk that they may not be able to enter into a closing transaction due to an illiquid market. Futures contracts outstanding at the end of the year, if any, are listed in each applicable Fund’s Schedule of Investments.
Options
The Funds may purchase call and put options. A call option gives the holder the right to buy an asset; a put option gives the holder the right to sell an asset. “Quanto” options are cash-settled options in which the underlying asset (often an index) is denominated in a currency other than the currency in which the option is settled. By purchasing options a Fund alters its exposure to the underlying asset by, in the case of a call option, entitling it to purchase the underlying asset at a set price from the writer of the option and, in the case of a put option, entitling it to sell the underlying asset at a set price to the writer of the option. A Fund pays a premium for a purchased
201
GMO Trust Funds
Notes to Financial Statements — (Continued)
February 28, 2023
option. That premium, if any, which is disclosed in the Schedule of Investments, is subsequently reflected in the marked-to-market value of the option. The potential loss associated with purchasing put and call options is limited to the premium paid. Purchased option contracts outstanding at the end of the year, if any, are listed in each applicable Fund’s Schedule of Investments.
The Funds may write (i.e. sell) call and put options on futures, swaps (“swaptions”), securities or currencies they own or in which they may invest. Writing options alters a Fund’s exposure to the underlying asset by, in the case of a call option, obligating that Fund to sell the underlying asset at a set price to the option-holder and, in the case of a put option, obligating that Fund to purchase the underlying asset at a set price from the option-holder. In some cases (e.g., index options), settlement will be in cash, based on a formula price. When a Fund writes a call or put option, an amount equal to the premium received is recorded as a liability and is subsequently included in the marked-to-market value of the option. As a writer of an option, a Fund has no control over whether it will be required to sell (call) or purchase (put) the underlying asset and as a result bears the risk of an unfavorable change in the price of the asset underlying the option. In the event that a Fund writes call options without an offsetting exposure (e.g., call options on an asset that the Fund does not own), it bears an unlimited risk of loss if the price of the underlying asset increases during the term of the option. OTC options expose a Fund to the risk the Fund may not be able to enter into a closing transaction because of an illiquid market. Written option contracts outstanding at the end of the year, if any, are listed in each applicable Fund’s Schedule of Investments.
When an option contract is closed, the Fund records a realized gain or loss equal to the difference between the value of the contract at the time it was opened and the value at the time it was closed. Realized gains and losses on purchased options are included in realized gains and losses on investment securities. If a written call option is exercised, the premium originally received is recorded as an addition to sales proceeds. If a written put option is exercised, the premium originally received is recorded as a reduction in the cost of investments purchased. Gains and losses from the expiration or closing of written option contracts are separately disclosed in the Statements of Operations.
In a credit linked option contract, one party makes payments to another party in exchange for the option to exercise a contract where the buyer has the right to receive a specified return if a credit event (e.g., default or similar event) occurs with respect to a reference entity or entities and a specified decrease in the value of the related collateral occurs. A writer of a credit linked option receives periodic payments in return for its obligation to pay an agreed-upon value to the other party if they exercise their option in the case of a credit event. If no credit event occurs, the seller has no payment obligation and will keep the premiums received.
Swap contracts
The Funds may directly or indirectly use various swap contracts, including, without limitation, swaps on securities and securities indices, total return swaps, interest rate swaps, basis swaps, currency swaps, credit default swaps, variance swaps, commodity swaps, inflation swaps, municipal swaps, dividend swaps, volatility swaps, correlation swaps and other types of available swaps. A swap contract is an agreement to exchange the return generated by one asset for the return generated by another asset. Some swap contracts are net settled. When entering into a swap contract and during the term of the transaction, a Fund and/or the swap counterparty may post or receive cash or securities as collateral.
Initial upfront payments received or made upon entering into a swap contract are included in the fair market value of the swap. The Funds do not amortize upfront payments. Net periodic payments made or received to compensate for differences between the stated terms of the swap contract and prevailing market conditions (credit spreads, currency exchange rates, interest rates, and other relevant factors) are recorded as realized gains or losses in the Statements of Operations. A liquidation payment received or made at the termination of the swap contract is recorded as realized gain or loss in the Statements of Operations. The periodic frequency of payments received may differ from periodic payment frequencies made and their frequencies could be monthly, quarterly, semiannually, annually or at maturity.
Interest rate swap contracts involve an exchange by the parties of their respective commitments to pay or rights to receive interest (e.g., an exchange of floating rate interest payments for fixed rate interest payments with respect to the notional amount of principal). Basis swaps are interest rate swaps that involve the exchange of two floating interest rate payments and may involve the exchange of two different currencies.
Inflation swaps involve the exchange of a floating rate linked to an index for a fixed rate interest payment with respect to a notional amount or principal.
202
GMO Trust Funds
Notes to Financial Statements — (Continued)
February 28, 2023
Total return swap contracts involve a commitment by one party to pay interest to the other party in exchange for a payment to it from the other party based on the return of a reference asset (e.g., a security, basket of securities, or futures contract), both based on notional amounts. To the extent the return of the reference asset exceeds or falls short of the interest payments, one party is entitled to receive a payment from or obligated to make a payment to the other party.
In a credit default swap contract, one party makes payments to another party in exchange for the right to receive a specified return (or to put a security) if a credit event (e.g., default or similar event) occurs with respect to a reference entity or entities. A seller of credit default protection receives periodic payments in return for its obligation to pay the principal amount of a debt security (or other agreed-upon value) to the other party upon the occurrence of a credit event. If no credit event occurs, the seller has no payment obligations so long as there is no early termination.
For credit default swap contracts on asset-backed securities, a credit event may be triggered by various occurrences, which may include an issuer’s failure to pay interest or principal on a reference security, a breach of a material representation or covenant, an agreement by the holders of an asset-backed security to a maturity extension, or a write-down on the collateral underlying the security. For credit default swap contracts on corporate or sovereign issuers, a credit event may be triggered by such occurrences as the issuer’s bankruptcy, failure to pay interest or principal, repudiation/moratorium and/or restructuring.
Correlation swaps involve receiving a stream of payments based on the actual average correlation between or among the price movements of two or more underlying variables over a period of time, in exchange for making a regular stream of payments based on a fixed “strike” correlation level (or vice versa), where both payment streams are based on a notional amount. The underlying variables may include, without limitation, commodity prices, exchange rates, interest rates and stock indices.
Variance swap contracts involve an agreement by two parties to exchange cash flows based on the measured variance (or square of volatility) of a specified underlying asset. One party agrees to exchange a “fixed rate” or strike price payment for the “floating rate” or realized price variance on the underlying asset with respect to the notional amount. At inception, the strike price chosen is generally fixed at a level such that the fair value of the swap is zero. As a result, no money changes hands at the initiation of the contract. At the expiration date, the amount payable by one party to the other is the difference between the realized price variance of the underlying asset and the strike price multiplied by the notional amount. A receiver of the realized price variance would be entitled to receive a payment when the realized price variance of the underlying asset is greater than the strike price and would be obligated to make a payment when that variance is less than the strike price. A payer of the realized price variance would be obligated to make a payment when the realized price variance of the underlying asset is greater than the strike price and would be entitled to receive a payment when that variance is less than the strike price. This type of agreement is essentially a forward contract on the future realized price variance of the underlying asset.
Forward starting dividend swap contracts involve an exchange by the parties of their respective commitments to pay or rights to receive the changes in a dividend index point. A Fund gains exposure by either paying or receiving an amount in respect of an increase or decrease in the change of the relevant dividend index point based on a notional amount. For example, if a Fund took a long position on a dividend index swap, the Fund would receive payments if the relevant index point increased in value and would be obligated to pay if that index point decreased in value.
Future swap contracts involve an exchange by the parties of their respective commitments to pay or rights to receive the changes in an index. The Fund gains exposure by either paying or receiving an amount in respect of an increase or decrease in the change of the index based on a notional amount. For example, if the Fund took a long position on a future swap, the Fund would receive payments if the relevant index increased in value and would be obligated to pay if that index decreased in value.
Generally, the Funds price their OTC swap contracts daily using industry standard models that may incorporate quotations from market makers or pricing vendors and record the change in value, if any, as unrealized gain or loss in the Statements of Operations. Gains or losses are realized upon the termination of the swap contracts or reset dates, as appropriate. Cleared swap contracts are valued using the quote (which may be based on a model) published by the relevant clearing house. If an updated quote for a cleared swap contract is not available by the time that a Fund calculates its net asset value on any business day, then that swap contract will generally be valued using an industry standard model, which may differ from the model used by the relevant clearing house.
The values assigned to swap contracts may differ significantly from the values realized upon termination, and the differences could be material. Entering into swap contracts involves counterparty credit, legal, and documentation risk that is generally not reflected in the value assigned to the swap contract. Such risks include the possibility that the counterparty defaults on its obligations to perform or
203
GMO Trust Funds
Notes to Financial Statements — (Continued)
February 28, 2023
disagrees as to the meaning of contractual terms, that a Fund has amounts on deposit in excess of amounts owed by that Fund, or that any collateral the other party posts is insufficient or not timely received by a Fund. Credit risk is particularly acute in economic environments in which financial services firms are exposed to systemic risks of the type evidenced by the insolvency of Lehman Brothers in 2008 and subsequent market disruptions. Swap contracts outstanding at the end of the year, if any, are listed in each applicable Fund’s Schedule of Investments.
* * *
As provided by U.S. GAAP, the table below is based on market values or unrealized appreciation/(depreciation) rather than the notional amounts of derivatives. Changes to market values of reference asset(s) will tend to have a greater impact on the Funds (with correspondingly greater risk) the greater the notional amount. For further information on notional amounts, see the Schedule of Investments.
The following is a summary of the valuations of derivative instruments categorized by risk exposure.
The Effect of Derivative Instruments on the Statements of Assets and Liabilities as of February 28, 2023 and the Statements of Operations for the year ended February 28, 2023^:
The risks referenced in the tables below are not intended to be inclusive of all risks. Please see the “Investment and other risks” and “Portfolio valuation” sections for a further discussion of risks.
| Foreign | Interest | |||||||||||||||||||||||
| Credit | Commodity | Equity | Currency | Rate | ||||||||||||||||||||
| Contracts | Contracts | Contracts | Contracts | Contracts | Total | |||||||||||||||||||
Consolidated Alternative Allocation Fund | ||||||||||||||||||||||||
Asset Derivatives | ||||||||||||||||||||||||
Unrealized Appreciation on Forward Currency Contracts | $ | — | $ | — | $ | — | $ | 1,290,869 | $ | — | $ | 1,290,869 | ||||||||||||
Unrealized Appreciation on Futures Contracts¤ | — | 165,534 | 398,397 | — | 146,728 | 710,659 | ||||||||||||||||||
Swap Contracts, at value¤ | 7,907,211 | — | 407,046 | — | 2,325,154 | 10,639,411 | ||||||||||||||||||
|
|
|
|
|
|
|
|
|
|
|
| |||||||||||||
Total | $ | 7,907,211 | $ | 165,534 | $ | 805,443 | $ | 1,290,869 | $ | 2,471,882 | $ | 12,640,939 | ||||||||||||
|
|
|
|
|
|
|
|
|
|
|
| |||||||||||||
Liability Derivatives | ||||||||||||||||||||||||
Unrealized Depreciation on Forward Currency Contracts | $ | — | $ | — | $ | — | $ | (818,439 | ) | $ | — | $ | (818,439 | ) | ||||||||||
Unrealized Depreciation on Futures Contracts¤ | — | (103,109 | ) | (557,674 | ) | — | (16,059 | ) | (676,842 | ) | ||||||||||||||
Written Options, at value | (91,162 | ) | — | (1,180,314 | ) | — | — | (1,271,476 | ) | |||||||||||||||
Swap Contracts, at value¤ | (2,541,464 | ) | — | (124,013 | ) | — | (1,880,438 | ) | (4,545,915 | ) | ||||||||||||||
|
|
|
|
|
|
|
|
|
|
|
| |||||||||||||
Total | $ | (2,632,626 | ) | $ | (103,109 | ) | $ | (1,862,001 | ) | $ | (818,439 | ) | $ | (1,896,497 | ) | $ | (7,312,672 | ) | ||||||
|
|
|
|
|
|
|
|
|
|
|
| |||||||||||||
Net Realized Gain (Loss) on | ||||||||||||||||||||||||
Investments (purchased options) | $ | — | $ | — | $ | (2,151 | ) | $ | — | $ | (229,929 | ) | $ | (232,080 | ) | |||||||||
Futures Contracts | — | 406,003 | 234,609 | — | 1,746,983 | 2,387,595 | ||||||||||||||||||
Written Options | — | — | (405,572 | ) | — | 749,738 | 344,166 | |||||||||||||||||
Swap Contracts | 2,302,270 | (288,322 | ) | 1,119,535 | — | (2,588,895 | ) | 544,588 | ||||||||||||||||
Forward Currency Contracts | — | — | — | (5,993,187 | ) | — | (5,993,187 | ) | ||||||||||||||||
|
|
|
|
|
|
|
|
|
|
|
| |||||||||||||
Total | $ | 2,302,270 | $ | 117,681 | $ | 946,421 | $ | (5,993,187 | ) | $ | (322,103 | ) | $ | (2,948,918 | ) | |||||||||
|
|
|
|
|
|
|
|
|
|
|
| |||||||||||||
Change in Net Appreciation (Depreciation) on | ||||||||||||||||||||||||
Investments (purchased options) | $ | — | $ | — | $ | — | $ | — | $ | (19,359 | ) | $ | (19,359 | ) | ||||||||||
Futures Contracts | — | 62,425 | 459,161 | — | (94,422 | ) | 427,164 | |||||||||||||||||
Written Options | 37,396 | — | (172,807 | ) | — | — | (135,411 | ) | ||||||||||||||||
Swap Contracts | (1,240,676 | ) | — | 496,498 | — | 1,365,070 | 620,892 | |||||||||||||||||
Forward Currency Contracts | — | — | — | 1,904,162 | — | 1,904,162 | ||||||||||||||||||
|
|
|
|
|
|
|
|
|
|
|
| |||||||||||||
Total | $ | (1,203,280 | ) | $ | 62,425 | $ | 782,852 | $ | 1,904,162 | $ | 1,251,289 | $ | 2,797,448 | |||||||||||
|
|
|
|
|
|
|
|
|
|
|
| |||||||||||||
204
GMO Trust Funds
Notes to Financial Statements — (Continued)
February 28, 2023
| Foreign | Interest | |||||||||||||||||||||||
| Credit | Commodity | Equity | Currency | Rate | ||||||||||||||||||||
| Contracts | Contracts | Contracts | Contracts | Contracts | Total | |||||||||||||||||||
Benchmark-Free Fund | ||||||||||||||||||||||||
Asset Derivatives | ||||||||||||||||||||||||
Unrealized Appreciation on Forward Currency Contracts | $ | — | $ | — | $ | — | $ | 448,540 | $ | — | $ | 448,540 | ||||||||||||
Swap Contracts, at value¤ | — | — | 730,289 | — | 2,726,041 | 3,456,330 | ||||||||||||||||||
|
|
|
|
|
|
|
|
|
|
|
| |||||||||||||
Total | $ | — | $ | — | $ | 730,289 | $ | 448,540 | $ | 2,726,041 | $ | 3,904,870 | ||||||||||||
|
|
|
|
|
|
|
|
|
|
|
| |||||||||||||
Liability Derivatives | ||||||||||||||||||||||||
Unrealized Depreciation on Forward Currency Contracts | $ | — | $ | — | $ | — | $ | (562,651 | ) | $ | — | $ | (562,651 | ) | ||||||||||
Swap Contracts, at value¤ | — | — | — | — | (2,776,265 | ) | (2,776,265 | ) | ||||||||||||||||
|
|
|
|
|
|
|
|
|
|
|
| |||||||||||||
Total | $ | — | $ | — | $ | — | $ | (562,651 | ) | $ | (2,776,265 | ) | $ | (3,338,916 | ) | |||||||||
|
|
|
|
|
|
|
|
|
|
|
| |||||||||||||
Net Realized Gain (Loss) on | ||||||||||||||||||||||||
Futures Contracts | $ | — | $ | — | $ | 46,020,438 | $ | — | $ | — | $ | 46,020,438 | ||||||||||||
Swap Contracts | — | — | 14,948,225 | — | (12,945,162 | ) | 2,003,063 | |||||||||||||||||
Forward Currency Contracts | — | — | — | 715,353 | — | 715,353 | ||||||||||||||||||
|
|
|
|
|
|
|
|
|
|
|
| |||||||||||||
Total | $ | — | $ | — | $ | 60,968,663 | $ | 715,353 | $ | (12,945,162 | ) | $ | 48,738,854 | |||||||||||
|
|
|
|
|
|
|
|
|
|
|
| |||||||||||||
Change in Net Appreciation (Depreciation) on |
| |||||||||||||||||||||||
Futures Contracts | $ | — | $ | — | $ | (20,222,689 | ) | $ | — | $ | — | $ | (20,222,689 | ) | ||||||||||
Swap Contracts | — | — | (312,653 | ) | — | 779,673 | 467,020 | |||||||||||||||||
Forward Currency Contracts | — | — | — | 434,285 | — | 434,285 | ||||||||||||||||||
|
|
|
|
|
|
|
|
|
|
|
| |||||||||||||
Total | $ | — | $ | — | $ | (20,535,342 | ) | $ | 434,285 | $ | 779,673 | $ | (19,321,384 | ) | ||||||||||
|
|
|
|
|
|
|
|
|
|
|
| |||||||||||||
Consolidated Implementation Fund | ||||||||||||||||||||||||
Asset Derivatives | ||||||||||||||||||||||||
Unrealized Appreciation on Forward Currency Contracts | $ | — | $ | — | $ | — | $ | 5,321,932 | $ | — | $ | 5,321,932 | ||||||||||||
Unrealized Appreciation on Futures Contracts¤ | — | 762,282 | 1,866,229 | — | 653,626 | 3,282,137 | ||||||||||||||||||
Swap Contracts, at value¤ | 155,320 | — | 3,514,056 | — | 19,775,772 | 23,445,148 | ||||||||||||||||||
|
|
|
|
|
|
|
|
|
|
|
| |||||||||||||
Total | $ | 155,320 | $ | 762,282 | $ | 5,380,285 | $ | 5,321,932 | $ | 20,429,398 | $ | 32,049,217 | ||||||||||||
|
|
|
|
|
|
|
|
|
|
|
| |||||||||||||
Liability Derivatives | ||||||||||||||||||||||||
Unrealized Depreciation on Forward Currency Contracts | $ | — | $ | — | $ | — | $ | (6,102,855 | ) | $ | — | $ | (6,102,855 | ) | ||||||||||
Unrealized Depreciation on Futures Contracts¤ | — | (478,416 | ) | (2,485,887 | ) | — | (62,223 | ) | (3,026,526 | ) | ||||||||||||||
Written Options, at value | — | — | (2,838,687 | ) | — | — | (2,838,687 | ) | ||||||||||||||||
Swap Contracts, at value¤ | (384,832 | ) | — | (579,637 | ) | — | (20,062,369 | ) | (21,026,838 | ) | ||||||||||||||
|
|
|
|
|
|
|
|
|
|
|
| |||||||||||||
Total | $ | (384,832 | ) | $ | (478,416 | ) | $ | (5,904,211 | ) | $ | (6,102,855 | ) | $ | (20,124,592 | ) | $ | (32,994,906 | ) | ||||||
|
|
|
|
|
|
|
|
|
|
|
| |||||||||||||
Net Realized Gain (Loss) on | ||||||||||||||||||||||||
Investments (purchased options) | $ | — | $ | — | $ | 15,525 | $ | — | $ | — | $ | 15,525 | ||||||||||||
Futures Contracts | — | 5,110,169 | 127,682,784 | — | 8,097,186 | 140,890,139 | ||||||||||||||||||
Written Options | — | — | 1,061,715 | — | — | 1,061,715 | ||||||||||||||||||
Swap Contracts | (149,626 | ) | — | 15,397,879 | — | (12,110,008 | ) | 3,138,245 | ||||||||||||||||
Forward Currency Contracts | — | — | — | (20,013,196 | ) | — | (20,013,196 | ) | ||||||||||||||||
|
|
|
|
|
|
|
|
|
|
|
| |||||||||||||
Total | $ | (149,626 | ) | $ | 5,110,169 | $ | 144,157,903 | $ | (20,013,196 | ) | $ | (4,012,822 | ) | $ | 125,092,428 | |||||||||
|
|
|
|
|
|
|
|
|
|
|
| |||||||||||||
Change in Net Appreciation (Depreciation) on |
| |||||||||||||||||||||||
Investments (purchased options) | $ | — | $ | — | $ | 62,806 | $ | — | $ | — | $ | 62,806 | ||||||||||||
Futures Contracts | — | (946,758 | ) | (46,072,671 | ) | — | (200,015 | ) | (47,219,444 | ) | ||||||||||||||
Written Options | — | — | 278,514 | — | — | 278,514 | ||||||||||||||||||
Swap Contracts | (183,867 | ) | — | 898,193 | — | 4,739,268 | 5,453,594 | |||||||||||||||||
Forward Currency Contracts | — | — | — | 5,235,136 | — | 5,235,136 | ||||||||||||||||||
|
|
|
|
|
|
|
|
|
|
|
| |||||||||||||
Total | $ | (183,867 | ) | $ | (946,758 | ) | $ | (44,833,158 | ) | $ | 5,235,136 | $ | 4,539,253 | $ | (36,189,394 | ) | ||||||||
|
|
|
|
|
|
|
|
|
|
|
| |||||||||||||
205
GMO Trust Funds
Notes to Financial Statements — (Continued)
February 28, 2023
| Foreign | Interest | |||||||||||||||||||||||
| Credit | Commodity | Equity | Currency | Rate | ||||||||||||||||||||
| Contracts | Contracts | Contracts | Contracts | Contracts | Total | |||||||||||||||||||
Consolidated SGM Major Markets Fund | ||||||||||||||||||||||||
Asset Derivatives | ||||||||||||||||||||||||
Unrealized Appreciation on Forward Currency Contracts | $ | — | $ | — | $ | — | $ | 807,354 | $ | — | $ | 807,354 | ||||||||||||
Unrealized Appreciation on Futures Contracts¤ | — | 329,801 | 808,051 | — | 294,513 | 1,432,365 | ||||||||||||||||||
Swap Contracts, at value¤ | — | — | 682,712 | — | — | 682,712 | ||||||||||||||||||
|
|
|
|
|
|
|
|
|
|
|
| |||||||||||||
Total | $ | — | $ | 329,801 | $ | 1,490,763 | $ | 807,354 | $ | 294,513 | $ | 2,922,431 | ||||||||||||
|
|
|
|
|
|
|
|
|
|
|
| |||||||||||||
Liability Derivatives | ||||||||||||||||||||||||
Unrealized Depreciation on Forward Currency Contracts | $ | — | $ | — | $ | — | $ | (806,355 | ) | $ | — | $ | (806,355 | ) | ||||||||||
Unrealized Depreciation on Futures Contracts¤ | — | (207,277 | ) | (1,042,357 | ) | — | (26,695 | ) | (1,276,329 | ) | ||||||||||||||
Swap Contracts, at value¤ | — | — | (294,036 | ) | — | — | (294,036 | ) | ||||||||||||||||
|
|
|
|
|
|
|
|
|
|
|
| |||||||||||||
Total | $ | — | $ | (207,277 | ) | $ | (1,336,393 | ) | $ | (806,355 | ) | $ | (26,695 | ) | $ | (2,376,720 | ) | |||||||
|
|
|
|
|
|
|
|
|
|
|
| |||||||||||||
Net Realized Gain (Loss) on | ||||||||||||||||||||||||
Futures Contracts | $ | — | $ | 3,296,703 | $ | (3,589,398 | ) | $ | — | $ | 4,494,853 | $ | 4,202,158 | |||||||||||
Swap Contracts | — | — | 827,298 | — | — | 827,298 | ||||||||||||||||||
Forward Currency Contracts | — | — | — | (6,858,168 | ) | — | (6,858,168 | ) | ||||||||||||||||
|
|
|
|
|
|
|
|
|
|
|
| |||||||||||||
Total | $ | — | $ | 3,296,703 | $ | (2,762,100 | ) | $ | (6,858,168 | ) | $ | 4,494,853 | $ | (1,828,712 | ) | |||||||||
|
|
|
|
|
|
|
|
|
|
|
| |||||||||||||
Change in Net Appreciation (Depreciation) on | ||||||||||||||||||||||||
Futures Contracts | $ | — | $ | (727,856 | ) | $ | 2,858,735 | $ | — | $ | (329,222 | ) | $ | 1,801,657 | ||||||||||
Swap Contracts | — | — | 1,120,017 | — | — | 1,120,017 | ||||||||||||||||||
Forward Currency Contracts | — | — | — | 300,089 | — | 300,089 | ||||||||||||||||||
|
|
|
|
|
|
|
|
|
|
|
| |||||||||||||
Total | $ | — | $ | (727,856 | ) | $ | 3,978,752 | $ | 300,089 | $ | (329,222 | ) | $ | 3,221,763 | ||||||||||
|
|
|
|
|
|
|
|
|
|
|
| |||||||||||||
Strategic Opportunities Allocation Fund | ||||||||||||||||||||||||
Asset Derivatives | ||||||||||||||||||||||||
Swap Contracts, at value¤ | $ | — | $ | — | $ | 99,263 | $ | — | $ | — | $ | 99,263 | ||||||||||||
|
|
|
|
|
|
|
|
|
|
|
| |||||||||||||
Total | $ | — | $ | — | $ | 99,263 | $ | — | $ | — | $ | 99,263 | ||||||||||||
|
|
|
|
|
|
|
|
|
|
|
| |||||||||||||
Net Realized Gain (Loss) on | ||||||||||||||||||||||||
Swap Contracts | $ | — | $ | — | $ | 582,171 | $ | — | $ | — | $ | 582,171 | ||||||||||||
|
|
|
|
|
|
|
|
|
|
|
| |||||||||||||
Total | $ | — | $ | — | $ | 582,171 | $ | — | $ | — | $ | 582,171 | ||||||||||||
|
|
|
|
|
|
|
|
|
|
|
| |||||||||||||
Change in Net Appreciation (Depreciation) on | ||||||||||||||||||||||||
Swap Contracts | $ | — | $ | — | $ | (46,249 | ) | $ | — | $ | — | $ | (46,249 | ) | ||||||||||
|
|
|
|
|
|
|
|
|
|
|
| |||||||||||||
Total | $ | — | $ | — | $ | (46,249 | ) | $ | — | $ | — | $ | (46,249 | ) | ||||||||||
|
|
|
|
|
|
|
|
|
|
|
| |||||||||||||
| ^ | Because the Funds recognize changes in value through the Statements of Operations, they do not qualify for hedge accounting under authoritative guidance for derivative instruments. The Funds’ investments in derivatives may represent an economic hedge; however, they are considered to be non-hedge transactions for the purpose of these tables. |
| ¤ | The table includes cumulative unrealized appreciation/depreciation of futures and value of cleared swap contracts, if any, as reported in the Schedule of Investments. Year end variation margin on open futures and cleared swap contracts, if any, is reported within the Statements of Assets and Liabilities. |
Certain Funds are party to International Swaps and Derivatives Association, Inc. Master Agreements, Global Master Repurchase Agreements, Master Securities Loan Agreements or other similar types of agreements (collectively, “Master Agreements”) that generally govern the terms of OTC derivative transactions, repurchase agreements, reverse repurchase agreements and securities loans. The Master Agreements may include collateral posting terms and set-off provisions that apply in the event of a default and/or termination event. Upon the occurrence of such an event, including the bankruptcy or insolvency of the counterparty, the Master Agreements may permit the non-defaulting party to calculate a single net payment to close out applicable transactions. However, there is no guarantee that the terms of a Master Agreement will be enforceable; for example, when bankruptcy or insolvency laws impose restrictions on or prohibitions against the right of offset. Additionally, the set-off and netting provisions of a Master Agreement may not extend to the obligations of the counterparty’s affiliates or across varying types of transactions. Because no such event has occurred, the Funds do not presently have a legally enforceable right of set-off and these amounts have not been offset in the Statements of Assets and Liabilities, but have been presented separately in the table below. Termination events may also include a
206
GMO Trust Funds
Notes to Financial Statements — (Continued)
February 28, 2023
decline in the net assets of a Fund below a certain level over a specified period of time and may entitle a counterparty to elect an early termination of all the transactions under the Master Agreement with that counterparty. Such an election by one or more of the counterparties could have a material adverse impact on a Fund’s operations. An estimate of the aggregate net payment, if any, that may need to be paid by a Fund (or may be received by a Fund) in such an event is represented by the Net Amounts in the tables below. For more information about other uncertainties and risks, see “Investments and other risks” above.
For financial reporting purposes, in the Statements of Assets and Liabilities any cash collateral that has been pledged to cover obligations of the Funds is reported as Due from broker and any cash collateral received from the counterparty is reported as Due to broker. Any non-cash collateral pledged by the Funds is noted in the Schedules of Investments. The tables below show the potential effect of netting arrangements made available by the Master Agreements on the financial position of the Funds. For financial reporting purposes, the Funds’ Statements of Assets and Liabilities generally show derivative assets and derivative liabilities (regardless of whether they are subject to netting arrangements) on a gross basis, which reflects the full risks and exposures of the Fund prior to netting. See Note 2 for information on repurchase agreements, reverse repurchase agreements and securities loans held by the Funds at February 28, 2023, if any.
The tables above present the Funds’ derivative assets and liabilities by type of financial instrument. The following tables present the Funds’ OTC and/or exchange-traded derivative assets and liabilities by counterparty net of amounts that may be available for offset under the Master Agreements by the terms of the agreement and net of the related collateral received or pledged by the Funds as of February 28, 2023:
Consolidated Alternative Allocation Fund
| Gross Derivative | Derivative | Net Amount | ||||||||||||||
| Assets Subject to | Collateral | Assets/Liabilities | of Derivative | |||||||||||||
| Counterparty | Master Agreements | Received | Available for Offset | Assets | ||||||||||||
Bank of America, N.A. | $ | 93,304 | $ | (15,106 | ) | $ | (33,335 | ) | $ | 44,863 | ||||||
Barclays Bank PLC | 312,253 | (89,357 | ) | (160,639 | ) | 62,257 | ||||||||||
Citibank N.A. | 613,963 | (499,082 | ) | (114,881 | ) | — | * | |||||||||
Deutsche Bank AG | 30,992 | — | (30,992 | ) | — | |||||||||||
Goldman Sachs International | 2,363,582 | (2,205,919 | ) | (157,663 | ) | — | * | |||||||||
JPMorgan Chase Bank, N.A. | 1,603,442 | (152,616 | ) | (1,089,626 | ) | 361,200 | ||||||||||
Merrill Lynch Capital Services, Inc. | 490,875 | — | (275,091 | ) | 215,784 | |||||||||||
Morgan Stanley & Co. International PLC | 3,873,498 | (3,240,000 | ) | (524,332 | ) | 109,166 | ||||||||||
Morgan Stanley Capital Services LLC | 115,102 | (10,000 | ) | — | 105,102 | |||||||||||
State Street Bank and Trust Company | 549,737 | (335,819 | ) | (30,226 | ) | 183,692 | ||||||||||
UBS AG | 124,504 | — | (54,191 | ) | 70,313 | |||||||||||
|
|
|
|
|
|
|
| |||||||||
Total | $ | 10,171,252 | $ | (6,547,899 | ) | $ | (2,470,976 | ) | $ | 1,152,377 | ||||||
|
|
|
|
|
|
|
| |||||||||
207
GMO Trust Funds
Notes to Financial Statements — (Continued)
February 28, 2023
Consolidated Alternative Allocation Fund (Continued)
| Gross Derivative | Derivative | Net Amount | ||||||||||||||
| Liabilities Subject to | Collateral | Assets/Liabilities | of Derivative | |||||||||||||
| Counterparty | Master Agreement | Pledged | Available for Offset | Liabilities | ||||||||||||
Bank of America, N.A. | $ | (33,335 | ) | $ | — | $ | 33,335 | $ | — | |||||||
Barclays Bank PLC | (160,639 | ) | — | 160,639 | — | |||||||||||
Citibank N.A. | (114,881 | ) | — | 114,881 | — | |||||||||||
Citigroup Global Markets Inc. | (167,516 | ) | — | — | (167,516 | ) | ||||||||||
Deutsche Bank AG | (50,163 | ) | 19,171 | 30,992 | — | * | ||||||||||
Goldman Sachs International | (157,663 | ) | — | 157,663 | — | |||||||||||
JPMorgan Chase Bank, N.A. | (1,089,626 | ) | — | 1,089,626 | — | |||||||||||
Merrill Lynch Capital Services, Inc. | (275,091 | ) | — | 275,091 | — | |||||||||||
Morgan Stanley & Co. International PLC | (524,332 | ) | — | 524,332 | — | |||||||||||
Morgan Stanley & Co. LLC | (1,200,245 | ) | 1,200,245 | — | — | * | ||||||||||
State Street Bank and Trust Company | (30,226 | ) | — | 30,226 | — | |||||||||||
UBS AG | (54,191 | ) | — | 54,191 | — | |||||||||||
|
|
|
|
|
|
|
| |||||||||
Total | $ | (3,857,908 | ) | $ | 1,219,416 | $ | 2,470,976 | $ | (167,516 | ) | ||||||
|
|
|
|
|
|
|
| |||||||||
Benchmark-Free Fund
| Gross Derivative | Derivative | Net Amount | ||||||||||||||
| Assets Subject to | Collateral | Assets/Liabilities | of Derivative | |||||||||||||
| Counterparty | Master Agreements | Received | Available for Offset | Assets | ||||||||||||
Bank of America, N.A. | $ | 357 | $ | — | $ | (357 | ) | $ | — | |||||||
Barclays Bank PLC | 285,208 | — | (102,609 | ) | 182,599 | |||||||||||
Citibank N.A. | 4,501 | — | (4,501 | ) | — | |||||||||||
Deutsche Bank AG | 15,206 | — | — | 15,206 | ||||||||||||
Goldman Sachs International | 74,851 | — | (23,157 | ) | 51,694 | |||||||||||
JPMorgan Chase Bank, N.A. | 12,789 | — | (12,789 | ) | — | |||||||||||
Morgan Stanley & Co. International PLC | 101,165 | — | (101,165 | ) | — | |||||||||||
Morgan Stanley Capital Services LLC | 668,582 | (379,000 | ) | — | 289,582 | |||||||||||
State Street Bank and Trust Company | 16,170 | — | (12,906 | ) | 3,264 | |||||||||||
|
|
|
|
|
|
|
| |||||||||
Total | $ | 1,178,829 | $ | (379,000 | ) | $ | (257,484 | ) | $ | 542,345 | ||||||
|
|
|
|
|
|
|
| |||||||||
| Gross Derivative | Derivative | Net Amount | ||||||||||||||
| Liabilities Subject to | Collateral | Assets/Liabilities | of Derivative | |||||||||||||
| Counterparty | Master Agreement | Pledged | Available for Offset | Liabilities | ||||||||||||
Bank of America, N.A. | $ | (23,826 | ) | $ | — | $ | 357 | $ | (23,469 | ) | ||||||
Barclays Bank PLC | (102,609 | ) | — | 102,609 | — | |||||||||||
Citibank N.A. | (5,340 | ) | — | 4,501 | (839 | ) | ||||||||||
Goldman Sachs International | (23,157 | ) | — | 23,157 | — | |||||||||||
JPMorgan Chase Bank, N.A. | (55,987 | ) | 36,987 | 12,789 | (6,211 | ) | ||||||||||
Morgan Stanley & Co. International PLC | (338,826 | ) | 90,969 | 101,165 | (146,692 | ) | ||||||||||
State Street Bank and Trust Company | (12,906 | ) | — | 12,906 | — | |||||||||||
|
|
|
|
|
|
|
| |||||||||
Total | $ | (562,651 | ) | $ | 127,956 | $ | 257,484 | $ | (177,211 | ) | ||||||
|
|
|
|
|
|
|
| |||||||||
208
GMO Trust Funds
Notes to Financial Statements — (Continued)
February 28, 2023
Consolidated Implementation Fund
| Gross Derivative | Derivative | Net Amount | ||||||||||||||
| Assets Subject to | Collateral | Assets/Liabilities | of Derivative | |||||||||||||
| Counterparty | Master Agreements | Received | Available for Offset | Assets | ||||||||||||
Bank of America, N.A. | $ | 198,703 | $ | — | $ | (198,703 | ) | $ | — | |||||||
Barclays Bank PLC | 2,269,561 | (840,000 | ) | (964,233 | ) | 465,328 | ||||||||||
Citibank N.A. | 32,663 | — | (32,663 | ) | — | |||||||||||
Deutsche Bank AG | 208,392 | — | (208,392 | ) | — | |||||||||||
Goldman Sachs International | 617,934 | (201,148 | ) | (416,786 | ) | — | * | |||||||||
JPMorgan Chase Bank, N.A. | 1,005,884 | — | (571,951 | ) | 433,933 | |||||||||||
Morgan Stanley & Co. International PLC | 1,412,801 | — | (1,412,801 | ) | — | |||||||||||
Morgan Stanley Capital Services LLC | 2,125,796 | (1,620,000 | ) | — | 505,796 | |||||||||||
State Street Bank and Trust Company | 324,510 | (128,212 | ) | (196,298 | ) | — | * | |||||||||
UBS AG | 795,064 | (398,226 | ) | (372,297 | ) | 24,541 | ||||||||||
|
|
|
|
|
|
|
| |||||||||
Total | $ | 8,991,308 | $ | (3,187,586 | ) | $ | (4,374,124 | ) | $ | 1,429,598 | ||||||
|
|
|
|
|
|
|
| |||||||||
| Gross Derivative | Derivative | Net Amount | ||||||||||||||
| Liabilities Subject to | Collateral | Assets/Liabilities | of Derivative | |||||||||||||
| Counterparty | Master Agreement | Pledged | Available for Offset | Liabilities | ||||||||||||
Bank of America, N.A. | $ | (252,108 | ) | $ | 12,793 | $ | 198,703 | $ | (40,612 | ) | ||||||
Barclays Bank PLC | (964,233 | ) | — | 964,233 | — | |||||||||||
Citibank N.A. | (38,904 | ) | — | 32,663 | (6,241 | ) | ||||||||||
Deutsche Bank AG | (241,002 | ) | 32,610 | 208,392 | — | * | ||||||||||
Goldman Sachs International | (416,786 | ) | — | 416,786 | — | |||||||||||
JPMorgan Chase Bank, N.A. | (571,951 | ) | — | 571,951 | — | |||||||||||
Morgan Stanley & Co. International PLC | (3,839,975 | ) | 2,427,174 | 1,412,801 | — | * | ||||||||||
Morgan Stanley & Co. LLC | (2,838,687 | ) | 2,838,687 | — | — | * | ||||||||||
State Street Bank and Trust Company | (196,298 | ) | — | 196,298 | — | |||||||||||
UBS AG | (372,297 | ) | — | 372,297 | — | |||||||||||
|
|
|
|
|
|
|
| |||||||||
Total | $ | (9,732,241 | ) | $ | 5,311,264 | $ | 4,374,124 | $ | (46,853 | ) | ||||||
|
|
|
|
|
|
|
| |||||||||
Consolidated SGM Major Markets Fund
| Gross Derivative | Derivative | Net Amount | ||||||||||||||
| Assets Subject to | Collateral | Assets/Liabilities | of Derivative | |||||||||||||
| Counterparty | Master Agreements | Received | Available for Offset | Assets | ||||||||||||
Barclays Bank PLC | $ | 19,620 | $ | — | $ | (19,620 | ) | $ | — | |||||||
Deutsche Bank AG | 43,562 | — | (43,562 | ) | — | |||||||||||
Goldman Sachs International | 321,773 | — | (184,378 | ) | 137,395 | |||||||||||
JPMorgan Chase Bank, N.A. | 360,444 | (107,000 | ) | (15,951 | ) | 237,493 | ||||||||||
Morgan Stanley & Co. International PLC | 286,705 | — | (286,705 | ) | — | |||||||||||
State Street Bank and Trust Company | 90,043 | (4,831 | ) | (44,952 | ) | 40,260 | ||||||||||
UBS AG | 367,919 | — | (133,638 | ) | 234,281 | |||||||||||
|
|
|
|
|
|
|
| |||||||||
Total | $ | 1,490,066 | $ | (111,831 | ) | $ | (728,806 | ) | $ | 649,429 | ||||||
|
|
|
|
|
|
|
| |||||||||
209
GMO Trust Funds
Notes to Financial Statements — (Continued)
February 28, 2023
Consolidated SGM Major Markets Fund (Continued)
| Gross Derivative | Derivative | Net Amount | ||||||||||||||
| Liabilities Subject to | Collateral | Assets/Liabilities | of Derivative | |||||||||||||
| Counterparty | Master Agreement | Pledged | Available for Offset | Liabilities | ||||||||||||
Barclays Bank PLC | $ | (52,363 | ) | $ | — | $ | 19,620 | $ | (32,743 | ) | ||||||
Deutsche Bank AG | (107,725 | ) | 45,929 | 43,562 | (18,234 | ) | ||||||||||
Goldman Sachs International | (184,378 | ) | — | 184,378 | — | |||||||||||
JPMorgan Chase Bank, N.A. | (15,951 | ) | — | 15,951 | — | |||||||||||
Morgan Stanley & Co. International PLC | (561,384 | ) | — | 286,705 | (274,679 | ) | ||||||||||
State Street Bank and Trust Company | (44,952 | ) | — | 44,952 | — | |||||||||||
UBS AG | (133,638 | ) | — | 133,638 | — | |||||||||||
|
|
|
|
|
|
|
| |||||||||
Total | $ | (1,100,391 | ) | $ | 45,929 | $ | 728,806 | $ | (325,656 | ) | ||||||
|
|
|
|
|
|
|
| |||||||||
Strategic Opportunities Allocation Fund
| Gross Derivative | Derivative | Net Amount | ||||||||||||||
| Assets Subject to | Collateral | Assets/Liabilities | of Derivative | |||||||||||||
| Counterparty | Master Agreements | Received | Available for Offset | Assets | ||||||||||||
Goldman Sachs International | $ | 9,259 | $ | — | $ | — | $ | 9,259 | ||||||||
Morgan Stanley Capital Services LLC | 90,004 | — | — | 90,004 | ||||||||||||
|
|
|
|
|
|
|
| |||||||||
Total | $ | 99,263 | $ | — | $ | — | $ | 99,263 | ||||||||
|
|
|
|
|
|
|
| |||||||||
| * | The actual collateral received and/or pledged is more than the amount shown. |
The average derivative activity of notional amounts (forward currency contracts, futures contracts and swap contracts) and principal amounts or number of contracts (options) outstanding, based on absolute values, at each month-end, was as follows for the year ended February 28, 2023:
| Fund Name | Forward Currency Contracts ($) | Futures Contracts ($) | Options (Principal) | Options (Contracts) | Swap Contracts ($) | |||||||||||||||
Consolidated Alternative Allocation Fund | 183,920,953 | 89,765,808 | 46,748,417 | 913 | 713,474,652 | |||||||||||||||
Benchmark-Free Fund | 152,641,647 | 115,160,263 | — | — | 679,374,114 | |||||||||||||||
Consolidated Implementation Fund | 1,146,238,409 | 713,601,994 | — | 3,612 | 4,384,207,260 | |||||||||||||||
Consolidated SGM Major Markets Fund | 131,355,356 | 231,230,498 | — | — | 49,844,487 | |||||||||||||||
Strategic Opportunities Allocation Fund | — | — | — | — | 3,983,555 | |||||||||||||||
210
GMO Trust Funds
Notes to Financial Statements — (Continued)
February 28, 2023
| 5. | Fees and other transactions with affiliates |
GMO receives a management fee for the services it provides to certain Funds. Management fees are paid monthly at the annual rate equal to the percentage of each Fund’s average daily net assets set forth in the table below:
| Alternative Allocation Fund | Benchmark- Free Allocation Fund | Benchmark- Free Fund | Global Asset Allocation Fund | Global Developed Equity Allocation Fund | Global Equity Allocation Fund | Implementation Fund | International Developed Equity Allocation Fund | International Equity Allocation Fund | SGM Major Markets Fund | Strategic Opportunities Allocation Fund | ||||||||||||||||||||||||||||||||||
Management Fee | 0.73 | % | 0.65 | % | — | — | — | — | — | — | — | 0.85 | % | — | ||||||||||||||||||||||||||||||
In addition, each class of shares of certain Funds pays GMO directly or indirectly a shareholder service or supplemental support fee. Shareholder service fees are paid to GMO for providing client services and reporting, such as performance information, client account information, personal and electronic access to Fund information, access to analysis and explanations of Fund reports, and assistance in maintaining and correcting client-related information. Class MF shares of Benchmark-Free Allocation Fund are subject to a supplemental support fee payable to GMO for providing supplemental support services to Class MF shareholders and their investment advisers. Those supplemental support services include, without limitation, (i) providing and presenting (a) educational and explanatory information about the Fund and its asset allocation strategy as requested or directed by an investor or its investment adviser; (b) similar educational and explanatory information about the strategies of the GMO Funds in which the Fund invests; (c) information for inclusion in the quarterly or other periodic reports of the investor; (ii) responding to information requests relating to oversight functions of the investor’s board of directors in areas including pricing, compliance, and taxation; (iii) providing access to and setting up meetings with GMO’s Chief Investment Strategist and Head of GMO’s Asset Allocation Team and other investment professionals of GMO; (iv) assisting with inquiries from an investor’s investment adviser; and (v) providing such other assistance as may be requested from time to time by an investor or its agent, so long as that assistance is not primarily intended to result in the sale of Fund shares.
Shareholder service and/or supplemental support fees are paid monthly at the annual rate equal to the percentage of each applicable Class’s average daily net assets set forth in the table below:
| Fund Name | Class II | Class III | Class IV | Class V | Class VI | Class MF | Class R6 | Class I | ||||||||||||||||||||||||
Alternative Allocation Fund | 0.22 | %* | 0.15 | %* | 0.105 | %* | 0.085 | %* | 0.055 | % | 0.22 | % | 0.22 | % | ||||||||||||||||||
Benchmark-Free Allocation Fund | 0.15 | % | 0.10 | % | 0.10 | % | 0.15 | % | 0.15 | % | ||||||||||||||||||||||
SGM Major Markets Fund | 0.15 | % | 0.10 | %* | 0.055 | % | 0.15 | %* | 0.15 | % | ||||||||||||||||||||||
| * | Class is offered but has no shareholders as of February 28, 2023. |
For certain Funds above, GMO does not charge the Fund a management fee or shareholder service fee, but it receives management and/or shareholder service fees from the underlying funds in which the Fund invests. Because those fees vary from fund to fund, the levels of indirect net expenses set forth below are affected by GMO’s asset allocation decisions.
211
GMO Trust Funds
Notes to Financial Statements — (Continued)
February 28, 2023
For each Fund (prior to June 30, 2022), other than Alternative Allocation Fund, GMO has contractually agreed to reimburse the Fund for its “Specified Operating Expenses” (as defined below). For the period starting June 30, 2022, for Implementation Fund and SGM Major Markets Fund, GMO has contractually agreed to reimburse the Fund for the portion of its “Specified Operating Expenses” (as defined below) that exceed 0.01% of the Funds’ average daily net assets.
Subject to the exclusions noted below, “Specified Operating Expenses” means: audit expenses, fund accounting expenses, pricing service expenses, expenses of non-investment related tax services, transfer agency expenses (excluding, in the case of Class I shares, any amounts paid for sub-transfer agency, recordkeeping and other administrative services provided by financial intermediaries for the benefit of Class I shareholders), expenses of non-investment related legal services provided to the Funds by or at the direction of GMO, organizational and start-up expenses, federal securities law filing expenses, printing expenses, state and federal registration fees and custody expenses. In the case of Benchmark-Free Fund, “Specified Operating Expenses” does not include the Fund’s direct custody expenses attributable to its holdings of emerging market securities.
For Alternative Allocation Fund (the “Fund), GMO has contractually agreed to waive its fees with respect to and/or reimburse the Fund to the extent that the Fund’s total annual fund operating expenses (after applying all other contractual and voluntary expense limitation arrangements in effect at the time) exceed the following amounts for each class of shares, in each case representing the average daily net assets for the indicated class of shares: 0.99% for Class II shares; 0.92% for Class III shares; 0.875% for Class IV shares; 0.855% for Class V shares; 0.825% for Class VI shares; 0.99% for Class R6 shares; and 0.99% for Class I shares (each, an “Expense Cap”). Fees and expenses of the “non-interested” Trustees and legal counsel to the “non-interested” Trustees, investment-related costs (such as brokerage commissions, interest, and acquired fund fees and expenses), payments out of assets attributable to Class I shares for sub-transfer agency, recordkeeping and other administrative services provided by financial intermediaries, taxes, litigation and indemnification expenses, judgments, and other extraordinary or non-recurring expenses not incurred in the ordinary course of the Fund’s business (collectively, “Excluded Expenses”), are excluded from the Expense Cap. GMO is permitted to recover from the Fund, on a class-by-class basis, expenses it has borne or reimbursed pursuant to an Expense Cap (whether through reduction of its fees or otherwise) to the extent that the Fund’s total annual fund operating expenses (excluding Excluded Expenses) later fall below that Expense Cap set forth above or any lower expense limit in effect when GMO seeks to recover the expenses. The Fund, however, is not obligated to pay any such amount more than three years after GMO bore or reimbursed an expense. Any such recovery will not cause the Fund to exceed the Expense Caps set forth above or any lower expense limits as is in effect at the time GMO seeks to recover expenses. GMO also has contractually agreed to waive or reduce the Fund’s management fees and shareholder service fees to the extent necessary to offset the management fees and shareholder service fees paid to GMO that are directly or indirectly borne by the Fund or a class of shares of the Fund as a result of the Fund’s direct or indirect investments in other series of GMO Trust (“GMO Funds”). Management fees and shareholder service fees will not be waived below zero. The reimbursement and waiver arrangements described above, including the Expense Cap, will remain in effect through at least June 30, 2023 and may not be terminated prior to this date without the action or consent of the Trust’s Board of Trustees.
For the year ended February 28, 2023, GMO did not recoup any previously recorded waivers and/or reimbursements.
On February 28, 2023, the waivers and/or reimbursements subject to possible future recoupment are as follows:
| Expiring the year ending February 29, 2024 | Expiring the year ending February 28, 2025 | Expiring the year ending February 28, 2026 | ||||||||||
Alternative Allocation Fund, Class VI | $ | 136,191 | $ | 245,810 | $ | 214,691 | ||||||
Alternative Allocation Fund, Class R6 | $ | 235 | $ | 185 | $ | 41 | ||||||
Alternative Allocation Fund, Class I | $ | 145,615 | $ | 264,576 | $ | 466,588 | ||||||
For each Fund, other than Benchmark-Free Allocation Fund, that pays GMO a management fee and shareholder service fee, GMO has contractually agreed to waive or reduce the Fund’s management fees and shareholder service fees to the extent necessary to offset the management fees and shareholder service fees paid to GMO that are directly or indirectly borne by the Fund or a class of shares of the Fund as a result of the Fund’s direct or indirect investments in other series of GMO Trust (“GMO Funds”). Management fees and shareholder service fees will not be waived below zero.
212
GMO Trust Funds
Notes to Financial Statements — (Continued)
February 28, 2023
These contractual waivers and reimbursements will continue through at least June 30, 2023 for each Fund unless the Funds’ Board of Trustees authorizes their modification or termination or reduces the fee rates paid to GMO under the Fund’s management contract or servicing and supplemental support agreement.
For Benchmark-Free Allocation Fund only, GMO has contractually agreed to waive or reduce the Fund’s management, shareholder service, and supplemental support fees to the extent necessary to offset the management fees and shareholder service fees paid to GMO that are directly or indirectly borne by the Fund or a class of shares of the Fund as a result of the Fund’s direct or indirect investments in other series of GMO Trust. In addition, GMO has contractually agreed to reduce the rate of the supplemental support fees charged to the Fund’s Class MF shares based on the net assets attributable to Class MF shares as of the last business day of the preceding month based on the following schedule: 0.10% on the first $6 billion of net assets, 0.05% on the next $2 billion, 0.03% on the next $2 billion, and 0.01% thereafter; provided, however, that the effective rate charged at any time will not be reduced to less than 0.06% of Class MF’s average daily net assets. The rate will be calculated before giving effect to any reduction or waiver described above, and any applicable reduction or waiver will serve to further reduce the supplemental support fees paid to GMO. This reduction will continue through at least June 30, 2023, and may not be terminated prior to this date without the action or consent of the Fund’s Board of Trustees.
GMO has contractually agreed to reimburse Class I assets of each Fund (or waive its fees) to the extent that payments for sub-transfer agency, recordkeeping and other administrative services provided by financial intermediaries from Class I assets exceed 0.10% of such Fund’s average daily net assets attributable to Class I assets.
Sub-Transfer Agent/Recordkeeping Payments
Class II, III, IV, V, VI, MF and R6 shares are not subject to payments to third parties for sub-transfer agent/recordkeeping and other administrative services. GMO may, on a case-by-case basis, make payments for sub-transfer agent, recordkeeping and other administrative services provided by financial intermediaries for the benefit of shareholders of these classes. Any such payments are made by GMO out of its own resources and are not an additional charge to a Fund or the holders of Class II, III, IV, V, VI, MF or Class R6 shares. These payments may create a conflict of interest by influencing a financial intermediary to recommend a Fund over another investment.
Class I shares are subject to payments for sub-transfer agency, recordkeeping and other administrative services provided by financial intermediaries for the benefit of holders of Class I shares through an account maintained by a third-party platform or intermediary. These services are not primarily intended to result in the sale of Fund shares but instead to provide ongoing services with respect to holders of Class I shares through a third-party platform or intermediary. Because payments for sub-transfer agency, recordkeeping and other administrative services are paid out of a Fund’s Class I assets on an ongoing basis, over time they will increase the cost of an investment in Class I shares. In addition, GMO may, on a case-by-case basis, make payments for sub-transfer agency, recordkeeping and other administrative services provided by financial intermediaries with respect to shareholders of Class I shares. Any such payments will be made by GMO out of its own resources and will not be an additional charge to a Fund or the holders of Class I shares. Any such payments will create a conflict of interest by influencing a financial intermediary to recommend a Fund over another investment.
The Funds’ portion of the fees paid by the Trust to the Trust’s independent Trustees and their legal counsel and any agents unaffiliated with GMO during the year ended February 28, 2023 is shown in the table below and is included in the Statements of Operations.
213
GMO Trust Funds
Notes to Financial Statements — (Continued)
February 28, 2023
| Fund Name | Independent Trustees and | |
Consolidated Alternative Allocation Fund | 9,524 | |
Benchmark-Free Allocation Fund | 221,637 | |
Benchmark-Free Fund | 64,683 | |
Global Asset Allocation Fund | 17,230 | |
Global Developed Equity Allocation Fund | 3,747 | |
Global Equity Allocation Fund | 65,284 | |
Consolidated Implementation Fund | 194,127 | |
International Developed Equity Allocation Fund | 9,752 | |
International Equity Allocation Fund | 24,303 | |
Consolidated SGM Major Markets Fund | 10,321 | |
Strategic Opportunities Allocation Fund | 7,499 |
Certain Funds incur fees and expenses indirectly as a shareholder in the underlying funds. For the year ended February 28, 2023, the Funds below had indirect fees and expenses greater than 0.01% of the Fund’s average daily net assets.
| Fund Name | Total Indirect Expenses | |
Consolidated Alternative Allocation Fund | 0.023% | |
Benchmark-Free Allocation Fund | 0.400%* | |
Benchmark-Free Fund | 0.117% | |
Global Asset Allocation Fund | 0.662%* | |
Global Developed Equity Allocation Fund | 0.516% | |
Global Equity Allocation Fund | 0.557% | |
International Developed Equity Allocation Fund | 0.605% | |
International Equity Allocation Fund | 0.654% | |
Strategic Opportunities Allocation Fund | 0.342% |
| * | Includes indirect interest and dividend expense on reverse repurchase agreements and short sales, respectively, and borrowing costs for investments sold short. |
The Funds are permitted to purchase or sell securities from or to other GMO Trust funds under specified conditions outlined in procedures adopted by the Trustees. The procedures have been designed to ensure that any purchase or sale of securities by a Fund from or to another GMO Trust fund complies with rule 17a-7 of the 1940 Act. Further, as defined under the procedures, each transaction is effectuated at the current market price. During the year ended February 28, 2023, Strategic Opportunities Allocation Fund engaged in cross trade sales in the amount of $8,936,387 with net realized losses of $1,366,724.
| 6. | Purchases and sales of securities |
Cost of purchases and proceeds from sales of securities, excluding short-term investments and including GMO U.S. Treasury Fund, if applicable, for the year ended February 28, 2023 are noted in the table below:
| Purchases ($) | Purchases ($) | Sales ($) | Sales ($) | |||||||||||||
| Fund Name | U.S. Government Securities | Investments (Non-U.S. Government Securities) | U.S. Government Securities | Investments (Non-U.S. Government Securities) | ||||||||||||
Consolidated Alternative Allocation Fund | 159,402,253 | 321,312,409 | 212,063,776 | 330,751,860 | ||||||||||||
Benchmark-Free Allocation Fund | — | 893,829,335 | — | 1,447,357,988 | ||||||||||||
Benchmark-Free Fund | 144,608,964 | 1,249,509,042 | 193,345,041 | 1,454,374,591 | ||||||||||||
Global Asset Allocation Fund | — | 129,478,223 | — | 359,250,179 | ||||||||||||
Global Developed Equity Allocation Fund | — | 28,359,121 | — | 38,471,458 | ||||||||||||
214
GMO Trust Funds
Notes to Financial Statements — (Continued)
February 28, 2023
| Purchases ($) | Purchases ($) | Sales ($) | Sales ($) | |||||||||||||
| U.S. Government | Investments (Non-U.S. | U.S. Government | Investments (Non-U.S. | |||||||||||||
| Fund Name | Securities | Government Securities) | Securities | Government Securities) | ||||||||||||
Global Equity Allocation Fund | — | 454,098,569 | — | 1,242,592,453 | ||||||||||||
Consolidated Implementation Fund | 545,532,858 | 3,924,238,070 | 580,916,074 | 4,267,631,827 | ||||||||||||
International Developed Equity Allocation Fund | — | 31,781,791 | — | 19,760,084 | ||||||||||||
International Equity Allocation Fund | — | 56,354,928 | — | 160,312,181 | ||||||||||||
Consolidated SGM Major Markets Fund | 114,765,278 | — | 232,992,078 | — | ||||||||||||
Strategic Opportunities Allocation Fund | 10,919,557 | 126,324,506 | 29,219,543 | 141,741,579 | ||||||||||||
| 7. | Guarantees |
In the normal course of business the Funds enter into contracts with third-party service providers that contain a variety of representations and warranties and that provide general indemnifications. The Funds’ maximum exposure under these arrangements is unknown, as it involves possible future claims that may or may not be made against the Funds. Based on experience, GMO is of the view that the risk of loss to the Funds in connection with the Funds’ indemnification obligations is remote; however, there can be no assurance that such obligations will not result in material liabilities that adversely affect the Funds.
| 8. | Principal shareholders as of February 28, 2023 |
| Percentage of | ||||||||
| outstanding shares of | ||||||||
| Number of | the Fund held by those | |||||||
| shareholders that held | shareholders owning | |||||||
| more than 10% of the | greater than 10% of the | |||||||
| outstanding shares of | outstanding shares of | |||||||
| Fund Name | the Fund | the Fund | ||||||
Alternative Allocation Fund | 3 | ‡ | 86.14 | % | ||||
Benchmark-Free Allocation Fund | 1 | 24.50 | % | |||||
Benchmark-Free Fund | 3 | 40.15 | % | |||||
Global Asset Allocation Fund | 1 | 21.27 | % | |||||
Global Developed Equity Allocation Fund | 2 | 99.80 | % | |||||
Global Equity Allocation Fund | 3 | 61.50 | % | |||||
Implementation Fund | 1 | ‡ | 100.00 | % | ||||
International Developed Equity Allocation Fund | 2 | 95.46 | % | |||||
International Equity Allocation Fund | 4 | 89.58 | % | |||||
SGM Major Markets Fund | 2 | # | 91.26 | % | ||||
Strategic Opportunities Allocation Fund | 3 | 84.45 | % | |||||
| ‡ | One of the shareholders is another fund of the Trust. |
| # | Two of the shareholders are other funds of the Trust. |
215
GMO Trust Funds
Notes to Financial Statements — (Continued)
February 28, 2023
| 9. | Share transactions |
The Declaration of Trust permits each Fund to issue an unlimited number of shares of beneficial interest (without par value). Transactions in the Funds’ shares were as follows:
| Year Ended | Year Ended | |||||||||||||||
| February 28, 2023 | February 28, 2022 | |||||||||||||||
| Shares | Amount | Shares | Amount | |||||||||||||
Consolidated Alternative Allocation Fund | ||||||||||||||||
Class VI: | ||||||||||||||||
Shares sold | 248,004 | $ | 4,519,995 | 451,346 | $ | 8,431,840 | ||||||||||
Shares issued to shareholders in reinvestment of distributions | 32,535 | 566,438 | 350,410 | 6,442,811 | ||||||||||||
Shares repurchased | (4,855,485 | ) | (86,707,512 | ) | (5,696,131 | ) | (106,350,858 | ) | ||||||||
|
|
|
|
|
|
|
| |||||||||
Net increase (decrease) | (4,574,946 | ) | $ | (81,621,079 | ) | (4,894,375 | ) | $ | (91,476,207 | ) | ||||||
|
|
|
|
|
|
|
| |||||||||
Class R6: | ||||||||||||||||
Shares sold | 296 | $ | 5,338 | 2,173 | $ | 39,785 | ||||||||||
Shares issued to shareholders in reinvestment of distributions | 14 | 239 | 831 | 15,298 | ||||||||||||
Shares repurchased | (1,299 | ) | (22,947 | ) | (27,006 | ) | (500,411 | ) | ||||||||
|
|
|
|
|
|
|
| |||||||||
Net increase (decrease) | (989 | ) | $ | (17,370 | ) | (24,002 | ) | $ | (445,328 | ) | ||||||
|
|
|
|
|
|
|
| |||||||||
Class I: | ||||||||||||||||
Shares sold | 2,656,932 | $ | 47,445,755 | 6,111,527 | $ | 113,826,130 | ||||||||||
Shares issued to shareholders in reinvestment of distributions | 40,690 | 704,752 | 190,953 | 3,500,091 | ||||||||||||
Shares repurchased | (2,957,606 | ) | (52,585,684 | ) | (12,228,627 | ) | (232,055,396 | ) | ||||||||
|
|
|
|
|
|
|
| |||||||||
Net increase (decrease) | (259,984 | ) | $ | (4,435,177 | ) | (5,926,147 | ) | $ | (114,729,175 | ) | ||||||
|
|
|
|
|
|
|
| |||||||||
Benchmark-Free Allocation Fund | ||||||||||||||||
Class III: | ||||||||||||||||
Shares sold | 6,170,726 | $ | 153,112,114 | 6,218,317 | $ | 163,296,953 | ||||||||||
Shares issued to shareholders in reinvestment of distributions | 1,700,038 | 41,055,923 | 1,502,582 | 38,090,456 | ||||||||||||
Shares repurchased | (13,268,957 | ) | (323,224,193 | ) | (25,965,137 | ) | (690,286,283 | ) | ||||||||
|
|
|
|
|
|
|
| |||||||||
Net increase (decrease) | (5,398,193 | ) | $ | (129,056,156 | ) | (18,244,238 | ) | $ | (488,898,874 | ) | ||||||
|
|
|
|
|
|
|
| |||||||||
Class IV: | ||||||||||||||||
Shares sold | 6,932,185 | $ | 170,895,298 | 9,376,363 | $ | 249,787,539 | ||||||||||
Shares issued to shareholders in reinvestment of distributions | 1,108,221 | 26,763,533 | 1,019,586 | 25,846,502 | ||||||||||||
Shares repurchased | (14,851,062 | ) | (366,844,337 | ) | (31,796,804 | ) | (829,350,870 | ) | ||||||||
|
|
|
|
|
|
|
| |||||||||
Net increase (decrease) | (6,810,656 | ) | $ | (169,185,506 | ) | (21,400,855 | ) | $ | (553,716,829 | ) | ||||||
|
|
|
|
|
|
|
| |||||||||
Class MF: | ||||||||||||||||
Shares sold | 2,625,655 | $ | 65,056,569 | 1,764,590 | $ | 46,575,757 | ||||||||||
Shares issued to shareholders in reinvestment of distributions | 1,413,113 | 34,154,940 | 1,367,575 | 34,695,369 | ||||||||||||
Shares repurchased | (14,268,897 | ) | (347,835,107 | ) | (15,595,646 | ) | (411,391,047 | ) | ||||||||
|
|
|
|
|
|
|
| |||||||||
Net increase (decrease) | (10,230,129 | ) | $ | (248,623,598 | ) | (12,463,481 | ) | $ | (330,119,921 | ) | ||||||
|
|
|
|
|
|
|
| |||||||||
Class R6: | ||||||||||||||||
Shares sold | 3,970,400 | $ | 97,481,607 | 3,354,486 | $ | 88,104,972 | ||||||||||
Shares issued to shareholders in reinvestment of distributions | 348,177 | 8,401,511 | 231,232 | 5,857,098 | ||||||||||||
Shares repurchased | (3,693,731 | ) | (89,437,851 | ) | (4,851,336 | ) | (129,002,250 | ) | ||||||||
|
|
|
|
|
|
|
| |||||||||
Net increase (decrease) | 624,846 | $ | 16,445,267 | (1,265,618 | ) | $ | (35,040,180 | ) | ||||||||
|
|
|
|
|
|
|
| |||||||||
216
GMO Trust Funds
Notes to Financial Statements — (Continued)
February 28, 2023
| Year Ended | Year Ended | |||||||||||||||
| February 28, 2023 | February 28, 2022 | |||||||||||||||
| Shares | Amount | Shares | Amount | |||||||||||||
Benchmark-Free Allocation Fund (continued) | ||||||||||||||||
Class I: | ||||||||||||||||
Shares sold | 4,738,564 | $ | 116,465,587 | 4,397,334 | $ | 116,032,792 | ||||||||||
Shares issued to shareholders in reinvestment of distributions | 304,924 | 7,357,817 | 286,161 | 7,248,470 | ||||||||||||
Shares repurchased | (6,742,198 | ) | (163,274,941 | ) | (2,900,373 | ) | (76,507,018 | ) | ||||||||
|
|
|
|
|
|
|
| |||||||||
Net increase (decrease) | (1,698,710 | ) | $ | (39,451,537 | ) | 1,783,122 | $ | 46,774,244 | ||||||||
|
|
|
|
|
|
|
| |||||||||
Benchmark-Free Fund | ||||||||||||||||
Class III: | ||||||||||||||||
Shares sold | 1,484,656 | $ | 24,689,894 | — | $ | — | ||||||||||
Shares issued to shareholders in reinvestment of distributions | 3,920,225 | 67,377,050 | 4,034,320 | 76,313,230 | ||||||||||||
Shares repurchased | (26,235,497 | ) | (470,868,019 | ) | (29,222,706 | ) | (564,384,055 | ) | ||||||||
|
|
|
|
|
|
|
| |||||||||
Net increase (decrease) | (20,830,616 | ) | $ | (378,801,075 | ) | (25,188,386 | ) | $ | (488,070,825 | ) | ||||||
|
|
|
|
|
|
|
| |||||||||
Global Asset Allocation Fund | ||||||||||||||||
Class III: | ||||||||||||||||
Shares sold | 473,497 | $ | 14,575,090 | 1,002,856 | $ | 36,431,590 | ||||||||||
Shares issued to shareholders in reinvestment of distributions | 357,538 | 10,298,498 | 920,717 | 31,925,106 | ||||||||||||
Shares repurchased | (8,400,721 | ) | (259,575,083 | ) | (3,947,615 | ) | (142,005,422 | ) | ||||||||
|
|
|
|
|
|
|
| |||||||||
Net increase (decrease) | (7,569,686 | ) | $ | (234,701,495 | ) | (2,024,042 | ) | $ | (73,648,726 | ) | ||||||
|
|
|
|
|
|
|
| |||||||||
Class R6: | ||||||||||||||||
Shares sold | 64,764 | $ | 1,982,932 | 106,284 | $ | 3,777,306 | ||||||||||
Shares issued to shareholders in reinvestment of distributions | 11,108 | 319,734 | 19,569 | 679,038 | ||||||||||||
Shares repurchased | (188,328 | ) | (5,666,318 | ) | (4,570,426 | ) | (166,223,124 | ) | ||||||||
|
|
|
|
|
|
|
| |||||||||
Net increase (decrease) | (112,456 | ) | $ | (3,363,652 | ) | (4,444,573 | ) | $ | (161,766,780 | ) | ||||||
|
|
|
|
|
|
|
| |||||||||
Class I: | ||||||||||||||||
Shares sold | 466,367 | $ | 13,525,172 | 50,466 | $ | 1,828,908 | ||||||||||
Shares issued to shareholders in reinvestment of distributions | 18,361 | 528,965 | 21,862 | 758,336 | ||||||||||||
Shares repurchased | (420,725 | ) | (12,679,758 | ) | (275,252 | ) | (9,978,958 | ) | ||||||||
|
|
|
|
|
|
|
| |||||||||
Net increase (decrease) | 64,003 | $ | 1,374,379 | (202,924 | ) | $ | (7,391,714 | ) | ||||||||
|
|
|
|
|
|
|
| |||||||||
Global Developed Equity Allocation Fund | ||||||||||||||||
Class III: | ||||||||||||||||
Shares issued to shareholders in reinvestment of distributions | 259,677 | $ | 5,190,290 | 380,228 | $ | 9,954,295 | ||||||||||
Shares repurchased | (739,254 | ) | (15,371,367 | ) | (245,335 | ) | (6,979,443 | ) | ||||||||
|
|
|
|
|
|
|
| |||||||||
Net increase (decrease) | (479,577 | ) | $ | (10,181,077 | ) | 134,893 | $ | 2,974,852 | ||||||||
|
|
|
|
|
|
|
| |||||||||
Global Equity Allocation Fund | ||||||||||||||||
Class III: | ||||||||||||||||
Shares sold | 1,532,903 | $ | 37,757,925 | 1,623 | $ | 50,000 | ||||||||||
Shares issued to shareholders in reinvestment of distributions | 3,990,115 | 92,127,935 | 3,748,182 | 114,586,982 | ||||||||||||
Shares repurchased | (37,940,588 | ) | (937,379,548 | ) | (3,319,307 | ) | (106,672,406 | ) | ||||||||
|
|
|
|
|
|
|
| |||||||||
Net increase (decrease) | (32,417,570 | ) | $ | (807,493,688 | ) | 430,498 | $ | 7,964,576 | ||||||||
|
|
|
|
|
|
|
| |||||||||
217
GMO Trust Funds
Notes to Financial Statements — (Continued)
February 28, 2023
| Year Ended | Year Ended | |||||||||||||||
| February 28, 2023 | February 28, 2022 | |||||||||||||||
| Shares | Amount | Shares | Amount | |||||||||||||
Global Equity Allocation Fund (continued) | ||||||||||||||||
Class R6: | ||||||||||||||||
Shares sold | 1,173,061 | $ | 29,466,929 | 29,814 | $ | 945,665 | ||||||||||
Shares issued to shareholders in reinvestment of distributions | 19,127 | 441,589 | 17,711 | 541,431 | ||||||||||||
Shares repurchased | (44,928 | ) | (1,113,582 | ) | (25,923 | ) | (837,307 | ) | ||||||||
|
|
|
|
|
|
|
| |||||||||
Net increase (decrease) | 1,147,260 | $ | 28,794,936 | 21,602 | $ | 649,789 | ||||||||||
|
|
|
|
|
|
|
| |||||||||
Class I: | ||||||||||||||||
Shares sold | 170,599 | $ | 4,396,674 | 16,756 | $ | 528,647 | ||||||||||
Shares issued to shareholders in reinvestment of distributions | 16,381 | 377,718 | 6,260 | 191,269 | ||||||||||||
Shares repurchased | (75,618 | ) | (1,802,725 | ) | (5,730 | ) | (184,132 | ) | ||||||||
|
|
|
|
|
|
|
| |||||||||
Net increase (decrease) | 111,362 | $ | 2,971,667 | 17,286 | $ | 535,784 | ||||||||||
|
|
|
|
|
|
|
| |||||||||
Consolidated Implementation Fund | ||||||||||||||||
Core Class: | ||||||||||||||||
Shares sold | 27,254,347 | $ | 330,599,610 | 17,972,770 | $ | 234,356,377 | ||||||||||
Shares issued to shareholders in reinvestment of distributions | 11,299,681 | 132,069,652 | 12,158,465 | 150,035,453 | ||||||||||||
Shares repurchased | (107,765,470 | ) | (1,293,197,003 | ) | (126,745,748 | ) | (1,639,490,784 | ) | ||||||||
|
|
|
|
|
|
|
| |||||||||
Net increase (decrease) | (69,211,442 | ) | $ | (830,527,741 | ) | (96,614,513 | ) | $ | (1,255,098,954 | ) | ||||||
|
|
|
|
|
|
|
| |||||||||
International Developed Equity Allocation Fund |
| |||||||||||||||
Class III: | ||||||||||||||||
Shares sold | 2,054,507 | $ | 30,234,734 | 1,325,004 | $ | 23,754,550 | ||||||||||
Shares issued to shareholders in reinvestment of distributions | 368,396 | 5,246,314 | 509,965 | 8,777,681 | ||||||||||||
Shares repurchased | (1,541,811 | ) | (23,674,258 | ) | (1,049,987 | ) | (18,578,827 | ) | ||||||||
|
|
|
|
|
|
|
| |||||||||
Net increase (decrease) | 881,092 | $ | 11,806,790 | 784,982 | $ | 13,953,404 | ||||||||||
|
|
|
|
|
|
|
| |||||||||
Class R6: | ||||||||||||||||
Shares sold | 28,805 | $ | 427,463 | 40,654 | $ | 734,355 | ||||||||||
Shares issued to shareholders in reinvestment of distributions | 22,740 | 323,823 | 31,628 | 544,452 | ||||||||||||
Shares repurchased | (26,596 | ) | (382,957 | ) | (53,617 | ) | (965,399 | ) | ||||||||
|
|
|
|
|
|
|
| |||||||||
Net increase (decrease) | 24,949 | $ | 368,329 | 18,665 | $ | 313,408 | ||||||||||
|
|
|
|
|
|
|
| |||||||||
International Equity Allocation Fund | ||||||||||||||||
Class III: | ||||||||||||||||
Shares sold | 1,109,511 | $ | 28,343,983 | 221,915 | $ | 7,458,093 | ||||||||||
Shares issued to shareholders in reinvestment of distributions | 513,528 | 12,524,610 | 913,296 | 29,091,830 | ||||||||||||
Shares repurchased | (5,222,926 | ) | (144,440,511 | ) | (4,811,910 | ) | (155,557,290 | ) | ||||||||
|
|
|
|
|
|
|
| |||||||||
Net increase (decrease) | (3,599,887 | ) | $ | (103,571,918 | ) | (3,676,699 | ) | $ | (119,007,367 | ) | ||||||
|
|
|
|
|
|
|
| |||||||||
Class R6: | ||||||||||||||||
Shares sold | 318,017 | $ | 8,752,419 | 168,085 | $ | 5,589,401 | ||||||||||
Shares issued to shareholders in reinvestment of distributions | 414,604 | 10,107,910 | 481,805 | 15,335,754 | ||||||||||||
Shares repurchased | (898,761 | ) | (22,014,901 | ) | (556,099 | ) | (18,171,988 | ) | ||||||||
|
|
|
|
|
|
|
| |||||||||
Net increase (decrease) | (166,140 | ) | $ | (3,154,572 | ) | 93,791 | $ | 2,753,167 | ||||||||
|
|
|
|
|
|
|
| |||||||||
218
GMO Trust Funds
Notes to Financial Statements — (Continued)
February 28, 2023
| Year Ended | Year Ended | |||||||||||||||
| February 28, 2023 | February 28, 2022 | |||||||||||||||
| Shares | Amount | Shares | Amount | |||||||||||||
Consolidated SGM Major Markets Fund | ||||||||||||||||
Class III: | ||||||||||||||||
Shares sold | 207,587 | $ | 5,795,420 | 665,260 | $ | 20,088,895 | ||||||||||
Shares issued to shareholders in reinvestment of distributions | 1,124 | 29,625 | 1,205 | 35,766 | ||||||||||||
Shares repurchased | (1,210,226 | ) | (33,150,649 | ) | (486,422 | ) | (14,257,990 | ) | ||||||||
|
|
|
|
|
|
|
| |||||||||
Net increase (decrease) | (1,001,515 | ) | $ | (27,325,604 | ) | 180,043 | $ | 5,866,671 | ||||||||
|
|
|
|
|
|
|
| |||||||||
Class VI: | ||||||||||||||||
Shares sold | 597 | $ | 16,927 | 1,958,773 | $ | 61,237,349 | ||||||||||
Shares issued to shareholders in reinvestment of distributions | 475,727 | 12,534,788 | 723,031 | 21,457,199 | ||||||||||||
Shares repurchased | (3,289,239 | ) | (89,638,909 | ) | (5,419,611 | ) | (160,325,548 | ) | ||||||||
|
|
|
|
|
|
|
| |||||||||
Net increase (decrease) | (2,812,915 | ) | $ | (77,087,194 | ) | (2,737,807 | ) | $ | (77,631,000 | ) | ||||||
|
|
|
|
|
|
|
| |||||||||
Class I: | ||||||||||||||||
Shares sold | 101,479 | $ | 2,869,440 | 884,435 | $ | 26,693,141 | ||||||||||
Shares issued to shareholders in reinvestment of distributions | 39,730 | 1,043,505 | 40,852 | 1,208,514 | ||||||||||||
Shares repurchased | (684,304 | ) | (18,390,403 | ) | (647,184 | ) | (18,902,142 | ) | ||||||||
|
|
|
|
|
|
|
| |||||||||
Net increase (decrease) | (543,095 | ) | $ | (14,477,458 | ) | 278,103 | $ | 8,999,513 | ||||||||
|
|
|
|
|
|
|
| |||||||||
Strategic Opportunities Allocation Fund | ||||||||||||||||
Class III: | ||||||||||||||||
Shares sold | 1,043,303 | $ | 16,819,874 | 407,969 | $ | 8,475,000 | ||||||||||
Shares issued to shareholders in reinvestment of distributions | 819,400 | 12,262,878 | 2,573,255 | 51,157,762 | ||||||||||||
Shares repurchased | (2,895,646 | ) | (47,123,159 | ) | (16,664,409 | ) | (361,479,168 | ) | ||||||||
|
|
|
|
|
|
|
| |||||||||
Net increase (decrease) | (1,032,943 | ) | $ | (18,040,407 | ) | (13,683,185 | ) | $ | (301,846,406 | ) | ||||||
|
|
|
|
|
|
|
| |||||||||
| 10. | Investments in affiliated companies and other Funds of the Trust |
An affiliated company for the purposes of this disclosure is a company in which a Fund has or had direct ownership of at least 5% of the issuer’s voting securities or an investment in other funds of GMO Trust. A summary of the Funds’ transactions involving companies that are or were affiliates during the year ended February 28, 2023 is set forth below:
| Affiliate | Value, beginning of period | Purchases | Sales Proceeds | Dividend Income | Distributions of Realized Gains | Net Realized Gain | Net Decrease in Unrealized Appreciation/ Depreciation | Value, end period | ||||||||||||||||||||||||
Consolidated Alternative Allocation Fund | ||||||||||||||||||||||||||||||||
GMO Emerging Markets ex-China Fund, Class VI | $ | — | $ | 6,060,878 | $ | — | $ | 233,376 | $ | — | $ | — | $ | (306,279 | ) | $ | 5,754,599 | |||||||||||||||
GMO Emerging Markets Fund, Class VI | 9,811,873 | — | 8,145,879 | 104,779 | — | (3,146,257 | ) | 1,480,263 | — | |||||||||||||||||||||||
|
|
|
|
|
|
|
|
|
|
|
|
|
|
|
| |||||||||||||||||
Totals | $ | 9,811,873 | $ | 6,060,878 | $ | 8,145,879 | $ | 338,155 | $ | — | $ | (3,146,257 | ) | $ | 1,173,984 | $ | 5,754,599 | |||||||||||||||
|
|
|
|
|
|
|
|
|
|
|
|
|
|
|
| |||||||||||||||||
Benchmark-Free Allocation Fund | ||||||||||||||||||||||||||||||||
GMO Emerging Country Debt Fund, Class VI | $ | 115,273,843 | $ | 140,209,129 | $ | — | $ | 25,609,130 | $ | — | $ | — | $ | (30,043,761 | ) | $ | 225,439,211 | |||||||||||||||
219
GMO Trust Funds
Notes to Financial Statements — (Continued)
February 28, 2023
| Affiliate | Value, beginning of period | Purchases | Sales Proceeds | Dividend Income | Distributions of Realized Gains | Net Realized Gain (Loss) | Net Decrease in Unrealized Appreciation/ Depreciation | Value, end of period | ||||||||||||||||||||||||
Benchmark-Free Allocation Fund (continued) |
| |||||||||||||||||||||||||||||||
GMO High Yield Fund, Class VI | $ | — | $ | 150,791,758 | $ | 57,480,000 | $ | 6,525,802 | $ | 265,956 | $ | 1,087,784 | $ | (3,729,525 | ) | $ | 90,670,017 | |||||||||||||||
GMO Implementation Fund | 4,681,432,538 | 462,663,953 | 1,293,197,002 | 132,069,652 | — | (67,259,706 | ) | (49,186,947 | ) | 3,734,452,836 | ||||||||||||||||||||||
GMO Opportunistic Income Fund, Class VI | 183,719,672 | 131,711,558 | 40,813,277 | 8,463,024 | 2,748,534 | (3,036,145 | ) | (8,142,873 | ) | 263,438,935 | ||||||||||||||||||||||
GMO SGM Major Markets Fund, Class VI | 141,735,622 | 8,452,937 | 55,867,709 | 2,754,904 | 5,698,032 | (10,395,751 | ) | 4,661,781 | 88,586,880 | |||||||||||||||||||||||
|
|
|
|
|
|
|
|
|
|
|
|
|
|
|
| |||||||||||||||||
Totals | $ | 5,122,161,675 | $ | 893,829,335 | $ | 1,447,357,988 | $ | 175,422,512 | $ | 8,712,522 | $ | (79,603,818 | ) | $ | (86,441,325 | ) | $ | 4,402,587,879 | ||||||||||||||
|
|
|
|
|
|
|
|
|
|
|
|
|
|
|
| |||||||||||||||||
Benchmark-Free Fund | ||||||||||||||||||||||||||||||||
GMO Emerging Country Debt Fund, Class VI | $ | 48,097,631 | $ | 46,433,342 | $ | — | $ | 9,433,342 | $ | — | $ | — | $ | (11,410,689 | ) | $ | 83,120,284 | |||||||||||||||
GMO Emerging Markets Fund, Class VI | 34,016,640 | — | 30,376,060 | — | — | (8,199,771 | ) | 4,559,191 | — | |||||||||||||||||||||||
GMO High Yield Fund, Class VI | — | 77,221,091 | 11,000,000 | 4,587,190 | 133,901 | 190,438 | (2,676,750 | ) | 63,734,779 | |||||||||||||||||||||||
GMO Opportunistic Income Fund, Class VI | 91,945,071 | 1,998,978 | 20,500,000 | 2,782,728 | 1,319,462 | (198,526 | ) | (4,609,894 | ) | 68,635,629 | ||||||||||||||||||||||
GMO Resources Fund | — | 63,505,821 | 16,220,000 | 2,111,386 | 3,154,435 | (3,903,419 | ) | (2,301,153 | ) | 41,081,249 | ||||||||||||||||||||||
GMO SGM Major Markets Fund, Class VI | 60,781,806 | 3,843,412 | 32,500,000 | 1,227,946 | 2,615,466 | (4,964,150 | ) | 1,914,404 | 29,075,472 | |||||||||||||||||||||||
GMO U.S. Treasury Fund | 10,090,292 | 105,425,734 | 114,202,520 | — | * | — | (124,846 | ) | 41,801 | 1,230,461 | ||||||||||||||||||||||
|
|
|
|
|
|
|
|
|
|
|
|
|
|
|
| |||||||||||||||||
Totals | $ | 244,931,440 | $ | 298,428,378 | $ | 224,798,580 | $ | 20,142,592 | $ | 7,223,264 | $ | (17,200,274 | ) | $ | (14,483,090 | ) | $ | 286,877,874 | ||||||||||||||
|
|
|
|
|
|
|
|
|
|
|
|
|
|
|
| |||||||||||||||||
Global Asset Allocation Fund |
| |||||||||||||||||||||||||||||||
GMO Alternative Allocation Fund, Class VI | $ | 130,004,197 | $ | 5,078,340 | $ | 86,650,030 | $ | — | $ | 558,341 | $ | (9,371,807 | ) | $ | 9,350,811 | $ | 48,411,511 | |||||||||||||||
GMO Asset Allocation Bond Fund, Class VI | 37,983,141 | 3,474,703 | 17,266,124 | 157,843 | — | (712,199 | ) | (3,365,849 | ) | 20,113,672 | ||||||||||||||||||||||
GMO Emerging Country Debt Fund, Class VI | 18,116,964 | 1,358,606 | 6,400,000 | 1,358,606 | — | (2,571,105 | ) | (35,565 | ) | 10,468,900 | ||||||||||||||||||||||
GMO Emerging Markets ex-China Fund, Class VI | 27,671,845 | 11,907,038 | 11,376,422 | 1,004,120 | 90,494 | (3,265,336 | ) | (1,583,044 | ) | 23,354,081 | ||||||||||||||||||||||
GMO Emerging Markets Fund, Class VI | 68,376,141 | 11,131,024 | 37,565,470 | 2,436,131 | — | (13,622,831 | ) | (2,321,175 | ) | 25,997,689 | ||||||||||||||||||||||
GMO High Yield Fund, Class VI | — | 9,284,625 | 2,136,785 | 498,926 | 15,699 | (2,924 | ) | (276,378 | ) | 6,868,538 | ||||||||||||||||||||||
GMO International Equity Fund, Class IV | 107,093,353 | 8,728,933 | 48,383,157 | 2,738,896 | — | (3,582,243 | ) | (2,102,160 | ) | 61,754,726 | ||||||||||||||||||||||
GMO-Usonian Japan Value Creation Fund, Class VI | 24,981,389 | 1,191,147 | 9,227,123 | 156,750 | 804,397 | (1,287,814 | ) | (1,862,553 | ) | 13,795,046 | ||||||||||||||||||||||
GMO Multi-Sector Fixed Income Fund, Class IV | 56,164,303 | 19,194,688 | 28,517,096 | 779,679 | — | (5,320,500 | ) | (861,511 | ) | 40,659,884 | ||||||||||||||||||||||
GMO Opportunistic Income Fund, Class VI | 19,591,715 | 1,654,325 | 10,100,726 | 403,538 | 170,787 | (533,972 | ) | (207,844 | ) | 10,403,498 | ||||||||||||||||||||||
GMO Quality Cyclicals Fund, Class VI | 20,219,676 | 1,766,248 | 9,571,627 | 316,381 | 1,044,382 | 1,569,790 | (3,615,302 | ) | 10,368,785 | |||||||||||||||||||||||
GMO Quality Fund, Class VI | 12,268,439 | 4,548,667 | 5,848,561 | 119,580 | 899,637 | 923,586 | (2,317,432 | ) | 9,574,699 | |||||||||||||||||||||||
220
GMO Trust Funds
Notes to Financial Statements — (Continued)
February 28, 2023
| Affiliate | Value, beginning of period | Purchases | Sales Proceeds | Dividend Income | Distributions of Realized Gains | Net Realized Gain (Loss) | Net Decrease in Unrealized Appreciation/ Depreciation | Value, end of period | ||||||||||||||||||||||||
Global Asset Allocation Fund (continued) |
| |||||||||||||||||||||||||||||||
GMO Small Cap Quality Fund, Class VI | $ | — | $ | 11,844,426 | $ | 2,427,458 | $ | 7,082 | $ | 832,169 | $ | 81,671 | $ | 1,156,161 | $ | 10,654,800 | ||||||||||||||||
GMO U.S. Equity Fund, Class VI | 61,434,084 | 5,193,304 | 46,608,629 | 516,130 | 2,276,653 | (6,787,882 | ) | 3,440,301 | 16,671,178 | |||||||||||||||||||||||
GMO U.S. Opportunistic Value Fund, Class VI | — | 25,103,805 | 2,315,000 | 33,805 | — | 20,140 | 199,119 | 23,008,064 | ||||||||||||||||||||||||
GMO U.S. Small Cap Value Fund, Class VI | 39,124,376 | 2,723,764 | 29,568,549 | 311,448 | 1,885,586 | (5,823,113 | ) | 605,330 | 7,061,808 | |||||||||||||||||||||||
GMO U.S. Treasury Fund | 1,879 | 5,294,580 | 5,287,422 | 4,726 | — | (1,011 | ) | 10 | 8,036 | |||||||||||||||||||||||
|
|
|
|
|
|
|
|
|
|
|
|
|
|
|
| |||||||||||||||||
Totals | $ | 623,031,502 | $ | 129,478,223 | $ | 359,250,179 | $ | 10,843,641 | $ | 8,578,145 | $ | (50,287,550 | ) | $ | (3,797,081 | ) | $ | 339,174,915 | ||||||||||||||
|
|
|
|
|
|
|
|
|
|
|
|
|
|
|
| |||||||||||||||||
Global Developed Equity Allocation Fund |
| |||||||||||||||||||||||||||||||
GMO Emerging Markets ex-China Fund, Class VI | $ | 5,198,953 | $ | 2,516,161 | $ | 1,320,000 | $ | 268,165 | $ | 23,977 | $ | (718,946 | ) | $ | (467,828 | ) | $ | 5,208,340 | ||||||||||||||
GMO Emerging Markets Fund, Class VI | 2,322,106 | 562,145 | 2,324,018 | 32,146 | — | (991,127 | ) | 430,894 | — | |||||||||||||||||||||||
GMO International Equity Fund, Class IV | 35,410,730 | 1,390,251 | 8,326,440 | 1,390,251 | — | 444,029 | (2,873,145 | ) | 26,045,425 | |||||||||||||||||||||||
GMO-Usonian Japan Value Creation Fund, Class VI | 3,551,214 | 176,878 | 555,000 | 31,478 | 145,400 | (127,919 | ) | (391,930 | ) | 2,653,243 | ||||||||||||||||||||||
GMO Quality Cyclicals Fund, Class VI | 4,855,891 | 447,349 | 800,000 | 101,788 | 345,561 | 101,613 | (752,091 | ) | 3,852,762 | |||||||||||||||||||||||
GMO Quality Fund, Class VI | 10,955,561 | 4,544,140 | 4,135,000 | 129,062 | 989,079 | 425,057 | (2,321,015 | ) | 9,468,743 | |||||||||||||||||||||||
GMO Small Cap Quality Fund, Class VI | — | 3,802,457 | 400,000 | 2,671 | 299,785 | 32,353 | 401,767 | 3,836,577 | ||||||||||||||||||||||||
GMO U.S. Equity Fund, Class VI | 15,406,078 | 2,222,608 | 12,326,000 | 220,187 | 802,421 | (972,425 | ) | (262,822 | ) | 4,067,439 | ||||||||||||||||||||||
GMO U.S. Opportunistic Value Fund, Class VI | — | 12,016,920 | 2,000,000 | 16,920 | — | (71,465 | ) | 95,371 | 10,040,826 | |||||||||||||||||||||||
GMO U.S. Small Cap Value Fund, Class VI | 9,077,255 | 680,212 | 6,285,000 | 113,530 | 566,682 | (1,466,449 | ) | (194,494 | ) | 1,811,524 | ||||||||||||||||||||||
|
|
|
|
|
|
|
|
|
|
|
|
|
|
|
| |||||||||||||||||
Totals | $ | 86,777,788 | $ | 28,359,121 | $ | 38,471,458 | $ | 2,306,198 | $ | 3,172,905 | $ | (3,345,279 | ) | $ | (6,335,293 | ) | $ | 66,984,879 | ||||||||||||||
|
|
|
|
|
|
|
|
|
|
|
|
|
|
|
| |||||||||||||||||
Global Equity Allocation Fund |
| |||||||||||||||||||||||||||||||
GMO Emerging Markets ex-China Fund, Class VI | $ | 109,848,838 | $ | 56,326,707 | $ | 85,820,000 | $ | 5,486,155 | $ | 495,551 | (16,056,512 | ) | $ | (6,726,628 | ) | $ | 57,572,405 | |||||||||||||||
GMO Emerging Markets Fund, Class VI | 234,294,075 | 53,555,581 | 157,395,000 | 13,340,582 | — | (53,265,042 | ) | (10,325,352 | ) | 66,864,262 | ||||||||||||||||||||||
GMO International Equity Fund, Class IV | 558,402,561 | 30,040,035 | 360,423,227 | 19,740,035 | — | (24,716,488 | ) | (9,582,837 | ) | 193,720,044 | ||||||||||||||||||||||
GMO-Usonian Japan Value Creation Fund, Class VI | 64,071,354 | 5,765,903 | 37,086,524 | 555,558 | 2,640,345 | (5,654,370 | ) | (3,551,446 | ) | 23,544,917 | ||||||||||||||||||||||
GMO Quality Cyclicals Fund, Class VI | 88,997,330 | 7,690,898 | 56,835,000 | 1,770,896 | 5,920,002 | 6,470,978 | (17,554,022 | ) | 28,770,184 | |||||||||||||||||||||||
GMO Quality Fund, Class VI | 217,951,740 | 21,269,342 | 136,240,318 | 2,309,151 | 17,875,190 | 4,706,369 | (36,149,633 | ) | 71,537,500 | |||||||||||||||||||||||
GMO Small Cap Quality Fund, Class VI | — | 67,481,819 | 46,960,000 | 47,304 | 4,289,516 | 6,807,117 | 2,422,053 | 29,750,989 | ||||||||||||||||||||||||
221
GMO Trust Funds
Notes to Financial Statements — (Continued)
February 28, 2023
| Affiliate | Value, beginning of period | Purchases | Sales Proceeds | Dividend Income | Distributions of Realized Gains | Net Realized Gain (Loss) | Net Decrease in Unrealized Appreciation/ Depreciation | Value, end of period | ||||||||||||||||||||||||
Global Equity Allocation Fund (continued) |
| |||||||||||||||||||||||||||||||
GMO U.S. Equity Fund, Class VI | $ | 142,993,024 | $ | 33,172,484 | $ | 134,532,384 | $ | 1,981,180 | $ | 6,891,303 | (18,586,181 | ) | $ | 6,652,499 | $ | 29,699,442 | ||||||||||||||||
GMO U.S. Opportunistic Value Fund, Class VI | — | 160,225,600 | 91,755,000 | 225,600 | — | 1,684,389 | 666,472 | 70,821,461 | ||||||||||||||||||||||||
GMO U.S. Small Cap Value Fund, Class VI | 163,718,031 | 18,570,200 | 135,545,000 | 1,865,617 | 10,259,584 | (31,606,365 | ) | 1,965,869 | 17,102,735 | |||||||||||||||||||||||
|
|
|
|
|
|
|
|
|
|
|
|
|
|
|
| |||||||||||||||||
Totals | $ | 1,580,276,953 | $ | 454,098,569 | $ | 1,242,592,453 | $ | 47,322,078 | $ | 48,371,491 | $ | (130,216,105 | ) | $ | (72,183,025 | ) | $ | 589,383,939 | ||||||||||||||
|
|
|
|
|
|
|
|
|
|
|
|
|
|
|
| |||||||||||||||||
Consolidated Implementation Fund |
| |||||||||||||||||||||||||||||||
GMO U.S. Treasury Fund | $ | 12,509,088 | $ | 259,258,208 | $ | 270,489,651 | $ | — | * | $ | — | $ | (218,844 | ) | $ | 60,867 | $ | 1,119,668 | ||||||||||||||
|
|
|
|
|
|
|
|
|
|
|
|
|
|
|
| |||||||||||||||||
International Developed Equity Allocation Fund |
| |||||||||||||||||||||||||||||||
GMO Emerging Markets ex-China Fund, Class VI | $ | 16,722,440 | $ | 5,540,527 | $ | 664,160 | $ | 703,820 | $ | 74,309 | $ | (349,240 | ) | $ | (3,233,409 | ) | $ | 18,016,158 | ||||||||||||||
GMO International Equity Fund, Class IV | 204,248,674 | 24,203,258 | 17,989,552 | 7,768,743 | — | (1,085,812 | ) | (9,434,546 | ) | 199,942,022 | ||||||||||||||||||||||
GMO-Usonian Japan Value Creation Fund, Class VI | 9,520,380 | 2,038,006 | 1,106,372 | 86,410 | 393,375 | (229,605 | ) | (1,049,680 | ) | 9,172,729 | ||||||||||||||||||||||
|
|
|
|
|
|
|
|
|
|
|
|
|
|
|
| |||||||||||||||||
Totals | $ | 230,491,494 | $ | 31,781,791 | $ | 19,760,084 | $ | 8,558,973 | $ | 467,684 | $ | (1,664,657 | ) | $ | (13,717,635 | ) | $ | 227,130,909 | ||||||||||||||
|
|
|
|
|
|
|
|
|
|
|
|
|
|
|
| |||||||||||||||||
International Equity Allocation Fund |
| |||||||||||||||||||||||||||||||
GMO Emerging Markets ex-China Fund, Class VI | $ | 51,415,947 | $ | 6,736,482 | $ | 8,810,000 | $ | 1,642,550 | $ | 181,351 | $ | (2,886,231 | ) | $ | (6,847,242 | ) | $ | 39,608,956 | ||||||||||||||
GMO Emerging Markets Fund, Class VI | 195,154,856 | 28,209,322 | 33,520,000 | 10,901,507 | — | (8,126,214 | ) | (40,800,909 | ) | 140,917,055 | ||||||||||||||||||||||
GMO International Equity Fund, Class IV | 404,162,685 | 19,185,527 | 110,852,181 | 12,232,611 | — | (1,492,366 | ) | (19,410,855 | ) | 291,592,810 | ||||||||||||||||||||||
GMO-Usonian Japan Value Creation Fund, Class VI | 28,241,638 | 2,223,597 | 7,130,000 | 203,510 | 972,803 | (1,112,699 | ) | (2,532,964 | ) | 19,689,572 | ||||||||||||||||||||||
|
|
|
|
|
|
|
|
|
|
|
|
|
|
|
| |||||||||||||||||
Totals | $ | 678,975,126 | $ | 56,354,928 | $ | 160,312,181 | $ | 24,980,178 | $ | 1,154,154 | $ | (13,617,510 | ) | $ | (69,591,970 | ) | $ | 491,808,393 | ||||||||||||||
|
|
|
|
|
|
|
|
|
|
|
|
|
|
|
| |||||||||||||||||
Strategic Opportunities Allocation Fund |
| |||||||||||||||||||||||||||||||
GMO Emerging Country Debt Fund, Class VI | $ | 8,106,380 | $ | 935,169 | $ | 1,255,000 | $ | 935,169 | $ | — | $ | (676,063 | ) | $ | (723,835 | ) | $ | 6,386,651 | ||||||||||||||
GMO Emerging Markets ex-China Fund, Class VI | 14,945,997 | 6,301,557 | 1,375,000 | 741,543 | 60,014 | (686,469 | ) | (2,314,600 | ) | 16,871,485 | ||||||||||||||||||||||
GMO Emerging Markets Fund, Class VI | 30,720,697 | 4,434,048 | 10,225,000 | 1,534,048 | — | (4,125,405 | ) | (4,136,240 | ) | 16,668,100 | ||||||||||||||||||||||
GMO International Equity Fund, Class IV | 31,835,141 | 1,773,348 | 7,265,000 | 1,073,348 | — | 435,000 | (2,187,039 | ) | 24,591,450 | |||||||||||||||||||||||
GMO-Usonian Japan Value Creation Fund, Class VI | — | 9,936,387 | — | — | — | — | 139,147 | 10,075,534 | ||||||||||||||||||||||||
GMO Multi-Sector Fixed Income Fund, Class IV | 6,442,772 | 7,857,471 | 2,420,000 | 207,471 | — | (278,876 | ) | (836,211 | ) | 10,765,156 | ||||||||||||||||||||||
GMO Quality Fund, Class VI | 12,951,749 | 1,136,516 | 4,855,000 | 129,315 | 1,007,201 | 181,608 | (2,006,103 | ) | 7,408,770 | |||||||||||||||||||||||
GMO Small Cap Quality Fund, Class VI | — | 6,576,959 | — | 4,579 | 572,380 | — | 755,892 | 7,332,851 | ||||||||||||||||||||||||
222
GMO Trust Funds
Notes to Financial Statements — (Continued)
February 28, 2023
| Affiliate | Value, beginning of period | Purchases | Sales Proceeds | Dividend Income | Distributions of Realized Gains | Net Realized Gain | Net Decrease in Unrealized Appreciation/ Depreciation | Value, end of period | ||||||||||||||||||||||||
Strategic Opportunities Allocation Fund (continued) |
| |||||||||||||||||||||||||||||||
GMO U.S. Equity Fund, Class VI | $ | 19,532,079 | $ | 3,179,662 | $ | 11,380,000 | $ | 249,304 | $ | 930,358 | $ | 128,100 | $ | (1,689,090 | ) | $ | 9,770,751 | |||||||||||||||
GMO U.S. Opportunistic Value Fund, Class VI | — | 17,966,531 | 1,375,000 | 23,889 | — | 13,614 | 195,619 | 16,800,764 | ||||||||||||||||||||||||
GMO U.S. Small Cap Value Fund, Class VI | 16,286,703 | 1,197,062 | 14,422,642 | 182,025 | 1,015,037 | (2,389,507 | ) | (671,616 | ) | — | ||||||||||||||||||||||
GMO U.S. Treasury Fund | 4,509,502 | 102,704 | 498,000 | 102,684 | — | (4,000 | ) | (14,930 | ) | 4,095,276 | ||||||||||||||||||||||
|
|
|
|
|
|
|
|
|
|
|
|
|
|
|
| |||||||||||||||||
Totals | $ | 145,331,020 | $ | 61,397,414 | $ | 55,070,642 | $ | 5,183,375 | $ | 3,584,990 | $ | (7,401,998 | ) | $ | (13,489,006 | ) | $ | 130,766,788 | ||||||||||||||
|
|
|
|
|
|
|
|
|
|
|
|
|
|
|
| |||||||||||||||||
| * | Excludes income from investment of cash collateral from securities lending in GMO U.S. Treasury Fund. Income (net of fee rebates paid to the borrower and fees paid to the lending agent) from investment of cash collateral from securities lending in GMO U.S. Treasury Fund was $86,240 and $186,068 in Benchmark-Free Fund and Consolidated Implementation Fund, respectively, during the year. |
| 11. | Subsequent events |
Subsequent to February 28, 2023, GMO International Equity Allocation Fund received redemption requests in the amount of $140,420,774.
223
Report of Independent Registered Public Accounting Firm
To the Board of Trustees of GMO Trust and Shareholders of GMO Alternative Allocation Fund, GMO Benchmark-Free Allocation Fund, GMO Benchmark-Free Fund, GMO Global Asset Allocation Fund, GMO Global Developed Equity Allocation Fund, GMO Global Equity Allocation Fund, GMO Implementation Fund, GMO International Developed Equity Allocation Fund, GMO International Equity Allocation Fund, GMO SGM Major Markets Fund, and GMO Strategic Opportunities Allocation Fund
Opinions on the Financial Statements
We have audited the accompanying statements of assets and liabilities, including the schedules of investments, of each of the funds listed in the table below (eleven of the funds constituting GMO Trust, hereafter collectively referred to as the “Funds”) as of February 28, 2023, the related statements of operations, of changes in net assets and of cash flows for each of the periods indicated in the table below, including the related notes, and the financial highlights for each of the periods indicated therein (collectively referred to as the “financial statements”). In our opinion, the financial statements present fairly, in all material respects, the financial position of each of the Funds as of February 28, 2023, and the results of each of their operations, the changes in each of their net assets and of each of their cash flows for the periods indicated in the table below, and each of the financial highlights for each of the periods indicated therein, in conformity with accounting principles generally accepted in the United States of America.
| GMO Benchmark-Free Allocation Fund, GMO Global Asset Allocation Fund, GMO Global Developed Equity Allocation Fund, GMO Global Equity Allocation Fund, GMO International Developed Equity Allocation Fund, GMO International Equity Allocation Fund | Statement of assets and liabilities, including the schedule of investments, as of February 28, 2023, the related statement of operations for the year ended February 28, 2023, the statement of changes in net assets for each of the two years in the period ended February 28, 2023, and the financial highlights for each of the periods indicated therein. | |
| GMO Benchmark-Free Fund, GMO Strategic Opportunities Allocation Fund | Statement of asset and liabilities, including the schedule of investments, as of February 28, 2023, the related statement of operations and of cash flows for the year ended February 28, 2023, the statement of changes in net assets for each of the two years in the period ended February 28, 2023, and the financial highlights for each of the periods indicated therein. | |
| GMO Alternative Allocation Fund, GMO Implementation Fund | Consolidated statement of asset and liabilities, including the consolidated schedule of investments, as of February 28, 2023, the related consolidated statement of operations and of cash flows for the year ended February 28, 2023, the consolidated statement of changes in net assets for each of the two years in the period ended February 28, 2023, and the consolidated financial highlights for each of the periods indicated therein. | |
| GMO SGM Major Markets Fund | Consolidated statement of asset and liabilities, including the consolidated schedule of investments, as of February 28, 2023, the related consolidated statement of operations for the year ended February 28, 2023, the consolidated statement of changes in net assets for each of the two years in the period ended February 28, 2023, and the consolidated financial highlights for each of the periods indicated therein. | |
Basis for Opinions
These financial statements are the responsibility of the Funds’ management. Our responsibility is to express an opinion on the Funds’ financial statements based on our audits. We are a public accounting firm registered with the Public Company Accounting Oversight Board (United States) (PCAOB) and are required to be independent with respect to the Funds in accordance with the U.S. federal securities laws and the applicable rules and regulations of the Securities and Exchange Commission and the PCAOB.
We conducted our audits of these financial statements in accordance with the standards of the PCAOB. Those standards require that we plan and perform the audit to obtain reasonable assurance about whether the financial statements are free of material misstatement, whether due to error or fraud.
Our audits included performing procedures to assess the risks of material misstatement of the financial statements, whether due to error or fraud, and performing procedures that respond to those risks. Such procedures included examining, on a test basis, evidence regarding the amounts and disclosures in the financial statements. Our audits also included evaluating the accounting principles used and significant estimates made by management, as well as evaluating the overall presentation of the financial statements.
224
Report of Independent Registered Public Accounting Firm - (Continued)
Our procedures included confirmation of securities owned as of February 28, 2023 by correspondence with the custodian, transfer agent and brokers; when replies were not received from brokers, we performed other auditing procedures. We believe that our audits provide a reasonable basis for our opinions.
/s/ PricewaterhouseCoopers LLP
Boston, MA
April 27, 2023
We have served as the auditor of one or more investment companies in the GMO mutual funds complex since 1985.
225
GMO Trust Funds
February 28, 2023 (Unaudited)
Expense Examples: The following information is in relation to expenses for the six month period ended February 28, 2023.
As a shareholder of the Funds, you may incur two types of costs: (1) transaction costs, and (2) ongoing costs, including direct and/or indirect management fees, direct and/or indirect shareholder services fees, and supplemental support fees to Class MF and other Fund expenses. This example is intended to help you understand your ongoing costs (in dollars) of investing in the Funds and to compare these costs with the ongoing costs of investing in other mutual funds.
These examples are based on an investment of $1,000 invested at the beginning of the period and held for the entire period, September 1, 2022 through February 28, 2023.
Actual Expenses
This section of the table for each class below provides information about actual account values and actual expenses. You may use the information in this section, together with the amount you invested, to estimate the expenses that you paid over the period. Simply divide your account value by $1,000 (for example, a $10,000,000 account value divided by $1,000 = 10,000), then multiply the result by the number under the heading entitled “Expenses Paid During the Period” to estimate the expenses you paid on your account during this period.
Hypothetical Example for Comparison Purposes
This section of the table for each class below provides information about hypothetical account values and hypothetical expenses based on the Funds’ actual expense ratio and an assumed rate of return of 5% per year before expenses, which is not the Funds’ actual return. The hypothetical account values and expenses may not be used to estimate the actual ending account balance or expenses you paid for the period. You may use this information to compare the ongoing costs of investing in the Funds with other funds. To do so, compare this 5% hypothetical example with the 5% hypothetical examples that appear in the shareholder reports of other funds.
Please note that the expenses shown in the table are meant to highlight your ongoing costs only and do not reflect any transactional costs. Therefore, this section of the table is useful in comparing ongoing costs only, and will not help you determine the relative total costs of owning different funds. In addition, if these transactional costs were included, your costs would have been higher.
| Actual | Hypothetical |
| ||||||||||||||||||||||||||
| Beginning Account Value September 1, 2022 | Ending Account Value February 28, 2023 | Expenses Paid During the Period* | Beginning Account Value September 1, 2022 | Ending Account Value February 28, 2023 | Expenses Paid During the Period* | Annualized Expense Ratio | ||||||||||||||||||||||
Alternative Allocation Fund |
| |||||||||||||||||||||||||||
Class VI | $ | 1,000.00 | $ | 1,047.60 | $ | 6.96 | $ | 1,000.00 | $ | 1,018.00 | $ | 6.85 | 1.37 | % | ||||||||||||||
Class R6 | $ | 1,000.00 | $ | 1,046.20 | $ | 8.22 | $ | 1,000.00 | $ | 1,016.76 | $ | 8.10 | 1.62 | % | ||||||||||||||
Class I | $ | 1,000.00 | $ | 1,046.10 | $ | 8.22 | $ | 1,000.00 | $ | 1,016.76 | $ | 8.10 | 1.62 | % | ||||||||||||||
Benchmark-Free Allocation Fund |
| |||||||||||||||||||||||||||
Class III | $ | 1,000.00 | $ | 1,065.90 | $ | 4.87 | $ | 1,000.00 | $ | 1,020.08 | $ | 4.76 | 0.95 | % | ||||||||||||||
Class IV | $ | 1,000.00 | $ | 1,066.00 | $ | 4.61 | $ | 1,000.00 | $ | 1,020.33 | $ | 4.51 | 0.90 | % | ||||||||||||||
Class MF | $ | 1,000.00 | $ | 1,065.80 | $ | 4.61 | $ | 1,000.00 | $ | 1,020.33 | $ | 4.51 | 0.90 | % | ||||||||||||||
Class R6 | $ | 1,000.00 | $ | 1,066.00 | $ | 4.87 | $ | 1,000.00 | $ | 1,020.08 | $ | 4.76 | 0.95 | % | ||||||||||||||
Class I | $ | 1,000.00 | $ | 1,065.20 | $ | 5.38 | $ | 1,000.00 | $ | 1,019.59 | $ | 5.26 | 1.05 | % | ||||||||||||||
Benchmark-Free Fund |
| |||||||||||||||||||||||||||
Class III | $ | 1,000.00 | $ | 1,066.10 | $ | 2.61 | $ | 1,000.00 | $ | 1,022.27 | $ | 2.56 | 0.51 | % | ||||||||||||||
Global Asset Allocation Fund |
| |||||||||||||||||||||||||||
Class III | $ | 1,000.00 | $ | 1,051.20 | $ | 3.05 | $ | 1,000.00 | $ | 1,021.82 | $ | 3.01 | 0.60 | % | ||||||||||||||
Class R6 | $ | 1,000.00 | $ | 1,050.90 | $ | 3.05 | $ | 1,000.00 | $ | 1,021.82 | $ | 3.01 | 0.60 | % | ||||||||||||||
Class I | $ | 1,000.00 | $ | 1,050.60 | $ | 3.56 | $ | 1,000.00 | $ | 1,021.32 | $ | 3.51 | 0.70 | % | ||||||||||||||
Global Developed Equity Allocation Fund |
| |||||||||||||||||||||||||||
Class III | $ | 1,000.00 | $ | 1,096.60 | $ | 2.81 | $ | 1,000.00 | $ | 1,022.12 | $ | 2.71 | 0.54 | % | ||||||||||||||
Global Equity Allocation Fund |
| |||||||||||||||||||||||||||
Class III | $ | 1,000.00 | $ | 1,080.70 | $ | 2.94 | $ | 1,000.00 | $ | 1,021.97 | $ | 2.86 | 0.57 | % | ||||||||||||||
Class R6 | $ | 1,000.00 | $ | 1,080.20 | $ | 2.94 | $ | 1,000.00 | $ | 1,021.97 | $ | 2.86 | 0.57 | % | ||||||||||||||
Class I | $ | 1,000.00 | $ | 1,080.00 | $ | 3.46 | $ | 1,000.00 | $ | 1,021.47 | $ | 3.36 | 0.67 | % | ||||||||||||||
| 226 |
GMO Trust Funds
Fund Expenses — (Continued)
February 28, 2023 (Unaudited)
| Actual | Hypothetical |
| ||||||||||||||||||||||||||
| Beginning Account Value September 1, 2022 | Ending Account Value February 28, 2023 | Expenses Paid During the Period* | Beginning Account Value September 1, 2022 | Ending Account Value February 28, 2023 | Expenses Paid During the Period* | Annualized Expense Ratio | ||||||||||||||||||||||
Implementation Fund |
| |||||||||||||||||||||||||||
Core Class | $ | 1,000.00 | $ | 1,074.30 | $ | 1.65 | $ | 1,000.00 | $ | 1,023.21 | $ | 1.61 | 0.32 | % | ||||||||||||||
International Developed Equity Allocation Fund |
| |||||||||||||||||||||||||||
Class III | $ | 1,000.00 | $ | 1,139.70 | $ | 3.29 | $ | 1,000.00 | $ | 1,021.72 | $ | 3.11 | 0.62 | % | ||||||||||||||
Class R6 | $ | 1,000.00 | $ | 1,139.70 | $ | 3.29 | $ | 1,000.00 | $ | 1,021.72 | $ | 3.11 | 0.62 | % | ||||||||||||||
International Equity Allocation Fund |
| |||||||||||||||||||||||||||
Class III | $ | 1,000.00 | $ | 1,087.60 | $ | 3.42 | $ | 1,000.00 | $ | 1,021.52 | $ | 3.31 | 0.66 | % | ||||||||||||||
Class R6 | $ | 1,000.00 | $ | 1,087.60 | $ | 3.42 | $ | 1,000.00 | $ | 1,021.52 | $ | 3.31 | 0.66 | % | ||||||||||||||
SGM Major Markets Fund |
| |||||||||||||||||||||||||||
Class III | $ | 1,000.00 | $ | 1,085.30 | $ | 5.27 | $ | 1,000.00 | $ | 1,019.74 | $ | 5.11 | 1.02 | % | ||||||||||||||
Class VI | $ | 1,000.00 | $ | 1,085.60 | $ | 4.76 | $ | 1,000.00 | $ | 1,020.23 | $ | 4.61 | 0.92 | % | ||||||||||||||
Class I | $ | 1,000.00 | $ | 1,084.50 | $ | 5.79 | $ | 1,000.00 | $ | 1,019.24 | $ | 5.61 | 1.12 | % | ||||||||||||||
Strategic Opportunities Allocation Fund |
| |||||||||||||||||||||||||||
Class III | $ | 1,000.00 | $ | 1,067.30 | $ | 3.38 | $ | 1,000.00 | $ | 1,021.52 | $ | 3.31 | 0.66 | % | ||||||||||||||
| * | Expenses are calculated using each class’s annualized net expense ratio (including indirect expenses incurred) for the six months ended February 28, 2023, multiplied by the average account value over the period, multiplied by 181 days in the period, divided by 365 days in the year. |
| 227 |
GMO Trust Funds
Tax Information for the Tax Year Ended February 28, 2023 (Unaudited)
The following information is being provided in order to meet reporting requirements set forth by the Code and/or to meet state specific requirements. Shareholders should consult their tax advisors.
With respect to distributions paid, the Fund designates the following amounts (or, if subsequently determined to be different, the maximum amount allowable) for the fiscal year ended February 28, 2023:
| Fund Name | Dividend Received Deduction (corporate shareholders)(1) | Qualified Dividend Income (non-corporate shareholders)(1) | U.S. (1)(2) | Interest- Related Dividend Income ($)(3) | Short-Term Capital Gain Dividends ($)(3) | Long-Term Capital Gain Distributions ($) | Foreign Taxes Paid ($)(4) | Foreign Income ($)(4) | Section 199A Dividend Income (non-corporate shareholders) ($)(5) | |||||||||||||||||||||||||||
Alternative Allocation Fund | — | — | — | — | — | 1,882,802 | — | — | — | |||||||||||||||||||||||||||
Benchmark-Free Allocation Fund | 11.35 | % | 73.43 | % | 11.85 | % | 20,003,547 | — | — | — | — | 262,843 | ||||||||||||||||||||||||
Benchmark-Free Fund | 6.02 | % | 49.10 | % | 7.75 | % | 7,182,866 | — | — | — | — | 1,304 | ||||||||||||||||||||||||
Global Asset Allocation Fund | 10.84 | % | 52.28 | % | 3.26 | % | 988,552 | — | — | 584,592 | 6,673,195 | 1,150 | ||||||||||||||||||||||||
Global Developed Equity Allocation Fund | 23.24 | % | 96.66 | % | — | — | — | 2,981,732 | 121,394 | 1,871,029 | 419 | |||||||||||||||||||||||||
Global Equity Allocation Fund | 14.15 | % | 74.40 | % | — | 1,123,312 | — | 43,939,821 | 3,317,489 | 40,980,736 | 6,888 | |||||||||||||||||||||||||
Implementation Fund | 11.61 | % | 75.07 | % | 10.10 | % | 18,156,269 | — | — | — | — | 262,843 | ||||||||||||||||||||||||
International Developed Equity Allocation Fund | — | 100.00 | % | — | — | — | 522,076 | 508,721 | 8,664,304 | — | ||||||||||||||||||||||||||
International Equity Allocation Fund | — | 83.08 | % | — | — | — | — | 2,003,357 | 23,354,064 | — | ||||||||||||||||||||||||||
SGM Major Markets Fund | — | — | 46.85 | % | 1,341,896 | — | 14,738,104 | — | — | — | ||||||||||||||||||||||||||
Strategic Opportunities Allocation Fund | 9.93 | % | 49.98 | % | 2.11 | % | 1,255,044 | 1,675,475 | 6,478,493 | 543,980 | 6,127,709 | 672 | ||||||||||||||||||||||||
| (1) | Presented as a percentage of net investment income and short-term capital gain distributions paid, if any. |
| (2) | All or a portion of these amounts may be exempt from taxation at the state level. |
| (3) | These amounts are generally exempt from U.S. withholding taxes for non-U.S. shareholders, provided certain conditions are satisfied by both the Funds and the Funds’ shareholders. If applicable, interest-related dividend amounts may include short-term capital gain distributions received from underlying funds. |
| (4) | The Funds expect to elect to treat foreign taxes attributed to foreign source income from certain of its investments, as if incurred directly by the Funds’ shareholders. All amounts presented above are based upon net investment income earned. |
| (5) | The Funds hereby designate the above qualified business income under Section 199A of the Code. |
In early 2024, the Funds will notify applicable shareholders of amounts for use in preparing 2023 U.S. federal income tax forms.
| 228 |
Trustees and Officers (Unaudited)
The following tables present information regarding each Trustee and officer of the Trust as of February 28, 2023. Each Trustee’s and officer’s year of birth (“YOB”) is set forth after his or her name. Unless otherwise noted, (i) each Trustee and officer has engaged in the principal occupation(s) noted in the table for at least the most recent five years, although not necessarily in the same capacity, and (ii) the address of each Trustee and officer is c/o GMO Trust, 53 State Street, Suite 3300, Boston, MA 02109. Each Trustee serves in office until the earlier of (a) the election and qualification of a successor at the next meeting of shareholders called to elect Trustees or (b) the Trustee dies, resigns, or is removed as provided in the Trust’s governing documents. Each of the Trustees of the Trust, other than Ms. Santoro, is not an “interested person” of the Trust, as such term is used in the 1940 Act (each, an “Independent Trustee”). Because the Funds do not hold annual meetings of shareholders, each Trustee will hold office for an indeterminate period. Each officer serves in office until his or her successor is elected and determined to be qualified to carry out the duties and responsibilities of the office, or until the officer resigns or is removed from office.
Independent Trustees
Name and Year of Birth | Position(s) Held with the Trust | Length of Time Served | Principal Occupation(s) During Past 5 Years | Number of | Other Directorships Held in the Past Five Years | |||||
Donald W. Glazer YOB: 1944 | Chairman of the Board of Trustees | Chairman of the Board of Trustees since March 2005; Lead Independent Trustee (September 2004 – March 2005); Trustee since December 2000. | Consultant – Law and Business; Author of Legal Treatises. | 33 | Director, BeiGene Ltd. (biotech). | |||||
Peter Tufano YOB: 1957 | Trustee | Since December 2008. | Peter Moores Professor of Finance (Since July 1, 2011) and Peter Moores Dean and Professor of Finance (July 1, 2011 – June 30, 2022) University of Oxford, Said Business School; Baker Foundation Professor, Harvard Business School (Since July 1, 2022). | 33 | None. | |||||
Paul Braverman YOB: 1949 | Trustee | Since March 2010. | Retired | 33 | Trustee HIMCO Variable Insurance Trust (27 Portfolios) April 2014 – April 2019). | |||||
229
| \Interested Trustee and Officer | ||||||||||
Dina Santoro2 YOB: 1973 | Trustee; President of the Trust | Trustee and President of the Trust since February 2023. | Chief Operating Officer, Grantham, Mayo, Van Otterloo & Co. LLC (February 2023 – Present); President, Chief Executive Officer, and Director, Voya Investments, LLC, Voya Capital, LLC, and Voya Funds Services, LLC (September 2022 – December 2022); Director and Senior Vice President, Voya Investments Distributor, LLC (April 2018 –December 2022); Chief Operating Officer, Voya Investment Management (January 2022 –December 2022); Senior Managing Director, Head of Product and Marketing Strategy, Voya Investment Management (September 2017-December 2022). Formerly, President and Director, Voya Investments, LLC and Voya Capital, LLC (March 2018-September 2022); Director, Voya Funds Services, LLC (March 2018-September 2022). | 33 | Voya Separate Portfolios Trust (July 2018 – December 2022). | |||||
| 1 | The Fund Complex includes series of each of GMO Trust. |
| 2 | Ms. Santoro is an “interested person” of the Trust, as such term is used in the 1940 Act (as “Interested Trustee”), by virtue of her positions with the Trust and GMO indicated in the table above. |
Officers
Name and Year of Birth | Position(s) Held with Trust | Length of Time Served | Principal Occupation(s) During Past Five Years* | |||
Dina Santoro YOB: 1973 | Trustee; President of the Trust | Trustee and President since February 2023. | Chief Operating Officer, Grantham, Mayo, Van Otterloo & Co. LLC (February 2023 – Present); Chief Operating Officer, Grantham, Mayo, Van Otterloo & Co. LLC (February 2023 – Present); President, Chief Executive Officer, and Director, Voya Investments, LLC, Voya Capital, LLC, and Voya Funds Services, LLC (September 2022 – February 2023); Director and Senior Vice President, Voya Investments Distributor, LLC (April 2018 –February 2023); Chief Operating Officer, Voya Investment Management (January 2022 –February 2023); Senior Managing Director, Head of Product and Marketing Strategy, Voya Investment Management (September 2017-February 2023); Formerly, President and Director, Voya Investments, LLC and Voya Capital, LLC (March 2018-September 2022); Director, Voya Funds Services, LLC (March 2018-September 2022). | |||
Tara Pari YOB: 1976 | Chief Executive Officer | Chief Executive Officer since November 2020. | Risk and Controls, Grantham, Mayo, Van Otterloo & Co. LLC (September 2004 – November 2020); Head of Fund Reporting and Risk and Controls, Grantham, Mayo, Van Otterloo & Co. LLC (November 2020 to present). | |||
Betty Maganzini YOB: 1972 | Treasurer, Chief Accounting Officer and Chief Financial Officer | Treasurer, Chief Accounting Officer and Chief Financial Officer since September 2018; Assistant Treasurer, September 2013 – September 2018. | Fund Administrator, Grantham, Mayo, Van Otterloo & Co. LLC (July 2010 – present). | |||
230
Name and Year of Birth | Position(s) Held with Trust | Length of Time Served | Principal Occupation(s) During Past Five Years* | |||
Susan Saw YOB: 1981 | Assistant Treasurer | Since September 2019. | Fund Administrator, Grantham, Mayo, Van Otterloo & Co. LLC (March 2011 – present). | |||
John L. Nasrah YOB: 1977 | Since March 2007. | Head of Tax, Grantham, Mayo, Van Otterloo & Co. LLC (November 2020 - present); Head of Fund Tax, Grantham, Mayo, Van Otterloo & Co. LLC (2018 - 2020). | ||||
Cathy Tao YOB: 1974 | Assistant Treasurer | Since September 2016. | Fund Administrator, Grantham, Mayo, Van Otterloo & Co. LLC (October 2007 – present). | |||
Devin Kelly YOB: 1984 | Assistant Treasurer | Since June 2020. | Fund Administrator, Grantham, Mayo, Van Otterloo & Co. LLC (October 2012 – present). | |||
Brian Kadehjian YOB: 1974 | Assistant Treasurer and Treasury Officer | Assistant Treasurer since February 2015; Treasury Officer since September 2013. | Fund Administrator, Grantham, Mayo, Van Otterloo & Co. LLC (April 2002 – present). | |||
Douglas Y. Charton YOB: 1982 | Chief Legal Officer, Vice President and Clerk | Since August 2015. | Legal Counsel, Grantham, Mayo, Van Otterloo & Co. LLC (July 2015 – present); Associate, K&L Gates LLP (September 2007 – July 2015). | |||
Megan Bunting YOB: 1978 | Vice President and Assistant Clerk | Since September 2013. | Legal Counsel, Grantham, Mayo, Van Otterloo & Co. LLC (September 2006 – present). | |||
Kevin O’Brien YOB: 1985 | Vice President and Assistant Clerk | Since March 2016. | Legal Counsel, Grantham, Mayo, Van Otterloo & Co. LLC (February 2015 – present). | |||
Gregory L. Pottle YOB: 1971 | Chief Compliance Officer | Chief Compliance Officer since May 2015; Vice President and Assistant Clerk, November 2006 – November 2015. | Chief Compliance Officer, Grantham, Mayo, Van Otterloo & Co. LLC (May 2015 – present). | |||
Kelly Butler YOB: 1974 | Anti-Money Laundering Officer | Since March 2020. | Compliance Manager (March 2016 – present); Compliance Specialist, Grantham, Mayo, Van Otterloo & Co. LLC (November 2007 – March 2016). | |||
| * | Each officer of the Trust may also serve as an officer and/or director of certain pooled investment vehicles of which GMO or an affiliate of GMO serves as the investment adviser. |
231
AR-022823-AA
Item 2. Code of Ethics.
As of February 28, 2023, the registrant has adopted a Code of Ethics that applies to the Principal Executive Officer and Principal Financial Officer pursuant to the Sarbanes-Oxley Act of 2002 (the “Code of Ethics”). During the year ended February 28, 2023 there were no substantive amendments to a provision of the Code of Ethics nor were there any waivers granted from a provision of the Code of Ethics. A copy of the Code of Ethics is filed with this Form N-CSR under item 12 (a).
Item 3. Audit Committee Financial Expert.
The registrant’s Board of Trustees has determined that the registrant does not have an “audit committee financial expert” (as such term has been defined in Form N-CSR) serving on its audit committee. The registrant’s Board believes that, although none of its members individually meets all required elements of the definition of an “audit committee financial expert”, the members of the registrant’s audit committee collectively possess the knowledge and experience necessary to execute all of the audit committee’s functions, duties and powers.
Item 4. Principal Accountant Fees and Services. *
| (a) | AUDIT FEES: The aggregate fees billed to the registrant for professional services rendered by its independent auditors, PricewaterhouseCoopers LLP for the audit of the registrant’s annual financial statements for 2023 and 2022 were $1,632,394 and $1,438,194, respectively. |
| (b) | AUDIT-RELATED FEES: The aggregate fees billed to the registrant in 2023 and 2022 for engagements for audit-related services rendered by PricewaterhouseCoopers LLP that related directly to the operations and financial reporting of the Funds were $28,518 and $31,227, respectively. The aggregate fees billed in 2023 and 2022 to the registrant’s Investment Advisor, and any entity controlling, controlled, or under common control with the Advisor that provides ongoing services to the Funds (each, a “Service Affiliate”) for engagements for audit-related services rendered by PricewaterhouseCoopers LLP that related directly to the operations and financial reporting of the Funds were $423,269 and $336,225, respectively. |
| (c) | TAX FEES: The aggregate fees billed to the registrant in 2023 and 2022 for professional services rendered by PricewaterhouseCoopers LLP for tax compliance, tax advice, and tax planning, including the preparation of Form 1120 RIC, Form 8613 and review of excise tax distribution calculations, were $741,910 and $544,982, respectively. The aggregate fees billed in 2023 and 2022 to the registrant’s Service Affiliates for engagements for tax services rendered by PricewaterhouseCoopers LLP that related directly to the operations and financial reporting of the Funds were $0 and $0, respectively. |
| (d) | ALL OTHER FEES: No such fees were billed by PricewaterhouseCoopers LLP to the registrant or to the registrant’s Service Affiliates that related directly to the operations and financial reporting of the Funds in 2023 or 2022. |
| (e) | (1) The Audit Committee has adopted an Audit and Non-Audit Services Pre-Approval Policy (the “Policy”), which sets forth the procedures and the conditions pursuant to which services to be performed by the independent auditor are to be preapproved. Under the Policy, the Audit Committee pre-approves, on an annual basis, the following services: (1) the engagement, scope and terms of the annual audit; (2) certain audit-related services; (3) certain tax services that the Committee believes would not impair, and are consistent with the SEC’s rules on auditor independence; and (4) certain permissible non-audit services that the Committee believes are routine and recurring services and that would not impair, and are consistent with the SEC’s rules on auditor independence, subject to certain limitations on the projected fees associated with each service. All other types of services not included on the schedule to the policy, or for which the projected fees exceed those provided in the schedule, require the specific pre-approval by the Audit Committee or the Chairperson of the Committee (if timing necessitates that preapproval is required before the Committee’s next regularly scheduled meeting) if they are to be provided by the independent auditor. |
| (e) | (2) None. |
| (f) | Not applicable. |
| (g) | NON-AUDIT FEES: The aggregate fees billed by PricewaterhouseCoopers LLP in 2023 and 2022 for non-audit services rendered to the registrant and the registrant’s Service Affiliates were $1,228,697 and $947,435, respectively. For the fiscal year ended February 28, 2023, this amount reflects the amounts disclosed above in Item 4(b), (c), (d), plus $35,000 in fees billed to the Funds’ Service Affiliates for non-audit services that did not relate directly to the operations and financial reporting of the Funds. For the fiscal year ended February 28, 2022, this amount reflects the amounts disclosed above in Item 4(b),(c),(d), plus $35,000 in fees billed to the Funds’ Service Affiliates for non-audit services that did not relate directly to the operations and financial reporting of the Funds. |
| (h) | The registrant’s Audit Committee has considered whether the provision of non-audit services by the registrant’s independent registered public accounting firm to the registrant’s Investment Advisor, and any entity controlling, controlled, or under common control with the Advisor that provided ongoing services to the registrant that were not pre-approved by the Committee (because such services did not relate directly to the operations and financial reporting of the registrant) was compatible with maintaining the independence of the independent registered public accounting firm. |
| * | Includes information regarding all series of GMO Trust. |
Item 5. Audit Committee of Listed Registrants.
Not applicable to this registrant.
Item 6. Schedule of Investments.
The complete schedule of investments for each series of the registrant is included as part of the annual reports to shareholders filed under Item 1 of this Form N-CSR.
Item 7. Disclosure of Proxy Voting Policies and Procedures for Closed-End Management Investment Companies.
Not applicable to this registrant.
Item 8. Portfolio Managers of Closed-End Management Investment Companies.
Not applicable to this registrant.
Item 9. Purchases of Equity Securities by Closed-End Management Investment Company and Affiliated Purchasers.
Not applicable to this registrant.
Item 10. Submission of Matters to a Vote of Security Holders.
There were no material changes to the procedures by which shareholders may recommend nominees to the registrant’s Board of Trustees.
Item 11. Controls and Procedures.
| (a) | The registrant’s Principal Executive Officer and Principal Financial Officer have concluded as of a date within 90 days of the filing of this report, based on their evaluation of the registrant’s disclosure controls and procedures (as defined in Rule 30a-3(c) under the Investment Company Act of 1940) that the design and operation of such procedures are effective to provide reasonable assurance that information required to be disclosed by the registrant on Form N-CSR is recorded, processed, summarized, and reported within the time periods specified in the Commission’s rules and forms. |
| (b) | There were no changes in the registrant’s internal control over financial reporting (as defined in Rule 30a-3(d) under the Investment Company Act of 1940) that occurred during the second fiscal quarter of the period covered by this report that has materially affected, or is reasonably likely to materially affect, the registrant’s internal control over financial reporting. |
Item 12. Disclosure of Securities Lending Activities for Closed-End Management Investment Companies.
Not applicable to this registrant.
Item 13. Exhibits.
(a)(1) Code of Ethics described in Item 2 is attached hereto as EX-99.CODEETH.
(a)(3) Not applicable to this registrant.
| (b) |
SIGNATURES
Pursuant to the requirements of the Securities Exchange Act of 1934 and the Investment Company Act of 1940, the registrant has duly caused this report to be signed on its behalf by the undersigned, thereunto duly authorized.
| (Registrant) | GMO Trust | |
| By (Signature and Title): | /s/ Tara Pari | |
| Tara Pari, Chief Executive Officer | ||
| Date: May 3, 2023 | ||
Pursuant to the requirements of the Securities Exchange Act of 1934 and the Investment Company Act of 1940, this report has been signed below by the following persons on behalf of the registrant and in the capacities and on the dates indicated.
| By (Signature and Title): | /s/ Tara Pari | |
| Tara Pari, Principal Executive Officer | ||
| Date: May 3, 2023 | ||
| By (Signature and Title): | /s/ Betty Maganzini | |
| Betty Maganzini, Principal Financial Officer | ||
| Date: May 3, 2023 | ||