UNITED STATES
SECURITIES AND EXCHANGE COMMISSION
Washington, D.C. 20549
FORM N-CSR
CERTIFIED SHAREHOLDER REPORT OF REGISTERED
MANAGEMENT INVESTMENT COMPANIES
Investment Company Act file number 811-04347
GMO Trust
(Exact name of the registrant as specified in charter)
40 Rowes Wharf, Boston, MA02110
(Address of principal executive offices) (Zip Code)
Tara Pari, Chief Executive Officer, 40 Rowes Wharf, Boston, MA 02110
(Name and address of agent for services)
Registrant’s telephone number, including area code: 617-346-7646
Date of fiscal year end: 02/28/22
Date of reporting period: 02/28/22
Item 1. Reports to Stockholders.
The annual reports for each series of the registrant for the period ended February 28, 2022 are filed herewith.
GMO Trust
Annual Report
February 28, 2022
Climate Change Fund
Emerging Domestic Opportunities Fund
Emerging Markets ex-China Fund
Emerging Markets Fund
International Equity Fund
Japan Value Creation Fund
Quality Cyclicals Fund (formerly Cyclical Focus Fund)
Quality Fund
Resources Fund
Tax-Managed International Equities Fund
U.S. Equity Fund
U.S. Small Cap Value Fund
For a free copy of the Funds’ proxy voting guidelines, shareholders may call 1-617-346-7646 (collect), visit GMO’s website at www.gmo.com or visit the Securities and Exchange Commission’s website at www.sec.gov. Information regarding how the Funds voted proxies relating to portfolio securities during the most recent 12-month period ended June 30 will be available without charge on GMO’s website at www.gmo.com and on the Securities and Exchange Commission’s website at www.sec.gov no later than August 31 of each year.
The Funds file their complete schedule of portfolio holdings with the Securities and Exchange Commission for the first and third quarter of each fiscal year on Form N-PORT, which is available on the Commission’s website at www.sec.gov. The Funds have a policy with respect to disclosure of portfolio holdings under which they may also make a complete schedule of portfolio holdings available on GMO’s website at www.gmo.com.
This report is prepared for the general information of shareholders. It is authorized for distribution to prospective investors only when preceded or accompanied by a prospectus for the GMO Trust, which contains a complete discussion of the risks associated with an investment in these Funds and other important information. The GMO Trust prospectus can be obtained at www.gmo.com. The GMO Trust Statement of Additional Information includes additional information about the Trustees of GMO Trust and is available without charge, upon request, by calling 1-617-346-7646 (collect).
An investment in the Funds is subject to risk, including the possible loss of principal amount invested. There can be no assurance that the Funds will achieve their stated investment objectives. Please see the Funds’ prospectus regarding specific principal risks for each Fund. General risks may include: market risk-equities, management and operational risk, non-U.S. investment risk, small company risk and derivatives risk.
The Funds are distributed by Funds Distributor LLC. Funds Distributor LLC is not affiliated with GMO.
TABLE OF CONTENTS
GMO Climate Change Fund
(A Series of GMO Trust)
Portfolio Management
Day-to-day management of the Fund’s portfolio is the responsibility of the Focused Equity team at Grantham, Mayo, Van Otterloo & Co. LLC.
Management Discussion and Analysis of Fund Performance
Although GMO does not manage the Fund to, or control the Fund’s risk relative to, any securities index or securities benchmark, a discussion of the Fund’s performance relative to the MSCI All Country World Index (“ACWI”) is included for comparative purposes.
Class III shares of GMO Climate Change Fund returned +2.91% (net) for the fiscal year ended February 28, 2022, as compared with +7.81% for the MSCI ACWI.
The Fund’s clean energy holdings declined about 7% during the year and held back performance relative to the index. Solar and wind companies were lower, while biofuels were essentially flat.
The Fund’s copper exposure gained approximately 36%. Ivanhoe Mines and Freeport- McMoRan Inc. were among the best performers.
The Fund’s agriculture exposure also performed well. The Mosaic Company, one of the world’s largest suppliers of phosphate and potash, was a strong contributor to performance.
Because some of the securities and instruments held directly or indirectly by the Fund had positive fair value adjustments at the beginning or end of the fiscal year (and the performance of indices are not fair valued), the Fund’s absolute and relative performance is higher than it otherwise would have been in the absence of such fair value adjustments.
The views expressed herein are exclusively those of Grantham, Mayo, Van Otterloo & Co. LLC as of the date of this report and are subject to change. GMO disclaims any responsibility to update such views. They are not meant as investment advice. References to specific securities are not recommendations of such securities and may not be representative of any GMO portfolio’s current or future investments. All information is unaudited.
GMO Climate Change Fund
(A Series of GMO Trust)
Comparison of Change in Value of a $5,000,000 Investment in
GMO Climate Change Fund Class III Shares and the MSCI ACWI
As of February 28, 2022
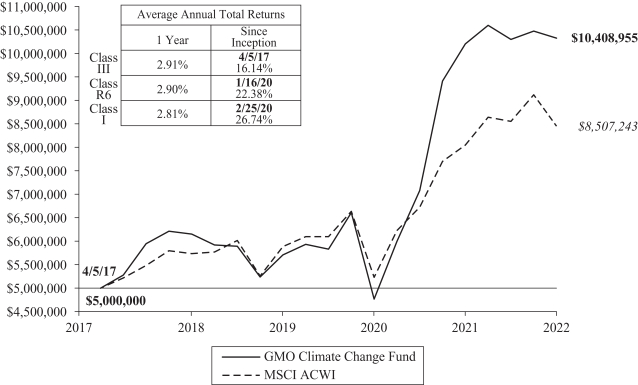
Performance data quoted represents past performance and is not indicative of future results. The investment return and principal value of an investment will fluctuate so that an investor’s shares, when redeemed, may be worth more or less than their original cost. Current performance data may be lower or higher than the performance data provided herein. To obtain performance information up to the most recent month-end, visit www.gmo.com. Performance shown is net of all fees after reimbursement from GMO. Returns would have been lower had certain expenses not been reimbursed during the periods shown and do not include the effect of taxes on distributions and redemptions. The performance information shown above only includes purchase premiums and/or redemption fees in effect as of February 28, 2022. All information is unaudited. Performance for classes may vary due to different fees.
MSCI data may not be reproduced or used for any other purpose. MSCI provides no warranties, has not prepared or approved this report, and has no liability hereunder.
For Class III, R6 and I the gross expense ratio of 0.91%, 0.89% and 0.99%, respectively, is equal to the Fund’s Total Annual Operating Expenses set forth in the Fund’s most recent prospectus dated June 30, 2021. For the Classes listed above, the corresponding net expense ratio of 0.78%, 0.78% and 0.88% reflects the reduction of expenses from fee reimbursements. The fee reimbursements will continue until at least June 30, 2022. Elimination of this reimbursement will result in higher fees and lower performance.
GMO Climate Change Fund
(A Series of GMO Trust)
Investment Concentration Summary
February 28, 2022 (Unaudited)
| | | | |
| Asset Class Summary& | | % of Total Net Assets | |
Common Stocks | | | 97.9 | % |
Mutual Funds | | | 8.1 | |
Preferred Stocks | | | 1.7 | |
Short-Term Investments | | | 0.2 | |
Other | | | (7.9 | ) |
| | | | |
| | | 100.0 | % |
| | | | |
| | | | |
| Country/Region Summary¤ | | % of Investments | |
United States | | | 56.4 | % |
Canada | | | 10.3 | |
Japan | | | 4.3 | |
China | | | 4.2 | |
France | | | 4.0 | |
Other Developed | | | 3.7 | ‡ |
South Korea | | | 2.9 | |
Mexico | | | 2.3 | |
Spain | | | 1.7 | |
Russia | | | 1.6 | |
United Kingdom | | | 1.6 | |
Chile | | | 1.6 | |
Norway | | | 1.5 | |
Brazil | | | 1.3 | |
Argentina | | | 1.0 | |
Australia | | | 1.0 | |
Other Emerging | | | 0.6 | † |
| | | | |
| | | 100.0 | % |
| | | | |
| | | | |
| Industry Group Summary | | % of Equity Investments# | |
Clean Energy | | | 59.1 | % |
Energy Efficiency | | | 13.4 | |
Agriculture | | | 9.7 | |
Copper | | | 7.4 | |
Water | | | 6.1 | |
Electric Grid | | | 4.3 | |
| | | | |
| | | 100.0 | % |
| | | | |
| & | In the table, derivative financial instruments, if any, are based on market values, rather than the notional amounts of derivatives, except for forward currency contracts which are based on unrealized appreciation/(depreciation). |
| ¤ | The table shows country exposure in the Fund. The table excludes short-term investments. The table excludes exposure through forward currency contracts and includes exposure through other derivative financial instruments, if any. The table takes into account the market value of securities and options and the notional amounts of swap contracts and other derivative financial instruments, if any. |
| ‡ | “Other Developed” is comprised of developed countries that each represent between (1.0)% and 1.0% of Investments. |
| † | “Other Emerging” is comprised of emerging countries that each represent between (1.0)% and 1.0% of Investments. |
| # | Equity investments may consist of common stocks and other stock-related securities, such as preferred stocks, if any. This table excludes exposure to derivative contracts, short-term investments, mutual funds and investment funds, if any. For a summary of these exposures, if any, see the Schedule of Investments. |
GMO Climate Change Fund
(A Series of GMO Trust)
Schedule of Investments
(showing percentage of total net assets)
February 28, 2022
| | | | | | | | | | |
| | | Shares | | | Description | | Value ($) | |
| | |
| | | | | | COMMON STOCKS — 97.9% | |
| | |
| | | | | | Argentina — 1.1% | |
| | | |
| | | 832,015 | | | Adecoagro SA * (a) | | | 7,954,063 | |
| | | | | | | | | | |
| | |
| | | | | | Australia — 1.1% | |
| | | |
| | | 320,055 | | | Clean TeQ Water Ltd * (a) | | | 141,301 | |
| | | |
| | | 668,367 | | | Sandfire Resources Ltd | | | 3,295,007 | |
| | | |
| | | 1,134,203 | | | Sunrise Energy Metals Ltd * (a) | | | 1,494,320 | |
| | | |
| | | 1,189,773 | | | Western Areas Ltd * | | | 2,973,190 | |
| | | | | | | | | | |
| | | |
| | | | | | Total Australia | | | 7,903,818 | |
| | | | | | | | | | |
| | |
| | | | | | Belgium — 0.1% | |
| | | |
| | | 232 | | | Elia Group SA/NV | | | 33,400 | |
| | | |
| | | 11,245 | | | Umicore SA | | | 460,029 | |
| | | | | | | | | | |
| | | |
| | | | | | Total Belgium | | | 493,429 | |
| | | | | | | | | | |
| | |
| | | | | | Brazil — 1.4% | |
| | | |
| | | 865,578 | | | Sao Martinho SA | | | 6,691,416 | |
| | | |
| | | 438,360 | | | SLC Agricola SA | | | 3,723,973 | |
| | | | | | | | | | |
| | | |
| | | | | | Total Brazil | | | 10,415,389 | |
| | | | | | | | | | |
| | |
| | | | | | Canada — 11.1% | |
| | | |
| | | 351,200 | | | Anaergia Inc * | | | 3,449,657 | |
| | | |
| | | 1,263,185 | | | Canadian Solar Inc * (a) | | | 39,992,437 | |
| | | |
| | | 353,348 | | | First Quantum Minerals Ltd (a) | | | 10,362,087 | |
| | | |
| | | 1,925,700 | | | Greenlane Renewables Inc * (a) | | | 1,656,026 | |
| | | |
| | | 780,070 | | | Ivanhoe Mines Ltd – Class A * | | | 7,939,174 | |
| | | |
| | | 876,815 | | | Largo Inc * (a) | | | 9,013,727 | |
| | | |
| | | 12,900 | | | Largo Resources Ltd * | | | 132,613 | |
| | | |
| | | 353,200 | | | Li-Cycle Holdings Corp * (a) | | | 2,744,364 | |
| | | |
| | | 398,300 | | | Lundin Mining Corp | | | 3,843,163 | |
| | | |
| | | 119,400 | | | NFI Group Inc (a) | | | 1,786,055 | |
| | | |
| | | 700 | | | Northland Power Inc (a) | | | 22,256 | |
| | | | | | | | | | |
| | | |
| | | | | | Total Canada | | | 80,941,559 | |
| | | | | | | | | | |
| | |
| | | | | | China — 4.5% | |
| | | |
| | | 408,000 | | | Beijing Energy International Holding Co Ltd * | | | 13,612 | |
| | | |
| | | 1,223,000 | | | Canvest Environmental Protection Group Co Ltd (a) | | | 595,294 | |
| | | |
| | | 1,746,000 | | | Chaowei Power Holdings Ltd (a) | | | 437,664 | |
| | | |
| | | 7,949,919 | | | China High Speed Transmission Equipment Group Co Ltd * (a) | | | 6,031,472 | |
| | | |
| | | 2,275,000 | | | China Longyuan Power Group Corp Ltd – Class H | | | 4,694,666 | |
| | | |
| | | 2,856,000 | | | China Water Affairs Group Ltd (a) | | | 3,155,207 | |
| | | |
| | | 210,400 | | | Hollysys Automation Technologies Ltd * | | | 2,962,432 | |
| | | |
| | | 135,622 | | | Sungrow Power Supply Co Ltd – Class A | | | 2,628,577 | |
| | | |
| | | 2,430,000 | | | Tianneng Power International Ltd (a) | | | 2,229,251 | |
| | | |
| | | 2,640,000 | | | Wasion Holdings Ltd | | | 1,022,145 | |
| | | |
| | | 2,451,800 | | | Xinjiang Goldwind Science & Technology Co Ltd – Class H | | | 4,011,586 | |
| | | | | | | | | | |
| | | Shares | | | Description | | Value ($) | |
| | |
| | | | | | China — continued | |
| | | |
| | | 5,600 | | | Xuji Electric Co Ltd – Class A | | | 19,776 | |
| | | |
| | | 1,226,576 | | | Yutong Bus Co Ltd – Class A | | | 1,899,885 | |
| | | |
| | | 577,685 | | | Zhuzhou CRRC Times Electric Co Ltd | | | 3,011,195 | |
| | | | | | | | | | |
| | | |
| | | | | | Total China | | | 32,712,762 | |
| | | | | | | | | | |
| | |
| | | | | | Denmark — 0.7% | |
| | | |
| | | 155,168 | | | Vestas Wind Systems A/S | | | 5,003,655 | |
| | | | | | | | | | |
| | |
| | | | | | Finland — 0.9% | |
| | | |
| | | 270,589 | | | Kemira Oyj | | | 3,578,248 | |
| | | |
| | | 69,325 | | | Neste Oyj | | | 2,703,302 | |
| | | | | | | | | | |
| | | |
| | | | | | Total Finland | | | 6,281,550 | |
| | | | | | | | | | |
| | |
| | | | | | France — 4.3% | |
| | | |
| | | 391,204 | | | Electricite de France SA (a) | | | 3,536,690 | |
| | | |
| | | 140,489 | | | Nexans SA | | | 13,552,187 | |
| | | |
| | | 272,834 | | | Veolia Environnement SA | | | 9,512,817 | |
| | | |
| | | 17,193 | | | Vilmorin & Cie SA | | | 889,166 | |
| | | |
| | | 114,522 | | | Waga Energy SA * (a) | | | 3,822,420 | |
| | | | | | | | | | |
| | | |
| | | | | | Total France | | | 31,313,280 | |
| | | | | | | | | | |
| | |
| | | | | | Germany — 1.0% | |
| | | |
| | | 225,513 | | | E.ON SE | | | 3,067,324 | |
| | | |
| | | 70,764 | | | Infineon Technologies AG | | | 2,394,364 | |
| | | |
| | | 15,139 | | | Siemens AG (Registered) | | | 2,132,818 | |
| | | | | | | | | | |
| | | |
| | | | | | Total Germany | | | 7,594,506 | |
| | | | | | | | | | |
| | |
| | | | | | India — 0.1% | |
| | | |
| | | 112,239 | | | VA Tech Wabag Ltd * | | | 449,798 | |
| | | | | | | | | | |
| | |
| | | | | | Japan — 4.6% | |
| | | |
| | | 40,100 | | | Daiseki Co Ltd | | | 1,633,599 | |
| | | |
| | | 151,000 | | | Ebara Corp | | | 7,880,875 | |
| | | |
| | | 161,500 | | | GS Yuasa Corp | | | 3,477,582 | |
| | | |
| | | 97,000 | | | Kurita Water Industries Ltd | | | 4,008,506 | |
| | | |
| | | 38,700 | | | METAWATER Co Ltd | | | 714,379 | |
| | | |
| | | 23,800 | | | Organo Corp | | | 1,694,036 | |
| | | |
| | | 310,500 | | | Panasonic Corp | | | 3,242,647 | |
| | | |
| | | 614,700 | | | Renesas Electronics Corp * | | | 7,241,593 | |
| | | |
| | | 39,300 | | | Takuma Co Ltd (a) | | | 499,455 | |
| | | |
| | | 46,400 | | | Tsukishima Kikai Co Ltd | | | 422,908 | |
| | | |
| | | 156,500 | | | Yokogawa Electric Corp | | | 2,525,021 | |
| | | | | | | | | | |
| | | |
| | | | | | Total Japan | | | 33,340,601 | |
| | | | | | | | | | |
| | |
| | | | | | Mexico — 2.5% | |
| | | |
| | | 3,513,218 | | | Grupo Mexico SAB de CV – Series B | | | 17,946,041 | |
| | | |
| | | 355,516 | | | Grupo Rotoplas SAB de CV * | | | 449,928 | |
| | | | | | | | | | |
| | | |
| | | | | | Total Mexico | | | 18,395,969 | |
| | | | | | | | | | |
| | |
| | | | | | Netherlands — 0.7% | |
| | | |
| | | 121,061 | | | Arcadis NV | | | 5,532,902 | |
| | | | | | | | | | |
| | | | |
| | |
| | | See accompanying notes to the financial statements. | | 5 |
GMO Climate Change Fund
(A Series of GMO Trust)
Schedule of Investments — (Continued)
(showing percentage of total net assets)
February 28, 2022
| | | | | | | | | | |
| | | Shares | | | Description | | Value ($) | |
| | |
| | | | | | Norway — 1.6% | |
| | | |
| | | 850,037 | | | Austevoll Seafood ASA | | | 12,002,370 | |
| | | | | | | | | | |
| | |
| | | | | | Pakistan — 0.1% | |
| | | |
| | | 1,233,094 | | | Fauji Fertilizer Co Ltd | | | 765,469 | |
| | | | | | | | | | |
| | |
| | | | | | Philippines — 0.1% | |
| | | |
| | | 4,867,900 | | | Nickel Asia Corp | | | 737,408 | |
| | | | | | | | | | |
| | |
| | | | | | Russia — 1.8% | |
| | | |
| | | 722,153 | | | MMC Norilsk Nickel PJSC ADR | | | 9,915,394 | |
| | | |
| | | 364,903 | | | PhosAgro PJSC GDR (Registered) | | | 2,232,440 | |
| | | |
| | | 169,638 | | | Ros Agro Plc GDR (Registered) | | | 748,449 | |
| | | | | | | | | | |
| | | |
| | | | | | Total Russia | | | 12,896,283 | |
| | | | | | | | | | |
| | |
| | | | | | South Korea — 3.1% | |
| | | |
| | | 47,564 | | | LG Chem Ltd | | | 22,571,215 | |
| | | | | | | | | | |
| | |
| | | | | | Spain — 1.9% | |
| | | |
| | | 28,134 | | | Acciona SA (a) | | | 4,807,930 | |
| | | |
| | | 231,084 | | | Endesa SA | | | 5,079,554 | |
| | | |
| | | 77,110 | | | Fomento de Construcciones y Contratas SA | | | 876,833 | |
| | | |
| | | 143,408 | | | Red Electrica Corp SA | | | 2,840,978 | |
| | | | | | | | | | |
| | | |
| | | | | | Total Spain | | | 13,605,295 | |
| | | | | | | | | | |
| | |
| | | | | | Switzerland — 0.5% | |
| | | |
| | | 2,333 | | | Gurit Holding AG (a) | | | 3,834,836 | |
| | | | | | | | | | |
| | |
| | | | | | Thailand — 0.2% | |
| | | |
| | | 2,291,100 | | | SPCG Pcl | | | 1,250,071 | |
| | | |
| | | 908,900 | | | Super Energy Corp Plc NVDR | | | 25,647 | |
| | | | | | | | | | |
| | | |
| | | | | | Total Thailand | | | 1,275,718 | |
| | | | | | | | | | |
| | |
| | | | | | Ukraine — 0.2% | |
| | | |
| | | 219,994 | | | Kernel Holding SA | | | 1,616,678 | |
| | | | | | | | | | |
| | |
| | | | | | United Kingdom — 1.7% | |
| | | |
| | | 668,883 | | | Drax Group Plc | | | 6,310,748 | |
| | | |
| | | 171,070 | | | Go-Ahead Group Plc * | | | 1,515,332 | |
| | | |
| | | 341,837 | | | Renewi Plc * | | | 2,812,282 | |
| | | |
| | | 1,760,877 | | | Stagecoach Group Plc * | | | 2,025,828 | |
| | | | | | | | | | |
| | | |
| | | | | | Total United Kingdom | | | 12,664,190 | |
| | | | | | | | | | |
| | |
| | | | | | United States — 52.6% | |
| | | |
| | | 366,820 | | | Aemetis, Inc. * (a) | | | 4,702,632 | |
| | | |
| | | 140,400 | | | AGCO Corp. | | | 16,870,464 | |
| | | |
| | | 688,087 | | | Ameresco, Inc. – Class A * | | | 44,209,590 | |
| | | |
| | | 326,000 | | | Archaea Energy, Inc. * | | | 5,978,840 | |
| | | |
| | | 279,886 | | | BorgWarner, Inc. | | | 11,478,125 | |
| | | |
| | | 3,725,819 | | | Clean Energy Fuels Corp. * | | | 27,086,704 | |
| | | |
| | | 30,421 | | | Constellation Energy Corp. | | | 1,398,758 | |
| | | | | | | | | | |
| | | Shares | | | Description | | Value ($) | |
| | |
| | | | | | United States — continued | |
| | | |
| | | 18,500 | | | Corteva, Inc. | | | 962,555 | |
| | | |
| | | 486,196 | | | Darling Ingredients, Inc. * | | | 35,239,486 | |
| | | |
| | | 21,900 | | | Deere & Co. | | | 7,884,438 | |
| | | |
| | | 50,900 | | | Edison International | | | 3,228,078 | |
| | | |
| | | 30,200 | | | Emerson Electric Co. | | | 2,806,184 | |
| | | |
| | | 52,600 | | | EnerSys | | | 3,825,598 | |
| | | |
| | | 94,664 | | | Exelon Corp. | | | 4,028,900 | |
| | | |
| | | 56,730 | | | First Solar, Inc. * | | | 4,271,202 | |
| | | |
| | | 221,899 | | | Freeport-McMoRan, Inc. | | | 10,418,158 | |
| | | |
| | | 732,100 | | | Gevo, Inc. * (a) | | | 2,598,955 | |
| | | |
| | | 2,732,356 | | | GrafTech International Ltd. | | | 27,542,149 | |
| | | |
| | | 171,000 | | | Green Plains, Inc. * | | | 5,598,540 | |
| | | |
| | | 85,500 | | | Infrastructure and Energy Alternatives, Inc. * | | | 930,240 | |
| | | |
| | | 70,400 | | | Johnson Controls International Plc | | | 4,573,184 | |
| | | |
| | | 454,024 | | | Livent Corp. * (a) | | | 10,692,265 | |
| | | |
| | | 552,218 | | | Montauk Renewables, Inc. * | | | 5,709,934 | |
| | | |
| | | 153,647 | | | Mosaic Co. (The) | | | 8,055,712 | |
| | | |
| | | 255,600 | | | Mueller Water Products, Inc. – Class A | | | 3,243,564 | |
| | | |
| | | 28,500 | | | MYR Group, Inc. * | | | 2,557,875 | |
| | | |
| | | 73,433 | | | Owens Corning | | | 6,843,221 | |
| | | |
| | | 33,800 | | | Pentair Plc | | | 1,957,358 | |
| | | |
| | | 46,600 | | | Quanta Services, Inc. | | | 5,076,604 | |
| | | |
| | | 552,360 | | | Renewable Energy Group, Inc. * | | | 33,970,140 | |
| | | |
| | | 100 | | | Rockwell Automation, Inc. | | | 26,658 | |
| | | |
| | | 51,600 | | | Sensata Technologies Holding Plc * | | | 2,988,156 | |
| | | |
| | | 99,234 | | | SolarEdge Technologies, Inc. * | | | 31,697,324 | |
| | | |
| | | 1,339,537 | | | Sunrun, Inc. * (a) | | | 36,542,569 | |
| | | |
| | | 27,329 | | | TE Connectivity Ltd. | | | 3,892,470 | |
| | | |
| | | 15,500 | | | Valmont Industries, Inc. | | | 3,354,975 | |
| | | |
| | | 63,100 | | | Zurn Water Solutions Corp. | | | 2,052,012 | |
| | | | | | | | | | |
| | | |
| | | | | | Total United States | | | 384,293,617 | |
| | | | | | | | | | |
| | | |
| | | | | | TOTAL COMMON STOCKS
(COST $704,677,489) | | | 714,596,360 | |
| | | | | | | | | | |
| | |
| | | | | | PREFERRED STOCKS (b) — 1.7% | |
| | |
| | | | | | Chile — 1.7% | |
| | | |
| | | 190,738 | | | Sociedad Quimica y Minera de Chile SA Sponsored ADR | | | 12,623,041 | |
| | | | | | | | | | |
| | | |
| | | | | | TOTAL PREFERRED STOCKS
(COST $8,475,796) | | | 12,623,041 | |
| | | | | | | | | | |
| | |
| | | | | | MUTUAL FUNDS — 8.1% | |
| | |
| | | | | | United States — 8.1% | |
| | |
| | | | | | Affiliated Issuers — 8.1% | |
| | | |
| | | 11,771,966 | | | GMO U.S. Treasury Fund (c) | | | 58,977,551 | |
| | | | | | | | | | |
| | | |
| | | | | | TOTAL MUTUAL FUNDS
(COST $59,022,760) | | | 58,977,551 | |
| | | | | | | | | | |
| | | | |
| | |
| 6 | | See accompanying notes to the financial statements. | | |
GMO Climate Change Fund
(A Series of GMO Trust)
Schedule of Investments — (Continued)
(showing percentage of total net assets)
February 28, 2022
| | | | | | | | | | |
| | | Shares | | | Description | | Value ($) | |
| | |
| | | | | | SHORT-TERM INVESTMENTS — 0.2% | |
| | |
| | | | | | Money Market Funds — 0.2% | |
| | | |
| | | 1,374,129 | | | State Street Institutional Treasury Money Market Fund – Premier Class, 0.01% (d) | | | 1,374,129 | |
| | | | | | | | | | |
| | | |
| | | | | | TOTAL SHORT-TERM INVESTMENTS
(COST $1,374,129) | | | 1,374,129 | |
| | | | | | | | | | |
| | | |
| | | | | | TOTAL INVESTMENTS — 107.9%
(Cost $773,550,174) | | | 787,571,081 | |
| | | |
| | | | | | Other Assets and Liabilities (net) — (7.9%) | | | (57,418,211 | ) |
| | | | | | | | | | |
| | | |
| | | | | | TOTAL NET ASSETS — 100.0% | | | $730,152,870 | |
| | | | | | | | | | |
Notes to Schedule of Investments:
| * | Non-income producing security. |
| (a) | All or a portion of this security is out on loan (Note 2). |
| (b) | Preferred dividend rates are disclosed to the extent that a stated rate exists. |
| (c) | All or a portion of this security is purchased with collateral from securities loaned (Note 2). |
| (d) | The rate disclosed is the 7 day net yield as of February 28, 2022. |
For a listing of definitions of acronyms, counterparty abbreviations and currency abbreviations used throughout the Schedule of Investments as well as the derivative tables, if any, please refer to page 87.
| | | | |
| | |
| | | See accompanying notes to the financial statements. | | 7 |
GMO Emerging Domestic Opportunities Fund
(A Series of GMO Trust)
Portfolio Management
Day-to-day management of the Fund’s portfolio is the responsibility of the Emerging Markets Equity team at Grantham, Mayo, Van Otterloo & Co. LLC and GMO Singapore Pte. Limited.
Management Discussion and Analysis of Fund Performance
Although GMO does not manage the Fund to, or control the Fund’s risk relative to, any securities index or securities benchmark, a discussion of the Fund’s performance relative to the MSCI Emerging Markets Index is included for comparative purposes.
Class II shares of GMO Emerging Domestic Opportunities Fund returned -14.13% (net) for the fiscal year ended February 28, 2022, as compared with -10.69% for the MSCI Emerging Markets Index.
Country-sector allocation detracted from the Fund’s relative returns for the fiscal year. The Fund’s overweight in China Communication Services and overweight in Russia Communication Services hurt relative performance.
Stock selection contributed to the Fund’s relative returns for the fiscal year. The Fund’s stock selection in China Consumer Discretionary and China Information Technology helped performance.
The views expressed herein are exclusively those of Grantham, Mayo, Van Otterloo & Co. LLC as of the date of this report and are subject to change. GMO disclaims any responsibility to update such views. They are not meant as investment advice. References to specific securities are not recommendations of such securities and may not be representative of any GMO portfolio’s current or future investments. All information is unaudited.
GMO Emerging Domestic Opportunities Fund
(A Series of GMO Trust)
Comparison of Change in Value of a $5,000,000 Investment in
GMO Emerging Domestic Opportunities Fund Class II Shares and the MSCI Emerging Markets Index
As of February 28, 2022
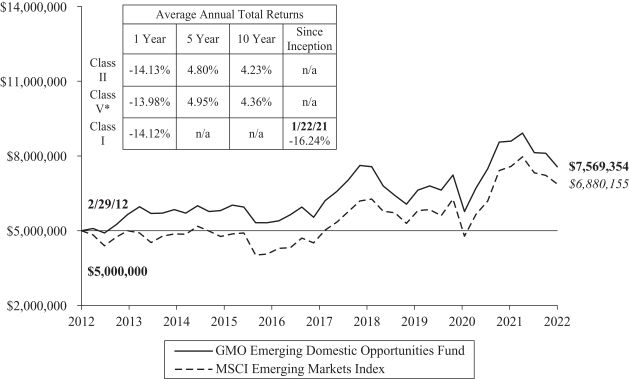
Performance data quoted represents past performance and is not indicative of future results. The investment return and principal value of an investment will fluctuate so that an investor’s shares, when redeemed, may be worth more or less than their original cost. Current performance data may be lower or higher than the performance data provided herein. To obtain performance information up to the most recent month-end, visit www.gmo.com. Performance shown is net of all fees after reimbursement from GMO. Returns would have been lower had certain expenses not been reimbursed during the periods shown and do not include the effect of taxes on distributions and redemptions. The performance information shown above only includes purchase premiums and/or redemption fees in effect as of February 28, 2022. All information is unaudited. Performance for classes may vary due to different fees.
| | * | For the period from October 27, 2011 to November 29, 2013, no Class V shares were outstanding. Performance for that period is that of Class II, which has higher expenses. Therefore, the performance shown is lower than it would have been if Class V expenses had been applied throughout. |
| | | MSCI data may not be reproduced or used for any other purpose. MSCI provides no warranties, has not prepared or approved this report, and has no liability hereunder. |
| | | For Class II, V and I the gross expense ratio of 1.15%, 1.02% and 1.25%, respectively, is equal to the Fund’s Total Annual Operating Expenses set forth in the Fund’s most recent prospectus dated June 30, 2021. For the Classes listed above, the corresponding net expense ratio of 1.13%, 1.00% and 1.16% reflects the reduction of expenses from fee reimbursements. The fee reimbursements will continue until at least June 30, 2022. Elimination of this reimbursement will result in higher fees and lower performance. |
GMO Emerging Domestic Opportunities Fund
(A Series of GMO Trust)
Investment Concentration Summary
February 28, 2022 (Unaudited)
| | | | |
| Asset Class Summary& | | % of Total Net Assets | |
Common Stocks | | | 87.9 | % |
Investment Funds | | | 5.6 | |
Short-Term Investments | | | 4.7 | |
Mutual Funds | | | 0.3 | |
Preferred Stocks | | | 0.2 | |
Other | | | 1.3 | |
| | | | |
| | | 100.0 | % |
| | | | |
| | | | |
| Country/Region Summary¤ | | % of Investments | |
China | | | 26.1 | % |
Taiwan | | | 18.3 | |
India | | | 13.7 | |
South Korea | | | 9.0 | |
Saudi Arabia | | | 4.4 | |
Brazil | | | 4.2 | |
Indonesia | | | 3.6 | |
Mexico | | | 3.4 | |
United States | | | 3.0 | |
South Africa | | | 2.9 | |
Thailand | | | 1.7 | |
Qatar | | | 1.5 | |
Vietnam | | | 1.5 | |
Greece | | | 1.3 | |
Switzerland | | | 1.0 | |
Russia | | | 1.0 | |
United Arab Emirates | | | 0.9 | |
Hong Kong | | | 0.8 | |
Philippines | | | 0.4 | |
Netherlands | | | 0.4 | |
Malaysia | | | 0.4 | |
Poland | | | 0.2 | |
Singapore | | | 0.2 | |
Peru | | | 0.1 | |
| | | | |
| | | 100.0 | % |
| | | | |
| | | | |
| Industry Group Summary | | % of Equity Investments# | |
Banks | | | 26.2 | % |
Semiconductors & Semiconductor Equipment | | | 14.0 | |
Technology Hardware & Equipment | | | 10.5 | |
Food, Beverage & Tobacco | | | 5.6 | |
Diversified Financials | | | 5.5 | |
Retailing | | | 5.5 | |
Media & Entertainment | | | 5.2 | |
Telecommunication Services | | | 3.5 | |
Software & Services | | | 3.4 | |
Capital Goods | | | 2.8 | |
Consumer Durables & Apparel | | | 2.7 | |
Food & Staples Retailing | | | 2.7 | |
Materials | | | 2.3 | |
Transportation | | | 2.3 | |
Insurance | | | 2.1 | |
Automobiles & Components | | | 1.5 | |
Pharmaceuticals, Biotechnology & Life Sciences | | | 1.3 | |
Consumer Services | | | 0.7 | |
Utilities | | | 0.5 | |
Household & Personal Products | | | 0.5 | |
Commercial & Professional Services | | | 0.4 | |
Health Care Equipment & Services | | | 0.4 | |
Real Estate | | | 0.3 | |
Energy | | | 0.1 | |
| | | | |
| | | 100.0 | % |
| | | | |
| & | In the table, derivative financial instruments, if any, are based on market values, rather than the notional amounts of derivatives, except for forward currency contracts which are based on unrealized appreciation/(depreciation). |
| ¤ | The table shows country exposure in the Fund. The table excludes short-term investments. The table excludes exposure through forward currency contracts and includes exposure through other derivative financial instruments, if any. The table takes into account the market value of securities and options and the notional amounts of swap contracts and other derivative financial instruments, if any. |
| # | Equity investments may consist of common stocks and other stock-related securities, such as preferred stocks, if any. This table excludes exposure to derivative contracts, short-term investments, mutual funds and investment funds, if any. For a summary of these exposures, if any, see the Schedule of Investments. |
GMO Emerging Domestic Opportunities Fund
(A Series of GMO Trust)
Schedule of Investments
(showing percentage of total net assets)
February 28, 2022
| | | | | | | | | | |
| | | Shares | | | Description | | Value ($) | |
| | |
| | | | | | COMMON STOCKS — 87.9% | |
| | |
| | | | | | Brazil — 2.7% | |
| | | |
| | | 736,900 | | | Atacadao SA | | | 2,716,326 | |
| | | |
| | | 1,068,100 | | | B3 SA – Brasil Bolsa Balcao | | | 3,004,976 | |
| | | |
| | | 579,800 | | | Banco BTG Pactual SA | | | 2,880,613 | |
| | | |
| | | 282,600 | | | Blau Farmaceutica SA | | | 1,629,876 | |
| | | |
| | | 572,800 | | | Cyrela Brazil Realty SA Empreendimentos e Participacoes | | | 1,672,442 | |
| | | |
| | | 280,400 | | | Localiza Rent a Car SA | | | 3,121,509 | |
| | | |
| | | 983,200 | | | Movida Participacoes SA | | | 3,105,227 | |
| | | |
| | | 1,256,700 | | | Vamos Locacao de Caminhoes Maquinas e Equipamentos SA | | | 2,673,699 | |
| | | | | | | | | | |
| | | |
| | | | | | Total Brazil | | | 20,804,668 | |
| | | | | | | | | | |
| | |
| | | | | | China — 24.5% | |
| | | |
| | | 785,688 | | | Alibaba Group Holding Ltd * | | | 10,342,698 | |
| | | |
| | | 3,300 | | | Bafang Electric Suzhou Co Ltd – Class A | | | 105,491 | |
| | | |
| | | 217,300 | | | Baidu Inc – Class A * | | | 4,101,716 | |
| | | |
| | | 154,500 | | | BYD Co Ltd – Class H | | | 4,787,545 | |
| | | |
| | | 87,477 | | | Changzhou Xingyu Automotive Lighting Systems Co Ltd – Class A | | | 2,148,410 | |
| | | |
| | | 15,277,000 | | | China Construction Bank Corp – Class H | | | 11,457,208 | |
| | | |
| | | 4,006,400 | | | China International Capital Corp Ltd – Class H | | | 9,747,258 | |
| | | |
| | | 804,000 | | | China Mengniu Dairy Co Ltd * | | | 5,227,944 | |
| | | |
| | | 2,164,002 | | | China Merchants Bank Co Ltd – Class H | | | 18,241,035 | |
| | | |
| | | 7,090,000 | | | China Modern Dairy Holdings Ltd | | | 1,310,244 | |
| | | |
| | | 577,200 | | | China Yangtze Power Co Ltd – Class A | | | 2,125,519 | |
| | | |
| | | 25,900 | | | Contemporary Amperex Technology Co Ltd – Class A | | | 2,220,597 | |
| | | |
| | | 526,500 | | | GoerTek Inc – Class A | | | 3,689,623 | |
| | | |
| | | 1,156,355 | | | Haier Smart Home Co Ltd – Class A | | | 4,692,175 | |
| | | |
| | | 322,000 | | | Hua Hong Semiconductor Ltd * | | | 1,677,546 | |
| | | |
| | | 482,727 | | | JD.com Inc – Class A * | | | 17,242,729 | |
| | | |
| | | 178,697 | | | Jiangsu Hengli Hydraulic Co Ltd – Class A | | | 1,906,467 | |
| | | |
| | | 9,286 | | | Kweichow Moutai Co Ltd – Class A | | | 2,643,245 | |
| | | |
| | | 444,000 | | | Longfor Group Holdings Ltd | | | 2,374,300 | |
| | | |
| | | 236,900 | | | Meituan – Class B * | | | 5,262,771 | |
| | | |
| | | 338,200 | | | Midea Group Co Ltd – Class A | | | 3,596,001 | |
| | | |
| | | 190,600 | | | NARI Technology Co Ltd | | | 1,076,764 | |
| | | |
| | | 128,675 | | | NetEase Inc | | | 2,488,793 | |
| | | |
| | | 35,800 | | | Pinduoduo Inc ADR * | | | 1,856,588 | |
| | | |
| | | 971,800 | | | Ping An Bank Co Ltd – Class A | | | 2,433,975 | |
| | | |
| | | 1,068,000 | | | Ping An Insurance Group Co of China Ltd – Class H | | | 8,280,911 | |
| | | |
| | | 13,076,000 | | | Postal Savings Bank of China Co Ltd – Class H | | | 10,736,493 | |
| | | |
| | | 46,400 | | | Proya Cosmetics Co Ltd – Class A | | | 1,370,506 | |
| | | |
| | | 215,800 | | | SF Holding Co Ltd – Class A | | | 2,072,376 | |
| | | |
| | | 213,085 | | | Shanghai Baosight Software Co Ltd – Class A | | | 1,824,414 | |
| | | |
| | | 134,272 | | | Shenzhen Inovance Technology Co Ltd – Class A | | | 1,367,841 | |
| | | |
| | | 97,600 | | | Shenzhou International Group Holdings Ltd | | | 1,639,349 | |
| | | |
| | | 111,300 | | | Sunny Optical Technology Group Co Ltd | | | 2,667,188 | |
| | | | | | | | | | |
| | | Shares | | | Description | | Value ($) | |
| | |
| | | | | | China — continued | |
| | | |
| | | 418,784 | | | Tencent Holdings Ltd | | | 22,598,134 | |
| | | |
| | | 890,000 | | | Tingyi Cayman Islands Holding Corp | | | 1,969,038 | |
| | | |
| | | 514,000 | | | Tsingtao Brewery Co Ltd – Class H | | | 4,945,112 | |
| | | |
| | | 896,000 | | | Weichai Power Co Ltd – Class H | | | 1,516,147 | |
| | | |
| | | 76,585 | | | Wuliangye Yibin Co Ltd – Class A | | | 2,320,432 | |
| | | |
| | | 7,100 | | | Yum China Holdings Inc | | | 369,342 | |
| | | | | | | | | | |
| | | |
| | | | | | Total China | | | 186,433,925 | |
| | | | | | | | | | |
| | |
| | | | | | Greece — 1.3% | |
| | | |
| | | 8,611,019 | | | Eurobank Ergasias Services and Holdings SA * | | | 9,432,774 | |
| | | | | | | | | | |
| | |
| | | | | | Hong Kong — 0.7% | |
| | | |
| | | 528,000 | | | AIA Group Ltd | | | 5,482,670 | |
| | | | | | | | | | |
| | |
| | | | | | India — 12.9% | |
| | | |
| | | 579,586 | | | Allcargo Logistics Ltd | | | 2,497,362 | |
| | | |
| | | 77,216 | | | Angel One Ltd | | | 1,373,070 | |
| | | |
| | | 38,646 | | | Apollo Hospitals Enterprise Ltd | | | 2,461,869 | |
| | | |
| | | 48,105 | | | Asian Paints Ltd | | | 2,031,274 | |
| | | |
| | | 335,187 | | | Axis Bank Ltd * | | | 3,322,304 | |
| | | |
| | | 490,511 | | | Canara Bank * | | | 1,439,188 | |
| | | |
| | | 78,909 | | | Central Depository Services India Ltd | | | 1,434,113 | |
| | | |
| | | 970,239 | | | Devyani International Ltd * | | | 2,015,108 | |
| | | |
| | | 99,539 | | | Escorts Ltd | | | 2,452,628 | |
| | | |
| | | 2,085,888 | | | Gayatri Projects Ltd * | | | 678,758 | |
| | | |
| | | 167,908 | | | Godrej Consumer Products Ltd * | | | 1,715,059 | |
| | | |
| | | 191,399 | | | Gujarat Gas Ltd | | | 1,497,407 | |
| | | |
| | | 209,736 | | | HCL Technologies Ltd | | | 3,151,189 | |
| | | |
| | | 64,779 | | | HDFC Bank Ltd | | | 1,231,883 | |
| | | |
| | | 37,292 | | | Housing Development Finance Corp Ltd | | | 1,177,323 | |
| | | |
| | | 935,127 | | | ICICI Bank Ltd | | | 9,249,713 | |
| | | |
| | | 387,424 | | | Infosys Ltd | | | 8,846,839 | |
| | | |
| | | 77,197 | | | JB Chemicals & Pharmaceuticals Ltd | | | 1,657,199 | |
| | | |
| | | 105,045 | | | Kajaria Ceramics Ltd | | | 1,519,838 | |
| | | |
| | | 44,708 | | | L&T Technology Services Ltd | | | 2,698,756 | |
| | | |
| | | 192,606 | | | Larsen & Toubro Ltd | | | 4,666,074 | |
| | | |
| | | 1,094,319 | | | Laxmi Organic Industries Ltd (a) (b) | | | 5,986,759 | |
| | | |
| | | 82,200 | | | MakeMyTrip Ltd * | | | 2,308,176 | |
| | | |
| | | 13,733 | | | Maruti Suzuki India Ltd | | | 1,520,384 | |
| | | |
| | | 270,539 | | | Metro Brands Ltd * | | | 1,946,078 | |
| | | |
| | | 186,033 | | | Muthoot Finance Ltd | | | 3,409,138 | |
| | | |
| | | 17,763 | | | Reliance Industries Ltd | | | 558,131 | |
| | | |
| | | 555,938 | | | Rupa & Co Ltd | | | 3,394,989 | |
| | | |
| | | 246,970 | | | Satin Creditcare Network Ltd * | | | 288,458 | |
| | | |
| | | 73,766 | | | SRF Ltd | | | 2,352,824 | |
| | | |
| | | 584,573 | | | State Bank of India | | | 3,780,369 | |
| | | |
| | | 183,005 | | | Sun Pharmaceutical Industries Ltd | | | 2,056,504 | |
| | | |
| | | 72,295 | | | Tata Consultancy Services Ltd | | | 3,420,836 | |
| | | |
| | | 298,234 | | | Tata Motors Ltd * | | | 1,807,550 | |
| | | |
| | | 84,851 | | | Tech Mahindra Ltd | | | 1,596,425 | |
| | | | |
| | |
| | | See accompanying notes to the financial statements. | | 11 |
GMO Emerging Domestic Opportunities Fund
(A Series of GMO Trust)
Schedule of Investments — (Continued)
(showing percentage of total net assets)
February 28, 2022
| | | | | | | | | | |
| | | Shares | | | Description | | Value ($) | |
| | |
| | | | | | India — continued | |
| | | |
| | | 244,952 | | | UPL Ltd | | | 2,177,495 | |
| | | |
| | | 350,350 | | | Wipro Ltd | | | 2,593,080 | |
| | | |
| | | 590,770 | | | Zee Entertainment Enterprises Ltd | | | 1,834,551 | |
| | | | | | | | | | |
| | | |
| | | | | | Total India | | | 98,148,701 | |
| | | | | | | | | | |
| | |
| | | | | | Indonesia — 3.4% | |
| | | |
| | | 26,102,600 | | | Bank Central Asia Tbk PT | | | 14,736,633 | |
| | | |
| | | 34,136,000 | | | Bank Rakyat Indonesia Persero Tbk PT | | | 10,915,332 | |
| | | | | | | | | | |
| | | |
| | | | | | Total Indonesia | | | 25,651,965 | |
| | | | | | | | | | |
| | |
| | | | | | Malaysia — 0.3% | |
| | | |
| | | 1,877,100 | | | CIMB Group Holdings Bhd | | | 2,556,974 | |
| | | | | | | | | | |
| | |
| | | | | | Mexico — 3.2% | |
| | | |
| | | 5,874,200 | | | America Movil SAB de CV – Series L | | | 5,340,443 | |
| | | |
| | | 1,360,500 | | | Banco del Bajio SA | | | 3,308,085 | |
| | | |
| | | 126,000 | | | Grupo Aeroportuario del Pacifico SAB de CV – Class B * | | | 1,845,367 | |
| | | |
| | | 722,500 | | | Grupo Financiero Banorte SAB de CV – Class O | | | 4,903,094 | |
| | | |
| | | 2,366,124 | | | Wal-Mart de Mexico SAB de CV | | | 9,011,165 | |
| | | | | | | | | | |
| | | |
| | | | | | Total Mexico | | | 24,408,154 | |
| | | | | | | | | | |
| | |
| | | | | | Netherlands — 0.4% | |
| | | |
| | | 4,435 | | | ASML Holding NV | | | 2,967,121 | |
| | | | | | | | | | |
| | |
| | | | | | Peru — 0.1% | |
| | | |
| | | 3,100 | | | Credicorp Ltd | | | 468,875 | |
| | | | | | | | | | |
| | |
| | | | | | Philippines — 0.4% | |
| | | |
| | | 60,245 | | | Globe Telecom Inc | | | 3,027,121 | |
| | | | | | | | | | |
| | |
| | | | | | Poland — 0.2% | |
| | | |
| | | 50,313 | | | Bank Polska Kasa Opieki SA | | | 1,380,288 | |
| | | | | | | | | | |
| | |
| | | | | | Qatar — 1.4% | |
| | | |
| | | 1,812,687 | | | Qatar National Bank QPSC | | | 10,877,575 | |
| | | | | | | | | | |
| | |
| | | | | | Russia — 0.5% | |
| | | |
| | | 34,988 | | | Magnit PJSC | | | 842,160 | |
| | | |
| | | 546,960 | | | Mobile TeleSystems PJSC | | | 1,083,873 | |
| | | |
| | | 132,504 | | | Sberbank of Russia PJSC Sponsored ADR | | | 138,475 | |
| | | |
| | | 46,548 | | | TCS Group Holding Plc GDR (Registered) | | | 445,040 | |
| | | |
| | | 69,200 | | | Yandex NV – Class A * (c) | | | 911,572 | |
| | | | | | | | | | |
| | | |
| | | | | | Total Russia | | | 3,421,120 | |
| | | | | | | | | | |
| | |
| | | | | | Singapore — 0.2% | |
| | | |
| | | 77,800 | | | TDCX Inc ADR * | | | 1,174,780 | |
| | | | | | | | | | |
| | |
| | | | | | South Africa — 2.7% | |
| | | |
| | | 235,274 | | | Aspen Pharmacare Holdings Ltd | | | 3,081,955 | |
| | | | | | | | | | |
| | | Shares | | | Description | | Value ($) | |
| | |
| | | | | | South Africa — continued | |
| | | |
| | | 44,411 | | | Capitec Bank Holdings Ltd | | | 5,996,048 | |
| | | |
| | | 433,945 | | | MTN Group Ltd * | | | 5,416,738 | |
| | | |
| | | 432,685 | | | Nedbank Group Ltd | | | 6,160,483 | |
| | | | | | | | | | |
| | | |
| | | | | | Total South Africa | | | 20,655,224 | |
| | | | | | | | | | |
| | |
| | | | | | South Korea — 8.4% | |
| | | |
| | | 19,430 | | | Iljin Materials Co Ltd | | | 1,487,302 | |
| | | |
| | | 222,427 | | | KB Financial Group Inc | | | 10,973,312 | |
| | | |
| | | 2,915 | | | LG Chem Ltd | | | 1,383,296 | |
| | | |
| | | 775,562 | | | Samsung Electronics Co Ltd | | | 46,730,229 | |
| | | |
| | | 17,690 | | | SK Hynix Inc | | | 1,844,262 | |
| | | |
| | | 36,839 | | | SK Telecom Co Ltd | | | 1,681,077 | |
| | | | | | | | | | |
| | | |
| | | | | | Total South Korea | | | 64,099,478 | |
| | | | | | | | | | |
| | |
| | | | | | Switzerland — 1.0% | |
| | | |
| | | 57,940 | | | Nestle SA (Registered) | | | 7,549,334 | |
| | | | | | | | | | |
| | |
| | | | | | Taiwan — 17.2% | |
| | | |
| | | 189,000 | | | Allied Supreme Corp | | | 1,705,372 | |
| | | |
| | | 558,450 | | | Chailease Holding Co Ltd | | | 5,068,219 | |
| | | |
| | | 4,702,000 | | | CTBC Financial Holding Co Ltd | | | 4,596,099 | |
| | | |
| | | 719,000 | | | Delta Electronics Inc | | | 6,407,805 | |
| | | |
| | | 3,727,724 | | | E.Sun Financial Holding Co Ltd | | | 3,940,401 | |
| | | |
| | | 314,000 | | | Giant Manufacturing Co Ltd | | | 3,259,885 | |
| | | |
| | | 963,000 | | | Hotai Finance Co Ltd | | | 4,279,610 | |
| | | |
| | | 337,000 | | | MediaTek Inc | | | 13,316,834 | |
| | | |
| | | 3,090,000 | | | Mega Financial Holding Co Ltd | | | 4,164,087 | |
| | | |
| | | 109,000 | | | Realtek Semiconductor Corp | | | 1,797,187 | |
| | | |
| | | 16,000 | | | Silergy Corp | | | 2,132,018 | |
| | | |
| | | 502,000 | | | Sinbon Electronics Co Ltd | | | 4,826,067 | |
| | | |
| | | 2,896,800 | | | Taiwan Semiconductor Manufacturing Co Ltd | | | 62,279,914 | |
| | | |
| | | 1,958,000 | | | United Microelectronics Corp | | | 3,689,560 | |
| | | |
| | | 375,000 | | | Vanguard International Semiconductor Corp | | | 1,701,886 | |
| | | |
| | | 119,779 | | | VisEra Technologies Co Ltd | | | 2,198,080 | |
| | | |
| | | 6,334,000 | | | Yuanta Financial Holding Co Ltd | | | 5,658,115 | |
| | | | | | | | | | |
| | | |
| | | | | | Total Taiwan | | | 131,021,139 | |
| | | | | | | | | | |
| | |
| | | | | | Thailand — 1.6% | |
| | | |
| | | 1,018,900 | | | Advanced Info Service Pcl (Foreign Registered) | | | 7,172,360 | |
| | | |
| | | 2,517,500 | | | CP ALL Pcl (Foreign Registered) | | | 5,259,601 | |
| | | | | | | | | | |
| | | |
| | | | | | Total Thailand | | | 12,431,961 | |
| | | | | | | | | | |
| | |
| | | | | | United Arab Emirates — 0.9% | |
| | | |
| | | 1,178,501 | | | First Abu Dhabi Bank PJSC | | | 6,641,146 | |
| | | | | | | | | | |
| | |
| | | | | | United States — 2.5% | |
| | | |
| | | 1,000 | | | Alphabet, Inc. – Class A * | | | 2,701,140 | |
| | | |
| | | 26,800 | | | Apple, Inc. | | | 4,425,216 | |
| | | |
| | | 72,200 | | | PepsiCo, Inc. | | | 11,822,028 | |
| | | | | | | | | | |
| | | |
| | | | | | Total United States | | | 18,948,384 | |
| | | | | | | | | | |
| | | | |
| | |
| 12 | | See accompanying notes to the financial statements. | | |
GMO Emerging Domestic Opportunities Fund
(A Series of GMO Trust)
Schedule of Investments — (Continued)
(showing percentage of total net assets)
February 28, 2022
| | | | | | | | | | |
| | | Shares | | | Description | | Value ($) | |
| | |
| | | | | | Vietnam — 1.4% | |
| | | |
| | | 2,833,368 | | | Bank for Foreign Trade of Vietnam JSC | | | 10,507,613 | |
| | | | | | | | | | |
| | | |
| | | | | | TOTAL COMMON STOCKS
(COST $658,820,397) | | | 668,090,990 | |
| | | | | | | | | | |
| | |
| | | | | | PREFERRED STOCKS (d) — 0.2% | |
| | |
| | | | | | Brazil — 0.2% | |
| | | |
| | | 839,000 | | | Randon SA Implementos e Participacoes | | | 1,712,499 | |
| | | | | | | | | | |
| | | |
| | | | | | TOTAL PREFERRED STOCKS
(COST $1,766,654) | | | 1,712,499 | |
| | | | | | | | | | |
| | |
| | | | | | INVESTMENT FUNDS — 5.6% | |
| | |
| | | | | | Brazil — 1.0% | |
| | | |
| | | 231,100 | | | iShares MSCI Brazil ETF | | | 7,600,879 | |
| | | | | | | | | | |
| | |
| | | | | | Russia — 0.5% | |
| | | |
| | | 352,300 | | | VanEck Russia ETF | | | 3,822,455 | |
| | | | | | | | | | |
| | |
| | | | | | Saudi Arabia — 4.1% | |
| | | |
| | | 670,300 | | | iShares MSCI Saudi Arabia ETF | | | 31,229,277 | |
| | | | | | | | | | |
| | | |
| | | | | | TOTAL INVESTMENT FUNDS
(COST $43,515,971) | | | 42,652,611 | |
| | | | | | | | | | |
| | | | | | | | | | |
| | | Shares /
Par Value† | | | Description | | Value ($) | |
| | |
| | | | | | MUTUAL FUNDS — 0.3% | |
| | |
| | | | | | United States — 0.3% | |
| | |
| | | | | | Affiliated Issuers — 0.3% | |
| | | |
| | | 465,374 | | | GMO U.S. Treasury Fund | | | 2,331,522 | |
| | | | | | | | | | |
| | | |
| | | | | | TOTAL MUTUAL FUNDS
(COST $2,340,826) | | | 2,331,522 | |
| | | | | | | | | | |
| | |
| | | | | | SHORT-TERM INVESTMENTS — 4.7% | |
| | |
| | | | | | Money Market Funds — 0.8% | |
| | | |
| | | 5,882,875 | | | State Street Institutional Treasury Money Market Fund – Premier Class, 0.01% (e) | | | 5,882,875 | |
| | | | | | | | | | |
| | |
| | | | | | U.S. Government — 3.9% | |
| | | |
| | | 800,000 | | | U.S. Treasury Bill, 0.58%, due 07/28/22 (f) | | | 798,113 | |
| | | |
| | | 27,000,000 | | | U.S. Treasury Bill, 0.64%, due 08/18/22 (f) | | | 26,918,825 | |
| | | |
| | | 2,000,000 | | | U.S. Treasury Bill, 0.63%, due 08/25/22 (f) | | | 1,993,631 | |
| | | | | | | | | | |
| | | |
| | | | | | Total U.S. Government | | | 29,710,569 | |
| | | | | | | | | | |
| | | |
| | | | | | TOTAL SHORT-TERM INVESTMENTS
(COST $35,590,412) | | | 35,593,444 | |
| | | | | | | | | | |
| | | |
| | | | | | TOTAL INVESTMENTS — 98.7%
(Cost $742,034,260) | | | 750,381,066 | |
| | | |
| | | | | | Other Assets and Liabilities (net) — 1.3% | | | 10,139,735 | |
| | | | | | | | | | |
| | | |
| | | | | | TOTAL NET ASSETS — 100.0% | | | $760,520,801 | |
| | | | | | | | | | |
Additional information on each restricted security is as follows:
| | | | | | | | | | | | |
Issuer Description | | Acquisition Date | | Acquisition
Cost | | | Value as a
Percentage
of Fund’s
Net Assets | | Value as of
February 28, 2022 | |
| | | | |
| Laxmi Organic Industries Ltd | | 03/02/21 | | $ | 1,924,110 | | | 0.79% | | $ | 5,986,759 | |
| | | | | | | | | | | | |
Notes to Schedule of Investments:
| † | Denominated in U.S. Dollar, unless otherwise indicated. |
| * | Non-income producing security. |
| (a) | The security is restricted as to resale. |
| (b) | Investment valued using significant unobservable inputs (Note 2). |
| (c) | Investment valued at fair value using methods determined in good faith by the Trustees of GMO Trust or persons acting at their direction pursuant to procedures approved by the Trustees. Investment valued using significant unobservable inputs(Note 2). |
| (d) | Preferred dividend rates are disclosed to the extent that a stated rate exists. |
| (e) | The rate disclosed is the 7 day net yield as of February 28, 2022. |
| (f) | The rate shown represents yield-to-maturity. |
For a listing of definitions of acronyms, counterparty abbreviations and currency abbreviations used throughout the Schedule of Investments as well as the derivative tables, if any, please refer to page 87.
| | | | |
| | |
| | | See accompanying notes to the financial statements. | | 13 |
GMO Emerging Markets ex-China Fund
(A Series of GMO Trust)
Portfolio Management
Day-to-day management of the Fund’s portfolio is the responsibility of the Emerging Markets Equity team at Grantham, Mayo, Van Otterloo & Co. LLC.
Management Discussion and Analysis of Fund Performance
Class VI shares of GMO Emerging Markets ex-China Fund returned -16.15% (net) for the period from the Fund’s inception on October 18, 2021 until the end of fiscal year ended February 28, 2022, as compared with -4.10% for the MSCI Emerging Markets ex-China Index.
Country-sector allocation detracted from the Fund’s relative returns for the period. In particular, the Fund’s overweight positions in Russian Materials, Russian Energy, and Russian Financials hurt relative performance.
Stock selection detracted from the Fund’s relative returns for the period. The Fund’s stock selection in Russian Materials, Russian Energy, and Russian Financials hurt relative performance.
The views expressed herein are exclusively those of Grantham, Mayo, Van Otterloo & Co. LLC as of the date of this report and are subject to change. GMO disclaims any responsibility to update such views. They are not meant as investment advice. References to specific securities are not recommendations of such securities and may not be representative of any GMO portfolio’s current or future investments. All information is unaudited.
GMO Emerging Markets ex-China Fund
(A Series of GMO Trust)
Comparison of Change in Value of a $300,000,000 Investment in
GMO Emerging Markets ex-China Fund Class VI Shares and the MSCI Emerging Markets ex-China Index
As of February 28, 2022
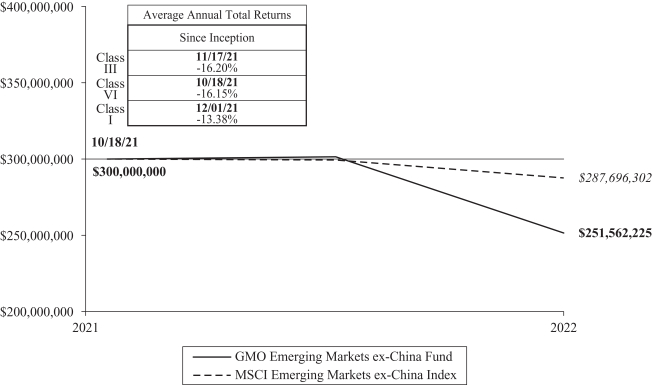
Performance data quoted represents past performance and is not indicative of future results. The investment return and principal value of an investment will fluctuate so that an investor’s shares, when redeemed, may be worth more or less than their original cost. Current performance data may be lower or higher than the performance data provided herein. To obtain performance information up to the most recent month-end, visit www.gmo.com. Performance shown is net of all fees after reimbursement from GMO. Returns would have been lower had certain expenses not been reimbursed during the periods shown and do not include the effect of taxes on distributions and redemptions. The performance information shown above only includes purchase premiums and/or redemption fees in effect as of February 28, 2022. All information is unaudited. Performance for classes may vary due to different fees.
MSCI data may not be reproduced or used for any other purpose. MSCI provides no warranties, has not prepared or approved this report, and has no liability hereunder.
For Class III, VI and I the gross expense ratio of 1.16%, 1.07 and 1.33%, respectively, is equal to the Fund’s Total Annual Operating Expenses set forth in the Fund’s most recent prospectus dated June 30, 2021. For the Classes listed above, the corresponding net expense ratio of 0.80%, 0.67% and 0.95% reflects the reduction of expenses from fee reimbursements. The fee reimbursements will continue until at least June 30, 2022. Elimination of this reimbursement will result in higher fees and lower performance.
GMO Emerging Markets ex-China Fund
(A Series of GMO Trust)
Investment Concentration Summary
February 28, 2022 (Unaudited)
| | | | |
| Asset Class Summary& | | % of Total Net Assets | |
Common Stocks | | | 92.8 | % |
Preferred Stocks | | | 5.1 | |
Short-Term Investments | | | 1.1 | |
Investment Funds | | | 0.5 | |
Mutual Funds | | | 0.0 | ^ |
Other | | | 0.5 | |
| | | | |
| | | 100.0 | % |
| | | | |
| | | | |
| Country/Region Summary¤ | | % of Investments | |
Taiwan | | | 37.1 | % |
South Korea | | | 24.1 | |
Mexico | | | 11.9 | |
Russia | | | 7.1 | |
Brazil | | | 6.6 | |
India | | | 4.5 | |
Indonesia | | | 2.5 | |
Turkey | | | 1.1 | |
Thailand | | | 0.9 | |
Chile | | | 0.7 | |
United Kingdom | | | 0.5 | * |
United States | | | 0.5 | * |
Egypt | | | 0.5 | |
South Africa | | | 0.4 | |
Philippines | | | 0.4 | |
Poland | | | 0.4 | |
Peru | | | 0.3 | |
Hungary | | | 0.3 | |
Czech Republic | | | 0.2 | |
Malaysia | | | 0.0 | ^ |
| | | | |
| | | 100.0 | % |
| | | | |
| | | | |
| Industry Group Summary | | % of Equity Investments# | |
Technology Hardware & Equipment | | | 19.4 | % |
Banks | | | 17.9 | |
Materials | | | 16.6 | |
Semiconductors & Semiconductor Equipment | | | 13.6 | |
Energy | | | 6.2 | |
Insurance | | | 5.4 | |
Food, Beverage & Tobacco | | | 5.2 | |
Telecommunication Services | | | 3.0 | |
Capital Goods | | | 2.5 | |
Food & Staples Retailing | | | 2.5 | |
Diversified Financials | | | 2.1 | |
Utilities | | | 1.9 | |
Software & Services | | | 1.2 | |
Household & Personal Products | | | 0.8 | |
Real Estate | | | 0.5 | |
Consumer Durables & Apparel | | | 0.5 | |
Media & Entertainment | | | 0.3 | |
Transportation | | | 0.2 | |
Automobiles & Components | | | 0.1 | |
Pharmaceuticals, Biotechnology & Life Sciences | | | 0.1 | |
Health Care Equipment & Services | | | 0.0 | ^ |
Commercial & Professional Services | | | 0.0 | ^ |
| | | | |
| | | 100.0 | % |
| | | | |
| & | In the table, derivative financial instruments, if any, are based on market values, rather than the notional amounts of derivatives, except for forward currency contracts which are based on unrealized appreciation/(depreciation). |
| ¤ | The table shows country exposure in the Fund. The table excludes short-term investments. The table excludes exposure through forward currency contracts and includes exposure through other derivative financial instruments, if any. The table takes into account the market value of securities and options and the notional amounts of swap contracts and other derivative financial instruments, if any. |
| * | Includes companies that derive more than 50% of their revenue or profits from emerging markets. |
| # | Equity investments may consist of common stocks and other stock-related securities, such as preferred stocks, if any. This table excludes exposure to derivative contracts, short-term investments, mutual funds and investment funds, if any. For a summary of these exposures, if any, see the Schedule of Investments. |
GMO Emerging Markets ex-China Fund
(A Series of GMO Trust)
Schedule of Investments
(showing percentage of total net assets)
February 28, 2022
| | | | | | | | | | |
| | | Shares | | | Description | | Value ($) | |
| | |
| | | | | | COMMON STOCKS — 92.8% | |
| | |
| | | | | | Brazil — 2.0% | |
| | | |
| | | 156,500 | | | Ambev SA | | | 459,290 | |
| | | |
| | | 35,600 | | | Blau Farmaceutica SA | | | 205,321 | |
| | | |
| | | 12,100 | | | Cia de Saneamento Basico do Estado de Sao Paulo | | | 97,093 | |
| | | |
| | | 10,900 | | | Cia Siderurgica Nacional SA | | | 53,647 | |
| | | |
| | | 12,300 | | | Equatorial Energia SA | | | 60,827 | |
| | | |
| | | 112,200 | | | Transmissora Alianca de Energia Eletrica SA | | | 859,792 | |
| | | |
| | | 215,800 | | | Vale SA Sponsored ADR – Class B | | | 3,990,142 | |
| | | |
| | | 142,150 | | | Vamos Locacao de Caminhoes Maquinas e Equipamentos SA | | | 302,432 | |
| | | | | | | | | | |
| | | |
| | | | | | Total Brazil | | | 6,028,544 | |
| | | | | | | | | | |
| | |
| | | | | | Chile — 0.6% | |
| | | |
| | | 56,089 | | | Aguas Andinas SA – Class A | | | 11,830 | |
| | | |
| | | 419,684 | | | Banco de Chile | | | 44,496 | |
| | | |
| | | 1,097,482 | | | Banco Santander Chile | | | 53,891 | |
| | | |
| | | 5,100 | | | Banco Santander Chile ADR | | | 99,552 | |
| | | |
| | | 28,622 | | | CAP SA | | | 331,308 | |
| | | |
| | | 24,755 | | | Cencosud SA | | | 45,514 | |
| | | |
| | | 55,591 | | | Cencosud Shopping SA | | | 59,656 | |
| | | |
| | | 24,100 | | | Cia Cervecerias Unidas SA Sponsored ADR | | | 385,118 | |
| | | |
| | | 3,402,440 | | | Colbun SA | | | 248,085 | |
| | | |
| | | 3,332 | | | Empresas COPEC SA | | | 25,838 | |
| | | |
| | | 526,587 | | | Enel Americas SA | | | 61,659 | |
| | | |
| | | 92,049 | | | Inversiones La Construccion SA | | | 368,661 | |
| | | | | | | | | | |
| | | |
| | | | | | Total Chile | | | 1,735,608 | |
| | | | | | | | | | |
| | |
| | | | | | Czech Republic — 0.2% | |
| | | |
| | | 9,265 | | | Moneta Money Bank AS | | | 36,666 | |
| | | |
| | | 895 | | | Philip Morris CR AS | | | 647,519 | |
| | | | | | | | | | |
| | | |
| | | | | | Total Czech Republic | | | 684,185 | |
| | | | | | | | | | |
| | |
| | | | | | Egypt — 0.5% | |
| | | |
| | | 216,835 | | | Commercial International Bank Egypt SAE * | | | 660,440 | |
| | | |
| | | 992,792 | | | Eastern Co SAE | | | 686,370 | |
| | | |
| | | 2,750 | | | Misr Fertilizers Production Co SAE | | | 15,558 | |
| | | | | | | | | | |
| | | |
| | | | | | Total Egypt | | | 1,362,368 | |
| | | | | | | | | | |
| | |
| | | | | | Hungary — 0.3% | |
| | | |
| | | 30,675 | | | MOL Hungarian Oil & Gas Plc | | | 239,274 | |
| | | |
| | | 14,810 | | | OTP Bank Nyrt Plc * | | | 565,138 | |
| | | | | | | | | | |
| | | |
| | | | | | Total Hungary | | | 804,412 | |
| | | | | | | | | | |
| | |
| | | | | | India — 4.4% | |
| | | |
| | | 20,000 | | | Axis Bank Ltd GDR (Registered) * | | | 979,313 | |
| | | |
| | | 118,500 | | | HDFC Bank Ltd ADR | | | 7,367,145 | |
| | | |
| | | 80,000 | | | ICICI Bank Ltd Sponsored ADR | | | 1,557,600 | |
| | | |
| | | 141,100 | | | Infosys Ltd Sponsored ADR | | | 3,169,106 | |
| | | | | | | | | | |
| | | Shares | | | Description | | Value ($) | |
| | |
| | | | | | India — continued | |
| | | |
| | | 193 | | | Reliance Industries Ltd GDR | | | 12,114 | |
| | | | | | | | | | |
| | | |
| | | | | | Total India | | | 13,085,278 | |
| | | | | | | | | | |
| | |
| | | | | | Indonesia — 2.5% | |
| | | |
| | | 1,370,700 | | | Adaro Energy Tbk PT | | | 234,844 | |
| | | |
| | | 261,800 | | | AKR Corporindo Tbk PT | | | 13,849 | |
| | | |
| | | 3,813,300 | | | Bank Central Asia Tbk PT | | | 2,152,859 | |
| | | |
| | | 1,528,900 | | | Bank Mandiri Persero Tbk PT | | | 826,586 | |
| | | |
| | | 171,700 | | | Bank Negara Indonesia Persero Tbk PT | | | 96,206 | |
| | | |
| | | 10,242,300 | | | Bank Rakyat Indonesia Persero Tbk PT | | | 3,275,079 | |
| | | |
| | | 366,200 | | | Bukit Asam Tbk PT | | | 80,449 | |
| | | |
| | | 107,800 | | | Indika Energy Tbk PT * | | | 16,814 | |
| | | |
| | | 121,100 | | | Indo Tambangraya Megah Tbk PT | | | 225,230 | |
| | | |
| | | 1,515,600 | | | Telkom Indonesia Persero Tbk PT | | | 457,579 | |
| | | |
| | | 44,900 | | | United Tractors Tbk PT | | | 78,350 | |
| | | | | | | | | | |
| | | |
| | | | | | Total Indonesia | | | 7,457,845 | |
| | | | | | | | | | |
| | |
| | | | | | Malaysia — 0.0% | |
| | | |
| | | 173,100 | | | Kossan Rubber Industries Bhd | | | 71,364 | |
| | | | | | | | | | |
| | |
| | | | | | Mexico — 11.7% | |
| | | |
| | | 153,900 | | | America Movil SAB de CV – Class L Sponsored ADR | | | 2,788,668 | |
| | | |
| | | 1,929,500 | | | America Movil SAB de CV – Series L | | | 1,754,177 | |
| | | |
| | | 119,100 | | | Arca Continental SAB de CV | | | 785,045 | |
| | | |
| | | 289,900 | | | Banco del Bajio SA | | | 704,898 | |
| | | |
| | | 13,100 | | | Bolsa Mexicana de Valores SAB de CV | | | 25,322 | |
| | | |
| | | 8,800 | | | Coca-Cola Femsa SAB de CV Sponsored ADR | | | 484,528 | |
| | | |
| | | 539,400 | | | Credito Real SAB de CV SOFOM ER * | | | 42,402 | |
| | | |
| | | 180,300 | | | Fomento Economico Mexicano SAB de CV | | | 1,448,756 | |
| | | |
| | | 69,700 | | | Fomento Economico Mexicano SAB de CV Sponsored ADR | | | 5,603,880 | |
| | | |
| | | 3,500 | | | GCC SAB de CV | | | 23,239 | |
| | | |
| | | 20,100 | | | Gentera SAB de CV * | | | 15,133 | |
| | | |
| | | 3,515 | | | Gruma SAB de CV – Class B | | | 47,599 | |
| | | |
| | | 300 | | | Grupo Aeroportuario del Centro Norte SAB de CV ADR | | | 17,439 | |
| | | |
| | | 4,500 | | | Grupo Aeroportuario del Centro Norte SAB de CV – Class B | | | 32,410 | |
| | | |
| | | 800 | | | Grupo Aeroportuario del Pacifico SAB de CV – Class B * | | | 11,717 | |
| | | |
| | | 15,535 | | | Grupo Aeroportuario del Sureste SAB de CV – Class B | | | 334,441 | |
| | | |
| | | 9,100 | | | Grupo Bimbo SAB de CV – Series A | | | 28,170 | |
| | | |
| | | 1,189,400 | | | Grupo Financiero Banorte SAB de CV – Class O | | | 8,071,613 | |
| | | |
| | | 11,100 | | | Grupo Financiero Inbursa SAB de CV – Class O * | | | 18,140 | |
| | | |
| | | 178,600 | | | Grupo Mexico SAB de CV – Series B | | | 912,315 | |
| | | |
| | | 206,100 | | | Industrias Bachoco SAB de CV – Series B | | | 690,120 | |
| | | |
| | | 1,100 | | | Industrias Penoles SAB de CV | | | 13,819 | |
| | | |
| | | 27,700 | | | Kimberly-Clark de Mexico SAB de CV – Class A | | | 38,721 | |
| | | |
| | | 6,900 | | | Megacable Holdings SAB de CV CPO | | | 20,298 | |
| | | | |
| | |
| | | See accompanying notes to the financial statements. | | 17 |
GMO Emerging Markets ex-China Fund
(A Series of GMO Trust)
Schedule of Investments — (Continued)
(showing percentage of total net assets)
February 28, 2022
| | | | | | | | | | |
| | | Shares | | | Description | | Value ($) | |
| | |
| | | | | | Mexico — continued | |
| | | |
| | | 11,600 | | | Orbia Advance Corp SAB de CV | | | 29,633 | |
| | | |
| | | 84,500 | | | Qualitas Controladora SAB de CV | | | 462,912 | |
| | | |
| | | 99,600 | | | Regional SAB de CV | | | 591,492 | |
| | | |
| | | 99,700 | | | Ternium SA Sponsored ADR | | | 3,916,216 | |
| | | |
| | | 1,524,800 | | | Wal-Mart de Mexico SAB de CV | | | 5,807,060 | |
| | | | | | | | | | |
| | | |
| | | | | | Total Mexico | | | 34,720,163 | |
| | | | | | | | | | |
| | |
| | | | | | Peru — 0.3% | |
| | | |
| | | 6,300 | | | Credicorp Ltd | | | 952,875 | |
| | | | | | | | | | |
| | |
| | | | | | Philippines — 0.4% | |
| | | |
| | | 64,460 | | | GT Capital Holdings Inc | | | 729,991 | |
| | | |
| | | 638,300 | | | Puregold Price Club Inc | | | 438,533 | |
| | | | | | | | | | |
| | | |
| | | | | | Total Philippines | | | 1,168,524 | |
| | | | | | | | | | |
| | |
| | | | | | Poland — 0.4% | |
| | | |
| | | 1,122 | | | Grupa Lotos SA * | | | 14,396 | |
| | | |
| | | 5,774 | | | Polski Koncern Naftowy ORLEN SA | | | 97,533 | |
| | | |
| | | 49,619 | | | Polskie Gornictwo Naftowe i Gazownictwo SA | | | 65,393 | |
| | | |
| | | 120,881 | | | Powszechny Zaklad Ubezpieczen SA | | | 906,928 | |
| | | | | | | | | | |
| | | |
| | | | | | Total Poland | | | 1,084,250 | |
| | | | | | | | | | |
| | |
| | | | | | Russia — 6.5% | |
| | | |
| | | 4,036,000 | | | Alrosa PJSC | | | 2,602,881 | |
| | | |
| | | 434,347 | | | Etalon Group Plc GDR (Registered) | | | 176,657 | |
| | | |
| | | 131,280 | | | Evraz Plc | | | 253,067 | |
| | | |
| | | 236,860,000 | | | Federal Grid Co Unified Energy System PJSC | | | 163,869 | |
| | | |
| | | 98,320 | | | Gazprom Neft PJSC | | | 320,626 | |
| | | |
| | | 787 | | | Gazprom Neft PJSC Sponsored ADR | | | 12,470 | |
| | | |
| | | 448,906 | | | Gazprom PJSC Sponsored ADR | | | 1,187,592 | |
| | | |
| | | 6,151,400 | | | Inter RAO UES PJSC | | | 137,400 | |
| | | |
| | | 122,088 | | | LUKOIL PJSC Sponsored ADR | | | 2,289,988 | |
| | | |
| | | 4,327,340 | | | Magnitogorsk Iron & Steel Works PJSC | | | 1,522,963 | |
| | | |
| | | 78,325 | | | MMC Norilsk Nickel PJSC ADR | | | 1,075,427 | |
| | | |
| | | 172,200 | | | Mobile TeleSystems PJSC ADR (a) | | | 658,720 | |
| | | |
| | | 88,090 | | | Moscow Exchange MICEX-RTS PJSC | | | 66,045 | |
| | | |
| | | 9,337 | | | Novatek PJSC Sponsored GDR (Registered) | | | 359,681 | |
| | | |
| | | 381,910 | | | Novolipetsk Steel PJSC | | | 549,508 | |
| | | |
| | | 102,160 | | | Novolipetsk Steel PJSC GDR | | | 783,245 | |
| | | |
| | | 14,846 | | | PhosAgro PJSC GDR (Registered) | | | 90,826 | |
| | | |
| | | 276,810 | | | Polymetal International Plc | | | 1,294,196 | |
| | | |
| | | 5,594 | | | Polyus PJSC | | | 588,423 | |
| | | |
| | | 12,617 | | | Polyus PJSC GDR (Registered) | | | 673,352 | |
| | | |
| | | 73,800 | | | QIWI Plc Sponsored ADR (a) | | | 291,035 | |
| | | |
| | | 55,866 | | | Raspadskaya OJSC | | | 126,262 | |
| | | |
| | | 4,917 | | | Ros Agro Plc GDR (Registered) | | | 21,694 | |
| | | |
| | | 48,335,000 | | | RusHydro PJSC | | | 269,370 | |
| | | |
| | | 17,394 | | | RusHydro PJSC ADR | | | 8,726 | |
| | | |
| | | 861,608 | | | Sberbank of Russia PJSC Sponsored ADR | | | 900,433 | |
| | | |
| | | 140,607 | | | Severstal PAO GDR (Registered) | | | 713,816 | |
| | | | | | | | | | |
| | | Shares | | | Description | | Value ($) | |
| | |
| | | | | | Russia — continued | |
| | | |
| | | 2,387,800 | | | Surgutneftegas PJSC | | | 432,107 | |
| | | |
| | | 109,514 | | | Tatneft PJSC Sponsored ADR | | | 1,492,445 | |
| | | |
| | | 9,408 | | | TCS Group Holding Plc GDR (Registered) | | | 231,129 | |
| | | | | | | | | | |
| | | |
| | | | | | Total Russia | | | 19,293,953 | |
| | | | | | | | | | |
| | |
| | | | | | South Africa — 0.4% | |
| | | |
| | | 3,577 | | | AVI Ltd | | | 16,686 | |
| | | |
| | | 1,793 | | | Capitec Bank Holdings Ltd | | | 242,078 | |
| | | |
| | | 2,586 | | | Investec Ltd | | | 14,558 | |
| | | |
| | | 14,766 | | | Kumba Iron Ore Ltd | | | 583,682 | |
| | | |
| | | 4,804 | | | Ninety One Ltd | | | 15,672 | |
| | | |
| | | 467,495 | | | Old Mutual Ltd | | | 383,820 | |
| | | | | | | | | | |
| | | |
| | | | | | Total South Africa | | | 1,256,496 | |
| | | | | | | | | | |
| | |
| | | | | | South Korea — 23.8% | |
| | | |
| | | 152 | | | BGF retail Co Ltd | | | 21,533 | |
| | | |
| | | 40,422 | | | BNK Financial Group Inc | | | 266,100 | |
| | | |
| | | 10,335 | | | Cheil Worldwide Inc | | | 194,318 | |
| | | |
| | | 747 | | | CJ CheilJedang Corp | | | 236,616 | |
| | | |
| | | 349 | | | Coway Co Ltd | | | 20,960 | |
| | | |
| | | 81,095 | | | Daewoo Engineering & Construction Co Ltd * | | | 426,551 | |
| | | |
| | | 61,233 | | | Daou Data Corp | | | 708,418 | |
| | | |
| | | 738 | | | Daou Technology Inc | | | 13,296 | |
| | | |
| | | 5,932 | | | DB Insurance Co Ltd | | | 305,398 | |
| | | |
| | | 2,650 | | | DGB Financial Group Inc | | | 20,976 | |
| | | |
| | | 2,221 | | | DL E&C Co Ltd | | | 239,436 | |
| | | |
| | | 923 | | | Dongkuk Steel Mill Co Ltd | | | 12,826 | |
| | | |
| | | 149,218 | | | Dongwon Development Co Ltd | | | 606,816 | |
| | | |
| | | 88 | | | GOLFZON Co Ltd * | | | 11,192 | |
| | | |
| | | 26,809 | | | GS Engineering & Construction Corp | | | 963,491 | |
| | | |
| | | 1,469 | | | GS Holdings Corp | | | 49,122 | |
| | | |
| | | 75,044 | | | Hana Financial Group Inc | | | 3,048,875 | |
| | | |
| | | 423 | | | Hankook Tire & Technology Co Ltd | | | 12,463 | |
| | | |
| | | 14,205 | | | Hanwha Life Insurance Co Ltd * | | | 35,080 | |
| | | |
| | | 37,172 | | | HDC Hyundai Development Co-Engineering & Construction * | | | 500,264 | |
| | | |
| | | 1,045 | | | Huchems Fine Chemical Corp | | | 19,442 | |
| | | |
| | | 25,525 | | | Hyundai Engineering & Construction Co Ltd | | | 929,932 | |
| | | |
| | | 22,150 | | | Hyundai Marine & Fire Insurance Co Ltd | | | 532,023 | |
| | | |
| | | 407 | | | Hyundai Mobis Co Ltd | | | 76,421 | |
| | | |
| | | 3,812 | | | Industrial Bank of Korea | | | 34,245 | |
| | | |
| | | 2,291 | | | JB Financial Group Co Ltd | | | 15,692 | |
| | | |
| | | 95,959 | | | KB Financial Group Inc | | | 4,734,083 | |
| | | |
| | | 5,881 | | | KCC Glass Corp | | | 285,695 | |
| | | |
| | | 2,428 | | | Kia Corp | | | 150,525 | |
| | | |
| | | 617 | | | KIWOOM Securities Co Ltd * | | | 52,392 | |
| | | |
| | | 4,564 | | | Korea Investment Holdings Co Ltd * | | | 303,210 | |
| | | |
| | | 2,337 | | | Korea Petrochemical Ind Co Ltd * | | | 334,286 | |
| | | |
| | | 162,307 | | | Korea Real Estate Investment & Trust Co Ltd | | | 297,159 | |
| | | |
| | | 2,171 | | | Korea Zinc Co Ltd | | | 995,709 | |
| | | | |
| | |
| 18 | | See accompanying notes to the financial statements. | | |
GMO Emerging Markets ex-China Fund
(A Series of GMO Trust)
Schedule of Investments — (Continued)
(showing percentage of total net assets)
February 28, 2022
| | | | | | | | | | |
| | | Shares | | | Description | | Value ($) | |
| | |
| | | | | | South Korea — continued | |
| | | |
| | | 2,729 | | | Korean Reinsurance Co | | | 22,036 | |
| | | |
| | | 90,016 | | | KT Skylife Co Ltd | | | 639,205 | |
| | | |
| | | 48,732 | | | KT&G Corp | | | 3,239,535 | |
| | | |
| | | 6,649 | | | Kumho Petrochemical Co Ltd * | | | 897,021 | |
| | | |
| | | 270 | | | Kyung Dong Navien Co Ltd | | | 10,027 | |
| | | |
| | | 722 | | | LG Household & Health Care Ltd | | | 572,866 | |
| | | |
| | | 7,600 | | | Lotte Chemical Corp | | | 1,400,678 | |
| | | |
| | | 1,340 | | | LOTTE Fine Chemical Co Ltd | | | 89,144 | |
| | | |
| | | 388 | | | LS Electric Co Ltd | | | 13,988 | |
| | | |
| | | 3,335 | | | LX Semicon Co Ltd | | | 320,337 | |
| | | |
| | | 1,357 | | | Meritz Financial Group Inc | | | 41,727 | |
| | | |
| | | 2,381 | | | Meritz Fire & Marine Insurance Co Ltd | | | 81,828 | |
| | | |
| | | 16,935 | | | Meritz Securities Co Ltd | | | 82,930 | |
| | | |
| | | 11,697 | | | Namsun Aluminum Co Ltd * | | | 23,005 | |
| | | |
| | | 16,282 | | | NH Investment & Securities Co Ltd * | | | 157,560 | |
| | | |
| | | 48 | | | NongShim Co Ltd | | | 12,290 | |
| | | |
| | | 576 | | | PI Advanced Materials Co Ltd * | | | 21,019 | |
| | | |
| | | 626 | | | Poongsan Corp | | | 16,673 | |
| | | |
| | | 22,596 | | | POSCO | | | 5,376,125 | |
| | | |
| | | 51 | | | POSCO International Corp | | | 885 | |
| | | |
| | | 7,300 | | | POSCO Sponsored ADR | | | 433,036 | |
| | | |
| | | 212 | | | S-1 Corp | | | 12,341 | |
| | | |
| | | 2,695 | | | Samsung C&T Corp | | | 248,898 | |
| | | |
| | | 875 | | | Samsung Card Co Ltd | | | 23,500 | |
| | | |
| | | 497,682 | | | Samsung Electronics Co Ltd | | | 29,987,021 | |
| | | |
| | | 45,404 | | | Samsung Engineering Co Ltd * | | | 886,970 | |
| | | |
| | | 6,944 | | | Samsung Fire & Marine Insurance Co Ltd | | | 1,104,239 | |
| | | |
| | | 13,723 | | | Samsung Life Insurance Co Ltd | | | 686,144 | |
| | | |
| | | 3,573 | | | Samsung Securities Co Ltd | | | 126,634 | |
| | | |
| | | 14,686 | | | Sangsangin Co Ltd | | | 114,608 | |
| | | |
| | | 666 | | | SD Biosensor Inc | | | 30,364 | |
| | | |
| | | 96,321 | | | Shinhan Financial Group Co Ltd | | | 3,133,875 | |
| | | |
| | | 139 | | | SK Gas Ltd | | | 13,819 | |
| | | |
| | | 7,834 | | | SK Telecom Co Ltd | | | 357,490 | |
| | | |
| | | 703 | | | Songwon Industrial Co Ltd | | | 12,002 | |
| | | |
| | | 13,751 | | | Spigen Korea Co Ltd | | | 488,867 | |
| | | |
| | | 938 | | | TY Holdings Co Ltd * | | | 21,386 | |
| | | |
| | | 412 | | | Unid Co Ltd | | | 30,046 | |
| | | |
| | | 286,916 | | | Woori Financial Group Inc | | | 3,431,973 | |
| | | | | | | | | | |
| | | |
| | | | | | Total South Korea | | | 70,616,637 | |
| | | | | | | | | | |
| | |
| | | | | | Taiwan — 36.4% | |
| | | |
| | | 10,000 | | | Accton Technology Corp | | | 90,686 | |
| | | |
| | | 363,000 | | | Acer Inc | | | 376,732 | |
| | | |
| | | 4,000 | | | Acter Group Corp Ltd | | | 31,580 | |
| | | |
| | | 10,000 | | | Advanced Ceramic X Corp | | | 96,955 | |
| | | |
| | | 20,000 | | | Advantech Co Ltd | | | 263,370 | |
| | | |
| | | 4,000 | | | Airtac International Group | | | 133,048 | |
| | | |
| | | 1,171,000 | | | AmTRAN Technology Co Ltd | | | 678,028 | |
| | | |
| | | 9,000 | | | Arcadyan Technology Corp | | | 37,278 | |
| | | | | | | | | | |
| | | Shares | | | Description | | Value ($) | |
| | |
| | | | | | Taiwan — continued | |
| | | |
| | | 261,000 | | | Asia Vital Components Co Ltd | | | 1,043,550 | |
| | | |
| | | 11,000 | | | ASROCK Inc | | | 89,943 | |
| | | |
| | | 175,000 | | | Asustek Computer Inc | | | 2,334,583 | |
| | | |
| | | 86,000 | | | Aten International Co Ltd | | | 248,706 | |
| | | |
| | | 243,000 | | | AU Optronics Corp | | | 181,928 | |
| | | |
| | | 20,000 | | | Aurora Corp | | | 65,646 | |
| | | |
| | | 27,000 | | | Capital Securities Corp | | | 15,278 | |
| | | |
| | | 175,000 | | | Catcher Technology Co Ltd | | | 898,242 | |
| | | |
| | | 2,479,000 | | | Cathay Financial Holding Co Ltd | | | 5,574,368 | |
| | | |
| | | 290,000 | | | Chailease Holding Co Ltd | | | 2,631,898 | |
| | | |
| | | 60,000 | | | Chicony Electronics Co Ltd | | | 193,001 | |
| | | |
| | | 1,328,176 | | | China Development Financial Holding Corp | | | 909,554 | |
| | | |
| | | 550,000 | | | China General Plastics Corp | | | 684,556 | |
| | | |
| | | 3,341,000 | | | China Steel Corp | | | 4,344,484 | |
| | | |
| | | 167,000 | | | Chipbond Technology Corp | | | 415,539 | |
| | | |
| | | 1,000 | | | Chlitina Holding Ltd | | | 7,540 | |
| | | |
| | | 449,000 | | | Chung Hung Steel Corp | | | 666,776 | |
| | | |
| | | 623,000 | | | Chunghwa Telecom Co Ltd | | | 2,768,996 | |
| | | |
| | | 9,000 | | | Cleanaway Co Ltd | | | 68,400 | |
| | | |
| | | 12,000 | | | CTCI Corp | | | 17,662 | |
| | | |
| | | 208,000 | | | Delta Electronics Inc | | | 1,853,718 | |
| | | |
| | | 955,000 | | | E.Sun Financial Holding Co Ltd | | | 1,009,485 | |
| | | |
| | | 24,000 | | | Eclat Textile Co Ltd | | | 497,476 | |
| | | |
| | | 42,000 | | | Elan Microelectronics Corp | | | 249,440 | |
| | | |
| | | 114,000 | | | Elite Material Co Ltd | | | 1,117,913 | |
| | | |
| | | 61,000 | | | Elite Semiconductor Microelectronics Technology Inc | | | 321,174 | |
| | | |
| | | 64,000 | | | Everlight Electronics Co Ltd | | | 115,272 | |
| | | |
| | | 36,000 | | | Feng Hsin Steel Co Ltd | | | 108,572 | |
| | | |
| | | 33,000 | | | First Financial Holding Co Ltd | | | 30,384 | |
| | | |
| | | 99,000 | | | FLEXium Interconnect Inc * | | | 337,949 | |
| | | |
| | | 35,000 | | | Flytech Technology Co Ltd | | | 92,555 | |
| | | |
| | | 110,000 | | | Formosa Advanced Technologies Co Ltd | | | 157,104 | |
| | | |
| | | 115,000 | | | Formosa Chemicals & Fibre Corp | | | 326,033 | |
| | | |
| | | 13,000 | | | Formosa Petrochemical Corp | | | 45,729 | |
| | | |
| | | 951,000 | | | Formosa Plastics Corp | | | 3,590,990 | |
| | | |
| | | 309,897 | | | Foxconn Technology Co Ltd | | | 713,306 | |
| | | |
| | | 1,737,000 | | | Fubon Financial Holding Co Ltd | | | 4,690,011 | |
| | | |
| | | 9,000 | | | Gamania Digital Entertainment Co Ltd | | | 20,468 | |
| | | |
| | | 159,000 | | | Gigabyte Technology Co Ltd | | | 814,747 | |
| | | |
| | | 19,000 | | | Global Mixed Mode Technology Inc | | | 164,433 | |
| | | |
| | | 1,000 | | | Global Unichip Corp | | | 16,591 | |
| | | |
| | | 457,000 | | | Grand Pacific Petrochemical | | | 468,733 | |
| | | |
| | | 66,000 | | | Greatek Electronics Inc | | | 172,740 | |
| | | |
| | | 1,292,000 | | | HannStar Display Corp | | | 745,172 | |
| | | |
| | | 5,000 | | | Hiwin Technologies Corp | | | 47,738 | |
| | | |
| | | 56,000 | | | Holtek Semiconductor Inc | | | 218,783 | |
| | | |
| | | 1,052,000 | | | Hon Hai Precision Industry Co Ltd | | | 3,907,715 | |
| | | |
| | | 299,000 | | | IEI Integration Corp | | | 498,050 | |
| | | |
| | | 225,000 | | | Inventec Corp | | | 207,787 | |
| | | | |
| | |
| | | See accompanying notes to the financial statements. | | 19 |
GMO Emerging Markets ex-China Fund
(A Series of GMO Trust)
Schedule of Investments — (Continued)
(showing percentage of total net assets)
February 28, 2022
| | | | | | | | | | |
| | | Shares | | | Description | | Value ($) | |
| | |
| | | | | | Taiwan — continued | |
| | | |
| | | 8,000 | | | Kindom Development Co Ltd | | | 10,668 | |
| | | |
| | | 2,000 | | | King Slide Works Co Ltd | | | 30,749 | |
| | | |
| | | 483,000 | | | King’s Town Bank Co Ltd | | | 697,910 | |
| | | |
| | | 143,000 | | | Kung Long Batteries Industrial Co Ltd | | | 700,252 | |
| | | |
| | | 62,000 | | | Largan Precision Co Ltd | | | 4,505,714 | |
| | | |
| | | 290,000 | | | Lite-On Technology Corp | | | 713,075 | |
| | | |
| | | 85,000 | | | MediaTek Inc | | | 3,358,845 | |
| | | |
| | | 737,000 | | | Mega Financial Holding Co Ltd | | | 993,182 | |
| | | |
| | | 210,000 | | | Micro-Star International Co Ltd | | | 1,183,723 | |
| | | |
| | | 152,000 | | | Mitac Holdings Corp | | | 183,744 | |
| | | |
| | | 793,000 | | | Nan Ya Plastics Corp | | | 2,501,122 | |
| | | |
| | | 242,528 | | | Nantex Industry Co Ltd | | | 646,032 | |
| | | |
| | | 35,000 | | | Nanya Technology Corp | | | 98,014 | |
| | | |
| | | 106,000 | | | Novatek Microelectronics Corp | | | 1,757,317 | |
| | | |
| | | 138,000 | | | Pegatron Corp | | | 342,041 | |
| | | |
| | | 107,000 | | | Phison Electronics Corp | | | 1,979,728 | |
| | | |
| | | 129,000 | | | Powertech Technology Inc | | | 437,560 | |
| | | |
| | | 116,000 | | | Quanta Computer Inc | | | 387,892 | |
| | | |
| | | 190,000 | | | Radiant Opto-Electronics Corp | | | 687,007 | |
| | | |
| | | 31,000 | | | Realtek Semiconductor Corp | | | 511,127 | |
| | | |
| | | 7,000 | | | Rexon Industrial Corp Ltd | | | 10,783 | |
| | | |
| | | 126,000 | | | Ruentex Development Co Ltd | | | 325,335 | |
| | | |
| | | 105,000 | | | Shanghai Commercial & Savings Bank Ltd (The) | | | 172,961 | |
| | | |
| | | 989,000 | | | Shin Kong Financial Holding Co Ltd | | | 401,074 | |
| | | |
| | | 22,000 | | | Simplo Technology Co Ltd | | | 246,878 | |
| | | |
| | | 503,000 | | | SinoPac Financial Holdings Co Ltd | | | 308,873 | |
| | | |
| | | 110,000 | | | Sitronix Technology Corp | | | 1,165,421 | |
| | | |
| | | 44,000 | | | Sonix Technology Co Ltd | | | 138,872 | |
| | | |
| | | 33,000 | | | Supreme Electronics Co Ltd | | | 63,367 | |
| | | |
| | | 527,000 | | | TA Chen Stainless Pipe * | | | 1,007,545 | |
| | | |
| | | 114,000 | | | Taita Chemical Co Ltd | | | 134,742 | |
| | | |
| | | 1,334,000 | | | Taiwan Cement Corp | | | 2,264,629 | |
| | | |
| | | 365,000 | | | Taiwan Glass Industry Corp | | | 303,752 | |
| | | |
| | | 300,000 | | | Taiwan PCB Techvest Co Ltd | | | 552,724 | |
| | | |
| | | 240,300 | | | Taiwan Semiconductor Manufacturing Co Ltd Sponsored ADR | | | 25,714,503 | |
| | | |
| | | 47,000 | | | Taiwan Union Technology Corp | | | 145,626 | |
| | | |
| | | 26,000 | | | TCI Co Ltd | | | 182,326 | |
| | | |
| | | 27,000 | | | Tripod Technology Corp | | | 123,791 | |
| | | |
| | | 92,730 | | | Tung Ho Steel Enterprise Corp | | | 233,570 | |
| | | |
| | | 58,000 | | | TXC Corp | | | 202,742 | |
| | | |
| | | 152,000 | | | Uni-President Enterprises Corp | | | 365,696 | |
| | | |
| | | 108,000 | | | United Integrated Services Co Ltd | | | 683,731 | |
| | | |
| | | 97,000 | | | Universal Inc | | | 139,709 | |
| | | |
| | | 603,000 | | | USI Corp | | | 618,455 | |
| | | |
| | | 333,000 | | | Vanguard International Semiconductor Corp | | | 1,511,275 | |
| | | |
| | | 151,000 | | | Walsin Technology Corp * | | | 799,818 | |
| | | |
| | | 215,000 | | | Weikeng Industrial Co Ltd | | | 238,223 | |
| | | |
| | | 1,199,000 | | | Yuanta Financial Holding Co Ltd | | | 1,071,058 | |
| | | | | | | | | | |
| | | |
| | | | | | Total Taiwan | | | 108,261,576 | |
| | | | | | | | | | |
| | | | | | | | | | |
| | | Shares | | | Description | | Value ($) | |
| | |
| | | | | | Thailand — 0.9% | |
| | | |
| | | 39,000 | | | AP Thailand Pcl NVDR | | | 12,677 | |
| | | |
| | | 200,600 | | | Bangkok Bank Pcl NVDR | | | 864,255 | |
| | | |
| | | 385,300 | | | CP ALL Pcl NVDR | | | 804,975 | |
| | | |
| | | 133,600 | | | Kasikornbank Pcl NVDR | | | 671,909 | |
| | | |
| | | 16,700 | | | PTT Exploration & Production Pcl NVDR | | | 70,311 | |
| | | |
| | | 30,500 | | | PTT Pcl NVDR | | | 37,127 | |
| | | |
| | | 49,200 | | | Siam Commercial Bank Pcl NVDR (The) | | | 190,121 | |
| | | |
| | | 21,200 | | | Supalai Pcl NVDR | | | 14,278 | |
| | | | | | | | | | |
| | | |
| | | | | | Total Thailand | | | 2,665,653 | |
| | | | | | | | | | |
| | |
| | | | | | Turkey — 1.0% | |
| | | |
| | | 2,289,812 | | | Akbank TAS | | | 1,168,784 | |
| | | |
| | | 123,454 | | | Enerjisa Enerji AS | | | 118,397 | |
| | | |
| | | 107,851 | | | Eregli Demir ve Celik Fabrikalari TAS | | | 242,730 | |
| | | |
| | | 915,120 | | | Turkiye Garanti Bankasi AS | | | 733,438 | |
| | | |
| | | 3,250,936 | | | Yapi ve Kredi Bankasi AS | | | 839,680 | |
| | | | | | | | | | |
| | | |
| | | | | | Total Turkey | | | 3,103,029 | |
| | | | | | | | | | |
| | |
| | | | | | United Kingdom — 0.5% | |
| | | |
| | | 30,000 | | | Unilever Plc | | | 1,506,959 | |
| | | | | | | | | | |
| | | |
| | | | | | TOTAL COMMON STOCKS
(COST $335,104,347) | | | 275,859,719 | |
| | | | | | | | | | |
| | |
| | | | | | PREFERRED STOCKS (b) — 5.1% | |
| | |
| | | | | | Brazil — 4.4% | |
| | | |
| | | 6,100 | | | Bradespar SA | | | 35,113 | |
| | | |
| | | 729,100 | | | Cia Energetica de Minas Gerais | | | 1,791,594 | |
| | | |
| | | 170,600 | | | Cia Energetica de Minas Gerais Sponsored ADR | | | 429,912 | |
| | | |
| | | 1,007,400 | | | Cia Paranaense de Energia – Class B | | | 1,346,081 | |
| | | |
| | | 54,700 | | | Gerdau SA | | | 271,302 | |
| | | |
| | | 21,900 | | | Itausa SA | | | 42,412 | |
| | | |
| | | 1,300,400 | | | Petroleo Brasileiro SA | | | 8,548,123 | |
| | | |
| | | 50,800 | | | Petroleo Brasileiro SA Sponsored ADR | | | 664,972 | |
| | | | | | | | | | |
| | | |
| | | | | | Total Brazil | | | 13,129,509 | |
| | | | | | | | | | |
| | |
| | | | | | Chile — 0.1% | |
| | | |
| | | 9,977 | | | Embotelladora Andina SA – Class B | | | 21,726 | |
| | | |
| | | 4,500 | | | Sociedad Quimica y Minera de Chile SA Sponsored ADR | | | 297,810 | |
| | | | | | | | | | |
| | | |
| | | | | | Total Chile | | | 319,536 | |
| | | | | | | | | | |
| | |
| | | | | | Russia — 0.5% | |
| | | |
| | | 3,948,700 | | | Surgutneftegas PJSC | | | 1,110,830 | |
| | | |
| | | 315 | | | Transneft PJSC | | | 389,258 | |
| | | | | | | | | | |
| | | |
| | | | | | Total Russia | | | 1,500,088 | |
| | | | | | | | | | |
| | | | |
| | |
| 20 | | See accompanying notes to the financial statements. | | |
GMO Emerging Markets ex-China Fund
(A Series of GMO Trust)
Schedule of Investments — (Continued)
(showing percentage of total net assets)
February 28, 2022
| | | | | | | | | | |
| | | Shares /
Par Value† | | | Description | | Value ($) | |
| | |
| | | | | | Taiwan — 0.1% | |
| | | |
| | | 224,635 | | | China Development Financial Holding Corp | | | 74,678 | |
| | | | | | | | | | |
| | | |
| | | | | | TOTAL PREFERRED STOCKS
(COST $15,642,013) | | | 15,023,811 | |
| | | | | | | | | | |
| | |
| | | | | | INVESTMENT FUNDS — 0.5% | |
| | |
| | | | | | United States — 0.5% | |
| | | |
| | | 26,130 | | | iShares Core MSCI Emerging Markets ETF | | | 1,495,420 | |
| | | | | | | | | | |
| | | |
| | | | | | TOTAL INVESTMENT FUNDS
(COST $1,558,697) | | | 1,495,420 | |
| | | | | | | | | | |
| | |
| | | | | | MUTUAL FUNDS — 0.0% | |
| | |
| | | | | | United States — 0.0% | |
| | |
| | | | | | Affiliated Issuers — 0.0% | |
| | | |
| | | 873 | | | GMO U.S. Treasury Fund | | | 4,374 | |
| | | | | | | | | | |
| | | |
| | | | | | TOTAL MUTUAL FUNDS
(COST $4,391) | | | 4,374 | |
| | | | | | | | | | |
| | |
| | | | | | SHORT-TERM INVESTMENTS — 1.1% | |
| | |
| | | | | | Money Market Funds — 0.3% | |
| | | |
| | | 911,285 | | | State Street Institutional Treasury Money Market Fund – Premier Class, 0.01% (c) | | | 911,285 | |
| | | | | | | | | | |
| | | | | | U.S. Government — 0.8% | | | | |
| | | |
| | | 1,400,000 | | | U.S. Treasury Bill, 0.64%, due 08/18/22 (d) | | | 1,395,791 | |
| | | |
| | | 900,000 | | | U.S. Treasury Bill, 0.90%, due 12/29/22 (d) | | | 893,296 | |
| | | | | | | | | | |
| | | |
| | | | | | Total U.S. Government | | | 2,289,087 | |
| | | | | | | | | | |
| | | |
| | | | | | TOTAL SHORT-TERM INVESTMENTS
(COST $3,203,298) | | | 3,200,372 | |
| | | | | | | | | | |
| | | |
| | | | | | TOTAL INVESTMENTS — 99.5%
(Cost $355,512,746) | | | 295,583,696 | |
| | | |
| | | | | | Other Assets and Liabilities (net) — 0.5% | | | 1,513,564 | |
| | | | | | | | | | |
| | | |
| | | | | | TOTAL NET ASSETS — 100.0% | | | $297,097,260 | |
| | | | | | | | | | |
Notes to Schedule of Investments:
| † | Denominated in U.S. Dollar, unless otherwise indicated. |
| * | Non-income producing security. |
| (a) | Investment valued at fair value using methods determined in good faith by the Trustees of GMO Trust or persons acting at their direction pursuant to procedures approved by the Trustees. Investment valued using significant unobservable inputs (Note 2). |
| (b) | Preferred dividend rates are disclosed to the extent that a stated rate exists. |
| (c) | The rate disclosed is the 7 day net yield as of February 28, 2022. |
| (d) | The rate shown represents yield-to-maturity. |
For a listing of definitions of acronyms, counterparty abbreviations and currency abbreviations used throughout the Schedule of Investments as well as the derivative tables, if any, please refer to page 87.
| | | | |
| | |
| | | See accompanying notes to the financial statements. | | 21 |
GMO Emerging Markets Fund
(A Series of GMO Trust)
Portfolio Management
Day-to-day management of the Fund’s portfolio is the responsibility of the Emerging Markets Equity team at Grantham, Mayo, Van Otterloo & Co. LLC.
Management Discussion and Analysis of Fund Performance
Class II shares of GMO Emerging Markets Fund returned -15.13% (net) for the fiscal year ended February 28, 2022, as compared with -10.69% for the MSCI Emerging Markets Index.
Country-sector allocation detracted from the Fund’s relative returns for the fiscal year. In particular, the Fund’s overweight positions in Russian Materials, Russian Energy, and Russian Financials hurt relative performance.
Stock selection detracted from the Fund’s relative returns for the fiscal year. The Fund’s stock selection in Russian Materials, Russian Energy, and Russian Financials hurt relative performance.
The views expressed herein are exclusively those of Grantham, Mayo, Van Otterloo & Co. LLC as of the date of this report and are subject to change. GMO disclaims any responsibility to update such views. They are not meant as investment advice. References to specific securities are not recommendations of such securities and may not be representative of any GMO portfolio’s current or future investments. All information is unaudited.
GMO Emerging Markets Fund
(A Series of GMO Trust)
Comparison of Change in Value of a $5,000,000 Investment in
GMO Emerging Markets Fund Class II Shares, the MSCI Emerging Markets Index and
the S&P/IFCI Composite
As of February 28, 2022
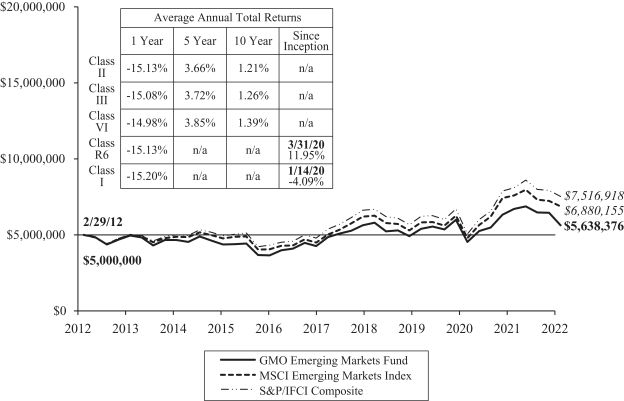
Performance data quoted represents past performance and is not indicative of future results. The investment return and principal value of an investment will fluctuate so that an investor’s shares, when redeemed, may be worth more or less than their original cost. Current performance data may be lower or higher than the performance data provided herein. To obtain performance information up to the most recent month-end, visit www.gmo.com. Performance shown is net of all fees after reimbursement from GMO. Returns would have been lower had certain expenses not been reimbursed during the periods shown and do not include the effect of taxes on distributions and redemptions. The performance information shown above only includes purchase premiums and/or redemption fees in effect as of February 28, 2022. All information is unaudited. Performance for classes may vary due to different fees.
For S&P disclaimers please visit https://www.gmo.com/north-america/benchmark-disclaimers/
MSCI data may not be reproduced or used for any other purpose. MSCI provides no warranties, has not prepared or approved this report, and has no liability hereunder.
For Class II, III, VI, R6 and I the gross expense ratio of 0.97%, 0.90%, 0.81%, 0.97% and 1.07%, respectively, is equal to the Fund’s Total Annual Operating Expenses set forth in the Fund’s most recent prospectus dated June 30, 2021. For the Classes listed above, the corresponding net expense ratio of 0.94%, 0.89%, 0.76%, 0.94% and 0.99% reflects the reduction of expenses from fee reimbursements. The fee reimbursements will continue until at least June 30, 2022. Elimination of this reimbursement will result in higher fees and lower performance.
GMO Emerging Markets Fund
(A Series of GMO Trust)
Investment Concentration Summary
February 28, 2022 (Unaudited)
| | | | |
| Asset Class Summary& | | % of Total Net Assets | |
Common Stocks | | | 91.0 | % |
Preferred Stocks | | | 5.4 | |
Short-Term Investments | | | 1.6 | |
Investment Funds | | | 1.5 | |
Debt Obligations | | | 0.4 | |
Futures Contracts | | | (0.3 | ) |
Other | | | 0.4 | |
| | | | |
| | | 100.0 | % |
| | | | |
| | | | |
| Country/Region Summary¤ | | % of Investments | |
China | | | 28.0 | % |
Taiwan | | | 22.8 | |
South Korea | | | 13.3 | |
United States | | | 9.0 | * |
Russia | | | 6.0 | |
Mexico | | | 5.4 | |
India | | | 4.6 | |
Brazil | | | 4.0 | |
Indonesia | | | 2.4 | |
Turkey | | | 0.8 | |
United Kingdom | | | 0.6 | * |
Kuwait | | | 0.6 | |
South Africa | | | 0.5 | |
Qatar | | | 0.5 | |
Thailand | | | 0.5 | |
Philippines | | | 0.4 | |
Chile | | | 0.2 | |
Czech Republic | | | 0.2 | |
Poland | | | 0.1 | |
Argentina | | | 0.1 | |
Sri Lanka | | | 0.0 | ^ |
Colombia | | | 0.0 | ^ |
Malaysia | | | 0.0 | ^ |
Egypt | | | 0.0 | ^ |
Hungary | | | 0.0 | ^ |
Vietnam | | | 0.0 | ^ |
United Arab Emirates | | | 0.0 | ^ |
| | | | |
| | | 100.0 | % |
| | | | |
| | | | |
| Industry Group Summary | | % of Equity Investments# | |
Banks | | | 19.9 | % |
Technology Hardware & Equipment | | | 16.6 | |
Materials | | | 11.8 | |
Semiconductors & Semiconductor Equipment | | | 8.4 | |
Energy | | | 5.6 | |
Insurance | | | 5.5 | |
Capital Goods | | | 5.2 | |
Food, Beverage & Tobacco | | | 4.3 | |
Media & Entertainment | | | 3.8 | |
Software & Services | | | 3.1 | |
Real Estate | | | 3.0 | |
Utilities | | | 2.9 | |
Consumer Durables & Apparel | | | 2.5 | |
Diversified Financials | | | 1.5 | |
Retailing | | | 1.4 | |
Food & Staples Retailing | | | 1.2 | |
Household & Personal Products | | | 1.1 | |
Automobiles & Components | | | 0.8 | |
Transportation | | | 0.7 | |
Pharmaceuticals, Biotechnology & Life Sciences | | | 0.3 | |
Consumer Services | | | 0.2 | |
Health Care Equipment & Services | | | 0.1 | |
Telecommunication Services | | | 0.1 | |
| | | | |
| | | 100.0 | % |
| | | | |
| & | In the table, derivative financial instruments, if any, are based on market values, rather than the notional amounts of derivatives, except for forward currency contracts which are based on unrealized appreciation/(depreciation). |
| ¤ | The table shows country exposure in the Fund. The table excludes short-term investments. The table excludes exposure through forward currency contracts and includes exposure through other derivative financial instruments, if any. The table takes into account the market value of securities and options and the notional amounts of swap contracts and other derivative financial instruments, if any. |
| * | Includes companies that derive more than 50% of their revenues or profits from emerging markets. |
| # | Equity investments may consist of common stocks and other stock-related securities, such as preferred stocks, if any. This table excludes exposure to derivative contracts, short-term investments, mutual funds and investment funds, if any. For a summary of these exposures, if any, see the Schedule of Investments. |
GMO Emerging Markets Fund
(A Series of GMO Trust)
Schedule of Investments
(showing percentage of total net assets)
February 28, 2022
| | | | | | | | | | |
| | | Shares | | | Description | | Value ($) | |
| | | |
| | | | | | COMMON STOCKS — 91.0% | | | | |
| | | |
| | | | | | Argentina — 0.1% | | | |
| | | |
| | | 171,300 | | | Banco BBVA Argentina SA ADR * | | | 553,299 | |
| | | |
| | | 156,300 | | | Grupo Financiero Galicia SA ADR (a) | | | 1,480,161 | |
| | | | | | | | | | |
| | | |
| | | | | | Total Argentina | | | 2,033,460 | |
| | | | | | | | | | |
| | | |
| | | | | | Brazil — 1.6% | | | |
| | | |
| | | 796,500 | | | Blau Farmaceutica SA * | | | 4,593,759 | |
| | | |
| | | 1,097,500 | | | Cia Siderurgica Nacional SA | | | 5,401,602 | |
| | | |
| | | 335,700 | | | Petroleo Brasileiro SA | | | 2,386,967 | |
| | | |
| | | 466,400 | | | Petroleo Brasileiro SA Sponsored ADR | | | 6,664,856 | |
| | | |
| | | 135,900 | | | Transmissora Alianca de Energia Eletrica SA | | | 1,041,406 | |
| | | |
| | | 4,631,300 | | | Vamos Locacao de Caminhoes Maquinas e Equipamentos SA | | | 9,853,348 | |
| | | | | | | | | | |
| | | |
| | | | | | Total Brazil | | | 29,941,938 | |
| | | | | | | | | | |
| | | |
| | | | | | Chile — 0.2% | | | |
| | | |
| | | 5,059,503 | | | Banco de Chile | | | 536,419 | |
| | | |
| | | 11,124,876 | | | Banco Santander Chile | | | 546,274 | |
| | | |
| | | 49,300 | | | Banco Santander Chile ADR | | | 962,336 | |
| | | |
| | | 20,638 | | | CAP SA | | | 238,891 | |
| | | |
| | | 130,516 | | | Cencosud SA | | | 239,962 | |
| | | |
| | | 333,998 | | | Cencosud Shopping SA | | | 358,420 | |
| | | |
| | | 23,000 | | | Cia Cervecerias Unidas SA Sponsored ADR | | | 367,540 | |
| | | |
| | | 7,527,391 | | | Colbun SA | | | 548,852 | |
| | | |
| | | 22,767 | | | Empresas COPEC SA | | | 176,547 | |
| | | |
| | | 1,899,134 | | | Enel Americas SA | | | 222,373 | |
| | | | | | | | | | |
| | | |
| | | | | | Total Chile | | | 4,197,614 | |
| | | | | | | | | | |
| | | |
| | | | | | China — 29.0% | | | |
| | | |
| | | 2,606,000 | | | 361 Degrees International Ltd * | | | 1,281,184 | |
| | | |
| | | 621,750 | | | A-Living Smart City Services Co Ltd | | | 1,114,500 | |
| | | |
| | | 1,852,300 | | | Agricultural Bank of China Ltd – Class A | | | 875,893 | |
| | | |
| | | 76,484,590 | | | Agricultural Bank of China Ltd – Class H | | | 28,966,172 | |
| | | |
| | | 238,000 | | | AK Medical Holdings Ltd | | | 163,919 | |
| | | |
| | | 87,100 | | | Angang Steel Co Ltd – Class A | | | 53,170 | |
| | | |
| | | 19,150 | | | Anhui Conch Cement Co Ltd – Class A | | | 122,705 | |
| | | |
| | | 688,800 | | | ANTA Sports Products Ltd | | | 10,520,181 | |
| | | |
| | | 138,800 | | | Autohome Inc ADR | | | 4,245,892 | |
| | | |
| | | 284,800 | | | Autohome Inc – Class A * | | | 2,102,960 | |
| | | |
| | | 360,400 | | | Baidu Inc – Class A * | | | 6,802,847 | |
| | | |
| | | 12,655,200 | | | Bank of China Ltd – Class A | | | 6,220,708 | |
| | | |
| | | 532,700 | | | Budweiser Brewing Co APAC Ltd | | | 1,653,485 | |
| | | |
| | | 28,435 | | | BYD Co Ltd – Class A | | | 1,144,464 | |
| | | |
| | | 2,142,000 | | | BYD Electronic International Co Ltd (a) | | | 6,044,321 | |
| | | |
| | | 816,000 | | | China BlueChemical Ltd – Class H | | | 244,336 | |
| | | |
| | | 7,787,878 | | | China Communications Services Corp Ltd – Class H | | | 4,272,594 | |
| | | |
| | | 511,500 | | | China Construction Bank Corp – Class A | | | 489,804 | |
| | | |
| | | 68,378,148 | | | China Construction Bank Corp – Class H | | | 51,281,187 | |
| | | | | | | | | | |
| | | Shares | | | Description | | Value ($) | |
| | | |
| | | | | | China — continued | | | |
| | | |
| | | 8,453,000 | | | China Datang Corp Renewable Power Co Ltd – Class H | | | 3,203,242 | |
| | | |
| | | 4,695,000 | | | China Dongxiang Group Co Ltd | | | 354,312 | |
| | | |
| | | 20,184,000 | | | China Feihe Ltd | | | 24,084,751 | |
| | | |
| | | 364,500 | | | China Hongqiao Group Ltd | | | 510,303 | |
| | | |
| | | 1,538,000 | | | China Lesso Group Holdings Ltd | | | 2,367,881 | |
| | | |
| | | 4,655,000 | | | China Longyuan Power Group Corp Ltd – Class H | | | 9,606,010 | |
| | | |
| | | 480,000 | | | China Medical System Holdings Ltd | | | 854,714 | |
| | | |
| | | 2,801,426 | | | China Merchants Bank Co Ltd – Class A | | | 22,164,678 | |
| | | |
| | | 7,806,095 | | | China Molybdenum Co Ltd – Class A | | | 7,495,167 | |
| | | |
| | | 708,000 | | | China Molybdenum Co Ltd – Class H | | | 426,147 | |
| | | |
| | | 2,118,000 | | | China Oriental Group Co Ltd | | | 615,659 | |
| | | |
| | | 602,511 | | | China Pacific Insurance Group Co Ltd – Class A | | | 2,536,254 | |
| | | |
| | | 563,600 | | | China Pacific Insurance Group Co Ltd – Class H | | | 1,569,387 | |
| | | |
| | | 5,825,000 | | | China Reinsurance Group Corp – Class H | | | 559,846 | |
| | | |
| | | 924,000 | | | China Resources Gas Group Ltd | | | 4,243,922 | |
| | | |
| | | 3,238,000 | | | China Resources Land Ltd | | | 15,750,596 | |
| | | |
| | | 450,000 | | | China Risun Group Ltd | | | 280,319 | |
| | | |
| | | 1,465,500 | | | China Shenhua Energy Co Ltd – Class A | | | 5,872,811 | |
| | | |
| | | 292,381 | | | China Tourism Group Duty Free Corp Ltd – Class A | | | 9,452,186 | |
| | | |
| | | 458,000 | | | CIFI Ever Sunshine Services Group Ltd | | | 832,904 | |
| | | |
| | | 556,000 | | | Country Garden Services Holdings Co Ltd | | | 3,325,968 | |
| | | |
| | | 100,000 | | | CSPC Pharmaceutical Group Ltd | | | 118,536 | |
| | | |
| | | 902,000 | | | Dongyue Group Ltd | | | 1,308,567 | |
| | | |
| | | 917,100 | | | ENN Energy Holdings Ltd | | | 13,281,802 | |
| | | |
| | | 6,237,330 | | | Fangda Special Steel Technology Co Ltd – Class A | | | 8,148,069 | |
| | | |
| | | 438,955 | | | Fuyao Glass Industry Group Co Ltd – Class A | | | 3,083,593 | |
| | | |
| | | 219,600 | | | Fuyao Glass Industry Group Co Ltd – Class H | | | 1,077,378 | |
| | | |
| | | 284,000 | | | Geely Automobile Holdings Ltd | | | 528,991 | |
| | | |
| | | 839,000 | | | Greenland Hong Kong Holdings Ltd | | | 143,623 | |
| | | |
| | | 303,322 | | | Hangzhou Robam Appliances Co Ltd – Class A | | | 1,605,769 | |
| | | |
| | | 4,780,138 | | | Hisense Home Appliances Group Co Ltd – Class A | | | 10,315,784 | |
| | | |
| | | 280,000 | | | Hisense Home Appliances Group Co Ltd – Class H | | | 314,255 | |
| | | |
| | | 78,100 | | | Hollysys Automation Technologies Ltd * | | | 1,099,648 | |
| | | |
| | | 10,248,000 | | | Hua Han Health Industry Holdings Ltd * (b) | | | 1 | |
| | | |
| | | 428,100 | | | Huayu Automotive Systems Co Ltd – Class A | | | 1,728,428 | |
| | | |
| | | 33,881,847 | | | Industrial & Commercial Bank of China Ltd – Class H | | | 20,225,940 | |
| | | |
| | | 5,727,809 | | | Inner Mongolia Eerduosi Resources Co Ltd – Class A | | | 23,680,868 | |
| | | |
| | | 39,536 | | | JD.com Inc – Class A * | | | 1,412,203 | |
| | | |
| | | 658,000 | | | JS Global Lifestyle Co Ltd | | | 758,916 | |
| | | |
| | | 402,000 | | | KE Holdings Inc ADR * | | | 7,802,820 | |
| | | |
| | | 216,500 | | | Kingboard Laminates Holdings Ltd | | | 360,764 | |
| | | | |
| | |
| | | See accompanying notes to the financial statements. | | 25 |
GMO Emerging Markets Fund
(A Series of GMO Trust)
Schedule of Investments — (Continued)
(showing percentage of total net assets)
February 28, 2022
| | | | | | | | | | |
| | | Shares | | | Description | | Value ($) | |
| | | |
| | | | | | China — continued | | | |
| | | |
| | | 2,910,000 | | | Kunlun Energy Co Ltd | | | 2,862,519 | |
| | | |
| | | 42,213 | | | Kweichow Moutai Co Ltd – Class A | | | 12,015,861 | |
| | | |
| | | 430,500 | | | KWG Group Holdings Ltd | | | 201,570 | |
| | | |
| | | 423,000 | | | KWG Living Group Holdings Ltd | | | 175,229 | |
| | | |
| | | 190,000 | | | Li Ning Co Ltd | | | 1,897,748 | |
| | | |
| | | 519,000 | | | Logan Group Co Ltd (a) | | | 172,447 | |
| | | |
| | | 2,563,000 | | | Lonking Holdings Ltd | | | 683,105 | |
| | | |
| | | 245,000 | | | Lufax Holding Ltd ADR * | | | 1,585,150 | |
| | | |
| | | 218,100 | | | Midea Group Co Ltd – Class A | | | 2,319,006 | |
| | | |
| | | 2,472,000 | | | MMG Ltd * | | | 895,431 | |
| | | |
| | | 24,250 | | | NetEase Inc | | | 469,036 | |
| | | |
| | | 28,250 | | | NetEase Inc ADR | | | 2,693,355 | |
| | | |
| | | 288,000 | | | Newborn Town Inc * | | | 162,467 | |
| | | |
| | | 450,000 | | | Nexteer Automotive Group Ltd | | | 450,711 | |
| | | |
| | | 676,000 | | | PAX Global Technology Ltd | | | 504,500 | |
| | | |
| | | 25,109,000 | | | PICC Property & Casualty Co Ltd – Class H | | | 26,504,717 | |
| | | |
| | | 18,210,610 | | | Postal Savings Bank of China Co Ltd – Class A | | | 16,146,852 | |
| | | |
| | | 151,000 | | | Q Technology Group Co Ltd | | | 142,601 | |
| | | |
| | | 4,526,400 | | | Qingling Motors Co Ltd – Class H | | | 875,184 | |
| | | |
| | | 1,978,581 | | | Shenzhen YUTO Packaging Technology Co Ltd – Class A | | | 9,142,050 | |
| | | |
| | | 1,832,000 | | | Sihuan Pharmaceutical Holdings Group Ltd (a) | | | 392,833 | |
| | | |
| | | 2,044,000 | | | Sinopec Engineering Group Co Ltd – Class H | | | 977,820 | |
| | | |
| | | 1,982,500 | | | Sinotruk Hong Kong Ltd | | | 2,959,212 | |
| | | |
| | | 138,000 | | | SITC International Holdings Co Ltd | | | 568,996 | |
| | | |
| | | 2,969,000 | | | Sunac China Holdings Ltd | | | 2,426,858 | |
| | | |
| | | 538,000 | | | Sunac Services Holdings Ltd * | | | 459,811 | |
| | | |
| | | 651,200 | | | Sunny Optical Technology Group Co Ltd | | | 15,605,325 | |
| | | |
| | | 696,765 | | | Tencent Holdings Ltd | | | 37,598,353 | |
| | | |
| | | 115,100 | | | Tencent Holdings Ltd ADR | | | 6,191,229 | |
| | | |
| | | 770,700 | | | Tencent Music Entertainment Group ADR* | | | 4,154,073 | |
| | | |
| | | 1,466,000 | | | Tianli Education International Holdings Ltd (c) | | | 358,311 | |
| | | |
| | | 1,102,708 | | | Vipshop Holdings Ltd ADR * | | | 9,560,478 | |
| | | |
| | | 409,500 | | | Xiabuxiabu Catering Management China Holdings Co Ltd * | | | 257,680 | |
| | | |
| | | 5,391,000 | | | Xinyi Glass Holdings Ltd | | | 14,360,226 | |
| | | |
| | | 26,000 | | | Xinyi Solar Holdings Ltd | | | 47,226 | |
| | | |
| | | 18,872,400 | | | Yangzijiang Shipbuilding Holdings Ltd | | | 19,305,531 | |
| | | |
| | | 68,000 | | | Yihai International Holding Ltd * (a) | | | 284,519 | |
| | | |
| | | 68,307 | | | Zhejiang Supor Co Ltd – Class A | | | 549,034 | |
| | | |
| | | 1,923,962 | | | Zhengzhou Coal Mining Machinery Group Co Ltd – Class A | | | 3,938,702 | |
| | | |
| | | 1,406,000 | | | Zhenro Properties Group Ltd (a) | | | 121,052 | |
| | | |
| | | 280,000 | | | Zhongsheng Group Holdings Ltd | | | 1,955,218 | |
| | | |
| | | 233,000 | | | Zhou Hei Ya International Holdings Co Ltd * | | | 155,669 | |
| | | |
| | | 9,470,579 | | | Zijin Mining Group Co Ltd – Class A | | | 16,964,540 | |
| | | |
| | | 156,000 | | | Zijin Mining Group Co Ltd – Class H | | | 231,532 | |
| | | |
| | | 937,800 | | | Zoomlion Heavy Industry Science and Technology Co Ltd – Class H | | | 623,828 | |
| | | | | | | | | | |
| | | |
| | | | | | Total China | | | 560,650,929 | |
| | | | | | | | | | |
| | | | | | | | | | |
| | | Shares | | | Description | | Value ($) | |
| | |
| | | | | | Czech Republic — 0.2% | |
| | | |
| | | 960,228 | | | Moneta Money Bank AS | | | 3,800,042 | |
| | | |
| | | 761 | | | Philip Morris CR AS | | | 550,572 | |
| | | | | | | | | | |
| | | |
| | | | | | Total Czech Republic | | | 4,350,614 | |
| | | | | | | | | | |
| | |
| | | | | | Egypt — 0.0% | |
| | | |
| | | 137,416 | | | Commercial International Bank Egypt SAE * | | | 418,544 | |
| | | | | | | | | | |
| | |
| | | | | | Hungary — 0.0% | |
| | | |
| | | 49,524 | | | MOL Hungarian Oil & Gas Plc | | | 386,302 | |
| | | | | | | | | | |
| | |
| | | | | | India — 7.0% | |
| | | |
| | | 219,434 | | | Asian Paints Ltd | | | 9,265,784 | |
| | | |
| | | 754,169 | | | Axis Bank Ltd * | | | 7,475,167 | |
| | | |
| | | 3,891 | | | Clean Science & Technology Ltd * | | | 95,834 | |
| | | |
| | | 11,567,064 | | | Gayatri Projects Ltd * (d) | | | 3,763,980 | |
| | | |
| | | 34,562 | | | Godrej Properties Ltd * | | | 693,661 | |
| | | |
| | | 64,522 | | | Gujarat Narmada Valley Fertilizers & Chemicals Ltd | | | 474,130 | |
| | | |
| | | 93,716 | | | Gujarat State Fertilizers & Chemicals Ltd | | | 156,867 | |
| | | |
| | | 980,934 | | | HCL Technologies Ltd | | | 14,738,093 | |
| | | |
| | | 195,803 | | | HDFC Bank Ltd | | | 3,723,527 | |
| | | |
| | | 62,789 | | | Hindustan Aeronautics Ltd | | | 1,155,971 | |
| | | |
| | | 278,953 | | | Hindustan Petroleum Corp Ltd | | | 1,014,785 | |
| | | |
| | | 223,369 | | | Hindustan Unilever Ltd | | | 6,469,714 | |
| | | |
| | | 201,768 | | | Hindustan Zinc Ltd | | | 840,098 | |
| | | |
| | | 215,355 | | | Housing Development Finance Corp Ltd | | | 6,798,839 | |
| | | |
| | | 1,139,177 | | | ICICI Bank Ltd | | | 11,268,052 | |
| | | |
| | | 1,698,234 | | | Indiabulls Real Estate Ltd * | | | 2,454,865 | |
| | | |
| | | 608,400 | | | Infosys Ltd Sponsored ADR | | | 13,664,664 | |
| | | |
| | | 2,561,259 | | | Jai Balaji Industries Ltd * | | | 1,566,184 | |
| | | |
| | | 1,128,660 | | | Kiri Industries Ltd * | | | 6,949,027 | |
| | | |
| | | 54,792 | | | Mahanagar Gas Ltd | | | 530,596 | |
| | | |
| | | 33,556 | | | Marico Ltd | | | 227,629 | |
| | | |
| | | 209,367 | | | Mindtree Ltd | | | 10,841,282 | |
| | | |
| | | 342,775 | | | NBCC India Ltd | | | 178,800 | |
| | | |
| | | 1,158,051 | | | NCC Ltd | | | 974,887 | |
| | | |
| | | 73,894 | | | Oberoi Realty Ltd * | | | 898,548 | |
| | | |
| | | 200,357 | | | Petronet LNG Ltd | | | 575,994 | |
| | | |
| | | 196,694 | | | Prestige Estates Projects Ltd | | | 1,190,082 | |
| | | |
| | | 353,391 | | | Redington India Ltd | | | 720,313 | |
| | | |
| | | 56,735 | | | Sobha Ltd | | | 583,243 | |
| | | |
| | | 48,586 | | | Sun TV Network Ltd | | | 291,058 | |
| | | |
| | | 308,777 | | | Tata Consultancy Services Ltd | | | 14,610,631 | |
| | | |
| | | 266,397 | | | Titan Co Ltd | | | 9,082,150 | |
| | | |
| | | 640,646 | | | TV18 Broadcast Ltd * | | | 519,277 | |
| | | |
| | | 124,453 | | | Welspun Corp Ltd | | | 238,922 | |
| | | | | | | | | | |
| | | |
| | | | | | Total India | | | 134,032,654 | |
| | | | | | | | | | |
| | |
| | | | | | Indonesia — 2.4% | |
| | | |
| | | 3,909,900 | | | Adaro Energy Tbk PT | | | 669,889 | |
| | | | |
| | |
| 26 | | See accompanying notes to the financial statements. | | |
GMO Emerging Markets Fund
(A Series of GMO Trust)
Schedule of Investments — (Continued)
(showing percentage of total net assets)
February 28, 2022
| | | | | | | | | | |
| | | Shares | | | Description | | Value ($) | |
| | |
| | | | | | Indonesia — continued | |
| | | |
| | | 40,657,000 | | | Bank Central Asia Tbk PT | | | 22,953,548 | |
| | | |
| | | 6,152,600 | | | Bank Mandiri Persero Tbk PT | | | 3,326,348 | |
| | | |
| | | 5,667,000 | | | Bank Negara Indonesia Persero Tbk PT | | | 3,175,297 | |
| | | |
| | | 12,847,600 | | | Bank Pembangunan Daerah Jawa Timur Tbk PT | | | 688,919 | |
| | | |
| | | 34,886,200 | | | Bank Rakyat Indonesia Persero Tbk PT | | | 11,155,216 | |
| | | |
| | | 1,355,800 | | | Bukit Asam Tbk PT | | | 297,850 | |
| | | |
| | | 610,991 | | | Indo Tambangraya Megah Tbk PT | | | 1,136,363 | |
| | | |
| | | 174,631,700 | | | Panin Financial Tbk PT * | | | 2,055,224 | |
| | | |
| | | 18,688,280 | | | Ramayana Lestari Sentosa Tbk PT * | | | 821,942 | |
| | | |
| | | 2,025,600 | | | Timah Tbk PT * | | | 225,454 | |
| | | |
| | | 211,700 | | | United Tractors Tbk PT | | | 369,413 | |
| | | | | | | | | | |
| | | |
| | | | | | Total Indonesia | | | 46,875,463 | |
| | | | | | | | | | |
| | |
| | | | | | Kuwait — 0.6% | |
| | | |
| | | 175,067 | | | Humansoft Holding Co KSC | | | 2,130,937 | |
| | | |
| | | 2,986,892 | | | Kuwait Finance House KSCP | | | 9,343,625 | |
| | | |
| | | 768,417 | | | Kuwait Projects Holding KSCP | | | 497,220 | |
| | | | | | | | | | |
| | | |
| | | | | | Total Kuwait | | | 11,971,782 | |
| | | | | | | | | | |
| | |
| | | | | | Malaysia — 0.0% | |
| | | |
| | | 1,039,900 | | | Kossan Rubber Industries Bhd | | | 428,721 | |
| | | | | | | | | | |
| | |
| | | | | | Mexico — 5.6% | |
| | | |
| | | 171,100 | | | Arca Continental SAB de CV | | | 1,127,801 | |
| | | |
| | | 913,800 | | | Banco del Bajio SA | | | 2,221,925 | |
| | | |
| | | 9,700 | | | Coca-Cola Femsa SAB de CV Sponsored ADR | | | 534,082 | |
| | | |
| | | 181,000 | | | Concentradora Fibra Danhos SA de CV (REIT) | | | 205,471 | |
| | | |
| | | 1,055,500 | | | Credito Real SAB de CV SOFOM ER * (a) | | | 82,972 | |
| | | |
| | | 79,200 | | | El Puerto de Liverpool SAB de CV – Class C1 | | | 386,275 | |
| | | |
| | | 224,900 | | | Fomento Economico Mexicano SAB de CV | | | 1,807,128 | |
| | | |
| | | 72,800 | | | Fomento Economico Mexicano SAB de CV Sponsored ADR | | | 5,853,120 | |
| | | |
| | | 17,955 | | | Gruma SAB de CV – Class B | | | 243,143 | |
| | | |
| | | 53,000 | | | Grupo Aeroportuario del Centro Norte SAB de CV – Class B | | | 381,721 | |
| | | |
| | | 200 | | | Grupo Aeroportuario del Sureste SAB de CV ADR | | | 43,188 | |
| | | |
| | | 18,145 | | | Grupo Aeroportuario del Sureste SAB de CV – Class B | | | 390,630 | |
| | | |
| | | 64,500 | | | Grupo Bimbo SAB de CV – Series A | | | 199,663 | |
| | | |
| | | 8,940,900 | | | Grupo Financiero Banorte SAB de CV –Class O | | | 60,675,538 | |
| | | |
| | | 126,100 | | | Grupo Financiero Inbursa SAB de CV – Class O * | | | 206,072 | |
| | | |
| | | 685,400 | | | Grupo Mexico SAB de CV – Series B | | | 3,501,125 | |
| | | |
| | | 189,200 | | | Kimberly-Clark de Mexico SAB de CV – Class A | | | 264,479 | |
| | | |
| | | 74,900 | | | Orbia Advance Corp SAB de CV | | | 191,337 | |
| | | |
| | | 174,127 | | | Qualitas Controladora SAB de CV | | | 953,911 | |
| | | | | | | | | | |
| | | Shares | | | Description | | Value ($) | |
| | |
| | | | | | Mexico — continued | |
| | | |
| | | 339,900 | | | Regional SAB de CV | | | 2,018,556 | |
| | | |
| | | 165,300 | | | Ternium SA Sponsored ADR | | | 6,492,984 | |
| | | |
| | | 384,621 | | | Unifin Financiera SAB de CV SOFOM ENR * (a) | | | 478,875 | |
| | | |
| | | 5,320,200 | | | Wal-Mart de Mexico SAB de CV | | | 20,261,491 | |
| | | | | | | | | | |
| | | |
| | | | | | Total Mexico | | | 108,521,487 | |
| | | | | | | | | | |
| | |
| | | | | | Philippines — 0.5% | |
| | | |
| | | 100,380 | | | GT Capital Holdings Inc | | | 1,136,775 | |
| | | |
| | | 275,490 | | | Manila Electric Co | | | 1,982,342 | |
| | | |
| | | 22,568,800 | | | Megaworld Corp | | | 1,418,018 | |
| | | |
| | | 1,623,200 | | | Puregold Price Club Inc | | | 1,115,191 | |
| | | |
| | | 4,972,700 | | | Semirara Mining & Power Corp | | | 2,696,283 | |
| | | | | | | | | | |
| | | |
| | | | | | Total Philippines | | | 8,348,609 | |
| | | | | | | | | | |
| | |
| | | | | | Poland — 0.1% | |
| | | |
| | | 37,920 | | | Budimex SA | | | 2,062,742 | |
| | | |
| | | 224,651 | | | Polskie Gornictwo Naftowe i Gazownictwo SA | | | 296,069 | |
| | | | | | | | | | |
| | | |
| | | | | | Total Poland | | | 2,358,811 | |
| | | | | | | | | | |
| | |
| | | | | | Qatar — 0.5% | |
| | | |
| | | 214,638 | | | Doha Bank QPSC | | | 167,818 | |
| | | |
| | | 1,325,938 | | | Qatar National Bank QPSC | | | 7,956,691 | |
| | | |
| | | 729,137 | | | Qatar National Cement Co QSC | | | 1,240,829 | |
| | | | | | | | | | |
| | | |
| | | | | | Total Qatar | | | 9,365,338 | |
| | | | | | | | | | |
| | |
| | | | | | Russia — 5.0% | |
| | | |
| | | 31,701,260 | | | Alrosa PJSC | | | 20,444,648 | |
| | | |
| | | 380,350 | | | Detsky Mir PJSC | | | 267,959 | |
| | | |
| | | 39,977 | | | Evraz Plc | | | 77,063 | |
| | | |
| | | 1,432,600,000 | | | Federal Grid Co Unified Energy System PJSC | | | 991,130 | |
| | | |
| | | 653,911 | | | Fix Price Group Ltd GDR (b) | | | 393,654 | |
| | | |
| | | 219,070 | | | Gazprom Neft PJSC | | | 714,398 | |
| | | |
| | | 625,430 | | | Gazprom PJSC Sponsored ADR | | | 1,654,591 | |
| | | |
| | | 575,658 | | | Globaltrans Investment Plc Sponsored GDR (Registered) | | | 1,076,307 | |
| | | |
| | | 78,536,400 | | | Inter RAO UES PJSC | | | 1,754,222 | |
| | | |
| | | 239,440 | | | LSR Group PJSC | | | 986,219 | |
| | | |
| | | 3 | | | LSR Group PJSC GDR (Registered) (b) | | | 3 | |
| | | |
| | | 285,469 | | | LUKOIL PJSC Sponsored ADR | | | 5,354,502 | |
| | | |
| | | 14,733,960 | | | Magnitogorsk Iron & Steel Works PJSC | | | 5,185,466 | |
| | | |
| | | 212,079 | | | Magnitogorsk Iron & Steel Works PJSC Sponsored GDR (Registered) | | | 593,846 | |
| | | |
| | | 237,400 | | | Mechel PJSC Sponsored ADR * (b) | | | 371,508 | |
| | | |
| | | 372,125 | | | MMC Norilsk Nickel PJSC ADR | | | 5,109,397 | |
| | | |
| | | 249,660 | | | Mobile TeleSystems PJSC | | | 494,734 | |
| | | |
| | | 35,508 | | | Mobile TeleSystems PJSC ADR (b) | | | 135,830 | |
| | | |
| | | 4,133,417 | | | Moscow Exchange MICEX-RTS PJSC | | | 3,098,992 | |
| | | |
| | | 1,001,556 | | | Novolipetsk Steel PJSC GDR | | | 7,678,781 | |
| | | |
| | | 36,002 | | | PhosAgro PJSC GDR (Registered) | | | 220,257 | |
| | | | |
| | |
| | | See accompanying notes to the financial statements. | | 27 |
GMO Emerging Markets Fund
(A Series of GMO Trust)
Schedule of Investments — (Continued)
(showing percentage of total net assets)
February 28, 2022
| | | | | | | | | | |
| | | Shares | | | Description | | Value ($) | |
| | |
| | | | | | Russia — continued | |
| | | |
| | | 916,204 | | | Polymetal International Plc | | | 4,283,616 | |
| | | |
| | | 160,188 | | | Polyus PJSC GDR (Registered) | | | 8,549,021 | |
| | | |
| | | 499,515 | | | QIWI Plc Sponsored ADR (a) (b) (e) | | | 1,969,866 | |
| | | |
| | | 11,693 | | | QIWI Plc Sponsored ADR (e) | | | 39,900 | |
| | | |
| | | 17,012 | | | Raspadskaya OJSC | | | 38,449 | |
| | | |
| | | 24,938,000 | | | RusHydro PJSC | | | 138,979 | |
| | | |
| | | 3,281,403 | | | Sberbank of Russia PJSC Sponsored ADR | | | 3,429,266 | |
| | | |
| | | 706,464 | | | Severstal PAO GDR (Registered) | | | 3,586,487 | |
| | | |
| | | 68,353 | | | SFI PJSC * | | | 252,174 | |
| | | |
| | | 21,037,700 | | | Surgutneftegas PJSC | | | 3,807,075 | |
| | | |
| | | 4,246,320 | | | Surgutneftegas PJSC Sponsored ADR | | | 7,298,600 | |
| | | |
| | | 476,673 | | | Tatneft PJSC Sponsored ADR | | | 6,496,050 | |
| | | |
| | | 8,118,000 | | | Unipro PJSC | | | 112,545 | |
| | | |
| | | 556,430 | | | United Co Rusal International PJSC * | | | 234,576 | |
| | | |
| | | 46,698 | | | X5 Retail Group NV GDR (Registered) | | | 122,178 | |
| | | | | | | | | | |
| | | |
| | | | | | Total Russia | | | 96,962,289 | |
| | | | | | | | | | |
| | |
| | | | | | South Africa — 0.5% | |
| | | |
| | | 652 | | | Anglo American Platinum Ltd | | | 101,668 | |
| | | |
| | | 389,794 | | | Investec Ltd | | | 2,194,336 | |
| | | |
| | | 110,185 | | | Kumba Iron Ore Ltd | | | 4,355,479 | |
| | | |
| | | 546,611 | | | Lewis Group Ltd | | | 1,654,019 | |
| | | |
| | | 10,650,393 | | | RMB Holdings Ltd | | | 1,157,619 | |
| | | | | | | | | | |
| | | |
| | | | | | Total South Africa | | | 9,463,121 | |
| | | | | | | | | | |
| | |
| | | | | | South Korea — 12.2% | |
| | | |
| | | 11,074 | | | APTC Co Ltd | | | 178,008 | |
| | | |
| | | 78,985 | | | BNK Financial Group Inc | | | 519,962 | |
| | | |
| | | 615,279 | | | Daewoo Engineering & Construction Co Ltd * | | | 3,236,300 | |
| | | |
| | | 61,753 | | | DB Insurance Co Ltd | | | 3,179,234 | |
| | | |
| | | 3,773 | | | DL E&C Co Ltd | | | 406,751 | |
| | | |
| | | 11,625 | | | Dongkuk Steel Mill Co Ltd | | | 161,545 | |
| | | |
| | | 996,696 | | | Dongwon Development Co Ltd | | | 4,053,208 | |
| | | |
| | | 11,745 | | | Doosan Bobcat Inc | | | 376,954 | |
| | | |
| | | 18,060 | | | Fila Holdings Corp | | | 533,685 | |
| | | |
| | | 219,790 | | | GS Engineering & Construction Corp | | | 7,899,051 | |
| | | |
| | | 5,148 | | | GS Holdings Corp | | | 172,144 | |
| | | |
| | | 4,516 | | | HAESUNG DS Co Ltd * | | | 202,281 | |
| | | |
| | | 171,413 | | | Hana Financial Group Inc | | | 6,964,139 | |
| | | |
| | | 12,234 | | | Hana Materials Inc | | | 533,484 | |
| | | |
| | | 11,277 | | | Hankook & Co Co Ltd | | | 126,634 | |
| | | |
| | | 27,635 | | | Hankook Tire & Technology Co Ltd | | | 814,216 | |
| | | |
| | | 12,042 | | | Hanmi Semiconductor Co Ltd | | | 339,471 | |
| | | |
| | | 50,477 | | | Hanwha Aerospace Co Ltd | | | 2,204,117 | |
| | | |
| | | 731,270 | | | Hanwha Investment & Securities Co Ltd * | | | 2,962,265 | |
| | | |
| | | 330,499 | | | HDC Hyundai Development Co-Engineering & Construction * | | | 4,447,886 | |
| | | |
| | | 754 | | | Hyosung TNC Corp | | | 306,604 | |
| | | |
| | | 3,149 | | | Hyundai Autoever Corp | | | 285,507 | |
| | | |
| | | 322,098 | | | Hyundai Engineering & Construction Co Ltd | | | 11,734,743 | |
| | | | | | | | | | |
| | | Shares | | | Description | | Value ($) | |
| | |
| | | | | | South Korea — continued | |
| | | |
| | | 16,957 | | | Hyundai Marine & Fire Insurance Co Ltd | | | 407,292 | |
| | | |
| | | 10,452 | | | Hyundai Mobis Co Ltd | | | 1,962,530 | |
| | | |
| | | 40,019 | | | Industrial Bank of Korea | | | 359,513 | |
| | | |
| | | 216,783 | | | KB Financial Group Inc | | | 10,694,868 | |
| | | |
| | | 18,666 | | | KC Tech Co Ltd | | | 325,709 | |
| | | |
| | | 6,440 | | | KCC Corp | | | 1,803,139 | |
| | | |
| | | 9,566 | | | KCC Glass Corp | | | 464,709 | |
| | | |
| | | 1,016 | | | Kia Corp | | | 62,987 | |
| | | |
| | | 11,805 | | | KIWOOM Securities Co Ltd * | | | 1,002,421 | |
| | | |
| | | 3,768 | | | Korea Electric Terminal Co Ltd | | | 183,589 | |
| | | |
| | | 11,000 | | | Korea Petrochemical Ind Co Ltd * | | | 1,573,447 | |
| | | |
| | | 112,397 | | | Korea Real Estate Investment & Trust Co Ltd | | | 205,782 | |
| | | |
| | | 453 | | | Korea Zinc Co Ltd | | | 207,764 | |
| | | |
| | | 471,484 | | | KT&G Corp (a) | | | 31,342,629 | |
| | | |
| | | 53,188 | | | Kumho Petrochemical Co Ltd * (a) | | | 7,175,627 | |
| | | |
| | | 29,200 | | | LG Electronics Inc | | | 3,048,373 | |
| | | |
| | | 3,229 | | | LG Household & Health Care Ltd | | | 2,562,029 | |
| | | |
| | | 29,475 | | | Lotte Chemical Corp (a) | | | 5,432,235 | |
| | | |
| | | 5,748 | | | LOTTE Fine Chemical Co Ltd | | | 382,389 | |
| | | |
| | | 14,735 | | | LX Semicon Co Ltd | | | 1,415,341 | |
| | | |
| | | 46,040 | | | POSCO | | | 10,954,009 | |
| | | |
| | | 11,419 | | | PSK Inc | | | 455,603 | |
| | | |
| | | 699 | | | Samsung C&T Corp | | | 64,557 | |
| | | |
| | | 682 | | | Samsung Electro-Mechanics Co Ltd | | | 95,349 | |
| | | |
| | | 1,046,166 | | | Samsung Electronics Co Ltd | | | 63,035,034 | |
| | | |
| | | 6,416 | | | Samsung Electronics Co Ltd GDR | | | 9,625,149 | |
| | | |
| | | 36,021 | | | Samsung Engineering Co Ltd * | | | 703,672 | |
| | | |
| | | 4,940 | | | Samsung SDS Co Ltd | | | 579,947 | |
| | | |
| | | 3,126 | | | Samwha Capacitor Co Ltd | | | 147,978 | |
| | | |
| | | 26,858 | | | SD Biosensor Inc | | | 1,224,499 | |
| | | |
| | | 8,234 | | | Sebang Global Battery Co Ltd | | | 439,760 | |
| | | |
| | | 234,687 | | | Shinhan Financial Group Co Ltd | | | 7,635,716 | |
| | | |
| | | 65,367 | | | SL Corp * | | | 1,303,040 | |
| | | |
| | | 15,184 | | | SM Entertainment Co Ltd | | | 949,455 | |
| | | |
| | | 3,405 | | | SNT Motiv Co Ltd | | | 123,115 | |
| | | |
| | | 7,635 | | | TES Co Ltd | | | 162,958 | |
| | | |
| | | 7,294 | | | TY Holdings Co Ltd * | | | 166,300 | |
| | | |
| | | 1,271,127 | | | Woori Financial Group Inc | | | 15,204,707 | |
| | | |
| | | 132,733 | | | Woori Technology Investment Co Ltd * (a) | | | 950,643 | |
| | | |
| | | 6,673 | | | Youlchon Chemical Co Ltd | | | 133,314 | |
| | | | | | | | | | |
| | | |
| | | | | | Total South Korea | | | 236,205,367 | |
| | | | | | | | | | |
| | |
| | | | | | Sri Lanka — 0.1% | |
| | | |
| | | 103,983,101 | | | Anilana Hotels & Properties Ltd * (d) | | | 712,685 | |
| | | | | | | | | | |
| | |
| | | | | | Taiwan — 23.5% | |
| | | |
| | | 85,532 | | | Acter Group Corp Ltd | | | 675,274 | |
| | | |
| | | 1,031,035 | | | Advantech Co Ltd | | | 13,577,192 | |
| | | |
| | | 1,697,689 | | | Asustek Computer Inc | | | 22,647,976 | |
| | | |
| | | 386,000 | | | Aten International Co Ltd | | | 1,116,285 | |
| | | | |
| | |
| 28 | | See accompanying notes to the financial statements. | | |
GMO Emerging Markets Fund
(A Series of GMO Trust)
Schedule of Investments — (Continued)
(showing percentage of total net assets)
February 28, 2022
| | | | | | | | | | |
| | | Shares | | | Description | | Value ($) | |
| | |
| | | | | | Taiwan — continued | |
| | | |
| | | 115,200 | | | Aurora Corp | | | 378,122 | |
| | | |
| | | 9,050,000 | | | Catcher Technology Co Ltd | | | 46,451,930 | |
| | | |
| | | 9,418,153 | | | Cathay Financial Holding Co Ltd | | | 21,177,993 | |
| | | |
| | | 1,524,808 | | | Chailease Holding Co Ltd | | | 13,838,410 | |
| | | |
| | | 79,000 | | | Chicony Electronics Co Ltd | | | 254,117 | |
| | | |
| | | 546,000 | | | Chong Hong Construction Co Ltd | | | 1,491,808 | |
| | | |
| | | 237,000 | | | Chunghwa Telecom Co Ltd | | | 1,053,374 | |
| | | |
| | | 1,581,400 | | | Coretronic Corp | | | 4,052,655 | |
| | | |
| | | 236,000 | | | Delta Electronics Inc | | | 2,103,257 | |
| | | |
| | | 92,000 | | | Elan Microelectronics Corp | | | 546,392 | |
| | | |
| | | 137,000 | | | Elite Material Co Ltd | | | 1,343,457 | |
| | | |
| | | 1,247,000 | | | Farglory Land Development Co Ltd | | | 2,728,193 | |
| | | |
| | | 474,000 | | | First Financial Holding Co Ltd | | | 436,430 | |
| | | |
| | | 686,000 | | | FIT Hon Teng Ltd * | | | 124,417 | |
| | | |
| | | 2,795,000 | | | FLEXium Interconnect Inc * | | | 9,541,094 | |
| | | |
| | | 1,253,000 | | | Formosa Plastics Corp | | | 4,731,347 | |
| | | |
| | | 1,879,778 | | | Foxconn Technology Co Ltd | | | 4,326,783 | |
| | | |
| | | 40,000 | | | Foxsemicon Integrated Technology Inc | | | 314,062 | |
| | | |
| | | 15,428,419 | | | Fubon Financial Holding Co Ltd | | | 41,657,719 | |
| | | |
| | | 115,000 | | | Gamania Digital Entertainment Co Ltd | | | 261,539 | |
| | | |
| | | 1,720,000 | | | Grand Pacific Petrochemical | | | 1,764,158 | |
| | | |
| | | 10,000 | | | Grand Plastic Technology Corp | | | 114,931 | |
| | | |
| | | 163,000 | | | HannStar Display Corp | | | 94,012 | |
| | | |
| | | 176,000 | | | Holtek Semiconductor Inc | | | 687,603 | |
| | | |
| | | 9,265,532 | | | Hon Hai Precision Industry Co Ltd | | | 34,417,356 | |
| | | |
| | | 1,304,000 | | | Huaku Development Co Ltd | | | 4,233,140 | |
| | | |
| | | 1,270,806 | | | IEI Integration Corp | | | 2,116,807 | |
| | | |
| | | 149,000 | | | International Games System Co Ltd | | | 3,682,757 | |
| | | |
| | | 266,000 | | | King’s Town Bank Co Ltd | | | 384,356 | |
| | | |
| | | 243,000 | | | Kung Long Batteries Industrial Co Ltd | | | 1,189,938 | |
| | | |
| | | 94,000 | | | Largan Precision Co Ltd | | | 6,831,244 | |
| | | |
| | | 1,472,000 | | | Lite-On Technology Corp | | | 3,619,470 | |
| | | |
| | | 26,000 | | | MediaTek Inc | | | 1,027,411 | |
| | | |
| | | 1,551,000 | | | Micro-Star International Co Ltd | | | 8,742,640 | |
| | | |
| | | 405,000 | | | Mitac Holdings Corp | | | 489,580 | |
| | | |
| | | 1,882,000 | | | Nan Ya Plastics Corp | | | 5,935,828 | |
| | | |
| | | 1,013,000 | | | Nantex Industry Co Ltd | | | 2,698,372 | |
| | | |
| | | 249,810 | | | Novatek Microelectronics Corp | | | 4,141,466 | |
| | | |
| | | 220,000 | | | Pegatron Corp | | | 545,282 | |
| | | |
| | | 521,000 | | | Phison Electronics Corp | | | 9,639,610 | |
| | | |
| | | 433,000 | | | Powertech Technology Inc | | | 1,468,710 | |
| | | |
| | | 7,377,870 | | | Radiant Opto-Electronics Corp | | | 26,677,106 | |
| | | |
| | | 114,000 | | | Shanghai Commercial & Savings Bank Ltd (The) | | | 187,786 | |
| | | |
| | | 634,000 | | | Shinkong Insurance Co Ltd | | | 1,079,434 | |
| | | |
| | | 348,468 | | | Simplo Technology Co Ltd | | | 3,910,418 | |
| | | |
| | | 487,000 | | | SinoPac Financial Holdings Co Ltd | | | 299,048 | |
| | | |
| | | 1,649,250 | | | Syncmold Enterprise Corp | | | 4,019,685 | |
| | | |
| | | 96,024 | | | Tah Hsin Industrial Corp * | | | 288,753 | |
| | | |
| | | 2,890,000 | | | Taiwan Cement Corp | | | 4,906,130 | |
| | | | | | | | | | |
| | | Shares | | | Description | | Value ($) | |
| | |
| | | | | | Taiwan — continued | |
| | | |
| | | 4,813,000 | | | Taiwan Semiconductor Manufacturing Co Ltd | | | 103,477,364 | |
| | | |
| | | 46,610 | | | Taiwan Semiconductor Manufacturing Co Ltd Sponsored ADR | | | 4,987,736 | |
| | | |
| | | 201,000 | | | Test Research Inc | | | 451,002 | |
| | | |
| | | 27,000 | | | Thinking Electronic Industrial Co Ltd | | | 135,766 | |
| | | |
| | | 827,000 | | | Transcend Information Inc | | | 2,097,513 | |
| | | |
| | | 719,160 | | | Tripod Technology Corp | | | 3,297,232 | |
| | | |
| | | 72,000 | | | Tung Ho Steel Enterprise Corp | | | 181,355 | |
| | | |
| | | 17,000 | | | TXC Corp | | | 59,424 | |
| | | |
| | | 675,224 | | | United Integrated Services Co Ltd | | | 4,274,739 | |
| | | |
| | | 742,000 | | | Universal Inc | | | 1,068,700 | |
| | | |
| | | 86,000 | | | Vanguard International Semiconductor Corp | | | 390,299 | |
| | | |
| | | 84,000 | | | Visual Photonics Epitaxy Co Ltd | | | 341,693 | |
| | | |
| | | 303,000 | | | Walsin Technology Corp * | | | 1,604,933 | |
| | | |
| | | 4,000 | | | Yageo Corp | | | 65,627 | |
| | | |
| | | 121,000 | | | Yulon Nissan Motor Co Ltd | | | 1,074,753 | |
| | | |
| | | 262,000 | | | Zeng Hsing Industrial Co Ltd | | | 1,345,063 | |
| | | | | | | | | | |
| | | |
| | | | | | Total Taiwan | | | 454,876,056 | |
| | | | | | | | | | |
| | |
| | | | | | Thailand — 0.5% | |
| | | |
| | | 627,000 | | | CP ALL Pcl (Foreign Registered) | | | 1,309,938 | |
| | | |
| | | 308,700 | | | Delta Electronics Thailand Pcl (Foreign Registered) | | | 3,816,826 | |
| | | |
| | | 334,000 | | | Kasikornbank Pcl (Foreign Registered) | | | 1,679,773 | |
| | | |
| | | 2,857,500 | | | Pruksa Holding Pcl (Foreign Registered) | | | 1,259,781 | |
| | | |
| | | 330,000 | | | SPCG Pcl | | | 180,055 | |
| | | |
| | | 1,583,475 | | | Supalai Pcl (Foreign Registered) | | | 1,066,419 | |
| | | | | | | | | | |
| | | |
| | | | | | Total Thailand | | | 9,312,792 | |
| | | | | | | | | | |
| | |
| | | | | | Turkey — 0.8% | |
| | | |
| | | 17,487,043 | | | Akbank TAS | | | 8,925,871 | |
| | | |
| | | 119,119 | | | Arcelik AS | | | 476,627 | |
| | | |
| | | 461,063 | | | Enerjisa Enerji AS | | | 442,178 | |
| | | |
| | | 4,849,630 | | | Turkiye Garanti Bankasi AS | | | 3,886,816 | |
| | | |
| | | 7,105,358 | | | Yapi ve Kredi Bankasi AS | | | 1,835,234 | |
| | | | | | | | | | |
| | | |
| | | | | | Total Turkey | | | 15,566,726 | |
| | | | | | | | | | |
| | |
| | | | | | United Arab Emirates — 0.0% | |
| | | |
| | | 118,400 | | | Dubai Islamic Bank PJSC | �� | | 196,771 | |
| | | | | | | | | | |
| | |
| | | | | | United Kingdom — 0.6% | |
| | | |
| | | 241,625 | | | Unilever Plc | | | 12,137,300 | |
| | | | | | | | | | |
| | |
| | | | | | Vietnam — 0.0% | |
| | | |
| | | 15 | | | Hoa Phat Group JSC | | | 31 | |
| | | |
| | | 213,700 | | | Pha Lai Thermal Power JSC | | | 209,424 | |
| | | | | | | | | | |
| | | |
| | | | | | Total Vietnam | | | 209,455 | |
| | | | | | | | | | |
| | | |
| | | | | | TOTAL COMMON STOCKS
(COST $2,022,736,268) | | | 1,759,524,828 | |
| | | | | | | | | | |
| | | | |
| | |
| | | See accompanying notes to the financial statements. | | 29 |
GMO Emerging Markets Fund
(A Series of GMO Trust)
Schedule of Investments — (Continued)
(showing percentage of total net assets)
February 28, 2022
| | | | | | | | | | |
| | | Shares | | | Description | | Value ($) | |
| | |
| | | | | | PREFERRED STOCKS (f) — 5.4% | |
| | |
| | | | | | Brazil — 2.6% | |
| | | |
| | | 118,200 | | | Bradespar SA | | | 680,389 | |
| | | |
| | | 1,570,900 | | | Cia Energetica de Minas Gerais | | | 3,860,123 | |
| | | |
| | | 752,200 | | | Cia Energetica de Minas Gerais Sponsored ADR | | | 1,895,544 | |
| | | |
| | | 5,644,400 | | | Cia Paranaense de Energia – Class B | | | 7,542,008 | |
| | | |
| | | 594,500 | | | Gerdau SA | | | 2,948,610 | |
| | | |
| | | 76,600 | | | Metalurgica Gerdau SA | | | 153,951 | |
| | | |
| | | 4,211,100 | | | Petroleo Brasileiro SA | | | 27,681,483 | |
| | | |
| | | 385,900 | | | Petroleo Brasileiro SA Sponsored ADR | | | 5,051,431 | |
| | | |
| | | 174,800 | | | Usinas Siderurgicas de Minas Gerais SA Usiminas – Class A | | | 494,117 | |
| | | | | | | | | | |
| | | |
| | | | | | Total Brazil | | | 50,307,656 | |
| | | | | | | | | | |
| | |
| | | | | | Chile — 0.0% | |
| | | |
| | | 5,900 | | | Sociedad Quimica y Minera de Chile SA Sponsored ADR | | | 390,462 | |
| | | | | | | | | | |
| | |
| | | | | | Colombia — 0.0% | |
| | | |
| | | 2,217,585 | | | Grupo Aval Acciones y Valores SA | | | 597,063 | |
| | | | | | | | | | |
| | |
| | | | | | Russia — 1.2% | |
| | | |
| | | 194,570 | | | Nizhnekamskneftekhim PJSC | | | 111,766 | |
| | | |
| | | 79,676,700 | | | Surgutneftegas PJSC | | | 22,414,272 | |
| | | |
| | | 869 | | | Transneft PJSC | | | 1,073,858 | |
| | | | | | | | | | |
| | | |
| | | | | | Total Russia | | | 23,599,896 | |
| | | | | | | | | | |
| | |
| | | | | | South Korea — 1.5% | |
| | | |
| | | 531,957 | | | Samsung Electronics Co Ltd | | | 29,399,925 | |
| | | | | | | | | | |
| | |
| | | | | | Taiwan — 0.1% | |
| | | |
| | | 256,798 | | | Chailease Holding Co Ltd | | | 934,594 | |
| | | | | | | | | | |
| | | |
| | | | | | TOTAL PREFERRED STOCKS
(COST $113,313,946) | | | 105,229,596 | |
| | | | | | | | | | |
| | | | | | | | | | |
| | | Shares /
Par Value† | | | Description | | Value ($) | |
| | |
| | | | | | INVESTMENT FUNDS — 1.5% | |
| | |
| | | | | | United States — 1.5% | |
| | | |
| | | 509,860 | | | iShares Core MSCI Emerging Markets ETF | | | 29,179,288 | |
| | | | | | | | | | |
| | | |
| | | | | | TOTAL INVESTMENT FUNDS
(COST $30,380,692) | | | 29,179,288 | |
| | | | | | | | | | |
| | |
| | | | | | DEBT OBLIGATIONS — 0.4% | |
| | |
| | | | | | United States — 0.4% | |
| | | |
| | | 8,157,000 | | | U.S. Treasury Note, Variable Rate, USBM + 0.03%, 0.39%, due 04/30/23 (g) | | | 8,159,722 | |
| | | | | | | | | | |
| | | |
| | | | | | TOTAL DEBT OBLIGATIONS
(COST $8,159,232) | | | 8,159,722 | |
| | | | | | | | | | |
| | |
| | | | | | SHORT-TERM INVESTMENTS — 1.6% | |
| | | |
| | | | | | Money Market Funds — 0.5% | | | |
| | | |
| | | 8,529,314 | | | State Street Institutional Treasury Money Market Fund – Premier Class, 0.01% (h) | | | 8,529,314 | |
| | | | | | | | | | |
| | | |
| | | | | | Total Money Market Funds | | | 8,529,314 | |
| | | | | | | | | | |
| | | |
| | | | | | U.S. Government — 1.1% | | | |
| | | |
| | | 4,800,000 | | | U.S. Treasury Bill, 0.60%, due 08/04/22 (g) (i) | | | 4,787,645 | |
| | | |
| | | 11,200,000 | | | U.S. Treasury Bill, 0.64%, due 08/18/22 (i) | | | 11,166,327 | |
| | | |
| | | 6,000,000 | | | U.S. Treasury Bill, 0.66%, due 08/25/22 (i) | | | 5,980,894 | |
| | | | | | | | | | |
| | | |
| | | | | | Total U.S. Government | | | 21,934,866 | |
| | | | | | | | | | |
| | | |
| | | | | | TOTAL SHORT-TERM INVESTMENTS
(COST $30,459,840) | | | 30,464,180 | |
| | | | | | | | | | |
| | | |
| | | | | | TOTAL INVESTMENTS — 99.9%
(Cost $2,205,049,978) | | | 1,932,557,614 | |
| | | |
| | | | | | Other Assets and Liabilities (net) — 0.1% | | | 2,174,774 | |
| | | | | | | | | | |
| | | |
| | | | | | TOTAL NET ASSETS — 100.0% | | | $1,934,732,388 | |
| | | | | | | | | | |
A summary of outstanding financial instruments at February 28, 2022 is as follows:
Futures Contracts
| | | | | | | | | | | | |
Number of
Contracts + | | Type | | Expiration
Date | | Notional
Amount ($) | | | Value/Net
Unrealized
Appreciation
(Depreciation) ($) | |
Buys
2,563 | | Mini MSCI Emerging Markets | | March 2022 | | $ | 150,640,325 | | | $ | (6,332,907 | ) |
| | | | | | | | | | | | |
Sales
1,238 | | SGX Nifty 50 | | March 2022 | | $ | 41,748,726 | | | $ | 840,989 | |
| | | | | | | | | | | | |
| + | Buys - Fund is long the futures contract. |
| | Sales - Fund is short the futures contract. |
| | | | |
| | |
| 30 | | See accompanying notes to the financial statements. | | |
GMO Emerging Markets Fund
(A Series of GMO Trust)
Schedule of Investments — (Continued)
February 28, 2022
As of February 28, 2022, for the above contracts and/or agreements, the Fund had sufficient cash and/or securities to cover commitments or collateral requirements, if any, of the relevant broker or exchange.
Notes to Schedule of Investments:
| † | Denominated in U.S. Dollar, unless otherwise indicated. |
| * | Non-income producing security. |
| (a) | All or a portion of this security is out on loan (Note 2). |
| (b) | Investment valued at fair value using methods determined in good faith by the Trustees of GMO Trust or persons acting at their direction pursuant to procedures approved by the Trustees. Investment valued using significant unobservable inputs (Note 2). |
| (c) | Investment valued using significant unobservable inputs (Note 2). |
| (d) | Affiliated company (Note 10). |
| (e) | Securities are traded on separate exchanges for the same entity. |
| (f) | Preferred dividend rates are disclosed to the extent that a stated rate exists. |
| (g) | All or a portion of this security has been pledged to cover margin requirements on futures and/or cleared swap contracts, collateral on OTC swap contracts, forward currency contracts, and/or written options, if any (Note 4). |
| (h) | The rate disclosed is the 7 day net yield as of February 28, 2022. |
| (i) | The rate shown represents yield-to-maturity. |
For a listing of definitions of acronyms, counterparty abbreviations and currency abbreviations used throughout the Schedule of Investments as well as the derivative tables, if any, please refer to page 87.
| | | | |
| | |
| | | See accompanying notes to the financial statements. | | 31 |
GMO International Equity Fund
(A Series of GMO Trust)
Portfolio Management
Day-to-day management of the Fund’s portfolio is the responsibility of the Global Equity team at Grantham, Mayo, Van Otterloo & Co. LLC.
Management Discussion and Analysis of Fund Performance
Although the Fund is not managed relative to any securities market index or benchmark, a discussion of the Fund’s performance relative to the MSCI EAFE Index is included for comparative purposes.
Class II shares of GMO International Equity Fund returned +5.00% (net) for the fiscal year ended February 28, 2022, as compared with +2.83% for the MSCI EAFE Index.
The environment saw a shift to tailwinds for Value, with strong performance from our valuation-oriented models. The magnitude of the favorable conditions for Value is illustrated by the 3.5% outperformance of the MSCI EAFE Value Index when compared to the MSCI EAFE Index for the fiscal year ended February 28, 2022.
Areas of notable positive stock selection included areas which had been challenging in the prior year, Japan, the Netherlands, Industrials, Consumer Discretionary, and Health Care. Stock selection was also strong in Communication Services. Top contributors included overweight positioning in Norsk Hydro (Norway Materials), British American Tobacco (UK Consumer Staples), DBS Group (Singapore Financials), and Mercedes-Benz Group (Germany Consumer Discretionary). Underweight positioning toward SoftBank Group (Japan Communication Services) also added value.
The UK was a challenging area for stock selection, along with value lost from names not held and underweight positioning toward Energy. Top detractors included underweight positioning in Nestle (Switzerland Consumer Staples), Royal Dutch Shell (UK Energy), and Novo Nordisk (Denmark Health Care). Overweights toward Fortescue Metals (Australia Materials) and WH Group (Hong Kong Consumer Staples) also detracted from performance.
Because some of the securities and instruments held directly or indirectly by the Fund had positive fair value adjustments at the beginning or end of the fiscal year (and the performance of indices are not fair valued), the Fund’s absolute and relative performance is higher than it otherwise would have been in the absence of such fair value adjustments.
The views expressed herein are exclusively those of Grantham, Mayo, Van Otterloo & Co. LLC as of the date of this report and are subject to change. GMO disclaims any responsibility to update such views. They are not meant as investment advice. References to specific securities are not recommendations of such securities and may not be representative of any GMO portfolio’s current or future investments. All information is unaudited.
GMO International Equity Fund
(A Series of GMO Trust)
Comparison of Change in Value of a $5,000,000 Investment in
GMO International Equity Fund Class II Shares and the MSCI EAFE Index
As of February 28, 2022
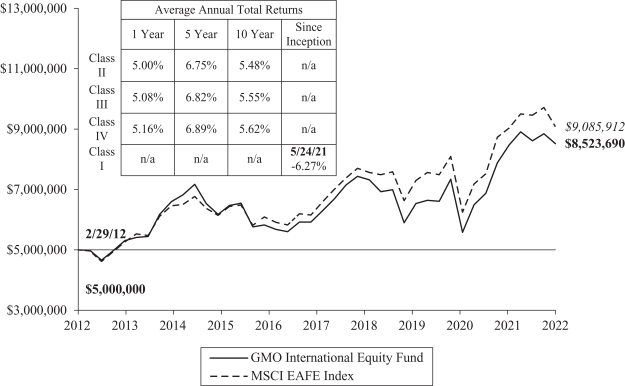
Performance data quoted represents past performance and is not indicative of future results. The investment return and principal value of an investment will fluctuate so that an investor’s shares, when redeemed, may be worth more or less than their original cost. Current performance data may be lower or higher than the performance data provided herein. To obtain performance information up to the most recent month-end, visit www.gmo.com. Performance shown is net of all fees after reimbursement from GMO. Returns would have been lower had certain expenses not been reimbursed during the periods shown and do not include the effect of taxes on distributions and redemptions. The performance information shown above only includes purchase premiums and/or redemption fees in effect as of February 28, 2022. All information is unaudited. Performance for classes may vary due to different fees.
MSCI data may not be reproduced or used for any other purpose. MSCI provides no warranties, has not prepared or approved this report, and has no liability hereunder.
For Class II, III, IV and I the gross expense ratio of 0.76%, 0.69%, 0.63% and 0.86%, respectively, is equal to the Fund’s Total Annual Operating Expenses set forth in the Fund’s most recent prospectus dated June 30, 2021. For the Classes listed above, the corresponding net expense ratio of 0.73%, 0.66%, 0.60% and 0.83% reflects the reduction of expenses from fee reimbursements. The fee reimbursements will continue until at least June 30, 2022. Elimination of this reimbursement will result in higher fees and lower performance.
GMO International Equity Fund
(A Series of GMO Trust)
Investment Concentration Summary
February 28, 2022 (Unaudited)
| | | | |
| Asset Class Summary& | | % of Total Net Assets | |
Common Stocks | | | 99.6 | % |
Short-Term Investments | | | 4.1 | |
Preferred Stocks | | | 0.3 | |
Other | | | (4.0 | ) |
| | | | |
| | | 100.0 | % |
| | | | |
| | | | |
| Country/Region Summary¤ | | % of Investments | |
Japan | | | 26.9 | % |
United Kingdom | | | 16.6 | |
France | | | 9.3 | |
Netherlands | | | 7.2 | |
Germany | | | 6.5 | |
Switzerland | | | 6.3 | |
Spain | | | 4.5 | |
Singapore | | | 4.4 | |
Norway | | | 4.3 | |
Australia | | | 3.8 | |
Italy | | | 3.4 | |
Hong Kong | | | 2.3 | |
Belgium | | | 1.7 | |
Other Developed | | | 1.7 | ‡ |
Ireland | | | 1.1 | |
| | | | |
| | | 100.0 | % |
| | | | |
| | | | |
| Industry Group Summary | | % of Equity Investments# | |
Capital Goods | | | 14.9 | % |
Pharmaceuticals, Biotechnology & Life Sciences | | | 12.5 | |
Banks | | | 11.0 | |
Materials | | | 10.4 | |
Food, Beverage & Tobacco | | | 9.1 | |
Telecommunication Services | | | 7.2 | |
Consumer Durables & Apparel | | | 4.8 | |
Automobiles & Components | | | 4.5 | |
Food & Staples Retailing | | | 3.5 | |
Retailing | | | 3.4 | |
Diversified Financials | | | 3.3 | |
Technology Hardware & Equipment | | | 3.1 | |
Commercial & Professional Services | | | 2.3 | |
Insurance | | | 2.2 | |
Energy | | | 1.8 | |
Software & Services | | | 1.7 | |
Transportation | | | 1.4 | |
Media & Entertainment | | | 1.1 | |
Semiconductors & Semiconductor Equipment | | | 0.9 | |
Real Estate | | | 0.5 | |
Utilities | | | 0.3 | |
Health Care Equipment & Services | | | 0.1 | |
Consumer Services | | | 0.0 | ^ |
| | | | |
| | | 100.0 | % |
| | | | |
| & | In the table, derivative financial instruments, if any, are based on market values, rather than the notional amounts of derivatives, except for forward currency contracts which are based on unrealized appreciation/(depreciation). |
| ¤ | The table shows country exposure in the Fund. The table excludes short-term investments. The table excludes exposure through forward currency contracts and includes exposure through other derivative financial instruments, if any. The table takes into account the market value of securities and options and the notional amounts of swap contracts and other derivative financial instruments, if any. |
| ‡ | “Other Developed” is comprised of developed countries that each represent between (1.0)% and 1.0% of Investments. |
| # | Equity investments may consist of common stocks and other stock-related securities, such as preferred stocks, if any. This table excludes exposure to derivative contracts, short-term investments, mutual funds and investment funds, if any. For a summary of these exposures, if any, see the Schedule of Investments. |
GMO International Equity Fund
(A Series of GMO Trust)
Schedule of Investments
(showing percentage of total net assets)
February 28, 2022
| | | | | | | | | | |
| | | Shares | | |
Description | | Value ($) | |
| | |
| | | | | | COMMON STOCKS — 99.6% | |
| | |
| | | | | | Australia — 3.8% | |
| | | |
| | | 718,948 | | | BlueScope Steel Ltd | | | 10,646,077 | |
| | | |
| | | 240,493 | | | GrainCorp Ltd – Class A | | | 1,470,938 | |
| | | |
| | | 89,611 | | | Pact Group Holdings Ltd | | | 168,926 | |
| | | |
| | | 680,833 | | | Rio Tinto Ltd | | | 58,713,001 | |
| | | |
| | | 443,950 | | | Sandfire Resources Ltd | | | 2,188,645 | |
| | | | | | | | | | |
| | | |
| | | | | | Total Australia | | | 73,187,587 | |
| | | | | | | | | | |
| | |
| | | | | | Belgium — 1.7% | |
| | | |
| | | 91,042 | | | AGFA-Gevaert NV * | | | 369,139 | |
| | | |
| | | 52,409 | | | Bekaert SA | | | 2,280,234 | |
| | | |
| | | 205,428 | | | KBC Group NV | | | 14,800,457 | |
| | | |
| | | 131,018 | | | UCB SA | | | 14,298,875 | |
| | | | | | | | | | |
| | | |
| | | | | | Total Belgium | | | 31,748,705 | |
| | | | | | | | | | |
| | |
| | | | | | Denmark — 0.1% | |
| | | |
| | | 9,627 | | | Per Aarsleff Holding A/S | | | 380,382 | |
| | | |
| | | 6,561 | | | Schouw & Co A/S | | | 572,056 | |
| | | | | | | | | | |
| | | |
| | | | | | Total Denmark | | | 952,438 | |
| | | | | | | | | | |
| | |
| | | | | | Finland — 0.5% | |
| | | |
| | | 301,836 | | | Kesko Oyj – B Shares | | | 8,882,942 | |
| | | |
| | | 103,849 | | | Outokumpu Oyj * | | | 612,149 | |
| | | | | | | | | | |
| | | |
| | | | | | Total Finland | | | 9,495,091 | |
| | | | | | | | | | |
| | |
| | | | | | France — 9.3% | |
| | | |
| | | 12,756 | | | Alten SA | | | 1,925,872 | |
| | | |
| | | 31,964 | | | APERAM SA | | | 1,789,734 | |
| | | |
| | | 675,997 | | | BNP Paribas SA | | | 39,224,402 | |
| | | |
| | | 3,116 | | | Christian Dior SE | | | 2,206,636 | |
| | | |
| | | 658,289 | | | Cie de Saint-Gobain | | | 40,817,260 | |
| | | |
| | | 165,498 | | | Derichebourg SA | | | 1,719,459 | |
| | | |
| | | 36,691 | | | Ipsen SA | | | 4,269,350 | |
| | | |
| | | 55,260 | | | IPSOS | | | 2,633,566 | |
| | | |
| | | 121,054 | | | Metropole Television SA | | | 2,399,416 | |
| | | |
| | | 71,988 | | | Publicis Groupe SA | | | 4,777,535 | |
| | | |
| | | 240,552 | | | Sanofi | | | 25,145,502 | |
| | | |
| | | 138,341 | | | Schneider Electric SE | | | 21,434,014 | |
| | | |
| | | 21,273 | | | Societe BIC SA | | | 1,122,513 | |
| | | |
| | | 691,458 | | | Societe Generale SA | | | 19,552,726 | |
| | | |
| | | 87,400 | | | STMicroelectronics NV – NY Shares | | | 3,698,768 | |
| | | |
| | | 263,720 | | | Television Francaise 1 | | | 2,603,272 | |
| | | |
| | | 14,633 | | | TotalEnergies SE | | | 751,510 | |
| | | | | | | | | | |
| | | |
| | | | | | Total France | | | 176,071,535 | |
| | | | | | | | | | |
| | |
| | | | | | Germany — 6.2% | |
| | | |
| | | 96,472 | | | ADVA Optical Networking SE * | | | 1,633,355 | |
| | | |
| | | 175,446 | | | Bayerische Motoren Werke AG | | | 16,896,708 | |
| | | | | | | | | | |
| | | Shares | | |
Description | | Value ($) | |
| | |
| | | | | | Germany — continued | |
| | | |
| | | 526,733 | | | Daimler AG (Registered) | | | 41,148,106 | |
| | | |
| | | 219,578 | | | Deutsche Post AG (Registered) | | | 11,036,473 | |
| | | |
| | | 3,109 | | | Hornbach Holding AG & Co KGaA | | | 407,233 | |
| | | |
| | | 5,326 | | | Indus Holding AG | | | 189,949 | |
| | | |
| | | 465,117 | | | Kloeckner & Co SE * | | | 6,292,259 | |
| | | |
| | | 133,921 | | | Merck KGaA | | | 26,562,891 | |
| | | |
| | | 36,288 | | | RTL Group SA | | | 2,022,036 | |
| | | |
| | | 49,805 | | | Traton SE | | | 1,017,237 | |
| | | |
| | | 39,746 | | | Volkswagen AG | | | 10,279,876 | |
| | | | | | | | | | |
| | | |
| | | | | | Total Germany | | | 117,486,123 | |
| | | | | | | | | | |
| | |
| | | | | | Hong Kong — 2.3% | |
| | | |
| | | 214,900 | | | ASM Pacific Technology Ltd | | | 2,357,671 | |
| | | |
| | | 1,229,487 | | | Champion (REIT) | | | 557,534 | |
| | | |
| | | 711,712 | | | Chow Tai Fook Jewellery Group Ltd * | | | 1,477,897 | |
| | | |
| | | 209,000 | | | CK Asset Holdings Ltd | | | 1,320,053 | |
| | | |
| | | 608,400 | | | Dah Sing Banking Group Ltd | | | 550,840 | |
| | | |
| | | 229,269 | | | Dah Sing Financial Holdings Ltd | | | 742,462 | |
| | | |
| | | 3,995,207 | | | Esprit Holdings Ltd * | | | 455,804 | |
| | | |
| | | 3,817,585 | | | IGG Inc | | | 2,286,398 | |
| | | |
| | | 485,901 | | | Johnson Electric Holdings Ltd | | | 809,087 | |
| | | |
| | | 297,640 | | | Kerry Logistics Network Ltd | | | 722,160 | |
| | | |
| | | 420,326 | | | Luk Fook Holdings International Ltd | | | 1,116,687 | |
| | | |
| | | 1,232,331 | | | Pacific Textiles Holdings Ltd | | | 597,868 | |
| | | |
| | | 1,301,023 | | | Shun Tak Holdings Ltd * | | | 332,485 | |
| | | |
| | | 359,526 | | | SmarTone Telecommunications Holdings Ltd | | | 205,079 | |
| | | |
| | | 84,500 | | | Sun Hung Kai Properties Ltd | | | 982,378 | |
| | | |
| | | 280,000 | | | Techtronic Industries Co Ltd | | | 4,691,696 | |
| | | |
| | | 313,588 | | | Television Broadcasts Ltd * | | | 205,045 | |
| | | |
| | | 1,016,000 | | | VSTECS Holdings Ltd | | | 1,044,551 | |
| | | |
| | | 325,800 | | | VTech Holdings Ltd | | | 2,678,458 | |
| | | |
| | | 29,823,015 | | | WH Group Ltd | | | 20,827,666 | |
| | | | | | | | | | |
| | | |
| | | | | | Total Hong Kong | | | 43,961,819 | |
| | | | | | | | | | |
| | |
| | | | | | Ireland — 1.1% | |
| | | |
| | | 145,807 | | | AIB Group Plc * | | | 384,679 | |
| | | |
| | | 835,871 | | | Bank of Ireland Group Plc * | | | 5,546,210 | |
| | | |
| | | 173,452 | | | CRH Plc Sponsored ADR | | | 7,786,260 | |
| | | |
| | | 99,674 | | | Glanbia Plc | | | 1,395,340 | |
| | | |
| | | 49,019 | | | Kingspan Group Plc | | | 4,787,304 | |
| | | |
| | | 19,058 | | | Smurfit Kappa Group Plc | | | 945,699 | |
| | | | | | | | | | |
| | | |
| | | | | | Total Ireland | | | 20,845,492 | |
| | | | | | | | | | |
| | |
| | | | | | Italy — 3.3% | |
| | | |
| | | 339,828 | | | Anima Holding SPA | | | 1,606,408 | |
| | | |
| | | 92,082 | | | Banca IFIS SPA | | | 1,943,329 | |
| | | |
| | | 774,212 | | | Banco BPM SPA | | | 2,656,505 | |
| | | |
| | | 90,779 | | | De’ Longhi SPA | | | 2,880,553 | |
| | | |
| | | 101,444 | | | Esprinet SPA | | | 1,264,854 | |
| | | |
| | | 340,051 | | | EXOR NV | | | 25,764,169 | |
| | | | |
| | |
| | | See accompanying notes to the financial statements. | | 35 |
GMO International Equity Fund
(A Series of GMO Trust)
Schedule of Investments — (Continued)
(showing percentage of total net assets)
February 28, 2022
| | | | | | | | | | |
| | | Shares | | |
Description | | Value ($) | |
| | |
| | | | | | Italy — continued | |
| | | |
| | | 605,347 | | | Italgas SPA | | | 3,907,522 | |
| | | |
| | | 36,751 | | | La Doria SPA | | | 677,411 | |
| | | |
| | | 137,441 | | | OVS SPA * | | | 346,744 | |
| | | |
| | | 753,770 | | | Poste Italiane SPA | | | 8,645,376 | |
| | | |
| | | 2,362 | | | Sesa SPA | | | 377,369 | |
| | | |
| | | 421,929 | | | Stellantis NV | | | 7,667,242 | |
| | | |
| | | 97,344 | | | Unieuro SPA | | | 1,927,204 | |
| | | |
| | | 805,018 | | | Unipol Gruppo SPA | | | 4,084,726 | |
| | | | | | | | | | |
| | | |
| | | | | | Total Italy | | | 63,749,412 | |
| | | | | | | | | | |
| | |
| | | | | | Japan — 26.9% | |
| | | |
| | | 133,500 | | | AGC Inc | | | 5,922,399 | |
| | | |
| | | 8,600 | | | Aisin Corp | | | 313,249 | |
| | | |
| | | 63,520 | | | AOKI Holdings Inc | | | 331,417 | |
| | | |
| | | 1,842,015 | | | Asahi Kasei Corp | | | 17,286,992 | |
| | | |
| | | 1,670,584 | | | Astellas Pharma Inc | | | 27,872,385 | |
| | | |
| | | 491,396 | | | Brother Industries Ltd | | | 8,943,841 | |
| | | |
| | | 952,700 | | | Canon Inc | | | 22,419,835 | |
| | | |
| | | 31,300 | | | Canon Inc Sponsored ADR | | | 739,619 | |
| | | |
| | | 39,584 | | | Cawachi Ltd | | | 845,340 | |
| | | |
| | | 17,400 | | | Dai Nippon Printing Co Ltd | | | 454,222 | |
| | | |
| | | 203,500 | | | Daiwa House Industry Co Ltd | | | 5,771,315 | |
| | | |
| | | 281,090 | | | Daiwabo Holdings Co Ltd | | | 4,351,094 | |
| | | |
| | | 70,574 | | | Dexerials Corp | | | 2,014,976 | |
| | | |
| | | 53,748 | | | Doutor Nichires Holdings Co Ltd | | | 757,838 | |
| | | |
| | | 84,354 | | | FUJIFILM Holdings Corp | | | 5,361,888 | |
| | | |
| | | 193,832 | | | Fujitsu Ltd | | | 28,160,684 | |
| | | |
| | | 20,606 | | | Fuyo General Lease Co Ltd | | | 1,349,810 | |
| | | |
| | | 90,436 | | | Geo Holdings Corp | | | 1,194,460 | |
| | | |
| | | 17,653 | | | Gunze Ltd | | | 606,433 | |
| | | |
| | | 415,204 | | | Hitachi Ltd | | | 20,532,958 | |
| | | |
| | | 86,000 | | | Hitachi Zosen Corp | | | 596,129 | |
| | | |
| | | 1,520,454 | | | ITOCHU Corp | | | 49,549,467 | |
| | | |
| | | 2,088,704 | | | Japan Tobacco Inc | | | 38,413,687 | |
| | | |
| | | 127,244 | | | Kanematsu Corp | | | 1,553,494 | |
| | | |
| | | 1,464,196 | | | KDDI Corp | | | 47,646,754 | |
| | | |
| | | 41,993 | | | Komeri Co Ltd | | | 1,032,533 | |
| | | |
| | | 495,500 | | | Konica Minolta Inc | | | 2,099,233 | |
| | | |
| | | 1,849,000 | | | Marubeni Corp | | | 19,408,281 | |
| | | |
| | | 110,757 | | | MCJ Co Ltd | | | 969,707 | |
| | | |
| | | 130,800 | | | Mitsubishi Corp | | | 4,397,977 | |
| | | |
| | | 2,654,818 | | | Mitsubishi UFJ Financial Group Inc | | | 16,297,884 | |
| | | |
| | | 869,938 | | | Mitsui & Co Ltd | | | 21,689,907 | |
| | | |
| | | 39,684 | | | Modec Inc | | | 405,901 | |
| | | |
| | | 24,600 | | | MS&AD Insurance Group Holdings Inc | | | 832,383 | |
| | | |
| | | 145,633 | | | NEC Networks & System Integration Corp | | | 2,239,189 | |
| | | |
| | | 97,126 | | | Nichias Corp | | | 2,200,224 | |
| | | |
| | | 29,500 | | | Nippo Corp | | | 1,020,662 | |
| | | |
| | | 59,031 | | | Nippon Signal Co Ltd | | | 447,084 | |
| | | |
| | | 1,664,995 | | | Nippon Telegraph & Telephone Corp | | | 47,853,435 | |
| | | | | | | | | | |
| | | Shares | | |
Description | | Value ($) | |
| | |
| | | | | | Japan — continued | |
| | | |
| | | 85,066 | | | Okinawa Electric Power Co (The) | | | 1,071,132 | |
| | | |
| | | 621,486 | | | Panasonic Corp | | | 6,490,369 | |
| | | |
| | | 82,324 | | | Press Kogyo Co Ltd | | | 267,962 | |
| | | |
| | | 63,219 | | | Prima Meat Packers Ltd | | | 1,334,512 | |
| | | |
| | | 29,783 | | | San-A Co Ltd | | | 1,105,845 | |
| | | |
| | | 196,800 | | | Seiko Epson Corp | | | 3,026,869 | |
| | | |
| | | 65,495 | | | Seiko Holdings Corp | | | 1,368,712 | |
| | | |
| | | 347,112 | | | Sekisui Chemical Co Ltd | | | 5,684,288 | |
| | | |
| | | 500,300 | | | Sekisui House Ltd | | | 10,200,161 | |
| | | |
| | | 541,781 | | | Sojitz Corp | | | 8,948,642 | |
| | | |
| | | 5,480,141 | | | Sumitomo Chemical Co Ltd | | | 26,163,446 | |
| | | |
| | | 103,300 | | | Sumitomo Forestry Co Ltd | | | 1,991,986 | |
| | | |
| | | 56,838 | | | T-Gaia Corp | | | 859,624 | |
| | | |
| | | 17,500 | | | Tokyo Electron Ltd | | | 8,588,605 | |
| | | |
| | | 26,977 | | | Tokyo Seimitsu Co Ltd | | | 1,123,250 | |
| | | |
| | | 130,975 | | | Tokyu Construction Co Ltd | | | 811,811 | |
| | | |
| | | 61,128 | | | Towa Pharmaceutical Co Ltd | | | 1,584,072 | |
| | | |
| | | 313,455 | | | Toyota Tsusho Corp | | | 13,013,084 | |
| | | |
| | | 24,269 | | | TPR Co Ltd | | | 293,742 | |
| | | |
| | | 93,669 | | | Valor Holdings Co Ltd | | | 1,814,092 | |
| | | |
| | | 20,256 | | | Warabeya Nichiyo Holdings Co Ltd | | | 322,497 | |
| | | |
| | | 21,608 | | | Yahagi Construction Co Ltd | | | 147,212 | |
| | | |
| | | 88,800 | | | Yamaha Motor Co Ltd | | | 1,996,190 | |
| | | | | | | | | | |
| | | |
| | | | | | Total Japan | | | 512,092,789 | |
| | | | | | | | | | |
| | |
| | | | | | Malta — 0.0% | |
| | | |
| | | 15,858,986 | | | BGP Holdings Plc * (a) | | | 18 | |
| | | | | | | | | | |
| | |
| | | | | | Netherlands — 7.2% | |
| | | |
| | | 122,142 | | | ABN AMRO Bank NV CVA | | | 1,625,370 | |
| | | |
| | | 5,425 | | | ASM International NV | | | 1,752,098 | |
| | | |
| | | 1,334,173 | | | Koninklijke Ahold Delhaize NV | | | 41,042,152 | |
| | | |
| | | 447,980 | | | NN Group NV | | | 21,500,747 | |
| | | |
| | | 1,951,492 | | | PostNL NV | | | 7,845,943 | |
| | | |
| | | 463,527 | | | Randstad NV | | | 31,588,751 | |
| | | |
| | | 438,438 | | | Signify NV | | | 22,427,762 | |
| | | |
| | | 91,817 | | | Wolters Kluwer NV | | | 9,355,210 | |
| | | | | | | | | | |
| | | |
| | | | | | Total Netherlands | | | 137,138,033 | |
| | | | | | | | | | |
| | |
| | | | | | Norway — 4.3% | |
| | | |
| | | 347,227 | | | BW LPG Ltd | | | 2,069,199 | |
| | | |
| | | 848,514 | | | Equinor ASA | | | 26,673,457 | |
| | | |
| | | 247,910 | | | Europris ASA | | | 1,581,373 | |
| | | |
| | | 85,867 | | | Kongsberg Gruppen ASA | | | 3,028,451 | |
| | | |
| | | 5,017,065 | | | Norsk Hydro ASA | | | 47,642,477 | |
| | | |
| | | 23,112 | | | SpareBank 1 SMN | | | 381,924 | |
| | | | | | | | | | |
| | | |
| | | | | | Total Norway | | | 81,376,881 | |
| | | | | | | | | | |
| | |
| | | | | | Portugal — 0.7% | |
| | | |
| | | 252,529 | | | CTT – Correios de Portugal SA | | | 1,223,276 | |
| | | | |
| | |
| 36 | | See accompanying notes to the financial statements. | | |
GMO International Equity Fund
(A Series of GMO Trust)
Schedule of Investments — (Continued)
(showing percentage of total net assets)
February 28, 2022
| | | | | | | | | | |
| | | Shares | | |
Description | | Value ($) | |
| | |
| | | | | | Portugal — continued | |
| | | |
| | | 77,389 | | | Galp Energia SGPS SA | | | 856,643 | |
| | | |
| | | 365,144 | | | Jeronimo Martins SGPS SA | | | 7,960,755 | |
| | | |
| | | 557,521 | | | REN – Redes Energeticas Nacionais SGPS SA | | | 1,617,524 | |
| | | |
| | | 2,270,049 | | | Sonae SGPS SA | | | 2,470,885 | |
| | | | | | | | | | |
| | | |
| | | | | | Total Portugal | | | 14,129,083 | |
| | | | | | | | | | |
| | |
| | | | | | Singapore — 4.4% | |
| | | |
| | | 1,902,325 | | | DBS Group Holdings Ltd | | | 47,824,702 | |
| | | |
| | | 247,987 | | | Jardine Cycle & Carriage Ltd | | | 4,005,142 | |
| | | |
| | | 376,400 | | | Keppel Corp Ltd | | | 1,675,715 | |
| | | |
| | | 428,300 | | | Sheng Siong Group Ltd | | | 481,185 | |
| | | |
| | | 7,075 | | | Venture Corp Ltd | | | 92,289 | |
| | | |
| | | 4,356,239 | | | Wilmar International Ltd | | | 14,157,918 | |
| | | |
| | | 15,668,822 | | | Yangzijiang Shipbuilding Holdings Ltd | | | 16,028,429 | |
| | | | | | | | | | |
| | | |
| | | | | | Total Singapore | | | 84,265,380 | |
| | | | | | | | | | |
| | |
| | | | | | Spain — 4.5% | |
| | | |
| | | 1,137,752 | | | Acerinox SA | | | 14,465,033 | |
| | | |
| | | 6,810,698 | | | Banco Bilbao Vizcaya Argentaria SA | | | 40,412,803 | |
| | | |
| | | 12,815,220 | | | Banco de Sabadell SA * | | | 11,080,989 | |
| | | |
| | | 1,436,465 | | | Banco Santander SA | | | 4,783,450 | |
| | | |
| | | 53,967 | | | Ebro Foods SA | | | 999,684 | |
| | | |
| | | 12,544 | | | Grupo Catalana Occidente SA | | | 404,350 | |
| | | |
| | | 340,338 | | | Industria de Diseno Textil SA | | | 8,877,977 | |
| | | |
| | | 318,625 | | | Mediaset Espana Comunicacion SA * | | | 1,634,558 | |
| | | |
| | | 2,601,025 | | | Unicaja Banco SA | | | 2,452,260 | |
| | | | | | | | | | |
| | | |
| | | | | | Total Spain | | | 85,111,104 | |
| | | | | | | | | | |
| | |
| | | | | | Sweden — 0.4% | |
| | | |
| | | 71,460 | | | Investor AB – A Shares | | | 1,580,158 | |
| | | |
| | | 22,946 | | | Skanska AB – B Shares | | | 519,343 | |
| | | |
| | | 444,542 | | | SSAB AB – A Shares * | | | 2,782,002 | |
| | | |
| | | 128,541 | | | Svenska Cellulosa AB SCA – Class B | | | 2,097,216 | |
| | | | | | | | | | |
| | | |
| | | | | | Total Sweden | | | 6,978,719 | |
| | | | | | | | | | |
| | |
| | | | | | Switzerland — 6.3% | |
| | | |
| | | 44,851 | | | Ascom Holding AG (Registered) * | | | 508,938 | |
| | | |
| | | 16,292 | | | Cie Financiere Richemont SA – Class A (Registered) | | | 2,181,605 | |
| | | |
| | | 209 | | | Forbo Holding AG (Registered) | | | 357,391 | |
| | | |
| | | 458,695 | | | Novartis AG (Registered) | | | 40,315,345 | |
| | | |
| | | 18,200 | | | Novartis AG Sponsored ADR | | | 1,591,772 | |
| | | |
| | | 184,431 | | | Roche Holding AG – Genusschein | | | 69,850,164 | |
| | | |
| | | 271,818 | | | UBS Group AG (Registered) | | | 5,000,573 | |
| | | |
| | | 3,995 | | | Zehnder Group AG – Class RG | | | 345,537 | |
| | | | | | | | | | |
| | | |
| | | | | | Total Switzerland | | | 120,151,325 | |
| | | | | | | | | | |
| | |
| | | | | | United Kingdom — 16.6% | |
| | | |
| | | 989,014 | | | 3i Group Plc | | | 17,618,413 | |
| | | |
| | | 371,516 | | | Aviva Plc | | | 2,081,744 | |
| | | | | | | | | | |
| | | Shares | | |
Description | | Value ($) | |
| | |
| | | | | | United Kingdom — continued | |
| | | |
| | | 2,544,534 | | | Barratt Developments Plc | | | 20,725,776 | |
| | | |
| | | 225,078 | | | Bellway Plc | | | 8,657,524 | |
| | | |
| | | 102,700 | | | BP Plc Sponsored ADR | | | 2,999,867 | |
| | | |
| | | 1,060,578 | | | British American Tobacco Plc | | | 46,481,835 | |
| | | |
| | | 342,858 | | | British American Tobacco Plc Sponsored ADR | | | 15,168,038 | |
| | | |
| | | 16,803,094 | | | BT Group Plc | | | 41,925,279 | |
| | | |
| | | 552,067 | | | Coca-Cola HBC AG * | | | 14,026,111 | |
| | | |
| | | 83,864 | | | Crest Nicholson Holdings Plc | | | 344,200 | |
| | | |
| | | 146,391 | | | Electrocomponents Plc | | | 1,931,080 | |
| | | |
| | | 1,117,494 | | | Ferrexpo Plc | | | 2,534,741 | |
| | | |
| | | 233,017 | | | Galliford Try Holdings Plc | | | 537,559 | |
| | | |
| | | 1,249,137 | | | GlaxoSmithKline Plc | | | 26,049,668 | |
| | | |
| | | 94,648 | | | Grafton Group Plc | | | 1,359,158 | |
| | | |
| | | 103,137 | | | Halfords Group Plc | | | 383,219 | |
| | | |
| | | 805,249 | | | Imperial Brands Plc | | | 17,607,785 | |
| | | |
| | | 399,418 | | | Investec Plc | | | 2,166,319 | |
| | | |
| | | 393,221 | | | ITV Plc * | | | 579,351 | |
| | | |
| | | 90,823 | | | JD Sports Fashion Plc | | | 182,703 | |
| | | |
| | | 4,299,779 | | | Kingfisher Plc | | | 17,540,325 | |
| | | |
| | | 1,197,862 | | | Legal & General Group Plc | | | 4,429,008 | |
| | | |
| | | 197,108 | | | M&G Plc | | | 542,614 | |
| | | |
| | | 292,502 | | | Next Plc | | | 26,782,177 | |
| | | |
| | | 618,618 | | | Persimmon Plc | | | 19,909,311 | |
| | | |
| | | 193,872 | | | Plus500 Ltd | | | 3,617,655 | |
| | | |
| | | 227,539 | | | Reach Plc | | | 695,024 | |
| | | |
| | | 542,563 | | | Redrow Plc | | | 4,136,233 | |
| | | |
| | | 1,265,202 | | | Royal Mail Plc | | | 6,649,338 | |
| | | |
| | | 24,954 | | | Schroders Plc | | | 1,021,569 | |
| | | |
| | | 529,538 | | | Spirent Communications Plc | | | 1,732,618 | |
| | | |
| | | 254,542 | | | Vesuvius Plc | | | 1,352,416 | |
| | | |
| | | 142,984 | | | Vistry Group Plc | | | 1,923,255 | |
| | | |
| | | 97,139 | | | WPP Plc | | | 1,366,249 | |
| | | | | | | | | | |
| | | |
| | | | | | Total United Kingdom | | | 315,058,162 | |
| | | | | | | | | | |
| | | |
| | | | | | TOTAL COMMON STOCKS (COST $1,911,077,689) | | | 1,893,799,696 | |
| | | | | | | | | | |
| | |
| | | | | | PREFERRED STOCKS (b) — 0.3% | |
| | |
| | | | | | Germany — 0.3% | |
| | | |
| | | 64,652 | | | Bayerische Motoren Werke AG | | | 5,228,278 | |
| | | |
| | | 18,328 | | | Draegerwerk AG & Co KGaA | | | 1,038,328 | |
| | | | | | | | | | |
| | | |
| | | | | | Total Germany | | | 6,266,606 | |
| | | | | | | | | | |
| | | |
| | | | | | TOTAL PREFERRED STOCKS (COST $6,656,610) | | | 6,266,606 | |
| | | | | | | | | | |
| | | | |
| | |
| | | See accompanying notes to the financial statements. | | 37 |
GMO International Equity Fund
(A Series of GMO Trust)
Schedule of Investments — (Continued)
(showing percentage of total net assets)
February 28, 2022
| | | | | | | | | | |
| | | Shares /
Par Value† | | | Description | | Value ($) | |
| | |
| | | | | | SHORT-TERM INVESTMENTS — 4.1% | |
| | |
| | | | | | Money Market Funds — 0.2% | |
| | | |
| | | 4,093,174 | | | State Street Institutional Treasury Money Market Fund – Premier Class, 0.01% (c) | | | 4,093,174 | |
| | | | | | | | | | |
| | |
| | | | | | U.S. Government — 3.9% | |
| | | |
| | | 200,000 | | | U.S. Treasury Bill, 0.58%, due 07/28/22 (d) | | | 199,528 | |
| | | |
| | | 7,000,000 | | | U.S. Treasury Bill, 0.63%, due 08/11/22 (d) | | | 6,980,183 | |
| | | |
| | | 13,800,000 | | | U.S. Treasury Bill, 0.64%, due 08/18/22 (d) | | | 13,758,511 | |
| | | |
| | | 12,100,000 | | | U.S. Treasury Bill, 0.73%, due 11/03/22 (d) (e) | | | 12,040,433 | |
| | | |
| | | 14,450,000 | | | U.S. Treasury Bill, 0.63%, due 12/01/22 (d) | | | 14,381,287 | |
| | | |
| | | 26,900,000 | | | U.S. Treasury Bill, 0.90%, due 12/29/22 (d) (e) | | | 26,699,629 | |
| | | | | | | | | | |
| | | |
| | | | | | Total U.S. Government | | | 74,059,571 | |
| | | | | | | | | | |
| | | |
| | | | | | TOTAL SHORT-TERM INVESTMENTS (COST $78,340,717) | | | 78,152,745 | |
| | | | | | | | | | |
| | | |
| | | | | | TOTAL INVESTMENTS — 104.0%
(Cost $1,996,075,016) | | | 1,978,219,047 | |
| | | |
| | | | | | Other Assets and Liabilities (net) — (4.0%) | | | (76,468,678 | ) |
| | | | | | | | | | |
| | | |
| | | | | | TOTAL NET ASSETS — 100.0% | | | $1,901,750,369 | |
| | | | | | | | | | |
Notes to Schedule of Investments:
| † | Denominated in U.S. Dollar, unless otherwise indicated. |
| * | Non-income producing security. |
| (a) | Investment valued at fair value using methods determined in good faith by the Trustees of GMO Trust or persons acting at their direction pursuant to procedures approved by the Trustees. Investment valued using significant unobservable inputs (Note 2). |
| (b) | Preferred dividend rates are disclosed to the extent that a stated rate exists. |
| (c) | The rate disclosed is the 7 day net yield as of February 28, 2022. |
| (d) | The rate shown represents yield-to-maturity. |
| (e) | All or a portion of this security has been pledged to cover margin requirements on futures and/or cleared swap contracts, collateral on OTC swap contracts, forward currency contracts, and/or written options, if any (Note 4). |
For a listing of definitions of acronyms, counterparty abbreviations and currency abbreviations used throughout the Schedule of Investments as well as the derivative tables, if any, please refer to page 87.
| | | | |
| | |
| 38 | | See accompanying notes to the financial statements. | | |
This page has been left blank intentionally.
GMO-Usonian Japan Value Creation Fund
(A Series of GMO Trust)
Portfolio Management
Day-to-day management of the Fund’s portfolio is the responsibility of the Usonian Japan Equity team at Grantham, Mayo, Van Otterloo & Co. LLC.
Management Discussion and Analysis of Fund Performance
Although the Fund is not managed relative to any securities market index or benchmark, a discussion of the Fund’s performance relative to the Tokyo Stock Price Index (TR) (“TOPIX”) is included for comparative purposes.
Class VI shares of GMO-Usonian Japan Value Creation Fund returned -1.45% (net) for the fiscal year ended February 28, 2022, as compared with -4.70% for TOPIX.
Japanese equities delivered a respectable return of 8.7% from March 2021 through year-end as measured by TOPIX in local currency terms but sold off early in 2022 driven by macro uncertainty giving back much of the previous gain. During the period, prime minister Kishida started his administration. The equity market is less sanguine toward the new prime minister relative to his predecessor due to Kishida’s dubious economic policy suggestion, a “new form of capitalism,” which has an extraordinary focus on wealth inequality.
Due to weakness in the yen, Japan equity returns were lower in U.S. dollar terms than in local currency terms. Despite higher real yields in Japan, the U.S. dollar appreciated against the yen by over 8% in the fiscal year, likely due to moves by the Federal Reserve to reduce monetary stimulus while the Bank of Japan stayed highly accommodative. GMO’s Asset Allocation team views the yen as the most attractively valued developed market currency relative to the U.S. dollar.
From a style factor perspective, value stocks jumped to a big lead in the first quarter of fiscal year 2022. For the full year, the MSCI Japan Value Index was up 10.8% versus the MSCI Japan Growth Index at -5.1% in local currency terms. Value’s outperformance was largely driven by large capitalization stocks as small cap value did not keep up (probably due to the mix of commodities exposure between the two ends of the capitalization spectrum). Small cap stocks, which the Fund favors, trailed large cap during the year, with the MSCI Japan Small Cap Index up 1.9% vs. the MSCI Japan Large Cap Index, which gained 3.9%.
Relative to TOPIX, security selection within sectors contributed to returns this period. Selection results in Communication Services and Consumer Discretionary made the largest positive impact while Materials and Consumer Staples detracted. Sector allocation also contributed to returns. An overweight in Financials and underweight in Communication Services contributed to the returns, while an underweight in Consumer Discretionary and Information Technology detracted.
The views expressed herein are exclusively those of Grantham, Mayo, Van Otterloo & Co. LLC as of the date of this report and are subject to change. GMO disclaims any responsibility to update such views. They are not meant as investment advice. References to specific securities are not recommendations of such securities and may not be representative of any GMO portfolio’s current or future investments. All information is unaudited.
GMO-Usonian Japan Value Creation Fund
(A Series of GMO Trust)
Comparison of Change in Value of a $300,000,000 Investment in
GMO-Usonian Japan Value Creation Fund Class VI Shares and the Tokyo Stock Price Index (TR)
As of February 28, 2022
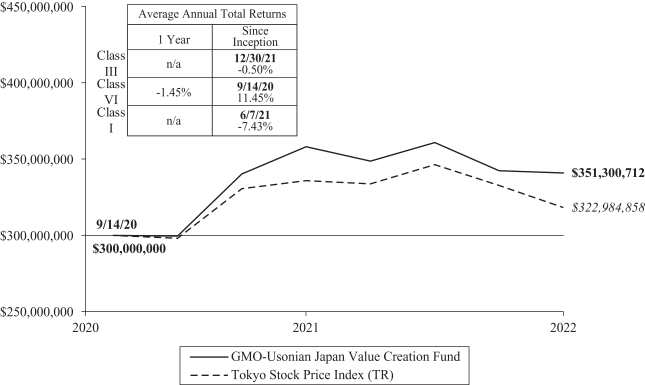
Performance data quoted represents past performance and is not indicative of future results. The investment return and principal value of an investment will fluctuate so that an investor’s shares, when redeemed, may be worth more or less than their original cost. Current performance data may be lower or higher than the performance data provided herein. To obtain performance information up to the most recent month-end, visit www.gmo.com. Performance shown is net of all fees after reimbursement from GMO. Returns would have been lower had certain expenses not been reimbursed during the periods shown and do not include the effect of taxes on distributions and redemptions. The performance information shown above only includes purchase premiums and/or redemption fees in effect as of February 28, 2022. All information is unaudited. Performance for classes may vary due to different fees.
For Class III, VI and I the gross expense ratio of 0.88%, 0.79% and 0.98%, respectively, is equal to the Fund’s Total Annual Operating Expenses set forth in the Fund’s most recent prospectus dated June 30, 2021. For the Classes listed above, the corresponding net expense ratio of 0.65%, 0.56%, 0.75% reflects the reduction of expenses from fee reimbursements. The fee reimbursements will continue until at least June 30, 2022. Elimination of this reimbursement will result in higher fees and lower performance.
GMO-Usonian Japan Value Creation Fund
(A Series of GMO Trust)
Investment Concentration Summary
February 28, 2022 (Unaudited)
| | | | |
| Asset Class Summary& | | % of Total Net Assets | |
Common Stocks | | | 95.9 | % |
Short-Term Investments | | | 4.8 | |
Other | | | (0.7 | ) |
| | | | |
| | | 100.0 | % |
| | | | |
| | | | |
| Industry Group Summary | | % of Equity Investments# | |
Capital Goods | | | 16.7 | % |
Materials | | | 12.2 | |
Food, Beverage & Tobacco | | | 10.6 | |
Consumer Durables & Apparel | | | 6.3 | |
Commercial & Professional Services | | | 6.2 | |
Banks | | | 6.1 | |
Automobiles & Components | | | 6.0 | |
Insurance | | | 5.6 | |
Technology Hardware & Equipment | | | 4.7 | |
Semiconductors & Semiconductor Equipment | | | 4.6 | |
Pharmaceuticals, Biotechnology & Life Sciences | | | 4.1 | |
Telecommunication Services | | | 3.2 | |
Retailing | | | 3.2 | |
Software & Services | | | 3.0 | |
Real Estate | | | 2.6 | |
Transportation | | | 2.5 | |
Diversified Financials | | | 2.4 | |
| | | | |
| | | 100.0 | % |
| | | | |
| & | In the table, derivative financial instruments, if any, are based on market values, rather than the notional amounts of derivatives, except for forward currency contracts which are based on unrealized appreciation/(depreciation). |
| # | Equity investments may consist of common stocks and other stock-related securities, such as preferred stocks, if any. This table excludes exposure to derivative contracts, short-term investments, mutual funds and investment funds, if any. For a summary of these exposures, if any, see the Schedule of Investments. |
GMO-Usonian Japan Value Creation Fund
(A Series of GMO Trust)
Schedule of Investments
(showing percentage of total net assets)
February 28, 2022
| | | | | | | | | | |
| | | Shares | | | Description | | Value ($) | |
| | |
| | | | | | COMMON STOCKS — 95.9% | |
| | |
| | | | | | Automobiles & Components — 5.8% | |
| | | |
| | | 170,300 | | | Honda Motor Co Ltd | | | 5,173,866 | |
| | | |
| | | 170,300 | | | Stanley Electric Co Ltd | | | 4,046,799 | |
| | | | | | | | | | |
| | | |
| | | | | | Total Automobiles & Components | | | 9,220,665 | |
| | | | | | | | | | |
| | |
| | | | | | Banks — 5.9% | |
| | | |
| | | 153,100 | | | Sumitomo Mitsui Financial Group Inc | | | 5,429,271 | |
| | | |
| | | 111,600 | | | Sumitomo Mitsui Trust Holdings Inc | | | 3,965,372 | |
| | | | | | | | | | |
| | | |
| | | | | | Total Banks | | | 9,394,643 | |
| | | | | | | | | | |
| | |
| | | | | | Capital Goods — 16.0% | |
| | | |
| | | 248,800 | | | EXEO Group Inc | | | 5,179,111 | |
| | | |
| | | 212,400 | | | Fuji Corp | | | 4,319,240 | |
| | | |
| | | 149,800 | | | Kyudenko Corp | | | 4,021,640 | |
| | | |
| | | 487,100 | | | Penta-Ocean Construction Co Ltd | | | 2,564,050 | |
| | | |
| | | 237,800 | | | Takuma Co Ltd | | | 3,022,147 | |
| | | |
| | | 114,600 | | | THK Co Ltd | | | 2,632,706 | |
| | | |
| | | 50,100 | | | Toyota Industries Corp | | | 3,810,660 | |
| | | | | | | | | | |
| | | |
| | | | | | Total Capital Goods | | | 25,549,554 | |
| | | | | | | | | | |
| | |
| | | | | | Commercial & Professional Services — 5.9% | |
| | | |
| | | 56,600 | | | Secom Co Ltd | | | 4,157,065 | |
| | | |
| | | 267,600 | | | Toppan Inc | | | 5,272,873 | |
| | | | | | | | | | |
| | | |
| | | | | | Total Commercial & Professional Services | | | 9,429,938 | |
| | | | | | | | | | |
| | |
| | | | | | Consumer Durables & Apparel — 6.1% | |
| | | |
| | | 260,500 | | | Haseko Corp | | | 3,325,258 | |
| | | |
| | | 153,000 | | | Sega Sammy Holdings Inc | | | 2,790,627 | |
| | | |
| | | 185,300 | | | Sumitomo Forestry Co Ltd | | | 3,573,234 | |
| | | | | | | | | | |
| | | |
| | | | | | Total Consumer Durables & Apparel | | | 9,689,119 | |
| | | | | | | | | | |
| | |
| | | | | | Diversified Financials — 2.3% | |
| | | |
| | | 88,700 | | | Zenkoku Hosho Co Ltd | | | 3,730,061 | |
| | | | | | | | | | |
| | |
| | | | | | Food, Beverage & Tobacco — 10.2% | |
| | | |
| | | 31,500 | | | Ezaki Glico Co Ltd | | | 1,074,602 | |
| | | |
| | | 246,300 | | | Kirin Holdings Co Ltd | | | 4,094,850 | |
| | | |
| | | 120,100 | | | Morinaga & Co Ltd | | | 3,907,562 | |
| | | |
| | | 123,500 | | | NH Foods Ltd | | | 4,635,291 | |
| | | |
| | | 260,300 | | | Takara Holdings Inc | | | 2,586,306 | |
| | | | | | | | | | |
| | | |
| | | | | | Total Food, Beverage & Tobacco | | | 16,298,611 | |
| | | | | | | | | | |
| | |
| | | | | | Insurance — 5.4% | |
| | | |
| | | 114,100 | | | MS&AD Insurance Group Holdings Inc | | | 3,860,767 | |
| | | |
| | | 327,000 | | | T&D Holdings Inc | | | 4,749,176 | |
| | | | | | | | | | |
| | | |
| | | | | | Total Insurance | | | 8,609,943 | |
| | | | | | | | | | |
| | |
| | | | | | Materials — 11.7% | |
| | | |
| | | 138,800 | | | Denka Co Ltd | | | 4,262,915 | |
| | | |
| | | 124,900 | | | Maruichi Steel Tube Ltd | | | 3,099,962 | |
| | | | | | | | | | |
| | | Shares | | | Description | | Value ($) | |
| | |
| | | | | | Materials — continued | |
| | | |
| | | 325,500 | | | Teijin Ltd | | | 3,915,730 | |
| | | |
| | | 334,100 | | | Tokai Carbon Co Ltd | | | 3,206,782 | |
| | | |
| | | 267,700 | | | Tosoh Corp | | | 4,154,190 | |
| | | | | | | | | | |
| | | |
| | | | | | Total Materials | | | 18,639,579 | |
| | | | | | | | | | |
| | |
| | | | | | Pharmaceuticals, Biotechnology & Life Sciences — 4.0% | |
| | | |
| | | 53,300 | | | Sawai Group Holdings Co Ltd | | | 2,118,285 | |
| | | |
| | | 152,500 | | | Tsumura & Co | | | 4,235,643 | |
| | | | | | | | | | |
| | | |
| | | | | | Total Pharmaceuticals, Biotechnology & Life Sciences | | | 6,353,928 | |
| | | | | | | | | | |
| | |
| | | | | | Real Estate — 2.4% | |
| | | |
| | | 278,000 | | | Aeon Mall Co Ltd | | | 3,909,250 | |
| | | | | | | | | | |
| | |
| | | | | | Retailing — 3.0% | |
| | | |
| | | 450,200 | | | K’s Holdings Corp | | | 4,878,364 | |
| | | | | | | | | | |
| | |
| | | | | | Semiconductors & Semiconductor Equipment — 4.4% | |
| | | |
| | | 38,500 | | | Rohm Co Ltd | | | 3,070,513 | |
| | | |
| | | 95,000 | | | Tokyo Seimitsu Co Ltd | | | 3,955,546 | |
| | | | | | | | | | |
| | | |
| | | | | | Total Semiconductors & Semiconductor Equipment | | | 7,026,059 | |
| | | | | | | | | | |
| | |
| | | | | | Software & Services — 2.8% | |
| | | |
| | | 105,600 | | | NEC Corp | | | 4,568,850 | |
| | | | | | | | | | |
| | |
| | | | | | Technology Hardware & Equipment — 4.5% | |
| | | |
| | | 154,700 | | | Amano Corp | | | 3,032,816 | |
| | | |
| | | 273,800 | | | Daiwabo Holdings Co Ltd | | | 4,238,250 | |
| | | | | | | | | | |
| | | |
| | | | | | Total Technology Hardware & Equipment | | | 7,271,066 | |
| | | | | | | | | | |
| | |
| | | | | | Telecommunication Services — 3.1% | |
| | | |
| | | 150,700 | | | KDDI Corp | | | 4,903,965 | |
| | | | | | | | | | |
| | |
| | | | | | Transportation — 2.4% | |
| | | |
| | | 109,500 | | | Sankyu Inc | | | 3,796,677 | |
| | | | | | | | | | |
| | | |
| | | | | | TOTAL COMMON STOCKS
(COST $158,505,246) | | | 153,270,272 | |
| | | | | | | | | | |
| | |
| | | | | | SHORT-TERM INVESTMENTS — 4.8% | |
| | |
| | | | | | Money Market Funds — 4.8% | |
| | | |
| | | 7,731,157 | | | State Street Institutional Treasury Money Market Fund – Premier Class, 0.01% (a) | | | 7,731,157 | |
| | | | | | | | | | |
| | | |
| | | | | | TOTAL SHORT-TERM INVESTMENTS
(COST $7,731,157) | | | 7,731,157 | |
| | | | | | | | | | |
| | | |
| | | | | | TOTAL INVESTMENTS — 100.7%
(Cost $166,236,403) | | | 161,001,429 | |
| | | |
| | | | | | Other Assets and Liabilities (net) — (0.7%) | | | (1,187,161 | ) |
| | | | | | | | | | |
| | | |
| | | | | | TOTAL NET ASSETS — 100.0% | | | $159,814,268 | |
| | | | | | | | | | |
| | | | |
| | |
| | | See accompanying notes to the financial statements. | | 43 |
GMO-Usonian Japan Value Creation Fund
(A Series of GMO Trust)
Schedule of Investments — (Continued)
February 28, 2022
Notes to Schedule of Investments:
| (a) | The rate disclosed is the 7 day net yield as of February 28, 2022. |
For a listing of definitions of acronyms, counterparty abbreviations and currency abbreviations used throughout the Schedule of Investments as well as the derivative tables, if any, please refer to page 87.
| | | | |
| | |
| 44 | | See accompanying notes to the financial statements. | | |
This page has been left blank intentionally.
GMO Quality Cyclicals Fund (formerly GMO Cyclical Focus Fund)
(A Series of GMO Trust)
Portfolio Management
Day-to-day management of the Fund’s portfolio is the responsibility of the Focused Equity team at Grantham, Mayo, Van Otterloo & Co. LLC.
Management Discussion and Analysis of Fund Performance
Although GMO does not manage the Fund to, or control the Fund’s risk relative to, any securities index or securities benchmark, a discussion of the Fund’s performance relative to the MSCI All Country World Index (“ACWI”) is included for comparative purposes.
Class VI shares of GMO Quality Cyclicals Fund returned +10.22% (net) for the fiscal year ended February 28, 2022, as compared with +7.81% for the MSCI ACWI.
Relative to the MSCI ACWI, sector allocation contributed to returns this period. The Energy (overweight) and Communication Services (underweight) allocations made the largest positive impact while Consumer Discretionary (overweight) and Information Technology (underweight) detracted. Security selection within sectors contributed to returns. Selection results in Materials and Financials made the largest positive impact. Energy, Information Technology, and Industrials reduced returns. Stock selection within sectors mattered more than sector allocation.
The U.S./non-U.S. regional allocation made a negative contribution.
EOG Resources, Nutrien, and American Express made positive contributions while Lukoil, Neste, and Lyft had a negative impact.
The views expressed herein are exclusively those of Grantham, Mayo, Van Otterloo & Co. LLC as of the date of this report and are subject to change. GMO disclaims any responsibility to update such views. They are not meant as investment advice. References to specific securities are not recommendations of such securities and may not be representative of any GMO portfolio’s current or future investments. All information is unaudited.
GMO Quality Cyclicals Fund (formerly GMO Cyclical Focus Fund)
(A Series of GMO Trust)
Comparison of Change in Value of a $300,000,000 Investment in
GMO Quality Cyclicals Fund (formerly GMO Cyclical Focus Fund) Class VI Shares and the MSCI ACWI
As of February 28, 2022
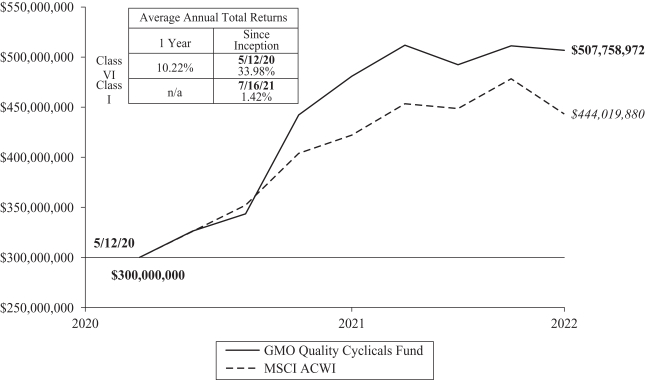
Performance data quoted represents past performance and is not indicative of future results. The investment return and principal value of an investment will fluctuate so that an investor’s shares, when redeemed, may be worth more or less than their original cost. Current performance data may be lower or higher than the performance data provided herein. To obtain performance information up to the most recent month-end, visit www.gmo.com. Performance shown is net of all fees after reimbursement from GMO. Returns would have been lower had certain expenses not been reimbursed during the periods shown and do not include the effect of taxes on distributions and redemptions. The performance information shown above only includes purchase premiums and/or redemption fees in effect as of February 28, 2022. All information is unaudited. Performance for classes may vary due to different fees.
MSCI data may not be reproduced or used for any other purpose. MSCI provides no warranties, has not prepared or approved this report, and has no liability hereunder.
For Class VI and I the gross expense ratio of 0.60% and 0.79%, respectively, is equal to the Fund’s Total Annual Operating Expenses set forth in the Fund’s most recent prospectus dated June 30, 2021. For the Classes listed above, the corresponding net expense ratio of 0.40% and 0.59% reflects the reduction of expenses from fee reimbursements. The fee reimbursements will continue until at least June 30, 2022. Elimination of this reimbursement will result in higher fees and lower performance.
GMO Quality Cyclicals Fund (formerly GMO Cyclical Focus Fund)
(A Series of GMO Trust)
Investment Concentration Summary
February 28, 2022 (Unaudited)
| | | | |
| Asset Class Summary& | | % of Total Net Assets | |
Common Stocks | | | 97.1 | % |
Preferred Stocks | | | 2.5 | |
Mutual Funds | | | 0.3 | |
Short-Term Investments | | | 0.1 | |
Other | | | 0.0 | ^ |
| | | | |
| | | 100.0 | % |
| | | | |
| | | | |
| Country/Region Summary¤ | | % of Investments | |
United States | | | 50.1 | % |
United Kingdom | | | 10.8 | |
France | | | 8.1 | |
Mexico | | | 6.8 | |
Canada | | | 6.1 | |
Spain | | | 4.2 | |
Brazil | | | 3.3 | |
Ireland | | | 2.8 | |
China | | | 2.7 | |
Germany | | | 1.8 | |
Finland | | | 1.6 | |
Hong Kong | | | 1.1 | |
Other Emerging | | | 0.6 | † |
| | | | |
| | | 100.0 | % |
| | | | |
| | | | |
| Industry Group Summary | | % of Equity Investments# | |
Consumer Durables & Apparel | | | 12.7 | % |
Energy | | | 12.3 | |
Consumer Services | | | 11.6 | |
Materials | | | 11.1 | |
Diversified Financials | | | 9.1 | |
Food, Beverage & Tobacco | | | 6.6 | |
Capital Goods | | | 6.6 | |
Banks | | | 6.4 | |
Transportation | | | 5.2 | |
Software & Services | | | 4.1 | |
Technology Hardware & Equipment | | | 3.2 | |
Retailing | | | 3.1 | |
Automobiles & Components | | | 2.4 | |
Insurance | | | 2.4 | |
Household & Personal Products | | | 1.8 | |
Media & Entertainment | | | 1.4 | |
| | | | |
| | | 100.0 | % |
| | | | |
| & | In the table, derivative financial instruments, if any, are based on market values, rather than the notional amounts of derivatives, except for forward currency contracts which are based on unrealized appreciation/(depreciation). |
| ¤ | The table shows country exposure in the Fund. The table excludes short-term investments. The table excludes exposure through forward currency contracts and includes exposure through other derivative financial instruments, if any. The table takes into account the market value of securities and options and the notional amounts of swap contracts and other derivative financial instruments, if any. |
| † | “Other Emerging” is comprised of emerging countries that each represent between (1.0)% and 1.0% of Investments. |
| # | Equity investments may consist of common stocks and other stock-related securities, such as preferred stocks, if any. This table excludes exposure to derivative contracts, short-term investments, mutual funds and investment funds, if any. For a summary of these exposures, if any, see the Schedule of Investments. |
GMO Quality Cyclicals Fund (formerly GMO Cyclical Focus Fund)
(A Series of GMO Trust)
Schedule of Investments
(showing percentage of total net assets)
February 28, 2022
| | | | | | | | | | |
| | | Shares | | | Description | | Value ($) | |
| | | | | | | | | | |
| | |
| | | | | | COMMON STOCKS — 97.1% | |
| | |
| | | | | | Brazil — 0.8% | |
| | | |
| | | 58,551 | | | Vale SA | | | 1,086,336 | |
| | | | | | | | | | |
| | |
| | | | | | Canada — 6.1% | |
| | | |
| | | 74,134 | | | Brookfield Asset Management Inc – Class A | | | 4,050,682 | |
| | | |
| | | 52,555 | | | Nutrien Ltd | | | 4,519,204 | |
| | | | | | | | | | |
| | | |
| | | | | | Total Canada | | | 8,569,886 | |
| | | | | | | | | | |
| | |
| | | | | | China — 2.7% | |
| | | |
| | | 132,639 | | | Alibaba Group Holding Ltd * | | | 1,746,043 | |
| | | |
| | | 1,747 | | | JD.com Inc – Class A * | | | 62,402 | |
| | | |
| | | 36,702 | | | Tencent Holdings Ltd | | | 1,980,488 | |
| | | | | | | | | | |
| | | |
| | | | | | Total China | | | 3,788,933 | |
| | | | | | | | | | |
| | |
| | | | | | Finland — 1.6% | |
| | | |
| | | 56,595 | | | Neste Oyj | | | 2,206,901 | |
| | | | | | | | | | |
| | |
| | | | | | France — 8.1% | |
| | | |
| | | 4,032 | | | Kering SA | | | 2,796,730 | |
| | | |
| | | 5,143 | | | LVMH Moet Hennessy Louis Vuitton SE | | | 3,779,616 | |
| | | |
| | | 38,590 | | | Safran SA | | | 4,906,608 | |
| | | | | | | | | | |
| | | |
| | | | | | Total France | | | 11,482,954 | |
| | | | | | | | | | |
| | |
| | | | | | Germany — 1.8% | |
| | | |
| | | 25,725 | | | Beiersdorf AG | | | 2,607,692 | |
| | | | | | | | | | |
| | |
| | | | | | Hong Kong — 1.1% | |
| | | |
| | | 276,715 | | | Galaxy Entertainment Group Ltd * | | | 1,543,303 | |
| | | | | | | | | | |
| | |
| | | | | | Ireland — 2.8% | |
| | | |
| | | 201,163 | | | Ryanair Holdings Plc * | | | 3,487,812 | |
| | | |
| | | 4,403 | | | Ryanair Holdings Plc Sponsored ADR * | | | 439,023 | |
| | | | | | | | | | |
| | | |
| | | | | | Total Ireland | | | 3,926,835 | |
| | | | | | | | | | |
| | |
| | | | | | Mexico — 6.8% | |
| | | |
| | | 529,556 | | | Fomento Economico Mexicano SAB de CV | | | 4,255,116 | |
| | | |
| | | 1,046,718 | | | Grupo Mexico SAB de CV – Series B | | | 5,346,792 | |
| | | | | | | | | | |
| | | |
| | | | | | Total Mexico | | | 9,601,908 | |
| | | | | | | | | | |
| | |
| | | | | | Russia — 0.6% | |
| | | |
| | | 33,541 | | | LUKOIL PJSC Sponsored ADR | | | 629,124 | |
| | | |
| | | 7,292 | | | Novatek PJSC Sponsored GDR (Registered) | | | 280,903 | |
| | | | | | | | | | |
| | | |
| | | | | | Total Russia | | | 910,027 | |
| | | | | | | | | | |
| | |
| | | | | | Spain — 4.2% | |
| | | |
| | | 53,292 | | | Amadeus IT Group SA * | | | 3,516,025 | |
| | | |
| | | 95,941 | | | Industria de Diseno Textil SA | | | 2,502,694 | |
| | | | | | | | | | |
| | | |
| | | | | | Total Spain | | | 6,018,719 | |
| | | | | | | | | | |
| | | | | | | | | | |
| | | Shares | | | Description | | Value ($) | |
| | |
| | | | | | United Kingdom — 10.7% | |
| | | |
| | | 48,313 | | | Berkeley Group Holdings Plc | | | 2,512,580 | |
| | | |
| | | 235,349 | | | Compass Group Plc | | | 5,319,606 | |
| | | |
| | | 96,374 | | | Persimmon Plc | | | 3,101,656 | |
| | | |
| | | 162,216 | | | Shell Plc | | | 4,277,764 | |
| | | | | | | | | | |
| | | |
| | | | | | Total United Kingdom | | | 15,211,606 | |
| | | | | | | | | | |
| | |
| | | | | | United States — 49.8% | |
| | | |
| | | 25,215 | | | American Express Co. | | | 4,905,326 | |
| | | |
| | | 1,753 | | | Booking Holdings, Inc. * | | | 3,807,954 | |
| | | |
| | | 84,493 | | | BorgWarner, Inc. | | | 3,465,058 | |
| | | |
| | | 25,958 | | | Chevron Corp. | | | 3,737,952 | |
| | | |
| | | 70,145 | | | Darling Ingredients, Inc. * | | | 5,084,110 | |
| | | |
| | | 45,198 | | | EOG Resources, Inc. | | | 5,194,154 | |
| | | |
| | | 17,149 | | | Global Payments, Inc. | | | 2,287,334 | |
| | | |
| | | 29,857 | | | Green Plains, Inc. * | | | 977,518 | |
| | | |
| | | 30,487 | | | Hasbro, Inc. | | | 2,958,763 | |
| | | |
| | | 24,019 | | | Hilton Worldwide Holdings, Inc. * | | | 3,575,468 | |
| | | |
| | | 29,848 | | | Intercontinental Exchange, Inc. | | | 3,824,126 | |
| | | |
| | | 50,552 | | | Las Vegas Sands Corp. * | | | 2,166,659 | |
| | | |
| | | 86,637 | | | Lyft, Inc. – Class A * | | | 3,373,645 | |
| | | |
| | | 2,687 | | | Markel Corp. * | | | 3,339,699 | |
| | | |
| | | 42,480 | | | Raytheon Technologies Corp. | | | 4,362,696 | |
| | | |
| | | 77,957 | | | Sensata Technologies Holding Plc * | | | 4,514,490 | |
| | | |
| | | 79,962 | | | US Bancorp | | | 4,521,052 | |
| | | |
| | | 40,963 | | | Verso Corp. – Class A | | | 1,085,929 | |
| | | |
| | | 47,622 | | | VF Corp. | | | 2,763,028 | |
| | | |
| | | 83,933 | | | Wells Fargo & Co. | | | 4,479,504 | |
| | | | | | | | | | |
| | | |
| | | | | | Total United States | | | 70,424,465 | |
| | | | | | | | | | |
| | | |
| | | | | | TOTAL COMMON STOCKS
(COST $107,258,259) | | | 137,379,565 | |
| | | | | | | | | | |
| | |
| | | | | | PREFERRED STOCKS (a) — 2.5% | |
| | |
| | | | | | Brazil — 2.5% | |
| | | |
| | | 618,456 | | | Bradespar SA | | | 3,559,990 | |
| | | | | �� | | | | | |
| | | |
| | | | | | TOTAL PREFERRED STOCKS
(COST $3,005,044) | | | 3,559,990 | |
| | | | | | | | | | |
| | |
| | | | | | MUTUAL FUNDS — 0.3% | |
| | |
| | | | | | United States — 0.3% | |
| | |
| | | | | | Affiliated Issuers — 0.3% | |
| | | |
| | | 86,818 | | | GMO U.S. Treasury Fund | | | 434,957 | |
| | | | | | | | | | |
| | | |
| | | | | | TOTAL MUTUAL FUNDS
(COST $436,694) | | | 434,957 | |
| | | | | | | | | | |
| | | | |
| | |
| | | See accompanying notes to the financial statements. | | 49 |
GMO Quality Cyclicals Fund (formerly GMO Cyclical Focus Fund)
(A Series of GMO Trust)
Schedule of Investments — (Continued)
(showing percentage of total net assets)
February 28, 2022
| | | | | | | | | | |
| | | Shares | | | Description | | Value ($) | |
| | |
| | | | | | SHORT-TERM INVESTMENTS — 0.1% | |
| | |
| | | | | | Money Market Funds — 0.1% | |
| | | |
| | | 139,819 | | | State Street Institutional Treasury Money Market Fund – Premier Class, 0.01%, due 12/31/30 (b) | | | 139,819 | |
| | | | | | | | | | |
| | | |
| | | | | | TOTAL SHORT-TERM INVESTMENTS
(COST $139,819) | | | 139,819 | |
| | | | | | | | | | |
| | | |
| | | | | | TOTAL INVESTMENTS — 100.0%
(Cost $110,839,816) | | | 141,514,331 | |
| | | |
| | | | | | Other Assets and Liabilities (net) — 0.0% | | | 31,872 | |
| | | | | | | | | | |
| | | |
| | | | | | TOTAL NET ASSETS — 100.0% | | | $141,546,203 | |
| | | | | | | | | | |
Notes to Schedule of Investments:
| * | Non-income producing security. |
| (a) | Preferred dividend rates are disclosed to the extent that a stated rate exists. |
| (b) | The rate disclosed is the 7 day net yield as of February 28, 2022. |
For a listing of definitions of acronyms, counterparty abbreviations and currency abbreviations used throughout the Schedule of Investments as well as the derivative tables, if any, please refer to page 87.
| | | | |
| | |
| 50 | | See accompanying notes to the financial statements. | | |
This page has been left blank intentionally.
GMO Quality Fund
(A Series of GMO Trust)
Portfolio Management
Day-to-day management of the Fund’s portfolio is the responsibility of the Focused Equity team at Grantham, Mayo, Van Otterloo & Co. LLC.
Management Discussion and Analysis of Fund Performance
Although GMO does not manage the Fund to, or control the Fund’s risk relative to, any securities index or securities benchmark, a discussion of the Fund’s performance relative to the S&P 500 Index is included for comparative purposes.
Class III shares of GMO Quality Fund returned +14.71% (net) for the fiscal year ended February 28, 2022, as compared with +16.39% for the S&P 500 Index.
Relative to the S&P 500, sector allocation had little impact this period. The Communication Services (underweight) and Information Technology (overweight) allocations helped returns while Energy (underweight) and Real Estate (underweight) reduced returns. Security selection within sectors made a negative contribution. Selection results in Financials and Communication Services helped returns. This was outweighed by stock selection within Information Technology and Industrials.
The allocation to non-U.S. stocks detracted from relative returns.
UnitedHealth, Wells Fargo, and Anthem made the largest positive impact while Alibaba, NVIDIA (underweight), and Medtronic detracted.
The views expressed herein are exclusively those of Grantham, Mayo, Van Otterloo & Co. LLC as of the date of this report and are subject to change. GMO disclaims any responsibility to update such views. They are not meant as investment advice. References to specific securities are not recommendations of such securities and may not be representative of any GMO portfolio’s current or future investments. All information is unaudited.
GMO Quality Fund
(A Series of GMO Trust)
Comparison of Change in Value of a $5,000,000 Investment in
GMO Quality Fund Class III Shares and the S&P 500 Index
As of February 28, 2022
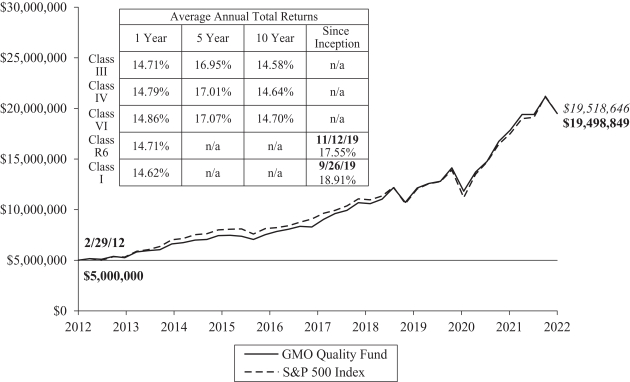
Performance data quoted represents past performance and is not indicative of future results. The investment return and principal value of an investment will fluctuate so that an investor’s shares, when redeemed, may be worth more or less than their original cost. Current performance data may be lower or higher than the performance data provided herein. To obtain performance information up to the most recent month-end, visit www.gmo.com. Performance shown is net of all fees after reimbursement from GMO. Returns would have been lower had certain expenses not been reimbursed during the periods shown and do not include the effect of taxes on distributions and redemptions. The performance information shown above only includes purchase premiums and/or redemption fees in effect as of February 28, 2022. All information is unaudited. Performance for classes may vary due to different fees.
For S&P disclaimers please visit https://www.gmo.com/north-america/benchmark-disclaimers/
For Class III, IV, VI, R6 and I the gross expense ratio of 0.50%, 0.46%, 0.41%, 0.50% and 0.60%, respectively, is equal to the Fund’s Total Annual Operating Expenses set forth in the Fund’s most recent prospectus dated June 30, 2021. For the Classes listed above, the corresponding net expense ratio of 0.48%, 0.44%, 0.39%, 0.48% and 0.58% reflects the reduction of expenses from fee reimbursements. The fee reimbursements will continue until at least June 30, 2022. Elimination of this reimbursement will result in higher fees and lower performance.
GMO Quality Fund
(A Series of GMO Trust)
Investment Concentration Summary
February 28, 2022 (Unaudited)
| | | | |
| Asset Class Summary& | | % of Total Net Assets | |
Common Stocks | | | 98.9 | % |
Short-Term Investments | | | 0.8 | |
Mutual Funds | | | 0.1 | |
Other | | | 0.2 | |
| | | | |
| | | 100.0 | % |
| | | | |
| | | | |
| Country/Region Summary¤ | | % of Investments | |
United States | | | 79.1 | % |
United Kingdom | | | 4.7 | |
France | | | 3.8 | |
Switzerland | | | 3.7 | |
Taiwan | | | 3.5 | |
Germany | | | 3.0 | |
China | | | 1.6 | |
Other Developed | | | 0.6 | ‡ |
| | | | |
| | | 100.0 | % |
| | | | |
| | | | |
| Industry Group Summary | | % of Equity Investments# | |
Software & Services | | | 20.8 | % |
Health Care Equipment & Services | | | 15.1 | |
Semiconductors & Semiconductor Equipment | | | 10.2 | |
Pharmaceuticals, Biotechnology & Life Sciences | | | 8.8 | |
Banks | | | 7.6 | |
Food, Beverage & Tobacco | | | 7.1 | |
Technology Hardware & Equipment | | | 6.6 | |
Retailing | | | 5.3 | |
Media & Entertainment | | | 5.2 | |
Capital Goods | | | 4.9 | |
Consumer Services | | | 2.6 | |
Household & Personal Products | | | 2.1 | |
Diversified Financials | | | 2.0 | |
Consumer Durables & Apparel | | | 1.1 | |
Transportation | | | 0.6 | |
| | | | |
| | | 100.0 | % |
| | | | |
| & | In the table, derivative financial instruments, if any, are based on market values, rather than the notional amounts of derivatives, except for forward currency contracts which are based on unrealized appreciation/(depreciation). |
| ¤ | The table shows country exposure in the Fund. The table excludes short-term investments. The table excludes exposure through forward currency contracts and includes exposure through other derivative financial instruments, if any. The table takes into account the market value of securities and options and the notional amounts of swap contracts and other derivative financial instruments, if any. |
| ‡ | “Other Developed” is comprised of developed countries that each represent between (1.0)% and 1.0% of Investments. |
| # | Equity investments may consist of common stocks and other stock-related securities, such as preferred stocks, if any. This table excludes exposure to derivative contracts, short-term investments, mutual funds and investment funds, if any. For a summary of these exposures, if any, see the Schedule of Investments. |
GMO Quality Fund
(A Series of GMO Trust)
Schedule of Investments
(showing percentage of total net assets)
February 28, 2022
| | | | | | | | | | |
| | |
Shares | | | Description | | Value ($) | |
| | |
| | | | | | COMMON STOCKS — 98.9% | |
| | |
| | | | | | Banks — 7.5% | |
| | | |
| | | 5,591,596 | | | US Bancorp | | | 316,148,838 | |
| | | |
| | | 5,886,702 | | | Wells Fargo & Co. | | | 314,173,286 | |
| | | | | | | | | | |
| | | |
| | | | | | Total Banks | | | 630,322,124 | |
| | | | | | | | | | |
| | |
| | | | | | Capital Goods — 4.9% | |
| | | |
| | | 616,928 | | | Knorr-Bremse AG | | | 54,388,382 | |
| | | |
| | | 1,605,931 | | | Otis Worldwide Corp. | | | 125,792,575 | |
| | | |
| | | 1,787,606 | | | Safran SA | | | 227,288,977 | |
| | | | | | | | | | |
| | | |
| | | | | | Total Capital Goods | | | 407,469,934 | |
| | | | | | | | | | |
| | |
| | | | | | Consumer Durables & Apparel — 1.0% | |
| | | |
| | | 118,572 | | | LVMH Moet Hennessy Louis Vuitton SE | | | 87,139,149 | |
| | | | | | | | | | |
| | |
| | | | | | Consumer Services — 2.6% | |
| | | |
| | | 9,434,458 | | | Compass Group Plc | | | 213,247,539 | |
| | | | | | | | | | |
| | |
| | | | | | Diversified Financials — 2.0% | |
| | | |
| | | 856,481 | | | American Express Co. | | | 166,619,814 | |
| | | | | | | | | | |
| | |
| | | | | | Food, Beverage & Tobacco — 7.0% | |
| | | |
| | | 5,882,990 | | | Coca-Cola Co. (The) | | | 366,157,298 | |
| | | |
| | | 487,515 | | | Constellation Brands, Inc. – Class A | | | 105,117,984 | |
| | | |
| | | 895,983 | | | Nestle SA (Registered) | | | 116,742,749 | |
| | | | | | | | | | |
| | | |
| | | | | | Total Food, Beverage & Tobacco | | | 588,018,031 | |
| | | | | | | | | | |
| | |
| | | | | | Health Care Equipment & Services — 14.9% | |
| | | |
| | | 998,228 | | | Abbott Laboratories | | | 120,406,261 | |
| | | |
| | | 571,605 | | | Anthem, Inc. | | | 258,279,719 | |
| | | |
| | | 409,820 | | | Cigna Corp. | | | 97,447,000 | |
| | | |
| | | 1,903,008 | | | Medtronic Plc | | | 199,796,810 | |
| | | |
| | | 966,332 | | | Quest Diagnostics, Inc. | | | 126,850,402 | |
| | | |
| | | 931,785 | | | UnitedHealth Group, Inc. | | | 443,408,528 | |
| | | | | | | | | | |
| | | |
| | | | | | Total Health Care Equipment & Services | | | 1,246,188,720 | |
| | | | | | | | | | |
| | |
| | | | | | Household & Personal Products — 2.1% | |
| | | |
| | | 3,453,296 | | | Unilever Plc | | | 173,465,864 | |
| | | | | | | | | | |
| | |
| | | | | | Media & Entertainment — 5.1% | |
| | | |
| | | 103,175 | | | Alphabet, Inc. – Class A * | | | 278,690,119 | |
| | | |
| | | 698,488 | | | Meta Platforms, Inc. – Class A * | | | 147,401,923 | |
| | | | | | | | | | |
| | | |
| | | | | | Total Media & Entertainment | | | 426,092,042 | |
| | | | | | | | | | |
| | |
| | | | | | Pharmaceuticals, Biotechnology & Life Sciences — 8.7% | |
| | | |
| | | 584,941 | | | Eli Lilly & Co. | | | 146,206,003 | |
| | | |
| | | 1,489,973 | | | Johnson & Johnson | | | 245,204,856 | |
| | | |
| | | 1,873,976 | | | Merck & Co., Inc. | | | 143,509,082 | |
| | | |
| | | 502,572 | | | Roche Holding AG – Genusschein | | | 190,340,762 | |
| | | | | | | | | | |
| | | |
| | | | | | Total Pharmaceuticals, Biotechnology & Life Sciences | | | 725,260,703 | |
| | | | | | | | | | |
| | | | | | | | | | |
| | |
Shares | | | Description | | Value ($) | |
| | |
| | | | | | Retailing — 5.2% | |
| | | |
| | | 10,376,132 | | | Alibaba Group Holding Ltd * | | | 136,590,092 | |
| | | |
| | | 30,143 | | | Amazon.com, Inc. * | | | 92,576,990 | |
| | | |
| | | 3,134,584 | | | TJX Cos, Inc. (The) | | | 207,196,002 | |
| | | | | | | | | | |
| | | |
| | | | | | Total Retailing | | | 436,363,084 | |
| | | | | | | | | | |
| | |
| | | | | | Semiconductors & Semiconductor Equipment — 10.1% | |
| | | |
| | | 250,286 | | | KLA Corp. | | | 87,224,671 | |
| | | |
| | | 458,535 | | | Lam Research Corp. | | | 257,398,622 | |
| | | |
| | | 13,584,790 | | | Taiwan Semiconductor Manufacturing Co Ltd | | | 292,066,955 | |
| | | |
| | | 1,216,216 | | | Texas Instruments, Inc. | | | 206,744,558 | |
| | | | | | | | | | |
| | | |
| | | | | | Total Semiconductors & Semiconductor Equipment | | | 843,434,806 | |
| | | | | | | | | | |
| | |
| | | | | | Software & Services — 20.6% | |
| | | |
| | | 775,902 | | | Accenture Plc – Class A | | | 245,200,550 | |
| | | |
| | | 238,832 | | | Adobe, Inc. * | | | 111,696,950 | |
| | | |
| | | 716,715 | | | Amadeus IT Group SA * | | | 47,286,416 | |
| | | |
| | | 613,059 | | | Global Payments, Inc. | | | 81,769,810 | |
| | | |
| | | 1,739,338 | | | Microsoft Corp. | | | 519,696,801 | |
| | | |
| | | 3,241,398 | | | Oracle Corp. | | | 246,249,006 | |
| | | |
| | | 538,936 | | | salesforce.com, Inc. * | | | 113,462,196 | |
| | | |
| | | 1,716,308 | | | SAP SE | | | 193,606,390 | |
| | | |
| | | 763,534 | | | Visa, Inc. – Class A | | | 165,014,968 | |
| | | | | | | | | | |
| | | |
| | | | | | Total Software & Services | | | 1,723,983,087 | |
| | | | | | | | | | |
| | |
| | | | | | Technology Hardware & Equipment — 6.6% | |
| | | |
| | | 2,437,729 | | | Apple, Inc. | | | 402,517,813 | |
| | | |
| | | 2,642,408 | | | Cisco Systems, Inc. | | | 147,367,094 | |
| | | | | | | | | | |
| | | |
| | | | | | Total Technology Hardware & Equipment | | | 549,884,907 | |
| | | | | | | | | | |
| | |
| | | | | | Transportation — 0.6% | |
| | | |
| | | 1,330,944 | | | Lyft, Inc. – Class A * | | | 51,826,959 | |
| | | | | | | | | | |
| | | |
| | | | | | TOTAL COMMON STOCKS
(COST $4,848,102,095) | | | 8,269,316,763 | |
| | | | | | | | | | |
| | |
| | | | | | MUTUAL FUNDS — 0.1% | |
| | |
| | | | | | Affiliated Issuers — 0.1% | |
| | | |
| | | 1,155,359 | | | GMO U.S. Treasury Fund | | | 5,788,348 | |
| | | | | | | | | | |
| | | |
| | | | | | TOTAL MUTUAL FUNDS
(COST $5,776,758) | | | 5,788,348 | |
| | | | | | | | | | |
| | | | |
| | |
| | | See accompanying notes to the financial statements. | | 55 |
GMO Quality Fund
(A Series of GMO Trust)
Schedule of Investments — (Continued)
(showing percentage of total net assets)
February 28, 2022
| | | | | | | | | | |
Shares / Par Value† | | | Description | | Value ($) | |
| | |
| | | | | | SHORT-TERM INVESTMENTS — 0.8% | |
| | |
| | | | | | Money Market Funds — 0.1% | |
| | | |
| | | 4,740,524 | | | State Street Institutional Treasury Money Market Fund – Premier Class, 0.01% (a) | | | 4,740,524 | |
| | | | | | | | | | |
| | |
| | | | | | U.S. Government — 0.7% | |
| | | |
| | | 52,500,000 | | | U.S. Treasury Bill, 0.64%, due 08/18/22 (b) | | | 52,342,160 | |
| | | |
| | | 14,400,000 | | | U.S. Treasury Bill, 0.58%, due 07/28/22 (b) | | | 14,366,028 | |
| | | | | | | | | | |
| | | |
| | | | | | Total U.S. Government
| | | 66,708,188 | |
| | | | | | | | | | |
| | | |
| | | | | | TOTAL SHORT-TERM INVESTMENTS
(COST $71,450,198) | | | 71,448,712 | |
| | | | | | | | | | |
| | | |
| | | | | | TOTAL INVESTMENTS — 99.8%
(Cost $4,925,329,051) | | | 8,346,553,823 | |
| | | |
| | | | | | Other Assets and Liabilities (net) (net) — 0.2% | | | 12,615,760 | |
| | | | | | | | | | |
| | | |
| | | | | | TOTAL NET ASSETS — 100.0% | | | $8,359,169,583 | |
| | | | | | | | | | |
Notes to Schedule of Investments:
| † | Denominated in U.S. Dollar, unless otherwise indicated. |
| * | Non-income producing security. |
| (a) | The rate disclosed is the 7 day net yield as of February 28, 2022. |
| (b) | The rate shown represents yield-to-maturity. |
For a listing of definitions of acronyms, counterparty abbreviations and currency abbreviations used throughout the Schedule of Investments as well as the derivative tables, if any, please refer to page 87.
| | | | |
| | |
| 56 | | See accompanying notes to the financial statements. | | |
This page has been left blank intentionally.
GMO Resources Fund
(A Series of GMO Trust)
Portfolio Management
Day-to-day management of the Fund’s portfolio is the responsibility of the Focused Equity team at Grantham, Mayo, Van Otterloo & Co. LLC.
Management Discussion and Analysis of Fund Performance
Although GMO does not manage the Fund to, or control the Fund’s risk relative to, any securities index or securities benchmark, a discussion of the Fund’s performance relative to the MSCI All Country World Index (“ACWI”) Commodity Producers Index is included for comparative purposes.
Class III shares of GMO Resources Fund returned 13.29% (net) for the fiscal year ended February 28, 2022, as compared with 30.66% for the MSCI ACWI Commodity Producers Index.
The Fund’s positioning in energy had a negative impact on relative results and led to the underperformance compared to the index. Fossil fuel companies outperformed other segments and the portfolio’s underweight position detracted from performance. The allocation to clean energy stocks also detracted, as these stocks posted losses and are not part of the benchmark.
The Fund outperformed in the industrial metals segment. Copper and lithium producers, which together make up over 10% of the portfolio, posted strong gains during the year. Diversified metals performed in line with the benchmark and had little impact.
Holdings in agriculture posted gains that did not keep pace with the other segments. The Fund’s overweight detracted from performance.
The views expressed herein are exclusively those of Grantham, Mayo, Van Otterloo & Co. LLC as of the date of this report and are subject to change. GMO disclaims any responsibility to update such views. They are not meant as investment advice. References to specific securities are not recommendations of such securities and may not be representative of any GMO portfolio’s current or future investments. All information is unaudited.
GMO Resources Fund
(A Series of GMO Trust)
Comparison of Change in Value of a $5,000,000 Investment in
GMO Resources Fund Class III Shares, the MSCI ACWI Commodity Producers and the MSCI ACWI
As of February 28, 2022
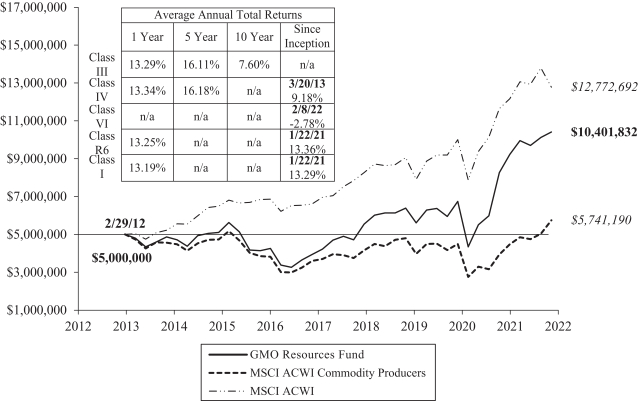
Performance data quoted represents past performance and is not indicative of future results. The investment return and principal value of an investment will fluctuate so that an investor’s shares, when redeemed, may be worth more or less than their original cost. Current performance data may be lower or higher than the performance data provided herein. To obtain performance information up to the most recent month-end, visit www.gmo.com. Performance shown is net of all fees after reimbursement from GMO. Returns would have been lower had certain expenses not been reimbursed during the periods shown and do not include the effect of taxes on distributions and redemptions. The performance information shown above only includes purchase premiums and/or redemption fees in effect as of February 28, 2022. All information is unaudited. Performance for classes may vary due to different fees.
MSCI data may not be reproduced or used for any other purpose. MSCI provides no warranties, has not prepared or approved this report, and has no liability hereunder.
For Class III, IV, VI, R6 and I the gross expense ratio of 0.72%, 0.67%, 0.63%, 0.72% and 0.82%, respectively, is equal to the Fund’s Total Annual Operating Expenses set forth in the Fund’s most recent prospectus dated June 30, 2021. For the Classes listed above, the corresponding net expense ratio of 0.72%, 0.67%, 0.63% ,0.72% and 0.82% reflects the reduction of expenses from fee reimbursements. The fee reimbursements will continue until at least June 30, 2022. Elimination of this reimbursement will result in higher fees and lower performance.
GMO Resources Fund
(A Series of GMO Trust)
Investment Concentration Summary
February 28, 2022 (Unaudited)
| | | | |
| Asset Class Summary& | | % of Total Net Assets | |
Common Stocks | | | 87.0 | % |
Preferred Stocks | | | 10.8 | |
Short-Term Investments | | | 1.7 | |
Rights/Warrants | | | 0.0 | ^ |
Other | | | 0.5 | |
| | | | |
| | | 100.0 | % |
| | | | |
| | | | |
| Country/Region Summary¤ | | % of Equity Investments | |
United States | | | 32.1 | % |
Brazil | | | 10.9 | |
United Kingdom | | | 10.3 | |
Canada | | | 9.1 | |
Australia | | | 6.5 | |
Russia | | | 5.3 | |
Mexico | | | 3.0 | |
Other Developed | | | 2.7 | ‡ |
Norway | | | 2.5 | |
Portugal | | | 2.5 | |
Japan | | | 2.4 | |
Other Emerging | | | 2.3 | † |
South Africa | | | 2.1 | |
Chile | | | 1.9 | |
China | | | 1.6 | |
India | | | 1.5 | |
Austria | | | 1.1 | |
Argentina | | | 1.1 | |
France | | | 1.1 | |
| | | | |
| | | 100.0 | % |
| | | | |
| | | | |
| Industry Group Summary | | % of Equity Investments# | |
Energy | | | 55.9 | % |
Industrial Metals | | | 32.6 | |
Agriculture | | | 9.3 | |
Water | | | 2.1 | |
Cash/Other | | | 0.1 | |
| | | | |
| | | 100.0 | % |
| | | | |
| & | In the table, derivative financial instruments, if any, are based on market values, rather than the notional amounts of derivatives, except for forward currency contracts which are based on unrealized appreciation/(depreciation). |
| ¤ | The table shows country exposure in the Fund. The table excludes short-term investments. The table excludes exposure through forward currency contracts and includes exposure through other derivative financial instruments, if any. The table takes into account the market value of securities and options and the notional amounts of swap contracts and other derivative financial instruments, if any. |
| ‡ | “Other Developed” is comprised of developed countries that each represent between (1.0)% and 1.0% of Investments. |
| † | “Other Emerging” is comprised of emerging countries that each represent between (1.0)% and 1.0% of Investments. |
| # | Equity investments may consist of common stocks and other stock-related securities, such as preferred stocks, if any. This table excludes exposure to derivative contracts, short-term investments, mutual funds and investment funds, if any. For a summary of these exposures, if any, see the Schedule of Investments. |
GMO Resources Fund
(A Series of GMO Trust)
Schedule of Investments
(showing percentage of total net assets)
February 28, 2022
| | | | | | | | | | |
| | |
Shares | | | Description | | Value ($) | |
| | |
| | | | | | COMMON STOCKS — 87.0% | |
| | |
| | | | | | Argentina — 1.1% | |
| | | |
| | | 2,471,654 | | | Adecoagro SA * | | | 23,629,012 | |
| | | | | | | | | | |
| | |
| | | | | | Australia — 6.3% | |
| | | |
| | | 10,346,627 | | | Beach Energy Ltd (a) | | | 11,524,857 | |
| | | |
| | | 835,003 | | | BHP Group Ltd | | | 28,227,953 | |
| | | |
| | | 735,000 | | | Clean TeQ Water Ltd * | | | 324,495 | |
| | | |
| | | 4,111,507 | | | Fortescue Metals Group Ltd | | | 54,774,881 | |
| | | |
| | | 6,201,772 | | | Jupiter Mines Ltd (a) | | | 1,022,149 | |
| | | |
| | | 679,106 | | | Mineral Resources Ltd | | | 22,645,833 | |
| | | |
| | | 6,990,374 | | | Perenti Global Ltd | | | 3,894,578 | |
| | | |
| | | 3,175,967 | | | Sandfire Resources Ltd | | | 15,657,314 | |
| | | |
| | | 1,470,000 | | | Sunrise Energy Metals Ltd * | | | 1,936,735 | |
| | | | | | | | | | |
| | | |
| | | | | | Total Australia | | | 140,008,795 | |
| | | | | | | | | | |
| | |
| | | | | | Austria — 1.1% | |
| | | |
| | | 518,984 | | | OMV AG | | | 24,705,443 | |
| | | | | | | | | | |
| | |
| | | | | | Brazil — 2.9% | |
| | | |
| | | 1,914,800 | | | Enauta Participacoes SA | | | 6,419,665 | |
| | | |
| | | 2,829,057 | | | Sao Martinho SA | | | 21,870,239 | |
| | | |
| | | 639,220 | | | SLC Agricola SA | | | 5,430,327 | |
| | | |
| | | 479,200 | | | Suzano SA | | | 5,165,281 | |
| | | |
| | | 1,325,768 | | | Vale SA | | | 24,597,871 | |
| | | | | | | | | | |
| | | |
| | | | | | Total Brazil | | | 63,483,383 | |
| | | | | | | | | | |
| | |
| | | | | | Canada — 8.9% | |
| | | |
| | | 850,200 | | | Anaergia Inc * (a) | | | 8,351,077 | |
| | | |
| | | 840,700 | | | Birchcliff Energy Ltd | | | 4,470,468 | |
| | | |
| | | 2,037,055 | | | Canadian Solar Inc * (a) | | | 64,493,161 | |
| | | |
| | | 574,000 | | | Enerflex Ltd | | | 3,545,893 | |
| | | |
| | | 1,201,900 | | | First Quantum Minerals Ltd | | | 35,246,251 | |
| | | |
| | | 1,617,600 | | | Greenlane Renewables Inc * (a) | | | 1,391,072 | |
| | | |
| | | 2,502,400 | | | Ivanhoe Mines Ltd – Class A * (a) | | | 25,468,213 | |
| | | |
| | | 1,614,188 | | | Largo Inc *(a) | | | 16,593,980 | |
| | | |
| | | 681,500 | | | Li-Cycle Holdings Corp * (a) | | | 5,295,255 | |
| | | |
| | | 380,200 | | | Teck Resources Ltd – Class B | | | 13,690,200 | |
| | | |
| | | 133,500 | | | Tourmaline Oil Corp | | | 5,266,272 | |
| | | |
| | | 647,000 | | | Vermilion Energy Inc * | | | 12,111,840 | |
| | | | | | | | | | |
| | | |
| | | | | | Total Canada | | | 195,923,682 | |
| | | | | | | | | | |
| | |
| | | | | | China — 1.5% | |
| | | |
| | | 10,860,000 | | | China High Speed Transmission Equipment Group Co Ltd * (a) | | | 8,239,303 | |
| | | |
| | | 3,580,000 | | | China Oilfield Services Ltd – Class H | | | 4,081,187 | |
| | | |
| | | 6,040,000 | | | China Water Affairs Group Ltd (a) | | | 6,672,777 | |
| | | |
| | | 302,412 | | | Sungrow Power Supply Co Ltd – Class A | | | 5,861,241 | |
| | | |
| | | 5,568,800 | | | Xinjiang Goldwind Science & Technology Co Ltd – Class H | | | 9,111,560 | |
| | | | | | | | | | |
| | | |
| | | | | | Total China | | | 33,966,068 | |
| | | | | | | | | | |
| | | | | | | | | | |
| | |
Shares | | | Description | | Value ($) | |
| | |
| | | | | | Denmark — 0.6% | |
| | | |
| | | 422,758 | | | Vestas Wind Systems A/S | | | 13,632,548 | |
| | | | | | | | | | |
| | |
| | | | | | Finland — 0.5% | |
| | | |
| | | 322,928 | | | Kemira Oyj | | | 4,270,375 | |
| | | |
| | | 176,452 | | | Neste Oyj | | | 6,880,679 | |
| | | | | | | | | | |
| | | |
| | | | | | Total Finland | | | 11,151,054 | |
| | | | | | | | | | |
| | |
| | | | | | France — 1.1% | |
| | | |
| | | 248,275 | | | Technip Energies NV * | | | 2,816,435 | |
| | | |
| | | 499,966 | | | Veolia Environnement SA | | | 17,432,156 | |
| | | |
| | | 58,741 | | | Vilmorin & Cie SA | | | 3,037,893 | |
| | | | | | | | | | |
| | | |
| | | | | | Total France | | | 23,286,484 | |
| | | | | | | | | | |
| | |
| | | | | | Hungary — 0.8% | |
| | | |
| | | 2,265,152 | | | MOL Hungarian Oil & Gas Plc | | | 17,668,865 | |
| | | | | | | | | | |
| | |
| | | | | | India — 1.5% | |
| | | |
| | | 10,771,513 | | | Oil & Natural Gas Corp Ltd | | | 23,163,198 | |
| | | |
| | | 2,988,787 | | | Oil India Ltd | | | 8,966,608 | |
| | | | | | | | | | |
| | | |
| | | | | | Total India | | | 32,129,806 | |
| | | | | | | | | | |
| | |
| | | | | | Israel — 0.8% | |
| | | |
| | | 82,915 | | | Delek Group Ltd * | | | 10,242,478 | |
| | | |
| | | 81,877 | | | Equital Ltd * | | | 3,271,885 | |
| | | |
| | | 6,800 | | | Israel Corp Ltd (The) * | | | 3,573,385 | |
| | | |
| | | 123,109 | | | Naphtha Israel Petroleum Corp Ltd * | | | 974,327 | |
| | | | | | | | | | |
| | | |
| | | | | | Total Israel | | | 18,062,075 | |
| | | | | | | | | | |
| | |
| | | | | | Japan — 2.3% | |
| | | |
| | | 313,700 | | | Ebara Corp | | | 16,372,388 | |
| | | |
| | | 2,547,800 | | | Inpex Corp | | | 26,261,489 | |
| | | |
| | | 274,300 | | | Mitsubishi Materials Corp | | | 4,937,203 | |
| | | |
| | | 69,700 | | | Nittetsu Mining Co Ltd | | | 4,035,765 | |
| | | | | | | | | | |
| | | |
| | | | | | Total Japan | | | 51,606,845 | |
| | | | | | | | | | |
| | |
| | | | | | Mexico — 3.0% | |
| | | |
| | | 12,766,940 | | | Grupo Mexico SAB de CV – Series B | | | 65,215,432 | |
| | | | | | | | | | |
| | |
| | | | | | Norway — 2.5% | |
| | | |
| | | 1,566,749 | | | Austevoll Seafood ASA | | | 22,122,215 | |
| | | |
| | | 4,272,496 | | | DNO ASA | | | 5,420,254 | |
| | | |
| | | 862,810 | | | Equinor ASA | | | 27,122,859 | |
| | | | | | | | | | |
| | | |
| | | | | | Total Norway | | | 54,665,328 | |
| | | | | | | | | | |
| | |
| | | | | | Pakistan — 0.2% | |
| | | |
| | | 4,324,845 | | | Fauji Fertilizer Co Ltd | | | 2,684,739 | |
| | | |
| | | 595,518 | | | Pakistan Oilfields Ltd | | | 1,251,955 | |
| | | | | | | | | | |
| | | |
| | | | | | Total Pakistan | | | 3,936,694 | |
| | | | | | | | | | |
| | | | |
| | |
| | | See accompanying notes to the financial statements. | | 61 |
GMO Resources Fund
(A Series of GMO Trust)
Schedule of Investments — (Continued)
(showing percentage of total net assets)
February 28, 2022
| | | | | | | | | | |
| | |
Shares | | | Description | | Value ($) | |
| | |
| | | | | | Poland — 0.6% | |
| | | |
| | | 10,234,883 | | | Polskie Gornictwo Naftowe i Gazownictwo SA | | | 13,488,642 | |
| | | | | | | | | | |
| | |
| | | | | | Portugal — 2.5% | |
| | | |
| | | 4,892,424 | | | Galp Energia SGPS SA | | | 54,155,742 | |
| | | | | | | | | | |
| | |
| | | | | | Russia — 4.1% | |
| | | |
| | | 3,574,704 | | | Gazprom Neft PJSC | | | 11,657,284 | |
| | | |
| | | 14,145,410 | | | Gazprom PJSC | | | 22,591,342 | |
| | | |
| | | 248,399 | | | LUKOIL PJSC Sponsored ADR | | | 4,659,185 | |
| | | |
| | | 2,329,179 | | | MMC Norilsk Nickel PJSC ADR | | | 31,980,380 | |
| | | |
| | | 1,020,829 | | | PhosAgro PJSC GDR (Registered) | | | 6,245,328 | |
| | | |
| | | 601,778 | | | Ros Agro Plc GDR (Registered) | | | 2,655,067 | |
| | | |
| | | 3,476,399 | | | Tatneft PJSC | | | 10,091,089 | |
| | | | | | | | | | |
| | | |
| | | | | | Total Russia | | | 89,879,675 | |
| | | | | | | | | | |
| | |
| | | | | | Singapore — 0.0% | |
| | | |
| | | 2,725,600 | | | Ezra Holdings Ltd *(a)(b) | | | — | |
| | | | | | | | | | |
| | |
| | | | | | South Africa — 2.0% | |
| | | |
| | | 486,133 | | | African Rainbow Minerals Ltd | | | 8,676,593 | |
| | | |
| | | 717,668 | | | Impala Platinum Holdings Ltd | | | 13,689,074 | |
| | | |
| | | 331,180 | | | Sasol Ltd * | | | 7,598,905 | |
| | | |
| | | 3,229,353 | | | Sibanye Stillwater Ltd | | | 15,234,880 | |
| | | | | | | | | | |
| | | |
| | | | | | Total South Africa | | | 45,199,452 | |
| | | | | | | | | | |
| | |
| | | | | | South Korea — 0.3% | |
| | | |
| | | 9,569 | | | Korea Zinc Co Ltd | | | 4,388,732 | |
| | | |
| | | 4,929 | | | Young Poong Corp * | | | 2,694,309 | |
| | | | | | | | | | |
| | | |
| | | | | | Total South Korea | | | 7,083,041 | |
| | | | | | | | | | |
| | |
| | | | | | Spain — 0.5% | |
| | | |
| | | 770,669 | | | Repsol SA | | | 10,000,229 | |
| | | | | | | | | | |
| | |
| | | | | | Switzerland — 0.2% | |
| | | |
| | | 2,706 | | | Gurit Holding AG (a) | | | 4,447,949 | |
| | | | | | | | | | |
| | |
| | | | | | Turkey — 0.2% | |
| | | |
| | | 3,277,331 | | | Koza Anadolu Metal Madencilik Isletmeleri AS * | | | 4,648,556 | |
| | | | | | | | | | |
| | |
| | | | | | Ukraine — 0.2% | |
| | | |
| | | 501,341 | | | Kernel Holding SA | | | 3,684,223 | |
| | | | | | | | | | |
| | |
| | | | | | United Kingdom — 10.0% | |
| | | |
| | | 9,690,823 | | | BP Plc | | | 47,234,159 | |
| | | |
| | | 1,510,504 | | | Central Asia Metals Plc | | | 4,237,624 | |
| | | |
| | | 3,378,271 | | | Ferrexpo Plc | | | 7,662,719 | |
| | | |
| | | 13,972,891 | | | Glencore Plc | | | 82,160,676 | |
| | | |
| | | 1,945,479 | | | John Wood Group Plc * | | | 4,718,866 | |
| | | |
| | | 1,360,870 | | | Petrofac Ltd * | | | 1,953,767 | |
| | | |
| | | 2,763,641 | | | Shell Plc | | | 72,879,398 | |
| | | | | | | | | | |
| | | |
| | | | | | Total United Kingdom | | | 220,847,209 | |
| | | | | | | | | | |
| | | | | | | | | | |
| | |
Shares | | | Description | | Value ($) | |
| | |
| | | | | | United States — 31.3% | |
| | | |
| | | 946,517 | | | Aemetis, Inc. * | | | 12,134,348 | |
| | | |
| | | 379,400 | | | AGCO Corp. | | | 45,588,704 | |
| | | |
| | | 808,300 | | | Ameresco, Inc. – Class A * | | | 51,933,275 | |
| | | |
| | | 267,700 | | | Baker Hughes Co. | | | 7,865,026 | |
| | | |
| | | 89,500 | | | California Resources Corp. | | | 3,690,085 | |
| | | |
| | | 7,241,166 | | | Clean Energy Fuels Corp. * | | | 52,643,277 | |
| | | |
| | | 871,200 | | | Darling Ingredients, Inc. * | | | 63,144,576 | |
| | | |
| | | 58,800 | | | Deere & Co. | | | 21,169,176 | |
| | | |
| | | 802,882 | | | Freeport-McMoRan, Inc. | | | 37,695,310 | |
| | | |
| | | 927,524 | | | GrafTech International Ltd. | | | 9,349,442 | |
| | | |
| | | 460,300 | | | Green Plains, Inc. * | | | 15,070,222 | |
| | | |
| | | 20,695,301 | | | Kosmos Energy Ltd. * | | | 100,579,163 | |
| | | |
| | | 1,464,500 | | | Livent Corp. * (a) | | | 34,488,975 | |
| | | |
| | | 513,343 | | | Montauk Renewables, Inc. * | | | 5,307,967 | |
| | | |
| | | 518,821 | | | Mosaic Co. (The) | | | 27,201,785 | |
| | | |
| | | 209,100 | | | Northern Oil and Gas, Inc. | | | 5,244,228 | |
| | | |
| | | 102,600 | | | PotlatchDeltic Corp. (REIT) | | | 5,632,740 | |
| | | |
| | | 509,300 | | | ProPetro Holding Corp. * | | | 6,503,761 | |
| | | |
| | | 1,140,946 | | | Renewable Energy Group, Inc. * | | | 70,168,179 | |
| | | |
| | | 161,124 | | | SolarEdge Technologies, Inc. * | | | 51,466,228 | |
| | | |
| | | 2,174,966 | | | Sunrun, Inc. *(a) | | | 59,333,072 | |
| | | |
| | | 662,632 | | | TechnipFMC Plc * (b) | | | 4,539,029 | |
| | | | | | | | | | |
| | | |
| | | | | | Total United States | | | 690,748,568 | |
| | | | | | | | | | |
| | | |
| | | | | | TOTAL COMMON STOCKS
(COST $1,676,940,229) | | | 1,917,254,800 | |
| | | | | | | | | | |
| | |
| | | | | | PREFERRED STOCKS (c) — 10.8% | |
| | |
| | | | | | Brazil — 7.8% | |
| | | |
| | | 16,217,518 | | | Bradespar SA | | | 93,352,157 | |
| | | |
| | | 11,952,381 | | | Petroleo Brasileiro SA | | | 78,568,457 | |
| | | | | | | | | | |
| | | |
| | | | | | Total Brazil | | | 171,920,614 | |
| | | | | | | | | | |
| | |
| | | | | | Chile — 1.8% | |
| | | |
| | | 612,695 | | | Sociedad Quimica y Minera de Chile SA Sponsored ADR | | | 40,548,155 | |
| | | | | | | | | | |
| | |
| | | | | | Russia — 1.2% | |
| | | |
| | | 20,237,584 | | | Surgutneftegas PJSC | | | 5,693,141 | |
| | | |
| | | 7,494,797 | | | Tatneft PJSC | | | 19,464,708 | |
| | | | | | | | | | |
| | | |
| | | | | | Total Russia | | | 25,157,849 | |
| | | | | | | | | | |
| | | |
| | | | | | TOTAL PREFERRED STOCKS
(COST $228,443,800) | | | 237,626,618 | |
| | | | | | | | | | |
| | |
| | | | | | RIGHTS/WARRANTS — 0.0% | |
| | |
| | | | | | Singapore — 0.0% | |
| | | |
| | | 2,117,812 | | | Ezion Holdings Ltd, Expires 04/16/23 * (a) (b) | | | 2 | |
| | | | | | | | | | |
| | | |
| | | | | | TOTAL RIGHTS/WARRANTS
(COST $0) | | | 2 | |
| | | | | | | | | | |
| | | | |
| | |
| 62 | | See accompanying notes to the financial statements. | | |
GMO Resources Fund
(A Series of GMO Trust)
Schedule of Investments — (Continued)
(showing percentage of total net assets)
February 28, 2022
| | | | | | | | | | |
| | | Shares / Par Value† | | | Description | | Value ($) | |
| | |
| | | | | | SHORT-TERM INVESTMENTS — 1.7% | |
| | |
| | | | | | Money Market Funds — 0.2% | |
| | | |
| | | 3,998,119 | | | State Street Institutional Treasury Money Market Fund – Premier Class, 0.01% (d) | | | 3,998,119 | |
| | | | | | | | | | |
| | | |
| | | | | | Total Money Market Funds | | | 3,998,119 | |
| | | | | | | | | | |
| | |
| | | | | | U.S. Government — 1.5% | |
| | | |
| | | 2,700,000 | | | U.S. Treasury Bill, 0.42%, due 08/11/22 (e) | | | 2,692,356 | |
| | | |
| | | 30,000,000 | | | U.S. Treasury Bill, 0.64%, due 08/18/22 (e) | | | 29,909,806 | |
| | | | | | | | | | |
| | | |
| | | | | | Total U.S. Government | | | 32,602,162 | |
| | | | | | | | | | |
| | | |
| | | | | | TOTAL SHORT-TERM INVESTMENTS
(COST $36,598,652) | | | 36,600,281 | |
| | | | | | | | | | |
| | | |
| | | | | | TOTAL INVESTMENTS — 99.5%
(Cost $1,941,982,681) | | | 2,191,481,701 | |
| | | |
| | | | | | Other Assets and Liabilities (net) — 0.5% | | | 12,070,211 | |
| | | | | | | | | | |
| | | |
| | | | | | TOTAL NET ASSETS — 100.0% | | | $2,203,551,912 | |
| | | | | | | | | | |
Notes to Schedule of Investments:
| † | Denominated in U.S. Dollar, unless otherwise indicated. |
| * | Non-income producing security. |
| (a) | All or a portion of this security is out on loan (Note 2). |
| (b) | Investment valued at fair value using methods determined in good faith by the Trustees of GMO Trust or persons acting at their direction pursuant to procedures approved by the Trustees. Investment valued using significant unobservable inputs (Note 2). |
| (c) | Preferred dividend rates are disclosed to the extent that a stated rate exists. |
| (d) | The rate disclosed is the 7 day net yield as of February 28, 2022. |
| (e) | The rate shown represents yield-to-maturity. |
For a listing of definitions of acronyms, counterparty abbreviations and currency abbreviations used throughout the Schedule of Investments as well as the derivative tables, if any, please refer to page 87.
| | | | |
| | |
| | | See accompanying notes to the financial statements. | | 63 |
GMO Tax-Managed International Equities Fund
(A Series of GMO Trust)
Portfolio Management
Day-to-day management of the Fund’s portfolio is the responsibility of the Asset Allocation team and the Global Equity team at Grantham, Mayo, Van Otterloo & Co. LLC.
Management Discussion and Analysis of Fund Performance
Although the Fund is not managed relative to any securities market index or benchmark, a discussion of the Fund’s performance relative to the MSCI EAFE Index is included for comparative purposes.
Class III shares of GMO Tax-Managed International Equities Fund returned +4.77% (net) for the fiscal year ended February 28, 2022, as compared with +2.83% for the MSCI EAFE Index.
The environment saw a shift to tailwinds for Value, with strong performance from our valuation-oriented models. The magnitude of the favorable conditions for Value is illustrated by the 3.5% outperformance of the MSCI EAFE Value Index when compared to the MSCI EAFE Index for the fiscal year ended February 28, 2022.
Areas of notable positive stock selection included areas which had been challenging in the prior year such as emerging markets, the Netherlands, Industrials, Consumer Discretionary, and Health Care. Stock selection was also strong in Japan and Communication Services. Top contributors included overweight positioning in Norsk Hydro (Norway Materials), British American Tobacco (UK Consumer Staples), DBS Group (Singapore Financials), and Mercedes-Benz Group (Germany Consumer Discretionary). Underweight positioning toward SoftBank Group (Japan Communication Services) also added value.
The UK, Australia, and Italy were challenging areas for stock selection, along with value lost from names not held and underweight positioning toward Energy. Top detractors included underweight positioning in Nestle (Switzerland Consumer Staples), Royal Dutch Shell (UK Energy), and Novo Nordisk (Denmark Health Care). Overweights toward Fortescue Metals (Australia Materials) and WH Group (Hong Kong Consumer Staples) also detracted from performance.
The views expressed herein are exclusively those of Grantham, Mayo, Van Otterloo & Co. LLC as of the date of this report and are subject to change. GMO disclaims any responsibility to update such views. They are not meant as investment advice. References to specific securities are not recommendations of such securities and may not be representative of any GMO portfolio’s current or future investments. All information is unaudited.
GMO Tax-Managed International Equities Fund
(A Series of GMO Trust)
Comparison of Change in Value of a $5,000,000 Investment in
GMO Tax-Managed International Equities Fund Class III Shares, the MSCI EAFE Index and
the MSCI EAFE Index (After Tax)
As of February 28, 2022
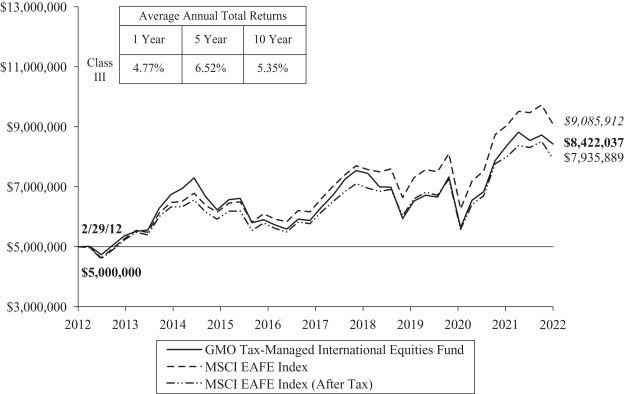
Performance data quoted represents past performance and is not indicative of future results. The investment return and principal value of an investment will fluctuate so that an investor’s shares, when redeemed, may be worth more or less than their original cost. Current performance data may be lower or higher than the performance data provided herein. To obtain performance information up to the most recent month-end, visit www.gmo.com. Performance shown is net of all fees after reimbursement from GMO. Returns would have been lower had certain expenses not been reimbursed during the periods shown and do not include the effect of taxes on distributions and redemptions. The performance information shown above only includes purchase premiums and/or redemption fees in effect as of February 28, 2022. All information is unaudited.
MSCI data may not be reproduced or used for any other purpose. MSCI provides no warranties, has not prepared or approved this report, and has no liability hereunder.
For Class III the gross expense ratio of 1.27% is equal to the Fund’s Total Annual Operating Expenses set forth in the Fund’s most recent prospectus dated June 30, 2021. For the Class listed above, the net expense ratio of 0.73% reflects the reduction of expenses from fee reimbursements. The fee reimbursements will continue until at least June 30, 2022. Elimination of this reimbursement will result in higher fees and lower performance.
GMO Tax-Managed International Equities Fund
(A Series of GMO Trust)
Investment Concentration Summary
February 28, 2022 (Unaudited)
| | | | |
| Asset Class Summary& | | % of Total Net Assets | |
Common Stocks | | | 97.6 | % |
Mutual Funds | | | 3.1 | |
Preferred Stocks | | | 0.5 | |
Short-Term Investments | | | 0.3 | |
Futures Contracts | | | (0.0 | )^ |
Other | | | (1.5 | ) |
| | | | |
| | | 100.0 | % |
| | | | |
| | | | |
| Country/Region Summary¤ | | % of Investments | |
Japan | | | 23.0 | % |
United Kingdom | | | 13.4 | |
France | | | 8.5 | |
Netherlands | | | 7.1 | |
Switzerland | | | 6.1 | |
Germany | | | 6.0 | |
Spain | | | 4.0 | |
Singapore | | | 3.8 | |
Norway | | | 3.8 | |
Australia | | | 3.7 | |
United States | | | 3.1 | |
Italy | | | 2.9 | |
Other Emerging | | | 2.5 | † |
Other Developed | | | 2.2 | ‡ |
China | | | 2.1 | |
South Korea | | | 2.0 | |
Taiwan | | | 1.6 | |
Belgium | | | 1.5 | |
Turkey | | | 1.0 | |
Hong Kong | | | 1.0 | |
Euro Region | | | 0.7 | § |
| | | | |
| | | 100.0 | % |
| | | | |
| | | | |
| Industry Group Summary | | % of Equity Investments# | |
Capital Goods | | | 14.2 | % |
Pharmaceuticals, Biotechnology & Life Sciences | | | 12.6 | |
Banks | | | 11.9 | |
Materials | | | 9.9 | |
Food, Beverage & Tobacco | | | 9.0 | |
Telecommunication Services | | | 7.2 | |
Consumer Durables & Apparel | | | 5.5 | |
Automobiles & Components | | | 5.0 | |
Technology Hardware & Equipment | | | 3.8 | |
Diversified Financials | | | 3.5 | |
Food & Staples Retailing | | | 3.2 | |
Retailing | | | 2.7 | |
Commercial & Professional Services | | | 2.3 | |
Insurance | | | 2.2 | |
Software & Services | | | 1.6 | |
Energy | | | 1.5 | |
Semiconductors & Semiconductor Equipment | | | 1.1 | |
Transportation | | | 1.1 | |
Media & Entertainment | | | 0.7 | |
Utilities | | | 0.4 | |
Real Estate | | | 0.3 | |
Health Care Equipment & Services | | | 0.3 | |
| | | | |
| | | 100.0 | % |
| | | | |
| & | In the table, derivative financial instruments, if any, are based on market values, rather than the notional amounts of derivatives, except for forward currency contracts which are based on unrealized appreciation/(depreciation). |
| ¤ | The table shows country exposure in the Fund. The table excludes short-term investments. The table excludes exposure through forward currency contracts and includes exposure through other derivative financial instruments, if any. The table takes into account the market value of securities and options and the notional amounts of swap contracts and other derivative financial instruments, if any. |
| † | “Other Emerging” is comprised of emerging countries that each represent between (1.0)% and 1.0% of Investments. |
| ‡ | “Other Developed” is comprised of developed countries that each represent between (1.0)% and 1.0% of Investments. |
| § | “Euro Region” is comprised of derivative financial instruments attributed to the Eurozone and not a particular country. |
| # | Equity investments may consist of common stocks and other stock-related securities, such as preferred stocks, if any. This table excludes exposure to derivative contracts, short-term investments, mutual funds and investment funds, if any. For a summary of these exposures, if any, see the Schedule of Investments. |
GMO Tax-Managed International Equities Fund
(A Series of GMO Trust)
Schedule of Investments
(showing percentage of total net assets)
February 28, 2022
| | | | | | | | | | |
| | | Shares | | | Description | | Value ($) | |
| | |
| | | | | | COMMON STOCKS — 97.6% | |
| | |
| | | | | | Australia — 3.7% | |
| | | |
| | | 6,116 | | | Accent Group Ltd | | | 8,334 | |
| | | |
| | | 11,450 | | | BlueScope Steel Ltd | | | 169,550 | |
| | | |
| | | 11,267 | | | Rio Tinto Ltd | | | 971,632 | |
| | | |
| | | 6,480 | | | Sandfire Resources Ltd | | | 31,946 | |
| | | | | | | | | | |
| | | |
| | | | | | Total Australia | | | 1,181,462 | |
| | | | | | | | | | |
| | |
| | | | | | Belgium — 1.5% | |
| | | |
| | | 245 | | | Bekaert SA | | | 10,659 | |
| | | |
| | | 3,256 | | | KBC Group NV | | | 234,585 | |
| | | |
| | | 2,171 | | | UCB SA | | | 236,936 | |
| | | | | | | | | | |
| | | |
| | | | | | Total Belgium | | | 482,180 | |
| | | | | | | | | | |
| | |
| | | | | | Brazil — 0.7% | |
| | | |
| | | 21,800 | | | Marfrig Global Foods SA | | | 94,358 | |
| | | |
| | | 12,200 | | | MRV Engenharia e Participacoes SA | | | 28,041 | |
| | | |
| | | 34,600 | | | TIM SA | | | 91,776 | |
| | | | | | | | | | |
| | | |
| | | | | | Total Brazil | | | 214,175 | |
| | | | | | | | | | |
| | |
| | | | | | China — 2.2% | |
| | | |
| | | 29,500 | | | BAIC Motor Corp Ltd – Class H | | | 10,307 | |
| | | |
| | | 104,000 | | | Bank of Communications Co Ltd – Class H | | | 71,295 | |
| | | |
| | | 22,000 | | | China CITIC Bank Corp Ltd – Class H | | | 10,338 | |
| | | |
| | | 20,000 | | | China Everbright Bank Co Ltd – Class H | | | 7,438 | |
| | | |
| | | 26,000 | | | China Lesso Group Holdings Ltd | | | 40,029 | |
| | | |
| | | 55,000 | | | China Medical System Holdings Ltd | | | 97,936 | |
| | | |
| | | 271,000 | | | China Railway Group Ltd – Class H | | | 159,119 | |
| | | |
| | | 40,500 | | | China Resources Pharmaceutical Group Ltd | | | 20,032 | |
| | | |
| | | 56,000 | | | Dongfeng Motor Group Co Ltd – Class H | | | 48,201 | |
| | | |
| | | 6,500 | | | Kingboard Holdings Ltd | | | 30,408 | |
| | | |
| | | 99,000 | | | Metallurgical Corp of China Ltd – Class H | | | 30,111 | |
| | | |
| | | 42,000 | | | PICC Property & Casualty Co Ltd – Class H | | | 44,335 | |
| | | |
| | | 32,100 | | | Shanghai Pharmaceuticals Holding Co Ltd – Class H | | | 57,943 | |
| | | |
| | | 3,200 | | | Sinopharm Group Co Ltd – Class H | | | 7,757 | |
| | | |
| | | 80,000 | | | Skyworth Group Ltd * | | | 45,194 | |
| | | |
| | | 16,000 | | | Tianneng Power International Ltd | | | 14,678 | |
| | | | | | | | | | |
| | | |
| | | | | | Total China | | | 695,121 | |
| | | | | | | | | | |
| | |
| | | | | | Denmark — 0.1% | |
| | | |
| | | 1,228 | | | Scandinavian Tobacco Group A/S | | | 27,692 | |
| | | | | | | | | | |
| | |
| | | | | | Finland — 0.5% | |
| | | |
| | | 4,887 | | | Kesko Oyj – B Shares | | | 143,823 | |
| | | | | | | | | | |
| | |
| | | | | | France — 8.7% | |
| | | |
| | | 184 | | | Alten SA | | | 27,780 | |
| | | |
| | | 366 | | | APERAM SA | | | 20,493 | |
| | | |
| | | 10,927 | | | BNP Paribas SA | | | 634,034 | |
| | | |
| | | 49 | | | Christian Dior SE | | | 34,700 | |
| | | | | | | | | | |
| | | Shares | | | Description | | Value ($) | |
| | |
| | | | | | France — continued | |
| | | |
| | | 10,706 | | | Cie de Saint-Gobain | | | 663,827 | |
| | | |
| | | 2,064 | | | Derichebourg SA | | | 21,444 | |
| | | |
| | | 728 | | | Ipsen SA | | | 84,710 | |
| | | |
| | | 385 | | | Kaufman & Broad SA | | | 13,983 | |
| | | |
| | | 1,376 | | | Publicis Groupe SA | | | 91,319 | |
| | | |
| | | 1,207 | | | Quadient SA | | | 22,067 | |
| | | |
| | | 3,850 | | | Sanofi | | | 402,450 | |
| | | |
| | | 2,209 | | | Schneider Electric SE | | | 342,254 | |
| | | |
| | | 373 | | | Societe BIC SA | | | 19,682 | |
| | | |
| | | 11,077 | | | Societe Generale SA | | | 313,230 | |
| | | |
| | | 1,200 | | | STMicroelectronics NV – NY Shares | | | 50,784 | |
| | | |
| | | 2,457 | | | Television Francaise 1 | | | 24,254 | |
| | | | | | | | | | |
| | | |
| | | | | | Total France | | | 2,767,011 | |
| | | | | | | | | | |
| | |
| | | | | | Germany — 5.9% | |
| | | |
| | | 3,155 | | | Bayerische Motoren Werke AG | | | 303,849 | |
| | | |
| | | 109 | | | Daimler Truck Holding AG * | | | 3,322 | |
| | | |
| | | 3,435 | | | Deutsche Post AG (Registered) | | | 172,650 | |
| | | |
| | | 6,248 | | | Kloeckner & Co SE * | | | 84,525 | |
| | | |
| | | 8,504 | | | Mercedes-Benz Group AG | | | 664,328 | |
| | | |
| | | 2,149 | | | Merck KGaA | | | 426,249 | |
| | | |
| | | 662 | | | RTL Group SA | | | 36,888 | |
| | | |
| | | 652 | | | Volkswagen AG | | | 168,633 | |
| | | | | | | | | | |
| | | |
| | | | | | Total Germany | | | 1,860,444 | |
| | | | | | | | | | |
| | |
| | | | | | Hong Kong — 1.0% | |
| | | |
| | | 2,000 | | | CK Asset Holdings Ltd | | | 12,632 | |
| | | |
| | | 11,200 | | | Dah Sing Banking Group Ltd | | | 10,140 | |
| | | |
| | | 57,000 | | | IGG Inc | | | 34,138 | |
| | | |
| | | 4,000 | | | Johnson Electric Holdings Ltd | | | 6,661 | |
| | | |
| | | 5,300 | | | VTech Holdings Ltd | | | 43,572 | |
| | | |
| | | 319,500 | | | WH Group Ltd | | | 223,131 | |
| | | | | | | | | | |
| | | |
| | | | | | Total Hong Kong | | | 330,274 | |
| | | | | | | | | | |
| | |
| | | | | | Hungary — 0.1% | |
| | | |
| | | 3,883 | | | Magyar Telekom Telecommunications Plc | | | 4,880 | |
| | | |
| | | 1,400 | | | Richter Gedeon Nyrt | | | 29,382 | |
| | | | | | | | | | |
| | | |
| | | | | | Total Hungary | | | 34,262 | |
| | | | | | | | | | |
| | |
| | | | | | India — 0.4% | |
| | | |
| | | 1,169 | | | Rajesh Exports Ltd | | | 10,971 | |
| | | |
| | | 70,471 | | | REC Ltd | | | 114,935 | |
| | | | | | | | | | |
| | | |
| | | | | | Total India | | | 125,906 | |
| | | | | | | | | | |
| | |
| | | | | | Ireland — 0.8% | |
| | | |
| | | 11,049 | | | Bank of Ireland Group Plc * | | | 73,313 | |
| | | |
| | | 1,600 | | | CRH Plc | | | 72,183 | |
| | | |
| | | 460 | | | CRH Plc Sponsored ADR | | | 20,649 | |
| | | |
| | | 933 | | | Glanbia Plc | | | 13,061 | |
| | | |
| | | 703 | | | Kingspan Group Plc | | | 68,657 | |
| | | | |
| | |
| | | See accompanying notes to the financial statements. | | 67 |
GMO Tax-Managed International Equities Fund
(A Series of GMO Trust)
Schedule of Investments — (Continued)
(showing percentage of total net assets)
February 28, 2022
| | | | | | | | | | |
| | | Shares | | | Description | | Value ($) | |
| | |
| | | | | | Ireland — continued | |
| | | |
| | | 359 | | | Smurfit Kappa Group Plc | | | 17,929 | |
| | | | | | | | | | |
| | | |
| | | | | | Total Ireland | | | 265,792 | |
| | | | | | | | | | |
| | |
| | | | | | Italy — 2.9% | |
| | | |
| | | 3,234 | | | Anima Holding SPA | | | 15,287 | |
| | | |
| | | 3,466 | | | Arnoldo Mondadori Editore SPA * | | | 7,607 | |
| | | |
| | | 8,953 | | | Banco BPM SPA | | | 30,720 | |
| | | |
| | | 1,566 | | | De’ Longhi SPA | | | 49,691 | |
| | | |
| | | 1,005 | | | Esprinet SPA | | | 12,531 | |
| | | |
| | | 5,645 | | | EXOR NV | | | 427,697 | |
| | | |
| | | 11,377 | | | Italgas SPA | | | 73,439 | |
| | | |
| | | 411 | | | Iveco Group NV * | | | 3,431 | |
| | | |
| | | 5,535 | | | OVS SPA * | | | 13,964 | |
| | | |
| | | 11,199 | | | Poste Italiane SPA | | | 128,447 | |
| | | |
| | | 63 | | | Sesa SPA | | | 10,065 | |
| | | |
| | | 4,685 | | | Stellantis NV | | | 85,135 | |
| | | |
| | | 209 | | | Telecom Italia SPA – RSP | | | 87 | |
| | | |
| | | 545 | | | Unieuro SPA | | | 10,790 | |
| | | |
| | | 11,930 | | | Unipol Gruppo SPA | | | 60,534 | |
| | | | | | | | | | |
| | | |
| | | | | | Total Italy | | | 929,425 | |
| | | | | | | | | | |
| | |
| | | | | | Japan — 23.4% | |
| | | |
| | | 2,000 | | | AGC Inc | | | 88,725 | |
| | | |
| | | 27,200 | | | Asahi Kasei Corp | | | 255,267 | |
| | | |
| | | 24,200 | | | Astellas Pharma Inc | | | 403,758 | |
| | | |
| | | 8,000 | | | Brother Industries Ltd | | | 145,607 | |
| | | |
| | | 15,700 | | | Canon Inc | | | 369,467 | |
| | | |
| | | 600 | | | Daiwa House Industry Co Ltd | | | 17,016 | |
| | | |
| | | 4,200 | | | Daiwabo Holdings Co Ltd | | | 65,013 | |
| | | |
| | | 1,200 | | | Dexerials Corp | | | 34,262 | |
| | | |
| | | 1,300 | | | FUJIFILM Holdings Corp | | | 82,633 | |
| | | |
| | | 3,100 | | | Fujitsu Ltd | | | 450,380 | |
| | | |
| | | 7,000 | | | Hitachi Ltd | | | 346,169 | |
| | | |
| | | 25,200 | | | ITOCHU Corp | | | 821,233 | |
| | | |
| | | 28,800 | | | Japan Tobacco Inc | | | 529,665 | |
| | | |
| | | 24,200 | | | KDDI Corp | | | 787,498 | |
| | | |
| | | 3,400 | | | Konica Minolta Inc | | | 14,404 | |
| | | |
| | | 29,400 | | | Marubeni Corp | | | 308,601 | |
| | | |
| | | 2,100 | | | Mitsubishi Corp | | | 70,610 | |
| | | |
| | | 30,900 | | | Mitsubishi UFJ Financial Group Inc | | | 189,695 | |
| | | |
| | | 14,300 | | | Mitsui & Co Ltd | | | 356,538 | |
| | | |
| | | 1,700 | | | NEC Networks & System Integration Corp | | | 26,138 | |
| | | |
| | | 1,000 | | | Nichias Corp | | | 22,653 | |
| | | |
| | | 400 | | | Nippo Corp | | | 13,840 | |
| | | |
| | | 26,900 | | | Nippon Telegraph & Telephone Corp | | | 773,130 | |
| | | |
| | | 9,200 | | | Panasonic Corp | | | 96,078 | |
| | | |
| | | 2,400 | | | Seiko Epson Corp | | | 36,913 | |
| | | |
| | | 4,800 | | | Sekisui Chemical Co Ltd | | | 78,605 | |
| | | |
| | | 7,600 | | | Sekisui House Ltd | | | 154,950 | |
| | | |
| | | 8,320 | | | Sojitz Corp | | | 137,422 | |
| | | | | | | | | | |
| | | Shares | | | Description | | Value ($) | |
| | |
| | | | | | Japan — continued | |
| | | |
| | | 79,600 | | | Sumitomo Chemical Co Ltd | | | 380,029 | |
| | | |
| | | 900 | | | Sumitomo Forestry Co Ltd | | | 17,355 | |
| | | |
| | | 300 | | | Tokyo Electron Ltd | | | 147,233 | |
| | | |
| | | 4,900 | | | Toyota Tsusho Corp | | | 203,424 | |
| | | |
| | | 600 | | | Yamaha Motor Co Ltd | | | 13,488 | |
| | | | | | | | | | |
| | | |
| | | | | | Total Japan | | | 7,437,799 | |
| | | | | | | | | | |
| | |
| | | | | | Malta — 0.0% | |
| | | |
| | | 1,718,063 | | | BGP Holdings Plc * (a) | | | 2 | |
| | | | | | | | | | |
| | |
| | | | | | Netherlands — 7.2% | |
| | | |
| | | 1,437 | | | ABN AMRO Bank NV CVA | | | 19,122 | |
| | | |
| | | 118 | | | ASM International NV | | | 38,110 | |
| | | |
| | | 21,842 | | | Koninklijke Ahold Delhaize NV | | | 671,909 | |
| | | |
| | | 7,403 | | | NN Group NV | | | 355,306 | |
| | | |
| | | 32,317 | | | PostNL NV | | | 129,930 | |
| | | |
| | | 7,727 | | | Randstad NV | | | 526,585 | |
| | | |
| | | 7,356 | | | Signify NV | | | 376,287 | |
| | | |
| | | 1,707 | | | Stellantis NV | | | 31,134 | |
| | | |
| | | 1,407 | | | Wolters Kluwer NV | | | 143,359 | |
| | | | | | | | | | |
| | | |
| | | | | | Total Netherlands | | | 2,291,742 | |
| | | | | | | | | | |
| | |
| | | | | | Norway — 3.9% | |
| | | |
| | | 13,555 | | | Equinor ASA | | | 426,108 | |
| | | |
| | | 407 | | | Kongsberg Gruppen ASA | | | 14,355 | |
| | | |
| | | 80,625 | | | Norsk Hydro ASA | | | 765,622 | |
| | | |
| | | 1,503 | | | SpareBank 1 Nord Norge | | | 18,389 | |
| | | |
| | | 879 | | | SpareBank 1 SR-Bank ASA | | | 13,025 | |
| | | |
| | | 4,556 | | | XXL ASA | | | 6,162 | |
| | | | | | | | | | |
| | | |
| | | | | | Total Norway | | | 1,243,661 | |
| | | | | | | | | | |
| | |
| | | | | | Poland — 0.4% | |
| | | |
| | | 233 | | | Asseco Poland SA | | | 4,106 | |
| | | |
| | | 2,677 | | | Bank Polska Kasa Opieki SA | | | 73,441 | |
| | | |
| | | 32,447 | | | Polskie Gornictwo Naftowe i Gazownictwo SA | | | 42,762 | |
| | | | | | | | | | |
| | | |
| | | | | | Total Poland | | | 120,309 | |
| | | | | | | | | | |
| | |
| | | | | | Portugal — 0.3% | |
| | | |
| | | 422 | | | Galp Energia SGPS SA | | | 4,671 | |
| | | |
| | | 4,653 | | | Jeronimo Martins SGPS SA | | | 101,443 | |
| | | | | | | | | | |
| | | |
| | | | | | Total Portugal | | | 106,114 | |
| | | | | | | | | | |
| | |
| | | | | | Russia — 0.0% | |
| | | |
| | | 833 | | | QIWI Plc Sponsored ADR | | | 2,842 | |
| | | |
| | | 9,800 | | | Surgutneftegas PJSC | | | 1,774 | |
| | | | | | | | | | |
| | | |
| | | | | | Total Russia | | | 4,616 | |
| | | | | | | | | | |
| | |
| | | | | | Singapore — 3.9% | |
| | | |
| | | 30,299 | | | DBS Group Holdings Ltd | | | 761,721 | |
| | | |
| | �� | 1,100 | | | Jardine Cycle & Carriage Ltd | | | 17,766 | |
| | | | |
| | |
| 68 | | See accompanying notes to the financial statements. | | |
GMO Tax-Managed International Equities Fund
(A Series of GMO Trust)
Schedule of Investments — (Continued)
(showing percentage of total net assets)
February 28, 2022
| | | | | | | | | | |
| | | Shares | | | Description | | Value ($) | |
| | |
| | | | | | Singapore — continued | |
| | | |
| | | 68,400 | | | Wilmar International Ltd | | | 222,302 | |
| | | |
| | | 223,700 | | | Yangzijiang Shipbuilding Holdings Ltd | | | 228,834 | |
| | | |
| | | 16,000 | | | Yanlord Land Group Ltd | | | 14,252 | |
| | | | | | | | | | |
| | | |
| | | | | | Total Singapore | | | 1,244,875 | |
| | | | | | | | | | |
| | |
| | | | | | South Africa — 0.2% | |
| | | |
| | | 4,189 | | | Aspen Pharmacare Holdings Ltd | | | 54,873 | |
| | | |
| | | 11,423 | | | Netcare Ltd | | | 10,890 | |
| | | |
| | | 2,290 | | | Truworths International Ltd | | | 8,710 | |
| | | | | | | | | | |
| | | |
| | | | | | Total South Africa | | | 74,473 | |
| | | | | | | | | | |
| | |
| | | | | | South Korea — 1.9% | |
| | | |
| | | 13,817 | | | BNK Financial Group Inc | | | 90,958 | |
| | | |
| | | 211 | | | DB Insurance Co Ltd | | | 10,863 | |
| | | |
| | | 4,624 | | | DGB Financial Group Inc | | | 36,601 | |
| | | |
| | | 615 | | | E-MART Inc | | | 67,068 | |
| | | |
| | | 1,634 | | | Hankook Tire & Technology Co Ltd | | | 48,143 | |
| | | |
| | | 24,449 | | | Hanwha Life Insurance Co Ltd * | | | 60,378 | |
| | | |
| | | 342 | | | Kia Corp | | | 21,202 | |
| | | |
| | | 2,484 | | | KT&G Corp | | | 165,128 | |
| | | |
| | | 606 | | | LG Electronics Inc | | | 63,264 | |
| | | |
| | | 447 | | | LX Semicon Co Ltd | | | 42,936 | |
| | | |
| | | 494 | | | SL Corp * | | | 9,848 | |
| | | | | | | | | | |
| | | |
| | | | | | Total South Korea | | | 616,389 | |
| | | | | | | | | | |
| | |
| | | | | | Spain — 4.1% | |
| | | |
| | | 18,515 | | | Acerinox SA | | | 235,394 | |
| | | |
| | | 109,856 | | | Banco Bilbao Vizcaya Argentaria SA | | | 651,855 | |
| | | |
| | | 199,845 | | | Banco de Sabadell SA * | | | 172,801 | |
| | | |
| | | 20,955 | | | Banco Santander SA | | | 69,780 | |
| | | |
| | | 480 | | | Ebro Foods SA | | | 8,892 | |
| | | |
| | | 5,598 | | | Industria de Diseno Textil SA | | | 146,028 | |
| | | |
| | | 277 | | | Mediaset Espana Comunicacion SA * | | | 1,421 | |
| | | |
| | | 10,328 | | | Unicaja Banco SA | | | 9,737 | |
| | | | | | | | | | |
| | | |
| | | | | | Total Spain | | | 1,295,908 | |
| | | | | | | | | | |
| | |
| | | | | | Sweden — 0.6% | |
| | | |
| | | 1,358 | | | Investor AB – A Shares | | | 30,029 | |
| | | |
| | | 736 | | | JM AB | | | 22,792 | |
| | | |
| | | 883 | | | Skanska AB – B Shares | | | 19,985 | |
| | | |
| | | 5,663 | | | SSAB AB – A Shares * | | | 35,440 | |
| | | |
| | | 4,049 | | | Svenska Cellulosa AB SCA – Class B | | | 66,061 | |
| | | | | | | | | | |
| | | |
| | | | | | Total Sweden | | | 174,307 | |
| | | | | | | | | | |
| | |
| | | | | | Switzerland — 6.2% | |
| | | |
| | | 92 | | | ALSO Holding AG (Registered) * | | | 24,547 | |
| | | |
| | | 242 | | | Cie Financiere Richemont SA – Class A (Registered) | | | 32,405 | |
| | | |
| | | 7,002 | | | Novartis AG (Registered) | | | 615,416 | |
| | | |
| | | 700 | | | Novartis AG Sponsored ADR | | | 61,222 | |
| | | |
| | | 85 | | | Roche Holding AG | | | 35,480 | |
| | | | | | | | | | |
| | | Shares | | | Description | | Value ($) | |
| | |
| | | | | | Switzerland — continued | |
| | | |
| | | 2,920 | | | Roche Holding AG – Genusschein | | | 1,105,901 | |
| | | |
| | | 4,493 | | | UBS Group AG (Registered) | | | 82,657 | |
| | | |
| | | 165 | | | Vetropack Holding AG (Registered) | | | 8,375 | |
| | | | | | | | | | |
| | | |
| | | | | | Total Switzerland | | | 1,966,003 | |
| | | | | | | | | | |
| | |
| | | | | | Taiwan — 1.6% | |
| | | |
| | | 17,000 | | | Asustek Computer Inc | | | 226,788 | |
| | | |
| | | 18,000 | | | Chipbond Technology Corp | | | 44,789 | |
| | | |
| | | 34,000 | | | Compal Electronics Inc | | | 30,974 | |
| | | |
| | | 1,000 | | | Phison Electronics Corp | | | 18,502 | |
| | | |
| | | 75,000 | | | Pou Chen Corp | | | 86,491 | |
| | | |
| | | 7,800 | | | Ruentex Industries Ltd | | | 32,449 | |
| | | |
| | | 85,000 | | | Yuanta Financial Holding Co Ltd | | | 75,930 | |
| | | | | | | | | | |
| | | |
| | | | | | Total Taiwan | | | 515,923 | |
| | | | | | | | | | |
| | |
| | | | | | Thailand — 0.6% | |
| | | |
| | | 93,200 | | | AP Thailand Pcl NVDR | | | 30,295 | |
| | | |
| | | 120,900 | | | Krung Thai Bank Pcl NVDR | | | 52,014 | |
| | | |
| | | 649,600 | | | Sansiri Pcl NVDR | | | 24,604 | |
| | | |
| | | 126,800 | | | Thai Union Group Pcl NVDR | | | 79,301 | |
| | | | | | | | | | |
| | | |
| | | | | | Total Thailand | | | 186,214 | |
| | | | | | | | | | |
| | |
| | | | | | Turkey — 1.1% | |
| | | |
| | | 21,851 | | | Arcelik AS | | | 87,432 | |
| | | |
| | | 3,483 | | | Dogus Otomotiv Servis ve Ticaret AS | | | 11,817 | |
| | | |
| | | 1,377 | | | Ford Otomotiv Sanayi AS | | | 26,841 | |
| | | |
| | | 76,811 | | | Haci Omer Sabanci Holding AS | | | 86,394 | |
| | | |
| | | 8,376 | | | Tofas Turk Otomobil Fabrikasi AS | | | 48,667 | |
| | | |
| | | 90,406 | | | Turkiye Garanti Bankasi AS | | | 72,458 | |
| | | | | | | | | | |
| | | |
| | | | | | Total Turkey | | | 333,609 | |
| | | | | | | | | | |
| | |
| | | | | | United Kingdom — 13.7% | |
| | | |
| | | 16,122 | | | 3i Group Plc | | | 287,199 | |
| | | |
| | | 5,147 | | | Aviva Plc | | | 28,841 | |
| | | |
| | | 40,982 | | | Barratt Developments Plc | | | 333,807 | |
| | | |
| | | 3,112 | | | Bellway Plc | | | 119,702 | |
| | | |
| | | 8,131 | | | British American Tobacco Plc | | | 356,356 | |
| | | |
| | | 14,700 | | | British American Tobacco Plc Sponsored ADR | | | 650,328 | |
| | | |
| | | 240,500 | | | BT Group Plc | | | 600,070 | |
| | | |
| | | 9,039 | | | Coca-Cola HBC AG* | | | 229,650 | |
| | | |
| | | 5,483 | | | Ferrexpo Plc | | | 12,437 | |
| | | |
| | | 8,200 | | | GlaxoSmithKline Plc Sponsored ADR | | | 343,252 | |
| | | |
| | | 9,199 | | | Imperial Brands Plc | | | 201,148 | |
| | | |
| | | 3,576 | | | Investec Plc | | | 19,395 | |
| | | |
| | | 68,134 | | | Kingfisher Plc | | | 277,943 | |
| | | |
| | | 297 | | | Morgan Sindall Group Plc | | | 9,185 | |
| | | |
| | | 4,170 | | | Next Plc | | | 381,815 | |
| | | |
| | | 9,998 | | | Persimmon Plc | | | 321,771 | |
| | | |
| | | 1,686 | | | Plus500 Ltd | | | 31,461 | |
| | | |
| | | 5,515 | | | Redrow Plc | | | 42,044 | |
| | | | |
| | |
| | | See accompanying notes to the financial statements. | | 69 |
GMO Tax-Managed International Equities Fund
(A Series of GMO Trust)
Schedule of Investments — (Continued)
(showing percentage of total net assets)
February 28, 2022
| | | | | | | | | | |
| | | Shares | | | Description | | Value ($) | |
| | |
| | | | | | United Kingdom — continued | |
| | | |
| | | 7,006 | | | Royal Mail Plc | | | 36,820 | |
| | | |
| | | 6,565 | | | Spirent Communications Plc | | | 21,480 | |
| | | |
| | | 1,290 | | | Vistry Group Plc | | | 17,352 | |
| | | |
| | | 976 | | | WPP Plc | | | 13,727 | |
| | | | | | | | | | |
| | | |
| | | | | | Total United Kingdom | | | 4,335,783 | |
| | | | | | | | | | |
| | | |
| | | | | | TOTAL COMMON STOCKS
(COST $26,616,527) | | | 31,005,294 | |
| | | | | | | | | | |
| | |
| | | | | | PREFERRED STOCKS (b) — 0.5% | |
| | |
| | | | | | Brazil — 0.2% | |
| | | |
| | | 47,300 | | | Cia Paranaense de Energia – Class B | | | 63,202 | |
| | | | | | | | | | |
| | |
| | | | | | Germany — 0.3% | |
| | | |
| | | 870 | | | Bayerische Motoren Werke AG | | | 70,355 | |
| | | |
| | | 186 | | | Draegerwerk AG & Co KGaA | | | 10,537 | |
| | | |
| | | 3 | | | Volkswagen AG | | | 590 | |
| | | | | | | | | | |
| | | |
| | | | | | Total Germany | | | 81,482 | |
| | | | | | | | | | |
| | |
| | | | | | South Korea — 0.0% | |
| | | |
| | | 302 | | | LG Electronics Inc | | | 15,115 | |
| | | | | | | | | | |
| | | |
| | | | | | TOTAL PREFERRED STOCKS
(COST $147,066) | | | 159,799 | |
| | | | | | | | | | |
| | |
| | | | | | MUTUAL FUNDS — 3.1% | |
| | |
| | | | | | United States — 3.1% | |
| | |
| | | | | | Affiliated Issuers — 3.1% | |
| | | |
| | | 199,568 | | | GMO U.S. Treasury Fund | | | 999,833 | |
| | | | | | | | | | |
| | | |
| | | | | | TOTAL MUTUAL FUNDS
(COST $1,002,797) | | | 999,833 | |
| | | | | | | | | | |
| | | | | | | | | | |
| | | Shares | | | Description | | Value ($) | |
| | |
| | | | | | SHORT-TERM INVESTMENTS — 0.3% | |
| | |
| | | | | | Money Market Funds — 0.3% | |
| | | |
| | | 96,940 | | | State Street Institutional Treasury Money Market Fund – Premier Class, 0.01% (c) | | | 96,940 | |
| | | | | | | | | | |
| | | |
| | | | | | TOTAL SHORT-TERM INVESTMENTS
(COST $96,940) | | | 96,940 | |
| | | | | | | | | | |
| | | |
| | | | | | TOTAL INVESTMENTS — 101.5%
(Cost $27,863,330) | | | 32,261,866 | |
| | | |
| | | | | | Other Assets and Liabilities (net) — (1.5%) | | | (480,592 | ) |
| | | | | | | | | | |
| | | |
| | | | | | TOTAL NET ASSETS — 100.0% | | | $31,781,274 | |
| | | | | | | | | | |
A summary of outstanding financial instruments at February 28, 2022 is as follows:
Futures Contracts
| | | | | | | | | | | | | | |
| | | | |
Number
of
Contracts + | | Type | | Expiration
Date | | | Notional
Amount ($) | | | Value/Net
Unrealized
Appreciation
(Depreciation) ($) | |
| Buys | | | | | | | | | | | | | | |
| 2 | | MSCI EAFE | | | March 2022 | | | $ | 215,980 | | | $ | (14,273 | ) |
| | | | | | | | | | | | | | |
| + | Buys - Fund is long the futures contract. |
| | Sales - Fund is short the futures contract. |
As of February 28, 2022, for the above contracts and/or agreements, the Fund had sufficient cash and/or securities to cover commitments or collateral requirements, if any, of the relevant broker or exchange.
Notes to Schedule of Investments:
| * | Non-income producing security. |
| (a) | Investment valued at fair value using methods determined in good faith by the Trustees of GMO Trust or persons acting at their direction pursuant to procedures approved by the Trustees. Investment valued using significant unobservable inputs (Note 2). |
| (b) | Preferred dividend rates are disclosed to the extent that a stated rate exists. |
| (c) | The rate disclosed is the 7 day net yield as of February 28, 2022. |
For a listing of definitions of acronyms, counterparty abbreviations and currency abbreviations used throughout the Schedule of Investments as well as the derivative tables, if any, please refer to page 87.
| | | | |
| | |
| 70 | | See accompanying notes to the financial statements. | | |
This page has been left blank intentionally.
GMO U.S. Equity Fund
(A Series of GMO Trust)
Portfolio Management
Day-to-day management of the Fund’s portfolio is the responsibility of the Global Equity team at Grantham, Mayo, Van Otterloo & Co. LLC.
Management Discussion and Analysis of Fund Performance
Although the Fund is not managed relative to any securities market index or benchmark, a discussion of the Fund’s performance relative to the S&P Composite 1500 Index is included for comparative purposes.
Class III shares of GMO U.S. Equity Fund returned +15.80% (net) for the fiscal year ended February 28, 2022, as compared with +15.54% for the S&P Composite 1500 Index.
The Fund outperformed the S&P Composite 1500 Index in a year where Value outperformed modestly, as reflected in the +0.3% outperformance of the S&P 1500 Composite Value Index when compared to the S&P Composite 1500 Index. In this period the performance of valuation-oriented models was mixed, with higher quality names underperforming the broader market. Stock selection was helped by other model groups, including Cross-Asset signals and Corporate Alerts.
Stock selection in Health Care and Information Technology were notable areas of strength. Top contributors included overweight positioning in Pfizer (Health Care) and Kroger (Consumer Staples). Underweight positioning toward PayPal (Information Technology), Walt Disney Company (Communication Services), and Amazon (Consumer Discretionary) also added value.
Likewise, top stock detractors included a mix of companies held underweight and overweight. Underweight positions among the top detractors included NVIDIA (Information Technology), Alphabet (Communication Services), and Apple (Information Technology). Overweight positioning toward attractively valued names including Philip Morris (Consumer Staples) and Activision Blizzard (Communication Services) also detracted from relative performance.
Sector allocation also detracted, primarily from underweight positioning toward Energy.
The views expressed herein are exclusively those of Grantham, Mayo, Van Otterloo & Co. LLC as of the date of this report and are subject to change. GMO disclaims any responsibility to update such views. They are not meant as investment advice. References to specific securities are not recommendations of such securities and may not be representative of any GMO portfolio’s current or future investments. All information is unaudited.
GMO U.S. Equity Fund
(A Series of GMO Trust)
Comparison of Change in Value of a $5,000,000 Investment in
GMO U.S. Equity Fund Class III Shares, the S&P Composite 1500 Index and the Russell 3000 Index
As of February 28, 2022
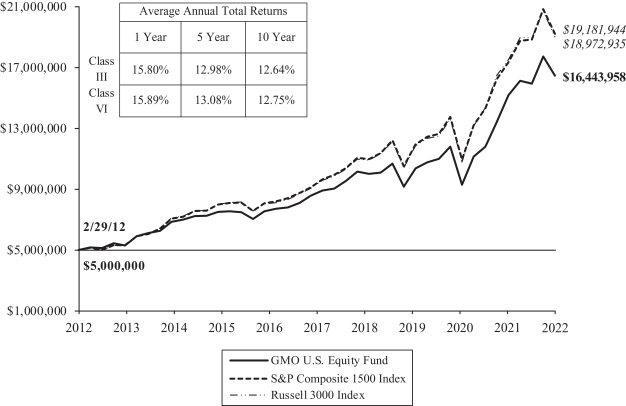
Performance data quoted represents past performance and is not indicative of future results. The investment return and principal value of an investment will fluctuate so that an investor’s shares, when redeemed, may be worth more or less than their original cost. Current performance data may be lower or higher than the performance data provided herein. To obtain performance information up to the most recent month-end, visit www.gmo.com. Performance shown is net of all fees after reimbursement from GMO. Returns would have been lower had certain expenses not been reimbursed during the periods shown and do not include the effect of taxes on distributions and redemptions. The performance information shown above only includes purchase premiums and/or redemption fees in effect as of February 28, 2022. All information is unaudited. Performance for classes may vary due to different fees.
For S&P and Russell disclaimers please visit https://www.gmo.com/north-america/benchmark-disclaimers/
For Class III and VI the gross expense ratio of 0.51% and 0.41%, respectively, is equal to the Fund’s Total Annual Operating Expenses set forth in the Fund’s most recent prospectus dated June 30, 2021. For the Classes listed above, the corresponding Net Expense Ratio of 0.47% and 0.37% reflects the reduction of expenses from fee reimbursements. The fee reimbursements will continue until at least June 30, 2022. Elimination of this reimbursement will result in higher fees and lower performance.
GMO U.S. Equity Fund
(A Series of GMO Trust)
Investment Concentration Summary
February 28, 2022 (Unaudited)
| | | | |
| Asset Class Summary& | | % of Total Net Assets | |
Common Stocks | | | 97.7 | % |
Mutual Funds | | | 2.3 | |
Short-Term Investments | | | 0.2 | |
Futures Contracts | | | (0.1 | ) |
Other | | | (0.1 | ) |
| | | | |
| | | 100.0 | % |
| | | | |
| | | | |
| Industry Group Summary | | % of Equity Investments# | |
Technology Hardware & Equipment | | | 12.2 | % |
Retailing | | | 9.7 | |
Software & Services | | | 9.3 | |
Capital Goods | | | 7.6 | |
Pharmaceuticals, Biotechnology & Life Sciences | | | 7.3 | |
Diversified Financials | | | 6.9 | |
Semiconductors & Semiconductor Equipment | | | 4.8 | |
Insurance | | | 4.7 | |
Consumer Durables & Apparel | | | 4.6 | |
Food, Beverage & Tobacco | | | 4.5 | |
Media & Entertainment | | | 4.3 | |
Food & Staples Retailing | | | 3.7 | |
Materials | | | 3.4 | |
Telecommunication Services | | | 3.3 | |
Energy | | | 3.3 | |
Health Care Equipment & Services | | | 3.1 | |
Real Estate | | | 2.8 | |
Commercial & Professional Services | | | 1.7 | |
Banks | | | 1.2 | |
Household & Personal Products | | | 1.1 | |
Automobiles & Components | | | 0.2 | |
Consumer Services | | | 0.2 | |
Transportation | | | 0.1 | |
| | | | |
| | | 100.0 | % |
| | | | |
| & | In the table, derivative financial instruments, if any, are based on market values, rather than the notional amounts of derivatives, except for forward currency contracts which are based on unrealized appreciation/(depreciation). |
| # | Equity investments may consist of common stocks and other stock-related securities, such as preferred stocks, if any. This table excludes exposure to derivative contracts, short-term investments, mutual funds and investment funds, if any. For a summary of these exposures, if any, see the Schedule of Investments. |
GMO U.S. Equity Fund
(A Series of GMO Trust)
Schedule of Investments
(showing percentage of total net assets)
February 28, 2022
| | | | | | | | | | |
| | | Shares | | | Description | | Value ($) | |
| | |
| | | | | | COMMON STOCKS — 97.7% | |
| | |
| | | | | | Automobiles & Components — 0.2% | |
| | | |
| | | 60,614 | | | Dana, Inc. | | | 1,128,633 | |
| | | |
| | | 21 | | | Lear Corp. | | | 3,304 | |
| | | | | | | | | | |
| | | |
| | | | | | Total Automobiles & Components | | | 1,131,937 | |
| | | | | | | | | | |
| | |
| | | | | | Banks — 1.2% | |
| | | |
| | | 46,092 | | | Associated Banc-Corp. | | | 1,124,184 | |
| | | |
| | | 8,000 | | | Atlantic Union Bankshares Corp. | | | 325,040 | |
| | | |
| | | 8,351 | | | East West Bancorp, Inc. | | | 731,213 | |
| | | |
| | | 5,649 | | | Flagstar Bancorp, Inc. | | | 257,481 | |
| | | |
| | | 4,900 | | | Hanmi Financial Corp. | | | 127,988 | |
| | | |
| | | 8,200 | | | KeyCorp. | | | 205,574 | |
| | | |
| | | 3,476 | | | Popular, Inc. | | | 319,271 | |
| | | |
| | | 56,500 | | | Radian Group, Inc. | | | 1,350,350 | |
| | | |
| | | 1,200 | | | SVB Financial Group * | | | 727,200 | |
| | | |
| | | 3,300 | | | Towne Bank | | | 102,894 | |
| | | |
| | | 5,100 | | | TriCo Bancshares | | | 221,340 | |
| | | | | | | | | | |
| | | |
| | | | | | Total Banks | | | 5,492,535 | |
| | | | | | | | | | |
| | |
| | | | | | Capital Goods — 7.4% | |
| | | |
| | | 700 | | | Allison Transmission Holdings, Inc. | | | 27,958 | |
| | | |
| | | 5,300 | | | Applied Industrial Technologies, Inc. | | | 535,830 | |
| | | |
| | | 14,300 | | | Atkore, Inc. * | | | 1,454,453 | |
| | | |
| | | 5,547 | | | Boise Cascade Co. | | | 443,427 | |
| | | |
| | | 9,302 | | | Carlisle Cos, Inc. | | | 2,208,295 | |
| | | |
| | | 40,853 | | | Carrier Global Corp. | | | 1,833,483 | |
| | | |
| | | 5,200 | | | Caterpillar, Inc. | | | 975,416 | |
| | | |
| | | 4,006 | | | Cummins, Inc. | | | 817,705 | |
| | | |
| | | 5,400 | | | Dover Corp. | | | 847,044 | |
| | | |
| | | 2,100 | | | Eaton Corp Plc | | | 324,009 | |
| | | |
| | | 6,650 | | | EMCOR Group, Inc. | | | 768,341 | |
| | | |
| | | 2,400 | | | Encore Wire Corp. | | | 279,408 | |
| | | |
| | | 97,643 | | | Fortive Corp. | | | 6,322,384 | |
| | | |
| | | 6,600 | | | Fortune Brands Home & Security, Inc. | | | 573,540 | |
| | | |
| | | 20,400 | | | Gates Industrial Corp Plc * | | | 323,136 | |
| | | |
| | | 6,300 | | | ITT, Inc. | | | 553,581 | |
| | | |
| | | 27,083 | | | Mueller Industries, Inc. | | | 1,545,085 | |
| | | |
| | | 1,400 | | | MYR Group, Inc. * | | | 125,650 | |
| | | |
| | | 14,700 | | | Otis Worldwide Corp. | | | 1,151,451 | |
| | | |
| | | 5,381 | | | Owens Corning | | | 501,455 | |
| | | |
| | | 9,363 | | | Stanley Black & Decker, Inc. | | | 1,523,360 | |
| | | |
| | | 81,917 | | | Textron, Inc. | | | 5,990,590 | |
| | | |
| | | 361 | | | Timken Co. (The) | | | 23,667 | |
| | | |
| | | 17,748 | | | Trane Technologies Plc | | | 2,731,950 | |
| | | |
| | | 21,436 | | | UFP Industries, Inc. | | | 1,838,137 | |
| | | |
| | | 1,315 | | | WW Grainger, Inc. | | | 627,334 | |
| | | | | | | | | | |
| | | |
| | | | | | Total Capital Goods | | | 34,346,689 | |
| | | | | | | | | | |
| | |
| | | | | | Commercial & Professional Services — 1.6% | |
| | | |
| | | 17,500 | | | ABM Industries, Inc. | | | 784,525 | |
| | | |
| | | 63,900 | | | ACCO Brands Corp. | | | 549,540 | |
| | | | | | | | | | |
| | | Shares | | | Description | | Value ($) | |
| | |
| | | | | | Commercial & Professional Services — continued | |
| | | |
| | | 9,600 | | | Deluxe Corp. | | | 298,656 | |
| | | |
| | | 2,700 | | | Heidrick & Struggles International, Inc. | | | 115,425 | |
| | | |
| | | 6,028 | | | HNI Corp. | | | 245,279 | |
| | | |
| | | 11,200 | | | ICF International, Inc. | | | 992,544 | |
| | | |
| | | 9,400 | | | Kforce, Inc. | | | 706,692 | |
| | | |
| | | 3,807 | | | ManpowerGroup, Inc. | | | 404,608 | |
| | | |
| | | 23,000 | | | Republic Services, Inc. – Class A | | | 2,766,440 | |
| | | |
| | | 12,300 | | | Resources Connection, Inc. | | | 204,180 | |
| | | |
| | | 41,744 | | | Steelcase, Inc. – Class A | | | 508,025 | |
| | | |
| | | 3,000 | | | TrueBlue, Inc. * | | | 81,600 | |
| | | | | | | | | | |
| | | |
| | | | | | Total Commercial & Professional Services | | | 7,657,514 | |
| | | | | | | | | | |
| | |
| | | | | | Consumer Durables & Apparel — 4.5% | |
| | | |
| | | 26,400 | | | Acushnet Holdings Corp. | | | 1,156,320 | |
| | | |
| | | 17,626 | | | DR Horton, Inc. | | | 1,505,260 | |
| | | |
| | | 29,000 | | | Ethan Allen Interiors, Inc. | | | 755,740 | |
| | | |
| | | 38,841 | | | Garmin Ltd. | | | 4,289,600 | |
| | | |
| | | 34,081 | | | La-Z-Boy, Inc. | | | 994,484 | |
| | | |
| | | 3,000 | | | Lennar Corp. – Class B | | | 226,500 | |
| | | |
| | | 18,768 | | | MDC Holdings, Inc. | | | 832,173 | |
| | | |
| | | 3,200 | | | Meritage Homes Corp. * | | | 315,456 | |
| | | |
| | | 28,730 | | | PulteGroup, Inc. | | | 1,426,732 | |
| | | |
| | | 19,500 | | | Steven Madden Ltd. | | | 831,870 | |
| | | |
| | | 44,800 | | | Taylor Morrison Home Corp. – Class A * | | | 1,321,600 | |
| | | |
| | | 28,817 | | | Tempur Sealy International, Inc. | | | 951,249 | |
| | | |
| | | 105,752 | | | TRI Pointe Homes, Inc. * | | | 2,365,672 | |
| | | |
| | | 19,400 | | | Vista Outdoor, Inc. * | | | 707,130 | |
| | | |
| | | 15,800 | | | Whirlpool Corp. | | | 3,180,066 | |
| | | | | | | | | | |
| | | |
| | | | | | Total Consumer Durables & Apparel | | | 20,859,852 | |
| | | | | | | | | | |
| | |
| | | | | | Consumer Services — 0.2% | |
| | | |
| | | 2,700 | | | Adtalem Global Education, Inc. * | | | 56,106 | |
| | | |
| | | 1,100 | | | Graham Holdings Co. – Class B | | | 661,243 | |
| | | |
| | | 17,275 | | | Perdoceo Education Corp. * | | | 180,869 | |
| | | | | | | | | | |
| | | |
| | | | | | Total Consumer Services | | | 898,218 | |
| | | | | | | | | | |
| | |
| | | | | | Diversified Financials — 6.7% | |
| | | |
| | | 12,707 | | | Ally Financial, Inc. | | | 634,079 | |
| | | |
| | | 4,100 | | | American Express Co. | | | 797,614 | |
| | | |
| | | 7,000 | | | Ameriprise Financial, Inc. | | | 2,098,530 | |
| | | |
| | | 3,900 | | | Berkshire Hathaway, Inc. – Class B * | | | 1,253,655 | |
| | | |
| | | 27,300 | | | Donnelley Financial Solutions, Inc. * | | | 876,330 | |
| | | |
| | | 26,243 | | | Enova International, Inc. * | | | 1,069,927 | |
| | | |
| | | 18,500 | | | Equitable Holdings, Inc. | | | 604,210 | |
| | | |
| | | 4,800 | | | FactSet Research Systems, Inc. | | | 1,949,232 | |
| | | |
| | | 811 | | | Federated Hermes, Inc. | | | 26,495 | |
| | | |
| | | 8,100 | | | Goldman Sachs Group, Inc. (The) | | | 2,764,449 | |
| | | |
| | | 43,800 | | | Intercontinental Exchange, Inc. | | | 5,611,656 | |
| | | |
| | | 30,900 | | | KKR & Co., Inc. | | | 1,857,708 | |
| | | |
| | | 2,200 | | | MSCI, Inc. – Class A | | | 1,103,718 | |
| | | | |
| | |
| | | See accompanying notes to the financial statements. | | 75 |
GMO U.S. Equity Fund
(A Series of GMO Trust)
Schedule of Investments — (Continued)
(showing percentage of total net assets)
February 28, 2022
| | | | | | | | | | |
| | | Shares | | | Description | | Value ($) | |
| | |
| | | | | | Diversified Financials — continued | |
| | | |
| | | 900 | | | Nasdaq, Inc. | | | 154,035 | |
| | | |
| | | 6,500 | | | Nelnet, Inc. – Class A | | | 523,575 | |
| | | |
| | | 800 | | | Northern Trust Corp. | | | 91,120 | |
| | | |
| | | 14,378 | | | OneMain Holdings, Inc. | | | 732,990 | |
| | | |
| | | 2,200 | | | Oppenheimer Holdings, Inc. – Class A | | | 95,018 | |
| | | |
| | | 3,247 | | | PROG Holdings, Inc. * | | | 99,488 | |
| | | |
| | | 43,670 | | | Raymond James Financial, Inc. | | | 4,788,416 | |
| | | |
| | | 15,213 | | | SEI Investments Co. | | | 891,178 | |
| | | |
| | | 36,923 | | | State Street Corp. | | | 3,150,640 | |
| | | |
| | | 2,900 | | | Victory Capital Holdings, Inc. – Class A | | | 96,193 | |
| | | | | | | | | | |
| | | |
| | | | | | Total Diversified Financials | | | 31,270,256 | |
| | | | | | | | | | |
| | |
| | | | | | Energy — 3.2% | |
| | | |
| | | 47,200 | | | Chevron Corp. | | | 6,796,800 | |
| | | |
| | | 7,300 | | | Devon Energy Corp. | | | 434,715 | |
| | | |
| | | 35,900 | | | Exxon Mobil Corp. | | | 2,815,278 | |
| | | |
| | | 46,500 | | | Hess Corp. | | | 4,699,290 | |
| | | |
| | | 3,600 | | | Phillips 66 | | | 303,264 | |
| | | | | | | | | | |
| | | |
| | | | | | Total Energy | | | 15,049,347 | |
| | | | | | | | | | |
| | |
| | | | | | Food & Staples Retailing — 3.6% | |
| | | |
| | | 3,800 | | | Costco Wholesale Corp. | | | 1,973,150 | |
| | | |
| | | 171,845 | | | Kroger Co. (The) | | | 8,042,346 | |
| | | |
| | | 19,600 | | | SpartanNash Co. | | | 551,544 | |
| | | |
| | | 42,100 | | | Walmart, Inc. | | | 5,690,236 | |
| | | |
| | | 9,300 | | | Weis Markets, Inc. | | | 573,531 | |
| | | | | | | | | | |
| | | |
| | | | | | Total Food & Staples Retailing | | | 16,830,807 | |
| | | | | | | | | | |
| | |
| | | | | | Food, Beverage & Tobacco — 4.4% | |
| | | |
| | | 25,363 | | | Archer-Daniels-Midland Co. | | | 1,989,727 | |
| | | |
| | | 39,400 | | | General Mills, Inc. | | | 2,656,742 | |
| | | |
| | | 24,300 | | | Hershey Co. (The) | | | 4,914,918 | |
| | | |
| | | 9,900 | | | Kraft Heinz Co. (The) | | | 388,278 | |
| | | |
| | | 24,429 | | | Mondelez International, Inc. – Class A | | | 1,599,611 | |
| | | |
| | | 8,600 | | | PepsiCo, Inc. | | | 1,408,164 | |
| | | |
| | | 52,200 | | | Tyson Foods, Inc. – Class A | | | 4,836,852 | |
| | | |
| | | 43,865 | | | Universal Corp. | | | 2,373,535 | |
| | | |
| | | 28,600 | | | Vector Group Ltd. | | | 320,606 | |
| | | | | | | | | | |
| | | |
| | | | | | Total Food, Beverage & Tobacco | | | 20,488,433 | |
| | | | | | | | | | |
| | |
| | | | | | Health Care Equipment & Services — 3.0% | |
| | | |
| | | 40,241 | | | AmerisourceBergen Corp. – Class A | | | 5,735,550 | |
| | | |
| | | 12,500 | | | Anthem, Inc. | | | 5,648,125 | |
| | | |
| | | 5,900 | | | Edwards Lifesciences Corp. * | | | 662,983 | |
| | | |
| | | 6,481 | | | McKesson Corp. | | | 1,782,016 | |
| | | |
| | | 5,600 | | | Varex Imaging Corp. * | | | 132,384 | |
| | | | | | | | | | |
| | | |
| | | | | | Total Health Care Equipment & Services | | | 13,961,058 | |
| | | | | | | | | | |
| | |
| | | | | | Household & Personal Products — 1.1% | |
| | | |
| | | 42,018 | | | Colgate-Palmolive Co. | | | 3,233,285 | |
| | | |
| | | 10,500 | | | Procter & Gamble Co. (The) | | | 1,636,845 | |
| | | | | | | | | | |
| | | |
| | | | | | Total Household & Personal Products | | | 4,870,130 | |
| | | | | | | | | | |
| | | | | | | | | | |
| | | Shares | | | Description | | Value ($) | |
| | |
| | | | | | Insurance — 4.6% | |
| | | |
| | | 30,286 | | | Allstate Corp. (The) | | | 3,705,795 | |
| | | |
| | | 3,600 | | | CNA Financial Corp. | | | 164,520 | |
| | | |
| | | 45,500 | | | CNO Financial Group, Inc. | | | 1,099,735 | |
| | | |
| | | 25,722 | | | Fidelity National Financial, Inc. | | | 1,225,396 | |
| | | |
| | | 48,315 | | | First American Financial Corp. | | | 3,239,038 | |
| | | |
| | | 99,700 | | | Genworth Financial, Inc. – Class A * | | | 404,782 | |
| | | |
| | | 21,200 | | | Marsh & McLennan Cos., Inc. | | | 3,294,692 | |
| | | |
| | | 80,800 | | | MetLife, Inc. | | | 5,458,040 | |
| | | |
| | | 1,709 | | | Principal Financial Group, Inc. | | | 120,724 | |
| | | |
| | | 31,163 | | | Stewart Information Services Corp. | | | 2,115,344 | |
| | | |
| | | 3,500 | | | Willis Towers Watson Plc | | | 778,050 | |
| | | | | | | | | | |
| | | |
| | | | | | Total Insurance | | | 21,606,116 | |
| | | | | | | | | | |
| | |
| | | | | | Materials — 3.3% | |
| | | |
| | | 20,800 | | | AdvanSix, Inc. | | | 833,248 | |
| | | |
| | | 4,093 | | | Avery Dennison Corp. | | | 721,187 | |
| | | |
| | | 26,769 | | | Avient Corp. | | | 1,402,428 | |
| | | |
| | | 13,300 | | | Cabot Corp. | | | 973,028 | |
| | | |
| | | 12,500 | | | Commercial Metals Co. | | | 481,875 | |
| | | |
| | | 1,993 | | | FMC Corp. | | | 233,679 | |
| | | |
| | | 2,200 | | | Greif, Inc. – Class A | | | 126,478 | |
| | | |
| | | 55,100 | | | Huntsman Corp. | | | 2,228,244 | |
| | | |
| | | 4,657 | | | LyondellBasell Industries NV – Class A | | | 452,800 | |
| | | |
| | | 4,073 | | | NewMarket Corp. | | | 1,294,236 | |
| | | |
| | | 1,859 | | | Nucor Corp. | | | 244,682 | |
| | | |
| | | 21,896 | | | Reliance Steel & Aluminum Co. | | | 4,179,289 | |
| | | |
| | | 3,674 | | | Stepan Co. | | | 380,700 | |
| | | |
| | | 8,100 | | | Trinseo Plc | | | 420,876 | |
| | | |
| | | 12,200 | | | Westlake Chemical Corp. | | | 1,345,782 | |
| | | | | | | | | | |
| | | |
| | | | | | Total Materials | | | 15,318,532 | |
| | | | | | | | | | |
| | |
| | | | | | Media & Entertainment — 4.2% | |
| | | |
| | | 2,400 | | | Alphabet, Inc. – Class A * | | | 6,482,736 | |
| | | |
| | | 2,173 | | | Alphabet, Inc. – Class C * | | | 5,862,363 | |
| | | |
| | | 2,300 | | | AMC Networks, Inc. – Class A * | | | 95,335 | |
| | | |
| | | 35,400 | | | Cars.com, Inc. * | | | 572,772 | |
| | | |
| | | 23,033 | | | Comcast Corp. – Class A | | | 1,077,023 | |
| | | |
| | | 10,342 | | | Electronic Arts, Inc. | | | 1,345,391 | |
| | | |
| | | 2,900 | | | Fox Corp. – Class B | | | 110,954 | |
| | | |
| | | 1,300 | | | IAC/InterActiveCorp * | | | 149,188 | |
| | | |
| | | 15,900 | | | Meta Platforms, Inc. – Class A * | | | 3,355,377 | |
| | | |
| | | 29,918 | | | TEGNA, Inc. | | | 685,720 | |
| | | | | | | | | | |
| | | |
| | | | | | Total Media & Entertainment | | | 19,736,859 | |
| | | | | | | | | | |
| | |
| | | | | | Pharmaceuticals, Biotechnology & Life Sciences — 7.2% | |
| | | |
| | | 109,741 | | | Bristol-Myers Squibb Co. | | | 7,535,915 | |
| | | |
| | | 15,576 | | | Eli Lilly & Co. | | | 3,893,221 | |
| | | |
| | | 7,200 | | | Gilead Sciences, Inc. | | | 434,880 | |
| | | |
| | | 40,900 | | | Johnson & Johnson | | | 6,730,913 | |
| | | |
| | | 145,050 | | | Merck & Co., Inc. | | | 11,107,929 | |
| | | | |
| | |
| 76 | | See accompanying notes to the financial statements. | | |
GMO U.S. Equity Fund
(A Series of GMO Trust)
Schedule of Investments — (Continued)
(showing percentage of total net assets)
February 28, 2022
| | | | | | | | | | |
| | | Shares | | | Description | | Value ($) | |
| | |
| | | | | | Pharmaceuticals, Biotechnology & Life
Sciences — continued | |
| | | |
| | | 60,876 | | | Pfizer, Inc. | | | 2,857,520 | |
| | | |
| | | 14,495 | | | Prestige Consumer Healthcare, Inc. * | | | 862,887 | |
| | | | | | | | | | |
| | | |
| | | | | | Total Pharmaceuticals, Biotechnology & Life Sciences | | | 33,423,265 | |
| | | | | | | | | | |
| | |
| | | | | | Real Estate — 2.7% | |
| | | |
| | | 89,200 | | | CBRE Group, Inc. – Class A * | | | 8,639,020 | |
| | | |
| | | 7,000 | | | Jones Lang LaSalle, Inc. * | | | 1,723,540 | |
| | | |
| | | 14,300 | | | PotlatchDeltic Corp. (REIT) | | | 785,070 | |
| | | |
| | | 76,920 | | | Realogy Holdings Corp. * | | | 1,398,406 | |
| | | | | | | | | | |
| | | |
| | | | | | Total Real Estate | | | 12,546,036 | |
| | | | | | | | | | |
| | |
| | | | | | Retailing — 9.5% | |
| | | |
| | | 4,900 | | | 1-800-Flowers.com, Inc. – Class A * | | | 75,852 | |
| | | |
| | | 18,568 | | | Abercrombie & Fitch Co. – Class A * | | | 707,069 | |
| | | |
| | | 34,000 | | | Academy Sports & Outdoors, Inc. * | | | 1,100,580 | |
| | | |
| | | 1,974 | | | Amazon.com, Inc. * | | | 6,062,667 | |
| | | |
| | | 7,048 | | | Asbury Automotive Group, Inc. * | | | 1,368,087 | |
| | | |
| | | 11,066 | | | AutoNation, Inc. * | | | 1,268,828 | |
| | | |
| | | 1,200 | | | AutoZone, Inc. * | | | 2,236,068 | |
| | | |
| | | 800 | | | Boot Barn Holdings, Inc. * | | | 69,616 | |
| | | |
| | | 40,800 | | | eBay, Inc. | | | 2,227,272 | |
| | | |
| | | 49,900 | | | Genuine Parts Co. | | | 6,095,784 | |
| | | |
| | | 7,754 | | | Group 1 Automotive, Inc. | | | 1,410,685 | |
| | | |
| | | 5,900 | | | Haverty Furniture Cos, Inc. | | | 167,619 | |
| | | |
| | | 3,400 | | | Home Depot, Inc. (The) | | | 1,073,822 | |
| | | |
| | | 18,215 | | | Lowe’s Cos., Inc. | | | 4,026,608 | |
| | | |
| | | 37,800 | | | Macy’s, Inc. | | | 979,776 | |
| | | |
| | | 10,467 | | | Murphy U.S.A., Inc. | | | 1,891,806 | |
| | | |
| | | 21,396 | | | Penske Automotive Group, Inc. | | | 2,103,013 | |
| | | |
| | | 256,978 | | | Qurate Retail, Inc. – Series A | | | 1,415,949 | |
| | | |
| | | 10,800 | | | Shoe Carnival, Inc. | | | 314,928 | |
| | | |
| | | 25,200 | | | Signet Jewelers Ltd. | | | 1,776,600 | |
| | | |
| | | 1,777 | | | Sleep Number Corp. * | | | 116,749 | |
| | | |
| | | 36,604 | | | Target Corp. | | | 7,312,381 | |
| | | |
| | | 30,800 | | | Tilly’s, Inc. – Class A | | | 391,160 | |
| | | | | | | | | | |
| | | |
| | | | | | Total Retailing | | | 44,192,919 | |
| | | | | | | | | | |
| | |
| | | | | | Semiconductors & Semiconductor Equipment — 4.7% | |
| | | |
| | | 1,392 | | | Cirrus Logic, Inc. * | | | 120,923 | |
| | | |
| | | 125,543 | | | Intel Corp. | | | 5,988,401 | |
| | | |
| | | 19,400 | | | Kulicke & Soffa Industries, Inc. | | | 1,013,456 | |
| | | |
| | | 29,900 | | | NVIDIA Corp. | | | 7,291,115 | |
| | | |
| | | 7,700 | | | ON Semiconductor Corp. * | | | 482,097 | |
| | | |
| | | 39,900 | | | QUALCOMM, Inc. | | | 6,862,401 | |
| | | | | | | | | | |
| | | |
| | | | | | Total Semiconductors & Semiconductor Equipment | | | 21,758,393 | |
| | | | | | | | | | |
| | |
| | | | | | Software & Services — 9.1% | |
| | | |
| | | 18,900 | | | Accenture Plc – Class A | | | 5,972,778 | |
| | | |
| | | 22,347 | | | Amdocs Ltd. | | | 1,758,709 | |
| | | | | | | | | | |
| | | Shares | | | Description | | Value ($) | |
| | |
| | | | | | Software & Services — continued | |
| | | |
| | | 14,722 | | | Cadence Design Systems, Inc. * | | | 2,229,352 | |
| | | |
| | | 3,500 | | | CSG Systems International, Inc. | | | 216,020 | |
| | | |
| | | 4,300 | | | International Business Machines Corp. | | | 526,793 | |
| | | |
| | | 1,321 | | | Intuit, Inc. | | | 626,643 | |
| | | |
| | | 86,019 | | | Microsoft Corp. | | | 25,701,617 | |
| | | |
| | | 16,974 | | | Synopsys, Inc. * | | | 5,302,508 | |
| | | | | | | | | | |
| | | |
| | | | | | Total Software & Services | | | 42,334,420 | |
| | | | | | | | | | |
| | |
| | | | | | Technology Hardware & Equipment — 11.9% | |
| | | |
| | | 125,224 | | | Apple, Inc. | | | 20,676,987 | |
| | | |
| | | 31,437 | | | Arrow Electronics, Inc. * | | | 3,831,542 | |
| | | |
| | | 25,222 | | | Avnet, Inc. | | | 1,061,090 | |
| | | |
| | | 11,700 | | | Ciena Corp. * | | | 800,514 | |
| | | |
| | | 176,652 | | | Cisco Systems, Inc. | | | 9,851,882 | |
| | | |
| | | 5,100 | | | CTS Corp. | | | 193,494 | |
| | | |
| | | 65,700 | | | Dell Technologies – Class C * | | | 3,348,072 | |
| | | |
| | | 258,844 | | | HP, Inc. | | | 8,893,880 | |
| | | |
| | | 36,350 | | | Juniper Networks, Inc. | | | 1,228,266 | |
| | | |
| | | 12,400 | | | Methode Electronics, Inc. | | | 565,936 | |
| | | |
| | | 4,200 | | | NetApp, Inc. | | | 329,196 | |
| | | |
| | | 3,100 | | | Plexus Corp. * | | | 252,557 | |
| | | |
| | | 21,986 | | | Seagate Technology Holdings Plc | | | 2,268,076 | |
| | | |
| | | 8,600 | | | Super Micro Computer, Inc. * | | | 337,894 | |
| | | |
| | | 10,019 | | | TE Connectivity Ltd. | | | 1,427,006 | |
| | | |
| | | 15,695 | | | Xerox Holdings Corp. | | | 309,348 | |
| | | | | | | | | | |
| | | |
| | | | | | Total Technology Hardware & Equipment | | | 55,375,740 | |
| | | | | | | | | | |
| | |
| | | | | | Telecommunication Services — 3.3% | |
| | | |
| | | 318,000 | | | AT&T, Inc. | | | 7,533,420 | |
| | | |
| | | 14,758 | | | Telephone & Data Systems, Inc. | | | 256,051 | |
| | | |
| | | 8,100 | | | United States Cellular Corp. * | | | 222,831 | |
| | | |
| | | 133,240 | | | Verizon Communications, Inc. | | | 7,150,991 | |
| | | | | | | | | | |
| | | |
| | | | | | Total Telecommunication Services | | | 15,163,293 | |
| | | | | | | | | | |
| | |
| | | | | | Transportation — 0.1% | |
| | | |
| | | 19,000 | | | Schneider National, Inc. – Class B | | | 496,280 | |
| | | | | | | | | | |
| | | |
| | | | | | TOTAL COMMON STOCKS
(COST $421,517,889) | | | 454,808,629 | |
| | | | | | | | | | |
| | |
| | | | | | MUTUAL FUNDS — 2.3% | |
| | |
| | | | | | Affiliated Issuers — 2.3% | |
| | | |
| | | 2,076,300 | | | GMO U.S. Treasury Fund | | | 10,402,263 | |
| | | | | | | | | | |
| | | |
| | | | | | TOTAL MUTUAL FUNDS
(COST $10,428,439) | | | 10,402,263 | |
| | | | | | | | | | |
| | | | |
| | |
| | | See accompanying notes to the financial statements. | | 77 |
GMO U.S. Equity Fund
(A Series of GMO Trust)
Schedule of Investments — (Continued)
(showing percentage of total net assets)
February 28, 2022
| | | | | | | | | | |
| | | Shares | | | Description | | Value ($) | |
| | |
| | | | | | SHORT-TERM INVESTMENTS — 0.2% | |
| | |
| | | | | | Money Market Funds — 0.2% | |
| | | |
| | | 1,071,794 | | | State Street Institutional Treasury Money Market Fund – Premier Class, 0.01% (a) | | | 1,071,794 | |
| | | | | | | | | | |
| | | |
| | | | | | TOTAL SHORT-TERM INVESTMENTS
(COST $1,071,794) | | | 1,071,794 | |
| | | | | | | | | | |
| | | |
| | | | | | TOTAL INVESTMENTS — 100.2%
(Cost $433,018,122) | | | 466,282,686 | |
| | | |
| | | | | | Other Assets and Liabilities (net) — (0.2%) | | | (804,683 | ) |
| | | | | | | | | | |
| | | |
| | | | | | TOTAL NET ASSETS — 100.0% | | | $465,478,003 | |
| | | | | | | | | | |
A summary of outstanding financial instruments at February 28, 2022 is as follows:
Futures Contracts
| | | | | | | | | | | | |
| | | | |
Number
of
Contracts + | | Type | | Expiration
Date | | Notional
Amount ($) | | | Value/Net
Unrealized
Appreciation
(Depreciation) ($) | |
| Buys | | | | | | | | | | | | |
| 37 | | S&P 500 E-Mini | | March 2022 | | $ | 8,080,800 | | | $ | (326,928 | ) |
| | | | | | | | | | | | |
| + | Buys - Fund is long the futures contract. |
| | Sales - Fund is short the futures contract. |
As of February 28, 2022, for the above contracts and/or agreements, the Fund had sufficient cash and/or securities to cover commitments or collateral requirements, if any, of the relevant broker or exchange.
Notes to Schedule of Investments:
| * | Non-income producing security. |
| (a) | The rate disclosed is the 7 day net yield as of February 28, 2022. |
For a listing of definitions of acronyms, counterparty abbreviations and currency abbreviations used throughout the Schedule of Investments as well as the derivative tables, if any, please refer to page 87.
| | | | |
| | |
| 78 | | See accompanying notes to the financial statements. | | |
This page has been left blank intentionally.
GMO U.S. Small Cap Value Fund
(A Series of GMO Trust)
Portfolio Management
Day-to-day management of the Fund’s portfolio is the responsibility of the Global Equity team at Grantham, Mayo, Van Otterloo & Co. LLC.
Management Discussion and Analysis of Fund Performance
Class VI shares of GMO U.S. Small Cap Value Fund returned +13.21% (net) for the fiscal year ended February 28, 2022, as compared with +8.87% for the S&P SmallCap 600 Value Index.
During the year the performance of valuation-oriented models was mixed, with higher quality names underperforming the broader market. Stock selection was helped by other model groups, including Growth, Cross-Asset signals, and Corporate Alerts.
Stock selection was strong across a range of sectors including Financials, Health Care, Real Estate, Communication Services, Industrials, and Information Technology. Top contributors included overweight positioning toward SM Energy Company (Energy), Newmark Group (Real Estate), Penske Automotive Group (Consumer Discretionary), and IDT Corporation (Communication Services).
Top detractors included overweight positioning toward attractively valued names Sleep Number (Consumer Discretionary), Hyster-Yale Materials Handling (Industrials), Xerox (Information Technology), and Schweitzer-Mauduit International (Materials).
Sector allocation also detracted, primarily from underweight positioning toward Energy.
The views expressed herein are exclusively those of Grantham, Mayo, Van Otterloo & Co. LLC as of the date of this report and are subject to change. GMO disclaims any responsibility to update such views. They are not meant as investment advice. References to specific securities are not recommendations of such securities and may not be representative of any GMO portfolio’s current or future investments. All information is unaudited.
GMO U.S. Small Cap Value Fund
(A Series of GMO Trust)
Comparison of Change in Value of a $300,000,000 Investment in
GMO U.S. Small Cap Value Fund Class VI Shares, the S&P SmallCap 600 Value Index
and the Russell 2000 Value Index
As of February 28, 2022
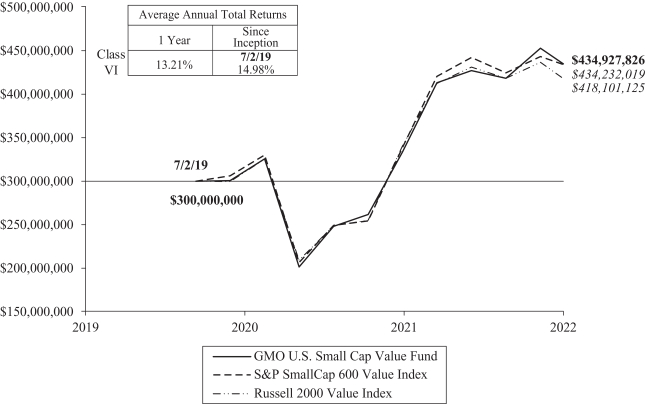
Performance data quoted represents past performance and is not indicative of future results. The investment return and principal value of an investment will fluctuate so that an investor’s shares, when redeemed, may be worth more or less than their original cost. Current performance data may be lower or higher than the performance data provided herein. To obtain performance information up to the most recent month-end, visit www.gmo.com. Performance shown is net of all fees after reimbursement from GMO. Returns would have been lower had certain expenses not been reimbursed during the periods shown and do not include the effect of taxes on distributions and redemptions. The performance information shown above only includes purchase premiums and/or redemption fees in effect as of February 28, 2022. All information is unaudited.
For S&P and Russell disclaimers please visit https://www.gmo.com/north-america/benchmark-disclaimers/
For Class VI the gross expense ratio of 0.41% is equal to the Fund’s Total Annual Operating Expenses set forth in the Fund’s most recent prospectus dated June 30, 2021. For the Class listed above, the net expense ratio of 0.41% reflects the reduction of expenses from fee reimbursements. The fee reimbursements will continue until at least June 30, 2022. Elimination of this reimbursement will result in higher fees and lower performance.
GMO U.S. Small Cap Value Fund
(A Series of GMO Trust)
Investment Concentration Summary
February 28, 2022 (Unaudited)
| | | | |
| Asset Class Summary& | | % of Total Net Assets | |
Common Stocks | | | 99.6 | % |
Mutual Funds | | | 0.5 | |
Short-Term Investments | | | 0.3 | |
Rights/Warrants | | | 0.0 | ^ |
Other | | | (0.4 | ) |
| | | | |
| | | 100.0 | % |
| | | | |
| | | | |
| Industry Group Summary | | % of Equity Investments# | |
Banks | | | 12.7 | % |
Capital Goods | | | 9.9 | |
Materials | | | 9.9 | |
Technology Hardware & Equipment | | | 8.8 | |
Retailing | | | 7.8 | |
Commercial & Professional Services | | | 7.7 | |
Diversified Financials | | | 6.8 | |
Consumer Durables & Apparel | | | 6.5 | |
Insurance | | | 5.6 | |
Real Estate | | | 5.0 | |
Media & Entertainment | | | 4.0 | |
Energy | | | 3.7 | |
Pharmaceuticals, Biotechnology & Life Sciences | | | 2.5 | |
Health Care Equipment & Services | | | 2.4 | |
Food, Beverage & Tobacco | | | 2.1 | |
Telecommunication Services | | | 1.3 | |
Food & Staples Retailing | | | 1.1 | |
Consumer Services | | | 1.0 | |
Transportation | | | 0.5 | |
Household & Personal Products | | | 0.3 | |
Semiconductors & Semiconductor Equipment | | | 0.2 | |
Automobiles & Components | | | 0.2 | |
| | | | |
| | | 100.0 | % |
| | | | |
| & | In the table, derivative financial instruments, if any, are based on market values, rather than the notional amounts of derivatives, except for forward currency contracts which are based on unrealized appreciation/(depreciation). |
| # | Equity investments may consist of common stocks and other stock-related securities, such as preferred stocks, if any. This table excludes exposure to derivative contracts, short-term investments, mutual funds and investment funds, if any. For a summary of these exposures, if any, see the Schedule of Investments. |
GMO U.S. Small Cap Value Fund
(A Series of GMO Trust)
Schedule of Investments
(showing percentage of total net assets)
February 28, 2022
| | | | | | | | | | |
| | | Shares | | | Description | | Value ($) | |
| | |
| | | | | | COMMON STOCKS — 99.6% | |
| | |
| | | | | | Automobiles & Components — 0.2% | |
| | | |
| | | 11,700 | | | Standard Motor Products, Inc. | | | 511,407 | |
| | | | | | | | | | |
| | |
| | | | | | Banks — 12.6% | |
| | | |
| | | 10,306 | | | 1st Source Corp. | | | 497,677 | |
| | | |
| | | 19,725 | | | Amalgamated Financial Corp. | | | 338,678 | |
| | | |
| | | 2,648 | | | Arrow Financial Corp. | | | 90,959 | |
| | | |
| | | 186,799 | | | Associated Banc-Corp. | | | 4,556,028 | |
| | | |
| | | 8,600 | | | Atlantic Union Bankshares Corp. | | | 349,418 | |
| | | |
| | | 9,000 | | | BCB Bancorp, Inc. | | | 163,980 | |
| | | |
| | | 18,391 | | | Brookline Bancorp, Inc. | | | 315,222 | |
| | | |
| | | 3,700 | | | Camden National Corp. | | | 175,935 | |
| | | |
| | | 24,776 | | | Cathay General Bancorp | | | 1,165,215 | |
| | | |
| | | 7,200 | | | Central Valley Community Bancorp | | | 166,104 | |
| | | |
| | | 4,670 | | | Civista Bancshares, Inc. | | | 113,901 | |
| | | |
| | | 7,567 | | | CNB Financial Corp. | | | 197,877 | |
| | | |
| | | 8,996 | | | Community Trust Bancorp, Inc. | | | 380,351 | |
| | | |
| | | 15,904 | | | Enterprise Financial Services Corp. | | | 786,294 | |
| | | |
| | | 8,500 | | | Farmers National Banc Corp. | | | 146,455 | |
| | | |
| | | 13,204 | | | Financial Institutions, Inc. | | | 421,736 | |
| | | |
| | | 8,668 | | | First Commonwealth Financial Corp. | | | 139,988 | |
| | | |
| | | 6,905 | | | First Community Bankshares, Inc. | | | 202,524 | |
| | | |
| | | 23,698 | | | First Financial Bancorp | | | 582,497 | |
| | | |
| | | 7,500 | | | First Financial Corp. | | | 348,825 | |
| | | |
| | | 658 | | | First Interstate BancSystem, Inc. – Class A | | | 26,715 | |
| | | |
| | | 105,512 | | | Flagstar Bancorp, Inc. | | | 4,809,237 | |
| | | |
| | | 12,153 | | | Flushing Financial Corp. | | | 285,474 | |
| | | |
| | | 19,066 | | | Fulton Financial Corp. | | | 343,569 | |
| | | |
| | | 3,012 | | | Great Southern Bancorp, Inc. | | | 184,997 | |
| | | |
| | | 26,289 | | | Hanmi Financial Corp. | | | 686,669 | |
| | | |
| | | 13,600 | | | Heartland Financial USA, Inc. | | | 674,832 | |
| | | |
| | | 93,400 | | | Hope Bancorp, Inc. | | | 1,584,064 | |
| | | |
| | | 14,900 | | | Horizon Bancorp, Inc. | | | 299,192 | |
| | | |
| | | 14,791 | | | Independent Bank Corp. | | | 352,026 | |
| | | |
| | | 15,151 | | | International Bancshares Corp. | | | 651,645 | |
| | | |
| | | 3,300 | | | LCNB Corp. | | | 60,027 | |
| | | |
| | | 5,636 | | | Mercantile Bank Corp. | | | 207,799 | |
| | | |
| | | 1,422 | | | Merchants Bancorp | | | 41,167 | |
| | | |
| | | 4,800 | | | MidWestOne Financial Group, Inc. | | | 144,912 | |
| | | |
| | | 15,226 | | | NBT Bancorp, Inc. | | | 584,222 | |
| | | |
| | | 86,480 | | | OFG Bancorp | | | 2,437,006 | |
| | | |
| | | 19,157 | | | Old National Bancorp | | | 350,190 | |
| | | |
| | | 29,711 | | | Provident Financial Services, Inc. | | | 705,042 | |
| | | |
| | | 7,000 | | | QCR Holdings, Inc. | | | 391,020 | |
| | | |
| | | 107,800 | | | Radian Group, Inc. | | | 2,576,420 | |
| | | |
| | | 5,395 | | | RBB Bancorp | | | 130,127 | |
| | | |
| | | 2,013 | | | Republic Bancorp, Inc. – Class A | | | 92,356 | |
| | | |
| | | 1,890 | | | Sierra Bancorp | | | 50,728 | |
| | | |
| | | 27,696 | | | Towne Bank | | | 863,561 | |
| | | |
| | | 19,886 | | | TriCo Bancshares | | | 863,052 | |
| | | | | | | | | | |
| | | Shares | | | Description | | Value ($) | |
| | |
| | | | | | Banks — continued | |
| | | |
| | | 12,720 | | | TrustCo Bank Corp. NY | | | 434,642 | |
| | | |
| | | 12,729 | | | Univest Financial Corp. | | | 368,886 | |
| | | |
| | | 33,867 | | | Waterstone Financial, Inc. | | | 661,761 | |
| | | | | | | | | | |
| | | |
| | | | | | Total Banks | | | 32,001,002 | |
| | | | | | | | | | |
| | |
| | | | | | Capital Goods — 9.9% | |
| | | |
| | | 37,800 | | | Allison Transmission Holdings, Inc. | | | 1,509,732 | |
| | | |
| | | 5,500 | | | American Woodmark Corp. * | | | 294,690 | |
| | | |
| | | 10,598 | | | Apogee Enterprises, Inc. | | | 477,652 | |
| | | |
| | | 20,871 | | | Applied Industrial Technologies, Inc. | | | 2,110,058 | |
| | | |
| | | 4,700 | | | Argan, Inc. | | | 182,783 | |
| | | |
| | | 29,400 | | | Atkore, Inc. * | | | 2,990,274 | |
| | | |
| | | 1,600 | | | AZZ, Inc. | | | 78,768 | |
| | | |
| | | 4,400 | | | Boise Cascade Co. | | | 351,736 | |
| | | |
| | | 2,181 | | | Ducommun, Inc. * | | | 110,162 | |
| | | |
| | | 3,300 | | | Encore Wire Corp. | | | 384,186 | |
| | | |
| | | 84,900 | | | Gates Industrial Corp Plc * | | | 1,344,816 | |
| | | |
| | | 1,500 | | | Global Industrial Co. | | | 47,670 | |
| | | |
| | | 4,900 | | | Griffon Corp. | | | 112,945 | |
| | | |
| | | 20,370 | | | Hyster-Yale Materials Handling, Inc. | | | 779,764 | |
| | | |
| | | 12,647 | | | Insteel Industries, Inc. | | | 469,330 | |
| | | |
| | | 20,300 | | | JELD-WEN Holding, Inc. * | | | 468,524 | |
| | | |
| | | 3,668 | | | Miller Industries, Inc. | | | 113,635 | |
| | | |
| | | 22,319 | | | Moog, Inc. – Class A | | | 1,854,932 | |
| | | |
| | | 3,400 | | | MSC Industrial Direct Co., Inc. – Class A | | | 263,432 | |
| | | |
| | | 49,655 | | | Mueller Industries, Inc. | | | 2,832,818 | |
| | | |
| | | 12,600 | | | MYR Group, Inc. * | | | 1,130,850 | |
| | | |
| | | 11,352 | | | Park-Ohio Holdings Corp. | | | 180,383 | |
| | | |
| | | 3,500 | | | PGT Innovations, Inc. * | | | 75,285 | |
| | | |
| | | 2,496 | | | Preformed Line Products Co. | | | 139,152 | |
| | | |
| | | 71,395 | | | Primoris Services Corp. | | | 1,882,686 | |
| | | |
| | | 23,735 | | | Resideo Technologies, Inc. * | | | 610,939 | |
| | | |
| | | 6,400 | | | Tennant Co. | | | 504,192 | |
| | | |
| | | 27,926 | | | Tutor Perini Corp. * | | | 273,675 | |
| | | |
| | | 28,519 | | | UFP Industries, Inc. | | | 2,445,504 | |
| | | |
| | | 22,848 | | | Vectrus, Inc. * | | | 1,047,352 | |
| | | | | | | | | | |
| | | |
| | | | | | Total Capital Goods | | | 25,067,925 | |
| | | | | | | | | | |
| | |
| | | | | | Commercial & Professional Services — 7.7% | |
| | | |
| | | 29,500 | | | ABM Industries, Inc. | | | 1,322,485 | |
| | | |
| | | 218,849 | | | ACCO Brands Corp. | | | 1,882,101 | |
| | | |
| | | 2,635 | | | Brady Corp. – Class A | | | 121,421 | |
| | | |
| | | 9,100 | | | CBIZ, Inc. * | | | 354,081 | |
| | | |
| | | 2,480 | | | CRA International, Inc. | | | 220,298 | |
| | | |
| | | 43,979 | | | Deluxe Corp. | | | 1,368,187 | |
| | | |
| | | 3,200 | | | DLH Holdings Corp. * | | | 55,360 | |
| | | |
| | | 10,900 | | | Ennis, Inc. | | | 204,702 | |
| | | |
| | | 446,285 | | | GEO Group, Inc. (The) (REIT) | | | 2,659,859 | |
| | | |
| | | 17,471 | | | Heidrick & Struggles International, Inc. | | | 746,885 | |
| | | |
| | | 30,534 | | | HNI Corp. | | | 1,242,428 | |
| | | |
| | | 10,300 | | | ICF International, Inc. | | | 912,786 | |
| | | | |
| | |
| | | See accompanying notes to the financial statements. | | 83 |
GMO U.S. Small Cap Value Fund
(A Series of GMO Trust)
Schedule of Investments — (Continued)
(showing percentage of total net assets)
February 28, 2022
| | | | | | | | | | |
| | | Shares | | | Description | | Value ($) | |
| | |
| | | | | | Commercial & Professional Services — continued | |
| | | |
| | | 48,318 | | | Interface, Inc. – Class A | | | 630,550 | |
| | | |
| | | 44,200 | | | Kelly Services, Inc. – Class A | | | 937,924 | |
| | | |
| | | 18,518 | | | Kforce, Inc. | | | 1,392,183 | |
| | | |
| | | 77,773 | | | Kimball International, Inc. – Class B | | | 720,956 | |
| | | |
| | | 14,960 | | | Matthews International Corp. – Class A | | | 496,373 | |
| | | |
| | | 123,200 | | | Pitney Bowes, Inc. | | | 613,536 | |
| | | |
| | | 35,500 | | | Quad/Graphics, Inc. * | | | 194,540 | |
| | | |
| | | 48,790 | | | Resources Connection, Inc. | | | 809,914 | |
| | | |
| | | 159,893 | | | Steelcase, Inc. – Class A | | | 1,945,898 | |
| | | |
| | | 24,293 | | | TrueBlue, Inc. * | | | 660,770 | |
| | | | | | | | | | |
| | | |
| | | | | | Total Commercial & Professional Services | | | 19,493,237 | |
| | | | | | | | | | |
| | |
| | | | | | Consumer Durables & Apparel — 6.5% | |
| | | |
| | | 27,000 | | | Acushnet Holdings Corp. | | | 1,182,600 | |
| | | |
| | | 3,700 | | | American Outdoor Brands, Inc. * | | | 57,831 | |
| | | |
| | | 11,200 | | | Bassett Furniture Industries, Inc. | | | 196,560 | |
| | | |
| | | 4,852 | | | Clarus Corp. | | | 110,480 | |
| | | |
| | | 109,977 | | | Ethan Allen Interiors, Inc. | | | 2,866,001 | |
| | | |
| | | 21,433 | | | G-III Apparel Group Ltd. * | | �� | 594,551 | |
| | | |
| | | 8,846 | | | Hooker Furniture Corp. | | | 185,766 | |
| | | |
| | | 4,922 | | | Johnson Outdoors, Inc. – Class A | | | 405,917 | |
| | | |
| | | 59,991 | | | La-Z-Boy, Inc. | | | 1,750,537 | |
| | | |
| | | 11,600 | | | MasterCraft Boat Holdings, Inc. * | | | 332,224 | |
| | | |
| | | 33,845 | | | MDC Holdings, Inc. | | | 1,500,687 | |
| | | |
| | | 42,435 | | | Movado Group, Inc. | | | 1,672,788 | |
| | | |
| | | 600 | | | Sturm Ruger & Co., Inc. | | | 43,446 | |
| | | |
| | | 189,892 | | | TRI Pointe Homes, Inc. * | | | 4,247,884 | |
| | | |
| | | 9,069 | | | Universal Electronics, Inc. * | | | 301,363 | |
| | | |
| | | 64,551 | | | Vera Bradley, Inc. * | | | 488,006 | |
| | | |
| | | 9,100 | | | Vista Outdoor, Inc. * | | | 331,695 | |
| | | |
| | | 12,100 | | | VOXX International Corp. * | | | 129,833 | |
| | | | | | | | | | |
| | | |
| | | | | | Total Consumer Durables & Apparel | | | 16,398,169 | |
| | | | | | | | | | |
| | |
| | | | | | Consumer Services — 1.0% | |
| | | |
| | | 11,700 | | | Adtalem Global Education, Inc. * | | | 243,126 | |
| | | |
| | | 4,300 | | | American Public Education, Inc. * | | | 85,828 | |
| | | |
| | | 9,500 | | | Carriage Services, Inc. | | | 467,495 | |
| | | |
| | | 1,552 | | | Graham Holdings Co. – Class B | | | 932,954 | |
| | | |
| | | 20,100 | | | Lincoln Educational Services Corp. * | | | 154,971 | |
| | | |
| | | 60,100 | | | Perdoceo Education Corp. * | | | 629,247 | |
| | | | | | | | | | |
| | | |
| | | | | | Total Consumer Services | | | 2,513,621 | |
| | | | | | | | | | |
| | |
| | | | | | Diversified Financials — 6.7% | |
| | | |
| | | 10,700 | | | A-Mark Precious Metals, Inc. | | | 767,190 | |
| | | |
| | | 32,100 | | | Blucora, Inc. * | | | 638,790 | |
| | | |
| | | 800 | | | Cowen, Inc. – Class A | | | 23,720 | |
| | | |
| | | 84,371 | | | Curo Group Holdings Corp. | | | 1,128,040 | |
| | | |
| | | 1,208 | | | Diamond Hill Investment Group, Inc. | | | 234,207 | |
| | | |
| | | 86,004 | | | Donnelley Financial Solutions, Inc. * | | | 2,760,729 | |
| | | |
| | | 21,500 | | | Encore Capital Group, Inc. * | | | 1,418,785 | |
| | | | | | | | | | |
| | | Shares | | | Description | | Value ($) | |
| | |
| | | | | | Diversified Financials — continued | |
| | | |
| | | 112,309 | | | Enova International, Inc. * | | | 4,578,838 | |
| | | |
| | | 86,302 | | | Federated Hermes, Inc. | | | 2,819,486 | |
| | | |
| | | 1,400 | | | Nelnet, Inc. – Class A | | | 112,770 | |
| | | |
| | | 13,700 | | | Oppenheimer Holdings, Inc. – Class A | | | 591,703 | |
| | | |
| | | 8,400 | | | Regional Management Corp. | | | 431,172 | |
| | | |
| | | 38,700 | | | Sculptor Capital Management, Inc. – Class A | | | 495,747 | |
| | | |
| | | 6,400 | | | StoneX Group, Inc. * | | | 482,880 | |
| | | |
| | | 12,200 | | | Victory Capital Holdings, Inc. – Class A | | | 404,674 | |
| | | |
| | | 8,814 | | | Westwood Holdings Group, Inc. | | | 145,872 | |
| | | | | | | | | | |
| | | |
| | | | | | Total Diversified Financials | | | 17,034,603 | |
| | | | | | | | | | |
| | |
| | | | | | Energy — 3.6% | |
| | | |
| | | 13,600 | | | California Resources Corp. | | | 560,728 | |
| | | |
| | | 47,260 | | | Evolution Petroleum Corp. | | | 369,101 | |
| | | |
| | | 38,600 | | | Falcon Minerals Corp. | | | 221,564 | |
| | | |
| | | 18,031 | | | Geospace Technologies Corp. * | | | 106,202 | |
| | | |
| | | 9,900 | | | Laredo Petroleum, Inc. * | | | 757,944 | |
| | | |
| | | 11,900 | | | Northern Oil and Gas, Inc. | | | 298,452 | |
| | | |
| | | 14,800 | | | Oil States International, Inc. * | | | 77,404 | |
| | | |
| | | 5,700 | | | SilverBow Resources, Inc. * | | | 146,604 | |
| | | |
| | | 551,100 | | | Southwestern Energy Co. * | | | 2,749,989 | |
| | | |
| | | 33,900 | | | VAALCO Energy, Inc. | | | 191,196 | |
| | | |
| | | 132,997 | | | World Fuel Services Corp. | | | 3,769,135 | |
| | | | | | | | | | |
| | | |
| | | | | | Total Energy | | | 9,248,319 | |
| | | | | | | | | | |
| | |
| | | | | | Food & Staples Retailing — 1.1% | |
| | | |
| | | 10,501 | | | Ingles Markets, Inc. – Class A | | | 863,392 | |
| | | |
| | | 14,200 | | | Natural Grocers by Vitamin Cottage, Inc. | | | 240,974 | |
| | | |
| | | 36,609 | | | SpartanNash Co. | | | 1,030,177 | |
| | | |
| | | 2,800 | | | Village Super Market, Inc. – Class A | | | 63,784 | |
| | | |
| | | 10,400 | | | Weis Markets, Inc. | | | 641,368 | |
| | | | | | | | | | |
| | | |
| | | | | | Total Food & Staples Retailing | | | 2,839,695 | |
| | | | | | | | | | |
| | |
| | | | | | Food, Beverage & Tobacco — 2.1% | |
| | | |
| | | 3,300 | | | Ingredion, Inc. | | | 292,842 | |
| | | |
| | | 4,400 | | | John B. Sanfilippo & Son, Inc. | | | 349,888 | |
| | | |
| | | 16 | | | Seaboard Corp. | | | 61,752 | |
| | | |
| | | 5,144 | | | Seneca Foods Corp. – Class A * | | | 255,914 | |
| | | |
| | | 5,600 | | | Turning Point Brands, Inc. | | | 187,712 | |
| | | |
| | | 48,959 | | | Universal Corp. | | | 2,649,171 | |
| | | |
| | | 126,500 | | | Vector Group Ltd. | | | 1,418,065 | |
| | | | | | | | | | |
| | | |
| | | | | | Total Food, Beverage & Tobacco | | | 5,215,344 | |
| | | | | | | | | | |
| | |
| | | | | | Health Care Equipment & Services — 2.4% | |
| | | |
| | | 79,500 | | | Allscripts Healthcare Solutions, Inc. * | | | 1,547,070 | |
| | | |
| | | 34,500 | | | Brookdale Senior Living, Inc. * | | | 237,360 | |
| | | |
| | | 7,700 | | | Computer Programs & Systems, Inc. * | | | 237,006 | |
| | | |
| | | 13,700 | | | Cross Country Healthcare, Inc. * | | | 305,921 | |
| | | |
| | | 19,800 | | | Eargo, Inc. * | | | 95,238 | |
| | | |
| | | 10,819 | | | FONAR Corp. * | | | 186,952 | |
| | | | |
| | |
| 84 | | See accompanying notes to the financial statements. | | |
GMO U.S. Small Cap Value Fund
(A Series of GMO Trust)
Schedule of Investments — (Continued)
(showing percentage of total net assets)
February 28, 2022
| | | | | | | | | | |
| | | Shares | | | Description | | Value ($) | |
| | |
| | | | | | Health Care Equipment & Services — continued | |
| | | |
| | | 12,100 | | | HealthStream, Inc. * | | | 247,929 | |
| | | |
| | | 10,058 | | | LENSAR, Inc. * | | | 58,940 | |
| | | |
| | | 6,000 | | | Meridian Bioscience, Inc. * | | | 151,800 | |
| | | |
| | | 3,300 | | | National HealthCare Corp. | | | 214,566 | |
| | | |
| | | 5,200 | | | Natus Medical, Inc. * | | | 144,664 | |
| | | |
| | | 36,900 | | | NextGen Healthcare, Inc. * | | | 720,657 | |
| | | |
| | | 38,500 | | | Select Medical Holdings Corp. | | | 891,275 | |
| | | |
| | | 46,200 | | | Varex Imaging Corp. * | | | 1,092,168 | |
| | | | | | | | | | |
| | | |
| | | | | | Total Health Care Equipment & Services | | | 6,131,546 | |
| | | | | | | | | | |
| | |
| | | | | | Household & Personal Products — 0.3% | |
| | | |
| | | 2,700 | | | Central Garden & Pet Co. * | | | 127,818 | |
| | | |
| | | 1,700 | | | Central Garden & Pet Co. – Class A * | | | 74,868 | |
| | | |
| | | 4,800 | | | Edgewell Personal Care Co. | | | 171,264 | |
| | | |
| | | 2,200 | | | Inter Parfums, Inc. | | | 204,336 | |
| | | |
| | | 29,143 | | | Lifevantage Corp. * | | | 162,618 | |
| | | | | | | | | | |
| | | |
| | | | | | Total Household & Personal Products | | | 740,904 | |
| | | | | | | | | | |
| | |
| | | | | | Insurance — 5.6% | |
| | | |
| | | 7,100 | | | American Equity Investment Life Holding Co. | | | 267,599 | |
| | | |
| | | 5,700 | | | American National Group, Inc. | | | 1,077,471 | |
| | | |
| | | 104,700 | | | CNO Financial Group, Inc. | | | 2,530,599 | |
| | | |
| | | 3,800 | | | Employers Holdings, Inc. | | | 147,668 | |
| | | |
| | | 55,600 | | | First American Financial Corp. | | | 3,727,424 | |
| | | |
| | | 367,200 | | | Genworth Financial, Inc. – Class A * | | | 1,490,832 | |
| | | |
| | | 249,100 | | | GoHealth, Inc. – Class A * | | | 555,493 | |
| | | |
| | | 22,000 | | | Horace Mann Educators Corp. | | | 914,980 | |
| | | |
| | | 4,000 | | | Mercury General Corp. | | | 220,000 | |
| | | |
| | | 67,100 | | | Selectquote, Inc. * | | | 208,681 | |
| | | |
| | | 41,590 | | | Stewart Information Services Corp. | | | 2,823,129 | |
| | | |
| | | 22,600 | | | Universal Insurance Holdings, Inc. | | | 261,256 | |
| | | | | | | | | | |
| | | |
| | | | | | Total Insurance | | | 14,225,132 | |
| | | | | | | | | | |
| | |
| | | | | | Materials — 9.8% | |
| | | |
| | | 29,648 | | | AdvanSix, Inc. | | | 1,187,699 | |
| | | |
| | | 18,808 | | | American Vanguard Corp. | | | 283,437 | |
| | | |
| | | 7,000 | | | Avient Corp. | | | 366,730 | |
| | | |
| | | 52,500 | | | Cabot Corp. | | | 3,840,900 | |
| | | |
| | | 14,000 | | | Commercial Metals Co. | | | 539,700 | |
| | | |
| | | 8,900 | | | FutureFuel Corp. | | | 65,504 | |
| | | |
| | | 8,100 | | | Greif, Inc. – Class A | | | 465,669 | |
| | | |
| | | 51,900 | | | Huntsman Corp. | | | 2,098,836 | |
| | | |
| | | 2,600 | | | Innospec, Inc. | | | 248,300 | |
| | | |
| | | 24,219 | | | Koppers Holdings, Inc. * | | | 693,390 | |
| | | |
| | | 44,180 | | | Mercer International, Inc. | | | 590,687 | |
| | | |
| | | 13,959 | | | Neenah, Inc. | | | 543,703 | |
| | | |
| | | 6,000 | | | NewMarket Corp. | | | 1,906,560 | |
| | | |
| | | 8,000 | | | Olympic Steel, Inc. | | | 214,160 | |
| | | |
| | | 5,500 | | | Reliance Steel & Aluminum Co. | | | 1,049,785 | |
| | | |
| | | 33,300 | | | Schnitzer Steel Industries, Inc. – Class A | | | 1,620,045 | |
| | | | | | | | | | |
| | | Shares | | | Description | | Value ($) | |
| | |
| | | | | | Materials — continued | |
| | | |
| | | 66,424 | | | Schweitzer-Mauduit International, Inc. | | | 2,073,757 | |
| | | |
| | | 9,400 | | | Stepan Co. | | | 974,028 | |
| | | |
| | | 63,443 | | | Trinseo Plc | | | 3,296,498 | |
| | | |
| | | 7,800 | | | Warrior Met Coal, Inc. | | | 245,700 | |
| | | |
| | | 15,800 | | | Westlake Chemical Corp. | | | 1,742,898 | |
| | | |
| | | 15,800 | | | Worthington Industries, Inc. | | | 900,916 | |
| | | | | | | | | | |
| | | |
| | | | | | Total Materials | | | 24,948,902 | |
| | | | | | | | | | |
| | |
| | | | | | Media & Entertainment — 4.0% | |
| | | |
| | | 64,000 | | | AMC Networks, Inc.– Class A * | | | 2,652,800 | |
| | | |
| | | 71,651 | | | Cars.com, Inc. * | | | 1,159,313 | |
| | | |
| | | 60,383 | | | DHI Group, Inc. * | | | 341,768 | |
| | | |
| | | 4,200 | | | Lee Enterprises, Inc. * | | | 139,860 | |
| | | |
| | | 17,100 | | | Scholastic Corp. | | | 719,568 | |
| | | |
| | | 26,500 | | | Sciplay Corp. – Class A * | | | 345,560 | |
| | | |
| | | 209,790 | | | TEGNA, Inc. | | | 4,808,387 | |
| | | | | | | | | | |
| | | |
| | | | | | Total Media & Entertainment | | | 10,167,256 | |
| | | | | | | | | | |
| | |
| | | | | | Pharmaceuticals, Biotechnology & Life Sciences — 2.5% | |
| | | |
| | | 13,600 | | | Amneal Pharmaceuticals, Inc. * | | | 61,608 | |
| | | |
| | | 12,700 | | | Phibro Animal Health Corp. – Class A | | | 270,510 | |
| | | |
| | | 99,220 | | | Prestige Consumer Healthcare, Inc. * | | | 5,906,567 | |
| | | |
| | | 2,300 | | | Supernus Pharmaceuticals, Inc. * | | | 73,485 | |
| | | | | | | | | | |
| | | |
| | | | | | Total Pharmaceuticals, Biotechnology & Life Sciences | | | 6,312,170 | |
| | | | | | | | | | |
| | |
| | | | | | Real Estate — 5.0% | |
| | | |
| | | 33,200 | | | Cushman & Wakefield Plc * | | | 727,744 | |
| | | |
| | | 68,300 | | | Diversified Healthcare Trust (REIT) | | | 196,704 | |
| | | |
| | | 12,381 | | | Five Point Holdings LLC – Class A * | | | 73,295 | |
| | | |
| | | 10,470 | | | Forestar Group, Inc. * | | | 191,706 | |
| | | |
| | | 288,014 | | | Newmark Group, Inc. – Class A | | | 5,092,087 | |
| | | |
| | | 3,600 | | | Piedmont Office Realty Trust, Inc. – Class A (REIT) | | | 61,344 | |
| | | |
| | | 26,600 | | | PotlatchDeltic Corp. (REIT) | | | 1,460,340 | |
| | | |
| | | 271,082 | | | Realogy Holdings Corp. * | | | 4,928,271 | |
| | | | | | | | | | |
| | | |
| | | | | | Total Real Estate | | | 12,731,491 | |
| | | | | | | | | | |
| | |
| | | | | | Retailing — 7.8% | |
| | | |
| | | 17,100 | | | Aaron’s Co. , Inc. (The) | | | 358,929 | |
| | | |
| | | 14,020 | | | Cato Corp. (The) – Class A | | | 246,752 | |
| | | |
| | | 20,300 | | | Container Store Group, Inc. (The) * | | | 179,249 | |
| | | |
| | | 37,987 | | | Genesco, Inc. * | | | 2,436,866 | |
| | | |
| | | 24,094 | | | Group 1 Automotive, Inc. | | | 4,383,421 | |
| | | |
| | | 60,294 | | | Haverty Furniture Cos, Inc. | | | 1,712,953 | |
| | | |
| | | 14,200 | | | Party City Holdco, Inc. * | | | 61,486 | |
| | | |
| | | 28,313 | | | Penske Automotive Group, Inc. | | | 2,782,885 | |
| | | |
| | | 79,100 | | | Qurate Retail, Inc. – Series A | | | 435,841 | |
| | | |
| | | 92,496 | | | Shoe Carnival, Inc. | | | 2,697,183 | |
| | | |
| | | 34,400 | | | Signet Jewelers Ltd. | | | 2,425,200 | |
| | | | |
| | |
| | | See accompanying notes to the financial statements. | | 85 |
GMO U.S. Small Cap Value Fund
(A Series of GMO Trust)
Schedule of Investments — (Continued)
(showing percentage of total net assets)
February 28, 2022
| | | | | | | | | | |
| | | Shares | | | Description | | Value ($) | |
| | |
| | | | | | Retailing — continued | |
| | | |
| | | 19,934 | | | Sleep Number Corp.* | | | 1,309,664 | |
| | | |
| | | 51,100 | | | Tilly’s, Inc. – Class A | | | 648,970 | |
| | | |
| | | 2,094 | | | Weyco Group, Inc. | | | 52,036 | |
| | | | | | | | | | |
| | | |
| | | | | | Total Retailing | | | 19,731,435 | |
| | | | | | | | | | |
| | |
| | | | | | Semiconductors & Semiconductor Equipment — 0.2% | |
| | | |
| | | 4,700 | | | Axcelis Technologies, Inc.* | | | 325,334 | |
| | | |
| | | 5,200 | | | CyberOptics Corp.* | | | 197,704 | |
| | | | | | | | | | |
| | | |
| | | | | | Total Semiconductors & Semiconductor Equipment | | | 523,038 | |
| | | | | | | | | | |
| | |
| | | | | | Technology Hardware & Equipment — 8.8% | |
| | | |
| | | 56,790 | | | ADTRAN, Inc. | | | 1,169,306 | |
| | | |
| | | 113,913 | | | Avnet, Inc. | | | 4,792,320 | |
| | | |
| | | 35,219 | | | Benchmark Electronics, Inc. | | | 920,625 | |
| | | |
| | | 15,400 | | | Casa Systems, Inc.* | | | 64,064 | |
| | | |
| | | 34,861 | | | CTS Corp. | | | 1,322,626 | |
| | | |
| | | 24,800 | | | Daktronics, Inc.* | | | 114,328 | |
| | | |
| | | 11,600 | | | DZS, Inc.* | | | 168,084 | |
| | | |
| | | 5,500 | | | ePlus, Inc.* | | | 257,950 | |
| | | |
| | | 24,878 | | | Kimball Electronics, Inc.* | | | 428,897 | |
| | | |
| | | 67,600 | | | Knowles Corp.* | | | 1,472,328 | |
| | | |
| | | 32,609 | | | Methode Electronics, Inc. | | | 1,488,275 | |
| | | |
| | | 3,500 | | | National Instruments Corp. | | | 140,525 | |
| | | |
| | | 21,100 | | | NETGEAR, Inc.* | | | 561,471 | |
| | | |
| | | 15,300 | | | NetScout Systems, Inc.* | | | 476,289 | |
| | | |
| | | 7,600 | | | OSI Systems, Inc.* | | | 613,092 | |
| | | |
| | | 5,100 | | | Plexus Corp.* | | | 415,497 | |
| | | |
| | | 8,600 | | | Quantum Corp.* | | | 22,360 | |
| | | |
| | | 22,400 | | | Ribbon Communications, Inc.* | | | 68,096 | |
| | | |
| | | 37,645 | | | Sanmina Corp.* | | | 1,497,518 | |
| | | |
| | | 12,853 | | | ScanSource, Inc.* | | | 405,898 | |
| | | |
| | | 27,944 | | | Super Micro Computer, Inc.* | | | 1,097,919 | |
| | | |
| | | 86,800 | | | Vishay Intertechnology, Inc. | | | 1,665,692 | |
| | | |
| | | 160,422 | | | Xerox Holdings Corp. | | | 3,161,917 | |
| | | | | | | | | | |
| | | |
| | | | | | Total Technology Hardware & Equipment | | | 22,325,077 | |
| | | | | | | | | | |
| | |
| | | | | | Telecommunication Services — 1.3% | |
| | | |
| | | 5,200 | | | ATN International, Inc. | | | 173,316 | |
| | | |
| | | 4,600 | | | Ooma, Inc.* | | | 76,912 | |
| | | |
| | | 58,721 | | | Spok Holdings, Inc. | | | 514,396 | |
| | | |
| | | 123,632 | | | Telephone & Data Systems, Inc. | | | 2,145,015 | |
| | | |
| | | 14,452 | | | United States Cellular Corp.* | | | 397,575 | |
| | | | | | | | | | |
| | | |
| | | | | | Total Telecommunication Services | | | 3,307,214 | |
| | | | | | | | | | |
| | |
| | | | | | Transportation — 0.5% | |
| | | |
| | | 51,100 | | | Schneider National, Inc. – Class B | | | 1,334,732 | |
| | | | | | | | | | |
| | | |
| | | | | | TOTAL COMMON STOCKS
(COST $229,015,361) | | | 252,802,219 | |
| | | | | | | | | | |
| | | | | | | | | | |
| | | Shares | | | Description | | Value ($) | |
| | | |
| | | | | | MUTUAL FUNDS — 0.5% | | | | |
| | |
| | | | | | Affiliated Issuers — 0.5% | |
| | | |
| | | 231,242 | | | GMO U.S. Treasury Fund | | | 1,158,524 | |
| | | | | | | | | | |
| | | |
| | | | | | TOTAL MUTUAL FUNDS
(COST $1,162,153) | | | 1,158,524 | |
| | | | | | | | | | |
| | |
| | | | | | RIGHTS/WARRANTS — 0.0% | |
| | |
| | | | | | Pharmaceuticals, Biotechnology & Life Sciences — 0.0% | |
| | | |
| | | 72,700 | | | Achillion Pharmaceuticals, Inc. CVR * (a) | | | 36,350 | |
| | | | | | | | | | |
| | | |
| | | | | | TOTAL RIGHTS/WARRANTS
(COST $33,442) | | | 36,350 | |
| | | | | | | | | | |
| | |
| | | | | | SHORT-TERM INVESTMENTS — 0.3% | |
| | |
| | | | | | Money Market Funds — 0.3% | |
| | | |
| | | 802,888 | | | State Street Institutional Treasury Money Market Fund – Premier Class, 0.01% (b) | | | 802,888 | |
| | | | | | | | | | |
| | | |
| | | | | | TOTAL SHORT-TERM INVESTMENTS
(COST $802,888) | | | 802,888 | |
| | | | | | | | | | |
| | | |
| | | | | | TOTAL INVESTMENTS — 100.4%
(Cost $231,013,844) | | | 254,799,981 | |
| | | |
| | | | | | Other Assets and Liabilities (net) — (0.4%) | | | (989,747 | ) |
| | | | | | | | | | |
| | | |
| | | | | | TOTAL NET ASSETS — 100.0% | | | $253,810,234 | |
| | | | | | | | | | |
Notes to Schedule of Investments:
| * | Non-income producing security. |
| (a) | Investment valued using significant unobservable inputs (Note 2). |
| (b) | The rate disclosed is the 7 day net yield as of February 28, 2022. |
For a listing of definitions of acronyms, counterparty abbreviations and currency abbreviations used throughout the Schedule of Investments as well as the derivative tables, if any, please refer to page 87.
| | | | |
| | |
| 86 | | See accompanying notes to the financial statements. | | |
GMO Trust Funds
Schedule of Investments — (Continued)
February 28, 2022
Portfolio Abbreviations:
ADR - American Depositary Receipt
CPO - Ordinary Participation Certificate (certificado de Participacion Ordinares), representing a bundle of shares of the multiple series of one issuer that trade together as a unit.
CVA - Certificaaten van aandelen (Share Certificates)
CVR - Contingent Value Right
ETF - Exchange-Traded Fund
Foreign Registered - Shares issued to foreign investors in markets that have foreign ownership limits.
GDR - Global Depositary Receipt
JSC - Joint-Stock Company
NVDR - Non-Voting Depositary Receipt
OJSC - Open Joint-Stock Company
PJSC - Private Joint-Stock Company
QPSC - Qatar Private Stock Company
QSC - Qatari Shareholding Company
REIT - Real Estate Investment Trust
SOFOM - Sociedades Financieras de Objeto Multi (Multi-purpose Financial Company)
USBM - U.S. Treasury 3 Month Bill Money Market Yield.
The rates shown on variable rate notes are the current interest rates at February 28, 2022, which are subject to change based on the terms of the security.
| | | | |
| | |
| | | See accompanying notes to the financial statements. | | 87 |
GMO Trust Funds
Statements of Assets and Liabilities — February 28, 2022
| | | | | | | | | | | | | | | | |
| | | Climate
Change Fund | | | Emerging
Domestic
Opportunities
Fund | | | Emerging
Markets
ex-China Fund | | | Emerging
Markets Fund | |
Assets: | |
| | | | |
Investments in affiliated issuers, at value (Notes 2 and 10)(a) | | $ | 58,977,551 | | | $ | 2,331,522 | | | $ | 4,374 | | | $ | 4,476,665 | |
| | | | |
Investments in unaffiliated issuers, at value (Note 2)(b) (c) | | | 728,593,530 | | | | 748,049,544 | | | | 295,579,322 | | | | 1,928,080,949 | |
| | | | |
Foreign currency, at value (Note 2)(d) | | | 53,245 | | | | 6,419,286 | | | | 27,698 | | | | 3,780,327 | |
| | | | |
Receivable for investments sold | | | — | | | | 3,537,968 | | | | 1,875,063 | | | | 398,217 | |
| | | | |
Receivable for Fund shares sold | | | 538,148 | | | | — | | | | — | | | | 246,364 | |
| | | | |
Dividends and interest receivable | | | 619,259 | | | | 1,772,891 | | | | 1,126,061 | | | | 5,120,047 | |
| | | | |
Dividend withholding tax receivable | | | 43,346 | | | | — | | | | 107 | | | | 14,810 | |
| | | | |
Foreign capital gains tax refund receivable (Note 2) | | | — | | | | 5,843,614 | | | | — | | | | 4,196,388 | |
| | | | |
Due from broker (Note 2) | | | — | | | | 12 | | | | — | | | | 1,358,526 | |
| | | | |
Receivable for expenses reimbursed and/or waived by GMO (Note 5) | | | 35,328 | | | | 22,821 | | | | 35,529 | | | | 85,364 | |
| | | | | | | | | | | | | | | | |
| | | | |
Total assets | | | 788,860,407 | | | | 767,977,658 | | | | 298,648,154 | | | | 1,947,757,657 | |
| | | | | | | | | | | | | | | | |
|
Liabilities: | |
| | | | |
Due to custodian | | | — | | | | 240,161 | | | | — | | | | — | |
| | | | |
Foreign taxes payable | | | — | | | | 953,055 | | | | — | | | | — | |
| | | | |
Payable for cash collateral from securities loaned (Note 2) | | | 58,114,580 | | | | — | | | | — | | | | — | |
| | | | |
Payable for investments purchased | | | 4,869 | | | | 4,340,167 | | | | 1,123,786 | | | | 1,762,680 | |
| | | | |
Payable for Fund shares repurchased | | | 24,341 | | | | 109,157 | | | | — | | | | 3,041,406 | |
| | | | |
Accrued foreign capital gains tax payable (Note 2) | | | — | | | | 820,634 | | | | — | | | | 2,665,834 | |
|
Payable to affiliate for (Note 5): | |
| | | | |
Management fee | | | 314,048 | | | | 454,351 | | | | 144,442 | | | | 1,077,132 | |
| | | | |
Shareholder service fee | | | 78,512 | | | | 77,679 | | | | 14,796 | | | | 169,718 | |
| | | | |
Payable for variation margin on open futures contracts (Note 4) | | | — | | | | — | | | | — | | | | 2,182,163 | |
| | | | |
Payable to Trustees and related expenses | | | 2,274 | | | | 2,826 | | | | 4,231 | | | | 3,867 | |
| | | | |
Accrued expenses | | | 168,913 | | | | 458,827 | | | | 263,639 | | | | 1,250,509 | |
| | | | |
Miscellaneous payable | | | — | | | | — | | | | — | | | | 871,960 | |
| | | | | | | | | | | | | | | | |
| | | | |
Total liabilities | | | 58,707,537 | | | | 7,456,857 | | | | 1,550,894 | | | | 13,025,269 | |
| | | | | | | | | | | | | | | | |
Net assets | | $ | 730,152,870 | | | $ | 760,520,801 | | | $ | 297,097,260 | | | $ | 1,934,732,388 | |
| | | | | | | | | | | | | | | | |
| | | | |
(a) Cost of investments – affiliated issuers: | | $ | 59,022,760 | | | $ | 2,340,826 | | | $ | 4,391 | | | $ | 13,358,337 | |
| | | | |
(b) Cost of investments – unaffiliated issuers: | | $ | 714,527,414 | | | $ | 739,693,434 | | | $ | 355,508,355 | | | $ | 2,191,691,641 | |
| | | | |
(c) Includes securities on loan at value (Note 2): | | $ | 91,001,729 | | | $ | — | | | $ | — | | | $ | 15,874,184 | |
| | | | |
(d) Cost of foreign currency: | | $ | 53,283 | | | $ | 6,434,365 | | | $ | 28,298 | | | $ | 3,815,629 | |
| | | | |
| | |
| 88 | | See accompanying notes to the financial statements. | | |
GMO Trust Funds
Statements of Assets and Liabilities — February 28, 2022 — (Continued)
| | | | | | | | | | | | | | | | |
| | | Climate
Change Fund | | | Emerging
Domestic
Opportunities
Fund | | | Emerging
Markets
ex-China Fund | | | Emerging
Markets Fund | |
Net assets consist of: | |
| | | | |
Paid-in capital | | $ | 713,162,521 | | | $ | 809,378,027 | | | $ | 356,217,566 | | | $ | 3,317,427,119 | |
| | | | |
Distributable earnings (accumulated loss) | | | 16,990,349 | | | | (48,857,226 | ) | | | (59,120,306 | ) | | | (1,382,694,731 | ) |
| | | | | | | | | | | | | | | | |
| | $ | 730,152,870 | | | $ | 760,520,801 | | | $ | 297,097,260 | | | $ | 1,934,732,388 | |
| | | | | | | | | | | | | | | | |
Net assets attributable to: | |
| | | | |
Class II | | $ | — | | | $ | 238,702,379 | | | $ | — | | | $ | 262,449,023 | |
| | | | | | | | | | | | | | | | |
| | | | |
Class III | | $ | 306,996,270 | | | $ | — | | | $ | 14,809,881 | | | $ | 267,177,349 | |
| | | | | | | | | | | | | | | | |
| | | | |
Class V | | $ | — | | | $ | 510,306,575 | | | $ | — | | | $ | — | |
| | | | | | | | | | | | | | | | |
| | | | |
Class VI | | $ | — | | | $ | — | | | $ | 282,286,946 | | | $ | 1,244,914,018 | |
| | | | | | | | | | | | | | | | |
| | | | |
Class R6 | | $ | 115,013,733 | | | $ | — | | | $ | — | | | $ | 40,197,323 | |
| | | | | | | | | | | | | | | | |
| | | | |
Class I | | $ | 308,142,867 | | | $ | 11,511,847 | | | $ | 433 | | | $ | 119,994,675 | |
| | | | | | | | | | | | | | | | |
Shares outstanding: | |
| | | | |
Class II | | | — | | | | 10,869,932 | | | | — | | | | 8,804,222 | |
| | | | | | | | | | | | | | | | |
| | | | |
Class III | | | 10,155,361 | | | | — | | | | 889,328 | | | | 8,933,779 | |
| | | | | | | | | | | | | | | | |
| | | | |
Class V | | | — | | | | 23,230,026 | | | | — | | | | — | |
| | | | | | | | | | | | | | | | |
| | | | |
Class VI | | | — | | | | — | | | | 16,948,677 | | | | 42,113,738 | |
| | | | | | | | | | | | | | | | |
| | | | |
Class R6 | | | 3,811,653 | | | | — | | | | — | | | | 1,349,923 | |
| | | | | | | | | | | | | | | | |
| | | | |
Class I | | | 10,217,888 | | | | 524,497 | | | | 26 | | | | 4,032,861 | |
| | | | | | | | | | | | | | | | |
Net asset value per share: | |
| | | | |
Class II | | $ | — | | | $ | 21.96 | | | $ | — | | | $ | 29.81 | |
| | | | | | | | | | | | | | | | |
| | | | |
Class III | | $ | 30.23 | | | $ | — | | | $ | 16.65 | | | $ | 29.91 | |
| | | | | | | | | | | | | | | | |
| | | | |
Class V | | $ | — | | | $ | 21.97 | | | $ | — | | | $ | — | |
| | | | | | | | | | | | | | | | |
| | | | |
Class VI | | $ | — | | | $ | — | | | $ | 16.66 | | | $ | 29.56 | |
| | | | | | | | | | | | | | | | |
| | | | |
Class R6 | | $ | 30.17 | | | $ | — | | | $ | — | | | $ | 29.78 | |
| | | | | | | | | | | | | | | | |
| | | | |
Class I | | $ | 30.16 | | | $ | 21.95 | | | $ | 16.64 | | | $ | 29.75 | |
| | | | | | | | | | | | | | | | |
| | | | |
| | |
| | | See accompanying notes to the financial statements. | | 89 |
GMO Trust Funds
Statements of Assets and Liabilities — February 28, 2022 — (Continued)
| | | | | | | | | | | | | | | | |
| | | International
Equity Fund | | | Japan Value
Creation Fund | | | Quality
Cyclicals Fund
(formerly
Cyclical Focus
Fund) | | | Quality Fund | |
Assets: | |
| | | | |
Investments in affiliated issuers, at value (Notes 2 and 10)(a) | | $ | — | | | $ | — | | | $ | 434,957 | | | $ | 5,788,348 | |
| | | | |
Investments in unaffiliated issuers, at value (Note 2)(b) | | | 1,978,219,047 | | | | 161,001,429 | | | | 141,079,374 | | | | 8,340,765,475 | |
| | | | |
Foreign currency, at value (Note 2)(c) | | | 65,228 | | | | — | | | | 44,203 | | | | 1,771,922 | |
| | | | |
Receivable for investments sold | | | — | | | | 208,708 | | | | — | | | | — | |
| | | | |
Receivable for Fund shares sold | | | 75,761 | | | | 451,392 | | | | — | | | | 8,215,138 | |
| | | | |
Dividends and interest receivable | | | 2,611,548 | | | | 173,303 | | | | 207,823 | | | | 8,324,814 | |
| | | | |
Dividend withholding tax receivable | | | 1,862,917 | | | | 3,332 | | | | 9,587 | | | | 2,208,037 | |
| | | | |
EU tax reclaims receivable (Note 2) | | | 1,840,967 | | | | — | | | | — | | | | 272,627 | |
| | | | |
Due from broker (Note 2) | | | 4,357 | | | | — | | | | — | | | | — | |
| | | | |
Receivable for expenses reimbursed and/or waived by GMO (Note 5) | | | 10,976 | | | | 28,616 | | | | 15,980 | | | | 258,701 | |
| | | | | | | | | | | | | | | | |
| | | | |
Total assets | | | 1,984,690,801 | | | | 161,866,780 | | | | 141,791,924 | | | | 8,367,605,062 | |
| | | | | | | | | | | | | | | | |
|
Liabilities: | |
| | | | |
Payable for investments purchased | | | — | | | | 154,172 | | | | 63,490 | | | | — | |
| | | | |
Payable for Fund shares repurchased | | | 30,329,451 | | | | 1,740,000 | | | | 75,994 | | | | 4,718,482 | |
| | | | |
Payable for IRS closing agreement fees (Note 2) | | | 50,614,118 | | | | — | | | | — | | | | — | |
|
Payable to affiliate for (Note 5): | |
| | | | |
Management fee | | | 770,861 | | | | 61,935 | | | | 36,843 | | | | 2,168,823 | |
| | | | |
Shareholder service fee | | | 156,949 | | | | 7,245 | | | | 6,147 | | | | 695,652 | |
| | | | |
Payable for variation margin on open futures contracts (Note 4) | | | 246,906 | | | | — | | | | — | | | | — | |
| | | | |
Payable to Trustees and related expenses | | | 7,083 | | | | 566 | | | | 486 | | | | 33,059 | |
| | | | |
Accrued expenses | | | 815,064 | | | | 88,594 | | | | 62,761 | | | | 819,463 | |
| | | | | | | | | | | | | | | | |
| | | | |
Total liabilities | | | 82,940,432 | | | | 2,052,512 | | | | 245,721 | | | | 8,435,479 | |
| | | | | | | | | | | | | | | | |
Net assets | | $ | 1,901,750,369 | | | $ | 159,814,268 | | | $ | 141,546,203 | | | $ | 8,359,169,583 | |
| | | | | | | | | | | | | | | | |
| | | | |
(a) Cost of investments – affiliated issuers: | | $ | — | | | $ | — | | | $ | 436,694 | | | $ | 5,776,758 | |
| | | | |
(b) Cost of investments – unaffiliated issuers: | | $ | 1,996,075,016 | | | $ | 166,236,403 | | | $ | 110,403,122 | | | $ | 4,919,552,293 | |
| | | | |
(c) Cost of foreign currency: | | $ | 64,854 | | | $ | — | | | $ | 44,196 | | | $ | 1,771,658 | |
| | | | |
| | |
| 90 | | See accompanying notes to the financial statements. | | |
GMO Trust Funds
Statements of Assets and Liabilities — February 28, 2022 — (Continued)
| | | | | | | | | | | | | | | | |
| | | International
Equity Fund | | | Japan Value
Creation Fund | | | Quality
Cyclicals Fund
(formerly
Cyclical Focus
Fund) | | | Quality Fund | |
Net assets consist of: | |
| | | | |
Paid-in capital | | $ | 2,794,618,548 | | | $ | 160,706,692 | | | $ | 108,008,649 | | | $ | 4,735,724,256 | |
| | | | |
Distributable earnings (accumulated loss) | | | (892,868,179 | ) | | | (892,424 | ) | | | 33,537,554 | | | | 3,623,445,327 | |
| | | | | | | | | | | | | | | | |
| | $ | 1,901,750,369 | | | $ | 159,814,268 | | | $ | 141,546,203 | | | $ | 8,359,169,583 | |
| | | | | | | | | | | | | | | | |
Net assets attributable to: | |
| | | | |
Class II | | $ | 5,614,671 | | | $ | — | | | $ | — | | | $ | — | |
| | | | | | | | | | | | | | | | |
| | | | |
Class III | | $ | 358,775,123 | | | $ | 23,672,679 | | | $ | — | | | $ | 2,996,329,899 | |
| | | | | | | | | | | | | | | | |
| | | | |
Class IV | | $ | 1,534,339,125 | | | $ | — | | | $ | — | | | $ | 912,163,111 | |
| | | | | | | | | | | | | | | | |
| | | | |
Class VI | | $ | — | | | $ | 133,034,877 | | | $ | 141,464,741 | | | $ | 3,461,579,804 | |
| | | | | | | | | | | | | | | | |
| | | | |
Class R6 | | $ | — | | | $ | — | | | $ | — | | | $ | 507,231,578 | |
| | | | | | | | | | | | | | | | |
| | | | |
Class I | | $ | 3,021,450 | | | $ | 3,106,712 | | | $ | 81,462 | | | $ | 481,865,191 | |
| | | | | | | | | | | | | | | | |
Shares outstanding: | |
| | | | |
Class II | | | 247,378 | | | | — | | | | — | | | | — | |
| | | | | | | | | | | | | | | | |
| | | | |
Class III | | | 15,596,831 | | | | 1,201,005 | | | | — | | | | 106,810,563 | |
| | | | | | | | | | | | | | | | |
| | | | |
Class IV | | | 66,826,180 | | | | — | | | | — | | | | 32,429,145 | |
| | | | | | | | | | | | | | | | |
| | | | |
Class VI | | | — | | | | 6,749,328 | | | | 5,490,036 | | | | 123,384,128 | |
| | | | | | | | | | | | | | | | |
| | | | |
Class R6 | | | — | | | | — | | | | — | | | | 18,101,684 | |
| | | | | | | | | | | | | | | | |
| | | | |
Class I | | | 130,920 | | | | 157,808 | | | | 3,162 | | | | 17,215,886 | |
| | | | | | | | | | | | | | | | |
Net asset value per share: | |
| | | | |
Class II | | $ | 22.70 | | | $ | — | | | $ | — | | | $ | — | |
| | | | | | | | | | | | | | | | |
| | | | |
Class III | | $ | 23.00 | | | $ | 19.71 | | | $ | — | | | $ | 28.05 | |
| | | | | | | | | | | | | | | | |
| | | | |
Class IV | | $ | 22.96 | | | $ | — | | | $ | — | | | $ | 28.13 | |
| | | | | | | | | | | | | | | | |
| | | | |
Class VI | | $ | — | | | $ | 19.71 | | | $ | 25.77 | | | $ | 28.06 | |
| | | | | | | | | | | | | | | | |
| | | | |
Class R6 | | $ | — | | | $ | — | | | $ | — | | | $ | 28.02 | |
| | | | | | | | | | | | | | | | |
| | | | |
Class I | | $ | 23.08 | | | $ | 19.69 | | | $ | 25.76 | | | $ | 27.99 | |
| | | | | | | | | | | | | | | | |
| | | | |
| | |
| | | See accompanying notes to the financial statements. | | 91 |
GMO Trust Funds
Statements of Assets and Liabilities — February 28, 2022 — (Continued)
| | | | | | | | | | | | | | | | |
| | | Resources
Fund | | | Tax-Managed
International
Equities Fund | | | U.S. Equity
Fund | | | U.S. Small
Cap Value
Fund | |
Assets: | |
| | | | |
Investments in affiliated issuers, at value (Notes 2 and 10)(a) | | $ | — | | | $ | 999,833 | | | $ | 10,402,263 | | | $ | 1,158,524 | |
| | | | |
Investments in unaffiliated issuers, at value (Note 2)(b) (c) | | | 2,191,481,701 | | | | 31,262,033 | | | | 455,880,423 | | | | 253,641,457 | |
| | | | |
Foreign currency, at value (Note 2)(d) | | | 1,063,562 | | | | 33,842 | | | | — | | | | — | |
| | | | |
Cash | | | 18,087,409 | | | | — | | | | — | | | | — | |
| | | | |
Receivable for Fund shares sold | | | 7,556,842 | | | | — | | | | — | | | | — | |
| | | | |
Dividends and interest receivable | | | 6,524,235 | | | | 56,286 | | | | 591,338 | | | | 222,277 | |
| | | | |
Dividend withholding tax receivable | | | 532,592 | | | | 26,845 | | | | — | | | | — | |
| | | | |
Foreign capital gains tax refund receivable (Note 2) | | | — | | | | 2,381 | | | | — | | | | — | |
| | | | |
Due from broker (Note 2) | | | — | | | | 31,167 | | | | 541,000 | | | | 51,316 | |
| | | | |
Receivable for expenses reimbursed and/or waived by GMO (Note 5) | | | — | | | | 34,776 | | | | 13,076 | | | | — | |
| | | | | | | | | | | | | | | | |
| | | | |
Total assets | | | 2,225,246,341 | | | | 32,447,163 | | | | 467,428,100 | | | | 255,073,574 | |
| | | | | | | | | | | | | | | | |
Liabilities: | |
| | | | |
Due to broker (Note 2) | | | — | | | | 38 | | | | 35 | | | | — | |
| | | | |
Payable for investments purchased | | | 18,087,409 | | | | — | | | | — | | | | — | |
| | | | |
Payable for Fund shares repurchased | | | 652,085 | | | | — | | | | 1,700,000 | | | | 1,100,000 | |
| | | | |
Accrued foreign capital gains tax payable (Note 2) | | | 1,500,519 | | | | — | | | | — | | | | — | |
| | | | |
Payable for IRS closing agreement fees (Note 2) | | | — | | | | 485,865 | | | | — | | | | — | |
|
Payable to affiliate for (Note 5): | |
| | | | |
Management fee | | | 847,143 | | | | 12,629 | | | | 112,120 | | | | 60,619 | |
| | | | |
Shareholder service fee | | | 186,560 | | | | 3,789 | | | | 25,835 | | | | 10,755 | |
| | | | |
Payable for variation margin on open futures contracts (Note 4) | | | — | | | | 4,180 | | | | 26,738 | | | | — | |
| | | | |
Payable to Trustees and related expenses | | | 7,642 | | | | 122 | | | | 1,692 | | | | 1,040 | |
| | | | |
Accrued expenses | | | 413,071 | | | | 159,266 | | | | 83,677 | | | | 90,926 | |
| | | | | | | | | | | | | | | | |
| | | | |
Total liabilities | | | 21,694,429 | | | | 665,889 | | | | 1,950,097 | | | | 1,263,340 | |
| | | | | | | | | | | | | | | | |
Net assets | | $ | 2,203,551,912 | | | $ | 31,781,274 | | | $ | 465,478,003 | | | $ | 253,810,234 | |
| | | | | | | | | | | | | | | | |
| | | | |
(a) Cost of investments – affiliated issuers: | | $ | — | | | $ | 1,002,797 | | | $ | 10,428,439 | | | $ | 1,162,153 | |
| | | | |
(b) Cost of investments – unaffiliated issuers: | | $ | 1,941,982,681 | | | $ | 26,860,533 | | | $ | 422,589,683 | | | $ | 229,851,691 | |
| | | | |
(c) Includes securities on loan at value (Note 2): | | $ | 71,566,064 | | | $ | — | | | $ | — | | | $ | — | |
| | | | |
(d) Cost of foreign currency: | | $ | 1,144,700 | | | $ | 34,414 | | | $ | — | | | $ | — | |
| | | | |
| | |
| 92 | | See accompanying notes to the financial statements. | | |
GMO Trust Funds
Statements of Assets and Liabilities — February 28, 2022 — (Continued)
| | | | | | | | | | | | | | | | |
| | | Resources
Fund | | | Tax-Managed
International
Equities Fund | | | U.S. Equity
Fund | | | U.S. Small
Cap Value
Fund | |
Net assets consist of: | |
| | | | |
Paid-in capital | | $ | 1,912,871,429 | | | $ | 27,463,518 | | | $ | 410,245,531 | | | $ | 215,087,124 | |
| | | | |
Distributable earnings (accumulated loss) | | | 290,680,483 | | | | 4,317,756 | | | | 55,232,472 | | | | 38,723,110 | |
| | | | | | | | | | | | | | | | |
| | $ | 2,203,551,912 | | | $ | 31,781,274 | | | $ | 465,478,003 | | | $ | 253,810,234 | |
| | | | | | | | | | | | | | | | |
Net assets attributable to: | |
| | | | |
Class III | | $ | 239,224,866 | | | $ | 31,781,274 | | | $ | 80,645,942 | | | $ | — | |
| | | | | | | | | | | | | | | | |
| | | | |
Class IV | | $ | 383,353,358 | | | $ | — | | | $ | — | | | $ | — | |
| | | | | | | | | | | | | | | | |
| | | | |
Class VI | | $ | 842,697,995 | | | $ | — | | | $ | 384,832,061 | | | $ | 253,810,234 | |
| | | | | | | | | | | | | | | | |
| | | | |
Class R6 | | $ | 105,086,404 | | | $ | — | | | $ | — | | | $ | — | |
| | | | | | | | | | | | | | | | |
| | | | |
Class I | | $ | 633,189,289 | | | $ | — | | | $ | — | | | $ | — | |
| | | | | | | | | | | | | | | | |
Shares outstanding: | |
| | | | |
Class III | | | 8,426,227 | | | | 2,222,202 | | | | 5,892,803 | | | | — | |
| | | | | | | | | | | | | | | | |
| | | | |
Class IV | | | 13,545,674 | | | | — | | | | — | | | | — | |
| | | | | | | | | | | | | | | | |
| | | | |
Class VI | | | 29,775,768 | | | | — | | | | 28,473,749 | | | | 12,855,601 | |
| | | | | | | | | | | | | | | | |
| | | | |
Class R6 | | | 3,703,714 | | | | — | | | | — | | | | — | |
| | | | | | | | | | | | | | | | |
| | | | |
Class I | | | 22,306,316 | | | | — | | | | — | | | | — | |
| | | | | | | | | | | | | | | | |
Net asset value per share: | |
| | | | |
Class III | | $ | 28.39 | | | $ | 14.30 | | | $ | 13.69 | | | $ | — | |
| | | | | | | | | | | | | | | | |
| | | | |
Class IV | | $ | 28.30 | | | $ | — | | | $ | — | | | $ | — | |
| | | | | | | | | | | | | | | | |
| | | | |
Class VI | | $ | 28.30 | | | $ | — | | | $ | 13.52 | | | $ | 19.74 | |
| | | | | | | | | | | | | | | | |
| | | | |
Class R6 | | $ | 28.37 | | | $ | — | | | $ | — | | | $ | — | |
| | | | | | | | | | | | | | | | |
| | | | |
Class I | | $ | 28.39 | | | $ | — | | | $ | — | | | $ | — | |
| | | | | | | | | | | | | | | | |
| | | | |
| | |
| | | See accompanying notes to the financial statements. | | 93 |
GMO Trust Funds
Statements of Operations — Year Ended February 28, 2022
| | | | | | | | | | | | | | | | |
| | | Climate
Change Fund | | | Emerging
Domestic
Opportunities
Fund | | | Emerging
Markets
ex-China Fund* | | | Emerging
Markets Fund | |
Investment Income: | | | | | | | | | | | | | | | | |
| | | | |
Dividends from unaffiliated issuers (Net of withholding tax) (Note 2)(a) | | $ | 7,834,884 | | | $ | 14,578,715 | | | $ | 3,753,885 | | | $ | 114,312,565 | |
| | | | |
Dividends from affiliated issuers (Note 10) | | | 35,129 | | | | 11,088 | | | | 132 | | | | — | |
| | | | |
Interest | | | — | | | | 179,241 | | | | 2,834 | | | | 143,232 | |
| | | | |
Securities lending income from affiliated issuers (net) | | | 311,596 | | | | — | | | | — | | | | — | |
| | | | |
Securities lending income (net) | | | 325,896 | | | | — | | | | — | | | | 310,261 | |
| | | | |
Other income (Note 2) | | | — | | | | — | | | | — | | | | 1,255,159 | |
| | | | | | | | | | | | | | | | |
| | | | |
Total investment income | | | 8,507,505 | | | | 14,769,044 | | | | 3,756,851 | | | | 116,021,217 | |
| | | | | | | | | | | | | | | | |
Expenses: | |
| | | | |
Management fee (Note 5) | | | 3,182,553 | | | | 6,823,176 | | | | 680,810 | | | | 17,405,532 | |
| | | | |
Shareholder service fee – Class II (Note 5) | | | — | | | | 625,987 | | | | — | | | | 605,210 | |
| | | | |
Shareholder service fee – Class III (Note 5) | | | 370,233 | | | | — | | | | 1,653 | ** | | | 658,999 | |
| | | | |
Shareholder service fee – Class V (Note 5) | | | — | | | | 518,076 | | | | — | | | | 40,320 | **** |
| | | | |
Shareholder service fee – Class VI (Note 5) | | | — | | | | — | | | | 67,475 | * | | | 963,534 | |
| | | | |
Shareholder service fee – Class R6 (Note 5) | | | 132,856 | | | | — | | | | — | | | | 97,511 | |
| | | | |
Shareholder service fee – Class I (Note 5) | | | 292,550 | | | | 34,576 | | | | — | *** | | | 263,357 | |
| | | | |
Organizational expenses | | | — | | | | — | | | | 70,850 | | | | — | |
| | | | |
Audit and tax fees | | | 87,810 | | | | 113,890 | | | | 63,438 | | | | 122,789 | |
| | | | |
Custodian, fund accounting agent and transfer agent fees | | | 363,364 | | | | 783,401 | | | | 105,714 | | | | 2,076,331 | |
| | | | |
Legal fees | | | 13,608 | | | | 13,251 | | | | 58,081 | | | | 47,969 | |
| | | | |
Registration fees | | | 50,173 | | | | 39,670 | | | | 6,817 | | | | 80,327 | |
| | | | |
Trustees’ fees and related expenses (Note 5) | | | 18,792 | | | | 31,733 | | | | 5,068 | | | | 87,828 | |
| | | | |
Miscellaneous | | | 14,840 | | | | 18,959 | | | | 17,990 | | | | 63,935 | |
| | | | | | | | | | | | | | | | |
| | | | |
Total expenses | | | 4,526,779 | | | | 9,002,719 | | | | 1,077,896 | | | | 22,513,642 | |
| | | | |
Fees and expenses reimbursed and/or waived by GMO (Note 5) | | | (227,502 | ) | | | (192,116 | ) | | | (241,842 | ) | | | (1,136,577 | ) |
| | | | |
Indirectly incurred management fees waived or borne by GMO (Note 5) | | | (923 | ) | | | (1,477 | ) | | | — | | | | — | |
| | | | | | | | | | | | | | | | |
| | | | |
Net expenses | | | 4,298,354 | | | | 8,809,126 | | | | 836,054 | | | | 21,377,065 | |
| | | | | | | | | | | | | | | | |
| | | | |
Net investment income (loss) | | | 4,209,151 | | | | 5,959,918 | | | | 2,920,797 | | | | 94,644,152 | |
| | | | | | | | | | | | | | | | |
Realized and unrealized gain (loss): | |
|
Net realized gain (loss) on: | |
| | | | |
Investments in unaffiliated issuers (net of foreign capital gains tax) (Note 2)(b) | | | 64,002,080 | | | | 11,523,260 | | | | 730,403 | | | | 150,822,756 | |
| | | | |
Investments in affiliated issuers | | | (314,684 | ) | | | (89,053 | ) | | | (787 | ) | | | — | |
| | | | |
Realized gain distributions from affiliated issuers (Note 10) | | | 25,854 | | | | 4,791 | | | | 46 | | | | — | |
| | | | |
Futures contracts | | | — | | | | (3,487,829 | ) | | | — | | | | (25,010,820 | ) |
| | | | |
Swap contracts | | | — | | | | — | | | | — | | | | 9,559,073 | |
| | | | |
Foreign currency and foreign currency related transactions | | | (127,847 | ) | | | (1,486,679 | ) | | | (502,190 | ) | | | (1,015,088 | ) |
| | | | | | | | | | | | | | | | |
| | | | |
Net realized gain (loss) | | | 63,585,403 | | | | 6,464,490 | | | | 227,472 | | | | 134,355,921 | |
| | | | | | | | | | | | | | | | |
|
Change in net unrealized appreciation (depreciation) on: | |
| | | | |
Investments in unaffiliated issuers (net of foreign capital gains tax) (Note 2)(c) | | | (58,305,222 | ) | | | (140,825,948 | ) | | | (59,929,033 | ) | | | (558,163,364 | ) |
| | | | |
Investments in affiliated issuers | | | (45,209 | ) | | | (9,304 | ) | | | (17 | ) | | | (2,497,741 | ) |
| | | | |
Futures contracts | | | — | | | | — | | | | — | | | | (12,125,679 | ) |
| | | | |
Swap contracts | | | — | | | | — | | | | — | | | | (225,326 | ) |
| | | | |
Foreign currency and foreign currency related transactions | | | 23,646 | | | | 5,770 | | | | (18,543 | ) | | | 65,184 | |
| | | | | | | | | | | | | | | | |
| | | | |
Net change in unrealized appreciation (depreciation) | | | (58,326,785 | ) | | | (140,829,482 | ) | | | (59,947,593 | ) | | | (572,946,926 | ) |
| | | | | | | | | | | | | | | | |
| | | | |
Net realized and unrealized gain (loss) | | | 5,258,618 | | | | (134,364,992 | ) | | | (59,720,121 | ) | | | (438,591,005 | ) |
| | | | | | | | | | | | | | | | |
Net increase (decrease) in net assets resulting from operations | | $ | 9,467,769 | | | $ | (128,405,074 | ) | | $ | (56,799,324 | ) | | $ | (343,946,853 | ) |
| | | | | | | | | | | | | | | | |
| | | | |
(a) Withholding tax: | | $ | 680,708 | | | $ | 1,829,337 | | | $ | 550,658 | | | $ | 14,499,308 | |
| | | | |
(b) Foreign capital gains tax (benefit) on net realized gain (loss): | | $ | 22,896 | | | $ | 4,921,650 | | | $ | — | | | $ | 1,663,156 | |
| | | | |
(c) Foreign capital gains tax (benefit) on change in net unrealized appreciation (depreciation): | | $ | (26,624 | ) | | $ | (1,566,656 | ) | | $ | — | | | $ | 1,576,507 | |
|
* Period from October 18, 2021 (commencement of operations) through February 28, 2022. | |
|
** Period from November 17, 2021 (commencement of operations) through February 28, 2022. | |
|
*** Period from December 1, 2021 (commencement of operations) through February 28, 2022. | |
|
**** Class V liquidated on April 29, 2021. | |
| | | | |
| | |
| 94 | | See accompanying notes to the financial statements. | | |
GMO Trust Funds
Statements of Operations — Year Ended February 28, 2022 — (Continued)
| | | | | | | | | | | | | | | | |
| | | International
Equity Fund | | | Japan Value
Creation Fund | | | Quality
Cyclicals Fund
(formerly
Cyclical Focus
Fund) | | | Quality Fund | |
Investment Income: | | | | | | | | | | | | | | | | |
| | | | |
Dividends from unaffiliated issuers (Net of withholding tax) (Note 2)(a) | | $ | 79,846,759 | | | $ | 4,075,853 | | | $ | 3,774,687 | | | $ | 116,346,276 | |
| | | | |
Dividends from affiliated issuers (Note 10) | | | — | | | | — | | | | 552 | | | | 10,404 | |
| | | | |
Interest | | | 64,101 | | | | — | | | | — | | | | 4,129,832 | |
| | | | |
Non-cash paid in-kind dividends from unaffiliated issuers | | | 13,089,203 | | | | — | | | | — | | | | — | |
| | | | |
Securities lending income from affiliated issuers (net) | | | — | | | | — | | | | 1,468 | | | | — | |
| | | | |
Other income (Note 2) | | | 7,401,894 | | | | — | | | | — | | | | 15,276,004 | |
| | | | |
Less: IRS closing agreement fees (Note 2) | | | (2,387,964 | ) | | | — | | | | — | | | | — | |
| | | | | | | | | | | | | | | | |
| | | | |
Total investment income | | | 98,013,993 | | | | 4,075,853 | | | | 3,776,707 | | | | 135,762,516 | |
| | | | | | | | | | | | | | | | |
Expenses: | |
| | | | |
Management fee (Note 5) | | | 10,889,079 | | | | 829,930 | | | | 479,276 | | | | 28,530,759 | |
| | | | |
Shareholder service fee – Class II (Note 5) | | | 13,102 | | | | — | | | | — | | | | — | |
| | | | |
Shareholder service fee – Class III (Note 5) | | | 615,248 | | | | 464 | *** | | | — | | | | 5,292,034 | |
| | | | |
Shareholder service fee – Class IV (Note 5) | | | 1,584,603 | | | | — | | | | — | | | | 937,283 | |
| | | | |
Shareholder service fee – Class VI (Note 5) | | | — | | | | 90,303 | | | | 79,849 | | | | 1,824,932 | |
| | | | |
Shareholder service fee – Class R6 (Note 5) | | | — | | | | — | | | | — | | | | 698,542 | |
| | | | |
Shareholder service fee – Class I (Note 5) | | | 2,256 | * | | | 2,225 | **** | | | 82 | ***** | | | 661,888 | |
| | | | |
Audit and tax fees | | | 107,162 | | | | 81,650 | | | | 70,497 | | | | 149,674 | |
| | | | |
Custodian, fund accounting agent and transfer agent fees | | | 538,046 | | | | 48,211 | | | | 37,083 | | | | 1,589,798 | |
| | | | |
Legal fees | | | 467,671 | | | | 13,842 | | | | 9,754 | | | | 140,030 | |
| | | | |
Registration fees | | | 47,030 | | | | 1,076 | | | | 938 | | | | 87,626 | |
| | | | |
Trustees’ fees and related expenses (Note 5) | | | 70,860 | | | | 5,312 | | | | 4,920 | | | | 292,600 | |
| | | | |
Miscellaneous | | | 28,132 | ** | | | 7,443 | | | | 11,103 | | | | 84,305 | |
| | | | | | | | | | | | | | | | |
| | | | |
Total expenses | | | 14,363,189 | | | | 1,080,456 | | | | 693,502 | | | | 40,289,471 | |
| | | | |
Fees and expenses reimbursed and/or waived by GMO (Note 5) | | | (725,210 | ) | | | (131,199 | ) | | | (112,291 | ) | | | (1,533,044 | ) |
| | | | |
Indirectly incurred management fees waived or borne by GMO (Note 5) | | | — | | | | — | | | | (5 | ) | | | (840 | ) |
| | | | | | | | | | | | | | | | |
| | | | |
Net expenses | | | 13,637,979 | | | | 949,257 | | | | 581,206 | | | | 38,755,587 | |
| | | | | | | | | | | | | | | | |
| | | | |
Net investment income (loss) | | | 84,376,014 | | | | 3,126,596 | | | | 3,195,501 | | | | 97,006,929 | |
| | | | | | | | | | | | | | | | |
Realized and unrealized gain (loss): | | | | | | | | | | | | | | | | |
| | | | |
Net realized gain (loss) on: | | | | | | | | | | | | | | | | |
| | | | |
Investments in unaffiliated issuers | | | 215,980,501 | | | | 20,620,741 | | | | 16,578,659 | | | | 511,542,581 | |
| | | | |
Investments in affiliated issuers | | | — | | | | — | | | | (6,306 | ) | | | 23,857 | |
| | | | |
Realized gain distributions from affiliated issuers (Note 10) | | | — | | | | — | | | | 241 | | | | 7,534 | |
| | | | |
Futures contracts | | | (3,719,225 | ) | | | — | | | | — | | | | — | |
| | | | |
Foreign currency and foreign currency related transactions | | | (590,145 | ) | | | (92,285 | ) | | | 13,553 | | | | (128,897 | ) |
| | | | | | | | | | | | | | | | |
| | | | |
Net realized gain (loss) | | | 211,671,131 | | | | 20,528,456 | | | | 16,586,147 | | | | 511,445,075 | |
| | | | | | | | | | | | | | | | |
|
Change in net unrealized appreciation (depreciation) on: | |
| | | | |
Investments in unaffiliated issuers | | | (177,825,512 | ) | | | (25,647,520 | ) | | | (5,435,076 | ) | | | 498,059,429 | |
| | | | |
Investments in affiliated issuers | | | — | | | | — | | | | (1,737 | ) | | | (66,470 | ) |
| | | | |
Futures contracts | | | 370,276 | | | | — | | | | — | | | | — | |
| | | | |
Foreign currency and foreign currency related transactions | | | (418,691 | ) | | | 5,482 | | | | (561 | ) | | | (147,560 | ) |
| | | | | | | | | | | | | | | | |
| | | | |
Net change in unrealized appreciation (depreciation) | | | (177,873,927 | ) | | | (25,642,038 | ) | | | (5,437,374 | ) | | | 497,845,399 | |
| | | | | | | | | | | | | | | | |
| | | | |
Net realized and unrealized gain (loss) | | | 33,797,204 | | | | (5,113,582 | ) | | | 11,148,773 | | | | 1,009,290,474 | |
| | | | | | | | | | | | | | | | |
Net increase (decrease) in net assets resulting from operations | | $ | 118,173,218 | | | $ | (1,986,986 | ) | | $ | 14,344,274 | | | $ | 1,106,297,403 | |
| | | | | | | | | | | | | | | | |
| | | | |
(a) Withholding tax: | | $ | 6,395,734 | | | $ | 452,869 | | | $ | 111,883 | | | $ | 3,298,086 | |
| |
* Period from May, 24 2021 (commencement of operations) through February 28, 2022. | | | | | |
| |
** Includes $10,241 of pricing related fees. | | | | | |
| |
*** Period from December 30, 2021 (commencement of operations) through February 28, 2022. | | | | | |
| |
**** Period from June, 7 2021 (commencement of operations) through February 28, 2022. | | | | | |
| |
***** Period from July, 16 2021 (commencement of operations) through February 28, 2022. | | | | | |
| | | | |
| | |
| | | See accompanying notes to the financial statements. | | 95 |
GMO Trust Funds
Statements of Operations — Year Ended February 28, 2022 — (Continued)
| | | | | | | | | | | | | | | | |
| | | Resources
Fund | | | Tax-Managed
International
Equities Fund | | | U.S. Equity
Fund | | | U.S. Small
Cap Value
Fund | |
Investment Income: | | | | | | | | | | | | | | | | |
| | | | |
Dividends from unaffiliated issuers (Net of withholding tax)(Note 2)(a) | | $ | 81,230,558 | | | $ | 1,461,001 | | | $ | 7,476,292 | | | $ | 5,186,711 | |
| | | | |
Dividends from affiliated issuers (Note 10) | | | — | | | | 1,363 | | | | 10,849 | | | | 3,512 | |
| | | | |
Interest | | | 70,634 | | | | — | | | | — | | | | — | |
| | | | |
Non-cash paid in-kind dividends from unaffiliated issuers | | | — | | | | 236,781 | | | | — | | | | — | |
| | | | |
Securities lending income (net) | | | 352,243 | | | | — | | | | — | | | | — | |
| | | | |
Other income (Note 2) | | | — | | | | 592,009 | | | | — | | | | — | |
| | | | |
Less: IRS closing agreement fees (Note 2) | | | — | | | | (485,865 | ) | | | — | | | | — | |
| | | | | | | | | | | | | | | | |
| | | | |
Total investment income | | | 81,653,435 | | | | 1,805,289 | | | | 7,487,141 | | | | 5,190,223 | |
| | | | | | | | | | | | | | | | |
Expenses: | |
| | | | |
Management fee (Note 5) | | | 8,308,311 | | | | 195,184 | | | | 1,294,837 | | | | 925,704 | |
| | | | |
Shareholder service fee – Class III (Note 5) | | | 388,442 | | | | 58,555 | | | | 158,321 | | | | — | |
| | | | |
Shareholder service fee – Class IV (Note 5) | | | 813,159 | | | | — | | | | — | | | | — | |
| | | | |
Shareholder service fee – Class VI (Note 5) | | | 25,978 | * | | | — | | | | 171,678 | | | | 164,238 | |
| | | | |
Shareholder service fee – Class R6 (Note 5) | | | 33,520 | | | | — | | | | — | | | | — | |
| | | | |
Shareholder service fee – Class I (Note 5) | | | 779,944 | | | | — | | | | — | | | | — | |
| | | | |
Audit and tax fees | | | 101,952 | | | | 102,688 | | | | 62,583 | | | | 58,712 | |
| | | | |
Custodian, fund accounting agent and transfer agent fees | | | 1,163,614 | | | | 122,683 | | | | 65,374 | | | | 75,997 | |
| | | | |
Legal fees | | | 34,450 | | | | 48,004 | ** | | | 10,117 | | | | 9,191 | |
| | | | |
Registration fees | | | 87,568 | | | | 5,253 | | | | 28,675 | | | | 952 | |
| | | | |
Trustees’ fees and related expenses (Note 5) | | | 58,338 | | | | 1,336 | | | | 13,637 | | | | 10,249 | |
| | | | |
Miscellaneous | | | 32,586 | | | | 30,593 | *** | | | 7,704 | | | | 8,773 | |
| | | | | | | | | | | | | | | | |
| | | | |
Total expenses | | | 11,827,862 | | | | 564,296 | | | | 1,812,926 | | | | 1,253,816 | |
| | | | |
Fees and expenses reimbursed and/or waived by GMO (Note 5) | | | — | | | | (234,695 | ) | | | (170,339 | ) | | | — | |
| | | | |
Indirectly incurred management fees waived or borne by GMO (Note 5) | | | — | | | | (48 | ) | | | (400 | ) | | | (9 | ) |
| | | | | | | | | | | | | | | | |
| | | | |
Net expenses | | | 11,827,862 | | | | 329,553 | | | | 1,642,187 | | | | 1,253,807 | |
| | | | | | | | | | | | | | | | |
| | | | |
Net investment income (loss) | | | 69,825,573 | | | | 1,475,736 | | | | 5,844,954 | | | | 3,936,416 | |
| | | | | | | | | | | | | | | | |
Realized and unrealized gain (loss): | | | | | | | | | | | | | | | | |
| | | | |
Net realized gain (loss) on: | | | | | | | | | | | | | | | | |
| | | | |
Investments in unaffiliated issuers (net of foreign capital gains tax) (Note 2)(b) | | | 126,770,271 | | | | 6,700,830 | | | | 78,320,495 | | | | 76,903,086 | |
| | | | |
Investments in affiliated issuers | | | 9,193,888 | | | | (2,326 | ) | | | (11,857 | ) | | | (8,944 | ) |
| | | | |
Realized gain distributions from affiliated issuers (Note 10) | | | — | | | | 954 | | | | 10,431 | | | | 4,379 | |
| | | | |
Futures contracts | | | — | | | | 31,307 | | | | 1,087,616 | | | | 81,102 | |
| | | | |
Foreign currency and foreign currency related transactions | | | (367,233 | ) | | | (7,039 | ) | | | — | | | | — | |
| | | | | | | | | | | | | | | | |
| | | | |
Net realized gain (loss) | | | 135,596,926 | | | | 6,723,726 | | | | 79,406,685 | | | | 76,979,623 | |
| | | | | | | | | | | | | | | | |
|
Change in net unrealized appreciation (depreciation) on: | |
| | | | |
Investments in unaffiliated issuers (net of foreign capital gains tax) (Note 2)(c) | | | (17,113,051 | ) | | | (6,119,273 | ) | | | (32,940,038 | ) | | | (32,012,002 | ) |
| | | | |
Investments in affiliated issuers | | | — | | | | (3,006 | ) | | | (26,176 | ) | | | (3,629 | ) |
| | | | |
Futures contracts | | | — | | | | (21,792 | ) | | | (333,912 | ) | | | 109,220 | |
| | | | |
Foreign currency and foreign currency related transactions | | | (86,544 | ) | | | (15,200 | ) | | | — | | | | — | |
| | | | | | | | | | | | | | | | |
| | | | |
Net change in unrealized appreciation (depreciation) | | | (17,199,595 | ) | | | (6,159,271 | ) | | | (33,300,126 | ) | | | (31,906,411 | ) |
| | | | | | | | | | | | | | | | |
| | | | |
Net realized and unrealized gain (loss) | | | 118,397,331 | | | | 564,455 | | | | 46,106,559 | | | | 45,073,212 | |
| | | | | | | | | | | | | | | | |
Net increase (decrease) in net assets resulting from operations | | $ | 188,222,904 | | | $ | 2,040,191 | | | $ | 51,951,513 | | | $ | 49,009,628 | |
| | | | | | | | | | | | | | | | |
| | | | |
(a) Withholding tax: | | $ | 4,883,255 | | | $ | 126,140 | | | $ | 1,528 | | | $ | 10,720 | |
| | | | |
(b) Foreign capital gains tax (benefit) on net realized gain (loss): | | $ | 2,099,831 | | | $ | 1,458 | | | $ | — | | | $ | — | |
| | | | |
(c) Foreign capital gains tax (benefit) on change in net unrealized appreciation (depreciation): | | $ | (324,511 | ) | | $ | (1,274 | ) | | $ | — | | | $ | — | |
| | | | |
* Period from February 8, 2022 (commencement of operations) through February 28, 2022. | | | | | | | | | | | | | | | | |
| | | |
** Includes $44,625 of legal fees which are contingent in nature and attributed to EU tax reclaims (Note 2). | | | | | | | | | | | | | |
| | | | |
*** Includes $24,074 of pricing related fees. | | | | | | | | | | | | | | | | |
| | | | |
| | |
| 96 | | See accompanying notes to the financial statements. | | |
GMO Trust Funds
Statements of Changes in Net Assets
| | | | | | | | | | | | | | | | |
| | | Climate Change Fund(a) | | | Emerging Domestic
Opportunities Fund(a) | |
| | | Year Ended
February 28, | | | Year Ended
February 28, | |
| | | 2022 | | | 2021 | | | 2022 | | | 2021 | |
Increase (decrease) in net assets: | |
|
Operations: | |
| | | | |
Net investment income (loss) | | $ | 4,209,151 | | | $ | 2,313,784 | | | $ | 5,959,918 | | | $ | 7,624,834 | |
| | | | |
Net realized gain (loss) | | | 63,585,403 | | | | 33,276,767 | | | | 6,464,490 | | | | 92,893,737 | |
| | | | |
Change in net unrealized appreciation (depreciation) | | | (58,326,785 | ) | | | 71,640,346 | | | | (140,829,482 | ) | | | 152,551,097 | |
| | | | | | | | | | | | | | | | |
| | | | |
Net increase (decrease) in net assets from operations | | | 9,467,769 | | | | 107,230,897 | | | | (128,405,074 | ) | | | 253,069,668 | |
| | | | | | | | | | | | | | | | |
|
Distributions to shareholders: | |
| | | | |
Class II | | | — | | | | — | | | | (19,585,057 | ) | | | (1,859,130 | ) |
| | | | |
Class III | | | (39,431,752 | ) | | | (9,171,238 | ) | | | — | | | | (84,526 | )* |
| | | | |
Class V | | | — | | | | — | | | | (40,195,516 | ) | | | (5,157,641 | ) |
| | | | |
Class R6 | | | (13,530,453 | ) | | | (2,822,175 | ) | | | — | | | | — | |
| | | | |
Class I | | | (30,161,491 | ) | | | (1,789,912 | ) | | | (1,037,354 | ) | | | — | ** |
| | | | | | | | | | | | | | | | |
| | | | |
Total distributions | | | (83,123,696 | ) | | | (13,783,325 | ) | | | (60,817,927 | ) | | | (7,101,297 | ) |
| | | | | | | | | | | | | | | | |
|
Net share transactions (Note 9): | |
| | | | |
Class II | | | — | | | | — | | | | (10,423,150 | ) | | | (60,686,694 | ) |
| | | | |
Class III | | | 165,751,876 | | | | (6,186,295 | ) | | | — | | | | (97,209,926 | )* |
| | | | |
Class V | | | — | | | | — | | | | (62,497,493 | ) | | | (42,006,078 | ) |
| | | | |
Class R6 | | | 50,189,598 | | | | 54,335,435 | | | | — | | | | — | |
| | | | |
Class I | | | 235,985,857 | | | | 87,130,973 | | | | (3,642,128 | ) | | | 19,375,366 | ** |
| | | | | | | | | | | | | | | | |
| | | | |
Increase (decrease) in net assets resulting from net share transactions | | | 451,927,331 | | | | 135,280,113 | | | | (76,562,771 | ) | | | (180,527,332 | ) |
| | | | | | | | | | | | | | | | |
| | | | |
Total increase (decrease) in net assets | | | 378,271,404 | | | | 228,727,685 | | | | (265,785,772 | ) | | | 65,441,039 | |
|
| Net assets: | |
| | | | |
Beginning of period | | | 351,881,466 | | | | 123,153,781 | | | | 1,026,306,573 | | | | 960,865,534 | |
| | | | | | | | | | | | | | | | |
| | | | |
End of period | | $ | 730,152,870 | | | $ | 351,881,466 | | | $ | 760,520,801 | | | $ | 1,026,306,573 | |
| | | | | | | | | | | | | | | | |
| |
(a) A plan of reorganization was completed on January 22, 2021. | | | | | |
| |
* Class III liquidated on January 22, 2021. | | | | | |
| |
** Period from January 22, 2021 (commencement of operations) through February 28, 2021. | | | | | |
| | | | |
| | |
| | | See accompanying notes to the financial statements. | | 97 |
GMO Trust Funds
Statements of Changes in Net Assets — (Continued)
| | | | | | | | | | | | |
| | | Emerging
Markets
ex-China Fund | | | Emerging Markets Fund(a) | |
| | | Period from
October 18,
2021
(commencement
of operations)
through
February 28,
2022 | | | Year Ended
February 28, | |
| | | 2022 | | | 2021 | |
Increase (decrease) in net assets: | | | | | | | | | | | | |
| | | |
Operations: | | | | | | | | | | | | |
| | | |
Net investment income (loss) | | $ | 2,920,797 | | | $ | 94,644,152 | | | $ | 78,474,906 | |
| | | |
Net realized gain (loss) | | | 227,472 | | | | 134,355,921 | | | | 141,192,809 | |
| | | |
Change in net unrealized appreciation (depreciation) | | | (59,947,593 | ) | | | (572,946,926 | ) | | | 413,173,731 | |
| | | | | | | | | | | | |
| | | |
Net increase (decrease) in net assets from operations | | | (56,799,324 | ) | | | (343,946,853 | ) | | | 632,841,446 | |
| | | | | | | | | | | | |
|
Distributions to shareholders: | |
| | | |
Class II | | | — | | | | (10,877,340 | ) | | | (12,199,534 | ) |
| | | |
Class III | | | (23,270 | )* | | | (15,036,779 | ) | | | (17,045,072 | ) |
| | | |
Class V | | | — | | | | — | *** | | | (5,655,265 | ) |
| | | |
Class VI | | | (2,297,709 | ) | | | (65,952,879 | ) | | | (76,765,259 | ) |
| | | |
Class R6 | | | — | | | | (1,932,217 | ) | | | (936,435 | )**** |
| | | |
Class I | | | (3 | )** | | | (6,142,292 | ) | | | (1,295,377 | ) |
| | | | | | | | | | | | |
| | | |
Total distributions | | | (2,320,982 | ) | | | (99,941,507 | ) | | | (113,896,942 | ) |
| | | | | | | | | | | | |
|
Net share transactions (Note 9): | |
| | | |
Class II | | | — | | | | 24,140,732 | | | | (168,183,437 | ) |
| | | |
Class III | | | 16,365,827 | * | | | (166,371,558 | ) | | | 89,373,406 | |
| | | |
Class V | | | — | | | | (315,869,299 | )*** | | | 80,614,160 | |
| | | |
Class VI | | | 339,851,236 | | | | (249,450,634 | ) | | | (740,332,831 | ) |
| | | |
Class R6 | | | — | | | | 5,685,636 | | | | 36,659,585 | **** |
| | | |
Class I | | | 503 | ** | | | 67,945,520 | | | | 60,222,895 | |
| | | | | | | | | | | | |
| | | |
Increase (decrease) in net assets resulting from net share transactions | | | 356,217,566 | | | | (633,919,603 | ) | | | (641,646,222 | ) |
| | | | | | | | | | | | |
| | | |
Total increase (decrease) in net assets | | | 297,097,260 | | | | (1,077,807,963 | ) | | | (122,701,718 | ) |
|
| Net assets: | |
| | | |
Beginning of period | | | — | | | | 3,012,540,351 | | | | 3,135,242,069 | |
| | | | | | | | | | | | |
| | | |
End of period | | $ | 297,097,260 | | | $ | 1,934,732,388 | | | $ | 3,012,540,351 | |
| | | | | | | | | | | | |
| | |
(a) A plan of reorganization was completed on January 22, 2021. | | | | | | | | | |
| | |
* Period from November 17, 2021 (commencement of operations) through February 28, 2022. | | | | | | | | | |
| | |
** Period from December 1, 2021 (commencement of operations) through February 28, 2022. | | | | | | | | | |
| | | |
*** Class V liquidated on April 29, 2021. | | | | | | | | | | | | |
| |
**** Period from March 31, 2020 (commencement of operations) through February 28, 2021. | | | | | |
| | | | |
| | |
| 98 | | See accompanying notes to the financial statements. | | |
GMO Trust Funds
Statements of Changes in Net Assets — (Continued)
| | | | | | | | | | | | | | | | |
| | | International Equity Fund | | | Japan Value Creation Fund | |
| | | Year Ended
February 28, | | | Year Ended
February 28,
2022 | | | Period from
September 14,
2020
(commencement
of operations)
through
February 28,
2021 | |
| | | 2022 | | | 2021 | |
Increase (decrease) in net assets: | |
|
Operations: | |
| | | | |
Net investment income (loss) | | $ | 84,376,014 | | | $ | 97,335,937 | | | $ | 3,126,596 | | | $ | 1,196,636 | |
| | | | |
Net realized gain (loss) | | | 211,671,131 | | | | 50,571,653 | | | | 20,528,456 | | | | 6,318,091 | |
| | | | |
Change in net unrealized appreciation (depreciation) | | | (177,873,927 | ) | | | 318,580,148 | | | | (25,642,038 | ) | | | 20,406,998 | |
| | | | | | | | | | | | | | | | |
| | | | |
Net increase (decrease) in net assets from operations | | | 118,173,218 | | | | 466,487,738 | | | | (1,986,986 | ) | | | 27,921,725 | |
| | | | | | | | | | | | | | | | |
|
Distributions to shareholders: | |
| | | | |
Class II | | | (366,324 | ) | | | (236,321 | ) | | | — | | | | — | |
| | | | |
Class III | | | (24,543,676 | ) | | | (20,929,248 | ) | | | — | ** | | | — | |
| | | | |
Class IV | | | (103,725,040 | ) | | | (91,693,467 | ) | | | — | | | | — | |
| | | | |
Class VI | | | — | | | | — | | | | (24,444,217 | ) | | | (2,070,899 | ) |
| | | | |
Class I | | | (143,501 | )* | | | — | | | | (312,047 | )*** | | | — | |
| | | | | | | | | | | | | | | | |
| | | | |
Total distributions | | | (128,778,541 | ) | | | (112,859,036 | ) | | | (24,756,264 | ) | | | (2,070,899 | ) |
| | | | | | | | | | | | | | | | |
|
Net share transactions (Note 9): | |
| | | | |
Class II | | | 154,410 | | | | (5,323,954 | ) | | | — | | | | — | |
| | | | |
Class III | | | (64,863,064 | ) | | | (100,462,179 | ) | | | 23,595,006 | ** | | | — | |
| | | | |
Class IV | | | (220,799,835 | ) | | | (1,100,892,967 | ) | | | — | | | | — | |
| | | | |
Class VI | | | — | | | | — | | | | (4,444,830 | ) | | | 138,021,194 | |
| | | | |
Class I | | | 3,300,506 | * | | | — | | | | 3,535,322 | *** | | | — | |
| | | | | | | | | | | | | | | | |
| | | | |
Increase (decrease) in net assets resulting from net share transactions | | | (282,207,983 | ) | | | (1,206,679,100 | ) | | | 22,685,498 | | | | 138,021,194 | |
| | | | | | | | | | | | | | | | |
| | | | |
Total increase (decrease) in net assets | | | (292,813,306 | ) | | | (853,050,398 | ) | | | (4,057,752 | ) | | | 163,872,020 | |
|
| Net assets: | |
| | | | |
Beginning of period | | | 2,194,563,675 | | | | 3,047,614,073 | | | | 163,872,020 | | | | — | |
| | | | | | | | | | | | | | | | |
| | | | |
End of period | | $ | 1,901,750,369 | | | $ | 2,194,563,675 | | | $ | 159,814,268 | | | $ | 163,872,020 | |
| | | | | | | | | | | | | | | | |
| | | |
* Period from May 24, 2021 (commencement of operations) through February 28, 2022. | | | | | | | | | | | | | |
| | | |
** Period from December 30, 2021 (commencement of operations) through February 28, 2022. | | | | | | | | | | | | | |
| | | |
*** Period from June 7, 2021 (commencement of operations) through February 28, 2022. | | | | | | | | | | | | | |
| | | | |
| | |
| | | See accompanying notes to the financial statements. | | 99 |
GMO Trust Funds
Statements of Changes in Net Assets — (Continued)
| | | | | | | | | | | | | | | | |
| | | Quality Cyclicals Fund
(formerly Cyclical Focus Fund) | | | Quality Fund(a) | |
| | | Year Ended
February 28,
2022 | | | Period from
May 12, 2020
(commencement
of operations)
through
February 28,
2021 | | | Year Ended
February 28, | |
| | | 2022 | | | 2021 | |
Increase (decrease) in net assets: | |
|
Operations: | |
| | | | |
Net investment income (loss) | | $ | 3,195,501 | | | $ | 1,985,274 | | | $ | 97,006,929 | | | $ | 91,756,243 | |
| | | | |
Net realized gain (loss) | | | 16,586,147 | | | | 17,779,535 | | | | 511,445,075 | | | | 799,447,332 | |
| | | | |
Change in net unrealized appreciation (depreciation) | | | (5,437,374 | ) | | | 36,112,885 | | | | 497,845,399 | | | | 949,979,968 | |
| | | | | | | | | | | | | | | | |
| | | | |
Net increase (decrease) in net assets from operations | | | 14,344,274 | | | | 55,877,694 | | | | 1,106,297,403 | | | | 1,841,183,543 | |
| | | | | | | | | | | | | | | | |
|
Distributions to shareholders: | |
| | | | |
Class III | | | — | | | | — | | | | (208,459,284 | ) | | | (448,796,803 | ) |
| | | | |
Class IV | | | — | | | | — | | | | (50,525,221 | ) | | | (123,440,372 | ) |
| | | | |
Class VI | | | (29,159,128 | ) | | | (7,515,852 | ) | | | (211,183,341 | ) | | | (317,805,859 | ) |
| | | | |
Class R6 | | | — | | | | — | | | | (30,631,216 | ) | | | (13,858,740 | ) |
| | | | |
Class I | | | (9,434 | )* | | | — | | | | (28,062,487 | ) | | | (21,984,988 | ) |
| | | | | | | | | | | | | | | | |
| | | | |
Total distributions | | | (29,168,562 | ) | | | (7,515,852 | ) | | | (528,861,549 | ) | | | (925,886,762 | ) |
| | | | | | | | | | | | | | | | |
|
Net share transactions (Note 9): | |
| | | | |
Class III | | | — | | | | — | | | | (857,439,954 | ) | | | (122,543,739 | ) |
| | | | |
Class IV | | | — | | | | — | | | | 111,734,620 | | | | (221,988,939 | ) |
| | | | |
Class VI | | | 14,291,719 | | | | 93,626,955 | | | | 839,898,152 | | | | 70,585,435 | |
| | | | |
Class R6 | | | — | | | | — | | | | 157,998,340 | | | | 242,131,286 | |
| | | | |
Class I | | | 89,975 | * | | | — | | | | 160,637,473 | | | | 202,555,586 | |
| | | | | | | | | | | | | | | | |
| | | | |
Increase (decrease) in net assets resulting from net share transactions | | | 14,381,694 | | | | 93,626,955 | | | | 412,828,631 | | | | 170,739,629 | |
| | | | | | | | | | | | | | | | |
| | | | |
Total increase (decrease) in net assets | | | (442,594 | ) | | | 141,988,797 | | | | 990,264,485 | | | | 1,086,036,410 | |
|
| Net assets: | |
| | | | |
Beginning of period | | | 141,988,797 | | | | — | | | | 7,368,905,098 | | | | 6,282,868,688 | |
| | | | | | | | | | | | | | | | |
| | | | |
End of period | | $ | 141,546,203 | | | $ | 141,988,797 | | | $ | 8,359,169,583 | | | $ | 7,368,905,098 | |
| | | | | | | | | | | | | | | | |
| |
(a) A plan of reorganization was completed on January 22, 2021. | | | | | |
| |
* Period from July 16, 2021 (commencement of operations) through February 28, 2022. | | | | | |
| | | | |
| | |
| 100 | | See accompanying notes to the financial statements. | | |
GMO Trust Funds
Statements of Changes in Net Assets — (Continued)
| | | | | | | | | | | | | | | | |
| | | Resources Fund(a) | | | Tax-Managed International
Equities Fund | |
| | | Year Ended
February 28, | | | Year Ended
February 28, | |
| | | 2022 | | | 2021 | | | 2022 | | | 2021 | |
Increase (decrease) in net assets: | |
|
Operations: | |
| | | | |
Net investment income (loss) | | $ | 69,825,573 | | | $ | 14,439,450 | | | $ | 1,475,736 | | | $ | 972,230 | |
| | | | |
Net realized gain (loss) | | | 135,596,926 | | | | 61,197,799 | | | | 6,723,726 | | | | 2,843,717 | |
| | | | |
Change in net unrealized appreciation (depreciation) | | | (17,199,595 | ) | | | 277,875,438 | | | | (6,159,271 | ) | | | 5,048,731 | |
| | | | | | | | | | | | | | | | |
| | | | |
Net increase (decrease) in net assets from operations | | | 188,222,904 | | | | 353,512,687 | | | | 2,040,191 | | | | 8,864,678 | |
| | | | | | | | | | | | | | | | |
|
Distributions to shareholders: | |
| | | | |
Class III | | | (29,937,354 | ) | | | (13,864,334 | ) | | | (5,390,526 | ) | | | (882,340 | ) |
| | | | |
Class IV | | | (94,223,444 | ) | | | (17,483,890 | ) | | | — | | | | — | |
| | | | |
Class VI | | | — | * | | | — | | | | — | | | | — | |
| | | | |
Class R6 | | | (3,478,525 | ) | | | — | ** | | | — | | | | — | |
| | | | |
Class I | | | (55,077,833 | ) | | | — | ** | | | — | | | | — | |
| | | | | | | | | | | | | | | | |
| | | | |
Total distributions | | | (182,717,156 | ) | | | (31,348,224 | ) | | | (5,390,526 | ) | | | (882,340 | ) |
| | | | | | | | | | | | | | | | |
|
Net share transactions (Note 9): | |
| | | | |
Class III | | | 138,203,591 | | | | (255,982,659 | ) | | | (3,827,951 | ) | | | (5,250,369 | ) |
| | | | |
Class IV | | | (167,410,013 | ) | | | 52,674,305 | | | | — | | | | — | |
| | | | |
Class VI | | | 866,735,067 | * | | | — | | | | — | | | | — | |
| | | | |
Class R6 | | | 103,708,055 | | | | 2,547,139 | ** | | | — | | | | — | |
| | | | |
Class I | | | 257,993,206 | | | | 364,577,456 | ** | | | — | | | | — | |
| | | | | | | | | | | | | | | | |
| | | | |
Increase (decrease) in net assets resulting from net share transactions | | | 1,199,229,906 | | | | 163,816,241 | | | | (3,827,951 | ) | | | (5,250,369 | ) |
| | | | | | | | | | | | | | | | |
| | | | |
Total increase (decrease) in net assets | | | 1,204,735,654 | | | | 485,980,704 | | | | (7,178,286 | ) | | | 2,731,969 | |
|
| Net assets: | |
| | | | |
Beginning of period | | | 998,816,258 | | | | 512,835,554 | | | | 38,959,560 | | | | 36,227,591 | |
| | | | | | | | | | | | | | | | |
| | | | |
End of period | | $ | 2,203,551,912 | | | $ | 998,816,258 | | | $ | 31,781,274 | | | $ | 38,959,560 | |
| | | | | | | | | | | | | | | | |
| |
(a) A plan of reorganization was completed on January 22, 2021. | | | | | |
| |
* Period from February 8, 2022 (commencement of operations) through February 28, 2022. | | | | | |
| |
** Period from January 22, 2021 (commencement of operations) through February 28, 2021. | | | | | |
| | | | |
| | |
| | | See accompanying notes to the financial statements. | | 101 |
GMO Trust Funds
Statements of Changes in Net Assets — (Continued)
| | | | | | | | | | | | | | | | |
| | | U.S. Equity Fund | | | U.S. Small Cap Value Fund | |
| | | Year Ended
February 28, | | | Year Ended
February 28, | |
| | | 2022 | | | 2021 | | | 2022 | | | 2021 | |
Increase (decrease) in net assets: | |
|
Operations: | |
| | | | |
Net investment income (loss) | | $ | 5,844,954 | | | $ | 5,802,364 | | | $ | 3,936,416 | | | $ | 6,865,015 | |
| | | | |
Net realized gain (loss) | | | 79,406,685 | | | | 40,584,781 | | | | 76,979,623 | | | | 40,908,019 | |
| | | | |
Change in net unrealized appreciation (depreciation) | | | (33,300,126 | ) | | | 58,549,878 | | | | (31,906,411 | ) | | | 102,509,169 | |
| | | | | | | | | | | | | | | | |
| | | | |
Net increase (decrease) in net assets from operations | | | 51,951,513 | | | | 104,937,023 | | | | 49,009,628 | | | | 150,282,203 | |
| | | | | | | | | | | | | | | | |
|
Distributions to shareholders: | |
| | | | |
Class III | | | (17,687,300 | ) | | | (8,735,355 | ) | | | — | | | | — | |
| | | | |
Class VI | | | (66,498,945 | ) | | | (26,985,388 | ) | | | (83,549,717 | ) | | | (6,891,863 | ) |
| | | | | | | | | | | | | | | | |
| | | | |
Total distributions | | | (84,186,245 | ) | | | (35,720,743 | ) | | | (83,549,717 | ) | | | (6,891,863 | ) |
| | | | | | | | | | | | | | | | |
|
Net share transactions (Note 9): | |
| | | | |
Class III | | | (24,924,349 | ) | | | 2,522,212 | | | | — | | | | — | |
| | | | |
Class VI | | | 171,434,661 | | | | (169,966,891 | ) | | | (84,147,317 | ) | | | (186,401,008 | ) |
| | | | | | | | | | | | | | | | |
| | | | |
Increase (decrease) in net assets resulting from net share transactions | | | 146,510,312 | | | | (167,444,679 | ) | | | (84,147,317 | ) | | | (186,401,008 | ) |
| | | | | | | | | | | | | | | | |
| | | | |
Total increase (decrease) in net assets | | | 114,275,580 | | | | (98,228,399 | ) | | | (118,687,406 | ) | | | (43,010,668 | ) |
|
| Net assets: | |
| | | | |
Beginning of period | | | 351,202,423 | | | | 449,430,822 | | | | 372,497,640 | | | | 415,508,308 | |
| | | | | | | | | | | | | | | | |
| | | | |
End of period | | $ | 465,478,003 | | | $ | 351,202,423 | | | $ | 253,810,234 | | | $ | 372,497,640 | |
| | | | | | | | | | | | | | | | |
| | | | |
| | |
| 102 | | See accompanying notes to the financial statements. | | |
GMO Trust Funds
Financial Highlights
(For a share outstanding throughout each period)
CLIMATE CHANGE FUND
| | | | | | | | | | | | | | | | | | | | | | | | | | | | | | | | | | | | | | | | |
| | | Class III Shares | | Class R6 Shares |
| | | Year Ended February 28/29, | | Period from
April 5, 2017
(commencement
of operations)
through
February 28,
2018 | | Year Ended
February 28, | | Period from
January 16,
2020
(commencement
of operations)
through
February 29,
2020 |
| | | 2022 | | 2021 | | 2020 | | 2019 | | 2022 | | 2021 |
Net asset value, beginning of period | | | $ | 34.39 | | | | $ | 22.36 | | | | $ | 22.04 | | | | $ | 23.81 | | | | $ | 20.00 | | | | $ | 34.33 | | | | $ | 22.36 | | | | $ | 24.55 | |
| | | | | | | | | | | | | | | | | | | | | | | | | | | | | | | | | | | | | | | | |
Income (loss) from investment operations: | | | | | | | | | | | |
Net investment income (loss)(a)† | | | | 0.28 | | | | | 0.35 | | | | | 0.41 | | | | | 0.36 | | | | | 0.23 | | | | | 0.28 | | | | | 0.31 | | | | | 0.01 | |
Net realized and unrealized gain (loss) | | | | 0.72 | | | | | 13.43 | | | | | 0.87 | | | | | (1.61 | ) | | | | 4.41 | | | | | 0.72 | | | | | 13.43 | | | | | (2.20 | ) |
| | | | | | | | | | | | | | | | | | | | | | | | | | | | | | | | | | | | | | | | |
Total from investment operations | | | | 1.00 | | | | | 13.78 | | | | | 1.28 | | | | | (1.25 | ) | | | | 4.64 | | | | | 1.00 | | | | | 13.74 | | | | | (2.19 | ) |
| | | | | | | | | | | | | | | | | | | | | | | | | | | | | | | | | | | | | | | | |
Less distributions to shareholders: | | | | | | | | | | | |
From net investment income | | | | (0.57 | ) | | | | (0.30 | ) | | | | (0.45 | ) | | | | (0.26 | ) | | | | (0.22 | ) | | | | (0.57 | ) | | | | (0.32 | ) | | | | — | |
From net realized gains | | | | (4.59 | ) | | | | (1.45 | ) | | | | (0.51 | ) | | | | (0.26 | ) | | | | (0.61 | ) | | | | (4.59 | ) | | | | (1.45 | ) | | | | — | |
| | | | | | | | | | | | | | | | | | | | | | | | | | | | | | | | | | | | | | | | |
Total distributions | | | | (5.16 | ) | | | | (1.75 | ) | | | | (0.96 | ) | | | | (0.52 | ) | | | | (0.83 | ) | | | | (5.16 | ) | | | | (1.77 | ) | | | | — | |
| | | | | | | | | | | | | | | | | | | | | | | | | | | | | | | | | | | | | | | | |
Net asset value, end of period | | | $ | 30.23 | | | | $ | 34.39 | | | | $ | 22.36 | | | | $ | 22.04 | | | | $ | 23.81 | | | | $ | 30.17 | | | | $ | 34.33 | | | | $ | 22.36 | |
| | | | | | | | | | | | | | | | | | | | | | | | | | | | | | | | | | | | | | | | |
Total Return(b) | | | | 2.91 | % | | | | 63.84 | % | | | | 5.66 | % | | | | (5.22 | )% | | | | 23.28 | %** | | | | 2.90 | % | | | | 63.71 | % | | | | (8.92 | )%** |
Ratios/Supplemental Data: | | | | | | | | | | | |
Net assets, end of period (000’s) | | | $ | 306,996 | | | | $ | 178,223 | | | | $ | 121,062 | | | | $ | 113,000 | | | | $ | 26,694 | | | | $ | 115,014 | | | | $ | 74,961 | | | | $ | 1,129 | |
Net expenses to average daily net assets(c) | | | | 0.77 | % | | | | 0.77 | % | | | | 0.77 | % | | | | 0.75 | % | | | | 0.78 | %* | | | | 0.77 | % | | | | 0.77 | % | | | | 0.77 | %* |
Net investment income (loss) to average daily net assets(a) | | | | 0.84 | % | | | | 1.39 | % | | | | 1.84 | % | | | | 1.61 | % | | | | 1.09 | %* | | | | 0.84 | % | | | | 1.04 | % | | | | 0.40 | %* |
Portfolio turnover rate(d) | | | | 63 | % | | | | 84 | % | | | | 62 | % | | | | 29 | % | | | | 44 | %** | | | | 63 | % | | | | 84 | % | | | | 62 | %** |
Fees and expenses reimbursed and/or waived by GMO to average daily net assets: | | | | 0.04 | %(e) | | | | 0.13 | %(e) | | | | 0.16 | %(e) | | | | 0.26 | % | | | | 0.73 | %* | | | | 0.04 | %(e) | | | | 0.11 | %(e) | | | | 0.23 | %(e)* |
| | | | | | | | | | | | | | | |
| | | Class I Shares |
| | | Year Ended
February 28, | | Period from
February 25,
2020
(commencement
of operations)
through
February 29,
2020 |
| | | 2022 | | 2021 |
Net asset value, beginning of period | | | $ | 34.33 | | | | $ | 22.36 | | | | $ | 23.37 | |
| | | | | | | | | | | | | | | |
Income (loss) from investment operations: | | | | | | | | | | | |
Net investment income (loss)(a)† | | | | 0.24 | | | | | 0.21 | | | | | 0.01 | |
Net realized and unrealized gain (loss) | | | | 0.73 | | | | | 13.53 | | | | | (1.02 | ) |
| | | | | | | | | | | | | | | |
Total from investment operations | | | | 0.97 | | | | | 13.74 | | | | | (1.01 | ) |
| | | | | | | | | | | | | | | |
Less distributions to shareholders: | | | | | | | | | | | |
From net investment income | | | | (0.55 | ) | | | | (0.32 | ) | | | | — | |
From net realized gains | | | | (4.59 | ) | | | | (1.45 | ) | | | | — | |
| | | | | | | | | | | | | | | |
Total distributions | | | | (5.14 | ) | | | | (1.77 | ) | | | | — | |
| | | | | | | | | | | | | | | |
Net asset value, end of period | | | $ | 30.16 | | | | $ | 34.33 | | | | $ | 22.36 | |
| | | | | | | | | | | | | | | |
Total Return(b) | | | | 2.81 | % | | | | 63.67 | % | | | | (4.32 | )%** |
Ratios/Supplemental Data: | | | | | | | | | | | |
Net assets, end of period (000’s) | | | $ | 308,143 | | | | $ | 98,697 | | | | $ | 962 | |
Net expenses to average daily net assets(c) | | | | 0.87 | % | | | | 0.87 | % | | | | 0.87 | %* |
Net investment income (loss) to average daily net assets(a) | | | | 0.72 | % | | | | 0.66 | % | | | | 1.93 | %* |
Portfolio turnover rate(d) | | | | 63 | % | | | | 84 | % | | | | 62 | %** |
Fees and expenses reimbursed and/or waived by GMO to average daily net assets: | | | | 0.04 | %(e) | | | | 0.11 | %(e) | | | | 0.43 | %(e)* |
| (a) | Net investment income is affected by the timing of the declaration of dividends by the other GMO Funds and/or other investment companies in which the Fund invests, if any. |
| (b) | The total returns would have been lower had certain expenses not been reimbursed and/or waived during the periods shown, if applicable, and assumes the effect of reinvested distributions, if any. Calculation excludes purchase premiums and redemption fees which are borne by the shareholder purchasing or redeeming Fund shares, if any. |
| (c) | Net expenses exclude expenses incurred indirectly through investment in the underlying funds, if any (Note 5). |
| (d) | The portfolio turnover rate excludes investments in GMO U.S. Treasury Fund (“USTF”) which is used as a short-term investment vehicle for cash management. The Fund’s portfolio turnover rate during the years ended February 28, 2022, February 28, 2021, February 29, 2020, February 28, 2019 and February 28, 2018, including transactions in USTF, was 140%, 145%, 173%, 121% and 174%, respectively, of the average value of its portfolio. |
| (e) | Ratio includes indirect fees waived or borne by GMO. |
| † | Calculated using average shares outstanding throughout the period. |
| | | | |
| | |
| | | See accompanying notes to the financial statements. | | 103 |
GMO Trust Funds
Financial Highlights
(For a share outstanding throughout each period)
EMERGING DOMESTIC OPPORTUNITIES FUND
| | | | | | | | | | | | | | | | | | | | | | | | | | | | | | | | | | | | | | | | | | | | | | | | | | |
| | | Class II Shares | | Class V Shares |
| | | Year Ended February 28/29, | | Year Ended February 28/29, |
| | | 2022 | | 2021 | | 2020 | | 2019 | | 2018 | | 2022 | | 2021 | | 2020 | | 2019 | | 2018 |
Net asset value, beginning of period | | | $ | 27.68 | | | | $ | 21.14 | | | | $ | 21.61 | | | | $ | 28.86 | | | | $ | 22.64 | | | | $ | 27.66 | | | | $ | 21.12 | | | | $ | 21.60 | | | | $ | 28.85 | | | | $ | 22.62 | |
| | | | | | | | | | | | | | | | | | | | | | | | | | | | | | | | | | | | | | | | | | | | | | | | | | |
Income (loss) from investment operations: | | | | | | | | | | | | | | | | | | | | | | | | | | | | | | | | | | | | | | | | | | | | | | | | | | |
Net investment income (loss)(a)† | | | | 0.15 | | | | | 0.17 | | | | | 0.40 | | | | | 0.24 | | | | | 0.25 | | | | | 0.18 | | | | | 0.20 | | | | | 0.43 | | | | | 0.28 | | | | | 0.29 | |
Net realized and unrealized gain (loss) | | | | (3.95 | ) | | | | 6.53 | | | | | 0.18 | | | | | (4.58 | ) | | | | 6.33 | | | | | (3.93 | ) | | | | 6.53 | | | | | 0.17 | | | | | (4.60 | ) | | | | 6.33 | |
| | | | | | | | | | | | | | | | | | | | | | | | | | | | | | | | | | | | | | | | | | | | | | | | | | |
Total from investment operations | | | | (3.80 | ) | | | | 6.70 | | | | | 0.58 | | | | | (4.34 | ) | | | | 6.58 | | | | | (3.75 | ) | | | | 6.73 | | | | | 0.60 | | | | | (4.32 | ) | | | | 6.62 | |
| | | | | | | | | | | | | | | | | | | | | | | | | | | | | | | | | | | | | | | | | | | | | | | | | | |
Less distributions to shareholders: | | | | | | | | | | | | | | | | | | | | | | | | | | | | | | | | | | | | | | | | | | | | | | | | | | |
From net investment income | | | | (0.06 | ) | | | | (0.16 | ) | | | | (1.05 | ) | | | | (0.17 | ) | | | | (0.36 | ) | | | | (0.08 | ) | | | | (0.19 | ) | | | | (1.08 | ) | | | | (0.19 | ) | | | | (0.39 | ) |
From net realized gains | | | | (1.86 | ) | | | | — | | | | | — | | | | | (2.74 | ) | | | | — | | | | | (1.86 | ) | | | | — | | | | | — | | | | | (2.74 | ) | | | | — | |
| | | | | | | | | | | | | | | | | | | | | | | | | | | | | | | | | | | | | | | | | | | | | | | | | | |
Total distributions | | | | (1.92 | ) | | | | (0.16 | ) | | | | (1.05 | ) | | | | (2.91 | ) | | | | (0.36 | ) | | | | (1.94 | ) | | | | (0.19 | ) | | | | (1.08 | ) | | | | (2.93 | ) | | | | (0.39 | ) |
| | | | | | | | | | | | | | | | | | | | | | | | | | | | | | | | | | | | | | | | | | | | | | | | | | |
Net asset value, end of period | | | $ | 21.96 | | | | $ | 27.68 | | | | $ | 21.14 | | | | $ | 21.61 | | | | $ | 28.86 | | | | $ | 21.97 | | | | $ | 27.66 | | | | $ | 21.12 | | | | $ | 21.60 | | | | $ | 28.85 | |
| | | | | | | | | | | | | | | | | | | | | | | | | | | | | | | | | | | | | | | | | | | | | | | | | | |
Total Return(b) | | | | (14.13 | )% | | | | 31.76 | % | | | | 2.39 | % | | | | (15.48 | )% | | | | 29.10 | % | | | | (13.98 | )% | | | | 31.95 | % | | | | 2.50 | % | | | | (15.37 | )% | | | | 29.31 | % |
Ratios/Supplemental Data: | | | | | | | | | | | | | | | | | | | | | | | | | | | | | | | | | | | | | | | | | | | | | | |
Net assets, end of period (000’s) | | | $ | 238,702 | | | | $ | 309,966 | | | | $ | 292,418 | | | | $ | 467,336 | | | | $ | 700,211 | | | | $ | 510,307 | | | | $ | 697,864 | | | | $ | 565,384 | | | | $ | 755,613 | | | | $ | 1,280,851 | |
Net expenses to average daily net assets(c) | | | | 1.06 | % | | | | 1.03 | % | | | | 1.03 | % | | | | 1.04 | % | | | | 1.06 | % | | | | 0.92 | % | | | | 0.90 | % | | | | 0.89 | % | | | | 0.90 | % | | | | 0.92 | % |
Net investment income (loss) to average daily net assets(a) | | | | 0.56 | % | | | | 0.73 | % | | | | 1.81 | % | | | | 1.00 | % | | | | 0.96 | % | | | | 0.70 | % | | | | 0.87 | % | | | | 1.94 | % | | | | 1.19 | % | | | | 1.09 | % |
Portfolio turnover rate | | | | 190 | %(d) | | | | 216 | %(d) | | | | 186 | %(d) | | | | 238 | %(d) | | | | 201 | %(d) | | | | 190 | %(d) | | | | 216 | %(d) | | | | 186 | %(d) | | | | 238 | %(d) | | | | 201 | %(d) |
Fees and expenses reimbursed and/or waived by GMO to average daily net assets: | | | | 0.02 | %(e) | | | | 0.02 | %(e) | | | | 0.02 | %(e) | | | | 0.01 | % | | | | 0.02 | % | | | | 0.02 | %(e) | | | | 0.02 | %(e) | | | | 0.02 | %(e) | | | | 0.01 | % | | | | 0.02 | % |
Purchase premiums and redemption fees consisted of the following per share amounts (Note 2):† | | | $ | — | | | | $ | — | | | | $ | 0.05 | | | | $ | 0.05 | | | | $ | 0.03 | | | | $ | — | | | | $ | — | | | | $ | 0.04 | | | | $ | 0.05 | | | | $ | 0.03 | |
| | | | | | | | | | |
| | | Class I Shares |
| | | Year Ended
February 28,
2022 | | Period from
January 22,
2021
(commencement
of operations)
through
February 28,
2021 |
Net asset value, beginning of period | | | $ | 27.67 | | | | $ | 28.88 | |
| | | | | | | | | | |
Income (loss) from investment operations: | |
Net investment income (loss)(a)† | | | | 0.15 | | | | | 0.02 | |
Net realized and unrealized gain (loss) | | | | (3.94 | ) | | | | (1.23 | ) |
| | | | | | | | | | |
Total from investment operations | | | | (3.79 | ) | | | | (1.21 | ) |
| | | | | | | | | | |
Less distributions to shareholders: | |
From net investment income | | | | (0.07 | ) | | | | — | |
From net realized gains | | | | (1.86 | ) | | | | — | |
| | | | | | | | | | |
Total distributions | | | | (1.93 | ) | | | | — | |
| | | | | | | | | | |
Net asset value, end of period | | | $ | 21.95 | | | | $ | 27.67 | |
| | | | | | | | | | |
Total Return(b) | | | | (14.12 | )% | | | | (4.19 | )%** |
Ratios/Supplemental Data: | |
Net assets, end of period (000’s) | | | $ | 11,512 | | | | $ | 18,476 | |
Net expenses to average daily net assets(c) | | | | 1.09 | % | | | | 1.04 | %* |
Net investment income (loss) to average daily net assets(a) | | | | 0.57 | % | | | | 0.82 | %* |
Portfolio turnover rate | | | | 190 | %(d) | | | | 216 | %(d)** |
Fees and expenses reimbursed and/or waived by GMO to average daily net assets: | | | | 0.09 | %(e) | | | | 0.08 | %(e)* |
Purchase premiums and redemption fees consisted of the following per share amounts (Note 2):† | | | $ | — | | | | $ | — | |
| (a) | Net investment income is affected by the timing of the declaration of dividends by the other GMO Funds and/or other investment companies in which the Fund invests, if any. |
| (b) | The total returns would have been lower had certain expenses not been reimbursed and/or waived during the periods shown, if applicable, and assumes the effect of reinvested distributions, if any. Calculation excludes purchase premiums and redemption fees which are borne by the shareholder purchasing or redeeming Fund shares, if any. |
| (c) | Net expenses exclude expenses incurred indirectly through investment in the underlying funds, if any (Note 5). |
| (d) | The portfolio turnover rate excludes investments in GMO U.S. Treasury Fund (“USTF”) which is used as a short-term investment vehicle for cash management. The Fund’s portfolio turnover rate during the years ended February 28, 2022, February 28, 2021, February 29, 2020, February 28, 2019 and February 28, 2018, including transactions in USTF, was 215%, 236%, 235%, 254% and 254%, respectively, of the average value of its portfolio. |
| (e) | Ratio includes indirect fees waived or borne by GMO. |
| † | Calculated using average shares outstanding throughout the period. |
| | | | |
| | |
| 104 | | See accompanying notes to the financial statements. | | |
GMO Trust Funds
Financial Highlights
(For a share outstanding throughout the period)
EMERGING MARKETS EX-CHINA FUND
| | | | | | | | | | | | | | | |
| | | Class III Shares | | Class VI Shares | | Class I Shares |
| | | Period from
November 17,
2021
(commencement
of operations)
through
February 28,
2022 | | Period from
October 18,
2021
(commencement
of operations)
through
February 28,
2022 | | Period from
December 1,
2021
(commencement
of operations)
through
February 28,
2022 |
Net asset value, beginning of period | | | $ | 20.00 | | | | $ | 20.00 | | | | $ | 19.34 | |
| | | | | | | | | | | | | | | |
Income (loss) from investment operations: | | | | | | | | | | | |
Net investment income (loss)(a)† | | | | 0.15 | | | | | 0.17 | | | | | 0.12 | |
Net realized and unrealized gain (loss) | | | | (3.37 | ) | | | | (3.38 | ) | | | | (2.69 | ) |
| | | | | | | | | | | | | | | |
Total from investment operations | | | | (3.22 | ) | | | | (3.21 | ) | | | | (2.57 | ) |
| | | | | | | | | | | | | | | |
Less distributions to shareholders: | | | | | | | | | | | |
From net investment income | | | | (0.13 | ) | | | | (0.13 | ) | | | | (0.13 | ) |
| | | | | | | | | | | | | | | |
Total distributions | | | | (0.13 | ) | | | | (0.13 | ) | | | | (0.13 | ) |
| | | | | | | | | | | | | | | |
Net asset value, end of period | | | $ | 16.65 | | | | $ | 16.66 | | | | $ | 16.64 | |
| | | | | | | | | | | | | | | |
Total Return(b) | | | | (16.20 | )%** | | | | (16.15 | )%** | | | | (13.38 | )%** |
Ratios/Supplemental Data: | | | | | | | | | | | |
Net assets, end of period (000’s) | | | $ | 14,810 | | | | $ | 282,287 | | | | $ | 0 | (e) |
Net expenses to average daily net assets(c) | | | | 0.80 | %* | | | | 0.67 | %* | | | | 0.93 | %* |
Net investment income (loss) to average daily net assets(a) | | | | 2.52 | %* | | | | 2.36 | %* | | | | 2.54 | %* |
Portfolio turnover rate(d) | | | | 43 | %** | | | | 43 | %** | | | | 43 | %** |
Fees and expenses reimbursed and/or waived by GMO to average daily net assets: | | | | 0.16 | %* | | | | 0.20 | %* | | | | 0.19 | %* |
| (a) | Net investment income is affected by the timing of the declaration of dividends by the other GMO Funds and/or other investment companies in which the Fund invests, if any. |
| (b) | The total returns would have been lower had certain expenses not been reimbursed and/or waived during the periods shown, if applicable, and assumes the effect of reinvested distributions, if any. Calculation excludes purchase premiums and redemption fees which are borne by the shareholder purchasing or redeeming Fund shares, if any. |
| (c) | Net expenses exclude expenses incurred indirectly through investment in the underlying funds, if any (Note 5). |
| (d) | The portfolio turnover rate excludes investments in GMO U.S. Treasury Fund (“USTF”) which is used as a short-term investment vehicle for cash management. The Fund’s portfolio turnover rate during the year ended February 28, 2022, including transactions in USTF, was 43% of the average value of its portfolio. |
| (e) | Rounds to less than $1,000. |
| † | Calculated using average shares outstanding throughout the period. |
| | | | |
| | |
| | | See accompanying notes to the financial statements. | | 105 |
GMO Trust Funds
Financial Highlights
(For a share outstanding throughout each period)
EMERGING MARKETS FUND
| | | | | | | | | | | | | | | | | | | | | | | | | | | | | | | | | | | | | | | | | | | | | | | | | | |
| | | Class II Shares | | Class III Shares |
| | | Year Ended February 28/29, | | Year Ended February 28/29, |
| | | 2022 | | 2021 | | 2020 | | 2019 | | 2018 | | 2022 | | 2021 | | 2020 | | 2019 | | 2018 |
Net asset value, beginning of period | | | $ | 36.70 | | | | $ | 30.75 | | | | $ | 32.23 | | | | $ | 36.42 | | | | $ | 29.98 | | | | $ | 36.81 | | | | $ | 30.84 | | | | $ | 32.32 | | | | $ | 36.51 | | | | $ | 30.05 | |
| | | | | | | | | | | | | | | | | | | | | | | | | | | | | | | | | | | | | | | | | | | | | | | | | | |
Income (loss) from investment operations: | | | | | | | | | | | | | | | | | | | | | | | | | | | | | | | | | | | | | | | | | | | | | | | | | | |
Net investment income (loss)(a)† | | | | 1.21 | | | | | 0.86 | | | | | 1.13 | | | | | 1.01 | | | | | 0.75 | | | | | 1.27 | | | | | 0.76 | | | | | 1.21 | | | | | 1.01 | | | | | 0.72 | |
Net realized and unrealized gain (loss) | | | | (6.58 | ) | | | | 6.36 | | | | | (1.02 | ) | | | | (4.22 | ) | | | | 6.58 | | | | | (6.64 | ) | | | | 6.51 | | | | | (1.09 | ) | | | | (4.21 | ) | | | | 6.64 | |
| | | | | | | | | | | | | | | | | | | | | | | | | | | | | | | | | | | | | | | | | | | | | | | | | | |
Total from investment operations | | | | (5.37 | ) | | | | 7.22 | | | | | 0.11 | | | | | (3.21 | ) | | | | 7.33 | | | | | (5.37 | ) | | | | 7.27 | | | | | 0.12 | | | | | (3.20 | ) | | | | 7.36 | |
| | | | | | | | | | | | | | | | | | | | | | | | | | | | | | | | | | | | | | | | | | | | | | | | | | |
Less distributions to shareholders: | | | | | | | | | | | | | | | | | | | | | | | | | | | | | | | | | | | | | | | | | | | | | | | | | | |
From net investment income | | | | (1.52 | ) | | | | (1.27 | ) | | | | (1.59 | ) | | | | (0.98 | ) | | | | (0.89 | ) | | | | (1.53 | ) | | | | (1.30 | ) | | | | (1.60 | ) | | | | (0.99 | ) | | | | (0.90 | ) |
| | | | | | | | | | | | | | | | | | | | | | | | | | | | | | | | | | | | | | | | | | | | | | | | | | |
Total distributions | | | | (1.52 | ) | | | | (1.27 | ) | | | | (1.59 | ) | | | | (0.98 | ) | | | | (0.89 | ) | | | | (1.53 | ) | | | | (1.30 | ) | | | | (1.60 | ) | | | | (0.99 | ) | | | | (0.90 | ) |
| | | | | | | | | | | | | | | | | | | | | | | | | | | | | | | | | | | | | | | | | | | | | | | | | | |
Net asset value, end of period | | | $ | 29.81 | | | | $ | 36.70 | | | | $ | 30.75 | | | | $ | 32.23 | | | | $ | 36.42 | | | | $ | 29.91 | | | | $ | 36.81 | | | | $ | 30.84 | | | | $ | 32.32 | | | | $ | 36.51 | |
| | | | | | | | | | | | | | | | | | | | | | | | | | | | | | | | | | | | | | | | | | | | | | | | | | |
Total Return(b) | | | | (15.13 | )% | | | | 23.89 | % | | | | (0.11 | )% | | | | (8.57 | )% | | | | 24.66 | % | | | | (15.08 | )% | | | | 23.99 | % | | | | (0.08 | )% | | | | (8.51 | )% | | | | 24.71 | % |
Ratios/Supplemental Data: | | | | | | | | | | | | | | | | | | | | | | | | | | | | | | | | | | | | | | | | | | | | | | |
Net assets, end of period (000’s) | | | $ | 262,449 | | | | $ | 291,833 | | | | $ | 397,798 | | | | $ | 451,720 | | | | $ | 479,640 | | | | $ | 267,177 | | | | $ | 501,907 | | | | $ | 333,779 | | | | $ | 277,824 | | | | $ | 390,827 | |
Net expenses to average daily net assets(c) | | | | 0.92 | % | | | | 0.93 | % | | | | 0.93 | % | | | | 0.93 | % | | | | 0.96 | % | | | | 0.87 | % | | | | 0.88 | % | | | | 0.88 | % | | | | 0.88 | % | | | | 0.91 | % |
Net investment income (loss) to average daily net assets(a) | | | | 3.34 | % | | | | 2.73 | % | | | | 3.44 | % | | | | 3.09 | % | | | | 2.25 | % | | | | 3.47 | % | | | | 2.36 | % | | | | 3.68 | % | | | | 3.08 | % | | | | 2.14 | % |
Portfolio turnover rate | | | | 102 | % | | | | 102 | % | | | | 100 | %(d) | | | | 98 | %(d) | | | | 87 | %(d) | | | | 102 | % | | | | 102 | % | | | | 100 | %(d) | | | | 98 | %(d) | | | | 87 | %(d) |
Fees and expenses reimbursed and/or waived by GMO to average daily net assets: | | | | 0.03 | % | | | | 0.07 | %(e) | | | | 0.13 | %(e) | | | | 0.13 | % | | | | 0.13 | % | | | | 0.01 | % | | | | 0.04 | %(e) | | | | 0.11 | %(e) | | | | 0.11 | % | | | | 0.11 | % |
Purchase premiums and redemption fees consisted of the following per share amounts (Note 2):† | | | $ | — | | | | $ | — | | | | $ | 0.02 | | | | $ | 0.08 | | | | $ | 0.11 | | | | $ | — | | | | $ | — | | | | $ | 0.02 | | | | $ | 0.08 | | | | $ | 0.11 | |
| (a) | Net investment income is affected by the timing of the declaration of dividends by the other GMO Funds and/or other investment companies in which the Fund invests, if any. |
| (b) | The total returns would have been lower had certain expenses not been reimbursed and/or waived during the periods shown, if applicable, and assumes the effect of reinvested distributions, if any. Calculation excludes purchase premiums and redemption fees which are borne by the shareholder purchasing or redeeming Fund shares, if any. |
| (c) | Net expenses exclude expenses incurred indirectly through investment in the underlying funds, if any (Note 5). |
| (d) | The portfolio turnover rate excludes investments in GMO U.S. Treasury Fund (“USTF”) which is used as a short-term investment vehicle for cash management. The Fund’s portfolio turnover rate during the years ended February 29, 2020, February 28, 2019 and February 28, 2018, including transactions in USTF, was 123%, 128% and 117%, respectively, of the average value of its portfolio. |
| (e) | Ratio includes indirect fees waived or borne by GMO. |
| † | Calculated using average shares outstanding throughout the period. |
| | | | |
| | |
| 106 | | See accompanying notes to the financial statements. | | |
GMO Trust Funds
Financial Highlights
(For a share outstanding throughout each period)
EMERGING MARKETS FUND (continued)
| | | | | | | | | | | | | | | | | | | | | | | | | | | | | | | | | | | |
| | | Class VI Shares | | Class R6 Shares |
| | | Year Ended February 28/29, | | Year Ended
February 28,
2022 | | Period from
March 31, 2020
(commencement
of operations)
through
February 28,
2021 |
| | | 2022 | | 2021 | | 2020 | | 2019 | | 2018 |
Net asset value, beginning of period | | | $ | 36.41 | | | | $ | 30.52 | | | | $ | 32.00 | | | | $ | 36.16 | | | | $ | 29.77 | | | | $ | 36.67 | | | | $ | 26.05 | |
| | | | | | | | | | | | | | | | | | | | | | | | | | | | | | | | | | | |
Income (loss) from investment operations: | | | | | | | | | | | | | | | | | | | | | | | | | | | | | | | | | | | |
Net investment income (loss)(a)† | | | | 1.33 | | | | | 0.87 | | | | | 1.23 | | | | | 1.06 | | | | | 0.78 | | | | | 1.15 | | | | | 0.72 | |
Net realized and unrealized gain (loss) | | | | (6.59 | ) | | | | 6.36 | | | | | (1.07 | ) | | | | (4.19 | ) | | | | 6.56 | | | | | (6.51 | ) | | | | 11.20 | |
| | | | | | | | | | | | | | | | | | | | | | | | | | | | | | | | | | | |
Total from investment operations | | | | (5.26 | ) | | | | 7.23 | | | | | 0.16 | | | | | (3.13 | ) | | | | 7.34 | | | | | (5.36 | ) | | | | 11.92 | |
| | | | | | | | | | | | | | | | | | | | | | | | | | | | | | | | | | | |
Less distributions to shareholders: | | | | | | | | | | | | | | | | | | | | | | | | | | | | | | | | | | | |
From net investment income | | | | (1.59 | ) | | | | (1.34 | ) | | | | (1.64 | ) | | | | (1.03 | ) | | | | (0.95 | ) | | | | (1.53 | ) | | | | (1.30 | ) |
| | | | | | | | | | | | | | | | | | | | | | | | | | | | | | | | | | | |
Total distributions | | | | (1.59 | ) | | | | (1.34 | ) | | | | (1.64 | ) | | | | (1.03 | ) | | | | (0.95 | ) | | | | (1.53 | ) | | | | (1.30 | ) |
| | | | | | | | | | | | | | | | | | | | | | | | | | | | | | | | | | | |
Net asset value, end of period | | | $ | 29.56 | | | | $ | 36.41 | | | | $ | 30.52 | | | | $ | 32.00 | | | | $ | 36.16 | | | | $ | 29.78 | | | | $ | 36.67 | |
| | | | | | | | | | | | | | | | | | | | | | | | | | | | | | | | | | | |
Total Return(b) | | | | (14.98 | )% | | | | 24.11 | % | | | | 0.05 | % | | | | (8.39 | )% | | | | 24.90 | % | | | | (15.13 | )% | | | | 46.24 | %** |
Ratios/Supplemental Data: | | | | | | | | | | | | | | | | | | | | | | | | | | | | | | | | | | | |
Net assets, end of period (000’s) | | | $ | 1,244,914 | | | | $ | 1,787,607 | | | | $ | 2,182,893 | | | | $ | 2,685,798 | | | | $ | 3,575,505 | | | | $ | 40,197 | | | | $ | 43,664 | |
Net expenses to average daily net assets(c) | | | | 0.74 | % | | | | 0.75 | % | | | | 0.75 | % | | | | 0.75 | % | | | | 0.78 | % | | | | 0.93 | % | | | | 0.93 | %* |
Net investment income (loss) to average daily net assets(a) | | | | 3.69 | % | | | | 2.75 | % | | | | 3.76 | % | | | | 3.25 | % | | | | 2.36 | % | | | | 3.18 | % | | | | 2.39 | %* |
Portfolio turnover rate | | | | 102 | % | | | | 102 | % | | | | 100 | %(d) | | | | 98 | %(d) | | | | 87 | %(d) | | | | 102 | % | | | | 102 | %** |
Fees and expenses reimbursed and/or waived by GMO to average daily net assets: | | | | 0.05 | % | | | | 0.08 | %(e) | | | | 0.15 | %(e) | | | | 0.14 | % | | | | 0.14 | % | | | | 0.03 | % | | | | 0.05 | %(e)* |
Purchase premiums and redemption fees consisted of the following per share amounts (Note 2):† | | | $ | — | | | | $ | — | | | | $ | 0.02 | | | | $ | 0.08 | | | | $ | 0.11 | | | | $ | — | | | | $ | — | |
| | | | | | | | | | | | | | | |
| | | Class I Shares |
| | | Year Ended
February 28, | | Period from
January 14,
2020
(commencement
of operations)
through
February 29,
2020 |
| | | 2022 | | 2021 |
Net asset value, beginning of period | | | $ | 36.66 | | | | $ | 30.75 | | | | $ | 35.29 | |
| | | | | | | | | | | | | | | |
Income (loss) from investment operations: | | | | | | | | | | | | | | | |
Net investment income (loss)(a)† | | | | 1.13 | | | | | 0.52 | | | | | 0.00 | (f) |
Net realized and unrealized gain (loss) | | | | (6.52 | ) | | | | 6.68 | | | | | (4.54 | ) |
| | | | | | | | | | | | | | | |
Total from investment operations | | | | (5.39 | ) | | | | 7.20 | | | | | (4.54 | ) |
| | | | | | | | | | | | | | | |
Less distributions to shareholders: | | | | | | | | | | | | | | | |
From net investment income | | | | (1.52 | ) | | | | (1.29 | ) | | | | — | |
| | | | | | | | | | | | | | | |
Total distributions | | | | (1.52 | ) | | | | (1.29 | ) | | | | — | |
| | | | | | | | | | | | | | | |
Net asset value, end of period | | | $ | 29.75 | | | | $ | 36.66 | | | | $ | 30.75 | |
| | | | | | | | | | | | | | | |
Total Return(b) | | | | (15.20 | )% | | | | 23.83 | % | | | | (12.86 | )%** |
Ratios/Supplemental Data: | | | | | | | | | | | | | | | |
Net assets, end of period (000’s) | | | $ | 119,995 | | | | $ | 79,824 | | | | $ | 16,158 | |
Net expenses to average daily net assets(c) | | | | 0.98 | % | | | | 0.98 | % | | | | 0.94 | %* |
Net investment income (loss) to average daily net assets(a) | | | | 3.14 | % | | | | 1.55 | % | | | | (0.05 | )%* |
Portfolio turnover rate | | | | 102 | % | | | | 102 | % | | | | 100 | %(d)** |
Fees and expenses reimbursed and/or waived by GMO to average daily net assets: | | | | 0.10 | % | | | | 0.10 | %(e) | | | | 0.19 | %(e)* |
| (a) | Net investment income is affected by the timing of the declaration of dividends by the other GMO Funds and/or other investment companies in which the Fund invests, if any. |
| (b) | The total returns would have been lower had certain expenses not been reimbursed and/or waived during the periods shown, if applicable, and assumes the effect of reinvested distributions, if any. Calculation excludes purchase premiums and redemption fees which are borne by the shareholder purchasing or redeeming Fund shares, if any. |
| (c) | Net expenses exclude expenses incurred indirectly through investment in the underlying funds, if any (Note 5). |
| (d) | The portfolio turnover rate excludes investments in GMO U.S. Treasury Fund (“USTF”) which is used as a short-term investment vehicle for cash management. The Fund’s portfolio turnover rate during the years ended February 29, 2020, February 28, 2019 and February 28, 2018, including transactions in USTF, was 123%, 128% and 117%, respectively, of the average value of its portfolio. |
| (e) | Ratio includes indirect fees waived or borne by GMO. |
| (f) | Rounds to less than $0.01. |
| † | Calculated using average shares outstanding throughout the period. |
| | | | |
| | |
| | | See accompanying notes to the financial statements. | | 107 |
GMO Trust Funds
Financial Highlights
(For a share outstanding throughout each period)
INTERNATIONAL EQUITY FUND
| | | | | | | | | | | | | | | | | | | | | | | | | | | | | | | | | | | | | | | | | | | | | | | | | | |
| | | Class II Shares | | Class III Shares |
| | | Year Ended February 28/29, | | Year Ended February 28/29, |
| | | 2022 | | 2021 | | 2020 | | 2019 | | 2018 | | 2022 | | 2021 | | 2020 | | 2019 | | 2018 |
Net asset value, beginning of period | | | $ | 23.04 | | | | $ | 19.83 | | | | $ | 20.08 | | | | $ | 23.63 | | | | $ | 20.18 | | | | $ | 23.32 | | | | $ | 20.09 | | | | $ | 20.33 | | | | $ | 23.92 | | | | $ | 20.41 | |
| | | | | | | | | | | | | | | | | | | | | | | | | | | | | | | | | | | | | | | | | | | | | | | | | | |
Income (loss) from investment operations: | | | | | | | | | | | | | | | | | | | | | | | | | | | | | | | | | | | | | | | | | | | | | | | | | | |
Net investment income (loss)(a)† | | | | 0.91 | (b) | | | | 0.75 | (c) | | | | 0.72 | | | | | 0.57 | | | | | 0.41 | | | | | 0.96 | (b) | | | | 0.75 | (c) | | | | 0.70 | | | | | 0.57 | | | | | 0.61 | |
Net realized and unrealized gain (loss) | | | | 0.26 | | | | | 3.46 | | | | | (0.22 | ) | | | | (3.45 | ) | | | | 3.78 | | | | | 0.25 | | | | | 3.51 | | | | | (0.17 | ) | | | | (3.47 | ) | | | | 3.64 | |
| | | | | | | | | | | | | | | | | | | | | | | | | | | | | | | | | | | | | | | | | | | | | | | | | | |
Total from investment operations | | | | 1.17 | | | | | 4.21 | | | | | 0.50 | | | | | (2.88 | ) | | | | 4.19 | | | | | 1.21 | | | | | 4.26 | | | | | 0.53 | | | | | (2.90 | ) | | | | 4.25 | |
| | | | | | | | | | | | | | | | | | | | | | | | | | | | | | | | | | | | | | | | | | | | | | | | | | |
Less distributions to shareholders: | | | | | | | | | | | | | | | | | | | | | | | | | | | | | | | | | | | | | | | | | | | | | | | | | | |
From net investment income | | | | (1.51 | ) | | | | (1.00 | ) | | | | (0.75 | ) | | | | (0.67 | ) | | | | (0.74 | ) | | | | (1.53 | ) | | | | (1.03 | ) | | | | (0.77 | ) | | | | (0.69 | ) | | | | (0.74 | ) |
| | | | | | | | | | | | | | | | | | | | | | | | | | | | | | | | | | | | | | | | | | | | | | | | | | |
Total distributions | | | | (1.51 | ) | | | | (1.00 | ) | | | | (0.75 | ) | | | | (0.67 | ) | | | | (0.74 | ) | | | | (1.53 | ) | | | | (1.03 | ) | | | | (0.77 | ) | | | | (0.69 | ) | | | | (0.74 | ) |
| | | | | | | | | | | | | | | | | | | | | | | | | | | | | | | | | | | | | | | | | | | | | | | | | | |
Net asset value, end of period | | | $ | 22.70 | | | | $ | 23.04 | | | | $ | 19.83 | | | | $ | 20.08 | | | | $ | 23.63 | | | | $ | 23.00 | | | | $ | 23.32 | | | | $ | 20.09 | | | | $ | 20.33 | | | | $ | 23.92 | |
| | | | | | | | | | | | | | | | | | | | | | | | | | | | | | | | | | | | | | | | | | | | | | | | | | |
Total Return(d) | | | | 5.00 | %(e) | | | | 21.58 | %(f) | | | | 2.19 | % | | | | (12.07 | )% | | | | 20.85 | % | | | | 5.08 | %(e) | | | | 21.60 | %(f) | | | | 2.29 | % | | | | (12.02 | )% | | | | 20.96 | % |
Ratios/Supplemental Data: | | | | | | | | | | | | | | | | | | | | | | | | | | | | | | | | | | | | | | | | | | | | | | | | | | |
Net assets, end of period (000’s) | | | $ | 5,615 | | | | $ | 5,546 | | | | $ | 10,802 | | | | $ | 18,202 | | | | $ | 23,736 | | | | $ | 358,775 | | | | $ | 423,332 | | | | $ | 452,165 | | | | $ | 507,195 | | | | $ | 485,782 | |
Net expenses to average daily net assets(g) | | | | 0.74 | % | | | | 0.73 | % | | | | 0.73 | % | | | | 0.73 | % | | | | 0.72 | % | | | | 0.67 | % | | | | 0.66 | % | | | | 0.66 | % | | | | 0.66 | % | | | | 0.65 | % |
Net investment income (loss) to average daily net assets(a) | | | | 3.69 | %(b) | | | | 3.82 | %(c) | | | | 3.52 | % | | | | 2.64 | % | | | | 1.77 | % | | | | 3.84 | %(b) | | | | 3.70 | %(c) | | | | 3.36 | % | | | | 2.64 | % | | | | 2.68 | % |
Portfolio turnover rate | | | | 64 | % | | | | 48 | % | | | | 46 | %(h) | | | | 41 | %(h) | | | | 45 | %(h) | | | | 64 | % | | | | 48 | % | | | | 46 | %(h) | | | | 41 | %(h) | | | | 45 | %(h) |
Fees and expenses reimbursed and/or waived by GMO to average daily net assets: | | | | 0.03 | % | | | | 0.03 | % | | | | 0.03 | %(i) | | | | 0.02 | % | | | | 0.04 | % | | | | 0.03 | % | | | | 0.03 | % | | | | 0.03 | %(i) | | | | 0.02 | % | | | | 0.04 | % |
| (a) | Net investment income is affected by the timing of the declaration of dividends by the other GMO Funds and/or other investment companies in which the Fund invests, if any. |
| (b) | Net investment income per share includes approximately $12,515, $861,919, $3,699,861 and $2,264 in Class II, III, IV and I, respectively, related to income received for EU reclaims, net of IRS closing agreement fees and non-recurring contingent legal fees attributed to EU tax reclaims, if any, in connection with certain Fund holdings. Excluding this amount, the net investment income to average daily net assets ratio would have been 3.48%, 3.63%, 3.67% and 1.63% in Class II, III, IV and I, respectively (Note 2). |
| (c) | Net investment income per share includes approximately $69,807, $6,194,610 and $27,980,578 in Class II, III and IV, respectively, related to income received for EU reclaims, net of IRS closing agreement fees, in connection with certain Fund holdings. Excluding this amount, the net investment income to average daily net assets ratio would have been 2.62%, 2.30%, and 2.49% in Class II, III and IV, respectively (See Note 2). |
| (d) | The total returns would have been lower had certain expenses not been reimbursed and/or waived during the periods shown, if applicable, and assumes the effect of reinvested distributions, if any. Calculation excludes purchase premiums and redemption fees which are borne by the shareholder purchasing or redeeming Fund shares, if any. |
| (e) | EU tax reclaim payments and related interest received during the year, net of IRS closing agreement fees and non-recurring contingent legal fees attributed to EU tax reclaims, had a positive impact to total return, adding 0.21% to each class’s total return (Note 2). |
| (f) | EU tax reclaim payments and related interest received during the year, net of IRS closing agreement fees, had a positive impact to total return, adding 1.58% to each class’s total return (See Note 2). |
| (g) | Net expenses exclude expenses incurred indirectly through investment in the underlying funds, if any (Note 5). |
| (h) | The portfolio turnover rate excludes investments in GMO U.S. Treasury Fund (“USTF”) which is used as a short-term investment vehicle for cash management. The Fund’s portfolio turnover rate during the years ended February 29, 2020, February 28, 2019, February 28, 2018 and February 28, 2017, including transactions in USTF as 65%, 54%, 61% and 50%, respectively, of the average value of its portfolio. |
| (i) | Ratio includes indirect fees waived or borne by GMO. |
| † | Calculated using average shares outstanding throughout the period. |
| | | | |
| | |
| 108 | | See accompanying notes to the financial statements. | | |
GMO Trust Funds
Financial Highlights
(For a share outstanding throughout each period)
INTERNATIONAL EQUITY FUND (continued)
| | | | | | | | | | | | | | | | | | | | | | | | | | | | | | |
| | | Class IV Shares | | Class I Shares |
| | | Year Ended February 28/29, | | Period from
May 24, 2021
(commencement
of operations)
through
February 28,
2022 |
| | | 2022 | | 2021 | | 2020 | | 2019 | | 2018 |
Net asset value, beginning of period | | | $ | 23.28 | | | | $ | 20.05 | | | | $ | 20.29 | | | | $ | 23.87 | | | | $ | 20.38 | | | | $ | 25.79 | |
| | | | | | | | | | | | | | | | | | | | | | | | | | | | | | |
Income (loss) from investment operations: | | | | | | | | | | | | | | | | | | | | | | | | | | | | | | |
Net investment income (loss)(a)† | | | | 0.96 | (b) | | | | 0.77 | (c) | | | | 0.74 | | | | | 0.63 | | | | | 0.56 | | | | | 0.44 | (b) |
Net realized and unrealized gain (loss) | | | | 0.26 | | | | | 3.50 | | | | | (0.20 | ) | | | | (3.51 | ) | | | | 3.69 | | | | | (2.05 | ) |
| | | | | | | | | | | | | | | | | | | | | | | | | | | | | | |
Total from investment operations | | | | 1.22 | | | | | 4.27 | | | | | 0.54 | | | | | (2.88 | ) | | | | 4.25 | | | | | (1.61 | ) |
| | | | | | | | | | | | | | | | | | | | | | | | | | | | | | |
Less distributions to shareholders: | | | | | | | | | | | | | | | | | | | | | | | | | | | | | | |
From net investment income | | | | (1.54 | ) | | | | (1.04 | ) | | | | (0.78 | ) | | | | (0.70 | ) | | | | (0.76 | ) | | | | (1.10 | ) |
| | | | | | | | | | | | | | | | | | | | | | | | | | | | | | |
Total distributions | | | | (1.54 | ) | | | | (1.04 | ) | | | | (0.78 | ) | | | | (0.70 | ) | | | | (0.76 | ) | | | | (1.10 | ) |
| | | | | | | | | | | | | | | | | | | | | | | | | | | | | | |
Net asset value, end of period | | | $ | 22.96 | | | | $ | 23.28 | | | | $ | 20.05 | | | | $ | 20.29 | | | | $ | 23.87 | | | | $ | 23.08 | |
| | | | | | | | | | | | | | | | | | | | | | | | | | | | | | |
Total Return(d) | | | | 5.16 | %(e) | | | | 21.71 | %(f) | | | | 2.34 | % | | | | (11.95 | )% | | | | 20.98 | % | | | | (6.27 | )%(g)** |
Ratios/Supplemental Data: | | | | | | | | | | | | | | | | | | | | | | | | | | | | | | |
Net assets, end of period (000’s) | | | $ | 1,534,339 | | | | $ | 1,765,686 | | | | $ | 2,584,648 | | | | $ | 3,156,760 | | | | $ | 4,558,167 | | | | $ | 3,021 | |
Net expenses to average daily net assets(h) | | | | 0.61 | % | | | | 0.60 | % | | | | 0.60 | % | | | | 0.60 | % | | | | 0.59 | % | | | | 0.89 | %* |
Net investment income (loss) to average daily net assets(a) | | | | 3.88 | %(b) | | | | 3.81 | %(c) | | | | 3.53 | % | | | | 2.89 | % | | | | 2.45 | % | | | | 2.35 | %(b)* |
Portfolio turnover rate | | | | 64 | % | | | | 48 | % | | | | 46 | %(i) | | | | 41 | %(i) | | | | 45 | %(i) | | | | 64 | %** |
Fees and expenses reimbursed and/or waived by GMO to average daily net assets: | | | | 0.03 | % | | | | 0.03 | % | | | | 0.03 | %(j) | | | | 0.02 | % | | | | 0.04 | % | | | | 0.03 | %* |
| (a) | Net investment income is affected by the timing of the declaration of dividends by the other GMO Funds and/or other investment companies in which the Fund invests, if any. |
| (b) | Net investment income per share includes approximately $12,515, $861,919, $3,699,861 and $2,264 in Class II, III, IV and I, respectively, related to income received for EU reclaims, net of IRS closing agreement fees and non-recurring contingent legal fees attributed to EU tax reclaims, if any, in connection with certain Fund holdings. Excluding this amount, the net investment income to average daily net assets ratio would have been 3.48%, 3.63%, 3.67% and 1.63% in Class II, III, IV and I, respectively (Note 2). |
| (c) | Net investment income per share includes approximately $69,807, $6,194,610 and $27,980,578 in Class II, III and IV, respectively, related to income received for EU reclaims, net of IRS closing agreement fees, in connection with certain Fund holdings. Excluding this amount, the net investment income to average daily net assets ratio would have been 2.62%, 2.30%, and 2.49% in Class II, III and IV, respectively (See Note 2). |
| (d) | The total returns would have been lower had certain expenses not been reimbursed and/or waived during the periods shown, if applicable, and assumes the effect of reinvested distributions, if any. Calculation excludes purchase premiums and redemption fees which are borne by the shareholder purchasing or redeeming Fund shares, if any. |
| (e) | EU tax reclaim payments and related interest received during the year, net of IRS closing agreement fees and non-recurring contingent legal fees attributed to EU tax reclaims, had a positive impact to total return, adding 0.21% to each class’s total return (Note 2). |
| (f) | EU tax reclaim payments and related interest received during the year, net of IRS closing agreement fees, had a positive impact to total return, adding 1.58% to each class’s total return (See Note 2). |
| (g) | EU tax reclaim payments and related interest received during the period, net of IRS closing agreement fees and non-recurring contingent legal fees attributed to EU tax reclaims, had a positive impact to total return, adding 0.16% to Class I’s total return (Note 2). Class I commenced operations on May 24, 2021. |
| (h) | Net expenses exclude expenses incurred indirectly through investment in the underlying funds, if any (Note 5). |
| (i) | The portfolio turnover rate excludes investments in GMO U.S. Treasury Fund (“USTF”) which is used as a short-term investment vehicle for cash management. The Fund’s portfolio turnover rate during the years ended February 29, 2020, February 28, 2019 and February 28, 2018, including transactions in USTF as 65%, 54% and 61%, respectively, of the average value of its portfolio. |
| (j) | Ratio includes indirect fees waived or borne by GMO. |
| † | Calculated using average shares outstanding throughout the period. |
| | | | |
| | |
| | | See accompanying notes to the financial statements. | | 109 |
GMO Trust Funds
Financial Highlights
(For a share outstanding throughout each period)
JAPAN VALUE CREATION FUND
| | | | | | | | | | | | | | | | | | | | |
| | | Class III Shares | | Class VI Shares | | Class I Shares |
| | | Period from
December 30,
2021
(commencement
of operations)
through
February 28,
2022 | | Year Ended
February 28,
2022 | | Period from
September 14,
2020
(commencement
of operations)
through
February 28,
2021 | | Period from
June 7, 2021
(commencement
of operations)
through
February 28,
2022 |
Net asset value, beginning of period | | | $ | 19.81 | | | | $ | 23.47 | | | | $ | 20.00 | | | | $ | 24.95 | |
| | | | | | | | | | | | | | | | | | | | |
Income (loss) from investment operations: | | | | | | | | | | | |
Net investment income (loss)(a)† | | | | (0.03 | ) | | | | 0.43 | | | | | 0.17 | | | | | 0.12 | |
Net realized and unrealized gain (loss) | | | | (0.07 | ) | | | | (0.71 | ) | | | | 3.59 | | | | | (1.91 | )(c) |
| | | | | | | | | | | | | | | | | | | | |
Total from investment operations | | | | (0.10 | ) | | | | (0.28 | ) | | | | 3.76 | | | | | (1.79 | ) |
| | | | | | | | | | | | | | | | | | | | |
Less distributions to shareholders: | | | | | | | | | | | |
From net investment income | | | | — | | | | | (1.50 | ) | | | | (0.28 | ) | | | | (1.49 | ) |
From net realized gains | | | | — | | | | | (1.98 | ) | | | | (0.01 | ) | | | | (1.98 | ) |
| | | | | | | | | | | | | | | | | | | | |
Total distributions | | | | — | | | | | (3.48 | ) | | | | (0.29 | ) | | | | (3.47 | ) |
| | | | | | | | | | | | | | | | | | | | |
Net asset value, end of period | | | $ | 19.71 | | | | $ | 19.71 | | | | $ | 23.47 | | | | $ | 19.69 | |
| | | | | | | | | | | | | | | | | | | | |
Total Return(b) | | | | (0.50 | )%** | | | | (1.45 | )% | | | | 18.82 | %** | | | | (7.43 | )%** |
Ratios/Supplemental Data: | | | | | | | | | | | |
Net assets, end of period (000’s) | | | $ | 23,673 | | | | $ | 133,035 | | | | $ | 163,872 | | | | $ | 3,107 | |
Net expenses to average daily net assets(d) | | | | 0.66 | %* | | | | 0.57 | % | | | | 0.56 | %* | | | | 0.77 | %* |
Net investment income (loss) to average daily net assets(a) | | | | (0.55 | )%* | | | | 1.90 | % | | | | 1.68 | %* | | | | 0.79 | %* |
Portfolio turnover rate | | | | 47 | %** | | | | 47 | % | | | | 28 | %** | | | | 47 | %** |
Fees and expenses reimbursed and/or waived by GMO to average daily net assets: | | | | 0.15 | %* | | | | 0.08 | % | | | | 0.23 | %* | | | | 0.12 | %* |
| (a) | Net investment income is affected by the timing of the declaration of dividends by the other GMO Funds and/or other investment companies in which the Fund invests, if any. |
| (b) | The total returns would have been lower had certain expenses not been reimbursed and/or waived during the periods shown, if applicable, and assumes the effect of reinvested distributions, if any. Calculation excludes purchase premiums and redemption fees which are borne by the shareholder purchasing or redeeming Fund shares, if any. |
| (c) | The amount shown for a share outstanding does not correspond with the aggregate net realized and unrealized gain (loss) on investments due to the timing of purchases and redemptions of the Fund shares in relation to fluctuating market values of the investments of the Fund. |
| (d) | Net expenses exclude expenses incurred indirectly through investment in the underlying funds, if any (Note 5). |
| † | Calculated using average shares outstanding throughout the period. |
| | | | |
| | |
| 110 | | See accompanying notes to the financial statements. | | |
GMO Trust Funds
Financial Highlights
(For a share outstanding throughout each period)
QUALITY CYCLICALS FUND (formerly Cyclical Focus Fund)
| | | | | | | | | | | | | | | |
| | | Class VI Shares | | Class I Shares |
| | | Year Ended
February 28,
2022 | | Period from
May 12, 2020
(commencement
of operations)
through
February 28,
2021 | | Period from
July 16, 2021
(commencement
of operations)
through
February 28,
2022 |
Net asset value, beginning of period | | | $ | 29.06 | | | | $ | 20.00 | | | | $ | 28.45 | |
| | | | | | | | | | | | | | | |
Income (loss) from investment operations: | | | | | | | | | | | |
Net investment income (loss)(a)† | | | | 0.64 | | | | | 0.38 | | | | | 0.34 | |
Net realized and unrealized gain (loss) | | | | 2.24 | | | | | 10.23 | | | | | (0.05 | )(b) |
| | | | | | | | | | | | | | | |
Total from investment operations | | | | 2.88 | | | | | 10.61 | | | | | 0.29 | |
| | | | | | | | | | | | | | | |
Less distributions to shareholders: | | | | | | | | | | | |
From net investment income | | | | (0.84 | ) | | | | (0.60 | ) | | | | (0.47 | ) |
From net realized gains | | | | (5.33 | ) | | | | (0.95 | ) | | | | (2.51 | ) |
| | | | | | | | | | | | | | | |
Total distributions | | | | (6.17 | ) | | | | (1.55 | ) | | | | (2.98 | ) |
| | | | | | | | | | | | | | | |
Net asset value, end of period | | | $ | 25.77 | | | | $ | 29.06 | | | | $ | 25.76 | |
| | | | �� | | | | | | | | | | | |
Total Return(c) | | | | 10.22 | % | | | | 53.56 | %** | | | | 1.42 | %** |
Ratios/Supplemental Data: | | | | | | | | | | | |
Net assets, end of period (000’s) | | | $ | 141,465 | | | | $ | 141,989 | | | | $ | 81 | |
Net expenses to average daily net assets(d) | | | | 0.40 | % | | | | 0.40 | %* | | | | 0.59 | %* |
Net investment income (loss) to average daily net assets(a) | | | | 2.20 | % | | | | 1.92 | %* | | | | 1.92 | %* |
Portfolio turnover rate(e) | | | | 22 | % | | | | 65 | %** | | | | 22 | %** |
Fees and expenses reimbursed and/or waived by GMO to average daily net assets: | | | | 0.08 | % | | | | 0.20 | %* | | | | 0.08 | %* |
| (a) | Net investment income is affected by the timing of the declaration of dividends by the other GMO Funds and/or other investment companies in which the Fund invests, if any. |
| (b) | The amount shown for a share outstanding does not correspond with the aggregate net realized and unrealized gain (loss) on investments due to the timing of purchases and redemptions of the Fund shares in relation to fluctuating market values of the investments of the Fund. |
| (c) | The total returns would have been lower had certain expenses not been reimbursed and/or waived during the periods shown, if applicable, and assumes the effect of reinvested distributions, if any. Calculation excludes purchase premiums and redemption fees which are borne by the shareholder purchasing or redeeming Fund shares, if any. |
| (d) | Net expenses exclude expenses incurred indirectly through investment in the underlying funds, if any (Note 5). |
| (e) | The portfolio turnover rate excludes investments in GMO U.S. Treasury Fund (“USTF”) which is used as a short-term investment vehicle for cash management. The Fund’s portfolio turnover rate during the years ended February 28, 2022 and February 28, 2021, including transactions in USTF was 27% and 70%, respectively, of the average value of its portfolio. |
| † | Calculated using average shares outstanding throughout the period. |
| | | | |
| | |
| | | See accompanying notes to the financial statements. | | 111 |
GMO Trust Funds
Financial Highlights
(For a share outstanding throughout each period)
QUALITY FUND
| | | | | | | | | | | | | | | | | | | | | | | | | | | | | | | | | | | | | | | | |
| | | Class III Shares | | | Class IV Shares | |
| | | Year Ended February 28/29, | | | Year Ended February 28/29, | |
| | | 2022 | | | 2021 | | | 2020 | | | 2019 | | | 2018 | | | 2022 | | | 2021 | | | 2020 | | | 2019 | | | 2018 | |
Net asset value, beginning of period | | $ | 25.98 | | | $ | 22.77 | | | $ | 22.28 | | | $ | 25.13 | | | $ | 22.05 | | | $ | 26.04 | | | $ | 22.82 | | | $ | 22.32 | | | $ | 25.17 | | | $ | 22.08 | |
| | | | | | | | | | | | | | | | | | | | | | | | | | | | | | | | | | | | | | | | |
Income (loss) from investment operations: | | | | | | | | | | | | | | | | | | | | | | | | | | | | | | | | | | | | | | | | |
Net investment income (loss)(a)† | | | 0.33 | (b) | | | 0.32 | | | | 0.35 | | | | 0.35 | | | | 0.36 | | | | 0.32 | (b) | | | 0.34 | | | | 0.37 | | | | 0.36 | | | | 0.37 | |
Net realized and unrealized gain (loss) | | | 3.56 | | | | 6.37 | | | | 2.15 | | | | 1.21 | | | | 4.70 | | | | 3.60 | | | | 6.37 | | | | 2.14 | | | | 1.22 | | | | 4.70 | |
| | | | | | | | | | | | | | | | | | | | | | | | | | | | | | | | | | | | | | | | |
Total from investment operations | | | 3.89 | | | | 6.69 | | | | 2.50 | | | | 1.56 | | | | 5.06 | | | | 3.92 | | | | 6.71 | | | | 2.51 | | | | 1.58 | | | | 5.07 | |
| | | | | | | | | | | | | | | | | | | | | | | | | | | | | | | | | | | | | | | | |
Less distributions to shareholders: | | | | | | | | | | | | | | | | | | | | | | | | | | | | | | | | | | | | | | | | |
From net investment income | | | (0.32 | ) | | | (0.35 | ) | | | (0.36 | ) | | | (0.39 | ) | | | (0.41 | ) | | | (0.33 | ) | | | (0.36 | ) | | | (0.36 | ) | | | (0.41 | ) | | | (0.41 | ) |
From net realized gains | | | (1.50 | ) | | | (3.13 | ) | | | (1.65 | ) | | | (4.02 | ) | | | (1.57 | ) | | | (1.50 | ) | | | (3.13 | ) | | | (1.65 | ) | | | (4.02 | ) | | | (1.57 | ) |
| | | | | | | | | | | | | | | | | | | | | | | | | | | | | | | | | | | | | | | | |
Total distributions | | | (1.82 | ) | | | (3.48 | ) | | | (2.01 | ) | | | (4.41 | ) | | | (1.98 | ) | | | (1.83 | ) | | | (3.49 | ) | | | (2.01 | ) | | | (4.43 | ) | | | (1.98 | ) |
| | | | | | | | | | | | | | | | | | | | | | | | | | | | | | | | | | | | | | | | |
Net asset value, end of period | | $ | 28.05 | | | $ | 25.98 | | | $ | 22.77 | | | $ | 22.28 | | | $ | 25.13 | | | $ | 28.13 | | | $ | 26.04 | | | $ | 22.82 | | | $ | 22.32 | | | $ | 25.17 | |
| | | | | | | | | | | | | | | | | | | | | | | | | | | | | | | | | | | | | | | | |
Total Return(c) | | | 14.71 | %(d) | | | 30.83 | % | | | 10.64 | % | | | 6.86 | % | | | 23.32 | % | | | 14.79 | %(d) | | | 30.86 | % | | | 10.70 | % | | | 6.91 | % | | | 23.37 | % |
Ratios/Supplemental Data: | | | | | | | | | | | | | | | | | | | | | | | | | | | | | | | | | | | | | | | | |
Net assets, end of period (000’s) | | $ | 2,996,330 | | | $ | 3,519,473 | | | $ | 3,195,240 | | | $ | 3,065,461 | | | $ | 3,524,103 | | | $ | 912,163 | | | $ | 750,632 | | | $ | 852,866 | | | $ | 1,139,024 | | | $ | 957,900 | |
Net expenses to average daily net assets(e) | | | 0.48 | % | | | 0.48 | % | | | 0.48 | % | | | 0.48 | % | | | 0.48 | % | | | 0.44 | % | | | 0.44 | % | | | 0.44 | % | | | 0.44 | % | | | 0.44 | % |
Net investment income (loss) to average daily net assets(a) | | | 1.12 | %(b) | | | 1.33 | % | | | 1.44 | % | | | 1.42 | % | | | 1.48 | % | | | 1.08 | %(b) | | | 1.37 | % | | | 1.52 | % | | | 1.46 | % | | | 1.53 | % |
Portfolio turnover rate(f) | | | 18 | % | | | 28 | % | | | 17 | % | | | 18 | % | | | 10 | % | | | 18 | % | | | 28 | % | | | 17 | % | | | 18 | % | | | 10 | % |
Fees and expenses reimbursed and/or waived by GMO to average daily net assets: | | | 0.02 | %(g) | | | 0.02 | %(g) | | | 0.02 | %(g) | | | 0.02 | % | | | 0.02 | % | | | 0.02 | %(g) | | | 0.02 | %(g) | | | 0.02 | %(g) | | | 0.02 | % | | | 0.02 | % |
| | | | | | | | | | | | | | | | | | | | | | | | | | | | | | | | | | | | | | | | |
| | | Class VI Shares | | Class R6 Shares |
| | | Year Ended February 28/29, | | Year Ended
February 28, | | Period from
November 12,
2019
(commencement
of operations)
through
February 29,
2020 |
| | | 2022 | | 2021 | | 2020 | | 2019 | | 2018 | | 2022 | | 2021 |
Net asset value, beginning of period | | | $ | 25.98 | | | | $ | 22.77 | | | | $ | 22.28 | | | | $ | 25.13 | | | | $ | 22.05 | | | | $ | 25.96 | | | | $ | 22.76 | | | | $ | 25.21 | |
| | | | | | | | | | | | | | | | | | | | | | | | | | | | | | | | | | | | | | | | |
Income (loss) from investment operations: | | | | | | | | | | | | | | | | | | | | | | | | | | |
Net investment income (loss)(a)† | | | | 0.34 | (b) | | | | 0.35 | | | | | 0.37 | | | | | 0.38 | | | | | 0.38 | | | | | 0.32 | (b) | | | | 0.30 | | | | | 0.10 | |
Net realized and unrealized gain (loss) | | | | 3.60 | | | | | 6.37 | | | | | 2.15 | | | | | 1.21 | | | | | 4.70 | | | | | 3.57 | | | | | 6.39 | | | | | (0.83 | ) |
| | | | | | | | | | | | | | | | | | | | | | | | | | | | | | | | | | | | | | | | |
Total from investment operations | | | | 3.94 | | | | | 6.72 | | | | | 2.52 | | | | | 1.59 | | | | | 5.08 | | | | | 3.89 | | | | | 6.69 | | | | | (0.73 | ) |
| | | | | | | | | | | | | | | | | | | | | | | | | | | | | | | | | | | | | | | | |
Less distributions to shareholders: | | | | | | | | | | | | | | | | | | | | | | | | | | |
From net investment income | | | | (0.36 | ) | | | | (0.38 | ) | | | | (0.38 | ) | | | | (0.42 | ) | | | | (0.43 | ) | | | | (0.33 | ) | | | | (0.36 | ) | | | | (0.32 | ) |
From net realized gains | | | | (1.50 | ) | | | | (3.13 | ) | | | | (1.65 | ) | | | | (4.02 | ) | | | | (1.57 | ) | | | | (1.50 | ) | | | | (3.13 | ) | | | | (1.40 | ) |
| | | | | | | | | | | | | | | | | | | | | | | | | | | | | | | | | | | | | | | | |
Total distributions | | | | (1.86 | ) | | | | (3.51 | ) | | | | (2.03 | ) | | | | (4.44 | ) | | | | (2.00 | ) | | | | (1.83 | ) | | | | (3.49 | ) | | | | (1.72 | ) |
| | | | | | | | | | | | | | | | | | | | | | | | | | | | | | | | | | | | | | | | |
Net asset value, end of period | | | $ | 28.06 | | | | $ | 25.98 | | | | $ | 22.77 | | | | $ | 22.28 | | | | $ | 25.13 | | | | $ | 28.02 | | | | $ | 25.96 | | | | $ | 22.76 | |
| | | | | | | | | | | | | | | | | | | | | | | | | | | | | | | | | | | | | | | | |
Total Return(c) | | | | 14.86 | %(d) | | | | 30.95 | % | | | | 10.73 | % | | | | 6.96 | % | | | | 23.43 | % | | | | 14.71 | %(d) | | | | 30.81 | % | | | | (3.39 | )%** |
Ratios/Supplemental Data: | | | | | | | | | | | | | | | | | | | | | | | | | | |
Net assets, end of period (000’s) | | | $ | 3,461,580 | | | | $ | 2,465,066 | | | | $ | 2,077,277 | | | | $ | 2,227,287 | | | | $ | 3,561,976 | | | | $ | 507,232 | | | | $ | 330,287 | | | | $ | 77,375 | |
Net expenses to average daily net assets(e) | | | | 0.39 | % | | | | 0.39 | % | | | | 0.39 | % | | | | 0.39 | % | | | | 0.39 | % | | | | 0.48 | % | | | | 0.48 | % | | | | 0.49 | %* |
Net investment income (loss) to average daily net assets(a) | | | | 1.16 | %(b) | | | | 1.41 | % | | | | 1.55 | % | | | | 1.54 | % | | | | 1.57 | % | | | | 1.07 | %(b) | | | | 1.22 | % | | | | 1.31 | %* |
Portfolio turnover rate(f) | | | | 18 | % | | | | 28 | % | | | | 17 | % | | | | 18 | % | | | | 10 | % | | | | 18 | % | | | | 28 | % | | | | 17 | %** |
Fees and expenses reimbursed and/or waived by GMO to average daily net assets: | | | | 0.02 | %(g) | | | | 0.02 | %(g) | | | | 0.02 | %(g) | | | | 0.02 | % | | | | 0.02 | % | | | | 0.02 | %(g) | | | | 0.02 | %(g) | | | | 0.02 | %(g)* |
| (a) | Net investment income is affected by the timing of the declaration of dividends by the other GMO Funds and/or other investment companies in which the Fund invests, if any. |
| (b) | Net investment income per share includes approximately $6,233,641, $1,577,219, $5,862,655, $822,832 and $779,657 in Class III, IV, VI, R6 and I, respectively, related to income received for EU reclaims, net of IRS closing agreement fees and non-recurring contingent legal fees attributed to EU tax reclaims, if any, in connection with certain Fund holdings. Excluding this amount, the net investment income to average daily net assets ratio would have been 0.94%, 0.91%, 0.99%, 0.89% and 0.79% in Class III, IV, VI, R6 and I, respectively (Note 2). |
| (c) | The total returns would have been lower had certain expenses not been reimbursed and/or waived during the periods shown, if applicable, and assumes the effect of reinvested distributions, if any. Calculation excludes purchase premiums and redemption fees which are borne by the shareholder purchasing or redeeming Fund shares, if any. |
| (d) | EU tax reclaim payments and related interest received during the year, net of IRS closing agreement fees and non-recurring contingent legal fees attributed to EU tax reclaims, had a positive impact to total return, adding 0.20% to each class’s total return (Note 2). |
| (e) | Net expenses exclude expenses incurred indirectly through investment in the underlying funds, if any (Note 5). |
| (f) | The portfolio turnover rate excludes investments in GMO U.S. Treasury Fund (“USTF”) which is used as a short-term investment vehicle for cash management. The Fund’s portfolio turnover rate during the years ended February 28, 2022, February 28, 2021, February 29, 2020, February 28, 2019 and February 28, 2018, including transactions in USTF, was 18%, 28%, 17%, 20% and 23%, respectively, of the average value of its portfolio. |
| (g) | Ratio includes indirect fees waived or borne by GMO. |
| † | Calculated using average shares outstanding throughout the period. |
| | | | |
| | |
| 112 | | See accompanying notes to the financial statements. | | |
GMO Trust Funds
Financial Highlights
(For a share outstanding throughout each period)
QUALITY FUND (continued)
| | | | | | | | | | | | | | | |
| | | Class I Shares |
| | | Year Ended
February 28, | | Period from
September 26,
2019
(commencement
of operations)
through
February 29,
2020 |
| | | 2022 | | 2021 |
Net asset value, beginning of period | | | $ | 25.93 | | | | $ | 22.75 | | | | $ | 23.95 | |
| | | | | | | | | | | | | | | |
Income (loss) from investment operations: | |
Net investment income (loss)(a)† | | | | 0.28 | (b) | | | | 0.28 | | | | | 0.12 | |
Net realized and unrealized gain (loss) | | | | 3.58 | | | | | 6.37 | | | | | 0.39 | |
| | | | | | | | | | | | | | | |
Total from investment operations | | | | 3.86 | | | | | 6.65 | | | | | 0.51 | |
| | | | | | | | | | | | | | | |
Less distributions to shareholders: | |
From net investment income | | | | (0.30 | ) | | | | (0.34 | ) | | | | (0.31 | ) |
From net realized gains | | | | (1.50 | ) | | | | (3.13 | ) | | | | (1.40 | ) |
| | | | | | | | | | | | | | | |
Total distributions | | | | (1.80 | ) | | | | (3.47 | ) | | | | (1.71 | ) |
| | | | | | | | | | | | | | | |
Net asset value, end of period | | | $ | 27.99 | | | | $ | 25.93 | | | | $ | 22.75 | |
| | | | | | | | | | | | | | | |
Total Return(c) | | | | 14.62 | %(d) | | | | 30.66 | % | | | | 1.62 | %** |
Ratios/Supplemental Data: | |
Net assets, end of period (000’s) | | | $ | 481,865 | | | | $ | 303,447 | | | | $ | 80,110 | |
Net expenses to average daily net assets(e) | | | | 0.58 | % | | | | 0.58 | % | | | | 0.57 | %* |
Net investment income (loss) to average daily net assets(a) | | | | 0.96 | %(b) | | | | 1.12 | % | | | | 1.13 | %* |
Portfolio turnover rate(f) | | | | 18 | % | | | | 28 | % | | | | 17 | %** |
Fees and expenses reimbursed and/or waived by GMO to average daily net assets: | | | | 0.04 | %(g) | | | | 0.02 | %(g) | | | | 0.02 | %(g)* |
| (a) | Net investment income is affected by the timing of the declaration of dividends by the other GMO Funds and/or other investment companies in which the Fund invests, if any. |
| (b) | Net investment income per share includes approximately $6,233,641, $1,577,219, $5,862,655, $822,832 and $779,657 in Class III, IV, VI, R6 and I, respectively, related to income received for EU reclaims, net of IRS closing agreement fees and non-recurring contingent legal fees attributed to EU tax reclaims, if any, in connection with certain Fund holdings. Excluding this amount, the net investment income to average daily net assets ratio would have been 0.94%, 0.91%, 0.99%, 0.89% and 0.79% in Class III, IV, VI, R6 and I, respectively (Note 2). |
| (c) | The total returns would have been lower had certain expenses not been reimbursed and/or waived during the periods shown, if applicable, and assumes the effect of reinvested distributions, if any. Calculation excludes purchase premiums and redemption fees which are borne by the shareholder purchasing or redeeming Fund shares, if any. |
| (d) | EU tax reclaim payments and related interest received during the year, net of IRS closing agreement fees and non-recurring contingent legal fees attributed to EU tax reclaims, had a positive impact to total return, adding 0.20% to each class’s total return (Note 2). |
| (e) | Net expenses exclude expenses incurred indirectly through investment in the underlying funds, if any (Note 5). |
| (f) | The portfolio turnover rate excludes investments in GMO U.S. Treasury Fund (“USTF”) which is used as a short-term investment vehicle for cash management. The Fund’s portfolio turnover rate during the years ended February 28, 2022, February 28, 2021, February 29, 2020, February 28, 2019 and February 28, 2018, including transactions in USTF, was 18%, 28%, 17%, 20% and 23%, respectively, of the average value of its portfolio. |
| (g) | Ratio includes indirect fees waived or borne by GMO. |
| † | Calculated using average shares outstanding throughout the period. |
| | | | |
| | |
| | | See accompanying notes to the financial statements. | | 113 |
GMO Trust Funds
Financial Highlights
(For a share outstanding throughout each period)
RESOURCES FUND
| | | | | | | | | | | | | | | | | | | | | | | | | | | | | | | | | | | | | | | | | | | | | | | | | | |
| | | Class III Shares | | Class IV Shares |
| | | Year Ended February 28/29, | | Year Ended February 28/29, |
| | | 2022 | | 2021 | | 2020 | | 2019 | | 2018 | | 2022 | | 2021 | | 2020 | | 2019 | | 2018 |
Net asset value, beginning of period | | | $ | 27.81 | | | | $ | 18.11 | | | | $ | 20.31 | | | | $ | 20.88 | | | | $ | 17.31 | | | | $ | 27.73 | | | | $ | 18.06 | | | | $ | 20.24 | | | | $ | 20.81 | | | | $ | 17.25 | |
| | | | | | | | | | | | | | | | | | | | | | | | | | | | | | | | | | | | | | | | | | | | | | | | | | |
Income (loss) from investment operations: | | | | | | | | | | | | | | | | | | | | | | | | | | | | | | | | | | | | | | | | | | | | | | | | | | |
Net investment income (loss)(a)† | | | | 1.54 | | | | | 0.48 | | | | | 0.65 | | | | | 0.54 | | | | | 0.33 | | | | | 1.79 | | | | | 0.47 | | | | | 0.68 | | | | | 0.62 | | | | | 0.38 | |
Net realized and unrealized gain (loss) | | | | 2.00 | | | | | 10.13 | | | | | (2.22 | ) | | | | (0.37 | ) | | | | 4.02 | | | | | 1.76 | | | | | 10.12 | | | | | (2.22 | ) | | | | (0.46 | ) | | | | 3.97 | |
| | | | | | | | | | | | | | | | | | | | | | | | | | | | | | | | | | | | | | | | | | | | | | | | | | |
Total from investment operations | | | | 3.54 | | | | | 10.61 | | | | | (1.57 | ) | | | | 0.17 | | | | | 4.35 | | | | | 3.55 | | | | | 10.59 | | | | | (1.54 | ) | | | | 0.16 | | | | | 4.35 | |
| | | | | | | | | | | | | | | | | | | | | | | | | | | | | | | | | | | | | | | | | | | | | | | | | | |
Less distributions to shareholders: | | | | | | | | | | | | | | | | | | | | | | | | | | | | | | | | | | | | | | | | | | | | | | | | | | |
From net investment income | | | | (1.35 | ) | | | | (0.47 | ) | | | | (0.63 | ) | | | | (0.74 | ) | | | | (0.78 | ) | | | | (1.37 | ) | | | | (0.48 | ) | | | | (0.64 | ) | | | | (0.73 | ) | | | | (0.79 | ) |
From net realized gains | | | | (1.61 | ) | | | | (0.44 | ) | | | | — | | | | | — | | | | | — | | | | | (1.61 | ) | | | | (0.44 | ) | | | | — | | | | | — | | | | | — | |
| | | | | | | | | | | | | | | | | | | | | | | | | | | | | | | | | | | | | | | | | | | | | | | | | | |
Total distributions | | | | (2.96 | ) | | | | (0.91 | ) | | | | (0.63 | ) | | | | (0.74 | ) | | | | (0.78 | ) | | | | (2.98 | ) | | | | (0.92 | ) | | | | (0.64 | ) | | | | (0.73 | ) | | | | (0.79 | ) |
| | | | | | | | | | | | | | | | | | | | | | | | | | | | | | | | | | | | | | | | | | | | | | | | | | |
Net asset value, end of period | | | $ | 28.39 | | | | $ | 27.81 | | | | $ | 18.11 | | | | $ | 20.31 | | | | $ | 20.88 | | | | $ | 28.30 | | | | $ | 27.73 | | | | $ | 18.06 | | | | $ | 20.24 | | | | $ | 20.81 | |
| | | | | | | | | | | | | | | | | | | | | | | | | | | | | | | | | | | | | | | | | | | | | | | | | | |
Total Return(b) | | | | 13.29 | % | | | | 59.36 | % | | | | (8.14 | )% | | | | 0.99 | % | | | | 26.00 | % | | | | 13.34 | % | | | | 59.42 | % | | | | (8.03 | )% | | | | 0.98 | % | | | | 26.12 | % |
Ratios/Supplemental Data: | | | | | | | | | | | | | | | | | | | | | | | | | | | | | | | | | | | | | | | | | | | | | | | | | | |
Net assets, end of period (000’s) | | | $ | 239,225 | | | | $ | 96,091 | | | | $ | 201,320 | | | | $ | 169,523 | | | | $ | 54,037 | | | | $ | 383,353 | | | | $ | 531,006 | | | | $ | 311,515 | | | | $ | 336,954 | | | | $ | 296,196 | |
Net expenses to average daily net assets(c) | | | | 0.71 | % | | | | 0.72 | % | | | | 0.73 | % | | | | 0.74 | %(d) | | | | 0.76 | %(d) | | | | 0.65 | % | | | | 0.67 | % | | | | 0.68 | % | | | | 0.70 | %(d) | | | | 0.71 | %(d) |
Net investment income (loss) to average daily net assets(a) | | | | 5.32 | % | | | | 2.44 | % | | | | 3.24 | % | | | | 2.68 | % | | | | 1.77 | % | | | | 6.21 | % | | | | 2.33 | % | | | | 3.40 | % | | | | 3.06 | % | | | | 2.04 | % |
Portfolio turnover rate(e) | | | | 60 | % | | | | 86 | % | | | | 37 | % | | | | 35 | % | | | | 48 | % | | | | 60 | % | | | | 86 | % | | | | 37 | % | | | | 35 | % | | | | 48 | % |
Fees and expenses reimbursed and/or waived by GMO to average daily net assets: | | | | — | | | | | 0.00 | %(f)(g) | | | | 0.00 | %(f)(g) | | | | — | | | | | 0.06 | % | | | | — | | | | | 0.00 | %(f)(g) | | | | 0.00 | %(f)(g) | | | | — | | | | | 0.06 | % |
Purchase premiums and redemption fees consisted of the following per share amounts (Note 2):† | | | $ | — | | | | $ | — | | | | $ | 0.01 | | | | $ | 0.02 | | | | $ | 0.05 | | | | $ | — | | | | $ | — | | | | $ | 0.01 | | | | $ | 0.02 | | | | $ | 0.04 | |
| (a) | Net investment income is affected by the timing of the declaration of dividends by the other GMO Funds and/or other investment companies in which the Fund invests, if any. |
| (b) | The total returns would have been lower had certain expenses not been reimbursed and/or waived during the periods shown, if applicable, and assumes the effect of reinvested distributions, if any. Calculation excludes purchase premiums and redemption fees which are borne by the shareholder purchasing or redeeming Fund shares, if any. |
| (c) | Net expenses exclude expenses incurred indirectly through investment in the underlying funds, if any (Note 5). |
| (d) | Includes recoupment of past reimbursed and/or waived fees (Note 5). |
| (e) | The portfolio turnover rate excludes investments in GMO U.S. Treasury Fund (“USTF”) which is used as a short-term investment vehicle for cash management. The Fund’s portfolio turnover rate during the years ended February 28, 2022, February 28, 2021, February 29, 2020, February 28, 2019 and February 28, 2018, including transactions in USTF, was 60%, 89%, 101%, 69% and 85%, respectively, of the average value of its portfolio. |
| (f) | Ratio includes indirect fees waived or borne by GMO. |
| (g) | Rounds to less than 0.01%. |
| † | Calculated using average shares outstanding throughout the period. |
| | | | |
| | |
| 114 | | See accompanying notes to the financial statements. | | |
GMO Trust Funds
Financial Highlights
(For a share outstanding throughout each period)
RESOURCES FUND (continued)
| | | | | | | | | | | | | | | | | | | | | | | | | |
| | | Class VI Shares | | Class R6 Shares | | Class I Shares |
| | | Period from
February 8,
2022
(commencement
of operations)
through
February 28,
2022 | | Year Ended
February 28,
2022 | | Period from
January 22,
2021
(commencement
of operations)
through
February 28,
2021 | | Year Ended
February 28,
2022 | | Period from
January 22,
2021
(commencement
of operations)
through
February 28,
2021 |
Net asset value, beginning of period | | | $ | 29.11 | | | | $ | 27.82 | | | | $ | 27.44 | | | | $ | 27.81 | | | | $ | 27.44 | |
| | | | | | | | | | | | | | | | | | | | | | | | | |
Income (loss) from investment operations: | | | | | | | | | | | | | | | | | | | | | |
Net investment income (loss)(a)† | | | | (0.57 | ) | | | | (0.06 | ) | | | | 0.03 | | | | | 1.25 | | | | | 0.02 | |
Net realized and unrealized gain (loss) | | | | (0.24 | )(h) | | | | 3.59 | | | | | 0.35 | | | | | 2.27 | | | | | 0.35 | |
| | | | | | | | | | | | | | | | | | | | | | | | | |
Total from investment operations | | | | (0.81 | ) | | | | 3.53 | | | | | 0.38 | | | | | 3.52 | | | | | 0.37 | |
| | | | | | | | | | | | | | | | | | | | | | | | | |
Less distributions to shareholders: | | | | | | | | | | | | | | | | | | | | | | | | | |
From net investment income | | | | — | | | | | (1.37 | ) | | | | — | | | | | (1.33 | ) | | | | — | |
From net realized gains | | | | — | | | | | (1.61 | ) | | | | — | | | | | (1.61 | ) | | | | — | |
| | | | | | | | | | | | | | | | | | | | | | | | | |
Total distributions | | | | — | | | | | (2.98 | ) | | | | — | | | | | (2.94 | ) | | | | — | |
| | | | | | | | | | | | | | | | | | | | | | | | | |
Net asset value, end of period | | | $ | 28.30 | | | | $ | 28.37 | | | | $ | 27.82 | | | | $ | 28.39 | | | | $ | 27.81 | |
| | | | | | | | | | | | | | | | | | | | | | | | | |
Total Return(b) | | | | (2.78 | )%** | | | | 13.25 | % | | | | 1.38 | %** | | | | 13.19 | % | | | | 1.35 | %** |
Ratios/Supplemental Data: | | | | | | | | | | | | | | | | | | | | | |
Net assets, end of period (000’s) | | | $ | 842,698 | | | | $ | 105,086 | | | | $ | 2,617 | | | | $ | 633,189 | | | | $ | 369,102 | |
Net expenses to average daily net assets(c) | | | | 0.74 | %* | | | | 0.74 | % | | | | 0.71 | %* | | | | 0.81 | % | | | | 0.81 | %* |
Net investment income (loss) to average daily net assets(a) | | | | (35.65 | )%* | | | | (0.20 | )% | | | | 0.98 | %* | | | | 4.32 | % | | | | 0.74 | %* |
Portfolio turnover rate(e) | | | | 60 | %** | | | | 60 | % | | | | 86 | %** | | | | 60 | % | | | | 86 | %** |
Fees and expenses reimbursed and/or waived by GMO to average daily net assets: | | | | — | | | | | — | | | | | — | | | | | — | | | | | — | |
Purchase premiums and redemption fees consisted of the following per share amounts (Note 2):† | | | $ | — | | | | $ | — | | | | $ | — | | | | $ | — | | | | $ | — | |
| (a) | Net investment income is affected by the timing of the declaration of dividends by the other GMO Funds and/or other investment companies in which the Fund invests, if any. |
| (b) | The total returns would have been lower had certain expenses not been reimbursed and/or waived during the periods shown, if applicable, and assumes the effect of reinvested distributions, if any. Calculation excludes purchase premiums and redemption fees which are borne by the shareholder purchasing or redeeming Fund shares, if any. |
| (c) | Net expenses exclude expenses incurred indirectly through investment in the underlying funds, if any (Note 5). |
| (d) | Includes recoupment of past reimbursed and/or waived fees (Note 5). |
| (e) | The portfolio turnover rate excludes investments in GMO U.S. Treasury Fund (“USTF”) which is used as a short-term investment vehicle for cash management. The Fund’s portfolio turnover rate during the years ended February 28, 2022, February 28, 2021, February 29, 2020, February 28, 2019 and February 28, 2018, including transactions in USTF, was 60%, 89%, 101%, 69% and 85%, respectively, of the average value of its portfolio. |
| (f) | Ratio includes indirect fees waived or borne by GMO. |
| (g) | Rounds to less than 0.01%. |
| (h) | The amount shown for a share outstanding does not correspond with the aggregate net realized and unrealized gain (loss) on investments due to the timing of purchases and redemptions of the Fund shares in relation to fluctuating market values of the investments of the Fund. |
| † | Calculated using average shares outstanding throughout the period. |
| | | | |
| | |
| | | See accompanying notes to the financial statements. | | 115 |
GMO Trust Funds
Financial Highlights
(For a share outstanding throughout each period)
TAX-MANAGED INTERNATIONAL EQUITIES FUND
| | | | | | | | | | | | | | | | | | | | |
| | | Class III Shares | |
| | | Year Ended February 28/29, | |
| | | 2022 | | | 2021 | | | 2020 | | | 2019 | | | 2018 | |
Net asset value, beginning of period | | $ | 15.98 | | | $ | 13.57 | | | $ | 13.82 | | | $ | 17.00 | | | $ | 14.28 | |
| | | | | | | | | | | | | | | | | | | | |
Income (loss) from investment operations: | | | | | | | | | | | | | | | | | | | | |
Net investment income (loss)(a)† | | | 0.63 | (b) | | | 0.34 | | | | 0.46 | | | | 0.37 | | | | 0.38 | |
Net realized and unrealized gain (loss) | | | 0.14 | | | | 2.42 | | | | (0.10 | ) | | | (2.63 | ) | | | 2.84 | |
| | | | | | | | | | | | | | | | | | | | |
Total from investment operations | | | 0.77 | | | | 2.76 | | | | 0.36 | | | | (2.26 | ) | | | 3.22 | |
| | | | | | | | | | | | | | | | | | | | |
Less distributions to shareholders: | | | | | | | | | | | | | | | | | | | | |
From net investment income | | | (0.76 | ) | | | (0.35 | ) | | | (0.61 | ) | | | (0.39 | ) | | | (0.50 | ) |
From net realized gains | | | (1.69 | ) | | | — | | | | — | | | | (0.53 | ) | | | — | |
| | | | | | | | | | | | | | | | | | | | |
Total distributions | | | (2.45 | ) | | | (0.35 | ) | | | (0.61 | ) | | | (0.92 | ) | | | (0.50 | ) |
| | | | | | | | | | | | | | | | | | | | |
Net asset value, end of period | | $ | 14.30 | | | $ | 15.98 | | | $ | 13.57 | | | $ | 13.82 | | | $ | 17.00 | |
| | | | | | | | | | | | | | | | | | | | |
Total Return(c) | | | 4.77 | %(d) | | | 20.53 | % | | | 2.31 | % | | | (13.50 | )% | | | 22.70 | % |
Ratios/Supplemental Data: | | | | | | | | | | | | | | | | | | | | |
Net assets, end of period (000’s) | | $ | 31,781 | | | $ | 38,960 | | | $ | 36,228 | | | $ | 48,739 | | | $ | 68,782 | |
Net expenses to average daily net assets(e) | | | 0.84 | %(f) | | | 0.73 | % | | | 0.80 | % | | | 0.79 | % | | | 0.70 | % |
Net investment income (loss) to average daily net assets(a) | | | 3.78 | %(b) | | | 2.47 | % | | | 3.28 | % | | | 2.47 | % | | | 2.35 | % |
Portfolio turnover rate(g) | | | 86 | % | | | 75 | % | | | 52 | % | | | 63 | % | | | 43 | % |
Fees and expenses reimbursed and/or waived by GMO to average daily net assets: | | | 0.60 | %(h) | | | 0.54 | %(h) | | | 0.54 | %(h) | | | 0.54 | % | | | 0.34 | % |
| (a) | Net investment income is affected by the timing of the declaration of dividends by the other GMO Funds and/or other investment companies in which the Fund invests, if any. |
| (b) | Net investment income per share includes approximately $61,519 in Class III related to income received for EU reclaims, net of IRS closing agreement fees and non-recurring contingent legal fees attributed to EU tax reclaims, if any, in connection with certain Fund holdings. Excluding this amount, the net investment income to average daily net assets ratio would have been 3.62% (Note 2). |
| (c) | The total returns would have been lower had certain expenses not been reimbursed and/or waived during the periods shown, if applicable, and assumes the effect of reinvested distributions, if any. Calculation excludes purchase premiums and redemption fees which are borne by the shareholder purchasing or redeeming Fund shares, if any. |
| (d) | EU tax reclaim payments and related interest received during the year, net of IRS closing agreement fees and non-recurring contingent legal fees attributed to EU tax reclaims, had a positive impact to total return, adding 0.14% to each class’s total return (Note 2). |
| (e) | Net expenses exclude expenses incurred indirectly through investment in the underlying funds, if any (Note 5). |
| (f) | Net expenses include non-recurring contingent legal fees attributed to EU tax reclaims. The net expense ratio excluding these legal fees is 0.73% (Note 2). |
| (g) | The portfolio turnover rate excludes investments in GMO U.S. Treasury Fund (“USTF”) which is used as a short-term investment vehicle for cash management. The Fund’s portfolio turnover rate during the years ended February 28, 2022, February 28, 2021, February 29, 2020, February 28, 2019, and February 28, 2018, including transactions in USTF, was 107%, 77%, 65%, 117%, and 80%, respectively, of the average value of its portfolio. |
| (h) | Ratio includes indirect fees waived or borne by GMO. |
| † | Calculated using average shares outstanding throughout the period. |
| | | | |
| | |
| 116 | | See accompanying notes to the financial statements. | | |
GMO Trust Funds
Financial Highlights
(For a share outstanding throughout each period)
U.S. EQUITY FUND
| | | | | | | | | | | | | | | | | | | | | | | | | | | | | | | | | | | | | | | | |
| | | Class III Shares | | | Class VI Shares | |
| | | Year Ended February 28/29, | | | Year Ended February 28/29, | |
| | | 2022 | | | 2021 | | | 2020 | | | 2019 | | | 2018 | | | 2022 | | | 2021 | | | 2020 | | | 2019 | | | 2018 | |
Net asset value, beginning of period | | $ | 14.39 | | | $ | 11.89 | | | $ | 13.07 | | | $ | 15.41 | | | $ | 15.14 | | | $ | 14.25 | | | $ | 11.78 | | | $ | 12.97 | | | $ | 15.31 | | | $ | 15.06 | |
| | | | | | | | | | | | | | | | | | | | | | | | | | | | | | | | | | | | | | | | |
Income (loss) from investment operations: | | | | | | | | | | | | | | | | | | | | | | | | | | | | | | | | | | | | | | | | |
Net investment income (loss)(a)† | | | 0.21 | | | | 0.18 | | | | 0.22 | | | | 0.23 | | | | 0.27 | | | | 0.22 | | | | 0.19 | | | | 0.23 | | | | 0.24 | | | | 0.29 | |
Net realized and unrealized gain (loss) | | | 2.13 | | | | 3.56 | | | | 0.21 | | | | (0.04 | )(b) | | | 1.73 | | | | 2.11 | | | | 3.53 | | | | 0.20 | | | | (0.04 | )(b) | | | 1.71 | |
| | | | | | | | | | | | | | | | | | | | | | | | | | | | | | | | | | | | | | | | |
Total from investment operations | | | 2.34 | | | | 3.74 | | | | 0.43 | | | | 0.19 | | | | 2.00 | | | | 2.33 | | | | 3.72 | | | | 0.43 | | | | 0.20 | | | | 2.00 | |
| | | | | | | | | | | | | | | | | | | | | | | | | | | | | | | | | | | | | | | | |
Less distributions to shareholders: | | | | | | | | | | | | | | | | | | | | | | | | | | | | | | | | | | | | | | | | |
From net investment income | | | (0.19 | ) | | | (0.21 | ) | | | (0.32 | ) | | | (0.26 | ) | | | (0.28 | ) | | | (0.21 | ) | | | (0.22 | ) | | | (0.33 | ) | | | (0.27 | ) | | | (0.30 | ) |
From net realized gains | | | (2.85 | ) | | | (1.03 | ) | | | (1.29 | ) | | | (2.27 | ) | | | (1.45 | ) | | | (2.85 | ) | | | (1.03 | ) | | | (1.29 | ) | | | (2.27 | ) | | | (1.45 | ) |
| | | | | | | | | | | | | | | | | | | | | | | | | | | | | | | | | | | | | | | | |
Total distributions | | | (3.04 | ) | | | (1.24 | ) | | | (1.61 | ) | | | (2.53 | ) | | | (1.73 | ) | | | (3.06 | ) | | | (1.25 | ) | | | (1.62 | ) | | | (2.54 | ) | | | (1.75 | ) |
| | | | | | | | | | | | | | | | | | | | | | | | | | | | | | | | | | | | | | | | |
Net asset value, end of period | | $ | 13.69 | | | $ | 14.39 | | | $ | 11.89 | | | $ | 13.07 | | | $ | 15.41 | | | $ | 13.52 | | | $ | 14.25 | | | $ | 11.78 | | | $ | 12.97 | | | $ | 15.31 | |
| | | | | | | | | | | | | | | | | | | | | | | | | | | | | | | | | | | | | | | | |
Total Return(c) | | | 15.80 | % | | | 33.74 | % | | | 2.51 | % | | | 1.94 | % | | | 13.76 | % | | | 15.89 | % | | | 33.92 | % | | | 2.53 | % | | | 2.05 | % | | | 13.84 | % |
Ratios/Supplemental Data: | | | | | | | | | | | | | | | | | | | | | | | | | | | | | | | | | | | | | | | | |
Net assets, end of period (000’s) | | $ | 80,646 | | | $ | 105,656 | | | $ | 83,738 | | | $ | 131,198 | | | $ | 77,297 | | | $ | 384,832 | | | $ | 245,547 | | | $ | 365,693 | | | $ | 758,714 | | | $ | 1,200,008 | |
Net expenses to average daily net assets(d) | | | 0.46 | % | | | 0.47 | % | | | 0.46 | % | | | 0.46 | % | | | 0.46 | % | | | 0.37 | % | | | 0.37 | % | | | 0.37 | % | | | 0.37 | % | | | 0.37 | % |
Net investment income (loss) to average daily net assets(a) | | | 1.34 | % | | | 1.47 | % | | | 1.64 | % | | | 1.62 | % | | | 1.78 | % | | | 1.42 | % | | | 1.56 | % | | | 1.75 | % | | | 1.68 | % | | | 1.88 | % |
Portfolio turnover rate(e) | | | 94 | % | | | 66 | % | | | 72 | % | | | 89 | % | | | 79 | % | | | 94 | % | | | 66 | % | | | 72 | % | | | 89 | % | | | 79 | % |
Fees and expenses reimbursed and/or waived by GMO to average daily net assets: | | | 0.04 | %(f) | | | 0.04 | %(f) | | | 0.03 | %(f) | | | 0.03 | % | | | 0.02 | % | | | 0.04 | %(f) | | | 0.04 | %(f) | | | 0.03 | %(f) | | | 0.03 | % | | | 0.02 | % |
| (a) | Net investment income is affected by the timing of the declaration of dividends by the other GMO Funds and/or other investment companies in which the Fund invests, if any. |
| (b) | The amount shown for a share outstanding does not correspond with the aggregate net realized and unrealized gain (loss) on investments due to the timing of purchases and redemptions of the Fund shares in relation to fluctuating market values of the investments of the Fund. |
| (c) | The total returns would have been lower had certain expenses not been reimbursed and/or waived during the periods shown, if applicable, and assumes the effect of reinvested distributions, if any. Calculation excludes purchase premiums and redemption fees which are borne by the shareholder purchasing or redeeming Fund shares, if any. |
| (d) | Net expenses exclude expenses incurred indirectly through investment in the underlying funds, if any (Note 5). |
| (e) | The portfolio turnover rate excludes investments in GMO U.S. Treasury Fund (“USTF”) which is used as a short-term investment vehicle for cash management. The Fund’s portfolio turnover rate during the years ended February 28, 2022, February 28, 2021, February 29, 2020, February 28, 2019 and February 28, 2018, including transactions in USTF, was 115%, 81%, 88%, 105% and 100%, respectively, of the average value of its portfolio. |
| (f) | Ratio includes indirect fees waived or borne by GMO. |
| † | Calculated using average shares outstanding throughout the period. |
| | | | |
| | |
| | | See accompanying notes to the financial statements. | | 117 |
GMO Trust Funds
Financial Highlights
(For a share outstanding throughout each period)
U.S. SMALL CAP VALUE FUND
| | | | | | | | | | | | |
| | | Class VI Shares | |
| | | Year Ended
February 28, | | | Period from
July 2, 2019
(commencement
of operations)
through
February 29,
2020 | |
| | | 2022 | | | 2021 | |
Net asset value, beginning of period | | $ | 24.99 | | | $ | 18.06 | | | $ | 20.00 | |
| | | | | | | | | | | | |
Income (loss) from investment operations: | |
Net investment income (loss)(a)† | | | 0.33 | | | | 0.30 | | | | 0.23 | |
Net realized and unrealized gain (loss) | | | 2.89 | | | | 6.96 | | | | (1.99 | ) |
| | | | | | | | | | | | |
Total from investment operations | | | 3.22 | | | | 7.26 | | | | (1.76 | ) |
| | | | | | | | | | | | |
Less distributions to shareholders: | |
From net investment income | | | (0.39 | ) | | | (0.33 | ) | | | (0.18 | ) |
From net realized gains | | | (8.08 | ) | | | — | | | | — | |
| | | | | | | | | | | | |
Total distributions | | | (8.47 | ) | | | (0.33 | ) | | | (0.18 | ) |
| | | | | | | | | | | | |
Net asset value, end of period | | $ | 19.74 | | | $ | 24.99 | | | $ | 18.06 | |
| | | | | | | | | | | | |
Total Return(b) | | | 13.21 | % | | | 40.64 | % | | | (8.95 | )%** |
Ratios/Supplemental Data: | |
Net assets, end of period (000’s) | | $ | 253,810 | | | $ | 372,498 | | | $ | 415,508 | |
Net expenses to average daily net assets(c) | | | 0.42 | % | | | 0.41 | % | | | 0.44 | %* |
Net investment income (loss) to average daily net assets(a) | | | 1.32 | % | | | 1.67 | % | | | 1.69 | %* |
Portfolio turnover rate(d) | | | 62 | % | | | 86 | % | | | 56 | %** |
Fees and expenses reimbursed and/or waived by GMO to average daily net assets: | | | 0.00 | %(e)(f) | | | 0.00 | %(e)(f) | | | 0.00 | %(e)(f)* |
| (a) | Net investment income is affected by the timing of the declaration of dividends by the other GMO Funds and/or other investment companies in which the Fund invests, if any. |
| (b) | The total returns would have been lower had certain expenses not been reimbursed and/or waived during the periods shown, if applicable, and assumes the effect of reinvested distributions, if any. Calculation excludes purchase premiums and redemption fees which are borne by the shareholder purchasing or redeeming Fund shares, if any. |
| (c) | Net expenses exclude expenses incurred indirectly through investment in the underlying funds, if any (Note 5). |
| (d) | The portfolio turnover rate excludes investments in GMO U.S. Treasury Fund (“USTF”) which is used as a short-term investment vehicle for cash management. The Fund’s portfolio turnover rate during the years ended February 28, 2022, February 28, 2021 and February 29, 2020, including transactions in USTF, was 71%, 98% and 69%, respectively, of the average value of its portfolio. |
| (e) | Ratio includes indirect fees waived or borne by GMO. |
| (f) | Rounds to less than 0.01%. |
| † | Calculated using average shares outstanding throughout the period. |
| | | | |
| | |
| 118 | | See accompanying notes to the financial statements. | | |
GMO Trust Funds
Notes to Financial Statements
February 28, 2022
Each of Climate Change Fund, Emerging Domestic Opportunities Fund, Emerging Markets ex-China Fund (commenced operations on October 18, 2021), Emerging Markets Fund, International Equity Fund, Japan Value Creation Fund, Quality Cyclicals Fund (formerly Cyclical Focus Fund), Quality Fund, Resources Fund, Tax-Managed International Equities Fund, U.S. Equity Fund and U.S. Small Cap Value Fund (each a “Fund” and collectively the “Funds”) is a series of GMO Trust (the “Trust”). The Trust is registered under the Investment Company Act of 1940, as amended (the “1940 Act”), as an open-end management investment company. The Trust was established as a Massachusetts business trust under the laws of The Commonwealth of Massachusetts on June 24, 1985. The Declaration of Trust permits the Trustees of the Trust (“Trustees”) to create an unlimited number of series of shares (Funds) and to subdivide Funds into classes. The Funds are advised and managed by Grantham, Mayo, Van Otterloo & Co. LLC (“GMO”).
The Funds may invest in GMO U.S. Treasury Fund and in money market funds unaffiliated with GMO. The Funds may also invest in other GMO Funds (“underlying funds”). The financial statements of the underlying funds should be read in conjunction with the Funds’ financial statements. The financial statements are available without charge on the Securities and Exchange Commission’s (“SEC”) website at www.sec.gov or on GMO’s website at www.gmo.com.
The following table provides information about the Funds’ principal investment objectives and benchmarks (if any):
| | | | |
| | | |
| Fund Name | | Benchmark | | Investment Objective |
| Climate Change Fund | | Not Applicable | | High total return |
| Emerging Domestic Opportunities Fund | | Not Applicable | | Total return |
| Emerging Markets ex-China Fund | | MSCI Emerging Markets ex-China Index | | Total return in excess of benchmark |
| Emerging Markets Fund | | MSCI Emerging Markets Index | | Total return in excess of benchmark |
| International Equity Fund | | Not Applicable | | High total return |
| Japan Value Creation Fund | | Not Applicable | | Total return |
| Quality Cyclicals Fund (formerly Cyclical Focus Fund) | | Not Applicable | | Total return |
| Quality Fund | | Not Applicable | | Total return |
| Resources Fund | | Not Applicable | | Total return |
| Tax-Managed International Equities Fund | | Not Applicable | | High after-tax total return |
| U.S. Equity Fund | | Not Applicable | | High total return |
| U.S. Small Cap Value Fund | | S&P SmallCap 600 Value Index | | Total return in excess of its benchmark |
Tax-Managed International Equities Fund currently limits subscriptions.
| 2. | Significant accounting policies |
The following is a summary of significant accounting policies followed by each Fund in the preparation of its financial statements. These policies are in conformity with accounting principles generally accepted in the United States of America (“U.S. GAAP”) and have been consistently followed by the Funds in preparing these financial statements. The preparation of financial statements in accordance with U.S. GAAP requires management to make estimates and assumptions that affect the reported amounts and disclosures in the financial statements. Actual results could differ from those estimates. The accounting records of the Funds are maintained in U.S. dollars.
Portfolio valuation
Exchange-traded securities (other than exchange-traded options) for which market quotations are readily available are valued at (i) the last sale price or (ii) official closing price or (iii) most recent quoted price published by the exchange (if no reported last sale or official closing price) or (iv) the quoted price provided by a pricing source (in the event GMO deems the private market to be a more reliable indicator of market value than the exchange). Exchange-traded options are valued at the last sale price, provided that price is between the closing bid and ask prices. If the last sale price is not within that range, then they will be valued at the closing bid price for long positions and the closing ask price for short positions. Cleared derivatives are valued using the price quoted (which may be
GMO Trust Funds
Notes to Financial Statements — (Continued)
February 28, 2022
based on a model) by the relevant clearing house. If an updated quote for a cleared derivative is not available when a Fund calculates its net asset value, the derivative will generally be valued using an industry standard model, which may differ from the model used by the relevant clearing house. Over-the-counter (“OTC”) derivatives are generally valued at the price determined by an industry standard model. Unlisted securities for which market quotations are readily available are generally valued at the most recent quoted price. Shares of the underlying funds and other open-end registered investment companies are valued at their most recent net asset value.
The foregoing valuation methodologies are modified for equities that trade in non-U.S. securities markets that close before the close of the New York Stock Exchange (“NYSE”) due to time zone differences, including the value of equities that underlie futures, options and other derivatives (to the extent the market for those derivatives closes prior to the close of the NYSE). In those cases, the price will generally be adjusted, to the extent practicable and available, based on inputs from an independent pricing service approved by the Trustees that are intended to reflect valuation changes through the NYSE close. These securities listed on foreign exchanges (including the value of equity securities that underlie futures, options and other derivatives (to the extent the market for such instruments closes prior to the close of the NYSE)) are classified as Level 2 (levels defined below).
Typically, the Funds and the underlying funds value fixed income securities at the most recent price supplied by a pricing source determined by GMO. GMO evaluates pricing sources on an ongoing basis and may change a pricing source at any time. GMO monitors erratic or unusual movements (including unusual inactivity) in the prices supplied for a security and has discretion to override a price supplied by a source (e.g., by taking a price supplied by another source) when it believes that the price supplied is not reliable. Alternative pricing sources are often but not always available for securities held by the Funds and the underlying funds.
“Quoted price” typically means the bid price for securities held long and the ask price for securities sold short. If a market quotation for a security does not involve a bid or an ask, the “quoted price” may be the price provided by a market participant or other third-party pricing source in accordance with the market practice for that security. If an updated quoted price for a security is not available when a Fund calculates its net asset value, the Fund will generally use the last quoted price so long as GMO believes that the last quoted price continues to represent that security’s fair value.
In the case of derivatives, prices determined by a model may reflect an estimate of the average of bid and ask prices, regardless of whether a Fund has a long position or a short position.
If quotations are not readily available or circumstances make an existing valuation methodology or procedure unreliable, derivatives and other securities are valued at fair value as determined in good faith by the Trustees or persons acting at their direction pursuant to procedures approved by the Trustees. Because of the uncertainty inherent in fair value pricing, the price determined for a particular security may be materially different from the value realized upon its sale. The Funds and/or the underlying funds classify such securities as Level 3 (levels defined below). For the year ended February 28, 2022, the Funds did not reduce the value of any of their OTC derivatives contracts, if any, based on the creditworthiness of their counterparties.
See Note 4 “Derivative financial instruments” for a further discussion on valuation of derivatives.
U.S. GAAP requires the Funds to disclose the fair value of their investments in a three-level hierarchy (Levels 1, 2 and 3). The valuation hierarchy is based upon the relative observability of inputs to the valuation of the Funds’ investments. The inputs or methodologies used for valuing securities are not necessarily an indication of the risk associated with investing in those securities.
Changes in valuation techniques may result in transfers into or out of an investment’s assigned level within the fair value hierarchy. In addition, in periods of market dislocation, the observability of prices and inputs may be reduced for many instruments. This condition, as well as changes related to the liquidity of investments, could cause a security to be reclassified between levels.
The three levels are defined as follows:
Level 1 – Valuations based on quoted prices for identical securities in active markets.
The types of assets and liabilities categorized in Level 1 generally include actively traded domestic and certain foreign equity securities; certain U.S. government obligations; derivatives actively traded on a national securities exchange (such as some futures and options); and shares of open-end mutual funds (even if their investments are valued using Level 2 or Level 3 inputs).
GMO Trust Funds
Notes to Financial Statements — (Continued)
February 28, 2022
Level 2 – Valuations determined using other significant direct or indirect observable inputs.
The types of assets and liabilities categorized in Level 2 generally include cleared derivatives and certain OTC derivatives such as swaps, options, swaptions, and forward currency contracts valued using industry standard models; certain restricted securities valued at the most recent available market or quoted price; certain securities that are valued at the local price; and certain foreign equity securities that are adjusted based on inputs from an independent pricing service approved by the Trustees, including the value of equity securities that underlie futures, options and other derivatives (to the extent the market for such instruments closes prior to the close of the NYSE) to reflect estimated valuation changes through the NYSE close.
Level 3 – Valuations based primarily on inputs that are unobservable and significant.
The types of assets and liabilities categorized in Level 3 generally include, but are not limited to, securities whose trading has been suspended or that have been de-listed from their current primary trading exchange valued at the most recent available market or quoted price; securities in default or bankruptcy proceedings for which there is no current market quotation valued at the most recent available market or quoted price; certain equity securities valued based on the last traded exchange price adjusted for the movement in a relevant index and/or a security type conversion discount; certain securities that are valued using a price from a comparable security related to the same issuer; and certain recently acquired equity securities that have yet to begin trading that are valued at cost.
The following is a summary of the respective levels assigned to the Funds’ direct securities and derivatives, if any, as of February 28, 2022:
| | | | | | | | | | | | | | | | |
| | | | | |
| Description | | Level 1 | | | Level 2 | | | Level 3 | | | Total | |
| Climate Change Fund | |
| Asset Valuation Inputs | |
Common Stocks | | | | | | | | | | | | | | | | |
Argentina | | $ | 7,954,063 | | | $ | — | | | $ | — | | | $ | 7,954,063 | |
Australia | | | — | | | | 7,903,818 | | | | — | | | | 7,903,818 | |
Belgium | | | — | | | | 493,429 | | | | — | | | | 493,429 | |
Brazil | | | — | | | | 10,415,389 | | | | — | | | | 10,415,389 | |
Canada | | | 80,941,559 | | | | — | | | | — | | | | 80,941,559 | |
China | | | 2,962,432 | | | | 29,750,330 | | | | — | | | | 32,712,762 | |
Denmark | | | — | | | | 5,003,655 | | | | — | | | | 5,003,655 | |
Finland | | | — | | | | 6,281,550 | | | | — | | | | 6,281,550 | |
France | | | — | | | | 31,313,280 | | | | — | | | | 31,313,280 | |
Germany | | | — | | | | 7,594,506 | | | | — | | | | 7,594,506 | |
India | | | — | | | | 449,798 | | | | — | | | | 449,798 | |
Japan | | | — | | | | 33,340,601 | | | | — | | | | 33,340,601 | |
Mexico | | | 18,395,969 | | | | — | | | | — | | | | 18,395,969 | |
Netherlands | | | — | | | | 5,532,902 | | | | — | | | | 5,532,902 | |
Norway | | | — | | | | 12,002,370 | | | | — | | | | 12,002,370 | |
Pakistan | | | — | | | | 765,469 | | | | — | | | | 765,469 | |
Philippines | | | — | | | | 737,408 | | | | — | | | | 737,408 | |
Russia | | | — | | | | 12,896,283 | | | | — | | | | 12,896,283 | |
South Korea | | | — | | | | 22,571,215 | | | | — | | | | 22,571,215 | |
Spain | | | — | | | | 13,605,295 | | | | — | | | | 13,605,295 | |
Switzerland | | | — | | | | 3,834,836 | | | | — | | | | 3,834,836 | |
Thailand | | | — | | | | 1,275,718 | | | | — | | | | 1,275,718 | |
Ukraine | | | — | | | | 1,616,678 | | | | — | | | | 1,616,678 | |
United Kingdom | | | — | | | | 12,664,190 | | | | — | | | | 12,664,190 | |
United States | | | 384,293,617 | | | | — | | | | — | | | | 384,293,617 | |
| | | | | | | | | | | | | | | | | |
TOTAL COMMON STOCKS | | | 494,547,640 | | | | 220,048,720 | | | | — | | | | 714,596,360 | |
| | | | | | | | | | | | | | | | | |
| | | | | | | | | | | | | | | | | |
GMO Trust Funds
Notes to Financial Statements — (Continued)
February 28, 2022
| | | | | | | | | | | | | | | | |
| | | | | |
| Description | | Level 1 | | | Level 2 | | | Level 3 | | | Total | |
| Climate Change Fund (continued) | |
| Asset Valuation Inputs (continued) | |
Preferred Stocks | | | | | | | | | | | | | | | | |
Chile | | $ | 12,623,041 | | | $ | — | | | $ | — | | | $ | 12,623,041 | |
| | | | | | | | | | | | | | | | | |
TOTAL PREFERRED STOCKS | | | 12,623,041 | | | | — | | | | — | | | | 12,623,041 | |
| | | | | | | | | | | | | | | | | |
Mutual Funds | | | | | | | | | | | | | | | | |
United States | | | 58,977,551 | | | | — | | | | — | | | | 58,977,551 | |
| | | | | | | | | | | | | | | | | |
TOTAL MUTUAL FUNDS | | | 58,977,551 | | | | — | | | | — | | | | 58,977,551 | |
| | | | | | | | | | | | | | | | | |
Short-Term Investments | | | 1,374,129 | | | | — | | | | — | | | | 1,374,129 | |
| | | | | | | | | | | | | | | | | |
Total Investments | | | 567,522,361 | | | | 220,048,720 | | | | — | | | | 787,571,081 | |
| | | | | | | | | | | | | | | | | |
Total | | $ | 567,522,361 | | | $ | 220,048,720 | | | $ | — | | | $ | 787,571,081 | |
| | | | | | | | | | | | | | | | | |
| | | | | | | | | | | | | | | | | |
| Emerging Domestic Opportunities Fund | |
| Asset Valuation Inputs | |
Common Stocks | | | | | | | | | | | | | | | | |
Brazil | | $ | — | | | $ | 20,804,668 | | | $ | — | | | $ | 20,804,668 | |
China | | | 2,225,930 | | | | 184,207,995 | | | | — | | | | 186,433,925 | |
Greece | | | — | | | | 9,432,774 | | | | — | | | | 9,432,774 | |
Hong Kong | | | — | | | | 5,482,670 | | | | — | | | | 5,482,670 | |
India | | | 2,308,176 | | | | 89,853,766 | | | | 5,986,759 | | | | 98,148,701 | |
Indonesia | | | — | | | | 25,651,965 | | | | — | | | | 25,651,965 | |
Malaysia | | | — | | | | 2,556,974 | | | | — | | | | 2,556,974 | |
Mexico | | | 24,408,154 | | | | — | | | | — | | | | 24,408,154 | |
Netherlands | | | — | | | | 2,967,121 | | | | — | | | | 2,967,121 | |
Peru | | | 468,875 | | | | — | | | | — | | | | 468,875 | |
Philippines | | | — | | | | 3,027,121 | | | | — | | | | 3,027,121 | |
Poland | | | — | | | | 1,380,288 | | | | — | | | | 1,380,288 | |
Qatar | | | — | | | | 10,877,575 | | | | — | | | | 10,877,575 | |
Russia | | | — | | | | 2,509,548 | | | | 911,572 | | | | 3,421,120 | |
Singapore | | | 1,174,780 | | | | — | | | | — | | | | 1,174,780 | |
South Africa | | | — | | | | 20,655,224 | | | | — | | | | 20,655,224 | |
South Korea | | | — | | | | 64,099,478 | | | | — | | | | 64,099,478 | |
Switzerland | | | — | | | | 7,549,334 | | | | — | | | | 7,549,334 | |
Taiwan | | | — | | | | 131,021,139 | | | | — | | | | 131,021,139 | |
Thailand | | | — | | | | 12,431,961 | | | | — | | | | 12,431,961 | |
United Arab Emirates | | | — | | | | 6,641,146 | | | | — | | | | 6,641,146 | |
United States | | | 18,948,384 | | | | — | | | | — | | | | 18,948,384 | |
Vietnam | | | — | | | | 10,507,613 | | | | — | | | | 10,507,613 | |
| | | | | | | | | | | | | | | | | |
TOTAL COMMON STOCKS | | | 49,534,299 | | | | 611,658,360 | | | | 6,898,331 | | | | 668,090,990 | |
| | | | | | | | | | | | | | | | | |
Preferred Stocks | | | | | | | | | | | | | | | | |
Brazil | | | — | | | | 1,712,499 | | | | — | | | | 1,712,499 | |
| | | | | | | | | | | | | | | | | |
TOTAL PREFERRED STOCKS | | | — | | | | 1,712,499 | | | | — | | | | 1,712,499 | |
| | | | | | | | | | | | | | | | | |
Investment Funds | | | | | | | | | | | | | | | | |
Brazil | | | 7,600,879 | | | | — | | | | — | | | | 7,600,879 | |
Russia | | | 3,822,455 | | | | — | | | | — | | | | 3,822,455 | |
Saudi Arabia | | | 31,229,277 | | | | — | | | | — | | | | 31,229,277 | |
| | | | | | | | | | | | | | | | | |
TOTAL INVESTMENT FUNDS | | | 42,652,611 | | | | — | | | | — | | | | 42,652,611 | |
| | | | | | | | | | | | | | | | | |
Mutual Funds | | | | | | | | | | | | | | | | |
United States | | | 2,331,522 | | | | — | | | | — | | | | 2,331,522 | |
| | | | | | | | | | | | | | | | | |
TOTAL MUTUAL FUNDS | | | 2,331,522 | | | | — | | | | — | | | | 2,331,522 | |
| | | | | | | | | | | | | | | | | |
| | | | | | | | | | | | | | | | | |
GMO Trust Funds
Notes to Financial Statements — (Continued)
February 28, 2022
| | | | | | | | | | | | | | | | |
| | | | | |
| Description | | Level 1 | | | Level 2 | | | Level 3 | | | Total | |
| Emerging Domestic Opportunities Fund (continued) | |
| Asset Valuation Inputs (continued) | |
Short-Term Investments | | $ | 35,593,444 | | | $ | — | | | $ | — | | | $ | 35,593,444 | |
| | | | | | | | | | | | | | | | | |
Total Investments | | | 130,111,876 | | | | 613,370,859 | | | | 6,898,331 | | | | 750,381,066 | |
| | | | | | | | | | | | | | | | | |
Total | | $ | 130,111,876 | | | $ | 613,370,859 | | | $ | 6,898,331 | | | $ | 750,381,066 | |
| | | | | | | | | | | | | | | | | |
| | | | | | | | | | | | | | | | | |
| Emerging Markets ex-China Fund | |
| Asset Valuation Inputs | |
Common Stocks | | | | | | | | | | | | | | | | |
Brazil | | $ | 3,990,142 | | | $ | 2,038,402 | | | $ | — | | | $ | 6,028,544 | |
Chile | | | 484,670 | | | | 1,250,938 | | | | — | | | | 1,735,608 | |
Czech Republic | | | — | | | | 684,185 | | | | — | | | | 684,185 | |
Egypt | | | — | | | | 1,362,368 | | | | — | | | | 1,362,368 | |
Hungary | | | — | | | | 804,412 | | | | — | | | | 804,412 | |
India | | | 12,093,851 | | | | 991,427 | | | | — | | | | 13,085,278 | |
Indonesia | | | — | | | | 7,457,845 | | | | — | | | | 7,457,845 | |
Malaysia | | | — | | | | 71,364 | | | | — | | | | 71,364 | |
Mexico | | | 34,720,163 | | | | — | | | | — | | | | 34,720,163 | |
Peru | | | 952,875 | | | | — | | | | — | | | | 952,875 | |
Philippines | | | — | | | | 1,168,524 | | | | — | | | | 1,168,524 | |
Poland | | | — | | | | 1,084,250 | | | | — | | | | 1,084,250 | |
Russia | | | — | | | | 18,344,198 | | | | 949,755 | | | | 19,293,953 | |
South Africa | | | — | | | | 1,256,496 | | | | — | | | | 1,256,496 | |
South Korea | | | 433,036 | | | | 70,183,601 | | | | — | | | | 70,616,637 | |
Taiwan | | | 25,714,503 | | | | 82,547,073 | | | | — | | | | 108,261,576 | |
Thailand | | | — | | | | 2,665,653 | | | | — | | | | 2,665,653 | |
Turkey | | | — | | | | 3,103,029 | | | | — | | | | 3,103,029 | |
United Kingdom | | | — | | | | 1,506,959 | | | | — | | | | 1,506,959 | |
| | | | | | | | | | | | | | | | | |
TOTAL COMMON STOCKS | | | 78,389,240 | | | | 196,520,724 | | | | 949,755 | | | | 275,859,719 | |
| | | | | | | | | | | | | | | | | |
Preferred Stocks | | | | | | | | | | | | | | | | |
Brazil | | | 1,094,884 | | | | 12,034,625 | | | | — | | | | 13,129,509 | |
Chile | | | 297,810 | | | | 21,726 | | | | — | | | | 319,536 | |
Russia | | | — | | | | 1,500,088 | | | | — | | | | 1,500,088 | |
Taiwan | | | — | | | | 74,678 | | | | — | | | | 74,678 | |
| | | | | | | | | | | | | | | | | |
TOTAL PREFERRED STOCKS | | | 1,392,694 | | | | 13,631,117 | | | | — | | | | 15,023,811 | |
| | | | | | | | | | | | | | | | | |
Investment Funds | | | | | | | | | | | | | | | | |
United States | | | 1,495,420 | | | | — | | | | — | | | | 1,495,420 | |
| | | | | | | | | | | | | | | | | |
TOTAL INVESTMENT FUNDS | | | 1,495,420 | | | | — | | | | — | | | | 1,495,420 | |
| | | | | | | | | | | | | | | | | |
Mutual Funds | | | | | | | | | | | | | | | | |
United States | | | 4,374 | | | | — | | | | — | | | | 4,374 | |
| | | | | | | | | | | | | | | | | |
TOTAL MUTUAL FUNDS | | | 4,374 | | | | — | | | | — | | | | 4,374 | |
| | | | | | | | | | | | | | | | | |
Short-Term Investments | | | 3,200,372 | | | | — | | | | — | | | | 3,200,372 | |
| | | | | | | | | | | | | | | | | |
Total Investments | | | 84,482,100 | | | | 210,151,841 | | | | 949,755 | | | | 295,583,696 | |
| | | | | | | | | | | | | | | | | |
Total | | $ | 84,482,100 | | | $ | 210,151,841 | | | $ | 949,755 | | | $ | 295,583,696 | |
| | | | | | | | | | | | | | | | | |
| | | | | | | | | | | | | | | | | |
| Emerging Markets Fund | |
| Asset Valuation Inputs | |
Common Stocks | | | | | | | | | | | | | | | | |
Argentina | | $ | 2,033,460 | | | $ | — | | | $ | — | | | $ | 2,033,460 | |
Brazil | | | 6,664,856 | | | | 23,277,082 | | | | — | | | | 29,941,938 | |
| | | | | | | | | | | | | | | | | |
GMO Trust Funds
Notes to Financial Statements — (Continued)
February 28, 2022
| | | | | | | | | | | | | | | | |
| | | | | |
| Description | | Level 1 | | | Level 2 | | | Level 3 | | | Total | |
| Emerging Markets Fund (continued) | |
| Asset Valuation Inputs (continued) | |
Common Stocks (continued) | | | | | | | | | | | | | | | | |
Chile | | $ | 1,329,876 | | | $ | 2,867,738 | | | $ | — | | | $ | 4,197,614 | |
China | | | 37,332,645 | | | | 522,959,972 | | | | 358,312 | | | | 560,650,929 | |
Czech Republic | | | — | | | | 4,350,614 | | | | — | | | | 4,350,614 | |
Egypt | | | — | | | | 418,544 | | | | — | | | | 418,544 | |
Hungary | | | — | | | | 386,302 | | | | — | | | | 386,302 | |
India | | | 13,664,664 | | | | 120,367,990 | | | | — | | | | 134,032,654 | |
Indonesia | | | — | | | | 46,875,463 | | | | — | | | | 46,875,463 | |
Kuwait | | | — | | | | 11,971,782 | | | | — | | | | 11,971,782 | |
Malaysia | | | — | | | | 428,721 | | | | — | | | | 428,721 | |
Mexico | | | 108,521,487 | | | | — | | | | — | | | | 108,521,487 | |
Philippines | | | — | | | | 8,348,609 | | | | — | | | | 8,348,609 | |
Poland | | | — | | | | 2,358,811 | | | | — | | | | 2,358,811 | |
Qatar | | | — | | | | 9,365,338 | | | | — | | | | 9,365,338 | |
Russia | | | — | | | | 94,091,428 | | | | 2,870,861 | | | | 96,962,289 | |
South Africa | | | — | | | | 9,463,121 | | | | — | | | | 9,463,121 | |
South Korea | | | — | | | | 236,205,367 | | | | — | | | | 236,205,367 | |
Sri Lanka | | | — | | | | 712,685 | | | | — | | | | 712,685 | |
Taiwan | | | 4,987,736 | | | | 449,888,320 | | | | — | | | | 454,876,056 | |
Thailand | | | — | | | | 9,312,792 | | | | — | | | | 9,312,792 | |
Turkey | | | — | | | | 15,566,726 | | | | — | | | | 15,566,726 | |
United Arab Emirates | | | — | | | | 196,771 | | | | — | | | | 196,771 | |
United Kingdom | | | — | | | | 12,137,300 | | | | — | | | | 12,137,300 | |
Vietnam | | | — | | | | 209,455 | | | | — | | | | 209,455 | |
| | | | | | | | | | | | | | | | | |
TOTAL COMMON STOCKS | | | 174,534,724 | | | | 1,581,760,931 | | | | 3,229,173 | | | | 1,759,524,828 | |
| | | | | | | | | | | | | | | | | |
Preferred Stocks | | | | | | | | | | | | | | | | |
Brazil | | | 6,946,975 | | | | 43,360,681 | | | | — | | | | 50,307,656 | |
Chile | | | 390,462 | | | | — | | | | — | | | | 390,462 | |
Colombia | | | 597,063 | | | | — | | | | — | | | | 597,063 | |
Russia | | | — | | | | 23,599,896 | | | | — | | | | 23,599,896 | |
South Korea | | | — | | | | 29,399,925 | | | | — | | | | 29,399,925 | |
Taiwan | | | — | | | | 934,594 | | | | — | | | | 934,594 | |
| | | | | | | | | | | | | | | | | |
TOTAL PREFERRED STOCKS | | | 7,934,500 | | | | 97,295,096 | | | | — | | | | 105,229,596 | |
| | | | | | | | | | | | | | | | | |
Investment Funds | | | | | | | | | | | | | | | | |
United States | | | 29,179,288 | | | | — | | | | — | | | | 29,179,288 | |
| | | | | | | | | | | | | | | | | |
TOTAL INVESTMENT FUNDS | | | 29,179,288 | | | | — | | | | — | | | | 29,179,288 | |
| | | | | | | | | | | | | | | | | |
Debt Obligations | | | | | | | | | | | | | | | | |
United States | | | 8,159,722 | | | | — | | | | — | | | | 8,159,722 | |
| | | | | | | | | | | | | | | | | |
TOTAL DEBT OBLIGATIONS | | | 8,159,722 | | | | — | | | | — | | | | 8,159,722 | |
| | | | | | | | | | | | | | | | | |
Short-Term Investments | | | 30,464,180 | | | | — | | | | — | | | | 30,464,180 | |
| | | | | | | | | | | | | | | | | |
Total Investments | | | 250,272,414 | | | | 1,679,056,027 | | | | 3,229,173 | | | | 1,932,557,614 | |
| | | | | | | | | | | | | | | | | |
Derivatives^ | | | | | | | | | | | | | | | | |
Futures Contracts | | | | | | | | | | | | | | | | |
Equity Risk | | $ | — | | | $ | 840,989 | | | $ | — | | | $ | 840,989 | |
| | | | | | | | | | | | | | | | | |
Total | | $ | 250,272,414 | | | $ | 1,679,897,016 | | | $ | 3,229,173 | | | $ | 1,933,398,603 | |
| | | | | | | | | | | | | | | | | |
| Liability Valuation Inputs | |
Derivatives^ | |
Futures Contracts | | | | | | | | | | | | | | | | |
Equity Risk | | $ | (6,332,907 | ) | | $ | — | | | $ | — | | | $ | (6,332,907 | ) |
| | | | | | | | | | | | | | | | | |
Total | | $ | (6,332,907 | ) | | $ | — | | | $ | — | | | $ | (6,332,907 | ) |
| | | | | | | | | | | | | | | | | |
| | | | | | | | | | | | | | | | | |
GMO Trust Funds
Notes to Financial Statements — (Continued)
February 28, 2022
| | | | | | | | | | | | | | | | |
| | | | | |
| Description | | Level 1 | | | Level 2 | | | Level 3 | | | Total | |
| International Equity Fund | |
| Asset Valuation Inputs | |
Common Stocks | | | | | | | | | | | | | | | | |
Australia | | $ | — | | | $ | 73,187,587 | | | $ | — | | | $ | 73,187,587 | |
Belgium | | | — | | | | 31,748,705 | | | | — | | | | 31,748,705 | |
Denmark | | | — | | | | 952,438 | | | | — | | | | 952,438 | |
Finland | | | — | | | | 9,495,091 | | | | — | | | | 9,495,091 | |
France | | | 3,698,768 | | | | 172,372,767 | | | | — | | | | 176,071,535 | |
Germany | | | — | | | | 117,486,123 | | | | — | | | | 117,486,123 | |
Hong Kong | | | — | | | | 43,961,819 | | | | — | | | | 43,961,819 | |
Ireland | | | 7,786,260 | | | | 13,059,232 | | | | — | | | | 20,845,492 | |
Italy | | | — | | | | 63,749,412 | | | | — | | | | 63,749,412 | |
Japan | | | 739,619 | | | | 511,353,170 | | | | — | | | | 512,092,789 | |
Malta | | | — | | | | — | | | | 18 | | | | 18 | |
Netherlands | | | — | | | | 137,138,033 | | | | — | | | | 137,138,033 | |
Norway | | | — | | | | 81,376,881 | | | | — | | | | 81,376,881 | |
Portugal | | | — | | | | 14,129,083 | | | | — | | | | 14,129,083 | |
Singapore | | | — | | | | 84,265,380 | | | | — | | | | 84,265,380 | |
Spain | | | — | | | | 85,111,104 | | | | — | | | | 85,111,104 | |
Sweden | | | — | | | | 6,978,719 | | | | — | | | | 6,978,719 | |
Switzerland | | | 1,591,772 | | | | 118,559,553 | | | | — | | | | 120,151,325 | |
United Kingdom | | | 18,167,905 | | | | 296,890,257 | | | | — | | | | 315,058,162 | |
| | | | | | | | | | | | | | | | | |
TOTAL COMMON STOCKS | | | 31,984,324 | | | | 1,861,815,354 | | | | 18 | | | | 1,893,799,696 | |
| | | | | | | | | | | | | | | | | |
Preferred Stocks | | | | | | | | | | | | | | | | |
Germany | | | — | | | | 6,266,606 | | | | — | | | | 6,266,606 | |
| | | | | | | | | | | | | | | | | |
TOTAL PREFERRED STOCKS | | | — | | | | 6,266,606 | | | | — | | | | 6,266,606 | |
| | | | | | | | | | | | | | | | | |
Short-Term Investments | | | 78,152,745 | | | | — | | | | — | | | | 78,152,745 | |
| | | | | | | | | | | | | | | | | |
Total Investments | | | 110,137,069 | | | | 1,868,081,960 | | | | 18 | | | | 1,978,219,047 | |
| | | | | | | | | | | | | | | | | |
Total | | $ | 110,137,069 | | | $ | 1,868,081,960 | | | $ | 18 | | | $ | 1,978,219,047 | |
| | | | | | | | | | | | | | | | | |
| | | | | | | | | | | | | | | | | |
| Japan Value Creation Fund | |
| Asset Valuation Inputs | |
Common Stocks | | $ | — | | | $ | 153,270,272 | | | $ | — | | | $ | 153,270,272 | |
Short-Term Investments | | | 7,731,157 | | | | — | | | | — | | | | 7,731,157 | |
| | | | | | | | | | | | | | | | | |
Total Investments | | | 7,731,157 | | | | 153,270,272 | | | | — | | | | 161,001,429 | |
| | | | | | | | | | | | | | | | | |
Total | | $ | 7,731,157 | | | $ | 153,270,272 | | | $ | — | | | $ | 161,001,429 | |
| | | | | | | | | | | | | | | | | |
| | | | | | | | | | | | | | | | | |
| Quality Cyclicals Fund (formerly Cyclical Focus Fund) | |
| Asset Valuation Inputs | |
Common Stocks | | | | | | | | | | | | | | | | |
Brazil | | $ | — | | | $ | 1,086,336 | | | $ | — | | | $ | 1,086,336 | |
Canada | | | 8,569,886 | | | | — | | | | — | | | | 8,569,886 | |
China | | | — | | | | 3,788,933 | | | | — | | | | 3,788,933 | |
Finland | | | — | | | | 2,206,901 | | | | — | | | | 2,206,901 | |
France | | | — | | | | 11,482,954 | | | | — | | | | 11,482,954 | |
Germany | | | — | | | | 2,607,692 | | | | — | | | | 2,607,692 | |
Hong Kong | | | — | | | | 1,543,303 | | | | — | | | | 1,543,303 | |
Ireland | | | 439,023 | | | | 3,487,812 | | | | — | | | | 3,926,835 | |
Mexico | | | 9,601,908 | | | | — | | | | — | | | | 9,601,908 | |
Russia | | | — | | | | 910,027 | | | | — | | | | 910,027 | |
| | | | | | | | | | | | | | | | | |
GMO Trust Funds
Notes to Financial Statements — (Continued)
February 28, 2022
| | | | | | | | | | | | | | | | |
| | | | | |
| Description | | Level 1 | | | Level 2 | | | Level 3 | | | Total | |
| Quality Cyclicals Fund (formerly Cyclical Focus Fund) (continued) | |
| Asset Valuation Inputs (continued) | |
Common Stocks (continued) | | | | | | | | | | | | | | | | |
Spain | | $ | — | | | $ | 6,018,719 | | | $ | — | | | $ | 6,018,719 | |
United Kingdom | | | — | | | | 15,211,606 | | | | — | | | | 15,211,606 | |
United States | | | 70,424,465 | | | | — | | | | — | | | | 70,424,465 | |
| | | | | | | | | | | | | | | | | |
TOTAL COMMON STOCKS | | | 89,035,282 | | | | 48,344,283 | | | | — | | | | 137,379,565 | |
| | | | | | | | | | | | | | | | | |
Preferred Stocks | | | | | | | | | | | | | | | | |
Brazil | | | — | | | | 3,559,990 | | | | — | | | | 3,559,990 | |
| | | | | | | | | | | | | | | | | |
TOTAL PREFERRED STOCKS | | | — | | | | 3,559,990 | | | | — | | | | 3,559,990 | |
| | | | | | | | | | | | | | | | | |
Mutual Funds | | | | | | | | | | | | | | | | |
United States | | | 434,957 | | | | — | | | | — | | | | 434,957 | |
| | | | | | | | | | | | | | | | | |
TOTAL MUTUAL FUNDS | | | 434,957 | | | | — | | | | — | | | | 434,957 | |
| | | | | | | | | | | | | | | | | |
Short-Term Investments | | | 139,819 | | | | — | | | | — | | | | 139,819 | |
| | | | | | | | | | | | | | | | | |
Total Investments | | | 89,610,058 | | | | 51,904,273 | | | | — | | | | 141,514,331 | |
| | | | | | | | | | | | | | | | | |
Total | | $ | 89,610,058 | | | $ | 51,904,273 | | | $ | — | | | $ | 141,514,331 | |
| | | | | | | | | | | | | | | | | |
| | | | | | | | | | | | | | | | | |
| Quality Fund | |
| Asset Valuation Inputs | |
Common Stocks | | | | | | | | | | | | | | | | |
China | | $ | — | | | $ | 136,590,092 | | | $ | — | | | $ | 136,590,092 | |
France | | | — | | | | 314,428,126 | | | | — | | | | 314,428,126 | |
Germany | | | — | | | | 247,994,772 | | | | — | | | | 247,994,772 | |
Spain | | | — | | | | 47,286,416 | | | | — | | | | 47,286,416 | |
Switzerland | | | — | | | | 307,083,511 | | | | — | | | | 307,083,511 | |
Taiwan | | | — | | | | 292,066,955 | | | | — | | | | 292,066,955 | |
United Kingdom | | | — | | | | 386,713,403 | | | | — | | | | 386,713,403 | |
United States | | | 6,537,153,488 | | | | — | | | | — | | | | 6,537,153,488 | |
| | | | | | | | | | | | | | | | | |
TOTAL COMMON STOCKS | | | 6,537,153,488 | | | | 1,732,163,275 | | | | — | | | | 8,269,316,763 | |
| | | | | | | | | | | | | | | | | |
Mutual Funds | | | | | | | | | | | | | | | | |
United States | | | 5,788,348 | | | | — | | | | — | | | | 5,788,348 | |
| | | | | | | | | | | | | | | | | |
TOTAL MUTUAL FUNDS | | | 5,788,348 | | | | — | | | | — | | | | 5,788,348 | |
| | | | | | | | | | | | | | | | | |
Short-Term Investments | | | 71,448,712 | | | | — | | | | — | | | | 71,448,712 | |
| | | | | | | | | | | | | | | | | |
Total Investments | | | 6,614,390,548 | | | | 1,732,163,275 | | | | — | | | | 8,346,553,823 | |
| | | | | | | | | | | | | | | | | |
Total | | $ | 6,614,390,548 | | | $ | 1,732,163,275 | | | $ | — | | | $ | 8,346,553,823 | |
| | | | | | | | | | | | | | | | | |
| | | | | | | | | | | | | | | | | |
| Resources Fund | |
| Asset Valuation Inputs | |
Common Stocks | | | | | | | | | | | | | | | | |
Argentina | | $ | 23,629,012 | | | $ | — | | | $ | — | | | $ | 23,629,012 | |
Australia | | | — | | | | 140,008,795 | | | | — | | | | 140,008,795 | |
Austria | | | — | | | | 24,705,443 | | | | — | | | | 24,705,443 | |
Brazil | | | — | | | | 63,483,383 | | | | — | | | | 63,483,383 | |
Canada | | | 195,923,682 | | | | — | | | | — | | | | 195,923,682 | |
China | | | — | | | | 33,966,068 | | | | — | | | | 33,966,068 | |
Denmark | | | — | | | | 13,632,548 | | | | — | | | | 13,632,548 | |
Finland | | | — | | | | 11,151,054 | | | | — | | | | 11,151,054 | |
France | | | — | | | | 23,286,484 | | | | — | | | | 23,286,484 | |
Hungary | | | — | | | | 17,668,865 | | | | — | | | | 17,668,865 | |
| | | | | | | | | | | | | | | | | |
GMO Trust Funds
Notes to Financial Statements — (Continued)
February 28, 2022
| | | | | | | | | | | | | | | | |
| | | | | |
| Description | | Level 1 | | | Level 2 | | | Level 3 | | | Total | |
| Resources Fund (continued) | |
| Asset Valuation Inputs (continued) | |
Common Stocks (continued) | | | | | | | | | | | | | | | | |
India | | $ | — | | | $ | 32,129,806 | | | $ | — | | | $ | 32,129,806 | |
Israel | | | — | | | | 18,062,075 | | | | — | | | | 18,062,075 | |
Japan | | | — | | | | 51,606,845 | | | | — | | | | 51,606,845 | |
Mexico | | | 65,215,432 | | | | — | | | | — | | | | 65,215,432 | |
Norway | | | — | | | | 54,665,328 | | | | — | | | | 54,665,328 | |
Pakistan | | | — | | | | 3,936,694 | | | | — | | | | 3,936,694 | |
Poland | | | — | | | | 13,488,642 | | | | — | | | | 13,488,642 | |
Portugal | | | — | | | | 54,155,742 | | | | — | | | | 54,155,742 | |
Russia | | | — | | | | 89,879,675 | | | | — | | | | 89,879,675 | |
Singapore | | | — | | | | — | | | | 0 | § | | | 0 | § |
South Africa | | | — | | | | 45,199,452 | | | | — | | | | 45,199,452 | |
South Korea | | | — | | | | 7,083,041 | | | | — | | | | 7,083,041 | |
Spain | | | — | | | | 10,000,229 | | | | — | | | | 10,000,229 | |
Switzerland | | | — | | | | 4,447,949 | | | | — | | | | 4,447,949 | |
Turkey | | | — | | | | 4,648,556 | | | | — | | | | 4,648,556 | |
Ukraine | | | — | | | | 3,684,223 | | | | — | | | | 3,684,223 | |
United Kingdom | | | — | | | | 220,847,209 | | | | — | | | | 220,847,209 | |
United States | | | 686,209,539 | | | | — | | | | 4,539,029 | | | | 690,748,568 | |
| | | | | | | | | | | | | | | | | |
TOTAL COMMON STOCKS | | | 970,977,665 | | | | 941,738,106 | | | | 4,539,029 | | | | 1,917,254,800 | |
| | | | | | | | | | | | | | | | | |
Preferred Stocks | | | | | | | | | | | | | | | | |
Brazil | | | — | | | | 171,920,614 | | | | — | | | | 171,920,614 | |
Chile | | | 40,548,155 | | | | — | | | | — | | | | 40,548,155 | |
Russia | | | — | | | | 25,157,849 | | | | — | | | | 25,157,849 | |
| | | | | | | | | | | | | | | | | |
TOTAL PREFERRED STOCKS | | | 40,548,155 | | | | 197,078,463 | | | | — | | | | 237,626,618 | |
| | | | | | | | | | | | | | | | | |
Rights/Warrants | | | | | | | | | | | | | | | | |
Singapore | | | — | | | | — | | | | 2 | | | | 2 | |
| | | | | | | | | | | | | | | | | |
TOTAL RIGHTS/WARRANTS | | | — | | | | — | | | | 2 | | | | 2 | |
| | | | | | | | | | | | | | | | | |
Short-Term Investments | | | 36,600,281 | | | | — | | | | — | | | | 36,600,281 | |
| | | | | | | | | | | | | | | | | |
Total Investments | | | 1,048,126,101 | | | | 1,138,816,569 | | | | 4,539,031 | | | | 2,191,481,701 | |
| | | | | | | | | | | | | | | | | |
Total | | $ | 1,048,126,101 | | | $ | 1,138,816,569 | | | $ | 4,539,031 | | | $ | 2,191,481,701 | |
| | | | | | | | | | | | | | | | | |
| | | | | | | | | | | | | | | | | |
| Tax-Managed International Equities Fund | |
| Asset Valuation Inputs | |
Common Stocks | | | | | | | | | | | | | | | | |
Australia | | $ | — | | | $ | 1,181,462 | | | $ | — | | | $ | 1,181,462 | |
Belgium | | | — | | | | 482,180 | | | | — | | | | 482,180 | |
Brazil | | | — | | | | 214,175 | | | | — | | | | 214,175 | |
China | | | — | | | | 695,121 | | | | — | | | | 695,121 | |
Denmark | | | — | | | | 27,692 | | | | — | | | | 27,692 | |
Finland | | | — | | | | 143,823 | | | | — | | | | 143,823 | |
France | | | 50,784 | | | | 2,716,227 | | | | — | | | | 2,767,011 | |
Germany | | | — | | | | 1,860,444 | | | | — | | | | 1,860,444 | |
Hong Kong | | | — | | | | 330,274 | | | | — | | | | 330,274 | |
Hungary | | | — | | | | 34,262 | | | | — | | | | 34,262 | |
India | | | — | | | | 125,906 | | | | — | | | | 125,906 | |
Ireland | | | 20,649 | | | | 245,143 | | | | — | | | | 265,792 | |
Italy | | | — | | | | 929,425 | | | | — | | | | 929,425 | |
Japan | | | — | | | | 7,437,799 | | | | — | | | | 7,437,799 | |
Malta | | | — | | | | — | | | | 2 | | | | 2 | |
| | | | | | | | | | | | | | | | | |
GMO Trust Funds
Notes to Financial Statements — (Continued)
February 28, 2022
| | | | | | | | | | | | | | | | |
| | | | | |
| Description | | Level 1 | | | Level 2 | | | Level 3 | | | Total | |
| Tax-Managed International Equities Fund (continued) | |
| Asset Valuation Inputs (continued) | |
Common Stocks (continued) | | | | | | | | | | | | | | | | |
Netherlands | | $ | — | | | $ | 2,291,742 | | | $ | — | | | $ | 2,291,742 | |
Norway | | | — | | | | 1,243,661 | | | | — | | | | 1,243,661 | |
Poland | | | — | | | | 120,309 | | | | — | | | | 120,309 | |
Portugal | | | — | | | | 106,114 | | | | — | | | | 106,114 | |
Russia | | | — | | | | 4,616 | | | | — | | | | 4,616 | |
Singapore | | | — | | | | 1,244,875 | | | | — | | | | 1,244,875 | |
South Africa | | | — | | | | 74,473 | | | | — | | | | 74,473 | |
South Korea | | | — | | | | 616,389 | | | | — | | | | 616,389 | |
Spain | | | — | | | | 1,295,908 | | | | — | | | | 1,295,908 | |
Sweden | | | — | | | | 174,307 | | | | — | | | | 174,307 | |
Switzerland | | | 61,222 | | | | 1,904,781 | | | | — | | | | 1,966,003 | |
Taiwan | | | — | | | | 515,923 | | | | — | | | | 515,923 | |
Thailand | | | — | | | | 186,214 | | | | — | | | | 186,214 | |
Turkey | | | — | | | | 333,609 | | | | — | | | | 333,609 | |
United Kingdom | | | 993,580 | | | | 3,342,203 | | | | — | | | | 4,335,783 | |
| | | | | | | | | | | | | | | | | |
TOTAL COMMON STOCKS | | | 1,126,235 | | | | 29,879,057 | | | | 2 | | | | 31,005,294 | |
| | | | | | | | | | | | | | | | | |
Preferred Stocks | | | | | | | | | | | | | | | | |
Brazil | | | — | | | | 63,202 | | | | — | | | | 63,202 | |
Germany | | | — | | | | 81,482 | | | | — | | | | 81,482 | |
South Korea | | | — | | | | 15,115 | | | | — | | | | 15,115 | |
| | | | | | | | | | | | | | | | | |
TOTAL PREFERRED STOCKS | | | — | | | | 159,799 | | | | — | | | | 159,799 | |
| | | | | | | | | | | | | | | | | |
Mutual Funds | | | | | | | | | | | | | | | | |
United States | | | 999,833 | | | | — | | | | — | | | | 999,833 | |
| | | | | | | | | | | | | | | | | |
TOTAL MUTUAL FUNDS | | | 999,833 | | | | — | | | | — | | | | 999,833 | |
| | | | | | | | | | | | | | | | | |
Short-Term Investments | | | 96,940 | | | | — | | | | — | | | | 96,940 | |
| | | | | | | | | | | | | | | | | |
Total Investments | | | 2,223,008 | | | | 30,038,856 | | | | 2 | | | | 32,261,866 | |
| | | | | | | | | | | | | | | | | |
Total | | $ | 2,223,008 | | | $ | 30,038,856 | | | $ | 2 | | | $ | 32,261,866 | |
| | | | | | | | | | | | | | | | | |
| Liability Valuation Inputs | |
Derivatives^ | |
Futures Contracts | | | | | | | | | | | | | | | | |
Equity Risk | | $ | (14,273 | ) | | $ | — | | | $ | — | | | $ | (14,273 | ) |
| | | | | | | | | | | | | | | | | |
Total | | $ | (14,273 | ) | | $ | — | | | $ | — | | | $ | (14,273 | ) |
| | | | | | | | | | | | | | | | | |
| | | | | | | | | | | | | | | | | |
| U.S. Equity Fund | |
| Asset Valuation Inputs | |
Common Stocks | | $ | 454,808,629 | | | $ | — | | | $ | — | | | $ | 454,808,629 | |
Mutual Funds | | | 10,402,263 | | | | — | | | | — | | | | 10,402,263 | |
Short-Term Investments | | | 1,071,794 | | | | — | | | | — | | | | 1,071,794 | |
| | | | | | | | | | | | | | | | | |
Total Investments | | | 466,282,686 | | | | — | | | | — | | | | 466,282,686 | |
| | | | | | | | | | | | | | | | | |
Total | | $ | 466,282,686 | | | $ | — | | | $ | — | | | $ | 466,282,686 | |
| | | | | | | | | | | | | | | | | |
| Liability Valuation Inputs | |
Derivatives^ | |
Futures Contracts | | | | | | | | | | | | | | | | |
Equity Risk | | $ | (326,928 | ) | | $ | — | | | $ | — | | | $ | (326,928 | ) |
| | | | | | | | | | | | | | | | | |
Total | | $ | (326,928 | ) | | $ | — | | | $ | — | | | $ | (326,928 | ) |
| | | | | | | | | | | | | | | | | |
| | | | | | | | | | | | | | | | | |
GMO Trust Funds
Notes to Financial Statements — (Continued)
February 28, 2022
| | | | | | | | | | | | | | | | |
| | | | | |
| Description | | Level 1 | | | Level 2 | | | Level 3 | | | Total | |
| U.S. Small Cap Value Fund | |
| Asset Valuation Inputs | |
Common Stocks | | $ | 252,802,219 | | | $ | — | | | $ | — | | | $ | 252,802,219 | |
Mutual Funds | | | 1,158,524 | | | | — | | | | — | | | | 1,158,524 | |
Rights/warrants | | | — | | | | — | | | | 36,350 | | | | 36,350 | |
Short-Term Investments | | | 802,888 | | | | — | | | | — | | | | 802,888 | |
| | | | | | | | | | | | | | | | | |
Total Investments | | | 254,763,631 | | | | — | | | | 36,350 | | | | 254,799,981 | |
| | | | | | | | | | | | | | | | | |
Total | | $ | 254,763,631 | | | $ | — | | | $ | 36,350 | | | $ | 254,799,981 | |
| | | | | | | | | | | | | | | | | |
| | | | | | | | | | | | | | | | | |
The risks referenced in the tables above are not intended to be inclusive of all risks. Please see the “Investment and other risks” and “Derivative financial instruments” sections below for a further discussion of risks.
| | ^ | In the tables above derivatives are based on market values, rather than the notional amounts of derivatives, except for forward currency contracts which are based on unrealized appreciation/(depreciation). Excludes purchased options and fully funded total return swaps, if any, which are included in investments. |
| | § | Represents the interest in securities that were determined to have a value of zero at February 28, 2022. |
The underlying funds held at year end are classified above as Level 1. Certain underlying funds invest in securities and/or derivatives which may have been fair valued using methods determined in good faith by or at the direction of the Trustees or which may have been valued using significant unobservable inputs. For a summary of the levels assigned to the underlying funds’ direct securities and derivatives, if any, please refer to the underlying funds��� Notes to Financial Statements which are available on the SEC’s website at www.sec.gov or on GMO’s website at www.gmo.com.
U.S. GAAP requires additional disclosures about fair value measurements for material Level 3 securities and derivatives, if any (determined by each category of asset or liability as compared to a Fund’s total net assets). Emerging Domestic Opportunities Fund, Emerging Markets ex-China Fund and Emerging Markets Fund Level 3 holdings includes common stocks that are valued based on a U.S. incorporated exchange-traded fund tracking publicly traded companies that are domiciled in Russia. Emerging Domestic Opportunities Fund’s Level 3 holdings also include one common stock that was purchased prior to the initial public offering (“IPO”) that is restricted from trading until March 22, 2022 and is being valued based on the post-IPO shares trading in the market. Resources Fund Level 3 holdings include a common stock that is valued off the U.S. dollar denominated line of the same security, converted to euros. Other than described above, there were no other Funds with classes of investments or derivatives with direct material Level 3 holdings at February 28, 2022.
GMO Trust Funds
Notes to Financial Statements — (Continued)
February 28, 2022
For Funds with material total Level 3 assets and/or liabilities, the following is a reconciliation of securities and derivatives, if any, in which significant unobservable inputs (Level 3) were used in determining value:
| | | | | | | | | | | | | | | | | | | | | | | | | | | | | | | | | | | | | | | | |
| | | | | | | | | | | | | | | | | | | | | | | | | | | | | | | | | | | | | | | | | |
| | | | | | | | | | | |
| | | Balances as of
February 28,
2021 | | | Purchases | | | Sales | | | Accrued
Discounts/
Premiums | | | Total
Realized Gain/(Loss) | | | Change in
Unrealized
Appreciation (Depreciation) | | | Transfer
into
Level 3 | | | Transfer
out of
Level 3 | | | Balances as
of
February 28,
2022 | | | Net Change in
Unrealized
Appreciation
(Depreciation)
from
Investments
Still Held as
of February
28, 2022 | |
| Emerging Domestic Opportunities Fund | | | | | | | | | | | | | | | | | | | |
| Common Stocks | | | | | | | | | | | | | | | | | | | | | | | | | |
India | | $ | 265,151 | | | $ | 1,924,110 | | | $ | (1,849,078 | ) | | $ | — | | | $ | 1,589,485 | | | $ | 4,057,091 | | | $ | — | | | $ | — | | | $ | 5,986,759 | | | $ | 4,062,649 | |
Russia | | | — | | | | — | | | | — | | | | — | | | | — | | | | — | | | | 911,572 | ‡ | | | — | | | | 911,572 | | | | (3,507,336 | ) |
| | | | | | | | | | | | | | | | | | | | | | | | | | | | | | | | | | | | | | | | | |
Total Investments | | $ | 265,151 | | | $ | 1,924,110 | | | $ | (1,849,078 | ) | | $ | — | | | $ | 1,589,485 | | | $ | 4,057,091 | | | $ | 911,572 | | | $ | — | | | $ | 6,898,331 | | | $ | 555,313 | |
| | | | | | | | | | | | | | | | | | | | | | | | | | | | | | | | | | | | | | | | | |
| | | | | | | | | | | | | | | | | | | | | | | | | | | | | | | | | | | | | | | | | |
| Emerging Markets Ex-China Fund | | | | | | | | | | | | | | | | | | | |
| Common Stocks | | | | | | | | | | | | | | | | | | | | | | | | | | | | | | | | | | | | | |
Russia | | $ | — | | | $ | 2,573,743 | | | $ | (279,742 | ) | | $ | — | | | $ | (29,332 | ) | | $ | (1,314,914 | ) | | $ | — | | | $ | — | | | $ | 949,755 | | | $ | (1,314,914 | ) |
| | | | | | | | | | | | | | | | | | | | | | | | | | | | | | | | | | | | | | | | | |
Total Investments | | $ | — | | | $ | 2,573,743 | | | $ | (279,742 | ) | | $ | — | | | $ | (29,332 | ) | | $ | (1,314,914 | ) | | $ | — | | | $ | — | | | $ | 949,755 | | | $ | (1,314,914 | ) |
| | | | | | | | | | | | | | | | | | | | | | | | | | | | | | | | | | | | | | | | | |
| | | | | | | | | | | | | | | | | | | | | | | | | | | | | | | | | | | | | | | | | |
| Emerging Markets Fund | | | | | | | | | | | | | | | | | | | | | | | | | |
| Common Stocks | | | | | | | | | | | | | | | | | | | | | | | | | | | | | | | | | | | | | |
China | | $ | — | | | $ | 343,639 | | | $ | — | | | $ | — | | | $ | — | | | $ | 14,672 | | | $ | 1 | ‡ | | $ | — | | | $ | 358,312 | | | $ | 14,672 | |
Russia | | | — | | | | 8,026,494 | | | | (696,081 | ) | | | — | | | | (76,821 | ) | | | (6,488,430 | ) | | | 2,105,699 | ‡ | | | — | | | | 2,870,861 | | | | (6,488,430 | ) |
| | | | | | | | | | | | | | | | | | | | | | | | | | | | | | | | | | | | | | | | | |
Total Investments | | $ | — | | | $ | 8,370,133 | | | $ | (696,081 | ) | | $ | — | | | $ | (76,821 | ) | | $ | (6,473,758 | ) | | $ | 2,105,700 | | | $ | — | | | $ | 3,229,173 | | | $ | (6,473,758 | ) |
| | | | | | | | | | | | | | | | | | | | | | | | | | | | | | | | | | | | | | | | | |
| | | | | | | | | | | | | | | | | | | | | | | | | | | | | | | | | | | | | | | | | |
| Resources Fund | | | | | | | | | | | | | | | | | | | | | | | | | |
| Common Stocks | | | | | | | | | | | | | | | | | | | | | | | | | | | | | | | | | | | | | |
United States | | $ | — | | | $ | 4,410,991 | | | $ | — | | | $ | — | | | $ | — | | | $ | 128,038 | | | $ | — | | | $ | — | | | $ | 4,539,029 | | | $ | 128,038 | |
| Rights/Warrants | | | | | | | | | | | | | | | | | | | | | | | | | | | | | | |
Singapore | | | 0 | § | | | — | | | | — | | | | — | | | | — | | | | 2 | | | | — | | | | — | | | | 2 | | | | 2 | |
| | | | | | | | | | | | | | | | | | | | | | | | | | | | | | | | | | | | | | | | | |
Total Investments | | $ | 0 | § | | $ | 4,410,991 | | | $ | — | | | $ | — | | | $ | — | | | $ | 128,040 | | | $ | — | | | $ | — | | | $ | 4,539,031 | | | $ | 128,040 | |
| | | | | | | | | | | | | | | | | | | | | | | | | | | | | | | | | | | | | | | | | |
| | | | | | | | | | | | | | | | | | | | | | | | | | | | | | | | | | | | | | | | | |
| | ‡ | Financial assets transferred between levels were due to a change in observable and/or unobservable inputs. |
| | § | Represents the interest in securities that were determined to have a value of zero at February 28, 2021. |
GMO Trust Funds
Notes to Financial Statements — (Continued)
February 28, 2022
The following table summarizes the quantitative inputs used in the valuation of investments classified within Level 3 of the fair value hierarchy for the year ended February 28, 2022 for Funds with material Level 3 investments.
Quantitative information about Level 3 Fair Value Measurements*
| | | | | | | | | | |
| | | | | |
| Investment Type | | Total Fair
Value ($) | | | Valuation
Methodology | | Unobservable Inputs | | Range (Weighted
Average) |
| Emerging Domestic Opportunities Fund | | | | | | | | | | |
Common Stock | | | 911,572 | | | Fair Value | | Price of comparable equity | | (N/A) |
| Emerging Markets ex-China Fund | | | | | | | | | | |
Common Stock | | | 949,755 | | | Fair Value | | Price of comparable equity | | (N/A) |
| Emerging Markets Fund | | | | | | | | | | |
Common Stock | | | 393,657 | | | Fair Value | | Price of comparable equity | | (N/A) |
Common Stock | | | 1 | | | Fair Value | | Discount for lack of liquidity/marketability | | $0 (N/A) |
Common Stock | | | 2,477,204 | | | Fair Value | | Price of comparable equity | | (N/A) |
| Resources Fund | | | | | | | | | | |
Common Stock | | | 4,539,029 | | | Fair Value | | Price of comparable equity | | (N/A) |
Common Stock | | | — | | | Fair Value | | Discount for lack of liquidity/marketability | | $0 (N/A) |
Warrant | | | 2 | | | Fair Value | | Discount for lack of liquidity/marketability | | $0 (N/A) |
| | * | The table does not include Level 3 securities or derivatives that are valued by pricing vendors or brokers. As of February 28, 2022, the value of these securities and/or derivatives for Emerging Domestic Opportunities Fund and Emerging Markets Fund was $5,986,759 and $358,311, respectively. The inputs for these investments are not readily available or cannot be reasonably estimated. |
Cash
Cash and foreign currency, if any, in the Statements of Assets and Liabilities consist of cash balances held with the custodian.
Due to/from broker
Due to/from broker in the Statements of Assets and Liabilities includes collateral on swap contracts, futures contracts, option contracts and forward currency contracts, if any, and may include marked-to-market amounts related to foreign currency or cash owed.
Foreign currency translation
The market values of foreign securities, currency holdings and related assets and liabilities are typically translated into U.S. dollars at the close of regular trading on the NYSE, generally at 4:00 pm Eastern time. Income and expenses denominated in foreign currencies are typically translated into U.S. dollars at the close of regular trading on the NYSE. Fluctuations in the value of currency holdings and other assets and liabilities resulting from changes in exchange rates are recorded as unrealized foreign currency gains or losses. Realized gains or losses and unrealized appreciation or depreciation on investment securities and income and expenses are translated on the respective dates of such transactions. The effects of changes in foreign currency exchange rates on investments in securities are not separated in the Statements of Operations from the effects of changes in market prices of those securities, but are included with the net realized and unrealized gain or loss on investment securities.
Rights and warrants
The Funds may purchase or otherwise receive warrants or rights. Warrants and rights generally give the holder the right to receive, upon exercise, a security of the issuer at a set price. Funds typically use warrants and rights in a manner similar to their use of purchased options on securities, as described in the section entitled “Options” in Note 4 “Derivative financial instruments”. Risks associated with the use of warrants and rights are generally similar to risks associated with the use of purchased options. However, warrants and rights often do not have standardized terms, and may have longer maturities and may be less liquid than exchange-traded options. In addition, the terms of warrants or rights may limit a Fund’s ability to exercise the warrants or rights at such times and in such quantities as the Fund would otherwise wish. Rights and/or warrants outstanding at the end of the year, if any, are listed in each applicable Fund’s Schedule of Investments.
GMO Trust Funds
Notes to Financial Statements — (Continued)
February 28, 2022
Securities lending
The Funds may make secured loans of their portfolio securities amounting to not more than one-third of their total assets. Securities loans are required to be collateralized by cash or securities in an amount equal to the securities loaned (marked to market daily). Daily market fluctuations could cause the value of loaned securities to be more or less than the value of the collateral received. When this occurs, the collateral is adjusted and settled on the following business day. Funds participating in securities lending receive compensation for lending their securities and/or net investment income earned on the investment of cash collateral, net of fee rebates paid to the borrower and fees paid to the lending agent. Cash collateral received is generally invested in GMO U.S. Treasury Fund. State Street Bank and Trust Company serves as the Funds’ lending agent.
A Fund that lends its portfolio securities bears the risk of delay in the recovery of loaned securities, including possible impairment of the Fund’s ability to vote the securities, the inability to invest proceeds from the sales of such securities and of loss of rights in the collateral should the borrower fail financially. A Fund also bears the risk that the value of investments made with collateral may decline and bears the risk of total loss with respect to the investment of collateral.
At February 28, 2022, securities on loan at value and collateral from securities on loan are listed below:
| | | | | | | | | | | | | | | | |
| | | | | |
| Fund Name | | Value of securities
on loan ($) | | | Cash
collateral ($) | | | Non-cash
collateral ($)* | | | Total
collateral ($) | |
Climate Change Fund | | | 91,001,729 | | | | 58,114,580 | | | | 31,991,980 | | | | 90,106,560 | ** |
Emerging Markets Fund | | | 15,874,184 | | | | — | | | | 17,012,389 | | | | 17,012,389 | |
Resources Fund | | | 71,566,064 | | | | — | | | | 71,033,973 | | | | 71,033,973 | ** |
| | * | Non-cash collateral is comprised of U.S. Treasuries and Agencies. The Fund cannot repledge non-cash collateral; therefore, they are excluded from the Statements of Assets and Liabilities. |
| | ** | While collateral for securities loans is marked to market daily, there may be instances where, as a result of market movement or other factors, the market value of the collateral at the close of trading on a business day is less than 100% of the market value of the loaned securities at the close of trading on that day. In such cases, the borrower is required to deliver, by the close of business on the following business day, an additional amount of collateral, so that the total amount of posted collateral is equal to at least 100% of the market value of all the loaned securities as of such preceding day. |
Information regarding the value of the securities loaned and the value of cash collateral at year end is included in the Statements of Assets and Liabilities.
Taxes and distributions
Each Fund has elected to be treated or intends to elect to be treated and intends to qualify each tax year as a regulated investment company under Subchapter M of the Internal Revenue Code of 1986, as amended (the “Code”). Each Fund intends to distribute its net investment income, if any, and its net realized short-term and long-term capital gains, if any, after giving effect to any available capital loss carryforwards for U.S. federal income tax purposes. Therefore, each Fund makes no provision for U.S. federal income or excise taxes.
The policy of each Fund is to declare and pay dividends of its net investment income, if any, at least annually, although the Funds are permitted to, and will from time to time, declare and pay dividends of net investment income, if any, more frequently. Each Fund also intends to distribute net realized short-term and long-term capital gains, if any, at least annually. In addition, each Fund may, from time to time at their discretion, make unscheduled distributions in advance of large redemptions by shareholders or as otherwise deemed appropriate by a Fund. Typically, all distributions are reinvested in additional shares of each Fund at net asset value, unless GMO or its agents receive and process a shareholder election to receive cash distributions. Distributions to shareholders are recorded by each Fund on the ex-dividend date.
Taxes on foreign interest and dividend income are generally withheld in accordance with the applicable country’s tax treaty with the United States. The foreign withholding rates applicable to a Fund’s investments in certain jurisdictions may be higher if a significant portion of the Fund is held by non-U.S. shareholders.
As a result of court cases involving several countries across the European Union, certain Funds have filed tax reclaims in addition to treaty-based claims, in respect of previously withheld taxes on dividends earned (“EU tax reclaims”). These filings are subject to various administrative proceedings by each local jurisdiction’s tax authority, as well as judicial proceedings. EU tax reclaim and
GMO Trust Funds
Notes to Financial Statements — (Continued)
February 28, 2022
associated interest entitlements that have been recognized, if any, are reflected as Other income in the Statements of Operations. As a result of its entitlements to EU tax reclaims and related interest amounts, a Fund may incur contingent legal fees. Such fees are presented within Legal fees in the Statements of Operations. Related receivables, if any, are reflected as EU tax reclaims receivable in the Statements of Assets and Liabilities. Generally, unless GMO believes that recovery amounts are collectible and free from significant contingencies, recoveries will not be reflected in a Fund’s net asset value. EU tax reclaims and related interest entitlements recognized by a Fund, if any, reduce the amount of foreign taxes, if any, that a Fund may elect to pass-through to its shareholders from a U.S. federal tax perspective. In certain circumstances and to the extent that EU tax reclaims recognized by a Fund were previously passed-through as foreign tax credits to its U.S. taxable shareholders, a Fund may enter into a closing agreement with the U.S. Internal Revenue Service (the “IRS”). Doing so will enable a Fund to quantify and remit its tax liability related to any recoveries (on behalf of its shareholders). Based on current guidance from the IRS, it is expected that International Equity Fund and Tax-Managed International Equities Fund will enter into a closing agreement with the IRS. Accordingly, estimated charges related to International Equity Fund and Tax-Managed International Equities Fund’s closing agreement liabilities are presented as a reduction of Other income in the Statements of Operations and their estimated closing agreement liabilities are presented as Payable for IRS closing agreement fees in the Statements of Assets and Liabilities.
Each Fund may be subject to taxation on realized capital gains, repatriation proceeds and other transaction-based charges imposed by certain countries in which it invests. Transaction-based charges are generally calculated as a percentage of the transaction amount. Taxes related to capital gains realized during the year ended February 28, 2022, if any, are reflected as part of Net realized gain (loss) in the Statements of Operations. Changes in tax liabilities related to capital gain taxes on unrealized investment gains, if any, are reflected as part of Change in net unrealized appreciation (depreciation) in the Statements of Operations.
Foreign taxes paid by each Fund may be treated, to the extent permissible by the Code (and other applicable U.S. federal tax guidance) and if that Fund so elects, as if paid by U.S. shareholders of that Fund.
Income and capital gain distributions are determined in accordance with U.S. federal income tax regulations, which may differ from U.S. GAAP. Certain capital accounts in the financial statements are periodically adjusted for permanent differences in order to reflect their tax character. These adjustments have no impact on net assets or net asset value per share. Temporary differences that arise from recognizing certain items of income, expense, gain or loss in different periods for financial statement and tax purposes will likely reverse at some time in the future.
Differences in distributable earnings on a U.S. GAAP and tax accounting basis primarily relate to the following:
| | | | | | | | | | | | | | | | | | | | | | | | |
| | | | | | | | | | | | | |
| Differences related to: | | Climate Change Fund | | Emerging Domestic Opportunities Fund | | Emerging Markets ex-China Fund | | Emerging Markets Fund | | International Equity Fund | | Japan Value Creation Fund | | Quality Cyclicals Fund (formerly Cyclical Focus Fund) | | Quality Fund | | Resources Fund | | Tax-Managed International Equities Fund | | U.S. Equity Fund | | U.S. Small Cap Value Fund |
| Capital loss carryforwards | | X | | | | | | X | | X | | | | | | | | | | X | | | | |
| Derivative contract transactions | | | | | | | | X | | | | | | | | | | | | | | X | | |
| Dividend income and withholding tax reclaim reserves | | | | | | | | X | | X | | | | | | | | | | X | | | | |
| Dividends received from underlying investments | | | | | | | | X | | | | | | | | | | | | | | | | |
| EU tax reclaims, associated interest entitlements and IRS closing agreement matters | | | | | | | | | | X | | | | | | | | | | | | | | |
GMO Trust Funds
Notes to Financial Statements — (Continued)
February 28, 2022
| | | | | | | | | | | | | | | | | | | | | | | | |
| | | | | | | | | | | | | |
| Differences related to: | | Climate Change Fund | | Emerging Domestic Opportunities Fund | | Emerging Markets ex-China Fund | | Emerging Markets Fund | | International Equity Fund | | Japan Value Creation Fund | | Quality Cyclicals Fund (formerly Cyclical Focus Fund) | | Quality Fund | | Resources Fund | | Tax-Managed International Equities Fund | | U.S. Equity Fund | | U.S. Small Cap Value Fund |
| Foreign capital gains taxes | | | | X | | | | X | | | | | | | | | | X | | | | | | |
| Foreign currency transactions | | | | X | | X | | X | | | | X | | | | | | | | | | | | |
| Late-year ordinary losses | | | | | | | | | | | | | | | | | | | | X | | | | |
| Losses on wash sale transactions | | X | | X | | X | | X | | | | | | X | | X | | X | | X | | | | X |
| Partnership interest tax allocations | | | | | | | | X | | | | | | | | | | | | | | | | |
| Passive foreign investment company transactions | | X | | X | | X | | X | | X | | X | | X | | | | X | | X | | | | |
| Post-October capital losses | | | | X | | | | X | | X | | | | | | | | | | | | | | |
| Real estate investment trust transactions | | | | | | | | | | | | | | | | | | | | | | | | X |
| U.S. federal tax equalization utilized | | | | | | | | | | | | | | | | X | | | | | | | | |
The tax character of distributions declared by each Fund to shareholders is as follows:
| | | | | | | | | | | | | | | | | | | | | | | | |
| | | |
| | | Tax year ended February 28, 2022 | | | Tax year ended February 28, 2021 | |
| | | | | | | |
| Fund Name | | Ordinary Income (including any net short-term capital gain) ($) | | | Net Long- Term Capital Gain ($) | | | Total Distributions ($) | | �� | Ordinary Income (including any net short-term capital gain) ($) | | | Net Long- Term Capital Gain ($) | | | Total Distributions ($) | |
| Climate Change Fund | | | 58,947,090 | | | | 24,176,606 | | | | 83,123,696 | | | | 6,683,492 | | | | 7,099,833 | | | | 13,783,325 | |
| Emerging Domestic Opportunities Fund | | | 2,585,729 | | | | 58,232,198 | | | | 60,817,927 | | | | 7,101,297 | | | | — | | | | 7,101,297 | |
| Emerging Markets ex-China Fund | | | 2,320,982 | | | | — | | | | 2,320,982 | | | | N/A | | | | N/A | | | | N/A | |
| Emerging Markets Fund | | | 99,941,507 | | | | — | | | | 99,941,507 | | | | 113,896,942 | | | | — | | | | 113,896,942 | |
| International Equity Fund | | | 128,778,541 | | | | — | | | | 128,778,541 | | | | 112,859,036 | | | | — | | | | 112,859,036 | |
| Japan Value Creation Fund | | | 23,620,607 | | | | 1,135,657 | | | | 24,756,264 | | | | 2,070,899 | | | | — | | | | 2,070,899 | |
| Quality Cyclicals Fund (formerly Cyclical Focus Fund) | | | 23,763,294 | | | | 5,405,268 | | | | 29,168,562 | | | | 7,515,852 | | | | — | | | | 7,515,852 | |
| Quality Fund | | | 216,653,021 | | | | 312,208,528 | | | | 528,861,549 | | | | 151,652,451 | | | | 774,234,311 | | | | 925,886,762 | |
| Resources Fund | | | 155,301,803 | | | | 27,415,353 | | | | 182,717,156 | | | | 20,325,831 | | | | 11,022,393 | | | | 31,348,224 | |
| Tax-Managed International Equities Fund | | | 1,685,418 | | | | 3,705,108 | | | | 5,390,526 | | | | 882,340 | | | | — | | | | 882,340 | |
| U.S. Equity Fund | | | 26,259,224 | | | | 57,927,021 | | | | 84,186,245 | | | | 15,615,633 | | | | 20,105,110 | | | | 35,720,743 | |
| U.S. Small Cap Value Fund | | | 55,774,484 | | | | 27,775,233 | | | | 83,549,717 | | | | 6,891,863 | | | | — | | | | 6,891,863 | |
GMO Trust Funds
Notes to Financial Statements — (Continued)
February 28, 2022
Distributions in excess of a Fund’s tax basis earnings and profits, if significant, are reported in the Funds’ financial statements as a return of capital.
As of February 28, 2022, the components of distributable earnings on a tax basis and certain tax attributes for the Funds consisted of the following:
| | | | | | | | | | | | | | | | | | | | |
| | | | | | |
| Fund Name | | Undistributed Ordinary Income (including any net short-term capital gain) ($) | | | Undistributed Net Long-Term Capital Gain ($) | | | Late-Year Ordinary Loss Deferral ($) | | | Capital Loss Carryforwards ($) | | | Post-October Capital Loss Deferral ($) | |
Climate Change Fund | | | 8,791,417 | | | | 5,482,058 | | | | — | | | | (2,366,029) | | | | — | |
Emerging Domestic Opportunities Fund | | | 143,315 | | | | — | | | | — | | | | — | | | | (18,035,811) | |
Emerging Markets ex-China Fund | | | 1,557,733 | | | | — | | | | — | | | | — | | | | — | |
Emerging Markets Fund | | | 4,566,352 | | | | — | | | | — | | | | (1,037,435,422) | | | | (51,201,848) | |
International Equity Fund | | | 2,203,393 | | | | — | | | | (525,712) | | | | (805,245,639) | | | | (7,043,749) | |
Japan Value Creation Fund | | | 868,402 | | | | 5,916,837 | | | | — | | | | — | | | | — | |
Quality Cyclicals Fund (formerly Cyclical Focus Fund) | | | 1,526,098 | | | | 2,140,673 | | | | — | | | | — | | | | — | |
Quality Fund | | | 17,870,540 | | | | 190,054,115 | | | | — | | | | — | | | | — | |
Resources Fund | | | 68,327,657 | | | | 20,098,924 | | | | — | | | | — | | | | — | |
Tax-Managed International Equities Fund | | | 100,048 | | | | 734,305 | | | | (46,643) | | | | (304,539) | | | | — | |
U.S. Equity Fund | | | 6,524,844 | | | | 15,562,384 | | | | — | | | | — | | | | — | |
U.S. Small Cap Value Fund | | | 7,505,126 | | | | 8,299,032 | | | | — | | | | — | | | | — | |
As of February 28, 2022, certain Funds had capital loss carryforwards available to offset future realized gains, if any, to the extent permitted by the Code. Net capital losses are carried forward without expiration and generally retain their short-term and/or long-term tax character, as applicable. Utilization of the capital loss carryforwards, post-October capital losses, late-year ordinary losses, and losses realized subsequent to February 28, 2022, if any, could be subject to further limitations imposed by the Code related to share ownership activity. The Funds’ capital loss carryforwards are as follows:
| | | | | | | | |
| | | |
| Fund Name | | Short-Term ($) | | | Long-Term ($) | |
| Climate Change Fund | | | (1,674,056) | | | | (691,973) | |
| Emerging Domestic Opportunities Fund | | | — | | | | — | |
| Emerging Markets ex-China Fund | | | — | | | | — | |
| Emerging Markets Fund | | | (33,803,872) | | | | (1,003,631,550) | |
| International Equity Fund | | | (731,542,134) | | | | (73,703,505) | |
| Japan Value Creation Fund | | | — | | | | — | |
| Quality Cyclicals Fund (formerly Cyclical Focus Fund) | | | — | | | | — | |
| Quality Fund | | | — | | | | — | |
| Resources Fund | | | — | | | | — | |
| Tax-Managed International Equities Fund | | | (304,539) | | | | — | |
| U.S. Equity Fund | | | — | | | | — | |
| U.S. Small Cap Value Fund | | | — | | | | — | |
GMO Trust Funds
Notes to Financial Statements — (Continued)
February 28, 2022
As of February 28, 2022, the approximate total cost, aggregate investment-level gross/net unrealized appreciation (depreciation) in the value of total investments (including total securities sold short, if any), and the net unrealized appreciation (depreciation) of outstanding financial instruments for U.S. federal income tax purposes were as follows:
| | | | | | | | | | | | | | | | | | | | |
| | | |
| | | Total Investments | | | Outstanding
Financial
Instruments | |
| | | | | | |
| Fund Name | | Aggregate
Cost ($) | | | Gross Unrealized
Appreciation ($) | | | Gross Unrealized
(Depreciation) ($) | | | Net Unrealized
Appreciation
(Depreciation) ($) | | | Net Unrealized
Appreciation
(Depreciation) ($) | |
| Climate Change Fund | | | 782,193,025 | | | | 68,074,132 | | | | (62,696,076) | | | | 5,378,056 | | | | — | |
| Emerging Domestic Opportunities Fund | | | 779,638,563 | | | | 15,937,725 | | | | (45,195,222) | | | | (29,257,497) | | | | — | |
| Emerging Markets ex-China Fund | | | 356,243,192 | | | | 9,898,125 | | | | (70,557,621) | | | | (60,659,496) | | | | — | |
| Emerging Markets Fund | | | 2,225,786,626 | | | | 205,341,441 | | | | (498,570,453) | | | | (293,229,012) | | | | 840,988 | |
| International Equity Fund | | | 2,003,254,600 | | | | 142,881,045 | | | | (167,916,598) | | | | (25,035,553) | | | | — | |
| Japan Value Creation Fund | | | 168,678,908 | | | | 7,028,956 | | | | (14,706,435) | | | | (7,677,479) | | | | — | |
| Quality Cyclicals Fund (formerly Cyclical Focus Fund) | | | 111,569,134 | | | | 34,664,453 | | | | (4,719,256) | | | | 29,945,197 | | | | — | |
| Quality Fund | | | 4,930,310,036 | | | | 3,569,709,562 | | | | (153,465,775) | | | | 3,416,243,787 | | | | — | |
| Resources Fund | | | 1,986,861,855 | | | | 401,259,765 | | | | (196,639,919) | | | | 204,619,846 | | | | — | |
| Tax-Managed International Equities Fund | | | 28,146,279 | | | | 5,290,339 | | | | (1,174,752) | | | | 4,115,587 | | | | — | |
| U.S. Equity Fund | | | 433,137,442 | | | | 48,923,153 | | | | (15,777,909) | | | | 33,145,244 | | | | — | |
| U.S. Small Cap Value Fund | | | 231,881,029 | | | | 40,979,398 | | | | (18,060,446) | | | | 22,918,952 | | | | — | |
The Funds are subject to authoritative guidance related to the accounting and disclosure of uncertain tax positions under U.S. GAAP. A Fund may recognize an income tax liability related to an uncertain tax position under U.S. GAAP when the uncertain tax position has a less than 50% probability that it would be sustained upon examination by the tax authorities, based on technical merits. United States and non-U.S. tax rules (including the interpretation and application of tax laws) are subject to change. The Funds file tax returns and/or adopt certain tax positions in various jurisdictions. Non-U.S. taxes are provided for based on the Funds’ understanding of the prevailing tax rules of the non-U.S. markets in which they invest. Recently enacted tax rules, including interpretations of tax laws and tax legislation/initiatives currently under consideration in various jurisdictions, including the U.S., might affect the way the Funds and their investors are taxed prospectively and/or retroactively. Prior to the expiration of the relevant statutes of limitations, if any, the Funds are subject to examination by U.S. federal, state, local and non-U.S. jurisdictions with respect to the tax returns they have filed and the tax positions they have adopted. The Funds’ U.S. federal income tax returns are generally subject to examination by the Internal Revenue Service for a period of three years after they are filed. State, local and/or non-U.S. tax returns and/or other filings may be subject to examination for different periods, depending upon the tax rules of each applicable jurisdiction. As of February 28, 2022, each Fund has determined that no tax liability is required to be accrued in its financial statements related to uncertain tax positions for any tax years which are subject to examination.
Security transactions and related investment income
Security transactions are accounted for in the financial statements on trade date. For purposes of daily net asset value calculations, the Funds’ policy is that security transactions are generally accounted for on the following business day. GMO may override that policy and a Fund may account for security transactions on trade date if it experiences significant purchases or redemptions or engages in significant portfolio transactions. Dividend income, net of applicable foreign withholding taxes, if any, is recorded on the ex-dividend date or, if later, when a Fund is informed of the ex-dividend date. Income dividends and capital gain distributions from underlying funds, if any, are recorded on the ex-dividend date. Interest income is recorded on the accrual basis and is adjusted for the amortization of premiums and accretion of discounts. Principal on inflation-indexed securities is adjusted for inflation/deflation and any increase or decrease is recorded as interest income or investment loss. Coupon income is not recognized on securities for which collection is not expected. Paydown gains and losses on mortgage-related and other asset-backed securities, if any, are recorded as
GMO Trust Funds
Notes to Financial Statements — (Continued)
February 28, 2022
components of interest income in the Statements of Operations. Non-cash dividends, if any, are recorded at the fair market value of the asset received. In determining the net gain or loss on securities sold, the Funds use the identified cost basis.
Expenses and class allocations
Most of the expenses of the Trust are directly attributable to an individual Fund. Generally, common expenses are allocated among the Funds based on, among other things, the nature and type of expense and the relative size of the Funds. Investment income, common expenses, purchase premiums and redemption fees, if any, and realized and unrealized gains and losses are allocated among the classes of shares of the Funds, if applicable, based on the relative net assets of each class. Shareholder service fees, if any, which are directly attributable to a class of shares, are charged to that class’s operations. In addition, the Funds may incur fees and expenses indirectly as a shareholder in the underlying funds. Because the underlying funds have different expense and fee levels and the Funds may own different proportions of the underlying funds at different times, the amount of fees and expenses indirectly incurred by a Fund will vary (see Note 5).
Custodian, Fund Accounting Agent and Transfer Agent
State Street Bank and Trust Company (“State Street”) serves as the Funds’ custodian, fund accounting agent and transfer agent. Prior to November 3, 2017, Brown Brothers Harriman & Co. served as the Funds’ custodian and fund accounting agent except for Climate Change Fund, Japan Value Creation Fund, Quality Cyclicals Fund (formerly Cyclical Focus Fund), Quality Fund and U.S. Equity Fund. Cash balances maintained at the custodian and transfer agent are held in a Demand Deposit Account and interest income earned, if any, is shown as interest income in the Statements of Operations.
Purchases and redemptions of Fund shares
Purchase premiums and redemption fees (if applicable) are paid to and retained by a Fund to help offset estimated portfolio transaction costs and other related costs (e.g., bid to ask spreads, stamp duties, and transfer fees) incurred by the Fund directly or indirectly (e.g., through investments in underlying funds) as a result of an investor’s purchase or redemption by allocating estimated transaction costs to the purchasing or redeeming shareholder. Such fees are recorded as a component of the Funds’ net share transactions. A Fund may impose a new purchase premium and redemption fee or increase or decrease an existing fee at any time.
Purchase premiums are not charged on reinvestments of dividends or other distributions. Redemption fees apply to all shares of a Fund regardless of how the shares were acquired (e.g., by direct purchase or by reinvestment of dividends or other distributions).
If GMO determines that any portion of a cash purchase or redemption, as applicable, is offset by a corresponding cash redemption or purchase occurring on the same day, it ordinarily will waive or reduce the purchase premium or redemption fee with respect to that portion.
GMO also may waive or reduce the purchase premium or redemption fee for a purchase or redemption of a Fund’s shares if the Fund will not incur transaction costs or will incur reduced transaction costs.
For example, GMO may reduce the purchase premium to the extent that securities are used to purchase a Fund’s shares (taking into account transaction costs, stamp duties or transfer fees), and GMO may reduce redemption fees to the extent a Fund uses portfolio securities to redeem its shares (taking into account transaction costs, stamp duties or transfer fees).
GMO Trust Funds
Notes to Financial Statements — (Continued)
February 28, 2022
As of February 28, 2022, none of the Funds charge a purchase premium or redemption fee. Historical information on purchase premiums and redemption fees are provided in the table below.
| | |
| Emerging Domestic Opportunities Fund | | For the period from December 1, 2018 to November 22, 2019, the premium on cash purchases and the fee on cash redemptions were each 0.40% of the amount invested or redeemed. Prior to December 1, 2018, the premium on cash purchases and the fee on cash redemptions were each 0.80% of the amount invested or redeemed. |
| Emerging Markets Fund | | For the period from December 1, 2018 to November 22, 2019, the premium on cash purchases and the fee on cash redemptions were each 0.40% of the amount invested or redeemed. Prior to December 1, 2018, the premium on cash purchases and the fee on cash redemptions were each 0.80% of the amount invested or redeemed. |
| Resources Fund | | Prior to March 9, 2020, the premium on cash purchases and the fee on cash redemptions were each 0.30% of the amount invested or redeemed. |
Other matters — Emerging Markets Fund (“EMF”)
Indian regulators alleged in 2002 that EMF violated some conditions under which it was granted permission to operate in India and have restricted some of EMF’s locally held assets pending resolution of the dispute. Although these locally held assets remain the property of EMF, a portion of the assets are not permitted to be withdrawn from EMF’s local custodial account located in India. The amount of restricted assets is small relative to the size of EMF, representing approximately 0.18% of the Fund’s total net assets as of February 28, 2022, though in recognition of the potential liability, a portion of that amount is included as a Miscellaneous payable within the Statements of Assets and Liabilities. The effect of this claim on the value of the restricted assets, and all matters relating to EMF’s response to these allegations, are subject to the supervision and control of GMO Trust’s Board of Trustees. Any costs in respect of this matter will be borne by EMF.
Recently-issued accounting guidance
In March 2020, the Financial Accounting Standards Board (FASB) issued Accounting Standards Update (ASU) No. 2020-04, “Reference Rate Reform (Topic 848) – Facilitation of the Effects of Reference Rate Reform on Financial Reporting”. The amendments in the ASU provides optional temporary financial reporting relief from the effect of certain types of contract modifications due to the planned discontinuation of the London Interbank Offered Rate (LIBOR) and other interbank-offered based reference rates as of the end of 2021. In March 2021, the administrator for LIBOR announced the extension of the publication of a majority of the USD LIBOR settings to June 30, 2023. The Investment Adviser does not expect ASU No. 2020-04 to have a material impact on the financial statements.
GMO Trust Funds
Notes to Financial Statements — (Continued)
February 28, 2022
| 3. | Investment and other risks |
The following chart identifies selected risks associated with each Fund. Risks not marked for a particular Fund may, however, still apply to some extent to that Fund at various times.
| | | | | | | | | | | | | | | | | | | | | | | | |
| | | | | | | | | | | | | |
| | | Climate Change Fund | | Emerging Domestic Opportunities Fund | | Emerging Markets ex-China Fund | | Emerging Markets Fund | | International Equity Fund | | Japan Value Creation Fund | | Quality Cyclicals Fund (formerly Cyclical Focus Fund) | | Quality Fund | | Resources Fund | | Tax-Managed International Equities Fund | | U.S. Equity Fund | | U.S. Small Cap Value Fund |
| Market Risk- Equities | | X | | X | | X | | X | | X | | X | | X | | X | | X | | X | | X | | X |
| Management and Operational Risk | | X | | X | | X | | X | | X | | X | | X | | X | | X | | X | | X | | X |
| Non-U.S. Investment Risk | | X | | X | | X | | X | | X | | X | | X | | X | | X | | X | | | | |
| Focused Investment Risk | | X | | X | | X | | X | | X | | X | | X | | X | | X | | X | | X | | X |
| Currency Risk | | X | | X | | X | | X | | X | | X | | X | | X | | X | | X | | | | |
| Commodities Risk | | X | | | | | | | | | | | | | | | | X | | | | | | |
| Illiquidity Risk | | X | | X | | X | | X | | X | | X | | X | | X | | X | | X | | X | | X |
| Market Disruption and Geopolitical Risk | | X | | X | | X | | X | | X | | X | | X | | X | | X | | X | | X | | X |
| Smaller Company Risk | | X | | X | | X | | X | | X | | X | | X | | X | | X | | X | | X | | X |
| Derivatives and Short Sales Risk | | X | | X | | X | | X | | X | | X | | X | | X | | X | | X | | X | | X |
| Counterparty Risk | | X | | X | | X | | X | | X | | X | | X | | X | | X | | X | | X | | X |
| Funds of Funds Risk | | | | X | | X | | X | | | | | | | | | | | | | | | | |
| Leveraging Risk | | X | | X | | X | | X | | X | | X | | X | | X | | X | | X | | X | | X |
| Market Risk – Fixed Income | | | | X | | | | | | | | | | | | | | | | | | | | |
| Large Shareholder Risk | | X | | | | X | | X | | X | | X | | X | | X | | X | | X | | X | | X |
| Credit Risk | | | | X | | | | | | | | | | | | | | | | | | | | |
| Event Driven Risk | | X | | | | | | | | | | | | X | | X | | X | | | | | | |
| Non-Diversified Funds | | | | X | | X | | | | | | X | | X | | X | | | | | | | | |
Investing in mutual funds involves many risks. The risks of investing in a particular Fund depend on the types of investments in its portfolio and the investment strategies GMO employs on its behalf. This section does not describe every potential risk of investing in the Funds. Funds could be subject to additional risks because of the types of investments they make and market conditions, which may change over time. Please see the Funds’ prospectus for more information regarding the risks of investing in the Funds.
Each Fund that invests in other GMO Funds or other investment companies (collectively, “Underlying Funds”) is exposed to the risks to which the Underlying Funds in which it invests are exposed, as well as the risk that the Underlying Funds will not perform as expected. Therefore, unless otherwise noted, the selected risks summarized below include both direct and indirect risks, and references in this section to investments made by a Fund include those made both directly by the Fund and indirectly by the Fund as a result of its investment in Underlying Funds.
GMO Trust Funds
Notes to Financial Statements — (Continued)
February 28, 2022
An investment in a Fund is not a bank deposit and, therefore, is not insured or guaranteed by the Federal Deposit Insurance Corporation or any other government agency.
• MARKET RISK — EQUITIES. The market price of an equity may decline due to factors affecting the issuer or its industry or the economy and equity markets generally. Equities that are characterized as relatively cyclical often are especially sensitive to economic cycles, which means they typically underperform non-cyclical equities during economic downturns. Cyclical equities may include investments in companies in any industry, including industries generally thought of as cyclical (e.g., consumer discretionary, financials, energy, real estate, materials and industrials) and industries not typically viewed as cyclical (e.g., healthcare, technology). If a Fund purchases an equity for less than its fundamental fair (or intrinsic) value as assessed by GMO and GMO’s assessment proves to be incorrect, the Fund runs the risk that the market price of the equity will not appreciate or will decline. A Fund also may purchase equities that typically trade at higher multiples of current earnings than other securities, and the market prices of these equities often are more sensitive to changes in future earnings expectations than the market prices of equities trading at lower multiples. Declines in stock market prices generally are likely to reduce the net asset value of the Fund’s shares.
• MANAGEMENT AND OPERATIONAL RISK. Each Fund runs the risk that GMO’s investment techniques will fail to produce desired results. For many Funds, GMO uses quantitative models as part of its investment process. GMO’s models may not accurately predict future market movements. In addition, GMO’s models rely on assumptions and data that are subject to limitations (e.g., inaccuracies, staleness) that could adversely affect their predictive value. The Funds also run the risk that GMO’s assessment of an investment (including a security’s fundamental fair (or intrinsic) value) is wrong or that deficiencies in GMO’s or another service provider’s internal systems or controls will cause losses for the Funds or impair Fund operations.
• NON-U.S. INVESTMENT RISK. The market prices of many non-U.S. securities (particularly of companies tied economically to emerging countries) fluctuate more than those of U.S. securities. Many non-U.S. securities markets (particularly emerging markets) are less stable, smaller, less liquid, and less regulated than U.S. securities markets, and the cost of trading in those markets often is higher than in U.S. securities markets. In addition, issuers of non-U.S. securities (particularly those tied economically to emerging countries) often are not subject to as much regulation as U.S. issuers, and the reporting, recordkeeping, accounting, custody, and auditing standards to which those issuers are subject often are not as rigorous as U.S. standards. In addition, a Fund may be subject to non-U.S. taxes, potentially on a retroactive basis, on (i) capital gains it realizes or dividends, interest, or other amounts it realizes or accrues in respect of non-U.S. investments; (ii) transactions in those investments; and (iii) repatriation of proceeds generated from the sale or other disposition of those investments. Also, the Funds need a license to invest directly in securities traded in many non-U.S. securities markets, and a Fund is subject to the risk that it could not invest if its license were terminated or suspended. In some non-U.S. securities markets, prevailing custody and trade settlement practices (e.g., the requirement to pay for securities prior to receipt) expose a Fund to credit and other risks. Further, adverse changes in investment regulations, capital requirements or exchange controls could adversely affect the value of a Fund’s investments. These and other risks (e.g., nationalization, expropriation or other confiscation of assets of non-U.S. issuers, limitations on, or difficulties enforcing, legal judgments, contractual rights, or other remedies) tend to be greater for investments in the securities of companies tied economically to emerging countries. The economies of emerging countries often depend predominantly on only a few industries or revenues from particular commodities, and often are more volatile than the economies of developed countries.
• FOCUSED INVESTMENT RISK. Investments focused in asset classes, countries, regions, sectors, industries, currencies or issuers (or in sectors within a country or region) that are subject to the same or similar risk factors and investments whose prices are closely correlated are subject to greater overall risk than investments that are more diversified or whose prices are not as closely correlated. A Fund that invests in the securities of a limited number of issuers has greater exposure to a decline in the market price of a particular security held by the Fund than if the Fund invested in the securities of a larger number of issuers.
• CURRENCY RISK. Fluctuations in exchange rates can adversely affect the market value of a Fund’s foreign currency holdings and investments denominated in foreign currencies.
• COMMODITIES RISK. Commodity prices can be extremely volatile, and exposure to commodities can cause the value of a Fund’s shares to decline or fluctuate in a rapid and unpredictable manner.
• ILLIQUIDITY RISK. Low trading volume, lack of a market maker, large position size or legal restrictions may limit or prevent a Fund from selling particular securities or closing derivative positions at desirable prices.
GMO Trust Funds
Notes to Financial Statements — (Continued)
February 28, 2022
• MARKET DISRUPTION AND GEOPOLITICAL RISK. Geopolitical and other events (e.g., wars, pandemics, sanctions, terrorism) may disrupt securities markets and adversely affect global economies and markets. Those events, as well as other changes in non-U.S. and U.S. economic and political conditions, could exacerbate other risks or otherwise reduce the value of the Funds’ investments.
In late February 2022, Russia began an invasion of Ukraine. Following such invasion, the United States, the European Union, and other countries and entities imposed wide-ranging sanctions on Russia, the President of Russia and other members of the Government of Russia as well as entities owned or controlled by, or acting on behalf of, the Government of Russia. The Government of Russia has also imposed countersanctions and taken other actions in response to the sanctions. The scope and scale of the sanctions may be expanded and the conflict between Russia and Ukraine may further deteriorate. These sanctions and current environment could impair the ability of the Funds to buy, sell, hold, receive, deliver or otherwise transact in certain securities and other instruments. The full impact of the sanctions and the conflict on the Funds, the financial markets and the global economy is not yet known.
• SMALLER COMPANY RISK. Smaller companies may have limited product lines, markets, or financial resources, lack the competitive strength of larger companies, have less experienced managers or depend on a few key employees. The securities of companies with smaller market capitalizations often are less widely held and trade less frequently and in lesser quantities, and their market prices often fluctuate more, than the securities of companies with larger market capitalizations.
• DERIVATIVES AND SHORT SALES RISK. The use of derivatives involves the risk that their value may not change as expected relative to changes in the value of the underlying assets, pools of assets, rates, currencies or indices. Derivatives also present other risks, including market risk, illiquidity risk, currency risk, credit risk, and counterparty risk. The market price of an option is affected by many factors, including changes in the market prices or dividend rates of underlying securities (or in the case of indices, the securities in such indices); the time remaining before expiration; changes in interest rates or exchange rates; and changes in the actual or perceived volatility of the relevant stock market and underlying securities. A Fund may create short investment exposure by taking a derivative position in which the value of the derivative moves in the opposite direction from the price of an underlying asset, pool of assets, rate, currency or index. The risks of loss associated with derivatives that provide short investment exposure and short sales of securities are theoretically unlimited.
• COUNTERPARTY RISK. A Fund runs the risk that the counterparty to a derivatives contract, a clearing member used by the Fund to hold a cleared derivatives contract, or a borrower of the Fund’s securities is unable or unwilling to make timely settlement payments, return the Fund’s margin or otherwise honor its obligations.
• FUND OF FUNDS RISK. A Fund is indirectly exposed to all of the risks of an investment in the underlying funds in which it invests (including ETFs), including the risk that those underlying funds will not perform as expected. Because a Fund bears the fees and expenses of the underlying funds in which it invests, the increase in fees and expenses of an underlying fund or a reallocation of the Fund’s investments to underlying funds with higher fees or expenses will increase the Fund’s total expenses.
• LEVERAGING RISK. The use of derivatives and securities lending creates leverage. Leverage increases a Fund’s losses when the value of its investments (including derivatives) declines. In addition, a Fund’s portfolio will be leveraged if it exercises its right to delay payment on a redemption, and losses will result if the value of the Fund’s assets declines between the time a redemption request is deemed to be received by a Fund and the time the Fund liquidates assets to meet that request.
• MARKET RISK – FIXED INCOME. The market price of a fixed income investment can decline due to market-related factors, including rising interest rates and widening credit spreads, or decreased liquidity due, for example, to market uncertainty about the value of a fixed income investment (or class of fixed income investments).
• LARGE SHAREHOLDER RISK. To the extent that a large number of shares of a Fund is held by a single shareholder (e.g., an institutional investor or another GMO Fund) or a group of shareholders with a common investment strategy (e.g., GMO asset allocation accounts), the Fund is subject to the risk that a redemption by those shareholders of all or a large portion of their Fund shares will require the Fund to sell securities at disadvantageous prices, disrupt the Fund’s operations, or force the Fund’s liquidation.
• CREDIT RISK. A Fund runs the risk that the issuer or guarantor of a fixed income investment or the obligors of obligations underlying an asset-backed security will be unable or unwilling to satisfy their obligations to pay principal and interest or otherwise to honor their obligations in a timely manner. The market price of a fixed income investment will normally decline as a result of the failure of an issuer, guarantor, or obligor to meet its payment obligations or in anticipation of such failure. Below investment grade
GMO Trust Funds
Notes to Financial Statements — (Continued)
February 28, 2022
investments have speculative characteristics, and negative changes in economic conditions or other circumstances are more likely to impair the ability of issuers of those investments to make principal and interest payments than issuers of investment grade investments.
• EVENT-DRIVEN RISK. If a Fund purchases securities in anticipation of a proposed merger, acquisition, exchange offer, tender offer, or other similar transaction and that transaction later appears likely to be delayed or unlikely to be consummated or, in fact, is not consummated or is delayed, the market price of the securities purchased by the Fund may decline sharply, resulting in losses to the Fund. The risk/reward payout of event-driven strategies (such as merger arbitrage) typically is asymmetric, with the losses in failed transactions often far exceeding the gains in successful transactions. Event-driven strategies are subject to the risk of overall market movements, and a Fund may experience losses even if a transaction is consummated. A Fund’s investments in derivatives or short sales of securities to hedge or otherwise adjust investment exposure in connection with an event-driven transaction may not perform as expected or may otherwise reduce the Fund’s gains or increase its losses.
• NON-DIVERSIFIED FUNDS. The following Funds are non-diversified investment companies under the 1940 Act and therefore a decline in the market price of a particular security held by the Funds may affect the Funds’ performance more than if the Funds were a diversified investment company.
| | • | | Emerging Domestic Opportunities Fund |
| | • | | Emerging Markets ex-China Fund |
| | • | | Japan Value Creation Fund |
| | • | | Quality Cyclicals Fund (formerly Cyclical Focus Fund) |
| 4. | Derivative financial instruments |
Derivatives are financial contracts whose value depends on, or is derived from, the value of underlying assets, reference rates, or indices that are used to increase, decrease or adjust elements of the investment exposures of a Fund’s portfolio. Derivatives may relate to securities, interest rates, currencies, currency exchange rates, inflation rates, commodities and indices, and include foreign currency contracts, swap contracts, reverse repurchase agreements, and other exchange-traded and OTC contracts.
The Funds may use derivatives to gain long investment exposure to securities or other assets. For example, a Fund may use derivatives instead of investing directly in equity securities, including using equity derivatives to maintain equity exposure when it holds cash by “equitizing” its cash balances using futures contracts or other types of derivatives. The Funds also may use currency derivatives (including forward currency contracts, futures contracts, swap contracts and options) to gain exposure to a given currency.
The Funds may use derivatives in an attempt to reduce their investment exposures (which may result in a reduction below zero). A Fund also may use currency derivatives in an attempt to reduce some aspect of the currency exposure in its portfolio. For these purposes, the Fund may use an instrument denominated in a different currency that GMO believes is highly correlated with the relevant currency.
The Funds may use derivatives in an attempt to adjust elements of their investment exposures to various securities, sectors, markets, indices, and currencies without actually having to sell existing investments or make new direct investments. For example, if a Fund holds a large proportion of stocks of companies in a particular sector and GMO believes that stocks of companies in another sector will outperform those stocks, the Fund might use a short futures contract on an appropriate index (to synthetically “sell” a portion of the Fund’s portfolio) in combination with a long futures contract on another index (to synthetically “buy” exposure to that index). In adjusting its investment exposures, a Fund also may use currency derivatives in an attempt to adjust its currency exposure, seeking currency exposure that is different (in some cases, significantly different) from the currencies in which its equities are traded.
The Funds may use derivatives to effect transactions intended as substitutes for securities lending.
Each of the Funds may have investment exposures in excess of its net assets (i.e. the Fund may be leveraged).
A Fund’s foreign currency exposure may differ significantly from the currencies in which its equities are traded.
GMO Trust Funds
Notes to Financial Statements — (Continued)
February 28, 2022
Certain derivatives transactions that may be used by the Funds, including certain interest rate swaps and certain credit default index swaps, are required to be transacted through a central clearing organization. The Funds hold cleared derivatives transactions, if any, through clearing members, who are members of derivatives clearing houses. Certain other derivatives, including futures and certain options, are transacted on exchanges. The Funds hold exchange-traded derivatives through clearing brokers that are typically members of the exchanges. In contrast to bilateral derivatives transactions, following a period of advance notice to the Fund, clearing brokers generally can require termination of existing cleared or exchange-traded derivatives transactions at any time and increases in margin above the margin that it required at the beginning of a transaction. Clearing houses and exchanges also have broad rights to increase margin requirements for existing transactions and to terminate transactions. Any such increase or termination could interfere with the ability of a Fund to pursue its investment strategy. Also, a Fund is subject to execution risk if it enters into a derivatives transaction that is required to be cleared (or that GMO expects to be cleared), and no clearing member is willing or able to clear the transaction on the Fund’s behalf. In that case, the transaction might have to be terminated, and the Fund could lose some or all of the benefit of any increase in the value of the transaction after the time of the transaction.
The use of derivatives involves risks that are in addition to, and potentially greater than, the risks associated with investing directly in securities and other more traditional assets. See “Investment and other risks” above for further information.
For Funds that held derivatives during the year ended February 28, 2022, the following table shows how the Fund used these derivatives (marked with an X):
| | | | | | | | | | | | | | | | | | | | | | | | |
| | | | | | | |
| Type of Derivative and Objective for Use | | Emerging
Domestic
Opportunities
Fund | | | Emerging
Markets
Fund | | | International
Equity Fund | | | Tax-Managed
International Equities
Fund | | | U.S.
Equity Fund | | | U.S. Small Cap
Value Fund | |
| Futures contracts | | | | | | | | | | | | | | | | | | | | | | | | |
Adjust exposure to certain securities markets | | | X | | | | X | | | | X | | | | X | | | | X | | | | X | |
Maintain the diversity and liquidity of the portfolio | | | | | | | | | | | X | | | | X | | | | X | | | | X | |
| Swap contracts | | | | | | | | | | | | | | | | | | | | | | | | |
Substitute for direct equity investment | | | | | | | X | | | | | | | | | | | | | | | | | |
Achieve returns comparable to holding and lending a direct equity position | | | | | | | X | | | | | | | | | | | | | | | | | |
Forward currency contracts
The Funds may enter into forward currency contracts, including forward cross currency contracts. A forward currency contract is an agreement between two parties to buy and sell a currency at a set price on a future date (or to pay or receive the amount of the change in relative values of the two currencies). The market price of a forward currency contract fluctuates with changes in forward currency exchange rates. The value of each of the Fund’s forward currency contracts is marked-to-market daily using rates supplied by a quotation service and changes in value are recorded by each Fund as unrealized gains or losses. Realized gains or losses on the contracts are equal to the difference between the value of the contract at the time it was opened and the value at the time it was settled.
These contracts involve market risk in excess of the unrealized gain or loss. Forward currency contracts expose a Fund to the market risk of unfavorable movements in currency values and the risk that the counterparty will be unable or unwilling to meet the terms of the contracts. Most forward currency contracts are collateralized. Forward currency contracts outstanding at the end of the year, if any, are listed in each applicable Fund’s Schedule of Investments.
Futures contracts
The Funds may purchase and sell futures contracts. A futures contract is a contract that obligates the holder to buy or sell an asset at a predetermined delivery price at a specified time in the future. Some futures contracts are net (cash) settled. Upon entering into a futures contract, a Fund is required to deposit cash, U.S. government and agency obligations or other liquid assets with the futures clearing broker in accordance with the initial margin requirements of the broker or exchange. Futures contracts are generally valued at the settlement price established at the close of business each day by the board of trade or exchange on which they are traded (and if the futures are traded outside the U.S. and the market for such futures is closed prior to the close of the NYSE due to time zone differences, the values will be adjusted, to the extent practicable and available, based on inputs from an independent pricing service approved by the Trustees to reflect estimated valuation changes through the NYSE close). The value of each of the Fund’s futures contracts is marked-to-market daily and an appropriate payable or receivable for the change in value (“variation margin”) is recorded
GMO Trust Funds
Notes to Financial Statements — (Continued)
February 28, 2022
by each Fund. The payable or receivable is settled on the following business day. Gains or losses are recognized but not accounted for as realized until the contracts expire or are closed. Futures contracts involve, to varying degrees, risk of loss in excess of the variation margin as recorded in the Statements of Assets and Liabilities. Under some circumstances, futures exchanges may establish daily limits on the amount that the price of a futures contract can vary from the previous day’s settlement price, thereby effectively preventing liquidation of unfavorable positions. Futures contracts expose the Funds to the risk that they may not be able to enter into a closing transaction due to an illiquid market. Futures contracts outstanding at the end of the year, if any, are listed in each applicable Fund’s Schedule of Investments.
Options
The Funds may purchase call and put options. A call option gives the holder the right to buy an asset; a put option gives the holder the right to sell an asset. By purchasing options a Fund alters its exposure to the underlying asset by, in the case of a call option, entitling it to purchase the underlying asset at a set price from the writer of the option and, in the case of a put option, entitling it to sell the underlying asset at a set price to the writer of the option. A Fund pays a premium for a purchased option. That premium, if any, which is disclosed in the Schedule of Investments, is subsequently reflected in the marked-to-market value of the option. The potential loss associated with purchasing put and call options is limited to the premium paid. Purchased option contracts outstanding at the end of the year, if any, are listed in each applicable Fund’s Schedule of Investments.
The Funds may write (i.e. sell) call and put options on futures, swaps (“swaptions”), securities or currencies they own or in which they may invest. Writing options alters a Fund’s exposure to the underlying asset by, in the case of a call option, obligating that Fund to sell the underlying asset at a set price to the option-holder and, in the case of a put option, obligating that Fund to purchase the underlying asset at a set price from the option-holder. In some cases (e.g., index options), settlement will be in cash, based on a formula price. When a Fund writes a call or put option, an amount equal to the premium received is recorded as a liability and is subsequently included in the marked-to-market value of the option. As a writer of an option, a Fund has no control over whether it will be required to sell (call) or purchase (put) the underlying asset and as a result bears the risk of an unfavorable change in the price of the asset underlying the option. In the event that a Fund writes call options without an offsetting exposure (e.g., call options on an asset that the Fund does not own), it bears an unlimited risk of loss if the price of the underlying asset increases during the term of the option. OTC options expose a Fund to the risk the Fund may not be able to enter into a closing transaction because of an illiquid market. Written option contracts outstanding at the end of the year, if any, are listed in each applicable Fund’s Schedule of Investments.
When an option contract is closed, the Fund records a realized gain or loss equal to the difference between the value of the contract at the time it was opened and the value at the time it was closed. Realized gains and losses on purchased options are included in realized gains and losses on investment securities. If a written call option is exercised, the premium originally received is recorded as an addition to sales proceeds. If a written put option is exercised, the premium originally received is recorded as a reduction in the cost of investments purchased. Gains and losses from the expiration or closing of written option contracts are separately disclosed in the Statements of Operations.
Swap contracts
The Funds may directly or indirectly use various swap contracts, including, without limitation, swaps on securities and securities indices, total return swaps, interest rate swaps, basis swaps, currency swaps, credit default swaps, variance swaps, commodity swaps, inflation swaps, municipal swaps, dividend swaps, volatility swaps, correlation swaps and other types of available swaps. A swap contract is an agreement to exchange the return generated by one asset for the return generated by another asset. Some swap contracts are net settled. When entering into a swap contract and during the term of the transaction, a Fund and/or the swap counterparty may post or receive cash or securities as collateral.
Initial upfront payments received or made upon entering into a swap contract are included in the fair market value of the swap. The Funds do not amortize upfront payments. Net periodic payments made or received to compensate for differences between the stated terms of the swap contract and prevailing market conditions (credit spreads, currency exchange rates, interest rates, and other relevant factors) are recorded as realized gains or losses in the Statements of Operations. A liquidation payment received or made at the termination of the swap contract is recorded as realized gain or loss in the Statements of Operations. The periodic frequency of payments received may differ from periodic payment frequencies made and their frequencies could be monthly, quarterly, semiannually, annually or at maturity.
Total return swap contracts involve a commitment by one party to pay interest to the other party in exchange for a payment to it from the other party based on the return of a reference asset (e.g., a security, basket of securities, or futures contract), both based on notional amounts. To the extent the return of the reference asset exceeds or falls short of the interest payments, one party is entitled to receive a payment from or obligated to make a payment to the other party.
GMO Trust Funds
Notes to Financial Statements — (Continued)
February 28, 2022
Generally, the Funds price their OTC swap contracts daily using industry standard models that may incorporate quotations from market makers or pricing vendors and record the change in value, if any, as unrealized gain or loss in the Statements of Operations. Gains or losses are realized upon the termination of the swap contracts or reset dates, as appropriate. Cleared swap contracts are valued using the quote (which may be based on a model) published by the relevant clearing house. If an updated quote for a cleared swap contract is not available by the time that a Fund calculates its net asset value on any business day, then that swap contract will generally be valued using an industry standard model, which may differ from the model used by the relevant clearing house.
The values assigned to swap contracts may differ significantly from the values realized upon termination, and the differences could be material. Entering into swap contracts involves counterparty credit, legal, and documentation risk that is generally not reflected in the value assigned to the swap contract. Such risks include the possibility that the counterparty defaults on its obligations to perform or disagrees as to the meaning of contractual terms, that a Fund has amounts on deposit in excess of amounts owed by that Fund, or that any collateral the other party posts is insufficient or not timely received by a Fund. Credit risk is particularly acute in economic environments in which financial services firms are exposed to systemic risks of the type evidenced by the insolvency of Lehman Brothers in 2008 and subsequent market disruptions. Swap contracts outstanding at the end of the year, if any, are listed in each applicable Fund’s Schedule of Investments.
***
As provided by U.S. GAAP, the table below is based on market values or unrealized appreciation/(depreciation) rather than the notional amounts of derivatives. Changes to market values of reference asset(s) will tend to have a greater impact on the Funds (with correspondingly greater risk) the greater the notional amount. For further information on notional amounts, see the Schedule of Investments.
The following is a summary of the valuations of derivative instruments categorized by risk exposure.
The Effect of Derivative Instruments on the Statements of Assets and Liabilities as of February 28, 2022 and the Statements of Operations for the year ended February 28, 2022^:
The risks referenced in the tables below are not intended to be inclusive of all risks. Please see the “Investment and other risks” and “Portfolio valuation” sections for a further discussion of risks.
| | | | |
| | |
| | | Equity
Contracts | |
Emerging Domestic Opportunities Fund | |
Net Realized Gain (Loss) on | |
Futures Contracts | | $ | (3,487,829 | ) |
| | | | | |
Total | | $ | (3,487,829 | ) |
| | | | | |
| | | | | |
Emerging Markets Fund | |
Asset Derivatives | | | | |
Unrealized Appreciation on Futures Contracts¤ | | $ | 840,989 | |
| | | | | |
Total | | $ | 840,989 | |
| | | | | |
Liability Derivatives | |
Unrealized Depreciation on Futures Contracts¤ | | $ | (6,332,907 | ) |
| | | | | |
Total | | $ | (6,332,907 | ) |
| | | | | |
Net Realized Gain (Loss) on | |
Futures Contracts | | $ | (25,010,820 | ) |
Swap Contracts | | | 9,559,073 | |
| | | | | |
Total | | $ | (15,451,747 | ) |
| | | | | |
Change in Net Appreciation (Depreciation) on | |
Futures Contracts | | $ | (12,125,679 | ) |
Swap Contracts | | | (225,326 | ) |
| | | | | |
Total | | $ | (12,351,005 | ) |
| | | | | |
| | | | | |
GMO Trust Funds
Notes to Financial Statements — (Continued)
February 28, 2022
| | | | |
| | |
| | | Equity
Contracts | |
International Equity Fund | |
Net Realized Gain (Loss) on | | | | |
Futures Contracts | | $ | (3,719,225 | ) |
| | | | | |
Total | | $ | (3,719,225 | ) |
| | | | | |
Change in Net Appreciation (Depreciation) on | |
Futures Contracts | | $ | 370,276 | |
| | | | | |
Total | | $ | 370,276 | |
| | | | | |
| | | | | |
Tax-Managed International Equities Fund | |
Liability Derivatives | |
Unrealized Depreciation on Futures Contracts¤ | | $ | (14,273 | ) |
| | | | | |
Total | | $ | (14,273 | ) |
| | | | | |
Net Realized Gain (Loss) on | |
Futures Contracts | | $ | 31,307 | |
| | | | | |
Total | | $ | 31,307 | |
| | | | | |
Change in Net Appreciation (Depreciation) on | |
Futures Contracts | | $ | (21,792 | ) |
| | | | | |
Total | | $ | (21,792 | ) |
| | | | | |
| | | | | |
U.S. Equity Fund | |
Liability Derivatives | |
Unrealized Depreciation on Futures Contracts¤ | | $ | (326,928 | ) |
| | | | | |
Total | | $ | (326,928 | ) |
| | | | | |
Net Realized Gain (Loss) on | |
Futures Contracts | | $ | 1,087,616 | |
| | | | | |
Total | | $ | 1,087,616 | |
| | | | | |
Change in Net Appreciation (Depreciation) on | |
Futures Contracts | | $ | (333,912 | ) |
| | | | | |
Total | | $ | (333,912 | ) |
| | | | | |
| | | | | |
U.S. Small Cap Value Fund | |
Net Realized Gain (Loss) on | |
Futures Contracts | | $ | 81,102 | |
| | | | | |
Total | | $ | 81,102 | |
| | | | | |
Change in Net Appreciation (Depreciation) on | |
Futures Contracts | | $ | 109,220 | |
| | | | | |
Total | | $ | 109,220 | |
| | | | | |
| | | | | |
| | ^ | Because the Funds recognize changes in value through the Statements of Operations, they do not qualify for hedge accounting under authoritative guidance for derivative instruments. The Funds’ investments in derivatives may represent an economic hedge; however, they are considered to be non-hedge transactions for the purpose of these tables. |
| | ¤ | The table includes cumulative unrealized appreciation/depreciation of futures and value of cleared swap contracts, if any, as reported in the Schedule of Investments. Year end variation margin on open futures and cleared swap contracts, if any, is reported within the Statements of Assets and Liabilities. |
GMO Trust Funds
Notes to Financial Statements — (Continued)
February 28, 2022
Certain Funds are party to International Swaps and Derivatives Association, Inc. Master Agreements, Global Master Repurchase Agreements, Master Securities Loan Agreements or other similar types of agreements (collectively, “Master Agreements”) that generally govern the terms of OTC derivative transactions, repurchase agreements, reverse repurchase agreements and securities loans. The Master Agreements may include collateral posting terms and set-off provisions that apply in the event of a default and/or termination event. Upon the occurrence of such an event, including the bankruptcy or insolvency of the counterparty, the Master Agreements may permit the non-defaulting party to calculate a single net payment to close out applicable transactions. However, there is no guarantee that the terms of a Master Agreement will be enforceable; for example, when bankruptcy or insolvency laws impose restrictions on or prohibitions against the right of offset. Additionally, the set-off and netting provisions of a Master Agreement may not extend to the obligations of the counterparty’s affiliates or across varying types of transactions. Because no such event has occurred, the Funds do not presently have a legally enforceable right of set-off and these amounts have not been offset in the Statements of Assets and Liabilities, but have been presented separately in the table below. Termination events may also include a decline in the net assets of a Fund below a certain level over a specified period of time and may entitle a counterparty to elect an early termination of all the transactions under the Master Agreement with that counterparty. Such an election by one or more of the counterparties could have a material adverse impact on a Fund’s operations. An estimate of the aggregate net payment, if any, that may need to be paid by a Fund (or may be received by a Fund) in such an event is represented by the Net Amounts in the tables below. For more information about other uncertainties and risks, see “Investments and other risks” above.
For financial reporting purposes, in the Statements of Assets and Liabilities any cash collateral that has been pledged to cover obligations of the Funds is reported as Due from broker and any cash collateral received from the counterparty is reported as Due to broker. Any non-cash collateral pledged by the Funds is noted in the Schedules of Investments. The tables below show the potential effect of netting arrangements made available by the Master Agreements on the financial position of the Funds. For financial reporting purposes, the Funds’ Statements of Assets and Liabilities generally show derivative assets and derivative liabilities (regardless of whether they are subject to netting arrangements) on a gross basis, which reflects the full risks and exposures of the Fund prior to netting. See Note 2 for information on repurchase agreements, reverse repurchase agreements and securities loans held by the Funds at February 28, 2022, if any.
The average derivative activity of notional amounts (futures contracts and swap contracts), based on absolute values, at each month-end, was as follows for the year ended February 28, 2022:
| | | | | | | | |
| | | |
| Fund Name | | Futures
Contracts ($) | | | Swap Contracts ($) | |
Emerging Domestic Opportunities Fund | | | 8,194,634 | | | | — | |
Emerging Markets Fund | | | 363,380,164 | | | | 32,248,238 | |
International Equity Fund | | | 14,292,310 | | | | — | |
Tax-Managed International Equities Fund | | | 226,640 | | | | — | |
U.S. Equity Fund | | | 6,467,650 | | | | — | |
U.S. Small Cap Value Fund | | | 2,612,609 | | | | — | |
| 5. | Fees and other transactions with affiliates |
GMO receives a management fee for the services it provides to each Fund. Management fees are paid monthly at the annual rate equal to the percentage of each Fund’s average daily net assets set forth in the table below:
| | | | | | | | | | | | | | | | | | | | | | | | | | | | | | | | | | | | | | | | | | | | | | | | |
| | | | | | | | | | | | | |
| | | Climate Change Fund | | | Emerging
Domestic
Opportunities
Fund | | | Emerging
Markets
ex-China
Fund | | | Emerging
Markets
Fund | | | International
Equity Fund | | | Japan
Value
Creation
Fund | | | Quality
Cyclicals
Fund
(formerly
Cyclical
Focus
Fund) | | | Quality
Fund | | | Resources
Fund | | | Tax-Managed
International
Equities
Fund | | | U.S.
Equity
Fund | | | U.S. Small
Cap
Value Fund | |
Management Fee | | | 0.60%(a) | | | | 0.75% | | | | 0.55% | | | | 0.65%(b) | | | | 0.50% | | | | 0.50% | | | | 0.33% | | | | 0.33% | | | | 0.50% | | | | 0.50% | | | | 0.31% | | | | 0.31% | |
| | (a) | Prior to December 31, 2018, GMO voluntarily agreed to reduce its annual management fee by 0.15%. |
| | (b) | Prior to June 30, 2020, GMO contractually agreed to reduce its annual management fee from 0.75% to 0.65%. |
GMO Trust Funds
Notes to Financial Statements — (Continued)
February 28, 2022
In addition, each class of shares of certain Funds pays GMO directly or indirectly a shareholder service fee for providing client services and reporting, such as performance information, client account information, personal and electronic access to Fund information, access to analysis and explanations of Fund reports, and assistance in maintaining and correcting client-related information. Shareholder service fees are paid monthly at the annual rate equal to the percentage of each applicable Class’s average daily net assets set forth in the table below:
| | | | | | | | | | | | | | | | | | | | | | | | | | | | |
| | | | | | | | |
| Fund Name | | Class II | | | Class III | | | Class IV | | | Class V | | | Class VI | | | Class R6 | | | Class I | |
Climate Change Fund | | | | | | | 0.15% | | | | 0.10%* | | | | 0.085%* | | | | 0.055%* | | | | 0.15% | | | | 0.15% | |
Emerging Domestic Opportunities Fund | | | 0.22% | | | | 0.15%* | | | | 0.105%* | | | | 0.085% | | | | 0.055%* | | | | 0.22%* | | | | 0.22% | |
Emerging Markets ex-China Fund | | | 0.22%* | | | | 0.15% | | | | 0.105%* | | | | 0.085%* | | | | 0.055% | | | | 0.22%* | | | | 0.22% | |
Emerging Markets Fund | | | 0.22% | | | | 0.15% | | | | 0.105%* | | | | 0.085%* | | | | 0.055% | | | | 0.22% | | | | 0.22% | |
International Equity Fund | | | 0.22% | | | | 0.15% | | | | 0.09% | | | | | | | | | | | | 0.22%* | | | | 0.22% | |
Japan Value Creation Fund | | | | | | | 0.15% | | | | 0.10%* | | | | 0.085%* | | | | 0.055% | | | | 0.15%* | | | | 0.15% | |
Quality Cyclicals Fund (formerly Cyclical Focus Fund) | | | | | | | 0.15%* | | | | 0.105%* | | | | 0.085%* | | | | 0.055% | | | | 0.15%* | | | | 0.15% | |
Quality Fund | | | | | | | 0.15% | | | | 0.105% | | | | 0.085%* | | | | 0.055% | | | | 0.15% | | | | 0.15% | |
Resources Fund | | | | | | | 0.15% | | | | 0.10% | | | | 0.085%* | | | | 0.055% | | | | 0.15% | | | | 0.15% | |
Tax-Managed International Equities Fund | | | | | | | 0.15% | | | | | | | | | | | | | | | | 0.15%* | | | | 0.15%* | |
U.S. Equity Fund | | | | | | | 0.15% | | | | 0.10%* | | | | 0.085%* | | | | 0.055% | | | | 0.15%* | | | | 0.15%* | |
U.S. Small Cap Value Fund | | | | | | | 0.15%* | | | | 0.10%* | | | | 0.085%* | | | | 0.055% | | | | 0.15%* | | | | 0.15%* | |
| | * | Class is offered but has no shareholders as of February 28, 2022. |
For each Fund, other than Climate Change Fund, Emerging Markets ex-China Fund, Resources Fund, and U.S. Small Cap Value Fund, GMO has contractually agreed to reimburse the Fund for its “Specified Operating Expenses” (as defined below). For Climate Change Fund (prior to September 25, 2018), Resources Fund and U.S. Small Cap Value Fund, GMO has contractually agreed to reimburse the Fund for the portion of its “Specified Operating Expenses” (as defined below) that exceeds 0.10% of the Fund’s average daily net assets. Any such reimbursements are paid to a Fund concurrently with the Fund’s payment of management fees to GMO.
Subject to the exclusions noted below, “Specified Operating Expenses” means: audit expenses, fund accounting expenses, pricing service expenses, expenses of non-investment related tax services, transfer agency expenses (excluding, in the case of Class I shares, any amounts paid for sub-transfer agency, recordkeeping and other administrative services provided by financial intermediaries for the benefit of Class I shareholders), expenses of non-investment related legal services provided to the Funds by or at the direction of GMO, organizational and start-up expenses, federal securities law filing expenses, printing expenses, state and federal registration fees and custody expenses. In the case of Emerging Markets Fund, “Specified Operating Expenses” does not include custody expenses, and in the case of Emerging Domestic Opportunities Fund, “Specified Operating Expenses” only includes custody expenses to the extent that they exceed 0.10% of the Fund’s average daily net assets.
For Resources Fund and U.S Small Cap Value Fund, GMO is permitted to recover from the Fund, on a class-by-class basis the “Specified Operating Expenses” GMO has borne or reimbursed (whether through reduction of its fees or otherwise) to the extent that the Funds’ “Specified Operating Expenses” later fall below the annualized rate of 0.10% per year or any lower expense limit in effect when GMO seeks to recover the expenses. A Fund, however, is not obligated to pay any such amount more than three years after GMO bore or reimbursed an expense. Any such recovery will not cause a Fund to exceed the annual limitation rate set forth above or any lower expense limit in effect when GMO seeks to recover the expenses.
With respect to Climate Change Fund (for the period starting September 25, 2018) and Emerging Markets ex-China Fund, GMO has contractually agreed to waive its fees with respect to and/or reimburse each Fund to the extent that the Fund’s total annual fund operating expenses (after applying all other contractual and voluntary expense limitation arrangements in effect at the time) exceed the following amounts for each class of shares, in each case representing the average daily net assets for the indicated class of shares (each, an “Expense Cap”). The Expense Cap for Climate Change Fund is 0.77% for Class III shares; 0.72% for Class IV shares; 0.705% for Class V shares; 0.675% for Class VI shares; 0.77% for Class R6 shares; and 0.77% for Class I shares. The Expense Cap
GMO Trust Funds
Notes to Financial Statements — (Continued)
February 28, 2022
for Emerging Markets ex-China Fund is 0.85% for Class II shares; 0.80% for Class III shares; 0.75%for Class IV shares; 0.70% for Class V shares; 0.67% for Class VI shares; 0.85% for Class R6 shares; and 0.85% for Class I shares. Fees and expenses of the “non-interested” Trustees and legal counsel and independent compliance consultant to the “non-interested” Trustees, investment-related costs (such as brokerage commissions, interest, and acquired fund fees and expenses), payments out of assets attributable to Class I shares for sub-transfer agency, recordkeeping and other administrative services provided by financial intermediaries, taxes, litigation and indemnification expenses, judgments, and other extraordinary or non-recurring expenses not incurred in the ordinary course of the Fund’s business (“Excluded Expenses”), are excluded from the Expense Cap. GMO is permitted to recover from Emerging Markets ex-China Fund, on a class by class basis, expenses it has borne or reimbursed or reimbursed pursuant to an Expense Cap (whether through reduction of its fees or otherwise) to the extent that the Fund’s total annual fund operating expenses (excluding Excluded Expenses) later fall below that Expense Cap or any lower expense limit in effect when GMO seeks to recover the expenses. The Fund, however, is not obligated to pay any such amount more than three years after GMO bore or reimbursed an expense. Any such recovery will not cause the Fund to exceed the Expense Caps set forth above or any lower expense limits as is in effect at the time GMO seeks to recover the expenses.
For the year ended February 28, 2022, GMO did not recoup any previously recorded waivers and/or reimbursements.
On February 28, 2022, the waivers and/or reimbursements subject to possible future recoupment are as follows:
| | | | | | | | | | | | |
| | | | |
| | | Expiring the
year ending
February 28,
2023 | | | Expiring the
year ending
February 29,
2024 | | | Expiring the
year ending
February 28,
2025 | |
| Emerging Markets ex-China Fund, Class III | | | — | | | | — | | | | $1,152 | |
| Emerging Markets ex-China Fund, Class VI | | | — | | | | — | | | | $240,690 | |
| Emerging Markets ex-China Fund, Class I | | | — | | | | — | | | | $0 | * |
For each Fund that pays GMO a management fee and shareholder service fee, GMO has contractually agreed to waive or reduce the Fund’s management fee and shareholder service fee, to the extent necessary to offset the management fees and shareholder service fees paid to GMO that are directly or indirectly borne by the Fund or a class of shares of the Fund as a result of the Fund’s direct or indirect investments in other series of GMO Trust (“GMO Funds”). Management fees and shareholder service fees will not be waived below zero.
In addition, for Emerging Markets Fund only, GMO has contractually agreed to waive the shareholder service fees charged to holders of each class of shares of the Fund to the extent necessary to prevent the shareholder service fees borne by each class of shares of the Fund from exceeding the percentage of the class’s average daily net assets as follows: 0.20% for Class II shares, 0.15% for Class III shares, 0.10% of Class IV shares, 0.05% for Class V shares, 0.02% for Class VI shares, 0.20% for Class R6 shares and 0.20% for Class I shares.
These contractual waivers and reimbursements will continue through at least June 30, 2022 for each Fund unless the Funds’ Board of Trustees authorizes their modification or termination or reduces the fee rates paid to GMO under the Fund’s management contract or servicing and supplemental support agreement.
GMO has contractually agreed to reimburse Class I assets of each Fund (or waive its fees) to the extent that payments for sub-transfer agency, recordkeeping and other administrative services provided by financial intermediaries from Class I assets exceed 0.10% of such Fund’s average daily net assets attributable to Class I assets. Effective January 27 2020, GMO has contractually agreed to reimburse Class I assets for Emerging Markets Fund and Emerging Domestic Opportunities Fund to the extent payments for sub-transfer agency, recordkeeping and other administrative services from Class I assets exceed 0.05% and 0.03%, respectively, of such Fund’s average daily net assets attributable to Class I assets.
Sub-Transfer Agent/Recordkeeping Payments
Class II, III, IV, V, VI and R6 shares are not subject to payments to third parties for sub-transfer agent, recordkeeping and other administrative services. GMO may, on a case-by-case basis, make payments for sub-transfer agent, recordkeeping and other
GMO Trust Funds
Notes to Financial Statements — (Continued)
February 28, 2022
administrative services provided by financial intermediaries for the benefit of shareholders of these classes. Any such payments are made by GMO out of its own resources and are not an additional charge to a Fund or the holders of Class II, III, IV, V, VI or Class R6 shares. These payments may create a conflict of interest by influencing a financial intermediary to recommend a Fund over another investment.
Class I shares are subject to payments for sub-transfer agency, recordkeeping and other administrative services provided by financial intermediaries for the benefit of holders of Class I shares through an account maintained by a third party platform or intermediary. These services are not primarily intended to result in the sale of Fund shares but instead to provide ongoing services with respect to holders of Class I shares through a third-party platform or intermediary. Because payments for sub-transfer agency, recordkeeping and other administrative services are paid out of a Fund’s Class I assets on an ongoing basis, over time they will increase the cost of an investment in Class I shares. In addition, GMO may, on a case-by-case basis, make payments for sub-transfer agency, recordkeeping and other administrative services provided by financial intermediaries with respect to shareholders of Class I shares. Any such payments will be made by GMO out of its own resources and will not be an additional charge to a Fund or the holders of Class I shares. Any such payments will create a conflict of interest by influencing a financial intermediary to recommend a Fund over another investment.
The Funds’ portion of the fees paid by the Trust to the Trust’s independent Trustees and their legal counsel and any agents unaffiliated with GMO during the year ended February 28, 2022 is shown in the table below and is included in the Statements of Operations.
| | | | | | | | |
| | | |
| Fund Name | | Independent Trustees and
their legal counsel ($) | | | Agent unaffiliated
with GMO ($) | |
Climate Change Fund | | | 18,792 | | | | 1,175 | |
Emerging Domestic Opportunities Fund | | | 31,733 | | | | 2,910 | |
Emerging Markets ex-China Fund | | | 5,068 | | | | 203 | |
Emerging Markets Fund | | | 87,828 | | | | 8,812 | |
International Equity Fund | | | 70,860 | | | | 6,797 | |
Japan Value Creation Fund | | | 5,312 | | | | 462 | |
Quality Cyclicals Fund (formerly Cyclical Focus Fund) | | | 4,920 | | | | 421 | |
Quality Fund | | | 292,600 | | | | 23,564 | |
Resources Fund | | | 58,338 | | | | 3,544 | |
Tax-Managed International Equities Fund | | | 1,336 | | | | 119 | |
U.S. Equity Fund | | | 13,637 | | | | 1,090 | |
U.S. Small Cap Value Fund | | | 10,249 | | | | 1,006 | |
Certain Funds incur fees and expenses indirectly as a shareholder in the underlying funds. For the year ended February 28, 2022, none of the Funds had annualized indirect fees and expenses greater than 0.01% of the Fund’s average daily net assets.
The Funds are permitted to purchase or sell securities from or to certain other GMO funds under specified conditions outlined in procedures adopted by the Trustees. The procedures have been designed to ensure that any purchase or sale of securities by a Fund from another fund or portfolio that is or could be considered an affiliate by virtue of having a common investment adviser (or affiliated investment advisers), common Trustees and/or common officers complies with Rule 17a-7 of the 1940 Act. Further, as defined under the procedures, each transaction is effectuated at the current market price. During the year ended February 28, 2022, the Funds did not engage in these transactions.
GMO Trust Funds
Notes to Financial Statements — (Continued)
February 28, 2022
| 6. | Purchases and sales of securities |
Cost of purchases and proceeds from sales of securities, excluding short-term investments and including GMO U.S. Treasury Fund, if applicable, for the year ended February 28, 2022 are noted in the table below:
| | | | | | | | | | | | | | | | |
| | | | | |
| | | Purchases ($) | | | Purchases ($) | | | Sales ($) | | | Sales ($) | |
| | | | | |
| Fund Name | | U.S. Government
Securities | | | Investments (Non-U.S.
Government Securities) | | | U.S. Government
Securities | | | Investments (Non-U.S.
Government Securities) | |
Climate Change Fund | | | — | | | | 1,192,641,144 | | | | — | | | | 770,603,197 | |
Emerging Domestic Opportunities Fund | | | — | | | | 1,885,382,243 | | | | — | | | | 2,043,664,508 | |
Emerging Markets ex-China Fund | | | — | | | | 487,857,535 | | | | — | | | | 136,160,328 | |
Emerging Markets Fund | | | 96,723,172 | | | | 2,543,209,690 | | | | 106,079,770 | | | | 3,181,107,783 | |
International Equity Fund | | | — | | | | 1,354,815,118 | | | | — | | | | 1,642,652,449 | |
Japan Value Creation Fund | | | — | | | | 74,696,309 | | | | — | | | | 77,198,503 | |
Quality Cyclicals Fund (formerly Cyclical Focus Fund) | | | — | | | | 37,954,795 | | | | — | | | | 48,128,122 | |
Quality Fund | | | 154,623,828 | | | | 1,350,029,185 | | | | 154,243,570 | | | | 1,334,090,908 | |
Resources Fund | | | — | | | | 2,046,951,166 | | | | — | | | | 961,888,533 | |
Tax-Managed International Equities Fund | | | — | | | | 41,137,364 | | | | — | | | | 47,721,328 | |
U.S. Equity Fund | | | — | | | | 539,680,753 | | | | — | | | | 469,374,489 | |
U.S. Small Cap Value Fund | | | — | | | | 209,371,957 | | | | — | | | | 364,771,684 | |
Included in the table above are cost of purchases and proceeds from sales of securities for in-kind transactions, excluding short-term investments, if any, in accordance with U.S. GAAP for the year ended February 28, 2022. In-kind purchases and sales of securities, including short-term investments, if any, and net realized gains/(losses) attributed to redemption in-kind transactions, if any, are noted in the table below:
| | | | | | | | | | | | |
| | | | |
| Fund Name | | In-Kind
Purchases ($) | | | In-Kind
Sales ($) | | | Net realized gains/(losses)
attributed to redemption
in-kind transactions ($) | |
Japan Value Creation Fund | | | 5,174,438 | | | | — | | | | — | |
In the normal course of business the Funds enter into contracts with third-party service providers that contain a variety of representations and warranties and that provide general indemnifications. The Funds’ maximum exposure under these arrangements is unknown, as it involves possible future claims that may or may not be made against the Funds. Based on experience, GMO is of the view that the risk of loss to the Funds in connection with the Funds’ indemnification obligations is remote; however, there can be no assurance that such obligations will not result in material liabilities that adversely affect the Funds.
| 8. | Principal shareholders as of February 28, 2022 |
| | | | | | | | |
| | | |
| Fund Name | | Number of
shareholders that held
more than 10% of the
outstanding shares of
the Fund | | | Percentage of outstanding
shares of the Fund held
by those shareholders
owning greater than 10%
of the outstanding shares
of the Fund | |
Climate Change Fund | | | 3 | | | | 43.03% | |
Emerging Domestic Opportunities Fund* | | | 1 | | | | 65.06% | |
GMO Trust Funds
Notes to Financial Statements — (Continued)
February 28, 2022
| | | | | | | | |
| | | |
| Fund Name | | Number of
shareholders that held
more than 10% of the
outstanding shares of
the Fund | | | Percentage of outstanding
shares of the Fund held
by those shareholders
owning greater than 10%
of the outstanding shares
of the Fund | |
Emerging Markets ex-China Fund* | | | 3 | # | | | 73.30% | |
Emerging Markets Fund* | | | 3 | # | | | 35.56% | |
International Equity Fund | | | 4 | § | | | 77.95% | |
Japan Value Creation Fund | | | 3 | § | | | 73.40% | |
Quality Cyclicals Fund (formerly Cyclical Focus Fund) | | | 3 | # | | | 89.16% | |
Quality Fund | | | — | | | | — | |
Resources Fund | | | 2 | | | | 51.84% | |
Tax-Managed International Equities Fund | | | 1 | | | | 79.48% | |
U.S. Equity Fund | | | 3 | # | | | 74.71% | |
U.S. Small Cap Value Fund | | | 2 | # | | | 79.93% | |
| | * | The Fund’s outstanding shares were owned by 10 or more shareholders as of February 28, 2022. |
| | # | Two of the shareholders are other funds of the Trust. |
| | § | Three of the shareholders are other funds of the Trust. |
The Declaration of Trust permits each Fund to issue an unlimited number of shares of beneficial interest (without par value). Transactions in the Funds’ shares were as follows:
| | | | | | | | | | | | | | | | |
| | | Year Ended
February 28, 2022 | | | Year Ended
February 29, 2021 | |
| | | | | |
| | | Shares | | | Amount | | | Shares | | | Amount | |
Climate Change Fund | |
Class III: | |
Shares sold | | | 4,396,243 | | | $ | 149,142,682 | | | | 814,512 | | | $ | 23,807,446 | |
Shares issued to shareholders in reinvestment of distributions | | | 1,249,982 | | | | 39,118,226 | | | | 333,433 | | | | 9,073,794 | |
Shares repurchased | | | (672,638 | ) | | | (22,509,032 | ) | | | (688,426 | ) | | | (14,748,239 | ) |
Shares repurchased in connection with reorganization(a) | | | — | | | | — | | | | (691,250 | ) | | | (24,319,296 | ) |
| | | | | | | | | | | | | | | | | |
Net increase (decrease) | | | 4,973,587 | | | $ | 165,751,876 | | | | (231,731 | ) | | $ | (6,186,295 | ) |
| | | | | | | | | | | | | | | | | |
Class R6: | |
Shares sold | | | 1,285,070 | | | $ | 39,436,952 | | | | 2,115,846 | | | $ | 53,282,325 | |
Shares issued to shareholders in reinvestment of distributions | | | 432,217 | | | | 13,530,454 | | | | 96,807 | | | | 2,822,175 | |
Shares repurchased | | | (88,861 | ) | | | (2,777,808 | ) | | | (79,939 | ) | | | (1,769,065 | ) |
| | | | | | | | | | | | | | | | | |
Net increase (decrease) | | | 1,628,426 | | | $ | 50,189,598 | | | | 2,132,714 | | | $ | 54,335,435 | |
| | | | | | | | | | | | | | | | | |
Class I: | |
Shares sold | | | 7,873,871 | | | $ | 255,196,026 | | | | 2,287,524 | | | $ | 67,483,965 | |
Shares issued to shareholders in reinvestment of distributions | | | 906,464 | | | | 28,189,754 | | | | 59,254 | | | | 1,739,936 | |
Shares issued to shareholders in connection with reorganization(a) | | | — | | | | — | | | | 696,975 | | | | 24,478,649 | |
Shares repurchased | | | (1,437,226 | ) | | | (47,399,923 | ) | | | (212,005 | ) | | | (6,571,577 | ) |
| | | | | | | | | | | | | | | | | |
Net increase (decrease) | | | 7,343,109 | | | $ | 235,985,857 | | | | 2,831,748 | | | $ | 87,130,973 | |
| | | | | | | | | | | | | | | | | |
| | | | | | | | | | | | | | | | | |
GMO Trust Funds
Notes to Financial Statements — (Continued)
February 28, 2022
| | | | | | | | | | | | | | | | |
| | | Year Ended
February 28, 2022 | | | Year Ended
February 29, 2021 | |
| | | | | |
| | | Shares | | | Amount | | | Shares | | | Amount | |
Emerging Domestic Opportunities Fund | |
Class II : | |
Shares sold | | | 407,827 | | | $ | 10,609,510 | | | | 2,559,887 | | | $ | 63,321,505 | |
Shares issued to shareholders in reinvestment of distributions | | | 833,460 | | | | 19,536,789 | | | | 66,747 | | | | 1,732,754 | |
Shares repurchased | | | (1,571,408 | ) | | | (40,569,449 | ) | | | (5,260,674 | ) | | | (125,740,953 | ) |
| | | | | | | | | | | | | | | | | |
Net increase (decrease) | | | (330,121 | ) | | $ | (10,423,150 | ) | | | (2,634,040 | ) | | $ | (60,686,694 | ) |
| | | | | | | | | | | | | | | | | |
Class III:(b) | |
Shares sold | | | | | | | | | | | 317,759 | | | $ | 6,587,104 | |
Shares issued to shareholders in reinvestment of distributions | | | | | | | | | | | 3,255 | | | | 84,526 | |
Shares repurchased | | | | | | | | | | | (4,653,377 | ) | | | (88,118,115 | ) |
Shares repurchased in connection with reorganization(a) | | | | | | | | | | | (545,433 | ) | | | (15,763,441 | ) |
Purchase premiums | | | | | | | | | | | — | | | | — | |
Redemption fees | | | | | | | | | | | — | | | | — | |
| | | | | | | | | | | | | | | | | |
Net increase (decrease) | | | | | | | | | | | (4,877,796 | ) | | $ | (97,209,926 | ) |
| | | | | | | | | | | | | | | | | |
Class V: | |
Shares sold | | | 1,027,838 | | | $ | 24,000,001 | | | | 138,555 | | | $ | 3,005,148 | |
Shares issued to shareholders in reinvestment of distributions | | | 1,710,648 | | | | 40,195,448 | | | | 198,807 | | | | 5,157,051 | |
Shares repurchased | | | (4,735,609 | ) | | | (126,692,942 | ) | | | (1,874,733 | ) | | | (50,168,277 | ) |
| | | | | | | | | | | | | | | | | |
Net increase (decrease) | | | (1,997,123 | ) | | $ | (62,497,493 | ) | | | (1,537,371 | ) | | $ | (42,006,078 | ) |
| | | | | | | | | | | | | | | | | |
Class I:(c) | |
Shares sold | | | 205,682 | | | $ | 5,688,566 | | | | 116,224 | | | $ | 3,449,122 | |
Shares issued to shareholders in reinvestment of distributions | | | 44,186 | | | | 1,037,354 | | | | — | | | | — | |
Shares issued to shareholders in connection with reorganization(a) | | | — | | | | — | | | | 551,407 | | | | 15,926,244 | |
Shares repurchased | | | (393,002 | ) | | | (10,368,048 | ) | | | — | | | | — | |
| | | | | | | | | | | | | | | | | |
Net increase (decrease) | | | (143,134 | ) | | $ | (3,642,128 | ) | | | 667,631 | | | $ | 19,375,366 | |
| | | | | | | | | | | | | | | | | |
| | | | | | | | | | | | | | | | | |
Emerging Markets ex-China Fund | |
Class III:(d) | |
Shares sold | | | 897,980 | | | $ | 16,532,557 | | | | | | | | | |
Shares issued to shareholders in reinvestment of distributions | | | 1,172 | | | | 23,270 | | | | | | | | | |
Shares repurchased | | | (9,824 | ) | | | (190,000 | ) | | | | | | | | |
| | | | | | | | | | | | | | | | | |
Net increase (decrease) | | | 889,328 | | | $ | 16,365,827 | | | | | | | | | |
| | | | | | | | | | | | | | | | | |
Class VI:(e) | |
Shares sold | | | 17,827,432 | | | $ | 355,913,395 | | | | | | | | | |
Shares issued to shareholders in reinvestment of distributions | | | 115,695 | | | | 2,297,709 | | | | | | | | | |
Shares repurchased | | | (994,450 | ) | | | (18,359,868 | ) | | | | | | | | |
| | | | | | | | | | | | | | | | | |
Net increase (decrease) | | | 16,948,677 | | | $ | 339,851,236 | | | | | | | | | |
| | | | | | | | | | | | | | | | | |
Class I:(f) | |
Shares sold | | | 26 | | | $ | 500 | | | | | | | | | |
Shares issued to shareholders in reinvestment of distributions | | | — | | | | 3 | | | | | | | | | |
| | | | | | | | | | | | | | | | | |
Net increase (decrease) | | | 26 | | | $ | 503 | | | | | | | | | |
| | | | | | | | | | | | | | | | | |
| | | | | | | | | | | | | | | | | |
GMO Trust Funds
Notes to Financial Statements — (Continued)
February 28, 2022
| | | | | | | | | | | | | | | | |
| | | Year Ended
February 28, 2022 | | | Year Ended
February 29, 2021 | |
| | | | | |
| | | Shares | | | Amount | | | Shares | | | Amount | |
Emerging Markets Fund | |
Class II : | |
Shares sold | | | 2,606,322 | | | $ | 88,755,053 | | | | 1,648,844 | | | $ | 53,161,685 | |
Shares issued to shareholders in reinvestment of distributions | | | 206,838 | | | | 7,025,529 | | | | 284,900 | | | | 9,549,283 | |
Shares repurchased | | | (1,960,353 | ) | | | (71,639,850 | ) | | | (6,920,252 | ) | | | (230,894,405 | ) |
| | | | | | | | | | | | | | | | | |
Net increase (decrease) | | | 852,807 | | | $ | 24,140,732 | | | | (4,986,508 | ) | | $ | (168,183,437 | ) |
| | | | | | | | | | | | | | | | | |
Class III: | |
Shares sold | | | 90,991 | | | $ | 3,125,000 | | | | 4,370,676 | | | $ | 146,164,042 | |
Shares issued to shareholders in reinvestment of distributions | | | 200,077 | | | | 6,847,588 | | | | 298,873 | | | | 10,087,950 | |
Shares repurchased | | | (4,992,075 | ) | | | (176,344,146 | ) | | | (812,877 | ) | | | (27,463,504 | ) |
Shares repurchased in connection with reorganization(a) | | | — | | | | — | | | | (1,043,359 | ) | | | (39,415,082 | ) |
| | | | | | | | | | | | | | | | | |
Net increase (decrease) | | | (4,701,007 | ) | | $ | (166,371,558 | ) | | | 2,813,313 | | | $ | 89,373,406 | |
| | | | | | | | | | | | | | | | | |
Class V:(g) | |
Shares sold | | | — | | | $ | — | | | | 5,421,878 | | | $ | 199,958,895 | |
Shares issued to shareholders in reinvestment of distributions | | | — | | | | — | | | | 169,700 | | | | 5,655,265 | |
Shares repurchased | | | (8,449,876 | ) | | | (315,869,299 | ) | | | (3,845,713 | ) | | | (125,000,000 | ) |
| | | | | | | | | | | | | | | | | |
Net increase (decrease) | | | (8,449,876 | ) | | $ | (315,869,299 | ) | | | 1,745,865 | | | $ | 80,614,160 | |
| | | | | | | | | | | | | | | | | |
Class VI: | |
Shares sold | | | 13,464,812 | | | $ | 499,344,486 | | | | 8,650,691 | | | $ | 256,039,952 | |
Shares issued to shareholders in reinvestment of distributions | | | 1,923,723 | | | | 64,976,185 | | | | 2,248,634 | | | | 74,845,061 | |
Shares repurchased | | | (22,366,927 | ) | | | (813,771,305 | ) | | | (33,325,115 | ) | | | (1,071,217,844 | ) |
| | | | | | | | | | | | | | | | | |
Net increase (decrease) | | | (6,978,392 | ) | | $ | (249,450,634 | ) | | | (22,425,790 | ) | | $ | (740,332,831 | ) |
| | | | | | | | | | | | | | | | | |
Class R6:(h) | |
Shares sold | | | 253,043 | | | $ | 9,226,510 | | | | 813,354 | | | $ | 22,128,535 | |
Shares issued to shareholders in reinvestment of distributions | | | 57,004 | | | | 1,932,218 | | | | 27,888 | | | | 936,435 | |
Shares issued to shareholders in connection with reorganization(a) | | | — | | | | — | | | | 439,317 | | | | 16,534,284 | |
Shares repurchased | | | (150,830 | ) | | | (5,473,092 | ) | | | (89,853 | ) | | | (2,939,669 | ) |
| | | | | | | | | | | | | | | | | |
Net increase (decrease) | | | 159,217 | | | $ | 5,685,636 | | | | 1,190,706 | | | $ | 36,659,585 | |
| | | | | | | | | | | | | | | | | |
Class I: | |
Shares sold | | | 2,589,594 | | | $ | 93,382,590 | | | | 1,160,474 | | | $ | 41,034,616 | |
Shares issued to shareholders in reinvestment of distributions | | | 158,470 | | | | 5,361,706 | | | | 28,672 | | | | 965,150 | |
Shares issued to shareholders in connection with reorganization(a) | | | — | | | | — | | | | 614,858 | | | | 23,134,094 | |
Shares repurchased | | | (892,702 | ) | | | (30,798,776 | ) | | | (151,985 | ) | | | (4,910,965 | ) |
| | | | | | | | | | | | | | | | | |
Net increase (decrease) | | | 1,855,362 | | | $ | 67,945,520 | | | | 1,652,019 | | | $ | 60,222,895 | |
| | | | | | | | | | | | | | | | | |
| | | | | | | | | | | | | | | | | |
International Equity Fund | |
Class II : | |
Shares sold | | | 67 | | | $ | 1,543 | | | | — | | | $ | — | |
Shares issued to shareholders in reinvestment of distributions | | | 6,894 | | | | 160,857 | | | | 4,663 | | | | 100,614 | |
Shares repurchased | | | (328 | ) | | | (7,990 | ) | | | (308,564 | ) | | | (5,424,568 | ) |
| | | | | | | | | | | | | | | | | |
Net increase (decrease) | | | 6,633 | | | $ | 154,410 | | | | (303,901 | ) | | $ | (5,323,954 | ) |
| | | | | | | | | | | | | | | | | |
Class III: | |
Shares sold | | | 902,391 | | | $ | 22,300,898 | | | | 3,720,329 | | | $ | 66,916,245 | |
Shares issued to shareholders in reinvestment of distributions | | | 1,036,029 | | | | 24,543,676 | | | | 960,872 | | | | 20,929,248 | |
Shares repurchased | | | (4,491,351 | ) | | | (111,707,638 | ) | | | (9,040,551 | ) | | | (188,307,672 | ) |
| | | | | | | | | | | | | | | | | |
Net increase (decrease) | | | (2,552,931 | ) | | $ | (64,863,064 | ) | | | (4,359,350 | ) | | $ | (100,462,179 | ) |
| | | | | | | | | | | | | | | | | |
| | | | | | | | | | | | | | | | | |
GMO Trust Funds
Notes to Financial Statements — (Continued)
February 28, 2022
| | | | | | | | | | | | | | | | |
| | | Year Ended
February 28, 2022 | | | Year Ended
February 29, 2021 | |
| | | | | |
| | | Shares | | | Amount | | | Shares | | | Amount | |
International Equity Fund (continued) | | | | | | | | | | | | | | | | |
Class IV: | |
Shares sold | | | 6,293,011 | | | $ | 158,848,803 | | | | 12,892,796 | | | $ | 240,379,292 | |
Shares issued to shareholders in reinvestment of distributions | | | 4,392,308 | | | | 103,725,041 | | | | 4,223,138 | | | | 91,652,733 | |
Shares repurchased | | | (19,692,831 | ) | | | (483,373,679 | ) | | | (70,171,356 | )(i) | | | (1,432,924,992 | )(i) |
| | | | | | | | | | | | | | | | | |
Net increase (decrease) | | | (9,007,512 | ) | | $ | (220,799,835 | ) | | | (53,055,422 | ) | | $ | (1,100,892,967 | ) |
| | | | | | | | | | | | | | | | | |
Class I:(j) | |
Shares sold | | | 130,919 | | | $ | 3,300,485 | | | | | | | | | |
Shares issued to shareholders in reinvestment of distributions | | | 6,199 | | | | 143,501 | | | | | | | | | |
Shares repurchased | | | (6,198 | ) | | | (143,480 | ) | | | | | | | | |
| | | | | | | | | | | | | | | | | |
Net increase (decrease) | | | 130,920 | | | $ | 3,300,506 | | | | | | | | | |
| | | | | | | | | | | | | | | | | |
| | | | | | | | | | | | | | | | | |
Japan Value Creation Fund | |
Class III:(k) | |
Shares sold | | | 1,201,005 | | | $ | 23,595,006 | | | | | | | | | |
| | | | | | | | | | | | | | | | | |
Net increase (decrease) | | | 1,201,005 | | | $ | 23,595,006 | | | | | | | | | |
| | | | | | | | | | | | | | | | | |
Class VI:(l) | |
Shares sold | | | 711,481 | (m) | | $ | 16,519,323 | (m) | | | 8,189,635 | | | $ | 164,396,732 | |
Shares issued to shareholders in reinvestment of distributions | | | 1,165,547 | | | | 24,281,578 | | | | 90,304 | | | | 2,043,576 | |
Shares repurchased | | | (2,110,286 | ) | | | (45,245,731 | ) | | | (1,297,353 | ) | | | (28,419,114 | ) |
| | | | | | | | | | | | | | | | | |
Net increase (decrease) | | | (233,258 | ) | | $ | (4,444,830 | ) | | | 6,982,586 | | | $ | 138,021,194 | |
| | | | | | | | | | | | | | | | | |
Class I:(n) | |
Shares sold | | | 150,076 | | | $ | 3,372,125 | | | | | | | | | |
Shares issued to shareholders in reinvestment of distributions | | | 14,815 | | | | 306,209 | | | | | | | | | |
Shares repurchased | | | (7,083 | ) | | | (143,012 | ) | | | | | | | | |
| | | | | | | | | | | | | | | | | |
Net increase (decrease) | | | 157,808 | | | $ | 3,535,322 | | | | | | | | | |
| | | | | | | | | | | | | | | | | |
| | | | | | | | | | | | | | | | | |
Quality Cyclicals Fund (formerly Cyclical Focus Fund) | |
Class VI:(o) | |
Shares sold | | | 4,504 | | | $ | 133,246 | | | | 6,591,975 | | | $ | 138,002,053 | |
Shares issued to shareholders in reinvestment of distributions | | | 1,088,936 | | | | 29,159,128 | | | | 272,615 | | | | 7,428,754 | |
Shares repurchased | | | (489,406 | ) | | | (15,000,655 | ) | | | (1,978,588 | ) | | | (51,803,852 | ) |
| | | | | | | | | | | | | | | | | |
Net increase (decrease) | | | 604,034 | | | $ | 14,291,719 | | | | 4,886,002 | | | $ | 93,626,955 | |
| | | | | | | | | | | | | | | | | |
Class I:(p) | |
Shares sold | | | 3,162 | | | $ | 89,975 | | | | | | | | | |
Shares issued to shareholders in reinvestment of distributions | | | 380 | | | | 9,434 | | | | | | | | | |
Shares repurchased | | | (380 | ) | | | (9,434 | ) | | | | | | | | |
| | | | | | | | | | | | | | | | | |
Net increase (decrease) | | | 3,162 | | | $ | 89,975 | | | | | | | | | |
| | | | | | | | | | | | | | | | | |
| | | | | | | | | | | | | | | | | |
Quality Fund | |
Class III: | |
Shares sold | | | 10,762,535 | | | $ | 311,185,638 | | | | 32,026,815 | (q) | | $ | 786,417,726 | (q) |
Shares issued to shareholders in reinvestment of distributions | | | 6,211,089 | | | | 184,230,822 | | | | 16,255,824 | | | | 396,418,267 | |
Shares repurchased | | | (45,655,713 | ) | | | (1,352,856,414 | ) | | | (42,127,119 | ) | | | (1,019,341,255 | ) |
Shares repurchased in connection with reorganization(a) | | | — | | | | — | | | | (10,985,195 | ) | | | (286,038,477 | ) |
| | | | | | | | | | | | | | | | | |
Net increase (decrease) | | | (28,682,089 | ) | | $ | (857,439,954 | ) | | | (4,829,675 | ) | | $ | (122,543,739 | ) |
| | | | | | | | | | | | | | | | | |
| | | | | | | | | | | | | | | | | |
GMO Trust Funds
Notes to Financial Statements — (Continued)
February 28, 2022
| | | | | | | | | | | | | | | | |
| | | Year Ended
February 28, 2022 | | | Year Ended
February 29, 2021 | |
| | | | | |
| | | Shares | | | Amount | | | Shares | | | Amount | |
Quality Fund (continued) | |
Class IV: | |
Shares sold | | | 24,890,734 | | | $ | 743,002,525 | | | | 6,158,990 | | | $ | 150,155,647 | |
Shares issued to shareholders in reinvestment of distributions | | | 1,698,410 | | | | 50,525,221 | | | | 5,043,483 | | | | 123,440,372 | |
Shares repurchased | | | (22,990,583 | ) | | | (681,793,126 | ) | | | (19,751,036 | ) | | | (495,584,958 | ) |
| | | | | | | | | | | | | | | | | |
Net increase (decrease) | | | 3,598,561 | | | $ | 111,734,620 | | | | (8,548,563 | ) | | $ | (221,988,939 | ) |
| | | | | | | | | | | | | | | | | |
Class VI: | |
Shares sold | | | 33,411,262 | | | $ | 985,954,280 | | | | 9,304,601 | | | $ | 207,464,992 | |
Shares issued to shareholders in reinvestment of distributions | | | 7,098,478 | | | | 210,592,163 | | | | 12,982,294 | | | | 316,855,443 | |
Shares repurchased | | | (12,013,379 | ) | | | (356,648,291 | ) | | | (18,610,905 | )(r) | | | (453,735,000 | )(r) |
| | | | | | | | | | | | | | | | | |
Net increase (decrease) | | | 28,496,361 | | | $ | 839,898,152 | | | | 3,675,990 | | | $ | 70,585,435 | |
| | | | | | | | | | | | | | | | | |
Class R6: | |
Shares sold | | | 6,146,062 | | | $ | 180,898,983 | | | | 2,926,477 | | | $ | 76,021,273 | |
Shares issued to shareholders in reinvestment of distributions | | | 827,128 | | | | 24,514,251 | | | | 99,528 | | | | 2,458,364 | |
Shares issued to shareholders in connection with reorganization(a) | | | — | | | | — | | | | 6,739,160 | | | | 175,346,775 | |
Shares repurchased | | | (1,596,874 | ) | | | (47,414,894 | ) | | | (439,543 | ) | | | (11,695,126 | ) |
| | | | | | | | | | | | | | | | | |
Net increase (decrease) | | | 5,376,316 | | | $ | 157,998,340 | | | | 9,325,622 | | | $ | 242,131,286 | |
| | | | | | | | | | | | | | | | | |
Class I: | |
Shares sold | | | 7,086,571 | | | $ | 206,735,852 | | | | 4,848,696 | | | $ | 115,110,578 | |
Shares issued to shareholders in reinvestment of distributions | | | 803,359 | | | | 23,785,537 | | | | 869,086 | | | | 21,195,796 | |
Shares issued to shareholders in connection with reorganization(a) | | | — | | | | — | | | | 4,273,468 | | | | 111,094,880 | |
Shares repurchased | | | (2,376,575 | ) | | | (69,883,916 | ) | | | (1,810,113 | ) | | | (44,845,668 | ) |
| | | | | | | | | | | | | | | | | |
Net increase (decrease) | | | 5,513,355 | | | $ | 160,637,473 | | | | 8,181,137 | | | $ | 202,555,586 | |
| | | | | | | | | | | | | | | | | |
| | | | | | | | | | | | | | | | | |
Resources Fund | |
Class III: | |
Shares sold | | | 8,981,611 | | | $ | 257,064,425 | | | | 5,566,651 | | | $ | 104,471,696 | |
Shares issued to shareholders in reinvestment of distributions | | | 1,052,726 | | | | 29,016,330 | | | | 567,771 | | | | 13,774,201 | |
Shares repurchased | | | (5,062,843 | ) | | | (147,877,164 | ) | | | (1,016,432 | ) | | | (23,560,174 | ) |
Shares repurchased in connection with reorganization(a) | | | — | | | | — | | | | (12,778,315 | ) | | | (350,668,382 | ) |
| | | | | | | | | | | | | | | | | |
Net increase (decrease) | | | 4,971,494 | | | $ | 138,203,591 | | | | (7,660,325 | ) | | $ | (255,982,659 | ) |
| | | | | | | | | | | | | | | | | |
Class IV: | |
Shares sold | | | 20,735,965 | | | $ | 604,670,278 | | | | 4,555,504 | | | $ | 107,109,178 | |
Shares issued to shareholders in reinvestment of distributions | | | 3,423,141 | | | | 94,223,444 | | | | 704,295 | | | | 17,024,643 | |
Shares repurchased | | | (29,760,042 | ) | | | (866,303,735 | ) | | | (3,363,546 | ) | | | (71,459,516 | ) |
| | | | | | | | | | | | | | | | | |
Net increase (decrease) | | | (5,600,936 | ) | | $ | (167,410,013 | ) | | | 1,896,253 | | | $ | 52,674,305 | |
| | | | | | | | | | | | | | | | | |
Class VI:(s) | |
Shares sold | | | 29,775,768 | | | $ | 866,735,067 | | | | | | | | | |
| | | | | | | | | | | | | | | | | |
Net increase (decrease) | | | 29,775,768 | | | $ | 866,735,067 | | | | | | | | | |
| | | | | | | | | | | | | | | | | |
Class R6:(t) | |
Shares sold | | | 3,927,986 | | | $ | 112,964,982 | | | | 40,259 | | | $ | 1,068,906 | |
Shares issued to shareholders in reinvestment of distributions | | | 121,620 | | | | 3,313,878 | | | | — | | | | — | |
Shares issued to shareholders in connection with reorganization(a) | | | — | | | | — | | | | 54,721 | | | | 1,501,686 | |
Shares repurchased | | | (439,984 | ) | | | (12,570,805 | ) | | | (888 | ) | | | (23,453 | ) |
| | | | | | | | | | | | | | | | | |
Net increase (decrease) | | | 3,609,622 | | | $ | 103,708,055 | | | | 94,092 | | | $ | 2,547,139 | |
| | | | | | | | | | | | | | | | | |
| | | | | | | | | | | | | | | | | |
GMO Trust Funds
Notes to Financial Statements — (Continued)
February 28, 2022
| | | | | | | | | | | | | | | | |
| | | Year Ended
February 28, 2022 | | | Year Ended
February 29, 2021 | |
| | | | | |
| | | Shares | | | Amount | | | Shares | | | Amount | |
Resources Fund (continued) | |
Class I:(t) | |
Shares sold | | | 12,802,341 | | | $ | 367,878,139 | | | | 695,863 | | | $ | 19,518,024 | |
Shares issued to shareholders in reinvestment of distributions | | | 942,416 | | | | 25,987,421 | | | | — | | | | — | |
Shares issued to shareholders in connection with reorganization(a) | | | — | | | | — | | | | 12,718,172 | | | | 349,017,891 | |
Shares repurchased | | | (4,708,721 | ) | | | (135,872,354 | ) | | | (143,755 | ) | | | (3,958,459 | ) |
| | | | | | | | | | | | | | | | | |
Net increase (decrease) | | | 9,036,036 | | | $ | 257,993,206 | | | | 13,270,280 | | | $ | 364,577,456 | |
| | | | | | | | | | | | | | | | | |
| | | | | | | | | | | | | | | | | |
Tax-Managed International Equities Fund | |
Class III: | |
Shares sold | | | 18,656 | | | $ | 275,619 | | | | 1,805,115 | | | $ | 20,617,208 | |
Shares issued to shareholders in reinvestment of distributions | | | 63,193 | | | | 910,792 | | | | 9,074 | | | | 135,500 | |
Shares repurchased | | | (297,762 | ) | | | (5,014,362 | ) | | | (2,045,534 | ) | | | (26,003,077 | ) |
| | | | | | | | | | | | | | | | | |
Net increase (decrease) | | | (215,913 | ) | | $ | (3,827,951 | ) | | | (231,345 | ) | | $ | (5,250,369 | ) |
| | | | | | | | | | | | | | | | | |
| | | | | | | | | | | | | | | | | |
U.S. Equity Fund | |
Class III: | |
Shares sold | | | — | | | $ | — | | | | 390,012 | | | $ | 4,296,146 | |
Shares issued to shareholders in reinvestment of distributions | | | 1,201,808 | | | | 17,671,434 | | | | 721,214 | | | | 8,728,187 | |
Shares repurchased | | | (2,649,751 | ) | | | (42,595,783 | ) | | | (815,138 | ) | | | (10,502,121 | ) |
| | | | | | | | | | | | | | | | | |
Net increase (decrease) | | | (1,447,943 | ) | | $ | (24,924,349 | ) | | | 296,088 | | | $ | 2,522,212 | |
| | | | | | | | | | | | | | | | | |
Class VI: | |
Shares sold | | | 11,888,253 | | | $ | 185,874,969 | | | | 3,501,114 | | | $ | 44,086,437 | |
Shares issued to shareholders in reinvestment of distributions | | | 4,617,810 | | | | 66,354,537 | | | | 2,251,552 | | | | 26,876,326 | |
Shares repurchased | | | (5,260,335 | ) | | | (80,794,845 | ) | | | (19,564,469 | )(u) | | | (240,929,654 | )(u) |
| | | | | | | | | | | | | | | | | |
Net increase (decrease) | | | 11,245,728 | | | $ | 171,434,661 | | | | (13,811,803 | ) | | $ | (169,966,891 | ) |
| | | | | | | | | | | | | | | | | |
| | | | | | | | | | | | | | | | | |
U.S. Small Cap Value Fund | |
Class VI: | |
Shares sold | | | 119,271 | | | $ | 3,183,172 | | | | 4,758,720 | | | $ | 67,971,759 | |
Shares issued to shareholders in reinvestment of distributions | | | 4,036,257 | | | | 83,549,717 | | | | 337,635 | | | | 6,843,929 | |
Shares repurchased | | | (6,207,447 | ) | | | (170,880,206 | ) | | | (13,194,884 | )(v) | | | (261,216,696 | )(v) |
| | | | | | | | | | | | | | | | | |
Net increase (decrease) | | | (2,051,919 | ) | | $ | (84,147,317 | ) | | | (8,098,529 | ) | | $ | (186,401,008 | ) |
| | | | | | | | | | | | | | | | | |
| | | | | | | | | | | | | | | | | |
| | (a) | A plan of reorganization was completed on January 22, 2021. |
| | (b) | Class III liquidated on January 22, 2021. |
| | (c) | The period under the heading “Year Ended February 28, 2021” represents the period from January 22, 2021 (commencement of operations) through February 28, 2021. |
| | (d) | The period under the heading “Year Ended February 28, 2022” represents the period from November 17, 2021 (commencement of operations) through February 28, 2022. |
| | (e) | The period under the heading “Year Ended February 28, 2022” represents the period from October 18, 2021 (commencement of operations) through February 28, 2022. |
| | (f) | The period under the heading “Year Ended February 28, 2022” represents the period from December 1, 2021 (commencement of operations) through February 28, 2022. |
| | (g) | Class V liquidated on April 29, 2021. |
| | (h) | The period under the heading “Year Ended February 28, 2021” represents the period from March 31, 2020 (commencement of operations) through February 28, 2021. |
| | (i) | 13,244,102 shares and $293,635,824 were redeemed in-kind. |
GMO Trust Funds
Notes to Financial Statements — (Continued)
February 28, 2022
| | (j) | The period under the heading “Year Ended February 28, 2022” represents the period from May 24, 2021 (commencement of operations) through February 28, 2022. |
| | (k) | The period under the heading “Year Ended February 28, 2022” represents the period from December 30, 2021 (commencement of operations) through February 28, 2022. |
| | (l) | The period under the heading “Year Ended February 28, 2021” represents the period from September 14, 2020 (commencement of operations) through February 28, 2021. |
| | (m) | 343,975 shares and $5,174,438 were purchased in-kind. |
| | (n) | The period under the heading “Year Ended February 28, 2022” represents the period from June 7, 2021 (commencement of operations) through February 28, 2022. |
| | (o) | The period under the heading “Year Ended February 28, 2021” represents the period from May 12, 2020 (commencement of operations) through February 28, 2022. |
| | (p) | The period under the heading “Year Ended February 28, 2022” represents the period from July 16, 2021 (commencement of operations) through February 28, 2022. |
| | (q) | 1,161,256 shares and $26,431,152 were purchased in-kind. |
| | (r) | 7,413,522 shares and $165,586,344 were redeemed in-kind. |
| | (s) | The period under the heading “Year Ended February 28, 2022” represents the period from February 8, 2022 (commencement of operations) through February 28, 2022. |
| | (t) | The period under the heading “Year Ended February 28, 2021” represents the period from January 22, 2021 (commencement of operations) through February 28, 2022. |
| | (u) | 3,849,646 shares and $51,936,295 were redeemed in-kind. |
| | (v) | 3,680,987 shares and $83,728,845 were redeemed in-kind. |
| 10. | Investments in affiliated companies and other Funds of the Trust |
An affiliated company for the purposes of this disclosure is a company in which a Fund has or had direct ownership of at least 5% of the issuer’s voting securities or an investment in other funds of GMO Trust. A summary of the Funds’ transactions involving companies that are or were affiliates during the year ended February 28, 2022 is set forth below:
| | | | | | | | | | | | | | | | | | | | | | | | | | | | | | | | |
| | | | | | | | | |
| Affiliate | | Value,
beginning of
period | | | Purchases | | | Sales
Proceeds | | | Dividend
Income | | | Distributions
of Realized
Gains | | | Net Realized
Gain (Loss) | | | Net Increase/
Decrease in
Unrealized
Appreciation/
Depreciation | | | Value, end
of period | |
Climate Change Fund | |
GMO U.S. Treasury Fund | | $ | 18,563,731 | | | $ | 484,639,225 | | | $ | 443,865,512 | | | $ | 35,129 | * | | $ | 25,854 | | | $ | (314,684 | ) | | $ | (45,209 | ) | | $ | 58,977,551 | |
| | | | | | | | | | | | | | | | | | | | | | | | | | | | | | | | | |
| | | | | | | | | | | | | | | | | | | | | | | | | | | | | | | | | |
Emerging Domestic Opportunities Fund | |
GMO U.S. Treasury Fund | | $ | — | | | $ | 238,885,879 | | | $ | 236,456,000 | | | $ | 11,088 | | | $ | 4,791 | | | $ | (89,053 | ) | | $ | (9,304 | ) | | $ | 2,331,522 | |
| | | | | | | | | | | | | | | | | | | | | | | | | | | | | | | | | |
| | | | | | | | | | | | | | | | | | | | | | | | | | | | | | | | | |
Emerging Markets ex-China Fund | |
GMO U.S. Treasury Fund | | $ | — | | | $ | 900,178 | | | $ | 895,000 | | | $ | 132 | | | $ | 46 | | | $ | (787 | ) | | $ | (17 | ) | | $ | 4,374 | |
| | | | | | | | | | | | | | | | | | | | | | | | | | | | | | | | | |
| | | | | | | | | | | | | | | | | | | | | | | | | | | | | | | | | |
| Emerging Markets Fund | |
Anilana Hotels & Properties Ltd | | $ | 678,007 | | | $ | — | | | $ | — | | | $ | — | | | $ | — | | | $ | — | | | $ | 34,678 | | | $ | 712,685 | |
Gayatri Projects Ltd | | | 6,296,399 | | | | — | | | | — | | | | — | | | | — | | | | — | | | | (2,532,419 | ) | | | 3,763,980 | |
| | | | | | | | | | | | | | | | | | | | | | | | | | | | | | | | | |
Totals | | $ | 6,974,406 | | | $ | — | | | $ | — | | | $ | — | | | $ | — | | | $ | — | | | $ | (2,497,741 | ) | | $ | 4,476,665 | |
| | | | | | | | | | | | | | | | | | | | | | | | | | | | | | | | | |
| | | | | | | | | | | | | | | | | | | | | | | | | | | | | | | | | |
| Quality Cyclicals Fund (formerly Cyclical Focus Fund) | |
GMO U.S. Treasury Fund | | $ | 528,000 | | | $ | 6,725,000 | | | $ | 6,810,000 | | | $ | 552 | | | $ | 241 | | | $ | (6,306 | ) | | $ | (1,737 | ) | | $ | 434,957 | |
| | | | | | | | | | | | | | | | | | | | | | | | | | | | | | | | | |
| | | | | | | | | | | | | | | | | | | | | | | | | | | | | | | | | |
| Quality Fund | |
GMO U.S. Treasury Fund | | $ | 9,830,961 | | | $ | — | | | $ | 4,000,000 | | | $ | 10,404 | | | $ | 7,534 | | | $ | 23,857 | | | $ | (66,470 | ) | | $ | 5,788,348 | |
| | | | | | | | | | | | | | | | | | | | | | | | | | | | | | | | | |
| | | | | | | | | | | | | | | | | | | | | | | | | | | | | | | | | |
GMO Trust Funds
Notes to Financial Statements — (Continued)
February 28, 2022
| | | | | | | | | | | | | | | | | | | | | | | | | | | | | | | | |
| | | | | | | | | |
| Affiliate | | Value,
beginning of
period | | | Purchases | | | Sales
Proceeds | | | Dividend
Income | | | Distributions
of Realized
Gains | | | Net Realized
Gain (Loss) | | | Net Increase/
Decrease in
Unrealized
Appreciation/
Depreciation | | | Value, end
of period | |
| Resources Fund | |
Kosmos Energy Ltd. | | $ | — | # | | $ | 33,154,355 | | | $ | 34,548,458 | | | $ | — | | | $ | — | | | $ | 9,193,888 | | | $ | — | | | $ | — | ## |
| | | | | | | | | | | | | | | | | | | | | | | | | | | | | | | | | |
| | | | | | | | | | | | | | | | | | | | | | | | | | | | | | | | | |
| Tax-Managed International Equities Fund | |
GMO U.S. Treasury Fund | | $ | 5,165 | | | $ | 8,770,000 | | | $ | 7,770,000 | | | $ | 1,363 | | | $ | 954 | | | $ | (2,326 | ) | | $ | (3,006 | ) | | $ | 999,833 | |
| | | | | | | | | | | | | | | | | | | | | | | | | | | | | | | | | |
| | | | | | | | | | | | | | | | | | | | | | | | | | | | | | | | | |
| U.S. Equity Fund | |
GMO U.S. Treasury Fund | | $ | 2,850,296 | | | $ | 97,700,000 | | | $ | 90,110,000 | | | $ | 10,849 | | | $ | 10,431 | | | $ | (11,857 | ) | | $ | (26,176 | ) | | $ | 10,402,263 | |
| | | | | | | | | | | | | | | | | | | | | | | | | | | | | | | | | |
| | | | | | | | | | | | | | | | | | | | | | | | | | | | | | | | | |
U.S. Small Cap Value Fund | | | | | |
GMO U.S. Treasury Fund | | $ | 101,097 | | | $ | 27,240,000 | | | $ | 26,170,000 | | | $ | 3,512 | | | $ | 4,379 | | | $ | (8,944 | ) | | $ | (3,629 | ) | | $ | 1,158,524 | |
| | | | | | | | | | | | | | | | | | | | | | | | | | | | | | | | | |
| | | | | | | | | | | | | | | | | | | | | | | | | | | | | | | | | |
| | * | Excludes income from investment of cash collateral from securities lending in GMO U.S. Treasury Fund. Income (net of fee rebates paid to the borrower and fees paid to the lending agent) from investment of cash collateral from securities lending in GMO U.S. Treasury Fund was $311,596 in Climate Change Fund during the period. |
| | # | Security was not an affiliate at the beginning of the year. |
| | ## | Security is no longer an affiliate at year end. |
Report of Independent Registered Public Accounting Firm
To the Board of Trustees of GMO Trust and Shareholders of GMO Climate Change Fund, GMO Emerging Domestic Opportunities Fund, GMO Emerging Markets ex-China Fund, GMO Emerging Markets Fund, GMO International Equity Fund, GMO-Usonian Japan Value Creation Fund, GMO Quality Cyclicals Fund, GMO Quality Fund, GMO Resources Fund, GMO Tax-Managed International Equities Fund, GMO U.S. Equity Fund, and GMO U.S. Small Cap Value Fund
Opinions on the Financial Statements
We have audited the accompanying statements of assets and liabilities, including the schedules of investments, of GMO Climate Change Fund, GMO Emerging Domestic Opportunities Fund, GMO Emerging Markets ex-China Fund, GMO Emerging Markets Fund, GMO International Equity Fund, GMO-Usonian Japan Value Creation Fund, GMO Quality Cyclicals Fund (formerly Cyclical Focus Fund), GMO Quality Fund, GMO Resources Fund, GMO Tax-Managed International Equities Fund, GMO U.S. Equity Fund, and GMO U.S. Small Cap Value Fund (twelve of the funds constituting GMO Trust, hereafter collectively referred to as the “Funds”) as of February 28, 2022, the related statements of operations and the statements of changes in net assets for each of the periods indicated in the table below, including the related notes, and the financial highlights for each of the periods indicated therein (collectively referred to as the “financial statements”). In our opinion, the financial statements present fairly, in all material respects, the financial position of each of the Funds as of February 28, 2022, the results of each of their operations and the changes in each of their net assets for each of the periods indicated in the table below and each of the financial highlights for each of the periods indicated therein in conformity with accounting principles generally accepted in the United States of America.
| | |
| GMO Climate Change Fund, GMO Emerging Domestic Opportunities Fund, GMO Emerging Markets Fund, GMO International Equity Fund, GMO Quality Fund, GMO Resources Fund, GMO Tax-Managed International Equities Fund, GMO U.S. Equity Fund, GMO U.S. Small Cap Value Fund | | Statements of operations for the year ended February 28, 2022 and the statements of changes in net assets for each of the two years in the period ended February 28, 2022 |
| GMO Quality Cyclicals Fund (formerly Cyclical Focus Fund) | | Statement of operations for the year ended February 28, 2022 and statement of changes in net assets for the year ended February 28, 2022 and for the period May 12, 2020 (commencement of operations) through February 28, 2021 |
| GMO Japan Value Creation Fund | | Statement of operations for the year ended February 28, 2022 and statement of changes in net assets for the year ended February 28, 2022 and for the period September 14, 2020 (commencement of operations) through February 28, 2021 |
| GMO Emerging Markets ex-China Fund | | Statements of operations and changes in net assets for the period October 18, 2021 (commencement of operations) through February 28, 2022 |
Basis for Opinions
These financial statements are the responsibility of the Funds’ management. Our responsibility is to express an opinion on the Funds’ financial statements based on our audits. We are a public accounting firm registered with the Public Company Accounting Oversight Board (United States) (PCAOB) and are required to be independent with respect to the Funds in accordance with the U.S. federal securities laws and the applicable rules and regulations of the Securities and Exchange Commission and the PCAOB.
We conducted our audits of these financial statements in accordance with the standards of the PCAOB. Those standards require that we plan and perform the audit to obtain reasonable assurance about whether the financial statements are free of material misstatement, whether due to error or fraud.
Our audits included performing procedures to assess the risks of material misstatement of the financial statements, whether due to error or fraud, and performing procedures that respond to those risks. Such procedures included examining, on a test basis, evidence regarding the amounts and disclosures in the financial statements. Our audits also included evaluating the accounting principles used and significant estimates made by management, as well as evaluating the overall presentation of the financial statements. Our procedures included confirmation of securities owned as of February 28, 2022 by correspondence with the custodian, transfer agent and brokers; when replies were not received from brokers, we performed other auditing procedures. We believe that our audits provide a reasonable basis for our opinions.
/s/ PricewaterhouseCoopers LLP
Boston, MA
April 27, 2022
We have served as the auditor of one or more investment companies in the GMO mutual funds complex since 1985.
GMO Trust Funds
Board Review of Investment Management Agreement
February 28, 2022 (Unaudited)
GMO Emerging Markets Ex-China Fund
Approval of initial management agreement and sub-advisory agreement for GMO Emerging Markets ex-China Fund (the “Fund”). At a meeting on June 10, 2021, the Trustees of GMO Trust (the “Trust”) approved for an initial two-year term commencing June 30, 2021 the management agreement between Grantham, Mayo, Van Otterloo & Co. LLC (“GMO”) and the Trust, on behalf of the Fund, and approved for an initial one-year term commencing June 30, 2021 the sub-advisory agreement among GMO, GMO Singapore Pte. Limited (“GMO Singapore”) and the Trust, on behalf of the Fund. In approving the initial management and sub-advisory agreements, the Trustees considered information they believed, in light of the legal advice furnished to them, to be relevant, including information relating specifically to the Fund as well as to the Trust generally and the other series of the Trust (collectively, the “GMO funds”).
At a meeting on June 10, 2021, the Trustees discussed materials provided by GMO for purposes of considering GMO’s proposal to establish the Fund as a new series of the Trust, a proposed management agreement between the Trust, on behalf of the Fund, and GMO, and a proposed sub-advisory agreement among GMO, GMO Singapore and the Trust, on behalf of the Fund. During this meeting, the Trustees met with representatives from GMO’s Product Development Team and GMO’s Legal Group.
Since the Fund had not yet commenced operations, the Trustees were unable to consider its investment performance. The Trustees therefore considered the performance of the other GMO funds whose investments were managed by the investment division of GMO that would be managing the Fund’s investments.
The Trustees considered the Fund’s estimated expenses and estimated expense ratio (annual operating expenses per share as a percentage of average annual net asset value per share) as compared to the expense ratios of other funds in a peer group determined by GMO to have similar investment characteristics. In considering the Fund’s estimated expense ratio, the Trustees took into account GMO’s undertaking to reimburse a portion of the Fund’s operating expenses.
The Trustees also considered the fees to be paid to GMO under the Fund’s management and shareholder servicing and supplemental support agreements. The Trustees reviewed information provided by GMO comparing the management fee to be paid by the Fund to the management fee of a GMO fund with an investment strategy similar to that of the Fund and whose investments were managed by the investment division of GMO that would manage the Fund’s investments, as well as funds managed by other managers determined by GMO to have similar investment characteristics. The Trustees also reviewed information regarding the fees received by GMO for providing sub-investment advisory services to a third-party managed fund with an investment strategy similar to that of the Fund. The Trustees noted the differences in the services provided by GMO to the Fund and to the third-party fund, as well as the business and other risks borne by GMO in managing the Fund as compared to the risks borne by GMO in providing sub-investment advisory services to the third-party fund. The Trustees also considered the shareholder servicing fees to be charged by GMO to different share classes of the Fund in light of the services to be provided to each class by GMO. In addition, the Trustees reviewed the fee to be paid by GMO to GMO Singapore under the Fund’s sub-advisory agreement and considered the services that GMO Singapore would provide to the Fund. The Trustees noted that GMO Singapore’s sub-advisory fee would be paid by GMO out of GMO’s management fee and not directly by the Fund.
The Trustees also considered that the non-investment management services to be provided by GMO to the Fund, including but not limited to valuation, legal and compliance, accounting, operational, operational risk management, and technology services, were the same as the services provided by GMO under its current management agreements with other GMO funds. In addition, the Trustees observed that GMO had carried on its business during the COVID-19 pandemic without interruption and without a reduction in the quality of its services to the other GMO funds.
Since the Fund had not yet commenced operations, no information regarding GMO’s profitability with respect to the Fund was available to the Trustees. The Trustees did, however, consider information provided to them by GMO regarding its profits from managing the Trust overall. The Trustees also considered how the proposed fees compared to fees paid by other GMO funds and took note of “fallout benefits” realized by GMO that would result from its management of the Fund and the other GMO funds. As the Fund had not yet commenced operations, the Trustees did not consider possible economies of scale to GMO associated with managing the Fund.
The Trustees also considered the experience and sophistication of GMO and its personnel (including, among others, management and investment-management personnel, and legal, compliance, and risk-management personnel), noting personnel changes made in the last few years. In addition, the Trustees considered the resources GMO would employ in managing the Fund, GMO’s organization, its reputation, its risk-management policies, and other aspects of GMO’s business relevant to the nature and quality of its services to be provided to the Fund.
GMO Trust Funds
Board Review of Investment Management Agreement — (Continued)
February 28, 2022 (Unaudited)
After reviewing these and other factors, the Trustees concluded, in the context of their overall review of the Fund’s initial management and sub-advisory agreements, that the nature, extent and quality of services to be provided supported their approval of the Fund’s management and sub-advisory agreements and that the fees to be charged under those agreements were reasonable.
In their deliberations, the Trustees considered the factors they individually deemed relevant, with each Trustee weighting specific factors as that Trustee thought appropriate. Following their deliberations, the Trustees who are not “interested persons” of the Trust voting separately, and then all Trustees voting together, approved the Fund’s initial management agreement and sub-advisory agreement.
GMO Trust Funds
Fund Expenses
February 28, 2022 (Unaudited)
Expense Examples: The following information is in relation to expenses for the six month period ended February 28, 2022.
As a shareholder of the Funds, you may incur two types of costs: (1) transaction cost, if applicable; and (2) ongoing costs, including direct and/or indirect management fees, direct and/or indirect shareholder services fees, and other Fund expenses. This example is intended to help you understand your ongoing costs (in dollars) of investing in the Funds and to compare these costs with the ongoing
costs of investing in other mutual funds.
These examples are based on an investment of $1,000 invested at the beginning of the period and held for the entire period, September 1, 2021 through February 28, 2022.
Actual Expenses
This section of the table for each class below provides information about actual account values and actual expenses. You may use the information in this section, together with the amount you invested, to estimate the expenses that you paid over the period. Simply divide your account value by $1,000 (for example, a $10,000,000 account value divided by $1,000 = 10,000), then multiply the result by the number under the heading entitled “Expenses Paid During the Period” to estimate the expenses you paid on your account during this period.
Hypothetical Example for Comparison Purposes
This section of the table for each class below provides information about hypothetical account values and hypothetical expenses based on the Funds’ actual expense ratio and an assumed rate of return of 5% per year before expenses, which is not the Funds’ actual return. The hypothetical account values and expenses may not be used to estimate the actual ending account balance or expenses you paid for the period. You may use this information to compare the ongoing costs of investing in the Funds with other funds. To do so, compare this 5% hypothetical example with the 5% hypothetical examples that appear in the shareholder reports of other funds.
Please note that the expenses shown in the table are meant to highlight your ongoing costs only and do not reflect any transactional costs. Therefore, this section of the table is useful in comparing ongoing costs only, and will not help you determine the relative total costs of owning different funds. In addition, if these transactional costs were included, your costs would have been higher.
| | | | | | | | | | | | | | | | | | | | | | | | | | | | |
| | | Actual | | | Hypothetical | | | | |
| | | Beginning
Account Value
September 1, 2021 | | | Ending
Account Value
February 28, 2022 | | | Expenses Paid
During the Period* | | | Beginning
Account Value
September 1, 2021 | | | Ending
Account Value
February 28, 2022 | | | Expenses Paid
During the Period* | | | Annualized
Expense Ratio | |
| | | | | |
Climate Change Fund | | | | | | | | | | | | | | | | | | | | | |
Class III | | | $1,000.00 | | | | $971.90 | | | | $3.76 | | | | $1,000.00 | | | | $1,020.98 | | | | $3.86 | | | | 0.77% | |
Class R6 | | | $1,000.00 | | | | $971.80 | | | | $3.76 | | | | $1,000.00 | | | | $1,020.98 | | | | $3.86 | | | | 0.77% | |
Class I | | | $1,000.00 | | | | $971.60 | | | | $4.25 | | | | $1,000.00 | | | | $1,020.48 | | | | $4.36 | | | | 0.87% | |
| | | | |
Emerging Domestic Opportunities Fund | | | | | | | | | | | | | | | | | |
Class II | | | $1,000.00 | | | | $893.20 | | | | $5.07 | | | | $1,000.00 | | | | $1,019.44 | | | | $5.41 | | | | 1.08% | |
Class V | | | $1,000.00 | | | | $893.60 | | | | $4.46 | | | | $1,000.00 | | | | $1,020.08 | | | | $4.76 | | | | 0.95% | |
Class I | | | $1,000.00 | | | | $892.80 | | | | $5.21 | | | | $1,000.00 | | | | $1,019.29 | | | | $5.56 | | | | 1.11% | |
| | | | |
Emerging Markets ex-China Fund | | | | | | | | | | | | | | | | | |
Class III(a) | | | $1,000.00 | | | | $838.00 | | | | $2.07 | | | | $1,000.00 | | | | $1,020.83 | | | | $4.01 | | | | 0.80% | |
Class VI(b) | | | $1,000.00 | | | | $838.50 | | | | $2.24 | | | | $1,000.00 | | | | $1,021.47 | | | | $3.36 | | | | 0.67% | |
Class I(c) | | | $1,000.00 | | | | $866.20 | | | | $2.12 | | | | $1,000.00 | | | | $1,020.18 | | | | $4.66 | | | | 0.93% | |
| | | | |
Emerging Markets Fund | | | | | | | | | | | | | | | | | |
Class II | | | $1,000.00 | | | | $835.20 | | | | $4.23 | | | | $1,000.00 | | | | $1,020.18 | | | | $4.66 | | | | 0.93% | |
Class III | | | $1,000.00 | | | | $835.60 | | | | $4.01 | | | | $1,000.00 | | | | $1,020.43 | | | | $4.41 | | | | 0.88% | |
Class VI | | | $1,000.00 | | | | $836.00 | | | | $3.41 | | | | $1,000.00 | | | | $1,021.08 | | | | $3.76 | | | | 0.75% | |
Class R6 | | | $1,000.00 | | | | $835.20 | | | | $4.23 | | | | $1,000.00 | | | | $1,020.18 | | | | $4.66 | | | | 0.93% | |
Class I | | | $1,000.00 | | | | $834.70 | | | | $4.46 | | | | $1,000.00 | | | | $1,019.94 | | | | $4.91 | | | | 0.98% | |
GMO Trust Funds
Fund Expenses — (Continued)
February 28, 2022 (Unaudited)
| | | | | | | | | | | | | | | | | | | | | | | | | | | | |
| | | Actual | | | Hypothetical | | | | |
| | | Beginning
Account Value
September 1, 2021 | | | Ending
Account Value
February 28, 2022 | | | Expenses Paid
During the Period* | | | Beginning
Account Value
September 1, 2021 | | | Ending
Account Value
February 28, 2022 | | | Expenses Paid
During the Period* | | | Annualized
Expense Ratio | |
| | | | |
International Equity Fund | | | | | | | | | | | | | | | | | |
Class II | | | $1,000.00 | | | | $953.20 | | | | $3.68 | | | | $1,000.00 | | | | $1,021.03 | | | | $3.81 | | | | 0.76% | |
Class III | | | $1,000.00 | | | | $953.30 | | | | $3.34 | | | | $1,000.00 | | | | $1,021.37 | | | | $3.46 | | | | 0.69% | |
Class IV | | | $1,000.00 | | | | $953.60 | | | | $3.05 | | | | $1,000.00 | | | | $1,021.67 | | | | $3.16 | | | | 0.63% | |
Class I | | | $1,000.00 | | | | $953.20 | | | | $4.31 | | | | $1,000.00 | | | | $1,020.38 | | | | $4.46 | | | | 0.89% | |
| | | | |
Japan Value Creation Fund | | | | | | | | | | | | | | | | | |
Class III(d) | | | $1,000.00 | | | | $995.00 | | | | $1.06 | | | | $1,000.00 | | | | $1,021.52 | | | | $3.31 | | | | 0.66% | |
Class VI | | | $1,000.00 | | | | $945.50 | | | | $2.75 | | | | $1,000.00 | | | | $1,021.97 | | | | $2.86 | | | | 0.57% | |
Class I | | | $1,000.00 | | | | $944.70 | | | | $3.71 | | | | $1,000.00 | | | | $1,020.98 | | | | $3.86 | | | | 0.77% | |
| | | | |
Quality Cyclicals Fund (formerly Cyclical Focus Fund) | | | | | | | | | | | | | | | | | |
Class VI | | | $1,000.00 | | | | $1,018.00 | | | | $2.00 | | | | $1,000.00 | | | | $1,022.81 | | | | $2.01 | | | | 0.40% | |
Class I | | | $1,000.00 | | | | $1,017.10 | | | | $2.95 | | | | $1,000.00 | | | | $1,021.87 | | | | $2.96 | | | | 0.59% | |
| | | | |
Quality Fund | | | | | | | | | | | | | | | | | |
Class III | | | $1,000.00 | | | | $957.80 | | | | $2.33 | | | | $1,000.00 | | | | $1,022.41 | | | | $2.41 | | | | 0.48% | |
Class IV | | | $1,000.00 | | | | $958.20 | | | | $2.14 | | | | $1,000.00 | | | | $1,022.61 | | | | $2.21 | | | | 0.44% | |
Class VI | | | $1,000.00 | | | | $958.40 | | | | $1.89 | | | | $1,000.00 | | | | $1,022.86 | | | | $1.96 | | | | 0.39% | |
Class R6 | | | $1,000.00 | | | | $957.90 | | | | $2.33 | | | | $1,000.00 | | | | $1,022.41 | | | | $2.41 | | | | 0.48% | |
Class I | | | $1,000.00 | | | | $957.30 | | | | $2.82 | | | | $1,000.00 | | | | $1,021.92 | | | | $2.91 | | | | 0.58% | |
| | | | |
Resources Fund | | | | | | | | | | | | | | | | | |
Class III | | | $1,000.00 | | | | $1,070.90 | | | | $3.65 | | | | $1,000.00 | | | | $1,021.27 | | | | $3.56 | | | | 0.71% | |
Class IV | | | $1,000.00 | | | | $1,071.00 | | | | $3.39 | | | | $1,000.00 | | | | $1,021.52 | | | | $3.31 | | | | 0.66% | |
Class VI(e) | | | $1,000.00 | | | | $972.20 | | | | $0.40 | | | | $1,000.00 | | | | $1,021.13 | | | | $3.71 | | | | 0.74% | |
Class R6 | | | $1,000.00 | | | | $1,070.80 | | | | $3.85 | | | | $1,000.00 | | | | $1,021.08 | | | | $3.76 | | | | 0.75% | |
Class I | | | $1,000.00 | | | | $1,070.30 | | | | $4.21 | | | | $1,000.00 | | | | $1,020.73 | | | | $4.11 | | | | 0.82% | |
| | | | |
Tax-Managed International Equities Fund | | | | | | | | | | | | | | | | | |
Class III | | | $1,000.00 | | | | $954.60 | | | | $3.20 | | | | $1,000.00 | | | | $1,021.52 | | | | $3.31 | | | | 0.66% | |
| | | | |
U.S. Equity Fund | | | | | | | | | | | | | | | | | |
Class III | | | $1,000.00 | | | | $976.80 | | | | $2.25 | | | | $1,000.00 | | | | $1,022.51 | | | | $2.31 | | | | 0.46% | |
Class VI | | | $1,000.00 | | | | $977.50 | | | | $1.81 | | | | $1,000.00 | | | | $1,022.96 | | | | $1.86 | | | | 0.37% | |
| | | | |
U.S. Small Cap Value Fund | | | | | | | | | | | | | | | | | |
Class VI | | | $1,000.00 | | | | $1,021.80 | | | | $2.11 | | | | $1,000.00 | | | | $1,022.71 | | | | $2.11 | | | | 0.42% | |
| | * | Expenses are calculated using each class’s annualized net expense ratio (including indirect expenses incurred) for the six months ended February 28, 2022, multiplied by the average account value over the period, multiplied by 181 days in the period, divided by 365 days in the year. |
| | (a) | For the period November 17, 2021 (commencement of operations) through February 28, 2022, expenses were calculated using the class’s annualized net expense ratio (including indirect expenses incurred) for the period ended February 28, 2022, multiplied by the average account value over the period, multiplied by 103 days in the period, divided by 365 days in the year. |
| | (b) | For the period October 18, 2021 (commencement of operations) through February 28, 2022, expenses were calculated using the class’s annualized net expense ratio (including indirect expenses incurred) for the period ended February 28, 2022, multiplied by the average account value over the period, multiplied by 133 days in the period, divided by 365 days in the year. |
| | (c) | For the period December 1, 2021 (commencement of operations) through February 28, 2022, expenses were calculated using the class’s annualized net expense ratio (including indirect expenses incurred) for the period ended February 28, 2022, multiplied by the average account value over the period, multiplied by 89 days in the period, divided by 365 days in the year. |
| | (d) | For the period December 30, 2021 (commencement of operations) through February 28, 2022, expenses were calculated using the class’s annualized net expense ratio (including indirect expenses incurred) for the period ended February 28, 2022, multiplied by the average account value over the period, multiplied by 59 days in the period, divided by 365 days in the year. |
| | (e) | For the period February 8, 2022 (commencement of operations) through February 28, 2022, expenses were calculated using the class’s annualized net expense ratio (including indirect expenses incurred) for the period ended February 28, 2022, multiplied by the average account value over the period, multiplied by 20 days in the period, divided by 365 days in the year. |
GMO Trust Funds
Tax Information for the Tax Year Ended February 28, 2022 (Unaudited)
The following information is being provided in order to meet reporting requirements set forth by the Code and/or to meet state-specific requirements. Shareholders should consult their tax advisors.
With respect to distributions paid, the Fund designates the following amounts (or, if subsequently determined to be different, the maximum amount allowable) for the fiscal year-ended February 28, 2022:
| | | | | | | | | | | | | | | | | | | | | | | | | | | | | | | | | | | | |
| | | | | | | | | | |
| Fund Name | | Dividend
Received
Deduction
(corporate
shareholders)(1) | | | Qualified
Dividend
Income (non-corporate
shareholders)(1) | | | U.S. Government
Obligation Income(1)(2) | | | Interest-
Related
Dividend
Income ($)(3) | | | Short-
Term
Capital
Gain
Dividends ($)(3) | | | Long-Term
Capital Gain
Distributions
($) | | | Foreign
Taxes
Paid ($)(4) | | | Foreign
Source
Income ($)(4) | | | Section 199A
Dividend
Income (non-corporate
shareholders) ($)(5) | |
Climate Change Fund | | | 1.80% | | | | 10.01% | | | | — | | | | — | | | | 49,739,067 | | | | 24,176,606 | | | | — | | | | — | | | | — | |
Emerging Domestic Opportunities Fund | | | 13.47% | | | | 100.00% | | | | — | | | | — | | | | — | | | | 58,232,198 | | | | 6,817,709 | | | | 2,724,213 | | | | — | |
Emerging Markets ex-China Fund | | | — | | | | 97.81% | | | | — | | | | — | | | | — | | | | — | | | | 446,649 | | | | 2,641,967 | | | | — | |
Emerging Markets Fund | | | — | | | | 69.69% | | | | — | | | | — | | | | — | | | | — | | | | 15,489,728 | | | | 104,507,859 | | | | — | |
International Equity Fund | | | — | | | | 72.31% | | | | — | | | | — | | | | — | | | | — | | | | — | | | | — | | | | — | |
Japan Value Creation Fund | | | — | | | | 15.96% | | | | — | | | | — | | | | 12,993,630 | | | | 1,135,657 | | | | 452,869 | | | | 4,528,685 | | | | — | |
Quality Cyclicals Fund (formerly Cyclical Focus Fund) | | | 4.96% | | �� | | 12.76% | | | | — | | | | — | | | | 19,751,917 | | | | 5,405,268 | | | | — | | | | — | | | | — | |
Quality Fund | | | 41.10% | | | | 53.58% | | | | — | | | | — | | | | 119,800,647 | | | | 338,485,262 | | | | — | | | | — | | | | — | |
Resources Fund | | | — | | | | 28.83% | | | | — | | | | — | | | | 71,220,515 | | | | 27,415,353 | | | | 6,707,705 | | | | 85,196,152 | | | | — | |
Tax-Managed International Equities Fund | | | — | | | | 95.00% | | | | — | | | | — | | | | — | | | | 3,705,108 | | | | — | | | | — | | | | — | |
U.S. Equity Fund | | | 26.06% | | | | 27.26% | | | | — | | | | — | | | | 20,394,932 | | | | 57,927,021 | | | | — | | | | — | | | | — | |
U.S. Small Cap Value Fund | | | 9.47% | | | | 9.45% | | | | — | | | | — | | | | 51,983,699 | | | | 27,775,233 | | | | — | | | | — | | | | 17,363 | |
| | (1) | Presented as a percentage of net investment income and short-term capital gain distributions paid, if any. |
| | (2) | All or a portion of these amounts may be exempt from taxation at the state level. |
| | (3) | These amounts are generally exempt from U.S. withholding taxes for non-U.S. shareholders, provided certain conditions are satisfied by both the Funds and the Funds’ shareholders. If applicable, interest-related dividend amounts may include short-term capital gain distributions received from underlying funds. |
| | (4) | The Funds expect to elect to treat foreign taxes attributed to foreign source income from certain of its investments, as if incurred directly by the Funds’ shareholders. All amounts presented above are based upon net investment income earned. |
| | (5) | The Funds hereby designate the above qualified business income under Section 199A of the Code. |
In early 2023, the Funds will notify applicable shareholders of amounts for use in preparing 2022 U.S. federal income tax forms.
Trustees and Officers (Unaudited)
The following tables present information regarding each Trustee and officer of the Trust as of February 28, 2022. Each Trustee’s and officer’s year of birth (“YOB”) is set forth after his or her name. Unless otherwise noted, (i) each Trustee and officer has engaged in the principal occupation(s) noted in the table for at least the most recent five years, although not necessarily in the same capacity, and (ii) the address of each Trustee and officer is c/o GMO Trust, 40 Rowes Wharf, Boston, MA 02110. Each Trustee serves in office until the earlier of (a) the election and qualification of a successor at the next meeting of shareholders called to elect Trustees or (b) the Trustee dies, resigns, or is removed as provided in the Trust’s governing documents. Each of the Trustees of the Trust, other than Mr. Feigelson, is not an “interested person” of the Trust, as such term is used in the 1940 Act (each, an “Independent Trustee”). Because the Funds do not hold annual meetings of shareholders, each Trustee will hold office for an indeterminate period. Each officer serves in office until his or her successor is elected and determined to be qualified to carry out the duties and responsibilities of the office, or until the officer resigns or is removed from office.
Independent Trustees
| | | | | | | | | | | | | |
Name and
Year of Birth | | Position(s)
Held with the Trust | | Length of
Time Served | | Principal Occupation(s)
During Past
5 Years* | | Number of
Portfolios in
Fund Complex1
Overseen | | Other Directorships
Held in the
Past Five Years |
| | | | | |
Donald W. Glazer
YOB: 1944 | | Chairman of the Board of Trustees | | Chairman of the Board of Trustees since March 2005; Lead Independent Trustee (September 2004 – March 2005); Trustee since December 2000. | | Consultant – Law and Business; Author of Legal Treatises. | | | | 30 | | | Director, BeiGene Ltd. (biotech). |
| | | | | |
Peter Tufano
YOB: 1957 | | Trustee | | Since December 2008. | | Peter Moores Professor of Finance (Since July 1, 2011) and Peter Moores Dean and Professor of Finance (July 1, 2011 – June 30, 2021) University of Oxford, Said Business School | | | | 30 | | | Trustee of State Street Navigator Securities Lending Trust (5 Portfolios) (January 1993 – June 2015). |
| | | | | |
Paul Braverman
YOB: 1949 | | Trustee | | Since March 2010. | | Retired. | | | | 30 | | | Trustee of HIMCO Variable Insurance Trust
(27 Portfolios) (April 2014 – April 2019). |
Interested Trustee and Officer |
| | | | | |
Carolyn Haley2 YOB: 1966 | | Trustee; President of the Trust | | Trustee and President since June 2021. | | Head of Global Operations and Finance, Head of Operations, Co-Head of Operations, Grantham, Mayo, Van Otterloo & Co. LLC (February 2015 – Present). | | | | 30 | | | None. |
| 1 | The Fund Complex includes series of each of GMO Trust. |
| 2 | Ms. Haley is an “interested person” of the Trust, as such term is used in the 1940 Act (an “Interested Trustee”), by virtue of her positions with the Trust and GMO indicated in the table above and her interest as a member of GMO. |
| | | | | | |
| Officers |
| |
Name and Year of Birth | | Position(s)
Held with the Trust | | Length of
Time Served | | Principal Occupation(s)
During Past 5 Years* |
| | | |
Carolyn Haley YOB: 1966 | | Trustee, President of the Trust | | Trustee and President since June 2021 | | Head of Global Operations and Finance, Head of Operations, Co-Head of Operations, Grantham, Mayo, Van Otterloo & Co. LLC (February 2015 – Present). |
| | | |
Tara Pari YOB: 1976 | | Chief Executive Officer | | Chief Executive Officer since November 2020 | | Risk and Controls, Grantham, Mayo, Van Otterloo & Co. LLC (September 2004 – November 2020); Head of Fund Reporting and Risk and Controls, Grantham, Mayo, Van Otterloo & Co. LLC (November 2020 to present). Head of Fund Reporting, Risk and Controls and Proxy Voting (October 2021 to present), Grantham, Mayo, Van Otterloo & Co. LLC. |
| | | |
Betty Maganzini YOB: 1972 | | Treasurer, Chief Accounting Officer and Chief Financial Officer | | Treasurer, Chief Accounting Officer and Chief Financial Officer since September 2018; Assistant Treasurer, September 2013 – September 2018. | | Fund Administrator, Grantham, Mayo, Van Otterloo & Co. LLC (July 2010 – present). |
| | | |
Susan Saw YOB: 1981 | | Assistant Treasurer | | Since September 2019. | | Fund Administrator, Grantham, Mayo, Van Otterloo & Co. LLC (March 2011 – present). |
| | | |
John L. Nasrah YOB: 1977 | | Assistant Treasurer and Chief Tax Officer | | Since March 2007. | | Fund Administrator, Grantham, Mayo, Van Otterloo & Co. LLC (September 2004 – present). |
| | | |
Cathy Tao YOB: 1974 | | Assistant Treasurer | | Since September 2016. | | Fund Administrator, Grantham, Mayo, Van Otterloo & Co. LLC (October 2007 – present). |
| | | |
Devin Kelly YOB: 1984 | | Assistant Treasurer | | Since June 2020 | | Fund Administrator, Grantham, Mayo, Van Otterloo & Co. LLC (October 2012 – present). |
| | | |
Brian Kadehjian YOB: 1974 | | Assistant Treasurer and Treasury Officer | | Assistant Treasurer since February 2015; Treasury Officer since September 2013. | | Fund Administrator, Grantham, Mayo, Van Otterloo & Co. LLC (April 2002 – November 2020). Treasury and Payables Manager, Grantham, Mayo, Van Otterloo & Co. LLC (November 2020 – present). |
| | | |
Douglas Y. Charton YOB: 1982 | | Chief Legal Officer, Vice President and Clerk | | Since August 2015. | | Legal Counsel, Grantham, Mayo, Van Otterloo & Co. LLC (July 2015 – present); Associate, K&L Gates LLP (September 2007 – July 2015). |
| | | |
Megan Bunting YOB: 1978 | | Vice President and Assistant Clerk | | Since September 2013. | | Legal Counsel, Grantham, Mayo, Van Otterloo & Co. LLC (September 2006 – present). |
| | | |
Kevin O’Brien YOB: 1985 | | Vice President and Assistant Clerk | | Since March 2016. | | Legal Counsel, Grantham, Mayo, Van Otterloo & Co. LLC (February 2015 – present). |
| | | |
Gregory L. Pottle YOB: 1971 | | Chief Compliance Officer | | Chief Compliance Officer since May 2015; Vice President and Assistant Clerk, November 2006 – November 2015. | | Chief Compliance Officer, Grantham, Mayo, Van Otterloo & Co. LLC (May 2015 – present). |
| | | |
Kelly Butler YOB: 1974 | | Anti-Money Laundering Officer | | Since March 2020. | | Compliance Manager (March 2016 – present); Compliance Specialist, Grantham, Mayo, Van Otterloo & Co. LLC (November 2007 – March 2016). |
| * | Each officer of the Trust may also serve as an officer and/or director of certain pooled investment vehicles of which GMO or an affiliate of GMO serves as the investment adviser. |
AR-022822-EQ
GMO Trust
Annual Report
February 28, 2022
Asset Allocation Bond Fund
Emerging Country Debt Fund
High Yield Fund
Multi-Sector Fixed Income Fund
Opportunistic Income Fund
U.S. Treasury Fund
For a free copy of the Funds’ proxy voting guidelines, shareholders may call 1-617-346-7646 (collect), visit GMO’s website at www.gmo.com or visit the Securities and Exchange Commission’s website at www.sec.gov. Information regarding how the Funds voted proxies relating to portfolio securities during the most recent 12-month period ended June 30 will be available without charge on GMO’s website at www.gmo.com and on the Securities and Exchange Commission’s website at www.sec.gov no later than August 31 of each year.
The Funds file their complete schedule of portfolio holdings with the Securities and Exchange Commission for the first and third quarter of each fiscal year on Form N-PORT which is available on the Commission’s website at www.sec.gov. The Funds have a policy with respect to disclosure of portfolio holdings under which they may also make a complete schedule of portfolio holdings available on GMO’s website at www.gmo.com.
This report is prepared for the general information of shareholders. It is authorized for distribution to prospective investors only when preceded or accompanied by a prospectus for the GMO Trust, which contains a complete discussion of the risks associated with an investment in these Funds and other important information. The GMO Trust prospectus can be obtained at www.gmo.com. The GMO Trust Statement of Additional Information includes additional information about the Trustees of GMO Trust and is available without charge, upon request, by calling 1-617-346-7646 (collect).
An investment in the Funds is subject to risk, including the possible loss of principal amount invested. There can be no assurance that the Funds will achieve their stated investment objectives. Please see the Funds’ prospectus regarding specific principal risks for each Fund. General risks may include: market risk-fixed income investments, management and operational risk, market risk-asset backed securities, credit risk and derivatives risk.
The Funds are distributed by Funds Distributor LLC. Funds Distributor LLC is not affiliated with GMO.
TABLE OF CONTENTS
GMO Asset Allocation Bond Fund
(A Series of GMO Trust)
Portfolio Management
Day-to-day management of the Fund’s portfolio is the responsibility of the Asset Allocation team at Grantham, Mayo, Van Otterloo & Co. LLC.
Management Discussion and Analysis of Fund Performance
Class III shares of GMO Asset Allocation Bond Fund returned +0.16% (net) for the fiscal year ended February 28, 2022, as compared with a +0.05% return for the FTSE 3-Month Treasury Bill Index.
The Fund started the period predominantly invested in Treasury Inflation-Protected Securities (“TIPS”). These had been preferred to nominal securities as we believed that they offered better valuations. For context, at the start of the period, the 10-year real yield was -0.71% and the 10-year nominal yield was 1.44%, leaving the break-even inflation measure at 2.15%.
The TIPS enjoyed solid absolute performance to start the period, strongly outperforming nominals, and this led us to reassess their relative valuations. Towards the end of April 2021, we switched the majority of the assets of the Fund from TIPS to nominal bonds. Again, for context, at the end of April 2021, the 10-year real yield had fallen modestly to -0.77% while the 10-year nominal yield had climbed meaningfully to 1.65%, leaving the break-even inflation measure at a more reasonable 2.42%.
Since the end of April 2021, nominal yields have continued to rise, and the 10-year nominal yield finished February 2022 at 1.83%. This led to negative performance of the nominal securities, offsetting much of the performance that had initially been generated by the TIPS.
The views expressed herein are exclusively those of Grantham, Mayo, Van Otterloo & Co. LLC as of the date of this report and are subject to change. GMO disclaims any responsibility to update such views. They are not meant as investment advice. References to specific securities are not recommendations of such securities and may not be representative of any GMO portfolio’s current or future investments. All information is unaudited.
GMO Asset Allocation Bond Fund
(A Series of GMO Trust)
Comparison of Change in Value of a $5,000,000 Investment in
GMO Asset Allocation Bond Fund Class III Shares and the FTSE 3-Month Treasury Bill Index
As of February 28, 2022
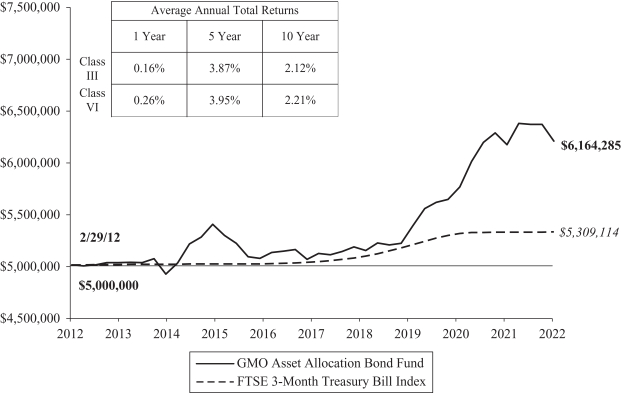
Performance data quoted represents past performance and is not indicative of future results. The investment return and principal value of an investment will fluctuate so that an investor’s shares, when redeemed, may be worth more or less than their original cost. Current performance data may be lower or higher than the performance data provided herein. To obtain performance information up to the most recent month-end, visit www.gmo.com. Performance shown is net of all fees after reimbursement from GMO. Returns would have been lower had certain expenses not been reimbursed during the periods shown and do not include the effect of taxes on distributions and redemptions. The performance information shown above only includes purchase premiums and/or redemption fees in effect as of February 28, 2022. All information is unaudited. Performance for classes may vary due to different fees.
For Class III and VI the gross expense ratio of 0.49% and 0.40%, respectively, is equal to the Fund’s Total Annual Operating Expenses set forth in the Fund’s most recent prospectus dated June 30, 2021. For the Classes listed above, the corresponding net expense ratio of 0.41% and 0.32% reflects the reduction of expenses from fee reimbursements. The fee reimbursements will continue until at least June 30, 2022. Elimination of this reimbursement will result in higher fees and lower performance.
GMO Asset Allocation Bond Fund
(A Series of GMO Trust)
Investment Concentration Summary
February 28, 2022 (Unaudited)
| | | | |
| Asset Class Summary& | | % of Total Net Assets | |
Debt Obligations | | | 99.6 | % |
Short-Term Investments | | | 0.6 | |
Mutual Funds | | | 0.0 | ^ |
Other | | | (0.2 | ) |
| | | | |
| | | 100.0 | % |
| | | | |
| & | In the table, derivative financial instruments, if any, are based on market values, rather than the notional amounts of derivatives, except for forward currency contracts which are based on unrealized appreciation/(depreciation). |
GMO Asset Allocation Bond Fund
(A Series of GMO Trust)
Schedule of Investments
(showing percentage of total net assets)
February 28, 2022
| | | | | | | | | | |
Par Value† /
Shares | | | Description | | Value ($) | |
| | |
| | | | | | DEBT OBLIGATIONS — 99.6% | |
| | |
| | | | | | U.S. Government — 99.6% | |
| | | |
| | | 15,035,000 | | | U.S. Treasury Note, 1.38%, due 12/31/28 | | | 14,598,045 | |
| | | |
| | | 24,490,000 | | | U.S. Treasury Note, 1.25%, due 08/15/31 | | | 23,254,021 | |
| | | | | | | | | | |
| | | |
| | | | | | Total U.S. Government | | | 37,852,066 | |
| | | | | | | | | | |
| | | |
| | | | | | TOTAL DEBT OBLIGATIONS
(COST $38,484,231) | | | 37,852,066 | |
| | | | | | | | | | |
| | |
| | | | | | MUTUAL FUNDS — 0.0% | |
| | |
| | | | | | United States — 0.0% | |
| | |
| | | | | | Affiliated Issuers — 0.0% | |
| | | |
| | | 2,321 | | | GMO U.S. Treasury Fund | | | 11,626 | |
| | | | | | | | | | |
| | | |
| | | | | | TOTAL MUTUAL FUNDS
(COST $11,673) | | | 11,626 | |
| | | | | | | | | | |
| | |
| | | | | | SHORT-TERM INVESTMENTS — 0.6% | |
| | |
| | | | | | Money Market Funds — 0.6% | |
| | | |
| | | 216,918 | | | State Street Institutional Treasury Money Market Fund – Premier Class, 0.01% (a) | | | 216,918 | |
| | | | | | | | | | |
| | | |
| | | | | | TOTAL SHORT-TERM INVESTMENTS
(COST $216,918) | | | 216,918 | |
| | | | | | | | | | |
| | | |
| | | | | | TOTAL INVESTMENTS — 100.2%
(Cost $38,712,822) | | | 38,080,610 | |
| | | |
| | | | | | Other Assets and Liabilities (net) — (0.2%) | | | (61,834 | ) |
| | | | | | | | | | |
| | | |
| | | | | | TOTAL NET ASSETS — 100.0% | | | $38,018,776 | |
| | | | | | | | | | |
Notes to Schedule of Investments:
| † | Denominated in U.S. Dollar, unless otherwise indicated. |
| (a) | The rate disclosed is the 7 day net yield as of February 28, 2022. |
For a listing of definitions of acronyms, counterparty abbreviations and currency abbreviations used throughout the Schedule of Investments as well as the derivative tables, if any, please refer to page 56.
| | | | |
| | |
| | | See accompanying notes to the financial statements. | | 5 |
GMO Emerging Country Debt Fund
(A Series of GMO Trust)
Portfolio Management
Day-to-day management of the Fund’s portfolio is the responsibility of the Emerging Country Debt team at Grantham, Mayo, Van Otterloo & Co. LLC.
Management Discussion and Analysis of Fund Performance
Class III shares of GMO Emerging Country Debt Fund returned -7.83% (net) for the fiscal year ended February 28, 2022, as compared with -7.50% for the J.P. Morgan EMBI Global Diversified + (EMBIGD).
EMBIGD’s spread over U.S. Treasuries widened by 111 basis points to 470 basis points during the fiscal year, and the yield on the 10-year U.S. Treasury bond rose by 42 basis points to 1.83%.
The Fund had negative alpha from country selection during the fiscal year, driven by losses from overweights in Ukraine and Tunisia, and underweights in Qatar and China. Partly offsetting these losses, the Fund’s overweights in Ecuador, Oman, Mexico, and Belize, and underweight in Colombia contributed to alpha during the fiscal year.
In terms of security selection, gains from the choice of holdings in Ukraine drove positive alpha, followed by contributions from security selection in Tunisia, Ghana, Iraq, and Russia. Negative alpha from security selection in Brazil, Chile, and Bahrain partly offsets these gains. The Fund also had positive alpha from holding of bonds in off-benchmark countries, which we consider security selection. The most notable country in this category was the Republic of the Congo, followed by Israel, Chad, and Grenada, though negative alpha from Venezuela partly offset these gains. Within quasi-sovereign security selection, the portfolio had negative alpha from Chile, Ukraine, and Russia, while Israel and Indonesia were notable contributors to alpha.
The views expressed herein are exclusively those of Grantham, Mayo, Van Otterloo & Co. LLC as of the date of this report and are subject to change. GMO disclaims any responsibility to update such views. They are not meant as investment advice. References to specific securities are not recommendations of such securities and may not be representative of any GMO portfolio’s current or future investments. All information is unaudited.
GMO Emerging Country Debt Fund
(A Series of GMO Trust)
Comparison of Change in Value of a $5,000,000 Investment in
GMO Emerging Country Debt Fund Class III Shares, the J.P. Morgan EMBI Global Diversified +*
and the J.P. Morgan EMBI Global
As of February 28, 2022
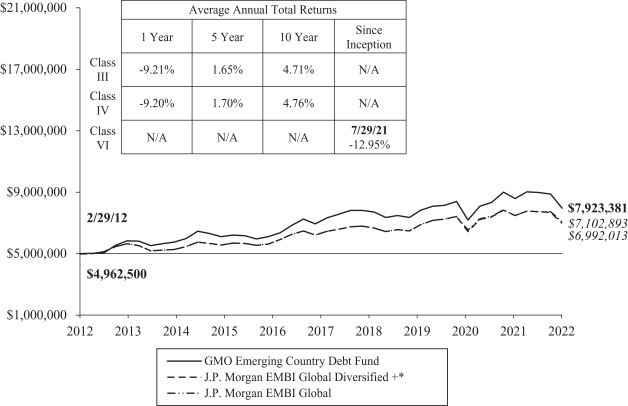
Performance data quoted represents past performance and is not indicative of future results. The investment return and principal value of an investment will fluctuate so that an investor’s shares, when redeemed, may be worth more or less than their original cost. Current performance data may be lower or higher than the performance data provided herein. To obtain performance information up to the most recent month-end, visit www.gmo.com. Performance shown is net of all fees after reimbursement from GMO. Each performance figure assumes a purchase at the beginning and redemption at the end of the stated period and reflects a transaction fee of 0.75% on the purchase and 0.75% on the redemption. Transaction fees are retained by the Fund to cover trading costs. Returns would have been lower had certain expenses not been reimbursed during the periods shown and do not include the effect of taxes on distributions and redemptions. All information is unaudited. Performance for classes may vary due to different fees.
For J.P. Morgan disclaimers please visit https://www.gmo.com/north-america/benchmark-disclaimers/
| | * | The J.P. Morgan Emerging Markets Bond Index Global Diversified + (composite index) reflects the performance of the J.P. Morgan Emerging Markets Bond Index Global through 2/29/2020 and the J.P. Morgan EMBI Global Diversified thereafter. |
For Class III, IV, and VI the gross expense ratio of 0.54%, 0.49%, and 0.45%, respectively, is equal to the Fund’s Total Annual Operating Expenses set forth in the Fund’s most recent prospectus dated June 30, 2021. For the Classes listed above, the corresponding net expense ratio of 0.54%, 0.49% and 0.45% reflects the reduction of expenses from fee reimbursements. The fee reimbursements will continue until at least June 30, 2022. Elimination of this reimbursement will result in higher fees and lower performance.
GMO Emerging Country Debt Fund
(A Series of GMO Trust)
Investment Concentration Summary
February 28, 2022 (Unaudited)
| | | | |
| Asset Class Summary† | | % of Total Net Assets | |
Debt Obligations | | | 90.9 | % |
Short-Term Investments | | | 3.7 | |
Loan Assignments | | | 1.4 | |
Loan Participations | | | 1.2 | |
Swap Contracts | | | 0.5 | |
Investment Funds | | | 0.2 | |
Rights/Warrants | | | 0.1 | |
Forward Currency Contracts | | | 0.1 | |
Written Options/Credit Linked Options | | | 0.0 | ^ |
Purchased Options | | | 0.0 | ^ |
Reverse Repurchase Agreements | | | (0.2 | ) |
Other | | | 2.1 | |
| | | | |
| | | 100.0 | % |
| | | | |
| | | | |
| Country/Region Summary‡ | | % of Investments | |
Other Emerging | | | 15.2 | %* |
Mexico | | | 6.4 | |
Turkey | | | 5.9 | |
Saudi Arabia | | | 4.9 | |
Oman | | | 4.7 | |
Colombia | | | 4.5 | |
South Africa | | | 3.5 | |
Brazil | | | 3.5 | |
Bahrain | | | 3.4 | |
Ecuador | | | 3.2 | |
Dominican Republic | | | 3.1 | |
Indonesia | | | 3.1 | |
Peru | | | 2.9 | |
Tunisia | | | 2.9 | |
Argentina | | | 2.8 | |
Egypt | | | 2.7 | |
United Arab Emirates | | | 2.7 | |
Panama | | | 2.0 | |
Jordan | | | 2.0 | |
Chile | | | 1.8 | |
Philippines | | | 1.5 | |
Ghana | | | 1.5 | |
Kazakhstan | | | 1.4 | |
India | | | 1.4 | |
Sri Lanka | | | 1.3 | |
Nigeria | | | 1.3 | |
Costa Rica | | | 1.3 | |
Ivory Coast | | | 1.2 | |
Kenya | | | 1.2 | |
Romania | | | 1.1 | |
Ukraine | | | 1.1 | |
Trinidad & Tobago | | | 1.1 | |
Vietnam | | | 1.1 | |
Israel | | | 1.0 | |
Uruguay | | | 1.0 | |
Other Developed | | | 0.3 | ¤ |
| | | | |
| | | 100.0 | % |
| | | | |
| † | The table incorporates aggregate indirect asset class exposure associated with investments in other funds of GMO Trust (“underlying funds”). Derivative financial instruments, if any, are based on market values, rather than the notional amounts of derivatives, except for forward currency contracts which are based on unrealized appreciation/(depreciation). |
| ‡ | The table incorporates aggregate indirect country exposure associated with investments in the underlying funds. The table excludes short-term investments. The table includes exposure through the use of certain derivative financial instruments and excludes exposure through certain currency linked derivatives such as forward currency contracts and currency options. The table is based on duration adjusted net exposures (both investments and derivatives), taking into account the market value of securities and the notional amounts of swaps and other derivative financial instruments. Duration is based on GMO’s models. The greater the duration of a bond, the greater its contribution to the concentration percentage. Credit default swap exposures are factored into the duration adjusted exposure using a reference security and applying the same methodology to that security. |
| * | “Other Emerging” is comprised of emerging countries that each represent between (1.0)% and 1.0% of Investments. |
| ¤ | “Other Developed” is comprised of developed countries that each represent between (1.0)% and 1.0% of Investments. |
GMO Emerging Country Debt Fund
(A Series of GMO Trust)
Schedule of Investments
(showing percentage of total net assets)
February 28, 2022
| | | | | | | | | | |
Par Value† | | | Description | | Value ($) | |
| | |
| | | | | | DEBT OBLIGATIONS — 90.9% | |
| | |
| | | | | | Albania — 1.4% | |
| | |
| | | | | | Sovereign and Sovereign Agency Issuers | |
| | | |
| | | 49,649,849 | | | Republic of Albania Par Bond, Zero Coupon, due 08/31/25 (a) (b) | | | 44,679,382 | |
| | | |
EUR | | | 9,100,000 | | | Republic of Albania Par Bond, Reg S, 3.50%, due 11/23/31 | | | 9,106,510 | |
| | | | | | | | | | |
| | | |
| | | | | | Total Albania | | | 53,785,892 | |
| | | | | | | | | | |
| | |
| | | | | | Angola — 0.3% | |
| | |
| | | | | | Sovereign and Sovereign Agency Issuers | |
| | | |
| | | 7,900,000 | | | Angolan Government International Bond, Reg S, 9.38%, due 05/08/48 | | | 7,465,500 | |
| | | |
| | | 5,500,000 | | | Angolan Government International Bond, Reg S, 9.13%, due 11/26/49 | | | 5,101,250 | |
| | | | | | | | | | |
| | | |
| | | | | | Total Angola | | | 12,566,750 | |
| | | | | | | | | | |
| | |
| | | | | | Argentina — 3.2% | |
| | |
| | | | | | Sovereign and Sovereign Agency Issuers | |
| | | |
| | | 29,090,713 | | | Republic of Argentina, 1.00%, due 07/09/29 | | | 9,569,176 | |
| | | |
| | | 35,333,493 | | | Republic of Argentina, Step Up, 0.50%, due 07/09/30 | | | 11,271,384 | |
| | | |
JPY | | | 407,485,276 | | | Republic of Argentina, Variable Rate, 4.33%, due 12/31/33 (c) (d) | | | 992,440 | |
| | | |
| | | 56,547,942 | | | Republic of Argentina, Step Up, 1.13%, due 07/09/35 | | | 16,766,465 | |
| | | |
EUR | | | 26,000,000 | | | Republic of Argentina, Step Up, 1.50%, due 01/09/38 | | | 9,503,713 | |
| | | |
| | | 72,008,994 | | | Republic of Argentina, Step Up, 2.00%, due 01/09/38 | | | 26,126,500 | |
| | | |
JPY | | | 334,073,000 | | | Republic of Argentina, 0.67%, due 12/31/38 (c) (d) | | | 581,175 | |
| | | |
EUR | | | 8,260,000 | | | Republic of Argentina, Step Up, 1.50%, due 07/09/41 | | | 2,727,516 | |
| | | |
| | | 72,201,240 | | | Republic of Argentina, Step Up, 2.50%, due 07/09/41 | | | 24,404,019 | |
| | | |
| | | 56,947,000 | | | Republic of Argentina, Step Up, 1.13%, due 07/09/46 | | | 17,084,100 | |
| | | | | | | | | | |
| | | |
| | | | | | Total Argentina | | | 119,026,488 | |
| | | | | | | | | | |
| | |
| | | | | | Armenia — 0.5% | |
| | |
| | | | | | Corporate Debt | |
| | | |
| | | 20,000,000 | | | Ardshinbank CJSC Via Dilijan Finance BV, Reg S, 6.50%, due 01/28/25 | | | 19,510,000 | |
| | | | | | | | | | |
| | |
| | | | | | Azerbaijan — 1.0% | |
| | |
| | | | | | Sovereign and Sovereign Agency Issuers | |
| | | |
| | | 11,388,000 | | | International Bank of Azerbaijan OJSC, Reg S, 3.50%, due 09/01/24 | | | 10,818,600 | |
| | | |
| | | 5,250,000 | | | Petkim Petrokimya Holding AS, Reg S, 5.88%, due 01/26/23 | | | 5,158,125 | |
| | | |
| | | 20,300,000 | | | Republic of Azerbaijan International Bond, Reg S, 5.13%, due 09/01/29 | | | 21,112,000 | |
| | | | | | | | | | |
| | | |
| | | | | | Total Azerbaijan | | | 37,088,725 | |
| | | | | | | | | | |
| | | | | | | | | | |
Par Value† | | | Description | | Value ($) | |
| | |
| | | | | | Bahamas — 0.8% | |
| | |
| | | | | | Sovereign and Sovereign Agency Issuers | |
| | | |
| | | 10,840,000 | | | Bahamas Government International Bond, Reg S, 6.00%, due 11/21/28 | | | 9,026,333 | |
| | | |
| | | 15,600,000 | | | Bahamas Government International Bond, Reg S, 8.95%, due 10/15/32 | | | 13,806,000 | |
| | | |
| | | 7,900,000 | | | Bahamas Government International Bond, Reg S, 7.13%, due 04/02/38 | | | 6,833,500 | |
| | | | | | | | | | |
| | | |
| | | | | | Total Bahamas | | | 29,665,833 | |
| | | | | | | | | | |
| | |
| | | | | | Bahrain — 1.9% | |
| | |
| | | | | | Sovereign and Sovereign Agency Issuers | |
| | | |
| | | 76,590,000 | | | Bahrain Government International Bond, Reg S, 7.50%, due 09/20/47 | | | 71,458,470 | |
| | | | | | | | | | |
| | |
| | | | | | Barbados — 0.4% | |
| | |
| | | | | | Sovereign and Sovereign Agency Issuers | |
| | | |
| | | 14,000,000 | | | Barbados Government International Bond, Reg S, 6.50%, due 10/01/29 | | | 13,748,875 | |
| | | | | | | | | | |
| | |
| | | | | | Belarus — 0.1% | |
| | |
| | | | | | Sovereign and Sovereign Agency Issuers | |
| | | |
| | | 8,304,000 | | | Development Bank of the Republic of Belarus JSC, Reg S, 6.75%, due 05/02/24 (c) | | | 1,245,600 | |
| | | |
| | | 20,300,000 | | | Republic of Belarus International Bond, Reg S, 6.20%, due 02/28/30 (c) | | | 3,045,000 | |
| | | | | | | | | | |
| | |
| | | Total Belarus | | | 4,290,600 | |
| | | | | | | | | | |
| | |
| | | | | | Bermuda — 0.2% | |
| | |
| | | | | | Sovereign and Sovereign Agency Issuers | |
| | | |
| | | 6,990,000 | | | Bermuda Government International Bond, Reg S, 4.75%, due 02/15/29 | | | 7,736,183 | |
| | | | | | | | | | |
| | |
| | | | | | Bolivia — 0.2% | |
| | |
| | | | | | Sovereign and Sovereign Agency Issuers | |
| | | |
| | | 9,200,000 | | | Bolivia Government International Bond, Reg S, 4.50%, due 03/20/28 (e) | | | 7,976,975 | |
| | | | | | | | | | |
| | |
| | | | | | Brazil — 3.0% | |
| | |
| | | | | | Corporate Debt — 0.6% | |
| | | |
| | | 24,870,548 | | | MV24 Capital BV, Reg S, 6.75%, due 06/01/34 | | | 24,093,343 | |
| | | | | | | | | | |
| |
| | | | Sovereign and Sovereign Agency Issuers — 2.4% | |
| | | |
| | | 59,639,000 | | | Petrobras Global Finance BV, 6.85%, due 06/05/2115 | | | 55,072,144 | |
| | | |
| | | 21,500,000 | | | Republic of Brazil, 4.75%, due 01/14/50 | | | 17,896,062 | |
| | | |
BRL | | | 75,100,000 | | | Rio Smart Lighting Sarl, Reg S, 12.25%, due 09/20/32 (f) | | | 14,618,712 | |
| | | | | | | | | | |
| | | |
| | | | | | | | | 87,586,918 | |
| | | | | | | | | | |
| | |
| | | Total Brazil | | | 111,680,261 | |
| | | | | | | | | | |
| | | | |
| | |
| | | See accompanying notes to the financial statements. | | 9 |
GMO Emerging Country Debt Fund
(A Series of GMO Trust)
Schedule of Investments — (Continued)
(showing percentage of total net assets)
February 28, 2022
| | | | | | | | | | |
Par Value† | | | Description | | Value ($) | |
| | |
| | | | | | Cameroon — 0.2% | |
| | |
| | | | | | Sovereign and Sovereign Agency Issuers | |
| | | |
EUR | | | 7,500,000 | | | Republic of Cameroon International Bond, Reg S, 5.95%, due 07/07/32 | | | 7,316,154 | |
| | | | | | | | | | |
| | |
| | | | | | Chile — 2.2% | |
| | |
| | | | | | Corporate Debt — 0.9% | |
| | | |
| | | 20,411,000 | | | Enel Generacion Chile SA, 8.13%, due 02/01/97 (a) | | | 20,629,398 | |
| | | |
| | | 17,048,994 | | | Inversiones Latin America Power Ltda, Reg S, 5.13%, due 06/15/33 | | | 14,612,053 | |
| | | | | | | | | | |
| | | |
| | | | | | | | | 35,241,451 | |
| | | | | | | | | | |
| |
| | | | Sovereign and Sovereign Agency Issuers — 1.3% | |
| | | |
| | | 2,200,000 | | | Chile Government International Bond, 3.50%, due 01/31/34 | | | 2,171,400 | |
| | | |
| | | 7,500,000 | | | Chile Government International Bond, 3.10%, due 05/07/41 | | | 6,581,250 | |
| | | |
| | | 3,700,000 | | | Chile Government International Bond, 4.00%, due 01/31/52 | | | 3,614,900 | |
| | | |
| | | 8,100,000 | | | Empresa Nacional del Petroleo, Reg S, 5.25%, due 11/06/29 | | | 8,404,560 | |
| | | |
| | | 5,300,000 | | | Empresa Nacional del Petroleo, Reg S, 3.45%, due 09/16/31 | | | 4,848,440 | |
| | | |
| | | 25,250,000 | | | Empresa Nacional del Petroleo, Reg S, 4.50%, due 09/14/47 | | | 21,406,950 | |
| | | | | | | | | | |
| | | |
| | | | | | | | | 47,027,500 | |
| | | | | | | | | | |
| | |
| | | Total Chile | | | 82,268,951 | |
| | | | | | | | | | |
| | |
| | | | | | China — 0.9% | |
| | |
| | | | | | Corporate Debt — 0.3% | |
| | | |
| | | 11,200,000 | | | China Evergrande Group, Reg S, 11.50%, due 01/22/23 (d) | | | 1,624,000 | |
| | | |
| | | 14,300,000 | | | China Evergrande Group, Reg S, 12.00%, due 01/22/24 (d) | | | 2,073,500 | |
| | | |
| | | 7,500,000 | | | China Evergrande Group, Reg S, 10.50%, due 04/11/24 (d) | | | 1,087,500 | |
| | | |
| | | 7,500,000 | | | CNAC HK Finbridge Co., Ltd., Reg S, 3.00%, due 09/22/30 | | | 7,144,425 | |
| | | |
| | | 6,100,000 | | | Scenery Journey Ltd., Reg S, 11.50%, due 10/24/22 (d) | | | 579,500 | |
| | | |
| | | 2,100,000 | | | Scenery Journey Ltd., Reg S, 13.00%, due 11/06/22 (d) | | | 204,750 | |
| | | |
| | | 3,600,000 | | | Scenery Journey Ltd., Reg S, 12.00%, due 10/24/23 (d) | | | 342,000 | |
| | | |
| | | 4,100,000 | | | Scenery Journey Ltd., Reg S, 13.75%, due 11/06/23 (d) | | | 378,738 | |
| | | | | | | | | | |
| | | |
| | | | | | | | | 13,434,413 | |
| | | | | | | | | | |
| |
| | | | Sovereign and Sovereign Agency Issuers — 0.6% | |
| | | |
| | | 14,200,000 | | | Lamar Funding Ltd., Reg S, 3.96%, due 05/07/25 | | | 13,905,350 | |
| | | |
| | | 7,300,000 | | | Oryx Funding Ltd., Reg S, 5.80%, due 02/03/31 | | | 7,382,125 | |
| | | | | | | | | | |
| | | |
| | | | | | | | | 21,287,475 | |
| | | | | | | | | | |
| | |
| | | Total China | | | 34,721,888 | |
| | | | | | | | | | |
| | | | | | | | | | |
Par Value† | | | Description | | Value ($) | |
| | |
| | | | | | Colombia — 3.1% | |
| | |
| | | | | | Corporate Debt — 0.2% | |
| | | |
COP | | | 26,700,000,000 | | | PA Autopista Rio Magdalena, Reg S, 6.05%, due 06/15/36 | | | 6,205,352 | |
| | | | | | | | | | |
| |
| | | | Sovereign and Sovereign Agency Issuers — 2.9% | |
| | | |
| | | 647,000 | | | Colombia Government International Bond, 8.38%, due 02/15/27 (a) | | | 706,406 | |
| | | |
| | | 745,000 | | | Colombia Government International Bond, 8.38%, due 02/15/27 (a) | | | 813,405 | |
| | | |
| | | 3,800,000 | | | Colombia Government International Bond, 11.85%, due 03/09/28 (a) | | | 4,844,566 | |
| | | |
| | | 26,100,000 | | | Colombia Government International Bond, 6.13%, due 01/18/41 | | | 25,158,769 | |
| | | |
| | | 38,400,000 | | | Colombia Government International Bond, 5.63%, due 02/26/44 | | | 34,447,200 | |
| | | |
| | | 7,600,000 | | | Colombia Government International Bond, 5.20%, due 05/15/49 | | | 6,399,675 | |
| | | |
| | | 25,611,000 | | | Ecopetrol SA, 7.38%, due 09/18/43 | | | 25,329,279 | |
| | | |
| | | 6,400,000 | | | Ecopetrol SA, 5.88%, due 11/02/51 | | | 5,367,680 | |
| | | |
COP | | | 30,200,000,000 | | | Empresas Publicas de Medellin ESP, Reg S, 8.38%, due 11/08/27 | | | 6,966,050 | |
| | | | | | | | | | |
| | | |
| | | | | | | | | 110,033,030 | |
| | | | | | | | | | |
| | |
| | | Total Colombia | | | 116,238,382 | |
| | | | | | | | | | |
| | |
| | | | | | Congo Republic (Brazzaville) — 1.2% | |
| | |
| | | | | | Sovereign and Sovereign Agency Issuers | |
| | | |
| | | 56,645,261 | | | Republic of Congo, Reg S, Step Up, 6.00%, due 06/30/29 (c) | | | 45,316,208 | |
| | | | | | | | | | |
| | |
| | | | | | Costa Rica — 1.0% | |
| | |
| | | | | | Sovereign and Sovereign Agency Issuers | |
| | | |
| | | 29,931,000 | | | Costa Rica Government International Bond, Reg S, 7.16%, due 03/12/45 | | | 29,094,803 | |
| | | |
| | | 9,198,000 | | | Instituto Costarricense de Electricidad, Reg S, 6.38%, due 05/15/43 | | | 7,526,838 | |
| | | | | | | | | | |
| | |
| | | Total Costa Rica | | | 36,621,641 | |
| | | | | | | | | | |
| | |
| | | | | | Czech Republic — 0.2% | |
| | |
| | | | | | Sovereign and Sovereign Agency Issuers | |
| | | |
| | | 5,458,000 | | | CEZ AS, Reg S, 5.63%, due 04/03/42 | | | 6,443,312 | |
| | | | | | | | | | |
| | |
| | | | | | Dominican Republic — 2.3% | |
| | |
| | | | | | Sovereign and Sovereign Agency Issuers | |
| | | |
| | | 7,400,000 | | | Dominican Republic International Bond, 144A, 6.00%, due 02/22/33 | | | 7,271,887 | |
| | | |
| | | 4,100,000 | | | Dominican Republic International Bond, Reg S, 5.30%, due 01/21/41 | | | 3,516,519 | |
| | | |
| | | 89,629,000 | | | Dominican Republic International Bond, Reg S, 5.88%, due 01/30/60 | | | 75,473,220 | |
| | | | | | | | | | |
| | |
| | | Total Dominican Republic | | | 86,261,626 | |
| | | | | | | | | | |
| | | | |
| | |
| 10 | | See accompanying notes to the financial statements. | | |
GMO Emerging Country Debt Fund
(A Series of GMO Trust)
Schedule of Investments — (Continued)
(showing percentage of total net assets)
February 28, 2022
| | | | | | | | | | |
Par Value† | | | Description | | Value ($) | |
| | |
| | | | | | Ecuador — 3.7% | |
| | |
| | | | | | Sovereign and Sovereign Agency Issuers | |
| | | |
| | | 1,000,000 | | | Ecuador Government International Bond, 5.00%, due 02/28/25 (c) | | | 900,000 | |
| | | |
| | | 18,576,250 | | | Ecuador Government International Bond, Reg S, Step Up, 5.00%, due 07/31/30 | | | 16,309,948 | |
| | | |
| | | 112,987,125 | | | Ecuador Government International Bond, Reg S, Step Up, 1.00%, due 07/31/35 | | | 79,535,874 | |
| | | |
| | | 36,603,750 | | | Ecuador Government International Bond, Reg S, Step Up, 0.50%, due 07/31/40 | | | 22,643,995 | |
| | | |
| | | 8,246,892 | | | Ecuador Government International Bond, Zero Coupon, Reg S, due 07/31/30 | | | 4,851,750 | |
| | | |
| | | 14,607,300 | | | Ecuador Social Bond Sarl, Zero Coupon, Reg S, due 01/30/35 | | | 11,768,006 | |
| | | | | | | | | | |
| | |
| | | Total Ecuador | | | 136,009,573 | |
| | | | | | | | | | |
| | |
| | | | | | Egypt — 2.0% | |
| | |
| | | | | | Sovereign and Sovereign Agency Issuers | |
| | | |
| | | 23,500,000 | | | Egypt Government International Bond, Reg S, 8.70%, due 03/01/49 | | | 18,388,750 | |
| | | |
| | | 22,800,000 | | | Egypt Government International Bond, Reg S, 8.88%, due 05/29/50 | | | 17,955,000 | |
| | | |
| | | 11,200,000 | | | Egypt Government International Bond, Reg S, 8.75%, due 09/30/51 | | | 8,736,000 | |
| | | |
| | | 38,364,000 | | | Egypt Government International Bond, Reg S, 8.15%, due 11/20/59 | | | 28,773,000 | |
| | | | | | | | | | |
| | | |
| | | | | | Total Egypt | | | 73,852,750 | |
| | | | | | | | | | |
| | |
| | | | | | El Salvador — 0.6% | |
| | |
| | | | | | Sovereign and Sovereign Agency Issuers | |
| | | |
| | | 5,300,000 | | | El Salvador Government International Bond, Reg S, 8.25%, due 04/10/32 | | | 2,962,369 | |
| | | |
| | | 7,775,000 | | | El Salvador Government International Bond, Reg S, 7.65%, due 06/15/35 | | | 4,044,458 | |
| | | |
| | | 32,900,000 | | | El Salvador Government International Bond, Reg S, 7.12%, due 01/20/50 | | | 16,055,200 | |
| | | | | | | | | | |
| | | |
| | | | | | Total El Salvador | | | 23,062,027 | |
| | | | | | | | | | |
| | |
| | | | | | Ethiopia — 0.1% | |
| | |
| | | | | | Sovereign and Sovereign Agency Issuers | |
| | | |
| | | 4,090,000 | | | Ethiopia International Bond, Reg S, 6.63%, due 12/11/24 | | | 3,051,651 | |
| | | | | | | | | | |
| | |
| | | | | | Gabon — 0.3% | |
| | |
| | | | | | Sovereign and Sovereign Agency Issuers | |
| | | |
| | | 13,300,000 | | | Gabon Government International Bond, Reg S, 6.63%, due 02/06/31 | | | 12,093,025 | |
| | | | | | | | | | |
| | |
| | | | | | Ghana — 1.5% | |
| | |
| | | | | | Sovereign and Sovereign Agency Issuers | |
| | | |
| | | 5,000,000 | | | Republic of Ghana, Reg S, 8.63%, due 04/07/34 | | | 3,312,500 | |
| | | |
| | | 5,900,000 | | | Republic of Ghana, Reg S, 8.63%, due 06/16/49 | | | 3,820,250 | |
| | | | | | | | | | |
Par Value† | | | Description | | Value ($) | |
| | |
| | | | | | Ghana — continued | |
| | |
| | | | | | Sovereign and Sovereign Agency
Issuers — continued | |
| | | |
| | | 30,000,000 | | | Republic of Ghana, Reg S, 8.95%, due 03/26/51 | | | 19,500,000 | |
| | | |
| | | 28,500,000 | | | Republic of Ghana, Reg S, 8.75%, due 03/11/61 | | | 18,453,750 | |
| | | |
| | | 10,444,727 | | | Saderea DAC, Reg S, 12.50%, due 11/30/26 | | | 9,609,149 | |
| | | | | | | | | | |
| | | |
| | | | | | Total Ghana | | | 54,695,649 | |
| | | | | | | | | | |
| | |
| | | | | | Grenada — 0.2% | |
| | |
| | | | | | Sovereign and Sovereign Agency Issuers | |
| | | |
| | | 9,776,063 | | | Grenada Government International Bond, Reg S, 7.00%, due 05/12/30 | | | 8,700,696 | |
| | | | | | | | | | |
| | |
| | | | | | Guatemala — 0.6% | |
| | |
| | | | | | Sovereign and Sovereign Agency Issuers | |
| | | |
| | | 4,815,000 | | | Republic of Guatemala, Reg S, 8.13%, due 10/06/34 | | | 5,898,375 | |
| | | |
| | | 2,000,000 | | | Republic of Guatemala, Reg S, 4.65%, due 10/07/41 | | | 1,819,125 | |
| | | |
| | | 15,200,000 | | | Republic of Guatemala, Reg S, 6.13%, due 06/01/50 | | | 15,497,350 | |
| | | | | | | | | | |
| | | |
| | | | | | Total Guatemala | | | 23,214,850 | |
| | | | | | | | | | |
| | |
| | | | | | Honduras — 0.4% | |
| | |
| | | | | | Sovereign and Sovereign Agency Issuers | |
| | | |
| | | 17,300,000 | | | Honduras Government International Bond, Reg S, 5.63%, due 06/24/30 | | | 14,946,119 | |
| | | | | | | | | | |
| | |
| | | | | | Hungary — 0.3% | |
| | |
| | | | | | Sovereign and Sovereign Agency Issuers | |
| | | |
| | | 11,300,000 | | | Hungary Government International Bond, Reg S, 3.13%, due 09/21/51 | | | 9,296,369 | |
| | | | | | | | | | |
| | |
| | | | | | India — 1.6% | |
| | |
| | | | | | Corporate Debt | |
| | | |
| | | 29,700,000 | | | Delhi International Airport Ltd., Reg S, 6.45%, due 06/04/29 | | | 27,769,500 | |
| | | |
| | | 1,000,000 | | | GMR Hyderabad International Airport Ltd., Reg S, 4.75%, due 02/02/26 | | | 964,250 | |
| | | |
| | | 21,140,000 | | | GMR Hyderabad International Airport Ltd., Reg S, 4.25%, due 10/27/27 | | | 19,465,976 | |
| | | |
| | | 10,750,000 | | | India Airport Infra, Reg S, 6.25%, due 10/25/25 | | | 10,320,000 | |
| | | | | | | | | | |
| | | |
| | | | | | Total India | | | 58,519,726 | |
| | | | | | | | | | |
| | |
| | | | | | Indonesia — 3.7% | |
| | |
| | | | | | Sovereign and Sovereign Agency Issuers | |
| | | |
| | | 9,200,000 | | | Hutama Karya Persero PT, Reg S, 3.75%, due 05/11/30 | | | 9,276,475 | |
| | | |
| | | 3,700,000 | | | Indonesia Asahan Aluminium Persero PT, Reg S, 5.45%, due 05/15/30 | | | 3,909,975 | |
| | | |
| | | 20,900,000 | | | Indonesia Asahan Aluminium Persero PT, Reg S, 5.80%, due 05/15/50 | | | 21,145,575 | |
| | | | |
| | |
| | | See accompanying notes to the financial statements. | | 11 |
GMO Emerging Country Debt Fund
(A Series of GMO Trust)
Schedule of Investments — (Continued)
(showing percentage of total net assets)
February 28, 2022
| | | | | | | | | | |
Par Value† | | | Description | | Value ($) | |
| | |
| | | | | | Indonesia — continued | |
| | |
| | | | | | Sovereign and Sovereign Agency
Issuers — continued | |
| | | |
| | | 8,091,000 | | | Indonesia Government International Bond, Reg S, 6.63%, due 02/17/37 | | | 10,206,291 | |
| | | |
| | | 11,900,000 | | | Minejesa Capital BV, Reg S, 5.63%, due 08/10/37 | | | 11,229,138 | |
| | | |
| | | 11,300,000 | | | Pertamina Persero PT, Reg S, 6.50%, due 05/27/41 | | | 13,226,650 | |
| | | |
| | | 8,200,000 | | | Pertamina Persero PT, Reg S, 4.15%, due 02/25/60 | | | 7,232,913 | |
| | | |
| | | 4,100,000 | | | Perusahaan Listrik Negara PT, Reg S, 6.15%, due 05/21/48 | | | 4,503,081 | |
| | | |
| | | 14,200,000 | | | Perusahaan Listrik Negara PT, Reg S, 6.25%, due 01/25/49 | | | 15,902,225 | |
| | | |
| | | 43,900,000 | | | Saka Energi Indonesia PT, Reg S, 4.45%, due 05/05/24 | | | 42,467,762 | |
| | | | | | | | | | |
| | |
| | | Total Indonesia | | | 139,100,085 | |
| | | | | | | | | | |
| | |
| | | | | | Israel — 0.5% | |
| | |
| | | | | | Sovereign and Sovereign Agency Issuers | |
| | | |
| | | 13,183,000 | | | Israel Electric Corp., Ltd., Reg S, 8.10%, due 12/15/96 | | | 19,352,863 | |
| | | | | | | | | | |
| | |
| | | | | | Ivory Coast — 0.8% | |
| | |
| | | | | | Sovereign and Sovereign Agency Issuers | |
| | | |
EUR | | | 29,000,000 | | | Ivory Coast Government International Bond, Reg S, 6.63%, due 03/22/48 | | | 27,756,676 | |
| | | | | | | | | | |
| | |
| | | | | | Jamaica — 0.9% | |
| | |
| | | | | | Corporate Debt — 0.2% | |
| | | |
| | | 6,471,979 | | | TransJamaican Highway Ltd., Reg S, 5.75%, due 10/10/36 | | | 6,390,270 | |
| | | | | | | | | | |
| |
| | | | Sovereign and Sovereign Agency Issuers — 0.7% | |
| | | |
| | | 9,375,000 | | | Jamaica Government International Bond, 7.88%, due 07/28/45 | | | 12,256,641 | |
| | | |
| | | 11,400,000 | | | National Road Operating & Construction Co., Ltd., Reg S, 9.38%, due 11/10/24 (c) | | | 13,110,000 | |
| | | | | | | | | | |
| | | |
| | | | | | | | | 25,366,641 | |
| | | | | | | | | | |
| | |
| | | Total Jamaica | | | 31,756,911 | |
| | | | | | | | | | |
| | |
| | | | | | Jordan — 1.2% | |
| | |
| | | | | | Sovereign and Sovereign Agency Issuers | |
| | | |
| | | 49,895,000 | | | Jordan Government International Bond, Reg S, 7.38%, due 10/10/47 | | | 45,257,883 | |
| | | | | | | | | | |
| | |
| | | | | | Kazakhstan — 1.0% | |
| | |
| | | | | | Sovereign and Sovereign Agency Issuers | |
| | | |
| | | 9,000,000 | | | Kazakhstan Temir Zholy Finance BV, Reg S, 6.95%, due 07/10/42 | | | 10,767,938 | |
| | | |
| | | 3,800,000 | | | KazMunayGas National Co JSC, Reg S, 5.75%, due 04/19/47 | | | 3,895,000 | |
| | | |
| | | 19,900,000 | | | KazMunayGas National Co JSC, Reg S, 6.38%, due 10/24/48 | | | 21,691,000 | |
| | | | | | | | | | |
| | |
| | | Total Kazakhstan | | | 36,353,938 | |
| | | | | | | | | | |
| | | | | | | | | | |
Par Value† | | | Description | | Value ($) | |
| | |
| | | | | | Kenya — 0.7% | |
| | |
| | | | | | Sovereign and Sovereign Agency Issuers | |
| | | |
| | | 30,400,000 | | | Kenya Government International Bond, Reg S, 8.25%, due 02/28/48 | | | 26,296,000 | |
| | | | | | | | | | |
| | |
| | | | | | Kuwait — 0.1% | |
| | |
| | | | | | Corporate Debt | |
| | | |
| | | 4,100,000 | | | Equate Petrochemical BV, Reg S, 2.63%, due 04/28/28 | | | 3,878,190 | |
| | | | | | | | | | |
| | |
| | | | | | Lebanon — 0.5% | |
| | |
| | | | | | Sovereign and Sovereign Agency Issuers | |
| | | |
| | | 20,400,000 | | | Lebanon Government International Bond, Reg S, 6.85%, due 03/23/27 (d) | | | 2,397,000 | |
| | | |
| | | 5,547,000 | | | Lebanon Government International Bond, Reg S, 7.00%, due 03/20/28 (d) | | | 596,302 | |
| | | |
| | | 60,605,000 | | | Lebanon Government International Bond, Reg S, 7.15%, due 11/20/31 (d) | | | 6,590,794 | |
| | | |
| | | 21,000,000 | | | Lebanon Government International Bond, 8.20%, due 05/17/33 (d) | | | 2,257,500 | |
| | | |
| | | 56,914,000 | | | Lebanon Government International Bond, 8.25%, due 05/17/34 (d) | | | 6,118,255 | |
| | | | | | | | | | |
| | |
| | | Total Lebanon | | | 17,959,851 | |
| | | | | | | | | | |
| | |
| | | | | | Malaysia — 1.0% | |
| | |
| | | | | | Sovereign and Sovereign Agency Issuers | |
| | | |
| | | 16,700,000 | | | 1MDB Global Investments Ltd., Reg S, 4.40%, due 03/09/23 | | | 16,249,100 | |
| | | |
| | | 6,000,000 | | | Dua Capital Ltd, Reg S, 2.78%, due 05/11/31 | | | 5,695,200 | |
| | | |
| | | 8,400,000 | | | Petronas Capital Ltd, Reg S, 4.80%, due 04/21/60 | | | 9,806,160 | |
| | | |
| | | 4,200,000 | | | Petronas Capital Ltd, Reg S, 3.40%, due 04/28/61 | | | 3,722,796 | |
| | | | | | | | | | |
| | |
| | | Total Malaysia | | | 35,473,256 | |
| | | | | | | | | | |
| | |
| | | | | | Mexico — 6.3% | |
| | |
| | | | | | Sovereign and Sovereign Agency Issuers | |
| | | |
| | | 27,884,000 | | | Petroleos Mexicanos, 6.35%, due 02/12/48 | | | 22,298,556 | |
| | | |
| | | 6,400,000 | | | Petroleos Mexicanos, Reg S, 6.63%, due 09/29/49 | | | 5,036,800 | |
| | | |
| | | 126,800,000 | | | Petroleos Mexicanos, 7.69%, due 01/23/50 | | | 113,486,000 | |
| | | |
| | | 23,486,000 | | | Petroleos Mexicanos, 6.95%, due 01/28/60 | | | 19,390,041 | |
| | | |
GBP | | | 56,096,000 | | | United Mexican States, 5.63%, due 03/19/2114 | | | 74,876,542 | |
| | | | | | | | | | |
| | |
| | | Total Mexico | | | 235,087,939 | |
| | | | | | | | | | |
| | |
| | | | | | Mongolia — 0.1% | |
| | |
| | | | | | Sovereign and Sovereign Agency Issuers | |
| | | |
| | | 3,700,000 | | | Mongolia Government International Bond, Reg S, 4.45%, due 07/07/31 | | | 3,321,157 | |
| | | | | | | | | | |
| | | | |
| | |
| 12 | | See accompanying notes to the financial statements. | | |
GMO Emerging Country Debt Fund
(A Series of GMO Trust)
Schedule of Investments — (Continued)
(showing percentage of total net assets)
February 28, 2022
| | | | | | | | | | |
Par Value† | | | Description | | Value ($) | |
| | |
| | | | | | Montenegro — 0.2% | |
| | |
| | | | | | Sovereign and Sovereign Agency Issuers | |
| | | |
EUR | | | 8,100,000 | | | Montenegro Government International Bond, 144A, 2.88%, due 12/16/27 | | | 8,014,973 | |
| | | | | | | | | | |
| | |
| | | | | | Morocco — 0.5% | |
| | |
| | | | | | Sovereign and Sovereign Agency Issuers | |
| | | |
| | | 11,300,000 | | | Office Cherifien des Phosphates SA, Reg S, 6.88%, due 04/25/44 | | | 11,376,275 | |
| | | |
| | | 10,500,000 | | | Office Cherifien des Phosphates SA, Reg S, 5.13%, due 06/23/51 | | | 8,465,625 | |
| | | | | | | | | | |
| | |
| | | Total Morocco | | | 19,841,900 | |
| | | | | | | | | | |
| | |
| | | | | | Mozambique — 0.2% | |
| | |
| | | | | | Sovereign and Sovereign Agency Issuers | |
| | | |
| | | 9,276,000 | | | Mozambique International Bond, Reg S, Step Up, 5.00%, due 09/15/31 | | | 7,947,213 | |
| | | | | | | | | | |
| | |
| | | | | | Nigeria — 1.0% | |
| | |
| | | | | | Sovereign and Sovereign Agency Issuers | |
| | | |
| | | 10,700,000 | | | Nigeria Government International Bond, Reg S, 7.70%, due 02/23/38 | | | 9,041,500 | |
| | | |
| | | 15,550,000 | | | Nigeria Government International Bond, Reg S, 7.63%, due 11/28/47 | | | 12,556,625 | |
| | | |
| | | 7,600,000 | | | Nigeria Government International Bond, Reg S, 9.25%, due 01/21/49 | | | 7,125,000 | |
| | | |
| | | 11,300,000 | | | Nigeria Government International Bond, Reg S, 8.25%, due 09/28/51 | | | 9,689,750 | |
| | | | | | | | | | |
| | |
| | | Total Nigeria | | | 38,412,875 | |
| | | | | | | | | | |
| | |
| | | | | | Oman — 2.7% | |
| | |
| | | | | | Sovereign and Sovereign Agency Issuers | |
| | | |
| | | 4,600,000 | | | Oman Government International Bond, Reg S, 6.50%, due 03/08/47 | | | 4,278,000 | |
| | | |
| | | 96,800,000 | | | Oman Government International Bond, Reg S, 6.75%, due 01/17/48 | | | 92,202,000 | |
| | | |
| | | 5,400,000 | | | Oman Government International Bond, Reg S, 7.00%, due 01/25/51 | | | 5,319,000 | |
| | | | | | | | | | |
| | |
| | | Total Oman | | | 101,799,000 | |
| | | | | | | | | | |
| | | |
| | | | | | Pakistan — 0.3% | | | |
| | |
| | | | | | Sovereign and Sovereign Agency Issuers | |
| | | |
| | | 14,762,000 | | | Islamic Republic of Pakistan, Reg S, 7.88%, due 03/31/36 | | | 12,227,549 | |
| | | | | | | | | | |
| | |
| | | | | | Panama — 1.9% | |
| | |
| | | | | | Sovereign and Sovereign Agency Issuers | |
| | | |
| | | 26,200,000 | | | Aeropuerto Internacional de Tocumen SA, Reg S, 5.13%, due 08/11/61 | | | 23,781,412 | |
| | | |
| | | 12,651,000 | | | Panama Government International Bond, 8.13%, due 04/28/34 | | | 18,007,908 | |
| | | |
| | | 16,800,000 | | | Panama Government International Bond, 4.50%, due 04/01/56 | | | 16,120,650 | |
| | | |
| | | 12,600,000 | | | Panama Government International Bond, 4.50%, due 01/19/63 | | | 11,831,400 | |
| | | | | | | | | | |
| | |
| | | Total Panama | | | 69,741,370 | |
| | | | | | | | | | |
| | | | | | | | | | |
Par Value† | | | Description | | Value ($) | |
| | |
| | | | | | Papua New Guinea — 0.0% | |
| | |
| | | | | | Sovereign and Sovereign Agency Issuers | |
| | | |
| | | 1,400,000 | | | Papua New Guinea Government International Bond, Reg S, 8.38%, due 10/04/28 | | | 1,260,154 | |
| | | | | | | | | | |
| | |
| | | | | | Peru — 2.4% | |
| | |
| | | | | | Sovereign and Sovereign Agency Issuers | |
| | | |
PEN | | | 52,700,000 | | | Peru Government Bond, 6.15%, due 08/12/32 | | | 13,741,817 | |
| | | |
| | | 16,100,000 | | | Peruvian Government International Bond, 3.60%, due 01/15/72 | | | 13,403,250 | |
| | | |
| | | 26,700,000 | | | Peruvian Government International Bond, 3.23%, due 07/28/2121 | | | 19,704,600 | |
| | | |
| | | 48,595,000 | | | Petroleos del Peru SA, Reg S, 5.63%, due 06/19/47 | | | 42,574,079 | |
| | | | | | | | | | |
| | |
| | | Total Peru | | | 89,423,746 | |
| | | | | | | | | | |
| | |
| | | | | | Philippines — 1.9% | |
| | |
| | | | | | Sovereign and Sovereign Agency Issuers | |
| | | |
| | | 4,700,000 | | | Bangko Sentral ng Pilipinas Bond, 8.60%, due 06/15/97 (c) | | | 7,614,000 | |
| | | |
| | | 13,500,000 | | | Philippine Government International Bond, 3.20%, due 07/06/46 | | | 11,915,235 | |
| | | |
| | | 40,012,000 | | | Power Sector Assets & Liabilities Management Corp, 9.63%, due 05/15/28 | | | 52,685,801 | |
| | | | | | | | | | |
| | |
| | | Total Philippines | | | 72,215,036 | |
| | | | | | | | | | |
| | |
| | | | | | Qatar — 0.4% | |
| | |
| | | | | | Sovereign and Sovereign Agency Issuers | |
| | | |
| | | 13,378,000 | | | QNB Finansbank AS, Reg S, 6.88%, due 09/07/24 | | | 13,907,267 | |
| | | | | | | | | | |
| | |
| | | | | | Republic of North Macedonia — 0.2% | |
| | |
| | | | | | Sovereign and Sovereign Agency Issuers | |
| | | |
EUR | | | 7,800,000 | | | North Macedonia Government International Bond, Reg S, 1.63%, due 03/10/28 | | | 7,652,529 | |
| | | | | | | | | | |
| | | |
| | | | | | Romania — 0.7% | | | |
| | |
| | | | | | Sovereign and Sovereign Agency Issuers | |
| | | |
EUR | | | 11,300,000 | | | Romanian Government International Bond, Reg S, 4.63%, due 04/03/49 | | | 11,862,401 | |
| | | |
EUR | | | 18,300,000 | | | Romanian Government International Bond, Reg S, 3.38%, due 01/28/50 | | | 15,594,341 | |
| | | | | | | | | | |
| | |
| | | Total Romania | | | 27,456,742 | |
| | | | | | | | | | |
| | |
| | | | | | Russia — 0.8% | |
| | |
| | | | | | Sovereign and Sovereign Agency Issuers | |
| | | |
| | | 21,870,000 | | | GTLK Europe Capital DAC, Reg S, 4.65%, due 03/10/27 (c) | | | 4,374,000 | |
| | | |
| | | 5,200,000 | | | GTLK Europe Capital DAC, Reg S, 4.80%, due 02/26/28 (c) | | | 1,040,000 | |
| | | | |
| | |
| | | See accompanying notes to the financial statements. | | 13 |
GMO Emerging Country Debt Fund
(A Series of GMO Trust)
Schedule of Investments — (Continued)
(showing percentage of total net assets)
February 28, 2022
| | | | | | | | | | |
Par Value† | | | Description | | Value ($) | |
| | |
| | | | | | Russia — continued | |
| | |
| | | | | | Sovereign and Sovereign Agency
Issuers — continued | |
| | | |
| | | 6,800,000 | | | GTLK Europe Capital DAC, Reg S, 4.35%, due 02/27/29 (c) | | | 1,360,000 | |
| | | |
| | | 34,000,000 | | | Russian Foreign Bond, 144A, 5.10%, due 03/28/35 (c) | | | 10,200,000 | |
| | | |
| | | 6,400,000 | | | Russian Foreign Bond, Reg S, 5.10%, due 03/28/35 (c) | | | 1,920,000 | |
| | | |
| | | 4,000,000 | | | Russian Foreign Bond, Reg S, 5.63%, due 04/04/42 (c) | | | 1,200,000 | |
| | | |
| | | 33,200,000 | | | Russian Foreign Bond, Reg S, 5.25%, due 06/23/47 (c) | | | 9,960,000 | |
| | | | | | | | | | |
| | |
| | | Total Russia | | | 30,054,000 | |
| | | | | | | | | | |
| | |
| | | | | | Saudi Arabia — 3.2% | |
| | |
| | | | | | Corporate Debt — 1.0% | |
| | | |
| | | 23,704,875 | | | ACWA Power Management And Investments One Ltd., Reg S, 5.95%, due 12/15/39 | | | 25,605,710 | |
| | | |
| | | 11,100,000 | | | EIG Pearl Holdings Sarl, 144A, 4.39%, due 11/30/46 | | | 10,807,515 | |
| | | | | | | | | | |
| | | |
| | | | | | | | | 36,413,225 | |
| | | | | | | | | | |
| |
| | | | Sovereign and Sovereign Agency Issuers — 2.2% | |
| | | |
| | | 1,600,000 | | | Saudi Government International Bond, Reg S, 3.75%, due 01/21/55 | | | 1,554,000 | |
| | | |
| | | 90,500,000 | | | Saudi Government International Bond, Reg S, 3.45%, due 02/02/61 | | | 82,468,125 | |
| | | | | | | | | | |
| | | |
| | | | | | | | | 84,022,125 | |
| | | | | | | | | | |
| | |
| | | Total Saudi Arabia | | | 120,435,350 | |
| | | | | | | | | | |
| | |
| | | | | | Senegal — 0.2% | |
| | |
| | | | | | Sovereign and Sovereign Agency Issuers | |
| | | |
| | | 8,800,000 | | | Senegal Government International Bond, Reg S, 6.75%, due 03/13/48 | | | 7,404,650 | |
| | | | | | | | | | |
| | |
| | | | | | Serbia — 0.3% | |
| | |
| | | | | | Sovereign and Sovereign Agency Issuers | |
| | | |
EUR | | | 14,500,000 | | | Serbia International Bond, Reg S, 2.05%, due 09/23/36 | | | 11,827,783 | |
| | | | | | | | | | |
| | |
| | | | | | South Africa — 3.7% | |
| | |
| | | | | | Sovereign and Sovereign Agency Issuers | |
| | | |
| | | 11,720,000 | | | Eskom Holdings SOC, Ltd., Reg S, 7.13%, due 02/11/25 | | | 11,473,147 | |
| | | |
| | | 15,300,000 | | | Eskom Holdings SOC, Ltd., Reg S, 8.45%, due 08/10/28 | | | 15,245,494 | |
| | | |
ZAR | | | 203,950,000 | | | Eskom Holdings SOC, Ltd., Zero Coupon, due 12/31/32 | | | 2,806,124 | |
| | | |
ZAR | | | 543,600,000 | | | Republic of South Africa Government International Bond, 6.50%, due 02/28/41 | | | 23,582,378 | |
| | | |
| | | 6,800,000 | | | Republic of South Africa Government International Bond, 6.30%, due 06/22/48 | | | 6,346,525 | |
| | | |
| | | 86,600,000 | | | Republic of South Africa Government International Bond, 5.75%, due 09/30/49 | | | 74,573,425 | |
| | | | | | | | | | |
Par Value† | | | Description | | Value ($) | |
| | |
| | | | | | South Africa — continued | |
| | |
| | | | | | Sovereign and Sovereign Agency
Issuers — continued | |
| | | |
ZAR | | | 27,300,000 | | | Transnet SOC, Ltd., 13.50%, due 04/18/28 | | | 2,097,748 | |
| | | | | | | | | | |
| | | |
| | | | | | Total South Africa | | | 136,124,841 | |
| | | | | | | | | | |
| | |
| | | | | | Sri Lanka — 1.1% | |
| | |
| | | | | | Sovereign and Sovereign Agency Issuers | |
| | | |
| | | 7,280,000 | | | Sri Lanka Government International Bond, Reg S, 6.83%, due 07/18/26 | | | 3,397,940 | |
| | | |
| | | 11,644,000 | | | Sri Lanka Government International Bond, Reg S, 6.20%, due 05/11/27 | | | 5,182,861 | |
| | | |
| | | 34,500,000 | | | Sri Lanka Government International Bond, Reg S, 6.75%, due 04/18/28 | | | 15,208,031 | |
| | | |
| | | 8,800,000 | | | Sri Lanka Government International Bond, Reg S, 7.85%, due 03/14/29 | | | 3,881,900 | |
| | | |
| | | 30,100,000 | | | Sri Lanka Government International Bond, Reg S, 7.55%, due 03/28/30 | | | 13,202,613 | |
| | | | | | | | | | |
| | | |
| | | | | | Total Sri Lanka | | | 40,873,345 | |
| | | | | | | | | | |
| | |
| | | | | | SupraNational — 0.3% | |
| | |
| | | | | | Sovereign and Sovereign Agency Issuers | |
| | | |
TRY | | | 263,000,000 | | | International Finance Corp., Zero Coupon, Reg S, due 02/15/29 | | | 4,370,586 | |
| | | |
BRL | | | 225,000,000 | | | International Finance Corp., Zero Coupon, due 02/25/41 | | | 7,420,366 | |
| | | | | | | | | | |
| | | |
| | | | | | Total SupraNational | | | 11,790,952 | |
| | | | | | | | | | |
| | |
| | | | | | Suriname — 0.6% | |
| | |
| | | | | | Sovereign and Sovereign Agency Issuers | |
| | | |
| | | 14,000,000 | | | Republic of Suriname, Reg S, 12.88%, due 12/30/23 (d) | | | 9,940,000 | |
| | | |
| | | 17,559,000 | | | Republic of Suriname, Reg S, 9.25%, due 10/26/26 (d) | | | 12,634,798 | |
| | | | | | | | | | |
| | | |
| | | | | | Total Suriname | | | 22,574,798 | |
| | | | | | | | | | |
| | |
| | | | | | Tajikistan — 0.3% | |
| | |
| | | | | | Sovereign and Sovereign Agency Issuers | |
| | | |
| | | 11,374,000 | | | Republic of Tajikistan International Bond, Reg S, 7.13%, due 09/14/27 | | | 9,861,969 | |
| | | | | | | | | | |
| | |
| | | | | | Trinidad And Tobago — 1.2% | |
| | |
| | | | | | Sovereign and Sovereign Agency Issuers | |
| | | |
| | | 9,800,000 | | | Telecommunications Services of Trinidad & Tobago Ltd., Reg S, 8.88%, due 10/18/29 | | | 10,010,088 | |
| | | |
| | | 3,800,000 | | | Trinidad & Tobago Government International Bond, Reg S, 4.50%, due 06/26/30 | | | 3,699,775 | |
| | | |
| | | 6,127,000 | | | Trinidad Generation UnLtd., Reg S, 5.25%, due 11/04/27 | | | 6,157,635 | |
| | | |
| | | 22,488,000 | | | Trinidad Petroleum Holdings Ltd., Reg S, 9.75%, due 06/15/26 | | | 23,082,526 | |
| | | | | | | | | | |
| | | |
| | | | | | Total Trinidad And Tobago | | | 42,950,024 | |
| | | | | | | | | | |
| | | | |
| | |
| 14 | | See accompanying notes to the financial statements. | | |
GMO Emerging Country Debt Fund
(A Series of GMO Trust)
Schedule of Investments — (Continued)
(showing percentage of total net assets)
February 28, 2022
| | | | | | | | | | |
Par Value† | | | Description | | Value ($) | |
| | |
| | | | | | Tunisia — 1.3% | |
| | |
| | | | | | Sovereign and Sovereign Agency Issuers | |
| | | |
JPY | | | 7,340,000,000 | | | Banque Centrale de Tunisie SA, 4.30%, due 08/02/30 (c) | | | 33,756,402 | |
| | | |
JPY | | | 2,500,000,000 | | | Banque Centrale de Tunisie SA, 4.20%, due 03/17/31 (c) | | | 11,369,112 | |
| | | |
JPY | | | 900,000,000 | | | Banque Centrale de Tunisie SA, 3.50%, due 02/03/33 | | | 3,992,520 | |
| | | | | | | | | | |
| | | |
| | | | | | Total Tunisia | | | 49,118,034 | |
| | | | | | | | | | |
| | |
| | | | | | Turkey — 3.9% | |
| | |
| | | | | | Sovereign and Sovereign Agency Issuers | |
| | | |
| | | 20,100,000 | | | Istanbul Metropolitan Municipality, Reg S, 6.38%, due 12/09/25 | | | 18,391,500 | |
| | | |
| | | 13,000,000 | | | Republic of Turkey, 6.50%, due 09/20/33 | | | 11,239,312 | |
| | | |
| | | 10,002,000 | | | Republic of Turkey, 6.00%, due 01/14/41 | | | 7,644,029 | |
| | | |
| | | 151,913,000 | | | Republic of Turkey, 5.75%, due 05/11/47 | | | 109,453,316 | |
| | | | | | | | | | |
| | | |
| | | | | | Total Turkey | | | 146,728,157 | |
| | | | | | | | | | |
| | |
| | | | | | Ukraine — 1.0% | |
| | |
| | | | | | Sovereign and Sovereign Agency Issuers | |
| | | |
EUR | | | 3,800,000 | | | NAK Naftogaz Ukraine via Kondor Finance Plc, Reg S, 7.13%, due 07/19/24 (c) | | | 1,065,187 | |
| | | |
| | | 19,000,000 | | | NAK Naftogaz Ukraine via Kondor Finance Plc, Reg S, 7.63%, due 11/08/26 (c) | | | 4,750,000 | |
| | | |
| | | 3,800,000 | | | NPC Ukrenergo, Reg S, 6.88%, due 11/09/26 (c) | | | 1,140,000 | |
| | | |
| | | 9,100,000 | | | State Agency of Roads of Ukraine, Reg S, 6.25%, due 06/24/28 (c) | | | 2,730,000 | |
| | | |
| | | 4,700,000 | | | Ukraine Government International Bond, Reg S, 7.75%, due 09/01/25 (c) | | | 1,504,000 | |
| | | |
| | | 8,019,000 | | | Ukraine Government International Bond, Reg S, 7.75%, due 09/01/26 (c) | | | 2,566,080 | |
| | | |
| | | 3,869,000 | | | Ukraine Government International Bond, Reg S, 7.75%, due 09/01/27 (c) | | | 1,238,080 | |
| | | |
| | | 37,600,000 | | | Ukraine Government International Bond, Reg S, 7.38%, due 09/25/32 (c) | | | 12,032,000 | |
| | | |
| | | 29,900,000 | | | Ukraine Government International Bond, Reg S, 7.25%, due 03/15/33 (c) | | | 9,568,000 | |
| | | |
| | | 200,000 | | | Ukraine Railways Via Rail Capital Markets Plc, Reg S, 7.88%, due 07/15/26 (c) | | | 50,000 | |
| | | | | | | | | | |
| | |
| | | Total Ukraine | | | 36,643,347 | |
| | | | | | | | | | |
| | |
| | | | | | United Arab Emirates — 1.8% | |
| | |
| | | | | | Sovereign and Sovereign Agency Issuers | |
| | | |
| | | 4,500,000 | | | Abu Dhabi Crude Oil Pipeline LLC, Reg S, 4.60%, due 11/02/47 | | | 4,911,469 | |
| | | |
| | | 8,200,000 | | | Abu Dhabi Government International Bond, Reg S, 3.13%, due 09/30/49 | | | 7,728,500 | |
| | | |
| | | 9,100,000 | | | Abu Dhabi Government International Bond, Reg S, 2.70%, due 09/02/70 | | | 7,484,750 | |
| | | |
| | | 6,000,000 | | | DAE Funding LLC, Reg S, 3.38%, due 03/20/28 | | | 5,752,650 | |
| | | |
| | | 18,700,000 | | | Finance Department Government of Sharjah, Reg S, 4.00%, due 07/28/50 | | | 15,349,194 | |
| | | | | | | | | | |
Par Value† | | | Description | | Value ($) | |
| | |
| | | | | | United Arab Emirates — continued | |
| | |
| | | | | | Sovereign and Sovereign Agency
Issuers — continued | |
| | | |
| | | 28,300,000 | | | Finance Department Government of Sharjah, Reg S, 4.38%, due 03/10/51 | | | 24,621,000 | |
| | | | | | | | | | |
| | |
| | | Total United Arab Emirates | | | 65,847,563 | |
| | | | | | | | | | |
| | |
| | | | | | United States — 3.2% | |
| | |
| | | | | | Asset-Backed Securities — 0.3% | |
| | | |
| | | 1,248,152 | | | CWHEQ Revolving Home Equity Loan Trust, Series 05-F, Class 2A, AMBAC, Variable Rate, 1 mo. LIBOR + 0.24%, 0.43%, due 12/15/35 | | | 1,208,662 | |
| | | |
| | | 476,543 | | | CWHEQ Revolving Home Equity Loan Trust, Series 05-H, Class 2A, FGIC, Variable Rate, 1 mo. LIBOR + 0.24%, 0.43%, due 12/15/35 | | | 470,639 | |
| | | |
| | | 917,302 | | | CWHEQ Revolving Home Equity Loan Trust, Series 06-D, Class 2A, XLCA, Variable Rate, 1 mo. LIBOR + 0.20%, 0.39%, due 05/15/36 | | | 877,977 | |
| | | |
| | | 8,485,463 | | | Morgan Stanley IXIS Real Estate Capital Trust, Series 06-2, Class A3, Variable Rate, 1 mo. LIBOR + 0.15%, 0.34%, due 11/25/36 | | | 3,597,954 | |
| | | |
| | | 8,598,602 | | | Morgan Stanley IXIS Real Estate Capital Trust, Series 06-2, Class A4, Variable Rate, 1 mo. LIBOR + 0.22%, 0.41%, due 11/25/36 | | | 3,676,264 | |
| | | |
| | | 4,413,051 | | | Wamu Asset-Backed Certificates, Series 07-HE2, Class 2A4, Variable Rate, 1 mo. LIBOR + 0.36%, 0.55%, due 04/25/37 | | | 2,076,422 | |
| | | | | | | | | | |
| |
| | | 11,907,918 | |
| | | | | | | | | | |
| |
| | | | Corporate Debt — 0.0% | |
| | | |
| | | 385,402 | | | AMBAC Assurance Corp., 144A, 5.10%, due 06/07/2170 | | | 505,840 | |
| | | | | | | | | | |
| |
| | | | U.S. Government — 2.9% | |
| | | |
| | | 7,000,000 | | | U.S. Treasury Note, 0.13%, due 11/30/22 | | | 6,958,164 | |
| | | |
| | | 26,000,000 | | | U.S. Treasury Note, 0.13%, due 12/31/22 | | | 25,811,094 | |
| | | |
| | | 43,000,000 | | | U.S. Treasury Note, 0.13%, due 03/31/23 (g) | | | 42,524,648 | |
| | | |
| | | 33,050,000 | | | U.S. Treasury Note, Variable Rate, USBM + 0.04%, 0.40%, due 10/31/23 (g) | | | 33,109,666 | |
| | | | | | | | | | |
| |
| | | 108,403,572 | |
| | | | | | | | | | |
| | |
| | | Total United States | | | 120,817,330 | |
| | | | | | | | | | |
| | |
| | | | | | Uruguay — 0.8% | |
| | |
| | | | | | Sovereign and Sovereign Agency Issuers | |
| | | |
| | | 24,918,000 | | | Uruguay Government International Bond, 5.10%, due 06/18/50 | | | 29,579,223 | |
| | | | | | | | | | |
| | |
| | | | | | Uzbekistan — 0.4% | |
| | |
| | | | | | Sovereign and Sovereign Agency Issuers | |
| | | |
| | | 7,600,000 | | | Republic of Uzbekistan International Bond, Reg S, 3.70%, due 11/25/30 | | | 6,536,000 | |
| | | |
| | | 10,000,000 | | | Uzbekneftegaz JSC, Reg S, 4.75%, due 11/16/28 | | | 8,800,000 | |
| | | | | | | | | | |
| | |
| | | Total Uzbekistan | | | 15,336,000 | |
| | | | | | | | | | |
| | | | |
| | |
| | | See accompanying notes to the financial statements. | | 15 |
GMO Emerging Country Debt Fund
(A Series of GMO Trust)
Schedule of Investments — (Continued)
(showing percentage of total net assets)
February 28, 2022
| | | | | | | | | | |
Par Value† | | | Description | | Value ($) | |
| | |
| | | | | | Venezuela — 0.8% | |
| | |
| | | | | | Sovereign and Sovereign Agency Issuers | |
| | | |
| | | 111,465,000 | | | Electricidad de Caracas Finance BV, Reg S, 8.50%, due 04/10/18 (c) (d) | | | 835,988 | |
| | | |
| | | 176,000,000 | | | Petroleos de Venezuela SA, Reg S, 6.00%, due 05/16/24 (c) (d) | | | 6,600,000 | |
| | | |
| | | 61,967,000 | | | Petroleos de Venezuela SA, Reg S, 6.00%, due 11/15/26 (c) (d) | | | 2,168,845 | |
| | | |
| | | 7,000,000 | | | Venezuela Government International Bond, 9.38%, due 01/13/34 (c) (d) | | | 385,000 | |
| | | |
| | | 19,028,000 | | | Venezuela Government International Bond, Reg S, 7.75%, due 10/13/19 (c) (d) | | | 1,094,110 | |
| | | |
| | | 36,600,000 | | | Venezuela Government International Bond, Reg S, 6.00%, due 12/09/20 (c) (d) | | | 2,013,000 | |
| | | |
| | | 23,750,000 | | | Venezuela Government International Bond, Reg S, 12.75%, due 08/23/22 (c) (d) | | | 1,306,250 | |
| | | |
| | | 172,793,000 | | | Venezuela Government International Bond, Reg S, 9.00%, due 05/07/23 (c) (d) | | | 9,503,615 | |
| | | |
| | | 68,700,000 | | | Venezuela Government International Bond, Reg S, 11.95%, due 08/05/31 (c) (d) | | | 3,778,500 | |
| | | | | | | | | | |
| | |
| | | Total Venezuela | | | 27,685,308 | |
| | | | | | | | | | |
| | |
| | | | | | Vietnam — 0.8% | |
| | |
| | | | | | Sovereign and Sovereign Agency Issuers | |
| | | |
| | | 22,558,000 | | | Debt and Asset Trading Corp., Reg S, 1.00%, due 10/10/25 | | | 20,355,775 | |
| | | |
| | | 9,918,000 | | | Socialist Republic of Vietnam, Series 30 Yr, Variable Rate, 6 mo. LIBOR + 0.81%, 0.96%, due 03/13/28 (c) | | | 9,372,510 | |
| | | | | | | | | | |
| | |
| | | Total Vietnam | | | 29,728,285 | |
| | | | | | | | | | |
| | |
| | | | | | Zambia — 0.6% | |
| | |
| | | | | | Sovereign and Sovereign Agency Issuers | |
| | | |
| | | 3,600,000 | | | Zambia Government International Bond, Reg S, 5.38%, due 09/20/22 (d) | | | 2,547,000 | |
| | | |
| | | 27,572,000 | | | Zambia Government International Bond, Reg S, 8.97%, due 07/30/27 (d) | | | 20,279,206 | |
| | | | | | | | | | |
| | |
| | | Total Zambia | | | 22,826,206 | |
| | | | | | | | | | |
| | |
| | | TOTAL DEBT OBLIGATIONS
(COST $4,271,472,622) | | | 3,390,867,917 | |
| | | | | | | | | | |
| | |
| | | | | | LOAN ASSIGNMENTS — 1.4% | |
| | |
| | | | | | Chad — 0.5% | |
| | | |
| | | 5,721,835 | | | Glencore UK (Chad) Loan Agreement, Tranche A, Variable Rate, 3 mo. LIBOR + 2.00%, 2.50%, due 09/30/25 (c) | | | 4,691,905 | |
| | | |
| | | 20,009,940 | | | Glencore UK (Chad) Loan Agreement, Tranche B, Variable Rate, 3 mo. LIBOR + 2.25%, 2.75%, due 12/31/27 (c) | | | 13,506,709 | |
| | | | | | | | | | |
| | |
| | | Total Chad | | | 18,198,614 | |
| | | | | | | | | | |
| |
| | | | Kenya — 0.1% | |
| | | |
| | | 4,258,333 | | | Republic of Kenya Loan Agreement, 6 mo. LIBOR + 6.70%, 7.50%, due 04/10/25 (a) | | | 4,116,565 | |
| | | | | | | | | | |
| | | | | | | | | | |
Par Value† | | | Description | | Value ($) | |
| |
| | | | Turkey — 0.8% | |
| | | |
EUR | | | 29,435,714 | | | Meridiam Eastern Europe Investment S.à.r.l. Loan Agreement, 8.85%, due 06/23/28 (a) | | | 31,554,295 | |
| | | | | | | | | | |
| | |
| | | TOTAL LOAN ASSIGNMENTS
(COST $56,367,480) | | | 53,869,474 | |
| | | | | | | | | | |
| | |
| | | | | | LOAN PARTICIPATIONS — 1.2% | |
| | |
| | | | | | Angola — 0.8% | |
| | | |
| | | 468,000 | | | Republic of Angola Loan Agreement (Participation via Avenir II BV), Reg S, 6 mo. LIBOR + 4.50%, 5.30%, due 12/07/23 (c) | | | 462,150 | |
| | | |
| | | 12,000,000 | | | Republic of Angola Loan Agreement (Participation via Avenir Issuer II Ireland DAC), Reg S, 6.93%, due 02/19/27 (c) | | | 11,280,000 | |
| | | |
| | | 7,275,000 | | | Republic of Angola Loan Agreement (Participation with Development Bank of Southern Africa), 6 mo. LIBOR + 6.25%, 7.05%, due 12/13/23 (c) | | | 7,165,875 | |
| | | |
| | | 4,162,149 | | | Republic of Angola Loan Agreement (Participation with Development Bank of Southern Africa), 6 mo. LIBOR + 6.25%, 7.05%, due 12/20/23 (c) | | | 4,099,717 | |
| | | |
| | | 7,916,667 | | | Republic of Angola Loan Agreement (Participation with GE Capital EFS Financing, Inc), 7.50%, due 08/30/24 (c) | | | 7,520,833 | |
| | | | | | | | | | |
| | |
| | | Total Angola | | | 30,528,575 | |
| | | | | | | | | | |
| |
| | | | Egypt — 0.0% | |
| | | |
CHF | | | 466 | | | Paris Club Loan Agreement (Participation with Standard Chartered Bank), Zero Coupon, due 01/03/24 (a) | | | 422 | |
| | | | | | | | | | |
| |
| | | | Iraq — 0.3% | |
| | | |
EUR | | | 727,635 | | | Republic of Iraq Paris Club Loan Agreement (Participation with Credit Suisse), 4.50%, due 12/30/27 (c) | | | 685,323 | |
| | | |
JPY | | | 1,070,250,340 | | | Republic of Iraq Paris Club Loan Agreement (Participation with Deutsche Bank), 2.57%, due 01/01/28 (c) | | | 7,540,580 | |
| | | |
JPY | | | 227,190,207 | | | Republic of Iraq Paris Club Loan Agreement (Participation with Deutsche Bank), 2.57%, due 01/01/28 (c) | | | 1,600,696 | |
| | | |
JPY | | | 96,567,776 | | | Republic of Iraq Paris Club Loan Agreement (Participation with Deutsche Bank), 2.57%, due 01/01/28 (c) | | | 680,380 | |
| | | | | | | | | | |
| | |
| | | Total Iraq | | | 10,506,979 | |
| | | | | | | | | | |
| |
| | | | Russia — 0.0% | |
| | | |
EUR | | | 76,893,500 | | | Russian Foreign Trade Obligations (Participation with GML International Ltd.) (c) (d) | | | 3 | |
| | | | | | | | | | |
| | | | |
| | |
| 16 | | See accompanying notes to the financial statements. | | |
GMO Emerging Country Debt Fund
(A Series of GMO Trust)
Schedule of Investments — (Continued)
(showing percentage of total net assets)
February 28, 2022
| | | | | | | | | | |
Par Value† /
Shares | | | Description | | Value ($) | |
| |
| | | | Sudan — 0.1% | |
| | | |
CHF | | | 11,833,578 | | | Republic of Sudan Loan Agreement, Tranche A (Participation via Abu Dhabi Investment Company) (c) (d) | | | 1,548,391 | |
| | | |
CHF | | | 5,155,077 | | | Republic of Sudan Loan Agreement, Tranche B (Participation via Abu Dhabi Investment Company) (c) (d) | | | 674,528 | |
| | | | | | | | | | |
| | |
| | | Total Sudan | | | 2,222,919 | |
| | | | | | | | | | |
| | |
| | | TOTAL LOAN PARTICIPATIONS
(COST $60,209,566) | | | 43,258,898 | |
| | | | | | | | | | |
| | |
| | | | | | INVESTMENT FUNDS — 0.2% | |
| | |
| | | | | | Colombia — 0.2% | |
| | | |
| | | 7,850,000 | | | Bona Fide Investments Feeder LLC (c) (h) | | | 7,850,000 | |
| | | | | | | | | | |
| | |
| | | TOTAL INVESTMENT FUNDS
(COST $7,850,000) | | | 7,850,000 | |
| | | | | | | | | | |
| | |
| | | | | | MUTUAL FUNDS — 2.0% | |
| | |
| | | | | | United States — 2.0% | |
| |
| | | | Affiliated Issuers — 2.0% | |
| | | |
| | | 14,838,144 | | | GMO U.S. Treasury Fund | | | 74,339,103 | |
| | | | | | | | | | |
| | |
| | | TOTAL MUTUAL FUNDS
(COST $74,296,430) | | | 74,339,103 | |
| | | | | | | | | | |
| | | | | | | | | | |
Par Value† /
Shares | | | Description | | Value ($) | |
| | |
| | | | | | RIGHTS/WARRANTS — 0.2% | |
| | |
| | | | | | Argentina — 0.1% | |
| | | |
EUR | | | 335,089,675 | | | Republic of Argentina GDP Linked, Variable Rate, Expires 12/15/35 (i) | | | 3,240,577 | |
| | | |
JPY | | | 740,189,000 | | | Republic of Argentina GDP Linked, Variable Rate, Expires 12/15/35 (a) (i) | | | 27,766 | |
| | | | | | | | | | |
| | |
| | | Total Argentina | | | 3,268,343 | |
| | | | | | | | | | |
| | |
| | | | | | Ukraine — 0.1% | |
| | | |
| | | 14,446,000 | | | Government of Ukraine GDP Linked, Reg S, Variable Rate, Expires 05/31/40 (c) (i) | | | 2,166,900 | |
| | | | | | | | | | |
| | |
| | | TOTAL RIGHTS/WARRANTS
(COST $49,378,719) | | | 5,435,243 | |
| | | | | | | | | | |
| | |
| | | | | | SHORT-TERM INVESTMENTS — 1.7% | |
| | |
| | | | | | Money Market Funds — 0.3% | |
| | | |
| | | 11,011,723 | | | State Street Institutional Treasury Money Market Fund – Premier Class, 0.01% (j) | | | 11,011,723 | |
| | | | | | | | | | |
| |
| | | | U.S. Government — 1.4% | |
| | | |
| | | 40,000,000 | | | U.S. Treasury Bill, 0.64%, due 08/18/22 (k) | | | 39,879,741 | |
| | | |
| | | 13,000,000 | | | U.S. Treasury Bill, 0.66%, due 08/25/22 (k) | | | 12,958,603 | |
| | | | | | | | | | |
| | |
| | | Total U.S. Government | | | 52,838,344 | |
| | | | | | | | | | |
| | |
| | | TOTAL SHORT-TERM
INVESTMENTS
(COST $63,840,888) | | | 63,850,067 | |
| | | | | | | | | | |
PURCHASED OPTIONS — 0.0%
| | | | | | | | | | | | | | | | | | | | | | | | | | |
| Description | | Counterparty | | Exercise
Price | | | Expiration
Date | | | Principal
Amount | | | Notional
Amount | | | Value ($) | |
| | | | | | | | | | | | | | | | | | | | | | | | | | |
Currency Options — Puts — 0.0% | |
USD Put/RUB Call | | BCLY | | | 72.50 | % | | | 09/22/22 | | | USD | | | 65,200,000 | | | USD | | | 65,200,000 | | | | 30,644 | |
| | | | | | | | | | | | | | | | | | | | | | | | | | |
| | | | | | | | | | |
| | | | | | | | | | |
| | | |
| | | | | | TOTAL PURCHASED OPTIONS (COST $1,094,708) | | | 30,644 | |
| | | | | | | | | | |
| | | |
| | | | | | TOTAL INVESTMENTS — 97.6%
(Cost $4,584,510,413) | | | 3,639,501,346 | |
| | | |
| | | | | | Other Assets and Liabilities (net) — 2.4% | | | 89,715,263 | |
| | | | | | | | | | |
| | | |
| | | | | | TOTAL NET ASSETS — 100.0% | | | $3,729,216,609 | |
| | | | | | | | | | |
Additional information on each restricted security is as follows:
| | | | | | | | | | | | |
Issuer Description | | Acquisition
Date | | Acquisition
Cost | | | Value as a
Percentage
of Fund’s
Net Assets | | Value as of
February 28,
2022 | |
| | | | |
| Bona Fide Investments Feeder LLC | | 12/31/21 | | | 7,850,000 | | | 0.21% | | $ | 7,850,000 | |
| | | | | | | | | | | | |
| | | | |
| | |
| | | See accompanying notes to the financial statements. | | 17 |
GMO Emerging Country Debt Fund
(A Series of GMO Trust)
Schedule of Investments — (Continued)
February 28, 2022
A summary of outstanding financial instruments at February 28, 2022 is as follows:
Forward Currency Contracts
| | | | | | | | | | | | | | | | | | | | |
| | | | |
Settlement
Date | | Counter-
party | | Currency
Sold | | | Currency
Purchased | | | Net Unrealized
Appreciation
(Depreciation) ($) | |
| 04/04/2022 | | JPM | | BRL | | | 70,300,000 | | | | USD | | | | 12,855,915 | | | | (673,202 | ) |
| 03/17/2022 | | MSCI | | COP | | | 84,900,000,000 | | | | USD | | | | 21,599,206 | | | | 67,825 | |
| 04/21/2022 | | SSB | | EUR | | | 163,000,000 | | | | USD | | | | 185,280,421 | | | | 2,160,435 | |
| 04/21/2022 | | MSCI | | GBP | | | 63,311,000 | | | | USD | | | | 86,289,221 | | | | 1,337,637 | |
| 04/18/2022 | | BCLY | | JPY | | | 8,000,000,000 | | | | USD | | | | 70,092,527 | | | | 433,648 | |
| 04/18/2022 | | MSCI | | PEN | | | 58,900,000 | | | | USD | | | | 15,704,573 | | | | 209,873 | |
| 03/16/2022 | | BCLY | | RUB | | | 419,000,000 | | | | USD | | | | 4,750,028 | | | | 881,321 | |
| 04/12/2022 | | BCLY | | RUB | | | 410,000,000 | | | | USD | | | | 5,366,492 | | | | 1,658,847 | |
| 04/12/2022 | | GS | | RUB | | | 377,000,000 | | | | USD | | | | 4,919,376 | | | | 1,510,151 | |
| 04/12/2022 | | MSCI | | RUB | | | 419,000,000 | | | | USD | | | | 4,661,123 | | | | 872,090 | |
| 04/25/2022 | | MSCI | | TRY | | | 66,400,000 | | | | USD | | | | 4,606,406 | | | | 183,906 | |
| 04/21/2022 | | SSB | | USD | | | 23,267,128 | | | | EUR | | | | 20,500,000 | | | | (236,701 | ) |
| 04/12/2022 | | BCLY | | USD | | | 13,639,493 | | | | RUB | | | | 1,065,400,000 | | | | (4,005,041 | ) |
| 05/31/2022 | | MSCI | | ZAR | | | 356,500,000 | | | | USD | | | | 22,759,920 | | | | (159,293 | ) |
| | | | | | | | | | | | | | | | | | | | |
| | | | | | | | | | | | | | | | | | $ | 4,241,496 | |
| | | | | | | | | | | | | | | | | | | | |
Reverse Repurchase Agreements(l)
| | | | | | | | | | |
Face Value | | | Description | | Value ($) | |
| | | |
| USD | | | 6,346,002 | | | J.P. Morgan Securities Plc, (0.50)%, dated 01/25/22, (collateral: Bolivia Government International Bond, Reg S, 4.50%, due 03/20/28), to be repurchased on demand at face value plus accrued interest. | | $ | (6,346,002 | ) |
| | | | | | | | | | |
| | | |
| | | | | | Average balance outstanding | | $ | (11,548,131 | ) |
| | | |
| | | | | | Average interest rate (net) | | | 0.45 | % |
| | | |
| | | | | | Maximum balance outstanding | | $ | (26,079,125 | ) |
Average balance outstanding was calculated based on daily face value balances outstanding during the period that the Fund had entered into reverse repurchase agreements. Average interest rate was calculated based on interest received and/or paid during the period that the Fund had entered into the reverse repurchase agreements.
Credit Linked Options
| | | | | | | | | | | | | | | | | | |
| | | | |
Principal / Notional Amount | | | Expiration
Date | | Description | | Premiums
Paid/
(Received) ($) | | | Value ($) | |
| | | | | | |
| Put Sold | | USD | | | 9,746,000 | | | 01/24/2024 | | Republic of Philippines Credit Linked Put Option, Fund receives premium of 0.25% (OTC) (CP-DB) (a) | | | (117,494 | ) | | | 48,767 | |
| | | | | | |
| Put Sold | | USD | | | 50,797,000 | | | 04/15/2024 | | Banco do Brasil Credit Linked Put Option, Fund receives premium of 0.30% (OTC) (CP-DB) (a) | | | (1,250,471 | ) | | | 202,562 | |
| | | | | | |
| Put Sold | | USD | | | 100,000,000 | | | 04/15/2024 | | Banco do Brasil Credit Linked Put Option, Fund receives premium of 0.44% (OTC) (CP-DB) (a) | | | (4,165,333 | ) | | | 74,782 | |
| | | | | | | | | | | | | | | | | | |
| | | | | | |
| | | | | | | | | | | | $ | (5,533,298 | ) | | $ | 326,111 | |
| | | | | | | | | | | | | | | | | | |
| | | | |
| | |
| 18 | | See accompanying notes to the financial statements. | | |
GMO Emerging Country Debt Fund
(A Series of GMO Trust)
Schedule of Investments — (Continued)
February 28, 2022
Swap Contracts
Centrally Cleared Credit Default Swaps
| | | | | | | | | | | | | | | | | | | | | | | | | | | | | | | | | | | | | | |
Reference Entity | | Notional
Amount | | | Annual
Premium | | | Implied
Credit
Spread (1) | | | Maximum
Potential
Amount of
Future
Payments
by the
Fund
Under the
Contract (2) | | | Expiration
Date | | | Periodic
Payment
Frequency
| | | Premiums
Paid/
(Received) ($) | | | Value ($) | | | Net Unrealized
Appreciation/
(Depreciation) ($) | |
Buy Protection^: | |
CDX-EMS.31.V1-5Y | | USD | | | 140,060,000 | | | | 1.00% | | | | 3.01% | | | | N/A | | | | 06/20/2024 | | | | Quarterly | | | | 4,376,875 | | | | 4,962,466 | | | | 585,591 | |
CDX-EMS.35.V1-5Y | | USD | | | 143,000,000 | | | | 1.00% | | | | 3.10% | | | | N/A | | | | 06/20/2026 | | | | Quarterly | | | | 4,242,750 | | | | 10,232,794 | | | | 5,990,044 | |
| | | | | | | | | | | | | | | | | | | | | | | | | | | | | | | | | | | | | | |
| | | | | | | | | | | | | | | | | | | | | | | | | | | | $ | 8,619,625 | | | $ | 15,195,260 | | | $ | 6,575,635 | |
| | | | | | | | | | | | | | | | | | | | | | | | | | | | | | | | | | | | | | |
OTC Credit Default Swaps
| | | | | | | | | | | | | | | | | | | | | | | | | | | | | | | | | | | | | | | | |
Reference Entity | | Counterparty | | Notional
Amount | | | Annual
Premium | | | Implied
Credit
Spread (1) | | | Maximum
Potential
Amount of
Future
Payments by
the Fund
Under the
Contract (2) | | | Expiration
Date | | | Periodic
Payment
Frequency | | | Premiums
Paid/
(Received) ($) | | | Value ($) | | | Net Unrealized
Appreciation/
(Depreciation) ($) | |
Buy Protection^: | | | | | | | | | | | | | | | | | | | | | | | | | | | | | | | | | | | | | | | | |
Banque Centrale de Tunisie SA | | JPM | | USD | | | 19,500,000 | | | | 1.00% | | | | 15.71% | | | | N/A | | | | 06/20/2022 | | | | Quarterly | | | | 2,109,320 | | | | 862,720 | | | | (1,246,600 | ) |
Republic of Ghana | | JPM | | USD | | | 3,700,000 | | | | 5.00% | | | | 12.29% | | | | N/A | | | | 06/20/2023 | | | | Quarterly | | | | 370,000 | | | | 318,375 | | | | (51,625 | ) |
Republic of Ghana | | JPM | | USD | | | 3,700,000 | | | | 5.00% | | | | 12.29% | | | | N/A | | | | 06/20/2023 | | | | Quarterly | | | | (112,514 | ) | | | 318,375 | | | | 430,889 | |
Republic of Ghana | | JPM | | USD | | | 3,700,000 | | | | 5.00% | | | | 12.29% | | | | N/A | | | | 06/20/2023 | | | | Quarterly | | | | (112,260 | ) | | | 318,375 | | | | 430,635 | |
Republic of South Africa | | CITI | | USD | | | 35,900,000 | | | | 1.00% | | | | 1.19% | | | | N/A | | | | 12/20/2023 | | | | Quarterly | | | | 56,177 | | | | 122,729 | | | | 66,552 | |
Petrobras Global Finance BV | | CITI | | USD | | | 13,000,000 | | | | 1.00% | | | | 1.74% | | | | N/A | | | | 06/20/2024 | | | | Quarterly | | | | 371,175 | | | | 214,578 | | | | (156,597 | ) |
Petrobras Global Finance BV | | CITI | | USD | | | 37,000,000 | | | | 1.00% | | | | 1.74% | | | | N/A | | | | 06/20/2024 | | | | Quarterly | | | | 1,923,458 | | | | 610,722 | | | | (1,312,736 | ) |
Republic of Ghana | | JPM | | USD | | | 7,500,000 | | | | 5.00% | | | | 11.59% | | | | N/A | | | | 06/20/2024 | | | | Quarterly | | | | 58,680 | | | | 954,163 | | | | 895,483 | |
Commonwealth of Bahamas | | DB | | EUR | | | 29,001,331 | | | | 1.00% | | | | 6.21% | | | | N/A | | | | 06/20/2025 | | | | Quarterly | | | | 3,767,513 | | | | 3,475,170 | | | | (292,343 | ) |
Republic of Colombia | | CITI | | USD | | | 6,000,000 | | | | 1.00% | | | | 2.27% | | | | N/A | | | | 12/20/2026 | | | | Quarterly | | | | 168,255 | | | | 329,394 | | | | 161,139 | |
Republic of South Africa | | GS | | USD | | | 41,800,000 | | | | 1.00% | | | | 2.31% | | | | N/A | | | | 12/20/2026 | | | | Quarterly | | | | 2,193,618 | | | | 2,366,355 | | | | 172,737 | |
Republic of South Africa | | CITI | | USD | | | 10,200,000 | | | | 1.00% | | | | 2.31% | | | | N/A | | | | 12/20/2026 | | | | Quarterly | | | | 505,046 | | | | 577,436 | | | | 72,390 | |
Republic of Turkey | | GS | | USD | | | 32,000,000 | | | | 1.00% | | | | 5.92% | | | | N/A | | | | 12/20/2026 | | | | Quarterly | | | | 4,436,785 | | | | 6,110,011 | | | | 1,673,226 | |
United States of Mexico | | MORD | | USD | | | 20,000,000 | | | | 1.00% | | | | 1.15% | | | | N/A | | | | 12/20/2026 | | | | Quarterly | | | | (19,611 | ) | | | 138,343 | | | | 157,954 | |
United States of Mexico | | GS | | USD | | | 20,000,000 | | | | 1.00% | | | | 1.63% | | | | N/A | | | | 06/20/2029 | | | | Quarterly | | | | 1,589,641 | | | | 804,479 | | | | (785,162 | ) |
United States of Mexico | | GS | | USD | | | 20,000,000 | | | | 1.00% | | | | 1.86% | | | | N/A | | | | 09/20/2031 | | | | Quarterly | | | | 2,640,655 | | | | 1,357,924 | | | | (1,282,731 | ) |
Sell Protection^: | | | | | | | | | | | | | | | | | | | | | | | | | | | | | | | | | | | | | | | | |
Commonwealth of Bahamas | | DB | | USD | | | 3,487,000 | | | | 1.00% | | | | 6.02% | | | | 3,487,000 USD | | | | 06/20/2023 | | | | Quarterly | | | | (641,463 | ) | | | (218,556 | ) | | | 422,907 | |
Commonwealth of Bahamas | | DB | | USD | | | 6,975,000 | | | | 1.00% | | | | 6.02% | | | | 6,975,000 USD | | | | 06/20/2023 | | | | Quarterly | | | | (1,263,915 | ) | | | (437,175 | ) | | | 826,740 | |
Commonwealth of Bahamas | | DB | | USD | | | 38,867,771 | | | | 1.00% | | | | 6.21% | | | | 38,867,771 USD | | | | 06/20/2025 | | | | Quarterly | | | | (4,311,666 | ) | | | (4,062,187 | ) | | | 249,479 | |
Russia | | CITI | | USD | | | 11,700,000 | | | | 1.00% | | | | 17.80% | | | | 11,700,000 USD | | | | 12/20/2026 | | | | Quarterly | | | | (974,925 | ) | | | (5,482,946 | ) | | | (4,508,021 | ) |
| | | | | | | | | | | | | | | | | | | | | | | | | | | | | | | | | | | | | | | | |
| | | | | | | | | | | | | | | | | | | | | | | | | | | | | | $ | 12,753,969 | | | $ | 8,678,285 | | | $ | (4,075,684 | ) |
| | | | | | | | | | | | | | | | | | | | | | | | | | | | | | | | | | | | | | | | |
| | | | |
| | |
| | | See accompanying notes to the financial statements. | | 19 |
GMO Emerging Country Debt Fund
(A Series of GMO Trust)
Schedule of Investments — (Continued)
February 28, 2022
| ^ | Buy Protection - Fund pays a premium and buys credit protection. If a credit event occurs the Fund will, depending on the terms of the particular swap contract, either (i) receive from the seller of protection an amount equal to the notional amount of the swap and deliver the referenced obligation or underlying securities comprising the referenced index or (ii) receive a net settlement amount in the form of cash or securities equal to the notional amount of the swap less the recovery value of the referenced obligation or underlying securities comprising the referenced index. |
| | Sell Protection - Fund receives a premium and sells credit protection. If a credit event occurs the Fund will, depending on the terms of the particular swap contract, either (i) pay to the buyer of protection an amount equal to the notional amount of the swap and take delivery of the referenced obligation or underlying securities comprising the referenced index or (ii) pay a net settlement amount in the form of cash or securities equal to the notional amount of the swap less the recovery value of the referenced obligation or underlying securities comprising the referenced index. |
| (1) | As of February 28, 2022, implied credit spreads in absolute terms, calculated using a model, and utilized in determining the market value of credit default swap contracts on the reference security, serve as an indicator of the current status of the payment/performance risk and reflect the likelihood or risk of default for the reference entity. The implied credit spread of a particular referenced entity reflects the cost of buying/selling protection. Wider (i.e. higher) credit spreads represent a deterioration of the referenced entity’s credit soundness and a greater likelihood or risk of default or other credit event occurring as defined under the terms of the contract. |
| (2) | The maximum potential amount the Fund could be required to pay as a seller of credit protection if a credit event occurs as defined under the terms of that particular swap contract. |
Centrally Cleared Interest Rate Swaps
| | | | | | | | | | | | | | | | | | | | | | | | | | | | | | | | |
Fund Pays | | | | | Fund Receives | | Notional
Amount | | | Expiration
Date | | Periodic
Payment
Frequency | | | Premiums
Paid/
(Received) ($) | | | Value ($) | | | Net Unrealized
Appreciation/
(Depreciation) ($) | |
BZDIOVRA Index | | | | | | 9.51% | | | BRL | | | | 1,255,000,000 | | | 01/02/2025 | | | At Maturity | | | | — | | | | (7,614,333 | ) | | | (7,614,333 | ) |
BZDIOVRA Index | | | | | | 9.78% | | | BRL | | | | 338,000,000 | | | 01/02/2025 | | | At Maturity | | | | — | | | | (1,642,268 | ) | | | (1,642,268 | ) |
BZDIOVRA Index | | | | | | 11.46% | | | BRL | | | | 627,000,000 | | | 01/02/2025 | | | At Maturity | | | | — | | | | 396,978 | | | | 396,978 | |
0.30% | | | | | | 6 Month EURIBOR | | | EUR | | | | 19,400,000 | | | 12/17/2031 | | | Semi-Annually | | | | 150,165 | | | | 1,007,032 | | | | 856,867 | |
0.90% | | | | | | GBP - SONIA - COMPOUND | | | GBP | | | | 34,300,000 | | | 06/10/2051 | | | Annually | | | | (223,919 | ) | | | 4,027,200 | | | | 4,251,119 | |
0.48% | | | | | | 6 Month EURIBOR | | | EUR | | | | 38,700,000 | | | 06/14/2051 | | | Semi-Annually | | | | 129,556 | | | | 3,585,663 | | | | 3,456,107 | |
| | | | | | | | | | | | | | | | | | | | | | | | | | | | | | | | |
| | | | | | | | | | | | | | | | | | | | | | $ | 55,802 | | | $ | (239,728 | ) | | $ | (295,530 | ) |
| | | | | | | | | | | | | | | | | | | | | | | | | | | | | | | | |
OTC Total Return Swaps
| | | | | | | | | | | | | | | | | | | | | | | | | | | | | | | | |
Fund Pays | | Fund Receives | | Counterparty | | Notional
Amount | | | Expiration
Date | | | Periodic
Payment
Frequency | | | Premiums
Paid/
(Received) ($) | | | Value ($) | | | Net Unrealized
Appreciation/
(Depreciation) ($) | |
4.30% | | Republic of Colombia Treasury Bond, 7.25%, due 10/26/50 | | CITI | | | COP | | | | 59,200,000,000 | | | | 03/03/2022 | | | | At Maturity | | | | — | | | | (759,493 | ) | | | (759,493 | ) |
4.35% | | Republic of Colombia Treasury Bond, 7.25%, due 10/26/50 | | CITI | | | COP | | | | 36,900,000,000 | | | | 03/08/2022 | | | | At Maturity | | | | — | | | | (400,346 | ) | | | (400,346 | ) |
4.50% | | Republic of Colombia Treasury Bond, 7.25%, due 10/26/50 | | CITI | | | COP | | | | 73,900,000,000 | | | | 03/10/2022 | | | | At Maturity | | | | — | | | | (713,484 | ) | | | (713,484 | ) |
4.40% | | Republic of Colombia Treasury Bond, 7.25%, due 10/26/50 | | CITI | | | COP | | | | 51,700,000,000 | | | | 03/11/2022 | | | | At Maturity | | | | — | | | | (533,510 | ) | | | (533,510 | ) |
4.45% | | Republic of Colombia Treasury Bond, 7.25%, due 10/26/50 | | CITI | | | COP | | | | 73,900,000,000 | | | | 03/17/2022 | | | | At Maturity | | | | — | | | | (774,284 | ) | | | (774,284 | ) |
| | | | | | | | | | | | | | | | | | | | | | | | | | | | | | | | |
| | | $ | — | | | $ | (3,181,117 | ) | | $ | (3,181,117 | ) |
| | | | | | | | | | | | | | | | | | | | | | | | | | | | | | | | |
As of February 28, 2022, for the above contracts and/or agreements, the Fund had sufficient cash and/or securities to cover commitments or collateral requirements, if any, of the relevant broker or exchange.
| | | | |
| | |
| 20 | | See accompanying notes to the financial statements. | | |
GMO Emerging Country Debt Fund
(A Series of GMO Trust)
Schedule of Investments — (Continued)
February 28, 2022
Notes to Schedule of Investments:
| † | Denominated in U.S. Dollar, unless otherwise indicated. |
| (a) | Investment valued at fair value using methods determined in good faith by the Trustees of GMO Trust or persons acting at their direction pursuant to procedures approved by the Trustees. Investment valued using significant unobservable inputs (Note 2). |
| (b) | Security is backed by U.S. Treasury Bonds. |
| (c) | Investment valued using significant unobservable inputs (Note 2). |
| (d) | Security is in default. |
| (e) | All or a portion of this security has been pledged to cover collateral requirements on reverse repurchase agreements (Note 2). |
| (f) | Security is backed by the United States International Development Finance Corporation. |
| (g) | All or a portion of this security has been pledged to cover margin requirements on futures and/or cleared swap contracts, collateral on OTC swap contracts, forward currency contracts, and/or written options, if any (Note 4). |
| (h) | Private placement security; restricted as to resale. Represents investment in a pool of constitutional obligations of the Colombian government owed to individuals. |
| (i) | Indexed security in which price and/or coupon is linked to the price of a specific instrument or financial statistic (Note 2). |
| (j) | The rate disclosed is the 7 day net yield as of February 28, 2022. |
| (k) | The rate shown represents yield-to-maturity. |
| (l) | Reverse repurchase agreements have an open maturity date and can be closed by either party on demand. |
For a listing of definitions of acronyms, counterparty abbreviations and currency abbreviations used throughout the Schedule of Investments as well as the derivative tables, if any, please refer to page 56.
| | | | |
| | |
| | | See accompanying notes to the financial statements. | | 21 |
GMO High Yield Fund
(A Series of GMO Trust)
Portfolio Management
Day-to-day management of the Fund’s portfolio is the responsibility of the Structured Products team at Grantham, Mayo, Van Otterloo & Co. LLC.
Management Discussion and Analysis of Fund Performance
Class VI shares of GMO High Yield Fund returned +1.35% (net) for the fiscal year ended February 28, 2022, as compared with +0.50% for the Markit iBoxx USD Liquid High Yield Index.
The Fund was invested in a mix of index portfolio products as well as cash high yield bonds. During the fiscal year, the Fund moved exposures between different products based on changes in the model’s alpha signals as well as other factors. Absolute performance was driven by high yield-based ETFs, short volatility overlay, and short-dated B–CCC bonds, which were top contributors for the period. Credit default swaps, BB-rated bonds, and fallen angel bonds (bonds originally issued as investment grade that have since been downgraded to below investment grade) also contributed positively during the period.
The views expressed herein are exclusively those of Grantham, Mayo, Van Otterloo & Co. LLC as of the date of this report and are subject to change. GMO disclaims any responsibility to update such views. They are not meant as investment advice. References to specific securities are not recommendations of such securities and may not be representative of any GMO portfolio’s current or future investments. All information is unaudited.
GMO High Yield Fund
(A Series of GMO Trust)
Comparison of Change in Value of a $300,000,000 Investment in
GMO High Yield Fund Class VI Shares and the Markit iBoxx USD Liquid High Yield Index
As of February 28, 2022
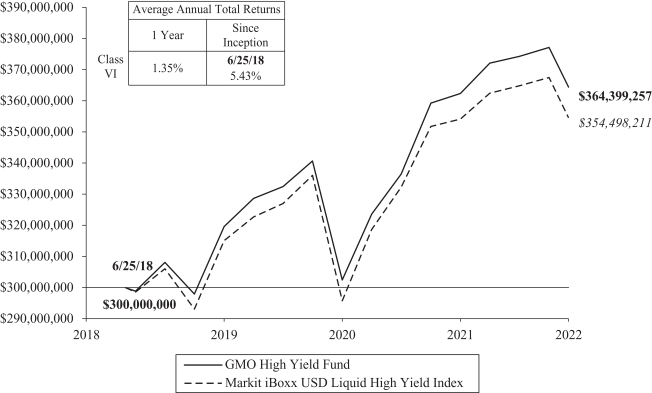
Performance data quoted represents past performance and is not indicative of future results. The investment return and principal value of an investment will fluctuate so that an investor’s shares, when redeemed, may be worth more or less than their original cost. Current performance data may be lower or higher than the performance data provided herein. To obtain performance information up to the most recent month-end, visit www.gmo.com. Performance shown is net of all fees after reimbursement from GMO. Returns would have been lower had certain expenses not been reimbursed during the periods shown and do not include the effect of taxes on distributions and redemptions. The performance information shown above only includes purchase premiums and/or redemption fees in effect as of February 28, 2022. All information is unaudited.
For Class VI the gross expense ratio of 0.70% is equal to the Fund’s Total Annual Operating Expenses set forth in the Fund’s most recent prospectus dated June 30, 2021. For the Class listed above, the net expense ratio of 0.70% reflects the reduction of expenses from fee reimbursements. The fee reimbursements will continue until at least June 30, 2022. Elimination of this reimbursement will result in higher fees and lower performance.
GMO High Yield Fund
(A Series of GMO Trust)
Investment Concentration Summary
February 28, 2022 (Unaudited)
| | | | |
| Asset Class Summary& | | % of Total Net Assets | |
Short-Term Investments | | | 66.6 | % |
Debt Obligations | | | 31.9 | |
Swap Contracts | | | 0.6 | |
Futures Contracts | | | 0.2 | |
Forward Currency Contracts | | | 0.2 | |
Written Options | | | (0.1 | ) |
Other | | | 0.6 | |
| | | | |
| | | 100.0 | % |
| | | | |
| | | | |
| Industry Group Summary¤ | | % of Investments | |
Consumer Cyclical | | | 23.7 | % |
Consumer Non-Cyclical | | | 14.5 | |
Communications | | | 14.1 | |
Energy | | | 10.4 | |
Capital Goods | | | 6.5 | |
Finance Companies | | | 6.0 | |
Basic Industry | | | 5.0 | |
Technology | | | 4.2 | |
Other Industrial | | | 3.4 | |
Insurance | | | 2.3 | |
Other Utility | | | 2.1 | |
REITS | | | 1.7 | |
Banking | | | 1.3 | |
Transportation | | | 1.1 | |
Electric | | | 0.9 | |
Other Financial | | | 0.4 | |
Brokerage/Asset Managers/Exchanges | | | 0.2 | |
| | | | |
| | | 97.8 | % |
| | | | |
| & | In the table, derivative financial instruments, if any, are based on market values, rather than the notional amounts of derivatives, except for forward currency contracts which are based on unrealized appreciation/(depreciation). |
| ¤ | The table excludes short-term investments and mutual funds, if any. The table includes exposure through the use of certain derivative financial instruments and excludes exposures through certain currency linked derivatives such as forward currency contracts. The table takes in account the market values of securities and the notional amounts of swaps. The table is not normalized, thus the table may not total to 100%. |
GMO High Yield Fund
(A Series of GMO Trust)
Schedule of Investments
(showing percentage of total net assets)
February 28, 2022
| | | | | | | | | | |
| Par Value† | | | Description | | Value ($) | |
| | |
| | | | | | DEBT OBLIGATIONS — 31.9% | |
| | |
| | | | | | Corporate Debt — 27.6% | |
| | |
| | | | | | Canada — 1.7% | |
| | | |
| | | 825,000 | | | Methanex Corp., 5.25%, due 12/15/29 | | | 833,250 | |
| | | |
| | | 125,000 | | | Mountain Province Diamonds, Inc., 144A, 8.00%, due 12/15/22 | | | 124,688 | |
| | | |
| | | 500,000 | | | Quebecor Media, Inc., 5.75%, due 01/15/23 | | | 508,750 | |
| | | | | | | | | | |
| | | |
| | | | | | Total Canada | | | 1,466,688 | |
| | | | | | | | | | |
| | |
| | | | | | Italy — 0.3% | |
| | | |
| | | 250,000 | | | UniCredit SPA, 144A, Variable Rate, 5.46%, due 06/30/35 | | | 249,089 | |
| | | | | | | | | | |
| | | |
| | | | | | United Kingdom — 2.6% | | | |
| | | |
| | | 350,000 | | | Avon Products, Inc., 6.50%, due 03/15/23 | | | 355,687 | |
| | | |
| | | 190,000 | | | Jaguar Land Rover Automotive Plc, 144A, 5.63%, due 02/01/23 | | | 189,940 | |
| | | |
| | | 725,000 | | | Rolls-Royce Plc, 144A, 3.63%, due 10/14/25 | | | 707,999 | |
| | | |
| | | 1,000,000 | | | Virgin Media Secured Finance Plc, 144A, 4.50%, due 08/15/30 | | | 945,470 | |
| | | | | | | | | | |
| | | |
| | | | | | Total United Kingdom | | | 2,199,096 | |
| | | | | | | | | | |
| | |
| | | | | | United States — 23.0% | |
| | | |
| | | 125,000 | | | Albertsons Cos, Inc. / Safeway, Inc. / New Albertsons LP / Albertsons LLC, 144A, 3.50%, due 02/15/23 | | | 125,294 | |
| | | |
| | | 375,000 | | | Ally Financial, Inc., 5.75%, due 11/20/25 | | | 399,244 | |
| | | |
| | | 250,000 | | | American Airlines Inc. / AAdvantage Loyalty IP Ltd, 144A, 5.75%, due 04/20/29 | | | 255,580 | |
| | | |
| | | 373,000 | | | AmeriGas Partners LP / AmeriGas Finance Corp., 5.63%, due 05/20/24 | | | 380,460 | |
| | | |
| | | 375,000 | | | Antero Resources Corp., 144A, 7.63%, due 02/01/29 | | | 405,949 | |
| | | |
| | | 325,000 | | | Apache Corp., 5.35%, due 07/01/49 | | | 323,529 | |
| | | |
| | | 446,000 | | | Arconic Corp., 144A, 6.00%, due 05/15/25 | | | 459,380 | |
| | | |
| | | 125,000 | | | Bath & Body Works, Inc., 6.88%, due 11/01/35 | | | 138,154 | |
| | | |
| | | 250,000 | | | Brinker International, Inc., 3.88%, due 05/15/23 | | | 252,362 | |
| | | |
| | | 250,000 | | | CCO Holdings LLC / CCO Holdings Capital Corp., 144A, 4.25%, due 01/15/34 | | | 229,850 | |
| | | |
| | | 275,000 | | | Cleaver-Brooks, Inc., 144A, 7.88%, due 03/01/23 | | | 264,476 | |
| | | |
| | | 250,000 | | | Cogent Communications Group, Inc., 144A, 3.50%, due 05/01/26 | | | 241,875 | |
| | | |
| | | 400,000 | | | Enact Holdings, Inc., 144A, 6.50%, due 08/15/25 | | | 413,960 | |
| | | |
| | | 125,000 | | | Fluor Corp., 4.25%, due 09/15/28 | | | 122,344 | |
| | | |
| | | 1,050,000 | | | Ford Motor Credit Co. LLC, 4.13%, due 08/04/25 | | | 1,061,812 | |
| | | |
| | | 802,000 | | | Ford Motor Credit Co. LLC, 3.82%, due 11/02/27 | | | 794,381 | |
| | | | | | | | | | |
| Par Value† | | | Description | | Value ($) | |
| | |
| | | | | | Corporate Debt — continued | |
| | |
| | | | | | United States — continued | |
| | | |
| | | 375,000 | | | G-III Apparel Group Ltd., 144A, 7.88%, due 08/15/25 | | | 395,156 | |
| | | |
| | | 670,000 | | | Hexcel Corp., 4.20%, due 02/15/27 | | | 690,239 | |
| | | |
| | | 500,000 | | | KB Home, 4.80%, due 11/15/29 | | | 499,625 | |
| | | |
| | | 625,000 | | | Kraft Heinz Foods Co., 3.88%, due 05/15/27 | | | 647,156 | |
| | | |
| | | 625,000 | | | Ladder Capital Finance Holdings LLLP / Ladder Capital Finance Corp., 144A, REIT, 4.25%, due 02/01/27 | | | 608,594 | |
| | | |
| | | 750,000 | | | Lumen Technologies, Inc., 144A, 4.50%, due 01/15/29 | | | 627,701 | |
| | | |
| | | 207,000 | | | Macy’s Retail Holdings LLC, 2.88%, due 02/15/23 | | | 206,766 | |
| | | |
| | | 750,000 | | | Molina Healthcare, Inc., 144A, 3.88%, due 05/15/32 | | | 734,771 | |
| | | |
| | | 625,000 | | | Murphy Oil USA, Inc., 144A, 3.75%, due 02/15/31 | | | 579,687 | |
| | | |
| | | 525,000 | | | Newell Brands, Inc., 4.70%, due 04/01/26 | | | 543,472 | |
| | | |
| | | 91,000 | | | NextEra Energy Operating Partners LP, 144A, 4.25%, due 07/15/24 | | | 92,789 | |
| | | |
| | | 375,000 | | | OneMain Finance Corp., 6.63%, due 01/15/28 | | | 400,654 | |
| | | |
| | | 250,000 | | | OneMain Finance Corp., 6.88%, due 03/15/25 | | | 266,774 | |
| | | |
| | | 166,000 | | | Owens-Brockway Glass Container, Inc., 144A, 5.88%, due 08/15/23 | | | 168,905 | |
| | | |
| | | 250,000 | | | PBF Logistics LP / PBF Logistics Finance Corp., 6.88%, due 05/15/23 | | | 248,750 | |
| | | |
| | | 750,000 | | | Perrigo Finance UnLtd Co, 3.90%, due 06/15/30 | | | 687,774 | |
| | | |
| | | 375,000 | | | Prime Security Services Borrower LLC / Prime Finance, Inc., 144A, 5.75%, due 04/15/26 | | | 385,339 | |
| | | |
| | | 400,000 | | | Royal Caribbean Cruises Ltd., 144A, 10.88%, due 06/01/23 | | | 429,348 | |
| | | |
| | | 625,000 | | | Sealed Air Corp., 144A, 5.25%, due 04/01/23 | | | 635,937 | |
| | | |
| | | 250,000 | | | Sensata Technologies BV, 144A, 4.88%, due 10/15/23 | | | 256,250 | |
| | | |
| | | 250,000 | | | Service Properties Trust, REIT, 4.50%, due 03/15/25 | | | 234,375 | |
| | | |
| | | 85,000 | | | Southwestern Energy Co., 5.95%, due 01/23/25 | | | 88,613 | |
| | | |
| | | 800,000 | | | Spirit AeroSystems, Inc., 3.85%, due 06/15/26 | | | 792,000 | |
| | | |
| | | 600,000 | | | Sprint Corp., 7.88%, due 09/15/23 | | | 645,000 | |
| | | |
| | | 625,000 | | | Tenet Healthcare Corp., 6.75%, due 06/15/23 | | | 650,000 | |
| | | |
| | | 227,403 | | | Transocean Guardian Ltd., 144A, 5.88%, due 01/15/24 | | | 217,559 | |
| | | |
| | | 375,000 | | | W&T Offshore, Inc., 2018 Term Loan, 144A, 9.75%, due 11/01/23 | | | 367,969 | |
| | | |
| | | 500,000 | | | Western Midstream Operating LP, 4.55%, due 02/01/30 | | | 514,280 | |
| | | | |
| | |
| | | See accompanying notes to the financial statements. | | 25 |
GMO High Yield Fund
(A Series of GMO Trust)
Schedule of Investments — (Continued)
(showing percentage of total net assets)
February 28, 2022
| | | | | | | | | | |
Par Value† / Shares | | | Description | | Value ($) | |
| | |
| | | | | | Corporate Debt — continued | |
| | |
| | | | | | United States — continued | |
| | | |
| | | 925,000 | | | Wynn Las Vegas LLC / Wynn Las Vegas Capital Corp., 144A, 4.25%, due 05/30/23 | | | 928,774 | |
| | | | | | | | | | |
| | |
| | | Total United States | | | 19,412,907 | |
| | | | | | | | | | |
| | |
| | | Total Corporate Debt | | | 23,327,780 | |
| | | | | | | | | | |
| | |
| | | | | | U.S. Government — 4.3% | |
| | | |
| | | 3,630,000 | | | U.S. Treasury Note, Variable Rate, USBM + 0.03%, 0.39%, due 07/31/23 | | | 3,635,687 | |
| | | | | | | | | | |
| | |
| | | TOTAL DEBT OBLIGATIONS (COST $27,229,588) | | | 26,963,467 | |
| | | | | | | | | | |
| | |
| | | | | | SHORT-TERM INVESTMENTS — 66.6% | |
| | |
| | | | | | Money Market Funds — 0.5% | |
| | | |
| | | 439,953 | | | State Street Institutional Treasury Money Market Fund – Premier Class, 0.01% (a) | | | 439,953 | |
| | | | | | | | | | |
| | |
| | | | | | Sovereign and Sovereign Agency Issuers — 24.4% | |
| | | |
JPY | | | 2,371,000,000 | | | Japan Treasury Discount Bill, Zero Coupon, due 04/25/22 | | | 20,626,496 | |
| | | | | | | | | | |
| | |
| | | | | | U.S. Government — 41.7% | |
| | | |
| | | 650,000 | | | U.S. Treasury Bill, 0.63%, due 08/11/22 (b) | | | 648,160 | |
| | | |
| | | 5,900,000 | | | U.S. Treasury Bill, 0.71%, due 10/06/22 (b) | | | 5,874,786 | |
| | | |
| | | 5,380,000 | | | U.S. Treasury Bill, 0.73%, due 11/03/22 (b) | | | 5,353,515 | |
| | | |
| | | 23,170,000 | | | U.S. Treasury Bill,
0.63%, due 12/01/22 (b) (c) | | | 23,059,822 | |
| | | |
| | | 320,000 | | | U.S. Treasury Bill, 0.90%, due 12/29/22 (b) | | | 317,616 | |
| | | | | | | | | | |
| | | |
| | | | | | Total U.S. Government | | | 35,253,899 | |
| | | | | | | | | | |
| | | |
| | | | | | TOTAL SHORT-TERM INVESTMENTS (COST $56,660,930) | | | 56,320,348 | |
| | | | | | | | | | |
| | | |
| | | | | | TOTAL INVESTMENTS — 98.5%
(Cost $83,890,518) | | | 83,283,815 | |
| | | |
| | | | | | Other Assets and Liabilities (net) — 1.5% | | | 1,302,406 | |
| | | | | | | | | | |
| | | |
| | | | | | TOTAL NET ASSETS — 100.0% | | | $84,586,221 | |
| | | | | | | | | | |
A summary of outstanding financial instruments at February 28, 2022 is as follows:
Forward Currency Contracts
| | | | | | | | | | | | | | | | | | |
| | | | |
Settlement
Date | | Counterparty | | Currency
Sold | | | Currency
Purchased | | | Net Unrealized
Appreciation
(Depreciation) ($) | |
| 04/25/2022 | | MSCI | | JPY | | | 2,371,000,000 | | | USD | | | 20,866,477 | | | $ | 218,399 | |
| | | | | | | | | | | | | | | | | | |
Futures Contracts
| | | | | | | | | | | | | | |
| | | | |
Number
of
Contracts + | | Type | | Expiration
Date | | | Notional
Amount ($) | | | Value/Net
Unrealized
Appreciation
(Depreciation) ($) | |
| Buys | | | |
| 7 | | U.S. Treasury Note 5 Yr. (CBT) | | | March 2022 | | | | 830,211 | | | | (8,922 | ) |
| 94 | | U.S. Treasury Note 10 Yr. (CBT) | | | June 2022 | | | | 11,979,125 | | | | 123,213 | |
| 37 | | U.S. Treasury Note 2 Yr. (CBT) | | | June 2022 | | | | 7,963,383 | | | | 25,993 | |
| 22 | | U.S. Treasury Note 5 Yr. (CBT) | | | June 2022 | | | | 2,602,187 | | | | 19,460 | |
| | | | | | | | | | | | | | |
| | | $ | 23,374,906 | | | $ | 159,744 | |
| | | | | | | | | | | | | | |
| Sales | | | | | | | | | | | | | | |
| 7 | | U.S. Treasury Note 5 Yr. (CBT) | | | March 2022 | | | | 830,211 | | | | 11,823 | |
| 1 | | U.S. Ultra Bond (CBT) | | | June 2022 | | | | 185,937 | | | | (2,407 | ) |
| | | | | | | | | | | | | | |
| | | $ | 1,016,148 | | | $ | 9,416 | |
| | | | | | | | | | | | | | |
| + | Buys - Fund is long the futures contract. |
| | Sales - Fund is short the futures contract. |
Written Options
| | | | | | | | | | | | | | | | | | | | | | | | | | | | |
Description | | Counterparty | | | Exercise
Rate | | | Expiration
Date | | | Principal/
Notional
Amount | | | Floating Rate
Index | | | Pay/
Receive
Floating
Rate | | | Value ($) | |
Written Options on Credit Default Swaps — Puts | |
CDX.NA.HYS.37.V1-5Y | | | DB | | | | 102.50 | % | | | 04/20/22 | | | | USD 16,748,000 | | | | Fixed Spread | | | | Pay | | | $ | (116,704 | ) |
| | | | | | | | | | | | | | | | | | | | | | | | | | | | |
| | |
| |
| TOTAL WRITTEN OPTIONS ON CREDIT DEFAULT SWAPS — PUTS
(Premiums $199,301) |
| | | | |
| | | | |
| | |
| 26 | | See accompanying notes to the financial statements. | | |
GMO High Yield Fund
(A Series of GMO Trust)
Schedule of Investments — (Continued)
February 28, 2022
Swap Contracts
Centrally Cleared Credit Default Swaps
| | | | | | | | | | | | | | | | | | | | | | | | | | | | | | | | | | | | | | |
Reference Entity | | Notional Amount | | | Annual
Premium | | | Implied
Credit
Spread (1) | | | Maximum
Potential
Amount of
Future
Payments by
the Fund
Under the
Contract (2) | | | Expiration
Date | | | Periodic
Payment
Frequency
| | | Premiums
Paid/
(Received) ($) | | | Value ($) | | | Net Unrealized
Appreciation/
(Depreciation) ($) | |
Buy Protection^: | |
CDX.NA.HYS.37.V1-5Y | | USD | | | 5,774,000 | | | | 5.00% | | | | 3.55% | | | | N/A | | | | 12/20/2026 | | | | Quarterly | | | | (321,850 | ) | | | (321,248 | ) | | | 602 | |
Sell Protection^: | |
CDX.NA.HYS.37.V1-5Y | | USD | | | 29,562,000 | | | | 5.00% | | | | 3.55% | | | | 29,562,000 USD | | | | 12/20/2026 | | | | Quarterly | | | | 2,822,615 | | | | 1,644,741 | | | | (1,177,874 | ) |
| | | | | | | | | | | | | | | | | | | | | | | | | | | | | | | | | | | | | | |
| | | $ | 2,500,765 | | | $ | 1,323,493 | | | $ | (1,177,272 | ) |
| | | | | | | | | | | | | | | | | | | | | | | | | | | | | | | | | | | | | | |
| ^ | Buy Protection - Fund pays a premium and buys credit protection. If a credit event occurs the Fund will, depending on the terms of the particular swap contract, either (i) receive from the seller of protection an amount equal to the notional amount of the swap and deliver the referenced obligation or underlying securities comprising the referenced index or (ii) receive a net settlement amount in the form of cash or securities equal to the notional amount of the swap less the recovery value of the referenced obligation or underlying securities comprising the referenced index. |
| | Sell Protection - Fund receives a premium and sells credit protection. If a credit event occurs the Fund will, depending on the terms of the particular swap contract, either (i) pay to the buyer of protection an amount equal to the notional amount of the swap and take delivery of the referenced obligation or underlying securities comprising the referenced index or (ii) pay a net settlement amount in the form of cash or securities equal to the notional amount of the swap less the recovery value of the referenced obligation or underlying securities comprising the referenced index. |
| (1) | As of February 28, 2022, implied credit spreads in absolute terms, calculated using a model, and utilized in determining the market value of credit default swap contracts on the reference security, serve as an indicator of the current status of the payment/performance risk and reflect the likelihood or risk of default for the reference entity. The implied credit spread of a particular referenced entity reflects the cost of buying/selling protection. Wider (i.e. higher) credit spreads represent a deterioration of the referenced entity’s credit soundness and a greater likelihood or risk of default or other credit event occurring as defined under the terms of the contract. |
| (2) | The maximum potential amount the Fund could be required to pay as a seller of credit protection if a credit event occurs as defined under the terms of that particular swap contract. |
OTC Total Return Swaps
| | | | | | | | | | | | | | | | | | | | | | | | | | | | | | | | |
Fund Pays | | Fund Receives | | Counterparty | | Notional
Amount | | | Expiration
Date | | | Periodic
Payment
Frequency | | | Premiums
Paid/
(Received) ($) | | | Value ($) | | | Net Unrealized
Appreciation/
(Depreciation) ($) | |
SOFR | | Total Return on iShares iBoxx High Yield Corporate Bond ETF | | GS | | | USD | | | | 5,000,003 | | | | 03/20/2022 | | | | Quarterly | | | | (27 | ) | | | (164,854 | ) | | | (164,827 | ) |
3 Month USD LIBOR | | Total Return on iShares iBoxx High Yield Corporate Bond ETF | | JPM | | | USD | | | | 23,090,000 | | | | 03/20/2022 | | | | Quarterly | | | | — | | | | (638,498 | ) | | | (638,498 | ) |
3 Month USD LIBOR | | Total Return on iShares iBoxx High Yield Corporate Bond ETF | | MSCI | | | USD | | | | 626,002 | | | | 03/20/2022 | | | | Quarterly | | | | — | | | | (11,557 | ) | | | (11,557 | ) |
| | | | | | | | | | | | | | | | | | | | | | | | | | | | | | | | |
| | | $ | (27 | ) | | $ | (814,909 | ) | | $ | (814,882 | ) |
| | | | | | | | | | | | | |
As of February 28, 2022, for the above contracts and/or agreements, the Fund had sufficient cash and/or securities to cover commitments or collateral requirements, if any, of the relevant broker or exchange.
Notes to Schedule of Investments:
| † | Denominated in U.S. Dollar, unless otherwise indicated. |
| (a) | The rate disclosed is the 7 day net yield as of February 28, 2022. |
| (b) | The rate shown represents yield-to-maturity. |
| (c) | All or a portion of this security has been pledged to cover margin requirements on futures and/or cleared swap contracts, collateral on OTC swap contracts, forward currency contracts, and/or written options, if any (Note 4). |
For a listing of definitions of acronyms, counterparty abbreviations and currency abbreviations used throughout the Schedule of Investments as well as the derivative tables, if any, please refer to page 56.
| | | | |
| | |
| | | See accompanying notes to the financial statements. | | 27 |
GMO Multi-Sector Fixed Income Fund
(A Series of GMO Trust)
Portfolio Management
Day-to-day management of the Fund’s portfolio is the responsibility of the Developed Rates & FX team at Grantham, Mayo, Van Otterloo & Co. LLC.
Management Discussion and Analysis of Fund Performance
Class III shares of GMO Multi-Sector Fixed Income Fund returned -3.74% (net) for the fiscal year ended February 28, 2022, as compared with -2.64% for the Bloomberg U.S. Aggregate Index (formerly Bloomberg Barclays U.S. Aggregate Index).
The Fund’s investment exposure was achieved through global interest rate and currency derivatives, as well as indirect (through ETFs and other GMO Funds, including GMO Opportunistic Income Fund, GMO Emerging Country Debt Fund, and GMO U.S. Treasury Fund) and direct fixed income investments.
Developed markets interest rate positioning contributed positively during the fiscal year. The Fund’s active duration positions in European and Canadian rates added value, while active exposure in U.S. duration dragged on returns. Slope positions (2-year vs. 10-year) in the UK and Sweden generated losses.
The Fund’s positions in developed market currencies produced negative alpha during the fiscal year. Exposure to Swedish krona and Swiss franc detracted from performance, while a position in Canadian dollar pared losses. Exposure to emerging market currencies resulted in negative contribution to performance. Positioning in EMEA was the primary driver of underperformance.
The Fund’s overweight positioning to off-benchmark securitized products added to relative returns, while an overweight to emerging country debt hurt the Fund during the year.
The views expressed herein are exclusively those of Grantham, Mayo, Van Otterloo & Co. LLC as of the date of this report and are subject to change. GMO disclaims any responsibility to update such views. They are not meant as investment advice. References to specific securities are not recommendations of such securities and may not be representative of any GMO portfolio’s current or future investments. All information is unaudited.
GMO Multi-Sector Fixed Income Fund
(A Series of GMO Trust)
Comparison of Change in Value of a $5,000,000 Investment in
GMO Multi-Sector Fixed Income Fund Class III Shares and the
Bloomberg U.S. Aggregate Index (formerly Bloomberg Barclays U.S. Aggregate Index)
As of February 28, 2022
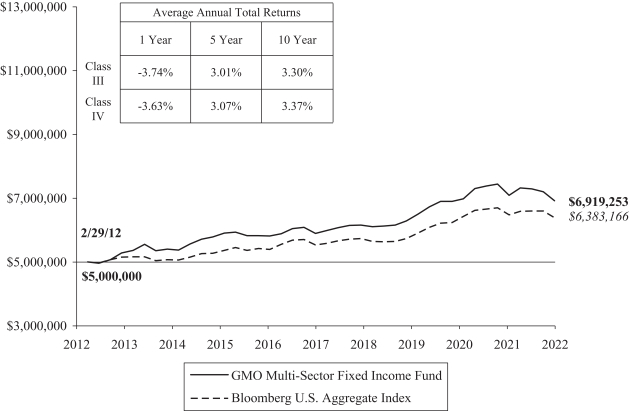
Performance data quoted represents past performance and is not indicative of future results. The investment return and principal value of an investment will fluctuate so that an investor’s shares, when redeemed, may be worth more or less than their original cost. Current performance data may be lower or higher than the performance data provided herein. To obtain performance information up to the most recent month-end, visit www.gmo.com. Performance shown is net of all fees after reimbursement from GMO. Returns would have been lower had certain expenses not been reimbursed during the periods shown and do not include the effect of taxes on distributions and redemptions. The performance information shown above only includes purchase premiums and/or redemption fees in effect as of February 28, 2022. All information is unaudited. Performance for classes may vary due to different fees.
For Class III and IV the gross expense ratio of 0.70% and 0.64%, respectively, is equal to the Fund’s Total Annual Operating Expenses set forth in the Fund’s most recent prospectus dated June 30, 2021. For the Classes listed above, the corresponding net expense ratio of 0.51% and 0.45% reflects the reduction of expenses from fee reimbursements. The fee reimbursements will continue until at least June 30, 2022. Elimination of this reimbursement will result in higher fees and lower performance.
GMO Multi-Sector Fixed Income Fund
(A Series of GMO Trust)
Investment Concentration Summary
February 28, 2022 (Unaudited)
| | | | |
| Asset Class Summary† | | % of Total Net Assets | |
Debt Obligations | | | 66.9 | % |
Short-Term Investments | | | 45.9 | |
Futures Contracts | | | 0.3 | |
Swap Contracts | | | 0.1 | |
Loan Assignments | | | 0.1 | |
Loan Participations | | | 0.1 | |
Purchased Options | | | 0.0 | ^ |
Investment Funds | | | 0.0 | ^ |
Rights/Warrants | | | 0.0 | ^ |
Reverse Repurchase Agreements | | | (0.0 | )^ |
Written Options/Credit Linked Options | | | (0.0 | )^ |
Forward Currency Contracts | | | (0.4 | ) |
Other | | | (13.0 | ) |
| | | | |
| | | 100.0 | % |
| | | | |
| | | | |
| Country/Region Summary‡ | | % of Investments | |
United States | | | 82.9 | % |
Switzerland | | | 11.3 | |
Canada | | | 10.3 | |
Sweden | | | 9.8 | |
Other Emerging | | | 5.1 | * |
Australia | | | 4.9 | |
Other Developed | | | 0.3 | ¤ |
New Zealand | | | (1.4 | ) |
Euro Region | | | (2.1 | )§ |
United Kingdom | | | (21.1 | ) |
| | | | |
| | | 100.0 | % |
| | | | |
| † | The table incorporates aggregate indirect asset class exposure associated with investments in other funds of GMO Trust (“underlying funds”). Derivative financial instruments, if any, are based on market values, rather than the notional amounts of derivatives, except for forward currency contracts which are based on unrealized appreciation/(depreciation). |
| ‡ | The table incorporates aggregate indirect country exposure associated with investments in the underlying funds. The table is normalized to 100%, therefore the absolute exposure presented for each country may not be representative of the true exposure of the Fund. The table excludes short-term investments. The table includes exposure through the use of certain derivative financial instruments and excludes exposure through certain currency linked derivatives such as forward currency contracts and currency options. The table is based on duration adjusted net exposures (both investments and derivatives), taking into account the market value of securities and the notional amounts of swaps and other derivative financial instruments. Duration is based on GMO’s models. The greater the duration of a bond, the greater its contribution to the concentration percentage. Credit default swap exposures are factored into the duration adjusted exposure using the reference security and applying the same methodology to that security. |
| * | “Other Emerging” is comprised of emerging countries that each represent between (1.0)% and 1.0% of Investments. |
| ¤ | “Other Developed” is comprised of developed countries that each represent between (1.0)% and 1.0% of Investments. |
| § | “Euro Region” is comprised of derivative financial instruments attributed to the Eurozone and not a particular country. |
GMO Multi-Sector Fixed Income Fund
(A Series of GMO Trust)
Schedule of Investments
(showing percentage of total net assets)
February 28, 2022
| | | | | | | | | | |
Par Value† | | | Description | | Value ($) | |
| | |
| | | | | | DEBT OBLIGATIONS — 43.6% | |
| | | |
| | | | | | Brazil — 0.7% | | | |
| | |
| | | | | | Corporate Debt | |
| | | |
| | | 400,000 | | | Fibria Overseas Finance Ltd., 5.50%, due 01/17/27 | | | 428,650 | |
| | | |
| | | 100,000 | | | Suzano Austria GmbH, 6.00%, due 01/15/29 | | | 109,425 | |
| | | |
| | | 200,000 | | | Suzano Austria GmbH, 5.00%, due 01/15/30 | | | 204,912 | |
| | | |
| | | 100,000 | | | Suzano Austria GmbH, 3.75%, due 01/15/31 | | | 93,575 | |
| | | | | | | | | | |
| | | |
| | | | | | Total Brazil | | | 836,562 | |
| | | | | | | | | | |
| | | |
| | | | | | Canada — 0.7% | | | |
| | |
| | | | | | Corporate Debt | |
| | | |
| | | 400,000 | | | Cenovus Energy, Inc., 5.40%, due 06/15/47 | | | 450,095 | |
| | | |
| | | 450,000 | | | National Bank of Canada, Variable Rate, 0.55%, due 11/15/24 | | | 438,986 | |
| | | | | | | | | | |
| | | |
| | | | | | Total Canada | | | 889,081 | |
| | | | | | | | | | |
| | | |
| | | | | | Chile — 0.1% | | | |
| | |
| | | | | | Corporate Debt | |
| | | |
| | | 200,000 | | | Enel Americas SA, 4.00%, due 10/25/26 | | | 205,288 | |
| | | | | | | | | | |
| | | |
| | | | | | Germany — 0.7% | | | |
| | | |
| | | | | | Corporate Debt | | | |
| | | |
| | | 400,000 | | | Deutsche Bank AG, Variable Rate, 3.96%, due 11/26/25 | | | 409,082 | |
| | | |
| | | 450,000 | | | Deutsche Bank AG, Variable Rate, 3.55%, due 09/18/31 | | | 444,088 | |
| | | | | | | | | | |
| | | |
| | | | | | Total Germany | | | 853,170 | |
| | | | | | | | | | |
| | | |
| | | | | | Ireland — 0.8% | | | |
| | |
| | | | | | Corporate Debt | |
| | | |
| | | 400,000 | | | AerCap Ireland Capital DAC / AerCap Global Aviation Trust, 6.50%, due 07/15/25 | | | 440,680 | |
| | | |
| | | 200,000 | | | AerCap Ireland Capital DAC / AerCap Global Aviation Trust, 3.88%, due 01/23/28 | | | 203,175 | |
| | | |
| | | 350,000 | | | AerCap Ireland Capital DAC / AerCap Global Aviation Trust, 3.40%, due 10/29/33 | | | 330,501 | |
| | | | | | | | | | |
| | | |
| | | | | | Total Ireland | | | 974,356 | |
| | | | | | | | | | |
| | | |
| | | | | | Netherlands — 0.3% | | | |
| | |
| | | | | | Corporate Debt | |
| | | |
| | | 350,000 | | | ING Groep NV, Variable Rate, 2.73%, due 04/01/32 | | | 334,273 | |
| | | | | | | | | | |
| | | | | | | | | | |
Par Value† | | | Description | | Value ($) | |
| | | |
| | | | | | United Kingdom — 1.4% | | | |
| | |
| | | | | | Corporate Debt | |
| | | |
| | | 300,000 | | | Barclays Plc, Variable Rate, 2.89%, due 11/24/32 | | | 284,258 | |
| | | |
| | | 250,000 | | | British Telecommunications Plc, 5.13%, due 12/04/28 | | | 269,145 | |
| | | |
| | | 350,000 | | | CNH Industrial NV, 4.50%, due 08/15/23 | | | 361,133 | |
| | | |
| | | 500,000 | | | HSBC Holdings Plc, Variable Rate, 3.97%, due 05/22/30 | | | 515,808 | |
| | | |
| | | 300,000 | | | Reynolds American, Inc., 5.70%, due 08/15/35 | | | 327,792 | |
| | | | | | | | | | |
| | | |
| | | | | | Total United Kingdom | | | 1,758,136 | |
| | | | | | | | | | |
| | | |
| | | | | | United States — 38.9% | | | |
| | |
| | | | | | Corporate Debt — 24.7% | |
| | | |
| | | 200,000 | | | Abbott Laboratories, 2.95%, due 03/15/25 | | | 204,897 | |
| | | |
| | | 450,000 | | | Alphabet, Inc., 0.45%, due 08/15/25 | | | 426,441 | |
| | | |
| | | 450,000 | | | Alphabet, Inc., 0.80%, due 08/15/27 | | | 416,591 | |
| | | |
| | | 100,000 | | | American Express Co., 4.05%, due 12/03/42 | | | 109,631 | |
| | | |
| | | 200,000 | | | American Financial Group Inc/OH, 4.50%, due 06/15/47 | | | 214,313 | |
| | | |
| | | 850,000 | | | Anthem, Inc., 2.38%, due 01/15/25 | | | 853,117 | |
| | | |
| | | 450,000 | | | Apple, Inc., 0.75%, due 05/11/23 | | | 447,055 | |
| | | |
| | | 350,000 | | | Ares Capital Corp., 2.15%, due 07/15/26 | | | 330,194 | |
| | | |
| | | 150,000 | | | Bank of America Corp., Variable Rate, 4.44%, due 01/20/48 | | | 167,347 | |
| | | |
| | | 200,000 | | | Bank of America Corp., Variable Rate, 4.33%, due 03/15/50 | | | 221,913 | |
| | | |
| | | 400,000 | | | Bank of America Corp., Variable Rate, 2.83%, due 10/24/51 | | | 349,840 | |
| | | |
| | | 200,000 | | | Boeing Co. (The), 5.04%, due 05/01/27 | | | 217,270 | |
| | | |
| | | 200,000 | | | Boeing Co. (The), 5.71%, due 05/01/40 | | | 232,979 | |
| | | |
| | | 250,000 | | | Broadcom, Inc., 5.00%, due 04/15/30 | | | 276,043 | |
| | | |
| | | 650,000 | | | Broadcom, Inc., 144A, 3.42%, due 04/15/33 | | | 633,836 | |
| | | |
| | | 550,000 | | | Carrier Global Corp., 2.72%, due 02/15/30 | | | 534,879 | |
| | | |
| | | 250,000 | | | CF Industries, Inc., 5.15%, due 03/15/34 | | | 279,749 | |
| | | |
| | | 450,000 | | | CF Industries, Inc., 5.38%, due 03/15/44 | | | 506,997 | |
| | | |
| | | 300,000 | | | Charter Communications Operating LLC / Charter Communications Operating Capital, 5.38%, due 04/01/38 | | | 313,793 | |
| | | |
| | | 150,000 | | | Charter Communications Operating LLC / Charter Communications Operating Capital, 6.48%, due 10/23/45 | | | 179,226 | |
| | | |
| | | 250,000 | | | Charter Communications Operating LLC / Charter Communications Operating Capital, 6.83%, due 10/23/55 | | | 313,167 | |
| | | |
| | | 350,000 | | | Cheniere Corpus Christi Holdings LLC, 7.00%, due 06/30/24 | | | 378,491 | |
| | | |
| | | 400,000 | | | Cheniere Corpus Christi Holdings LLC, 5.13%, due 06/30/27 | | | 436,189 | |
| | | |
| | | 450,000 | | | CNH Industrial Capital LLC, 1.95%, due 07/02/23 | | | 449,748 | |
| | | | |
| | |
| | | See accompanying notes to the financial statements. | | 31 |
GMO Multi-Sector Fixed Income Fund
(A Series of GMO Trust)
Schedule of Investments — (Continued)
(showing percentage of total net assets)
February 28, 2022
| | | | | | | | | | |
Par Value† | | | Description | | Value ($) | |
| | | |
| | | | | | United States — continued | | | |
| | |
| | | | | | Corporate Debt — continued | |
| | | |
| | | 200,000 | | | CNH Industrial Capital LLC, 1.45%, due 07/15/26 | | | 189,871 | |
| | | |
| | | 400,000 | | | Constellation Brands, Inc., 4.25%, due 05/01/23 | | | 411,093 | |
| | | |
| | | 350,000 | | | Corning, Inc., 5.45%, due 11/15/79 | | | 403,849 | |
| | | |
| | | 500,000 | | | Devon Energy Corp., 5.60%, due 07/15/41 | | | 584,539 | |
| | | |
| | | 200,000 | | | Devon Energy Corp., 5.00%, due 06/15/45 | | | 222,891 | |
| | | |
| | | 400,000 | | | DH Europe Finance II Sarl, 2.60%, due 11/15/29 | | | 390,330 | |
| | | |
| | | 350,000 | | | DuPont de Nemours, Inc., 5.32%, due 11/15/38 | | | 416,083 | |
| | | |
| | | 300,000 | | | DuPont de Nemours, Inc., 5.42%, due 11/15/48 | | | 376,492 | |
| | | |
| | | 100,000 | | | Ecolab, Inc., 2.70%, due 11/01/26 | | | 101,715 | |
| | | |
| | | 300,000 | | | Ecolab, Inc., 4.80%, due 03/24/30 | | | 343,340 | |
| | | |
| | | 400,000 | | | Equifax, Inc., 2.35%, due 09/15/31 | | | 367,474 | |
| | | |
| | | 400,000 | | | Estee Lauder Cos, Inc. (The), 2.60%, due 04/15/30 | | | 396,998 | |
| | | |
| | | 100,000 | | | Exelon Generation Co. LLC, 5.60%, due 06/15/42 | | | 110,769 | |
| | | |
| | | 450,000 | | | Expedia Group, Inc., 3.80%, due 02/15/28 | | | 462,597 | |
| | | |
| | | 250,000 | | | Expedia Group, Inc., 3.25%, due 02/15/30 | | | 246,590 | |
| | | |
| | | 350,000 | | | Fortive Corp., 4.30%, due 06/15/46 | | | 376,055 | |
| | | |
| | | 400,000 | | | GLP Capital LP / GLP Financing II, Inc., REIT, 4.00%, due 01/15/31 | | | 398,620 | |
| | | |
| | | 350,000 | | | HCA, Inc., 4.75%, due 05/01/23 | | | 360,161 | |
| | | |
| | | 350,000 | | | HCA, Inc., 4.50%, due 02/15/27 | | | 370,944 | |
| | | |
| | | 300,000 | | | HCA, Inc., 5.50%, due 06/15/47 | | | 350,972 | |
| | | |
| | | 200,000 | | | Host Hotels & Resorts LP, REIT, 3.38%, due 12/15/29 | | | 196,786 | |
| | | |
| | | 450,000 | | | Host Hotels & Resorts LP, REIT, 3.50%, due 09/15/30 | | | 439,015 | |
| | | |
| | | 350,000 | | | Huntington Bancshares, Inc., 2.63%, due 08/06/24 | | | 352,959 | |
| | | |
| | | 350,000 | | | Johnson & Johnson, 3.63%, due 03/03/37 | | | 377,870 | |
| | | |
| | | 850,000 | | | Keurig Dr Pepper, Inc., 4.42%, due 05/25/25 | | | 899,877 | |
| | | |
| | | 450,000 | | | Las Vegas Sands Corp., 3.20%, due 08/08/24 | | | 443,592 | |
| | | |
| | | 450,000 | | | Las Vegas Sands Corp., 3.50%, due 08/18/26 | | | 437,262 | |
| | | |
| | | 300,000 | | | Marathon Oil Corp., 5.20%, due 06/01/45 | | | 329,794 | |
| | | |
| | | 250,000 | | | Marathon Petroleum Corp., 6.50%, due 03/01/41 | | | 316,096 | |
| | | |
| | | 400,000 | | | Marathon Petroleum Corp., 4.75%, due 09/15/44 | | | 420,808 | |
| | | |
| | | 350,000 | | | Marvell Technology, Inc., 2.45%, due 04/15/28 | | | 337,498 | |
| | | |
| | | 150,000 | | | Microchip Technology, Inc., 4.25%, due 09/01/25 | | | 153,943 | |
| | | |
| | | 300,000 | | | Morgan Stanley, 6.38%, due 07/24/42 | | | 409,146 | |
| | | |
| | | 300,000 | | | Morgan Stanley, Variable Rate, 5.60%, due 03/24/51 | | | 399,791 | |
| | | | | | | | | | |
Par Value† | | | Description | | Value ($) | |
| | | |
| | | | | | United States — continued | | | |
| | |
| | | | | | Corporate Debt — continued | |
| | | |
| | | 350,000 | | | NIKE, Inc., 3.38%, due 03/27/50 | | | 357,226 | |
| | | |
| | | 350,000 | | | Office Properties Income Trust, REIT, 4.50%, due 02/01/25 | | | 358,652 | |
| | | |
| | | 250,000 | | | ONEOK, Inc., 4.95%, due 07/13/47 | | | 263,033 | |
| | | |
| | | 700,000 | | | PacifiCorp, 4.15%, due 02/15/50 | | | 739,041 | |
| | | |
| | | 400,000 | | | Procter & Gamble Co. (The), 3.10%, due 08/15/23 | | | 409,199 | |
| | | |
| | | 400,000 | | | Sabra Health Care LP, REIT, 5.13%, due 08/15/26 | | | 424,982 | |
| | | |
| | | 250,000 | | | Simon Property Group LP, REIT, 4.75%, due 03/15/42 | | | 282,788 | |
| | | |
| | | 300,000 | | | Simon Property Group LP, REIT, 4.25%, due 11/30/46 | | | 324,690 | |
| | | |
| | | 300,000 | | | Simon Property Group LP, REIT, 3.80%, due 07/15/50 | | | 302,781 | |
| | | |
| | | 350,000 | | | Starbucks Corp., 4.45%, due 08/15/49 | | | 372,620 | |
| | | |
| | | 300,000 | | | Starbucks Corp., 3.50%, due 11/15/50 | | | 280,959 | |
| | | |
| | | 400,000 | | | Synchrony Financial, 4.38%, due 03/19/24 | | | 413,615 | |
| | | |
| | | 300,000 | | | Synchrony Financial, 4.25%, due 08/15/24 | | | 310,914 | |
| | | |
| | | 300,000 | | | Time Warner Cable LLC, 5.50%, due 09/01/41 | | | 319,789 | |
| | | |
| | | 350,000 | | | Union Pacific Corp., 4.10%, due 09/15/67 | | | 374,996 | |
| | | |
| | | 350,000 | | | Union Pacific Corp., 3.80%, due 04/06/71 | | | 352,672 | |
| | | |
| | | 400,000 | | | United Parcel Service, Inc., 3.90%, due 04/01/25 | | | 421,109 | |
| | | |
| | | 300,000 | | | United Parcel Service, Inc., 5.20%, due 04/01/40 | | | 372,389 | |
| | | |
| | | 350,000 | | | Verizon Communications, Inc., 4.33%, due 09/21/28 | | | 381,110 | |
| | | |
| | | 400,000 | | | Walt Disney Co. (The), 2.65%, due 01/13/31 | | | 396,141 | |
| | | |
| | | 350,000 | | | Wells Fargo & Co., Variable Rate, 4.48%, due 04/04/31 | | | 382,037 | |
| | | |
| | | 100,000 | | | Wells Fargo & Co., 3.90%, due 05/01/45 | | | 103,715 | |
| | | |
| | | 350,000 | | | Wells Fargo & Co., Variable Rate, 5.01%, due 04/04/51 | | | 430,986 | |
| | | |
| | | 450,000 | | | Welltower, Inc., REIT, 2.80%, due 06/01/31 | | | 436,254 | |
| | | |
| | | 400,000 | | | Williams Cos, Inc. (The), 5.40%, due 03/04/44 | | | 446,595 | |
| | | |
| | | 250,000 | | | Williams Cos, Inc. (The), 5.75%, due 06/24/44 | | | 293,397 | |
| | | |
| | | 400,000 | | | Williams Cos, Inc. (The), 5.10%, due 09/15/45 | | | 440,982 | |
| | | | | | | | | | |
| | | |
| | | | | | | | | 30,882,198 | |
| | | | | | | | | | |
| |
| | | | U.S. Government Agency — 14.2% | |
| | | |
| | | 2,400,000 | | | Federal National Mortgage Association, TBA, 2.50%, due 03/16/36 | | | 2,428,116 | |
| | | |
| | | 4,300,000 | | | Federal National Mortgage Association, TBA, 3.00%, due 04/25/49 | | | 4,343,000 | |
| | | |
| | | 4,400,000 | | | Federal National Mortgage Association, TBA, 2.50%, due 11/25/51 | | | 4,341,047 | |
| | | | |
| | |
| 32 | | See accompanying notes to the financial statements. | | |
GMO Multi-Sector Fixed Income Fund
(A Series of GMO Trust)
Schedule of Investments — (Continued)
(showing percentage of total net assets)
February 28, 2022
| | | | | | | | | | |
Par Value† /
Shares | | | Description | | Value ($) | |
| | | |
| | | | | | United States — continued | | | |
| |
| | | | U.S. Government Agency — continued | |
| | | |
| | | 4,100,000 | | | Federal National Mortgage Association, TBA, 2.00%, due 03/14/52 | | | 3,932,797 | |
| | | |
| | | 2,700,000 | | | Government National Mortgage Association, TBA, 3.00%, due 03/21/52 | | | 2,744,824 | |
| | | | | | | | | | |
| |
| | | 17,789,784 | |
| | | | | | | | | | |
| | | |
| | | | | | Total United States | | | 48,671,982 | |
| | | | | | | | | | |
| | |
| | | TOTAL DEBT OBLIGATIONS (COST $56,729,160) | | | 54,522,848 | |
| | | | | | | | | | |
| |
| | | | MUTUAL FUNDS — 27.7% | |
| |
| | | | United States — 27.7% | |
| |
| | | | Affiliated Issuers | |
| | | |
| | | 295,373 | | | GMO Emerging Country Debt Fund, Class VI | | | 6,291,438 | |
| | | |
| | | 1,014,268 | | | GMO Opportunistic Income Fund, Class VI | | | 25,924,702 | |
| | | |
| | | 478,907 | | | GMO U.S. Treasury Fund | | | 2,399,326 | |
| | | | | | | | | | |
| | |
| | | TOTAL MUTUAL FUNDS (COST $37,221,238) | | | 34,615,466 | |
| | | | | | | | | | |
| |
| | | | SHORT-TERM INVESTMENTS — 42.2% | |
| |
| | | | Money Market Funds — 0.4% | |
| | | |
| | | 537,009 | | | State Street Institutional Treasury Money Market Fund – Premier Class, 0.01% (a) | | | 537,009 | |
| | | | | | | | | | |
| | |
| | | | Sovereign and Sovereign Agency
Issuers — 22.9% | | | |
| | | |
JPY | | | 1,142,000,000 | | | Japan Treasury Discount Bill, Zero Coupon | | | 9,934,820 | |
| | | |
JPY | | | 2,142,000,000 | | | Japan Treasury Discount Bill, Zero Coupon | | | 18,633,695 | |
| | | | | | | | | | |
| | |
| | | Total Sovereign and Sovereign Agency Issuers | | | 28,568,515 | |
| | | | | | | | | | |
| | |
| | | | U.S. Government — 18.9% | | | |
| | | |
| | | 2,200,000 | | | U.S. Treasury Bill, 0.73%, due 11/03/22 (b) (c) | | | 2,189,170 | |
| | | |
| | | 21,600,000 | | | U.S. Treasury Bill, 0.90%, due 12/29/22 (b) | | | 21,439,107 | |
| | | | | | | | | | |
| | | |
| | | | | | Total U.S. Government | | | 23,628,277 | |
| | | | | | | | | | |
| | |
| | | TOTAL SHORT-TERM INVESTMENTS
(COST $52,840,283) | | | 52,733,801 | |
| | | | | | | | | | |
| | |
| | | TOTAL INVESTMENTS — 113.5%
(Cost $146,790,681) | | | 141,872,115 | |
| | |
| | | Other Assets and Liabilities (net) — (13.5%) | | | (16,891,956 | ) |
| | | | | | | | | | |
| | |
| | | TOTAL NET ASSETS — 100.0% | | | $124,980,159 | |
| | | | | | | | | | |
A summary of outstanding financial instruments at February 28, 2022 is as follows:
Forward Currency Contracts
| | | | | | | | | | | | | | | | | | | | |
| | | | |
Settlement
Date | | Counter-
party | | Currency
Sold | | | Currency
Purchased | | | Net Unrealized
Appreciation
(Depreciation) ($) | |
| 05/09/2022 | | BCLY | | AUD | | | 1,720,000 | | | | USD | | | | 1,225,500 | | | | (24,962 | ) |
| 05/09/2022 | | JPM | | AUD | | | 440,000 | | | | USD | | | | 312,655 | | | | (7,230 | ) |
| 05/09/2022 | | MSCI | | AUD | | | 4,271,000 | | | | USD | | | | 3,016,657 | | | | (88,414 | ) |
| 05/02/2022 | | JPM | | CAD | | | 1,040,846 | | | | USD | | | | 820,000 | | | | (1,301 | ) |
| 05/16/2022 | | MSCI | | CHF | | | 5,180,426 | | | | USD | | | | 5,624,845 | | | | (41,591 | ) |
| 05/16/2022 | | MSCI | | CLP | | | 198,388,500 | | | | USD | | | | 245,637 | | | | (72 | ) |
| 03/17/2022 | | MSCI | | COP | | | 2,500,560,000 | | | | USD | | | | 636,162 | | | | 1,998 | |
| 03/31/2022 | | JPM | | EUR | | | 470,000 | | | | USD | | | | 528,069 | | | | 449 | |
| 05/16/2022 | | BCLY | | GBP | | | 450,000 | | | | USD | | | | 602,616 | | | | (1,127 | ) |
| 05/16/2022 | | MSCI | | HUF | | | 137,199,348 | | | | USD | | | | 439,263 | | | | 28,764 | |
| 04/29/2022 | | CITI | | ILS | | | 452,907 | | | | USD | | | | 140,000 | | | | (1,271 | ) |
| 04/29/2022 | | GS | | ILS | | | 807,993 | | | | USD | | | | 253,479 | | | | 1,451 | |
| 04/29/2022 | | JPM | | ILS | | | 517,022 | | | | USD | | | | 160,000 | | | | (1,269 | ) |
| 03/08/2022 | | JPM | | INR | | | 60,053,064 | | | | USD | | | | 800,759 | | | | 4,103 | |
| 03/08/2022 | | MSCI | | INR | | | 7,544,300 | | | | USD | | | | 100,000 | | | | (82 | ) |
| 06/03/2022 | | MSCI | | INR | | | 67,597,364 | | | | USD | | | | 884,840 | | | | (1,404 | ) |
| 03/09/2022 | | JPM | | JPY | | | 129,313,584 | | | | USD | | | | 1,120,000 | | | | (4,940 | ) |
| 04/11/2022 | | DB | | JPY | | | 2,142,000,000 | | | | USD | | | | 18,507,462 | | | | (141,058 | ) |
| 04/25/2022 | | MSCI | | JPY | | | 1,142,000,000 | | | | USD | | | | 10,050,408 | | | | 105,192 | |
| 05/09/2022 | | BCLY | | KRW | | | 1,101,484,877 | | | | USD | | | | 914,262 | | | | (1,163 | ) |
| 03/22/2022 | | MSCI | | MXN | | | 8,472,288 | | | | USD | | | | 415,422 | | | | 3,137 | |
| 03/01/2022 | | JPM | | NZD | | | 1,610,000 | | | | USD | | | | 1,075,831 | | | | (13,495 | ) |
| 03/01/2022 | | MSCI | | NZD | | | 8,260,000 | | | | USD | | | | 5,474,878 | | | | (113,839 | ) |
| 06/01/2022 | | JPM | | NZD | | | 9,290,000 | | | | USD | | | | 6,244,134 | | | | (32,877 | ) |
| 04/19/2022 | | JPM | | PLN | | | 552,097 | | | | USD | | | | 130,000 | | | | (1,052 | ) |
| 04/19/2022 | | SSB | | PLN | | | 1,207,153 | | | | USD | | | | 300,000 | | | | 13,456 | |
| 03/31/2022 | | CITI | | RON | | | 4,401,688 | | | | USD | | | | 983,266 | | | | (11,282 | ) |
| 03/16/2022 | | BCLY | | RUB | | | 46,810,947 | | | | USD | | | | 527,552 | | | | 95,338 | |
| 05/11/2022 | | MSCI | | RUB | | | 27,119,418 | | | | USD | | | | 311,621 | | | | 78,335 | |
| 03/07/2022 | | JPM | | SEK | | | 13,620,243 | | | | USD | | | | 1,460,210 | | | | 22,126 | |
| 05/18/2022 | | MSCI | | THB | | | 20,645,125 | | | | USD | | | | 638,535 | | | | 6,524 | |
| 05/17/2022 | | JPM | | TWD | | | 8,075,039 | | | | USD | | | | 291,381 | | | | 2,259 | |
| 05/09/2022 | | JPM | | USD | | | 2,109,283 | | | | AUD | | | | 2,930,000 | | | | 20,864 | |
| 04/04/2022 | | CITI | | USD | | | 280,000 | | | | BRL | | | | 1,518,083 | | | | 12,153 | |
| 04/04/2022 | | GS | | USD | | | 370,000 | | | | BRL | | | | 1,938,080 | | | | 2,980 | |
| 04/04/2022 | | MSCI | | USD | | | 320,000 | | | | BRL | | | | 1,716,254 | | | | 10,290 | |
| 05/02/2022 | | BCLY | | USD | | | 5,468,879 | | | | CAD | | | | 6,983,064 | | | | 41,250 | |
| 05/02/2022 | | JPM | | USD | | | 2,810,000 | | | | CAD | | | | 3,565,431 | | | | 3,377 | |
| 05/16/2022 | | JPM | | USD | | | 1,550,000 | | | | CHF | | | | 1,419,497 | | | | 2,670 | |
| 05/16/2022 | | MSCI | | USD | | | 242,321 | | | | CLP | | | | 198,388,500 | | | | 3,387 | |
| 03/17/2022 | | MSCI | | USD | | | 460,000 | | | | COP | | | | 1,807,120,800 | | | | (1,698 | ) |
| 05/18/2022 | | MSCI | | USD | | | 850,401 | | | | CZK | | | | 18,416,276 | | | | (36,364 | ) |
| 03/31/2022 | | SSB | | USD | | | 525,472 | | | | EUR | | | | 470,000 | | | | 2,147 | |
| 05/16/2022 | | BCLY | | USD | | | 203,862 | | | | GBP | | | | 150,000 | | | | (2,615 | ) |
| 05/16/2022 | | MSCI | | USD | | | 3,828,245 | | | | GBP | | | | 2,811,000 | | | | (56,867 | ) |
| 05/16/2022 | | MSCI | | USD | | | 180,000 | | | | HUF | | | | 56,869,200 | | | | (9,848 | ) |
| 05/04/2022 | | JPM | | USD | | | 527,103 | | | | IDR | | | | 7,643,000,000 | | | | 2,410 | |
| 04/29/2022 | | JPM | | USD | | | 415,248 | | | | ILS | | | | 1,325,015 | | | | (1,950 | ) |
| 03/08/2022 | | MSCI | | USD | | | 894,595 | | | | INR | | | | 67,597,364 | | | | 2,143 | |
| 03/09/2022 | | DB | | USD | | | 580,000 | | | | JPY | | | | 66,939,540 | | | | 2,329 | |
| 03/09/2022 | | JPM | | USD | | | 950,000 | | | | JPY | | | | 108,612,550 | | | | (5,145 | ) |
| 03/09/2022 | | MSCI | | USD | | | 5,664,633 | | | | JPY | | | | 652,832,815 | | | | 14,570 | |
| 05/09/2022 | | BCLY | | USD | | | 180,000 | | | | KRW | | | | 216,126,000 | | | | (381 | ) |
| 05/09/2022 | | JPM | | USD | | | 130,000 | | | | KRW | | | | 156,059,800 | | | | (301 | ) |
| | | | |
| | |
| | | See accompanying notes to the financial statements. | | 33 |
GMO Multi-Sector Fixed Income Fund
(A Series of GMO Trust)
Schedule of Investments — (Continued)
February 28, 2022
| | | | | | | | | | | | | | | | | | | | |
| | | | |
Settlement
Date | | Counter-
party | | Currency
Sold | | | Currency
Purchased | | | Net Unrealized
Appreciation
(Depreciation) ($) | |
| 05/09/2022 | | MSCI | | USD | | | 320,000 | | | | KRW | | | | 383,883,040 | | | | (961 | ) |
| 03/22/2022 | | JPM | | USD | | | 160,000 | | | | MXN | | | | 3,277,289 | | | | (518 | ) |
| 05/16/2022 | | BCLY | | USD | | | 4,266,428 | | | | NOK | | | | 37,742,954 | | | | 11,918 | |
| 03/01/2022 | | JPM | | USD | | | 6,254,028 | | | | NZD | | | | 9,290,000 | | | | 31,587 | |
| 03/01/2022 | | MSCI | | USD | | | 391,013 | | | | NZD | | | | 580,000 | | | | 1,415 | |
| 04/19/2022 | | DB | | USD | | | 150,000 | | | | PLN | | | | 597,481 | | | | (8,175 | ) |
| 04/19/2022 | | MSCI | | USD | | | 390,330 | | | | PLN | | | | 1,551,718 | | | | (21,996 | ) |
| 05/11/2022 | | MSCI | | USD | | | 945,679 | | | | RUB | | | | 73,930,365 | | | | (309,719 | ) |
| 03/07/2022 | | BCLY | | USD | | | 2,963,778 | | | | SEK | | | | 26,981,421 | | | | (114,965 | ) |
| 03/18/2022 | | MSCI | | USD | | | 250,379 | | | | SGD | | | | 336,610 | | | | (2,111 | ) |
| 05/18/2022 | | MSCI | | USD | | | 110,000 | | | | THB | | | | 3,568,191 | | | | (767 | ) |
| 05/17/2022 | | JPM | | USD | | | 110,000 | | | | TWD | | | | 3,062,730 | | | | (341 | ) |
| 05/31/2022 | | MSCI | | USD | | | 162,730 | | | | ZAR | | | | 2,548,915 | | | | 1,139 | |
| | | | | | | | | | | | | | | | | | | | |
| | | $ | (533,390 | ) |
| | | | | |
Futures Contracts
| | | | | | | | | | | | | | |
Number of
Contracts + | | Type | | Expiration
Date | | | Notional
Amount ($) | | | Value/Net
Unrealized
Appreciation
(Depreciation) ($) | |
| Buys | | | |
| 6 | | U.S. Long Bond (CBT) | | | June 2022 | | | | 940,125 | | | | 14,898 | |
| 52 | | U.S. Treasury Note 10 Yr. (CBT) | | | June 2022 | | | | 6,626,750 | | | | 68,161 | |
| 85 | | U.S. Treasury Note 2 Yr. (CBT) | | | June 2022 | | | | 18,294,258 | | | | 59,713 | |
| 146 | | U.S. Treasury Note 5 Yr. (CBT) | | | June 2022 | | | | 17,269,062 | | | | 129,142 | |
| 27 | | U.S. Treasury Ultra 10 Yr. (CBT) | | | June 2022 | | | | 3,815,859 | | | | 45,092 | |
| 55 | | U.S. Ultra Bond (CBT) | | | June 2022 | | | | 10,226,563 | | | | 133,620 | |
| | | | | | | | | | | | | | |
| | |
| | | $ | 57,172,617 | | | $ | 450,626 | |
| | | | | | | | | | | | | | |
| | | | | | | | | | | | | | |
Number of
Contracts + | | Type | | Expiration
Date | | | Notional
Amount ($) | | | Value/Net
Unrealized
Appreciation
(Depreciation) ($) | |
| Sales | | | | | | | | | | | | | | |
| 6 | | U.S. Long Bond (CBT) | | | June 2022 | | | | 940,125 | | | | (13,911 | ) |
| 2 | | U.S. Treasury Note 2 Yr. (CBT) | | | June 2022 | | | | 430,453 | | | | (1,480 | ) |
| 11 | | U.S. Ultra Bond (CBT) | | | June 2022 | | | | 2,045,313 | | | | (26,484 | ) |
| | | | | | | | | | | | | | |
| | |
| | | $ | 3,415,891 | | | $ | (41,875 | ) |
| | | | | | | | | | | | | | |
| + | Buys - Fund is long the futures contract. |
| | Sales - Fund is short the futures contract. |
Swap Contracts
Centrally Cleared Interest Rate Swaps
| | | | | | | | | | | | | | | | | | | | | | | | | | |
Fund Pays | | Fund Receives | | Notional Amount | | | Expiration
Date | | | Periodic
Payment
Frequency | | Premiums
Paid/
(Received) ($) | | | Value ($) | | | Net Unrealized
Appreciation/
(Depreciation) ($) | |
1.60% | | 3 Month AUD BBSW | | AUD | | | 3,520,000 | | | | 03/16/2024 | | | Quarterly | | | — | | | | (9,171 | ) | | | (9,171 | ) |
1.82% | | 3 Month CAD CDOR | | CAD | | | 33,670,000 | | | | 03/16/2024 | | | Semi-Annually | | | (8,946 | ) | | | 104,568 | | | | 113,514 | |
1.99% | | 3 Month CAD CDOR | | CAD | | | 4,660,000 | | | | 03/16/2024 | | | Semi-Annually | | | — | | | | 2,115 | | | | 2,115 | |
1.90% | | 3 Month CAD CDOR | | CAD | | | 10,450,000 | | | | 03/16/2024 | | | Semi-Annually | | | — | | | | 19,777 | | | | 19,777 | |
1.95% | | 3 Month CAD CDOR | | CAD | | | 3,400,000 | | | | 03/16/2024 | | | Semi-Annually | | | — | | | | 3,474 | | | | 3,474 | |
3 Month CAD CDOR | | 2.12% | | CAD | | | 3,300,000 | | | | 03/16/2024 | | | Semi-Annually | | | — | | | | 5,148 | | | | 5,148 | |
3 Month CAD CDOR | | 1.74% | | CAD | | | 5,830,000 | | | | 03/16/2024 | | | Semi-Annually | | | — | | | | (25,541 | ) | | | (25,541 | ) |
3 Month CAD CDOR | | 1.80% | | CAD | | | 5,010,000 | | | | 03/16/2024 | | | Semi-Annually | | | — | | | | (16,650 | ) | | | (16,650 | ) |
2.03% | | 3 Month CAD CDOR | | CAD | | | 4,250,000 | | | | 03/16/2024 | | | Semi-Annually | | | — | | | | (880 | ) | | | (880 | ) |
(0.54)% | | CHF - SARON - OIS - COMPOUND | | CHF | | | 10,580,000 | | | | 03/16/2024 | | | Annually | | | — | | | | 58,873 | | | | 58,873 | |
(0.54)% | | CHF - SARON - OIS - COMPOUND | | CHF | | | 1,610,000 | | | | 03/16/2024 | | | Annually | | | (488 | ) | | | 9,229 | | | | 9,717 | |
(0.44)% | | CHF - SARON - OIS - COMPOUND | | CHF | | | 3,420,000 | | | | 03/16/2024 | | | Annually | | | — | | | | 11,733 | | | | 11,733 | |
CHF - SARON - OIS - COMPOUND | | (0.17)% | | CHF | | | 2,610,000 | | | | 03/16/2024 | | | Annually | | | — | | | | 6,733 | | | | 6,733 | |
CHF - SARON - OIS - COMPOUND | | (0.57)% | | CHF | | | 3,600,000 | | | | 03/16/2024 | | | Annually | | | (943 | ) | | | (22,807 | ) | | | (21,864 | ) |
(0.08)% | | CHF - SARON - OIS - COMPOUND | | CHF | | | 3,920,000 | | | | 03/16/2024 | | | Annually | | | — | | | | (18,127 | ) | | | (18,127 | ) |
| | | | |
| | |
| 34 | | See accompanying notes to the financial statements. | | |
GMO Multi-Sector Fixed Income Fund
(A Series of GMO Trust)
Schedule of Investments — (Continued)
February 28, 2022
| | | | | | | | | | | | | | | | | | | | | | | | | | |
Fund Pays | | Fund Receives | | Notional Amount | | | Expiration
Date | | | Periodic
Payment
Frequency | | Premiums
Paid/
(Received) ($) | | | Value ($) | | | Net Unrealized
Appreciation/
(Depreciation) ($) | |
(0.24)% | | CHF - SARON - OIS - COMPOUND | | CHF | | | 5,920,000 | | | | 03/16/2024 | | | Annually | | | — | | | | (6,145 | ) | | | (6,145 | ) |
(0.25)% | | CHF - SARON - OIS - COMPOUND | | CHF | | | 5,390,000 | | | | 03/16/2024 | | | Annually | | | — | | | | (4,390 | ) | | | (4,390 | ) |
(0.28)% | | CHF - SARON - OIS - COMPOUND | | CHF | | | 5,890,000 | | | | 03/16/2024 | | | Annually | | | — | | | | (850 | ) | | | (850 | ) |
GBP - SONIA - COMPOUND | | 1.64% | | GBP | | | 28,790,000 | | | | 03/16/2024 | | | Annually | | | 12,031 | | | | 19,311 | | | | 7,280 | |
GBP - SONIA - COMPOUND | | 1.80% | | GBP | | | 3,070,000 | | | | 03/16/2024 | | | Annually | | | 2,112 | | | | 15,395 | | | | 13,283 | |
1.62% | | GBP - SONIA - COMPOUND | | GBP | | | 4,320,000 | | | | 03/16/2024 | | | Annually | | | 1,403 | | | | (1,192 | ) | | | (2,595 | ) |
1.67% | | GBP - SONIA - COMPOUND | | GBP | | | 2,460,000 | | | | 03/16/2024 | | | Annually | | | 73 | | | | (3,593 | ) | | | (3,666 | ) |
1.67% | | GBP - SONIA - COMPOUND | | GBP | | | 2,610,000 | | | | 03/16/2024 | | | Annually | | | (259 | ) | | | (4,431 | ) | | | (4,172 | ) |
2.51% | | 3 Month NZD Bank Bill Rate | | NZD | | | 15,790,000 | | | | 03/16/2024 | | | Quarterly | | | — | | | | 59,573 | | | | 59,573 | |
2.40% | | 3 Month NZD Bank Bill Rate | | NZD | | | 4,160,000 | | | | 03/16/2024 | | | Quarterly | | | — | | | | 21,731 | | | | 21,731 | |
2.38% | | 3 Month NZD Bank Bill Rate | | NZD | | | 5,900,000 | | | | 03/16/2024 | | | Quarterly | | | — | | | | 32,377 | | | | 32,377 | |
2.61% | | 3 Month NZD Bank Bill Rate | | NZD | | | 6,500,000 | | | | 03/16/2024 | | | Quarterly | | | — | | | | 15,950 | | | | 15,950 | |
3 Month NZD Bank Bill Rate | | 2.53% | | NZD | | | 17,660,000 | | | | 03/16/2024 | | | Quarterly | | | — | | | | (61,970 | ) | | | (61,970 | ) |
3 Month NZD Bank Bill Rate | | 2.60% | | NZD | | | 22,070,000 | | | | 03/16/2024 | | | Quarterly | | | 2,016 | | | | (56,776 | ) | | | (58,792 | ) |
0.34% | | 3 Month SEK STIBOR | | SEK | | | 319,700,000 | | | | 03/16/2024 | | | Quarterly | | | — | | | | 199,257 | | | | 199,257 | |
0.33% | | 3 Month SEK STIBOR | | SEK | | | 47,090,000 | | | | 03/16/2024 | | | Quarterly | | | (3,441 | ) | | | 29,857 | | | | 33,298 | |
0.32% | | 3 Month SEK STIBOR | | SEK | | | 18,800,000 | | | | 03/16/2024 | | | Quarterly | | | — | | | | 12,298 | | | | 12,298 | |
3 Month SEK STIBOR | | 0.72% | | SEK | | | 44,100,000 | | | | 03/16/2024 | | | Quarterly | | | — | | | | 7,763 | | | | 7,763 | |
3 Month SEK STIBOR | | 0.69% | | SEK | | | 61,700,000 | | | | 03/16/2024 | | | Quarterly | | | — | | | | 7,207 | | | | 7,207 | |
3 Month SEK STIBOR | | 0.69% | | SEK | | | 58,400,000 | | | | 03/16/2024 | | | Quarterly | | | — | | | | 7,192 | | | | 7,192 | |
3 Month SEK STIBOR | | 0.64% | | SEK | | | 32,200,000 | | | | 03/16/2024 | | | Quarterly | | | — | | | | 560 | | | | 560 | |
3 Month SEK STIBOR | | 0.33% | | SEK | | | 72,000,000 | | | | 03/16/2024 | | | Quarterly | | | 1,903 | | | | (45,956 | ) | | | (47,859 | ) |
3 Month SEK STIBOR | | 0.42% | | SEK | | | 13,700,000 | | | | 03/16/2024 | | | Quarterly | | | 309 | | | | (6,137 | ) | | | (6,446 | ) |
3 Month SEK STIBOR | | 0.63% | | SEK | | | 27,600,000 | | | | 03/16/2024 | | | Quarterly | | | — | | | | (103 | ) | | | (103 | ) |
1.22% | | USD - SOFR - COMPOUND | | USD | | | 4,600,000 | | | | 03/16/2024 | | | Annually | | | 980 | | | | 17,176 | | | | 16,196 | |
USD - SOFR - COMPOUND | | 1.46% | | USD | | | 2,700,000 | | | | 03/16/2024 | | | Annually | | | 339 | | | | 2,644 | | | | 2,305 | |
USD - SOFR - COMPOUND | | 0.97% | | USD | | | 2,550,000 | | | | 03/16/2024 | | | Annually | | | (810 | ) | | | (22,406 | ) | | | (21,596 | ) |
USD - SOFR - COMPOUND | | 1.01% | | USD | | | 6,360,000 | | | | 03/16/2024 | | | Annually | | | (1,212 | ) | | | (50,802 | ) | | | (49,590 | ) |
USD - SOFR - COMPOUND | | 1.15% | | USD | | | 3,800,000 | | | | 03/16/2024 | | | Annually | | | (434 | ) | | | (19,729 | ) | | | (19,295 | ) |
USD - SOFR - COMPOUND | | 1.05% | | USD | | | 4,040,000 | | | | 03/16/2024 | | | Annually | | | (609 | ) | | | (29,446 | ) | | | (28,837 | ) |
1.61% | | USD - SOFR - COMPOUND | | USD | | | 2,810,000 | | | | 03/16/2024 | | | Annually | | | (825 | ) | | | (10,945 | ) | | | (10,120 | ) |
6 Month EURIBOR | | 0.22% | | EUR | | | 4,210,000 | | | | 03/20/2024 | | | Semi-Annually | | | 120 | | | | 16,359 | | | | 16,239 | |
6 Month EURIBOR | | 0.20% | | EUR | | | 2,920,000 | | | | 03/20/2024 | | | Semi-Annually | | | (459 | ) | | | 10,335 | | | | 10,794 | |
6 Month EURIBOR | | 0.20% | | EUR | | | 2,170,000 | | | | 03/20/2024 | | | Semi-Annually | | | (2,019 | ) | | | 7,730 | | | | 9,749 | |
6 Month EURIBOR | | 0.17% | | EUR | | | 2,890,000 | | | | 03/20/2024 | | | Semi-Annually | | | 309 | | | | 7,775 | | | | 7,466 | |
6 Month EURIBOR | | (0.23)% | | EUR | | | 2,800,000 | | | | 03/20/2024 | | | Semi-Annually | | | (195 | ) | | | (17,318 | ) | | | (17,123 | ) |
6 Month EURIBOR | | (0.20)% | | EUR | | | 3,230,000 | | | | 03/20/2024 | | | Semi-Annually | | | (9 | ) | | | (17,711 | ) | | | (17,702 | ) |
6 Month EURIBOR | | (0.07)% | | EUR | | | 3,120,000 | | | | 03/20/2024 | | | Semi-Annually | | | 37 | | | | (8,136 | ) | | | (8,173 | ) |
1.95% | | 6 Month AUD BBSW | | AUD | | | 1,400,000 | | | | 03/16/2032 | | | Semi-Annually | | | — | | | | 46,534 | | | | 46,534 | |
1.96% | | 6 Month AUD BBSW | | AUD | | | 1,600,000 | | | | 03/16/2032 | | | Semi-Annually | | | — | | | | 51,940 | | | | 51,940 | |
2.10% | | 6 Month AUD BBSW | | AUD | | | 1,065,000 | | | | 03/16/2032 | | | Semi-Annually | | | — | | | | 24,796 | | | | 24,796 | |
2.10% | | 6 Month AUD BBSW | | AUD | | | 1,065,000 | | | | 03/16/2032 | | | Semi-Annually | | | — | | | | 25,141 | | | | 25,141 | |
2.15% | | 6 Month AUD BBSW | | AUD | | | 920,000 | | | | 03/16/2032 | | | Semi-Annually | | | — | | | | 18,863 | | | | 18,863 | |
2.43% | | 6 Month AUD BBSW | | AUD | | | 2,220,000 | | | | 03/16/2032 | | | Semi-Annually | | | — | | | | 4,796 | | | | 4,796 | |
6 Month AUD BBSW | | 2.52% | | AUD | | | 1,550,000 | | | | 03/16/2032 | | | Semi-Annually | | | — | | | | 5,795 | | | | 5,795 | |
6 Month AUD BBSW | | 2.52% | | AUD | | | 3,200,000 | | | | 03/16/2032 | | | Semi-Annually | | | — | | | | 11,964 | | | | 11,964 | |
6 Month AUD BBSW | | 2.53% | | AUD | | | 780,000 | | | | 03/16/2032 | | | Semi-Annually | | | — | | | | 3,294 | | | | 3,294 | |
6 Month AUD BBSW | | 2.54% | | AUD | | | 910,000 | | | | 03/16/2032 | | | Semi-Annually | | | — | | | | 4,579 | | | | 4,579 | |
6 Month AUD BBSW | | 2.07% | | AUD | | | 1,160,000 | | | | 03/16/2032 | | | Semi-Annually | | | — | | | | (29,408 | ) | | | (29,408 | ) |
6 Month AUD BBSW | | 1.99% | | AUD | | | 8,980,000 | | | | 03/16/2032 | | | Semi-Annually | | | (815 | ) | | | (273,808 | ) | | | (272,993 | ) |
6 Month AUD BBSW | | 2.25% | | AUD | | | 1,030,000 | | | | 03/16/2032 | | | Semi-Annually | | | — | | | | (14,460 | ) | | | (14,460 | ) |
1.88% | | 3 Month CAD CDOR | | CAD | | | 2,170,000 | | | | 03/16/2032 | | | Semi-Annually | | | — | | | | 76,392 | | | | 76,392 | |
2.03% | | 3 Month CAD CDOR | | CAD | | | 1,460,000 | | | | 03/16/2032 | | | Semi-Annually | | | — | | | | 35,213 | | | | 35,213 | |
2.14% | | 3 Month CAD CDOR | | CAD | | | 1,260,000 | | | | 03/16/2032 | | | Semi-Annually | | | — | | | | 21,108 | | | | 21,108 | |
2.16% | | 3 Month CAD CDOR | | CAD | | | 570,000 | | | | 03/16/2032 | | | Semi-Annually | | | — | | | | 8,367 | | | | 8,367 | |
2.23% | | 3 Month CAD CDOR | | CAD | | | 1,090,000 | | | | 03/16/2032 | | | Semi-Annually | | | — | | | | 10,621 | | | | 10,621 | |
2.23% | | 3 Month CAD CDOR | | CAD | | | 1,210,000 | | | | 03/16/2032 | | | Semi-Annually | | | — | | | | 11,704 | | | | 11,704 | |
3 Month CAD CDOR | | 2.39% | | CAD | | | 1,020,000 | | | | 03/16/2032 | | | Semi-Annually | | | — | | | | 1,149 | | | | 1,149 | |
2.34% | | 3 Month CAD CDOR | | CAD | | | 900,000 | | | | 03/16/2032 | | | Semi-Annually | | | — | | | | 2,044 | | | | 2,044 | |
3 Month CAD CDOR | | 2.42% | | CAD | | | 930,000 | | | | 03/16/2032 | | | Semi-Annually | | | — | | | | 3,242 | | | | 3,242 | |
| | | | |
| | |
| | | See accompanying notes to the financial statements. | | 35 |
GMO Multi-Sector Fixed Income Fund
(A Series of GMO Trust)
Schedule of Investments — (Continued)
February 28, 2022
| | | | | | | | | | | | | | | | | | | | | | | | | | |
Fund Pays | | Fund Receives | | Notional Amount | | | Expiration
Date | | | Periodic
Payment
Frequency | | Premiums
Paid/
(Received) ($) | | | Value ($) | | | Net Unrealized
Appreciation/
(Depreciation) ($) | |
3 Month CAD CDOR | | 2.12% | | CAD | | | 7,460,000 | | | | 03/16/2032 | | | Semi-Annually | | | 9,435 | | | | (132,443 | ) | | | (141,878 | ) |
3 Month CAD CDOR | | 2.12% | | CAD | | | 18,800,000 | | | | 03/16/2032 | | | Semi-Annually | | | 4,794 | | | | (333,771 | ) | | | (338,565 | ) |
3 Month CAD CDOR | | 2.33% | | CAD | | | 3,440,000 | | | | 03/16/2032 | | | Semi-Annually | | | — | | | | (10,887 | ) | | | (10,887 | ) |
3 Month CAD CDOR | | 2.37% | | CAD | | | 2,670,000 | | | | 03/16/2032 | | | Semi-Annually | | | — | | | | (48 | ) | | | (48 | ) |
3 Month CAD CDOR | | 2.35% | | CAD | | | 1,540,000 | | | | 03/16/2032 | | | Semi-Annually | | | — | | | | (1,790 | ) | | | (1,790 | ) |
3 Month CAD CDOR | | 2.28% | | CAD | | | 2,280,000 | | | | 03/16/2032 | | | Semi-Annually | | | — | | | | (14,961 | ) | | | (14,961 | ) |
3 Month CAD CDOR | | 2.32% | | CAD | | | 110,000 | | | | 03/16/2032 | | | Semi-Annually | | | — | | | | (364 | ) | | | (364 | ) |
3 Month CAD CDOR | | 2.32% | | CAD | | | 740,000 | | | | 03/16/2032 | | | Semi-Annually | | | — | | | | (2,421 | ) | | | (2,421 | ) |
2.39% | | 3 Month CAD CDOR | | CAD | | | 1,420,000 | | | | 03/16/2032 | | | Semi-Annually | | | — | | | | (2,310 | ) | | | (2,310 | ) |
2.42% | | 3 Month CAD CDOR | | CAD | | | 1,740,000 | | | | 03/16/2032 | | | Semi-Annually | | | — | | | | (6,626 | ) | | | (6,626 | ) |
2.44% | | 3 Month CAD CDOR | | CAD | | | 1,180,000 | | | | 03/16/2032 | | | Semi-Annually | | | — | | | | (5,970 | ) | | | (5,970 | ) |
2.44% | | 3 Month CAD CDOR | | CAD | | | 720,000 | | | | 03/16/2032 | | | Semi-Annually | | | — | | | | (3,643 | ) | | | (3,643 | ) |
(0.06)% | | CHF - SARON - OIS - COMPOUND | | CHF | | | 700,000 | | | | 03/16/2032 | | | Annually | | | 331 | | | | 42,871 | | | | 42,540 | |
CHF - SARON - OIS - COMPOUND | | 0.51% | | CHF | | | 810,000 | | | | 03/16/2032 | | | Annually | | | — | | | | 393 | | | | 393 | |
CHF - SARON - OIS - COMPOUND | | 0.56% | | CHF | | | 1,040,000 | | | | 03/16/2032 | | | Annually | | | — | | | | 5,774 | | | | 5,774 | |
CHF - SARON - OIS - COMPOUND | | 0.51% | | CHF | | | 570,000 | | | | 03/16/2032 | | | Annually | | | — | | | | 494 | | | | 494 | |
CHF - SARON - OIS - COMPOUND | | 0.51% | | CHF | | | 580,000 | | | | 03/16/2032 | | | Annually | | | — | | | | 313 | | | | 313 | |
CHF - SARON - OIS - COMPOUND | | 0.52% | | CHF | | | 1,230,000 | | | | 03/16/2032 | | | Annually | | | — | | | | 1,468 | | | | 1,468 | |
CHF - SARON - OIS - COMPOUND | | 0.55% | | CHF | | | 1,120,000 | | | | 03/16/2032 | | | Annually | | | — | | | | 5,303 | | | | 5,303 | |
CHF - SARON - OIS - COMPOUND | | 0.52% | | CHF | | | 1,220,000 | | | | 03/16/2032 | | | Annually | | | — | | | | 2,453 | | | | 2,453 | |
CHF - SARON - OIS - COMPOUND | | 0.05% | | CHF | | | 2,170,000 | | | | 03/16/2032 | | | Annually | | | — | | | | (108,544 | ) | | | (108,544 | ) |
CHF - SARON - OIS - COMPOUND | | (0.01)% | | CHF | | | 320,000 | | | | 03/16/2032 | | | Annually | | | 832 | | | | (17,959 | ) | | | (18,791 | ) |
CHF - SARON - OIS - COMPOUND | | 0.20% | | CHF | | | 700,000 | | | | 03/16/2032 | | | Annually | | | — | | | | (23,344 | ) | | | (23,344 | ) |
CHF - SARON - OIS - COMPOUND | | 0.22% | | CHF | | | 840,000 | | | | 03/16/2032 | | | Annually | | | — | | | | (25,633 | ) | | | (25,633 | ) |
CHF - SARON - OIS - COMPOUND | | 0.23% | | CHF | | | 9,390,000 | | | | 03/16/2032 | | | Annually | | | 9,451 | | | | (280,400 | ) | | | (289,851 | ) |
CHF - SARON - OIS - COMPOUND | | 0.32% | | CHF | | | 200,000 | | | | 03/16/2032 | | | Annually | | | — | | | | (4,011 | ) | | | (4,011 | ) |
0.53% | | CHF - SARON - OIS - COMPOUND | | CHF | | | 540,000 | | | | 03/16/2032 | | | Annually | | | — | | | | (1,468 | ) | | | (1,468 | ) |
1.37% | | GBP - SONIA - COMPOUND | | GBP | | | 20,080,000 | | | | 03/16/2032 | | | Annually | | | (57,664 | ) | | | 87,367 | | | | 145,031 | |
1.35% | | GBP - SONIA - COMPOUND | | GBP | | | 5,880,000 | | | | 03/16/2032 | | | Annually | | | (10,015 | ) | | | 40,166 | | | | 50,181 | |
GBP - SONIA - COMPOUND | | 1.43% | | GBP | | | 1,360,000 | | | | 03/16/2032 | | | Annually | | | — | | | | 3,695 | | | | 3,695 | |
GBP - SONIA - COMPOUND | | 1.41% | | GBP | | | 520,000 | | | | 03/16/2032 | | | Annually | | | (1,355 | ) | | | 446 | | | | 1,801 | |
1.35% | | GBP - SONIA - COMPOUND | | GBP | | | 460,000 | | | | 03/16/2032 | | | Annually | | | — | | | | 3,256 | | | | 3,256 | |
GBP - SONIA - COMPOUND | | 1.34% | | GBP | | | 910,000 | | | | 03/16/2032 | | | Annually | | | (1,286 | ) | | | (7,401 | ) | | | (6,115 | ) |
GBP - SONIA - COMPOUND | | 1.41% | | GBP | | | 550,000 | | | | 03/16/2032 | | | Annually | | | 1,125 | | | | 62 | | | | (1,063 | ) |
1.46% | | GBP - SONIA - COMPOUND | | GBP | | | 650,000 | | | | 03/16/2032 | | | Annually | | | (938 | ) | | | (4,748 | ) | | | (3,810 | ) |
2.64% | | 3 Month NZD Bank Bill Rate | | NZD | | | 3,910,000 | | | | 03/16/2032 | | | Quarterly | | | 1,239 | | | | 91,435 | | | | 90,196 | |
2.69% | | 3 Month NZD Bank Bill Rate | | NZD | | | 4,900,000 | | | | 03/16/2032 | | | Quarterly | | | (1,156 | ) | | | 99,039 | | | | 100,195 | |
3.02% | | 3 Month NZD Bank Bill Rate | | NZD | | | 650,000 | | | | 03/16/2032 | | | Quarterly | | | — | | | | 725 | | | | 725 | |
2.98% | | 3 Month NZD Bank Bill Rate | | NZD | | | 1,290,000 | | | | 03/16/2032 | | | Quarterly | | | — | | | | 4,471 | | | | 4,471 | |
3 Month NZD Bank Bill Rate | | 2.57% | | NZD | | | 3,430,000 | | | | 03/16/2032 | | | Quarterly | | | — | | | | (93,512 | ) | | | (93,512 | ) |
3 Month NZD Bank Bill Rate | | 2.82% | | NZD | | | 930,000 | | | | 03/16/2032 | | | Quarterly | | | (34 | ) | | | (11,693 | ) | | | (11,659 | ) |
3 Month NZD Bank Bill Rate | | 2.78% | | NZD | | | 1,320,000 | | | | 03/16/2032 | | | Quarterly | | | — | | | | (19,622 | ) | | | (19,622 | ) |
3 Month NZD Bank Bill Rate | | 2.99% | | NZD | | | 1,460,000 | | | | 03/16/2032 | | | Quarterly | | | (1,288 | ) | | | (3,774 | ) | | | (2,486 | ) |
3.05% | | 3 Month NZD Bank Bill Rate | | NZD | | | 610,000 | | | | 03/16/2032 | | | Quarterly | | | — | | | | (502 | ) | | | (502 | ) |
0.84% | | 3 Month SEK STIBOR | | SEK | | | 15,000,000 | | | | 03/16/2032 | | | Quarterly | | | (1,477 | ) | | | 87,776 | | | | 89,253 | |
1.10% | | 3 Month SEK STIBOR | | SEK | | | 2,900,000 | | | | 03/16/2032 | | | Quarterly | | | (46 | ) | | | 9,422 | | | | 9,468 | |
1.42% | | 3 Month SEK STIBOR | | SEK | | | 9,400,000 | | | | 03/16/2032 | | | Quarterly | | | — | | | | 430 | | | | 430 | |
1.40% | | 3 Month SEK STIBOR | | SEK | | | 5,900,000 | | | | 03/16/2032 | | | Quarterly | | | — | | | | 1,451 | | | | 1,451 | |
1.41% | | 3 Month SEK STIBOR | | SEK | | | 13,200,000 | | | | 03/16/2032 | | | Quarterly | | | — | | | | 1,661 | | | | 1,661 | |
3 Month SEK STIBOR | | 0.90% | | SEK | | | 65,250,000 | | | | 03/16/2032 | | | Quarterly | | | — | | | | (343,943 | ) | | | (343,943 | ) |
3 Month SEK STIBOR | | 0.84% | | SEK | | | 11,610,000 | | | | 03/16/2032 | | | Quarterly | | | 2,877 | | | | (67,474 | ) | | | (70,351 | ) |
3 Month SEK STIBOR | | 0.85% | | SEK | | | 3,900,000 | | | | 03/16/2032 | | | Quarterly | | | — | | | | (22,627 | ) | | | (22,627 | ) |
3 Month SEK STIBOR | | 1.39% | | SEK | | | 90,550,000 | | | | 03/16/2032 | | | Quarterly | | | 19,014 | | | | (35,869 | ) | | | (54,883 | ) |
3 Month SEK STIBOR | | 1.38% | | SEK | | | 8,500,000 | | | | 03/16/2032 | | | Quarterly | | | — | | | | (3,792 | ) | | | (3,792 | ) |
3 Month SEK STIBOR | | 1.42% | | SEK | | | 7,100,000 | | | | 03/16/2032 | | | Quarterly | | | — | | | | (41 | ) | | | (41 | ) |
3 Month SEK STIBOR | | 1.39% | | SEK | | | 7,500,000 | | | | 03/16/2032 | | | Quarterly | | | — | | | | (2,896 | ) | | | (2,896 | ) |
1.45% | | 3 Month SEK STIBOR | | SEK | | | 12,500,000 | | | | 03/16/2032 | | | Quarterly | | | — | | | | (3,432 | ) | | | (3,432 | ) |
1.43% | | 3 Month SEK STIBOR | | SEK | | | 6,900,000 | | | | 03/16/2032 | | | Quarterly | | | — | | | | (548 | ) | | | (548 | ) |
1.57% | | USD - SOFR - COMPOUND | | USD | | | 550,000 | | | | 03/16/2032 | | | Annually | | | (31 | ) | | | 5,231 | | | | 5,262 | |
1.56% | | USD - SOFR - COMPOUND | | USD | | | 1,370,000 | | | | 03/16/2032 | | | Annually | | | (599 | ) | | | 13,795 | | | | 14,394 | |
1.58% | | USD - SOFR - COMPOUND | | USD | | | 870,000 | | | | 03/16/2032 | | | Annually | | | (878 | ) | | | 7,143 | | | | 8,021 | |
| | | | |
| | |
| 36 | | See accompanying notes to the financial statements. | | |
GMO Multi-Sector Fixed Income Fund
(A Series of GMO Trust)
Schedule of Investments — (Continued)
February 28, 2022
| | | | | | | | | | | | | | | | | | | | | | | | | | |
Fund Pays | | Fund Receives | | Notional Amount | | | Expiration
Date | | | Periodic
Payment
Frequency | | Premiums
Paid/
(Received) ($) | | | Value ($) | | | Net Unrealized
Appreciation/
(Depreciation) ($) | |
USD - SOFR - COMPOUND | | 1.87% | | USD | | | 610,000 | | | | 03/16/2032 | | | Annually | | | 1,884 | | | | 11,210 | | | | 9,326 | |
1.70% | | USD - SOFR - COMPOUND | | USD | | | 820,000 | | | | 03/16/2032 | | | Annually | | | (760 | ) | | | (2,568 | ) | | | (1,808 | ) |
USD - SOFR - COMPOUND | | 1.61% | | USD | | | 990,000 | | | | 03/16/2032 | | | Annually | | | 341 | | | | (5,367 | ) | | | (5,708 | ) |
1.75% | | USD - SOFR - COMPOUND | | USD | | | 1,190,000 | | | | 03/16/2032 | | | Annually | | | — | | | | (8,760 | ) | | | (8,760 | ) |
1.76% | | USD - SOFR - COMPOUND | | USD | | | 15,520,000 | | | | 03/16/2032 | | | Annually | | | (26,688 | ) | | | (132,282 | ) | | | (105,594 | ) |
1.79% | | USD - SOFR - COMPOUND | | USD | | | 880,000 | | | | 03/16/2032 | | | Annually | | | — | | | | (9,791 | ) | | | (9,791 | ) |
1.82% | | USD - SOFR - COMPOUND | | USD | | | 730,000 | | | | 03/16/2032 | | | Annually | | | — | | | | (10,056 | ) | | | (10,056 | ) |
1.84% | | USD - SOFR - COMPOUND | | USD | | | 380,000 | | | | 03/16/2032 | | | Annually | | | — | | | | (6,012 | ) | | | (6,012 | ) |
1.71% | | USD - SOFR - COMPOUND | | USD | | | 580,000 | | | | 03/16/2032 | | | Annually | | | (287 | ) | | | (2,275 | ) | | | (1,988 | ) |
0.36% | | 6 Month EURIBOR | | EUR | | | 570,000 | | | | 03/17/2032 | | | Semi-Annually | | | 57 | | | | 27,556 | | | | 27,499 | |
0.39% | | 6 Month EURIBOR | | EUR | | | 660,000 | | | | 03/17/2032 | | | Semi-Annually | | | 169 | | | | 29,944 | | | | 29,775 | |
0.39% | | 6 Month EURIBOR | | EUR | | | 9,110,000 | | | | 03/17/2032 | | | Semi-Annually | | | (25,710 | ) | | | 408,295 | | | | 434,005 | |
0.45% | | 6 Month EURIBOR | | EUR | | | 710,000 | | | | 03/17/2032 | | | Semi-Annually | | | — | | | | 27,402 | | | | 27,402 | |
0.42% | | 6 Month EURIBOR | | EUR | | | 800,000 | | | | 03/17/2032 | | | Semi-Annually | | | (692 | ) | | | 33,211 | | | | 33,903 | |
0.49% | | 6 Month EURIBOR | | EUR | | | 640,000 | | | | 03/17/2032 | | | Semi-Annually | | | 174 | | | | 21,987 | | | | 21,813 | |
0.71% | | 6 Month EURIBOR | | EUR | | | 870,000 | | | | 03/17/2032 | | | Semi-Annually | | | 1,288 | | | | 8,547 | | | | 7,259 | |
0.76% | | 6 Month EURIBOR | | EUR | | | 600,000 | | | | 03/17/2032 | | | Semi-Annually | | | 848 | | | | 2,769 | | | | 1,921 | |
6 Month EURIBOR | | 0.81% | | EUR | | | 1,680,000 | | | | 03/17/2032 | | | Semi-Annually | | | — | | | | 2,240 | | | | 2,240 | |
6 Month EURIBOR | | 0.82% | | EUR | | | 680,000 | | | | 03/17/2032 | | | Semi-Annually | | | — | | | | 1,768 | | | | 1,768 | |
6 Month EURIBOR | | 0.83% | | EUR | | | 1,060,000 | | | | 03/17/2032 | | | Semi-Annually | | | — | | | | 4,274 | | | | 4,274 | |
6 Month EURIBOR | | 0.82% | | EUR | | | 1,060,000 | | | | 03/17/2032 | | | Semi-Annually | | | — | | | | 2,698 | | | | 2,698 | |
6 Month EURIBOR | | 0.81% | | EUR | | | 640,000 | | | | 03/17/2032 | | | Semi-Annually | | | — | | | | 995 | | | | 995 | |
6 Month EURIBOR | | 0.86% | | EUR | | | 1,090,000 | | | | 03/17/2032 | | | Semi-Annually | | | — | | | | 7,757 | | | | 7,757 | |
6 Month EURIBOR | | 0.77% | | EUR | | | 1,540,000 | | | | 03/17/2032 | | | Semi-Annually | | | — | | | | (5,155 | ) | | | (5,155 | ) |
6 Month EURIBOR | | 0.76% | | EUR | | | 470,000 | | | | 03/17/2032 | | | Semi-Annually | | | — | | | | (2,090 | ) | | | (2,090 | ) |
0.77% | | 6 Month EURIBOR | | EUR | | | 450,000 | | | | 03/17/2032 | | | Semi-Annually | | | 1,631 | | | | 1,334 | | | | (297 | ) |
0.81% | | 6 Month EURIBOR | | EUR | | | 600,000 | | | | 03/17/2032 | | | Semi-Annually | | | (68 | ) | | | (964 | ) | | | (896 | ) |
| | | | | | | | | | | | | | | | | | | | | | | | | | |
| | $ | (75,314 | ) | | $ | (374,366 | ) | | $ | (299,052 | ) |
| | | | | | | | | | | | | | | | | | | | | | | | | | |
As of February 28, 2022, for the above contracts and/or agreements, the Fund had sufficient cash and/or securities to cover commitments or collateral requirements, if any, of the relevant broker or exchange.
Notes to Schedule of Investments:
| † | Denominated in U.S. Dollar, unless otherwise indicated. |
| (a) | The rate disclosed is the 7 day net yield as of February 28, 2022. |
| (b) | The rate shown represents yield-to-maturity. |
| (c) | All or a portion of this security has been pledged to cover margin requirements on futures and/or cleared swap contracts, collateral on OTC swap contracts, forward currency contracts, and/or written options, if any (Note 4). |
For a listing of definitions of acronyms, counterparty abbreviations and currency abbreviations used throughout the Schedule of Investments as well as the derivative tables, if any, please refer to page 56.
| | | | |
| | |
| | | See accompanying notes to the financial statements. | | 37 |
GMO Opportunistic Income Fund
(A Series of GMO Trust)
Portfolio Management
Day-to-day management of the Fund’s portfolio is the responsibility of the Structured Products team at Grantham, Mayo, Van Otterloo & Co. LLC.
Management Discussion and Analysis of Fund Performance
Although the Fund is not managed relative to any securities market index or benchmark, a discussion of the Fund’s performance relative to the Bloomberg U.S. Securitized + Index (formerly Bloomberg Barclays U.S. Securitized + Index) * is included for comparative purposes.
Class VI shares of GMO Opportunistic Income Fund returned +1.00% (net) for the fiscal year ended February 28, 2022, as compared with -2.85% for the Bloomberg U.S. Securitized + Index (formerly Bloomberg Barclays U.S. Securitized + Index).
Absolute performance was driven by Residential Mortgage-Backed Securities and Student Loans, followed by gains from securitization related asset-backed products, such as Small Balance Commercial securities, and corporate debt markets, such as Collateralized Loan Obligations. Additionally, the Fund’s credit relative value hedge positions also contributed positively during the fiscal year. While not enough to fully offset gains, the Fund’s hedge positions in long interest-rate futures and credit hedge positions detracted during the fiscal year.
*The Bloomberg U.S. Securitized + Index (formerly Bloomberg Barclays U.S. Securitized + Index) is an internally maintained benchmark computed by GMO, comprised of the J.P. Morgan U.S. 3-Month Cash Index through 12/30/2016 and the Bloomberg U.S. Securitized: MBS, ABS, CMBS Index (formerly Bloomberg Barclays U.S. Securitized: MBS, ABS, CMBS Index) thereafter.
The views expressed herein are exclusively those of Grantham, Mayo, Van Otterloo & Co. LLC as of the date of this report and are subject to change. GMO disclaims any responsibility to update such views. They are not meant as investment advice. References to specific securities are not recommendations of such securities and may not be representative of any GMO portfolio’s current or future investments. All information is unaudited.
GMO Opportunistic Income Fund
(A Series of GMO Trust)
Comparison of Change in Value of a $300,000,000 Investment in
GMO Opportunistic Income Fund^ Class VI Shares, the Bloomberg U.S. Securitized + Index**
(formerly Bloomberg Barclays U.S. Securitized + Index) and the Bloomberg U.S. Securitized Index
(formerly Bloomberg Barclays U.S. Securitized Index)
As of February 28, 2022
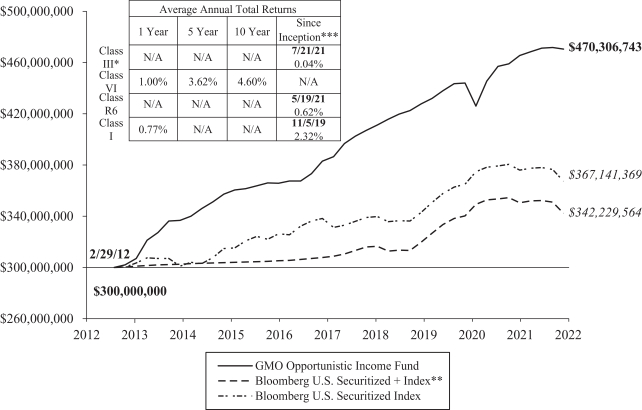
Performance data quoted represents past performance and is not indicative of future results. The investment return and principal value of an investment will fluctuate so that an investor’s shares, when redeemed, may be worth more or less than their original cost. Current performance data may be lower or higher than the performance data provided herein. To obtain performance information up to the most recent month-end, visit www.gmo.com. Performance shown is net of all fees after reimbursement from GMO. Transaction fees are retained by the Fund to cover trading costs. Returns would have been lower had certain expenses not been reimbursed during the periods shown and do not include the effect of taxes on distributions and redemptions. The performance information shown above only includes purchase premiums and/or redemption fees in effect as of February 28, 2022. All information is unaudited. Performance for classes may vary due to different fees.
| | ^ | Effective February 12, 2014, GMO Opportunistic Income Fund (the “Acquired Fund”) merged into GMO Short-Duration Collateral Fund and the surviving entity was renamed GMO Opportunistic Income Fund. For accounting and financial reporting purposes, the Acquired Fund is the surviving entity, meaning that the combined entity adopted the historical financial reporting and performance history of the Acquired Fund. The information shown prior to February 12, 2014 is that of the Acquired Fund and reflects the Acquired Fund’s performance. |
| | * | For the period December 28, 2021 to February 1, 2022, no Class III shares were outstanding. Performance for that period is that of Class I shares, which have higher expenses. Therefore, the performance shown is lower than it would have been if Class III expenses had been applied throughout. |
| | ** | The Bloomberg U.S. Securitized + Index is a composite benchmark computed by GMO and comprised of the J.P. Morgan U.S. 3 Month Cash Index through December 30, 2016 and the Bloomberg U.S. Securitized Index thereafter. |
| | *** | Beginning December 21, 2015 the pricing source for certain fixed income assets of the Fund changed, which may have had a material impact on the Fund’s performance for the period shown. |
For J.P. Morgan disclaimers please visit https://www.gmo.com/north-america/benchmark-disclaimers/
For Class III, VI, R6 and I the gross expense ratio of 0.61%, 0.52%, 0.61% and 0.75%, respectively, is equal to the Fund’s Total Annual Operating Expenses set forth in the Fund’s most recent prospectus dated June 30, 2021. For the Classes listed above, the corresponding net expense ratio of 0.56%, 0.47%, 0.56%, and 0.68% reflects the reduction of expenses from fee reimbursements. The fee reimbursements will continue until at least June 30, 2022. Elimination of this reimbursement will result in higher fees and lower performance.
GMO Opportunistic Income Fund
(A Series of GMO Trust)
Investment Concentration Summary
February 28, 2022 (Unaudited)
| | | | |
| Asset Class Summary& | | % of Total Net Assets | |
Debt Obligations | | | 90.1 | % |
Short-Term Investments | | | 6.4 | |
Swap Contracts | | | 2.0 | |
Mutual Funds | | | 1.1 | |
Purchased Options | | | 0.2 | |
Forward Currency Contracts | | | 0.0 | ^ |
Futures Contracts | | | 0.0 | ^ |
Written Options | | | (0.2 | ) |
Other | | | 0.4 | |
| | | | |
| | | 100.0 | % |
| | | | |
| | | | |
| Industry Sector Summary | | % of Debt Obligations | |
Commercial Mortgage-Backed Securities | | | 20.7 | % |
U.S. Government | | | 19.3 | |
Collateralized Loan Obligations | | | 12.4 | |
Student Loans – Private | | | 12.2 | |
Small Balance Commercial Mortgages | | | 8.3 | |
Residential Mortgage-Backed Securities – Other | | | 7.2 | |
Student Loans – Federal Family Education Loan Program | | | 6.8 | |
Residential Mortgage-Backed Securities – Prime | | | 4.4 | |
Residential Mortgage-Backed Securities – Subprime | | | 2.2 | |
Residential Mortgage-Backed Securities – Performing Loans | | | 2.0 | |
Collateralized Debt Obligations | | | 1.6 | |
Residential Mortgage-Backed Securities –Alt-A | | | 1.3 | |
U.S. Government Agency | | | 0.8 | |
Airlines | | | 0.5 | |
CMBS Collateralized Debt Obligations | | | 0.3 | |
| | | | |
| | | 100.0 | % |
| | | | |
| & | In the table, derivative financial instruments, if any, are based on market values, rather than the notional amounts of derivatives, except for forward currency contracts which are based on unrealized appreciation/(depreciation). |
GMO Opportunistic Income Fund
(A Series of GMO Trust)
Schedule of Investments
(showing percentage of total net assets)
February 28, 2022
| | | | | | | | | | |
| Par Value† | | | Description | | Value ($) | |
| | |
| | | | | | DEBT OBLIGATIONS — 90.1% | |
| | | |
| | | | | | Asset-Backed Securities — 71.5% | | | |
| | |
| | | | | | CMBS Collateralized Debt Obligations — 0.3% | |
| | | |
| | | 8,586,000 | | | ARCap Resecuritization Trust, Series 05-1A, Class B, 144A, 5.55%, due 12/21/42 | | | 2,187,799 | |
| | | |
| | | 564,382 | | | GS Mortgage Securities Corp., Series 06-CC1, Class A, 144A, Variable Rate, 5.33%, due 03/21/46 | | | 505,223 | |
| | | | | | | | | | |
| | | |
| | | | | | Total CMBS Collateralized Debt Obligations | | | 2,693,022 | |
| | | | | | | | | | |
| | |
| | | | | | Collateralized Debt Obligations — 1.4% | |
| | | |
| | | 4,320,000 | | | JFIN CLO Ltd., Series 12-1A, Class BR, 144A, Variable Rate, 3 mo. LIBOR + 2.35%, 2.60%, due 07/20/28 | | | 4,285,889 | |
| | | |
| | | 10,007,467 | | | OZLM VII Ltd., Series 14-7RA, Class A1R, 144A, Variable Rate, 3 mo. LIBOR + 1.01%, 1.25%, due 07/17/29 | | | 10,003,034 | |
| | | | | | | | | | |
| | | |
| | | | | | Total Collateralized Debt Obligations | | | 14,288,923 | |
| | | | | | | | | | |
| | |
| | | | | | Collateralized Loan Obligations — 11.2% | |
| | | |
| | | 6,093,000 | | | Crestline Denali CLO XVI Ltd., Series 18-1A, Class A, 144A, Variable Rate, 3 mo. LIBOR + 1.12%, 1.37%, due 01/20/30 | | | 6,049,697 | |
| | | |
| | | 8,161,387 | | | Gallatin CLO IX Ltd., Series 18-1A, Class A, 144A, Variable Rate, 3 mo. LIBOR + 1.05%, 1.31%, due 01/21/28 | | | 8,160,441 | |
| | | |
| | | 1,582,170 | | | Halcyon Loan Advisors Funding Ltd., Series 14-2A, Class C, 144A, Variable Rate, 3 mo. LIBOR + 3.50%, 3.78%, due 04/28/25 | | | 1,580,748 | |
| | | |
| | | 127,509 | | | Halcyon Loan Advisors Funding Ltd., Series 14-3A, Class B1R, 144A, Variable Rate, 3 mo. LIBOR + 1.70%, 1.96%, due 10/22/25 | | | 127,539 | |
| | | |
| | | 3,272,471 | | | Hull Street CLO Ltd., Series 14-1A, Class CR, 144A, Variable Rate, 3 mo. LIBOR + 2.70%, 2.94%, due 10/18/26 | | | 3,268,348 | |
| | | |
| | | 1,327,600 | | | Jamestown CLO V Ltd., Series 14-5A, Class D, 144A, Variable Rate, 3 mo. LIBOR + 3.75%, 3.99%, due 01/17/27 | | | 1,327,603 | |
| | | |
| | | 1,905,000 | | | JFIN CLO Ltd., Series 15-2A, Class CR, 144A, Variable Rate, 3 mo. LIBOR + 1.90%, 2.14%, due 10/17/26 | | | 1,889,122 | |
| | | |
| | | 5,718,682 | | | JFIN CLO Ltd., Series 15-2A, Class DR, 144A, Variable Rate, 3 mo. LIBOR + 3.20%, 3.44%, due 10/17/26 | | | 5,669,850 | |
| | | |
| | | 1,726,347 | | | JMP Credit Advisors CLO IV Ltd., Series 17-1A, Class AR, 144A, Variable Rate, 3 mo. LIBOR + 1.28%, 1.52%, due 07/17/29 | | | 1,724,638 | |
| | | |
| | | 6,161,000 | | | Man GLG US CLO, Series 18-1A, Class A1R, 144A, Variable Rate, 3 mo. LIBOR + 1.14%, 1.39%, due 04/22/30 | | | 6,116,672 | |
| | | |
| | | 3,906,000 | | | Northwoods Capital XVII Ltd., Series 18-17A, Class A, 144A, Variable Rate, 3 mo. LIBOR + 1.06%, 1.32%, due 04/22/31 | | | 3,865,272 | |
| | | |
| | | 1,083,456 | | | OZLM VII Ltd., Series 14-7A, Class SUB, 144A, Variable Rate, 144A, Variable Rate, due 07/17/26 | | | 110,683 | |
| | | | | | | | | | |
| Par Value† | | | Description | | Value ($) | |
| | | |
| | | | | | Asset-Backed Securities — continued | | | |
| | |
| | | | | | Collateralized Loan Obligations — continued | |
| | | |
| | | 1,991,025 | | | Saranac CLO III Ltd., Series 14-3A, Class ALR, 144A, Variable Rate, 3 mo. LIBOR + 1.60%, 1.81%, due 06/22/30 | | | 1,990,955 | |
| | | |
| | | 2,000,000 | | | Telos CLO Ltd., Series 13-3A, Class CR, 144A, Variable Rate, 3 mo. LIBOR + 2.60%, 2.84%, due 07/17/26 | | | 2,000,872 | |
| | | |
| | | 7,737,500 | | | Telos CLO Ltd., Series 14-5A, Class BR, 144A, Variable Rate, 3 mo. LIBOR + 1.48%, 1.72%, due 04/17/28 | | | 7,693,768 | |
| | | |
| | | 4,335,500 | | | Telos CLO Ltd., Series 14-5A, Class CR, 144A, Variable Rate, 3 mo. LIBOR + 2.15%, 2.39%, due 04/17/28 | | | 4,299,996 | |
| | | |
| | | 4,993,200 | | | Venture 32 CLO Ltd., Series 18-32A, Class A1, 144A, Variable Rate, 3 mo. LIBOR + 1.10%, 1.34%, due 07/18/31 | | | 4,957,553 | |
| | | |
| | | 3,352,500 | | | Venture XVIII CLO Ltd., Series 14-18A, Class AR, 144A, Variable Rate, 3 mo. LIBOR + 1.22%, 1.46%, due 10/15/29 | | | 3,340,940 | |
| | | |
| | | 9,000,000 | | | Venture XXIV CLO Ltd., Series 16-24A, Class BRR, 144A, Variable Rate, 3 mo. LIBOR + 1.50%, 1.75%, due 10/20/28 | | | 8,904,951 | |
| | | |
| | | 531,321 | | | Voya CLO Ltd., Series 14-3A, Class A2A, 144A, Variable Rate, 3 mo. LIBOR + 1.90%, 2.16%, due 07/25/26 | | | 531,606 | |
| | | |
| | | 14,331,096 | | | Wellfleet CLO Ltd., Series 17-2A, Class A1R, 144A, Variable Rate, 3 mo. LIBOR + 1.06%, 1.31%, due 10/20/29 | | | 14,300,944 | |
| | | |
| | | 4,057,600 | | | WhiteHorse VIII Ltd., Series 14-1A, Class DR, 144A, Variable Rate, 3 mo. LIBOR + 3.45%, 3.77%, due 05/01/26 | | | 4,051,684 | |
| | | |
| | | 4,042,250 | | | WhiteHorse X Ltd., Series 15-10A, Class DR, 144A, Variable Rate, 3 mo. LIBOR + 3.00%, 3.24%, due 04/17/27 | | | 4,043,503 | |
| | | |
| | | 4,453,900 | | | Whitehorse XII Ltd., Series 18-12A, Class A, 144A, Variable Rate, 3 mo. LIBOR + 1.25%, 1.49%, due 10/15/31 | | | 4,426,201 | |
| | | |
| | | 4,989,484 | | | Zais CLO 7 Ltd., Series 17-2A, Class A, 144A, Variable Rate, 3 mo. LIBOR + 1.29%, 1.53%, due 04/15/30 | | | 4,972,620 | |
| | | |
| | | 1,348,522 | | | Zais CLO 8 Ltd., Series 18-1A, Class A, 144A, Variable Rate, 3 mo. LIBOR + 0.95%, 1.19%, due 04/15/29 | | | 1,341,885 | |
| | | |
| | | 3,474,000 | | | Zais CLO 8 Ltd., Series 18-1A, Class B, 144A, Variable Rate, 3 mo. LIBOR + 1.45%, 1.69%, due 04/15/29 | | | 3,416,168 | |
| | | | | | | | | | |
| | | |
| | | | | | Total Collateralized Loan Obligations | | | 110,164,259 | |
| | | | | | | | | | |
| | |
| | | | | | Commercial Mortgage-Backed Securities — 18.6% | |
| | | |
| | | 10,000,000 | | | BAMLL Commercial Mortgage Securities Trust, Series 19-BPR, Class ANM, 144A, 3.11%, due 11/05/32 | | | 9,943,918 | |
| | | |
| | | 8,448,000 | | | Barclays Commercial Mortgage Trust, Series 18-CHRS, Class E, 144A, Variable Rate, 4.27%, due 08/05/38 | | | 7,014,497 | |
| | | |
| | | 1,172,131 | | | Bear Stearns Commercial Mortgage Securities Trust, Series 06-PW13, Class D, 144A, Variable Rate, 5.75%, due 09/11/41 | | | 1,147,056 | |
| | | | |
| | |
| | | See accompanying notes to the financial statements. | | 41 |
GMO Opportunistic Income Fund
(A Series of GMO Trust)
Schedule of Investments — (Continued)
(showing percentage of total net assets)
February 28, 2022
| | | | | | | | | | |
| Par Value† | | | Description | | Value ($) | |
| | | |
| | | | | | Asset-Backed Securities — continued | | | |
| | |
| | | | | | Commercial Mortgage-Backed Securities — continued | |
| | | |
| | | 12,000,000 | | | Benchmark Mortgage Trust, Series 19-B15, Class A5, 2.93%, due 12/15/72 | | | 12,007,849 | |
| | | |
| | | 4,719,281 | | | BX Commercial Mortgage Trust, Series 19-XL, Class A, 144A, Variable Rate, 1 mo. LIBOR + 0.92%, 1.11%, due 10/15/36 | | | 4,698,581 | |
| | | |
| | | 8,000,000 | | | BX Commercial Mortgage Trust, Series 20-VIV4, Class A, 144A, 2.84%, due 03/09/44 | | | 7,730,934 | |
| | | |
| | | 8,000,000 | | | BX Commercial Mortgage Trust, Series 20-VIVA, Class D, 144A, Variable Rate, 3.55%, due 03/11/44 | | | 7,244,427 | |
| | | |
| | | 8,000,000 | | | BX Trust, Series 19-OC11, Class A, 144A, 3.20%, due 12/09/41 | | | 8,001,263 | |
| | | |
| | | 4,895,000 | | | BX Trust, Series 19-OC11, Class C, 144A, 3.86%, due 12/09/41 | | | 4,797,241 | |
| | | |
| | | 9,000,000 | | | BX Trust, Series 19-OC11, Class E, 144A, Variable Rate, 4.08%, due 12/09/41 | | | 8,080,795 | |
| | | |
| | | 6,800,000 | | | Citigroup Commercial Mortgage Trust, Series 19-C7, Class A4, 3.10%, due 12/15/72 | | | 6,885,734 | |
| | | |
| | | 4,186,852 | | | Commercial Mortgage Trust, Series 18-COR3, Class A3, 4.23%, due 05/10/51 | | | 4,492,264 | |
| | | |
| | | 132,593 | | | Credit Suisse First Boston Mortgage Securities Corp., Series 05-C2, Class AMFL, Variable Rate, 1 mo. LIBOR + 0.25%, 0.37%, due 04/15/37 | | | 132,494 | |
| | | |
| | | 104,757 | | | Credit Suisse First Boston Mortgage Securities Corp., Series 05-C2, Class AMFX, 4.88%, due 04/15/37 | | | 104,765 | |
| | | |
| | | 8,600,000 | | | Great Wolf Trust, Series 19-WOLF, Class E, 144A, Variable Rate, 1 mo. LIBOR + 2.73%, 2.92%, due 12/15/36 | | | 8,255,083 | |
| | | |
| | | 10,000,000 | | | GS Mortgage Securities Trust, Series 21-GSA3, Class A5, 2.62%, due 12/15/54 | | | 9,710,878 | |
| | | |
| | | 232,769 | | | LB Commercial Conduit Mortgage Trust, Series 98-C1, Class K, 144A, 6.30%, due 02/18/30 | | | 232,318 | |
| | | |
| | | 637,749 | | | LB-UBS Commercial Mortgage Trust, Series 04-C6, Class K, 144A, Variable Rate, 6.31%, due 08/15/36 | | | 640,957 | |
| | | |
| | | 1,208,736 | | | Merrill Lynch Mortgage Investors Trust, Series 98-C1, Class F, Variable Rate, 6.25%, due 11/15/26 | | | 1,218,831 | |
| | | |
| | | 4,213,000 | | | MKT Mortgage Trust, Series 20-525M, Class E, 144A, Variable Rate, 2.94%, due 02/12/40 | | | 3,708,677 | |
| | | |
| | | 2,505,000 | | | MKT Mortgage Trust, Series 20-525M, Class F, 144A, Variable Rate, 2.94%, due 02/12/40 | | | 2,135,402 | |
| | | |
| | | 3,710,000 | | | Morgan Stanley Bank of America Merrill Lynch Trust, Series 13-C10, Class A4, Variable Rate, 4.07%, due 07/15/46 | | | 3,767,104 | |
| | | |
| | | 1,982,000 | | | Morgan Stanley Capital I Trust, Series 19-H6, Class A4, 3.42%, due 06/15/52 | | | 2,038,738 | |
| | | |
| | | 3,176,494 | | | SLIDE, Series 18-FUN, Class E, 144A, Variable Rate, 1 mo. LIBOR + 2.55%, 2.74%, due 06/15/31 | | | 3,056,647 | |
| | | |
| | | 5,268,100 | | | UBS Commercial Mortgage Trust, Series 18-C9, Class A4, Variable Rate, 4.12%, due 03/15/51 | | | 5,564,434 | |
| | | |
| | | 15,433,000 | | | UBS Commercial Mortgage Trust, Series 18-C12, Class A5, 4.30%, due 08/15/51 | | | 16,659,559 | |
| | | | | | | | | | |
| Par Value† | | | Description | | Value ($) | |
| | | |
| | | | | | Asset-Backed Securities — continued | | | |
| | |
| | | | | | Commercial Mortgage-Backed Securities — continued | |
| | | |
| | | 1,998,053 | | | Velocity Commercial Capital Loan Trust, Series 22-1, Class A, 144A, Variable rate, 144A,, 3.38%, due 02/25/52 | | | 1,984,370 | |
| | | |
| | | 2,550,000 | | | WaMu Commercial Mortgage Securities Trust, Series 06-SL1, Class E, 144A, Variable Rate, 1.74%, due 11/23/43 | | | 2,511,928 | |
| | | |
| | | 3,572,960 | | | WaMu Commercial Mortgage Securities Trust, Series 07-SL3, Class J, 144A, Variable Rate, 2.30%, due 03/23/45 | | | 3,303,063 | |
| | | |
| | | 4,873,173 | | | WaMu Commercial Mortgage Securities Trust, Series 07-SL3, Class G, 144A, Variable Rate, 2.30%, due 03/23/45 | | | 4,875,020 | |
| | | |
| | | 4,317,000 | | | Wells Fargo Commercial Mortgage Trust, Series 13-BTC, Class D, 144A, Variable Rate, 3.55%, due 04/16/35 | | | 4,177,215 | |
| | | |
| | | 8,733,000 | | | Wells Fargo Commercial Mortgage Trust, Series 13-BTC, Class F, 144A, Variable Rate, 3.55%, due 04/16/35 | | | 8,222,742 | |
| | | |
| | | 2,000,000 | | | Wells Fargo Commercial Mortgage Trust, Series 18-C44, Class A5, 4.21%, due 05/15/51 | | | 2,152,402 | |
| | | |
| | | 6,267,600 | | | Wells Fargo Commercial Mortgage Trust, Series 18-C46, Class A4, 4.15%, due 08/15/51 | | | 6,725,208 | |
| | | |
| | | 7,788,283 | | | Wells Fargo Commercial Mortgage Trust, Series 18-C48, Class A5, 4.30%, due 01/15/52 | | | 8,447,004 | |
| | | |
| | | 1,395,022 | | | Wells Fargo Commercial Mortgage Trust, Series 18-C47, Class A4, 4.44%, due 09/15/61 | | | 1,520,217 | |
| | | | | | | | | | |
| | | |
| | | | | | Total Commercial Mortgage-Backed Securities | | | 183,189,615 | |
| | | | | | | | | | |
| | |
| | | | | | Residential Mortgage-Backed Securities —
Other — 6.5% | |
| | | |
| | | 821,710 | | | ACE Securities Corp. Home Equity Loan Trust, Series 06-ASL1, Class A, Variable Rate, 1 mo. LIBOR + 0.28%, 0.47%, due 02/25/36 | | | 136,618 | |
| | | |
| | | 17,720,614 | | | American Home Mortgage Investment Trust, Series 06-2, Class 4A, Variable Rate, 1 mo. LIBOR + 0.36%, 0.55%, due 02/25/36 | | | 575,867 | |
| | | |
| | | 13,743,281 | | | BankAmerica Manufactured Housing Contract Trust, Series 98-1, Class B2, Variable Rate, 8.00%, due 08/10/25 | | | 5,192,563 | |
| | | |
| | | 4,760,730 | | | BCMSC Trust, Series 99-A, Class M1, Variable Rate, 6.79%, due 03/15/29 | | | 4,507,724 | |
| | | |
| | | 8,834,023 | | | BCMSC Trust, Series 99-B, Class A4, Variable Rate, 7.30%, due 12/15/29 | | | 1,691,792 | |
| | | |
| | | 2,928,137 | | | BCMSC Trust, Series 00-A, Class A4, Variable Rate, 8.29%, due 06/15/30 | | | 636,386 | |
| | | |
| | | 210,478 | | | Bear Stearns Mortgage Funding Trust, Series 07-SL2, Class 1A, Variable Rate, 1 mo. LIBOR + 0.32%, 0.51%, due 02/25/37 | | | 213,099 | |
| | | |
| | | 3,620,920 | | | Conseco Finance Corp., Series 97-6, Class M1, Variable Rate, 7.21%, due 01/15/29 | | | 3,579,638 | |
| | | |
| | | 2,763,466 | | | Conseco Finance Corp., Series 97-5, Class B1, Variable Rate, 6.97%, due 05/15/29 | | | 2,677,997 | |
| | | |
| | | 2,604,548 | | | Conseco Finance Corp., Series 98-6, Class M1, Variable Rate, 6.63%, due 06/01/30 | | | 2,596,050 | |
| | | | |
| | |
| 42 | | See accompanying notes to the financial statements. | | |
GMO Opportunistic Income Fund
(A Series of GMO Trust)
Schedule of Investments — (Continued)
(showing percentage of total net assets)
February 28, 2022
| | | | | | | | | | |
| Par Value† | | | Description | | Value ($) | |
| | | |
| | | | | | Asset-Backed Securities — continued | | | |
| | |
| | | | | | Residential Mortgage-Backed Securities —
Other — continued | |
| | | |
| | | 5,284,243 | | | Conseco Finance Securitizations Corp., Series 01-3, Class M1, Variable Rate, 7.15%, due 05/01/33 | | | 5,157,035 | |
| | | |
| | | 1,060,969 | | | Corevest American Finance Trust, Series 21-1, Class A, 144A, 1.57%, due 04/15/53 | | | 1,012,719 | |
| | | |
| | | 8,000,000 | | | FirstKey Homes Trust, Series 21-SFR3, Class A, 144A, 2.14%, due 12/17/38 | | | 7,848,654 | |
| | | |
| | | 834,645 | | | GMACM Home Equity Loan Trust, Series 04-HE3, Class A3, FSA, Variable Rate, 1 mo. LIBOR + 0.50%, 0.69%, due 10/25/34 | | | 801,858 | |
| | | |
| | | 3,836,103 | | | GMACM Home Equity Loan Trust, Series 07-HE3, Class 2A1, Variable Rate, 7.00%, due 09/25/37 | | | 3,675,101 | |
| | | |
| | | 4,332,782 | | | Home Equity Loan Trust, Series 05-HS1, Class AI4, Step Up, 5.61%, due 09/25/35 | | | 687,916 | |
| | | |
| | | 28,597,652 | | | Home Equity Mortgage Loan Asset-Backed Trust, Series 06-A, Class A, Variable Rate, 1 mo. LIBOR + 0.26%, 0.45%, due 06/25/36 | | | 711,736 | |
| | | |
| | | 9,760,742 | | | Home Loan Trust, Series 06-HI4, Class A4, Step Up, 5.72%, due 09/25/36 | | | 4,680,911 | |
| | | |
| | | 9,934,796 | | | Home Loan Trust, Series 07-HI1, Class A4, Step Up, due 03/25/37 | | | 2,672,294 | |
| | | |
| | | 3,750,761 | | | Master Second Lien Trust, Series 06-1, Class A, Variable Rate, 1 mo. LIBOR + 0.32%, 0.51%, due 03/25/36 | | | 398,706 | |
| | | |
| | | 261,686 | | | Mellon Re-REMIC Pass-Through Trust, Series 04-TBC1, Class A, 144A, Variable Rate, 1 mo. LIBOR + 0.25%, 0.46%, due 02/26/34 | | | 229,322 | |
| | | |
| | | 13,736,548 | | | New Century Home Equity Loan Trust, Series 06-S1, Class A2A, Variable Rate, 1 mo. LIBOR + 0.20%, 0.39%, due 03/25/36 | | | 577,773 | |
| | | |
| | | 7,835,609 | | | New Century Home Equity Loan Trust, Series 06-S1, Class A1, Variable Rate, 1 mo. LIBOR + 0.34%, 0.53%, due 03/25/36 | | | 329,482 | |
| | | |
| | | 20,890,595 | | | New Century Home Equity Loan Trust, Series 06-S1, Class A2B, Variable Rate, 1 mo. LIBOR + 0.40%, 0.59%, due 03/25/36 | | | 878,331 | |
| | | |
| | | 137,767 | | | Nomura Asset Acceptance Corp. Alternative Loan Trust, Series 05-S3, Class M1, Variable Rate, 1 mo. LIBOR + 0.90%, 1.09%, due 08/25/35 | | | 453,626 | |
| | | |
| | | 1,312,944 | | | Oakwood Mortgage Investors, Inc., Series 98-A, Class B1, Variable Rate, 7.50%, due 05/15/28 | | | 1,302,553 | |
| | | |
| | | 1,391,252 | | | Oakwood Mortgage Investors, Inc., Series 98-D, Class M1, 144A, 7.42%, due 01/15/29 | | | 1,407,846 | |
| | | |
| | | 3,948,299 | | | Oakwood Mortgage Investors, Inc., Series 99-E, Class A1, Variable Rate, 7.61%, due 03/15/30 | | | 2,929,539 | |
| | | |
| | | 10,266,142 | | | Oakwood Mortgage Investors, Inc., Series 00-D, Class A4, Variable Rate, 7.40%, due 07/15/30 | | | 3,466,509 | |
| | | |
| | | 989,924 | | | Oakwood Mortgage Investors, Inc., Series 01-D, Class A4, Variable Rate, 6.93%, due 09/15/31 | | | 707,957 | |
| | | |
| | | 579,774 | | | Oakwood Mortgage Investors, Inc., Series 01-E, Class A3, 5.69%, due 12/15/31 | | | 595,378 | |
| | | | | | | | | | |
| Par Value† | | | Description | | Value ($) | |
| | | |
| | | | | | Asset-Backed Securities — continued | | | |
| | |
| | | | | | Residential Mortgage-Backed Securities —
Other — continued | |
| | | |
| | | 1,350,000 | | | Progress Residential Trust, Series 21-SFR10, Class A, 144A, 2.39%, due 12/17/40 | | | 1,314,636 | |
| | | | | | | | | | |
| | | |
| | | | | | Total Residential Mortgage-Backed Securities — Other | | | 63,647,616 | |
| | | | | | | | | | |
| | |
| | | | | | Residential Mortgage-Backed Securities — Performing
Loans — 1.8% | |
| | | |
| | | 3,651,134 | | | Ajax Mortgage Loan Trust, Series 21-A, Class A1, 144A, Variable Rate, 1.07%, due 09/25/65 | | | 3,518,647 | |
| | | |
| | | 7,425,657 | | | CSMC Mortgage-Backed Trust, Series 22-NQM1, Class A1, 144A, Variable Rate, 2.27%, due 11/25/66 | | | 7,313,599 | |
| | | |
| | | 6,724,078 | | | Verus Securitization Trust, Series 21-8, Class A1, 144A, Variable Rate, 1.82%, due 11/25/66 | | | 6,556,330 | |
| | | | | | | | | | |
| | | |
| | | | | | Total Residential Mortgage-Backed Securities — Performing Loans | | | 17,388,576 | |
| | | | | | | | | | |
| | |
| | | | | | Residential Mortgage-Backed Securities —
Prime — 4.0% | |
| | | |
| | | 7,859,927 | | | American Home Mortgage Assets Trust, Series 06-4, Class 1A12, Variable Rate, 1 mo. LIBOR + 0.21%, 0.40%, due 10/25/46 | | | 4,903,316 | |
| | | |
| | | 619,027 | | | Bear Stearns ARM Trust, Series 05-9, Class A1, Variable Rate, U.S. Treasury Yield 1 Year CMT + 2.30%, 2.38%, due 10/25/35 | | | 631,406 | |
| | | |
| | | 4,029,472 | | | CSMC Mortgage-Backed Trust, Series 07-4, Class 2A1, 6.00%, due 06/25/37 | | | 2,968,470 | |
| | | |
| | | 1,446,129 | | | IndyMac INDA Mortgage Loan Trust, Series 06-AR3, Class 1A1, Variable Rate, 2.95%, due 12/25/36 | | | 1,358,050 | |
| | | |
| | | 1,146,828 | | | IndyMac INDA Mortgage Loan Trust, Series 07-AR1, Class 1A1, Variable Rate, 3.01%, due 03/25/37 | | | 1,063,789 | |
| | | |
| | | 8,445,864 | | | IndyMac INDX Mortgage Loan Trust, Series 06-AR2, Class 1A1A, Variable Rate, 1 mo. LIBOR + 0.44%, 0.63%, due 04/25/46 | | | 8,073,950 | |
| | | |
| | | 1,646,075 | | | Morgan Stanley Mortgage Loan Trust, Series 06-2, Class 6A, 6.50%, due 02/25/36 | | | 1,003,067 | |
| | | |
| | | 180,134 | | | RFMSI Trust, Series 05-SA4, Class 2A2, Variable Rate, 3.26%, due 09/25/35 | | | 172,658 | |
| | | |
| | | 5,381,016 | | | Structured Adjustable Rate Mortgage Loan Trust, Series 05-9, Class 2A2A, Variable Rate, 12 MTA + 1.40%, 1.50%, due 05/25/35 | | | 4,471,590 | |
| | | |
| | | 837,624 | | | WaMu Mortgage Pass-Through Certificates, Series 05-AR10, Class 1A3, Variable Rate, 2.94%, due 09/25/35 | | | 837,298 | |
| | | |
| | | 1,096,839 | | | WaMu Mortgage Pass-Through Certificates, Series 06-AR19, Class 2A, Variable Rate, COFI + 1.25%, 1.47%, due 01/25/47 | | | 1,089,149 | |
| | | |
| | | 2,454,328 | | | Washington Mutual Mortgage Pass-Through Certificates, Series 05-4, Class CB3, Variable Rate, 1 mo. LIBOR + 0.45%, 0.64%, due 06/25/35 | | | 2,096,582 | |
| | | | |
| | |
| | | See accompanying notes to the financial statements. | | 43 |
GMO Opportunistic Income Fund
(A Series of GMO Trust)
Schedule of Investments — (Continued)
(showing percentage of total net assets)
February 28, 2022
| | | | | | | | | | |
| Par Value† | | | Description | | Value ($) | |
| | | |
| | | | | | Asset-Backed Securities — continued | | | |
| | |
| | | | | | Residential Mortgage-Backed Securities —
Prime — continued | |
| | | |
| | | 10,267,999 | | | Washington Mutual Mortgage Pass-Through Certificates, Series 07-5, Class A6, 6.00%, due 06/25/37 | | | 10,383,008 | |
| | | | | | | | | | |
| | | |
| | | | | | Total Residential Mortgage-Backed Securities — Prime | | | 39,052,333 | |
| | | | | | | | | | |
| | |
| | | | | | Residential Mortgage-Backed Securities —
Subprime — 2.0% | |
| | | |
| | | 1,509,480 | | | Asset Backed Funding Certificates, Series 05-AQ1, Class A5, Step Up, 4.47%, due 06/25/35 | | | 1,519,069 | |
| | | |
| | | 1,677,084 | | | BCAP LLC, Series 14-RR2, Class 11A3, 144A, Variable Rate, 0.27%, due 05/26/37 | | | 1,633,168 | |
| | | |
| | | 1,493,128 | | | Bear Stearns Asset Backed Securities I Trust, Series 05-TC2, Class M4, Variable Rate, 1 mo. LIBOR + 1.88%, 2.06%, due 08/25/35 | | | 1,495,518 | |
| | | |
| | | 9,026,544 | | | Bravo Mortgage Asset Trust, Series 06-1A, Class M1,144A, Variable Rate, 1 mo. LIBOR + 0.40%, 0.79%, due 07/25/36 | | | 8,574,636 | |
| | | |
| | | 759,833 | | | Carrington Mortgage Loan Trust, Series 07-RFC1, Class A3, Variable Rate, 1 mo. LIBOR + 0.14%, 0.33%, due 12/25/36 | | | 721,264 | |
| | | |
| | | 1,131,597 | | | CHL Mortgage Pass-Through Trust, Series 04-HYB6, Class A2, Variable Rate, 2.54%, due 11/20/34 | | | 1,161,183 | |
| | | |
| | | 3,172,422 | | | First Franklin Mortgage Loan Trust, Series 06-FF12, Class A1, Variable Rate, 1 mo. LIBOR + 0.11%, 0.29%, due 09/25/36 | | | 3,014,374 | |
| | | |
| | | 1,132,467 | | | Lehman XS Trust, Series 07-15N, Class 2A1, Variable Rate, 1 mo. LIBOR + 0.25%, 0.44%, due 08/25/37 | | | 1,107,744 | |
| | | | | | | | | | |
| | | |
| | | | | | Total Residential Mortgage-Backed Securities — Subprime | | | 19,226,956 | |
| | | | | | | | | | |
| | |
| | | | | | Residential Mortgage-Backed Securities —
Alt-A — 1.2% | |
| | | |
| | | 456,573 | | | Alternative Loan Trust, Series 04-J11, Class 1CB1, 5.50%, due 11/25/34 | | | 467,833 | |
| | | |
| | | 1,734,760 | | | Alternative Loan Trust, Series 06-7CB, Class 1A1, Variable Rate, 1 mo. LIBOR + 0.70%, 0.89%, due 05/25/36 | | | 795,281 | |
| | | |
| | | 1,710,527 | | | Alternative Loan Trust, Series 06-28CB, Class A1, Variable Rate, 1 mo. LIBOR + 0.70%, 0.89%, due 10/25/36 | | | 685,297 | |
| | | |
| | | 1,652,789 | | | Bear Stearns ALT-A Trust, Series 04-11, Class 1M1, Variable Rate, 1 mo. LIBOR + 0.90%, 1.09%, due 11/25/34 | | | 1,657,893 | |
| | | |
| | | 2,343,046 | | | Bear Stearns Asset Backed Securities I Trust, Series 04-AC5, Class A1, Step Up, 5.75%, due 10/25/34 | | | 2,346,337 | |
| | | |
| | | 4,005,061 | | | Citigroup Mortgage Loan Trust, Inc., Series 06-AR5, Class 2A2A, Variable Rate, 2.77%, due 07/25/36 | | | 2,608,319 | |
| | | |
| | | 305,118 | | | JP Morgan Resecuritization Trust, Series 09-10, Class 7A1, 144A, Variable Rate, 6.05%, due 02/26/37 | | | 306,100 | |
| | | | | | | | | | |
| Par Value† | | | Description | | Value ($) | |
| | | |
| | | | | | Asset-Backed Securities — continued | | | |
| | |
| | | | | | Residential Mortgage-Backed Securities —
Alt-A — continued | |
| | | |
| | | 2,798,196 | | | RBSSP Resecuritization Trust, Series 09-6, Class 12A4, 144A, Variable Rate, 5.50%, due 05/26/35 | | | 2,748,222 | |
| | | | | | | | | | |
| | | |
| | | | | | Total Residential Mortgage-Backed Securities — Alt-A | | | 11,615,282 | |
| | | | | | | | | | |
| | |
| | | | | | Small Balance Commercial Mortgages — 7.4% | |
| | | |
| | | 2,255,015 | | | Bayview Commercial Asset Trust, Series 06-1A, Class A2, 144A, Variable Rate, 1 mo. LIBOR + 0.54%, 0.73%, due 04/25/36 | | | 2,140,937 | |
| | | |
| | | 3,765,982 | | | Bayview Commercial Asset Trust, Series 05-2A, Class A1, 144A, Variable Rate, 1 mo. LIBOR + 0.47%, 0.65%, due 08/25/35 | | | 3,607,496 | |
| | | |
| | | 1,821,376 | | | Bayview Commercial Asset Trust, Series 05-4A, Class A2, 144A, Variable Rate, 1 mo. LIBOR + 0.59%, 0.77%, due 01/25/36 | | | 1,749,835 | |
| | | |
| | | 994,253 | | | Bayview Commercial Asset Trust, Series 06-1A, Class M1, 144A, Variable Rate, 1 mo. LIBOR + 0.57%, 0.76%, due 04/25/36 | | | 932,306 | |
| | | |
| | | 1,390,674 | | | Bayview Commercial Asset Trust, Series 06-2A, Class A1, 144A, Variable Rate, 1 mo. LIBOR + 0.35%, 0.53%, due 07/25/36 | | | 1,332,816 | |
| | | |
| | | 2,844,642 | | | Bayview Commercial Asset Trust, Series 06-2A, Class A2, 144A, Variable Rate, 1 mo. LIBOR + 0.42%, 0.61%, due 07/25/36 | | | 2,733,241 | |
| | | |
| | | 3,301,068 | | | Bayview Commercial Asset Trust, Series 06-3A, Class A1, 144A, Variable Rate, 1 mo. LIBOR + 0.25%, 0.44%, due 10/25/36 | | | 3,179,217 | |
| | | |
| | | 10,815,958 | | | Bayview Commercial Asset Trust, Series 06-SP2, Class A, 144A, Variable Rate, 1 mo. LIBOR + 0.28%, 0.61%, due 01/25/37 | | | 10,396,947 | |
| | | |
| | | 1,885,021 | | | Bayview Commercial Asset Trust, Series 07-1, Class A1, 144A, Variable Rate, 1 mo. LIBOR + 0.22%, 0.41%, due 03/25/37 | | | 1,808,675 | |
| | | |
| | | 3,029,475 | | | Bayview Commercial Asset Trust, Series 07-3, Class A1, 144A, Variable Rate, 1 mo. LIBOR + 0.24%, 0.43%, due 07/25/37 | | | 2,877,486 | |
| | | |
| | | 6,195,039 | | | Bayview Commercial Asset Trust, Series 07-2A, Class A1, 144A, Variable Rate, 1 mo. LIBOR + 0.27%, 0.46%, due 07/25/37 | | | 5,939,339 | |
| | | |
| | | 94,179,685 | | | FRESB Mortgage Trust, Series 20-SB76, Class X1, IO, Variable Rate, 1.18%, due 05/25/30 | | | 6,209,775 | |
| | | |
| | | 22,874,300 | | | FRESB Mortgage Trust, Series 20-SB74, Class X1, IO, Variable Rate, 1.18%, due 03/25/40 | | | 1,471,986 | |
| | | |
| | | 78,302,153 | | | FRESB Mortgage Trust, Series 20-SB77, Class X1, IO, Variable Rate, 0.95%, due 06/25/40 | | | 4,247,258 | |
| | | |
| | | 1,269,805 | | | Lehman Brothers Small Balance Commercial Mortgage Trust, Series 06-1A, Class M3, 144A, Variable Rate, 1 mo. LIBOR + 0.53%, 0.72%, due 04/25/31 | | | 1,266,579 | |
| | | |
| | | 2,022,599 | | | Lehman Brothers Small Balance Commercial Mortgage Trust, Series 06-1A, Class B, 144A, Variable Rate, 1 mo. LIBOR + 1.00%, 1.19%, due 04/25/31 | | | 1,992,015 | |
| | | | |
| | |
| 44 | | See accompanying notes to the financial statements. | | |
GMO Opportunistic Income Fund
(A Series of GMO Trust)
Schedule of Investments — (Continued)
(showing percentage of total net assets)
February 28, 2022
| | | | | | | | | | |
| Par Value† | | | Description | | Value ($) | |
| | | |
| | | | | | Asset-Backed Securities — continued | | | |
| | |
| | | | | | Small Balance Commercial Mortgages — continued | |
| | | |
| | | 3,501,830 | | | Lehman Brothers Small Balance Commercial Mortgage Trust, Series 07-2A, Class M1, 144A, Variable Rate, 1 mo. LIBOR + 0.40%, 0.59%, due 06/25/37 | | | 3,466,387 | |
| | | |
| | | 991,596 | | | Lehman Brothers Small Balance Commercial Mortgage Trust, Series 07-3A, Class AJ, 144A, Variable Rate, 4.31%, due 10/25/37 | | | 989,075 | |
| | | |
| | | 3,300,000 | | | Lehman Brothers Small Balance Commercial Mortgage Trust, Series 07-3A, Class M1, 144A, Variable Rate, 4.31%, due 10/25/37 | | | 3,322,112 | |
| | | |
| | | 7,696,930 | | | Velocity Commercial Capital Loan Trust, Series 21-4, Class A, 144A, Variable Rate, 2.52%, due 12/26/51 | | | 7,506,456 | |
| | | |
| | | 1,969,995 | | | Velocity Commercial Capital Loan Trust, Series 21-4, Class M3, 144A, Variable Rate, 3.81%, due 12/26/51 | | | 1,888,289 | |
| | | |
| | | 1,148,486 | | | WaMu Commercial Mortgage Securities Trust, Series 07-SL2, Class D, 144A, Variable Rate, 2.15%, due 12/27/49 | | | 1,148,779 | |
| | | |
| | | 3,176,664 | | | WaMu Commercial Mortgage Securities Trust, Series 07-SL2, Class E, 144A, Variable Rate, 2.30%, due 12/27/49 | | | 3,141,535 | |
| | | | | | | | | | |
| | | |
| | | | | | Total Small Balance Commercial Mortgages | | | 73,348,541 | |
| | | | | | | | | | |
| | |
| | | | | | Student Loans — Federal Family Education Loan
Program — 6.1% | |
| | | |
| | | 2,467,397 | | | AccessLex Institute, Series 04-2, Class A3, Variable Rate, 3 mo. LIBOR + 0.19%, 0.45%, due 10/25/24 | | | 2,450,582 | |
| | | |
| | | 6,454,704 | | | AccessLex Institute, Series 04-2, Class B, Variable Rate, 3 mo. LIBOR + 0.70%, 0.96%, due 01/25/43 | | | 6,121,944 | |
| | | |
| | | 2,805,353 | | | AccessLex Institute, Series 07-1, Class A4, Variable Rate, 3 mo. LIBOR + 0.06%, 0.32%, due 01/25/23 | | | 2,796,012 | |
| | | |
| | | 3,400,888 | | | Collegiate Funding Services Education Loan Trust, Series 05-B, Class B, Variable Rate, 3 mo. LIBOR + 0.32%, 0.54%, due 03/28/35 | | | 2,984,801 | |
| | | |
| | | 8,744,910 | | | SLC Student Loan Trust, Series 08-2, Class A4, Variable Rate, 3 mo. LIBOR + 0.90%, 1.10%, due 06/15/21 | | | 8,570,303 | |
| | | |
| | | 10,114,013 | | | SLM Student Loan Trust, Series 08-4, Class A4, Variable Rate, 3 mo. LIBOR + 1.65%, 1.91%, due 07/25/22 | | | 10,155,270 | |
| | | |
| | | 7,693,345 | | | SLM Student Loan Trust, Series 08-5, Class A4, Variable Rate, 3 mo. LIBOR + 1.70%, 1.96%, due 07/25/23 | | | 7,715,627 | |
| | | |
| | | 19,342,165 | | | SLM Student Loan Trust, Series 08-9, Class A, Variable Rate, 3 mo. LIBOR + 1.50%, 1.76%, due 04/25/23 | | | 19,377,108 | |
| | | | | | | | | | |
| | | |
| | | | | | Total Student Loans — Federal Family Education Loan Program | | | 60,171,647 | |
| | | | | | | | | | |
| | | | | | | | | | |
| Par Value† | | | Description | | Value ($) | |
| | | |
| | | | | | Asset-Backed Securities — continued | | | |
| | |
| | | | | | Student Loans — Private — 11.0% | |
| | | |
| | | 2,367,185 | | | Access Group, Inc., Series 05-A, Class B, Variable Rate, 3 mo. LIBOR + 0.80%, 1.06%, due 07/25/34 | | | 2,304,400 | |
| | | |
| | | 6,465,715 | | | KeyCorp Student Loan Trust, Series 06-A, Class 2B, Variable Rate, 3 mo. LIBOR + 0.48%, 0.70%, due 12/27/41 | | | 6,426,099 | |
| | | |
| | | 1,223,903 | | | KeyCorp Student Loan Trust, Series 04-A, Class 2C, Variable Rate, 3 mo. LIBOR + 0.80%, 1.07%, due 04/28/42 | | | 1,222,373 | |
| | | |
| | | 5,622,500 | | | KeyCorp Student Loan Trust, Series 04-A, Class 2D, Variable Rate, 3 mo. LIBOR + 1.25%, 1.52%, due 07/28/42 | | | 5,353,192 | |
| | | |
| | | 556,482 | | | L2L Education Loan Trust, Series 06-1A, Class B, 144A, Variable Rate, 1 mo. LIBOR + 0.50%, 0.69%, due 10/15/28 | | | 555,245 | |
| | | |
| | | 8,775,000 | | | National Collegiate Commutation Trust, Series 07-3, Class A3R4, 144A, Variable Rate, 7-DayAuct + 0.00%, due 03/31/38 (a) | | | 2,522,813 | |
| | | |
| | | 7,625,000 | | | National Collegiate II Commutation Trust, Series 07-4, Class A3R7, Variable Rate, 28-DayAuct + 0.00%, due 03/25/38 (a) | | | 2,125,469 | |
| | | |
| | | 3,275,000 | | | National Collegiate II Commutation Trust, Series 07-4, Class A3R6, Variable Rate, 28-DayAuct + 0.00%, due 03/25/38 (a) | | | 912,906 | |
| | | |
| | | 5,587,288 | | | National Collegiate Student Loan Trust, Series 06-4, Class A4, Variable Rate, 1 mo. LIBOR + 0.31%, 0.50%, due 05/25/32 | | | 5,411,465 | |
| | | |
| | | 3,906,730 | | | National Collegiate Student Loan Trust, Series 07-2, Class A4, Variable Rate, 1 mo. LIBOR + 0.29%, 0.48%, due 01/25/33 | | | 3,714,170 | |
| | | |
| | | 9,597,147 | | | National Collegiate Student Loan Trust, Series 06-1, Class A5, Variable Rate, 1 mo. LIBOR + 0.35%, 0.54%, due 03/25/33 | | | 9,271,143 | |
| | | |
| | | 5,698,791 | | | National Collegiate Student Loan Trust, Series 05-2, Class A51, Variable Rate, 1 mo. LIBOR + 0.37%, 0.56%, due 06/25/33 | | | 5,489,323 | |
| | | |
| | | 18,574,333 | | | National Collegiate Student Loan Trust, Series 07-1, Class A4, Variable Rate, 1 mo. LIBOR + 0.31%, 0.49%, due 10/25/33 | | | 17,661,107 | |
| | | |
| | | 3,809,000 | | | National Collegiate Student Loan Trust, Series 04-2, Class B, Variable Rate, 1 mo. LIBOR + 0.54%, 0.73%, due 12/26/33 | | | 3,693,894 | |
| | | |
| | | 75,000 | | | National Collegiate Student Loan Trust, Series 07-4, Class A3A7, Variable Rate, 28-DayAuct + 0.00%, due 03/25/38 (b) | | | 61,500 | |
| | | |
| | | 25,000 | | | National Collegiate Student Loan Trust, Series 07-3, Class A3A4, Variable Rate, 28-DayAuct + 0.00%, due 03/25/38 (b) | | | 20,750 | |
| | | |
| | | 4,000,000 | | | Navient Student Loan Trust, Series 22-A, Class A, 144A, 2.23%, due 07/15/70 | | | 3,965,112 | |
| | | |
| | | 4,028,110 | | | Nelnet Student Loan Trust, Series 21-A, Class APT1, 144A, 1.36%, due 04/20/62 | | | 3,862,976 | |
| | | |
| | | 4,463,000 | | | SLM Private Credit Student Loan Trust, Series 03-A, Class A3, Variable Rate, 28-DayAuct + 0.00%, due 06/15/32 (a) | | | 4,463,000 | |
| | | | |
| | |
| | | See accompanying notes to the financial statements. | | 45 |
GMO Opportunistic Income Fund
(A Series of GMO Trust)
Schedule of Investments — (Continued)
(showing percentage of total net assets)
February 28, 2022
| | | | | | | | | | |
| Par Value† | | | Description | | Value ($) | |
| | | |
| | | | | | Asset-Backed Securities — continued | | | |
| | |
| | | | | | Student Loans — Private — continued | |
| | | |
| | | 2,250,000 | | | SLM Private Credit Student Loan Trust, Series 03-C, Class A3, Variable Rate, 28-DayAuct + 0.00%, due 09/15/32 (a) | | | 2,250,000 | |
| | | |
| | | 5,400,350 | | | SLM Private Credit Student Loan Trust, Series 03-C, Class C, Variable Rate, 3 mo. LIBOR + 1.60%, 1.80%, due 09/15/32 | | | 1,956,444 | |
| | | |
| | | 1,286,518 | | | SLM Private Credit Student Loan Trust, Series 04-A, Class A3, Variable Rate, 3 mo. LIBOR + 0.40%, 0.60%, due 06/15/33 | | | 1,270,481 | |
| | | |
| | | 9,080,000 | | | SLM Private Credit Student Loan Trust, Series 04-B, Class A4, Variable Rate, 3 mo. LIBOR + 0.43%, 0.63%, due 09/15/33 | | | 8,840,464 | |
| | | |
| | | 3,392,684 | | | SLM Private Credit Student Loan Trust, Series 06-A, Class A5, Variable Rate, 3 mo. LIBOR + 0.29%, 0.49%, due 06/15/39 | | | 3,292,982 | |
| | | |
| | | 2,775,996 | | | SLM Private Credit Student Loan Trust, Series 05-B, Class A4, Variable Rate, 3 mo. LIBOR + 0.33%, 0.53%, due 06/15/39 | | | 2,711,363 | |
| | | |
| | | 2,672,291 | | | SLM Private Credit Student Loan Trust, Series 06-C, Class C, Variable Rate, 3 mo. LIBOR + 0.39%, 0.59%, due 12/15/39 | | | 2,388,935 | |
| | | |
| | | 6,989,400 | | | Towd Point Asset Trust, Series 18-SL1, Class B, 144A, Variable Rate, 1 mo. LIBOR + 1.05%, 1.24%, due 01/25/46 | | | 6,878,346 | |
| | | | | | | | | | |
| | | |
| | | | | | Total Student Loans — Private | | | 108,625,952 | |
| | | | | | | | | | |
| | | |
| | | | | | Total Asset-Backed Securities | | | 703,412,722 | |
| | | | | | | | | | |
| | | |
| | | | | | Corporate Debt — 0.4% | | | |
| | | |
| | | | | | Airlines — 0.4% | | | |
| | | |
| | | 2,651,250 | | | American Airlines Class AA Pass-Through Certificates, 3.65%, due 02/15/29 | | | 2,714,489 | |
| | | |
| | | 1,507,664 | | | American Airlines Class AA Pass-Through Certificates, 3.35%, due 04/15/31 | | | 1,518,756 | |
| | | | | | | | | | |
| | | |
| | | | | | Total Airlines | | | 4,233,245 | |
| | | | | | | | | | |
| | | |
| | | | | | Total Corporate Debt | | | 4,233,245 | |
| | | | | | | | | | |
| | |
| | | | | | U.S. Government — 17.4% | |
| | | |
| | | 29,000,000 | | | U.S. Treasury Note, 0.13%, due 11/30/22 | | | 28,826,680 | |
| | | |
| | | 30,000,000 | | | U.S. Treasury Note, Variable Rate, USBM + 0.03%, 0.39%, due 04/30/23 (c) | | | 30,010,013 | |
| | | |
| | | 46,800,000 | | | U.S. Treasury Note, Variable Rate, USBM + 0.03%, 0.39%, due 07/31/23 (c) | | | 46,873,312 | |
| | | |
| | | 65,000,000 | | | U.S. Treasury Note, Variable Rate, USBM + 0.04%, 0.40%, due 10/31/23 | | | 65,117,346 | |
| | | | | | | | | | |
| | | |
| | | | | | Total U.S. Government | | | 170,827,351 | |
| | | | | | | | | | |
| | | | | | | | | | |
| Par Value† | | | Description | | Value ($) | |
| | |
| | | | | | U.S. Government Agency — 0.8% | |
| | | |
| | | 1,057,500 | | | Agency for International Development Floater (Support of Tunisia), Variable Rate, 6 mo. LIBOR + 0.00%, 0.78%, due 07/01/23 (a) | | | 1,049,155 | |
| | | |
| | | 2,959,179 | | | Agency for International Development Floater (Support of Morocco), Variable Rate, 6 mo. LIBOR – 0.02%, 0.77%, due 02/01/25 (a) | | | 2,912,162 | |
| | | |
| | | 3,750,000 | | | Agency for International Development Floater (Support of Morocco), Variable Rate, 6 mo. LIBOR + 0.15%, 0.93%, due 10/29/26 (a) | | | 3,679,120 | |
| | | | | | | | | | |
| | | |
| | | | | | Total U.S. Government Agency | | | 7,640,437 | |
| | | | | | | | | | |
| | | |
| | | | | | TOTAL DEBT OBLIGATIONS (COST $939,313,948) | | | 886,113,755 | |
| | | | | | | | | | |
| | |
| | | | | | MUTUAL FUNDS — 1.1% | |
| | | |
| | | | | | United States — 1.1% | | | |
| | |
| | | | | | Affiliated Issuers — 1.1% | |
| | | |
| | | 2,183,242 | | | GMO U.S. Treasury Fund | | | 10,938,043 | |
| | | | | | | | | | |
| | | |
| | | | | | TOTAL MUTUAL FUNDS
(COST $11,003,541) | | | 10,938,043 | |
| | | | | | | | | | |
| | |
| | | | | | SHORT-TERM INVESTMENTS — 6.4% | |
| | | |
| | | | | | Money Market Funds — 0.4% | | | |
| | | |
| | | 4,404,441 | | | State Street Institutional Treasury Money Market Fund – Premier Class, 0.01% (d) | | | 4,404,441 | |
| | | | | | | | | | |
| | | |
| | | | | | U.S. Government — 6.0% | | | |
| | | |
| | | 24,000,000 | | | U.S. Treasury Bill, 0.54%, due 07/21/22 (e) | | | 23,948,975 | |
| | | |
| | | 235,000 | | | U.S. Treasury Bill, 0.58%, due 07/28/22 (e) | | | 234,446 | |
| | | |
| | | 5,765,000 | | | U.S. Treasury Bill, 0.64%, due 08/18/22 (e) | | | 5,747,668 | |
| | | |
| | | 5,000,000 | | | U.S. Treasury Bill, 0.66%, due 08/25/22 (e) | | | 4,984,078 | |
| | | |
| | | 23,750,000 | | | U.S. Treasury Bill, 0.70%, due 10/06/22 (e) | | | 23,648,503 | |
| | | | | | | | | | |
| | | |
| | | | | | Total U.S. Government | | | 58,563,670 | |
| | | | | | | | | | |
| | | |
| | | | | | TOTAL SHORT-TERM INVESTMENTS
(COST $63,073,862) | | | 62,968,111 | |
| | | | | | | | | | |
| | | | |
| | |
| 46 | | See accompanying notes to the financial statements. | | |
GMO Opportunistic Income Fund
(A Series of GMO Trust)
Schedule of Investments — (Continued)
(showing percentage of total net assets)
February 28, 2022
PURCHASED OPTIONS — 0.2%
| | | | | | | | | | | | | | | | | | | | |
| Description | | Counterparty | | Exercise
Rate | | Expiration
Date | | | Principal/
Notional
Amount | | | Floating
Rate Index | | Pay/Receive
Floating Rate | | Value ($) |
|
| Options on Credit Default Swaps — Puts — 0.2% |
| | | | | | | | |
CDX.NA.HYS.37.V1-5Y | | BCLY | | 104.50% | | | 03/16/22 | | | USD | | | 67,090,000 | | | Fixed Spread | | Pay | | 290,547 |
| | | | | | | | |
CDX.NA.HYS.37.V1-5Y | | BCLY | | 105.50% | | | 03/16/22 | | | USD | | | 67,090,000 | | | Fixed Spread | | Pay | | 514,103 |
| | | | | | | | |
CDX.NA.IGS.37.V1-5Y | | BOA | | 65.00% | | | 03/16/22 | | | USD | | | 104,440,000 | | | Fixed Spread | | Pay | | 240,780 |
| | | | | | | | |
CDX.NA.IGS.37.V1-5Y | | BOA | | 55.00% | | | 03/16/22 | | | USD | | | 104,440,000 | | | Fixed Spread | | Pay | | 634,206 |
| | | | | | | | |
CDX.NA.IGS.37.V1-5Y | | BCLY | | 67.50% | | | 04/20/22 | | | USD | | | 89,230,000 | | | Fixed Spread | | Pay | | 293,816 |
| | | | | | | | |
CDX.NA.IGS.37.V1-5Y | | BCLY | | 82.50% | | | 04/20/22 | | | USD | | | 89,230,000 | | | Fixed Spread | | Pay | | 144,503 |
| | | | | | | | | | | | | | | | | | | | |
| | | |
Total Options on Credit Default Swaps — Puts | | | | | | | 2,117,955 |
| | | | | | | | | | | | | | | | | | | | |
| | | |
TOTAL PURCHASED OPTIONS (COST $2,048,106) | | | | | | | 2,117,955 |
| | | | | | | | | | | | | | | | | | | | |
| | | |
TOTAL INVESTMENTS — 97.8%
(Cost $1,015,439,457) | | | | | | | 962,137,864 |
| | | |
Other Assets and Liabilities (net) — 2.2% | | | | | | | 21,739,296 |
| | | | | | | | | | | | | | | | | | | | |
| | | |
TOTAL NET ASSETS — 100.0% | | | | | | | $983,877,160 |
| | | | | | | | | | | | | | | | | | | | |
A summary of outstanding financial instruments at February 28, 2022 is as follows:
Forward Currency Contracts
| | | | | | | | | | | | | | | | | | | | | | |
| | | | |
Settlement
Date | | Counter-
party | | Currency
Sold | | | Currency
Purchased | | | Net Unrealized
Appreciation
(Depreciation) ($) | |
| 04/21/2022 | | MSCI | | | EUR | | | | 1,845,528 | | | | USD | | | | 2,078,342 | | | | 5,010 | |
| 04/21/2022 | | SSB | | | EUR | | | | 6,854,186 | | | | USD | | | | 7,793,957 | | | | 93,721 | |
| 04/21/2022 | | SSB | | | USD | | | | 2,098,567 | | | | EUR | | | | 1,845,528 | | | | (25,235 | ) |
| | | | | | | | | | | | | | | | | | | | | | |
| | | | | | | | | | | | | | | | | | | | $ | 73,496 | |
| | | | | | | | | | | | | | | | | | | | | | |
Futures Contracts
| | | | | | | | | | | | |
| | | | |
Number of
Contracts + | | Type | | Expiration
Date | | Notional
Amount ($) | | | Value/Net
Unrealized
Appreciation
(Depreciation) ($) | |
| Buys | | | | | | | | | | | | |
| 221 | | U.S. Treasury Note
2 Yr. (CBT) | | June 2022 | | $ | 47,565,070 | | | $ | 155,255 | |
| | | | | | | | | | | | |
| Sales | | | | | | | | | | | | |
| 267 | | U.S. Treasury Note
5 Yr. (CBT) | | June 2022 | | | 31,581,094 | | | | (71,411 | ) |
| 292 | | U.S. Treasury Note
10 Yr. (CBT) | | June 2022 | | | 37,211,750 | | | | (365,106 | ) |
| 65 | | U.S. Treasury Ultra
10 Yr. (CBT) | | June 2022 | | | 9,186,328 | | | | (922 | ) |
| | | | | | | | | | | | |
| | $ | 77,979,172 | | | $ | (437,439 | ) |
| | | | | | | | | | | | |
| + | Buys - Fund is long the futures contract. |
| | Sales - Fund is short the futures contract. |
Written Options
| | | | | | | | | | | | | | | | | | | | | | | | | | |
Description | | Counterparty | | Exercise
Rate | | Expiration
Date | | | Principal/
Notional
Amount | | | Floating
Rate Index | | | Pay/Receive
Floating Rate | | Value ($) | |
Written Options on Credit Default Swaps — Puts | |
CDX.NA.HYS.37.V1-5Y | | BCLY | | 105.00% | | | 03/16/22 | | | | USD | | | | (134,180,000 | ) | | | Fixed Spread | | | Pay | | | (772,696 | ) |
CDX.NA.IGS.37.V1-5Y | | DB | | 75.00% | | | 03/16/22 | | | | USD | | | | (65,535,000 | ) | | | Fixed Spread | | | Pay | | | (52,790 | ) |
CDX.NA.IGS.37.V1-5Y | | BOA | | 60.00% | | | 03/16/22 | | | | USD | | | | (208,870,000 | ) | | | Fixed Spread | | | Pay | | | (811,612 | ) |
CDX.NA.IGS.37.V1-5Y | | GS | | 70.00% | | | 03/16/22 | | | | USD | | | | (65,535,000 | ) | | | Fixed Spread | | | Pay | | | (88,794 | ) |
CDX.NA.IGS.37.V1-5Y | | BCLY | | 75.00% | | | 04/20/22 | | | | USD | | | | (178,460,000 | ) | | | Fixed Spread | | | Pay | | | (406,285 | ) |
| | | | | | | | | | | | | | | | | | | | | | | | | | |
| | | | | | | Total Written Options on Credit Default Swaps — Puts | | | (2,132,177 | ) |
| | | | | | | | | | | | | | | | | | | | | | | | | | |
| | | | | | | TOTAL WRITTEN OPTIONS (Premiums $2,098,960) | | $ | (2,132,177 | ) |
| | | | | | | | | | | | | | | | | | | | | | | | | | |
| | | | |
| | |
| | | See accompanying notes to the financial statements. | | 47 |
GMO Opportunistic Income Fund
(A Series of GMO Trust)
Schedule of Investments — (Continued)
February 28, 2022
Swap Contracts
Centrally Cleared Credit Default Swaps
| | | | | | | | | | | | | | | | | | | | | | | | | | | | | | | | | | | | | | |
Reference Entity | | Notional
Amount | | | Annual
Premium | | | Implied
Credit
Spread (1) | | | Maximum
Potential
Amount of
Future
Payments by
the Fund
Under the
Contract (2) | | | Expiration
Date | | | Periodic
Payment
Frequency
| | | Premiums
Paid/
(Received) ($) | | | Value ($) | | | Net Unrealized
Appreciation/
(Depreciation) ($) | |
Buy Protection^: | |
ITRAXX.EUROPE.S32.V1-5Y | | EUR | | | 29,470,000 | | | | 1.00% | | | | 0.48% | | | | N/A | | | | 12/20/2024 | | | | Quarterly | | | | (859,948 | ) | | | (470,271 | ) | | | 389,677 | |
ITRAXX.EUROPE.S34.V1-5Y | | EUR | | | 20,633,760 | | | | 1.00% | | | | 0.56% | | | | N/A | | | | 12/20/2025 | | | | Quarterly | | | | (648,690 | ) | | | (377,249 | ) | | | 271,441 | |
ITRAXX.XOVER.S34.V2-5Y | | EUR | | | 10,451,689 | | | | 5.00% | | | | 2.63% | | | | N/A | | | | 12/20/2025 | | | | Quarterly | | | | (1,543,611 | ) | | | (886,047 | ) | | | 657,564 | |
CDX.NA.IGS.37.V1-5Y | | USD | | | 131,070,000 | | | | 1.00% | | | | 0.69% | | | | N/A | | | | 12/20/2026 | | | | Quarterly | | | | (3,176,534 | ) | | | (1,922,404 | ) | | | 1,254,130 | |
Sell Protection^: | |
CDX.NA.IGS.28.V1-5Y | | USD | | | 17,200,000 | | | | 1.00% | | | | 0.26% | | | | 17,200,000 USD | | | | 06/20/2022 | | | | Quarterly | | | | 300,982 | | | | 39,199 | | | | (261,783 | ) |
CDX.NA.HYS.33.V3-5Y | | USD | | | 2,300,650 | | | | 5.00% | | | | 2.54% | | | | 2,300,650 USD | | | | 12/20/2024 | | | | Quarterly | | | | 78,900 | | | | 135,009 | | | | 56,109 | |
| | | | | | | | | | | | | | | | | | | | | | | | | | | | | | | | | | | | | | |
| | | $ | (5,848,901 | ) | | $ | (3,481,763 | ) | | $ | 2,367,138 | |
| | | | | | | | | | | | | |
OTC Credit Default Swaps
| | | | | | | | | | | | | | | | | | | | | | | | | | | | | | | | | | | | | | | | | | |
Reference Entity | | Counter-
party | | Notional
Amount | | | Annual
Premium | | | Implied
Credit
Spread (1) | | | Maximum
Potential
Amount of
Future
Payments by
the Fund
Under the
Contract (2) | | | Expiration
Date | | | Periodic
Payment
Frequency | | | Premiums
Paid/
(Received) ($) | | | Value ($) | | | Net
Unrealized
Appreciation/
(Depreciation)
($) | |
Buy Protection^: | |
D.R. Horton, Inc. | | BCLY | | | USD | | | | 17,200,000 | | | | 1.00% | | | | 0.15% | | | | N/A | | | | 06/20/2022 | | | | Quarterly | | | | (165,250 | ) | | | (45,657 | ) | | | 119,593 | |
CDX.NA.HYS.29.V1-5Y | | JPM | | | USD | | | | 6,425,250 | | | | 5.00% | | | | 1.64% | | | | N/A | | | | 12/20/2022 | | | | Quarterly | | | | (282,711 | ) | | | (204,255 | ) | | | 78,456 | |
CDX.NA.HYS.29.V1-5Y | | MORD | | | USD | | | | 3,450,800 | | | | 5.00% | | | | 1.64% | | | | N/A | | | | 12/20/2022 | | | | Quarterly | | | | (188,414 | ) | | | (109,699 | ) | | | 78,715 | |
CDX.NA.HYS.29.V1-5Y | | JPM | | | USD | | | | 870,000 | | | | 5.00% | | | | 1.64% | | | | N/A | | | | 12/20/2022 | | | | Quarterly | | | | (51,765 | ) | | | (27,657 | ) | | | 24,108 | |
Navient Corp. | | GS | | | USD | | | | 4,050,000 | | | | 5.00% | | | | 1.26% | | | | N/A | | | | 12/20/2022 | | | | Quarterly | | | | (421,122 | ) | | | (122,452 | ) | | | 298,670 | |
Navient Corp. | | GS | | | USD | | | | 2,700,000 | | | | 5.00% | | | | 1.26% | | | | N/A | | | | 12/20/2022 | | | | Quarterly | | | | (277,471 | ) | | | (81,634 | ) | | | 195,837 | |
Navient Corp. | | BCLY | | | USD | | | | 2,082,800 | | | | 5.00% | | | | 1.26% | | | | N/A | | | | 12/20/2022 | | | | Quarterly | | | | (160,628 | ) | | | (62,973 | ) | | | 97,655 | |
Navient Corp. | | BCLY | | | USD | | | | 3,435,200 | | | | 5.00% | | | | 1.26% | | | | N/A | | | | 12/20/2022 | | | | Quarterly | | | | (264,646 | ) | | | (103,863 | ) | | | 160,783 | |
CDX.NA.HYS.31.V14-5Y | | CITI | | | USD | | | | 3,941,000 | | | | 5.00% | | | | 2.06% | | | | N/A | | | | 12/20/2023 | | | | Quarterly | | | | (15,370 | ) | | | (51,027 | ) | | | (35,657 | ) |
CMBX.NA.A.7 | | CGMI | | | USD | | | | 1,420,000 | | | | 2.00% | | | | 5.26% | | | | N/A | | | | 01/17/2047 | | | | Monthly | | | | 89,177 | | | | 71,312 | | | | (17,865 | ) |
CMBX.NA.A.7 | | GS | | | USD | | | | 2,840,000 | | | | 2.00% | | | | 5.26% | | | | N/A | | | | 01/17/2047 | | | | Monthly | | | | 156,358 | | | | 142,625 | | | | (13,733 | ) |
CMBX.NA.AA.7 | | GS | | | USD | | | | 5,000,000 | | | | 1.50% | | | | 2.43% | | | | N/A | | | | 01/17/2047 | | | | Monthly | | | | 7,975 | | | | 73,366 | | | | 65,391 | |
CMBX.NA.AS.7 | | DB | | | USD | | | | 7,608,000 | | | | 1.00% | | | | 0.90% | | | | N/A | | | | 01/17/2047 | | | | Monthly | | | | (119,899 | ) | | | (11,706 | ) | | | 108,193 | |
CMBX.NA.AS.7 | | BOA | | | USD | | | | 4,505,000 | | | | 1.00% | | | | 0.90% | | | | N/A | | | | 01/17/2047 | | | | Monthly | | | | 47,352 | | | | (6,932 | ) | | | (54,284 | ) |
CMBX.NA.AS.7 | | DB | | | USD | | | | 16,677,794 | | | | 1.00% | | | | 0.90% | | | | N/A | | | | 01/17/2047 | | | | Monthly | | | | 197,705 | | | | (25,662 | ) | | | (223,367 | ) |
CMBX.NA.AS.7 | | GS | | | USD | | | | 4,400,000 | | | | 1.00% | | | | 0.90% | | | | N/A | | | | 01/17/2047 | | | | Monthly | | | | 112,812 | | | | (6,770 | ) | | | (119,582 | ) |
CMBX.NA.AS.7 | | MORD | | | USD | | | | 13,270,000 | | | | 1.00% | | | | 0.90% | | | | N/A | | | | 01/17/2047 | | | | Monthly | | | | 205,782 | | | | (20,419 | ) | | | (226,201 | ) |
CMBX.NA.AA.11 | | CGMI | | | USD | | | | 4,626,000 | | | | 1.50% | | | | 1.27% | | | | N/A | | | | 11/18/2054 | | | | Monthly | | | | (63,740 | ) | | | (55,268 | ) | | | 8,472 | |
CMBX.NA.AA.11 | | MORD | | | USD | | | | 4,624,500 | | | | 1.50% | | | | 1.27% | | | | N/A | | | | 11/18/2054 | | | | Monthly | | | | (61,371 | ) | | | (55,250 | ) | | | 6,121 | |
CMBX.NA.AA.11 | | MORD | | | USD | | | | 4,624,500 | | | | 1.50% | | | | 1.27% | | | | N/A | | | | 11/18/2054 | | | | Monthly | | | | (67,279 | ) | | | (55,250 | ) | | | 12,029 | |
CMBX.NA.BBB-.11 | | GS | | | USD | | | | 3,064,050 | | | | 3.00% | | | | 4.76% | | | | N/A | | | | 11/18/2054 | | | | Monthly | | | | 116,418 | | | | 254,417 | | | | 137,999 | |
CMBX.NA.AA.8 | | CSI | | | USD | | | | 8,892,000 | | | | 1.50% | | | | 1.36% | | | | N/A | | | | 10/17/2057 | | | | Monthly | | | | 247,717 | | | | (31,691 | ) | | | (279,408 | ) |
CMBX.NA.AS.8 | | CGMI | | | USD | | | | 8,892,000 | | | | 1.00% | | | | 0.87% | | | | N/A | | | | 10/17/2057 | | | | Monthly | | | | 73,095 | | | | (28,746 | ) | | | (101,841 | ) |
CMBX.NA.AS.8 | | MORD | | | USD | | | | 3,384,000 | | | | 1.00% | | | | 0.87% | | | | N/A | | | | 10/17/2057 | | | | Monthly | | | | 140,432 | | | | (10,940 | ) | | | (151,372 | ) |
CMBX.NA.BBB-.8 | | GS | | | USD | | | | 4,224,000 | | | | 3.00% | | | | 9.30% | | | | N/A | | | | 10/17/2057 | | | | Monthly | | | | 400,908 | | | | 605,298 | | | | 204,390 | |
CMBX.NA.BBB-.8 | | GS | | | USD | | | | 6,889,000 | | | | 3.00% | | | | 9.30% | | | | N/A | | | | 10/17/2057 | | | | Monthly | | | | 1,034,610 | | | | 987,191 | | | | (47,419 | ) |
CMBX.NA.BBB-.9 | | MORD | | | USD | | | | 2,585,000 | | | | 3.00% | | | | 6.51% | | | | N/A | | | | 09/17/2058 | | | | Monthly | | | | 63,490 | | | | 284,239 | | | | 220,749 | |
CMBX.NA.BBB-.9 | | CGMI | | | USD | | | | 3,425,200 | | | | 3.00% | | | | 6.51% | | | | N/A | | | | 09/17/2058 | | | | Monthly | | | | 955,105 | | | | 376,625 | | | | (578,480 | ) |
CMBX.NA.BBB-.9 | | CGMI | | | USD | | | | 2,500,000 | | | | 3.00% | | | | 6.51% | | | | N/A | | | | 09/17/2058 | | | | Monthly | | | | 290,110 | | | | 274,893 | | | | (15,217 | ) |
CMBX.NA.BBB-.9 | | CGMI | | | USD | | | | 1,500,000 | | | | 3.00% | | | | 6.51% | | | | N/A | | | | 09/17/2058 | | | | Monthly | | | | 175,119 | | | | 164,936 | | | | (10,183 | ) |
| | | | |
| | |
| 48 | | See accompanying notes to the financial statements. | | |
GMO Opportunistic Income Fund
(A Series of GMO Trust)
Schedule of Investments — (Continued)
February 28, 2022
| | | | | | | | | | | | | | | | | | | | | | | | | | | | | | | | | | | | | | | | | | |
Reference Entity | | Counter-
party | | Notional
Amount | | | Annual
Premium | | | Implied
Credit
Spread (1) | | | Maximum
Potential
Amount of
Future
Payments by
the Fund
Under the
Contract (2) | | | Expiration
Date | | | Periodic
Payment
Frequency | | | Premiums
Paid/
(Received) ($) | | | Value ($) | | | Net
Unrealized
Appreciation/
(Depreciation)
($) | |
CMBX.NA.BBB-.9 | | MORD | | | USD | | | | 5,116,800 | | | | 3.00% | | | | 6.51% | | | | N/A | | | | 09/17/2058 | | | | Monthly | | | | 584,727 | | | | 562,628 | | | | (22,099 | ) |
CMBX.NA.BBB-.9 | | DB | | | USD | | | | 4,263,000 | | | | 3.00% | | | | 6.51% | | | | N/A | | | | 09/17/2058 | | | | Monthly | | | | 517,160 | | | | 468,747 | | | | (48,413 | ) |
CMBX.NA.AA.12 | | GS | | | USD | | | | 6,974,000 | | | | 1.50% | | | | 1.34% | | | | N/A | | | | 08/17/2061 | | | | Monthly | | | | (61,732 | ) | | | (64,170 | ) | | | (2,438 | ) |
CMBX.NA.BBB-.12 | | GS | | | USD | | | | 2,949,240 | | | | 3.00% | | | | 4.74% | | | | N/A | | | | 08/17/2061 | | | | Monthly | | | | 116,575 | | | | 274,247 | | | | 157,672 | |
CMBX.NA.AA.6 | | GS | | | USD | | | | 5,000,000 | | | | 1.50% | | | | 4.69% | | | | N/A | | | | 05/11/2063 | | | | Monthly | | | | 35,145 | | | | 78,024 | | | | 42,879 | |
CMBX.NA.BBB-.6 | | CGMI | | | USD | | | | 4,274,000 | | | | 3.00% | | | | 58.55% | | | | N/A | | | | 05/11/2063 | | | | Monthly | | | | 1,357,351 | | | | 1,037,514 | | | | (319,837 | ) |
CMBX.NA.BB.13 | | GS | | | USD | | | | 1,860,000 | | | | 5.00% | | | | 7.34% | | | | N/A | | | | 12/16/2072 | | | | Monthly | | | | 182,990 | | | | 239,353 | | | | 56,363 | |
CMBX.NA.BB.13 | | GS | | | USD | | | | 3,000,000 | | | | 5.00% | | | | 7.34% | | | | N/A | | | | 12/16/2072 | | | | Monthly | | | | 295,146 | | | | 386,054 | | | | 90,908 | |
CMBX.NA.BB.14 | | GS | | | USD | | | | 3,140,000 | | | | 5.00% | | | | 6.61% | | | | N/A | | | | 12/16/2072 | | | | Quarterly | | | | 175,274 | | | | 304,657 | | | | 129,383 | |
CMBX.NA.BB.14 | | GS | | | USD | | | | 1,360,000 | | | | 5.00% | | | | 6.61% | | | | N/A | | | | 12/16/2072 | | | | Quarterly | | | | 75,915 | | | | 131,953 | | | | 56,038 | |
CMBX.NA.BBB-.13 | | GS | | | USD | | | | 1,800,000 | | | | 3.00% | | | | 4.63% | | | | N/A | | | | 12/16/2072 | | | | Monthly | | | | 66,662 | | | | 177,051 | | | | 110,389 | |
CMBX.NA.BBB-.13 | | GS | | | USD | | | | 273,500 | | | | 3.00% | | | | 4.63% | | | | N/A | | | | 12/16/2072 | | | | Monthly | | | | 16,840 | | | | 26,902 | | | | 10,062 | |
CMBX.NA.BBB-.13 | | MSCI | | | USD | | | | 4,008,000 | | | | 3.00% | | | | 4.63% | | | | N/A | | | | 12/16/2072 | | | | Monthly | | | | 224,513 | | | | 394,233 | | | | 169,720 | |
Sell Protection^: | |
CDX.NA.HYS.29.V1-5Y | | MORD | | | USD | | | | 4,264,000 | | | | 5.00% | | | | 1.64% | | | | 4,264,000 USD | | | | 12/20/2022 | | | | Quarterly | | | | 644,717 | | | | 161,483 | | | | (483,234 | ) |
CDX.NA.HYS.29.V1-5Y | | BOA | | | USD | | | | 5,115,600 | | | | 5.00% | | | | 1.64% | | | | 5,115,600 USD | | | | 12/20/2022 | | | | Quarterly | | | | 742,274 | | | | 193,735 | | | | (548,539 | ) |
CDX.NA.HYS.29.V6-5Y | | CITI | | | USD | | | | 5,994,100 | | | | 5.00% | | | | 1.64% | | | | 5,994,100 USD | | | | 12/20/2022 | | | | Quarterly | | | | 229,274 | | | | 227,005 | | | | (2,269 | ) |
CDX.NA.HYS.31.V14-5Y | | CITI | | | USD | | | | 2,866,000 | | | | 5.00% | | | | 2.06% | | | | 2,866,000 USD | | | | 12/20/2023 | | | | Quarterly | | | | 293,765 | | | | 207,416 | | | | (86,349 | ) |
CDX.NA.HYS.31.V14-5Y | | CITI | | | USD | | | | 4,657,000 | | | | 5.00% | | | | 2.06% | | | | 4,657,000 USD | | | | 12/20/2023 | | | | Quarterly | | | | 492,478 | | | | 337,033 | | | | (155,445 | ) |
CDX.NA.HYS.33.V1-5Y | | GS | | | USD | | | | 25,938,066 | | | | 5.00% | | | | 2.54% | | | | 25,938,066 USD | | | | 12/20/2024 | | | | Quarterly | | | | 5,736,852 | | | | 3,311,561 | | | | (2,425,291 | ) |
CDX.NA.HYS.33.V12-5Y | | MORD | | | USD | | | | 2,800,895 | | | | 5.00% | | | | 2.54% | | | | 2,800,895 USD | | | | 12/20/2024 | | | | Quarterly | | | | 482,034 | | | | 357,596 | | | | (124,438 | ) |
CDX.NA.HYS.33.V12-5Y | | CITI | | | USD | | | | 10,598,036 | | | | 5.00% | | | | 2.54% | | | | 10,598,036 USD | | | | 12/20/2024 | | | | Quarterly | | | | 1,827,631 | | | | 1,353,071 | | | | (474,560 | ) |
CDX.NA.HYS.33.V12-5Y | | JPM | | | USD | | | | 10,394,872 | | | | 5.00% | | | | 2.54% | | | | 10,394,872 USD | | | | 12/20/2024 | | | | Quarterly | | | | 1,704,759 | | | | 1,327,133 | | | | (377,626 | ) |
CDX.NA.HYS.33.V3-5Y | | CITI | | | USD | | | | 4,185,325 | | | | 5.00% | | | | 2.54% | | | | 4,185,325 USD | | | | 12/20/2024 | | | | Quarterly | | | | 442,877 | | | | 534,348 | | | | 91,471 | |
ITRAXX.EUROPE.S32.V1-5Y | | GS | | | EUR | | | | 58,940,000 | | | | 1.00% | | | | 0.48% | | | | 58,940,000 EUR | | | | 12/20/2024 | | | | Quarterly | | | | 2,667,689 | | | | 1,558,788 | | | | (1,108,901 | ) |
CDX.NA.HYS.35.V1-5Y | | JPM | | | USD | | | | 4,008,000 | | | | 5.00% | | | | 3.12% | | | | 4,008,000 USD | | | | 12/20/2025 | | | | Quarterly | | | | 292,584 | | | | 162,443 | | | | (130,141 | ) |
CDX.NA.HYS.35.V1-5Y | | MSCI | | | USD | | | | 4,810,000 | | | | 5.00% | | | | 3.12% | | | | 4,810,000 USD | | | | 12/20/2025 | | | | Quarterly | | | | 353,535 | | | | 194,947 | | | | (158,588 | ) |
ITRAXX.EUROPE.S34.V1-5Y | | BOA | | | EUR | | | | 36,846,000 | | | | 1.00% | | | | 0.56% | | | | 36,846,000 USD | | | | 12/20/2025 | | | | Quarterly | | | | 1,774,799 | | | | 1,221,560 | | | | (553,239 | ) |
ITRAXX.XOVER.S34.V2-5Y | | JPM | | | EUR | | | | 33,204,268 | | | | 5.00% | | | | 2.62% | | | | 33,204,268 USD | | | | 12/20/2025 | | | | Quarterly | | | | 7,819,556 | | | | 6,219,851 | | | | (1,599,705 | ) |
CMBX.NA.A.9 | | GS | | | USD | | | | 6,822,400 | | | | 2.00% | | | | 2.29% | | | | 6,822,400 USD | | | | 09/17/2058 | | | | Monthly | | | | 89,487 | | | | (67,439 | ) | | | (156,926 | ) |
CMBX.NA.A.9 | | CGMI | | | USD | | | | 2,500,000 | | | | 2.00% | | | | 2.29% | | | | 2,500,000 USD | | | | 09/17/2058 | | | | Monthly | | | | (74,374 | ) | | | (24,712 | ) | | | 49,662 | |
CMBX.NA.AAA.10 | | GS | | | USD | | | | 7,540,000 | | | | 0.50% | | | | 0.44% | | | | 7,540,000 USD | | | | 11/17/2059 | | | | Monthly | | | | 68,960 | | | | 20,361 | | | | (48,599 | ) |
CMBX.NA.AAA.10 | | GS | | | USD | | | | 1,700,000 | | | | 0.50% | | | | 0.44% | | | | 1,700,000 USD | | | | 11/17/2059 | | | | Monthly | | | | 15,500 | | | | 4,591 | | | | (10,909 | ) |
CMBX.NA.AAA.13 | | GS | | | USD | | | | 2,825,000 | | | | 0.50% | | | | 0.59% | | | | 2,825,000 USD | | | | 12/16/2072 | | | | Monthly | | | | 6,615 | | | | (17,134 | ) | | | (23,749 | ) |
CMBX.NA.AAA.13 | | MORD | | | USD | | | | 7,399,200 | | | | 0.50% | | | | 0.59% | | | | 7,399,200 USD | | | | 12/16/2072 | | | | Monthly | | | | 30,438 | | | | (44,877 | ) | | | (75,315 | ) |
CMBX.NA.AAA.13 | | MORD | | | USD | | | | 7,399,200 | | | | 0.50% | | | | 0.59% | | | | 7,399,200 USD | | | | 12/16/2072 | | | | Monthly | | | | 30,438 | | | | (44,878 | ) | | | (75,316 | ) |
| | | | | | | | | | | | | | | | | | | | | | | | | | | | | | | | | | | | | | | | | | |
| | | $ | 31,432,953 | | | $ | 23,328,126 | | | $ | (8,104,827 | ) |
| | | | | | | | | | | | | | | | | | | | | | | | | | | | | | | | | | | | | | | | | | |
| ^ | Buy Protection - Fund pays a premium and buys credit protection. If a credit event occurs the Fund will, depending on the terms of the particular swap contract, either (i) receive from the seller of protection an amount equal to the notional amount of the swap and deliver the referenced obligation or underlying securities comprising the referenced index or (ii) receive a net settlement amount in the form of cash or securities equal to the notional amount of the swap less the recovery value of the referenced obligation or underlying securities comprising the referenced index. |
| | Sell Protection - Fund receives a premium and sells credit protection. If a credit event occurs the Fund will, depending on the terms of the particular swap contract, either (i) pay to the buyer of protection an amount equal to the notional amount of the swap and take delivery of the referenced obligation or underlying securities comprising the referenced index or (ii) pay a net settlement amount in the form of cash or securities equal to the notional amount of the swap less the recovery value of the referenced obligation or underlying securities comprising the referenced index. |
| (1) | As of February 28, 2022, implied credit spreads in absolute terms, calculated using a model, and utilized in determining the market value of credit default swap contracts on the reference security, serve as an indicator of the current status of the payment/performance risk and reflect the likelihood or risk of default for the reference entity. The implied credit spread of a particular referenced entity reflects the cost of buying/selling protection. Wider (i.e. higher) credit spreads represent a deterioration of the referenced entity’s credit soundness and a greater likelihood or risk of default or other credit event occurring as defined under the terms of the contract. |
| (2) | The maximum potential amount the Fund could be required to pay as a seller of credit protection if a credit event occurs as defined under the terms of that particular swap contract. |
| | | | |
| | |
| | | See accompanying notes to the financial statements. | | 49 |
GMO Opportunistic Income Fund
(A Series of GMO Trust)
Schedule of Investments — (Continued)
February 28, 2022
Centrally Cleared Interest Rate Swaps
| | | | | | | | | | | | | | | | | | | | | | | | | | | | |
Fund Pays | | Fund Receives | | | Notional
Amount | | | Expiration
Date | | | Periodic
Payment
Frequency | | Premiums
Paid/
(Received) ($) | | | Value ($) | | | Net Unrealized
Appreciation/
(Depreciation) ($) | |
0.92% | | | USD - SOFR - COMPOUND | | | USD | | | 7,450,000 | | | | 12/10/2024 | | | Annually | | | — | | | | 115,145 | | | | 115,145 | |
0.92% | | | USD - SOFR - COMPOUND | | | USD | | | 2,250,000 | | | | 12/10/2024 | | | Annually | | | — | | | | 34,775 | | | | 34,775 | |
1.73% | | | USD - SOFR - COMPOUND | | | USD | | | 2,100,000 | | | | 02/16/2025 | | | Annually | | | — | | | | (14,336 | ) | | | (14,336 | ) |
| | | | | | | | | | | | | | | | | | | | | | | | | | | | |
| | $ | — | | | $ | 135,584 | | | $ | 135,584 | |
| | | | | | | | | | | | | | | | | | | | | | | | | | | | |
As of February 28, 2022, for the above contracts and/or agreements, the Fund had sufficient cash and/or securities to cover commitments or collateral requirements, if any, of the relevant broker or exchange.
Notes to Schedule of Investments:
| † | Denominated in U.S. Dollar, unless otherwise indicated. |
| (a) | Investment valued at fair value using methods determined in good faith by the Trustees of GMO Trust or persons acting at their direction pursuant to procedures approved by the Trustees. Investment valued using significant unobservable inputs (Note 2). |
| (b) | Investment valued using significant unobservable inputs (Note 2). |
| (c) | All or a portion of this security has been pledged to cover margin requirements on futures and/or cleared swap contracts, collateral on OTC swap contracts, forward currency contracts, and/or written options, if any (Note 4). |
| (d) | The rate disclosed is the 7 day net yield as of February 28, 2022. |
| (e) | The rate shown represents yield-to-maturity. |
For a listing of definitions of acronyms, counterparty abbreviations and currency abbreviations used throughout the Schedule of Investments as well as the derivative tables, if any, please refer to page 56.
| | | | |
| | |
| 50 | | See accompanying notes to the financial statements. | | |
This page has been left blank intentionally.
GMO U.S. Treasury Fund
(A Series of GMO Trust)
Portfolio Management
Day-to-day management of the Fund’s portfolio is the responsibility of the Short Duration Strategies team at Grantham, Mayo, Van Otterloo & Co. LLC.
Management Discussion and Analysis of Fund Performance
Although the Fund is not managed relative to any securities market index or benchmark, a discussion of the Fund’s performance relative to the FTSE 3-Month Treasury Bill Index is included for comparative purposes.
GMO U.S. Treasury Fund returned -0.37% (net) for the fiscal year ended February 28, 2022, as compared with +0.05% for the FTSE 3-Month Treasury Bill Index.
Security selection in U.S. Treasury Notes drove negative performance during the year, followed by losses from U.S. Treasury Bills. Positive contribution from security selection in Floating Rate Treasury Notes partly offset losses.
The views expressed herein are exclusively those of Grantham, Mayo, Van Otterloo & Co. LLC as of the date of this report and are subject to change. GMO disclaims any responsibility to update such views. They are not meant as investment advice. References to specific securities are not recommendations of such securities and may not be representative of any GMO portfolio’s current or future investments. All information is unaudited.
GMO U.S. Treasury Fund
(A Series of GMO Trust)
Comparison of Change in Value of a $5,000,000 Investment in
GMO U.S. Treasury Fund and the FTSE 3-Month Treasury Bill Index
As of February 28, 2022
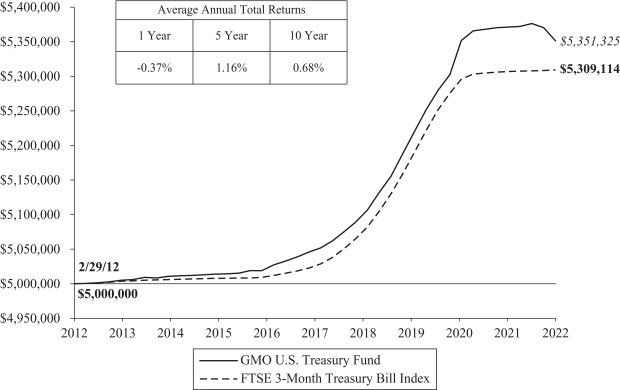
Performance data quoted represents past performance and is not indicative of future results. The investment return and principal value of an investment will fluctuate so that an investor’s shares, when redeemed, may be worth more or less than their original cost. Current performance data may be lower or higher than the performance data provided herein. To obtain performance information up to the most recent month-end, visit www.gmo.com. Performance shown is net of all fees after reimbursement from GMO. Returns would have been lower had certain expenses not been reimbursed during the periods shown and do not include the effect of taxes on distributions and redemptions. The performance information shown above only includes purchase premiums and/or redemption fees in effect as of February 28, 2022. All information is unaudited.
The gross expense ratio of 0.11% is equal to the Fund’s Total Annual Operating Expenses set forth in the Fund’s most recent prospectus dated June 30, 2021. The corresponding net expense ratio of 0.08% reflects the reduction of expenses from fee reimbursements. The fee reimbursements will continue until at least June 30, 2022. Elimination of this reimbursement will result in higher fees and lower performance.
GMO U.S. Treasury Fund
(A Series of GMO Trust)
Investment Concentration Summary
February 28, 2022 (Unaudited)
| | | | |
| Asset Class Summary | | % of Total Net Assets | |
Short-Term Investments | | | 101.2 | % |
Other | | | (1.2 | ) |
| | | | |
| | | 100.0 | % |
| | | | |
GMO U.S. Treasury Fund
(A Series of GMO Trust)
Schedule of Investments
(showing percentage of total net assets)
February 28, 2022
| | | | | | | | | | |
| | | Par Value† / Shares | | | Description | | Value ($) | |
| | |
| | | | | | SHORT-TERM INVESTMENTS — 101.2% | |
| | | |
| | | | | | U.S. Government — 97.2% | | | |
| | | |
| | | 1,200,000 | | | U.S. Treasury Bill, 0.54%, due 07/21/22 (a) | | | 1,197,449 | |
| | | |
| | | 1,000,000 | | | U.S. Treasury Bill, 0.58%, due 07/28/22 (a) | | | 997,641 | |
| | | |
| | | 550,000 | | | U.S. Treasury Bill, 0.63%, due 08/11/22 (a) | | | 548,443 | |
| | | |
| | | 49,850,000 | | | U.S. Treasury Bill, 0.64%, due 08/18/22 (a) | | | 49,700,127 | |
| | | |
| | | 29,500,000 | | | U.S. Treasury Note, 0.13%, due 11/30/22 | | | 29,323,692 | |
| | | |
| | | 47,100,000 | | | U.S. Treasury Note, 0.13%, due 12/31/22 | | | 46,757,789 | |
| | | |
| | | 16,900,000 | | | U.S. Treasury Note, 0.13%, due 01/31/23 | | | 16,754,766 | |
| | | |
| | | 7,000,000 | | | U.S. Treasury Note, Variable Rate, USBM + 0.05%, 0.41%, due 01/31/23 | | | 7,002,825 | |
| | | |
| | | 16,000,000 | | | U.S. Treasury Note, Variable Rate, USBM + 0.03%, 0.39%, due 07/31/23 | | | 16,025,064 | |
| | | |
| | | 82,220,000 | | | U.S. Treasury Note, Variable Rate, USBM + 0.04%, 0.40%, due 10/31/23 | | | 82,368,433 | |
| | | | | | | | | | |
| | | |
| | | | | | Total U.S. Government | | | 250,676,229 | |
| | | | | | | | | | |
| | | |
| | | | | | U.S. Government Agency — 3.9% | | | |
| | | |
| | | 5,000,000 | | | Federal Home Loan Banks, Variable Rate, SOFR + 0.02%, 0.07%, due 03/15/23 | | | 4,998,945 | |
| | | |
| | | 5,000,000 | | | Federal Home Loan Banks, Variable Rate, SOFR + 0.03%, 0.08%, due 06/07/23 | | | 4,999,357 | |
| | | | | | | | | | |
| | | |
| | | | | | Total U.S. Government Agency | | | 9,998,302 | |
| | | | | | | | | | |
| | | |
| | | | | | Money Market Funds — 0.1% | | | |
| | | |
| | | 176,233 | | | State Street Institutional Treasury Plus Money Market Fund – Premier Class, 0.02% (b) | | | 176,233 | |
| | | | | | | | | | |
| | | |
| | | | | | TOTAL SHORT-TERM INVESTMENTS (COST $261,243,750) | | | 260,850,764 | |
| | | | | | | | | | |
| | | |
| | | | | | TOTAL INVESTMENTS — 101.2%
(Cost $261,243,750) | | | 260,850,764 | |
| | | |
| | | | | | Other Assets and Liabilities (net) — (1.2%) | | | (3,084,446 | ) |
| | | | | | | | | | |
| | | |
| | | | | | TOTAL NET ASSETS — 100.0% | | | $257,766,318 | |
| | | | | | | | | | |
Notes to Schedule of Investments:
| (a) | The rate shown represents yield-to-maturity. |
| (b) | The rate disclosed is the 7 day net yield as of February 28, 2022. |
For a listing of definitions of acronyms, counterparty abbreviations and currency abbreviations used throughout the Schedule of Investments as well as the derivative tables, if any, please refer to page 56.
| | | | |
| | |
| | | See accompanying notes to the financial statements. | | 55 |
GMO Trust Funds
February 28, 2022
Portfolio Abbreviations:
144A - Securities exempt from registration under Rule 144A of the Securities Act of 1933. These securities may be resold in transactions exempt from registration, normally to qualified institutional investors.
AMBAC - Insured as to the payment of principal and interest by AMBAC Assurance Corporation.
AUD BBSW - Bank Bill Swap Reference Rate denominated in Australian Dollar.
BZDIOVRA - Brazil Interbank Deposit Rate
CDOR - Canadian Dollar Offered Rate
CJSC - Closed Joint-Stock Company
CLO - Collateralized Loan Obligation
CMBS - Commercial Mortgage Backed Security
CMT - Constant Maturity Treasury
COFI - Cost of Funds Index
CP - Counterparty
ETF - Exchange-Traded Fund
EURIBOR - Euro Interbank Offered Rate
FGIC - Insured as to the payment of principal and interest by Financial Guaranty Insurance Corporation.
FSA - Insured as to the payment of principal and interest by Financial Security Assurance.
GDP - Gross Domestic Product
JSC - Joint-Stock Company
LIBOR - London Interbank Offered Rate
MTA - Monthly Treasury Average Index
NZD Bank Bill Rate - Bank Bill Rate denominated in New Zealand Dollar.
OJSC - Open Joint-Stock Company
OTC - Over-the-Counter
Reg S - Security exempt from registration under Regulation S of the Securities Act of 1933, which exempts from registration securities offered and sold outside the United States. Security may not be offered or sold in the United States except pursuant to an exemption from, or in a transaction not subject to, the registration requirements of the Securities Act of 1933.
REIT - Real Estate Investment Trust
SARON - Swiss Average Rate Overnight
SEK STIBOR - Stockholm Interbank Offered Rate denominated in Swedish Krona.
SOFR - Secured Overnight Financing Rate
SONIA - Sterling Overnight Interbank Average Rate
TBA - To Be Announced - Delayed Delivery Security
USBM - U.S. Treasury 3 Month Bill Money Market Yield.
USD LIBOR - London Interbank Offered Rate denominated in United States Dollar.
XLCA - Insured as to the payment of principal and interest by XL Capital Assurance.
The rates shown on variable rate notes are the current interest rates at February 28, 2022, which are subject to change based on the terms of the security.
Counterparty Abbreviations:
BCLY - Barclays Bank PLC
BOA - Bank of America, N.A.
CGMI - Citigroup Global Markets Inc.
CITI - Citibank N.A.
CSI - Credit Suisse International
DB - Deutsche Bank AG
GS - Goldman Sachs International
JPM - JPMorgan Chase Bank, N.A.
MORD - Morgan Stanley Capital Services LLC
MSCI - Morgan Stanley & Co. International PLC
SSB - State Street Bank and Trust Company
Currency Abbreviations:
AUD - Australian Dollar
BRL - Brazilian Real
CAD - Canadian Dollar
CHF - Swiss Franc
CLP - Chilean Peso
COP - Colombian Peso
CZK - Czech Koruna
EUR - Euro
GBP - British Pound
HUF - Hungarian Forint
IDR - Indonesian Rupiah
ILS - Israeli Shekel
INR - Indian Rupee
JPY - Japanese Yen
KRW - South Korean Won
MXN - Mexican Peso
NOK - Norwegian Krone
NZD - New Zealand Dollar
PEN - Peruvian Sol
PLN - Polish Zloty
RON - Romanian Leu
RUB - Russian Ruble
SEK - Swedish Krona
SGD - Singapore Dollar
THB - Thai Baht
TRY - Turkish Lira
TWD - Taiwan Dollar
USD - United States Dollar
ZAR - South African Rand
| | | | |
| | |
| 56 | | See accompanying notes to the financial statements. | | |
GMO Trust Funds
Statements of Assets and Liabilities — February 28, 2022
| | | | | | | | | | | | |
| | | Asset Allocation
Bond Fund | | | Emerging
Country Debt
Fund | | | High Yield
Fund | |
Assets: | | | | | | | | | | | | |
| | | |
Investments in affiliated issuers, at value (Notes 2 and 10)(a) | | $ | 11,626 | | | $ | 74,339,103 | | | $ | — | |
| | | |
Investments in unaffiliated issuers, at value (Note 2)(b) | | | 38,068,984 | | | | 3,565,162,243 | | | | 83,283,815 | |
| | | |
Foreign currency, at value (Note 2)(c) | | | — | | | | 1,218,980 | | | | — | |
| | | |
Cash | | | — | | | | 1,878,692 | | | | 87,964 | |
| | | |
Receivable for investments sold | | | — | | | | 12,760,938 | | | | 199,301 | |
| | | |
Receivable for Fund shares sold | | | — | | | | 403,281 | | | | — | |
| | | |
Dividends and interest receivable | | | 46,109 | | | | 64,235,222 | | | | 277,883 | |
| | | |
Unrealized appreciation on open forward currency contracts (Note 4) | | | — | | | | 9,315,733 | | | | 218,399 | |
| | | |
Receivable for variation margin on open cleared swap contracts (Note 4) | | | — | | | | 3,741,884 | | | | — | |
| | | |
Due from broker (Note 2) | | | — | | | | 39,190,316 | | | | 1,840,273 | |
| | | |
Receivable for variation margin on open futures contracts (Note 4) | | | — | | | | — | | | | 159,764 | |
| | | |
Receivable for open OTC swap contracts (Note 4) | | | — | | | | 18,879,149 | | | | — | |
| | | |
Interest receivable for open OTC swap contracts (Note 4) | | | — | | | | 120,364 | | | | — | |
| | | |
Receivable for expenses reimbursed and/or waived by GMO (Note 5) | | | — | | | | — | | | | 2,986 | |
| | | |
Receivable for options (Note 4)(d) | | | — | | | | 326,111 | | | | — | |
| | | |
Miscellaneous receivable | | | — | | | | 167,167 | | | | — | |
| | | | | | | | | | | | |
| | | |
Total assets | | | 38,126,719 | | | | 3,791,739,183 | | | | 86,070,385 | |
| | | | | | | | | | | | |
|
Liabilities: | |
| | | |
Payable for investments purchased | | | 3 | | | | 12,956,530 | | | | 398,345 | |
| | | |
Payable for Fund shares repurchased | | | — | | | | 22,054,105 | | | | — | |
| | | |
Payable for expenses reimbursed by GMO (Note 5) | | | 39,389 | | | | — | | | | — | |
|
Payable to affiliate for (Note 5): | |
| | | |
Management fee | | | 7,243 | | | | 1,068,298 | | | | 22,639 | |
| | | |
Shareholder service fee | | | 1,594 | | | | 296,879 | | | | 3,558 | |
| | | |
Payable for variation margin on open cleared swap contracts (Note 4) | | | — | | | | — | | | | 57,886 | |
| | | |
Unrealized depreciation on open forward currency contracts (Note 4) | | | — | | | | 5,074,237 | | | | — | |
| | | |
Interest payable for open OTC swap contracts (Note 4) | | | — | | | | 751,255 | | | | — | |
| | | |
Payable for open OTC swap contracts (Note 4) | | | — | | | | 13,381,981 | | | | 814,909 | |
| | | |
Payable for reverse repurchase agreements (Note 2) | | | — | | | | 6,346,002 | | | | — | |
| | | |
Payable to Trustees and related expenses | | | 473 | | | | 14,825 | | | | 328 | |
| | | |
Written options outstanding, at value (Note 4)(d) | | | — | | | | — | | | | 116,704 | |
| | | |
Accrued expenses | | | 59,241 | | | | 578,462 | | | | 69,795 | |
| | | | | | | | | | | | |
| | | |
Total liabilities | | | 107,943 | | | | 62,522,574 | | | | 1,484,164 | |
| | | | | | | | | | | | |
Net assets | | $ | 38,018,776 | | | $ | 3,729,216,609 | | | $ | 84,586,221 | |
| | | | | | | | | | | | |
| | | |
(a) Cost of investments – affiliated issuers: | | $ | 11,673 | | | $ | 74,296,430 | | | $ | — | |
| | | |
(b) Cost of investments – unaffiliated issuers: | | $ | 38,701,149 | | | $ | 4,510,213,983 | | | $ | 83,890,518 | |
| | | |
(c) Cost of foreign currency: | | $ | — | | | $ | 1,210,781 | | | $ | — | |
| | | |
(d) Premiums on options: | | $ | — | | | $ | 5,533,298 | | | $ | 199,301 | |
| | | | |
| | |
| | | See accompanying notes to the financial statements. | | 57 |
GMO Trust Funds
Statements of Assets and Liabilities — February 28, 2022 — (Continued)
| | | | | | | | | | | | |
| | | Asset Allocation
Bond Fund | | | Emerging
Country Debt
Fund | | | High Yield
Fund | |
Net assets consist of: | |
| | | |
Paid-in capital | | $ | 84,940,399 | | | $ | 4,991,893,204 | | | $ | 86,234,815 | |
| | | |
Distributable earnings (accumulated loss) | | | (46,921,623 | ) | | | (1,262,676,595 | ) | | | (1,648,594 | ) |
| | | | | | | | | | | | |
| | $ | 38,018,776 | | | $ | 3,729,216,609 | | | $ | 84,586,221 | |
| | | | | | | | | | | | |
Net assets attributable to: | |
| | | |
Class III | | $ | 21,990 | | | $ | 942,564,796 | | | $ | — | |
| | | | | | | | | | | | |
| | | |
Class IV | | $ | — | | | $ | 1,531,528,446 | | | $ | — | |
| | | | | | | | | | | | |
| | | |
Class VI | | $ | 37,996,786 | | | $ | 1,255,123,367 | | | $ | 84,586,221 | |
| | | | | | | | | | | | |
Shares outstanding: | |
| | | |
Class III | | | 937 | | | | 44,172,663 | | | | — | |
| | | | | | | | | | | | |
| | | |
Class IV | | | — | | | | 71,897,096 | | | | — | |
| | | | | | | | | | | | |
| | | |
Class VI | | | 1,615,851 | | | | 58,939,373 | | | | 4,544,739 | |
| | | | | | | | | | | | |
Net asset value per share: | |
| | | |
Class III | | $ | 23.48 | | | $ | 21.34 | | | $ | — | |
| | | | | | | | | | | | |
| | | |
Class IV | | $ | — | | | $ | 21.30 | | | $ | — | |
| | | | | | | | | | | | |
| | | |
Class VI | | $ | 23.52 | | | $ | 21.30 | | | $ | 18.61 | |
| | | | | | | | | | | | |
| | | | |
| | |
| 58 | | See accompanying notes to the financial statements. | | |
GMO Trust Funds
Statements of Assets and Liabilities — February 28, 2022 — (Continued)
| | | | | | | | | | | | |
| | | Multi-Sector
Fixed Income
Fund | | | Opportunistic
Income Fund | | | U.S. Treasury
Fund | |
Assets: | |
| | | |
Investments in affiliated issuers, at value (Notes 2 and 10)(a) | | $ | 34,615,466 | | | $ | 10,938,043 | | | $ | — | |
| | | |
Investments in unaffiliated issuers, at value (Note 2)(b) | | | 107,256,649 | | | | 951,199,821 | | | | 260,850,764 | |
| | | |
Cash | | | 148,607 | | | | 444,470 | | | | — | |
| | | |
Receivable for investments sold | | | — | | | | 25,396,350 | | | | — | |
| | | |
Receivable for Fund shares sold | | | — | | | | 325,520 | | | | 672,064 | |
| | | |
Receivable for closed swap contracts (Note 4) | | | 287 | | | | 62,022 | | | | — | |
| | | |
Dividends and interest receivable | | | 375,318 | | | | 2,037,823 | | | | 53,592 | |
| | | |
Unrealized appreciation on open forward currency contracts (Note 4) | | | 529,761 | | | | 98,731 | | | | — | |
| | | |
Receivable for variation margin on open cleared swap contracts (Note 4) | | | — | | | | 96,781 | | | | — | |
| | | |
Due from broker (Note 2) | | | 1,315,224 | | | | 3,135,566 | | | | — | |
| | | |
Receivable for variation margin on open futures contracts (Note 4) | | | 464,359 | | | | — | | | | — | |
| | | |
Receivable for open OTC swap contracts (Note 4) | | | — | | | | 24,709,187 | | | | — | |
| | | |
Interest receivable for open OTC swap contracts (Note 4) | | | — | | | | 1,440,340 | | | | — | |
| | | |
Receivable for expenses reimbursed and/or waived by GMO (Note 5) | | | 20,384 | | | | 56,466 | | | | 6,383 | |
| | | | | | | | | | | | |
| | | |
Total assets | | | 144,726,055 | | | | 1,019,941,120 | | | | 261,582,803 | |
| | | | | | | | | | | | |
|
Liabilities: | |
| | | |
Due to broker (Note 2) | | | 297 | | | | — | | | | — | |
| | | |
Payable for investments purchased | | | 17,963,391 | | | | 25,558,217 | | | | — | |
| | | |
Payable for Fund shares repurchased | | | 400,000 | | | | 5,172,376 | | | | 3,701,326 | |
| | | |
Payable for expenses reimbursed and/or waived by GMO (Note 5) | | | — | | | | — | | | | — | |
|
Payable to affiliate for (Note 5): | |
| | | |
Management fee | | | 24,172 | | | | 303,043 | | | | 660 | |
| | | |
Shareholder service fee | | | 10,010 | | | | 85,903 | | | | — | |
| | | |
Payable for variation margin on open futures contracts (Note 4) | | | — | | | | 287,418 | | | | — | |
| | | |
Payable for variation margin on open cleared swap contracts (Note 4) | | | 139,875 | | | | — | | | | — | |
| | | |
Payable for closed swap contracts (Note 4) | | | 339 | | | | 538,200 | | | | — | |
| | | |
Dividend payable | | | — | | | | — | | | | 52,003 | |
| | | |
Unrealized depreciation on open forward currency contracts (Note 4) | | | 1,063,151 | | | | 25,235 | | | | — | |
| | | |
Interest payable for open OTC swap contracts (Note 4) | | | — | | | | 354,024 | | | | — | |
| | | |
Payable for open OTC swap contracts (Note 4) | | | — | | | | 1,381,061 | | | | — | |
| | | |
Payable to Trustees and related expenses | | | 1,521 | | | | 3,642 | | | | 1,230 | |
| | | |
Written options outstanding, at value (Note 4)(c) | | | — | | | | 2,132,177 | | | | — | |
| | | |
Accrued expenses | | | 143,140 | | | | 222,664 | | | | 61,266 | |
| | | | | | | | | | | | |
| | | |
Total liabilities | | | 19,745,896 | | | | 36,063,960 | | | | 3,816,485 | |
| | | | | | | | | | | | |
Net assets | | $ | 124,980,159 | | | $ | 983,877,160 | | | $ | 257,766,318 | |
| | | | | | | | | | | | |
| | | |
(a) Cost of investments – affiliated issuers: | | $ | 37,221,238 | | | $ | 11,003,541 | | | $ | — | |
| | | |
(b) Cost of investments – unaffiliated issuers: | | $ | 109,569,443 | | | $ | 1,004,435,916 | | | $ | 261,243,750 | |
| | | |
(c) Premiums on written options: | | $ | — | | | $ | 2,098,960 | | | $ | — | |
| | | | |
| | |
| | | See accompanying notes to the financial statements. | | 59 |
GMO Trust Funds
Statements of Assets and Liabilities — February 28, 2022 — (Continued)
| | | | | | | | | | | | |
| | | Multi-Sector
Fixed Income
Fund | | | Opportunistic
Income Fund | | | U.S. Treasury
Fund | |
Net assets consist of: | |
| | | |
Paid-in capital | | $ | 159,119,210 | | | $ | 1,088,702,688 | | | $ | 258,891,929 | |
| | | |
Distributable earnings (accumulated loss) | | | (34,139,051 | ) | | | (104,825,528 | ) | | | (1,125,611 | ) |
| | | | | | | | | | | | |
| | $ | 124,980,159 | | | $ | 983,877,160 | | | $ | 257,766,318 | |
| | | | | | | | | | | | |
Net assets attributable to: | |
| | | |
Core Class | | $ | — | | | $ | — | | | $ | 257,766,318 | |
| | | | | | | | | | | | |
| | | |
Class III | | $ | 8,802,582 | | | $ | 12,281,483 | | | $ | — | |
| | | | | | | | | | | | |
| | | |
Class IV | | $ | 116,177,577 | | | $ | — | | | $ | — | |
| | | | | | | | | | | | |
| | | |
Class VI | | $ | — | | | $ | 375,116,849 | | | $ | — | |
| | | | | | | | | | | | |
| | | |
Class R6 | | $ | — | | | $ | 152,877,264 | | | $ | — | |
| | | | | | | | | | | | |
| | | |
Class I | | $ | — | | | $ | 443,601,564 | | | $ | — | |
| | | | | | | | | | | | |
Shares outstanding: | |
| | | |
Core Class | | | — | | | | — | | | | 51,414,447 | |
| | | | | | | | | | | | |
| | | |
Class III | | | 467,193 | | | | 480,510 | | | | — | |
| | | | | | | | | | | | |
| | | |
Class IV | | | 6,138,144 | | | | — | | | | — | |
| | | | | | | | | | | | |
| | | |
Class VI | | | — | | | | 14,675,819 | | | | — | |
| | | | | | | | | | | | |
| | | |
Class R6 | | | — | | | | 6,000,948 | | | | — | |
| | | | | | | | | | | | |
| | | |
Class I | | | — | | | | 17,387,831 | | | | — | |
| | | | | | | | | | | | |
Net asset value per share: | |
| | | |
Core Class | | $ | — | | | $ | — | | | $ | 5.01 | |
| | | | | | | | | | | | |
| | | |
Class III | | $ | 18.84 | | | $ | 25.56 | | | $ | — | |
| | | | | | | | | | | | |
| | | |
Class IV | | $ | 18.93 | | | $ | — | | | $ | — | |
| | | | | | | | | | | | |
| | | |
Class VI | | $ | — | | | $ | 25.56 | | | $ | — | |
| | | | | | | | | | | | |
| | | |
Class R6 | | $ | — | | | $ | 25.48 | | | $ | — | |
| | | | | | | | | | | | |
| | | |
Class I | | $ | — | | | $ | 25.51 | | | $ | — | |
| | | | | | | | | | | | |
| | | | |
| | |
| 60 | | See accompanying notes to the financial statements. | | |
GMO Trust Funds
Statements of Operations — Year Ended February 28, 2022
| | | | | | | | | | | | |
| | | Asset Allocation
Bond Fund | | | Emerging
Country Debt
Fund | | | High Yield
Fund | |
Investment Income: | | | | | | | | | | | | |
| | | |
Interest | | $ | 1,342,127 | | | $ | 259,318,864 | | | $ | 1,458,618 | |
| | | |
Dividends from affiliated issuers (Note 10) | | | 632 | | | | 100,129 | | | | — | |
| | | |
Dividends from unaffiliated issuers | | | 16 | | | | 874 | | | | 10,412 | |
| | | | | | | | | | | | |
| | | |
Total investment income | | | 1,342,775 | | | | 259,419,867 | | | | 1,469,030 | |
| | | | | | | | | | | | |
Expenses: | |
| | | |
Management fee (Note 5) | | | 168,765 | | | | 15,073,047 | | | | 328,143 | |
| | | |
Shareholder service fee – Class III (Note 5) | | | 46,141 | | | | 1,512,834 | | | | — | |
| | | |
Shareholder service fee – Class IV (Note 5) | | | — | | | | 2,553,136 | | | | — | |
| | | |
Shareholder service fee – Class VI (Note 5) | | | 20,210 | | | | 409,691 | * | | | 51,565 | |
| | | |
Audit and tax fees | | | 79,347 | | | | 144,985 | | | | 72,104 | |
| | | |
Custodian, fund accounting agent and transfer agent fees | | | 26,406 | | | | 689,084 | | | | 35,223 | |
| | | |
Legal fees | | | 3,210 | | | | 168,864 | | | | 3,898 | |
| | | |
Registration fees | | | — | | | | 72,421 | | | | 3,577 | |
| | | |
Trustees’ fees and related expenses (Note 5) | | | 1,775 | | | | 145,138 | | | | 2,866 | |
| | | |
Interest expense (Note 2) | | | — | | | | — | | | | 2,664 | |
| | | |
Miscellaneous | | | 6,728 | | | | 99,906 | | | | 10,579 | |
| | | | | | | | | | | | |
| | | |
Total expenses | | | 352,582 | | | | 20,869,106 | | | | 510,619 | |
| | | |
Fees and expenses reimbursed and/or waived by GMO (Note 5) | | | (113,348 | ) | | | — | | | | (28,545 | ) |
| | | |
Indirectly incurred management fees waived or borne by GMO (Note 5) | | | (241 | ) | | | (6,392 | ) | | | — | |
| | | | | | | | | | | | |
| | | |
Net expenses | | | 238,993 | | | | 20,862,714 | | | | 482,074 | |
| | | | | | | | | | | | |
| | | |
Net investment income (loss) | | | 1,103,782 | | | | 238,557,153 | | | | 986,956 | |
| | | | | | | | | | | | |
Realized and unrealized gain (loss): | | | | | | | | | | | | |
| | | |
Net realized gain (loss) on: | | | | | | | | | | | | |
| | | |
Investments in unaffiliated issuers | | | 9,713,821 | | | | 36,092,409 | | | | 169,123 | |
| | | |
Investments in affiliated issuers | | | (618 | ) | | | — | | | | — | |
| | | |
Realized gain distributions from affiliated issuers (Note 10) | | | 824 | | | | 71,223 | | | | — | |
| | | |
Futures contracts | | | — | | | | — | | | | (486,116 | ) |
| | | |
Options | | | — | | | | 317,281 | | | | 314,381 | |
| | | |
Swap contracts | | | — | | | | (11,076,905 | ) | | | 3,636,126 | |
| | | |
Forward currency contracts | | | — | | | | 16,529,875 | | | | 793,954 | |
| | | |
Foreign currency and foreign currency related transactions | | | — | | | | 458,040 | | | | 27,318 | |
| | | | | | | | | | | | |
| | | |
Net realized gain (loss) | | | 9,714,027 | | | | 42,391,923 | | | | 4,454,786 | |
| | | | | | | | | | | | |
| | | |
Change in net unrealized appreciation (depreciation) on: | | | | | | | | | | | | |
| | | |
Investments in unaffiliated issuers (Note 2) | | | (10,233,544 | ) | | | (611,216,955 | ) | | | (1,808,500 | ) |
| | | |
Investments in affiliated issuers | | | (47 | ) | | | (445,144 | ) | | | — | |
| | | |
Futures contracts | | | — | | | | — | | | | 229,217 | |
| | | |
Options | | | — | | | | (381,689 | ) | | | 82,597 | |
| | | |
Swap contracts | | | — | | | | 9,401,567 | | | | (2,339,001 | ) |
| | | |
Forward currency contracts | | | — | | | | 4,586,507 | | | | (45,999 | ) |
| | | |
Foreign currency and foreign currency related transactions | | | — | | | | (595,014 | ) | | | — | |
| | | | | | | | | | | | |
| | | |
Net change in unrealized appreciation (depreciation) | | | (10,233,591 | ) | | | (598,650,728 | ) | | | (3,881,686 | ) |
| | | | | | | | | | | | |
| | | |
Net realized and unrealized gain (loss) | | | (519,564 | ) | | | (556,258,805 | ) | | | 573,100 | |
| | | | | | | | | | | | |
Net increase (decrease) in net assets resulting from operations | | $ | 584,218 | | | $ | (317,701,652 | ) | | $ | 1,560,056 | |
| | | | | | | | | | | | |
| * | Period from July 29, 2021 (commencement of operations) through February 28, 2022. |
| | | | |
| | |
| | | See accompanying notes to the financial statements. | | 61 |
GMO Trust Funds
Statements of Operations — Year Ended February 28, 2022 — (Continued)
| | | | | | | | | | | | |
| | | Multi-Sector
Fixed Income
Fund | | | Opportunistic
Income Fund | | | U.S. Treasury
Fund | |
Investment Income: | | | | | | | | | | | | |
| | | |
Interest | | $ | 1,257,136 | | | $ | 35,720,441 | | | $ | 445,448 | |
| | | |
Dividends from affiliated issuers (Note 10) | | | 1,070,783 | | | | 14,732 | | | | — | |
| | | |
Dividends from unaffiliated issuers | | | 527,379 | | | | 616 | | | | 3,299 | |
| | | | | | | | | | | | |
| | | |
Total investment income | | | 2,855,298 | | | | 35,735,789 | | | | 448,747 | |
| | | | | | | | | | | | |
Expenses: | |
| | | |
Management fee (Note 5) | | | 434,722 | | | | 3,922,934 | | | | 252,608 | |
| | | |
Shareholder service fee – Class III (Note 5) | | | 30,798 | | | | 10,209 | * | | | — | |
| | | |
Shareholder service fee – Class IV (Note 5) | | | 153,357 | | | | — | | | | — | |
| | | |
Shareholder service fee – Class VI (Note 5) | | | — | | | | 243,683 | | | | — | |
| | | |
Shareholder service fee – Class R6 (Note 5) | | | — | | | | 107,693 | ** | | | — | |
| | | |
Shareholder service fee – Class I (Note 5) | | | — | | | | 688,608 | | | | — | |
| | | |
Audit and tax fees | | | 79,797 | | | | 115,445 | | | | 32,890 | |
| | | |
Custodian, fund accounting agent and transfer agent fees | | | 158,214 | | | | 640,225 | | | | 54,932 | |
| | | |
Legal fees | | | 5,872 | | | | 166,915 | | | | 9,301 | |
| | | |
Registration fees | | | 7,746 | | | | 54,315 | | | | 3,900 | |
| | | |
Trustees’ fees and related expenses (Note 5) | | | 5,568 | | | | 34,000 | | | | 9,900 | |
| | | |
Interest expense (Note 2) | | | 1,208 | | | | 21,329 | | | | — | |
| | | |
Miscellaneous | | | 7,612 | | | | 56,184 | | | | 7,250 | |
| | | | | | | | | | | | |
| | | |
Total expenses | | | 884,894 | | | | 6,061,540 | | | | 370,781 | |
| | | |
Fees and expenses reimbursed and/or waived by GMO (Note 5) | | | (255,404 | ) | | | (446,405 | ) | | | (322,593 | ) |
| | | |
Indirectly incurred management fees waived or borne by GMO (Note 5) | | | (155,424 | ) | | | (941 | ) | | | — | |
| | | |
Indirectly incurred shareholder service fees waived or borne by GMO (Note 5) | | | (23,870 | ) | | | — | | | | — | |
| | | | | | | | | | | | |
| | | |
Net expenses | | | 450,196 | | | | 5,614,194 | | | | 48,188 | |
| | | | | | | | | | | | |
| | | |
Net investment income (loss) | | | 2,405,102 | | | | 30,121,595 | | | | 400,559 | |
| | | | | | | | | | | | |
Realized and unrealized gain (loss): | | | | | | | | | | | | |
| | | |
Net realized gain (loss) on: | | | | | | | | | | | | |
| | | |
Investments in unaffiliated issuers | | | 8,596,159 | | | | 4,570,086 | | | | (591,117 | ) |
| | | |
Investments in affiliated issuers | | | (720,315 | ) | | | — | | | | — | |
| | | |
Realized gain distributions from affiliated issuers (Note 10) | | | 232,943 | | | | 10,480 | | | | — | |
| | | |
Futures contracts | | | (1,649,668 | ) | | | 3,741,319 | | | | — | |
| | | |
Written options | | | — | | | | 1,278,191 | | | | — | |
| | | |
Swap contracts | | | (10,314,273 | ) | | | (2,845,581 | ) | | | — | |
| | | |
Forward currency contracts | | | 2,266,522 | | | | 303,454 | | | | — | |
| | | |
Foreign currency and foreign currency related transactions | | | 60,209 | | | | 5,613 | | | | — | |
| | | | | | | | | | | | |
| | | |
Net realized gain (loss) | | | (1,528,423 | ) | | | 7,063,562 | | | | (591,117 | ) |
| | | | | | | | | | | | |
| | | |
Change in net unrealized appreciation (depreciation) on: | | | | | | | | | | | | |
| | | |
Investments in unaffiliated issuers | | | (2,886,851 | ) | | | (28,153,004 | ) | | | (560,101 | ) |
| | | |
Investments in affiliated issuers | | | (695,911 | ) | | | (65,498 | ) | | | — | |
| | | |
Investments in securities sold short | | | — | | | | (37,695 | ) | | | — | |
| | | |
Futures contracts | | | 596,190 | | | | 14,614 | | | | — | |
| | | |
Written options | | | — | | | | (126,348 | ) | | | — | |
| | | |
Swap contracts | | | (736,114 | ) | | | (242,986 | ) | | | — | |
| | | |
Forward currency contracts | | | (1,571,293 | ) | | | 74,197 | | | | — | |
| | | |
Foreign currency and foreign currency related transactions | | | (31,813 | ) | | | (27,961 | ) | | | — | |
| | | | | | | | | | | | |
| | | |
Net change in unrealized appreciation (depreciation) | | | (5,325,792 | ) | | | (28,564,681 | ) | | | (560,101 | ) |
| | | | | | | | | | | | |
| | | |
Net realized and unrealized gain (loss) | | | (6,854,215 | ) | | | (21,501,119 | ) | | | (1,151,218 | ) |
| | | | | | | | | | | | |
Net increase (decrease) in net assets resulting from operations | | $ | (4,449,113 | ) | | $ | 8,620,476 | | | $ | (750,659 | ) |
| | | | | | | | | | | | |
| * | Period from July 21, 2021 (commencement of operations) through December 28, 2021 when all outstanding shares of the class were redeemed, and February 1, 2022, when the class recommenced operations, to February 28, 2022. |
| ** | Period from May 19, 2021 (commencement of operations) through February 28, 2022. |
| | | | |
| | |
| 62 | | See accompanying notes to the financial statements. | | |
GMO Trust Funds
Statements of Changes in Net Assets
| | | | | | | | | | | | | | | | |
| | | Asset Allocation
Bond Fund | | | Emerging Country
Debt Fund | |
| | | Year Ended
February 28, | | | Year Ended
February 28, | |
| | | 2022 | | | 2021 | | | 2022 | | | 2021 | |
Increase (decrease) in net assets: | |
|
Operations: | |
| | | | |
Net investment income (loss) | | $ | 1,103,782 | | | $ | 1,685,489 | | | $ | 238,557,153 | | | $ | 234,615,368 | |
| | | | |
Net realized gain (loss) | | | 9,714,027 | | | | 11,202,659 | | | | 42,391,923 | | | | 112,641,594 | |
| | | | |
Change in net unrealized appreciation (depreciation) | | | (10,233,591 | ) | | | (4,762,322 | ) | | | (598,650,728 | ) | | | (230,763,388 | ) |
| | | | | | | | | | | | | | | | |
| | | | |
Net increase (decrease) in net assets from operations | | | 584,218 | | | | 8,125,826 | | | | (317,701,652 | ) | | | 116,493,574 | |
| | | | | | | | | | | | | | | | |
|
Distributions to shareholders: | |
| | | | |
Class III | | | (300,707 | ) | | | (403,791 | ) | | | (100,344,029 | ) | | | (110,457,805 | ) |
| | | | |
Class IV | | | — | | | | — | | | | (220,289,705 | ) | | | (299,019,091 | ) |
| | | | |
Class VI | | | (699,355 | ) | | | (1,120,355 | ) | | | (98,169,031 | )* | | | — | |
| | | | | | | | | | | | | | | | |
| | | | |
Total distributions | | | (1,000,062 | ) | | | (1,524,146 | ) | | | (418,802,765 | ) | | | (409,476,896 | ) |
| | | | | | | | | | | | | | | | |
|
Net share transactions (Note 9): | |
| | | | |
Class III | | | (62,140,074 | ) | | | 18,928,517 | | | | 113,189,447 | | | | (59,256,916 | ) |
| | | | |
Class IV | | | — | | | | — | | | | (1,395,160,087 | ) | | | 222,010,887 | |
| | | | |
Class VI | | | (19,881,378 | ) | | | (138,607,964 | ) | | | 1,516,676,054 | * | | | — | |
| | | | | | | | | | | | | | | | |
| | | | |
Increase (decrease) in net assets resulting from net share transactions | | | (82,021,452 | ) | | | (119,679,447 | ) | | | 234,705,414 | | | | 162,753,971 | |
| | | | | | | | | | | | | | | | |
|
Purchase premiums and redemption fees (Notes 2 and 9): | |
| | | | |
Class III | | | — | | | | — | | | | 678,088 | | | | 1,428,115 | |
| | | | |
Class IV | | | — | | | | — | | | | 1,511,015 | | | | 3,980,122 | |
| | | | |
Class VI | | | — | | | | — | | | | 605,125 | * | | | — | |
| | | | | | | | | | | | | | | | |
| | | | |
Total increase (decrease) in net assets resulting from net share transactions, purchase premiums and redemption fees | | | (82,021,452 | ) | | | (119,679,447 | ) | | | 237,499,642 | | | | 168,162,208 | |
| | | | | | | | | | | | | | | | |
| | | | |
Total increase (decrease) in net assets | | | (82,437,296 | ) | | | (113,077,767 | ) | | | (499,004,775 | ) | | | (124,821,114 | ) |
|
| Net assets: | |
| | | | |
Beginning of period | | | 120,456,072 | | | | 233,533,839 | | | | 4,228,221,384 | | | | 4,353,042,498 | |
| | | | | | | | | | | | | | | | |
| | | | |
End of period | | $ | 38,018,776 | | | $ | 120,456,072 | | | $ | 3,729,216,609 | | | $ | 4,228,221,384 | |
| | | | | | | | | | | | | | | | |
| * | Period from July 29, 2021 (commencement of operations) through February 28, 2022. |
| | | | |
| | |
| | | See accompanying notes to the financial statements. | | 63 |
GMO Trust Funds
Statements of Changes in Net Assets — (Continued)
| | | | | | | | | | | | | | | | |
| | | High Yield Fund | | | Multi-Sector Fixed
Income Fund | |
| | | Year Ended
February 28, | | | Year Ended
February 28, | |
| | | 2022 | | | 2021 | | | 2022 | | | 2021 | |
Increase (decrease) in net assets: | |
|
Operations: | |
| | | | |
Net investment income (loss) | | $ | 986,956 | | | $ | 4,744,456 | | | $ | 2,405,102 | | | $ | 5,442,597 | |
| | | | |
Net realized gain (loss) | | | 4,454,786 | | | | 4,870,688 | | | | (1,528,423 | ) | | | 19,749,096 | |
| | | | |
Change in net unrealized appreciation (depreciation) | | | (3,881,686 | ) | | | 2,460,343 | | | | (5,325,792 | ) | | | (17,582,435 | ) |
| | | | | | | | | | | | | | | | |
| | | | |
Net increase (decrease) in net assets from operations | | | 1,560,056 | | | | 12,075,487 | | | | (4,449,113 | ) | | | 7,609,258 | |
| | | | | | | | | | | | | | | | |
|
Distributions to shareholders: | |
| | | | |
Class III | | | — | | | | — | | | | (771,747 | ) | | | (8,300,596 | ) |
| | | | |
Class IV | | | — | | | | — | | | | (4,376,860 | ) | | | (24,041,607 | ) |
| | | | |
Class VI | | | (11,979,726 | ) | | | (3,588,431 | ) | | | — | | | | — | |
| | | | | | | | | | | | | | | | |
| | | | |
Total distributions | | | (11,979,726 | ) | | | (3,588,431 | ) | | | (5,148,607 | ) | | | (32,342,203 | ) |
| | | | | | | | | | | | | | | | |
|
Net share transactions (Note 9): | |
| | | | |
Class III | | | — | | | | — | | | | (22,088,583 | ) | | | (42,133,243 | ) |
| | | | |
Class IV | | | — | | | | — | | | | (8,797,990 | ) | | | (297,963,316 | ) |
| | | | |
Class VI | | | 460,560 | | | | (75,391,205 | ) | | | — | | | | — | |
| | | | | | | | | | | | | | | | |
| | | | |
Increase (decrease) in net assets resulting from net share transactions | | | 460,560 | | | | (75,391,205 | ) | | | (30,886,573 | ) | | | (340,096,559 | ) |
| | | | | | | | | | | | | | | | |
| | | | |
Total increase (decrease) in net assets | | | (9,959,110 | ) | | | (66,904,149 | ) | | | (40,484,293 | ) | | | (364,829,504 | ) |
Net assets: | |
| | | | |
Beginning of period | | | 94,545,331 | | | | 161,449,480 | | | | 165,464,452 | | | | 530,293,956 | |
| | | | | | | | | | | | | | | | |
| | | | |
End of period | | $ | 84,586,221 | | | $ | 94,545,331 | | | $ | 124,980,159 | | | $ | 165,464,452 | |
| | | | | | | | | | | | | | | | |
| | | | |
| | |
| 64 | | See accompanying notes to the financial statements. | | |
GMO Trust Funds
Statements of Changes in Net Assets — (Continued)
| | | | | | | | | | | | | | | | |
| | | Opportunistic
Income Fund | | | U.S. Treasury Fund | |
| | | Year Ended
February 28, | | | Year Ended
February 28, | |
| | | 2022 | | | 2021 | | | 2022 | | | 2021 | |
Increase (decrease) in net assets: | |
|
Operations: | |
| | | | |
Net investment income (loss) | | $ | 30,121,595 | | | $ | 31,707,361 | | | $ | 400,559 | | | $ | 735,938 | |
| | | | |
Net realized gain (loss) | | | 7,063,562 | | | | 2,929,109 | | | | (591,117 | ) | | | 1,188,447 | |
| | | | |
Change in net unrealized appreciation (depreciation) | | | (28,564,681 | ) | | | (12,603,709 | ) | | | (560,101 | ) | | | (507,093 | ) |
| | | | | | | | | | | | | | | | |
| | | | |
Net increase (decrease) in net assets from operations | | | 8,620,476 | | | | 22,032,761 | | | | (750,659 | ) | | | 1,417,292 | |
| | | | | | | | | | | | | | | | |
|
Distributions to shareholders: | |
| | | | |
Core Class | | | — | | | | — | | | | (700,751 | ) | | | (773,665 | ) |
| | | | |
Class III | | | (224,578 | )* | | | — | | | | — | | | | — | |
| | | | |
Class IV | | | — | | | | — | | | | — | | | | — | |
| | | | |
Class VI | | | (8,572,000 | ) | | | (24,129,562 | ) | | | — | | | | — | |
| | | | |
Class R6 | | | (2,592,002 | )** | | | — | | | | — | | | | — | |
| | | | |
Class I | | | (8,435,870 | ) | | | (5,867,931 | ) | | | — | | | | — | |
| | | | | | | | | | | | | | | | |
| | | | |
Total distributions | | | (19,824,450 | ) | | | (29,997,493 | ) | | | (700,751 | ) | | | (773,665 | ) |
| | | | | | | | | | | | | | | | |
|
Net share transactions (Note 9): | |
| | | | |
Core Class | | | — | | | | — | | | | (123,236,970 | ) | | | 159,049,444 | |
| | | | |
Class III | | | 12,503,177 | * | | | — | | | | — | | | | — | |
| | | | |
Class IV | | | — | | | | — | | | | — | | | | — | |
| | | | |
Class VI | | | (98,588,215 | ) | | | (337,486,350 | ) | | | — | | | | — | |
| | | | |
Class R6 | | | 155,415,258 | ** | | | — | | | | — | | | | — | |
| | | | |
Class I | | | 31,143,682 | | | | 391,498,422 | | | | — | | | | — | |
| | | | | | | | | | | | | | | | |
| | | | |
Increase (decrease) in net assets resulting from net share transactions | | | 100,473,902 | | | | 54,012,072 | | | | (123,236,970 | ) | | | 159,049,444 | |
| | | | | | | | | | | | | | | | |
| | | | |
Total increase (decrease) in net assets | | | 89,269,928 | | | | 46,047,340 | | | | (124,688,380 | ) | | | 159,693,071 | |
Net assets: | |
| | | | |
Beginning of period | | | 894,607,232 | | | | 848,559,892 | | | | 382,454,698 | | | | 222,761,627 | |
| | | | | | | | | | | | | | | | |
| | | | |
End of period | | $ | 983,877,160 | | | $ | 894,607,232 | | | $ | 257,766,318 | | | $ | 382,454,698 | |
| | | | | | | | | | | | | | | | |
| * | Period from July 21, 2021 (commencement of operations) through December 28, 2021, when all outstanding shares of the class were redeemed, and February 1, 2022, when the class recommenced operations, to February 28, 2022. |
| ** | Period from May 19, 2021 (commencement of operations) through February 28, 2022. |
| | | | |
| | |
| | | See accompanying notes to the financial statements. | | 65 |
GMO Trust Funds
Financial Highlights
(For a share outstanding throughout each period)
ASSET ALLOCATION BOND FUND
| | | | | | | | | | | | | | | | | | | | | | | | | | | | | | | | | | | | | | | | | | | | | | | | | | |
| | | Class III Shares | | Class VI Shares |
| | | Year Ended February 28/29, | | Year Ended February 28/29, |
| | | 2022 | | 2021 | | 2020 | | 2019 | | 2018 | | 2022 | | 2021 | | 2020 | | 2019 | | 2018 |
Net asset value, beginning of period | | | $ | 23.82 | | | | $ | 22.66 | | | | $ | 21.61 | | | | $ | 21.95 | | | | $ | 22.15 | | | | $ | 23.88 | | | | $ | 22.72 | | | | $ | 21.67 | | | | $ | 22.02 | | | | $ | 22.23 | |
| | | | | | | | | | | | | | | | | | | | | | | | | | | | | | | | | | | | | | | | | | | | | | | | | | |
Income (loss) from investment operations: | | | | | | | | | | | | | | | | | | | | | | | | | | | | | | | | | | | | | | | | | | | | | | | | | | |
Net investment income (loss)(a)† | | | | 0.41 | | | | | 0.26 | | | | | 0.55 | | | | | 0.54 | | | | | 0.33 | | | | | 0.39 | | | | | 0.27 | | | | | 0.56 | | | | | 0.57 | | | | | 0.36 | |
Net realized and unrealized gain (loss) | | | | (0.36 | ) | | | | 1.18 | | | | | 1.52 | | | | | 0.18 | | | | | (0.31 | ) | | | | (0.31 | ) | | | | 1.18 | | | | | 1.53 | | | | | 0.18 | | | | | (0.33 | ) |
| | | | | | | | | | | | | | | | | | | | | | | | | | | | | | | | | | | | | | | | | | | | | | | | | | |
Total from investment operations | | | | 0.05 | | | | | 1.44 | | | | | 2.07 | | | | | 0.72 | | | | | 0.02 | | | | | 0.08 | | | | | 1.45 | | | | | 2.09 | | | | | 0.75 | | | | | 0.03 | |
| | | | | | | | | | | | | | | | | | | | | | | | | | | | | | | | | | | | | | | | | | | | | | | | | | |
Less distributions to shareholders: | | | | | | | | | | | | | | | | | | | | | | | | | | | | | | | | | | | | | | | | | | | | | | | | | | |
From net investment income | | | | (0.39 | ) | | | | (0.28 | ) | | | | (1.02 | ) | | | | (1.06 | ) | | | | (0.22 | ) | | | | (0.44 | ) | | | | (0.29 | ) | | | | (1.04 | ) | | | | (1.10 | ) | | | | (0.24 | ) |
| | | | | | | | | | | | | | | | | | | | | | | | | | | | | | | | | | | | | | | | | | | | | | | | | | |
Total distributions | | | | (0.39 | ) | | | | (0.28 | ) | | | | (1.02 | ) | | | | (1.06 | ) | | | | (0.22 | ) | | | | (0.44 | ) | | | | (0.29 | ) | | | | (1.04 | ) | | | | (1.10 | ) | | | | (0.24 | ) |
| | | | | | | | | | | | | | | | | | | | | | | | | | | | | | | | | | | | | | | | | | | | | | | | | | |
Net asset value, end of period | | | $ | 23.48 | | | | $ | 23.82 | | | | $ | 22.66 | | | | $ | 21.61 | | | | $ | 21.95 | | | | $ | 23.52 | | | | $ | 23.88 | | | | $ | 22.72 | | | | $ | 21.67 | | | | $ | 22.02 | |
| | | | | | | | | | | | | | | | | | | | | | | | | | | | | | | | | | | | | | | | | | | | | | | | | | |
Total Return(b) | | | | 0.16 | % | | | | 6.33 | % | | | | 9.74 | % | | | | 3.37 | % | | | | 0.07 | % | | | | 0.26 | % | | | | 6.39 | % | | | | 9.83 | % | | | | 3.48 | % | | | | 0.12 | % |
Ratios/Supplemental Data: | | | | | | | | | | | | | | | | | | | | | | | | | | | | | | | | | | | | | | | | | | | | | | | | | | |
Net assets, end of period (000’s) | | | $ | 22 | | | | $ | 61,836 | | | | $ | 41,124 | | | | $ | 82,801 | | | | $ | 207,008 | | | | $ | 37,997 | | | | $ | 58,621 | | | | $ | 192,410 | | | | $ | 305,842 | | | | $ | 1,019,135 | |
Net operating expenses to average daily net assets | | | | 0.41 | %(c) | | | | 0.41 | %(c) | | | | 0.40 | %(c) | | | | 0.41 | %(c) | | | | 0.41 | % | | | | 0.31 | %(c) | | | | 0.31 | %(c) | | | | 0.31 | %(c) | | | | 0.31 | %(c) | | | | 0.31 | % |
Interest and/or dividend expenses and/or borrowing costs to average daily net assets(d) | | | | — | | | | | — | | | | | 0.00 | %(e) | | | | 0.00 | %(e) | | | | 0.00 | %(e) | | | | — | | | | | — | | | | | 0.00 | %(e) | | | | 0.00 | %(e) | | | | 0.00 | %(e) |
Total net expenses to average daily net assets | | | | 0.41 | %(c) | | | | 0.41 | %(c) | | | | 0.40 | %(c) | | | | 0.41 | %(c) | | | | 0.41 | % | | | | 0.31 | %(c) | | | | 0.31 | %(c) | | | | 0.31 | %(c) | | | | 0.31 | %(c) | | | | 0.31 | % |
Net investment income (loss) to average daily net assets(a) | | | | 1.68 | % | | | | 1.11 | % | | | | 2.49 | % | | | | 2.48 | % | | | | 1.50 | % | | | | 1.60 | % | | | | 1.15 | % | | | | 2.49 | % | | | | 2.57 | % | | | | 1.59 | % |
Portfolio turnover rate | | | | 209 | %(f) | | | | 30 | %(f) | | | | 16 | %(f) | | | | 59 | %(f) | | | | 89 | % | | | | 209 | %(f) | | | | 30 | %(f) | | | | 16 | %(f) | | | | 59 | %(f) | | | | 89 | % |
Fees and expenses reimbursed and/or waived by GMO to average daily net assets: | | | | 0.16 | %(g) | | | | 0.08 | %(g) | | | | 0.06 | %(g) | | | | 0.04 | % | | | | 0.02 | % | | | | 0.17 | %(g) | | | | 0.08 | %(g) | | | | 0.06 | %(g) | | | | 0.04 | % | | | | 0.02 | % |
| (a) | Net investment income is affected by the timing of the declaration of dividends by the other GMO Funds and/or other investment companies in which the Fund invests, if any. |
| (b) | The total returns would have been lower had certain expenses not been reimbursed and/or waived during the periods shown, if applicable, and assumes the effect of reinvested distributions, if any. Calculation excludes purchase premiums and redemption fees which are borne by the shareholder purchasing or redeeming Fund shares, if any. |
| (c) | Net expenses exclude expenses incurred indirectly through investment in the underlying funds, if any (Note 5). |
| (d) | Interest and dividend expense and/or borrowing costs incurred as a result of entering into reverse repurchase agreements, securities sold short or margin on cleared swap contracts, if any, is included in the Fund’s net expenses. Income earned on investing proceeds from reverse repurchase agreements, if any, is included in interest income. |
| (e) | Rounds to less than 0.01%. |
| (f) | The portfolio turnover rate excludes investments in GMO U.S. Treasury Fund (“USTF”) which is used as a short-term investment vehicle for cash management. The Fund’s portfolio turnover rate during the years ended February 28, 2022, February 28, 2021, February 28, 2020 and February 29, 2019, including transactions in USTF, was 206%, 39%, 37% and 88%, respectively, of the average value of its portfolio. |
| (g) | Ratio includes indirect fees waived or borne by GMO. |
| † | Calculated using average shares outstanding throughout the period. |
| | | | |
| | |
| 66 | | See accompanying notes to the financial statements. | | |
GMO Trust Funds
Financial Highlights
(For a share outstanding throughout each period)
EMERGING COUNTRY DEBT FUND
| | | | | | | | | | | | | | | | | | | | | | | | | | | | | | | | | | | | | | | | | | | | | | | | | | |
| | | Class III Shares | | Class IV Shares |
| | | Year Ended February 28/29, | | Year Ended February 28/29, |
| | | 2022 | | 2021 | | 2020 | | 2019 | | 2018 | | 2022 | | 2021 | | 2020 | | 2019 | | 2018 |
Net asset value, beginning of period | | | $ | 25.54 | | | | $ | 27.38 | | | | $ | 26.82 | | | | $ | 28.62 | | | | $ | 28.99 | | | | $ | 25.50 | | | | $ | 27.34 | | | | $ | 26.77 | | | | $ | 28.57 | | | | $ | 28.95 | |
| | | | | | | | | | | | | | | | | | | | | | | | | | | | | | | | | | | | | | | | | | | | | | | | | | |
Income (loss) from investment operations: | | | | | | | | | | | | | | | | | | | | | | | | | | | | | | | | | | | | | | | | | | | | | | | | | | |
Net investment income (loss)(a)† | | | | 1.42 | | | | | 1.56 | | | | | 1.44 | | | | | 1.36 | | | | | 1.36 | | | | | 1.41 | | | | | 1.39 | | | | | 1.43 | | | | | 1.37 | | | | | 1.39 | |
Net realized and unrealized gain (loss) | | | | (3.16 | ) | | | | (0.85 | ) | | | | 0.91 | | | | | (1.19 | ) | | | | 0.32 | | | | | (3.14 | ) | | | | (0.66 | ) | | | | 0.94 | | | | | (1.19 | ) | | | | 0.29 | |
| | | | | | | | | | | | | | | | | | | | | | | | | | | | | | | | | | | | | | | | | | | | | | | | | | |
Total from investment operations | | | | (1.74 | ) | | | | 0.71 | | | | | 2.35 | | | | | 0.17 | | | | | 1.68 | | | | | (1.73 | ) | | | | 0.73 | | | | | 2.37 | | | | | 0.18 | | | | | 1.68 | |
| | | | | | | | | | | | | | | | | | | | | | | | | | | | | | | | | | | | | | | | | | | | | | | | | | |
Less distributions to shareholders: | | | | | | | | | | | | | | | | | | | | | | | | | | | | | | | | | | | | | | | | | | | | | | | | | | |
From net investment income | | | | (1.82 | ) | | | | (1.93 | ) | | | | (1.79 | ) | | | | (1.97 | ) | | | | (2.05 | ) | | | | (1.83 | ) | | | | (1.95 | ) | | | | (1.80 | ) | | | | (1.98 | ) | | | | (2.06 | ) |
From net realized gains | | | | (0.64 | ) | | | | (0.62 | ) | | | | — | | | | | — | | | | | — | | | | | (0.64 | ) | | | | (0.62 | ) | | | | — | | | | | — | | | | | — | |
| | | | | | | | | | | | | | | | | | | | | | | | | | | | | | | | | | | | | | | | | | | | | | | | | | |
Total distributions | | | | (2.46 | ) | | | | (2.55 | ) | | | | (1.79 | ) | | | | (1.97 | ) | | | | (2.05 | ) | | | | (2.47 | ) | | | | (2.57 | ) | | | | (1.80 | ) | | | | (1.98 | ) | | | | (2.06 | ) |
| | | | | | | | | | | | | | | | | | | | | | | | | | | | | | | | | | | | | | | | | | | | | | | | | | |
Net asset value, end of period | | | $ | 21.34 | | | | $ | 25.54 | | | | $ | 27.38 | | | | $ | 26.82 | | | | $ | 28.62 | | | | $ | 21.30 | | | | $ | 25.50 | | | | $ | 27.34 | | | | $ | 26.77 | | | | $ | 28.57 | |
| | | | | | | | | | | | | | | | | | | | | | | | | | | | | | | | | | | | | | | | | | | | | | | | | | |
Total Return(b) | | | | (7.83 | )% | | | | 2.67 | % | | | | 8.97 | % | | | | 0.97 | % | | | | 5.81 | % | | | | (7.82 | )% | | | | 2.73 | % | | | | 9.08 | % | | | | 1.02 | % | | | | 5.83 | % |
Ratios/Supplemental Data: | | | | | | | | | | | | | | | | | | | | | | | | | | | | | | | | | | | | | | | | | | | | | | | | | | |
Net assets, end of period (000’s) | | | $ | 942,565 | | | | $ | 1,010,106 | | | | $ | 1,133,945 | | | | $ | 1,294,577 | | | | $ | 1,273,188 | | | | $ | 1,531,528 | | | | $ | 3,218,116 | | | | $ | 3,219,098 | | | | $ | 2,849,316 | | | | $ | 2,862,977 | |
Net operating expenses to average daily net assets(c) | | | | 0.53 | % | | | | 0.54 | % | | | | 0.53 | % | | | | 0.52 | % | | | | 0.53 | % | | | | 0.48 | % | | | | 0.49 | % | | | | 0.48 | % | | | | 0.47 | % | | | | 0.48 | % |
Interest and/or dividend expenses and/or borrowing costs to average daily net assets(d) | | | | — | | | | | 0.00 | %(e) | | | | 0.01 | % | | | | 0.02 | % | | | | 0.00 | %(e) | | | | — | | | | | 0.00 | %(e) | | | | 0.01 | % | | | | 0.02 | % | | | | 0.00 | %(e) |
Total net expenses to average daily net assets(c) | | | | 0.53 | % | | | | 0.54 | % | | | | 0.54 | % | | | | 0.54 | % | | | | 0.53 | % | | | | 0.48 | % | | | | 0.49 | % | | | | 0.49 | % | | | | 0.49 | % | | | | 0.48 | % |
Net investment income (loss) to average daily net assets(a) | | | | 5.62 | % | | | | 6.02 | % | | | | 5.23 | % | | | | 4.99 | % | | | | 4.57 | % | | | | 5.56 | % | | | | 5.38 | % | | | | 5.22 | % | | | | 5.04 | % | | | | 4.67 | % |
Portfolio turnover rate(f) | | | | 34 | % | | | | 56 | % | | | | 41 | % | | | | 15 | % | | | | 34 | % | | | | 34 | % | | | | 56 | % | | | | 41 | % | | | | 15 | % | | | | 34 | % |
Fees and expenses reimbursed and/or waived by GMO to average daily net assets:(g) | | | | 0.00 | %(e) | | | | 0.00 | %(e) | | | | 0.00 | %(e) | | | | 0.00 | %(e) | | | | 0.00 | %(e) | | | | 0.00 | %(e) | | | | 0.00 | %(e) | | | | 0.00 | %(e) | | | | 0.00 | %(e) | | | | 0.00 | %(e) |
Purchase premiums and redemption fees consisted of the following per share amounts (Note 2):† | | | $ | 0.02 | | | | $ | 0.03 | | | | $ | 0.03 | | | | $ | 0.03 | | | | $ | 0.03 | | | | $ | 0.02 | | | | $ | 0.03 | | | | $ | 0.03 | | | | $ | 0.03 | | | | $ | 0.03 | |
| | | | | |
| | | Class VI Shares |
| | | Period from
July 29, 2021
(commencement
of operations)
through
February 28,
2022 |
| |
Net asset value, beginning of period | | | $ | 25.89 | |
| | | | | |
Income (loss) from investment operations: | | | | | |
Net investment income (loss)(a)† | | | | 0.77 | |
Net realized and unrealized gain (loss) | | | | (3.60 | ) |
| | | | | |
Total from investment operations | | | | (2.83 | ) |
| | | | | |
Less distributions to shareholders: | | | | | |
From net investment income | | | | (1.55 | ) |
From net realized gains | | | | (0.21 | ) |
| | | | | |
Total distributions | | | | (1.76 | ) |
| | | | | |
Net asset value, end of period | | | $ | 21.30 | |
| | | | | |
Total Return(b) | | | | (11.63 | )%** |
Ratios/Supplemental Data: | | | | | |
Net assets, end of period (000’s) | | | $ | 1,255,123 | |
Net operating expenses to average daily net assets(c) | | | | 0.43 | %* |
Interest and/or dividend expenses and/or borrowing costs to average daily net assets(d) | | | | — | |
Total net expenses to average daily net assets(c) | | | | 0.43 | %* |
Net investment income (loss) to average daily net assets(a) | | | | 5.35 | %* |
Portfolio turnover rate(f) | | | | 34 | %** |
Fees and expenses reimbursed and/or waived by GMO to average daily net assets:(g) | | | | 0.00 | %(e) |
Purchase premiums and redemption fees consisted of the following per share amounts (Note 2):† | | | $ | 0.01 | |
| (a) | Net investment income is affected by the timing of the declaration of dividends by the other GMO Funds and/or other investment companies in which the Fund invests, if any. |
| (b) | The total returns would have been lower had certain expenses not been reimbursed and/or waived during the periods shown, if applicable, and assumes the effect of reinvested distributions, if any. Calculation excludes purchase premiums and redemption fees which are borne by the shareholder purchasing or redeeming Fund shares, if any. |
| (c) | Net expenses exclude expenses incurred indirectly through investment in the underlying funds, if any (Note 5). |
| (d) | Interest and dividend expense and/or borrowing costs incurred as a result of entering into reverse repurchase agreements, securities sold short or margin on cleared swap contracts, if any, is included in the Fund’s net expenses. Income earned on investing proceeds from reverse repurchase agreements, if any, is included in interest income. |
| (e) | Rounds to less than 0.01%. |
| (f) | The portfolio turnover rate excludes investments in GMO U.S. Treasury Fund (“USTF”) which is used as a short-term investment vehicle for cash management. The Fund’s portfolio turnover rate during the years ended February 28, 2022, February 28, 2021, February 29, 2020, February 28, 2019 and February 28, 2018, including transactions in USTF, was 33%, 55%, 40%, 15% and 33%, respectively, of the average value of its portfolio. |
| (g) | Ratio includes indirect fees waived or borne by GMO. |
| † | Calculated using average shares outstanding throughout the period. |
| | | | |
| | |
| | | See accompanying notes to the financial statements. | | 67 |
GMO Trust Funds
Financial Highlights
(For a share outstanding throughout each period)
HIGH YIELD FUND
| | | | | | | | | | | | | | | | | | | | |
| | | Class VI Shares |
| | | Year Ended February 28/29, | | Period From
June 25, 2018
(commencement
of operations)
through
February 28,
2019 |
| | | 2022 | | 2021 | | 2020 |
Net asset value, beginning of period | | | $ | 20.90 | | | | $ | 19.94 | | | | $ | 20.21 | | | | $ | 20.00 | |
| | | | | | | | | | | | | | | | | | | | |
Income (loss) from investment operations: | | | | | | | | | | | | | | | | | | | | |
Net investment income (loss)(a)† | | | | 0.21 | | | | | 0.64 | | | | | 0.48 | | | | | 0.27 | |
Net realized and unrealized gain (loss) | | | | 0.13 | | | | | 0.77 | | | | | 0.82 | | | | | 0.71 | |
| | | | | | | | | | | | | | | | | | | | |
Total from investment operations | | | | 0.34 | | | | | 1.41 | | | | | 1.30 | | | | | 0.98 | |
| | | | | | | | | | | | | | | | | | | | |
Less distributions to shareholders: | | | | | | | | | | | | | | | | | | | | |
From net investment income | | | | (0.68 | ) | | | | (0.40 | ) | | | | (1.57 | ) | | | | (0.61 | ) |
From net realized gains | | | | (1.95 | ) | | | | (0.05 | ) | | | | — | | | | | (0.16 | ) |
| | | | | | | | | | | | | | | | | | | | |
Total distributions | | | | (2.63 | ) | | | | (0.45 | ) | | | | (1.57 | ) | | | | (0.77 | ) |
| | | | | | | | | | | | | | | | | | | | |
Net asset value, end of period | | | $ | 18.61 | | | | $ | 20.90 | | | | $ | 19.94 | | | | $ | 20.21 | |
| | | | | | | | | | | | | | | | | | | | |
Total Return(b) | | | | 1.35 | % | | | | 7.21 | % | | | | 6.40 | % | | | | 5.07 | %** |
Ratios/Supplemental Data: | | | | | | | | | | | | | | | | | | | | |
Net assets, end of period (000’s) | | | $ | 84,586 | | | | $ | 94,545 | | | | $ | 161,449 | | | | $ | 212,762 | |
Net operating expenses to average daily net assets(c) | | | | 0.51 | % | | | | 0.52 | %(d) | | | | 0.52 | %(d) | | | | 0.51 | %*(d) |
Interest and/or dividend expenses and/or borrowing costs to average daily net assets(e) | | | | 0.00 | %(f) | | | | 0.00 | %(f) | | | | 0.03 | % | | | | 0.04 | %* |
Total net expenses to average daily net assets(c) | | | | 0.51 | % | | | | 0.52 | %(d) | | | | 0.55 | %(d) | | | | 0.55 | %*(d) |
Net investment income (loss) to average daily net assets(a) | | | | 1.05 | % | | | | 3.23 | % | | | | 2.34 | % | | | | 2.00 | %* |
Portfolio turnover rate | | | | 98 | % | | | | 288 | %(g) | | | | 105 | %(g) | | | | 81 | %(g)** |
Fees and expenses reimbursed and/or waived by GMO to average daily net assets: | | | | 0.03 | % | | | | 0.00 | %(f)(h) | | | | 0.00 | %(f)(h) | | | | 0.12 | %* |
| (a) | Net investment income is affected by the timing of the declaration of dividends by the other GMO Funds and/or other investment companies in which the Fund invests, if any. |
| (b) | The total returns would have been lower had certain expenses not been reimbursed and/or waived during the periods shown, if applicable, and assumes the effect of reinvested distributions, if any. Calculation excludes purchase premiums and redemption fees which are borne by the shareholder purchasing or redeeming Fund shares, if any. |
| (c) | Net expenses exclude expenses incurred indirectly through investment in the underlying funds, if any (Note 5). |
| (d) | Includes recoupment of past reimbursed and/or waived fees (Note 5). |
| (e) | Interest expense incurred as a result of entering into reverse repurchase agreements, securities sold short or margin on cleared swap contracts, if any, is included in the Fund’s net expenses. Income earned on investing proceeds from reverse repurchase agreements, if any, is included in interest income. |
| (f) | Rounds to less than 0.01%. |
| (g) | The portfolio turnover rate excludes investments in GMO U.S. Treasury Fund (“USTF”) which is used as a short-term investment vehicle for cash management. The Fund’s portfolio turnover rate during the years ended February 28, 2021, February 29, 2020 and February 28, 2019, including transactions in USTF, was 317%, 214% and 159%, respectively, of the average value of its portfolio. |
| (h) | Ratio includes indirect fees waived or borne by GMO. |
| † | Calculated using average shares outstanding throughout the period. |
| | | | |
| | |
| 68 | | See accompanying notes to the financial statements. | | |
GMO Trust Funds
Financial Highlights
(For a share outstanding throughout each period)
MULTI-SECTOR FIXED INCOME FUND
| | | | | | | | | | | | | | | | | | | | | | | | | | | | | | | | | | | | | | | | | | | | | | | | | | |
| | | Class III Shares | | Class IV Shares |
| | | Year Ended February 28/29, | | Year Ended February 28/29, |
| | | 2022 | | 2021 | | 2020 | | 2019 | | 2018 | | 2022 | | 2021 | | 2020 | | 2019 | | 2018 |
Net asset value, beginning of period | | | $ | 20.13 | | | | $ | 22.19 | | | | $ | 20.88 | | | | $ | 20.93 | | | | $ | 21.10 | | | | $ | 20.20 | | | | $ | 22.26 | | | | $ | 20.94 | | | | $ | 20.98 | | | | $ | 21.15 | |
| | | | | | | | | | | | | | | | | | | | | | | | | | | | | | | | | | | | | | | | | | | | | | | | | | |
Income (loss) from investment operations: | | | | | | | | | | | | | | | | | | | | | | | | | | | | | | | | | | | | | | | | | | | | | | | | | | |
Net investment income (loss)(a)† | | | | 0.27 | | | | | 0.43 | | | | | 0.53 | | | | | 0.51 | | | | | 0.41 | | | | | 0.28 | | | | | 0.35 | | | | | 0.54 | | | | | 0.48 | | | | | 0.46 | |
Net realized and unrealized gain (loss) | | | | (0.99 | ) | | | | (0.24 | )(b) | | | | 2.01 | | | | | 0.49 | | | | | (0.06 | ) | | | | (0.98 | ) | | | | (0.16 | )(b) | | | | 2.02 | | | | | 0.53 | | | | | (0.10 | ) |
| | | | | | | | | | | | | | | | | | | | | | | | | | | | | | | | | | | | | | | | | | | | | | | | | | |
Total from investment operations | | | | (0.72 | ) | | | | 0.19 | | | | | 2.54 | | | | | 1.00 | | | | | 0.35 | | | | | (0.70 | ) | | | | 0.19 | | | | | 2.56 | | | | | 1.01 | | | | | 0.36 | |
| | | | | | | | | | | | | | | | | | | | | | | | | | | | | | | | | | | | | | | | | | | | | | | | | | |
Less distributions to shareholders: | | | | | | | | | | | | | | | | | | | | | | | | | | |
From net investment income | | | | — | | | | | (0.93 | ) | | | | (0.64 | ) | | | | (1.05 | ) | | | | (0.52 | ) | | | | — | | | | | (0.93 | ) | | | | (0.65 | ) | | | | (1.05 | ) | | | | (0.53 | ) |
From net realized gains | | | | (0.57 | ) | | | | (1.32 | ) | | | | (0.59 | ) | | | | — | | | | | — | | | | | (0.57 | ) | | | | (1.32 | ) | | | | (0.59 | ) | | | | — | | | | | — | |
| | | | | | | | | | | | | | | | | | | | | | | | | | | | | | | | | | | | | | | | | | | | | | | | | | |
Total distributions | | | | (0.57 | ) | | | | (2.25 | ) | | | | (1.23 | ) | | | | (1.05 | ) | | | | (0.52 | ) | | | | (0.57 | ) | | | | (2.25 | ) | | | | (1.24 | ) | | | | (1.05 | ) | | | | (0.53 | ) |
| | | | | | | | | | | | | | | | | | | | | | | | | | | | | | | | | | | | | | | | | | | | | | | | | | |
Net asset value, end of period | | | $ | 18.84 | | | | $ | 20.13 | | | | $ | 22.19 | | | | $ | 20.88 | | | | $ | 20.93 | | | | $ | 18.93 | | | | $ | 20.20 | | | | $ | 22.26 | | | | $ | 20.94 | | | | $ | 20.98 | |
| | | | | | | | | | | | | | | | | | | | | | | | | | | | | | | | | | | | | | | | | | | | | | | | | | |
Total Return(c) | | | | (3.74 | )% | | | | 0.59 | % | | | | 12.38 | % | | | | 4.88 | % | | | | 1.61 | % | | | | (3.63 | )% | | | | 0.59 | % | | | | 12.44 | % | | | | 4.93 | % | | | | 1.68 | % |
Ratios/Supplemental Data: | | | | | | | | | | | | | | | | | | | | | | | | | | | | | | | | | | | | | | | | | | | | | | | | | | |
Net assets, end of period (000’s) | | | $ | 8,803 | | | | $ | 31,602 | | | | $ | 80,639 | | | | $ | 84,163 | | | | $ | 34,641 | | | | $ | 116,178 | | | | $ | 133,862 | | | | $ | 449,655 | | | | $ | 580,456 | | | | $ | 920,637 | |
Net operating expenses to average daily net assets(d) | | | | 0.31 | % | | | | 0.30 | % | | | | 0.29 | % | | | | 0.29 | % | | | | 0.29 | % | | | | 0.25 | % | | | | 0.24 | % | | | | 0.24 | % | | | | 0.24 | % | | | | 0.24 | % |
Interest and/or dividend expenses and/or borrowing costs to average daily net assets(e) | | | | 0.00 | %(f) | | | | 0.00 | %(f) | | | | 0.00 | %(f) | | | | 0.00 | %(f) | | | | 0.00 | %(f) | | | | 0.00 | %(f) | | | | 0.00 | %(f) | | | | 0.00 | %(f) | | | | 0.00 | %(f) | | | | 0.00 | %(f) |
Total net expenses to average daily net assets(d) | | | | 0.31 | % | | | | 0.30 | % | | | | 0.29 | % | | | | 0.29 | % | | | | 0.29 | % | | | | 0.25 | % | | | | 0.24 | % | | | | 0.24 | % | | | | 0.24 | % | | | | 0.24 | % |
Net investment income (loss) to average daily net assets(a) | | | | 1.33 | % | | | | 1.98 | % | | | | 2.43 | % | | | | 2.41 | % | | | | 1.91 | % | | | | 1.39 | % | | | | 1.57 | % | | | | 2.47 | % | | | | 2.29 | % | | | | 2.14 | % |
Portfolio turnover rate(g) | | | | 256 | % | | | | 262 | % | | | | 215 | % | | | | 201 | % | | | | 198 | % | | | | 256 | % | | | | 262 | % | | | | 215 | % | | | | 201 | % | | | | 198 | % |
Fees and expenses reimbursed and/or waived by GMO to average daily net assets:(h) | | | | 0.24 | % | | | | 0.19 | % | | | | 0.16 | % | | | | 0.16 | % | | | | 0.14 | % | | | | 0.25 | % | | | | 0.19 | % | | | | 0.16 | % | | | | 0.15 | % | | | | 0.14 | % |
| (a) | Net investment income is affected by the timing of the declaration of dividends by the other GMO Funds and/or other investment companies in which the Fund invests, if any. |
| (b) | The amount shown for a share outstanding does not correspond with the aggregate net realized and unrealized gain (loss) on investments due to the timing of purchases and redemptions of the Fund shares in relation to fluctuating market values of the investments of the Fund. |
| (c) | The total returns would have been lower had certain expenses not been reimbursed and/or waived during the periods shown, if applicable, and assumes the effect of reinvested distributions, if any. Calculation excludes purchase premiums and redemption fees which are borne by the shareholder purchasing or redeeming Fund shares, if any. |
| (d) | Net expenses exclude expenses incurred indirectly through investment in the underlying funds, if any (Note 5). |
| (e) | Interest expense incurred as a result of entering into reverse repurchase agreements, securities sold short or margin on cleared swap contracts, if any, is included in the Fund’s net expenses. Income earned on investing proceeds from reverse repurchase agreements, if any, is included in interest income. |
| (f) | Rounds to less than 0.01%. |
| (g) | The portfolio turnover rate excludes investments in GMO U.S. Treasury Fund (“USTF”) which is used as a short-term investment vehicle for cash management. The Fund’s portfolio turnover rate during the years ended February 28, 2022, February 28, 2021, February 29, 2020, February 28, 2019 and February 28, 2018, including transactions in USTF, was 263%, 335%, 285%, 250% and 221%, respectively, of the average value of its portfolio. |
| (h) | Ratio includes indirect fees waived or borne by GMO. |
| † | Calculated using average shares outstanding throughout the period. |
| | | | |
| | |
| | | See accompanying notes to the financial statements. | | 69 |
GMO Trust Funds
Financial Highlights
(For a share outstanding throughout each period)
OPPORTUNISTIC INCOME FUND
| | | | | | | | | | | | | | | | | | | | | | | | | | | | | | | | | | | |
| | | Class III Shares | | Class VI Shares |
| | | Period from
February 1,
2022
(commencement
of operations)
through
February 28,
2022 | | Period from
July 21,
2021
(commencement
of operations)
through
December 28,
2021 | | Year Ended February 28/29, |
| | | 2022 | | 2021 | | 2020 | | 2019 | | 2018 |
Net asset value, beginning of period | | | $ | 25.66 | | | | $ | 25.88 | | | | $ | 25.84 | | | | $ | 26.15 | | | | $ | 26.21 | | | | $ | 26.41 | | | | $ | 25.78 | |
| | | | | | | | | | | | | | | | | | | | | | | | | | | | | | | | | | | |
Income (loss) from investment operations: | | | | | | | | | | | | | | | | | | | | | | | | | | | | | | | | | | | |
Net investment income (loss)(a)† | | | | 0.07 | | | | | 0.44 | | | | | 0.81 | | | | | 1.06 | | | | | 1.46 | | | | | 1.32 | | | | | 1.15 | |
Net realized and unrealized gain (loss) | | | | (0.17 | ) | | | | (0.33 | ) | | | | (0.55 | ) | | | | (0.31 | ) | | | | (0.06 | ) | | | | (0.38 | ) | | | | 0.18 | |
| | | | | | | | | | | | | | | | | | | | | | | | | | | | | | | | | | | |
Total from investment operations | | | | (0.10 | ) | | | | 0.11 | | | | | 0.26 | | | | | 0.75 | | | | | 1.40 | | | | | 0.94 | | | | | 1.33 | |
| | | | | | | | | | | | | | | | | | | | | | | | | | | | | | | | | | | |
Less distributions to shareholders: | | | | | | | | | | | | | | | | | | | | | | | | | | | | | | | | | | | |
From net investment income | | | | — | | | | | (0.42 | ) | | | | (0.54 | ) | | | | (1.06 | ) | | | | (1.46 | ) | | | | (1.14 | ) | | | | (0.70 | ) |
From net realized gains | | | | — | | | | | — | | | | | — | | | | | 0.00 | | | | | — | | | | | — | | | | | — | |
| | | | | | | | | | | | | | | | | | | | | | | | | | | | | | | | | | | |
Total distributions | | | | — | | | | | (0.42 | ) | | | | (0.54 | ) | | | | (1.06 | ) | | | | (1.46 | ) | | | | (1.14 | ) | | | | (0.70 | ) |
| | | | | | | | | | | | | | | | | | | | | | | | | | | | | | | | | | | |
Net asset value, end of period | | | $ | 25.56 | | | | $ | 25.57 | | | | $ | 25.56 | | | | $ | 25.84 | | | | $ | 26.15 | | | | $ | 26.21 | | | | $ | 26.41 | |
| | | | | | | | | | | | | | | | | | | | | | | | | | | | | | | | | | | |
Total Return(b) | | | | (0.39 | )%** | | | | 0.43 | %** | | | | 1.00 | % | | | | 2.95 | % | | | | 5.45 | % | | | | 3.58 | % | | | | 5.18 | % |
Ratios/Supplemental Data: | | | | | | | | | | | | | | | | | | | | | | | | | | | | | | | | | | | |
Net assets, end of period (000’s) | | | $ | 12,281 | | | | $ | 13,847 | | | | $ | 375,117 | | | | $ | 477,457 | | | | $ | 825,876 | | | | $ | 1,001,146 | | | | $ | 1,205,954 | |
Net operating expenses to average daily net assets(c) | | | | 0.70 | %* | | | | 0.56 | %* | | | | 0.47 | % | | | | 0.47 | % | | | | 0.47 | % | | | | 0.49 | % | | | | 0.47 | % |
Interest and/or dividend expenses and/or borrowing costs to average daily net assets(e) | | | | 0.00 | %*(d) | | | | 0.00 | %*(d) | | | | 0.00 | %(d) | | | | 0.00 | %(d) | | | | 0.00 | %(d) | | | | 0.00 | %(d) | | | | 0.00 | %(d) |
Total net expenses to average daily net assets(c) | | | | 0.70 | %* | | | | 0.56 | %* | | | | 0.47 | % | | | | 0.47 | % | | | | 0.47 | % | | | | 0.49 | % | | | | 0.47 | % |
Net investment income (loss) to average daily net assets(a) | | | | 3.92 | %* | | | | 3.84 | %* | | | | 3.13 | % | | | | 4.12 | % | | | | 5.50 | % | | | | 4.99 | % | | | | 4.39 | % |
Portfolio turnover rate(f) | | | | 95 | %** | | | | 95 | %** | | | | 95 | % | | | | 43 | % | | | | 47 | % | | | | 75 | % | | | | 152 | % |
Fees and expenses reimbursed and/or waived by GMO to average daily net assets: | | | | 0.08 | %* | | | | 0.04 | %* | | | | 0.05 | %(g) | | | | 0.05 | %(g) | | | | 0.04 | %(g) | | | | 0.04 | % | | | | 0.03 | % |
Purchase premiums and redemption fees consisted of the following per share amounts (Note 2):† | | | $ | — | | | | $ | — | | | | $ | — | | | | $ | — | | | | $ | 0.01 | | | | $ | 0.05 | | | | $ | 0.04 | |
| (a) | Net investment income is affected by the timing of the declaration of dividends by the other GMO Funds and/or other investment companies in which the Fund invests, if any. |
| (b) | The total returns would have been lower had certain expenses not been reimbursed and/or waived during the periods shown, if applicable, and assumes the effect of reinvested distributions, if any. Calculation excludes purchase premiums and redemption fees which are borne by the shareholder purchasing or redeeming Fund shares, if any. |
| (c) | Net expenses exclude expenses incurred indirectly through investment in the underlying funds, if any (Note 5). |
| (d) | Rounds to less than 0.01%. |
| (e) | Interest and dividend expense and/or borrowing costs incurred as a result of entering into reverse repurchase agreements, securities sold short or margin on cleared swap contracts, if any, is included in the Fund’s net expenses. Income earned on investing proceeds from reverse repurchase agreements, if any, is included in interest income. |
| (f) | The portfolio turnover rate excludes investments in GMO U.S. Treasury Fund (“USTF”) which is used as a short-term investment vehicle for cash management. The Fund’s portfolio turnover rate during the years ended February 28, 2022, February 28, 2021, February 29, 2020, February 28, 2019, and February 28, 2018, including transactions in USTF, was 94%, 45%, 48%, 83%, and 175%, respectively, of the average value of its portfolio. |
| (g) | Ratio includes indirect fees waived or borne by GMO. |
| † | Calculated using average shares outstanding throughout the period. |
| | | | |
| | |
| 70 | | See accompanying notes to the financial statements. | | |
GMO Trust Funds
Financial Highlights
(For a share outstanding throughout each period)
OPPORTUNISTIC INCOME FUND (continued)
| | | | | | | | | | | | | | | | | | | | |
| | | Class R6 Shares | | Class I Shares |
| | | Period from
May 19, 2021
(commencement
of operations)
through
February 28,
2022 | | Year Ended
February 28, | | Period from
November 5,
2019
(commencement
of operations)
through
February 29,
2020 |
| | | 2022 | | 2021 |
Net asset value, beginning of period | | | $ | 25.86 | | | | $ | 25.80 | | | | $ | 26.12 | | | | $ | 26.85 | |
| | | | | | | | | | | | | | | | | | | | |
Income (loss) from investment operations: | | | | | | | | | | | | | | | | | | | | |
Net investment income (loss)(a)† | | | | 0.67 | | | | | 0.77 | | | | | 0.89 | | | | | 0.54 | |
Net realized and unrealized gain (loss) | | | | (0.51 | ) | | | | (0.57 | ) | | | | (0.18 | ) | | | | (0.08 | ) |
| | | | | | | | | | | | | | | | | | | | |
Total from investment operations | | | | 0.16 | | | | | 0.20 | | | | | 0.71 | | | | | 0.46 | |
| | | | | | | | | | | | | | | | | | | | |
Less distributions to shareholders: | | | | | | | | | | | | | | | | | | | | |
From net investment income | | | | (0.54 | ) | | | | (0.49 | ) | | | | (1.03 | ) | | | | (1.19 | ) |
From net realized gains | | | | — | | | | | — | | | | | — | | | | | — | |
| | | | | | | | | | | | | | | | | | | | |
Total distributions | | | | (0.54 | ) | | | | (0.49 | ) | | | | (1.03 | ) | | | | (1.19 | ) |
| | | | | | | | | | | | | | | | | | | | |
Net asset value, end of period | | | $ | 25.48 | | | | $ | 25.51 | | | | $ | 25.80 | | | | $ | 26.12 | |
| | | | | | | | | | | | | | | | | | | | |
Total Return(b) | | | | 0.62 | %** | | | | 0.77 | % | | | | 2.79 | % | | | | 1.80 | %** |
Ratios/Supplemental Data: | | | | | | | | | | | | | | | | | | | | |
Net assets, end of period (000’s) | | | $ | 152,877 | | | | $ | 443,602 | | | | $ | 417,150 | | | | $ | 22,684 | |
Net operating expenses to average daily net assets(c) | | | | 0.58 | %* | | | | 0.67 | % | | | | 0.68 | % | | | | 0.66 | %* |
Interest and/or dividend expenses and/or borrowing costs to average daily net assets(e) | | | | 0.00 | %*(d) | | | | 0.00 | %(d) | | | | 0.00 | %(d) | | | | 0.00 | %*(d) |
Total net expenses to average daily net assets(c) | | | | 0.58 | %* | | | | 0.67 | % | | | | 0.68 | % | | | | 0.66 | %* |
Net investment income (loss) to average daily net assets(a) | | | | 3.29 | %* | | | | 2.97 | % | | | | 3.47 | % | | | | 6.55 | %* |
Portfolio turnover rate(f) | | | | 95 | %** | | | | 95 | % | | | | 43 | % | | | | 47 | %** |
Fees and expenses reimbursed and/or waived by GMO to average daily net assets: | | | | 0.05 | %* | | | | 0.05 | %(g) | | | | 0.07 | %(g) | | | | 0.07 | %*(g) |
| (a) | Net investment income is affected by the timing of the declaration of dividends by the other GMO Funds and/or other investment companies in which the Fund invests, if any. |
| (b) | The total returns would have been lower had certain expenses not been reimbursed and/or waived during the periods shown, if applicable, and assumes the effect of reinvested distributions, if any. Calculation excludes purchase premiums and redemption fees which are borne by the shareholder purchasing or redeeming Fund shares, if any. |
| (c) | Net expenses exclude expenses incurred indirectly through investment in the underlying funds, if any (Note 5). |
| (d) | Rounds to less than 0.01%. |
| (e) | Interest and dividend expense and/or borrowing costs incurred as a result of entering into reverse repurchase agreements, securities sold short or margin on cleared swap contracts, if any, is included in the Fund’s net expenses. Income earned on investing proceeds from reverse repurchase agreements, if any, is included in interest income. |
| (f) | The portfolio turnover rate excludes investments in GMO U.S. Treasury Fund (“USTF”) which is used as a short-term investment vehicle for cash management. The Fund’s portfolio turnover rate during the years ended February 28, 2022, February 28, 2021 and February 29, 2020, including transactions in USTF, was 94%, 45% and 48%, respectively, of the average value of its portfolio. |
| (g) | Ratio includes indirect fees waived or borne by GMO. |
| † | Calculated using average shares outstanding throughout the period. |
| | | | |
| | |
| | | See accompanying notes to the financial statements. | | 71 |
GMO Trust Funds
Financial Highlights
(For a share outstanding throughout each period)
U.S. TREASURY FUND
| | | | | | | | | | | | | | | | | | | | | | | | | |
| | | Core Shares |
| | | Year Ended February 28/29, |
| | | 2022 | | 2021 | | 2020 | | 2019(a) | | 2018(a) |
Net asset value, beginning of period | | | $ | 5.04 | | | | $ | 5.02 | | | | $ | 5.00 | | | | $ | 5.00 | | | | $ | 5.01 | |
| | | | | | | | | | | | | | | | | | | | | | | | | |
Income (loss) from investment operations: | | | | | | | | | | | | | | | | | | | | | | | | | |
Net investment income (loss)† | | | | 0.01 | | | | | 0.01 | | | | | 0.10 | | | | | 0.10 | | | | | 0.05 | |
Net realized and unrealized gain (loss) | | | | (0.04 | ) | | | | 0.02 | | | | | 0.02 | | | | | 0.01 | | | | | (0.01 | ) |
| | | | | | | | | | | | | | | | | | | | | | | | | |
Total from investment operations | | | | (0.03 | ) | | | | 0.03 | | | | | 0.12 | | | | | 0.11 | | | | | 0.04 | |
| | | | | | | | | | | | | | | | | | | | | | | | | |
Less distributions to shareholders: | | | | | | | | | | | | | | | | | | | | | | | | | |
From net investment income | | | | (0.00 | )(b) | | | | (0.01 | ) | | | | (0.10 | ) | | | | (0.11 | ) | | | | (0.05 | ) |
From net realized gains | | | | (0.00 | )(b) | | | | (0.00 | )(b) | | | | — | | | | | — | | | | | — | |
| | | | | | | | | | | | | | | | | | | | | | | | | |
Total distributions | | | | (0.00 | )(b) | | | | (0.01 | ) | | | | (0.10 | ) | | | | (0.11 | ) | | | | (0.05 | ) |
| | | | | | | | | | | | | | | | | | | | | | | | | |
Net asset value, end of period | | | $ | 5.01 | | | | $ | 5.04 | | | | $ | 5.02 | | | | $ | 5.00 | | | | $ | 5.00 | |
| | | | | | | | | | | | | | | | | | | | | | | | | |
Total Return(c) | | | | (0.37 | )% | | | | 0.63 | % | | | | 2.47 | % | | | | 2.16 | % | | | | 0.96 | % |
Ratios/Supplemental Data: | | | | | | | | | | | | | | | | | | | | | | | | | |
Net assets, end of period (000’s) | | | $ | 257,766 | | | | $ | 382,455 | | | | $ | 222,762 | | | | $ | 635,777 | | | | $ | 2,324,706 | |
Net expenses to average daily net assets | | | | 0.02 | % | | | | 0.08 | % | | | | 0.06 | % | | | | 0.00 | %(d) | | | | 0.00 | %(d) |
Net investment income (loss) to average daily net assets | | | | 0.13 | % | | | | 0.20 | % | | | | 2.03 | % | | | | 1.97 | % | | | | 1.06 | % |
Portfolio turnover rate(e) | | | | 0 | % | | | | 0 | % | | | | 0 | % | | | | 0 | % | | | | 0 | % |
Fees and expenses reimbursed and/or waived by GMO to average daily net assets: | | | | 0.10 | % | | | | 0.03 | % | | | | 0.05 | % | | | | 0.10 | % | | | | 0.09 | % |
| (a) | Per share amounts were adjusted to reflect an approximate 5 for 1 stock split effective December 6, 2018. |
| (b) | Rounds to less than $0.01. |
| (c) | The total returns would have been lower had certain expenses not been reimbursed and/or waived during the periods shown, if applicable, and assumes the effect of reinvested distributions, if any. Calculation excludes purchase premiums and redemption fees which are borne by the shareholder purchasing or redeeming Fund shares, if any. |
| (d) | Rounds to less than 0.01%. |
| (e) | Portfolio turnover rate calculation excludes short-term investments. |
| † | Calculated using average shares outstanding throughout the period. |
| | | | |
| | |
| 72 | | See accompanying notes to the financial statements. | | |
GMO Trust Funds
Notes to Financial Statements
February 28, 2022
Each of Asset Allocation Bond Fund, Emerging Country Debt Fund, High Yield Fund, Multi-Sector Fixed Income Fund, Opportunistic Income Fund and U.S. Treasury Fund (each a “Fund” and collectively the “Funds”) is a series of GMO Trust (the “Trust”). The Trust is registered under the Investment Company Act of 1940, as amended (the “1940 Act”), as an open-end management investment company. The Trust was established as a Massachusetts business trust under the laws of The Commonwealth of Massachusetts on June 24, 1985. The Declaration of Trust permits the Trustees of the Trust (“Trustees”) to create an unlimited number of series of shares (Funds) and to subdivide Funds into classes. The Funds are advised and managed by Grantham, Mayo, Van Otterloo & Co. LLC (“GMO”).
The Funds may invest in GMO U.S. Treasury Fund and in money market funds unaffiliated with GMO.
Many of the Funds may invest without limitation in other GMO Funds (“underlying funds”). In particular, pursuant to an exemptive order granted by the Securities and Exchange Commission (“SEC”), some of the Funds may invest in Emerging Country Debt Fund, Opportunistic Income Fund and U.S. Treasury Fund. The financial statements of the underlying funds should be read in conjunction with the Funds’ financial statements. The financial statements are available without charge on the SEC’s website at www.sec.gov or on GMO’s website at www.gmo.com.
The following table provides information about the Funds’ principal investment objectives and benchmarks (if any):
| | | | |
| | | |
| Fund Name | | Benchmark | | Investment Objective |
| Asset Allocation Bond Fund | | FTSE 3-Month Treasury Bill Index | | Total return in excess of benchmark |
| Emerging Country Debt Fund | | J.P. Morgan EMBI Global Diversified | | Total return in excess of benchmark |
| High Yield Fund | | Markit iBoxx USD Liquid High Yield Index | | Total return in excess of benchmark |
| Multi-Sector Fixed Income Fund | | Bloomberg U.S. Aggregate Index | | Total return in excess of benchmark |
| Opportunistic Income Fund | | Not Applicable | | Capital appreciation and current income |
| U.S. Treasury Fund | | Not Applicable | | Liquidity and safety of principal with current income as a secondary objective |
Asset Allocation Bond Fund currently limits subscriptions.
| 2. | Significant accounting policies |
The following is a summary of significant accounting policies followed by each Fund in the preparation of its financial statements. These policies are in conformity with accounting principles generally accepted in the United States of America (“U.S. GAAP”) and have been consistently followed by the Funds in preparing these financial statements. The preparation of financial statements in accordance with U.S. GAAP requires management to make estimates and assumptions that affect the reported amounts and disclosures in the financial statements. Actual results could differ from those estimates. The accounting records of the Funds are maintained in U.S. dollars.
Portfolio valuation
Typically, the Funds and the underlying funds value fixed income securities at the most recent price supplied by a pricing source determined by GMO. GMO evaluates pricing sources on an ongoing basis and may change a pricing source at any time. GMO monitors erratic or unusual movements (including unusual inactivity) in the prices supplied for a security and has discretion to override a price supplied by a source (e.g., by taking a price supplied by another source) when it believes that the price supplied is not reliable. Alternative pricing sources are often but not always available for securities held by the Funds and the underlying funds.
Exchange-traded securities (other than exchange-traded options) for which market quotations are readily available are valued at (i) the last sale price or (ii) official closing price or (iii) most recent quoted price published by the exchange (if no reported last sale or official closing price) or (iv) the quoted price provided by a pricing source (in the event GMO deems the private market to be a more reliable indicator of market value than the exchange). Exchange-traded options are valued at the last sale price, provided that price is between the closing bid and ask prices. If the last sale price is not within that range, then they will be valued at the closing bid price
GMO Trust Funds
Notes to Financial Statements — (Continued)
February 28, 2022
for long positions and the closing ask price for short positions. Cleared derivatives are valued using the price quoted (which may be based on a model) by the relevant clearing house. If an updated quote for a cleared derivative is not available when a Fund calculates its net asset value, the derivative will generally be valued using an industry standard model, which may differ from the model used by the relevant clearing house. Over-the-counter (“OTC”) derivatives are generally valued at the price determined by an industry standard model. Unlisted securities for which market quotations are readily available are generally valued at the most recent quoted price. Shares of the underlying funds and other open-end registered investment companies are valued at their most recent net asset value.
The foregoing valuation methodologies are modified for equities that trade in non-U.S. securities markets that close before the close of the New York Stock Exchange (“NYSE”) due to time zone differences, including the value of equities that underlie futures, options and other derivatives (to the extent the market for those derivatives closes prior to the close of the NYSE). In those cases, the price will generally be adjusted, to the extent practicable and available, based on inputs from an independent pricing service approved by the Trustees that are intended to reflect valuation changes through the NYSE close. These securities listed on foreign exchanges (including the value of equity securities that underlie futures, options and other derivatives (to the extent the market for such instruments closes prior to the close of the NYSE)) are classified as Level 2 (levels defined below).
“Quoted price” typically means the bid price for securities held long and the ask price for securities sold short. If a market quotation for a security does not involve a bid or an ask, the “quoted price” may be the price provided by a market participant or other third-party pricing source in accordance with the market practice for that security. If an updated quoted price for a security is not available when a Fund calculates its net asset value, the Fund will generally use the last quoted price so long as GMO believes that the last quoted price continues to represent that security’s fair value.
In the case of derivatives, prices determined by a model may reflect an estimate of the average of bid and ask prices, regardless of whether a Fund has a long position or a short position.
If quotations are not readily available or circumstances make an existing valuation methodology or procedure unreliable, derivatives and other securities are valued at fair value as determined in good faith by the Trustees or persons acting at their direction pursuant to procedures approved by the Trustees. Because of the uncertainty inherent in fair value pricing, the price determined for a particular security may be materially different from the value realized upon its sale. The Funds and/or the underlying funds classify such securities as Level 3 (levels defined below). For the year ended February 28, 2022, the Funds did not reduce the value of any of their OTC derivatives contracts, if any, based on the creditworthiness of their counterparties. See Note 4 “Derivative financial instruments” for a further discussion on valuation of derivatives.
U.S. GAAP requires the Funds to disclose the fair value of their investments in a three-level hierarchy (Levels 1, 2 and 3). The valuation hierarchy is based upon the relative observability of inputs to the valuation of the Funds’ investments. The inputs or methodologies used for valuing securities are not necessarily an indication of the risk associated with investing in those securities.
Changes in valuation techniques may result in transfers into or out of an investment’s assigned level within the fair value hierarchy. In addition, in periods of market dislocation, the observability of prices and inputs may be reduced for many instruments. This condition, as well as changes related to the liquidity of investments, could cause a security to be reclassified between levels.
The three levels are defined as follows:
Level 1 – Valuations based on quoted prices for identical securities in active markets.
The types of assets and liabilities categorized in Level 1 generally include actively traded domestic and certain foreign equity securities; certain U.S. government obligations; derivatives actively traded on a national securities exchange (such as some futures and options); and shares of open-end mutual funds (even if their investments are valued using Level 2 or Level 3 inputs).
Level 2 – Valuations determined using other significant direct or indirect observable inputs.
The types of assets and liabilities categorized in Level 2 generally include certain U.S. government agency securities, mortgage-backed securities, asset-backed securities, certain sovereign debt obligations, and corporate bonds valued using vendor prices or broker quotes; cleared derivatives and certain OTC derivatives such as swaps, options, swaptions, and forward currency contracts
GMO Trust Funds
Notes to Financial Statements — (Continued)
February 28, 2022
valued using industry standard models; certain restricted securities valued at the most recent available market or quoted price; certain debt obligations, such as collateralized loan obligations, that have yet to begin trading that are valued at cost; and certain foreign equity securities that are adjusted based on inputs from an independent pricing service approved by the Trustees, including the value of equity securities that underlie futures, options and other derivatives (to the extent the market for such instruments closes prior to the close of the NYSE) to reflect estimated valuation changes through the NYSE close.
Level 3 – Valuations based primarily on inputs that are unobservable and significant.
The types of assets and liabilities categorized in Level 3 generally include, but are not limited to, certain debt securities (such as asset-backed, mortgage-backed, loans and sovereign debt) and derivatives even though they may be valued using broker quotes; certain debt securities and derivatives adjusted by a specified discount for liquidity or other considerations; certain sovereign debt securities valued using comparable securities issued by the sovereign adjusted by a specified spread; securities whose trading has been suspended or that have been de-listed from their current primary trading exchange valued at the most recent available market or quoted price; certain investment funds valued at cost; securities in default or bankruptcy proceedings for which there is no current market quotation valued at the most recent available market or quoted price and potential litigation recoveries and interests related to bankruptcy proceedings.
The following is a summary of the respective levels assigned to the Funds’ direct securities and derivatives, if any, as of February 28, 2022:
| | | | | | | | | | | | | | | | |
| | | | | |
| Description | | Level 1 | | | Level 2 | | | Level 3 | | | Total | |
| Asset Allocation Bond Fund | |
| Asset Valuation Inputs | |
Debt Obligations | | | | | | | | | | | | | | | | |
U.S. Government | | $ | 37,852,066 | | | $ | — | | | $ | — | | | $ | 37,852,066 | |
| | | | | | | | | | | | | | | | | |
TOTAL DEBT OBLIGATIONS | | | 37,852,066 | | | | — | | | | — | | | | 37,852,066 | |
| | | | | | | | | | | | | | | | | |
Mutual Funds | | | 11,626 | | | | — | | | | — | | | | 11,626 | |
Short-Term Investments | | | 216,918 | | | | — | | | | — | | | | 216,918 | |
| | | | | | | | | | | | | | | | | |
Total Investments | | | 38,080,610 | | | | — | | | | — | | | | 38,080,610 | |
| | | | | | | | | | | | | | | | | |
Total | | $ | 38,080,610 | | | $ | — | | | $ | — | | | $ | 38,080,610 | |
| | | | | | | | | | | | | | | | | |
| | | | | | | | | | | | | | | | | |
| Emerging Country Debt Fund | |
Asset Valuation Inputs | |
Debt Obligations | | | | | | | | | | | | | | | | |
Asset-Backed Securities | | $ | — | | | $ | 11,907,918 | | | $ | — | | | $ | 11,907,918 | |
Corporate Debt | | | — | | | | 183,562,412 | | | | 20,629,398 | | | | 204,191,810 | |
Sovereign and Sovereign Agency Issuers | | | — | | | | 2,793,635,756 | | | | 272,728,861 | | | | 3,066,364,617 | |
U.S. Government | | | 108,403,572 | | | | — | | | | — | | | | 108,403,572 | |
| | | | | | | | | | | | | | | | | |
TOTAL DEBT OBLIGATIONS | | | 108,403,572 | | | | 2,989,106,086 | | | | 293,358,259 | | | | 3,390,867,917 | |
| | | | | | | | | | | | | | | | | |
Loan Assignments | | | — | | | | — | | | | 53,869,474 | | | | 53,869,474 | |
Loan Participations | | | — | | | | — | | | | 43,258,898 | | | | 43,258,898 | |
Investment Funds | | | — | | | | — | | | | 7,850,000 | | | | 7,850,000 | |
Mutual Funds | | | 74,339,103 | | | | — | | | | — | | | | 74,339,103 | |
Purchased Options | | | — | | | | 30,644 | | | | — | | | | 30,644 | |
Rights/Warrants | | | — | | | | 3,240,577 | | | | 2,194,666 | | | | 5,435,243 | |
Short-Term Investments | | | 63,850,067 | | | | — | | | | — | | | | 63,850,067 | |
| | | | | | | | | | | | | | | | | |
Total Investments | | | 246,592,742 | | | | 2,992,377,307 | | | | 400,531,297 | | | | 3,639,501,346 | |
| | | | | | | | | | | | | | | | | |
Derivatives^ | | | | | | | | | | | | | | | | |
Forward Currency Contracts | | | | | | | | | | | | | | | | |
Foreign Currency Risk | | | — | | | | 9,315,733 | | | | — | | | | 9,315,733 | |
Options | | | | | | | | | | | | | | | | |
Credit Risk | | | — | | | | — | | | | 326,111 | | | | 326,111 | |
Swap Contracts | | | | | | | | | | | | | | | | |
Credit Risk | | | — | | | | 34,074,409 | | | | — | | | | 34,074,409 | |
Interest Rate Risk | | | — | | | | 9,016,873 | | | | — | | | | 9,016,873 | |
| | | | | | | | | | | | | | | | | |
Total | | $ | 246,592,742 | | | $ | 3,044,784,322 | | | $ | 400,857,408 | | | $ | 3,692,234,472 | |
| | | | | | | | | | | | | | | | | |
| | | | | | | | | | | | | | | | | |
GMO Trust Funds
Notes to Financial Statements — (Continued)
February 28, 2022
| | | | | | | | | | | | | | | | |
| | | | | |
| Description | | Level 1 | | | Level 2 | | | Level 3 | | | Total | |
| Emerging Country Debt Fund (continued) | |
| Liability Valuation Inputs | |
Derivatives^ | |
Forward Currency Contracts | | | | | | | | | | | | | | | | |
Foreign Currency Risk | | $ | — | | | $ | (5,074,237 | ) | | $ | — | | | $ | (5,074,237 | ) |
Swap Contracts | | | | | | | | | | | | | | | | |
Credit Risk | | | — | | | | (10,200,864 | ) | | | — | | | | (10,200,864 | ) |
Interest Rate Risk | | | — | | | | (12,437,718 | ) | | | — | | | | (12,437,718 | ) |
| | | | | | | | | | | | | | | | | |
Total | | $ | — | | | $ | (27,712,819 | ) | | $ | — | | | $ | (27,712,819 | ) |
| | | | | | | | | | | | | | | | | |
| | | | | | | | | | | | | | | | | |
| High Yield Fund | |
| Asset Valuation Inputs | |
Debt Obligations | | | | | | | | | | | | | | | | |
Corporate Debt | | $ | — | | | $ | 23,327,780 | | | $ | — | | | $ | 23,327,780 | |
U.S. Government | | | 3,635,687 | | | | — | | | | — | | | | 3,635,687 | |
| | | | | | | | | | | | | | | | | |
TOTAL DEBT OBLIGATIONS | | | 3,635,687 | | | | 23,327,780 | | | | — | | | | 26,963,467 | |
| | | | | | | | | | | | | | | | | |
Short-Term Investments | | | 35,693,852 | | | | 20,626,496 | | | | — | | | | 56,320,348 | |
| | | | | | | | | | | | | | | | | |
Total Investments | | | 39,329,539 | | | | 43,954,276 | | | | — | | | | 83,283,815 | |
| | | | | | | | | | | | | | | | | |
Derivatives^ | | | | | | | | | | | | | | | | |
Forward Currency Contracts | | | | | | | | | | | | | | | | |
Foreign Currency Risk | | | — | | | | 218,399 | | | | — | | | | 218,399 | |
Futures Contracts | | | | | | | | | | | | | | | | |
Interest Rate Risk | | | 180,489 | | | | — | | | | — | | | | 180,489 | |
Swap Contracts | | | | | | | | | | | | | | | | |
Credit Risk | | | — | | | | 1,644,741 | | | | — | | | | 1,644,741 | |
| | | | | | | | | | | | | | | | | |
Total | | $ | 39,510,028 | | | $ | 45,817,416 | | | $ | — | | | $ | 85,327,444 | |
| | | | | | | | | | | | | | | | | |
| Liability Valuation Inputs | |
Derivatives^ | | | | | | | | | | | | | | | | |
Futures Contracts | | | | | | | | | | | | | | | | |
Interest Rate Risk | | $ | (11,329 | ) | | $ | — | | | $ | — | | | $ | (11,329 | ) |
Swap Contracts | | | | | | | | | | | | | | | | |
Credit Risk | | | — | | | | (321,248 | ) | | | — | | | | (321,248 | ) |
Interest Rate Risk | | | — | | | | (814,909 | ) | | | — | | | | (814,909 | ) |
Written Options | | | | | | | | | | | | | | | | |
Credit Risk | | | — | | | | (116,704 | ) | | | — | | | | (116,704 | ) |
| | | | | | | | | | | | | | | | | |
Total | | $ | (11,329 | ) | | $ | (1,252,861 | ) | | $ | — | | | $ | (1,264,190 | ) |
| | | | | | | | | | | | | | | | | |
| | | | | | | | | | | | | | | | | |
| Multi-Sector Fixed Income Fund | |
| Asset Valuation Inputs | |
Debt Obligations | | | | | | | | | | | | | | | | |
Corporate Debt | | $ | — | | | $ | 36,733,064 | | | $ | — | | | $ | 36,733,064 | |
U.S. Government Agency | | | — | | | | 17,789,784 | | | | — | | | | 17,789,784 | |
| | | | | | | | | | | | | | | | | |
TOTAL DEBT OBLIGATIONS | | | — | | | | 54,522,848 | | | | — | | | | 54,522,848 | |
| | | | | | | | | | | | | | | | | |
Mutual Funds | | | 34,615,466 | | | | — | | | | — | | | | 34,615,466 | |
Short-Term Investments | | | 24,165,286 | | | | 28,568,515 | | | | — | | | | 52,733,801 | |
| | | | | | | | | | | | | | | | | |
Total Investments | | | 58,780,752 | | | | 83,091,363 | | | | — | | | | 141,872,115 | |
| | | | | | | | | | | | | | | | | |
| | | | | | | | | | | | | | | | | |
GMO Trust Funds
Notes to Financial Statements — (Continued)
February 28, 2022
| | | | | | | | | | | | | | | | |
| | | | | |
| Description | | Level 1 | | | Level 2 | | | Level 3 | | | Total | |
| Multi-Sector Fixed Income Fund (continued) | |
| Asset Valuation Inputs (continued) | |
Derivatives^ | | | | | | | | | | | | | | | | |
Forward Currency Contracts | | | | | | | | | | | | | | | | |
Foreign Currency Risk | | $ | — | | | $ | 529,761 | | | $ | — | | | $ | 529,761 | |
Futures Contracts | | | | | | | | | | | | | | | | |
Interest Rate Risk | | | 450,626 | | | | — | | | | — | | | | 450,626 | |
Swap Contracts | | | | | | | | | | | | | | | | |
Interest Rate Risk | | | — | | | | 2,188,309 | | | | — | | | | 2,188,309 | |
| | | | | | | | | | | | | | | | | |
Total | | $ | 59,231,378 | | | $ | 85,809,433 | | | $ | — | | | $ | 145,040,811 | |
| | | | | | | | | | | | | | | | | |
| Liability Valuation Inputs | |
Derivatives^ | |
Forward Currency Contracts | | | | | | | | | | | | | | | | |
Foreign Currency Risk | | $ | — | | | $ | (1,063,151 | ) | | $ | — | | | $ | (1,063,151 | ) |
Futures Contracts | | | | | | | | | | | | | | | | |
Interest Rate Risk | | | (41,875 | ) | | | — | | | | — | | | | (41,875 | ) |
Swap Contracts | | | | | | | | | | | | | | | | |
Interest Rate Risk | | | — | | | | (2,562,675 | ) | | | — | | | | (2,562,675 | ) |
| | | | | | | | | | | | | | | | | |
Total | | $ | (41,875 | ) | | $ | (3,625,826 | ) | | $ | — | | | $ | (3,667,701 | ) |
| | | | | | | | | | | | | | | | | |
| | | | | | | | | | | | | | | | | |
| Opportunistic Income Fund | |
| Asset Valuation Inputs | |
Debt Obligations | | | | | | | | | | | | | | | | |
Asset-Backed Securities | | $ | — | | | $ | 691,056,284 | | | $ | 12,356,438 | | | $ | 703,412,722 | |
Corporate Debt | | | — | | | | 4,233,245 | | | | — | | | | 4,233,245 | |
U.S. Government | | | 170,827,351 | | | | — | | | | — | | | | 170,827,351 | |
U.S. Government Agency | | | — | | | | — | | | | 7,640,437 | | | | 7,640,437 | |
| | | | | | | | | | | | | | | | | |
TOTAL DEBT OBLIGATIONS | | | 170,827,351 | | | | 695,289,529 | | | | 19,996,875 | | | | 886,113,755 | |
| | | | | | | | | | | | | | | | | |
Mutual Funds | | | 10,938,043 | | | | — | | | | — | | | | 10,938,043 | |
Short-Term Investments | | | 62,968,111 | | | | — | | | | — | | | | 62,968,111 | |
Purchased Options | | | — | | | | 2,117,955 | | | | — | | | | 2,117,955 | |
| | | | | | | | | | | | | | | | | |
Total Investments | | | 244,733,505 | | | | 697,407,484 | | | | 19,996,875 | | | | 962,137,864 | |
| | | | | | | | | | | | | | | | | |
Derivatives^ | | | | | | | | | | | | | | | | |
Forward Currency Contracts | | | | | | | | | | | | | | | | |
Foreign Currency Risk | | | — | | | | 98,731 | | | | — | | | | 98,731 | |
Futures Contracts | | | | | | | | | | | | | | | | |
Interest Rate Risk | | | 155,255 | | | | — | | | | — | | | | 155,255 | |
Swap Contracts | | | | | | | | | | | | | | | | |
Credit Risk | | | — | | | | 24,883,395 | | | | — | | | | 24,883,395 | |
Interest Rate Risk | | | — | | | | 149,920 | | | | — | | | | 149,920 | |
| | | | | | | | | | | | | | | | | |
Total | | $ | 244,888,760 | | | $ | 722,539,530 | | | $ | 19,996,875 | | | $ | 987,425,165 | |
| | | | | | | | | | | | | | | | | |
| Liability Valuation Inputs | |
Derivatives^ | |
Forward Currency Contracts | | | | | | | | | | | | | | | | |
Foreign Currency Risk | | $ | — | | | $ | (25,235 | ) | | $ | — | | | $ | (25,235 | ) |
Futures Contracts | | | | | | | | | | | | | | | | |
Interest Rate Risk | | | (437,439 | ) | | | — | | | | — | | | | (437,439 | ) |
Written Options | | | | | | | | | | | | | | | | |
Credit Risk | | | — | | | | (2,132,177 | ) | | | — | | | | (2,132,177 | ) |
Swap Contracts | | | | | | | | | | | | | | | | |
Credit Risk | | | — | | | | (5,037,032 | ) | | | — | | | | (5,037,032 | ) |
Interest Rate Risk | | | — | | | | (14,336 | ) | | | — | | | | (14,336 | ) |
| | | | | | | | | | | | | | | | | |
Total | | $ | (437,439 | ) | | $ | (7,208,780 | ) | | $ | — | | | $ | (7,646,219 | ) |
| | | | | | | | | | | | | | | | | |
| | | | | | | | | | | | | | | | | |
GMO Trust Funds
Notes to Financial Statements — (Continued)
February 28, 2022
| | | | | | | | | | | | | | | | |
| | | | | |
| Description | | Level 1 | | | Level 2 | | | Level 3 | | | Total | |
| U.S. Treasury Fund | |
| Asset Valuation Inputs | |
Short-Term Investments | | $ | 260,850,764 | | | $ | — | | | $ | — | | | $ | 260,850,764 | |
| | | | | | | | | | | | | | | | | |
Total Investments | | | 260,850,764 | | | | — | | | | — | | | | 260,850,764 | |
| | | | | | | | | | | | | | | | | |
Total | | $ | 260,850,764 | | | $ | — | | | $ | — | | | $ | 260,850,764 | |
| | | | | | | | | | | | | | | | | |
| | | | | | | | | | | | | | | | | |
The risks referenced in the tables above are not intended to be inclusive of all risks. Please see the “Investment and other risks” and “Derivative financial instruments” sections below for a further discussion of risks.
| | ^ | In the tables above derivatives are based on market values, rather than the notional amounts of derivatives, except for forward currency contracts which are based on unrealized appreciation/(depreciation). Excludes purchased options, if any, which are included in investments. |
Emerging Country Debt Fund has committed an additional $7,850,000 to its investment in Bona Fide Investments Feeder LLC, a private investment in a pool of constitutional obligations of the Colombian government owed to individuals.
The underlying funds held at year end are classified above as Level 1. Certain underlying funds invest in securities and/or derivatives which may have been fair valued using methods determined in good faith by or at the direction of the Trustees or which may have been valued using significant unobservable inputs. For a summary of the levels assigned to the underlying funds’ direct securities and derivatives, if any, please refer to the underlying funds’ Notes to Financial Statements which are available on the SEC’s website at www.sec.gov or on GMO’s website at www.gmo.com.
U.S. GAAP requires additional disclosures about fair value measurements for material Level 3 securities and derivatives, if any (determined by each category of asset or liability as compared to a Fund’s total net assets). Level 3 holdings include investments valued using unadjusted prices supplied by a third-party pricing source (e.g., broker quotes, vendor). Emerging Country Debt Fund’s Level 3 holdings also include the Republic of Albania Par Bond, due 8/31/25, which is valued by applying a 140 basis point spread to the yield of the U.S. Treasury Strip Principal, due 8/15/25, an investment fund valued at cost, two Colombia Government International Bonds, due 2/15/27 and 3/09/28, respectively, which are valued by applying a 150 and 160 basis point spread, respectively, to the yield of the Colombia Government International Bond, due 4/25/27, Empresa Nacional de Electricidad SA, due 2/01/97 which is valued based on the average of a selection of comparable bonds and applying a 200 basis point discount for liquidity considerations, a Meridiam Eastern Europe Investment S.à.r.l. Loan Agreement, due 6/23/28, which is valued by applying a 550 basis point spread to the yield of the Republic of Turkey, due 3/31/25 and a Republic of Kenya loan agreement, which is valued by applying 500 basis point yield spread to a comparable bond. Opportunistic Income Fund’s Level 3 holdings also consists of three U.S. Agency for International Development Floater Bonds which were valued using current LIBOR yield and adjusted by 125 basis points for liquidity considerations and five asset-backed securities that were valued in line with general movement of spreads, interest rates or a comparable bond. There were no other Funds with classes of investments or derivatives with direct material Level 3 holdings at February 28, 2022.
GMO Trust Funds
Notes to Financial Statements — (Continued)
February 28, 2022
For Funds with material total Level 3 assets and/or liabilities, the following is a reconciliation of securities and derivatives, if any, in which significant unobservable inputs (Level 3) were used in determining value:
| | | | | | | | | | | | | | | | | | | | | | | | | | | | | | | | | | | | | | | | |
| | | | | | | | | | | |
| | | Balances
as of
February 28,
2021 | | | Purchases | | | Sales | | | Accrued
Discounts/
Premiums | | | Total
Realized
Gain/
(Loss) | | | Change in
Unrealized
Appreciation
(Depreciation) | | | Transfer
into Level 3 | | | Transfer
out of
Level 3 | | | Balances
as of
February 28,
2022 | | | Net Change in
Unrealized
Appreciation
(Depreciation)
from
Investments
Still Held as
of February 28,
2022 | |
| Emerging Country Debt Fund | | | | | | | | | | | | | | | | | | | | | | | | | | | | |
| Debt Obligations | | | | | | | | | | | | | | | | | | | | | | | | | | | | | | | | | | | | | | | | |
Corporate Debt | | $ | 27,230,315 | | | $ | — | | | $ | — | | | $ | (1,731 | ) $ | | | — | | | $ | (6,599,186 | ) | | $ | — | | | $ | — | | | $ | 20,629,398 | | | $ | (6,599,186 | ) |
Sovereign and Sovereign Agency Issuers | | | 232,617,919 | | | | 75,196,898 | | | | (6,412,671 | ) | | | 4,601,513 | | | | 1,345,428 | | | | (84,476,580 | ) | | | 49,856,354 | ‡ | | | — | | | | 272,728,861 | | | | (84,476,580 | ) |
| Loan Assignments | | | 23,371,890 | | | | 37,367,603 | | | | (6,395,216 | ) | | | 1,430,357 | | | | — | | | | (1,905,160 | ) | | | — | | | | — | | | | 53,869,474 | | | | (1,904,408 | ) |
| Loan Participations | | | 39,866,840 | | | | 15,401,752 | | | | (19,967,493 | ) | | | 2,081,987 | | | | 471,942 | | | | 5,403,870 | | | | — | | | | — | | | | 43,258,898 | | | | 5,403,870 | |
| Investment Funds | | | — | | | | 7,850,000 | | | | — | | | | — | | | | — | | | | — | | | | — | | | | — | | | | 7,850,000 | | | | — | |
| Rights/Warrants | | | 34,800 | | | | — | | | | — | | | | — | | | | — | | | | (7,034 | ) | | | 2,166,900 | ‡ | | | — | | | | 2,194,666 | | | | (7,034 | ) |
| | | | | | | | | | | | | | | | | | | | | | | | | | | | | | | | | | | | | | | | | |
Total Investments | | | 323,121,764 | | | | 135,816,253 | | | | (32,775,380 | ) | | | 8,112,126 | | | | 1,817,370 | | | | (87,584,090 | ) | | | 52,023,254 | | | | — | | | | 400,531,297 | | | | (87,583,338 | ) |
| | | | | | | | | | | | | | | | | | | | | | | | | | | | | | | | | | | | | | | | | |
| Derivatives | | | | | | | | | | | | | | | | | | | | | | | | | | | | | | | | | | | | | | | | |
Options | | | 390,519 | | | | — | | | | — | | | | — | | | | 317,281 | | | | (381,689 | ) | | | — | | | | — | | | | 326,111 | | | | 501,175 | |
| | | | | | | | | | | | | | | | | | | | | | | | | | | | | | | | | | | | | | | | | |
Total | | $ | 323,512,283 | | | $ | 135,816,253 | | | $ | (32,775,380 | )# | | $ | 8,112,126 | | | $ | 2,134,651 | | | $ | (87,965,779 | ) | | | $52,023,254 | | | $ | — | | | $ | 400,857,408 | | | $ | (87,082,163 | ) |
| | | | | | | | | | | | | | | | | | | | | | | | | | | | | | | | | | | | | | | | | |
| | | | | | | | | | | | | | | | | | | | | | | | | | | | | | | | | | | | | | | | | |
| Opportunistic Income Fund | | | | | | | | | | | | | | | | | | | |
| Debt Obligations | | | | | | | | | | | | | | | | | | | | | | | | | | | | | | | | | | | | | | | | |
Asset-Backed Securities | | $ | 42,612,548 | | | $ | 2,756,923 | | | $ | (9,202,211 | ) | | $ | 201,728 | | | $ | 4,987,004 | | | $ | (3,670,878 | ) | | $ | — | | | $ | (25,328,676 | )‡ | | $ | 12,356,438 | | | $ | (837,367 | ) |
U.S. Government Agency | | | 9,938,002 | | | | — | | | | (2,445,822 | ) | | | 32,876 | | | | — | | | | 115,381 | | | | — | | | | — | | | | 7,640,437 | | | | 115,381 | |
| | | | | | | | | | | | | | | | | | | | | | | | | | | | | | | | | | | | | | | | | |
Total | | $ | 52,550,550 | | | $ | 2,756,923 | | | $ | (11,648,033 | )## | | $ | 234,604 | | | $ | 4,987,004 | | | $ | (3,555,497 | ) | | $ | — | | | $ | (25,328,676 | ) | | $ | 19,996,875 | | | $ | (721,986 | ) |
| | | | | | | | | | | | | | | | | | | | | | | | | | | | | | | | | | | | | | | | | |
| | | | | | | | | | | | | | | | | | | | | | | | | | | | | | | | | | | | | | | | | |
| | # | Includes $26,128,709 of proceeds received from partial calls and/or principal paydowns as applicable. |
| | ## | Includes $6,163,957 of proceeds received from partial calls and/or principal paydowns as applicable. |
| | ‡ | Financial assets transferred between levels were due to a change in observable and/or unobservable inputs as well as the impact of the Russian invasion of Ukraine on local and global markets, as applicable. |
The following table summarizes the quantitative inputs used in the valuation of investments classified within Level 3 of the fair value hierarchy for the year ended February 28, 2022 for Funds with material Level 3 investments.
GMO Trust Funds
Notes to Financial Statements — (Continued)
February 28, 2022
Quantitative information about Level 3 Fair Value Measurements*
| | | | | | | | | | | | | | |
| | | | | |
| Investment Type | | Total Fair
Value ($) | | | Valuation
Methodology | | | Unobservable Inputs | | Range (Weighted
Average) | |
| Emerging Country Debt Fund | | | | | | | | | | | | | | |
Sovereign and Sovereign Agency Issuers | | | 51,043,759 | | | | Fair Value | | | Discount for lack of liquidity/marketability | | | 1.40%-1.60% (1.42%) | |
Corporate Debt | | | 20,629,398 | | | | Fair Value | | | Discount for lack of liquidity/marketability | | | 2.00% (N/A) | |
Loan Assignments and Participations | | | 35,671,282 | | | | Fair Value | | | Discount for lack of liquidity/marketability | | | 5.00%-6.00% (5.44%) | |
Warrants | | | 27,766 | | | | Fair Value | | | Discount for lack of liquidity/marketability | | | 50% (N/A) | |
Options | | | 326,111 | | | | Fair Value | | | Probability of CDS threshold event | | | <5% (N/A) | |
| Opportunistic Income Fund | | | | | | | | | | | | | | |
Asset-Backed Securities | | | 12,274,188 | | | | Fair Value | | | Broker mark of comparable bond | | | N/A | |
Government Agency | | | 7,640,437 | | | | Fair Value | | | Discount for lack of liquidity/marketability | | | 1.25% (N/A) | |
| | * | The table does not include Level 3 securities or derivatives that are valued by pricing vendors or brokers. As of February 28, 2022, the value of these securities and/or derivatives for Emerging Country Debt Fund and Opportunistic Income Fund was $293,159,092 and $82,250 respectively. The inputs for these investments are not readily available or cannot be reasonably estimated. |
Cash
Cash and foreign currency, if any, in the Statements of Assets and Liabilities consist of cash balances held with the custodian.
Due to/from broker
Due to/from broker in the Statements of Assets and Liabilities includes collateral on swap contracts, futures contracts, option contracts and forward currency contracts, if any, and may include marked-to-market amounts related to foreign currency or cash owed.
Foreign currency translation
The market values of foreign securities, currency holdings and related assets and liabilities are typically translated into U.S. dollars at the close of regular trading on the NYSE, generally at 4:00 pm Eastern time. Income and expenses denominated in foreign currencies are typically translated into U.S. dollars at the close of regular trading on the NYSE. Fluctuations in the value of currency holdings and other assets and liabilities resulting from changes in exchange rates are recorded as unrealized foreign currency gains or losses. Realized gains or losses and unrealized appreciation or depreciation on investment securities and income and expenses are translated on the respective dates of such transactions. The effects of changes in foreign currency exchange rates on investments in securities are not separated in the Statements of Operations from the effects of changes in market prices of those securities, but are included with the net realized and unrealized gain or loss on investment securities.
Indexed investments
Each Fund may invest in various transactions and instruments that are designed to track the performance of an index (including, but not limited to, securities indices and credit default indices). Indexed securities are securities the redemption values and/or coupons of which are indexed to a specific instrument, group of instruments, index, or other statistic. Indexed securities typically, but not always, are debt securities or deposits whose value at maturity or coupon rate is determined by reference to other securities, securities or inflation indices, currencies, precious metals or other commodities, or other financial indicators. For example, the maturity value of gold-indexed securities depends on the price of gold and, therefore, their price tends to rise and fall with gold prices.
Loan assignments and participations
The Funds (except U.S. Treasury Fund) may invest in direct debt instruments, which are interests in amounts owed to lenders or lending syndicates, to suppliers of goods or services, or to other parties by corporate, governmental or other borrower. Such “loans” may include bank loans, promissory notes, and loan participations, or in the case of suppliers of goods or services, trade claims or other receivables. A loan is often administered by a bank or other financial institution that acts as agent for all holders. The agent administers the terms of the loan, as specified in the loan agreement. Unless, under the terms of the loan or other indebtedness a Fund has direct recourse against the borrower, it may have to rely on the agent to enforce its rights against the borrower. When investing in a loan participation, (i) a Fund has the right to receive payments of principal, interest and any fees to which it is entitled only from the
GMO Trust Funds
Notes to Financial Statements — (Continued)
February 28, 2022
party from whom the Fund has purchased the participation and only upon receipt by that party of payments from the borrower and (ii) a Fund generally has no right to enforce compliance by the borrower with the terms of the loan agreement or to vote on matters arising under the loan agreement. Thus, a Fund may be subject to credit risk both of the party from whom it purchased the loan participation and the borrower and that Fund may have minimal control over the terms of any loan modification. Loan assignments and participations outstanding at the end of the year, if any, are listed in each applicable Fund’s Schedule of Investments.
Rights and warrants
The Funds may purchase or otherwise receive warrants or rights. Warrants and rights generally give the holder the right to receive, upon exercise, a security of the issuer at a set price. Funds typically use warrants and rights in a manner similar to their use of purchased options on securities, as described in the section entitled “Options” in Note 4 “Derivative financial instruments”. Risks associated with the use of warrants and rights are generally similar to risks associated with the use of purchased options. However, warrants and rights often do not have standardized terms, and may have longer maturities and may be less liquid than exchange-traded options. In addition, the terms of warrants or rights may limit a Fund’s ability to exercise the warrants or rights at such times and in such quantities as the Fund would otherwise wish. Rights and/or warrants outstanding at the end of the year, if any, are listed in each applicable Fund’s Schedule of Investments.
Repurchase agreements
The Funds may enter into repurchase agreements with banks and brokers. Under a repurchase agreement a Fund acquires a security for a relatively short period for cash and obtains a simultaneous commitment from the seller to repurchase the security at an agreed upon price and date. The Fund, through its custodian, takes possession of securities it acquired under the repurchase agreement. The value of the securities acquired may be less than the amount owed to the Fund by the seller. If the seller in a repurchase agreement transaction defaults or enters into insolvency proceedings and the value of the securities subject to the repurchase agreement is insufficient, the Fund’s recovery of cash from the seller may be delayed and, even if the Fund is able to dispose of the securities, the Fund may incur a loss equal to the difference between the cash it paid and the value of the securities. Repurchase agreements outstanding at the end of the year, if any, are listed in each applicable Fund���s Schedule of Investments.
Reverse repurchase agreements
The Funds may enter into reverse repurchase agreements with banks and brokers to enhance return. Under a reverse repurchase agreement a Fund sells portfolio assets subject to an agreement by that Fund to repurchase the same assets at an agreed upon price and date. A Fund can use the proceeds received from entering into a reverse repurchase agreement to make additional investments, which generally causes the Fund’s portfolio to behave as if it were leveraged. If the buyer in a reverse repurchase agreement files for bankruptcy or becomes insolvent, the Fund may be unable to recover the securities it sold and as a result may realize a loss on the transaction if the securities it sold are worth more than the purchase price it originally received from the buyer. As of February 28, 2022, the Funds listed below had entered into reverse repurchase agreements.
| | | | | | | | |
| | | |
| Fund Name | | Received from
reverse repurchase
agreements ($) | | | Market value of
securities plus
accrued interest ($) | |
Emerging Country Debt Fund | | | 6,346,002 | | | | 6,300,945 | |
As of February 28, 2022, Emerging Country Debt Fund had investments in reverse repurchase agreements with J.P. Morgan Securities Plc with a gross value of $6,346,002. The value of related collateral on reverse repurchase agreements exceeded the value at year end. As of February 28, 2022, the reverse repurchase agreements held by Emerging Country Debt Fund had open maturity dates.
Reverse repurchase agreements outstanding at the end of the year, if any, are listed in each applicable Fund’s Schedule of Investments.
GMO Trust Funds
Notes to Financial Statements — (Continued)
February 28, 2022
The following is a summary of the gross value of reverse repurchase agreements categorized by class of collateral pledged and maturity date:
| | | | | | | | | | | | | | | | | | | | | | | | |
| | |
| | | February 28, 2022 | |
| | |
| | | Remaining Contractual Maturity of the Agreements | |
| | | | | | | |
| | | Overnight and
Continuous | | | Up to
30 days | | | Between
30-90 days | | | Greater Than
90 days | | | On
Demand | | | Total | |
| Emerging Country Debt Fund | | | | | | | | | | | | | | | | | | |
| Reverse Repurchase Agreements | | | | | | | | | | | | | | | | | | |
Sovereign and Sovereign Agency Issuers | | $ | — | | | $ | — | | | $ | — | | | $ | — | | | $ | 6,346,002 | | | $ | 6,346,002 | |
| | | | | | | | | | | | | | | | | | | | | | | | | |
Total borrowings | | $ | — | | | $ | — | | | $ | — | | | $ | — | | | $ | 6,346,002 | | | $ | 6,346,002 | |
| | | | | | | | | | | | | | | | | | | | | | | | | |
| | | | | | | | | | | | | | | | | | | | | | | | | |
Inflation-indexed bonds
The Funds may invest in inflation-indexed bonds. Inflation-indexed bonds are fixed income securities whose principal value is adjusted periodically according to the rate of inflation/deflation. Two structures are common. The U.S. Treasury and some other issuers use a structure that accrues inflation/deflation into the principal value of the bond. Many other issuers adjust the coupon accruals for inflation related changes.
The market price of inflation-indexed bonds normally changes when real interest rates change. Real interest rates, in turn, are tied to the relationship between nominal interest rates (i.e. stated interest rates) and the rate of inflation. Therefore, if the rate of inflation rises at a faster rate than nominal interest rates, real interest rates (i.e. nominal interest rate minus inflation) might decline, leading to an increase in value of inflation-indexed bonds. In contrast, if nominal interest rates increase at a faster rate than inflation, real interest rates might rise, leading to a decrease in value of inflation-indexed bonds. Coupon payments received by a Fund from inflation-indexed bonds are generally included in the Fund’s gross income for the period in which they accrue. In addition, any increase/decrease in the principal amount of an inflation-indexed bond is generally included in the Fund’s gross income even though principal is not paid until maturity. Inflation-indexed bonds outstanding at the end of the year, if any, are listed in each applicable Fund’s Schedule of Investments.
Delayed delivery commitments and when-issued securities
The Funds (except U.S. Treasury Fund) may purchase or sell securities on a when-issued or forward commitment basis. Payment and delivery may take place a month or more after the date of the transaction. The price of the underlying securities and the date when the securities will be delivered and paid for are fixed at the time the transaction is negotiated. The purchase of when-issued or delayed delivery securities can cause a Fund’s portfolio to be leveraged. Investments in when-issued securities also present the risk that the security will not be issued or delivered. Delayed delivery commitments outstanding at the end of the year, if any, are listed in each applicable Fund’s Schedule of Investments.
Short sales
Certain Funds may enter into short sales transactions. A short sale is a transaction in which a Fund sells securities it may not own in anticipation of a decline in the fair market value of the securities. Securities sold in short sale transactions and the dividend and/or interest payable on such securities, if any, are reflected as a liability in the Statements of Assets and Liabilities. A Fund is obligated to deliver securities at the trade price at the time the short position is closed. Possible losses from short sales may be unlimited, whereas losses from purchases cannot exceed the total amount invested. Short sales outstanding at the end of the year, if any, are listed in each applicable Fund’s Schedule of Investments.
Taxes and distributions
Each Fund has elected to be treated or intends to elect to be treated and intends to qualify each tax year as a regulated investment company under Subchapter M of the Internal Revenue Code of 1986, as amended (the “Code”). Each Fund intends to distribute its net investment income, if any, and its net realized short-term and long-term capital gains, if any, after giving effect to any available capital loss carryforwards for U.S. federal income tax purposes. Therefore, each Fund makes no provision for U.S. federal income or excise taxes.
GMO Trust Funds
Notes to Financial Statements — (Continued)
February 28, 2022
With the exception of U.S. Treasury Fund, the policy of each Fund is to declare and pay dividends of its net investment income, if any, at least annually, although the Funds are permitted to, and will from time to time, declare and pay dividends of net investment income, if any, more frequently. The policy of U.S. Treasury Fund is to declare dividends daily, to the extent net investment income is available. U.S. Treasury Fund will generally pay dividends on the first business day following the end of each month in which dividends were declared. Accrued dividends in respect of a shareholder’s partial redemption of U.S. Treasury Fund shares redeemed between monthly payment dates will be paid on the first business day following the end of the month in which redemptions are made. Accrued dividends in respect of a shareholder’s complete redemption of U.S. Treasury Fund shares between monthly payment dates will be paid with the redemption proceeds. Each Fund also intends to distribute net realized short-term and long-term capital gains, if any, at least annually. In addition, each Fund may, from time to time at their discretion, make unscheduled distributions in advance of large redemptions by shareholders or as otherwise deemed appropriate by a Fund. Typically, all distributions are reinvested in additional shares of each Fund, at net asset value, unless GMO or its agents receive and process a shareholder election to receive cash distributions. Distributions to shareholders are recorded by each Fund on the ex-dividend date.
Taxes on foreign interest and dividend income are generally withheld in accordance with the applicable country’s tax treaty with the United States. The foreign withholding rates applicable to a Fund’s investments in certain jurisdictions may be higher if a significant portion of the Fund is held by non-U.S. shareholders. Each Fund may be subject to taxation on realized capital gains, repatriation proceeds and other transaction-based charges imposed by certain countries in which it invests. Transaction-based charges are generally calculated as a percentage of the transaction amount. Taxes related to capital gains realized during the year ended February 28, 2022, if any, are reflected as part of Net realized gain (loss) in the Statements of Operations. Changes in tax liabilities related to capital gain taxes on unrealized investment gains, if any, are reflected as part of Change in net unrealized appreciation (depreciation) in the Statements of Operations.
Income and capital gain distributions are determined in accordance with U.S. federal income tax regulations, which may differ from U.S. GAAP. Certain capital accounts in the financial statements are periodically adjusted for permanent differences in order to reflect their tax character. These adjustments have no impact on net assets or net asset value per share. Temporary differences that arise from recognizing certain items of income, expense, gain or loss in different periods for financial statement and tax purposes will likely reverse at some time in the future.
GMO Trust Funds
Notes to Financial Statements — (Continued)
February 28, 2022
Differences in distributable earnings on a U.S. GAAP and tax accounting basis primarily relate to the following:
| | | | | | | | | | | | |
| | | | | | | |
| Differences related to: | | Asset Allocation Bond Fund | | Emerging Country Debt Fund | | High Yield Fund | | Multi-Sector Fixed Income Fund | | Opportunistic Income Fund | | U.S. Treasury Fund |
| Interest, accretion and amortization | | | | X | | X | | | | X | | |
| Capital loss carryforwards | | X | | | | | | X | | X | | |
| Debt modifications | | | | | | | | | | | | |
| Defaulted bonds | | | | X | | | | | | | | |
| Derivative contract transactions | | | | X | | X | | X | | X | | |
| Foreign currency transactions | | | | X | | X | | X | | | | |
| Late-year ordinary losses | | | | | | X | | X | | | | |
| Litigation proceeds received | | X | | | | | | X | | | | |
| Losses on wash sale transactions | | X | | X | | | | X | | | | |
| Losses related to debt obligations | | | | | | | | | | X | | |
| Mutual fund distributions received | | | | | | | | X | | | | |
| Net operating losses | | | | | | | | X | | | | |
| Paydown gain/losses | | | | | | | | | | X | | |
| Post-October capital losses | | X | | X | | | | X | | | | X |
| Straddle Loss Deferrals | | | | | | X | | | | | | |
The tax character of distributions declared by each Fund to shareholders is as follows:
| | | | | | | | | | | | | | | | | | | | | | | | |
| | | |
| | | Tax year ended February 28, 2022 | | | Tax year ended February 28, 2021 | |
| | | | | | | |
| Fund Name | | Ordinary
Income
(including
any net
short-term
capital gain) ($) | | | Net Long-Term
Capital
Gain ($) | | | Total
Distributions ($) | | | Ordinary
Income
(including
any net
short-term
capital gain) ($) | | | Net Long-Term
Capital
Gain ($) | | | Total
Distributions ($) | |
| Asset Allocation Bond Fund | | | 1,000,062 | | | | — | | | | 1,000,062 | | | | 1,524,146 | | | | — | | | | 1,524,146 | |
| Emerging Country Debt Fund | | | 344,849,612 | | | | 73,953,153 | | | | 418,802,765 | | | | 351,626,283 | | | | 57,850,613 | | | | 409,476,896 | |
| High Yield Fund | | | 11,531,519 | | | | 448,207 | | | | 11,979,726 | | | | 3,469,056 | | | | 119,375 | | | | 3,588,431 | |
| Multi-Sector Fixed Income Fund | | | — | | | | 5,148,607 | | | | 5,148,607 | | | | 15,707,759 | | | | 16,634,444 | | | | 32,342,203 | |
| Opportunistic Income Fund | | | 19,824,450 | | | | — | | | | 19,824,450 | | | | 29,997,493 | | | | — | | | | 29,997,493 | |
| U.S. Treasury Fund | | | 564,398 | | | | 136,353 | | | | 700,751 | | | | 773,665 | | | | — | | | | 773,665 | |
Distributions in excess of a Fund’s tax basis earnings and profits, if significant, are reported in the Funds’ financial statements as a return of capital.
GMO Trust Funds
Notes to Financial Statements — (Continued)
February 28, 2022
As of February 28, 2022, the components of distributable earnings on a tax basis and certain tax attributes for the Funds consisted of the following:
| | | | | | | | | | | | | | | | | | | | |
| | | | | | |
| Fund Name | | Undistributed
Ordinary
Income
(including any
net short-term
capital gain) ($) | | | Undistributed
Net Long-Term
Capital Gain ($) | | | Late-Year
Ordinary Loss
Deferral ($) | | | Capital Loss
Carryforwards ($) | | | Post-October
Capital Loss Deferral ($) | |
Asset Allocation Bond Fund | | | 147,922 | | | | — | | | | — | | | | (45,902,559) | | | | (148,152) | |
Emerging Country Debt Fund | | | 62,279,515 | | | | — | | | | — | | | | — | | | | (6,905,248) | |
High Yield Fund | | | 450,671 | | | | 168,310 | | | | (68,060) | | | | — | | | | — | |
| Multi-Sector Fixed Income Fund | | | — | | | | — | | | | (2,852,871) | | | | (22,199,368) | | | | (3,662,952) | |
Opportunistic Income Fund | | | 11,049,698 | | | | 9,982,443 | | | | — | | | | (58,989,497) | | | | — | |
U.S. Treasury Fund | | | — | | | | — | | | | — | | | | — | | | | (732,625) | |
As of February 28, 2022, certain Funds had capital loss carryforwards available to offset future realized gains, if any, to the extent permitted by the Code. Net capital losses are carried forward without expiration and generally retain their short-term and/or long-term tax character, as applicable. Utilization of the capital loss carryforwards, post-October capital losses, late-year ordinary losses, and losses realized subsequent to February 28, 2022, if any, could be subject to further limitations imposed by the Code related to share ownership activity. The Funds’ capital loss carryforwards are as follows:
| | | | | | | | |
| | | |
| Fund Name | | Short-Term ($) | | | Long-Term ($) | |
| Asset Allocation Bond Fund | | | (25,503,316) | | | | (20,399,243) | |
| Emerging Country Debt Fund | | | — | | | | — | |
| High Yield Fund | | | — | | | | — | |
| Multi-Sector Fixed Income Fund | | | — | | | | (22,199,368) | |
| Opportunistic Income Fund | | | — | | | | (58,989,497) | |
| U.S. Treasury Fund | | | — | | | | — | |
As of February 28, 2022, the approximate total cost, aggregate investment-level gross/net unrealized appreciation (depreciation) in the value of total investments (including total securities sold short, if any), and the net unrealized appreciation (depreciation) of outstanding financial instruments for U.S. federal income tax purposes were as follows:
| | | | | | | | | | | | | | | | | | | | |
| | | |
| | | Total Investments | | | Outstanding
Financial
Instruments | |
| | | | | | |
| Fund Name | | Aggregate
Cost ($) | | | Gross Unrealized
Appreciation ($) | | | Gross Unrealized
(Depreciation) ($) | | | Net Unrealized
Appreciation
(Depreciation) ($) | | | Net Unrealized
Appreciation
(Depreciation) ($) | |
| Asset Allocation Bond Fund | | | 39,099,446 | | | | — | | | | (1,018,836) | | | | (1,018,836) | | | | — | |
| Emerging Country Debt Fund | | | 4,789,037,584 | | | | 77,427,316 | | | | (1,226,963,554) | | | | (1,149,536,238) | | | | (1,972,979) | |
| High Yield Fund | | | 83,920,204 | | | | 409,683 | | | | (1,046,072) | | | | (636,389) | | | | (1,563,126) | |
| Multi-Sector Fixed Income Fund | | | 146,998,274 | | | | 139,717 | | | | (5,265,876) | | | | (5,126,159) | | | | (307,943) | |
| Opportunistic Income Fund | | | 1,021,293,589 | | | | 12,329,434 | | | | (71,485,159) | | | | (59,155,725) | | | | (5,713,698) | |
| U.S. Treasury Fund | | | 261,243,750 | | | | 155,623 | | | | (548,609) | | | | (392,986) | | | | — | |
GMO Trust Funds
Notes to Financial Statements — (Continued)
February 28, 2022
The Funds are subject to authoritative guidance related to the accounting and disclosure of uncertain tax positions under U.S. GAAP. A Fund may recognize an income tax liability related to an uncertain tax position under U.S. GAAP when the uncertain tax position has a less than 50% probability that it would be sustained upon examination by the tax authorities, based on technical merits. United States and non-U.S. tax rules (including the interpretation and application of tax laws) are subject to change. The Funds file tax returns and/or adopt certain tax positions in various jurisdictions. Non-U.S. taxes are provided for based on the Funds’ understanding of the prevailing tax rules of the non-U.S. markets in which they invest. Recently enacted tax rules, including interpretations of tax laws and tax legislation/initiatives currently under consideration in various jurisdictions, including the U.S., might affect the way the Funds and their investors are taxed prospectively and/or retroactively. Prior to the expiration of the relevant statutes of limitations, if any, the Funds are subject to examination by U.S. federal, state, local and non-U.S. jurisdictions with respect to the tax returns they have filed and the tax positions they have adopted. The Funds’ U.S. federal income tax returns are generally subject to examination by the Internal Revenue Service for a period of three years after they are filed. State, local and/or non-U.S. tax returns and/or other filings may be subject to examination for different periods, depending upon the tax rules of each applicable jurisdiction. As of February 28, 2022, each Fund has determined that no tax liability is required to be accrued in its financial statements related to uncertain tax positions for any tax years which are subject to examination.
Security transactions and related investment income
Security transactions are accounted for in the financial statements on trade date. For purposes of daily net asset value calculations, the Funds’ policy is that security transactions are generally accounted for on the following business day. GMO may override that policy and a Fund may account for security transactions on trade date if it experiences significant purchases or redemptions or engages in significant portfolio transactions. Dividend income, net of applicable foreign withholding taxes, if any, is recorded on the ex-dividend date or, if later, when a Fund is informed of the ex-dividend date. Income dividends and capital gain distributions from underlying funds, if any, are recorded on the ex-dividend date. Interest income is recorded on the accrual basis and is adjusted for the amortization of premiums and accretion of discounts. Principal on inflation-indexed securities is adjusted for inflation/deflation and any increase or decrease is recorded as interest income or investment loss. Coupon income is not recognized on securities for which collection is not expected. Paydown gains and losses on mortgage-related and other asset-backed securities, if any, are recorded as components of interest income in the Statements of Operations. Non-cash dividends, if any, are recorded at the fair market value of the asset received. In determining the net gain or loss on securities sold, the Funds use the identified cost basis.
Expenses and class allocations
Most of the expenses of the Trust are directly attributable to an individual Fund. Generally, common expenses are allocated among the Funds based on, among other things, the nature and type of expense and the relative size of the Funds. Investment income, common expenses, purchase premiums and redemption fees, if any, and realized and unrealized gains and losses are allocated among the classes of shares of the Funds, if applicable, based on the relative net assets of each class. Shareholder service fees, if any, which are directly attributable to a class of shares, are charged to that class’s operations. In addition, the Funds may incur fees and expenses indirectly as a shareholder in the underlying funds. Because the underlying funds have different expense and fee levels and the Funds may own different proportions of the underlying funds at different times, the amount of fees and expenses indirectly incurred by a Fund will vary (see Note 5).
Custodian, Fund Accounting Agent and Transfer Agent
State Street Bank and Trust Company (“State Street”) serves as the Funds’ custodian, fund accounting agent and transfer agent. Cash balances maintained at the custodian and transfer agent are held in a Demand Deposit Account and interest income earned, if any, is shown as interest income in the Statements of Operations.
Purchases and redemptions of Fund shares
Purchase premiums and redemption fees (if applicable) are paid to and retained by a Fund to help offset estimated portfolio transaction costs and other related costs (e.g., bid to ask spreads, stamp duties, and transfer fees) incurred by the Fund directly or indirectly (e.g., through investments in underlying funds) as a result of an investor’s purchase or redemption by allocating estimated transaction costs to the purchasing or redeeming shareholder. Such fees are recorded as a component of the Funds’ net share transactions. A Fund may impose a new purchase premium and redemption fee or increase or decrease an existing fee at any time.
Purchase premiums are not charged on reinvestments of dividends or other distributions. Redemption fees apply to all shares of a Fund regardless of how the shares were acquired (e.g., by direct purchase or by reinvestment of dividends or other distributions).
GMO Trust Funds
Notes to Financial Statements — (Continued)
February 28, 2022
If GMO determines that any portion of a cash purchase or redemption, as applicable, is offset by a corresponding cash redemption or purchase occurring on the same day, it ordinarily will waive or reduce the purchase premium or redemption fee with respect to that portion.
GMO also may waive or reduce the purchase premium or redemption fee for a purchase or redemption of a Fund’s shares if the Fund will not incur transaction costs or will incur reduced transaction costs.
For example, GMO may reduce the purchase premium to the extent that securities are used to purchase a Fund’s shares (taking into account transaction costs, stamp duties or transfer fees), and GMO may reduce redemption fees to the extent a Fund uses portfolio securities to redeem its shares (taking into account transaction costs, stamp duties or transfer fees).
As of February 28, 2022, the premium on cash purchases and the fee on cash redemptions were as follows:
| | | | | | | | | | | | |
| | | | | | | |
| | | Asset Allocation Bond Fund | | Emerging Country Debt Fund(1) | | High Yield Fund | | Multi-Sector Fixed Income Fund | | Opportunistic Income Fund(2) | | U.S. Treasury Fund |
| Purchase Premium | | — | | 0.75% | | — | | — | | — | | — |
| Redemption Fee | | — | | 0.75% | | — | | — | | — | | — |
| | (1) | For the periods from July 31, 2020 to May 18, 2021, May 8, 2020 to July 31, 2020, March 25, 2020 to May 8, 2020, March 16, 2020 to March 25, 2020, February 1, 2016 to March 16, 2020 the premiums on purchases and the fee on redemptions were each 1.00%, 1.50%, 2.00%, 1.15% and 0.75%, respectively, of the amount invested or redeemed. |
| | (2) | Prior to June 30, 2019, the premiums on purchases and the fee on redemptions were each 0.40% of the amount invested or redeemed. |
Recently-issued accounting guidance
In March 2020, the Financial Accounting Standards Board (FASB) issued Accounting Standards Update (ASU) No. 2020-04, “Reference Rate Reform (Topic 848) — Facilitation of the Effects of Reference Rate Reform on Financial Reporting”. The amendments in the ASU provides optional temporary financial reporting relief from the effect of certain types of contract modifications due to the planned discontinuation of the London Interbank Offered Rate (LIBOR) and other interbank-offered based reference rates as of the end of 2021. In March 2021, the administrator for LIBOR announced the extension of the publication of a majority of the USD LIBOR settings to June 30, 2023. The Investment Adviser does not expect ASU No. 2020-04 to have a material impact on the financial statements.
GMO Trust Funds
Notes to Financial Statements — (Continued)
February 28, 2022
| 3. | Investment and other risks |
The following chart identifies selected risks associated with each Fund. Risks not marked for a particular Fund may, however, still apply to some extent to that Fund at various times.
| | | | | | | | | | | | |
| | | | | | | |
| | | Asset Allocation Bond Fund | | Emerging Country Debt Fund | | High Yield Fund | | Multi-Sector Fixed Income Fund | | Opportunistic Income Fund | | U.S. Treasury Fund |
| Credit Risk | | X | | X | | X | | X | | X | | X |
| Market Risk – Fixed Income | | X | | X | | X | | X | | X | | X |
| Illiquidity Risk | | X | | X | | X | | X | | X | | |
| Derivatives and Short Sales Risk | | X | | X | | X | | X | | X | | |
| Market Risk – Asset-Backed Securities | | X | | X | | | | X | | X | | |
| Counterparty Risk | | X | | X | | X | | X | | X | | X |
| Management and Operational Risk | | X | | X | | X | | X | | X | | X |
| Focused Investment Risk | | X | | X | | X | | X | | X | | |
| Futures Contracts Risk | | | | | | X | | X | | X | | |
| Currency Risk | | X | �� | X | | X | | X | | X | | |
| Commodities Risk | | X | | | | | | | | | | |
| Fund of Funds Risk | | X | | X | | X | | X | | X | | |
| Non-US Investment Risk | | X | | X | | X | | X | | X | | |
| Market Disruption and Geopolitical Risk | | X | | X | | X | | X | | X | | X |
| Leveraging Risk | | X | | X | | X | | X | | X | | |
| Large Shareholder Risk | | X | | X | | X | | X | | X | | X |
| Market Risk – Equities | | X | | | | | | | | X | | |
| Smaller Company Risk | | X | | | | | | X | | X | | |
| Non-Diversified Funds | | | | | | X | | X | | | | |
Investing in mutual funds involves many risks. The risks of investing in a particular Fund depend on the types of investments in its portfolio and the investment strategies GMO employs on its behalf. This section does not describe every potential risk of investing in the Funds. Funds could be subject to additional risks because of the types of investments they make and market conditions, which may change over time. Please see the Funds’ prospectus for more information regarding the risks of investing in the Funds.
Each Fund that invests in other GMO Funds or other investment companies (collectively, “Underlying Funds”) is exposed to the risks to which the Underlying Funds in which it invests are exposed, as well as the risk that the Underlying Funds will not perform as expected. Therefore, unless otherwise noted, the selected risks summarized below include both direct and indirect risks, and references in this section to investments made by a Fund include those made both directly by the Fund and indirectly by the Fund as a result of its investment in Underlying Funds.
An investment in a Fund is not a bank deposit and, therefore, is not insured or guaranteed by the Federal Deposit Insurance Corporation or any other government agency.
• CREDIT RISK. A Fund runs the risk that the issuer or guarantor of a fixed income investment or the obligors of obligations underlying an asset-backed security will be unable or unwilling to satisfy their obligations to pay principal and interest or otherwise to
GMO Trust Funds
Notes to Financial Statements — (Continued)
February 28, 2022
honor their obligations in a timely manner. The market price of a fixed income investment will normally decline as a result of the failure of an issuer, guarantor, or obligor to meet its payment obligations or in anticipation of such failure. In addition, investments in emerging country sovereign or quasi-sovereign debt involve a heightened risk that the issuer responsible for repayment of the debt may be unable or unwilling to pay interest and repay principal when due, and the Fund may lack recourse against the issuer in the event of default. Investments in quasi-sovereign debt also are subject to the risk that the issuer will default independently of its sovereign. In addition, investments in emerging country sovereign or quasi-sovereign debt involve a heightened risk that the issuer responsible for repayment of the debt may be unable or unwilling to pay interest and repay principal when due, and the Fund may lack recourse against the issuer in the event of default. Investments in quasi-sovereign debt also are subject to the risk that the issuer will default independently of its sovereign. Securities issued by the U.S. Treasury historically have presented minimal credit risk. However, events in 2011 led to a downgrade in the long-term credit rating of U.S. bonds by several major rating agencies and introduced greater uncertainty about the repayment by the United States of its obligations. A further credit rating downgrade could decrease, and a U.S. credit default would decrease, the value of a Fund’s investments and increase the volatility of a Fund’s portfolio. Below investment grade investments have speculative characteristics, and negative changes in economic conditions or other circumstances are more likely to impair the ability of issuers of those investments to make principal and interest payments than issuers of investment grade investments.
• MARKET RISK — FIXED INCOME. The market price of a fixed income investment can decline due to market-related factors, including rising interest rates and widening credit spreads, or decreased liquidity due, for example, to market uncertainty about the value of a fixed income investment (or class of fixed income investments). In addition, the market prices of emerging country sovereign and quasi-sovereign debt investments can decline due to uncertainty about their credit quality and the reliability of their payment streams.
• ILLIQUIDITY RISK. Low trading volume, lack of a market maker, large position size, or legal restrictions may limit or prevent a Fund from selling particular securities or closing derivative positions at desirable prices.
• DERIVATIVES AND SHORT SALES RISK. The use of derivatives involves the risk that their value may not change as expected relative to changes in the value of the underlying assets, pools of assets, rates, currencies or indices. Derivatives also present other risks, including market risk, illiquidity risk, currency risk, credit risk, and counterparty risk. The market price of an option is affected by many factors, including changes in the market prices or dividend rates of underlying securities (or in the case of indices, the securities in such indices); the time remaining before expiration; changes in interest rates or exchange rates; and changes in the actual or perceived volatility of the relevant stock market and underlying securities. A Fund may create short investment exposure by taking a derivative position in which the value of the derivative moves in the opposite direction from the price of an underlying asset, pool of assets, rate, currency or index. The risks of loss associated with derivatives that provide short investment exposure and short sales of securities are theoretically unlimited.
• MARKET RISK — ASSET BACKED SECURITIES. The market price of asset-backed securities, like that of other fixed income investments with complex structures, can decline for a variety of reasons, including market uncertainty about their credit quality and the reliability of their payment streams. Payment streams associated with asset-backed securities held by a Fund depend on many factors (e.g., the cash flow generated by the assets backing the securities, deal structure, creditworthiness of any credit-support provider, and reliability of various other service providers with access to the payment stream), and a problem in any of these factors can lead to a reduction in the payment stream GMO expected a Fund to receive when the Fund purchased the asset-backed security. The liquidity of below investment grade asset-based and mortgage-backed securities (including non-agency and unregistered asset-backed securities) may change over time. During periods of deteriorating economic conditions, such as recessions or periods of rising unemployment, delinquencies and losses generally increase, sometimes dramatically, with respect to securitizations involving loans, sales contracts, receivables and other obligations underlying asset-backed securities. The effects of the COVID-19 virus, and governmental responses to the effects of the virus, may result in increased delinquencies and losses and have other, potentially unanticipated, adverse effects on such investments and the markets for those investments.
• COUNTERPARTY RISK. A Fund runs the risk that the counterparty to a derivatives contract, a clearing member used by the Fund to hold a cleared derivatives contract, or a borrower of the Fund’s securities is unable or unwilling to make timely settlement payments, return the Fund’s margin or otherwise honor its obligations.
• MANAGEMENT AND OPERATIONAL RISK. A Fund runs the risk that GMO’s investment techniques will fail to produce desired results. For many funds, GMO uses quantitative models as part of its investment process. GMO’s models may not accurately
GMO Trust Funds
Notes to Financial Statements — (Continued)
February 28, 2022
predict future market movements. In addition, GMO’s models rely on assumptions and data that are subject to limitations (e.g., inaccuracies, staleness) that could adversely affect their predictive value. Those Fund also runs the risk that GMO’s assessment of an investment (including a security’s fundamental fair (or intrinsic) value) is wrong or that deficiencies in GMO’s or another service provider’s internal systems or controls will cause losses for the Fund or impair Fund operations.
• FOCUSED INVESTMENT RISK. Investments focused in asset classes, countries, regions, sectors, industries, currencies, or issuers that are subject to the same or similar risk factors and investments whose prices are closely correlated are subject to greater overall risk than investments that are more diversified or whose prices are not as closely correlated.
• FUTURES CONTRACTS RISK. The loss to a Fund resulting from its use of futures contracts is potentially unlimited. Futures markets are highly volatile, and the use of futures contracts increases the volatility of the Fund’s net asset value. A liquid secondary market may not exist for any particular futures contract at any particular time, and a Fund may be unable when it wishes to effect closing transactions to terminate its exposure under that contract. When a Fund uses futures contracts for hedging purposes, it runs the risk that changes in the prices of the contracts will not correlate perfectly with changes in the securities, index, or other asset underlying the contracts or movements in the prices of the Fund’s investments that are subject to the hedge. In addition, a Fund may be unable to recover or may be delayed in recovering margin or other amounts deposited with a futures commission merchant or futures clearinghouse. Foreign futures contracts are often less liquid and more volatile than U.S. futures contracts.
• CURRENCY RISK. Fluctuations in exchange rates can adversely affect the market value of a Fund’s foreign currency holdings and investments denominated in foreign currencies.
• COMMODITIES RISK. Commodity prices can be extremely volatile, and exposure to commodities can cause the value of a Fund’s shares to decline or fluctuate in a rapid and unpredictable manner.
• FUND OF FUNDS RISK. A Fund is indirectly exposed to all of the risks of an investment in the underlying funds (including underlying GMO Funds and ETFs) in which it invests, including the risk that those underlying funds will not perform as expected. Because a Fund bears the fees and expenses of the underlying funds in which it invests, the increase in fees and expenses of an underlying fund or a reallocation of the Fund’s investments to underlying funds with higher fees or expenses will increase the Fund’s total expenses.
• NON-U.S. INVESTMENT RISK. The market prices of many non-U.S. securities (particularly of companies tied economically to emerging countries) fluctuate more than those of U.S. securities. Many non-U.S. securities markets (particularly emerging markets) are less stable, smaller, less liquid, and less regulated than U.S. securities markets, and the cost of trading in those markets often is higher than in U.S. securities markets. In addition, issuers of non-U.S. securities (particularly those tied economically to emerging countries) often are not subject to as much regulation as U.S. issuers, and the reporting, recordkeeping, accounting, custody, and auditing standards to which those issuers are subject often are not as rigorous as U.S. standards. In addition, a Fund may be subject to non-U.S. taxes, potentially on a retroactive basis, on (i) capital gains it realizes or dividends, interest, or other amounts it realizes or accrues in respect of non-U.S. investments; (ii) transactions in those investments; and (iii) repatriation of proceeds generated from the sale or other disposition of those investments. Also, the Fund needs a license to invest directly in securities traded in many non-U.S. securities markets, and a Fund is subject to the risk that it could not invest if its license were terminated or suspended. In some non-U.S. securities markets, prevailing custody and trade settlement practices (e.g., the requirement to pay for securities prior to receipt) expose a Fund to credit and other risks. Further, adverse changes in investment regulations, capital requirements or exchange controls could adversely affect the value of the Fund’s investments. These and other risks (e.g., nationalization, expropriation or other confiscation of assets of non-U.S. issuers, limitations on, or difficulties enforcing, legal judgments, contractual rights, or other remedies) tend to be greater for investments in the securities of companies tied economically to emerging countries. The economies of emerging countries often depend predominantly on only a few industries or revenues from particular commodities, and often are more volatile than the economies of developed countries.
• MARKET DISRUPTION AND GEOPOLITICAL RISK. Geopolitical and other events (e.g., wars, pandemics, sanctions, terrorism) may disrupt securities markets and adversely affect global economies and markets. Those events, as well as other changes in non-U.S. and U.S. economic and political conditions, could exacerbate other risks or otherwise reduce the value of the Funds’ investments.
In late February 2022, Russia began an invasion of Ukraine. Following such invasion, the United States, the European Union, and other countries and entities imposed wide-ranging sanctions on Russia, the President of Russia and other members of the Government
GMO Trust Funds
Notes to Financial Statements — (Continued)
February 28, 2022
of Russia as well as entities owned or controlled by, or acting on behalf of, the Government of Russia. The Government of Russia has also imposed countersanctions and taken other actions in response to the sanctions. The scope and scale of the sanctions may be expanded and the conflict between Russia and Ukraine may further deteriorate. These sanctions and current environment could impair the ability of the Funds to buy, sell, hold, receive, deliver or otherwise transact in certain securities and other instruments. The full impact of the sanctions and the conflict on the Funds, the financial markets and the global economy is not yet known.
• LEVERAGING RISK. The use of derivatives and securities lending creates leverage. Leverage increases a Fund’s losses when the value of its investments (including derivatives) declines. In addition, a Fund’s portfolio will be leveraged if it exercises its right to delay payment on a redemption, and losses will result if the value of the Fund’s assets declines between the time a redemption request is deemed to be received by a Fund and the time the Fund liquidates assets to meet that request
• LARGE SHAREHOLDER RISK. To the extent that a large number of shares of a Fund is held by a single shareholder (e.g., an institutional investor or another GMO Fund) or a group of shareholders with a common investment strategy (e.g., GMO asset allocation accounts), the Fund is subject to the risk that a redemption by those shareholders of all or a large portion of their Fund shares will require the Fund to sell securities at disadvantageous prices, disrupt the Fund’s operations, or force the Fund’s liquidation.
• MARKET RISK — EQUITIES. The market price of an equity may decline due to factors affecting the issuer or its industry or the economy and equity markets generally. If a Fund purchases an equity for less than its fundamental fair (or intrinsic) value as assessed by GMO and GMO’s assessment proves to be incorrect, the Fund runs the risk that the market price of the equity will not appreciate or will decline. A Fund also may purchase equities that typically trade at higher multiples of current earnings than other securities, and the market prices of these equities often are more sensitive to changes in future earnings expectations than the market prices of equities trading at lower multiples. Declines in stock market prices generally are likely to reduce the net asset value of the Fund’s shares.
• SMALLER COMPANY RISK. Smaller companies may have limited product lines, markets, or financial resources, lack the competitive strength of larger companies, have less experienced managers or depend on a few key employees. The securities of companies with smaller market capitalizations often are less widely held and trade less frequently and in lesser quantities, and their market prices often fluctuate more, than the securities of companies with larger market capitalizations.
• NON-DIVERSIFIED FUNDS. High Yield Fund and Multi-Sector Fixed Income Fund are non-diversified investment companies under the 1940 Act and therefore a decline in the market price of a particular security held by the Funds may affect the Funds’ performance more than if the Funds were a diversified investment company.
| 4. | Derivative financial instruments |
Derivatives are financial contracts whose value depends on, or is derived from, the value of underlying assets, reference rates, or indices that are used to increase, decrease or adjust elements of the investment exposures of a Fund’s portfolio. Derivatives may relate to securities, interest rates, currencies, currency exchange rates, inflation rates, commodities and indices, and include foreign currency contracts, swap contracts, reverse repurchase agreements, and other exchange-traded and OTC contracts.
The Funds may use derivatives to gain long investment exposure to securities or other assets. In particular, the Funds may use swaps, options, or other derivatives on an index, an ETF, a single security, or a basket of securities to gain investment exposures (e.g., by selling protection under a credit default swap). The Funds also may use currency derivatives (including forward currency contracts, futures contracts, swap contracts and options) to gain exposure to a given currency.
The Funds may use derivatives in an attempt to reduce their investment exposures (which may result in a reduction below zero). For example, a Fund may use credit default swaps to take a short position with respect to the likelihood of default by an issuer or may use a bond futures contract to short the bond market of a particular country. A Fund also may use currency derivatives in an attempt to reduce (which may result in a reduction below zero) some aspect of the currency exposure in its portfolio. For these purposes, the Fund may use an instrument denominated in a different currency that GMO believes is highly correlated with the relevant currency. The Funds may use derivatives in an attempt to adjust elements of their investment exposures to various securities, sectors, markets, indices, ETFs, and currencies without actually having to sell existing investments or make new direct investments. For instance, GMO may alter the interest rate exposure of debt instruments by employing interest rate swaps. Such a strategy is designed to maintain the Fund’s exposure to the credit of an issuer through the debt instrument but adjust the Fund’s interest rate exposure through the swap. With these swaps, the Fund and its counterparties exchange interest rate exposure, such as fixed versus variable rates and shorter
GMO Trust Funds
Notes to Financial Statements — (Continued)
February 28, 2022
duration versus longer duration exposure. In adjusting its investment exposures, a Fund also may use currency derivatives in an attempt to adjust its currency exposure, seeking currency exposure that is different (in some cases, significantly different) from the currency exposure represented by its portfolio investments.
Each of the Funds is not limited in its use of derivatives or in the total notional value of its derivative positions. As a result of their derivative positions, a Fund may have gross investment exposures in excess of its net assets (i.e., the Fund may be leveraged) and therefore are subject to heightened risk of loss. Each Fund’s (other than U.S. Treasury Fund) performance can depend substantially, if not primarily, on the performance of assets or indices underlying its derivatives even though it does not own those assets or indices.
Certain derivatives transactions that may be used by the Funds, including certain interest rate swaps and certain credit default index swaps, are required to be transacted through a central clearing organization. The Funds hold cleared derivatives transactions, if any, through clearing members, who are members of derivatives clearing houses. Certain other derivatives, including futures and certain options, are transacted on exchanges. The Funds hold exchange-traded derivatives through clearing brokers that are typically members of the exchanges. In contrast to bilateral derivatives transactions, following a period of advance notice to the Fund, clearing brokers generally can require termination of existing cleared or exchange-traded derivatives transactions at any time and increases in margin above the margin that it required at the beginning of a transaction. Clearing houses and exchanges also have broad rights to increase margin requirements for existing transactions and to terminate transactions. Any such increase or termination could interfere with the ability of a Fund to pursue its investment strategy. Also, a Fund is subject to execution risk if it enters into a derivatives transaction that is required to be cleared (or that GMO expects to be cleared), and no clearing member is willing or able to clear the transaction on the Fund’s behalf. In that case, the transaction might have to be terminated, and the Fund could lose some or all of the benefit of any increase in the value of the transaction after the time of the transaction.
The use of derivatives involves risks that are in addition to, and potentially greater than, the risks associated with investing directly in securities and other more traditional assets. See “Investment and other risks” above for further information.
GMO Trust Funds
Notes to Financial Statements — (Continued)
February 28, 2022
For Funds that held derivatives during the year ended February 28, 2022, the following table shows how the Fund used these derivatives (marked with an X):
| | | | | | | | | | | | | | | | |
| | | | | |
| Type of Derivative and Objective for Use | | Emerging Country
Debt Fund | | | High Yield
Fund | | | Multi-Sector
Fixed Income
Fund | | | Opportunistic
Income Fund | |
| Forward currency contracts | | | | | | | | | | | | | | | | |
Adjust currency exchange rate risk | | | X | | | | X | | | | X | | | | X | |
Adjust exposure to foreign currencies | | | X | | | | X | | | | X | | | | | |
| Futures contracts | | | | | | | | | | | | | | | | |
Adjust interest rate exposure | | | | | | | X | | | | X | | | | X | |
Maintain the diversity and liquidity of the portfolio | | | | | | | X | | | | X | | | | X | |
| Options (Purchased) | | | | | | | | | | | | | | | | |
Adjust exposure to foreign currencies | | | X | | | | | | | | | | | | | |
Achieve exposure to a reference entity’s credit | | | | | | | | | | | | | | | X | |
Provide a measure of protection against default loss | | | | | | | | | | | | | | | X | |
| Options (Written) | | | | | | | | | | | | | | | | |
Achieve exposure to a reference entity’s credit | | | | | | | X | | | | | | | | X | |
Provide a measure of protection against default loss | | | | | | | | | | | | | | | X | |
| Options (Credit linked) | | | | | | | | | | | | | | | | |
Achieve exposure to a reference entity’s credit | | | X | | | | | | | | | | | | | |
| Swap contracts | | | | | | | | | | | | | | | | |
Achieve exposure to a reference entity’s credit | | | X | | | | X | | | | | | | | X | |
Adjust exposure to certain markets | | | X | | | | | | | | | | | | X | |
Adjust interest rate exposure | | | X | | | | | | | | X | | | | X | |
Provide a measure of protection against default loss | | | X | | | | X | | | | | | | | X | |
Provide exposure to the Fund’s benchmark | | | | | | | X | | | | X | | | | | |
Hedge non-core equity exposure | | | | | | | | | | | X | | | | | |
Adjust portfolio beta | | | X | | | | | | | | | | | | | |
Generate long risk exposure to an index | | | | | | | X | | | | | | | | | |
Forward currency contracts
The Funds (except U.S. Treasury Fund) may enter into forward currency contracts, including forward cross currency contracts. A forward currency contract is an agreement between two parties to buy and sell a currency at a set price on a future date (or to pay or receive the amount of the change in relative values of the two currencies). The market price of a forward currency contract fluctuates with changes in forward currency exchange rates. The value of each of the Fund’s forward currency contracts is marked-to-market daily using rates supplied by a quotation service and changes in value are recorded by each Fund as unrealized gains or losses. Realized gains or losses on the contracts are equal to the difference between the value of the contract at the time it was opened and the value at the time it was settled.
These contracts involve market risk in excess of the unrealized gain or loss. Forward currency contracts expose a Fund to the market risk of unfavorable movements in currency values and the risk that the counterparty will be unable or unwilling to meet the terms of the contracts. Most forward currency contracts are collateralized. Forward currency contracts outstanding at the end of the year, if any, are listed in each applicable Fund’s Schedule of Investments.
GMO Trust Funds
Notes to Financial Statements — (Continued)
February 28, 2022
Futures contracts
The Funds may purchase and sell futures contracts. A futures contract is a contract that obligates the holder to buy or sell an asset at a predetermined delivery price at a specified time in the future. Some futures contracts are net (cash) settled. Upon entering into a futures contract, a Fund is required to deposit cash, U.S. government and agency obligations or other liquid assets with the futures clearing broker in accordance with the initial margin requirements of the broker or exchange. Futures contracts are generally valued at the settlement price established at the close of business each day by the board of trade or exchange on which they are traded (and if the futures are traded outside the U.S. and the market for such futures is closed prior to the close of the NYSE due to time zone differences, the values will be adjusted, to the extent practicable and available, based on inputs from an independent pricing service approved by the Trustees to reflect estimated valuation changes through the NYSE close). The value of each of the Fund’s futures contracts is marked-to-market daily and an appropriate payable or receivable for the change in value (“variation margin”) is recorded by each Fund. The payable or receivable is settled on the following business day. Gains or losses are recognized but not accounted for as realized until the contracts expire or are closed. Futures contracts involve, to varying degrees, risk of loss in excess of the variation margin as recorded in the Statements of Assets and Liabilities. Under some circumstances, futures exchanges may establish daily limits on the amount that the price of a futures contract can vary from the previous day’s settlement price, thereby effectively preventing liquidation of unfavorable positions. Futures contracts expose the Funds to the risk that they may not be able to enter into a closing transaction due to an illiquid market. Futures contracts outstanding at the end of the year, if any, are listed in each applicable Fund’s Schedule of Investments.
Options
The Funds may purchase call and put options. A call option gives the holder the right to buy an asset; a put option gives the holder the right to sell an asset. “Quanto” options are cash-settled options in which the underlying asset (often an index) is denominated in a currency other than the currency in which the option is settled. By purchasing options a Fund alters its exposure to the underlying asset by, in the case of a call option, entitling it to purchase the underlying asset at a set price from the writer of the option and, in the case of a put option, entitling it to sell the underlying asset at a set price to the writer of the option. A Fund pays a premium for a purchased option. That premium, if any, which is disclosed in the Schedule of Investments, is subsequently reflected in the marked-to-market value of the option. The potential loss associated with purchasing put and call options is limited to the premium paid. Purchased option contracts outstanding at the end of the year, if any, are listed in each applicable Fund’s Schedule of Investments.
The Funds may write (i.e. sell) call and put options on futures, swaps (“swaptions”), securities or currencies they own or in which they may invest. Writing options alters a Fund’s exposure to the underlying asset by, in the case of a call option, obligating that Fund to sell the underlying asset at a set price to the option-holder and, in the case of a put option, obligating that Fund to purchase the underlying asset at a set price from the option-holder. In some cases (e.g., index options), settlement will be in cash, based on a formula price. When a Fund writes a call or put option, an amount equal to the premium received is recorded as a liability and is subsequently included in the marked-to-market value of the option. As a writer of an option, a Fund has no control over whether it will be required to sell (call) or purchase (put) the underlying asset and as a result bears the risk of an unfavorable change in the price of the asset underlying the option. In the event that a Fund writes call options without an offsetting exposure (e.g., call options on an asset that the Fund does not own), it bears an unlimited risk of loss if the price of the underlying asset increases during the term of the option. OTC options expose a Fund to the risk the Fund may not be able to enter into a closing transaction because of an illiquid market. Written option contracts outstanding at the end of the year, if any, are listed in each applicable Fund’s Schedule of Investments.
When an option contract is closed, the Fund records a realized gain or loss equal to the difference between the value of the contract at the time it was opened and the value at the time it was closed. Realized gains and losses on purchased options are included in realized gains and losses on investment securities. If a written call option is exercised, the premium originally received is recorded as an addition to sales proceeds. If a written put option is exercised, the premium originally received is recorded as a reduction in the cost of investments purchased. Gains and losses from the expiration or closing of written option contracts are separately disclosed in the Statements of Operations.
In a credit linked option contract, one party makes payments to another party in exchange for the option to exercise a contract where the buyer has the right to receive a specified return if a credit event (e.g., default or similar event) occurs with respect to a reference entity or entities and a specified decrease in the value of the related collateral occurs. A writer of a credit linked option receives periodic payments in return for its obligation to pay an agreed-upon value to the other party if they exercise their option in the case of a credit event. If no credit event occurs, the seller has no payment obligation and will keep the premiums received.
GMO Trust Funds
Notes to Financial Statements — (Continued)
February 28, 2022
Swap contracts
The Funds may directly or indirectly use various swap contracts, including, without limitation, swaps on securities and securities indices, total return swaps, interest rate swaps, basis swaps, currency swaps, credit default swaps, variance swaps, commodity swaps, inflation swaps, municipal swaps, dividend swaps, volatility swaps, correlation swaps and other types of available swaps. A swap contract is an agreement to exchange the return generated by one asset for the return generated by another asset. Some swap contracts are net settled. When entering into a swap contract and during the term of the transaction, a Fund and/or the swap counterparty may post or receive cash or securities as collateral.
Initial upfront payments received or made upon entering into a swap contract are included in the fair market value of the swap. The Funds do not amortize upfront payments. Net periodic payments made or received to compensate for differences between the stated terms of the swap contract and prevailing market conditions (credit spreads, currency exchange rates, interest rates, and other relevant factors) are recorded as realized gains or losses in the Statements of Operations. A liquidation payment received or made at the termination of the swap contract is recorded as realized gain or loss in the Statements of Operations. The periodic frequency of payments received may differ from periodic payment frequencies made and their frequencies could be monthly, quarterly, semiannually, annually or at maturity.
Interest rate swap contracts involve an exchange by the parties of their respective commitments to pay or rights to receive interest (e.g., an exchange of floating rate interest payments for fixed rate interest payments with respect to the notional amount of principal). Basis swaps are interest rate swaps that involve the exchange of two floating interest rate payments and may involve the exchange of two different currencies.
Inflation swaps involve the exchange of a floating rate linked to an index for a fixed rate interest payment with respect to a notional amount or principal.
Total return swap contracts involve a commitment by one party to pay interest to the other party in exchange for a payment to it from the other party based on the return of a reference asset (e.g., a security, basket of securities, or futures contract), both based on notional amounts. To the extent the return of the reference asset exceeds or falls short of the interest payments, one party is entitled to receive a payment from or obligated to make a payment to the other party.
In a credit default swap contract, one party makes payments to another party in exchange for the right to receive a specified return (or to put a security) if a credit event (e.g., default or similar event) occurs with respect to a reference entity or entities. A seller of credit default protection receives periodic payments in return for its obligation to pay the principal amount of a debt security (or other agreed-upon value) to the other party upon the occurrence of a credit event. If no credit event occurs, the seller has no payment obligations so long as there is no early termination.
For credit default swap contracts on asset-backed securities, a credit event may be triggered by various occurrences, which may include an issuer’s failure to pay interest or principal on a reference security, a breach of a material representation or covenant, an agreement by the holders of an asset-backed security to a maturity extension, or a write-down on the collateral underlying the security. For credit default swap contracts on corporate or sovereign issuers, a credit event may be triggered by such occurrences as the issuer’s bankruptcy, failure to pay interest or principal, repudiation/moratorium and/or restructuring.
Correlation swaps involve receiving a stream of payments based on the actual average correlation between or among the price movements of two or more underlying variables over a period of time, in exchange for making a regular stream of payments based on a fixed “strike” correlation level (or vice versa), where both payment streams are based on a notional amount. The underlying variables may include, without limitation, commodity prices, exchange rates, interest rates and stock indices.
Variance swap contracts involve an agreement by two parties to exchange cash flows based on the measured variance (or square of volatility) of a specified underlying asset. One party agrees to exchange a “fixed rate” or strike price payment for the “floating rate” or realized price variance on the underlying asset with respect to the notional amount. At inception, the strike price chosen is generally fixed at a level such that the fair value of the swap is zero. As a result, no money changes hands at the initiation of the contract. At the expiration date, the amount payable by one party to the other is the difference between the realized price variance of the underlying asset and the strike price multiplied by the notional amount. A receiver of the realized price variance would be entitled to receive a payment when the realized price variance of the underlying asset is greater than the strike price and would be obligated to make a payment when that variance is less than the strike price. A payer of the realized price variance would be obligated to make a payment
GMO Trust Funds
Notes to Financial Statements — (Continued)
February 28, 2022
when the realized price variance of the underlying asset is greater than the strike price and would be entitled to receive a payment when that variance is less than the strike price. This type of agreement is essentially a forward contract on the future realized price variance of the underlying asset.
Generally, the Funds price their OTC swap contracts daily using industry standard models that may incorporate quotations from market makers or pricing vendors and record the change in value, if any, as unrealized gain or loss in the Statements of Operations. Gains or losses are realized upon the termination of the swap contracts or reset dates, as appropriate. Cleared swap contracts are valued using the quote (which may be based on a model) published by the relevant clearing house. If an updated quote for a cleared swap contract is not available by the time that a Fund calculates its net asset value on any business day, then that swap contract will generally be valued using an industry standard model, which may differ from the model used by the relevant clearing house.
The values assigned to swap contracts may differ significantly from the values realized upon termination, and the differences could be material. Entering into swap contracts involves counterparty credit, legal, and documentation risk that is generally not reflected in the value assigned to the swap contract. Such risks include the possibility that the counterparty defaults on its obligations to perform or disagrees as to the meaning of contractual terms, that a Fund has amounts on deposit in excess of amounts owed by that Fund, or that any collateral the other party posts is insufficient or not timely received by a Fund. Credit risk is particularly acute in economic environments in which financial services firms are exposed to systemic risks of the type evidenced by the insolvency of Lehman Brothers in 2008 and subsequent market disruptions. Swap contracts outstanding at the end of the year, if any, are listed in each applicable Fund’s Schedule of Investments.
***
As provided by U.S. GAAP, the table below is based on market values or unrealized appreciation/(depreciation) rather than the notional amounts of derivatives. Changes to market values of reference asset(s) will tend to have a greater impact on the Funds (with correspondingly greater risk) the greater the notional amount. For further information on notional amounts, see the Schedule of Investments.
The following is a summary of the valuations of derivative instruments categorized by risk exposure.
GMO Trust Funds
Notes to Financial Statements — (Continued)
February 28, 2022
The Effect of Derivative Instruments on the Statements of Assets and Liabilities as of February 28, 2022 and the Statements of Operations for the year ended February 28, 2022^:
The risks referenced in the tables below are not intended to be inclusive of all risks. Please see the “Investment and other risks” and “Portfolio valuation” sections for a further discussion of risks.
| | | | | | | | | | | | | | | | |
| | | | | |
| | | Credit
Contracts | | | Foreign
Currency
Contracts | | | Interest
Rate
Contracts | | | Total | |
| Emerging Country Debt Fund | |
| Asset Derivatives | |
Investments, at value (purchased options) | | $ | — | | | $ | 30,644 | | | $ | — | | | $ | 30,644 | |
Unrealized Appreciation on Forward Currency Contracts | | | — | | | | 9,315,733 | | | | — | | | | 9,315,733 | |
Options, at value | | | 326,111 | | | | — | | | | — | | | | 326,111 | |
Swap Contracts, at value¤ | | | 34,074,409 | | | | — | | | | 9,016,873 | | | | 43,091,282 | |
| | | | | | | | | | | | | | | | | |
Total | | $ | 34,400,520 | | | $ | 9,346,377 | | | $ | 9,016,873 | | | $ | 52,763,770 | |
| | | | | | | | | | | | | | | | | |
| Liability Derivatives | |
Unrealized Depreciation on Forward Currency Contracts | | $ | — | | | $ | (5,074,237 | ) | | $ | — | | | $ | (5,074,237 | ) |
Swap Contracts, at value¤ | | | (10,200,864 | ) | | | — | | | | (12,437,718 | ) | | | (22,638,582 | ) |
| | | | | | | | | | | | | | | | | |
Total | | $ | (10,200,864 | ) | | $ | (5,074,237 | ) | | $ | (12,437,718 | ) | | $ | (27,712,819 | ) |
| | | | | | | | | | | | | | | | | |
| Net Realized Gain (Loss) on | |
Forward Currency Contracts | | $ | — | | | $ | 16,529,875 | | | $ | — | | | $ | 16,529,875 | |
Options | | | 317,281 | | | | — | | | | — | | | | 317,281 | |
Swap Contracts | | | (10,844,980 | ) | | | — | | | | (231,925 | ) | | | (11,076,905 | ) |
| | | | | | | | | | | | | | | | | |
Total | | $ | (10,527,699 | ) | | $ | 16,529,875 | | | $ | (231,925 | ) | | $ | 5,770,251 | |
| | | | | | | | | | | | | | | | | |
| Change in Net Appreciation (Depreciation) on | |
Investments (purchased options) | | $ | — | | | $ | (1,064,064 | ) | | $ | — | | | $ | (1,064,064 | ) |
Forward Currency Contracts | | | — | | | | 4,586,507 | | | | — | | | | 4,586,507 | |
Options | | | (381,689 | ) | | | — | | | | — | | | | (381,689 | ) |
Swap Contracts | | | 12,495,049 | | | | — | | | | (3,093,482 | ) | | | 9,401,567 | |
| | | | | | | | | | | | | | | | | |
Total | | $ | 12,113,360 | | | $ | 3,522,443 | | | $ | (3,093,482 | ) | | $ | 12,542,321 | |
| | | | | | | | | | | | | | | | | |
| | | | | | | | | | | | | | | | | |
| High Yield Fund | |
| Asset Derivatives | |
Unrealized Appreciation on Forward Currency Contracts | | $ | — | | | $ | 218,399 | | | $ | — | | | $ | 218,399 | |
Unrealized Appreciation on Futures Contracts¤ | | | — | | | | — | | | | 180,489 | | | | 180,489 | |
Swap Contracts, at value¤ | | | 1,644,741 | | | | — | | | | — | | | | 1,644,741 | |
| | | | | | | | | | | | | | | | | |
Total | | $ | 1,644,741 | | | $ | 218,399 | | | $ | 180,489 | | | $ | 2,043,629 | |
| | | | | | | | | | | | | | | | | |
| Liability Derivatives | |
Unrealized Depreciation on Futures Contracts¤ | | $ | — | | | $ | — | | | $ | (11,329 | ) | | $ | (11,329 | ) |
Written Options, at value | | | (116,704 | ) | | | — | | | | — | | | | (116,704 | ) |
Swap Contracts, at value¤ | | | (321,248 | ) | | | — | | | | (814,909 | ) | | | (1,136,157 | ) |
| | | | | | | | | | | | | | | | | |
Total | | $ | (437,952 | ) | | $ | — | | | $ | (826,238 | ) | | $ | (1,264,190 | ) |
| | | | | | | | | | | | | | | | | |
| Net Realized Gain (Loss) on | |
Forward Currency Contracts | | $ | — | | | $ | 793,954 | | | $ | — | | | $ | 793,954 | |
Futures Contracts | | | — | | | | — | | | | (486,116 | ) | | | (486,116 | ) |
Written Options | | | 314,381 | | | | — | | | | — | | | | 314,381 | |
Swap Contracts | | | 2,255,474 | | | | — | | | | 1,380,652 | | | | 3,636,126 | |
| | | | | | | | | | | | | | | | | |
Total | | $ | 2,569,855 | | | $ | 793,954 | | | $ | 894,536 | | | $ | 4,258,345 | |
| | | | | | | | | | | | | | | | | |
| Change in Net Appreciation (Depreciation) on | |
Forward Currency Contracts | | $ | — | | | $ | (45,999 | ) | | $ | — | | | $ | (45,999 | ) |
Futures Contracts | | | — | | | | — | | | | 229,217 | | | | 229,217 | |
Written Options | | | 82,597 | | | | — | | | | — | | | | 82,597 | |
Swap Contracts | | | (1,652,025 | ) | | | — | | | | (686,976 | ) | | | (2,339,001 | ) |
| | | | | | | | | | | | | | | | | |
Total | | $ | (1,569,428 | ) | | $ | (45,999 | ) | | $ | (457,759 | ) | | $ | (2,073,186 | ) |
| | | | | | | | | | | | | | | | | |
| | | | | | | | | | | | | | | | | |
GMO Trust Funds
Notes to Financial Statements — (Continued)
February 28, 2022
| | | | | | | | | | | | | | | | |
| | | | | |
| | | Credit
Contracts | | | Foreign
Currency
Contracts | | | Interest
Rate
Contracts | | | Total | |
| Multi-Sector Fixed Income Fund | |
| Asset Derivatives | |
Unrealized Appreciation on Forward Currency Contracts | | $ | — | | | $ | 529,761 | | | $ | — | | | $ | 529,761 | |
Unrealized Appreciation on Futures Contracts¤ | | | — | | | | — | | | | 450,626 | | | | 450,626 | |
Swap Contracts, at value¤ | | | — | | | | — | | | | 2,188,309 | | | | 2,188,309 | |
| | | | | | | | | | | | | | | | | |
Total | | $ | — | | | $ | 529,761 | | | $ | 2,638,935 | | | $ | 3,168,696 | |
| | | | | | | | | | | | | | | | | |
| Liability Derivatives | |
Unrealized Depreciation on Forward Currency Contracts | | $ | — | | | $ | (1,063,151 | ) | | $ | — | | | $ | (1,063,151 | ) |
Unrealized Depreciation on Futures Contracts¤ | | | — | | | | — | | | | (41,875 | ) | | | (41,875 | ) |
Swap Contracts, at value¤ | | | — | | | | — | | | | (2,562,675 | ) | | | (2,562,675 | ) |
| | | | | | | | | | | | | | | | | |
Total | | $ | — | | | $ | (1,063,151 | ) | | $ | (2,604,550 | ) | | $ | (3,667,701 | ) |
| | | | | | | | | | | | | | | | | |
| Net Realized Gain (Loss) on | |
Forward Currency Contracts | | $ | — | | | $ | 2,266,522 | | | $ | — | | | $ | 2,266,522 | |
Futures Contracts | | | — | | | | — | | | | (1,649,668 | ) | | | (1,649,668 | ) |
Swap Contracts | | | — | | | | — | | | | (10,314,273 | ) | | | (10,314,273 | ) |
| | | | | | | | | | | | | | | | | |
Total | | $ | — | | | $ | 2,266,522 | | | $ | (11,963,941 | ) | | $ | (9,697,419 | ) |
| | | | | | | | | | | | | | | | | |
| Change in Net Appreciation (Depreciation) on | |
Forward Currency Contracts | | $ | — | | | $ | (1,571,293 | ) | | $ | — | | | $ | (1,571,293 | ) |
Futures Contracts | | | — | | | | — | | | | 596,190 | | | | 596,190 | |
Swap Contracts | | | — | | | | — | | | | (736,114 | ) | | | (736,114 | ) |
| | | | | | | | | | | | | | | | | |
Total | | $ | — | | | $ | (1,571,293 | ) | | $ | (139,924 | ) | | $ | (1,711,217 | ) |
| | | | | | | | | | | | | | | | | |
| | | | | | | | | | | | | | | | | |
| Opportunistic Income Fund | |
| Asset Derivatives | |
Investments, at value (purchased options) | | $ | 2,117,955 | | | $ | — | | | $ | — | | | $ | 2,117,955 | |
Unrealized Appreciation on Forward Currency Contracts | | | — | | | | 98,731 | | | | — | | | | 98,731 | |
Unrealized Appreciation on Futures Contracts¤ | | | — | | | | — | | | | 155,255 | | | | 155,255 | |
Swap Contracts, at value¤ | | | 24,883,395 | | | | — | | | | 149,920 | | | | 25,033,315 | |
| | | | | | | | | | | | | | | | | |
Total | | $ | 27,001,350 | | | $ | 98,731 | | | $ | 305,175 | | | $ | 27,405,256 | |
| | | | | | | | | | | | | | | | | |
| Liability Derivatives | |
Unrealized Depreciation on Forward Currency Contracts | | $ | — | | | $ | (25,235 | ) | | $ | — | | | $ | (25,235 | ) |
Unrealized Depreciation on Futures Contracts¤ | | | — | | | | — | | | | (437,439 | ) | | | (437,439 | ) |
Written Options, at value | | | (2,132,177 | ) | | | — | | | | — | | | | (2,132,177 | ) |
Swap Contracts, at value¤ | | | (5,037,032 | ) | | | — | | | | (14,336 | ) | | | (5,051,368 | ) |
| | | | | | | | | | | | | | | | | |
Total | | $ | (7,169,209 | ) | | $ | (25,235 | ) | | $ | (451,775 | ) | | $ | (7,646,219 | ) |
| | | | | | | | | | | | | | | | | |
| Net Realized Gain (Loss) on | |
Investments (purchased options) | | $ | — | | | $ | — | | | $ | (232,856 | ) | | $ | (232,856 | ) |
Forward Currency Contracts | | | — | | | | 303,454 | | | | — | | | | 303,454 | |
Futures Contracts | | | — | | | | — | | | | 3,741,319 | | | | 3,741,319 | |
Written Options | | | — | | | | — | | | | 1,278,191 | | | | 1,278,191 | |
Swap Contracts | | | (5,711,050 | ) | | | — | | | | 2,865,469 | | | | (2,845,581 | ) |
| | | | | | | | | | | | | | | | | |
Total | | $ | (5,711,050 | ) | | $ | 303,454 | | | $ | 7,652,123 | | | $ | 2,244,527 | |
| | | | | | | | | | | | | | | | | |
| Change in Net Appreciation (Depreciation) on | |
Investments (purchased options) | | $ | 110,921 | | | $ | — | | | $ | — | | | $ | 110,921 | |
Forward Currency Contracts | | | — | | | | 74,197 | | | | — | | | | 74,197 | |
Futures Contracts | | | — | | | | — | | | | 14,614 | | | | 14,614 | |
Written Options | | | (126,348 | ) | | | — | | | | — | | | | (126,348 | ) |
Swap Contracts | | | 2,255,644 | | | | — | | | | (2,498,630 | ) | | | (242,986 | ) |
| | | | | | | | | | | | | | | | | |
Total | | $ | 2,240,217 | | | $ | 74,197 | | | $ | (2,484,016 | ) | | $ | (169,602 | ) |
| | | | | | | | | | | | | | | | | |
| | | | | | | | | | | | | | | | | |
GMO Trust Funds
Notes to Financial Statements — (Continued)
February 28, 2022
| | ^ | Because the Funds recognize changes in value through the Statements of Operations, they do not qualify for hedge accounting under authoritative guidance for derivative instruments. The Funds’ investments in derivatives may represent an economic hedge; however, they are considered to be non-hedge transactions for the purpose of these tables. |
| | ¤ | The table includes cumulative unrealized appreciation/depreciation of futures and value of cleared swap contracts, if any, as reported in the Schedule of Investments. Year-end variation margin on open futures and cleared swap contracts, if any, is reported within the Statements of Assets and Liabilities. |
Certain Funds are party to International Swaps and Derivatives Association, Inc. Master Agreements, Global Master Repurchase Agreements or other similar types of agreements (collectively, “Master Agreements”) that generally govern the terms of OTC derivative transactions, repurchase agreements and reverse repurchase agreements. The Master Agreements may include collateral posting terms and set-off provisions that apply in the event of a default and/or termination event. Upon the occurrence of such an event, including the bankruptcy or insolvency of the counterparty, the Master Agreements may permit the non-defaulting party to calculate a single net payment to close out applicable transactions. However, there is no guarantee that the terms of a Master Agreement will be enforceable; for example, when bankruptcy or insolvency laws impose restrictions on or prohibitions against the right of offset. Additionally, the set-off and netting provisions of a Master Agreement may not extend to the obligations of the counterparty’s affiliates or across varying types of transactions. Because no such event has occurred, the Funds do not presently have a legally enforceable right of set-off and these amounts have not been offset in the Statements of Assets and Liabilities, but have been presented separately in the table below. Termination events may also include a decline in the net assets of a Fund below a certain level over a specified period of time and may entitle a counterparty to elect an early termination of all the transactions under the Master Agreement with that counterparty. Such an election by one or more of the counterparties could have a material adverse impact on a Fund’s operations. An estimate of the aggregate net payment, if any, that may need to be paid by a Fund (or may be received by a Fund) in such an event is represented by the Net Amounts in the tables below. For more information about other uncertainties and risks, see “Investments and other risks” above.
For financial reporting purposes, in the Statements of Assets and Liabilities any cash collateral that has been pledged to cover obligations of the Funds is reported as Due from broker and any cash collateral received from the counterparty is reported as Due to broker. Any non-cash collateral pledged by the Funds is noted in the Schedules of Investments. The tables below show the potential effect of netting arrangements made available by the Master Agreements on the financial position of the Funds. For financial reporting purposes, the Funds’ Statements of Assets and Liabilities generally show derivative assets and derivative liabilities (regardless of whether they are subject to netting arrangements) on a gross basis, which reflects the full risks and exposures of the Fund prior to netting. See Note 2 for information on repurchase agreements and, reverse repurchase agreements held by the Funds at February 28, 2022, if any.
The tables above present the Funds’ derivative assets and liabilities by type of financial instrument. The following tables present the Funds’ OTC and/or exchange-traded derivative assets and liabilities by counterparty net of amounts that may be available for offset under the Master Agreements by the terms of the agreement and net of the related collateral received or pledged by the Funds as of February 28, 2022:
Emerging Country Debt Fund
| | | | | | | | | | | | | | | | |
| | | | | |
| Counterparty | | Gross Derivative
Assets Subject to
Master Agreements | | | Collateral
Received | | | Derivative
Assets/Liabilities
Available for Offset | | | Net Amount
of Derivative
Assets | |
Barclays Bank PLC | | $ | 3,004,460 | | | $ | — | | | $ | (3,004,460 | ) | | $ | — | |
Citibank N.A. | | | 1,854,859 | | | | — | | | | (1,854,859 | ) | | | — | |
Deutsche Bank AG | | | 3,801,281 | | | | — | | | | (3,801,281 | ) | | | — | |
Goldman Sachs International | | | 12,148,920 | | | | (10,869,231 | ) | | | — | | | | 1,279,689 | |
JPMorgan Chase Bank, N.A. | | | 2,772,008 | | | | (2,098,806 | ) | | | (673,202 | ) | | | — | * |
Morgan Stanley & Co. International PLC | | | 2,671,331 | | | | (1,199,741 | ) | | | (159,293 | ) | | | 1,312,297 | |
Morgan Stanley Capital Services LLC | | | 138,343 | | | | — | | | | — | | | | 138,343 | |
State Street Bank and Trust Company | | | 2,160,435 | | | | (1,489,930 | ) | | | (236,701 | ) | | | 433,804 | |
| | | | | | | | | | | | | | | | | |
Total | | $ | 28,551,637 | | | $ | (15,657,708 | ) | | $ | (9,729,796 | ) | | $ | 3,164,133 | |
| | | | | | | | | | | | | | | | | |
| | | | | | | | | | | | | | | | | |
GMO Trust Funds
Notes to Financial Statements — (Continued)
February 28, 2022
Emerging Country Debt Fund (continued)
| | | | | | | | | | | | | | | | |
| | | | | |
| Counterparty | | Gross Derivative
Liabilities Subject to
Master Agreements | | | Collateral
Pledged | | | Derivative
Assets/Liabilities
Available for Offset | | | Net Amount
of Derivative
Liabilities | |
Barclays Bank PLC | | $ | (4,005,041 | ) | | $ | — | | | $ | 3,004,460 | | | $ | (1,000,581 | ) |
Citibank N.A. | | | (8,664,063 | ) | | | 3,540,250 | | | | 1,854,859 | | | | (3,268,954 | ) |
Deutsche Bank AG | | | (4,717,918 | ) | | | 916,637 | | | | 3,801,281 | | | | — | * |
JPMorgan Chase Bank, N.A. | | | (673,202 | ) | | | — | | | | 673,202 | | | | — | |
Morgan Stanley & Co. International PLC | | | (159,293 | ) | | | — | | | | 159,293 | | | | — | |
State Street Bank and Trust Company | | | (236,701 | ) | | | — | | | | 236,701 | | | | — | |
| | | | | | | | | | | | | | | | | |
Total | | $ | (18,456,218 | ) | | $ | 4,456,887 | | | $ | 9,729,796 | | | $ | (4,269,535 | ) |
| | | | | | | | | | | | | | | | | |
| | | | | | | | | | | | | | | | | |
High Yield Fund
| | | | | | | | | | | | | | | | |
| | | | | |
| Counterparty | | Gross Derivative
Assets Subject to
Master Agreements | | | Collateral
Received | | | Derivative
Assets/Liabilities
Available for Offset | | | Net Amount
of Derivative
Assets | |
Morgan Stanley & Co. International PLC | | $ | 218,399 | | | $ | (206,842 | ) | | $ | (11,557 | ) | | $ | — | * |
| | | | | | | | | | | | | | | | | |
Total | | $ | 218,399 | | | $ | (206,842 | ) | | $ | (11,557 | ) | | $ | — | |
| | | | | | | | | | | | | | | | | |
| | | | | | | | | | | | | | | | | |
| | | | | |
| Counterparty | | Gross Derivative
Liabilities Subject to
Master Agreements | | | Collateral
Pledged | | | Derivative
Assets/Liabilities
Available for Offset | | | Net Amount
of Derivative
Liabilities | |
Deutsche Bank AG | | $ | (116,704 | ) | | $ | — | | | $ | — | | | $ | (116,704 | ) |
Goldman Sachs International | | | (164,854 | ) | | | 164,854 | | | | — | | | | — | * |
JPMorgan Chase Bank, N.A. | | | (638,498 | ) | | | 638,498 | | | | — | | | | — | * |
Morgan Stanley & Co. International PLC | | | (11,557 | ) | | | — | | | | 11,557 | | | | — | |
| | | | | | | | | | | | | | | | | |
Total | | $ | (931,613 | ) | | $ | 803,352 | | | $ | 11,557 | | | $ | (116,704 | ) |
| | | | | | | | | | | | | | | | | |
| | | | | | | | | | | | | | | | | |
Multi-Sector Fixed Income Fund
| | | | | | | | | | | | | | | | |
| | | | | |
| Counterparty | | Gross Derivative
Assets Subject to
Master Agreements | | | Collateral
Received | | | Derivative
Assets/Liabilities
Available for Offset | | | Net Amount
of Derivative
Assets | |
Barclays Bank PLC | | $ | 148,506 | | | $ | — | | | $ | (145,213 | ) | | $ | 3,293 | |
Citibank N.A. | | | 12,153 | | | | — | | | | (12,153 | ) | | | — | |
Deutsche Bank AG | | | 2,329 | | | | — | | | | (2,329 | ) | | | — | |
Goldman Sachs International | | | 4,431 | | | | (4,431 | ) | | | — | | | | — | * |
JPMorgan Chase Bank, N.A. | | | 89,845 | | | | — | | | | (70,419 | ) | | | 19,426 | |
Morgan Stanley & Co. International PLC | | | 256,894 | | | | — | | | | (256,894 | ) | | | — | |
State Street Bank and Trust Company | | | 15,603 | | | | — | | | | — | | | | 15,603 | |
| | | | | | | | | | | | | | | | | |
Total | | $ | 529,761 | | | $ | (4,431 | ) | | $ | (487,008 | ) | | $ | 38,322 | |
| | | | | | | | | | | | | | | | | |
| | | | | | | | | | | | | | | | | |
GMO Trust Funds
Notes to Financial Statements — (Continued)
February 28, 2022
Multi-Sector Fixed Income Fund (continued)
| | | | | | | | | | | | | | | | |
| | | | | |
| Counterparty | | Gross Derivative
Liabilities Subject to
Master Agreements | | | Collateral
Pledged | | | Derivative
Assets/Liabilities
Available for Offset | | | Net Amount
of Derivative
Liabilities | |
Barclays Bank PLC | | $ | (145,213 | ) | | $ | — | | | $ | 145,213 | | | $ | — | |
Citibank N.A. | | | (12,553 | ) | | | — | | | | 12,153 | | | | (400 | ) |
Deutsche Bank AG | | | (149,233 | ) | | | 146,904 | | | | 2,329 | | | | — | * |
JPMorgan Chase Bank, N.A. | | | (70,419 | ) | | | — | | | | 70,419 | | | | — | |
Morgan Stanley & Co. International PLC | | | (685,733 | ) | | | 171,076 | | | | 256,894 | | | | (257,763 | ) |
| | | | | | | | | | | | | | | | | |
Total | | $ | (1,063,151 | ) | | $ | 317,980 | | | $ | 487,008 | | | $ | (258,163 | ) |
| | | | | | | | | | | | | | | | | |
| | | | | | | | | | | | | | | | | |
Opportunistic Income Fund
| | | | | | | | | | | | | | | | |
| | | | | |
| Counterparty | | Gross Derivative
Assets Subject to
Master Agreements | | | Collateral
Received | | | Derivative
Assets/Liabilities
Available for Offset | | | Net Amount
of Derivative
Assets | |
Bank of America, N.A. | | $ | 2,290,281 | | | $ | (1,471,737 | ) | | $ | (818,544 | ) | | $ | — | * |
Barclays Bank PLC | | | 1,242,969 | | | | — | | | | (1,242,969 | ) | | | — | |
Citigroup Global Markets Inc. | | | 1,925,280 | | | | (1,816,554 | ) | | | (108,726 | ) | | | — | * |
Citibank N.A. | | | 2,658,873 | | | | (2,607,846 | ) | | | (51,027 | ) | | | — | * |
Deutsche Bank AG | | | 468,747 | | | | (378,589 | ) | | | (90,158 | ) | | | — | * |
Goldman Sachs International | | | 8,576,439 | | | | (8,128,046 | ) | | | (448,393 | ) | | | — | * |
JPMorgan Chase Bank, N.A. | | | 7,709,427 | | | | (7,376,294 | ) | | | (231,912 | ) | | | 101,221 | |
Morgan Stanley & Co. International PLC | | | 594,190 | | | | (594,190 | ) | | | — | | | | — | * |
Morgan Stanley Capital Services LLC | | | 1,365,946 | | | | (1,000,000 | ) | | | (341,313 | ) | | | 24,633 | |
State Street Bank and Trust Company | | | 93,721 | | | | — | | | | (25,235 | ) | | | 68,486 | |
| | | | | | | | | | | | | | | | | |
Total | | $ | 26,925,873 | | | $ | (23,373,256 | ) | | $ | (3,358,277 | ) | | $ | 194,340 | |
| | | | | | | | | | | | | | | | | |
| | | | | | | | | | | | | | | | | |
| | | | | |
| Counterparty | | Gross Derivative
Liabilities Subject to
Master Agreements | | | Collateral
Pledged | | | Derivative
Assets/Liabilities
Available for Offset | | | Net Amount
of Derivative
Liabilities | |
Bank of America, N.A. | | $ | (818,544 | ) | | $ | — | | | $ | 818,544 | | | $ | — | |
Barclays Bank PLC | | | (1,391,474 | ) | | | 148,505 | | | | 1,242,969 | | | | — | * |
Citigroup Global Markets Inc. | | | (108,726 | ) | | | — | | | | 108,726 | | | | — | |
Citibank N.A. | | | (51,027 | ) | | | — | | | | 51,027 | | | | — | |
Credit Suisse International | | | (31,691 | ) | | | — | | | | — | | | | (31,691 | ) |
Deutsche Bank AG | | | (90,158 | ) | | | — | | | | 90,158 | | | | — | |
Goldman Sachs International | | | (448,393 | ) | | | — | | | | 448,393 | | | | — | |
JPMorgan Chase Bank, N.A. | | | (231,912 | ) | | | — | | | | 231,912 | | | | — | |
Morgan Stanley Capital Services LLC | | | (341,313 | ) | | | — | | | | 341,313 | | | | — | |
State Street Bank and Trust Company | | | (25,235 | ) | | | — | | | | 25,235 | | | | — | |
| | | | | | | | | | | | | | | | | |
Total | | $ | (3,538,473 | ) | | $ | 148,505 | | | $ | 3,358,277 | | | $ | (31,691 | ) |
| | | | | | | | | | | | | | | | | |
| | | | | | | | | | | | | | | | | |
| | * | The actual collateral received and/or pledged is more than the amount shown. |
GMO Trust Funds
Notes to Financial Statements — (Continued)
February 28, 2022
The average derivative activity of notional amounts (forward currency contracts, futures contracts and swap contracts) and principal amounts (options) outstanding, based on absolute values, at each month-end, was as follows for the year ended February 28, 2022:
| | | | | | | | | | | | | | | | |
| | | | | |
| Fund Name | | Forward
Currency
Contracts ($) | | | Futures
Contracts ($) | | | Options
(Principal) | | | Swap
Contracts ($) | |
Emerging Country Debt Fund | | | 361,665,458 | | | | — | | | | 196,976,333 | | | | 880,475,532 | |
High Yield Fund | | | 13,936,159 | | | | 23,265,404 | | | | 19,894,167 | | | | 66,739,337 | |
Multi-Sector Fixed Income Fund | | | 153,164,844 | | | | 85,317,616 | | | | — | | | | 568,534,177 | |
Opportunistic Income Fund | | | 9,302,983 | | | | 165,361,362 | | | | 307,820,557 | | | | 919,408,596 | |
| 5. | Fees and other transactions with affiliates |
GMO receives a management fee for the services it provides to each Fund. Management fees are paid monthly at the annual rate equal to the percentage of each Fund’s average daily net assets set forth in the table below:
| | | | | | | | | | | | | | | | | | | | | | | | |
| | | | | | | |
| | | Asset
Allocation
Bond Fund | | | Emerging Country
Debt Fund | | | High Yield
Fund | | | Multi-Sector
Fixed Income
Fund | | | Opportunistic
Income Fund | | | U.S. Treasury Fund | |
Management Fee | | | 0.25% | | | | 0.35% | | | | 0.35% | | | | 0.25% | | | | 0.40% | | | | 0.08%(a) | |
| | (a) | Since April 9, 2021 and prior to June 30, 2019, GMO voluntarily waived the Fund’s entire management fee. |
In addition, each class of shares of certain Funds pays GMO directly or indirectly a shareholder service fee for providing client services and reporting, such as performance information, client account information, personal and electronic access to Fund information, access to analysis and explanations of Fund reports, and assistance in maintaining and correcting client-related information. Shareholder service fees are paid monthly at the annual rate equal to the percentage of each applicable Class’s average daily net assets set forth in the table below:
| | | | | | | | | | | | | | | | | | | | | | | | |
| | | | | | | |
| Fund Name | | Class III | | | Class IV | | | Class V | | | Class VI | | | Class R6 | | | Class I | |
Asset Allocation Bond Fund | | | 0.15% | | | | | | | | | | | | 0.055% | | | | | | | | | |
Emerging Country Debt Fund | | | 0.15% | | | | 0.10% | | | | | | | | 0.055% | | | | | | | | | |
High Yield Fund | | | 0.15% | * | | | 0.10% | * | | | 0.085% | * | | | 0.055% | | | | 0.15% | * | | | 0.15% | * |
Multi-Sector Fixed Income Fund | | | 0.15% | | | | 0.10% | | | | | | | | | | | | 0.15% | * | | | 0.15% | * |
Opportunistic Income Fund | | | 0.15% | | | | | | | | | | | | 0.055% | | | | 0.15% | | | | 0.15% | |
| | * | Class is offered but has no shareholders as of February 28, 2022. |
For each Fund, other than Emerging Country Debt Fund and High Yield Fund, GMO has contractually agreed to reimburse the Fund for its “Specified Operating Expenses” (as defined below). For High Yield Fund, GMO has contractually agreed to reimburse the Fund for the portion of its “Specified Operating Expenses” (as defined below) that exceeds 0.10% of the Fund’s average daily net assets. Any such reimbursements are paid to a Fund concurrently with the Fund’s payment of management fees to GMO.
“Specified Operating Expenses” means: audit expenses, fund accounting expenses, pricing service expenses, expenses of non-investment related tax services, transfer agency expenses (excluding, in the case of Class I shares, any amounts paid for sub-transfer agency, recordkeeping and other administrative services provided by financial intermediaries for the benefit of Class I shareholders), expenses of non-investment related legal services provided to the Funds by or at the direction of GMO, organizational and start-up expenses, federal securities law filing expenses, printing expenses, state and federal registration fees and custody expenses.
GMO Trust Funds
Notes to Financial Statements — (Continued)
February 28, 2022
For High Yield Fund, GMO is permitted to recover from the Fund, on a class-by-class basis, “Specified Operating Expenses” GMO has borne or reimbursed (whether through reduction of its fees or otherwise) to the extent that the Fund’s “Specified Operating Expenses” later fall below the annualized rate of 0.10% per year or any lower expense limit in effect when GMO seeks to recover the expenses. The Fund, however, is not obligated to pay any such amount more than three years after GMO bore or reimbursed an expense. Any such recovery will not cause the Fund to exceed the annual limitation rate set forth above or any lower expense limit as is in effect at the time GMO seeks to recover the expenses.
For the year ended February 28, 2022, GMO did not recoup any previously recorded waivers and/or reimbursements.
On February 28, 2022, the waivers and/or reimbursements subject to possible future recoupment are as follows:
| | | | | | | | | | | | |
| | | | |
| | | Expiring the
year ending
February 28,
2023 | | | Expiring the
year ending
February 29,
2024 | | | Expiring the
year ending
February 28,
2025 | |
High Yield Fund, Class VI | | | $— | | | | $— | | | | $28,545 | |
GMO has contractually agreed to waive or reduce the Fund’s management fees and shareholder service fees to the extent necessary to offset the management fees and shareholder service fees paid to GMO that are directly or indirectly borne by the Fund or a class of shares of the Fund as a result of the Fund’s direct or indirect investments in other series of GMO Trust (“GMO Funds”). Management fees and shareholder service fees will not be waived below zero.
These contractual waivers and reimbursements will continue through at least June 30, 2022 for each Fund unless the Funds’ Board of Trustees authorizes their modification or termination or reduces the fee rates paid to GMO under the Fund’s management contract or servicing and supplemental support agreement.
GMO has contractually agreed to reimburse Class I assets of each Fund (or waive its fees) to the extent that payments for sub-transfer agency, recordkeeping and other administrative services provided by financial intermediaries from Class I assets exceed 0.10% of such Fund’s average daily net assets attributable to Class I assets.
Sub-Transfer Agent/Recordkeeping Payments
Class III, IV, V, VI, and R6 shares are not subject to payments to third parties for sub-transfer agent, recordkeeping and other administrative services. GMO may, on a case-by-case basis, make payments for sub-transfer agent, recordkeeping and other administrative services provided by financial intermediaries for the benefit of shareholders of these classes. Any such payments are made by GMO out of its own resources and are not an additional charge to a Fund or the holders of Class III, IV, V, VI, or Class R6 shares. These payments may create a conflict of interest by influencing a financial intermediary to recommend a Fund over another investment.
Class I shares are subject to payments for sub-transfer agency, recordkeeping and other administrative services provided by financial intermediaries for the benefit of holders of Class I shares through an account maintained by a third-party platform or intermediary. These services are not primarily intended to result in the sale of Fund shares but instead to provide ongoing services with respect to holders of Class I shares through a third-party platform or intermediary. Because payments for sub-transfer agency, recordkeeping and other administrative services are paid out of a Fund’s Class I assets on an ongoing basis, over time they will increase the cost of an investment in Class I shares. In addition, GMO may, on a case-by-case basis, make payments for sub-transfer agency, recordkeeping and other administrative services provided by financial intermediaries with respect to shareholders of Class I shares. Any such payments will be made by GMO out of its own resources and will not be an additional charge to a Fund or the holders of Class I shares. Any such payments will create a conflict of interest by influencing a financial intermediary to recommend a Fund over another investment.
GMO Trust Funds
Notes to Financial Statements — (Continued)
February 28, 2022
The Funds’ portion of the fees paid by the Trust to the Trust’s independent Trustees and their legal counsel and any agents unaffiliated with GMO during the year ended February 28, 2022 is shown in the table below and is included in the Statements of Operations.
| | | | | | | | |
| | | |
| Fund Name | | Independent Trustees and
their legal counsel ($) | | | Agent unaffiliated
with GMO ($) | |
Asset Allocation Bond Fund | | | 1,775 | | | | 263 | |
Emerging Country Debt Fund | | | 145,138 | | | | 12,635 | |
High Yield Fund | | | 2,866 | | | | 298 | |
Multi-Sector Fixed Income Fund | | | 5,568 | | | | 636 | |
Opportunistic Income Fund | | | 34,000 | | | | 2,717 | |
U.S. Treasury Fund | | | 9,900 | | | | 968 | |
Certain Funds incur fees and expenses indirectly as a shareholder in the underlying funds. For the year ended February 28, 2022, the Funds below had indirect fees and expenses greater than 0.01% of the Fund’s average daily net assets.
| | | | |
| | |
| Fund Name | | Total Indirect Expenses | |
Multi-Sector Fixed Income Fund | | | 0.107% | |
The Funds are permitted to purchase or sell securities from or to certain other GMO funds under specified conditions outlined in procedures adopted by the Trustees. The procedures have been designed to ensure that any purchase or sale of securities by a Fund from another fund or portfolio that is or could be considered an affiliate by virtue of having a common investment adviser (or affiliated investment advisers), common Trustees and/or common officers complies with Rule 17a-7 of the 1940 Act. Further, as defined under the procedures, each transaction is effectuated at the current market price. During the year ended February 28, 2022, the Funds did not engage in these transactions.
| 6. | Purchases and sales of securities |
Cost of purchases and proceeds from sales of securities, excluding short-term investments and including GMO U.S. Treasury Fund, if applicable, for the year ended February 28, 2022 are noted in the table below:
| | | | | | | | | | | | | | | | |
| | | | | |
| | | Purchases ($) | | | Purchases ($) | | | Sales ($) | | | Sales ($) | |
| | | | | |
| Fund Name | | U.S. Government
Securities | | | Investments (Non-U.S.
Government Securities) | | | U.S. Government
Securities | | | Investments (Non-U.S.
Government Securities) | |
Asset Allocation Bond Fund | | | 141,400,534 | | | | 731,456 | | | | 218,607,231 | | | | 5,720,000 | |
Emerging Country Debt Fund | | | 302,056,324 | | | | 1,098,192,329 | | | | 406,185,057 | | | | 960,847,074 | |
High Yield Fund | | | 3,630,374 | | | | 27,591,531 | | | | 150,082 | | | | 39,992,209 | |
Multi-Sector Fixed Income Fund | | | 285,535,508 | | | | 113,661,385 | | | | 292,426,848 | | | | 176,802,904 | |
Opportunistic Income Fund | | | 605,494,040 | | | | 369,744,005 | | | | 453,880,820 | | | | 282,838,755 | |
U.S. Treasury Fund | | | — | | | | — | | | | — | | | | — | |
In the normal course of business the Funds enter into contracts with third-party service providers that contain a variety of representations and warranties and that provide general indemnifications. The Funds’ maximum exposure under these arrangements is unknown, as it involves possible future claims that may or may not be made against the Funds. Based on experience, GMO is of the view that the risk of loss to the Funds in connection with the Funds’ indemnification obligations is remote; however, there can be no assurance that such obligations will not result in material liabilities that adversely affect the Funds.
GMO Trust Funds
Notes to Financial Statements — (Continued)
February 28, 2022
| 8. | Principal shareholders as of February 28, 2022 |
| | | | | | | | |
| | | |
| Fund Name | | Number of
shareholders that held
more than 10% of the
outstanding shares of
the Fund | | | Percentage of
outstanding shares of
the Fund held by those
shareholders owning
greater than 10% of the
outstanding shares of
the Fund | |
Asset Allocation Bond Fund | | | 1 | ‡ | | | 99.89% | |
Emerging Country Debt Fund | | | 1 | | | | 18.13% | |
High Yield Fund | | | 1 | | | | 92.45% | |
Multi-Sector Fixed Income Fund | | | 3 | ‡ | | | 81.47% | |
Opportunistic Income Fund | | | 3 | ‡ | | | 57.86% | |
U.S. Treasury Fund | | | 3 | # | | | 62.29% | |
| | ‡ | One of the shareholders is another fund of the Trust. |
| | # | Two of the shareholders are other funds of the Trust. |
The Declaration of Trust permits each Fund to issue an unlimited number of shares of beneficial interest (without par value). Transactions in the Funds’ shares were as follows:
| | | | | | | | | | | | | | | | |
| | | |
| | | Year Ended
February 28, 2022 | | | Year Ended
February 28, 2021 | |
| | | | | |
| | | Shares | | | Amount | | | Shares | | | Amount | |
Asset Allocation Bond Fund | | | | | | | | | | | | | | | | |
Class III: | |
Shares sold | | | 231,090 | | | $ | 5,615,500 | | | | 1,248,070 | | | $ | 29,430,309 | |
Shares issued to shareholders in reinvestment of distributions | | | 15 | | | | 359 | | | | 16,888 | | | | 403,791 | |
Shares repurchased | | | (2,826,353 | ) | | | (67,755,933 | ) | | | (483,688 | ) | | | (10,905,583 | ) |
| | | | | | | | | | | | | | | | | |
Net increase (decrease) | | | (2,595,248 | ) | | $ | (62,140,074 | ) | | | 781,270 | | | $ | 18,928,517 | |
| | | | | | | | | | | | | | | | | |
Class VI: | |
Shares sold | | | 685,291 | | | $ | 16,677,005 | | | | 433,703 | | | $ | 10,053,052 | |
Shares issued to shareholders in reinvestment of distributions | | | 28,792 | | | | 699,355 | | | | 33,513 | | | | 802,127 | |
Shares repurchased | | | (1,552,611 | ) | | | (37,257,738 | ) | | | (6,482,285 | ) | | | (149,463,143 | ) |
| | | | | | | | | | | | | | | | | |
Net increase (decrease) | | | (838,528 | ) | | $ | (19,881,378 | ) | | | (6,015,069 | ) | | $ | (138,607,964 | ) |
| | | | | | | | | | | | | | | | | |
| | | | | | | | | | | | | | | | | |
| Emerging Country Debt Fund | |
Class III: | |
Shares sold | | | 7,338,675 | | | $ | 177,081,443 | | | | 11,064,651 | | | $ | 283,435,647 | |
Shares issued to shareholders in reinvestment of distributions | | | 3,749,384 | | | | 91,061,066 | | | | 3,930,574 | | | | 101,703,325 | |
Shares repurchased | | | (6,465,058 | ) | | | (154,953,062 | ) | | | (16,856,375 | ) | | | (444,395,888 | ) |
Purchase premiums | | | — | | | | 262,799 | | | | — | | | | 490,114 | |
Redemption fees | | | — | | | | 415,289 | | | | — | | | | 938,001 | |
| | | | | | | | | | | | | | | | | |
Net increase (decrease) | | | 4,623,001 | | | $ | 113,867,535 | | | | (1,861,150 | ) | | $ | (57,828,801 | ) |
| | | | | | | | | | | | | | | | | |
| | | | | | | | | | | | | | | | | |
GMO Trust Funds
Notes to Financial Statements — (Continued)
February 28, 2022
| | | | | | | | | | | | | | | | |
| | | |
| | | Year Ended
February 28, 2022 | | | Year Ended
February 28, 2021 | |
| | | | | |
| | | Shares | | | Amount | | | Shares | | | Amount | |
| Emerging Country Debt Fund (continued) | |
Class IV: | |
Shares sold | | | 19,770,838 | | | $ | 511,809,366 | | | | 23,275,901 | | | $ | 606,562,660 | |
Shares issued to shareholders in reinvestment of distributions | | | 7,567,539 | | | | 186,159,290 | | | | 10,246,489 | | | | 264,614,402 | |
Shares repurchased | | | (81,664,417 | ) | | | (2,093,128,743 | ) | | | (25,052,203 | ) | | | (649,166,175 | ) |
Purchase premiums | | | — | | | | 676,346 | | | | — | | | | 1,390,217 | |
Redemption fees | | | — | | | | 834,669 | | | | — | | | | 2,589,905 | |
| | | | | | | | | | | | | | | | | |
Net increase (decrease) | | | (54,326,040 | ) | | $ | (1,393,649,072 | ) | | | 8,470,187 | | | $ | 225,991,009 | |
| | | | | | | | | | | | | | | | | |
| | | | | | | | | | | | | | | | | |
Class VI:(a) | |
Shares sold | | | 57,276,130 | | | $ | 1,479,762,322 | | | | | | | | | |
Shares issued to shareholders in reinvestment of distributions | | | 4,061,385 | | | | 96,336,051 | | | | | | | | | |
Shares repurchased | | | (2,398,142 | ) | | | (59,422,319 | ) | | | | | | | | |
Purchase premiums | | | — | | | | 151,434 | | | | | | | | | |
Redemption fees | | | — | | | | 453,691 | | | | | | | | | |
| | | | | | | | | | | | | | | | | |
Net increase (decrease) | | | 58,939,373 | | | $ | 1,517,281,179 | | | | | | | | | |
| | | | | | | | | | | | | | | | | |
| | | | | | | | | | | | | | | | | |
High Yield Fund | |
Class VI: | |
Shares sold | | | — | | | $ | — | | | | 2,201,261 | | | $ | 42,312,765 | |
Shares issued to shareholders in reinvestment of distributions | | | 607,965 | | | | 11,960,560 | | | | 178,442 | | | | 3,585,146 | |
Shares repurchased | | | (585,873 | ) | | | (11,500,000 | ) | | | (5,954,398 | ) | | | (121,289,116 | ) |
| | | | | | | | | | | | | | | | | |
Net increase (decrease) | | | 22,092 | | | $ | 460,560 | | | | (3,574,695 | ) | | $ | (75,391,205 | ) |
| | | | | | | | | | | | | | | | | |
| | | | | | | | | | | | | | | | | |
Multi-Sector Fixed Income Fund | |
Class III: | |
Shares sold | | | 198,808 | | | $ | 4,000,000 | | | | 812,914 | | | $ | 17,690,556 | |
Shares issued to shareholders in reinvestment of distributions | | | 38,703 | | | | 771,747 | | | | 382,203 | | | | 8,066,426 | |
Shares repurchased | | | (1,340,616 | ) | | | (26,860,330 | ) | | | (3,258,411 | ) | | | (67,890,225 | ) |
| | | | | | | | | | | | | | | | | |
Net increase (decrease) | | | (1,103,105 | ) | | $ | (22,088,583 | ) | | | (2,063,294 | ) | | $ | (42,133,243 | ) |
| | | | | | | | | | | | | | | | | |
Class IV: | |
Shares sold | | | 2,988,268 | | | $ | 60,053,854 | | | | 3,063,305 | | | $ | 64,755,408 | |
Shares issued to shareholders in reinvestment of distributions | | | 193,216 | | | | 3,868,186 | | | | 1,036,159 | | | | 22,030,270 | |
Shares repurchased | | | (3,669,201 | ) | | | (72,720,030 | ) | | | (17,672,884 | ) | | | (384,748,994 | ) |
| | | | | | | | | | | | | | | | | |
Net increase (decrease) | | | (487,717 | ) | | $ | (8,797,990 | ) | | | (13,573,420 | ) | | $ | (297,963,316 | ) |
| | | | | | | | | | | | | | | | | |
| | | | | | | | | | | | | | | | | |
Opportunistic Income Fund | |
Class III:(b) | |
Shares sold | | | 1,013,442 | | | $ | 26,129,885 | | | | | | | | | |
Shares issued to shareholders in reinvestment of distributions | | | 8,790 | | | | 224,578 | | | | | | | | | |
Shares repurchased | | | (541,722 | ) | | | (13,851,286 | ) | | | | | | | | |
| | | | | | | | | | | | | | | | | |
Net increase (decrease) | | | 480,510 | | | $ | 12,503,177 | | | | | | | | | |
| | | | | | | | | | | | | | | | | |
Class VI: | |
Shares sold | | | 1,201,167 | | | $ | 30,987,689 | | | | 2,091,345 | | | $ | 53,827,718 | |
Shares issued to shareholders in reinvestment of distributions | | | 294,328 | | | | 7,561,416 | | | | 855,202 | | | | 21,741,055 | |
Shares repurchased | | | (5,293,597 | ) | | | (137,137,320 | ) | | | (16,058,148 | ) | | | (413,055,123 | ) |
| | | | | | | | | | | | | | | | | |
Net increase (decrease) | | | (3,798,102 | ) | | $ | (98,588,215 | ) | | | (13,111,601 | ) | | $ | (337,486,350 | ) |
| | | | | | | | | | | | | | | | | |
| | | | | | | | | | | | | | | | | |
GMO Trust Funds
Notes to Financial Statements — (Continued)
February 28, 2022
| | | | | | | | | | | | | | | | |
| | | |
| | | Year Ended
February 28, 2022 | | | Year Ended
February 28, 2021 | |
| | | | | |
| | | Shares | | | Amount | | | Shares | | | Amount | |
| Opportunistic Income Fund (continued) | |
Class R6:(c) | |
Shares sold | | | 6,348,670 | | | $ | 164,336,615 | | | | | | | | | |
Shares issued to shareholders in reinvestment of distributions | | | 26,344 | | | | 673,318 | | | | | | | | | |
Shares repurchased | | | (374,066 | ) | | | (9,594,675 | ) | | | | | | | | |
| | | | | | | | | | | | | | | | | |
Net increase (decrease) | | | 6,000,948 | | | $ | 155,415,258 | | | | | | | | | |
| | | | | | | | | | | | | | | | | |
Class I: | |
Shares sold | | | 5,654,035 | | | $ | 146,238,616 | | | | 16,150,520 | | | $ | 413,015,196 | |
Shares issued to shareholders in reinvestment of distributions | | | 234,350 | | | | 6,009,933 | | | | 92,094 | | | | 2,336,633 | |
Shares repurchased | | | (4,671,231 | ) | | | (121,104,867 | ) | | | (940,346 | ) | | | (23,853,407 | ) |
| | | | | | | | | | | | | | | | | |
Net increase (decrease) | | | 1,217,154 | | | $ | 31,143,682 | | | | 15,302,268 | | | $ | 391,498,422 | |
| | | | | | | | | | | | | | | | | |
| | | | | | | | | | | | | | | | | |
U.S. Treasury Fund | |
Core Class: | |
Shares sold | | | 304,783,797 | | | $ | 1,534,292,585 | | | | 373,331,155 | | | $ | 1,880,713,417 | |
Shares issued to shareholders in reinvestment of distributions | | | 63,726 | | | | 320,558 | | | | 72,372 | | | | 364,660 | |
Shares repurchased | | | (329,360,932 | ) | | | (1,657,850,113 | ) | | | (341,823,451 | ) | | | (1,722,028,633 | ) |
| | | | | | | | | | | | | | | | | |
Net increase (decrease) | | | (24,513,409 | ) | | $ | (123,236,970 | ) | | | 31,580,076 | | | $ | 159,049,444 | |
| | | | | | | | | | | | | | | | | |
| | | | | | | | | | | | | | | | | |
| | (a) | The period under the heading “Year Ended February 28, 2022” represents the period from July 29, 2021 (commencement of operations) through February 28, 2022. |
| | (b) | The period under the heading “Year Ended February 28, 2022” represents the period from July 21, 2021 (commencement of operations) through December 28, 2021 and the period under the heading “Year Ended February 28, 2022” represents the period from February 1, 2022 (commencement of operations) through February 28, 2022. |
| | (c) | The period under the heading “Year Ended February 28, 2022” represents the period from May 19, 2021 (commencement of operations) through February 28, 2022. |
GMO Trust Funds
Notes to Financial Statements — (Continued)
February 28, 2022
| 10. | Investments in affiliated companies and other Funds of the Trust |
An affiliated company for the purposes of this disclosure is a company in which a Fund has or had direct ownership of at least 5% of the issuer’s voting securities or an investment in other funds of GMO Trust. A summary of the Funds’ transactions involving companies that are or were affiliates during the year ended February 28, 2022 is set forth below:
| | | | | | | | | | | | | | | | | | | | | | | | | | | | | | | | |
| | | | | | | | | |
| Affiliate | | Value,
beginning
of
period | | | Purchases | | | Sales
Proceeds | | | Dividend
Income | | | Distributions
of Realized
Gains | | | Net Realized
Gain (Loss) | | | Net Increase/
Decrease in
Unrealized
Appreciation/
Depreciation | | | Value,
end of
period | |
Asset Allocation Bond Fund | |
GMO U.S. Treasury Fund | | $ | 5,000,835 | | | $ | 731,456 | | | $ | 5,720,000 | | | $ | 632 | | | $ | 824 | | | $ | (618 | ) | | $ | (47 | ) | | $ | 11,626 | |
| | | | | | | | | | | | | | | | | | | | | | | | | | | | | | | | | |
| | | | | | | | | | | | | | | | | | | | | | | | | | | | | | | | | |
Emerging Country Debt Fund | |
GMO U.S. Treasury Fund | | $ | 74,784,247 | | | $ | — | | | $ | — | | | $ | 100,129 | | | $ | 71,223 | | | $ | — | | | $ | (445,144 | ) | | $ | 74,339,103 | |
| | | | | | | | | | | | | | | | | | | | | | | | | | | | | | | | | |
| | | | | | | | | | | | | | | | | | | | | | | | | | | | | | | | | |
Multi-Sector Fixed Income Fund | |
GMO Emerging Country Debt Fund, Class IV | | $ | 8,584,702 | | | $ | 2,000,000 | | | $ | 11,866,039 | | | $ | 123,288 | | | $ | 176,281 | | | $ | (145,567 | ) | | $ | 1,426,904 | | | $ | — | |
GMO Emerging Country Debt Fund, Class VI | | | — | | | | 11,866,039 | | | | 3,100,000 | | | | 390,598 | | | | 53,662 | | | | (525,336 | ) | | | (1,949,265 | ) | | | 6,291,438 | |
GMO Opportunistic Income Fund, Class VI | | | 27,641,535 | | | | 5,200,002 | | | | 6,700,000 | | | | 552,136 | | | | — | | | | (52,863 | ) | | | (163,972 | ) | | | 25,924,702 | |
GMO U.S. Treasury Fund | | | 14,825,453 | | | | 25,290,000 | | | | 37,710,000 | | | | 4,761 | | | | 3,000 | | | | 3,451 | | | | (9,578 | ) | | | 2,399,326 | |
| | | | | | | | | | | | | | | | | | | | | | | | | | | | | | | | | |
Totals | | $ | 51,051,690 | | | $ | 44,356,041 | | | $ | 59,376,039 | | | $ | 1,070,783 | | | $ | 232,943 | | | $ | (720,315 | ) | | $ | (695,911 | ) | | $ | 34,615,466 | |
| | | | | | | | | | | | | | | | | | | | | | | | | | | | | | | | | |
| | | | | | | | | | | | | | | | | | | | | | | | | | | | | | | | | |
Opportunistic Income Fund | |
GMO U.S. Treasury Fund | | $ | 11,003,541 | | | $ | — | | | $ | — | | | $ | 14,732 | | | $ | 10,480 | | | $ | — | | | $ | (65,498 | ) | | $ | 10,938,043 | |
| | | | | | | | | | | | | | | | | | | | | | | | | | | | | | | | | |
| | | | | | | | | | | | | | | | | | | | | | | | | | | | | | | | | |
Subsequent to February 28, 2022, GMO Asset Allocation Bond Fund received redemption requests in the amount of $9,535,397.
Report of Independent Registered Public Accounting Firm
To the Board of Trustees of GMO Trust and Shareholders of
GMO Asset Allocation Bond Fund, GMO Emerging Country Debt Fund, GMO High Yield Fund, GMO Multi-Sector Fixed Income Fund, GMO Opportunistic Income Fund, and GMO U.S. Treasury Fund
Opinions on the Financial Statements
We have audited the accompanying statements of assets and liabilities, including the schedules of investments, of GMO Asset Allocation Bond Fund, GMO Emerging Country Debt Fund, GMO High Yield Fund, GMO Multi-Sector Fixed Income Fund, GMO Opportunistic Income Fund, and GMO U.S. Treasury Fund (six of the funds constituting GMO Trust, hereafter collectively referred to as the “Funds”) as of February 28, 2022, the related statements of operations for the year ended February 28, 2022, the statements of changes in net assets for each of the two years in the period ended February 28, 2022, including the related notes, and the financial highlights for each of the periods indicated therein (collectively referred to as the “financial statements”). In our opinion, the financial statements present fairly, in all material respects, the financial position of each of the Funds as of February 28, 2022, the results of each of their operations for the year then ended, the changes in each of their net assets for each of the two years in the period ended February 28, 2022 and each of the financial highlights for each of the periods indicated therein in conformity with accounting principles generally accepted in the United States of America.
Basis for Opinions
These financial statements are the responsibility of the Funds’ management. Our responsibility is to express an opinion on the Funds’ financial statements based on our audits. We are a public accounting firm registered with the Public Company Accounting Oversight Board (United States) (PCAOB) and are required to be independent with respect to the Funds in accordance with the U.S. federal securities laws and the applicable rules and regulations of the Securities and Exchange Commission and the PCAOB.
We conducted our audits of these financial statements in accordance with the standards of the PCAOB. Those standards require that we plan and perform the audit to obtain reasonable assurance about whether the financial statements are free of material misstatement, whether due to error or fraud.
Our audits included performing procedures to assess the risks of material misstatement of the financial statements, whether due to error or fraud, and performing procedures that respond to those risks. Such procedures included examining, on a test basis, evidence regarding the amounts and disclosures in the financial statements. Our audits also included evaluating the accounting principles used and significant estimates made by management, as well as evaluating the overall presentation of the financial statements. Our procedures included confirmation of securities owned as of February 28, 2022 by correspondence with the custodian, transfer agent and brokers; when replies were not received from brokers, we performed other auditing procedures. We believe that our audits provide a reasonable basis for our opinions.
/s/ PricewaterhouseCoopers LLP
Boston, MA
April 27, 2022
We have served as the auditor of one or more investment companies in the GMO mutual funds complex since 1985.
GMO Trust Funds
Fund Expenses
February 28, 2022 (Unaudited)
Expense Examples: The following information is in relation to expenses for the six month period ended February 28, 2022.
As a shareholder of the Funds, you may incur two types of costs: (1) transaction costs, including purchase premium and redemption fees, if applicable; and (2) ongoing costs, including direct and/or indirect management fees, direct and/or indirect shareholder services fees, and other Fund expenses. This example is intended to help you understand your ongoing costs (in dollars) of investing in the Funds and to compare these costs with the ongoing costs of investing in other mutual funds.
These examples are based on an investment of $1,000 invested at the beginning of the period and held for the entire period, September 1, 2021 through February 28, 2022.
Actual Expenses
This section of the table for each class below provides information about actual account values and actual expenses. You may use the information in this section, together with the amount you invested, to estimate the expenses that you paid over the period. Simply divide your account value by $1,000 (for example, a $10,000,000 account value divided by $1,000 = 10,000), then multiply the result by the number under the heading entitled “Expenses Paid During the Period” to estimate the expenses you paid on your account during this period.
Hypothetical Example for Comparison Purposes
This section of the table for each class below provides information about hypothetical account values and hypothetical expenses based on the Funds’ actual expense ratio and an assumed rate of return of 5% per year before expenses, which is not the Funds’ actual return. The hypothetical account values and expenses may not be used to estimate the actual ending account balance or expenses you paid for the period. You may use this information to compare the ongoing costs of investing in the Funds with other funds. To do so, compare this 5% hypothetical example with the 5% hypothetical examples that appear in the shareholder reports of other funds.
Please note that the expenses shown in the table are meant to highlight your ongoing costs only and do not reflect any transactional costs, such as purchase premium and redemption fees. Therefore, this section of the table is useful in comparing ongoing costs only, and will not help you determine the relative total costs of owning different funds. In addition, if these transactional costs were included, your costs would have been higher.
| | | | | | | | | | | | | | | | | | | | | | | | | | | | |
| | | Actual | | | Hypothetical | | | | |
| | | Beginning
Account Value
September 1,
2021 | | | Ending
Account Value
February 28,
2022 | | | Expenses Paid
During the Period* | | | Beginning
Account Value
September 1,
2021 | | | Ending
Account Value
February 28,
2022 | | | Expenses Paid
During the Period* | | | Annualized
Expense Ratio | |
| | | | | |
Asset Allocation Bond Fund | | | | | | | | | | | | | | | | | | | | | |
Class III | | | $1,000.00 | | | | $960.10 | | | | $1.94 | | | | $1,000.00 | | | | $1,022.81 | | | | $2.01 | | | | 0.40% | |
Class VI | | | $1,000.00 | | | | $960.40 | | | | $1.51 | | | | $1,000.00 | | | | $1,023.26 | | | | $1.56 | | | | 0.31% | |
| | | | | |
Emerging Country Debt Fund | | | | | | | | | | | | | | | | | | | | | |
Class III | | | $1,000.00 | | | | $871.50 | | | | $2.46 | | | | $1,000.00 | | | | $1,022.17 | | | | $2.66 | | | | 0.53% | |
Class IV | | | $1,000.00 | | | | $871.70 | | | | $2.23 | | | | $1,000.00 | | | | $1,022.41 | | | | $2.41 | | | | 0.48% | |
Class VI | | | $1,000.00 | | | | $872.20 | | | | $2.00 | | | | $1,000.00 | | | | $1,022.66 | | | | $2.16 | | | | 0.43% | |
| | | | | |
High Yield Fund | | | | | | | | | | | | | | | | | | | | | |
Class VI | | | $1,000.00 | | | | $970.20 | | | | $2.49 | | | | $1,000.00 | | | | $1,022.27 | | | | $2.56 | | | | 0.51% | |
| | | | | |
Multi-Sector Fixed Income Fund | | | | | | | | | | | | | | | | | | | | | |
Class III | | | $1,000.00 | | | | $937.30 | | | | $1.97 | | | | $1,000.00 | | | | $1,022.76 | | | | $2.06 | | | | 0.41% | |
Class IV | | | $1,000.00 | | | | $938.10 | | | | $1.73 | | | | $1,000.00 | | | | $1,023.01 | | | | $1.81 | | | | 0.36% | |
| | | | | |
Opportunistic Income Fund | | | | | | | | | | | | | | | | | | | | | |
Class III(a) | | | $1,000.00 | | | | $996.10 | | | | $0.52 | | | | $1,000.00 | | | | $1,021.32 | | | | $3.51 | | | | 0.70% | |
Class VI | | | $1,000.00 | | | | $999.50 | | | | $2.38 | | | | $1,000.00 | | | | $1,022.41 | | | | $2.41 | | | | 0.48% | |
Class R6 | | | $1,000.00 | | | | $999.40 | | | | $2.92 | | | | $1,000.00 | | | | $1,021.87 | | | | $2.96 | | | | 0.59% | |
Class I | | | $1,000.00 | | | | $998.70 | | | | $3.32 | | | | $1,000.00 | | | | $1,021.47 | | | | $3.36 | | | | 0.67% | |
| | | | | |
U.S. Treasury Fund | | | | | | | | | | | | | | | | | | | | | |
Core | | | $1,000.00 | | | | $995.50 | | | | $0.00 | | | | $1,000.00 | | | | $1,024.80 | | | | $0.00 | | | | 0.00% | |
| | * | Expenses are calculated using each class’s annualized net expense ratio (including indirect expenses incurred) for the six months ended February 28, 2022, multiplied by the average account value over the period, multiplied by 181 days in the period, divided by 365 days in the year. |
| | (a) | For the period February 1, 2022 (commencement of operations) through February 28, 2022, expenses were calculated using the class’s annualized net expense ratio (including indirect expenses incurred) for the period ended February 28, 2022, multiplied by the average account value over the period, multiplied by 27 days in the period, divided by 365 days in the year. |
GMO Trust Funds
Tax Information for the Tax Year Ended February 28, 2022 (Unaudited)
The following information is being provided in order to meet reporting requirements set forth by the Code and/or to meet state-specific requirements. Shareholders should consult their tax advisors.
With respect to distributions paid, the Funds designate the following amounts (or, if subsequently determined to be different, the maximum amount allowable) for the fiscal year-ended February 28, 2022:
| | | | | | | | | | | | | | | | |
| | | | | |
| Fund Name | | U.S. Government
Obligation Income(1)(2) | | | Interest-
Related
Dividend
Income ($)(3) | | | Short-Term
Capital Gain
Dividends ($)(3) | | | Long-Term
Capital Gain
Distributions
($) | |
Asset Allocation Bond Fund | | | 100.00% | | | | 865,298 | | | | — | | | | — | |
Emerging Country Debt Fund | | | — | | | | 1,591,477 | | | | 33,352,294 | | | | 73,953,153 | |
High Yield Fund | | | — | | | | 1,397,456 | | | | 8,409,039 | | | | 448,207 | |
Multi-Sector Fixed Income Fund | | | — | | | | — | | | | — | | | | 5,148,607 | |
Opportunistic Income Fund | | | 1.04% | | | | 17,562,105 | | | | — | | | | — | |
U.S. Treasury Fund | | | 65.96% | | | | 400,559 | | | | 163,840 | | | | 136,353 | |
| | (1) | Presented as a percentage of net investment income and short-term capital gain distributions paid, if any. |
| | (2) | All or a portion of these amounts may be exempt from taxation at the state level. |
| | (3) | These amounts are generally exempt from U.S. withholding taxes for non-U.S. shareholders, provided certain conditions are satisfied by both the Funds and the Funds’ shareholders. If applicable, interest related dividend amounts could include short-term capital gain distributions received from underlying funds. |
| | (4) | The Funds hereby designate the above business interest-related dividend income pursuant to Section 163(j) of the Code and the regulations thereunder. |
U.S. Treasury Fund hereby designates $317,452 (or, if subsequently determined to be different, the maximum amount allowable) of business interest-related dividend income pursuant to Section 163(j) of the Code and the regulations thereunder.
In early 2023, the Funds will notify applicable shareholders of amounts for use in preparing 2022 U.S. federal income tax forms.
Trustees and Officers (Unaudited)
The following tables present information regarding each Trustee and officer of the Trust as of February 28, 2022. Each Trustee’s and officer’s year of birth (“YOB”) is set forth after his or her name. Unless otherwise noted, (i) each Trustee and officer has engaged in the principal occupation(s) noted in the table for at least the most recent five years, although not necessarily in the same capacity, and (ii) the address of each Trustee and officer is c/o GMO Trust, 40 Rowes Wharf, Boston, MA 02110. Each Trustee serves in office until the earlier of (a) the election and qualification of a successor at the next meeting of shareholders called to elect Trustees or (b) the Trustee dies, resigns, or is removed as provided in the Trust’s governing documents. Each of the Trustees of the Trust, other than Mr. Feigelson, is not an “interested person” of the Trust, as such term is used in the 1940 Act (each, an “Independent Trustee”). Because the Funds do not hold annual meetings of shareholders, each Trustee will hold office for an indeterminate period. Each officer serves in office until his or her successor is elected and determined to be qualified to carry out the duties and responsibilities of the office, or until the officer resigns or is removed from office.
| | | | | | | | | | | | | |
| Independent Trustees |
| |
Name and
Year of Birth | | Position(s)
Held with the Trust | | Length of
Time Served | | Principal Occupation(s)
During Past
5 Years* | | Number of
Portfolios in
Fund Complex1
Overseen | | Other
Directorships
Held in the
Past Five
Years |
| | | | | |
Donald W. Glazer
YOB: 1944 | | Chairman of the Board of Trustees | | Chairman of the Board of Trustees since March 2005; Lead Independent Trustee (September 2004 – March 2005); Trustee since December 2000. | | Consultant – Law and Business; Author of Legal Treatises. | | | | 30 | | | Director, BeiGene Ltd. (biotech). |
| | | | | |
Peter Tufano
YOB: 1957 | | Trustee | | Since December 2008. | | Peter Moores Professor of Finance (Since July 1, 2011) and Peter Moores Dean and Professor of Finance (July 1, 2011 – June 30, 2021) University of Oxford, Said Business School | | | | 30 | | | Trustee of State Street Navigator Securities Lending Trust (5 Portfolios) (January 1993 – June 2015). |
| | | | | |
Paul Braverman
YOB: 1949 | | Trustee | | Since March 2010. | | Retired. | | | | 30 | | | Trustee of HIMCO Variable Insurance Trust
(27 Portfolios) (April 2014 – April 2019). |
|
| Interested Trustee and Officer |
| |
| | | | | |
Carolyn Haley2
YOB: 1966 | | Trustee; President of the Trust | | Trustee and President since June 2021. | | Head of Global Operations and Finance, Head of Operations, Co-Head of Operations, Grantham, Mayo, Van Otterloo & Co. LLC (February 2015 – Present). | | | | 30 | | | None. |
| 1 | The Fund Complex includes series of each of GMO Trust. |
| 2 | Ms. Haley is an “interested person” of the Trust, as such term is used in the 1940 Act (an “Interested Trustee”), by virtue of her positions with the Trust and GMO indicated in the table above and her interest as a member of GMO. |
| | | | | | |
| Officers |
| |
Name and Year of Birth | | Position(s)
Held with the Trust | | Length of
Time Served | | Principal Occupation(s)
During Past 5 Years* |
| | | |
Carolyn Haley YOB: 1966 | | Trustee, President of the Trust | | Trustee and President since June 2021 | | Head of Global Operations and Finance, Head of Operations, Co-Head of Operations, Grantham, Mayo, Van Otterloo & Co. LLC (February 2015 – Present). |
| | | |
Tara Pari YOB: 1976 | | Chief Executive Officer | | Chief Executive Officer since November 2020 | | Risk and Controls, Grantham, Mayo, Van Otterloo & Co. LLC (September 2004 – November 2020); Head of Fund Reporting and Risk and Controls, Grantham, Mayo, Van Otterloo & Co. LLC (November 2020 to present). Head of Fund Reporting, Risk and Controls and Proxy Voting (October 2021 to present), Grantham, Mayo, Van Otterloo & Co. LLC. |
| | | |
Betty Maganzini YOB: 1972 | | Treasurer, Chief Accounting Officer and Chief Financial Officer | | Treasurer, Chief Accounting Officer and Chief Financial Officer since September 2018; Assistant Treasurer, September 2013 – September 2018. | | Fund Administrator, Grantham, Mayo, Van Otterloo & Co. LLC (July 2010 – present). |
| | | |
Susan Saw YOB: 1981 | | Assistant Treasurer | | Since September 2019. | | Fund Administrator, Grantham, Mayo, Van Otterloo & Co. LLC (March 2011– present). |
| | | |
John L. Nasrah YOB: 1977 | | Assistant Treasurer and Chief Tax Officer | | Since March 2007. | | Fund Administrator, Grantham, Mayo, Van Otterloo & Co. LLC (September 2004 – present). |
| | | |
Cathy Tao YOB: 1974 | | Assistant Treasurer | | Since September 2016. | | Fund Administrator, Grantham, Mayo, Van Otterloo & Co. LLC (October 2007 – present). |
| | | |
Devin Kelly YOB: 1984 | | Assistant Treasurer | | Since June 2020 | | Fund Administrator, Grantham, Mayo, Van Otterloo & Co. LLC (October 2012 – present). |
| | | |
Brian Kadehjian YOB: 1974 | | Assistant Treasurer and Treasury Officer | | Assistant Treasurer since February 2015; Treasury Officer since September 2013. | | Fund Administrator, Grantham, Mayo, Van Otterloo & Co. LLC (April 2002-November 2020). Treasury and Payables Manager, Grantham, Mayo, Van Otterloo & Co. LLC (November 2020 – present). |
| | | |
Douglas Y. Charton YOB: 1982 | | Chief Legal Officer, Vice President and Clerk | | Since August 2015. | | Legal Counsel, Grantham, Mayo, Van Otterloo & Co. LLC (July 2015 – present); Associate, K&L Gates LLP (September 2007 – July 2015). |
| | | |
Megan Bunting YOB: 1978 | | Vice President and Assistant Clerk | | Since September 2013. | | Legal Counsel, Grantham, Mayo, Van Otterloo & Co. LLC (September 2006 – present). |
| | | |
Kevin O’Brien YOB: 1985 | | Vice President and Assistant Clerk | | Since March 2016. | | Legal Counsel, Grantham, Mayo, Van Otterloo & Co. LLC (February 2015 – present). |
| | | |
Gregory L. Pottle YOB: 1971 | | Chief Compliance Officer | | Chief Compliance Officer since May 2015; Vice President and Assistant Clerk, November 2006-November 2015. | | Chief Compliance Officer, Grantham, Mayo, Van Otterloo & Co. LLC (May 2015 – present). |
| | | |
Kelly Butler YOB: 1974 | | Anti-Money Laundering Officer | | Since March 2020. | | Compliance Manager (March 2016 – present); Compliance Specialist, Grantham, Mayo, Van Otterloo & Co. LLC (November 2007 – March 2016). |
| * | Each officer of the Trust may also serve as an officer and/or director of certain pooled investment vehicles of which GMO or an affiliate of GMO serves as the investment adviser. |
AR-022822-FI
GMO Trust
Annual Report
February 28, 2022
Alternative Allocation Fund
Benchmark-Free Allocation Fund
Benchmark-Free Fund
Global Asset Allocation Fund
Global Developed Equity Allocation Fund
Global Equity Allocation Fund
Implementation Fund
International Developed Equity Allocation Fund
International Equity Allocation Fund
SGM Major Markets Fund
Strategic Opportunities Allocation Fund
For a free copy of the Funds’ proxy voting guidelines, shareholders may call 1-617-346-7646 (collect), visit GMO’s website at www.gmo.com or visit the Securities and Exchange Commission’s website at www.sec.gov. Information regarding how the Funds voted proxies relating to portfolio securities during the most recent 12-month period ended June 30 will be available without charge on GMO’s website at www.gmo.com and on the Securities and Exchange Commission’s website at www.sec.gov no later than August 31 of each year.
The Funds file their complete schedule of portfolio holdings with the Securities and Exchange Commission for the first and third quarter of each fiscal year on Form N-PORT which is available on the Commission’s website at www.sec.gov. The Funds have a policy with respect to disclosure of portfolio holdings under which they may also make a complete schedule of portfolio holdings available on GMO’s website at www.gmo.com.
This report is prepared for the general information of shareholders. It is authorized for distribution to prospective investors only when preceded or accompanied by a prospectus for the GMO Trust, which contains a complete discussion of the risks associated with an investment in these Funds and other important information. The GMO Trust prospectus can be obtained at www.gmo.com. The GMO Trust Statement of Additional Information includes additional information about the Trustees of GMO Trust and is available without charge, upon request, by calling 1-617-346-7646 (collect).
An investment in the Funds is subject to risk, including the possible loss of principal amount invested. There can be no assurance that the Funds will achieve their stated investment objectives. Please see the Funds’ prospectus regarding specific principal risks for each Fund. General risks may include: market risk-equities, management and operational risk, market risk-asset backed securities, credit risk, non- U.S. investment risk, small company risk and derivatives risk.
The Funds are distributed by Funds Distributor LLC. Funds Distributor LLC is not affiliated with GMO.
TABLE OF CONTENTS
GMO Alternative Allocation Fund
(A Series of GMO Trust)
Portfolio Management
Day-to-day management of the Fund’s portfolio is the responsibility of the Asset Allocation team at Grantham, Mayo, Van Otterloo & Co. LLC.
Management Discussion and Analysis of Fund Performance
Although GMO does not manage the Fund to, or control the Fund’s risk relative to, any securities index or securities benchmark, a discussion of the Fund’s performance relative to the FTSE 3-Month Treasury Bill Index is included for comparative purposes only.
Class VI shares of GMO Alternative Allocation Fund returned -0.99% (net) for the fiscal year ended February 28, 2022, as compared with +0.05% for the FTSE-3 Month Treasury Bill Index.
Equity Dislocation, which is broadly 100% long cheap global Value and 100% short expensive global Growth, had a very strong year and, as a sizeable allocation, was the biggest contributor to total Fund returns with a 3.5% contribution. Other strategies that had a positive impact included Put Selling, Event-Driven, and Relative Credit which contributed a little over 1% between them. That left three strategies posting negative returns. The Asset Allocation Long/Short strategy suffered a very difficult year, but the relatively modest exposure mitigated some of this and it detracted -1.3%. Unfortunately, two of the larger exposures, Systematic Global Macro and Fixed Income Absolute Return, also had a disappointing 12 months and detracted -1.4% and -1.8%, respectively.
The views expressed herein are exclusively those of Grantham, Mayo, Van Otterloo & Co. LLC as of the date of this report and are subject to change. GMO disclaims any responsibility to update such views. They are not meant as investment advice. References to specific securities are not recommendations of such securities and may not be representative of any GMO portfolio’s current or future investments. All information is unaudited.
GMO Alternative Allocation Fund
(A Series of GMO Trust)
Comparison of Change in Value of a $300,000,000 Investment in
GMO Alternative Allocation Fund Class VI Shares and the FTSE 3-Month Treasury Bill Index
As of February 28, 2022
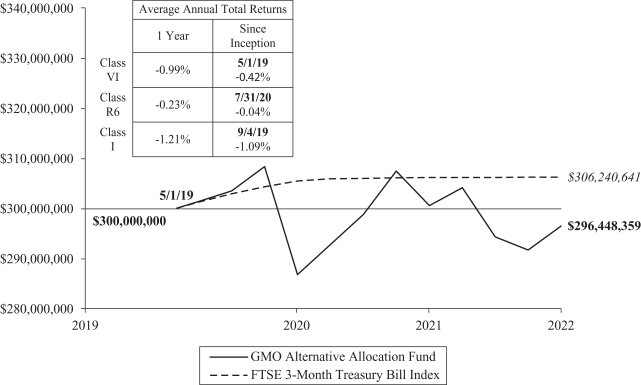
Performance data quoted represents past performance and is not indicative of future results. The investment return and principal value of an investment will fluctuate so that an investor’s shares, when redeemed, may be worth more or less than their original cost. Current performance data may be lower or higher than the performance data provided herein. To obtain performance information up to the most recent month-end, visit www.gmo.com. Performance shown is net of all fees after reimbursement from GMO. Returns would have been lower had certain expenses not been reimbursed during the periods shown and do not include the effect of taxes on distributions and redemptions. The performance information shown above only includes purchase premiums and/or redemption fees in effect as of February 28, 2022. All information is unaudited. Performance for classes may vary due to different fees.
For Class VI, R6 and I the gross expense ratio of 1.49%, 1.69% and 1.77%, respectively, is equal to the Fund’s Total Annual Operating Expenses set forth in the Fund’s most recent prospectus dated June 30, 2021. For the Classes listed above, the corresponding net expense ratio of 1.34%, 1.53% and 1.62% reflects the reduction of expenses from fee reimbursements. The fee reimbursements will continue until at least June 30, 2022. Elimination of this reimbursement will result in higher fees and lower performance.
3
GMO Alternative Allocation Fund
(A Series of GMO Trust)
Consolidated Investment Concentration Summary(a)
February 28, 2022 (Unaudited)
| | | | |
| Asset Class Summary& | | % of Total Net Assets | |
Common Stocks | | | 64.3 | % |
Debt Obligations | | | 35.2 | |
Short-Term Investments | | | 27.4 | |
Investment Funds | | | 2.1 | |
Swap Contracts | | | 1.0 | |
Preferred Stocks | | | 0.4 | |
Purchased Options | | | 0.3 | |
Rights/Warrants | | | 0.1 | |
Futures Contracts | | | (0.2 | ) |
Written Options | | | (0.5 | ) |
Forward Currency Contracts | | | (0.5 | ) |
Securities Sold Short | | | (36.7 | ) |
Other | | | 7.1 | |
| | | | |
| | | 100.0 | % |
| | | | |
| | | | |
| Country/Region Summary¤ | | Debt Obligations as a
% of Total Net Assets | |
Switzerland | | | 15.0 | % |
Canada | | | 12.5 | |
Sweden | | | 12.5 | |
Australia | | | 6.5 | |
New Zealand | | | (1.5 | ) |
Euro Region | | | (1.7 | )# |
Germany | | | (3.2 | ) |
United States | | | (18.1 | ) |
United Kingdom | | | (29.6 | ) |
| | | | |
| | | (7.6 | )% |
| | | | |
| | | | |
| Country/Region Summary¤ | | Equity Investments as a
% of Total Net Assets | |
United States | | | 19.1 | % |
Other Emerging | | | 3.3 | † |
Other Developed | | | 3.0 | ‡ |
Australia | | | 2.5 | |
China | | | 2.3 | |
United Kingdom | | | 1.6 | |
| | | | |
| | | 31.8 | % |
| | | | |
| (a) | GMO Alternative Allocation SPC Ltd. is a 100% owned subsidiary of GMO Alternative Allocation Fund. As such, the holdings of GMO Alternative Allocation SPC Ltd. have been included with GMO Alternative Allocation Fund. |
| & | The table incorporates aggregate indirect asset class exposure associated with investments in other funds of GMO Trust (“underlying funds”). Derivative financial instruments, if any, are based on market values, rather than the notional amounts of derivatives, except for forward currency contracts which are based on unrealized appreciation/(depreciation). |
| ¤ | The table incorporates aggregate indirect country exposure associated with investments in the underlying funds. The table excludes short-term investments. The table includes exposure through the use of certain derivative financial instruments and excludes exposure through certain currency linked derivatives such as forward currency contracts and currency options. The table is based on duration adjusted net exposures (both investments and derivatives), taking into account the market value of securities and the notional amounts of swaps and other derivative financial instruments. Duration is based on GMO’s models. The greater the duration of a bond, the greater its contribution to the concentration percentage. Credit default swap exposures are factored into the duration-adjusted exposure using the reference security and applying the same methodology to that security. The table is not normalized, thus, due to the exclusions listed above and negative exposures, which may be attributable to derivatives or short sales, if any, the tables may not total to 100%. |
| # | “Euro Region” is comprised of derivative financial instruments attributed to the Eurozone and not a particular country. |
| † | “Other Emerging” is comprised of emerging countries that each represent between (1.0)% and 1.0% of Total Net Assets. |
| ‡ | “Other Developed” is comprised of developed countries that each represent between (1.0)% and 1.0% of Total Net Assets. |
GMO Alternative Allocation Fund
(A Series of GMO Trust)
Consolidated Schedule of Investments
(showing percentage of total net assets)
February 28, 2022
| | | | | | | | | | |
| | | Shares | | | Description | | Value ($) | |
| | |
| | | | | | COMMON STOCKS — 61.1% | |
| | |
| | | | | | Australia — 1.1% | |
| | | |
| | | 18,532 | | | Aurizon Holdings Ltd (a) | | | 47,273 | |
| | | |
| | | 32,619 | | | BlueScope Steel Ltd | | | 483,017 | |
| | | |
| | | 26,458 | | | Brambles Ltd | | | 190,570 | |
| | | |
| | | 41,316 | | | Dexus (REIT) | | | 327,057 | |
| | | |
| | | 38,021 | | | Fortescue Metals Group Ltd (a) | | | 506,529 | |
| | | |
| | | 83,955 | | | GPT Group (The) (REIT) | | | 299,558 | |
| | | |
| | | 150,357 | | | Mirvac Group (REIT) | | | 280,403 | |
| | | |
| | | 4,693 | | | Rio Tinto Ltd (a) | | | 404,710 | |
| | | |
| | | 95,582 | | | Scentre Group (REIT) | | | 212,345 | |
| | | |
| | | 85,657 | | | Stockland (REIT) | | | 259,189 | |
| | | | | | | | | | |
| | | |
| | | | | | Total Australia | | | 3,010,651 | |
| | | | | | | | | | |
| | |
| | | | | | Belgium — 0.3% | |
| | | |
| | | 7,921 | | | Ageas SA/NV (a) | | | 381,049 | |
| | | |
| | | 299 | | | Sofina SA (a) | | | 116,118 | |
| | | |
| | | 3,561 | | | UCB SA | | | 388,636 | |
| | | | | | | | | | |
| | | |
| | | | | | Total Belgium | | | 885,803 | |
| | | | | | | | | | |
| | |
| | | | | | Brazil — 0.1% | |
| | | |
| | | 23,300 | | | Petroleo Brasileiro SA Sponsored ADR (a) | | | 332,957 | |
| | | | | | | | | | |
| | |
| | | | | | Canada — 1.7% | |
| | | |
| | | 6,700 | | | Canadian Apartment Properties (REIT) | | | 278,889 | |
| | | |
| | | 2,800 | | | Canadian Tire Corp Ltd – Class A (a) | | | 412,809 | |
| | | |
| | | 800 | | | iA Financial Corp Inc | | | 47,533 | |
| | | |
| | | 2,300 | | | Imperial Oil Ltd (a) | | | 103,232 | |
| | | |
| | | 2,100 | | | Linamar Corp | | | 109,664 | |
| | | |
| | | 4,600 | | | Magna International Inc | | | 341,761 | |
| | | |
| | | 1,000 | | | Onex Corp (a) | | | 67,156 | |
| | | |
| | | 1,100 | | | Power Corp of Canada (a) | | | 33,924 | |
| | | |
| | | 6,000 | | | Quebecor Inc – Class B | | | 131,219 | |
| | | |
| | | 4,000 | | | RioCan Real Estate Investment Trust (REIT) | | | 79,274 | |
| | | |
| | | 88,397 | | | Shaw Communications Inc – Class B (a) | | | 2,650,864 | |
| | | |
| | | 3,300 | | | Teck Resources Ltd – Class B (a) | | | 118,826 | |
| | | |
| | | 4,400 | | | West Fraser Timber Co Ltd | | | 439,202 | |
| | | | | | | | | | |
| | | |
| | | | | | Total Canada | | | 4,814,353 | |
| | | | | | | | | | |
| | |
| | | | | | China — 1.4% | |
| | | |
| | | 74,000 | | | Agile Group Holdings Ltd | | | 33,716 | |
| | | |
| | | 1,700 | | | Autohome Inc ADR | | | 52,003 | |
| | | |
| | | 581,000 | | | Bank of Communications Co Ltd – Class H | | | 398,292 | |
| | | |
| | | 29,500 | | | Beijing Enterprises Holdings Ltd | | | 100,846 | |
| | | |
| | | 222,000 | | | China Communications Services Corp Ltd – Class H | | | 121,794 | |
| | | |
| | | 181,500 | | | China Overseas Land & Investment Ltd | | | 554,150 | |
| | | |
| | | 610,000 | | | China Railway Group Ltd – Class H | | | 358,165 | |
| | | |
| | | 308,000 | | | China Zhongwang Holdings Ltd * (b) | | | 66,215 | |
| | | |
| | | 231,000 | | | CITIC Ltd | | | 269,559 | |
| | | |
| | | 316,000 | | | Dongfeng Motor Group Co Ltd – Class H | | | 271,989 | |
| | | | | | | | | | |
| | | Shares | | | Description | | Value ($) | |
| | |
| | | | | | China — continued | |
| | | |
| | | 50,500 | | | Fosun International Ltd | | | 54,793 | |
| | | |
| | | 256,800 | | | Guangzhou R&F Properties Co Ltd – Class H | | | 109,320 | |
| | | |
| | | 8,000 | | | Haier Smart Home Co Ltd – Class H | | | 28,033 | |
| | | |
| | | 38,700 | | | Hello Group Inc Sponsored ADR | | | 368,811 | |
| | | |
| | | 26,500 | | | Kingboard Holdings Ltd | | | 123,971 | |
| | | |
| | | 44,000 | | | Seazen Group Ltd * | | | 23,217 | |
| | | |
| | | 57,500 | | | Shanghai Pharmaceuticals Holding Co Ltd – Class H | | | 103,791 | |
| | | |
| | | 239,500 | | | Shimao Group Holdings Ltd | | | 143,723 | |
| | | |
| | | 120,800 | | | Sinopharm Group Co Ltd – Class H | | | 292,841 | |
| | | |
| | | 282,000 | | | Skyworth Group Ltd * | | | 159,310 | |
| | | |
| | | 214,000 | | | Sunac China Holdings Ltd | | | 174,923 | |
| | | |
| | | 19,100 | | | Vipshop Holdings Ltd ADR * (a) | | | 165,597 | |
| | | |
| | | 461,616 | | | Yuzhou Group Holdings Co Ltd | | | 36,676 | |
| | | | | | | | | | |
| | | |
| | | | | | Total China | | | 4,011,735 | |
| | | | | | | | | | |
| | |
| | | | | | Denmark — 0.6% | |
| | | |
| | | 46 | | | AP Moller – Maersk A/S – Class A (a) | | | 137,929 | |
| | | |
| | | 136 | | | AP Moller – Maersk A/S – Class B (a) | | | 430,238 | |
| | | |
| | | 541 | | | Carlsberg A/S – Class B (a) | | | 79,337 | |
| | | |
| | | 29,834 | | | Danske Bank A/S (a) | | | 505,329 | |
| | | |
| | | 3,960 | | | Pandora A/S | | | 405,493 | |
| | | | | | | | | | |
| | | |
| | | | | | Total Denmark | | | 1,558,326 | |
| | | | | | | | | | |
| | |
| | | | | | Finland — 0.2% | |
| | | |
| | | 85,324 | | | Nokia Oyj * (a) | | | 461,376 | |
| | | | | | | | | | |
| | |
| | | | | | France — 0.5% | |
| | | |
| | | 14,074 | | | ArcelorMittal SA | | | 436,697 | |
| | | |
| | | 6,364 | | | BNP Paribas SA (a) | | | 369,268 | |
| | | |
| | | 3,425 | | | Publicis Groupe SA (a) | | | 227,302 | |
| | | |
| | | 15,352 | | | Societe Generale SA (a) | | | 434,117 | |
| | | | | | | | | | |
| | | |
| | | | | | Total France | | | 1,467,384 | |
| | | | | | | | | | |
| | |
| | | | | | Germany — 1.5% | |
| | | |
| | | 7,724 | | | Bayer AG (Registered) (a) | | | 446,161 | |
| | | |
| | | 3,665 | | | Bayerische Motoren Werke AG | | | 352,966 | |
| | | |
| | | 6,817 | | | Fresenius SE & Co KGaA | | | 237,860 | |
| | | |
| | | 5,680 | | | HeidelbergCement AG | | | 368,558 | |
| | | |
| | | 5,579 | | | Mercedes-Benz Group AG (a) | | | 435,829 | |
| | | |
| | | 2,054 | | | SAP SE (a) | | | 231,699 | |
| | | |
| | | 17,785 | | | Siltronic AG | | | 2,021,190 | |
| | | | | | | | | | |
| | | |
| | | | | | Total Germany | | | 4,094,263 | |
| | | | | | | | | | |
| | |
| | | | | | Hong Kong — 0.3% | |
| | | |
| | | 75,000 | | | CK Hutchison Holdings Ltd (a) | | | 525,830 | |
| | | |
| | | 110,000 | | | First Pacific Co Ltd | | | 43,063 | |
| | | |
| | | 45,000 | | | Kerry Properties Ltd | | | 123,308 | |
| | | |
| | | 198,000 | | | PCCW Ltd | | | 110,770 | |
| | | | | | | | | | |
| | | |
| | | | | | Total Hong Kong | | | 802,971 | |
| | | | | | | | | | |
| | | | |
| | |
| | | See accompanying notes to the financial statements. | | 5 |
GMO Alternative Allocation Fund
(A Series of GMO Trust)
Consolidated Schedule of Investments — (Continued)
(showing percentage of total net assets)
February 28, 2022
| | | | | | | | | | |
| | | Shares | | | Description | | Value ($) | |
| | |
| | | | | | India — 0.5% | |
| | | |
| | | 20,309 | | | Hindustan Petroleum Corp Ltd | | | 73,881 | |
| | | |
| | | 102,719 | | | NTPC Ltd | | | 182,922 | |
| | | |
| | | 259,110 | | | Oil & Natural Gas Corp Ltd | | | 557,193 | |
| | | |
| | | 88,036 | | | REC Ltd | | | 143,583 | |
| | | |
| | | 24,127 | | | Tata Steel Ltd | | | 394,126 | |
| | | | | | | | | | |
| | | |
| | | | | | Total India | | | 1,351,705 | |
| | | | | | | | | | |
| | |
| | | | | | Israel — 0.8% | |
| | | |
| | | 3,500 | | | Check Point Software Technologies Ltd * | | | 507,080 | |
| | | |
| | | 51,000 | | | Teva Pharmaceutical Industries Ltd Sponsored ADR * | | | 414,630 | |
| | | |
| | | 27,969 | | | Tower Semiconductor Ltd * | | | 1,310,348 | |
| | | | | | | | | | |
| | | |
| | | | | | Total Israel | | | 2,232,058 | |
| | | | | | | | | | |
| | |
| | | | | | Italy — 1.0% | |
| | | |
| | | 5,592 | | | EXOR NV (a) | | | 423,681 | |
| | | |
| | | 33,207 | | | Leonardo SPA * | | | 296,036 | |
| | | |
| | | 5,048,396 | | | Telecom Italia SPA | | | 2,121,062 | |
| | | | | | | | | | |
| | | |
| | | | | | Total Italy | | | 2,840,779 | |
| | | | | | | | | | |
| | |
| | | | | | Japan — 3.5% | |
| | | |
| | | 3,400 | | | AGC Inc (a) | | | 150,833 | |
| | | |
| | | 3,600 | | | Aisin Corp | | | 131,127 | |
| | | |
| | | 52,000 | | | Asahi Kasei Corp (a) | | | 488,011 | |
| | | |
| | | 12,800 | | | Astellas Pharma Inc (a) | | | 213,558 | |
| | | |
| | | 10,000 | | | Daiwa House Industry Co Ltd (a) | | | 283,603 | |
| | | |
| | | 9,000 | | | Electric Power Development Co Ltd (a) | | | 142,796 | |
| | | |
| | | 18,100 | | | Honda Motor Co Ltd (a) | | | 549,894 | |
| | | |
| | | 1,700 | | | Honda Motor Co Ltd Sponsored ADR (a) | | | 51,952 | |
| | | |
| | | 4,300 | | | Idemitsu Kosan Co Ltd (a) | | | 115,268 | |
| | | |
| | | 58,300 | | | Inpex Corp (a) | | | 600,928 | |
| | | |
| | | 18,100 | | | ITOCHU Corp (a) | | | 589,854 | |
| | | |
| | | 24,000 | | | JFE Holdings Inc | | | 357,301 | |
| | | |
| | | 2,500 | | | Kajima Corp (a) | | | 33,646 | |
| | | |
| | | 14,900 | | | KDDI Corp (a) | | | 484,864 | |
| | | |
| | | 2,300 | | | MEIJI Holdings Co Ltd | | | 138,041 | |
| | | |
| | | 11,900 | | | Mitsubishi Corp (a) | | | 400,122 | |
| | | |
| | | 5,300 | | | Mitsubishi UFJ Financial Group Inc (a) | | | 32,537 | |
| | | |
| | | 1,700 | | | Mitsui Chemicals Inc | | | 43,460 | |
| | | |
| | | 20,700 | | | Nippon Steel Corp (a) | | | 378,996 | |
| | | |
| | | 19,700 | | | Nippon Telegraph & Telephone Corp (a) | | | 566,195 | |
| | | |
| | | 63,700 | | | Obayashi Corp (a) | | | 533,359 | |
| | | |
| | | 16,200 | | | ORIX Corp (a) | | | 321,135 | |
| | | |
| | | 25,700 | | | Sekisui House Ltd (a) | | | 523,974 | |
| | | |
| | | 44,400 | | | Shimizu Corp (a) | | | 293,891 | |
| | | |
| | | 11,600 | | | Subaru Corp | | | 190,249 | |
| | | |
| | | 68,300 | | | Sumitomo Chemical Co Ltd | | | 326,080 | |
| | | |
| | | 15,500 | | | Sumitomo Corp (a) | | | 252,892 | |
| | | |
| | | 28,400 | | | Sumitomo Dainippon Pharma Co Ltd | | | 311,681 | |
| | | |
| | | 4,600 | | | Sumitomo Electric Industries Ltd | | | 61,065 | |
| | | | | | | | | | |
| | | Shares | | | Description | | Value ($) | |
| | |
| | | | | | Japan — continued | |
| | | |
| | | 1,400 | | | Suzuki Motor Corp | | | 55,745 | |
| | | |
| | | 12,200 | | | Taisei Corp (a) | | | 405,668 | |
| | | |
| | | 151,300 | | | Tokyo Electric Power Co Holdings Inc * (a) | | | 474,929 | |
| | | |
| | | 16,300 | | | Tosoh Corp | | | 252,945 | |
| | | |
| | | 4,700 | | | Yamaha Motor Co Ltd | | | 105,654 | |
| | | | | | | | | | |
| | | |
| | | | | | Total Japan | | | 9,862,253 | |
| | | | | | | | | | |
| | |
| | | | | | Malaysia — 0.0% | |
| | | |
| | | 87,400 | | | Top Glove Corp Bhd | | | 42,655 | |
| | | | | | | | | | |
| | |
| | | | | | Netherlands — 0.8% | |
| | | |
| | | 67,151 | | | Aegon NV (a) | | | 331,712 | |
| | | |
| | | 5,900 | | | AerCap Holdings NV * | | | 321,137 | |
| | | |
| | | 25,955 | | | ING Groep NV (a) | | | 303,115 | |
| | | |
| | | 11,728 | | | JDE Peet’s NV (a) | | | 385,021 | |
| | | |
| | | 1 | | | Just Eat Takeaway.com NV Sponsored ADR * (a) | | | 8 | |
| | | |
| | | 15,312 | | | Koninklijke Ahold Delhaize NV | | | 471,032 | |
| | | |
| | | 7,952 | | | NN Group NV (a) | | | 381,655 | |
| | | |
| | | 1,098 | | | Prosus NV * | | | 68,166 | |
| | | | | | | | | | |
| | | |
| | | | | | Total Netherlands | | | 2,261,846 | |
| | | | | | | | | | |
| | |
| | | | | | New Zealand — 0.1% | |
| | | |
| | | 15,249 | | | Auckland International Airport Ltd * (a) | | | 73,836 | |
| | | |
| | | 50,699 | | | Meridian Energy Ltd (a) | | | 172,128 | |
| | | |
| | | 10,696 | | | Spark New Zealand Ltd | | | 32,840 | |
| | | | | | | | | | |
| | | |
| | | | | | Total New Zealand | | | 278,804 | |
| | | | | | | | | | |
| | |
| | | | | | South Africa — 0.1% | |
| | | |
| | | 23,649 | | | Bidvest Group Ltd (The) | | | 324,022 | |
| | | | | | | | | | |
| | |
| | | | | | South Korea — 0.2% | |
| | | |
| | | 5,625 | | | Kia Corp | | | 348,723 | |
| | | |
| | | 162 | | | POSCO | | | 38,544 | |
| | | |
| | | 900 | | | POSCO Sponsored ADR | | | 53,388 | |
| | | | | | | | | | |
| | | |
| | | | | | Total South Korea | | | 440,655 | |
| | | | | | | | | | |
| | |
| | | | | | Spain — 0.4% | |
| | | |
| | | 77,022 | | | Banco Bilbao Vizcaya Argentaria SA (a) | | | 457,027 | |
| | | |
| | | 145,629 | | | Banco Santander SA (a) | | | 484,947 | |
| | | |
| | | 9,557 | | | Telefonica SA (a) | | | 45,644 | |
| | | | | | | | | | |
| | | |
| | | | | | Total Spain | | | 987,618 | |
| | | | | | | | | | |
| | |
| | | | | | Sweden — 0.3% | |
| | | |
| | | 1,747 | | | Investor AB – A Shares (a) | | | 38,630 | |
| | | |
| | | 18,412 | | | Investor AB – B Shares (a) | | | 374,914 | |
| | | |
| | | 7,320 | | | Kinnevik AB – Class B * (a) | | | 186,369 | |
| | | |
| | | 1,952 | | | Securitas AB – B Shares | | | 23,633 | |
| | | |
| | | 8,838 | | | Skanska AB – B Shares (a) | | | 200,033 | |
| | | |
| | | 3,739 | | | Svenska Cellulosa AB SCA – Class B | | | 61,004 | |
| | | | | | | | | | |
| | | |
| | | | | | Total Sweden | | | 884,583 | |
| | | | | | | | | | |
| | | | |
| | |
| 6 | | See accompanying notes to the financial statements. | | |
GMO Alternative Allocation Fund
(A Series of GMO Trust)
Consolidated Schedule of Investments — (Continued)
(showing percentage of total net assets)
February 28, 2022
| | | | | | | | | | |
| | | Shares | | | Description | | Value ($) | |
| | |
| | | | | | Switzerland — 0.2% | |
| | | |
| | | 7,777 | | | Adecco Group AG (Registered) | | | 367,297 | |
| | | |
| | | 3,319 | | | Logitech International SA (Registered) | | | 248,357 | |
| | | |
| | | 900 | | | Novartis AG Sponsored ADR (a) | | | 78,714 | |
| | | | | | | | | | |
| | | |
| | | | | | Total Switzerland | | | 694,368 | |
| | | | | | | | | | |
| | |
| | | | | | Taiwan — 0.1% | |
| | | |
| | | 11,000 | | | Hon Hai Precision Industry Co Ltd | | | 40,860 | |
| | | |
| | | 106,000 | | | Ruentex Development Co Ltd | | | 273,695 | |
| | | | | | | | | | |
| | | |
| | | | | | Total Taiwan | | | 314,555 | |
| | | | | | | | | | |
| | |
| | | | | | United Kingdom — 3.8% | |
| | | |
| | | 82 | | | AstraZeneca Plc Sponsored ADR (a) | | | 4,992 | |
| | | |
| | | 476,720 | | | Avast Plc (a) | | | 4,015,416 | |
| | | |
| | | 7,771 | | | Berkeley Group Holdings Plc | | | 404,141 | |
| | | |
| | | 236,593 | | | BT Group Plc | | | 590,322 | |
| | | |
| | | 6,138 | | | Coca-Cola HBC AG * | | | 155,945 | |
| | | |
| | | 93,455 | | | Kingfisher Plc (a) | | | 381,236 | |
| | | |
| | | 175,691 | | | M&G Plc (a) | | | 483,655 | |
| | | |
| | | 327,643 | | | Meggitt Plc * | | | 3,300,008 | |
| | | |
| | | 48,283 | | | Micro Focus International Plc | | | 250,948 | |
| | | |
| | | 2,800 | | | Rio Tinto Plc Sponsored ADR (a) | | | 220,024 | |
| | | |
| | | 116,432 | | | Taylor Wimpey Plc | | | 233,538 | |
| | | |
| | | 2,926 | | | Unilever Plc (a) | | | 146,811 | |
| | | |
| | | 21,192 | | | WPP Plc | | | 298,063 | |
| | | | | | | | | | |
| | | |
| | | | | | Total United Kingdom | | | 10,485,099 | |
| | | | | | | | | | |
| | |
| | | | | | United States — 41.6% | |
| | | |
| | | 59,680 | | | Activision Blizzard, Inc. (a) (c) | | | 4,863,920 | |
| | | |
| | | 15 | | | Advanced Micro Devices, Inc. * | | | 1,850 | |
| | | |
| | | 6,700 | | | Aflac, Inc. (a) | | | 409,303 | |
| | | |
| | | 3,400 | | | AGNC Investment Corp. (REIT) (a) | | | 43,894 | |
| | | |
| | | 5,800 | | | Alliance Data Systems Corp. | | | 391,210 | |
| | | |
| | | 1,100 | | | Allstate Corp. (The) (a) | | | 134,596 | |
| | | |
| | | 9,100 | | | Ally Financial, Inc. (a) | | | 454,090 | |
| | | |
| | | 1,200 | | | Arch Capital Group Ltd. * (a) | | | 56,532 | |
| | | |
| | | 20,928 | | | Arena Pharmaceuticals, Inc. * | | | 1,987,532 | |
| | | |
| | | 4,100 | | | Arrow Electronics, Inc. * | | | 499,708 | |
| | | |
| | | 17,300 | | | AT&T, Inc. (a) | | | 409,837 | |
| | | |
| | | 800 | | | Bath & Body Works, Inc. (a) | | | 42,696 | |
| | | |
| | | 4,200 | | | Best Buy Co., Inc. (a) | | | 405,888 | |
| | | |
| | | 700 | | | Bio-Rad Laboratories, Inc. – Class A * | | | 438,172 | |
| | | |
| | | 1,800 | | | Biogen, Inc. * (a) | | | 379,818 | |
| | | |
| | | 8,800 | | | BorgWarner, Inc. | | | 360,888 | |
| | | |
| | | 6,400 | | | Bristol-Myers Squibb Co. (a) | | | 439,488 | |
| | | |
| | | 3,700 | | | Capital One Financial Corp. (a) | | | 567,099 | |
| | | |
| | | 9,900 | | | Carrier Global Corp. (a) | | | 444,312 | |
| | | |
| | | 5,300 | | | CBRE Group, Inc. – Class A * (a) | | | 513,305 | |
| | | |
| | | 6,000 | | | Centene Corp. * (a) | | | 495,720 | |
| | | |
| | | 35,790 | | | Cerner Corp. (a) | | | 3,337,418 | |
| | | |
| | | 346,453 | | | Change Healthcare, Inc. * (a) | | | 7,421,023 | |
| | | | | | | | | | |
| | | Shares | | | Description | | Value ($) | |
| | |
| | | | | | United States — continued | |
| | | |
| | | 2,500 | | | Cigna Corp. (a) | | | 594,450 | |
| | | |
| | | 8,700 | | | Citigroup, Inc. (a) | | | 515,301 | |
| | | |
| | | 3,200 | | | Citizens Financial Group, Inc. | | | 167,744 | |
| | | |
| | | 19,204 | | | Citrix Systems, Inc. (a) | | | 1,968,410 | |
| | | |
| | | 14,304 | | | CMC Materials, Inc. (a) | | | 2,652,391 | |
| | | |
| | | 5,600 | | | Cognizant Technology Solutions Corp. – Class A (a) | | | 482,328 | |
| | | |
| | | 4,869 | | | Coherent, Inc. * | | | 1,286,974 | |
| | | |
| | | 8,800 | | | Comcast Corp. – Class A (a) | | | 411,488 | |
| | | |
| | | 58,524 | | | Cornerstone Building Brands, Inc. * | | | 1,292,210 | |
| | | |
| | | 3,800 | | | CVS Health Corp. (a) | | | 393,870 | |
| | | |
| | | 66,081 | | | CyrusOne, Inc. (REIT) (a) | | | 5,970,418 | |
| | | |
| | | 3,500 | | | Discover Financial Services (a) | | | 432,040 | |
| | | |
| | | 13,100 | | | DISH Network Corp. – Class A * | | | 418,676 | |
| | | |
| | | 5,300 | | | DR Horton, Inc. (a) | | | 452,620 | |
| | | |
| | | 6,800 | | | eBay, Inc. (a) | | | 371,212 | |
| | | |
| | | 8,000 | | | Fidelity National Financial, Inc. (a) | | | 381,120 | |
| | | |
| | | 1,800 | | | FleetCor Technologies, Inc. * (a) | | | 421,560 | |
| | | |
| | | 24,200 | | | Ford Motor Co. | | | 424,952 | |
| | | |
| | | 2,100 | | | Fox Corp. – Class A | | | 87,843 | |
| | | |
| | | 95,651 | | | Fox Corp. – Class B (a) | | | 3,659,607 | |
| | | |
| | | 12,900 | | | Franklin Resources, Inc. (a) | | | 383,517 | |
| | | |
| | | 147,328 | | | Frontier Group Holdings, Inc. * (a) | | | 1,897,585 | |
| | | |
| | | 8,900 | | | General Motors Co. * | | | 415,808 | |
| | | |
| | | 7,500 | | | Gilead Sciences, Inc. (a) | | | 453,000 | |
| | | |
| | | 1,100 | | | Goldman Sachs Group, Inc. (The) (a) | | | 375,419 | |
| | | |
| | | 14,500 | | | HP, Inc. (a) | | | 498,220 | |
| | | |
| | | 3,500 | | | IAC/InterActiveCorp * | | | 401,660 | |
| | | |
| | | 5,700 | | | Incyte Corp. * (a) | | | 389,310 | |
| | | |
| | | 9,800 | | | Intel Corp. (a) | | | 467,460 | |
| | | |
| | | 4,200 | | | International Business Machines Corp. (a) | | | 514,542 | |
| | | |
| | | 18,000 | | | Invesco Ltd. (a) | | | 382,320 | |
| | | |
| | | 268,098 | | | Investors Bancorp, Inc. (a) | | | 4,487,961 | |
| | | |
| | | 3,200 | | | Jazz Pharmaceuticals Plc * | | | 439,744 | |
| | | |
| | | 32,700 | | | Kinder Morgan, Inc. (a) | | | 568,980 | |
| | | |
| | | 6,600 | | | Kohl’s Corp. (a) | | | 367,092 | |
| | | |
| | | 8,500 | | | Kroger Co. (The) (a) | | | 397,800 | |
| | | |
| | | 1,900 | | | Laboratory Corp. of America Holdings * (a) | | | 515,394 | |
| | | |
| | | 3,700 | | | Leidos Holdings, Inc. (a) | | | 376,808 | |
| | | |
| | | 5,100 | | | Lennar Corp. – Class A (a) | | | 458,388 | |
| | | |
| | | 15,592 | | | Liberty Broadband Corp. – Class C * | | | 2,287,346 | |
| | | |
| | | 7,100 | | | Liberty Global Plc – Class A * | | | 183,038 | |
| | | |
| | | 13,500 | | | Liberty Global Plc – Class C * | | | 349,245 | |
| | | |
| | | 7,100 | | | Lincoln National Corp. (a) | | | 478,682 | |
| | | |
| | | 7,000 | | | LKQ Corp. (a) | | | 328,650 | |
| | | |
| | | 32,000 | | | Lumen Technologies, Inc. | | | 331,520 | |
| | | |
| | | 5,800 | | | LyondellBasell Industries NV – Class A (a) | | | 563,934 | |
| | | |
| | | 5,500 | | | Merck & Co., Inc. (a) | | | 421,190 | |
| | | |
| | | 600 | | | Meta Platforms, Inc. – Class A * (a) | | | 126,618 | |
| | | |
| | | 8,500 | | | MetLife, Inc. (a) | | | 574,175 | |
| | | |
| | | 6,100 | | | Micron Technology, Inc. (a) | | | 542,046 | |
| | | | |
| | |
| | | See accompanying notes to the financial statements. | | 7 |
GMO Alternative Allocation Fund
(A Series of GMO Trust)
Consolidated Schedule of Investments — (Continued)
(showing percentage of total net assets)
February 28, 2022
| | | | | | | | | | |
| | |
Shares | | | Description | | Value ($) | |
| | |
| | | | | | United States — continued | |
| | | |
| | | 1,700 | | | Mohawk Industries, Inc. * | | | 239,326 | |
| | | |
| | | 9,900 | | | Molson Coors Brewing Co. – Class B (a) | | | 516,582 | |
| | | |
| | | 4,400 | | | NRG Energy, Inc. (a) | | | 166,496 | |
| | | |
| | | 118,386 | | | Nuance Communications, Inc. * (a) | | | 6,572,791 | |
| | | |
| | | 20 | | | NVR, Inc. * (a) | | | 99,169 | |
| | | |
| | | 3,000 | | | Omnicom Group, Inc. (a) | | | 251,670 | |
| | | |
| | | 5,700 | | | Oracle Corp. (a) | | | 433,029 | |
| | | |
| | | 700 | | | Owens Corning (a) | | | 65,233 | |
| | | |
| | | 12,600 | | | Paramount Global – Class B | | | 385,686 | |
| | | |
| | | 216,100 | | | People’s United Financial, Inc. (a) | | | 4,555,388 | |
| | | |
| | | 189,448 | | | Pershing Square Tontine Holdings Ltd. – Class A * | | | 3,752,965 | |
| | | |
| | | 29,020 | | | PNM Resources, Inc. (a) | | | 1,310,833 | |
| | | |
| | | 1,500 | | | Principal Financial Group, Inc. (a) | | | 105,960 | |
| | | |
| | | 4,800 | | | Prudential Financial, Inc. (a) | | | 535,968 | |
| | | |
| | | 9,300 | | | PulteGroup, Inc. | | | 461,838 | |
| | | |
| | | 3,200 | | | Quest Diagnostics, Inc. (a) | | | 420,064 | |
| | | |
| | | 54,000 | | | Qurate Retail, Inc. – Series A (a) | | | 297,540 | |
| | | |
| | | 800 | | | Regeneron Pharmaceuticals, Inc. * (a) | | | 494,688 | |
| | | |
| | | 2,100 | | | Regions Financial Corp. (a) | | | 50,799 | |
| | | |
| | | 9,535 | | | S&P Global, Inc. | | | 3,582,129 | |
| | | |
| | | 800 | | | Skyworks Solutions, Inc. (a) | | | 110,536 | |
| | | |
| | | 400 | | | Snap-on, Inc. (a) | | | 84,072 | |
| | | |
| | | 38,841 | | | South Jersey Industries, Inc. | | | 1,317,875 | |
| | | |
| | | 62,736 | | | Sportsman’s Warehouse Holdings, Inc. * | | | 715,818 | |
| | | |
| | | 3,800 | | | SS&C Technologies Holdings, Inc. (a) | | | 284,886 | |
| | | |
| | | 3,200 | | | Steel Dynamics, Inc. | | | 225,856 | |
| | | |
| | | 11,400 | | | Synchrony Financial (a) | | | 487,692 | |
| | | |
| | | 26 | | | Teledyne Technologies, Inc. * | | | 11,164 | |
| | | |
| | | 82,904 | | | Terminix Global Holdings, Inc. * (a) | | | 3,528,394 | |
| | | |
| | | 5,100 | | | Textron, Inc. (a) | | | 372,963 | |
| | | |
| | | 6,200 | | | Tyson Foods, Inc. – Class A (a) | | | 574,492 | |
| | | |
| | | 131,015 | | | Umpqua Holdings Corp. (a) | | | 2,797,170 | |
| | | |
| | | 3,800 | | | Universal Health Services, Inc. – Class B | | | 546,934 | |
| | | |
| | | 8,200 | | | Verizon Communications, Inc. (a) | | | 440,094 | |
| | | |
| | | 32,800 | | | Viatris, Inc. | | | 361,128 | |
| | | |
| | | 3,300 | | | VMware, Inc. – Class A (a) | | | 387,156 | |
| | | |
| | | 3,600 | | | Walgreens Boots Alliance, Inc. (a) | | | 165,924 | |
| | | |
| | | 22,300 | | | Western Union Co. (The) (a) | | | 405,414 | |
| | | |
| | | 7,800 | | | Western Digital Corp. * | | | 397,332 | |
| | | |
| | | 1,900 | | | Whirlpool Corp. | | | 382,413 | |
| | | |
| | | 23,408 | | | Willis Towers Watson Plc (a) | | | 5,203,599 | |
| | | |
| | | 24,954 | | | Zogenix, Inc. * | | | 655,292 | |
| | | |
| | | 1,600 | | | Zoom Video Communications, Inc. – Class A * (a) | | | 212,160 | |
| | | |
| | | 619,478 | | | Zynga Inc. – Class A * (a) (c) | | | 5,624,860 | |
| | | | | | | | | | |
| | | |
| | | | | | Total United States | | | 116,052,343 | |
| | | | | | | | | | |
| | | |
| | | | | | TOTAL COMMON STOCKS
(COST $173,686,090) | | | 170,493,162 | |
| | | | | | | | | | |
| | | | | | | | | | |
| | | Shares /
Par Value† | | | Description | | Value ($) | |
| | |
| | | | | | PREFERRED STOCKS (d) — 0.2% | |
| | |
| | | | | | Brazil — 0.1% | |
| | | |
| | | 24,100 | | | Petroleo Brasileiro SA Sponsored ADR (a) | | | 315,469 | |
| | | | | | | | | | |
| | |
| | | | | | Germany — 0.1% | |
| | | |
| | | 2,544 | | | Bayerische Motoren Werke AG | | | 205,728 | |
| | | |
| | | 443 | | | Volkswagen AG (a) | | | 87,084 | |
| | | | | | | | | | |
| | | |
| | | | | | Total Germany | | | 292,812 | |
| | | | | | | | | | |
| | | |
| | | | | | TOTAL PREFERRED STOCKS
(COST $554,082) | | | 608,281 | |
| | | | | | | | | | |
| | |
| | | | | | RIGHTS/WARRANTS — 0.1% | |
| | |
| | | | | | United States — 0.1% | |
| | | |
| | | 195,149 | | | Bristol-Myers Squibb Co. CVR * (b) | | | 263,451 | |
| | | | | | | | | | |
| | | |
| | | | | | TOTAL RIGHTS/WARRANTS
(COST $284,429) | | | 263,451 | |
| | | | | | | | | | |
| | | |
| | | | | | INVESTMENT FUNDS — 2.0% | | | |
| | |
| | | | | | United States — 2.0% | |
| | | |
| | | 950,441 | | | Altaba, Inc. (b) | | | 5,607,602 | |
| | | | | | | | | | |
| | | |
| | | | | | TOTAL INVESTMENT FUNDS
(COST $5,422,144) | | | 5,607,602 | |
| | | | | | | | | | |
| | |
| | | | | | DEBT OBLIGATIONS — 35.2% | |
| | |
| | | | | | United States — 35.2% | |
| | |
| | | | | | U.S. Government — 35.2% | |
| | | |
| | | 14,200,000 | | | U.S. Treasury Note, Variable Rate, USBM + 0.05%, 0.41%, due 01/31/23 (a) | | | 14,205,732 | |
| | | |
| | | 39,025,000 | | | U.S. Treasury Note, 0.13%, due 02/28/23 | | | 38,653,043 | |
| | | |
| | | 17,025,000 | | | U.S. Treasury Note, 0.13%, due 03/31/23 | | | 16,836,794 | |
| | | |
| | | 17,025,000 | | | U.S. Treasury Note, 0.13%, due 04/30/23 | | | 16,813,517 | |
| | | |
| | | 8,073,000 | | | U.S. Treasury Note, 0.13%, due 06/30/23 (a) | | | 7,952,220 | |
| | | |
| | | 400,000 | | | U.S. Treasury Note, 0.13%, due 07/31/23 (a) | | | 393,422 | |
| | | |
| | | 3,500,000 | | | U.S. Treasury Note, Variable Rate, USBM + 0.04%, 0.40%, due 10/31/23 (a) | | | 3,506,319 | |
| | | | | | | | | | |
| | | |
| | | | | | Total U.S. Government | | | 98,361,047 | |
| | | | | | | | | | |
| | | |
| | | | | | Total United States | | | 98,361,047 | |
| | | | | | | | | | |
| | | |
| | | | | | TOTAL DEBT OBLIGATIONS
(COST $98,790,289) | | | 98,361,047 | |
| | | | | | | | | | |
| | |
| | | | | | MUTUAL FUNDS — 3.5% | |
| | |
| | | | | | United States — 3.5% | |
| | |
| | | | | | Affiliated Issuers — 3.5% | |
| | | |
| | | 331,931 | | | GMO Emerging Markets Fund, Class VI | | | 9,811,873 | |
| | | | | | | | | | |
| | | |
| | | | | | TOTAL MUTUAL FUNDS
(COST $11,292,136) | | | 9,811,873 | |
| | | | | | | | | | |
| | | | |
| | |
| 8 | | See accompanying notes to the financial statements. | | |
GMO Alternative Allocation Fund
(A Series of GMO Trust)
Consolidated Schedule of Investments — (Continued)
(showing percentage of total net assets)
February 28, 2022
| | | | | | | | | | |
| | | Shares /
Par Value† | | | Description | | Value ($) | |
| | |
| | | | | | SHORT-TERM INVESTMENTS — 27.4% | |
| | |
| | | | | | Money Market Funds — 0.2% | |
| | | |
| | | 569,327 | | | State Street Institutional Treasury Money Market Fund – Premier Class, 0.01% (e) | | | 569,327 | |
| | | | | | | | | | |
| | | |
| | | | | | U.S. Government — 27.2% | | | |
| | | |
| | | 8,200,000 | | | U.S. Treasury Bill, 0.31%, due 05/24/22 (a) (f) | | | 8,193,992 | |
| | | |
| | | 24,500,000 | | | U.S. Treasury Bill, 0.54%, due 07/21/22 (a) (f) | | | 24,447,912 | |
| | | | | | | | | | |
| | |
Par Value† | | | Description | | Value ($) | |
| | | |
| | | | | | U.S. Government — continued | | | |
| | | |
| | | 1,190,000 | | | U.S. Treasury Bill, 0.58%, due 07/28/22 (f) | | | 1,187,193 | |
| | | |
| | | 42,050,000 | | | U.S. Treasury Bill, 0.64%, due 08/18/22 (f) | | | 41,923,577 | |
| | | | | | | | | | |
| | | |
| | | | | | Total U.S. Government | | | 75,752,674 | |
| | | | | | | | | | |
| | | |
| | | | | | TOTAL SHORT-TERM INVESTMENTS
(COST $76,335,374) | | | 76,322,001 | |
| | | | | | | | | | |
PURCHASED OPTIONS — 0.3%
| | | | | | | | | | | | | | | | | | | | | | |
Description | | Counterparty | | Exercise
Rate | | Expiration
Date | | Principal/
Notional
Amount | | | Floating
Rate Index | | Pay/Receive
Floating
Rate | | | Value ($) | |
Options on Credit Default Swaps – Puts — 0.3% | |
CDX.NA.HYS.37.V1-5Y | | BCLY | | 104.50% | | 03/16/22 | | USD | | | 22,250,000 | | | Fixed Spread | | | Pay | | | | 96,358 | |
CDX.NA.HYS.37.V1-5Y | | BCLY | | 105.50% | | 03/16/22 | | USD | | | 22,250,000 | | | Fixed Spread | | | Pay | | | | 170,499 | |
CDX.NA.IGS.37.V1-5Y | | BOA | | 65.00% | | 03/16/22 | | USD | | | 41,720,000 | | | Fixed Spread | | | Pay | | | | 96,183 | |
CDX.NA.IGS.37.V1-5Y | | BOA | | 55.00% | | 03/16/22 | | USD | | | 41,720,000 | | | Fixed Spread | | | Pay | | | | 253,342 | |
CDX.NA.IGS.37.V1-5Y | | BCLY | | 67.50% | | 04/20/22 | | USD | | | 29,815,000 | | | Fixed Spread | | | Pay | | | | 98,175 | |
CDX.NA.IGS.37.V1-5Y | | BCLY | | 82.50% | | 04/20/22 | | USD | | | 29,815,000 | | | Fixed Spread | | | Pay | | | | 48,284 | |
| | | | | | | | | | | | | | | | | | | | | | |
| | | | | | | | | | |
| | | | | | Total Options on Credit Default Swaps – Puts | | | 762,841 | |
| | | | | | | | | | |
| | | |
| | | | | | TOTAL PURCHASED OPTIONS (COST $699,402) | | | 762,841 | |
| | | | | | | | | | |
| | | |
| | | | | | TOTAL INVESTMENTS — 129.8%
(Cost $367,063,946) | | | 362,230,258 | |
| | | | | | | | | | |
| | | | | | | | | | |
| | | Shares | | | Description | | Value ($) | |
| | |
| | | | | | SECURITIES SOLD SHORT — (36.7)% | |
| | | |
| | | | | | Common Stocks — (36.6)% | | | |
| | | |
| | | | | | Australia — (0.5)% | | | |
| | | |
| | | (65,190 | ) | | APA Group | | | (476,570 | ) |
| | | |
| | | (6,284 | ) | | ASX Ltd | | | (377,426 | ) |
| | | |
| | | (1,270 | ) | | Cochlear Ltd | | | (207,320 | ) |
| | | |
| | | (111,793 | ) | | Qantas Airways Ltd * | | | (414,246 | ) |
| | | |
| | | (309 | ) | | Santos Ltd | | | (1,646 | ) |
| | | | | | | | | | |
| | | |
| | | | | | Total Australia | | | (1,477,208 | ) |
| | | | | | | | | | |
| | | |
| | | | | | Austria — (0.2)% | | | |
| | | |
| | | (5,064 | ) | | Verbund AG | | | (610,802 | ) |
| | | | | | | | | | |
| | | |
| | | | | | Belgium — (0.2)% | | | |
| | | |
| | | (7,093 | ) | | Anheuser-Busch InBev SA/NV | | | (437,693 | ) |
| | | |
| | | (351 | ) | | Galapagos NV * | | | (23,185 | ) |
| | | | | | | | | | |
| | | |
| | | | | | Total Belgium | | | (460,878 | ) |
| | | | | | | | | | |
| | | |
| | | | | | Canada — (0.9)% | | | |
| | | |
| | | (2,301 | ) | | Agnico Eagle Mines Ltd | | | (116,177 | ) |
| | | |
| | | (1,500 | ) | | Algonquin Power & Utilities Corp | | | (21,720 | ) |
| | | |
| | | (17,200 | ) | | AltaGas Ltd | | | (378,875 | ) |
| | | | | | | | | | |
| | | Shares | | | Description | | Value ($) | |
| | | |
| | | | | | Common Stocks — continued | | | |
| | | |
| | | | | | Canada — continued | | | |
| | | |
| | | (8,500 | ) | | Cameco Corp | | | (208,930 | ) |
| | | |
| | | (2 | ) | | Canadian Pacific Railway Ltd | | | (141 | ) |
| | | |
| | | (10,300 | ) | | Enbridge Inc | | | (444,754 | ) |
| | | |
| | | (3,100 | ) | | Franco-Nevada Corp | | | (456,072 | ) |
| | | |
| | | (3,700 | ) | | Pan American Silver Corp | | | (87,431 | ) |
| | | |
| | | (12,400 | ) | | Pembina Pipeline Corp | | | (421,104 | ) |
| | | |
| | | (5,700 | ) | | Restaurant Brands International Inc | | | (319,086 | ) |
| | | | | | | | | | |
| | | |
| | | | | | Total Canada | | | (2,454,290 | ) |
| | | | | | | | | | |
| | | |
| | | | | | Denmark — (0.1)% | | | |
| | | |
| | | (13,383 | ) | | Ambu A/S – Class B | | | (246,793 | ) |
| | | | | | | | | | |
| | | |
| | | | | | France — (0.8)% | | | |
| | | |
| | | (12,804 | ) | | Accor SA * | | | (437,299 | ) |
| | | |
| | | (2,689 | ) | | Aeroports de Paris * | | | (380,197 | ) |
| | | |
| | | (32,724 | ) | | Getlink SE | | | (533,707 | ) |
| | | |
| | | (312 | ) | | Hermes International | | | (430,259 | ) |
| | | |
| | | (313 | ) | | Sartorius Stedim Biotech | | | (120,026 | ) |
| | | |
| | | (3,433 | ) | | Ubisoft Entertainment SA * | | | (184,067 | ) |
| | | |
| | | (1,621 | ) | | Wendel SE | | | (164,561 | ) |
| | | | | | | | | | |
| | | |
| | | | | | Total France | | | (2,250,116 | ) |
| | | | | | | | | | |
| | | | |
| | |
| | | See accompanying notes to the financial statements. | | 9 |
GMO Alternative Allocation Fund
(A Series of GMO Trust)
Consolidated Schedule of Investments — (Continued)
(showing percentage of total net assets)
February 28, 2022
| | | | | | | | | | |
| | | Shares | | | Description | | Value ($) | |
| | | |
| | | | | | Common Stocks — continued | | | |
| | | |
| | | | | | Germany — (1.0)% | | | | |
| | | |
| | | (62 | ) | | adidas AG | | | (14,659 | ) |
| | | |
| | | (5,270 | ) | | Delivery Hero SE * | | | (282,475 | ) |
| | | |
| | | (342 | ) | | MTU Aero Engines AG | | | (81,870 | ) |
| | | |
| | | (4,281 | ) | | Puma SE | | | (392,587 | ) |
| | | |
| | | (3,854 | ) | | QIAGEN NV * | | | (193,634 | ) |
| | | |
| | | (88 | ) | | Rational AG | | | (64,765 | ) |
| | | |
| | | (3,813 | ) | | Scout24 SE | | | (222,414 | ) |
| | | |
| | | (3,429 | ) | | Symrise AG – Class A | | | (407,868 | ) |
| | | |
| | | (188,893 | ) | | Telefonica Deutschland Holding AG | | | (515,460 | ) |
| | | |
| | | (6,543 | ) | | Uniper SE | | | (209,318 | ) |
| | | |
| | | (4,995 | ) | | Zalando SE * | | | (330,602 | ) |
| | | | | | | | | | |
| | | |
| | | | | | Total Germany | | | (2,715,652 | ) |
| | | | | | | | | | |
| | | |
| | | | | | Israel — (0.3)% | | | |
| | | |
| | | (2,900 | ) | | CyberArk Software Ltd * | | | (493,406 | ) |
| | | |
| | | (700 | ) | | Kornit Digital Ltd * | | | (66,381 | ) |
| | | |
| | | (2,700 | ) | | Wix.com Ltd * | | | (247,266 | ) |
| | | | | | | | | | |
| | | |
| | | | | | Total Israel | | | (807,053 | ) |
| | | | | | | | | | |
| | | |
| | | | | | Italy — (0.7)% | | | |
| | | |
| | | (8,147 | ) | | Amplifon SPA | | | (349,624 | ) |
| | | |
| | | (21,822 | ) | | Atlantia SPA * | | | (401,421 | ) |
| | | |
| | | (1,500 | ) | | CNH Industrial NV | | | (21,495 | ) |
| | | |
| | | (1,865 | ) | | Ferrari NV | | | (400,767 | ) |
| | | |
| | | (27,501 | ) | | FinecoBank Banca Fineco SPA | | | (458,327 | ) |
| | | |
| | | (37,205 | ) | | Infrastrutture Wireless Italiane SPA | | | (379,912 | ) |
| | | | | | | | | | |
| | | |
| | | | | | Total Italy | | | (2,011,546 | ) |
| | | | | | | | | | |
| | | |
| | | | | | Japan — (3.1)% | | | |
| | | |
| | | (27,200 | ) | | Acom Co Ltd | | | (75,769 | ) |
| | | |
| �� | | (8,300 | ) | | Aeon Co Ltd | | | (188,026 | ) |
| | | |
| | | (18,200 | ) | | ANA Holdings Inc * | | | (400,731 | ) |
| | | |
| | | (15,400 | ) | | Asahi Intecc Co Ltd | | | (332,537 | ) |
| | | |
| | | (1,300 | ) | | Benefit One Inc | | | (30,111 | ) |
| | | |
| | | (2,600 | ) | | East Japan Railway Co | | | (154,463 | ) |
| | | |
| | | (4,200 | ) | | GMO Payment Gateway Inc | | | (406,257 | ) |
| | | |
| | | (2,900 | ) | | Harmonic Drive Systems Inc | | | (118,621 | ) |
| | | |
| | | (16,700 | ) | | Hitachi Metals Ltd * | | | (297,686 | ) |
| | | |
| | | (26,800 | ) | | Isetan Mitsukoshi Holdings Ltd | | | (216,130 | ) |
| | | |
| | | (600 | ) | | Ito En Ltd | | | (34,507 | ) |
| | | |
| | | (20,100 | ) | | Japan Airlines Co Ltd * | | | (398,556 | ) |
| | | |
| | | (6,300 | ) | | Japan Airport Terminal Co Ltd * | | | (294,187 | ) |
| | | |
| | | (9,600 | ) | | Japan Exchange Group Inc | | | (179,770 | ) |
| | | |
| | | (20 | ) | | Japan Real Estate Investment Corp (REIT) | | | (106,835 | ) |
| | | |
| | | (16,500 | ) | | JGC Holding Corp | | | (165,378 | ) |
| | | |
| | | (18,600 | ) | | Keikyu Corp | | | (194,894 | ) |
| | | |
| | | (5,600 | ) | | Keio Corp | | | (229,135 | ) |
| | | |
| | | (3,800 | ) | | Kintetsu Group Holdings Co Ltd * | | | (114,161 | ) |
| | | |
| | | (2,100 | ) | | Lasertec Corp | | | (389,282 | ) |
| | | | | | | | | | |
| | | Shares | | | Description | | Value ($) | |
| | | |
| | | | | | Common Stocks — continued | | | |
| | | |
| | | | | | Japan — continued | | | | |
| | | |
| | | (9,100 | ) | | LIXIL Corp | | | (202,815 | ) |
| | | |
| | | (11,200 | ) | | M3 Inc | | | (421,383 | ) |
| | | |
| | | (9,200 | ) | | Mercari Inc * | | | (288,144 | ) |
| | | |
| | | (24,000 | ) | | MonotaRO Co Ltd | | | (451,752 | ) |
| | | |
| | | (3,200 | ) | | Nidec Corp | | | (278,188 | ) |
| | | |
| | | (19,800 | ) | | Nihon M&A Center Holdings Inc | | | (292,863 | ) |
| | | |
| | | (43,600 | ) | | Nippon Paint Holdings Co Ltd | | | (390,224 | ) |
| | | |
| | | (4,200 | ) | | Nissin Foods Holdings Co Ltd | | | (335,568 | ) |
| | | |
| | | (14,100 | ) | | Odakyu Electric Railway Co Ltd | | | (232,629 | ) |
| | | |
| | | (2,900 | ) | | ORIENTAL LAND CO LTD | | | (536,108 | ) |
| | | |
| | | (33,600 | ) | | Rakuten Group Inc | | | (285,621 | ) |
| | | |
| | | (2,500 | ) | | Shiseido Co Ltd | | | (143,465 | ) |
| | | |
| | | (3,900 | ) | | Tobu Railway Co Ltd | | | (95,864 | ) |
| | | |
| | | (5,600 | ) | | Tokyu Corp | | | (74,683 | ) |
| | | |
| | | (9,200 | ) | | West Japan Railway Co | | | (396,924 | ) |
| | | | | | | | | | |
| | | |
| | | | | | Total Japan | | | (8,753,267 | ) |
| | | | | | | | | | |
| | | |
| | | | | | Netherlands — (0.4)% | | | |
| | | |
| | | (215 | ) | | Adyen NV * | | | (448,119 | ) |
| | | |
| | | (1,343 | ) | | Heineken Holding NV | | | (109,681 | ) |
| | | |
| | | (1,150 | ) | | IMCD NV | | | (186,808 | ) |
| | | |
| | | (8,450 | ) | | Just Eat Takeaway.com NV * | | | (341,989 | ) |
| | | | | | | | | | |
| | | |
| | | | | | Total Netherlands | | | (1,086,597 | ) |
| | | | | | | | | | |
| | | |
| | | | | | New Zealand — (0.1)% | | | |
| | | |
| | | (4,729 | ) | | Xero Ltd * | | | (325,157 | ) |
| | | | | | | | | | |
| | | |
| | | | | | Norway — (0.0)% | | | |
| | | |
| | | (1,416 | ) | | Schibsted ASA – Class A | | | (40,693 | ) |
| | | |
| | | (1,246 | ) | | Schibsted ASA – Class B | | | (32,345 | ) |
| | | | | | | | | | |
| | | |
| | | | | | Total Norway | | | (73,038 | ) |
| | | | | | | | | | |
| | | |
| | | | | | Singapore — (0.3)% | | | |
| | | |
| | | (22,900 | ) | | City Developments Ltd | | | (121,176 | ) |
| | | |
| | | (107,700 | ) | | Singapore Airlines Ltd * | | | (407,804 | ) |
| | | |
| | | (40,500 | ) | | Singapore Exchange Ltd | | | (280,980 | ) |
| | | | | | | | | | |
| | | |
| | | | | | Total Singapore | | | (809,960 | ) |
| | | | | | | | | | |
| | | |
| | | | | | Spain — (0.6)% | | | |
| | | |
| | | (2,384 | ) | | Aena SME SA * | | | (389,081 | ) |
| | | |
| | | (8,628 | ) | | Cellnex Telecom SA | | | (390,264 | ) |
| | | |
| | | (17,643 | ) | | Ferrovial SA | | | (480,669 | ) |
| | | |
| | | (21,349 | ) | | Siemens Gamesa Renewable Energy SA * | | | (491,236 | ) |
| | | | | | | | | | |
| | | |
| | | | | | Total Spain | | | (1,751,250 | ) |
| | | | | | | | | | |
| | | |
| | | | | | Sweden — (0.4)% | | | |
| | | |
| | | (42,154 | ) | | Embracer Group AB – Class B * | | | (361,856 | ) |
| | | |
| | | (1,384 | ) | | EQT AB | | | (46,323 | ) |
| | | |
| | | (3,547 | ) | | Evolution AB | | | (406,695 | ) |
| | | | |
| | |
| 10 | | See accompanying notes to the financial statements. | �� | |
GMO Alternative Allocation Fund
(A Series of GMO Trust)
Consolidated Schedule of Investments — (Continued)
(showing percentage of total net assets)
February 28, 2022
| | | | | | | | | | |
| | | Shares | | | Description | | Value ($) | |
| | | |
| | | | | | Common Stocks — continued | | | |
| | | |
| | | | | | Sweden — continued | | | | |
| | | |
| | | (38,234 | ) | | Sinch AB * | | | (322,519 | ) |
| | | | | | | | | | |
| | | |
| | | | | | Total Sweden | | | (1,137,393 | ) |
| | | | | | | | | | |
| | | |
| | | | | | Switzerland — (0.3)% | | | |
| | | |
| | | (6 | ) | | Chocoladefabriken Lindt & Spruengli AG | | | (63,646 | ) |
| | | |
| | | (310 | ) | | Partners Group Holding AG | | | (419,054 | ) |
| | | |
| | | (198 | ) | | Sika AG (Registered) | | | (65,703 | ) |
| | | |
| | | (247 | ) | | Straumann Holding AG (Registered) | | | (392,351 | ) |
| | | | | | | | | | |
| | | |
| | | | | | Total Switzerland | | | (940,754 | ) |
| | | | | | | | | | |
| | | |
| | | | | | United Kingdom — (2.2)% | | | |
| | | |
| | | (5,295 | ) | | Admiral Group Plc | | | (210,929 | ) |
| | | |
| | | (10,252 | ) | | Antofagasta Plc | | | (207,581 | ) |
| | | |
| | | (56,978 | ) | | Auto Trader Group Plc | | | (503,918 | ) |
| | | |
| | | (87,143 | ) | | ConvaTec Group Plc | | | (210,681 | ) |
| | | |
| | | (970 | ) | | Croda International Plc | | | (97,096 | ) |
| | | |
| | | (548 | ) | | Experian Plc | | | (21,407 | ) |
| | | |
| | | (4,686 | ) | | Halma Plc | | | (151,142 | ) |
| | | |
| | | (25,122 | ) | | Hargreaves Lansdown Plc | | | (380,754 | ) |
| | | |
| | | (69,320 | ) | | Informa Plc * | | | (548,864 | ) |
| | | |
| | | (1,992 | ) | | InterContinental Hotels Group Plc * | | | (138,709 | ) |
| | | |
| | | (19,566 | ) | | Land Securities Group Plc (REIT) | | | (207,335 | ) |
| | | |
| | | (4,804 | ) | | London Stock Exchange Group Plc | | | (419,661 | ) |
| | | |
| | | (20,611 | ) | | Ocado Group Plc * | | | (379,014 | ) |
| | | |
| | | (284,708 | ) | | Rentokil Initial Plc | | | (1,932,131 | ) |
| | | |
| | | (281,555 | ) | | Rolls-Royce Holdings Plc * | | | (388,395 | ) |
| | | |
| | | (1,439 | ) | | Spirax-Sarco Engineering Plc | | | (229,312 | ) |
| | | | | | | | | | |
| | | |
| | | | | | Total United Kingdom | | | (6,026,929 | ) |
| | | | | | | | | | |
| | | |
| | | | | | United States — (24.5)% | | | |
| | | |
| | | (18,800 | ) | | AES Corp. (The) | | | (399,124 | ) |
| | | |
| | | (2,500 | ) | | Airbnb, Inc. – Class A * | | | (378,725 | ) |
| | | |
| | | (1,300 | ) | | American Tower Corp. (REIT) | | | (294,931 | ) |
| | | |
| | | (1 | ) | | Analog Devices, Inc. | | | (160 | ) |
| | | |
| | | (19,252 | ) | | Aon Plc – Class A | | | (5,624,279 | ) |
| | | |
| | | (11,300 | ) | | Aramark | | | (417,648 | ) |
| | | |
| | | (2,900 | ) | | Arthur J Gallagher & Co. | | | (458,751 | ) |
| | | |
| | | (1,700 | ) | | Autodesk, Inc. * | | | (374,391 | ) |
| | | |
| | | (4,000 | ) | | Avalara, Inc. * | | | (415,640 | ) |
| | | |
| | | (2,200 | ) | | Bill.com Holdings, Inc. * | | | (523,336 | ) |
| | | |
| | | (500 | ) | | Bio-Techne Corp. | | | (209,705 | ) |
| | | |
| | | (4,700 | ) | | BioMarin Pharmaceutical, Inc. * | | | (367,164 | ) |
| | | |
| | | (3,903 | ) | | Block Inc. – Class A * | | | (497,633 | ) |
| | | |
| | | (2,100 | ) | | Boeing Co. (The) * | | | (431,214 | ) |
| | | |
| | | (1 | ) | | Bristol-Myers Squibb Co. | | | (69 | ) |
| | | |
| | | (800 | ) | | Broadcom, Inc. | | | (469,952 | ) |
| | | |
| | | (1,900 | ) | | Burlington Stores, Inc. * | | | (429,191 | ) |
| | | |
| | | (5,600 | ) | | Caesars Entertainment, Inc. * | | | (471,464 | ) |
| | | |
| | | (300 | ) | | Camden Property Trust (REIT) | | | (49,533 | ) |
| | | | | | | | | | |
| | | Shares | | | Description | | Value ($) | |
| | | |
| | | | | | Common Stocks — continued | | | |
| | | |
| | | | | | United States — continued | | | | |
| | | |
| | | (2,900 | ) | | Carvana Co. – Class A * | | | (436,363 | ) |
| | | |
| | | (2,500 | ) | | Catalent, Inc. * | | | (255,100 | ) |
| | | |
| | | (5,200 | ) | | Ceridian HCM Holding, Inc. * | | | (379,132 | ) |
| | | |
| | | (3,520 | ) | | Charter Communications, Inc. – Class A * | | | (2,118,266 | ) |
| | | |
| | | (300 | ) | | Chipotle Mexican Grill, Inc. – Class A * | | | (457,005 | ) |
| | | |
| | | (79,627 | ) | | Citizens Financial Group, Inc. | | | (4,174,048 | ) |
| | | |
| | | (19,500 | ) | | Clarivate Plc * | | | (292,110 | ) |
| | | |
| | | (4,600 | ) | | Cloudflare, Inc. – Class A * | | | (535,532 | ) |
| | | |
| | | (1,900 | ) | | CME Group, Inc. | | | (449,407 | ) |
| | | |
| | | (78,059 | ) | | Columbia Banking System, Inc. | | | (2,859,301 | ) |
| | | |
| | | (3,100 | ) | | Coupa Software, Inc. * | | | (375,131 | ) |
| | | |
| | | (1,700 | ) | | Crown Castle International Corp. (REIT) | | | (283,203 | ) |
| | | |
| | | (7,700 | ) | | Delta Air Lines, Inc. * | | | (307,384 | ) |
| | | |
| | | (1,000 | ) | | Dexcom, Inc. * | | | (413,910 | ) |
| | | |
| | | (3,500 | ) | | DocuSign, Inc. – Class A * | | | (414,505 | ) |
| | | |
| | | (1,200 | ) | | DoorDash, Inc. – Class A * | | | (125,940 | ) |
| | | |
| | | (20,400 | ) | | DraftKings Inc. – Class A * | | | (483,072 | ) |
| | | |
| | | (400 | ) | | Ecolab, Inc. | | | (70,504 | ) |
| | | |
| | | (6,446 | ) | | Entegris, Inc. | | | (841,074 | ) |
| | | |
| | | (400 | ) | | Equinix, Inc. (REIT) | | | (283,892 | ) |
| | | |
| | | (3,900 | ) | | Equity LifeStyle Properties, Inc. (REIT) | | | (291,018 | ) |
| | | |
| | | (200 | ) | | Erie Indemnity Co. – Class A | | | (35,020 | ) |
| | | |
| | | (5,100 | ) | | Exact Sciences Corp. * | | | (398,106 | ) |
| | | |
| | | (2,100 | ) | | Expedia Group, Inc. * | | | (411,831 | ) |
| | | |
| | | (100 | ) | | Extra Space Storage, Inc. (REIT) | | | (18,815 | ) |
| | | |
| | | (3,500 | ) | | Fastenal Co. | | | (180,110 | ) |
| | | |
| | | (1,500 | ) | | First Republic Bank | | | (259,890 | ) |
| | | |
| | | (74,925 | ) | | Fox Corp. – Class A | | | (3,134,113 | ) |
| | | |
| | | (4,300 | ) | | Guidewire Software, Inc. * | | | (379,045 | ) |
| | | |
| | | (2,600 | ) | | Hess Corp. | | | (262,756 | ) |
| | | |
| | | (900 | ) | | HubSpot, Inc. * | | | (472,500 | ) |
| | | |
| | | (800 | ) | | IDEXX Laboratories, Inc. * | | | (425,880 | ) |
| | | |
| | | (4,362 | ) | | II-VI, Inc. * | | | (302,984 | ) |
| | | |
| | | (6,700 | ) | | Ingersoll Rand, Inc. | | | (338,484 | ) |
| | | |
| | | (1,700 | ) | | Insulet Corp. * | | | (449,973 | ) |
| | | |
| | | (1,700 | ) | | Invitation Homes, Inc. (REIT) | | | (64,260 | ) |
| | | |
| | | (1,300 | ) | | Ionis Pharmaceuticals, Inc. * | | | (43,394 | ) |
| | | |
| | | (2,200 | ) | | IQVIA Holdings, Inc. * | | | (506,264 | ) |
| | | |
| | | (6,700 | ) | | Iron Mountain, Inc. (REIT) | | | (329,506 | ) |
| | | |
| | | (7,400 | ) | | Lamb Weston Holdings, Inc. | | | (491,582 | ) |
| | | |
| | | (1,400 | ) | | Liberty Broadband Corp. – Class A * | | | (202,734 | ) |
| | | |
| | | (2,700 | ) | | Liberty Broadband Corp. – Class C * | | | (396,090 | ) |
| | | |
| | | (8,800 | ) | | Liberty Media Corp-Liberty Formula One – Class C * | | | (534,424 | ) |
| | | |
| | | (1,500 | ) | | Linde Plc | | | (439,860 | ) |
| | | |
| | | (4,700 | ) | | Live Nation Entertainment, Inc. * | | | (567,854 | ) |
| | | |
| | | (25,502 | ) | | M&T Bank Corp. | | | (4,647,230 | ) |
| | | |
| | | (1,100 | ) | | MarketAxess Holdings, Inc. | | | (419,573 | ) |
| | | |
| | | (2,600 | ) | | Marriott International, Inc. – Class A * | | | (442,364 | ) |
| | | |
| | | (2,300 | ) | | Marvell Technology, Inc. | | | (157,159 | ) |
| | | | |
| | |
| | | See accompanying notes to the financial statements. | | 11 |
GMO Alternative Allocation Fund
(A Series of GMO Trust)
Consolidated Schedule of Investments — (Continued)
(showing percentage of total net assets)
February 28, 2022
| | | | | | | | | | |
| | | Shares | | | Description | | Value ($) | |
| | | |
| | | | | | Common Stocks — continued | | | |
| | | |
| | | | | | United States — continued | | | | |
| | | |
| | | (100 | ) | | Mastercard, Inc. | | | (36,082 | ) |
| | | |
| | | (5,600 | ) | | MGM Resorts International | | | (248,024 | ) |
| | | |
| | | (1,100 | ) | | MongoDB, Inc.—Class A * | | | (420,189 | ) |
| | | |
| | | (600 | ) | | Monolithic Power Systems, Inc. | | | (275,220 | ) |
| | | |
| | | (900 | ) | | MSCI, Inc.—Class A | | | (451,521 | ) |
| | | |
| | | (300 | ) | | NIKE Inc. – Class B | | | (40,965 | ) |
| | | |
| | | (900 | ) | | NiSource, Inc. | | | (26,037 | ) |
| | | |
| | | (14,418 | ) | | NortonLifeLock, Inc. | | | (417,833 | ) |
| | | |
| | | (5,900 | ) | | Novocure Ltd. * | | | (482,974 | ) |
| | | |
| | | (24,400 | ) | | Oak Street Health, Inc. * | | | (427,244 | ) |
| | | |
| | | (2,200 | ) | | Okta, Inc. * | | | (402,248 | ) |
| | | |
| | | (600 | ) | | ONEOK, Inc. | | | (39,180 | ) |
| | | |
| | | (24,700 | ) | | Palantir Technologies, Inc. – Class A * | | | (292,695 | ) |
| | | |
| | | (200 | ) | | Palo Alto Networks, Inc. * | | | (118,850 | ) |
| | | |
| | | (500 | ) | | Paycom Software, Inc. * | | | (169,605 | ) |
| | | |
| | | (10,200 | ) | | Peloton Interactive, Inc. – Class A * | | | (296,412 | ) |
| | | |
| | | (1 | ) | | Realty Income Corp. (REIT) | | | (66 | ) |
| | | |
| | | (2,400 | ) | | RingCentral, Inc. – Class A * | | | (314,016 | ) |
| | | |
| | | (2,600 | ) | | Roku, Inc. * | | | (362,778 | ) |
| | | |
| | | (6,900 | ) | | Rollins, Inc. | | | (225,147 | ) |
| | | |
| | | (5,800 | ) | | Royal Caribbean Cruises Ltd. * | | | (468,176 | ) |
| | | |
| | | (9,528 | ) | | S&P Global, Inc. | | | (3,579,670 | ) |
| | | |
| | | (7 | ) | | salesforce.com, Inc. * | | | (1,473 | ) |
| | | |
| | | (5,700 | ) | | Sarepta Therapeutics, Inc. * | | | (436,677 | ) |
| | | |
| | | (3,200 | ) | | Seagen, Inc. * | | | (412,384 | ) |
| | | |
| | | (800 | ) | | ServiceNow, Inc. * | | | (463,936 | ) |
| | | |
| | | (2,100 | ) | | Simon Property Group, Inc. (REIT) | | | (288,876 | ) |
| | | |
| | | (12,700 | ) | | Snap, Inc. – Class A * | | | (507,238 | ) |
| | | |
| | | (1,500 | ) | | Snowflake, Inc. – Class A * | | | (398,490 | ) |
| | | |
| | | (77,031 | ) | | Spirit Airlines, Inc. * | | | (1,931,937 | ) |
| | | |
| | | (600 | ) | | Starbucks Corp. | | | (55,074 | ) |
| | | |
| | | (3,000 | ) | | T-Mobile US, Inc. * | | | (369,630 | ) |
| | | |
| | | (17,025 | ) | | Take-Two Interactive Software, Inc. * | | | (2,758,050 | ) |
| | | |
| | | (5,500 | ) | | Teladoc Health, Inc. * | | | (417,505 | ) |
| | | |
| | | (600 | ) | | Tesla, Inc. * | | | (522,258 | ) |
| | | | | | | | | | |
| | | Shares | | | Description | | Value ($) | |
| | | |
| | | | | | Common Stocks — continued | | | |
| | | |
| | | | | | United States — continued | | | | |
| | | |
| | | (1,700 | ) | | Trade Desk, Inc. (The) – Class A * | | | (145,044 | ) |
| | | |
| | | (600 | ) | | Tradeweb Markets, Inc. – Class A | | | (50,688 | ) |
| | | |
| | | (2,100 | ) | | Twilio, Inc. – Class A * | | | (367,080 | ) |
| | | |
| | | (10,900 | ) | | Twitter, Inc. * | | | (387,495 | ) |
| | | |
| | | (11,500 | ) | | Uber Technologies, Inc. * | | | (414,345 | ) |
| | | |
| | | (5,400 | ) | | UDR, Inc. (REIT) | | | (296,298 | ) |
| | | |
| | | (3,800 | ) | | Upstart Holdings, Inc. * | | | (600,362 | ) |
| | | |
| | | (1,500 | ) | | Vail Resorts, Inc. | | | (390,825 | ) |
| | | |
| | | (18,000 | ) | | Vistra Corp. | | | (410,760 | ) |
| | | |
| | | (31,717 | ) | | Vonage Holdings Corp. * | | | (644,489 | ) |
| | | |
| | | (1,900 | ) | | Wayfair, Inc. – Class A * | | | (267,653 | ) |
| | | |
| | | (19,400 | ) | | Williams Cos, Inc. (The) | | | (606,832 | ) |
| | | |
| | | (4,200 | ) | | Zendesk, Inc. * | | | (490,014 | ) |
| | | |
| | | (7,800 | ) | | Zillow Group, Inc. – Class A * | | | (446,706 | ) |
| | | |
| | | (3,488 | ) | | Zillow Group, Inc. – Class C * | | | (200,629 | ) |
| | | |
| | | (600 | ) | | Zoetis, Inc. | | | (116,190 | ) |
| | | |
| | | (5,200 | ) | | ZoomInfo Technologies, Inc. – Class A * | | | (284,388 | ) |
| | | |
| | | (1,600 | ) | | Zscaler, Inc. * | | | (382,640 | ) |
| | | | | | | | | | |
| | | |
| | | | | | Total United States | | | (68,131,506 | ) |
| | | | | | | | | | |
| | | |
| | | | | | TOTAL COMMON STOCKS
(PROCEEDS $108,182,047) | | | (102,070,189 | ) |
| | | | | | | | | | |
| | | |
| | | | | | PREFERRED STOCKS (d) — (0.1)% | | | |
| | | |
| | | | | | Germany — (0.1)% | | | |
| | | |
| | | (744 | ) | | Sartorius AG | | | (328,486 | ) |
| | | | | | | | | | |
| | | |
| | | | | | TOTAL PREFERRED STOCKS (PROCEEDS $364,907) | | | (328,486 | ) |
| | | | | | | | | | |
| | | |
| | | | | | TOTAL SECURITIES SOLD SHORT
(PROCEEDS $108,546,954) | | | (102,398,675 | ) |
| | | |
| | | | | | Other Assets and Liabilities (net) — 6.9% | | | 19,333,389 | |
| | | | | | | | | | |
| | | |
| | | | | | TOTAL NET ASSETS — 100.0% | | | $279,164,972 | |
| | | | | | | | | | |
A summary of outstanding financial instruments at February 28, 2022 is as follows:
Forward Currency Contracts
| | | | | | | | | | | | | | | | | | | | | | |
| | | | |
Settlement
Date | | Counter-
party | | Currency
Sold | | | Currency
Purchased | | | Net
Unrealized
Appreciation
(Depreciation)
($) | |
| 03/18/2022 | | MSCI | | | AUD | | | | 8,641,154 | | | | USD | | | | 6,312,510 | | | | 35,026 | |
| 03/18/2022 | | SSB | | | AUD | | | | 433,345 | | | | USD | | | | 308,420 | | | | (6,390 | ) |
| 04/21/2022 | | BOA | | | AUD | | | | 6,961,693 | | | | USD | | | | 5,055,772 | | | | (4,235 | ) |
| 04/21/2022 | | MSCI | | | AUD | | | | 1,680,271 | | | | USD | | | | 1,207,292 | | | | (13,989 | ) |
| 04/21/2022 | | SSB | | | AUD | | | | 2,006,209 | | | | USD | | | | 1,447,156 | | | | (11,029 | ) |
| 05/09/2022 | | BCLY | | | AUD | | | | 4,870,000 | | | | USD | | | | 3,469,875 | | | | (70,676 | ) |
| | | | | | | | | | | | | | | | | | | | | | |
| | | | |
Settlement
Date | | Counter-
party | | Currency
Sold | | | Currency
Purchased | | | Net
Unrealized
Appreciation
(Depreciation)
($) | |
| 05/09/2022 | | JPM | | | AUD | | | | 1,530,000 | | | | USD | | | | 1,087,187 | | | | (25,142 | ) |
| 05/09/2022 | | MSCI | | | AUD | | | | 12,019,000 | | | | USD | | | | 8,489,277 | | | | (248,687 | ) |
| 03/25/2022 | | MSCI | | | CAD | | | | 7,185,087 | | | | USD | | | | 5,685,997 | | | | 16,659 | |
| 04/12/2022 | | SSB | | | CAD | | | | 5,454,175 | | | | USD | | | | 4,310,653 | | | | 6,922 | |
| 04/25/2022 | | JPM | | | CAD | | | | 6,000,000 | | | | USD | | | | 4,747,211 | | | | 12,788 | |
| 04/25/2022 | | SSB | | | CAD | | | | 1,025,416 | | | | USD | | | | 810,703 | | | | 1,578 | |
| | | | |
| | |
| 12 | | See accompanying notes to the financial statements. | | |
GMO Alternative Allocation Fund
(A Series of GMO Trust)
Consolidated Schedule of Investments — (Continued)
February 28, 2022
Forward Currency Contracts — continued
| | | | | | | | | | | | | | | | | | | | | | |
| | | | |
Settlement
Date | | Counter-
party | | Currency
Sold | | | Currency
Purchased | | | Net
Unrealized
Appreciation
(Depreciation)
($) | |
| 05/02/2022 | | JPM | | | CAD | | | | 2,564,034 | | | | USD | | | | 2,020,000 | | | | (3,204 | ) |
| 03/28/2022 | | UBSA | | | CHF | | | | 2,300,640 | | | | USD | | | | 2,513,262 | | | | 1,680 | |
| 05/16/2022 | | MSCI | | | CHF | | | | 14,440,792 | | | | USD | | | | 15,679,640 | | | | (115,938 | ) |
| 05/16/2022 | | MSCI | | | CLP | | | | 567,052,500 | | | | USD | | | | 702,102 | | | | (206 | ) |
| 03/17/2022 | | MSCI | | | COP | | | | 7,209,730,000 | | | | USD | | | | 1,834,210 | | | | 5,760 | |
| 03/18/2022 | | JPM | | | EUR | | | | 764,890 | | | | USD | | | | 865,840 | | | | 7,655 | |
| 03/18/2022 | | SSB | | | EUR | | | | 477,794 | | | | USD | | | | 539,154 | | | | 3,083 | |
| 03/21/2022 | | JPM | | | EUR | | | | 472,873 | | | | USD | | | | 536,356 | | | | 5,738 | |
| 03/21/2022 | | MSCI | | | EUR | | | | 711,468 | | | | USD | | | | 809,821 | | | | 11,472 | |
| 03/21/2022 | | SSB | | | EUR | | | | 526,228 | | | | USD | | | | 594,935 | | | | 4,447 | |
| 03/31/2022 | | JPM | | | EUR | | | | 1,390,000 | | | | USD | | | | 1,561,735 | | | | 1,327 | |
| 04/21/2022 | | MSCI | | | EUR | | | | 2,052,593 | | | | USD | | | | 2,333,572 | | | | 27,615 | |
| 04/21/2022 | | SSB | | | EUR | | | | 4,805,800 | | | | USD | | | | 5,464,718 | | | | 65,712 | |
| 03/21/2022 | | SSB | | | GBP | | | | 1,194,717 | | | | USD | | | | 1,624,152 | | | | 21,167 | |
| 04/21/2022 | | MSCI | | | GBP | | | | 2,570,288 | | | | USD | | | | 3,488,849 | | | | 40,002 | |
| 04/21/2022 | | SSB | | | GBP | | | | 50,856 | | | | USD | | | | 68,186 | | | | (53 | ) |
| 05/16/2022 | | BCLY | | | GBP | | | | 1,390,000 | | | | USD | | | | 1,861,328 | | | | (3,566 | ) |
| 05/16/2022 | | MSCI | | | HUF | | | | 392,623,910 | | | | USD | | | | 1,257,040 | | | | 82,315 | |
| 04/29/2022 | | CITI | | | ILS | | | | 1,294,020 | | | | USD | | | | 400,000 | | | | (3,630 | ) |
| 04/29/2022 | | GS | | | ILS | | | | 2,488,858 | | | | USD | | | | 780,780 | | | | 4,457 | |
| 04/29/2022 | | JPM | | | ILS | | | | 1,421,811 | | | | USD | | | | 440,000 | | | | (3,491 | ) |
| 03/08/2022 | | JPM | | | INR | | | | 167,627,376 | | | | USD | | | | 2,235,172 | | | | 11,450 | |
| 03/08/2022 | | MSCI | | | INR | | | | 26,405,050 | | | | USD | | | | 350,000 | | | | (286 | ) |
| 06/03/2022 | | MSCI | | | INR | | | | 194,032,426 | | | | USD | | | | 2,539,858 | | | | (4,029 | ) |
| 03/07/2022 | | MSCI | | | JPY | | | | 70,391,498 | | | | USD | | | | 613,214 | | | | 877 | |
| 03/07/2022 | | SSB | | | JPY | | | | 28,553,440 | | | | USD | | | | 248,237 | | | | (151 | ) |
| 03/09/2022 | | JPM | | | JPY | | | | 374,179,656 | | | | USD | | | | 3,240,000 | | | | (15,109 | ) |
| 05/09/2022 | | BCLY | | | KRW | | | | 3,222,590,377 | | | | USD | | | | 2,674,837 | | | | (3,402 | ) |
| 03/22/2022 | | MSCI | | | MXN | | | | 24,093,955 | | | | USD | | | | 1,181,401 | | | | 8,921 | |
| 03/01/2022 | | JPM | | | NZD | | | | 5,030,000 | | | | USD | | | | 3,361,137 | | | | (42,162 | ) |
| 03/01/2022 | | MSCI | | | NZD | | | | 23,910,000 | | | | USD | | | | 15,851,733 | | | | (325,775 | ) |
| 06/01/2022 | | JPM | | | NZD | | | | 26,770,000 | | | | USD | | | | 17,993,054 | | | | (94,737 | ) |
| 04/19/2022 | | JPM | | | PLN | | | | 1,656,291 | | | | USD | | | | 390,000 | | | | (3,156 | ) |
| 04/19/2022 | | SSB | | | PLN | | | | 3,259,196 | | | | USD | | | | 810,000 | | | | 36,359 | |
| 03/31/2022 | | CITI | | | RON | | | | 12,392,218 | | | | USD | | | | 2,768,221 | | | | (31,761 | ) |
| 03/16/2022 | | BCLY | | | RUB | | | | 130,043,160 | | | | USD | | | | 1,464,881 | | | | 264,167 | |
| 05/11/2022 | | MSCI | | | RUB | | | | 78,335,878 | | | | USD | | | | 900,133 | | | | 226,276 | |
| 03/07/2022 | | JPM | | | SEK | | | | 36,606,902 | | | | USD | | | | 3,920,485 | | | | 55,372 | |
| 05/18/2022 | | MSCI | | | THB | | | | 60,427,657 | | | | USD | | | | 1,868,974 | | | | 19,096 | |
| 05/17/2022 | | JPM | | | TWD | | | | 22,838,753 | | | | USD | | | | 824,117 | | | | 6,389 | |
| 03/18/2022 | | DB | | | USD | | | | 205,278 | | | | AUD | | | | 287,585 | | | | 3,642 | |
| 03/18/2022 | | GS | | | USD | | | | 205,206 | | | | AUD | | | | 287,585 | | | | 3,714 | |
| 05/09/2022 | | JPM | | | USD | | | | 5,996,864 | | | | AUD | | | | 8,330,000 | | | | 59,151 | |
| 04/04/2022 | | CITI | | | USD | | | | 790,000 | | | | BRL | | | | 4,283,654 | | | | 34,382 | |
| 04/04/2022 | | GS | | | USD | | | | 1,120,000 | | | | BRL | | | | 5,867,759 | | | | 9,240 | |
| 04/04/2022 | | MSCI | | | USD | | | | 940,000 | | | | BRL | | | | 5,041,120 | | | | 30,155 | |
| 03/25/2022 | | JPM | | | USD | | | | 205,002 | | | | CAD | | | | 261,092 | | | | 1,010 | |
| 03/25/2022 | | SSB | | | USD | | | | 34,042 | | | | CAD | | | | 43,255 | | | | 88 | |
| | | | | | | | | | | | | | | | | | | | | | |
| | | | |
Settlement
Date | | Counter-
party | | Currency
Sold | | | Currency
Purchased | | | Net
Unrealized
Appreciation
(Depreciation)
($) | |
| 04/12/2022 | | MSCI | | | USD | | | | 1,474,019 | | | | CAD | | | | 1,874,097 | | | | 4,776 | |
| 05/02/2022 | | BCLY | | | USD | | | | 15,526,955 | | | | CAD | | | | 19,825,950 | | | | 117,116 | |
| 05/02/2022 | | JPM | | | USD | | | | 8,130,000 | | | | CAD | | | | 10,317,398 | | | | 11,154 | |
| 05/16/2022 | | JPM | | | USD | | | | 3,860,000 | | | | CHF | | | | 3,535,213 | | | | 6,875 | |
| 05/16/2022 | | MSCI | | | USD | | | | 692,626 | | | | CLP | | | | 567,052,500 | | | | 9,682 | |
| 03/17/2022 | | MSCI | | | USD | | | | 1,320,000 | | | | COP | | | | 5,185,629,300 | | | | (4,879 | ) |
| 05/18/2022 | | MSCI | | | USD | | | | 2,441,022 | | | | CZK | | | | 52,862,764 | | | | (104,382 | ) |
| 03/18/2022 | | BCLY | | | USD | | | | 54,161 | | | | EUR | | | | 47,193 | | | | (1,212 | ) |
| 03/18/2022 | | UBSA | | | USD | | | | 1,772,675 | | | | EUR | | | | 1,542,748 | | | | (41,754 | ) |
| 03/21/2022 | | UBSA | | | USD | | | | 8,995,886 | | | | EUR | | | | 7,926,708 | | | | (101,200 | ) |
| 03/28/2022 | | BCLY | | | USD | | | | 2,405,069 | | | | EUR | | | | 2,126,624 | | | | (18,038 | ) |
| 03/31/2022 | | SSB | | | USD | | | | 1,554,057 | | | | EUR | | | | 1,390,000 | | | | 6,350 | |
| 04/21/2022 | | MSCI | | | USD | | | | 38,143 | | | | EUR | | | | 33,930 | | | | (25 | ) |
| 04/26/2022 | | MSCI | | | USD | | | | 4,830,599 | | | | EUR | | | | 4,266,797 | | | | (36,313 | ) |
| 03/21/2022 | | BCLY | | | USD | | | | 386,130 | | | | GBP | | | | 285,450 | | | | (3,134 | ) |
| 05/16/2022 | | BCLY | | | USD | | | | 842,631 | | | | GBP | | | | 620,000 | | | | (10,808 | ) |
| 05/16/2022 | | MSCI | | | USD | | | | 10,971,305 | | | | GBP | | | | 8,056,000 | | | | (162,974 | ) |
| 05/16/2022 | | MSCI | | | USD | | | | 520,000 | | | | HUF | | | | 164,288,800 | | | | (28,450 | ) |
| 05/04/2022 | | JPM | | | USD | | | | 1,460,937 | | | | IDR | | | | 21,183,591,000 | | | | 6,680 | |
| 04/29/2022 | | JPM | | | USD | | | | 1,225,569 | | | | ILS | | | | 3,910,669 | | | | (5,756 | ) |
| 03/08/2022 | | MSCI | | | USD | | | | 2,567,857 | | | | INR | | | | 194,032,426 | | | | 6,151 | |
| 03/07/2022 | | DB | | | USD | | | | 6,481,319 | | | | JPY | | | | 742,218,000 | | | | (24,743 | ) |
| 03/09/2022 | | DB | | | USD | | | | 2,040,000 | | | | JPY | | | | 235,442,520 | | | | 8,190 | |
| 03/09/2022 | | JPM | | | USD | | | | 2,970,000 | | | | JPY | | | | 339,557,130 | | | | (16,084 | ) |
| 03/09/2022 | | MSCI | | | USD | | | | 15,860,493 | | | | JPY | | | | 1,827,876,784 | | | | 40,794 | |
| 04/04/2022 | | MSCI | | | USD | | | | 6,545,091 | | | | JPY | | | | 750,000,000 | | | | (16,423 | ) |
| 05/09/2022 | | SSB | | | USD | | | | 6,548,914 | | | | JPY | | | | 750,000,000 | | | | (15,318 | ) |
| 05/09/2022 | | UBSA | | | USD | | | | 537,589 | | | | JPY | | | | 61,993,082 | | | | 2,462 | |
| 05/09/2022 | | BCLY | | | USD | | | | 550,000 | | | | KRW | | | | 660,385,000 | | | | (1,165 | ) |
| 05/09/2022 | | JPM | | | USD | | | | 360,000 | | | | KRW | | | | 432,165,600 | | | | (835 | ) |
| 05/09/2022 | | MSCI | | | USD | | | | 940,000 | | | | KRW | | | | 1,127,729,420 | | | | (2,764 | ) |
| 03/22/2022 | | JPM | | | USD | | | | 450,000 | | | | MXN | | | | 9,217,375 | | | | (1,457 | ) |
| 05/16/2022 | | BCLY | | | USD | | | | 12,141,736 | | | | NOK | | | | 107,411,871 | | | | 33,918 | |
| 03/01/2022 | | JPM | | | USD | | | | 18,021,564 | | | | NZD | | | | 26,770,000 | | | | 91,020 | |
| 03/01/2022 | | MSCI | | | USD | | | | 1,462,927 | | | | NZD | | | | 2,170,000 | | | | 5,295 | |
| 03/18/2022 | | GS | | | USD | | | | 511,291 | | | | NZD | | | | 755,604 | | | | (150 | ) |
| 03/18/2022 | | SSB | | | USD | | | | 424,567 | | | | NZD | | | | 636,477 | | | | 5,989 | |
| 04/19/2022 | | DB | | | USD | | | | 370,000 | | | | PLN | | | | 1,473,787 | | | | (20,165 | ) |
| 04/19/2022 | | MSCI | | | USD | | | | 1,140,045 | | | | PLN | | | | 4,532,133 | | | | (64,245 | ) |
| 05/11/2022 | | MSCI | | | USD | | | | 2,665,478 | | | | RUB | | | | 208,379,038 | | | | (872,970 | ) |
| 03/07/2022 | | BCLY | | | USD | | | | 8,291,287 | | | | SEK | | | | 75,481,596 | | | | (321,620 | ) |
| 03/18/2022 | | MSCI | | | USD | | | | 731,115 | | | | SGD | | | | 982,911 | | | | (6,163 | ) |
| 05/18/2022 | | MSCI | | | USD | | | | 340,000 | | | | THB | | | | 11,028,954 | | | | (2,369 | ) |
| 05/17/2022 | | JPM | | | USD | | | | 310,000 | | | | TWD | | | | 8,631,330 | | | | (960 | ) |
| 05/31/2022 | | MSCI | | | USD | | | | 469,157 | | | | ZAR | | | | 7,348,636 | | | | 3,284 | |
| | | | | | | | | | | | | | | | | | | | | | |
| | | $ | (1,431,732 | ) |
| | | | | | | | | | | | | | | | | | | | | | |
| | | | |
| | |
| | | See accompanying notes to the financial statements. | | 13 |
GMO Alternative Allocation Fund
(A Series of GMO Trust)
Consolidated Schedule of Investments — (Continued)
February 28, 2022
Futures Contracts
| | | | | | | | | | | | |
Number
of
Contracts + | | Type | | Expiration
Date | | Notional
Amount ($) | | | Value/Net
Unrealized
Appreciation
(Depreciation) ($) | |
Buys
15 | | Australian Government Bond 10 Yr. | | March 2022 | | | 1,465,639 | | | | (51,881 | ) |
| 52 | | CAC40 10 Euro | | March 2022 | | | 3,850,851 | | | | (201,708 | ) |
| 3 | | Canadian Government Bond 10 Yr. | | June 2022 | | | 323,479 | | | | 2,196 | |
| 29 | | DAX Index | | March 2022 | | | 11,703,431 | | | | (934,397 | ) |
| 102 | | FTSE 100 Index | | March 2022 | | | 10,145,420 | | | | 250,797 | |
| 39 | | Hang Seng Index | | March 2022 | | | 5,658,058 | | | | (232,326 | ) |
| 334 | | Mini MSCI Emerging Markets | | March 2022 | | | 19,630,850 | | | | (913,460 | ) |
| 8 | | MSCI Singapore | | March 2022 | | | 196,931 | | | | (6,105 | ) |
| 3 | | S&P/TSX 60 | | March 2022 | | | 603,740 | | | | (6,425 | ) |
| | | | | | | | | | | | |
| | $ | 53,578,399 | | | $ | (2,093,309 | ) |
| | | | | | | | | | | | |
| | | | | | | | | | | | |
Number
of
Contracts + | | Type | | Expiration
Date | | Notional
Amount ($) | | | Value/Net
Unrealized
Appreciation
(Depreciation) ($) | |
Sales
113 | | E-mini Russell 2000 Index | | March 2022 | | | 11,551,425 | | | | 768,702 | |
| 47 | | Euro Bund | | March 2022 | | | 8,802,797 | | | | 329,372 | |
| 26 | | FTSE Taiwan Index | | March 2022 | | | 1,620,600 | | | | 19,015 | |
| 93 | | S&P 500 E-Mini | | March 2022 | | | 20,311,200 | | | | 386,198 | |
| 2 | | SPI 200 Futures | | March 2022 | | | 255,855 | | | | 7,970 | |
| 35 | | TOPIX Index | | March 2022 | | | 5,766,067 | | | | 243,301 | |
| 29 | | U.S. Treasury Note 10 Yr. (CBT) | | June 2022 | | | 3,695,687 | | | | (27,896 | ) |
| 33 | | UK Gilt Long Bond | | June 2022 | | | 5,448,692 | | | | (26,700 | ) |
| | | | | | | | | | | | |
| | $ | 57,452,323 | | | $ | 1,699,962 | |
| | | | | | | | | | | | |
| + | Buys - Fund is long the futures contract. |
| | Sales - Fund is short the futures contract. |
Written Options
Equity Options
| | | | | | | | | | | | | | | | | | | | | | |
Description | | Exercise
Price | | Expiration
Date | | | Number of
Contracts | | | Notional
Amount | | | Value
($) | |
Equity Options – Calls | | | | | | | | | | | | | | | | | | | | | | |
Activision Blizzard, Inc. (c) | | 82.50 | | | 05/20/22 | | | | (317 | ) | | | USD | | | | (2,583,550 | ) | | | (42,795 | ) |
Zynga, Inc. (c) | | 9.00 | | | 05/20/22 | | | | (1,802 | ) | | | USD | | | | (1,636,216 | ) | | | (102,714 | ) |
Activision Blizzard, Inc. (c) | | 82.50 | | | 06/17/22 | | | | (166 | ) | | | USD | | | | (2,583,550 | ) | | | (29,050 | ) |
| | | | | | | | | | | | | | | | | | | | | | |
| | | |
| | | | | Total Equity Options – Calls | | | | (174,559) | |
| | | | | | | | | | | | | | | | | | | | | | |
Index Options – Puts | | | | | | | | | | | | | | | | | | | | | | |
S&P 500 Index | | 4,420.00 | | | 03/04/22 | | | | (15 | ) | | | USD | | | | (6,560,910 | ) | | | (120,000 | ) |
S&P 500 Index | | 4,350.00 | | | 03/11/22 | | | | (16 | ) | | | USD | | | | (6,998,304 | ) | | | (117,120 | ) |
S&P 500 Index | | 4,385.00 | | | 03/18/22 | | | | (15 | ) | | | USD | | | | (6,560,910 | ) | | | (164,100 | ) |
| | | | | | | | | | | | | | | | | | | | | | |
| | | |
| | | | | Total Index Options – Puts | | | | (401,220) | |
| | | | | | | | | | | | | | | | | | | | | | |
Written Options on Credit Default Swaps – Puts
| | | | | | | | | | | | | | | | | | | | | | | | | | | | |
Description | | Counterparty | | | Exercise
Rate | | | Expiration
Date | | | Principal /
Notional
Amount | | | Floating
Rate Index | | | Pay/Receive
Floating Rate | | | Value
($) | |
CDX.NA.HYS.37.V1-5Y | | | BCLY | | | | 105.00% | | | | 03/16/22 | | | | USD (44,500,000) | | | | Fixed Spread | | | | Pay | | | | (256,260 | ) |
CDX.NA.IGS.37.V1-5Y | | | GS | | | | 70.00% | | | | 03/16/22 | | | | USD (11,125,000) | | | | Fixed Spread | | | | Pay | | | | (15,073 | ) |
CDX.NA.IGS.37.V1-5Y | | | BOA | | | | 60.00% | | | | 03/16/22 | | | | USD (83,440,000) | | | | Fixed Spread | | | | Pay | | | | (324,225 | ) |
CDX.NA.IGS.37.V1-5Y | | | DB | | | | 75.00% | | | | 03/16/22 | | | | USD (11,125,000) | | | | Fixed Spread | | | | Pay | | | | (8,962 | ) |
CDX.NA.IGS.37.V1-5Y | | | BCLY | | | | 75.00% | | | | 04/20/22 | | | | USD (59,630,000) | | | | Fixed Spread | | | | Pay | | | | (135,755 | ) |
| | | | | | | | | | | | | | | | | | | | | | | | | | | | |
| | | | | | | | | | | | | |
| Total Written Options on Credit Default Swaps –
Puts |
| | | (740,275 | ) |
| | | | | | | | | | | | | | | | | | | | | | | | | | | | |
| | | | | | | | | | | | | | | TOTAL WRITTEN OPTIONS | | | | | |
| | | | | | | | | | | | | | | (Premiums $1,406,726) | | | $ | (1,316,054 | ) |
| | | | | | | | | | | | | | | | | | | | | | | | | | | | |
| | | | |
| | |
| 14 | | See accompanying notes to the financial statements. | | |
GMO Alternative Allocation Fund
(A Series of GMO Trust)
Consolidated Schedule of Investments — (Continued)
February 28, 2022
Swap Contracts
Centrally Cleared Credit Default Swaps
| | | | | | | | | | | | | | | | | | | | | | | | | | | | | | | | | | | | | | |
Reference Entity | | Notional
Amount | | | Annual
Premium | | | Implied
Credit
Spread (1) | | | Maximum
Potential
Amount of
Future
Payments by
the Fund
Under the
Contract (2) | | | Expiration
Date | | | Periodic
Payment
Frequency
| | | Premiums
Paid/
(Received) ($) | | | Value ($) | | | Net
Unrealized
Appreciation/
(Depreciation) ($) | |
Buy Protection^: | | | | | | | | | | | | | | | | | | | | | | | | | | | | | | | | | | | | | | |
ITRAXX.EUROPE.S34.V1-5Y | | EUR | | | 9,968,000 | | | | 1.00% | | | | 0.56% | | | | N/A | | | | 12/20/2025 | | | | Quarterly | | | | (313,377 | ) | | | (182,246 | ) | | | 131,131 | |
ITRAXX.XOVER.S34.V2-5Y | | EUR | | | 4,116,345 | | | | 5.00% | | | | 2.63% | | | | N/A | | | | 12/20/2025 | | | | Quarterly | | | | (607,943 | ) | | | (348,965 | ) | | | 258,978 | |
CDX.NA.IGS.37.V1-5Y | | USD | | | 22,250,000 | | | | 1.00% | | | | 0.69% | | | | N/A | | | | 12/20/2026 | | | | Quarterly | | | | (539,238 | ) | | | (326,341 | ) | | | 212,897 | |
| | | | | | | | | | | | | | | | | | | | | | | | | | | | | | | | | | | | | | |
| | | | | | | | | | | | | | | | | | | | | | | | | | | | $ | (1,460,558 | ) | | $ | (857,552 | ) | | $ | 603,006 | |
| | | | | | | | | | | | | | | | | | | | | | | | | | | | | | | | | | | | | | |
OTC Credit Default Swaps
| | | | | | | | | | | | | | | | | | | | | | | | | | | | | | | | | | | | | | | | | | |
Reference Entity | | Counterparty | | Notional
Amount | | | Annual
Premium | | | Implied
Credit
Spread (1) | | | Maximum
Potential
Amount of
Future
Payments by the
Fund
Under the
Contract (2) | | | Expiration
Date | | | Periodic
Payment
Frequency | | | Premiums
Paid/
(Received) ($) | | | Value ($) | | | Net
Unrealized
Appreciation/
(Depreciation) ($) | |
Buy Protection^: | | | | | | | | | | | | | | | | | | | | | | | | | | | | | | | | | | | | | | | | | | |
CDX.NA.HYS.31.V14-5Y | | CITI | | | USD | | | | 1,631,000 | | | | 5.00% | | | | 2.06% | | | | N/A | | | | 12/20/2023 | | | | Quarterly | | | | (6,361 | ) | | | (21,118 | ) | | | (14,757 | ) |
CMBX.NA.BBB-.11 | | GS | | | USD | | | | 1,440,000 | | | | 3.00% | | | | 4.76% | | | | N/A | | | | 11/18/2054 | | | | Monthly | | | | 54,713 | | | | 119,567 | | | | 64,854 | |
CMBX.NA.BBB-.9 | | CGMI | | | USD | | | | 1,110,000 | | | | 3.00% | | | | 6.51% | | | | N/A | | | | 09/17/2058 | | | | Monthly | | | | 128,809 | | | | 122,052 | | | | (6,757 | ) |
CMBX.NA.BBB-.9 | | CGMI | | | USD | | | | 666,000 | | | | 3.00% | | | | 6.51% | | | | N/A | | | | 09/17/2058 | | | | Monthly | | | | 77,753 | | | | 73,231 | | | | (4,522 | ) |
CMBX.NA.BBB-.9 | | MLCS | | | USD | | | | 2,750,000 | | | | 3.00% | | | | 6.51% | | | | N/A | | | | 09/17/2058 | | | | Monthly | | | | 221,087 | | | | 302,382 | | | | 81,295 | |
CMBX.NA.BBB-.12 | | GS | | | USD | | | | 1,260,000 | | | | 3.00% | | | | 4.74% | | | | N/A | | | | 08/17/2061 | | | | Monthly | | | | 49,804 | | | | 117,166 | | | | 67,362 | |
CMBX.NA.BBB-.13 | | CGMI | | | USD | | | | 1,500,000 | | | | 3.00% | | | | 4.63% | | | | N/A | | | | 12/16/2072 | | | | Monthly | | | | 65,524 | | | | 147,542 | | | | 82,018 | |
CMBX.NA.BBB-.13 | | GS | | | USD | | | | 576,500 | | | | 3.00% | | | | 4.63% | | | | N/A | | | | 12/16/2072 | | | | Monthly | | | | 35,496 | | | | 56,705 | | | | 21,209 | |
CMBX.NA.BBB-.13 | | MSCI | | | USD | | | | 1,780,000 | | | | 3.00% | | | | 4.63% | | | | N/A | | | | 12/16/2072 | | | | Monthly | | | | 99,709 | | | | 175,084 | | | | 75,375 | |
| | | | | | | | | | | |
Sell Protection^: | | | | | | | | | | | | | | | | | | | | | | | | | | | | | | | | | | | | | | | | | | |
CDX.NA.HYS.31.V14-5Y | | CITI | | | USD | | | | 1,187,000 | | | | 5.00% | | | | 2.06% | | | | 1,187,000 USD | | | | 12/20/2023 | | | | Quarterly | | | | 121,667 | | | | 85,906 | | | | (35,761 | ) |
CDX.NA.HYS.31.V14-5Y | | CITI | | | USD | | | | 1,928,000 | | | | 5.00% | | | | 2.06% | | | | 1,928,000 USD | | | | 12/20/2023 | | | | Quarterly | | | | 203,886 | | | | 139,532 | | | | (64,354 | ) |
CDX.NA.HYS.33.V12-5Y | | CITI | | | USD | | | | 4,388,727 | | | | 5.00% | | | | 2.54% | | | | 4,388,727 USD | | | | 12/20/2024 | | | | Quarterly | | | | 756,836 | | | | 560,317 | | | | (196,519 | ) |
CDX.NA.HYS.35.V1-5Y | | JPM | | | USD | | | | 1,780,000 | | | | 5.00% | | | | 3.12% | | | | 1,780,000 USD | | | | 12/20/2025 | | | | Quarterly | | | | 129,940 | | | | 72,143 | | | | (57,797 | ) |
CDX.NA.HYS.35.V1-5Y | | MSCI | | | USD | | | | 2,160,000 | | | | 5.00% | | | | 3.12% | | | | 2,160,000 USD | | | | 12/20/2025 | | | | Quarterly | | | | 158,760 | | | | 87,544 | | | | (71,216 | ) |
ITRAXX.EUROPE.S34.V1-5Y | | BOA | | | EUR | | | | 17,800,000 | | | | 1.00% | | | | 0.56% | | | | 17,800,000 EUR | | | | 12/20/2025 | | | | Quarterly | | | | 857,391 | | | | 590,126 | | | | (267,265 | ) |
ITRAXX.XOVER.S34.V2-5Y | | JPM | | | EUR | | | | 13,076,017 | | | | 5.00% | | | | 2.62% | | | | 13,076,017 EUR | | | | 12/20/2025 | | | | Quarterly | | | | 3,079,383 | | | | 2,449,410 | | | | (629,973 | ) |
CMBX.NA.A.9 | | CGMI | | | USD | | | | 1,112,500 | | | | 2.00% | | | | 2.29% | | | | 1,112,500 USD | | | | 09/17/2058 | | | | Monthly | | | | (33,096 | ) | | | (10,997 | ) | | | 22,099 | |
CMBX.NA.A.9 | | CGMI | | | USD | | | | 1,780,000 | | | | 2.00% | | | | 2.29% | | | | 1,780,000 USD | | | | 09/17/2058 | | | | Monthly | | | | (44,602 | ) | | | (17,595 | ) | | | 27,007 | |
CMBX.NA.A.9 | | MLCS | | | USD | | | | 4,750,000 | | | | 2.00% | | | | 2.29% | | | | 4,750,000 USD | | | | 09/17/2058 | | | | Monthly | | | | 9,294 | | | | (46,954 | ) | | | (56,248 | ) |
CMBX.NA.AAA.10 | | GS | | | USD | | | | 4,610,000 | | | | 0.50% | | | | 0.44% | | | | 4,610,000 USD | | | | 11/17/2059 | | | | Monthly | | | | 42,162 | | | | 12,450 | | | | (29,712 | ) |
CMBX.NA.AAA.13 | | GS | | | USD | | | | 1,730,000 | | | | 0.50% | | | | 0.59% | | | | 1,730,000 USD | | | | 12/16/2072 | | | | Monthly | | | | 4,051 | | | | (10,493 | ) | | | (14,544 | ) |
| | | | | | | | | | | | | | | | | | | | | | | | | | | | | | | | | | | | | | | | | | |
| | | $ | 6,012,206 | | | $ | 5,004,000 | | | $ | (1,008,206 | ) |
| | | | | | | | | | | | | | | | | | | | | | | | | | | | | | | | | | | | | | | | | | |
| ^ | Buy Protection - Fund pays a premium and buys credit protection. If a credit event occurs the Fund will, depending on the terms of the particular swap contract, either (i) receive from the seller of protection an amount equal to the notional amount of the swap and deliver the referenced obligation or underlying securities comprising the referenced index or (ii) receive a net settlement amount in the form of cash or securities equal to the notional amount of the swap less the recovery value of the referenced obligation or underlying securities comprising the referenced index. |
| | Sell Protection - Fund receives a premium and sells credit protection. If a credit event occurs the Fund will, depending on the terms of the particular swap contract, either (i) pay to the buyer of protection an amount equal to the notional amount of the swap and take delivery of the referenced obligation or underlying securities comprising the referenced index or (ii) pay a net settlement amount in the form of cash or securities equal to the notional amount of the swap less the recovery value of the referenced obligation or underlying securities comprising the referenced index. |
| | | | |
| | |
| | | See accompanying notes to the financial statements. | | 15 |
GMO Alternative Allocation Fund
(A Series of GMO Trust)
Consolidated Schedule of Investments — (Continued)
February 28, 2022
Swap Contracts — continued
| (1) | As of February 28, 2022, implied credit spreads in absolute terms, calculated using a model, and utilized in determining the market value of credit default swap contracts on the reference security, serve as an indicator of the current status of the payment/performance risk and reflect the likelihood or risk of default for the reference entity. The implied credit spread of a particular referenced entity reflects the cost of buying/selling protection. Wider (i.e. higher) credit spreads represent a deterioration of the referenced entity’s credit soundness and a greater likelihood or risk of default or other credit event occurring as defined under the terms of the contract. |
| (2) | The maximum potential amount the Fund could be required to pay as a seller of credit protection if a credit event occurs as defined under the terms of that particular swap contract. |
Centrally Cleared Interest Rate Swaps
| | | | | | | | | | | | | | | | | | | | | | | | | | |
Fund Pays | | Fund Receives | | Notional
Amount | | | Expiration
Date | | | Periodic
Payment
Frequency | | Premiums
Paid/
(Received) ($) | | | Value ($) | | | Net
Unrealized
Appreciation/
(Depreciation) ($) | |
1.60% | | 3 Month AUD BBSW | | AUD | | | 10,100,000 | | | | 03/16/2024 | | | Quarterly | | | — | | | | (26,313 | ) | | | (26,313 | ) |
1.82% | | 3 Month CAD CDOR | | CAD | | | 93,040,000 | | | | 03/16/2024 | | | Semi-Annually | | | (27,504 | ) | | | 288,951 | | | | 316,455 | |
1.99% | | 3 Month CAD CDOR | | CAD | | | 14,790,000 | | | | 03/16/2024 | | | Semi-Annually | | | — | | | | 6,714 | | | | 6,714 | |
1.90% | | 3 Month CAD CDOR | | CAD | | | 27,730,000 | | | | 03/16/2024 | | | Semi-Annually | | | — | | | | 52,481 | | | | 52,481 | |
1.95% | | 3 Month CAD CDOR | | CAD | | | 12,210,000 | | | | 03/16/2024 | | | Semi-Annually | | | — | | | | 12,474 | | | | 12,474 | |
3 Month CAD CDOR | | 2.12% | | CAD | | | 9,840,000 | | | | 03/16/2024 | | | Semi-Annually | | | — | | | | 15,351 | | | | 15,351 | |
3 Month CAD CDOR | | 1.74% | | CAD | | | 15,820,000 | | | | 03/16/2024 | | | Semi-Annually | | | — | | | | (69,307 | ) | | | (69,307 | ) |
3 Month CAD CDOR | | 1.80% | | CAD | | | 14,070,000 | | | | 03/16/2024 | | | Semi-Annually | | | — | | | | (46,760 | ) | | | (46,760 | ) |
2.03% | | 3 Month CAD CDOR | | CAD | | | 13,760,000 | | | | 03/16/2024 | | | Semi-Annually | | | — | | | | (2,848 | ) | | | (2,848 | ) |
(0.54)% | | CHF - SARON - OIS - COMPOUND | | CHF | | | 26,650,000 | | | | 03/16/2024 | | | Annually | | | — | | | | 148,295 | | | | 148,295 | |
(0.54)% | | CHF - SARON - OIS - COMPOUND | | CHF | | | 4,070,000 | | | | 03/16/2024 | | | Annually | | | (1,233 | ) | | | 23,330 | | | | 24,563 | |
(0.44)% | | CHF - SARON - OIS - COMPOUND | | CHF | | | 9,440,000 | | | | 03/16/2024 | | | Annually | | | — | | | | 32,386 | | | | 32,386 | |
CHF - SARON - OIS - COMPOUND | | (0.17)% | | CHF | | | 6,860,000 | | | | 03/16/2024 | | | Annually | | | — | | | | 17,697 | | | | 17,697 | |
CHF - SARON - OIS - COMPOUND | | (0.57)% | | CHF | | | 6,200,000 | | | | 03/16/2024 | | | Annually | | | (1,625 | ) | | | (39,280 | ) | | | (37,655 | ) |
(0.08)% | | CHF - SARON - OIS - COMPOUND | | CHF | | | 12,660,000 | | | | 03/16/2024 | | | Annually | | | — | | | | (58,542 | ) | | | (58,542 | ) |
(0.24)% | | CHF - SARON - OIS - COMPOUND | | CHF | | | 16,280,000 | | | | 03/16/2024 | | | Annually | | | — | | | | (16,899 | ) | | | (16,899 | ) |
(0.25)% | | CHF - SARON - OIS - COMPOUND | | CHF | | | 16,080,000 | | | | 03/16/2024 | | | Annually | | | — | | | | (13,098 | ) | | | (13,098 | ) |
(0.28)% | | CHF - SARON - OIS - COMPOUND | | CHF | | | 17,140,000 | | | | 03/16/2024 | | | Annually | | | — | | | | (2,472 | ) | | | (2,472 | ) |
GBP - SONIA - COMPOUND | | 1.64% | | GBP | | | 81,760,000 | | | | 03/16/2024 | | | Annually | | | 34,166 | | | | 54,840 | | | | 20,674 | |
GBP - SONIA - COMPOUND | | 1.80% | | GBP | | | 8,420,000 | | | | 03/16/2024 | | | Annually | | | 5,791 | | | | 42,225 | | | | 36,434 | |
1.62% | | GBP - SONIA - COMPOUND | | GBP | | | 11,580,000 | | | | 03/16/2024 | | | Annually | | | 3,760 | | | | (3,194 | ) | | | (6,954 | ) |
1.67% | | GBP - SONIA - COMPOUND | | GBP | | | 6,950,000 | | | | 03/16/2024 | | | Annually | | | 208 | | | | (10,151 | ) | | | (10,359 | ) |
1.67% | | GBP - SONIA - COMPOUND | | GBP | | | 7,320,000 | | | | 03/16/2024 | | | Annually | | | (725 | ) | | | (12,426 | ) | | | (11,701 | ) |
2.51% | | 3 Month NZD Bank Bill Rate | | NZD | | | 33,640,000 | | | | 03/16/2024 | | | Quarterly | | | — | | | | 126,919 | | | | 126,919 | |
2.40% | | 3 Month NZD Bank Bill Rate | | NZD | | | 11,450,000 | | | | 03/16/2024 | | | Quarterly | | | — | | | | 59,812 | | | | 59,812 | |
2.38% | | 3 Month NZD Bank Bill Rate | | NZD | | | 15,920,000 | | | | 03/16/2024 | | | Quarterly | | | — | | | | 87,363 | | | | 87,363 | |
2.61% | | 3 Month NZD Bank Bill Rate | | NZD | | | 17,600,000 | | | | 03/16/2024 | | | Quarterly | | | — | | | | 43,187 | | | | 43,187 | |
3 Month NZD Bank Bill Rate | | 2.53% | | NZD | | | 44,640,000 | | | | 03/16/2024 | | | Quarterly | | | — | | | | (156,644 | ) | | | (156,644 | ) |
3 Month NZD Bank Bill Rate | | 2.6% | | NZD | | | 55,800,000 | | | | 03/16/2024 | | | Quarterly | | | 5,109 | | | | (143,548 | ) | | | (148,657 | ) |
0.34% | | 3 Month SEK STIBOR | | SEK | | | 809,500,000 | | | | 03/16/2024 | | | Quarterly | | | — | | | | 504,531 | | | | 504,531 | |
0.33% | | 3 Month SEK STIBOR | | SEK | | | 119,180,000 | | | | 03/16/2024 | | | Quarterly | | | (8,708 | ) | | | 75,566 | | | | 84,274 | |
0.32% | | 3 Month SEK STIBOR | | SEK | | | 60,300,000 | | | | 03/16/2024 | | | Quarterly | | | — | | | | 39,445 | | | | 39,445 | |
3 Month SEK STIBOR | | 0.72% | | SEK | | | 98,500,000 | | | | 03/16/2024 | | | Quarterly | | | — | | | | 17,340 | | | | 17,340 | |
3 Month SEK STIBOR | | 0.69% | | SEK | | | 179,800,000 | | | | 03/16/2024 | | | Quarterly | | | — | | | | 21,003 | | | | 21,003 | |
3 Month SEK STIBOR | | 0.69% | | SEK | | | 166,200,000 | | | | 03/16/2024 | | | Quarterly | | | — | | | | 20,469 | | | | 20,469 | |
3 Month SEK STIBOR | | 0.64% | | SEK | | | 92,400,000 | | | | 03/16/2024 | | | Quarterly | | | — | | | | 1,608 | | | | 1,608 | |
3 Month SEK STIBOR | | 0.33% | | SEK | | | 108,000,000 | | | | 03/16/2024 | | | Quarterly | | | 2,855 | | | | (68,934 | ) | | | (71,789 | ) |
3 Month SEK STIBOR | | 0.42% | | SEK | | | 40,700,000 | | | | 03/16/2024 | | | Quarterly | | | 917 | | | | (18,230 | ) | | | (19,147 | ) |
3 Month SEK STIBOR | | 0.63% | | SEK | | | 79,600,000 | | | | 03/16/2024 | | | Quarterly | | | — | | | | (298 | ) | | | (298 | ) |
1.22% | | USD - SOFR - COMPOUND | | USD | | | 11,990,000 | | | | 03/16/2024 | | | Annually | | | 2,554 | | | | 44,769 | | | | 42,215 | |
USD - SOFR - COMPOUND | | 1.46% | | USD | | | 7,500,000 | | | | 03/16/2024 | | | Annually | | | 942 | | | | 7,345 | | | | 6,403 | |
USD - SOFR - COMPOUND | | 0.97% | | USD | | | 7,110,000 | | | | 03/16/2024 | | | Annually | | | (2,257 | ) | | | (62,472 | ) | | | (60,215 | ) |
USD - SOFR - COMPOUND | | 1.01% | | USD | | | 17,820,000 | | | | 03/16/2024 | | | Annually | | | (3,397 | ) | | | (142,340 | ) | | | (138,943 | ) |
USD - SOFR - COMPOUND | | 1.15% | | USD | | | 11,060,000 | | | | 03/16/2024 | | | Annually | | | (1,262 | ) | | | (57,420 | ) | | | (56,158 | ) |
USD - SOFR - COMPOUND | | 1.05% | | USD | | | 10,640,000 | | | | 03/16/2024 | | | Annually | | | (1,604 | ) | | | (77,552 | ) | | | (75,948 | ) |
1.61% | | USD - SOFR - COMPOUND | | USD | | | 7,230,000 | | | | 03/16/2024 | | | Annually | | | (2,124 | ) | | | (28,162 | ) | | | (26,038 | ) |
6 Month EURIBOR | | 0.22% | | EUR | | | 12,420,000 | | | | 03/20/2024 | | | Semi-Annually | | | 353 | | | | 48,262 | | | | 47,909 | |
6 Month EURIBOR | | 0.20% | | EUR | | | 8,560,000 | | | | 03/20/2024 | | | Semi-Annually | | | (1,345 | ) | | | 30,297 | | | | 31,642 | |
| | | | |
| | |
| 16 | | See accompanying notes to the financial statements. | | |
GMO Alternative Allocation Fund
(A Series of GMO Trust)
Consolidated Schedule of Investments — (Continued)
February 28, 2022
Swap Contracts — continued
Centrally Cleared Interest Rate Swaps — continued
| | | | | | | | | | | | | | | | | | | | | | | | | | |
Fund Pays | | Fund Receives | | Notional
Amount | | | Expiration
Date | | | Periodic
Payment
Frequency | | Premiums
Paid/
(Received) ($) | | | Value ($) | | | Net
Unrealized
Appreciation/
(Depreciation) ($) | |
6 Month EURIBOR | | 0.20% | | EUR | | | 6,160,000 | | | | 03/20/2024 | | | Semi-Annually | | | (5,731 | ) | | | 21,942 | | | | 27,673 | |
6 Month EURIBOR | | 0.17% | | EUR | | | 8,720,000 | | | | 03/20/2024 | | | Semi-Annually | | | 934 | | | | 23,460 | | | | 22,526 | |
6 Month EURIBOR | | (0.23)% | | EUR | | | 7,750,000 | | | | 03/20/2024 | | | Semi-Annually | | | (539 | ) | | | (47,935 | ) | | | (47,396 | ) |
6 Month EURIBOR | | (0.2)% | | EUR | | | 9,150,000 | | | | 03/20/2024 | | | Semi-Annually | | | (26 | ) | | | (50,172 | ) | | | (50,146 | ) |
6 Month EURIBOR | | (0.07)% | | EUR | | | 9,180,000 | | | | 03/20/2024 | | | Semi-Annually | | | 109 | | | | (23,939 | ) | | | (24,048 | ) |
1.95% | | 6 Month AUD BBSW | | AUD | | | 2,210,000 | | | | 03/16/2032 | | | Semi-Annually | | | — | | | | 73,457 | | | | 73,457 | |
1.96% | | 6 Month AUD BBSW | | AUD | | | 3,970,000 | | | | 03/16/2032 | | | Semi-Annually | | | — | | | | 128,876 | | | | 128,876 | |
2.10% | | 6 Month AUD BBSW | | AUD | | | 2,900,000 | | | | 03/16/2032 | | | Semi-Annually | | | — | | | | 67,521 | | | | 67,521 | |
2.10% | | 6 Month AUD BBSW | | AUD | | | 2,900,000 | | | | 03/16/2032 | | | Semi-Annually | | | — | | | | 68,458 | | | | 68,458 | |
2.15% | | 6 Month AUD BBSW | | AUD | | | 3,230,000 | | | | 03/16/2032 | | | Semi-Annually | | | — | | | | 66,225 | | | | 66,225 | |
2.43% | | 6 Month AUD BBSW | | AUD | | | 6,060,000 | | | | 03/16/2032 | | | Semi-Annually | | | — | | | | 13,091 | | | | 13,091 | |
6 Month AUD BBSW | | 2.52% | | AUD | | | 4,650,000 | | | | 03/16/2032 | | | Semi-Annually | | | — | | | | 17,385 | | | | 17,385 | |
6 Month AUD BBSW | | 2.52% | | AUD | | | 8,960,000 | | | | 03/16/2032 | | | Semi-Annually | | | — | | | | 33,498 | | | | 33,498 | |
6 Month AUD BBSW | | 2.53% | | AUD | | | 2,240,000 | | | | 03/16/2032 | | | Semi-Annually | | | — | | | | 9,461 | | | | 9,461 | |
6 Month AUD BBSW | | 2.54% | | AUD | | | 2,820,000 | | | | 03/16/2032 | | | Semi-Annually | | | — | | | | 14,189 | | | | 14,189 | |
6 Month AUD BBSW | | 1.97% | | AUD | | | 6,940,000 | | | | 03/16/2032 | | | Semi-Annually | | | — | | | | (222,149 | ) | | | (222,149 | ) |
6 Month AUD BBSW | | 2.07% | | AUD | | | 3,060,000 | | | | 03/16/2032 | | | Semi-Annually | | | — | | | | (77,576 | ) | | | (77,576 | ) |
6 Month AUD BBSW | | 1.99% | | AUD | | | 16,650,000 | | | | 03/16/2032 | | | Semi-Annually | | | (1,506 | ) | | | (507,673 | ) | | | (506,167 | ) |
6 Month AUD BBSW | | 2.25% | | AUD | | | 3,020,000 | | | | 03/16/2032 | | | Semi-Annually | | | — | | | | (42,397 | ) | | | (42,397 | ) |
1.88% | | 3 Month CAD CDOR | | CAD | | | 4,450,000 | | | | 03/16/2032 | | | Semi-Annually | | | — | | | | 156,655 | | | | 156,655 | |
2.03% | | 3 Month CAD CDOR | | CAD | | | 4,080,000 | | | | 03/16/2032 | | | Semi-Annually | | | — | | | | 98,404 | | | | 98,404 | |
2.14% | | 3 Month CAD CDOR | | CAD | | | 3,420,000 | | | | 03/16/2032 | | | Semi-Annually | | | — | | | | 57,294 | | | | 57,294 | |
2.16% | | 3 Month CAD CDOR | | CAD | | | 3,280,000 | | | | 03/16/2032 | | | Semi-Annually | | | — | | | | 48,146 | | | | 48,146 | |
2.23% | | 3 Month CAD CDOR | | CAD | | | 3,060,000 | | | | 03/16/2032 | | | Semi-Annually | | | — | | | | 29,817 | | | | 29,817 | |
2.23% | | 3 Month CAD CDOR | | CAD | | | 3,020,000 | | | | 03/16/2032 | | | Semi-Annually | | | — | | | | 29,211 | | | | 29,211 | |
3 Month CAD CDOR | | 2.39% | | CAD | | | 3,240,000 | | | | 03/16/2032 | | | Semi-Annually | | | — | | | | 3,649 | | | | 3,649 | |
2.34% | | 3 Month CAD CDOR | | CAD | | | 3,000,000 | | | | 03/16/2032 | | | Semi-Annually | | | — | | | | 6,812 | | | | 6,812 | |
3 Month CAD CDOR | | 2.42% | | CAD | | | 3,010,000 | | | | 03/16/2032 | | | Semi-Annually | | | — | | | | 10,494 | | | | 10,494 | |
3 Month CAD CDOR | | 2.12% | | CAD | | | 20,620,000 | | | | 03/16/2032 | | | Semi-Annually | | | 29,206 | | | | (366,083 | ) | | | (395,289 | ) |
3 Month CAD CDOR | | 2.12% | | CAD | | | 52,300,000 | | | | 03/16/2032 | | | Semi-Annually | | | 13,334 | | | | (928,523 | ) | | | (941,857 | ) |
3 Month CAD CDOR | | 2.33% | | CAD | | | 9,910,000 | | | | 03/16/2032 | | | Semi-Annually | | | — | | | | (31,362 | ) | | | (31,362 | ) |
3 Month CAD CDOR | | 2.37% | | CAD | | | 7,990,000 | | | | 03/16/2032 | | | Semi-Annually | | | — | | | | (144 | ) | | | (144 | ) |
3 Month CAD CDOR | | 2.35% | | CAD | | | 4,000,000 | | | | 03/16/2032 | | | Semi-Annually | | | — | | | | (4,649 | ) | | | (4,649 | ) |
3 Month CAD CDOR | | 2.28% | | CAD | | | 6,050,000 | | | | 03/16/2032 | | | Semi-Annually | | | — | | | | (39,698 | ) | | | (39,698 | ) |
3 Month CAD CDOR | | 2.32% | | CAD | | | 1,410,000 | | | | 03/16/2032 | | | Semi-Annually | | | — | | | | (4,664 | ) | | | (4,664 | ) |
3 Month CAD CDOR | | 2.32% | | CAD | | | 2,660,000 | | | | 03/16/2032 | | | Semi-Annually | | | — | | | | (8,703 | ) | | | (8,703 | ) |
2.39% | | 3 Month CAD CDOR | | CAD | | | 3,170,000 | | | | 03/16/2032 | | | Semi-Annually | | | — | | | | (5,157 | ) | | | (5,157 | ) |
2.42% | | 3 Month CAD CDOR | | CAD | | | 5,240,000 | | | | 03/16/2032 | | | Semi-Annually | | | — | | | | (19,954 | ) | | | (19,954 | ) |
2.44% | | 3 Month CAD CDOR | | CAD | | | 3,540,000 | | | | 03/16/2032 | | | Semi-Annually | | | — | | | | (17,911 | ) | | | (17,911 | ) |
2.44% | | 3 Month CAD CDOR | | CAD | | | 2,150,000 | | | | 03/16/2032 | | | Semi-Annually | | | — | | | | (10,878 | ) | | | (10,878 | ) |
(0.06)% | | CHF - SARON - OIS - COMPOUND | | CHF | | | 1,300,000 | | | | 03/16/2032 | | | Annually | | | 614 | | | | 79,617 | | | | 79,003 | |
CHF - SARON - OIS - COMPOUND | | 0.51% | | CHF | | | 2,620,000 | | | | 03/16/2032 | | | Annually | | | — | | | | 1,271 | | | | 1,271 | |
CHF - SARON - OIS - COMPOUND | | 0.56% | | CHF | | | 3,400,000 | | | | 03/16/2032 | | | Annually | | | — | | | | 18,877 | | | | 18,877 | |
CHF - SARON - OIS - COMPOUND | | 0.51% | | CHF | | | 1,750,000 | | | | 03/16/2032 | | | Annually | | | — | | | | 1,517 | | | | 1,517 | |
CHF - SARON - OIS - COMPOUND | | 0.51% | | CHF | | | 1,780,000 | | | | 03/16/2032 | | | Annually | | | — | | | | 961 | | | | 961 | |
CHF - SARON - OIS - COMPOUND | | 0.52% | | CHF | | | 3,380,000 | | | | 03/16/2032 | | | Annually | | | — | | | | 4,035 | | | | 4,035 | |
CHF - SARON - OIS - COMPOUND | | 0.55% | | CHF | | | 3,340,000 | | | | 03/16/2032 | | | Annually | | | — | | | | 15,815 | | | | 15,815 | |
CHF - SARON - OIS - COMPOUND | | 0.52% | | CHF | | | 3,550,000 | | | | 03/16/2032 | | | Annually | | | — | | | | 7,139 | | | | 7,139 | |
CHF - SARON - OIS - COMPOUND | | 0.05% | | CHF | | | 5,460,000 | | | | 03/16/2032 | | | Annually | | | — | | | | (273,110 | ) | | | (273,110 | ) |
CHF - SARON - OIS - COMPOUND | | (0.01)% | | CHF | | | 810,000 | | | | 03/16/2032 | | | Annually | | | 2,106 | | | | (45,459 | ) | | | (47,565 | ) |
CHF - SARON - OIS - COMPOUND | | 0.20% | | CHF | | | 1,930,000 | | | | 03/16/2032 | | | Annually | | | — | | | | (64,362 | ) | | | (64,362 | ) |
CHF - SARON - OIS - COMPOUND | | 0.22% | | CHF | | | 2,590,000 | | | | 03/16/2032 | | | Annually | | | — | | | | (79,035 | ) | | | (79,035 | ) |
CHF - SARON - OIS - COMPOUND | | 0.23% | | CHF | | | 26,040,000 | | | | 03/16/2032 | | | Annually | | | 26,209 | | | | (777,594 | ) | | | (803,803 | ) |
CHF - SARON - OIS - COMPOUND | | 0.32% | | CHF | | | 1,100,000 | | | | 03/16/2032 | | | Annually | | | — | | | | (22,060 | ) | | | (22,060 | ) |
0.53% | | CHF - SARON - OIS - COMPOUND | | CHF | | | 1,420,000 | | | | 03/16/2032 | | | Annually | | | — | | | | (3,861 | ) | | | (3,861 | ) |
| | | | |
| | |
| | | See accompanying notes to the financial statements. | | 17 |
GMO Alternative Allocation Fund
(A Series of GMO Trust)
Consolidated Schedule of Investments — (Continued)
February 28, 2022
Swap Contracts — continued
Centrally Cleared Interest Rate Swaps — continued
| | | | | | | | | | | | | | | | | | | | | | | | | | |
Fund Pays | | Fund Receives | | Notional
Amount | | | Expiration
Date | | | Periodic
Payment
Frequency | | Premiums
Paid/
(Received) ($) | | | Value ($) | | | Net
Unrealized
Appreciation/
(Depreciation) ($) | |
1.37% | | GBP - SONIA - COMPOUND | | GBP | | | 56,150,000 | | | | 03/16/2032 | | | Annually | | | (161,248 | ) | | | 244,305 | | | | 405,553 | |
1.35% | | GBP - SONIA - COMPOUND | | GBP | | | 16,760,000 | | | | 03/16/2032 | | | Annually | | | (28,546 | ) | | | 114,487 | | | | 143,033 | |
GBP - SONIA - COMPOUND | | 1.43% | | GBP | | | 2,070,000 | | | | 03/16/2032 | | | Annually | | | — | | | | 5,624 | | | | 5,624 | |
GBP - SONIA - COMPOUND | | 1.41% | | GBP | | | 1,470,000 | | | | 03/16/2032 | | | Annually | | | (3,831 | ) | | | 1,260 | | | | 5,091 | |
1.35% | | GBP - SONIA - COMPOUND | | GBP | | | 1,640,000 | | | | 03/16/2032 | | | Annually | | | — | | | | 11,610 | | | | 11,610 | |
GBP - SONIA - COMPOUND | | 1.34% | | GBP | | | 2,440,000 | | | | 03/16/2032 | | | Annually | | | (3,449 | ) | | | (19,844 | ) | | | (16,395 | ) |
GBP - SONIA - COMPOUND | | 1.41% | | GBP | | | 1,540,000 | | | | 03/16/2032 | | | Annually | | | 3,150 | | | | 174 | | | | (2,976 | ) |
1.46% | | GBP - SONIA - COMPOUND | | GBP | | | 1,780,000 | | | | 03/16/2032 | | | Annually | | | (2,569 | ) | | | (13,003 | ) | | | (10,434 | ) |
2.64% | | 3 Month NZD Bank Bill Rate | | NZD | | | 9,860,000 | | | | 03/16/2032 | | | Quarterly | | | 3,125 | | | | 230,575 | | | | 227,450 | |
2.69% | | 3 Month NZD Bank Bill Rate | | NZD | | | 12,350,000 | | | | 03/16/2032 | | | Quarterly | | | (2,850 | ) | | | 249,618 | | | | 252,468 | |
3.02% | | 3 Month NZD Bank Bill Rate | | NZD | | | 1,920,000 | | | | 03/16/2032 | | | Quarterly | | | — | | | | 2,142 | | | | 2,142 | |
2.98% | | 3 Month NZD Bank Bill Rate | | NZD | | | 3,670,000 | | | | 03/16/2032 | | | Quarterly | | | — | | | | 12,720 | | | | 12,720 | |
3 Month NZD Bank Bill Rate | | 2.57% | | NZD | | | 7,310,000 | | | | 03/16/2032 | | | Quarterly | | | — | | | | (199,292 | ) | | | (199,292 | ) |
3 Month NZD Bank Bill Rate | | 2.82% | | NZD | | | 2,560,000 | | | | 03/16/2032 | | | Quarterly | | | (94 | ) | | | (32,188 | ) | | | (32,094 | ) |
3 Month NZD Bank Bill Rate | | 2.78% | | NZD | | | 3,560,000 | | | | 03/16/2032 | | | Quarterly | | | — | | | | (52,920 | ) | | | (52,920 | ) |
3 Month NZD Bank Bill Rate | | 2.99% | | NZD | | | 3,950,000 | | | | 03/16/2032 | | | Quarterly | | | (3,484 | ) | | | (10,210 | ) | | | (6,726 | ) |
3.05% | | 3 Month NZD Bank Bill Rate | | NZD | | | 1,810,000 | | | | 03/16/2032 | | | Quarterly | | | — | | | | (1,490 | ) | | | (1,490 | ) |
0.84% | | 3 Month SEK STIBOR | | SEK | | | 22,400,000 | | | | 03/16/2032 | | | Quarterly | | | (2,205 | ) | | | 131,079 | | | | 133,284 | |
1.10% | | 3 Month SEK STIBOR | | SEK | | | 8,600,000 | | | | 03/16/2032 | | | Quarterly | | | (136 | ) | | | 27,942 | | | | 28,078 | |
1.42% | | 3 Month SEK STIBOR | | SEK | | | 21,000,000 | | | | 03/16/2032 | | | Quarterly | | | — | | | | 961 | | | | 961 | |
1.40% | | 3 Month SEK STIBOR | | SEK | | | 17,000,000 | | | | 03/16/2032 | | | Quarterly | | | — | | | | 4,181 | | | | 4,181 | |
1.41% | | 3 Month SEK STIBOR | | SEK | | | 38,500,000 | | | | 03/16/2032 | | | Quarterly | | | — | | | | 4,845 | | | | 4,845 | |
3 Month SEK STIBOR | | 0.90% | | SEK | | | 164,530,000 | | | | 03/16/2032 | | | Quarterly | | | — | | | | (867,263 | ) | | | (867,263 | ) |
3 Month SEK STIBOR | | 0.84% | | SEK | | | 29,270,000 | | | | 03/16/2032 | | | Quarterly | | | 7,253 | | | | (170,109 | ) | | | (177,362 | ) |
3 Month SEK STIBOR | | 0.85% | | SEK | | | 12,500,000 | | | | 03/16/2032 | | | Quarterly | | | — | | | | (72,521 | ) | | | (72,521 | ) |
3 Month SEK STIBOR | | 1.39% | | SEK | | | 255,800,000 | | | | 03/16/2032 | | | Quarterly | | | 53,712 | | | | (101,328 | ) | | | (155,040 | ) |
3 Month SEK STIBOR | | 1.38% | | SEK | | | 29,800,000 | | | | 03/16/2032 | | | Quarterly | | | — | | | | (13,296 | ) | | | (13,296 | ) |
3 Month SEK STIBOR | | 1.42% | | SEK | | | 20,900,000 | | | | 03/16/2032 | | | Quarterly | | | — | | | | (120 | ) | | | (120 | ) |
3 Month SEK STIBOR | | 1.39% | | SEK | | | 23,100,000 | | | | 03/16/2032 | | | Quarterly | | | — | | | | (8,919 | ) | | | (8,919 | ) |
1.45% | | 3 Month SEK STIBOR | | SEK | | | 35,600,000 | | | | 03/16/2032 | | | Quarterly | | | — | | | | (9,775 | ) | | | (9,775 | ) |
1.43% | | 3 Month SEK STIBOR | | SEK | | | 19,800,000 | | | | 03/16/2032 | | | Quarterly | | | — | | | | (1,571 | ) | | | (1,571 | ) |
1.57% | | USD - SOFR - COMPOUND | | USD | | | 1,530,000 | | | | 03/16/2032 | | | Annually | | | (85 | ) | | | 14,553 | | | | 14,638 | |
1.56% | | USD - SOFR - COMPOUND | | USD | | | 3,840,000 | | | | 03/16/2032 | | | Annually | | | (1,678 | ) | | | 38,666 | | | | 40,344 | |
1.58% | | USD - SOFR - COMPOUND | | USD | | | 2,290,000 | | | | 03/16/2032 | | | Annually | | | (2,312 | ) | | | 18,801 | | | | 21,113 | |
USD - SOFR - COMPOUND | | 1.87% | | USD | | | 1,570,000 | | | | 03/16/2032 | | | Annually | | | 4,848 | | | | 28,852 | | | | 24,004 | |
1.70% | | USD - SOFR - COMPOUND | | USD | | | 2,390,000 | | | | 03/16/2032 | | | Annually | | | (2,216 | ) | | | (7,484 | ) | | | (5,268 | ) |
USD - SOFR - COMPOUND | | 1.61% | | USD | | | 2,580,000 | | | | 03/16/2032 | | | Annually | | | 889 | | | | (13,986 | ) | | | (14,875 | ) |
1.75% | | USD - SOFR - COMPOUND | | USD | | | 3,930,000 | | | | 03/16/2032 | | | Annually | | | — | | | | (28,930 | ) | | | (28,930 | ) |
1.76% | | USD - SOFR - COMPOUND | | USD | | | 44,250,000 | | | | 03/16/2032 | | | Annually | | | (76,092 | ) | | | (377,157 | ) | | | (301,065 | ) |
1.79% | | USD - SOFR - COMPOUND | | USD | | | 2,640,000 | | | | 03/16/2032 | | | Annually | | | — | | | | (29,373 | ) | | | (29,373 | ) |
1.82% | | USD - SOFR - COMPOUND | | USD | | | 2,110,000 | | | | 03/16/2032 | | | Annually | | | — | | | | (29,067 | ) | | | (29,067 | ) |
1.84% | | USD - SOFR - COMPOUND | | USD | | | 1,890,000 | | | | 03/16/2032 | | | Annually | | | — | | | | (29,901 | ) | | | (29,901 | ) |
1.71% | | USD - SOFR - COMPOUND | | USD | | | 1,610,000 | | | | 03/16/2032 | | | Annually | | | (796 | ) | | | (6,314 | ) | | | (5,518 | ) |
0.36% | | 6 Month EURIBOR | | EUR | | | 1,580,000 | | | | 03/17/2032 | | | Semi-Annually | | | 157 | | | | 76,382 | | | | 76,225 | |
0.39% | | 6 Month EURIBOR | | EUR | | | 1,870,000 | | | | 03/17/2032 | | | Semi-Annually | | | 478 | | | | 84,840 | | | | 84,362 | |
0.39% | | 6 Month EURIBOR | | EUR | | | 25,280,000 | | | | 03/17/2032 | | | Semi-Annually | | | (71,344 | ) | | | 1,133,006 | | | | 1,204,350 | |
0.45% | | 6 Month EURIBOR | | EUR | | | 2,580,000 | | | | 03/17/2032 | | | Semi-Annually | | | — | | | | 99,575 | | | | 99,575 | |
0.42% | | 6 Month EURIBOR | | EUR | | | 2,150,000 | | | | 03/17/2032 | | | Semi-Annually | | | (1,861 | ) | | | 89,255 | | | | 91,116 | |
0.49% | | 6 Month EURIBOR | | EUR | | | 1,880,000 | | | | 03/17/2032 | | | Semi-Annually | | | 511 | | | | 64,586 | | | | 64,075 | |
0.71% | | 6 Month EURIBOR | | EUR | | | 2,570,000 | | | | 03/17/2032 | | | Semi-Annually | | | 3,805 | | | | 25,249 | | | | 21,444 | |
0.76% | | 6 Month EURIBOR | | EUR | | | 1,760,000 | | | | 03/17/2032 | | | Semi-Annually | | | 2,486 | | | | 8,122 | | | | 5,636 | |
6 Month EURIBOR | | 0.81% | | EUR | | | 4,960,000 | | | | 03/17/2032 | | | Semi-Annually | | | — | | | | 6,613 | | | | 6,613 | |
6 Month EURIBOR | | 0.82% | | EUR | | | 2,000,000 | | | | 03/17/2032 | | | Semi-Annually | | | — | | | | 5,200 | | | | 5,200 | |
6 Month EURIBOR | | 0.83% | | EUR | | | 2,960,000 | | | | 03/17/2032 | | | Semi-Annually | | | — | | | | 11,934 | | | | 11,934 | |
6 Month EURIBOR | | 0.82% | | EUR | | | 2,960,000 | | | | 03/17/2032 | | | Semi-Annually | | | — | | | | 7,533 | | | | 7,533 | |
| | | | |
| | |
| 18 | | See accompanying notes to the financial statements. | | |
GMO Alternative Allocation Fund
(A Series of GMO Trust)
Consolidated Schedule of Investments — (Continued)
February 28, 2022
Swap Contracts — continued
Centrally Cleared Interest Rate Swaps — continued
| | | | | | | | | | | | | | | | | | | | | | | | | | |
Fund Pays | | Fund Receives | | Notional
Amount | | | Expiration
Date | | | Periodic
Payment
Frequency | | Premiums
Paid/
(Received) ($) | | | Value ($) | | | Net
Unrealized
Appreciation/
(Depreciation) ($) | |
6 Month EURIBOR | | 0.81% | | EUR | | | 1,950,000 | | | | 03/17/2032 | | | Semi-Annually | | | — | | | | 3,029 | | | | 3,029 | |
6 Month EURIBOR | | 0.86% | | EUR | | | 3,180,000 | | | | 03/17/2032 | | | Semi-Annually | | | — | | | | 22,629 | | | | 22,629 | |
0.77% | | 6 Month EURIBOR | | EUR | | | 1,280,000 | | | | 03/17/2032 | | | Semi-Annually | | | 4,639 | | | | 3,792 | | | | (847 | ) |
0.81% | | 6 Month EURIBOR | | EUR | | | 1,810,000 | | | | 03/17/2032 | | | Semi-Annually | | | (201 | ) | | | (2,912 | ) | | | (2,711 | ) |
6 Month EURIBOR | | 0.77% | | EUR | | | 3,800,000 | | | | 03/17/2032 | | | Semi-Annually | | | — | | | | (12,722 | ) | | | (12,722 | ) |
6 Month EURIBOR | | 0.76% | | EUR | | | 1,250,000 | | | | 03/17/2032 | | | Semi-Annually | | | — | | | | (5,562 | ) | | | (5,562 | ) |
| | | | | | | | | | | | | | | | | | | | | | | | | | |
| | $ | (210,363 | ) | | $ | (1,135,118 | ) | | $ | (924,755 | ) |
| | | | | | | | | | | | |
OTC Total Return Swaps
| | | | | | | | | | | | | | | | | | | | | | | | | | | | | | | | |
Fund Pays | | Fund Receives | | Counterparty | | Notional
Amount | | | Expiration
Date | | | Periodic
Payment
Frequency | | | Premiums
Paid/
(Received) ($) | | | Value ($) | | | Net
Unrealized
Appreciation/
(Depreciation) ($) | |
Total Return on Bloomberg Commodity Index (g) | | (0.15)% | | MSCI | | | USD | | | | 3,813,679 | | | | 03/09/2022 | | | | Monthly | | | | — | | | | (167,395 | ) | | | (167,395 | ) |
1 Month Federal Funds Rate plus 0.10% | | Total Return on MSCI World
Daily Total Return Net
Value Index | | GS | | | USD | | | | 3,406,277 | | | | 05/06/2022 | | | | Monthly | | | | — | | | | (134,820 | ) | | | (134,820 | ) |
1 Month Federal Funds Rate plus 0.09% | | Total Return on MSCI World
Daily Total Return Net
Value Index | | UBSA | | | USD | | | | 3,950,214 | | | | 05/12/2022 | | | | Monthly | | | | — | | | | (138,966 | ) | | | (138,966 | ) |
Total Return on MSCI World Daily Total Return Net Growth Index | | 1 Month Federal Funds Rate
plus 0.10% | | UBSA | | | USD | | | | 3,702,346 | | | | 05/12/2022 | | | | Monthly | | | | — | | | | 22,107 | | | | 22,107 | |
1 Month Federal Funds Rate plus 0.05% | | Total Return on MSCI World
Daily Total Return Net
Value Index | | UBSA | | | USD | | | | 2,703,455 | | | | 05/20/2022 | | | | Monthly | | | | — | | | | (95,064 | ) | | | (95,064 | ) |
Total Return on MSCI World Daily Total Return Net Growth Index | | 1 Month Federal Funds Rate
plus 0.05% | | UBSA | | | USD | | | | 2,492,851 | | | | 05/20/2022 | | | | Monthly | | | | — | | | | 14,837 | | | | 14,837 | |
1 Month Federal Funds Rate plus 0.60% | | Total Return on Equity
Basket (h) | | GS | | | USD | | | | 115,795 | | | | 05/24/2022 | | | | Monthly | | | | — | | | | 2,109 | | | | 2,109 | |
Total Return on Equity Basket | | 1 Month Federal Funds Rate
minus 0.50% (h) | | GS | | | USD | | | | 605,784 | | | | 05/24/2022 | | | | Monthly | | | | — | | | | (10,034 | ) | | | (10,034 | ) |
Total Return on Equity Basket | | 1 Month Federal Funds Rate
minus 0.75% (h) | | GS | | | USD | | | | 107,440 | | | | 05/24/2022 | | | | Monthly | | | | — | | | | 5,493 | | | | 5,493 | |
Total Return on Equity Basket | | 1 Month Federal Funds Rate
minus 0.75% (h) | | GS | | | USD | | | | 902,630 | | | | 05/24/2022 | | | | Monthly | | | | — | | | | 2,578 | | | | 2,578 | |
Total Return on Equity Basket | | 1 Month Federal Funds Rate
minus 0.50% (h) | | GS | | | USD | | | | 502,772 | | | | 05/24/2022 | | | | Monthly | | | | — | | | | (26,076 | ) | | | (26,076 | ) |
Total Return on Equity Basket | | 1 Month Federal Funds Rate
minus 0.75% (h) | | GS | | | USD | | | | 137,940 | | | | 05/24/2022 | | | | Monthly | | | | — | | | | (2,931 | ) | | | (2,931 | ) |
Total Return on MSCI World Daily Total Return Net Growth Index | | 1 Month Federal Funds Rate
minus 0.02% | | GS | | | USD | | | | 3,198,611 | | | | 06/06/2022 | | | | Monthly | | | | — | | | | 89,489 | | | | 89,489 | |
1 Month Federal Funds Rate plus 0.95% | | Total Return on Equity
Basket (h) | | MORD | | | USD | | | | 102,282 | | | | 10/18/2022 | | | | Monthly | | | | — | | | | (2,003 | ) | | | (2,003 | ) |
Total Return on Equity Basket | | 1 Month Federal Funds Rate
minus 0.40% (i) | | MORD | | | USD | | | | 4,508,932 | | | | 10/18/2022 | | | | Monthly | | | | — | | | | 256,695 | | | | 256,695 | |
Total Return on Equity Basket | | 1 Month Federal Funds Rate
plus 1.00% (h) | | MORD | | | USD | | | | 25,627 | | | | 12/19/2022 | | | | Monthly | | | | — | | | | 1,647 | | | | 1,647 | |
Total Return on Equity Basket | | 1 Month Federal Funds Rate
minus 2.55% (h) | | MORD | | | USD | | | | 1,483,100 | | | | 06/20/2023 | | | | Monthly | | | | — | | | | (47,388 | ) | | | (47,388 | ) |
Total Return on Equity Basket | | 1 Month Federal Funds Rate
minus 0.40% (h) | | MORD | | | USD | | | | 534,382 | | | | 11/18/2023 | | | | Monthly | | | | — | | | | 17,364 | | | | 17,364 | |
Total Return on Equity Basket | | 1 Month Federal Funds Rate
minus 0.50% (h) | | GS | | | USD | | | | 40,878 | | | | 05/24/2024 | | | | Monthly | | | | — | | | | (1,107 | ) | | | (1,107 | ) |
| | | | | | | | | | | | | | | | | | | | | | | | | | | | | | | | |
| | | $ | — | | | $ | (213,465 | ) | | $ | (213,465 | ) |
| | | | | | | | | | | | | |
| | | | |
| | |
| | | See accompanying notes to the financial statements. | | 19 |
GMO Alternative Allocation Fund
(A Series of GMO Trust)
Consolidated Schedule of Investments — (Continued)
February 28, 2022
As of February 28, 2022, for the above contracts and/or agreements, the Fund had sufficient cash and/or securities to cover commitments or collateral requirements, if any, of the relevant broker or exchange.
Notes to Schedule of Investments:
| † | Denominated in U.S. Dollar, unless otherwise indicated. |
| * | Non-income producing security. |
| (a) | All or a portion of this security has been pledged to cover margin requirements on futures and/or cleared swap contracts, collateral on securities sold short, OTC swap contracts, forward currency contracts, and/or written options, if any (Note 4). |
| (b) | Investment valued using significant unobservable inputs (Note 2). |
| (c) | All or a portion of this investment is held in connection with one or more holdings within the Fund. |
| (d) | Preferred dividend rates are disclosed to the extent that a stated rate exists. |
| (e) | The rate disclosed is the 7 day net yield as of February 28, 2022. |
| (f) | The rate shown represents yield-to-maturity. |
| (g) | All or a portion of this security or derivative is owned by GMO Alternative Allocation SPC Ltd., which is a 100% owned subsidiary of GMO Alternative Allocation Fund. |
| (h) | Periodic payments made/received are based on the total return of the referenced entity. Custom equity basket swap which has a notional amount of less than 1% of the Fund’s total net assets. |
| (i) | The following table represents the individual short positions within the custom equity basket swap as of February 28, 2022: |
| | | | | | | | | | | | | | |
| | |
Shares | | | Description | | % of
Equity Basket | | | Value ($) | |
| | | | |
| | | 240,000 | | | Alibaba Health Information Technology Ltd | | | 4.0 | % | | | 168,056 | |
| | | | |
| | | 1,100,000 | | | Alibaba Pictures Group Ltd | | | 2.6 | % | | | 109,977 | |
| | | | |
| | | 729,000 | | | China Molybdenum Co Ltd –Class H | | | 10.3 | % | | | 438,787 | |
| | | | |
| | | 50,000 | | | China Resources Beer Holdings Co Ltd | | | 9.3 | % | | | 396,470 | |
| | | | |
| | | 70,000 | | | Citic Securities Co Ltd – Class H | | | 4.0 | % | | | 169,589 | |
| | | | |
| | | 72,000 | | | Cosco Shipping Holdings Co –Class H | | | 3.4 | % | | | 145,528 | |
| | | | |
| | | 7,000 | | | Country Garden Services Holdings Co Ltd | | | 1.0 | % | | | 41,874 | |
| | | | |
| | | 24,600 | | | Ganfeng Lithium Co Ltd –Class H | | | 9.8 | % | | | 417,516 | |
| | | | |
| | | 192,000 | | | Greentown Service Group Co Ltd | | | 4.6 | % | | | 192,868 | |
| | | | |
| | | 8,800 | | | Hong Kong Exchanges and Clearing Ltd | | | 10.0 | % | | | 426,418 | |
| | | | |
| | | 169,000 | | | Kingdee International Software Group Co Lt | | | 9.8 | % | | | 417,707 | |
| | | | |
| | | 43,000 | | | New World Development Co Ltd | | | 4.1 | % | | | 171,985 | |
| | | | |
| | | 172,800 | | | Sands China Ltd | | | 10.7 | % | | | 455,757 | |
| | | | |
| | | 169,000 | | | Weimob Inc | | | 2.6 | % | | | 111,769 | |
| | | | |
| | | 396,000 | | | Zijin Mining Group Co Ltd –Class H | | | 13.8 | % | | | 587,736 | |
| | | | | | | | | | | | | | |
| | | | |
| | | | | | TOTAL COMMON STOCKS | | | | | | $ | 4,252,037 | |
| | | | | | | | | | | | | | |
For a listing of definitions of acronyms, counterparty abbreviations and currency abbreviations used throughout the Schedule of Investments as well as the derivative tables, if any, please refer to page 133.
| | | | |
| | |
| 20 | | See accompanying notes to the financial statements. | | |
This page has been left blank intentionally.
GMO Benchmark-Free Allocation Fund
(A Series of GMO Trust)
Portfolio Management
Day-to-day management of the Fund’s portfolio is the responsibility of the Asset Allocation team at Grantham, Mayo, Van Otterloo & Co. LLC.
Management Discussion and Analysis of Fund Performance
Although GMO does not manage the Fund to, or control the Fund’s risk relative to, any securities index or securities benchmark, a discussion of the Fund’s performance relative to the Consumer Price Index (“CPI”) is included for comparative purposes only.
Class III shares of GMO Benchmark-Free Allocation Fund returned +0.86% (net) for the fiscal year ended February 28, 2022, as compared with +7.99% for the CPI.
This was a fairly lackluster 12 months for performance, both from an absolute perspective and a relative one. There was a tremendous spread in returns across risk assets with, for example, the S&P 500 Index returning 16.4% while the MSCI Emerging Markets Index faltered to a -10.7% return. Our equity and equity long/short positions, which together accounted for an average of broadly 46% of the Fund, were biased towards emerging markets and away from the U.S. and therefore performed poorly. We believed that emerging markets were trading at very preferential valuations, but regulatory actions in China and the Russian invasion of Ukraine proved extremely challenging. The disappointing returns suffered by the equity book were exacerbated by security selection within emerging markets, as we were meaningfully overweight Russia. Alternative assets, which accounted for an average of broadly 44% of the Fund, enjoyed a strong year with a 7.5% return. This was driven by an excellent showing from the Equity Dislocation Strategy, which is long cheap Value stocks and short expensive Growth stocks. Fixed income assets accounted for the remaining 10% of the Fund, and these too enjoyed a solid 12 months. We generated a modestly positive return, as the High Yield/Distressed portfolio and Asset-Backed Securities more than offset the difficult year for Emerging Debt, which was well ahead of the -2.6% posted by the Bloomberg U.S. Aggregate Index (formerly Bloomberg Barclays U.S. Aggregate Index).
The views expressed herein are exclusively those of Grantham, Mayo, Van Otterloo & Co. LLC as of the date of this report and are subject to change. GMO disclaims any responsibility to update such views. They are not meant as investment advice. References to specific securities are not recommendations of such securities and may not be representative of any GMO portfolio’s current or future investments. All information is unaudited.
GMO Benchmark-Free Allocation Fund
(A Series of GMO Trust)
Comparison of Change in Value of a $5,000,000 Investment in
GMO Benchmark-Free Allocation Fund Class III Shares, the Consumer Price Index and the Bloomberg U.S. Treasury Inflation Notes: 1-10 Year Index (formerly Bloomberg Barclays U.S. Treasury Inflation Notes: 1-10 Year Index)
As of February 28, 2022
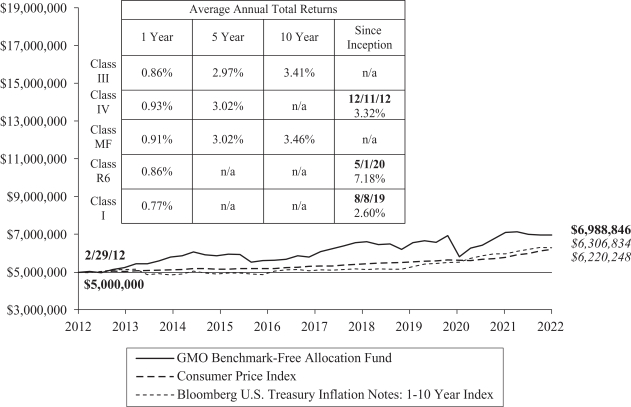
Performance data quoted represents past performance and is not indicative of future results. The investment return and principal value of an investment will fluctuate so that an investor’s shares, when redeemed, may be worth more or less than their original cost. Current performance data may be lower or higher than the performance data provided herein. To obtain performance information up to the most recent month-end, visit www.gmo.com. Performance shown is net of all fees after reimbursement from GMO. Returns would have been lower had certain expenses not been reimbursed during the periods shown and do not include the effect of taxes on distributions and redemptions. The performance information shown above only includes purchase premiums and/or redemption fees in effect as of February 28, 2022. All information is unaudited. Performance for classes may vary due to different fees.
For Class III, IV, MF, R6 and I the gross expense ratio of 1.07%, 1.02%, 1.02%, 1.05% and 1.17%, respectively, is equal to the Fund’s Total Annual Operating Expenses set forth in the Fund’s most recent prospectus dated June 30, 2021. For the Classes listed above, the corresponding net expense ratio of 0.96%, 0.92%, 0.91%, 0.97% and 1.07% reflects the reduction of expenses from fee reimbursements. The fee reimbursements will continue until at least June 30, 2022. Elimination of this reimbursement will result in higher fees and lower performance.
23
GMO Benchmark-Free Allocation Fund
(A Series of GMO Trust)
Investment Concentration Summary
February 28, 2022 (Unaudited)
| | | | |
| Asset Class Summary& | | % of Total Net Assets | |
Common Stocks | | | 71.3 | % |
Debt Obligations | | | 31.7 | |
Short-Term Investments | | | 11.7 | |
Preferred Stocks | | | 1.4 | |
Futures Contracts | | | 0.9 | |
Investment Funds | | | 0.6 | |
Loan Assignments | | | 0.0 | ^ |
Loan Participations | | | 0.0 | ^ |
Rights/Warrants | | | 0.0 | ^ |
Purchased Options | | | 0.0 | ^ |
Reverse Repurchase Agreements | | | (0.0 | )^ |
Swap Contracts | | | (0.0 | )^ |
Written/Credit Linked Options | | | (0.0 | )^ |
Forward Currency Contracts | | | (0.1 | ) |
Securities Sold Short | | | (21.0 | ) |
Other | | | 3.5 | |
| | | | |
| | | 100.0 | % |
| | | | |
| | | | |
| Country/Region Summary¤ | | Debt Obligations as a
% of Total Net Assets | |
Switzerland | | | 4.4 | % |
Sweden | | | 3.7 | |
Canada | | | 3.7 | |
Other Emerging | | | 2.2 | † |
Australia | | | 1.9 | |
Euro Region | | | (0.6 | )# |
Other Developed | | | (1.2 | )‡ |
United States | | | (2.4 | ) |
United Kingdom | | | (8.8 | ) |
| | | | |
| | | 2.9 | % |
| | | | |
| | | | |
| Country/Region Summary¤ | | Equity Investments as a
% of Total Net Assets | |
Japan | | | 8.5 | % |
United States | | | 7.6 | |
China | | | 7.0 | |
Other Developed | | | 5.9 | ‡ |
Taiwan | | | 4.5 | |
South Korea | | | 3.6 | |
Other Emerging | | | 3.0 | † |
United Kingdom | | | 2.5 | |
India | | | 2.2 | |
Brazil | | | 1.9 | |
Mexico | | | 1.3 | |
Australia | | | 1.2 | |
Canada | | | 1.1 | |
France | | | 1.0 | |
Russia | | | 1.0 | |
| | | | |
| | | 52.3 | % |
| | | | |
| & | The table incorporates aggregate indirect asset class exposure associated with investments in other funds of GMO Trust (“underlying funds”). Derivative financial instruments, if any, are based on market values, rather than the notional amounts of derivatives, except for forward currency contracts which are based on unrealized appreciation/(depreciation). |
| ¤ | The table incorporates aggregate indirect country exposure associated with investments in the underlying funds. The table excludes short-term investments. The table includes exposure through the use of certain derivative financial instruments and excludes exposure through certain currency linked derivatives such as forward currency contracts and currency options. The table is based on duration adjusted net exposures (both investments and derivatives), taking into account the market value of securities and the notional amounts of swaps and other derivative financial instruments. Duration is based on GMO’s models. The greater the duration of a bond, the greater contribution to the concentration percentage. Credit default swap exposure are factored into the duration adjusted exposure using the reference securities and applying the same methodology to that security. The tables are not normalized, thus, due to the exclusions listed above and negative exposure which may be attributable to derivatives or short sales, if any, the tables may not total to 100%. |
| † | “Other Emerging” is comprised of emerging countries that each represent between (1.0)% and 1.0% of Total Net Assets. |
| # | “Euro Region” is comprised of derivative financial instruments attributed to the Eurozone and not a particular country. |
| ‡ | “Other Developed” is comprised of developed countries that each represent between (1.0)% and 1.0% of Total Net Assets. |
GMO Benchmark-Free Allocation Fund
(A Series of GMO Trust)
Schedule of Investments
(showing percentage of total net assets)
February 28, 2022
| | | | | | | | | | |
| | | Shares | | | Description | | Value ($) | |
| | | |
| | | | | | MUTUAL FUNDS — 100.0% | | | | |
| | | |
| | | | | | Affiliated Issuers — 100.0% | | | |
| | | |
| | | 5,411,918 | | | GMO Emerging Country Debt Fund, Class VI | | | 115,273,843 | |
| | | |
| | | 373,319,979 | | | GMO Implementation Fund | | | 4,681,432,538 | |
| | | |
| | | 7,187,781 | | | GMO Opportunistic Income Fund, Class VI | | | 183,719,672 | |
| | | |
| | | 4,842,351 | | | GMO SGM Major Markets Fund, Class VI | | | 141,735,622 | |
| | | | | | | | | | |
| | | |
| | | | | | TOTAL MUTUAL FUNDS (COST $5,344,673,966) | | | 5,122,161,675 | |
| | | | | | | | | | |
| | |
| | | | | | SHORT-TERM INVESTMENTS — 0.1% | |
| | | |
| | | | | | Money Market Funds — 0.1% | | | |
| | | |
| | | 4,385,029 | | | State Street Institutional Treasury Money Market Fund – Premier Class, 0.01% (a) | | | 4,385,029 | |
| | | | | | | | | | |
| | | |
| | | | | | TOTAL SHORT-TERM INVESTMENTS (COST $4,385,029) | | | 4,385,029 | |
| | | | | | | | | | |
| | | |
| | | | | | TOTAL INVESTMENTS — 100.1%
(Cost $5,349,058,995) | | | 5,126,546,704 | |
| | | |
| | | | | | Other Assets and Liabilities (net) — (0.1%) | | | (2,901,665 | ) |
| | | | | | | | | | |
| | | |
| | | | | | TOTAL NET ASSETS — 100.0% | | | $5,123,645,039 | |
| | | | | | | | | | |
Notes to Schedule of Investments:
| (a) | The rate disclosed is the 7 day net yield as of February 28, 2022. |
For a listing of definitions of acronyms, counterparty abbreviations and currency abbreviations used throughout the Schedule of Investments as well as the derivative tables, if any, please refer to page 133.
| | | | |
| | |
| | | See accompanying notes to the financial statements. | | 25 |
GMO Benchmark-Free Fund
(A Series of GMO Trust)
Portfolio Management
Day-to-day management of the Fund’s portfolio is the responsibility of the Asset Allocation team at Grantham, Mayo, Van Otterloo & Co. LLC.
Management Discussion and Analysis of Fund Performance
Although GMO does not manage the Fund to, or control the Fund’s risk relative to, any index or benchmark, a discussion of the Fund’s performance relative to the Consumer Price Index (“CPI”) is included for comparative purposes only.
Class III shares of GMO Benchmark-Free Fund returned +1.21% (net) for the fiscal year ended February 28, 2022, as compared with +7.99% for the CPI.
This was a fairly lackluster 12 months for performance, both from an absolute perspective and a relative one. There was a tremendous spread in returns across risk assets with, for example, the S&P 500 Index returning 16.4% while the MSCI Emerging Markets Index faltered to a -10.7% return. Our equity and equity long/short positions were biased towards emerging markets and away from the U.S., and therefore performed poorly. We believed that emerging markets were trading at very preferential valuations, but regulatory actions in China and the Russian invasion of Ukraine proved extremely challenging. The disappointing returns suffered by the equity book were exacerbated by security selection within emerging markets, as we were meaningfully overweight Russia. Alternative assets enjoyed a strong year, driven by an excellent showing from the Equity Dislocation Strategy, which is long cheap Value stocks and short expensive Growth stocks. The exposure to fixed income assets was relatively modest, a positive return from Asset-Backed Securities worked to offset the difficult year for Emerging Debt.
The views expressed herein are exclusively those of Grantham, Mayo, Van Otterloo & Co. LLC as of the date of this report and are subject to change. GMO disclaims any responsibility to update such views. They are not meant as investment advice. References to specific securities are not recommendations of such securities and may not be representative of any GMO portfolio’s current or future investments. All information is unaudited.
GMO Benchmark-Free Fund
(A Series of GMO Trust)
Comparison of Change in Value of a $5,000,000 Investment in
GMO Benchmark-Free Fund Class III Shares, the Consumer Price Index and the Bloomberg U.S. Treasury Inflation Notes: 1-10 Year Index (formerly Bloomberg Barclays U.S. Treasury Inflation Notes: 1-10 Year Index)
As of February 28, 2022

Performance data quoted represents past performance and is not indicative of future results. The investment return and principal value of an investment will fluctuate so that an investor’s shares, when redeemed, may be worth more or less than their original cost. Current performance data may be lower or higher than the performance data provided herein. To obtain performance information up to the most recent month-end, visit www.gmo.com. Performance shown is net of all fees after reimbursement from GMO. Returns would have been lower had certain expenses not been reimbursed during the periods shown and do not include the effect of taxes on distributions and redemptions. The performance information shown above only includes purchase premiums and/or redemption fees in effect as of February 28, 2022. All information is unaudited.
For Class III the gross expense ratio of 0.36% is equal to the Fund’s Total Annual Operating Expenses set forth in the Fund’s most recent prospectus dated June 30, 2021. For the Class listed above, the net expense ratio of 0.31% reflects the reduction of expenses from fee reimbursements. The fee reimbursements will continue until at least June 30, 2022. Elimination of this reimbursement will result in higher fees and lower performance.
27
GMO Benchmark-Free Fund
(A Series of GMO Trust)
Investment Concentration Summary
February 28, 2022 (Unaudited)
| | | | |
| Asset Class Summary& | | % of Total Net Assets | |
Common Stocks | | | 80.5 | % |
Debt Obligations | | | 28.0 | |
Short-Term Investments | | | 16.7 | |
Preferred Stocks | | | 1.6 | |
Futures Contracts | | | 1.2 | |
Investment Funds | | | 0.2 | |
Swap Contracts | | | 0.1 | |
Loan Assignments | | | 0.0 | ^ |
Loan Participations | | | 0.0 | ^ |
Purchased Options | | | 0.0 | ^ |
Rights/Warrants | | | 0.0 | ^ |
Reverse Repurchase Agreements | | | (0.0 | )^ |
Written/Credit Linked Options | | | (0.0 | )^ |
Forward Currency Contracts | | | (0.0 | )^ |
Securities Sold Short | | | (20.6 | ) |
Other | | | (7.7 | ) |
| | | | |
| | | 100.0 | % |
| | | | |
| | | | |
| Country/Region Summary¤ | | Debt Obligations as a % of Total Net Assets | |
Other Emerging | | | 2.9 | %† |
Switzerland | | | 2.4 | |
Sweden | | | 1.8 | |
Canada | | | 1.8 | |
Other Developed | | | (0.0 | )^‡ |
Euro Region | | | (0.4 | )# |
United Kingdom | | | (4.3 | ) |
| | | | |
| | | 4.2 | % |
| | | | |
| | | | |
| Country/Region Summary¤ | | Equity Investments as a % of Total Net Assets | |
Japan | | | 11.5 | % |
China | | | 8.8 | |
Taiwan | | | 6.2 | |
Other Developed | | | 5.1 | ‡ |
South Korea | | | 4.7 | |
United States | | | 3.9 | |
Other Emerging | | | 3.9 | † |
United Kingdom | | | 2.9 | |
India | | | 2.8 | |
Brazil | | | 2.5 | |
Mexico | | | 1.7 | |
France | | | 1.4 | |
Russia | | | 1.4 | |
Canada | | | 1.2 | |
Netherlands | | | 1.1 | |
Australia | | | 1.0 | |
Hong Kong | | | 1.0 | |
| | | | |
| | | 61.1 | % |
| | | | |
| & | The table incorporates aggregate indirect asset class exposure associated with investments in other funds of GMO Trust (“underlying funds”). Derivative financial instruments, if any, are based on market values, rather than the notional amounts of derivatives, except for forward currency contracts which are based on unrealized appreciation/(depreciation). |
| ¤ | The table incorporates aggregate indirect country exposure associated with investments in the underlying funds. The table excludes short-term investments. The table includes exposure through the use of certain derivative financial instruments and excludes exposure through certain currency linked derivatives such as forward currency contracts and currency options. The table is based on duration adjusted net exposures (both investments and derivatives), taking into account the market value of securities and the notional amounts of swaps and other derivative financial instruments. Duration is based on GMO’s models. The greater the duration of a bond, the greater contribution to the concentration percentage. Credit default swap exposure are factored into the duration adjusted exposure using the reference securities and applying the same methodology to that security. The tables are not normalized, thus, due to the exclusions listed above and negative exposure which may be attributable to derivatives or short sales, if any, the tables may not total to 100%. |
| † | “Other Emerging” is comprised of emerging countries that each represent between (1.0)% and 1.0% of Total Net Assets. |
| ‡ | “Other Developed” is comprised of developed countries that each represent between (1.0)% and 1.0% of Total Net Assets. |
| # | “Euro Region” is comprised of derivative financial instruments attributed to the Eurozone and not a particular country. |
GMO Benchmark-Free Fund
(A Series of GMO Trust)
Schedule of Investments
(showing percentage of total net assets)
February 28, 2022
| | | | | | | | | | |
Shares | | | Description | | Value ($) | |
| | |
| | | | | | COMMON STOCKS — 78.6% | |
| | |
| | | | | | Argentina — 0.0% | |
| | | |
| | | 4,800 | | | Banco BBVA Argentina SA ADR * | | | 15,504 | |
| | | |
| | | 7,296 | | | Grupo Financiero Galicia SA ADR | | | 69,093 | |
| | | | | | | | | | |
| | | |
| | | | | | Total Argentina | | | 84,597 | |
| | | | | | | | | | |
| | | |
| | | | | | Australia — 1.5% | | | |
| | | |
| | | 17,150 | | | Abacus Property Group (REIT) | | | 44,049 | |
| | | |
| | | 54,811 | | | Accent Group Ltd | | | 74,683 | |
| | | |
| | | 25,859 | | | Adairs Ltd (a) | | | 54,019 | |
| | | |
| | | 96,619 | | | Aurizon Holdings Ltd (b) | | | 246,466 | |
| | | |
| | | 60,850 | | | Australian Pharmaceutical Industries Ltd (b) | | | 67,703 | |
| | | |
| | | 93,039 | | | Beach Energy Ltd (a) | | | 103,634 | |
| | | |
| | | 295,992 | | | BlueScope Steel Ltd | | | 4,383,006 | |
| | | |
| | | 135,795 | | | Brambles Ltd | | | 978,093 | |
| | | |
| | | 212,047 | | | Dexus (REIT) (b) | | | 1,678,560 | |
| | | |
| | | 260,673 | | | Fortescue Metals Group Ltd (a) | | | 3,472,774 | |
| | | |
| | | 39,768 | | | GDI Property Group (REIT) | | | 30,336 | |
| | | |
| | | 149,150 | | | Genworth Mortgage Insurance Australia Ltd (a) | | | 325,351 | |
| | | |
| | | 430,888 | | | GPT Group (The) (REIT) | | | 1,537,441 | |
| | | |
| | | 65,691 | | | GrainCorp Ltd – Class A | | | 401,789 | |
| | | |
| | | 67,954 | | | HomeCo Daily Needs (REIT) | | | 75,637 | |
| | | |
| | | 2,473 | | | JB Hi-Fi Ltd | | | 88,953 | |
| | | |
| | | 14,449 | | | McMillan Shakespeare Ltd | | | 126,291 | |
| | | |
| | | 130,157 | | | Metcash Ltd | | | 390,538 | |
| | | |
| | | 17,530 | | | Mineral Resources Ltd | | | 584,565 | |
| | | |
| | | 767,728 | | | Mirvac Group (REIT) (b) | | | 1,431,747 | |
| | | |
| | | 99,102 | | | Mount Gibson Iron Ltd | | | 38,009 | |
| | | |
| | | 66,896 | | | Rio Tinto Ltd (b) | | | 5,768,911 | |
| | | |
| | | 60,671 | | | Sandfire Resources Ltd | | | 299,104 | |
| | | |
| | | 510,173 | | | Scentre Group (REIT) (b) | | | 1,133,401 | |
| | | |
| | | 24,820 | | | Southern Cross Media Group Ltd | | | 31,983 | |
| | | |
| | | 410,016 | | | Stockland (REIT) (b) | | | 1,240,665 | |
| | | |
| | | 11,084 | | | Super Retail Group Ltd | | | 89,080 | |
| | | |
| | | 13,140 | | | Virtus Health Ltd (a) | | | 71,298 | |
| | | | | | | | | | |
| | | |
| | | | | | Total Australia | | | 24,768,086 | |
| | | | | | | | | | |
| | | |
| | | | | | Austria — 0.0% | | | |
| | | |
| | | 1,904 | | | Raiffeisen Bank International AG | | | 31,026 | |
| | | |
| | | 2,078 | | | Vienna Insurance Group AG Wiener Versicherung Gruppe | | | 54,410 | |
| | | | | | | | | | |
| | | |
| | | | | | Total Austria | | | 85,436 | |
| | | | | | | | | | |
| | | |
| | | | | | Belgium — 0.5% | | | |
| | | |
| | | 2,304 | | | Ackermans & van Haaren NV | | | 430,099 | |
| | | |
| | | 52,236 | | | Ageas SA/NV | | | 2,512,873 | |
| | | |
| | | 11,906 | | | Bekaert SA | | | 518,011 | |
| | | |
| | | 872 | | | Cie d’Entreprises CFE | | | 115,903 | |
| | | |
| | | 2,397 | | | D’ieteren Group (b) | | | 387,223 | |
| | | | | | | | | | |
Shares | | | Description | | Value ($) | |
| | | |
| | | | | | Belgium — continued | | | |
| | | |
| | | 8,100 | | | KBC Group NV | | | 583,580 | |
| | | |
| | | 2,423 | | | Orange Belgium SA | | | 52,900 | |
| | | |
| | | 4,937 | | | Proximus SADP | | | 98,149 | |
| | | |
| | | 1,580 | | | Sofina SA | | | 613,602 | |
| | | |
| | | 26,137 | | | UCB SA | | | 2,852,506 | |
| | | |
| | | 282 | | | VGP NV (b) | | | 72,008 | |
| | | | | | | | | | |
| | | |
| | | | | | Total Belgium | | | 8,236,854 | |
| | | | | | | | | | |
| | | |
| | | | | | Brazil — 1.6% | | | |
| | | |
| | | 22,100 | | | Ambev SA | | | 64,858 | |
| | | |
| | | 39,300 | | | Ambev SA ADR | | | 115,149 | |
| | | |
| | | 240,040 | | | Banco Bradesco SA | | | 787,295 | |
| | | |
| | | 135,000 | | | Banco do Brasil SA | | | 912,745 | |
| | | |
| | | 98,100 | | | Blau Farmaceutica SA | | | 565,785 | |
| | | |
| | | 9,500 | | | Cia Paranaense de Energia | | | 64,189 | |
| | | |
| | | 56,000 | | | Cia Siderurgica Nacional SA | | | 275,617 | |
| | | |
| | | 11,400 | | | Equatorial Energia SA | | | 56,376 | |
| | | |
| | | 66,200 | | | JBS SA | | | 463,717 | |
| | | |
| | | 603,900 | | | Marfrig Global Foods SA | | | 2,613,888 | |
| | | |
| | | 15,700 | | | Petroleo Brasileiro SA | | | 111,634 | |
| | | |
| | | 202,800 | | | Petroleo Brasileiro SA Sponsored ADR (b) | | | 2,898,012 | |
| | | |
| | | 59,300 | | | Ser Educacional SA | | | 127,231 | |
| | | |
| | | 419,300 | | | Telefonica Brasil SA | | | 4,111,930 | |
| | | |
| | | 1,393,500 | | | TIM SA | | | 3,696,242 | |
| | | |
| | | 35,600 | | | Transmissora Alianca de Energia Eletrica SA | | | 272,804 | |
| | | |
| | | 55,152 | | | Vale SA | | | 1,023,272 | |
| | | |
| | | 236,500 | | | Vale SA Sponsored ADR – Class B (b) | | | 4,372,885 | |
| | | |
| | | 291,900 | | | Vamos Locacao de Caminhoes Maquinas e Equipamentos SA | | | 621,034 | |
| | | |
| | | 727,140 | | | Vibra Energia SA | | | 3,312,062 | |
| | | | | | | | | | |
| | | |
| | | | | | Total Brazil | | | 26,466,725 | |
| | | | | | | | | | |
| | | |
| | | | | | Canada — 1.9% | | | |
| | | |
| | | 7,100 | | | AGF Management Ltd – Class B | | | 39,547 | |
| | | |
| | | 19,800 | | | Bank of Montreal | | | 2,260,871 | |
| | | |
| | | 8,200 | | | Baytex Energy Corp * (a) | | | 37,458 | |
| | | |
| | | 69,848 | | | Brookfield Asset Management Inc – Class A (b) | | | 3,816,495 | |
| | | |
| | | 42,100 | | | Canaccord Genuity Group Inc (a) | | | 428,806 | |
| | | |
| | | 32,300 | | | Canadian Apartment Properties (REIT) (b) | | | 1,344,496 | |
| | | |
| | | 13,900 | | | Canadian Tire Corp Ltd – Class A (a) (b) | | | 2,049,304 | |
| | | |
| | | 7,200 | | | Canadian Western Bank | | | 210,802 | |
| | | |
| | | 32,400 | | | Canfor Corp * | | | 733,378 | |
| | | |
| | | 17,400 | | | Celestica Inc * (c) | | | 206,886 | |
| | | |
| | | 47,900 | | | Celestica Inc * (a) (c) | | | 569,509 | |
| | | |
| | | 10,600 | | | Cenovus Energy Inc | | | 166,420 | |
| | | |
| | | 3,703 | | | Cogeco Inc (b) | | | 229,162 | |
| | | |
| | | 50,700 | | | Corus Entertainment Inc – Class B (b) | | | 203,200 | |
| | | |
| | | 5,000 | | | DREAM Unlimited Corp – Class A | | | 185,602 | |
| | | | |
| | |
| | | See accompanying notes to the financial statements. | | 29 |
GMO Benchmark-Free Fund
(A Series of GMO Trust)
Schedule of Investments — (Continued)
(showing percentage of total net assets)
February 28, 2022
| | | | | | | | | | |
Shares | | | Description | | Value ($) | |
| | | |
| | | | | | Canada — continued | | | |
| | | |
| | | 20,100 | | | Finning International Inc | | | 584,843 | |
| | | |
| | | 1,200 | | | Great-West Lifeco Inc (b) | | | 36,099 | |
| | | |
| | | 12,500 | | | iA Financial Corp Inc | | | 742,702 | |
| | | |
| | | 8,300 | | | Imperial Oil Ltd (c) | | | 372,534 | |
| | | |
| | | 17,300 | | | Imperial Oil Ltd (c) | | | 775,732 | |
| | | |
| | | 19,700 | | | Interfor Corp | | | 600,092 | |
| | | |
| | | 900 | | | Laurentian Bank of Canada | | | 30,227 | |
| | | |
| | | 10,300 | | | Linamar Corp | | | 537,875 | |
| | | |
| | | 21,300 | | | Magna International Inc | | | 1,582,502 | |
| | | |
| | | 2,400 | | | Morguard North American Residential Real Estate Investment Trust (REIT) | | | 36,052 | |
| | | |
| | | 49,586 | | | Nutrien Ltd | | | 4,263,900 | |
| | | |
| | | 5,300 | | | Onex Corp | | | 355,926 | |
| | | |
| | | 22,500 | | | Parex Resources Inc | | | 496,154 | |
| | | |
| | | 73,000 | | | Power Corp of Canada (a) | | | 2,251,337 | |
| | | |
| | | 24,000 | | | PrairieSky Royalty Ltd (a) | | | 324,544 | |
| | | |
| | | 30,700 | | | Quebecor Inc – Class B (b) | | | 671,404 | |
| | | |
| | | 21,100 | | | RioCan Real Estate Investment Trust (REIT) (b) | | | 418,171 | |
| | | |
| | | 3,000 | | | Russel Metals Inc (a) | | | 74,320 | |
| | | |
| | | 7,100 | | | Tamarack Valley Energy Ltd | | | 28,904 | |
| | | |
| | | 9,700 | | | Teck Resources Ltd – Class B | | | 349,277 | |
| | | |
| | | 32,600 | | | Teck Resources Ltd – Class B | | | 1,171,970 | |
| | | |
| | | 12,200 | | | Topaz Energy Corp | | | 191,157 | |
| | | |
| | | 1,700 | | | Tourmaline Oil Corp (a) | | | 67,061 | |
| | | |
| | | 5,000 | | | Wajax Corp | | | 92,899 | |
| | | |
| | | 21,300 | | | West Fraser Timber Co Ltd | | | 2,126,135 | |
| | | |
| | | 2,800 | | | Westshore Terminals Investment Corp (a) (b) | | | 65,632 | |
| | | | | | | | | | |
| | | |
| | | | | | Total Canada | | | 30,729,385 | |
| | | | | | | | | | |
| | | |
| | | | | | Chile — 0.1% | | | |
| | | |
| | | 448,993 | | | Banco de Chile | | | 47,603 | |
| | | |
| | | 994,744 | | | Banco Santander Chile | | | 48,846 | |
| | | |
| | | 4,500 | | | Banco Santander Chile ADR | | | 87,840 | |
| | | |
| | | 1,433 | | | CAP SA | | | 16,587 | |
| | | |
| | | 10,026 | | | Cencosud SA | | | 18,434 | |
| | | |
| | | 37,376 | | | Cencosud Shopping SA | | | 40,109 | |
| | | |
| | | 9,200 | | | Cia Cervecerias Unidas SA Sponsored ADR | | | 147,016 | |
| | | |
| | | 3,870,250 | | | Colbun SA | | | 282,195 | |
| | | |
| | | 1,368 | | | Empresas COPEC SA | | | 10,608 | |
| | | |
| | | 213,361 | | | Enel Americas SA | | | 24,983 | |
| | | |
| | | 187,321 | | | Falabella SA | | | 616,751 | |
| | | |
| | | 28,643 | | | Inversiones La Construccion SA | | | 114,717 | |
| | | | | | | | | | |
| | | |
| | | | | | Total Chile | | | 1,455,689 | |
| | | | | | | | | | |
| | | |
| | | | | | China — 8.3% | | | |
| | | |
| | | 364,000 | | | 361 Degrees International Ltd * | | | 178,953 | |
| | | |
| | | 22,500 | | | A-Living Smart City Services Co Ltd | | | 40,332 | |
| | | |
| | | 508,000 | | | Agile Group Holdings Ltd (a) | | | 231,456 | |
| | | | | | | | | | |
Shares | | | Description | | Value ($) | |
| | | |
| | | | | | China — continued | | | |
| | | |
| | | 293,276 | | | Agricultural Bank of China Ltd – Class A | | | 138,681 | |
| | | |
| | | 17,511,136 | | | Agricultural Bank of China Ltd – Class H | | | 6,631,801 | |
| | | |
| | | 123,095 | | | Alibaba Group Holding Ltd * | | | 1,620,407 | |
| | | |
| | | 9,100 | | | Anhui Conch Cement Co Ltd – Class A | | | 58,309 | |
| | | |
| | | 29,320 | | | ANTA Sports Products Ltd | | | 447,810 | |
| | | |
| | | 11,796 | | | Autohome Inc ADR (b) | | | 360,840 | |
| | | |
| | | 11,584 | | | Autohome Inc – Class A * | | | 85,536 | |
| | | |
| | | 2,695,500 | | | BAIC Motor Corp Ltd – Class H | | | 941,739 | |
| | | |
| | | 641,796 | | | Bank of China Ltd – Class A | | | 315,477 | |
| | | |
| | | 17,409,840 | | | Bank of China Ltd – Class H | | | 6,777,680 | |
| | | |
| | | 6,772,091 | | | Bank of Communications Co Ltd – Class H | | | 4,642,467 | |
| | | |
| | | 149,500 | | | Beijing Enterprises Holdings Ltd | | | 511,066 | |
| | | |
| | | 3,495 | | | BYD Co Ltd – Class A | | | 140,668 | |
| | | |
| | | 107,400 | | | BYD Electronic International Co Ltd (a) | | | 303,063 | |
| | | |
| | | 149,000 | | | China Aoyuan Group Ltd (a) | | | 24,836 | |
| | | |
| | | 456,000 | | | China BlueChemical Ltd – Class H | | | 136,540 | |
| | | |
| | | 4,554,000 | | | China Cinda Asset Management Co Ltd – Class H | | | 822,059 | |
| | | |
| | | 2,788,354 | | | China Communications Services Corp Ltd – Class H | | | 1,529,750 | |
| | | |
| | | 62,456 | | | China Construction Bank Corp – Class A | | | 59,807 | |
| | | |
| | | 3,628,480 | | | China Construction Bank Corp – Class H | | | 2,721,231 | |
| | | |
| | | 292,000 | | | China Datang Corp Renewable Power Co Ltd – Class H (a) | | | 110,653 | |
| | | |
| | | 1,845,040 | | | China Dongxiang Group Co Ltd | | | 139,237 | |
| | | |
| | | 4,574,000 | | | China Energy Engineering Corp Ltd – Class H (a) | | | 749,691 | |
| | | |
| | | 80,000 | | | China Everbright Bank Co Ltd – Class H | | | 29,753 | |
| | | |
| | | 631,000 | | | China Everbright Environment Group Ltd | | | 453,042 | |
| | | |
| | | 773,280 | | | China Feihe Ltd | | | 922,724 | |
| | | |
| | | 1,058,000 | | | China Greenfresh Group Co Ltd * (d) | | | — | |
| | | |
| | | 104,000 | | | China High Speed Transmission Equipment Group Co Ltd * | | | 78,903 | |
| | | |
| | | 1,881,000 | | | China Hongqiao Group Ltd | | | 2,633,416 | |
| | | |
| | | 889,920 | | | China Lesso Group Holdings Ltd | | | 1,370,107 | |
| | | |
| | | 54,000 | | | China Lilang Ltd | | | 29,997 | |
| | | |
| | | 174,000 | | | China Longyuan Power Group Corp Ltd – Class H | | | 359,065 | |
| | | |
| | | 983,645 | | | China Medical System Holdings Ltd | | | 1,751,531 | |
| | | |
| | | 142,031 | | | China Merchants Bank Co Ltd – Class A | | | 1,123,739 | |
| | | |
| | | 74,000 | | | China Merchants Port Holdings Co Ltd | | | 139,519 | |
| | | |
| | | 423,000 | | | China Molybdenum Co Ltd – Class A | | | 406,151 | |
| | | |
| | | 51,000 | | | China Molybdenum Co Ltd – Class H | | | 30,697 | |
| | | |
| | | 1,724,000 | | | China National Building Material Co Ltd – Class H | | | 2,211,596 | |
| | | |
| | | 112,640 | | | China Oriental Group Co Ltd | | | 32,742 | |
| | | |
| | | 714,000 | | | China Overseas Grand Oceans Group Ltd | | | 411,903 | |
| | | |
| | | 1,256,860 | | | China Overseas Land & Investment Ltd | | | 3,837,403 | |
| | | |
| | | 18,273 | | | China Pacific Insurance Group Co Ltd – Class A | | | 76,920 | |
| | | | |
| | |
| 30 | | See accompanying notes to the financial statements. | | |
GMO Benchmark-Free Fund
(A Series of GMO Trust)
Schedule of Investments — (Continued)
(showing percentage of total net assets)
February 28, 2022
| | | | | | | | | | |
Shares | | | Description | | Value ($) | |
| | | |
| | | | | | China — continued | | | |
| | | |
| | | 94,928 | | | China Pacific Insurance Group Co Ltd – Class H | | | 264,334 | |
| | | |
| | | 3,138 | | | China Petroleum & Chemical Corp ADR (b) | | | 156,429 | |
| | | |
| | | 11,514,000 | | | China Petroleum & Chemical Corp – Class H | | | 5,728,062 | |
| | | |
| | | 28,000 | | | China Pioneer Pharma Holdings Ltd | | | 8,480 | |
| | | |
| | | 7,540,042 | | | China Railway Group Ltd – Class H | | | 4,427,180 | |
| | | |
| | | 1,122,120 | | | China Reinsurance Group Corp – Class H | | | 107,848 | |
| | | |
| | | 32,240 | | | China Resources Gas Group Ltd | | | 148,078 | |
| | | |
| | | 135,440 | | | China Resources Land Ltd | | | 658,820 | |
| | | |
| | | 2,019,500 | | | China Resources Pharmaceutical Group Ltd | | | 998,855 | |
| | | |
| | | 191,000 | | | China Shineway Pharmaceutical Group Ltd | | | 156,281 | |
| | | |
| | | 1,156,000 | | | China South City Holdings Ltd | | | 96,499 | |
| | | |
| | | 648,000 | | | China State Construction International Holdings Ltd | | | 912,589 | |
| | | |
| | | 2,582,000 | | | China Traditional Chinese Medicine Holdings Co Ltd | | | 1,471,894 | |
| | | |
| | | 2,900 | | | China Yuchai International Ltd | | | 35,873 | |
| | | |
| | | 1,776,400 | | | China Zhongwang Holdings Ltd * (a) (e) | | | 381,894 | |
| | | |
| | | 14,000 | | | CIFI Ever Sunshine Services Group Ltd | | | 25,460 | |
| | | |
| | | 4,126,000 | | | CITIC Ltd | | | 4,814,729 | |
| | | |
| | | 1,221,000 | | | Country Garden Holdings Co Ltd (a) | | | 948,633 | |
| | | |
| | | 33,000 | | | Country Garden Services Holdings Co Ltd | | | 197,405 | |
| | | |
| | | 3,736,000 | | | CSPC Pharmaceutical Group Ltd | | | 4,428,515 | |
| | | |
| | | 3,730,000 | | | Dongfeng Motor Group Co Ltd – Class H | | | 3,210,509 | |
| | | |
| | | 44,000 | | | Dongyue Group Ltd | | | 63,833 | |
| | | |
| | | 36,860 | | | ENN Energy Holdings Ltd | | | 533,821 | |
| | | |
| | | 480,527 | | | Fangda Special Steel Technology Co Ltd – Class A | | | 627,731 | |
| | | |
| | | 991,500 | | | Fosun International Ltd | | | 1,075,781 | |
| | | |
| | | 23,400 | | | Fuyao Glass Industry Group Co Ltd – Class A | | | 164,381 | |
| | | |
| | | 23,600 | | | Fuyao Glass Industry Group Co Ltd – Class H | | | 115,784 | |
| | | |
| | | 18,000 | | | Geely Automobile Holdings Ltd | | | 33,528 | |
| | | |
| | | 132,240 | | | Guangdong Investment Ltd | | | 177,955 | |
| | | |
| | | 252,000 | | | Guangzhou Baiyunshan Pharmaceutical Holdings Co Ltd – Class H | | | 673,561 | |
| | | |
| | | 1,718,800 | | | Guangzhou R&F Properties Co Ltd – Class H (a) | | | 731,693 | |
| | | |
| | | 44,600 | | | Haier Smart Home Co Ltd – Class H | | | 156,282 | |
| | | |
| | | 195,500 | | | Hello Group Inc Sponsored ADR (b) | | | 1,863,115 | |
| | | |
| | | 113,380 | | | Hisense Home Appliances Group Co Ltd – Class A | | | 244,680 | |
| | | |
| | | 158,000 | | | Hisense Home Appliances Group Co Ltd – Class H | | | 177,330 | |
| | | |
| | | 4,172 | | | Hollysys Automation Technologies Ltd * | | | 58,742 | |
| | | |
| | | 223,310 | | | Hopson Development Holdings Ltd | | | 459,696 | |
| | | |
| | | 1,541,080 | | | Industrial & Commercial Bank of China Ltd – Class H | | | 919,955 | |
| | | |
| | | 264,595 | | | Inner Mongolia Eerduosi Resources Co Ltd – Class A | | | 1,093,933 | |
| | | | | | | | | | |
Shares | | | Description | | Value ($) | |
| | | |
| | | | | | China — continued | | | |
| | | |
| | | 2,970 | | | JD.com Inc – Class A * | | | 106,087 | |
| | | |
| | | 14,900 | | | KE Holdings Inc ADR * (b) | | | 289,209 | |
| | | |
| | | 363,000 | | | Kingboard Holdings Ltd | | | 1,698,168 | |
| | | |
| | | 22,240 | | | Kingboard Laminates Holdings Ltd | | | 37,060 | |
| | | |
| | | 96,000 | | | Kunlun Energy Co Ltd | | | 94,434 | |
| | | |
| | | 82,880 | | | KWG Group Holdings Ltd | | | 38,806 | |
| | | |
| | | 419,000 | | | Legend Holdings Corp – Class H | | | 589,446 | |
| | | |
| | | 4,350,000 | | | Lenovo Group Ltd | | | 4,844,025 | |
| | | |
| | | 9,000 | | | Li Ning Co Ltd | | | 89,893 | |
| | | |
| | | 135,781 | | | Livzon Pharmaceutical Group Inc – Class H | | | 509,637 | |
| | | |
| | | 35,320 | | | Logan Group Co Ltd (a) | | | 11,736 | |
| | | |
| | | 1,157,520 | | | Lonking Holdings Ltd | | | 308,509 | |
| | | |
| | | 16,032 | | | Lufax Holding Ltd ADR * | | | 103,727 | |
| | | |
| | | 5,165,000 | | | Metallurgical Corp of China Ltd – Class H | | | 1,570,965 | |
| | | |
| | | 128,000 | | | MMG Ltd * | | | 46,365 | |
| | | |
| | | 23,500 | | | NetDragon Websoft Holdings Ltd. | | | 52,698 | |
| | | |
| | | 4,874 | | | NetEase Inc | | | 94,271 | |
| | | |
| | | 802 | | | NetEase Inc ADR (b) | | | 76,463 | |
| | | |
| | | 1,149,000 | | | Nexteer Automotive Group Ltd | | | 1,150,814 | |
| | | |
| | | 38,500 | | | PetroChina Co Ltd ADR | | | 2,050,510 | |
| | | |
| | | 3,780,000 | | | PetroChina Co Ltd – Class H | | | 2,024,665 | |
| | | |
| | | 4,413,600 | | | PICC Property & Casualty Co Ltd – Class H | | | 4,658,936 | |
| | | |
| | | 667,000 | | | Ping An Insurance Group Co of China Ltd – Class H | | | 5,171,693 | |
| | | |
| | | 745,000 | | | Poly Property Group Co Ltd | | | 202,231 | |
| | | |
| | | 688,032 | | | Postal Savings Bank of China Co Ltd – Class A | | | 610,059 | |
| | | |
| | | 1,108,000 | | | Powerlong Real Estate Holdings Ltd | | | 531,087 | |
| | | |
| | | 58,000 | | | Road King Infrastructure Ltd | | | 55,183 | |
| | | |
| | | 202,000 | | | Seazen Group Ltd * | | | 106,587 | |
| | | |
| | | 156,000 | | | Shanghai Jin Jiang Capital Co Ltd – Class H | | | 59,346 | |
| | | |
| | | 737,200 | | | Shanghai Pharmaceuticals Holding Co Ltd – Class H | | | 1,330,693 | |
| | | |
| | | 1,294,500 | | | Shimao Group Holdings Ltd (a) | | | 776,827 | |
| | | |
| | | 3,052,000 | | | Sihuan Pharmaceutical Holdings Group Ltd (a) | | | 654,435 | |
| | | |
| | | 616,000 | | | Sino-Ocean Land Holdings Ltd | | | 132,500 | |
| | | |
| | | 910,520 | | | Sinopec Engineering Group Co Ltd – Class H | | | 435,580 | |
| | | |
| | | 1,525,600 | | | Sinopharm Group Co Ltd – Class H | | | 3,698,334 | |
| | | |
| | | 880,360 | | | Sinotruk Hong Kong Ltd | | | 1,314,084 | |
| | | |
| | | 4,276,000 | | | Skyworth Group Ltd * | | | 2,415,630 | |
| | | |
| | | 1,182,000 | | | Sunac China Holdings Ltd | | | 966,166 | |
| | | |
| | | 15,000 | | | Sunac Services Holdings Ltd | | | 12,820 | |
| | | |
| | | 29,232 | | | Sunny Optical Technology Group Co Ltd | | | 700,514 | |
| | | |
| | | 1,108,000 | | | TCL Electronics Holdings Ltd | | | 519,417 | |
| | | |
| | | 55,071 | | | Tencent Holdings Ltd | | | 2,971,703 | |
| | | |
| | | 11,200 | | | Tencent Holdings Ltd ADR (b) | | | 602,448 | |
| | | | |
| | |
| | | See accompanying notes to the financial statements. | | 31 |
GMO Benchmark-Free Fund
(A Series of GMO Trust)
Schedule of Investments — (Continued)
(showing percentage of total net assets)
February 28, 2022
| | | | | | | | | | |
Shares | | | Description | | Value ($) | |
| | | |
| | | | | | China — continued | | | |
| | | |
| | | 36,300 | | | Tencent Music Entertainment Group ADR * (b) | | | 195,657 | |
| | | |
| | | 554,000 | | | Tianjin Port Development Holdings Ltd | | | 44,637 | |
| | | |
| | | 1,022,960 | | | Tianneng Power International Ltd (a) | | | 938,450 | |
| | | |
| | | 142,500 | | | Vipshop Holdings Ltd ADR * | | | 1,235,475 | |
| | | |
| | | 88,000 | | | West China Cement Ltd | | | 15,107 | |
| | | |
| | | 2,782,512 | | | Yuzhou Group Holdings Co Ltd (a) | | | 221,072 | |
| | | |
| | | 124,640 | | | Zhengzhou Coal Mining Machinery Group Co Ltd – Class A | | | 255,161 | |
| | | |
| | | 56,000 | | | Zhenro Properties Group Ltd (a) | | | 4,821 | |
| | | |
| | | 308,240 | | | Zhongsheng Group Holdings Ltd | | | 2,152,416 | |
| | | |
| | | 59,700 | | | Zhuzhou CRRC Times Electric Co Ltd – Class H | | | 311,187 | |
| | | |
| | | 666,800 | | | Zijin Mining Group Co Ltd – Class A | | | 1,194,431 | |
| | | |
| | | 90,800 | | | Zoomlion Heavy Industry Science and Technology Co Ltd – Class H | | | 60,400 | |
| | | | | | | | | | |
| | | |
| | | | | | Total China | | | 134,312,040 | |
| | | | | | | | | | |
| | | |
| | | | | | Czech Republic — 0.1% | | | |
| | | |
| | | 1,435 | | | CEZ AS | | | 54,595 | |
| | | |
| | | 733 | | | Komercni Banka AS | | | 28,836 | |
| | | |
| | | 109,122 | | | Moneta Money Bank AS | | | 431,843 | |
| | | |
| | | 410 | | | Philip Morris CR AS | | | 296,629 | |
| | | | | | | | | | |
| | | |
| | | | | | Total Czech Republic | | | 811,903 | |
| | | | | | | | | | |
| | | |
| | | | | | Denmark — 0.5% | | | |
| | | |
| | | 200 | | | AP Moller – Maersk A/S – Class A (b) | | | 599,694 | |
| | | |
| | | 743 | | | AP Moller – Maersk A/S – Class B (b) | | | 2,350,489 | |
| | | |
| | | 3,159 | | | Carlsberg A/S – Class B | | | 463,266 | |
| | | |
| | | 155,611 | | | Danske Bank A/S | | | 2,635,741 | |
| | | |
| | | 7,316 | | | Matas A/S | | | 106,766 | |
| | | |
| | | 20,341 | | | Pandora A/S | | | 2,082,864 | |
| | | |
| | | 21,753 | | | Scandinavian Tobacco Group A/S | | | 490,537 | |
| | | | | | | | | | |
| | | |
| | | | | | Total Denmark | | | 8,729,357 | |
| | | | | | | | | | |
| | | |
| | | | | | Egypt — 0.1% | | | |
| | | |
| | | 98,547 | | | Commercial International Bank Egypt SAE * | | | 300,156 | |
| | | |
| | | 414,351 | | | Eastern Co SAE | | | 286,463 | |
| | | |
| | | 40,669 | | | Misr Fertilizers Production Co SAE | | | 230,087 | |
| | | | | | | | | | |
| | | |
| | | | | | Total Egypt | | | 816,706 | |
| | | | | | | | | | |
| | | |
| | | | | | Finland — 0.4% | | | |
| | | |
| | | 2,416 | | | Aktia Bank Oyj | | | 27,526 | |
| | | |
| | | 23,985 | | | Kesko Oyj – B Shares | | | 705,871 | |
| | | |
| | | 53,345 | | | Neste Oyj | | | 2,080,168 | |
| | | |
| | | 482,283 | | | Nokia Oyj * | | | 2,607,868 | |
| | | |
| | | 77,829 | | | Outokumpu Oyj * | | | 458,771 | |
| | | | | | | | | | |
| | | |
| | | | | | Total Finland | | | 5,880,204 | |
| | | | | | | | | | |
| | | | | | | | | | |
Shares | | | Description | | Value ($) | |
| | | |
| | | | | | France — 2.1% | | | |
| | | |
| | | 18,514 | | | ALD SA (b) | | | 258,429 | |
| | | |
| | | 298 | | | Alten SA (b) | | | 44,991 | |
| | | |
| | | 17,208 | | | APERAM SA (a) | | | 963,513 | |
| | | |
| | | 71,239 | | | ArcelorMittal SA | | | 2,210,448 | |
| | | |
| | | 282 | | | Arkema SA | | | 37,398 | |
| | | |
| | | 700 | | | Axway Software SA | | | 14,547 | |
| | | |
| | | 81,247 | | | BNP Paribas SA | | | 4,714,318 | |
| | | |
| | | 721 | | | Boiron SA | | | 33,628 | |
| | | |
| | | 680 | | | Bonduelle SCA | | | 13,631 | |
| | | |
| | | 165 | | | Christian Dior SE (b) | | | 116,847 | |
| | | |
| | | 40,523 | | | Cie de Saint-Gobain | | | 2,512,632 | |
| | | |
| | | 24,403 | | | Coface SA | | | 324,601 | |
| | | |
| | | 55,233 | | | Derichebourg SA | | | 573,849 | |
| | | |
| | | 956 | | | Eramet SA * | | | 125,266 | |
| | | |
| | | 337 | | | Groupe Crit (a) | | | 23,299 | |
| | | |
| | | 389 | | | HEXAOM | | | 14,720 | |
| | | |
| | | 11,132 | | | Ipsen SA | | | 1,295,315 | |
| | | |
| | | 14,558 | | | IPSOS (b) | | | 693,801 | |
| | | |
| | | 1,514 | | | Kaufman & Broad SA | | | 54,987 | |
| | | |
| | | 3,801 | | | Kering SA (b) | | | 2,636,501 | |
| | | |
| | | 4,847 | | | LVMH Moet Hennessy Louis Vuitton SE (b) | | | 3,562,084 | |
| | | |
| | | 23,776 | | | Metropole Television SA (b) | | | 471,265 | |
| | | |
| | | 1,974 | | | Nexity SA | | | 77,811 | |
| | | |
| | | 48,951 | | | Publicis Groupe SA (b) | | | 3,248,668 | |
| | | |
| | | 18,273 | | | Quadient SA | | | 334,080 | |
| | | |
| | | 1,204 | | | Rothschild & Co | | | 46,739 | |
| | | |
| | | 36,374 | | | Safran SA | | | 4,624,850 | |
| | | |
| | | 3,294 | | | Sanofi (b) | | | 344,330 | |
| | | |
| | | 3,076 | | | Schneider Electric SE (b) | | | 476,583 | |
| | | |
| | | 5,965 | | | Societe BIC SA | | | 314,755 | |
| | | |
| | | 106,130 | | | Societe Generale SA | | | 3,001,095 | |
| | | |
| | | 2,700 | | | STMicroelectronics NV – NY Shares | | | 114,264 | |
| | | |
| | | 695 | | | Synergie SE | | | 27,192 | |
| | | |
| | | 62,672 | | | Television Francaise 1 (b) | | | 618,657 | |
| | | |
| | | 172 | | | TotalEnergies SE (b) | | | 8,763 | |
| | | |
| | | 369 | | | Vilmorin & Cie SA | | | 19,084 | |
| | | | | | | | | | |
| | | |
| | | | | | Total France | | | 33,952,941 | |
| | | | | | | | | | |
| | | |
| | | | | | Germany — 1.4% | | | |
| | | |
| | | 10,395 | | | ADVA Optical Networking SE * | | | 175,996 | |
| | | |
| | | 137 | | | Amadeus Fire AG | | | 22,099 | |
| | | |
| | | 39,668 | | | Bayer AG (Registered) | | | 2,291,341 | |
| | | |
| | | 20,722 | | | Bayerische Motoren Werke AG | | | 1,995,677 | |
| | | |
| | | 24,247 | | | Beiersdorf AG | | | 2,457,870 | |
| | | |
| | | 478 | | | Cewe Stiftung & Co KGaA | | | 54,271 | |
| | | |
| | | 1,065 | | | Covestro AG | | | 56,323 | |
| | | |
| | | 20,787 | | | Deutsche Pfandbriefbank AG | | | 225,408 | |
| | | |
| | | 900 | | | Draegerwerk AG & Co KGaA (b) | | | 47,221 | |
| | | |
| | | 1,126 | | | Elmos Semiconductor SE | | | 72,522 | |
| | | | |
| | |
| 32 | | See accompanying notes to the financial statements. | | |
GMO Benchmark-Free Fund
(A Series of GMO Trust)
Schedule of Investments — (Continued)
(showing percentage of total net assets)
February 28, 2022
| | | | | | | | | | |
Shares | | | Description | | Value ($) | |
| | | |
| | | | | | Germany — continued | | | |
| | | |
| | | 34,922 | | | Fresenius SE & Co KGaA (b) | | | 1,218,507 | |
| | | |
| | | 4,219 | | | Hamburger Hafen und Logistik AG (b) | | | 83,595 | |
| | | |
| | | 28,750 | | | HeidelbergCement AG | | | 1,865,499 | |
| | | |
| | | 2,415 | | | Hornbach Holding AG & Co KGaA | | | 316,329 | |
| | | |
| | | 78,520 | | | Kloeckner & Co SE * | | | 1,062,245 | |
| | | |
| | | 62,249 | | | Mercedes-Benz Group AG (b) | | | 4,862,859 | |
| | | |
| | | 9,381 | | | Merck KGaA (b) | | | 1,860,698 | |
| | | |
| | | 2,286 | | | RTL Group SA | | | 127,380 | |
| | | |
| | | 15,447 | | | Salzgitter AG * | | | 674,750 | |
| | | |
| | | 11,594 | | | SAP SE (b) | | | 1,307,850 | |
| | | |
| | | 3,031 | | | Takkt AG | | | 52,051 | |
| | | |
| | | 3,431 | | | Traton SE | | | 70,076 | |
| | | |
| | | 3,822 | | | Volkswagen AG | | | 988,519 | |
| | | | | | | | | | |
| | | |
| | | | | | Total Germany | | | 21,889,086 | |
| | | | | | | | | | |
| | | |
| | | | | | Greece — 0.0% | | | |
| | | |
| | | 12,055 | | | FF Group * (d) | | | — | |
| | | |
| | | 19,243 | | | Hellenic Telecommunications Organization SA | | | 384,898 | |
| | | |
| | | 13,566 | | | JUMBO SA | | | 194,906 | |
| | | | | | | | | | |
| | | |
| | | | | | Total Greece | | | 579,804 | |
| | | | | | | | | | |
| | | |
| | | | | | Hong Kong — 0.9% | | | |
| | | |
| | | 85,500 | | | ASM Pacific Technology Ltd | | | 938,022 | |
| | | |
| | | 53,400 | | | Bank of East Asia Ltd (The) | | | 90,013 | |
| | | |
| | | 26,400 | | | Budweiser Brewing Co APAC Ltd | | | 81,945 | |
| | | |
| | | 58,400 | | | Champion (REIT) | | | 26,483 | |
| | | |
| | | 71,000 | | | Chow Sang Sang Holdings International Ltd | | | 99,650 | |
| | | |
| | | 491,000 | | | CITIC Telecom International Holdings Ltd | | | 174,749 | |
| | | |
| | | 22,500 | | | CK Asset Holdings Ltd (b) | | | 142,111 | |
| | | |
| | | 385,500 | | | CK Hutchison Holdings Ltd (b) | | | 2,702,765 | |
| | | |
| | | 550,000 | | | CSI Properties Ltd | | | 14,526 | |
| | | |
| | | 100,500 | | | Dah Sing Banking Group Ltd | | | 90,992 | |
| | | |
| | | 36,800 | | | Dah Sing Financial Holdings Ltd | | | 119,173 | |
| | | |
| | | 1,222,000 | | | First Pacific Co Ltd | | | 478,385 | |
| | | |
| | | 260,495 | | | Galaxy Entertainment Group Ltd * | | | 1,452,841 | |
| | | |
| | | 212,000 | | | Giordano International Ltd | | | 42,894 | |
| | | |
| | | 186,500 | | | HK Electric Investments & HK Electric Investments Ltd (b) | | | 184,011 | |
| | | |
| | | 327,000 | | | HKT Trust & HKT Ltd | | | 441,238 | |
| | | |
| | | 231,000 | | | IGG Inc | | | 138,349 | |
| | | |
| | | 102,000 | | | Johnson Electric Holdings Ltd | | | 169,843 | |
| | | |
| | | 30,000 | | | JS Global Lifestyle Co Ltd | | | 34,601 | |
| | | |
| | | 113,000 | | | K Wah International Holdings Ltd | | | 42,889 | |
| | | |
| | | 85,500 | | | Kerry Logistics Network Ltd | | | 207,447 | |
| | | |
| | | 314,000 | | | Kerry Properties Ltd | | | 860,418 | |
| | | |
| | | 52,800 | | | Luk Fook Holdings International Ltd | | | 140,275 | |
| | | |
| | | 4,000 | | | Orient Overseas International Ltd. (b) | | | 113,158 | |
| | | |
| | | 376,000 | | | Pacific Textiles Holdings Ltd | | | 182,417 | |
| | | | | | | | | | |
Shares | | | Description | | Value ($) | |
| | | |
| | | | | | Hong Kong — continued | | | |
| | | |
| | | 29,760 | | | PAX Global Technology Ltd | | | 22,210 | |
| | | |
| | | 1,086,000 | | | PCCW Ltd | | | 607,557 | |
| | | |
| | | 135,500 | | | Power Assets Holdings Ltd (b) | | | 853,992 | |
| | | |
| | | 268,000 | | | Shun Tak Holdings Ltd * | | | 68,489 | |
| | | |
| | | 60,500 | | | SmarTone Telecommunications Holdings Ltd | | | 34,510 | |
| | | |
| | | 102,000 | | | Sun Hung Kai & Co Ltd | | | 51,783 | |
| | | |
| | | 13,500 | | | Sun Hung Kai Properties Ltd (b) | | | 156,948 | |
| | | |
| | | 53,000 | | | Swire Pacific Ltd – Class A (b) | | | 292,889 | |
| | | |
| | | 56,500 | | | Texhong Textile Group Ltd | | | 70,315 | |
| | | |
| | | 180,000 | | | Texwinca Holdings Ltd | | | 37,577 | |
| | | |
| | | 258,000 | | | VSTECS Holdings Ltd | | | 265,250 | |
| | | |
| | | 80,900 | | | VTech Holdings Ltd | | | 665,093 | |
| | | |
| | | 2,592,500 | | | WH Group Ltd | | | 1,810,539 | |
| | | |
| | | 201,880 | | | Xinyi Glass Holdings Ltd | | | 537,756 | |
| | | |
| | | 189,000 | | | Yue Yuen Industrial Holdings Ltd * | | | 319,385 | |
| | | | | | | | | | |
| | | |
| | | | | | Total Hong Kong | | | 14,763,488 | |
| | | | | | | | | | |
| | | |
| | | | | | Hungary — 0.0% | | | |
| | | |
| | | 38,427 | | | MOL Hungarian Oil & Gas Plc | | | 299,742 | |
| | | |
| | | 3,495 | | | OTP Bank Nyrt Plc * | | | 133,366 | |
| | | | | | | | | | |
| | | |
| | | | | | Total Hungary | | | 433,108 | |
| | | | | | | | | | |
| | | |
| | | | | | India — 2.8% | | | |
| | | |
| | | 5 | | | Amara Raja Batteries Ltd | | | 37 | |
| | | |
| | | 23 | | | Ambuja Cements Ltd | | | 97 | |
| | | |
| | | 78,614 | | | Apollo Tyres Ltd | | | 193,919 | |
| | | |
| | | 242,669 | | | Arvind Ltd * | | | 383,465 | |
| | | |
| | | 18,741 | | | Asian Paints Ltd | | | 791,354 | |
| | | |
| | | 5 | | | Astral Ltd | | | 130 | |
| | | |
| | | 54,403 | | | Axis Bank Ltd * | | | 539,231 | |
| | | |
| | | 4,001 | | | Bajaj Consumer Care Ltd | | | 8,670 | |
| | | |
| | | 7,102 | | | Balrampur Chini Mills Ltd | | | 37,584 | |
| | | |
| | | 11,640 | | | Bharat Electronics Ltd | | | 32,688 | |
| | | |
| | | 18,119 | | | Bharat Petroleum Corp Ltd | | | 84,443 | |
| | | |
| | | 85,089 | | | Brightcom Group Ltd | | | 137,855 | |
| | | |
| | | 2,326 | | | Clean Science & Technology Ltd * | | | 57,289 | |
| | | |
| | | 176,772 | | | Coal India Ltd | | | 399,005 | |
| | | |
| | | 3 | | | Colgate-Palmolive India Ltd | | | 57 | |
| | | |
| | | 3,412 | | | Coromandel International Ltd | | | 35,058 | |
| | | |
| | | 3,900 | | | Cummins India Ltd | | | 49,858 | |
| | | |
| | | 2 | | | Cyient Ltd | | | 22 | |
| | | |
| | | 47,932 | | | Dhampur Sugar Mills Ltd | | | 240,217 | |
| | | |
| | | 2,681 | | | Emami Ltd | | | 17,619 | |
| | | |
| | | 315,467 | | | GAIL India Ltd | | | 609,779 | |
| | | |
| | | 44,323 | | | Glenmark Pharmaceuticals Ltd | | | 264,915 | |
| | | |
| | | 1,326 | | | Godrej Properties Ltd * | | | 26,613 | |
| | | |
| | | 6,703 | | | Grasim Industries Ltd | | | 143,180 | |
| | | |
| | | 9 | | | Gujarat Gas Ltd | | | 70 | |
| | | | |
| | |
| | | See accompanying notes to the financial statements. | | 33 |
GMO Benchmark-Free Fund
(A Series of GMO Trust)
Schedule of Investments — (Continued)
(showing percentage of total net assets)
February 28, 2022
| | | | | | | | | | |
Shares | | | Description | | Value ($) | |
| | | |
| | | | | | India — continued | | | |
| | | |
| | | 8,151 | | | Gujarat Narmada Valley Fertilizers & Chemicals Ltd | | | 59,896 | |
| | | |
| | | 68,257 | | | Gujarat State Fertilizers & Chemicals Ltd | | | 114,253 | |
| | | |
| | | 6,909 | | | Gujarat State Petronet Ltd | | | 26,531 | |
| | | |
| | | 184,262 | | | HCL Technologies Ltd | | | 2,768,454 | |
| | | |
| | | 24,036 | | | HDFC Bank Ltd | | | 457,085 | |
| | | |
| | | 12,000 | | | HDFC Bank Ltd ADR | | | 746,040 | |
| | | |
| | | 70,186 | | | Hindalco Industries Ltd | | | 537,884 | |
| | | |
| | | 9,003 | | | Hindustan Aeronautics Ltd | | | 165,749 | |
| | | |
| | | 89,468 | | | Hindustan Petroleum Corp Ltd | | | 325,470 | |
| | | |
| | | 17,479 | | | Hindustan Unilever Ltd | | | 506,266 | |
| | | |
| | | 11,763 | | | Hindustan Zinc Ltd | | | 48,977 | |
| | | |
| | | 21,541 | | | Housing Development Finance Corp Ltd | | | 680,057 | |
| | | |
| | | 82,548 | | | ICICI Bank Ltd | | | 816,515 | |
| | | |
| | | 459,335 | | | Indiabulls Housing Finance Ltd | | | 922,895 | |
| | | |
| | | 61,099 | | | Indiabulls Real Estate Ltd * | | | 88,321 | |
| | | |
| | | 152,712 | | | Indian Oil Corp Ltd | | | 234,498 | |
| | | |
| | | 26,857 | | | Indus Towers Ltd * | | | 77,408 | |
| | | |
| | | 13,107 | | | Infosys Ltd | | | 299,299 | |
| | | |
| | | 53,100 | | | Infosys Ltd Sponsored ADR (b) | | | 1,192,626 | |
| | | |
| | | 2,062,780 | | | ITC Ltd | | | 5,940,956 | |
| | | |
| | | 127,481 | | | Jai Balaji Industries Ltd * | | | 77,953 | |
| | | |
| | | 433,260 | | | Karnataka Bank Ltd (The) | | | 348,156 | |
| | | |
| | | 8 | | | KEI Industries Ltd | | | 106 | |
| | | |
| | | 1 | | | KNR Constructions Ltd | | | 4 | |
| | | |
| | | 2 | | | L&T Technology Services Ltd | | | 121 | |
| | | |
| | | 6,289 | | | Mahanagar Gas Ltd | | | 60,902 | |
| | | |
| | | 95,145 | | | Mahindra & Mahindra Ltd | | | 1,004,731 | |
| | | |
| | | 77 | | | Manappuram Finance Ltd | | | 118 | |
| | | |
| | | 13,868 | | | Marico Ltd | | | 94,074 | |
| | | |
| | | 13,609 | | | Mindtree Ltd | | | 704,691 | |
| | | |
| | | 218,033 | | | National Aluminium Co Ltd | | | 353,668 | |
| | | |
| | | 24,979 | | | NBCC India Ltd | | | 13,030 | |
| | | |
| | | 35,842 | | | NCC Ltd | | | 30,173 | |
| | | |
| | | 50,102 | | | NHPC Ltd | | | 18,241 | |
| | | |
| | | 354,867 | | | NMDC Ltd | | | 679,406 | |
| | | |
| | | 478,359 | | | NTPC Ltd | | | 851,861 | |
| | | |
| | | 3,045 | | | Oberoi Realty Ltd * | | | 37,027 | |
| | | |
| | | 2,884,029 | | | Oil & Natural Gas Corp Ltd | | | 6,201,853 | |
| | | |
| | | 482 | | | Oracle Financial Services Software Ltd | | | 21,837 | |
| | | |
| | | 28,405 | | | Petronet LNG Ltd | | | 81,660 | |
| | | |
| | | 1 | | | PI Industries Ltd | | | 33 | |
| | | |
| | | 3 | | | Polycab India Ltd | | | 94 | |
| | | |
| | | 1,346,055 | | | Power Finance Corp Ltd | | | 1,974,755 | |
| | | |
| | | 193,949 | | | Power Grid Corp of India Ltd | | | 537,859 | |
| | | |
| | | 6,569 | | | Prestige Estates Projects Ltd | | | 39,745 | |
| | | |
| | | 72,356 | | | PTC India Ltd | | | 81,995 | |
| | | |
| | | 56,068 | | | Rajesh Exports Ltd | | | 526,174 | |
| | | |
| | | 1,744,566 | | | REC Ltd | | | 2,845,308 | |
| | | |
| | | 166,085 | | | Redington India Ltd | | | 338,529 | |
| | | | | | | | | | |
Shares | | | Description | | Value ($) | |
| | | |
| | | | | | India — continued | | | |
| | | |
| | | 2 | | | Reliance Industries Ltd | | | 63 | |
| | | |
| | | 2,047 | | | Sobha Ltd | | | 21,043 | |
| | | |
| | | 190,377 | | | Sun Pharmaceutical Industries Ltd | | | 2,139,346 | |
| | | |
| | | 12,668 | | | Sun TV Network Ltd | | | 75,889 | |
| | | |
| | | 18,431 | | | Tata Consultancy Services Ltd | | | 872,113 | |
| | | |
| | | 36,243 | | | Tata Motors Ltd – Class A * | | | 105,555 | |
| | | |
| | | 103,988 | | | Tata Steel Ltd | | | 1,698,696 | |
| | | |
| | | 20,805 | | | Titan Co Ltd | | | 709,295 | |
| | | |
| | | 167,956 | | | TV18 Broadcast Ltd * | | | 136,137 | |
| | | |
| | | 679 | | | United Spirits Ltd * | | | 8,080 | |
| | | |
| | | 4,557 | | | UPL Ltd | | | 40,509 | |
| | | |
| | | 7,026 | | | Vardhman Textiles Ltd | | | 240,750 | |
| | | |
| | | 7,963 | | | Welspun Corp Ltd | | | 15,287 | |
| | | |
| | | 199,249 | | | Wipro Ltd | | | 1,474,721 | |
| | | | | | | | | | |
| | | |
| | | | | | Total India | | | 44,523,923 | |
| | | | | | | | | | |
| | | |
| | | | | | Indonesia — 0.5% | | | |
| | | |
| | | 924,200 | | | Adaro Energy Tbk PT | | | 158,345 | |
| | | |
| | | 5,782,900 | | | Bank Central Asia Tbk PT | | | 3,264,827 | |
| | | |
| | | 1,612,400 | | | Bank Mandiri Persero Tbk PT | | | 871,730 | |
| | | |
| | | 442,547 | | | Bank Negara Indonesia Persero Tbk PT | | | 247,965 | |
| | | |
| | | 2,588,500 | | | Bank Pembangunan Daerah Jawa Timur Tbk PT | | | 138,801 | |
| | | |
| | | 6,507,600 | | | Bank Rakyat Indonesia Persero Tbk PT | | | 2,080,871 | |
| | | |
| | | 1,935,900 | | | Bukit Asam Tbk PT | | | 425,290 | |
| | | |
| | | 179,200 | | | Indo Tambangraya Megah Tbk PT | | | 333,288 | |
| | | |
| | | 1,182,500 | | | Media Nusantara Citra Tbk PT | | | 71,980 | |
| | | |
| | | 138,120 | | | Pakuwon Jati Tbk PT * | | | 4,447 | |
| | | |
| | | 963,900 | | | Panin Financial Tbk PT * | | | 11,344 | |
| | | |
| | | 1,263,024 | | | Telkom Indonesia Persero Tbk PT | | | 381,323 | |
| | | |
| | | 35,548 | | | United Tractors Tbk PT | | | 62,031 | |
| | | | | | | | | | |
| | | |
| | | | | | Total Indonesia | | | 8,052,242 | |
| | | | | | | | | | |
| | | |
| | | | | | Ireland — 0.6% | | | |
| | | |
| | | 79,900 | | | AIB Group Plc * (a) | | | 210,798 | |
| | | |
| | | 320,010 | | | Bank of Ireland Group Plc * | | | 2,123,345 | |
| | | |
| | | 3,941 | | | CRH Plc | | | 179,151 | |
| | | |
| | | 12,640 | | | CRH Plc Sponsored ADR | | | 567,410 | |
| | | |
| | | 29,000 | | | Glanbia Plc | | | 405,972 | |
| | | |
| | | 111,663 | | | Hibernia REIT Plc | | | 145,760 | |
| | | |
| | | 3,640 | | | Kingspan Group Plc | | | 355,490 | |
| | | |
| | | 15,644 | | | Origin Enterprises Plc | | | 63,340 | |
| | | |
| | | 11,448 | | | Permanent TSB Group Holdings Plc * | | | 22,104 | |
| | | |
| | | 114,409 | | | Ryanair Holdings Plc * | | | 1,983,650 | |
| | | |
| | | 16,112 | | | Ryanair Holdings Plc Sponsored ADR * (b) | | | 1,606,528 | |
| | | |
| | | 7,054 | | | Smurfit Kappa Group Plc (c) | | | 350,035 | |
| | | |
| | | 37,501 | | | Smurfit Kappa Group Plc (c) | | | 1,872,883 | |
| | | | | | | | | | |
| | | |
| | | | | | Total Ireland | | | 9,886,466 | |
| | | | | | | | | | |
| | | | |
| | |
| 34 | | See accompanying notes to the financial statements. | | |
GMO Benchmark-Free Fund
(A Series of GMO Trust)
Schedule of Investments — (Continued)
(showing percentage of total net assets)
February 28, 2022
| | | | | | | | | | |
Shares | | | Description | | Value ($) | |
| | | |
| | | | | | Israel — 0.4% | | | |
| | | |
| | | 132,397 | | | Bank Leumi Le-Israel BM | | | 1,434,246 | |
| | | |
| | | 17,900 | | | Check Point Software Technologies Ltd * | | | 2,593,352 | |
| | | |
| | | 6,798 | | | First International Bank of Israel Ltd | | | 292,422 | |
| | | |
| | | 530 | | | Fox Wizel Ltd | | | 89,802 | |
| | | |
| | | 29,050 | | | Isracard Ltd | | | 152,466 | |
| | | |
| | | 213 | | | Israel Corp Ltd (The) * | | | 111,931 | |
| | | |
| | | 424,975 | | | Oil Refineries Ltd * | | | 152,280 | |
| | | |
| | | 257,400 | | | Teva Pharmaceutical Industries Ltd Sponsored ADR * | | | 2,092,662 | |
| | | | | | | | | | |
| | | |
| | | | | | Total Israel | | | 6,919,161 | |
| | | | | | | | | | |
| | | |
| | | | | | Italy — 0.9% | | | |
| | | |
| | | 34,484 | | | A2A SPA (b) | | | 61,523 | |
| | | |
| | | 12,314 | | | ACEA SPA (b) | | | 233,853 | |
| | | |
| | | 15,804 | | | Anima Holding SPA | | | 74,707 | |
| | | |
| | | 10,608 | | | Azimut Holding SPA | | | 253,122 | |
| | | |
| | | 16,544 | | | Banca IFIS SPA | | | 349,150 | |
| | | |
| | | 90,247 | | | Banco BPM SPA | | | 309,659 | |
| | | |
| | | 55,960 | | | Cofide SPA * | | | 25,143 | |
| | | |
| | | 22,116 | | | Credito Emiliano SPA | | | 158,815 | |
| | | |
| | | 5,505 | | | De’ Longhi SPA | | | 174,682 | |
| | | |
| | | 1,378 | | | El.En. SPA (b) | | | 19,984 | |
| | | |
| | | 161,034 | | | Enel SPA (b) | | | 1,186,650 | |
| | | |
| | | 7,503 | | | Esprinet SPA | | | 93,551 | |
| | | |
| | | 73,113 | | | EXOR NV | | | 5,539,451 | |
| | | |
| | | 180,666 | | | Italgas SPA (b) | | | 1,166,201 | |
| | | |
| | | 9,031 | | | La Doria SPA | | | 166,463 | |
| | | |
| | | 178,725 | | | Leonardo SPA * | | | 1,593,308 | |
| | | |
| | | 79,574 | | | Poste Italiane SPA | | | 912,675 | |
| | | |
| | | 847 | | | Salcef SPA | | | 20,926 | |
| | | |
| | | 2,484,855 | | | Telecom Italia SPA | | | 1,044,001 | |
| | | |
| | | 1,189,605 | | | Telecom Italia SPA – RSP | | | 494,004 | |
| | | |
| | | 6,007 | | | Unieuro SPA (a) | | | 118,926 | |
| | | |
| | | 260,188 | | | Unipol Gruppo SPA | | | 1,320,215 | |
| | | | | | | | | | |
| | | |
| | | | | | Total Italy | | | 15,317,009 | |
| | | | | | | | | | |
| | | |
| | | | | | Japan — 14.4% | | | |
| | | |
| | | 7,900 | | | ADEKA Corp | | | 183,219 | |
| | | |
| | | 20,700 | | | Aeon Delight Co Ltd (a) | | | 537,441 | |
| | | |
| | | 195,600 | | | Aeon Mall Co Ltd (a) | | | 2,750,537 | |
| | | |
| | | 68,800 | | | AGC Inc | | | 3,052,143 | |
| | | |
| | | 6,100 | | | Aichi Corp | | | 46,830 | |
| | | |
| | | 20,200 | | | Aisin Corp | | | 735,770 | |
| | | |
| | | 75,300 | | | Amano Corp | | | 1,476,219 | |
| | | |
| | | 6,600 | | | AOKI Holdings Inc | | | 34,436 | |
| | | |
| | | 55,300 | | | Arcs Co Ltd (a) | | | 1,047,336 | |
| | | |
| | | 343,300 | | | Asahi Kasei Corp | | | 3,221,811 | |
| | | |
| | | 128,100 | | | Astellas Pharma Inc | | | 2,137,248 | |
| | | |
| | | 3,600 | | | Bando Chemical Industries Ltd | | | 26,993 | |
| | | | | | | | | | |
Shares | | | Description | | Value ($) | |
| | | |
| | | | | | Japan — continued | | | |
| | | |
| | | 76,200 | | | Brother Industries Ltd | | | 1,386,907 | |
| | | |
| | | 8,500 | | | Calbee Inc (a) | | | 191,129 | |
| | | |
| | | 2,500 | | | Canon Electronics Inc | | | 34,892 | |
| | | |
| | | 54,800 | | | Canon Inc (b) | | | 1,289,605 | |
| | | |
| | | 1,900 | | | Canon Inc Sponsored ADR (b) | | | 44,897 | |
| | | |
| | | 9,600 | | | Canon Marketing Japan Inc | | | 200,643 | |
| | | |
| | | 1,600 | | | Cawachi Ltd (a) | | | 34,169 | |
| | | |
| | | 3,400 | | | Central Glass Co Ltd | | | 61,012 | |
| | | |
| | | 1,600 | | | Chiyoda Integre Co Ltd | | | 27,667 | |
| | | |
| | | 121,700 | | | Chugoku Marine Paints Ltd | | | 975,359 | |
| | | |
| | | 31,700 | | | Citizen Watch Co Ltd | | | 138,088 | |
| | | |
| | | 4,300 | | | CONEXIO Corp | | | 52,103 | |
| | | |
| | | 43,900 | | | Dai Nippon Printing Co Ltd | | | 1,145,996 | |
| | | |
| | | 5,400 | | | Dai Nippon Toryo Co Ltd | | | 38,212 | |
| | | |
| | | 1,500 | | | Dai-Dan Co Ltd | | | 30,462 | |
| | | |
| | | 17,700 | | | Daihen Corp | | | 666,382 | |
| | | |
| | | 1,400 | | | Daiichi Jitsugyo Co Ltd | | | 53,241 | |
| | | |
| | | 59,600 | | | Daiwa House Industry Co Ltd (b) | | | 1,690,272 | |
| | | |
| | | 280,600 | | | Daiwabo Holdings Co Ltd | | | 4,343,509 | |
| | | |
| | | 99,800 | | | Denka Co Ltd | | | 3,065,122 | |
| | | |
| | | 800 | | | Dowa Holdings Co Ltd | | | 36,104 | |
| | | |
| | | 4,400 | | | DTS Corp (b) | | | 105,425 | |
| | | |
| | | 2,800 | | | Ehime Bank Ltd (The) | | | 23,398 | |
| | | |
| | | 1,300 | | | Eizo Corp | | | 41,774 | |
| | | |
| | | 43,600 | | | Electric Power Development Co Ltd (b) | | | 691,766 | |
| | | |
| | | 181,800 | | | EXEO Group Inc | | | 3,784,415 | |
| | | |
| | | 25,000 | | | Ezaki Glico Co Ltd | | | 852,859 | |
| | | |
| | | 129,200 | | | Fuji Corp (a) | | | 2,627,334 | |
| | | |
| | | 4,500 | | | Fuji Electric Co Ltd | | | 231,532 | |
| | | |
| | | 4,700 | | | FUJIFILM Holdings Corp (b) | | | 298,751 | |
| | | |
| | | 700 | | | Fujimori Kogyo Co Ltd | | | 24,294 | |
| | | |
| | | 9,600 | | | Fujitsu Ltd (b) | | | 1,394,726 | |
| | | |
| | | 2,600 | | | Furuno Electric Co Ltd (a) | | | 23,385 | |
| | | |
| | | 6,000 | | | G-7 Holdings Inc | | | 86,794 | |
| | | |
| | | 9,300 | | | Hanwa Co Ltd | | | 270,512 | |
| | | |
| | | 224,000 | | | Haseko Corp | | | 2,859,339 | |
| | | |
| | | 8,700 | | | Hazama Ando Corp | | | 70,077 | |
| | | |
| | | 1,800 | | | Heiwado Co Ltd | | | 31,374 | |
| | | |
| | | 18,700 | | | Hitachi Ltd (b) | | | 924,765 | |
| | | |
| | | 300 | | | Hitachi Zosen Corp | | | 2,080 | |
| | | |
| | | 42,600 | | | Hogy Medical Co Ltd (b) | | | 1,242,309 | |
| | | |
| | | 181,500 | | | Honda Motor Co Ltd | | | 5,514,132 | |
| | | |
| | | 2,300 | | | Hyakujushi Bank Ltd (The) | | | 36,021 | |
| | | |
| | | 21,900 | | | Idemitsu Kosan Co Ltd | | | 587,063 | |
| | | |
| | | 41,700 | | | Iida Group Holdings Co Ltd | | | 773,916 | |
| | | |
| | | 70,000 | | | Inabata & Co Ltd | | | 1,413,620 | |
| | | |
| | | 413,400 | | | Inpex Corp | | | 4,261,127 | |
| | | |
| | | 45,100 | | | Isuzu Motors Ltd | | | 609,960 | |
| | | |
| | | 187,900 | | | ITOCHU Corp (b) | | | 6,123,398 | |
| | | |
| | | 3,700 | | | Itochu Enex Co Ltd | | | 33,671 | |
| | | | |
| | |
| | | See accompanying notes to the financial statements. | | 35 |
GMO Benchmark-Free Fund
(A Series of GMO Trust)
Schedule of Investments — (Continued)
(showing percentage of total net assets)
February 28, 2022
| | | | | | | | | | |
Shares | | | Description | | Value ($) | |
| | | |
| | | | | | Japan — continued | | | |
| | | |
| | | 600 | | | Itochu-Shokuhin Co Ltd | | | 26,100 | |
| | | |
| | | 23,300 | | | Itoham Yonekyu Holdings Inc | | | 140,009 | |
| | | |
| | | 11,600 | | | Itoki Corp | | | 36,261 | |
| | | |
| | | 6,800 | | | Jaccs Co Ltd | | | 192,043 | |
| | | |
| | | 105,500 | | | Japan Tobacco Inc | | | 1,940,267 | |
| | | |
| | | 123,000 | | | JFE Holdings Inc | | | 1,831,169 | |
| | | |
| | | 173,800 | | | JVCKenwood Corp | | | 280,611 | |
| | | |
| | | 344,300 | | | K’s Holdings Corp | | | 3,730,832 | |
| | | |
| | | 5,100 | | | Kaga Electronics Co Ltd | | | 134,226 | |
| | | |
| | | 127,600 | | | Kajima Corp | | | 1,717,303 | |
| | | |
| | | 3,500 | | | Kamei Corp | | | 32,054 | |
| | | |
| | | 2,700 | | | Kanamoto Co Ltd | | | 53,495 | |
| | | |
| | | 18,200 | | | Kandenko Co Ltd | | | 138,394 | |
| | | |
| | | 5,300 | | | Kaneka Corp | | | 173,357 | |
| | | |
| | | 122,500 | | | Kanematsu Corp | | | 1,495,576 | |
| | | |
| | | 900 | | | Kato Sangyo Co Ltd | | | 24,261 | |
| | | |
| | | 238,600 | | | KDDI Corp | | | 7,764,340 | |
| | | |
| | | 22,900 | | | Kinden Corp | | | 324,782 | |
| | | |
| | | 1,000 | | | Kintetsu World Express Inc (b) | | | 26,207 | |
| | | |
| | | 181,000 | | | Kirin Holdings Co Ltd | | | 3,009,208 | |
| | | |
| | | 3,497 | | | Kohnan Shoji Co Ltd (a) | | | 111,203 | |
| | | |
| | | 10,200 | | | Kokuyo Co Ltd | | | 142,995 | |
| | | |
| | | 15,401 | | | Komeri Co Ltd | | | 378,683 | |
| | | |
| | | 8,674 | | | Konica Minolta Inc | | | 36,748 | |
| | | |
| | | 81,800 | | | Konoike Transport Co Ltd (b) | | | 855,506 | |
| | | |
| | | 1,900 | | | Kumagai Gumi Co Ltd | | | 47,765 | |
| | | |
| | | 5,100 | | | Kyokuto Kaihatsu Kogyo Co Ltd | | | 64,389 | |
| | | |
| | | 103,500 | | | Kyudenko Corp | | | 2,778,637 | |
| | | |
| | | 6,800 | | | Lintec Corp | | | 151,576 | |
| | | |
| | | 3,300 | | | Macnica Fuji Electronics Holdings Inc | | | 77,670 | |
| | | |
| | | 94,900 | | | Macromill Inc | | | 932,525 | |
| | | |
| | | 116,200 | | | Mandom Corp | | | 1,393,421 | |
| | | |
| | | 85,500 | | | Marubeni Corp | | | 897,462 | |
| | | |
| | | 104,700 | | | Maruichi Steel Tube Ltd | | | 2,598,607 | |
| | | |
| | | 2,100 | | | Maruzen Showa Unyu Co Ltd (b) | | | 58,444 | |
| | | |
| | | 103,700 | | | Maxell Ltd | | | 1,068,224 | |
| | | |
| | | 14,900 | | | MCJ Co Ltd | | | 130,453 | |
| | | |
| | | 13,200 | | | MEIJI Holdings Co Ltd | | | 792,237 | |
| | | |
| | | 1,300 | | | Melco Holdings Inc | | | 43,580 | |
| | | |
| | | 1,700 | | | Mirait Holdings Corp | | | 28,891 | |
| | | |
| | | 70,900 | | | Mitsubishi Corp (b) | | | 2,383,919 | |
| | | |
| | | 3,400 | | | Mitsubishi Research Institute Inc (b) | | | 114,957 | |
| | | |
| | | 1,400 | | | Mitsubishi Shokuhin Co Ltd | | | 37,739 | |
| | | |
| | | 447,500 | | | Mitsubishi UFJ Financial Group Inc (b) | | | 2,747,195 | |
| | | |
| | | 3,100 | | | Mitsuboshi Belting Ltd | | | 58,434 | |
| | | |
| | | 26,400 | | | Mitsui & Co Ltd (b) | | | 658,223 | |
| | | |
| | | 22,400 | | | Mitsui Chemicals Inc | | | 572,646 | |
| | | |
| | | 6,200 | | | Mitsui DM Sugar Holdings Co Ltd | | | 110,679 | |
| | | |
| | | 5,595 | | | Mixi Inc (b) | | | 108,829 | |
| | | |
| | | 90,800 | | | Morinaga & Co Ltd | | | 2,954,260 | |
| | | | | | | | | | |
Shares | | | Description | | Value ($) | |
| | | |
| | | | | | Japan — continued | | | |
| | | |
| | | 76,600 | | | MS&AD Insurance Group Holdings Inc | | | 2,591,891 | |
| | | |
| | | 74,900 | | | NEC Corp (b) | | | 3,240,595 | |
| | | |
| | | 15,400 | | | NEC Networks & System Integration Corp (b) | | | 236,784 | |
| | | |
| | | 6,400 | | | NGK Insulators Ltd | | | 99,391 | |
| | | |
| | | 3,600 | | | NGK Spark Plug Co Ltd | | | 64,874 | |
| | | |
| | | 99,200 | | | NH Foods Ltd | | | 3,723,247 | |
| | | |
| | | 4,700 | | | Nichias Corp | | | 106,471 | |
| | | |
| | | 5,500 | | | Nichiha Corp | | | 123,887 | |
| | | |
| | | 6,100 | | | Nichireki Co Ltd | | | 68,625 | |
| | | |
| | | 50,100 | | | Nikon Corp | | | 523,687 | |
| | | |
| | | 7,400 | | | Nippn Corp (a) | | | 109,775 | |
| | | |
| | | 1,800 | | | Nippo Corp | | | 62,278 | |
| | | |
| | | 2,000 | | | Nippon Densetsu Kogyo Co Ltd | | | 27,732 | |
| | | |
| | | 2,200 | | | Nippon Soda Co Ltd | | | 64,450 | |
| | | |
| | | 105,900 | | | Nippon Steel Corp | | | 1,938,919 | |
| | | |
| | | 3,100 | | | Nippon Steel Trading Corp | | | 147,051 | |
| | | |
| | | 43,200 | | | Nippon Suisan Kaisha Ltd | | | 204,568 | |
| | | |
| | | 209,500 | | | Nippon Telegraph & Telephone Corp (b) | | | 6,021,216 | |
| | | |
| | | 42,900 | | | Nippon Television Holdings Inc (b) | | | 490,770 | |
| | | |
| | | 1,500 | | | Nissin Corp | | | 22,622 | |
| | | |
| | | 8,400 | | | Nissin Electric Co Ltd | | | 106,897 | |
| | | |
| | | 7,600 | | | Nojima Corp | | | 168,804 | |
| | | |
| | | 11,300 | | | Nomura Real Estate Holdings Inc (b) | | | 281,354 | |
| | | |
| | | 1,600 | | | Noritake Co Ltd | | | 63,894 | |
| | | |
| | | 339,600 | | | Obayashi Corp | | | 2,843,468 | |
| | | |
| | | 17,800 | | | Okamura Corp | | | 183,410 | |
| | | |
| | | 16,000 | | | Organo Corp | | | 1,138,848 | |
| | | |
| | | 83,200 | | | ORIX Corp | | | 1,649,284 | |
| | | |
| | | 24,200 | | | Osaka Gas Co Ltd (b) | | | 442,891 | |
| | | |
| | | 1,700 | | | Osaka Soda Co Ltd | | | 46,515 | |
| | | |
| | | 112,200 | | | Pacific Industrial Co Ltd | | | 994,677 | |
| | | |
| | | 12,900 | | | Panasonic Corp | | | 134,719 | |
| | | |
| | | 250,000 | | | Penta-Ocean Construction Co Ltd | | | 1,315,977 | |
| | | |
| | | 4,300 | | | Prima Meat Packers Ltd | | | 90,770 | |
| | | |
| | | 5,700 | | | Proto Corp | | | 57,365 | |
| | | |
| | | 9,100 | | | Raito Kogyo Co Ltd | | | 155,042 | |
| | | |
| | | 42,300 | | | Resona Holdings Inc | | | 189,178 | |
| | | |
| | | 2,500 | | | Restar Holdings Corp | | | 43,201 | |
| | | |
| | | 900 | | | Rion Co Ltd | | | 17,006 | |
| | | |
| | | 18,000 | | | Rohm Co Ltd | | | 1,435,565 | |
| | | |
| | | 2,800 | | | Roland DG Corp | | | 74,094 | |
| | | |
| | | 1,300 | | | Ryobi Ltd | | | 12,375 | |
| | | |
| | | 18,400 | | | San-A Co Ltd (a) | | | 683,193 | |
| | | |
| | | 4,500 | | | San-Ai Oil Co Ltd | | | 37,414 | |
| | | |
| | | 10,800 | | | Sanki Engineering Co Ltd | | | 140,153 | |
| | | |
| | | 78,800 | | | Sankyu Inc (b) | | | 2,732,220 | |
| | | |
| | | 8,300 | | | Sanwa Holdings Corp | | | 92,758 | |
| | | |
| | | 48,800 | | | Sawai Group Holdings Co Ltd | | | 1,939,443 | |
| | | |
| | | 42,200 | | | Secom Co Ltd (b) | | | 3,099,437 | |
| | | | |
| | |
| 36 | | See accompanying notes to the financial statements. | | |
GMO Benchmark-Free Fund
(A Series of GMO Trust)
Schedule of Investments — (Continued)
(showing percentage of total net assets)
February 28, 2022
| | | | | | | | | | |
Shares | | | Description | | Value ($) | |
| | | |
| | | | | | Japan — continued | | | |
| | | |
| | | 114,400 | | | Sega Sammy Holdings Inc | | | 2,086,587 | |
| | | |
| | | 39,300 | | | Seiko Epson Corp | | | 604,451 | |
| | | |
| | | 3,500 | | | Seiko Holdings Corp | | | 73,143 | |
| | | |
| | | 5,300 | | | Sekisui Chemical Co Ltd | | | 86,793 | |
| | | |
| | | 160,100 | | | Sekisui House Ltd | | | 3,264,133 | |
| | | |
| | | 2,900 | | | Sekisui Jushi Corp | | | 48,410 | |
| | | |
| | | 11,800 | | | Shimamura Co Ltd | | | 1,070,379 | |
| | | |
| | | 243,200 | | | Shimizu Corp | | | 1,609,780 | |
| | | |
| | | 10,600 | | | Shizuoka Gas Co Ltd (b) | | | 80,021 | |
| | | |
| | | 800 | | | Sinanen Holdings Co Ltd | | | 24,093 | |
| | | |
| | | 3,600 | | | Sinko Industries Ltd | | | 54,487 | |
| | | |
| | | 196,000 | | | SKY Perfect JSAT Holdings Inc (b) | | | 737,044 | |
| | | |
| | | 122,260 | | | Sojitz Corp | | | 2,019,379 | |
| | | |
| | | 138,800 | | | Stanley Electric Co Ltd | | | 3,298,272 | |
| | | |
| | | 65,300 | | | Subaru Corp | | | 1,070,972 | |
| | | |
| | | 1,004,700 | | | Sumitomo Chemical Co Ltd | | | 4,796,668 | |
| | | |
| | | 72,500 | | | Sumitomo Corp | | | 1,182,882 | |
| | | |
| | | 181,100 | | | Sumitomo Dainippon Pharma Co Ltd (a) | | | 1,987,515 | |
| | | |
| | | 19,100 | | | Sumitomo Electric Industries Ltd | | | 253,555 | |
| | | |
| | | 166,600 | | | Sumitomo Forestry Co Ltd | | | 3,212,632 | |
| | | |
| | | 5,600 | | | Sumitomo Heavy Industries Ltd | | | 135,692 | |
| | | |
| | | 112,600 | | | Sumitomo Mitsui Financial Group Inc | | | 3,993,049 | |
| | | |
| | | 91,900 | | | Sumitomo Mitsui Trust Holdings Inc | | | 3,265,391 | |
| | | |
| | | 1,500 | | | Sumitomo Seika Chemicals Co Ltd | | | 42,690 | |
| | | |
| | | 7,500 | | | Suzuki Motor Corp | | | 298,635 | |
| | | |
| | | 1,200 | | | T Hasegawa Co Ltd | | | 25,196 | |
| | | |
| | | 233,600 | | | T&D Holdings Inc | | | 3,392,683 | |
| | | |
| | | 4,000 | | | T-Gaia Corp (a) | | | 60,496 | |
| | | |
| | | 80,200 | | | Tachi-S Co Ltd | | | 785,172 | |
| | | |
| | | 65,300 | | | Taisei Corp | | | 2,171,319 | |
| | | |
| | | 116,900 | | | Takara Holdings Inc | | | 1,161,503 | |
| | | |
| | | 32,900 | | | Takara Leben Co Ltd | | | 89,943 | |
| | | |
| | | 161,200 | | | Takuma Co Ltd (a) | | | 2,048,655 | |
| | | |
| | | 3,000 | | | Tamron Co Ltd | | | 61,651 | |
| | | |
| | | 247,600 | | | Teijin Ltd | | | 2,978,601 | |
| | | |
| | | 86,800 | | | THK Co Ltd | | | 1,994,056 | |
| | | |
| | | 71,400 | | | Toho Holdings Co Ltd (b) | | | 1,174,749 | |
| | | |
| | | 229,900 | | | Tokai Carbon Co Ltd | | | 2,206,642 | |
| | | |
| | | 821,400 | | | Tokyo Electric Power Co Holdings Inc * (b) | | | 2,578,368 | |
| | | |
| | | 70,300 | | | Tokyo Gas Co Ltd (b) | | | 1,431,893 | |
| | | |
| | | 72,700 | | | Tokyo Seimitsu Co Ltd | | | 3,027,034 | |
| | | |
| | | 20,800 | | | Tokyu Construction Co Ltd | | | 128,923 | |
| | | |
| | | 189,300 | | | Toppan Inc | | | 3,730,026 | |
| | | |
| | | 49,000 | | | Toray Industries Inc | | | 279,432 | |
| | | |
| | | 110,300 | | | Tosei Corp | | | 1,051,161 | |
| | | |
| | | 210,984 | | | Tosoh Corp | | | 3,274,066 | |
| | | |
| | | 8,300 | | | Towa Pharmaceutical Co Ltd | | | 215,086 | |
| | | |
| | | 35,400 | | | Toyo Construction Co Ltd | | | 184,458 | |
| | | |
| | | 28,100 | | | Toyota Boshoku Corp | | | 514,229 | |
| | | |
| | | 35,600 | | | Toyota Industries Corp (b) | | | 2,707,774 | |
| | | |
| | | 15,700 | | | Toyota Tsusho Corp | | | 651,785 | |
| | | |
| | | 2,200 | | | TPR Co Ltd | | | 26,628 | |
| | | | | | | | | | |
Shares | | | Description | | Value ($) | |
| | | |
| | | | | | Japan — continued | | | |
| | | |
| | | 1,000 | | | Tsubakimoto Chain Co | | | 28,598 | |
| | | |
| | | 70,000 | | | Tsumura & Co | | | 1,944,230 | |
| | | |
| | | 6,000 | | | TV Asahi Holdings Corp (b) | | | 82,006 | |
| | | |
| | | 14,100 | | | Ulvac Inc | | | 703,778 | |
| | | |
| | | 5,300 | | | Wacoal Holdings Corp | | | 90,976 | |
| | | |
| | | 13,400 | | | YAMABIKO Corp | | | 155,190 | |
| | | |
| | | 33,400 | | | Yamaha Motor Co Ltd | | | 750,819 | |
| | | |
| | | 5,300 | | | Yamazen Corp | | | 47,503 | |
| | | |
| | | 4,900 | | | Yellow Hat Ltd | | | 69,570 | |
| | | |
| | | 42,100 | | | Yokogawa Bridge Holdings Corp | | | 769,046 | |
| | | |
| | | 18,800 | | | Yokohama Rubber Co Ltd (The) | | | 263,583 | |
| | | |
| | | 5,500 | | | Yuasa Trading Co Ltd | | | 143,065 | |
| | | |
| | | 71,700 | | | Zenkoku Hosho Co Ltd (a) | | | 3,015,168 | |
| | | | | | | | | | |
| | | |
| | | | | | Total Japan | | | 232,452,462 | |
| | | | | | | | | | |
| | | |
| | | | | | Kuwait — 0.1% | | | |
| | | |
| | | 18,005 | | | Humansoft Holding Co KSC | | | 219,159 | |
| | | |
| | | 554,796 | | | Kuwait Finance House KSCP | | | 1,735,518 | |
| | | | | | | | | | |
| | | |
| | | | | | Total Kuwait | | | 1,954,677 | |
| | | | | | | | | | |
| | | |
| | | | | | Luxembourg — 0.1% | | | |
| | | |
| | | 26,700 | | | Ternium SA Sponsored ADR | | | 1,048,776 | |
| | | | | | | | | | |
| | | |
| | | | | | Malaysia — 0.0% | | | |
| | | |
| | | 216,400 | | | DRB-Hicom Bhd | | | 76,488 | |
| | | |
| | | 116,300 | | | Kossan Rubber Industries Bhd | | | 47,947 | |
| | | |
| | | 72,200 | | | Petronas Chemicals Group Bhd | | | 164,500 | |
| | | |
| | | 77,800 | | | Syarikat Takaful Malaysia Keluarga Bhd | | | 69,019 | |
| | | |
| | | 485,300 | | | Top Glove Corp Bhd | | | 236,849 | |
| | | |
| | | 98,700 | | | Westports Holdings Bhd | | | 91,993 | |
| | | | | | | | | | |
| | | |
| | | | | | Total Malaysia | | | 686,796 | |
| | | | | | | | | | |
| | | |
| | | | | | Mexico — 1.6% | | | |
| | | |
| | | 41,936 | | | America Movil SAB de CV – Class L Sponsored ADR | | | 759,880 | |
| | | |
| | | 275,600 | | | America Movil SAB de CV – Series L | | | 250,558 | |
| | | |
| | | 83,612 | | | Arca Continental SAB de CV | | | 551,126 | |
| | | |
| | | 158,600 | | | Banco del Bajio SA | | | 385,639 | |
| | | |
| | | 6,376 | | | Coca-Cola Femsa SAB de CV Sponsored ADR | | | 351,063 | |
| | | |
| | | 495,200 | | | Credito Real SAB de CV SOFOM ER * | | | 38,927 | |
| | | |
| | | 69,492 | | | El Puerto de Liverpool SAB de CV – Class C1 | | | 338,927 | |
| | | |
| | | 19,996 | | | Fibra Uno Administracion SA de CV (REIT) | | | 22,416 | |
| | | |
| | | 525,024 | | | Fomento Economico Mexicano SAB de CV | | | 4,218,700 | |
| | | |
| | | 22,600 | | | Fomento Economico Mexicano SAB de CV Sponsored ADR | | | 1,817,040 | |
| | | |
| | | 302,608 | | | Gentera SAB de CV * | | | 227,831 | |
| | | |
| | | 1,440 | | | Gruma SAB de CV – Class B | | | 19,500 | |
| | | | |
| | |
| | | See accompanying notes to the financial statements. | | 37 |
GMO Benchmark-Free Fund
(A Series of GMO Trust)
Schedule of Investments — (Continued)
(showing percentage of total net assets)
February 28, 2022
| | | | | | | | | | |
Shares | | | Description | | Value ($) | |
| | | |
| | | | | | Mexico — continued | | | |
| | | |
| | | 100 | | | Grupo Aeroportuario del Centro Norte SAB de CV ADR | | | 5,813 | |
| | | |
| | | 8,339 | | | Grupo Aeroportuario del Centro Norte SAB de CV – Class B | | | 60,060 | |
| | | |
| | | 1,600 | | | Grupo Aeroportuario del Pacifico SAB de CV – Class B * | | | 23,433 | |
| | | |
| | | 3,060 | | | Grupo Aeroportuario del Sureste SAB de CV – Class B | | | 65,877 | |
| | | |
| | | 262,300 | | | Grupo Bimbo SAB de CV – Series A | | | 811,963 | |
| | | |
| | | 1,034,200 | | | Grupo Financiero Banorte SAB de CV – Class O | | | 7,018,381 | |
| | | |
| | | 25,856 | | | Grupo Financiero Inbursa SAB de CV – Class O * | | | 42,254 | |
| | | |
| | | 1,083,385 | | | Grupo Mexico SAB de CV – Series B | | | 5,534,092 | |
| | | |
| | | 90,500 | | | Industrias Bachoco SAB de CV – Series B | | | 303,037 | |
| | | |
| | | 53,856 | | | Kimberly-Clark de Mexico SAB de CV – Class A | | | 75,284 | |
| | | |
| | | 4,600 | | | Orbia Advance Corp SAB de CV | | | 11,751 | |
| | | |
| | | 74,100 | | | Qualitas Controladora SAB de CV | | | 405,938 | |
| | | |
| | | 29,200 | | | Regional SAB de CV | | | 173,409 | |
| | | |
| | | 8,151 | | | Unifin Financiera SAB de CV SOFOM ENR * | | | 10,149 | |
| | | |
| | | 794,700 | | | Wal-Mart de Mexico SAB de CV | | | 3,026,542 | |
| | | | | | | | | | |
| | | |
| | | | | | Total Mexico | | | 26,549,590 | |
| | | | | | | | | | |
| | | |
| | | | | | Netherlands — 1.5% | | | |
| | | |
| | | 127,226 | | | ABN AMRO Bank NV CVA GDR | | | 1,693,024 | |
| | | |
| | | 377,170 | | | Aegon NV (a) | | | 1,863,141 | |
| | | |
| | | 27,400 | | | AerCap Holdings NV * | | | 1,491,382 | |
| | | |
| | | 17,355 | | | ForFarmers NV | | | 70,795 | |
| | | |
| | | 125,402 | | | ING Groep NV | | | 1,464,506 | |
| | | |
| | | 59,341 | | | JDE Peet’s NV (a) | | | 1,948,120 | |
| | | |
| | | 128,445 | | | Koninklijke Ahold Delhaize NV | | | 3,951,256 | |
| | | |
| | | 7,301 | | | Koninklijke BAM Groep NV * | | | 20,541 | |
| | | |
| | | 64,266 | | | NN Group NV | | | 3,084,439 | |
| | | |
| | | 101,573 | | | PostNL NV (b) | | | 408,373 | |
| | | |
| | | 5,767 | | | Prosus NV * | | | 358,025 | |
| | | |
| | | 56,706 | | | Randstad NV | | | 3,864,439 | |
| | | |
| | | 38,746 | | | Signify NV | | | 1,982,005 | |
| | | |
| | | 45,513 | | | Stellantis NV | | | 830,101 | |
| | | |
| | | 4,839 | | | Van Lanschot Kempen NV | | | 122,425 | |
| | | |
| | | 2,907 | | | Wolters Kluwer NV (b) | | | 296,193 | |
| | | | | | | | | | |
| | | |
| | | | | | Total Netherlands | | | 23,448,765 | |
| | | | | | | | | | |
| | | |
| | | | | | New Zealand — 0.1% | | | |
| | | |
| | | 78,269 | | | Auckland International Airport Ltd * (b) | | | 378,980 | |
| | | |
| | | 298,491 | | | Meridian Energy Ltd (b) | | | 1,013,405 | |
| | | |
| | | 62,536 | | | Spark New Zealand Ltd | | | 192,004 | |
| | | | | | | | | | |
| | | |
| | | | | | Total New Zealand | | | 1,584,389 | |
| | | | | | | | | | |
| | | | | | | | | | |
Shares | | | Description | | Value ($) | |
| | | |
| | | | | | Norway — 0.7% | | | |
| | | |
| | | 11,832 | | | Austevoll Seafood ASA | | | 167,066 | |
| | | |
| | | 30,967 | | | BW LPG Ltd | | | 184,539 | |
| | | |
| | | 45,147 | | | Equinor ASA | | | 1,419,218 | |
| | | |
| | | 62,441 | | | Europris ASA | | | 398,300 | |
| | | |
| | | 12,231 | | | Kongsberg Gruppen ASA | | | 431,376 | |
| | | |
| | | 631,489 | | | Norsk Hydro ASA | | | 5,996,673 | |
| | | |
| | | 132,889 | | | Orkla ASA | | | 1,244,819 | |
| | | |
| | | 14,029 | | | Sbanken ASA | | | 145,235 | |
| | | |
| | | 11,817 | | | Selvaag Bolig ASA | | | 67,788 | |
| | | |
| | | 15,914 | | | SpareBank 1 Nord Norge | | | 194,710 | |
| | | |
| | | 19,287 | | | SpareBank 1 SMN | | | 318,716 | |
| | | |
| | | 40,830 | | | SpareBank 1 SR-Bank ASA | | | 605,009 | |
| | | | | | | | | | |
| | | |
| | | | | | Total Norway | | | 11,173,449 | |
| | | | | | | | | | |
| | | |
| | | | | | Peru — 0.0% | | | |
| | | |
| | | 1,784 | | | Credicorp Ltd | | | 269,830 | |
| | | | | | | | | | |
| | | |
| | | | | | Philippines — 0.0% | | | |
| | | |
| | | 10,800 | | | GT Capital Holdings Inc | | | 122,307 | |
| | | |
| | | 4,691 | | | Manila Electric Co | | | 33,755 | |
| | | |
| | | 758,080 | | | Megaworld Corp | | | 47,631 | |
| | | |
| | | 76,600 | | | Puregold Price Club Inc | | | 52,626 | |
| | | |
| | | 80,750 | | | Semirara Mining & Power Corp – Class A | | | 43,784 | |
| | | | | | | | | | |
| | | |
| | | | | | Total Philippines | | | 300,103 | |
| | | | | | | | | | |
| | | |
| | | | | | Poland — 0.3% | | | |
| | | |
| | | 14,716 | | | Asseco Poland SA | | | 259,310 | |
| | | |
| | | 108,745 | | | Bank Polska Kasa Opieki SA | | | 2,983,312 | |
| | | |
| | | 3,461 | | | Budimex SA | | | 188,269 | |
| | | |
| | | 25,688 | | | Cyfrowy Polsat SA | | | 166,302 | |
| | | |
| | | 35,171 | | | Polski Koncern Naftowy ORLEN SA | | | 594,103 | |
| | | |
| | | 581,280 | | | Polskie Gornictwo Naftowe i Gazownictwo SA | | | 766,074 | |
| | | |
| | | 17,142 | | | Powszechny Zaklad Ubezpieczen SA | | | 128,610 | |
| | | | | | | | | | |
| | | |
| | | | | | Total Poland | | | 5,085,980 | |
| | | | | | | | | | |
| | | |
| | | | | | Portugal — 0.2% | | | |
| | | |
| | | 14,825 | | | CTT – Correios de Portugal SA | | | 71,814 | |
| | | |
| | | 160,251 | | | Galp Energia SGPS SA | | | 1,773,867 | |
| | | |
| | | 19,389 | | | Jeronimo Martins SGPS SA | | | 422,713 | |
| | | |
| | | 51,896 | | | Navigator Co SA (The) | | | 185,443 | |
| | | |
| | | 85,939 | | | NOS SGPS SA | | | 330,856 | |
| | | |
| | | 626,748 | | | Sonae SGPS SA | | | 682,198 | |
| | | | | | | | | | |
| | | |
| | | | | | Total Portugal | | | 3,466,891 | |
| | | | | | | | | | |
| | | |
| | | | | | Qatar — 0.1% | | | |
| | | |
| | | 7,568 | | | Qatar Gas Transport Co Ltd | | | 7,841 | |
| | | |
| | | 135,099 | | | Qatar National Bank QPSC | | | 810,702 | |
| | | |
| | | 14,520 | | | Qatar National Cement Co QSC | | | 24,710 | |
| | | | | | | | | | |
| | | |
| | | | | | Total Qatar | | | 843,253 | |
| | | | | | | | | | |
| | | | |
| | |
| 38 | | See accompanying notes to the financial statements. | | |
GMO Benchmark-Free Fund
(A Series of GMO Trust)
Schedule of Investments — (Continued)
(showing percentage of total net assets)
February 28, 2022
| | | | | | | | | | |
Shares | | | Description | | Value ($) | |
| | | |
| | | | | | Russia — 1.0% | | | |
| | | |
| | | 3,038,020 | | | Alrosa PJSC | | | 1,959,267 | |
| | | |
| | | 10,190 | | | Detsky Mir PJSC | | | 7,179 | |
| | | |
| | | 148,200,000 | | | Federal Grid Co Unified Energy System PJSC | | | 102,531 | |
| | | |
| | | 68,395 | | | Fix Price Group Ltd GDR (d) | | | 41,174 | |
| | | |
| | | 164,130 | | | Gazprom Neft PJSC | | | 535,236 | |
| | | |
| | | 3,296 | | | Gazprom Neft PJSC Sponsored ADR | | | 52,226 | |
| | | |
| | | 497,450 | | | Gazprom PJSC | | | 794,467 | |
| | | |
| | | 776,704 | | | Gazprom PJSC Sponsored ADR | | | 2,054,791 | |
| | | |
| | | 7,736 | | | Globaltrans Investment Plc Sponsored GDR (Registered) | | | 14,464 | |
| | | |
| | | 6,310,100 | | | Inter RAO UES PJSC | | | 140,945 | |
| | | |
| | | 1 | | | LSR Group PJSC GDR (Registered) (d) | | | 1 | |
| | | |
| | | 19,776 | | | LSR Group PJSC – Class A | | | 81,454 | |
| | | |
| | | 13 | | | LUKOIL PJSC | | | 376 | |
| | | |
| | | 74,931 | | | LUKOIL PJSC Sponsored ADR | | | 1,405,470 | |
| | | |
| | | 7,805 | | | Magnit PJSC Sponsored GDR (Registered) | | | 12,388 | |
| | | |
| | | 1,468,850 | | | Magnitogorsk Iron & Steel Works PJSC | | | 516,947 | |
| | | |
| | | 30,345 | | | Magnitogorsk Iron & Steel Works PJSC Sponsored GDR (Registered) | | | 84,971 | |
| | | |
| | | 12,700 | | | Mechel PJSC Sponsored ADR * (d) | | | 19,873 | |
| | | |
| | | 45,541 | | | MMC Norilsk Nickel PJSC ADR | | | 625,293 | |
| | | |
| | | 16,770 | | | Mobile TeleSystems PJSC | | | 33,232 | |
| | | |
| | | 20,400 | | | Mobile TeleSystems PJSC ADR (d) | | | 78,037 | |
| | | |
| | | 361,420 | | | Moscow Exchange MICEX-RTS PJSC | | | 270,971 | |
| | | |
| | | 3,294,000 | | | Mosenergo PJSC | | | 46,590 | |
| | | |
| | | 7,572 | | | Novatek PJSC Sponsored GDR (Registered) | | | 291,689 | |
| | | |
| | | 117,310 | | | Novolipetsk Steel PJSC | | | 168,790 | |
| | | |
| | | 109,470 | | | Novolipetsk Steel PJSC GDR | | | 839,290 | |
| | | |
| | | 10,465 | | | PhosAgro PJSC GDR (Registered) | | | 64,024 | |
| | | |
| | | 130,264 | | | Polymetal International Plc | | | 609,036 | |
| | | |
| | | 622 | | | Polyus PJSC | | | 65,427 | |
| | | |
| | | 19,187 | | | Polyus PJSC GDR (Registered) | | | 1,023,985 | |
| | | |
| | | 46,000 | | | QIWI Plc Sponsored ADR (c) (d) | | | 181,404 | |
| | | |
| | | 1,352 | | | QIWI Plc Sponsored ADR (c) | | | 4,613 | |
| | | |
| | | 9,900 | | | Raspadskaya OJSC | | | 22,376 | |
| | | |
| | | 5,248 | | | Ros Agro Plc GDR (Registered) | | | 36,323 | |
| | | |
| | | 1,879,040 | | | ROSSETI PJSC | | | 9,392 | |
| | | |
| | | 23,515,000 | | | RusHydro PJSC | | | 131,048 | |
| | | |
| | | 9,562 | | | RusHydro PJSC ADR | | | 4,797 | |
| | | |
| | | 1,286,440 | | | Sberbank of Russia PJSC | | | 644,740 | |
| | | |
| | | 597,803 | | | Sberbank of Russia PJSC Sponsored ADR | | | 624,741 | |
| | | |
| | | 91,185 | | | Severstal PAO GDR (Registered) | | | 462,916 | |
| | | |
| | | 425 | | | Severstal PJSC | | | 4,904 | |
| | | |
| | | 11,580 | | | SFI PJSC * | | | 42,722 | |
| | | |
| | | 2,709,800 | | | Surgutneftegas PJSC | | | 490,377 | |
| | | |
| | | 323,082 | | | Surgutneftegas PJSC Sponsored ADR | | | 555,315 | |
| | | |
| | | 55,398 | | | Tatneft PJSC Sponsored ADR | | | 754,958 | |
| | | |
| | | 1,300,440 | | | Unipro PJSC | | | 18,029 | |
| | | | | | | | | | |
Shares | | | Description | | Value ($) | |
| | | |
| | | | | | Russia — continued | | | |
| | | |
| | | 50,950 | | | United Co Rusal International PJSC * | | | 21,479 | |
| | | |
| | | 8,456 | | | X5 Retail Group NV GDR (Registered) | | | 22,124 | |
| | | | | | | | | | |
| | | |
| | | | | | Total Russia | | | 15,972,382 | |
| | | | | | | | | | |
| | | |
| | | | | | Singapore — 0.7% | | | |
| | | |
| | | 100,500 | | | AIMS APAC (REIT) | | | 100,323 | |
| | | |
| | | 101,400 | | | ARA LOGOS Logistics Trust (REIT) | | | 62,531 | |
| | | |
| | | 67,200 | | | Ascendas India Trust | | | 59,130 | |
| | | |
| | | 148,800 | | | Ascendas Real Estate Investment Trust (REIT) | | | 305,106 | |
| | | |
| | | 155,300 | | | Asian Pay Television Trust | | | 15,581 | |
| | | |
| | | 93,594 | | | Capitaland Investment Ltd * | | | 256,472 | |
| | | |
| | | 228,800 | | | ComfortDelGro Corp Ltd | | | 238,992 | |
| | | |
| | | 101,635 | | | DBS Group Holdings Ltd | | | 2,555,117 | |
| | | |
| | | 187,200 | | | First Real Estate Investment Trust | | | 41,558 | |
| | | |
| | | 1,318,100 | | | Golden Agri-Resources Ltd | | | 278,704 | |
| | | |
| | | 391,840 | | | Japfa Ltd (a) | | | 171,338 | |
| | | |
| | | 49,216 | | | Jardine Cycle & Carriage Ltd | | | 794,869 | |
| | | |
| | | 125,900 | | | Keppel Corp Ltd | | | 560,501 | |
| | | |
| | | 78,000 | | | Lendlease Global Commercial (REIT) | | | 47,616 | |
| | | |
| | | 136,600 | | | Sasseur Real Estate Investment Trust (a) | | | 85,353 | |
| | | |
| | | 53,700 | | | Sembcorp Industries Ltd | | | 100,098 | |
| | | |
| | | 27,500 | | | Sheng Siong Group Ltd | | | 30,896 | |
| | | |
| | | 329,700 | | | Silverlake Axis Ltd. | | | 69,673 | |
| | | |
| | | 700 | | | Singapore Exchange Ltd | | | 4,856 | |
| | | |
| | | 142,200 | | | StarHub Ltd | | | 131,436 | |
| | | |
| | | 6,300 | | | UOL Group Ltd | | | 32,649 | |
| | | |
| | | 270,400 | | | Wilmar International Ltd | | | 878,809 | |
| | | |
| | | 3,609,899 | | | Yangzijiang Shipbuilding Holdings Ltd | | | 3,692,748 | |
| | | |
| | | 223,700 | | | Yanlord Land Group Ltd | | | 199,264 | |
| | | | | | | | | | |
| | | |
| | | | | | Total Singapore | | | 10,713,620 | |
| | | | | | | | | | |
| | | |
| | | | | | South Africa — 1.0% | | | |
| | | |
| | | 427,675 | | | Absa Group Ltd | | | 4,916,838 | |
| | | |
| | | 32,844 | | | Aspen Pharmacare Holdings Ltd | | | 430,238 | |
| | | |
| | | 19,085 | | | Astral Foods Ltd | | | 202,579 | |
| | | |
| | | 67,174 | | | Barloworld Ltd | | | 536,048 | |
| | | |
| | | 113,934 | | | Bidvest Group Ltd (The) | | | 1,561,045 | |
| | | |
| | | 77,272 | | | Blue Label Telecoms Ltd * | | | 26,706 | |
| | | |
| | | 15,645 | | | Imperial Logistics Ltd | | | 66,972 | |
| | | |
| | | 48,127 | | | Investec Ltd | | | 270,930 | |
| | | |
| | | 68,642 | | | Kumba Iron Ore Ltd | | | 2,713,335 | |
| | | |
| | | 18,305 | | | Lewis Group Ltd | | | 55,390 | |
| | | |
| | | 31,586 | | | Metair Investments Ltd | | | 57,478 | |
| | | |
| | | 106,659 | | | Motus Holdings Ltd | | | 762,166 | |
| | | |
| | | 160,130 | | | MTN Group Ltd * | | | 1,998,830 | |
| | | |
| | | 49,611 | | | Old Mutual Ltd | | | 40,731 | |
| | | |
| | | 13,551 | | | Pepkor Holdings Ltd | | | 19,357 | |
| | | |
| | | 30,943 | | | Raubex Group Ltd | | | 80,731 | |
| | | |
| | | 32,778 | | | Reunert Ltd | | | 100,274 | |
| | | | |
| | |
| | | See accompanying notes to the financial statements. | | 39 |
GMO Benchmark-Free Fund
(A Series of GMO Trust)
Schedule of Investments — (Continued)
(showing percentage of total net assets)
February 28, 2022
| | | | | | | | | | |
Shares | | | Description | | Value ($) | |
| | | |
| | | | | | South Africa — continued | | | |
| | | |
| | | 492,133 | | | RMB Holdings Ltd | | | 53,491 | |
| | | |
| | | 307,875 | | | Telkom SA SOC Ltd * | | | 826,782 | |
| | | |
| | | 141,915 | | | Truworths International Ltd | | | 539,780 | |
| | | |
| | | 90,743 | | | Tsogo Sun Gaming Ltd * | | | 68,645 | |
| | | |
| | | 15,741 | | | Wilson Bayly Holmes-Ovcon Ltd | | | 85,412 | |
| | | | | | | | | | |
| | | |
| | | | | | Total South Africa | | | 15,413,758 | |
| | | | | | | | | | |
| | | |
| | | | | | South Korea — 4.3% | | | |
| | | |
| | | 257,969 | | | BNK Financial Group Inc | | | 1,698,223 | |
| | | |
| | | 544 | | | Cheil Worldwide Inc | | | 10,228 | |
| | | |
| | | 223 | | | CJ CheilJedang Corp | | | 70,636 | |
| | | |
| | | 907 | | | Coway Co Ltd | | | 54,473 | |
| | | |
| | | 63,888 | | | Daewoo Engineering & Construction Co Ltd * | | | 336,044 | |
| | | |
| | | 2,167 | | | Daihan Pharmaceutical Co Ltd | | | 52,039 | |
| | | |
| | | 5,533 | | | Daou Data Corp | | | 64,012 | |
| | | |
| | | 5,705 | | | DB Insurance Co Ltd | | | 293,711 | |
| | | |
| | | 115,002 | | | DGB Financial Group Inc | | | 910,291 | |
| | | |
| | | 688 | | | DL E&C Co Ltd | | | 74,170 | |
| | | |
| | | 396 | | | Dongkuk Steel Mill Co Ltd | | | 5,503 | |
| | | |
| | | 34,093 | | | Dongwon Development Co Ltd | | | 138,644 | |
| | | |
| | | 609 | | | Doosan Bobcat Inc | | | 19,546 | |
| | | |
| | | 3,629 | | | Fila Holdings Corp | | | 107,239 | |
| | | |
| | | 22,868 | | | GS Engineering & Construction Corp | | | 821,855 | |
| | | |
| | | 592 | | | GS Holdings Corp | | | 19,796 | |
| | | |
| | | 1,141 | | | GS Retail Co Ltd | | | 25,373 | |
| | | |
| | | 168 | | | HAESUNG DS Co Ltd * | | | 7,525 | |
| | | |
| | | 119,971 | | | Hana Financial Group Inc | | | 4,874,162 | |
| | | |
| | | 581 | | | Hana Materials Inc | | | 25,335 | |
| | | |
| | | 47,869 | | | Hankook Tire & Technology Co Ltd | | | 1,410,375 | |
| | | |
| | | 1,023 | | | Hanmi Semiconductor Co Ltd | | | 28,839 | |
| | | |
| | | 2,208 | | | Hanwha Aerospace Co Ltd | | | 96,414 | |
| | | |
| | | 28,888 | | | Hanwha Investment & Securities Co Ltd * | | | 117,021 | |
| | | |
| | | 89,253 | | | Hanwha Life Insurance Co Ltd * | | | 220,415 | |
| | | |
| | | 38,379 | | | HDC Hyundai Development Co-Engineering & Construction * | | | 516,508 | |
| | | |
| | | 308 | | | Hyosung TNC Corp | | | 125,244 | |
| | | |
| | | 229 | | | Hyundai Autoever Corp | | | 20,762 | |
| | | |
| | | 31,751 | | | Hyundai Engineering & Construction Co Ltd | | | 1,156,759 | |
| | | |
| | | 4,813 | | | Hyundai Home Shopping Network Corp | | | 234,025 | |
| | | |
| | | 4,707 | | | Hyundai Marine & Fire Insurance Co Ltd | | | 113,058 | |
| | | |
| | | 1,312 | | | Hyundai Mobis Co Ltd | | | 246,349 | |
| | | |
| | | 2,160 | | | Hyundai Motor Co GDR (Registered) | | | 77,136 | |
| | | |
| | | 18,286 | | | Industrial Bank of Korea | | | 164,273 | |
| | | |
| | | 56,972 | | | JB Financial Group Co Ltd | | | 390,226 | |
| | | |
| | | 52,707 | | | KB Financial Group Inc | | | 2,600,270 | |
| | | |
| | | 7,326 | | | KC Co Ltd | | | 119,225 | |
| | | |
| | | 272 | | | KCC Corp | | | 76,157 | |
| | | |
| | | 643 | | | KCC Glass Corp | | | 31,236 | |
| | | |
| | | 123,780 | | | Kia Corp | | | 7,673,780 | |
| | | | | | | | | | |
Shares | | | Description | | Value ($) | |
| | | |
| | | | | | South Korea — continued | | | |
| | | |
| | | 882 | | | KIWOOM Securities Co Ltd * | | | 74,895 | |
| | | |
| | | 58 | | | Kolon Industries Inc | | | 2,861 | |
| | | |
| | | 1,179 | | | Korea Petrochemical Ind Co Ltd * | | | 168,645 | |
| | | |
| | | 6,570 | | | Korea Real Estate Investment & Trust Co Ltd | | | 12,029 | |
| | | |
| | | 645 | | | Korea Zinc Co Ltd | | | 295,823 | |
| | | |
| | | 37,569 | | | KT Skylife Co Ltd | | | 266,778 | |
| | | |
| | | 130,703 | | | KT&G Corp | | | 8,688,684 | |
| | | |
| | | 5,073 | | | Kumho Petrochemical Co Ltd * | | | 684,402 | |
| | | |
| | | 13,560 | | | LF Corp | | | 202,109 | |
| | | |
| | | 53,286 | | | LG Electronics Inc | | | 5,562,864 | |
| | | |
| | | 526 | | | LG Household & Health Care Ltd | | | 417,351 | |
| | | |
| | | 2,811 | | | LG Uplus Corp | | | 30,877 | |
| | | |
| | | 3,755 | | | Lotte Chemical Corp | | | 692,046 | |
| | | |
| | | 9,739 | | | LOTTE Fine Chemical Co Ltd | | | 647,893 | |
| | | |
| | | 1,391 | | | LX Semicon Co Ltd | | | 133,610 | |
| | | |
| | | 317 | | | Meritz Financial Group Inc | | | 9,748 | |
| | | |
| | | 700 | | | Meritz Fire & Marine Insurance Co Ltd | | | 24,057 | |
| | | |
| | | 5,706 | | | Meritz Securities Co Ltd | | | 27,942 | |
| | | |
| | | 21,590 | | | Mirae Asset Life Insurance Co Ltd | | | 73,651 | |
| | | |
| | | 14,874 | | | NAVER Corp | | | 3,963,285 | |
| | | |
| | | 1,743 | | | NH Investment & Securities Co Ltd * | | | 16,867 | |
| | | |
| | | 10,945 | | | POSCO | | | 2,604,075 | |
| | | |
| | | 4,346 | | | POSCO Sponsored ADR | | | 257,805 | |
| | | |
| | | 652 | | | PSK Inc | | | 26,014 | |
| | | |
| | | 7,767 | | | Samjin Pharmaceutical Co Ltd | | | 163,928 | |
| | | |
| | | 1,739 | | | Samsung C&T Corp | | | 160,606 | |
| | | |
| | | 178,588 | | | Samsung Electronics Co Ltd | | | 10,760,530 | |
| | | |
| | | 21,427 | | | Samsung Engineering Co Ltd * | | | 418,578 | |
| | | |
| | | 935 | | | Samsung Fire & Marine Insurance Co Ltd | | | 148,684 | |
| | | |
| | | 658 | | | Samsung Life Insurance Co Ltd | | | 32,900 | |
| | | |
| | | 907 | | | Samsung SDS Co Ltd | | | 106,480 | |
| | | |
| | | 1,865 | | | Samsung Securities Co Ltd | | | 66,099 | |
| | | |
| | | 1,510 | | | SD Biosensor Inc | | | 68,843 | |
| | | |
| | | 326 | | | Sebang Global Battery Co Ltd | | | 17,411 | |
| | | |
| | | 117,835 | | | Shinhan Financial Group Co Ltd | | | 3,833,850 | |
| | | |
| | | 3,056 | | | SK Telecom Co Ltd | | | 139,455 | |
| | | |
| | | 50,593 | | | SK Telecom Co Ltd Sponsored ADR | | | 1,268,367 | |
| | | |
| | | 21 | | | SKC Co Ltd | | | 2,442 | |
| | | |
| | | 2,438 | | | SL Corp * | | | 48,600 | |
| | | |
| | | 510 | | | SM Entertainment Co Ltd | | | 31,890 | |
| | | |
| | | 168 | | | Unid Co Ltd | | | 12,252 | |
| | | |
| | | 148,952 | | | Woori Financial Group Inc | | | 1,781,704 | |
| | | |
| | | 5,838 | | | Woori Technology Investment Co Ltd * | | | 41,812 | |
| | | | | | | | | | |
| | | |
| | | | | | Total South Korea | | | 69,015,619 | |
| | | | | | | | | | |
| | | |
| | | | | | Spain — 1.4% | | | |
| | | |
| | | 659 | | | Acciona SA (b) | | | 112,619 | |
| | | |
| | | 203,598 | | | Acerinox SA | | | 2,588,483 | |
| | | | |
| | |
| 40 | | See accompanying notes to the financial statements. | | |
GMO Benchmark-Free Fund
(A Series of GMO Trust)
Schedule of Investments — (Continued)
(showing percentage of total net assets)
February 28, 2022
| | | | | | | | | | |
Shares | | | Description | | Value ($) | |
| | | |
| | | | | | Spain — continued | | | |
| | | |
| | | 15,955 | | | ACS Actividades de Construccion y Servicios SA (a) | | | 387,716 | |
| | | |
| | | 48,634 | | | Amadeus IT Group SA * (b) | | | 3,208,706 | |
| | | |
| | | 41,700 | | | Atresmedia Corp de Medios de Comunicacion SA (b) | | | 180,246 | |
| | | |
| | | 822,323 | | | Banco Bilbao Vizcaya Argentaria SA | | | 4,879,438 | |
| | | |
| | | 2,202,224 | | | Banco de Sabadell SA * | | | 1,904,206 | |
| | | |
| | | 1,214,102 | | | Banco Santander SA | | | 4,042,978 | |
| | | |
| | | 47,618 | | | Bankinter SA | | | 270,391 | |
| | | |
| | | 23,037 | | | Cia de Distribucion Integral Logista Holdings SA (b) | | | 418,388 | |
| | | |
| | | 27,450 | | | Faes Farma SA | | | 105,006 | |
| | | |
| | | 897 | | | Grupo Catalana Occidente SA | | | 28,914 | |
| | | |
| | | 87,060 | | | Industria de Diseno Textil SA (b) | | | 2,271,027 | |
| | | |
| | | 102,122 | | | Mediaset Espana Comunicacion SA * | | | 523,890 | |
| | | |
| | | 2,074 | | | Red Electrica Corp SA (b) | | | 41,087 | |
| | | |
| | | 50,208 | | | Repsol SA | | | 651,501 | |
| | | |
| | | 50,833 | | | Telefonica SA | | | 242,774 | |
| | | |
| | | 252,077 | | | Unicaja Banco SA | | | 237,659 | |
| | | | | | | | | | |
| | | |
| | | | | | Total Spain | | | 22,095,029 | |
| | | | | | | | | | |
| | | |
| | | | | | Sweden — 0.3% | | | |
| | | |
| | | 1,725 | | | Bufab AB | | | 60,413 | |
| | | |
| | | 13,589 | | | Investor AB – A Shares (b) | | | 300,487 | |
| | | |
| | | 95,763 | | | Investor AB – B Shares | | | 1,949,971 | |
| | | |
| | | 27,367 | | | Inwido AB | | | 423,755 | |
| | | |
| | | 35,209 | | | Kinnevik AB – Class B * | | | 896,432 | |
| | | |
| | | 1,701 | | | KNOW IT AB (b) | | | 56,103 | |
| | | |
| | | 6,220 | | | New Wave Group AB – B Shares | | | 94,051 | |
| | | |
| | | 14,105 | | | Securitas AB – B Shares | | | 170,767 | |
| | | |
| | | 50,337 | | | Skanska AB – B Shares | | | 1,139,292 | |
| | | |
| | | 13,945 | | | SSAB AB – A Shares * | | | 87,270 | |
| | | |
| | | 20,043 | | | Svenska Cellulosa AB SCA – Class B | | | 327,012 | |
| | | | | | | | | | |
| | | |
| | | | | | Total Sweden | | | 5,505,553 | |
| | | | | | | | | | |
| | | |
| | | | | | Switzerland — 0.6% | | | |
| | | |
| | | 41,542 | | | Adecco Group AG (Registered) | | | 1,961,972 | |
| | | |
| | | 404 | | | ALSO Holding AG (Registered) * | | | 107,793 | |
| | | |
| | | 1,804 | | | BKW AG (b) | | | 227,288 | |
| | | |
| | | 2,121 | | | Bobst Group SA (Registered) * | | | 192,988 | |
| | | |
| | | 373 | | | Cie Financiere Richemont SA – Class A (Registered) (b) | | | 49,947 | |
| | | |
| | | 119 | | | Huber + Suhner AG (Registered) | | | 11,473 | |
| | | |
| | | 244 | | | Kardex Holding AG (Registered) | | | 63,346 | |
| | | |
| | | 17,755 | | | Logitech International SA (Registered) | | | 1,328,587 | |
| | | |
| | | 2,853 | | | Mobilezone Holding AG (Registered) | | | 42,187 | |
| | | |
| | | 15,043 | | | Novartis AG (Registered) (b) | | | 1,322,150 | |
| | | |
| | | 4,600 | | | Novartis AG Sponsored ADR (b) | | | 402,316 | |
| | | |
| | | 8,492 | | | Roche Holding AG – Genusschein (b) | | | 3,216,203 | |
| | | |
| | | 14,025 | | | UBS Group AG (Registered) (b) | | | 258,015 | |
| | | | | | | | | | |
Shares | | | Description | | Value ($) | |
| | | |
| | | | | | Switzerland — continued | | | |
| | | |
| | | 1,742 | | | Zehnder Group AG – Class RG | | | 150,670 | |
| | | | | | | | | | |
| | | |
| | | | | | Total Switzerland | | | 9,334,935 | |
| | | | | | | | | | |
| | | |
| | | | | | Taiwan — 5.9% | | | |
| | | |
| | | 98,560 | | | Acer Inc | | | 102,288 | |
| | | |
| | | 7,207 | | | Acter Group Corp Ltd | | | 56,899 | |
| | | |
| | | 489,000 | | | AmTRAN Technology Co Ltd | | | 283,139 | |
| | | |
| | | 23,000 | | | Arcadyan Technology Corp | | | 95,267 | |
| | | |
| | | 713,035 | | | Asustek Computer Inc | | | 9,512,225 | |
| | | |
| | | 19,000 | | | Aten International Co Ltd | | | 54,947 | |
| | | |
| | | 8,400 | | | Aurora Corp | | | 27,571 | |
| | | |
| | | 898,000 | | | Catcher Technology Co Ltd | | | 4,609,263 | |
| | | |
| | | 1,493,399 | | | Cathay Financial Holding Co Ltd | | | 3,358,110 | |
| | | |
| | | 150,651 | | | Chailease Holding Co Ltd | | | 1,367,235 | |
| | | |
| | | 79,000 | | | Chicony Electronics Co Ltd | | | 254,117 | |
| | | |
| | | 295,490 | | | China Development Financial Holding Corp | | | 202,356 | |
| | | |
| | | 52,000 | | | China Steel Corp | | | 67,618 | |
| | | |
| | | 683,000 | | | Chipbond Technology Corp | | | 1,699,481 | |
| | | |
| | | 9,280 | | | Chong Hong Construction Co Ltd | | | 25,355 | |
| | | |
| | | 200,000 | | | Chunghwa Telecom Co Ltd | | | 888,923 | |
| | | |
| | | 913,000 | | | Compal Electronics Inc | | | 831,754 | |
| | | |
| | | 360,440 | | | Coretronic Corp | | | 923,700 | |
| | | |
| | | 1,248,000 | | | CTBC Financial Holding Co Ltd | | | 1,219,892 | |
| | | |
| | | 86,000 | | | Delta Electronics Inc | | | 766,441 | |
| | | |
| | | 13,000 | | | E.Sun Financial Holding Co Ltd | | | 13,742 | |
| | | |
| | | 72,000 | | | Elan Microelectronics Corp | | | 427,611 | |
| | | |
| | | 70,000 | | | Elite Material Co Ltd | | | 686,438 | |
| | | |
| | | 91,000 | | | Farglory Land Development Co Ltd | | | 199,090 | |
| | | |
| | | 46,000 | | | First Financial Holding Co Ltd | | | 42,354 | |
| | | |
| | | 315,000 | | | FLEXium Interconnect Inc * | | | 1,075,293 | |
| | | |
| | | 6,000 | | | Formosa Petrochemical Corp | | | 21,106 | |
| | | |
| | | 251,000 | | | Formosa Plastics Corp | | | 947,780 | |
| | | |
| | | 195,821 | | | Foxconn Technology Co Ltd | | | 450,731 | |
| | | |
| | | 1,792,175 | | | Fubon Financial Holding Co Ltd | | | 4,838,987 | |
| | | |
| | | 6,080 | | | Fusheng Precision Co Ltd | | | 42,900 | |
| | | |
| | | 15,000 | | | Gamania Digital Entertainment Co Ltd | | | 34,114 | |
| | | |
| | | 11,560 | | | Getac Holdings Corp | | | 24,427 | |
| | | |
| | | 74,000 | | | Gigabyte Technology Co Ltd | | | 379,190 | |
| | | |
| | | 445,000 | | | Grand Pacific Petrochemical | | | 456,425 | |
| | | |
| | | 26,000 | | | HannStar Display Corp | | | 14,996 | |
| | | |
| | | 22,000 | | | Holiday Entertainment Co Ltd | | | 47,740 | |
| | | |
| | | 10,000 | | | Holtek Semiconductor Inc | | | 39,068 | |
| | | |
| | | 3,673,318 | | | Hon Hai Precision Industry Co Ltd | | | 13,644,753 | |
| | | |
| | | 78,000 | | | Huaku Development Co Ltd | | | 253,209 | |
| | | |
| | | 86,820 | | | IEI Integration Corp | | | 144,618 | |
| | | |
| | | 32,721 | | | Innodisk Corp | | | 248,511 | |
| | | |
| | | 28,000 | | | International Games System Co Ltd | | | 692,062 | |
| | | |
| | | 210,000 | | | King’s Town Bank Co Ltd | | | 303,439 | |
| | | |
| | | 62,000 | | | Kung Long Batteries Industrial Co Ltd | | | 303,606 | |
| | | | |
| | |
| | | See accompanying notes to the financial statements. | | 41 |
GMO Benchmark-Free Fund
(A Series of GMO Trust)
Schedule of Investments — (Continued)
(showing percentage of total net assets)
February 28, 2022
| | | | | | | | | | |
Shares | | | Description | | Value ($) | |
| | | |
| | | | | | Taiwan — continued | | | |
| | | |
| | | 13,000 | | | Largan Precision Co Ltd | | | 944,747 | |
| | | |
| | | 591,000 | | | Lite-On Technology Corp ADR | | | 1,453,198 | |
| | | |
| | | 2,807 | | | Makalot Industrial Co Ltd | | | 22,174 | |
| | | |
| | | 176,000 | | | MediaTek Inc | | | 6,954,786 | |
| | | |
| | | 91,120 | | | Mega Financial Holding Co Ltd | | | 122,793 | |
| | | |
| | | 5,408 | | | Merry Electronics Co Ltd | | | 15,871 | |
| | | |
| | | 196,000 | | | Micro-Star International Co Ltd | | | 1,104,808 | |
| | | |
| | | 246,000 | | | Mitac Holdings Corp | | | 297,374 | |
| | | |
| | | 266,000 | | | Nan Ya Plastics Corp | | | 838,964 | |
| | | |
| | | 140,903 | | | Nantex Industry Co Ltd | | | 375,329 | |
| | | |
| | | 26,000 | | | Nichidenbo Corp | | | 49,234 | |
| | | |
| | | 4,800 | | | Nien Made Enterprise Co Ltd | | | 62,226 | |
| | | |
| | | 65,000 | | | Novatek Microelectronics Corp | | | 1,077,600 | |
| | | |
| | | 52,000 | | | Pegatron Corp | | | 128,885 | |
| | | |
| | | 121,000 | | | Phison Electronics Corp | | | 2,238,758 | |
| | | |
| | | 1,337,000 | | | Pou Chen Corp | | | 1,541,845 | |
| | | |
| | | 48,000 | | | Powertech Technology Inc | | | 162,813 | |
| | | |
| | | 160,000 | | | Qisda Corp ADR | | | 176,829 | |
| | | |
| | | 175,000 | | | Quanta Computer Inc | | | 585,182 | |
| | | |
| | | 131,472 | | | Radiant Opto-Electronics Corp | | | 475,380 | |
| | | |
| | | 634,400 | | | Ruentex Development Co Ltd | | | 1,638,037 | |
| | | |
| | | 273,400 | | | Ruentex Industries Ltd | | | 1,137,387 | |
| | | |
| | | 89,000 | | | Shin Kong Financial Holding Co Ltd | | | 36,093 | |
| | | |
| | | 31,760 | | | Shin Zu Shing Co Ltd | | | 103,172 | |
| | | |
| | | 76,000 | | | Shinkong Insurance Co Ltd | | | 129,396 | |
| | | |
| | | 39,900 | | | Simplo Technology Co Ltd | | | 447,748 | |
| | | |
| | | 22,945 | | | Sinmag Equipment Corp | | | 85,521 | |
| | | |
| | | 39,000 | | | Sitronix Technology Corp | | | 413,195 | |
| | | |
| | | 29,750 | | | Syncmold Enterprise Corp | | | 72,509 | |
| | | |
| | | 692,000 | | | Taiwan Cement Corp | | | 1,174,755 | |
| | | |
| | | 30,000 | | | Taiwan Sakura Corp | | | 72,108 | |
| | | |
| | | 592,000 | | | Taiwan Semiconductor Manufacturing Co Ltd | | | 12,727,737 | |
| | | |
| | | 22,885 | | | Taiwan Semiconductor Manufacturing Co Ltd Sponsored ADR (b) | | | 2,448,924 | |
| | | |
| | | 6,760 | | | TCI Co Ltd | | | 47,405 | |
| | | |
| | | 80,000 | | | Teco Electric and Machinery Co Ltd | | | 86,414 | |
| | | |
| | | 23,000 | | | Test Research Inc | | | 51,607 | |
| | | |
| | | 36,681 | | | TOPBI International Holdings Ltd * | | | 14,048 | |
| | | |
| | | 40,000 | | | Transcend Information Inc | | | 101,452 | |
| | | |
| | | 94,000 | | | Tripod Technology Corp | | | 430,975 | |
| | | |
| | | 6,000 | | | Tung Ho Steel Enterprise Corp | | | 15,113 | |
| | | |
| | | 68,560 | | | Uni-President Enterprises Corp | | | 164,948 | |
| | | |
| | | 77,624 | | | United Integrated Services Co Ltd | | | 491,426 | |
| | | |
| | | 178,000 | | | Universal Inc | | | 256,373 | |
| | | |
| | | 24,000 | | | USI Corp | | | 24,615 | |
| | | |
| | | 47,000 | | | Vanguard International Semiconductor Corp | | | 213,303 | |
| | | |
| | | 10,000 | | | Via Technologies Inc | | | 22,934 | |
| | | |
| | | 7,000 | | | Visual Photonics Epitaxy Co Ltd | | | 28,474 | |
| | | | | | | | | | |
Shares | | | Description | | Value ($) | |
| | | |
| | | | | | Taiwan — continued | | | |
| | | |
| | | 28,000 | | | Walsin Technology Corp * | | | 148,311 | |
| | | |
| | | 2,694,000 | | | Yuanta Financial Holding Co Ltd | | | 2,406,530 | |
| | | |
| | | 6,000 | | | Yulon Nissan Motor Co Ltd | | | 53,294 | |
| | | |
| | | 33,000 | | | Zeng Hsing Industrial Co Ltd | | | 169,416 | |
| | | | | | | | | | |
| | | |
| | | | | | Total Taiwan | | | 95,520,787 | |
| | | | | | | | | | |
| | | |
| | | | | | Thailand — 0.8% | | | |
| | | |
| | | 1,825,224 | | | AP Thailand Pcl NVDR | | | 593,289 | |
| | | |
| | | 128,900 | | | Bangkok Bank Pcl NVDR | | | 555,346 | |
| | | |
| | | 32,300 | | | CP ALL Pcl (Foreign Registered) | | | 67,482 | |
| | | |
| | | 34,600 | | | CP ALL Pcl NVDR | | | 72,287 | |
| | | |
| | | 11,300 | | | Delta Electronics Thailand Pcl NVDR | | | 141,479 | |
| | | |
| | | 17,200 | | | Kasikornbank Pcl (Foreign Registered) | | | 86,503 | |
| | | |
| | | 900,400 | | | Kasikornbank Pcl NVDR | | | 4,528,346 | |
| | | |
| | | 1,215,600 | | | Krung Thai Bank Pcl NVDR | | | 522,985 | |
| | | |
| | | 53,632 | | | Pruksa Holding Pcl NVDR | | | 23,645 | |
| | | |
| | | 53,100 | | | PTT Exploration & Production Pcl NVDR | | | 223,564 | |
| | | |
| | | 1,307,400 | | | PTT Global Chemical Pcl NVDR | | | 2,130,626 | |
| | | |
| | | 237,500 | | | PTT Pcl NVDR | | | 289,101 | |
| | | |
| | | 3,453,500 | | | Sansiri Pcl NVDR | | | 130,805 | |
| | | |
| | | 217,304 | | | Siam Cement Pcl NVDR (The) | | | 2,615,174 | |
| | | |
| | | 112,748 | | | Siam Commercial Bank Pcl NVDR (The) | | | 435,687 | |
| | | |
| | | 141,300 | | | Somboon Advance Technology Pcl NVDR | | | 91,431 | |
| | | |
| | | 23,760 | | | Supalai Pcl (Foreign Registered) | | | 16,002 | |
| | | |
| | | 97,624 | | | Supalai Pcl NVDR | | | 65,747 | |
| | | |
| | | 1,555,100 | | | Thai Union Group Pcl NVDR | | | 972,562 | |
| | | |
| | | 80,000 | | | Thai Vegetable Oil Pcl NVDR | | | 79,702 | |
| | | | | | | | | | |
| | | |
| | | | | | Total Thailand | | | 13,641,763 | |
| | | | | | | | | | |
| | | |
| | | | | | Turkey — 0.7% | | | |
| | | |
| | | 1,316,070 | | | Akbank TAS | | | 671,759 | |
| | | |
| | | 480,551 | | | Arcelik AS | | | 1,922,814 | |
| | | |
| | | 519,002 | | | Dogan Sirketler Grubu Holding AS | | | 95,625 | |
| | | |
| | | 63,018 | | | Dogus Otomotiv Servis ve Ticaret AS | | | 213,810 | |
| | | |
| | | 73,924 | | | Enerjisa Enerji AS | | | 70,896 | |
| | | |
| | | 249,129 | | | Eregli Demir ve Celik Fabrikalari TAS | | | 560,692 | |
| | | |
| | | 102,847 | | | Ford Otomotiv Sanayi AS | | | 2,004,746 | |
| | | |
| | | 1,170,159 | | | Haci Omer Sabanci Holding AS | | | 1,316,153 | |
| | | |
| | | 15,249 | | | Koza Altin Isletmeleri AS * | | | 126,429 | |
| | | |
| | | 166,633 | | | Tofas Turk Otomobil Fabrikasi AS | | | 968,190 | |
| | | |
| | | 2,801,385 | | | Turkiye Garanti Bankasi AS | | | 2,245,216 | |
| | | |
| | | 153,019 | | | Vestel Elektronik Sanayi ve Ticaret AS | | | 248,815 | |
| | | |
| | | 511,431 | | | Yapi ve Kredi Bankasi AS | | | 132,097 | |
| | | | | | | | | | |
| | | |
| | | | | | Total Turkey | | | 10,577,242 | |
| | | | | | | | | | |
| | | |
| | | | | | United Arab Emirates — 0.0% | | | |
| | | |
| | | 20,644 | | | Dubai Islamic Bank PJSC | | | 34,309 | |
| | | | | | | | | | |
| | | |
| | | | | | United Kingdom — 4.2% | | | |
| | | |
| | | 124,054 | | | 3i Group Plc | | | 2,209,913 | |
| | | | |
| | |
| 42 | | See accompanying notes to the financial statements. | | |
GMO Benchmark-Free Fund
(A Series of GMO Trust)
Schedule of Investments — (Continued)
(showing percentage of total net assets)
February 28, 2022
| | | | | | | | | | |
Shares | | | Description | | Value ($) | |
| | | |
| | | | | | United Kingdom — continued | | | |
| | | |
| | | 134,901 | | | Airtel Africa Plc | | | 254,883 | |
| | | |
| | | 5,111 | | | Bank of Georgia Group Plc | | | 90,525 | |
| | | |
| | | 380,860 | | | Barratt Developments Plc | | | 3,102,186 | |
| | | |
| | | 35,068 | | | Bellway Plc | | | 1,348,875 | |
| | | |
| | | 83,495 | | | Berkeley Group Holdings Plc | | | 4,342,266 | |
| | | |
| | | 40,000 | | | BP Plc Sponsored ADR (b) | | | 1,168,400 | |
| | | |
| | | 47,424 | | | British American Tobacco Plc (b) | | | 2,078,446 | |
| | | |
| | | 43,900 | | | British American Tobacco Plc Sponsored ADR (b) | | | 1,942,136 | |
| | | |
| | | 2,432,378 | | | BT Group Plc | | | 6,069,009 | |
| | | |
| | | 29,584 | | | Centrica Plc * (b) | | | 30,471 | |
| | | |
| | | 11,654 | | | CMC Markets Plc | | | 36,429 | |
| | | |
| | | 116,258 | | | Coca-Cola HBC AG * | | | 2,953,713 | |
| | | |
| | | 221,802 | | | Compass Group Plc (b) | | | 5,013,402 | |
| | | |
| | | 2,537 | | | Computacenter Plc (b) | | | 92,864 | |
| | | |
| | | 46,229 | | | Crest Nicholson Holdings Plc | | | 189,736 | |
| | | |
| | | 892 | | | DCC Plc | | | 69,998 | |
| | | |
| | | 4,137 | | | EMIS Group Plc (b) | | | 68,246 | |
| | | |
| | | 23,265 | | | Evraz Plc | | | 44,848 | |
| | | |
| | | 262,378 | | | Ferrexpo Plc | | | 595,136 | |
| | | |
| | | 11,710 | | | Galliford Try Holdings Plc | | | 27,014 | |
| | | |
| | | 3,400 | | | GlaxoSmithKline Plc Sponsored ADR (b) | | | 142,324 | |
| | | |
| | | 11,933 | | | Grafton Group Plc | | | 171,359 | |
| | | |
| | | 72,648 | | | Halfords Group Plc | | | 269,933 | |
| | | |
| | | 3,376 | | | IMI Plc | | | 66,136 | |
| | | |
| | | 32,754 | | | Imperial Brands Plc | | | 716,208 | |
| | | |
| | | 144,010 | | | Indivior Plc * | | | 541,883 | |
| | | |
| | | 22,506 | | | International Personal Finance Plc | | | 33,683 | |
| | | |
| | | 85,553 | | | Investec Plc | | | 464,013 | |
| | | |
| | | 454,468 | | | ITV Plc * (b) | | | 669,589 | |
| | | |
| | | 38,809 | | | J Sainsbury Plc | | | 143,132 | |
| | | |
| | | 84,890 | | | JD Sports Fashion Plc (b) | | | 170,768 | |
| | | |
| | | 4,789 | | | Keller Group Plc | | | 50,677 | |
| | | |
| | | 1,175,646 | | | Kingfisher Plc (b) | | | 4,795,878 | |
| | | |
| | | 361,170 | | | Legal & General Group Plc | | | 1,335,400 | |
| | | |
| | | 1,550,591 | | | M&G Plc | | | 4,268,584 | |
| | | |
| | | 23,885 | | | Marks & Spencer Group Plc * | | | 55,670 | |
| | | |
| | | 258,566 | | | Micro Focus International Plc (b) | | | 1,343,879 | |
| | | |
| | | 16,499 | | | Morgan Advanced Materials Plc | | | 67,049 | |
| | | |
| | | 14,875 | | | Morgan Sindall Group Plc | | | 460,050 | |
| | | |
| | | 6,503 | | | Next Plc (b) | | | 595,430 | |
| | | |
| | | 3,429 | | | Numis Corp Plc | | | 11,821 | |
| | | |
| | | 51,383 | | | OSB Group Plc | | | 343,369 | |
| | | |
| | | 61,108 | | | Paragon Banking Group Plc | | | 411,442 | |
| | | |
| | | 126,276 | | | Persimmon Plc | | | 4,064,007 | |
| | | |
| | | 43,838 | | | Pets at Home Group Plc | | | 211,929 | |
| | | |
| | | 70,375 | | | Plus500 Ltd | | | 1,313,199 | |
| | | |
| | | 158,059 | | | Premier Foods Plc | | | 232,687 | |
| | | |
| | | 110,446 | | | Reach Plc (b) | | | 337,360 | |
| | | |
| | | 35,451 | | | Redde Northgate Plc (b) | | | 179,920 | |
| | | | | | | | | | |
Shares | | | Description | | Value ($) | |
| | | |
| | | | | | United Kingdom — continued | | | |
| | | |
| | | 97,894 | | | Redrow Plc | | | 746,296 | |
| | | |
| | | 11,000 | | | Rio Tinto Plc Sponsored ADR (b) | | | 864,380 | |
| | | |
| | | 158,662 | | | Royal Mail Plc (b) | | | 833,857 | |
| | | |
| | | 44,288 | | | Serica Energy Plc | | | 164,668 | |
| | | |
| | | 153,151 | | | Shell Plc (b) | | | 4,038,713 | |
| | | |
| | | 41,626 | | | Spirent Communications Plc | | | 136,198 | |
| | | |
| | | 28,209 | | | Tate & Lyle Plc | | | 283,176 | |
| | | |
| | | 723,367 | | | Taylor Wimpey Plc | | | 1,450,919 | |
| | | |
| | | 1,270 | | | TBC Bank Group Plc | | | 20,439 | |
| | | |
| | | 15,564 | | | Unilever Plc (c) | | | 780,916 | |
| | | |
| | | 15,642 | | | Unilever Plc (b) (c) | | | 785,729 | |
| | | |
| | | 12,980 | | | Vesuvius Plc | | | 68,964 | |
| | | |
| | | 9,507 | | | Vistry Group Plc | | | 127,877 | |
| | | |
| | | 131,507 | | | WPP Plc (b) | | | 1,849,631 | |
| | | | | | | | | | |
| | | |
| | | | | | Total United Kingdom | | | 67,347,638 | |
| | | | | | | | | | |
| | | |
| | | | | | United States — 14.0% | | | |
| | | |
| | | 29,400 | | | Aflac, Inc. | | | 1,796,046 | |
| | | |
| | | 600 | | | AGNC Investment Corp. (REIT) | | | 7,746 | |
| | | |
| | | 30,300 | | | Alliance Data Systems Corp. (b) | | | 2,043,735 | |
| | | |
| | | 2,800 | | | Allstate Corp. (The) (b) | | | 342,608 | |
| | | |
| | | 47,500 | | | Ally Financial, Inc. | | | 2,370,250 | |
| | | |
| | | 23,753 | | | American Express Co. (b) | | | 4,620,909 | |
| | | |
| | | 3,300 | | | Arch Capital Group Ltd. * | | | 155,463 | |
| | | |
| | | 20,200 | | | Arrow Electronics, Inc. * | | | 2,461,976 | |
| | | |
| | | 87,700 | | | AT&T, Inc. (b) | | | 2,077,613 | |
| | | |
| | | 4,000 | | | Bath & Body Works, Inc. (b) | | | 213,480 | |
| | | |
| | | 20,600 | | | Best Buy Co., Inc. (b) | | | 1,990,784 | |
| | | |
| | | 3,400 | | | Bio-Rad Laboratories, Inc. – Class A * | | | 2,128,264 | |
| | | |
| | | 9,100 | | | Biogen, Inc. * | | | 1,920,191 | |
| | | |
| | | 1,638 | | | Booking Holdings, Inc. * (b) | | | 3,558,146 | |
| | | |
| | | 120,523 | | | BorgWarner, Inc. | | | 4,942,648 | |
| | | |
| | | 22,600 | | | Bristol-Myers Squibb Co. (b) | | | 1,551,942 | |
| | | |
| | | 16,800 | | | Capital One Financial Corp. (b) | | | 2,574,936 | |
| | | |
| | | 52,300 | | | Carrier Global Corp. | | | 2,347,224 | |
| | | |
| | | 23,800 | | | CBRE Group, Inc. – Class A * (b) | | | 2,305,030 | |
| | | |
| | | 30,100 | | | Centene Corp. * (b) | | | 2,486,862 | |
| | | |
| | | 24,448 | | | Chevron Corp. (b) | | | 3,520,512 | |
| | | |
| | | 11,600 | | | Cigna Corp. (b) | | | 2,758,248 | |
| | | |
| | | 41,500 | | | Citigroup, Inc. (b) | | | 2,458,045 | |
| | | |
| | | 9,800 | | | Citizens Financial Group, Inc. | | | 513,716 | |
| | | |
| | | 25,600 | | | Cognizant Technology Solutions Corp. – Class A (b) | | | 2,204,928 | |
| | | |
| | | 31,200 | | | Comcast Corp. – Class A (b) | | | 1,458,912 | |
| | | |
| | | 14,100 | | | CVS Health Corp. (b) | | | 1,461,465 | |
| | | |
| | | 66,077 | | | Darling Ingredients, Inc. * | | | 4,789,261 | |
| | | |
| | | 17,800 | | | Discover Financial Services (b) | | | 2,197,232 | |
| | | |
| | | 61,200 | | | DISH Network Corp. – Class A * (b) | | | 1,955,952 | |
| | | |
| | | 26,600 | | | DR Horton, Inc. | | | 2,271,640 | |
| | | |
| | | 32,400 | | | eBay, Inc. (b) | | | 1,768,716 | |
| | | | |
| | |
| | | See accompanying notes to the financial statements. | | 43 |
GMO Benchmark-Free Fund
(A Series of GMO Trust)
Schedule of Investments — (Continued)
(showing percentage of total net assets)
February 28, 2022
| | | | | | | | | | |
Shares | | | Description | | Value ($) | |
| | | |
| | | | | | United States — continued | | | |
| | | |
| | | 42,749 | | | EOG Resources, Inc. | | | 4,912,715 | |
| | | |
| | | 42,400 | | | Fidelity National Financial, Inc. | | | 2,019,936 | |
| | | |
| | | 8,200 | | | FleetCor Technologies, Inc. * (b) | | | 1,920,440 | |
| | | |
| | | 112,300 | | | Ford Motor Co. | | | 1,971,988 | |
| | | |
| | | 12,900 | | | Fox Corp. – Class A (b) | | | 539,607 | |
| | | |
| | | 70,300 | | | Fox Corp. – Class B (b) | | | 2,689,678 | |
| | | |
| | | 58,900 | | | Franklin Resources, Inc. | | | 1,751,097 | |
| | | |
| | | 45,900 | | | General Motors Co. * | | | 2,144,448 | |
| | | |
| | | 35,800 | | | Gilead Sciences, Inc. (b) | | | 2,162,320 | |
| | | |
| | | 16,121 | | | Global Payments, Inc. (b) | | | 2,150,219 | |
| | | |
| | | 4,600 | | | Goldman Sachs Group, Inc. (The) (b) | | | 1,569,934 | |
| | | |
| | | 28,185 | | | Green Plains, Inc. * | | | 922,777 | |
| | | |
| | | 28,774 | | | Hasbro, Inc. | | | 2,792,517 | |
| | | |
| | | 22,549 | | | Hilton Worldwide Holdings, Inc. * (b) | | | 3,356,644 | |
| | | |
| | | 69,300 | | | HP, Inc. | | | 2,381,148 | |
| | | |
| | | 20,400 | | | IAC/InterActiveCorp * (b) | | | 2,341,104 | |
| | | |
| | | 27,400 | | | Incyte Corp. * | | | 1,871,420 | |
| | | |
| | | 54,000 | | | Intel Corp. (b) | | | 2,575,800 | |
| | | |
| | | 27,402 | | | Intercontinental Exchange, Inc. (b) | | | 3,510,744 | |
| | | |
| | | 21,800 | | | International Business Machines Corp. (b) | | | 2,670,718 | |
| | | |
| | | 81,100 | | | Invesco Ltd. | | | 1,722,564 | |
| | | |
| | | 16,400 | | | Jazz Pharmaceuticals Plc * | | | 2,253,688 | |
| | | |
| | | 159,900 | | | Kinder Morgan, Inc. | | | 2,782,260 | |
| | | |
| | | 27,300 | | | Kohl’s Corp. | | | 1,518,426 | |
| | | |
| | | 39,100 | | | Kroger Co. (The) (b) | | | 1,829,880 | |
| | | |
| | | 9,900 | | | Laboratory Corp. of America Holdings * (b) | | | 2,685,474 | |
| | | |
| | | 47,621 | | | Las Vegas Sands Corp. * (b) | | | 2,041,036 | |
| | | |
| | | 14,800 | | | Leidos Holdings, Inc. (b) | | | 1,507,232 | |
| | | |
| | | 25,300 | | | Lennar Corp. – Class A | | | 2,273,964 | |
| | | |
| | | 31,800 | | | Liberty Global Plc – Class A * | | | 819,804 | |
| | | |
| | | 60,900 | | | Liberty Global Plc – Class C * | | | 1,575,483 | |
| | | |
| | | 38,300 | | | Lincoln National Corp. | | | 2,582,186 | |
| | | |
| | | 29,600 | | | LKQ Corp. (b) | | | 1,389,720 | |
| | | |
| | | 147,700 | | | Lumen Technologies, Inc. | | | 1,530,172 | |
| | | |
| | | 81,627 | | | Lyft, Inc. – Class A * (b) | | | 3,178,555 | |
| | | |
| | | 27,300 | | | LyondellBasell Industries NV – Class A (b) | | | 2,654,379 | |
| | | |
| | | 2,530 | | | Markel Corp. * | | | 3,144,562 | |
| | | |
| | | 26,000 | | | Merck & Co., Inc. (b) | | | 1,991,080 | |
| | | |
| | | 3,000 | | | Meta Platforms, Inc. – Class A * (b) | | | 633,090 | |
| | | |
| | | 41,000 | | | MetLife, Inc. | | | 2,769,550 | |
| | | |
| | | 30,100 | | | Micron Technology, Inc. (b) | | | 2,674,686 | |
| | | |
| | | 7,300 | | | Mohawk Industries, Inc. * | | | 1,027,694 | |
| | | |
| | | 51,600 | | | Molson Coors Brewing Co. – Class B | | | 2,692,488 | |
| | | |
| | | 17,700 | | | NRG Energy, Inc. (b) | | | 669,768 | |
| | | |
| | | 30 | | | NVR, Inc. * | | | 148,753 | |
| | | |
| | | 9,100 | | | Omnicom Group, Inc. (b) | | | 763,399 | |
| | | |
| | | 26,800 | | | Oracle Corp. (b) | | | 2,035,996 | |
| | | |
| | | 3,500 | | | Owens Corning | | | 326,165 | |
| | | |
| | | 68,400 | | | Paramount Global – Class B (b) | | | 2,093,724 | |
| | | |
| | | 4,700 | | | Principal Financial Group, Inc. | | | 332,008 | |
| | | | | | | | | | |
Shares | | | Description | | Value ($) | |
| | | |
| | | | | | United States — continued | | | |
| | | |
| | | 24,300 | | | Prudential Financial, Inc. | | | 2,713,338 | |
| | | |
| | | 47,500 | | | PulteGroup, Inc. | | | 2,358,850 | |
| | | |
| | | 16,200 | | | Quest Diagnostics, Inc. (b) | | | 2,126,574 | |
| | | |
| | | 288,100 | | | Qurate Retail, Inc. – Series A | | | 1,587,431 | |
| | | |
| | | 40,077 | | | Raytheon Technologies Corp. (b) | | | 4,115,908 | |
| | | |
| | | 4,500 | | | Regeneron Pharmaceuticals, Inc. * (b) | | | 2,782,620 | |
| | | |
| | | 10,300 | | | Regions Financial Corp. | | | 249,157 | |
| | | |
| | | 7,600 | | | Resolute Forest Products, Inc. (c) | | | 94,772 | |
| | | |
| | | 6,900 | | | Resolute Forest Products, Inc. (c) | | | 86,230 | |
| | | |
| | | 73,515 | | | Sensata Technologies Holding Plc * | | | 4,257,254 | |
| | | |
| | | 1,500 | | | Skyworks Solutions, Inc. | | | 207,255 | |
| | | |
| | | 500 | | | Snap-on, Inc. | | | 105,090 | |
| | | |
| | | 13,300 | | | SS&C Technologies Holdings, Inc. (b) | | | 997,101 | |
| | | |
| | | 12,100 | | | Steel Dynamics, Inc. | | | 854,018 | |
| | | |
| | | 60,100 | | | Synchrony Financial | | | 2,571,078 | |
| | | |
| | | 22,700 | | | Textron, Inc. | | | 1,660,051 | |
| | | |
| | | 27,800 | | | Tyson Foods, Inc. – Class A (b) | | | 2,575,948 | |
| | | |
| | | 18,900 | | | Universal Health Services, Inc. – Class B (b) | | | 2,720,277 | |
| | | |
| | | 75,389 | | | US Bancorp | | | 4,262,494 | |
| | | |
| | | 39,400 | | | Verizon Communications, Inc. (b) | | | 2,114,598 | |
| | | |
| | | 5,799 | | | Verso Corp. – Class A | | | 153,731 | |
| | | |
| | | 44,883 | | | VF Corp. | | | 2,604,112 | |
| | | |
| | | 153,400 | | | Viatris, Inc. | | | 1,688,934 | |
| | | |
| | | 16,000 | | | VMware, Inc. – Class A (b) | | | 1,877,120 | |
| | | |
| | | 13,500 | | | Walgreens Boots Alliance, Inc. (b) | | | 622,215 | |
| | | |
| | | 79,100 | | | Wells Fargo & Co. | | | 4,221,567 | |
| | | |
| | | 116,000 | | | Western Union Co. (The) (b) | | | 2,108,880 | |
| | | |
| | | 39,600 | | | Western Digital Corp. * | | | 2,017,224 | |
| | | |
| | | 9,200 | | | Whirlpool Corp. | | | 1,851,684 | |
| | | |
| | | 7,500 | | | Zoom Video Communications, Inc. – Class A * (b) | | | 994,500 | |
| | | | | | | | | | |
| | | |
| | | | | | Total United States | | | 225,737,531 | |
| | | | | | | | | | |
| | | |
| | | | | | TOTAL COMMON STOCKS
(COST $1,294,231,128) | | | 1,268,469,337 | |
| | | | | | | | | | |
| | |
| | | | | | PREFERRED STOCKS (f) — 1.4% | |
| | |
| | | | | | Brazil — 0.8% | |
| | | |
| | | 591,693 | | | Bradespar SA | | | 3,405,935 | |
| | | |
| | | 278,400 | | | Cia Energetica de Minas Gerais | | | 684,104 | |
| | | |
| | | 119,000 | | | Cia Energetica de Minas Gerais Sponsored ADR (b) | | | 299,880 | |
| | | |
| | | 1,277,400 | | | Cia Paranaense de Energia – Class B | | | 1,706,853 | |
| | | |
| | | 57,900 | | | Gerdau SA | | | 287,173 | |
| | | |
| | | 7,900 | | | Gerdau SA Sponsored ADR | | | 38,473 | |
| | | |
| | | 670,200 | | | Petroleo Brasileiro SA | | | 4,405,531 | |
| | | |
| | | 189,500 | | | Petroleo Brasileiro SA Sponsored ADR | | | 2,480,555 | |
| | | |
| | | 18,200 | | | Usinas Siderurgicas de Minas Gerais SA Usiminas – Class A | | | 51,447 | |
| | | | | | | | | | |
| | | |
| | | | | | Total Brazil | | | 13,359,951 | |
| | | | | | | | | | |
| | | | |
| | |
| 44 | | See accompanying notes to the financial statements. | | |
GMO Benchmark-Free Fund
(A Series of GMO Trust)
Schedule of Investments — (Continued)
(showing percentage of total net assets)
February 28, 2022
| | | | | | | | | | |
Shares | | | Description | | Value ($) | |
| | | | | | Chile — 0.0% | |
| | | |
| | | 1,900 | | | Sociedad Quimica y Minera de Chile SA Sponsored ADR | | | 125,742 | |
| | | |
| | | 2,163 | | | Sociedad Quimica y Minera de Chile SA – Class B | | | 143,649 | |
| | | | | | | | | | |
| | | |
| | | | | | Total Chile | | | 269,391 | |
| | | | | | | | | | |
| | |
| | | | | | Colombia — 0.0% | |
| | | |
| | | 297,879 | | | Grupo Aval Acciones y Valores SA | | | 80,201 | |
| | | | | | | | | | |
| | |
| | | | | | Germany — 0.1% | |
| | | |
| | | 17,917 | | | Bayerische Motoren Werke AG | | | 1,448,912 | |
| | | |
| | | 5,449 | | | Draegerwerk AG & Co KGaA (b) | | | 308,700 | |
| | | |
| | | 1,243 | | | Sixt SE (b) | | | 101,361 | |
| | | |
| | | 1,552 | | | Villeroy & Boch AG | | | 41,460 | |
| | | |
| | | 2,951 | | | Volkswagen AG | | | 580,100 | |
| | | | | | | | | | |
| | | |
| | | | | | Total Germany | | | 2,480,533 | |
| | | | | | | | | | |
| | |
| | | | | | Russia — 0.2% | |
| | | |
| | | 12,924 | | | Bashneft PJSC | | | 61,467 | |
| | | |
| | | 56,000 | | | Nizhnekamskneftekhim PJSC – Class S | | | 32,168 | |
| | | |
| | | 20,810 | | | Sberbank of Russia PJSC | | | 19,320 | |
| | | |
| | | 9,254,300 | | | Surgutneftegas PJSC | | | 2,603,376 | |
| | | |
| | | 161 | | | Transneft PJSC | | | 198,954 | |
| | | | | | | | | | |
| | | |
| | | | | | Total Russia | | | 2,915,285 | |
| | | | | | | | | | |
| | |
| | | | | | South Korea — 0.3% | |
| | | |
| | | 5,999 | | | Hyundai Motor Co Ltd-Prf | | | 440,007 | |
| | | |
| | | 4,881 | | | LG Electronics Inc | | | 244,284 | |
| | | |
| | | 62,498 | | | Samsung Electronics Co Ltd | | | 3,454,107 | |
| | | | | | | | | | |
| | | |
| | | | | | Total South Korea | | | 4,138,398 | |
| | | | | | | | | | |
| | |
| | | | | | Taiwan — 0.0% | |
| | | |
| | | 12,589 | | | Chailease Holding Co Ltd | | | 45,817 | |
| | | |
| | | 77,681 | | | China Development Financial Holding Corp | | | 25,824 | |
| | | | | | | | | | |
| | | |
| | | | | | Total Taiwan | | | 71,641 | |
| | | | | | | | | | |
| | | |
| | | | | | TOTAL PREFERRED STOCKS
(COST $23,246,867) | | | 23,315,400 | |
| | | | | | | | | | |
| | |
| | | | | | INVESTMENT FUNDS — 0.2% | |
| | |
| | | | | | United States — 0.2% | |
| | | |
| | | 42,458 | | | iShares Core MSCI Emerging Markets ETF | | | 2,429,871 | |
| | | | | | | | | | |
| | | |
| | | | | | TOTAL INVESTMENT FUNDS
(COST $2,628,363) | | | 2,429,871 | |
| | | | | | | | | | |
| | | | | | | | | | |
Par Value† /
Shares | | | Description | | Value ($) | |
| | | | | | DEBT OBLIGATIONS — 16.8% | |
| | |
| | | | | | United States — 16.8% | |
| | |
| | | | | | Asset-Backed Securities — 0.0% | |
| | | |
| | | 2,571,735 | | | Crest G-Star LP, Series 01-1A, Class D, 144A, 9.00%, due 11/28/35 (g) | | | 3 | |
| | | | | | | | | | |
| | |
| | | Total Asset-Backed Securities | | | 3 | |
| | | | | | | | | | |
| | |
| | | | | | U.S. Government — 16.8% | |
| | | |
| | | 107,850,000 | | | U.S. Treasury Note, 0.13%, due 02/28/23 | | | 106,822,055 | |
| | | |
| | | 50,000,000 | | | U.S. Treasury Note, 0.13%, due 03/31/23 | | | 49,447,265 | |
| | | |
| | | 50,000,000 | | | U.S. Treasury Note, 0.13%, due 04/30/23 | | | 49,378,906 | |
| | | |
| | | 13,700,000 | | | U.S. Treasury Note, 0.13%, due 06/30/23 (b) | | | 13,495,035 | |
| | | |
| | | 1,000,000 | | | U.S. Treasury Note, 0.13%, due 07/31/23 | | | 983,555 | |
| | | |
| | | 5,000,000 | | | U.S. Treasury Note, Variable Rate, USBM + 0.03%, 0.39%, due 07/31/23 (b) | | | 5,007,832 | |
| | | |
| | | 46,725,000 | | | U.S. Treasury Note, Variable Rate, USBM + 0.04%, 0.40%, due 10/31/23 (b) | | | 46,809,354 | |
| | | | | | | | | | |
| | | |
| | | | | | Total U.S. Government | | | 271,944,002 | |
| | | | | | | | | | |
| | | |
| | | | | | Total United States | | | 271,944,005 | |
| | | | | | | | | | |
| | | |
| | | | | | TOTAL DEBT OBLIGATIONS
(COST $274,284,708) | | | 271,944,005 | |
| | | | | | | | | | |
| | |
| | | | | | MUTUAL FUNDS — 15.2% | |
| | |
| | | | | | United States — 15.2% | |
| | |
| | | | | | Affiliated Issuers — 15.2% | |
| | | |
| | | 2,258,105 | | | GMO Emerging Country Debt Fund, Class VI | | | 48,097,631 | |
| | | |
| | | 1,150,766 | | | GMO Emerging Markets Fund, Class VI | | | 34,016,640 | |
| | | |
| | | 3,597,225 | | | GMO Opportunistic Income Fund, Class VI | | | 91,945,071 | |
| | | |
| | | 2,076,590 | | | GMO SGM Major Markets Fund, Class VI | | | 60,781,806 | |
| | | |
| | | 2,014,030 | | | GMO U.S. Treasury Fund (h) | | | 10,090,292 | |
| | | | | | | | | | |
| | | |
| | | | | | TOTAL MUTUAL FUNDS (COST $269,215,510) | | | 244,931,440 | |
| | | | | | | | | | |
| | |
| | | | | | SHORT-TERM INVESTMENTS — 14.9% | |
| | |
| | | | | | Money Market Funds — 0.2% | |
| | | |
| | | 2,958,576 | | | State Street Institutional Treasury Money Market Fund – Premier Class, 0.01% (i) | | | 2,958,576 | |
| | | | | | | | | | |
| | | |
| | | | | | U.S. Government — 14.7% | | | |
| | | |
| | | 24,000,000 | | | U.S. Treasury Bill, 0.31%, due 05/24/22 (b) (j) | | | 23,982,416 | |
| | | |
| | | 50,000,000 | | | U.S. Treasury Bill, 0.35%, due 05/31/22 (b) (j) | | | 49,955,764 | |
| | | | |
| | |
| | | See accompanying notes to the financial statements. | | 45 |
GMO Benchmark-Free Fund
(A Series of GMO Trust)
Schedule of Investments — (Continued)
(showing percentage of total net assets)
February 28, 2022
| | | | | | | | | | |
Par Value† /
Shares | | | Description | | Value ($) | |
| | | |
| | | | | | U.S. Government — continued | | | |
| | | |
| | | 25,000,000 | | | U.S. Treasury Bill, 0.54%, due 07/21/22 (b) (j) | | | 24,946,849 | |
| | | |
| | | 2,900,000 | | | U.S. Treasury Bill, 0.58%, due 07/28/22 (b) (j) | | | 2,893,158 | |
| | | |
| | | 86,700,000 | | | U.S. Treasury Bill, 0.64%, due 08/18/22 (b) (j) | | | 86,439,338 | |
| | | |
| | | 50,000,000 | | | U.S. Treasury Bill, 0.89%, due 01/26/23 (j) | | | 49,598,893 | |
| | | | | | | | | | |
| | | |
| | | | | | Total U.S. Government | | | 237,816,418 | |
| | | | | | | | | | |
| | | |
| | | | | | TOTAL SHORT-TERM INVESTMENTS
(COST $240,868,576) | | | 240,774,994 | |
| | | | | | | | | | |
| | | |
| | | | | | TOTAL INVESTMENTS — 127.1%
(Cost $2,104,475,152) | | | 2,051,865,047 | |
| | | | | | | | | | |
| | |
| | | | | | SECURITIES SOLD SHORT — (20.6)% | |
| | | |
| | | | | | Common Stocks — (20.5)% | | | |
| | | |
| | | | | | Australia — (0.5)% | | | |
| | | |
| | | (347,879 | ) | | APA Group | | | (2,543,160 | ) |
| | | |
| | | (31,944 | ) | | ASX Ltd | | | (1,918,603 | ) |
| | | |
| | | (6,457 | ) | | Cochlear Ltd | | | (1,054,067 | ) |
| | | |
| | | (1,414 | ) | | Domino’s Pizza Enterprises Ltd | | | (81,647 | ) |
| | | |
| | | (593,725 | ) | | Qantas Airways Ltd * | | | (2,200,033 | ) |
| | | | | | | | | | |
| | | |
| | | | | | Total Australia | | | (7,797,510 | ) |
| | | | | | | | | | |
| | | |
| | | | | | Austria — (0.2)% | | | |
| | | |
| | | (26,070 | ) | | Verbund AG | | | (3,144,473 | ) |
| | | | | | | | | | |
| | | |
| | | | | | Belgium — (0.1)% | | | |
| | | |
| | | (35,915 | ) | | Anheuser-Busch InBev SA/NV | | | (2,216,236 | ) |
| | | | | | | | | | |
| | | |
| | | | | | Canada — (0.7)% | | | |
| | | |
| | | (8,400 | ) | | Agnico Eagle Mines Ltd | | | (424,116 | ) |
| | | |
| | | (86,900 | ) | | AltaGas Ltd | | | (1,914,200 | ) |
| | | |
| | | (33,900 | ) | | Cameco Corp | | | (833,262 | ) |
| | | |
| | | (49,800 | ) | | Enbridge Inc | | | (2,150,364 | ) |
| | | |
| | | (14,300 | ) | | Franco-Nevada Corp | | | (2,103,816 | ) |
| | | |
| | | (15,700 | ) | | Pan American Silver Corp | | | (370,991 | ) |
| | | |
| | | (61,600 | ) | | Pembina Pipeline Corp | | | (2,091,936 | ) |
| | | |
| | | (26,200 | ) | �� | Restaurant Brands International Inc | | | (1,466,676 | ) |
| | | | | | | | | | |
| | | |
| | | | | | Total Canada | | | (11,355,361 | ) |
| | | | | | | | | | |
| | | |
| | | | | | Denmark — (0.1)% | | | |
| | | |
| | | (71,137 | ) | | Ambu A/S – Class B | | | (1,311,820 | ) |
| | | | | | | | | | |
| | | |
| | | | | | France — (0.7)% | | | |
| | | |
| | | (64,836 | ) | | Accor SA * | | | (2,214,361 | ) |
| | | |
| | | (13,833 | ) | | Aeroports de Paris * | | | (1,955,841 | ) |
| | | |
| | | (176,550 | ) | | Getlink SE | | | (2,879,413 | ) |
| | | |
| | | (1,600 | ) | | Hermes International | | | (2,206,459 | ) |
| | | |
| | | (1,579 | ) | | Sartorius Stedim Biotech | | | (605,500 | ) |
| | | |
| | | (18,453 | ) | | Ubisoft Entertainment SA * | | | (989,394 | ) |
| | | |
| | | (8,332 | ) | | Wendel SE | | | (845,851 | ) |
| | | | | | | | | | |
| | | |
| | | | | | Total France | | | (11,696,819 | ) |
| | | | | | | | | | |
| | | | | | | | | | |
Shares | | | Description | | Value ($) | |
| | | | | | Common Stocks — continued | | | |
| | | | | | Germany — (0.9)% | | | |
| | | |
| | | (828 | ) | | adidas AG | | | (195,774 | ) |
| | | |
| | | (26,788 | ) | | Delivery Hero SE * | | | (1,435,853 | ) |
| | | |
| | | (1,740 | ) | | MTU Aero Engines AG | | | (416,532 | ) |
| | | |
| | | (1,075 | ) | | Nemetschek SE | | | (95,386 | ) |
| | | |
| | | (22,044 | ) | | Puma SE | | | (2,021,532 | ) |
| | | |
| | | (20,468 | ) | | QIAGEN NV * | | | (1,028,361 | ) |
| | | |
| | | (467 | ) | | Rational AG | | | (343,694 | ) |
| | | |
| | | (20,250 | ) | | Scout24 SE | | | (1,181,190 | ) |
| | | |
| | | (17,429 | ) | | Symrise AG – Class A | | | (2,073,119 | ) |
| | | |
| | | (925,836 | ) | | Telefonica Deutschland Holding AG | | | (2,526,463 | ) |
| | | |
| | | (35,555 | ) | | Uniper SE | | | (1,137,445 | ) |
| | | |
| | | (26,884 | ) | | Zalando SE * | | | (1,779,362 | ) |
| | | | | | | | | | |
| | | |
| | | | | | Total Germany | | | (14,234,711 | ) |
| | | | | | | | | | |
| | | |
| | | | | | Israel — (0.2)% | | | |
| | | |
| | | (13,900 | ) | | CyberArk Software Ltd * | | | (2,364,946 | ) |
| | | |
| | | (3,500 | ) | | Kornit Digital Ltd * | | | (331,905 | ) |
| | | |
| | | (13,600 | ) | | Wix.com Ltd * | | | (1,245,488 | ) |
| | | | | | | | | | |
| | | |
| | | | | | Total Israel | | | (3,942,339 | ) |
| | | | | | | | | | |
| | | |
| | | | | | Italy — (0.6)% | | | |
| | | |
| | | (43,270 | ) | | Amplifon SPA | | | (1,856,909 | ) |
| | | |
| | | (110,630 | ) | | Atlantia SPA * | | | (2,035,067 | ) |
| | | |
| | | (10,076 | ) | | Ferrari NV | | | (2,165,215 | ) |
| | | |
| | | (141,699 | ) | | FinecoBank Banca Fineco SPA | | | (2,361,530 | ) |
| | | |
| | | (189,125 | ) | | Infrastrutture Wireless Italiane SPA | | | (1,931,214 | ) |
| | | | | | | | | | |
| | | |
| | | | | | Total Italy | | | (10,349,935 | ) |
| | | | | | | | | | |
| | | |
| | | | | | Japan — (2.8)% | | | |
| | | |
| | | (145,800 | ) | | Acom Co Ltd | | | (406,144 | ) |
| | | |
| | | (42,000 | ) | | Aeon Co Ltd | | | (951,455 | ) |
| | | |
| | | (96,700 | ) | | ANA Holdings Inc * | | | (2,129,158 | ) |
| | | |
| | | (79,400 | ) | | Asahi Intecc Co Ltd | | | (1,714,509 | ) |
| | | |
| | | (6,900 | ) | | Benefit One Inc | | | (159,817 | ) |
| | | |
| | | (14,600 | ) | | East Japan Railway Co | | | (867,368 | ) |
| | | |
| | | (22,400 | ) | | GMO Payment Gateway Inc | | | (2,166,703 | ) |
| | | |
| | | (14,400 | ) | | Harmonic Drive Systems Inc | | | (589,014 | ) |
| | | |
| | | (86,100 | ) | | Hitachi Metals Ltd * | | | (1,534,776 | ) |
| | | |
| | | (131,800 | ) | | Isetan Mitsukoshi Holdings Ltd | | | (1,062,907 | ) |
| | | |
| | | (107,200 | ) | | Japan Airlines Co Ltd * | | | (2,125,633 | ) |
| | | |
| | | (30,900 | ) | | Japan Airport Terminal Co Ltd * | | | (1,442,919 | ) |
| | | |
| | | (47,700 | ) | | Japan Exchange Group Inc | | | (893,233 | ) |
| | | |
| | | (103 | ) | | Japan Real Estate Investment Corp (REIT) | | | (550,200 | ) |
| | | |
| | | (86,300 | ) | | JGC Holding Corp | | | (864,977 | ) |
| | | |
| | | (91,700 | ) | | Keikyu Corp | | | (960,846 | ) |
| | | |
| | | (28,400 | ) | | Keio Corp | | | (1,162,044 | ) |
| | | |
| | | (21,900 | ) | | Kintetsu Group Holdings Co Ltd * | | | (657,927 | ) |
| | | |
| | | (10,400 | ) | | Lasertec Corp | | | (1,927,875 | ) |
| | | |
| | | (41,600 | ) | | LIXIL Corp | | | (927,154 | ) |
| | | | |
| | |
| 46 | | See accompanying notes to the financial statements. | | |
GMO Benchmark-Free Fund
(A Series of GMO Trust)
Schedule of Investments — (Continued)
(showing percentage of total net assets)
February 28, 2022
| | | | | | | | | | |
Shares | | | Description | | Value ($) | |
| | | | | | Common Stocks — continued | | | |
| | | |
| | | | | | Japan — continued | | | |
| | | |
| | | (57,100 | ) | | M3 Inc | | | (2,148,301 | ) |
| | | |
| | | (2,000 | ) | | McDonald’s Holdings Co Japan Ltd | | | (85,997 | ) |
| | | |
| | | (49,100 | ) | | Mercari Inc * | | | (1,537,814 | ) |
| | | |
| | | (9,000 | ) | | Mizuho Financial Group Inc | | | (118,612 | ) |
| | | |
| | | (120,800 | ) | | MonotaRO Co Ltd | | | (2,273,818 | ) |
| | | |
| | | (17,500 | ) | | Nidec Corp | | | (1,521,338 | ) |
| | | |
| | | (105,100 | ) | | Nihon M&A Center Holdings Inc | | | (1,554,540 | ) |
| | | |
| | | (219,100 | ) | | Nippon Paint Holdings Co Ltd | | | (1,960,965 | ) |
| | | |
| | | (23,600 | ) | | Nissin Foods Holdings Co Ltd | | | (1,885,573 | ) |
| | | |
| | | (76,100 | ) | | Odakyu Electric Railway Co Ltd | | | (1,255,535 | ) |
| | | |
| | | (14,500 | ) | | ORIENTAL LAND CO LTD | | | (2,680,539 | ) |
| | | |
| | | (170,700 | ) | | Rakuten Group Inc | | | (1,451,057 | ) |
| | | |
| | | (13,500 | ) | | Shiseido Co Ltd | | | (774,712 | ) |
| | | |
| | | (23,000 | ) | | Tobu Railway Co Ltd | | | (565,353 | ) |
| | | |
| | | (33,500 | ) | | Tokyu Corp | | | (446,769 | ) |
| | | |
| | | (48,800 | ) | | West Japan Railway Co | | | (2,105,423 | ) |
| | | | | | | | | | |
| | | |
| | | | | | Total Japan | | | (45,461,005 | ) |
| | | | | | | | | | |
| | | |
| | | | | | Netherlands — (0.3)% | | | |
| | | |
| | | (1,092 | ) | | Adyen NV * | | | (2,276,025 | ) |
| | | |
| | | (6,321 | ) | | Heineken Holding NV | | | (516,230 | ) |
| | | |
| | | (6,106 | ) | | IMCD NV | | | (991,867 | ) |
| | | |
| | | (42,911 | ) | | Just Eat Takeaway.com NV * | | | (1,736,700 | ) |
| | | | | | | | | | |
| | | |
| | | | | | Total Netherlands | | | (5,520,822 | ) |
| | | | | | | | | | |
| | | |
| | | | | | New Zealand — (0.1)% | | | |
| | | |
| | | (25,114 | ) | | Xero Ltd * | | | (1,726,788 | ) |
| | | | | | | | | | |
| | | |
| | | | | | Norway — (0.0)% | | | |
| | | |
| | | (6,374 | ) | | Schibsted ASA – Class A | | | (183,176 | ) |
| | | |
| | | (8,129 | ) | | Schibsted ASA – Class B | | | (211,022 | ) |
| | | | | | | | | | |
| | | |
| | | | | | Total Norway | | | (394,198 | ) |
| | | | | | | | | | |
| | | |
| | | | | | Russia — (0.0)% | | | |
| | | |
| | | (5,690 | ) | | Magnit PJSC Sponsored GDR (Registered) | | | (9,031 | ) |
| | | | | | | | | | |
| | | |
| | | | | | Singapore — (0.3)% | | | |
| | | |
| | | (119,400 | ) | | City Developments Ltd | | | (631,806 | ) |
| | | |
| | | (545,300 | ) | | Singapore Airlines Ltd * | | | (2,064,770 | ) |
| | | |
| | | (206,600 | ) | | Singapore Exchange Ltd | | | (1,433,346 | ) |
| | | | | | | | | | |
| | | |
| | | | | | Total Singapore | | | (4,129,922 | ) |
| | | | | | | | | | |
| | | |
| | | | | | Spain — (0.6)% | | | |
| | | |
| | | (12,664 | ) | | Aena SME SA * | | | (2,066,830 | ) |
| | | |
| | | (46,805 | ) | | Cellnex Telecom SA | | | (2,117,094 | ) |
| | | |
| | | (90,938 | ) | | Ferrovial SA | | | (2,477,533 | ) |
| | | |
| | | (113,384 | ) | | Siemens Gamesa Renewable Energy SA * | | | (2,608,943 | ) |
| | | | | | | | | | |
| | | |
| | | | | | Total Spain | | | (9,270,400 | ) |
| | | | | | | | | | |
| | | | | | | | | | |
Shares | | | Description | | Value ($) | |
| | | | | | Common Stocks — continued | | | |
| | | | | | Sweden — (0.4)% | | | |
| | | |
| | | (208,527 | ) | | Embracer Group AB – Class B * | | | (1,790,024 | ) |
| | | |
| | | (8,109 | ) | | EQT AB | | | (271,408 | ) |
| | | |
| | | (19,226 | ) | | Evolution AB | | | (2,204,435 | ) |
| | | |
| | | (10,109 | ) | | Nibe Industrier AB-Class B | | | (89,988 | ) |
| | | |
| | | (194,356 | ) | | Sinch AB * | | | (1,639,471 | ) |
| | | | | | | | | | |
| | | |
| | | | | | Total Sweden | | | (5,995,326 | ) |
| | | | | | | | | | |
| | | |
| | | | | | Switzerland — (0.3)% | | | |
| | | |
| | | (14 | ) | | Chocoladefabriken Lindt & Spruengli AG | | | (148,508 | ) |
| | | |
| | | (2 | ) | | Chocoladefabriken Lindt & Spruengli AG (Registered) | | | (224,490 | ) |
| | | |
| | | (1,592 | ) | | Partners Group Holding AG | | | (2,152,047 | ) |
| | | |
| | | (1,006 | ) | | Sika AG (Registered) | | | (333,826 | ) |
| | | |
| | | (1,269 | ) | | Straumann Holding AG (Registered) | | | (2,015,759 | ) |
| | | | | | | | | | |
| | | |
| | | | | | Total Switzerland | | | (4,874,630 | ) |
| | | | | | | | | | |
| | | |
| | | | | | United Kingdom — (1.3)% | | | |
| | | |
| | | (31,603 | ) | | Admiral Group Plc | | | (1,258,924 | ) |
| | | |
| | | (60,750 | ) | | Antofagasta Plc | | | (1,230,056 | ) |
| | | |
| | | (289,857 | ) | | Auto Trader Group Plc | | | (2,563,517 | ) |
| | | |
| | | (494,209 | ) | | ConvaTec Group Plc | | | (1,194,823 | ) |
| | | |
| | | (4,036 | ) | �� | Croda International Plc | | | (403,999 | ) |
| | | |
| | | (2,910 | ) | | Experian Plc | | | (113,678 | ) |
| | | |
| | | (26,892 | ) | | Halma Plc | | | (867,376 | ) |
| | | |
| | | (130,093 | ) | | Hargreaves Lansdown Plc | | | (1,971,716 | ) |
| | | |
| | | (370,733 | ) | | Informa Plc * | | | (2,935,404 | ) |
| | | |
| | | (10,126 | ) | | InterContinental Hotels Group Plc * | | | (705,103 | ) |
| | | |
| | | (97,319 | ) | | Land Securities Group Plc (REIT) | | | (1,031,262 | ) |
| | | |
| | | (24,083 | ) | | London Stock Exchange Group Plc | | | (2,103,810 | ) |
| | | |
| | | (109,465 | ) | | Ocado Group Plc * | | | (2,012,942 | ) |
| | | |
| | | (1,445,591 | ) | | Rolls-Royce Holdings Plc * | | | (1,994,136 | ) |
| | | |
| | | (7,304 | ) | | Spirax-Sarco Engineering Plc | | | (1,163,925 | ) |
| | | | | | | | | | |
| | | |
| | | | | | Total United Kingdom | | | (21,550,671 | ) |
| | | | | | | | | | |
| | | |
| | | | | | United States — (10.4)% | | | |
| | | |
| | | (84,500 | ) | | AES Corp. (The) | | | (1,793,935 | ) |
| | | |
| | | (13,200 | ) | | Airbnb, Inc. – Class A * | | | (1,999,668 | ) |
| | | |
| | | (6,000 | ) | | American Tower Corp. (REIT) | | | (1,361,220 | ) |
| | | |
| | | (57,500 | ) | | Aramark | | | (2,125,200 | ) |
| | | |
| | | (13,800 | ) | | Arthur J Gallagher & Co. | | | (2,183,022 | ) |
| | | |
| | | (9,300 | ) | | Autodesk, Inc. * | | | (2,048,139 | ) |
| | | |
| | | (19,500 | ) | | Avalara, Inc. * | | | (2,026,245 | ) |
| | | |
| | | (9,400 | ) | | Bill.com Holdings, Inc. * | | | (2,236,072 | ) |
| | | |
| | | (2,100 | ) | | Bio-Techne Corp. | | | (880,761 | ) |
| | | |
| | | (23,800 | ) | | BioMarin Pharmaceutical, Inc. * | | | (1,859,256 | ) |
| | | |
| | | (17,000 | ) | | Block Inc. – Class A * | | | (2,167,500 | ) |
| | | |
| | | (10,400 | ) | | Boeing Co. (The) * | | | (2,135,536 | ) |
| | | |
| | | (4,000 | ) | | Broadcom, Inc. | | | (2,349,760 | ) |
| | | |
| | | (8,800 | ) | | Burlington Stores, Inc. * | | | (1,987,832 | ) |
| | | |
| | | (26,900 | ) | | Caesars Entertainment, Inc. * | | | (2,264,711 | ) |
| | | | |
| | |
| | | See accompanying notes to the financial statements. | | 47 |
GMO Benchmark-Free Fund
(A Series of GMO Trust)
Schedule of Investments — (Continued)
(showing percentage of total net assets)
February 28, 2022
| | | | | | | | | | |
Shares | | | Description | | Value ($) | |
| | | | | | Common Stocks — continued | | | |
| | | | | | United States — continued | | | |
| | | |
| | | (900 | ) | | Camden Property Trust (REIT) | | | (148,599 | ) |
| | | |
| | | (14,200 | ) | | Carvana Co. – Class A * | | | (2,136,674 | ) |
| | | |
| | | (10,200 | ) | | Catalent, Inc. * | | | (1,040,808 | ) |
| | | |
| | | (25,200 | ) | | Ceridian HCM Holding, Inc. * | | | (1,837,332 | ) |
| | | |
| | | (1,400 | ) | | Chipotle Mexican Grill, Inc. – Class A * | | | (2,132,690 | ) |
| | | |
| | | (83,200 | ) | | Clarivate Plc * | | | (1,246,336 | ) |
| | | |
| | | (22,000 | ) | | Cloudflare, Inc. – Class A * | | | (2,561,240 | ) |
| | | |
| | | (8,800 | ) | | CME Group, Inc. | | | (2,081,464 | ) |
| | | |
| | | (15,100 | ) | | Coupa Software, Inc. * | | | (1,827,251 | ) |
| | | |
| | | (8,100 | ) | | Crown Castle International Corp. (REIT) | | | (1,349,379 | ) |
| | | |
| | | (37,800 | ) | | Delta Air Lines, Inc. * | | | (1,508,976 | ) |
| | | |
| | | (4,600 | ) | | Dexcom, Inc. * | | | (1,903,986 | ) |
| | | |
| | | (16,800 | ) | | DocuSign, Inc. – Class A * | | | (1,989,624 | ) |
| | | |
| | | (5,200 | ) | | DoorDash, Inc. – Class A * | | | (545,740 | ) |
| | | |
| | | (98,300 | ) | | DraftKings Inc. – Class A * | | | (2,327,744 | ) |
| | | |
| | | (1,000 | ) | | Ecolab, Inc. | | | (176,260 | ) |
| | | |
| | | (2,000 | ) | | Equinix, Inc. (REIT) | | | (1,419,460 | ) |
| | | |
| | | (18,100 | ) | | Equity LifeStyle Properties, Inc. (REIT) | | | (1,350,622 | ) |
| | | |
| | | (800 | ) | | Erie Indemnity Co. – Class A | | | (140,080 | ) |
| | | |
| | | (25,700 | ) | | Exact Sciences Corp. * | | | (2,006,142 | ) |
| | | |
| | | (9,200 | ) | | Expedia Group, Inc. * | | | (1,804,212 | ) |
| | | |
| | | (600 | ) | | Extra Space Storage, Inc. (REIT) | | | (112,890 | ) |
| | | |
| | | (14,600 | ) | | Fastenal Co. | | | (751,316 | ) |
| | | |
| | | (7,000 | ) | | First Republic Bank | | | (1,212,820 | ) |
| | | |
| | | (22,500 | ) | | Guidewire Software, Inc. * | | | (1,983,375 | ) |
| | | |
| | | (12,700 | ) | | Hess Corp. | | | (1,283,462 | ) |
| | | |
| | | (4,600 | ) | | HubSpot, Inc. * | | | (2,415,000 | ) |
| | | |
| | | (3,900 | ) | | IDEXX Laboratories, Inc. * | | | (2,076,165 | ) |
| | | |
| | | (28,400 | ) | | Ingersoll Rand, Inc. | | | (1,434,768 | ) |
| | | |
| | | (9,000 | ) | | Insulet Corp. * | | | (2,382,210 | ) |
| | | |
| | | (6,600 | ) | | Invitation Homes, Inc. (REIT) | | | (249,480 | ) |
| | | |
| | | (4,000 | ) | | Ionis Pharmaceuticals, Inc. * | | | (133,520 | ) |
| | | |
| | | (10,100 | ) | | IQVIA Holdings, Inc. * | | | (2,324,212 | ) |
| | | |
| | | (28,300 | ) | | Iron Mountain, Inc. (REIT) | | | (1,391,794 | ) |
| | | |
| | | (36,700 | ) | | Lamb Weston Holdings, Inc. | | | (2,437,981 | ) |
| | | |
| | | (8,700 | ) | | Liberty Broadband Corp. – Class A * | | | (1,259,847 | ) |
| | | |
| | | (11,200 | ) | | Liberty Broadband Corp. – Class C * | | | (1,643,040 | ) |
| | | |
| | | (43,800 | ) | | Liberty Media Corp-Liberty Formula One – Class C * | | | (2,659,974 | ) |
| | | |
| | | (6,600 | ) | | Linde Plc | | | (1,935,384 | ) |
| | | |
| | | (22,000 | ) | | Live Nation Entertainment, Inc. * | | | (2,658,040 | ) |
| | | |
| | | (5,500 | ) | | MarketAxess Holdings, Inc. | | | (2,097,865 | ) |
| | | |
| | | (12,700 | ) | | Marriott International, Inc. – Class A * | | | (2,160,778 | ) |
| | | |
| | | (10,500 | ) | | Marvell Technology, Inc. | | | (717,465 | ) |
| | | |
| | | (22,100 | ) | | MGM Resorts International | | | (978,809 | ) |
| | | |
| | | (5,500 | ) | | MongoDB, Inc. – Class A * | | | (2,100,945 | ) |
| | | |
| | | (2,900 | ) | | Monolithic Power Systems, Inc. | | | (1,330,230 | ) |
| | | |
| | | (4,500 | ) | | MSCI, Inc. – Class A | | | (2,257,605 | ) |
| | | |
| | | (28,500 | ) | | Novocure Ltd. * | | | (2,333,010 | ) |
| | | |
| | | (104,300 | ) | | Oak Street Health, Inc. * | | | (1,826,293 | ) |
| | | |
| | | (11,100 | ) | | Okta, Inc. * | | | (2,029,524 | ) |
| | | | | | | | | | |
Shares | | | Description | | Value ($) | |
| | | | | | Common Stocks — continued | | | |
| | | | | | United States — continued | | | |
| | | |
| | | (2,800 | ) | | ONEOK, Inc. | | | (182,840 | ) |
| | | |
| | | (105,600 | ) | | Palantir Technologies, Inc. – Class A * | | | (1,251,360 | ) |
| | | |
| | | (800 | ) | | Palo Alto Networks, Inc. * | | | (475,400 | ) |
| | | |
| | | (47,400 | ) | | Peloton Interactive, Inc. – Class A * | | | (1,377,444 | ) |
| | | |
| | | (11,600 | ) | | RingCentral, Inc. – Class A * | | | (1,517,744 | ) |
| | | |
| | | (12,800 | ) | | Roku, Inc. * | | | (1,785,984 | ) |
| | | |
| | | (29,900 | ) | | Rollins, Inc. | | | (975,637 | ) |
| | | |
| | | (29,900 | ) | | Royal Caribbean Cruises Ltd. * | | | (2,413,528 | ) |
| | | |
| | | (29,400 | ) | | Sarepta Therapeutics, Inc. * | | | (2,252,334 | ) |
| | | |
| | | (15,200 | ) | | Seagen, Inc. * | | | (1,958,824 | ) |
| | | |
| | | (4,300 | ) | | ServiceNow, Inc. * | | | (2,493,656 | ) |
| | | |
| | | (9,700 | ) | | Simon Property Group, Inc. (REIT) | | | (1,334,332 | ) |
| | | |
| | | (61,500 | ) | | Snap, Inc. – Class A * | | | (2,456,310 | ) |
| | | |
| | | (8,000 | ) | | Snowflake, Inc. – Class A * | | | (2,125,280 | ) |
| | | |
| | | (14,300 | ) | | T-Mobile US, Inc. * | | | (1,761,903 | ) |
| | | |
| | | (26,400 | ) | | Teladoc Health, Inc. * | | | (2,004,024 | ) |
| | | |
| | | (2,700 | ) | | Tesla, Inc. * | | | (2,350,161 | ) |
| | | |
| | | (6,000 | ) | | Trade Desk, Inc. (The) – Class A * | | | (511,920 | ) |
| | | |
| | | (1,600 | ) | | Tradeweb Markets, Inc. – Class A | | | (135,168 | ) |
| | | |
| | | (10,300 | ) | | Twilio, Inc. – Class A * | | | (1,800,440 | ) |
| | | |
| | | (49,000 | ) | | Twitter, Inc. * | | | (1,741,950 | ) |
| | | |
| | | (55,300 | ) | | Uber Technologies, Inc. * | | | (1,992,459 | ) |
| | | |
| | | (24,600 | ) | | UDR, Inc. (REIT) | | | (1,349,802 | ) |
| | | |
| | | (16,200 | ) | | Upstart Holdings, Inc. * | | | (2,559,438 | ) |
| | | |
| | | (7,800 | ) | | Vail Resorts, Inc. | | | (2,032,290 | ) |
| | | |
| | | (88,100 | ) | | Vistra Corp. | | | (2,010,442 | ) |
| | | |
| | | (8,400 | ) | | Wayfair, Inc. – Class A * | | | (1,183,308 | ) |
| | | |
| | | (91,100 | ) | | Williams Cos, Inc. (The) | | | (2,849,608 | ) |
| | | |
| | | (20,300 | ) | | Zendesk, Inc. * | | | (2,368,401 | ) |
| | | |
| | | (38,900 | ) | | Zillow Group, Inc. – Class A * | | | (2,227,803 | ) |
| | | |
| | | (18,356 | ) | | Zillow Group, Inc. – Class C * | | | (1,055,837 | ) |
| | | |
| | | (3,400 | ) | | Zoetis, Inc. | | | (658,410 | ) |
| | | |
| | | (19,600 | ) | | ZoomInfo Technologies, Inc. – Class A * | | | (1,071,924 | ) |
| | | |
| | | (8,500 | ) | | Zscaler, Inc. * | | | (2,032,775 | ) |
| | | | | | | | | | |
| | | |
| | | | | | Total United States | | | (165,430,014 | ) |
| | | | | | | | | | |
| | | |
| | | | | | TOTAL COMMON STOCKS
(PROCEEDS $356,653,250) | | | (330,412,011 | ) |
| | | | | | | | | | |
| | | |
| | | | | | PREFERRED STOCKS (f) — (0.1)% | | | |
| | | |
| | | | | | Germany — (0.1)% | | | |
| | | |
| | | (4,035 | ) | | Sartorius AG | | | (1,781,505 | ) |
| | | | | | | | | | |
| | | |
| | | | | | TOTAL PREFERRED STOCKS (PROCEEDS $1,785,022) | | | (1,781,505 | ) |
| | | | | | | | | | |
| | | |
| | | | | | TOTAL SECURITIES SOLD SHORT
(PROCEEDS $358,438,272) | | | (332,193,516 | ) |
| | | |
| | | | | | Other Assets and Liabilities (net) — (6.5%) | | | (105,817,761 | ) |
| | | | | | | | | | |
| | | |
| | | | | | TOTAL NET ASSETS — 100.0% | | | $1,613,853,770 | |
| | | | | | | | | | |
| | | | |
| | |
| 48 | | See accompanying notes to the financial statements. | | |
GMO Benchmark-Free Fund
(A Series of GMO Trust)
Schedule of Investments — (Continued)
February 28, 2022
A summary of outstanding financial instruments at February 28, 2022 is as follows:
Forward Currency Contracts
| | | | | | | | | | | | | | | | | | | | |
| | | | |
Settlement
Date | | Counter
party | | Currency
Sold | | | Currency
Purchased | | | Net
Unrealized
Appreciation
(Depreciation)
($) | |
| 04/21/2022 | | SSB | | AUD | | | 9,435,800 | | | | USD | | | | 6,800,366 | | | | (57,912 | ) |
| 05/09/2022 | | BCLY | | AUD | | | 4,450,000 | | | | USD | | | | 3,170,625 | | | | (64,581 | ) |
| 05/09/2022 | | JPM | | AUD | | | 1,410,000 | | | | USD | | | | 1,001,918 | | | | (23,170 | ) |
| 05/09/2022 | | MSCI | | AUD | | | 10,980,000 | | | | USD | | | | 7,755,410 | | | | (227,189 | ) |
| 05/02/2022 | | DB | | CAD | | | 1,901,352 | | | | USD | | | | 1,500,000 | | | | (300 | ) |
| 05/02/2022 | | JPM | | CAD | | | 2,348,249 | | | | USD | | | | 1,850,000 | | | | (2,934 | ) |
| 05/16/2022 | | MSCI | | CHF | | | 13,205,545 | | | | USD | | | | 14,338,424 | | | | (106,021 | ) |
| 05/16/2022 | | MSCI | | CLP | | | 519,112,500 | | | | USD | | | | 642,744 | | | | (189 | ) |
| 03/17/2022 | | MSCI | | COP | | | 6,592,425,000 | | | | USD | | | | 1,677,163 | | | | 5,267 | |
| 05/18/2022 | | BCLY | | CZK | | | 3,844,446 | | | | USD | | | | 170,000 | | | | 68 | |
| 03/31/2022 | | JPM | | EUR | | | 1,270,000 | | | | USD | | | | 1,426,908 | | | | 1,213 | |
| 04/21/2022 | | SSB | | EUR | | | 44,244,200 | | | | USD | | | | 50,336,161 | | | | 630,657 | |
| 04/21/2022 | | BCLY | | GBP | | | 1,327,400 | | | | USD | | | | 1,801,083 | | | | 19,959 | |
| 04/21/2022 | | MSCI | | GBP | | | 8,254,600 | | | | USD | | | | 11,250,541 | | | | 174,403 | |
| 05/16/2022 | | BCLY | | GBP | | | 1,780,000 | | | | USD | | | | 2,383,991 | | | | (4,146 | ) |
| 04/21/2022 | | JPM | | HKD | | | 21,358,500 | | | | USD | | | | 2,741,803 | | | | 8,446 | |
| 04/21/2022 | | SSB | | HKD | | | 4,411,700 | | | | USD | | | | 565,721 | | | | 1,133 | |
| 05/16/2022 | | MSCI | | HUF | | | 361,390,452 | | | | USD | | | | 1,157,042 | | | | 75,767 | |
| 04/29/2022 | | CITI | | ILS | | | 1,164,618 | | | | USD | | | | 360,000 | | | | (3,267 | ) |
| 04/29/2022 | | GS | | ILS | | | 2,269,129 | | | | USD | | | | 711,851 | | | | 4,066 | |
| 04/29/2022 | | JPM | | ILS | | | 1,292,556 | | | | USD | | | | 400,000 | | | | (3,173 | ) |
| 03/08/2022 | | JPM | | INR | | | 154,397,074 | | | | USD | | | | 2,058,791 | | | | 10,580 | |
| 03/08/2022 | | MSCI | | INR | | | 23,387,330 | | | | USD | | | | 310,000 | | | | (253 | ) |
| 06/03/2022 | | MSCI | | INR | | | 164,223,204 | | | | USD | | | | 2,149,659 | | | | (3,410 | ) |
| 03/09/2022 | | JPM | | JPY | | | 342,997,320 | | | | USD | | | | 2,970,000 | | | | (13,844 | ) |
| 03/09/2022 | | SSB | | JPY | | | 137,931,132 | | | | USD | | | | 1,200,000 | | | | 93 | |
| 04/21/2022 | | DB | | JPY | | | 396,486,400 | | | | USD | | | | 3,438,199 | | | | (14,361 | ) |
| 04/21/2022 | | SSB | | JPY | | | 1,635,935,500 | | | | USD | | | | 14,303,835 | | | | 58,290 | |
| 05/09/2022 | | BCLY | | KRW | | | 2,939,238,054 | | | | USD | | | | 2,439,647 | | | | (3,103 | ) |
| 03/22/2022 | | MSCI | | MXN | | | 22,107,439 | | | | USD | | | | 1,083,996 | | | | 8,186 | |
| 05/16/2022 | | GS | | NOK | | | 7,056,177 | | | | USD | | | | 800,000 | | | | 148 | |
| 03/01/2022 | | JPM | | NZD | | | 4,600,000 | | | | USD | | | | 3,073,803 | | | | (38,557 | ) |
| 03/01/2022 | | MSCI | | NZD | | | 21,860,000 | | | | USD | | | | 14,492,604 | | | | (297,873 | ) |
| 06/01/2022 | | JPM | | NZD | | | 24,480,000 | | | | USD | | | | 16,453,865 | | | | (86,633 | ) |
| 04/19/2022 | | JPM | | PLN | | | 1,528,884 | | | | USD | | | | 360,000 | | | | (2,914 | ) |
| 04/19/2022 | | SSB | | PLN | | | 3,017,776 | | | | USD | | | | 750,000 | | | | 33,665 | |
| 03/31/2022 | | CITI | | RON | | | 11,343,046 | | | | USD | | | | 2,533,853 | | | | (29,072 | ) |
| 03/16/2022 | | BCLY | | RUB | | | 118,773,241 | | | | USD | | | | 1,337,903 | | | | 241,247 | |
| 05/11/2022 | | MSCI | | RUB | | | 71,556,801 | | | | USD | | | | 822,237 | | | | 206,694 | |
| 03/07/2022 | | JPM | | SEK | | | 36,269,628 | | | | USD | | | | 3,880,443 | | | | 50,941 | |
| 03/18/2022 | | JPM | | SGD | | | 67,868 | | | | USD | | | | 50,000 | | | | (56 | ) |
| 05/18/2022 | | MSCI | | THB | | | 55,230,454 | | | | USD | | | | 1,708,229 | | | | 17,453 | |
| 05/17/2022 | | JPM | | TWD | | | 20,881,550 | | | | USD | | | | 753,493 | | | | 5,842 | |
| 04/21/2022 | | GS | | USD | | | 641,400 | | | | AUD | | | | 893,800 | | | | 8,246 | |
| 05/09/2022 | | JPM | | USD | | | 5,485,761 | | | | AUD | | | | 7,620,000 | | | | 54,075 | |
| 05/09/2022 | | MSCI | | USD | | | 508,776 | | | | AUD | | | | 700,000 | | | | 133 | |
| 04/04/2022 | | CITI | | USD | | | 730,000 | | | | BRL | | | | 3,958,441 | | | | 31,795 | |
| | | | | | | | | | | | | | | | | | | | |
| | | | |
Settlement
Date | | Counter
party | | Currency
Sold | | | Currency
Purchased | | | Net
Unrealized
Appreciation
(Depreciation)
($) | |
| 04/04/2022 | | GS | | USD | | | 1,030,000 | | | | BRL | | | | 5,395,695 | | | | 8,392 | |
| 04/04/2022 | | MSCI | | USD | | | 850,000 | | | | BRL | | | | 4,558,501 | | | | 27,276 | |
| 05/02/2022 | | BCLY | | USD | | | 14,194,498 | | | | CAD | | | | 18,124,571 | | | | 107,065 | |
| 05/02/2022 | | JPM | | USD | | | 7,440,000 | | | | CAD | | | | 9,441,691 | | | | 10,160 | |
| 05/16/2022 | | JPM | | USD | | | 4,340,000 | | | | CHF | | | | 3,975,113 | | | | 8,045 | |
| 05/16/2022 | | MSCI | | USD | | | 634,069 | | | | CLP | | | | 519,112,500 | | | | 8,864 | |
| 03/17/2022 | | MSCI | | USD | | | 1,210,000 | | | | COP | | | | 4,753,535,100 | | | | (4,462 | ) |
| 05/18/2022 | | MSCI | | USD | | | 2,230,918 | | | | CZK | | | | 48,312,756 | | | | (95,397 | ) |
| 03/31/2022 | | SSB | | USD | | | 1,419,894 | | | | EUR | | | | 1,270,000 | | | | 5,802 | |
| 04/21/2022 | | BCLY | | USD | | | 8,370,241 | | | | EUR | | | | 7,391,500 | | | | (66,367 | ) |
| 04/21/2022 | | SSB | | USD | | | 2,094,220 | | | | EUR | | | | 1,876,100 | | | | 13,457 | |
| 04/21/2022 | | MSCI | | USD | | | 963,080 | | | | GBP | | | | 710,000 | | | | (10,392 | ) |
| 04/21/2022 | | SSB | | USD | | | 547,452 | | | | GBP | | | | 405,400 | | | | (3,481 | ) |
| 05/16/2022 | | BCLY | | USD | | | 774,677 | | | | GBP | | | | 570,000 | | | | (9,936 | ) |
| 05/16/2022 | | MSCI | | USD | | | 10,030,246 | | | | GBP | | | | 7,365,000 | | | | (148,995 | ) |
| 04/21/2022 | | JPM | | USD | | | 100,948 | | | | HKD | | | | 785,800 | | | | (385 | ) |
| 05/16/2022 | | MSCI | | USD | | | 490,000 | | | | HUF | | | | 154,810,600 | | | | (26,809 | ) |
| 05/16/2022 | | SSB | | USD | | | 50,000 | | | | HUF | | | | 16,608,583 | | | | (307 | ) |
| 05/04/2022 | | JPM | | USD | | | 1,332,282 | | | | IDR | | | | 19,318,085,000 | | | | 6,092 | |
| 04/29/2022 | | JPM | | USD | | | 1,116,201 | | | | ILS | | | | 3,561,685 | | | | (5,242 | ) |
| 03/08/2022 | | MSCI | | USD | | | 2,352,873 | | | | INR | | | | 177,784,404 | | | | 5,591 | |
| 03/09/2022 | | DB | | USD | | | 1,860,000 | | | | JPY | | | | 214,668,180 | | | | 7,467 | |
| 03/09/2022 | | JPM | | USD | | | 2,720,000 | | | | JPY | | | | 310,974,880 | | | | (14,730 | ) |
| 03/09/2022 | | MSCI | | USD | | | 14,505,064 | | | | JPY | | | | 1,671,667,403 | | | | 37,308 | |
| 04/21/2022 | | CITI | | USD | | | 2,038,363 | | | | JPY | | | | 234,208,900 | | | | 1,102 | |
| 04/21/2022 | | DB | | USD | | | 2,080,337 | | | | JPY | | | | 237,505,100 | | | | (12,169 | ) |
| 05/09/2022 | | BCLY | | USD | | | 500,000 | | | | KRW | | | | 600,350,000 | | | | (1,060 | ) |
| 05/09/2022 | | GS | | USD | | | 60,000 | | | | KRW | | | | 72,252,448 | | | | 48 | |
| 05/09/2022 | | JPM | | USD | | | 330,000 | | | | KRW | | | | 396,151,800 | | | | (765 | ) |
| 05/09/2022 | | MSCI | | USD | | | 860,000 | | | | KRW | | | | 1,031,734,330 | | | | (2,543 | ) |
| 03/22/2022 | | GS | | USD | | | 50,000 | | | | MXN | | | | 1,024,674 | | | | (136 | ) |
| 03/22/2022 | | JPM | | USD | | | 410,000 | | | | MXN | | | | 8,398,052 | | | | (1,327 | ) |
| 05/16/2022 | | BCLY | | USD | | | 11,107,145 | | | | NOK | | | | 98,259,359 | | | | 31,027 | |
| 03/01/2022 | | JPM | | USD | | | 16,479,936 | | | | NZD | | | | 24,480,000 | | | | 83,233 | |
| 03/01/2022 | | MSCI | | USD | | | 1,334,837 | | | | NZD | | | | 1,980,000 | | | | 4,831 | |
| 04/19/2022 | | DB | | USD | | | 350,000 | | | | PLN | | | | 1,394,123 | | | | (19,075 | ) |
| 04/19/2022 | | MSCI | | USD | | | 1,037,274 | | | | PLN | | | | 4,123,579 | | | | (58,453 | ) |
| 03/31/2022 | | CITI | | USD | | | 190,000 | | | | RON | | | | 840,215 | | | | (156 | ) |
| 05/11/2022 | | MSCI | | USD | | | 2,434,604 | | | | RUB | | | | 190,330,042 | | | | (797,356 | ) |
| 03/07/2022 | | BCLY | | USD | | | 7,586,681 | | | | SEK | | | | 69,067,053 | | | | (294,288 | ) |
| 03/18/2022 | | MSCI | | USD | | | 671,018 | | | | SGD | | | | 902,116 | | | | (5,657 | ) |
| 05/18/2022 | | CITI | | USD | | | 110,000 | | | | THB | | | | 3,591,148 | | | | (64 | ) |
| 05/18/2022 | | MSCI | | USD | | | 310,000 | | | | THB | | | | 10,055,811 | | | | (2,160 | ) |
| 05/17/2022 | | JPM | | USD | | | 280,000 | | | | TWD | | | | 7,796,040 | | | | (868 | ) |
| 05/31/2022 | | MSCI | | USD | | | 430,805 | | | | ZAR | | | | 6,747,915 | | | | 3,015 | |
| | | | | | | | | | | | | | | | | | | | |
| | | | | | | | | | | | | | | | | | $ | (548,396 | ) |
| | | | | | | | | | | | | | | | | | | | |
| | | | |
| | |
| | | See accompanying notes to the financial statements. | | 49 |
GMO Benchmark-Free Fund
(A Series of GMO Trust)
Schedule of Investments — (Continued)
February 28, 2022
Futures Contracts
| | | | | | | | | | | | | | |
| | | | |
Number
of
Contracts + | | Type | | Expiration
Date | | | Notional
Amount ($) | | | Value/Net
Unrealized
Appreciation
(Depreciation) ($) | |
| Sales | | | | | | | | | | | | | | |
| 886 | | Euro STOXX 50 | | | March 2022 | | | | 38,772,218 | | | | 2,854,752 | |
| 114 | | FTSE 100 Index | | | March 2022 | | | | 11,338,999 | | | | (227,034 | ) |
| 19 | | Hang Seng Index | | | March 2022 | | | | 2,756,490 | | | | 103,801 | |
| 2,183 | | Mini MSCI Emerging Markets | | | March 2022 | | | | 128,305,825 | | | | 5,859,021 | |
| 774 | | S&P 500 E-Mini | | | March 2022 | | | | 169,041,600 | | | | 10,881,316 | |
| 177 | | SGX Nifty 50 | | | March 2022 | | | | 5,968,921 | | | | 119,997 | |
| 45 | | SPI 200 Futures | | | March 2022 | | | | 5,756,743 | | | | 165,150 | |
| 83 | | TOPIX Index | | | March 2022 | | | | 13,673,817 | | | | 465,686 | |
| | | | | | | | | | | | | | |
| | | | | | | | $ | 375,614,613 | | | $ | 20,222,689 | |
| | | | | | | | | | | | | | |
| + | Buys - Fund is long the futures contract. |
| | Sales - Fund is short the futures contract. |
Reverse Repurchase Agreements
| | | | |
| |
Average balance outstanding | | $ | (72,635,000 | ) |
| |
Average interest rate (net) | | | (0.09 | )% |
| |
Maximum balance outstanding | | $ | (72,635,000 | ) |
Average balance outstanding was calculated based on daily face value balances outstanding during the period that the Fund had entered into reverse repurchase agreements. Average interest rate was calculated based on interest received and/or paid during the period that the Fund had entered into the reverse repurchase agreements.
Swap Contracts
Centrally Cleared Interest Rate Swaps
| | | | | | | | | | | | | | | | | | | | | | | | |
Fund Pays | | Fund Receives | | Notional
Amount | | | Expiration
Date | | | Periodic
Payment
Frequency | | Premiums
Paid/
(Received) ($) | | | Value ($) | | | Net
Unrealized
Appreciation/
(Depreciation) ($) | |
1.60% | | 3 Month AUD BBSW | | AUD | 9,250,000 | | | | 03/16/2024 | | | Quarterly | | | — | | | | (24,099 | ) | | | (24,099 | ) |
1.82% | | 3 Month CAD CDOR | | CAD | 85,680,000 | | | | 03/16/2024 | | | Semi-Annually | | | (22,127 | ) | | | 266,093 | | | | 288,220 | |
1.99% | | 3 Month CAD CDOR | | CAD | 13,560,000 | | | | 03/16/2024 | | | Semi-Annually | | | — | | | | 6,156 | | | | 6,156 | |
1.90% | | 3 Month CAD CDOR | | CAD | 25,300,000 | | | | 03/16/2024 | | | Semi-Annually | | | — | | | | 47,882 | | | | 47,882 | |
1.95% | | 3 Month CAD CDOR | | CAD | 11,200,000 | | | | 03/16/2024 | | | Semi-Annually | | | — | | | | 11,442 | | | | 11,442 | |
3 Month CAD CDOR | | 2.12% | | CAD | 9,020,000 | | | | 03/16/2024 | | | Semi-Annually | | | — | | | | 14,072 | | | | 14,072 | |
3 Month CAD CDOR | | 2.05% | | CAD | 8,450,000 | | | | 03/16/2024 | | | Semi-Annually | | | 1,007 | | | | 4,443 | | | | 3,436 | |
3 Month CAD CDOR | | 1.74% | | CAD | 14,620,000 | | | | 03/16/2024 | | | Semi-Annually | | | — | | | | (64,050 | ) | | | (64,050 | ) |
3 Month CAD CDOR | | 1.80% | | CAD | 12,870,000 | | | | 03/16/2024 | | | Semi-Annually | | | — | | | | (42,772 | ) | | | (42,772 | ) |
2.03% | | 3 Month CAD CDOR | | CAD | 12,570,000 | | | | 03/16/2024 | | | Semi-Annually | | | — | | | | (2,602 | ) | | | (2,602 | ) |
(0.54)% | | CHF - SARON - OIS - COMPOUND | | CHF | 19,360,000 | | | | 03/16/2024 | | | Annually | | | — | | | | 107,730 | | | | 107,730 | |
(0.54)% | | CHF - SARON - OIS - COMPOUND | | CHF | 2,960,000 | | | | 03/16/2024 | | | Annually | | | (897 | ) | | | 16,967 | | | | 17,864 | |
(0.44)% | | CHF - SARON - OIS - COMPOUND | | CHF | 8,610,000 | | | | 03/16/2024 | | | Annually | | | — | | | | 29,539 | | | | 29,539 | |
CHF - SARON - OIS - COMPOUND | | (0.17)% | | CHF | 6,330,000 | | | | 03/16/2024 | | | Annually | | | — | | | | 16,330 | | | | 16,330 | |
(0.08)% | | CHF - SARON - OIS - COMPOUND | | CHF | 11,600,000 | | | | 03/16/2024 | | | Annually | | | — | | | | (53,640 | ) | | | (53,640 | ) |
(0.24)% | | CHF - SARON - OIS - COMPOUND | | CHF | 14,880,000 | | | | 03/16/2024 | | | Annually | | | — | | | | (15,445 | ) | | | (15,445 | ) |
(0.25)% | | CHF - SARON - OIS - COMPOUND | | CHF | 14,730,000 | | | | 03/16/2024 | | | Annually | | | — | | | | (11,998 | ) | | | (11,998 | ) |
(0.28)% | | CHF - SARON - OIS - COMPOUND | | CHF | 9,170,000 | | | | 03/16/2024 | | | Annually | | | — | | | | (1,323 | ) | | | (1,323 | ) |
GBP - SONIA - COMPOUND | | 1.64% | | GBP | 75,140,000 | | | | 03/16/2024 | | | Annually | | | 31,400 | | | | 50,399 | | | | 18,999 | |
| | | | |
| | |
| 50 | | See accompanying notes to the financial statements. | | |
GMO Benchmark-Free Fund
(A Series of GMO Trust)
Schedule of Investments — (Continued)
February 28, 2022
Swap Contracts — continued
Centrally Cleared Interest Rate Swaps — continued
| | | | | | | | | | | | | | | | | | | | | | | | |
Fund Pays | | Fund Receives | | Notional
Amount | | | Expiration
Date | | | Periodic
Payment
Frequency | | Premiums
Paid/
(Received) ($) | | | Value ($) | | | Net
Unrealized
Appreciation/
(Depreciation) ($) | |
GBP - SONIA - COMPOUND | | 1.80% | | GBP | 7,710,000 | | | | 03/16/2024 | | | Annually | | | 5,303 | | | | 38,664 | | | | 33,361 | |
1.62% | | GBP - SONIA - COMPOUND | | GBP | 10,530,000 | | | | 03/16/2024 | | | Annually | | | 3,419 | | | | (2,904 | ) | | | (6,323 | ) |
1.67% | | GBP - SONIA - COMPOUND | | GBP | 6,380,000 | | | | 03/16/2024 | | | Annually | | | 191 | | | | (9,318 | ) | | | (9,509 | ) |
1.67% | | GBP - SONIA - COMPOUND | | GBP | 6,700,000 | | | | 03/16/2024 | | | Annually | | | (664 | ) | | | (11,373 | ) | | | (10,709 | ) |
1.64% | | GBP - SONIA - COMPOUND | | GBP | 4,220,000 | | | | 03/16/2024 | | | Annually | | | (2,343 | ) | | | (3,164 | ) | | | (821 | ) |
2.51% | | 3 Month NZD Bank Bill Rate | | NZD | 12,010,000 | | | | 03/16/2024 | | | Quarterly | | | — | | | | 45,312 | | | | 45,312 | |
2.40% | | 3 Month NZD Bank Bill Rate | | NZD | 10,240,000 | | | | 03/16/2024 | | | Quarterly | | | — | | | | 53,492 | | | | 53,492 | |
2.38% | | 3 Month NZD Bank Bill Rate | | NZD | 14,530,000 | | | | 03/16/2024 | | | Quarterly | | | — | | | | 79,735 | | | | 79,735 | |
2.61% | | 3 Month NZD Bank Bill Rate | | NZD | 16,130,000 | | | | 03/16/2024 | | | Quarterly | | | — | | | | 39,580 | | | | 39,580 | |
3 Month NZD Bank Bill Rate | | 2.53% | | NZD | 32,560,000 | | | | 03/16/2024 | | | Quarterly | | | — | | | | (114,255 | ) | | | (114,255 | ) |
3 Month NZD Bank Bill Rate | | 2.60% | | NZD | 40,690,000 | | | | 03/16/2024 | | | Quarterly | | | 3,727 | | | | (104,677 | ) | | | (108,404 | ) |
0.34% | | 3 Month SEK STIBOR | | SEK | 586,900,000 | | | | 03/16/2024 | | | Quarterly | | | — | | | | 365,792 | | | | 365,792 | |
0.33% | | 3 Month SEK STIBOR | | SEK | 86,340,000 | | | | 03/16/2024 | | | Quarterly | | | (6,309 | ) | | | 54,744 | | | | 61,053 | |
0.33% | | 3 Month SEK STIBOR | | SEK | 73,400,000 | | | | 03/16/2024 | | | Quarterly | | | — | | | | 46,850 | | | | 46,850 | |
0.32% | | 3 Month SEK STIBOR | | SEK | 56,400,000 | | | | 03/16/2024 | | | Quarterly | | | — | | | | 36,894 | | | | 36,894 | |
3 Month SEK STIBOR | | 0.72% | | SEK | 90,000,000 | | | | 03/16/2024 | | | Quarterly | | | — | | | | 15,843 | | | | 15,843 | |
3 Month SEK STIBOR | | 0.69% | | SEK | 163,900,000 | | | | 03/16/2024 | | | Quarterly | | | — | | | | 19,146 | | | | 19,146 | |
3 Month SEK STIBOR | | 0.69% | | SEK | 152,200,000 | | | | 03/16/2024 | | | Quarterly | | | — | | | | 18,745 | | | | 18,745 | |
3 Month SEK STIBOR | | 0.64% | | SEK | 97,000,000 | | | | 03/16/2024 | | | Quarterly | | | — | | | | 1,688 | | | | 1,688 | |
3 Month SEK STIBOR | | 0.42% | | SEK | 37,400,000 | | | | 03/16/2024 | | | Quarterly | | | 843 | | | | (16,752 | ) | | | (17,595 | ) |
3 Month SEK STIBOR | | 0.63% | | SEK | 73,100,000 | | | | 03/16/2024 | | | Quarterly | | | — | | | | (274 | ) | | | (274 | ) |
1.22% | | USD - SOFR - COMPOUND | | USD | 10,970,000 | | | | 03/16/2024 | | | Annually | | | 2,337 | | | | 40,960 | | | | 38,623 | |
USD - SOFR - COMPOUND | | 1.46% | | USD | 4,470,000 | | | | 03/16/2024 | | | Annually | | | 561 | | | | 4,378 | | | | 3,817 | |
USD - SOFR - COMPOUND | | 0.97% | | USD | 6,500,000 | | | | 03/16/2024 | | | Annually | | | (2,064 | ) | | | (57,112 | ) | | | (55,048 | ) |
USD - SOFR - COMPOUND | | 1.01% | | USD | 16,290,000 | | | | 03/16/2024 | | | Annually | | | (3,105 | ) | | | (130,119 | ) | | | (127,014 | ) |
USD - SOFR - COMPOUND | | 1.15% | | USD | 10,140,000 | | | | 03/16/2024 | | | Annually | | | (1,157 | ) | | | (52,644 | ) | | | (51,487 | ) |
USD - SOFR - COMPOUND | | 1.05% | | USD | 9,710,000 | | | | 03/16/2024 | | | Annually | | | (1,464 | ) | | | (70,773 | ) | | | (69,309 | ) |
1.61% | | USD - SOFR - COMPOUND | | USD | 6,630,000 | | | | 03/16/2024 | | | Annually | | | (1,947 | ) | | | (25,825 | ) | | | (23,878 | ) |
6 Month EURIBOR | | 0.22% | | EUR | 11,310,000 | | | | 03/20/2024 | | | Semi-Annually | | | 321 | | | | 43,948 | | | | 43,627 | |
6 Month EURIBOR | | 0.20% | | EUR | 7,830,000 | | | | 03/20/2024 | | | Semi-Annually | | | (1,231 | ) | | | 27,713 | | | | 28,944 | |
6 Month EURIBOR | | 0.20% | | EUR | 5,680,000 | | | | 03/20/2024 | | | Semi-Annually | | | (5,284 | ) | | | 20,232 | | | | 25,516 | |
6 Month EURIBOR | | 0.17% | | EUR | 7,950,000 | | | | 03/20/2024 | | | Semi-Annually | | | 851 | | | | 21,388 | | | | 20,537 | |
6 Month EURIBOR | | (0.23)% | | EUR | 7,070,000 | | | | 03/20/2024 | | | Semi-Annually | | | (492 | ) | | | (43,729 | ) | | | (43,237 | ) |
6 Month EURIBOR | | (0.20)% | | EUR | 8,370,000 | | | | 03/20/2024 | | | Semi-Annually | | | (24 | ) | | | (45,895 | ) | | | (45,871 | ) |
6 Month EURIBOR | | (0.07)% | | EUR | 8,440,000 | | | | 03/20/2024 | | | Semi-Annually | | | 100 | | | | (22,010 | ) | | | (22,110 | ) |
0.12% | | 6 Month EURIBOR | | EUR | 4,290,000 | | | | 03/20/2024 | | | Semi-Annually | | | 31 | | | | (7,035 | ) | | | (7,066 | ) |
1.95% | | 6 Month AUD BBSW | | AUD | 2,060,000 | | | | 03/16/2032 | | | Semi-Annually | | | — | | | | 68,471 | | | | 68,471 | |
1.96% | | 6 Month AUD BBSW | | AUD | 3,640,000 | | | | 03/16/2032 | | | Semi-Annually | | | — | | | | 118,164 | | | | 118,164 | |
2.10% | | 6 Month AUD BBSW | | AUD | 2,650,000 | | | | 03/16/2032 | | | Semi-Annually | | | — | | | | 61,700 | | | | 61,700 | |
2.10% | | 6 Month AUD BBSW | | AUD | 2,650,000 | | | | 03/16/2032 | | | Semi-Annually | | | — | | | | 62,556 | | | | 62,556 | |
2.15% | | 6 Month AUD BBSW | | AUD | 2,940,000 | | | | 03/16/2032 | | | Semi-Annually | | | — | | | | 60,279 | | | | 60,279 | |
2.43% | | 6 Month AUD BBSW | | AUD | 5,540,000 | | | | 03/16/2032 | | | Semi-Annually | | | — | | | | 11,967 | | | | 11,967 | |
6 Month AUD BBSW | | 2.52% | | AUD | 4,260,000 | | | | 03/16/2032 | | | Semi-Annually | | | — | | | | 15,927 | | | | 15,927 | |
6 Month AUD BBSW | | 2.52% | | AUD | 8,180,000 | | | | 03/16/2032 | | | Semi-Annually | | | — | | | | 30,582 | | | | 30,582 | |
6 Month AUD BBSW | | 2.53% | | AUD | 2,050,000 | | | | 03/16/2032 | | | Semi-Annually | | | — | | | | 8,658 | | | | 8,658 | |
6 Month AUD BBSW | | 2.54% | | AUD | 2,580,000 | | | | 03/16/2032 | | | Semi-Annually | | | — | | | | 12,981 | | | | 12,981 | |
6 Month AUD BBSW | | 1.97% | | AUD | 5,070,000 | | | | 03/16/2032 | | | Semi-Annually | | | — | | | | (162,291 | ) | | | (162,291 | ) |
6 Month AUD BBSW | | 2.07% | | AUD | 2,810,000 | | | | 03/16/2032 | | | Semi-Annually | | | — | | | | (71,238 | ) | | | (71,238 | ) |
6 Month AUD BBSW | | 1.99% | | AUD | 16,530,000 | | | | 03/16/2032 | | | Semi-Annually | | | (1,486 | ) | | | (504,014 | ) | | | (502,528 | ) |
6 Month AUD BBSW | | 2.25% | | AUD | 2,750,000 | | | | 03/16/2032 | | | Semi-Annually | | | — | | | | (38,606 | ) | | | (38,606 | ) |
1.88% | | 3 Month CAD CDOR | | CAD | 4,320,000 | | | | 03/16/2032 | | | Semi-Annually | | | — | | | | 152,079 | | | | 152,079 | |
2.03% | | 3 Month CAD CDOR | | CAD | 3,720,000 | | | | 03/16/2032 | | | Semi-Annually | | | — | | | | 89,721 | | | | 89,721 | |
2.14% | | 3 Month CAD CDOR | | CAD | 3,160,000 | | | | 03/16/2032 | | | Semi-Annually | | | — | | | | 52,938 | | | | 52,938 | |
2.16% | | 3 Month CAD CDOR | | CAD | 3,010,000 | | | | 03/16/2032 | | | Semi-Annually | | | — | | | | 44,183 | | | | 44,183 | |
2.23% | | 3 Month CAD CDOR | | CAD | 2,800,000 | | | | 03/16/2032 | | | Semi-Annually | | | — | | | | 27,283 | | | | 27,283 | |
| | | | |
| | |
| | | See accompanying notes to the financial statements. | | 51 |
GMO Benchmark-Free Fund
(A Series of GMO Trust)
Schedule of Investments — (Continued)
February 28, 2022
Swap Contracts — continued
Centrally Cleared Interest Rate Swaps — continued
| | | | | | | | | | | | | | | | | | | | | | | | |
Fund Pays | | Fund Receives | | Notional
Amount | | | Expiration
Date | | | Periodic
Payment
Frequency | | Premiums
Paid/
(Received) ($) | | | Value ($) | | | Net
Unrealized
Appreciation/
(Depreciation) ($) | |
2.23% | | 3 Month CAD CDOR | | CAD | 2,760,000 | | | | 03/16/2032 | | | Semi-Annually | | | — | | | | 26,696 | | | | 26,696 | |
3 Month CAD CDOR | | 2.39% | | CAD | 2,970,000 | | | | 03/16/2032 | | | Semi-Annually | | | — | | | | 3,345 | | | | 3,345 | |
2.34% | | 3 Month CAD CDOR | | CAD | 2,740,000 | | | | 03/16/2032 | | | Semi-Annually | | | — | | | | 6,222 | | | | 6,222 | |
3 Month CAD CDOR | | 2.42% | | CAD | 2,750,000 | | | | 03/16/2032 | | | Semi-Annually | | | — | | | | 9,587 | | | | 9,587 | |
3 Month CAD CDOR | | 2.12% | | CAD | 18,890,000 | | | | 03/16/2032 | | | Semi-Annually | | | 23,171 | | | | (335,369 | ) | | | (358,540 | ) |
3 Month CAD CDOR | | 2.12% | | CAD | 48,070,000 | | | | 03/16/2032 | | | Semi-Annually | | | 12,086 | | | | (853,424 | ) | | | (865,510 | ) |
3 Month CAD CDOR | | 2.33% | | CAD | 9,070,000 | | | | 03/16/2032 | | | Semi-Annually | | | — | | | | (28,704 | ) | | | (28,704 | ) |
3 Month CAD CDOR | | 2.37% | | CAD | 7,300,000 | | | | 03/16/2032 | | | Semi-Annually | | | — | | | | (132 | ) | | | (132 | ) |
3 Month CAD CDOR | | 2.35% | | CAD | 3,650,000 | | | | 03/16/2032 | | | Semi-Annually | | | — | | | | (4,242 | ) | | | (4,242 | ) |
3 Month CAD CDOR | | 2.28% | | CAD | 5,520,000 | | | | 03/16/2032 | | | Semi-Annually | | | — | | | | (36,220 | ) | | | (36,220 | ) |
3 Month CAD CDOR | | 2.32% | | CAD | 1,290,000 | | | | 03/16/2032 | | | Semi-Annually | | | — | | | | (4,267 | ) | | | (4,267 | ) |
3 Month CAD CDOR | | 2.32% | | CAD | 2,440,000 | | | | 03/16/2032 | | | Semi-Annually | | | — | | | | (7,984 | ) | | | (7,984 | ) |
2.39% | | 3 Month CAD CDOR | | CAD | 2,900,000 | | | | 03/16/2032 | | | Semi-Annually | | | — | | | | (4,718 | ) | | | (4,718 | ) |
2.42% | | 3 Month CAD CDOR | | CAD | 4,790,000 | | | | 03/16/2032 | | | Semi-Annually | | | — | | | | (18,240 | ) | | | (18,240 | ) |
2.44% | | 3 Month CAD CDOR | | CAD | 3,240,000 | | | | 03/16/2032 | | | Semi-Annually | | | — | | | | (16,393 | ) | | | (16,393 | ) |
2.44% | | 3 Month CAD CDOR | | CAD | 1,970,000 | | | | 03/16/2032 | | | Semi-Annually | | | — | | | | (9,967 | ) | | | (9,967 | ) |
2.39% | | 3 Month CAD CDOR | | CAD | 1,860,000 | | | | 03/16/2032 | | | Semi-Annually | | | (1,542 | ) | | | (2,361 | ) | | | (819 | ) |
2.39% | | 3 Month CAD CDOR | | CAD | 3,200,000 | | | | 03/16/2032 | | | Semi-Annually | | | (1,629 | ) | | | (4,977 | ) | | | (3,348 | ) |
CHF - SARON - OIS - COMPOUND | | 0.51% | | CHF | 2,400,000 | | | | 03/16/2032 | | | Annually | | | — | | | | 1,165 | | | | 1,165 | |
CHF - SARON - OIS - COMPOUND | | 0.56% | | CHF | 3,100,000 | | | | 03/16/2032 | | | Annually | | | — | | | | 17,212 | | | | 17,212 | |
CHF - SARON - OIS - COMPOUND | | 0.51% | | CHF | 1,610,000 | | | | 03/16/2032 | | | Annually | | | — | | | | 1,396 | | | | 1,396 | |
CHF - SARON - OIS - COMPOUND | | 0.51% | | CHF | 1,620,000 | | | | 03/16/2032 | | | Annually | | | — | | | | 875 | | | | 875 | |
CHF - SARON - OIS - COMPOUND | | 0.52% | | CHF | 3,090,000 | | | | 03/16/2032 | | | Annually | | | — | | | | 3,689 | | | | 3,689 | |
CHF - SARON - OIS - COMPOUND | | 0.55% | | CHF | 3,060,000 | | | | 03/16/2032 | | | Annually | | | — | | | | 14,490 | | | | 14,490 | |
CHF - SARON - OIS - COMPOUND | | 0.52% | | CHF | 1,900,000 | | | | 03/16/2032 | | | Annually | | | — | | | | 3,821 | | | | 3,821 | |
CHF - SARON - OIS - COMPOUND | | 0.05% | | CHF | 3,980,000 | | | | 03/16/2032 | | | Annually | | | — | | | | (199,080 | ) | | | (199,080 | ) |
CHF - SARON - OIS - COMPOUND | | (0.01)% | | CHF | 580,000 | | | | 03/16/2032 | | | Annually | | | 1,509 | | | | (32,551 | ) | | | (34,060 | ) |
CHF - SARON - OIS - COMPOUND | | 0.20% | | CHF | 1,760,000 | | | | 03/16/2032 | | | Annually | | | — | | | | (58,693 | ) | | | (58,693 | ) |
CHF - SARON - OIS - COMPOUND | | 0.22% | | CHF | 2,380,000 | | | | 03/16/2032 | | | Annually | | | — | | | | (72,626 | ) | | | (72,626 | ) |
CHF - SARON - OIS - COMPOUND | | 0.23% | | CHF | 23,800,000 | | | | 03/16/2032 | | | Annually | | | 23,955 | | | | (710,704 | ) | | | (734,659 | ) |
CHF - SARON - OIS - COMPOUND | | 0.32% | | CHF | 1,010,000 | | | | 03/16/2032 | | | Annually | | | — | | | | (20,255 | ) | | | (20,255 | ) |
0.53% | | CHF - SARON - OIS - COMPOUND | | CHF | 1,310,000 | | | | 03/16/2032 | | | Annually | | | — | | | | (3,562 | ) | | | (3,562 | ) |
1.37% | | GBP - SONIA - COMPOUND | | GBP | 51,340,000 | | | | 03/16/2032 | | | Annually | | | (147,435 | ) | | | 223,377 | | | | 370,812 | |
1.35% | | GBP - SONIA - COMPOUND | | GBP | 15,320,000 | | | | 03/16/2032 | | | Annually | | | (26,094 | ) | | | 104,650 | | | | 130,744 | |
GBP - SONIA - COMPOUND | | 1.43% | | GBP | 1,900,000 | | | | 03/16/2032 | | | Annually | | | — | | | | 5,163 | | | | 5,163 | |
GBP - SONIA - COMPOUND | | 1.41% | | GBP | 1,350,000 | | | | 03/16/2032 | | | Annually | | | (3,519 | ) | | | 1,157 | | | | 4,676 | |
1.35% | | GBP - SONIA - COMPOUND | | GBP | 1,510,000 | | | | 03/16/2032 | | | Annually | | | — | | | | 10,689 | | | | 10,689 | |
GBP - SONIA - COMPOUND | | 1.43% | | GBP | 3,840,000 | | | | 03/16/2032 | | | Annually | | | — | | | | 11,339 | | | | 11,339 | |
GBP - SONIA - COMPOUND | | 1.45% | | GBP | 900,000 | | | | 03/16/2032 | | | Annually | | | 1,819 | | | | 5,012 | | | | 3,193 | |
GBP - SONIA - COMPOUND | | 1.34% | | GBP | 2,220,000 | | | | 03/16/2032 | | | Annually | | | (3,138 | ) | | | (18,055 | ) | | | (14,917 | ) |
GBP - SONIA - COMPOUND | | 1.41% | | GBP | 1,410,000 | | | | 03/16/2032 | | | Annually | | | 2,884 | | | | 159 | | | | (2,725 | ) |
1.46% | | GBP - SONIA - COMPOUND | | GBP | 1,630,000 | | | | 03/16/2032 | | | Annually | | | (2,352 | ) | | | (11,907 | ) | | | (9,555 | ) |
2.64% | | 3 Month NZD Bank Bill Rate | | NZD | 7,190,000 | | | | 03/16/2032 | | | Quarterly | | | 2,279 | | | | 168,138 | | | | 165,859 | |
2.69% | | 3 Month NZD Bank Bill Rate | | NZD | 9,010,000 | | | | 03/16/2032 | | | Quarterly | | | (2,071 | ) | | | 182,110 | | | | 184,181 | |
3.02% | | 3 Month NZD Bank Bill Rate | | NZD | 1,750,000 | | | | 03/16/2032 | | | Quarterly | | | — | | | | 1,953 | | | | 1,953 | |
2.98% | | 3 Month NZD Bank Bill Rate | | NZD | 3,360,000 | | | | 03/16/2032 | | | Quarterly | | | — | | | | 11,646 | | | | 11,646 | |
3 Month NZD Bank Bill Rate | | 2.57% | | NZD | 2,610,000 | | | | 03/16/2032 | | | Quarterly | | | — | | | | (71,156 | ) | | | (71,156 | ) |
3 Month NZD Bank Bill Rate | | 2.82% | | NZD | 2,290,000 | | | | 03/16/2032 | | | Quarterly | | | (84 | ) | | | (28,793 | ) | | | (28,709 | ) |
3 Month NZD Bank Bill Rate | | 2.78% | | NZD | 3,250,000 | | | | 03/16/2032 | | | Quarterly | | | — | | | | (48,311 | ) | | | (48,311 | ) |
3 Month NZD Bank Bill Rate | | 2.99% | | NZD | 3,620,000 | | | | 03/16/2032 | | | Quarterly | | | (3,193 | ) | | | (9,357 | ) | | | (6,164 | ) |
3.05% | | 3 Month NZD Bank Bill Rate | | NZD | 1,660,000 | | | | 03/16/2032 | | | Quarterly | | | — | | | | (1,367 | ) | | | (1,367 | ) |
1.10% | | 3 Month SEK STIBOR | | SEK | 7,900,000 | | | | 03/16/2032 | | | Quarterly | | | (125 | ) | | | 25,668 | | | | 25,793 | |
1.42% | | 3 Month SEK STIBOR | | SEK | 19,200,000 | | | | 03/16/2032 | | | Quarterly | | | — | | | | 879 | | | | 879 | |
1.40% | | 3 Month SEK STIBOR | | SEK | 15,600,000 | | | | 03/16/2032 | | | Quarterly | | | — | | | | 3,837 | | | | 3,837 | |
1.41% | | 3 Month SEK STIBOR | | SEK | 35,100,000 | | | | 03/16/2032 | | | Quarterly | | | — | | | | 4,417 | | | | 4,417 | |
| | | | |
| | |
| 52 | | See accompanying notes to the financial statements. | | |
GMO Benchmark-Free Fund
(A Series of GMO Trust)
Schedule of Investments — (Continued)
February 28, 2022
Swap Contracts — continued
Centrally Cleared Interest Rate Swaps — continued
| | | | | | | | | | | | | | | | | | | | | | | | | | |
Fund Pays | | Fund Receives | | Notional
Amount | | | Expiration
Date | | | Periodic
Payment
Frequency | | | Premiums
Paid/
(Received) ($) | | | Value ($) | | | Net
Unrealized
Appreciation/
(Depreciation) ($) | |
3 Month SEK STIBOR | | 0.90% | | SEK | 119,950,000 | | | | 03/16/2032 | | | | Quarterly | | | | — | | | | (632,275 | ) | | | (632,275 | ) |
3 Month SEK STIBOR | | 0.84% | | SEK | 21,350,000 | | | | 03/16/2032 | | | | Quarterly | | | | 5,291 | | | | (124,080 | ) | | | (129,371 | ) |
3 Month SEK STIBOR | | 0.83% | | SEK | 15,300,000 | | | | 03/16/2032 | | | | Quarterly | | | | — | | | | (90,757 | ) | | | (90,757 | ) |
3 Month SEK STIBOR | | 0.85% | | SEK | 11,700,000 | | | | 03/16/2032 | | | | Quarterly | | | | — | | | | (67,880 | ) | | | (67,880 | ) |
3 Month SEK STIBOR | | 1.39% | | SEK | 233,870,000 | | | | 03/16/2032 | | | | Quarterly | | | | 49,108 | | | | (92,641 | ) | | | (141,749 | ) |
3 Month SEK STIBOR | | 1.38% | | SEK | 27,300,000 | | | | 03/16/2032 | | | | Quarterly | | | | — | | | | (12,180 | ) | | | (12,180 | ) |
3 Month SEK STIBOR | | 1.42% | | SEK | 19,100,000 | | | | 03/16/2032 | | | | Quarterly | | | | — | | | | (109 | ) | | | (109 | ) |
3 Month SEK STIBOR | | 1.39% | | SEK | 21,100,000 | | | | 03/16/2032 | | | | Quarterly | | | | — | | | | (8,147 | ) | | | (8,147 | ) |
1.45% | | 3 Month SEK STIBOR | | SEK | 32,600,000 | | | | 03/16/2032 | | | | Quarterly | | | | — | | | | (8,951 | ) | | | (8,951 | ) |
1.43% | | 3 Month SEK STIBOR | | SEK | 20,800,000 | | | | 03/16/2032 | | | | Quarterly | | | | — | | | | (1,651 | ) | | | (1,651 | ) |
1.44% | | 3 Month SEK STIBOR | | SEK | 22,720,000 | | | | 03/16/2032 | | | | Quarterly | | | | (236 | ) | | | (3,282 | ) | | | (3,046 | ) |
1.57% | | USD - SOFR - COMPOUND | | USD | 1,400,000 | | | | 03/16/2032 | | | | Annually | | | | (78 | ) | | | 13,316 | | | | 13,394 | |
1.56% | | USD - SOFR - COMPOUND | | USD | 3,510,000 | | | | 03/16/2032 | | | | Annually | | | | (1,534 | ) | | | 35,343 | | | | 36,877 | |
1.58% | | USD - SOFR - COMPOUND | | USD | 2,090,000 | | | | 03/16/2032 | | | | Annually | | | | (2,110 | ) | | | 17,159 | | | | 19,269 | |
USD - SOFR - COMPOUND | | 1.87% | | USD | 1,440,000 | | | | 03/16/2032 | | | | Annually | | | | 4,447 | | | | 26,463 | | | | 22,016 | |
USD - SOFR - COMPOUND | | 1.70% | | USD | 3,840,000 | | | | 03/16/2032 | | | | Annually | | | | — | | | | 12,560 | | | | 12,560 | |
1.84% | | USD - SOFR - COMPOUND | | USD | 1,730,000 | | | | 03/16/2032 | | | | Annually | | | | — | | | | (27,370 | ) | | | (27,370 | ) |
1.71% | | USD - SOFR - COMPOUND | | USD | 960,000 | | | | 03/16/2032 | | | | Annually | | | | (475 | ) | | | (3,765 | ) | | | (3,290 | ) |
1.70% | | USD - SOFR - COMPOUND | | USD | 2,190,000 | | | | 03/16/2032 | | | | Annually | | | | (2,031 | ) | | | (6,858 | ) | | | (4,827 | ) |
USD - SOFR - COMPOUND | | 1.61% | | USD | 2,360,000 | | | | 03/16/2032 | | | | Annually | | | | 814 | | | | (12,794 | ) | | | (13,608 | ) |
1.75% | | USD - SOFR - COMPOUND | | USD | 3,600,000 | | | | 03/16/2032 | | | | Annually | | | | — | | | | (26,501 | ) | | | (26,501 | ) |
1.76% | | USD - SOFR - COMPOUND | | USD | 40,450,000 | | | | 03/16/2032 | | | | Annually | | | | (69,558 | ) | | | (344,768 | ) | | | (275,210 | ) |
1.79% | | USD - SOFR - COMPOUND | | USD | 2,410,000 | | | | 03/16/2032 | | | | Annually | | | | — | | | | (26,814 | ) | | | (26,814 | ) |
1.82% | | USD - SOFR - COMPOUND | | USD | 1,930,000 | | | | 03/16/2032 | | | | Annually | | | | — | | | | (26,587 | ) | | | (26,587 | ) |
0.36% | | 6 Month EURIBOR | | EUR | 1,440,000 | | | | 03/17/2032 | | | | Semi-Annually | | | | 143 | | | | 69,614 | | | | 69,471 | |
0.39% | | 6 Month EURIBOR | | EUR | 1,710,000 | | | | 03/17/2032 | | | | Semi-Annually | | | | 437 | | | | 77,581 | | | | 77,144 | |
0.39% | | 6 Month EURIBOR | | EUR | 23,120,000 | | | | 03/17/2032 | | | | Semi-Annually | | | | (65,248 | ) | | | 1,036,199 | | | | 1,101,447 | |
0.45% | | 6 Month EURIBOR | | EUR | 2,350,000 | | | | 03/17/2032 | | | | Semi-Annually | | | | — | | | | 90,698 | | | | 90,698 | |
0.42% | | 6 Month EURIBOR | | EUR | 1,970,000 | | | | 03/17/2032 | | | | Semi-Annually | | | | (1,705 | ) | | | 81,782 | | | | 83,487 | |
0.49% | | 6 Month EURIBOR | | EUR | 1,730,000 | | | | 03/17/2032 | | | | Semi-Annually | | | | 470 | | | | 59,433 | | | | 58,963 | |
0.71% | | 6 Month EURIBOR | | EUR | 2,340,000 | | | | 03/17/2032 | | | | Semi-Annually | | | | 3,465 | | | | 22,990 | | | | 19,525 | |
0.76% | | 6 Month EURIBOR | | EUR | 1,610,000 | | | | 03/17/2032 | | | | Semi-Annually | | | | 2,275 | | | | 7,430 | | | | 5,155 | |
6 Month EURIBOR | | 0.81% | | EUR | 4,530,000 | | | | 03/17/2032 | | | | Semi-Annually | | | | — | | | | 6,040 | | | | 6,040 | |
6 Month EURIBOR | | 0.82% | | EUR | 1,830,000 | | | | 03/17/2032 | | | | Semi-Annually | | | | — | | | | 4,758 | | | | 4,758 | |
6 Month EURIBOR | | 0.83% | | EUR | 2,710,000 | | | | 03/17/2032 | | | | Semi-Annually | | | | — | | | | 10,926 | | | | 10,926 | |
6 Month EURIBOR | | 0.82% | | EUR | 2,710,000 | | | | 03/17/2032 | | | | Semi-Annually | | | | — | | | | 6,897 | | | | 6,897 | |
6 Month EURIBOR | | 0.81% | | EUR | 1,780,000 | | | | 03/17/2032 | | | | Semi-Annually | | | | — | | | | 2,765 | | | | 2,765 | |
6 Month EURIBOR | | 0.86% | | EUR | 3,330,000 | | | | 03/17/2032 | | | | Semi-Annually | | | | — | | | | 23,696 | | | | 23,696 | |
6 Month EURIBOR | | 0.86% | | EUR | 900,000 | | | | 03/17/2032 | | | | Semi-Annually | | | | 17 | | | | 6,256 | | | | 6,239 | |
6 Month EURIBOR | | 0.77% | | EUR | 3,480,000 | | | | 03/17/2032 | | | | Semi-Annually | | | | — | | | | (11,651 | ) | | | (11,651 | ) |
6 Month EURIBOR | | 0.76% | | EUR | 1,140,000 | | | | 03/17/2032 | | | | Semi-Annually | | | | — | | | | (5,072 | ) | | | (5,072 | ) |
0.77% | | 6 Month EURIBOR | | EUR | 1,180,000 | | | | 03/17/2032 | | | | Semi-Annually | | | | 4,276 | | | | 3,496 | | | | (780 | ) |
0.81% | | 6 Month EURIBOR | | EUR | 1,650,000 | | | | 03/17/2032 | | | | Semi-Annually | | | | (183 | ) | | | (2,654 | ) | | | (2,471 | ) |
| | | | | | | | | | | | | | | | | | | | | | | | | | |
| | | | | | | | | | | | | | | | $ | (196,397 | ) | | $ | (1,032,399 | ) | | $ | (836,002 | ) |
| | | | | | | | | | | | | | | | | | | | | | | | | | |
| | | | |
| | |
| | | See accompanying notes to the financial statements. | | 53 |
GMO Benchmark-Free Fund
(A Series of GMO Trust)
Schedule of Investments — (Continued)
February 28, 2022
Swap Contracts — continued
OTC Total Return Swaps
| | | | | | | | | | | | | | | | | | | | | | | | | | | | |
Fund Pays | | Fund Receives | | Counterparty | | Notional
Amount | | | Expiration
Date | | | Periodic
Payment
Frequency | | | Premiums
Paid/
(Received) ($) | | | Value ($) | | | Net Unrealized
Appreciation/
(Depreciation) ($) | |
Total Return on Equity Basket (k) | | 1 Month Federal Funds
Rate minus 0.50% | | GS | | USD | 3,224,746 | | | | 05/24/2022 | | | | Monthly | | | | — | | | | (55,606 | ) | | | (55,606 | ) |
Total Return on Equity Basket (k) | | 1 Month Federal Funds
Rate minus 0.75% | | GS | | USD | 534,480 | | | | 05/24/2022 | | | | Monthly | | | | — | | | | 27,526 | | | | 27,526 | |
Total Return on Equity Basket (k) | | 1 Month Federal Funds
Rate minus 0.75% | | GS | | USD | 4,679,598 | | | | 05/24/2022 | | | | Monthly | | | | — | | | | 3,289 | | | | 3,289 | |
Total Return on Equity Basket (k) | | 1 Month Federal Funds
Rate minus 0.75% | | GS | | USD | 1,332,289 | | | | 05/24/2022 | | | | Monthly | | | | — | | | | (83,353 | ) | | | (83,353 | ) |
Total Return on Equity Basket (k) | | 1 Month Federal Funds
Rate minus 0.75% | | GS | | USD | 732,635 | | | | 05/24/2022 | | | | Monthly | | | | — | | | | (15,000 | ) | | | (15,000 | ) |
Total Return on Equity Basket (k) | | 1 Month Federal Funds
Rate minus 1.00% | | MORD | | USD | 2 | | | | 06/21/2022 | | | | Monthly | | | | — | | | | — | | | | — | |
Total Return on Equity Basket (k) | | 1 Month Federal Funds
Rate minus 1.00% | | MORD | | USD | 446,423 | | | | 10/18/2022 | | | | Monthly | | | | — | | | | 29,238 | | | | 29,238 | |
Total Return on Equity Basket (1) | | 1 Month Federal Funds
Rate minus 0.40% | | MORD | | USD | 23,163,951 | | | | 10/18/2022 | | | | Monthly | | | | — | | | | 1,336,808 | | | | 1,336,808 | |
Total Return on Equity Basket (k) | | 1 Month Federal Funds
Rate minus 2.50% | | MORD | | USD | 9,123,624 | | | | 05/18/2023 | | | | Monthly | | | | — | | | | (284,478 | ) | | | (284,478 | ) |
Total Return on Equity Basket (k) | | 1 Month Federal Funds
Rate minus 0.40% | | MORD | | USD | 2,752,252 | | | | 11/20/2023 | | | | Monthly | | | | — | | | | 89,567 | | | | 89,567 | |
Total Return on Equity Basket (k) | | 1 Month Federal Funds
Rate minus 0.50% | | GS | | USD | 186,525 | | | | 05/24/2024 | | | | Monthly | | | | — | | | | (5,049 | ) | | | (5,049 | ) |
| | | | | | | | | | | | | | | | | | | | | | | | | | | | |
| | | | | | | | | | | | | | | | | | $ | — | | | $ | 1,042,942 | | | $ | 1,042,942 | |
| | | | | | | | | | | | | |
As of February 28, 2022, for the above contracts and/or agreements, the Fund had sufficient cash and/or securities to cover commitments or collateral requirements, if any, of the relevant broker or exchange.
Notes to Schedule of Investments:
| † | Denominated in U.S. Dollar, unless otherwise indicated. |
| * | Non-income producing security. |
| (a) | All or a portion of this security is out on loan (Note 2). |
| (b) | All or a portion of this security has been pledged to cover margin requirements on futures and/or cleared swap contracts, collateral on securities sold short, OTC swap contracts, forward currency contracts, and/or written options, if any (Note 4). |
| (c) | Securities are traded on separate exchanges for the same entity. |
| (d) | Investment valued at fair value using methods determined in good faith by the Trustees of GMO Trust or persons acting at their direction pursuant to procedures approved by the Trustees. Investment valued using significant unobservable inputs (Note 2). |
| (e) | Investment valued using significant unobservable inputs (Note 2). |
| (f) | Preferred dividend rates are disclosed to the extent that a stated rate exists. |
| (g) | Security is in default. |
| (h) | All or a portion of this security is purchased with collateral from securities loaned (Note 2). |
| (i) | The rate disclosed is the 7 day net yield as of February 28, 2022. |
| (j) | The rate shown represents yield-to-maturity. |
| (k) | Periodic payments made/received are based on the total return of the referenced entity. Custom equity basket swap which has a notional amount of less than 1% of the Fund’s total net assets. |
| | | | |
| | |
| 54 | | See accompanying notes to the financial statements. | | |
GMO Benchmark-Free Fund
(A Series of GMO Trust)
Schedule of Investments — (Continued)
February 28, 2022
| (l) | The following table represents the individual short positions within the custom equity basket swap as of February 28, 2022: |
| | | | | | | | | | | | | | |
| | | Shares | | | Description | | % of
Equity Basket | | | Value ($) | |
| | | | |
| | | 1,172,000 | | | Alibaba Health Information Technology Ltd | | | 3.8 | % | | | 820,671 | |
| | | | |
| | | 5,800,000 | | | Alibaba Pictures Group Ltd | | | 2.7 | % | | | 579,880 | |
| | | | |
| | | 3,759,000 | | | China Molybdenum Co Ltd –Class H | | | 10.4 | % | | | 2,262,552 | |
| | | | |
| | | 264,000 | | | China Resources Beer Holdings Co Ltd | | | 9.6 | % | | | 2,093,362 | |
| | | | |
| | | 329,500 | | | Citic Securities Co Ltd – Class H | | | 3.7 | % | | | 798,280 | |
| | | | |
| | | 366,500 | | | Cosco Shipping Holdings Co –Class H | | | 3.4 | % | | | 740,779 | |
| | | | |
| | | 34,000 | | | Country Garden Services Holdings Co Ltd | | | 0.9 | % | | | 203,386 | |
| | | | |
| | | 121,600 | | | Ganfeng Lithium Co Ltd – Class H | | | 9.4 | % | | | 2,063,819 | |
| | | | |
| | | 976,000 | | | Greentown Service Group Co Ltd | | | 4.5 | % | | | 980,414 | |
| | | | |
| | | 45,500 | | | Hong Kong Exchanges and Clearing Ltd | | | 10.1 | % | | | 2,204,778 | |
| | | | |
| | | 857,000 | | | Kingdee International Software Group Co Lt | | | 9.7 | % | | | 2,118,197 | |
| | | | |
| | | 215,000 | | | New World Development Co Ltd | | | 3.9 | % | | | 859,923 | |
| | | | |
| | | 910,800 | | | Sands China Ltd | | | 11.0 | % | | | 2,402,218 | |
| | | | |
| | | 18,750 | | | Shandong Gold Mining Co Ltd – Class H | | | 0.2 | % | | | 35,209 | |
| | | | |
| | | 969,000 | | | Weimob Inc | | | 2.9 | % | | | 640,852 | |
| | | | |
| | | 2,036,000 | | | Zijin Mining Group Co Ltd –Class H | | | 13.8 | % | | | 3,021,793 | |
| | | | | | | | | | | | | | |
| | | | |
| | | | | | TOTAL COMMON STOCKS | | | | | | $ | 21,826,113 | |
| | | | | | | | | | | | | | |
For a listing of definitions of acronyms, counterparty abbreviations and currency abbreviations used throughout the Schedule of Investments as well as the derivative tables, if any, please refer to page 133.
| | | | |
| | |
| | | See accompanying notes to the financial statements. | | 55 |
GMO Global Asset Allocation Fund
(A Series of GMO Trust)
Portfolio Management
Day-to-day management of the Fund’s portfolio is the responsibility of the Asset Allocation team at Grantham, Mayo, Van Otterloo & Co. LLC.
Management Discussion and Analysis of Fund Performance
Class III shares of GMO Global Asset Allocation Fund returned -0.10% (net) for the fiscal year ended February 28, 2022, as compared with +4.16% for the Fund’s benchmark, the GMO Global Asset Allocation Index (65% MSCI All Country World Index (“ACWI”) and 35% Bloomberg U.S. Aggregate Index (formerly Bloomberg Barclays U.S. Aggregate Index).
The Fund’s underweight in equities, compared to the benchmark, had a negative impact on performance, and this was exacerbated by the bias towards emerging markets and away from the U.S., as the S&P 500 Index returned 16.4% while the MSCI Emerging Markets index faltered to a -10.7% return. We believed that emerging markets were trading at very preferential valuations, but regulatory actions in China and the Russian invasion of Ukraine proved extremely challenging. The disappointing returns suffered by the equity book were exacerbated by security selection within emerging markets, as we were meaningfully overweight Russia. The Fund’s exposure to alternative strategies detracted from relative performance, as they did not manage to keep up with the return generated by the Fund’s benchmark. The underweighting to fixed income was additive to performance as the asset class did relatively less well, with the Bloomberg U.S. Aggregate Index (formerly Bloomberg Barclays U.S. Aggregate Index) posting -2.6%, and this was complemented by modest outperformance within fixed income.
The views expressed herein are exclusively those of Grantham, Mayo, Van Otterloo & Co. LLC as of the date of this report and are subject to change. GMO disclaims any responsibility to update such views. They are not meant as investment advice. References to specific securities are not recommendations of such securities and may not be representative of any GMO portfolio’s current or future investments. All information is unaudited.
GMO Global Asset Allocation Fund
(A Series of GMO Trust)
Comparison of Change in Value of a $5,000,000 Investment in
GMO Global Asset Allocation Fund Class III Shares, the GMO Global Asset Allocation Index*, the MSCI ACWI and the Bloomberg U.S. Aggregate Index (formerly Bloomberg Barclays U.S. Aggregate Index)
As of February 28, 2022
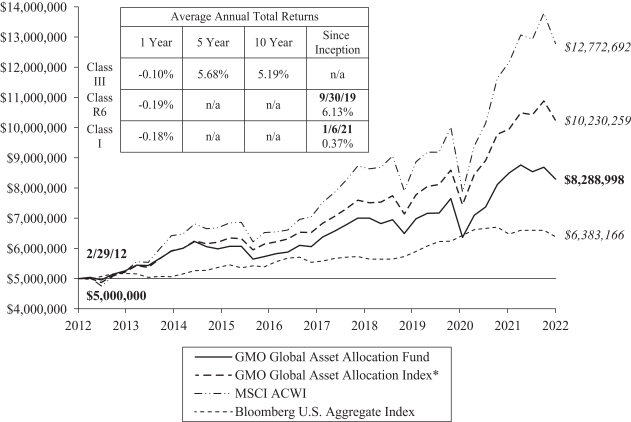
Performance data quoted represents past performance and is not indicative of future results. The investment return and principal value of an investment will fluctuate so that an investor’s shares, when redeemed, may be worth more or less than their original cost. Current performance data may be lower or higher than the performance data provided herein. To obtain performance information up to the most recent month-end, visit www.gmo.com. Performance shown is net of all fees after reimbursement from GMO. Returns would have been lower had certain expenses not been reimbursed during the periods shown and do not include the effect of taxes on distributions and redemptions. The performance information shown above only includes purchase premiums and/or redemption fees in effect as of February 28, 2022. All information is unaudited. Performance for classes may vary due to different fees.
| | * | The GMO Global Asset Allocation Index is comprised of 65% MSCI ACWI (All Country World Index) and 35% Bloomberg U.S. Aggregate Index. |
MSCI data may not be reproduced or used for any other purpose. MSCI provides no warranties, has not prepared or approved this report, and has no liability hereunder.
For Class III, R6 and I the gross expense ratio of 0.64%, 0.64% and 0.74%, respectively, is equal to the Fund’s Total Annual Operating Expenses set forth in the Fund’s most recent prospectus dated June 30, 2021. For the Classes listed above, the corresponding net expense ratio of 0.63%, 0.63% and 0.73% reflects the reduction of expenses from fee reimbursements. The fee reimbursements will continue until at least June 30, 2022. Elimination of this reimbursement will result in higher fees and lower performance.
GMO Global Asset Allocation Fund
(A Series of GMO Trust)
Investment Concentration Summary
February 28, 2022 (Unaudited)
| | | | |
| Asset Class Summary& | | % of Total Net Assets | |
Common Stocks | | | 69.4 | % |
Debt Obligations | | | 24.9 | |
Short-Term Investments | | | 11.8 | |
Preferred Stocks | | | 1.0 | |
Investment Funds | | | 0.6 | |
Swap Contracts | | | 0.3 | |
Purchased Options | | | 0.1 | |
Loan Assignments | | | 0.0 | ^ |
Loan Participations | | | 0.0 | ^ |
Rights/Warrants | | | 0.0 | ^ |
Reverse Repurchase Agreements | | | (0.0 | )^ |
Futures Contracts | | | (0.0 | )^ |
Written/Credit Linked Options | | | (0.1 | ) |
Forward Currency Contracts | | | (0.1 | ) |
Securities Sold Short | | | (7.6 | ) |
Other | | | (0.3 | ) |
| | | | |
| | | 100.0 | % |
| | | | |
| | | | |
| Country/Region Summary¤ | | Debt Obligations as a % of Total Net Assets | |
United States | | | 6.7 | % |
Switzerland | | | 4.1 | |
Canada | | | 3.5 | |
Sweden | | | 3.5 | |
Other Emerging | | | 3.1 | † |
Australia | | | 1.8 | |
Euro Region | | | (0.6 | )# |
Other Developed | | | (0.9 | )‡ |
United Kingdom | | | (8.1 | ) |
| | | | |
| | | 13.1 | % |
| | | | |
| | | | |
| Country/Region Summary¤ | | Equity Investments as a
% of Total Net Assets | |
United States | | | 23.1 | % |
Japan | | | 8.5 | |
Other Developed | | | 5.0 | ‡ |
Taiwan | | | 4.3 | |
United Kingdom | | | 3.7 | |
China | | | 3.4 | |
South Korea | | | 2.5 | |
Other Emerging | | | 2.1 | † |
France | | | 1.9 | |
Germany | | | 1.4 | |
Mexico | | | 1.3 | |
Netherlands | | | 1.3 | |
Australia | | | 1.2 | |
Switzerland | | | 1.2 | |
Russia | | | 1.1 | |
India | | | 1.0 | |
| | | | |
| | | 63.0 | % |
| | | | |
| & | The table incorporates aggregate indirect asset class exposure associated with investments in other funds of GMO Trust (“underlying funds”). Derivative financial instruments, if any, are based on market values, rather than the notional amounts of derivatives, except for forward currency contracts which are based on unrealized appreciation/depreciation). |
| ¤ | The table incorporates aggregate indirect country exposure associated with investments in the underlying funds. The table excludes short-term investments. The table includes exposure through the use of certain derivative financial instruments and excludes exposure through certain currency linked derivatives such as forward currency contracts and currency options. The table is based on duration adjusted net exposures (both investments and derivatives), taking into account the market value of securities and the notional amounts of swaps and other derivative financial instruments. Duration is based on GMO’s models. The greater the duration of a bond, the greater its contribution to the concentration percentage. Credit default swap exposures are factored into the duration adjusted exposure using the reference security and applying the same methodology to that security. The table is not normalized, thus, due to the exclusions listed above and negative exposures, which may be attributable to derivatives or short sales, if any, the table may not total to 100%. |
| † | “Other Emerging” is comprised of emerging countries that each represent between (1.0)% and 1.0% of Total Net Assets. |
| # | “Euro Region” is comprised of derivative financial instruments attributed to the Eurozone and not a particular country. |
| ‡ | “Other Developed” is comprised of developed countries that each represent between (1.0)% and 1.0% of Total Net Assets. |
GMO Global Asset Allocation Fund
(A Series of GMO Trust)
Schedule of Investments
(showing percentage of total net assets)
February 28, 2022
| | | | | | | | | | |
| | | Shares | | | Description | | Value ($) | |
| | |
| | | | | | MUTUAL FUNDS — 99.9% | |
| | |
| | | | | | Affiliated Issuers — 99.9% | |
| | | |
| | | 7,190,498 | | | GMO Alternative Allocation Fund, Class VI | | | 130,004,197 | |
| | | |
| | | 1,614,929 | | | GMO Asset Allocation Bond Fund, Class VI | | | 37,983,141 | |
| | | |
| | | 850,562 | | | GMO Emerging Country Debt Fund, Class VI | | | 18,116,964 | |
| | | |
| | | 1,660,975 | | | GMO Emerging Markets ex-China Fund, Class VI | | | 27,671,845 | |
| | | |
| | | 2,313,131 | | | GMO Emerging Markets Fund, Class VI | | | 68,376,141 | |
| | | |
| | | 4,664,345 | | | GMO International Equity Fund, Class IV | | | 107,093,353 | |
| | | |
| | | 1,267,447 | | | GMO-Usonian Japan Value Creation Fund, Class VI | | | 24,981,389 | |
| | | |
| | | 2,966,947 | | | GMO Multi-Sector Fixed Income Fund, Class IV | | | 56,164,303 | |
| | | |
| | | 766,499 | | | GMO Opportunistic Income Fund, Class VI | | | 19,591,715 | |
| | | |
| | | 784,621 | | | GMO Quality Cyclicals Fund (formerly GMO Cyclical Focus Fund), Class VI | | | 20,219,676 | |
| | | |
| | | 437,222 | | | GMO Quality Fund, Class VI | | | 12,268,439 | |
| | | |
| | | 4,543,941 | | | GMO U.S. Equity Fund, Class VI | | | 61,434,084 | |
| | | |
| | | 1,981,985 | | | GMO U.S. Small Cap Value Fund, Class VI | | | 39,124,376 | |
| | | |
| | | 375 | | | GMO U.S. Treasury Fund | | | 1,879 | |
| | | | | | | | | | |
| | | |
| | | | | | TOTAL MUTUAL FUNDS (COST $672,082,054) | | | 623,031,502 | |
| | | | | | | | | | |
| | | |
| | | | | | SHORT-TERM INVESTMENTS — 0.1% | | | |
| | | |
| | | | | | Money Market Funds — 0.1% | | | |
| | | |
| | | 833,893 | | | State Street Institutional Treasury Money Market Fund – Premier Class, 0.01% (a) | | | 833,893 | |
| | | | | | | | | | |
| | | |
| | | | | | TOTAL SHORT-TERM INVESTMENTS (COST $833,893) | | | 833,893 | |
| | | | | | | | | | |
| | | |
| | | | | | TOTAL INVESTMENTS — 100.0%
(Cost $672,915,947) | | | 623,865,395 | |
| | | |
| | | | | | Other Assets and Liabilities (net) — 0.00% | | | 115,351 | |
| | | | | | | | | | |
| | | |
| | | | | | TOTAL NET ASSETS — 100.0% | | | $623,980,746 | |
| | | | | | | | | | |
Notes to Schedule of Investments:
| (a) | The rate disclosed is the 7 day net yield as of February 28, 2022. |
For a listing of definitions of acronyms, counterparty abbreviations and currency abbreviations used throughout the Schedule of Investments as well as the derivative tables, if any, please refer to page 133.
| | | | |
| | |
| | | See accompanying notes to the financial statements. | | 59 |
GMO Global Developed Equity Allocation Fund
(A Series of GMO Trust)
Portfolio Management
Day-to-day management of the Fund’s portfolio is the responsibility of the Asset Allocation team at Grantham, Mayo, Van Otterloo & Co. LLC.
Management Discussion and Analysis of Fund Performance
Class III shares of GMO Global Developed Equity Allocation Fund returned +6.80% (net) for the fiscal year ended February 28, 2022, as compared with +10.74% for the Fund’s benchmark, the MSCI World Index.
The Fund’s underweight to the U.S. market and overweight to developed ex-U.S. detracted from performance relative to the benchmark. We also believed that emerging markets were trading at very preferential valuations, and therefore held an “off-benchmark” position here. Unfortunately, regulatory actions in China and the Russian invasion of Ukraine proved extremely detrimental. Security selection in developed markets was strong. In developed ex-U.S., strong outperformance of the Value style provided a decent tailwind, although this was partly offset by being overweight to Japan, which was the laggard within developed equities. The performance challenge from being overweight emerging markets was exacerbated by security selection within emerging markets, as we were meaningfully overweight Russia.
The views expressed herein are exclusively those of Grantham, Mayo, Van Otterloo & Co. LLC as of the date of this report and are subject to change. GMO disclaims any responsibility to update such views. They are not meant as investment advice. References to specific securities are not recommendations of such securities and may not be representative of any GMO portfolio’s current or future investments. All information is unaudited.
GMO Global Developed Equity Allocation Fund
(A Series of GMO Trust)
Comparison of Change in Value of a $5,000,000 Investment in
GMO Global Developed Equity Allocation Fund Class III Shares and the MSCI World Index
As of February 28, 2022
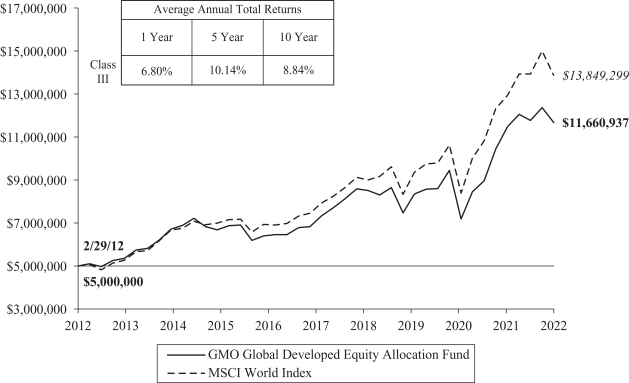
Performance data quoted represents past performance and is not indicative of future results. The investment return and principal value of an investment will fluctuate so that an investor’s shares, when redeemed, may be worth more or less than their original cost. Current performance data may be lower or higher than the performance data provided herein. To obtain performance information up to the most recent month-end, visit www.gmo.com. Performance shown is net of all fees after reimbursement from GMO. Returns would have been lower had certain expenses not been reimbursed during the periods shown and do not include the effect of taxes on distributions and redemptions. The performance information shown above only includes purchase premiums and/or redemption fees in effect as of February 28, 2022. All information is unaudited.
MSCI data may not be reproduced or used for any other purpose. MSCI provides no warranties, has not prepared or approved this report, and has no liability hereunder.
For Class III the gross expense ratio of 0.58% is equal to the Fund’s Total Annual Operating Expenses set forth in the Fund’s most recent prospectus dated June 30, 2021. For the Class listed above, the net expense ratio of 0.52% reflects the reduction of expenses from fee reimbursements. The fee reimbursements will continue until at least June 30, 2022. Elimination of this reimbursement will result in higher fees and lower performance.
GMO Global Developed Equity Allocation Fund
(A Series of GMO Trust)
Investment Concentration Summary
February 28, 2022 (Unaudited)
| | | | |
| Asset Class Summary& | | % of Total Net Assets | |
Common Stocks | | | 98.2 | % |
Short -Term Investments | | | 2.7 | |
Preferred Stocks | | | 0.7 | |
Investment Funds | | | 0.1 | |
Debt Obligations | | | 0.0 | ^ |
Rights/Warrants | | | 0.0 | ^ |
Futures Contracts | | | (0.0 | )^ |
Other | | | (1.7 | ) |
| | | | |
| | | 100.0 | % |
| | | | |
| | | | |
| Country/Region Summary¤ | | % of Investments | |
United States | | | 40.7 | % |
Japan | | | 14.9 | |
United Kingdom | | | 8.0 | |
France | | | 4.8 | |
Taiwan | | | 3.3 | |
Germany | | | 3.2 | |
Switzerland | | | 3.1 | |
Netherlands | | | 3.0 | |
Other Developed | | | 2.5 | ‡ |
Other Emerging | | | 2.5 | † |
Spain | | | 2.2 | |
Singapore | | | 1.8 | |
Korea | | | 1.8 | |
Norway | | | 1.8 | |
Australia | | | 1.6 | |
Italy | | | 1.4 | |
China | | | 1.2 | |
Mexico | | | 1.2 | |
Hong Kong | | | 1.0 | |
| | | | |
| | | 100.0 | % |
| | | | |
| & | The table incorporates aggregate indirect asset class exposure associated with investments in other funds of GMO Trust (“underlying funds”). Derivative financial instruments, if any, are based on market values, rather than the notional amounts of derivatives, except for forward currency contracts which are based on unrealized appreciation/(depreciation). |
| ¤ | The table incorporates aggregate indirect country exposure associated with investments in the underlying funds. The table excludes short -term investments and includes exposure through the use of derivative financial instruments, if any. The table excludes exposure through forward currency contracts, if any. |
| ‡ | “Other Developed” is comprised of developed countries that each represent between (1.0)% and 1.0% of Investments. |
| † | “Other Emerging” is comprised of emerging countries that each represent between (1.0)% and 1.0% of Investments. |
GMO Global Developed Equity Allocation Fund
(A Series of GMO Trust)
Schedule of Investments
(showing percentage of total net assets)
February 28, 2022
| | | | | | | | | | |
| | | Shares | | | Description | | Value ($) | |
| | |
| | | | | | MUTUAL FUNDS — 99.9% | |
| | |
| | | | | | Affiliated Issuers — 99.9% | |
| | | |
| | | 312,062 | | | GMO Emerging Markets ex-China Fund, Class VI | | | 5,198,953 | |
| | | |
| | | 78,556 | | | GMO Emerging Markets Fund, Class VI | | | 2,322,106 | |
| | | |
| | | 1,542,279 | | | GMO International Equity Fund, Class IV | | | 35,410,730 | |
| | | |
| | | 180,173 | | | GMO-Usonian Japan Value Creation Fund, Class VI | | | 3,551,214 | |
| | | |
| | | 188,432 | | | GMO Quality Cyclicals Fund (formerly GMO Cyclical Focus Fund), Class VI | | | 4,855,891 | |
| | | |
| | | 390,433 | | | GMO Quality Fund, Class VI | | | 10,955,561 | |
| | | |
| | | 1,139,503 | | | GMO U.S. Equity Fund, Class VI | | | 15,406,078 | |
| | | |
| | | 459,841 | | | GMO U.S. Small Cap Value Fund, Class VI | | | 9,077,255 | |
| | | | | | | | | | |
| | | |
| | | | | | TOTAL MUTUAL FUNDS
(COST $82,024,578) | | | 86,777,788 | |
| | | | | | | | | | |
| | | |
| | | | | | SHORT-TERM INVESTMENTS — 0.1% | | | |
| | | |
| | | | | | Money Market Funds — 0.1% | | | |
| | | |
| | | 49,828 | | | State Street Institutional Treasury Money Market Fund – Premier Class, 0.01% (a) | | | 49,828 | |
| | | | | | | | | | |
| | | |
| | | | | | TOTAL SHORT-TERM INVESTMENTS (COST $49,828) | | | 49,828 | |
| | | | | | | | | | |
| | | |
| | | | | | TOTAL INVESTMENTS — 100.0%
(Cost $82,074,406) | | | 86,827,616 | |
| | | |
| | | | | | Other Assets and Liabilities (net) — (0.0%) | | | (17,742 | ) |
| | | | | | | | | | |
| | | |
| | | | | | TOTAL NET ASSETS — 100.0% | | | $86,809,874 | |
| | | | | | | | | | |
Notes to Schedule of Investments:
| (a) | The rate disclosed is the 7 day net yield as of February 28, 2022. |
For a listing of definitions of acronyms, counterparty abbreviations and currency abbreviations used throughout the Schedule of Investments as well as the derivative tables, if any, please refer to page 133.
| | | | |
| | |
| | | See accompanying notes to the financial statements. | | 63 |
GMO Global Equity Allocation Fund
(A Series of GMO Trust)
Portfolio Management
Day-to-day management of the Fund’s portfolio is the responsibility of the Asset Allocation team at Grantham, Mayo, Van Otterloo & Co. LLC. Specific security selection is primarily handled by other GMO investment teams in collaboration with the Asset Allocation team.
Management Discussion and Analysis of Fund Performance
Class III shares of GMO Global Equity Allocation Fund returned +2.49% (net) for the fiscal year ended February 28, 2022, as compared with +7.81% for the Fund’s benchmark, the MSCI All Country World Index (“ACWI”).
The Fund’s underweight to the U.S. market and overweight to developed ex-U.S. and emerging markets detracted from performance relative to the benchmark. In particular, we believed that emerging markets were trading at very preferential valuations, but regulatory actions in China and the Russian invasion of Ukraine proved extremely detrimental. Security selection in developed markets was strong. In developed ex-U.S., strong outperformance of the Value style provided a decent tailwind, although this was partly offset by being overweight to Japan, which was the laggard within developed equities. The performance challenge from being overweight emerging markets was exacerbated by security selection within emerging markets, as we were meaningfully overweight Russia.
The views expressed herein are exclusively those of Grantham, Mayo, Van Otterloo & Co. LLC as of the date of this report and are subject to change. GMO disclaims any responsibility to update such views. They are not meant as investment advice. References to specific securities are not recommendations of such securities and may not be representative of any GMO portfolio’s current or future investments. All information is unaudited.
GMO Global Equity Allocation Fund
(A Series of GMO Trust)
Comparison of Change in Value of a $5,000,000 Investment in
GMO Global Equity Allocation Fund Class III Shares and the MSCI ACWI
As of February 28, 2022
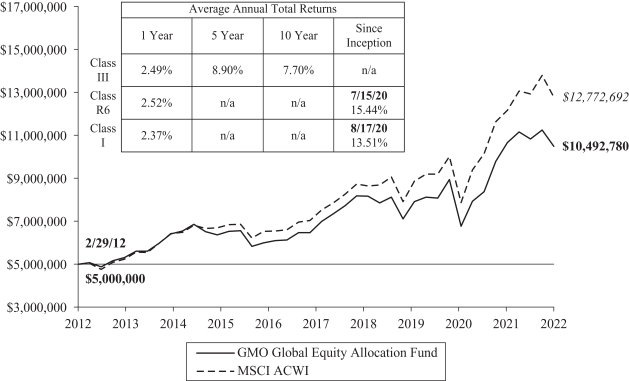
Performance data quoted represents past performance and is not indicative of future results. The investment return and principal value of an investment will fluctuate so that an investor’s shares, when redeemed, may be worth more or less than their original cost. Current performance data may be lower or higher than the performance data provided herein. To obtain performance information up to the most recent month-end, visit www.gmo.com. Performance shown is net of all fees after reimbursement from GMO. Returns would have been lower had certain expenses not been reimbursed during the periods shown and do not include the effect of taxes on distributions and redemptions. The performance information shown above only includes purchase premiums and/or redemption fees in effect as of February 28, 2022. All information is unaudited. Performance for classes may vary due to different fees.
MSCI data may not be reproduced or used for any other purpose. MSCI provides no warranties, has not prepared or approved this report, and has no liability hereunder.
For Class III, R6 and I the gross expense ratio of 0.57%, 0.57% and 0.67%, respectively, is equal to the Fund’s Total Annual Operating Expenses set forth in the Fund’s most recent prospectus dated June 30, 2021. For the Classes listed above, the corresponding net expense ratio of 0.56%, 0.56% and 0.66% reflects the reduction of expenses from fee reimbursements. The fee reimbursements will continue until at least June 30, 2022. Elimination of this reimbursement will result in higher fees and lower performance.
GMO Global Equity Allocation Fund
(A Series of GMO Trust)
Investment Concentration Summary
February 28, 2022 (Unaudited)
| | | | |
| Asset Class Summary& | | % of Total Net Assets | |
Common Stocks | | | 97.2 | % |
Short -Term Investments | | | 2.5 | |
Preferred Stocks | | | 1.4 | |
Investment Funds | | | 0.3 | |
Debt Obligations | | | 0.1 | |
Rights/Warrants | | | 0.0 | ^ |
Futures Contracts | | | (0.0 | )^ |
Other | | | (1.5 | ) |
| | | | |
| | | 100.0 | % |
| | | | |
| | | | |
| Country/Region Summary¤ | | % of Investments | |
United States | | | 32.8 | % |
Japan | | | 13.4 | |
United Kingdom | | | 7.3 | |
Taiwan | | | 6.7 | |
China | | | 4.8 | |
France | | | 4.3 | |
Korea | | | 3.8 | |
Germany | | | 2.8 | |
Switzerland | | | 2.7 | |
Netherlands | | | 2.5 | |
Other Developed | | | 2.3 | ‡ |
Mexico | | | 1.9 | |
Spain | | | 1.9 | |
Singapore | | | 1.7 | |
Other Emerging | | | 1.7 | † |
Russia | | | 1.6 | |
Norway | | | 1.5 | |
India | | | 1.5 | |
Australia | | | 1.3 | |
Brazil | | | 1.3 | |
Italy | | | 1.2 | |
Hong Kong | | | 1.0 | |
| | | | |
| | | 100.0 | % |
| | | | |
| & | The table incorporates aggregate indirect asset class exposure associated with investments in other funds of GMO Trust (“underlying funds”). Derivative financial instruments, if any, are based on market values, rather than the notional amounts of derivatives, except for forward currency contracts which are based on unrealized appreciation/(depreciation). |
| ¤ | The table incorporates aggregate indirect country exposure associated with investments in the underlying funds. The table excludes short -term investments and includes exposure through the use of derivative financial instruments, if any. The table excludes exposure through forward currency contracts, if any. |
| ‡ | “Other Developed” is comprised of developed countries that each represent between (1.0)% and 1.0% of Investments. |
| † | “Other Emerging” is comprised of emerging countries that each represent between (1.0)% and 1.0% of Investments. |
GMO Global Equity Allocation Fund
(A Series of GMO Trust)
Schedule of Investments
(showing percentage of total net assets)
February 28, 2022
| | | | | | | | | | |
| | | Shares | | | Description | | Value ($) | |
| | |
| | | | | | MUTUAL FUNDS — 100.0% | |
| | |
| | | | | | Affiliated Issuers — 100.0% | |
| | | |
| | | 6,593,568 | | | GMO Emerging Markets ex-China Fund, Class VI | | | 109,848,838 | |
| | | |
| | | 7,926,051 | | | GMO Emerging Markets Fund, Class VI | | | 234,294,075 | |
| | | |
| | | 24,320,669 | | | GMO International Equity Fund, Class IV | | | 558,402,561 | |
| | | |
| | | 3,250,703 | | | GMO-Usonian Japan Value Creation Fund, Class VI | | | 64,071,354 | |
| | | |
| | | 3,453,525 | | | GMO Quality Cyclicals Fund (formerly GMO Cyclical Focus Fund), Class VI | | | 88,997,330 | |
| | | |
| | | 7,767,346 | | | GMO Quality Fund, Class VI | | | 217,951,740 | |
| | | |
| | | 10,576,407 | | | GMO U.S. Equity Fund, Class VI | | | 142,993,024 | |
| | | |
| | | 8,293,720 | | | GMO U.S. Small Cap Value Fund, Class VI | | | 163,718,031 | |
| | | | | | | | | | |
| | | |
| | | | | | TOTAL MUTUAL FUNDS (COST $1,620,458,042) | | | 1,580,276,953 | |
| | | | | | | | | | |
| | |
| | | | | | SHORT-TERM INVESTMENTS — 0.0% | |
| | |
| | | | | | Money Market Funds — 0.0% | |
| | | |
| | | 608,775 | | | State Street Institutional Treasury Money Market Fund – Premier Class, 0.01% (a) | | | 608,775 | |
| | | | | | | | | | |
| | | |
| | | | | | TOTAL SHORT-TERM INVESTMENTS (COST $608,775) | | | 608,775 | |
| | | | | | | | | | |
| | | |
| | | | | | TOTAL INVESTMENTS — 100.0%
(Cost $1,621,066,817) | | | 1,580,885,728 | |
| | | |
| | | | | | Other Assets and Liabilities (net) — (0.0%) | | | (52,551 | ) |
| | | | | | | | | | |
| | | |
| | | | | | TOTAL NET ASSETS — 100.0% | | | $1,580,833,177 | |
| | | | | | | | | | |
| (a) | The rate disclosed is the 7 day net yield as of February 28, 2022. |
For a listing of definitions of acronyms, counterparty abbreviations and currency abbreviations used throughout the Schedule of Investments as well as the derivative tables, if any, please refer to page 133.
| | | | |
| | |
| | | See accompanying notes to the financial statements. | | 67 |
GMO Implementation Fund
(A Series of GMO Trust)
Portfolio Management
Day-to-day management of the Fund’s portfolio is the responsibility of the Asset Allocation team at Grantham, Mayo, Van Otterloo & Co. LLC. Allocations among asset classes are made by the Asset Allocation team and specific security selection is primarily handled by other GMO investment teams in collaboration with the Asset Allocation team.
Management Discussion and Analysis of Fund Performance
Although GMO does not manage the Fund to, or control the Fund’s risk relative to, any securities index or securities benchmark, a discussion of the Fund’s performance relative to the Consumer Price Index (“CPI”) is included for comparative purposes only.
GMO Implementation Fund returned +2.02% (net) for the fiscal year ended February 28, 2022, as compared with +7.99% for the CPI.
This was a fairly lackluster 12 months for performance, both from an absolute perspective and a relative one. There was a tremendous spread in returns across risk assets with, for example, the S&P 500 Index returning 16.4% while the MSCI Emerging Market Index faltered to a -10.7% return. Our equity and equity long/short positions were biased towards emerging markets and away from the U.S. and therefore performed poorly. We believed that emerging markets were trading at very preferential valuations, but regulatory actions in China and the Russian invasion of Ukraine proved extremely challenging. The disappointing returns suffered by the equity book were exacerbated by security selection within emerging markets, as we were meaningfully overweight Russia. Alternative assets enjoyed a strong year, driven by an excellent showing from the Equity Dislocation strategy, which is long cheap Value stocks and short expensive Growth stocks. Fixed Income assets also enjoyed a very solid 12 months, well ahead of the -2.6% posted by the Bloomberg U.S. Aggregate Index (formerly Bloomberg Barclays U.S. Aggregate Index), as the High Yield/Distressed portfolio delivered decent positive returns.
The views expressed herein are exclusively those of Grantham, Mayo, Van Otterloo & Co. LLC as of the date of this report and are subject to change. GMO disclaims any responsibility to update such views. They are not meant as investment advice. References to specific securities are not recommendations of such securities and may not be representative of any GMO portfolio’s current or future investments. All information is unaudited.
GMO Implementation Fund
(A Series of GMO Trust)
Comparison of Change in Value of a $5,000,000 Investment in
GMO Implementation Fund, the Consumer Price Index and the Bloomberg U.S. Treasury
Inflation Notes: 1-10 Year Index (formerly Bloomberg Barclays U.S. Treasury Inflation Notes: 1-10 Year Index)
As of February 28, 2022
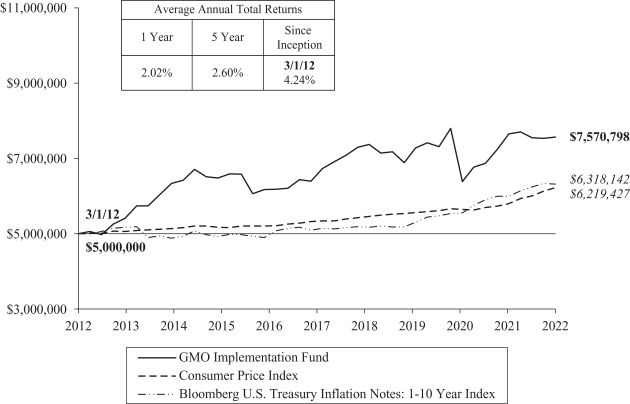
Performance data quoted represents past performance and is not indicative of future results. The investment return and principal value of an investment will fluctuate so that an investor’s shares, when redeemed, may be worth more or less than their original cost. Current performance data may be lower or higher than the performance data provided herein. To obtain performance information up to the most recent month-end, visit www.gmo.com. Performance shown is net of all fees after reimbursement from GMO. Returns would have been lower had certain expenses not been reimbursed during the periods shown and do not include the effect of taxes on distributions and redemptions. The performance information shown above only includes purchase premiums and/or redemption fees in effect as of February 28, 2022. All information is unaudited.
The gross expense ratio of 0.22% is equal to the Fund’s Total Annual Operating Expenses set forth in the Fund’s most recent prospectus dated June 30, 2021. The net expense ratio of 0.16% reflects the reduction of expenses from fee reimbursements. The fee reimbursements will continue until at least June 30, 2022. Elimination of this reimbursement will result in higher fees and lower performance.
69
GMO Implementation Fund
(A Series of GMO Trust)
Consolidated Investment Concentration Summary (a)
February 28, 2022 (Unaudited)
| | | | |
| Asset Class Summary& | | % of Total Net Assets | |
Common Stocks | | | 78.1 | % |
Debt Obligations | | | 26.3 | |
Short-Term Investments | | | 11.6 | |
Preferred Stocks | | | 1.5 | |
Futures Contracts | | | 1.0 | |
Investment Funds | | | 0.6 | |
Mutual Funds | | | 0.3 | |
Rights/Warrants | | | 0.0 | ^ |
Purchased Options | | | 0.0 | ^ |
Written Options | | | (0.0 | )^ |
Swap Contracts | | | (0.1 | ) |
Forward Currency Contracts | | | (0.1 | ) |
Securities Sold Short | | | (22.9 | ) |
Other | | | 3.7 | |
| | | | |
| | | 100.0 | % |
| | | | |
| | | | |
| Country/Region Summary¤ | | Debt Obligations as a % of Total Net Assets | |
Switzerland | | | 4.9 | % |
Canada | | | 4.1 | |
Sweden | | | 4.0 | |
Australia | | | 2.1 | |
Euro Region | | | (0.6 | )§ |
Other Developed | | | (1.0 | )‡ |
United States | | | (3.3 | ) |
United Kingdom | | | (9.4 | ) |
| | | | |
| | | 0.8 | % |
| | | | |
| | | | |
| Country/Region Summary¤ | | Equity Investments
% of Total Net Assets | |
Japan | | | 9.3 | % |
United States | | | 8.3 | |
China | | | 7.6 | |
Other Developed | | | 6.1 | ‡ |
Taiwan | | | 4.9 | |
South Korea | | | 3.9 | |
Other Emerging | | | 3.2 | † |
United Kingdom | | | 2.7 | |
India | | | 2.4 | |
Brazil | | | 2.2 | |
Mexico | | | 1.5 | |
Australia | | | 1.3 | |
Canada | | | 1.2 | |
Russia | | | 1.2 | |
France | | | 1.1 | |
| | | | |
| | | 56.9 | % |
| | | | |
| | | | |
| Industry Group Summary | | % of Equity Investments# | |
Banks | | | 13.9 | % |
Materials | | | 11.2 | |
Capital Goods | | | 9.4 | |
Technology Hardware & Equipment | | | 8.7 | |
Consumer Durables & Apparel | | | 6.4 | |
Food, Beverage & Tobacco | | | 6.0 | |
Energy | | | 5.8 | |
Automobiles & Components | | | 5.1 | |
Insurance | | | 5.1 | |
Pharmaceuticals, Biotechnology & Life Sciences | | | 4.5 | |
Diversified Financials | | | 4.4 | |
Semiconductors & Semiconductor Equipment | | | 4.1 | |
Telecommunication Services | | | 3.9 | |
Real Estate | | | 3.2 | |
Media & Entertainment | | | 2.7 | |
Retailing | | | 2.4 | |
Commercial & Professional Services | | | 1.4 | |
Health Care Equipment & Services | | | 1.4 | |
Food & Staples Retailing | | | 1.2 | |
Utilities | | | 1.1 | |
Household & Personal Products | | | 0.5 | |
Software & Services | | | 0.3 | |
Consumer Services | | | (1.3 | ) |
Transportation | | | (1.4 | ) |
| | | | |
| | | 100.0 | % |
| | | | |
| (a) | GMO Implementation SPC Ltd. is a 100% owned subsidiary of GMO Implementation Fund. As such, the holdings of GMO Implementation SPC Ltd. have been included with GMO Implementation Fund. |
| & | In the table, derivative financial instruments, if any, are based on market values, rather than the notional amounts of derivatives, except for forward currency contracts which are based on unrealized appreciation/(depreciation). |
| ¤ | The table incorporates aggregate indirect country exposure associated with investments in the underlying funds. The table excludes short-term investments. The table includes exposure through the use of certain derivative financial instruments and excludes exposure through certain currency linked derivatives such as forward currency contracts and currency options. The table is based on duration adjusted net exposures (both investments and derivatives), taking into account the market value of securities and the notional amounts of swaps and other derivative financial instruments. Duration is based on GMO’s models. The greater the duration of a bond, the greater its contribution to the concentration percentage. Credit default swap exposures are factored into the duration adjusted exposure using the reference security and applying the same methodology to that security. The table is not normalized, thus, due to the exclusions listed above and negative exposures, which may be attributable to derivatives or short sales, if any, the table may not total to 100%. |
| § | “Euro Region” is comprised of derivative financial instruments attributed to the Eurozone and not a particular country. |
| ‡ | “Other Developed” is comprised of developed countries that each represent between (1.0)% and 1.0% of Total Net Assets. |
| † | “Other Emerging” is comprised of emerging countries that each represent between (1.0)% and 1.0% of Total Net Assets. |
| # | Equity investments may consist of common stocks and other stock-related securities, such as preferred stocks, if any. This table excludes exposure to derivative contracts, short-term investments, mutual funds and investment funds, if any. For a summary of these exposures, if any, see the Schedule of Investments. |
GMO Implementation Fund
(A Series of GMO Trust)
Consolidated Schedule of Investments
(showing percentage of total net assets)
February 28, 2022
| | | | | | | | | | |
| | |
Shares | | | Description | | Value ($) | |
| | |
| | | | | | COMMON STOCKS — 78.1% | |
| | | |
| | | | | | Argentina — 0.0% | | | |
| | | |
| | | 18,036 | | | Banco BBVA Argentina SA ADR * | | | 58,256 | |
| | | | | | | | | | |
| | | |
| | | | | | Australia — 1.3% | | | |
| | | |
| | | 40,966 | | | Abacus Property Group (REIT) | | | 105,218 | |
| | | |
| | | 97,638 | | | Accent Group Ltd (a) | | | 133,037 | |
| | | |
| | | 120,256 | | | Adairs Ltd (a) | | | 251,214 | |
| | | |
| | | 253,221 | | | Aurizon Holdings Ltd (b) | | | 645,944 | |
| | | |
| | | 94,352 | | | Australian Pharmaceutical Industries Ltd (b) | | | 104,978 | |
| | | |
| | | 223,636 | | | Beach Energy Ltd (a) | | | 249,103 | |
| | | |
| | | 780,271 | | | BlueScope Steel Ltd | | | 11,554,139 | |
| | | |
| | | 361,511 | | | Brambles Ltd | | | 2,603,863 | |
| | | |
| | | 566,766 | | | Dexus (REIT) | | | 4,486,509 | |
| | | |
| | | 669,793 | | | Fortescue Metals Group Ltd | | | 8,923,208 | |
| | | |
| | | 82,845 | | | GDI Property Group (REIT) | | | 63,195 | |
| | | |
| | | 328,387 | | | Genworth Mortgage Insurance Australia Ltd | | | 716,333 | |
| | | |
| | | 1,151,688 | | | GPT Group (The) (REIT) | | | 4,109,310 | |
| | | |
| | | 146,147 | | | GrainCorp Ltd – Class A | | | 893,886 | |
| | | |
| | | 107,307 | | | HomeCo Daily Needs (REIT) | | | 119,441 | |
| | | |
| | | 6,109 | | | JB Hi-Fi Ltd (b) | | | 219,739 | |
| | | |
| | | 34,357 | | | McMillan Shakespeare Ltd | | | 300,295 | |
| | | |
| | | 339,847 | | | Metcash Ltd (a) | | | 1,019,716 | |
| | | |
| | | 40,784 | | | Mineral Resources Ltd | | | 1,360,005 | |
| | | |
| | | 1,994,768 | | | Mirvac Group (REIT) | | | 3,720,071 | |
| | | |
| | | 233,134 | | | Mount Gibson Iron Ltd | | | 89,416 | |
| | | |
| | | 157,263 | | | Rio Tinto Ltd (b) | | | 13,561,890 | |
| | | |
| | | 160,116 | | | Sandfire Resources Ltd | | | 789,362 | |
| | | |
| | | 1,499,927 | | | Scentre Group (REIT) | | | 3,332,240 | |
| | | |
| | | 54,595 | | | Southern Cross Media Group Ltd | | | 70,350 | |
| | | |
| | | 1,137,783 | | | Stockland (REIT) | | | 3,442,810 | |
| | | |
| | | 25,651 | | | Super Retail Group Ltd | | | 206,153 | |
| | | |
| | | 33,424 | | | Virtus Health Ltd (a) | | | 181,360 | |
| | | | | | | | | | |
| | | |
| | | | | | Total Australia | | | 63,252,785 | |
| | | | | | | | | | |
| | | |
| | | | | | Austria — 0.0% | | | |
| | | |
| | | 5,487 | | | Raiffeisen Bank International AG | | | 89,410 | |
| | | | | | | | | | |
| | | |
| | | | | | Belgium — 0.4% | | | |
| | | |
| | | 5,597 | | | Ackermans & van Haaren NV | | | 1,044,820 | |
| | | |
| | | 134,831 | | | Ageas SA/NV | | | 6,486,201 | |
| | | |
| | | 15,143 | | | AGFA-Gevaert NV * (b) | | | 61,399 | |
| | | |
| | | 27,049 | | | Bekaert SA | | | 1,176,860 | |
| | | |
| | | 2,117 | | | Cie d’Entreprises CFE | | | 281,384 | |
| | | |
| | | 5,403 | | | D’ieteren Group (b) | | | 872,826 | |
| | | |
| | | 17,028 | | | KBC Group NV | | | 1,226,815 | |
| | | |
| | | 5,551 | | | Orange Belgium SA | | | 121,191 | |
| | | |
| | | 15,954 | | | Proximus SADP | | | 317,170 | |
| | | | | | | | | | |
| | |
Shares | | | Description | | Value ($) | |
| | | |
| | | | | | Belgium — continued | | | |
| | | |
| | | 4,408 | | | Sofina SA | | | 1,711,871 | |
| | | |
| | | 64,774 | | | UCB SA | | | 7,069,222 | |
| | | |
| | | 471 | | | VGP NV | | | 120,268 | |
| | | | | | | | | | |
| | | |
| | | | | | Total Belgium | | | 20,490,027 | |
| | | | | | | | | | |
| | | |
| | | | | | Brazil — 1.4% | | | |
| | | |
| | | 90,000 | | | Ambev SA | | | 264,129 | |
| | | |
| | | 59,400 | | | Ambev SA ADR | | | 174,042 | |
| | | |
| | | 526,700 | | | Banco Bradesco SA | | | 1,727,497 | |
| | | |
| | | 275,700 | | | Banco do Brasil SA | | | 1,864,029 | |
| | | |
| | | 299,700 | | | Blau Farmaceutica SA | | | 1,728,499 | |
| | | |
| | | 2,800 | | | Cia de Saneamento Basico do Estado de Sao Paulo | | | 22,468 | |
| | | |
| | | 165,800 | | | Cia Siderurgica Nacional SA | | | 816,023 | |
| | | |
| | | 28,100 | | | Equatorial Energia SA | | | 138,963 | |
| | | |
| | | 172,800 | | | JBS SA | | | 1,210,429 | |
| | | |
| | | 1,364,200 | | | Marfrig Global Foods SA | | | 5,904,730 | |
| | | |
| | | 48,600 | | | Petroleo Brasileiro SA | | | 345,566 | |
| | | |
| | | 552,500 | | | Petroleo Brasileiro SA Sponsored ADR (b) | | | 7,895,225 | |
| | | |
| | | 136,200 | | | Ser Educacional SA | | | 292,223 | |
| | | |
| | | 1,026,700 | | | Telefonica Brasil SA | | | 10,068,491 | |
| | | |
| | | 3,588,500 | | | TIM SA | | | 9,518,452 | |
| | | |
| | | 141,400 | | | Transmissora Alianca de Energia Eletrica SA | | | 1,083,552 | |
| | | |
| | | 130,519 | | | Vale SA | | | 2,421,607 | |
| | | |
| | | 534,100 | | | Vale SA Sponsored ADR – Class B (b) | | | 9,875,509 | |
| | | |
| | | 1,178,700 | | | Vamos Locacao de Caminhoes Maquinas e Equipamentos SA | | | 2,507,750 | |
| | | |
| | | 1,681,300 | | | Vibra Energia SA | | | 7,658,181 | |
| | | | | | | | | | |
| | | |
| | | | | | Total Brazil | | | 65,517,365 | |
| | | | | | | | | | |
| | | |
| | | | | | Canada — 1.9% | | | |
| | | |
| | | 44,600 | | | Bank of Montreal | | | 5,092,669 | |
| | | |
| | | 21,400 | | | Baytex Energy Corp * | | | 97,756 | |
| | | |
| | | 1,336,333 | | | Bombardier Inc – Class B * (a) | | | 1,665,804 | |
| | | |
| | | 165,310 | | | Brookfield Asset Management Inc – Class A (b) | | | 9,032,538 | |
| | | |
| | | 98,100 | | | Canaccord Genuity Group Inc | | | 999,188 | |
| | | |
| | | 92,500 | | | Canadian Apartment Properties (REIT) | | | 3,850,335 | |
| | | |
| | | 40,800 | | | Canadian Tire Corp Ltd – Class A (b) | | | 6,015,224 | |
| | | |
| | | 21,300 | | | Canadian Western Bank | | | 623,624 | |
| | | |
| | | 78,800 | | | Canfor Corp * | | | 1,783,647 | |
| | | |
| | | 8,200 | | | Canfor Pulp Products Inc * (a) | | | 37,005 | |
| | | |
| | | 39,700 | | | Celestica Inc * (c) | | | 472,033 | |
| | | |
| | | 118,000 | | | Celestica Inc * (c) | | | 1,402,966 | |
| | | |
| | | 18,300 | | | Cenovus Energy Inc | | | 287,310 | |
| | | |
| | | 9,800 | | | Cogeco Inc | | | 606,479 | |
| | | |
| | | 109,300 | | | Corus Entertainment Inc – Class B | | | 438,062 | |
| | | |
| | | 12,000 | | | DREAM Unlimited Corp – Class A | | | 445,444 | |
| | | |
| | | 5,700 | | | Enerplus Corp | | | 72,852 | |
| | | | |
| | |
| | | See accompanying notes to the financial statements. | | 71 |
GMO Implementation Fund
(A Series of GMO Trust)
Consolidated Schedule of Investments — (Continued)
(showing percentage of total net assets)
February 28, 2022
| | | | | | | | | | |
| | |
Shares | | | Description | | Value ($) | |
| | | |
| | | | | | Canada — continued | | | |
| | | |
| | | 45,500 | | | Finning International Inc | | | 1,323,897 | |
| | | |
| | | 27,000 | | | iA Financial Corp Inc | | | 1,604,237 | |
| | | |
| | | 31,200 | | | Imperial Oil Ltd (c) | | | 1,400,369 | |
| | | |
| | | 30,700 | | | Imperial Oil Ltd (c) | | | 1,376,588 | |
| | | |
| | | 41,700 | | | Interfor Corp | | | 1,270,246 | |
| | | |
| | | 3,700 | | | Laurentian Bank of Canada (a) | | | 124,267 | |
| | | |
| | | 26,300 | | | Linamar Corp | | | 1,373,410 | |
| | | |
| | | 65,200 | | | Magna International Inc | | | 4,844,090 | |
| | | |
| | | 5,400 | | | Morguard North American Residential Real Estate Investment Trust (REIT) | | | 81,117 | |
| | | |
| | | 117,357 | | | Nutrien Ltd (b) | | | 10,091,528 | |
| | | |
| | | 14,200 | | | Onex Corp | | | 953,613 | |
| | | |
| | | 53,900 | | | Parex Resources Inc | | | 1,188,564 | |
| | | |
| | | 171,000 | | | Power Corp of Canada (a) | | | 5,273,680 | |
| | | |
| | | 60,200 | | | PrairieSky Royalty Ltd (a) | | | 814,065 | |
| | | |
| | | 81,700 | | | Quebecor Inc – Class B | | | 1,786,765 | |
| | | |
| | | 66,800 | | | RioCan Real Estate Investment Trust (REIT) | | | 1,323,879 | |
| | | |
| | | 8,800 | | | Russel Metals Inc (a) | | | 218,004 | |
| | | |
| | | 346,330 | | | Shaw Communications Inc – Class B (b) | | | 10,385,801 | |
| | | |
| | | 19,700 | | | Tamarack Valley Energy Ltd | | | 80,199 | |
| | | |
| | | 36,300 | | | Teck Resources Ltd – Class B (c) | | | 1,307,086 | |
| | | |
| | | 69,800 | | | Teck Resources Ltd – Class B (c) | | | 2,509,310 | |
| | | |
| | | 29,800 | | | Topaz Energy Corp | | | 466,925 | |
| | | |
| | | 1,500 | | | Tourmaline Oil Corp (a) | | | 59,172 | |
| | | |
| | | 11,800 | | | Transat AT Inc – Class B * (a) | | | 45,338 | |
| | | |
| | | 720 | | | Transcontinental Inc – Class A (a) | | | 11,617 | |
| | | |
| | | 11,900 | | | Wajax Corp | | | 221,101 | |
| | | |
| | | 58,400 | | | West Fraser Timber Co Ltd | | | 5,829,403 | |
| | | |
| | | 3,100 | | | Westshore Terminals Investment Corp (a) (b) | | | 72,664 | |
| | | | | | | | | | |
| | | |
| | | | | | Total Canada | | | 88,959,871 | |
| | | | | | | | | | |
| | | |
| | | | | | Chile — 0.1% | | | |
| | | |
| | | 49,497 | | | Aguas Andinas SA – Class A | | | 10,440 | |
| | | |
| | | 1,391,419 | | | Banco de Chile | | | 147,521 | |
| | | |
| | | 2,992,951 | | | Banco Santander Chile | | | 146,965 | |
| | | |
| | | 16,900 | | | Banco Santander Chile ADR | | | 329,888 | |
| | | |
| | | 6,734 | | | CAP SA | | | 77,948 | |
| | | |
| | | 43,448 | | | Cencosud SA | | | 79,882 | |
| | | |
| | | 107,776 | | | Cencosud Shopping SA | | | 115,657 | |
| | | |
| | | 22,600 | | | Cia Cervecerias Unidas SA Sponsored ADR | | | 361,148 | |
| | | |
| | | 10,286,240 | | | Colbun SA | | | 750,011 | |
| | | |
| | | 6,759 | | | Empresas COPEC SA | | | 52,413 | |
| | | |
| | | 873,397 | | | Enel Americas SA | | | 102,267 | |
| | | |
| | | 521,373 | | | Falabella SA | | | 1,716,611 | |
| | | |
| | | 62,938 | | | Inversiones La Construccion SA | | | 252,070 | |
| | | | | | | | | | |
| | | |
| | | | | | Total Chile | | | 4,142,821 | |
| | | | | | | | | | |
| | | | | | | | | | |
| | |
Shares | | | Description | | Value ($) | |
| | | |
| | | | | | China — 7.8% | | | |
| | | |
| | | 3,033,720 | | | 361 Degrees International Ltd * | | | 1,491,463 | |
| | | |
| | | 270,000 | | | 7Road Holdings Ltd * | | | 84,621 | |
| | | |
| | | 128,750 | | | A-Living Smart City Services Co Ltd | | | 230,787 | |
| | | |
| | | 866,000 | | | Agile Group Holdings Ltd (a) | | | 394,569 | |
| | | |
| | | 46,170,280 | | | Agricultural Bank of China Ltd – Class H | | | 17,485,565 | |
| | | |
| | | 291,832 | | | Alibaba Group Holding Ltd * | | | 3,841,640 | |
| | | |
| | | 278,000 | | | Angang Steel Co Ltd – Class H | | | 138,246 | |
| | | |
| | | 500 | | | Anhui Conch Cement Co Ltd – Class H | | | 2,683 | |
| | | |
| | | 55,920 | | | ANTA Sports Products Ltd | | | 854,077 | |
| | | |
| | | 52,190 | | | Autohome Inc ADR | | | 1,596,492 | |
| | | |
| | | 39,960 | | | Autohome Inc – Class A * | | | 295,064 | |
| | | |
| | | 7,093,000 | | | BAIC Motor Corp Ltd – Class H | | | 2,478,112 | |
| | | |
| | | 2,590,096 | | | Bank of China Ltd – Class A | | | 1,273,171 | |
| | | |
| | | 43,883,720 | | | Bank of China Ltd – Class H | | | 17,084,006 | |
| | | |
| | | 17,811,416 | | | Bank of Communications Co Ltd – Class H | | | 12,210,247 | |
| | | |
| | | 435,000 | | | Beijing Enterprises Holdings Ltd | | | 1,487,048 | |
| | | |
| | | 385,220 | | | BYD Electronic International Co Ltd��(a) | | | 1,087,018 | |
| | | |
| | | 369,000 | | | China Aoyuan Group Ltd (a) | | | 61,507 | |
| | | |
| | | 1,210,000 | | | China BlueChemical Ltd – Class H | | | 362,311 | |
| | | |
| | | 11,555,000 | | | China Cinda Asset Management Co Ltd – Class H | | | 2,085,834 | |
| | | |
| | | 7,901,893 | | | China Communications Services Corp Ltd – Class H | | | 4,335,145 | |
| | | |
| | | 10,353,513 | | | China Construction Bank Corp – Class H | | | 7,764,768 | |
| | | |
| | | 1,151,000 | | | China Datang Corp Renewable Power Co Ltd – Class H (a) | | | 436,168 | |
| | | |
| | | 2,419,480 | | | China Dongxiang Group Co Ltd | | | 182,588 | |
| | | |
| | | 11,684,000 | | | China Energy Engineering Corp Ltd – Class H (a) | | | 1,915,039 | |
| | | |
| | | 603,000 | | | China Everbright Bank Co Ltd – Class H | | | 224,260 | |
| | | |
| | | 1,664,000 | | | China Everbright Environment Group Ltd | | | 1,194,711 | |
| | | |
| | | 3,189,200 | | | China Feihe Ltd | | | 3,805,543 | |
| | | |
| | | 3,659,000 | | | China Greenfresh Group Co Ltd * (d) | | | — | |
| | | |
| | | 231,000 | | | China High Speed Transmission Equipment Group Co Ltd – Class H * | | | 175,256 | |
| | | |
| | | 4,731,000 | | | China Hongqiao Group Ltd | | | 6,623,439 | |
| | | |
| | | 2,096,480 | | | China Lesso Group Holdings Ltd | | | 3,227,708 | |
| | | |
| | | 410,000 | | | China Lilang Ltd | | | 227,759 | |
| | | |
| | | 865,600 | | | China Longyuan Power Group Corp Ltd – Class H | | | 1,786,243 | |
| | | |
| | | 2,804,925 | | | China Medical System Holdings Ltd | | | 4,994,599 | |
| | | |
| | | 685,713 | | | China Merchants Bank Co Ltd – Class A | | | 5,425,311 | |
| | | |
| | | 74,000 | | | China Merchants Port Holdings Co Ltd | | | 139,519 | |
| | | |
| | | 1,028,600 | | | China Molybdenum Co Ltd – Class A | | | 987,629 | |
| | | |
| | | 30,000 | | | China Molybdenum Co Ltd – Class H | | | 18,057 | |
| | | |
| | | 4,394,000 | | | China National Building Material Co Ltd – Class H | | | 5,636,747 | |
| | | |
| | | 355,520 | | | China Oriental Group Co Ltd | | | 103,342 | |
| | | |
| | | 1,923,000 | | | China Overseas Grand Oceans Group Ltd | | | 1,109,368 | |
| | | | |
| | |
| 72 | | See accompanying notes to the financial statements. | | |
GMO Implementation Fund
(A Series of GMO Trust)
Consolidated Schedule of Investments — (Continued)
(showing percentage of total net assets)
February 28, 2022
| | | | | | | | | | |
| | |
Shares | | | Description | | Value ($) | |
| | | |
| | | | | | China — continued | | | |
| | | |
| | | 3,207,000 | | | China Overseas Land & Investment Ltd | | | 9,791,506 | |
| | | |
| | | 81,840 | | | China Pacific Insurance Group Co Ltd – Class A | | | 344,503 | |
| | | |
| | | 232,728 | | | China Pacific Insurance Group Co Ltd – Class H | | | 648,049 | |
| | | |
| | | 30,784,000 | | | China Petroleum & Chemical Corp – Class H | | | 15,314,632 | |
| | | |
| | | 18,763,000 | | | China Railway Group Ltd – Class H | | | 11,016,805 | |
| | | |
| | | 629,000 | | | China Railway Signal & Communication Corp Ltd – Class H (a) | | | 229,224 | |
| | | |
| | | 4,560,320 | | | China Reinsurance Group Corp – Class H | | | 438,296 | |
| | | |
| | | 84,160 | | | China Resources Gas Group Ltd | | | 386,546 | |
| | | |
| | | 492,640 | | | China Resources Land Ltd | | | 2,396,348 | |
| | | |
| | | 4,952,000 | | | China Resources Pharmaceutical Group Ltd | | | 2,449,284 | |
| | | |
| | | 80,000 | | | China Risun Group Ltd | | | 49,834 | |
| | | |
| | | 510,000 | | | China Shineway Pharmaceutical Group Ltd | | | 417,295 | |
| | | |
| | | 2,586,000 | | | China South City Holdings Ltd | | | 215,871 | |
| | | |
| | | 1,532,000 | | | China State Construction International Holdings Ltd | | | 2,157,541 | |
| | | |
| | | 5,902,000 | | | China Traditional Chinese Medicine Holdings Co Ltd | | | 3,364,492 | |
| | | |
| | | 129,000 | | | China Yongda Automobiles Services Holdings Ltd | | | 150,505 | |
| | | |
| | | 14,600 | | | China Yuchai International Ltd | | | 180,603 | |
| | | |
| | | 4,237,600 | | | China Zhongwang Holdings Ltd * (a) (e) | | | 911,008 | |
| | | |
| | | 60,000 | | | CIFI Ever Sunshine Services Group Ltd | | | 109,114 | |
| | | |
| | | 11,267,000 | | | CITIC Ltd | | | 13,147,735 | |
| | | |
| | | 2,865,000 | | | Country Garden Holdings Co Ltd ADR (a) | | | 2,225,909 | |
| | | |
| | | 112,000 | | | Country Garden Services Holdings Co Ltd | | | 669,979 | |
| | | |
| | | 9,126,000 | | | CSPC Pharmaceutical Group Ltd | | | 10,817,620 | |
| | | |
| | | 10,022,000 | | | Dongfeng Motor Group Co Ltd – Class H | | | 8,626,198 | |
| | | |
| | | 98,000 | | | Dongyue Group Ltd (a) | | | 142,172 | |
| | | |
| | | 114,060 | | | ENN Energy Holdings Ltd | | | 1,651,862 | |
| | | |
| | | 1,014,534 | | | Fangda Special Steel Technology Co Ltd – Class A | | | 1,325,326 | |
| | | |
| | | 2,615,500 | | | Fosun International Ltd | | | 2,837,827 | |
| | | |
| | | 58,100 | | | Fuyao Glass Industry Group Co Ltd – Class A | | | 408,144 | |
| | | |
| | | 32,000 | | | Fuyao Glass Industry Group Co Ltd – Class H | | | 156,995 | |
| | | |
| | | 13,000 | | | Geely Automobile Holdings Ltd | | | 24,214 | |
| | | |
| | | 142,040 | | | Greenland Hong Kong Holdings Ltd | | | 24,315 | |
| | | |
| | | 264,080 | | | Guangdong Investment Ltd | | | 355,371 | |
| | | |
| | | 578,000 | | | Guangzhou Baiyunshan Pharmaceutical Holdings Co Ltd – Class H | | | 1,544,914 | |
| | | |
| | | 4,548,800 | | | Guangzhou R&F Properties Co Ltd – Class H (a) | | | 1,936,425 | |
| | | |
| | | 76,600 | | | Haier Smart Home Co Ltd – Class H | | | 268,413 | |
| | | |
| | | 553,300 | | | Hello Group Inc Sponsored ADR | | | 5,272,949 | |
| | | | | | | | | | |
| | |
Shares | | | Description | | Value ($) | |
| | | |
| | | | | | China — continued | | | |
| | | |
| | | 941,244 | | | Hisense Home Appliances Group Co Ltd – Class A | | | 2,031,253 | |
| | | |
| | | 425,000 | | | Hisense Home Appliances Group Co Ltd – Class H | | | 476,994 | |
| | | |
| | | 8,964 | | | Hollysys Automation Technologies Ltd * | | | 126,213 | |
| | | |
| | | 640,210 | | | Hopson Development Holdings Ltd | | | 1,317,906 | |
| | | |
| | | 88 | | | Industrial & Commercial Bank of China Ltd – Class A | | | 65 | |
| | | |
| | | 4,070,696 | | | Industrial & Commercial Bank of China Ltd – Class H | | | 2,430,023 | |
| | | |
| | | 877,793 | | | Inner Mongolia Eerduosi Resources Co Ltd – Class A | | | 3,629,119 | |
| | | |
| | | 10,792 | | | JD.com Inc – Class A * | | | 385,484 | |
| | | |
| | | 66,500 | | | KE Holdings Inc ADR * | | | 1,290,765 | |
| | | |
| | | 910,000 | | | Kingboard Holdings Ltd | | | 4,257,115 | |
| | | |
| | | 55,260 | | | Kingboard Laminates Holdings Ltd | | | 92,082 | |
| | | |
| | | 316,000 | | | Kunlun Energy Co Ltd | | | 310,844 | |
| | | |
| | | 87,000 | | | KWG Living Group Holdings Ltd | | | 36,040 | |
| | | |
| | | 1,007,100 | | | Legend Holdings Corp – Class H | | | 1,416,780 | |
| | | |
| | | 10,578,000 | | | Lenovo Group Ltd | | | 11,779,332 | |
| | | |
| | | 326,400 | | | Livzon Pharmaceutical Group Inc – Class H | | | 1,225,101 | |
| | | |
| | | 50,880 | | | Logan Group Co Ltd (a) | | | 16,906 | |
| | | |
| | | 2,658,640 | | | Lonking Holdings Ltd | | | 708,596 | |
| | | |
| | | 62,392 | | | Lufax Holding Ltd ADR * | | | 403,676 | |
| | | |
| | | 13,831,000 | | | Metallurgical Corp of China Ltd – Class H | | | 4,206,779 | |
| | | |
| | | 348,000 | | | MMG Ltd * | | | 126,056 | |
| | | |
| | | 55,000 | | | NetDragon Websoft Holdings Ltd. | | | 123,335 | |
| | | |
| | | 15,668 | | | NetEase Inc | | | 303,046 | |
| | | |
| | | 10,132 | | | NetEase Inc ADR (b) | | | 965,985 | |
| | | |
| | | 28,000 | | | Newborn Town Inc * | | | 15,795 | |
| | | |
| | | 2,894,000 | | | Nexteer Automotive Group Ltd | | | 2,898,570 | |
| | | |
| | | 87,000 | | | PetroChina Co Ltd ADR | | | 4,633,620 | |
| | | |
| | | 10,374,000 | | | PetroChina Co Ltd – Class H | | | 5,556,580 | |
| | | |
| | | 12,087,720 | | | PICC Property & Casualty Co Ltd – Class H | | | 12,759,632 | |
| | | |
| | | 1,624,000 | | | Ping An Insurance Group Co of China Ltd – Class H | | | 12,591,948 | |
| | | |
| | | 754,000 | | | Poly Property Group Co Ltd | | | 204,674 | |
| | | |
| | | 2,789,729 | | | Postal Savings Bank of China Co Ltd – Class A | | | 2,473,577 | |
| | | |
| | | 2,584,000 | | | Powerlong Real Estate Holdings Ltd | | | 1,238,563 | |
| | | |
| | | 17,000 | | | Q Technology Group Co Ltd | | | 16,054 | |
| | | |
| | | 265,000 | | | Road King Infrastructure Ltd | | | 252,131 | |
| | | |
| | | 514,000 | | | Seazen Group Ltd * | | | 271,215 | |
| | | |
| | | 372,000 | | | Shanghai Jin Jiang Capital Co Ltd – Class H | | | 141,518 | |
| | | |
| | | 2,089,900 | | | Shanghai Pharmaceuticals Holding Co Ltd – Class H | | | 3,772,402 | |
| | | |
| | | 3,118,000 | | | Shimao Group Holdings Ltd (a) | | | 1,871,105 | |
| | | |
| | | 7,089,000 | | | Sihuan Pharmaceutical Holdings Group Ltd (a) | | | 1,520,083 | |
| | | | |
| | |
| | | See accompanying notes to the financial statements. | | 73 |
GMO Implementation Fund
(A Series of GMO Trust)
Consolidated Schedule of Investments — (Continued)
(showing percentage of total net assets)
February 28, 2022
| | | | | | | | | | |
| | |
Shares | | | Description | | Value ($) | |
| | | |
| | | | | | China — continued | | | |
| | | |
| | | 1,787,500 | | | Sino-Ocean Land Holdings Ltd | | | 384,486 | |
| | | |
| | | 2,223,540 | | | Sinopec Engineering Group Co Ltd – Class H | | | 1,063,710 | |
| | | |
| | | 4,328,800 | | | Sinopharm Group Co Ltd – Class H | | | 10,493,804 | |
| | | |
| | | 2,446,440 | | | Sinotruk Hong Kong Ltd | | | 3,651,720 | |
| | | |
| | | 10,646,000 | | | Skyworth Group Ltd * | | | 6,014,218 | |
| | | |
| | | 2,918,000 | | | Sunac China Holdings Ltd (a) | | | 2,385,171 | |
| | | |
| | | 35,000 | | | Sunac Services Holdings Ltd | | | 29,913 | |
| | | |
| | | 100,872 | | | Sunny Optical Technology Group Co Ltd | | | 2,417,292 | |
| | | |
| | | 3,093,000 | | | TCL Electronics Holdings Ltd | | | 1,449,961 | |
| | | |
| | | 196,137 | | | Tencent Holdings Ltd | | | 10,583,810 | |
| | | |
| | | 15,092 | | | Tencent Holdings Ltd ADR (b) | | | 811,799 | |
| | | |
| | | 161,400 | | | Tencent Music Entertainment Group ADR * | | | 869,946 | |
| | | |
| | | 914,000 | | | Tianjin Port Development Holdings Ltd | | | 73,644 | |
| | | |
| | | 221,000 | | | Tianli Education International Holdings Ltd (e) | | | 54,016 | |
| | | |
| | | 3,038,000 | | | Tianneng Power International Ltd (a) | | | 2,787,022 | |
| | | |
| | | 560,700 | | | Vipshop Holdings Ltd ADR * (b) | | | 4,861,269 | |
| | | |
| | | 1,032,000 | | | West China Cement Ltd | | | 177,167 | |
| | | |
| | | 47,500 | | | Xiabuxiabu Catering Management China Holdings Co Ltd * | | | 29,890 | |
| | | |
| | | 10,000 | | | Yihai International Holding Ltd * (a) | | | 41,841 | |
| | | |
| | | 7,717,484 | | | Yuzhou Group Holdings Co Ltd (a) | | | 613,158 | |
| | | |
| | | 366,750 | | | Zhengzhou Coal Mining Machinery Group Co Ltd – Class A | | | 750,804 | |
| | | |
| | | 220,000 | | | Zhenro Properties Group Ltd | | | 18,941 | |
| | | |
| | | 812,680 | | | Zhongsheng Group Holdings Ltd | | | 5,674,882 | |
| | | |
| | | 29,500 | | | Zhou Hei Ya International Holdings Co Ltd * (a) | | | 19,709 | |
| | | |
| | | 182,300 | | | Zhuzhou CRRC Times Electric Co Ltd – Class H | | | 950,243 | |
| | | |
| | | 1,525,600 | | | Zijin Mining Group Co Ltd – Class A | | | 2,732,790 | |
| | | |
| | | 277,400 | | | Zoomlion Heavy Industry Science and Technology Co Ltd – Class H | | | 184,528 | |
| | | | | | | | | | |
| | | |
| | | | | | Total China | | | 363,868,180 | |
| | | | | | | | | | |
| | | |
| | | | | | Czech Republic — 0.0% | | | |
| | | |
| | | 278,754 | | | Moneta Money Bank AS | | | 1,103,152 | |
| | | |
| | | 861 | | | Philip Morris CR AS | | | 622,920 | |
| | | | | | | | | | |
| | | |
| | | | | | Total Czech Republic | | | 1,726,072 | |
| | | | | | | | | | |
| | | |
| | | | | | Denmark — 0.5% | | | |
| | | |
| | | 733 | | | AP Moller – Maersk A/S – Class A (b) | | | 2,197,877 | |
| | | |
| | | 1,848 | | | AP Moller – Maersk A/S – Class B (b) | | | 5,846,169 | |
| | | |
| | | 7,774 | | | Carlsberg A/S – Class B | | | 1,140,054 | |
| | | |
| | | 416,295 | | | Danske Bank A/S | | | 7,051,210 | |
| | | |
| | | 17,339 | | | Matas A/S | | | 253,038 | |
| | | |
| | | 55,800 | | | Pandora A/S | | | 5,713,769 | |
| | | |
| | | 58,408 | | | Scandinavian Tobacco Group A/S | | | 1,317,119 | |
| | | | | | | | | | |
| | | |
| | | | | | Total Denmark | | | 23,519,236 | |
| | | | | | | | | | |
| | | | | | | | | | |
| | |
Shares | | | Description | | Value ($) | |
| | | |
| | | | | | Egypt — 0.0% | | | |
| | | |
| | | 217,739 | | | Commercial International Bank Egypt SAE * | | | 663,193 | |
| | | |
| | | 872,223 | | | Eastern Co SAE | | | 603,015 | |
| | | |
| | | 56,312 | | | Medinet Nasr Housing | | | 6,924 | |
| | | |
| | | 32,198 | | | Misr Fertilizers Production Co SAE | | | 182,162 | |
| | | | | | | | | | |
| | | |
| | | | | | Total Egypt | | | 1,455,294 | |
| | | | | | | | | | |
| | | |
| | | | | | Finland — 0.3% | | | |
| | | |
| | | 50,239 | | | Kesko Oyj – B Shares | | | 1,478,519 | |
| | | |
| | | 126,248 | | | Neste Oyj | | | 4,922,993 | |
| | | |
| | | 1,274,638 | | | Nokia Oyj * | | | 6,892,399 | |
| | | |
| | | 188,767 | | | Outokumpu Oyj * | | | 1,112,707 | |
| | | |
| | | 5,821 | | | Sanoma Oyj | | | 84,876 | |
| | | | | | | | | | |
| | | |
| | | | | | Total Finland | | | 14,491,494 | |
| | | | | | | | | | |
| | | |
| | | | | | France — 1.8% | | | |
| | | |
| | | 46,270 | | | ALD SA (b) | | | 645,862 | |
| | | |
| | | 331 | | | Alten SA (b) | | | 49,974 | |
| | | |
| | | 40,113 | | | APERAM SA | | | 2,246,014 | |
| | | |
| | | 207,935 | | | ArcelorMittal SA | | | 6,451,937 | |
| | | |
| | | 546 | | | Arkema SA | | | 72,409 | |
| | | |
| | | 1,788 | | | Axway Software SA | | | 37,157 | |
| | | |
| | | 203,567 | | | BNP Paribas SA | | | 11,811,878 | |
| | | |
| | | 1,836 | | | Boiron SA | | | 85,632 | |
| | | |
| | | 909 | | | Caisse Regionale de Credit Agricole Mutuel Nord de France | | | 19,766 | |
| | | |
| | | 468 | | | Christian Dior SE (b) | | | 331,420 | |
| | | |
| | | 89,776 | | | Cie de Saint-Gobain | | | 5,566,568 | |
| | | |
| | | 54,256 | | | Coface SA | | | 721,697 | |
| | | |
| | | 120,410 | | | Derichebourg SA | | | 1,251,012 | |
| | | |
| | | 3,572 | | | Eramet SA * | | | 468,044 | |
| | | |
| | | 820 | | | Groupe Crit (a) | | | 56,691 | |
| | | |
| | | 989 | | | HEXAOM (a) | | | 37,426 | |
| | | |
| | | 26,893 | | | Ipsen SA | | | 3,129,259 | |
| | | |
| | | 33,240 | | | IPSOS | | | 1,584,143 | |
| | | |
| | | 8,995 | | | Kering SA (b) | | | 6,239,233 | |
| | | |
| | | 11,472 | | | LVMH Moet Hennessy Louis Vuitton SE (b) | | | 8,430,830 | |
| | | |
| | | 1,885 | | | Mersen SA | | | 69,706 | |
| | | |
| | | 66,711 | | | Metropole Television SA | | | 1,322,281 | |
| | | |
| | | 6,572 | | | Nexity SA | | | 259,054 | |
| | | |
| | | 117,253 | | | Publicis Groupe SA | | | 7,781,579 | |
| | | |
| | | 41,751 | | | Quadient SA | | | 763,322 | |
| | | |
| | | 2,190 | | | Rothschild & Co | | | 85,016 | |
| | | |
| | | 86,083 | | | Safran SA (b) | | | 10,945,207 | |
| | | |
| | | 8,058 | | | Sanofi (b) | | | 842,323 | |
| | | |
| | | 7,292 | | | Schneider Electric SE (b) | | | 1,129,794 | |
| | | |
| | | 15,342 | | | Societe BIC SA | | | 809,551 | |
| | | |
| | | 273,045 | | | Societe Generale SA | | | 7,721,039 | |
| | | |
| | | 4,200 | | | STMicroelectronics NV – NY Shares | | | 177,744 | |
| | | | |
| | |
| 74 | | See accompanying notes to the financial statements. | | |
GMO Implementation Fund
(A Series of GMO Trust)
Consolidated Schedule of Investments — (Continued)
(showing percentage of total net assets)
February 28, 2022
| | | | | | | | | | |
| | |
Shares | | | Description | | Value ($) | |
| | | |
| | | | | | France — continued | | | |
| | | |
| | | 1,769 | | | Synergie SE | | | 69,212 | |
| | | |
| | | 155,310 | | | Television Francaise 1 | | | 1,533,119 | |
| | | |
| | | 2,003 | | | TotalEnergies SE (b) | | | 102,868 | |
| | | | | | | | | | |
| | | |
| | | | | | Total France | | | 82,848,767 | |
| | | | | | | | | | |
| | | |
| | | | | | Germany — 1.3% | | | |
| | | |
| | | 21,598 | | | ADVA Optical Networking SE * | | | 365,673 | |
| | | |
| | | 279 | | | Amadeus Fire AG | | | 45,004 | |
| | | |
| | | 115,376 | | | Bayer AG (Registered) | | | 6,664,460 | |
| | | |
| | | 49,356 | | | Bayerische Motoren Werke AG | | | 4,753,337 | |
| | | |
| | | 57,385 | | | Beiersdorf AG | | | 5,817,002 | |
| | | |
| | | 933 | | | Cewe Stiftung & Co KGaA | | | 105,930 | |
| | | |
| | | 1,257 | | | Covestro AG | | | 66,477 | |
| | | |
| | | 44,360 | | | Deutsche Pfandbriefbank AG | | | 481,027 | |
| | | |
| | | 2,151 | | | Draegerwerk AG & Co KGaA | | | 112,858 | |
| | | |
| | | 2,771 | | | Elmos Semiconductor SE | | | 178,472 | |
| | | |
| | | 92,249 | | | Fresenius SE & Co KGaA (b) | | | 3,218,773 | |
| | | |
| | | 4,837 | | | Hamburger Hafen und Logistik AG (b) | | | 95,840 | |
| | | |
| | | 83,943 | | | HeidelbergCement AG | | | 5,446,802 | |
| | | |
| | | 5,792 | | | Hornbach Holding AG & Co KGaA | | | 758,667 | |
| | | |
| | | 1,035 | | | HUGO BOSS AG | | | 63,158 | |
| | | |
| | | 173,307 | | | Kloeckner & Co SE * | | | 2,344,556 | |
| | | |
| | | 155,245 | | | Mercedes-Benz Group AG (b) | | | 12,127,658 | |
| | | |
| | | 21,143 | | | Merck KGaA (b) | | | 4,193,661 | |
| | | |
| | | 5,191 | | | RTL Group SA | | | 289,252 | |
| | | |
| | | 35,636 | | | Salzgitter AG * | | | 1,556,639 | |
| | | |
| | | 27,841 | | | SAP SE (b) | | | 3,140,576 | |
| | | |
| | | 70,928 | | | Siltronic AG | | | 8,060,667 | |
| | | |
| | | 7,018 | | | Traton SE | | | 143,338 | |
| | | |
| | | 8,752 | | | Volkswagen AG | | | 2,263,611 | |
| | | |
| | | 813 | | | Wuestenrot & Wuerttembergische AG | | | 16,078 | |
| | | | | | | | | | |
| | | |
| | | | | | Total Germany | | | 62,309,516 | |
| | | | | | | | | | |
| | | |
| | | | | | Greece — 0.0% | | | |
| | | |
| | | 47,176 | | | Hellenic Telecommunications Organization SA | | | 943,613 | |
| | | | | | | | | | |
| | | |
| | | 18,868 | | | JUMBO SA | | | 271,081 | |
| | | | | | | | | | |
| | | |
| | | | | | Total Greece | | | 1,214,694 | |
| | | | | | | | | | |
| | | |
| | | | | | Hong Kong — 0.8% | | | |
| | | |
| | | 201,000 | | | ASM Pacific Technology Ltd | | | 2,205,174 | |
| | | |
| | | 123,200 | | | Bank of East Asia Ltd (The) | | | 207,671 | |
| | | |
| | | 102,388 | | | Budweiser Brewing Co APAC Ltd | | | 317,809 | |
| | | |
| | | 173,000 | | | Chow Sang Sang Holdings International Ltd | | | 242,810 | |
| | | |
| | | 1,193,000 | | | CITIC Telecom International Holdings Ltd | | | 424,595 | |
| | | |
| | | 37,500 | | | CK Asset Holdings Ltd (b) | | | 236,852 | |
| | | |
| | | 1,120,500 | | | CK Hutchison Holdings Ltd | | | 7,855,896 | |
| | | |
| | | 1,170,000 | | | CSI Properties Ltd | | | 30,900 | |
| | | | | | | | | | |
| | |
Shares | | | Description | | Value ($) | |
| | | |
| | | | | | Hong Kong — continued | | | |
| | | |
| | | 274,400 | | | Dah Sing Banking Group Ltd | | | 248,439 | |
| | | |
| | | 88,000 | | | Dah Sing Financial Holdings Ltd | | | 284,978 | |
| | | |
| | | 3,132,000 | | | First Pacific Co Ltd | | | 1,226,107 | |
| | | |
| | | 616,523 | | | Galaxy Entertainment Group Ltd * | | | 3,438,491 | |
| | | |
| | | 528,000 | | | Giordano International Ltd | | | 106,829 | |
| | | |
| | | 332,500 | | | HK Electric Investments & HK Electric Investments Ltd (b) | | | 328,063 | |
| | | |
| | | 800,000 | | | HKT Trust & HKT Ltd | | | 1,079,481 | |
| | | |
| | | 517,000 | | | IGG Inc | | | 309,638 | |
| | | |
| | | 243,500 | | | Johnson Electric Holdings Ltd | | | 405,459 | |
| | | |
| | | 62,500 | | | JS Global Lifestyle Co Ltd | | | 72,085 | |
| | | |
| | | 443,000 | | | K Wah International Holdings Ltd | | | 168,139 | |
| | | |
| | | 148,000 | | | Kerry Logistics Network Ltd | | | 359,090 | |
| | | |
| | | 838,000 | | | Kerry Properties Ltd | | | 2,296,276 | |
| | | |
| | | 65,000 | | | Luk Fook Holdings International Ltd | | | 172,687 | |
| | | |
| | | 6,500 | | | Orient Overseas International Ltd.(b) | | | 183,881 | |
| | | |
| | | 921,000 | | | Pacific Textiles Holdings Ltd | | | 446,825 | |
| | | |
| | | 1,222,000 | | | PAX Global Technology Ltd | | | 911,980 | |
| | | |
| | | 2,724,000 | | | PCCW Ltd | | | 1,523,927 | |
| | | |
| | | 369,000 | | | Power Assets Holdings Ltd (b) | | | 2,325,632 | |
| | | |
| | | 142,000 | | | Regal Real Estate Investment Trust (REIT) | | | 26,383 | |
| | | |
| | | 700,000 | | | Shun Tak Holdings Ltd * | | | 178,889 | |
| | | |
| | | 350,000 | | | Singamas Container Holdings Ltd | | | 48,983 | |
| | | |
| | | 54,000 | | | SITC International Holdings Co Ltd | | | 222,650 | |
| | | |
| | | 139,500 | | | SmarTone Telecommunications Holdings Ltd | | | 79,573 | |
| | | |
| | | 246,000 | | | Sun Hung Kai & Co Ltd | | | 124,890 | |
| | | |
| | | 24,000 | | | Sun Hung Kai Properties Ltd (b) | | | 279,019 | |
| | | |
| | | 139,500 | | | Swire Pacific Ltd – Class A | | | 770,907 | |
| | | |
| | | 40,000 | | | TAI Cheung Holdings Ltd | | | 25,421 | |
| | | |
| | | 137,500 | | | Texhong Textile Group Ltd | | | 171,120 | |
| | | |
| | | 414,000 | | | VPower Group International Holdings Ltd – Class H | | | 61,764 | |
| | | |
| | | 632,000 | | | VSTECS Holdings Ltd | | | 649,760 | |
| | | |
| | | 197,500 | | | VTech Holdings Ltd | | | 1,623,682 | |
| | | |
| | | 5,828,000 | | | WH Group Ltd | | | 4,070,133 | |
| | | |
| | | 844,920 | | | Xinyi Glass Holdings Ltd | | | 2,250,648 | |
| | | |
| | | 484,500 | | | Yue Yuen Industrial Holdings Ltd * | | | 818,741 | |
| | | | | | | | | | |
| | | |
| | | | | | Total Hong Kong | | | 38,812,277 | |
| | | | | | | | | | |
| | | |
| | | | | | Hungary — 0.0% | | | |
| | | |
| | | 17,265 | | | MOL Hungarian Oil & Gas Plc | | | 134,672 | |
| | | |
| | | 14,831 | | | OTP Bank Nyrt Plc * | | | 565,939 | |
| | | | | | | | | | |
| | | |
| | | | | | Total Hungary | | | 700,611 | |
| | | | | | | | | | |
| | | |
| | | | | | India — 2.5% | | | |
| | | |
| | | 10 | | | Amara Raja Batteries Ltd | | | 75 | |
| | | |
| | | 16,032 | | | Ambuja Cements Ltd | | | 67,448 | |
| | | |
| | | 83,788 | | | Apollo Tyres Ltd | | | 206,682 | |
| | | |
| | | 491,260 | | | Arvind Ltd * | | | 776,288 | |
| | | | |
| | |
| | | See accompanying notes to the financial statements. | | 75 |
GMO Implementation Fund
(A Series of GMO Trust)
Consolidated Schedule of Investments — (Continued)
(showing percentage of total net assets)
February 28, 2022
| | | | | | | | | | |
| | |
Shares | | | Description | | Value ($) | |
| | | |
| | | | | | India — continued | | | |
| | | |
| | | 57,385 | | | Asian Paints Ltd | | | 2,423,130 | |
| | | |
| | | 10 | | | Astral Ltd | | | 259 | |
| | | |
| | | 2 | | | AU Small Finance Bank Ltd * | | | 32 | |
| | | |
| | | 166,314 | | | Axis Bank Ltd * | | | 1,648,470 | |
| | | |
| | | 15,336 | | | Bajaj Consumer Care Ltd | | | 33,231 | |
| | | |
| | | 55,845 | | | Balrampur Chini Mills Ltd | | | 295,537 | |
| | | |
| | | 49,336 | | | Bharat Electronics Ltd | | | 138,549 | |
| | | |
| | | 17,075 | | | Bharat Petroleum Corp Ltd | | | 79,577 | |
| | | |
| | | 206,177 | | | Brightcom Group Ltd | | | 334,032 | |
| | | |
| | | 2,576 | | | Chambal Fertilizers and Chemicals Ltd | | | 12,940 | |
| | | |
| | | 7,165 | | | Clean Science & Technology Ltd * | | | 176,471 | |
| | | |
| | | 512,404 | | | Coal India Ltd | | | 1,156,584 | |
| | | |
| | | 861 | | | Colgate-Palmolive India Ltd | | | 16,479 | |
| | | |
| | | 8,572 | | | Coromandel International Ltd | | | 88,076 | |
| | | |
| | | 10,516 | | | Cummins India Ltd | | | 134,437 | |
| | | |
| | | 3 | | | Cyient Ltd | | | 33 | |
| | | |
| | | 151,712 | | | Dhampur Sugar Mills Ltd | | | 760,322 | |
| | | |
| | | 82 | | | Dr Lal PathLabs Ltd | | | 2,757 | |
| | | |
| | | 7,859 | | | Emami Ltd | | | 51,649 | |
| | | |
| | | 26,184 | | | Engineers India Ltd | | | 21,585 | |
| | | |
| | | 12 | | | Exide Industries Ltd | | | 24 | |
| | | |
| | | 1,507 | | | Finolex Cables Ltd | | | 8,350 | |
| | | |
| | | 7,780 | | | Finolex Industries Ltd | | | 15,902 | |
| | | |
| | | 774,482 | | | GAIL India Ltd | | | 1,497,027 | |
| | | |
| | | 77,288 | | | Glenmark Pharmaceuticals Ltd | | | 461,944 | |
| | | |
| | | 7,304 | | | Grasim Industries Ltd | | | 156,018 | |
| | | |
| | | 18 | | | Gujarat Gas Ltd | | | 141 | |
| | | |
| | | 49,605 | | | Gujarat Narmada Valley Fertilizers & Chemicals Ltd | | | 364,514 | |
| | | |
| | | 232,599 | | | Gujarat State Fertilizers & Chemicals Ltd | | | 389,338 | |
| | | |
| | | 28,921 | | | Gujarat State Petronet Ltd | | | 111,057 | |
| | | |
| | | 508,344 | | | HCL Technologies Ltd | | | 7,637,641 | |
| | | |
| | | 77,139 | | | HDFC Bank Ltd | | | 1,466,929 | |
| | | |
| | | 18,600 | | | HDFC Bank Ltd ADR | | | 1,156,362 | |
| | | |
| | | 136,720 | | | Hindalco Industries Ltd | | | 1,047,780 | |
| | | |
| | | 30,974 | | | Hindustan Aeronautics Ltd | | | 570,244 | |
| | | |
| | | 282,141 | | | Hindustan Petroleum Corp Ltd | | | 1,026,382 | |
| | | |
| | | 53,452 | | | Hindustan Unilever Ltd | | | 1,548,197 | |
| | | |
| | | 57,558 | | | Hindustan Zinc Ltd | | | 239,653 | |
| | | |
| | | 70,971 | | | Housing Development Finance Corp Ltd | | | 2,240,581 | |
| | | |
| | | 254,908 | | | ICICI Bank Ltd | | | 2,521,396 | |
| | | |
| | | 9,500 | | | ICICI Bank Ltd Sponsored ADR | | | 184,965 | |
| | | |
| | | 1,058,648 | | | Indiabulls Housing Finance Ltd | | | 2,127,033 | |
| | | |
| | | 258,924 | | | Indiabulls Real Estate Ltd * | | | 374,285 | |
| | | |
| | | 252,480 | | | Indian Oil Corp Ltd | | | 387,698 | |
| | | |
| | | 97,373 | | | Indus Towers Ltd * | | | 280,650 | |
| | | |
| | | 34 | | | Infosys Ltd | | | 776 | |
| | | |
| | | 177,600 | | | Infosys Ltd Sponsored ADR (b) | | | 3,988,896 | |
| | | |
| | | 5,033,895 | | | ITC Ltd | | | 14,497,983 | |
| | | |
| | | 239,470 | | | Jai Balaji Industries Ltd * | | | 146,434 | |
| | | | | | | | | | |
| | |
Shares | | | Description | | Value ($) | |
| | | |
| | | | | | India — continued | | | |
| | | |
| | | 5,418 | | | Jindal Stainless Hisar Ltd * | | | 25,631 | |
| | | |
| | | 985,774 | | | Karnataka Bank Ltd (The) | | | 792,141 | |
| | | |
| | | 16 | | | KEI Industries Ltd | | | 211 | |
| | | |
| | | 3 | | | KNR Constructions Ltd | | | 12 | |
| | | |
| | | 5 | | | L&T Technology Services Ltd | | | 302 | |
| | | |
| | | 26,111 | | | Mahanagar Gas Ltd | | | 252,854 | |
| | | |
| | | 252,265 | | | Mahindra & Mahindra Ltd | | | 2,663,918 | |
| | | |
| | | 19,623 | | | Manappuram Finance Ltd | | | 30,082 | |
| | | |
| | | 36,830 | | | Marico Ltd | | | 249,839 | |
| | | |
| | | 42,620 | | | Mindtree Ltd | | | 2,206,916 | |
| | | |
| | | 285,269 | | | National Aluminium Co Ltd | | | 462,730 | |
| | | |
| | | 72,851 | | | NBCC India Ltd | | | 38,001 | |
| | | |
| | | 186,690 | | | NCC Ltd | | | 157,162 | |
| | | |
| | | 236,794 | | | NHPC Ltd | | | 86,213 | |
| | | |
| | | 932,331 | | | NMDC Ltd | | | 1,784,982 | |
| | | |
| | | 1,251,300 | | | NTPC Ltd | | | 2,228,314 | |
| | | |
| | | 10,240 | | | Oberoi Realty Ltd * | | | 124,518 | |
| | | |
| | | 7,103,937 | | | Oil & Natural Gas Corp Ltd | | | 15,276,396 | |
| | | |
| | | 1,223 | | | Oracle Financial Services Software Ltd | | | 55,408 | |
| | | |
| | | 2 | | | Persistent Systems Ltd | | | 105 | |
| | | |
| | | 99,387 | | | Petronet LNG Ltd | | | 285,722 | |
| | | |
| | | 2 | | | PI Industries Ltd | | | 66 | |
| | | |
| | | 5,207 | | | PNC Infratech Ltd | | | 18,387 | |
| | | |
| | | 6 | | | Polycab India Ltd | | | 189 | |
| | | |
| | | 438 | | | Polyplex Corp Ltd | | | 10,625 | |
| | | |
| | | 3,251,091 | | | Power Finance Corp Ltd | | | 4,769,573 | |
| | | |
| | | 557,329 | | | Power Grid Corp of India Ltd | | | 1,545,584 | |
| | | |
| | | 27,090 | | | Prestige Estates Projects Ltd | | | 163,906 | |
| | | |
| | | 225,121 | | | PTC India Ltd | | | 255,110 | |
| | | |
| | | 132,791 | | | Rajesh Exports Ltd | | | 1,246,186 | |
| | | |
| | | 4,384,966 | | | REC Ltd | | | 7,151,680 | |
| | | |
| | | 473,241 | | | Redington India Ltd | | | 964,602 | |
| | | |
| | | 2 | | | Reliance Industries Ltd | | | 63 | |
| | | |
| | | 10 | | | SKF India Ltd | | | 477 | |
| | | |
| | | 8,836 | | | Sobha Ltd | | | 90,835 | |
| | | |
| | | 86,897 | | | Steel Authority of India Ltd | | | 112,203 | |
| | | |
| | | 453,396 | | | Sun Pharmaceutical Industries Ltd | | | 5,095,001 | |
| | | |
| | | 19,478 | | | Sun TV Network Ltd | | | 116,684 | |
| | | |
| | | 1,272 | | | Supreme Industries Ltd | | | 34,607 | |
| | | |
| | | 63,106 | | | Tata Consultancy Services Ltd | | | 2,986,034 | |
| | | |
| | | 156,774 | | | Tata Motors Ltd – Class A * | | | 456,592 | |
| | | |
| | | 251,828 | | | Tata Steel Ltd | | | 4,113,736 | |
| | | |
| | | 63,688 | | | Titan Co Ltd | | | 2,171,286 | |
| | | |
| | | 3,509 | | | Triveni Engineering & Industries Ltd | | | 11,629 | |
| | | |
| | | 465,570 | | | TV18 Broadcast Ltd * | | | 377,369 | |
| | | |
| | | 3 | | | United Spirits Ltd * | | | 36 | |
| | | |
| | | 21,882 | | | UPL Ltd | | | 194,520 | |
| | | |
| | | 22,191 | | | Vardhman Textiles Ltd | | | 760,386 | |
| | | |
| | | 80,745 | | | Welspun Corp Ltd | | | 155,013 | |
| | | |
| | | 466,587 | | | Wipro Ltd | | | 3,453,396 | |
| | | | |
| | |
| 76 | | See accompanying notes to the financial statements. | | |
GMO Implementation Fund
(A Series of GMO Trust)
Consolidated Schedule of Investments — (Continued)
(showing percentage of total net assets)
February 28, 2022
| | | | | | | | | | |
| | |
Shares | | | Description | | Value ($) | |
| | | |
| | | | | | India — continued | | | |
| | | |
| | | 21 | | | Zensar Technologies Ltd | | | 99 | |
| | | | | | | | | | |
| | | |
| | | | | | Total India | | | 115,850,174 | |
| | | | | | | | | | |
| | | |
| | | | | | Indonesia — 0.5% | | | |
| | | |
| | | 2,181,300 | | | Adaro Energy Tbk PT | | | 373,725 | |
| | | |
| | | 216,600 | | | AKR Corporindo Tbk PT | | | 11,458 | |
| | | |
| | | 16,422,400 | | | Bank Central Asia Tbk PT | | | 9,271,524 | |
| | | |
| | | 4,838,200 | | | Bank Mandiri Persero Tbk PT | | | 2,615,730 | |
| | | |
| | | 1,454,781 | | | Bank Negara Indonesia Persero Tbk PT | | | 815,133 | |
| | | |
| | | 3,202,200 | | | Bank Pembangunan Daerah Jawa Timur Tbk PT | | | 171,710 | |
| | | |
| | | 17,494,300 | | | Bank Rakyat Indonesia Persero Tbk PT | | | 5,593,980 | |
| | | |
| | | 625,900 | | | Bukit Asam Tbk PT | | | 137,501 | |
| | | |
| | | 81,100 | | | Indika Energy Tbk PT * | | | 12,650 | |
| | | |
| | | 634,600 | | | Indo Tambangraya Megah Tbk PT | | | 1,180,272 | |
| | | |
| | | 2,757,100 | | | Media Nusantara Citra Tbk PT | | | 167,828 | |
| | | |
| | | 45,688,800 | | | Panin Financial Tbk PT * | | | 537,707 | |
| | | |
| | | 44,700 | | | Ramayana Lestari Sentosa Tbk PT * | | | 1,966 | |
| | | |
| | | 3,082,868 | | | Telkom Indonesia Persero Tbk PT | | | 930,758 | |
| | | |
| | | 333,500 | | | Timah Tbk PT * | | | 37,119 | |
| | | |
| | | 78,200 | | | United Tractors Tbk PT | | | 136,458 | |
| | | | | | | | | | |
| | | |
| | | | | | Total Indonesia | | | 21,995,519 | |
| | | | | | | | | | |
| | | |
| | | | | | Ireland — 0.5% | | | |
| | | |
| | | 164,848 | | | AIB Group Plc * | | | 434,915 | |
| | | |
| | | 758,839 | | | Bank of Ireland Group Plc * | | | 5,035,084 | |
| | | |
| | | 1,924 | | | CRH Plc | | | 87,462 | |
| | | |
| | | 33,200 | | | CRH Plc Sponsored ADR | | | 1,490,348 | |
| | | |
| | | 59,861 | | | Glanbia Plc | | | 837,996 | |
| | | |
| | | 244,384 | | | Hibernia REIT Plc | | | 319,007 | |
| | | |
| | | 7,809 | | | Kingspan Group Plc | | | 762,644 | |
| | | |
| | | 38,104 | | | Origin Enterprises Plc | | | 154,276 | |
| | | |
| | | 31,131 | | | Permanent TSB Group Holdings Plc * | | | 60,109 | |
| | | |
| | | 194,970 | | | Ryanair Holdings Plc * | | | 3,380,436 | |
| | | |
| | | 52,276 | | | Ryanair Holdings Plc Sponsored ADR * (b) | | | 5,212,440 | |
| | | |
| | | 91,730 | | | Smurfit Kappa Group Plc (c) | | | 4,581,200 | |
| | | |
| | | 13,714 | | | Smurfit Kappa Group Plc (c) | | | 680,518 | |
| | | | | | | | | | |
| | | |
| | | | | | Total Ireland | | | 23,036,435 | |
| | | | | | | | | | |
| | | |
| | | | | | Israel — 0.5% | | | |
| | | |
| | | 314,849 | | | Bank Leumi Le-Israel BM | | | 3,410,734 | |
| | | |
| | | 52,400 | | | Check Point Software Technologies Ltd * | | | 7,591,712 | |
| | | |
| | | 16,564 | | | First International Bank of Israel Ltd | | | 712,514 | |
| | | |
| | | 57,020 | | | Isracard Ltd | | | 299,263 | |
| | | |
| | | 836,336 | | | Oil Refineries Ltd * | | | 299,682 | |
| | | |
| | | 749,000 | | | Teva Pharmaceutical Industries Ltd Sponsored ADR * | | | 6,089,370 | |
| | | |
| | | 111,209 | | | Tower Semiconductor Ltd * | | | 5,210,142 | |
| | | | | | | | | | |
| | | |
| | | | | | Total Israel | | | 23,613,417 | |
| | | | | | | | | | |
| | | | | | | | | | |
| | |
Shares | | | Description | | Value ($) | |
| | | |
| | | | | | Italy — 1.0% | | | |
| | | |
| | | 47,141 | | | A2A SPA (b) | | | 84,104 | |
| | | |
| | | 25,505 | | | ACEA SPA (b) | | | 484,360 | |
| | | |
| | | 44,306 | | | Anima Holding SPA | | | 209,440 | |
| | | |
| | | 52,995 | | | Arnoldo Mondadori Editore SPA * | | | 116,310 | |
| | | |
| | | 24,264 | | | Azimut Holding SPA | | | 578,974 | |
| | | |
| | | 40,805 | | | Banca IFIS SPA | | | 861,162 | |
| | | |
| | | 175,429 | | | Banco BPM SPA | | | 601,938 | |
| | | |
| | | 60,403 | | | Credito Emiliano SPA | | | 433,753 | |
| | | |
| | | 11,774 | | | De’ Longhi SPA | | | 373,607 | |
| | | |
| | | 360,697 | | | Enel SPA (b) | | | 2,657,954 | |
| | | |
| | | 16,855 | | | Esprinet SPA | | | 210,156 | |
| | | |
| | | 181,347 | | | EXOR NV | | | 13,739,865 | |
| | | |
| | | 9,105 | | | Hera SPA (b) | | | 35,305 | |
| | | |
| | | 100,916 | | | IMMSI SPA * (a) | | | 47,305 | |
| | | |
| | | 411,198 | | | Italgas SPA (b) | | | 2,654,288 | |
| | | |
| | | 23,101 | | | La Doria SPA | | | 425,808 | |
| | | |
| | | 439,698 | | | Leonardo SPA * | | | 3,919,846 | |
| | | |
| | | 199,565 | | | Poste Italiane SPA | | | 2,288,914 | |
| | | |
| | | 1,097 | | | Prima Industrie SPA * | | | 19,023 | |
| | | |
| | | 1,858 | | | Sabaf SPA | | | 41,063 | |
| | | |
| | | 2,146 | | | Salcef SPA | | | 53,019 | |
| | | |
| | | 25,925,049 | | | Telecom Italia SPA | | | 10,892,298 | |
| | | |
| | | 2,729,938 | | | Telecom Italia SPA – RSP | | | 1,133,654 | |
| | | |
| | | 10,058 | | | Unieuro SPA (a) | | | 199,127 | |
| | | |
| | | 617,374 | | | Unipol Gruppo SPA | | | 3,132,606 | |
| | | | | | | | | | |
| | | |
| | | | | | Total Italy | | | 45,193,879 | |
| | | | | | | | | | |
| | | |
| | | | | | Japan — 12.1% | | | |
| | | |
| | | 15,600 | | | ADEKA Corp | | | 361,800 | |
| | | |
| | | 52,300 | | | Aeon Delight Co Ltd (a) | | | 1,357,882 | |
| | | |
| | | 498,200 | | | Aeon Mall Co Ltd (a) | | | 7,005,714 | |
| | | |
| | | 160,600 | | | AGC Inc | | | 7,124,624 | |
| | | |
| | | 15,500 | | | Aichi Corp | | | 118,994 | |
| | | |
| | | 51,100 | | | Aisin Corp | | | 1,861,280 | |
| | | |
| | | 177,600 | | | Amano Corp | | | 3,481,759 | |
| | | |
| | | 29,500 | | | AOKI Holdings Inc | | | 153,917 | |
| | | |
| | | 135,700 | | | Arcs Co Ltd (a) | | | 2,570,044 | |
| | | |
| | | 899,200 | | | Asahi Kasei Corp | | | 8,438,836 | |
| | | |
| | | 307,800 | | | Astellas Pharma Inc | | | 5,135,402 | |
| | | |
| | | 9,100 | | | Bando Chemical Industries Ltd | | | 68,233 | |
| | | |
| | | 182,500 | | | Brother Industries Ltd | | | 3,321,661 | |
| | | |
| | | 18,800 | | | Calbee Inc | | | 422,731 | |
| | | |
| | | 5,600 | | | Canon Electronics Inc | | | 78,158 | |
| | | |
| | | 118,000 | | | Canon Inc (b) | | | 2,776,887 | |
| | | |
| | | 4,100 | | | Canon Inc Sponsored ADR (b) | | | 96,883 | |
| | | |
| | | 19,700 | | | Canon Marketing Japan Inc | | | 411,736 | |
| | | |
| | | 4,800 | | | Central Glass Co Ltd | | | 86,135 | |
| | | |
| | | 4,000 | | | Chiyoda Integre Co Ltd | | | 69,168 | |
| | | |
| | | 276,100 | | | Chugoku Marine Paints Ltd | | | 2,212,791 | |
| | | |
| | | 74,900 | | | Citizen Watch Co Ltd | | | 326,271 | |
| | | | |
| | |
| | | See accompanying notes to the financial statements. | | 77 |
GMO Implementation Fund
(A Series of GMO Trust)
Consolidated Schedule of Investments — (Continued)
(showing percentage of total net assets)
February 28, 2022
| | | | | | | | | | |
| | |
Shares | | | Description | | Value ($) | |
| | | |
| | | | | | Japan — continued | | | |
| | | |
| | | 9,600 | | | CONEXIO Corp | | | 116,322 | |
| | | |
| | | 104,700 | | | Dai Nippon Printing Co Ltd | | | 2,733,161 | |
| | | |
| | | 13,700 | | | Dai Nippon Toryo Co Ltd | | | 96,945 | |
| | | |
| | | 4,000 | | | Dai-Dan Co Ltd | | | 81,232 | |
| | | |
| | | 41,600 | | | Daihen Corp | | | 1,566,185 | |
| | | |
| | | 4,800 | | | Daiichi Jitsugyo Co Ltd | | | 182,542 | |
| | | |
| | | 2,800 | | | Daito Pharmaceutical Co Ltd | | | 73,519 | |
| | | |
| | | 144,300 | | | Daiwa House Industry Co Ltd (b) | | | 4,092,387 | |
| | | |
| | | 695,400 | | | Daiwabo Holdings Co Ltd | | | 10,764,349 | |
| | | |
| | | 239,400 | | | Denka Co Ltd | | | 7,352,607 | |
| | | |
| | | 2,000 | | | Dowa Holdings Co Ltd | | | 90,261 | |
| | | |
| | | 5,000 | | | Eizo Corp | | | 160,667 | |
| | | |
| | | 104,700 | | | Electric Power Development Co Ltd (b) | | | 1,661,190 | |
| | | |
| | | 437,100 | | | EXEO Group Inc | | | 9,098,832 | |
| | | |
| | | 61,200 | | | Ezaki Glico Co Ltd | | | 2,087,798 | |
| | | |
| | | 9,200 | | | FJ Next Holdings Co Ltd | | | 81,495 | |
| | | |
| | | 313,900 | | | Fuji Corp | | | 6,383,283 | |
| | | |
| | | 10,000 | | | Fuji Electric Co Ltd | | | 514,516 | |
| | | |
| | | 3,800 | | | Fuji Pharma Co Ltd | | | 33,610 | |
| | | |
| | | 9,100 | | | FUJIFILM Holdings Corp (b) | | | 578,433 | |
| | | |
| | | 2,900 | | | Fujimori Kogyo Co Ltd | | | 100,646 | |
| | | |
| | | 20,800 | | | Fujitsu Ltd (b) | | | 3,021,907 | |
| | | |
| | | 6,800 | | | Furuno Electric Co Ltd (a) | | | 61,161 | |
| | | |
| | | 7,800 | | | Furyu Corp | | | 70,661 | |
| | | |
| | | 14,800 | | | G-7 Holdings Inc | | | 214,091 | |
| | | |
| | | 21,800 | | | Hanwa Co Ltd | | | 634,104 | |
| | | |
| | | 535,194 | | | Haseko Corp | | | 6,831,701 | |
| | | |
| | | 18,400 | | | Hazama Ando Corp | | | 148,209 | |
| | | |
| | | 5,900 | | | Heiwado Co Ltd (a) | | | 102,837 | |
| | | |
| | | 39,900 | | | Hitachi Ltd (b) | | | 1,973,163 | |
| | | |
| | | 8,400 | | | Hitachi Zosen Corp | | | 58,227 | |
| | | |
| | | 2,700 | | | Hochiki Corp | | | 28,727 | |
| | | |
| | | 101,400 | | | Hogy Medical Co Ltd | | | 2,957,045 | |
| | | |
| | | 478,600 | | | Honda Motor Co Ltd | | | 14,540,295 | |
| | | |
| | | 3,400 | | | Hosokawa Micron Corp | | | 79,544 | |
| | | |
| | | 5,900 | | | Hyakujushi Bank Ltd (The) | | | 92,403 | |
| | | |
| | | 57,000 | | | Idemitsu Kosan Co Ltd | | | 1,527,973 | |
| | | |
| | | 105,500 | | | Iida Group Holdings Co Ltd | | | 1,957,989 | |
| | | |
| | | 170,700 | | | Inabata & Co Ltd | | | 3,447,213 | |
| | | |
| | | 1,064,100 | | | Inpex Corp | | | 10,968,228 | |
| | | |
| | | 106,300 | | | Isuzu Motors Ltd | | | 1,437,665 | |
| | | |
| | | 462,300 | | | ITOCHU Corp (b) | | | 15,065,710 | |
| | | |
| | | 1,600 | | | Itochu-Shokuhin Co Ltd | | | 69,600 | |
| | | |
| | | 58,500 | | | Itoham Yonekyu Holdings Inc | | | 351,525 | |
| | | |
| | | 29,400 | | | Itoki Corp | | | 91,902 | |
| | | |
| | | 15,600 | | | Jaccs Co Ltd | | | 440,570 | |
| | | |
| | | 229,500 | | | Japan Tobacco Inc | | | 4,220,771 | |
| | | |
| | | 303,800 | | | JFE Holdings Inc | | | 4,522,840 | |
| | | |
| | | 450,700 | | | JVCKenwood Corp | | | 727,683 | |
| | | |
| | | 825,800 | | | K’s Holdings Corp | | | 8,948,362 | |
| | | | | | | | | | |
| | |
Shares | | | Description | | Value ($) | |
| | | |
| | | | | | Japan — continued | | | |
| | | |
| | | 11,500 | | | Kaga Electronics Co Ltd | | | 302,666 | |
| | | |
| | | 305,600 | | | Kajima Corp | | | 4,112,913 | |
| | | |
| | | 13,400 | | | Kamei Corp | | | 122,721 | |
| | | |
| | | 6,600 | | | Kanamoto Co Ltd | | | 130,767 | |
| | | |
| | | 47,500 | | | Kandenko Co Ltd | | | 361,193 | |
| | | |
| | | 13,200 | | | Kaneka Corp | | | 431,758 | |
| | | |
| | | 301,500 | | | Kanematsu Corp | | | 3,680,948 | |
| | | |
| | | 500 | | | Kato Sangyo Co Ltd | | | 13,478 | |
| | | |
| | | 570,600 | | | KDDI Corp | | | 18,568,032 | |
| | | |
| | | 53,500 | | | Kinden Corp | | | 758,770 | |
| | | |
| | | 2,300 | | | Kintetsu World Express Inc (b) | | | 60,277 | |
| | | |
| | | 436,400 | | | Kirin Holdings Co Ltd | | | 7,255,349 | |
| | | |
| | | 19,400 | | | Kitz Corp | | | 110,722 | |
| | | |
| | | 7,279 | | | Kohnan Shoji Co Ltd (a) | | | 231,469 | |
| | | |
| | | 21,500 | | | Kokuyo Co Ltd | | | 301,410 | |
| | | |
| | | 40,300 | | | Komeri Co Ltd | | | 990,905 | |
| | | |
| | | 28,700 | | | Konica Minolta Inc | | | 121,590 | |
| | | |
| | | 193,800 | | | Konoike Transport Co Ltd (b) | | | 2,026,859 | |
| | | |
| | | 1,700 | | | Krosaki Harima Corp | | | 64,713 | |
| | | |
| | | 4,400 | | | Kumagai Gumi Co Ltd | | | 110,613 | |
| | | |
| | | 11,300 | | | Kyokuto Kaihatsu Kogyo Co Ltd | | | 142,666 | |
| | | |
| | | 12,100 | | | Kyosan Electric Manufacturing Co Ltd | | | 44,701 | |
| | | |
| | | 249,500 | | | Kyudenko Corp | | | 6,698,260 | |
| | | |
| | | 14,200 | | | Lintec Corp | | | 316,527 | |
| | | |
| | | 5,000 | | | Macnica Fuji Electronics Holdings Inc | | | 117,682 | |
| | | |
| | | 221,700 | | | Macromill Inc | | | 2,178,511 | |
| | | |
| | | 271,500 | | | Mandom Corp | | | 3,255,712 | |
| | | |
| | | 181,300 | | | Marubeni Corp | | | 1,903,040 | |
| | | |
| | | 251,400 | | | Maruichi Steel Tube Ltd | | | 6,239,636 | |
| | | |
| | | 5,400 | | | Maruzen Showa Unyu Co Ltd (b) | | | 150,284 | |
| | | |
| | | 225,600 | | | Maxell Ltd | | | 2,323,927 | |
| | | |
| | | 48,800 | | | MCJ Co Ltd | | | 427,257 | |
| | | |
| | | 28,100 | | | MEIJI Holdings Co Ltd | | | 1,686,505 | |
| | | |
| | | 1,600 | | | Melco Holdings Inc | | | 53,637 | |
| | | |
| | | 1,200 | | | Mirait Holdings Corp | | | 20,394 | |
| | | |
| | | 181,700 | | | Mitsubishi Corp (b) | | | 6,109,422 | |
| | | |
| | | 5,300 | | | Mitsubishi Research Institute Inc (b) | | | 179,198 | |
| | | |
| | | 5,400 | | | Mitsubishi Shokuhin Co Ltd | | | 145,564 | |
| | | |
| | | 968,100 | | | Mitsubishi UFJ Financial Group Inc (b) | | | 5,943,150 | |
| | | |
| | | 11,100 | | | Mitsuboshi Belting Ltd | | | 209,230 | |
| | | |
| | | 55,300 | | | Mitsui & Co Ltd (b) | | | 1,378,779 | |
| | | |
| | | 49,600 | | | Mitsui Chemicals Inc | | | 1,268,002 | |
| | | |
| | | 12,600 | | | Mitsui DM Sugar Holdings Co Ltd | | | 224,928 | |
| | | |
| | | 10,570 | | | Mixi Inc (a) | | | 205,598 | |
| | | |
| | | 13,900 | | | Modec Inc | | | 142,174 | |
| | | |
| | | 221,900 | | | Morinaga & Co Ltd | | | 7,219,717 | |
| | | |
| | | 185,100 | | | MS&AD Insurance Group Holdings Inc | | | 6,263,173 | |
| | | |
| | | 13,800 | | | MTI Ltd | | | 55,376 | |
| | | |
| | | 180,400 | | | NEC Corp (b) | | | 7,805,118 | |
| | | |
| | | 43,900 | | | NEC Networks & System Integration Corp (b) | | | 674,987 | |
| | | | |
| | |
| 78 | | See accompanying notes to the financial statements. | | |
GMO Implementation Fund
(A Series of GMO Trust)
Consolidated Schedule of Investments — (Continued)
(showing percentage of total net assets)
February 28, 2022
| | | | | | | | | | |
| | |
Shares | | | Description | | Value ($) | |
| | | |
| | | | | | Japan — continued | | | |
| | | |
| | | 10,900 | | | NGK Insulators Ltd | | | 169,276 | |
| | | |
| | | 7,600 | | | NGK Spark Plug Co Ltd | | | 136,957 | |
| | | |
| | | 239,200 | | | NH Foods Ltd | | | 8,977,828 | |
| | | |
| | | 12,400 | | | Nichias Corp | | | 280,901 | |
| | | |
| | | 14,800 | | | Nichiha Corp | | | 333,370 | |
| | | |
| | | 8,400 | | | Nichireki Co Ltd | | | 94,501 | |
| | | |
| | | 120,400 | | | Nikon Corp | | | 1,258,520 | |
| | | |
| | | 21,500 | | | Nippn Corp | | | 318,942 | |
| | | |
| | | 3,700 | | | Nippo Corp(a) | | | 128,015 | |
| | | |
| | | 4,200 | | | Nippon Densetsu Kogyo Co Ltd | | | 58,237 | |
| | | |
| | | 263,700 | | | Nippon Steel Corp | | | 4,828,074 | |
| | | |
| | | 7,600 | | | Nippon Steel Trading Corp | | | 360,513 | |
| | | |
| | | 106,400 | | | Nippon Suisan Kaisha Ltd | | | 503,844 | |
| | | |
| | | 530,500 | | | Nippon Telegraph & Telephone Corp (b) | | | 15,247,041 | |
| | | |
| | | 102,300 | | | Nippon Television Holdings Inc | | | 1,170,298 | |
| | | |
| | | 7,100 | | | Nisshin Oillio Group Ltd (The) | | | 188,722 | |
| | | |
| | | 3,800 | | | Nissin Corp | | | 57,308 | |
| | | |
| | | 19,500 | | | Nissin Electric Co Ltd | | | 248,154 | |
| | | |
| | | 20,600 | | | Nojima Corp | | | 457,547 | |
| | | |
| | | 26,600 | | | Nomura Real Estate Holdings Inc | | | 662,303 | |
| | | |
| | | 3,800 | | | Noritake Co Ltd | | | 151,747 | |
| | | |
| | | 919,700 | | | Obayashi Corp | | | 7,700,641 | |
| | | |
| | | 41,700 | | | Okamura Corp | | | 429,673 | |
| | | |
| | | 37,400 | | | Organo Corp | | | 2,662,056 | |
| | | |
| | | 206,700 | | | ORIX Corp (b) | | | 4,097,441 | |
| | | |
| | | 61,600 | | | Osaka Gas Co Ltd (b) | | | 1,127,358 | |
| | | |
| | | 3,700 | | | Osaka Soda Co Ltd | | | 101,238 | |
| | | |
| | | 7,700 | | | Osaki Electric Co Ltd | | | 32,909 | |
| | | |
| | | 273,000 | | | Pacific Industrial Co Ltd | | | 2,420,202 | |
| | | |
| | | 24,700 | | | Panasonic Corp | | | 257,950 | |
| | | |
| | | 538,100 | | | Penta-Ocean Construction Co Ltd | | | 2,832,510 | |
| | | |
| | | 9,100 | | | Prima Meat Packers Ltd | | | 192,095 | |
| | | |
| | | 8,000 | | | Proto Corp | | | 80,512 | |
| | | |
| | | 20,300 | | | Raito Kogyo Co Ltd | | | 345,863 | |
| | | |
| | | 90,100 | | | Resona Holdings Inc | | | 402,954 | |
| | | |
| | | 40,800 | | | Rohm Co Ltd | | | 3,253,947 | |
| | | |
| | | 43,000 | | | San-A Co Ltd (a) | | | 1,596,593 | |
| | | |
| | | 7,400 | | | San-Ai Oil Co Ltd | | | 61,524 | |
| | | |
| | | 21,600 | | | Sanki Engineering Co Ltd | | | 280,306 | |
| | | |
| | | 190,200 | | | Sankyu Inc (b) | | | 6,594,775 | |
| | | |
| | | 19,000 | | | Sanwa Holdings Corp | | | 212,338 | |
| | | |
| | | 111,600 | | | Sawai Group Holdings Co Ltd | | | 4,435,283 | |
| | | |
| | | 102,400 | | | Secom Co Ltd | | | 7,520,909 | |
| | | |
| | | 275,600 | | | Sega Sammy Holdings Inc | | | 5,026,778 | |
| | | |
| | | 8,100 | | | Seikitokyu Kogyo Co Ltd (a) | | | 57,784 | |
| | | |
| | | 87,700 | | | Seiko Epson Corp | | | 1,348,864 | |
| | | |
| | | 17,400 | | | Sekisui Chemical Co Ltd | | | 284,941 | |
| | | |
| | | 425,400 | | | Sekisui House Ltd | | | 8,673,093 | |
| | | |
| | | 7,500 | | | Sekisui Jushi Corp | | | 125,198 | |
| | | |
| | | 28,300 | | | Shimamura Co Ltd (b) | | | 2,567,095 | |
| | | |
| | | 674,900 | | | Shimizu Corp | | | 4,467,272 | |
| | | |
| | | 6,900 | | | Shin-Etsu Polymer Co Ltd | | | 66,057 | |
| | | | | | | | | | |
| | |
Shares | | | Description | | Value ($) | |
| | | |
| | | | | | Japan — continued | | | |
| | | |
| | | 5,300 | | | Shinnihon Corp | | | 34,591 | |
| | | |
| | | 16,900 | | | Shizuoka Gas Co Ltd (b) | | | 127,580 | |
| | | |
| | | 2,000 | | | Sinanen Holdings Co Ltd | | | 60,234 | |
| | | |
| | | 10,600 | | | Sinko Industries Ltd | | | 160,435 | |
| | | |
| | | 500,700 | | | SKY Perfect JSAT Holdings Inc | | | 1,882,846 | |
| | | |
| | | 293,220 | | | Sojitz Corp | | | 4,843,139 | |
| | | |
| | | 334,400 | | | Stanley Electric Co Ltd | | | 7,946,270 | |
| | | |
| | | 167,200 | | | Subaru Corp | | | 2,742,212 | |
| | | |
| | | 2,523,100 | | | Sumitomo Chemical Co Ltd | | | 12,045,856 | |
| | | |
| | | 169,000 | | | Sumitomo Corp | | | 2,757,338 | |
| | | |
| | | 465,200 | | | Sumitomo Dainippon Pharma Co Ltd | | | 5,105,421 | |
| | | |
| | | 52,600 | | | Sumitomo Electric Industries Ltd | | | 698,271 | |
| | | |
| | | 400,200 | | | Sumitomo Forestry Co Ltd | | | 7,717,259 | |
| | | |
| | | 10,600 | | | Sumitomo Heavy Industries Ltd | | | 256,846 | |
| | | |
| | | 270,300 | | | Sumitomo Mitsui Financial Group Inc | | | 9,585,446 | |
| | | |
| | | 217,900 | | | Sumitomo Mitsui Trust Holdings Inc | | | 7,742,424 | |
| | | |
| | | 1,500 | | | Sumitomo Seika Chemicals Co Ltd | | | 42,690 | |
| | | |
| | | 27,500 | | | Suzuki Motor Corp | | | 1,094,993 | |
| | | |
| | | 2,900 | | | T Hasegawa Co Ltd | | | 60,891 | |
| | | |
| | | 570,600 | | | T&D Holdings Inc | | | 8,287,094 | |
| | | |
| | | 183,400 | | | Tachi-S Co Ltd | | | 1,795,519 | |
| | | |
| | | 169,100 | | | Taisei Corp | | | 5,622,819 | |
| | | |
| | | 292,700 | | | Takara Holdings Inc | | | 2,908,228 | |
| | | |
| | | 75,800 | | | Takara Leben Co Ltd | | | 207,223 | |
| | | |
| | | 386,600 | | | Takuma Co Ltd | | | 4,913,213 | |
| | | |
| | | 7,500 | | | Tamron Co Ltd | | | 154,128 | |
| | | |
| | | 604,500 | | | Teijin Ltd | | | 7,272,070 | |
| | | |
| | | 209,500 | | | THK Co Ltd | | | 4,812,844 | |
| | | |
| | | 172,100 | | | Toho Holdings Co Ltd | | | 2,831,573 | |
| | | |
| | | 554,200 | | | Tokai Carbon Co Ltd | | | 5,319,361 | |
| | | |
| | | 2,500 | | | Token Corp | | | 198,019 | |
| | | |
| | | 2,265,900 | | | Tokyo Electric Power Co Holdings Inc * (b) | | | 7,112,641 | |
| | | |
| | | 174,700 | | | Tokyo Gas Co Ltd (b) | | | 3,558,346 | |
| | | |
| | | 174,300 | | | Tokyo Seimitsu Co Ltd | | | 7,257,386 | |
| | | |
| | | 26,200 | | | Tokyu Construction Co Ltd | | | 162,393 | |
| | | |
| | | 455,400 | | | Toppan Inc | | | 8,973,342 | |
| | | |
| | | 133,300 | | | Toray Industries Inc | | | 760,169 | |
| | | |
| | | 258,300 | | | Tosei Corp | | | 2,461,604 | |
| | | |
| | | 520,649 | | | Tosoh Corp | | | 8,079,473 | |
| | | |
| | | 19,900 | | | Towa Pharmaceutical Co Ltd | | | 515,689 | |
| | | |
| | | 80,000 | | | Toyo Construction Co Ltd | | | 416,855 | |
| | | |
| | | 2,500 | | | Toyo Ink SC Holdings Co Ltd | | | 41,905 | |
| | | |
| | | 69,700 | | | Toyota Boshoku Corp | | | 1,275,506 | |
| | | |
| | | 85,600 | | | Toyota Industries Corp | | | 6,510,828 | |
| | | |
| | | 32,900 | | | Toyota Tsusho Corp | | | 1,365,843 | |
| | | |
| | | 2,700 | | | Tsubakimoto Chain Co | | | 77,215 | |
| | | |
| | | 166,100 | | | Tsumura & Co | | | 4,613,380 | |
| | | |
| | | 11,200 | | | TV Asahi Holdings Corp | | | 153,078 | |
| | | |
| | | 33,000 | | | Ulvac Inc | | | 1,647,139 | |
| | | |
| | | 10,600 | | | Unipres Corp | | | 71,095 | |
| | | |
| | | 8,000 | | | Vital KSK Holdings Inc | | | 56,698 | |
| | | | |
| | |
| | | See accompanying notes to the financial statements. | | 79 |
GMO Implementation Fund
(A Series of GMO Trust)
Consolidated Schedule of Investments — (Continued)
(showing percentage of total net assets)
February 28, 2022
| | | | | | | | | | |
| | |
Shares | | | Description | | Value ($) | |
| | | |
| | | | | | Japan — continued | | | |
| | | |
| | | 8,900 | | | Wacoal Holdings Corp | | | 152,771 | |
| | | |
| | | 9,100 | | | Warabeya Nichiyo Holdings Co Ltd (a) | | | 144,882 | |
| | | |
| | | 23,800 | | | YAMABIKO Corp | | | 275,635 | |
| | | |
| | | 73,700 | | | Yamaha Motor Co Ltd | | | 1,656,748 | |
| | | |
| | | 23,300 | | | Yamazen Corp | | | 208,836 | |
| | | |
| | | 19,300 | | | Yellow Hat Ltd | | | 274,022 | |
| | | |
| | | 106,000 | | | Yokogawa Bridge Holdings Corp | | | 1,936,316 | |
| | | |
| | | 40,400 | | | Yokohama Rubber Co Ltd (The) | | | 566,423 | |
| | | |
| | | 7,200 | | | Yuasa Trading Co Ltd | | | 187,286 | |
| | | |
| | | 176,200 | | | Zenkoku Hosho Co Ltd (a) | | | 7,409,658 | |
| | | | | | | | | | |
| | | |
| | | | | | Total Japan | | | 565,101,552 | |
| | | | | | | | | | |
| | | |
| | | | | | Kuwait — 0.1% | | | |
| | | |
| | | 30,338 | | | Humansoft Holding Co KSC | | | 369,278 | |
| | | |
| | | 1,436,792 | | | Kuwait Finance House KSCP | | | 4,494,587 | |
| | | |
| | | 54,896 | | | Kuwait Projects Holding KSCP | | | 35,522 | |
| | | | | | | | | | |
| | | |
| | | | | | Total Kuwait | | | 4,899,387 | |
| | | | | | | | | | |
| | | |
| | | | | | Luxembourg — 0.1% | | | |
| | | |
| | | 76,600 | | | Ternium SA Sponsored ADR | | | 3,008,848 | |
| | | | | | | | | | |
| | | |
| | | | | | Malaysia — 0.0% | | | |
| | | |
| | | 335,600 | | | Kossan Rubber Industries Bhd | | | 138,358 | |
| | | |
| | | 143,100 | | | Petronas Chemicals Group Bhd | | | 326,039 | |
| | | |
| | | 1,169,100 | | | Top Glove Corp Bhd | | | 570,575 | |
| | | |
| | | 258,300 | | | Westports Holdings Bhd | | | 240,747 | |
| | | | | | | | | | |
| | | |
| | | | | | Total Malaysia | | | 1,275,719 | |
| | | | | | | | | | |
| | | |
| | | | | | Mexico — 1.5% | | | |
| | | |
| | | 84,944 | | | America Movil SAB de CV – Class L Sponsored ADR | | | 1,539,185 | |
| | | |
| | | 903,200 | | | America Movil SAB de CV – Series L | | | 821,131 | |
| | | |
| | | 182,140 | | | Arca Continental SAB de CV | | | 1,200,571 | |
| | | |
| | | 371,400 | | | Banco del Bajio SA | | | 903,067 | |
| | | |
| | | 10,500 | | | Bolsa Mexicana de Valores SAB de CV | | | 20,297 | |
| | | |
| | | 13,296 | | | Coca-Cola Femsa SAB de CV Sponsored ADR | | | 732,078 | |
| | | |
| | | 1,136,700 | | | Credito Real SAB de CV SOFOM ER * | | | 89,355 | |
| | | |
| | | 107,028 | | | El Puerto de Liverpool SAB de CV – Class C1 | | | 521,997 | |
| | | |
| | | 1,247,449 | | | Fomento Economico Mexicano SAB de CV | | | 10,023,567 | |
| | | |
| | | 64,800 | | | Fomento Economico Mexicano SAB de CV Sponsored ADR | | | 5,209,920 | |
| | | |
| | | 2,700 | | | GCC SAB de CV | | | 17,928 | |
| | | |
| | | 6,045 | | | Gruma SAB de CV – Class B | | | 81,860 | |
| | | |
| | | 200 | | | Grupo Aeroportuario del Centro Norte SAB de CV ADR | | | 11,626 | |
| | | |
| | | 12,600 | | | Grupo Aeroportuario del Centro Norte SAB de CV – Class B | | | 90,749 | |
| | | |
| | | 2,600 | | | Grupo Aeroportuario del Pacifico SAB de CV – Class B * | | | 38,079 | |
| | | | | | | | | | |
| | |
Shares | | | Description | | Value ($) | |
| | | |
| | | | | | Mexico — continued | | | |
| | | |
| | | 15,200 | | | Grupo Aeroportuario del Sureste SAB de CV – Class B | | | 327,229 | |
| | | |
| | | 586,000 | | | Grupo Bimbo SAB de CV – Series A | | | 1,813,994 | |
| | | |
| | | 3,121,100 | | | Grupo Financiero Banorte SAB de CV – Class O | | | 21,180,689 | |
| | | |
| | | 35,800 | | | Grupo Financiero Inbursa SAB de CV – Class O * | | | 58,504 | |
| | | |
| | | 29,255 | | | Grupo Herdez SAB de CV – Series * | | | 41,067 | |
| | | |
| | | 2,600,603 | | | Grupo Mexico SAB de CV – Series B | | | 13,284,268 | |
| | | |
| | | 600 | | | Industrias Bachoco SAB de CV Sponsored ADR | | | 24,246 | |
| | | |
| | | 174,944 | | | Industrias Bachoco SAB de CV – Series B | | | 585,795 | |
| | | |
| | | 55,500 | | | Kimberly-Clark de Mexico SAB de CV – Class A | | | 77,583 | |
| | | |
| | | 5,900 | | | Megacable Holdings SAB de CV CPO | | | 17,356 | |
| | | |
| | | 23,300 | | | Orbia Advance Corp SAB de CV | | | 59,521 | |
| | | |
| | | 144,600 | | | Qualitas Controladora SAB de CV | | | 792,155 | |
| | | |
| | | 104,700 | | | Regional SAB de CV | | | 621,779 | |
| | | |
| | | 141,348 | | | Unifin Financiera SAB de CV SOFOM ENR * | | | 175,986 | |
| | | |
| | | 2,073,100 | | | Wal-Mart de Mexico SAB de CV | | | 7,895,210 | |
| | | | | | | | | | |
| | | |
| | | | | | Total Mexico | | | 68,256,792 | |
| | | | | | | | | | |
| | | |
| | | | | | Netherlands — 1.3% | | | |
| | | |
| | | 302,912 | | | ABN AMRO Bank NV CVA GDR (a) | | | 4,030,916 | |
| | | |
| | | 992,402 | | | Aegon NV (a) | | | 4,902,260 | |
| | | |
| | | 80,500 | | | AerCap Holdings NV * | | | 4,381,615 | |
| | | |
| | | 16,510 | | | Evander Gold Mines Ltd (e) | | | 185 | |
| | | |
| | | 59,053 | | | ForFarmers NV | | | 240,891 | |
| | | |
| | | 333,867 | | | ING Groep NV | | | 3,899,062 | |
| | | |
| | | 172,663 | | | JDE Peet’s NV (a) | | | 5,668,396 | |
| | | |
| | | 1 | | | Just Eat Takeaway.com NV Sponsored ADR * (b) | | | 8 | |
| | | |
| | | 315,851 | | | Koninklijke Ahold Delhaize NV | | | 9,716,285 | |
| | | |
| | | 38,303 | | | Koninklijke BAM Groep NV * | | | 107,761 | |
| | | |
| | | 162,810 | | | NN Group NV | | | 7,814,047 | |
| | | |
| | | 244,362 | | | PostNL NV (b) | | | 982,453 | |
| | | |
| | | 15,359 | | | Prosus NV * | | | 953,512 | |
| | | |
| | | 131,272 | | | Randstad NV | | | 8,946,013 | |
| | | |
| | | 87,903 | | | Signify NV | | | 4,496,571 | |
| | | |
| | | 96,381 | | | Stellantis NV | | | 1,757,870 | |
| | | |
| | | 11,732 | | | Van Lanschot Kempen NV | | | 296,816 | |
| | | |
| | | 5,633 | | | Wolters Kluwer NV (b) | | | 573,945 | |
| | | | | | | | | | |
| | | |
| | | | | | Total Netherlands | | | 58,768,606 | |
| | | | | | | | | | |
| | | |
| | | | | | New Zealand — 0.1% | | | |
| | | |
| | | 208,370 | | | Auckland International Airport Ltd * (b) | | | 1,008,932 | |
| | | |
| | | 778,343 | | | Meridian Energy Ltd (b) | | | 2,642,546 | |
| | | |
| | | 164,375 | | | Spark New Zealand Ltd | | | 504,681 | |
| | | | | | | | | | |
| | | |
| | | | | | Total New Zealand | | | 4,156,159 | |
| | | | | | | | | | |
| | | | |
| | |
| 80 | | See accompanying notes to the financial statements. | | |
GMO Implementation Fund
(A Series of GMO Trust)
Consolidated Schedule of Investments — (Continued)
(showing percentage of total net assets)
February 28, 2022
| | | | | | | | | | |
| | |
Shares | | | Description | | Value ($) | |
| | | |
| | | | | | Norway — 0.6% | | | |
| | | |
| | | 24,902 | | | Austevoll Seafood ASA | | | 351,612 | |
| | | |
| | | 56,509 | | | BW LPG Ltd | | | 336,749 | |
| | | |
| | | 102,687 | | | Equinor ASA | | | 3,228,017 | |
| | | |
| | | 154,946 | | | Europris ASA | | | 988,372 | |
| | | |
| | | 29,670 | | | Kongsberg Gruppen ASA | | | 1,046,434 | |
| | | |
| | | 1,455,207 | | | Norsk Hydro ASA | | | 13,818,770 | |
| | | |
| | | 315,355 | | | Orkla ASA | | | 2,954,044 | |
| | | |
| | | 36,490 | | | Sbanken ASA | | | 377,761 | |
| | | |
| | | 27,627 | | | Selvaag Bolig ASA | | | 158,481 | |
| | | |
| | | 37,286 | | | SpareBank 1 Nord Norge | | | 456,200 | |
| | | |
| | | 48,956 | | | SpareBank 1 SMN | | | 808,994 | |
| | | |
| | | 108,954 | | | SpareBank 1 SR-Bank ASA | | | 1,614,454 | |
| | | |
| | | 14,066 | | | Wallenius Wilhelmsen ASA * (b) | | | 106,186 | |
| | | | | | | | | | |
| | | |
| | | | | | Total Norway | | | 26,246,074 | |
| | | | | | | | | | |
| | | |
| | | | | | Philippines — 0.0% | | | |
| | | |
| | | 33,040 | | | GT Capital Holdings Inc | | | 374,169 | |
| | | |
| | | 133,142 | | | Manila Electric Co | | | 958,049 | |
| | | |
| | | 6,457,024 | | | Megaworld Corp | | | 405,701 | |
| | | |
| | | 257,600 | | | Puregold Price Club Inc | | | 176,979 | |
| | | |
| | | 411,695 | | | Semirara Mining & Power Corp – Class A | | | 223,228 | |
| | | | | | | | | | |
| | | |
| | | | | | Total Philippines | | | 2,138,126 | |
| | | | | | | | | | |
| | | |
| | | | | | Poland — 0.3% | | | |
| | | |
| | | 29,598 | | | Asseco Poland SA | | | 521,546 | |
| | | |
| | | 253,543 | | | Bank Polska Kasa Opieki SA | | | 6,955,703 | |
| | | |
| | | 14,399 | | | Budimex SA | | | 783,265 | |
| | | |
| | | 60,792 | | | Cyfrowy Polsat SA | | | 393,563 | |
| | | |
| | | 921 | | | Grupa Lotos SA * | | | 11,817 | |
| | | |
| | | 73,633 | | | Polski Koncern Naftowy ORLEN SA | | | 1,243,796 | |
| | | |
| | | 1,256,261 | | | Polskie Gornictwo Naftowe i Gazownictwo SA | | | 1,655,637 | |
| | | |
| | | 126,701 | | | Powszechny Zaklad Ubezpieczen SA | | | 950,593 | |
| | | | | | | | | | |
| | | |
| | | | | | Total Poland | | | 12,515,920 | |
| | | | | | | | | | |
| | | |
| | | | | | Portugal — 0.2% | | | |
| | | |
| | | 32,641 | | | CTT – Correios de Portugal SA (a) | | | 158,116 | |
| | | |
| | | 370,473 | | | Galp Energia SGPS SA | | | 4,100,879 | |
| | | |
| | | 39,431 | | | Jeronimo Martins SGPS SA | | | 859,662 | |
| | | |
| | | 128,713 | | | Navigator Co SA (The) | | | 459,937 | |
| | | |
| | | 191,711 | | | NOS SGPS SA | | | 738,068 | |
| | | |
| | | 1,510,548 | | | Sonae SGPS SA | | | 1,644,190 | |
| | | | | | | | | | |
| | | |
| | | | | | Total Portugal | | | 7,960,852 | |
| | | | | | | | | | |
| | | |
| | | | | | Qatar — 0.1% | | | |
| | | |
| | | 98,838 | | | Doha Bank QPSC | | | 77,278 | |
| | | |
| | | 17,462 | | | Qatar Electricity & Water Co QSC | | | 86,422 | |
| | | |
| | | 992,300 | | | Qatar National Bank QPSC | | | 5,954,596 | |
| | | |
| | | 170,042 | | | Qatar National Cement Co QSC | | | 289,374 | |
| | | | | | | | | | |
| | | |
| | | | | | Total Qatar | | | 6,407,670 | |
| | | | | | | | | | |
| | | | | | | | | | |
| | |
Shares | | | Description | | Value ($) | |
| | | |
| | | | | | Russia — 0.9% | | | |
| | | |
| | | 10,221,010 | | | Alrosa PJSC | | | 6,591,692 | |
| | | |
| | | 376,870,000 | | | Federal Grid Co Unified Energy System PJSC | | | 260,734 | |
| | | |
| | | 214,678 | | | Fix Price Group Ltd GDR (d) | | | 129,236 | |
| | | |
| | | 402,578 | | | Gazprom Neft PJSC | | | 1,312,826 | |
| | | |
| | | 2,557 | | | Gazprom Neft PJSC Sponsored ADR | | | 40,516 | |
| | | |
| | | 873,330 | | | Gazprom PJSC | | | 1,394,777 | |
| | | |
| | | 2,025,633 | | | Gazprom PJSC Sponsored ADR | | | 5,358,865 | |
| | | |
| | | 75,924 | | | Globaltrans Investment Plc Sponsored GDR (Registered) | | | 141,955 | |
| | | |
| | | 18,204,300 | | | Inter RAO UES PJSC | | | 406,619 | |
| | | |
| | | 4 | | | LSR Group PJSC GDR (Registered) (d) | | | 4 | |
| | | |
| | | 88,304 | | | LSR Group PJSC – Class A | | | 363,712 | |
| | | |
| | | 192,855 | | | LUKOIL PJSC Sponsored ADR | | | 3,617,354 | |
| | | |
| | | 4,239,830 | | | Magnitogorsk Iron & Steel Works PJSC | | | 1,492,165 | |
| | | |
| | | 116,953 | | | Magnitogorsk Iron & Steel Works PJSC Sponsored GDR (Registered) | | | 327,483 | |
| | | |
| | | 35,900 | | | Mechel PJSC Sponsored ADR * (d) | | | 56,179 | |
| | | |
| | | 127,978 | | | MMC Norilsk Nickel PJSC ADR | | | 1,757,179 | |
| | | |
| | | 23,942 | | | Mobile TeleSystems PJSC | | | 47,444 | |
| | | |
| | | 37,065 | | | Mobile TeleSystems PJSC ADR (d) | | | 141,786 | |
| | | |
| | | 1,472,470 | | | Moscow Exchange MICEX-RTS PJSC | | | 1,103,971 | |
| | | |
| | | 7,545,000 | | | Mosenergo PJSC | | | 106,717 | |
| | | |
| | | 19,196 | | | Novatek PJSC Sponsored GDR (Registered) | | | 739,470 | |
| | | |
| | | 119,670 | | | Novolipetsk Steel PJSC | | | 172,186 | |
| | | |
| | | 337,373 | | | Novolipetsk Steel PJSC GDR | | | 2,586,589 | |
| | | |
| | | 18,463 | | | PhosAgro PJSC GDR (Registered) | | | 112,955 | |
| | | |
| | | 254,956 | | | Polymetal International Plc | | | 1,192,020 | |
| | | |
| | | 51,105 | | | Polyus PJSC GDR (Registered) | | | 2,727,406 | |
| | | |
| | | 138,892 | | | QIWI Plc Sponsored ADR (c) (d) | | | 547,729 | |
| | | |
| | | 4,500 | | | QIWI Plc Sponsored ADR (c) | | | 15,355 | |
| | | |
| | | 13,022 | | | Raspadskaya OJSC | | | 29,431 | |
| | | |
| | | 1,493 | | | Ros Agro Plc GDR (Registered) (c) | | | 10,334 | |
| | | |
| | | 1,208 | | | Ros Agro Plc GDR (Registered) (c) | | | 5,330 | |
| | | |
| | | 47,669,440 | | | RusHydro PJSC | | | 265,660 | |
| | | |
| | | 23,047 | | | RusHydro PJSC ADR | | | 11,562 | |
| | | |
| | | 2,211,870 | | | Sberbank of Russia PJSC | | | 1,108,548 | |
| | | |
| | | 1,465,525 | | | Sberbank of Russia PJSC Sponsored ADR | | | 1,531,563 | |
| | | |
| | | 261,549 | | | Severstal PAO GDR (Registered) | | | 1,327,799 | |
| | | |
| | | 7,395 | | | Severstal PJSC | | | 85,333 | |
| | | |
| | | 29,090 | | | SFI PJSC * | | | 107,321 | |
| | | |
| | | 100 | | | Surgutneftegas PJSC | | | 18 | |
| | | |
| | | 2,777,057 | | | Surgutneftegas PJSC Sponsored ADR | | | 4,773,222 | |
| | | |
| | | 35,844 | | | Tatneft PJSC | | | 104,046 | |
| | | |
| | | 158,512 | | | Tatneft PJSC Sponsored ADR | | | 2,160,185 | |
| | | |
| | | 725,480 | | | Unipro PJSC | | | 10,058 | |
| | | |
| | | 55,470 | | | United Co Rusal International PJSC * | | | 23,385 | |
| | | |
| | | 376,156 | | | VTB Bank PJSC GDR (Registered) (d) | | | 373,281 | |
| | | | | | | | | | |
| | | |
| | | | | | Total Russia | | | 44,672,000 | |
| | | | | | | | | | |
| | | | |
| | |
| | | See accompanying notes to the financial statements. | | 81 |
GMO Implementation Fund
(A Series of GMO Trust)
Consolidated Schedule of Investments — (Continued)
(showing percentage of total net assets)
February 28, 2022
| | | | | | | | | | |
| | |
Shares | | | Description | | Value ($) | |
| | | |
| | | | | | Saudi Arabia — 0.0% | | | |
| | | |
| | | 17,860 | | | Al Rajhi Bank | | | 766,225 | |
| | | |
| | | 8,460 | | | Saudi Arabian Oil Co | | | 93,859 | |
| | | | | | | | | | |
| | | |
| | | | | | Total Saudi Arabia | | | 860,084 | |
| | | | | | | | | | |
| | | |
| | | | | | Singapore — 0.5% | | | |
| | | |
| | | 167,800 | | | AIMS APAC (REIT) | | | 167,505 | |
| | | |
| | | 125,800 | | | ARA LOGOS Logistics Trust (REIT) | | | 77,578 | |
| | | |
| | | 149,900 | | | Ascendas India Trust | | | 131,898 | |
| | | |
| | | 324,100 | | | Ascendas Real Estate Investment Trust (REIT) | | | 664,548 | |
| | | |
| | | 621,000 | | | Asian Pay Television Trust | | | 62,304 | |
| | | |
| | | 171,573 | | | Capitaland Investment Ltd * | | | 470,155 | |
| | | |
| | | 524,300 | | | ComfortDelGro Corp Ltd | | | 547,655 | |
| | | |
| | | 225,124 | | | DBS Group Holdings Ltd | | | 5,659,647 | |
| | | |
| | | 512,600 | | | First Real Estate Investment Trust | | | 113,797 | |
| | | |
| | | 3,114,200 | | | Golden Agri-Resources Ltd | | | 658,478 | |
| | | |
| | | 940,299 | | | Japfa Ltd | | | 411,159 | |
| | | |
| | | 117,100 | | | Jardine Cycle & Carriage Ltd | | | 1,891,237 | |
| | | |
| | | 316,000 | | | Keppel Corp Ltd (a) | | | 1,406,817 | |
| | | |
| | | 242,500 | | | Sasseur Real Estate Investment Trust (a) | | | 151,523 | |
| | | |
| | | 129,500 | | | Sembcorp Industries Ltd | | | 241,391 | |
| | | |
| | | 57,600 | | | Sheng Siong Group Ltd | | | 64,712 | |
| | | |
| | | 929,900 | | | Silverlake Axis Ltd. | | | 196,508 | |
| | | |
| | | 279,000 | | | StarHub Ltd | | | 257,881 | |
| | | |
| | | 100 | | | UOL Group Ltd | | | 518 | |
| | | |
| | | 596,300 | | | Wilmar International Ltd | | | 1,937,994 | |
| | | |
| | | 9,501,513 | | | Yangzijiang Shipbuilding Holdings Ltd | | | 9,719,578 | |
| | | |
| | | 530,800 | | | Yanlord Land Group Ltd | | | 472,818 | |
| | | | | | | | | | |
| | | |
| | | | | | Total Singapore | | | 25,305,701 | |
| | | | | | | | | | |
| | | |
| | | | | | South Africa — 0.8% | | | |
| | | |
| | | 1,120,163 | | | Absa Group Ltd | | | 12,878,143 | |
| | | |
| | | 39,872 | | | AECI Ltd | | | 281,187 | |
| | | |
| | | 462 | | | Anglo American Platinum Ltd | | | 72,041 | |
| | | |
| | | 75,317 | | | Aspen Pharmacare Holdings Ltd | | | 986,610 | |
| | | |
| | | 28,563 | | | Astral Foods Ltd | | | 303,184 | |
| | | |
| | | 8,735 | | | AVI Ltd | | | 40,746 | |
| | | |
| | | 147,186 | | | Barloworld Ltd | | | 1,174,543 | |
| | | |
| | | 297,706 | | | Bidvest Group Ltd (The) | | | 4,078,961 | |
| | | |
| | | 666,562 | | | Blue Label Telecoms Ltd * | | | 230,370 | |
| | | |
| | | 1,149 | | | Capitec Bank Holdings Ltd | | | 155,130 | |
| | | |
| | | 82,774 | | | Imperial Logistics Ltd | | | 354,331 | |
| | | |
| | | 79,176 | | | Investec Ltd | | | 445,719 | |
| | | |
| | | 162,822 | | | Kumba Iron Ore Ltd | | | 6,436,156 | |
| | | |
| | | 177,857 | | | Lewis Group Ltd | | | 538,187 | |
| | | |
| | | 247,293 | | | Motus Holdings Ltd | | | 1,767,112 | |
| | | |
| | | 380,070 | | | MTN Group Ltd * | | | 4,744,241 | |
| | | |
| | | 3,977 | | | Ninety One Ltd | | | 12,974 | |
| | | |
| | | 239,500 | | | Old Mutual Ltd | | | 196,633 | |
| | | | | | | | | | |
| | |
Shares | | | Description | | Value ($) | |
| | | |
| | | | | | South Africa — continued | | | |
| | | |
| | | 128,820 | | | Pepkor Holdings Ltd | | | 184,014 | |
| | | |
| | | 111,635 | | | Reunert Ltd | | | 341,511 | |
| | | |
| | | 830,569 | | | RMB Holdings Ltd | | | 90,277 | |
| | | |
| | | 38,708 | | | Santam Ltd | | | 690,286 | |
| | | |
| | | 743,602 | | | Telkom SA SOC Ltd * | | | 1,996,903 | |
| | | |
| | | 277,984 | | | Truworths International Ltd | | | 1,057,324 | |
| | | |
| | | 270,551 | | | Tsogo Sun Gaming Ltd * | | | 204,667 | |
| | | | | | | | | | |
| | | |
| | | | | | Total South Africa | | | 39,261,250 | |
| | | | | | | | | | |
| | | |
| | | | | | South Korea — 3.7% | | | |
| | | |
| | | 121 | | | BGF retail Co Ltd | | | 17,142 | |
| | | |
| | | 572,493 | | | BNK Financial Group Inc | | | 3,768,750 | |
| | | |
| | | 2,330 | | | Cheil Worldwide Inc | | | 43,809 | |
| | | |
| | | 573 | | | CJ CheilJedang Corp | | | 181,501 | |
| | | |
| | | 1,185 | | | Coway Co Ltd | | | 71,170 | |
| | | |
| | | 234,403 | | | Daewoo Engineering & Construction Co Ltd * | | | 1,232,934 | |
| | | |
| | | 5,118 | | | Daihan Pharmaceutical Co Ltd | | | 122,904 | |
| | | |
| | | 991 | | | Daou Data Corp | | | 11,465 | |
| | | |
| | | 4,213 | | | DB Insurance Co Ltd | | | 216,898 | |
| | | |
| | | 297,901 | | | DGB Financial Group Inc | | | 2,358,016 | |
| | | |
| | | 1,087 | | | DL E&C Co Ltd | | | 117,185 | |
| | | |
| | | 265,854 | | | Dongwon Development Co Ltd | | | 1,081,134 | |
| | | |
| | | 1,204 | | | Doosan Bobcat Inc | | | 38,642 | |
| | | |
| | | 3,923 | | | Fila Holdings Corp | | | 115,927 | |
| | | |
| | | 79,784 | | | GS Engineering & Construction Corp | | | 2,867,364 | |
| | | |
| | | 2,457 | | | GS Holdings Corp | | | 82,160 | |
| | | |
| | | 308,409 | | | Hana Financial Group Inc | | | 12,529,990 | |
| | | |
| | | 1,205 | | | Hana Materials Inc | | | 52,546 | |
| | | |
| | | 6,228 | | | Handsome Co Ltd | | | 186,762 | |
| | | |
| | | 1,808 | | | Hankook & Co Co Ltd | | | 20,303 | |
| | | |
| | | 125,424 | | | Hankook Tire & Technology Co Ltd | | | 3,695,395 | |
| | | |
| | | 7,037 | | | Hanwha Aerospace Co Ltd | | | 307,276 | |
| | | |
| | | 85,925 | | | Hanwha Investment & Securities Co Ltd * | | | 348,069 | |
| | | |
| | | 220,371 | | | Hanwha Life Insurance Co Ltd * | | | 544,217 | |
| | | |
| | | 96,562 | | | HDC Hyundai Development Co-Engineering & Construction * | | | 1,299,540 | |
| | | |
| | | 882 | | | Huchems Fine Chemical Corp | | | 16,410 | |
| | | |
| | | 1,140 | | | Hyosung TNC Corp | | | 463,566 | |
| | | |
| | | 107,287 | | | Hyundai Engineering & Construction Co Ltd | | | 3,908,703 | |
| | | |
| | | 13,309 | | | Hyundai Home Shopping Network Corp | | | 647,132 | |
| | | |
| | | 12,268 | | | Hyundai Marine & Fire Insurance Co Ltd | | | 294,666 | |
| | | |
| | | 3,575 | | | Hyundai Mobis Co Ltd | | | 671,263 | |
| | | |
| | | 5,895 | | | Hyundai Motor Co GDR (Registered) | | | 210,516 | |
| | | |
| | | 73,961 | | | Industrial Bank of Korea | | | 664,433 | |
| | | |
| | | 116,323 | | | JB Financial Group Co Ltd | | | 796,746 | |
| | | |
| | | 126,708 | | | KB Financial Group Inc | | | 6,251,068 | |
| | | |
| | | 9,994 | | | KC Co Ltd | | | 162,645 | |
| | | |
| | | 2,839 | | | KC Tech Co Ltd | | | 49,539 | |
| | | | |
| | |
| 82 | | See accompanying notes to the financial statements. | | |
GMO Implementation Fund
(A Series of GMO Trust)
Consolidated Schedule of Investments — (Continued)
(showing percentage of total net assets)
February 28, 2022
| | | | | | | | | | |
| | |
Shares | | | Description | | Value ($) | |
| | | |
| | | | | | South Korea — continued | | | |
| | | |
| | | 787 | | | KCC Corp | | | 220,353 | |
| | | |
| | | 2,426 | | | KCC Glass Corp | | | 117,853 | |
| | | |
| | | 307,639 | | | Kia Corp | | | 19,072,177 | |
| | | |
| | | 2,789 | | | KIWOOM Securities Co Ltd * | | | 236,828 | |
| | | |
| | | 609 | | | Korea Electric Terminal Co Ltd | | | 29,672 | |
| | | |
| | | 1,387 | | | Korea Investment Holdings Co Ltd * | | | 92,146 | |
| | | |
| | | 5,376 | | | Korea Petrochemical Ind Co Ltd * | | | 768,987 | |
| | | |
| | | 31,846 | | | Korea Real Estate Investment & Trust Co Ltd | | | 58,305 | |
| | | |
| | | 1,090 | | | Korea Zinc Co Ltd | | | 499,918 | |
| | | |
| | | 1,884 | | | Korean Reinsurance Co | | | 15,213 | |
| | | |
| | | 57,175 | | | KT Skylife Co Ltd | | | 406,001 | |
| | | |
| | | 366,117 | | | KT&G Corp | | | 24,338,195 | |
| | | |
| | | 20,241 | | | Kumho Petrochemical Co Ltd * | | | 2,730,726 | |
| | | |
| | | 23,042 | | | LF Corp | | | 343,436 | |
| | | |
| | | 122,618 | | | LG Electronics Inc | | | 12,800,872 | |
| | | |
| | | 1,454 | | | LG Household & Health Care Ltd | | | 1,153,667 | |
| | | |
| | | 11,796 | | | Lotte Chemical Corp | | | 2,174,000 | |
| | | |
| | | 19,367 | | | LOTTE Fine Chemical Co Ltd | | | 1,288,401 | |
| | | |
| | | 5,172 | | | LOTTE Himart Co Ltd | | | 100,433 | |
| | | |
| | | 5,044 | | | LX Semicon Co Ltd | | | 484,491 | |
| | | |
| | | 461 | | | Meritz Financial Group Inc | | | 14,175 | |
| | | |
| | | 1,339 | | | Meritz Fire & Marine Insurance Co Ltd | | | 46,018 | |
| | | |
| | | 12,236 | | | Meritz Securities Co Ltd | | | 59,919 | |
| | | |
| | | 28,523 | | | Mirae Asset Life Insurance Co Ltd | | | 97,302 | |
| | | |
| | | 20,626 | | | Namsun Aluminum Co Ltd * | | | 40,565 | |
| | | |
| | | 35,696 | | | NAVER Corp | | | 9,511,457 | |
| | | |
| | | 3,835 | | | NH Investment & Securities Co Ltd * | | | 37,111 | |
| | | |
| | | 433 | | | PI Advanced Materials Co Ltd | | | 15,801 | |
| | | |
| | | 497 | | | Poongsan Corp | | | 13,237 | |
| | | |
| | | 22,894 | | | POSCO | | | 5,447,026 | |
| | | |
| | | 17,900 | | | POSCO Sponsored ADR | | | 1,061,828 | |
| | | |
| | | 27,999 | | | Samjin Pharmaceutical Co Ltd | | | 590,938 | |
| | | |
| | | 3,234 | | | Samsung C&T Corp | | | 298,678 | |
| | | |
| | | 622 | | | Samsung Card Co Ltd | | | 16,705 | |
| | | |
| | | 315,602 | | | Samsung Electronics Co Ltd | | | 19,016,086 | |
| | | |
| | | 52,355 | | | Samsung Engineering Co Ltd * | | | 1,022,758 | |
| | | |
| | | 3,618 | | | Samsung Fire & Marine Insurance Co Ltd | | | 575,336 | |
| | | |
| | | 1,590 | | | Samsung Life Insurance Co Ltd | | | 79,499 | |
| | | |
| | | 3,340 | | | Samsung SDS Co Ltd | | | 392,110 | |
| | | |
| | | 4,771 | | | Samsung Securities Co Ltd | | | 169,093 | |
| | | |
| | | 1,860 | | | Sangsangin Co Ltd | | | 14,515 | |
| | | |
| | | 6,363 | | | SD Biosensor Inc | | | 290,099 | |
| | | |
| | | 1,119 | | | Sebang Global Battery Co Ltd | | | 59,763 | |
| | | |
| | | 1,077 | | | SFA Engineering Corp | | | 33,979 | |
| | | |
| | | 307,819 | | | Shinhan Financial Group Co Ltd | | | 10,015,120 | |
| | | |
| | | 122 | | | SK Gas Ltd | | | 12,129 | |
| | | |
| | | 4,579 | | | SK Hynix Inc | | | 477,381 | |
| | | |
| | | 6,213 | | | SK Telecom Co Ltd | | | 283,518 | |
| | | |
| | | 127,267 | | | SK Telecom Co Ltd Sponsored ADR | | | 3,190,584 | |
| | | |
| | | 17,008 | | | SL Corp * | | | 339,041 | |
| | | | | | | | | | |
| | |
Shares | | | Description | | Value ($) | |
| | | |
| | | | | | South Korea — continued | | | |
| | | |
| | | 551 | | | SNT Motiv Co Ltd | | | 19,923 | |
| | | |
| | | 180 | | | Taekwang Industrial Co Ltd * | | | 152,520 | |
| | | |
| | | 1,947 | | | TY Holdings Co Ltd * | | | 44,391 | |
| | | |
| | | 684 | | | Unid Co Ltd | | | 49,882 | |
| | | |
| | | 457,391 | | | Woori Financial Group Inc | | | 5,471,126 | |
| | | |
| | | 29,503 | | | Woori Technology Investment Co Ltd * | | | 211,303 | |
| | | |
| | | 5,207 | | | Youngone Corp | | | 185,181 | |
| | | |
| | | 14,399 | | | Yuhan Corp | | | 699,621 | |
| | | | | | | | | | |
| | | |
| | | | | | Total South Korea | | | 172,435,178 | |
| | | | | | | | | | |
| | | |
| | | | | | Spain — 1.2% | | | |
| | | |
| | | 1,189 | | | Acciona SA (b) | | | 203,193 | |
| | | |
| | | 483,450 | | | Acerinox SA | | | 6,146,436 | |
| | | |
| | | 42,067 | | | ACS Actividades de Construccion y Servicios SA (a) | | | 1,022,252 | |
| | | |
| | | 115,099 | | | Amadeus IT Group SA * (b) | | | 7,593,840 | |
| | | |
| | | 96,182 | | | Atresmedia Corp de Medios de Comunicacion SA | | | 415,741 | |
| | | |
| | | 2,134,541 | | | Banco Bilbao Vizcaya Argentaria SA | | | 12,665,777 | |
| | | |
| | | 5,191,485 | | | Banco de Sabadell SA * | | | 4,488,943 | |
| | | |
| | | 3,103,987 | | | Banco Santander SA | | | 10,336,324 | |
| | | |
| | | 103,629 | | | Bankinter SA | | | 588,440 | |
| | | |
| | | 57,507 | | | Cia de Distribucion Integral Logista Holdings SA (b) | | | 1,044,418 | |
| | | |
| | | 68,131 | | | Faes Farma SA | | | 260,625 | |
| | | |
| | | 2,218 | | | Grupo Catalana Occidente SA | | | 71,496 | |
| | | |
| | | 8,138 | | | Iberdrola SA (b) | | | 92,330 | |
| | | |
| | | 206,039 | | | Industria de Diseno Textil SA (b) | | | 5,374,685 | |
| | | |
| | | 248,556 | | | Mediaset Espana Comunicacion SA * | | | 1,275,102 | |
| | | |
| | | 9,181 | | | Red Electrica Corp SA (b) | | | 181,880 | |
| | | |
| | | 129,032 | | | Repsol SA | | | 1,674,324 | |
| | | |
| | | 133,628 | | | Telefonica SA | | | 638,196 | |
| | | |
| | | 516,524 | | | Unicaja Banco SA | | | 486,982 | |
| | | | | | | | | | |
| | | |
| | | | | | Total Spain | | | 54,560,984 | |
| | | | | | | | | | |
| | | |
| | | | | | Sweden — 0.3% | | | |
| | | |
| | | 4,371 | | | Bufab AB | | | 153,080 | |
| | | |
| | | 16,178 | | | Investor AB – A Shares (b) | | | 357,736 | |
| | | |
| | | 262,926 | | | Investor AB – B Shares (b) | | | 5,353,824 | |
| | | |
| | | 63,592 | | | Inwido AB | | | 984,669 | |
| | | |
| | | 88,194 | | | Kinnevik AB – Class B * | | | 2,245,447 | |
| | | |
| | | 22,978 | | | New Wave Group AB – B Shares | | | 347,444 | |
| | | |
| | | 27,940 | | | Securitas AB – B Shares | | | 338,266 | |
| | | |
| | | 119,029 | | | Skanska AB – B Shares | | | 2,694,017 | |
| | | |
| | | 41,510 | | | SSAB AB – A Shares * | | | 259,775 | |
| | | |
| | | 53,737 | | | Svenska Cellulosa AB SCA – Class B | | | 876,748 | |
| | | | | | | | | | |
| | | |
| | | | | | Total Sweden | | | 13,611,006 | |
| | | | | | | | | | |
| | | |
| | | | | | Switzerland — 0.5% | | | |
| | | |
| | | 115,855 | | | Adecco Group AG (Registered) | | | 5,471,673 | |
| | | |
| | | 532 | | | ALSO Holding AG (Registered) * | | | 141,945 | |
| | | |
| | | 4,728 | | | BKW AG (b) | | | 595,688 | |
| | | | |
| | |
| | | See accompanying notes to the financial statements. | | 83 |
GMO Implementation Fund
(A Series of GMO Trust)
Consolidated Schedule of Investments — (Continued)
(showing percentage of total net assets)
February 28, 2022
| | | | | | | | | | |
| | |
Shares | | | Description | | Value ($) | |
| | | |
| | | | | | Switzerland — continued | | | |
| | | |
| | | 4,508 | | | Bobst Group SA (Registered) * | | | 410,179 | |
| | | |
| | | 1,376 | | | Cie Financiere Richemont SA – Class A (Registered) (b) | | | 184,255 | |
| | | |
| | | 518 | | | Huber + Suhner AG (Registered) | | | 49,941 | |
| | | |
| | | 513 | | | Kardex Holding AG (Registered) | | | 133,182 | |
| | | |
| | | 44,860 | | | Logitech International SA (Registered) | | | 3,356,824 | |
| | | |
| | | 5,037 | | | Mobilezone Holding AG (Registered) | | | 74,482 | |
| | | |
| | | 32,092 | | | Novartis AG (Registered) (b) | | | 2,820,611 | |
| | | |
| | | 14,300 | | | Novartis AG Sponsored ADR (b) | | | 1,250,678 | |
| | | |
| | | 19,048 | | | Roche Holding AG – Genusschein (b) | | | 7,214,112 | |
| | | |
| | | 27,142 | | | UBS Group AG (Registered) (b) | | | 499,325 | |
| | | |
| | | 6,153 | | | Zehnder Group AG – Class RG | | | 532,187 | |
| | | | | | | | | | |
| | | |
| | | | | | Total Switzerland | | | 22,735,082 | |
| | | | | | | | | | |
| | | |
| | | | | | Taiwan — 5.0% | | | |
| | | |
| | | 13,000 | | | Acer Inc | | | 13,492 | |
| | | |
| | | 23,788 | | | Acter Group Corp Ltd | | | 187,806 | |
| | | |
| | | 928,224 | | | AmTRAN Technology Co Ltd | | | 537,457 | |
| | | |
| | | 1,734,672 | | | Asustek Computer Inc | | | 23,141,347 | |
| | | |
| | | 60,000 | | | Aten International Co Ltd | | | 173,516 | |
| | | |
| | | 23,000 | | | Capital Securities Corp | | | 13,015 | |
| | | |
| | | 3,179,000 | | | Catcher Technology Co Ltd | | | 16,317,203 | |
| | | |
| | | 3,265,000 | | | Cathay Financial Holding Co Ltd | | | 7,341,795 | |
| | | |
| | | 529,451 | | | Chailease Holding Co Ltd | | | 4,805,038 | |
| | | |
| | | 74,490 | | | Chicony Electronics Co Ltd | | | 239,610 | |
| | | |
| | | 404,200 | | | China Development Financial Holding Corp | | | 276,802 | |
| | | |
| | | 9,000 | | | China Steel Corp | | | 11,703 | |
| | | |
| | | 1,518,000 | | | Chipbond Technology Corp | | | 3,777,178 | |
| | | |
| | | 1,000 | | | Chlitina Holding Ltd | | | 7,540 | |
| | | |
| | | 136,640 | | | Chong Hong Construction Co Ltd | | | 373,335 | |
| | | |
| | | 427,000 | | | Chunghwa Telecom Co Ltd | | | 1,897,851 | |
| | | |
| | | 5,000 | | | Cleanaway Co Ltd | | | 38,000 | |
| | | |
| | | 2,114,000 | | | Compal Electronics Inc | | | 1,925,878 | |
| | | |
| | | 812,080 | | | Coretronic Corp | | | 2,081,118 | |
| | | |
| | | 2,733,000 | | | CTBC Financial Holding Co Ltd | | | 2,671,446 | |
| | | |
| | | 25,000 | | | CTCI Corp | | | 36,796 | |
| | | |
| | | 65,000 | | | Delta Electronics Inc | | | 579,287 | |
| | | |
| | | 61,000 | | | Depo Auto Parts Ind Co Ltd | | | 128,037 | |
| | | |
| | | 108,000 | | | E.Sun Financial Holding Co Ltd | | | 114,162 | |
| | | |
| | | 79,080 | | | Elan Microelectronics Corp | | | 469,659 | |
| | | |
| | | 18,960 | | | Elite Material Co Ltd | | | 185,927 | |
| | | |
| | | 326,000 | | | Farglory Land Development Co Ltd | | | 713,224 | |
| | | |
| | | 6,520 | | | Feng Hsin Steel Co Ltd | | | 19,664 | |
| | | |
| | | 145,000 | | | First Financial Holding Co Ltd | | | 133,507 | |
| | | |
| | | 121,000 | | | FIT Hon Teng Ltd * | | | 21,945 | |
| | | |
| | | 1,042,000 | | | FLEXium Interconnect Inc * | | | 3,557,002 | |
| | | |
| | | 127,000 | | | Formosa Advanced Technologies Co Ltd | | | 181,384 | |
| | | |
| | | 26,000 | | | Formosa Petrochemical Corp | | | 91,457 | |
| | | |
| | | 701,000 | | | Formosa Plastics Corp | | | 2,646,986 | |
| | | |
| | | 397,000 | | | Foxconn Technology Co Ltd | | | 913,795 | |
| | | | | | | | | | |
| | |
Shares | | | Description | | Value ($) | |
| | | |
| | | | | | Taiwan — continued | | | |
| | | |
| | | 3,000 | | | Foxsemicon Integrated Technology Inc | | | 23,555 | |
| | | |
| | | 4,440,903 | | | Fubon Financial Holding Co Ltd | | | 11,990,722 | |
| | | |
| | | 30,000 | | | Gamania Digital Entertainment Co Ltd | | | 68,227 | |
| | | |
| | | 127,000 | | | Getac Holdings Corp | | | 268,355 | |
| | | |
| | | 950,000 | | | Grand Pacific Petrochemical | | | 974,389 | |
| | | |
| | | 2,000 | | | Grand Plastic Technology Corp | | | 22,986 | |
| | | |
| | | 265,160 | | | HannStar Display Corp | | | 152,933 | |
| | | |
| | | 107,000 | | | Holiday Entertainment Co Ltd | | | 232,192 | |
| | | |
| | | 32,000 | | | Holtek Semiconductor Inc | | | 125,019 | |
| | | |
| | | 8,312,406 | | | Hon Hai Precision Industry Co Ltd | | | 30,876,915 | |
| | | |
| | | 332,000 | | | Huaku Development Co Ltd | | | 1,077,763 | |
| | | |
| | | 427,980 | | | IEI Integration Corp | | | 712,895 | |
| | | |
| | | 53,000 | | | International Games System Co Ltd | | | 1,309,974 | |
| | | |
| | | 8,000 | | | Kindom Development Co Ltd | | | 10,668 | |
| | | |
| | | 474,000 | | | King’s Town Bank Co Ltd | | | 684,905 | |
| | | |
| | | 191,000 | | | Kung Long Batteries Industrial Co Ltd | | | 935,301 | |
| | | |
| | | 42,000 | | | Largan Precision Co Ltd | | | 3,052,258 | |
| | | |
| | | 1,281,000 | | | Lite-On Technology Corp ADR | | | 3,149,824 | |
| | | |
| | | 376,000 | | | MediaTek Inc | | | 14,857,951 | |
| | | |
| | | 88,000 | | | Mega Financial Holding Co Ltd | | | 118,589 | |
| | | |
| | | 664,132 | | | Mercuries Life Insurance Co Ltd * | | | 211,740 | |
| | | |
| | | 460,000 | | | Micro-Star International Co Ltd | | | 2,592,917 | |
| | | |
| | | 551,000 | | | Mitac Holdings Corp | | | 666,070 | |
| | | |
| | | 750,000 | | | Nan Ya Plastics Corp | | | 2,365,500 | |
| | | |
| | | 390,502 | | | Nantex Industry Co Ltd | | | 1,040,197 | |
| | | |
| | | 69,000 | | | Pegatron Corp | | | 171,020 | |
| | | |
| | | 217,000 | | | Phison Electronics Corp | | | 4,014,962 | |
| | | |
| | | 3,229,566 | | | Pou Chen Corp | | | 3,724,376 | |
| | | |
| | | 140,000 | | | Powertech Technology Inc | | | 474,871 | |
| | | |
| | | 474,000 | | | Qisda Corp ADR | | | 523,857 | |
| | | |
| | | 263,000 | | | Quanta Computer Inc | | | 879,445 | |
| | | |
| | | 2,198,378 | | | Radiant Opto-Electronics Corp | | | 7,948,956 | |
| | | |
| | | 17,000 | | | Rexon Industrial Corp Ltd | | | 26,188 | |
| | | |
| | | 1,691,400 | | | Ruentex Development Co Ltd | | | 4,367,239 | |
| | | |
| | | 637,000 | | | Ruentex Industries Ltd | | | 2,650,020 | |
| | | |
| | | 20,000 | | | Shanghai Commercial & Savings Bank Ltd (The) | | | 32,945 | |
| | | |
| | | 185,000 | | | Shin Kong Financial Holding Co Ltd | | | 75,024 | |
| | | |
| | | 176,280 | | | Shin Zu Shing Co Ltd | | | 572,645 | |
| | | |
| | | 178,000 | | | Shinkong Insurance Co Ltd | | | 303,059 | |
| | | |
| | | 85,000 | | | Simplo Technology Co Ltd | | | 953,848 | |
| | | |
| | | 145,000 | | | SinoPac Financial Holdings Co Ltd | | | 89,039 | |
| | | |
| | | 42,360 | | | Sitronix Technology Corp | | | 448,793 | |
| | | |
| | | 387,000 | | | Syncmold Enterprise Corp | | | 943,227 | |
| | | |
| | | 25,311 | | | Tah Hsin Industrial Corp | | | 76,112 | |
| | | |
| | | 1,419,000 | | | Taiwan Cement Corp | | | 2,408,927 | |
| | | |
| | | 1,213,000 | | | Taiwan Semiconductor Manufacturing Co Ltd | | | 26,078,962 | |
| | | |
| | | 130,850 | | | Taiwan Semiconductor Manufacturing Co Ltd Sponsored ADR (b) | | | 14,002,258 | |
| | | |
| | | 24,000 | | | Teco Electric and Machinery Co Ltd | | | 25,924 | |
| | | |
| | | 4,000 | | | Thinking Electronic Industrial Co Ltd | | | 20,114 | |
| | | | |
| | |
| 84 | | See accompanying notes to the financial statements. | | |
GMO Implementation Fund
(A Series of GMO Trust)
Consolidated Schedule of Investments — (Continued)
(showing percentage of total net assets)
February 28, 2022
| | | | | | | | | | |
| | |
Shares | | | Description | | Value ($) | |
| | | |
| | | | | | Taiwan — continued | | | |
| | | |
| | | 411,699 | | | TOPBI International Holdings Ltd * | | | 157,673 | |
| | | |
| | | 431,000 | | | Transcend Information Inc | | | 1,093,142 | |
| | | |
| | | 231,000 | | | Tripod Technology Corp | | | 1,059,098 | |
| | | |
| | | 28,000 | | | Tung Ho Steel Enterprise Corp | | | 70,527 | |
| | | |
| | | 190,681 | | | United Integrated Services Co Ltd | | | 1,207,172 | |
| | | |
| | | 348,000 | | | Universal Inc | | | 501,223 | |
| | | |
| | | 47,000 | | | Vanguard International Semiconductor Corp | | | 213,303 | |
| | | |
| | | 85,000 | | | Walsin Technology Corp * | | | 450,229 | |
| | | |
| | | 303,000 | | | Youngtek Electronics Corp | | | 899,428 | |
| | | |
| | | 6,114,000 | | | Yuanta Financial Holding Co Ltd | | | 5,461,591 | |
| | | |
| | | 7,000 | | | Yulon Nissan Motor Co Ltd | | | 62,176 | |
| | | | | | | | | | |
| | | |
| | | | | | Total Taiwan | | | 235,133,180 | |
| | | | | | | | | | |
| | | |
| | | | | | Thailand — 0.7% | | | |
| | | |
| | | 4,804,000 | | | AP Thailand Pcl NVDR | | | 1,561,540 | |
| | | |
| | | 240,000 | | | Bangkok Bank Pcl NVDR | | | 1,034,004 | |
| | | |
| | | 147,600 | | | CP ALL Pcl (Foreign Registered) | | | 308,368 | |
| | | |
| | | 57,400 | | | CP ALL Pcl NVDR | | | 119,921 | |
| | | |
| | | 32,800 | | | Delta Electronics Thailand Pcl NVDR | | | 410,666 | |
| | | |
| | | 79,800 | | | Kasikornbank Pcl (Foreign Registered) | | | 401,335 | |
| | | |
| | | 2,187,800 | | | Kasikornbank Pcl NVDR | | | 11,003,015 | |
| | | |
| | | 2,880,600 | | | Krung Thai Bank Pcl NVDR | | | 1,239,314 | |
| | | |
| | | 159,808 | | | Pruksa Holding Pcl (Foreign Registered) | | | 70,454 | |
| | | |
| | | 565,380 | | | Pruksa Holding Pcl NVDR | | | 249,258 | |
| | | |
| | | 123,600 | | | PTT Exploration & Production Pcl NVDR | | | 520,388 | |
| | | |
| | | 3,130,500 | | | PTT Global Chemical Pcl NVDR | | | 5,101,672 | |
| | | |
| | | 373,900 | | | PTT Pcl NVDR | | | 455,137 | |
| | | |
| | | 8,185,700 | | | Sansiri Pcl NVDR | | | 310,041 | |
| | | |
| | | 849,700 | | | SC Asset Corp Pcl (Foreign Registered) | | | 101,404 | |
| | | |
| | | 483,596 | | | Siam Cement Pcl NVDR (The) | | | 5,819,901 | |
| | | |
| | | 132,612 | | | Siam Commercial Bank Pcl NVDR (The) | | | 512,447 | |
| | | |
| | | 207,800 | | | Somboon Advance Technology Pcl NVDR | | | 134,461 | |
| | | |
| | | 192,799 | | | Supalai Pcl (Foreign Registered) | | | 129,844 | |
| | | |
| | | 34,000 | | | Supalai Pcl NVDR | | | 22,898 | |
| | | |
| | | 3,338,600 | | | Thai Union Group Pcl NVDR | | | 2,087,965 | |
| | | |
| | | 189,300 | | | Thai Vegetable Oil Pcl NVDR | | | 188,595 | |
| | | | | | | | | | |
| | | |
| | | | | | Total Thailand | | | 31,782,628 | |
| | | | | | | | | | |
| | | |
| | | | | | Turkey — 0.6% | | | |
| | | |
| | | 4,814,110 | | | Akbank TAS | | | 2,457,255 | |
| | | |
| | | 18,061 | | | Aksa Akrilik Kimya Sanayii AS | | | 47,042 | |
| | | |
| | | 1,123,943 | | | Arcelik AS | | | 4,497,198 | |
| | | |
| | | 181,574 | | | Dogus Otomotiv Servis ve Ticaret AS | | | 616,052 | |
| | | |
| | | 176,203 | | | Enerjisa Enerji AS | | | 168,986 | |
| | | |
| | | 988,895 | | | Eregli Demir ve Celik Fabrikalari TAS | | | 2,225,617 | |
| | | |
| | | 243,290 | | | Ford Otomotiv Sanayi AS | | | 4,742,332 | |
| | | |
| | | 2,564,897 | | | Haci Omer Sabanci Holding AS | | | 2,884,906 | |
| | | | | | | | | | |
| | |
Shares | | | Description | | Value ($) | |
| | | |
| | | | | | Turkey — continued | | | |
| | | |
| | | 6,614 | | | Koza Altin Isletmeleri AS * | | | 54,836 | |
| | | |
| | | 357,197 | | | Tofas Turk Otomobil Fabrikasi AS | | | 2,075,427 | |
| | | |
| | | 7,063,818 | | | Turkiye Garanti Bankasi AS | | | 5,661,414 | |
| | | |
| | | 369,614 | | | Vestel Elektronik Sanayi ve Ticaret AS | | | 601,007 | |
| | | |
| | | 1,045,924 | | | Yapi ve Kredi Bankasi AS | | | 270,150 | |
| | | | | | | | | | |
| | | |
| | | | | | Total Turkey | | | 26,302,222 | |
| | | | | | | | | | |
| | | |
| | | | | | United Kingdom — 4.1% | | | |
| | | |
| | | 291,494 | | | 3i Group Plc | | | 5,192,709 | |
| | | |
| | | 300,197 | | | Airtel Africa Plc | | | 567,195 | |
| | | |
| | | 1,884,016 | | | Avast Plc (b) | | | 15,869,080 | |
| | | |
| | | 11,845 | | | Bank of Georgia Group Plc | | | 209,796 | |
| | | |
| | | 901,231 | | | Barratt Developments Plc | | | 7,340,720 | |
| | | |
| | | 84,796 | | | Bellway Plc | | | 3,261,640 | |
| | | |
| | | 223,103 | | | Berkeley Group Holdings Plc | | | 11,602,761 | |
| | | |
| | | 90,900 | | | BP Plc Sponsored ADR (b) | | | 2,655,189 | |
| | | |
| | | 65,118 | | | British American Tobacco Plc (b) | | | 2,853,919 | |
| | | |
| | | 136,100 | | | British American Tobacco Plc Sponsored ADR (b) | | | 6,021,064 | |
| | | |
| | | 5,874,357 | | | BT Group Plc | | | 14,657,066 | |
| | | |
| | | 63,458 | | | Centrica Plc * (b) | | | 65,361 | |
| | | |
| | | 280,882 | | | Coca-Cola HBC AG * | | | 7,136,239 | |
| | | |
| | | 524,863 | | | Compass Group Plc (b) | | | 11,863,505 | |
| | | |
| | | 3,537 | | | Computacenter Plc (b) | | | 129,468 | |
| | | |
| | | 104,461 | | | Crest Nicholson Holdings Plc | | | 428,735 | |
| | | |
| | | 1,869 | | | DCC Plc | | | 146,667 | |
| | | |
| | | 10,765 | | | EMIS Group Plc (b) | | | 177,586 | |
| | | |
| | | 30,601 | | | Evraz Plc | | | 58,989 | |
| | | |
| | | 624,007 | | | Ferrexpo Plc | | | 1,415,396 | |
| | | |
| | | 9,400 | | | GlaxoSmithKline Plc Sponsored ADR (b) | | | 393,484 | |
| | | |
| | | 19,354 | | | Grafton Group Plc | | | 277,926 | |
| | | |
| | | 180,667 | | | Halfords Group Plc | | | 671,291 | |
| | | |
| | | 6,794 | | | IMI Plc | | | 133,096 | |
| | | |
| | | 69,093 | | | Imperial Brands Plc | | | 1,510,806 | |
| | | |
| | | 348,468 | | | Indivior Plc * | | | 1,311,221 | |
| | | |
| | | 27,836 | | | International Personal Finance Plc | | | 41,660 | |
| | | |
| | | 182,508 | | | Investec Plc | | | 989,867 | |
| | | |
| | | 1,128,455 | | | ITV Plc * | | | 1,662,606 | |
| | | |
| | | 72,951 | | | J Sainsbury Plc | | | 269,052 | |
| | | |
| | | 154,676 | | | JD Sports Fashion Plc (b) | | | 311,152 | |
| | | |
| | | 11,440 | | | Keller Group Plc | | | 121,058 | |
| | | |
| | | 2,955,981 | | | Kingfisher Plc | | | 12,058,496 | |
| | | |
| | | 778,289 | | | Legal & General Group Plc | | | 2,877,667 | |
| | | |
| | | 4,216,318 | | | M&G Plc | | | 11,606,999 | |
| | | |
| | | 54,540 | | | Marks & Spencer Group Plc * (b) | | | 127,119 | |
| | | |
| | | 1,291,301 | | | Meggitt Plc * | | | 13,005,936 | |
| | | |
| | | 696,509 | | | Micro Focus International Plc (b) | | | 3,620,059 | |
| | | |
| | | 44,825 | | | Morgan Sindall Group Plc | | | 1,386,334 | |
| | | |
| | | 14,377 | | | Next Plc (b) | | | 1,316,392 | |
| | | |
| | | 122,553 | | | OSB Group Plc | | | 818,965 | |
| | | |
| | | 140,399 | | | Paragon Banking Group Plc | | | 945,310 | |
| | | | |
| | |
| | | See accompanying notes to the financial statements. | | 85 |
GMO Implementation Fund
(A Series of GMO Trust)
Consolidated Schedule of Investments — (Continued)
(showing percentage of total net assets)
February 28, 2022
| | | | | | | | | | |
| | |
Shares | | | Description | | Value ($) | |
| | | |
| | | | | | United Kingdom — continued | | | |
| | | |
| | | 289,962 | | | Persimmon Plc | | | 9,332,001 | |
| | | |
| | | 111,672 | | | Pets at Home Group Plc | | | 539,864 | |
| | | |
| | | 171,437 | | | Plus500 Ltd | | | 3,199,018 | |
| | | |
| | | 436,316 | | | Premier Foods Plc | | | 642,323 | |
| | | |
| | | 272,265 | | | Reach Plc | | | 831,641 | |
| | | |
| | | 101,046 | | | Redde Northgate Plc (b) | | | 512,827 | |
| | | |
| | | 233,148 | | | Redrow Plc | | | 1,777,406 | |
| | | |
| | | 32,200 | | | Rio Tinto Plc Sponsored ADR (b) | | | 2,530,276 | |
| | | |
| | | 366,827 | | | Royal Mail Plc (b) | | | 1,927,879 | |
| | | |
| | | 102,406 | | | Serica Energy Plc | | | 380,757 | |
| | | |
| | | 362,328 | | | Shell Plc(b) | | | 9,554,876 | |
| | | |
| | | 101,487 | | | Spirent Communications Plc | | | 332,060 | |
| | | |
| | | 68,194 | | | Tate & Lyle Plc | | | 684,564 | |
| | | |
| | | 1,491,838 | | | Taylor Wimpey Plc | | | 2,992,308 | |
| | | |
| | | 3,053 | | | TBC Bank Group Plc | | | 49,133 | |
| | | |
| | | 48,550 | | | Unilever Plc (b) (c) | | | 2,438,762 | |
| | | |
| | | 40,915 | | | Unilever Plc (c) | | | 2,052,889 | |
| | | |
| | | 42,325 | | | Vesuvius Plc | | | 224,878 | |
| | | |
| | | 14,497 | | | Vistry Group Plc | | | 194,997 | |
| | | |
| | | 347,798 | | | WPP Plc | | | 4,891,740 | |
| | | | | | | | | | |
| | | |
| | | | | | Total United Kingdom | | | 192,199,780 | |
| | | | | | | | | | |
| | | |
| | | | | | United States — 20.8% | | | |
| | | |
| | | 235,946 | | | Activision Blizzard, Inc. (b) (f) | | | 19,229,599 | |
| | | |
| | | 1 | | | Advanced Micro Devices, Inc. * | | | 24 | |
| | | |
| | | 89,900 | | | Aflac, Inc. (b) | | | 5,491,991 | |
| | | |
| | | 25,600 | | | AGNC Investment Corp. (REIT) | | | 330,496 | |
| | | |
| | | 86,200 | | | Alliance Data Systems Corp. (b) | | | 5,814,190 | |
| | | |
| | | 10,600 | | | Allstate Corp. (The) (b) | | | 1,297,016 | |
| | | |
| | | 131,100 | | | Ally Financial, Inc. | | | 6,541,890 | |
| | | |
| | | 56,218 | | | American Express Co. (b) | | | 10,936,650 | |
| | | |
| | | 51,758 | | | Apollo Investment Corp. | | | 695,628 | |
| | | |
| | | 10,300 | | | Arch Capital Group Ltd. * | | | 485,233 | |
| | | |
| | | 83,225 | | | Arena Pharmaceuticals, Inc. * | | | 7,903,878 | |
| | | |
| | | 59,100 | | | Arrow Electronics, Inc. * | | | 7,203,108 | |
| | | |
| | | 265,700 | | | AT&T, Inc. (b) | | | 6,294,433 | |
| | | |
| | | 5,000 | | | Bath & Body Works, Inc. (b) | | | 266,850 | |
| | | |
| | | 60,300 | | | Best Buy Co., Inc. (b) | | | 5,827,392 | |
| | | |
| | | 9,200 | | | Bio-Rad Laboratories, Inc. – Class A * | | | 5,758,832 | |
| | | |
| | | 26,100 | | | Biogen, Inc. * | | | 5,507,361 | |
| | | |
| | | 3,878 | | | Booking Holdings, Inc. * (b) | | | 8,423,986 | |
| | | |
| | | 307,445 | | | BorgWarner, Inc. | | | 12,608,319 | |
| | | |
| | | 69,778 | | | Bristol-Myers Squibb Co. (b) | | | 4,791,655 | |
| | | |
| | | 99,576 | | | Bruin Blocker LLC (e) | | | 57,226 | |
| | | |
| | | 50,500 | | | Capital One Financial Corp. (b) | | | 7,740,135 | |
| | | |
| | | 144,100 | | | Carrier Global Corp. (b) | | | 6,467,208 | |
| | | |
| | | 74,600 | | | CBRE Group, Inc. – Class A * (b) | | | 7,225,010 | |
| | | |
| | | 90,500 | | | Centene Corp. * (b) | | | 7,477,110 | |
| | | |
| | | 141,148 | | | Cerner Corp. (b) | | | 13,162,051 | |
| | | |
| | | 1,350,675 | | | Change Healthcare, Inc. * (b) | | | 28,931,459 | |
| | | |
| | | 293,348 | | | Chatham Lodging Trust (REIT) * | | | 4,033,535 | |
| | | |
| | | 57,861 | | | Chevron Corp. (b) | | | 8,331,984 | |
| | | | | | | | | | |
| | |
Shares | | | Description | | Value ($) | |
| | | |
| | | | | | United States — continued | | | |
| | | |
| | | 34,800 | | | Cigna Corp. (b) | | | 8,274,744 | |
| | | |
| | | 130,121 | | | Citigroup, Inc. (b) | | | 7,707,067 | |
| | | |
| | | 34,200 | | | Citizens Financial Group, Inc. | | | 1,792,764 | |
| | | |
| | | 76,369 | | | Citrix Systems, Inc. (b) | | | 7,827,823 | |
| | | |
| | | 56,413 | | | CMC Materials, Inc. | | | 10,460,663 | |
| | | |
| | | 77,400 | | | Cognizant Technology Solutions Corp. – Class A (b) | | | 6,666,462 | |
| | | |
| | | 19,207 | | | Coherent, Inc. * | | | 5,076,794 | |
| | | |
| | | 127,900 | | | Comcast Corp. – Class A (b) | | | 5,980,604 | |
| | | |
| | | 232,729 | | | Cornerstone Building Brands, Inc. * | | | 5,138,656 | |
| | | |
| | | 43,500 | | | CVS Health Corp. (b) | | | 4,508,775 | |
| | | |
| | | 260,438 | | | CyrusOne, Inc. (REIT) (b) | | | 23,530,573 | |
| | | |
| | | 156,998 | | | Darling Ingredients, Inc. * | | | 11,379,215 | |
| | | |
| | | 53,800 | | | Discover Financial Services (b) | | | 6,641,072 | |
| | | |
| | | 186,000 | | | DISH Network Corp. – Class A * | | | 5,944,560 | |
| | | |
| | | 73,000 | | | DR Horton, Inc. (b) | | | 6,234,200 | |
| | | |
| | | 99,100 | | | eBay, Inc. (b) | | | 5,409,869 | |
| | | |
| | | 101,146 | | | EOG Resources, Inc. | | | 11,623,698 | |
| | | |
| | | 1,288,200 | | | ESC NII Holdings, Inc. (e) | | | 386,460 | |
| | | |
| | | 115,300 | | | Fidelity National Financial, Inc. | | | 5,492,892 | |
| | | |
| | | 24,200 | | | FleetCor Technologies, Inc. * (b) | | | 5,667,640 | |
| | | |
| | | 341,200 | | | Ford Motor Co. | | | 5,991,472 | |
| | | |
| | | 62,100 | | | Fox Corp. – Class A (b) | | | 2,597,643 | |
| | | |
| | | 502,887 | | | Fox Corp. – Class B | | | 19,240,457 | |
| | | |
| | | 159,600 | | | Franklin Resources, Inc. | | | 4,744,908 | |
| | | |
| | | 578,586 | | | Frontier Group Holdings, Inc. * (b) | | | 7,452,188 | |
| | | |
| | | 131,100 | | | General Motors Co. * | | | 6,124,992 | |
| | | |
| | | 108,300 | | | Gilead Sciences, Inc. (b) | | | 6,541,320 | |
| | | |
| | | 38,154 | | | Global Payments, Inc. (b) | | | 5,088,981 | |
| | | |
| | | 14,200 | | | Goldman Sachs Group, Inc. (The) (b) | | | 4,846,318 | |
| | | |
| | | 66,707 | | | Green Plains, Inc. * | | | 2,183,987 | |
| | | |
| | | 12,031 | | | Gulfport Energy Corp. * | | | 829,898 | |
| | | |
| | | 68,100 | | | Hasbro, Inc. | | | 6,609,105 | |
| | | |
| | | 53,572 | | | Hilton Worldwide Holdings, Inc. * (b) | | | 7,974,728 | |
| | | |
| | | 208,900 | | | HP, Inc. | | | 7,177,804 | |
| | | |
| | | 44,900 | | | IAC/InterActiveCorp * | | | 5,152,724 | |
| | | |
| | | 82,400 | | | Incyte Corp. * | | | 5,627,920 | |
| | | |
| | | 149,300 | | | Intel Corp. (b) | | | 7,121,610 | |
| | | |
| | | 64,853 | | | Intercontinental Exchange, Inc. (b) | | | 8,308,966 | |
| | | |
| | | 60,500 | | | International Business Machines Corp. (b) | | | 7,411,855 | |
| | | |
| | | 246,000 | | | Invesco Ltd. | | | 5,225,040 | |
| | | |
| | | 1,058,540 | | | Investors Bancorp, Inc. | | | 17,719,960 | |
| | | |
| | | 47,300 | | | Jazz Pharmaceuticals Plc * | | | 6,499,966 | |
| | | |
| | | 474,100 | | | Kinder Morgan, Inc. | | | 8,249,340 | |
| | | |
| | | 84,100 | | | Kohl’s Corp. (b) | | | 4,677,642 | |
| | | |
| | | 108,800 | | | Kroger Co. (The) (b) | | | 5,091,840 | |
| | | |
| | | 27,400 | | | Laboratory Corp. of America Holdings * (b) | | | 7,432,524 | |
| | | |
| | | 112,705 | | | Las Vegas Sands Corp. * (b) | | | 4,830,536 | |
| | | |
| | | 43,500 | | | Leidos Holdings, Inc. | | | 4,430,040 | |
| | | |
| | | 69,500 | | | Lennar Corp. – Class A | | | 6,246,660 | |
| | | |
| | | 62,164 | | | Liberty Broadband Corp. – Class C * | | | 9,119,459 | |
| | | | |
| | |
| 86 | | See accompanying notes to the financial statements. | | |
GMO Implementation Fund
(A Series of GMO Trust)
Consolidated Schedule of Investments — (Continued)
(showing percentage of total net assets)
February 28, 2022
| | | | | | | | | | |
| | |
Shares | | | Description | | Value ($) | |
| | | |
| | | | | | United States — continued | | | |
| | | |
| | | 87,800 | | | Liberty Global Plc – Class A * | | | 2,263,484 | |
| | | |
| | | 167,500 | | | Liberty Global Plc – Class C * | | | 4,333,225 | |
| | | |
| | | 106,300 | | | Lincoln National Corp. | | | 7,166,746 | |
| | | |
| | | 91,500 | | | LKQ Corp. (b) | | | 4,295,925 | |
| | | |
| | | 435,200 | | | Lumen Technologies, Inc. | | | 4,508,672 | |
| | | |
| | | 193,188 | | | Lyft, Inc. – Class A * (b) | | | 7,522,741 | |
| | | |
| | | 81,800 | | | LyondellBasell Industries NV – Class A | | | 7,953,414 | |
| | | |
| | | 63,800 | | | Macquarie Infrastructure Holdings Corp. | | | 232,870 | |
| | | |
| | | 5,988 | | | Markel Corp. * | | | 7,442,545 | |
| | | |
| | | 79,100 | | | Merck & Co., Inc. (b) | | | 6,057,478 | |
| | | |
| | | 6,900 | | | Meta Platforms, Inc. – Class A * (b) | | | 1,456,107 | |
| | | |
| | | 123,700 | | | MetLife, Inc. | | | 8,355,935 | |
| | | |
| | | 36,745 | | | MGM Growth Properties LLC – Class A (REIT) (b) | | | 1,391,533 | |
| | | |
| | | 87,800 | | | Micron Technology, Inc. (b) | | | 7,801,908 | |
| | | |
| | | 23,300 | | | Mohawk Industries, Inc. * | | | 3,280,174 | |
| | | |
| | | 147,900 | | | Molson Coors Brewing Co. – Class B | | | 7,717,422 | |
| | | |
| | | 51,800 | | | NRG Energy, Inc. (b) | | | 1,960,112 | |
| | | |
| | | 471,940 | | | Nuance Communications, Inc. * (b) | | | 26,202,109 | |
| | | |
| | | 160 | | | NVR, Inc. * | | | 793,350 | |
| | | |
| | | 29,800 | | | Omnicom Group, Inc. (b) | | | 2,499,922 | |
| | | |
| | | 81,400 | | | Oracle Corp. (b) | | | 6,183,958 | |
| | | |
| | | 8,100 | | | Owens Corning | | | 754,839 | |
| | | |
| | | 185,800 | | | Paramount Global – Class B | | | 5,687,338 | |
| | | |
| | | 153,618 | | | Park Hotels & Resorts, Inc. (REIT) * | | | 2,894,163 | |
| | | |
| | | 852,466 | | | People’s United Financial, Inc. | | | 17,969,983 | |
| | | |
| | | 755,227 | | | Pershing Square Tontine Holdings Ltd. – Class A * | | | 14,961,047 | |
| | | |
| | | 86,781 | | | PG&E Corp. * (b) | | | 986,700 | |
| | | |
| | | 113,348 | | | PNM Resources, Inc. (b) | | | 5,119,929 | |
| | | |
| | | 15,300 | | | Principal Financial Group, Inc. | | | 1,080,792 | |
| | | |
| | | 69,900 | | | Prudential Financial, Inc. | | | 7,805,034 | |
| | | |
| | | 131,100 | | | PulteGroup, Inc. | | | 6,510,426 | |
| | | |
| | | 47,500 | | | Quest Diagnostics, Inc. (b) | | | 6,235,325 | |
| | | |
| | | 782,600 | | | Qurate Retail, Inc. – Series A | | | 4,312,126 | |
| | | |
| | | 94,850 | | | Raytheon Technologies Corp. (b) | | | 9,741,095 | |
| | | |
| | | 12,100 | | | Regeneron Pharmaceuticals, Inc. * (b) | | | 7,482,156 | |
| | | |
| | | 22,500 | | | Regions Financial Corp. | | | 544,275 | |
| | | |
| | | 14,200 | | | Resolute Forest Products, Inc. (c) | | | 177,074 | |
| | | |
| | | 15,600 | | | Resolute Forest Products, Inc. (c) | | | 194,954 | |
| | | |
| | | 37,356 | | | S&P Global, Inc. | | | 14,034,553 | |
| | | |
| | | 173,988 | | | Sensata Technologies Holding Plc * | | | 10,075,645 | |
| | | |
| | | 69,780 | | | Service Properties Trust (REIT) | | | 602,201 | |
| | | |
| | | 114,350 | | | Skillsoft Corp. * | | | 740,988 | |
| | | |
| | | 6,500 | | | Skyworks Solutions, Inc. | | | 898,105 | |
| | | |
| | | 2,800 | | | Snap-on, Inc. | | | 588,504 | |
| | | |
| | | 152,904 | | | South Jersey Industries, Inc. | | | 5,188,033 | |
| | | |
| | | 234,975 | | | Southeastern Grocers, Inc. * (d) | | | 5,345,681 | |
| | | |
| | | 249,781 | | | Sportsman’s Warehouse Holdings, Inc.* | | | 2,850,001 | |
| | | |
| | | 42,500 | | | SS&C Technologies Holdings, Inc. (b) | | | 3,186,225 | |
| | | | | | | | | | |
| | |
Shares | | | Description | | Value ($) | |
| | | |
| | | | | | United States — continued | | | |
| | | |
| | | 33,000 | | | Steel Dynamics, Inc. | | | 2,329,140 | |
| | | |
| | | 166,000 | | | Synchrony Financial | | | 7,101,480 | |
| | | |
| | | 1,507,100 | | | Syncora Holdings Ltd. (d) | | | 232,998 | |
| | | |
| | | 23,689 | | | Tempur Sealy International, Inc. | | | 781,974 | |
| | | |
| | | 328,566 | | | Terminix Global Holdings, Inc. * (b) | | | 13,983,769 | |
| | | |
| | | 69,100 | | | Textron, Inc. | | | 5,053,283 | |
| | | |
| | | 1,888,723 | | | The Oneida Group (d) | | | 2,058,708 | |
| | | |
| | | 160,204 | | | TRU TAJ (d) | | | 874,714 | |
| | | |
| | | 5,869 | | | TRU TAJ Liquidation Unit Trust (d) | | | 59 | |
| | | |
| | | 83,500 | | | Tyson Foods, Inc. – Class A (b) | | | 7,737,110 | |
| | | |
| | | 516,004 | | | Umpqua Holdings Corp. | | | 11,016,685 | |
| | | |
| | | 54,300 | | | Universal Health Services, Inc. – Class B (b) | | | 7,815,399 | |
| | | |
| | | 178,423 | | | US Bancorp | | | 10,088,036 | |
| | | |
| | | 119,300 | | | Verizon Communications, Inc. (b) | | | 6,402,831 | |
| | | |
| | | 23,741 | | | Verso Corp. – Class A | | | 629,374 | |
| | | |
| | | 106,224 | | | VF Corp. | | | 6,163,117 | |
| | | |
| | | 463,600 | | | Viatris, Inc. | | | 5,104,236 | |
| | | |
| | | 48,900 | | | VMware, Inc. – Class A (b) | | | 5,736,948 | |
| | | |
| | | 45,500 | | | Walgreens Boots Alliance, Inc. (b) | | | 2,097,095 | |
| | | |
| | | 187,207 | | | Wells Fargo & Co. | | | 9,991,238 | |
| | | |
| | | 329,600 | | | Western Union Co. (The) (b) | | | 5,992,128 | |
| | | |
| | | 106,700 | | | Western Digital Corp. * | | | 5,435,298 | |
| | | |
| | | 107,060 | | | Westmoreland Mining Holdings LLC (e) | | | 5,353 | |
| | | |
| | | 28,100 | | | Whirlpool Corp. | | | 5,655,687 | |
| | | |
| | | 92,574 | | | Willis Towers Watson Plc (b) | | | 20,579,200 | |
| | | |
| | | 95,760 | | | Xenia Hotels & Resorts, Inc. (REIT) * | | | 1,775,390 | |
| | | |
| | | 99,222 | | | Zogenix, Inc. * | | | 2,605,570 | |
| | | |
| | | 17,800 | | | Zoom Video Communications, Inc. – Class A * (b) | | | 2,360,280 | |
| | | |
| | | 2,465,641 | | | Zynga Inc. – Class A * (b) (f) | | | 22,388,020 | |
| | | | | | | | | | |
| | | |
| | | | | | Total United States | | | 972,510,605 | |
| | | | | | | | | | |
| | | |
| | | | | | Vietnam — 0.0% | | | |
| | | |
| | | 11,000 | | | PetroVietnam Nhon Trach 2 Power JSC | | | 11,144 | |
| | | |
| | | 35,000 | | | Pha Lai Thermal Power JSC | | | 34,300 | |
| | | | | | | | | | |
| | | |
| | | | | | Total Vietnam | | | 45,444 | |
| | | | | | | | | | |
| | | |
| | | | | | TOTAL COMMON STOCKS
(COST $3,834,366,652) | | | 3,655,296,949 | |
| | | | | | | | | | |
| | |
| | | | | | PREFERRED STOCKS (g) — 1.5% | |
| | |
| | | | | | Brazil — 0.8% | |
| | | |
| | | 1,401,602 | | | Bradespar SA | | | 8,067,977 | |
| | | |
| | | 871,300 | | | Cia Energetica de Minas Gerais | | | 2,141,018 | |
| | | |
| | | 377,600 | | | Cia Energetica de Minas Gerais Sponsored ADR (b) | | | 951,552 | |
| | | |
| | | 3,524,000 | | | Cia Paranaense de Energia – Class B | | | 4,708,745 | |
| | | |
| | | 139,900 | | | Gerdau SA | | | 693,878 | |
| | | |
| | | 58,000 | | | Gerdau SA Sponsored ADR | | | 282,460 | |
| | | | |
| | |
| | | See accompanying notes to the financial statements. | | 87 |
GMO Implementation Fund
(A Series of GMO Trust)
Consolidated Schedule of Investments — (Continued)
(showing percentage of total net assets)
February 28, 2022
| | | | | | | | | | |
| | |
Shares | | | Description | | Value ($) | |
| | |
| | | | | | Brazil — continued | |
| | | |
| | | 12,800 | | | Metalurgica Gerdau SA | | | 25,725 | |
| | | |
| | | 1,579,100 | | | Petroleo Brasileiro SA | | | 10,380,145 | |
| | | |
| | | 596,300 | | | Petroleo Brasileiro SA Sponsored ADR | | | 7,805,567 | |
| | | |
| | | 35,000 | | | Usinas Siderurgicas de Minas Gerais SA Usiminas – Class A | | | 98,937 | |
| | | | | | | | | | |
| | | |
| | | | | | Total Brazil | | | 35,156,004 | |
| | | | | | | | | | |
| | | |
| | | | | | Chile — 0.0% | | | |
| | | |
| | | 22,769 | | | Embotelladora Andina SA – Class B | | | 49,582 | |
| | | |
| | | 9,400 | | | Sociedad Quimica y Minera de Chile SA Sponsored ADR | | | 622,092 | |
| | | | | | | | | | |
| | | |
| | | | | | Total Chile | | | 671,674 | |
| | | | | | | | | | |
| | | |
| | | | | | Colombia — 0.0% | | | |
| | | |
| | | 494,873 | | | Grupo Aval Acciones y Valores SA | | | 133,240 | |
| | | | | | | | | | |
| | | |
| | | | | | Germany — 0.1% | | | |
| | | |
| | | 54,059 | | | Bayerische Motoren Werke AG | | | 4,371,644 | |
| | | |
| | | 11,008 | | | Draegerwerk AG & Co KGaA | | | 623,631 | |
| | | |
| | | 3,461 | | | Villeroy & Boch AG | | | 92,457 | |
| | | |
| | | 5,481 | | | Volkswagen AG | | | 1,077,442 | |
| | | | | | | | | | |
| | | |
| | | | | | Total Germany | | | 6,165,174 | |
| | | | | | | | | | |
| | | |
| | | | | | Russia — 0.2% | | | |
| | | |
| | | 15,222 | | | Bashneft PJSC | | | 72,397 | |
| | | |
| | | 79,750 | | | Nizhnekamskneftekhim PJSC – Class S | | | 45,810 | |
| | | |
| | | 49,530 | | | Sberbank of Russia PJSC | | | 45,984 | |
| | | |
| | | 20,862,000 | | | Surgutneftegas PJSC | | | 5,868,799 | |
| | | |
| | | 12,313 | | | Tatneft PJSC | | | 31,978 | |
| | | |
| | | 337 | | | Transneft PJSC | | | 416,445 | |
| | | | | | | | | | |
| | | |
| | | | | | Total Russia | | | 6,481,413 | |
| | | | | | | | | | |
| | | |
| | | | | | South Korea — 0.4% | | | |
| | | |
| | | 4,357 | | | Hyundai Motor Co Ltd-Prf | | | 319,572 | |
| | | |
| | | 37,422 | | | LG Electronics Inc | | | 1,872,892 | |
| | | |
| | | 277,666 | | | Samsung Electronics Co Ltd | | | 15,345,901 | |
| | | |
| | | 1,262 | | | Samsung Electronics Co Ltd GDR (Registered) | | | 1,739,601 | |
| | | | | | | | | | |
| | | |
| | | | | | Total South Korea | | | 19,277,966 | |
| | | | | | | | | | |
| | |
| | | | Taiwan — 0.0% | | | |
| | | |
| | | 97,864 | | | Chailease Holding Co Ltd | | | 356,168 | |
| | | |
| | | 368,832 | | | China Development Financial Holding Corp | | | 122,615 | |
| | | | | | | | | | |
| | |
| | | Total Taiwan | | | 478,783 | |
| | | | | | | | | | |
| | |
| | | | United States — 0.0% | | | |
| | | |
| | | 39 | | | Gulfport Energy Corp. (e) | | | 181,350 | |
| | | | | | | | | | |
| | | Shares /
Par Value† | | | Description | | Value ($) | |
| | | | United States — continued | | | |
| | | |
| | | 2,313 | | | Murray Energy Corp. (e) | | | 693,900 | |
| | | | | | | | | | |
| | |
| | | Total United States | | | 875,250 | |
| | | | | | | | | | |
| | |
| | | TOTAL PREFERRED STOCKS
(COST $66,417,912) | | | 69,239,504 | |
| | | | | | | | | | |
| | |
| | | | | | RIGHTS/WARRANTS — 0.0% | |
| | |
| | | | | | Egypt — 0.0% | |
| | | |
| | | 14,078 | | | Medinet Nasr Housing Co. CVR * | | | 762 | |
| | | | | | | | | | |
| | |
| | | | United States — 0.0% | | | |
| | | |
| | | 408,963 | | | Bristol-Myers Squibb Co. CVR * (e) | | | 552,100 | |
| | | |
| | | 222,285 | | | Contra Clementia Pharma CVR * (e) | | | 300,085 | |
| | | |
| | �� | 2,616,810 | | | Media General, Inc. CVR * (e) | | | 130,840 | |
| | | | | | | | | | |
| | |
| | | Total United States | | | 983,025 | |
| | | | | | | | | | |
| | |
| | | TOTAL RIGHTS/WARRANTS
(COST $1,183,901) | | | 983,787 | |
| | | | | | | | | | |
| | |
| | | | | | INVESTMENT FUNDS — 0.6% | |
| | |
| | | | | | United States — 0.6% | |
| | | |
| | | 3,755,410 | | | Altaba, Inc. (e) | | | 22,156,919 | |
| | | |
| | | 110,708 | | | iShares Core MSCI Emerging Markets ETF | | | 6,335,819 | |
| | | | | | | | | | |
| | |
| | | Total United States | | | 28,492,738 | |
| | | | | | | | | | |
| | |
| | | TOTAL INVESTMENT FUNDS
(COST $25,808,468) | | | 28,492,738 | |
| | | | | | | | | | |
| | |
| | | | | | DEBT OBLIGATIONS — 26.3% | |
| | |
| | | | | | Canada — 0.1% | |
| | |
| | | | | | Corporate Debt — 0.1% | |
| | | |
| | | 250,931 | | | Air Canada Pass-Through Trust – Class A, 144A, 3.60%, due 09/15/28 | | | 251,303 | |
| | | |
| | | 2,626,000 | | | Bombardier Inc, 144A, 7.88%, due 04/15/27 | | | 2,662,764 | |
| | | | | | | | | | |
| | |
| | | Total Canada | | | 2,914,067 | |
| | | | | | | | | | |
| | |
| | | | | | China — 0.0% | |
| | |
| | | | | | Corporate Debt — 0.0% | |
| | | |
| | | 709,000 | | | Scenery Journey Ltd., Reg S, 13.00%, due 11/06/22 (h) | | | 69,127 | |
| | | |
| | | 630,000 | | | Scenery Journey Ltd., Reg S, 11.50%, due 10/24/22 (h) | | | 57,415 | |
| | | |
| | | 2,130,000 | | | Scenery Journey Ltd., Reg S, 12.00%, due 10/24/23 (h) | | | 202,350 | |
| | | | | | | | | | |
| | |
| | | Total China | | | 328,892 | |
| | | | | | | | | | |
| | | | |
| | |
| 88 | | See accompanying notes to the financial statements. | | |
GMO Implementation Fund
(A Series of GMO Trust)
Consolidated Schedule of Investments — (Continued)
(showing percentage of total net assets)
February 28, 2022
| | | | | | | | | | |
| | |
Par Value† | | | Description | | Value ($) | |
| | | | | | Israel — 0.1% | |
| | |
| | | | | | Corporate Debt — 0.1% | |
| | | |
| | | 5,496,000 | | | Teva Pharmaceutical Finance Co. LLC, 6.15%, due 02/01/36 | | | 5,550,273 | |
| | | | | | | | | | |
| | |
| | | | | | Italy — 0.0% | |
| | |
| | | | | | Corporate Debt — 0.0% | |
| | | |
EUR | | | 545,000 | | | Banca Monte dei Paschi di Siena SPA, Reg. S, Variable Rate, 5.38%, due 01/18/28 | | | 408,762 | |
| | | | | | | | | | |
| | |
| | | | | | Luxembourg — 0.1% | |
| | |
| | | | | | Bank Loans | |
| | | |
| | | 2,460,000 | | | Delta 2 (LUX) S.a.r.l., 2018 USD Term Loan, Variable Rate, 1 mo. LIBOR plus 2.50%, 3.50%, due 02/01/24 (e) | | | 2,436,433 | |
| | | | | | | | | | |
| | |
| | | | | | Macau — 0.1% | |
| | |
| | | | | | Corporate Debt — 0.1% | |
| | | |
| | | 1,120,000 | | | Wynn Macau Ltd., 144A, 5.50%, due 10/01/27 | | | 982,800 | |
| | | |
| | | 2,250,000 | | | Wynn Macau Ltd., 144A, 5.63%, due 08/26/28 | | | 1,958,771 | |
| | | | | | | | | | |
| | |
| | | Total Macau | | | 2,941,571 | |
| | | | | | | | | | |
| | |
| | | | | | Netherlands — 0.0% | |
| | |
| | | | | | Corporate Debt — 0.0% | |
| | | |
EUR | | | 490,150 | | | Evander Gold Mines Ltd, 1.00%, due 04/19/26 (d) (h) | | | 55 | |
| | | | | | | | | | |
| | |
| | | | | | United States — 25.9% | |
| | |
| | | | | | Asset-Backed Securities — 0.2% | |
| | | |
| | | 4,697,761 | | | Alaska Airlines Pass-Through Trust, Series 20-1, Class B, 144A, 8.00%, due 02/15/27 | | | 5,165,120 | |
| | | |
| | | 7,063,383 | | | Crest G-Star LP, Series 01-1A, Class D, 144A, 9.00%, due 11/28/35 (h) | | | 7 | |
| | | |
| | | 3,792,678 | | | JetBlue Pass-Through Trust, Series 20-1, Class B, 7.75%, due 05/15/30 | | | 4,346,102 | |
| | | | | | | | | | |
| | |
| | | Total Asset-Backed Securities | | | 9,511,229 | |
| | | | | | | | | | |
| | |
| | | | | | Bank Loans — 0.4% | |
| | | |
| | | 2,077,685 | | | American Consolidated Natural Resources, Inc., 2020 Exit Term Loan, Variable Rate, 3 mo. LIBOR plus 13.00%, 14.00%, due 09/16/25 (e) | | | 2,124,433 | |
| | | |
| | | 1,908,740 | | | Envision Healthcare Corp., 2018 1st Lien Term Loan, Variable Rate, 1 mo. LIBOR plus 3.75%,, 3.96%, due 10/10/25 (e) | | | 1,388,609 | |
| | | | | | | | | | |
| | |
Par Value† | | | Description | | Value ($) | |
| | |
| | | | | | United States — continued | |
| | |
| | | | | | Bank Loans — continued | |
| | | |
| | | 2,447,669 | | | Frontier Communications Corp., 2021 DIP Term Loan B, Variable Rate, 3 mo. LIBOR plus 3.75%,, 4.50%, due 05/01/28 (e) | | | 2,430,340 | |
| | | |
| | | 4,015,517 | | | Quorum Health Corporation, 2020 Term Loan, Variable Rate, 3 mo. LIBOR plus 7.75%, 8.75%, due 04/29/25 (e) | | | 3,613,965 | |
| | | |
| | | 7,059,431 | | | SeaWorld Parks & Entertainment, Inc., 2021 Term Loan B, Variable Rate, 1 mo. LIBOR plus 3.00%, 3.50%, due 08/25/28 (e) | | | 6,951,351 | |
| | | |
| | | 1,997,229 | | | Serta Simmons Bedding, LLC, 2020 Super Priority Second Out Term Loan, Variable Rate, 1 mo. LIBOR plus 7.50%, 8.50%, due 08/10/23 (e) | | | 1,919,836 | |
| | | | | | | | | | |
| | |
| | | Total Bank Loans | | | 18,428,534 | |
| | | | | | | | | | |
| | |
| | | | | | Corporate Debt — 2.7% | |
| | | |
| | | 1,323,873 | | | American Airlines Pass-Through Trust – Class B, 4.38%, due 04/01/24 | | | 1,325,819 | |
| | | |
| | | 1,966,706 | | | American Airlines Pass-Through Trust – Class B, 3.70%, due 11/01/24 | | | 1,935,043 | |
| | | |
| | | 5,044,625 | | | American Airlines Pass-Through Trust – Class B, 4.40%, due 03/22/25 | | | 4,960,035 | |
| | | |
| | | 2,205,560 | | | American Airlines Pass-Through Trust – Class B, 5.25%, due 07/15/25 | | | 2,200,890 | |
| | | |
| | | 1,916,750 | | | American Airlines Pass-Through Trust – Class B, 144A, 4.38%, due 12/15/25 | | | 1,866,662 | |
| | | |
| | | 2,866,554 | | | American Airlines Pass-Through Trust – Class B, 4.95%, due 08/15/26 | | | 2,812,770 | |
| | | |
| | | 3,825,079 | | | American Airlines Pass-Through Trust – Class B, 3.70%, due 04/15/27 | | | 3,644,999 | |
| | | |
| | | 2,895,004 | | | American Airlines Pass-Through Trust – Class B, 3.75%, due 04/15/27 | | | 2,756,514 | |
| | | |
| | | 2,601,646 | | | American Airlines Pass-Through Trust – Class B, 3.85%, due 08/15/29 | | | 2,415,170 | |
| | | |
| | | 1,140,000 | | | Antero Midstream Partners LP / Antero Midstream Finance Corp., 144A, 5.75%, due 01/15/28 | | | 1,157,100 | |
| | | |
| | | 422,000 | | | Boeing Co. (The), 5.81%, due 05/01/50 | | | 501,340 | |
| | | |
| | | 2,963,000 | | | Boeing Co. (The), 5.93%, due 05/01/60 | | | 3,518,320 | |
| | | |
| | | 6,270,000 | | | Carnival Corp, 144A, 7.63%, due 03/01/26 | | | 6,445,497 | |
| | | |
| | | 4,280,000 | | | Carnival Corp, 144A, 5.75%, due 03/01/27 | | | 4,168,741 | |
| | | |
| | | 3,579,000 | | | Carnival Corp, 6.65%, due 01/15/28 | | | 3,502,946 | |
| | | |
| | | 1,120,000 | | | Carrols Restaurant Group, Inc., 144A, 5.88%, due 07/01/29 | | | 963,435 | |
| | | |
| | | 3,615,000 | | | CEC Entertainment LLC, 144A, 6.75%, due 05/01/26 | | | 3,440,106 | |
| | | |
| | | 6,700,000 | | | Cedar Fair LP / Canada’s Wonderland Co. / Magnum Management Corp. / Millennium Op, 6.50%, due 10/01/28 (f) | | | 6,867,500 | |
| | | | |
| | |
| | | See accompanying notes to the financial statements. | | 89 |
GMO Implementation Fund
(A Series of GMO Trust)
Consolidated Schedule of Investments — (Continued)
(showing percentage of total net assets)
February 28, 2022
| | | | | | | | | | |
| | |
Par Value† | | | Description | | Value ($) | |
| | |
| | | | | | United States — continued | |
| | |
| | | | | | Corporate Debt — continued | |
| | | |
| | | 768,000 | | | Cumulus Media New Holdings, Inc., 144A, 6.75%, due 07/01/26 | | | 781,440 | |
| | | |
| | | 4,856,000 | | | Dave & Buster’s, Inc., 144A, 7.63%, due 11/01/25 | | | 5,086,660 | |
| | | |
| | | 1,610,000 | | | Endo Dac / Endo Finance LLC / Endo Finco Inc, 144A, 9.50%, due 07/31/27 | | | 1,569,750 | |
| | | |
| | | 2,010,000 | | | EnLink Midstream Partners LP, 5.60%, due 04/01/44 | | | 1,713,525 | |
| | | |
| | | 1,818,000 | | | EnLink Midstream Partners LP, 5.05%, due 04/01/45 | | | 1,503,232 | |
| | | |
| | | 1,523,000 | | | Envision Healthcare Corp., 144A, 8.75%, due 10/15/26 | | | 807,190 | |
| | | |
| | | 1,400,000 | | | Esc Cb Gulfport Energy, 6.38%, due 01/15/26 (d) (h) | | | 140 | |
| | | |
| | | 1,340,000 | | | Ford Motor Credit Co. LLC, 5.58%, due 03/18/24 | | | 1,393,600 | |
| | | |
| | | 290,000 | | | Ford Motor Credit Co. LLC, 4.27%, due 01/09/27 | | | 292,175 | |
| | | |
| | | 890,000 | | | Ford Motor Credit Co. LLC, 5.11%, due 05/03/29 | | | 938,229 | |
| | | |
| | | 330,563 | | | Frontier Communications Holdings LLC, 5.88%, due 11/01/29 | | | 304,118 | |
| | | |
| | | 7,923,000 | | | Frontier Communications Holdings LLC, 144A, 6.00%, due 01/15/30 | | | 7,380,275 | |
| | | |
| | | 860,000 | | | Goldman Sachs Group, Inc. (The), Variable Rate, 5 year CMT + 3.22%, 4.95%, due 12/31/99 | | | 864,816 | |
| | | |
| | | 4,040,000 | | | Guitar Center, Inc., 144A, 8.50%, due 01/15/26 | | | 4,237,637 | |
| | | |
| | | 18,156 | | | Gulfport Energy Corp., 8.00%, due 05/17/26 | | | 19,200 | |
| | | |
| | | 2,534,100 | | | JPMorgan Chase & Co., Variable Rate, SOFR + 2.75%, 4.00%, due 12/31/99 | | | 2,395,688 | |
| | | |
| | | 2,240,000 | | | LD Holdings Group LLC, 144A, 6.50%, due 11/01/25 | | | 2,128,000 | |
| | | |
| | | 1,120,000 | | | LD Holdings Group LLC, 144A, 6.13%, due 04/01/28 | | | 998,760 | |
| | | |
| | | 2,615,000 | | | Marriott Ownership Resorts, Inc., 4.75%, due 01/15/28 | | | 2,555,443 | |
| | | |
| | | 10,720,000 | | | NCL Finance Ltd., 144A, 6.13%, due 03/15/28 | | | 10,344,800 | |
| | | |
| | | 6,282,000 | | | New Residential Investment Corp., 144A, REIT, 6.25%, due 10/15/25 | | | 6,161,009 | |
| | | |
| | | 1,454,000 | | | Owens & Minor, Inc., 4.38%, due 12/15/24 | | | 1,508,525 | |
| | | |
| | | 2,986,000 | | | Redfin Corp., 144A, due 10/15/25 | | | 2,248,831 | |
| | | |
| | | 4,746,000 | | | Royal Caribbean Cruises Ltd, 7.50%, due 10/15/27 | | | 5,180,686 | |
| | | |
| | | 3,280,000 | | | Royal Caribbean Cruises Ltd, 3.70%, due 03/15/28 | | | 2,973,451 | |
| | | |
| | | 2,967,000 | | | SeaWorld Parks & Entertainment, Inc., 144A, 8.75%, due 05/01/25 | | | 3,115,350 | |
| | | |
| | | 198,799 | | | Spirit Airlines Pass-Through Trust, 4.10%, due 10/01/29 | | | 199,944 | |
| | | | | | | | | | |
| | | Par Value† /
Shares | | | Description | | Value ($) | |
| | |
| | | | | | United States — continued | |
| | |
| | | | | | Corporate Debt — continued | |
| | | |
| | | 1,620,000 | | | Triumph Group, Inc., 144A, 6.25%, due 09/15/24 | | | 1,607,850 | |
| | | |
| | | 1,300,000 | | | Uber Technologies, Inc., 144A, 8.00%, due 11/01/26 | | | 1,380,600 | |
| | | |
| | | 1,120,000 | | | United Wholesale Mortgage LLC, 144A, 5.75%, due 06/15/27 | | | 1,070,210 | |
| | | |
| | | 1,680,000 | | | Wayfair, Inc., 0.63%, due 10/01/25 | | | 1,454,880 | |
| | | |
| | | 278,000 | | | XHR LP, 144A, REIT, 4.88%, due 06/01/29 | | | 270,355 | |
| | | | | | | | | | |
| | | |
| | | | | | Total Corporate Debt | | | 126,969,256 | |
| | | | | | | | | | |
| | | |
| | | | | | U.S. Government — 22.6% | | | |
| | | |
| | | 342,100,000 | | | U.S. Treasury Note, 0.13%, due 02/28/23 | | | 338,839,359 | |
| | | |
| | | 133,550,000 | | | U.S. Treasury Note, 0.13%, due 03/31/23 | | | 132,073,646 | |
| | | |
| | | 133,550,000 | | | U.S. Treasury Note, 0.13%, due 04/30/23 | | | 131,891,058 | |
| | | |
| | | 205,000,000 | | | U.S. Treasury Note, 0.13%, due 06/30/23 (b) | | | 201,933,007 | |
| | | |
| | | 100,000,000 | | | U.S. Treasury Note, 0.13%, due 07/31/23 | | | 98,355,469 | |
| | | |
| | | 70,000,000 | | | U.S. Treasury Note, Variable Rate, USBM + 0.03%, 0.39%, due 07/31/23 (b) | | | 70,109,656 | |
| | | |
| | | 88,450,000 | | | U.S. Treasury Note, Variable Rate, USBM + 0.04%, 0.40%, due 10/31/23 (b) | | | 88,609,681 | |
| | | | | | | | | | |
| | | |
| | | | | | Total U.S. Government | | | 1,061,811,876 | |
| | | | | | | | | | |
| | | |
| | | | | | Total United States | | | 1,216,720,895 | |
| | | | | | | | | | |
| | | |
| | | | | | TOTAL DEBT OBLIGATIONS (COST $1,240,643,558) | | | 1,231,300,948 | |
| | | | | | | | | | |
| | | |
| | | | | | MUTUAL FUNDS — 0.3% | | | |
| | | |
| | | | | | United States — 0.3% | | | |
| | | |
| | | | | | Affiliated Issuers — 0.3% | | | |
| | | |
| | | 2,496,824 | | | GMO U.S. Treasury Fund (i) | | | 12,509,088 | |
| | | | | | | | | | |
| | | |
| | | | | | TOTAL MUTUAL FUNDS (COST $12,572,470) | | | 12,509,088 | |
| | | | | | | | | | |
| | |
| | | | | | SHORT-TERM INVESTMENTS — 11.6% | |
| | | |
| | | | | | Money Market Funds — 0.3% | | | |
| | | |
| | | 15,271,872 | | | State Street Institutional Treasury Money Market Fund – Premier Class, 0.01% (j) | | | 15,271,872 | |
| | | |
| | | 203,728 | | | State Street U.S. Treasury Liquidity Fund – Class D Shares, 0.01% (k) | | | 203,728 | |
| | | | | | | | | | |
| | | |
| | | | | | Total Money Market Funds | | | 15,475,600 | |
| | | | | | | | | | |
| | | | |
| | |
| 90 | | See accompanying notes to the financial statements. | | |
GMO Implementation Fund
(A Series of GMO Trust)
Consolidated Schedule of Investments — (Continued)
(showing percentage of total net assets)
February 28, 2022
| | | | | | | | | | |
| | |
Par Value† | | | Description | | Value ($) | |
| | | |
| | | | | | U.S. Government — 11.3% | | | |
| | | |
| | | 64,400,000 | | | U.S. Treasury Bill, 0.31%, due 05/24/22 (b) (l) | | | 64,352,816 | |
| | | |
| | | 50,700,000 | | | U.S. Treasury Bill, 0.35%, due 05/31/22 (b) (k) (l) | | | 50,655,145 | |
| | | |
| | | 135,000,000 | | | U.S. Treasury Bill, 0.54%, due 07/21/22 (b) (l) | | | 134,712,982 | |
| | | |
| | | 7,705,000 | | | U.S. Treasury Bill, 0.58%, due 07/28/22 (b) (l) | | | 7,686,822 | |
| | | |
| | | 800,000 | | | U.S. Treasury Bill, 0.60%, due 08/04/22 (k) (l) | | | 797,941 | |
| | | |
| | | 254,425,000 | | | U.S. Treasury Bill, 0.64%, due 08/18/22 (l) | | | 253,660,076 | |
| | | | | | | | | | |
| | |
Par Value† | | | Description | | Value ($) | |
| | | |
| | | | | | U.S. Government — continued | | | |
| | | |
| | | 11,690,000 | | | U.S. Treasury Bill, 0.73%, due 11/03/22 (b) (k) (l) | | | 11,632,452 | |
| | | |
| | | 4,060,000 | | | U.S. Treasury Bill, 0.63%, due 12/01/22 (k) (l) | | | 4,040,694 | |
| | | | | | | | | | |
| | | |
| | | | | | Total U.S. Government | | | 527,538,928 | |
| | | | | | | | | | |
| | | |
| | | | | | TOTAL SHORT-TERM INVESTMENTS
(COST $543,161,347) | | | 543,014,528 | |
| | | | | | | | | | |
PURCHASED OPTIONS — 0.0%
| | | | | | | | | | | | | | | | | | | | |
| Description | | Exercise
Price | | | Expiration
Date | | | Number of
Contracts | | | Notional
Amount | | | Value ($) |
| | | | | | | | | | | | | | | | | | | | |
Equity Options – Calls — 0.0% |
Cedar Fair LP (f) | | | 65.00 | | | | 04/14/22 | | | | 263 | | | USD | | | 1,509,094 | | | 9,205 |
| | | | | | | | | | | | | | | | | | | | |
Total Equity Options – Calls | | | | | | | | | | | | | | | | | | | | 9,205 |
| | | | | | | | | | | | | | | | | | | | |
Equity Options – Puts — 0.0% |
Kyndryl Holdings, Inc. (f) | | | 15.00 | | | | 03/18/22 | | | | 1,110 | | | USD | | | 1,760,460 | | | 61,050 |
| | | | | | | | | | | | | | | | | | | | |
Total Equity Options – Puts | | | | | | | | | | | | | | | | | | | | 61,050 |
| | | | | | | | | | | | | | | | | | | | |
| | | | | | | | | | |
| | | |
| | | | | | TOTAL PURCHASED OPTIONS (COST $133,061) | | | 70,255 | |
| | | | | | | | | | |
| | | |
| | | | | | TOTAL INVESTMENTS — 118.4%
(Cost $5,724,287,369) | | | 5,540,907,797 | |
| | | | | | | | | | |
| | | | | | | | | | |
| | | Shares | | | Description | |
Value ($) | |
| | |
| | | | | | SECURITIES SOLD SHORT — (22.9)% | |
| | | |
| | | | | | Common Stocks — (22.8)% | | | |
| | | |
| | | | | | Australia — (0.4)% | | | |
| | | |
| | | (936,532 | ) | | APA Group | | | (6,846,492 | ) |
| | | |
| | | (85,398 | ) | | ASX Ltd | | | (5,129,128 | ) |
| | | |
| | | (17,053 | ) | | Cochlear Ltd | | | (2,783,800 | ) |
| | | |
| | | (3,697 | ) | | Domino’s Pizza Enterprises Ltd | | | (213,473 | ) |
| | | |
| | | (1,574,038 | ) | | Qantas Airways Ltd * | | | (5,832,559 | ) |
| | | |
| | | (1,132 | ) | | Santos Ltd | | | (6,029 | ) |
| | | | | | | | | | |
| | | |
| | | | | | Total Australia | | | (20,811,481 | ) |
| | | | | | | | | | |
| | |
| | | | | | Austria — (0.2)% | |
| | | |
| | | (69,243 | ) | | Verbund AG | | | (8,351,850 | ) |
| | | | | | | | | | |
| | |
| | | | | | Belgium — (0.1)% | |
| | | |
| | | (104,741 | ) | | Anheuser-Busch InBev SA/NV | | | (6,463,337 | ) |
| | | | | | | | | | |
| | |
| | | | | | Canada — (0.7)% | |
| | | |
| | | (24,401 | ) | | Agnico Eagle Mines Ltd | | | (1,232,007 | ) |
| | | |
| | | (253,100 | ) | | AltaGas Ltd | | | (5,575,189 | ) |
| | | | | | | | | | |
| | | Shares | | | Description | |
Value ($) | |
| | | |
| | | | | | Common Stocks — continued | | | |
| | |
| | | | | | Canada — continued | |
| | | |
| | | (98,800 | ) | | Cameco Corp | | | (2,428,504 | ) |
| | | |
| | | (1 | ) | | Canadian Pacific Railway Ltd | | | (70 | ) |
| | | |
| | | (145,100 | ) | | Enbridge Inc | | | (6,265,418 | ) |
| | | |
| | | (41,700 | ) | | Franco-Nevada Corp | | | (6,134,904 | ) |
| | | |
| | | (45,800 | ) | | Pan American Silver Corp | | | (1,082,254 | ) |
| | | |
| | | (179,400 | ) | | Pembina Pipeline Corp | | | (6,092,424 | ) |
| | | |
| | | (76,200 | ) | | Restaurant Brands International Inc | | | (4,265,676 | ) |
| | | | | | | | | | |
| | | |
| | | | | | Total Canada | | | (33,076,446 | ) |
| | | | | | | | | | |
| | |
| | | | | | Denmark — (0.1)% | |
| | | |
| | | (197,671 | ) | | Ambu A/S – Class B | | | (3,645,202 | ) |
| | | | | | | | | | |
| | |
| | | | | | France — (0.7)% | |
| | | |
| | | (189,085 | ) | | Accor SA * | | | (6,457,868 | ) |
| | | |
| | | (40,200 | ) | | Aeroports de Paris * | | | (5,683,859 | ) |
| | | |
| | | (471,085 | ) | | Getlink SE | | | (7,683,082 | ) |
| | | |
| | | (4,448 | ) | | Hermes International | | | (6,133,955 | ) |
| | | |
| | | (3,919 | ) | | Sartorius Stedim Biotech | | | (1,502,821 | ) |
| | | |
| | | (42,442 | ) | | Ubisoft Entertainment SA * | | | (2,275,611 | ) |
| | | | |
| | |
| | | See accompanying notes to the financial statements. | | 91 |
GMO Implementation Fund
(A Series of GMO Trust)
Consolidated Schedule of Investments — (Continued)
(showing percentage of total net assets)
February 28, 2022
| | | | | | | | | | |
| | | Shares | | | Description | |
Value ($) | |
| | | |
| | | | | | Common Stocks — continued | | | |
| | |
| | | | | | France — continued | |
| | | |
| | | (24,232 | ) | | Wendel SE | | | (2,459,996 | ) |
| | | | | | | | | | |
| | | |
| | | | | | Total France | | | (32,197,192 | ) |
| | | | | | | | | | |
| | |
| | | | | | Germany — (0.8)% | |
| | | |
| | | (71,614 | ) | | Delivery Hero SE * | | | (3,838,555 | ) |
| | | |
| | | (4,596 | ) | | MTU Aero Engines AG | | | (1,100,219 | ) |
| | | |
| | | (64,042 | ) | | Puma SE | | | (5,872,933 | ) |
| | | |
| | | (53,500 | ) | | QIAGEN NV * | | | (2,687,968 | ) |
| | | |
| | | (1,221 | ) | | Rational AG | | | (898,609 | ) |
| | | |
| | | (52,931 | ) | | Scout24 SE | | | (3,087,484 | ) |
| | | |
| | | (46,026 | ) | | Symrise AG – Class A | | | (5,474,634 | ) |
| | | |
| | | (2,707,286 | ) | | Telefonica Deutschland Holding AG | | | (7,387,763 | ) |
| | | |
| | | (103,725 | ) | | Uniper SE | | | (3,318,282 | ) |
| | | |
| | | (74,690 | ) | | Zalando SE * | | | (4,943,481 | ) |
| | | | | | | | | | |
| | | |
| | | | | | Total Germany | | | (38,609,928 | ) |
| | | | | | | | | | |
| | |
| | | | | | Israel — (0.2)% | |
| | | |
| | | (40,600 | ) | | CyberArk Software Ltd * | | | (6,907,684 | ) |
| | | |
| | | (9,300 | ) | | Kornit Digital Ltd * | | | (881,919 | ) |
| | | |
| | | (39,500 | ) | | Wix.com Ltd * | | | (3,617,410 | ) |
| | | | | | | | | | |
| | | |
| | | | | | Total Israel | | | (11,407,013 | ) |
| | | | | | | | | | |
| | |
| | | | | | Italy — (0.6)% | |
| | | |
| | | (113,048 | ) | | Amplifon SPA | | | (4,851,395 | ) |
| | | |
| | | (292,947 | ) | | Atlantia SPA * | | | (5,388,835 | ) |
| | | |
| | | (26,610 | ) | | Ferrari NV | | | (5,718,179 | ) |
| | | |
| | | (411,672 | ) | | FinecoBank Banca Fineco SPA | | | (6,860,852 | ) |
| | | |
| | | (499,454 | ) | | Infrastrutture Wireless Italiane SPA | | | (5,100,079 | ) |
| | | | | | | | | | |
| | | |
| | | | | | Total Italy | | | (27,919,340 | ) |
| | | | | | | | | | |
| | |
| | | | | | Japan — (2.6)% | |
| | | |
| | | (361,800 | ) | | Acom Co Ltd | | | (1,007,839 | ) |
| | | |
| | | (110,800 | ) | | Aeon Co Ltd | | | (2,510,028 | ) |
| | | |
| | | (251,100 | ) | | ANA Holdings Inc * | | | (5,528,766 | ) |
| | | |
| | | (211,200 | ) | | Asahi Intecc Co Ltd | | | (4,560,509 | ) |
| | | |
| | | (18,200 | ) | | Benefit One Inc | | | (421,547 | ) |
| | | |
| | | (40,600 | ) | | East Japan Railway Co | | | (2,411,995 | ) |
| | | |
| | | (58,600 | ) | | GMO Payment Gateway Inc | | | (5,668,249 | ) |
| | | |
| | | (35,900 | ) | | Harmonic Drive Systems Inc | | | (1,468,444 | ) |
| | | |
| | | (237,100 | ) | | Hitachi Metals Ltd * | | | (4,226,427 | ) |
| | | |
| | | (361,100 | ) | | Isetan Mitsukoshi Holdings Ltd | | | (2,912,107 | ) |
| | | |
| | | (279,300 | ) | | Japan Airlines Co Ltd * | | | (5,538,146 | ) |
| | | |
| | | (88,500 | ) | | Japan Airport Terminal Co Ltd * | | | (4,132,632 | ) |
| | | |
| | | (114,100 | ) | | Japan Exchange Group Inc | | | (2,136,644 | ) |
| | | |
| | | (213 | ) | | Japan Real Estate Investment Corp (REIT) | | | (1,137,793 | ) |
| | | |
| | | (260,700 | ) | | JGC Holding Corp | | | (2,612,972 | ) |
| | | |
| | | (251,100 | ) | | Keikyu Corp | | | (2,631,062 | ) |
| | | | | | | | | | |
| | | Shares | | | Description | |
Value ($) | |
| | | |
| | | | | | Common Stocks — continued | | | |
| | |
| | | | | | Japan — continued | |
| | | |
| | | (75,000 | ) | | Keio Corp | | | (3,068,778 | ) |
| | | |
| | | (53,800 | ) | | Kintetsu Group Holdings Co Ltd * | | | (1,616,277 | ) |
| | | |
| | | (28,500 | ) | | Lasertec Corp | | | (5,283,119 | ) |
| | | |
| | | (95,300 | ) | | LIXIL Corp | | | (2,123,985 | ) |
| | | |
| | | (152,700 | ) | | M3 Inc | | | (5,745,107 | ) |
| | | |
| | | (130,100 | ) | | Mercari Inc * | | | (4,074,737 | ) |
| | | |
| | | (313,200 | ) | | MonotaRO Co Ltd | | | (5,895,362 | ) |
| | | |
| | | (40,400 | ) | | Nidec Corp | | | (3,512,118 | ) |
| | | |
| | | (274,800 | ) | | Nihon M&A Center Holdings Inc | | | (4,064,583 | ) |
| | | |
| | | (496,500 | ) | | Nippon Paint Holdings Co Ltd | | | (4,443,721 | ) |
| | | |
| | | (60,200 | ) | | Nissin Foods Holdings Co Ltd | | | (4,809,810 | ) |
| | | |
| | | (208,800 | ) | | Odakyu Electric Railway Co Ltd | | | (3,444,883 | ) |
| | | |
| | | (42,000 | ) | | ORIENTAL LAND CO LTD | | | (7,764,320 | ) |
| | | |
| | | (450,800 | ) | | Rakuten Group Inc | | | (3,832,083 | ) |
| | | |
| | | (39,900 | ) | | Shiseido Co Ltd | | | (2,289,705 | ) |
| | | |
| | | (63,200 | ) | | Tobu Railway Co Ltd | | | (1,553,493 | ) |
| | | |
| | | (97,000 | ) | | Tokyu Corp | | | (1,293,629 | ) |
| | | |
| | | (129,200 | ) | | West Japan Railway Co | | | (5,574,190 | ) |
| | | | | | | | | | |
| | | |
| | | | | | Total Japan | | | (119,295,060 | ) |
| | | | | | | | | | |
| | |
| | | | | | Netherlands — (0.3)% | |
| | | |
| | | (2,920 | ) | | Adyen NV * | | | (6,086,075 | ) |
| | | |
| | | (16,495 | ) | | Heineken Holding NV | | | (1,347,129 | ) |
| | | |
| | | (14,409 | ) | | IMCD NV | | | (2,340,617 | ) |
| | | |
| | | (114,752 | ) | | Just Eat Takeaway.com NV * | | | (4,644,262 | ) |
| | | | | | | | | | |
| | | |
| | | | | | Total Netherlands | | | (14,418,083 | ) |
| | | | | | | | | | |
| | |
| | | | | | New Zealand — (0.1)% | |
| | | |
| | | (66,582 | ) | | Xero Ltd * | | | (4,578,045 | ) |
| | | | | | | | | | |
| | |
| | | | | | Norway — (0.0)% | |
| | | |
| | | (18,122 | ) | | Schibsted ASA – Class A | | | (520,789 | ) |
| | | |
| | | (24,400 | ) | | Schibsted ASA – Class B | | | (633,404 | ) |
| | | | | | | | | | |
| | | |
| | | | | | Total Norway | | | (1,154,193 | ) |
| | | | | | | | | | |
| | |
| | | | | | Singapore — (0.2)% | |
| | | |
| | | (322,500 | ) | | City Developments Ltd | | | (1,706,512 | ) |
| | | |
| | | (1,589,800 | ) | | Singapore Airlines Ltd * | | | (6,019,752 | ) |
| | | |
| | | (543,800 | ) | | Singapore Exchange Ltd | | | (3,772,768 | ) |
| | | | | | | | | | |
| | | |
| | | | | | Total Singapore | | | (11,499,032 | ) |
| | | | | | | | | | |
| | |
| | | | | | Spain — (0.5)% | |
| | | |
| | | (33,533 | ) | | Aena SME SA * | | | (5,472,759 | ) |
| | | |
| | | (129,034 | ) | | Cellnex Telecom SA | | | (5,836,493 | ) |
| | | |
| | | (264,194 | ) | | Ferrovial SA | | | (7,197,755 | ) |
| | | |
| | | (300,239 | ) | | Siemens Gamesa Renewable Energy SA * | | | (6,908,437 | ) |
| | | | | | | | | | |
| | | |
| | | | | | Total Spain | | | (25,415,444 | ) |
| | | | | | | | | | |
| | | | |
| | |
| 92 | | See accompanying notes to the financial statements. | | |
GMO Implementation Fund
(A Series of GMO Trust)
Consolidated Schedule of Investments — (Continued)
(showing percentage of total net assets)
February 28, 2022
| | | | | | | | | | |
| | | Shares | | | Description | |
Value ($) | |
| | | |
| | | | | | Common Stocks — continued | | | |
| | |
| | | | | | Sweden — (0.3)% | |
| | | |
| | | (578,046 | ) | | Embracer Group AB – Class B * | | | (4,962,025 | ) |
| | | |
| | | (10,356 | ) | | EQT AB | | | (346,615 | ) |
| | | |
| | | (50,487 | ) | | Evolution AB | | | (5,788,793 | ) |
| | | |
| | | (514,088 | ) | | Sinch AB * | | | (4,336,538 | ) |
| | | | | | | | | | |
| | | |
| | | | | | Total Sweden | | | (15,433,971 | ) |
| | | | | | | | | | |
| | |
| | | | | | Switzerland — (0.3)% | |
| | | |
| | | (9 | ) | | Chocoladefabriken Lindt & Spruengli AG (Registered) | | | (1,010,204 | ) |
| | | |
| | | (4,628 | ) | | Partners Group Holding AG | | | (6,256,077 | ) |
| | | |
| | | (2,656 | ) | | Sika AG (Registered) | | | (881,353 | ) |
| | | |
| | | (3,447 | ) | | Straumann Holding AG (Registered) | | | (5,475,432 | ) |
| | | | | | | | | | |
| | | |
| | | | | | Total Switzerland | | | (13,623,066 | ) |
| | | | | | | | | | |
| | |
| | | | | | United Kingdom — (1.5)% | |
| | | |
| | | (75,513 | ) | | Admiral Group Plc | | | (3,008,105 | ) |
| | | |
| | | (146,207 | ) | | Antofagasta Plc | | | (2,960,376 | ) |
| | | |
| | | (64 | ) | | AstraZeneca Plc Sponsored ADR | | | (3,896 | ) |
| | | |
| | | (800,119 | ) | | Auto Trader Group Plc | | | (7,076,311 | ) |
| | | |
| | | (1,316,297 | ) | | ConvaTec Group Plc | | | (3,182,343 | ) |
| | | |
| | | (10,549 | ) | | Croda International Plc | | | (1,055,943 | ) |
| | | |
| | | (7,607 | ) | | Experian Plc | | | (297,163 | ) |
| | | |
| | | (71,627 | ) | | Halma Plc | | | (2,310,261 | ) |
| | | |
| | | (377,520 | ) | | Hargreaves Lansdown Plc | | | (5,721,771 | ) |
| | | |
| | | (1,032,662 | ) | | Informa Plc * | | | (8,176,450 | ) |
| | | |
| | | (26,741 | ) | | InterContinental Hotels Group Plc * | | | (1,862,053 | ) |
| | | |
| | | (257,010 | ) | | Land Securities Group Plc (REIT) | | | (2,723,462 | ) |
| | | |
| | | (69,887 | ) | | London Stock Exchange Group Plc | | | (6,105,095 | ) |
| | | |
| | | (290,001 | ) | | Ocado Group Plc * | | | (5,332,801 | ) |
| | | |
| | | (1,121,570 | ) | | Rentokil Initial Plc | | | (7,611,379 | ) |
| | | |
| | | (4,194,989 | ) | | Rolls-Royce Holdings Plc * | | | (5,786,823 | ) |
| | | |
| | | (18,035 | ) | | Spirax-Sarco Engineering Plc | | | (2,873,958 | ) |
| | | | | | | | | | |
| | | |
| | | | | | Total United Kingdom | | | (66,088,190 | ) |
| | | | | | | | | | |
| | |
| | | | | | United States — (13.2)% | |
| | | |
| | | (57 | ) | | Advanced Micro Devices, Inc. * | | | (7,030 | ) |
| | | |
| | | (246,100 | ) | | AES Corp. (The) | | | (5,224,703 | ) |
| | | |
| | | (38,200 | ) | | Airbnb, Inc. – Class A * | | | (5,786,918 | ) |
| | | |
| | | (23,762 | ) | | Albertsons Cos, Inc. – Class A | | | (692,662 | ) |
| | | |
| | | (17,500 | ) | | American Tower Corp. (REIT) | | | (3,970,225 | ) |
| | | |
| | | (1 | ) | | Analog Devices, Inc. | | | (160 | ) |
| | | |
| | | (74,397 | ) | | Aon Plc – Class A | | | (21,734,340 | ) |
| | | |
| | | (167,600 | ) | | Aramark | | | (6,194,496 | ) |
| | | |
| | | (40,300 | ) | | Arthur J Gallagher & Co. | | | (6,375,057 | ) |
| | | |
| | | (26,900 | ) | | Autodesk, Inc. * | | | (5,924,187 | ) |
| | | |
| | | (56,800 | ) | | Avalara, Inc. * | | | (5,902,088 | ) |
| | | |
| | | (27,400 | ) | | Bill.com Holdings, Inc. * | | | (6,517,912 | ) |
| | | |
| | | (6,900 | ) | | Bio-Techne Corp. | | | (2,893,929 | ) |
| | | | | | | | | | |
| | | Shares | | | Description | |
Value ($) | |
| | | |
| | | | | | Common Stocks — continued | | | |
| | |
| | | | | | United States — continued | |
| | | |
| | | (69,300 | ) | | BioMarin Pharmaceutical, Inc. * | | | (5,413,716 | ) |
| | | |
| | | (49,502 | ) | | Block Inc. – Class A * | | | (6,311,505 | ) |
| | | |
| | | (30,200 | ) | | Boeing Co. (The) * | | | (6,201,268 | ) |
| | | |
| | | (11,700 | ) | | Broadcom, Inc. | | | (6,873,048 | ) |
| | | |
| | | (25,700 | ) | | Burlington Stores, Inc. * | | | (5,805,373 | ) |
| | | |
| | | (78,300 | ) | | Caesars Entertainment, Inc. * | | | (6,592,077 | ) |
| | | |
| | | (2,700 | ) | | Camden Property Trust (REIT) | | | (445,797 | ) |
| | | |
| | | (41,400 | ) | | Carvana Co. – Class A * | | | (6,229,458 | ) |
| | | |
| | | (32,700 | ) | | Catalent, Inc. * | | | (3,336,708 | ) |
| | | |
| | | (73,500 | ) | | Ceridian HCM Holding, Inc. * | | | (5,358,885 | ) |
| | | |
| | | (14,085 | ) | | Charter Communications, Inc. – Class A * | | | (8,476,071 | ) |
| | | |
| | | (4,200 | ) | | Chipotle Mexican Grill, Inc. – Class A * | | | (6,398,070 | ) |
| | | |
| | | (314,389 | ) | | Citizens Financial Group, Inc. | | | (16,480,271 | ) |
| | | |
| | | (242,400 | ) | | Clarivate Plc * | | | (3,631,152 | ) |
| | | |
| | | (64,200 | ) | | Cloudflare, Inc. – Class A * | | | (7,474,164 | ) |
| | | |
| | | (25,600 | ) | | CME Group, Inc. | | | (6,055,168 | ) |
| | | |
| | | (2,500 | ) | | Cognex Corp. | | | (168,900 | ) |
| | | |
| | | (307,436 | ) | | Columbia Banking System, Inc. | | | (11,261,381 | ) |
| | | |
| | | (44,000 | ) | | Coupa Software, Inc. * | | | (5,324,440 | ) |
| | | |
| | | (23,500 | ) | | Crown Castle International Corp. (REIT) | | | (3,914,865 | ) |
| | | |
| | | (110,200 | ) | | Delta Air Lines, Inc. * | | | (4,399,184 | ) |
| | | |
| | | (13,400 | ) | | Dexcom, Inc. * | | | (5,546,394 | ) |
| | | |
| | | (49,000 | ) | | DocuSign, Inc. – Class A * | | | (5,803,070 | ) |
| | | |
| | | (15,100 | ) | | DoorDash, Inc. – Class A * | | | (1,584,745 | ) |
| | | |
| | | (286,400 | ) | | DraftKings Inc. – Class A * | | | (6,781,952 | ) |
| | | |
| | | (3,300 | ) | | Ecolab, Inc. | | | (581,658 | ) |
| | | |
| | | (25,420 | ) | | Entegris, Inc. | | | (3,316,802 | ) |
| | | |
| | | (6,100 | ) | | Equinix, Inc. (REIT) | | | (4,329,353 | ) |
| | | |
| | | (53,500 | ) | | Equity LifeStyle Properties, Inc. (REIT) | | | (3,992,170 | ) |
| | | |
| | | (2,200 | ) | | Erie Indemnity Co. – Class A | | | (385,220 | ) |
| | | |
| | | (74,900 | ) | | Exact Sciences Corp. * | | | (5,846,694 | ) |
| | | |
| | | (26,800 | ) | | Expedia Group, Inc. * | | | (5,255,748 | ) |
| | | |
| | | (1,200 | ) | | Extra Space Storage, Inc. (REIT) | | | (225,780 | ) |
| | | |
| | | (42,400 | ) | | Fastenal Co. | | | (2,181,904 | ) |
| | | |
| | | (20,400 | ) | | First Republic Bank | | | (3,534,504 | ) |
| | | |
| | | (295,170 | ) | | Fox Corp. – Class A | | | (12,346,961 | ) |
| | | |
| | | (65,600 | ) | | Guidewire Software, Inc. * | | | (5,782,640 | ) |
| | | |
| | | (35,000 | ) | | Hess Corp. | | | (3,537,100 | ) |
| | | |
| | | (13,300 | ) | | HubSpot, Inc. * | | | (6,982,500 | ) |
| | | |
| | | (11,500 | ) | | IDEXX Laboratories, Inc. * | | | (6,122,025 | ) |
| | | |
| | | (17,414 | ) | | II-VI, Inc. * | | | (1,209,576 | ) |
| | | |
| | | (87,100 | ) | | Ingersoll Rand, Inc. | | | (4,400,292 | ) |
| | | |
| | | (26,200 | ) | | Insulet Corp. * | | | (6,934,878 | ) |
| | | |
| | | (19,200 | ) | | Invitation Homes, Inc. (REIT) | | | (725,760 | ) |
| | | |
| | | (10,400 | ) | | Ionis Pharmaceuticals, Inc. * | | | (347,152 | ) |
| | | |
| | | (29,500 | ) | | IQVIA Holdings, Inc. * | | | (6,788,540 | ) |
| | | |
| | | (91,100 | ) | | Iron Mountain, Inc. (REIT) | | | (4,480,298 | ) |
| | | |
| | | (14,600 | ) | | Kroger Co. (The) | | | (683,280 | ) |
| | | |
| | | (110,800 | ) | | Lamb Weston Holdings, Inc. | | | (7,360,444 | ) |
| | | | |
| | |
| | | See accompanying notes to the financial statements. | | 93 |
GMO Implementation Fund
(A Series of GMO Trust)
Consolidated Schedule of Investments — (Continued)
(showing percentage of total net assets)
February 28, 2022
| | | | | | | | | | |
| | | Shares | | | Description | |
Value ($) | |
| | | |
| | | | | | Common Stocks — continued | | | |
| | |
| | | | | | United States — continued | |
| | | |
| | | (23,500 | ) | | Liberty Broadband Corp. – Class A * | | | (3,403,035 | ) |
| | | |
| | | (33,600 | ) | | Liberty Broadband Corp. – Class C * | | | (4,929,120 | ) |
| | | |
| | | (129,000 | ) | | Liberty Media Corp-Liberty Formula One – Class C * | | | (7,834,170 | ) |
| | | |
| | | (19,300 | ) | | Linde Plc | | | (5,659,532 | ) |
| | | |
| | | (68,400 | ) | | Live Nation Entertainment, Inc. * | | | (8,264,088 | ) |
| | | |
| | | (100,593 | ) | | M&T Bank Corp. | | | (18,331,062 | ) |
| | | |
| | | (15,900 | ) | | MarketAxess Holdings, Inc. | | | (6,064,737 | ) |
| | | |
| | | (36,900 | ) | | Marriott International, Inc. – Class A * | | | (6,278,166 | ) |
| | | |
| | | (30,613 | ) | | Marvell Technology, Inc. | | | (2,091,786 | ) |
| | | |
| | | (64,400 | ) | | MGM Resorts International | | | (2,852,276 | ) |
| | | |
| | | (15,700 | ) | | MongoDB, Inc. – Class A * | | | (5,997,243 | ) |
| | | |
| | | (8,800 | ) | | Monolithic Power Systems, Inc. | | | (4,036,560 | ) |
| | | |
| | | (12,800 | ) | | MSCI, Inc. – Class A | | | (6,421,632 | ) |
| | | |
| | | (56,829 | ) | | NortonLifeLock, Inc. | | | (1,646,905 | ) |
| | | |
| | | (83,000 | ) | | Novocure Ltd. * | | | (6,794,380 | ) |
| | | |
| | | (303,700 | ) | | Oak Street Health, Inc. * | | | (5,317,787 | ) |
| | | |
| | | (32,400 | ) | | Okta, Inc. * | | | (5,924,016 | ) |
| | | |
| | | (7,400 | ) | | ONEOK, Inc. | | | (483,220 | ) |
| | | |
| | | (307,600 | ) | | Palantir Technologies, Inc. – Class A * | | | (3,645,060 | ) |
| | | |
| | | (2,200 | ) | | Palo Alto Networks, Inc. * | | | (1,307,350 | ) |
| | | |
| | | (138,000 | ) | | Peloton Interactive, Inc. – Class A * | | | (4,010,280 | ) |
| | | |
| | | (1 | ) | | Realty Income Corp. (REIT) | | | (66 | ) |
| | | |
| | | (33,700 | ) | | RingCentral, Inc. – Class A * | | | (4,409,308 | ) |
| | | |
| | | (37,200 | ) | | Roku, Inc. * | | | (5,190,516 | ) |
| | | |
| | | (89,350 | ) | | Rollins, Inc. | | | (2,915,491 | ) |
| | | |
| | | (86,200 | ) | | Royal Caribbean Cruises Ltd. * | | | (6,958,064 | ) |
| | | |
| | | (37,380 | ) | | S&P Global, Inc. | | | (14,043,666 | ) |
| | | |
| | | (14 | ) | | salesforce.com, Inc. * | | | (2,948 | ) |
| | | |
| | | (85,700 | ) | | Sarepta Therapeutics, Inc. * | | | (6,565,477 | ) |
| | | |
| | | (44,400 | ) | | Seagen, Inc. * | | | (5,721,828 | ) |
| | | |
| | | (12,400 | ) | | ServiceNow, Inc. * | | | (7,191,008 | ) |
| | | |
| | | (28,300 | ) | | Simon Property Group, Inc. (REIT) | | | (3,892,948 | ) |
| | | |
| | | (179,000 | ) | | Snap, Inc. – Class A * | | | (7,149,260 | ) |
| | | |
| | | (22,600 | ) | | Snowflake, Inc. – Class A * | | | (6,003,916 | ) |
| | | |
| | | (302,513 | ) | | Spirit Airlines, Inc. * | | | (7,587,026 | ) |
| | | |
| | | (41,600 | ) | | T-Mobile US, Inc. * | | | (5,125,536 | ) |
| | | |
| | | (67,757 | ) | | Take-Two Interactive Software, Inc. * | | | (10,976,634 | ) |
| | | |
| | | (77,000 | ) | | Teladoc Health, Inc. * | | | (5,845,070 | ) |
| | | |
| | | (110 | ) | | Teledyne Technologies, Inc. * | | | (47,232 | ) |
| | | |
| | | (7,900 | ) | | Tesla, Inc. * | | | (6,876,397 | ) |
| | | |
| | | (17,600 | ) | | Trade Desk, Inc. (The) – Class A * | | | (1,501,632 | ) |
| | | |
| | | (4,600 | ) | | Tradeweb Markets, Inc. – Class A | | | (388,608 | ) |
| | | |
| | | (29,900 | ) | | Twilio, Inc. – Class A * | | | (5,226,520 | ) |
| | | |
| | | (142,600 | ) | | Twitter, Inc. * | | | (5,069,430 | ) |
| | | |
| | | (161,100 | ) | | Uber Technologies, Inc. * | | | (5,804,433 | ) |
| | | |
| | | (73,500 | ) | | UDR, Inc. (REIT) | | | (4,032,945 | ) |
| | | |
| | | (47,300 | ) | | Upstart Holdings, Inc. * | | | (7,472,927 | ) |
| | | |
| | | (22,800 | ) | | Vail Resorts, Inc. | | | (5,940,540 | ) |
| | | | | | | | | | |
| | | Shares /
Par Value† | | | Description | |
Value ($) | |
| | | |
| | | | | | Common Stocks — continued | | | |
| | |
| | | | | | United States — continued | |
| | | |
| | | (258,000 | ) | | Vistra Corp. | | | (5,887,560 | ) |
| | | |
| | | (125,115 | ) | | Vonage Holdings Corp. * | | | (2,542,337 | ) |
| | | |
| | | (24,600 | ) | | Wayfair, Inc. – Class A * | | | (3,465,402 | ) |
| | | |
| | | (272,700 | ) | | Williams Cos, Inc. (The) | | | (8,530,056 | ) |
| | | |
| | | (59,100 | ) | | Zendesk, Inc. * | | | (6,895,197 | ) |
| | | |
| | | (94,900 | ) | | Zillow Group, Inc. – Class A * | | | (5,434,923 | ) |
| | | |
| | | (72,949 | ) | | Zillow Group, Inc. – Class C * | | | (4,196,026 | ) |
| | | |
| | | (9,000 | ) | | Zoetis, Inc. | | | (1,742,850 | ) |
| | | |
| | | (57,000 | ) | | ZoomInfo Technologies, Inc. – Class A * | | | (3,117,330 | ) |
| | | |
| | | (25,100 | ) | | Zscaler, Inc. * | | | (6,002,664 | ) |
| | | | | | | | | | |
| | | |
| | | | | | Total United States | | | (615,488,824 | ) |
| | | | | | | | | | |
| | | |
| | | | | | TOTAL COMMON STOCKS
(PROCEEDS $1,137,546,440) | | | (1,069,475,697 | ) |
| | | | | | | | | | |
| | |
| | | | | | PREFERRED STOCKS (g) — (0.1)% | |
| | |
| | | | | | Germany — (0.1)% | |
| | | |
| | | (10,645 | ) | | Sartorius AG | | | (4,699,907 | ) |
| | | | | | | | | | |
| | | |
| | | | | | TOTAL PREFERRED STOCKS
(PROCEEDS $4,623,495) | | | (4,699,907 | ) |
| | | | | | | | | | |
| | |
| | | | | | DEBT OBLIGATIONS — (0.0)% | |
| | |
| | | | | | United States — (0.0)% | |
| | |
| | | | | | Corporate Debt — (0.0)% | |
| | | |
| | | (1,335,400 | ) | | Kyndryl Holdings, Inc. 144A,
3.15%, due 10/15/31 (f) | | | (1,210,022 | ) |
| | | | | | | | | | |
| | | |
| | | | | | TOTAL DEBT OBLIGATIONS
(PROCEEDS $1,263,658) | | | (1,210,022 | ) |
| | | | | | | | | | |
| | | |
| | | | | | TOTAL SECURITIES SOLD SHORT (PROCEEDS $1,143,433,593) | | | (1,075,385,626 | ) |
| | | |
| | | | | | Other Assets and Liabilities (net) — 4.5% | | | 215,703,728 | |
| | | | | | | | | | |
| | | |
| | | | | | TOTAL NET ASSETS — 100.0% | | | $4,681,225,899 | |
| | | | | | | | | | |
| | | | |
| | |
| 94 | | See accompanying notes to the financial statements. | | |
GMO Implementation Fund
(A Series of GMO Trust)
Consolidated Schedule of Investments — (Continued)
February 28, 2022
A summary of outstanding financial instruments at February 28, 2022 is as follows:
Forward Currency Contracts
| | | | | | | | | | | | | | | | | | | | | | |
| | | | |
Settlement
Date | | Counter-
party | | Currency
Sold | | | Currency
Purchased | | | Net
Unrealized
Appreciation
(Depreciation)
($) | |
| 03/18/2022 | | MSCI | | | AUD | | | | 32,361,058 | | | | USD | | | | 23,640,595 | | | | 131,466 | |
| 03/18/2022 | | SSB | | | AUD | | | | 1,754,080 | | | | USD | | | | 1,248,412 | | �� | | (25,863 | ) |
| 04/21/2022 | | BOA | | | AUD | | | | 30,351,282 | | | | USD | | | | 22,040,035 | | | | (20,364 | ) |
| 04/21/2022 | | MSCI | | | AUD | | | | 6,208,545 | | | | USD | | | | 4,460,902 | | | | (51,690 | ) |
| 04/21/2022 | | SSB | | | AUD | | | | 27,624,660 | | | | USD | | | | 19,911,863 | | | | (166,729 | ) |
| 05/09/2022 | | BCLY | | | AUD | | | | 26,510,000 | | | | USD | | | | 18,888,375 | | | | (384,730 | ) |
| 05/09/2022 | | JPM | | | AUD | | | | 8,360,000 | | | | USD | | | | 5,940,449 | | | | (137,377 | ) |
| 05/09/2022 | | MSCI | | | AUD | | | | 65,420,050 | | | | USD | | | | 46,207,594 | | | | (1,353,608 | ) |
| 03/25/2022 | | MSCI | | | CAD | | | | 24,691,148 | | | | USD | | | | 19,539,608 | | | | 57,247 | |
| 04/12/2022 | | SSB | | | CAD | | | | 21,744,531 | | | | USD | | | | 17,185,573 | | | | 27,598 | |
| 04/25/2022 | | JPM | | | CAD | | | | 25,000,000 | | | | USD | | | | 19,780,046 | | | | 53,282 | |
| 04/25/2022 | | SSB | | | CAD | | | | 3,801,693 | | | | USD | | | | 3,005,653 | | | | 5,849 | |
| 05/02/2022 | | JPM | | | CAD | | | | 14,013,337 | | | | USD | | | | 11,040,000 | | | | (17,510 | ) |
| 03/28/2022 | | UBSA | | | CHF | | | | 9,130,938 | | | | USD | | | | 9,974,807 | | | | 6,667 | |
| 05/16/2022 | | MSCI | | | CHF | | | | 78,638,805 | | | | USD | | | | 85,385,080 | | | | (631,354 | ) |
| 05/16/2022 | | MSCI | | | CLP | | | | 3,090,639,500 | | | | USD | | | | 3,826,706 | | | | (1,124 | ) |
| 03/17/2022 | | MSCI | | | COP | | | | 39,147,255,000 | | | | USD | | | | 9,959,360 | | | | 31,274 | |
| 03/21/2022 | | JPM | | | EUR | | | | 2,675,275 | | | | USD | | | | 3,028,639 | | | | 26,670 | |
| 03/21/2022 | | MSCI | | | EUR | | | | 2,749,217 | | | | USD | | | | 3,129,269 | | | | 44,328 | |
| 03/21/2022 | | SSB | | | EUR | | | | 3,473,656 | | | | USD | | | | 3,924,067 | | | | 26,222 | |
| 03/28/2022 | | JPM | | | EUR | | | | 1,748,851 | | | | USD | | | | 1,984,071 | | | | 21,071 | |
| 03/31/2022 | | JPM | | | EUR | | | | 7,600,000 | | | | USD | | | | 8,538,980 | | | | 7,258 | |
| 04/21/2022 | | BOA | | | EUR | | | | 11,445,200 | | | | USD | | | | 13,020,174 | | | | 162,230 | |
| 04/21/2022 | | MSCI | | | EUR | | | | 10,250,391 | | | | USD | | | | 11,650,060 | | | | 134,407 | |
| 04/21/2022 | | SSB | | | EUR | | | | 104,438,758 | | | | USD | | | | 118,787,148 | | | | 1,456,942 | |
| 03/21/2022 | | SSB | | | GBP | | | | 4,484,937 | | | | USD | | | | 6,097,025 | | | | 79,462 | |
| 04/21/2022 | | BCLY | | | GBP | | | | 6,189,000 | | | | USD | | | | 8,412,349 | | | | 107,861 | |
| 04/21/2022 | | MSCI | | | GBP | | | | 22,513,208 | | | | USD | | | | 30,623,986 | | | | 415,448 | |
| 05/16/2022 | | BCLY | | | GBP | | | | 7,590,000 | | | | USD | | | | 10,163,664 | | | | (19,458 | ) |
| 04/21/2022 | | CITI | | | HKD | | | | 9,734,200 | | | | USD | | | | 1,250,457 | | | | 4,722 | |
| 04/21/2022 | | JPM | | | HKD | | | | 37,206,100 | | | | USD | | | | 4,776,169 | | | | 14,714 | |
| 04/21/2022 | | SSB | | | HKD | | | | 10,074,000 | | | | USD | | | | 1,291,809 | | | | 2,587 | |
| 05/16/2022 | | MSCI | | | HUF | | | | 2,148,383,873 | | | | USD | | | | 6,878,350 | | | | 450,416 | |
| 04/29/2022 | | CITI | | | ILS | | | | 6,923,009 | | | | USD | | | | 2,140,000 | | | | (19,421 | ) |
| 04/29/2022 | | GS | | | ILS | | | | 13,463,010 | | | | USD | | | | 4,223,497 | | | | 24,123 | |
| 04/29/2022 | | JPM | | | ILS | | | | 7,819,962 | | | | USD | | | | 2,420,000 | | | | (19,198 | ) |
| 03/08/2022 | | JPM | | | INR | | | | 913,703,030 | | | | USD | | | | 12,183,611 | | | | 62,549 | |
| 03/08/2022 | | MSCI | | | INR | | | | 143,341,700 | | | | USD | | | | 1,900,000 | | | | (1,552 | ) |
| 06/03/2022 | | MSCI | | | INR | | | | 1,057,044,730 | | | | USD | | | | 13,836,569 | | | | (21,950 | ) |
| 03/07/2022 | | MSCI | | | JPY | | | | 248,767,820 | | | | USD | | | | 2,167,137 | | | | 3,098 | |
| 03/07/2022 | | SSB | | | JPY | | | | 101,121,756 | | | | USD | | | | 879,128 | | | | (533 | ) |
| 03/09/2022 | | JPM | | | JPY | | | | 2,038,379,448 | | | | USD | | | | 17,650,000 | | | | (82,517 | ) |
| 04/21/2022 | | BCLY | | | JPY | | | | 733,043,700 | | | | USD | | | | 6,426,294 | | | | 43,031 | |
| 04/21/2022 | | DB | | | JPY | | | | 929,727,700 | | | | USD | | | | 8,062,291 | | | | (33,674 | ) |
| 04/21/2022 | | SSB | | | JPY | | | | 3,095,070,200 | | | | USD | | | | 27,061,809 | | | | 110,281 | |
| 05/09/2022 | | BCLY | | | KRW | | | | 17,520,506,982 | | | | USD | | | | 14,542,495 | | | | (18,495 | ) |
| 03/22/2022 | | MSCI | | | MXN | | | | 131,035,729 | | | | USD | | | | 6,425,084 | | | | 48,517 | |
| 03/01/2022 | | JPM | | | NZD | | | | 27,360,000 | | | | USD | | | | 18,282,444 | | | | (229,333 | ) |
| 03/01/2022 | | MSCI | | | NZD | | | | 155,970,000 | | | | USD | | | | 103,358,312 | | | | (2,170,998 | ) |
| 06/01/2022 | | JPM | | | NZD | | | | 145,700,000 | | | | USD | | | | 97,930,069 | | | | (515,621 | ) |
| 04/19/2022 | | JPM | | | PLN | | | | 9,045,897 | | | | USD | | | | 2,130,000 | | | | (17,239 | ) |
| 04/19/2022 | | SSB | | | PLN | | | | 17,825,029 | | | | USD | | | | 4,430,000 | | | | 198,845 | |
| 03/31/2022 | | CITI | | | RON | | | | 70,423,727 | | | | USD | | | | 15,731,521 | | | | (180,496 | ) |
| | | | | | | | | | | | | | | | | | | | | | |
| | | | |
Settlement
Date | | Counter-
party | | Currency
Sold | | | Currency
Purchased | | | Net
Unrealized
Appreciation
(Depreciation)
($) | |
| 03/16/2022 | | BCLY | | | RUB | | | | 757,620,094 | | | | USD | | | | 8,539,530 | | | | 1,544,278 | |
| 05/11/2022 | | MSCI | | | RUB | | | | 425,279,311 | | | | USD | | | | 4,886,751 | | | | 1,228,435 | |
| 03/07/2022 | | CITI | | | SEK | | | | 51,796,940 | | | | USD | | | | 5,652,331 | | | | 183,390 | |
| 03/07/2022 | | JPM | | | SEK | | | | 147,773,717 | | | | USD | | | | 15,720,000 | | | | 117,425 | |
| 05/18/2022 | | MSCI | | | THB | | | | 327,958,759 | | | | USD | | | | 10,143,473 | | | | 103,637 | |
| 05/17/2022 | | JPM | | | TWD | | | | 124,951,385 | | | | USD | | | | 4,508,764 | | | | 34,956 | |
| 03/18/2022 | | DB | | | USD | | | | 701,812 | | | | AUD | | | | 983,205 | | | | 12,450 | |
| 03/18/2022 | | GS | | | USD | | | | 701,565 | | | | AUD | | | | 983,204 | | | | 12,697 | |
| 04/21/2022 | | GS | | | USD | | | | 1,843,253 | | | | AUD | | | | 2,568,600 | | | | 23,697 | |
| 05/09/2022 | | JPM | | | USD | | | | 32,691,307 | | | | AUD | | | | 45,410,000 | | | | 322,337 | |
| 04/04/2022 | | CITI | | | USD | | | | 4,320,000 | | | | BRL | | | | 23,423,549 | | | | 187,823 | |
| 04/04/2022 | | GS | | | USD | | | | 6,110,000 | | | | BRL | | | | 32,009,144 | | | | 50,106 | |
| 04/04/2022 | | MSCI | | | USD | | | | 5,090,000 | | | | BRL | | | | 27,297,893 | | | | 163,434 | |
| 03/25/2022 | | JPM | | | USD | | | | 528,421 | | | | CAD | | | | 673,000 | | | | 2,604 | |
| 03/25/2022 | | SSB | | | USD | | | | 172,977 | | | | CAD | | | | 219,792 | | | | 448 | |
| 04/12/2022 | | MSCI | | | USD | | | | 6,070,530 | | | | CAD | | | | 7,718,166 | | | | 19,650 | |
| 04/12/2022 | | SSB | | | USD | | | | 916,817 | | | | CAD | | | | 1,150,120 | | | | (9,291 | ) |
| 05/02/2022 | | BCLY | | | USD | | | | 84,516,579 | | | | CAD | | | | 107,916,938 | | | | 637,485 | |
| 05/02/2022 | | JPM | | | USD | | | | 44,290,000 | | | | CAD | | | | 56,205,986 | | | | 60,481 | |
| 05/16/2022 | | JPM | | | USD | | | | 21,080,000 | | | | CHF | | | | 19,306,285 | | | | 37,536 | |
| 05/16/2022 | | MSCI | | | USD | | | | 3,775,057 | | | | CLP | | | | 3,090,639,500 | | | | 52,773 | |
| 03/17/2022 | | MSCI | | | USD | | | | 7,200,000 | | | | COP | | | | 28,284,479,700 | | | | (26,809 | ) |
| 05/18/2022 | | MSCI | | | USD | | | | 13,285,325 | | | | CZK | | | | 287,706,993 | | | | (568,100 | ) |
| 03/18/2022 | | BCLY | | | USD | | | | 389,294 | | | | EUR | | | | 339,210 | | | | (8,710 | ) |
| 03/18/2022 | | UBSA | | | USD | | | | 353,651 | | | | EUR | | | | 307,780 | | | | (8,330 | ) |
| 03/21/2022 | | UBSA | | | USD | | | | 11,381,324 | | | | EUR | | | | 10,028,632 | | | | (128,036 | ) |
| 03/28/2022 | | BCLY | | | USD | | | | 22,915,959 | | | | EUR | | | | 20,262,879 | | | | (171,865 | ) |
| 03/31/2022 | | SSB | | | USD | | | | 8,497,001 | | | | EUR | | | | 7,600,000 | | | | 34,721 | |
| 04/21/2022 | | BCLY | | | USD | | | | 24,506,392 | | | | EUR | | | | 21,720,500 | | | | (104,811 | ) |
| 04/21/2022 | | MSCI | | | USD | | | | 153,875 | | | | EUR | | | | 136,880 | | | | (99 | ) |
| 04/21/2022 | | SSB | | | USD | | | | 6,828,374 | | | | EUR | | | | 6,101,444 | | | | 26,205 | |
| 04/26/2022 | | MSCI | | | USD | | | | 32,590,877 | | | | EUR | | | | 28,787,041 | | | | (244,996 | ) |
| 03/21/2022 | | BCLY | | | USD | | | | 1,427,426 | | | | GBP | | | | 1,055,238 | | | | (11,584 | ) |
| 04/21/2022 | | CITI | | | USD | | | | 3,285,631 | | | | GBP | | | | 2,452,700 | | | | 5,436 | |
| 04/21/2022 | | SSB | | | USD | | | | 2,992,893 | | | | GBP | | | | 2,216,300 | | | | (19,031 | ) |
| 05/16/2022 | | BCLY | | | USD | | | | 4,566,516 | | | | GBP | | | | 3,360,000 | | | | (58,573 | ) |
| 05/16/2022 | | MSCI | | | USD | | | | 59,749,353 | | | | GBP | | | | 43,872,700 | | | | (887,551 | ) |
| 04/21/2022 | | JPM | | | USD | | | | 744,478 | | | | HKD | | | | 5,795,200 | | | | (2,837 | ) |
| 05/16/2022 | | MSCI | | | USD | | | | 2,880,000 | | | | HUF | | | | 909,907,200 | | | | (157,570 | ) |
| 05/04/2022 | | JPM | | | USD | | | | 7,927,012 | | | | IDR | | | | 114,941,677,400 | | | | 36,247 | |
| 04/29/2022 | | JPM | | | USD | | | | 6,669,896 | | | | ILS | | | | 21,282,972 | | | | (31,324 | ) |
| 03/08/2022 | | MSCI | | | USD | | | | 13,989,105 | | | | INR | | | | 1,057,044,730 | | | | 33,510 | |
| 03/07/2022 | | DB | | | USD | | | | 30,129,566 | | | | JPY | | | | 3,450,332,473 | | | | (115,024 | ) |
| 03/09/2022 | | DB | | | USD | | | | 11,050,000 | | | | JPY | | | | 1,275,313,650 | | | | 44,363 | |
| 03/09/2022 | | JPM | | | USD | | | | 16,240,000 | | | | JPY | | | | 1,856,702,960 | | | | (87,945 | ) |
| 03/09/2022 | | MSCI | | | USD | | | | 86,308,380 | | | | JPY | | | | 9,946,795,658 | | | | 221,989 | |
| 04/04/2022 | | MSCI | | | USD | | | | 21,816,970 | | | | JPY | | | | 2,500,000,000 | | | | (54,743 | ) |
| 04/21/2022 | | DB | | | USD | | | | 11,665,124 | | | | JPY | | | | 1,338,669,700 | | | | (8,137 | ) |
| 05/09/2022 | | SSB | | | USD | | | | 21,829,714 | | | | JPY | | | | 2,500,000,000 | | | | (51,059 | ) |
| 05/09/2022 | | UBSA | | | USD | | | | 2,222,380 | | | | JPY | | | | 256,278,010 | | | | 10,176 | |
| 05/09/2022 | | BCLY | | | USD | | | | 2,990,000 | | | | KRW | | | | 3,590,093,000 | | | | (6,336 | ) |
| 05/09/2022 | | JPM | | | USD | | | | 1,970,000 | | | | KRW | | | | 2,364,906,200 | | | | (4,567 | ) |
| 05/09/2022 | | MSCI | | | USD | | | | 5,110,000 | | | | KRW | | | | 6,130,485,080 | | | | (15,059 | ) |
| | | | |
| | |
| | | See accompanying notes to the financial statements. | | 95 |
GMO Implementation Fund
(A Series of GMO Trust)
Consolidated Schedule of Investments — (Continued)
February 28, 2022
Forward Currency Contracts — continued
| | | | | | | | | | | | | | | | | | | | | | |
| | | | |
Settlement
Date | | Counter-
party | | Currency
Sold | | | Currency
Purchased | | | Net
Unrealized
Appreciation
(Depreciation)
($) | |
| 03/22/2022 | | JPM | | | USD | | | | 2,420,000 | | | | MXN | | | | 49,568,993 | | | | (7,834 | ) |
| 05/16/2022 | | BCLY | | �� | USD | | | | 66,130,185 | | | | NOK | | | | 585,020,685 | | | | 184,732 | |
| 03/01/2022 | | JPM | | | USD | | | | 98,085,240 | | | | NZD | | | | 145,700,000 | | | | 495,388 | |
| 03/01/2022 | | MSCI | | | USD | | | | 25,034,350 | | | | NZD | | | | 37,630,000 | | | | 426,110 | |
| 03/18/2022 | | GS | | | USD | | | | 1,918,048 | | | | NZD | | | | 2,835,010 | | | | (256 | ) |
| 03/18/2022 | | SSB | | | USD | | | | 1,617,358 | | | | NZD | | | | 2,424,663 | | | | 22,846 | |
| 04/19/2022 | | DB | | | USD | | | | 2,020,000 | | | | PLN | | | | 8,046,082 | | | | (110,089 | ) |
| 04/19/2022 | | MSCI | | | USD | | | | 6,213,463 | | | | PLN | | | | 24,701,002 | | | | (350,147 | ) |
| | | | | | | | | | | | | | | | | | | | | | |
| | | | |
Settlement
Date | | Counter-
party | | Currency
Sold | | | Currency
Purchased | | | Net
Unrealized
Appreciation
(Depreciation)
($) | |
| 05/11/2022 | | MSCI | | | USD | | | | 15,131,041 | | | | RUB | | | | 1,182,899,405 | | | | (4,955,563 | ) |
| 03/07/2022 | | BCLY | | | USD | | | | 45,131,777 | | | | SEK | | | | 410,867,289 | | | | (1,750,668 | ) |
| 03/18/2022 | | MSCI | | | USD | | | | 4,016,125 | | | | SGD | | | | 5,399,279 | | | | (33,857 | ) |
| 05/18/2022 | | MSCI | | | USD | | | | 1,810,000 | | | | THB | | | | 58,712,961 | | | | (12,614 | ) |
| 05/17/2022 | | JPM | | | USD | | | | 1,710,000 | | | | TWD | | | | 47,611,530 | | | | (5,298 | ) |
| 05/31/2022 | | MSCI | | | USD | | | | 2,565,791 | | | | ZAR | | | | 40,189,269 | | | | 17,958 | |
| | | | | | | | | | | | | | | | | | | | | | |
| | | | | | | | | | | | | | | | | | | | $ | (6,016,059 | ) |
| | | | | | | | | | | | | | | | | | | | | | |
Futures Contracts
| | | | | | | | | | | | |
| | | | |
Number
of
Contracts + | | Type | | Expiration
Date | | Notional
Amount ($) | | | Value/Net
Unrealized
Appreciation
(Depreciation) ($) | |
| Buys | | | |
| 56 | | Australian Government Bond 10 Yr. | | March 2022 | | | 5,471,718 | | | | (193,689 | ) |
| 197 | | CAC40 10 Euro | | March 2022 | | | 14,588,802 | | | | (764,782 | ) |
| 11 | | Canadian Government Bond 10 Yr. | | June 2022 | | | 1,186,091 | | | | 8,053 | |
| 64 | | Corn (k) | | May 2022 | | | 2,210,400 | | | | 159,873 | |
| 111 | | DAX Index | | March 2022 | | | 44,795,891 | | | | (3,539,206 | ) |
| 383 | | FTSE 100 Index | | March 2022 | | | 38,095,058 | | | | 915,239 | |
| 149 | | Hang Seng Index | | March 2022 | | | 21,616,684 | | | | (882,989 | ) |
| 34 | | MSCI Singapore | | March 2022 | | | 836,958 | | | | (25,944 | ) |
| 14 | | S&P/TSX 60 | | March 2022 | | | 2,817,452 | | | | (29,298 | ) |
| 109 | | Silver (k) | | May 2022 | | | 13,279,470 | | | | 596,285 | |
| 4 | | U.S. Treasury Ultra 10 Yr. (CBT) | | June 2022 | | | 565,313 | | | | 6,680 | |
| 92 | | WTI Crude (k) | | April 2022 | | | 8,806,240 | | | | 596,139 | |
| | | | | | | | | | | | |
| | $ | 154,270,077 | | | $ | (3,153,639 | ) |
| | | | | | | | | | | | |
| | | | | | | | | | | | |
| | | | |
Number
of
Contracts + | | Type | | Expiration
Date | | Notional
Amount ($) | | | Value/Net
Unrealized
Appreciation
(Depreciation) ($) | |
| Sales | | | |
| 428 | | E-mini Russell 2000 Index | | March 2022 | | | 43,752,300 | | | | 2,850,893 | |
| 176 | | Euro Bund | | March 2022 | | | 32,963,665 | | | | 1,218,238 | |
| 2,016 | | Euro STOXX 50 | | March 2022 | | | 88,222,112 | | | | 6,699,003 | |
| 189 | | FTSE 100 Index | | March 2022 | | | 18,798,867 | | | | (160,463 | ) |
| 98 | | FTSE Taiwan Index | | March 2022 | | | 6,108,415 | | | | 71,395 | |
| 6 | | Gold 100 OZ (k) | | April 2022 | | | 1,140,420 | | | | (48,792 | ) |
| 36 | | Hang Seng Index | | March 2022 | | | 5,222,823 | | | | 196,691 | |
| 3,630 | | Mini MSCI Emerging Markets | | March 2022 | | | 213,353,250 | | | | 11,345,810 | |
| 2,117 | | S&P 500 E-Mini | | March 2022 | | | 462,352,800 | | | | 26,165,742 | |
| 479 | | SGX Nifty 50 | | March 2022 | | | 16,153,182 | | | | 325,189 | |
| 34 | | Soybean (k) | | May 2022 | | | 2,782,475 | | | | (72,881 | ) |
| 110 | | SPI 200 Futures | | March 2022 | | | 14,072,040 | | | | 389,549 | |
| 315 | | TOPIX Index | | March 2022 | | | 51,894,605 | | | | 1,896,184 | |
| 109 | | U.S. Treasury Note 10 Yr. (CBT) | | June 2022 | | | 13,890,688 | | | | (105,055 | ) |
| 17 | | U.S. Ultra Bond (CBT) | | June 2022 | | | 3,160,938 | | | | (40,930 | ) |
| 126 | | UK Gilt Long Bond | | June 2022 | | | 20,804,095 | | | | (101,879 | ) |
| | | | | | | | | | | | |
| | $ | 994,672,675 | | | $ | 50,628,694 | |
| | | | | | | | | | | | |
| + | Buys - Fund is long the futures contract. |
| | Sales - Fund is short the futures contract. |
Reverse Repurchase Agreements
| | | | |
Average balance outstanding | | $ | (152,043,750 | ) |
Average interest rate (net) | | | (0.02 | )% |
Maximum balance outstanding | | $ | (152,043,750 | ) |
Average balance outstanding was calculated based on daily face value balances outstanding during the period that the Fund had entered into reverse repurchase agreements. Average interest rate was calculated based on interest received and/or paid during the period that the Fund had entered into the reverse repurchase agreements.
| | | | |
| | |
| 96 | | See accompanying notes to the financial statements. | | |
GMO Implementation Fund
(A Series of GMO Trust)
Consolidated Schedule of Investments — (Continued)
February 28, 2022
Written Options
Equity Options
| | | | | | | | | | | | | | | | | | | | |
Description | | Exercise
Price | | | Expiration
Date | | | Number of
Contracts | | | Notional
Amount | | | Value
($) | |
Equity Options – Calls | | | | | | | | | | | | | | | | | | | | |
Activision Blizzard, Inc. (f) | | | 82.50 | | | | 05/20/22 | | | | (1,265 | ) | | USD | (10,309,750) | | | | (170,775 | ) |
Zynga, Inc. (f) | | | 9.00 | | | | 05/20/22 | | | | (7,188 | ) | | USD | (6,526,704) | | | | (409,716 | ) |
Activision Blizzard, Inc. (f) | | | 82.50 | | | | 06/17/22 | | | | (649 | ) | | USD | (5,289,350) | | | | (113,575 | ) |
| | | | | | | | | | | | | | | | | | | | |
| | | | |
| | | | | | | | | | | Total Equity Options — Calls | | | | (694,066 | ) |
| | | | | | | | | | | | | | | | | | | | |
| | | | |
| | | | | | | | | |
| TOTAL WRITTEN OPTIONS
(Premiums $955,223) |
| | | $(694,066) | |
| | | | | | | | | | | | | | | | | | | | |
Swap Contracts
OTC Credit Default Swaps
| | | | | | | | | | | | | | | | | | | | | | | | | | | | | | | | | | | | | | | | | | |
Reference Entity | | Counterparty | | Notional
Amount | | | Annual
Premium | | | Implied
Credit
Spread (1) | | | Maximum
Potential
Amount of
Future
Payments
by the
Fund
Under the
Contract (2) | | | Expiration
Date | | | Periodic
Payment
Frequency | | | Premiums
Paid/
(Received) ($) | | | Value ($) | | | Net
Unrealized
Appreciation/
(Depreciation)
($) | |
Buy Protection^: | |
Halliburton Co. | | BOA | | | USD | | | | 1,140,000 | | | | 1.00% | | | | 0.54% | | | | N/A | | | | 12/20/2024 | | | | Quarterly | | | | 96,637 | | | | (14,284 | ) | | | (110,921 | ) |
HCA, Inc. | | BCLY | | | USD | | | | 1,140,000 | | | | 5.00% | | | | 0.80% | | | | N/A | | | | 12/20/2024 | | | | Quarterly | | | | (139,584 | ) | | | (130,709 | ) | | | 8,875 | |
Tenet Healthcare Corp. | | JPM | | | USD | | | | 570,000 | | | | 5.00% | | | | 2.06% | | | | N/A | | | | 12/20/2024 | | | | Quarterly | | | | 14,842 | | | | (44,317 | ) | | | (59,159 | ) |
Tenet Healthcare Corp. | | JPM | | | USD | | | | 1,140,000 | | | | 5.00% | | | | 2.06% | | | | N/A | | | | 12/20/2024 | | | | Quarterly | | | | 142,500 | | | | (88,634 | ) | | | (231,134 | ) |
United Rentals North America, Inc. | | CSI | | | USD | | | | 1,140,000 | | | | 5.00% | | | | 0.77% | | | | N/A | | | | 12/20/2024 | | | | Quarterly | | | | (96,605 | ) | | | (131,440 | ) | | | (34,835 | ) |
United Rentals North America, Inc. | | JPM | | | USD | | | | 1,140,000 | | | | 5.00% | | | | 0.77% | | | | N/A | | | | 12/20/2024 | | | | Quarterly | | | | (51,323 | ) | | | (131,440 | ) | | | (80,117 | ) |
| | | | | | | | | | | | | | | | | | | | | | | | | | | | | | | | | | | | | | | | | | |
| | | $ | (33,533 | ) | | $ | (540,824 | ) | | $ | (507,291 | ) |
| | | | | | | | | | | | | |
| ^ | Buy Protection - Fund pays a premium and buys credit protection. If a credit event occurs the Fund will, depending on the terms of the particular swap contract, either (i) receive from the seller of protection an amount equal to the notional amount of the swap and deliver the referenced obligation or underlying securities comprising the referenced index or (ii) receive a net settlement amount in the form of cash or securities equal to the notional amount of the swap less the recovery value of the referenced obligation or underlying securities comprising the referenced index. |
| | Sell Protection - Fund receives a premium and sells credit protection. If a credit event occurs the Fund will, depending on the terms of the particular swap contract, either (i) pay to the buyer of protection an amount equal to the notional amount of the swap and take delivery of the referenced obligation or underlying securities comprising the referenced index or (ii) pay a net settlement amount in the form of cash or securities equal to the notional amount of the swap less the recovery value of the referenced obligation or underlying securities comprising the referenced index. |
| (1) | As of February 28, 2022, implied credit spreads in absolute terms, calculated using a model, and utilized in determining the market value of credit default swap contracts on the reference security, serve as an indicator of the current status of the payment/performance risk and reflect the likelihood or risk of default for the reference entity. The implied credit spread of a particular referenced entity reflects the cost of buying/selling protection. Wider (i.e. higher) credit spreads represent a deterioration of the referenced entity’s credit soundness and a greater likelihood or risk of default or other credit event occurring as defined under the terms of the contract. |
| (2) | The maximum potential amount the Fund could be required to pay as a seller of credit protection if a credit event occurs as defined under the terms of that particular swap contract. |
| | | | |
| | |
| | | See accompanying notes to the financial statements. | | 97 |
GMO Implementation Fund
(A Series of GMO Trust)
Consolidated Schedule of Investments — (Continued)
February 28, 2022
Swap Contracts — continued
Centrally Cleared Interest Rate Swaps
| | | | | | | | | | | | | | | | | | | | | | | | | | |
Fund Pays | | Fund
Receives | | Notional
Amount | | | Expiration
Date | | | Periodic
Payment
Frequency | | Premiums
Paid/
(Received) ($) | | | Value ($) | | | Net
Unrealized
Appreciation/
(Depreciation) ($) | |
1.60% | | 3 Month AUD BBSW | | AUD | | | 54,980,000 | | | | 03/16/2024 | | | Quarterly | | | — | | | | (143,237 | ) | | | (143,237 | ) |
1.82% | | 3 Month CAD CDOR | | CAD | | | 533,270,000 | | | | 03/16/2024 | | | Semi-Annually | | | (111,492 | ) | | | 1,656,156 | | | | 1,767,648 | |
1.99% | | 3 Month CAD CDOR | | CAD | | | 80,780,000 | | | | 03/16/2024 | | | Semi-Annually | | | — | | | | 36,672 | | | | 36,672 | |
1.90% | | 3 Month CAD CDOR | | CAD | | | 150,850,000 | | | | 03/16/2024 | | | Semi-Annually | | | — | | | | 285,494 | | | | 285,494 | |
1.95% | | 3 Month CAD CDOR | | CAD | | | 66,360,000 | | | | 03/16/2024 | | | Semi-Annually | | | — | | | | 67,796 | | | | 67,796 | |
3 Month CAD CDOR | | 2.12% | | CAD | | | 53,560,000 | | | | 03/16/2024 | | | Semi-Annually | | | — | | | | 83,558 | | | | 83,558 | |
3 Month CAD CDOR | | 1.74% | | CAD | | | 109,780,000 | | | | 03/16/2024 | | | Semi-Annually | | | — | | | | (480,942 | ) | | | (480,942 | ) |
3 Month CAD CDOR | | 1.80% | | CAD | | | 76,440,000 | | | | 03/16/2024 | | | Semi-Annually | | | — | | | | (254,040 | ) | | | (254,040 | ) |
2.03% | | 3 Month CAD CDOR | | CAD | | | 74,980,000 | | | | 03/16/2024 | | | Semi-Annually | | | — | | | | (15,522 | ) | | | (15,522 | ) |
(0.54)% | | CHF - SARON - OIS - COMPOUND | | CHF | | | 120,680,000 | | | | 03/16/2024 | | | Annually | | | — | | | | 671,531 | | | | 671,531 | |
(0.54)% | | CHF - SARON - OIS - COMPOUND | | CHF | | | 18,430,000 | | | | 03/16/2024 | | | Annually | | | (5,582 | ) | | | 105,643 | | | | 111,225 | |
(0.44)% | | CHF - SARON - OIS - COMPOUND | | CHF | | | 45,310,000 | | | | 03/16/2024 | | | Annually | | | — | | | | 155,447 | | | | 155,447 | |
CHF - SARON - OIS - COMPOUND | | (0.17)% | | CHF | | | 37,550,000 | | | | 03/16/2024 | | | Annually | | | — | | | | 96,868 | | | | 96,868 | |
(0.08)% | | CHF - SARON - OIS - COMPOUND | | CHF | | | 68,870,000 | | | | 03/16/2024 | | | Annually | | | — | | | | (318,465 | ) | | | (318,465 | ) |
(0.24)% | | CHF - SARON - OIS - COMPOUND | | CHF | | | 88,780,000 | | | | 03/16/2024 | | | Annually | | | — | | | | (92,153 | ) | | | (92,153 | ) |
(0.25)% | | CHF - SARON - OIS - COMPOUND | | CHF | | | 87,380,000 | | | | 03/16/2024 | | | Annually | | | — | | | | (71,176 | ) | | | (71,176 | ) |
(0.28)% | | CHF - SARON - OIS - COMPOUND | | CHF | | | 93,240,000 | | | | 03/16/2024 | | | Annually | | | — | | | | (13,450 | ) | | | (13,450 | ) |
GBP - SONIA - COMPOUND | | 1.64% | | GBP | | | 447,810,000 | | | | 03/16/2024 | | | Annually | | | 187,132 | | | | 300,363 | | | | 113,231 | |
GBP - SONIA - COMPOUND | | 1.80% | | GBP | | | 45,600,000 | | | | 03/16/2024 | | | Annually | | | 31,363 | | | | 228,675 | | | | 197,312 | |
1.62% | | GBP - SONIA - COMPOUND | | GBP | | | 62,880,000 | | | | 03/16/2024 | | | Annually | | | 20,419 | | | | (17,344 | ) | | | (37,763 | ) |
1.67% | | GBP - SONIA - COMPOUND | | GBP | | | 37,870,000 | | | | 03/16/2024 | | | Annually | | | 1,131 | | | | (55,312 | ) | | | (56,443 | ) |
1.67% | | GBP - SONIA - COMPOUND | | GBP | | | 39,510,000 | | | | 03/16/2024 | | | Annually | | | (3,915 | ) | | | (67,069 | ) | | | (63,154 | ) |
2.51% | | 3 Month NZD Bank Bill Rate | | NZD | | | 74,590,000 | | | | 03/16/2024 | | | Quarterly | | | — | | | | 281,418 | | | | 281,418 | |
2.40% | | 3 Month NZD Bank Bill Rate | | NZD | | | 76,150,000 | | | | 03/16/2024 | | | Quarterly | | | — | | | | 397,792 | | | | 397,792 | |
2.38% | | 3 Month NZD Bank Bill Rate | | NZD | | | 86,680,000 | | | | 03/16/2024 | | | Quarterly | | | — | | | | 475,665 | | | | 475,665 | |
2.61% | | 3 Month NZD Bank Bill Rate | | NZD | | | 96,080,000 | | | | 03/16/2024 | | | Quarterly | | | — | | | | 235,764 | | | | 235,764 | |
3 Month NZD Bank Bill Rate | | 2.53% | | NZD | | | 201,880,000 | | | | 03/16/2024 | | | Quarterly | | | — | | | | (708,408 | ) | | | (708,408 | ) |
3 Month NZD Bank Bill Rate | | 2.60% | | NZD | | | 252,290,000 | | | | 03/16/2024 | | | Quarterly | | | 23,085 | | | | (649,028 | ) | | | (672,113 | ) |
0.34% | | 3 Month SEK STIBOR | | SEK | | | 3,652,000,000 | | | | 03/16/2024 | | | Quarterly | | | — | | | | 2,276,152 | | | | 2,276,152 | |
0.33% | | 3 Month SEK STIBOR | | SEK | | | 537,510,000 | | | | 03/16/2024 | | | Quarterly | | | (39,275 | ) | | | 340,808 | | | | 380,083 | |
0.33% | | 3 Month SEK STIBOR | | SEK | | | 452,900,000 | | | | 03/16/2024 | | | Quarterly | | | — | | | | 289,077 | | | | 289,077 | |
0.32% | | 3 Month SEK STIBOR | | SEK | | | 150,900,000 | | | | 03/16/2024 | | | Quarterly | | | — | | | | 98,710 | | | | 98,710 | |
3 Month SEK STIBOR | | 0.72% | | SEK | | | 537,000,000 | | | | 03/16/2024 | | | Quarterly | | | — | | | | 94,532 | | | | 94,532 | |
3 Month SEK STIBOR | | 0.69% | | SEK | | | 977,600,000 | | | | 03/16/2024 | | | Quarterly | | | — | | | | 114,197 | | | | 114,197 | |
3 Month SEK STIBOR | | 0.69% | | SEK | | | 904,900,000 | | | | 03/16/2024 | | | Quarterly | | | — | | | | 111,447 | | | | 111,447 | |
3 Month SEK STIBOR | | 0.64% | | SEK | | | 503,300,000 | | | | 03/16/2024 | | | Quarterly | | | — | | | | 8,759 | | | | 8,759 | |
3 Month SEK STIBOR | | 0.42% | | SEK | | | 230,700,000 | | | | 03/16/2024 | | | Quarterly | | | 5,200 | | | | (103,335 | ) | | | (108,535 | ) |
3 Month SEK STIBOR | | 0.63% | | SEK | | | 434,300,000 | | | | 03/16/2024 | | | Quarterly | | | — | | | | (1,627 | ) | | | (1,627 | ) |
1.22% | | USD - SOFR - COMPOUND | | USD | | | 65,120,000 | | | | 03/16/2024 | | | Annually | | | 13,871 | | | | 243,147 | | | | 229,276 | |
USD - SOFR - COMPOUND | | 1.46% | | USD | | | 40,790,000 | | | | 03/16/2024 | | | Annually | | | 5,121 | | | | 39,948 | | | | 34,827 | |
USD - SOFR - COMPOUND | | 0.97% | | USD | | | 38,560,000 | | | | 03/16/2024 | | | Annually | | | (12,242 | ) | | | (338,808 | ) | | | (326,566 | ) |
USD - SOFR - COMPOUND | | 1.01% | | USD | | | 97,090,000 | | | | 03/16/2024 | | | Annually | | | (18,508 | ) | | | (775,523 | ) | | | (757,015 | ) |
USD - SOFR - COMPOUND | | 1.15% | | USD | | | 60,470,000 | | | | 03/16/2024 | | | Annually | | | (6,901 | ) | | | (313,943 | ) | | | (307,042 | ) |
USD - SOFR - COMPOUND | | 1.05% | | USD | | | 57,610,000 | | | | 03/16/2024 | | | Annually | | | (8,685 | ) | | | (419,901 | ) | | | (411,216 | ) |
1.61% | | USD - SOFR - COMPOUND | | USD | | | 39,480,000 | | | | 03/16/2024 | | | Annually | | | (11,596 | ) | | | (153,780 | ) | | | (142,184 | ) |
6 Month EURIBOR | | 0.22% | | EUR | | | 67,470,000 | | | | 03/20/2024 | | | Semi-Annually | | | 1,916 | | | | 262,175 | | | | 260,259 | |
6 Month EURIBOR | | 0.20% | | EUR | | | 46,750,000 | | | | 03/20/2024 | | | Semi-Annually | | | (7,347 | ) | | | 165,466 | | | | 172,813 | |
6 Month EURIBOR | | 0.20% | | EUR | | | 33,660,000 | | | | 03/20/2024 | | | Semi-Annually | | | (31,316 | ) | | | 119,898 | | | | 151,214 | |
6 Month EURIBOR | | 0.17% | | EUR | | | 47,370,000 | | | | 03/20/2024 | | | Semi-Annually | | | 5,073 | | | | 127,441 | | | | 122,368 | |
6 Month EURIBOR | | (0.23)% | | EUR | | | 42,040,000 | | | | 03/20/2024 | | | Semi-Annually | | | (2,926 | ) | | | (260,023 | ) | | | (257,097 | ) |
6 Month EURIBOR | | (0.20)% | | EUR | | | 49,880,000 | | | | 03/20/2024 | | | Semi-Annually | | | (145 | ) | | | (273,505 | ) | | | (273,360 | ) |
6 Month EURIBOR | | (0.07)% | | EUR | | | 50,080,000 | | | | 03/20/2024 | | | Semi-Annually | | | 593 | | | | (130,598 | ) | | | (131,191 | ) |
1.95% | | 6 Month AUD BBSW | | AUD | | | 12,910,000 | | | | 03/16/2032 | | | Semi-Annually | | | — | | | | 429,106 | | | | 429,106 | |
1.96% | | 6 Month AUD BBSW | | AUD | | | 21,380,000 | | | | 03/16/2032 | | | Semi-Annually | | | — | | | | 694,049 | | | | 694,049 | |
2.10% | | 6 Month AUD BBSW | | AUD | | | 15,790,000 | | | | 03/16/2032 | | | Semi-Annually | | | — | | | | 367,638 | | | | 367,638 | |
| | | | |
| | |
| 98 | | See accompanying notes to the financial statements. | | |
GMO Implementation Fund
(A Series of GMO Trust)
Consolidated Schedule of Investments — (Continued)
February 28, 2022
Swap Contracts — continued
Centrally Cleared Interest Rate Swaps — continued
| | | | | | | | | | | | | | | | | | | | | | | | | | |
Fund Pays | | Fund
Receives | | Notional
Amount | | | Expiration
Date | | | Periodic
Payment
Frequency | | Premiums
Paid/
(Received) ($) | | | Value ($) | | | Net
Unrealized
Appreciation/
(Depreciation) ($) | |
2.10% | | 6 Month AUD BBSW | | AUD | | | 15,790,000 | | | | 03/16/2032 | | | Semi-Annually | | | — | | | | 372,741 | | | | 372,741 | |
2.15% | | 6 Month AUD BBSW | | AUD | | | 17,560,000 | | | | 03/16/2032 | | | Semi-Annually | | | — | | | | 360,036 | | | | 360,036 | |
2.43% | | 6 Month AUD BBSW | | AUD | | | 32,990,000 | | | | 03/16/2032 | | | Semi-Annually | | | — | | | | 71,265 | | | | 71,265 | |
6 Month AUD BBSW | | 2.52% | | AUD | | | 25,350,000 | | | | 03/16/2032 | | | Semi-Annually | | | — | | | | 94,775 | | | | 94,775 | |
6 Month AUD BBSW | | 2.52% | | AUD | | | 48,720,000 | | | | 03/16/2032 | | | Semi-Annually | | | — | | | | 182,148 | | | | 182,148 | |
6 Month AUD BBSW | | 2.53% | | AUD | | | 12,190,000 | | | | 03/16/2032 | | | Semi-Annually | | | — | | | | 51,484 | | | | 51,484 | |
6 Month AUD BBSW | | 2.54% | | AUD | | | 15,350,000 | | | | 03/16/2032 | | | Semi-Annually | | | — | | | | 77,234 | | | | 77,234 | |
6 Month AUD BBSW | | 1.97% | | AUD | | | 25,460,000 | | | | 03/16/2032 | | | Semi-Annually | | | — | | | | (814,975 | ) | | | (814,975 | ) |
6 Month AUD BBSW | | 2.07% | | AUD | | | 17,560,000 | | | | 03/16/2032 | | | Semi-Annually | | | — | | | | (445,174 | ) | | | (445,174 | ) |
6 Month AUD BBSW | | 1.99% | | AUD | | | 102,700,000 | | | | 03/16/2032 | | | Semi-Annually | | | (9,266 | ) | | | (3,131,411 | ) | | | (3,122,145 | ) |
6 Month AUD BBSW | | 2.25% | | AUD | | | 16,380,000 | | | | 03/16/2032 | | | Semi-Annually | | | — | | | | (229,954 | ) | | | (229,954 | ) |
1.88% | | 3 Month CAD CDOR | | CAD | | | 25,230,000 | | | | 03/16/2032 | | | Semi-Annually | | | — | | | | 888,184 | | | | 888,184 | |
2.03% | | 3 Month CAD CDOR | | CAD | | | 22,280,000 | | | | 03/16/2032 | | | Semi-Annually | | | — | | | | 537,363 | | | | 537,363 | |
2.14% | | 3 Month CAD CDOR | | CAD | | | 23,740,000 | | | | 03/16/2032 | | | Semi-Annually | | | — | | | | 397,706 | | | | 397,706 | |
2.16% | | 3 Month CAD CDOR | | CAD | | | 17,950,000 | | | | 03/16/2032 | | | Semi-Annually | | | — | | | | 263,481 | | | | 263,481 | |
2.23% | | 3 Month CAD CDOR | | CAD | | | 16,630,000 | | | | 03/16/2032 | | | Semi-Annually | | | — | | | | 162,044 | | | | 162,044 | |
2.23% | | 3 Month CAD CDOR | | CAD | | | 16,450,000 | | | | 03/16/2032 | | | Semi-Annually | | | — | | | | 159,114 | | | | 159,114 | |
3 Month CAD CDOR | | 2.39% | | CAD | | | 17,700,000 | | | | 03/16/2032 | | | Semi-Annually | | | — | | | | 19,934 | | | | 19,934 | |
2.34% | | 3 Month CAD CDOR | | CAD | | | 16,330,000 | | | | 03/16/2032 | | | Semi-Annually | | | — | | | | 37,081 | | | | 37,081 | |
3 Month CAD CDOR | | 2.42% | | CAD | | | 16,400,000 | | | | 03/16/2032 | | | Semi-Annually | | | — | | | | 57,174 | | | | 57,174 | |
3 Month CAD CDOR | | 2.12% | | CAD | | | 117,300,000 | | | | 03/16/2032 | | | Semi-Annually | | | 114,554 | | | | (2,082,518 | ) | | | (2,197,072 | ) |
3 Month CAD CDOR | | 2.12% | | CAD | | | 285,870,000 | | | | 03/16/2032 | | | Semi-Annually | | | 75,091 | | | | (5,075,272 | ) | | | (5,150,363 | ) |
3 Month CAD CDOR | | 2.33% | | CAD | | | 53,970,000 | | | | 03/16/2032 | | | Semi-Annually | | | — | | | | (170,798 | ) | | | (170,798 | ) |
3 Month CAD CDOR | | 2.37% | | CAD | | | 43,470,000 | | | | 03/16/2032 | | | Semi-Annually | | | — | | | | (783 | ) | | | (783 | ) |
3 Month CAD CDOR | | 2.35% | | CAD | | | 21,770,000 | | | | 03/16/2032 | | | Semi-Annually | | | — | | | | (25,302 | ) | | | (25,302 | ) |
3 Month CAD CDOR | | 2.28% | | CAD | | | 32,920,000 | | | | 03/16/2032 | | | Semi-Annually | | | — | | | | (216,010 | ) | | | (216,010 | ) |
3 Month CAD CDOR | | 2.32% | | CAD | | | 7,670,000 | | | | 03/16/2032 | | | Semi-Annually | | | — | | | | (25,370 | ) | | | (25,370 | ) |
3 Month CAD CDOR | | 2.32% | | CAD | | | 14,460,000 | | | | 03/16/2032 | | | Semi-Annually | | | — | | | | (47,313 | ) | | | (47,313 | ) |
2.39% | | 3 Month CAD CDOR | | CAD | | | 17,240,000 | | | | 03/16/2032 | | | Semi-Annually | | | — | | | | (28,047 | ) | | | (28,047 | ) |
2.42% | | 3 Month CAD CDOR | | CAD | | | 28,560,000 | | | | 03/16/2032 | | | Semi-Annually | | | — | | | | (108,758 | ) | | | (108,758 | ) |
2.44% | | 3 Month CAD CDOR | | CAD | | | 19,270,000 | | | | 03/16/2032 | | | Semi-Annually | | | — | | | | (97,498 | ) | | | (97,498 | ) |
2.44% | | 3 Month CAD CDOR | | CAD | | | 11,700,000 | | | | 03/16/2032 | | | Semi-Annually | | | — | | | | (59,197 | ) | | | (59,197 | ) |
CHF - SARON - OIS - COMPOUND | | 0.51% | | CHF | | | 14,250,000 | | | | 03/16/2032 | | | Annually | | | — | | | | 6,918 | | | | 6,918 | |
CHF - SARON - OIS - COMPOUND | | 0.56% | | CHF | | | 18,480,000 | | | | 03/16/2032 | | | Annually | | | — | | | | 102,609 | | | | 102,609 | |
CHF - SARON - OIS - COMPOUND | | 0.51% | | CHF | | | 9,580,000 | | | | 03/16/2032 | | | Annually | | | — | | | | 8,305 | | | | 8,305 | |
CHF - SARON - OIS - COMPOUND | | 0.51% | | CHF | | | 9,670,000 | | | | 03/16/2032 | | | Annually | | | — | | | | 5,221 | | | | 5,221 | |
CHF - SARON - OIS - COMPOUND | | 0.52% | | CHF | | | 18,430,000 | | | | 03/16/2032 | | | Annually | | | — | | | | 22,001 | | | | 22,001 | |
CHF - SARON - OIS - COMPOUND | | 0.55% | | CHF | | | 18,150,000 | | | | 03/16/2032 | | | Annually | | | — | | | | 85,943 | | | | 85,943 | |
CHF - SARON - OIS - COMPOUND | | 0.52% | | CHF | | | 19,310,000 | | | | 03/16/2032 | | | Annually | | | — | | | | 38,832 | | | | 38,832 | |
CHF - SARON - OIS - COMPOUND | | 0.05% | | CHF | | | 24,750,000 | | | | 03/16/2032 | | | Annually | | | — | | | | (1,238,000 | ) | | | (1,238,000 | ) |
CHF - SARON - OIS - COMPOUND | | (0.01)% | | CHF | | | 3,630,000 | | | | 03/16/2032 | | | Annually | | | 9,442 | | | | (203,724 | ) | | | (213,166 | ) |
CHF - SARON - OIS - COMPOUND | | 0.20% | | CHF | | | 9,260,000 | | | | 03/16/2032 | | | Annually | | | — | | | | (308,806 | ) | | | (308,806 | ) |
CHF - SARON - OIS - COMPOUND | | 0.22% | | CHF | | | 14,200,000 | | | | 03/16/2032 | | | Annually | | | — | | | | (433,318 | ) | | | (433,318 | ) |
CHF - SARON - OIS - COMPOUND | | 0.23% | | CHF | | | 141,650,000 | | | | 03/16/2032 | | | Annually | | | 142,574 | | | | (4,229,885 | ) | | | (4,372,459 | ) |
CHF - SARON - OIS - COMPOUND | | 0.32% | | CHF | | | 5,980,000 | | | | 03/16/2032 | | | Annually | | | — | | | | (119,926 | ) | | | (119,926 | ) |
0.53% | | CHF - SARON - OIS - COMPOUND | | CHF | | | 7,770,000 | | | | 03/16/2032 | | | Annually | | | — | | | | (21,129 | ) | | | (21,129 | ) |
1.37% | | GBP - SONIA - COMPOUND | | GBP | | | 305,640,000 | | | | 03/16/2032 | | | Annually | | | (877,716 | ) | | | 1,329,821 | | | | 2,207,537 | |
1.35% | | GBP - SONIA - COMPOUND | | GBP | | | 91,170,000 | | | | 03/16/2032 | | | Annually | | | (155,284 | ) | | | 622,779 | | | | 778,063 | |
GBP - SONIA - COMPOUND | | 1.43% | | GBP | | | 11,280,000 | | | | 03/16/2032 | | | Annually | | | — | | | | 30,649 | | | | 30,649 | |
GBP - SONIA - COMPOUND | | 1.41% | | GBP | | | 8,010,000 | | | | 03/16/2032 | | | Annually | | | (20,877 | ) | | | 6,865 | | | | 27,742 | |
1.35% | | GBP - SONIA - COMPOUND | | GBP | | | 8,910,000 | | | | 03/16/2032 | | | Annually | | | — | | | | 63,074 | | | | 63,074 | |
GBP - SONIA - COMPOUND | | 1.34% | | GBP | | | 13,250,000 | | | | 03/16/2032 | | | Annually | | | (18,730 | ) | | | (107,762 | ) | | | (89,032 | ) |
GBP - SONIA - COMPOUND | | 1.41% | | GBP | | | 8,320,000 | | | | 03/16/2032 | | | Annually | | | 17,016 | | | | 941 | | | | (16,075 | ) |
1.46% | | GBP - SONIA - COMPOUND | | GBP | | | 9,640,000 | | | | 03/16/2032 | | | Annually | | | (13,911 | ) | | | (70,422 | ) | | | (56,511 | ) |
2.64% | | 3 Month NZD Bank Bill Rate | | NZD | | | 44,670,000 | | | | 03/16/2032 | | | Quarterly | | | 14,157 | | | | 1,044,604 | | | | 1,030,447 | |
| | | | |
| | |
| | | See accompanying notes to the financial statements. | | 99 |
GMO Implementation Fund
(A Series of GMO Trust)
Consolidated Schedule of Investments — (Continued)
February 28, 2022
Swap Contracts — continued
Centrally Cleared Interest Rate Swaps — continued
| | | | | | | | | | | | | | | | | | | | | | | | | | |
Fund Pays | | Fund
Receives | | Notional
Amount | | | Expiration
Date | | | Periodic
Payment
Frequency | | Premiums
Paid/
(Received) ($) | | | Value ($) | | | Net
Unrealized
Appreciation/
(Depreciation) ($) | |
2.69% | | 3 Month NZD Bank Bill Rate | | NZD | | | 55,920,000 | | | | 03/16/2032 | | | Quarterly | | | (12,893 | ) | | | 1,130,255 | | | | 1,143,148 | |
3.02% | | 3 Month NZD Bank Bill Rate | | NZD | | | 10,440,000 | | | | 03/16/2032 | | | Quarterly | | | — | | | | 11,648 | | | | 11,648 | |
2.98% | | 3 Month NZD Bank Bill Rate | | NZD | | | 19,970,000 | | | | 03/16/2032 | | | Quarterly | | | — | | | | 69,217 | | | | 69,217 | |
3 Month NZD Bank Bill Rate | | 2.57% | | NZD | | | 16,210,000 | | | | 03/16/2032 | | | Quarterly | | | — | | | | (441,932 | ) | | | (441,932 | ) |
3 Month NZD Bank Bill Rate | | 2.82% | | NZD | | | 17,020,000 | | | | 03/16/2032 | | | Quarterly | | | (627 | ) | | | (214,001 | ) | | | (213,374 | ) |
3 Month NZD Bank Bill Rate | | 2.78% | | NZD | | | 19,380,000 | | | | 03/16/2032 | | | Quarterly | | | — | | | | (288,085 | ) | | | (288,085 | ) |
3 Month NZD Bank Bill Rate | | 2.99% | | NZD | | | 21,570,000 | | | | 03/16/2032 | | | Quarterly | | | (19,023 | ) | | | (55,752 | ) | | | (36,729 | ) |
3.05% | | 3 Month NZD Bank Bill Rate | | NZD | | | 9,860,000 | | | | 03/16/2032 | | | Quarterly | | | — | | | | (8,117 | ) | | | (8,117 | ) |
1.10% | | 3 Month SEK STIBOR | | SEK | | | 48,700,000 | | | | 03/16/2032 | | | Quarterly | | | (771 | ) | | | 158,230 | | | | 159,001 | |
1.42% | | 3 Month SEK STIBOR | | SEK | | | 114,500,000 | | | | 03/16/2032 | | | Quarterly | | | — | | | | 5,240 | | | | 5,240 | |
1.40% | | 3 Month SEK STIBOR | | SEK | | | 92,700,000 | | | | 03/16/2032 | | | Quarterly | | | — | | | | 22,801 | | | | 22,801 | |
1.41% | | 3 Month SEK STIBOR | | SEK | | | 209,300,000 | | | | 03/16/2032 | | | Quarterly | | | — | | | | 26,339 | | | | 26,339 | |
3 Month SEK STIBOR | | 0.90% | | SEK | | | 745,390,000 | | | | 03/16/2032 | | | Quarterly | | | — | | | | (3,929,065 | ) | | | (3,929,065 | ) |
3 Month SEK STIBOR | | 0.84% | | SEK | | | 132,630,000 | | | | 03/16/2032 | | | Quarterly | | | 32,867 | | | | (770,807 | ) | | | (803,674 | ) |
3 Month SEK STIBOR | | 0.83% | | SEK | | | 94,400,000 | | | | 03/16/2032 | | | Quarterly | | | — | | | | (559,965 | ) | | | (559,965 | ) |
3 Month SEK STIBOR | | 0.85% | | SEK | | | 31,300,000 | | | | 03/16/2032 | | | Quarterly | | | — | | | | (181,593 | ) | | | (181,593 | ) |
3 Month SEK STIBOR | | 1.39% | | SEK | | | 1,392,120,000 | | | | 03/16/2032 | | | Quarterly | | | 292,315 | | | | (551,451 | ) | | | (843,766 | ) |
3 Month SEK STIBOR | | 1.38% | | SEK | | | 162,800,000 | | | | 03/16/2032 | | | Quarterly | | | — | | | | (72,637 | ) | | | (72,637 | ) |
3 Month SEK STIBOR | | 1.42% | | SEK | | | 113,500,000 | | | | 03/16/2032 | | | Quarterly | | | — | | | | (649 | ) | | | (649 | ) |
3 Month SEK STIBOR | | 1.39% | | SEK | | | 126,000,000 | | | | 03/16/2032 | | | Quarterly | | | — | | | | (48,650 | ) | | | (48,650 | ) |
1.45% | | 3 Month SEK STIBOR | | SEK | | | 193,800,000 | | | | 03/16/2032 | | | Quarterly | | | — | | | | (53,211 | ) | | | (53,211 | ) |
1.43% | | 3 Month SEK STIBOR | | SEK | | | 107,900,000 | | | | 03/16/2032 | | | Quarterly | | | — | | | | (8,564 | ) | | | (8,564 | ) |
1.57% | | USD - SOFR - COMPOUND | | USD | | | 8,300,000 | | | | 03/16/2032 | | | Annually | | | (462 | ) | | | 78,945 | | | | 79,407 | |
1.56% | | USD - SOFR - COMPOUND | | USD | | | 20,920,000 | | | | 03/16/2032 | | | Annually | | | (9,142 | ) | | | 210,648 | | | | 219,790 | |
1.58% | | USD - SOFR - COMPOUND | | USD | | | 12,400,000 | | | | 03/16/2032 | | | Annually | | | (12,517 | ) | | | 101,804 | | | | 114,321 | |
USD - SOFR - COMPOUND | | 1.87% | | USD | | | 8,570,000 | | | | 03/16/2032 | | | Annually | | | 26,463 | | | | 157,494 | | | | 131,031 | |
1.70% | | USD - SOFR - COMPOUND | | USD | | | 13,060,000 | | | | 03/16/2032 | | | Annually | | | (12,109 | ) | | | (40,897 | ) | | | (28,788 | ) |
USD - SOFR - COMPOUND | | 1.61% | | USD | | | 14,010,000 | | | | 03/16/2032 | | | Annually | | | 4,829 | | | | (75,950 | ) | | | (80,779 | ) |
1.75% | | USD - SOFR - COMPOUND | | USD | | | 21,400,000 | | | | 03/16/2032 | | | Annually | | | — | | | | (157,531 | ) | | | (157,531 | ) |
1.76% | | USD - SOFR - COMPOUND | | USD | | | 240,850,000 | | | | 03/16/2032 | | | Annually | | | (414,166 | ) | | | (2,052,839 | ) | | | (1,638,673 | ) |
1.79% | | USD - SOFR - COMPOUND | | USD | | | 14,360,000 | | | | 03/16/2032 | | | Annually | | | — | | | | (159,773 | ) | | | (159,773 | ) |
1.82% | | USD - SOFR - COMPOUND | | USD | | | 11,490,000 | | | | 03/16/2032 | | | Annually | | | — | | | | (158,283 | ) | | | (158,283 | ) |
1.84% | | USD - SOFR - COMPOUND | | USD | | | 10,270,000 | | | | 03/16/2032 | | | Annually | | | — | | | | (162,481 | ) | | | (162,481 | ) |
1.71% | | USD - SOFR - COMPOUND | | USD | | | 8,760,000 | | | | 03/16/2032 | | | Annually | | | (4,333 | ) | | | (34,354 | ) | | | (30,021 | ) |
0.36% | | 6 Month EURIBOR | | EUR | | | 8,570,000 | | | | 03/17/2032 | | | Semi-Annually | | | 850 | | | | 414,299 | | | | 413,449 | |
0.39% | | 6 Month EURIBOR | | EUR | | | 10,190,000 | | | | 03/17/2032 | | | Semi-Annually | | | 2,605 | | | | 462,310 | | | | 459,705 | |
0.39% | | 6 Month EURIBOR | | EUR | | | 137,660,000 | | | | 03/17/2032 | | | Semi-Annually | | | (388,499 | ) | | | 6,169,686 | | | | 6,558,185 | |
0.45% | | 6 Month EURIBOR | | EUR | | | 14,000,000 | | | | 03/17/2032 | | | Semi-Annually | | | — | | | | 540,330 | | | | 540,330 | |
0.42% | | 6 Month EURIBOR | | EUR | | | 11,680,000 | | | | 03/17/2032 | | | Semi-Annually | | | (10,107 | ) | | | 484,882 | | | | 494,989 | |
0.49% | | 6 Month EURIBOR | | EUR | | | 10,260,000 | | | | 03/17/2032 | | | Semi-Annually | | | 2,790 | | | | 352,475 | | | | 349,685 | |
0.71% | | 6 Month EURIBOR | | EUR | | | 13,960,000 | | | | 03/17/2032 | | | Semi-Annually | | | 20,670 | | | | 137,152 | | | | 116,482 | |
0.76% | | 6 Month EURIBOR | | EUR | | | 9,610,000 | | | | 03/17/2032 | | | Semi-Annually | | | 13,577 | | | | 44,347 | | | | 30,770 | |
6 Month EURIBOR | | 0.81% | | EUR | | | 26,940,000 | | | | 03/17/2032 | | | Semi-Annually | | | — | | | | 35,918 | | | | 35,918 | |
6 Month EURIBOR | | 0.82% | | EUR | | | 10,910,000 | | | | 03/17/2032 | | | Semi-Annually | | | — | | | | 28,366 | | | | 28,366 | |
6 Month EURIBOR | | 0.83% | | EUR | | | 16,130,000 | | | | 03/17/2032 | | | Semi-Annually | | | — | | | | 65,034 | | | | 65,034 | |
6 Month EURIBOR | | 0.82% | | EUR | | | 16,130,000 | | | | 03/17/2032 | | | Semi-Annually | | | — | | | | 41,049 | | | | 41,049 | |
6 Month EURIBOR | | 0.81% | | EUR | | | 10,610,000 | | | | 03/17/2032 | | | Semi-Annually | | | — | | | | 16,483 | | | | 16,483 | |
6 Month EURIBOR | | 0.86% | | EUR | | | 17,300,000 | | | | 03/17/2032 | | | Semi-Annually | | | — | | | | 123,107 | | | | 123,107 | |
6 Month EURIBOR | | 0.77% | | EUR | | | 20,690,000 | | | | 03/17/2032 | | | Semi-Annually | | | — | | | | (69,270 | ) | | | (69,270 | ) |
6 Month EURIBOR | | 0.76% | | EUR | | | 6,810,000 | | | | 03/17/2032 | | | Semi-Annually | | | — | | | | (30,301 | ) | | | (30,301 | ) |
0.77% | | 6 Month EURIBOR | | EUR | | | 6,990,000 | | | | 03/17/2032 | | | Semi-Annually | | | 25,331 | | | | 20,708 | | | | (4,623 | ) |
0.81% | | 6 Month EURIBOR | | EUR | | | 9,840,000 | | | | 03/17/2032 | | | Semi-Annually | | | (1,094 | ) | | | (15,829 | ) | | | (14,735 | ) |
| | | | | | | | | | | | | | | | | | | | | | | | | | |
| | $ | (1,151,422 | ) | | $ | (6,220,043 | ) | | $ | (5,068,621 | ) |
| | | | | | | | | | | | |
| | | | |
| | |
| 100 | | See accompanying notes to the financial statements. | | |
GMO Implementation Fund
(A Series of GMO Trust)
Consolidated Schedule of Investments — (Continued)
February 28, 2022
Swap Contracts — continued
OTC Total Return Swaps
| | | | | | | | | | | | | | | | | | | | | | | | | | | | |
Fund Pays | | Fund Receives | | Counterparty | | Notional
Amount | | | Expiration
Date | | | Periodic
Payment
Frequency | | Premiums
Paid/
(Received) ($) | | | Value ($) | | | Net
Unrealized
Appreciation/
(Depreciation) ($) | |
1 Month Federal Funds Rate plus 0.10% | | Total Return on MSCI World Daily Total Return Net Value Index | | GS | | USD | | | 10,784,763 | | | | 05/06/2022 | | | Monthly | | | — | | | | (426,861 | ) | | | (426,861 | ) |
Total Return on MSCI World Daily Total Return Net Growth Index | | 1 Month Federal Funds Rate minus 0.02% | | GS | | USD | | | 10,122,717 | | | | 05/06/2022 | | | Monthly | | | — | | | | 283,210 | | | | 283,210 | |
1 Month Federal Funds Rate plus 0.09% | | Total Return on MSCI World Daily Total Return Net Value Index | | UBSA | | USD | | | 12,517,232 | | | | 05/12/2022 | | | Monthly | | | — | | | | (440,348 | ) | | | (440,348 | ) |
Total Return on MSCI World Daily Total Return Net Growth Index | | 1 Month Federal Funds Rate plus 0.10% | | UBSA | | USD | | | 11,731,893 | | | | 05/12/2022 | | | Monthly | | | — | | | | 70,052 | | | | 70,052 | |
1 Month Federal Funds Rate plus 0.05% | | Total Return on MSCI World Daily Total Return Net Value Index | | UBSA | | USD | | | 11,692,367 | | | | 05/20/2022 | | | Monthly | | | — | | | | (411,148 | ) | | | (411,148 | ) |
Total Return on MSCI World Daily Total Return Net Growth Index | | 1 Month Federal Funds Rate plus 0.05% | | UBSA | | USD | | | 10,781,640 | | | | 05/20/2022 | | | Monthly | | | — | | | | 64,169 | | | | 64,169 | |
Total Return on Equity Basket (m) | | 1 Month Federal Funds Rate minus 0.50% | | GS | | USD | | | 9,034,320 | | | | 05/24/2022 | | | Monthly | | | — | | | | (187,021 | ) | | | (187,021 | ) |
Total Return on Equity Basket (m) | | 1 Month Federal Funds Rate minus 0.75% | | GS | | USD | | | 1,552,733 | | | | 05/24/2022 | | | Monthly | | | — | | | | 80,171 | | | | 80,171 | |
Total Return on Equity Basket (m) | | 1 Month Federal Funds Rate minus 0.75% | | GS | | USD | | | 2,094,990 | | | | 05/24/2022 | | | Monthly | | | — | | | | (135,505 | ) | | | (135,505 | ) |
Total Return on Equity Basket (m) | | 1 Month Federal Funds Rate minus 0.75% | | GS | | USD | | | 12,221,165 | | | | 05/24/2022 | | | Monthly | | | — | | | | (5,485 | ) | | | (5,485 | ) |
Total Return on Equity Basket (n) | | 1 Month Federal Funds Rate minus 0.75% | | GS | | USD | | | 1,914,967 | | | | 05/24/2022 | | | Monthly | | | — | | | | (38,993 | ) | | | (38,993 | ) |
Total Return on Equity Basket (m) | | 1 Month Federal Funds Rate minus 1.00% | | MORD | | USD | | | 1,293,958 | | | | 10/18/2022 | | | Monthly | | | — | | | | 84,748 | | | | 84,748 | |
Total Return on Equity Basket (m) | | 1 Month Federal Funds Rate minus 0.40% | | MORD | | USD | | | 62,713,507 | | | | 10/18/2022 | | | Monthly | | | — | | | | 3,646,405 | | | | 3,646,405 | |
Total Return on Equity Basket (m) | | 1 Month Federal Funds Rate minus 2.66% | | MORD | | USD | | | 25,208,866 | | | | 05/18/2023 | | | Monthly | | | — | | | | (787,798 | ) | | | (787,798 | ) |
Total Return on Equity Basket (m) | | 1 Month Federal Funds Rate minus 0.40% | | MORD | | USD | | | 7,847,046 | | | | 11/20/2023 | | | Monthly | | | — | | | | 254,318 | | | | 254,318 | |
Total Return on Equity Basket (m) | | 1 Month Federal Funds Rate minus 0.50% | | GS | | USD | | | 505,676 | | | | 05/24/2024 | | | Monthly | | | — | | | | (13,688 | ) | | | (13,688 | ) |
| | | | | | | | | | | | | | | | | | | | | | | | | | | | |
| | $ | — | | | $ | 2,036,226 | | | $ | 2,036,226 | |
| | | | | | | | | | | | |
| | | | |
| | |
| | | See accompanying notes to the financial statements. | | 101 |
GMO Implementation Fund
(A Series of GMO Trust)
Consolidated Schedule of Investments — (Continued)
February 28, 2022
As of February 28, 2022, for the above contracts and/or agreements, the Fund had sufficient cash and/or securities to cover commitments or collateral requirements, if any, of the relevant broker or exchange.
Notes to Schedule of Investments:
| † | Denominated in U.S. Dollar, unless otherwise indicated. |
| * | Non-income producing security. |
| (a) | All or a portion of this security is out on loan (Note 2). |
| (b) | All or a portion of this security has been pledged to cover margin requirements on futures and/or cleared swap contracts, collateral on securities sold short, OTC swap contracts, forward currency contracts, and/or written options, if any (Note 4). |
| (c) | Securities are traded on separate exchanges for the same entity. |
| (d) | Investment valued at fair value using methods determined in good faith by the Trustees of GMO Trust or persons acting at their direction pursuant to procedures approved by the Trustees. Investment valued using significant unobservable inputs (Note 2). |
| (e) | Investment valued using significant unobservable inputs (Note 2). |
| (f) | All or a portion of this investment is held in connection with one or more holdings within the Fund. |
| (g) | Preferred dividend rates are disclosed to the extent that a stated rate exists. |
| (h) | Security is in default. |
| (i) | All or a portion of this security is purchased with collateral from securities loaned (Note 2). |
| (j) | The rate disclosed is the 7 day net yield as of February 28, 2022. |
| (k) | All or a portion of this security or derivative is owned by GMO Implementation SPC Ltd., which is a 100% owned subsidiary of GMO Implementation Fund. |
| (l) | The rate shown represents yield-to-maturity. |
| (m) | Periodic payments made/received are based on the total return of the referenced entity. Custom equity basket swap which has a notional amount of less than 1% of the Fund’s total net assets. |
| (n) | The following table represents the individual short positions within the custom equity basket swap as of February 28, 2022: |
| | | | | | | | | | |
| Shares | | Description | | % of
Equity Basket | | | Value ($) | |
| | | |
3,094,000 | | Alibaba Health Information Technology Ltd | | | 3.7 | % | | | 2,166,517 | |
| | | |
14,570,000 | | Alibaba Pictures Group Ltd | | | 2.5 | % | | | 1,456,698 | |
| | | |
10,923,000 | | China Molybdenum Co Ltd – Class H | | | 11.1 | % | | | 6,574,583 | |
| | | |
716,000 | | China Resources Beer Holdings Co Ltd | | | 9.6 | % | | | 5,677,452 | |
| | | |
913,500 | | Citic Securities Co Ltd – Class H | | | 3.7 | % | | | 2,213,138 | |
| | | |
968,000 | | Cosco Shipping Holdings Co –Class H | | | 3.3 | % | | | 1,956,546 | |
| | | |
39,000 | | Country Garden Services Holdings Co Ltd | | | 0.4 | % | | | 233,296 | |
| | | |
277,200 | | Ganfeng Lithium Co Ltd – Class H | | | 8.0 | % | | | 4,704,692 | |
| | | |
2,610,000 | | Greentown Service Group Co Ltd | | | 4.4 | % | | | 2,621,804 | |
| | | |
132,100 | | Hong Kong Exchanges and Clearing Ltd | | | 10.8 | % | | | 6,401,124 | |
| | | |
2,291,000 | | Kingdee International Software Group Co Lt | | | 9.6 | % | | | 5,662,531 | |
| | | |
576,000 | | New World Development Co Ltd | | | 3.9 | % | | | 2,303,793 | |
| | | |
2,524,000 | | Sands China Ltd | | | 11.3 | % | | | 6,657,002 | |
| | | |
2,511,000 | | Weimob Inc | | | 2.8 | % | | | 1,660,659 | |
| | | |
5,912,000 | | Zijin Mining Group Co Ltd –Class H | | | 14.9 | % | | | 8,774,480 | |
| | | | | | | | | | |
| | | |
| | TOTAL COMMON STOCKS | | | | | | $ | 59,064,315 | |
| | | | | | | | | | |
For a listing of definitions of acronyms, counterparty abbreviations and currency abbreviations used throughout the Schedule of Investments as well as the derivative tables, if any, please refer to page 133.
| | | | |
| | |
| 102 | | See accompanying notes to the financial statements. | | |
This page has been left blank intentionally.
GMO International Developed Equity Allocation Fund
(A Series of GMO Trust)
Portfolio Management
Day-to-day management of the Fund’s portfolio is the responsibility of the Asset Allocation team at Grantham, Mayo, Van Otterloo & Co. LLC.
Management Discussion and Analysis of Fund Performance
Class III shares of GMO International Developed Equity Allocation Fund returned +2.88% (net) for the fiscal year ended February 28, 2022, as compared with +2.83% for the Fund’s benchmark, the MSCI EAFE Index.
The Fund’s decision to hold a broadly 9% position in emerging markets, initially in broad emerging markets and laterally in emerging ex-China, detracted from performance relative to the benchmark. We believed that emerging markets were trading at very preferential valuations but, unfortunately, regulatory actions in China and the Russian invasion of Ukraine proved extremely detrimental. Security selection in developed markets was strong. Outperformance of the Value style undoubtedly provided a decent tailwind, although this was partly offset by being overweight to Japan, which was the laggard within developed equities. The performance challenge from being overweight emerging markets was exacerbated by security selection within emerging markets, as we were meaningfully overweight Russia.
The views expressed herein are exclusively those of Grantham, Mayo, Van Otterloo & Co. LLC as of the date of this report and are subject to change. GMO disclaims any responsibility to update such views. They are not meant as investment advice. References to specific securities are not recommendations of such securities and may not be representative of any GMO portfolio’s current or future investments. All information is unaudited.
GMO International Developed Equity Allocation Fund
(A Series of GMO Trust)
Comparison of Change in Value of a $5,000,000 Investment in
GMO International Developed Equity Allocation Fund Class III Shares and the MSCI EAFE Index
As of February 28, 2022
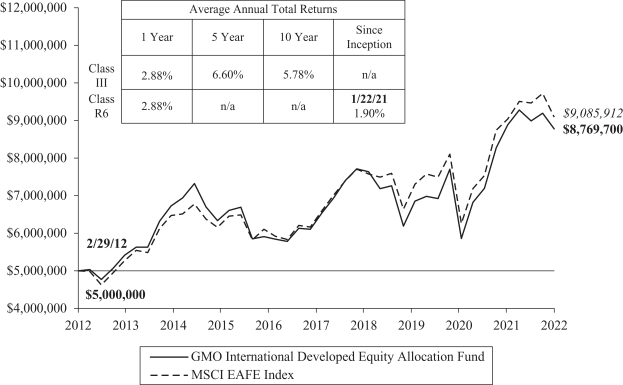
Performance data quoted represents past performance and is not indicative of future results. The investment return and principal value of an investment will fluctuate so that an investor’s shares, when redeemed, may be worth more or less than their original cost. Current performance data may be lower or higher than the performance data provided herein. To obtain performance information up to the most recent month-end, visit www.gmo.com. Performance shown is net of all fees after reimbursement from GMO. Returns would have been lower had certain expenses not been reimbursed during the periods shown and do not include the effect of taxes on distributions and redemptions. The performance information shown above only includes purchase premiums and/or redemption fees in effect as of February 28, 2022. All information is unaudited. Performance for classes may vary due to different fees.
MSCI data may not be reproduced or used for any other purpose. MSCI provides no warranties, has not prepared or approved this report, and has no liability hereunder.
For Class III and R6 the gross expense ratio of 0.65% and 0.65%, respectively, is equal to the Fund’s Total Annual Operating Expenses set forth in the Fund’s most recent prospectus dated June 30, 2021. For the Classes listed above, the corresponding net expense ratio of 0.62% and 0.62% reflects the reduction of expenses from fee reimbursements. The fee reimbursements will continue until at least June 30, 2022. Elimination of this reimbursement will result in higher fees and lower performance.
105
GMO International Developed Equity Allocation Fund
(A Series of GMO Trust)
Investment Concentration Summary
February 28, 2022 (Unaudited)
| | | | |
| Asset Class Summary& | | % of Total Net Assets | |
Common Stocks | | | 98.9 | % |
Short-Term Investments | | | 4.0 | |
Preferred Stocks | | | 0.7 | |
Investment Funds | | | 0.0 | ^ |
Other | | | (3.6 | ) |
| | | | |
| | | 100.0 | % |
| | | | |
| | | | |
| Country/Region Summary¤ | | % of Investments | |
Japan | | | 27.9 | % |
United Kingdom | | | 14.8 | |
France | | | 8.3 | |
Netherlands | | | 6.4 | |
Germany | | | 5.8 | |
Switzerland | | | 5.6 | |
Spain | | | 4.0 | |
Singapore | | | 3.9 | |
Norway | | | 3.8 | |
Australia | | | 3.4 | |
Italy | | | 3.0 | |
Other Emerging | | | 2.7 | † |
Taiwan | | | 2.6 | |
Other Developed | | | 2.6 | ‡ |
Hong Kong | | | 2.0 | |
Korea | | | 1.7 | |
Belgium | | | 1.5 | |
| | | | |
| | | 100.0 | % |
| | | | |
| & | The table incorporates aggregate indirect asset class exposure associated with investments in other funds of GMO Trust (“underlying funds”). Derivative financial instruments, if any, are based on market values, rather than the notional amounts of derivatives, except for forward currency contracts which are based on unrealized appreciation/(depreciation). |
| ¤ | The table incorporates aggregate indirect country exposure associated with investments in the underlying funds. The table excludes short-term investments and includes exposure through the use of derivative financial instruments, if any. The table excludes exposure through forward currency contracts, if any. |
| † | “Other Emerging” is comprised of emerging countries that each represent between (1.0)% and 1.0% of Investments. |
| ‡ | “Other Developed” is comprised of developed countries that each represent between (1.0)% and 1.0% of Investments. |
GMO International Developed Equity Allocation Fund
(A Series of GMO Trust)
Schedule of Investments
(showing percentage of total net assets)
February 28, 2022
| | | | | | | | | | |
| | | Shares | | | Description | | Value ($) | |
| | | |
| | | | | | MUTUAL FUNDS — 100.0% | | | | |
| | | |
| | | | | | Affiliated Issuers — 100.0% | | | |
| | | |
| | | 1,003,748 | | | GMO Emerging Markets ex-China Fund, Class VI | | | 16,722,440 | |
| | | |
| | | 8,895,848 | | | GMO International Equity Fund, Class IV | | | 204,248,674 | |
| | | |
| | | 483,023 | | | GMO-Usonian Japan Value Creation Fund, Class VI | | | 9,520,380 | |
| | | | | | | | | | |
| | | |
| | | | | | TOTAL MUTUAL FUNDS
(COST $235,083,070) | | | 230,491,494 | |
| | | | | | | | | | |
| | | |
| | | | | | Money Market Funds — 0.0% | | | |
| | | |
| | | 80,822 | | | State Street Institutional Treasury Money Market Fund – Premier Class, 0.01% (a) | | | 80,822 | |
| | | | | | | | | | |
| | | |
| | | | | | TOTAL SHORT-TERM INVESTMENTS
(COST $80,822) | | | 80,822 | |
| | | | | | | | | | |
| | | |
| | | | | | TOTAL INVESTMENTS — 100.0%
(Cost $235,163,892) | | | 230,572,316 | |
| | | |
| | | | | | Other Assets and Liabilities (net) — 0.00% | | | 3,801 | |
| | | | | | | | | | |
| | | |
| | | | | | TOTAL NET ASSETS — 100.0% | | | $230,576,117 | |
| | | | | | | | | | |
Notes to Schedule of Investments:
| (a) | The rate disclosed is the 7 day net yield as of February 28, 2022. |
For a listing of definitions of acronyms, counterparty abbreviations and currency abbreviations used throughout the Schedule of Investments as well as the derivative tables, if any, please refer to page 133.
| | | | |
| | |
| | | See accompanying notes to the financial statements. | | 107 |
GMO International Equity Allocation Fund
(A Series of GMO Trust)
Portfolio Management
Day-to-day management of the Fund’s portfolio is the responsibility of the Asset Allocation team at Grantham, Mayo, Van Otterloo & Co. LLC.
Management Discussion and Analysis of Fund Performance
Class III shares of GMO International Equity Allocation Fund returned -3.37% (net) for the fiscal year ended February 28, 2022, compared to -0.40% for the MSCI All Country World Index (“ACWI”) ex USA.
The Fund’s overweight to emerging markets detracted from performance relative to the benchmark as the MSCI Emerging Markets Index stumbled to a -10.7% return. We believed that emerging markets were trading at very preferential valuations but, unfortunately, regulatory actions in China and the Russian invasion of Ukraine proved extremely detrimental. Security selection in developed markets was strong. Outperformance of the Value style undoubtedly provided a decent tailwind, although this was partly offset by being overweight to Japan, which was the laggard within developed equities. The performance challenge from being overweight emerging markets was exacerbated by security selection within emerging markets, as we were meaningfully overweight Russia.
The views expressed herein are exclusively those of Grantham, Mayo, Van Otterloo & Co. LLC as of the date of this report and are subject to change. GMO disclaims any responsibility to update such views. They are not meant as investment advice. References to specific securities are not recommendations of such securities and may not be representative of any GMO portfolio’s current or future investments. All information is unaudited.
GMO International Equity Allocation Fund
(A Series of GMO Trust)
Comparison of Change in Value of a $5,000,000 Investment in
GMO International Equity Allocation Fund Class III Shares and the MSCI ACWI ex USA
As of February 28, 2022
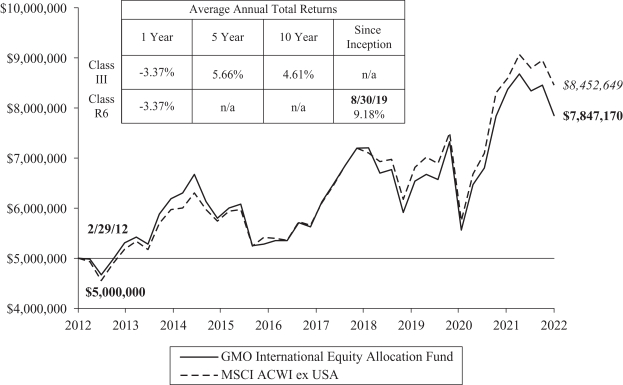
Performance data quoted represents past performance and is not indicative of future results. The investment return and principal value of an investment will fluctuate so that an investor’s shares, when redeemed, may be worth more or less than their original cost. Current performance data may be lower or higher than the performance data provided herein. To obtain performance information up to the most recent month-end, visit www.gmo.com. Performance shown is net of all fees after reimbursement from GMO. Returns would have been lower had certain expenses not been reimbursed during the periods shown and do not include the effect of taxes on distributions and redemptions. The performance information shown above only includes purchase premiums and/or redemption fees in effect as of February 28, 2022. All information is unaudited. Performance for classes may vary due to different fees.
MSCI data may not be reproduced or used for any other purpose. MSCI provides no warranties, has not prepared or approved this report, and has no liability hereunder.
For Class III and R6 the gross expense ratio of 0.67% and 0.67%, respectively, is equal to the Fund’s Total Annual Operating Expenses set forth in the Fund’s most recent prospectus dated June 30, 2021. For the Classes listed above, the corresponding net expense ratio of 0.65% and 0.65% reflects the reduction of expenses from fee reimbursements. The fee reimbursements will continue until at least June 30, 2022. Elimination of this reimbursement will result in higher fees and lower performance.
109
GMO International Equity Allocation Fund
(A Series of GMO Trust)
Investment Concentration Summary
February 28, 2022 (Unaudited)
| | | | |
| Asset Class Summary& | | % of Total Net Assets | |
Common Stocks | | | 96.4 | % |
Short-Term Investments | | | 3.2 | |
Preferred Stocks | | | 2.1 | |
Investment Funds | | | 0.5 | |
Debt Obligations | | | 0.1 | |
Futures Contracts | | | (0.1 | ) |
Other | | | (2.2 | ) |
| | | | |
| | | 100.0 | % |
| | | | |
| | | | |
| Country/Region Summary¤ | | % of Investments | |
Japan | | | 19.6 | % |
United Kingdom | | | 9.9 | |
Taiwan | | | 9.8 | |
China | | | 8.5 | |
Korea | | | 6.0 | |
France | | | 5.5 | |
Netherlands | | | 4.2 | |
Germany | | | 3.9 | |
Switzerland | | | 3.7 | |
Singapore | | | 2.9 | |
Other Developed | | | 2.9 | ‡ |
Other Emerging | | | 2.9 | † |
Spain | | | 2.6 | |
India | | | 2.6 | |
Russia | | | 2.6 | |
Norway | | | 2.5 | |
Mexico | | | 2.3 | |
Australia | | | 2.2 | |
Italy | | | 2.0 | |
Brazil | | | 1.8 | |
Hong Kong | | | 1.6 | |
| | | | |
| | | 100.0 | % |
| | | | |
| & | The table incorporates aggregate indirect asset class exposure associated with investments in other funds of GMO Trust (“underlying funds”). Derivative financial instruments, if any, are based on market values, rather than the notional amounts of derivatives, except for forward currency contracts which are based on unrealized appreciation/(depreciation). |
| ¤ | The table incorporates aggregate indirect country exposure associated with investments in the underlying funds. The table excludes short-term investments and includes exposure through the use of derivative financial instruments, if any. The table excludes exposure through forward currency contracts, if any. |
| ‡ | “Other Developed” is comprised of developed countries that each represent between (1.0)% and 1.0% of Investments. |
| † | “Other Emerging” is comprised of emerging countries that each represent between (1.0)% and 1.0% of Investments. |
GMO International Equity Allocation Fund
(A Series of GMO Trust)
Schedule of Investments
(showing percentage of total net assets)
February 28, 2022
| | | | | | | | | | |
| | | Shares | | | Description | | Value ($) | |
| | | |
| | | | | | MUTUAL FUNDS — 100.0% | | | | |
| | | |
| | | | | | Affiliated Issuers — 100.0% | | | |
| | | |
| | | 3,086,191 | | | GMO Emerging Markets ex-China Fund, Class VI | | | 51,415,947 | |
| | | |
| | | 6,601,991 | | | GMO Emerging Markets Fund, Class VI | | | 195,154,856 | |
| | | |
| | | 17,602,904 | | | GMO International Equity Fund, Class IV | | | 404,162,685 | |
| | | |
| | | 1,432,858 | | | GMO-Usonian Japan Value Creation Fund, Class VI | | | 28,241,638 | |
| | | | | | | | | | |
| | | |
| | | | | | TOTAL MUTUAL FUNDS
(COST $696,780,270) | | | 678,975,126 | |
| | | | | | | | | | |
| | |
| | | | | | SHORT-TERM INVESTMENTS — 0.0% | |
| | | |
| | | | | | Money Market Funds — 0.0% | | | |
| | | |
| | | 110,766 | | | State Street Institutional Treasury Money Market Fund – Premier Class, 0.01% (a) | | | 110,766 | |
| | | | | | | | | | |
| | | |
| | | | | | TOTAL SHORT-TERM INVESTMENTS
(COST $110,766) | | | 110,766 | |
| | | | | | | | | | |
| | | |
| | | | | | TOTAL INVESTMENTS — 100.0%
(Cost $696,891,036) | | | 679,085,892 | |
| | | |
| | | | | | Other Assets and Liabilities (net) — 0.00% | | | 231,448 | |
| | | | | | | | | | |
| | | |
| | | | | | TOTAL NET ASSETS — 100.0% | | | $679,317,340 | |
| | | | | | | | | | |
Notes to Schedule of Investments:
| (a) | The rate disclosed is the 7 day net yield as of February 28, 2022. |
For a listing of definitions of acronyms, counterparty abbreviations and currency abbreviations used throughout the Schedule of Investments as well as the derivative tables, if any, please refer to page 133.
| | | | |
| | |
| | | See accompanying notes to the financial statements. | | 111 |
GMO SGM Major Markets Fund
(A Series of GMO Trust)
Portfolio Management
Day-to-day management of the Fund’s portfolio is the responsibility of the Systematic Global Macro team at Grantham, Mayo, Van Otterloo & Co. LLC.
Management Discussion and Analysis of Fund Performance
Class III shares of GMO SGM Major Markets Fund returned -2.00% (net) for the fiscal year ended February 28, 2022, as compared with +0.05% for the FTSE 3-Month Treasury Bill Index.
The Fund added value from commodity and fixed income positions, while equities and currencies detracted value. The year saw a period of strong economic recovery from the Covid pandemic, but that also brought with it the issues of higher inflation and the prospect of higher interest rates. With this, we saw many assets rally over the beginning of the period, only then to later stall and face headwinds.
Commodities were the main positive contributor through the year. Major gains came from being long energy, and long commodities in general. Fixed income also added value, mainly through long Australian and short European positions.
Currencies and equities detracted over the period. Currencies were a detractor, primarily due to long euro positions. Equity positions were marginally negative, with losses from long emerging market positions offsetting gains from long European positions.
The views expressed herein are exclusively those of Grantham, Mayo, Van Otterloo & Co. LLC as of the date of this report and are subject to change. GMO disclaims any responsibility to update such views. They are not meant as investment advice. References to specific securities are not recommendations of such securities and may not be representative of any GMO portfolio’s current or future investments. All information is unaudited.
GMO SGM Major Markets Fund
(A Series of GMO Trust)
Comparison of Change in Value of a $5,000,000 Investment in
GMO SGM Major Markets Fund Class III Shares, the FTSE 3-Month Treasury Bill +++ Index* and the FTSE 3-Month Treasury Bill Index
As of February 28, 2022
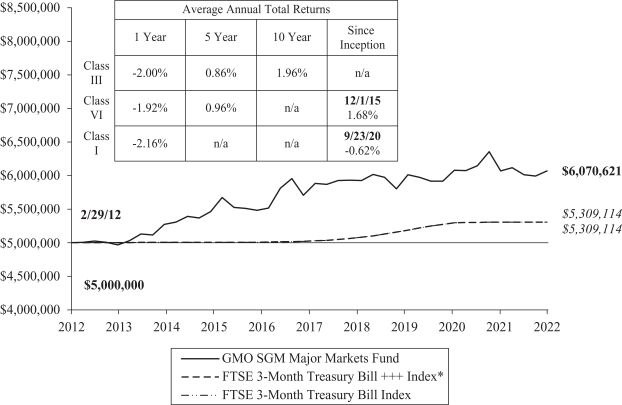
Performance data quoted represents past performance and is not indicative of future results. The investment return and principal value of an investment will fluctuate so that an investor’s shares, when redeemed, may be worth more or less than their original cost. Current performance data may be lower or higher than the performance data provided herein. To obtain performance information up to the most recent month-end, visit www.gmo.com. Performance shown is net of all fees after reimbursement from GMO. Returns would have been lower had certain expenses not been reimbursed during the periods shown and do not include the effect of taxes on distributions and redemptions. The performance information shown above only includes purchase premiums and/or redemption fees in effect as of February 28, 2022. All information is unaudited. Performance for classes may vary due to different fees.
| | * | The FTSE 3-Month Treasury Bill +++ Index is a composite benchmark computed by GMO and comprised of 50% Bloomberg Commodity Total Return Index (formerly the Dow Jones-UBS Commodity Index) and 50% J.P. Morgan U.S. 3 Month Cash Index through October 3, 2011 and the FTSE 3-Month Treasury Bill Index thereafter. |
For Class III, VI and I the gross expense ratio of 1.08%, 0.98% and 1.23%, respectively, is equal to the Fund’s Total Annual Operating Expenses set forth in the Fund’s most recent prospectus dated June 30, 2021. For the Classes listed above, the corresponding net expense ratio of 1.01%, 0.91% and 1.11% reflects the reduction of expenses from fee reimbursements. The fee reimbursements will continue until at least June 30, 2022. Elimination of this reimbursement will result in higher fees and lower performance.
113
GMO SGM Major Markets Fund
(A Series of GMO Trust)
Consolidated Investment Concentration Summary (a)
February 28, 2022 (Unaudited)
| | | | |
| Asset Class Summary& | | % of Total Net Assets | |
Debt Obligations | | | 87.8 | %�� |
Short-Term Investments | | | 14.8 | |
Forward Currency Contracts | | | (0.1 | ) |
Swap Contracts | | | (0.3 | ) |
Futures Contracts | | | (0.6 | )# |
Other | | | (1.6 | ) |
| | | | |
| | | 100.0 | % |
| | | | |
| (a) | GMO Alternative Asset SPC Ltd. is a 100% owned subsidiary of GMO SGM Major Markets Fund. As such, the holdings of GMO Alternative Asset SPC Ltd. have been included with GMO SGM Major Markets Fund. |
| & | In the table, derivative financial instruments, if any, are based on market values, rather than the notional amounts of derivatives, except for forward currency contracts which are based on unrealized appreciation/(depreciation). The exposure the Fund has to futures contracts based on notional amounts is 12.6% of net assets. |
| # | Some or all is comprised of commodity exposure. See the Consolidated Schedule of Investments. |
GMO SGM Major Markets Fund
(A Series of GMO Trust)
Consolidated Schedule of Investments
(showing percentage of total net assets)
February 28, 2022
| | | | | | | | | | |
| | |
Par Value† | | | Description | | Value ($) | |
| | | |
| | | | | | DEBT OBLIGATIONS — 87.8% | | | | |
| | | |
| | | | | | United States — 87.8% | | | |
| | | |
| | | | | | U.S. Government — 87.8% | | | |
| | | |
| | | 30,000,000 | | | U.S. Treasury Note, Variable Rate, USBM + 0.03%, 0.39%, due 04/30/23 | | | 30,010,013 | |
| | | |
| | | 33,900,000 | | | U.S. Treasury Note, 0.13%, due 12/31/22 (a) | | | 33,653,695 | |
| | | |
| | | 20,000,000 | | | U.S. Treasury Note, 0.13%, due 01/31/23 | | | 19,828,125 | |
| | | |
| | | 60,000,000 | | | U.S. Treasury Note, Variable Rate, USBM + 0.05%, 0.41%, due 01/31/23 (a) (b) | | | 60,024,218 | |
| | | |
| | | 35,000,000 | | | U.S. Treasury Note, 0.13%, due 03/31/23 | | | 34,613,086 | |
| | | |
| | | 31,000,000 | | | U.S. Treasury Note, 0.13%, due 06/30/23 | | | 30,536,211 | |
| | | |
| | | 20,000,000 | | | U.S. Treasury Note, Variable Rate, USBM + 0.04%, 0.40%, due 10/31/23 (b) | | | 20,036,106 | |
| | | | | | | | | | |
| | | |
| | | | | | Total U.S. Government | | | 228,701,454 | |
| | | | | | | | | | |
| | | |
| | | | | | Total United States | | | 228,701,454 | |
| | | | | | | | | | |
| | | |
| | | | | | TOTAL DEBT OBLIGATIONS
(COST $229,805,660) | | | 228,701,454 | |
| | | | | | | | | | |
| | | | | | | | | | |
| | | Shares /
Par Value† | | | Description | | Value ($) | |
| | |
| | | | | | SHORT-TERM INVESTMENTS — 14.8% | |
| | | |
| | | | | | Money Market Funds — 2.9% | | | |
| | | |
| | | 6,558,736 | | | State Street Institutional Treasury Money Market Fund – Premier Class, 0.01% (c) | | | 6,558,736 | |
| | | |
| | | 847,313 | | | State Street U.S. Treasury Liquidity Fund – Class D Shares, 0.01% (a) | | | 847,313 | |
| | | | | | | | | | |
| | | |
| | | | | | Total Money Market Funds | | | 7,406,049 | |
| | | | | | | | | | |
| | | |
| | | | | | U.S. Government — 11.9% | | | |
| | | |
| | | 250,000 | | | U.S. Treasury Bill, 0.58%, due 07/28/22 (d) | | | 249,410 | |
| | | |
| | | 5,750,000 | | | U.S. Treasury Bill, 0.64%, due 08/18/22 (d) | | | 5,732,713 | |
| | | |
| | | 5,840,000 | | | U.S. Treasury Bill, 0.73%, due 11/03/22 (a) (d) | | | 5,811,251 | |
| | | |
| | | 19,250,000 | | | U.S. Treasury Bill, 0.63%, due 12/01/22 (a) (d) | | | 19,158,462 | |
| | | | | | | | | | |
| | | |
| | | | | | Total U.S. Government | | | 30,951,836 | |
| | | | | | | | | | |
| | | |
| | | | | | TOTAL SHORT-TERM INVESTMENTS
(COST $38,430,823) | | | 38,357,885 | |
| | | | | | | | | | |
| | | |
| | | | | | TOTAL INVESTMENTS — 102.6%
(Cost $268,236,483) | | | 267,059,339 | |
| | | |
| | | | | | Other Assets and Liabilities (net) — (2.6%) | | | (6,668,439 | ) |
| | | | | | | | | | |
| | | |
| | | | | | TOTAL NET ASSETS — 100.0% | | | $260,390,900 | |
| | | | | | | | | | |
A summary of outstanding financial instruments at February 28, 2022 is as follows:
Forward Currency Contracts
| | | | | | | | | | | | | | | | | | | | |
| | | | |
Settlement
Date | | Counter-
party | | Currency
Sold | | | Currency
Purchased | | | Net
Unrealized
Appreciation
(Depreciation) ($) | |
| 03/18/2022 | | MSCI | | AUD | | | 21,901,621 | | | | USD | | | | 15,999,087 | | | | 88,358 | |
| 03/18/2022 | | SSB | | AUD | | | 1,373,739 | | | | USD | | | | 977,716 | | | | (20,255 | ) |
| 03/25/2022 | | MSCI | | CAD | | | 17,454,889 | | | | USD | | | | 13,813,116 | | | | 40,470 | |
| 04/25/2022 | | JPM | | CAD | | | 17,000,000 | | | | USD | | | | 13,450,431 | | | | 36,232 | |
| 04/25/2022 | | SSB | | CAD | | | 2,651,069 | | | | USD | | | | 2,095,959 | | | | 4,078 | |
| 03/28/2022 | | UBSA | | CHF | | | 5,714,212 | | | | USD | | | | 6,242,312 | | | | 4,172 | |
| 03/18/2022 | | JPM | | EUR | | | 1,571,976 | | | | USD | | | | 1,779,445 | | | | 15,732 | |
| 03/21/2022 | | JPM | | EUR | | | 1,235,632 | | | | USD | | | | 1,401,516 | | | | 14,993 | |
| 03/21/2022 | | MSCI | | EUR | | | 1,891,643 | | | | USD | | | | 2,153,144 | | | | 30,501 | |
| 03/21/2022 | | SSB | | EUR | | | 1,277,739 | | | | USD | | | | 1,444,568 | | | | 10,797 | |
| 03/21/2022 | | SSB | | GBP | | | 3,036,060 | | | | USD | | | | 4,127,357 | | | | 53,792 | |
| 03/07/2022 | | MSCI | | JPY | | | 121,345,896 | | | | USD | | | | 1,057,103 | | | | 1,511 | |
| 03/07/2022 | | SSB | | JPY | | | 72,004,054 | | | | USD | | | | 625,985 | | | | (380 | ) |
| 03/18/2022 | | DB | | USD | | | 271,264 | | | | AUD | | | | 380,027 | | | | 4,812 | |
| 03/18/2022 | | GS | | USD | | | 271,168 | | | | AUD | | | | 380,026 | | | | 4,907 | |
| 03/25/2022 | | JPM | | USD | | | 114,479 | | | | CAD | | | | 145,801 | | | | 564 | |
| 03/25/2022 | | SSB | | USD | | | 95,858 | | | | CAD | | | | 121,802 | | | | 248 | |
| 03/18/2022 | | BCLY | | USD | | | 306,311 | | | | EUR | | | | 266,903 | | | | (6,853 | ) |
| 03/18/2022 | | UBSA | | USD | | | 2,080,929 | | | | EUR | | | | 1,811,020 | | | | (49,015 | ) |
| 03/21/2022 | | UBSA | | USD | | | 20,178,316 | | | | EUR | | | | 17,780,085 | | | | (226,999 | ) |
| 03/28/2022 | | BCLY | | USD | | | 9,972,986 | | | | EUR | | | | 8,818,370 | | | | (74,795 | ) |
| 04/26/2022 | | MSCI | | USD | | | 13,309,420 | | | | EUR | | | | 11,756,014 | | | | (100,051 | ) |
| | | | | | | | | | | | | | | | | | | | |
| | | | |
Settlement
Date | | Counter-
party | | Currency
Sold | | | Currency
Purchased | | | Net
Unrealized
Appreciation
(Depreciation) ($) | |
| 03/21/2022 | | BCLY | | USD | | | 883,737 | | | | GBP | | | | 653,311 | | | | (7,172 | ) |
| 03/07/2022 | | DB | | USD | | | 17,109,312 | | | | JPY | | | | 1,959,298,510 | | | | (65,317 | ) |
| 04/04/2022 | | MSCI | | USD | | | 17,017,236 | | | | JPY | | | | 1,950,000,000 | | | | (42,699 | ) |
| 05/09/2022 | | SSB | | USD | | | 17,027,177 | | | | JPY | | | | 1,950,000,000 | | | | (39,826 | ) |
| 05/09/2022 | | UBSA | | USD | | | 1,725,370 | | | | JPY | | | | 198,964,380 | | | | 7,900 | |
| 03/18/2022 | | GS | | USD | | | 1,358,753 | | | | NZD | | | | 2,008,031 | | | | (386 | ) |
| 03/18/2022 | | SSB | | USD | | | 1,101,957 | | | | NZD | | | | 1,652,036 | | | | 15,591 | |
| | | | | | | | | | | | | | | | | | | | |
| | | | | | | | | | | | | | | | | | $ | (299,090 | ) |
| | | | | | | | | | | | | | | | | | | | |
| | | | |
| | |
| | | See accompanying notes to the financial statements. | | 115 |
GMO SGM Major Markets Fund
(A Series of GMO Trust)
Consolidated Schedule of Investments — (Continued)
February 28, 2022
Futures Contracts
| | | | | | | | | | | | | | |
| | | | |
Number
of
Contracts + | | Type | | Expiration
Date | | | Notional
Amount ($) | | | Value/Net
Unrealized
Appreciation
(Depreciation) ($) | |
| Buys | | | | | | | | | | | | | | |
| 39 | | Australian Government Bond 10 Yr. | | | March 2022 | | | | 3,810,661 | | | | (134,891 | ) |
| 138 | | CAC40 10 Euro | | | March 2022 | | | | 10,219,567 | | | | (532,466 | ) |
| 8 | | Canadian Government Bond 10 Yr. | | | June 2022 | | | | 862,611 | | | | 5,857 | |
| 45 | | Corn (a) | | | May 2022 | | | | 1,554,188 | | | | 113,284 | |
| 78 | | DAX Index | | | March 2022 | | | | 31,478,194 | | | | (2,511,716 | ) |
| 266 | | FTSE 100 Index | | | March 2022 | | | | 26,457,664 | | | | 618,470 | |
| 105 | | Hang Seng Index | | | March 2022 | | | | 15,233,233 | | | | (622,222 | ) |
| 884 | | Mini MSCI Emerging Markets | | | March 2022 | | | | 51,957,100 | | | | (2,378,182 | ) |
| 22 | | MSCI Singapore | | | March 2022 | | | | 541,561 | | | | (16,788 | ) |
| 10 | | S&P/TSX 60 | | | March 2022 | | | | 2,012,465 | | | | (21,074 | ) |
| 76 | | Silver (a) | | | May 2022 | | | | 9,259,080 | | | | 413,582 | |
| 64 | | WTI Crude (a) | | | March 2022 | | | | 6,126,080 | | | | 415,258 | |
| | | | | | | | | | | | | | |
| | | | | | | | $ | 159,512,404 | | | $ | (4,650,888 | ) |
| | | | | | | | | | | | | | |
| | | | | | | | | | | | | | |
| | | | |
Number
of
Contracts + | | Type | | Expiration
Date | | | Notional
Amount ($) | | | Value/Net
Unrealized
Appreciation
(Depreciation) ($) | |
| Sales | | | | | | | | | | | | | | |
| 301 | | E-mini Russell 2000 Index | | | March 2022 | | | | 30,769,725 | | | | 1,983,506 | |
| 123 | | Euro Bund | | | March 2022 | | | | 23,037,107 | | | | 868,499 | |
| 69 | | FTSE Taiwan Index | | | March 2022 | | | | 4,300,823 | | | | 50,038 | |
| 5 | | Gold 100 OZ (a) | | | April 2022 | | | | 950,350 | | | | (40,660 | ) |
| 118 | | S&P 500 E-Mini | | | March 2022 | | | | 25,771,200 | | | | (307,964 | ) |
| 24 | | Soybean (a) | | | May 2022 | | | | 1,964,100 | | | | (51,084 | ) |
| 6 | | SPI 200 Futures | | | March 2022 | | | | 767,566 | | | | 23,908 | |
| 92 | | TOPIX Index | | | March 2022 | | | | 15,156,520 | | | | 621,449 | |
| 75 | | U.S. Treasury Note 10 Yr. (CBT) | | | June 2022 | | | | 9,557,812 | | | | (72,198 | ) |
| 87 | | UK Gilt Long Bond | | | June 2022 | | | | 14,364,732 | | | | (70,227 | ) |
| | | | | | | | | | | | | | |
| | | | | | | | $ | 126,639,935 | | | $ | 3,005,267 | |
| | | | | | | | | | | | | | |
| + | Buys - Fund is long the futures contract. |
| | Sales - Fund is short the futures contract. |
Swap Contracts
OTC Total Return Swaps
| | | | | | | | | | | | | | | | | | | | | | | | | | | | |
Fund Pays | | Fund Receives | | Counterparty | | Notional
Amount | | | Expiration
Date | | Periodic
Payment
Frequency | | | Premiums
Paid/
(Received) ($) | | | Value ($) | | | Net
Unrealized
Appreciation/
(Depreciation) ($) | |
1 Month Federal Funds Rate plus 0.10% | | Total Return on MSCI World Daily Total Return Net Growth Index | | GS | | USD | | | 9,129,675 | | | 05/06/2022 | | | Monthly | | | | — | | | | (361,352 | ) | | | (361,352 | ) |
1 Month Federal Funds Rate plus 0.09% | | Total Return on MSCI World Daily Total Return Net Growth Index | | UBSA | | USD | | | 10,591,553 | | | 05/12/2022 | | | Monthly | | | | — | | | | (372,604 | ) | | | (372,604 | ) |
Total Return on MSCI World Daily Total Return Net Growth Index | | 1 Month Federal Funds Rate plus 0.10% | | UBSA | | USD | | | 9,926,951 | | | 05/12/2022 | | | Monthly | | | | — | | | | 59,275 | | | | 59,275 | |
1 Month Federal Funds Rate plus 0.05% | | Total Return on MSCI World Daily Total Return Net Growth Index | | UBSA | | USD | | | 9,980,132 | | | 05/20/2022 | | | Monthly | | | | — | | | | (350,940 | ) | | | (350,940 | ) |
Total Return on MSCI World Daily Total Return Net Growth Index | | 1 Month Federal Funds Rate plus 0.05% | | UBSA | | USD | | | 9,202,795 | | | 05/20/2022 | | | Monthly | | | | — | | | | 54,772 | | | | 54,772 | |
Total Return on MSCI World Daily Total Return Net Growth Index | | 1 Month Federal Funds Rate minus 0.02% | | GS | | USD | | | 8,560,714 | | | 06/06/2022 | | | Monthly | | | | — | | | | 239,508 | | | | 239,508 | |
| | | | | | | | | | | | | | | | | | | | | | | | | | | | |
| | | $ | — | | | $ | (731,341 | ) | | $ | (731,341 | ) |
| | | | | | | | | | | | | |
As of February 28, 2022, for the above contracts and/or agreements, the Fund had sufficient cash and/or securities to cover commitments or collateral requirements, if any, of the relevant broker or exchange.
Notes to Schedule of Investments:
| † | Denominated in U.S. Dollar, unless otherwise indicated. |
| (a) | All or a portion of this security or derivative is owned by GMO Alternative Asset SPC Ltd., which is a 100% owned subsidiary of GMO SGM Major Markets Fund. |
| (b) | All or a portion of this security has been pledged to cover margin requirements on futures and/or cleared swap contracts, collateral on OTC swap contracts, forward currency contracts, and/or written options, if any (Note 4). |
| (c) | The rate disclosed is the 7 day net yield as of February 28, 2022. |
| (d) | The rate shown represents yield-to-maturity. |
For a listing of definitions of acronyms, counterparty abbreviations and currency abbreviations used throughout the Schedule of Investments as well as the derivative tables, if any, please refer to page 133.
| | | | |
| | |
| 116 | | See accompanying notes to the financial statements. | | |
This page has been left blank intentionally.
GMO Strategic Opportunities Allocation Fund
(A Series of GMO Trust)
Portfolio Management
Day-to-day management of the Fund’s portfolio is the responsibility of the Asset Allocation team at Grantham, Mayo, Van Otterloo & Co. LLC.
Management Discussion and Analysis of Fund Performance
Class III shares of GMO Strategic Opportunities Allocation Fund returned +3.57% (net) for the fiscal year ended February 28, 2022, as compared with +7.36% for the GMO Strategic Opportunities Allocation Index (75% MSCI World Index (MSCI Standard Index Series) and 25% Bloomberg U.S. Aggregate Index (formerly Bloomberg Barclays U.S. Aggregate Index)).
The Fund’s equity weight is not that different from the benchmark, so this had minimal effect on relative performance. There was a tremendous spread in returns across risk assets with, for example, the S&P 500 Index returning 16.4% while the MSCI Emerging Markets Index faltered to a -10.7% return. Our equity positions were biased towards emerging markets and away from the U.S. and therefore performed poorly. We believed that emerging markets were trading at very preferential valuations, but regulatory actions in China and the Russian invasion of Ukraine proved extremely challenging. The disappointing returns suffered by the equity book were exacerbated by security selection within emerging markets, as we were meaningfully overweight Russia. The underweighting to fixed income was additive to performance as the -2.6% posted by the Bloomberg U.S. Aggregate Index (formerly Bloomberg Barclays U.S. Aggregate Index) was well behind the blended benchmark. Alternative assets, invested in the Equity Dislocation Strategy which is long cheap Value stocks and short expensive Growth stocks, enjoyed an excellent year.
The views expressed herein are exclusively those of Grantham, Mayo, Van Otterloo & Co. LLC as of the date of this report and are subject to change. GMO disclaims any responsibility to update such views. They are not meant as investment advice. References to specific securities are not recommendations of such securities and may not be representative of any GMO portfolio’s current or future investments. All information is unaudited.
GMO Strategic Opportunities Allocation Fund
(A Series of GMO Trust)
Comparison of Change in Value of a $5,000,000 Investment in
GMO Strategic Opportunities Allocation Fund Class III Shares, the GMO Strategic Opportunities Allocation Index*, the MSCI World Index and the Bloomberg U.S. Aggregate Index (formerly Bloomberg Barclays U.S. Aggregate Index)
As of February 28, 2022
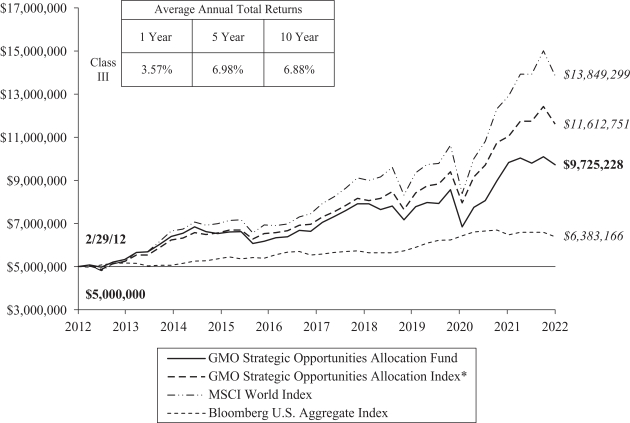
Performance data quoted represents past performance and is not indicative of future results. The investment return and principal value of an investment will fluctuate so that an investor’s shares, when redeemed, may be worth more or less than their original cost. Current performance data may be lower or higher than the performance data provided herein. To obtain performance information up to the most recent month-end, visit www.gmo.com. Performance shown is net of all fees after reimbursement from GMO. Returns would have been lower had certain expenses not been reimbursed during the periods shown and do not include the effect of taxes on distributions and redemptions. The performance information shown above only includes purchase premiums and/or redemption fees in effect as of February 28, 2022. All information is unaudited.
| | * | The GMO Strategic Opportunities Allocation Index is a composite benchmark computed by GMO and comprised of 75% MSCI World Index and 25% Bloomberg U.S. Aggregate Index. |
MSCI data may not be reproduced or used for any other purpose. MSCI provides no warranties, has not prepared or approved this report, and has no liability hereunder.
For Class III the gross expense ratio of 0.57% is equal to the Fund’s Total Annual Operating Expenses set forth in the Fund’s most recent prospectus dated June 30, 2021. For the Class listed above, the net expense ratio of 0.50% reflects the reduction of expenses from fee reimbursements. The fee reimbursements will continue until at least June 30, 2022. Elimination of this reimbursement will result in higher fees and lower performance.
119
GMO Strategic Opportunities Allocation Fund
(A Series of GMO Trust)
Investment Concentration Summary
February 28, 2022 (Unaudited)
| | | | |
| Asset Class Summary& | | % of Total Net Assets | |
Common Stocks | | | 92.4 | % |
Debt Obligations | | | 15.5 | |
Short-Term Investments | | | 14.3 | |
Preferred Stocks | | | 1.4 | |
Investment Funds | | | 0.2 | |
Swap Contracts | | | 0.1 | |
Loan Assignments | | | 0.1 | |
Loan Participations | | | 0.0 | ^ |
Rights/Warrants | | | 0.0 | ^ |
Purchased Options | | | 0.0 | ^ |
Written/Credit Linked Options | | | (0.0 | )^ |
Reverse Repurchase Agreements | | | (0.0 | )^ |
Forward Currency Contracts | | | (0.0 | )^ |
Futures Contracts | | | (0.0 | )^ |
Securities Sold Short | | | (19.2 | ) |
Other | | | (4.8 | ) |
| | | | |
| | | 100.0 | % |
| | | | |
| | | | |
Country/Region Summary¤ | | Debt Obligations as a % of Total Net Assets | |
Other Emerging | | | 3.3 | %† |
United States | | | 2.7 | |
Other Developed | | | 0.4 | ‡ |
Euro Region | | | (0.1 | )# |
| | | | |
| | | 6.3 | % |
| | | | |
| | | | |
| Country/Region Summary¤ | | Equity Investments as a % of Total Net Assets | |
United States | | | 21.3 | % |
Japan | | | 12.4 | |
Taiwan | | | 5.6 | |
China | | | 4.8 | |
Other Developed | | | 4.6 | ‡ |
United Kingdom | | | 4.3 | |
South Korea | | | 3.3 | |
France | | | 2.2 | |
Netherlands | | | 1.8 | |
India | | | 1.6 | |
Mexico | | | 1.6 | |
Australia | | | 1.5 | |
Other Emerging | | | 1.5 | † |
Hong Kong | | | 1.4 | |
Brazil | | | 1.3 | |
Russia | | | 1.3 | |
Germany | | | 1.1 | |
Norway | | | 1.1 | |
Spain | | | 1.1 | |
Switzerland | | | 1.0 | |
| | | | |
| | | 74.8 | % |
| | | | |
| & | The table incorporates aggregate indirect asset class exposure associated with investments in other funds of GMO Trust (“underlying funds”). Derivative financial instruments, if any, are based on market values, rather than the notional amounts of derivatives, except for forward currency contracts which are based on unrealized appreciation/(depreciation). |
| ¤ | The table incorporates aggregate indirect country exposure associated with investments in the underlying funds. The table excludes short-term investments. The table includes exposure through the use of certain derivative financial instruments and excludes exposure through certain currency linked derivatives such as forward currency contracts and currency options. The table is based on duration adjusted net exposures (both investments and derivatives), taking into account the market value of securities and the notional amounts of swaps and other derivative financial instruments. Duration is based on GMO’s models. The greater the duration of a bond, the greater its contribution to the concentration percentage. Credit default swap exposures are factored into the duration-adjusted exposure using the reference security and applying the same methodology to that security. The tables are not normalized, thus, due to the exclusions listed above and negative exposures, which may be attributable to derivatives or short sales, if any, the tables may not total to 100%. |
| † | “Other Emerging” is comprised of emerging countries that each represent between (1.0)% and 1.0% of Total Net Assets. |
| ‡ | “Other Developed” is comprised of developed countries that each represent between (1.0)% and 1.0% of Total Net Assets. |
| # | “Euro Region” is comprised of derivative financial instruments attributed to the Eurozone and not a particular country. |
GMO Strategic Opportunities Allocation Fund
(A Series of GMO Trust)
Schedule of Investments
(showing percentage of total net assets)
February 28, 2022
| | | | | | | | | | |
Shares | | | Description | | Value ($) | |
| | | |
| | | | | | COMMON STOCKS — 41.0% | | | | |
| | | |
| | | | | | Australia — 1.4% | | | |
| | | |
| | | 19,065 | | | Aurizon Holdings Ltd (a) | | | 48,633 | |
| | | |
| | | 34,691 | | | Australian Pharmaceutical Industries Ltd (a) | | | 38,598 | |
| | | |
| | | 30,249 | | | Beach Energy Ltd | | | 33,694 | |
| | | |
| | | 44,000 | | | BlueScope Steel Ltd | | | 651,545 | |
| | | |
| | | 16,614 | | | Brambles Ltd (a) | | | 119,666 | |
| | | |
| | | 28,656 | | | Dexus (REIT) (a) | | | 226,840 | |
| | | |
| | | 40,047 | | | Fortescue Metals Group Ltd (a) | | | 533,519 | |
| | | |
| | | 22,136 | | | Genworth Mortgage Insurance Australia Ltd | | | 48,287 | |
| | | |
| | | 58,230 | | | GPT Group (The) (REIT) (a) | | | 207,769 | |
| | | |
| | | 9,987 | | | GrainCorp Ltd – Class A | | | 61,084 | |
| | | |
| | | 859 | | | JB Hi-Fi Ltd | | | 30,898 | |
| | | |
| | | 4,640 | | | McMillan Shakespeare Ltd | | | 40,556 | |
| | | |
| | | 38,140 | | | Metcash Ltd | | | 114,440 | |
| | | |
| | | 4,342 | | | Mineral Resources Ltd | | | 144,791 | |
| | | |
| | | 114,039 | | | Mirvac Group (REIT) (a) | | | 212,673 | |
| | | |
| | | 3,552 | | | Rio Tinto Ltd (a) | | | 306,314 | |
| | | |
| | | 15,242 | | | Sandfire Resources Ltd | | | 75,142 | |
| | | |
| | | 72,165 | | | Scentre Group (REIT) (a) | | | 160,322 | |
| | | |
| | | 67,231 | | | Stockland (REIT) (a) | | | 203,434 | |
| | | |
| | | 3,919 | | | Super Retail Group Ltd | | | 31,496 | |
| | | | | | | | | | |
| | | |
| | | | | | Total Australia | | | 3,289,701 | |
| | | | | | | | | | |
| | | |
| | | | | | Austria — 0.0% | | | |
| | | |
| | | 830 | | | Raiffeisen Bank International AG | | | 13,525 | |
| | | | | | | | | | |
| | | |
| | | | | | Belgium — 0.4% | | | |
| | | |
| | | 476 | | | Ackermans & van Haaren NV | | | 88,857 | |
| | | |
| | | 8,370 | | | Ageas SA/NV | | | 402,649 | |
| | | |
| | | 1,493 | | | Bekaert SA | | | 64,958 | |
| | | |
| | | 594 | | | D’ieteren Group (a) | | | 95,958 | |
| | | |
| | | 1,288 | | | Proximus SADP | | | 25,606 | |
| | | |
| | | 243 | | | Sofina SA | | | 94,370 | |
| | | |
| | | 2,613 | | | UCB SA | | | 285,174 | |
| | | |
| | | 76 | | | VGP NV (a) | | | 19,406 | |
| | | | | | | | | | |
| | | |
| | | | | | Total Belgium | | | 1,076,978 | |
| | | | | | | | | | |
| | | |
| | | | | | Brazil — 0.1% | | | |
| | | |
| | | 13,400 | | | Petroleo Brasileiro SA Sponsored ADR (a) | | | 191,486 | |
| | | |
| | | 4,255 | | | Vale SA | | | 78,946 | |
| | | | | | | | | | |
| | | |
| | | | | | Total Brazil | | | 270,432 | |
| | | | | | | | | | |
| | | |
| | | | | | Canada — 1.3% | | | |
| | | |
| | | 5,570 | | | Brookfield Asset Management Inc – Class A (a) | | | 304,345 | |
| | | |
| | | 5,900 | | | Canaccord Genuity Group Inc | | | 60,094 | |
| | | |
| | | 4,700 | | | Canadian Apartment Properties (REIT) (a) | | | 195,639 | |
| | | |
| | | 2,000 | | | Canadian Tire Corp Ltd – Class A (a) | | | 294,864 | |
| | | |
| | | 2,300 | | | Canadian Western Bank | | | 67,340 | |
| | | | | | | | | | |
Shares | | | Description | | Value ($) | |
| | | |
| | | | | | Canada — continued | | | |
| | | |
| | | 5,000 | | | Canfor Corp * | | | 113,175 | |
| | | |
| | | 8,358 | | | Celestica Inc * | | | 99,373 | |
| | | |
| | | 700 | | | Cogeco Inc | | | 43,320 | |
| | | |
| | | 10,400 | | | Corus Entertainment Inc – Class B | | | 41,682 | |
| | | |
| | | 4,300 | | | Finning International Inc | | | 125,116 | |
| | | |
| | | 2,100 | | | iA Financial Corp Inc | | | 124,774 | |
| | | |
| | | 1,100 | | | Imperial Oil Ltd (a) | | | 49,372 | |
| | | |
| | | 1,500 | | | Interfor Corp | | | 45,692 | |
| | | |
| | | 1,300 | | | Linamar Corp | | | 67,887 | |
| | | |
| | | 2,900 | | | Magna International Inc | | | 215,458 | |
| | | |
| | | 3,900 | | | Nutrien Ltd (a) | | | 335,361 | |
| | | |
| | | 700 | | | Onex Corp | | | 47,009 | |
| | | |
| | | 4,500 | | | Parex Resources Inc | | | 99,231 | |
| | | |
| | | 1,000 | | | Power Corp of Canada | | | 30,840 | |
| | | |
| | | 5,000 | | | PrairieSky Royalty Ltd | | | 67,613 | |
| | | |
| | | 4,200 | | | Quebecor Inc – Class B (a) | | | 91,853 | |
| | | |
| | | 2,800 | | | RioCan Real Estate Investment Trust (REIT) (a) | | | 55,492 | |
| | | |
| | | 900 | | | Russel Metals Inc | | | 22,296 | |
| | | |
| | | 1,300 | | | Teck Resources Ltd – Class B | | | 46,810 | |
| | | |
| | | 3,000 | | | Topaz Energy Corp | | | 47,006 | |
| | | |
| | | 2,800 | | | West Fraser Timber Co Ltd | | | 279,492 | |
| | | | | | | | | | |
| | | |
| | | | | | Total Canada | | | 2,971,134 | |
| | | | | | | | | | |
| | | |
| | | | | | China — 1.3% | | | |
| | | |
| | | 42,000 | | | Agile Group Holdings Ltd | | | 19,136 | |
| | | |
| | | 9,804 | | | Alibaba Group Holding Ltd * | | | 129,059 | |
| | | |
| | | 1,300 | | | Autohome Inc ADR (a) | | | 39,767 | |
| | | |
| | | 383,000 | | | Bank of Communications Co Ltd – Class H | | | 262,558 | |
| | | |
| | | 22,000 | | | Beijing Enterprises Holdings Ltd | | | 75,207 | |
| | | |
| | | 20,000 | | | China Aoyuan Group Ltd | | | 3,334 | |
| | | |
| | | 138,000 | | | China Communications Services Corp Ltd – Class H | | | 75,710 | |
| | | |
| | | 120,000 | | | China Overseas Land & Investment Ltd | | | 366,380 | |
| | | |
| | | 407,000 | | | China Railway Group Ltd – Class H | | | 238,972 | |
| | | |
| | | 286,000 | | | China Zhongwang Holdings Ltd * (b) | | | 61,485 | |
| | | |
| | | 158,000 | | | CITIC Ltd | | | 184,374 | |
| | | |
| | | 224,000 | | | Dongfeng Motor Group Co Ltd – Class H | | | 192,803 | |
| | | |
| | | 32,000 | | | Fosun International Ltd | | | 34,720 | |
| | | |
| | | 189,200 | | | Guangzhou R&F Properties Co Ltd – Class H | | | 80,542 | |
| | | |
| | | 11,200 | | | Haier Smart Home Co Ltd – Class H | | | 39,246 | |
| | | |
| | | 27,500 | | | Hello Group Inc Sponsored ADR | | | 262,075 | |
| | | |
| | | 128 | | | JD.com Inc – Class A * | | | 4,572 | |
| | | |
| | | 17,500 | | | Kingboard Holdings Ltd | | | 81,868 | |
| | | |
| | | 28,000 | | | Seazen Group Ltd * | | | 14,774 | |
| | | |
| | | 40,800 | | | Shanghai Pharmaceuticals Holding Co Ltd – Class H | | | 73,647 | |
| | | |
| | | 154,000 | | | Shimao Group Holdings Ltd | | | 92,415 | |
| | | |
| | | 73,200 | | | Sinopharm Group Co Ltd – Class H | | | 177,450 | |
| | | |
| | | 152,000 | | | Skyworth Group Ltd * | | | 85,869 | |
| | | |
| | | 148,000 | | | Sunac China Holdings Ltd | | | 120,975 | |
| | | | |
| | |
| | | See accompanying notes to the financial statements. | | 121 |
GMO Strategic Opportunities Allocation Fund
(A Series of GMO Trust)
Schedule of Investments — (Continued)
(showing percentage of total net assets)
February 28, 2022
| | | | | | | | | | |
Shares | | | Description | | Value ($) | |
| | | |
| | | | | | China — continued | | | |
| | | |
| | | 2,701 | | | Tencent Holdings Ltd | | | 145,749 | |
| | | |
| | | 14,500 | | | Vipshop Holdings Ltd ADR * | | | 125,715 | |
| | | |
| | | 353,585 | | | Yuzhou Group Holdings Co Ltd | | | 28,092 | |
| | | | | | | | | | |
| | | |
| | | | | | Total China | | | 3,016,494 | |
| | | | | | | | | | |
| | | |
| | | | | | Denmark — 0.5% | | | |
| | | |
| | | 46 | | | AP Moller – Maersk A/S – Class A (a) | | | 137,930 | |
| | | |
| | | 88 | | | AP Moller – Maersk A/S – Class B (a) | | | 278,389 | |
| | | |
| | | 394 | | | Carlsberg A/S – Class B (a) | | | 57,780 | |
| | | |
| | | 20,531 | | | Danske Bank A/S | | | 347,754 | |
| | | |
| | | 2,723 | | | Pandora A/S | | | 278,828 | |
| | | |
| | | 3,387 | | | Scandinavian Tobacco Group A/S | | | 76,378 | |
| | | | | | | | | | |
| | | |
| | | | | | Total Denmark | | | 1,177,059 | |
| | | | | | | | | | |
| | | |
| | | | | | Finland — 0.2% | | | |
| | | |
| | | 4,227 | | | Neste Oyj | | | 164,830 | |
| | | |
| | | 57,326 | | | Nokia Oyj * | | | 309,981 | |
| | | |
| | | 16,345 | | | Outokumpu Oyj * | | | 96,348 | |
| | | | | | | | | | |
| | | |
| | | | | | Total Finland | | | 571,159 | |
| | | | | | | | | | |
| | | |
| | | | | | France — 1.4% | | | |
| | | |
| | | 3,743 | | | ALD SA (a) | | | 52,247 | |
| | | |
| | | 3,122 | | | APERAM SA | | | 174,807 | |
| | | |
| | | 10,159 | | | ArcelorMittal SA | | | 315,220 | |
| | | |
| | | 4,609 | | | BNP Paribas SA | | | 267,435 | |
| | | |
| | | 4,068 | | | Coface SA | | | 54,111 | |
| | | |
| | | 7,253 | | | Derichebourg SA | | | 75,356 | |
| | | |
| | | 1,951 | | | Ipsen SA | | | 227,018 | |
| | | |
| | | 1,905 | | | IPSOS (a) | | | 90,788 | |
| | | |
| | | 301 | | | Kering SA (a) | | | 208,784 | |
| | | |
| | | 384 | | | LVMH Moet Hennessy Louis Vuitton SE (a) | | | 282,203 | |
| | | |
| | | 4,198 | | | Metropole Television SA (a) | | | 83,209 | |
| | | |
| | | 409 | | | Nexity SA | | | 16,122 | |
| | | |
| | | 8,722 | | | Publicis Groupe SA (a) | | | 578,842 | |
| | | |
| | | 2,705 | | | Quadient SA | | | 49,455 | |
| | | |
| | | 2,882 | | | Safran SA (a) | | | 366,438 | |
| | | |
| | | 1,103 | | | Societe BIC SA | | | 58,202 | |
| | | |
| | | 9,903 | | | Societe Generale SA | | | 280,032 | |
| | | |
| | | 8,502 | | | Television Francaise 1 (a) | | | 83,926 | |
| | | | | | | | | | |
| | | |
| | | | | | Total France | | | 3,264,195 | |
| | | | | | | | | | |
| | | |
| | | | | | Germany — 0.9% | | | |
| | | |
| | | 1,436 | | | ADVA Optical Networking SE * | | | 24,313 | |
| | | |
| | | 5,775 | | | Bayer AG (Registered) (a) | | | 333,581 | |
| | | |
| | | 2,373 | | | Bayerische Motoren Werke AG | | | 228,537 | |
| | | |
| | | 1,921 | | | Beiersdorf AG (a) | | | 194,728 | |
| | | |
| | | 374 | | | Covestro AG | | | 19,779 | |
| | | |
| | | 3,942 | | | Deutsche Pfandbriefbank AG | | | 42,746 | |
| | | |
| | | 182 | | | Draegerwerk AG & Co KGaA (a) | | | 9,549 | |
| | | |
| | | 4,683 | | | Fresenius SE & Co KGaA (a) | | | 163,400 | |
| | | | | | | | | | |
Shares | | | Description | | Value ($) | |
| | | |
| | | | | | Germany — continued | | | |
| | | |
| | | 4,100 | | | HeidelbergCement AG | | | 266,036 | |
| | | |
| | | 368 | | | Hornbach Holding AG & Co KGaA | | | 48,203 | |
| | | |
| | | 9,298 | | | Kloeckner & Co SE * | | | 125,787 | |
| | | |
| | | 4,069 | | | Mercedes-Benz Group AG (a) | | | 317,868 | |
| | | |
| | | 1,855 | | | Salzgitter AG * | | | 81,029 | |
| | | |
| | | 1,540 | | | SAP SE (a) | | | 173,718 | |
| | | | | | | | | | |
| | | |
| | | | | | Total Germany | | | 2,029,274 | |
| | | | | | | | | | |
| | | |
| | | | | | Hong Kong — 0.8% | | | |
| | | |
| | | 15,300 | | | ASM Pacific Technology Ltd (a) | | | 167,857 | |
| | | |
| | | 13,200 | | | Bank of East Asia Ltd (The) | | | 22,251 | |
| | | |
| | | 12,000 | | | Chow Sang Sang Holdings International Ltd | | | 16,842 | |
| | | |
| | | 122,000 | | | CITIC Telecom International Holdings Ltd | | | 43,420 | |
| | | |
| | | 50,500 | | | CK Hutchison Holdings Ltd (a) | | | 354,059 | |
| | | |
| | | 7,200 | | | Dah Sing Financial Holdings Ltd | | | 23,316 | |
| | | |
| | | 224,000 | | | First Pacific Co Ltd | | | 87,691 | |
| | | |
| | | 20,323 | | | Galaxy Entertainment Group Ltd * | | | 113,346 | |
| | | |
| | | 21,000 | | | HK Electric Investments & HK Electric Investments Ltd (a) | | | 20,720 | |
| | | |
| | | 70,000 | | | HKT Trust & HKT Ltd | | | 94,455 | |
| | | |
| | | 26,000 | | | Johnson Electric Holdings Ltd | | | 43,293 | |
| | | |
| | | 40,000 | | | K Wah International Holdings Ltd | | | 15,182 | |
| | | |
| | | 49,500 | | | Kerry Properties Ltd (a) | | | 135,639 | |
| | | |
| | | 85,000 | | | Pacific Textiles Holdings Ltd | | | 41,238 | |
| | | |
| | | 160,000 | | | PCCW Ltd | | | 89,511 | |
| | | |
| | | 32,500 | | | Power Assets Holdings Ltd (a) | | | 204,832 | |
| | | |
| | | 60,000 | | | Shun Tak Holdings Ltd * | | | 15,333 | |
| | | |
| | | 34,000 | | | Sun Hung Kai & Co Ltd | | | 17,261 | |
| | | |
| | | 12,500 | | | Swire Pacific Ltd – Class A (a) | | | 69,078 | |
| | | |
| | | 64,000 | | | VSTECS Holdings Ltd | | | 65,798 | |
| | | |
| | | 12,000 | | | VTech Holdings Ltd | | | 98,654 | |
| | | |
| | | 189,500 | | | WH Group Ltd | | | 132,342 | |
| | | |
| | | 47,000 | | | Yue Yuen Industrial Holdings Ltd * | | | 79,424 | |
| | | | | | | | | | |
| | | |
| | | | | | Total Hong Kong | | | 1,951,542 | |
| | | | | | | | | | |
| | | |
| | | | | | India — 0.4% | | | |
| | | |
| | | 18,123 | | | Hindustan Petroleum Corp Ltd | | | 65,928 | |
| | | |
| | | 54,302 | | | Indiabulls Housing Finance Ltd | | | 109,103 | |
| | | |
| | | 59,298 | | | NTPC Ltd | | | 105,598 | |
| | | |
| | | 179,816 | | | Oil & Natural Gas Corp Ltd | | | 386,679 | |
| | | |
| | | 86,044 | | | REC Ltd | | | 140,334 | |
| | | |
| | | 14,463 | | | Tata Steel Ltd | | | 236,260 | |
| | | | | | | | | | |
| | | |
| | | | | | Total India | | | 1,043,902 | |
| | | | | | | | | | |
| | | |
| | | | | | Ireland — 0.5% | | | |
| | | |
| | | 13,545 | | | AIB Group Plc * | | | 35,736 | |
| | | |
| | | 52,388 | | | Bank of Ireland Group Plc * | | | 347,607 | |
| | | |
| | | 5,092 | | | Glanbia Plc | | | 71,283 | |
| | | |
| | | 44,520 | | | Hibernia REIT Plc | | | 58,114 | |
| | | |
| | | 6,929 | | | Origin Enterprises Plc | | | 28,054 | |
| | | | |
| | |
| 122 | | See accompanying notes to the financial statements. | | |
GMO Strategic Opportunities Allocation Fund
(A Series of GMO Trust)
Schedule of Investments — (Continued)
(showing percentage of total net assets)
February 28, 2022
| | | | | | | | | | |
Shares | | | Description | | Value ($) | |
| | | |
| | | | | | Ireland — continued | | | |
| | | |
| | | 15,024 | | | Ryanair Holdings Plc * | | | 260,490 | |
| | | |
| | | 325 | | | Ryanair Holdings Plc Sponsored ADR * (a) | | | 32,406 | |
| | | |
| | | 7,081 | | | Smurfit Kappa Group Plc | | | 353,641 | |
| | | | | | | | | | |
| | | |
| | | | | | Total Ireland | | | 1,187,331 | |
| | | | | | | | | | |
| | | |
| | | | | | Israel — 0.4% | | | |
| | | |
| | | 26,873 | | | Bank Leumi Le-Israel BM | | | 291,113 | |
| | | |
| | | 2,400 | | | Check Point Software Technologies Ltd * | | | 347,712 | |
| | | |
| | | 1,719 | | | First International Bank of Israel Ltd | | | 73,944 | |
| | | |
| | | 8,519 | | | Isracard Ltd | | | 44,711 | |
| | | |
| | | 33,700 | | | Teva Pharmaceutical Industries Ltd Sponsored ADR * | | | 273,981 | |
| | | | | | | | | | |
| | | |
| | | | | | Total Israel | | | 1,031,461 | |
| | | | | | | | | | |
| | | |
| | | | | | Italy — 0.9% | | | |
| | | |
| | | 2,000 | | | ACEA SPA (a) | | | 37,982 | |
| | | |
| | | 2,745 | | | Ascopiave SPA (a) | | | 10,762 | |
| | | |
| | | 2,303 | | | Azimut Holding SPA | | | 54,953 | |
| | | |
| | | 2,511 | | | Banca IFIS SPA | | | 52,993 | |
| | | |
| | | 3,249 | | | Credito Emiliano SPA | | | 23,331 | |
| | | |
| | | 10,212 | | | EXOR NV | | | 773,718 | |
| | | |
| | | 30,261 | | | Italgas SPA (a) | | | 195,335 | |
| | | |
| | | 1,208 | | | La Doria SPA | | | 22,266 | |
| | | |
| | | 25,257 | | | Leonardo SPA * | | | 225,163 | |
| | | |
| | | 17,269 | | | Poste Italiane SPA | | | 198,067 | |
| | | |
| | | 321,360 | | | Telecom Italia SPA | | | 135,018 | |
| | | |
| | | 301,464 | | | Telecom Italia SPA – RSP | | | 125,188 | |
| | | |
| | | 43,953 | | | Unipol Gruppo SPA | | | 223,021 | |
| | | | | | | | | | |
| | | |
| | | | | | Total Italy | | | 2,077,797 | |
| | | | | | | | | | |
| | | |
| | | | | | Japan — 11.4% | | | |
| | | |
| | | 1,500 | | | ADEKA Corp | | | 34,788 | |
| | | |
| | | 3,700 | | | Aeon Delight Co Ltd | | | 96,064 | |
| | | |
| | | 20,500 | | | Aeon Mall Co Ltd (a) | | | 288,272 | |
| | | |
| | | 10,800 | | | AGC Inc (a) | | | 479,115 | |
| | | |
| | | 2,700 | | | Aisin Corp | | | 98,345 | |
| | | |
| | | 5,100 | | | Amano Corp | | | 99,983 | |
| | | |
| | | 400 | | | Arata Corp | | | 13,943 | |
| | | |
| | | 2,300 | | | Arcland Sakamoto Co Ltd | | | 31,477 | |
| | | |
| | | 9,300 | | | Arcs Co Ltd | | | 176,134 | |
| | | |
| | | 36,900 | | | Asahi Kasei Corp | | | 346,300 | |
| | | |
| | | 9,300 | | | Astellas Pharma Inc (a) | | | 155,163 | |
| | | |
| | | 11,300 | | | Brother Industries Ltd | | | 205,670 | |
| | | |
| | | 1,400 | | | Calbee Inc | | | 31,480 | |
| | | |
| | | 1,900 | | | Canon Marketing Japan Inc | | | 39,711 | |
| | | |
| | | 20,700 | | | Chugoku Marine Paints Ltd | | | 165,899 | |
| | | |
| | | 7,000 | | | Citizen Watch Co Ltd | | | 30,493 | |
| | | |
| | | 9,700 | | | Dai Nippon Printing Co Ltd | | | 253,215 | |
| | | |
| | | 200 | | | Dai Nippon Toryo Co Ltd | | | 1,415 | |
| | | |
| | | 2,500 | | | Daihen Corp | | | 94,122 | |
| | | | | | | | | | |
Shares | | | Description | | Value ($) | |
| | | |
| | | | | | Japan — continued | | | |
| | | |
| | | 300 | | | Daiichi Jitsugyo Co Ltd | | | 11,409 | |
| | | |
| | | 600 | | | Daishi Hokuetsu Financial Group Inc | | | 13,878 | |
| | | |
| | | 7,800 | | | Daiwa House Industry Co Ltd (a) | | | 221,210 | |
| | | |
| | | 32,600 | | | Daiwabo Holdings Co Ltd | | | 504,627 | |
| | | |
| | | 10,200 | | | Denka Co Ltd | | | 313,269 | |
| | | |
| | | 200 | | | Eizo Corp | | | 6,427 | |
| | | |
| | | 7,700 | | | Electric Power Development Co Ltd (a) | | | 122,170 | |
| | | |
| | | 700 | | | ESPEC Corp | | | 12,608 | |
| | | |
| | | 19,100 | | | EXEO Group Inc | | | 397,592 | |
| | | |
| | | 4,200 | | | Ezaki Glico Co Ltd | | | 143,280 | |
| | | |
| | | 12,200 | | | Fuji Corp | | | 248,092 | |
| | | |
| | | 1,200 | | | Fuji Electric Co Ltd | | | 61,742 | |
| | | |
| | | 1,900 | | | Hanwa Co Ltd | | | 55,266 | |
| | | |
| | | 24,300 | | | Haseko Corp | | | 310,187 | |
| | | |
| | | 2,900 | | | Hazama Ando Corp | | | 23,359 | |
| | | |
| | | 7,300 | | | Hogy Medical Co Ltd (a) | | | 212,884 | |
| | | |
| | | 19,900 | | | Honda Motor Co Ltd (a) | | | 604,580 | |
| | | |
| | | 2,900 | | | Idemitsu Kosan Co Ltd | | | 77,739 | |
| | | |
| | | 8,800 | | | Iida Group Holdings Co Ltd | | | 163,320 | |
| | | |
| | | 11,300 | | | Inabata & Co Ltd | | | 228,199 | |
| | | |
| | | 62,900 | | | Inpex Corp | | | 648,343 | |
| | | |
| | | 11,400 | | | Isuzu Motors Ltd | | | 154,180 | |
| | | |
| | | 13,200 | | | ITOCHU Corp (a) | | | 430,169 | |
| | | |
| | | 2,100 | | | Itochu Enex Co Ltd | | | 19,110 | |
| | | |
| | | 5,300 | | | Itoham Yonekyu Holdings Inc | | | 31,848 | |
| | | |
| | | 1,500 | | | Jaccs Co Ltd | | | 42,362 | |
| | | |
| | | 16,500 | | | JFE Holdings Inc | | | 245,645 | |
| | | |
| | | 1,700 | | | Juroku Financial Group Inc | | | 36,007 | |
| | | |
| | | 28,900 | | | JVCKenwood Corp | | | 46,661 | |
| | | |
| | | 37,500 | | | K’s Holdings Corp | | | 406,350 | |
| | | |
| | | 27,300 | | | Kajima Corp | | | 367,417 | |
| | | |
| | | 200 | | | Kanamoto Co Ltd | | | 3,963 | |
| | | |
| | | 4,800 | | | Kandenko Co Ltd | | | 36,499 | |
| | | |
| | | 800 | | | Kaneka Corp | | | 26,167 | |
| | | |
| | | 20,700 | | | Kanematsu Corp | | | 252,722 | |
| | | |
| | | 500 | | | Kanematsu Electronics Ltd (a) | | | 17,032 | |
| | | |
| | | 14,700 | | | KDDI Corp (a) | | | 478,356 | |
| | | |
| | | 4,500 | | | Kinden Corp | | | 63,822 | |
| | | |
| | | 19,000 | | | Kirin Holdings Co Ltd (a) | | | 315,884 | |
| | | |
| | | 600 | | | Kissei Pharmaceutical Co Ltd | | | 12,683 | |
| | | |
| | | 800 | | | Kohnan Shoji Co Ltd | | | 25,440 | |
| | | |
| | | 3,100 | | | Kokuyo Co Ltd | | | 43,459 | |
| | | |
| | | 2,900 | | | Komeri Co Ltd | | | 71,306 | |
| | | |
| | | 13,100 | | | Konoike Transport Co Ltd (a) | | | 137,006 | |
| | | |
| | | 700 | | | Kumagai Gumi Co Ltd | | | 17,597 | |
| | | |
| | | 10,800 | | | Kyudenko Corp | | | 289,945 | |
| | | |
| | | 16,700 | | | Macromill Inc | | | 164,101 | |
| | | |
| | | 18,300 | | | Mandom Corp | | | 219,446 | |
| | | |
| | | 12,200 | | | Maruichi Steel Tube Ltd | | | 302,799 | |
| | | |
| | | 400 | | | Maruzen Showa Unyu Co Ltd (a) | | | 11,132 | |
| | | | |
| | |
| | | See accompanying notes to the financial statements. | | 123 |
GMO Strategic Opportunities Allocation Fund
(A Series of GMO Trust)
Schedule of Investments — (Continued)
(showing percentage of total net assets)
February 28, 2022
| | | | | | | | | | |
Shares | | | Description | | Value ($) | |
| | | |
| | | | | | Japan — continued | | | |
| | | |
| | | 17,500 | | | Maxell Ltd | | | 180,269 | |
| | | |
| | | 2,100 | | | MEIJI Holdings Co Ltd | | | 126,038 | |
| | | |
| | | 800 | | | Mirait Holdings Corp | | | 13,596 | |
| | | |
| | | 8,600 | | | Mitsubishi Corp (a) | | | 289,164 | |
| | | |
| | | 1,900 | | | Mitsubishi UFJ Financial Group Inc (a) | | | 11,664 | |
| | | |
| | | 700 | | | Mitsuboshi Belting Ltd | | | 13,195 | |
| | | |
| | | 4,000 | | | Mitsui Chemicals Inc | | | 102,258 | |
| | | |
| | | 900 | | | Mitsui DM Sugar Holdings Co Ltd | | | 16,066 | |
| | | |
| | | 800 | | | Mixi Inc (a) | | | 15,561 | |
| | | |
| | | 9,300 | | | Morinaga & Co Ltd | | | 302,584 | |
| | | |
| | | 7,800 | | | MS&AD Insurance Group Holdings Inc | | | 263,926 | |
| | | |
| | | 7,700 | | | NEC Corp (a) | | | 333,145 | |
| | | |
| | | 3,000 | | | NEC Networks & System Integration Corp (a) | | | 46,127 | |
| | | |
| | | 1,600 | | | NGK Insulators Ltd | | | 24,848 | |
| | | |
| | | 11,000 | | | NH Foods Ltd | | | 412,860 | |
| | | |
| | | 1,100 | | | Nichiha Corp | | | 24,777 | |
| | | |
| | | 10,000 | | | Nikon Corp | | | 104,528 | |
| | | |
| | | 1,100 | | | Nippon Soda Co Ltd | | | 32,225 | |
| | | |
| | | 15,400 | | | Nippon Steel Corp (a) | | | 281,958 | |
| | | |
| | | 200 | | | Nippon Steel Trading Corp | | | 9,487 | |
| | | |
| | | 10,700 | | | Nippon Suisan Kaisha Ltd | | | 50,668 | |
| | | |
| | | 13,500 | | | Nippon Telegraph & Telephone Corp (a) | | | 388,002 | |
| | | |
| | | 8,500 | | | Nippon Television Holdings Inc (a) | | | 97,239 | |
| | | |
| | | 1,900 | | | Nojima Corp | | | 42,201 | |
| | | |
| | | 2,500 | | | Nomura Real Estate Holdings Inc (a) | | | 62,247 | |
| | | |
| | | 44,700 | | | Obayashi Corp | | | 374,273 | |
| | | |
| | | 3,400 | | | Okamura Corp | | | 35,033 | |
| | | |
| | | 2,800 | | | Organo Corp | | | 199,298 | |
| | | |
| | | 10,700 | | | ORIX Corp (a) | | | 212,107 | |
| | | |
| | | 4,800 | | | Osaka Gas Co Ltd (a) | | | 87,846 | |
| | | |
| | | 400 | | | Osaka Soda Co Ltd | | | 10,945 | |
| | | |
| | | 18,400 | | | Pacific Industrial Co Ltd | | | 163,120 | |
| | | |
| | | 16,300 | | | Penta-Ocean Construction Co Ltd | | | 85,802 | |
| | | |
| | | 1,400 | | | Proto Corp | | | 14,090 | |
| | | |
| | | 1,000 | | | Raito Kogyo Co Ltd | | | 17,038 | |
| | | |
| | | 1,400 | | | Raiznext Corp | | | 13,862 | |
| | | |
| | | 10,900 | | | Resona Holdings Inc | | | 48,748 | |
| | | |
| | | 1,200 | | | Rohm Co Ltd (a) | | | 95,704 | |
| | | |
| | | 3,200 | | | San-A Co Ltd | | | 118,816 | |
| | | |
| | | 1,600 | | | San-Ai Oil Co Ltd | | | 13,303 | |
| | | |
| | | 3,100 | | | Sanki Engineering Co Ltd | | | 40,229 | |
| | | |
| | | 8,300 | | | Sankyu Inc (a) | | | 287,785 | |
| | | |
| | | 1,700 | | | Sanwa Holdings Corp | | | 18,999 | |
| | | |
| | | 5,600 | | | Sawai Group Holdings Co Ltd | | | 222,559 | |
| | | |
| | | 4,600 | | | Secom Co Ltd (a) | | | 337,853 | |
| | | |
| | | 12,400 | | | Sega Sammy Holdings Inc | | | 226,168 | |
| | | |
| | | 7,300 | | | Seiko Epson Corp | | | 112,277 | |
| | | |
| | | 19,600 | | | Sekisui House Ltd | | | 399,606 | |
| | | |
| | | 400 | | | Sekisui Jushi Corp | | | 6,677 | |
| | | |
| | | 2,400 | | | Shimamura Co Ltd | | | 217,704 | |
| | | | | | | | | | |
Shares | | | Description | | Value ($) | |
| | | |
| | | | | | Japan — continued | | | |
| | | |
| | | 33,200 | | | Shimizu Corp | | | 219,756 | |
| | | |
| | | 1,100 | | | Shizuoka Gas Co Ltd (a) | | | 8,304 | |
| | | |
| | | 1,100 | | | Sinko Industries Ltd | | | 16,649 | |
| | | |
| | | 33,400 | | | SKY Perfect JSAT Holdings Inc (a) | | | 125,598 | |
| | | |
| | | 16,940 | | | Sojitz Corp | | | 279,799 | |
| | | |
| | | 15,400 | | | Stanley Electric Co Ltd | | | 365,947 | |
| | | |
| | | 9,600 | | | Subaru Corp | | | 157,448 | |
| | | |
| | | 133,600 | | | Sumitomo Chemical Co Ltd | | | 637,837 | |
| | | |
| | | 9,900 | | | Sumitomo Corp (a) | | | 161,524 | |
| | | |
| | | 25,800 | | | Sumitomo Dainippon Pharma Co Ltd | | | 283,147 | |
| | | |
| | | 1,600 | | | Sumitomo Electric Industries Ltd | | | 21,240 | |
| | | |
| | | 19,400 | | | Sumitomo Forestry Co Ltd | | | 374,100 | |
| | | |
| | | 1,100 | | | Sumitomo Heavy Industries Ltd | | | 26,654 | |
| | | |
| | | 11,700 | | | Sumitomo Mitsui Financial Group Inc | | | 414,908 | |
| | | |
| | | 10,500 | | | Sumitomo Mitsui Trust Holdings Inc | | | 373,086 | |
| | | |
| | | 400 | | | Sumitomo Seika Chemicals Co Ltd | | | 11,384 | |
| | | |
| | | 1,400 | | | Suzuki Motor Corp | | | 55,745 | |
| | | |
| | | 24,600 | | | T&D Holdings Inc | | | 357,277 | |
| | | |
| | | 12,000 | | | Tachi-S Co Ltd | | | 117,482 | |
| | | |
| | | 8,800 | | | Taisei Corp | | | 292,613 | |
| | | |
| | | 8,200 | | | Takara Holdings Inc | | | 81,474 | |
| | | |
| | | 5,700 | | | Takara Leben Co Ltd | | | 15,583 | |
| | | |
| | | 17,500 | | | Takuma Co Ltd | | | 222,404 | |
| | | |
| | | 1,900 | | | Tamron Co Ltd | | | 39,046 | |
| | | |
| | | 27,200 | | | Teijin Ltd | | | 327,213 | |
| | | |
| | | 9,200 | | | THK Co Ltd | | | 211,352 | |
| | | |
| | | 11,500 | | | Toho Holdings Co Ltd (a) | | | 189,210 | |
| | | |
| | | 23,700 | | | Tokai Carbon Co Ltd | | | 227,479 | |
| | | |
| | | 107,400 | | | Tokyo Electric Power Co Holdings Inc * (a) | | | 337,128 | |
| | | |
| | | 14,100 | | | Tokyo Gas Co Ltd (a) | | | 287,193 | |
| | | |
| | | 7,700 | | | Tokyo Seimitsu Co Ltd | | | 320,607 | |
| | | |
| | | 5,000 | | | Tokyu Construction Co Ltd | | | 30,991 | |
| | | |
| | | 19,700 | | | Toppan Inc | | | 388,175 | |
| | | |
| | | 16,200 | | | Toray Industries Inc | | | 92,384 | |
| | | |
| | | 17,100 | | | Tosei Corp | | | 162,963 | |
| | | |
| | | 19,800 | | | Tosoh Corp | | | 307,258 | |
| | | |
| | | 1,200 | | | Totetsu Kogyo Co Ltd | | | 26,204 | |
| | | |
| | | 900 | | | Towa Pharmaceutical Co Ltd | | | 23,323 | |
| | | |
| | | 3,300 | | | Toyo Construction Co Ltd | | | 17,195 | |
| | | |
| | | 5,800 | | | Toyota Boshoku Corp | | | 106,140 | |
| | | |
| | | 3,700 | | | Toyota Industries Corp (a) | | | 281,426 | |
| | | |
| | | 5,000 | | | Tsumura & Co | | | 138,874 | |
| | | |
| | | 1,700 | | | TV Asahi Holdings Corp (a) | | | 23,235 | |
| | | |
| | | 3,500 | | | Ulvac Inc | | | 174,697 | |
| | | |
| | | 2,000 | | | YAMABIKO Corp | | | 23,163 | |
| | | |
| | | 3,800 | | | Yamaha Motor Co Ltd | | | 85,422 | |
| | | |
| | | 2,000 | | | Yamazen Corp | | | 17,926 | |
| | | |
| | | 2,200 | | | Yellow Hat Ltd | | | 31,236 | |
| | | |
| | | 8,100 | | | Yokogawa Bridge Holdings Corp | | | 147,964 | |
| | | |
| | | 4,100 | | | Yokohama Rubber Co Ltd (The) | | | 57,484 | |
| | | | |
| | |
| 124 | | See accompanying notes to the financial statements. | | |
GMO Strategic Opportunities Allocation Fund
(A Series of GMO Trust)
Schedule of Investments — (Continued)
(showing percentage of total net assets)
February 28, 2022
| | | | | | | | | | |
Shares | | | Description | | Value ($) | |
| | | |
| | | | | | Japan — continued | | | |
| | | |
| | | 600 | | | Yuasa Trading Co Ltd | | | 15,607 | |
| | | |
| | | 7,700 | | | Zenkoku Hosho Co Ltd | | | 323,805 | |
| | | | | | | | | | |
| | | |
| | | | | | Total Japan | | | 26,930,012 | |
| | | | | | | | | | |
| | | |
| | | | | | Malaysia — 0.0% | | | |
| | | |
| | | 56,800 | | | Top Glove Corp Bhd | | | 27,721 | |
| | | | | | | | | | |
| | | |
| | | | | | Malta — 0.0% | | | |
| | | |
| | | 125,500 | | | BGP Holdings Plc * (c) | | | — | |
| | | | | | | | | | |
| | | |
| | | | | | Mexico — 0.3% | | | |
| | | |
| | | 39,619 | | | Fomento Economico Mexicano SAB de CV | | | 318,349 | |
| | | |
| | | 78,208 | | | Grupo Mexico SAB de CV – Series B | | | 399,498 | |
| | | | | | | | | | |
| | | |
| | | | | | Total Mexico | | | 717,847 | |
| | | | | | | | | | |
| | | |
| | | | | | Netherlands — 1.2% | | | |
| | | |
| | | 29,043 | | | ABN AMRO Bank NV CVA GDR | | | 386,482 | |
| | | |
| | | 50,971 | | | Aegon NV | | | 251,786 | |
| | | |
| | | 3,600 | | | AerCap Holdings NV * | | | 195,948 | |
| | | |
| | | 16,947 | | | ING Groep NV | | | 197,915 | |
| | | |
| | | 8,521 | | | JDE Peet’s NV | | | 279,738 | |
| | | |
| | | 11,228 | | | Koninklijke Ahold Delhaize NV (a) | | | 345,398 | |
| | | |
| | | 6,070 | | | Koninklijke BAM Groep NV * | | | 17,077 | |
| | | |
| | | 9,632 | | | NN Group NV | | | 462,287 | |
| | | |
| | | 1,035 | | | Prosus NV * | | | 64,255 | |
| | | |
| | | 5,892 | | | Randstad NV | | | 401,532 | |
| | | |
| | | 2,918 | | | Signify NV | | | 149,267 | |
| | | | | | | | | | |
| | | |
| | | | | | Total Netherlands | | | 2,751,685 | |
| | | | | | | | | | |
| | | |
| | | | | | New Zealand — 0.1% | | | |
| | | |
| | | 7,740 | | | Auckland International Airport Ltd * (a) | | | 37,477 | |
| | | |
| | | 46,553 | | | Meridian Energy Ltd (a) | | | 158,052 | |
| | | |
| | | 14,108 | | | Spark New Zealand Ltd | | | 43,316 | |
| | | | | | | | | | |
| | | |
| | | | | | Total New Zealand | | | 238,845 | |
| | | | | | | | | | |
| | | |
| | | | | | Norway — 0.5% | | | |
| | | |
| | | 1,169 | | | Austevoll Seafood ASA | | | 16,506 | |
| | | |
| | | 12,647 | | | Europris ASA | | | 80,673 | |
| | | |
| | | 2,233 | | | Kongsberg Gruppen ASA | | | 78,756 | |
| | | |
| | | 55,121 | | | Norsk Hydro ASA | | | 523,434 | |
| | | |
| | | 27,005 | | | Orkla ASA | | | 252,966 | |
| | | |
| | | 2,138 | | | Sbanken ASA | | | 22,134 | |
| | | |
| | | 3,519 | | | SpareBank 1 Nord Norge | | | 43,055 | |
| | | |
| | | 3,239 | | | SpareBank 1 SMN | | | 53,524 | |
| | | |
| | | 8,038 | | | SpareBank 1 SR-Bank ASA | | | 119,105 | |
| | | | | | | | | | |
| | | |
| | | | | | Total Norway | | | 1,190,153 | |
| | | | | | | | | | |
| | | |
| | | | | | Portugal — 0.2% | | | |
| | | |
| | | 13,312 | | | CTT – Correios de Portugal SA | | | 64,485 | |
| | | |
| | | 14,726 | | | Galp Energia SGPS SA | | | 163,007 | |
| | | | | | | | | | |
Shares | | | Description | | Value ($) | |
| | | |
| | | | | | Portugal — continued | | | |
| | | |
| | | 9,241 | | | Navigator Co SA (The) | | | 33,021 | |
| | | |
| | | 16,961 | | | NOS SGPS SA | | | 65,298 | |
| | | |
| | | 98,476 | | | Sonae SGPS SA | | | 107,188 | |
| | | | | | | | | | |
| | | |
| | | | | | Total Portugal | | | 432,999 | |
| | | | | | | | | | |
| | | |
| | | | | | Russia — 0.0% | | | |
| | | |
| | | 2,505 | | | LUKOIL PJSC Sponsored ADR | | | 46,986 | |
| | | |
| | | 541 | | | Novatek PJSC Sponsored GDR (Registered) | | | 20,840 | |
| | | | | | | | | | |
| | | |
| | | | | | Total Russia | | | 67,826 | |
| | | | | | | | | | |
| | | |
| | | | | | Singapore — 0.4% | | | |
| | | |
| | | 36,800 | | | Ascendas Real Estate Investment Trust (REIT) | | | 75,456 | |
| | | |
| | | 2,100 | | | Capitaland Investment Ltd * | | | 5,755 | |
| | | |
| | | 53,400 | | | ComfortDelGro Corp Ltd | | | 55,779 | |
| | | |
| | | 222,800 | | | Golden Agri-Resources Ltd | | | 47,110 | |
| | | |
| | | 27,900 | | | Japfa Ltd | | | 12,200 | |
| | | |
| | | 8,400 | | | Jardine Cycle & Carriage Ltd | | | 135,665 | |
| | | |
| | | 27,900 | | | Keppel Corp Ltd | | | 124,209 | |
| | | |
| | | 48,600 | | | StarHub Ltd | | | 44,921 | |
| | | |
| | | 388,900 | | | Yangzijiang Shipbuilding Holdings Ltd | | | 397,825 | |
| | | |
| | | 35,100 | | | Yanlord Land Group Ltd | | | 31,266 | |
| | | | | | | | | | |
| | | |
| | | | | | Total Singapore | | | 930,186 | |
| | | | | | | | | | |
| | | |
| | | | | | South Africa — 0.1% | | | |
| | | |
| | | 16,368 | | | Bidvest Group Ltd (The) | | | 224,263 | |
| | | | | | | | | | |
| | | |
| | | | | | South Korea — 0.1% | | | |
| | | |
| | | 4,164 | | | Kia Corp | | | 258,148 | |
| | | |
| | | 137 | | | POSCO | | | 32,596 | |
| | | |
| | | 600 | | | POSCO Sponsored ADR | | | 35,592 | |
| | | | | | | | | | |
| | | |
| | | | | | Total South Korea | | | 326,336 | |
| | | | | | | | | | |
| | | |
| | | | | | Spain — 1.0% | | | |
| | | |
| | | 27,967 | | | Acerinox SA | | | 355,564 | |
| | | |
| | | 4,595 | | | ACS Actividades de Construccion y Servicios SA | | | 111,661 | |
| | | |
| | | 3,853 | | | Amadeus IT Group SA * (a) | | | 254,208 | |
| | | |
| | | 7,772 | | | Atresmedia Corp de Medios de Comunicacion SA | | | 33,594 | |
| | | |
| | | 58,662 | | | Banco Bilbao Vizcaya Argentaria SA | | | 348,084 | |
| | | |
| | | 236,551 | | | Banco de Sabadell SA * | | | 204,539 | |
| | | |
| | | 100,175 | | | Banco Santander SA | | | 333,584 | |
| | | |
| | | 11,787 | | | Bankinter SA | | | 66,931 | |
| | | |
| | | 4,606 | | | Cia de Distribucion Integral Logista Holdings SA(a) | | | 83,652 | |
| | | |
| | | 3,874 | | | Faes Farma SA | | | 14,819 | |
| | | |
| | | 721 | | | Grupo Catalana Occidente SA | | | 23,241 | |
| | | |
| | | 6,898 | | | Industria de Diseno Textil SA (a) | | | 179,940 | |
| | | |
| | | 15,553 | | | Mediaset Espana Comunicacion SA * (a) | | | 79,787 | |
| | | |
| | | 1,258 | | | Red Electrica Corp SA (a) | | | 24,922 | |
| | | | |
| | |
| | | See accompanying notes to the financial statements. | | 125 |
GMO Strategic Opportunities Allocation Fund
(A Series of GMO Trust)
Schedule of Investments — (Continued)
(showing percentage of total net assets)
February 28, 2022
| | | | | | | | | | |
Shares | | | Description | | Value ($) | |
| | | |
| | | | | | Spain — continued | | | |
| | | |
| | | 12,427 | | | Repsol SA | | | 161,253 | |
| | | |
| | | 6,780 | | | Telefonica SA (a) | | | 32,381 | |
| | | |
| | | 49,033 | | | Unicaja Banco SA | | | 46,229 | |
| | | | | | | | | | |
| | | |
| | | | | | Total Spain | | | 2,354,389 | |
| | | | | | | | | | |
| | | |
| | | | | | Sweden — 0.3% | | | |
| | | |
| | | 1,941 | | | Investor AB – A Shares (a) | | | 42,920 | |
| | | |
| | | 13,341 | | | Investor AB – B Shares (a) | | | 271,656 | |
| | | |
| | | 5,114 | | | Inwido AB | | | 79,186 | |
| | | |
| | | 4,552 | | | Kinnevik AB – Class B * | | | 115,895 | |
| | | |
| | | 1,539 | | | New Wave Group AB – B Shares | | | 23,271 | |
| | | |
| | | 1,815 | | | Securitas AB – B Shares | | | 21,974 | |
| | | |
| | | 7,187 | | | Skanska AB – B Shares | | | 162,665 | |
| | | |
| | | 2,571 | | | SSAB AB – A Shares * | | | 16,090 | |
| | | |
| | | 2,725 | | | Svenska Cellulosa AB SCA – Class B | | | 44,460 | |
| | | | | | | | | | |
| | | |
| | | | | | Total Sweden | | | 778,117 | |
| | | | | | | | | | |
| | | |
| | | | | | Switzerland — 0.3% | | | |
| | | |
| | | 5,610 | | | Adecco Group AG (Registered) | | | 264,953 | |
| | | |
| | | 487 | | | BKW AG (a) | | | 61,358 | |
| | | |
| | | 2,770 | | | Logitech International SA (Registered) | | | 207,276 | |
| | | |
| | | 600 | | | Novartis AG Sponsored ADR (a) | | | 52,476 | |
| | | |
| | | 27 | | | Schindler Holding AG (Registered) | | | 6,052 | |
| | | |
| | | 281 | | | Zehnder Group AG – Class RG | | | 24,304 | |
| | | | | | | | | | |
| | | |
| | | | | | Total Switzerland | | | 616,419 | |
| | | | | | | | | | |
| | | |
| | | | | | Taiwan — 0.2% | | | |
| | | |
| | | 41,000 | | | Hon Hai Precision Industry Co Ltd | | | 152,297 | |
| | | |
| | | 88,800 | | | Ruentex Development Co Ltd | | | 229,284 | |
| | | | | | | | | | |
| | | |
| | | | | | Total Taiwan | | | 381,581 | |
| | | | | | | | | | |
| | | |
| | | | | | United Kingdom — 3.0% | | | |
| | | |
| | | 14,899 | | | 3i Group Plc | | | 265,413 | |
| | | |
| | | 24,839 | | | Airtel Africa Plc | | | 46,931 | |
| | | |
| | | 923 | | | Bank of Georgia Group Plc | | | 16,348 | |
| | | |
| | | 46,425 | | | Barratt Developments Plc | | | 378,142 | |
| | | |
| | | 5,696 | | | Bellway Plc | | | 219,094 | |
| | | |
| | | 8,910 | | | Berkeley Group Holdings Plc | | | 463,376 | |
| | | |
| | | 168,899 | | | BT Group Plc | | | 421,419 | |
| | | |
| | | 16,183 | | | Coca-Cola HBC AG * | | | 411,154 | |
| | | |
| | | 17,578 | | | Compass Group Plc (a) | | | 397,317 | |
| | | |
| | | 9,585 | | | Crest Nicholson Holdings Plc | | | 39,339 | |
| | | |
| | | 290 | | | DCC Plc | | | 22,757 | |
| | | |
| | | 34,999 | | | Ferrexpo Plc | | | 79,386 | |
| | | |
| | | 3,201 | | | Go-Ahead Group Plc (The) * | | | 28,354 | |
| | | |
| | | 1,249 | | | Grafton Group Plc | | | 17,936 | |
| | | |
| | | 13,618 | | | Halfords Group Plc | | | 50,599 | |
| | | |
| | | 1,061 | | | IMI Plc | | | 20,785 | |
| | | |
| | | 33,563 | | | Indivior Plc * | | | 126,291 | |
| | | |
| | | 17,036 | | | Investec Plc | | | 92,398 | |
| | | | | | | | | | |
Shares | | | Description | | Value ($) | |
| | | |
| | | | | | United Kingdom — continued | | | |
| | | |
| | | 94,566 | | | ITV Plc * (a) | | | 139,329 | |
| | | |
| | | 8,387 | | | J Sainsbury Plc | | | 30,932 | |
| | | |
| | | 152,504 | | | Kingfisher Plc (a) | | | 622,118 | |
| | | |
| | | 250,130 | | | M&G Plc | | | 688,577 | |
| | | |
| | | 7,962 | | | Marks & Spencer Group Plc * | | | 18,558 | |
| | | |
| | | 36,454 | | | Micro Focus International Plc (a) | | | 189,467 | |
| | | |
| | | 3,126 | | | Morgan Sindall Group Plc | | | 96,680 | |
| | | |
| | | 2,853 | | | Numis Corp Plc | | | 9,835 | |
| | | |
| | | 11,884 | | | OSB Group Plc | | | 79,415 | |
| | | |
| | | 11,950 | | | Paragon Banking Group Plc | | | 80,460 | |
| | | |
| | | 7,198 | | | Persimmon Plc | | | 231,657 | |
| | | |
| | | 10,305 | | | Pets at Home Group Plc | | | 49,818 | |
| | | |
| | | 11,397 | | | Plus500 Ltd | | | 212,668 | |
| | | |
| | | 54,167 | | | Premier Foods Plc | | | 79,742 | |
| | | |
| | | 20,059 | | | Reach Plc | | | 61,271 | |
| | | |
| | | 9,276 | | | Redde Northgate Plc (a) | | | 47,077 | |
| | | |
| | | 16,468 | | | Redrow Plc | | | 125,544 | |
| | | |
| | | 1,500 | | | Rio Tinto Plc Sponsored ADR (a) | | | 117,870 | |
| | | |
| | | 19,639 | | | Royal Mail Plc (a) | | | 103,214 | |
| | | |
| | | 12,127 | | | Shell Plc (a) | | | 319,799 | |
| | | |
| | | 5,081 | | | Tate & Lyle Plc | | | 51,006 | |
| | | |
| | | 98,406 | | | Taylor Wimpey Plc | | | 197,381 | |
| | | |
| | | 2,076 | | | Unilever Plc (a) | | | 104,162 | |
| | | |
| | | 19,973 | | | WPP Plc (a) | | | 280,918 | |
| | | | | | | | | | |
| | | |
| | | | | | Total United Kingdom | | | 7,034,537 | |
| | | | | | | | | | |
| | | |
| | | | | | United States — 11.4% | | | |
| | | |
| | | 3,900 | | | Aflac, Inc. (a) | | | 238,251 | |
| | | |
| | | 200 | | | AGNC Investment Corp. (REIT) | | | 2,582 | |
| | | |
| | | 4,000 | | | Alliance Data Systems Corp. (a) | | | 269,800 | |
| | | |
| | | 400 | | | Allstate Corp. (The) (a) | | | 48,944 | |
| | | |
| | | 6,000 | | | Ally Financial, Inc. (a) | | | 299,400 | |
| | | |
| | | 1,878 | | | American Express Co. (a) | | | 365,346 | |
| | | |
| | | 900 | | | Arch Capital Group Ltd. * | | | 42,399 | |
| | | |
| | | 2,700 | | | Arrow Electronics, Inc. * | | | 329,076 | |
| | | |
| | | 12,500 | | | AT&T, Inc. (a) | | | 296,125 | |
| | | |
| | | 2,900 | | | Best Buy Co., Inc. (a) | | | 280,256 | |
| | | |
| | | 400 | | | Bio-Rad Laboratories, Inc. – Class A * | | | 250,384 | |
| | | |
| | | 1,200 | | | Biogen, Inc. * (a) | | | 253,212 | |
| | | |
| | | 130 | | | Booking Holdings, Inc. * (a) | | | 282,392 | |
| | | |
| | | 11,813 | | | BorgWarner, Inc. | | | 484,451 | |
| | | |
| | | 3,000 | | | Bristol-Myers Squibb Co. (a) | | | 206,010 | |
| | | |
| | | 2,400 | | | Capital One Financial Corp. (a) | | | 367,848 | |
| | | |
| | | 6,300 | | | Carrier Global Corp. (a) | | | 282,744 | |
| | | |
| | | 3,600 | | | CBRE Group, Inc. – Class A * (a) | | | 348,660 | |
| | | |
| | | 4,000 | | | Centene Corp. * (a) | | | 330,480 | |
| | | |
| | | 1,959 | | | Chevron Corp. (a) | | | 282,096 | |
| | | |
| | | 1,600 | | | Cigna Corp. (a) | | | 380,448 | |
| | | |
| | | 5,300 | | | Citigroup, Inc. (a) | | | 313,919 | |
| | | |
| | | 1,400 | | | Citizens Financial Group, Inc. | | | 73,388 | |
| | | | |
| | |
| 126 | | See accompanying notes to the financial statements. | | |
GMO Strategic Opportunities Allocation Fund
(A Series of GMO Trust)
Schedule of Investments — (Continued)
(showing percentage of total net assets)
February 28, 2022
| | | | | | | | | | |
Shares | | | Description | | Value ($) | |
| | | |
| | | | | | United States — continued | | | |
| | | |
| | | 3,400 | | | Cognizant Technology Solutions Corp. – Class A (a) | | | 292,842 | |
| | | |
| | | 4,100 | | | Comcast Corp. – Class A (a) | | | 191,716 | |
| | | |
| | | 1,900 | | | CVS Health Corp. (a) | | | 196,935 | |
| | | |
| | | 5,220 | | | Darling Ingredients, Inc. * (a) | | | 378,346 | |
| | | |
| | | 2,600 | | | Discover Financial Services (a) | | | 320,944 | |
| | | |
| | | 8,900 | | | DISH Network Corp. – Class A * (a) | | | 284,444 | |
| | | |
| | | 3,500 | | | DR Horton, Inc. (a) | | | 298,900 | |
| | | |
| | | 4,300 | | | eBay, Inc. (a) | | | 234,737 | |
| | | |
| | | 3,373 | | | EOG Resources, Inc. | | | 387,625 | |
| | | |
| | | 6,100 | | | Fidelity National Financial, Inc. | | | 290,604 | |
| | | |
| | | 1,100 | | | FleetCor Technologies, Inc. * (a) | | | 257,620 | |
| | | |
| | | 14,900 | | | Ford Motor Co. | | | 261,644 | |
| | | |
| | | 1,100 | | | Fox Corp. – Class A (a) | | | 46,013 | |
| | | |
| | | 9,500 | | | Fox Corp. – Class B (a) | | | 363,470 | |
| | | |
| | | 7,800 | | | Franklin Resources, Inc. | | | 231,894 | |
| | | |
| | | 6,000 | | | General Motors Co. * | | | 280,320 | |
| | | |
| | | 5,000 | | | Gilead Sciences, Inc. (a) | | | 302,000 | |
| | | |
| | | 1,308 | | | Global Payments, Inc. (a) | | | 174,461 | |
| | | |
| | | 600 | | | Goldman Sachs Group, Inc. (The) (a) | | | 204,774 | |
| | | |
| | | 2,197 | | | Green Plains, Inc. * | | | 71,930 | |
| | | |
| | | 2,265 | | | Hasbro, Inc. | | | 219,818 | |
| | | |
| | | 1,796 | | | Hilton Worldwide Holdings, Inc. * (a) | | | 267,353 | |
| | | |
| | | 9,200 | | | HP, Inc. (a) | | | 316,112 | |
| | | |
| | | 2,500 | | | IAC/InterActiveCorp * (a) | | | 286,900 | |
| | | |
| | | 4,100 | | | Incyte Corp. * (a) | | | 280,030 | |
| | | |
| | | 6,400 | | | Intel Corp. (a) | | | 305,280 | |
| | | |
| | | 2,184 | | | Intercontinental Exchange, Inc. (a) | | | 279,814 | |
| | | |
| | | 3,000 | | | International Business Machines Corp. (a) | | | 367,530 | |
| | | |
| | | 12,000 | | | Invesco Ltd. | | | 254,880 | |
| | | |
| | | 2,100 | | | Jazz Pharmaceuticals Plc * | | | 288,582 | |
| | | |
| | | 21,600 | | | Kinder Morgan, Inc. (a) | | | 375,840 | |
| | | |
| | | 3,600 | | | Kohl’s Corp. | | | 200,232 | |
| | | |
| | | 5,400 | | | Kroger Co. (The) (a) | | | 252,720 | |
| | | |
| | | 1,300 | | | Laboratory Corp. of America Holdings * (a) | | | 352,638 | |
| | | |
| | | 3,770 | | | Las Vegas Sands Corp. * (a) | | | 161,582 | |
| | | |
| | | 2,000 | | | Leidos Holdings, Inc. (a) | | | 203,680 | |
| | | |
| | | 3,400 | | | Lennar Corp. – Class A | | | 305,592 | |
| | | |
| | | 4,388 | | | Liberty Global Plc – Class A * | | | 113,123 | |
| | | |
| | | 8,799 | | | Liberty Global Plc – Class C * | | | 227,630 | |
| | | |
| | | 5,000 | | | Lincoln National Corp. | | | 337,100 | |
| | | |
| | | 4,200 | | | LKQ Corp. (a) | | | 197,190 | |
| | | |
| | | 19,600 | | | Lumen Technologies, Inc. | | | 203,056 | |
| | | |
| | | 6,447 | | | Lyft, Inc. – Class A * (a) | | | 251,046 | |
| | | |
| | | 3,600 | | | LyondellBasell Industries NV – Class A (a) | | | 350,028 | |
| | | |
| | | 196 | | | Markel Corp. * | | | 243,610 | |
| | | |
| | | 3,500 | | | Merck & Co., Inc. (a) | | | 268,030 | |
| | | |
| | | 600 | | | Meta Platforms, Inc. – Class A * (a) | | | 126,618 | |
| | | |
| | | 5,900 | | | MetLife, Inc. (a) | | | 398,545 | |
| | | |
| | | 4,200 | | | Micron Technology, Inc. (a) | | | 373,212 | |
| | | | | | | | | | |
Shares | | | Description | | Value ($) | |
| | | |
| | | | | | United States — continued | | | |
| | | |
| | | 1,000 | | | Mohawk Industries, Inc. * | | | 140,780 | |
| | | |
| | | 6,700 | | | Molson Coors Brewing Co. – Class B | | | 349,606 | |
| | | |
| | | 2,800 | | | NRG Energy, Inc. (a) | | | 105,952 | |
| | | |
| | | 1,200 | | | Omnicom Group, Inc. (a) | | | 100,668 | |
| | | |
| | | 3,600 | | | Oracle Corp. (a) | | | 273,492 | |
| | | |
| | | 600 | | | Owens Corning | | | 55,914 | |
| | | |
| | | 9,800 | | | Paramount Global – Class B (a) | | | 299,978 | |
| | | |
| | | 1,100 | | | Principal Financial Group, Inc. | | | 77,704 | |
| | | |
| | | 3,100 | | | Prudential Financial, Inc. | | | 346,146 | |
| | | |
| | | 6,200 | | | PulteGroup, Inc. | | | 307,892 | |
| | | |
| | | 2,200 | | | Quest Diagnostics, Inc. (a) | | | 288,794 | |
| | | |
| | | 41,100 | | | Qurate Retail, Inc. – Series A | | | 226,461 | |
| | | |
| | | 3,187 | | | Raytheon Technologies Corp. (a) | | | 327,305 | |
| | | |
| | | 600 | | | Regeneron Pharmaceuticals, Inc. * (a) | | | 371,016 | |
| | | |
| | | 2,000 | | | Regions Financial Corp. | | | 48,380 | |
| | | |
| | | 5,798 | | | Sensata Technologies Holding Plc * | | | 335,762 | |
| | | |
| | | 400 | | | Skyworks Solutions, Inc. (a) | | | 55,268 | |
| | | |
| | | 100 | | | Snap-on, Inc. | | | 21,018 | |
| | | |
| | | 1,800 | | | SS&C Technologies Holdings, Inc. (a) | | | 134,946 | |
| | | |
| | | 1,700 | | | Steel Dynamics, Inc. | | | 119,986 | |
| | | |
| | | 8,000 | | | Synchrony Financial (a) | | | 342,240 | |
| | | |
| | | 3,200 | | | Textron, Inc. | | | 234,016 | |
| | | |
| | | 3,700 | | | Tyson Foods, Inc. – Class A (a) | | | 342,842 | |
| | | |
| | | 2,700 | | | Universal Health Services, Inc. – Class B (a) | | | 388,611 | |
| | | |
| | | 6,018 | | | US Bancorp | | | 340,258 | |
| | | |
| | | 5,200 | | | Verizon Communications, Inc. (a) | | | 279,084 | |
| | | |
| | | 3,111 | | | Verso Corp. – Class A | | | 82,473 | |
| | | |
| | | 3,550 | | | VF Corp. | | | 205,971 | |
| | | |
| | | 21,400 | | | Viatris, Inc. | | | 235,614 | |
| | | |
| | | 2,100 | | | VMware, Inc. – Class A (a) | | | 246,372 | |
| | | |
| | | 1,800 | | | Walgreens Boots Alliance, Inc. (a) | | | 82,962 | |
| | | |
| | | 6,252 | | | Wells Fargo & Co. (a) | | | 333,669 | |
| | | |
| | | 16,100 | | | Western Union Co. (The) (a) | | | 292,698 | |
| | | |
| | | 5,400 | | | Western Digital Corp. * | | | 275,076 | |
| | | |
| | | 1,300 | | | Whirlpool Corp. | | | 261,651 | |
| | | |
| | | 1,000 | | | Zoom Video Communications, Inc. – Class A * (a) | | | 132,600 | |
| | | | | | | | | | |
| | | |
| | | | | | Total United States | | | 26,970,406 | |
| | | | | | | | | | |
| | | |
| | | | | | TOTAL COMMON STOCKS
(COST $91,459,110) | | | 96,945,306 | |
| | | | | | | | | | |
| | |
| | | | | | PREFERRED STOCKS (d) — 0.3% | |
| | |
| | | | | | Brazil — 0.2% | |
| | | |
| | | 46,048 | | | Bradespar SA | | | 265,064 | |
| | | |
| | | 18,400 | | | Petroleo Brasileiro SA Sponsored ADR (a) | | | 240,856 | |
| | | | | | | | | | |
| | | |
| | | | | | Total Brazil | | | 505,920 | |
| | | | | | | | | | |
| | |
| | | | | | Germany — 0.1% | |
| | | |
| | | 2,060 | | | Bayerische Motoren Werke AG | | | 166,588 | |
| | | |
| | | 742 | | | Draegerwerk AG & Co KGaA (a) | | | 42,036 | |
| | | | |
| | |
| | | See accompanying notes to the financial statements. | | 127 |
GMO Strategic Opportunities Allocation Fund
(A Series of GMO Trust)
Schedule of Investments — (Continued)
(showing percentage of total net assets)
February 28, 2022
| | | | | | | | | | |
Shares /
Par Value† | | | Description | | Value ($) | |
| | |
| | | | | | Germany — continued | |
| | | |
| | | 364 | | | Volkswagen AG (a) | | | 71,554 | |
| | | | | | | | | | |
| | | |
| | | | | | Total Germany | | | 280,178 | |
| | | | | | | | | | |
| | | |
| | | | | | TOTAL PREFERRED STOCKS
(COST $699,741) | | | 786,098 | |
| | | | | | | | | | |
| | | |
| | | | | | DEBT OBLIGATIONS — 10.5% | | | | |
| | | |
| | | | | | United States — 10.5% | | | |
| | | |
| | | | | | U.S. Government — 10.5% | | | |
| | | |
| | | 14,025,000 | | | U.S. Treasury Note, 0.13%, due 02/28/23 | | | 13,891,324 | |
| | | |
| | | 7,015,000 | | | U.S. Treasury Note, 0.13%, due 03/31/23 | | | 6,937,452 | |
| | | |
| | | 4,015,000 | | | U.S. Treasury Note, 0.13%, due 04/30/23 | | | 3,965,126 | |
| | | | | | | | | | |
| | | |
| | | | | | Total U.S. Government | | | 24,793,902 | |
| | | | | | | | | | |
| | | |
| | | | | | TOTAL DEBT OBLIGATIONS
(COST $24,910,434) | | | 24,793,902 | |
| | | | | | | | | | |
| | | |
| | | | | | MUTUAL FUNDS — 61.5% | | | | |
| | | |
| | | | | | United States — 61.5% | | | |
| | | |
| | | | | | Affiliated Issuers — 61.5% | | | |
| | | |
| | | 380,581 | | | GMO Emerging Country Debt Fund, Class VI | | | 8,106,380 | |
| | | |
| | | 897,119 | | | GMO Emerging Markets ex-China Fund, Class VI | | | 14,945,997 | |
| | | |
| | | 1,039,266 | | | GMO Emerging Markets Fund, Class VI | | | 30,720,697 | |
| | | |
| | | 1,386,548 | | | GMO International Equity Fund, Class IV | | | 31,835,141 | |
| | | |
| | | 340,347 | | | GMO Multi-Sector Fixed Income Fund, Class IV | | | 6,442,772 | |
| | | |
| | | 461,574 | | | GMO Quality Fund, Class VI | | | 12,951,749 | |
| | | |
| | | 1,444,680 | | | GMO U.S. Equity Fund, Class VI | | | 19,532,079 | |
| | | |
| | | 825,061 | | | GMO U.S. Small Cap Value Fund, Class VI | | | 16,286,703 | |
| | | |
| | | 900,100 | | | GMO U.S. Treasury Fund | | | 4,509,502 | |
| | | | | | | | | | |
| | | |
| | | | | | TOTAL MUTUAL FUNDS
(COST $145,058,758) | | | 145,331,020 | |
| | | | | | | | | | |
| | |
| | | | | | SHORT-TERM INVESTMENTS — 9.8% | |
| | |
| | | | | | Money Market Funds — 0.2% | |
| | | |
| | | 435,147 | | | State Street Institutional Treasury Money Market Fund – Premier Class, 0.01% (e) | | | 435,147 | |
| | | | | | | | | | |
| | | |
| | | | | | U.S. Government — 9.6% | | | |
| | | |
| | | 3,400,000 | | | U.S. Treasury Bill, 0.31%, due 05/24/22 (a) (f) | | | 3,397,509 | |
| | | |
| | | 10,000,000 | | | U.S. Treasury Bill, 0.54%, due 07/21/22 (a) (f) | | | 9,978,740 | |
| | | |
| | | 370,000 | | | U.S. Treasury Bill, 0.58%, due 07/28/22 (a) (f) | | | 369,127 | |
| | | |
| | | 9,060,000 | | | U.S. Treasury Bill, 0.64%, due 08/18/22 (a) (f) | | | 9,032,761 | |
| | | | | | | | | | |
| | | |
| | | | | | Total U.S. Government | | | 22,778,137 | |
| | | | | | | | | | |
| | | |
| | | | | | TOTAL SHORT-TERM INVESTMENTS (COST $23,220,375) | | | 23,213,284 | |
| | | | | | | | | | |
| | | |
| | | | | | TOTAL INVESTMENTS — 123.1%
(Cost $285,348,418) | | | 291,069,610 | |
| | | | | | | | | | |
| | | | | | | | | | |
Shares | | | Description | | Value ($) | |
| | |
| | | | | | SECURITIES SOLD SHORT — (19.2)% | |
| | | |
| | | | | | Common Stocks — (19.1)% | | | |
| | | |
| | | | | | Australia — (0.5)% | | | |
| | | |
| | | (48,797 | ) | | APA Group | | | (356,729 | ) |
| | | |
| | | (4,253 | ) | | ASX Ltd | | | (255,441 | ) |
| | | |
| | | (860 | ) | | Cochlear Ltd | | | (140,390 | ) |
| | | |
| | | (85,353 | ) | | Qantas Airways Ltd * | | | (316,274 | ) |
| | | | | | | | | | |
| | | |
| | | | | | Total Australia | | | (1,068,834 | ) |
| | | | | | | | | | |
| | |
| | | | | | Austria — (0.2)% | |
| | | |
| | | (3,419 | ) | | Verbund AG | | | (412,388 | ) |
| | | | | | | | | | |
| | |
| | | | | | Belgium — (0.1)% | |
| | | |
| | | (5,114 | ) | | Anheuser-Busch InBev SA/NV | | | (315,574 | ) |
| | | | | | | | | | |
| | |
| | | | | | Canada — (0.7)% | |
| | | |
| | | (1,400 | ) | | Agnico Eagle Mines Ltd | | | (70,686 | ) |
| | | |
| | | (12,300 | ) | | AltaGas Ltd | | | (270,940 | ) |
| | | |
| | | (5,000 | ) | | Cameco Corp | | | (122,900 | ) |
| | | |
| | | (6,500 | ) | | Enbridge Inc | | | (280,670 | ) |
| | | |
| | | (1,900 | ) | | Franco-Nevada Corp | | | (279,528 | ) |
| | | |
| | | (2,064 | ) | | Pan American Silver Corp | | | (48,772 | ) |
| | | |
| | | (8,100 | ) | | Pembina Pipeline Corp | | | (275,076 | ) |
| | | |
| | | (3,800 | ) | | Restaurant Brands International Inc | | | (212,724 | ) |
| | | | | | | | | | |
| | | |
| | | | | | Total Canada | | | (1,561,296 | ) |
| | | | | | | | | | |
| | |
| | | | | | Denmark — (0.1)% | |
| | | |
| | | (9,822 | ) | | Ambu A/S – Class B | | | (181,125 | ) |
| | | | | | | | | | |
| | |
| | | | | | France — (0.7)% | |
| | | |
| | | (9,238 | ) | | Accor SA * | | | (315,508 | ) |
| | | |
| | | (2,037 | ) | | Aeroports de Paris * | | | (288,010 | ) |
| | | |
| | | (24,970 | ) | | Getlink SE | | | (407,244 | ) |
| | | |
| | | (235 | ) | | Hermes International | | | (324,074 | ) |
| | | |
| | | (238 | ) | | Sartorius Stedim Biotech | | | (91,266 | ) |
| | | |
| | | (2,418 | ) | | Ubisoft Entertainment SA * | | | (129,646 | ) |
| | | |
| | | (1,163 | ) | | Wendel SE | | | (118,066 | ) |
| | | | | | | | | | |
| | | |
| | | | | | Total France | | | (1,673,814 | ) |
| | | | | | | | | | |
| | |
| | | | | | Germany — (0.8)% | |
| | | |
| | | (3,613 | ) | | Delivery Hero SE * | | | (193,659 | ) |
| | | |
| | | (147 | ) | | MTU Aero Engines AG | | | (35,190 | ) |
| | | |
| | | (85 | ) | | Nemetschek SE | | | (7,542 | ) |
| | | |
| | | (3,030 | ) | | Puma SE | | | (277,864 | ) |
| | | |
| | | (2,526 | ) | | QIAGEN NV * | | | (126,912 | ) |
| | | |
| | | (67 | ) | | Rational AG | | | (49,310 | ) |
| | | |
| | | (2,911 | ) | | Scout24 SE | | | (169,800 | ) |
| | | |
| | | (2,276 | ) | | Symrise AG – Class A | | | (270,722 | ) |
| | | |
| | | (139,009 | ) | | Telefonica Deutschland Holding AG | | | (379,334 | ) |
| | | |
| | | (5,065 | ) | | Uniper SE | | | (162,035 | ) |
| | | | |
| | |
| 128 | | See accompanying notes to the financial statements. | | |
GMO Strategic Opportunities Allocation Fund
(A Series of GMO Trust)
Schedule of Investments — (Continued)
(showing percentage of total net assets)
February 28, 2022
| | | | | | | | | | |
Shares | | | Description | | Value ($) | |
| | | |
| | | | | | Common Stocks — continued | | | |
| | |
| | | | | | Germany — continued | |
| | | |
| | | (3,682 | ) | | Zalando SE * | | | (243,699 | ) |
| | | | | | | | | | |
| | | |
| | | | | | Total Germany | | | (1,916,067 | ) |
| | | | | | | | | | |
| | |
| | | | | | Israel — (0.2)% | |
| | | |
| | | (1,800 | ) | | CyberArk Software Ltd * | | | (306,252 | ) |
| | | |
| | | (500 | ) | | Kornit Digital Ltd * | | | (47,415 | ) |
| | | |
| | | (1,800 | ) | | Wix.com Ltd * | | | (164,844 | ) |
| | | | | | | | | | |
| | | |
| | | | | | Total Israel | | | (518,511 | ) |
| | | | | | | | | | |
| | |
| | | | | | Italy — (0.6)% | |
| | | |
| | | (6,220 | ) | | Amplifon SPA | | | (266,928 | ) |
| | | |
| | | (15,904 | ) | | Atlantia SPA * | | | (292,558 | ) |
| | | |
| | | (1,342 | ) | | Ferrari NV | | | (288,380 | ) |
| | | |
| | | (19,543 | ) | | FinecoBank Banca Fineco SPA | | | (325,701 | ) |
| | | |
| | | (25,830 | ) | | Infrastrutture Wireless Italiane SPA | | | (263,758 | ) |
| | | | | | | | | | |
| | | |
| | | | | | Total Italy | | | (1,437,325 | ) |
| | | | | | | | | | |
| | |
| | | | | | Japan — (2.6)% | |
| | | |
| | | (20,300 | ) | | Acom Co Ltd | | | (56,548 | ) |
| | | |
| | | (5,000 | ) | | Aeon Co Ltd | | | (113,268 | ) |
| | | |
| | | (13,100 | ) | | ANA Holdings Inc * | | | (288,438 | ) |
| | | |
| | | (11,200 | ) | | Asahi Intecc Co Ltd | | | (241,845 | ) |
| | | |
| | | (400 | ) | | Benefit One Inc | | | (9,265 | ) |
| | | |
| | | (2,100 | ) | | East Japan Railway Co | | | (124,758 | ) |
| | | |
| | | (2,900 | ) | | GMO Payment Gateway Inc | | | (280,511 | ) |
| | | |
| | | (1,900 | ) | | Harmonic Drive Systems Inc | | | (77,717 | ) |
| | | |
| | | (11,400 | ) | | Hitachi Metals Ltd * | | | (203,211 | ) |
| | | |
| | | (17,800 | ) | | Isetan Mitsukoshi Holdings Ltd | | | (143,549 | ) |
| | | |
| | | (15,400 | ) | | Japan Airlines Co Ltd * | | | (305,361 | ) |
| | | |
| | | (4,300 | ) | | Japan Airport Terminal Co Ltd * | | | (200,795 | ) |
| | | |
| | | (6,100 | ) | | Japan Exchange Group Inc | | | (114,229 | ) |
| | | |
| | | (14 | ) | | Japan Real Estate Investment Corp (REIT) | | | (74,785 | ) |
| | | |
| | | (12,100 | ) | | JGC Holding Corp | | | (121,277 | ) |
| | | |
| | | (13,700 | ) | | Keikyu Corp | | | (143,551 | ) |
| | | |
| | | (3,700 | ) | | Keio Corp | | | (151,393 | ) |
| | | |
| | | (2,900 | ) | | Kintetsu Group Holdings Co Ltd * | | | (87,123 | ) |
| | | |
| | | (1,500 | ) | | Lasertec Corp | | | (278,059 | ) |
| | | |
| | | (4,800 | ) | | LIXIL Corp | | | (106,979 | ) |
| | | |
| | | (7,800 | ) | | M3 Inc | | | (293,463 | ) |
| | | |
| | | (7,100 | ) | | Mercari Inc * | | | (222,372 | ) |
| | | |
| | | (15,200 | ) | | MonotaRO Co Ltd | | | (286,110 | ) |
| | | |
| | | (2,400 | ) | | Nidec Corp | | | (208,641 | ) |
| | | |
| | | (15,100 | ) | | Nihon M&A Center Holdings Inc | | | (223,345 | ) |
| | | |
| | | (31,600 | ) | | Nippon Paint Holdings Co Ltd | | | (282,823 | ) |
| | | |
| | | (3,400 | ) | | Nissin Foods Holdings Co Ltd | | | (271,650 | ) |
| | | |
| | | (10,700 | ) | | Odakyu Electric Railway Co Ltd | | | (176,534 | ) |
| | | |
| | | (2,000 | ) | | ORIENTAL LAND CO LTD | | | (369,729 | ) |
| | | |
| | | (22,700 | ) | | Rakuten Group Inc | | | (192,964 | ) |
| | | |
| | | (2,000 | ) | | Shiseido Co Ltd | | | (114,772 | ) |
| | | | | | | | | | |
Shares | | | Description | | Value ($) | |
| | | |
| | | | | | Common Stocks — continued | | | |
| | |
| | | | | | Japan — continued | |
| | | |
| | | (3,400 | ) | | Tobu Railway Co Ltd | | | (83,574 | ) |
| | | |
| | | (4,800 | ) | | Tokyu Corp | | | (64,015 | ) |
| | | |
| | | (6,500 | ) | | West Japan Railway Co | | | (280,435 | ) |
| | | | | | | | | | |
| | | |
| | | | | | Total Japan | | | (6,193,089 | ) |
| | | | | | | | | | |
| | |
| | | | | | Netherlands — (0.3)% | |
| | | |
| | | (150 | ) | | Adyen NV * | | | (312,641 | ) |
| | | |
| | | (1,056 | ) | | Heineken Holding NV | | | (86,242 | ) |
| | | |
| | | (879 | ) | | IMCD NV | | | (142,786 | ) |
| | | |
| | | (5,414 | ) | | Just Eat Takeaway.com NV * | | | (219,116 | ) |
| | | | | | | | | | |
| | | |
| | | | | | Total Netherlands | | | (760,785 | ) |
| | | | | | | | | | |
| | |
| | | | | | New Zealand — (0.1)% | |
| | | |
| | | (3,610 | ) | | Xero Ltd * | | | (248,216 | ) |
| | | | | | | | | | |
| | |
| | | | | | Norway — (0.0)% | |
| | | |
| | | (930 | ) | | Schibsted ASA – Class A | | | (26,726 | ) |
| | | |
| | | (1,098 | ) | | Schibsted ASA – Class B | | | (28,503 | ) |
| | | | | | | | | | |
| | | |
| | | | | | Total Norway | | | (55,229 | ) |
| | | | | | | | | | |
| | |
| | | | | | Singapore — (0.2)% | |
| | | |
| | | (17,100 | ) | | City Developments Ltd | | | (90,485 | ) |
| | | |
| | | (77,700 | ) | | Singapore Airlines Ltd * | | | (294,210 | ) |
| | | |
| | | (27,400 | ) | | Singapore Exchange Ltd | | | (190,095 | ) |
| | | | | | | | | | |
| | | |
| | | | | | Total Singapore | | | (574,790 | ) |
| | | | | | | | | | |
| | |
| | | | | | Spain — (0.5)% | |
| | | |
| | | (1,820 | ) | | Aena SME SA * | | | (297,033 | ) |
| | | |
| | | (6,269 | ) | | Cellnex Telecom SA | | | (283,561 | ) |
| | | |
| | | (12,247 | ) | | Ferrovial SA | | | (333,660 | ) |
| | | |
| | | (16,300 | ) | | Siemens Gamesa Renewable Energy SA * | | | (375,060 | ) |
| | | | | | | | | | |
| | | |
| | | | | | Total Spain | | | (1,289,314 | ) |
| | | | | | | | | | |
| | |
| | | | | | Sweden — (0.3)% | |
| | | |
| | | (28,478 | ) | | Embracer Group AB – Class B * | | | (244,459 | ) |
| | | |
| | | (1,289 | ) | | EQT AB | | | (43,143 | ) |
| | | |
| | | (2,742 | ) | | Evolution AB | | | (314,395 | ) |
| | | |
| | | (25,658 | ) | | Sinch AB * | | | (216,436 | ) |
| | | | | | | | | | |
| | | |
| | | | | | Total Sweden | | | (818,433 | ) |
| | | | | | | | | | |
| | |
| | | | | | Switzerland — (0.3)% | |
| | | |
| | | (5 | ) | | Chocoladefabriken Lindt & Spruengli AG | | | (53,038 | ) |
| | | |
| | | (223 | ) | | Partners Group Holding AG | | | (301,449 | ) |
| | | |
| | | (26 | ) | | Schindler Holding AG | | | (5,966 | ) |
| | | |
| | | (134 | ) | | Sika AG (Registered) | | | (44,466 | ) |
| | | |
| | | (186 | ) | | Straumann Holding AG (Registered) | | | (295,454 | ) |
| | | | | | | | | | |
| | | |
| | | | | | Total Switzerland | | | (700,373 | ) |
| | | | | | | | | | |
| | | | |
| | |
| | | See accompanying notes to the financial statements. | | 129 |
GMO Strategic Opportunities Allocation Fund
(A Series of GMO Trust)
Schedule of Investments — (Continued)
(showing percentage of total net assets)
February 28, 2022
| | | | | | | | | | |
Shares | | | Description | | Value ($) | |
| | | |
| | | | | | Common Stocks — continued | | | |
| | |
| | | | | | United Kingdom — (1.3)% | |
| | | |
| | | (3,808 | ) | | Admiral Group Plc | | | (151,694 | ) |
| | | |
| | | (8,176 | ) | | Antofagasta Plc | | | (165,546 | ) |
| | | |
| | | (40,117 | ) | | Auto Trader Group Plc | | | (354,798 | ) |
| | | |
| | | (63,208 | ) | | ConvaTec Group Plc | | | (152,815 | ) |
| | | |
| | | (580 | ) | | Croda International Plc | | | (58,057 | ) |
| | | |
| | | (419 | ) | | Experian Plc | | | (16,368 | ) |
| | | |
| | | (3,812 | ) | | Halma Plc | | | (122,952 | ) |
| | | |
| | | (16,968 | ) | | Hargreaves Lansdown Plc | | | (257,171 | ) |
| | | |
| | | (51,230 | ) | | Informa Plc * | | | (405,631 | ) |
| | | |
| | | (1,170 | ) | | InterContinental Hotels Group Plc * | | | (81,470 | ) |
| | | |
| | | (14,893 | ) | | Land Securities Group Plc (REIT) | | | (157,817 | ) |
| | | |
| | | (3,373 | ) | | London Stock Exchange Group Plc | | | (294,654 | ) |
| | | |
| | | (15,736 | ) | | Ocado Group Plc * | | | (289,368 | ) |
| | | |
| | | (202,267 | ) | | Rolls-Royce Holdings Plc * | | | (279,019 | ) |
| | | |
| | | (1,035 | ) | | Spirax-Sarco Engineering Plc | | | (164,932 | ) |
| | | | | | | | | | |
| | | |
| | | | | | Total United Kingdom | | | (2,952,292 | ) |
| | | | | | | | | | |
| | |
| | | | | | United States — (9.6)% | |
| | | |
| | | (12,200 | ) | | AES Corp. (The) | | | (259,006 | ) |
| | | |
| | | (1,700 | ) | | Airbnb, Inc. – Class A * | | | (257,533 | ) |
| | | |
| | | (900 | ) | | American Tower Corp. (REIT) | | | (204,183 | ) |
| | | |
| | | (8,200 | ) | | Aramark | | | (303,072 | ) |
| | | |
| | | (1,900 | ) | | Arthur J Gallagher & Co. | | | (300,561 | ) |
| | | |
| | | (1,200 | ) | | Autodesk, Inc. * | | | (264,276 | ) |
| | | |
| | | (2,600 | ) | | Avalara, Inc. * | | | (270,166 | ) |
| | | |
| | | (1,200 | ) | | Bill.com Holdings, Inc. * | | | (285,456 | ) |
| | | |
| | | (300 | ) | | Bio-Techne Corp. | | | (125,823 | ) |
| | | |
| | | (3,400 | ) | | BioMarin Pharmaceutical, Inc. * | | | (265,608 | ) |
| | | |
| | | (2,200 | ) | | Block Inc. – Class A * | | | (280,500 | ) |
| | | |
| | | (1,400 | ) | | Boeing Co. (The) * | | | (287,476 | ) |
| | | |
| | | (500 | ) | | Broadcom, Inc. | | | (293,720 | ) |
| | | |
| | | (1,200 | ) | | Burlington Stores, Inc. * | | | (271,068 | ) |
| | | |
| | | (3,500 | ) | | Caesars Entertainment, Inc. * | | | (294,665 | ) |
| | | |
| | | (100 | ) | | Camden Property Trust (REIT) | | | (16,511 | ) |
| | | |
| | | (1,900 | ) | | Carvana Co. – Class A * | | | (285,893 | ) |
| | | |
| | | (1,300 | ) | | Catalent, Inc. * | | | (132,652 | ) |
| | | |
| | | (3,300 | ) | | Ceridian HCM Holding, Inc. * | | | (240,603 | ) |
| | | |
| | | (200 | ) | | Chipotle Mexican Grill, Inc. – Class A * | | | (304,670 | ) |
| | | |
| | | (10,900 | ) | | Clarivate Plc * | | | (163,282 | ) |
| | | |
| | | (2,900 | ) | | Cloudflare, Inc. – Class A * | | | (337,618 | ) |
| | | |
| | | (1,200 | ) | | CME Group, Inc. | | | (283,836 | ) |
| | | |
| | | (100 | ) | | Cognex Corp. | | | (6,756 | ) |
| | | |
| | | (2,000 | ) | | Coupa Software, Inc. * | | | (242,020 | ) |
| | | |
| | | (1,200 | ) | | Crown Castle International Corp. (REIT) | | | (199,908 | ) |
| | | |
| | | (5,000 | ) | | Delta Air Lines, Inc. * | | | (199,600 | ) |
| | | |
| | | (600 | ) | | Dexcom, Inc. * | | | (248,346 | ) |
| | | |
| | | (2,200 | ) | | DocuSign, Inc. – Class A * | | | (260,546 | ) |
| | | |
| | | (700 | ) | | DoorDash, Inc. – Class A * | | | (73,465 | ) |
| | | |
| | | (12,900 | ) | | DraftKings Inc. – Class A * | | | (305,472 | ) |
| | | | | | | | | | |
Shares | | | Description | | Value ($) | |
| | | |
| | | | | | Common Stocks — continued | | | |
| | |
| | | | | | United States — continued | |
| | | |
| | | (200 | ) | | Ecolab, Inc. | | | (35,252 | ) |
| | | |
| | | (300 | ) | | Equinix, Inc. (REIT) | | | (212,919 | ) |
| | | |
| | | (2,700 | ) | | Equity LifeStyle Properties, Inc. (REIT) | | | (201,474 | ) |
| | | |
| | | (100 | ) | | Erie Indemnity Co. – Class A | | | (17,510 | ) |
| | | |
| | | (3,400 | ) | | Exact Sciences Corp. * | | | (265,404 | ) |
| | | |
| | | (1,200 | ) | | Expedia Group, Inc. * | | | (235,332 | ) |
| | | |
| | | (100 | ) | | Extra Space Storage, Inc. (REIT) | | | (18,815 | ) |
| | | |
| | | (1,900 | ) | | Fastenal Co. | | | (97,774 | ) |
| | | |
| | | (900 | ) | | First Republic Bank | | | (155,934 | ) |
| | | |
| | | (3,100 | ) | | Guidewire Software, Inc. * | | | (273,265 | ) |
| | | |
| | | (1,600 | ) | | Hess Corp. | | | (161,696 | ) |
| | | |
| | | (600 | ) | | HubSpot, Inc. * | | | (315,000 | ) |
| | | |
| | | (500 | ) | | IDEXX Laboratories, Inc. * | | | (266,175 | ) |
| | | |
| | | (3,900 | ) | | Ingersoll Rand, Inc. | | | (197,028 | ) |
| | | |
| | | (1,300 | ) | | Insulet Corp. * | | | (344,097 | ) |
| | | |
| | | (1,000 | ) | | Invitation Homes, Inc. (REIT) | | | (37,800 | ) |
| | | |
| | | (1,100 | ) | | Ionis Pharmaceuticals, Inc. * | | | (36,718 | ) |
| | | |
| | | (1,300 | ) | | IQVIA Holdings, Inc. * | | | (299,156 | ) |
| | | |
| | | (3,700 | ) | | Iron Mountain, Inc. (REIT) | | | (181,966 | ) |
| | | |
| | | (4,900 | ) | | Lamb Weston Holdings, Inc. | | | (325,507 | ) |
| | | |
| | | (1,100 | ) | | Liberty Broadband Corp. – Class A * | | | (159,291 | ) |
| | | |
| | | (1,500 | ) | | Liberty Broadband Corp. – Class C * | | | (220,050 | ) |
| | | |
| | | (5,800 | ) | | Liberty Media Corp-Liberty Formula One – Class C * | | | (352,234 | ) |
| | | |
| | | (900 | ) | | Linde Plc | | | (263,916 | ) |
| | | |
| | | (2,900 | ) | | Live Nation Entertainment, Inc. * | | | (350,378 | ) |
| | | |
| | | (800 | ) | | MarketAxess Holdings, Inc. | | | (305,144 | ) |
| | | |
| | | (1,700 | ) | | Marriott International, Inc. – Class A * | | | (289,238 | ) |
| | | |
| | | (1,400 | ) | | Marvell Technology, Inc. | | | (95,662 | ) |
| | | |
| | | (2,900 | ) | | MGM Resorts International | | | (128,441 | ) |
| | | |
| | | (700 | ) | | MongoDB, Inc. – Class A * | | | (267,393 | ) |
| | | |
| | | (400 | ) | | Monolithic Power Systems, Inc. | | | (183,480 | ) |
| | | |
| | | (600 | ) | | MSCI, Inc. – Class A | | | (301,014 | ) |
| | | |
| | | (3,700 | ) | | Novocure Ltd. * | | | (302,882 | ) |
| | | |
| | | (14,800 | ) | | Oak Street Health, Inc. * | | | (259,148 | ) |
| | | |
| | | (1,500 | ) | | Okta, Inc. * | | | (274,260 | ) |
| | | |
| | | (400 | ) | | ONEOK, Inc. | | | (26,120 | ) |
| | | |
| | | (13,900 | ) | | Palantir Technologies, Inc. – Class A * | | | (164,715 | ) |
| | | |
| | | (100 | ) | | Palo Alto Networks, Inc. * | | | (59,425 | ) |
| | | |
| | | (6,900 | ) | | Peloton Interactive, Inc. – Class A * | | | (200,514 | ) |
| | | |
| | | (1,500 | ) | | RingCentral, Inc. – Class A * | | | (196,260 | ) |
| | | |
| | | (1,700 | ) | | Roku, Inc. * | | | (237,201 | ) |
| | | |
| | | (4,500 | ) | | Rollins, Inc. | | | (146,835 | ) |
| | | |
| | | (4,200 | ) | | Royal Caribbean Cruises Ltd. * | | | (339,024 | ) |
| | | |
| | | (3,900 | ) | | Sarepta Therapeutics, Inc. * | | | (298,779 | ) |
| | | |
| | | (2,000 | ) | | Seagen, Inc. * | | | (257,740 | ) |
| | | |
| | | (600 | ) | | ServiceNow, Inc. * | | | (347,952 | ) |
| | | |
| | | (1,400 | ) | | Simon Property Group, Inc. (REIT) | | | (192,584 | ) |
| | | |
| | | (8,100 | ) | | Snap, Inc. – Class A * | | | (323,514 | ) |
| | | | |
| | |
| 130 | | See accompanying notes to the financial statements. | | |
GMO Strategic Opportunities Allocation Fund
(A Series of GMO Trust)
Schedule of Investments — (Continued)
(showing percentage of total net assets)
February 28, 2022
| | | | | | | | | | |
Shares | | | Description | | Value ($) | |
| | | |
| | | | | | Common Stocks — continued | | | |
| | |
| | | | | | United States — continued | |
| | | |
| | | (1,100 | ) | | Snowflake, Inc. – Class A * | | | (292,226 | ) |
| | | |
| | | (1,900 | ) | | T-Mobile US, Inc. * | | | (234,099 | ) |
| | | |
| | | (3,500 | ) | | Teladoc Health, Inc. * | | | (265,685 | ) |
| | | |
| | | (400 | ) | | Tesla, Inc. * | | | (348,172 | ) |
| | | |
| | | (800 | ) | | Trade Desk, Inc. (The) – Class A * | | | (68,256 | ) |
| | | |
| | | (200 | ) | | Tradeweb Markets, Inc. – Class A | | | (16,896 | ) |
| | | |
| | | (1,300 | ) | | Twilio, Inc. – Class A * | | | (227,240 | ) |
| | | |
| | | (7,200 | ) | | Twitter, Inc. * | | | (255,960 | ) |
| | | |
| | | (7,300 | ) | | Uber Technologies, Inc. * | | | (263,019 | ) |
| | | |
| | | (3,700 | ) | | UDR, Inc. (REIT) | | | (203,019 | ) |
| | | |
| | | (2,100 | ) | | Upstart Holdings, Inc. * | | | (331,779 | ) |
| | | |
| | | (1,100 | ) | | Vail Resorts, Inc. | | | (286,605 | ) |
| | | |
| | | (13,000 | ) | | Vistra Corp. | | | (296,660 | ) |
| | | |
| | | (1,100 | ) | | Wayfair, Inc. – Class A * | | | (154,957 | ) |
| | | |
| | | (12,000 | ) | | Williams Cos, Inc. (The) | | | (375,360 | ) |
| | | |
| | | (2,900 | ) | | Zendesk, Inc. * | | | (338,343 | ) |
| | | |
| | | (5,500 | ) | | Zillow Group, Inc. – Class A * | | | (314,985 | ) |
| | | |
| | | (2,242 | ) | | Zillow Group, Inc. – Class C * | | | (128,960 | ) |
| | | |
| | | (500 | ) | | Zoetis, Inc. | | | (96,825 | ) |
| | | | | | | | | | |
Shares | | | Description | | Value ($) | |
| | | |
| | | | | | Common Stocks — continued | | | |
| | |
| | | | | | United States — continued | |
| | | |
| | | (3,000 | ) | | ZoomInfo Technologies, Inc. – Class A * | | | (164,070 | ) |
| | | |
| | | (1,200 | ) | | Zscaler, Inc. * | | | (286,980 | ) |
| | | | | | | | | | |
| | | |
| | | | | | Total United States | | | (22,436,403 | ) |
| | | | | | | | | | |
| | | |
| | | | | | TOTAL COMMON STOCKS
(PROCEEDS $50,404,184) | | | (45,113,858 | ) |
| | | | | | | | | | |
| | | |
| | | | | | PREFERRED STOCKS (d)— (0.1)% | | | |
| | | |
| | | | | | Germany — (0.1)% | | | |
| | | |
| | | (529 | ) | | Sartorius AG | | | (233,560 | ) |
| | | | | | | | | | |
| | | |
| | | | | | TOTAL PREFERRED STOCKS
(PROCEEDS $230,863) | | | (233,560 | ) |
| | | | | | | | | | |
| | | |
| | | | | | TOTAL SECURITIES SOLD SHORT
(PROCEEDS $50,635,047) | | | (45,347,418 | ) |
| | | |
| | | | | | Other Assets and Liabilities (net) — (3.9%) | | | (9,270,170 | ) |
| | | | | | | | | | |
| | | |
| | | | | | TOTAL NET ASSETS — 100.0% | | | $236,452,022 | |
| | | | | | | | | | |
A summary of outstanding financial instruments at February 28, 2022 is as follows:
Swap Contracts
OTC Total Return Swaps
| | | | | | | | | | | | | | | | | | | | | | | | | | | | | | |
Fund Pays | | Fund Receives | | Counterparty | | Notional
Amount | | | Expiration
Date | | | Periodic
Payment
Frequency | | | Premiums
Paid/
(Received) ($) | | | Value ($) | | | Net
Unrealized
Appreciation/
(Depreciation) ($) | |
Total Return on Equity Basket (g) | | 1 Month Federal Funds Rate minus 0.75% | | GS | | USD | | | 565,187 | | | | 05/24/2022 | | | | Monthly | | | | — | | | | (874 | ) | | | (874 | ) |
Total Return on Equity Basket (g) | | 1 Month Federal Funds Rate minus 0.50% | | GS | | USD | | | 419,478 | | | | 05/24/2022 | | | | Monthly | | | | — | | | | (7,365 | ) | | | (7,365 | ) |
Total Return on Equity Basket (g) | | 1 Month Federal Funds Rate minus 0.75% | | GS | | USD | | | 47,838 | | | | 05/24/2022 | | | | Monthly | | | | — | | | | 4,649 | | | | 4,649 | |
Total Return on Equity Basket (g) | | 1 Month Federal Funds Rate minus 0.63% | | GS | | USD | | | 247,285 | | | | 05/24/2022 | | | | Monthly | | | | — | | | | (15,000 | ) | | | (15,000 | ) |
Total Return on Equity Basket (g) | | 1 Month Federal Funds Rate minus 0.75% | | GS | | USD | | | 105,314 | | | | 05/24/2022 | | | | Monthly | | | | — | | | | (2,269 | ) | | | (2,269 | ) |
Total Return on Equity Basket (g) | | 1 Month Federal Funds Rate minus 1.00% | | MORD | | USD | | | 110,801 | | | | 10/18/2022 | | | | Monthly | | | | — | | | | 7,258 | | | | 7,258 | |
Total Return on Equity Basket (h) | | 1 Month Federal Funds Rate minus 0.40% | | MORD | | USD | | | 3,173,838 | | | | 10/18/2022 | | | | Monthly | | | | — | | | | 180,623 | | | | 180,623 | |
Total Return on Equity Basket (g) | | 1 Month Federal Funds Rate minus 2.50% | | MORD | | USD | | | 1,124,142 | | | | 05/18/2023 | | | | Monthly | | | | — | | | | (34,270 | ) | | | (34,270 | ) |
Total Return on Equity Basket (g) | | 1 Month Federal Funds Rate minus 0.40% | | MORD | | USD | | | 391,917 | | | | 11/18/2023 | | | | Monthly | | | | — | | | | 12,760 | | | | 12,760 | |
| | | | | | | | | | | | | | | | | | | | | | | | | | | | | | |
| | | $ | — | | | $ | 145,512 | | | $ | 145,512 | |
| | | | | | | | | | | | | | | | | | | | | | | | | | | | | | |
As of February 28, 2022, for the above contracts and/or agreements, the Fund had sufficient cash and/or securities to cover commitments or collateral requirements, if any, of the relevant broker or exchange.
| | | | |
| | |
| | | See accompanying notes to the financial statements. | | 131 |
GMO Strategic Opportunities Allocation Fund
(A Series of GMO Trust)
Schedule of Investments — (Continued)
February 28, 2022
Notes to Schedule of Investments:
| † | Denominated in U.S. Dollar, unless otherwise indicated. |
| * | Non-income producing security. |
| (a) | All or a portion of this security has been pledged to cover margin requirements on futures and/or cleared swap contracts, collateral on securities sold short, OTC swap contracts, forward currency contracts, and/or written options, if any (Note 4). |
| (b) | Investment valued using significant unobservable inputs (Note 2). |
| (c) | Investment valued at fair value using methods determined in good faith by the Trustees of GMO Trust or persons acting at their direction pursuant to procedures approved by the Trustees. Investment valued using significant unobservable inputs (Note 2). |
| (d) | Preferred dividend rates are disclosed to the extent that a stated rate exists. |
| (e) | The rate disclosed is the 7 day net yield as of February 28, 2022. |
| (f) | The rate shown represents yield-to-maturity. |
| (g) | Periodic payments made/received are based on the total return of the referenced entity. Custom equity basket swap which has a notional amount of less than 1% of the Fund’s total net assets. |
| (h) | The following table represents the individual short positions within the custom equity basket swap as of February 28, 2022: |
| | | | | | | | | | | | | | |
Shares | | | Description | | % of
Equity Basket | | | Value ($) | |
| | | | |
| | | 156,000 | | | Alibaba Health Information Technology Ltd | | | 3.7% | | | | 109,236 | |
| | | | |
| | | 890,000 | | | Alibaba Pictures Group Ltd | | | 3.0% | | | | 88,982 | |
| | | | |
| | | 555,000 | | | China Molybdenum Co Ltd –Class H | | | 11.2% | | | | 334,056 | |
| | | | |
| | | 38,000 | | | China Resources Beer Holdings Co Ltd | | | 10.1% | | | | 301,317 | |
| | | | |
| | | 44,000 | | | Citic Securities Co Ltd – Class H | | | 3.5% | | | | 106,599 | |
| | | | |
| | | 49,000 | | | Cosco Shipping Holdings Co – Class H | | | 3.3% | | | | 99,040 | |
| | | | |
| | | 18,000 | | | Ganfeng Lithium Co Ltd –Class H | | | 10.2% | | | | 305,499 | |
| | | | |
| | | 130,000 | | | Greentown Service Group Co Ltd | | | 4.4% | | | | 130,588 | |
| | | | |
| | | 6,100 | | | Hong Kong Exchanges and Clearing Ltd | | | 9.9% | | | | 295,586 | |
| | | | |
| | | 114,000 | | | Kingdee International Software Group Co Lt | | | 9.4% | | | | 281,767 | |
| | | | |
| | | 31,000 | | | New World Development Co Ltd | | | 4.1% | | | | 123,989 | |
| | | | |
| | | 128,800 | | | Sands China Ltd | | | 11.3% | | | | 339,708 | |
| | | | |
| | | 144,000 | | | Weimob Inc | | | 3.2% | | | | 95,235 | |
| | | | |
| | | 256,000 | | | Zijin Mining Group Co Ltd – Class H | | | 12.7% | | | | 379,950 | |
| | | | | | | | | | | | | | |
| | | | |
| | | | | | TOTAL COMMON STOCKS | | | | | | $ | 2,991,552 | |
| | | | | | | | | | | | | | |
For a listing of definitions of acronyms, counterparty abbreviations and currency abbreviations used throughout the Schedule of Investments as well as the derivative tables, if any, please refer to page 133.
| | | | |
| | |
| 132 | | See accompanying notes to the financial statements. | | |
GMO Trust Funds
February 28, 2022
Portfolio Abbreviations:
144A - Securities exempt from registration under Rule 144A of the Securities Act of 1933. These securities may be resold in transactions exempt from registration, normally to qualified institutional investors.
ADR - American Depositary Receipt
AUD BBSW - Bank Bill Swap Reference Rate denominated in Australian Dollar.
CDOR - Canadian Dollar Offered Rate
CMT - Constant Maturity Treasury
CVA - Certificaaten van aandelen (Share Certificates)
CVR - Contingent Value Right
ETF - Exchange-Traded Fund
EURIBOR - Euro Interbank Offered Rate
Foreign Registered - Shares issued to foreign investors in markets that have foreign ownership limits.
GDR - Global Depositary Receipt
JSC - Joint-Stock Company
LIBOR - London Interbank Offered Rate
NVDR - Non-Voting Depositary Receipt
NZD Bank Bill Rate - Bank Bill Rate denominated in New Zealand Dollar.
OIS - Overnight Indexed Swaps
PJSC - Private Joint-Stock Company
QPSC - Qatar Private Stock Company
QSC - Qatari Shareholding Company
Reg S - Security exempt from registration under Regulation S of the Securities Act of 1933, which exempts from registration securities offered and sold outside the United States. Security may not be offered or sold in the United States except pursuant to an exemption from, or in a transaction not subject to, the registration requirements of the Securities Act of 1933.
REIT - Real Estate Investment Trust
SARON - Swiss Average Rate Overnight
SEK STIBOR - Stockholm Interbank Offered Rate denominated in Swedish Krona.
SOFOM - Sociedades Financieras de Objeto Multi (Multi-purpose Financial Company)
SOFR - Secured Overnight Financing Rate
SONIA - Sterling Overnight Interbank Average Rate
USBM - U.S. Treasury 3 Month Bill Money Market Yield.
Counterparty Abbreviations:
BCLY - Barclays Bank PLC
BOA - Bank of America, N.A.
CGMI - Citigroup Global Markets Inc.
CITI - Citibank N.A.
CSI - Credit Suisse International
DB - Deutsche Bank AG
GS - Goldman Sachs International
JPM - JPMorgan Chase Bank, N.A.
MLCS - Merrill Lynch Capital Services, Inc.
MORD - Morgan Stanley Capital Services LLC
MSCI - Morgan Stanley & Co. International PLC
SSB - State Street Bank and Trust Company
UBSA - UBS AG
Currency Abbreviations:
AUD - Australian Dollar
BRL - Brazilian Real
CAD - Canadian Dollar
CHF - Swiss Franc
CLP - Chilean Peso
COP - Colombian Peso
CZK - Czech Koruna
EUR - Euro
GBP - British Pound
HKD - Hong Kong Dollar
HUF - Hungarian Forint
IDR - Indonesian Rupiah
ILS - Israeli Shekel
INR - Indian Rupee
JPY - Japanese Yen
KRW - South Korean Won
MXN - Mexican Peso
NOK - Norwegian Krone
NZD - New Zealand Dollar
PLN - Polish Zloty
RON - Romanian Leu
RUB - Russian Ruble
SEK - Swedish Krona
SGD - Singapore Dollar
THB - Thai Baht
TWD - Taiwan Dollar
USD - United States Dollar
ZAR - South African Rand
| | | | |
| | |
| | | See accompanying notes to the financial statements. | | 133 |
GMO Trust Funds
Statements of Assets and Liabilities — February 28, 2022
| | | | | | | | | | | | | | | | |
| | | Consolidated
Alternative
Allocation Fund | | | Benchmark-Free
Allocation Fund | | | Benchmark-Free
Fund | | | Global Asset
Allocation Fund | |
Assets: | |
| | | | |
Investments in affiliated issuers, at value (Notes 2 and 10)(a) | | $ | 9,811,873 | | | $ | 5,122,161,675 | | | $ | 244,931,440 | | | $ | 623,031,502 | |
| | | | |
Investments in unaffiliated issuers, at value (Note 2)(b)(c) | | | 352,418,385 | | | | 4,385,029 | | | | 1,806,933,607 | | | | 833,893 | |
| | | | |
Foreign currency, at value (Note 2)(d) | | | 47,179 | | | | — | | | | 726,993 | | | | — | |
| | | | |
Cash | | | 3,479,779 | | | | — | | | | 414,432 | | | | — | |
| | | | |
Receivable for investments sold | | | 23,243,230 | | | | — | | | | 43,049,027 | | | | — | |
| | | | |
Receivable for Fund shares sold | | | 206,654 | | | | 2,991,123 | | | | — | | | | 105 | |
| | | | |
Receivable for closed swap contracts (Note 4) | | | 7,694 | | | | — | | | | 43,023 | | | | — | |
| | | | |
Dividends and interest receivable | | | 213,471 | | | | 17 | | | | 3,566,659 | | | | 4 | |
| | | | |
Dividend withholding tax receivable | | | 14,521 | | | | — | | | | 338,330 | | | | — | |
| | | | |
Foreign capital gains tax refund receivable (Note 2) | | | — | | | | — | | | | 120,817 | | | | — | |
| | | | |
Unrealized appreciation on open forward currency contracts (Note 4) | | | 1,485,428 | | | | — | | | | 2,017,142 | | | | — | |
| | | | |
Receivable from liquidated underlying funds (Note 2) | | | 397,568 | | | | — | | | | — | | | | 259,135 | |
| | | | |
Due from broker (Note 2) | | | 5,018,776 | | | | — | | | | 4,185,081 | | | | — | |
| | | | |
Receivable for variation margin on open futures contracts (Note 4) | | | — | | | | — | | | | 2,030,052 | | | | — | |
| | | | |
Receivable for open OTC swap contracts (Note 4) | | | 5,523,476 | | | | — | | | | 1,486,428 | | | | — | |
| | | | |
Interest receivable for open OTC swap contracts (Note 4) | | | 302,472 | | | | — | | | | — | | | | — | |
| | | | |
Receivable for expenses reimbursed and/or waived by GMO (Note 5) | | | 162,319 | | | | 282,547 | | | | 13,188 | | | | 19,040 | |
| | | | | | | | | | | | | | | | |
| | | | |
Total assets | | | 402,332,825 | | | | 5,129,820,391 | | | | 2,109,856,219 | | | | 624,143,679 | |
| | | | | | | | | | | | | | | | |
Liabilities: | |
| | | | |
Investments sold short, at value (Note 2)(e) | | | 102,398,675 | | | | — | | | | 332,193,516 | | | | — | |
| | | | |
Due to broker (Note 2) | | | — | | | | — | | | | 649 | | | | — | |
| | | | |
Payable for cash collateral from securities loaned (Note 2) | | | — | | | | — | | | | 10,110,041 | | | | — | |
| | | | |
Payable for investments purchased | | | 14,290,836 | | | | 2,516,407 | | | | 21,924,574 | | | | — | |
| | | | |
Payable for Fund shares repurchased | | | 117,901 | | | | 331,985 | | | | 126,616,181 | | | | 84,300 | |
| | | | |
Accrued foreign capital gains tax payable (Note 2) | | | 16,028 | | | | — | | | | 339,599 | | | | — | |
|
Payable to affiliate for (Note 5): | |
| | | | |
Management fee | | | 160,904 | | | | 2,639,838 | | | | — | | | | — | |
| | | | |
Supplemental support fee – Class MF | | | — | | | | 107,987 | | | | — | | | | — | |
| | | | |
Shareholder service fee | | | 31,489 | | | | 389,088 | | | | — | | | | — | |
| | | | |
Payable for variation margin on open futures contracts (Note 4) | | | 456,631 | | | | — | | | | — | | | | — | |
| | | | |
Payable for variation margin on open cleared swap contracts (Note 4) | | | 379,047 | | | | — | | | | 372,515 | | | | — | |
| | | | |
Payable for closed swap contracts (Note 4) | | | 18,691 | | | | — | | | | 116,089 | | | | — | |
| | | | |
Unrealized depreciation on open forward currency contracts (Note 4) | | | 2,917,160 | | | | — | | | | 2,565,538 | | | | — | |
| | | | |
Interest payable for open OTC swap contracts (Note 4) | | | 19,052 | | | | — | | | | — | | | | — | |
| | | | |
Interest and dividend payable for short sales | | | 67,123 | | | | — | | | | 168,509 | | | | — | |
| | | | |
Payable for open OTC swap contracts (Note 4) | | | 732,941 | | | | — | | | | 443,486 | | | | — | |
| | | | |
Payable to Trustees and related expenses | | | 1,267 | | | | 20,061 | | | | 6,599 | | | | 4,432 | |
| | | | |
Written options outstanding, at value (Note 4)(f) | | | 1,316,054 | | | | — | | | | — | | | | — | |
| | | | |
Accrued expenses | | | 244,054 | | | | 169,986 | | | | 1,145,153 | | | | 74,201 | |
| | | | | | | | | | | | | | | | |
| | | | |
Total liabilities | | | 123,167,853 | | | | 6,175,352 | | | | 496,002,449 | | | | 162,933 | |
| | | | | | | | | | | | | | | | |
Net assets | | $ | 279,164,972 | | | $ | 5,123,645,039 | | | $ | 1,613,853,770 | | | $ | 623,980,746 | |
| | | | | | | | | | | | | | | | |
| | | | |
(a) Cost of investments – affiliated issuers: | | $ | 11,292,136 | | | $ | 5,344,673,966 | | | $ | 269,215,510 | | | $ | 672,082,054 | |
| | | | |
(b) Cost of investments – unaffiliated issuers: | | $ | 355,771,810 | | | $ | 4,385,029 | | | $ | 1,835,259,642 | | | $ | 833,893 | |
| | | | |
(c) Includes securities on loan at value (Note 2): | | $ | — | | | $ | — | | | $ | 22,621,074 | | | $ | — | |
| | | | |
(d) Cost of foreign currency: | | $ | 86,715 | | | $ | — | | | $ | 731,699 | | | $ | — | |
| | | | |
(e) Proceeds from securities sold short: | | $ | 108,546,954 | | | $ | — | | | $ | 358,438,272 | | | $ | — | |
| | | | |
(f) Premiums on written options: | | $ | 1,406,726 | | | $ | — | | | $ | — | | | $ | — | |
| | | | |
| | |
| 134 | | See accompanying notes to the financial statements. | | |
GMO Trust Funds
Statements of Assets and Liabilities — February 28, 2022 — (Continued)
| | | | | | | | | | | | | | | | |
| | | Consolidated
Alternative
Allocation Fund | | | Benchmark-Free
Allocation Fund | | | Benchmark-Free
Fund | | | Global Asset
Allocation Fund | |
Net assets consist of: | |
| | | | |
Paid-in capital | | $ | 294,945,508 | | | $ | 5,558,848,671 | | | $ | 1,915,642,042 | | | $ | 848,744,082 | |
| | | | |
Distributable earnings (accumulated loss) | | | (15,780,536 | ) | | | (435,203,632 | ) | | | (301,788,272 | ) | | | (224,763,336 | ) |
| | | | | | | | | | | | | | | | |
| | $ | 279,164,972 | | | $ | 5,123,645,039 | | | $ | 1,613,853,770 | | | $ | 623,980,746 | |
| | | | | | | | | | | | | | | | |
Net assets attributable to: | |
| | | | |
Class III | | $ | — | | | $ | 1,726,439,698 | | | $ | 1,613,853,770 | | | $ | 585,211,755 | |
| | | | | | | | | | | | | | | | |
| | | | |
Class IV | | $ | — | | | $ | 1,388,080,443 | | | $ | — | | | $ | — | |
| | | | | | | | | | | | | | | | |
| | | | |
Class VI | | $ | 130,895,825 | | | $ | — | | | $ | — | | | $ | — | |
| | | | | | | | | | | | | | | | |
| | | | |
Class MF | | $ | — | | | $ | 1,370,526,909 | | | $ | — | | | $ | — | |
| | | | | | | | | | | | | | | | |
| | | | |
Class R6 | | $ | 22,377 | | | $ | 273,490,582 | | | $ | — | | | $ | 26,147,965 | |
| | | | | | | | | | | | | | | | |
| | | | |
Class I | | $ | 148,246,770 | | | $ | 365,107,407 | | | $ | — | | | $ | 12,621,026 | |
| | | | | | | | | | | | | | | | |
Shares outstanding: | |
| | | | |
Class III | | | — | | | | 67,544,619 | | | | 85,634,132 | | | | 17,807,189 | |
| | | | | | | | | | | | | | | | |
| | | | |
Class IV | | | — | | | | 54,304,859 | | | | — | | | | — | |
| | | | | | | | | | | | | | | | |
| | | | |
Class VI | | | 7,239,073 | | | | — | | | | — | | | | — | |
| | | | | | | | | | | | | | | | |
| | | | |
Class MF | | | — | | | | 53,572,631 | | | | — | | | | — | |
| | | | | | | | | | | | | | | | |
| | | | |
Class R6 | | | 1,231 | | | | 10,707,315 | | | | — | | | | 796,114 | |
| | | | | | | | | | | | | | | | |
| | | | |
Class I | | | 8,230,207 | | | | 14,300,832 | | | | — | | | | 384,019 | |
| | | | | | | | | | | | | | | | |
Net asset value per share: | |
| | | | |
Class III | | $ | — | | | $ | 25.56 | | | $ | 18.85 | | | $ | 32.86 | |
| | | | | | | | | | | | | | | | |
| | | | |
Class IV | | $ | — | | | $ | 25.56 | | | $ | — | | | $ | — | |
| | | | | | | | | | | | | | | | |
| | | | |
Class VI | | $ | 18.08 | | | $ | — | | | $ | — | | | $ | — | |
| | | | | | | | | | | | | | | | |
| | | | |
Class MF | | $ | — | | | $ | 25.58 | | | $ | — | | | $ | — | |
| | | | | | | | | | | | | | | | |
| | | | |
Class R6 | | $ | 18.18 | | | $ | 25.54 | | | $ | — | | | $ | 32.84 | |
| | | | | | | | | | | | | | | | |
| | | | |
Class I | | $ | 18.01 | | | $ | 25.53 | | | $ | — | | | $ | 32.87 | |
| | | | | | | | | | | | | | | | |
| | | | |
| | |
| | | See accompanying notes to the financial statements. | | 135 |
GMO Trust Funds
Statements of Assets and Liabilities — February 28, 2022 — (Continued)
| | | | | | | | | | | | | | | | |
| | | Global
Developed Equity
Allocation Fund | | | Global Equity
Allocation Fund | | | Consolidated
Implementation
Fund | | | International
Developed Equity
Allocation Fund | |
Assets: | |
| | | | |
Investments in affiliated issuers, at value (Notes 2 and 10)(a) | | $ | 86,777,788 | | | $ | 1,580,276,953 | | | $ | 12,509,088 | | | $ | 230,491,494 | |
| | | | |
Investments in unaffiliated issuers, at value (Note 2)(b)(c) | | | 49,828 | | | | 608,775 | | | | 5,528,398,709 | | | | 80,822 | |
| | | | |
Foreign currency, at value (Note 2)(d) | | | — | | | | — | | | | 2,036,343 | | | | — | |
| | | | |
Receivable for investments sold | | | — | | | | — | | | | 53,375,502 | | | | — | |
| | | | |
Receivable for Fund shares sold | | | — | | | | 9,960 | | | | 2,516,407 | | | | 17,805 | |
| | | | |
Receivable for closed swap contracts (Note 4) | | | — | | | | — | | | | 103,337 | | | | — | |
| | | | |
Dividends and interest receivable | | | — | | | | 2 | | | | 12,425,667 | | | | — | |
| | | | |
Dividend withholding tax receivable | | | — | | | | — | | | | 880,751 | | | | — | |
| | | | |
Foreign capital gains tax refund receivable (Note 2) | | | — | | | | — | | | | 7,095 | | | | — | |
| | | | |
Unrealized appreciation on open forward currency contracts (Note 4) | | | — | | | | — | | | | 10,113,488 | | | | — | |
| | | | |
Due from broker (Note 2) | | | — | | | | — | | | | 179,166,881 | | | | — | |
| | | | |
Receivable for variation margin on open futures contracts (Note 4) | | | — | | | | — | | | | 4,028,560 | | | | — | |
| | | | |
Receivable for open OTC swap contracts (Note 4) | | | — | | | | — | | | | 4,483,073 | | | | — | |
| | | | |
Receivable for expenses reimbursed and/or waived by GMO (Note 5) | | | 5,848 | | | | 22,016 | | | | 21,588 | | | | 24,360 | |
| | | | | | | | | | | | | | | | |
| | | | |
Total assets | | | 86,833,464 | | | | 1,580,917,706 | | | | 5,810,066,489 | | | | 230,614,481 | |
| | | | | | | | | | | | | | | | |
Liabilities: | |
| | | | |
Investments sold short, at value (Note 2)(e) | | | — | | | | — | | | | 1,075,385,626 | | | | — | |
| | | | |
Due to custodian | | | — | | | | — | | | | 156,171 | | | | — | |
| | | | |
Due to broker (Note 2) | | | — | | | | — | | | | 276 | | | | — | |
| | | | |
Payable for cash collateral from securities loaned (Note 2) | | | — | | | | — | | | | 12,555,636 | | | | — | |
| | | | |
Payable for investments purchased | | | — | | | | — | | | | 14,205,793 | | | | — | |
| | | | |
Payable for Fund shares repurchased | | | — | | | | 1,729 | | | | — | | | | 711 | |
| | | | |
Accrued foreign capital gains tax payable (Note 2) | | | — | | | | — | | | | 1,260,252 | | | | — | |
| | | | |
Payable for variation margin on open futures contracts (Note 4) | | | — | | | | — | | | | 213,368 | | | | — | |
| | | | |
Payable for variation margin on open cleared swap contracts (Note 4) | | | — | | | | — | | | | 2,230,534 | | | | — | |
| | | | |
Payable for closed swap contracts (Note 4) | | | — | | | | — | | | | 235,003 | | | | — | |
| | | | |
Unrealized depreciation on open forward currency contracts (Note 4) | | | — | | | | — | | | | 16,129,547 | | | | — | |
| | | | |
Interest payable for open OTC swap contracts (Note 4) | | | — | | | | — | | | | 52,836 | | | | — | |
| | | | |
Interest and dividend payable for short sales | | | — | | | | — | | | | 603,730 | | | | — | |
| | | | |
Payable for open OTC swap contracts (Note 4) | | | — | | | | — | | | | 2,987,671 | | | | — | |
| | | | |
Payable to Trustees and related expenses | | | 304 | | | | 5,860 | | | | 18,045 | | | | 814 | |
| | | | |
Written options outstanding, at value (Note 4)(f) | | | — | | | | — | | | | 694,066 | | | | — | |
| | | | |
Accrued expenses | | | 23,286 | | | | 76,940 | | | | 2,112,036 | | | | 36,839 | |
| | | | | | | | | | | | | | | | |
| | | | |
Total liabilities | | | 23,590 | | | | 84,529 | | | | 1,128,840,590 | | | | 38,364 | |
| | | | | | | | | | | | | | | | |
Net assets | | $ | 86,809,874 | | | $ | 1,580,833,177 | | | $ | 4,681,225,899 | | | $ | 230,576,117 | |
| | | | | | | | | | | | | | | | |
| | | | |
(a) Cost of investments – affiliated issuers: | | $ | 82,024,578 | | | $ | 1,620,458,042 | | | $ | 12,572,470 | | | $ | 235,083,070 | |
| | | | |
(b) Cost of investments – unaffiliated issuers: | | $ | 49,828 | | | $ | 608,775 | | | $ | 5,711,714,899 | | | $ | 80,822 | |
| | | | |
(c) Includes securities on loan at value (Note 2): | | $ | — | | | $ | — | | | $ | 41,044,798 | | | $ | — | |
| | | | |
(d) Proceeds from securities sold short: | | $ | — | | | $ | — | | | $ | 1,143,433,593 | | | $ | — | |
| | | | |
(e) Cost of foreign currency: | | $ | — | | | $ | — | | | $ | 2,059,373 | | | $ | — | |
| | | | |
(f) Premiums on written options: | | $ | — | | | $ | — | | | $ | 955,223 | | | $ | — | |
| | | | |
| | |
| 136 | | See accompanying notes to the financial statements. | | |
GMO Trust Funds
Statements of Assets and Liabilities — February 28, 2022 — (Continued)
| | | | | | | | | | | | | | | | |
| | | Global
Developed Equity
Allocation Fund | | | Global Equity
Allocation Fund | | | Consolidated
Implementation
Fund | | | International
Developed Equity
Allocation Fund | |
Net assets consist of: | |
| | | | |
Paid-in capital | | $ | 152,164,704 | | | $ | 1,614,300,672 | | | $ | 5,750,539,475 | | | $ | 399,069,086 | |
| | | | |
Distributable earnings (accumulated loss) | | | (65,354,830 | ) | | | (33,467,495 | ) | | | (1,069,313,576 | ) | | | (168,492,969 | ) |
| | | | | | | | | | | | | | | | |
| | $ | 86,809,874 | | | $ | 1,580,833,177 | | | $ | 4,681,225,899 | | | $ | 230,576,117 | |
| | | | | | | | | | | | | | | | |
Net assets attributable to: | |
| | | | |
Core Class | | $ | — | | | $ | — | | | $ | 4,681,225,899 | | | $ | — | |
| | | | | | | | | | | | | | | | |
| | | | |
Class III | | $ | 86,809,874 | | | $ | 1,571,153,412 | | | $ | — | | | $ | 222,308,135 | |
| | | | | | | | | | | | | | | | |
| | | | |
Class R6 | | $ | — | | | $ | 7,064,794 | | | $ | — | | | $ | 8,267,982 | |
| | | | | | | | | | | | | | | | |
| | | | |
Class I | | $ | — | | | $ | 2,614,971 | | | $ | — | | | $ | — | |
| | | | | | | | | | | | | | | | |
Shares outstanding: | |
| | | | |
Core Class | | | — | | | | — | | | | 373,319,979 | | | | — | |
| | | | | | | | | | | | | | | | |
| | | | |
Class III | | | 3,552,981 | | | | 55,217,401 | | | | — | | | | 13,595,963 | |
| | | | | | | | | | | | | | | | |
| | | | |
Class R6 | | | — | | | | 248,277 | | | | — | | | | 505,711 | |
| | | | | | | | | | | | | | | | |
| | | | |
Class I | | | — | | | | 91,941 | | | | — | | | | — | |
| | | | | | | | | | | | | | | | |
Net asset value per share: | |
| | | | |
Core Class | | $ | — | | | $ | — | | | $ | 12.54 | | | $ | — | |
| | | | | | | | | | | | | | | | |
| | | | |
Class III | | $ | 24.43 | | | $ | 28.45 | | | $ | — | | | $ | 16.35 | |
| | | | | | | | | | | | | | | | |
| | | | |
Class R6 | | $ | — | | | $ | 28.46 | | | $ | — | | | $ | 16.35 | |
| | | | | | | | | | | | | | | | |
| | | | |
Class I | | $ | — | | | $ | 28.44 | | | $ | — | | | $ | — | |
| | | | | | | | | | | | | | | | |
| | | | |
| | |
| | | See accompanying notes to the financial statements. | | 137 |
GMO Trust Funds
Statements of Assets and Liabilities — February 28, 2022 — (Continued)
| | | | | | | | | | | | |
| | | International
Equity Allocation
Fund | | | Consolidated
SGM Major
Markets Fund | | | Strategic
Opportunities
Allocation Fund | |
Assets: | |
| | | |
Investments in affiliated issuers, at value (Notes 2 and 10)(a) | | $ | 678,975,126 | | | $ | — | | | $ | 145,331,020 | |
| | | |
Investments in unaffiliated issuers, at value (Note 2)(b) | | | 110,766 | | | | 267,059,339 | | | | 145,738,590 | |
| | | |
Foreign currency, at value (Note 2)(c) | | | — | | | | 40 | | | | 46,610 | |
| | | |
Receivable for investments sold | | | 30,290,000 | | | | — | | | | 13,357,857 | |
| | | |
Receivable for Fund shares sold | | | 72 | | | | 85,665 | | | | — | |
| | | |
Receivable for closed swap contracts (Note 4) | | | — | | | | — | | | | 4,757 | |
| | | |
Dividends and interest receivable | | | 2 | | | | 90,088 | | | | 193,272 | |
| | | |
Dividend withholding tax receivable | | | — | | | | — | | | | 39,693 | |
| | | |
Foreign capital gains tax refund receivable (Note 2) | | | — | | | | — | | | | 1,252 | |
| | | |
Unrealized appreciation on open forward currency contracts (Note 4) | | | — | | | | 334,658 | | | | — | |
| | | |
Due from broker (Note 2) | | | — | | | | 464,163 | | | | 85 | |
| | | |
Receivable for open OTC swap contracts (Note 4) | | | — | | | | 353,555 | | | | 205,290 | |
| | | |
Receivable for expenses reimbursed and/or waived by GMO (Note 5) | | | 8,148 | | | | 69,715 | | | | 6,013 | |
| | | | | | | | | | | | |
| | | |
Total assets | | | 709,384,114 | | | | 268,457,223 | | | | 304,924,439 | |
| | | | | | | | | | | | |
Liabilities: | |
| | | |
Investments sold short, at value (Note 2)(d) | | | — | | | | — | | | | 45,347,418 | |
| | | |
Due to custodian | | | — | | | | — | | | | 844 | |
| | | |
Due to broker (Note 2) | | | — | | | | 33,340 | | | | — | |
| | | |
Payable for investments purchased | | | — | | | | — | | | | 3,076,501 | |
| | | |
Payable for Fund shares repurchased | | | 30,001,365 | | | | 5,056,150 | | | | 19,680,000 | |
| | | |
Accrued foreign capital gains tax payable (Note 2) | | | — | | | | — | | | | 14,669 | |
|
Payable to affiliate for (Note 5): | |
| | | |
Management fee | | | — | | | | 176,622 | | | | — | |
| | | |
Shareholder service fee | | | — | | | | 15,333 | | | | — | |
| | | |
Payable for variation margin on open futures contracts (Note 4) | | | — | | | | 877,620 | | | | — | |
| | | |
Payable for closed swap contracts (Note 4) | | | — | | | | — | | | | 10,843 | |
| | | |
Unrealized depreciation on open forward currency contracts (Note 4) | | | — | | | | 633,748 | | | | — | |
| | | |
Interest and dividend payable for short sales | | | — | | | | — | | | | 22,956 | |
| | | |
Payable for open OTC swap contracts (Note 4) | | | — | | | | 1,084,896 | | | | 59,778 | |
| | | |
Payable to Trustees and related expenses | | | 2,710 | | | | 1,186 | | | | 3,262 | |
| | | |
Accrued expenses | | | 62,699 | | | | 187,428 | | | | 256,146 | |
| | | | | | | | | | | | |
| | | |
Total liabilities | | | 30,066,774 | | | | 8,066,323 | | | | 68,472,417 | |
| | | | | | | | | | | | |
Net assets | | $ | 679,317,340 | | | $ | 260,390,900 | | | $ | 236,452,022 | |
| | | | | | | | | | | | |
| | | |
(a) Cost of investments – affiliated issuers: | | $ | 696,780,270 | | | $ | — | | | $ | 145,058,758 | |
| | | |
(b) Cost of investments – unaffiliated issuers: | | $ | 110,766 | | | $ | 268,236,483 | | | $ | 140,289,660 | |
| | | |
(c) Cost of foreign currency | | $ | — | | | $ | 40 | | | $ | 46,620 | |
| | | |
(d) Proceeds from securities sold short: | | $ | — | | | $ | — | | | $ | 50,635,047 | |
| | | | |
| | |
| 138 | | See accompanying notes to the financial statements. | | |
GMO Trust Funds
Statements of Assets and Liabilities — February 28, 2022 — (Continued)
| | | | | | | | | | | | |
| | | International
Equity Allocation
Fund | | | Consolidated
SGM Major
Markets Fund | | | Strategic
Opportunities
Allocation Fund | |
Net assets consist of: | | | | | | | | | | | | |
| | | |
Paid-in capital | | $ | 829,842,474 | | | $ | 325,046,382 | | | $ | 224,639,942 | |
| | | |
Distributable earnings (accumulated loss) | | | (150,525,134 | ) | | | (64,655,482 | ) | | | 11,812,080 | |
| | | | | | | | | | | | |
| | $ | 679,317,340 | | | $ | 260,390,900 | | | $ | 236,452,022 | |
| | | | | | | | | | | | |
Net assets attributable to: | |
| | | |
Class III | | $ | 437,139,445 | | | $ | 32,796,478 | | | $ | 236,452,022 | |
| | | | | | | | | | | | |
| | | |
Class VI | | $ | — | | | $ | 206,841,467 | | | $ | — | |
| | | | | | | | | | | | |
| | | |
Class R6 | | $ | 242,177,895 | | | $ | — | | | $ | — | |
| | | | | | | | | | | | |
| | | |
Class I | | $ | — | | | $ | 20,752,955 | | | $ | — | |
| | | | | | | | | | | | |
Shares outstanding: | |
| | | |
Class III | | | 14,854,139 | | | | 1,119,509 | | | | 13,203,339 | |
| | | | | | | | | | | | |
| | | |
Class VI | | | — | | | | 7,067,757 | | | | — | |
| | | | | | | | | | | | |
| | | |
Class R6 | | | 8,231,819 | | | | — | | | | — | |
| | | | | | | | | | | | |
| | | |
Class I | | | — | | | | 709,920 | | | | — | |
| | | | | | | | | | | | |
Net asset value per share: | |
| | | |
Class III | | $ | 29.43 | | | $ | 29.30 | | | $ | 17.91 | |
| | | | | | | | | | | | |
| | | |
Class VI | | $ | — | | | $ | 29.27 | | | $ | — | |
| | | | | | | | | | | | |
| | | |
Class R6 | | $ | 29.42 | | | $ | — | | | $ | — | |
| | | | | | | | | | | | |
| | | |
Class I | | $ | — | | | $ | 29.23 | | | $ | — | |
| | | | | | | | | | | | |
| | | | |
| | |
| | | See accompanying notes to the financial statements. | | 139 |
GMO Trust Funds
Statements of Operations — Year Ended February 28, 2022
| | | | | | | | | | | | | | | | |
| | | Consolidated
Alternative
Allocation Fund | | | Benchmark-Free
Allocation Fund | | | Benchmark-Free
Fund | | | Global Asset
Allocation Fund | |
Investment Income: | | | | | | | | | | | | | | | | |
| | | | |
Dividends from unaffiliated issuers (Net of withholding tax) (Note 2)(a) | | $ | 4,224,680 | | | $ | 264 | | | $ | 60,183,782 | | | $ | 47 | |
| | | | |
Dividends from affiliated issuers (Note 10) | | | 527,989 | | | | 169,236,847 | | | | 9,627,127 | | | | 17,513,874 | |
| | | | |
Interest | | | 583,826 | | | | — | | | | 458,633 | | | | 1,207 | |
| | | | |
Securities lending income from affiliated issuers (net) | | | — | | | | — | | | | 103,230 | | | | — | |
| | | | |
Securities lending income (net) | | | — | | | | — | | | | 310,093 | | | | — | |
| | | | |
Other income (Note 2) | | | 397,568 | | | | — | | | | 324,793 | | | | 259,135 | |
| | | | | | | | | | | | | | | | |
| | | | |
Total investment income | | | 5,734,063 | | | | 169,237,111 | | | | 71,007,658 | | | | 17,774,263 | |
| | | | | | | | | | | | | | | | |
Expenses: | |
| | | | |
Management fee (Note 5) | | | 2,591,953 | | | | 39,044,859 | | | | — | | | | — | |
| | | | |
Shareholder service fee – Class III (Note 5) | | | — | | | | 2,806,356 | | | | — | | | | — | |
| | | | |
Shareholder service fee – Class IV (Note 5) | | | — | | | | 1,940,922 | | | | — | | | | — | |
| | | | |
Shareholder service fee – Class VI (Note 5) | | | 93,313 | | | | — | | | | — | | | | — | |
| | | | |
Shareholder service fee – Class R6 (Note 5) | | | 423 | | | | 425,697 | | | | — | | | | — | |
| | | | |
Shareholder service fee – Class I (Note 5) | | | 407,463 | | | | 516,782 | | | | — | | | | — | |
| | | | |
Supplemental support fee – Class MF (Note 5) | | | — | | | | 1,566,755 | | | | — | | | | — | |
| | | | |
Audit and tax fees | | | 118,841 | | | | 37,293 | | | | 158,106 | | | | 32,068 | |
| | | | |
Custodian, fund accounting agent and transfer agent fees | | | 598,301 | | | | 491,929 | | | | 1,608,707 | | | | 99,227 | |
| | | | |
Dividend expense on short sales | | | 1,312,092 | | | | — | | | | 4,166,022 | | | | — | |
| | | | |
Legal fees | | | 43,696 | | | | 89,691 | | | | 71,665 | | | | 9,293 | |
| | | | |
Registration fees | | | 41,792 | | | | 74,452 | | | | 421 | | | | 45,820 | |
| | | | |
Trustees’ fees and related expenses (Note 5) | | | 13,932 | | | | 193,319 | | | | 67,893 | | | | 23,883 | |
| | | | |
Interest expense and borrowing costs for investments sold short (Note 2) | | | 485,057 | | | | — | | | | 1,195,430 | | | | — | |
| | | | |
Miscellaneous | | | 65,355 | | | | 84,171 | | | | 146,804 | * | | | 15,896 | ** |
| | | | | | | | | | | | | | | | |
| | | | |
Total expenses | | | 5,772,218 | | | | 47,272,226 | | | | 7,415,048 | | | | 226,187 | |
| | | | |
Fees and expenses reimbursed and/or waived by GMO (Note 5) | | | (539,514 | ) | | | (401,129 | ) | | | (1,423,492 | ) | | | (185,307 | ) |
| | | | |
Indirectly incurred management fees waived or borne by GMO (Note 5) | | | (99,640 | ) | | | (2,759,456 | ) | | | — | | | | — | |
| | | | |
Indirectly incurred shareholder service fees waived or borne by GMO (Note 5) | | | (3,066 | ) | | | (319,870 | ) | | | — | | | | — | |
| | | | | | | | | | | | | | | | |
| | | | |
Net expenses | | | 5,129,998 | | | | 43,791,771 | | | | 5,991,556 | | | | 40,880 | |
| | | | | | | | | | | | | | | | |
| | | | |
Net investment income (loss) | | | 604,065 | | | | 125,445,340 | | | | 65,016,102 | | | | 17,733,383 | |
| | | | | | | | | | | | | | | | |
Realized and unrealized gain (loss): | | | | | | | | | | | | | | | | |
| | | | |
Net realized gain (loss) on: | | | | | | | | | | | | | | | | |
| | | | |
Investments in unaffiliated issuers (net of foreign capital gains tax) (Note 2)(b) | | | 53,414,395 | | | | 32,213 | | | | 223,570,814 | | | | 99,218 | |
| | | | |
Investments in affiliated issuers | | | 2,884,552 | | | | (63,539,730 | ) | | | 5,388,413 | | | | 33,151,714 | |
| | | | |
Investments in securities sold short | | | (41,858,091 | ) | | | — | | | | (28,713,774 | ) | | | — | |
| | | | |
Realized gain distributions from affiliated issuers (Note 10) | | | — | | | | 11,724,196 | | | | 4,843,358 | | | | 35,109,437 | |
| | | | |
Futures contracts | | | (5,677,101 | ) | | | — | | | | (82,085,229 | ) | | | — | |
| | | | |
Written options | | | 2,852,823 | | | | — | | | | — | | | | — | |
| | | | |
Swap contracts | | | (6,308,142 | ) | | | — | | | | 15,689,562 | | | | — | |
| | | | |
Forward currency contracts | | | (3,359,178 | ) | | | — | | | | 8,789,482 | | | | — | |
| | | | |
Foreign currency and foreign currency related transactions | | | (86,510 | ) | | | — | | | | (475,496 | ) | | | — | |
| | | | | | | | | | | | | | | | |
| | | | |
Net realized gain (loss) | | | 1,862,748 | | | | (51,783,321 | ) | | | 147,007,130 | | | | 68,360,369 | |
| | | | | | | | | | | | | | | | |
|
Change in net unrealized appreciation (depreciation) on: | |
| | | | |
Investments in unaffiliated issuers (net of foreign capital gains tax) (Note 2)(c) | | | (24,456,975 | ) | | | — | | | | (250,003,200 | ) | | | 3,628 | |
| | | | |
Investments in affiliated issuers | | | (4,705,383 | ) | | | (9,001,883 | ) | | | (30,436,600 | ) | | | (76,903,445 | ) |
| | | | |
Investments in securities sold short | | | 23,659,273 | | | | — | | | | 56,997,660 | | | | — | |
| | | | |
Futures contracts | | | 803,471 | | | | — | | | | 36,486,489 | | | | — | |
| | | | |
Written options | | | 297,241 | | | | — | | | | — | | | | — | |
| | | | |
Swap contracts | | | 2,348,632 | | | | — | | | | (2,903,562 | ) | | | — | |
| | | | |
Forward currency contracts | | | (1,289,077 | ) | | | — | | | | (739,814 | ) | | | — | |
| | | | |
Foreign currency and foreign currency related transactions | | | (25,266 | ) | | | — | | | | 16,598 | | | | — | |
| | | | | | | | | | | | | | | | |
| | | | |
Net change in unrealized appreciation (depreciation) | | | (3,368,084 | ) | | | (9,001,883 | ) | | | (190,582,429 | ) | | | (76,899,817 | ) |
| | | | | | | | | | | | | | | | |
| | | | |
Net realized and unrealized gain (loss) | | | (1,505,336 | ) | | | (60,785,204 | ) | | | (43,575,299 | ) | | | (8,539,448 | ) |
| | | | | | | | | | | | | | | | |
Net increase (decrease) in net assets resulting from operations | | $ | (901,271 | ) | | $ | 64,660,136 | | | $ | 21,440,803 | | | $ | 9,193,935 | |
| | | | | | | | | | | | | | | | |
| | | | |
(a) Withholding tax: | | $ | 138,994 | | | $ | — | | | $ | 5,095,245 | | | $ | — | |
| | | | |
(b) Foreign capital gains tax (benefit) on net realized gain (loss): | | $ | 1,840 | | | $ | — | | | $ | 547,067 | | | $ | — | |
| | | | |
(c) Foreign capital gains tax (benefit) on change in net unrealized appreciation (depreciation): | | $ | 16,028 | | | $ | — | | | $ | 293,790 | | | $ | — | |
| * | Includes $122,038 of pricing expenses. |
| ** | Includes $8,367 of printing expenses. |
| | | | |
| | |
| 140 | | See accompanying notes to the financial statements. | | |
GMO Trust Funds
Statements of Operations — Year Ended February 28, 2022 — (Continued)
| | | | | | | | | | | | | | | | |
| | | Global
Developed Equity
Allocation Fund | | | Global Equity
Allocation Fund | | | Consolidated
Implementation
Fund | | | International
Developed Equity
Allocation Fund | |
Investment Income: | | | | | | | | | | | | | | | | |
| | | | |
Dividends from unaffiliated issuers (Net of withholding tax ) (Note 2)(a) | | $ | — | | | $ | 39 | | | $ | 160,840,100 | | | $ | 3 | |
| | | | |
Dividends from affiliated issuers (Note 10) | | | 3,389,840 | | | | 62,896,197 | | | | — | | | | 14,392,284 | |
| | | | |
Interest | | | 4 | | | | — | | | | 16,281,867 | | | | — | |
| | | | |
Securities lending income from affiliated issuers (net) | | | — | | | | — | | | | 380,552 | | | | — | |
| | | | |
Securities lending income (net) | | | — | | | | — | | | | 620,927 | | | | — | |
| | | | |
Other income (Note 2) | | | — | | | | — | | | | 1,329,452 | | | | — | |
| | | | | | | | | | | | | | | | |
| | | | |
Total investment income | | | 3,389,844 | | | | 62,896,236 | | | | 179,452,898 | | | | 14,392,287 | |
| | | | | | | | | | | | | | | | |
Expenses: | |
| | | | |
Audit and tax fees | | | 23,606 | | | | 25,364 | | | | 259,935 | | | | 30,502 | |
| | | | |
Custodian, fund accounting agent and transfer agent fees | | | 8,699 | | | | 75,636 | | | | 2,748,229 | | | | 48,900 | |
| | | | |
Dividend expense on short sales | | | — | | | | — | | | | 13,496,665 | | | | — | |
| | | | |
Legal fees | | | 1,162 | | | | 26,109 | | | | 106,446 | | | | 3,909 | |
| | | | |
Registration fees | | | 4,109 | | | | 58,233 | | | | 843 | | | | 26,170 | |
| | | | |
Trustees’ fees and related expenses (Note 5) | | | 3,262 | | | | 59,021 | | | | 180,401 | | | | 7,791 | |
| | | | |
Interest expense and borrowing costs for investments sold short (Note 2) | | | — | | | | — | | | | 3,915,523 | | | | — | |
| | | | |
Miscellaneous | | | 6,309 | * | | | 22,691 | ** | | | 193,680 | *** | | | 7,821 | **** |
| | | | | | | | | | | | | | | | |
| | | | |
Total expenses | | | 47,147 | | | | 267,054 | | | | 20,901,722 | | | | 125,093 | |
| | | | |
Fees and expenses reimbursed and/or waived by GMO (Note 5) | | | (43,605 | ) | | | (199,062 | ) | | | (3,099,640 | ) | | | (116,568 | ) |
| | | | |
Indirectly incurred management fees waived or borne by GMO (Note 5) | | | — | | | | — | | | | (2,889 | ) | | | — | |
| | | | | | | | | | | | | | | | |
| | | | |
Net expenses | | | 3,542 | | | | 67,992 | | | | 17,799,193 | | | | 8,525 | |
| | | | | | | | | | | | | | | | |
| | | | |
Net investment income (loss) | | | 3,386,302 | | | | 62,828,244 | | | | 161,653,705 | | | | 14,383,762 | |
| | | | | | | | | | | | | | | | |
Realized and unrealized gain (loss): | | | | | | | | | | | | | | | | |
| | | | |
Net realized gain (loss) on: | | | | | | | | | | | | | | | | |
| | | | |
Investments in unaffiliated issuers (net of foreign capital gains tax) (Note 2)(b) | | | — | | | | — | | | | 549,278,418 | | | | — | |
| | | | |
Investments in affiliated issuers | | | 4,891,548 | | | | 67,677,875 | | | | (64,989 | ) | | | 2,517,002 | |
| | | | |
Investments in securities sold short | | | — | | | | — | | | | (190,235,093 | ) | | | — | |
| | | | |
Realized gain distributions from affiliated issuers (Note 10) | | | 7,361,580 | | | | 106,796,624 | | | | — | | | | 863,345 | |
| | | | |
Futures contracts | | | — | | | | — | | | | (201,295,836 | ) | | | — | |
| | | | |
Written options | | | — | | | | — | | | | 107,440 | | | | — | |
| | | | |
Swap contracts | | | — | | | | — | | | | 39,982,690 | | | | — | |
| | | | |
Forward currency contracts | | | — | | | | — | | | | 11,763,114 | | | | — | |
| | | | |
Foreign currency and foreign currency related transactions | | | — | | | | — | | | | (1,391,546 | ) | | | — | |
| | | | | | | | | | | | | | | | |
| | | | |
Net realized gain (loss) | | | 12,253,128 | | | | 174,474,499 | | | | 208,144,198 | | | | 3,380,347 | |
| | | | | | | | | | | | | | | | |
| | | | |
Change in net unrealized appreciation (depreciation) on: | | | | | | | | | | | | | | | | |
| | | | |
Investments in unaffiliated issuers (net of foreign capital gains tax) (Note 2)(c) | | | — | | | | — | | | | (529,931,440 | ) | | | — | |
| | | | |
Investments in affiliated issuers | | | (9,298,594 | ) | | | (190,742,470 | ) | | | (63,382 | ) | | | (10,962,253 | ) |
| | | | |
Investments in securities sold short | | | — | | | | — | | | | 197,036,385 | | | | — | |
| | | | |
Futures contracts | | | — | | | | — | | | | 87,734,235 | | | | — | |
| | | | |
Written options | | | — | | | | — | | | | 261,157 | | | | — | |
| | | | |
Swap contracts | | | — | | | | — | | | | (2,055,731 | ) | | | — | |
| | | | |
Forward currency contracts | | | — | | | | — | | | | (7,021,471 | ) | | | — | |
| | | | |
Foreign currency and foreign currency related transactions | | | — | | | | — | | | | 235,429 | | | | — | |
| | | | | | | | | | | | | | | | |
| | | | |
Net change in unrealized appreciation (depreciation) | | | (9,298,594 | ) | | | (190,742,470 | ) | | | (253,804,818 | ) | | | (10,962,253 | ) |
| | | | | | | | | | | | | | | | |
| | | | |
Net realized and unrealized gain (loss) | | | 2,954,534 | | | | (16,267,971 | ) | | | (45,660,620 | ) | | | (7,581,906 | ) |
| | | | | | | | | | | | | | | | |
Net increase (decrease) in net assets resulting from operations | | $ | 6,340,836 | | | $ | 46,560,273 | | | $ | 115,993,085 | | | $ | 6,801,856 | |
| | | | | | | | | | | | | | | | |
| | | | |
(a) Withholding tax: | | $ | — | | | $ | — | | | $ | 13,218,492 | | | $ | — | |
| | | | |
(b) Foreign capital gains tax (benefit) on net realized gain (loss): | | $ | — | | | $ | — | | | $ | 1,800,082 | | | $ | — | |
| | | | |
(c) Foreign capital gains tax (benefit) on change in net unrealized appreciation (depreciation): | | $ | — | | | $ | — | | | $ | 724,617 | | | $ | — | |
| * | Includes $5,187 of printing expenses. |
| ** | Includes $10,871 of printing expenses. |
| *** | Includes $129,340 of pricing expenses. |
| **** | Includes $5,390 of printing expenses. |
| | | | |
| | |
| | | See accompanying notes to the financial statements. | | 141 |
GMO Trust Funds
Statements of Operations — Year Ended February 28, 2022 — (Continued)
| | | | | | | | | | | | |
| | | International
Equity Allocation
Fund | | | Consolidated
SGM Major
Markets Fund | | | Strategic
Opportunities
Allocation Fund | |
Investment Income: | | | | | | | | | | | | |
| | | |
Dividends from unaffiliated issuers (Net of withholding tax) (Note 2)(a) | | $ | 19 | | | $ | 328 | | | $ | 4,842,824 | |
| | | |
Dividends from affiliated issuers (Note 10) | | | 41,108,743 | | | | — | | | | 6,156,995 | |
| | | |
Interest | | | — | | | | 662,019 | | | | 24,265 | |
| | | | | | | | | | | | |
| | | |
Total investment income | | | 41,108,762 | | | | 662,347 | | | | 11,024,084 | |
| | | | | | | | | | | | |
Expenses: | |
| | | |
Management fee (Note 5) | | | — | | | | 2,842,393 | | | | — | |
| | | |
Shareholder service fee – Class III (Note 5) | | | — | | | | 45,617 | | | | — | |
| | | |
Shareholder service fee – Class VI (Note 5) | | | — | | | | 155,126 | | | | — | |
| | | |
Shareholder service fee – Class I (Note 5) | | | — | | | | 32,909 | | | | — | |
| | | |
Audit and tax fees | | | 24,182 | | | | 84,436 | | | | 51,368 | |
| | | |
Custodian, fund accounting agent and transfer agent fees | | | 69,484 | | | | 166,706 | | | | 405,977 | |
| | | |
Dividend expense on short sales | | | — | | | | — | | | | 746,932 | |
| | | |
Legal fees | | | 11,759 | | | | 13,181 | | | | 14,372 | |
| | | |
Registration fees | | | 35,498 | | | | 54,477 | | | | 4,859 | |
| | | |
Trustees’ fees and related expenses (Note 5) | | | 28,030 | | | | 9,280 | | | | 14,053 | |
| | | |
Interest expense and borrowing costs for investments sold short (Note 2) | | | — | | | | — | | | | 202,848 | |
| | | |
Miscellaneous | | | 11,247 | * | | | 36,707 | | | | 62,416 | ** |
| | | | | | | | | | | | |
| | | |
Total expenses | | | 180,200 | | | | 3,440,832 | | | | 1,502,825 | |
| | | |
Fees and expenses reimbursed and/or waived by GMO (Note 5) | | | (148,894 | ) | | | (329,145 | ) | | | (511,841 | ) |
| | | | | | | | | | | | |
| | | |
Net expenses | | | 31,306 | | | | 3,111,687 | | | | 990,984 | |
| | | | | | | | | | | | |
| | | |
Net investment income (loss) | | | 41,077,456 | | | | (2,449,340 | ) | | | 10,033,100 | |
| | | | | | | | | | | | |
Realized and unrealized gain (loss): | | | | | | | | | | | | |
| | | |
Net realized gain (loss) on: | | | | | | | | | | | | |
| | | |
Investments in unaffiliated issuers (net of foreign capital gains tax) (Note 2)(b) | | | — | | | | 31,768 | | | | 35,341,914 | |
| | | |
Investments in affiliated issuers | | | 16,671,765 | | | | — | | | | 26,052,334 | |
| | | |
Investments in securities sold short | | | — | | | | — | | | | (10,163,734 | ) |
| | | |
Realized gain distributions from affiliated issuers (Note 10) | | | 2,744,179 | | | | — | | | | 9,921,109 | |
| | | |
Futures contracts | | | — | | | | (2,111,965 | ) | | | — | |
| | | |
Swap contracts | | | — | | | | 2,210,504 | | | | 3,693,996 | |
| | | |
Forward currency contracts | | | — | | | | (6,979,629 | ) | | | — | |
| | | |
Foreign currency and foreign currency related transactions | | | — | | | | 150,716 | | | | (15,729 | ) |
| | | | | | | | | | | | |
| | | |
Net realized gain (loss) | | | 19,415,944 | | | | (6,698,606 | ) | | | 64,829,890 | |
| | | | | | | | | | | | |
| | | |
Change in net unrealized appreciation (depreciation) on: | | | | | | | | | | | | |
| | | |
Investments in unaffiliated issuers (net of foreign capital gains tax) (Note 2)(c) | | | — | | | | (1,565,447 | ) | | | (25,629,172 | ) |
| | | |
Investments in affiliated issuers | | | (81,975,337 | ) | | | — | | | | (35,069,004 | ) |
| | | |
Investments in securities sold short | | | — | | | | — | | | | 12,848,880 | |
| | | |
Futures contracts | | | — | | | | 2,122,119 | | | | — | |
| | | |
Swap contracts | | | — | | | | (731,341 | ) | | | (936,471 | ) |
| | | |
Forward currency contracts | | | — | | | | 1,281,588 | | | | — | |
| | | |
Foreign currency and foreign currency related transactions | | | — | | | | (12,036 | ) | | | (19,449 | ) |
| | | | | | | | | | | | |
| | | |
Net change in unrealized appreciation (depreciation) | | | (81,975,337 | ) | | | 1,094,883 | | | | (48,805,216 | ) |
| | | | | | | | | | | | |
| | | |
Net realized and unrealized gain (loss) | | | (62,559,393 | ) | | | (5,603,723 | ) | | | 16,024,674 | |
| | | | | | | | | | | | |
Net increase (decrease) in net assets resulting from operations | | $ | (21,481,937 | ) | | $ | (8,053,063 | ) | | $ | 26,057,774 | |
| | | | | | | | | | | | |
| | | |
(a) Withholding tax: | | $ | — | | | $ | — | | | $ | 356,693 | |
| | | |
(b) Foreign capital gains tax (benefit) on net realized gain (loss): | | $ | — | | | $ | — | | | $ | 95,529 | |
| | | |
(c) Foreign capital gains tax (benefit) on change in net unrealized appreciation (depreciation): | | $ | — | | | $ | — | | | $ | (88,660 | ) |
| * | Includes $6,471 of printing expenses. |
| ** | Includes $53,076 of pricing expenses. |
| | | | |
| | |
| 142 | | See accompanying notes to the financial statements. | | |
GMO Trust Funds
Statements of Changes in Net Assets
| | | | | | | | | | | | | | | | |
| | | Consolidated Alternative
Allocation Fund | | | Benchmark-Free
Allocation Fund(a) | |
| | | Year Ended
February 28, | | | Year Ended
February 28, | |
| | | 2022 | | | 2021 | | | 2022 | | | 2021 | |
Increase (decrease) in net assets: | |
|
Operations: | |
| | | | |
Net investment income (loss) | | $ | 604,065 | | | $ | (994,645 | ) | | $ | 125,445,340 | | | $ | 114,142,597 | |
| | | | |
Net realized gain (loss) | | | 1,862,748 | | | | (7,143,588 | ) | | | (51,783,321 | ) | | | 60,048,306 | |
| | | | |
Change in net unrealized appreciation (depreciation) | | | (3,368,084 | ) | | | 4,116,009 | | | | (9,001,883 | ) | | | 80,415,746 | |
| | | | | | | | | | | | | | | | |
| | | | |
Net increase (decrease) in net assets from operations | | | (901,271 | ) | | | (4,022,224 | ) | | | 64,660,136 | | | | 254,606,649 | |
| | | | | | | | | | | | | | | | |
|
Distributions to shareholders: | |
| | | | |
Class III | | | — | | | | — | | | | (40,126,356 | ) | | | (104,307,810 | ) |
| | | | |
Class IV | | | — | | | | — | | | | (36,148,761 | ) | | | (71,760,959 | ) |
| | | | |
Class VI | | | (6,442,811 | ) | | | (5,356,980 | ) | | | — | | | | — | |
| | | | |
Class MF | | | — | | | | — | | | | (34,695,369 | ) | | | (69,378,466 | ) |
| | | | |
Class R6 | | | (15,298 | ) | | | (9,953 | )* | | | (5,897,575 | ) | | | (1,488,297 | )** |
| | | | |
Class I | | | (6,161,945 | ) | | | (4,350,593 | ) | | | (8,143,311 | ) | | | (4,256,750 | ) |
| | | | | | | | | | | | | | | | |
| | | | |
Total distributions | | | (12,620,054 | ) | | | (9,717,526 | ) | | | (125,011,372 | ) | | | (251,192,282 | ) |
| | | | | | | | | | | | | | | | |
| | | | |
Net share transactions (Note 9): | | | | | | | | | | | | | | | | |
| | | | |
Class III | | | — | | | | — | | | | (488,898,874 | ) | | | (1,549,777,251 | ) |
| | | | |
Class IV | | | — | | | | — | | | | (553,716,829 | ) | | | (144,019,491 | ) |
| | | | |
Class VI | | | (91,476,207 | ) | | | 37,929,124 | | | | — | | | | — | |
| | | | |
Class MF | | | — | | | | — | | | | (330,119,921 | ) | | | (1,092,603,160 | ) |
| | | | |
Class R6 | | | (445,328 | ) | | | 487,583 | * | | | (35,040,180 | ) | | | 308,687,885 | ** |
| | | | |
Class I | | | (114,729,175 | ) | | | 239,618,890 | | | | 46,774,244 | | | | 222,508,366 | |
| | | | | | | | | | | | | | | | |
| | | | |
Increase (decrease) in net assets resulting from net share transactions | | | (206,650,710 | ) | | | 278,035,597 | | | | (1,361,001,560 | ) | | | (2,255,203,651 | ) |
| | | | | | | | | | | | | | | | |
| | | | |
Total increase (decrease) in net assets | | | (220,172,035 | ) | | | 264,295,847 | | | | (1,421,352,796 | ) | | | (2,251,789,284 | ) |
|
| Net assets: | |
| | | | |
Beginning of period | | | 499,337,007 | | | | 235,041,160 | | | | 6,544,997,835 | | | | 8,796,787,119 | |
| | | | | | | | | | | | | | | | |
| | | | |
End of period | | $ | 279,164,972 | | | $ | 499,337,007 | | | $ | 5,123,645,039 | | | $ | 6,544,997,835 | |
| | | | | | | | | | | | | | | | |
| (a) | A plan of reorganization was completed on January 22, 2021. |
| * | Period from July 31, 2020 (commencement of operations) through February 28, 2021. |
| ** | Period from May 1, 2020 (commencement of operations) through February 28, 2021. |
| | | | |
| | |
| | | See accompanying notes to the financial statements. | | 143 |
GMO Trust Funds
Statements of Changes in Net Assets — (Continued)
| | | | | | | | | | | | | | | | |
| | | Benchmark-Free Fund | | | Global Asset Allocation Fund(a) | |
| | | Year Ended
February 28, | | | Year Ended
February 28, | |
| | | 2022 | | | 2021 | | | 2022 | | | 2021 | |
Increase (decrease) in net assets: | |
|
Operations: | |
| | | | |
Net investment income (loss) | | $ | 65,016,102 | | | $ | 64,891,218 | | | $ | 17,733,383 | | | $ | 33,047,243 | |
| | | | |
Net realized gain (loss) | | | 147,007,130 | | | | (174,343,234 | ) | | | 68,360,369 | | | | 38,313,845 | |
| | | | |
Change in net unrealized appreciation (depreciation) | | | (190,582,429 | ) | | | 239,716,675 | | | | (76,899,817 | ) | | | 72,475,821 | |
| | | | | | | | | | | | | | | | |
| | | | |
Net increase (decrease) in net assets from operations | | | 21,440,803 | | | | 130,264,659 | | | | 9,193,935 | | | | 143,836,909 | |
| | | | | | | | | | | | | | | | |
|
Distributions to shareholders: | |
| | | | |
Class III | | | (78,012,250 | ) | | | (71,248,951 | ) | | | (36,020,211 | ) | | | (38,839,616 | ) |
| | | | |
Class R6 | | | — | | | | — | | | | (1,757,031 | ) | | | (1,148,742 | ) |
| | | | |
Class I | | | — | | | | — | | | | (758,336 | ) | | | — | * |
| | | | | | | | | | | | | | | | |
| | | | |
Total distributions | | | (78,012,250 | ) | | | (71,248,951 | ) | | | (38,535,578 | ) | | | (39,988,358 | ) |
| | | | | | | | | | | | | | | | |
| | | | |
Net share transactions (Note 9): | | | | | | | | | | | | | | | | |
| | | | |
Class III | | | (488,070,825 | ) | | | (484,449,320 | ) | | | (73,648,726 | ) | | | (950,346,978 | ) |
| | | | |
Class R6 | | | — | | | | — | | | | (161,766,780 | ) | | | 164,512,376 | |
| | | | |
Class I | | | — | | | | — | | | | (7,391,714 | ) | | | 20,705,602 | * |
| | | | | | | | | | | | | | | | |
| | | | |
Increase (decrease) in net assets resulting from net share transactions | | | (488,070,825 | ) | | | (484,449,320 | ) | | | (242,807,220 | ) | | | (765,129,000 | ) |
| | | | | | | | | | | | | | | | |
| | | | |
Total increase (decrease) in net assets | | | (544,642,272 | ) | | | (425,433,612 | ) | | | (272,148,863 | ) | | | (661,280,449 | ) |
|
| Net assets: | |
| | | | |
Beginning of period | | | 2,158,496,042 | | | | 2,583,929,654 | | | | 896,129,609 | | | | 1,557,410,058 | |
| | | | | | | | | | | | | | | | |
| | | | |
End of period | | $ | 1,613,853,770 | | | $ | 2,158,496,042 | | | $ | 623,980,746 | | | $ | 896,129,609 | |
| | | | | | | | | | | | | | | | |
| (a) | A plan of reorganization was completed on January 22, 2021. |
| * | Period from January 6, 2021 (commencement of operations) through February 28, 2021. |
| | | | |
| | |
| 144 | | See accompanying notes to the financial statements. | | |
GMO Trust Funds
Statements of Changes in Net Assets — (Continued)
| | | | | | | | | | | | | | | | |
| | | Global Developed Equity
Allocation Fund | | | Global Equity Allocation Fund | |
| | | Year Ended
February 28, | | | Year Ended
February 28, | |
| | | 2022 | | | 2021 | | | 2022 | | | 2021 | |
Increase (decrease) in net assets: | |
|
Operations: | |
| | | | |
Net investment income (loss) | | $ | 3,386,302 | | | $ | 2,465,589 | | | $ | 62,828,244 | | | $ | 51,214,464 | |
| | | | |
Net realized gain (loss) | | | 12,253,128 | | | | 1,263,773 | | | | 174,474,499 | | | | 77,284,915 | |
| | | | |
Change in net unrealized appreciation (depreciation) | | | (9,298,594 | ) | | | 14,596,077 | | | | (190,742,470 | ) | | | 249,758,702 | |
| | | | | | | | | | | | | | | | |
| | | | |
Net increase (decrease) in net assets from operations | | | 6,340,836 | | | | 18,325,439 | | | | 46,560,273 | | | | 378,258,081 | |
| | | | | | | | | | | | | | | | |
|
Distributions to shareholders: | |
| | | | |
Class III | | | (10,659,337 | ) | | | (2,967,463 | ) | | | (122,025,655 | ) | | | (58,232,912 | ) |
| | | | |
Class R6 | | | — | | | | — | | | | (541,431 | ) | | | (227,894 | )* |
| | | | |
Class I | | | — | | | | — | | | | (191,269 | ) | | | (64,254 | )** |
| | | | | | | | | | | | | | | | |
| | | | |
Total distributions | | | (10,659,337 | ) | | | (2,967,463 | ) | | | (122,758,355 | ) | | | (58,525,060 | ) |
| | | | | | | | | | | | | | | | |
|
Net share transactions (Note 9): | |
| | | | |
Class III | | | 2,974,852 | | | | (587,343 | ) | | | 7,964,576 | | | | (135,640,442 | ) |
| | | | |
Class R6 | | | — | | | | — | | | | 649,789 | | | | 5,755,476 | * |
| | | | |
Class I | | | — | | | | — | | | | 535,784 | | | | 1,969,305 | ** |
| | | | | | | | | | | | | | | | |
| | | | |
Increase (decrease) in net assets resulting from net share transactions | | | 2,974,852 | | | | (587,343 | ) | | | 9,150,149 | | | | (127,915,661 | ) |
| | | | | | | | | | | | | | | | |
| | | | |
Total increase (decrease) in net assets | | | (1,343,649 | ) | | | 14,770,633 | | | | (67,047,933 | ) | | | 191,817,360 | |
|
| Net assets: | |
| | | | |
Beginning of period | | | 88,153,523 | | | | 73,382,890 | | | | 1,647,881,110 | | | | 1,456,063,750 | |
| | | | | | | | | | | | | | | | |
| | | | |
End of period | | $ | 86,809,874 | | | $ | 88,153,523 | | | $ | 1,580,833,177 | | | $ | 1,647,881,110 | |
| | | | | | | | | | | | | | | | |
| * | Period from July 15, 2020 (commencement of operations) through February 28 , 2021. |
| ** | Period from August 17, 2020 (commencement of operations) through February 28, 2021. |
| | | | |
| | |
| | | See accompanying notes to the financial statements. | | 145 |
GMO Trust Funds
Statements of Changes in Net Assets — (Continued)
| | | | | | | | | | | | | | | | |
| | | Consolidated
Implementation Fund | | | International Developed
Equity Allocation Fund(a) | |
| | | Year Ended
February 28, | | | Year Ended
February 28, | |
| | | 2022 | | | 2021 | | | 2022 | | | 2021 | |
Increase (decrease) in net assets: | |
|
Operations: | |
| | | | |
Net investment income (loss) | | $ | 161,653,705 | | | $ | 175,368,048 | | | $ | 14,383,762 | | | $ | 9,596,314 | |
| | | | |
Net realized gain (loss) | | | 208,144,198 | | | | (653,822,989 | ) | | | 3,380,347 | | | | 1,580,267 | |
| | | | |
Change in net unrealized appreciation (depreciation) | | | (253,804,818 | ) | | | 511,939,039 | | | | (10,962,253 | ) | | | 30,626,653 | |
| | | | | | | | | | | | | | | | |
| | | | |
Net increase (decrease) in net assets from operations | | | 115,993,085 | | | | 33,484,098 | | | | 6,801,856 | | | | 41,803,234 | |
| | | | | | | | | | | | | | | | |
|
Distributions to shareholders: | |
| | | | |
Core Class | | | (150,035,453 | ) | | | (132,218,180 | ) | | | — | | | | — | |
| | | | |
Class III | | | — | | | | — | | | | (15,331,043 | ) | | | (9,649,537 | ) |
| | | | |
Class R6 | | | — | | | | — | | | | (544,452 | ) | | | — | |
| | | | | | | | | | | | | | | | |
| | | | |
Total distributions | | | (150,035,453 | ) | | | (132,218,180 | ) | | | (15,875,495 | ) | | | (9,649,537 | ) |
| | | | | | | | | | | | | | | | |
|
Net share transactions (Note 9): | |
| | | | |
Core Class | | | (1,255,098,954 | ) | | | (1,045,204,818 | ) | | | — | | | | — | |
| | | | |
Class III | | | — | | | | — | | | | 13,953,404 | | | | (112,552,246 | ) |
| | | | |
Class R6 | | | — | | | | — | | | | 313,408 | | | | 8,318,148 | * |
| | | | | | | | | | | | | | | | |
| | | | |
Increase (decrease) in net assets resulting from net share transactions | | | (1,255,098,954 | ) | | | (1,045,204,818 | ) | | | 14,266,812 | | | | (104,234,098 | ) |
| | | | | | | | | | | | | | | | |
| | | | |
Total increase (decrease) in net assets | | | (1,289,141,322 | ) | | | (1,143,938,900 | ) | | | 5,193,173 | | | | (72,080,401 | ) |
|
| Net assets: | |
| | | | |
Beginning of period | | | 5,970,367,221 | | | | 7,114,306,121 | | | | 225,382,944 | | | | 297,463,345 | |
| | | | | | | | | | | | | | | | |
| | | | |
End of period | | $ | 4,681,225,899 | | | $ | 5,970,367,221 | | | $ | 230,576,117 | | | $ | 225,382,944 | |
| | | | | | | | | | | | | | | | |
| (a) | A plan of reorganization was completed on January 22, 2021. |
| * | Period from January 22, 2021 (commencement of operations) through February 28, 2021. |
| | | | |
| | |
| 146 | | See accompanying notes to the financial statements. | | |
GMO Trust Funds
Statements of Changes in Net Assets — (Continued)
| | | | | | | | | | | | | | | | |
| | | International Equity
Allocation Fund(a) | | | Consolidated SGM Major
Markets Fund | |
| | | Year Ended
February 28, | | | Year Ended
February 28, | |
| | | 2022 | | | 2021 | | | 2022 | | | 2021 | |
Increase (decrease) in net assets: | |
|
Operations: | |
| | | | |
Net investment income (loss) | | $ | 41,077,456 | | | $ | 33,987,418 | | | $ | (2,449,340 | ) | | $ | (717,925 | ) |
| | | | |
Net realized gain (loss) | | | 19,415,944 | | | | (20,360,817 | ) | | | (6,698,606 | ) | | | 53,389,439 | |
| | | | |
Change in net unrealized appreciation (depreciation) | | | (81,975,337 | ) | | | 133,302,879 | | | | 1,094,883 | | | | (19,979,166 | ) |
| | | | | | | | | | | | | | | | |
| | | | |
Net increase (decrease) in net assets from operations | | | (21,481,937 | ) | | | 146,929,480 | | | | (8,053,063 | ) | | | 32,692,348 | |
| | | | | | | | | | | | | | | | |
|
Distributions to shareholders: | |
| | | | |
Class III | | | (29,164,941 | ) | | | (23,516,204 | ) | | | (2,188,743 | ) | | | (605,875 | ) |
| | | | |
Class VI | | | — | | | | — | | | | (23,082,080 | ) | | | (7,340,475 | ) |
| | | | |
Class R6 | | | (15,335,754 | ) | | | (10,144,475 | ) | | | — | | | | — | |
| | | | |
Class I | | | — | | | | — | | | | (1,575,727 | ) | | | (170,853 | )* |
| | | | | | | | | | | | | | | | |
| | | | |
Total distributions | | | (44,500,695 | ) | | | (33,660,679 | ) | | | (26,846,550 | ) | | | (8,117,203 | ) |
| | | | | | | | | | | | | | | | |
|
Net share transactions (Note 9): | |
| | | | |
Class III | | | (119,007,367 | ) | | | (121,597,130 | ) | | | 5,866,671 | | | | 11,338,628 | |
| | | | |
Class VI | | | — | | | | — | | | | (77,631,000 | ) | | | (542,443,992 | ) |
| | | | |
Class R6 | | | 2,753,167 | | | | 13,037,294 | | | | — | | | | — | |
| | | | |
Class I | | | — | | | | — | | | | 8,999,513 | | | | 14,188,676 | * |
| | | | | | | | | | | | | | | | |
| | | | |
Increase (decrease) in net assets resulting from net share transactions | | | (116,254,200 | ) | | | (108,559,836 | ) | | | (62,764,816 | ) | | | (516,916,688 | ) |
| | | | | | | | | | | | | | | | |
| | | | |
Total increase (decrease) in net assets | | | (182,236,832 | ) | | | 4,708,965 | | | | (97,664,429 | ) | | | (492,341,543 | ) |
|
| Net assets: | |
| | | | |
Beginning of period | | | 861,554,172 | | | | 856,845,207 | | | | 358,055,329 | | | | 850,396,872 | |
| | | | | | | | | | | | | | | | |
| | | | |
End of period | | $ | 679,317,340 | | | $ | 861,554,172 | | | $ | 260,390,900 | | | $ | 358,055,329 | |
| | | | | | | | | | | | | | | | |
| (a) | A plan of reorganization was completed on January 22, 2021. |
| * | Period from September 23, 2020 (commencement of operations) through February 28, 2021. |
| | | | |
| | |
| | | See accompanying notes to the financial statements. | | 147 |
GMO Trust Funds
Statements of Changes in Net Assets — (Continued)
| | | | | | | | |
| | | Strategic Opportunities
Allocation Fund | |
| | | Year Ended
February 28, | |
| | | 2022 | | | 2021 | |
Increase (decrease) in net assets: | |
|
Operations: | |
| | |
Net investment income (loss) | | $ | 10,033,100 | | | $ | 18,754,742 | |
| | |
Net realized gain (loss) | | | 64,829,890 | | | | 14,588,170 | |
| | |
Change in net unrealized appreciation (depreciation) | | | (48,805,216 | ) | | | 66,489,403 | |
| | | | | | | | |
| | |
Net increase (decrease) in net assets from operations | | | 26,057,774 | | | | 99,832,315 | |
| | | | | | | | |
|
Distributions to shareholders: | |
| | |
Class III | | | (67,555,650 | ) | | | (26,956,390 | ) |
| | | | | | | | |
| | |
Total distributions | | | (67,555,650 | ) | | | (26,956,390 | ) |
| | | | | | | | |
|
Net share transactions (Note 9): | |
| | |
Class III | | | (301,846,406 | ) | | | (266,517,298 | ) |
| | | | | | | | |
| | |
Increase (decrease) in net assets resulting from net share transactions | | | (301,846,406 | ) | | | (266,517,298 | ) |
| | | | | | | | |
| | |
Total increase (decrease) in net assets | | | (343,344,282 | ) | | | (193,641,373 | ) |
|
| Net assets: | |
| | |
Beginning of period | | | 579,796,304 | | | | 773,437,677 | |
| | | | | | | | |
| | |
End of period | | $ | 236,452,022 | | | $ | 579,796,304 | |
| | | | | | | | |
| | | | |
| | |
| 148 | | See accompanying notes to the financial statements. | | |
GMO Trust Funds
Financial Highlights
(For a share outstanding throughout each period)
CONSOLIDATED ALTERNATIVE ALLOCATION FUND
| | | | | | | | | | | | | | | | | | | | | | | | | | | | | | | | | | | | | | | | |
| | | Class VI Shares | | Class R6 Shares | | Class I Shares |
| | | Year Ended
February 28, | | Period from
May 1, 2019
(commencement
of operations)
through
February 29,
2020 | | Year Ended
February 28,
2022 | | Period from
July 31, 2020
(commencement
of operations)
through
February 28,
2021 | | Year Ended
February 28, | | Period from
September 4, 2019
(commencement
of operations)
through
February 29,
2020 |
| | | 2022 | | 2021 | | 2022 | | 2021 |
Net asset value, beginning of period | | | $ | 18.99 | | | | $ | 19.45 | | | | $ | 20.00 | | | | $ | 18.95 | | | | $ | 19.33 | | | | $ | 18.96 | | | | $ | 19.44 | | | | $ | 20.18 | |
| | | | | | | | | | | | | | | | | | | | | | | | | | | | | | | | | | | | | | | | |
Income (loss) from investment operations: | | | | | | | | | | | | | | | | | | | | | | | | | | | | | | | | | | | | | | | | |
Net investment income (loss)(a)† | | | | 0.05 | | | | | (0.02 | ) | | | | 0.15 | | | | | (0.00 | )(b) | | | | (0.03 | ) | | | | 0.01 | | | | | (0.09 | ) | | | | 0.10 | |
Net realized and unrealized gain (loss) | | | | (0.23 | ) | | | | 0.03 | (c) | | | | (0.18 | ) | | | | (0.04 | ) | | | | 0.07 | (c) | | | | (0.23 | ) | | | | 0.04 | (c) | | | | (0.33 | ) |
| | | | | | | | | | | | | | | | | | | | | | | | | | | | | | | | | | | | | | | | |
Total from investment operations | | | | (0.18 | ) | | | | 0.01 | | | | | (0.03 | ) | | | | (0.04 | ) | | | | 0.04 | | | | | (0.22 | ) | | | | (0.05 | ) | | | | (0.23 | ) |
| | | | | | | | | | | | | | | | | | | | | | | | | | | | | | | | | | | | | | | | |
Less distributions to shareholders: | | | | | | | | | | | | | | | | | | | | | | | | | | | | | | | | | | | | | | | | |
From net investment income | | | | — | | | | | (0.47 | ) | | | | (0.06 | ) | | | | — | | | | | (0.42 | ) | | | | — | | | | | (0.43 | ) | | | | (0.05 | ) |
From net realized gains | | | | (0.73 | ) | | | | — | | | | | (0.46 | ) | | | | (0.73 | ) | | | | — | | | | | (0.73 | ) | | | | — | | | | | (0.46 | ) |
| | | | | | | | | | | | | | | | | | | | | | | | | | | | | | | | | | | | | | | | |
Total distributions | | | | (0.73 | ) | | | | (0.47 | ) | | | | (0.52 | ) | | | | (0.73 | ) | | | | (0.42 | ) | | | | (0.73 | ) | | | | (0.43 | ) | | | | (0.51 | ) |
| | | | | | | | | | | | | | | | | | | | | | | | | | | | | | | | | | | | | | | | |
Net asset value, end of period | | | $ | 18.08 | | | | $ | 18.99 | | | | $ | 19.45 | | | | $ | 18.18 | | | | $ | 18.95 | | | | $ | 18.01 | | | | $ | 18.96 | | | | $ | 19.44 | |
| | | | | | | | | | | | | | | | | | | | | | | | | | | | | | | | | | | | | | | | |
Total Return(d) | | | | (0.99 | )% | | | | 0.01 | % | | | | (0.21 | )%** | | | | (0.23 | )% | | | | 0.16 | %** | | | | (1.21 | )% | | | | (0.30 | )% | | | | (1.20 | )%** |
Ratios/Supplemental Data: | | | | | | | | | | | | | | | | | | | | | | | | | | | | | | | | | | | | | | | | |
Net assets, end of period (000’s) | | | $ | 130,896 | | | | $ | 230,386 | | | | $ | 200,812 | | | | $ | 22 | | | | $ | 478 | | | | $ | 148,247 | | | | $ | 268,473 | | | | $ | 34,229 | |
Net operating expenses to average daily net assets(e) | | | | 0.80 | % | | | | 0.76 | % | | | | 0.77 | %* | | | | 0.97 | % | | | | 0.93 | %* | | | | 1.07 | % | | | | 1.02 | % | | | | 1.02 | %* |
Interest and/or dividend expenses and/or borrowing costs to average daily net assets(f) | | | | 0.51 | % | | | | 0.49 | % | | | | 0.29 | %* | | | | 0.58 | % | | | | 0.53 | %* | | | | 0.50 | % | | | | 0.51 | % | | | | 0.23 | %* |
Total net expenses to average daily net assets(e) | | | | 1.31 | % | | | | 1.25 | % | | | | 1.05 | %* | | | | 1.55 | % | | | | 1.46 | %* | | | | 1.57 | % | | | | 1.53 | % | | | | 1.25 | %* |
Net investment income (loss) to average daily net assets(a) | | | | 0.29 | % | | | | (0.10 | )% | | | | 0.88 | %* | | | | 0.01 | % | | | | (0.26 | )%* | | | | 0.06 | % | | | | (0.44 | )% | | | | 0.98 | %* |
Portfolio turnover rate(g) | | | | 572 | % | | | | 410 | % | | | | 243 | %** | | | | 572 | % | | | | 410 | %** | | | | 572 | % | | | | 410 | % | | | | 243 | %** |
Fees and expenses reimbursed and/or waived by GMO to average daily net assets:(h) | | | | 0.17 | % | | | | 0.15 | % | | | | 0.27 | %* | | | | 0.13 | % | | | | 0.16 | %* | | | | 0.19 | % | | | | 0.15 | % | | | | 0.24 | %* |
| (a) | Net investment income is affected by the timing of the declaration of dividends by the other GMO Funds and/or other investment companies in which the Fund invests, if any. |
| (b) | Rounds to less than $0.01. |
| (c) | The amount shown for a share outstanding does not correspond with the aggregate net realized and unrealized gain (loss) on investments due to the timing of purchases and redemptions of the Fund shares in relation to fluctuating market values of the investments of the Fund. |
| (d) | The total returns would have been lower had certain expenses not been reimbursed and/or waived during the periods shown, if applicable, and assumes the effect of reinvested distributions, if any. Calculation excludes purchase premiums and redemption fees which are borne by the shareholder purchasing or redeeming Fund shares, if any. |
| (e) | Net expenses exclude expenses incurred indirectly through investment in the underlying funds, if any (Note 5). |
| (f) | Interest and dividend expense and/or borrowing costs incurred as a result of entering into reverse repurchase agreements, securities sold short or margin on cleared swap contracts, if any, is included in the Fund’s net expenses. Income earned on investing proceeds from reverse repurchase agreements, if any, is included in interest income. |
| (g) | The portfolio turnover rate excludes investments in GMO U.S. Treasury Fund (“USTF”) which is used as a short-term investment vehicle for cash management. The Fund’s portfolio turnover rate during the periods ended February 28, 2022, February 28, 2021 and February 29, 2020, including transactions in USTF, was 572%, 411% and 250%, respectively, of the average value of its portfolio. |
| (h) | Ratio includes indirect fees waived or borne by GMO. |
| † | Calculated using average shares outstanding throughout the period. |
| | | | |
| | |
| | | See accompanying notes to the financial statements. | | 149 |
GMO Trust Funds
Financial Highlights
(For a share outstanding throughout each period)
BENCHMARK-FREE ALLOCATION FUND
| | | | | | | | | | | | | | | | | | | | | | | | | | | | | | | | | | | | | | | | | | | | | | | | | | |
| | | Class III Shares | | Class IV Shares |
| | | Year Ended February 28/29, | | Year Ended February 28/29, |
| | | 2022 | | 2021 | | 2020 | | 2019 | | 2018 | | 2022 | | 2021 | | 2020 | | 2019 | | 2018 |
Net asset value, beginning of period | | | $ | 25.97 | | | | $ | 25.53 | | | | $ | 26.36 | | | | $ | 27.76 | | | | $ | 25.78 | | | | $ | 25.96 | | | | $ | 25.53 | | | | $ | 26.35 | | | | $ | 27.75 | | | | $ | 25.78 | |
| | | | | | | | | | | | | | | | | | | | | | | | | | | | | | | | | | | | | | | | | | | | | | | | | | |
Income (loss) from investment operations: | | | | | | | | | | | | | | | | | | | | | | | | | | | | | | | | | | | | | | | | | | | | | | | | | | |
Net investment income (loss)(a)† | | | | 0.57 | | | | | 0.40 | | | | | 0.83 | | | | | 0.82 | | | | | 0.52 | | | | | 0.49 | | | | | 0.43 | | | | | 0.83 | | | | | 0.88 | | | | | 0.58 | |
Net realized and unrealized gain (loss) | | | | (0.35 | ) | | | | 0.98 | | | | | (0.75 | ) | | | | (1.30 | ) | | | | 2.12 | | | | | (0.25 | ) | | | | 0.96 | | | | | (0.73 | ) | | | | (1.35 | ) | | | | 2.06 | |
| | | | | | | | | | | | | | | | | | | | | | | | | | | | | | | | | | | | | | | | | | | | | | | | | | |
Total from investment operations | | | | 0.22 | | | | | 1.38 | | | | | 0.08 | | | | | (0.48 | ) | | | | 2.64 | | | | | 0.24 | | | | | 1.39 | | | | | 0.10 | | | | | (0.47 | ) | | | | 2.64 | |
| | | | | | | | | | | | | | | | | | | | | | | | | | | | | | | | | | | | | | | | | | | | | | | | | | |
Less distributions to shareholders: | | | | | | | | | | | | | | | | | | | | | | | | | | | | | | | | | | | | | | | | | | | | | | | | | | |
From net investment income | | | | (0.63 | ) | | | | (0.78 | ) | | | | (0.90 | ) | | | | (0.90 | ) | | | | (0.66 | ) | | | | (0.64 | ) | | | | (0.80 | ) | | | | (0.91 | ) | | | | (0.91 | ) | | | | (0.67 | ) |
From net realized gains | | | | — | | | | | (0.16 | ) | | | | (0.01 | ) | | | | (0.02 | ) | | | | — | | | | | — | | | | | (0.16 | ) | | | | (0.01 | ) | | | | (0.02 | ) | | | | — | |
| | | | | | | | | | | | | | | | | | | | | | | | | | | | | | | | | | | | | | | | | | | | | | | | | | |
Total distributions | | | | (0.63 | ) | | | | (0.94 | ) | | | | (0.91 | ) | | | | (0.92 | ) | | | | (0.66 | ) | | | | (0.64 | ) | | | | (0.96 | ) | | | | (0.92 | ) | | | | (0.93 | ) | | | | (0.67 | ) |
| | | | | | | | | | | | | | | | | | | | | | | | | | | | | | | | | | | | | | | | | | | | | | | | | | |
Net asset value, end of period | | | $ | 25.56 | | | | $ | 25.97 | | | | $ | 25.53 | | | | $ | 26.36 | | | | $ | 27.76 | | | | $ | 25.56 | | | | $ | 25.96 | | | | $ | 25.53 | | | | $ | 26.35 | | | | $ | 27.75 | |
| | | | | | | | | | | | | | | | | | | | | | | | | | | | | | | | | | | | | | | | | | | | | | | | | | |
Total Return(b) | | | | 0.86 | % | | | | 5.60 | % | | | | 0.11 | % | | | | (1.55 | )% | | | | 10.28 | % | | | | 0.93 | % | | | | 5.61 | % | | | | 0.21 | % | | | | (1.50 | )% | | | | 10.30 | % |
Ratios/Supplemental Data: | | | | | | | | | | | | | | | | | | | | | | | | | | | | | | | | | | | | | | | | | | | | | | | | | | |
Net assets, end of period (000’s) | | | $ | 1,726,440 | | | | $ | 2,227,712 | | | | $ | 3,785,568 | | | | $ | 4,642,211 | | | | $ | 5,162,084 | | | | $ | 1,388,080 | | | | $ | 1,965,528 | | | | $ | 2,085,324 | | | | $ | 2,737,619 | | | | $ | 2,756,005 | |
Net operating expenses to average daily net assets(c) | | | | 0.75 | % | | | | 0.70 | % | | | | 0.66 | % | | | | 0.65 | % | | | | 0.65 | % | | | | 0.70 | % | | | | 0.66 | % | | | | 0.61 | % | | | | 0.60 | % | | | | 0.60 | % |
Net investment income (loss) to average daily net assets(a) | | | | 2.15 | % | | | | 1.59 | % | | | | 3.12 | % | | | | 3.07 | % | | | | 1.93 | % | | | | 1.85 | % | | | | 1.73 | % | | | | 3.12 | % | | | | 3.29 | % | | | | 2.13 | % |
Portfolio turnover rate | | | | 7 | % | | | | 20 | % | | | | 10 | % | | | | 18 | % | | | | 9 | % | | | | 7 | % | | | | 20 | % | | | | 10 | % | | | | 18 | % | | | | 9 | % |
Fees and expenses reimbursed and/or waived by GMO to average daily net assets:(d) | | | | 0.06 | % | | | | 0.11 | % | | | | 0.15 | % | | | | 0.15 | % | | | | 0.16 | % | | | | 0.06 | % | | | | 0.10 | % | | | | 0.15 | % | | | | 0.15 | % | | | | 0.16 | % |
Purchase premiums and redemption fees consisted of the following per share amounts (Note 2):† | | | $ | — | | | | $ | — | | | | $ | — | | | | $ | 0.00 | (e) | | | $ | 0.01 | | | | $ | — | | | | $ | — | | | | $ | — | | | | $ | 0.00 | (e) | | | $ | 0.01 | |
| | | | | | | | | | | | | | | | | | | | |
| | | Class MF Shares | |
| | | Year Ended February 28/29, | |
| | | 2022 | | | 2021 | | | 2020 | | | 2019 | | | 2018 | |
Net asset value, beginning of period | | $ | 25.99 | | | $ | 25.55 | | | $ | 26.38 | | | $ | 27.77 | | | $ | 25.80 | |
| | | | | | | | | | | | | | | | | | | | |
Income (loss) from investment operations: | | | | | | | | | | | | | | | | | | | | |
Net investment income (loss)(a)† | | | 0.60 | | | | 0.38 | | | | 0.83 | | | | 0.77 | | | | 0.56 | |
Net realized and unrealized gain (loss) | | | (0.37 | ) | | | 1.01 | | | | (0.74 | ) | | | (1.23 | ) | | | 2.08 | |
| | | | | | | | | | | | | | | | | | | | |
Total from investment operations | | | 0.23 | | | | 1.39 | | | | 0.09 | | | | (0.46 | ) | | | 2.64 | |
| | | | | | | | | | | | | | | | | | | | |
Less distributions to shareholders: | | | | | | | | | | | | | | | | | | | | |
From net investment income | | | (0.64 | ) | | | (0.79 | ) | | | (0.91 | ) | | | (0.91 | ) | | | (0.67 | ) |
From net realized gains | | | — | | | | (0.16 | ) | | | (0.01 | ) | | | (0.02 | ) | | | — | |
| | | | | | | | | | | | | | | | | | | | |
Total distributions | | | (0.64 | ) | | | (0.95 | ) | | | (0.92 | ) | | | (0.93 | ) | | | (0.67 | ) |
| | | | | | | | | | | | | | | | | | | | |
Net asset value, end of period | | $ | 25.58 | | | $ | 25.99 | | | $ | 25.55 | | | $ | 26.38 | | | $ | 27.77 | |
| | | | | | | | | | | | | | | | | | | | |
Total Return(b) | | | 0.91 | % | | | 5.64 | % | | | 0.16 | % | | | (1.47 | )% | | | 10.29 | % |
Ratios/Supplemental Data: | | | | | | | | | | | | | | | | | | | | |
Net assets, end of period (000’s) | | $ | 1,370,527 | | | $ | 1,716,252 | | | $ | 2,827,442 | | | $ | 3,926,518 | | | $ | 5,622,091 | |
Net operating expenses to average daily net assets(c) | | | 0.70 | % | | | 0.65 | % | | | 0.61 | % | | | 0.60 | % | | | 0.60 | % |
Net investment income (loss) to average daily net assets(a) | | | 2.25 | % | | | 1.54 | % | | | 3.12 | % | | | 2.88 | % | | | 2.06 | % |
Portfolio turnover rate | | | 7 | % | | | 20 | % | | | 10 | % | | | 18 | % | | | 9 | % |
Fees and expenses reimbursed and/or waived by GMO to average daily net assets:(d) | | | 0.06 | % | | | 0.11 | % | | | 0.15 | % | | | 0.15 | % | | | 0.16 | % |
Purchase premiums and redemption fees consisted of the following per share amounts (Note 2):† | | $ | — | | | $ | — | | | $ | — | | | $ | 0.00 | (e) | | $ | 0.01 | |
| (a) | Net investment income is affected by the timing of the declaration of dividends by the other GMO Funds and/or other investment companies in which the Fund invests, if any. |
| (b) | The total returns would have been lower had certain expenses not been reimbursed and/or waived during the periods shown, if applicable, and assumes the effect of reinvested distributions, if any. Calculation excludes purchase premiums and redemption fees which are borne by the shareholder purchasing or redeeming Fund shares, if any. |
| (c) | Net expenses exclude expenses incurred indirectly through investment in the underlying funds, if any (Note 5). |
| (d) | Ratios include indirect fees waived or borne by GMO. |
| (e) | Rounds to less than $0.01. |
| † | Calculated using average shares outstanding throughout the period. |
| | | | |
| | |
| 150 | | See accompanying notes to the financial statements. | | |
GMO Trust Funds
Financial Highlights
(For a share outstanding throughout each period)
BENCHMARK-FREE ALLOCATION FUND (continued)
| | | | | | | | | | | | | | | | | | | | | | | | | |
| | | Class R6 Shares | | Class I Shares |
| | | Year Ended
February 28,
2022 | | Period from
May 1, 2020
(commencement
of operations)
through
February 28,
2021 | | Year Ended
February 28, | | Period from
August 8, 2019
(commencement
of operations)
through
February 29,
2020 |
| | | 2022 | | 2021 |
Net asset value, beginning of period | | | $ | 25.95 | | | | $ | 23.95 | | | | $ | 25.95 | | | | $ | 25.52 | | | | $ | 26.24 | |
| | | | | | | | | | | | | | | | | | | | | | | | | |
Income (loss) from investment operations: | | | | | | | | | | | | | | | | | | | | | | | | | |
Net investment income (loss)(a)† | | | | 0.55 | | | | | 0.24 | | | | | 0.63 | | | | | 0.33 | | | | | 1.10 | |
Net realized and unrealized gain (loss) | | | | (0.33 | ) | | | | 2.72 | | | | | (0.44 | ) | | | | 1.02 | | | | | (0.93 | ) |
| | | | | | | | | | | | | | | | | | | | | | | | | |
Total from investment operations | | | | 0.22 | | | | | 2.96 | | | | | 0.19 | | | | | 1.35 | | | | | 0.17 | |
| | | | | | | | | | | | | | | | | | | | | | | | | |
Less distributions to shareholders: | | | | | | | | | | | | | | | | | | | | | | | | | |
From net investment income | | | | (0.63 | ) | | | | (0.80 | ) | | | | (0.61 | ) | | | | (0.76 | ) | | | | (0.89 | ) |
From net realized gains | | | | — | | | | | (0.16 | ) | | | | — | | | | | (0.16 | ) | | | | — | |
| | | | | | | | | | | | | | | | | | | | | | | | | |
Total distributions | | | | (0.63 | ) | | | | (0.96 | ) | | | | (0.61 | ) | | | | (0.92 | ) | | | | (0.89 | ) |
| | | | | | | | | | | | | | | | | | | | | | | | | |
Net asset value, end of period | | | $ | 25.54 | | | | $ | 25.95 | | | | $ | 25.53 | | | | $ | 25.95 | | | | $ | 25.52 | |
| | | | | | | | | | | | | | | | | | | | | | | | | |
Total Return(b) | | | | 0.86 | % | | | | 12.55 | %** | | | | 0.77 | % | | | | 5.47 | % | | | | 0.48 | %** |
Ratios/Supplemental Data: | | | | | | | | | | | | | | | | | | | | | | | | | |
Net assets, end of period (000’s) | | | $ | 273,491 | | | | $ | 310,687 | | | | $ | 365,107 | | | | $ | 324,819 | | | | $ | 98,453 | |
Net expenses to average daily net assets(c) | | | | 0.75 | % | | | | 0.74 | %* | | | | 0.85 | % | | | | 0.81 | % | | | | 0.74 | %* |
Net investment income (loss) to average daily net assets(a) | | | | 2.06 | % | | | | 1.16 | %* | | | | 2.38 | % | | | | 1.30 | % | | | | 7.22 | %* |
Portfolio turnover rate | | | | 7 | % | | | | 20 | %** | | | | 7 | % | | | | 20 | % | | | | 10 | %** |
Fees and expenses reimbursed and/or waived by GMO to average daily net assets:(d) | | | | 0.06 | % | | | | 0.08 | %* | | | | 0.07 | % | | | | 0.10 | % | | | | 0.15 | %* |
| (a) | Net investment income is affected by the timing of the declaration of dividends by the other GMO Funds and/or other investment companies in which the Fund invests, if any. |
| (b) | The total returns would have been lower had certain expenses not been reimbursed and/or waived during the periods shown, if applicable, and assumes the effect of reinvested distributions, if any. Calculation excludes purchase premiums and redemption fees which are borne by the shareholder purchasing or redeeming Fund shares, if any. |
| (c) | Net expenses exclude expenses incurred indirectly through investment in the underlying funds, if any (Note 5). |
| (d) | Ratios include indirect fees waived or borne by GMO. |
| † | Calculated using average shares outstanding throughout the period. |
| | | | |
| | |
| | | See accompanying notes to the financial statements. | | 151 |
GMO Trust Funds
Financial Highlights
(For a share outstanding throughout each period)
BENCHMARK-FREE FUND
| | | | | | | | | | | | | | | | | | | | | | | | | |
| | | Class III Shares |
| | | Year Ended February 28/29, |
| | | 2022 | | 2021 | | 2020 | | 2019 | | 2018 |
Net asset value, beginning of period | | | $ | 19.48 | | | | $ | 18.88 | | | | $ | 19.56 | | | | $ | 20.91 | | | | $ | 18.95 | |
| | | | | | | | | | | | | | | | | | | | | | | | | |
Income (loss) from investment operations: | | | | | | | | | | | | | | | | | | | | | | | | | |
Net investment income (loss)(a)† | | | | 0.63 | | | | | 0.52 | | | | | 0.72 | | | | | 0.58 | | | | | 0.46 | |
Net realized and unrealized gain (loss) | | | | (0.39 | ) | | | | 0.71 | | | | | (0.59 | ) | | | | (1.21 | ) | | | | 2.10 | |
| | | | | | | | | | | | | | | | | | | | | | | | | |
Total from investment operations | | | | 0.24 | | | | | 1.23 | | | | | 0.13 | | | | | (0.63 | ) | | | | 2.56 | |
| | | | | | | | | | | | | | | | | | | | | | | | | |
Less distributions to shareholders: | | | | | | | | | | | | | | | | | | | | | | | | | |
From net investment income | | | | (0.87 | ) | | | | (0.63 | ) | | | | (0.81 | ) | | | | (0.72 | ) | | | | (0.60 | ) |
| | | | | | | | | | | | | | | | | | | | | | | | | |
Total distributions | | | | (0.87 | ) | | | | (0.63 | ) | | | | (0.81 | ) | | | | (0.72 | ) | | | | (0.60 | ) |
| | | | | | | | | | | | | | | | | | | | | | | | | |
Net asset value, end of period | | | $ | 18.85 | | | | $ | 19.48 | | | | $ | 18.88 | | | | $ | 19.56 | | | | $ | 20.91 | |
| | | | | | | | | | | | | | | | | | | | | | | | | |
Total Return(b) | | | | 1.21 | % | | | | 6.64 | % | | | | 0.41 | % | | | | (2.80 | )% | | | | 13.59 | % |
Ratios/Supplemental Data: | | | | | | | | | | | | | | | | | | | | | | | | | |
Net assets, end of period (000’s) | | | $ | 1,613,854 | | | | $ | 2,158,496 | | | | $ | 2,583,930 | | | | $ | 3,165,731 | | | | $ | 4,486,489 | |
Net operating expenses to average daily net assets(c) | | | | 0.03 | % | | | | 0.04 | % | | | | 0.02 | % | | | | 0.02 | % | | | | 0.02 | % |
Interest and/or dividend expenses and/or borrowing costs to average daily net assets(d) | | | | 0.26 | % | | | | 0.08 | % | | | | 0.03 | % | | | | 0.04 | % | | | | 0.00 | %(e) |
Total net expenses to average daily net assets(c) | | | | 0.29 | % | | | | 0.12 | % | | | | 0.05 | % | | | | 0.06 | % | | | | 0.02 | % |
Net investment income (loss) to average daily net assets(a) | | | | 3.19 | % | | | | 2.86 | % | | | | 3.64 | % | | | | 2.92 | % | | | | 2.29 | % |
Portfolio turnover rate(f) | | | | 138 | % | | | | 145 | % | | | | 50 | % | | | | 59 | % | | | | 78 | % |
Fees and expenses reimbursed and/or waived by GMO to average daily net assets: | | | | 0.07 | % | | | | 0.05 | % | | | | 0.04 | % | | | | 0.03 | % | | | | 0.03 | % |
Purchase premiums and redemption fees consisted of the following per share amounts (Note 2):† | | | $ | — | | | | $ | — | | | | $ | — | | | | $ | 0.00 | (g) | | | $ | 0.01 | |
| (a) | Net investment income is affected by the timing of the declaration of dividends by the other GMO Funds and/or other investment companies in which the Fund invests, if any. |
| (b) | The total returns would have been lower had certain expenses not been reimbursed and/or waived during the periods shown, if applicable, and assumes the effect of reinvested distributions, if any. Calculation excludes purchase premiums and redemption fees which are borne by the shareholder purchasing or redeeming Fund shares, if any. |
| (c) | Net expenses exclude expenses incurred indirectly through investment in the underlying funds, if any (Note 5). |
| (d) | Interest and dividend expense and/or borrowing costs incurred as a result of entering into reverse repurchase agreements, securities sold short or margin on cleared swap contracts, if any, is included in the Fund’s net expenses. Income earned on investing proceeds from reverse repurchase agreements, if any, is included in interest income. |
| (e) | Rounds to less than 0.01%. |
| (f) | The portfolio turnover rate excludes investments in GMO U.S. Treasury Fund (“USTF”) which is used as a short-term investment vehicle for cash management. The Fund’s portfolio turnover rate during the years ended February 28, 2022, February 28, 2021, February 29, 2020, February 28, 2019 and February 28, 2018, including transactions in USTF, was 145%, 151%, 52%, 59% and 81%, respectively, of the average value of its portfolio. |
| (g) | Rounds to less than $0.01. |
| † | Calculated using average shares outstanding throughout the period. |
| | | | |
| | |
| 152 | | See accompanying notes to the financial statements. | | |
GMO Trust Funds
Financial Highlights
(For a share outstanding throughout each period)
GLOBAL ASSET ALLOCATION FUND
| | | | | | | | | | | | | | | | | | | | | | | | | | | | | | | | | | | | | | | | | | | | | | | | | | |
| | | Class III Shares | | Class R6 Shares | | Class I Shares |
| | | Year Ended February 28/29, | | Year Ended
February 28, | | Period from
September 30, 2019
(commencement of
operations)
through
February 29,
2020 | | Year Ended
February 28,
2022 | | Period from
January 6, 2021
(commencement
of operations)
through
February 28,
2021 |
| | | 2022 | | 2021 | | 2020 | | 2019 | | 2018 | | 2022 | | 2021 |
Net asset value, beginning of period | | | $ | 34.92 | | | | $ | 31.50 | | | | $ | 31.47 | | | | $ | 33.31 | | | | $ | 30.48 | | | | $ | 34.93 | | | | $ | 31.50 | | | | $ | 32.56 | | | | $ | 34.92 | | | | $ | 34.71 | |
| | | | | | | | | | | | | | | | | | | | | | | | | | | | | | | | | | | | | | | | | | | | | | | | | | |
Income (loss) from investment operations: | | | | | | | | | | | | | | | | | | | | | | | | | | | | | | | | | | | | | | | | | | | | | | | | | | |
Net investment income (loss)(a)† | | | | 0.96 | | | | | 0.88 | | | | | 1.08 | | | | | 1.02 | | | | | 0.73 | | | | | 0.51 | | | | | 0.93 | | | | | 0.86 | | | | | 0.87 | | | | | (0.01 | ) |
Net realized and unrealized gain (loss) | | | | (0.90 | ) | | | | 3.91 | | | | | 0.29 | | | | | (1.74 | ) | | | | 2.93 | | | | | (0.48 | ) | | | | 3.87 | | | | | (0.71 | ) | | | | (0.84 | ) | | | | 0.22 | |
| | | | | | | | | | | | | | | | | | | | | | | | | | | | | | | | | | | | | | | | | | | | | | | | | | |
Total from investment operations | | | | 0.06 | | | | | 4.79 | | | | | 1.37 | | | | | (0.72 | ) | | | | 3.66 | | | | | 0.03 | | | | | 4.80 | | | | | 0.15 | | | | | 0.03 | | | | | 0.21 | |
| | | | | | | | | | | | | | | | | | | | | | | | | | | | | | | | | | | | | | | | | | | | | | | | | | |
Less distributions to shareholders: | | | | | | | | | | | | | | | | | | | | | | | | | | | | | | | | | | | | | | | | | | | | | | | | | | |
From net investment income | | | | (2.12 | ) | | | | (1.37 | ) | | | | (1.34 | ) | | | | (1.12 | ) | | | | (0.83 | ) | | | | (2.12 | ) | | | | (1.37 | ) | | | | (1.21 | ) | | | | (2.08 | ) | | | | — | |
From net realized gains | | | | — | | | | | — | | | | | — | | | | | — | | | | | — | | | | | — | | | | | — | | | | | — | | | | | — | | | | | — | |
| | | | | | | | | | | | | | | | | | | | | | | | | | | | | | | | | | | | | | | | | | | | | | | | | | |
Total distributions | | | | (2.12 | ) | | | | (1.37 | ) | | | | (1.34 | ) | | | | (1.12 | ) | | | | (0.83 | ) | | | | (2.12 | ) | | | | (1.37 | ) | | | | (1.21 | ) | | | | (2.08 | ) | | | | — | |
| | | | | | | | | | | | | | | | | | | | | | | | | | | | | | | | | | | | | | | | | | | | | | | | | | |
Net asset value, end of period | | | $ | 32.86 | | | | $ | 34.92 | | | | $ | 31.50 | | | | $ | 31.47 | | | | $ | 33.31 | | | | $ | 32.84 | | | | $ | 34.93 | | | | $ | 31.50 | | | | $ | 32.87 | | | | $ | 34.92 | |
| | | | | | | | | | | | | | | | | | | | | | | | | | | | | | | | | | | | | | | | | | | | | | | | | | |
Total Return(b) | | | | (0.10 | )% | | | | 15.39 | % | | | | 4.12 | % | | | | (1.96 | )% | | | | 12.04 | % | | | | (0.19 | )% | | | | 15.42 | % | | | | 0.22 | %** | | | | (0.18 | )% | | | | 0.61 | %** |
Ratios/Supplemental Data: | | | | | | | | | | | | | | | | | | | | | | | | | | | | | | | | | | | | | | | | | | | | | | | | | | |
Net assets, end of period (000’s) | | | $ | 585,212 | | | | $ | 692,580 | | | | $ | 1,539,522 | | | | $ | 1,909,728 | | | | $ | 2,475,605 | | | | $ | 26,148 | | | | $ | 183,052 | | | | $ | 17,888 | | | | $ | 12,621 | | | | $ | 20,497 | |
Net operating expenses to average daily net assets(c) | | | | 0.00 | %(d) | | | | 0.00 | %(d) | | | | 0.00 | %(d) | | | | 0.00 | %(d) | | | | 0.00 | %(d) | | | | 0.00 | %(d) | | | | 0.01 | % | | | | 0.00 | %(d) | | | | 0.10 | % | | | | 0.11 | % |
Net investment income (loss) to average daily net assets(a) | | | | 2.68 | % | | | | 2.78 | % | | | | 3.32 | % | | | | 3.17 | % | | | | 2.24 | % | | | | 1.44 | % | | | | 2.78 | % | | | | 6.23 | %* | | | | 2.41 | % | | | | (0.10 | )%* |
Portfolio turnover rate(e) | | | | 27 | % | | | | 30 | % | | | | 27 | % | | | | 21 | % | | | | 20 | % | | | | 27 | % | | | | 30 | % | | | | 27 | %** | | | | 27 | % | | | | 30 | %** |
Fees and expenses reimbursed and/or waived by GMO to average daily net assets: | | | | 0.03 | % | | | | 0.01 | % | | | | 0.01 | % | | | | 0.01 | % | | | | 0.01 | % | | | | 0.02 | % | | | | 0.02 | % | | | | 0.01 | %* | | | | 0.03 | % | | | | 0.02 | %* |
Purchase premiums and redemption fees consisted of the following per share amounts (Note 2):† | | | $ | — | | | | $ | — | | | | $ | — | | | | $ | 0.00 | (f) | | | $ | 0.01 | | | | $ | — | | | | $ | — | | | | $ | — | | | | $ | — | | | | $ | — | |
| (a) | Net investment income is affected by the timing of the declaration of dividends by the other GMO Funds and/or other investment companies in which the Fund invests, if any. |
| (b) | The total returns would have been lower had certain expenses not been reimbursed and/or waived during the periods shown, if applicable, and assumes the effect of reinvested distributions, if any. Calculation excludes purchase premiums and redemption fees which are borne by the shareholder purchasing or redeeming Fund shares, if any. |
| (c) | Net expenses exclude expenses incurred indirectly through investment in the underlying funds, if any (Note 5). |
| (d) | Rounds to less than 0.01%. |
| (e) | The portfolio turnover rate excludes investments in GMO U.S. Treasury Fund (“USTF”) which is used as a short-term investment vehicle for cash management. The Fund’s portfolio turnover rate during the years ended February 28, 2022, February 28, 2021, February 29, 2020, February 28, 2019 and February 28, 2018, including transactions in USTF, was 31%, 41%, 28%, 24% and 22%, respectively, of the average value of its portfolio. |
| (f) | Rounds to less than $0.01. |
| † | Calculated using average shares outstanding throughout the period. |
| | | | |
| | |
| | | See accompanying notes to the financial statements. | | 153 |
GMO Trust Funds
Financial Highlights
(For a share outstanding throughout each period)
GLOBAL DEVELOPED EQUITY ALLOCATION FUND
| | | | | | | | | | | | | | | | | | | | | | | | | |
| | | Class III Shares |
| | | Year Ended February 28/29, |
| | | 2022 | | 2021 | | 2020 | | 2019 | | 2018 |
Net asset value, beginning of period | | | $ | 25.79 | | | | $ | 20.87 | | | | $ | 21.20 | | | | $ | 22.88 | | | | $ | 19.60 | |
| | | | | | | | | | | | | | | | | | | | | | | | | |
Income (loss) from investment operations: | | | | | | | | | | | | | | | | | | | | | | | | | |
Net investment income (loss)(a)† | | | | 1.00 | | | | | 0.75 | | | | | 0.25 | | | | | 0.57 | | | | | 0.42 | |
Net realized and unrealized gain (loss) | | | | 0.94 | | | | | 5.12 | | | | | 0.42 | | | | | (1.67 | ) | | | | 3.55 | |
| | | | | | | | | | | | | | | | | | | | | | | | | |
Total from investment operations | | | | 1.94 | | | | | 5.87 | | | | | 0.67 | | | | | (1.10 | ) | | | | 3.97 | |
| | | | | | | | | | | | | | | | | | | | | | | | | |
Less distributions to shareholders: | | | | | | | | | | | | | | | | | | | | | | | | | |
From net investment income | | | | (2.08 | ) | | | | (0.95 | ) | | | | (0.74 | ) | | | | (0.58 | ) | | | | (0.69 | ) |
From net realized gains | | | | (1.22 | ) | | | | — | | | | | (0.26 | ) | | | | — | | | | | — | |
| | | | | | | | | | | | | | | | | | | | | | | | | |
Total distributions | | | | (3.30 | ) | | | | (0.95 | ) | | | | (1.00 | ) | | | | (0.58 | ) | | | | (0.69 | ) |
| | | | | | | | | | | | | | | | | | | | | | | | | |
Net asset value, end of period | | | $ | 24.43 | | | | $ | 25.79 | | | | $ | 20.87 | | | | $ | 21.20 | | | | $ | 22.88 | |
| | | | | | | | | | | | | | | | | | | | | | | | | |
Total Return(b) | | | | 6.80 | % | | | | 28.41 | % | | | | 2.87 | % | | | | (4.58 | )% | | | | 20.39 | % |
Ratios/Supplemental Data: | | | | | | | | | | | | | | | | | | | | | | | | | |
Net assets, end of period (000’s) | | | $ | 86,810 | | | | $ | 88,154 | | | | $ | 73,383 | | | | $ | 447,874 | | | | $ | 469,283 | |
Net expenses to average daily net assets(c)(d) | | | | 0.00 | % | | | | 0.00 | % | | | | 0.00 | % | | | | 0.00 | % | | | | 0.00 | % |
Net investment income (loss) to average daily net assets(a) | | | | 3.61 | % | | | | 3.39 | % | | | | 1.16 | % | | | | 2.62 | % | | | | 1.99 | % |
Portfolio turnover rate | | | | 19 | % | | | | 25 | % | | | | 21 | % | | | | 6 | % | | | | 5 | % |
Fees and expenses reimbursed and/or waived by GMO to average daily net assets: | | | | 0.05 | % | | | | 0.06 | % | | | | 0.03 | % | | | | 0.02 | % | | | | 0.01 | % |
Purchase premiums and redemption fees consisted of the following per share amounts (Note 2):† | | | $ | — | | | | $ | — | | | | $ | — | | | | $ | 0.00 | (e) | | | $ | 0.02 | |
| (a) | Net investment income is affected by the timing of the declaration of dividends by the other GMO Funds and/or other investment companies in which the Fund invests, if any. |
| (b) | The total returns would have been lower had certain expenses not been reimbursed and/or waived during the periods shown, if applicable, and assumes the effect of reinvested distributions, if any. Calculation excludes purchase premiums and redemption fees which are borne by the shareholder purchasing or redeeming Fund shares, if any. |
| (c) | Net expenses exclude expenses incurred indirectly through investment in the underlying funds, if any (Note 5). |
| (d) | Rounds to less than 0.01%. |
| (e) | Rounds to less than $0.01. |
| † | Calculated using average shares outstanding throughout the period. |
| | | | |
| | |
| 154 | | See accompanying notes to the financial statements. | | |
GMO Trust Funds
Financial Highlights
(For a share outstanding throughout each period)
GLOBAL EQUITY ALLOCATION FUND
| | | | | | | | | | | | | | | | | | | | | | | | | | | | | | | | | | | | | | | | | | | | | |
| | | Class III Shares | | Class R6 Shares | | Class I Shares |
| | | Year Ended February 28/29, | | Year Ended
February 28,
2022 | | Period from
July 15, 2020
(commencement
of operations)
through
February 28,
2021 | | Year Ended
February 28,
2022 | | Period from
August 17, 2020
(commencement
of operations)
through
February 28,
2021
(Unaudited) |
| | | 2022 | | 2021 | | 2020 | | 2019 | | 2018 |
Net asset value, beginning of period | | | $ | 29.91 | | | | $ | 24.37 | | | | $ | 24.63 | | | | $ | 26.86 | | | | $ | 22.84 | | | | $ | 29.91 | | | | $ | 25.19 | | | | $ | 29.91 | | | | $ | 26.14 | |
| | | | | | | | | | | | | | | | | | | | | | | | | | | | | | | | | | | | | | | | | | | | | |
Income (loss) from investment operations: | | | | | | | | | | | | | | | | | | | | | | | | | | | | | | | | | | | | | | | | | | | | | |
Net investment income (loss)(a)† | | | | 1.18 | | | | | 0.88 | | | | | 0.83 | | | | | 0.65 | | | | | 0.68 | | | | | 1.19 | | | | | 0.81 | | | | | 1.17 | | | | | 0.90 | |
Net realized and unrealized gain (loss) | | | | (0.28 | ) | | | | 5.75 | | | | | (0.16 | ) | | | | (2.18 | ) | | | | 4.11 | | | | | (0.28 | ) | | | | 4.96 | | | | | (0.31 | ) | | | | 3.91 | |
| | | | | | | | | | | | | | | | | | | | | | | | | | | | | | | | | | | | | | | | | | | | | |
Total from investment operations | | | | 0.90 | | | | | 6.63 | | | | | 0.67 | | | | | (1.53 | ) | | | | 4.79 | | | | | 0.91 | | | | | 5.77 | | | | | 0.86 | | | | | 4.81 | |
| | | | | | | | | | | | | | | | | | | | | | | | | | | | | | | | | | | | | | | | | | | | | |
Less distributions to shareholders: | | | | | | | | | | | | | | | | | | | | | | | | | | | | | | | | | | | | | | | | | | | | | |
From net investment income | | | | (2.35 | ) | | | | (1.09 | ) | | | | (0.93 | ) | | | | (0.70 | ) | | | | (0.77 | ) | | | | (2.35 | ) | | | | (1.05 | ) | | | | (2.32 | ) | | | | (1.04 | ) |
From net realized gains | | | | (0.01 | ) | | | | — | | | | | — | | | | | — | | | | | — | | | | | (0.01 | ) | | | | — | | | | | (0.01 | ) | | | | — | |
| | | | | | | | | | | | | | | | | | | | | | | | | | | | | | | | | | | | | | | | | | | | | |
Total distributions | | | | (2.36 | ) | | | | (1.09 | ) | | | | (0.93 | ) | | | | (0.70 | ) | | | | (0.77 | ) | | | | (2.36 | ) | | | | (1.05 | ) | | | | (2.33 | ) | | | | (1.04 | ) |
| | | | | | | | | | | | | | | | | | | | | | | | | | | | | | | | | | | | | | | | | | | | | |
Net asset value, end of period | | | $ | 28.45 | | | | $ | 29.91 | | | | $ | 24.37 | | | | $ | 24.63 | | | | $ | 26.86 | | | | $ | 28.46 | | | | $ | 29.91 | | | | $ | 28.44 | | | | $ | 29.91 | |
| | | | | | | | | | | | | | | | | | | | | | | | | | | | | | | | | | | | | | | | | | | | | |
Total Return(b) | | | | 2.49 | % | | | | 27.51 | % | | | | 2.36 | % | | | | (5.43 | )% | | | | 21.06 | % | | | | 2.52 | % | | | | 23.14 | %** | | | | 2.37 | % | | | | 18.64 | %** |
Ratios/Supplemental Data: | | | | | | | | | | | | | | | | | | | | | | | | | | | | | | | | | | | | | | | | | | | | | |
Net assets, end of period (000’s) | | | $ | 1,571,153 | | | | $ | 1,638,868 | | | | $ | 1,456,064 | | | | $ | 1,637,744 | | | | $ | 2,328,921 | | | | $ | 7,065 | | | | $ | 6,781 | | | | $ | 2,615 | | | | $ | 2,233 | |
Net expenses to average daily net assets(c) | | | | 0.00 | % (d) | | | | 0.00 | %(d) | | | | 0.00 | %(d) | | | | 0.00 | %(d) | | | | 0.00 | %(d) | | | | 0.00 | %(d) | | | | 0.00 | %(d)* | | | | 0.10 | % | | | | 0.10 | %* |
Net investment income (loss) to average daily net assets(a) | | | | 3.69 | % | | | | 3.44 | % | | | | 3.26 | % | | | | 2.56 | % | | | | 2.67 | % | | | | 3.74 | % | | | | 4.70 | %* | | | | 3.67 | % | | | | 5.95 | %* |
Portfolio turnover rate | | | | 20 | % | | | | 20 | % | | | | 20 | % | | | | 11 | % | | | | 14 | % | | | | 20 | % | | | | 20 | %** | | | | 20 | % | | | | 20 | %** |
Fees and expenses reimbursed and/or waived by GMO to average daily net assets: | | | | 0.01 | % | | | | 0.01 | % | | | | 0.01 | % | | | | 0.01 | % | | | | 0.01 | % | | | | 0.01 | % | | | | 0.01 | %* | | | | 0.01 | % | | | | 0.01 | %* |
Purchase premiums and redemption fees consisted of the following per share amounts (Note 2):† | | | $ | — | | | | $ | — | | | | $ | — | | | | $ | 0.00 | (e) | | | $ | 0.01 | | | | $ | — | | | | $ | — | | | | $ | — | | | | $ | — | |
| (a) | Net investment income is affected by the timing of the declaration of dividends by the other GMO Funds and/or other investment companies in which the Fund invests, if any. |
| (b) | The total returns would have been lower had certain expenses not been reimbursed and/or waived during the periods shown, if applicable, and assumes the effect of reinvested distributions, if any. Calculation excludes purchase premiums and redemption fees which are borne by the shareholder purchasing or redeeming Fund shares, if any. |
| (c) | Net expenses exclude expenses incurred indirectly through investment in the underlying funds, if any (Note 5). |
| (d) | Rounds to less than 0.01%. |
| (e) | Rounds to less than $0.01. |
| † | Calculated using average shares outstanding throughout the period. |
| | | | |
| | |
| | | See accompanying notes to the financial statements. | | 155 |
GMO Trust Funds
Financial Highlights
(For a share outstanding throughout each period)
CONSOLIDATED IMPLEMENTATION FUND
| | | | | | | | | | | | | | | | | | | | | | | | | |
| | | Core Shares |
| | | Year Ended February 28/29, |
| | | 2022 | | 2021 | | 2020 | | 2019 | | 2018 |
Net asset value, beginning of period | | | $ | 12.70 | | | | $ | 12.74 | | | | $ | 13.22 | | | | $ | 14.09 | | | | $ | 13.06 | |
| | | | | | | | | | | | | | | | | | | | | | | | | |
Income (loss) from investment operations: | | | | | | | | | | | | | | | | | | | | | | | | | |
Net investment income (loss)† | | | | 0.38 | (a) | | | | 0.35 | (a) | | | | 0.49 | (a) | | | | 0.40 | | | | | 0.33 | |
Net realized and unrealized gain (loss) | | | | (0.13 | ) | | | | (0.11 | ) | | | | (0.43 | ) | | | | (0.69 | ) | | | | 1.11 | |
| | | | | | | | | | | | | | | | | | | | | | | | | |
Total from investment operations | | | | 0.25 | | | | | 0.24 | | | | | 0.06 | | | | | (0.29 | ) | | | | 1.44 | |
| | | | | | | | | | | | | | | | | | | | | | | | | |
Less distributions to shareholders: | | | | | | | | | | | | | | | | | | | | | | | | | |
From net investment income | | | | (0.41 | ) | | | | (0.28 | ) | | | | (0.54 | ) | | | | (0.58 | ) | | | | (0.41 | ) |
| | | | | | | | | | | | | | | | | | | | | | | | | |
Total distributions | | | | (0.41 | ) | | | | (0.28 | ) | | | | (0.54 | ) | | | | (0.58 | ) | | | | (0.41 | ) |
| | | | | | | | | | | | | | | | | | | | | | | | | |
Net asset value, end of period | | | $ | 12.54 | | | | $ | 12.70 | | | | $ | 12.74 | | | | $ | 13.22 | | | | $ | 14.09 | |
| | | | | | | | | | | | | | | | | | | | | | | | | |
Total Return(b) | | | | 2.02 | % | | | | 1.95 | % | | | | 0.25 | % | | | | (1.88 | )% | | | | 11.12 | % |
Ratios/Supplemental Data: | | | | | | | | | | | | | | | | | | | | | | | | | |
Net assets, end of period (000’s) | | | $ | 4,681,226 | | | | $ | 5,970,367 | | | | $ | 7,114,306 | | | | $ | 8,965,578 | | | | $ | 11,505,699 | |
Net operating expenses to average daily net assets | | | | 0.00 | %(c)(d) | | | | 0.01 | %(c) | | | | 0.00 | %(c)(d) | | | | 0.00 | %(d) | | | | 0.00 | %(d) |
Interest and/or dividend expenses to average daily net assets(e) | | | | 0.32 | % | | | | 0.15 | % | | | | 0.06 | % | | | | 0.10 | % | | | | 0.04 | % |
Total net expenses to average daily net assets | | | | 0.32 | %(c) | | | | 0.16 | %(c) | | | | 0.06 | %(c) | | | | 0.10 | % | | | | 0.04 | % |
Net investment income (loss) to average daily net assets | | | | 2.95 | %(a) | | | | 2.89 | %(a) | | | | 3.65 | %(a) | | | | 2.95 | % | | | | 2.44 | % |
Portfolio turnover rate | | | | 194 | %(f) | | | | 189 | %(f) | | | | 97 | %(f) | | | | 112 | % | | | | 146 | % |
Fees and expenses reimbursed and/or waived by GMO to average daily net assets: | | | | 0.06 | %(g) | | | | 0.06 | %(g) | | | | 0.05 | %(g) | | | | 0.04 | % | | | | 0.04 | % |
Purchase premiums and redemption fees consisted of the following per share amounts (Note 2):† | | | $ | — | | | | $ | — | | | | $ | — | | | | $ | 0.00 | (h) | | | $ | 0.01 | |
| (a) | Net investment income is affected by the timing of the declaration of dividends by the other GMO Funds and/or other investment companies in which the Fund invests, if any. |
| (b) | The total returns would have been lower had certain expenses not been reimbursed and/or waived during the periods shown, if applicable, and assumes the effect of reinvested distributions, if any. Calculation excludes purchase premiums and redemption fees which are borne by the shareholder purchasing or redeeming Fund shares, if any. |
| (c) | Net expenses exclude expenses incurred indirectly through investment in the underlying funds, if any (Note 5). |
| (d) | Rounds to less than 0.01%. |
| (e) | Interest and dividend expense and/or borrowing costs incurred as a result of entering into reverse repurchase agreements, securities sold short or margin on cleared swap contracts, if any, is included in the Fund’s net expenses. Income earned on investing proceeds from reverse repurchase agreements, if any, is included in interest income. |
| (f) | The portfolio turnover rate excludes investments in GMO U.S. Treasury Fund (“USTF”) which is used as a short-term investment vehicle for cash management. The Fund’s portfolio turnover rate during the years ended February 28, 2022, February 28, 2021 and February 29, 2020, including transactions in USTF, was 200%, 196% and 100%, respectively, of the average value of its portfolio. |
| (g) | Ratio includes indirect fees waived or borne by GMO. |
| (h) | Rounds to less than $0.01. |
| † | Calculated using average shares outstanding throughout the period. |
| | | | |
| | |
| 156 | | See accompanying notes to the financial statements. | | |
GMO Trust Funds
Financial Highlights
(For a share outstanding throughout each period)
��
INTERNATIONAL DEVELOPED EQUITY ALLOCATION FUND
| | | | | | | | | | | | | | | | | | | | | | | | | | | | | | | | | | | |
| | | Class III Shares | | Class R6 Shares |
| | | Year Ended February 28/29, | | Year Ended
February 28,
2022 | | Period from
January 22, 2021
(commencement
of operations)
through
February 28,
2021 |
| | | 2022 | | 2021 | | 2020 | | 2019 | | 2018 |
Net asset value, beginning of period | | | $ | 16.95 | | | | $ | 14.52 | | | | $ | 14.75 | | | | $ | 17.32 | | | | $ | 14.72 | | | | $ | 16.95 | | | | $ | 17.08 | |
| | | | | | | | | | | | | | | | | | | | | | | | | | | | | | | | | | | |
Income (loss) from investment operations: | | | | | | | | | | | | | | | | | | | | | | | | | | | | | | | | | | | |
Net investment income (loss)(a)† | | | | 1.05 | | | | | 0.61 | | | | | 0.49 | | | | | 0.51 | | | | | 0.53 | | | | | 1.02 | | | | | (0.00 | )(b) |
Net realized and unrealized gain (loss) | | | | (0.51 | ) | | | | 2.56 | | | | | (0.12 | ) | | | | (2.56 | ) | | | | 2.61 | | | | | (0.48 | ) | | | | (0.13 | ) |
| | | | | | | | | | | | | | | | | | | | | | | | | | | | | | | | | | | |
Total from investment operations | | | | 0.54 | | | | | 3.17 | | | | | 0.37 | | | | | (2.05 | ) | | | | 3.14 | | | | | 0.54 | | | | | (0.13 | ) |
| | | | | | | | | | | | | | | | | | | | | | | | | | | | | | | | | | | |
Less distributions to shareholders: | | | | | | | | | | | | | | | | | | | | | | | | | | | | | | | | | | | |
From net investment income | | | | (1.09 | ) | | | | (0.74 | ) | | | | (0.60 | ) | | | | (0.52 | ) | | | | (0.54 | ) | | | | (1.09 | ) | | | | — | |
From net realized gains | | | | (0.05 | ) | | | | 0.00 | | | | | 0.00 | | | | | 0.00 | | | | | 0.00 | | | | | (0.05 | ) | | | | — | |
| | | | | | | | | | | | | | | | | | | | | | | | | | | | | | | | | | | |
Total distributions | | | | (1.14 | ) | | | | (0.74 | ) | | | | (0.60 | ) | | | | (0.52 | ) | | | | (0.54 | ) | | | | (1.14 | ) | | | | — | |
| | | | | | | | | | | | | | | | | | | | | | | | | | | | | | | | | | | |
Net asset value, end of period | | | $ | 16.35 | | | | $ | 16.95 | | | | $ | 14.52 | | | | $ | 14.75 | | | | $ | 17.32 | | | | $ | 16.35 | | | | $ | 16.95 | |
| | | | | | | | | | | | | | | | | | | | | | | | | | | | | | | | | | | |
Total Return(c) | | | | 2.88 | % | | | | 22.02 | % | | | | 2.14 | % | | | | (11.57 | )% | | | | 21.41 | % | | | | 2.88 | % | | | | (0.76 | )%** |
Ratios/Supplemental Data: | | | | | | | | | | | | | | | | | | | | | | | | | | | | | | | | | | | |
Net assets, end of period (000’s) | | | $ | 222,308 | | | | $ | 217,129 | | | | $ | 297,463 | | | | $ | 572,830 | | | | $ | 664,867 | | | | $ | 8,268 | | | | $ | 8,254 | |
Net expenses to average daily net assets(d) | | | | 0.00 | % | | | | 0.00 | % | | | | 0.00 | % | | | | 0.00 | % | | | | 0.00 | % | | | | 0.00 | %(e) | | | | 0.01 | %* |
Net investment income (loss) to average daily net assets(a) | | | | 5.82 | % | | | | 4.20 | % | | | | 3.25 | % | | | | 3.25 | % | | | | 3.20 | % | | | | 5.66 | % | | | | (0.01 | )%* |
Portfolio turnover rate | | | | 18 | % | | | | 17 | % | | | | 11 | % | | | | 8 | % | | | | 5 | % | | | | 18 | % | | | | 17 | %** |
Fees and expenses reimbursed and/or waived by GMO to average daily net assets: | | | | 0.05 | % | | | | 0.03 | % | | | | 0.02 | % | | | | 0.02 | % | | | | 0.01 | % | | | | 0.05 | % | | | | 0.05 | %* |
Purchase premiums and redemption fees consisted of the following per share amounts (Note 2):† | | | $ | — | | | | $ | — | | | | $ | — | | | | $ | 0.00 | (e) | | | $ | 0.00 | (e) | | | $ | — | | | | $ | — | |
| (a) | Net investment income is affected by the timing of the declaration of dividends by the other GMO Funds and/or other investment companies in which the Fund invests, if any. |
| (b) | Rounds to less than $0.01. |
| (c) | The total returns would have been lower had certain expenses not been reimbursed and/or waived during the periods shown, if applicable, and assumes the effect of reinvested distributions, if any. Calculation excludes purchase premiums and redemption fees which are borne by the shareholder purchasing or redeeming Fund shares, if any. |
| (d) | Net expenses exclude expenses incurred indirectly through investment in the underlying funds, if any (Note 5). |
| (e) | Rounds to less than 0.01%. |
| † | Calculated using average shares outstanding throughout the period. |
| | | | |
| | |
| | | See accompanying notes to the financial statements. | | 157 |
GMO Trust Funds
Financial Highlights
(For a share outstanding throughout each period)
INTERNATIONAL EQUITY ALLOCATION FUND
| | | | | | | | | | | | | | | | | | | | | | | | | | | | | | | | | | | | | | | | |
| | | Class III Shares | | Class R6 Shares |
| | | Year Ended February 28/29, | | Year Ended
February 28, | | Period from
August 30, 2019
(commencement
of operations)
through
February 29,
2020 |
| | | 2022 | | 2021 | | 2020 | | 2019 | | 2018 | | 2022 | | 2021 |
Net asset value, beginning of period | | | $ | 32.31 | | | | $ | 27.45 | | | | $ | 28.09 | | | | $ | 32.62 | | | | $ | 27.49 | | | | $ | 32.30 | | | | $ | 27.44 | | | | $ | 27.07 | |
| | | | | | | | | | | | | | | | | | | | | | | | | | | | | | | | | | | | | | | | |
Income (loss) from investment operations: | | | | | | | | | | | | | | | | | | | | | | | | | | | | | | | | | | | | | | | | |
Net investment income (loss)(a)† | | | | 1.64 | | | | | 1.24 | | | | | 1.02 | | | | | 0.91 | | | | | 0.93 | | | | | 1.74 | | | | | 1.29 | | | | | 1.14 | |
Net realized and unrealized gain (loss) | | | | (2.59 | ) | | | | 4.91 | | | | | (0.46 | ) | | | | (4.47 | ) | | | | 5.19 | | | | | (2.69 | ) | | | | 4.86 | | | | | 0.33 | |
| | | | | | | | | | | | | | | | | | | | | | | | | | | | | | | | | | | | | | | | |
Total from investment operations | | | | (0.95 | ) | | | | 6.15 | | | | | 0.56 | | | | | (3.56 | ) | | | | 6.12 | | | | | (0.95 | ) | | | | 6.15 | | | | | 1.47 | |
| | | | | | | | | | | | | | | | | | | | | | | | | | | | | | | | | | | | | | | | |
Less distributions to shareholders: | | | | | | | | | | | | | | | | | | | | | | | | | | | | | | | | | | | | | | | | |
From net investment income | | | | (1.93 | ) | | | | (1.29 | ) | | | | (1.20 | ) | | | | (0.97 | ) | | | | (0.99 | ) | | | | (1.93 | ) | | | | (1.29 | ) | | | | (1.10 | ) |
| | | | | | | | | | | | | | | | | | | | | | | | | | | | | | | | | | | | | | | | |
Total distributions | | | | (1.93 | ) | | | | (1.29 | ) | | | | (1.20 | ) | | | | (0.97 | ) | | | | (0.99 | ) | | | | (1.93 | ) | | | | (1.29 | ) | | | | (1.10 | ) |
| | | | | | | | | | | | | | | | | | | | | | | | | | | | | | | | | | | | | | | | |
Net asset value, end of period | | | $ | 29.43 | | | | $ | 32.31 | | | | $ | 27.45 | | | | $ | 28.09 | | | | $ | 32.62 | | | | $ | 29.42 | | | | $ | 32.30 | | | | $ | 27.44 | |
| | | | | | | | | | | | | | | | | | | | | | | | | | | | | | | | | | | | | | | | |
Total Return(b) | | | | (3.37 | )% | | | | 22.67 | % | | | | 1.62 | % | | | | (10.69 | )% | | | | 22.38 | % | | | | (3.37 | )% | | | | 22.68 | % | | | | 5.04 | %** |
Ratios/Supplemental Data: | | | | | | | | | | | | | | | | | | | | | | | | | | | | | | | | | | | | | | | | |
Net assets, end of period (000’s) | | | $ | 437,139 | | | | $ | 598,701 | | | | $ | 646,622 | | | | $ | 929,967 | | | | $ | 1,151,327 | | | | $ | 242,178 | | | | $ | 262,853 | | | | $ | 210,223 | |
Net expenses to average daily net assets(c)(d) | | | | 0.00 | % | | | | 0.00 | % | | | | 0.00 | % | | | | 0.00 | % | | | | 0.00 | % | | | | 0.00 | % | | | | 0.00 | % | | | | 0.00 | %* |
Net investment income (loss) to average daily net assets(a) | | | | 4.90 | % | | | | 4.40 | % | | | | 3.55 | % | | | | 3.09 | % | | | | 3.00 | % | | | | 5.20 | % | | | | 4.56 | % | | | | 7.83 | %* |
Portfolio turnover rate | | | | 18 | % | | | | 16 | % | | | | 7 | % | | | | 8 | % | | | | 12 | % | | | | 18 | % | | | | 16 | % | | | | 7 | %** |
Fees and expenses reimbursed and/or waived by GMO to average daily net assets: | | | | 0.02 | % | | | | 0.02 | % | | | | 0.01 | % | | | | 0.01 | % | | | | 0.01 | % | | | | 0.02 | % | | | | 0.02 | % | | | | 0.02 | %* |
Purchase premiums and redemption fees consisted of the following per share amounts (Note 2):† | | | $ | — | | | | $ | — | | | | $ | — | | | | $ | 0.00 | (e) | | | $ | 0.02 | | | | $ | — | | | | $ | — | | | | $ | — | |
| (a) | Net investment income is affected by the timing of the declaration of dividends by the other GMO Funds and/or other investment companies in which the Fund invests, if any. |
| (b) | The total returns would have been lower had certain expenses not been reimbursed and/or waived during the periods shown, if applicable, and assumes the effect of reinvested distributions, if any. Calculation excludes purchase premiums and redemption fees which are borne by the shareholder purchasing or redeeming Fund shares, if any. |
| (c) | Net expenses exclude expenses incurred indirectly through investment in the underlying funds, if any (Note 5). |
| (d) | Rounds to less than 0.01%. |
| (e) | Rounds to less than $0.01. |
| † | Calculated using average shares outstanding throughout the period. |
| | | | |
| | |
| 158 | | See accompanying notes to the financial statements. | | |
GMO Trust Funds
Financial Highlights
(For a share outstanding throughout each period)
CONSOLIDATED SGM MAJOR MARKETS FUND
| | | | | | | | | | | | | | | | | | | | | | | | | | | | | | | | | | | | | | | | | | | | | | | | | | |
| | | Class III Shares | | Class VI Shares |
| | | Year Ended February 28/29, | | Year Ended February 28/29, |
| | | 2022 | | 2021 | | 2020 | | 2019 | | 2018 | | 2022 | | 2021 | | 2020 | | 2019 | | 2018 |
Net asset value, beginning of period | | | $ | 32.07 | | | | $ | 31.13 | | | | $ | 32.17 | | | | $ | 31.87 | | | | $ | 32.68 | | | | $ | 32.03 | | | | $ | 31.07 | | | | $ | 32.11 | | | | $ | 31.78 | | | | $ | 32.57 | |
| | | | | | | | | | | | | | | | | | | | | | | | | | | | | | | | | | | | | | | | | | | | | | | | | | |
Income (loss) from investment operations: | | | | | | | | | | | | | | | | | | | | | | | | | | | | | | | | | | | | | | | | | | | | | | | | | | |
Net investment income (loss)(a)† | | | | (0.24 | ) | | | | (0.09 | ) | | | | 0.27 | | | | | 0.31 | | | | | 0.24 | | | | | (0.22 | ) | | | | (0.06 | ) | | | | 0.25 | | | | | 0.33 | | | | | 0.05 | |
Net realized and unrealized gain (loss) | | | | (0.39 | ) | | | | 1.81 | | | | | (0.83 | ) | | | | 0.11 | (b) | | | | 0.23 | | | | | (0.38 | ) | | | | 1.80 | | | | | (0.77 | ) | | | | 0.13 | (b) | | | | 0.44 | |
| | | | | | | | | | | | | | | | | | | | | | | | | | | | | | | | | | | | | | | | | | | | | | | | | | |
Total from investment operations | | | | (0.63 | ) | | | | 1.72 | | | | | (0.56 | ) | | | | 0.42 | | | | | 0.47 | | | | | (0.60 | ) | | | | 1.74 | | | | | (0.52 | ) | | | | 0.46 | | | | | 0.49 | |
| | | | | | | | | | | | | | | | | | | | | | | | | | | | | | | | | | | | | | | | | | | | | | | | | | |
Less distributions to shareholders: | | | | | | | | | | | | | | | | | | | | | | | | | | | | | | | | | | | | | | | | | | | | | | | | | | |
From net investment income | | | | (0.71 | ) | | | | (0.03 | ) | | | | (0.48 | ) | | | | (0.12 | ) | | | | — | | | | | (0.73 | ) | | | | (0.03 | ) | | | | (0.52 | ) | | | | (0.13 | ) | | | | — | |
From net realized gains | | | | (1.43 | ) | | | | (0.75 | ) | | | | — | | | | | — | | | | | (1.28 | ) | | | | (1.43 | ) | | | | (0.75 | ) | | | | — | | | | | — | | | | | (1.28 | ) |
| | | | | | | | | | | | | | | | | | | | | | | | | | | | | | | | | | | | | | | | | | | | | | | | | | |
Total distributions | | | | (2.14 | ) | | | | (0.78 | ) | | | | (0.48 | ) | | | | (0.12 | ) | | | | (1.28 | ) | | | | (2.16 | ) | | | | (0.78 | ) | | | | (0.52 | ) | | | | (0.13 | ) | | | | (1.28 | ) |
| | | | | | | | | | | | | | | | | | | | | | | | | | | | | | | | | | | | | | | | | | | | | | | | | | |
Net asset value, end of period | | | $ | 29.30 | | | | $ | 32.07 | | | | $ | 31.13 | | | | $ | 32.17 | | | | $ | 31.87 | | | | $ | 29.27 | | | | $ | 32.03 | | | | $ | 31.07 | | | | $ | 32.11 | | | | $ | 31.78 | |
| | | | | | | | | | | | | | | | | | | | | | | | | | | | | | | | | | | | | | | | | | | | | | | | | | |
Total Return(c) | | | | (2.00 | )% | | | | 5.48 | % | | | | (1.74 | )% | | | | 1.32 | % | | | �� | 1.44 | % | | | | (1.92 | )% | | | | 5.56 | % | | | | (1.65 | )% | | | | 1.47 | % | | | | 1.50 | % |
Ratios/Supplemental Data: | | | | | | | | | | | | | | | | | | | | | | | | | | | | | | | | | | | | | | | | | | | | | | | | | | |
Net assets, end of period (000’s) | | | $ | 32,796 | | | | $ | 30,126 | | | | $ | 18,527 | | | | $ | 45,409 | | | | $ | 26,630 | | | | $ | 206,841 | | | | $ | 314,087 | | | | $ | 831,870 | | | | $ | 1,161,238 | | | | $ | 1,843,748 | |
Net expenses to average daily net assets(d) | | | | 1.00 | % | | | | 1.01 | % | | | | 1.01 | % | | | | 1.00 | % | | | | 1.00 | % | | | | 0.91 | % | | | | 0.91 | % | | | | 0.91 | % | | | | 0.91 | % | | | | 0.91 | % |
Net investment income (loss) to average daily net assets(a) | | | | (0.81 | )% | | | | (0.27 | )% | | | | 0.85 | % | | | | 0.97 | % | | | | 0.75 | % | | | | (0.71 | )% | | | | (0.17 | )% | | | | 0.79 | % | | | | 1.04 | % | | | | 0.16 | % |
Portfolio turnover rate | | | | 81 | % | | | | 76 | % | | | | 46 | % | | | | 49 | %(e) | | | | 106 | %(e) | | | | 81 | % | | | | 76 | % | | | | 46 | % | | | | 49 | %(e) | | | | 106 | %(e) |
Fees and expenses reimbursed and/or waived by GMO to average daily net assets: | | | | 0.10 | % | | | | 0.07 | % | | | | 0.05 | % | | | | 0.04 | % | | | | 0.03 | % | | | | 0.09 | % | | | | 0.07 | % | | | | 0.04 | % | | | | 0.04 | % | | | | 0.03 | % |
| | | | | | | | | | |
| | | Class I Shares |
| | | Year Ended
February 28,
2022 | | Period from
September 23, 2020
(commencement of
operations)
through
February 28,
2021 |
Net asset value, beginning of period | | | $ | 32.06 | | | | $ | 32.37 | |
| | | | | | | | | | |
Income (loss) from investment operations: | | | | | | | | | | |
Net investment income (loss)(a)† | | | | (0.28 | ) | | | | (0.04 | ) |
Net realized and unrealized gain (loss) | | | | (0.40 | ) | | | | 0.48 | |
| | | | | | | | | | |
Total from investment operations | | | | (0.68 | ) | | | | 0.44 | |
| | | | | | | | | | |
Less distributions to shareholders: | | | | | | | | | | |
From net investment income | | | | (0.72 | ) | | | | — | |
From net realized gains | | | | (1.43 | ) | | | | (0.75 | ) |
| | | | | | | | | | |
Total distributions | | | | (2.15 | ) | | | | (0.75 | ) |
| | | | | | | | | | |
Net asset value, end of period | | | $ | 29.23 | | | | $ | 32.06 | |
| | | | | | | | | | |
Total Return(c) | | | | (2.16 | )% | | | | 1.30 | %** |
Ratios/Supplemental Data: | | | | | | | | | | |
Net assets, end of period (000’s) | | | $ | 20,753 | | | | $ | 13,842 | |
Net expenses to average daily net assets(d) | | | | 1.10 | % | | | | 1.11 | %* |
Net investment income (loss) to average daily net assets(a) | | | | (0.93 | )% | | | | (0.28 | )%* |
Portfolio turnover rate | | | | 81 | % | | | | 76 | %** |
Fees and expenses reimbursed and/or waived by GMO to average daily net assets: | | | | 0.15 | % | | | | 0.14 | %* |
| (a) | Net investment income is affected by the timing of the declaration of dividends by the other GMO Funds and/or other investment companies in which the Fund invests, if any. |
| (b) | The amount shown for a share outstanding does not correspond with the aggregate net realized and unrealized gain (loss) on investments due to the timing of purchases and redemptions of the Fund shares in relation to fluctuating market values of the investments of the Fund. |
| (c) | The total returns would have been lower had certain expenses not been reimbursed and/or waived during the periods shown, if applicable, and assumes the effect of reinvested distributions, if any. Calculation excludes purchase premiums and redemption fees which are borne by the shareholder purchasing or redeeming Fund shares, if any. |
| (d) | Net expenses exclude expenses incurred indirectly through investment in the underlying funds, if any (Note 5). |
| (e) | The portfolio turnover rate excludes investments in GMO U.S. Treasury Fund (“USTF”) which is used as a short-term investment vehicle for cash management. The Fund’s portfolio turnover rate during the years ended February 28, 2019 and February 28, 2018, including transactions in USTF, was 75% and 51%, respectively, of the average value of its portfolio. |
| † | Calculated using average shares outstanding throughout the period. |
| | | | |
| | |
| | | See accompanying notes to the financial statements. | | 159 |
GMO Trust Funds
Financial Highlights
(For a share outstanding throughout each period)
STRATEGIC OPPORTUNITIES ALLOCATION FUND
| | | | | | | | | | | | | | | | | | | | | | | | | |
| | | Class III Shares |
| | | Year Ended February 28/29, |
| | | 2022 | | 2021 | | 2020 | | 2019 | | 2018 |
Net asset value, beginning of period | | | $ | 21.56 | | | | $ | 18.98 | | | | $ | 19.48 | | | | $ | 22.08 | | | | $ | 19.76 | |
| | | | | | | | | | | | | | | | | | | | | | | | | |
Income (loss) from investment operations: | | | | | | | | | | | | | | | | | | | | | | | | | |
Net investment income (loss)(a)† | | | | 0.59 | | | | | 0.54 | | | | | 0.67 | | | | | 0.62 | | | | | 0.58 | |
Net realized and unrealized gain (loss) | | | | 0.32 | | | | | 2.93 | | | | | (0.11 | ) | | | | (1.45 | ) | | | | 2.39 | |
| | | | | | | | | | | | | | | | | | | | | | | | | |
Total from investment operations | | | | 0.91 | | | | | 3.47 | | | | | 0.56 | | | | | (0.83 | ) | | | | 2.97 | |
| | | | | | | | | | | | | | | | | | | | | | | | | |
Less distributions to shareholders: | | | | | | | | | | | | | | | | | | | | | | | | | |
From net investment income | | | | (1.22 | ) | | | | (0.71 | ) | | | | (0.77 | ) | | | | (0.67 | ) | | | | (0.63 | ) |
From net realized gains | | | | (3.34 | ) | | | | (0.18 | ) | | | | (0.29 | ) | | | | (1.10 | ) | | | | (0.02 | ) |
| | | | | | | | | | | | | | | | | | | | | | | | | |
Total distributions | | | | (4.56 | ) | | | | (0.89 | ) | | | | (1.06 | ) | | | | (1.77 | ) | | | | (0.65 | ) |
| | | | | | | | | | | | | | | | | | | | | | | | | |
Net asset value, end of period | | | $ | 17.91 | | | | $ | 21.56 | | | | $ | 18.98 | | | | $ | 19.48 | | | | $ | 22.08 | |
| | | | | | | | | | | | | | | | | | | | | | | | | |
Total Return(b) | | | | 3.57 | % | | | | 18.66 | % | | | | 2.57 | % | | | | (3.45 | )% | | | | 15.10 | % |
Ratios/Supplemental Data: | | | | | | | | | | | | | | | | | | | | | | | | | |
Net assets, end of period (000’s) | | | $ | 236,452 | | | | $ | 579,796 | | | | $ | 773,438 | | | | $ | 915,148 | | | | $ | 1,302,441 | |
Net operating expenses to average daily net assets(c) | | | | 0.01 | % | | | | 0.01 | % | | | | 0.01 | % | | | | 0.01 | % | | | | 0.00 | %(d) |
Interest and/or dividend expenses and/or borrowing costs to average daily net assets(e) | | | | 0.26 | % | | | | 0.07 | % | | | | 0.03 | % | | | | 0.03 | % | | | | — | |
Total net expenses to average daily net assets(c) | | | | 0.27 | % | | | | 0.08 | % | | | | 0.04 | % | | | | 0.04 | % | | | | 0.00 | %(d) |
Net investment income (loss) to average daily net assets(a) | | | | 2.71 | % | | | | 2.85 | % | | | | 3.35 | % | | | | 3.01 | % | | | | 2.73 | % |
Portfolio turnover rate(f) | | | | 95 | % | | | | 61 | % | | | | 36 | % | | | | 35 | % | | | | 20 | % |
Fees and expenses reimbursed and/or waived by GMO to average daily net assets: | | | | 0.14 | % | | | | 0.07 | % | | | | 0.03 | % | | | | 0.03 | % | | | | 0.01 | % |
Purchase premiums and redemption fees consisted of the following per share amounts (Note 2):† | | | $ | — | | | | $ | — | | | | $ | — | | | | $ | 0.00 | (g) | | | $ | 0.02 | |
| (a) | Net investment income is affected by the timing of the declaration of dividends by the other GMO Funds and/or other investment companies in which the Fund invests, if any. |
| (b) | The total returns would have been lower had certain expenses not been reimbursed and/or waived during the periods shown, if applicable, and assumes the effect of reinvested distributions, if any. Calculation excludes purchase premiums and redemption fees which are borne by the shareholder purchasing or redeeming Fund shares, if any. |
| (c) | Net expenses exclude expenses incurred indirectly through investment in the underlying funds, if any (Note 5). |
| (d) | Rounds to less than 0.01%. |
| (e) | Interest and dividend expense and/or borrowing costs incurred as a result of entering into reverse repurchase agreements, securities sold short or margin on cleared swap contracts, if any, is included in the Fund’s net expenses. Income earned on investing proceeds from reverse repurchase agreements, if any, is included in interest income. |
| (f) | The portfolio turnover rate excludes investments in GMO U.S. Treasury Fund (“USTF”) which is used as a short-term investment vehicle for cash management. The Fund’s portfolio turnover rate during the years ended February 28, 2022, February 28, 2021, February 29, 2020, February 28, 2019 and February 28, 2018, including transactions in USTF, was 122%, 80%, 41%, 38% and 25%, respectively, of the average value of its portfolio. |
| (g) | Rounds to less than $0.01. |
| † | Calculated using average shares outstanding throughout the period. |
| | | | |
| | |
| 160 | | See accompanying notes to the financial statements. | | |
GMO Trust Funds
Notes to Financial Statements
February 28, 2022
Each of Alternative Allocation Fund, Benchmark-Free Allocation Fund, Benchmark-Free Fund, Global Asset Allocation Fund, Global Developed Equity Allocation Fund, Global Equity Allocation Fund, Implementation Fund, International Developed Equity Allocation Fund, International Equity Allocation Fund, SGM Major Markets Fund and Strategic Opportunities Allocation Fund (each a “Fund” and collectively the “Funds”) is a series of GMO Trust (the “Trust”). The Trust is registered under the Investment Company Act of 1940, as amended (the “1940 Act”), as an open-end management investment company. The Trust was established as a Massachusetts business trust under the laws of The Commonwealth of Massachusetts on June 24, 1985. The Declaration of Trust permits the Trustees of the Trust (“Trustees”) to create an unlimited number of series of shares (Funds) and to subdivide Funds into classes. The Funds are advised and managed by Grantham, Mayo, Van Otterloo & Co. LLC (“GMO”).
The Funds may invest in GMO U.S. Treasury Fund and in money market funds unaffiliated with GMO.
Many of the Funds may invest primarily in other GMO Funds and Alternative Allocation Fund, Implementation Fund and SGM Major Markets Fund may also invest in GMO Alternative Allocation SPC Ltd., GMO Implementation SPC Ltd. and GMO Alternative Asset SPC Ltd. (each a “wholly-owned subsidiary”), respectively. These GMO Funds and wholly-owned subsidiaries are referenced herein as “underlying funds”. As a result, the Funds are exposed to all of the risks of the underlying funds in which they invest. Several of the underlying funds themselves invest a substantial portion of their assets in other GMO Funds. The financial statements of the underlying funds should be read in conjunction with the Funds’ financial statements. The financial statements are available without charge on the Securities and Exchange Commission’s (“SEC”) website at www.sec.gov or on GMO’s website at www.gmo.com.
The following table provides information about the Funds’ principal investment objectives and benchmarks (if any):
| | | | |
| | | |
| Fund Name | | Benchmark | | Investment Objective |
| Alternative Allocation Fund | | Not Applicable | | Positive total return |
| Benchmark-Free Allocation Fund | | Not Applicable | | Positive total return |
| Benchmark-Free Fund | | Not Applicable | | Positive total return |
| Global Asset Allocation Fund | | GMO Global Asset Allocation Index (65% MSCI ACWI, 35% Bloomberg U.S. Aggregate Index) | | Total return greater than benchmark |
| Global Developed Equity Allocation Fund | | MSCI World Index | | Total return greater than benchmark |
| Global Equity Allocation Fund | | MSCI ACWI | | Total return greater than benchmark |
| Implementation Fund | | Not Applicable | | Positive total return, not relative return |
| International Developed Equity Allocation Fund | | MSCI EAFE Index | | Total return greater than benchmark |
| International Equity Allocation Fund | | MSCI ACWI ex USA | | Total return greater than benchmark |
| SGM Major Markets Fund | | Not Applicable | | Long-term total return |
| Strategic Opportunities Allocation Fund | | GMO Strategic Opportunities Allocation Index (75% MSCI World Index (MSCI Standard Index Series), 25% Bloomberg U.S. Aggregate Index) | | Total return greater than benchmark |
Benchmark-Free Fund, Implementation Fund and Strategic Opportunities Allocation Fund currently limit subscriptions.
| 2. | Significant accounting policies |
The following is a summary of significant accounting policies followed by each Fund in the preparation of its financial statements. These policies are in conformity with accounting principles generally accepted in the United States of America (“U.S. GAAP”) and have been consistently followed by the Funds in preparing these financial statements. The preparation of financial statements in accordance with U.S. GAAP requires management to make estimates and assumptions that affect the reported amounts and disclosures in the financial statements. Actual results could differ from those estimates. The accounting records of the Funds are maintained in U.S. dollars.
GMO Trust Funds
Notes to Financial Statements — (Continued)
February 28, 2022
Basis of presentation and principles of consolidation: Alternative Allocation Fund, Implementation Fund and SGM Major Markets Fund
Alternative Allocation Fund, Implementation Fund and SGM Major Markets Fund include the accounts of their wholly-owned subsidiaries and the accompanying financial statements have been consolidated for those accounts. The consolidated financial statements include all of the assets and liabilities of each wholly-owned subsidiary. All interfund accounts and transactions have been eliminated in consolidation.
Portfolio valuation
Shares of the underlying funds and other open-end registered investment companies are valued at their most recent net asset value. Direct investments held by the Funds and underlying funds are valued as follows: Exchange-traded securities (other than exchange-traded options) for which market quotations are readily available are valued at (i) the last sale price or (ii) official closing price or (iii) most recent quoted price published by the exchange (if no reported last sale or official closing price) or (iv) the quoted price provided by a pricing source (in the event GMO deems the private market to be a more reliable indicator of market value than the exchange). Exchange-traded options are valued at the last sale price, provided that price is between the closing bid and ask prices. If the last sale price is not within that range, then they will be valued at the closing bid price for long positions and the closing ask price for short positions. Cleared derivatives are valued using the price quoted (which may be based on a model) by the relevant clearing house. If an updated quote for a cleared derivative is not available when a Fund calculates its net asset value, the derivative will generally be valued using an industry standard model, which may differ from the model used by the relevant clearing house. Over-the-counter (“OTC”) derivatives are generally valued at the price determined by an industry standard model. Unlisted securities for which market quotations are readily available are generally valued at the most recent quoted price.
The foregoing valuation methodologies are modified for equities that trade in non-U.S. securities markets that close before the close of the New York Stock Exchange (“NYSE”) due to time zone differences, including the value of equities that underlie futures, options and other derivatives (to the extent the market for those derivatives closes prior to the close of the NYSE). In those cases, the price will generally be adjusted, to the extent practicable and available, based on inputs from an independent pricing service approved by the Trustees that are intended to reflect valuation changes through the NYSE close. These securities listed on foreign exchanges (including the value of equity securities that underlie futures, options and other derivatives (to the extent the market for such instruments closes prior to the close of the NYSE)) are classified as Level 2 (levels defined below) and are described in the disclosures of the underlying funds.
Typically, the Funds and the underlying funds value fixed income securities at the most recent price supplied by a pricing source determined by GMO. GMO evaluates pricing sources on an ongoing basis and may change a pricing source at any time. GMO monitors erratic or unusual movements (including unusual inactivity) in the prices supplied for a security and has discretion to override a price supplied by a source (e.g., by taking a price supplied by another source) when it believes that the price supplied is not reliable. Alternative pricing sources are often but not always available for securities held by the Funds and the underlying funds.
“Quoted price” typically means the bid price for securities held long and the ask price for securities sold short. If a market quotation for a security does not involve a bid or an ask, the “quoted price” may be the price provided by a market participant or other third-party pricing source in accordance with the market practice for that security. If an updated quoted price for a security is not available when a Fund calculates its net asset value, the Fund will generally use the last quoted price so long as GMO believes that the last quoted price continues to represent that security’s fair value.
In the case of derivatives, prices determined by a model may reflect an estimate of the average of bid and ask prices, regardless of whether a Fund has a long position or a short position.
If quotations are not readily available or circumstances make an existing valuation methodology or procedure unreliable, derivatives and other securities are valued at fair value as determined in good faith by the Trustees or persons acting at their direction pursuant to procedures approved by the Trustees. Because of the uncertainty inherent in fair value pricing, the price determined for a particular security may be materially different from the value realized upon its sale. The Funds and/or the underlying funds classify such securities as Level 3 (levels defined below). For the year ended February 28, 2022, the Funds did not reduce the value of any of their OTC derivatives contracts, if any, based on the creditworthiness of their counterparties. See Note 4 “Derivative financial instruments” for a further discussion on valuation of derivatives.
GMO Trust Funds
Notes to Financial Statements — (Continued)
February 28, 2022
U.S. GAAP requires the Funds to disclose the fair value of their investments in a three-level hierarchy (Levels 1, 2 and 3). The valuation hierarchy is based upon the relative observability of inputs to the valuation of the Funds’ investments. The inputs or methodologies used for valuing securities are not necessarily an indication of the risk associated with investing in those securities.
Changes in valuation techniques may result in transfers into or out of an investment’s assigned level within the fair value hierarchy. In addition, in periods of market dislocation, the observability of prices and inputs may be reduced for many instruments. This condition, as well as changes related to the liquidity of investments, could cause a security to be reclassified between levels.
The three levels are defined as follows:
Level 1 – Valuations based on quoted prices for identical securities in active markets.
The types of assets and liabilities categorized in Level 1 generally include actively traded domestic and certain foreign equity securities; certain U.S. government obligations; derivatives actively traded on a national securities exchange (such as some futures and options); and shares of open-end mutual funds (even if their investments are valued using Level 2 or Level 3 inputs).
Level 2 – Valuations determined using other significant direct or indirect observable inputs.
The types of assets and liabilities categorized in Level 2 generally include certain U.S. government agency securities, mortgage-backed securities, asset-backed securities, certain sovereign debt obligations, and corporate bonds valued using vendor prices or broker quotes; cleared derivatives and certain OTC derivatives such as swaps, options, swaptions, and forward currency contracts valued using industry standard models; certain restricted securities valued at the most recent available market or quoted price; certain securities that are valued at the local price; certain debt obligations, such as collateralized loan obligations, that have yet to begin trading that are valued at cost; and certain foreign equity securities that are adjusted based on inputs from an independent pricing service approved by the Trustees, including the value of equity securities that underlie futures, options and other derivatives (to the extent the market for such instruments closes prior to the close of the NYSE) to reflect estimated valuation changes through the NYSE close.
Level 3 – Valuations based primarily on inputs that are unobservable and significant.
The types of assets and liabilities categorized in Level 3 generally include, but are not limited to, certain debt securities (such as asset-backed, mortgage-backed, loans and sovereign debt) and derivatives even though they may be valued using broker quotes; certain debt securities and derivatives adjusted by a specified discount for liquidity or other considerations; securities whose trading has been suspended or that have been de-listed from their current primary trading exchange valued at the most recent available market or quoted price; securities in default or bankruptcy proceedings for which there is no current market quotation valued at the most recent available market or quoted price; potential litigation recoveries and interests related to bankruptcy proceedings; certain equity securities valued based on the last traded exchange price adjusted for the movement in a relevant index; certain securities that are valued using a price from a comparable security related to the same issuer; and certain recently acquired equity securities that have yet to begin trading that are valued at cost.
GMO Trust Funds
Notes to Financial Statements — (Continued)
February 28, 2022
The following is a summary of the respective levels assigned to the Funds’ direct securities and derivatives, if any, as of February 28, 2022:
| | | | | | | | | | | | | | | | |
| | | | | |
| Description | | Level 1 | | | Level 2 | | | Level 3 | | | Total | |
| Consolidated Alternative Allocation Fund | | | | | | | | | | | | |
| Asset Valuation Inputs | | | | | | | | | | | | |
Common Stocks | | | | | | | | | | | | | | | | |
Australia | | $ | — | | | $ | 3,010,651 | | | $ | — | | | $ | 3,010,651 | |
Belgium | | | — | | | | 885,803 | | | | — | | | | 885,803 | |
Brazil | | | 332,957 | | | | — | | | | — | | | | 332,957 | |
Canada | | | 4,814,353 | | | | — | | | | — | | | | 4,814,353 | |
China | | | 586,411 | | | | 3,359,109 | | | | 66,215 | | | | 4,011,735 | |
Denmark | | | — | | | | 1,558,326 | | | | — | | | | 1,558,326 | |
Finland | | | — | | | | 461,376 | | | | — | | | | 461,376 | |
France | | | — | | | | 1,467,384 | | | | — | | | | 1,467,384 | |
Germany | | | — | | | | 4,094,263 | | | | — | | | | 4,094,263 | |
Hong Kong | | | — | | | | 802,971 | | | | — | | | | 802,971 | |
India | | | — | | | | 1,351,705 | | | | — | | | | 1,351,705 | |
Israel | | | 2,232,058 | | | | — | | | | — | | | | 2,232,058 | |
Italy | | | — | | | | 2,840,779 | | | | — | | | | 2,840,779 | |
Japan | | | 51,952 | | | | 9,810,301 | | | | — | | | | 9,862,253 | |
Malaysia | | | — | | | | 42,655 | | | | — | | | | 42,655 | |
Netherlands | | | 321,145 | | | | 1,940,701 | | | | — | | | | 2,261,846 | |
New Zealand | | | — | | | | 278,804 | | | | — | | | | 278,804 | |
South Africa | | | — | | | | 324,022 | | | | — | | | | 324,022 | |
South Korea | | | 53,388 | | | | 387,267 | | | | — | | | | 440,655 | |
Spain | | | — | | | | 987,618 | | | | — | | | | 987,618 | |
Sweden | | | — | | | | 884,583 | | | | — | | | | 884,583 | |
Switzerland | | | 78,714 | | | | 615,654 | | | | — | | | | 694,368 | |
Taiwan | | | — | | | | 314,555 | | | | — | | | | 314,555 | |
United Kingdom | | | 225,016 | | | | 10,260,083 | | | | — | | | | 10,485,099 | |
United States | | | 116,052,343 | | | | — | | | | — | | | | 116,052,343 | |
| | | | | | | | | | | | | | | | | |
TOTAL COMMON STOCKS | | | 124,748,337 | | | | 45,678,610 | | | | 66,215 | | | | 170,493,162 | |
| | | | | | | | | | | | | | | | | |
Preferred Stocks | | | | | | | | | | | | | | | | |
Brazil | | | 315,469 | | | | — | | | | — | | | | 315,469 | |
Germany | | | — | | | | 292,812 | | | | — | | | | 292,812 | |
| | | | | | | | | | | | | | | | | |
TOTAL PREFERRED STOCKS | | | 315,469 | | | | 292,812 | | | | — | | | | 608,281 | |
| | | | | | | | | | | | | | | | | |
Rights/Warrants | | | | | | | | | | | | | | | | |
United States | | | — | | | | — | | | | 263,451 | | | | 263,451 | |
| | | | | | | | | | | | | | | | | |
TOTAL RIGHTS/WARRANTS | | | — | | | | — | | | | 263,451 | | | | 263,451 | |
| | | | | | | | | | | | | | | | | |
Investment Funds | | | | | | | | | | | | | | | | |
United States | | | — | | | | — | | | | 5,607,602 | | | | 5,607,602 | |
| | | | | | | | | | | | | | | | | |
TOTAL INVESTMENT FUNDS | | | — | | | | — | | | | 5,607,602 | | | | 5,607,602 | |
| | | | | | | | | | | | | | | | | |
Debt Obligations | | | | | | | | | | | | | | | | |
United States | | | 98,361,047 | | | | — | | | | — | | | | 98,361,047 | |
| | | | | | | | | | | | | | | | | |
TOTAL DEBT OBLIGATIONS | | | 98,361,047 | | | | — | | | | — | | | | 98,361,047 | |
| | | | | | | | | | | | | | | | | |
Mutual Funds | | | | | | | | | | | | | | | | |
United States | | | 9,811,873 | | | | — | | | | — | | | | 9,811,873 | |
| | | | | | | | | | | | | | | | | |
TOTAL MUTUAL FUNDS | | | 9,811,873 | | | | — | | | | — | | | | 9,811,873 | |
| | | | | | | | | | | | | | | | | |
Short-Term Investments | | | 76,322,001 | | | | — | | | | — | | | | 76,322,001 | |
Purchased Options | | | — | | | | 762,841 | | | | — | | | | 762,841 | |
| | | | | | | | | | | | | | | | | |
Total Investments | | | 309,558,727 | | | | 46,734,263 | | | | 5,937,268 | | | | 362,230,258 | |
| | | | | | | | | | | | | | | | | |
| | | | | | | | | | | | | | | | | |
GMO Trust Funds
Notes to Financial Statements — (Continued)
February 28, 2022
| | | | | | | | | | | | | | | | |
| | | | | |
| Description | | Level 1 | | | Level 2 | | | Level 3 | | | Total | |
| Consolidated Alternative Allocation Fund (continued) | | | | | | | | | | | | |
| Asset Valuation Inputs (continued) | | | | | | | | | | | | |
Derivatives^ | | | | | | | | | | | | | | | | |
Forward Currency Contracts | | | | | | | | | | | | | | | | |
Foreign Currency Risk | | $ | — | | | $ | 1,485,428 | | | $ | — | | | $ | 1,485,428 | |
Futures Contracts | | | | | | | | | | | | | | | | |
Equity Risk | | | 1,154,900 | | | | 521,083 | | | | — | | | | 1,675,983 | |
Interest Rate Risk | | | 331,568 | | | | — | | | | — | | | | 331,568 | |
Swap Contracts | | | | | | | | | | | | | | | | |
Credit Risk | | | — | | | | 5,111,157 | | | | — | | | | 5,111,157 | |
Equity Risk | | | — | | | | 412,319 | | | | — | | | | 412,319 | |
Interest Rate Risk | | | — | | | | 5,714,077 | | | | — | | | | 5,714,077 | |
| | | | | | | | | | | | | | | | | |
Total | | $ | 311,045,195 | | | $ | 59,978,327 | | | $ | 5,937,268 | | | $ | 376,960,790 | |
| | | | | | | | | | | | | | | | | |
| Liability Valuation Inputs | | | | | | | | | | | | |
Common Stocks | | | | | | | | | | | | | | | | |
Australia | | $ | — | | | $ | (1,477,208 | ) | | $ | — | | | $ | (1,477,208 | ) |
Austria | | | — | | | | (610,802 | ) | | | — | | | | (610,802 | ) |
Belgium | | | — | | | | (460,878 | ) | | | — | | | | (460,878 | ) |
Canada | | | (2,454,290 | ) | | | — | | | | — | | | | (2,454,290 | ) |
Denmark | | | — | | | | (246,793 | ) | | | — | | | | (246,793 | ) |
France | | | — | | | | (2,250,116 | ) | | | — | | | | (2,250,116 | ) |
Germany | | | — | | | | (2,715,652 | ) | | | — | | | | (2,715,652 | ) |
Israel | | | (807,053 | ) | | | — | | | | — | | | | (807,053 | ) |
Italy | | | (21,495 | ) | | | (1,990,051 | ) | | | — | | | | (2,011,546 | ) |
Japan | | | — | | | | (8,753,267 | ) | | | — | | | | (8,753,267 | ) |
Netherlands | | | — | | | | (1,086,597 | ) | | | — | | | | (1,086,597 | ) |
New Zealand | | | — | | | | (325,157 | ) | | | — | | | | (325,157 | ) |
Norway | | | — | | | | (73,038 | ) | | | — | | | | (73,038 | ) |
Singapore | | | — | | | | (809,960 | ) | | | — | | | | (809,960 | ) |
Spain | | | — | | | | (1,751,250 | ) | | | — | | | | (1,751,250 | ) |
Sweden | | | — | | | | (1,137,393 | ) | | | — | | | | (1,137,393 | ) |
Switzerland | | | — | | | | (940,754 | ) | | | — | | | | (940,754 | ) |
United Kingdom | | | — | | | | (6,026,929 | ) | | | — | | | | (6,026,929 | ) |
United States | | | (68,131,506 | ) | | | — | | | | — | | | | (68,131,506 | ) |
| | | | | | | | | | | | | | | | | |
TOTAL COMMON STOCKS | | | (71,414,344 | ) | | | (30,655,845 | ) | | | — | | | | (102,070,189 | ) |
| | | | | | | | | | | | | | | | | |
Preferred Stocks | | | | | | | | | | | | | | | | |
Germany | | | — | | | | (328,486 | ) | | | — | | | | (328,486 | ) |
| | | | | | | | | | | | | | | | | |
TOTAL PREFERRED STOCKS | | | — | | | | (328,486 | ) | | | — | | | | (328,486 | ) |
| | | | | | | | | | | | | | | | | |
Derivatives^ | | | | | | | | | | | | | | | | |
Forward Currency Contracts | | | | | | | | | | | | | | | | |
Foreign Currency Risk | | | — | | | | (2,917,160 | ) | | | — | | | | (2,917,160 | ) |
Futures Contracts | | | | | | | | | | | | | | | | |
Equity Risk | | | (919,885 | ) | | | (1,374,536 | ) | | | — | | | | (2,294,421 | ) |
Interest Rate Risk | | | (106,477 | ) | | | — | | | | — | | | | (106,477 | ) |
Written Options | | | | | | | | | | | | | | | | |
Credit Risk | | | — | | | | (740,275 | ) | | | — | | | | (740,275 | ) |
Equity Risk | | | (575,779 | ) | | | — | | | | — | | | | (575,779 | ) |
Swap Contracts | | | | | | | | | | | | | | | | |
Credit Risk | | | — | | | | (964,709 | ) | | | — | | | | (964,709 | ) |
Equity Risk | | | — | | | | (625,784 | ) | | | — | | | | (625,784 | ) |
Interest Rate Risk | | | — | | | | (6,849,195 | ) | | | — | | | | (6,849,195 | ) |
| | | | | | | | | | | | | | | | | |
Total | | $ | (73,016,485 | ) | | $ | (44,455,990 | ) | | $ | — | | | $ | (117,472,475 | ) |
| | | | | | | | | | | | | | | | | |
| | | | | | | | | | | | | | | | | |
GMO Trust Funds
Notes to Financial Statements — (Continued)
February 28, 2022
| | | | | | | | | | | | | | | | |
| | | | | |
| Description | | Level 1 | | | Level 2 | | | Level 3 | | | Total | |
| Benchmark-Free Allocation Fund | | | | | | | | | | | | |
| Asset Valuation Inputs | | | | | | | | | | | | |
Mutual Funds | | $ | 5,122,161,675 | | | $ | — | | | $ | — | | | $ | 5,122,161,675 | |
Short-Term Investments | | | 4,385,029 | | | | — | | | | — | | | | 4,385,029 | |
Total Investments | | | 5,126,546,704 | | | | — | | | | — | | | | 5,126,546,704 | |
| | | | | | | | | | | | | | | | | |
Total | | $ | 5,126,546,704 | | | $ | — | | | $ | — | | | $ | 5,126,546,704 | |
| | | | | | | | | | | | | | | | | |
| | | | | | | | | | | | | | | | | |
| Benchmark-Free Fund | | | | | | | | | | | | |
| Asset Valuation Inputs | | | | | | | | | | | | |
Common Stocks | | | | | | | | | | | | | | | | |
Argentina | | $ | 84,597 | | | $ | — | | | $ | — | | | $ | 84,597 | |
Australia | | | — | | | | 24,768,086 | | | | — | | | | 24,768,086 | |
Austria | | | — | | | | 85,436 | | | | — | | | | 85,436 | |
Belgium | | | — | | | | 8,236,854 | | | | — | | | | 8,236,854 | |
Brazil | | | 7,386,046 | | | | 19,080,679 | | | | — | | | | 26,466,725 | |
Canada | | | 30,729,385 | | | | — | | | | — | | | | 30,729,385 | |
Chile | | | 234,856 | | | | 1,220,833 | | | | — | | | | 1,455,689 | |
China | | | 7,028,488 | | | | 126,901,658 | | | | 381,894 | | | | 134,312,040 | |
Czech Republic | | | — | | | | 811,903 | | | | — | | | | 811,903 | |
Denmark | | | — | | | | 8,729,357 | | | | — | | | | 8,729,357 | |
Egypt | | | — | | | | 816,706 | | | | — | | | | 816,706 | |
Finland | | | — | | | | 5,880,204 | | | | — | | | | 5,880,204 | |
France | | | 114,264 | | | | 33,838,677 | | | | — | | | | 33,952,941 | |
Germany | | | — | | | | 21,889,086 | | | | — | | | | 21,889,086 | |
Greece | | | — | | | | 579,804 | | | | 0 | § | | | 579,804 | |
Hong Kong | | | — | | | | 14,763,488 | | | | — | | | | 14,763,488 | |
Hungary | | | — | | | | 433,108 | | | | — | | | | 433,108 | |
India | | | 1,938,666 | | | | 42,585,257 | | | | — | | | | 44,523,923 | |
Indonesia | | | — | | | | 8,052,242 | | | | — | | | | 8,052,242 | |
Ireland | | | 2,173,938 | | | | 7,712,528 | | | | — | | | | 9,886,466 | |
Israel | | | 4,686,014 | | | | 2,233,147 | | | | — | | | | 6,919,161 | |
Italy | | | — | | | | 15,317,009 | | | | — | | | | 15,317,009 | |
Japan | | | 44,897 | | | | 232,407,565 | | | | — | | | | 232,452,462 | |
Kuwait | | | — | | | | 1,954,677 | | | | — | | | | 1,954,677 | |
Luxembourg | | | 1,048,776 | | | | — | | | | — | | | | 1,048,776 | |
Malaysia | | | — | | | | 686,796 | | | | — | | | | 686,796 | |
Mexico | | | 26,549,590 | | | | — | | | | — | | | | 26,549,590 | |
Netherlands | | | 1,491,382 | | | | 21,957,383 | | | | — | | | | 23,448,765 | |
New Zealand | | | — | | | | 1,584,389 | | | | — | | | | 1,584,389 | |
Norway | | | — | | | | 11,173,449 | | | | — | | | | 11,173,449 | |
Peru | | | 269,830 | | | | — | | | | — | | | | 269,830 | |
Philippines | | | — | | | | 300,103 | | | | — | | | | 300,103 | |
Poland | | | — | | | | 5,085,980 | | | | — | | | | 5,085,980 | |
Portugal | | | — | | | | 3,466,891 | | | | — | | | | 3,466,891 | |
Qatar | | | — | | | | 843,253 | | | | — | | | | 843,253 | |
Russia | | | — | | | | 15,651,893 | | | | 320,489 | | | | 15,972,382 | |
Singapore | | | — | | | | 10,713,620 | | | | — | | | | 10,713,620 | |
South Africa | | | — | | | | 15,413,758 | | | | — | | | | 15,413,758 | |
South Korea | | | 1,526,172 | | | | 67,489,447 | | | | — | | | | 69,015,619 | |
Spain | | | — | | | | 22,095,029 | | | | — | | | | 22,095,029 | |
Sweden | | | — | | | | 5,505,553 | | | | — | | | | 5,505,553 | |
Switzerland | | | 402,316 | | | | 8,932,619 | | | | — | | | | 9,334,935 | |
Taiwan | | | 2,448,924 | | | | 93,071,863 | | | | — | | | | 95,520,787 | |
Thailand | | | — | | | | 13,641,763 | | | | — | | | | 13,641,763 | |
| | | | | | | | | | | | | | | | | |
GMO Trust Funds
Notes to Financial Statements — (Continued)
February 28, 2022
| | | | | | | | | | | | | | | | |
| | | | | |
| Description | | Level 1 | | | Level 2 | | | Level 3 | | | Total | |
| Benchmark-Free Fund (continued) | | | | | | | | | | | | |
| Asset Valuation Inputs (continued) | | | | | | | | | | | | |
Common Stocks (continued) | | | | | | | | | | | | | | | | |
Turkey | | $ | — | | | $ | 10,577,242 | | | $ | — | | | $ | 10,577,242 | |
United Arab Emirates | | | — | | | | 34,309 | | | | — | | | | 34,309 | |
United Kingdom | | | 4,117,240 | | | | 63,230,398 | | | | — | | | | 67,347,638 | |
United States | | | 225,737,531 | | | | — | | | | — | | | | 225,737,531 | |
| | | | | | | | | | | | | | | | | |
TOTAL COMMON STOCKS | | | 318,012,912 | | | | 949,754,042 | | | | 702,383 | | | | 1,268,469,337 | |
| | | | | | | | | | | | | | | | | |
Preferred Stocks | | | | | | | | | | | | | | | | |
Brazil | | | 2,818,908 | | | | 10,541,043 | | | | — | | | | 13,359,951 | |
Chile | | | 125,742 | | | | 143,649 | | | | — | | | | 269,391 | |
Colombia | | | 80,201 | | | | — | | | | — | | | | 80,201 | |
Germany | | | — | | | | 2,480,533 | | | | — | | | | 2,480,533 | |
Russia | | | — | | | | 2,915,285 | | | | — | | | | 2,915,285 | |
South Korea | | | — | | | | 4,138,398 | | | | — | | | | 4,138,398 | |
Taiwan | | | — | | | | 71,641 | | | | — | | | | 71,641 | |
| | | | | | | | | | | | | | | | | |
TOTAL PREFERRED STOCKS | | | 3,024,851 | | | | 20,290,549 | | | | — | | | | 23,315,400 | |
| | | | | | | | | | | | | | | | | |
Investment Funds | | | | | | | | | | | | | | | | |
United States | | | 2,429,871 | | | | — | | | | — | | | | 2,429,871 | |
| | | | | | | | | | | | | | | | | |
TOTAL INVESTMENT FUNDS | | | 2,429,871 | | | | — | | | | — | | | | 2,429,871 | |
| | | | | | | | | | | | | | | | | |
Debt Obligations | | | | | | | | | | | | | | | | |
United States | | | 271,944,002 | | | | 3 | | | | — | | | | 271,944,005 | |
| | | | | | | | | | | | | | | | | |
TOTAL DEBT OBLIGATIONS | | | 271,944,002 | | | | 3 | | | | — | | | | 271,944,005 | |
| | | | | | | | | | | | | | | | | |
Mutual Funds | | | | | | | | | | | | | | | | |
United States | | | 244,931,440 | | | | — | | | | — | | | | 244,931,440 | |
| | | | | | | | | | | | | | | | | |
TOTAL MUTUAL FUNDS | | | 244,931,440 | | | | — | | | | — | | | | 244,931,440 | |
| | | | | | | | | | | | | | | | | |
Short-Term Investments | | | 240,774,994 | | | | — | | | | — | | | | 240,774,994 | |
| | | | | | | | | | | | | | | | | |
Total Investments | | | 1,081,118,070 | | | | 970,044,594 | | | | 702,383 | | | | 2,051,865,047 | |
| | | | | | | | | | | | | | | | | |
Derivatives^ | | | | | | | | | | | | | | | | |
Forward Currency Contracts | | | | | | | | | | | | | | | | |
Foreign Currency Risk | | | — | | | | 2,017,142 | | | | — | | | | 2,017,142 | |
Futures Contracts | | | | | | | | | | | | | | | | |
Equity Risk | | | 16,740,337 | | | | 3,709,386 | | | | — | | | | 20,449,723 | |
Swap Contracts | | | | | | | | | | | | | | | | |
Equity Risk | | | — | | | | 1,486,428 | | | | — | | | | 1,486,428 | |
Interest Rate Risk | | | — | | | | 4,827,740 | | | | — | | | | 4,827,740 | |
| | | | | | | | | | | | | | | | | |
Total | | $ | 1,097,858,407 | | | $ | 982,085,290 | | | $ | 702,383 | | | $ | 2,080,646,080 | |
| | | | | | | | | | | | | | | | | |
| Liability Valuation Inputs | | | | | | | | | | | | |
Common Stocks | | | | | | | | | | | | | | | | |
Australia | | $ | — | | | $ | (7,797,510 | ) | | $ | — | | | $ | (7,797,510 | ) |
Austria | | | — | | | | (3,144,473 | ) | | | — | | | | (3,144,473 | ) |
Belgium | | | — | | | | (2,216,236 | ) | | | — | | | | (2,216,236 | ) |
Canada | | | (11,355,361 | ) | | | — | | | | — | | | | (11,355,361 | ) |
Denmark | | | — | | | | (1,311,820 | ) | | | — | | | | (1,311,820 | ) |
France | | | — | | | | (11,696,819 | ) | | | — | | | | (11,696,819 | ) |
Germany | | | — | | | | (14,234,711 | ) | | | — | | | | (14,234,711 | ) |
Israel | | | (3,942,339 | ) | | | — | | | | — | | | | (3,942,339 | ) |
Italy | | | — | | | | (10,349,935 | ) | | | — | | | | (10,349,935 | ) |
| | | | | | | | | | | | | | | | | |
GMO Trust Funds
Notes to Financial Statements — (Continued)
February 28, 2022
| | | | | | | | | | | | | | | | |
| | | | | |
| Description | | Level 1 | | | Level 2 | | | Level 3 | | | Total | |
| Benchmark-Free Fund (continued) | | | | | | | | | | | | |
| Liability Valuation Inputs (continued) | | | | | | | | | | | | |
Common Stocks (continued) | | | | | | | | | | | | | | | | |
Japan | | $ | — | | | $ | (45,461,005 | ) | | $ | — | | | $ | (45,461,005 | ) |
Netherlands | | | — | | | | (5,520,822 | ) | | | — | | | | (5,520,822 | ) |
New Zealand | | | — | | | | (1,726,788 | ) | | | — | | | | (1,726,788 | ) |
Norway | | | — | | | | (394,198 | ) | | | — | | | | (394,198 | ) |
Russia | | | — | | | | (9,031 | ) | | | — | | | | (9,031 | ) |
Singapore | | | — | | | | (4,129,922 | ) | | | — | | | | (4,129,922 | ) |
Spain | | | — | | | | (9,270,400 | ) | | | — | | | | (9,270,400 | ) |
Sweden | | | — | | | | (5,995,326 | ) | | | — | | | | (5,995,326 | ) |
Switzerland | | | — | | | | (4,874,630 | ) | | | — | | | | (4,874,630 | ) |
United Kingdom | | | — | | | | (21,550,671 | ) | | | — | | | | (21,550,671 | ) |
United States | | | (165,430,014 | ) | | | — | | | | — | | | | (165,430,014 | ) |
| | | | | | | | | | | | | | | | | |
TOTAL COMMON STOCKS | | | (180,727,714 | ) | | | (149,684,297 | ) | | | — | | | | (330,412,011 | ) |
| | | | | | | | | | | | | | | | | |
Preferred Stocks | | | | | | | | | | | | | | | | |
Germany | | | — | | | | (1,781,505 | ) | | | — | | | | (1,781,505 | ) |
| | | | | | | | | | | | | | | | | |
TOTAL PREFERRED STOCKS | | | — | | | | (1,781,505 | ) | | | — | | | | (1,781,505 | ) |
| | | | | | | | | | | | | | | | | |
Derivatives^ | | | | | | | | | | | | | | | | |
Forward Currency Contracts | | | | | | | | | | | | | | | | |
Foreign Currency Risk | | | — | | | | (2,565,538 | ) | | | — | | | | (2,565,538 | ) |
Futures Contracts | | | | | | | | | | | | | | | | |
Equity Risk | | | — | | | | (227,034 | ) | | | — | | | | (227,034 | ) |
Swap Contracts | | | | | | | | | | | | | | | | |
Equity Risk | | | — | | | | (443,486 | ) | | | — | | | | (443,486 | ) |
Interest Rate Risk | | | — | | | | (5,860,139 | ) | | | — | | | | (5,860,139 | ) |
| | | | | | | | | | | | | | | | | |
Total | | $ | (180,727,714 | ) | | $ | (160,561,999 | ) | | $ | — | | | $ | (341,289,713 | ) |
| | | | | | | | | | | | | | | | | |
| | | | | | | | | | | | | | | | | |
Global Asset Allocation Fund | |
Asset Valuation Inputs | | | | | | | | | | | | | | | | |
Mutual Funds | | $ | 623,031,502 | | | $ | — | | | $ | — | | | $ | 623,031,502 | |
Short-Term Investments | | | 833,893 | | | | — | | | | — | | | | 833,893 | |
| | | | | | | | | | | | | | | | | |
Total Investments | | | 623,865,395 | | | | — | | | | — | | | | 623,865,395 | |
| | | | | | | | | | | | | | | | | |
Total | | $ | 623,865,395 | | | $ | — | | | $ | — | | | $ | 623,865,395 | |
| | | | | | | | | | | | | | | | | |
| | | | | | | | | | | | | | | | | |
Global Developed Equity Allocation Fund | |
Asset Valuation Inputs | | | | | | | | | | | | | | | | |
Mutual Funds | | $ | 86,777,788 | | | $ | — | | | $ | — | | | $ | 86,777,788 | |
Short-Term Investments | | | 49,828 | | | | — | | | | — | | | | 49,828 | |
| | | | | | | | | | | | | | | | | |
Total Investments | | | 86,827,616 | | | | — | | | | — | | | | 86,827,616 | |
| | | | | | | | | | | | | | | | | |
Total | | $ | 86,827,616 | | | $ | — | | | $ | — | | | $ | 86,827,616 | |
| | | | | | | | | | | | | | | | | |
| | | | | | | | | | | | | | | | | |
Global Equity Allocation Fund | |
Asset Valuation Inputs | | | | | | | | | | | | | | | | |
Mutual Funds | | $ | 1,580,276,953 | | | $ | — | | | $ | — | | | $ | 1,580,276,953 | |
Short-Term Investments | | | 608,775 | | | | — | | | | — | | | | 608,775 | |
| | | | | | | | | | | | | | | | | |
Total Investments | | | 1,580,885,728 | | | | — | | | | — | | | | 1,580,885,728 | |
| | | | | | | | | | | | | | | | | |
Total | | $ | 1,580,885,728 | | | $ | — | | | $ | — | | | $ | 1,580,885,728 | |
| | | | | | | | | | | | | | | | | |
| | | | | | | | | | | | | | | | | |
GMO Trust Funds
Notes to Financial Statements — (Continued)
February 28, 2022
| | | | | | | | | | | | | | | | |
| | | | | |
| Description | | Level 1 | | | Level 2 | | | Level 3 | | | Total | |
| Consolidated Implementation Fund | |
| Asset Valuation Inputs | | | | | | | | | | | | |
Common Stocks | | | | | | | | | | | | | | | | |
Argentina | | $ | 58,256 | | | $ | — | | | $ | — | | | $ | 58,256 | |
Australia | | | — | | | | 63,252,785 | | | | — | | | | 63,252,785 | |
Austria | | | — | | | | 89,410 | | | | — | | | | 89,410 | |
Belgium | | | — | | | | 20,490,027 | | | | — | | | | 20,490,027 | |
Brazil | | | 17,944,776 | | | | 47,572,589 | | | | — | | | | 65,517,365 | |
Canada | | | 88,959,871 | | | | — | | | | — | | | | 88,959,871 | |
Chile | | | 691,036 | | | | 3,451,785 | | | | — | | | | 4,142,821 | |
China | | | 21,013,317 | | | | 341,889,839 | | | | 965,024 | | | | 363,868,180 | |
Czech Republic | | | — | | | | 1,726,072 | | | | — | | | | 1,726,072 | |
Denmark | | | — | | | | 23,519,236 | | | | — | | | | 23,519,236 | |
Egypt | | | — | | | | 1,455,294 | | | | — | | | | 1,455,294 | |
Finland | | | — | | | | 14,491,494 | | | | — | | | | 14,491,494 | |
France | | | 177,744 | | | | 82,671,023 | | | | — | | | | 82,848,767 | |
Germany | | | — | | | | 62,309,516 | | | | — | | | | 62,309,516 | |
Greece | | | — | | | | 1,214,694 | | | | — | | | | 1,214,694 | |
Hong Kong | | | — | | | | 38,812,277 | | | | — | | | | 38,812,277 | |
Hungary | | | — | | | | 700,611 | | | | — | | | | 700,611 | |
India | | | 5,330,223 | | | | 110,519,951 | | | | — | | | | 115,850,174 | |
Indonesia | | | — | | | | 21,995,519 | | | | — | | | | 21,995,519 | |
Ireland | | | 6,702,788 | | | | 16,333,647 | | | | — | | | | 23,036,435 | |
Israel | | | 18,891,224 | | | | 4,722,193 | | | | — | | | | 23,613,417 | |
Italy | | | — | | | | 45,193,879 | | | | — | | | | 45,193,879 | |
Japan | | | 96,883 | | | | 565,004,669 | | | | — | | | | 565,101,552 | |
Kuwait | | | — | | | | 4,899,387 | | | | — | | | | 4,899,387 | |
Luxembourg | | | 3,008,848 | | | | — | | | | — | | | | 3,008,848 | |
Malaysia | | | — | | | | 1,275,719 | | | | — | | | | 1,275,719 | |
Mexico | | | 68,256,792 | | | | — | | | | — | | | | 68,256,792 | |
Netherlands | | | 4,381,623 | | | | 54,386,798 | | | | 185 | | | | 58,768,606 | |
New Zealand | | | — | | | | 4,156,159 | | | | — | | | | 4,156,159 | |
Norway | | | — | | | | 26,246,074 | | | | — | | | | 26,246,074 | |
Philippines | | | — | | | | 2,138,126 | | | | — | | | | 2,138,126 | |
Poland | | | — | | | | 12,515,920 | | | | — | | | | 12,515,920 | |
Portugal | | | — | | | | 7,960,852 | | | | — | | | | 7,960,852 | |
Qatar | | | — | | | | 6,407,670 | | | | — | | | | 6,407,670 | |
Russia | | | — | | | | 43,423,785 | | | | 1,248,215 | | | | 44,672,000 | |
Saudi Arabia | | | — | | | | 860,084 | | | | — | | | | 860,084 | |
Singapore | | | — | | | | 25,305,701 | | | | — | | | | 25,305,701 | |
South Africa | | | — | | | | 39,261,250 | | | | — | | | | 39,261,250 | |
South Korea | | | 4,252,412 | | | | 168,182,766 | | | | — | | | | 172,435,178 | |
Spain | | | — | | | | 54,560,984 | | | | — | | | | 54,560,984 | |
Sweden | | | — | | | | 13,611,006 | | | | — | | | | 13,611,006 | |
Switzerland | | | 1,250,678 | | | | 21,484,404 | | | | — | | | | 22,735,082 | |
Taiwan | | | 14,002,258 | | | | 221,130,922 | | | | — | | | | 235,133,180 | |
Thailand | | | — | | | | 31,782,628 | | | | — | | | | 31,782,628 | |
Turkey | | | — | | | | 26,302,222 | | | | — | | | | 26,302,222 | |
United Kingdom | | | 11,600,013 | | | | 180,599,767 | | | | — | | | | 192,199,780 | |
United States | | | 963,549,406 | | | | — | | | | 8,961,199 | | | | 972,510,605 | |
Vietnam | | | — | | | | 45,444 | | | | — | | | | 45,444 | |
| | | | | | | | | | | | | | | | | |
TOTAL COMMON STOCKS | | | 1,230,168,148 | | | | 2,413,954,178 | | | | 11,174,623 | | | | 3,655,296,949 | |
| | | | | | | | | | | | | | | | | |
Preferred Stocks | | | | | | | | | | | | | | | | |
Brazil | | | 9,039,579 | | | | 26,116,425 | | | | — | | | | 35,156,004 | |
Chile | | | 622,092 | | | | 49,582 | | | | — | | | | 671,674 | |
| | | | | | | | | | | | | | | | | |
GMO Trust Funds
Notes to Financial Statements — (Continued)
February 28, 2022
| | | | | | | | | | | | | | | | |
| | | | | |
| Description | | Level 1 | | | Level 2 | | | Level 3 | | | Total | |
| Consolidated Implementation Fund (continued) | |
| Asset Valuation Inputs (continued) | | | | | | | | | | | | |
Preferred Stocks (continued) | | | | | | | | | | | | | | | | |
Colombia | | $ | 133,240 | | | $ | — | | | $ | — | | | $ | 133,240 | |
Germany | | | — | | | | 6,165,174 | | | | — | | | | 6,165,174 | |
Russia | | | — | | | | 6,481,413 | | | | — | | | | 6,481,413 | |
South Korea | | | — | | | | 19,277,966 | | | | — | | | | 19,277,966 | |
Taiwan | | | — | | | | 478,783 | | | | — | | | | 478,783 | |
United States | | | — | | | | — | | | | 875,250 | | | | 875,250 | |
| | | | | | | | | | | | | | | | | |
TOTAL PREFERRED STOCKS | | | 9,794,911 | | | | 58,569,343 | | | | 875,250 | | | | 69,239,504 | |
| | | | | | | | | | | | | | | | | |
Rights/Warrants | | | | | | | | | | | | | | | | |
Egypt | | | 762 | | | | — | | | | — | | | | 762 | |
United States | | | — | | | | — | | | | 983,025 | | | | 983,025 | |
| | | | | | | | | | | | | | | | | |
TOTAL RIGHTS/WARRANTS | | | 762 | | | | — | | | | 983,025 | | | | 983,787 | |
| | | | | | | | | | | | | | | | | |
Investment Funds | | | | | | | | | | | | | | | | |
United States | | | 6,335,819 | | | | — | | | | 22,156,919 | | | | 28,492,738 | |
| | | | | | | | | | | | | | | | | |
TOTAL INVESTMENT FUNDS | | | 6,335,819 | | | | — | | | | 22,156,919 | | | | 28,492,738 | |
| | | | | | | | | | | | | | | | | |
Debt Obligations | | | | | | | | | | | | | | | | |
Canada | | | — | | | | 2,914,067 | | | | — | | | | 2,914,067 | |
China | | | — | | | | 328,892 | | | | — | | | | 328,892 | |
Israel | | | — | | | | 5,550,273 | | | | — | | | | 5,550,273 | |
Italy | | | — | | | | 408,762 | | | | — | | | | 408,762 | |
Luxembourg | | | — | | | | — | | | | 2,436,433 | | | | 2,436,433 | |
Macau | | | — | | | | 2,941,571 | | | | — | | | | 2,941,571 | |
Netherlands | | | — | | | | — | | | | 55 | | | | 55 | |
United States | | | 1,061,811,876 | | | | 136,480,345 | | | | 18,428,674 | | | | 1,216,720,895 | |
| | | | | | | | | | | | | | | | | |
TOTAL DEBT OBLIGATIONS | | | 1,061,811,876 | | | | 148,623,910 | | | | 20,865,162 | | | | 1,231,300,948 | |
| | | | | | | | | | | | | | | | | |
Mutual Funds | | | | | | | | | | | | | | | | |
United States | | | 12,509,088 | | | | — | | | | — | | | | 12,509,088 | |
| | | | | | | | | | | | | | | | | |
TOTAL MUTUAL FUNDS | | | 12,509,088 | | | | — | | | | — | | | | 12,509,088 | |
| | | | | | | | | | | | | | | | | |
Short-Term Investments | | | 542,810,800 | | | | 203,728 | | | | — | | | | 543,014,528 | |
Purchased Options | | | 70,255 | | | | — | | | | — | | | | 70,255 | |
| | | | | | | | | | | | | | | | | |
Total Investments | | | 2,863,501,659 | | | | 2,621,351,159 | | | | 56,054,979 | | | | 5,540,907,797 | |
| | | | | | | | | | | | | | | | | |
Derivatives^ | |
Forward Currency Contracts | | | | | | | | | | | | | | | | |
Foreign Currency Risk | | | — | | | | 10,113,488 | | | | — | | | | 10,113,488 | |
Futures Contracts | | | | | | | | | | | | | | | | |
Equity Risk | | | 40,362,445 | | | | 10,493,250 | | | | — | | | | 50,855,695 | |
Interest Rate Risk | | | 1,232,971 | | | | — | | | | — | | | | 1,232,971 | |
Physical Commodity Contract Risk | | | 1,352,297 | | | | — | | | | — | | | | 1,352,297 | |
Swap Contracts | | | | | | | | | | | | | | | | |
Equity Risk | | | — | | | | 4,483,073 | | | | — | | | | 4,483,073 | |
Interest Rate Risk | | | — | | | | 28,870,485 | | | | — | | | | 28,870,485 | |
| | | | | | | | | | | | | | | | | |
Total | | $ | 2,906,449,372 | | | $ | 2,675,311,455 | | | $ | 56,054,979 | | | $ | 5,637,815,806 | |
| | | | | | | | | | | | | | | | | |
| Liability Valuation Inputs | | | | | | | | | | | | |
Common Stocks | |
Australia | | $ | — | | | $ | (20,811,481 | ) | | $ | — | | | $ | (20,811,481 | ) |
Austria | | | — | | | | (8,351,850 | ) | | | — | | | | (8,351,850 | ) |
Belgium | | | — | | | | (6,463,337 | ) | | | — | | | | (6,463,337 | ) |
Canada | | | (33,076,446 | ) | | | — | | | | — | | | | (33,076,446 | ) |
| | | | | | | | | | | | | | | | | |
GMO Trust Funds
Notes to Financial Statements — (Continued)
February 28, 2022
| | | | | | | | | | | | | | | | |
| | | | | |
| Description | | Level 1 | | | Level 2 | | | Level 3 | | | Total | |
| Consolidated Implementation Fund (continued) | |
| Liability Valuation Inputs (continued) | | | | | | | | | | | | |
Common Stocks (continued) | | | | | | | | | | | | | | | | |
Denmark | | $ | — | | | $ | (3,645,202 | ) | | $ | — | | | $ | (3,645,202 | ) |
France | | | — | | | | (32,197,192 | ) | | | — | | | | (32,197,192 | ) |
Germany | | | — | | | | (38,609,928 | ) | | | — | | | | (38,609,928 | ) |
Israel | | | (11,407,013 | ) | | | — | | | | — | | | | (11,407,013 | ) |
Italy | | | — | | | | (27,919,340 | ) | | | — | | | | (27,919,340 | ) |
Japan | | | — | | | | (119,295,060 | ) | | | — | | | | (119,295,060 | ) |
Netherlands | | | — | | | | (14,418,083 | ) | | | — | | | | (14,418,083 | ) |
New Zealand | | | — | | | | (4,578,045 | ) | | | — | | | | (4,578,045 | ) |
Norway | | | — | | | | (1,154,193 | ) | | | — | | | | (1,154,193 | ) |
Singapore | | | — | | | | (11,499,032 | ) | | | — | | | | (11,499,032 | ) |
Spain | | | — | | | | (25,415,444 | ) | | | — | | | | (25,415,444 | ) |
Sweden | | | — | | | | (15,433,971 | ) | | | — | | | | (15,433,971 | ) |
Switzerland | | | — | | | | (13,623,066 | ) | | | — | | | | (13,623,066 | ) |
United Kingdom | | | (3,896 | ) | | | (66,084,294 | ) | | | — | | | | (66,088,190 | ) |
United States | | | (615,488,824 | ) | | | — | | | | — | | | | (615,488,824 | ) |
| | | | | | | | | | | | | | | | | |
TOTAL COMMON STOCKS | | | (659,976,179 | ) | | | (409,499,518 | ) | | | — | | | | (1,069,475,697 | ) |
| | | | | | | | | | | | | | | | | |
Preferred Stocks | | | | | | | | | | | | | | | | |
Germany | | | — | | | | (4,699,907 | ) | | | — | | | | (4,699,907 | ) |
| | | | | | | | | | | | | | | | | |
TOTAL PREFERRED STOCKS | | | — | | | | (4,699,907 | ) | | | — | | | | (4,699,907 | ) |
| | | | | | | | | | | | | | | | | |
Debt Obligations | | | | | | | | | | | | | | | | |
United States | | | — | | | | (1,210,022 | ) | | | — | | | | (1,210,022 | ) |
| | | | | | | | | | | | | | | | | |
TOTAL DEBT OBLIGATIONS | | | — | | | | (1,210,022 | ) | | | — | | | | (1,210,022 | ) |
| | | | | | | | | | | | | | | | | |
Derivatives^ | | | | | | | | | | | | | | | | |
Forward Currency Contracts | | | | | | | | | | | | | | | | |
Foreign Currency Risk | | | — | | | | (16,129,547 | ) | | | — | | | | (16,129,547 | ) |
Futures Contracts | | | | | | | | | | | | | | | | |
Equity Risk | | | (29,298 | ) | | | (5,373,384 | ) | | | — | | | | (5,402,682 | ) |
Interest Rate Risk | | | (441,553 | ) | | | — | | | | — | | | | (441,553 | ) |
Physical Commodity Contract Risk | | | (121,673 | ) | | | — | | | | — | | | | (121,673 | ) |
Written Options | | | | | | | | | | | | | | | | |
Equity Risk | | | (694,066 | ) | | | — | | | | — | | | | (694,066 | ) |
Swap Contracts | | | | | | | | | | | | | | | | |
Credit Risk | | | — | | | | (540,824 | ) | | | — | | | | (540,824 | ) |
Equity Risk | | | — | | | | (2,446,847 | ) | | | — | | | | (2,446,847 | ) |
Interest Rate Risk | | | — | | | | (35,090,528 | ) | | | — | | | | (35,090,528 | ) |
| | | | | | | | | | | | | | | | | |
Total | | $ | (661,262,769 | ) | | $ | (474,990,577 | ) | | $ | — | | | $ | (1,136,253,346 | ) |
| | | | | | | | | | | | | | | | | |
| | | | | | | | | | | | | | | | | |
International Developed Equity Allocation Fund | |
Asset Valuation Inputs | | | | | | | | | | | | | | | | |
Mutual Funds | | $ | 230,491,494 | | | $ | — | | | $ | — | | | $ | 230,491,494 | |
Short-Term Investments | | | 80,822 | | | | — | | | | — | | | | 80,822 | |
| | | | | | | | | | | | | | | | | |
Total Investments | | | 230,572,316 | | | | — | | | | — | | | | 230,572,316 | |
| | | | | | | | | | | | | | | | | |
Total | | $ | 230,572,316 | | | $ | — | | | $ | — | | | $ | 230,572,316 | |
| | | | | | | | | | | | | | | | | |
| | | | | | | | | | | | | | | | | |
GMO Trust Funds
Notes to Financial Statements — (Continued)
February 28, 2022
| | | | | | | | | | | | | | | | |
| | | | | |
| Description | | Level 1 | | | Level 2 | | | Level 3 | | | Total | |
International Equity Allocation Fund | |
Asset Valuation Inputs | | | | | | | | | | | | | | | | |
Mutual Funds | | $ | 678,975,126 | | | $ | — | | | $ | — | | | $ | 678,975,126 | |
Short-Term Investments | | | 110,766 | | | | — | | | | — | | | | 110,766 | |
| | | | | | | | | | | | | | | | | |
Total Investments | | | 679,085,892 | | | | — | | | | — | | | | 679,085,892 | |
| | | | | | | | | | | | | | | | | |
Total | | $ | 679,085,892 | | | $ | — | | | $ | — | | | $ | 679,085,892 | |
| | | | | | | | | | | | | | | | | |
| | | | | | | | | | | | | | | | | |
| Consolidated SGM Major Markets Fund | |
| Asset Valuation Inputs | | | | | | | | | | | | |
Debt Obligations | | | | | | | | | | | | | | | | |
U.S. Government | | $ | 228,701,454 | | | $ | — | | | $ | — | | | $ | 228,701,454 | |
| | | | | | | | | | | | | | | | | |
TOTAL DEBT OBLIGATIONS | | | 228,701,454 | | | | — | | | | — | | | | 228,701,454 | |
| | | | | | | | | | | | | | | | | |
Short-Term Investments | | | 37,510,572 | | | | 847,313 | | | | — | | | | 38,357,885 | |
| | | | | | | | | | | | | | | | | |
Total Investments | | | 266,212,026 | | | | 847,313 | | | | — | | | | 267,059,339 | |
| | | | | | | | | | | | | | | | | |
Derivatives^ | | | | | | | | | | | | | | | | |
Forward Currency Contracts | | | | | | | | | | | | | | | | |
Foreign Currency Risk | | | — | | | | 334,658 | | | | — | | | | 334,658 | |
Futures Contracts | | | | | | | | | | | | | | | | |
Equity Risk | | | 1,983,506 | | | | 1,313,865 | | | | — | | | | 3,297,371 | |
Interest Rate Risk | | | 874,356 | | | | — | | | | — | | | | 874,356 | |
Physical Commodity Contract Risk | | | 942,124 | | | | — | | | | — | | | | 942,124 | |
Swap Contracts | | | | | | | | | | | | | | | | |
Equity Risk | | | — | | | | 353,555 | | | | — | | | | 353,555 | |
| | | | | | | | | | | | | | | | | |
Total | | $ | 270,012,012 | | | $ | 2,849,391 | | | $ | — | | | $ | 272,861,403 | |
| | | | | | | | | | | | | | | | | |
Liability Valuation Inputs | | | | | | | | | | | | | | | | |
Derivatives^ | |
Forward Currency Contracts | | | | | | | | | | | | | | | | |
Foreign Currency Risk | | $ | — | | | $ | (633,748 | ) | | $ | — | | | $ | (633,748 | ) |
Futures Contracts | | | | | | | | | | | | | | | | |
Equity Risk | | | (2,707,220 | ) | | | (3,683,192 | ) | | | — | | | | (6,390,412 | ) |
Interest Rate Risk | | | (277,316 | ) | | | — | | | | — | | | | (277,316 | ) |
Physical Commodity Contract Risk | | | (91,744 | ) | | | — | | | | — | | | | (91,744 | ) |
Swap Contracts | | | | | | | | | | | | | | | | |
Equity Risk | | | — | | | | (1,084,896 | ) | | | — | | | | (1,084,896 | ) |
| | | | | | | | | | | | | | | | | |
Total | | $ | (3,076,280 | ) | | $ | (5,401,836 | ) | | $ | — | | | $ | (8,478,116 | ) |
| | | | | | | | | | | | | | | | | |
| | | | | | | | | | | | | | | | | |
| Strategic Opportunities Allocation Fund | |
| Asset Valuation Inputs | | | | | | | | | | | | |
Common Stocks | | | | | | | | | | | | | | | | |
Australia | | $ | — | | | $ | 3,289,701 | | | $ | — | | | $ | 3,289,701 | |
Austria | | | — | | | | 13,525 | | | | — | | | | 13,525 | |
Belgium | | | — | | | | 1,076,978 | | | | — | | | | 1,076,978 | |
Brazil | | | 191,486 | | | | 78,946 | | | | — | | | | 270,432 | |
Canada | | | 2,971,134 | | | | — | | | | — | | | | 2,971,134 | |
China | | | 427,557 | | | | 2,527,452 | | | | 61,485 | | | | 3,016,494 | |
Denmark | | | — | | | | 1,177,059 | | | | — | | | | 1,177,059 | |
Finland | | | — | | | | 571,159 | | | | — | | | | 571,159 | |
France | | | — | | | | 3,264,195 | | | | — | | | | 3,264,195 | |
Germany | | | — | | | | 2,029,274 | | | | — | | | | 2,029,274 | |
Hong Kong | | | — | | | | 1,951,542 | | | | — | | | | 1,951,542 | |
| | | | | | | | | | | | | | | | | |
GMO Trust Funds
Notes to Financial Statements — (Continued)
February 28, 2022
| | | | | | | | | | | | | | | | |
| | | | | |
| Description | | Level 1 | | | Level 2 | | | Level 3 | | | Total | |
| Strategic Opportunities Allocation Fund (continued) | |
| Asset Valuation Inputs (continued) | | | | | | | | | | | | |
Common Stocks (continued) | | | | | | | | | | | | | | | | |
India | | $ | — | | | $ | 1,043,902 | | | $ | — | | | $ | 1,043,902 | |
Ireland | | | 32,406 | | | | 1,154,925 | | | | — | | | | 1,187,331 | |
Israel | | | 621,693 | | | | 409,768 | | | | — | | | | 1,031,461 | |
Italy | | | — | | | | 2,077,797 | | | | — | | | | 2,077,797 | |
Japan | | | — | | | | 26,930,012 | | | | — | | | | 26,930,012 | |
Malaysia | | | — | | | | 27,721 | | | | — | | | | 27,721 | |
Malta | | | — | | | | — | | | | 0 | § | | | 0 | § |
Mexico | | | 717,847 | | | | — | | | | — | | | | 717,847 | |
Netherlands | | | 195,948 | | | | 2,555,737 | | | | — | | | | 2,751,685 | |
New Zealand | | | — | | | | 238,845 | | | | — | | | | 238,845 | |
Norway | | | — | | | | 1,190,153 | | | | — | | | | 1,190,153 | |
Portugal | | | — | | | | 432,999 | | | | — | | | | 432,999 | |
Russia | | | — | | | | 67,826 | | | | — | | | | 67,826 | |
Singapore | | | — | | | | 930,186 | | | | — | | | | 930,186 | |
South Africa | | | — | | | | 224,263 | | | | — | | | | 224,263 | |
South Korea | | | 35,592 | | | | 290,744 | | | | — | | | | 326,336 | |
Spain | | | — | | | | 2,354,389 | | | | — | | | | 2,354,389 | |
Sweden | | | — | | | | 778,117 | | | | — | | | | 778,117 | |
Switzerland | | | 52,476 | | | | 563,943 | | | | — | | | | 616,419 | |
Taiwan | | | — | | | | 381,581 | | | | — | | | | 381,581 | |
United Kingdom | | | 117,870 | | | | 6,916,667 | | | | — | | | | 7,034,537 | |
United States | | | 26,970,406 | | | | — | | | | — | | | | 26,970,406 | |
| | | | | | | | | | | | | | | | | |
TOTAL COMMON STOCKS | | | 32,334,415 | | | | 64,549,406 | | | | 61,485 | | | | 96,945,306 | |
| | | | | | | | | | | | | | | | | |
Preferred Stocks | | | | | | | | | | | | | | | | |
Brazil | | | 240,856 | | | | 265,064 | | | | — | | | | 505,920 | |
Germany | | | — | | | | 280,178 | | | | — | | | | 280,178 | |
| | | | | | | | | | | | | | | | | |
TOTAL PREFERRED STOCKS | | | 240,856 | | | | 545,242 | | | | — | | | | 786,098 | |
| | | | | | | | | | | | | | | | | |
Debt Obligations | | | | | | | | | | | | | | | | |
United States | | | 24,793,902 | | | | — | | | | — | | | | 24,793,902 | |
| | | | | | | | | | | | | | | | | |
TOTAL DEBT OBLIGATIONS | | | 24,793,902 | | | | — | | | | — | | | | 24,793,902 | |
| | | | | | | | | | | | | | | | | |
Mutual Funds | | | | | | | | | | | | | | | | |
United States | | | 145,331,020 | | | | — | | | | — | | | | 145,331,020 | |
| | | | | | | | | | | | | | | | | |
TOTAL MUTUAL FUNDS | | | 145,331,020 | | | | — | | | | — | | | | 145,331,020 | |
| | | | | | | | | | | | | | | | | |
Short-Term Investments | | | 23,213,284 | | | | — | | | | — | | | | 23,213,284 | |
| | | | | | | | | | | | | | | | | |
Total Investments | | | 225,913,477 | | | | 65,094,648 | | | | 61,485 | | | | 291,069,610 | |
| | | | | | | | | | | | | | | | | |
Derivatives^ | | | | | | | | | | | | | | | | |
Swap Contracts | | | | | | | | | | | | | | | | |
Equity Risk | | | — | | | | 205,290 | | | | — | | | | 205,290 | |
| | | | | | | | | | | | | | | | | |
Total | | $ | 225,913,477 | | | $ | 65,299,938 | | | $ | 61,485 | | | $ | 291,274,900 | |
| | | | | | | | | | | | | | | | | |
| Liability Valuation Inputs | |
Common Stocks | | | | | | | | | | | | | | | | |
Australia | | $ | — | | | $ | (1,068,834 | ) | | $ | — | | | $ | (1,068,834 | ) |
Austria | | | — | | | | (412,388 | ) | | | — | | | | (412,388 | ) |
Belgium | | | — | | | | (315,574 | ) | | | — | | | | (315,574 | ) |
Canada | | | (1,561,296 | ) | | | — | | | | — | | | | (1,561,296 | ) |
Denmark | | | — | | | | (181,125 | ) | | | — | | | | (181,125 | ) |
France | | | — | | | | (1,673,814 | ) | | | — | | | | (1,673,814 | ) |
| | | | | | | | | | | | | | | | | |
GMO Trust Funds
Notes to Financial Statements — (Continued)
February 28, 2022
| | | | | | | | | | | | | | | | |
| | | | | |
| Description | | Level 1 | | | Level 2 | | | Level 3 | | | Total | |
| Strategic Opportunities Allocation Fund (continued) | |
| Liability Valuation Inputs (continued) | |
Common Stocks (continued) | | | | | | | | | | | | | | | | |
Germany | | $ | — | | | $ | (1,916,067 | ) | | $ | — | | | $ | (1,916,067 | ) |
Israel | | | (518,511 | ) | | | — | | | | — | | | | (518,511 | ) |
Italy | | | — | | | | (1,437,325 | ) | | | — | | | | (1,437,325 | ) |
Japan | | | — | | | | (6,193,089 | ) | | | — | | | | (6,193,089 | ) |
Netherlands | | | — | | | | (760,785 | ) | | | — | | | | (760,785 | ) |
New Zealand | | | — | | | | (248,216 | ) | | | — | | | | (248,216 | ) |
Norway | | | — | | | | (55,229 | ) | | | — | | | | (55,229 | ) |
Singapore | | | — | | | | (574,790 | ) | | | — | | | | (574,790 | ) |
Spain | | | — | | | | (1,289,314 | ) | | | — | | | | (1,289,314 | ) |
Sweden | | | — | | | | (818,433 | ) | | | — | | | | (818,433 | ) |
Switzerland | | | — | | | | (700,373 | ) | | | — | | | | (700,373 | ) |
United Kingdom | | | — | | | | (2,952,292 | ) | | | — | | | | (2,952,292 | ) |
United States | | | (22,436,403 | ) | | | — | | | | — | | | | (22,436,403 | ) |
| | | | | | | | | | | | | | | | | |
TOTAL COMMON STOCKS | | | (24,516,210 | ) | | | (20,597,648 | ) | | | — | | | | (45,113,858 | ) |
| | | | | | | | | | | | | | | | | |
Preferred Stocks | | | | | | | | | | | | | | | | |
Germany | | | — | | | | (233,560 | ) | | | — | | | | (233,560 | ) |
| | | | | | | | | | | | | | | | | |
TOTAL PREFERRED STOCKS | | | — | | | | (233,560 | ) | | | — | | | | (233,560 | ) |
| | | | | | | | | | | | | | | | | |
Derivatives^ | | | | | | | | | | | | | | | | |
Swap Contracts | | | | | | | | | | | | | | | | |
Equity Risk | | | — | | | | (59,778 | ) | | | — | | | | (59,778 | ) |
| | | | | | | | | | | | | | | | | |
Total | | $ | (24,516,210 | ) | | $ | (20,890,986 | ) | | $ | — | | | $ | (45,407,196 | ) |
| | | | | | | | | | | | | | | | | |
| | | | | | | | | | | | | | | | | |
The risks referenced in the tables above are not intended to be inclusive of all risks. Please see the “Investment and other risks” and “Derivative financial instruments” sections below for a further discussion of risks.
| | ^ | In the tables above derivatives are based on market values, rather than the notional amounts of derivatives, except for forward currency contracts which are based on unrealized appreciation/(depreciation). Excludes purchased options, if any, which are included in investments. |
| | § | Represents the interest in securities that were determined to have a value of zero at February 28, 2022. |
The underlying funds held at year end are classified above as Level 1. Certain underlying funds invest in securities and/or derivatives which may have been fair valued using methods determined in good faith by or at the direction of the Trustees or which may have been valued using significant unobservable inputs. For a summary of the levels assigned to the underlying funds’ direct securities and derivatives, if any, please refer to the underlying funds’ Notes to Financial Statements which are available on the SEC’s website at www.sec.gov or on GMO’s website at www.gmo.com.
U.S. GAAP requires additional disclosures about fair value measurements for material Level 3 securities and derivatives, if any (determined by each category of asset or liability as compared to a Fund’s total net assets). Level 3 holdings include investments valued using unadjusted prices supplied by a third-party pricing source (e.g., broker quotes, vendor). Implementation Fund’s Level 3 holdings include two common stocks that are priced at the average of broker bids, a common stock valued at its last price prior to trading being suspended and a common stock priced with a 2,000 basis point discount to a comparable stock and an additional 1,000 basis point discount for liquidity considerations. Other than described above, there were no other Funds with classes of investments or derivatives with direct material Level 3 holdings at February 28, 2022.
GMO Trust Funds
Notes to Financial Statements — (Continued)
February 28, 2022
For Funds with material total Level 3 assets and/or liabilities, the following is a reconciliation of securities and derivatives, if any, in which significant unobservable inputs (Level 3) were used in determining value:
| | | | | | | | | | | | | | | | | | | | | | | | | | | | | | | | | | | | | | | | |
| | | | | | | | | | | |
| | | Balances
as of
February 28,
2021 | | | Purchases | | | Sales | | | Accrued
Discounts/
Premiums | | | Total
Realized
Gain/ (Loss) | | | Change in
Unrealized
Appreciation
(Depreciation) | | | Transfer
into
Level 3 | | | Transfer
out of
Level 3 | | | Balances
as of
February 28,
2022 | | | Net Change in
Unrealized
Appreciation
(Depreciation)
from
Investments
Still Held as
of February 28,
2022 | |
| Consolidated Alternative Allocation Fund | | | | | | | | | | | | | | | | | | | | | | | | | | | | | | |
| Common Stocks | | | | | | | | | | | | | | | | | | | | | | | | | | | | | | | | | | | | | | | | |
China | | $ | — | | | $ | — | | | $ | — | | | $ | — | | | $ | — | | | $ | — | | | $ | 66,215 | ‡ | | $ | — | | | $ | 66,215 | | | $ | — | |
| Investment Funds | | | | | | | | | | | | | | | | | | | | | | | | | | | | | | | | | | | | | | | | |
United States | | | 10,681,155 | | | | 5,793,448 | | | | (10,833,271 | ) | | | — | | | | 849,312 | | | | (883,042 | ) | | | — | | | | — | | | | 5,607,602 | | | | (883,042 | ) |
| Rights/Warrants | | | | | | | | | | | | | | | | | | | | | | | | | | | | | | | | | �� | | | | | | | |
United States | | | 146,362 | | | | 13,648 | | | | — | | | | — | | | | — | | | | 103,441 | | | | — | | | | — | | | | 263,451 | | | | 103,441 | |
| | | | | | | | | | | | | | | | | | | | | | | | | | | | | | | | | | | | | | | | | |
Total Investments | | $ | 10,827,517 | | | $ | 5,807,096 | | | $ | (10,833,271 | ) | | $ | — | | | $ | 849,312 | | | $ | (779,601 | ) | | $ | 66,215 | | | $ | — | | | $ | 5,937,268 | | | $ | (779,601 | ) |
| | | | | | | | | | | | | | | | | | | | | | | | | | | | | | | | | | | | | | | | | |
| | | | | | | | | | | | | | | | | | | | | | | | | | | | | | | | | | | | | | | | | |
| Consolidated Implementation Fund | | | | | | | | | | | | | | | | | | | | | | | | | | | | | | |
| Common Stocks | | | | | | | | | | | | | | | | | | | | | | | | | | | | | | | | | | | | | | | | |
China | | $ | 38,211 | | | $ | 51,987 | | | $ | — | | | $ | — | | | $ | — | | | $ | (36,183 | ) | | $ | 911,009 | ‡ | | $ | — | | | $ | 965,024 | | | $ | 2,028 | |
Netherlands | | | 199 | | | | — | | | | — | | | | — | | | | — | | | | (14 | ) | | | — | | | | — | | | | 185 | | | | (14 | ) |
Russia | | | — | | | | 3,722,637 | | | | (1,141,174 | ) | | | — | | | | (2,010 | ) | | | (2,252,251 | ) | | | 921,013 | ‡ | | | — | | | | 1,248,215 | | | | (2,252,251 | ) |
United States | | | 13,767,769 | | | | 1,868,694 | | | | (10,229,417 | ) | | | — | | | | 591,691 | | | | 2,729,464 | | | | 232,998 | ‡ | | | — | | | | 8,961,199 | | | | 3,538,584 | |
| Preferred Stocks | | | | | | | | | | | | | | | | | | | | | | | | | | | | | | | | | | | | | | | | |
United States | | | 881,040 | | | | 38,000 | | | | (1,651,583 | ) | | | — | | | | 1,564,173 | | | | 43,620 | | | | — | | | | — | | | | 875,250 | | | | 43,620 | |
| Rights/Warrants | | | | | | | | | | | | | | | | | | | | | | | | | | | | | | | | | | | | | | | | |
United States | | | 737,648 | | | | 28,602 | | | | — | | | | — | | | | — | | | | 216,775 | | | | — | | | | — | | | | 983,025 | | | | 216,775 | |
| Investment Funds | | | | | | | | | | | | | | | | | | | | | | | | | | | | | | | | | | | | | | | | |
United States | | | 22,494,300 | | | | 27,062,304 | | | | (27,370,315 | ) | | | — | | | | — | | | | (29,370 | ) | | | — | | | | — | | | | 22,156,919 | | | | (29,370 | ) |
| Debt Obligations | | | | | | | | | | | | | | | | | | | | | | | | | | | | | | | | | | | | | | | | |
Bank Loans | | | | | | | | | | | | | | | | | | | | | | | | | | | | | | | | | | | | | | | | |
Jamaica | | | 6,415,674 | | | | — | | | | (6,479,715 | ) | | | 36,625 | | | | 273,633 | | | | (246,217 | ) | | | — | | | | — | | | | — | | | | — | |
Luxembourg | | | 2,478,466 | | | | 2,542,991 | | | | (2,569,793 | ) | | | 8,613 | | | | — | | | | (23,844 | ) | | | — | | | | — | | | | 2,436,433 | | | | (13,412 | ) |
United States | | | 32,146,412 | | | | 17,280,285 | | | | (27,089,116 | ) | | | 2,418,905 | | | | (8,894,919 | ) | | | 2,566,967 | | | | — | | | | — | | | | 18,428,534 | | | | (1,367,026 | ) |
Corporate Debt | | | | | | | | | | | | | | | | | | | | | | | | | | | | | | | | | | | | | | | | |
Netherlands | | | 304,846 | | | | 60,352 | | | | (273,005 | ) | | | (27,873 | ) | | | (371,585 | ) | | | 307,320 | | | | — | | | | — | | | | 55 | | | | 307,320 | |
United States | | | — | | | | 42,000 | | | | (66,076 | ) | | | 2,470 | | | | 21,606 | | | | 140 | | | | — | | | | — | | | | 140 | | | | 140 | |
| | | | | | | | | | | | | | | | | | | | | | | | | | | | | | | | | | | | | | | | | |
Total Investments | | $ | 79,264,565 | | | $ | 52,697,852 | | | $ | (76,870,194 | )# | | $ | 2,438,740 | | | $ | (6,817,411 | ) | | $ | 3,276,407 | | | $ | 2,065,020 | | | $ | — | | | $ | 56,054,979 | | | $ | 446,394 | |
| | | | | | | | | | | | | | | | | | | | | | | | | | | | | | | | | | | | | | | | | |
| | | | | | | | | | | | | | | | | | | | | | | | | | | | | | | | | | | | | | | | | |
| | ‡ | Financial assets transferred between levels were due to a change in observable and/or unobservable inputs. |
| | # | Includes $20,762,365 of proceeds received from partial calls and/or principal paydowns as applicable. |
GMO Trust Funds
Notes to Financial Statements — (Continued)
February 28, 2022
The following table summarizes the quantitative inputs used in the valuation of investments classified within Level 3 of the fair value hierarchy for the year ended February 28, 2022 for Funds with material Level 3 investments.
Quantitative information about Level 3 Fair Value Measurements*
| | | | | | | | | | | | | | | | |
| | | | | |
| Investment Type | | Total Fair
Value ($) | | | Valuation Methodology | | | Unobservable Inputs | | | Range (Weighted
Average) | |
Consolidated Alternative Allocation Fund | | | | | | | | | | | | | | | | |
Common Stock | | | — | | | | Fair Value | | | | Discount rate | | | | (N/A) | |
Consolidated Implementation Fund | | | | | | | | | | | | | | | | |
Common Stock | | | 2,291,706 | | | | Fair Value | | | | Discount rate | | | | 10-30% (27.97%) | |
Common Stock | | | 6,220,395 | | | | Fair Value | | | | Most relevant broker quote | | | | $5.46-22.75 ($20.32) | |
Common Stock | | | 502,521 | | | | Fair Value | | | | Price of comparable equity | | | | (N/A) | |
Common Stock | | | — | | | | Fair Value | | |
| Discount for lack of
liquidity/marketability |
| | | $0 (N/A) | |
Corporate Debt | | | 195 | | | | Fair Value | | |
| Discount for lack of
liquidity/marketability |
| | | $0 (N/A) | |
Common Stock | | | 1,293,423 | | | | Fair Value | | | | Price of comparable equity | | | | (N/A) | |
| | * | The table does not include Level 3 securities or derivatives that are valued by pricing vendors or brokers. As of February 28, 2022, the value of these securities and/or derivatives for Consolidated Alternative Allocation Fund and Consolidated Implementation Fund was $5,937,268 and $45,746,739, respectively. The inputs for these investments are not readily available or cannot be reasonably estimated. |
Cash
Cash and foreign currency, if any, in the Statements of Assets and Liabilities consist of cash balances held with the custodian.
Due to/from broker
Due to/from broker in the Statements of Assets and Liabilities includes collateral on swap contracts, futures contracts, option contracts and forward currency contracts, if any, and may include marked-to-market amounts related to foreign currency or cash owed.
Foreign currency translation
The market values of foreign securities, currency holdings and related assets and liabilities are typically translated into U.S. dollars at the close of regular trading on the NYSE, generally at 4:00 pm Eastern time. Income and expenses denominated in foreign currencies are typically translated into U.S. dollars at the close of regular trading on the NYSE. Fluctuations in the value of currency holdings and other assets and liabilities resulting from changes in exchange rates are recorded as unrealized foreign currency gains or losses. Realized gains or losses and unrealized appreciation or depreciation on investment securities and income and expenses are translated on the respective dates of such transactions. The effects of changes in foreign currency exchange rates on investments in securities are not separated in the Statements of Operations from the effects of changes in market prices of those securities, but are included with the net realized and unrealized gain or loss on investment securities.
Loan assignments and participations
Certain Funds may invest in direct debt instruments, which are interests in amounts owed to lenders or lending syndicates, to suppliers of goods or services, or to other parties by corporate, governmental or other borrower. Such “loans” may include bank loans, promissory notes, and loan participations, or in the case of suppliers of goods or services, trade claims or other receivables. A loan is often administered by a bank or other financial institution that acts as agent for all holders. The agent administers the terms of the loan, as specified in the loan agreement. Unless, under the terms of the loan or other indebtedness a Fund has direct recourse against the borrower, it may have to rely on the agent to enforce its rights against the borrower. When investing in a loan participation, (i) a Fund has the right to receive payments of principal, interest and any fees to which it is entitled only from the party from whom the Fund has purchased the participation and only upon receipt by that party of payments from the borrower and (ii) a Fund generally has no right to enforce compliance by the borrower with the terms of the loan agreement or to vote on matters arising under the loan agreement. Thus, a Fund may be subject to credit risk both of the party from whom it purchased the loan participation and the borrower and that Fund may have minimal control over the terms of any loan modification. Loan assignments and participations outstanding at the end of the year, if any, are listed in each applicable Fund’s Schedule of Investments.
GMO Trust Funds
Notes to Financial Statements — (Continued)
February 28, 2022
Rights and warrants
The Funds may purchase or otherwise receive warrants or rights. Warrants and rights generally give the holder the right to receive, upon exercise, a security of the issuer at a set price. Funds typically use warrants and rights in a manner similar to their use of purchased options on securities, as described in the section entitled “Options” in Note 4 “Derivative financial instruments”. Risks associated with the use of warrants and rights are generally similar to risks associated with the use of purchased options. However, warrants and rights often do not have standardized terms, and may have longer maturities and may be less liquid than exchange-traded options. In addition, the terms of warrants or rights may limit a Fund’s ability to exercise the warrants or rights at such times and in such quantities as the Fund would otherwise wish. Rights and/or warrants outstanding at the end of the year, if any, are listed in each applicable Fund’s Schedule of Investments.
Repurchase agreements
The Funds may enter into repurchase agreements with banks and brokers. Under a repurchase agreement a Fund acquires a security for a relatively short period for cash and obtains a simultaneous commitment from the seller to repurchase the security at an agreed upon price and date. The Fund, through its custodian, takes possession of securities it acquired under the repurchase agreement. The value of the securities acquired may be less than the amount owed to the Fund by the seller. If the seller in a repurchase agreement transaction defaults or enters into insolvency proceedings and the value of the securities subject to the repurchase agreement is insufficient, the Fund’s recovery of cash from the seller may be delayed and, even if the Fund is able to dispose of the securities, the Fund may incur a loss equal to the difference between the cash it paid and the value of the securities. Repurchase agreements outstanding at the end of the year, if any, are listed in each applicable Fund’s Schedule of Investments.
Reverse repurchase agreements
The Funds may enter into reverse repurchase agreements with banks and brokers to enhance return. Under a reverse repurchase agreement a Fund sells portfolio assets subject to an agreement by that Fund to repurchase the same assets at an agreed upon price and date. A Fund can use the proceeds received from entering into a reverse repurchase agreement to make additional investments, which generally causes the Fund’s portfolio to behave as if it were leveraged. If the buyer in a reverse repurchase agreement files for bankruptcy or becomes insolvent, the Fund may be unable to recover the securities it sold and as a result may realize a loss on the transaction if the securities it sold are worth more than the purchase price it originally received from the buyer. Reverse repurchase agreements outstanding at the end of the year, if any, are listed in each applicable Fund’s Schedule of Investments.
Inflation-indexed bonds
Certain Funds may invest in inflation-indexed bonds. Inflation-indexed bonds are fixed income securities whose principal value is adjusted periodically according to the rate of inflation/deflation. Two structures are common. The U.S. Treasury and some other issuers use a structure that accrues inflation/deflation into the principal value of the bond. Many other issuers adjust the coupon accruals for inflation related changes.
The market price of inflation-indexed bonds normally changes when real interest rates change. Real interest rates, in turn, are tied to the relationship between nominal interest rates (i.e. stated interest rates) and the rate of inflation. Therefore, if the rate of inflation rises at a faster rate than nominal interest rates, real interest rates (i.e. nominal interest rate minus inflation) might decline, leading to an increase in value of inflation-indexed bonds. In contrast, if nominal interest rates increase at a faster rate than inflation, real interest rates might rise, leading to a decrease in value of inflation-indexed bonds. Coupon payments received by a Fund from inflation-indexed bonds are generally included in the Fund’s gross income for the period in which they accrue. In addition, any increase/decrease in the principal amount of an inflation-indexed bond is generally included in the Fund’s gross income even though principal is not paid until maturity. Inflation-indexed bonds outstanding at the end of the year, if any, are listed in each applicable Fund’s Schedule of Investments.
Securities lending
The Funds may make secured loans of their portfolio securities amounting to not more than one-third of their total assets. Securities loans are required to be collateralized by cash or securities in an amount equal to the securities loaned (marked to market daily). Daily market fluctuations could cause the value of loaned securities to be more or less than the value of the collateral received. When this occurs, the collateral is adjusted and settled on the following business day. Funds participating in securities lending receive compensation for lending their securities and/or net investment income earned on the investment of cash collateral, net of fee rebates paid to the borrower and fees paid to the lending agent. Cash collateral received is generally invested in GMO U.S. Treasury Fund. State Street Bank and Trust Company serves as the Funds’ lending agent.
GMO Trust Funds
Notes to Financial Statements — (Continued)
February 28, 2022
A Fund that lends its portfolio securities bears the risk of delay in the recovery of loaned securities, including possible impairment of the Fund’s ability to vote the securities, the inability to invest proceeds from the sales of such securities and of loss of rights in the collateral should the borrower fail financially. A Fund also bears the risk that the value of investments made with collateral may decline and bear the risk of total loss with respect to the investment of collateral.
At February 28, 2022, securities on loan at value and collateral from securities on loan are listed below:
| | | | | | | | | | | | | | | | |
| | | | | |
| Fund Name | | Value of securities
on loan ($) | | | Cash
collateral ($) | | | Non-cash
collateral ($)* | | | Total
collateral ($) | |
Benchmark-Free Fund | | | 22,621,074 | | | | 10,110,041 | | | | 13,935,836 | | | | 24,045,877 | |
Consolidated Implementation Fund | | | 41,044,798 | | | | 12,555,636 | | | | 31,394,431 | | | | 43,950,067 | |
| | * | Non-cash collateral is comprised of U.S. Treasury and Agencies. The Fund cannot repledge non-cash collateral; therefore, they are excluded from the Statements of Assets and Liabilities. |
In addition, some Funds may loan their portfolio securities through an “enhanced custody” program offered by the Funds’ custodian to facilitate the borrowing of securities for the Funds’ short sales. Under the program, a Fund borrows securities from the custodian and sells short those borrowed securities. The Fund may utilize various ways of collateralizing its obligation to return the borrowed securities, including by pledging securities held in the Fund’s custodial account to the custodian. For its participation in the enhanced custody program, the Fund will pay the custodian a securities borrow fee and a financing charge.
Information regarding the value of the securities loaned and the value of cash collateral at year end is included in the Statements of Assets and Liabilities.
Short sales
Certain Funds may enter into short sales transactions. A short sale is a transaction in which a Fund sells securities it may not own in anticipation of a decline in the fair market value of the securities. Securities sold in short sale transactions and the dividend and/or interest payable on such securities, if any, are reflected as a liability in the Statements of Assets and Liabilities. A Fund is obligated to deliver securities at the trade price at the time the short position is closed. Possible losses from short sales may be unlimited, whereas losses from purchases cannot exceed the total amount invested. Some Funds may also loan their portfolio securities through an enhanced custody program offered by the Funds’ custodian to facilitate the borrowing of securities for the Funds’ short sales (see Securities lending above). Short sales outstanding at the end of the year, if any, are listed in each applicable Fund’s Schedule of Investments.
Municipal obligations
Municipal obligations are issued by or on behalf of states, territories and possessions of the United States and their political subdivisions, agencies and instrumentalities and the District of Columbia to obtain funds for various public purposes. Municipal notes are generally used to provide for short-term capital needs, such as to finance working capital needs of municipalities or to provide various interim or construction financing, and generally have maturities of one year or less. Municipal bonds, which meet longer-term capital needs and generally have maturities of more than one year when issued, have two principal classifications: “general obligation” bonds and “revenue” bonds. Issuers of general obligation bonds include states, counties, cities, towns and regional districts. The basic security behind general obligation bonds is the issuer’s pledge of its full faith, credit, and taxing power for the payment of principal and interest. Revenue bonds have been issued to fund a wide variety of capital projects. The principal security for a revenue bond is generally the net revenues derived from a particular facility or group of facilities or, in some cases, from the proceeds of a special excise or other specific revenue source. Although the principal security behind these bonds varies widely, many provide additional security in the form of a debt service reserve fund whose monies also may be used to make principal and interest payments on the issuer’s obligations. Municipal obligations at the end of the year, if any, are listed in each applicable Fund’s Schedule of Investments.
Trade claims
Certain Funds may purchase trade claims against companies, including companies in bankruptcy or reorganization proceedings. Trade claims generally include claims of suppliers for goods delivered and not paid, claims for unpaid services rendered, claims for contract rejection damages and claims related to litigation. Trade claims are illiquid instruments which generally do not pay interest and there can be no guarantee that the debtor will ever be able to satisfy the obligation on the trade claim. Such claims are typically unsecured and may be subordinated to other unsecured obligations of a debtor, and generally are subject to defenses of the debtor with respect to
GMO Trust Funds
Notes to Financial Statements — (Continued)
February 28, 2022
the underlying transaction giving rise to the trade claim. Trade claims outstanding at the end of the year, if any, are listed in each applicable Fund’s Schedule of Investments.
Taxes and distributions
Each Fund has elected to be treated or intends to elect to be treated and intends to qualify each tax year as a regulated investment company under Subchapter M of the Internal Revenue Code of 1986, as amended (the “Code”). Each Fund intends to distribute its net investment income, if any, and its net realized short-term and long-term capital gains, if any, after giving effect to any available capital loss carryforwards for U.S. federal income tax purposes. Therefore, each Fund makes no provision for U.S. federal income or excise taxes.
Alternative Allocation SPC Ltd., Alternative Asset SPC Ltd. and Implementation SPC Ltd. are wholly-owned subsidiaries of Alternative Allocation Fund, SGM Major Markets Fund and Implementation Fund, respectively, and each has elected to be treated as a (non-U.S.) corporation for U.S. federal income tax purposes.
The policy of each Fund is to declare and pay dividends of its net investment income, if any, at least annually, although the Funds are permitted to, and will from time to time, declare and pay dividends of net investment income, if any, more frequently. Each Fund also intends to distribute net realized short-term and long-term capital gains, if any, at least annually. In addition, each Fund may, from time to time at their discretion, make unscheduled distributions in advance of large redemptions by shareholders or as otherwise deemed appropriate by a Fund. Typically, all distributions are reinvested in additional shares of each Fund, at net asset value, unless GMO or its agents receive and process a shareholder election to receive cash distributions. Distributions to shareholders are recorded by each Fund on the ex-dividend date.
Taxes on foreign interest and dividend income are generally withheld in accordance with the applicable country’s tax treaty with the United States. The foreign withholding rates applicable to a Fund’s investments in certain jurisdictions may be higher if a significant portion of the Fund is held by non-U.S. shareholders and/or if certain investments are made by a Fund’s wholly-owned subsidiary. Certain Funds have previously filed for and/or may file for additional tax refunds with respect to certain taxes withheld by certain countries. Generally, the amount of such refunds that a Fund reasonably determines are collectible and free from significant contingencies are reflected in a Fund’s net asset value and are reflected as Dividends from unaffiliated issuers in the Statements of Operations. In certain circumstances, a Fund’s receipt of such refunds may cause the Fund and/or its shareholders to be liable for U.S. federal income taxes, interest charges and related fees.
As a result of court cases involving several countries across the European Union, certain Funds and/or underlying funds have filed tax reclaims in addition to treaty-based claims, in respect of previously withheld taxes on dividends earned (“EU tax reclaims”). These filings are subject to various administrative proceedings by each local jurisdiction’s tax authority, as well as judicial proceedings. EU tax reclaim and associated interest entitlements that have been recognized, if any, are reflected as Other income in the Statements of Operations. As a result of its entitlements to EU tax reclaims and related interest amounts, a Fund may incur contingent legal fees. Such fees are presented within Legal fees in the Statements of Operations. Related receivables, if any, are reflected as EU tax reclaims receivable in the Statements of Assets and Liabilities. Receivables resulting from EU tax reclaims pursued by liquidated underlying funds, if any, are reflected as Receivable from liquidated underlying funds in the Statements of Assets and Liabilities. Generally, unless GMO believes that recovery amounts are collectible and free from significant contingencies, recoveries will not be reflected in a Fund’s net asset value. EU tax reclaims and related interest entitlements recognized by a Fund, if any, reduce the amount of foreign taxes, if any, that a Fund may elect to pass-through to its shareholders from a U.S. federal tax perspective. In certain circumstances and to the extent that EU tax reclaims recognized by a Fund were previously passed-through as foreign tax credits to its U.S. taxable shareholders, a Fund may enter into a closing agreement with the U.S. Internal Revenue Service. Doing so will enable a Fund to quantify and remit its tax liability related to any recoveries (on behalf of its shareholders).
Each Fund may be subject to taxation on realized capital gains, repatriation proceeds and other transaction-based charges imposed by certain countries in which it invests. Transaction-based charges are generally calculated as a percentage of the transaction amount. Taxes related to capital gains realized during the year ended February 28, 2022, if any, are reflected as part of Net realized gain (loss) in the Statements of Operations. Changes in tax liabilities related to capital gain taxes on unrealized investment gains, if any, are reflected as part of Change in net unrealized appreciation (depreciation) in the Statements of Operations.
Foreign taxes paid by each Fund may be treated, to the extent permissible by the Code (and other applicable U.S. federal tax guidance) and if that Fund so elects, as if paid by U.S. shareholders of that Fund.
GMO Trust Funds
Notes to Financial Statements — (Continued)
February 28, 2022
Income and capital gain distributions are determined in accordance with U.S. federal income tax regulations, which may differ from U.S. GAAP. Certain capital accounts in the financial statements are periodically adjusted for permanent differences in order to reflect their tax character. These adjustments have no impact on net assets or net asset value per share. Temporary differences that arise from recognizing certain items of income, expense, gain or loss in different periods for financial statement and tax purposes will likely reverse at some time in the future.
Differences in distributable earnings on a U.S. GAAP and tax accounting basis primarily relate to the following:
| | | | | | | | | | | | | | | | | | | | | | |
| | | | | | | | | | | | |
| Differences related to: | | Consolidated
Alternative
Allocation
Fund | | Benchmark-Free
Allocation
Fund | | Benchmark-Free
Fund | | Global
Asset
Allocation
Fund | | Global
Developed
Equity
Allocation
Fund | | Global
Equity
Allocation
Fund | | Consolidated
Implementation
Fund | | International
Developed
Equity
Allocation
Fund | | International
Equity
Allocation
Fund | | Consolidated
SGM
Major
Markets
Fund | | Strategic
Opportunities
Allocation
Fund |
| Capital loss carryforwards | | X | | X | | X | | X | | X | | | | X | | X | | X | | X | | |
| Constructive sale gains | | X | | | | | | | | | | | | | | | | | | | | |
| Contribution of assets to wholly-owned subsidiary | | | | | | | | | | | | | | | | | | | | | | X |
| Controlled foreign corporation transactions | | X | | | | | | | | | | | | X | | | | | | X | | |
| Defaulted bonds | | | | | | | | | | | | | | X | | | | | | | | |
| Derivative contract transactions | | X | | | | X | | | | | | | | X | | | | | | X | | X |
| Dividend income and withholding tax reclaim reserves | | | | | | X | | | | | | | | X | | | | | | | | |
| EU tax reclaims, associated interest entitlements and IRS closing agreement matters | | X | | | | | | | | | | | | | | | | | | | | |
| Foreign currency transactions | | X | | | | X | | | | | | | | X | | | | | | X | | |
| Gain/losses on underlying fund shares | | | | X | | | | | | | | | | | | | | | | | | |
| Interest, accretion and amortization | | | | | | | | | | | | | | X | | | | | | | | |
| Late year ordinary losses | | X | | X | | | | | | | | | | | | | | X | | | | |
| Losses on wash sale transactions | | X | | X | | X | | X | | X | | X | | X | | X | | X | | | | X |
| Mutual fund distributions received | | | | | | | | X | | X | | X | | | | X | | X | | | | X |
| Passive foreign investment company transactions | | X | | | | X | | | | | | | | X | | | | | | | | X |
| Post-October capital losses | | | | X | | | | | | | | | | | | | | X | | | | X |
| Net operating losses | | X | | | | | | | | | | | | | | | | | | | | |
| Securities Sold Short | | X | | | | X | | | | | | | | | | | | | | | | X |
| Straddle loss deferrals | | X | | | | | | | | | | | | X | | | | | | | | |
GMO Trust Funds
Notes to Financial Statements — (Continued)
February 28, 2022
The tax character of distributions declared by each Fund to shareholders is as follows:
| | | | | | | | | | | | | | | | | | | | | | | | |
| | | |
| | | Tax year ended February 28, 2022 | | | Tax year ended February 28, 2021 | |
| | | | | | | |
| Fund Name | | Ordinary
Income
(including
any net
short-term
capital gain) ($) | | | Net Long-Term
Capital Gain ($) | | | Total
Distributions ($) | | | Ordinary
Income
(including
any net
short-term
capital gain) ($) | | | Net Long-Term
Capital Gain ($) | | | Total
Distributions ($) | |
| Consolidated Alternative Allocation Fund | | | 10,917,959 | | | | 1,702,095 | | | | 12,620,054 | | | | 9,717,526 | | | | — | | | | 9,717,526 | |
| Benchmark-Free Allocation Fund | | | 125,011,372 | | | | — | | | | 125,011,372 | | | | 203,031,960 | | | | 48,160,322 | | | | 251,192,282 | |
| Benchmark-Free Fund | | | 78,012,250 | | | | — | | | | 78,012,250 | | | | 71,248,951 | | | | — | | | | 71,248,951 | |
| Global Asset Allocation Fund | | | 38,535,578 | | |
| —
|
| | | 38,535,578 | | | | 39,988,358 | | | | — | | | | 39,988,358 | |
| Global Developed Equity Allocation Fund | | | 6,882,171 | | | | 3,777,166 | | | | 10,659,337 | | | | 2,967,463 | | | | — | | | | 2,967,463 | |
| Global Equity Allocation Fund | | | 122,244,648 | | | | 513,707 | | | | 122,758,355 | | | | 58,525,060 | | | | — | | | | 58,525,060 | |
| Consolidated Implementation Fund | | | 150,035,453 | | | | — | | | | 150,035,453 | | | | 132,218,180 | | | | — | | | | 132,218,180 | |
| International Developed Equity Allocation Fund | | | 15,376,326 | | | | 499,169 | | | | 15,875,495 | | | | 9,649,537 | | | | — | | | | 9,649,537 | |
| International Equity Allocation Fund | | | 44,500,695 | | | | — | | | | 44,500,695 | | | | 33,660,679 | | | | — | | | | 33,660,679 | |
| Consolidated SGM Major Markets Fund | | | 9,313,520 | | | | 17,533,030 | | | | 26,846,550 | | | | 346,979 | | | | 7,770,224 | | | | 8,117,203 | |
| Strategic Opportunities Allocation Fund | | | 37,102,686 | | | | 30,452,964 | | | | 67,555,650 | | | | 20,110,114 | | | | 6,846,276 | | | | 26,956,390 | |
Distributions in excess of a Fund’s tax basis earnings and profits, if significant, are reported in the Funds’ financial statements as a return of capital.
As of February 28, 2022, the components of distributable earnings on a tax basis and certain tax attributes for the Funds consisted of the following:
| | | | | | | | | | | | | | | | | | | | |
| | | | | | |
| Fund Name | | Undistributed
Ordinary
Income
(including any
net short-term
capital gain) ($) | | | Undistributed
Net Long-Term
Capital Gain ($) | | | Late-Year
Ordinary Loss
Deferral ($) | | | Capital Loss
Carryforwards ($) | | | Post-October
Capital Losses
Deferral ($) | |
Consolidated Alternative Allocation Fund | | | — | | | | 1,894,254 | | | | (5,005,107) | | | | (892,348) | | | | — | |
Benchmark-Free Allocation Fund | | | — | | | | — | | | | (2,845,246) | | | | (52,860,563) | | | | (21,630,301) | |
Benchmark-Free Fund | | | 6,982,124 | | | | — | | | | — | | | | (264,717,871) | | | | — | |
Global Asset Allocation Fund | | | 1,328,285 | | | | — | | | | — | | | | (167,761,990) | | | | — | |
Global Developed Equity Allocation Fund | | | 419,419 | | | | 2,981,732 | | | | (599) | | | | (68,957,360) | | | | — | |
Global Equity Allocation Fund | | | 1,180,885 | | | | 43,939,821 | | | | (11,633) | | | | — | | | | — | |
Consolidated Implementation Fund | | | 18,578,679 | | | | — | | | | — | | | | (884,166,716) | | | | — | |
International Developed Equity Allocation Fund | | | 72,735 | | | | 522,076 | | | | (1,231) | | | | (134,524,362) | | | | — | |
International Equity Allocation Fund | | | 1,100,633 | | | | — | | | | (4,145) | | | | (102,201,850) | | | | (3,228,388) | |
Consolidated SGM Major Markets Fund | | | 3,722,069 | | | | 10,388,629 | | | | — | | | | (1,102,705) | | | | — | |
Strategic Opportunities Allocation Fund | | | 1,200,300 | | | | 6,481,277 | | | | — | | | | — | | | | (2,024,041) | |
As of February 28, 2022, certain Funds had capital loss carryforwards available to offset future realized gains, if any, to the extent permitted by the Code. Net capital losses are carried forward without expiration and generally retain their short-term and/or long-term tax character, as applicable. Utilization of the capital loss carryforwards, post-October capital losses, late-year ordinary losses, and
GMO Trust Funds
Notes to Financial Statements — (Continued)
February 28, 2022
losses realized subsequent to February 28, 2022, if any, could be subject to further limitations imposed by the Code related to share ownership activity. The Funds’ capital loss carryforwards are as follows:
| | | | | | | | |
| | | |
| Fund Name | | Short-Term ($) | | | Long-Term ($) | |
Consolidated Alternative Allocation Fund | | | — | | | | (892,348) | |
Benchmark-Free Allocation Fund | | | (1,561,499) | | | | (51,299,064) | |
Benchmark-Free Fund | | | (125,199,260) | | | | (139,518,611) | |
Global Asset Allocation Fund | | | — | | | | (167,761,990) | |
Global Developed Equity Allocation Fund | | | — | | | | (68,957,360) | |
Global Equity Allocation Fund | | | — | | | | — | |
Consolidated Implementation Fund | | | (625,499,699) | | | | (258,667,017) | |
International Developed Equity Allocation Fund | | | — | | | | (134,524,362) | |
International Equity Allocation Fund | | | — | | | | (102,201,850) | |
Consolidated SGM Major Markets Fund | | | (1,102,705) | | | | — | |
Strategic Opportunities Allocation Fund | | | — | | | | — | |
As of February 28, 2022, the approximate total cost, aggregate investment-level gross/net unrealized appreciation (depreciation) in the value of total investments (including total securities sold short, if any), and the net unrealized appreciation (depreciation) of outstanding financial instruments for U.S. federal income tax purposes were as follows:
| | | | | | | | | | | | | | | | | | | | |
| | | |
| | | Total Investments | | | Outstanding
Financial
Instruments | |
| | | | | | |
| Fund Name | | Aggregate
Cost ($) | | | Gross Unrealized
Appreciation ($) | | | Gross
Unrealized
(Depreciation) ($) | | | Net Unrealized
Appreciation
(Depreciation) ($) | | | Net Unrealized
Appreciation
(Depreciation) ($) | |
| Consolidated Alternative Allocation Fund | | | 270,321,310 | | | | 5,358,588 | | | | (15,848,315) | | | | (10,489,727) | | | | (1,542,852) | |
| Benchmark-Free Allocation Fund | | | 5,484,414,224 | | | | — | | | | (357,867,520) | | | | (357,867,520) | | | | — | |
| Benchmark-Free Fund | | | 1,761,961,394 | | | | 161,174,113 | | | | (203,463,976) | | | | (42,289,863) | | | | (14,670) | |
| Global Asset Allocation Fund | | | 682,371,759 | | | | 4,815,844 | | | | (63,322,208) | | | | (58,506,364) | | | | — | |
| Global Developed Equity Allocation Fund | | | 86,625,640 | | | | 1,843,263 | | | | (1,641,287) | | | | 201,976 | | | | — | |
| Global Equity Allocation Fund | | | 1,659,462,297 | | | | 43,711,923 | | | | (122,288,492) | | | | (78,576,569) | | | | — | |
| Consolidated Implementation Fund | | | 4,656,544,727 | | | | 448,419,753 | | | | (639,442,309) | | | | (191,022,556) | | | | (4,358,189) | |
| International Developed Equity Allocation Fund | | | 265,134,505 | | | | — | | | | (34,562,189) | | | | (34,562,189) | | | | — | |
| International Equity Allocation Fund | | | 725,277,275 | | | | 14,710,609 | | | | (60,901,992) | | | | (46,191,383) | | | | — | |
| Consolidated SGM Major Markets Fund | | | 344,967,090 | | | | 63,845 | | | | (77,971,596) | | | | (77,907,751) | | | | (626,193) | |
| Strategic Opportunities Allocation Fund | | | 239,468,110 | | | | 21,532,198 | | | | (15,278,116) | | | | 6,254,082 | | | | — | |
The Funds are subject to authoritative guidance related to the accounting and disclosure of uncertain tax positions under U.S. GAAP. A Fund may recognize an income tax liability related to an uncertain tax position under U.S. GAAP when the uncertain tax position has a less than 50% probability that it would be sustained upon examination by the tax authorities, based on technical merits. United States and non-U.S. tax rules (including the interpretation and application of tax laws) are subject to change. The Funds file tax returns and/or adopt certain tax positions in various jurisdictions. Non-U.S. taxes are provided for based on the Funds’ understanding of the prevailing tax rules of the non-U.S. markets in which they invest. Recently enacted tax rules, including interpretations of tax laws and tax legislation/initiatives currently under consideration in various jurisdictions, including the U.S., might affect the way the Funds and their investors are taxed prospectively and/or retroactively. Prior to the expiration of the relevant statutes of limitations, if
GMO Trust Funds
Notes to Financial Statements — (Continued)
February 28, 2022
any, the Funds are subject to examination by U.S. federal, state, local and non-U.S. jurisdictions with respect to the tax returns they have filed and the tax positions they have adopted. The Funds’ U.S. federal income tax returns are generally subject to examination by the Internal Revenue Service for a period of three years after they are filed. State, local and/or non-U.S. tax returns and/or other filings may be subject to examination for different periods, depending upon the tax rules of each applicable jurisdiction. As of February 28, 2022, each Fund has determined that no tax liability is required to be accrued in its financial statements related to uncertain tax positions for any tax years which are subject to examination.
Security transactions and related investment income
Security transactions are accounted for in the financial statements on trade date. For purposes of daily net asset value calculations, the Funds’ policy is that security transactions are generally accounted for on the following business day. GMO may override that policy and a Fund may account for security transactions on trade date if it experiences significant purchases or redemptions or engages in significant portfolio transactions. Dividend income, net of applicable foreign withholding taxes, if any, is recorded on the ex-dividend date or, if later, when a Fund is informed of the ex-dividend date. Income dividends and capital gain distributions from underlying funds, if any, are recorded on the ex-dividend date. Interest income is recorded on the accrual basis and is adjusted for the amortization of premiums and accretion of discounts. Principal on inflation-indexed securities is adjusted for inflation/deflation and any increase or decrease is recorded as interest income or investment loss. Coupon income is not recognized on securities for which collection is not expected. Paydown gains and losses on mortgage-related and other asset-backed securities, if any, are recorded as components of interest income in the Statements of Operations. Non-cash dividends, if any, are recorded at the fair market value of the asset received. In determining the net gain or loss on securities sold, the Funds use the identified cost basis.
Expenses and class allocations
Most of the expenses of the Trust are directly attributable to an individual Fund. Generally, common expenses are allocated among the Funds based on, among other things, the nature and type of expense and the relative size of the Funds. Investment income, common expenses, purchase premiums and redemption fees, if any, and realized and unrealized gains and losses are allocated among the classes of shares of the Funds, if applicable, based on the relative net assets of each class. Shareholder service fees and supplemental support fees, if any, which are directly attributable to a class of shares, are charged to that class’s operations. In addition, the Funds may incur fees and expenses indirectly as a shareholder in the underlying funds. Because the underlying funds have different expense and fee levels and the Funds may own different proportions of the underlying funds at different times, the amount of fees and expenses indirectly incurred by a Fund will vary (see Note 5).
Custodian, Fund Accounting Agent and Transfer Agent
State Street Bank and Trust Company (“State Street”) serves as the Funds’ custodian, fund accounting agent and transfer agent. Cash balances maintained at the custodian and transfer agent are held in a Demand Deposit Account and interest income earned, if any, is shown as interest income in the Statements of Operations.
Purchases and redemptions of Fund shares
Purchase premiums and redemption fees (if applicable) are paid to and retained by a Fund to help offset estimated portfolio transaction costs and other related costs (e.g., bid to ask spreads, stamp duties, and transfer fees) incurred by the Fund (directly or indirectly through investments in underlying funds or a wholly-owned subsidiary) as a result of an investor’s purchase or redemption by allocating estimated transaction costs to the purchasing or redeeming shareholder. Such fees are recorded as a component of the Funds’ net share transactions. A Fund may impose a new purchase premium and redemption fee or increase or decrease an existing fee at any time.
Purchase premiums are not charged on reinvestments of dividends or other distributions. Redemption fees apply to all shares of a Fund regardless of how the shares were acquired (e.g., by direct purchase or by reinvestment of dividends or other distributions).
If GMO determines that any portion of a cash purchase or redemption, as applicable, is offset by a corresponding cash redemption or purchase occurring on the same day, it ordinarily will waive or reduce the purchase premium or redemption fee with respect to that portion.
GMO also may waive or reduce the purchase premium or redemption fee for a purchase or redemption of a Fund’s shares if the Fund will not incur transaction costs or will incur reduced transaction costs.
For example, GMO may reduce the purchase premium to the extent that securities are used to purchase a Fund’s shares (taking into account transaction costs, stamp duties or transfer fees), and GMO may reduce redemption fees to the extent a Fund uses portfolio securities to redeem its shares (taking into account transaction costs, stamp duties or transfer fees).
GMO Trust Funds
Notes to Financial Statements — (Continued)
February 28, 2022
As of February 28, 2022, none of the Funds charge a purchase premium or redemption fee. Historical information on purchase premiums and redemption fees are provided in the table below.
| | |
Benchmark-Free Allocation Fund | | For the period from June 30, 2016 to June 30, 2018, the premium on cash purchases and the fee on cash redemptions were each 0.20% of the amount invested or redeemed. |
Benchmark-Free Fund | | For the period from June 30, 2016 to June 30, 2018, the premium on cash purchases and the fee on cash redemptions were each 0.25% of the amount invested or redeemed. |
Global Asset Allocation Fund | | For the period from June 30, 2016 to June 30, 2018, the premium on cash purchases and the fee on cash redemptions were each 0.15% of the amount invested or redeemed. |
Global Developed Equity Allocation Fund | | For the period from March 10, 2014 to June 30, 2018, the premium on cash purchases and the fee on cash redemptions were each 0.08% of the amount invested or redeemed. |
Global Equity Allocation Fund | | For the period from June 30, 2016 to June 30, 2018, the premium on cash purchases and the fee on cash redemptions were each 0.18% of the amount invested or redeemed. |
Implementation Fund | | For the period from June 30, 2015 to June 30, 2018, the premium on cash purchases and the fee on cash redemptions were each 0.20% of the amount invested or redeemed. |
International Developed Equity Allocation Fund | | For the period from March 10, 2014 to June 30, 2018, the premium on cash purchases and the fee on cash redemptions were each 0.08% of the amount invested or redeemed. |
International Equity Allocation Fund | | For the period from June 30, 2016 to June 30, 2018, the premium on cash purchases and the fee on cash redemptions were each 0.25% of the amount invested or redeemed. |
Strategic Opportunities Allocation Fund | | For the period from June 30, 2016 to June 30, 2018, the premium on cash purchases and the fee on cash redemptions were each 0.20% of the amount invested or redeemed. |
Recently-issued accounting guidance
In March 2020, the Financial Accounting Standards Board (FASB) issued Accounting Standards Update (ASU) No. 2020-04, “Reference Rate Reform (Topic 848) – Facilitation of the Effects of Reference Rate Reform on Financial Reporting”. The amendments in the ASU provides optional temporary financial reporting relief from the effect of certain types of contract modifications due to the planned discontinuation of the London Interbank Offered Rate (LIBOR) and other interbank-offered based reference rates as of the end of 2021. In March 2021, the administrator for LIBOR announced the extension of the publication of a majority of the USD LIBOR settings to June 30, 2023. The Investment Adviser does not expect ASU No. 2020-04 to have a material impact on the financial statements.
GMO Trust Funds
Notes to Financial Statements — (Continued)
February 28, 2022
| 3. | Investment and other risks |
The following chart identifies selected risks associated with each Fund. Risks not marked for a particular Fund may, however, still apply to some extent to that Fund at various times.
| | | | | | | | | | | | | | | | | | | | | | |
| | | | | | | | | | | | |
| | | Alternative
Allocation
Fund | | Benchmark-Free
Allocation
Fund | | Benchmark-Free
Fund | | Global
Asset
Allocation
Fund | | Global
Developed
Equity
Allocation
Fund | | Global
Equity
Allocation
Fund | | Implementation
Fund | | International
Developed
Equity
Allocation
Fund | | International
Equity
Allocation
Fund | | SGM
Major
Markets
Fund | | Strategic
Opportunities
Allocation
Fund |
Management and Operational Risk | | X | | X | | X | | X | | X | | X | | X | | X | | X | | X | | X |
Market Risk-Equities | | X | | X | | X | | X | | X | | X | | X | | X | | X | | X | | X |
Non-U.S. Investment Risk | | X | | X | | X | | X | | X | | X | | X | | X | | X | | X | | X |
Derivatives and Short Sales Risk | | X | | X | | X | | X | | X | | X | | X | | X | | X | | X | | X |
Market Risk-Fixed Income | | X | | X | | X | | X | | X | | X | | X | | X | | X | | X | | X |
Futures Contracts Risk | | X | | X | | X | | X | | | | | | | | | | | | X | | X |
Currency Risk | | X | | X | | X | | X | | X | | X | | X | | X | | X | | X | | X |
Credit Risk | | X | | X | | X | | X | | X | | X | | X | | X | | X | | X | | X |
Leveraging Risk | | X | | X | | X | | X | | X | | X | | X | | X | | X | | X | | X |
Commodities Risk | | X | | X | | X | | X | | | | | | X | | | | | | X | | X |
Counterparty Risk | | X | | X | | X | | X | | X | | X | | X | | X | | X | | X | | X |
Funds of Funds Risk | | X | | X | | X | | X | | X | | X | | X | | X | | X | | X | | X |
Illiquidity Risk | | X | | X | | X | | X | | X | | X | | X | | X | | X | | X | | X |
Event-Driven Risk | | X | | X | | | | | | | | | | X | | | | | | | | X |
Market Disruption and Geopolitical Risk | | X | | X | | X | | X | | X | | X | | X | | X | | X | | X | | X |
Smaller Company Risk | | X | | X | | X | | X | | X | | X | | X | | X | | X | | | | X |
Market Risk-Asset-Backed Securities | | | | X | | X | | X | | | | | | X | | | | | | X | | X |
Focused Investment Risk | | X | | X | | X | | X | | X | | X | | X | | X | | X | | X | | X |
Large Shareholder Risk | | X | | X | | X | | X | | X | | X | | X | | X | | X | | X | | X |
Non-Diversified Funds | | X | | X | | X | | X | | X | | X | | | | X | | X | | X | | X |
Investing in mutual funds involves many risks. The risks of investing in a particular Fund depend on the types of investments in its portfolio and the investment strategies GMO employs on its behalf. This section does not describe every potential risk of investing in the Funds. Funds could be subject to additional risks because of the types of investments they make and market conditions, which may change over time. Please see the Funds’ prospectus for more information regarding the risks of investing in the Funds.
Each Fund that invests in other GMO Funds, other investment companies or in a wholly-owned subsidiary (collectively, “Underlying Funds”) is exposed to the risks to which the Underlying Funds in which it invests are exposed, as well as the risk that the Underlying Funds will not perform as expected. Therefore, unless otherwise noted, the selected risks summarized below include both direct and
GMO Trust Funds
Notes to Financial Statements — (Continued)
February 28, 2022
indirect risks, and references in this section to investments made by a Fund include those made both directly by the Fund and indirectly by the Fund as a result of its investment in Underlying Funds.
An investment in a Fund is not a bank deposit and, therefore, is not insured or guaranteed by the Federal Deposit Insurance Corporation or any other government agency.
• MANAGEMENT AND OPERATIONAL RISK. A Fund runs the risk that GMO’s investment techniques will fail to produce desired results. GMO uses quantitative models as part of its investment process. GMO’s models may not accurately predict future market movements. In addition, GMO’s models rely on assumptions and data that are subject to limitations (e.g., inaccuracies, staleness) that could adversely affect their predictive value. A Fund also runs the risk that GMO’s assessment of an investment (including a security’s fundamental fair (or intrinsic) value) is wrong or that deficiencies in GMO’s or another service provider’s internal systems or controls will cause losses for the Fund or impair Fund operations.
• MARKET RISK – EQUITIES. The market price of an equity may decline due to factors affecting the issuer or its industry or the economy and equity markets generally. If the Fund purchases an equity for less than its fundamental fair (or intrinsic) value as assessed by GMO and GMO’s assessment proves to be incorrect, a Fund runs the risk that the market price of the equity will not appreciate or will decline. A Fund also may purchase equities that typically trade at higher multiples of current earnings than other securities, and the market prices of these equities often are more sensitive to changes in future earnings expectations than the market prices of equities trading at lower multiples. Declines in stock market prices generally are likely to reduce the net asset value of the Fund’s shares.
• NON-U.S. INVESTMENT RISK. The market prices of many non-U.S. securities (particularly of companies tied economically to emerging countries) fluctuate more than those of U.S. securities. Many non-U.S. securities markets (particularly emerging markets) are less stable, smaller, less liquid, and less regulated than U.S. securities markets, and the cost of trading in those markets often is higher than in U.S. securities markets. In addition, issuers of non-U.S. securities (particularly those tied economically to emerging countries) often are not subject to as much regulation as U.S. issuers, and the reporting, recordkeeping, accounting, custody, and auditing standards to which those issuers are subject often are not as rigorous as U.S. standards. In addition, a Fund may be subject to non-U.S. taxes, potentially on a retroactive basis, on (i) capital gains it realizes or dividends, interest, or other amounts it realizes or accrues in respect of non-U.S. investments; (ii) transactions in those investments; and (iii) repatriation of proceeds generated from the sale or other disposition of those investments. Also, the Funds need a license to invest directly in securities traded in many non-U.S. securities markets, and a Fund is subject to the risk that it could not invest if its license were terminated or suspended. In some non-U.S. securities markets, prevailing custody and trade settlement practices (e.g., the requirement to pay for securities prior to receipt) expose a Fund to credit and other risks. Further, adverse changes in investment regulations, capital requirements or exchange controls could adversely affect the value of the Fund’s investments. These and other risks (e.g., nationalization, expropriation or other confiscation of assets of non-U.S. issuers, limitations on, or difficulties enforcing, legal judgments, contractual rights, or other remedies) tend to be greater for investments in the securities of companies tied economically to emerging countries. The economies of emerging countries often depend predominantly on only a few industries or revenues from particular commodities and often are more volatile than the economies of developed countries.
• DERIVATIVES AND SHORT SALES RISK. The use of derivatives involves the risk that their value may not change as expected relative to changes in the value of the underlying assets, pools of assets, rates, currencies or indices. Derivatives also present other risks, including market risk, illiquidity risk, currency risk, credit risk, and counterparty risk. The market price of an option is affected by many factors, including changes in the market prices or dividend rates of underlying securities (or in the case of indices, the securities in such indices); the time remaining before expiration; changes in interest rates or exchange rates; and changes in the actual or perceived volatility of the relevant stock market and underlying securities. A Fund may create short investment exposure by taking a derivative position in which the value of the derivative moves in the opposite direction from the price of an underlying asset, pool of assets, rate, currency or index. The risks of loss associated with derivatives that provide short investment exposure and short sales of securities are theoretically unlimited.
• MARKET RISK – FIXED INCOME. The market price of a fixed income investment can decline due to market-related factors, including rising interest rates and widening credit spreads, or decreased liquidity due, for example, to market uncertainty about the value of a fixed income investment (or class of fixed income investments).
• FUTURES CONTRACTS RISK. The loss to a Fund resulting from its use of futures contracts is potentially unlimited. Futures markets are highly volatile, and the use of futures contracts increases the volatility of the Fund’s net asset value. A liquid secondary
GMO Trust Funds
Notes to Financial Statements — (Continued)
February 28, 2022
market may not exist for any particular futures contract at any particular time, and a Fund may be unable when it wishes to effect closing transactions to terminate its exposure under that contract. When a Fund uses futures contracts for hedging purposes, it runs the risk that changes in the prices of the contracts will not correlate perfectly with changes in the securities, index, or other asset underlying the contracts or movements in the prices of the Fund’s investments that are subject to the hedge. In addition, a Fund may be unable to recover or may be delayed in recovering margin or other amounts deposited with a futures commission merchant or futures clearinghouse. Foreign futures contracts are often less liquid and more volatile than U.S. futures contracts.
• CURRENCY RISK. Fluctuations in exchange rates can adversely affect the market value of a Fund’s foreign currency holdings and investments denominated in foreign currencies.
• CREDIT RISK. A Fund runs the risk that the issuer or guarantor of a fixed income investment or the obligors of obligations underlying an asset-backed security will be unable or unwilling to satisfy their obligations to pay principal and interest or otherwise to honor their obligations in a timely manner. The market price of a fixed income investment will normally decline as a result of the failure of an issuer, guarantor, or obligor to meet its payment obligations or in anticipation of such failure. Below investment grade investments have speculative characteristics, and negative changes in economic conditions or other circumstances are more likely to impair the ability of issuers of those investments to make principal and interest payments than issuers of investment grade investments.
• LEVERAGING RISK. The use of derivatives, short sales and securities lending creates leverage. Leverage increases a Fund’s losses when the value of its investments (including derivatives) declines. In addition, the Fund’s portfolio will be leveraged if it exercises its right to delay payment on a redemption, and losses will result if the value of the Fund’s assets declines between the time a redemption request is deemed to be received by the Fund and the time the Fund liquidates assets to meet that request.
• COMMODITIES RISK. Commodity prices can be extremely volatile, and exposure to commodities can cause the value of a Fund’s shares to decline or fluctuate in a rapid and unpredictable manner.
• COUNTERPARTY RISK. A Fund runs the risk that the counterparty to a derivatives contract, a clearing member used by the Fund to hold a cleared derivatives contract, or a borrower of the Fund’s securities is unable or unwilling to make timely settlement payments, return the Fund’s margin or otherwise honor its obligations.
• FUND OF FUNDS RISK. A Fund is indirectly exposed to all of the risks of an investment (if any) in its wholly-owned subsidiary and the underlying funds (including underlying GMO Funds and ETFs) in which it invests, including the risk that its wholly-owned subsidiary (if any) and those underlying funds will not perform as expected. Because a Fund bears the fees and expenses of the underlying funds in which it invests, the increase in fees and expenses of an underlying fund or a reallocation of the Fund’s investments to underlying funds with higher fees or expenses will increase the Fund’s total expenses.
• ILLIQUIDITY RISK. Low trading volume, lack of a market maker, large position size or legal restrictions may limit or prevent a Fund or an underlying fund from selling particular securities or closing derivative positions at desirable prices.
• EVENT-DRIVEN RISK. If a Fund purchases securities in anticipation of a proposed merger, acquisition, exchange offer, tender offer, or other similar transaction and that transaction later appears likely to be delayed or unlikely to be consummated or, in fact, is not consummated or is delayed, the market price of the securities purchased by the Fund may decline sharply, resulting in losses to the Fund. The risk/reward payout of event-driven strategies (such as merger arbitrage) typically is asymmetric, with the losses in failed transactions often far exceeding the gains in successful transactions. Event-driven strategies are subject to the risk of overall market movements, and a Fund may experience losses even if a transaction is consummated. A Fund’s investments in derivatives or short sales of securities to hedge or otherwise adjust investment exposure in connection with an event-driven transaction may not perform as expected or may otherwise reduce the Fund’s gains or increase its losses.
• MARKET DISRUPTION AND GEOPOLITICAL RISK. Geopolitical and other events (e.g., wars, pandemics, sanctions, terrorism) may disrupt securities markets and adversely affect global economies and markets. Those events, as well as other changes in non-U.S. and U.S. economic and political conditions, could exacerbate other risks or otherwise reduce the value of the Fund’s investments.
In late February 2022, Russia began an invasion of Ukraine. Following such invasion, the United States, the European Union, and other countries and entities imposed wide-ranging sanctions on Russia, the President of Russia and other members of the Government of Russia as well as entities owned or controlled by, or acting on behalf of, the Government of Russia. The Government of Russia has
GMO Trust Funds
Notes to Financial Statements — (Continued)
February 28, 2022
also imposed countersanctions and taken other actions in response to the sanctions. The scope and scale of the sanctions may be expanded and the conflict between Russia and Ukraine may further deteriorate. These sanctions and current environment could impair the ability of the Funds to buy, sell, hold, receive, deliver or otherwise transact in certain securities and other instruments. The full impact of the sanctions and the conflict on the Funds, the financial markets and the global economy is not yet known.
• SMALLER COMPANY RISK. Smaller companies may have limited product lines, markets, or financial resources, lack the competitive strength of larger companies, have less experienced managers or depend on a few key employees. The securities of companies with smaller market capitalizations often are less widely held and trade less frequently and in lesser quantities, and their market prices often fluctuate more, than the securities of companies with larger market capitalizations.
• MARKET RISK – ASSET BACKED SECURITIES. The market price of asset-backed securities, like that of other fixed income investments with complex structures, can decline for a variety of reasons, including market uncertainty about their credit quality and the reliability of their payment streams. Payment streams associated with asset-backed securities held by a Fund depend on many factors (e.g., the cash flow generated by the assets backing the securities, deal structure, creditworthiness of any credit-support provider, and reliability of various other service providers with access to the payment stream), and a problem in any of these factors can lead to a reduction in the payment stream GMO expected a Fund to receive when the Fund purchased the asset-backed security.
• FOCUSED INVESTMENT RISK. Investments focused in asset classes, countries, regions, sectors, industries, currencies or issuers (or in sectors within a country or region) that are subject to the same or similar risk factors and investments whose prices are closely correlated are subject to greater overall risk than investments that are more diversified or whose prices are not as closely correlated.
• LARGE SHAREHOLDER RISK. To the extent that a large number of shares of a Fund is held by a single shareholder (e.g., an institutional investor or another GMO Fund) or a group of shareholders with a common investment strategy (e.g., GMO asset allocation accounts), the Fund is subject to the risk that a redemption by those shareholders of all or a large portion of their Fund shares will require the Fund to sell securities at disadvantageous prices, disrupt the Fund’s operations, or force the Fund’s liquidation.
| | • | | NON-DIVERSIFIED FUNDS. Alternative Allocation Fund and SGM Major Markets Fund are non-diversified investment companies under the 1940 Act and therefore a decline in the market price of a particular security held by the Funds may affect the Funds’ performance more than if the Funds were a diversified investment company. |
| 4. | Derivative financial instruments |
During the year ended February 28, 2022, only Alternative Allocation Fund, Benchmark-Free Fund, Implementation Fund, SGM Major Markets Fund, and Strategic Opportunities Allocation Fund held derivative financial instruments directly. For a listing of derivative financial instruments, if any, held by the underlying funds, please refer to the underlying funds’ Schedule of Investments. The derivative information provided below only pertains to direct investments made by Alternative Allocation Fund, Benchmark-Free Fund, Implementation Fund, SGM Major Markets Fund and Strategic Opportunities Allocation Fund (or their respective wholly-owned subsidiary, if any).
Derivatives are financial contracts whose value depends on, or is derived from, the value of underlying assets, reference rates, or indices, that are used to increase, decrease or adjust elements of the investment exposures of a Fund’s portfolio. Derivatives may relate to securities, interest rates, currencies, currency exchange rates, inflation rates, commodities and indices, and include foreign currency contracts, swap contracts, reverse repurchase agreements, and other exchange-traded and OTC contracts.
Consolidated Alternative Allocation Fund may use derivatives in some or all of the ways described below.
Use of Derivatives by Benchmark-Free Fund, Consolidated Implementation Fund and Strategic Opportunities Allocation Fund
The Funds may use derivatives to gain long or short investment exposure to securities, commodities or other assets. For example, a Fund may use derivatives instead of investing directly in equity securities, including using equity derivatives to maintain equity exposure when it holds cash by “equitizing” its cash balances using futures contracts or other types of derivatives. The Funds also may use exchange-traded futures and forward foreign exchange contracts to gain exposure to a range of global equity, bond, currency, and commodity markets and may use currency derivatives (including forward currency contracts, futures contracts, swap contracts and options) to gain exposure to a given currency.
GMO Trust Funds
Notes to Financial Statements — (Continued)
February 28, 2022
The Funds may use derivatives such as futures, options, and swap contracts, in an attempt to reduce their investment exposures (which may result in a reduction below zero). A Fund also may use currency derivatives in an attempt to reduce (which may result in a reduction below zero) some aspect of the currency exposure in its portfolio. For these purposes, the Funds may use an instrument denominated in a different currency that GMO believes is highly correlated with the relevant currency. Implementation Fund uses exchange-traded futures and forward contracts as an integral part of its investment program.
The Funds may use derivatives in an attempt to adjust elements of their investment exposures to individual commodities, various securities, sectors, markets, indices and currencies without actually having to sell existing investments or make new direct investments. For example, if a Fund holds a large proportion of a certain type of security or commodity and GMO believes that another security or commodity will outperform such security or commodity, the Fund might use a short futures contract on an appropriate index(to synthetically “sell” a portion of the Fund’s portfolio) in combination with a long futures contract on another index (to synthetically “buy” exposure to that index). Long and short swap contracts and contracts for differences also may be used for these purposes. Derivatives used to effect synthetic sales and purchases will generally be unwound as actual portfolio securities are sold and purchased. In adjusting investment exposures, each Fund also may use currency derivatives, seeking currency exposure that is different (in some cases, significantly different) from the currency exposure represented by its portfolio. Each Fund’s foreign currency exposure may differ significantly from the currency exposure represented by its investments.
The Funds may use derivatives to effect transactions intended as substitutes for securities lending.
Each of the Funds is not limited in its use of derivatives or in the total notional value of its derivative positions. As a result of their derivative positions, the Funds may have gross investment exposures in excess of their net assets (i.e. the Funds may be leveraged) and therefore are subject to heightened risk of loss. Each Fund’s performance can depend substantially, if not primarily, on the performance of assets or indices underlying its derivatives even though it does not own those assets or indices.
Use of Derivatives by Consolidated SGM Major Markets Fund
The Fund may use derivatives to gain long and/or short investment exposure to securities, currencies, commodities, or other assets. In particular, the Fund may use exchange traded futures and forward foreign exchange contracts to gain exposure to a range of global equity, bond, currency, and commodity markets. The Fund also may use currency derivatives (including forward currency contracts, futures contracts, swap contracts and options) to gain exposure to a given currency.
The Fund may use derivatives in an attempt to adjust its investment exposures. For example, the Fund may use credit default swaps to take a short position with respect to the likelihood of default by an issuer. The Fund also may use currency derivatives in an attempt to reduce (which may result in a reduction below zero) some aspect of the currency exposure in its portfolio. For these purposes, the Fund may use an instrument denominated in a different currency that GMO believes is highly correlated with the relevant currency.
The Fund may use derivatives, such as futures, options, and swap contracts, in an attempt to adjust elements of its investment exposures to individual commodities, various securities, sectors, markets, indices and currencies without actually having to sell existing investments or make new direct investments. For example, if the Fund holds a large proportion of a certain type of security or commodity and GMO believes that another security or commodity will outperform such security or commodity, the Fund might use a short futures contract on an appropriate index (to synthetically “sell” a portion of the Fund’s portfolio) in combination with a long futures contract on another index (to synthetically “buy” exposure to that index). Long and short swap contracts and contracts for differences also may be used for these purposes. Derivatives used to effect synthetic sales and purchases will generally be unwound as actual portfolio securities are sold and purchased. In addition, GMO may alter the interest rate exposure of debt instruments by employing interest rate swaps. Such a strategy is designed to maintain the Fund’s exposure to the credit of an issuer through the debt instrument but adjust the Fund’s interest rate exposure through the swap. With these swaps, the Fund and its counterparties exchange interest rate exposure, such as fixed versus variable rates and shorter duration versus longer duration exposure. In adjusting its investment exposure, the Fund also may use currency derivatives in an attempt to adjust its currency exposure, seeking currency exposure that is different (in some cases, significantly different) from the currencies in which their equities are traded.
The Fund is not limited in its use of derivatives or in the total notional value of its derivative positions. As a result of its derivative positions, the Fund will typically have gross investment exposures in excess of its net assets (i.e. the Fund will be leveraged) and therefore is subject to heightened risk of loss. The Fund’s performance can depend substantially, if not primarily, on the performance of assets or indices underlying its derivatives even though it does not own those assets or indices.
* * *
GMO Trust Funds
Notes to Financial Statements — (Continued)
February 28, 2022
Certain derivatives transactions that may be used by the Funds, including certain interest rate swaps and certain credit default index swaps, are required to be transacted through a central clearing organization. The Funds hold cleared derivatives transactions, if any, through clearing members, who are members of derivatives clearing houses. Certain other derivatives, including futures and certain options, are transacted on exchanges. The Funds hold exchange-traded derivatives through clearing brokers that are typically members of the exchanges. In contrast to bilateral derivatives transactions, following a period of advance notice to the Fund, clearing brokers generally can require termination of existing cleared or exchange-traded derivatives transactions at any time and increases in margin above the margin that it required at the beginning of a transaction. Clearing houses and exchanges also have broad rights to increase margin requirements for existing transactions and to terminate transactions. Any such increase or termination could interfere with the ability of a Fund to pursue its investment strategy. Also, a Fund is subject to execution risk if it enters into a derivatives transaction that is required to be cleared (or that GMO expects to be cleared), and no clearing member is willing or able to clear the transaction on the Fund’s behalf. In that case, the transaction might have to be terminated, and the Fund could lose some or all of the benefit of any increase in the value of the transaction after the time of the transaction.
The use of derivatives involves risks that are in addition to, and potentially greater than, the risks associated with investing directly in securities and other more traditional assets. See “Investment and other risks” above for further information.
For Funds that held derivatives during the year ended February 28, 2022, the following table shows how the Fund used these derivatives (marked with an X):
| | | | | | | | | | | | | | | | | | | | |
| | | | | | |
| Type of Derivative and Objective for Use | | Consolidated
Alternative
Allocation
Fund* | | | Benchmark-
Free Fund | | | Consolidated
Implementation
Fund* | | | Consolidated
SGM Major
Markets
Fund* | | | Strategic
Opportunities
Allocation
Fund | |
| Forward currency contracts | | | | | | | | | | | | | | | | | | | | |
Adjust currency exchange rate risk | | | | | | | | | | | | | | | X | | | | | |
Adjust exposure to foreign currencies | | | X | | | | X | | | | X | | | | X | | | | | |
Manage against anticipated currency exchange rate changes | | | X | | | | | | | | X | | | | | | | | | |
| Futures contracts | | | | | | | | | | | | | | | | | | | | |
Adjust exposure to certain securities markets | | | X | | | | X | | | | X | | | | X | | | | | |
Substitute for direct investment | | | | | | | | | | | | | | | X | | | | | |
Adjust interest rate exposure | | | X | | | | | | | | | | | | X | | | | | |
Maintain the diversity and liquidity of the portfolio | | | X | | | | X | | | | X | | | | X | | | | | |
| Options (Purchased) | | | | | | | | | | | | | | | | | | | | |
Substitute for direct equity investment | | | X | | | | | | | | X | | | | | | | | | |
| Options (Written) | | | | | | | | | | | | | | | | | | | | |
Substitute for direct equity investment | | | X | | | | | | | | X | | | | | | | | | |
| Swap contracts | | | | | | | | | | | | | | | | | | | | |
Adjust exposure to certain markets | | | | | | | | | | | | | | | X | | | | | |
Adjust interest rate exposure | | | X | | | | X | | | | X | | | | X | | | | | |
Substitute for direct investment in securities | | | X | | | | X | | | | X | | | | | | | | X | |
Achieve exposure to a reference entity’s credit | | | X | | | | | | | | X | | | | | | | | | |
| | * | Certain derivatives may be held by the Fund’s wholly-owned subsidiary. |
Forward currency contracts
The Funds may enter into forward currency contracts, including forward cross currency contracts. A forward currency contract is an agreement between two parties to buy and sell a currency at a set price on a future date (or to pay or receive the amount of the change in relative values of the two currencies). The market price of a forward currency contract fluctuates with changes in forward currency exchange rates. The value of each of the Fund’s forward currency contracts is marked-to-market daily using rates supplied by a
GMO Trust Funds
Notes to Financial Statements — (Continued)
February 28, 2022
quotation service and changes in value are recorded by each Fund as unrealized gains or losses. Realized gains or losses on the contracts are equal to the difference between the value of the contract at the time it was opened and the value at the time it was settled.
These contracts involve market risk in excess of the unrealized gain or loss. Forward currency contracts expose a Fund to the market risk of unfavorable movements in currency values and the risk that the counterparty will be unable or unwilling to meet the terms of the contracts. Most forward currency contracts are collateralized. Forward currency contracts outstanding at the end of the year, if any, are listed in each applicable Fund’s Schedule of Investments.
Futures contracts
The Funds may purchase and sell futures contracts. A futures contract is a contract that obligates the holder to buy or sell an asset at a predetermined delivery price at a specified time in the future. Some futures contracts are net (cash) settled. Upon entering into a futures contract, a Fund is required to deposit cash, U.S. government and agency obligations or other liquid assets with the futures clearing broker in accordance with the initial margin requirements of the broker or exchange. Futures contracts are generally valued at the settlement price established at the close of business each day by the board of trade or exchange on which they are traded (and if the futures are traded outside the U.S. and the market for such futures is closed prior to the close of the NYSE due to time zone differences, the values will be adjusted, to the extent practicable and available, based on inputs from an independent pricing service approved by the Trustees to reflect estimated valuation changes through the NYSE close). The value of each of the Fund’s futures contracts is marked-to-market daily and an appropriate payable or receivable for the change in value (“variation margin”) is recorded by each Fund. The payable or receivable is settled on the following business day. Gains or losses are recognized but not accounted for as realized until the contracts expire or are closed. Futures contracts involve, to varying degrees, risk of loss in excess of the variation margin as recorded in the Statements of Assets and Liabilities. Under some circumstances, futures exchanges may establish daily limits on the amount that the price of a futures contract can vary from the previous day’s settlement price, thereby effectively preventing liquidation of unfavorable positions. Futures contracts expose the Funds to the risk that they may not be able to enter into a closing transaction due to an illiquid market. Futures contracts outstanding at the end of the year, if any, are listed in each applicable Fund’s Schedule of Investments.
Options
The Funds may purchase call and put options. A call option gives the holder the right to buy an asset; a put option gives the holder the right to sell an asset. “Quanto” options are cash-settled options in which the underlying asset (often an index) is denominated in a currency other than the currency in which the option is settled. By purchasing options a Fund alters its exposure to the underlying asset by, in the case of a call option, entitling it to purchase the underlying asset at a set price from the writer of the option and, in the case of a put option, entitling it to sell the underlying asset at a set price to the writer of the option. A Fund pays a premium for a purchased option. That premium, if any, which is disclosed in the Schedule of Investments, is subsequently reflected in the marked-to-market value of the option. The potential loss associated with purchasing put and call options is limited to the premium paid. Purchased option contracts outstanding at the end of the year, if any, are listed in each applicable Fund’s Schedule of Investments.
The Funds may write (i.e. sell) call and put options on futures, swaps (“swaptions”), securities or currencies they own or in which they may invest. Writing options alters a Fund’s exposure to the underlying asset by, in the case of a call option, obligating that Fund to sell the underlying asset at a set price to the option-holder and, in the case of a put option, obligating that Fund to purchase the underlying asset at a set price from the option-holder. In some cases (e.g., index options), settlement will be in cash, based on a formula price. When a Fund writes a call or put option, an amount equal to the premium received is recorded as a liability and is subsequently included in the marked-to-market value of the option. As a writer of an option, a Fund has no control over whether it will be required to sell (call) or purchase (put) the underlying asset and as a result bears the risk of an unfavorable change in the price of the asset underlying the option. In the event that a Fund writes call options without an offsetting exposure (e.g., call options on an asset that the Fund does not own), it bears an unlimited risk of loss if the price of the underlying asset increases during the term of the option. OTC options expose a Fund to the risk the Fund may not be able to enter into a closing transaction because of an illiquid market. Written option contracts outstanding at the end of the year, if any, are listed in each applicable Fund’s Schedule of Investments.
When an option contract is closed, the Fund records a realized gain or loss equal to the difference between the value of the contract at the time it was opened and the value at the time it was closed. Realized gains and losses on purchased options are included in realized gains and losses on investment securities. If a written call option is exercised, the premium originally received is recorded as an addition to sales proceeds. If a written put option is exercised, the premium originally received is recorded as a reduction in the cost of
GMO Trust Funds
Notes to Financial Statements — (Continued)
February 28, 2022
investments purchased. Gains and losses from the expiration or closing of written option contracts are separately disclosed in the Statements of Operations.
In a credit linked option contract, one party makes payments to another party in exchange for the option to exercise a contract where the buyer has the right to receive a specified return if a credit event (e.g., default or similar event) occurs with respect to a reference entity or entities and a specified decrease in the value of the related collateral occurs. A writer of a credit linked option receives periodic payments in return for its obligation to pay an agreed-upon value to the other party if they exercise their option in the case of a credit event. If no credit event occurs, the seller has no payment obligation and will keep the premiums received.
Swap contracts
The Funds may directly or indirectly use various swap contracts, including, without limitation, swaps on securities and securities indices, total return swaps, interest rate swaps, basis swaps, currency swaps, credit default swaps, variance swaps, commodity swaps, inflation swaps, municipal swaps, dividend swaps, volatility swaps, correlation swaps and other types of available swaps. A swap contract is an agreement to exchange the return generated by one asset for the return generated by another asset. Some swap contracts are net settled. When entering into a swap contract and during the term of the transaction, a Fund and/or the swap counterparty may post or receive cash or securities as collateral.
Initial upfront payments received or made upon entering into a swap contract are included in the fair market value of the swap. The Funds do not amortize upfront payments. Net periodic payments made or received to compensate for differences between the stated terms of the swap contract and prevailing market conditions (credit spreads, currency exchange rates, interest rates, and other relevant factors) are recorded as realized gains or losses in the Statements of Operations. A liquidation payment received or made at the termination of the swap contract is recorded as realized gain or loss in the Statements of Operations. The periodic frequency of payments received may differ from periodic payment frequencies made and their frequencies could be monthly, quarterly, semiannually, annually or at maturity.
Interest rate swap contracts involve an exchange by the parties of their respective commitments to pay or rights to receive interest (e.g., an exchange of floating rate interest payments for fixed rate interest payments with respect to the notional amount of principal). Basis swaps are interest rate swaps that involve the exchange of two floating interest rate payments and may involve the exchange of two different currencies.
Inflation swaps involve the exchange of a floating rate linked to an index for a fixed rate interest payment with respect to a notional amount or principal.
Total return swap contracts involve a commitment by one party to pay interest to the other party in exchange for a payment to it from the other party based on the return of a reference asset (e.g., a security, basket of securities, or futures contract), both based on notional amounts. To the extent the return of the reference asset exceeds or falls short of the interest payments, one party is entitled to receive a payment from or obligated to make a payment to the other party.
In a credit default swap contract, one party makes payments to another party in exchange for the right to receive a specified return (or to put a security) if a credit event (e.g., default or similar event) occurs with respect to a reference entity or entities. A seller of credit default protection receives periodic payments in return for its obligation to pay the principal amount of a debt security (or other agreed-upon value) to the other party upon the occurrence of a credit event. If no credit event occurs, the seller has no payment obligations so long as there is no early termination.
For credit default swap contracts on asset-backed securities, a credit event may be triggered by various occurrences, which may include an issuer’s failure to pay interest or principal on a reference security, a breach of a material representation or covenant, an agreement by the holders of an asset-backed security to a maturity extension, or a write-down on the collateral underlying the security. For credit default swap contracts on corporate or sovereign issuers, a credit event may be triggered by such occurrences as the issuer’s bankruptcy, failure to pay interest or principal, repudiation/moratorium and/or restructuring.
Correlation swaps involve receiving a stream of payments based on the actual average correlation between or among the price movements of two or more underlying variables over a period of time, in exchange for making a regular stream of payments based on a fixed “strike” correlation level (or vice versa), where both payment streams are based on a notional amount. The underlying variables may include, without limitation, commodity prices, exchange rates, interest rates and stock indices.
GMO Trust Funds
Notes to Financial Statements — (Continued)
February 28, 2022
Variance swap contracts involve an agreement by two parties to exchange cash flows based on the measured variance (or square of volatility) of a specified underlying asset. One party agrees to exchange a “fixed rate” or strike price payment for the “floating rate” or realized price variance on the underlying asset with respect to the notional amount. At inception, the strike price chosen is generally fixed at a level such that the fair value of the swap is zero. As a result, no money changes hands at the initiation of the contract. At the expiration date, the amount payable by one party to the other is the difference between the realized price variance of the underlying asset and the strike price multiplied by the notional amount. A receiver of the realized price variance would be entitled to receive a payment when the realized price variance of the underlying asset is greater than the strike price and would be obligated to make a payment when that variance is less than the strike price. A payer of the realized price variance would be obligated to make a payment when the realized price variance of the underlying asset is greater than the strike price and would be entitled to receive a payment when that variance is less than the strike price. This type of agreement is essentially a forward contract on the future realized price variance of the underlying asset.
Forward starting dividend swap contracts involve an exchange by the parties of their respective commitments to pay or rights to receive the changes in a dividend index point. A Fund gains exposure by either paying or receiving an amount in respect of an increase or decrease in the change of the relevant dividend index point based on a notional amount. For example, if a Fund took a long position on a dividend index swap, the Fund would receive payments if the relevant index point increased in value and would be obligated to pay if that index point decreased in value.
Future swap contracts involve an exchange by the parties of their respective commitments to pay or rights to receive the changes in an index. The Fund gains exposure by either paying or receiving an amount in respect of an increase or decrease in the change of the index based on a notional amount. For example, if the Fund took a long position on a future swap, the Fund would receive payments if the relevant index increased in value and would be obligated to pay if that index decreased in value.
Generally, the Funds price their OTC swap contracts daily using industry standard models that may incorporate quotations from market makers or pricing vendors and record the change in value, if any, as unrealized gain or loss in the Statements of Operations. Gains or losses are realized upon the termination of the swap contracts or reset dates, as appropriate. Cleared swap contracts are valued using the quote (which may be based on a model) published by the relevant clearing house. If an updated quote for a cleared swap contract is not available by the time that a Fund calculates its net asset value on any business day, then that swap contract will generally be valued using an industry standard model, which may differ from the model used by the relevant clearing house.
The values assigned to swap contracts may differ significantly from the values realized upon termination, and the differences could be material. Entering into swap contracts involves counterparty credit, legal, and documentation risk that is generally not reflected in the value assigned to the swap contract. Such risks include the possibility that the counterparty defaults on its obligations to perform or disagrees as to the meaning of contractual terms, that a Fund has amounts on deposit in excess of amounts owed by that Fund, or that any collateral the other party posts is insufficient or not timely received by a Fund. Credit risk is particularly acute in economic environments in which financial services firms are exposed to systemic risks of the type evidenced by the insolvency of Lehman Brothers in 2008 and subsequent market disruptions. Swap contracts outstanding at the end of the year, if any, are listed in each applicable Fund’s Schedule of Investments.
* * *
As provided by U.S. GAAP, the table below is based on market values or unrealized appreciation/(depreciation) rather than the notional amounts of derivatives. Changes to market values of reference asset(s) will tend to have a greater impact on the Funds (with correspondingly greater risk) the greater the notional amount. For further information on notional amounts, see the Schedule of Investments.
GMO Trust Funds
Notes to Financial Statements — (Continued)
February 28, 2022
The following is a summary of the valuations of derivative instruments categorized by risk exposure.
The Effect of Derivative Instruments on the Statements of Assets and Liabilities as of February 28, 2022 and the Statements of Operations for the year ended February 28, 2022^:
The risks referenced in the tables below are not intended to be inclusive of all risks. Please see the “Investment and other risks” and “Portfolio valuation” sections for a further discussion of risks.
| | | | | | | | | | | | | | | | | | | | | | | | |
| | | | | | | |
| | | Credit
Contracts | | | Commodity
Contracts | | | Equity
Contracts | | | Foreign
Currency
Contracts | | | Interest
Rate
Contracts | | | Total | |
| Consolidated Alternative Allocation Fund | | | | | | | | | | | | | | | | | | |
| Asset Derivatives | | | | | | | | | | | | | | | | | | |
Investments, at value (purchased options) | | $ | 762,841 | | | $ | — | | | $ | — | | | $ | — | | | $ | — | | | $ | 762,841 | |
Unrealized Appreciation on Forward Currency Contracts | | | — | | | | — | | | | — | | | | 1,485,428 | | | | — | | | | 1,485,428 | |
Unrealized Appreciation on Futures Contracts¤ | | | — | | | | — | | | | 1,675,983 | | | | — | | | | 331,568 | | | | 2,007,551 | |
Swap Contracts, at value¤ | | | 5,111,157 | | | | — | | | | 412,319 | | | | — | | | | 5,714,077 | | | | 11,237,553 | |
| | | | | | | | | | | | | | | | | | | | | | | | | |
Total | | $ | 5,873,998 | | | $ | — | | | $ | 2,088,302 | | | $ | 1,485,428 | | | $ | 6,045,645 | | | $ | 15,493,373 | |
| | | | | | | | | | | | | | | | | | | | | | | | | |
Liability Derivatives | |
Unrealized Depreciation on Forward Currency Contracts | | $ | — | | | $ | — | | | $ | — | | | $ | (2,917,160 | ) | | $ | — | | | $ | (2,917,160 | ) |
Unrealized Depreciation on Futures Contracts¤ | | | — | | | | — | | | | (2,294,421 | ) | | | — | | | | (106,477 | ) | | | (2,400,898 | ) |
Written Options, at value | | | (740,275 | ) | | | — | | | | (575,779 | ) | | | — | | | | — | | | | (1,316,054 | ) |
Swap Contracts, at value¤ | | | (964,709 | ) | | | — | | | | (625,784 | ) | | | — | | | | (6,849,195 | ) | | | (8,439,688 | ) |
| | | | | | | | | | | | | | | | | | | | | | | | | |
Total | | $ | (1,704,984 | ) | | $ | — | | | $ | (3,495,984 | ) | | $ | (2,917,160 | ) | | $ | (6,955,672 | ) | | $ | (15,073,800 | ) |
| | | | | | | | | | | | | | | | | | | | | | | | | |
Net Realized Gain (Loss) on | |
Investments (purchased options) | | $ | (281,068 | ) | | $ | — | | | $ | — | | | $ | — | | | $ | — | | | $ | (281,068 | ) |
Futures Contracts | | | — | | | | — | | | | (5,344,090 | ) | | | — | | | | (333,011 | ) | | | (5,677,101 | ) |
Written Options | | | 497,901 | | | | — | | | | 2,354,922 | | | | — | | | | — | | | | 2,852,823 | |
Swap Contracts | | | 312,544 | | | | (2,589,594 | ) | | | 2,716,899 | | | | — | | | | (6,747,991 | ) | | | (6,308,142 | ) |
Forward Currency Contracts | | | — | | | | — | | | | — | | | | (3,359,178 | ) | | | — | | | | (3,359,178 | ) |
| | | | | | | | | | | | | | | | | | | | | | | | | |
Total | | $ | 529,377 | | | $ | (2,589,594 | ) | | $ | (272,269) | | | $ | (3,359,178 | ) | | $ | (7,081,002) | | | $ | (12,772,666 | ) |
| | | | | | | | | | | | | | | | | | | | | | | | | |
Change in Net Appreciation (Depreciation) on | | | | | | | | | | | | | | | | | | | | | | | | |
Investments (purchased options) | | $ | — | | | $ | — | | | $ | — | | | $ | — | | | $ | 82,319 | | | $ | 82,319 | |
Futures Contracts | | | — | | | | — | | | | (660,817 | ) | | | — | | | | 1,464,288 | | | | 803,471 | |
Written Options | | | (97,959 | ) | | | — | | | | 395,200 | | | | — | | | | — | | | | 297,241 | |
Swap Contracts | | | (390,240 | ) | | | — | | | | (937,850 | ) | | | — | | | | 3,676,722 | | | | 2,348,632 | |
Forward Currency Contracts | | | — | | | | — | | | | — | | | | (1,289,077 | ) | | | — | | | | (1,289,077 | ) |
| | | | | | | | | | | | | | | | | | | | | | | | | |
Total | | $ | (488,199 | ) | | $ | — | | | $ | (1,203,467 | ) | | $ | (1,289,077 | ) | | $ | 5,223,329 | | | $ | 2,242,586 | |
| | | | | | | | | | | | | | | | | | | | | | | | | |
| | | | | | | | | | | | | | | | | | | | | | | | | |
| Benchmark-Free Fund | |
| Asset Derivatives | |
Unrealized Appreciation on Forward Currency Contracts | | $ | — | | | $ | — | | | $ | — | | | $ | 2,017,142 | | | $ | — | | | $ | 2,017,142 | |
Unrealized Appreciation on Futures Contracts¤ | | | — | | | | — | | | | 20,449,723 | | | | — | | | | — | | | | 20,449,723 | |
Swap Contracts, at value¤ | | | — | | | | — | | | | 1,486,428 | | | | — | | | | 4,827,740 | | | | 6,314,168 | |
| | | | | | | | | | | | | | | | | | | | | | | | | |
Total | | $ | — | | | $ | — | | | $ | 21,936,151 | | | $ | 2,017,142 | | | $ | 4,827,740 | | | $ | 28,781,033 | |
| | | | | | | | | | | | | | | | | | | | | | | | | |
| Liability Derivatives | |
Unrealized Depreciation on Forward Currency Contracts | | $ | — | | | $ | — | | | $ | — | | | $ | (2,565,538 | ) | | $ | — | | | $ | (2,565,538 | ) |
Unrealized Depreciation on Futures Contracts¤ | | | — | | | | — | | | | (227,034 | ) | | | — | | | | — | | | | (227,034 | ) |
Swap Contracts, at value¤ | | | — | | | | — | | | | (443,486 | ) | | | — | | | | (5,860,139 | ) | | | (6,303,625 | ) |
| | | | | | | | | | | | | | | | | | | | | | | | | |
Total | | $ | — | | | $ | — | | | $ | (670,520 | ) | | $ | (2,565,538 | ) | | $ | (5,860,139 | ) | | $ | (9,096,197 | ) |
| | | | | | | | | | | | | | | | | | | | | | | | | |
| | | | | | | | | | | | | | | | | | | | | | | | | |
GMO Trust Funds
Notes to Financial Statements — (Continued)
February 28, 2022
| | | | | | | | | | | | | | | | | | | | | | | | |
| | | | | | | |
| | | Credit
Contracts | | | Commodity
Contracts | | | Equity
Contracts | | | Foreign
Currency
Contracts | | | Interest
Rate
Contracts | | | Total | |
| Benchmark-Free Fund (continued) | |
Net Realized Gain (Loss) on | |
Futures Contracts | | $ | — | | | $ | — | | | $ | (82,085,229 | ) | | $ | — | | | $ | — | | | $ | (82,085,229 | ) |
Swap Contracts | | | — | | | | — | | | | 19,636,202 | | | | — | | | | (3,946,640 | ) | | | 15,689,562 | |
Forward Currency Contracts | | | — | | | | — | | | | — | | | | 8,789,482 | | | | — | | | | 8,789,482 | |
| | | | | | | | | | | | | | | | | | | | | | | | | |
Total | | $ | — | | | $ | — | | | $ | (62,449,027 | ) | | $ | 8,789,482 | | | $ | (3,946,640 | ) | | $ | (57,606,185 | ) |
| | | | | | | | | | | | | | | | | | | | | | | | | |
Change in Net Appreciation (Depreciation) on | |
Futures Contracts | | $ | — | | | $ | — | | | $ | 36,486,489 | | | $ | — | | | $ | — | | | $ | 36,486,489 | |
Swap Contracts | | | — | | | | — | | | | (3,305,227 | ) | | | — | | | | 401,665 | | | | (2,903,562 | ) |
Forward Currency Contracts | | | — | | | | — | | | | — | | | | (739,814 | ) | | | — | | | | (739,814 | ) |
| | | | | | | | | | | | | | | | | | | | | | | | | |
Total | | $ | — | | | $ | — | | | $ | 33,181,262 | | | $ | (739,814 | ) | | $ | 401,665 | | | $ | 32,843,113 | |
| | | | | | | | | | | | | | | | | | | | | | | | | |
| | | | | | | | | | | | | | | | | | | | | | | | | |
| Consolidated Implementation Fund | |
| Asset Derivatives | |
Investments, at value (purchased options) | | $ | — | | | $ | — | | | $ | 70,255 | | | $ | — | | | $ | — | | | $ | 70,255 | |
Unrealized Appreciation on Forward Currency Contracts | | | — | | | | — | | | | — | | | | 10,113,488 | | | | — | | | | 10,113,488 | |
Unrealized Appreciation on Futures Contracts¤ | | | — | | | | 1,352,297 | | | | 50,855,695 | | | | — | | | | 1,232,971 | | | | 53,440,963 | |
Swap Contracts, at value¤ | | | — | | | | — | | | | 4,483,073 | | | | — | | | | 28,870,485 | | | | 33,353,558 | |
| | | | | | | | | | | | | | | | | | | | | | | | | |
Total | | $ | — | | | $ | 1,352,297 | | | $ | 55,409,023 | | | $ | 10,113,488 | | | $ | 30,103,456 | | | $ | 96,978,264 | |
| | | | | | | | | | | | | | | | | | | | | | | | | |
Liability Derivatives | |
Unrealized Depreciation on Forward Currency Contracts | | $ | — | | | $ | — | | | $ | — | | | $ | (16,129,547 | ) | | $ | — | | | $ | (16,129,547 | ) |
Unrealized Depreciation on Futures Contracts¤ | | | — | | | | (121,673 | ) | | | (5,402,682 | ) | | | — | | | | (441,553 | ) | | | (5,965,908 | ) |
Written Options, at value | | | — | | | | — | | | | (694,066 | ) | | | — | | | | — | | | | (694,066 | ) |
Swap Contracts, at value¤ | | | (540,824 | ) | | | — | | | | (2,446,847 | ) | | | — | | | | (35,090,528 | ) | | | (38,078,199 | ) |
| | | | | | | | | | | | | | | | | | | | | | | | | |
Total | | $ | (540,824 | ) | | $ | (121,673 | ) | | $ | (8,543,595 | ) | | $ | (16,129,547 | ) | | $ | (35,532,081 | ) | | $ | (60,867,720 | ) |
| | | | | | | | | | | | | | | | | | | | | | | | | |
Net Realized Gain (Loss) on | |
Investments (purchased options) | | $ | — | | | $ | — | | | $ | (821,401 | ) | | $ | — | | | $ | — | | | $ | (821,401 | ) |
Futures Contracts | | | — | | | | (344,723 | ) | | | (200,054,019 | ) | | | — | | | | (897,094 | ) | | | (201,295,836 | ) |
Written Options | | | — | | | | — | | | | 107,440 | | | | — | | | | — | | | | 107,440 | |
Swap Contracts | | | (271,621 | ) | | | — | | | | 51,793,708 | | | | — | | | | (11,539,397 | ) | | | 39,982,690 | |
Forward Currency Contracts | | | — | | | | — | | | | — | | | | 11,763,114 | | | | — | | | | 11,763,114 | |
| | | | | | | | | | | | | | | | | | | | | | | | | |
Total | | $ | (271,621 | ) | | $ | (344,723 | ) | | $ | (148,974,272 | ) | | $ | 11,763,114 | | | $ | (12,436,491 | ) | | $ | (150,263,993 | ) |
| | | | | | | | | | | | | | | | | | | | | | | | | |
Change in Net Appreciation (Depreciation) on | |
Investments (purchased options) | | $ | — | | | $ | — | | | $ | (62,806 | ) | | $ | — | | | $ | — | | | $ | (62,806 | ) |
Futures Contracts | | | — | | | | 4,156,166 | | | | 79,637,769 | | | | — | | | | 3,940,300 | | | | 87,734,235 | |
Written Options | | | — | | | | — | | | | 261,157 | | | | — | | | | — | | | | 261,157 | |
Swap Contracts | | | 151,287 | | | | — | | | | (8,063,777 | ) | | | — | | | | 5,856,759 | | | | (2,055,731 | ) |
Forward Currency Contracts | | | — | | | | — | | | | — | | | | (7,021,471 | ) | | | — | | | | (7,021,471 | ) |
| | | | | | | | | | | | | | | | | | | | | | | | | |
Total | | $ | 151,287 | | | $ | 4,156,166 | | | $ | 71,772,343 | | | $ | (7,021,471 | ) | | $ | 9,797,059 | | | $ | 78,855,384 | |
| | | | | | | | | | | | | | | | | | | | | | | | | |
| | | | | | | | | | | | | | | | | | | | | | | | | |
| Consolidated SGM Major Markets Fund | |
| Asset Derivatives | |
Unrealized Appreciation on Forward Currency Contracts | | $ | — | | | $ | — | | | $ | — | | | $ | 334,658 | | | $ | — | | | $ | 334,658 | |
Unrealized Appreciation on Futures Contracts¤ | | | — | | | | 942,124 | | | | 3,297,371 | | | | — | | | | 874,356 | | | | 5,113,851 | |
Swap Contracts, at value¤ | | | — | | | | — | | | | 353,555 | | | | — | | | | — | | | | 353,555 | |
| | | | | | | | | | | | | | | | | | | | | | | | | |
Total | | $ | — | | | $ | 942,124 | | | $ | 3,650,926 | | | $ | 334,658 | | | $ | 874,356 | | | $ | 5,802,064 | |
| | | | | | | | | | | | | | | | | | | | | | | | | |
Liability Derivatives | |
Unrealized Depreciation on Forward Currency Contracts | | $ | — | | | $ | — | | | $ | — | | | $ | (633,748 | ) | | $ | — | | | $ | (633,748 | ) |
Unrealized Depreciation on Futures Contracts¤ | | | — | | | | (91,744 | ) | | | (6,390,412 | ) | | | — | | | | (277,316 | ) | | | (6,759,472 | ) |
Swap Contracts, at value¤ | | | — | | | | — | | | | (1,084,896 | ) | | | — | | | | — | | | | (1,084,896 | ) |
| | | | | | | | | | | | | | | | | | | | | | | | | |
Total | | $ | — | | | $ | (91,744 | ) | | $ | (7,475,308 | ) | | $ | (633,748 | ) | | $ | (277,316 | ) | | $ | (8,478,116 | ) |
| | | | | | | | | | | | | | | | | | | | | | | | | |
| | | | | | | | | | | | | | | | | | | | | | | | | |
GMO Trust Funds
Notes to Financial Statements — (Continued)
February 28, 2022
| | | | | | | | | | | | | | | | | | | | | | | | |
| | | | | | | |
| | | Credit
Contracts | | | Commodity
Contracts | | | Equity
Contracts | | | Foreign
Currency
Contracts | | | Interest
Rate
Contracts | | | Total | |
| Consolidated SGM Major Markets Fund (continued) | |
Net Realized Gain (Loss) on | |
Futures Contracts | | $ | — | | | $ | (337,788 | ) | | $ | (1,591,477 | ) | | $ | — | | | $ | (182,700 | ) | | $ | (2,111,965 | ) |
Swap Contracts | | | — | | | | — | | | | 2,210,504 | | | | — | | | | — | | | | 2,210,504 | |
Forward Currency Contracts | | | — | | | | — | | | | — | | | | (6,979,629 | ) | | | — | | | | (6,979,629 | ) |
| | | | | | | | | | | | | | | | | | | | | | | | | |
Total | | $ | — | | | $ | (337,788 | ) | | $ | 619,027 | | | $ | (6,979,629 | ) | | $ | (182,700 | ) | | $ | (6,881,090 | ) |
| | | | | | | | | | | | | | | | | | | | | | | | | |
Change in Net Appreciation (Depreciation) on | |
Futures Contracts | | $ | — | | | $ | 3,067,074 | | | $ | (3,944,030 | ) | | $ | — | | | $ | 2,999,075 | | | $ | 2,122,119 | |
Swap Contracts | | | — | | | | — | | | | (731,341 | ) | | | — | | | | — | | | | (731,341 | ) |
Forward Currency Contracts | | | — | | | | — | | | | — | | | | 1,281,588 | | | | — | | | | 1,281,588 | |
| | | | | | | | | | | | | | | | | | | | | | | | | |
Total | | $ | — | | | $ | 3,067,074 | | | $ | (4,675,371 | ) | | $ | 1,281,588 | | | $ | 2,999,075 | | | $ | 2,672,366 | |
| | | | | | | | | | | | | | | | | | | | | | | | | |
| | | | | | | | | | | | | | | | | | | | | | | | | |
| Strategic Opportunities Allocation Fund | |
| Asset Derivatives | |
Swap Contracts, at value¤ | | $ | — | | | $ | — | | | $ | 205,290 | | | $ | — | | | $ | — | | | $ | 205,290 | |
| | | | | | | | | | | | | | | | | | | | | | | | | |
Total | | $ | — | | | $ | — | | | $ | 205,290 | | | $ | — | | | $ | — | | | $ | 205,290 | |
| | | | | | | | | | | | | | | | | | | | | | | | | |
Liability Derivatives | |
Swap Contracts, at value¤ | | $ | — | | | $ | — | | | $ | (59,778 | ) | | $ | — | | | $ | — | | | $ | (59,778 | ) |
| | | | | | | | | | | | | | | | | | | | | | | | | |
Total | | $ | — | | | $ | — | | | $ | (59,778 | ) | | $ | — | | | $ | — | | | $ | (59,778 | ) |
| | | | | | | | | | | | | | | | | | | | | | | | | |
Net Realized Gain (Loss) on | |
Swap Contracts | | $ | — | | | $ | — | | | $ | 3,693,996 | | | $ | — | | | $ | — | | | $ | 3,693,996 | |
| | | | | | | | | | | | | | | | | | | | | | | | | |
Total | | $ | — | | | $ | — | | | $ | 3,693,996 | | | $ | — | | | $ | — | | | $ | 3,693,996 | |
| | | | | | | | | | | | | | | | | | | | | | | | | |
Change in Net Appreciation (Depreciation) on | |
Swap Contracts | | $ | — | | | $ | — | | | $ | (936,471 | ) | | $ | — | | | $ | — | | | $ | (936,471 | ) |
| | | | | | | | | | | | | | | | | | | | | | | | | |
Total | | $ | — | | | $ | — | | | $ | (936,471 | ) | | $ | — | | | $ | — | | | $ | (936,471 | ) |
| | | | | | | | | | | | | | | | | | | | | | | | | |
| | | | | | | | | | | | | | | | | | | | | | | | | |
| | ^ | Because the Funds recognize changes in value through the Statements of Operations, they do not qualify for hedge accounting under authoritative guidance for derivative instruments. The Funds’ investments in derivatives may represent an economic hedge; however, they are considered to be non-hedge transactions for the purpose of these tables. |
| | ¤ | The table includes cumulative unrealized appreciation/depreciation of futures and value of cleared swap contracts, if any, as reported in the Schedule of Investments. Year end variation margin on open futures and cleared swap contracts, if any, is reported within the Statements of Assets and Liabilities. |
Certain Funds are party to International Swaps and Derivatives Association, Inc. Master Agreements, Global Master Repurchase Agreements, Master Securities Loan Agreements or other similar types of agreements (collectively, “Master Agreements”) that generally govern the terms of OTC derivative transactions, repurchase agreements, reverse repurchase agreements and securities loans. The Master Agreements may include collateral posting terms and set-off provisions that apply in the event of a default and/or termination event. Upon the occurrence of such an event, including the bankruptcy or insolvency of the counterparty, the Master Agreements may permit the non-defaulting party to calculate a single net payment to close out applicable transactions. However, there is no guarantee that the terms of a Master Agreement will be enforceable; for example, when bankruptcy or insolvency laws impose restrictions on or prohibitions against the right of offset. Additionally, the set-off and netting provisions of a Master Agreement may not extend to the obligations of the counterparty’s affiliates or across varying types of transactions. Because no such event has occurred, the Funds do not presently have a legally enforceable right of set-off and these amounts have not been offset in the Statements of Assets and Liabilities, but have been presented separately in the table below. Termination events may also include a decline in the net assets of a Fund below a certain level over a specified period of time and may entitle a counterparty to elect an early termination of all the transactions under the Master Agreement with that counterparty. Such an election by one or more of the counterparties could have a material adverse impact on a Fund’s operations. An estimate of the aggregate net payment, if any, that may need to be paid by a Fund (or may be received by a Fund) in such an event is represented by the Net Amounts in the tables below. For more information about other uncertainties and risks, see “Investments and other risks” above.
GMO Trust Funds
Notes to Financial Statements — (Continued)
February 28, 2022
For financial reporting purposes, in the Statements of Assets and Liabilities any cash collateral that has been pledged to cover obligations of the Funds is reported as Due from broker and any cash collateral received from the counterparty is reported as Due to broker. Any non-cash collateral pledged by the Funds is noted in the Schedules of Investments. The tables below show the potential effect of netting arrangements made available by the Master Agreements on the financial position of the Funds. For financial reporting purposes, the Funds’ Statements of Assets and Liabilities generally show derivative assets and derivative liabilities (regardless of whether they are subject to netting arrangements) on a gross basis, which reflects the full risks and exposures of the Fund prior to netting. See Note 2 for information on repurchase agreements, reverse repurchase agreements and securities loans held by the Funds at February 28, 2022, if any.
The tables above present the Funds’ derivative assets and liabilities by type of financial instrument. The following tables present the Funds’ OTC and/or exchange-traded derivative assets and liabilities by counterparty net of amounts that may be available for offset under the Master Agreements by the terms of the agreement and net of the related collateral received or pledged by the Funds as of February 28, 2022:
Consolidated Alternative Allocation Fund
| | | | | | | | | | | | | | | | |
| | | | | |
| Counterparty | | Gross Derivative
Assets Subject to
Master Agreements | | | Collateral
Received | | | Derivative
Assets/Liabilities
Available for Offset | | | Net Amount
of Derivative
Assets | |
Bank of America, N.A. | | $ | 939,651 | | | $ | (611,191 | ) | | $ | (328,460 | ) | | $ | — | * |
Barclays Bank PLC | | | 828,517 | | | | — | | | | (825,636 | ) | | | 2,881 | |
Citigroup Global Markets Inc. | | | 342,825 | | | | (314,233 | ) | | | (28,592 | ) | | | — | * |
Citibank N.A. | | | 820,137 | | | | (763,628 | ) | | | (56,509 | ) | | | — | * |
Deutsche Bank AG | | | 11,832 | | | | — | | | | (11,832 | ) | | | — | |
Goldman Sachs International | | | 422,968 | | | | (222,285 | ) | | | (200,683 | ) | | | — | * |
JPMorgan Chase Bank, N.A. | | | 2,798,162 | | | | (2,510,000 | ) | | | (212,093 | ) | | | 76,069 | |
Merrill Lynch Capital Services, Inc. | | | 302,382 | | | | (255,428 | ) | | | (46,954 | ) | | | — | * |
Morgan Stanley & Co. International PLC | | | 836,784 | | | | — | | | | (836,784 | ) | | | — | |
Morgan Stanley Capital Services LLC | | | 275,706 | | | | (226,315 | ) | | | (49,391 | ) | | | — | * |
State Street Bank and Trust Company | | | 151,695 | | | | — | | | | (32,941 | ) | | | 118,754 | |
UBS AG | | | 41,086 | | | | — | | | | (41,086 | ) | | | — | |
| | | | | | | | | | | | | | | | | |
Total | | $ | 7,771,745 | | | $ | (4,903,080 | ) | | $ | (2,670,961 | ) | | $ | 197,704 | |
| | | | | | | | | | | | | | | | | |
| | | | | | | | | | | | | | | | | |
| | | | | |
| Counterparty | | Gross Derivative
Liabilities Subject to
Master Agreements | | | Collateral
Pledged | | | Derivative
Assets/Liabilities
Available for Offset | | | Net Amount
of Derivative
Liabilities | |
Bank of America, N.A. | | $ | (328,460 | ) | | $ | — | | | $ | 328,460 | | | $ | — | |
Barclays Bank PLC | | | (825,636 | ) | | | — | | | | 825,636 | | | | — | |
Citigroup Global Markets Inc. | | | (28,592 | ) | | | — | | | | 28,592 | | | | — | |
Citibank N.A. | | | (56,509 | ) | | | — | | | | 56,509 | | | | — | |
Deutsche Bank AG | | | (53,870 | ) | | | — | | | | 11,832 | | | | (42,038 | ) |
Goldman Sachs International | | | (200,684 | ) | | | — | | | | 200,684 | | | | — | |
JPMorgan Chase Bank, N.A. | | | (212,093 | ) | | | — | | | | 212,093 | | | | — | |
Merrill Lynch Capital Services, Inc. | | | (46,954 | ) | | | — | | | | 46,954 | | | | — | |
Morgan Stanley & Co. International PLC | | | (2,178,262 | ) | | | 991,434 | | | | 836,784 | | | | (350,044 | ) |
Morgan Stanley Capital Services LLC | | | (49,391 | ) | | | — | | | | 49,391 | | | | — | |
Morgan Stanley & Co. LLC | | | (575,779 | ) | | | 575,779 | | | | — | | | | — | * |
State Street Bank and Trust Company | | | (32,941 | ) | | | — | | | | 32,941 | | | | — | |
UBS AG | | | (376,984 | ) | | | — | | | | 41,086 | | | | (335,898 | ) |
| | | | | | | | | | | | | | | | | |
Total | | $ | (4,966,155 | ) | | $ | 1,567,213 | | | $ | 2,670,962 | | | $ | (727,980 | ) |
| | | | | | | | | | | | | | | | | |
| | | | | | | | | | | | | | | | | |
GMO Trust Funds
Notes to Financial Statements — (Continued)
February 28, 2022
Benchmark-Free Fund
| | | | | | | | | | | | | | | | |
| | | | | |
| Counterparty | | Gross Derivative
Assets Subject to
Master Agreements | | | Collateral
Received | | | Derivative
Assets/Liabilities
Available for Offset | | | Net Amount
of Derivative
Assets | |
Barclays Bank PLC | | $ | 399,366 | | | $ | — | | | $ | (399,366 | ) | | $ | — | |
Citibank N.A. | | | 32,897 | | | | — | | | | (32,559 | ) | | | 338 | |
Deutsche Bank AG | | | 7,467 | | | | — | | | | (7,467 | ) | | | — | |
Goldman Sachs International | | | 51,715 | | | | — | | | | (51,715 | ) | | | — | |
JPMorgan Chase Bank, N.A. | | | 238,627 | | | | — | | | | (194,598 | ) | | | 44,029 | |
Morgan Stanley & Co. International PLC | | | 574,788 | | | | — | | | | (574,788 | ) | | | — | |
Morgan Stanley Capital Services LLC | | | 1,455,613 | | | | (1,171,135 | ) | | | (284,478 | ) | | | — | * |
State Street Bank and Trust Company | | | 743,097 | | | | (662,484 | ) | | | (61,700 | ) | | | 18,913 | |
| | | | | | | | | | | | | | | | | |
Total | | $ | 3,503,570 | | | $ | (1,833,619 | ) | | $ | (1,606,671 | ) | | $ | 63,280 | |
| | | | | | | | | | | | | | | | | |
| | | | | | | | | | | | | | | | | |
| | | | | |
| Counterparty | | Gross Derivative
Liabilities Subject to
Master Agreements | | | Collateral
Pledged | | | Derivative
Assets/Liabilities
Available for Offset | | | Net Amount
of Derivative
Liabilities | |
Barclays Bank PLC | | $ | (443,481 | ) | | $ | 44,115 | | | $ | 399,366 | | | $ | — | * |
Citibank N.A. | | | (32,559 | ) | | | — | | | | 32,559 | | | | — | |
Deutsche Bank AG | | | (45,905 | ) | | | — | | | | 7,467 | | | | (38,438 | ) |
Goldman Sachs International | | | (159,144 | ) | | | — | | | | 51,715 | | | | (107,429 | ) |
JPMorgan Chase Bank, N.A. | | | (194,598 | ) | | | — | | | | 194,598 | | | | — | |
Morgan Stanley & Co. International PLC | | | (1,787,159 | ) | | | 440,615 | | | | 574,788 | | | | (771,756 | ) |
Morgan Stanley Capital Services LLC | | | (284,478 | ) | | | — | | | | 284,478 | | | | — | |
State Street Bank and Trust Company | | | (61,700 | ) | | | — | | | | 61,700 | | | | — | |
| | | | | | | | | | | | | | | | | |
Total | | $ | (3,009,024 | ) | | $ | 484,730 | | | $ | 1,606,671 | | | $ | (917,623 | ) |
| | | | | | | | | | | | | | | | | |
| | | | | | | | | | | | | | | | | |
Consolidated Implementation Fund
| | | | | | | | | | | | | | | | |
| | | | | |
| Counterparty | | Gross Derivative
Assets Subject to
Master Agreements | | | Collateral
Received | | | Derivative
Assets/Liabilities
Available for Offset | | | Net Amount
of Derivative
Assets | |
Bank of America, N.A. | | $ | 162,230 | | | $ | (127,582 | ) | | $ | (34,648 | ) | | $ | — | * |
Barclays Bank PLC | | | 2,517,387 | | | | — | | | | (2,517,387 | ) | | | — | |
Citibank N.A. | | | 381,371 | | | | (181,454 | ) | | | (199,917 | ) | | | — | * |
Deutsche Bank AG | | | 56,813 | | | | — | | | | (56,813 | ) | | | — | |
Goldman Sachs International | | | 474,004 | | | | — | | | | (474,004 | ) | | | — | |
JPMorgan Chase Bank, N.A. | | | 1,292,518 | | | | — | | | | (1,292,518 | ) | | | — | |
Morgan Stanley & Co. International PLC | | | 3,583,697 | | | | — | | | | (3,583,697 | ) | | | — | |
Morgan Stanley Capital Services LLC | | | 3,985,471 | | | | (3,197,673 | ) | | | (787,798 | ) | | | — | * |
Morgan Stanley & Co. LLC | | | 70,255 | | | | — | | | | (70,255 | ) | | | — | |
State Street Bank and Trust Company | | | 1,992,006 | | | | (1,567,177 | ) | | | (272,506 | ) | | | 152,323 | |
UBS AG | | | 151,064 | | | | — | | | | (151,064 | ) | | | — | |
| | | | | | | | | | | | | | | | | |
Total | | $ | 14,666,816 | | | $ | (5,073,886 | ) | | $ | (9,440,607 | ) | | $ | 152,323 | |
| | | | | | | | | | | | | | | | | |
| | | | | | | | | | | | | | | | | |
GMO Trust Funds
Notes to Financial Statements — (Continued)
February 28, 2022
Consolidated Implementation Fund (Continued)
| | | | | | | | | | | | | | | | |
| | | | | |
| Counterparty | | Gross Derivative
Liabilities Subject to
Master Agreements | | | Collateral
Pledged | | | Derivative
Assets/Liabilities
Available for Offset | | | Net Amount
of Derivative
Liabilities | |
Bank of America, N.A. | | $ | (34,648 | ) | | $ | — | | | $ | 34,648 | | | $ | — | |
Barclays Bank PLC | | | (2,665,939 | ) | | | 148,552 | | | | 2,517,387 | | | | — | * |
Citibank N.A. | | | (199,917 | ) | | | — | | | | 199,917 | | | | — | |
Credit Suisse International | | | (131,440 | ) | | | — | | | | — | | | | (131,440 | ) |
Deutsche Bank AG | | | (266,924 | ) | | | 210,111 | | | | 56,813 | | | | — | * |
Goldman Sachs International | | | (807,809 | ) | | | 333,805 | | | | 474,004 | | | | — | * |
JPMorgan Chase Bank, N.A. | | | (1,422,991 | ) | | | 130,473 | | | | 1,292,518 | | | | — | * |
Morgan Stanley & Co. International PLC | | | (11,539,384 | ) | | | 4,289,112 | | | | 3,583,697 | | | | (3,666,575 | ) |
Morgan Stanley Capital Services LLC | | | (787,798 | ) | | | — | | | | 787,798 | | | | — | |
Morgan Stanley & Co. LLC | | | (694,066 | ) | | | 623,811 | | | | 70,255 | | | | — | * |
State Street Bank and Trust Company | | | (272,506 | ) | | | — | | | | 272,506 | | | | — | |
UBS AG | | | (987,862 | ) | | | 479,956 | | | | 151,064 | | | | (356,842 | ) |
| | | | | | | | | | | | | | | | | |
Total | | $ | (19,811,284 | ) | | $ | 6,215,820 | | | $ | 9,440,607 | | | $ | (4,154,857 | ) |
| | | | | | | | | | | | | | | | | |
| | | | | | | | | | | | | | | | | |
Consolidated SGM Major Markets Fund
| | | | | | | | | | | | | | | | |
| | | | | |
| Counterparty | | Gross Derivative
Assets Subject to
Master Agreements | | | Collateral
Received | | | Derivative
Assets/Liabilities
Available for Offset | | | Net Amount
of Derivative
Assets | |
Deutsche Bank AG | | $ | 4,812 | | | $ | — | | | $ | (4,812 | ) | | $ | — | |
Goldman Sachs International | | | 244,415 | | | | — | | | | (244,415 | ) | | | — | |
JPMorgan Chase Bank, N.A. | | | 67,521 | | | | (67,521 | ) | | | — | | | | — | * |
Morgan Stanley & Co. International PLC | | | 160,840 | | | | (18,090 | ) | | | (142,750 | ) | | | — | * |
State Street Bank and Trust Company | | | 84,506 | | | | — | | | | (60,461 | ) | | | 24,045 | |
UBS AG | | | 126,119 | | | | — | | | | (126,119 | ) | | | — | |
| | | | | | | | | | | | | | | | | |
Total | | $ | 688,213 | | | $ | (85,611 | ) | | $ | (578,557 | ) | | $ | 24,045 | |
| | | | | | | | | | | | | | | | | |
| | | | | | | | | | | | | | | | | |
| | | | | |
| Counterparty | | Gross Derivative
Liabilities Subject to
Master Agreements | | | Collateral
Pledged | | | Derivative
Assets/Liabilities
Available for Offset | | | Net Amount
of Derivative
Liabilities | |
Barclays Bank PLC | | $ | (88,820 | ) | | $ | 14,025 | | | $ | — | | | $ | (74,795 | ) |
Deutsche Bank AG | | | (65,317 | ) | | | 60,505 | | | | 4,812 | | | | — | * |
Goldman Sachs International | | | (361,738 | ) | | | 117,323 | | | | 244,415 | | | | — | * |
Morgan Stanley & Co. International PLC | | | (142,750 | ) | | | — | | | | 142,750 | | | | — | |
State Street Bank and Trust Company | | | (60,461 | ) | | | — | | | | 60,461 | | | | — | |
UBS AG | | | (999,558 | ) | | | 617,089 | | | | 126,119 | | | | (256,350 | ) |
| | | | | | | | | | | | | | | | | |
Total | | $ | (1,718,644 | ) | | $ | 808,942 | | | $ | 578,557 | | | $ | (331,145 | ) |
| | | | | | | | | | | | | | | | | |
| | | | | | | | | | | | | | | | | |
GMO Trust Funds
Notes to Financial Statements — (Continued)
February 28, 2022
Strategic Opportunities Allocation Fund
| | | | | | | | | | | | | | | | |
| | | | | |
| Counterparty | | Gross Derivative
Assets Subject to
Master Agreements | | | Collateral
Received | | | Derivative
Assets/Liabilities
Available for
Offset | | | Net Amount
of Derivative
Assets | |
Goldman Sachs International | | $ | 4,649 | | | $ | — | | | $ | (4,649 | ) | | $ | — | |
Morgan Stanley Capital Services LLC | | | 200,641 | | | | (166,371 | ) | | | (34,270 | ) | | | — | * |
| | | | | | | | | | | | | | | | | |
Total | | $ | 205,290 | | | $ | (166,371 | ) | | $ | (38,919 | ) | | $ | — | |
| | | | | | | | | | | | | | | | | |
| | | | | | | | | | | | | | | | | |
| | | | | |
| Counterparty | | Gross Derivative
Liabilities Subject to
Master Agreements | | | Collateral
Pledged | | | Derivative
Assets/Liabilities
Available for
Offset | | | Net Amount
of Derivative
Liabilities | |
Goldman Sachs International | | $ | (25,508 | ) | | $ | — | | | $ | 4,649 | | | $ | (20,859 | ) |
Morgan Stanley Capital Services LLC | | | (34,270 | ) | | | — | | | | 34,270 | | | | — | |
| | | | | | | | | | | | | | | | | |
Total | | $ | (59,778 | ) | | $ | — | | | $ | 38,919 | | | $ | (20,859 | ) |
| | | | | | | | | | | | | | | | | |
| | | | | | | | | | | | | | | | | |
| | * | The actual collateral received and/or pledged is more than the amount shown. |
The average derivative activity of notional amounts (forward currency contracts, futures contracts and swap contracts) and principal amounts or number of contracts (options) outstanding, based on absolute values, at each month-end, was as follows for the year ended February 28, 2022:
| | | | | | | | | | | | | | | | | | | | |
| | | | | | |
| Fund Name | | Forward Currency Contracts ($) | | | Futures Contracts ($) | | | Options (Principal) | | | Options (Contracts) | | | Swap Contracts ($) | |
Consolidated Alternative Allocation Fund | | | 584,896,791 | | | | 167,908,477 | | | | 98,816,701 | | | | 687 | | | | 1,901,814,928 | |
Benchmark-Free Fund | | | 484,791,854 | | | | 439,038,057 | | | | — | | | | — | | | | 1,213,698,324 | |
Consolidated Implementation Fund | | | 2,508,602,694 | | | | 1,753,421,597 | | | | — | | | | 2,755 | | | | 7,253,433,936 | |
Consolidated SGM Major Markets Fund | | | 261,065,057 | | | | 505,469,319 | | | | — | | | | — | | | | 55,188,570 | |
Strategic Opportunities Allocation Fund | | | — | | | | — | | | | — | | | | — | | | | 6,905,318 | |
| 5. | Fees and other transactions with affiliates |
GMO receives a management fee for the services it provides to certain Funds. Management fees are paid monthly at the annual rate equal to the percentage of each Fund’s average daily net assets set forth in the table below:
| | | | | | | | | | | | | | | | | | | | | | | | | | | | | | | | | | | | | | | | | | | | |
| | | | | | | | | | | | |
| | | Alternative
Allocation
Fund | | | Benchmark-
Free
Allocation
Fund | | | Benchmark-
Free Fund | | | Global
Asset
Allocation
Fund | | | Global
Developed
Equity
Allocation
Fund | | | Global
Equity
Allocation
Fund | | | Implementation
Fund | | | International
Developed
Equity
Allocation
Fund | | | International
Equity
Allocation
Fund | | | SGM
Major
Markets
Fund | | | Strategic
Opportunities
Allocation
Fund | |
Management Fee | | | 0.73% | | | | 0.65% | | | | — | | | | — | | | | — | | | | — | | | | — | | | | — | | | | — | | | | 0.85% | | | | — | |
In addition, each class of shares of certain Funds pays GMO directly or indirectly a shareholder service or supplemental support fee. Shareholder service fees are paid to GMO for providing client services and reporting, such as performance information, client account information, personal and electronic access to Fund information, access to analysis and explanations of Fund reports, and assistance in maintaining and correcting client-related information. Class MF shares of Benchmark-Free Allocation Fund are subject to a supplemental support fee payable to GMO for providing supplemental support services to Class MF shareholders and their investment advisers. Those supplemental support services include, without limitation, (i) providing and presenting (a) educational and
GMO Trust Funds
Notes to Financial Statements — (Continued)
February 28, 2022
explanatory information about the Fund and its asset allocation strategy as requested or directed by an investor or its investment adviser; (b) similar educational and explanatory information about the strategies of the GMO Funds in which the Fund invests; (c) information for inclusion in the quarterly or other periodic reports of the investor; (ii) responding to information requests relating to oversight functions of the investor’s board of directors in areas including pricing, compliance, and taxation; (iii) providing access to and setting up meetings with GMO’s Chief Investment Strategist and Head of GMO’s Asset Allocation Team and other investment professionals of GMO; (iv) assisting with inquiries from an investor’s investment adviser; and (v) providing such other assistance as may be requested from time to time by an investor or its agent, so long as that assistance is not primarily intended to result in the sale of Fund shares.
Shareholder service and/or supplemental support fees are paid monthly at the annual rate equal to the percentage of each applicable Class’s average daily net assets set forth in the table below:
| | | | | | | | | | | | | | | | | | | | | | | | | | | | | | | | |
| | | | | | | | | |
| Fund Name | | Class II | | | Class III | | | Class IV | | | Class V | | | Class VI | | | Class MF | | | Class R6 | | | Class I | |
Alternative Allocation Fund | | | 0.22%* | | | | 0.15% | * | | | 0.105% | * | | | 0.085%* | | | | 0.055% | | | | | | | | 0.22% | | | | 0.22% | |
Benchmark-Free Allocation Fund | | | | | | | 0.15% | | | | 0.10% | | | | | | | | | | | | 0.10% | | | | 0.15% | | | | 0.15% | |
SGM Major Markets Fund | | | | | | | 0.15% | | | | 0.10% | * | | | | | | | 0.055% | | | | | | | | 0.15% | * | | | 0.15% | |
| | * | Class is offered but has no shareholders as of February 28, 2022. |
For certain Funds above, GMO does not charge the Fund a management fee or shareholder service fee, but it receives management and/or shareholder service fees from the underlying funds in which the Fund invests. Because those fees vary from fund to fund, the levels of indirect net expenses set forth below are affected by GMO’s asset allocation decisions.
For each Fund, other than Alternative Allocation Fund, GMO has contractually agreed to reimburse the Fund for its “Specified Operating Expenses” (as defined below).
Subject to the exclusions noted below, “Specified Operating Expenses” means: audit expenses, fund accounting expenses, pricing service expenses, expenses of non-investment related tax services, transfer agency expenses (excluding, in the case of Class I shares, any amounts paid for sub-transfer agency, recordkeeping and other administrative services provided by financial intermediaries for the benefit of Class I shareholders), expenses of non-investment related legal services provided to the Funds by or at the direction of GMO, organizational and start-up expenses, federal securities law filing expenses, printing expenses, state and federal registration fees and custody expenses. In the case of Benchmark-Free Fund, “Specified Operating Expenses” does not include the Fund’s direct custody expenses attributable to its holdings of emerging market securities.
For Alternative Allocation Fund (the “Fund), GMO has contractually agreed to waive its fees with respect to and/or reimburse the Fund to the extent that the Fund’s total annual fund operating expenses (after applying all other contractual and voluntary expense limitation arrangements in effect at the time) exceed the following amounts for each class of shares, in each case representing the average daily net assets for the indicated class of shares: 0.99% for Class II shares; 0.92% for Class III shares; 0.875% for Class IV shares; 0.855% for Class V shares; 0.825% for Class VI shares; 0.99% for Class R6 shares; and 0.99% for Class I shares (each, an “Expense Cap”). Fees and expenses of the “non-interested” Trustees and legal counsel and independent compliance consultant to the “non-interested” Trustees, investment-related costs (such as brokerage commissions, interest, and acquired fund fees and expenses), payments out of assets attributable to Class I shares for sub-transfer agency, recordkeeping and other administrative services provided by financial intermediaries, taxes, litigation and indemnification expenses, judgments, and other extraordinary or non-recurring expenses not incurred in the ordinary course of the Fund’s business (collectively, “Excluded Expenses”), are excluded from the Expense Cap. GMO is permitted to recover from the Fund, on a class-by-class basis, expenses it has borne or reimbursed pursuant to an Expense Cap (whether through reduction of its fees or otherwise) to the extent that the Fund’s total annual fund operating expenses (excluding Excluded Expenses) later fall below that Expense Cap set forth above or any lower expense limit in effect when GMO seeks to recover the expenses. The Fund, however, is not obligated to pay any such amount more than three years after GMO bore or reimbursed an expense. Any such recovery will not cause the Fund to exceed the Expense Caps set forth above or any lower expense limits as is in effect at the time GMO seeks to recover expenses. GMO also has contractually agreed to waive or reduce the Fund’s management fees and shareholder service fees to the extent necessary to offset the management fees and shareholder service fees paid to GMO that are directly or indirectly borne by the Fund or a class of shares of the Fund as a result of the Fund’s direct or indirect investments in other series of GMO Trust (“GMO Funds”). Management fees and shareholder service fees will not be waived below
GMO Trust Funds
Notes to Financial Statements — (Continued)
February 28, 2022
zero. The reimbursement and waiver arrangements described above, including the Expense Cap, will remain in effect through at least June 30, 2022 and may not be terminated prior to this date without the action or consent of the Trust’s Board of Trustees.
For each Fund, other than Benchmark-Free Allocation Fund, that pays GMO a management fee and shareholder service fee, GMO has contractually agreed to waive or reduce the Fund’s management fees and shareholder service fees to the extent necessary to offset the management fees and shareholder service fees paid to GMO that are directly or indirectly borne by the Fund or a class of shares of the Fund as a result of the Fund’s direct or indirect investments in other series of GMO Trust (“GMO Funds”). Management fees and shareholder service fees will not be waived below zero.
These contractual waivers and reimbursements will continue through at least June 30, 2022 for each Fund unless the Funds’ Board of Trustees authorizes their modification or termination or reduces the fee rates paid to GMO under the Fund’s management contract or servicing and supplemental support agreement.
For Benchmark-Free Allocation Fund only, GMO has contractually agreed to waive or reduce the Fund’s management, shareholder service, and supplemental support fees to the extent necessary to offset the management fees and shareholder service fees paid to GMO that are directly or indirectly borne by the Fund or a class of shares of the Fund as a result of the Fund’s direct or indirect investments in other series of GMO Trust. In addition, GMO has contractually agreed to reduce the rate of the supplemental support fees charged to the Fund’s Class MF shares based on the net assets attributable to Class MF shares as of the last business day of the preceding month based on the following schedule: 0.10% on the first $6 billion of net assets, 0.05% on the next $2 billion, 0.03% on the next $2 billion, and 0.01% thereafter; provided, however, that the effective rate charged at any time will not be reduced to less than 0.06% of Class MF’s average daily net assets. The rate will be calculated before giving effect to any reduction or waiver described above, and any applicable reduction or waiver will serve to further reduce the supplemental support fees paid to GMO. This reduction will continue through at least June 30, 2022, and may not be terminated prior to this date without the action or consent of the Fund’s Board of Trustees.
GMO has contractually agreed to reimburse Class I assets of each Fund (or waive its fees) to the extent that payments for sub-transfer agency, recordkeeping and other administrative services provided by financial intermediaries from Class I assets exceed 0.10% of such Fund’s average daily net assets attributable to Class I assets.
Sub-Transfer Agent/Recordkeeping Payments
Class II, III, IV, V, VI, MF and R6 shares are not subject to payments to third parties for sub-transfer agent/recordkeeping and other administrative services. GMO may, on a case-by-case basis, make payments for sub-transfer agent, recordkeeping and other administrative services provided by financial intermediaries for the benefit of shareholders of these classes. Any such payments are made by GMO out of its own resources and are not an additional charge to a Fund or the holders of Class II, III, IV, V, VI, MF or Class R6 shares. These payments may create a conflict of interest by influencing a financial intermediary to recommend a Fund over another investment.
Class I shares are subject to payments for sub-transfer agency, recordkeeping and other administrative services provided by financial intermediaries for the benefit of holders of Class I shares through an account maintained by a third-party platform or intermediary. These services are not primarily intended to result in the sale of Fund shares but instead to provide ongoing services with respect to holders of Class I shares through a third-party platform or intermediary. Because payments for sub-transfer agency, recordkeeping and other administrative services are paid out of a Fund’s Class I assets on an ongoing basis, over time they will increase the cost of an investment in Class I shares. In addition, GMO may, on a case-by-case basis, make payments for sub-transfer agency, recordkeeping and other administrative services provided by financial intermediaries with respect to shareholders of Class I shares. Any such payments will be made by GMO out of its own resources and will not be an additional charge to a Fund or the holders of Class I shares. Any such payments will create a conflict of interest by influencing a financial intermediary to recommend a Fund over another investment.
GMO Trust Funds
Notes to Financial Statements — (Continued)
February 28, 2022
The Funds’ portion of the fees paid by the Trust to the Trust’s independent Trustees and their legal counsel and any agents unaffiliated with GMO during the year ended February 28, 2022 is shown in the table below and is included in the Statements of Operations.
| | | | | | | | |
| | | |
| Fund Name | | Independent Trustees
and their legal counsel ($) | | | Agent unaffiliated
with GMO ($) | |
Consolidated Alternative Allocation Fund | | | 13,932 | | | | 1,237 | |
Benchmark-Free Allocation Fund | | | 193,319 | | | | 19,554 | |
Benchmark-Free Fund | | | 67,893 | | | | 6,529 | |
Global Asset Allocation Fund | | | 23,883 | | | | 2,401 | |
Global Developed Equity Allocation Fund | | | 3,262 | | | | 276 | |
Global Equity Allocation Fund | | | 59,021 | | | | 5,000 | |
Consolidated Implementation Fund | | | 180,401 | | | | 17,658 | |
International Developed Equity Allocation Fund | | | 7,791 | | | | 729 | |
International Equity Allocation Fund | | | 28,030 | | | | 2,501 | |
Consolidated SGM Major Markets Fund | | | 9,280 | | | | 1,185 | |
Strategic Opportunities Allocation Fund | | | 14,053 | | | | 1,411 | |
Certain Funds incur fees and expenses indirectly as a shareholder in the underlying funds. For the year ended February 28, 2022, the Funds below had indirect fees and expenses greater than 0.01% of the Fund’s average daily net assets.
| | | | |
| | |
| Fund Name | | Total Indirect Expenses | |
Consolidated Alternative Allocation Fund | | | 0.032% | |
Benchmark-Free Allocation Fund | | | 0.349%* | |
Benchmark-Free Fund | | | 0.092% | |
Global Asset Allocation Fund | | | 0.684%* | |
Global Developed Equity Allocation Fund | | | 0.523% | |
Global Equity Allocation Fund | | | 0.578% | |
International Developed Equity Allocation Fund | | | 0.622% | |
International Equity Allocation Fund | | | 0.659% | |
Strategic Opportunities Allocation Fund | | | 0.328% | |
| | * | Includes indirect interest and dividend expense on reverse repurchase agreements and short sales, respectively, and borrowing costs for investments sold short. |
The Funds are permitted to purchase or sell securities from or to certain other GMO funds under specified conditions outlined in procedures adopted by the Trustees. The procedures have been designed to ensure that any purchase or sale of securities by a Fund from another fund or portfolio that is or could be considered an affiliate by virtue of having a common investment adviser (or affiliated investment advisers), common Trustees and/or common officers complies with Rule 17a-7 of the 1940 Act. Further, as defined under the procedures, each transaction is effectuated at the current market price. During the year ended February 28, 2022, the Funds did not engage in these transactions.
GMO Trust Funds
Notes to Financial Statements — (Continued)
February 28, 2022
| 6. | Purchases and sales of securities |
Cost of purchases and proceeds from sales of securities, excluding short-term investments and including GMO U.S. Treasury Fund, if applicable, for the year ended February 28, 2022 are noted in the table below:
| | | | | | | | | | | | | | | | |
| | | | | |
| | | Purchases ($) | | | Purchases ($) | | | Sales ($) | | | Sales ($) | |
| | | | | |
| Fund Name | | U.S. Government
Securities | | | Investments (Non-U.S.
Government Securities) | | | U.S. Government
Securities | | | Investments (Non-U.S.
Government Securities) | |
Consolidated Alternative Allocation Fund | | | 259,721,320 | | | | 799,166,583 | | | | 240,553,009 | | | | 918,469,122 | |
Benchmark-Free Allocation Fund | | | — | | | | 421,317,419 | | | | — | | | | 1,770,236,677 | |
Benchmark-Free Fund | | | 735,077,907 | | | | 1,631,025,964 | | | | 588,160,184 | | | | 1,986,025,979 | |
Global Asset Allocation Fund | | | — | | | | 207,657,535 | | | | — | | | | 436,592,792 | |
Global Developed Equity Allocation Fund | | | — | | | | 20,213,111 | | | | — | | | | 17,158,256 | |
Global Equity Allocation Fund | | | — | | | | 396,160,192 | | | | — | | | | 340,152,763 | |
Consolidated Implementation Fund | | | 2,085,570,668 | | | | 5,903,072,806 | | | | 1,496,450,597 | | | | 6,741,903,456 | |
International Developed Equity Allocation Fund | | | — | | | | 58,526,603 | | | | — | | | | 44,889,290 | |
International Equity Allocation Fund | | | — | | | | 145,686,869 | | | | — | | | | 262,747,341 | |
Consolidated SGM Major Markets Fund | | | 222,110,300 | | | | — | | | | 292,638,242 | | | | — | |
Strategic Opportunities Allocation Fund | | | 27,872,767 | | | | 327,116,833 | | | | 2,972,461 | | | | 600,940,935 | |
In the normal course of business the Funds enter into contracts with third-party service providers that contain a variety of representations and warranties and that provide general indemnifications. The Funds’ maximum exposure under these arrangements is unknown, as it involves possible future claims that may or may not be made against the Funds. Based on experience, GMO is of the view that the risk of loss to the Funds in connection with the Funds’ indemnification obligations is remote; however, there can be no assurance that such obligations will not result in material liabilities that adversely affect the Funds.
| 8. | Principal shareholders as of February 28, 2022 |
| | | | | | | | |
| | | |
| Fund Name | | Number of
shareholders that held
more than 10% of the
outstanding shares of
the Fund | | | Percentage of
outstanding shares of
the Fund held by those
shareholders owning
greater than 10% of the
outstanding shares of
the Fund | |
Alternative Allocation Fund | | | 3 | ‡ | | | 90.78% | |
Benchmark-Free Allocation Fund | | | 1 | | | | 26.73% | |
Benchmark-Free Fund | | | 3 | | | | 38.31% | |
Global Asset Allocation Fund | | | 2 | | | | 31.10% | |
Global Developed Equity Allocation Fund | | | 2 | | | | 89.86% | |
Global Equity Allocation Fund | | | 3 | | | | 65.93% | |
Implementation Fund | | | 1 | ‡ | | | 100.00% | |
International Developed Equity Allocation Fund | | | 2 | | | | 95.39% | |
International Equity Allocation Fund | | | 4 | | | | 77.35% | |
SGM Major Markets Fund | | | 3 | # | | | 90.15% | |
Strategic Opportunities Allocation Fund | | | 3 | | | | 71.82% | |
| | ‡ | One of the shareholders is another fund of the Trust. |
| | # | Two of the shareholders are other funds of the Trust. |
GMO Trust Funds
Notes to Financial Statements — (Continued)
February 28, 2022
The Declaration of Trust permits each Fund to issue an unlimited number of shares of beneficial interest (without par value). Transactions in the Funds’ shares were as follows:
| | | | | | | | | | | | | | | | |
| | | |
| | | Year Ended
February 28, 2022 | | | Year Ended
February 28, 2021 | |
| | | | | |
| | | Shares | | | Amount | | | Shares | | | Amount | |
Consolidated Alternative Allocation Fund | | | | | | | | | | | | | | | | |
Class VI: | | | | | | | | | | | | | | | | |
Shares sold | | | 451,346 | | | $ | 8,431,840 | | | | 6,069,438 | | | $ | 120,301,372 | |
Shares issued to shareholders in reinvestment of distributions | | | 350,410 | | | | 6,442,811 | | | | 277,343 | | | | 5,356,980 | |
Shares repurchased | | | (5,696,131 | ) | | | (106,350,858 | ) | | | (4,536,437 | ) | | | (87,729,228 | ) |
| | | | | | | | | | | | | | | | | |
Net increase (decrease) | | | (4,894,375 | ) | | $ | (91,476,207 | ) | | | 1,810,344 | | | $ | 37,929,124 | |
| | | | | | | | | | | | | | | | | |
Class R6:(a) | |
Shares sold | | | 2,173 | | | $ | 39,785 | | | | 26,831 | | | $ | 519,188 | |
Shares issued to shareholders in reinvestment of distributions | | | 831 | | | | 15,298 | | | | 516 | | | | 9,953 | |
Shares repurchased | | | (27,006 | ) | | | (500,411 | ) | | | (2,114 | ) | | | (41,558 | ) |
| | | | | | | | | | | | | | | | | |
Net increase (decrease) | | | (24,002 | ) | | $ | (445,328 | ) | | | 25,233 | | | $ | 487,583 | |
| | | | | | | | | | | | | | | | | |
Class I: | |
Shares sold | | | 6,111,527 | | | $ | 113,826,130 | | | | 15,492,543 | | | $ | 298,991,109 | |
Shares issued to shareholders in reinvestment of distributions | | | 190,953 | | | | 3,500,091 | | | | 80,844 | | | | 1,560,033 | |
Shares repurchased | | | (12,228,627 | ) | | | (232,055,396 | ) | | | (3,178,089 | ) | | | (60,932,252 | ) |
| | | | | | | | | | | | | | | | | |
Net increase (decrease) | | | (5,926,147 | ) | | $ | (114,729,175 | ) | | | 12,395,298 | | | $ | 239,618,890 | |
| | | | | | | | | | | | | | | | | |
| | | | | | | | | | | | | | | | | |
Benchmark-Free Allocation Fund | | | | | | | | | | | | | | | | |
Class III: | | | | | | | | | | | | | | | | |
Shares sold | | | 6,218,317 | | | $ | 163,296,953 | | | | 3,785,990 | | | $ | 92,615,446 | |
Shares issued to shareholders in reinvestment of distributions | | | 1,502,582 | | | | 38,090,456 | | | | 4,019,280 | | | | 100,605,473 | |
Shares repurchased | | | (25,965,137 | ) | | | (690,286,283 | ) | | | (52,416,850 | ) | | | (1,279,526,091 | ) |
Shares repurchased in connection with reorganization:(b) | | | — | | | | — | | | | (17,852,866 | ) | | | (463,472,079 | ) |
| | | | | | | | | | | | | | | | | |
Net increase (decrease) | | | (18,244,238 | ) | | $ | (488,898,874 | ) | | | (62,464,446 | ) | | $ | (1,549,777,251 | ) |
| | | | | | | | | | | | | | | | | |
Class IV: | |
Shares sold | | | 9,376,363 | | | $ | 249,787,539 | | | | 4,395,247 | | | $ | 107,395,880 | |
Shares issued to shareholders in reinvestment of distributions | | | 1,019,586 | | | | 25,846,502 | | | | 2,254,813 | | | | 56,425,045 | |
Shares repurchased | | | (31,796,804 | ) | | | (829,350,870 | ) | | | (12,628,848 | ) | | | (307,840,416 | ) |
| | | | | | | | | | | | | | | | | |
Net increase (decrease) | | | (21,400,855 | ) | | $ | (553,716,829 | ) | | | (5,978,788 | ) | | $ | (144,019,491 | ) |
| | | | | | | | | | | | | | | | | |
Class MF: | |
Shares sold | | | 1,764,590 | | | $ | 46,575,757 | | | | 863,586 | | | $ | 22,063,346 | |
Shares issued to shareholders in reinvestment of distributions | | | 1,367,575 | | | | 34,695,369 | | | | 2,769,815 | | | | 69,378,466 | |
Shares repurchased | | | (15,595,646 | ) | | | (411,391,047 | ) | | | (48,245,572 | ) | | | (1,184,044,972 | ) |
| | | | | | | | | | | | | | | | | |
Net increase (decrease) | | | (12,463,481 | ) | | $ | (330,119,921 | ) | | | (44,612,171 | ) | | $ | (1,092,603,160 | ) |
| | | | | | | | | | | | | | | | | |
| | | | | | | | | | | | | | | | | |
GMO Trust Funds
Notes to Financial Statements — (Continued)
February 28, 2022
| | | | | | | | | | | | | | | | |
| | | |
| | | Year Ended
February 28, 2022 | | | Year Ended
February 28, 2021 | |
| | | | | |
| | | Shares | | | Amount | | | Shares | | | Amount | |
Benchmark-Free Allocation Fund (continued) | | | | | | | | | | | | | | | | |
Class R6:(c) | | | | | | | | | | | | | | | | |
Shares sold | | | 3,354,486 | | | $ | 88,104,972 | | | | 2,363,878 | | | $ | 59,336,390 | |
Shares issued to shareholders in reinvestment of distributions | | | 231,232 | | | | 5,857,098 | | | | 59,411 | | | | 1,488,297 | |
Shares issued to shareholders in connection with reorganization(b) | | | — | | | | — | | | | 9,884,492 | | | | 256,421,515 | |
Shares repurchased | | | (4,851,336 | ) | | | (129,002,250 | ) | | | (334,848 | ) | | | (8,558,317 | ) |
| | | | | | | | | | | | | | | | | |
Net increase (decrease) | | | (1,265,618 | ) | | $ | (35,040,180 | ) | | | 11,972,933 | | | $ | 308,687,885 | |
| | | | | | | | | | | | | | | | | |
Class I: | | | | | | | | | | | | | | | | |
Shares sold | | | 4,397,334 | | | $ | 116,032,792 | | | | 3,200,275 | | | $ | 79,569,402 | |
Shares issued to shareholders in reinvestment of distributions | | | 286,161 | | | | 7,248,470 | | | | 159,203 | | | | 3,981,436 | |
Shares issued to shareholders in connection with reorganization(b) | | | — | | | | — | | | | 8,138,329 | | | | 211,141,897 | |
Shares repurchased | | | (2,900,373 | ) | | | (76,507,018 | ) | | | (2,838,085 | ) | | | (72,184,369 | ) |
| | | | | | | | | | | | | | | | | |
Net increase (decrease) | | | 1,783,122 | | | $ | 46,774,244 | | | | 8,659,722 | | | $ | 222,508,366 | |
| | | | | | | | | | | | | | | | | |
| | | | | | | | | | | | | | | | | |
Benchmark-Free Fund | | | | | | | | | | | | | | | | |
Class III: | | | | | | | | | | | | | | | | |
Shares sold | | | — | | | $ | — | | | | 3,380,765 | | | $ | 56,376,837 | |
Shares issued to shareholders in reinvestment of distributions | | | 4,034,320 | | | | 76,313,230 | | | | 3,731,306 | | | | 69,942,505 | |
Shares repurchased | | | (29,222,706 | ) | | | (564,384,055 | ) | | | (33,134,537 | ) | | | (610,768,662 | ) |
| | | | | | | | | | | | | | | | | |
Net increase (decrease) | | | (25,188,386 | ) | | $ | (488,070,825 | ) | | | (26,022,466 | ) | | $ | (484,449,320 | ) |
| | | | | | | | | | | | | | | | | |
| | | | | | | | | | | | | | | | | |
Global Asset Allocation Fund | |
Class III: | | | | | | | | | | | | | | | | |
Shares sold | | | 1,002,856 | | | $ | 36,431,590 | | | | 1,216,073 | | | $ | 38,212,261 | |
Shares issued to shareholders in reinvestment of distributions | | | 920,717 | | | | 31,925,106 | | | | 976,697 | | | | 32,629,383 | |
Shares repurchased | | | (3,947,615 | ) | | | (142,005,422 | ) | | | (26,333,561 | ) | | | (848,073,134 | ) |
Shares repurchased in connection with reorganization(b) | | | — | | | | — | | | | (4,904,836 | ) | | | (173,115,488 | ) |
| | | | | | | | | | | | | | | | | |
Net increase (decrease) | | | (2,024,042 | ) | | $ | (73,648,726 | ) | | | (29,045,627 | ) | | $ | (950,346,978 | ) |
| | | | | | | | | | | | | | | | | |
Class R6: | | | | | | | | | | | | | | | | |
Shares sold | | | 106,284 | | | $ | 3,777,306 | | | | 609,510 | | | $ | 20,452,550 | |
Shares issued to shareholders in reinvestment of distributions | | | 19,569 | | | | 679,038 | | | | 15,573 | | | | 521,472 | |
Shares issued to shareholders in connection with reorganization(b) | | | — | | | | — | | | | 4,380,291 | | | | 154,608,023 | |
Shares repurchased | | | (4,570,426 | ) | | | (166,223,124 | ) | | | (332,593 | ) | | | (11,069,669 | ) |
| | | | | | | | | | | | | | | | | |
Net increase (decrease) | | | (4,444,573 | ) | | $ | (161,766,780 | ) | | | 4,672,781 | | | $ | 164,512,376 | |
| | | | | | | | | | | | | | | | | |
Class I:(d) | | | | | | | | | | | | | | | | |
Shares sold | | | 50,466 | | | $ | 1,828,908 | | | | 75,778 | | | $ | 2,667,247 | |
Shares issued to shareholders in reinvestment of distributions | | | 21,862 | | | | 758,336 | | | | — | | | | — | |
Shares issued to shareholders in connection with reorganization(b) | | | — | | | | — | | | | 554,741 | | | | 19,578,025 | |
Shares repurchased | | | (275,252 | ) | | | (9,978,958 | ) | | | (43,576 | ) | | | (1,539,670 | ) |
| | | | | | | | | | | | | | | | | |
Net increase (decrease) | | | (202,924 | ) | | $ | (7,391,714 | ) | | | 586,943 | | | $ | 20,705,602 | |
| | | | | | | | | | | | | | | | | |
| | | | | | | | | | | | | | | | | |
Global Developed Equity Allocation Fund | | | | | | | | | | | | | | | | |
Class III: | | | | | | | | | | | | | | | | |
Shares sold | | | — | | | $ | — | | | | 219,276 | | | $ | 5,622,223 | |
Shares issued to shareholders in reinvestment of distributions | | | 380,228 | | | | 9,954,295 | | | | 85,417 | | | | 2,073,187 | |
Shares repurchased | | | (245,335 | ) | | | (6,979,443 | ) | | | (403,077 | ) | | | (8,282,753 | ) |
| | | | | | | | | | | | | | | | | |
Net increase (decrease) | | | 134,893 | | | $ | 2,974,852 | | | | (98,384 | ) | | $ | (587,343 | ) |
| | | | | | | | | | | | | | | | | |
| | | | | | | | | | | | | | | | | |
GMO Trust Funds
Notes to Financial Statements — (Continued)
February 28, 2022
| | | | | | | | | | | | | | | | |
| | | |
| | | Year Ended
February 28, 2022 | | | Year Ended
February 28, 2021 | |
| | | | | |
| | | Shares | | | Amount | | | Shares | | | Amount | |
Global Equity Allocation Fund | | | | | | | | | | | | | | | | |
Class III: | | | | | | | | | | | | | | | | |
Shares sold | | | 1,623 | | | $ | 50,000 | | | | 1,378,390 | | | $ | 33,559,963 | |
Shares issued to shareholders in reinvestment of distributions | | | 3,748,182 | | | | 114,586,982 | | | | 1,927,822 | | | | 54,272,843 | |
Shares repurchased | | | (3,319,307 | ) | | | (106,672,406 | ) | | | (8,268,761 | ) | | | (223,473,248 | ) |
| | | | | | | | | | | | | | | | | |
Net increase (decrease) | | | 430,498 | | | $ | 7,964,576 | | | | (4,962,549 | ) | | $ | (135,640,442 | ) |
| | | | | | | | | | | | | | | | | |
Class R6:(e) | | | | | | | | | | | | | | | | |
Shares sold | | | 29,814 | | | $ | 945,665 | | | | 246,021 | | | $ | 6,259,686 | |
Shares issued to shareholders in reinvestment of distributions | | | 17,711 | | | | 541,431 | | | | 8,041 | | | | 227,894 | |
Shares repurchased | | | (25,923 | ) | | | (837,307 | ) | | | (27,387 | ) | | | (732,104 | ) |
| | | | | | | | | | | | | | | | | |
Net increase (decrease) | | | 21,602 | | | $ | 649,789 | | | | 226,675 | | | $ | 5,755,476 | |
| | | | | | | | | | | | | | | | | |
Class I:(f) | | | | | | | | | | | | | | | | |
Shares sold | | | 16,756 | | | $ | 528,647 | | | | 72,846 | | | $ | 1,917,462 | |
Shares issued to shareholders in reinvestment of distributions | | | 6,260 | | | | 191,269 | | | | 2,267 | | | | 64,254 | |
Shares repurchased | | | (5,730 | ) | | | (184,132 | ) | | | (458 | ) | | | (12,411 | ) |
| | | | | | | | | | | | | | | | | |
Net increase (decrease) | | | 17,286 | | | $ | 535,784 | | | | 74,655 | | | $ | 1,969,305 | |
| | | | | | | | | | | | | | | | | |
| | | | | | | | | | | | | | | | | |
Consolidated Implementation Fund | | | | | | | | | | | | | | | | |
Core Class: | | | | | | | | | | | | | | | | |
Shares sold | | | 17,972,770 | | | $ | 234,356,377 | | | | 86,220,208 | | | $ | 1,048,235,578 | |
Shares issued to shareholders in reinvestment of distributions | | | 12,158,465 | | | | 150,035,453 | | | | 10,748,813 | | | | 132,218,180 | |
Shares repurchased | | | (126,745,748 | ) | | | (1,639,490,784 | ) | | | (185,451,038 | ) | | | (2,225,658,576 | ) |
| | | | | | | | | | | | | | | | | |
Net increase (decrease) | | | (96,614,513 | ) | | $ | (1,255,098,954 | ) | | | (88,482,017 | ) | | $ | (1,045,204,818 | ) |
| | | | | | | | | | | | | | | | | |
| | | | | | | | | | | | | | | | | |
International Developed Equity Allocation Fund | |
Class III: | | | | | | | | | | | | | | | | |
Shares sold | | | 1,325,004 | | | $ | 23,754,550 | | | | 2,334,558 | | | $ | 33,800,999 | |
Shares issued to shareholders in reinvestment of distributions | | | 509,965 | | | | 8,777,681 | | | | 386,519 | | | | 6,277,230 | |
Shares repurchased | | | (1,049,987 | ) | | | (18,578,827 | ) | | | (9,909,526 | ) | | | (144,296,950 | ) |
Shares repurchased in connection with reorganization(b) | | | — | | | | — | | | | (487,958 | ) | | | (8,333,525 | ) |
| | | | | | | | | | | | | | | | | |
Net increase (decrease) | | | 784,982 | | | $ | 13,953,404 | | | | (7,676,407 | ) | | $ | (112,552,246 | ) |
| | | | | | | | | | | | | | | | | |
Class R6:(g) | | | | | | | | | | | | | | | | |
Shares sold | | | 40,654 | | | $ | 734,355 | | | | 6,577 | | | $ | 112,468 | |
Shares issued to shareholders in reinvestment of distributions | | | 31,628 | | | | 544,452 | | | | — | | | | — | |
Shares issued to shareholders in connection with reorganization(b) | | | — | | | | — | | | | 492,914 | | | | 8,418,168 | |
Shares repurchased | | | (53,617 | ) | | | (965,399 | ) | | | (12,445 | ) | | | (212,488 | ) |
| | | | | | | | | | | | | | | | | |
Net increase (decrease) | | | 18,665 | | | $ | 313,408 | | | | 487,046 | | | $ | 8,318,148 | |
| | | | | | | | | | | | | | | | | |
| | | | | | | | | | | | | | | | | |
International Equity Allocation Fund | | | | | | | | | | | | | | | | |
Class III: | | | | | | | | | | | | | | | | |
Shares sold | | | 221,915 | | | $ | 7,458,093 | | | | 165,164 | | | $ | 4,658,164 | |
Shares issued to shareholders in reinvestment of distributions | | | 913,296 | | | | 29,091,830 | | | | 767,681 | | | | 23,461,457 | |
Shares repurchased | | | (4,811,910 | ) | | | (155,557,290 | ) | | | (5,584,470 | ) | | | (137,383,719 | ) |
Shares repurchased in connection with reorganization(b) | | | — | | | | — | | | | (376,439 | ) | | | (12,333,032 | ) |
| | | | | | | | | | | | | | | | | |
Net increase (decrease) | | | (3,676,699 | ) | | $ | (119,007,367 | ) | | | (5,028,064 | ) | | $ | (121,597,130 | ) |
| | | | | | | | | | | | | | | | | |
| | | | | | | | | | | | | | | | | |
GMO Trust Funds
Notes to Financial Statements — (Continued)
February 28, 2022
| | | | | | | | | | | | | | | | |
| | | |
| | | Year Ended
February 28, 2022 | | | Year Ended
February 28, 2021 | |
| | | | | |
| | | Shares | | | Amount | | | Shares | | | Amount | |
International Equity Allocation Fund (continued) | | | | | | | | | | | | | | | | |
Class R6: | | | | | | | | | | | | | | | | |
Shares sold | | | 168,085 | | | $ | 5,589,401 | | | | 315,758 | | | $ | 7,840,712 | |
Shares issued to shareholders in reinvestment of distributions | | | 481,805 | | | | 15,335,754 | | | | 331,970 | | | | 10,144,475 | |
Shares issued to shareholders in connection with reorganization(b) | | | — | | | | — | | | | 380,466 | | | | 12,461,474 | |
Shares repurchased | | | (556,099 | ) | | | (18,171,988 | ) | | | (551,315 | ) | | | (17,409,367 | ) |
| | | | | | | | | | | | | | | | | |
Net increase (decrease) | | | 93,791 | | | $ | 2,753,167 | | | | 476,879 | | | $ | 13,037,294 | |
| | | | | | | | | | | | | | | | | |
| | | | | | | | | | | | | | | | | |
Consolidated SGM Major Markets Fund | | | | | | | | | | | | | | | | |
Class III: | | | | | | | | | | | | | | | | |
Shares sold | | | 665,260 | | | $ | 20,088,895 | | | | 384,363 | | | $ | 12,641,912 | |
Shares issued to shareholders in reinvestment of distributions | | | 1,205 | | | | 35,766 | | | | 515 | | | | 16,796 | |
Shares repurchased | | | (486,422 | ) | | | (14,257,990 | ) | | | (40,476 | ) | | | (1,320,080 | ) |
| | | | | | | | | | | | | | | | | |
Net increase (decrease) | | | 180,043 | | | $ | 5,866,671 | | | | 344,402 | | | $ | 11,338,628 | |
| | | | | | | | | | | | | | | | | |
Class VI: | | | | | | | | | | | | | | | | |
Shares sold | | | 1,958,773 | | | $ | 61,237,349 | | | | 3,231,526 | | | $ | 104,242,857 | |
Shares issued to shareholders in reinvestment of distributions | | | 723,031 | | | | 21,457,199 | | | | 200,949 | | | | 6,549,429 | |
Shares repurchased | | | (5,419,611 | ) | | | (160,325,548 | ) | | | (20,403,300 | ) | | | (653,236,278 | ) |
| | | | | | | | | | | | | | | | | |
Net increase (decrease) | | | (2,737,807 | ) | | $ | (77,631,000 | ) | | | (16,970,825 | ) | | $ | (542,443,992 | ) |
| | | | | | | | | | | | | | | | | |
Class I:(h) | | | | | | | | | | | | | | | | |
Shares sold | | | 884,435 | | | $ | 26,693,141 | | | | 438,717 | | | $ | 14,414,202 | |
Shares issued to shareholders in reinvestment of distributions | | | 40,852 | | | | 1,208,514 | | | | 2,797 | | | | 91,322 | |
Shares repurchased | | | (647,184 | ) | | | (18,902,142 | ) | | | (9,697 | ) | | | (316,848 | ) |
| | | | | | | | | | | | | | | | | |
Net increase (decrease) | | | 278,103 | | | $ | 8,999,513 | | | | 431,817 | | | $ | 14,188,676 | |
| | | | | | | | | | | | | | | | | |
| | | | | | | | | | | | | | | | | |
Strategic Opportunities Allocation Fund | | | | | | | | | | | | | | | | |
Class III: | | | | | | | | | | | | | | | | |
Shares sold | | | 407,969 | | | $ | 8,475,000 | | | | 1,900,987 | | | $ | 32,587,762 | |
Shares issued to shareholders in reinvestment of distributions | | | 2,573,255 | | | | 51,157,762 | | | | 1,193,465 | | | | 23,704,892 | |
Shares repurchased | | | (16,664,409 | ) | | | (361,479,168 | ) | | | (16,950,871 | ) | | | (322,809,952 | ) |
| | | | | | | | | | | | | | | | | |
Net increase (decrease) | | | (13,683,185 | ) | | $ | (301,846,406 | ) | | | (13,856,419 | ) | | $ | (266,517,298 | ) |
| | | | | | | | | | | | | | | | | |
| | | | | | | | | | | | | | | | | |
| | (a) | The period under the heading “Year Ended February 28, 2021” represents the period from July 31, 2020 (commencement of operations) through February 28, 2021. |
| | (b) | A plan of reorganization was completed on January 22, 2021. |
| | (c) | The period under the heading “Year Ended February 28, 2021” represents the period from May 1, 2020 (commencement of operations) through February 28, 2021. |
| | (d) | The period under the heading “Year Ended February 28, 2021” represents the period from January 6, 2021 (commencement of operations) through February 28, 2021. |
| | (e) | The period under the heading “Year Ended February 28, 2021 “represents the period from July 15, 2020 (commencement of operations) through February 28, 2021. |
| | (f) | The period under the heading “Year Ended February 28, 2021 “represents the period from August 17, 2020 (commencement of operations) through February 28, 2021. |
| | (g) | The period under the heading “Year Ended February 28, 2021” represents the period from January 22, 2021 (commencement of operations) through February 28, 2021. |
| | (h) | The period under the heading “Year Ended February 28, 2021” represents the period from September 23, 2020 (commencement of operations) through February 28, 2021. |
GMO Trust Funds
Notes to Financial Statements — (Continued)
February 28, 2022
| 10. | Investments in affiliated companies and other Funds of the Trust |
An affiliated company for the purposes of this disclosure is a company in which a Fund has or had direct ownership of at least 5% of the issuer’s voting securities or an investment in other funds of GMO Trust. A summary of the Funds’ transactions involving companies that are or were affiliates during the year ended February 28, 2022 is set forth below:
| | | | | | | | | | | | | | | | | | | | | | | | | | | | | | | | |
| | | | | | | | | |
| Affiliate | | Value,
beginning of
period | | | Purchases | | | Sales
Proceeds | | | Dividend
Income | | | Distributions
of Realized
Gains | | | Net Realized
Gain
(Loss) | | | Net
Increase/
Decrease in
Unrealized
Appreciation/
Depreciation | | | Value, end of
period | |
Consolidated Alternative Allocation Fund | |
GMO Emerging Markets Fund, Class VI | | $ | 29,192,704 | | | $ | 1,200,000 | | | $ | 18,760,000 | | | $ | 527,989 | | | $ | — | | | $ | 2,884,552 | | | $ | (4,705,383 | ) | | $ | 9,811,873 | |
| | | | | | | | | | | | | | | | | | | | | | | | | | | | | | | | | |
| | | | | | | | | | | | | | | | | | | | | | | | | | | | | | | | | |
Benchmark-Free Allocation Fund | |
GMO Emerging Country Debt Fund, Class IV | | $ | 161,366,088 | | | $ | 4,512,052 | | | $ | 174,494,031 | | | $ | 1,856,950 | | | $ | 2,655,102 | | | $ | (136,976 | ) | | $ | 8,752,867 | | | $ | — | |
GMO Emerging Country Debt Fund, Class VI | | | — | | | | 182,557,303 | | | | 35,000,000 | | | | 9,199,416 | | | | 1,263,856 | | | | (4,173,920 | ) | | | (28,109,540 | ) | | | 115,273,843 | |
GMO Implementation Fund | | | 5,968,168,051 | | | | 384,391,830 | | | | 1,639,490,784 | | | | 150,035,453 | | | | — | | | | (55,830,921 | ) | | | 24,194,362 | | | | 4,681,432,538 | |
GMO Opportunistic Income Fund, Class VI | | | 237,695,110 | | | | 10,146,302 | | | | 62,282,498 | | | | 4,146,302 | | | | — | | | | (106,474 | ) | | | (1,732,768 | ) | | | 183,719,672 | |
GMO SGM Major Markets Fund, Class VI | | | 176,393,296 | | | | 11,803,964 | | | | 31,063,395 | | | | 3,998,726 | | | | 7,805,238 | | | | (3,291,439 | ) | | | (12,106,804 | ) | | | 141,735,622 | |
| | | | | | | | | | | | | | | | | | | | | | | | | | | | | | | | | |
Totals | | $ | 6,543,622,545 | | | $ | 593,411,451 | | | $ | 1,942,330,708 | | | $ | 169,236,847 | | | $ | 11,724,196 | | | $ | (63,539,730 | ) | | $ | (9,001,883 | ) | | $ | 5,122,161,675 | |
| | | | | | | | | | | | | | | | | | | | | | | | | | | | | | | | | |
| | | | | | | | | | | | | | | | | | | | | | | | | | | | | | | | | |
Benchmark-Free Fund | |
GMO Emerging Country Debt Fund, Class IV | | $ | 68,079,210 | | | $ | 1,931,848 | | | $ | 73,642,006 | | | $ | 795,059 | | | $ | 1,136,789 | | | $ | — | | | $ | 3,630,948 | | | $ | — | |
GMO Emerging Country Debt Fund, Class VI | | | — | | | | 77,337,056 | | | | 16,300,000 | | | | 3,248,726 | | | | 446,324 | | | | (68,248 | ) | | | (12,871,177 | ) | | | 48,097,631 | |
GMO Emerging Markets Fund, Class VI | | | 73,462,563 | | | | 1,860,085 | | | | 33,000,000 | | | | 1,860,085 | | | | — | | | | 5,542,187 | | | | (13,848,195 | ) | | | 34,016,640 | |
GMO Opportunistic Income Fund, Class VI | | | 95,150,641 | | | | 13,253,942 | | | | 15,500,000 | | | | 2,053,942 | | | | — | | | | 660,797 | | | | (1,620,309 | ) | | | 91,945,071 | |
GMO SGM Major Markets Fund, Class VI | | | 53,275,871 | | | | 24,923,068 | | | | 11,000,000 | | | | 1,662,823 | | | | 3,260,245 | | | | (731,067 | ) | | | (5,686,066 | ) | | | 60,781,806 | |
GMO U.S. Treasury Fund | | | 15,629,132 | | | | 130,476,415 | | | | 135,958,198 | | | | 6,492 | * | | | — | | | | (15,256 | ) | | | (41,801 | ) | | | 10,090,292 | |
| | | | | | | | | | | | | | | | | | | | | | | | | | | | | | | | | |
Totals | | $ | 305,597,417 | | | $ | 249,782,414 | | | $ | 285,400,204 | | | $ | 9,627,127 | | | $ | 4,843,358 | | | $ | 5,388,413 | | | $ | (30,436,600 | ) | | $ | 244,931,440 | |
| | | | | | | | | | | | | | | | | | | | | | | | | | | | | | | | | |
| | | | | | | | | | | | | | | | | | | | | | | | | | | | | | | | | |
Global Asset Allocation Fund | |
GMO Alternative Allocation Fund, Class VI | | $ | 178,571,877 | | | $ | 12,133,361 | | | $ | 55,206,032 | | | $ | — | | | $ | 4,989,608 | | | $ | (1,862,933 | ) | | $ | (3,632,076 | ) | | $ | 130,004,197 | |
GMO Asset Allocation Bond Fund, Class VI | | | 58,588,962 | | | | 17,375,965 | | | | 37,257,738 | | | | 698,960 | | | | — | | | | 2,289,745 | | | | (3,013,793 | ) | | | 37,983,141 | |
GMO Emerging Country Debt Fund, Class IV | | | 26,636,433 | | | | 557,358 | | | | 29,196,240 | | | | 229,383 | | | | 327,975 | | | | (428,933 | ) | | | 2,431,382 | | | | — | |
GMO Emerging Country Debt Fund, Class VI | | | — | | | | 23,588,057 | | | | — | | | | 1,223,700 | | | | 168,117 | | | | — | | | | (5,471,093 | ) | | | 18,116,964 | |
| | | | | | | | | | | | | | | | | | | | | | | | | | | | | | | | | |
GMO Trust Funds
Notes to Financial Statements — (Continued)
February 28, 2022
| | | | | | | | | | | | | | | | | | | | | | | | | | | | | | | | |
| | | | | | | | | |
| Affiliate | | Value,
beginning of
period | | | Purchases | | | Sales
Proceeds | | | Dividend
Income | | | Distributions
of Realized
Gains | | | Net
Realized
Gain
(Loss) | | | Net
Increase/
Decrease in
Unrealized
Appreciation/
Depreciation | | | Value, end of
period | |
Global Asset Allocation Fund (continued) | |
GMO Emerging Markets ex-China Fund, Class VI | | $ | — | | | $ | 33,217,965 | | | $ | — | | | $ | 217,965 | | | $ | — | | | $ | — | | | $ | (5,546,120 | ) | | $ | 27,671,845 | |
GMO Emerging Markets Fund, Class VI | | | 175,044,536 | | | | 10,315,674 | | | | 102,052,348 | | | | 3,890,335 | | | | — | | | | 10,419,982 | | | | (25,351,703 | ) | | | 68,376,141 | |
GMO International Equity Fund, Class IV | | | 143,733,654 | | | | 25,654,850 | | | | 62,802,342 | | | | 7,160,674 | | | | — | | | | 5,496,604 | | | | (4,989,413 | ) | | | 107,093,353 | |
GMO-Usonian Japan Value Creation Fund, Class VI | | | 35,718,441 | | | | 5,165,004 | | | | 12,206,000 | | | | 1,678,405 | | | | 2,231,692 | | | | 2,263,107 | | | | (5,959,163 | ) | | | 24,981,389 | |
GMO Multi-Sector Fixed Income Fund, Class IV | | | 49,437,917 | | | | 33,352,151 | | | | 22,907,203 | | | | — | | | | 1,638,831 | | | | (161,552 | ) | | | (3,557,010 | ) | | | 56,164,303 | |
GMO Opportunistic Income Fund, Class VI | | | 26,706,075 | | | | 538,593 | | | | 7,448,346 | | | | 406,635 | | | | — | | | | (68,492 | ) | | | (136,115 | ) | | | 19,591,715 | |
GMO Quality Cyclicals Fund (formerly GMO Cyclical Focus Fund), Class VI | | | 26,821,332 | | | | 4,104,046 | | | | 9,200,000 | | | | 565,143 | | | | 3,538,903 | | | | 3,366,139 | | | | (4,871,841 | ) | | | 20,219,676 | |
GMO Quality Fund, Class VI | | | 18,091,344 | | | | 1,136,569 | | | | 8,495,000 | | | | 154,675 | | | | 658,169 | | | | 2,107,541 | | | | (572,015 | ) | | | 12,268,439 | |
GMO U.S. Equity Fund, Class VI | | | 73,489,034 | | | | 21,845,564 | | | | 32,949,154 | | | | 710,356 | | | | 9,526,098 | | | | 2,319,722 | | | | (3,271,082 | ) | | | 61,434,084 | |
GMO U.S. Small Cap Value Fund, Class VI | | | 58,149,527 | | | | 14,467,527 | | | | 27,940,270 | | | | 575,717 | | | | 12,030,042 | | | | 7,410,988 | | | | (12,963,396 | ) | | | 39,124,376 | |
GMO U.S. Treasury Fund | | | 24,707,179 | | | | 26,401,090 | | | | 51,106,179 | | | | 1,926 | | | | 2 | | | | (204 | ) | | | (7 | ) | | | 1,879 | |
| | | | | | | | | | | | | | | | | | | | | | | | | | | | | | | | | |
Totals | | $ | 895,696,311 | | | $ | 229,853,774 | | | $ | 458,766,852 | | | $ | 17,513,874 | | | $ | 35,109,437 | | | $ | 33,151,714 | | | $ | (76,903,445 | ) | | $ | 623,031,502 | |
| | | | | | | | | | | | | | | | | | | | | | | | | | | | | | | | | |
| | | | | | | | | | | | | | | | | | | | | | | | | | | | | | | | | |
Global Developed Equity Allocation Fund | |
GMO Emerging Markets ex-China Fund, Class VI | | $ | — | | | $ | 6,240,951 | | | $ | — | | | $ | 40,951 | | | $ | — | | | $ | — | | | $ | (1,041,998 | ) | | $ | 5,198,953 | |
GMO Emerging Markets Fund, Class VI | | | 8,499,013 | | | | 1,307,764 | | | | 6,920,000 | | | | 140,287 | | | | — | | | | 2,565,509 | | | | (3,130,180 | ) | | | 2,322,106 | |
GMO International Equity Fund, Class IV | | | 37,111,417 | | | | 3,020,525 | | | | 4,501,227 | | | | 2,355,525 | | | | — | | | | 906,359 | | | | (1,126,344 | ) | | | 35,410,730 | |
GMO-Usonian Japan Value Creation Fund, Class VI | | | 3,494,510 | | | | 932,512 | | | | 300,000 | | | | 234,255 | | | | 313,228 | | | | 54,601 | | | | (630,409 | ) | | | 3,551,214 | |
GMO Quality Cyclicals Fund (formerly GMO Cyclical Focus Fund), Class VI | | | 4,589,809 | | | | 1,005,694 | | | | 200,000 | | | | 137,941 | | | | 867,753 | | | | 59,452 | | | | (599,064 | ) | | | 4,855,891 | |
GMO Quality Fund, Class VI | | | 10,925,424 | | | | 1,013,581 | | | | 1,935,029 | | | | 138,267 | | | | 595,314 | | | | 584,705 | | | | 366,880 | | | | 10,955,561 | |
GMO U.S. Equity Fund, Class VI | | | 14,166,705 | | | | 3,046,910 | | | | 1,012,000 | | | | 211,101 | | | | 2,835,809 | | | | 108,882 | | | | (904,419 | ) | | | 15,406,078 | |
GMO U.S. Small Cap Value Fund, Class VI | | | 9,343,101 | | | | 3,645,174 | | | | 2,290,000 | | | | 131,513 | | | | 2,749,476 | | | | 612,040 | | | | (2,233,060 | ) | | | 9,077,255 | |
| | | | | | | | | | | | | | | | | | | | | | | | | | | | | | | | | |
Totals | | $ | 88,129,979 | | | $ | 20,213,111 | | | $ | 17,158,256 | | | $ | 3,389,840 | | | $ | 7,361,580 | | | $ | 4,891,548 | | | $ | (9,298,594 | ) | | $ | 86,777,788 | |
| | | | | | | | | | | | | | | | | | | | | | | | | | | | | | | | | |
| | | | | | | | | | | | | | | | | | | | | | | | | | | | | | | | | |
Global Equity Allocation Fund | |
GMO Emerging Markets ex-China Fund, Class VI | | $ | — | | | $ | 131,865,255 | | | $ | — | | | $ | 865,255 | | | $ | — | | | $ | — | | | $ | (22,016,417 | ) | | $ | 109,848,838 | |
GMO Emerging Markets Fund, Class VI | | | 451,468,804 | | | | 19,614,162 | | | | 183,819,854 | | | | 12,614,161 | | | | — | | | | 38,694,971 | | | | (91,664,008 | ) | | | 234,294,075 | |
GMO International Equity Fund, Class IV | | | 546,831,021 | | | | 74,817,891 | | | | 55,733,599 | | | | 35,688,131 | | | | — | | | | 3,799,652 | | | | (11,312,404 | ) | | | 558,402,561 | |
GMO-Usonian Japan Value Creation Fund, Class VI | | | 65,011,818 | | | | 10,013,020 | | | | — | | | | 4,296,687 | | | | 5,716,332 | | | | — | | | | (10,953,484 | ) | | | 64,071,354 | |
GMO Quality Cyclicals Fund (formerly GMO Cyclical Focus Fund), Class VI | | | 81,133,477 | | | | 18,151,018 | | | | 425,000 | | | | 2,499,466 | | | | 15,651,552 | | | | 92,449 | | | | (9,954,614 | ) | | | 88,997,330 | |
| | | | | | | | | | | | | | | | | | | | | | | | | | | | | | | | | |
GMO Trust Funds
Notes to Financial Statements — (Continued)
February 28, 2022
| | | | | | | | | | | | | | | | | | | | | | | | | | | | | | | | |
| | | | | | | | | |
| Affiliate | | Value,
beginning of
period | | | Purchases | | | Sales
Proceeds | | | Dividend
Income | | | Distributions
of Realized
Gains | | | Net
Realized
Gain
(Loss) | | | Net
Increase/
Decrease in
Unrealized
Appreciation/
Depreciation | | | Value, end of
period | |
Global Equity Allocation Fund (continued) | |
GMO Quality Fund, Class VI | | $ | 220,601,446 | | | $ | 22,813,678 | | | $ | 44,913,480 | | | $ | 2,707,590 | | | $ | 11,606,089 | | | $ | 12,195,563 | | | $ | 7,254,533 | | | $ | 217,951,740 | |
GMO U.S. Equity Fund, Class VI | | | 104,407,865 | | | | 66,489,297 | | | | 17,349,462 | | | | 1,841,963 | | | | 23,939,506 | | | | 2,194,567 | | | | (12,749,243 | ) | | | 142,993,024 | |
GMO U.S. Small Cap Value Fund, Class VI | | | 177,879,688 | | | | 52,395,871 | | | | 37,911,368 | | | | 2,382,944 | | | | 49,883,145 | | | | 10,700,673 | | | | (39,346,833 | ) | | | 163,718,031 | |
| | | | | | | | | | | | | | | | | | | | | | | | | | | | | | | | | |
Totals | | $ | 1,647,334,119 | | | $ | 396,160,192 | | | $ | 340,152,763 | | | $ | 62,896,197 | | | $ | 106,796,624 | | | $ | 67,677,875 | | | $ | (190,742,470 | ) | | $ | 1,580,276,953 | |
| | | | | | | | | | | | | | | | | | | | | | | | | | | | | | | | | |
| | | | | | | | | | | | | | | | | | | | | | | | | | | | | | | | | |
Consolidated Implementation Fund | |
GMO U.S. Treasury Fund | | $ | 35,272,723 | | | $ | 285,385,262 | | | $ | 308,020,526 | | | $ | — | * | | $ | — | | | $ | (64,989 | ) | | $ | (63,382 | ) | | $ | 12,509,088 | |
| | | | | | | | | | | | | | | | | | | | | | | | | | | | | | | | | |
| | | | | | | | | | | | | | | | | | | | | | | | | | | | | | | | | |
International Development Equity Allocation Fund | |
GMO Emerging Markets ex-China Fund, Class VI | | $ | — | | | $ | 21,306,878 | | | $ | 1,271,953 | | | $ | 133,498 | | | $ | — | | | $ | (4,299 | ) | | $ | (3,308,186 | ) | | $ | 16,722,440 | |
GMO Emerging Markets Fund, Class VI | | | 22,008,788 | | | | 3,566,832 | | | | 25,561,606 | | | | 80,440 | | | | — | | | | 1,860,875 | | | | (1,874,889 | ) | | | — | |
GMO International Equity Fund, Class IV | | | 194,337,465 | | | | 30,437,490 | | | | 17,087,086 | | | | 13,530,307 | | | | — | | | | 615,101 | | | | (4,054,296 | ) | | | 204,248,674 | |
GMO-Usonian Japan Value Creation Fund, Class VI | | | 8,953,179 | | | | 3,215,403 | | | | 968,645 | | | | 648,039 | | | | 863,345 | | | | 45,325 | | | | (1,724,882 | ) | | | 9,520,380 | |
| | | | | | | | | | | | | | | | | | | | | | | | | | | | | | | | | |
Totals | | $ | 225,299,432 | | | $ | 58,526,603 | | | $ | 44,889,290 | | | $ | 14,392,284 | | | $ | 863,345 | | | $ | 2,517,002 | | | $ | (10,962,253 | ) | | $ | 230,491,494 | |
| | | | | | | | | | | | | | | | | | | | | | | | | | | | | | | | | |
| | | | | | | | | | | | | | | | | | | | | | | | | | | | | | | | | |
International Equity Allocation Fund | |
GMO Emerging Markets ex-China Fund, Class VI | | $ | — | | | $ | 65,445,178 | | | $ | 3,635,357 | | | $ | 405,419 | | | $ | — | | | $ | (97,086 | ) | | $ | (10,296,788 | ) | | $ | 51,415,947 | |
GMO Emerging Markets Fund, Class VI | | | 354,876,079 | | | | 19,914,562 | | | | 134,809,900 | | | | 10,379,256 | | | | — | | | | 24,646,395 | | | | (69,472,280 | ) | | | 195,154,856 | |
GMO International Equity Fund, Class IV | | | 470,885,277 | | | | 54,458,761 | | | | 116,174,095 | | | | 28,234,303 | | | | — | | | | (8,785,783 | ) | | | 3,778,525 | | | | 404,162,685 | |
GMO-Usonian Japan Value Creation Fund, Class VI | | | 35,577,814 | | | | 5,868,368 | | | | 8,127,989 | | | | 2,089,765 | | | | 2,744,179 | | | | 908,239 | | | | (5,984,794 | ) | | | 28,241,638 | |
| | | | | | | | | | | | | | | | | | | | | | | | | | | | | | | | | |
Totals | | $ | 861,339,170 | | | $ | 145,686,869 | | | $ | 262,747,341 | | | $ | 41,108,743 | | | $ | 2,744,179 | | | $ | 16,671,765 | | | $ | (81,975,337 | ) | | $ | 678,975,126 | |
| | | | | | | | | | | | | | | | | | | | | | | | | | | | | | | | | |
| | | | | | | | | | | | | | | | | | | | | | | | | | | | | | | | | |
Strategic Opportunities Allocation Fund | |
GMO Emerging Country Debt Fund, Class IV | | $ | 19,111,645 | | | $ | 356,555 | | | $ | 19,908,092 | | | $ | 146,742 | | | $ | 209,814 | | | $ | (739,751 | ) | | $ | 1,179,643 | | | $ | — | |
GMO Emerging Country Debt Fund, Class VI | | | — | | | | 14,030,856 | | | | 3,900,000 | | | | 547,541 | | | | 75,223 | | | | (252,892 | ) | | | (1,771,584 | ) | | | 8,106,380 | |
GMO Emerging Markets ex-China Fund, Class VI | | | — | | | | 18,622,193 | | | | 680,000 | | | | 122,192 | | | | — | | | | (681 | ) | | | (2,995,515 | ) | | | 14,945,997 | |
GMO Emerging Markets Fund, Class VI | | | 132,412,873 | | | | 5,069,583 | | | | 99,650,000 | | | | 1,869,583 | | | | — | | | | 9,282,378 | | | | (16,394,137 | ) | | | 30,720,697 | |
GMO International Equity Fund, Class IV | | | 68,841,799 | | | | 12,635,570 | | | | 50,800,000 | | | | 2,635,570 | | | | — | | | | 4,604,997 | | | | (3,447,225 | ) | | | 31,835,141 | |
GMO Multi-Sector Fixed Income Fund, Class IV | | | — | | | | 7,059,876 | | | | 400,000 | | | | — | | | | — | | | | (12,896 | ) | | | (204,208 | ) | | | 6,442,772 | |
GMO Opportunistic Income Fund, Class VI | | | 16,234,952 | | | | 161,329 | | | | 16,364,876 | | | | 161,329 | | | | — | | | | 320,688 | | | | (352,093 | ) | | | — | |
GMO Quality Fund, Class VI | | | 31,416,895 | | | | 1,025,777 | | | | 22,510,000 | | | | 183,484 | | | | 842,293 | | | | 4,236,119 | | | | (1,217,042 | ) | | | 12,951,749 | |
GMO U.S. Equity Fund, Class VI | | | 29,319,352 | | | | 10,710,369 | | | | 20,900,000 | | | | 213,659 | | | | 2,996,710 | | | | 1,957,221 | | | | (1,554,863 | ) | | | 19,532,079 | |
GMO U.S. Small Cap Value Fund, Class VI | | | 41,144,715 | | | | 6,062,227 | | | | 29,300,000 | | | | 270,331 | | | | 5,791,896 | | | | 6,682,742 | | | | (8,302,981 | ) | | | 16,286,703 | |
| | | | | | | | | | | | | | | | | | | | | | | | | | | | | | | | | |
GMO Trust Funds
Notes to Financial Statements — (Continued)
February 28, 2022
| | | | | | | | | | | | | | | | | | | | | | | | | | | | | | | | |
| | | | | | | | | |
| Affiliate | | Value,
beginning of
period | | | Purchases | | | Sales
Proceeds | | | Dividend
Income | | | Distributions
of Realized
Gains | | | Net
Realized
Gain
(Loss) | | | Net
Increase/
Decrease in
Unrealized
Appreciation/
Depreciation | | | Value, end of
period | |
Strategic Opportunities Allocation Fund (continued) | |
GMO U.S. Treasury Fund | | $ | 2,500,173 | | | $ | 82,961,092 | | | $ | 80,917,173 | | | $ | 6,564 | | | $ | 5,173 | | | $ | (25,591 | ) | | $ | (8,999 | ) | | $ | 4,509,502 | |
| | | | | | | | | | | | | | | | | | | | | | | | | | | | | | | | | |
Totals | | $ | 340,982,404 | | | $ | 158,695,427 | | | $ | 345,330,141 | | | $ | 6,156,995 | | | $ | 9,921,109 | | | $ | 26,052,334 | | | $ | (35,069,004 | ) | | $ | 145,331,020 | |
| | | | | | | | | | | | | | | | | | | | | | | | | | | | | | | | | |
| | | | | | | | | | | | | | | | | | | | | | | | | | | | | | | | | |
| | * | Excludes income from investment of cash collateral from securities lending in GMO U.S. Treasury Fund. Income (net of fee rebates paid to the borrower and fees paid to the lending agent) from investment of cash collateral from securities lending in GMO U.S. Treasury Fund was $103,230 and $366,611 in Benchmark-Free Fund and Consolidated Implementation Fund, respectively, during the year. |
Subsequent to February 28, 2022, GMO Global Asset Allocation Fund received redemption requests in the amount of $157,664,189.
Report of Independent Registered Public Accounting Firm
To the Board of Trustees of GMO Trust and Shareholders of
GMO Alternative Allocation Fund, GMO Benchmark-Free Allocation Fund, GMO Benchmark-Free Fund, GMO Global Asset Allocation Fund, GMO Global Developed Equity Allocation Fund, GMO Global Equity Allocation Fund, GMO Implementation Fund, GMO International Developed Equity Allocation Fund, GMO International Equity Allocation Fund, GMO SGM Major Markets Fund, and GMO Strategic Opportunities Allocation Fund
Opinions on the Financial Statements
We have audited the accompanying statements of assets and liabilities, including the schedules of investments, of GMO Alternative Allocation Fund, GMO Benchmark-Free Allocation Fund, GMO Benchmark-Free Fund, GMO Global Asset Allocation Fund, GMO Global Developed Equity Allocation Fund, GMO Global Equity Allocation Fund, GMO Implementation Fund, GMO International Developed Equity Allocation Fund, GMO International Equity Allocation Fund, GMO SGM Major Markets Fund, and GMO Strategic Opportunities Allocation Fund (eleven of the funds constituting GMO Trust, hereafter collectively referred to as the “Funds”) as of February 28, 2022, the related statements of operations for the year ended February 28, 2022, the statements of changes in net assets for each of the two years in the period ended February 28, 2022, including the related notes, and the financial highlights for each of the periods indicated therein (collectively referred to as the “financial statements”). In our opinion, the financial statements present fairly, in all material respects, the financial position of each of the Funds as of February 28, 2022, the results of each of their operations for the year then ended, the changes in each of their net assets for each of the two years in the period ended February 28, 2022 and each of the financial highlights for each of the periods indicated therein in conformity with accounting principles generally accepted in the United States of America.
Basis for Opinions
These financial statements are the responsibility of the Funds’ management. Our responsibility is to express an opinion on the Funds’ financial statements based on our audits. We are a public accounting firm registered with the Public Company Accounting Oversight Board (United States) (PCAOB) and are required to be independent with respect to the Funds in accordance with the U.S. federal securities laws and the applicable rules and regulations of the Securities and Exchange Commission and the PCAOB.
We conducted our audits of these financial statements in accordance with the standards of the PCAOB. Those standards require that we plan and perform the audit to obtain reasonable assurance about whether the financial statements are free of material misstatement, whether due to error or fraud.
Our audits included performing procedures to assess the risks of material misstatement of the financial statements, whether due to error or fraud, and performing procedures that respond to those risks. Such procedures included examining, on a test basis, evidence regarding the amounts and disclosures in the financial statements. Our audits also included evaluating the accounting principles used and significant estimates made by management, as well as evaluating the overall presentation of the financial statements.
Our procedures included confirmation of securities owned as of February 28, 2022 by correspondence with the custodian, transfer agent and brokers; when replies were not received from brokers, we performed other auditing procedures. We believe that our audits provide a reasonable basis for our opinions.
/s/ PricewaterhouseCoopers LLP
Boston, MA
April 27, 2022
We have served as the auditor of one or more investment companies in the GMO mutual funds complex since 1985.
GMO Trust Funds
Fund Expenses
February 28, 2022 (Unaudited)
Expense Examples: The following information is in relation to expenses for the six month period ended February 28, 2022.
As a shareholder of the Funds, you may incur two types of costs: (1) transaction costs, and (2) ongoing costs, including direct and/or indirect management fees, direct and/or indirect shareholder services fees, and supplemental support fees to Class MF and other Fund expenses. This example is intended to help you understand your ongoing costs (in dollars) of investing in the Funds and to compare these costs with the ongoing costs of investing in other mutual funds.
These examples are based on an investment of $1,000 invested at the beginning of the period and held for the entire period, September 1, 2021 through February 28, 2022.
Actual Expenses
This section of the table for each class below provides information about actual account values and actual expenses. You may use the information in this section, together with the amount you invested, to estimate the expenses that you paid over the period. Simply divide your account value by $1,000 (for example, a $10,000,000 account value divided by $1,000 = 10,000), then multiply the result by the number under the heading entitled “Expenses Paid During the Period” to estimate the expenses you paid on your account during this period.
Hypothetical Example for Comparison Purposes
This section of the table for each class below provides information about hypothetical account values and hypothetical expenses based on the Funds’ actual expense ratio and an assumed rate of return of 5% per year before expenses, which is not the Funds’ actual return. The hypothetical account values and expenses may not be used to estimate the actual ending account balance or expenses you paid for the period. You may use this information to compare the ongoing costs of investing in the Funds with other funds. To do so, compare this 5% hypothetical example with the 5% hypothetical examples that appear in the shareholder reports of other funds.
Please note that the expenses shown in the table are meant to highlight your ongoing costs only and do not reflect any transactional costs. Therefore, this section of the table is useful in comparing ongoing costs only, and will not help you determine the relative total costs of owning different funds. In addition, if these transactional costs were included, your costs would have been higher.
| | | | | | | | | | | | | | | | | | | | | | | | | | | | |
| | | Actual | | | Hypothetical | | | | |
| | | Beginning
Account Value
September 1, 2021 | | | Ending
Account Value
February 28, 2022 | | | Expenses Paid
During the Period* | | | Beginning
Account Value
September 1, 2021 | | | Ending
Account Value
February 28, 2022 | | | Expenses Paid
During the Period* | | | Annualized
Expense Ratio | |
| | | | |
Alternative Allocation Fund | | | | | | | | | | | | | | | | | |
Class VI | | | $1,000.00 | | | | $1,004.50 | | | | $5.77 | | | | $1,000.00 | | | | $1,019.04 | | | | $5.81 | | | | 1.16% | |
Class R6 | | | $1,000.00 | | | | $1,004.50 | | | | $5.86 | | | | $1,000.00 | | | | $1,018.94 | | | | $5.91 | | | | 1.18% | |
Class I | | | $1,000.00 | | | | $1,003.40 | | | | $7.01 | | | | $1,000.00 | | | | $1,017.80 | | | | $7.05 | | | | 1.41% | |
| | | | |
Benchmark-Free Allocation Fund | | | | | | | | | | | | | | | | | |
Class III | | | $1,000.00 | | | | $992.60 | | | | $4.99 | | | | $1,000.00 | | | | $1,019.79 | | | | $5.06 | | | | 1.01% | |
Class IV | | | $1,000.00 | | | | $992.90 | | | | $4.74 | | | | $1,000.00 | | | | $1,020.03 | | | | $4.81 | | | | 0.96% | |
Class MF | | | $1,000.00 | | | | $992.70 | | | | $4.74 | | | | $1,000.00 | | | | $1,020.03 | | | | $4.81 | | | | 0.96% | |
Class R6 | | | $1,000.00 | | | | $992.50 | | | | $4.99 | | | | $1,000.00 | | | | $1,019.79 | | | | $5.06 | | | | 1.01% | |
Class I | | | $1,000.00 | | | | $992.00 | | | | $5.53 | | | | $1,000.00 | | | | $1,019.24 | | | | $5.61 | | | | 1.12% | |
| | | | |
Benchmark-Free Fund | | | | | | | | | | | | | | | | | |
Class III | | | $1,000.00 | | | | $992.40 | | | | $1.63 | | | | $1,000.00 | | | | $1,023.16 | | | | $1.66 | | | | 0.33% | |
| | | | |
Global Asset Allocation Fund | | | | | | | | | | | | | | | | | |
Class III | | | $1,000.00 | | | | $948.30 | | | | $3.14 | | | | $1,000.00 | | | | $1,021.57 | | | | $3.26 | | | | 0.65% | |
Class R6 | | | $1,000.00 | | | | $948.30 | | | | $3.14 | | | | $1,000.00 | | | | $1,021.57 | | | | $3.26 | | | | 0.65% | |
Class I | | | $1,000.00 | | | | $948.00 | | | | $3.62 | | | | $1,000.00 | | | | $1,021.08 | | | | $3.76 | | | | 0.75% | |
| | | | |
Global Developed Equity Allocation Fund | | | | | | | | | | | | | | | | | |
Class III | | | $1,000.00 | | | | $956.00 | | | | $2.57 | | | | $1,000.00 | | | | $1,022.17 | | | | $2.66 | | | | 0.53% | |
| | | | |
Global Equity Allocation Fund | | | | | | | | | | | | | | | | | |
Class III | | | $1,000.00 | | | | $936.30 | | | | $2.83 | | | | $1,000.00 | | | | $1,021.87 | | | | $2.96 | | | | 0.59% | |
Class R6 | | | $1,000.00 | | | | $936.30 | | | | $2.83 | | | | $1,000.00 | | | | $1,021.87 | | | | $2.96 | | | | 0.59% | |
Class I | | | $1,000.00 | | | | $935.80 | | | | $3.31 | | | | $1,000.00 | | | | $1,021.37 | | | | $3.46 | | | | 0.69% | |
GMO Trust Funds
Fund Expenses — (Continued)
February 28, 2022 (Unaudited)
| | | | | | | | | | | | | | | | | | | | | | | | | | | | |
| | | Actual | | | Hypothetical | | | | |
| | | Beginning
Account Value
September 1, 2021 | | | Ending
Account Value
February 28, 2022 | | | Expenses Paid
During the Period* | | | Beginning
Account Value
September 1, 2021 | | | Ending
Account Value
February 28, 2022 | | | Expenses Paid
During the Period* | | | Annualized
Expense Ratio | |
| | | | |
Implementation Fund | | | | | | | | | | | | | | | | | |
Core | | | $1,000.00 | | | | $999.70 | | | | $1.14 | | | | $1,000.00 | | | | $1,023.65 | | | | $1.15 | | | | 0.23% | |
| | | | |
International Developed Equity Allocation Fund | | | | | | | | | | | | | | | | | |
Class III | | | $1,000.00 | | | | $942.60 | | | | $3.08 | | | | $1,000.00 | | | | $1,021.62 | | | | $3.21 | | | | 0.64% | |
Class R6 | | | $1,000.00 | | | | $942.60 | | | | $3.08 | | | | $1,000.00 | | | | $1,021.62 | | | | $3.21 | | | | 0.64% | |
| | | | |
International Equity Allocation Fund | | | | | | | | | | | | | | | | | |
Class III | | | $1,000.00 | | | | $907.80 | | | | $3.17 | | | | $1,000.00 | | | | $1,021.47 | | | | $3.36 | | | | 0.67% | |
Class R6 | | | $1,000.00 | | | | $907.80 | | | | $3.17 | | | | $1,000.00 | | | | $1,021.47 | | | | $3.36 | | | | 0.67% | |
| | | | |
SGM Major Markets Fund | | | | | | | | | | | | | | | | | |
Class III | | | $1,000.00 | | | | $992.40 | | | | $4.94 | | | | $1,000.00 | | | | $1,019.84 | | | | $5.01 | | | | 1.00% | |
Class VI | | | $1,000.00 | | | | $992.70 | | | | $4.50 | | | | $1,000.00 | | | | $1,020.28 | | | | $4.56 | | | | 0.91% | |
Class I | | | $1,000.00 | | | | $991.30 | | | | $5.43 | | | | $1,000.00 | | | | $1,019.34 | | | | $5.51 | | | | 1.10% | |
| | | | |
Strategic Opportunities Allocation Fund | | | | | | | | | | | | | | | | | |
Class III | | | $1,000.00 | | | | $970.60 | | | | $2.54 | | | | $1,000.00 | | | | $1,022.22 | | | | $2.61 | | | | 0.52% | |
| | * | Expenses are calculated using each class’s annualized net expense ratio (including indirect expenses incurred) for the six months ended February 28, 2022, multiplied by the average account value over the period, multiplied by 181 days in the period, divided by 365 days in the year. |
GMO Trust Funds
Tax Information for the Tax Year Ended February 28, 2022 (Unaudited)
The following information is being provided in order to meet reporting requirements set forth by the Code and/or to meet state-specific requirements. Shareholders should consult their tax advisors.
With respect to distributions paid, the Funds designate the following amounts (or, if subsequently determined to be different, the maximum amount allowable) for the fiscal year-ended February 28, 2022:
| | | | | | | | | | | | | | | | | | | | | | | | | | | | | | | | | | | | |
| | | | | | | | | | |
| Fund Name | | Dividend
Received
Deduction
(corporate
shareholders)(1) | | | Qualified
Dividend
Income
(non-corporate
shareholders)(1) | | | U.S.
Government
Obligation
Income(1)(2) | | | Interest-
Related
Dividend
Income(3)
($) | | | Short-
Term
Capital
Gain
Dividends(3)
($) | | | Long-Term
Capital Gain
Distributions
($) | | | Foreign
Taxes
Paid(4) ($) | | | Foreign
Source
Income(4)
($) | | | Section 199A Dividend Income (non-corporate shareholders) ($)(5) | |
Alternative Allocation Fund | | | 17.56% | | | | 41.19% | | | | — | | | | — | | | | 10,919,589 | | | | 1,702,095 | | | | — | | | | — | | | | — | |
Benchmark-Free Allocation Fund | | | 16.98% | | | | 99.91% | | | | — | | | | 7,265,341 | | | | — | | | | — | | | | 13,224,292 | | | | 125,011,373 | | | | 771,732 | |
Benchmark-Free Fund | | | 6.76% | | | | 60.22% | | | | — | | | | 1,870,521 | | | | — | | | | — | | | | — | | | | — | | | | 29,531 | |
Global Asset Allocation Fund | | | 6.92% | | | | 32.95% | | | | 1.83% | | | | 1,070,001 | | | | — | | | | — | | | | 666,595 | | | | 5,323,655 | | | | 2,620 | |
Global Developed Equity Allocation Fund | | | 8.63% | | | | 38.23% | | | | — | | | | 115,873 | | | | 193,464 | | | | 3,777,166 | | | | 33,473 | | | | 289,074 | | | | 599 | |
Global Equity Allocation Fund | | | 6.99% | | | | 38.85% | | | | — | | | | 53,845,253 | | | | 155,669 | | | | 513,707 | | | | 2,122,745 | | | | 16,938,839 | | | | 10,862 | |
Implementation Fund | | | 14.15% | | | | 83.25% | | | | — | | | | 5,788,914 | | | | — | | | | — | | | | 14,952,196 | | | | 149,411,521 | | | | 771,732 | |
International Developed Equity Allocation Fund | | | — | | | | 66.34% | | | | — | | | | 82,769 | | | | 173,679 | | | | 499,169 | | | | 48,637 | | | | 462,749 | | | | — | |
International Equity Allocation Fund | | | — | | | | 64.68% | | | | — | | | | 231,156 | | | | — | | | | — | | | | 1,664,754 | | | | 13,097,127 | | | | — | |
SGM Major Markets Fund | | | — | | | | — | | | | 8.19% | | | | 1,885,610 | | | | — | | | | 17,533,030 | | | | — | | | | — | | | | — | |
Strategic Opportunities Allocation Fund | | | 4.72% | | | | 23.82% | | | | — | | | | 4,549,479 | | | | 18,700,637 | | | | 30,452,964 | | | | 703,921 | | | | 6,131,027 | | | | 5,961 | |
| | (1) | Presented as a percentage of net investment income and short-term capital gain distributions paid, if any. |
| | (2) | All or a portion of these amounts may be exempt from taxation at the state level. |
| | (3) | These amounts are generally exempt from U.S. withholding taxes for non-U.S. shareholders, provided certain conditions are satisfied by both the Funds and the Funds’ shareholders. If applicable, interest related dividend amounts could include short-term capital gain distributions received from underlying funds. |
| | (4) | The Funds expect to elect to treat foreign taxes attributed to foreign source income from certain of its investments, as if incurred directly by the Funds’ shareholders. |
| | (5) | The Funds hereby designate the above qualified business income under Section 199A of the Code. |
In early 2023, the Funds will notify applicable shareholders of amounts for use in preparing 2022 U.S. federal income tax forms.
Trustees and Officers (Unaudited)
The following tables present information regarding each Trustee and officer of the Trust as of February 28, 2022. Each Trustee’s and officer’s year of birth (“YOB”) is set forth after his or her name. Unless otherwise noted, (i) each Trustee and officer has engaged in the principal occupation(s) noted in the table for at least the most recent five years, although not necessarily in the same capacity, and (ii) the address of each Trustee and officer is c/o GMO Trust, 40 Rowes Wharf, Boston, MA 02110. Each Trustee serves in office until the earlier of (a) the election and qualification of a successor at the next meeting of shareholders called to elect Trustees or (b) the Trustee dies, resigns, or is removed as provided in the Trust’s governing documents. Each of the Trustees of the Trust, other than Mr. Feigelson, is not an “interested person” of the Trust, as such term is used in the 1940 Act (each, an “Independent Trustee”). Because the Funds do not hold annual meetings of shareholders, each Trustee will hold office for an indeterminate period. Each officer serves in office until his or her successor is elected and determined to be qualified to carry out the duties and responsibilities of the office, or until the officer resigns or is removed from office.
| | | | | | | | | | | | | |
| Independent Trustees |
| |
Name and
Year of Birth | | Position(s)
Held with the Trust | | Length of Time Served | | Principal Occupation(s)
During Past
5 Years* | | Number of
Portfolios in
Fund Complex1
Overseen | | Other
Directorships
Held in the
Past Five
Years |
| | | | | |
Donald W. Glazer
YOB: 1944 | | Chairman of the Board of Trustees | | Chairman of the Board of Trustees since March 2005; Lead Independent Trustee (September 2004 – March 2005); Trustee since December 2000. | | Consultant – Law and Business; Author of Legal Treatises. | | | | 30 | | | Director, BeiGene Ltd. (biotech). |
| | | | | |
Peter Tufano
YOB: 1957 | | Trustee | | Since December 2008. | | Peter Moores Professor of Finance (Since July 1, 2011) and Peter Moores Dean and Professor of Finance (July 1, 2011 – June 30, 2021) University of Oxford, Said Business School | | | | 30 | | | Trustee of State Street Navigator Securities Lending Trust (5 Portfolios) (January 1993 – June 2015). |
| | | | | |
Paul Braverman
YOB: 1949 | | Trustee | | Since March 2010. | | Retired. | | | | 30 | | | Trustee of HIMCO Variable Insurance Trust
(27 Portfolios) (April 2014 – April 2019). |
| Interested Trustee and Officer | | | | |
| |
| | | | | |
Carolyn Haley2 YOB: 1966 | | Trustee; President of the Trust | | Trustee and President since June 2021. | | Head of Global Operations and Finance, Head of Operations, Co-Head of Operations, Grantham, Mayo, Van Otterloo & Co. LLC (February 2015 – Present). | | | | 30 | | | None. |
| 1 | The Fund Complex includes series of each of GMO Trust. |
| 2 | Ms. Haley is an “interested person” of the Trust, as such term is used in the 1940 Act (an “Interested Trustee”), by virtue of her positions with the Trust and GMO indicated in the table above and her interest as a member of GMO. |
| | | | | | |
| Officers |
| |
Name and
Year of Birth | | Position(s) Held with the Trust | | Length of Time Served | | Principal Occupation(s) During Past Five Years* |
| | | |
Carolyn Haley YOB: 1966 | | Trustee, President of the Trust | | Trustee and President since June 2021 | | Head of Global Operations and Finance, Head of Operations, Co-Head of Operations, Grantham, Mayo, Van Otterloo & Co. LLC (February 2015 – Present). |
| | | |
Tara Pari YOB: 1976 | | Chief Executive Officer | | Chief Executive Officer since November 2020 | | Risk and Controls, Grantham, Mayo, Van Otterloo & Co. LLC (September 2004 – November 2020); Head of Fund Reporting and Risk and Controls, Grantham, Mayo, Van Otterloo & Co. LLC (November 2020 to present). Head of Fund Reporting, Risk and Controls and Proxy Voting (October 2021 to present), Grantham, Mayo, Van Otterloo & Co. LLC. |
| | | |
Betty Maganzini YOB: 1972 | | Treasurer, Chief Accounting Officer and Chief Financial Officer | | Treasurer, Chief Accounting Officer and Chief Financial Officer since September 2018; Assistant Treasurer, September 2013 – September 2018. | | Fund Administrator, Grantham, Mayo, Van Otterloo & Co. LLC (July 2010 – present). |
| | | |
Susan Saw YOB: 1981 | | Assistant Treasurer | | Since September 2019. | | Fund Administrator, Grantham, Mayo, Van Otterloo & Co. LLC (March 2011 – present). |
| | | |
John L. Nasrah YOB: 1977 | | Assistant Treasurer and Chief Tax Officer | | Since March 2007. | | Fund Administrator, Grantham, Mayo, Van Otterloo & Co. LLC (September 2004 – present). |
| | | |
Cathy Tao YOB: 1974 | | Assistant Treasurer | | Since September 2016. | | Fund Administrator, Grantham, Mayo, Van Otterloo & Co. LLC (October 2007 – present). |
| | | |
Devin Kelly YOB: 1984 | | Assistant Treasurer | | Since June 2020 | | Fund Administrator, Grantham, Mayo, Van Otterloo & Co. LLC (October 2012 – present). |
| | | |
Brian Kadehjian YOB: 1974 | | Assistant Treasurer and Treasury Officer | | Assistant Treasurer since February 2015; Treasury Officer since September 2013. | | Fund Administrator, Grantham, Mayo, Van Otterloo & Co. LLC (April 2002 – November 2020). Treasury and Payables Manager, Grantham, Mayo, Van Otterloo & Co. LLC (November 2020 – present). |
| | | |
Douglas Y. Charton YOB: 1982 | | Chief Legal Officer, Vice President and Clerk | | Since August 2015. | | Legal Counsel, Grantham, Mayo, Van Otterloo & Co. LLC (July 2015 – present); Associate, K&L Gates LLP (September 2007-July 2015). |
| | | |
Megan Bunting YOB: 1978 | | Vice President and Assistant Clerk | | Since September 2013. | | Legal Counsel, Grantham, Mayo, Van Otterloo & Co. LLC (September 2006 – present). |
| | | |
Kevin O’Brien YOB: 1985 | | Vice President and Assistant Clerk | | Since March 2016. | | Legal Counsel, Grantham, Mayo, Van Otterloo & Co. LLC (February 2015 – present). |
| | | |
Gregory L. Pottle YOB: 1971 | | Chief Compliance Officer | | Chief Compliance Officer since May 2015; Vice President and Assistant Clerk, November 2006 – November 2015. | | Chief Compliance Officer, Grantham, Mayo, Van Otterloo & Co. LLC (May 2015 – present). |
| | | |
Kelly Butler YOB: 1974 | | Anti-Money Laundering Officer | | Since March 2020. | | Compliance Manager (March 2016 – present); Compliance Specialist, Grantham, Mayo, Van Otterloo & Co. LLC (November 2007 – March 2016). |
| * | Each officer of the Trust may also serve as an officer and/or director of certain pooled investment vehicles of which GMO or an affiliate of GMO serves as the investment adviser. |
AR-022822-AA
Item 2. Code of Ethics.
As of February 28, 2022, the registrant has adopted a Code of Ethics that applies to the Principal Executive Officer and Principal Financial Officer pursuant to the Sarbanes-Oxley Act of 2002 (the “Code of Ethics”). During the year ended February 28, 2022 there were no substantive amendments to a provision of the Code of Ethics nor were there any waivers granted from a provision of the Code of Ethics. A copy of the Code of Ethics is filed with this Form N-CSR under item 12 (a).
Item 3. Audit Committee Financial Expert.
The registrant’s Board of Trustees has determined that the registrant does not have an “audit committee financial expert” (as such term has been defined in Form N-CSR) serving on its audit committee. The registrant’s Board believes that, although none of its members individually meets all required elements of the definition of an “audit committee financial expert”, the members of the registrant’s audit committee collectively possess the knowledge and experience necessary to execute all of the audit committee’s functions, duties and powers.
Item 4. Principal Accountant Fees and Services. *
| | (a) | AUDIT FEES: The aggregate fees billed to the registrant for professional services rendered by its independent auditors, PricewaterhouseCoopers LLP for the audit of the registrant’s annual financial statements for 2022 and 2021 were $1,438,194 and $1,379,851, respectively. |
| | (b) | AUDIT-RELATED FEES: The aggregate fees billed to the registrant in 2022 and 2021 for engagements for audit-related services rendered by PricewaterhouseCoopers LLP that related directly to the operations and financial reporting of the Funds were $31,227 and $107,695, respectively. The aggregate fees billed in 2022 and 2021 to the registrant’s Investment Advisor, and any entity controlling, controlled, or under common control with the Advisor that provides ongoing services to the Funds (each, a “Service Affiliate”) for engagements for audit-related services rendered by PricewaterhouseCoopers LLP that related directly to the operations and financial reporting of the Funds were $336,225 and $394,551, respectively. |
| | (c) | TAX FEES: The aggregate fees billed to the registrant in 2022 and 2021 for professional services rendered by PricewaterhouseCoopers LLP for tax compliance, tax advice, and tax planning, including the preparation of Form 1120 RIC, Form 8613 and review of excise tax distribution calculations, were $544,982 and $517,625, respectively. The aggregate fees billed in 2022 and 2021 to the registrant’s Service Affiliates for engagements for tax services rendered by PricewaterhouseCoopers LLP that related directly to the operations and financial reporting of the Funds were $0 and $0, respectively. |
| | (d) | ALL OTHER FEES: No such fees were billed by PricewaterhouseCoopers LLP to the registrant or to the registrant’s Service Affiliates that related directly to the operations and financial reporting of the Funds in 2022 or 2021. |
| | (e) | (1) The Audit Committee has adopted an Audit and Non-Audit Services Pre-Approval Policy (the “Policy”), which sets forth the procedures and the conditions pursuant to which services to be performed by the independent auditor are to be preapproved. Under the Policy, the Audit Committee pre-approves, on an annual basis, the following services: (1) the engagement, scope and terms of the annual audit; (2) certain audit-related services; (3) certain tax services that the Committee believes would not impair, and are consistent with the SEC’s rules on auditor independence; and (4) certain permissible non-audit services that the Committee believes are routine and recurring services and that would not impair, and are consistent with the SEC’s rules on auditor independence, subject to certain limitations on the projected fees associated with each service. All other types of services not included on the schedule to the policy, or for which the projected fees exceed those provided in the schedule, require the specific pre-approval by the Audit Committee or the Chairperson of the Committee (if timing necessitates that preapproval is required before the Committee’s next regularly scheduled meeting) if they are to be provided by the independent auditor. |
| | (g) | NON-AUDIT FEES: The aggregate fees billed by PricewaterhouseCoopers LLP in 2022 and 2021 for non-audit services rendered to the registrant and the registrant’s Service Affiliates were $947,435 and $1,054,871, respectively. For the fiscal year ended February 28, 2022, this amount reflects the amounts disclosed above in Item 4(b), (c), (d), plus $35,000 in fees billed to the Funds’ Service Affiliates for non-audit services that did not relate directly to the operations and financial reporting of the Funds. For the fiscal year ended February 28, 2021, this amount reflects the amounts disclosed above in Item 4(b),(c),(d), plus $35,000 in fees billed to the Funds’ Service Affiliates for non-audit services that did not relate directly to the operations and financial reporting of the Funds. |
| | (h) | The registrant’s Audit Committee has considered whether the provision of non-audit services by the registrant’s independent registered public accounting firm to the registrant’s Investment Advisor, and any entity controlling, controlled, or under common control with the Advisor that provided ongoing services to the registrant that were not pre-approved by the Committee (because such services did not relate directly to the operations and financial reporting of the registrant) was compatible with maintaining the independence of the independent registered public accounting firm. |
| * | Includes information regarding all series of GMO Trust. |
Item 5. Audit Committee of Listed Registrants.
Not applicable to this registrant.
Item 6. Schedule of Investments.
The complete schedule of investments for each series of the registrant is included as part of the annual reports to shareholders filed under Item 1 of this Form N-CSR.
Item 7. Disclosure of Proxy Voting Policies and Procedures for Closed-End Management Investment Companies.
Not applicable to this registrant.
Item 8. Portfolio Managers of Closed-End Management Investment Companies.
Not applicable to this registrant.
Item 9. Purchases of Equity Securities by Closed-End Management Investment Company and Affiliated Purchasers.
Not applicable to this registrant.
Item 10. Submission of Matters to a Vote of Security Holders.
There were no material changes to the procedures by which shareholders may recommend nominees to the registrant’s Board of Trustees.
Item 11. Controls and Procedures.
| | (a) | The registrant’s Principal Executive Officer and Principal Financial Officer have concluded as of a date within 90 days of the filing of this report, based on their evaluation of the registrant’s disclosure controls and procedures (as defined in Rule 30a-3(c) under the Investment Company Act of 1940) that the design and operation of such procedures are effective to provide reasonable assurance that information required to be disclosed by the registrant on Form N-CSR is recorded, processed, summarized, and reported within the time periods specified in the Commission’s rules and forms. |
| | (b) | There were no changes in the registrant’s internal control over financial reporting (as defined in Rule 30a-3(d) under the Investment Company Act of 1940) that occurred during the second fiscal quarter of the period covered by this report that has materially affected, or is reasonably likely to materially affect, the registrant’s internal control over financial reporting. |
Item 12. Disclosure of Securities Lending Activities for Closed-End Management Investment Companies.
Not applicable to this registrant.
Item 13. Exhibits.
| | (a)(3) | Not applicable to this registrant. |
SIGNATURES
Pursuant to the requirements of the Securities Exchange Act of 1934 and the Investment Company Act of 1940, the registrant has duly caused this report to be signed on its behalf by the undersigned, thereunto duly authorized.
| | |
| (Registrant) | | GMO Trust |
| |
| By (Signature and Title): | | /s/ Tara Pari |
| | Tara Pari, Chief Executive Officer |
| |
| | Date: May 3, 2022 |
Pursuant to the requirements of the Securities Exchange Act of 1934 and the Investment Company Act of 1940, this report has been signed below by the following persons on behalf of the registrant and in the capacities and on the dates indicated.
| | |
| |
| By (Signature and Title): | | /s/ Tara Pari |
| | Tara Pari, Principal Executive Officer |
| |
| | Date: May 3, 2022 |
| | |
| |
| By (Signature and Title): | | /s/ Betty Maganzini |
| | Betty Maganzini, Principal Financial Officer |
| |
| | Date: May 3, 2022 |