Exhibit 99.1
Pennsylvania Real Estate Investment Trust
QUARTERLY SUPPLEMENTAL DISCLOSURE
December 31, 2005
www.preit.com
Pennsylvania REIT
QUARTERLY SUPPLEMENTAL DISCLOSURE (December 31, 2005)
Table of Contents
| | |
Company Information | | 1 |
| |
Timeline/Recent Developments | | 2 |
| |
Stock Information | | 3 |
| |
Shareholder Information | | 4 |
| |
Market Capitalization and Capital Resources | | 5 |
| |
Balance Sheet—Proportionate Consolidation Method | | 6 |
| |
Balance Sheet—Property Type | | 7 |
| |
Income Statement—Proportionate Consolidation Method- Quarterly Comparison | | 8 |
| |
Income Statement—Proportionate Consolidation Method- Annual Comparison | | 9 |
| |
Income Statement—Same Store- Quarterly Comparison | | 10 |
| |
Income Statement—Same Store- Annual Comparison | | 11 |
| |
Income Statement—Retail Property Type- Quarterly Comparison | | 12 |
| |
Income Statement—Retail Property Type- Annual Comparison | | 13 |
| |
Earnings per Share | | 14 |
| |
Funds From Operations and Funds Available for Distribution | | 15 |
| |
Key Ratios | | 16 |
| |
Property Debt Schedule | | 17 |
| |
Debt Amortization Schedule | | 19 |
| |
Debt Analysis | | 20 |
| |
Debt Ratios | | 21 |
| |
Portfolio Summary—Retail | | 22 |
| |
Property Acquisitions/Dispositions- Annual Summary | | 27 |
| |
Property Development Summary | | 28 |
| |
Property Redevelopment Summary | | 29 |
| |
Top Twenty Tenants Schedule | | 30 |
| |
Lease Expiration Schedule | | 31 |
| |
New Lease/Renewal Summary and Analysis | | 32 |
| |
Capital Expenditures | | 33 |
| |
Retail Overall- Summary and Occupancy | | 34 |
| |
Enclosed Mall- Summary and Occupancy | | 35 |
| |
Enclosed Mall- Rent Summary | | 36 |
| |
Power Center- Summary and Occupancy | | 37 |
| |
Strip Center- Summary and Occupancy | | 38 |
| |
RECONCILIATION TO GAAP: | | |
| |
Balance Sheet-Reconciliation to GAAP | | 39 |
| |
Income Statement-Reconciliation to GAAP- Quarterly | | 40 |
| |
Income Statement-Reconciliation to GAAP- Annual | | 41 |
| |
Definitions page | | 42 |
THIS QUARTERLY SUPPLEMENTAL DISCLOSURE CONTAINS CERTAIN “FORWARD-LOOKING STATEMENTS” THAT RELATE TO EXPECTATIONS, PROJECTIONS, ANTICIPATED EVENTS, TRENDS AND OTHER MATTERS THAT ARE NOT HISTORICAL FACTS. THESE FORWARD-LOOKING STATEMENTS REFLECT PREIT’S CURRENT VIEWS ABOUT FUTURE EVENTS AND ARE SUBJECT TO RISKS, UNCERTAINTIES AND ASSUMPTIONS THAT MAY CAUSE FUTURE EVENTS, ACHIEVEMENTS OR RESULTS TO DIFFER MATERIALLY FROM THOSE EXPRESSED BY THE FORWARD-LOOKING STATEMENTS. PREIT’S BUSINESS IS SUBJECT TO UNCERTAINTIES REGARDING THE REVENUES, OPERATING EXPENSES, LEASING ACTIVITIES, OCCUPANCY RATES, AND OTHER COMPETITIVE FACTORS RELATING TO PREIT’S PORTFOLIO AND CHANGES IN LOCAL MARKET CONDITIONS AS WELL AS GENERAL ECONOMIC, FINANCIAL AND POLITICAL CONDITIONS, WHICH MAY CAUSE FUTURE EVENTS, ACHIEVEMENTS OR RESULTS TO DIFFER MATERIALLY FROM THOSE EXPRESSED BY THE FORWARD-LOOKING STATEMENTS. PREIT DISCLAIMS ANY DUTY TO UPDATE ANY FORWARD-LOOKING STATEMENTS SET FORTH IN THIS QUARTERLY SUPPLEMENTAL DISCLOSURE TO REFLECT NEW INFORMATION, FUTURE EVENTS OR OTHERWISE. INVESTORS ARE ALSO DIRECTED TO CONSIDER THE RISKS DISCUSSED IN DOCUMENTS PREIT HAS FILED WITH THE SECURITIES AND EXCHANGE COMMISSION AND, IN PARTICULAR, PREIT’S ANNUAL REPORT ON FORM 10-K FOR THE YEAR ENDED DECEMBER 31, 2004.
Pennsylvania REIT
QUARTERLY SUPPLEMENTAL DISCLOSURE (December 31, 2005)
COMPANY INFORMATION
PENNSYLVANIA REIT
200 South Broad Street, Philadelphia, PA 19102
http://www.preit.com
Pennsylvania Real Estate Investment Trust, founded in 1960 and one of the first equity REITs in the U.S., has a primary investment focus on retail shopping malls and power centers located in the eastern United States. As of December 31, 2005, PREIT’s portfolio consists of 51 retail properties (approximately 34.5 million square feet) in 13 states. PREIT’s portfolio includes 39 shopping malls, 12 strip and power centers and one office property. PREIT is headquartered in Philadelphia, Pennsylvania.
Research Coverage
| | | | |
Company | | Analyst | | Phone Number |
Green Street Advisors | | Gregory R. Andrews
Ben Yang | | (949) 640-8780
(949) 640-8780 |
| | |
JP Morgan | | Michael W. Mueller
Anthony Paolone
Joshua Bederman | | (212) 622-6689
(212) 622-6682
(212) 622-6530 |
| | |
Stifel Nicolaus | | David M. Fick
Nathan Isbee | | (410) 539-0000
(410) 454-4143 |
| | |
Lehman Brothers | | David Harris
Alexander D. Goldfarb | | (212) 526-1790
(212) 526-5232 |
Quarterly Earnings Schedule
PREIT’s quarterly results will be announced in accordance with the following schedule:
| | |
Quarter | | 2006(1) |
First Quarter | | 5/4/2006 |
Second Quarter | | 8/3/2006 |
Third Quarter | | 11/2/2006 |
Fourth Quarter | | 3/1/2007 |
To participate in a quarterly conference call, please contact PREIT’s investor relations department at (215) 875-0735.
For additional information, please contact:
Robert McCadden or Nurit Yaron
200 South Broad Street
Philadelphia, PA 19102
Phone (215) 875-0700 Toll Free (866) 875-0700
Fax (215) 546-7311 Email yaronn@preit.com
PAGE 1
Pennsylvania REIT
QUARTERLY SUPPLEMENTAL DISCLOSURE (December 31, 2005)
Timeline/Recent Developments
Dividends and Distributions:
February 23, 2006, the Board of Trustees of the Company declared a quarterly cash dividend of $0.57 per common share and a regular quarterly dividend of $1.375 per share on its 11.00% senior preferred shares. PREIT also will pay a previously announced Redemption of Rights of $0.001 per common share. All dividends are payable on March 15, 2006 to shareholders of record on March 1, 2006.
January 13, 2006 PREIT announced the tax status of its dividend distributions for 2005.
Acquisitions, dispositions, development and redevelopment activities:
February 9, 2006 PREIT announced that it had completed the acquisition of approximately 540-acres of land parcels known as Springhills in Gainesville, Florida for $21.5 million.
January 3, 2006 PREIT announced that it had acquired Woodland Mall in Grand Rapids, Michigan for $177.4 million.
December 9, 2005 PREIT announced that it had begun construction of a new retail center anchored by The Home Depot (NYSE:HD) and situated on 43 acres at Route 9 and Sunrise Boulevard in Lacey Township, New Jersey.
November 18, 2005, PREIT and Kravco Simon announced that they have completed the acquisition of Springfield Mall in Springfield, Pennsylvania for approximately $103.5 million. PREIT and Kravco Simon will each have a 50% ownership interest in the property.
Financing activities:
February 15, 2006 PREIT announced that it completed a $90 million financing of Valley Mall in Hagerstown, Maryland.
December 9, 2005 PREIT announced that it had completed the refinancing of Willow Grove Park in Willow Grove, Pennsylvania with a new $160 million first mortgage loan.
October 3, 2005, PREIT completed the refinancing of Cherry Hill Mall in Cherry Hill, NJ with a new $200 million first mortgage loan.
Other activities:
February 15, 2006 PREIT scheduled fourth quarter 2005 conference call on Thursday, March 2, 2006.
December 15, 2005, PREIT announced that its Board of Trustees appointed M. Walter D’Alessio as a new trustee of PREIT. Mr. D’Alessio will serve on the Board until PREIT’s next Annual Meeting of Shareholders, at which time he will appear on the ballot with the other Class B trustees for election to a three year term.
October 31, 2005 PREIT announced that its Board of Trustees had authorized a program to repurchase up to $100 million of the Company’s common shares. The program will be in effect until the end of 2007, subject to the Company’s authority to terminate the program earlier.
October 31, 2005 PREIT announced its results for the third quarter and nine months ended September 30, 2005, and its 2006 guidance.
NOTE: The press releases are available on the Company’s website at www.preit.com.
PAGE 2
Pennsylvania REIT
QUARTERLY SUPPLEMENTAL DISCLOSURE (December 31, 2005)
Stock Information
PREIT’s common stock trades on the New York Stock Exchange (symbol: PEI).
PREIT’s preferred stock trades on the New York Stock Exchange (symbol: PEIPRA).
| | | | | | | | | | | | | | | | | | | | | | | | | | | | | | | | |
| | | Year 2005 | | | QUARTERS 2005 | | | Year 2004 | | | Quarter 2004 December | | | Year 2003 | |
| | | | December | | | September | | | June | | | March | | | | |
Stock Information | | | | | | | | | | | | | | | | | | | | | | | | | | | | | | | | |
High Price | | $ | 50.20 | | | $ | 42.60 | | | $ | 50.20 | | | $ | 48.10 | | | $ | 43.21 | | | $ | 43.70 | | | $ | 43.70 | | | $ | 36.30 | |
Low Price | | $ | 35.24 | | | $ | 35.24 | | | $ | 39.60 | | | $ | 39.66 | | | $ | 38.91 | | | $ | 30.25 | | | $ | 38.66 | | | $ | 24.70 | |
Close | | $ | 37.36 | | | $ | 37.36 | | | $ | 42.18 | | | $ | 47.50 | | | $ | 40.32 | | | $ | 42.80 | | | $ | 42.80 | | | $ | 36.30 | |
Average Daily Trading Volume | | | 209,537 | | | | 345,222 | | | | 165,764 | | | | 119,916 | | | | 146,698 | | | | 161,659 | | | | 123,000 | | | | 109,892 | |
Shares Outstanding and Market Value Information | | | | | | | | | | | | | | | | | | | | | | | | | | | | | | | | |
Common Shares Outstanding | | | 36,520,715 | | | | 36,520,715 | | | | 36,714,465 | | | | 36,511,624 | | | | 36,474,699 | | | | 36,272,162 | | | | 36,272,162 | | | | 35,544,265 | |
O.P. Units | | | 4,155,921 | | | | 4,155,921 | | | | 4,499,800 | | | | 4,686,418 | | | | 4,686,418 | | | | 4,413,559 | | | | 4,413,559 | | | | 3,691,516 | |
| | | | | | | | | | | | | | | | | | | | | | | | | | | | | | | | |
Total Shares Outstanding | | | 40,676,636 | | | | 40,676,636 | | | | 41,214,265 | | | | 41,198,042 | | | | 41,161,117 | | | | 40,685,721 | | | | 40,685,721 | | | | 39,235,781 | |
| | | | | | | | | | | | | | | | | | | | | | | | | | | | | | | | |
Weighted Average of Common Shares | | | 36,089,870 | | | | 36,210,394 | | | | 36,148,847 | | | | 36,024,984 | | | | 35,972,274 | | | | 35,609,350 | | | | 35,818,787 | | | | 20,389,577 | |
Weighted Average of O.P. Units | | | 4,580,421 | | | | 4,460,657 | | | | 4,592,689 | | | | 4,686,418 | | | | 4,583,338 | | | | 4,183,059 | | | | 4,425,874 | | | | 2,303,449 | |
| | | | | | | | | | | | | | | | | | | | | | | | | | | | | | | | |
Weighted Average Common Shares and O.P. Units | | | 40,670,291 | | | | 40,671,051 | | | | 40,741,536 | | | | 40,711,402 | | | | 40,555,612 | | | | 39,792,409 | | | | 40,244,661 | | | | 22,693,026 | |
| | | | | | | | | | | | | | | | | | | | | | | | | | | | | | | | |
Preferred Shares, Nominal Value | | $ | 123,750,000 | | | $ | 123,750,000 | | | $ | 123,750,000 | | | $ | 123,750,000 | | | $ | 123,750,000 | | | $ | 123,750,000 | | | $ | 123,750,000 | | | $ | 123,750,000 | |
Market Value of Shares (based on closing price) | | $ | 1,643,429,121 | | | $ | 1,643,429,121 | | | $ | 1,862,167,698 | | | $ | 2,080,656,995 | | | $ | 1,783,366,237 | | | $ | 1,865,098,859 | | | $ | 1,865,098,859 | | | $ | 1,548,008,850 | |
Distribution Information for Common Shares | | | | | | | | | | | | | | | | | | | | | | | | | | | | | | | | |
Dividend per share | | $ | 2.250 | | | $ | 0.570 | | | $ | 0.570 | | | $ | 0.570 | | | $ | 0.540 | | | $ | 2.160 | | | $ | 0.540 | | | $ | 2.070 | |
Annualized Dividend Yield(1) | | | 6.0 | % | | | 6.1 | % | | | 5.4 | % | | | 4.8 | % | | | 5.4 | % | | | 5.0 | % | | | 5.0 | % | | | 5.7 | % |
Capital Gain Pre-May 6 | | $ | — | | | $ | — | | | $ | — | | | $ | — | | | $ | — | | | $ | 0.026 | | | $ | 0.026 | | | $ | 0.096 | |
Capital Gain Post-May 5 | | $ | — | | | $ | — | | | $ | — | | | $ | — | | | $ | — | | | $ | — | | | $ | — | | | $ | 0.213 | |
Section 1250 Gain | | $ | — | | | $ | — | | | $ | — | | | $ | — | | | $ | — | | | $ | 0.026 | | | $ | 0.026 | | | $ | 0.480 | |
Return of Capital/Non-Taxable | | $ | 0.175 | | | $ | 0.044 | | | $ | 0.044 | | | $ | 0.044 | | | $ | 0.043 | | | $ | 0.517 | | | $ | 0.182 | | | $ | 0.085 | |
Qualified 5 Year Gain (incl. in cap. Gain) | | $ | — | | | $ | — | | | $ | — | | | $ | — | | | $ | — | | | $ | — | | | $ | — | | | $ | — | |
Ordinary Income | | $ | 2.075 | | | $ | 0.526 | | | $ | 0.526 | | | $ | 0.526 | | | $ | 0.497 | | | $ | 1.617 | | | $ | 0.332 | | | $ | 1.196 | |
| (1) | Based on closing stock price for the period. |
PAGE 3
Pennsylvania REIT
QUARTERLY SUPPLEMENTAL DISCLOSURE (December 31, 2005)
Shareholder Information
| | | |
| | | 12/31/2005 | |
Ten Largest Institutional Shareholders: | | | |
Common Shares Held(1) | | | |
Barclays Global Investors | | 3,556,200 | |
J.P Morgan Investment Management Inc. (NY) | | 2,430,231 | |
Vanguard Group, Inc. | | 1,827,363 | |
ING Clarion Real Estate Securities | | 1,769,153 | |
RREEF Real Estate Securities Advisers, L.P. | | 1,519,683 | |
Fidelity Management & Research | | 1,421,200 | |
LaSalle Investment Management Securities, L.P. | | 1,067,417 | |
State Street Global Advisors | | 793,758 | |
Neuberger Berman, LLC | | 675,675 | |
Cohen & Steers Capital Management, Inc. | | 666,700 | |
| | | |
TOTAL of Ten Largest Institutional: | | 15,727,380 | |
TOTAL of all Institutional Holders: | | 25,620,533 | |
Ten Largest as % of Total Institutional: | | 61.4 | % |
| (1) | Based on 13F filings as of 12/31/05 or most recent filings. |
| | | | | | | |
| | | 12/31/2005 | | 12/31/2004 | | % of
12/31/2005 total | |
Breakdown of Share & Unit Ownership: | | | | | | | |
Shares Held | | | | | | | |
Institutional(1) | | 25,620,533 | | 21,655,541 | | 63.0 | % |
Retail(2) | | 9,480,453 | | 14,796,395 | | 23.3 | % |
Insiders(3) | | 5,575,650 | | 4,233,785 | | 13.7 | % |
| | | | | | | |
TOTAL | | 40,676,636 | | 40,685,721 | | 100.0 | % |
| | | | | | | |
| (1) | Based on 13F filings as of 12/31/05 or most recent filings. |
| (2) | Retail ownership equals total shares outstanding minus institutional and insider ownership as of 4/1/05. Refer to our proxy, to be filed no later than April 30, 2006. |
| (3) | Insider holdings as of 4/1/05. (Shares and O.P. Units only. Excludes 433,865 exercisable options and 460,014 shares of unvested restricted stock). |
PAGE 4
Pennsylvania REIT
QUARTERLY SUPPLEMENTAL DISCLOSURE (December 31, 2005)
MARKET CAPITALIZATION
| | | | | | | | | | | | | | | | | | | | | | | | |
| | | December 31, 2005 | | | September 30, 2005 | | | June 30, 2005 | | | March 31, 2005 | | | December 31, 2004 | | | December 31, 2003 | |
EQUITY CAPITALIZATION | | | | | | | | | | | | | | | | | | | | | | | | |
Common Shares Outstanding | | | 36,520,715 | | | | 36,714,465 | | | | 36,511,624 | | | | 36,474,699 | | | | 36,272,162 | | | | 35,544,265 | |
O.P. Units Outstanding | | | 4,155,921 | | | | 4,499,800 | | | | 4,686,418 | | | | 4,686,418 | | | | 4,413,559 | | | | 3,691,516 | |
| | | | | | | | | | | | | | | | | | | | | | | | |
TOTAL Shares and O.P. Units | | | 40,676,636 | | | | 41,214,265 | | | | 41,198,042 | | | | 41,161,117 | | | | 40,685,721 | | | | 39,235,781 | |
Market Price (at end of period) | | $ | 37.36 | | | $ | 42.18 | | | $ | 47.50 | | | $ | 40.32 | | | $ | 42.80 | | | $ | 36.30 | |
Preferred Shares, Nominal Value | | $ | 123,750,000 | | | $ | 123,750,000 | | | $ | 123,750,000 | | | $ | 123,750,000 | | | $ | 123,750,000 | | | $ | 123,750,000 | |
Equity Market Capitalization | | $ | 1,643,429,121 | | | $ | 1,862,167,698 | | | $ | 2,080,656,995 | | | $ | 1,783,366,237 | | | $ | 1,865,098,859 | | | $ | 1,548,008,850 | |
DEBT CAPITALIZATION | | | | | | | | | | | | | | | | | | | | | | | | |
Unsecured Debt Balance(1) | | $ | 436,900,000 | | | $ | 276,000,000 | | | $ | 431,000,000 | | | $ | 402,000,000 | | | $ | 271,000,000 | | | $ | 170,000,000 | |
Secured Debt Balance | | | 1,523,745,400 | | | | 1,442,536,218 | | | | 1,284,981,735 | | | | 1,307,545,347 | | | | 1,326,127,000 | | | | 1,396,262,538 | |
| | | | | | | | | | | | | | | | | | | | | | | | |
Debt Capitalization | | $ | 1,960,645,400 | | | $ | 1,718,536,218 | | | $ | 1,715,981,735 | | | $ | 1,709,545,347 | | | $ | 1,597,127,000 | | | $ | 1,566,262,538 | |
| | | | | | | | | | | | | | | | | | | | | | | | |
TOTAL MARKET CAPITALIZATION | | $ | 3,604,074,521 | | | $ | 3,580,703,916 | | | $ | 3,796,638,730 | | | $ | 3,492,911,584 | | | $ | 3,462,225,859 | | | $ | 3,114,271,388 | |
| | | | | | | | | | | | | | | | | | | | | | | | |
Preferred Shares/Total Market Capitalization | | | 3.4 | % | | | 3.5 | % | | | 3.3 | % | | | 3.5 | % | | | 3.6 | % | | | 4.0 | % |
Shares and O.P. Units/Total Market Capitalization | | | 42.2 | % | | | 48.5 | % | | | 51.5 | % | | | 47.5 | % | | | 50.3 | % | | | 45.7 | % |
Debt Capitalization/Total Market Capitalization | | | 54.4 | % | | | 48.0 | % | | | 45.2 | % | | | 48.9 | % | | | 46.1 | % | | | 50.3 | % |
Equity Capitalization/Total Market Capitalization | | | 45.6 | % | | | 52.0 | % | | | 54.8 | % | | | 51.1 | % | | | 53.9 | % | | | 49.7 | % |
Unsecured Debt Balance/Total Debt | | | 22.3 | % | | | 16.1 | % | | | 25.1 | % | | | 23.5 | % | | | 17.0 | % | | | 10.9 | % |
|
| CAPITAL RESOURCES | |
| | | | | | |
| | | December 31, 2005 | | | September 30, 2005 | | | June 30, 2005 | | | March 31, 2005 | | | December 31, 2004 | | | December 31, 2003 | |
Cash on Hand | | $ | 25,828,011 | | | $ | 32,012,926 | | | $ | 30,308,297 | | | $ | 34,378,813 | | | $ | 45,949,300 | | | $ | 46,883,041 | |
Line of Credit Capacity (2) | | $ | 500,000,000 | | | $ | 500,000,000 | | | $ | 500,000,000 | | | $ | 500,000,000 | | | $ | 500,000,000 | | | $ | 500,000,000 | |
Amount Used (includes letters of credit) | | | (352,985,396 | ) | | | (289,335,396 | ) | | | (448,985,396 | ) | | | (410,054,533 | ) | | | (279,054,533 | ) | | | (170,500,000 | ) |
| | | | | | | | | | | | | | | | | | | | | | | | |
Available LOC(3) | | $ | 147,014,604 | | | $ | 210,664,604 | | | $ | 51,014,604 | | | $ | 89,945,467 | | | $ | 220,945,467 | | | $ | 329,500,000 | |
Shelf Registration | | $ | 1,000,000,000 | | | $ | 1,000,000,000 | | | $ | 1,000,000,000 | | | $ | 1,000,000,000 | | | $ | 1,000,000,000 | | | $ | 1,000,000,000 | |
Amount Used | | | (344,146,042 | ) | | | (344,146,042 | ) | | | (344,146,042 | ) | | | (344,146,042 | ) | | | (344,146,042 | ) | | | (344,146,042 | ) |
| | | | | | | | | | | | | | | | | | | | | | | | |
Available Shelf | | $ | 655,853,958 | | | $ | 655,853,958 | | | $ | 655,853,958 | | | $ | 655,853,958 | | | $ | 655,853,958 | | | $ | 655,853,958 | |
| | | | | | | | | | | | | | | | | | | | | | | | |
TOTAL CAPITAL RESOURCES | | $ | 828,696,573 | | | $ | 898,531,488 | | | $ | 737,176,859 | | | $ | 780,178,238 | | | $ | 922,748,725 | | | $ | 1,032,236,999 | |
| | | | | | | | | | | | | | | | | | | | | | | | |
| (1) | The unsecured debt balance for the period ended December 31, 2005 includes $94,400,000 of corporate notes payable. |
| (2) | The unsecured credit facility established in November 2003 and amended in January 2005 gives PREIT the ability to increase the facility to $650 million under prescribed conditions. |
| (3) | The available line of credit is subject to covenants that may restrict amounts that can be borrowed. |
PAGE 5
Pennsylvania REIT
QUARTERLY SUPPLEMENTAL DISCLOSURE (December 31, 2005)
BALANCE SHEET(1)
(Proportionate consolidation method)
| | | | | | | | | | | | | | | | | | | | | | | | | | | | | | | | |
| | | December 31, 2005 | | | December 31, 2004 | |
| | Consolidated
Entities | | | PREIT’s share
of
Unconsolidated
Partnerships (1) | | | Corporate | | | TOTAL | | | Consolidated
Entities | | | PREIT’s share
of
Unconsolidated
Partnerships (1) | | | Corporate | | | TOTAL | |
ASSETS | | | | | | | | | | | | | | | | | | | | | | | | | | | | | | | | |
Investments in real estate, at cost | | | | | | | | | | | | | | | | | | | | | | | | | | | | | | | | |
Retail properties (2) | | $ | 2,815,843,068 | | | $ | 169,300,611 | | | $ | — | | | $ | 2,985,143,679 | | | $ | 2,518,364,388 | | | $ | 131,343,981 | | | $ | — | | | $ | 2,649,708,369 | |
Office/industrial properties | | | 1,504,307 | | | | — | | | | — | | | | 1,504,307 | | | | 2,504,211 | | | | — | | | | — | | | | 2,504,211 | |
Land held for development | | | 5,615,744 | | | | — | | | | — | | | | 5,615,744 | | | | 9,862,704 | | | | — | | | | — | | | | 9,862,704 | |
Construction in progress | | | 55,368,040 | | | | 2,220,602 | | | | — | | | | 57,588,642 | | | | 10,952,450 | | | | 2,542,307 | | | | — | | | | 13,494,757 | |
| | | | | | | | | | | | | | | | | | | | | | | | | | | | | | | | |
TOTAL INVESTMENTS IN REAL ESTATE | | | 2,878,331,159 | | | | 171,521,213 | | | | — | | | | 3,049,852,372 | | | | 2,541,683,753 | | | | 133,886,288 | | | | — | | | | 2,675,570,041 | |
Accumulated depreciation | | | (220,788,156 | ) | | | (32,459,101 | ) | | | — | | | | (253,247,257 | ) | | | (150,885,609 | ) | | | (34,023,363 | ) | | | — | | | | (184,908,972 | ) |
| | | | | | | | | | | | | | | | | | | | | | | | | | | | | | | | |
Net real estate | | | 2,657,543,003 | | | | 139,062,112 | | | | — | | | | 2,796,605,115 | | | | 2,390,798,144 | | | | 99,862,925 | | | | — | | | | 2,490,661,069 | |
| | | | | | | | | | | | | | | | | | | | | | | | | | | | | | | | |
Other assets: | | | | | | | | | | | | | | | | | | | | | | | | | | | | | | | | |
Cash and cash equivalents | | | 15,902,499 | | | | 4,186,114 | | | | 5,739,398 | | | | 25,828,011 | | | | 25,096,539 | | | | 5,609,103 | | | | 15,243,658 | | | | 45,949,300 | |
Rents and other receivables | | | 39,096,218 | | | | 11,406,791 | | | | 7,395,426 | | | | 57,898,435 | | | | 27,286,042 | | | | 11,328,239 | | | | 4,691,167 | | | | 43,305,448 | |
Other assets held for sale (2) | | | 7,948,349 | | | | — | | | | — | | | | 7,948,349 | | | | 6,837,914 | | | | — | | | | — | | | | 6,837,914 | |
Intangible assets | | | 161,765,833 | | | | — | | | | 11,828,562 | | | | 173,594,395 | | | | 159,804,366 | | | | — | | | | 12,045,312 | | | | 171,849,678 | |
Deferred costs, prepaid taxes & exp. & other assets | | | 44,884,357 | | | | 12,151,373 | | | | 24,906,692 | | | | 81,942,422 | | | | 42,573,601 | | | | 7,550,568 | | | | 19,782,031 | | | | 69,906,200 | |
| | | | | | | | | | | | | | | | | | | | | | | | | | | | | | | | |
TOTAL OTHER ASSETS | | | 269,597,256 | | | | 27,744,278 | | | | 49,870,078 | | | | 347,211,612 | | | | 261,598,462 | | | | 24,487,910 | | | | 51,762,168 | | | | 337,848,540 | |
| | | | | | | | | | | | | | | | | | | | | | | | | | | | | | | | |
TOTAL ASSETS | | | 2,927,140,259 | | | | 166,806,390 | | | | 49,870,078 | | | | 3,143,816,727 | | | | 2,652,396,606 | | | | 124,350,835 | | | | 51,762,168 | | | | 2,828,509,609 | |
| | | | | | | | | | | | | | | | | | | | | | | | | | | | | | | | |
LIABILITIES AND SHAREHOLDERS’ EQUITY | | | | | | | | | | | | | | | | | | | | | | | | | | | | | | | | |
Liabilities: | | | | | | | | | | | | | | | | | | | | | | | | | | | | | | | | |
Mortgage notes payable | | | 1,349,179,500 | | | | 134,500,192 | | | | — | | | | 1,483,679,692 | | | | 1,162,479,171 | | | | 107,513,205 | | | | — | | | | 1,269,992,376 | |
Mortgage debt premium | | | 40,065,708 | | | | — | | | | — | | | | 40,065,708 | | | | 56,134,624 | | | | — | | | | — | | | | 56,134,624 | |
Bank loans payable | | | — | | | | — | | | | 342,500,000 | | | | 342,500,000 | | | | — | | | | — | | | | 271,000,000 | | | | 271,000,000 | |
Notes payable | | | — | | | | — | | | | 94,400,000 | | | | 94,400,000 | | | | — | | | | — | | | | — | | | | — | |
Liabilities related to assets held for sale | | | 1,118,865 | | | | — | | | | — | | | | 1,118,865 | | | | 1,156,442 | | | | — | | | | — | | | | 1,156,442 | |
Other liabilities | | | 58,261,404 | | | | 4,123,314 | | | | 24,471,783 | | | | 86,856,501 | | | | 50,292,594 | | | | 3,351,797 | | | | 40,146,857 | | | | 93,791,248 | |
| | | | | | | | | | | | | | | | | | | | | | | | | | | | | | | | |
TOTAL LIABILITIES | | | 1,448,625,477 | | | | 138,623,506 | | | | 461,371,783 | | | | 2,048,620,766 | | | | 1,270,062,831 | | | | 110,865,002 | | | | 311,146,857 | | | | 1,692,074,690 | |
| | | | | | | | | | | | | | | | | | | | | | | | | | | | | | | | |
Minority interest | | | 3,016,253 | | | | — | | | | 115,303,996 | | | | 118,320,249 | | | | 3,584,992 | | | | — | | | | 128,383,925 | | | | 131,968,917 | |
| | | | | | | | | | | | | | | | | | | | | | | | | | | | | | | | |
Shareholders’ equity: | | | | | | | | | | | | | | | | | | | | | | | | | | | | | | | | |
Shares of beneficial interest at $1 par | | | — | | | | — | | | | 36,520,715 | | | | 36,520,715 | | | | — | | | | — | | | | 36,272,160 | | | | 36,272,160 | |
Preferred shares at $0.01 par | | | — | | | | — | | | | 24,750 | | | | 24,750 | | | | — | | | | — | | | | 24,750 | | | | 24,750 | |
Capital contributed in excess of par | | | — | | | | — | | | | 912,798,152 | | | | 912,798,152 | | | | — | | | | — | | | | 899,506,128 | | | | 899,506,128 | |
Restricted stock | | | — | | | | — | | | | (13,359,486 | ) | | | (13,359,486 | ) | | | — | | | | — | | | | (7,736,812 | ) | | | (7,736,812 | ) |
Accumulated other comprehensive income (loss) | | | — | | | | — | | | | 4,376,594 | | | | 4,376,594 | | | | — | | | | — | | | | (1,821,457 | ) | | | (1,821,457 | ) |
Retained earnings | | | — | | | | — | | | | 36,514,987 | | | | 36,514,987 | | | | — | | | | — | | | | 78,221,233 | | | | 78,221,233 | |
| | | | | | | | | | | | | | | | | | | | | | | | | | | | | | | | |
TOTAL SHAREHOLDERS’ EQUITY | | | — | | | | — | | | | 976,875,712 | | | | 976,875,712 | | | | — | | | | — | | | | 1,004,466,002 | | | | 1,004,466,002 | |
| | | | | | | | | | | | | | | | | | | | | | | | | | | | | | | | |
TOTAL LIABILITIES AND SHAREHOLDERS’ EQUITY | | $ | 1,451,641,730 | | | $ | 138,623,506 | | | $ | 1,553,551,491 | | | $ | 3,143,816,727 | | | $ | 1,273,647,823 | | | $ | 110,865,002 | | | $ | 1,443,996,784 | | | $ | 2,828,509,609 | |
| | | | | | | | | | | | | | | | | | | | | | | | | | | | | | | | |
| (1) | Includes PREIT’s proportionate share of partnership assets and liabilities “grossed up” to reflect the Company’s share of the total assets and liabilities of the underlying properties. The consolidated financial statements, which are presented in accordance with GAAP, reflect only the Company’s equity in these properties. |
| (2) | Investment in real estate as of December 31, 2005 and December 31, 2004 includes $8,267,586 and $8,108,066, respectively, relating to the assets held for sale. Other assets held for sale represents intangible assets and current assets of these properties. |
NOTE: A reconciliation of the proportionate consolidation method to GAAP is included on pages 39 to 41.
PAGE 6
Pennsylvania REIT
QUARTERLY SUPPLEMENTAL DISCLOSURE (December 31, 2005)
BALANCE SHEET(1)
(Property Type)
| | | | | | | | | | | | | | | | | | | | | | | | | | | | | | | | | | | | | | | | |
| | | December 31, 2005 | | | December 31, 2004 | |
| | Malls | | | Power and Strip
Centers | | | Total Retail | | | Corporate and Other
Properties | | | Total | | | Malls | | | Power and Strip
Centers | | | Total Retail | | | Corporate and Other
Properties | | | Total | |
ASSETS | | | | | | | | | | | | | | | | | | | | | | | | | | | | | | | | | | | | | | | | |
Investments in real estate, at cost (2) | | $ | 2,720,316,880 | | | $ | 287,218,766 | | | $ | 3,007,535,646 | | | $ | 42,316,726 | | | $ | 3,049,852,372 | | | $ | 2,344,341,323 | | | $ | 317,355,625 | | | $ | 2,661,696,948 | | | $ | 13,873,093 | | | $ | 2,675,570,041 | |
Accumulated depreciation | | | (201,175,738 | ) | | | (52,071,519 | ) | | | (253,247,257 | ) | | | — | | | | (253,247,257 | ) | | | (135,017,071 | ) | | | (47,764,970 | ) | | | (182,782,041 | ) | | | (2,126,931 | ) | | | (184,908,972 | ) |
| | | | | | | | | | | | | | | | | | | | | | | | | | | | | | | | | | | | | | | | |
Net Real Estate | | | 2,519,141,142 | | | | 235,147,247 | | | | 2,754,288,389 | | | | 42,316,726 | | | | 2,796,605,115 | | | | 2,209,324,252 | | | | 269,590,655 | | | | 2,478,914,907 | | | | 11,746,162 | | | | 2,490,661,069 | |
Other assets: | | | | | | | | | | | | | | | | | | | | | | | | | | | | | | | | | | | | | | | | |
Cash | | | 16,288,437 | | | | 3,673,619 | | | | 19,962,056 | | | | 5,865,955 | | | | 25,828,011 | | | | 26,115,513 | | | | 4,590,129 | | | | 30,705,642 | | | | 15,243,658 | | | | 45,949,300 | |
Rents and other receivables | | | 35,697,869 | | | | 14,805,140 | | | | 50,503,009 | | | | 7,395,426 | | | | 57,898,435 | | | | 24,596,557 | | | | 14,021,952 | | | | 38,618,509 | | | | 4,686,939 | | | | 43,305,448 | |
Other assets held for sale | | | 7,860,728 | | | | 87,162 | | | �� | 7,947,890 | | | | 459 | | | | 7,948,349 | | | | 6,837,914 | | | | — | | | | 6,837,914 | | | | — | | | | 6,837,914 | |
Intangible assets | | | 161,765,833 | | | | — | | | | 161,765,833 | | | | 11,828,562 | | | | 173,594,395 | | | | 159,804,366 | | | | — | | | | 159,804,366 | | | | 12,045,312 | | | | 171,849,678 | |
Other assets, net | | | 38,908,502 | | | | 12,002,753 | | | | 50,911,255 | | | | 31,031,167 | | | | 81,942,422 | | | | 27,779,353 | | | | 9,791,194 | | | | 37,570,547 | | | | 32,335,653 | | | | 69,906,200 | |
| | | | | | | | | | | | | | | | | | | | | | | | | | | | | | | | | | | | | | | | |
Total other assets | | | 260,521,369 | | | | 30,568,674 | | | | 291,090,043 | | | | 56,121,569 | | | | 347,211,612 | | | | 245,133,703 | | | | 28,403,275 | | | | 273,536,978 | | | | 64,311,562 | | | | 337,848,540 | |
| | | | | | | | | | | | | | | | | | | | | | | | | | | | | | | | | | | | | | | | |
TOTAL ASSETS | | | 2,779,662,511 | | | | 265,715,921 | | | | 3,045,378,432 | | | | 98,438,295 | | | | 3,143,816,727 | | | | 2,454,457,955 | | | | 297,993,930 | | | | 2,752,451,885 | | | | 76,057,724 | | | | 2,828,509,609 | |
| | | | | | | | | | | | | | | | | | | | | | | | | | | | | | | | | | | | | | | | |
LIABILITIES AND SHAREHOLDERS’ EQUITY | | | | | | | | | | | | | | | | | | | | | | | | | | | | | | | | | | | | | | | | |
Liabilities: | | | | | | | | | | | | | | | | | | | | | | | | | | | | | | | | | | | | | | | | |
Mortgage notes payable | | | 1,393,726,570 | | | | 89,953,122 | | | | 1,483,679,692 | | | | — | | | | 1,483,679,692 | | | | 1,165,736,877 | | | | 104,255,499 | | | | 1,269,992,376 | | | | — | | | | 1,269,992,376 | |
Mortgage debt premium | | | 39,093,748 | | | | 971,960 | | | | 40,065,708 | | | | — | | | | 40,065,708 | | | | 54,794,532 | | | | 1,340,092 | | | | 56,134,624 | | | | — | | | | 56,134,624 | |
Bank loans payable | | | — | | | | — | | | | — | | | | 342,500,000 | | | | 342,500,000 | | | | — | | | | — | | | | — | | | | 271,000,000 | | | | 271,000,000 | |
Notes payable | | | — | | | | — | | | | — | | | | 94,400,000 | | | | 94,400,000 | | | | — | | | | — | | | | — | | | | — | | | | — | |
Liabilities related to assets held for sale | | | 1,093,991 | | | | 3,545 | | | | 1,097,536 | | | | 21,329 | | | | 1,118,865 | | | | 1,156,442 | | | | — | | | | 1,156,442 | | | | — | | | | 1,156,442 | |
Other liabilities | | | 49,531,442 | | | | 4,014,426 | | | | 53,545,868 | | | | 33,310,633 | | | | 86,856,501 | | | | 44,391,004 | | | | 5,723,480 | | | | 50,114,484 | | | | 43,676,764 | | | | 93,791,248 | |
| | | | | | | | | | | | | | | | | | | | | | | | | | | | | | | | | | | | | | | | |
TOTAL LIABILITIES | | | 1,483,445,751 | | | | 94,943,053 | | | | 1,578,388,804 | | | | 470,231,962 | | | | 2,048,620,766 | | | | 1,266,078,855 | | | | 111,319,071 | | | | 1,377,397,926 | | | | 314,676,764 | | | | 1,692,074,690 | |
| | | | | | | | | | | | | | | | | | | | | | | | | | | | | | | | | | | | | | | | |
Minority interest | | | 3,016,253 | | | | — | | | | 3,016,253 | | | | 115,303,996 | | | | 118,320,249 | | | | 3,584,992 | | | | — | | | | 3,584,992 | | | | 128,383,925 | | | | 131,968,917 | |
| | | | | | | | | | | | | | | | | | | | | | | | | | | | | | | | | | | | | | | | |
Shareholders’ equity: | | | | | | | | | | | | | | | | | | | | | | | | | | | | | | | | | | | | | | | | |
Shares of beneficial interest at $1 par | | | — | | | | — | | | | — | | | | 36,520,715 | | | | 36,520,715 | | | | — | | | | — | | | | — | | | | 36,272,160 | | | | 36,272,160 | |
Preferred shares at $0.01 par | | | — | | | | — | | | | — | | | | 24,750 | | | | 24,750 | | | | — | | | | — | | | | — | | | | 24,750 | | | | 24,750 | |
Capital contributed in excess of par | | | — | | | | — | | | | — | | | | 912,798,152 | | | | 912,798,152 | | | | — | | | | — | | | | — | | | | 899,506,128 | | | | 899,506,128 | |
Restricted stock | | | — | | | | — | | | | — | | | | (13,359,486 | ) | | | (13,359,486 | ) | | | — | | | | — | | | | — | | | | (7,736,812 | ) | | | (7,736,812 | ) |
Accumulated other comprehensive income (loss) | | | — | | | | — | | | | — | | | | 4,376,594 | | | | 4,376,594 | | | | — | | | | — | | | | — | | | | (1,821,457 | ) | | | (1,821,457 | ) |
Retained earnings | | | — | | | | — | | | | — | | | | 36,514,987 | | | | 36,514,987 | | | | — | | | | — | | | | — | | | | 78,221,233 | | | | 78,221,233 | |
| | | | | | | | | | | | | | | | | | | | | | | | | | | | | | | | | | | | | | | | |
TOTAL SHAREHOLDERS’ EQUITY | | | — | | | | — | | | | — | | | | 976,875,712 | | | | 976,875,712 | | | | — | | | | — | | | | — | | | | 1,004,466,002 | | | | 1,004,466,002 | |
| | | | | | | | | | | | | | | | | | | | | | | | | | | | | | | | | | | | | | | | |
TOTAL LIABILITIES AND SHAREHOLDERS’ EQUITY | | $ | 1,486,462,004 | | | $ | 94,943,053 | | | $ | 1,581,405,057 | | | $ | 1,562,411,670 | | | $ | 3,143,816,727 | | | $ | 1,269,663,847 | | | $ | 111,319,071 | | | $ | 1,380,982,918 | | | $ | 1,447,526,691 | | | $ | 2,828,509,609 | |
| | | | | | | | | | | | | | | | | | | | | | | | | | | | | | | | | | | | | | | | |
| (1) | Includes PREIT’s proportionate share of partnership assets and liabilities “grossed up” to reflect the Company’s share of the total assets and liabilities of the underlying properties. The consolidated financial statements, which are presented in accordance with GAAP, reflect only the Company’s equity in these properties. |
| (2) | Investment in real estate as of December 31, 2005 and December 31, 2004 includes $8,267,586 and $8,108,066, respectively, relating to the assets held for sale. Other assets held for sale represents intangible assets and other assets of these properties. |
NOTE: A reconciliation of the proportionate consolidation method to GAAP is included on pages 39 to 41.
PAGE 7
Pennsylvania REIT
QUARTERLY SUPPLEMENTAL DISCLOSURE (December 31, 2005)
INCOME STATEMENT(1)
QUARTERLY COMPARISON
(Proportionate consolidation method)
| | | | | | | | | | | | | | | | | | | | | | | | | | | | | | | | | | | | | | | | | | | | | | | | | | | |
| | | Three months ended December 31, 2005 | | | | | | Three months ended December 31, 2004 | |
| | Consolidated
properties | | | PREIT’s share
of
unconsolidated
partnerships(1) | | | Corporate and
other | | Total | | | TOTAL
%
CHANGE | | | Consolidated
properties | | | PREIT’s
share of
unconsolidated
partnerships(1) | | | Corporate and
other | | Total | |
Real estate revenues: | | | | | | | | | | | | | | | | | | | | | | | | | | | | | | | | | | | | | | | | | | | | | | | | | | | |
Base rents | | $ | 73,287,668 | | | | | | $ | 5,554,193 | | | | | | $ | — | | | | | $ | 78,841,861 | | | 5.0 | % | | $ | 69,725,658 | | | | | | $ | 5,380,110 | | | | | | $ | — | | | | | $ | 75,105,768 | |
Straight line rent | | | 1,083,118 | | | | | | | 84,464 | | | | | | | — | | | | | | 1,167,582 | | | -15.1 | % | | | 1,312,651 | | | | | | | 62,109 | | | | | | | — | | | | | | 1,374,760 | |
Percentage rents | | | 4,458,125 | | | | | | | 150,590 | | | | | | | — | | | | | | 4,608,715 | | | -2.9 | % | | | 4,618,507 | | | | | | | 126,665 | | | | | | | — | | | | | | 4,745,172 | |
Expense reimbursements | | | 32,110,187 | | | | | | | 1,975,439 | | | | | | | — | | | | | | 34,085,626 | | | 14.9 | % | | | 27,934,268 | | | | | | | 1,723,062 | | | | | | | — | | | | | | 29,657,330 | |
Lease termination revenue | | | 587,298 | | | | | | | (35,846 | ) | | | | | | — | | | | | | 551,452 | | | -56.0 | % | | | 1,252,868 | | | | | | | — | | | | | | | — | | | | | | 1,252,868 | |
Other real estate revenues | | | 7,544,990 | | | | | | | 304,459 | | | | | | | — | | | | | | 7,849,449 | | | 8.2 | % | | | 6,999,260 | | | | | | | 258,452 | | | | | | | — | | | | | | 7,257,712 | |
| | | | | | | | | | | | | | | | | | | | | | | | | | | | | | | | | | | | | | | | | | | | | | | | | | | |
TOTAL REAL ESTATE REVENUES | | | 119,071,386 | | | 94 | % | | | 8,033,299 | | | 6 | % | | | — | | | — | | | 127,104,685 | | | 6.5 | % | | | 111,843,212 | | | 94 | % | | | 7,550,398 | | | 6 | % | | | — | | | — | | | 119,393,610 | |
| | | | | | | | | | | | | | | | | | | | | | | | | | | | | | | | | | | | | | | | | | | | | | | | | | | |
Property operating expenses: | | | | | | | | | | | | | | | | | | | | | | | | | | | | | | | | | | | | | | | | | | | | | | | | | | | |
CAM and real estate taxes | | | (30,463,304 | ) | | | | | | (1,316,789 | ) | | | | | | — | | | | | | (31,780,093 | ) | | 14.0 | % | | | (26,215,237 | ) | | | | | | (1,657,812 | ) | | | | | | — | | | | | | (27,873,049 | ) |
Utilities | | | (5,876,499 | ) | | | | | | 48,974 | | | | | | | — | | | | | | (5,827,525 | ) | | 29.8 | % | | | (4,630,750 | ) | | | | | | 139,784 | | | | | | | — | | | | | | (4,490,966 | ) |
Other property operating expenses | | | (9,628,745 | ) | | | | | | (1,290,936 | ) | | | | | | — | | | | | | (10,919,681 | ) | | 16.2 | % | | | (8,707,944 | ) | | | | | | (692,592 | ) | | | | | | — | | | | | | (9,400,536 | ) |
| | | | | | | | | | | | | | | | | | | | | | | | | | | | | | | | | | | | | | | | | | | | | | | | | | — | |
| | | | | | | | | | | | | | | | | | | | | | | | | | | | | | | | | | | | | | | | | | | | | | | | | | | |
TOTAL PROPERTY OPERATING EXPENSES | | | (45,968,548 | ) | | 95 | % | | | (2,558,751 | ) | | 5 | % | | | — | | | — | | | (48,527,299 | ) | | 16.2 | % | | | (39,553,931 | ) | | 95 | % | | | (2,210,620 | ) | | 5 | % | | | — | | | — | | | (41,764,551 | ) |
| | | | | | | | | | | | | | | | | | | | | | | | | | | | | | | | | | | | | | | | | | | | | | | | | | | |
NET OPERATING INCOME | | | 73,102,838 | | | 93 | % | | | 5,474,548 | | | 7 | % | | | — | | | — | | | 78,577,386 | | | 1.2 | % | | | 72,289,281 | | | 93 | % | | | 5,339,778 | | | 7 | % | | | — | | | — | | | 77,629,059 | |
Management company revenue | | | — | | | | | | | — | | | | | | | 1,912,627 | | | | | | 1,912,627 | | | -18.0 | % | | | — | | | | | | | — | | | | | | | 2,331,728 | | | | | | 2,331,728 | |
Interest and other income | | | — | | | | | | | — | | | | | | | 310,511 | | | | | | 310,511 | | | 92.5 | % | | | — | | | | | | | — | | | | | | | 161,323 | | | | | | 161,323 | |
Other: | | | | | | | | | | | | | | | | | | | | | | | | | | | | | | | | | | | | | | | | | | | | | | | | | | | |
General and administrative expenses | | | — | | | | | | | — | | | | | | | (8,890,316 | ) | | | | | (8,890,316 | ) | | -13.2 | % | | | — | | | | | | | — | | | | | | | (10,241,548 | ) | | | | | (10,241,548 | ) |
Income taxes | | | (78,162 | ) | | | | | | — | | | | | | | — | | | | | | (78,162 | ) | | N/A | | | | — | | | | | | | — | | | | | | | — | | | | | | — | |
| | | | | | | | | | | | | | | | | | | | | | | | | | | | | | | | | | | | | | | | | | | | | | | | | | | |
Earnings before interest, taxes, depreciation and amortization (EBITDA) | | | 73,024,676 | | | | | | | 5,474,548 | | | | | | | (6,667,178 | ) | | | | | 71,832,046 | | | 2.8 | % | | | 72,289,281 | | | | | | | 5,339,778 | | | | | | | (7,748,497 | ) | | | | | 69,880,562 | |
| | | | | | | | | | | | | | | | | | | | | | | | | | | | | | | | | | | | | | | | | | | | | | | | | | | |
Interest expense | | | (18,187,198 | ) | | | | | | (2,130,646 | ) | | | | | | (3,039,708 | ) | | | | | (23,357,552 | ) | | 12.0 | % | | | (16,880,514 | ) | | | | | | (2,083,405 | ) | | | | | | (1,890,539 | ) | | | | | (20,854,458 | ) |
Depreciation and amortization | | | (28,669,941 | ) | | | | | | (1,295,366 | ) | | | | | | (441,844 | ) | | | | | (30,407,151 | ) | | 11.0 | % | | | (24,549,304 | ) | | | | | | (2,558,956 | ) | | | | | | (285,982 | ) | | | | | (27,394,242 | ) |
| | | | | | | | | | | | | | | | | | | | | | | | | | | | | | | | | | | | | | | | | | | | | | | | | | | |
OTHER EXPENSES | | | (46,857,139 | ) | | | | | | (3,426,012 | ) | | | | | | (3,481,552 | ) | | | | | (53,764,703 | ) | | 11.4 | % | | | (41,429,818 | ) | | | | | | (4,642,361 | ) | | | | | | (2,176,521 | ) | | | | | (48,248,700 | ) |
| | | | | | | | | | | | | | | | | | | | | | | | | | | | | | | | | | | | | | | | | | | | | | | | | | | |
Gains on sales of interests in real estate | | | — | | | | | | | 1,389,919 | | | | | | | — | | | | | | 1,389,919 | | | N/A | | | | — | | | | | | | (45,001 | ) | | | | | | — | | | | | | (45,001 | ) |
| | | | | | | | | | | | | | | | | | | | | | | | | | | | | | | | | | | | | | | | | | | | | | | | | | | |
Income before minority interest | | | 26,167,537 | | | | | | | 3,438,455 | | | | | | | (10,148,730 | ) | | | | | 19,457,262 | | | -9.9 | % | | | 30,859,463 | | | | | | | 652,416 | | | | | | | (9,925,018 | ) | | | | | 21,586,861 | |
| | | | | | | | | | | | | | | | | | | | | | | | | | | | | | | | | | | | | | | | | | | | | | | | | | | |
Minority interest | | | (51,561 | ) | | | | | | — | | | | | | | (2,050,708 | ) | | | | | (2,102,269 | ) | | -17.0 | % | | | (66,183 | ) | | | | | | — | | | | | | | (2,466,827 | ) | | | | | (2,533,010 | ) |
| | | | | | | | | | | | | | | | | | | | | | | | | | | | | | | | | | | | | | | | | | | | | | | | | | | |
TOTAL CONTINUING OPERATIONS | | | 26,115,976 | | | | | | | 3,438,455 | | | | | | | (12,199,438 | ) | | | | | 17,354,993 | | | -8.9 | % | | | 30,793,280 | | | | | | | 652,416 | | | | | | | (12,391,845 | ) | | | | | 19,053,851 | |
| | | | | | | | | | | | | | | | | | | | | | | | | | | | | | | | | | | | | | | | | | | | | | | | | | | |
Discontinued Operations: | | | | | | | | | | | | | | | | | | | | | | | | | | | | | | | | | | | | | | | | | | | | | | | | | | | |
Minority interest | | | — | | | | | | | — | | | | | | | (338,406 | ) | | | | | (338,406 | ) | | -405.8 | % | | | 1,283 | | | | | | | — | | | | | | | 109,365 | | | | | | 110,648 | |
Gains on sales of discontinued operations | | | 2,422,136 | | | | | | | — | | | | | | | — | | | | | | 2,422,136 | | | N/A | | | | — | | | | | | | — | | | | | | | — | | | | | | — | |
| | | | | | | | | | | | | | | | | | | | | | | | | | | | | | | | | | | | | | | | | | | | | | | | | | | |
TOTAL DISCONTINUED OPERATIONS | | | 2,422,136 | | | | | | | — | | | | | | | (338,406 | ) | | | | | 2,083,730 | | | 1783.2 | % | | | 1,283 | | | | | | | — | | | | | | | 109,365 | | | | | | 110,648 | |
| | | | | | | | | | | | | | | | | | | | | | | | | | | | | | | | | | | | | | | | | | | | | | | | | | | |
NET INCOME | | $ | 28,538,112 | | | | | | $ | 3,438,455 | | | | | | $ | (12,537,844 | ) | | | | $ | 19,438,723 | | | 1.4 | % | | $ | 30,794,563 | | | | | | $ | 652,416 | | | | | | $ | (12,282,480 | ) | | | | $ | 19,164,499 | |
| | | | | | | | | | | | | | | | | | | | | | | | | | | | | | | | | | | | | | | | | | | | | | | | | | | |
| (1) | Includes PREIT’s proportionate share of partnership investments “grossed up” to reflect the Company’s share of the total revenues and expenses of the underlying properties. |
NOTE: A reconciliation of the proportionate consolidation method to GAAP is included on pages 39 to 41.
PAGE 8
Pennsylvania REIT
QUARTERLY SUPPLEMENTAL DISCLOSURE (December 31, 2005)
INCOME STATEMENT(1)
ANNUAL COMPARISON
(Proportionate consolidation method)
| | | | | | | | | | | | | | | | | | | | | | | | | | | | | | | | | | | | | | | | | | | | | | | | | | | |
| | | Twelve months ended December 31, 2005 | | | | | | Twelve months ended December 31, 2004 | |
| | Consolidated
properties | | | PREIT’s share of
unconsolidated
partnerships(1) | | | Corporate and other | | Total | | | TOTAL %
CHANGE | | | Consolidated
properties | | | PREIT’s share of
unconsolidated
partnerships(1) | | | Corporate and other | | Total | |
Real estate revenues: | | | | | | | | | | | | | | | | | | | | | | | | | | | | | | | | | | | | | | | | | | | | | | | | | | | |
Base rents | | $ | 272,745,555 | | | | | | $ | 20,780,246 | | | | | �� | $ | — | | | | | $ | 293,525,801 | | | 2.3 | % | | $ | 265,787,460 | | | | | | $ | 21,001,930 | | | | | | $ | — | | | | | $ | 286,789,390 | |
Straight line rent | | | 4,266,077 | | | | | | | 108,101 | | | | | | | — | | | | | | 4,374,178 | | | -16.1 | % | | | 5,098,086 | | | | | | | 113,878 | | | | | | | — | | | | | | 5,211,964 | |
Percentage rents | | | 10,432,204 | | | | | | | 246,607 | | | | | | | — | | | | | | 10,678,811 | | | 2.0 | % | | | 10,152,341 | | | | | | | 314,402 | | | | | | | — | | | | | | 10,466,743 | |
Expense reimbursements | | | 126,169,097 | | | | | | | 6,700,686 | | | | | | | — | | | | | | 132,869,783 | | | 4.4 | % | | | 120,885,008 | | | | | | | 6,365,863 | | | | | | | — | | | | | | 127,250,871 | |
Lease termination revenue | | | 2,785,075 | | | | | | | 512,483 | | | | | | | — | | | | | | 3,297,558 | | | -16.6 | % | | | 3,953,471 | | | | | | | — | | | | | | | — | | | | | | 3,953,471 | |
Other real estate revenues | | | 16,939,892 | | | | | | | 705,146 | | | | | | | — | | | | | | 17,645,038 | | | 4.8 | % | | | 16,147,305 | | | | | | | 697,021 | | | | | | | — | | | | | | 16,844,326 | |
| | | | | | | | | | | | | | | | | | | | | | | | | | | | | | | | | | | | | | | | | | | | | | | | | | | |
TOTAL REAL ESTATE REVENUES | | | 433,337,900 | | | 94 | % | | | 29,053,269 | | | 6 | % | | | — | | | — | | | 462,391,169 | | | 2.6 | % | | | 422,023,671 | | | 94 | % | | | 28,493,094 | | | 6 | % | | | — | | | — | | | 450,516,765 | |
| | | | | | | | | | | | | | | | | | | | | | | | | | | | | | | | | | | | | | | | | | | | | | | | | | | |
Property Operating Expenses: | | | | | | | | | | | | | | | | | | | | | | | | | | | | | | | | | | | | | | | | | | | | | | | | | | | |
CAM and real estate taxes | | | (116,144,146 | ) | | | | | | (5,830,058 | ) | | | | | | — | | | | | | (121,974,204 | ) | | 5.8 | % | | | (109,310,252 | ) | | | | | | (5,991,981 | ) | | | | | | — | | | | | | (115,302,233 | ) |
Utilities | | | (23,479,141 | ) | | | | | | (268,631 | ) | | | | | | — | | | | | | (23,747,772 | ) | | 4.3 | % | | | (22,310,283 | ) | | | | | | (460,944 | ) | | | | | | — | | | | | | (22,771,227 | ) |
Other property operating expenses | | | (26,524,799 | ) | | | | | | (2,732,307 | ) | | | | | | — | | | | | | (29,257,106 | ) | | 0.0 | % | | | (26,932,381 | ) | | | | | | (2,336,235 | ) | | | | | | — | | | | | | (29,268,616 | ) |
| | | | | | | | | | | | | | | | | | | | | | | | | | | | | | | | | | | | | | | | | | | | | | | | | | | |
TOTAL PROPERTY OPERATING EXPENSES | | | (166,148,086 | ) | | 95 | % | | | (8,830,996 | ) | | 5 | % | | | — | | | — | | | (174,979,082 | ) | | 4.6 | % | | | (158,552,916 | ) | | 95 | % | | | (8,789,160 | ) | | 5 | % | | | — | | | — | | | (167,342,076 | ) |
| | | | | | | | | | | | | | | | | | | | | | | | | | | | | | | | | | | | | | | | | | | | | | | | | | | |
NET OPERATING INCOME | | | 267,189,814 | | | 93 | % | | | 20,222,273 | | | 7 | % | | | — | | | — | | | 287,412,087 | | | 1.5 | % | | | 263,470,755 | | | 93 | % | | | 19,703,934 | | | 7 | % | | | — | | | — | | | 283,174,689 | |
Management company revenue | | | — | | | | | | | — | | | | | | | 3,956,046 | | | | | | 3,956,046 | | | -25.0 | % | | | — | | | | | | | — | | | | | | | 5,276,556 | | | | | | 5,276,556 | |
Interest and other income | | | — | | | | | | | — | | | | | | | 1,047,632 | | | | | | 1,047,632 | | | 2.0 | % | | | — | | | | | | | — | | | | | | | 1,027,016 | | | | | | 1,027,016 | |
Other: | | | | | | | | | | | | | | | | | | | | | | | | | | | | | | | | | | | | | | | | | | | | | | | | | | | |
General and administrative | | | — | | | | | | | — | | | | | | | (36,723,338 | ) | | | | | (36,723,338 | ) | | -14.7 | % | | | — | | | | | | | — | | | | | | | (43,032,865 | ) | | | | | (43,032,865 | ) |
Income taxes | | | (597,141 | ) | | | | | | — | | | | | | | — | | | | | | (597,141 | ) | | N/A | | | | — | | | | | | | — | | | | | | | — | | | | | | — | |
| | | | | | | | | | | | | | | | | | | | | | | | | | | | | | | | | | | | | | | | | | | | | | | | | | | |
Earnings before interest, taxes, depreciation and amortization (EBITDA) | | | 266,592,673 | | | | | | | 20,222,273 | | | | | | | (31,719,660 | ) | | | | | 255,095,286 | | | 3.5 | % | | | 263,470,755 | | | | | | | 19,703,934 | | | | | | | (36,729,293 | ) | | | | | 246,445,396 | |
| | | | | | | | | | | | | | | | | | | | | | | | | | | | | | | | | | | | | | | | | | | | | | | | | | | |
Interest expense | | | (68,556,941 | ) | | | | | | (8,165,858 | ) | | | | | | (14,590,648 | ) | | | | | (91,313,447 | ) | | 9.3 | % | | | (68,044,768 | ) | | | | | | (8,316,640 | ) | | | | | | (7,190,486 | ) | | | | | (83,551,894 | ) |
Depreciation and amortization | | | (108,838,660 | ) | | | | | | (4,581,995 | ) | | | | | | (1,597,132 | ) | | | | | (115,017,787 | ) | | 11.6 | % | | | (96,379,792 | ) | | | | | | (5,780,885 | ) | | | | | | (931,325 | ) | | | | | (103,092,002 | ) |
| | | | | | | | | | | | | | | | | | | | | | | | | | | | | | | | | | | | | | | | | | | | | | | | | | | |
OTHER EXPENSES | | | (177,395,601 | ) | | | | | | (12,747,853 | ) | | | | | | (16,187,780 | ) | | | | | (206,331,234 | ) | | 10.5 | % | | | (164,424,560 | ) | | | | | | (14,097,525 | ) | | | | | | (8,121,811 | ) | | | | | (186,643,896 | ) |
| | | | | | | | | | | | | | | | | | | | | | | | | | | | | | | | | | | | | | | | | | | | | | | | | | | |
Gains on sales of interests in real estate | | | 628,421 | | | | | | | 9,482,080 | | | | | | | — | | | | | | 10,110,501 | | | 581.2 | % | | | — | | | | | | | 1,484,182 | | | | | | | — | | | | | | 1,484,182 | |
| | | | | | | | | | | | | | | | | | | | | | | | | | | | | | | | | | | | | | | | | | | | | | | | | | | |
Income before minority interest | | | 89,825,493 | | | | | | | 16,956,500 | | | | | | | (47,907,440 | ) | | | | | 58,874,553 | | | -3.9 | % | | | 99,046,195 | | | | | | | 7,090,591 | | | | | | | (44,851,104 | ) | | | | | 61,285,682 | |
| | | | | | | | | | | | | | | | | | | | | | | | | | | | | | | | | | | | | | | | | | | | | | | | | | | |
Minority interest | | | (178,581 | ) | | | | | | — | | | | | | | (6,205,301 | ) | | | | | (6,383,882 | ) | | 1.7 | % | | | (611,173 | ) | | | | | | — | | | | | | | (5,665,147 | ) | | | | | (6,276,320 | ) |
| | | | | | | | | | | | | | | | | | | | | | | | | | | | | | | | | | | | | | | | | | | | | | | | | | | |
TOTAL CONTINUING OPERATIONS | | | 89,646,912 | | | | | | | 16,956,500 | | | | | | | (54,112,741 | ) | | | | | 52,490,671 | | | -4.6 | % | | | 98,435,022 | | | | | | | 7,090,591 | | | | | | | (50,516,251 | ) | | | | | 55,009,362 | |
| | | | | | | | | | | | | | | | | | | | | | | | | | | | | | | | | | | | | | | | | | | | | | | | | | | |
Discontinued Operations: | | | | | | | | | | | | | | | | | | | | | | | | | | | | | | | | | | | | | | | | | | | | | | | | | | | |
Minority interest | | | (33 | ) | | | | | | — | | | | | | | (1,020,013 | ) | | | | | (1,020,046 | ) | | 51.8 | % | | | (18,426 | ) | | | | | | — | | | | | | | (653,327 | ) | | | | | (671,753 | ) |
Gains/(adjustment to gains) on sales of discontinued operations | | | 6,158,550 | | | | | | | — | | | | | | | — | | | | | | 6,158,550 | | | N/A | | | | — | | | | | | | — | | | | | | | (550,000 | ) | | | | | (550,000 | ) |
| | | | | | | | | | | | | | | | | | | | | | | | | | | | | | | | | | | | | | | | | | | | | | | | | | | |
TOTAL DISCONTINUED OPERATIONS | | | 6,158,517 | | | | | | | — | | | | | | | (1,020,013 | ) | | | | | 5,138,504 | | | N/A | | | | (18,426 | ) | | | | | | — | | | | | | | (1,203,327 | ) | | | | | (1,221,753 | ) |
| | | | | | | | | | | | | | | | | | | | | | | | | | | | | | | | | | | | | | | | | | | | | | | | | | | |
NET INCOME | | $ | 95,805,429 | | | | | | $ | 16,956,500 | | | | | | $ | (55,132,754 | ) | | | | $ | 57,629,175 | | | 7.1 | % | | $ | 98,416,596 | | | | | | $ | 7,090,591 | | | | | | $ | (51,719,578 | ) | | | | $ | 53,787,609 | |
| | | | | | | | | | | | | | | | | | | | | | | | | | | | | | | | | | | | | | | | | | | | | | | | | | | |
| (1) | Includes PREIT’s proportionate share of partnership investments “grossed up” to reflect the Company’s share of the total revenues and expenses of the underlying properties. |
NOTE: A reconciliation of the proportionate consolidation method to GAAP is included on pages 39 to 41.
PAGE 9
Pennsylvania REIT
QUARTERLY SUPPLEMENTAL DISCLOSURE (December 31, 2005)
SAME STORE QUARTERLY COMPARISON(1)
| | | | | | | | | | | | | | | | | | | | | | | | | | | | | | | | | | | | | | | | | | | | | | | | | | | | | | | | | | | | | | | | |
| | | Three months ended December 31, 2005 | | | | | Three months ended December 31, 2004 |
| | | TOTAL | | | SAME | | | NEW | | | DIVEST | | OTHER | | % Change
Same Store | | | TOTAL | | | SAME | | | NEW | | | DIVEST | | | OTHER |
Real estate revenues: | | | | | | | | | | | | | | | | | | | | | | | | | | | | | | | | | | | | | | | | | | | | | | | | | | | | | | | | | | | | | | | | |
Base rents | | $ | 78,841,861 | | | $ | 72,085,790 | | | | | | $ | 6,461,682 | | | | | | $ | 248,400 | | | | | $ | 45,989 | | | | | -1.3 | % | | $ | 75,105,768 | | | $ | 73,007,673 | | | | | | $ | 1,037,776 | | | | | | $ | 965,924 | | | | | | $ | 94,395 | | | |
Straight line rent | | | 1,167,582 | | | | 979,846 | | | | | | | 184,535 | | | | | | | 3,201 | | | | | | — | | | | | -27.6 | % | | | 1,374,760 | | | | 1,352,466 | | | | | | | 26,306 | | | | | | | (4,012 | ) | | | | | | — | | | |
Percentage rents | | | 4,608,715 | | | | 4,304,413 | | | | | | | 305,027 | | | | | | | (725 | ) | | | | | — | | | | | -11.2 | % | | | 4,745,172 | | | | 4,848,991 | | | | | | | 2,141 | | | | | | | (105,960 | ) | | | | | | — | | | |
Expense reimbursements | | | 34,085,626 | | | | 31,434,235 | | | | | | | 2,525,900 | | | | | | | 125,491 | | | | | | — | | | | | 7.4 | % | | | 29,657,330 | | | | 29,254,840 | | | | | | | 392,851 | | | | | | | 1,346 | | | | | | | 8,293 | | | |
Lease termination revenue | | | 551,452 | | | | 478,952 | | | | | | | 72,500 | | | | | | | — | | | | | | — | | | | | -61.8 | % | | | 1,252,868 | | | | 1,252,868 | | | | | | | (11,956 | ) | | | | | | 11,956 | | | | | | | — | | | |
Other real estate revenues | | | 7,849,449 | | | | 7,096,231 | | | | | | | 749,821 | | | | | | | 3,397 | | | | | | — | | | | | -0.6 | % | | | 7,257,712 | | | | 7,136,041 | | | | | | | 65,332 | | | | | | | 56,339 | | | | | | | — | | | |
| | | | | | | | | | | | | | | | | | | | | | | | | | | | | | | | | | | | | | | | | | | | | | | | | | | | | | | | | | | | | | | | |
TOTAL REAL ESTATE REVENUES | | | 127,104,685 | | | | 116,379,467 | | | 92 | % | | | 10,299,465 | | | 8 | % | | | 379,764 | | | — | | | 45,989 | | | — | | -0.4 | % | | | 119,393,610 | | | | 116,852,879 | | | 98 | % | | | 1,512,450 | | | 1 | % | | | 925,593 | | | — | | | | 102,688 | | | — |
| | | | | | | | | | | | | | | | | | | | | | | | | | | | | | | | | | | | | | | | | | | | | | | | | | | | | | | | | | | | | | | | |
Property operating expenses: | | | | | | | | | | | | | | | | | | | | | | | | | | | | | | | | | | | | | | | | | | | | | | | | | | | | | | | | | | | | | | | | |
CAM and real estate taxes | | | (31,780,093 | ) | | | (28,540,225 | ) | | | | | | (3,110,615 | ) | | | | | | (126,871 | ) | | | | | (2,382 | ) | | | | 5.9 | % | | | (27,873,049 | ) | | | (26,959,631 | ) | | | | | | (461,190 | ) | | | | | | (439,435 | ) | | | | | | (12,793 | ) | | |
Utilities | | | (5,827,525 | ) | | | (5,723,126 | ) | | | | | | (100,915 | ) | | | | | | (3,484 | ) | | | | | — | | | | | 26.9 | % | | | (4,490,966 | ) | | | (4,510,779 | ) | | | | | | (6,538 | ) | | | | | | 26,351 | | | | | | | — | | | |
Other property operating expenses | | | (10,919,681 | ) | | | (9,653,537 | ) | | | | | | (1,240,854 | ) | | | | | | (18,560 | ) | | | | | (6,730 | ) | | | | 4.6 | % | | | (9,400,536 | ) | | | (9,224,873 | ) | | | | | | (150,533 | ) | | | | | | (23,408 | ) | | | | | | (1,722 | ) | | |
| | | | | | | | | | | | | | | | | | | | | | | | | | | | | | | | | | | | | | | | | | | | | | | | | | | | | | | | | | | | | | | | |
TOTAL PROPERTY OPERATING EXPENSES | | | (48,527,299 | ) | | | (43,916,888 | ) | | 90 | % | | | (4,452,384 | ) | | 9 | % | | | (148,915 | ) | | — | | | (9,112 | ) | | — | | 7.9 | % | | | (41,764,551 | ) | | | (40,695,283 | ) | | 97 | % | | | (618,261 | ) | | 1 | % | | | (436,492 | ) | | 1 | % | | | (14,515 | ) | | — |
| | | | | | | | | | | | | | | | | | | | | | | | | | | | | | | | | | | | | | | | | | | | | | | | | | | | | | | | | | | | �� | | | | |
NET OPERATING INCOME | | | 78,577,386 | | | | 72,462,579 | | | 92 | % | | | 5,847,081 | | | 7 | % | | | 230,849 | | | — | | | 36,877 | | | — | | -4.9 | % | | | 77,629,059 | | | | 76,157,596 | | | 98 | % | | | 894,189 | | | 1 | % | | | 489,101 | | | — | | | | 88,173 | | | — |
Management company revenue | | | 1,912,627 | | | | — | | | | | | | — | | | | | | | — | | | | | | 1,912,627 | | | | | N/A | | | | 2,331,728 | | | | — | | | | | | | — | | | | | | | — | | | | | | | 2,331,728 | | | |
Interest and other income | | | 310,511 | | | | — | | | | | | | — | | | | | | | — | | | | | | 310,511 | | | | | N/A | | | | 161,323 | | | | — | | | | | | | — | | | | | | | — | | | | | | | 161,323 | | | |
General and administrative expenses | | | (8,890,316 | ) | | | — | | | | | | | — | | | | | | | — | | | | | | (8,890,316 | ) | | | | N/A | | | | (10,241,548 | ) | | | — | | | | | | | — | | | | | | | — | | | | | | | (10,241,548 | ) | | |
Income taxes | | | (78,162 | ) | | | (78,162 | ) | | | | | | — | | | | | | | — | | | | | | — | | | | | N/A | | | | — | | | | — | | | | | | | — | | | | | | | — | | | | | | | — | | | |
Interest expense | | | (23,357,552 | ) | | | (19,338,042 | ) | | | | | | (979,802 | ) | | | | | | — | | | | | | (3,039,708 | ) | | | | 2.8 | % | | | (20,854,458 | ) | | | (18,818,833 | ) | | | | | | — | | | | | | | (145,086 | ) | | | | | | (1,890,539 | ) | | |
Depreciation and amortization | | | (30,407,151 | ) | | | (27,055,849 | ) | | | | | | (2,845,599 | ) | | | | | | (63,859 | ) | | | | | (441,844 | ) | | | | 2.2 | % | | | (27,394,242 | ) | | | (26,485,866 | ) | | | | | | (411,297 | ) | | | | | | (198,557 | ) | | | | | | (298,522 | ) | | |
| | | | | | | | | | | | | | | | | | | | | | | | | | | | | | | | | | | | | | | | | | | | | | | | | | | | | | | | | | | | | | | | |
OTHER | | | (60,510,043 | ) | | | (46,472,053 | ) | | | | | | (3,825,401 | ) | | | | | | (63,859 | ) | | | | | (10,148,730 | ) | | | | 2.6 | % | | | (55,997,197 | ) | | | (45,304,699 | ) | | | | | | (411,297 | ) | | | | | | (343,643 | ) | | | | | | (9,937,558 | ) | | |
| | | | | | | | | | | | | | | | | | | | | | | | | | | | | | | | | | | | | | | | | | | | | | | | | | | | | | | | | | | | | | | | |
Gains on sales of interests in real estate | | | 3,812,055 | | | | — | | | | | | | — | | | | | | | 2,348,101 | | | | | | 1,463,954 | | | | | N/A | | | | (45,001 | ) | | | — | | | | | | | — | | | | | | | (45,001 | ) | | | | | | — | | | |
| | | | | | | | | | | | | | | | | | | | | | | | | | | | | | | | | | | | | | | | | | | | | | | | | | | | | | | | | | | | | | | | |
Income before minority interest | | | 21,879,398 | | | | 25,990,526 | | | | | | | 2,021,680 | | | | | | | 2,515,091 | | | | | | (8,647,899 | ) | | | | -15.8 | % | | | 21,586,861 | | | | 30,852,897 | | | | | | | 482,892 | | | | | | | 100,457 | | | | | | | (9,849,385 | ) | | |
| | | | | | | | | | | | | | | | | | | | | | | | | | | | | | | | | | | | | | | | | | | | | | | | | | | | | | | | | | | | | | | | |
Minority interest | | | (2,440,675 | ) | | | (51,561 | ) | | | | | | — | | | | | | | — | | | | | | (2,389,114 | ) | | | | -22.1 | % | | | (2,422,362 | ) | | | (66,183 | ) | | | | | | — | | | | | | | 1,283 | | | | | | | (2,357,462 | ) | | |
| | | | | | | | | | | | | | | | | | | | | | | | | | | | | | | | | | | | | | | | | | | | | | | | | | | | | | | | | | | | | | | | |
NET INCOME | | $ | 19,438,723 | | | $ | 25,938,965 | | | | | | $ | 2,021,680 | | | | | | $ | 2,515,091 | | | | | $ | (11,037,013 | ) | | | | -15.7 | % | | $ | 19,164,499 | | | $ | 30,786,714 | | | | | | $ | 482,892 | | | | | | $ | 101,740 | | | | | | $ | (12,206,847 | ) | | |
| | | | | | | | | | | | | | | | | | | | | | | | | | | | | | | | | | | | | | | | | | | | | | | | | | | | | | | | | | | | | | | | |
| (1) | Includes PREIT’s proportionate share of partnership investments “grossed up” to reflect the Company’s share of the total revenues and expenses of the underlying properties. |
NOTE: A reconciliation of the proportionate consolidation method to GAAP is included on pages 39 to 41.
PAGE 10
Pennsylvania REIT
QUARTERLY SUPPLEMENTAL DISCLOSURE (December 31, 2005)
SAME STORE ANNUAL COMPARISON(1)
| | | | | | | | | | | | | | | | | | | | | | | | | | | | | | | | | | | | | | | | | | | | | | | | | | | | | | | | | | | | | | | | | |
| | | Twelve months ended December 31, 2005 | | | | | Twelve months ended December 31, 2004 |
| | | TOTAL | | | SAME | | | NEW | | | DIVEST | | | OTHER | | % Change
Same Store | | | TOTAL | | | SAME | | | NEW | | | DIVEST | | | OTHER |
Real estate revenue: | | | | | | | | | | | | | | | | | | | | | | | | | | | | | | | | | | | | | | | | | | | | | | | | | | | | | | | | | | | | | | | | | |
Base rents | | $ | 293,525,801 | | | $ | 264,555,103 | | | | | | $ | 26,302,467 | | | | | | $ | 2,280,870 | | | | | | $ | 387,361 | | | | | -0.7 | % | | $ | 286,789,390 | | | $ | 266,338,372 | | | | | | $ | 4,416,972 | | | | | | $ | 15,684,183 | | | | | | $ | 349,863 | | | |
Straight line rent | | | 4,374,178 | | | | 3,497,726 | | | | | | | 893,055 | | | | | | | (16,603 | ) | | | | | | — | | | | | -28.9 | % | | | 5,211,964 | | | | 4,922,122 | | | | | | | 181,947 | | | | | | | 107,895 | | | | | | | — | | | |
Percentage rents | | | 10,678,811 | | | | 9,854,540 | | | | | | | 792,547 | | | | | | | 31,724 | | | | | | | — | | | | | -0.6 | % | | | 10,466,743 | | | | 9,914,364 | | | | | | | 249,531 | | | | | | | 302,848 | | | | | | | — | | | |
Expense reimbursements | | | 132,869,783 | | | | 121,493,936 | | | | | | | 10,640,250 | | | | | | | 707,781 | | | | | | | 27,816 | | | | | 1.3 | % | | | 127,250,871 | | | | 119,989,836 | | | | | | | 1,367,018 | | | | | | | 5,849,404 | | | | | | | 44,613 | | | |
Lease termination revenue | | | 3,297,558 | | | | 2,280,072 | | | | | | | 84,500 | | | | | | | 932,986 | | | | | | | — | | | | | -42.3 | % | | | 3,953,471 | | | | 3,953,471 | | | | | | | — | | | | | | | — | | | | | | | — | | | |
Other real estate revenues | | | 17,645,038 | | | | 15,885,525 | | | | | | | 1,732,529 | | | | | | | 26,984 | | | | | | | — | | | | | -0.3 | % | | | 16,844,326 | | | | 15,926,791 | | | | | | | 194,519 | | | | | | | 723,016 | | | | | | | — | | | |
| | | | | | | | | | | | | | | | | | | | | | | | | | | | | | | | | | | | | | | | | | | | | | | | | | | | | | | | | | | | | | | | | |
TOTAL REAL ESTATE REVENUES | | | 462,391,169 | | | | 417,566,902 | | | 90 | % | | | 40,445,348 | | | 9 | % | | | 3,963,742 | | | 1 | % | | | 415,177 | | | — | | -0.8 | % | | | 450,516,765 | | | | 421,044,956 | | | 93 | % | | | 6,409,987 | | | 1 | % | | | 22,667,346 | | | 5 | % | | | 394,476 | | | — |
| | | | | | | | | | | | | | | | | | | | | | | | | | | | | | | | | | | | | | | | | | | | | | | | | | | | | | | | | | | | | | | | | |
Property operating expenses: | | | | | | | | | | | | | | | | | | | | | | | | | | | | | | | | | | | | | | | | | | | | | | | | | | | | | | | | | | | | | | | | | |
CAM and real estate taxes | | | (121,974,204 | ) | | | (109,144,353 | ) | | | | | | (11,767,181 | ) | | | | | | (1,022,711 | ) | | | | | | (39,959 | ) | | | | 3.9 | % | | | (115,302,233 | ) | | | (105,086,527 | ) | | | | | | (1,490,844 | ) | | | | | | (8,680,049 | ) | | | | | | (44,813 | ) | | |
Utilities | | | (23,747,772 | ) | | | (22,611,394 | ) | | | | | | (1,105,828 | ) | | | | | | (30,550 | ) | | | | | | — | | | | | 8.9 | % | | | (22,771,227 | ) | | | (20,759,785 | ) | | | | | | (550,201 | ) | | | | | | (1,461,241 | ) | | | | | | — | | | |
Other property operating expenses | | | (29,257,106 | ) | | | (24,738,841 | ) | | | | | | (4,362,463 | ) | | | | | | (141,724 | ) | | | | | | (14,078 | ) | | | | -7.8 | % | | | (29,268,616 | ) | | | (26,840,246 | ) | | | | | | (573,912 | ) | | | | | | (1,846,657 | ) | | | | | | (7,801 | ) | | |
| | | | | | | | | | | | | | | | | | | | | | | | | | | | | | | | | | | | | | | | | | | | | | | | | | | | | | | | | | | | | | | | | |
TOTAL PROPERTY OPERATING EXPENSES | | | (174,979,082 | ) | | | (156,494,588 | ) | | 89 | % | | | (17,235,472 | ) | | 10 | % | | | (1,194,985 | ) | | 1 | % | | | (54,037 | ) | | — | | 2.5 | % | | | (167,342,076 | ) | | | (152,686,558 | ) | | 91 | % | | | (2,614,957 | ) | | 2 | % | | | (11,987,947 | ) | | 7 | % | | | (52,614 | ) | | — |
| | | | | | | | | | | | | | | | | | | | | | | | | | | | | | | | | | | | | | | | | | | | | | | | | | | | | | | | | | | | | | | | | |
NET OPERATING INCOME | | | 287,412,087 | | | | 261,072,314 | | | 91 | % | | | 23,209,876 | | | 8 | % | | | 2,768,757 | | | 1 | % | | | 361,140 | | | — | | -2.7 | % | | | 283,174,689 | | | | 268,358,398 | | | 95 | % | | | 3,795,030 | | | 1 | % | | | 10,679,399 | | | 4 | % | | | 341,862 | | | — |
Management company revenue | | | 3,956,046 | | | | — | | | | | | | — | | | | | | | — | | | | | | | 3,956,046 | | | | | N/A | | | | 5,276,556 | | | | — | | | | | | | — | | | | | | | — | | | | | | | 5,276,556 | | | |
Interest and other income | | | 1,047,632 | | | | — | | | | | | | — | | | | | | | — | | | | | | | 1,047,632 | | | | | N/A | | | | 1,027,016 | | | | — | | | | | | | — | | | | | | | — | | | | | | | 1,027,016 | | | |
General and administrative expenses | | | (36,723,338 | ) | | | — | | | | | | | — | | | | | | | — | | | | | | | (36,723,338 | ) | | | | N/A | | | | (43,032,865 | ) | | | — | | | | | | | — | | | | | | | — | | | | | | | (43,032,865 | ) | | |
Income taxes | | | (597,141 | ) | | | (451,608 | ) | | | | | | (145,533 | ) | | | | | | — | | | | | | | — | | | | | N/A | | | | — | | | | — | | | | | | | — | | | | | | | — | | | | | | | — | | | |
Interest expense | | | (91,313,447 | ) | | | (73,548,489 | ) | | | | | | (2,809,331 | ) | | | | | | (364,979 | ) | | | | | | (14,590,648 | ) | | | | -0.8 | % | | | (83,551,894 | ) | | | (74,158,721 | ) | | | | | | — | | | | | | | (2,202,687 | ) | | | | | | (7,190,486 | ) | | |
Depreciation and amortization | | | (115,017,787 | ) | | | (102,012,684 | ) | | | | | | (10,779,030 | ) | | | | | | (616,401 | ) | | | | | | (1,609,672 | ) | | | | 2.1 | % | | | (103,092,002 | ) | | | (99,893,860 | ) | | | | | | (1,268,022 | ) | | | | | | (948,635 | ) | | | | | | (981,485 | ) | | |
| | | | | | | | | | | | | | | | | | | | | | | | | | | | | | | | | | | | | | | | | | | | | | | | | | | | | | | | | | | | | | | | | |
OTHER | | | (238,648,035 | ) | | | (176,012,781 | ) | | | | | | (13,733,894 | ) | | | | | | (981,380 | ) | | | | | | (47,919,980 | ) | | | | 1.1 | % | | | (223,373,189 | ) | | | (174,052,581 | ) | | | | | | (1,268,022 | ) | | | | | | (3,151,322 | ) | | | | | | (44,901,264 | ) | | |
| | | | | | | | | | | | | | | | | | | | | | | | | | | | | | | | | | | | | | | | | | | | | | | | | | | | | | | | | | | | | | | | | |
Gains on sales of interests in real estate | | | 16,269,051 | | | | 628,422 | | | | | | | — | | | | | | | 7,440,261 | | | | | | | 8,200,368 | | | | | N/A | | | | 934,182 | | | | — | | | | | | | — | | | | | | | 1,484,182 | | | | | | | (550,000 | ) | | |
| | | | | | | | | | | | | | | | | | | | | | | | | | | | | | | | | | | | | | | | | | | | | | | | | | | | | | | | | | | | | | | | | |
Income before minority interest | | | 65,033,103 | | | | 85,687,955 | | | | | | | 9,475,982 | | | | | | | 9,227,638 | | | | | | | (39,358,472 | ) | | | | -9.1 | % | | | 60,735,682 | | | | 94,305,817 | | | | | | | 2,527,008 | | | | | | | 9,012,259 | | | | | | | (45,109,402 | ) | | |
| | | | | | | | | | | | | | | | | | | | | | | | | | | | | | | | | | | | | | | | | | | | | | | | | | | | | | | | | | | | | | | | | |
Minority interest | | | (7,403,928 | ) | | | (178,581 | ) | | | | | | — | | | | | | | (33 | ) | | | | | | (7,225,314 | ) | | | | -70.8 | % | | | (6,948,073 | ) | | | (611,174 | ) | | | | | | — | | | | | | | (18,425 | ) | | | | | | (6,318,474 | ) | | |
| | | | | | | | | | | | | | | | | | | | | | | | | | | | | | | | | | | | | | | | | | | | | | | | | | | | | | | | | | | | | | | | | |
NET INCOME | | $ | 57,629,175 | | | $ | 85,509,374 | | | | | | $ | 9,475,982 | | | | | | $ | 9,227,605 | | | | | | $ | (46,583,786 | ) | | | | -8.7 | % | | $ | 53,787,609 | | | $ | 93,694,643 | | | | | | $ | 2,527,008 | | | | | | $ | 8,993,834 | | | | | | $ | (51,427,876 | ) | | |
| | | | | | | | | | | | | | | | | | | | | | | | | | | | | | | | | | | | | | | | | | | | | | | | | | | | | | | | | | | | | | | | | |
| (1) | Includes PREIT’s proportionate share of partnership investments “grossed up” to reflect the Company’s share of the total revenues and expenses of the underlying properties. |
NOTE: A reconciliation of the proportionate consolidation method to GAAP is included on pages 39 to 41.
PAGE 11
Pennsylvania REIT
QUARTERLY SUPPLEMENTAL DISCLOSURE (December 31, 2005)
RETAIL PROPERTY TYPE QUARTERLY COMPARISON(1)
| | | | | | | | | | | | | | | | | | | | | | | | | | | | | | | | | | | | | | | | | | | | | |
| | | Three months ended December 31, 2005 | | | | | | | | | | | | Three months ended December 31, 2004 | |
| | Total | | | Enclosed Mall | | | Power and
Strip Center | | | % Change Total | | | % Change Enclosed Mall | | | % Change Power and Strip
Center | | | Total | | | Enclosed Mall | | | Power and
Strip Center | |
| | | | | | | | | |
Real estate revenues: | | | | | | | | | | | | | | | | | | | | | | | | | | | | | | | | | | | | | | | | | | | | | |
Base rents | | $ | 78,795,872 | | | $ | 71,103,856 | | | | | | $ | 7,692,016 | | | | | | 5.0 | % | | 6.3 | % | | -5.1 | % | | $ | 75,011,373 | | | $ | 66,906,925 | | | | | | $ | 8,104,448 | | | | |
Straight line rent | | | 1,167,582 | | | | 1,029,128 | | | | | | | 138,454 | | | | | | -15.1 | % | | -16.9 | % | | 1.2 | % | | | 1,374,760 | | | | 1,237,975 | | | | | | | 136,785 | | | | |
Percentage rents | | | 4,608,715 | | | | 4,477,076 | | | | | | | 131,639 | | | | | | -2.9 | % | | -3.7 | % | | 40.5 | % | | | 4,745,172 | | | | 4,651,465 | | | | | | | 93,707 | | | | |
Expense reimbursements | | | 34,085,626 | | | | 32,327,989 | | | | | | | 1,757,637 | | | | | | 15.0 | % | | 14.8 | % | | 17.4 | % | | | 29,649,037 | | | | 28,151,636 | | | | | | | 1,497,401 | | | | |
Lease termination revenue | | | 551,452 | | | | 550,139 | | | | | | | 1,313 | | | | | | -56.0 | % | | -56.1 | % | | N/A | | | | 1,252,868 | | | | 1,252,868 | | | | | | | — | | | | |
Other real estate revenues | | | 7,849,449 | | | | 7,770,167 | | | | | | | 79,282 | | | | | | 8.2 | % | | 7.7 | % | | 99.1 | % | | | 7,257,712 | | | | 7,217,896 | | | | | | | 39,816 | | | | |
| | | | | | | | | | | | | | | | | | | | | | | | | | | | | | | | | | | | | | | | | | | | | |
TOTAL REAL ESTATE REVENUES | | | 127,058,696 | | | | 117,258,355 | | | 92 | % | | | 9,800,341 | | | 8 | % | | 6.5 | % | | 7.2 | % | | -0.7 | % | | | 119,290,922 | | | | 109,418,765 | | | 92 | % | | | 9,872,157 | | | 8 | % |
| | | | | | | | | | | | | | | | | | | | | | | | | | | | | | | | | | | | | | | | | | | | | |
Property operating expenses: | | | | | | | | | | | | | | | | | | | | | | | | | | | | | | | | | | | | | | | | | | | | | |
CAM and real estate taxes | | | (31,777,711 | ) | | | (30,092,057 | ) | | | | | | (1,685,654 | ) | | | | | 14.1 | % | | 15.5 | % | | -7.0 | % | | | (27,860,256 | ) | | | (26,048,029 | ) | | | | | | (1,812,227 | ) | | | |
Utilities | | | (5,827,525 | ) | | | (5,784,732 | ) | | | | | | (42,793 | ) | | | | | 29.8 | % | | 30.1 | % | | -2.4 | % | | | (4,490,966 | ) | | | (4,447,116 | ) | | | | | | (43,850 | ) | | | |
Other property operating expenses | | | (10,912,951 | ) | | | (10,512,941 | ) | | | | | | (400,010 | ) | | | | | 16.1 | % | | 17.6 | % | | -13.3 | % | | | (9,398,814 | ) | | | (8,937,430 | ) | | | | | | (461,384 | ) | | | |
| | | | | | | | | | | | | | | | | | | | | | | | | | | | | | | | | | | | | | | | | | | | | |
TOTAL PROPERTY OPERATING EXPENSES | | | (48,518,187 | ) | | | (46,389,730 | ) | | 96 | % | | | (2,128,457 | ) | | 4 | % | | 16.2 | % | | 17.6 | % | | -8.2 | % | | | (41,750,036 | ) | | | (39,432,575 | ) | | 94 | % | | | (2,317,461 | ) | | 6 | % |
| | | | | | | | | | | | | | | | | | | | | | | | | | | | | | | | | | | | | | | | | | | | | |
NET OPERATING INCOME | | | 78,540,509 | | | | 70,868,625 | | | 90 | % | | | 7,671,884 | | | 10 | % | | 1.3 | % | | 1.3 | % | | 1.6 | % | | | 77,540,886 | | | | 69,986,190 | | | 90 | % | | | 7,554,696 | | | 10 | % |
Income taxes | | | (78,162 | ) | | | (64,320 | ) | | | | | | (13,842 | ) | | | | | N/A | | | N/A | | | N/A | | | | — | | | | — | | | | | | | — | | | | |
Interest expense | | | (20,317,844 | ) | | | (18,672,825 | ) | | | | | | (1,645,019 | ) | | | | | 7.1 | % | | 9.5 | % | | -14.2 | % | | | (18,963,919 | ) | | | (17,047,356 | ) | | | | | | (1,916,563 | ) | | | |
Depreciation and amortization | | | (29,965,307 | ) | | | (27,417,706 | ) | | | | | | (2,547,601 | ) | | | | | 10.6 | % | | 18.6 | % | | -36.1 | % | | | (27,095,720 | ) | | | (23,111,854 | ) | | | | | | (3,983,866 | ) | | | |
| | | | | | | | | | | | | | | | | | | | | | | | | | | | | | | | | | | | | | | | | | | | | |
OTHER EXPENSES | | | (50,361,313 | ) | | | (46,154,851 | ) | | | | | | (4,206,462 | ) | | | | | 9.3 | % | | 14.9 | % | | -28.7 | % | | | (46,059,639 | ) | | | (40,159,210 | ) | | | | | | (5,900,429 | ) | | | |
| | | | | | | | | | | | | | | | | | | | | | | | | | | | | | | | | | | | | | | | | | | | | |
Gains on sales of interests in real estate | | | 2,348,101 | | | | (74,035 | ) | | | | | | 2,422,136 | | | | | | N/A | | | N/A | | | N/A | | | | (45,001 | ) | | | — | | | | | | | (45,001 | ) | | | |
| | | | | | | | | | | | | | | | | | | | | | | | | | | | | | | | | | | | | | | | | | | | | |
Income before minority interest | | | 30,527,297 | | | | 24,639,739 | | | | | | | 5,887,558 | | | | | | -2.9 | % | | -17.4 | % | | 265.9 | % | | | 31,436,246 | | | | 29,826,980 | | | | | | | 1,609,266 | | | | |
| | | | | | | | | | | | | | | | | | | | | | | | | | | | | | | | | | | | | | | | | | | | | |
Minority interest | | | (51,561 | ) | | | (51,561 | ) | | | | | | — | | | | | | -20.6 | % | | -20.6 | % | | N/A | | | | (64,900 | ) | | | (64,900 | ) | | | | | | — | | | | |
| | | | | | | | | | | | | | | | | | | | | | | | | | | | | | | | | | | | | | | | | | | | | |
NET INCOME | | $ | 30,475,736 | | | $ | 24,588,178 | | | | | | $ | 5,887,558 | | | | | | -2.9 | % | | -17.4 | % | | 265.9 | % | | $ | 31,371,346 | | | $ | 29,762,080 | | | | | | $ | 1,609,266 | | | | |
| | | | | | | | | | | | | | | | | | | | | | | | | | | | | | | | | | | | | | | | | | | | | |
| | | | | | | | | | | | | |
| SAME STORE COMPARISON | | | | | | | | | | | | | | | | | | | | | | | | | | | | | | | | | | | | | | | | | | | | | |
| | | Three months ended December 31, 2005 | | | % Change TOTAL(1) | | | % Change Enclosed Mall | | | % Change Power and Strip
Center | | | Three months ended December 31, 2004 | |
| | Total | | | Enclosed Mall | | | Power and
Strip Center | | | | | | Total | | | Enclosed Mall | | | Power and
Strip Center | |
| | | | | | | | | |
Real estate revenues: | | | | | | | | | | | | | | | | | | | | | | | | | | | | | | | | | | | | | | | | | | | | | |
Base rents | | $ | 72,085,790 | | | $ | 64,642,174 | | | | | | $ | 7,443,616 | | | | | | -1.3 | % | | -1.2 | % | | -2.0 | % | | $ | 73,007,673 | | | $ | 65,411,671 | | | | | | $ | 7,596,002 | | | | |
Straight line rents | | | 979,846 | | | | 844,593 | | | | | | | 135,253 | | | | | | -27.6 | % | | -30.0 | % | | -7.5 | % | | | 1,352,466 | | | | 1,206,309 | | | | | | | 146,157 | | | | |
Percentage rents | | | 4,304,413 | | | | 4,172,774 | | | | | | | 131,639 | | | | | | -11.2 | % | | -12.2 | % | | 40.5 | % | | | 4,848,991 | | | | 4,755,284 | | | | | | | 93,707 | | | | |
Expense reimbursements | | | 31,434,235 | | | | 29,802,088 | | | | | | | 1,632,147 | | | | | | 7.4 | % | | 6.9 | % | | 18.5 | % | | | 29,254,840 | | | | 27,877,090 | | | | | | | 1,377,750 | | | | |
Lease termination revenue | | | 478,952 | | | | 477,639 | | | | | | | 1,313 | | | | | | -61.8 | % | | -61.9 | % | | N/A | | | | 1,252,868 | | | | 1,252,868 | | | | | | | — | | | | |
Other real estate revenues | | | 7,096,231 | | | | 7,020,345 | | | | | | | 75,886 | | | | | | -0.6 | % | | -1.0 | % | | 67.1 | % | | | 7,136,041 | | | | 7,090,627 | | | | | | | 45,414 | | | | |
| | | | | | | | | | | | | | | | | | | | | | | | | | | | | | | | | | | | | | | | | | | | | |
TOTAL REAL ESTATE REVENUES | | | 116,379,467 | | | | 106,959,613 | | | 92 | % | | | 9,419,854 | | | 8 | % | | -0.4 | % | | -0.6 | % | | 1.7 | % | | | 116,852,879 | | | | 107,593,849 | | | 92 | % | | | 9,259,030 | | | 8 | % |
| | | | | | | | | | | | | | | | | | | | | | | | | | | | | | | | | | | | | | | | | | | | | |
Property operating expenses: | | | | | | | | | | | | | | | | | | | | | | | | | | | | | | | | | | | | | | | | | | | | | |
CAM and real estate taxes | | | (28,540,225 | ) | | | (26,981,442 | ) | | | | | | (1,558,783 | ) | | | | | 5.9 | % | | 6.8 | % | | -8.0 | % | | | (26,959,631 | ) | | | (25,265,823 | ) | | | | | | (1,693,808 | ) | | | |
Utilities | | | (5,723,126 | ) | | | (5,683,817 | ) | | | | | | (39,309 | ) | | | | | 26.9 | % | | 27.3 | % | | -14.6 | % | | | (4,510,779 | ) | | | (4,464,760 | ) | | | | | | (46,019 | ) | | | |
Other property operating expenses | | | (9,653,537 | ) | | | (9,272,087 | ) | | | | | | (381,450 | ) | | | | | 4.6 | % | | 5.2 | % | | -6.3 | % | | | (9,224,873 | ) | | | (8,817,821 | ) | | | | | | (407,052 | ) | | | |
| | | | | | | | | | | | | | | | | | | | | | | | | | | | | | | | | | | | | | | | | | | | | |
TOTAL PROPERTY OPERATING EXPENSES | | | (43,916,888 | ) | | | (41,937,346 | ) | | 95 | % | | | (1,979,542 | ) | | 5 | % | | 7.9 | % | | 8.8 | % | | -7.8 | % | | | (40,695,283 | ) | | | (38,548,404 | ) | | 95 | % | | | (2,146,879 | ) | | 5 | % |
| | | | | | | | | | | | | | | | | | | | | | | | | | | | | | | | | | | | | | | | | | | | | |
NET OPERATING INCOME | | | 72,462,579 | | | | 65,022,267 | | | 90 | % | | | 7,440,312 | | | 10 | % | | -4.9 | % | | -5.8 | % | | 4.6 | % | | | 76,157,596 | | | | 69,045,445 | | | 91 | % | | | 7,112,151 | | | 9 | % |
Income taxes | | | (78,162 | ) | | | (64,320 | ) | | | | | | (13,842 | ) | | | | | N/A | | | N/A | | | N/A | | | | — | | | | — | | | | | | | — | | | | |
Interest expense | | | (19,338,042 | ) | | | (17,693,023 | ) | | | | | | (1,645,019 | ) | | | | | 2.8 | % | | 4.7 | % | | -14.2 | % | | | (18,818,833 | ) | | | (16,902,270 | ) | | | | | | (1,916,563 | ) | | | |
Depreciation and amortization | | | (27,055,849 | ) | | | (24,572,107 | ) | | | | | | (2,483,742 | ) | | | | | 2.2 | % | | 8.7 | % | | -35.8 | % | | | (26,485,866 | ) | | | (22,615,486 | ) | | | | | | (3,870,380 | ) | | | |
| | | | | | | | | | | | | | | | | | | | | | | | | | | | | | | | | | | | | | | | | | | | | |
OTHER EXPENSES | | | (46,472,053 | ) | | | (42,329,450 | ) | | | | | | (4,142,603 | ) | | | | | 2.6 | % | | 7.1 | % | | -28.4 | % | | | (45,304,699 | ) | | | (39,517,756 | ) | | | | | | (5,786,943 | ) | | | |
| | | | | | | | | | | | | | | | | | | | | | | | | | | | | | | | | | | | | | | | | | | | | |
Gains on sales of interests in real estate | | | — | | | | — | | | | | | | — | | | | | | N/A | | | N/A | | | N/A | | | | — | | | | — | | | | | | | — | | | | |
| | | | | | | | | | | | | | | | | | | | | | | | | | | | | | | | | | | | | | | | | | | | | |
Income before minority interest | | | 25,990,526 | | | | 22,692,817 | | | | | | | 3,297,709 | | | | | | -15.8 | % | | -23.1 | % | | 148.8 | % | | | 30,852,897 | | | | 29,527,689 | | | | | | | 1,325,208 | | | | |
| | | | | | | | | | | | | | | | | | | | | | | | | | | | | | | | | | | | | | | | | | | | | |
Minority interest | | | (51,561 | ) | | | (51,561 | ) | | | | | | — | | | | | | -22.1 | % | | -22.1 | % | | N/A | | | | (66,183 | ) | | | (66,183 | ) | | | | | | — | | | | |
| | | | | | | | | | | | | | | | | | | | | | | | | | | | | | | | | | | | | | | | | | | | | |
NET INCOME | | $ | 25,938,965 | | | $ | 22,641,256 | | | | | | $ | 3,297,709 | | | | | | -15.7 | % | | -23.1 | % | | 148.8 | % | | $ | 30,786,714 | | | $ | 29,461,506 | | | | | | $ | 1,325,208 | | | | |
| | | | | | | | | | | | | | | | | | | | | | | | | | | | | | | | | | | | | | | | | | | | | |
| (1) | Includes PREIT’s proportionate share of partnership investments “grossed up” to reflect the Company’s share of the total revenues and expenses of the underlying properties. |
PAGE 12
Pennsylvania REIT
QUARTERLY SUPPLEMENTAL DISCLOSURE (December 31, 2005)
RETAIL PROPERTY TYPE ANNUAL COMPARISON(1)
| | | | | | | | | | | | | | | | | | | | | | | | | | | | | | | | | | | | | | | | | | | | | |
| | | Twelve months ended December 31, 2005 | | | | | | | | | | | | Twelve months ended December 31, 2004 | |
| | Total | | | Enclosed Mall | | | Power and Strip
Center | | | % Change Total | | | % Change Enclosed Mall | | | % Change Power and Strip
Center | | | Total | | | Enclosed Mall | | | Power and Strip
Center | |
| | | | | | | | | |
Real estate revenues: | | | | | | | | | | | | | | | | | | | | | | | | | | | | | | | | | | | | | | | | | | | | | |
Base rents | | $ | 293,138,440 | | | $ | 262,017,284 | | | | | | $ | 31,121,156 | | | | | | 2.3 | % | | 3.3 | % | | -5.3 | % | | $ | 286,439,527 | | | $ | 253,572,088 | | | | | | $ | 32,867,439 | | | | |
Straight line rent | | | 4,374,178 | | | | 3,756,409 | | | | | | | 617,769 | | | | | | -16.1 | % | | -19.8 | % | | 16.8 | % | | | 5,211,964 | | | | 4,682,948 | | | | | | | 529,016 | | | | |
Percentage rents | | | 10,678,811 | | | | 10,433,691 | | | | | | | 245,120 | | | | | | 2.0 | % | | 2.0 | % | | 3.2 | % | | | 10,466,743 | | | | 10,229,269 | | | | | | | 237,474 | | | | |
Expense reimbursements | | | 132,841,967 | | | | 125,844,991 | | | | | | | 6,996,976 | | | | | | 4.4 | % | | 4.4 | % | | 5.6 | % | | | 127,206,258 | | | | 120,577,404 | | | | | | | 6,628,854 | | | | |
Lease termination revenue | | | 3,297,558 | | | | 1,810,497 | | | | | | | 1,487,061 | | | | | | -16.6 | % | | -26.2 | % | | -0.9 | % | | | 3,953,471 | | | | 2,453,471 | | | | | | | 1,500,000 | | | | |
Other real estate revenues | | | 17,645,038 | | | | 17,399,240 | | | | | | | 245,798 | | | | | | 4.8 | % | | 4.2 | % | | 71.3 | % | | | 16,844,326 | | | | 16,700,831 | | | | | | | 143,495 | | | | |
| | | | | | | | | | | | | | | | | | | | | | | | | | | | | | | | | | | | | | | | | | | | | |
TOTAL REAL ESTATE REVENUES | | | 461,975,992 | | | | 421,262,112 | | | 91 | % | | | 40,713,880 | | | 9 | % | | 2.6 | % | | 3.2 | % | | -2.8 | % | | | 450,122,289 | | | | 408,216,011 | | | 91 | % | | | 41,906,278 | | | 9 | % |
| | | | | | | | | | | | | | | | | | | | | | | | | | | | | | | | | | | | | | | | | | | | | |
Property operating expenses | | | | | | | | | | | | | | | | | | | | | | | | | | | | | | | | | | | | | | | | | | | | | |
CAM and real estate taxes | | | (121,934,245 | ) | | | (114,762,903 | ) | | | | | | (7,171,342 | ) | | | | | 5.8 | % | | 6.2 | % | | -1.0 | % | | | (115,257,420 | ) | | | (108,016,683 | ) | | | | | | (7,240,737 | ) | | | |
Utilities | | | (23,747,772 | ) | | | (23,556,618 | ) | | | | | | (191,154 | ) | | | | | 4.3 | % | | 4.4 | % | | -6.5 | % | | | (22,771,227 | ) | | | (22,566,869 | ) | | | | | | (204,358 | ) | | | |
Other property operating expenses | | | (29,243,028 | ) | | | (28,111,983 | ) | | | | | | (1,131,045 | ) | | | | | -0.1 | % | | 1.1 | % | | -22.3 | % | | | (29,260,815 | ) | | | (27,804,516 | ) | | | | | | (1,456,299 | ) | | | |
| | | | | | | | | | | | | | | | | | | | | | | | | | | | | | | | | | | | | | | | | | | | | |
TOTAL PROPERTY OPERATING EXPENSES | | | (174,925,045 | ) | | | (166,431,504 | ) | | 95 | % | | | (8,493,541 | ) | | 5 | % | | 4.6 | % | | 5.1 | % | | -4.6 | % | | | (167,289,462 | ) | | | (158,388,068 | ) | | 95 | % | | | (8,901,394 | ) | | 5 | % |
| | | | | | | | | | | | | | | | | | | | | | | | | | | | | | | | | | | | | | | | | | | | | |
NET OPERATING INCOME | | | 287,050,947 | | | | 254,830,608 | | | 89 | % | | | 32,220,339 | | | 11 | % | | 1.5 | % | | 2.0 | % | | -2.4 | % | | | 282,832,827 | | | | 249,827,943 | | | 88 | % | | | 33,004,884 | | | 12 | % |
Income taxes | | | (597,141 | ) | | | (424,838 | ) | | | | | | (172,303 | ) | | | | | N/A | | | N/A | | | N/A | | | | — | | | | — | | | | | | | — | | | | |
Interest expense | | | (76,722,799 | ) | | | (69,806,076 | ) | | | | | | (6,916,723 | ) | | | | | 0.5 | % | | 0.7 | % | | -1.3 | % | | | (76,361,408 | ) | | | (69,353,966 | ) | | | | | | (7,007,442 | ) | | | |
Depreciation and amortization | | | (113,408,115 | ) | | | (103,197,278 | ) | | | | | | (10,210,837 | ) | | | | | 11.1 | % | | 14.2 | % | | -12.9 | % | | | (102,110,517 | ) | | | (90,387,062 | ) | | | | | | (11,723,455 | ) | | | |
| | | | | | | | | | | | | | | | | | | | | | | | | | | | | | | | | | | | | | | | | | | | | |
OTHER EXPENSES | | | (190,728,055 | ) | | | (173,428,192 | ) | | | | | | (17,299,863 | ) | | | | | 6.9 | % | | 8.6 | % | | -7.6 | % | | | (178,471,925 | ) | | | (159,741,028 | ) | | | | | | (18,730,897 | ) | | | |
| | | | | | | | | | | | | | | | | | | | | | | | | | | | | | | | | | | | | | | | | | | | | |
Gains on sales of interests in real estate | | | 8,068,683 | | | | 5,031,507 | | | | | | | 3,037,176 | | | | | | 443.6 | % | | N/A | | | 104.6 | % | | | 1,484,182 | | | | — | | | | | | | 1,484,182 | | | | |
| | | | | | | | | | | | | | | | | | | | | | | | | | | | | | | | | | | | | | | | | | | | | |
Income before minority interest | | | 104,391,575 | | | | 86,433,923 | | | | | | | 17,957,652 | | | | | | -1.4 | % | | -4.1 | % | | 14.0 | % | | | 105,845,084 | | | | 90,086,915 | | | | | | | 15,758,169 | | | | |
| | | | | | | | | | | | | | | | | | | | | | | | | | | | | | | | | | | | | | | | | | | | | |
Minority interest | | | (178,614 | ) | | | (178,614 | ) | | | | | | — | | | | | | -71.6 | % | | -71.6 | % | | N/A | | | | (629,599 | ) | | | (629,599 | ) | | | | | | — | | | | |
| | | | | | | | | | | | | | | | | | | | | | | | | | | | | | | | | | | | | | | | | | | | | |
NET INCOME | | $ | 104,212,961 | | | $ | 86,255,309 | | | | | | $ | 17,957,652 | | | | | | -1.0 | % | | -3.6 | % | | 14.0 | % | | $ | 105,215,485 | | | $ | 89,457,316 | | | | | | $ | 15,758,169 | | | | |
| | | | | | | | | | | | | | | | | | | | | | | | | | | | | | | | | | | | | | | | | | | | | |
| | | | | |
| | | Twelve months ended December 31, 2005 | | | | | | | | | | | | Twelve months ended December 31, 2004 | |
SAME STORE
COMPARISON | | Total | | | Enclosed Mall | | | Power and Strip
Center | | | % Change TOTAL (1) | | | % Change Enclosed Mall | | | % Change Power and
Strip Center | | | Total | | | Enclosed Mall | | | Power and Strip
Center | |
| | | | | | | | | |
Real estate revenues: | | | | | | | | | | | | | | | | | | | | | | | | | | | | | | | | | | | | | | | | | | | | | |
Base rents | | $ | 264,555,103 | | | $ | 234,733,736 | | | | | | $ | 29,821,367 | | | | | | -0.7 | % | | -0.5 | % | | -2.1 | % | | $ | 266,338,372 | | | $ | 235,863,650 | | | | | | $ | 30,474,722 | | | | |
Straight line rent | | | 3,497,726 | | | | 2,872,666 | | | | | | | 625,060 | | | | | | -28.9 | % | | -34.0 | % | | 9.2 | % | | | 4,922,122 | | | | 4,349,621 | | | | | | | 572,501 | | | | |
Percentage rents | | | 9,854,540 | | | | 9,609,420 | | | | | | | 245,120 | | | | | | -0.6 | % | | -0.7 | % | | 3.2 | % | | | 9,914,364 | | | | 9,676,890 | | | | | | | 237,474 | | | | |
Expense reimbursements | | | 121,493,936 | | | | 114,903,110 | | | | | | | 6,590,826 | | | | | | 1.3 | % | | 0.8 | % | | 9.4 | % | | | 119,989,836 | | | | 113,964,113 | | | | | | | 6,025,723 | | | | |
Lease termination revenue | | | 2,280,072 | | | | 1,725,997 | | | | | | | 554,075 | | | | | | -42.3 | % | | -29.7 | % | | -63.1 | % | | | 3,953,472 | | | | 2,453,472 | | | | | | | 1,500,000 | | | | |
Other real estate revenues | | | 15,885,525 | | | | 15,643,124 | | | | | | | 242,401 | | | | | | -0.3 | % | | -0.9 | % | | 62.6 | % | | | 15,926,791 | | | | 15,777,696 | | | | | | | 149,095 | | | | |
| | | | | | | | | | | | | | | | | | | | | | | | | | | | | | | | | | | | | | | | | | | | | |
TOTAL REAL ESTATE REVENUES | | | 417,566,902 | | | | 379,488,053 | | | 91 | % | | | 38,078,849 | | | 9 | % | | -0.8 | % | | -0.7 | % | | -2.3 | % | | | 421,044,957 | | | | 382,085,442 | | | 91 | % | | | 38,959,515 | | | 9 | % |
| | | | | | | | | | | | | | | | | | | | | | | | | | | | | | | | | | | | | | | | | | | | | |
Property operating expenses: | | | | | | | | | | | | | | | | | | | | | | | | | | | | | | | | | | | | | | | | | | | | | |
CAM and real estate taxes | | | (109,144,353 | ) | | | (102,498,231 | ) | | | | | | (6,646,122 | ) | | | | | 3.9 | % | | 4.1 | % | | 0.3 | % | | | (105,086,527 | ) | | | (98,460,306 | ) | | | | | | (6,626,221 | ) | | | |
Utilities | | | (22,611,394 | ) | | | (22,450,790 | ) | | | | | | (160,604 | ) | | | | | 8.9 | % | | 9.1 | % | | -13.8 | % | | | (20,759,785 | ) | | | (20,573,532 | ) | | | | | | (186,253 | ) | | | |
Other property operating expenses | | | (24,738,841 | ) | | | (23,660,173 | ) | | | | | | (1,078,668 | ) | | | | | -7.8 | % | | -7.2 | % | | -19.2 | % | | | (26,840,246 | ) | | | (25,505,457 | ) | | | | | | (1,334,789 | ) | | | |
| | | | | | | | | | | | | | | | | | | | | | | | | | | | | | | | | | | | | | | | | | | | | |
TOTAL PROPERTY OPERATING EXPENSES | | | (156,494,588 | ) | | | (148,609,194 | ) | | 95 | % | | | (7,885,394 | ) | | 5 | % | | 2.5 | % | | 2.8 | % | | -3.2 | % | | | (152,686,558 | ) | | | (144,539,295 | ) | | 95 | % | | | (8,147,263 | ) | | 5 | % |
| | | | | | | | | | | | | | | | | | | | | | | | | | | | | | | | | | | | | | | | | | | | | |
NET OPERATING INCOME | | | 261,072,314 | | | | 230,878,859 | | | 88 | % | | | 30,193,455 | | | 12 | % | | -2.7 | % | | -2.8 | % | | -2.0 | % | | | 268,358,399 | | | | 237,546,147 | | | 89 | % | | | 30,812,252 | | | 11 | % |
Income taxes | | | (451,608 | ) | | | (279,305 | ) | | | | | | (172,303 | ) | | | | | N/A | | | N/A | | | N/A | | | | — | | | | — | | | | | | | — | | | | |
Interest expense | | | (73,548,489 | ) | | | (66,631,766 | ) | | | | | | (6,916,723 | ) | | | | | -0.8 | % | | -0.8 | % | | -1.3 | % | | | (74,158,720 | ) | | | (67,151,278 | ) | | | | | | (7,007,442 | ) | | | |
Depreciation and amortization | | | (102,012,684 | ) | | | (92,222,608 | ) | | | | | | (9,790,076 | ) | | | | | 2.1 | % | | 3.9 | % | | -12.0 | % | | | (99,893,860 | ) | | | (88,771,621 | ) | | | | | | (11,122,239 | ) | | | |
| | | | | | | | | | | | | | | | | | | | | | | | | | | | | | | | | | | | | | | | | | | | | |
OTHER EXPENSES | | | (176,012,781 | ) | | | (159,133,679 | ) | | | | | | (16,879,102 | ) | | | | | 1.1 | % | | 2.1 | % | | -6.9 | % | | | (174,052,580 | ) | | | (155,922,899 | ) | | | | | | (18,129,681 | ) | | | |
| | | | | | | | | | | | | | | | | | | | | | | | | | | | | | | | | | | | | | | | | | | | | |
Gains on sales of interests in real estate | | | 628,422 | | | | 60,536 | | | | | | | 567,886 | | | | | | N/A | | | N/A | | | N/A | | | | — | | | | — | | | | | | | — | | | | |
| | | | | | | | | | | | | | | | | | | | | | | | | | | | | | | | | | | | | | | | | | | | | |
Income before minority interest | | | 85,687,955 | | | | 71,805,716 | | | | | | | 13,882,239 | | | | | | -9.1 | % | | -12.0 | % | | 9.5 | % | | | 94,305,819 | | | | 81,623,248 | | | | | | | 12,682,571 | | | | |
| | | | | | | | | | | | | | | | | | | | | | | | | | | | | | | | | | | | | | | | | | | | | |
Minority interest | | | (178,581 | ) | | | (178,581 | ) | | | | | | — | | | | | | -70.8 | % | | -70.8 | % | | N/A | | | | (611,174 | ) | | | (611,174 | ) | | | | | | — | | | | |
| | | | | | | | | | | | | | | | | | | | | | | | | | | | | | | | | | | | | | | | | | | | | |
NET INCOME | | $ | 85,509,374 | | | $ | 71,627,135 | | | | | | $ | 13,882,239 | | | | | | -8.7 | % | | -11.6 | % | | 9.5 | % | | $ | 93,694,645 | | | $ | 81,012,074 | | | | | | $ | 12,682,571 | | | | |
| | | | | | | | | | | | | | | | | | | | | | | | | | | | | | | | | | | | | | | | | | | | | |
| (1) | Includes PREIT’s proportionate share of partnership investments “grossed up” to reflect the Company’s share of the total revenues and expenses of the underlying properties. |
PAGE 13
Pennsylvania REIT
QUARTERLY SUPPLEMENTAL DISCLOSURE (December 31, 2005)
EARNINGS PER SHARE
| | | | | | | | | | | | | | | | |
| | | Three months ended
December 31, | | | Twelve months ended
December 31, | |
| | | 2005 | | | 2004 | | | 2005 | | | 2004 | |
Net income from continuing operations | | $ | 16,685,598 | | | $ | 18,546,251 | | | $ | 49,493,538 | | | $ | 46,502,691 | |
Dividends on preferred shares | | | (3,403,125 | ) | | | (3,403,125 | ) | | | (13,612,500 | ) | | | (13,612,500 | ) |
| | | | | | | | | | | | | | | | |
Net income from continuing operations available to common shareholders | | | 13,282,473 | | | | 15,143,126 | | | | 35,881,038 | | | | 32,890,191 | |
Dividends on unvested restricted shares | | | (263,713 | ) | | | (185,186 | ) | | | (1,033,905 | ) | | | (732,894 | ) |
| | | | | | | | | | | | | | | | |
Income from continuing operations used to calculate earnings per share - basic | | | 13,018,760 | | | | 14,957,940 | | | | 34,847,133 | | | | 32,157,297 | |
Minority interest in properties-continuing operations | | | 51,561 | | | | 66,183 | | | | 178,581 | | | | 611,173 | |
| | | | | | | | | | | | | | | | |
Income from continuing operations used to calculate earnings per share - diluted | | $ | 13,070,321 | | | $ | 15,024,123 | | | $ | 35,025,714 | | | $ | 32,768,470 | |
| | | | | | | | | | | | | | | | |
Income from discontinued operations - basic | | $ | 2,753,125 | | | $ | 618,247 | | | $ | 8,135,636 | | | $ | 7,284,917 | |
Minority interest in properties-discontinued operations | | | — | | | | (1,283 | ) | | | 33 | | | | 18,426 | |
| | | | | | | | | | | | | | | | |
Income from discontinued operations - diluted | | $ | 2,753,125 | | | $ | 616,964 | | | $ | 8,135,669 | | | $ | 7,303,343 | |
| | | | | | | | | | | | | | | | |
Basic earnings per share: | | | | | | | | | | | | | | | | |
Income from continuing operations | | $ | 0.36 | | | $ | 0.42 | | | $ | 0.97 | | | $ | 0.90 | |
Income from discontinued operations | | | 0.08 | | | | 0.02 | | | | 0.22 | | | | 0.21 | |
| | | | | | | | | | | | | | | | |
| | $ | 0.44 | | | $ | 0.44 | | | $ | 1.19 | | | $ | 1.11 | |
| | | | | | | | | | | | | | | | |
Diluted earnings per share: | | | | | | | | | | | | | | | | |
Income from continuing operations | | $ | 0.36 | | | $ | 0.41 | | | $ | 0.95 | | | $ | 0.90 | |
Income from discontinued operations | | | 0.07 | | | | 0.02 | | | | 0.22 | | | | 0.20 | |
| | | | | | | | | | | | | | | | |
| | $ | 0.43 | | | $ | 0.43 | | | $ | 1.17 | | | $ | 1.10 | |
| | | | | | | | | | | | | | | | |
Weighted average of common shares outstanding | | | 36,670,408 | | | | 36,159,747 | | | | 36,535,376 | | | | 35,928,885 | |
Weighted average of unvested restricted stock | | | (460,014 | ) | | | (340,960 | ) | | | (445,506 | ) | | | (319,535 | ) |
| | | | | | | | | | | | | | | | |
Weighted average shares outstanding-basic | | | 36,210,394 | | | | 35,818,787 | | | | 36,089,870 | | | | 35,609,350 | |
Weighted average effect of common share equivalents | | | 614,543 | | | | 718,157 | | | | 672,506 | | | | 659,461 | |
| | | | | | | | | | | | | | | | |
Total weighted average shares outstanding-diluted | | | 36,824,937 | | | | 36,536,944 | | | | 36,762,376 | | | | 36,268,811 | |
| | | | | | | | | | | | | | | | |
PAGE 14
Pennsylvania REIT
QUARTERLY SUPPLEMENTAL DISCLOSURE (December 31, 2005)
FUNDS FROM OPERATIONS (FFO)(1)
| | | | | | | | | | | | | | | | | | | | | | |
| | | Three months ended December 31, | | | Twelve months ended December 31, | |
| | | 2005 | | | 2004 | | | % Change | | | 2005 | | | 2004 | | | % Change | |
Net income | | $ | 19,438,723 | | | $ | 19,164,499 | | | 1.4 | % | | $ | 57,629,175 | | | $ | 53,787,609 | | | 7.1 | % |
Dividends on preferred shares | | | (3,403,125 | ) | | | (3,403,125 | ) | | 0.0 | % | | | (13,612,500 | ) | | | (13,612,500 | ) | | 0.0 | % |
| | | | | | | | | | | | | | | | | | | | | | |
Net income available to common shareholders | | $ | 16,035,598 | | | $ | 15,761,374 | | | 1.7 | % | | $ | 44,016,675 | | | $ | 40,175,109 | | | 9.6 | % |
Minority interest in operating partnership-continuing operations | | | 2,050,708 | | | | 2,466,827 | | | -16.9 | % | | | 6,205,301 | | | | 5,665,147 | | | 9.5 | % |
Minority interest in operating partnership-discontinued operations | | | 338,406 | | | | (109,365 | ) | | -409.4 | % | | | 1,020,046 | | | | 653,327 | | | 56.1 | % |
Gains on sales of interests in real estate | | | 74,035 | | | | 45,001 | | | 64.5 | % | | | (5,586,011 | ) | | | (1,484,182 | ) | | 276.4 | % |
Gains and adjustments to gains on disposition of discontinued operations | | | (2,422,136 | ) | | | — | | | N/A | | | | (6,158,551 | ) | | | 550,000 | | | N/A | |
Depreciation and amortization: (2) | | | | | | | | | | | | | | | | | | | | | | |
Wholly owned and consolidated partnerships | | | 28,468,894 | | | | 24,292,367 | | | 17.2 | % | | | 107,873,898 | | | | 95,359,067 | | | 13.1 | % |
Unconsolidated partnerships | | | 1,295,366 | | | | 2,558,956 | | | -49.4 | % | | | 4,581,995 | | | | 5,780,885 | | | -20.7 | % |
Discontinued operations | | | 63,859 | | | | 126,026 | | | -49.3 | % | | | 433,301 | | | | 502,361 | | | -13.7 | % |
| | | | | | | | | | | | | | | | | | | | | | |
FFO | | $ | 45,904,730 | | | $ | 45,141,186 | | | 1.7 | % | | $ | 152,386,654 | | | $ | 147,201,714 | | | 3.5 | % |
| | | | | | | | | | | | | | | | | | | | | | |
Minority interest in properties | | | 123,749 | | | | 130,811 | | | -5.4 | % | | | 450,075 | | | | 473,629 | | | -5.0 | % |
| | | | | | | | | | | | | | | | | | | | | | |
FFO for diluted calculation | | $ | 46,028,479 | | | $ | 45,271,997 | | | 1.7 | % | | $ | 152,836,729 | | | $ | 147,675,343 | | | 3.5 | % |
| | | | | | | | | | | | | | | | | | | | | | |
FUNDS AVAILABLE FOR DISTRIBUTION (FAD) | | | | | | | | | | | | | | | | | | | | | | |
FFO | | $ | 45,904,730 | | | $ | 45,141,186 | | | 1.7 | % | | $ | 152,386,654 | | | $ | 147,201,714 | | | 3.5 | % |
Adjustments: | | | | | | | | | | | | | | | | | | | | | | |
Straight line rents | | | (1,167,582 | ) | | | (1,374,760 | ) | | -15.1 | % | | | (4,374,178 | ) | | | (5,211,964 | ) | | -16.1 | % |
Recurring capital expenditures | | | (6,047,000 | ) | | | (3,989,314 | ) | | 51.6 | % | | | (15,357,000 | ) | | | (8,905,629 | ) | | 72.4 | % |
Tenant allowances | | | (6,364,000 | ) | | | (9,164,115 | ) | | -30.6 | % | | | (18,201,000 | ) | | | (11,660,288 | ) | | 56.1 | % |
Capitalized leasing costs | | | (1,011,044 | ) | | | (1,221,605 | ) | | -17.2 | % | | | (3,574,175 | ) | | | (2,912,712 | ) | | 22.7 | % |
Amortization of debt premium | | | (4,245,756 | ) | | | (4,811,196 | ) | | -11.8 | % | | | (18,773,323 | ) | | | (19,353,620 | ) | | -3.0 | % |
Amortization of above- and below-market lease intangibles | | | 877,375 | | | | 115,173 | | | 661.8 | % | | | 1,384,615 | | | | 707,192 | | | 95.8 | % |
| | | | | | | | | | | | | | | | | | | | | | |
FAD | | $ | 27,946,723 | | | $ | 24,695,369 | | | 13.2 | % | | $ | 93,491,593 | | | $ | 99,864,693 | | | -6.4 | % |
| | | | | | | | | | | | | | | | | | | | | | |
Minority interest in properties | | | 123,749 | | | | 130,811 | | | -5.4 | % | | | 450,075 | | | | 473,629 | | | -5.0 | % |
| | | | | | | | | | | | | | | | | | | | | | |
FAD for diluted calculation | | $ | 28,070,472 | | | $ | 24,826,180 | | | 13.1 | % | | $ | 93,941,668 | | | $ | 100,338,322 | | | -6.4 | % |
| | | | | | | | | | | | | | | | | | | | | | |
Weighted average of common shares outstanding | | | 36,210,394 | | | | 35,818,787 | | | 1.1 | % | | | 36,089,870 | | | | 35,609,350 | | | 1.3 | % |
Weighted average of O.P. Units outstanding | | | 4,460,657 | | | | 4,425,874 | | | 0.8 | % | | | 4,580,421 | | | | 4,183,059 | | | 9.5 | % |
| | | | | | | | | | | | | | | | | | | | | | |
Weighted average shares and O.P. Units outstanding-basic | | | 40,671,051 | | | | 40,244,661 | | | 1.1 | % | | | 40,670,291 | | | | 39,792,409 | | | 2.2 | % |
Weighted average effect of common share equivalents | | | 614,543 | | | | 718,157 | | | -14.4 | % | | | 672,506 | | | | 659,461 | | | 2.0 | % |
| | | | | | | | | | | | | | | | | | | | | | |
Total weighted average shares outstanding, including O.P. Units-diluted | | | 41,285,594 | | | | 40,962,818 | | | 0.8 | % | | | 41,342,797 | | | | 40,451,870 | | | 2.2 | % |
| | | | | | | | | | | | | | | | | | | | | | |
Net income per share (diluted) | | $ | 0.43 | | | $ | 0.43 | | | 0.0 | % | | $ | 1.17 | | | $ | 1.10 | | | 6.4 | % |
| | | | | | | | | | | | | | | | | | | | | | |
FFO per share (basic) | | $ | 1.13 | | | $ | 1.12 | | | 0.6 | % | | $ | 3.75 | | | $ | 3.70 | | | 1.3 | % |
| | | | | | | | | | | | | | | | | | | | | | |
FFO per share (diluted) | | $ | 1.11 | | | $ | 1.11 | | | 0.9 | % | | $ | 3.70 | | | $ | 3.65 | | | 1.3 | % |
| | | | | | | | | | | | | | | | | | | | | | |
FAD per Share (basic) | | $ | 0.69 | | | $ | 0.61 | | | 12.0 | % | | $ | 2.30 | | | $ | 2.51 | | | -8.4 | % |
| | | | | | | | | | | | | | | | | | | | | | |
FAD per Share (diluted) | | $ | 0.68 | | | $ | 0.61 | | | 12.2 | % | | $ | 2.27 | | | $ | 2.48 | | | -8.4 | % |
| | | | | | | | | | | | | | | | | | | | | | |
Dividend per Common Share | | $ | 0.57 | | | $ | 0.54 | | | 5.6 | % | | $ | 2.25 | | | $ | 2.16 | | | 4.2 | % |
| | | | | | | | | | | | | | | | | | | | | | |
PAYOUT RATIOS | | | | | | | | | | | | | | | | | | | | | | |
Payout Ratio of FFO | | | 51.1 | % | | | 48.9 | % | | 2.3 | % | | | 60.9 | % | | | 59.2 | % | | 1.7 | % |
| | | | | | | | | | | | | | | | | | | | | | |
Payout Ratio of FAD | | | 83.8 | % | | | 89.1 | % | | -5.3 | % | | | 99.0 | % | | | 87.1 | % | | 11.9 | % |
| | | | | | | | | | | | | | | | | | | | | | |
| (1) | Certain prior period amounts have been reclassified to conform with the current period’s presentation. |
| (2) | Excludes depreciation of non-real estate assets and amortization of deferred financing costs. |
PAGE 15
Pennsylvania REIT
QUARTERLY SUPPLEMENTAL DISCLOSURE (December 31, 2005)
KEY RATIOS
| | | | | | |
| | | For the period ended December 31, | |
| | | 2005 | | | 2004 | |
Coverage Ratio(1) | | | | | | |
Interest Coverage Ratio (EBITDA/Interest Expense) | | 2.79 | | | 2.95 | |
Leverage Ratios(1) | | | | | | |
Debt / Total Market Capitalization | | 54.4 | % | | 46.1 | % |
Operating Ratios(1) | | | | | | |
NOI/Real Estate Revenues | | 62.2 | % | | 62.9 | % |
Return on Investment Ratios(1) | | | | | | |
Total FFO/Equity Market Capitalization, net of preferred shares | | 10.0 | % | | 8.5 | % |
NOI/Total Market Capitalization at Period End | | 8.0 | % | | 8.2 | % |
NOI/Investment in Real Estate at Period End | | 9.4 | % | | 10.6 | % |
Payout Ratios | | | | | | |
FFO Payout Ratio (Dividend/FFO-diluted) per Share | | 60.9 | % | | 59.2 | % |
FAD Payout Ratio (Dividend/FAD-diluted) per Share | | 99.0 | % | | 87.1 | % |
| (1) | The calculation of these ratios includes consolidated properties, including properties held for sale, and PREIT’s proportionate share of partnership properties. |
PAGE 16
Pennsylvania REIT
QUARTERLY SUPPLEMENTAL DISCLOSURE (December 31, 2005)
DEBT SCHEDULE(6)
| | | | | | | | | | | | | | | | | | | | | | | | | | | | | | | |
Property Name | | PREIT’s
Ownership
Interest | | | PREIT’s
Investment
to Date (1) | | PREIT’s
Depreciated Costs | | PREIT’s Share of
O/S Debt and Debt
Premuim | | PREIT’s Share of
Mortgage | | PREIT’s Share of Mortgage
Debt Premium | | Stated
Interest
Rate | | | Marked to
Market
Interest
Rate
(GAAP) | | | Annual
Mortgage Debt
Service | | Mortgage Balance
at Maturity | | Date of
Maturity |
Retail Properties | | | | | | | | | | | | | | | | | | | | | | | | | | | | | | | |
Beaver Valley Mall | | 100 | % | | $ | 56,002,744 | | $ | 50,158,742 | | 46,377,550 | | $ | 46,377,550 | | $ | — | | 7.36 | % | | 7.36 | % | | $ | 3,972,402 | | $ | 42,265,601 | | 2012 |
Capital City Mall | | 100 | % | | | 88,627,806 | | | 84,077,332 | | 57,472,373 | | | 52,236,917 | | | 5,235,456 | | 7.61 | % | | 5.50 | % | | | 4,602,529 | | | 47,842,921 | | 2012 |
Chambersburg Mall(2)(3) | | 89 | % | | | 35,238,383 | | | 33,144,288 | | 19,470,978 | | | 18,360,167 | | | 1,110,811 | | 7.43 | % | | 4.99 | % | | | 1,762,666 | | | 17,199,298 | | 2008 |
Cherry Hill Mall | | 100 | % | | | 209,683,087 | | | 196,206,011 | | 199,554,710 | | | 199,554,710 | | | — | | 5.42 | % | | 5.42 | % | | | 13,509,720 | | | 177,689,279 | | 2012 |
Christiana Power I | | 100 | % | | | 40,705,347 | | | 34,179,269 | | — | | | — | | | — | | — | | | — | | | | — | | | — | | |
Court at Oxford Valley | | 50 | % | | | 27,702,193 | | | 22,152,460 | | 20,598,300 | | | 20,598,300 | | | — | | 8.02 | % | | 8.02 | % | | | 2,319,426 | | | 15,666,965 | | 2011 |
Creekview | | 100 | % | | | 19,094,685 | | | 15,322,314 | | — | | | — | | | — | | — | | | — | | | | — | | | — | | |
Crest Plaza Shopping Center | | 100 | % | | | 16,260,819 | | | 13,784,841 | | — | | | — | | | — | | — | | | — | | | | — | | | — | | |
Crossroads Mall | | 100 | % | | | 32,268,762 | | | 29,950,958 | | 13,690,281 | | | 13,201,663 | | | 488,618 | | 7.39 | % | | 5.75 | % | | | 1,191,103 | | | 12,646,534 | | 2008 |
Cumberland Mall | | 100 | % | | | 55,235,676 | | | 54,153,551 | | 45,843,013 | | | 43,437,867 | | | 2,405,146 | | 6.50 | % | | 5.40 | % | | | 3,413,167 | | | 38,782,132 | | 2012 |
| | | | | | | | | | | 3,662,154 | | | 3,662,154 | | | — | | 5.00 | % | | 5.00 | % | | | 205,512 | | | — | | 2017 |
Dartmouth Mall | | 100 | % | | | 60,547,728 | | | 46,828,324 | | 67,436,109 | | | 67,436,109 | | | — | | 4.95 | % | | 4.95 | % | | | 4,483,668 | | | 57,594,279 | | 2013 |
Echelon Mall | | 100 | % | | | 18,174,896 | | | 15,132,038 | | — | | | — | | | — | | — | | | — | | | | | | | | | |
Exton Square Mall | | 100 | % | | | 144,828,038 | | | 135,128,584 | | 102,010,985 | | | 97,233,723 | | | 4,777,262 | | 6.95 | % | | 5.00 | % | | | 8,102,242 | | | 93,034,213 | | 2008 |
Francis Scott Key Mall(2)(3) | | 89 | % | | | 62,261,927 | | | 58,637,747 | | 34,074,211 | | | 32,130,293 | | | 1,943,918 | | 7.43 | % | | 4.99 | % | | | 3,084,665 | | | 30,098,771 | | 2008 |
Gadsden Mall | | 100 | % | | | 50,448,142 | | | 49,431,844 | | — | | | — | | | — | | — | | | — | | | | — | | | — | | |
Jacksonville Mall(3) | | 100 | % | | | 67,271,553 | | | 63,162,390 | | 26,285,819 | | | 24,786,226 | | | 1,499,593 | | 7.43 | % | | 4.99 | % | | | 2,379,598 | | | 23,219,052 | | 2008 |
Lehigh Valley Mall | | 50 | % | | | 17,952,478 | | | 7,729,216 | | 22,362,216 | | | 22,362,216 | | | — | | 7.90 | % | | 7.90 | % | | | 2,479,260 | | | 21,750,439 | | 2006 |
Logan Valley Mall(3) | | 100 | % | | | 91,916,248 | | | 85,467,637 | | 55,492,286 | | | 52,326,476 | | | 3,165,810 | | 7.43 | % | | 4.99 | % | | | 5,023,597 | | | 49,017,998 | | 2008 |
Lycoming Mall(2)(3) | | 89 | % | | | 57,216,496 | | | 54,009,510 | | 34,074,212 | | | 32,130,293 | | | 1,943,919 | | 7.43 | % | | 4.99 | % | | | 3,084,664 | | | 30,098,771 | | 2008 |
Magnolia Mall | | 100 | % | | | 65,587,418 | | | 54,601,843 | | 65,653,388 | | | 65,653,388 | | | — | | 5.33 | % | | 5.33 | % | | | 4,412,779 | | | 54,212,017 | | 2015 |
Metroplex Shopping Center | | 50 | % | | | 42,023,644 | | | 34,454,151 | | 31,454,736 | | | 31,454,736 | | | — | | 7.25 | % | | 7.25 | % | | | 2,680,953 | | | 28,784,676 | | 2011 |
Moorestown Mall | | 100 | % | | | 76,653,978 | | | 68,587,706 | | 61,896,715 | | | 61,896,715 | | | — | | 4.95 | % | | 4.95 | % | | | 4,115,367 | | | 52,863,321 | | 2013 |
New River Valley Mall(2)(3) | | 89 | % | | | 31,506,372 | | | 29,672,776 | | 16,550,331 | | | 15,606,142 | | | 944,189 | | 7.43 | % | | 4.99 | % | | | 1,498,266 | | | 14,619,403 | | 2008 |
Nittany Mall(2)(3) | | 89 | % | | | 39,587,252 | | | 37,305,822 | | 29,206,467 | | | 27,540,251 | | | 1,666,216 | | 7.43 | % | | 4.99 | % | | | 2,643,998 | | | 25,798,946 | | 2008 |
North Hanover Mall(2)(3) | | 89 | % | | | 29,014,965 | | | 27,173,106 | | 19,470,978 | | | 18,360,167 | | | 1,110,811 | | 7.43 | % | | 4.99 | % | | | 1,762,666 | | | 17,199,298 | | 2008 |
Northeast Tower Center(3) | | 100 | % | | | 33,660,510 | | | 29,420,931 | | 17,037,106 | | | 16,065,146 | | | 971,960 | | 7.43 | % | | 4.99 | % | | | 1,542,332 | | | 15,049,385 | | 2008 |
Orlando Fashion Square | | 100 | % | | | 109,717,743 | | | 106,592,822 | | — | | | — | | | — | | — | | | — | | | | — | | | — | | — |
Palmer Park Mall | | 100 | % | | | 33,543,480 | | | 25,906,162 | | 17,258,579 | | | 17,258,579 | | | — | | 6.77 | % | | 6.77 | % | | | 1,661,220 | | | 15,674,394 | | 2009 |
Patrick Henry Mall(2)(3) | | 89 | % | | | 131,103,136 | | | 125,126,944 | | 49,164,222 | | | 46,359,423 | | | 2,804,799 | | 7.43 | % | | 4.99 | % | | | 4,450,730 | | | 43,428,226 | | 2008 |
Paxton Towne Centre | | 100 | % | | | 53,892,843 | | | 46,270,786 | | — | | | — | | | — | | — | | | — | | | | — | | | — | | — |
Phillipsburg Mall(2)(3) | | 89 | % | | | 49,161,808 | | | 46,247,327 | | 29,206,467 | | | 27,540,251 | | | 1,666,216 | | 7.43 | % | | 4.99 | % | | | 2,643,998 | | | 25,798,946 | | 2008 |
Plymouth Meeting Mall | | 100 | % | | | 81,746,296 | | | 75,499,963 | | — | | | — | | | — | | — | | | — | | | | — | | | — | | — |
Red Rose Commons | | 50 | % | | | 11,941,686 | | | 9,967,487 | | 13,382,870 | | | 13,382,870 | | | — | | 7.66 | % | | 7.66 | % | | | 1,220,048 | | | 12,425,422 | | 2009 |
Schuylkill Mall(4) | | 100 | % | | | 8,267,586 | | | 8,267,586 | | 17,113,872 | | | 17,113,872 | | | — | | 7.25 | % | | 7.25 | % | | | N/A | | | N/A | | 2008 |
Springfield Mall | | 50 | % | | | 47,743,175 | | | 47,617,616 | | 38,250,000 | | | 38,250,000 | | | — | | 5.49 | % | | 5.49 | % | | | 2,272,050 | | | 38,250,000 | | 2007 |
Springfield Park I&II | | 50 | % | | | 7,020,939 | | | 6,208,718 | | 1,723,487 | | | 1,723,487 | | | — | | 7.79 | % | | 7.79 | % | | | 202,561 | | | 1,411,804 | | 2010 |
South Blanding Village | | 100 | % | | | 9,504,950 | | | 5,911,336 | | — | | | — | | | — | | — | | | — | | | | — | | | — | | — |
South Mall(2)(3) | | 89 | % | | | 27,109,930 | | | 25,483,283 | | 14,603,234 | | | 13,770,126 | | | 833,108 | | 7.43 | % | | 4.99 | % | | | 1,321,999 | | | 12,899,473 | | 2008 |
The Commons at Magnolia | | 100 | % | | | 9,784,341 | | | 8,052,781 | | — | | | �� | | | — | | — | | | — | | | | — | | | — | | — |
The Gallery at Market East I | | 100 | % | | | 48,383,058 | | | 44,963,090 | | — | | | — | | | — | | — | | | — | | | | — | | | — | | — |
The Gallery at Market East II | | 100 | % | | | 29,651,016 | | | 28,490,633 | | — | | | — | | | — | | — | | | — | | | | — | | | — | | — |
The Mall at Prince Georges | | 100 | % | | | 92,674,649 | | | 77,007,487 | | 41,724,430 | | | 40,842,108 | | | 882,322 | | 8.70 | % | | 6.80 | % | | | 4,134,936 | | | 39,986,536 | | 2007 |
Uniontown Mall(2)(3) | | 89 | % | | | 35,127,115 | | | 32,512,404 | | 23,365,174 | | | 22,032,201 | | | 1,332,973 | | 7.43 | % | | 4.99 | % | | | 2,155,199 | | | 20,639,157 | | 2008 |
PAGE 17
Pennsylvania REIT
QUARTERLY SUPPLEMENTAL DISCLOSURE (December 31, 2005)
DEBT SCHEDULE(6)
| | | | | | | | | | | | | | | | | | | | | | | | | | | | | | | | |
Property Name | | PREIT’s
Ownership
Interest | | | PREIT’s
Investment to
Date(1) | | PREIT’s
Depreciated Costs | | PREIT’s Share of
O/S Debt and Debt
Premuim | | PREIT’s Share of
Mortgage | | PREIT’s Share of Mortgage
Debt Premium | | Stated
Interest
Rate | | | Marked to
Market
Interest
Rate
(GAAP) | | | Annual
Mortgage Debt
Service | | Mortgage Balance
at Maturity | | Date of
Maturity |
Valley Mall | | 100 | % | | | 86,301,310 | | | 80,371,100 | | | — | | | — | | | — | | — | | | — | | | | — | | | — | | — |
Valley View Mall | | 100 | % | | | 61,166,891 | | | 57,767,519 | | | 36,850,810 | | | 36,400,255 | | | 450,555 | | 6.15 | % | | 5.75 | % | | | 2,773,295 | | | 34,280,656 | | 2009 |
Viewmont Mall(2)(3) | | 89 | % | | | 77,311,261 | | | 73,241,930 | | | 29,206,467 | | | 27,540,251 | | | 1,666,216 | | 7.43 | % | | 4.99 | % | | | 2,643,998 | | | 25,798,946 | | 2008 |
Washington Crown Center(2) | | 89 | % | | | 42,538,203 | | | 38,554,614 | | | — | | | — | | | — | | — | | | — | | | | — | | | — | | — |
Whitehall Mall | | 50 | % | | | 15,626,809 | | | 9,422,175 | | | 6,728,583 | | | 6,728,583 | | | — | | 6.77 | % | | 6.77 | % | | | 641,436 | | | 6,128,937 | | 2008 |
Willow Grove Park | | 100 | % | | | 176,107,325 | | | 159,421,779 | | | 160,000,000 | | | 160,000,000 | | | — | | 5.65 | % | | 5.65 | % | | | 11,082,927 | | | 133,248,622 | | 2015 |
Wiregrass Mall | | 100 | % | | | 37,458,994 | | | 35,213,505 | | | — | | | — | | | — | | — | | | — | | | | — | | | — | | — |
Woodland Mall(5) | | 100 | % | | | 160,044,109 | | | 160,019,953 | | | — | | | — | | | — | | — | | | — | | | | — | | | — | | — |
Wyoming Valley Mall(3) | | 100 | % | | | 91,736,246 | | | 86,876,398 | | | 55,492,287 | | | 52,326,477 | | | 3,165,810 | | 7.43 | % | | 4.99 | % | | | 5,023,597 | | | 49,017,998 | | 2008 |
Westgate Anchor Pad | | 100 | % | | | 3,399,600 | | | 3,399,600 | | | — | | | — | | | — | | — | | | — | | | | — | | | — | | — |
| | | | | | | | | | | | | | | | | | | | | | | | | | | | | | | | |
Sub-Total Retail Properties | | | | | $ | 3,007,535,646 | | $ | 2,754,288,389 | | $ | 1,523,745,400 | | $ | 1,483,679,692 | | $ | 40,065,708 | | 6.55 | % | | 5.54 | % | | $ | 120,498,574 | | $ | 1,324,422,416 | | |
| | | | | | | | | | | | | | | | | | | | | | | | | | | | | | | | |
Office Properties | | | | | | | | | | | | | | | | | | | | | | | | | | | | | | | | |
P&S Building | | 100 | % | | | 1,504,307 | | | 1,504,307 | | | — | | | — | | | — | | — | | | — | | | | — | | | — | | — |
| | | | | | | | | | | | | | | | | | | | | | | | | | | | | | | | |
Sub-Total Office Properties | | | | | $ | 1,504,307 | | $ | 1,504,307 | | $ | — | | $ | — | | $ | — | | — | | | — | | | $ | — | | $ | — | | |
| | | | | | | | | | | | | | | | | | | | | | | | | | | | | | | | |
Land/Development Properties | | | | | | | | | | | | | | | | | | | | | | | | | | | | | | | | |
Lacey | | 100 | % | | $ | 16,039,806 | | | 16,039,806 | | | | | | | | | | | — | | | — | | | | — | | | — | | — |
New Garden | | 100 | % | | | 8,683,073 | | | 8,683,073 | | | | | | | | | | | — | | | — | | | | — | | | — | | — |
New River Valley | | 100 | % | | | 4,500,197 | | | 4,500,197 | | | | | | | | | | | — | | | — | | | | — | | | — | | — |
Pavilion at Market East | | 50 | % | | | 1,510,289 | | | 1,510,289 | | | | | | | | | | | — | | | — | | | | — | | | — | | — |
The Plaza at Magnolia | | 100 | % | | | 4,463,310 | | | 4,463,310 | | | | | | | | | | | — | | | — | | | | — | | | — | | — |
Land held for development | | 100 | % | | | 5,615,744 | | | 5,615,744 | | | | | | | | | | | — | | | — | | | | — | | | — | | — |
| | | | | | | | | | | | | | | | | | | | | | | | | | | | | | | | |
Sub-Total Land/Development Properties | | | | | $ | 40,812,419 | | $ | 40,812,419 | | $ | — | | $ | — | | $ | — | | — | | | — | | | $ | — | | $ | — | | |
| | | | | | | | | | | | | | | | | | | | | | | | | | | | | | | | |
TOTAL for CONSOLIDATED PROPERTIES | | | | | $ | 2,878,331,159 | | $ | 2,657,543,003 | | $ | 1,389,245,208 | | $ | 1,349,179,500 | | $ | 40,065,708 | | 6.51 | % | | 5.54 | % | | $ | 108,682,840 | | $ | 1,200,004,173 | | |
| | | | | | | | | | | | | | | | | | | | | | | | | | | | | | | | |
TOTAL for PARTNERSHIPS | | | | | $ | 171,521,213 | | $ | 139,062,112 | | $ | 134,500,192 | | $ | 134,500,192 | | $ | — | | 7.00 | % | | 7.00 | % | | $ | 11,815,734 | | $ | 124,418,243 | | |
| | | | | | | | | | | | | | | | | | | | | | | | | | | | | | | | |
CORPORATE /LINE OF CREDIT | | | | | | | | | | | $ | 342,500,000 | | $ | 342,500,000 | | $ | — | | | | | | | | | | | | | | |
| | | | | | | | | | | | | | | | | | | | | | | | | | | | | | | | |
CORPORATE NOTES PAYABLE(5) | | | | | | | | | | | $ | 94,400,000 | | $ | 94,400,000 | | $ | — | | 6.85 | % | | 5.00 | % | | | | | | | | 2006 |
| | | | | | | | | | | | | | | | | | | | | | | | | | | | | | | | |
TOTAL for CONSOLIDATED and PARTNERSHIPS | | | | | $ | 3,049,852,372 | | $ | 2,796,605,115 | | $ | 1,960,645,400 | | $ | 1,920,579,692 | | $ | 40,065,708 | | 6.57 | % | | 5.63 | % | | $ | 120,498,574 | | $ | 1,324,422,416 | | |
| | | | | | | | | | | | | | | | | | | | | | | | | | | | | | | | |
| (1) | Includes development and CIP costs. |
| (2) | PREIT has an 89% ownership interest and a 99% economic interest in these properties. These properties are consolidated for financial reporting purposes. |
| (3) | Mortgage Debt represents the properties’ allocated portion of the REMIC provided by General Electric Capital Corporation. |
| (4) | In December 2004, the Company completed a modification of the mortgage on Schuylkill Mall. The modification limits the monthly payments to interest plus the excess cash flow from the property after management fees, leasing commissions, and lender-approved capital expenditures. Monthly excess cash flow will accumulate throughout the year in escrow, and an annual principal payment will be made on the last day of each year from this account. All other terms of the loan remained unchanged. Due to the modification, the timing of future principal payment amounts can not be determined. |
| (5) | In December 2005, the Company funded $94,400,000 of the purchase price of Woodland Mall with two 90-day promissory notes to the seller with an average interest rate of 6.85% and secured by letters of credit. The Company intends to obtain long term financing on the Woodland Mall before the notes mature. |
| (6) | Includes 100% of consolidated properties and proportionate share of equity method investments. |
PAGE 18
Pennsylvania REIT
QUARTERLY SUPPLEMENTAL DISCLOSURE (December 31, 2005)
Schedule of Debt Premium Amortization(1)
| | | | | | |
| | | Scheduled Amortization of Premium | | Debt Premium Balance |
Q4 05 | | | | | $ | 40,065,708 |
Q1 06 | | $ | 3,364,412 | | | 36,701,296 |
Q2 06 | | | 3,364,389 | | | 33,336,907 |
Q3 06 | | | 3,348,669 | | | 29,988,238 |
Q4 06 | | | 3,324,908 | | | 26,663,330 |
Q1 07 | | | 3,300,910 | | | 23,362,420 |
Q2 07 | | | 3,299,681 | | | 20,062,739 |
Q3 07 | | | 3,135,723 | | | 16,927,016 |
Q4 07 | | | 3,110,838 | | | 13,816,178 |
Q1 08 | | | 3,093,316 | | | 10,722,862 |
Q2 08 | | | 3,083,019 | | | 7,639,843 |
Q3 08 | | | 3,017,091 | | | 4,622,752 |
Q4 08 | | | 596,438 | | | 4,026,314 |
Q1 09 | | | 320,666 | | | 3,705,648 |
Q2 09 | | | 334,270 | | | 3,371,378 |
Q3 09 | | | 332,872 | | | 3,038,506 |
Q4 09 | | | 295,072 | | | 2,743,434 |
Q1 10 | | | 286,447 | | | 2,456,987 |
Q2 10 | | | 299,845 | | | 2,157,142 |
Q3 10 | | | 298,489 | | | 1,858,653 |
Q4 10 | | | 289,844 | | | 1,568,809 |
Q1 11 | | | 281,258 | | | 1,287,551 |
Q2 11 | | | 294,287 | | | 993,264 |
Q3 11 | | | 292,828 | | | 700,436 |
Q4 11 | | | 284,220 | | | 416,216 |
Q1 12 | | | 215,864 | | | 200,352 |
Q2 12 | | | 88,293 | | | 112,059 |
Q3 12 | | | 87,817 | | | 24,242 |
Q4 12 | | | 24,242 | | | — |
| | | | | | |
| | $ | 40,065,708 | | | |
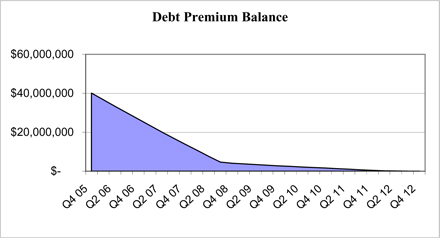
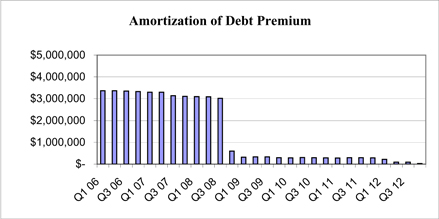
| (1) | The above schedule assumes that PREIT continues to own the corresponding properties throughout the period presented and that no refinancings occur to pay off the debt on those properties. The above schedule also assumes that PREIT does not acquire additional properties with above or below market debt in place where adjustments would be made to reflect a debt premium or discount. |
PAGE 19
Pennsylvania REIT
QUARTERLY SUPPLEMENTAL DISCLOSURE (December 31, 2005)
DEBT ANALYSIS
Outstanding Debt(1)
| | | | | | | | | | | | | | | | | | |
| | | Fixed Rate | | % of Total Indebtedness | | | Floating Rate | | % of Total Indebtedness | | | Total | | | |
Consolidated | | | | | | | | | | | | | | | | | | |
Mortgage Notes Payable | | $ | 1,389,245,208 | | 70.9 | % | | $ | — | | 0.0 | % | | $ | 1,389,245,208 | | 70.9 | % |
Corporate Notes Payable | | | 94,400,000 | | 4.8 | % | | | — | | 0.0 | % | | | 94,400,000 | | 4.8 | % |
Partnerships (at PREIT’s share) | | | | | | | | | | | | | | | | | | |
Mortgage Notes Payable | | | 96,250,192 | | 4.9 | % | | | 38,250,000 | | 2.0 | % | | | 134,500,192 | | 6.9 | % |
Corporate | | | | | | | | | | | | | | | | | | |
Revolving Line of Credit | | | — | | 0.0 | % | | | 342,500,000 | | 17.5 | % | | | 342,500,000 | | 17.5 | % |
| | | | | | | | | | | | | | | | | | |
TOTAL OUTSTANDING DEBT | | | 1,579,895,400 | | | | | | 380,750,000 | | | | | | 1,960,645,400 | | | |
SWAP | | | — | | | | | | — | | | | | | — | | | |
| | | | | | | | | | | | | | | | | | |
TOTAL DEBT AFTER HEDGE | | $ | 1,579,895,400 | | 80.6 | % | | $ | 380,750,000 | | 19.4 | % | | $ | 1,960,645,400 | | 100.0 | % |
| | | | | | | | | | | | | | | | | | |
| (1) | Includes mark to market of debt. |
OUTSTANDING PRINCIPAL BALANCE
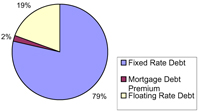
Weighted Average Interest Rates
| | | | | | |
| | | Principal Balance | | Weighted Average Interest Rate | |
Fixed Rate Debt | | $ | 1,539,829,692 | | 6.60 | % |
Mortgage Debt Premium | | | 40,065,708 | | N/A | |
Floating Rate Debt | | | 380,750,000 | | 4.90 | % |
| | | | | | |
TOTAL(1) | | $ | 1,960,645,400 | | 6.26 | % |
| | | | | | |
| (1) | Weighted average interest rate is based on principal balance excluding mortgage debt premium. |
Interest Rate Hedging Instruments(1)
| | | | | | | | |
| | | Notional Amount | | Blended Rate | | | Latest Settlement Date |
SWAP | | $ | 120,000,000 | | 4.69 | % | | 10/31/2007 |
SWAP | | $ | 250,000,000 | | 4.80 | % | | 12/10/2008 |
| (1) | On June 7, 2005 The Company announced that it had entered into interest rate swap agreements to hedge interest rates on $370 million of future debt. |
Mortgage Maturity Schedule (1)
| | | | | | | | | |
Year | | Mortgage Balance at Maturity | | % of Debt Expiring | | | Cumulative % of Debt Expiring | |
2006 | | $ | 21,750,439 | | 1.6 | % | | 1.6 | % |
2007 | | | 78,236,536 | | 5.9 | % | | 7.5 | % |
2008 | | | 511,693,352 | | 38.6 | % | | 46.2 | % |
2009 | | | 62,380,472 | | 4.7 | % | | 50.9 | % |
2010 | | | 1,411,804 | | 0.1 | % | | 51.0 | % |
2011 | | | 44,451,641 | | 3.4 | % | | 54.4 | % |
2012 | | | 306,579,933 | | 23.1 | % | | 77.5 | % |
2013 | | | 110,457,600 | | 8.3 | % | | 85.8 | % |
Thereafter | | | 187,460,639 | | 14.2 | % | | 100.0 | % |
| | | | | | | | | |
| | $ | 1,324,422,416 | | 100.0 | % | | | |
| | | | | | | | | |
| (1) | The average period to mortgage maturity is 4.3 years. Excludes mark to market of debt. |
Average Debt Balance
| | | | | | | | | | | | | | | | | | | | | |
| | | | | Mortgage Debt(1) | | | Corporate Notes | | Line of Credit & Bank Loans | | | REMIC(1) | | | TOTAL | |
Beginning Balance | | 9/30/2005 | | $ | 985,207,921 | | | $ | — | | $ | 276,000,000 | | | $ | 457,328,297 | | | $ | 1,718,536,218 | |
Paydown | | 10/17/2005 | | | | | | | | | | (5,000,000 | ) | | | | | | | (5,000,000 | ) |
Acquisition-Springfield Mall | | 10/31/2005 | | | 38,250,000 | | | | | | | 6,000,000 | | | | | | | | 44,250,000 | |
Other Borrowings | | 11/10/2005 | | | | | | | | | | 7,000,000 | | | | | | | | 7,000,000 | |
Other Borrowings | | 11/16/2005 | | | | | | | | | | 5,000,000 | | | | | | | | 5,000,000 | |
Refinancing Willow Grove Park Mall | | 12/1/2005 | | | 52,500,000 | | | | | | | | | | | | | | | 52,500,000 | |
Paydown | | 12/9/2005 | | | | | | | | | | (50,000,000 | ) | | | | | | | (50,000,000 | ) |
Other Borrowings | | 12/15/2005 | | | | | | | | | | 23,000,000 | | | | | | | | 23,000,000 | |
Acquisition-Woodland Mall | | 12/30/2005 | | | | | | | 94,400,000 | | | 80,500,000 | | | | | | | | 174,900,000 | |
Debt Amortization(2) | | 12/31/2005 | | | (4,912,760 | ) | | | | | | | | | | (4,628,058 | ) | | | (9,540,818 | ) |
| | | | | | | | | | | | | | | | | | | | | |
Ending Balance | | 12/31/2005 | | $ | 1,071,045,161 | | | $ | 94,400,000 | | $ | 342,500,000 | | | $ | 452,700,239 | | | $ | 1,960,645,400 | |
Weighted Average Balance | | | | $ | 1,027,688,899 | | | $ | 1,026,087 | | $ | 275,146,739 | | | $ | 457,328,297 | | | $ | 1,761,190,022 | |
| | | | | | | | | | | | | | | | | | | | | |
| (1) | Includes mark to market of debt. |
| (2) | Includes the amortization of debt premium. |
PAGE 20
Pennsylvania REIT
QUARTERLY SUPPLEMENTAL DISCLOSURE (December 31, 2005)
DEBT RATIOS(1)
| | | | | | | | |
| | | 12/31/2005 | | | 12/31/2004 | |
Total Liabilities to Gross Asset Value | | | | | | | | |
Ratio of Total Liabilities(2) to Gross Asset Value(3)less than or equal to 0.65 to 1.00. | | | | | | | | |
Total Liabilities | | $ | 2,014,001,787 | | | $ | 1,639,890,798 | |
Gross Asset Value | | $ | 3,733,598,088 | | | $ | 3,447,400,516 | |
Ratio | | | 53.94 | % | | | 47.57 | % |
EBITDA to Interest Expense | | | | | | | | |
Ratio of EBITDA(4) to Interest Expense(5)greater than or equal to 1.90 to 1.00. | | | | | | | | |
EBITDA | | $ | 255,095,286 | | | $ | 246,445,396 | |
Interest Expense | | $ | 112,081,865 | | | $ | 104,323,539 | |
Ratio | | | 2.28 | | | | 2.36 | |
Adjusted EBITDA to Fixed Charges | | | | | | | | |
Ratio of Adjusted EBITDA(6)to Fixed Charges(7)greater than or equal to 1.50 to 1.00. | | | | | | | | |
Adjusted EBITDA | | $ | 253,951,045 | | | $ | 244,718,046 | |
Fixed Charges | | $ | 148,857,869 | | | $ | 140,162,712 | |
Ratio | | | 1.71 | | | | 1.75 | |
Secured Indebtedness to Gross Asset Value | | | | | | | | |
Ratio of Secured Indebtedness(8)to Gross Asset Value(3) less than or equal to 0.60 to 1.00. | | | | | | | | |
Secured Indebtedness | | $ | 1,483,679,690 | | | $ | 1,269,992,376 | |
Gross Asset Value | | $ | 3,733,598,088 | | | $ | 3,447,400,516 | |
Ratio | | | 39.74 | % | | | 36.84 | % |
| (1) | Debt ratios are based on loan covenants included in the Company’s Credit Facility, led by Wells Fargo Bank National Association, which was effective as of November 20, 2003 and as amended on January 31, 2005. |
| (2) | Total Liabilities defined as: Total PREIT consolidated GAAP liabilities plus certain letters of credit and other off balance sheet liabilities. |
| (3) | For the calculations above Gross Asset Value is defined as: The sum of (i) Adjusted NOI for all Properties of PREIT, its subsidiaries and unconsolidated affiliates (excluding adjusted NOI for development and major redevelopment Property) for the previous rolling four quarter period, capitalized at 8.25%, plus (ii) cash and cash equivalents plus (iii) all accounts receivable net of reserves plus (iv) book value of Property upon which construction is in progress and land held for development plus (v) development costs plus (vi) adjusted NOI for major redevelopment Properties for the recent fiscal quarter (excluding those acquired or disposed of during such quarter) multiplied by 4 and capitalized at 8.25% plus (vii) redevelopment and predevelopment costs plus (viii) the purchase price of Property purchased in the last 2 fiscal quarters plus (ix) greater of PREIT’s: |
(a) ownership share or (b) recourse share of book value of construction in progress of unconsolidated affiliates plus (x) purchase price of Property by PREIT and its subsidiaries subject to purchase obligations, forward commitments and unfunded obligations. Capitalized terms used in this footnote shall have the meanings ascribed to such terms in the Credit Agreement.
| (4) | EBITDA defined as: Rolling four quarters of net earnings (loss) of the Company before minority interests and distributions to holders of Preferred Stock, plus the sum of (i) depreciation and amortization expense and other non-cash charges, plus (ii) interest expense, plus (iii) all provisions for income taxes, minus (plus) (iv) extraordinary gains (losses), plus (v) the greater of (a) ownership share or (b) recourse share of EBITDA of unconsolidated affiliates. |
| (5) | Interest Expense defined as: All paid, accrued or capitalized interest expense excluding capitalized interest funded from construction loans plus the greater of (a) ownership share or (b) recourse share of all paid, accrued or capitalized interest expense of unconsolidated affiliates. |
| (6) | Adjusted EBITDA defined as: EBITDA plus ground rent payments minus the Reserve for Replacements for all Properties. |
| (7) | Fixed Charges defined as: Interest Expense plus regularly scheduled principal payments on Indebtedness other than any balloon, bullet or similar principal payment on any Indebtedness plus preferred dividends payments plus ground rent payments. |
| (8) | Secured Indebtedness defined as: (a) Aggregated principal amount of all Indebtedness that is secured by any Lien and (b) Indebtedness under a Guaranty of the Secured Indebtedness of another. |
PAGE 21
Pennsylvania REIT
QUARTERLY SUPPLEMENTAL DISCLOSURE (December 31, 2005)
PORTFOLIO SUMMARY—RETAIL
(Ordered by State)
| | | | | | | | | | | | | | | | | | | | | | | | | | | | | |
Retail Properties(1) | | Property
Subtype | | Same
Store/
New | | Ownership
Interest | | | Date
Acquired | | Year Built/ Last
Renovated | | Years
Since
Renovation | | Owned
GLA
(anchors) | | Owned
GLA
(non-
anchors) | | TOTAL
Owned
GLA | | Space Not Owned (Name/GLA) | | TOTAL
Property
GLA | | Anchors/
Majors Tenants | | Lease
Expiration |
Wiregrass Commons Dothan, AL | | Enclosed
Mall | | Same
Store | | 100 | % | | 2003 | | 1986/1999 | | 6 | | — | | 229,713 | | 229,713 | | Dillard’s
JC Penney
McRae’s
Parisian | | 403,163 | | 632,876 | | Dillard’s
JC Penney
McRae’s
Parisian | | N/A
N/A
N/A
N/A |
Gadsden Mall Gadsden, AL | | Enclosed
Mall | | New | | 100 | % | | 2005 | | 1974/1990 | | 15 | | 274,060 | | 203,489 | | 477,549 | | | | — | | 477,549 | | Belk
McRae’s
Sears | | 2/19/11
7/31/14
3/5/09 |
Christiana Power Center I Newark, DE | | Power
Center | | Same
Store | | 100 | % | | 1998 | | 1998 | | 7 | | 190,814 | | 111,595 | | 302,409 | | | | — | | 302,409 | | Costco
Dick’s Sporting
Goods | | 1/31/19
11/30/13 |
South Blanding Village Jacksonville, FL | | Strip
Center | | Same
Store | | 100 | % | | 1988/1990 | | 1986 | | 19 | | 73,921 | | 32,836 | | 106,757 | | | | — | | 106,757 | | Staples
Food Lion | | 9/30/08
7/31/08 |
Orlando Fashion Square Orlando, FL | | Enclosed
Mall | | New | | 100 | % | | 2004 | | 1973/2003 | | 2 | | 491,999 | | 436,319 | | 928,318 | | Sears | | 155,576 | | 1,083,894 | | Burdines-
Macy’s
Dillard’s
JC Penney
Sears | | 10/31/71
1/31/14
4/30/13
N/A |
Francis Scott Key Mall(2) Frederick, MD | | Enclosed
Mall | | Same
Store
Redev. | | 89 | % | | 2003 | | 1978/1991 | | 14 | | 291,620 | | 275,356 | | 566,976 | | Hecht’s | | 139,333 | | 706,309 | | Hecht’s
Sears
JC Penney
Value City | | N/A
7/31/08
9/30/11
6/30/10 |
Valley Mall Hagerstown, MD | | Enclosed
Mall | | Same
Store | | 100 | % | | 2003 | | 1974/1999 | | 6 | | 294,348 | | 364,962 | | 659,310 | | Sears
Hecht’s | | 243,400 | | 902,710 | | Sears
JC Penney
Bon-Ton
Hecht’s | | N/A
10/3/09
1/31/14
N/A |
The Mall at Prince Georges Hyattsville, MD | | Enclosed
Mall | | Same
Store | | 100 | % | | 1998 | | 1959/2004 | | 1 | | 479,619 | | 355,941 | | 835,560 | | | | — | | 835,560 | | JC Penney
Hecht’s
Target | | 7/31/11
10/31/08
1/31/10 |
Dartmouth Mall Dartmouth, MA | | Enclosed
Mall | | Same
Store | | 100 | % | | 1997 | | 1971/2000 | | 5 | | 208,460 | | 322,500 | | 530,960 | | Filene’s | | 140,000 | | 670,960 | | JC Penney
Sears
Filene’s | | 7/31/09
4/12/16
N/A |
Woodland Mall Grand Rapids, MI | | Enclosed
Mall | | New | | 100 | % | | 2005 | | 1968/1998 | | 7 | | — | | 397,897 | | 397,897 | | JC Penney
Sears
Marshall Field’s
Kohl’s | | 796,186 | | 1,194,083 | | JC Penney
Sears
Marshall Field’s
Kohl’s | | N/A
N/A
N/A
N/A |
Cherry Hill Mall Cherry Hill, NJ | | Enclosed
Mall | | Same
Store
Redev. | | 100 | % | | 2003 | | 1961/1990 | | 15 | | — | | 522,392 | | 522,392 | | JC Penney
Macy’s
Strawbridge’s | | 740,770 | | 1,263,162 | | JC Penney
Macy’s
Strawbridge’s | | N/A
N/A
N/A |
Moorestown Mall Moorestown, NJ | | Enclosed
Mall | | Same
Store | | 100 | % | | 2003 | | 1963/2000 | | 5 | | 408,356 | | 315,523 | | 723,879 | | Lord & Taylor
Strawbridge’s | | 321,200 | | 1,045,079 | | Boscov’s
Lord & Taylor
Sears
Strawbridge’s | | 10/31/10
N/A
10/5/22
N/A |
Phillipsburg Mall(2) Phillipsburg, NJ | | Enclosed
Mall | | Same
Store | | 89 | % | | 2003 | | 1989/2003 | | 2 | | 326,170 | | 245,985 | | 572,155 | | | | — | | 572,155 | | Bon-Ton
JC Penney
Sears
Kohl’s | | 1/31/10
3/31/10
4/30/09
1/31/25 |
Cumberland Mall Vineland, NJ | | Enclosed
Mall | | Same
Store
Redev. | | 100 | % | | 2005 | | 1973/2003 | | 2 | | 283,365 | | 365,076 | | 648,441 | | BJ’s
Boscov’s | | 273,230 | | 921,671 | | Boscov’s
Home Depot
JC Penney
Value City | | N/A
10/31/19
11/30/08
7/31/08 |
Echelon Mall Voorhees, NJ | | Enclosed
Mall | | Same
Store | | 100 | % | | 2003 | | 1970/1998 | | 7 | | 297,323 | | 433,202 | | 730,525 | | Boscov’s
Strawbridge’s | | 396,783 | | 1,127,308 | | Boscov’s
Strawbridge’s | | N/A
N/A |
Jacksonville Mall Jacksonville, NC | | Enclosed
Mall | | Same
Store | | 100 | % | | 2003 | | 1981/1998 | | 7 | | 242,115 | | 231,771 | | 473,886 | | | | — | | 473,886 | | Belk
JC Penney
Sears | | 8/21/11
8/31/10
8/4/11 |
PAGE 22
Pennsylvania REIT
QUARTERLY SUPPLEMENTAL DISCLOSURE (December 31, 2005)
PORTFOLIO SUMMARY—RETAIL
(Ordered by State)
| | | | | | | | | | | | | | | | | | | | | | | | | | | | | |
Retail Properties(1) | | Property
Subtype | | Same
Store/
New | | Ownership
Interest | | | Date
Acquired | | Year Built/ Last
Renovated | | Years
Since
Renovation | | Owned
GLA
(anchors) | | Owned
GLA
(non-
anchors) | | TOTAL
Owned
GLA | | Space Not Owned (Name/GLA) | | TOTAL
Property
GLA | | Anchors /
Majors Tenants | | Lease
Expiration |
Crest Plaza Shopping Center Allentown, PA | | Strip
Center | | Same
Store | | 100 | % | | 1964 | | 1959/2003 | | 2 | | 53,445 | | 60,826 | | 114,271 | | Target | | 143,130 | | 257,401 | | Weis Market
Target | | 1/31/07
N/A |
Lehigh Valley Mall(4) Allentown, PA | | Enclosed
Mall | | Same
Store | | 50 | % | | 1973 | | 1977/1996 | | 9 | | 212,000 | | 452,703 | | 664,703 | | JC Penney
Strawbridge’s
Firestone | | 371,986 | | 1,036,689 | | Macy’s
JC Penney
Strawbridge’s | | 7/31/12
N/A
N/A |
South Mall(2) Allentown, PA | | Enclosed
Mall | | Same
Store
Redev. | | 89 | % | | 2003 | | 1975/1992 | | 13 | | 188,858 | | 214,742 | | 403,600 | | | | — | | 403,600 | | Bon-Ton
Stein Mart
Steve &
Barry’s | | 1/28/11
10/31/06
1/31/11 |
Whitehall Mall(4) Allentown, PA | | Power
Center | | Same
Store | | 50 | % | | 1964 | | 1964/1998 | | 7 | | 294,635 | | 259,383 | | 554,018 | | | | — | | 554,018 | | Kohl’s
Sears
Bed, Bath &
Beyond | | 3/9/07
9/18/11
1/31/10 |
Logan Valley Mall Altoona, PA | | Enclosed
Mall | | Same
Store | | 100 | % | | 2003 | | 1960/1997 | | 8 | | 454,387 | | 327,241 | | 781,628 | | | | — | | 781,628 | | JC Penney
Kaufmann’s
Sears | | 6/30/17
1/31/10
10/31/16 |
Capital City Mall Camp Hill, PA | | Enclosed
Mall | | Same
Store
Redev. | | 100 | % | | 2003 | | 1974/2005 | | 0 | | 204,301 | | 252,145 | | 456,446 | | Hecht’s | | 120,000 | | 576,446 | | JC Penney
Hecht’s
Sears | | 11/30/10
N/A
7/28/09 |
Chambersburg Mall(2) Chambersburg, PA | | Enclosed
Mall | | Same
Store | | 89 | % | | 2003 | | 1982 | | 23 | | 241,690 | | 212,252 | | 453,942 | | | | — | | 453,942 | | Bon-Ton
JC Penney
Sears
Value City | | 1/28/11
3/31/12
2/9/10
2/28/07 |
Palmer Park Mall Easton, PA | | Enclosed
Mall | | Same
Store | | 100 | % | | 1972/2003 | | 1972/1998 | | 7 | | 314,235 | | 139,558 | | 453,793 | | | | — | | 453,793 | | Bon-Ton
Boscov’s | | 7/25/14
10/31/18 |
Exton Square Mall Exton, PA | | Enclosed
Mall | | Same
Store | | 100 | % | | 2003 | | 1973/2000 | | 5 | | 440,301 | | 369,988 | | 810,289 | | Strawbridge’s
K-Mart | | 277,468 | | 1,087,757 | | Boscov’s
JC Penney
K-Mart
Sears
Strawbridge’s | | 10/31/19
5/31/20
N/A
1/31/20
N/A |
North Hanover Mall(2) Hanover, PA | | Enclosed
Mall | | Same
Store | | 89 | % | | 2003 | | 1967/1999 | | 6 | | 288,177 | | 164,903 | | 453,080 | | | | — | | 453,080 | | Bon-Ton
JC Penney
Black Rose
Antiques
Sears | | 9/30/06
1/31/11
N/A
11/30/09 |
Paxton Towne Centre Harrisburg, PA | | Power
Center | | Same
Store | | 100 | % | | 1999 | | 2001 | | 4 | | 151,627 | | 292,856 | | 444,483 | | Target
Costco | | 273,058 | | 717,541 | | Target
Kohl’s
Weis Markets
Costco | | N/A
1/25/21
11/30/20
N/A |
Red Rose Commons(4) Lancaster, PA | | Power
Center | | Same
Store | | 50 | % | | 1998 | | 1998 | | 7 | | — | | 263,452 | | 263,452 | | Weis Markets
Home Depot | | 199,590 | | 463,042 | | Weis Markets
Home Depot | | N/A
N/A |
The Court at Oxford Valley(4) Langhorne, PA | | Power
Center | | Same
Store | | 50 | % | | 1997 | | 1996 | | 9 | | 176,831 | | 280,032 | | 456,863 | | Home Depot
BJ’s | | 247,623 | | 704,486 | | Best Buy
BJ’s
Dick’s
Sporting
Goods
Home Depot
Linens N
Things | | 12/31/11
N/A
4/15/11
N/A
2/14/17 |
Beaver Valley Mall Monaca, PA | | Enclosed
Mall | | Same
Store | | 100 | % | | 2002 | | 1970/1991 | | 14 | | 511,267 | | 434,860 | | 946,127 | | Kaufmann’s | | 204,770 | | 1,150,897 | | Boscov’s
JC Penney
Sears
Kaufmann’s | | 9/30/18
9/30/17
8/15/11
N/A |
Lycoming Mall(2) Pennsdale, PA | | Enclosed
Mall | | Same
Store
Redev. | | 89 | % | | 2003 | | 1978/1990 | | 15 | | 321,441 | | 341,571 | | 663,012 | | Kaufmann’s | | 120,000 | | 783,012 | | Bon-Ton
JC Penney
Kaufman’s
Sears
Value City | | 7/31/11
10/31/10
N/A
7/31/08
7/31/08 |
PAGE 23
Pennsylvania REIT
QUARTERLY SUPPLEMENTAL DISCLOSURE (December 31, 2005)
PORTFOLIO SUMMARY—RETAIL
(Ordered by State)
| | | | | | | | | | | | | | | | | | | | | | | | | | | | | |
Retail Properties (1) | | Property
Subtype | | Same
Store/
New | | Ownership
Interest | | | Date
Acquired | | Year
Built/ Last
Renovated | | Years
Since
Renovation | | Owned
GLA
(anchors) | | Owned
GLA
(non-
anchors) | | TOTAL
Owned
GLA | | Space Not Owned
(Name/GLA) | | TOTAL
Property
GLA | | Anchors / Majors
Tenants | | Lease
Expiration |
Northeast Tower Center Philadelphia, PA | | Power
Center | | Same
Store | | 100 | % | | 1998/1999 | | 1997/1998 | | 7 | | 119,388 | | 182,521 | | 301,909 | | Raymour &
Flanigan Home
Depot | | 175,311 | | 477,220 | | Home Depot
Petsmart
Raymour & Flanigan
Wal-Mart | | N/A
2/28/12
N/A
1/31/14 |
The Gallery at Market East I(3) Philadelphia, PA | | Enclosed
Mall | | Same
Store | | 100 | % | | 2003 | | 1977/1990 | | 15 | | | | 193,487 | | 193,487 | | | | — | | 193,487 | | K-Mart
Strawbridge’s | | N/A
N/A |
The Gallery at Market East II(3) Philadelphia, PA | | Enclosed
Mall | | Same
Store | | 100 | % | | 2004 | | 1984 | | 21 | | 127,271 | | 206,302 | | 333,573 | | | | — | | 333,573 | | Burlington Coat
Factory | | 2/28/2032 |
Plymouth Meeting Mall Plymouth Meeting, PA | | Enclosed
Mall | | Same
Store
Redev. | | 100 | % | | 2003 | | 1966/1999 | | 6 | | 185,000 | | 413,614 | | 598,614 | | Strawbridge’s | | 214,635 | | 813,249 | | AMC Theater
Boscov’s
Strawbridge’s | | 12/31/18
10/31/16
N/A |
Metroplex Shopping Center(4) Plymouth Meeting, PA | | Power
Center | | Same
Store | | 50 | % | | 1999 | | 2001 | | 4 | | 67,185 | | 410,276 | | 477,461 | | Target
Lowe’s | | 300,729 | | 778,190 | | Target
Lowe’s
Giant | | N/A
N/A
2/28/21 |
Viewmont Mall(2) Scranton, PA | | Enclosed
Mall | | Same
Store | | 89 | % | | 2003 | | 1968/1996 | | 9 | | 386,262 | | 236,975 | | 623,237 | | Kaufmann’s | | 120,000 | | 743,237 | | JC Penney
Sears
Kaufmann’s | | 10/31/10
12/31/10
N/A |
Springfield Mall Springfield, PA | | Enclosed
Mall | | New | | 50 | % | | 2005 | | 1974/1997 | | 8 | | — | | 221,514 | | 221,514 | | Macy’s
Strawbridge’s | | 367,176 | | 588,690 | | Macy’s
Strawbridge’s | | N/A
N/A |
Springfield Park I & II Springfield, PA | | Strip
Center | | Same
Store | | 50 | % | | 1997/1998 | | 1997/1998 | | 7 | | 83,539 | | 43,432 | | 126,971 | | Target | | 145,669 | | 272,640 | | Target
Bed, Bath & Beyond
LA Fitness | | N/A
1/31/09
3/31/17 |
Nittany Mall(2) State College, PA | | Enclosed
Mall | | Same
Store | | 89 | % | | 2003 | | 1968/1990 | | 15 | | 221,462 | | 215,783 | | 437,245 | | Kaufmann’s | | 95,000 | | 532,245 | | Bon-Ton
JC Penney
Kaufmann’s
Sears | | 1/31/08
7/31/10
N/A
8/31/10 |
Uniontown Mall(2) Uniontown, PA | | Enclosed
Mall | | Same
Store | | 89 | % | | 2003 | | 1972/1990 | | 15 | | 421,378 | | 277,173 | | 698,551 | | | | — | | 698,551 | | Bon-Ton
JC Penney
Roomful Express Furn.
Sears
Teletech Customer Care
Value City | | 1/31/11
10/31/10
3/26/10
2/25/08
6/28/08
7/31/07 |
Creekview Shopping Center Warrington, PA | | Power
Center | | Same
Store | | 100 | % | | 1999 | | 2001 | | 4 | | — | | 136,086 | | 136,086 | | Target
Lowe’s | | 288,916 | | 425,002 | | Target
Lowe’s
Genuardi’s | | N/A
N/A
12/31/21 |
Washington Crown Center(2) Washington, PA | | Enclosed
Mall | | Same
Store | | 89 | % | | 2003 | | 1969/1999 | | 6 | | 245,401 | | 288,173 | | 533,574 | | Kaufmann’s | | 140,095 | | 673,669 | | Sears
Bon-Ton
Gander
Kaufmann’s | | 8/17/09
1/31/10
7/24/13
N/A |
Wyoming Valley Mall Wilkes-Barre, PA | | Enclosed
Mall | | Same
Store | | 100 | % | | 2003 | | 1974/1995 | | 10 | | 592,110 | | 321,771 | | 913,881 | | | | — | | 913,881 | | Bon-Ton
JC Penney
Sears
Kaufmann’s | | 1/31/07
1/31/07
8/1/11
1/31/07 |
Willow Grove Park Willow Grove, PA | | Enclosed
Mall | | Same
Store | | 100 | % | | 2000/2003 | | 1982/2001 | | 4 | | 225,000 | | 336,629 | | 561,629 | | Sears
Bloomingdale’s
Strawbridge | | 641,861 | | 1,203,490 | | Sears
Bloomingdale’s
Strawbridge’s
Macy’s | | N/A
N/A
N/A
1/31/22 |
Magnolia Mall Florence, SC | | Enclosed
Mall | | Same
Store | | 100 | % | | 1997 | | 1979/1992 | | 12 | | 343,118 | | 228,634 | | 571,752 | | | | — | | 571,752 | | Belk
Best Buy
JC Penney
Sears | | 1/31/11
1/31/13
3/31/07
10/16/09 |
PAGE 24
Pennsylvania REIT
QUARTERLY SUPPLEMENTAL DISCLOSURE (December 31, 2005)
PORTFOLIO SUMMARY—RETAIL
(Ordered by State)
| | | | | | | | | | | | | | | | | | | | | | | | | | | | | |
Retail Properties(1) | | Property
Subtype | | Same
Store/
New | | Ownership
Interest | | | Date
Acquired | | Year
Built/ Last
Renovated | | Years
Since
Renovation | | Owned
GLA
(anchors) | | Owned
GLA
(non-
anchors) | | TOTAL
Owned
GLA | | Space Not Owned
(Name/GLA) | | TOTAL
Property
GLA | | Anchors / Majors
Tenants | | Lease
Expiration |
The Commons at Magnolia Florence, SC | | Strip
Center | | Same
Store | | 100 | % | | 1999 | | 1991/2002 | | 3 | | 51,574 | | 52,915 | | 104,489 | | Target | | 126,200 | | 230,689 | | Goody’s
Target | | 5/31/12
N/A |
New River Valley Mall(2) Christiansburg, VA | | Enclosed
Mall | | Same
Store
Redev. | | 89 | % | | 2003 | | 1988 | | 17 | | 240,306 | | 187,777 | | 428,083 | | | | — | | 428,083 | | Belk
JC Penney
Sears | | 4/19/08
3/31/08
8/2/08 |
Patrick Henry Mall(2) Newport News, VA | | Enclosed
Mall | | Same
Store
Redev. | | 89 | % | | 2003 | | 1988/2005 | | 0 | | 229,369 | | 297,893 | | 527,262 | | Hecht’s | | 140,000 | | 667,262 | | Dillard’s
JC Penney
Hecht’s | | 4/30/08
10/31/15
N/A |
Valley View Mall La Crosse, WI | | Enclosed
Mall | | Same
Store
Redev. | | 100 | % | | 2003 | | 1980/2001 | | 4 | | 96,357 | | 235,400 | | 331,757 | | Herberger’s
Marshall Fields
Sears | | 254,596 | | 586,353 | | JC Penney
Herberger’s
Marshall Fields
Sears | | 7/31/10
N/A
N/A
N/A |
Crossroads Mall Beckley, WV | | Enclosed
Mall | | Same
Store | | 100 | % | | 2003 | | 1981 | | 24 | | 256,248 | | 194,980 | | 451,228 | | | | — | | 451,228 | | Sears
JC Penney
Belk | | 3/31/11
12/31/11
11/4/08 |
Properties Held For Sale | | | | | | | | | | | | | | | | | | | | | | | | | | | | | |
Schuylkill Mall Frackville, PA | | Enclosed
Mall | | Same
Store | | 100 | % | | 2003 | | 1980/1991 | | 14 | | 346,990 | | 318,756 | | 665,746 | | Bon-Ton | | 60,916 | | 726,662 | | K-Mart
Sears
Bon-Ton
Black Diamond Antiques | | 10/31/10
10/31/10
N/A
12/31/04 |
| | | | | | | | | | | | | | | | | | | | | | | | | | | | | |
TOTAL ASSETS HELD FOR SALE | | | | | | | | | | | | | | | 346,990 | | 318,756 | | 665,746 | | — | | 60,916 | | 726,662 | | | | |
| | | | | | | | | | | | | | | | | | | | | | | | | | | | | |
TOTAL CONTINUING PROPERTIES | | | | | | | | | | | | | | | 11,606,333 | | 13,592,404 | | 25,198,737 | | — | | 8,577,454 | | 33,776,191 | | | | |
| | | | | | | | | | | | | | | | | | | | | | | | | | | | | |
TOTAL CONSOLIDATED | | | | | | | | | | | | | | | 11,119,133 | | 11,980,368 | | 23,099,501 | | | | 7,005,597 | | 30,105,098 | | | | |
| | | | | | | | | | | | | | | | | | | | | | | | | | | | | |
TOTAL UNCONSOLIDATED PARTNERSHIPS | | | | | | | | | | | | | | | 834,190 | | 1,930,792 | | 2,764,982 | | | | 1,632,773 | | 4,397,755 | | | | |
| | | | | | | | | | | | | | | | | | | | | | | | | | | | | |
TOTAL FOR ALL PROPERTIES | | | | | | | | | | | | | | | 11,953,323 | | 13,911,160 | | 25,864,483 | | | | 8,638,370 | | 34,502,853 | | | | |
| | | | | | | | | | | | | | | | | | | | | | | | | | | | | |
AVERAGE FOR ALL PROPERTIES | | | | | | | | | | | | | 8.9 | | | | | | | | | | | | | | | | |
| (1) | Does not include 108,100 sf at Westgate Anchor pad in Bethlehem, PA leased to Bon-Ton with expiration date of 11/23/2010 |
| (2) | PREIT has an 89% ownership interest and a 99% economic interest in these properties. These properties are consolidated for financial reporting purposes. |
| (3) | The Gallery at Market East I & The Gallery at Market East II were counted as one property. |
| (4) | Property is managed by a third party. |
PAGE 25
Pennsylvania REIT
QUARTERLY SUPPLEMENTAL DISCLOSURE (December 31, 2005)
PORTFOLIO SUMMARY—RETAIL
Summary of Retail Properties
| | | | | | | | | | | | | | | | | |
| #/Owned GLA | | #/Owned GLA | | #/Owned GLA | | | #/Owned GLA |
| Enclosed Mall | | PREIT Managed | | Same Store | | | Consolidated |
| | | | | | | | |
| 39 | | 22,475,314 | | 46 | | 23,447,986 | | 37 | | 18,692,622 | | | | | 44 | | 23,099,501 |
| | | | | 10 | | 5,146,583 | | (redev | ) | | |
| | | |
| Power/Strip Center | | Third Party Managed | | New | | | Unconsolidated Partnerships |
| | | | | | | | |
| 12 | | 3,389,169 | | 5 | | 2,416,497 | | 4 | | 2,025,278 | | | | | 7 | | 2,764,982 |
| | | | | | | | | | | | | | | | | | |
| 51 | | 25,864,483 | | 51 | | 25,864,483 | | 51 | | 25,864,483 | | | | | 51 | | 25,864,483 |
| | | | | | | | | | | | | | | | | | |
| | | |
Five largest assets (Owned GLA) as a % of Total | | 17.1 | % |
Largest asset (Owned GLA) as a % of Total | | 3.7 | % |
PAGE 26
Pennsylvania REIT
QUARTERLY SUPPLEMENTAL DISCLOSURE (December 31, 2005)
ANNUAL ACTIVITY
Property Acquisitions/Dispositions Summary
| | | | | | | | | | | | | | | | | | | |
Name of Project, Location | | | | Square
Feet/Acres(1) | | Ownership
Interest | | | Date or Expected Date
Acquired, Completed, or
Sold | | Total Cost or Price | | PREIT’s Cost or
Price | | Expected NOI
Cap (2) | | Major Tenants |
Acquisitions: | | | | | | | | | | | | | | | | | | | |
Cumberland Mall, Vineland, New Jersey | | Square Feet | | 919,241 | | 100 | % | | 1Q05 | | $ | 59,500,000 | | $ | 59,500,000 | | 10.2% | | Boscov’s, JC Penney, Value City |
Gadsden Mall, Gadsden, Alabama | | Square Feet | | 477,549 | | 100 | % | | 1Q05 | | | 58,800,000 | | | 58,800,000 | | 8.5% | | Sears, McRae’s, Belk |
Springfield Mall, Springfield, Pennsylvania | | Square Feet | | 588,690 | | 50 | % | | 4Q05 | | | 103,500,000 | | | 51,750,000 | | 7.1% | | Macy’s, Strawbridge’s |
Woodland Mall, Grand Rapids, Michigan | | Square Feet | | 1,194,083 | | 100 | % | | 4Q05 | | | 177,400,000 | | | 177,400,000 | | 7.9% | | Sears, JCPenney, Marshall Fields |
| | | | | | | | | | | | | | | | | | | |
TOTAL RETAIL ACQUISITIONS | | Square Feet | | 3,179,563 | | | | | | | $ | 399,200,000 | | $ | 347,450,000 | | | | |
Land Acquisitions: | | | | | | | | | | | | | | | | | | | |
Land at Lacey Township, Ocean County, New Jersey | | Acres | | 45 | | 100 | % | | 2Q05, 3Q05 | | $ | 11,600,000 | | $ | 11,600,000 | | N/A | | Home Depot |
Land at New Garden, Chester County, Pennsylvania | | Acres | | 33 | | 100 | % | | 2Q05, 4Q05 | | | 6,600,000 | | | 6,600,000 | | N/A | | |
Land at Magnolia Mall, Florence, South Carolina(3) | | Acres | | 73 | | 100 | % | | 2Q05 | | | 5,900,000 | | | 5,900,000 | | N/A | | |
Land at New River Valley, Christiansburg, Virginia | | Acres | | 15 | | 100 | % | | 3Q05 | | | 4,100,000 | | | 4,100,000 | | N/A | | |
| | | | | | | | | | | | | | | | | | | |
TOTAL LAND ACQUISITIONS | | Acres | | 166 | | | | | | | | 28,200,000 | | | 28,200,000 | | | | |
Pending Acquisitions: | | | | | | | | | | | | | | | | | | | |
Land at New Garden, Chester County, Pennsylvania | | Acres | | 155 | | 100 | % | | 1Q06 | | $ | 23,500,000 | | $ | 23,500,000 | | N/A | | |
Land in Gainesville, Florida | | Acres | | 540 | | 100 | % | | 1Q06 | | | 21,500,000 | | | 21,500,000 | | N/A | | |
| | | | | | | | | | | | | | | | | | | |
TOTAL PENDING ACQUISITIONS | | Acres | | 695 | | | | | | | $ | 45,000,000 | | $ | 45,000,000 | | | | |
Dispositions | | | | | | | | | | | | | | | | | | | |
Parcel of Land - Wiregrass Commons, Dothan, Alabama | | Acres | | 0.2 | | 100 | % | | 1Q05 | | $ | 60,536 | | $ | 60,536 | | N/A | | |
Home Depot Parcel, Philadelphia, Pennsylvania | | Acres | | 14 | | 100 | % | | 2Q05 | | | 12,500,000 | | | 12,500,000 | | N/A | | Home Depot |
Christiana Power Center - Phase II Property, Newark, Delaware | | Acres | | 32 | | 50 | % | | 3Q05 | | | 17,000,000 | | | 9,500,000 | | N/A | | |
Laurel Mall, Hazleton, Pennsylvania | | Square Feet | | 453,793 | | 40 | % | | 3Q05 | | | 33,500,000 | | | 13,400,000 | | 10.0% | | Boscov’s, K-Mart, JC Penney |
Industrial Properties (ARA Services, Allentown, PA, ARA Services, Pennsauken, NJ, Interstate Container Corporation, Sears Pennsauken) | | Square Feet | | 254,791 | | 100 | % | | 3Q05 | | | 4,300,000 | | | 4,300,000 | | N/A | | |
Festival at Exton, Exton, Pennsylvania | | Square Feet | | 145,043 | | 100 | % | | 4Q05 | | | 20,150,000 | | | 20,150,000 | | N/A | | Sears Hardware |
| | | | | | | | | | | | | | | | | | | |
TOTAL DISPOSITIONS | | Square Feet | | 853,627 | | | | | | | $ | 87,510,536 | | $ | 59,910,536 | | | | |
| | Acres | | 46.2 | | | | | | | | | | | | | | | |
Pending Dispositions: | | | | | | | | | | | | | | | | | | | |
Schuylkill Mall, Frackville, Pennsylvania | | Square Feet | | 726,662 | | 100 | % | | 2Q06 | | | N/A | | | N/A | | N/A | | Bon-Ton, K-Mart, Sears |
Land at Florence, South Carolina | | Acres | | 11 | | 100 | % | | 1Q06 | | | N/A | | | N/A | | N/A | | |
| | | | | | | | | | | | | | | | | | | |
TOTAL PENDING DISPOSITIONS | | Square Feet | | 726,662 | | | | | | | | N/A | | | N/A | | | | |
| | Acres | | 11.0 | | | | | | | | | | | | | | | |
| (1) | Includes both owned and non-owned square footage. |
| (2) | Expected NOI Cap is defined as PREIT’s share of NOI in the year of stabilization divided by PREIT’s share of the investment, except in the case of partner buyout. |
| (3) | Previously ground leased land. |
PAGE 27
Pennsylvania REIT
QUARTERLY SUPPLEMENTAL DISCLOSURE (December 31, 2005)
Development Activity
| | | | | | | | | | | | | | | | | | | | | | | | | | | | | | | |
NAME OF
PROJECT
LOCATION | | TOTAL
PROJECTED
PROPERTY
GLA
(sq ft)(1) | | PREIT’S
SHARE | | | PREIT’s
PROJECTED
SHARE OF
COST | | PREIT’s
SHARE OF
INVESTMENT
TO DATE | | EXPECTED
STABILIZED
NOI CAP | | | CONSTRUCTION
START DATE | | DATE OF
INITIAL
OCCUPANCY | | EXPECTED
DATE OF
COMPLETION | | % OF
SPENDING
COMPLETED | | | %
LEASED | | | %
OCCUPIED | | | DESCRIPTION |
Power Center | | | | | | | | | | | | | | | | | | | | | | | | | | | | | | | |
Lacey(2) Lacey Township, NJ | | 296,000 | | 100 | % | | $ | 39,300,000 | | $ | 16,000,000 | | 6.1 | % | | 4Q05 | | 1Q07 | | 4Q07 | | 41 | % | | 46 | % | | 0 | % | | A retail shopping center will be built, anchored by Home
Depot. There will also be at least two outparcels. |
New Garden New Garden Township, PA | | TBD | | 100 | % | | | TBD | | | 8,700,000 | | TBD | | | TBD | | TBD | | TBD | | N/ | A | | N/ | A | | 0 | % | | TBD |
The Plaza at Magnolia Florence, SC | | 240,000 | | 100 | % | | | 11,500,000 | | | 4,500,000 | | 11.0 | % | | 1Q06 | | 2Q06 | | 3Q07 | | 39 | % | | 10 | % | | 0 | % | | Across the street from Magnolia Mall, a 240,000 sf power
center will be added with Home Depot as the anchor and four
outparcel locations. |
New River Valley Retail Center Christiansburg, VA | | 170,000 | | 100 | % | | | 26,800,000 | | | 4,500,000 | | 8.7 | % | | 4Q06 | | 3Q07 | | 1Q08 | | 17 | % | | 0 | % | | 0 | % | | A power center is planned adjacent to the existing New River
Valley Mall. |
Mixed Use | | | | | | | | | | | | | | | | | | | | | | | | | | | | | | | |
Gainesville Gainesville, FL | | TBD | | 100 | % | | | TBD | | | 2,900,000 | | TBD | | | TBD | | TBD | | TBD | | N/ | A | | N/ | A | | 0 | % | | On 2/8/06, PREIT purchased a 540 acre parcel of land for
$21.5 million. The Company’s plans include a mixed-use
development program. |
Land | | | | | | | | | | | | | | | | | | | | | | | | | | | | | | | |
Valley View Downs(3) South Beaver Township, PA | | 300,000 | | TBD | | | | 10,000,000 | | | 1,200,000 | | (3 | ) | | TBD | | TBD | | TBD | | 12 | % | | N/ | A | | 0 | % | | PREIT will manage the development of a harness racetrack
and a casino accommodating up to 3,000 slot machines on an
approximately 208 acre property. |
Pavilion at Market East(4) Philadelphia, PA | | TBD | | 50 | % | | | TBD | | | 1,500,000 | | TBD | | | TBD | | TBD | | TBD | | N/ | A | | N/ | A | | 0 | % | | TBD |
| | | | | | | | | | | | | | | | | | | | | | | | | | | | | | | |
Total Develop-
ment Activity | | 1,006,000 | | | | | $ | 87,600,000 | | $ | 39,300,000 | | 7.7 | % | | | | | | | | | | | | | | | | | |
| | | | | | | | | | | | | | | | | | | | | | | | | | | | | | | |
| (1) | GLA & total project cost include tenants that purchased their respective land; therefore, the % leased & occupied will also include these tenants. |
| (2) | Home Depot is expected to open in 1Q07 with the balance of the Shopping Center to open during the 4Q07. |
| (3) | Our acquisition of the Site and the construction of the racetrack require the issuance to Valley View Downs of the sole remaining unissued harness racetrack license (the “Racing License”) in Pennsylvania. The construction of the casino requires the issuance to Valley View Downs, under the Pennsylvania Race Horse Development and Gaming Act, of a license for Alternative Gaming. Valley View Downs had been one of two applicants for the Racing License. There have been a number of hearings on the applications before the Pennsylvania Harness Racing Commission, and on November 3, 2005, the Harness Racing Commission issued an order denying award of the license to both of the applicants. On December 8, 2005, Valley View Downs filed with the Commission a motion for reconsideration and request to re-open the record for the purpose of presenting additional information relating to concerns identified in the Order. In addition, Valley View Downs filed an appeal of the ruling in the Pennsylvania Commonwealth Court. Valley View Downs is awaiting action by the Court and Commission regarding these appeals. However, we are unable to predict whether or when Valley View Downs will be issued the Racing License. |
| (4) | The Partnership’s original development plans for the Pavilion at Market East are under review. The company retains a 50% interest in the partnership. |
PAGE 28
Pennsylvania REIT
QUARTERLY SUPPLEMENTAL DISCLOSURE (December 31, 2005)
Redevelopment Activity (1)
| | | | | | | | | | | | | | | | | | | | | | | | | |
NAME OF
PROJECT
LOCATION | | TOTAL
PROJECTED
PROPERTY
GLA
(sq ft) (1) | | PREIT’S
SHARE | | | PREIT’s
PROJECTED
SHARE OF
COST | | PREIT’s
SHARE OF
INVESTMENT
TO DATE | | EXPECTED
STABILIZED
NOI CAP | | | CONST
START
DATE | | DATE OF
INITIAL
OCCUPANCY | | EXPECTED
DATE OF
COMPLETION | | % OF
SPENDING
COMPLETED | | | DESCRIPTION |
Enclosed Mall | | | | | | | | | | | | | | | | | | | | | | | | | |
Capital City Mall Camp Hill, PA | | 640,000 | | 100 | % | | $ | 11,600,000 | | $ | 7,200,000 | | 10.8 | % | | 1Q05 | | 4Q05 | | 2Q06 | | 62 | % | | The existing
food court will
be redeveloped
into new
specialty retail
space; a new
eight-bay food
court and two
family-themed
restaurants will
be added. |
Patrick Henry Mall Newport News, VA | | 710,000 | | 100 | % | | | 26,900,000 | | | 20,300,000 | | 10.0 | % | | 1Q05 | | 4Q05 | | 3Q06 | | 75 | % | | Dillard’s
Men’s store
was merged
with Dillard’s;
Dick’s
Sporting
Goods,
Borders and
new mall shops
will occupy the
old Dillard’s
Men’s store. |
Cumberland Mall Vineland, NJ | | 950,000 | | 100 | % | | | 5,400,000 | | | 2,300,000 | | 10.6 | % | | 2Q05 | | 1Q06 | | 1Q06 | | 43 | % | | A Best Buy
will be added
on land
adjacent to the
Cumberland
Mall. |
New River Valley Mall Christiansburg, VA | | 440,000 | | 100 | % | | | 23,000,000 | | | 1,000,000 | | 8.5 | % | | 4Q05 | | 1Q06 | | 1Q07 | | 4 | % | | Regal Cinemas
will be
relocated and
expanded into
a free-standing
14 screen
theater. Also,
Red Robin
restaurant will
be added at the
mall. |
Valley View Mall LaCrosse, WI | | 600,000 | | 100 | % | | | 3,600,000 | | | 700,000 | | 10.0 | % | | 4Q05 | | 3Q06 | | 4Q06 | | 19 | % | | Barnes &
Noble will be
added to the
mall in a
31,000 sf in-
line location. |
South Mall Allentown, PA | | 420,000 | | 100 | % | | | 6,900,000 | | | 100,000 | | 8.1 | % | | 1Q06 | | 3Q06 | | 4Q07 | | 1 | % | | Ross Dress For
Less will be
added at the
Stein Mart end
of the center
and Gold’s
Gym will be
expanded. A
Starbucks
drive-through
concept will
open on a pad
location. |
Francis Scott Key Mall Frederick, MD | | 720,000 | | 100 | % | | | 3,500,000 | | | 100,000 | | 8.5 | % | | 1Q06 | | 3Q06 | | 4Q06 | | 3 | % | | A 27,000 sf
Barnes &
Noble will be
added. |
Lycoming Mall Pennsdale, PA | | 810,000 | | 100 | % | | | 11,800,000 | | | 900,000 | | 11.0 | % | | 1Q06 | | 3Q06 | | 4Q06 | | 8 | % | | Dick’s
Sporting
Goods,
Borders, and
Old Navy will
occupy in-line
space;
Applebees and
Best Buy will
open outparcel
locations. A
cosmetic
renovation is
also planned. |
Plymouth Meeting Mall Plymouth Meeting, PA | | 1,100,000 | | 100 | % | | | 53,400,000 | | | 18,900,000 | | 9.5 | % | | 4Q06 | | 4Q07 | | 4Q08 | | 35 | % | | A 200,000 sf
lifestyle
addition will
include a
70,000 sf
Whole Foods
market and 6
themed
restaurants. |
Cherry Hill Mall Cherry Hill, NJ | | 1,400,000 | | 100 | % | | | 40,000,000 | | | 900,000 | | 8.5 | % | | 1Q03 | | 1Q07 | | 4Q07 | | 2 | % | | PREIT will
add Bistro
Row and new
leaseable area. |
Mixed Use | | | | | | | | | | | | | | | | | | | | | | | | | |
Echelon Mall (Voorhees Town Center)(2) Voorhees, NJ | | TBD | | TBD | | | | TBD | | | 1,600,000 | | TBD | | | TBD | | TBD | | TBD | | TBD | | | Redevelopment
plans for the
Echelon Mall
include
reducing the
mall size to
allow
development of
a mixed-use
town center at
the eastern half
of the property,
together with
renaming the
asset as
Voorhees
Town Center. |
| | | | | | | | | | | | | | | | | | | | | | | | | |
Total Redevelopment Activity | | 7,790,000 | | | | | $ | 186,100,000 | | $ | 54,000,000 | | 9.4 | % | | | | | | | | | | | |
| | | | | | | | | | | | | | | | | | | | | | | | | |
| (1) | GLA and total project cost include tenants that purchased their respective land. |
| (2) | For more information see PREIT’s press release from 9/14/05. |
PAGE 29
Pennsylvania REIT
QUARTERLY SUPPLEMENTAL DISCLOSURE (December 31, 2005)
Top Twenty Tenants (by share of PREIT’s Annualized Base Rent)
| | | | | | | | | | | | | | | | | | | | | | |
| | | Number of Stores | | GLA of Stores | | Annualized
Base Rent | | PREIT’s share
of Annualized
Base Rent (2) | | | Percent
of PREIT’s
Total
Retail
Base Rent | |
Tenant | | Fixed Rent | | Percentage Rent
In Lieu of
Fixed Rent or
Common
Area Costs (1) | | Total | | Fixed Rent | | Percentage Rent
In Lieu of
Fixed Rent or
Common
Area Costs (1) | | Total | | | |
Gap, Inc. | | 57 | | 5 | | 62 | | 713,166 | | 35,137 | | 748,303 | | $ | 14,655,910 | | $ | 13,706,910 | | | 4.35 | % |
Limited Brands, Inc. | | 87 | | 19 | | 106 | | 541,199 | | 90,262 | | 631,461 | | | 13,458,535 | | | 12,585,730 | | | 3.99 | % |
Foot Locker, Inc. | | 81 | | 4 | | 85 | | 424,712 | | 8,532 | | 433,244 | | | 8,747,193 | | | 8,302,703 | | | 2.63 | % |
JC Penney Company, Inc. | | 23 | | 6 | | 29 | | 2,295,459 | | 824,327 | | 3,119,786 | | | 7,099,316 | | | 7,099,316 | | | 2.25 | % |
Sears Holding Corporation | | 28 | | 4 | | 32 | | 3,000,483 | | 725,201 | | 3,725,684 | | | 6,209,010 | | | 6,065,264 | | | 1.92 | % |
Zales Corporation | | 92 | | 0 | | 92 | | 76,152 | | — | | 76,152 | | | 6,048,343 | | | 5,786,519 | | | 1.84 | % |
Luxottica Group S.p.A. | | 89 | | 2 | | 91 | | 155,664 | | 932 | | 156,596 | | | 5,412,590 | | | 5,035,793 | | | 1.60 | % |
Hallmark Cards, Inc. | | 58 | | 2 | | 60 | | 208,655 | | 8,482 | | 217,137 | | | 4,839,942 | | | 4,645,858 | | | 1.47 | % |
American Eagle Outfitters, Inc. | | 32 | | 2 | | 34 | | 173,192 | | 8,813 | | 182,005 | | | 4,651,146 | | | 4,440,259 | | | 1.41 | % |
Sterling Jewelers, Inc. | | 46 | | 0 | | 46 | | 64,502 | | — | | 64,502 | | | 4,588,911 | | | 4,401,411 | | | 1.40 | % |
Borders Group Inc. | | 33 | | 2 | | 35 | | 211,133 | | 7,928 | | 219,061 | | | 4,262,060 | | | 3,995,397 | | | 1.27 | % |
Transworld Entertainment Corp. | | 31 | | 0 | | 31 | | 157,951 | | — | | 157,951 | | | 3,422,824 | | | 3,335,946 | | | 1.06 | % |
The Finish Line, Inc. | | 32 | | 1 | | 33 | | 152,080 | | 5,960 | | 158,040 | | | 3,292,591 | | | 3,292,591 | | | 1.04 | % |
Regis Corporation | | 94 | | 0 | | 94 | | 113,555 | | — | | 113,555 | | | 3,412,768 | | | 3,284,780 | | | 1.04 | % |
The Bon-Ton Dept. Stores, Inc. | | 15 | | 1 | | 16 | | 1,077,982 | | 60,916 | | 1,138,898 | | | 2,973,869 | | | 2,973,869 | | | 0.94 | % |
Aeropostale, Inc. | | 34 | | 0 | | 34 | | 115,732 | | — | | 115,732 | | | 2,940,563 | | | 2,790,090 | | | 0.89 | % |
Sun Capital Partners, Inc. | | 27 | | 2 | | 29 | | 87,977 | | 7,810 | | 95,787 | | | 2,948,192 | | | 2,708,032 | | | 0.86 | % |
Pacific Sunwear of California | | 35 | | 4 | | 39 | | 112,792 | | 14,352 | | 127,144 | | | 2,764,161 | | | 2,672,833 | | | 0.85 | % |
Charming Shoppes, Inc. | | 28 | | 2 | | 30 | | 171,978 | | 12,539 | | 184,517 | | | 2,870,047 | | | 2,657,420 | | | 0.84 | % |
Shoe Show, Inc. | | 33 | | 0 | | 33 | | 162,465 | | — | | 162,465 | | | 2,680,854 | | | 2,615,137 | | | 0.83 | % |
| | | | | | | | | | | | | | | | | | | | | | |
Total Top 20 Tenants | | 955 | | 56 | | 1,011 | | 10,016,829 | | 1,811,191 | | 11,828,020 | | $ | 107,278,825 | | $ | 102,395,858 | | | 32.49 | % |
| | | | | | | | | | | | | | | | | | | | | | |
Total Retail Leased | | | | | | 3,607 | | | | | | 24,017,422 | | $ | 328,129,515 | | $ | 315,183,488 | (3) | | 100.00 | % |
| | | | | | | | | | | | | | | | | | | | | | |
| (1) | Income from lease(s) in which tenant pays percentage rent in lieu of fixed rent or common area costs are not included in annualized base rent. |
| (2) | Includes PREIT’s proportionate share of tenant rents from partnership properties based on PREIT’s ownership percentage in the respective partnerships. |
| (3) | PREIT’s share of annualized base rent is derived by annualizing 4th quarter base rent. Straight line rent is not included in the base rent figures. |
PAGE 30
Pennsylvania REIT
QUARTERLY SUPPLEMENTAL DISCLOSURE (December 31, 2005)
Retail Lease Expiration Schedule - Anchors(1)
| | | | | | | | | | | | | | | | | | | |
Year | | Leases | | Gross Leasable Area | | | Annualized Base Rent | | | Average
Expiring
Base
Rent psf |
Lease Expiration Year | | Number
of
Leases
Expiring | | Expiring
GLA | | Percent
of
Total | | | Rent in
Expiring Year | | PREIT’s Share
of Rent in
Expiring Year (3) | | Percent
of Total
(PREIT’s
Share) | | |
2005 and Prior(2) | | 1 | | 154,852 | | 1.32 | % | | $ | 188,400 | | $ | 188,400 | | 0.53 | % | | $ | 1.22 |
2006 | | 4 | | 107,219 | | 0.92 | % | | | 475,011 | | | 475,011 | | 1.34 | % | | | 4.43 |
2007 | | 9 | | 822,331 | | 7.02 | % | | | 2,055,073 | | | 2,045,173 | | 5.77 | % | | | 2.50 |
2008 | | 17 | | 1,226,147 | | 10.47 | % | | | 3,206,682 | | | 3,206,682 | | 9.05 | % | | | 2.62 |
2009 | | 12 | | 929,598 | | 7.94 | % | | | 2,713,570 | | | 2,321,570 | | 6.55 | % | | | 2.92 |
2010 | | 22 | | 2,089,444 | | 17.84 | % | | | 6,144,328 | | | 6,144,328 | | 17.35 | % | | | 2.94 |
2011 | | 22 | | 1,847,700 | | 15.77 | % | | | 6,242,565 | | | 5,119,750 | | 14.45 | % | | | 3.38 |
2012 | | 3 | | 302,710 | | 2.58 | % | | | 512,783 | | | 475,902 | | 1.34 | % | | | 1.69 |
2013 | | 6 | | 453,533 | | 3.87 | % | | | 2,728,654 | | | 2,728,654 | | 7.70 | % | | | 6.02 |
2014 | | 6 | | 662,582 | | 5.66 | % | | | 2,081,285 | | | 2,081,285 | | 5.88 | % | | | 3.14 |
2015 | | 1 | | 85,212 | | 0.73 | % | | | 468,666 | | | 468,666 | | 1.32 | % | | | 5.50 |
Thereafter | | 23 | | 3,033,063 | | 25.89 | % | | | 11,495,182 | | | 10,164,586 | | 28.70 | % | | | 3.79 |
| | | | | | | | | | | | | | | | | | | |
Totals: | | 126 | | 11,714,391 | | 100 | % | | $ | 38,312,199 | | $ | 35,420,007 | | 100 | % | | $ | 3.27 |
| | | | | | | | | | | | | | | | | | | |
|
| Retail Lease Expiration Schedule - Non-Anchors(1) |
| | | | |
Year | | Leases | | Gross Leasable Area | | | Annualized Base Rent | | | Average
Expiring
Base
Rent psf |
Lease Expiration Year | | Number
of
Leases
Expiring | | Expiring
GLA | | Percent
of
Total | | | Rent in
Expiring Year | | PREIT’s Share
of Rent in
Expiring Year(3) | | Percent
of Total
(PREIT’s
Share) | | |
2005 and Prior (2) | | 236 | | 595,689 | | 4.84 | % | | $ | 13,745,835 | | $ | 13,214,865 | | 4.89 | % | | $ | 23.08 |
2006 | | 399 | | 1,057,971 | | 8.60 | % | | | 23,527,068 | | | 21,580,956 | | 7.98 | % | | | 22.24 |
2007 | | 481 | | 1,346,217 | | 10.94 | % | | | 29,726,123 | | | 28,257,617 | | 10.45 | % | | | 22.08 |
2008 | | 404 | | 1,175,389 | | 9.55 | % | | | 29,040,341 | | | 27,896,430 | | 10.31 | % | | | 24.71 |
2009 | | 410 | | 1,136,760 | | 9.24 | % | | | 29,682,740 | | | 28,683,004 | | 10.60 | % | | | 26.11 |
2010 | | 427 | | 1,404,584 | | 11.42 | % | | | 34,117,579 | | | 32,775,899 | | 12.12 | % | | | 24.29 |
2011 | | 265 | | 1,238,935 | | 10.07 | % | | | 28,966,807 | | | 25,264,258 | | 9.34 | % | | | 23.38 |
2012 | | 231 | | 985,049 | | 8.01 | % | | | 24,875,807 | | | 22,774,882 | | 8.42 | % | | | 25.25 |
2013 | | 180 | | 615,727 | | 5.00 | % | | | 16,292,228 | | | 15,045,681 | | 5.56 | % | | | 26.46 |
2014 | | 158 | | 568,686 | | 4.62 | % | | | 15,416,167 | | | 13,510,192 | | 4.99 | % | | | 27.11 |
2015 | | 168 | | 747,196 | | 6.07 | % | | | 18,997,490 | | | 16,722,379 | | 6.18 | % | | | 25.43 |
Thereafter | | 122 | | 1,430,828 | | 11.63 | % | | | 26,628,525 | | | 24,786,130 | | 9.16 | % | | | 18.61 |
| | | | | | | | | | | | | | | | | | | |
Totals: | | 3,481 | | 12,303,031 | | 100 | % | | $ | 291,016,710 | | $ | 270,512,293 | | 100 | % | | $ | 23.65 |
| | | | | | | | | | | | | | | | | | | |
| (1) | Includes only Owned space. |
| (2) | Includes all tenant leases which have already expired and are on a month-to-month basis. |
| (3) | Includes PREIT’s proportionate share of tenant rents from partnership properties based on PREIT’s ownership percentage in the respective partnerships. |
PAGE 31
Pennsylvania REIT
QUARTERLY SUPPLEMENTAL DISCLOSURE (December 31, 2005)
Leasing Activity Summary
| | | | | | | | | | | | | | | | |
| | | Number | | GLA | | Average
Previous Base
Rent psf | | Average New
Base Rent
psf | | Increase/
Decrease
in Base
Rent psf | | Annualized
Tenant
Improvements
psf (1) |
Previously Leased Space: | | | | | | | | | | | | | | | | |
| | | | | | |
1st Quarter | | 17 | | 78,456 | | $ | 26.14 | | $ | 28.40 | | $ | 2.26 | | $ | 5.02 |
2nd Quarter | | 24 | | 82,653 | | | 26.05 | | | 29.58 | | | 3.53 | | | 3.32 |
3rd Quarter(2) | | 71 | | 124,764 | | | 31.73 | | | 36.89 | | | 5.16 | | | 2.17 |
4th Quarter | | 27 | | 81,680 | | | 20.19 | | | 24.40 | | | 4.21 | | | 2.07 |
| | | | | | | | | | | | | | | | |
Total or Average | | 139 | | 367,553 | | $ | 26.70 | | $ | 30.66 | | $ | 3.96 | | $ | 3.01 |
| | | | | | | | | | | | | | | | |
Previously Vacant Space: | | | | | | | | | | | | | | | | |
| | | | | | |
1st Quarter | | 19 | | 42,134 | | $ | — | | $ | 29.51 | | $ | 29.51 | | $ | 3.42 |
2nd Quarter | | 25 | | 138,153 | | | — | | | 16.62 | | | 16.62 | | | 2.56 |
3rd Quarter(2) | | 51 | | 204,737 | | | — | | | 19.26 | | | 19.26 | | | 0.79 |
4th Quarter | | 34 | | 155,048 | | | — | | | 20.37 | | | 20.37 | | | 2.87 |
| | | | | | | | | | | | | | | | |
Total or Average | | 129 | | 540,072 | | $ | — | | $ | 19.70 | | $ | 19.70 | | $ | 2.05 |
| | | | | | | | | | | | | | | | |
Renewal(3) | | | | | | | | | | | | | | | | |
| | | | | | |
1st Quarter(4) | | 81 | | 765,662 | | $ | 7.82 | | $ | 8.17 | | $ | 0.35 | | $ | — |
2nd Quarter(5) | | 97 | | 971,952 | | | 8.04 | | | 8.18 | | | 0.14 | | | 0.03 |
3rd Quarter(6) | | 93 | | 521,100 | | | 10.55 | | | 11.05 | | | 0.50 | | | 0.02 |
4th Quarter(7) | | 104 | | 467,354 | | | 15.72 | | | 16.00 | | | 0.28 | | | 0.01 |
| | | | | | | | | | | | | | | | |
Total or Average | | 375 | | 2,726,068 | | $ | 9.77 | | $ | 10.07 | | $ | 0.29 | | $ | 0.02 |
| | | | | | | | | | | | | | | | |
| (1) | These leasing costs are presented as annualized costs per square foot and are spread uniformly over the life of the lease. |
| (2) | Previously leased space includes 32 leases for ATMs. Excluding these leases, previously leased space would have been 39 leases with 124,476 square feet for an average new base rent per square foot of $26.00, an increase of $4.37 per square foot. Previously vacant space includes 12 leases for ATMs. Excluding these leases, previously vacant space would have been 39 leases with 204,629 square feet for an average new base rent psf of $17.43. |
| (3) | This category includes expansions, relocations, lease extensions and modifications. |
| (4) | Includes eight anchor leases for 561,135 square feet for an average base rent of $3.29 per square foot. Also includes 73 renewal leases for 204,527 square feet with an average new base rent psf of $21.57, representing an increase of $1.30 in base rent psf. |
| (5) | Includes six anchor leases for 630,896 square feet for an average base rent of $2.10 per square foot. Also includes 91 renewal leases for 341,056 square feet with an average new base rent psf of $19.41, representing an increase of $0.42 in base rent psf. |
| (6) | Includes three anchor leases for 308,613 square feet for an average base rent of $3.07 per square foot. Also includes 90 renewal leases for 212,487 square feet with an average new base rent psf of $22.64, representing an increase of $1.24 in base rent psf. |
| (7) | Includes two anchor leases for 161,445 square feet for an average base rent of $3.32 per square foot. Also includes 102 renewal leases for 305,909 square feet with an average new base rent psf of $22.70, representing an increase of $0.43 in base rent psf. |
PAGE 32
Pennsylvania REIT
QUARTERLY SUPPLEMENTAL DISCLOSURE (December 31, 2005)
Capital Expenditures
| | | | | | | | | | | | | | | | | | |
| | | Three months ended December 31, 2005 | | Twelve months ended December 31, 2005 |
Retail | | Consolidated | | Unconsolidated
Partnerships | | Total | | Consolidated | | Unconsolidated
Partnerships | | Total |
New development projects | | $ | 3,911,000 | | $ | — | | $ | 3,911,000 | | $ | 29,714,000 | | $ | — | | $ | 29,714,000 |
Redevelopment projects with incremental GLA and/or Anchor Replacement | | | 15,841,000 | | | — | | | 15,841,000 | | | 38,403,000 | | | 650,000 | | | 39,053,000 |
Renovation with no incremental GLA | | | 110,000 | | | — | | | 110,000 | | | 1,988,000 | | | 83,000 | | | 2,071,000 |
Tenant allowances | | | 6,355,000 | | | 9,000 | | | 6,364,000 | | | 17,401,000 | | | 800,000 | | | 18,201,000 |
Operational capital expenditures at properties: | | | | | | | | | | | | | | | | | | |
CAM expenditures | | | 4,526,000 | | | — | | | 4,526,000 | | | 9,968,000 | | | — | | | 9,968,000 |
Non-CAM expenditures | | | 758,000 | | | 653,000 | | | 1,411,000 | | | 2,477,000 | | | 841,000 | | | 3,318,000 |
| | | | | | | | | | | | | | | | | | |
Subtotal operational capital expenditures at properties | | $ | 5,284,000 | | $ | 653,000 | | $ | 5,937,000 | | $ | 12,445,000 | | $ | 841,000 | | $ | 13,286,000 |
| | | | | | | | | | | | | | | | | | |
Total | | $ | 31,501,000 | | $ | 662,000 | | $ | 32,163,000 | | $ | 99,951,000 | | $ | 2,374,000 | | $ | 102,325,000 |
| | | | | | | | | | | | | | | | | | |
PAGE 33
Pennsylvania REIT
QUARTERLY SUPPLEMENTAL DISCLOSURE (December 31, 2005)
Retail Portfolio
(Includes Non-Anchor Owned Space)
| | | | | | | | | | | | | | | | | | | | | | | | | | | |
| | | December 31, 2005 | | % Change | | | December 31, 2004 |
| | | Avg Base Rent
psf (1) | | Avg % Rent
psf(1) | | Additional
Charges
psf(1) | | Avg Base Rent
psf(1) | | | Avg % Rent
psf(1) | | | Additional
Charges
psf(1) | | | Avg Base Rent
psf(1) | | Avg % Rent
psf(1) | | Additional
Charges
psf(1) |
Enclosed Malls weighted average | | $ | 25.01 | | $ | 0.82 | | $ | 9.57 | | 6.2 | % | | -0.3 | % | | 7.3 | % | | $ | 23.54 | | $ | 0.82 | | $ | 8.92 |
Power Centers weighted average | | $ | 16.28 | | $ | 0.06 | | $ | 3.14 | | 5.4 | % | | 25.7 | % | | 6.0 | % | | $ | 15.44 | | $ | 0.05 | | $ | 2.97 |
Strip Centers weighted average | | $ | 15.64 | | $ | — | | $ | 2.30 | | 9.2 | % | | N/A | | | -7.7 | % | | $ | 14.32 | | $ | — | | $ | 2.49 |
| | | | | | | | | | | | | | | | | | | | | | | | | | | |
Retail Portfolio weighted average | | $ | 23.55 | | $ | 0.69 | | $ | 8.49 | | 6.6 | % | | 1.2 | % | | 8.1 | % | | $ | 22.09 | | $ | 0.68 | | $ | 7.86 |
| | | | | | | | | | | | | | | | | | | | | | | | | | | |
Consolidated Properties | | $ | 24.01 | | $ | 0.78 | | $ | 8.94 | | 6.4 | % | | 2.1 | % | | 6.8 | % | | $ | 22.56 | | $ | 0.76 | | $ | 8.37 |
Partnership Properties | | $ | 21.01 | | $ | 0.20 | | $ | 6.04 | | 9.2 | % | | -0.3 | % | | 25.3 | % | | $ | 19.25 | | $ | 0.20 | | $ | 4.82 |
| | | | | | | | | | | | | | | | | | | | | | | | | | | |
PRI-managed | | $ | 24.18 | | $ | 0.77 | | $ | 9.02 | | 7.2 | % | | 1.6 | % | | 8.0 | % | | $ | 22.55 | | $ | 0.76 | | $ | 8.35 |
Non PRI-managed | | $ | 19.45 | | $ | 0.16 | | $ | 5.08 | | 0.9 | % | | -23.7 | % | | 5.4 | % | | $ | 19.28 | | $ | 0.21 | | $ | 4.82 |
| | | | | | | | | | | | | | | | | | | | | | | | | | | |
Same Properties/Existing | | $ | 23.04 | | $ | 0.71 | | $ | 7.96 | | 4.3 | % | | 4.8 | % | | 1.3 | % | | $ | 22.09 | | $ | 0.68 | | $ | 7.86 |
New | | $ | 28.79 | | $ | 0.44 | | $ | 13.99 | | N/A | | | N/A | | | N/A | | | | N/A | | | N/A | | | N/A |
| | | | | | | | | | | | | | | | | | | | | | | | | | | |
| (1) | Base rent is actual for the fourth quarter 2005. Additional charges and % rent are projections for 2005. |
(Includes Only Owned Space)
| | | | | | | | | | | | | | | | | | |
| | | December 31, 2005 | | | Occupancy Change in % Occupancy | | | December 31, 2004 | |
| | | Total w/Anchor %
Leased | | | In-Line only
(Non-Anchor)
% Leased | | | Total w/Anchor %
Leased | | | In-Line only
(Non-Anchor)
% Leased | | | Total w/Anchor %
Leased | | | In-Line only
(Non-Anchor)
% Leased | |
Enclosed Malls weighted average | | 91.3 | % | | 87.0 | % | | -0.2 | % | | -0.3 | % | | 91.5 | % | | 87.3 | % |
Power Centers weighted average | | 97.8 | % | | 96.7 | % | | 1.0 | % | | 1.7 | % | | 96.8 | % | | 95.0 | % |
Strip Centers weighted average | | 96.1 | % | | 90.7 | % | | -0.1 | % | | -0.3 | % | | 96.2 | % | | 91.0 | % |
| | | | | | | | | | | | | | | | | | |
Retail Portfolio weighted average | | 92.2 | % | | 88.4 | % | | 0.0 | % | | -0.1 | % | | 92.2 | % | | 88.6 | % |
| | | | | | | | | | | | | | | | | | |
Consolidated Properties | | 91.5 | % | | 87.0 | % | | -0.2 | % | | -0.6 | % | | 91.7 | % | | 87.6 | % |
Partnership Properties | | 98.1 | % | | 97.2 | % | | 1.5 | % | | 2.2 | % | | 96.6 | % | | 95.0 | % |
| | | | | | | | | | | | | | | | | | |
PRI-managed | | 91.5 | % | | 87.1 | % | | -0.2 | % | | -0.4 | % | | 91.7 | % | | 87.5 | % |
Non PRI-managed | | 98.8 | % | | 98.3 | % | | 1.9 | % | | 2.7 | % | | 96.9 | % | | 95.6 | % |
| | | | | | | | | | | | | | | | | | |
Same Properties | | 92.0 | % | | 88.1 | % | | -0.2 | % | | -0.5 | % | | 92.2 | % | | 88.6 | % |
New | | 94.5 | % | | 92.0 | % | | N/A | | | N/A | | | N/A | | | N/A | |
| | | | | | | | | | | | | | | | | | |
| * | Westgate Anchor Pad consists of a 108,100 sf. Bon-Ton Store for which PREIT receives $307,003/yr ($2.84/sf) and is not included in the Occupancy and Rent reports. |
PAGE 34
Pennsylvania REIT
QUARTERLY SUPPLEMENTAL DISCLOSURE (December 31, 2005)
Enclosed Malls
(Includes Only Owned Space)
| | | | | | | | | | | | | | | | | | |
| | | December 31, 2005 | | | Change in % Occupancy | | | December 31, 2004 | |
| | | Total w/Anchor %
Leased | | | In-Line only
(Non-Anchor)
% Leased | | | Total w/Anchor %
Leased | | | In-Line only
(Non-Anchor)
% Leased | | | Total w/Anchor %
Leased | | | In-Line only
(Non-Anchor)
% Leased | |
Beaver Valley Mall | | 91.6 | % | | 81.6 | % | | 2.6 | % | | 5.1 | % | | 89.0 | % | | 76.5 | % |
Capital City | | 96.4 | % | | 93.5 | % | | -2.2 | % | | -4.0 | % | | 98.6 | % | | 97.5 | % |
Chambersburg Mall | | 93.2 | % | | 85.4 | % | | 0.9 | % | | 1.9 | % | | 92.3 | % | | 83.5 | % |
Cherry Hill Mall | | 95.6 | % | | 95.6 | % | | 3.1 | % | | 3.1 | % | | 92.5 | % | | 92.5 | % |
Crossroads Mall | | 96.8 | % | | 92.6 | % | | 1.7 | % | | 4.1 | % | | 95.1 | % | | 88.5 | % |
Cumberland Mall | | 97.7 | % | | 95.9 | % | | N/A | | | N/A | | | N/A | | | N/A | |
Dartmouth Mall | | 96.4 | % | | 94.1 | % | | 0.0 | % | | 0.0 | % | | 96.4 | % | | 94.1 | % |
Echelon Mall | | 32.2 | % | | 53.3 | % | | -4.9 | % | | -10.4 | % | | 37.1 | % | | 63.7 | % |
Exton Square Mall | | 93.1 | % | | 84.8 | % | | -1.0 | % | | -2.2 | % | | 94.1 | % | | 87.0 | % |
Francis Scott Key Mall | | 94.1 | % | | 87.9 | % | | -1.8 | % | | -3.7 | % | | 95.9 | % | | 91.6 | % |
Gadsden Mall | | 95.0 | % | | 88.2 | % | | N/A | | | N/A | | | N/A | | | N/A | |
Jacksonville Mall | | 97.3 | % | | 94.5 | % | | -0.5 | % | | -1.1 | % | | 97.8 | % | | 95.6 | % |
Lehigh Valley Mall | | 97.2 | % | | 95.8 | % | | 5.7 | % | | 8.1 | % | | 91.5 | % | | 87.7 | % |
Logan Valley Mall | | 97.8 | % | | 94.6 | % | | -0.1 | % | | -0.4 | % | | 97.9 | % | | 95.0 | % |
Lycoming Mall | | 88.7 | % | | 78.1 | % | | -0.9 | % | | -1.7 | % | | 89.6 | % | | 79.8 | % |
Magnolia Mall | | 95.4 | % | | 88.5 | % | | 1.5 | % | | 4.0 | % | | 93.9 | % | | 84.5 | % |
Moorestown Mall | | 94.2 | % | | 86.7 | % | | 0.1 | % | | 0.0 | % | | 94.1 | % | | 86.7 | % |
New River Valley Mall | | 78.5 | % | | 85.6 | % | | 1.8 | % | | 4.1 | % | | 76.7 | % | | 81.5 | % |
Nittany Mall | | 93.2 | % | | 86.2 | % | | -0.3 | % | | -0.6 | % | | 93.5 | % | | 86.8 | % |
North Hanover Mall | | 93.4 | % | | 81.9 | % | | 0.0 | % | | 0.1 | % | | 93.4 | % | | 81.8 | % |
Orlando Fashion Square | | 91.1 | % | | 81.0 | % | | 0.4 | % | | 1.8 | % | | 90.7 | % | | 79.2 | % |
Palmer Park Mall | | 99.7 | % | | 99.1 | % | | 0.5 | % | | 1.9 | % | | 99.2 | % | | 97.2 | % |
Patrick Henry Mall | | 90.4 | % | | 83.0 | % | | -8.9 | % | | -15.4 | % | | 99.3 | % | | 98.4 | % |
Phillipsburg Mall | | 91.8 | % | | 81.0 | % | | -0.8 | % | | -1.6 | % | | 92.6 | % | | 82.6 | % |
Plymouth Meeting | | 89.9 | % | | 85.4 | % | | -2.8 | % | | -4.0 | % | | 92.7 | % | | 89.4 | % |
Schuylkill Mall | | 75.0 | % | | 66.2 | % | | -1.5 | % | | -3.1 | % | | 76.5 | % | | 69.3 | % |
South Mall | | 92.2 | % | | 85.3 | % | | -5.1 | % | | -9.6 | % | | 97.3 | % | | 94.9 | % |
Springfield Mall | | 95.9 | % | | 95.9 | % | | N/A | | | N/A | | | N/A | | | N/A | |
The Gallery at Market East I | | 89.2 | % | | 89.2 | % | | -1.4 | % | | -1.4 | % | | 90.6 | % | | 90.6 | % |
The Gallery at Market East II | | 86.8 | % | | 78.6 | % | | 5.3 | % | | 8.4 | % | | 81.5 | % | | 70.2 | % |
The Mall at Prince Georges | | 97.2 | % | | 93.4 | % | | 0.1 | % | | 0.2 | % | | 97.1 | % | | 93.2 | % |
Uniontown Mall | | 94.5 | % | | 86.1 | % | | -1.5 | % | | -3.8 | % | | 96.0 | % | | 89.9 | % |
Valley Mall | | 98.8 | % | | 97.9 | % | | -0.5 | % | | -0.9 | % | | 99.3 | % | | 98.8 | % |
Valley View Mall | | 92.3 | % | | 89.2 | % | | -4.0 | % | | -5.5 | % | | 96.3 | % | | 94.7 | % |
Viewmont Mall | | 99.3 | % | | 98.3 | % | | 0.0 | % | | 0.0 | % | | 99.3 | % | | 98.3 | % |
Washington Crown Center | | 91.8 | % | | 84.9 | % | | -2.2 | % | | -4.0 | % | | 94.0 | % | | 88.9 | % |
Willow Grove Park | | 96.1 | % | | 93.4 | % | | 1.0 | % | | 1.6 | % | | 95.1 | % | | 91.8 | % |
Wiregrass Mall | | 83.8 | % | | 83.8 | % | | 0.0 | % | | 0.0 | % | | 83.8 | % | | 83.8 | % |
Woodland Mall | | 88.1 | % | | 88.1 | % | | N/A | | | N/A | | | N/A | | | N/A | |
Wyoming Valley Mall | | 96.6 | % | | 90.4 | % | | -1.3 | % | | -3.7 | % | | 97.9 | % | | 94.1 | % |
| | | | | | | | | | | | | | | | | | |
Enclosed Malls weighted average | | 91.3 | % | | 87.0 | % | | -0.2 | % | | -0.3 | % | | 91.5 | % | | 87.3 | % |
| | | | | | | | | | | | | | | | | | |
Consolidated Properties | | 91.1 | % | | 86.5 | % | | -0.4 | % | | -0.8 | % | | 91.5 | % | | 87.3 | % |
Partnership Properties | | 96.8 | % | | 95.9 | % | | 5.3 | % | | 8.2 | % | | 91.5 | % | | 87.7 | % |
| | | | | | | | | | | | | | | | | | |
PRI-managed | | 91.2 | % | | 86.7 | % | | -0.3 | % | | -0.6 | % | | 91.5 | % | | 87.3 | % |
Non PRI-managed | | 97.2 | % | | 95.8 | % | | 5.7 | % | | 8.1 | % | | 91.5 | % | | 87.7 | % |
| | | | | | | | | | | | | | | | | | |
Same Properties | | 91.1 | % | | 86.5 | % | | -0.4 | % | | -0.8 | % | | 91.5 | % | | 87.3 | % |
New | | 94.5 | % | | 92.0 | % | | N/A | | | N/A | | | N/A | | | N/A | |
| | | | | | | | | | | | | | | | | | |
Continuing Operations | | 91.8 | % | | 87.6 | % | | -0.2 | % | | -0.3 | % | | 92.0 | % | | 87.9 | % |
Discontinued Operations | | 75.0 | % | | 66.2 | % | | -1.5 | % | | -3.1 | % | | 76.5 | % | | 69.3 | % |
| | | | | | | | | | | | | | | | | | |
PAGE 35
Pennsylvania REIT
QUARTERLY SUPPLEMENTAL DISCLOSURE (December 31, 2005)
Enclosed Malls
(Includes Non-Anchor Owned Space)
| | | | | | | | | | | | | | | | | | | | | | | | | | | | | | | | | | | | | | | | | | | | | | | | |
| | | % of
Current
Quarter
Mall
NOI | | | December 31, 2005 | | | % Change | | | December 31, 2004 | |
| | | Avg Base
Rent psf (1) | | Avg %
Rent psf (1) | | Additional
Charges psf | | Avg
Comp
Sales
psf | | Occup.
Cost
Ratio | | | Avg
Base
Rent
psf (1) | | | Avg %
Rent psf | | | Additional
Charges psf | | | Avg
Comp
Sales
psf | | | Occup.
Cost
Ratio | | | Avg Base
Rent psf (1) | | Avg %
Rent psf (1) | | Additional
Charges psf | | Avg
Comp
Sales psf | | Occup.
Cost
Ratio | |
Sales per square foot above $400 | | | | | | | | | | | | | | | | | | | | | | | | | | | | | | | | | | | | | | | | | | | | | | | | |
Lehigh Valley Mall | | | | | $ | 29.73 | | $ | 0.35 | | $ | 9.97 | | $ | 468 | | 8.56 | % | | -5.5 | % | | -41.7 | % | | 2.8 | % | | 4.4 | % | | -0.8 | % | | $ | 31.47 | | $ | 0.60 | | $ | 9.69 | | $ | 448 | | 9.32 | % |
Patrick Henry Mall | | | | | | 32.26 | | | 2.07 | | | 13.33 | | | 455 | | 10.48 | % | | 2.6 | % | | -13.0 | % | | 21.0 | % | | 3.2 | % | | 0.3 | % | | | 31.43 | | | 2.38 | | | 11.02 | | | 441 | | 10.17 | % |
Cherry Hill Mall | | | | | | 38.92 | | | 1.05 | | | 18.73 | | | 444 | | 13.22 | % | | 7.2 | % | | 8.1 | % | | 5.4 | % | | 2.3 | % | | 0.5 | % | | | 36.32 | | | 0.97 | | | 17.76 | | | 434 | | 12.69 | % |
The Gallery at Market East II | | | | | | 29.69 | | | 1.34 | | | 5.98 | | | 440 | | 8.41 | % | | -0.8 | % | | -21.1 | % | | 62.8 | % | | 4.5 | % | | 0.0 | % | | | 29.92 | | | 1.71 | | | 3.68 | | | 421 | | 8.39 | % |
Willow Grove Park | | | | | | 40.15 | | | 0.16 | | | 19.36 | | | 416 | | 14.34 | % | | 4.4 | % | | 9.8 | % | | 0.2 | % | | 1.7 | % | | 0.2 | % | | | 38.44 | | | 0.15 | | | 19.31 | | | 409 | | 14.16 | % |
| | | | | | | | | | | | | | | | | | | | | | | | | | | | | | | | | | | | | | | | | | | | | | | | |
Weighted Average | | 22.1 | % | | $ | 34.85 | | $ | 0.88 | | $ | 14.50 | | $ | 444 | | 11.31 | % | | 1.9 | % | | -10.8 | % | | 5.6 | % | | 3.0 | % | | 0.0 | % | | $ | 34.20 | | $ | 0.99 | | $ | 13.73 | | $ | 432 | | 11.34 | % |
| | | | | | | | | | | | | | | | | | | | | | | | | | | | | | | | | | | | | | | | | | | | | | | | |
Sales per square foot between $350 - $400 | | | | | | | | | | | | | | | | | | | | | | | | | | | | | | | | | | | | | | | | | | | | | | | | |
The Mall at Prince Georges | | | | | $ | 27.31 | | $ | 1.84 | | $ | 13.77 | | $ | 392 | | 10.95 | % | | 9.9 | % | | 14.8 | % | | 4.7 | % | | 5.1 | % | | 0.3 | % | | $ | 24.86 | | $ | 1.60 | | $ | 13.15 | | $ | 373 | | 10.62 | % |
Moorestown Mall | | | | | | 25.01 | | | 0.87 | | | 13.58 | | | 388 | | 10.17 | % | | 0.5 | % | | -12.8 | % | | -1.9 | % | | 4.9 | % | | -0.6 | % | | | 24.89 | | | 1.00 | | | 13.84 | | | 370 | | 10.74 | % |
Dartmouth Mall | | | | | | 21.09 | | | 1.31 | | | 7.42 | | | 386 | | 7.73 | % | | 1.8 | % | | -10.4 | % | | 7.6 | % | | -5.2 | % | | 0.6 | % | | | 20.72 | | | 1.47 | | | 6.90 | | | 407 | | 7.15 | % |
Jacksonville Mall | | | | | | 24.25 | | | 1.88 | | | 5.84 | | | 385 | | 8.31 | % | | 10.1 | % | | 28.1 | % | | 7.7 | % | | 6.4 | % | | 0.3 | % | | | 22.02 | | | 1.47 | | | 5.43 | | | 362 | | 7.99 | % |
Exton Square Mall | | | | | | 36.69 | | | 0.61 | | | 14.91 | | | 358 | | 14.59 | % | | 2.7 | % | | -11.2 | % | | 2.8 | % | | -4.5 | % | | 1.0 | % | | | 35.72 | | | 0.69 | | | 14.51 | | | 375 | | 13.58 | % |
| | | | | | | | | | | | | | | | | | | | | | | | | | | | | | | | | | | | | | | | | | | | | | | | |
Weighted Average | | 19.3 | % | | $ | 24.54 | | $ | 1.37 | | $ | 11.59 | | $ | 389 | | 9.64 | % | | -17.0 | % | | 41.8 | % | | -15.1 | % | | 4.7 | % | | -2.3 | % | | $ | 29.59 | | $ | 0.97 | | $ | 13.66 | | $ | 372 | | 11.89 | % |
| | | | | | | | | | | | | | | | | | | | | | | | | | | | | | | | | | | | | | | | | | | | | | | | |
Sales per square foot between $300 - $350 | | | | | | | | | | | | | | | | | | | | | | | | | | | | | | | | | | | | | | | | | | | | | | | | |
Viewmont Mall | | | | | $ | 24.14 | | $ | 1.15 | | $ | 7.58 | | $ | 342 | | 9.61 | % | | 4.6 | % | | -33.6 | % | | 2.7 | % | | 0.6 | % | | 0.1 | % | | $ | 23.08 | | $ | 1.73 | | $ | 7.38 | | $ | 340 | | 9.47 | % |
The Gallery at Market East I | | | | | | 35.56 | | | 0.41 | | | 9.00 | | | 339 | | 13.27 | % | | 6.0 | % | | 0.0 | % | | -6.0 | % | | -1.2 | % | | 0.6 | % | | | 33.55 | | | 0.41 | | | 9.57 | | | 343 | | 12.69 | % |
Capital City | | | | | | 26.00 | | | 1.11 | | | 7.29 | | | 336 | | 10.24 | % | | 15.8 | % | | 19.9 | % | | 9.3 | % | | -3.7 | % | | 1.6 | % | | | 22.44 | | | 0.93 | | | 6.66 | | | 349 | | 8.60 | % |
Valley Mall | | | | | | 18.74 | | | 1.38 | | | 5.07 | | | 331 | | 7.61 | % | | 1.3 | % | | 32.8 | % | | 3.5 | % | | 1.8 | % | | 0.1 | % | | | 18.50 | | | 1.04 | | | 4.89 | | | 325 | | 7.52 | % |
Wyoming Valley Mall | | | | | | 23.19 | | | 0.62 | | | 7.64 | | | 330 | | 9.53 | % | | -2.2 | % | | 6.7 | % | | 3.3 | % | | 1.2 | % | | -0.2 | % | | | 23.70 | | | 0.58 | | | 7.39 | | | 326 | | 9.72 | % |
Valley View Mall | | | | | | 23.72 | | | 0.87 | | | 11.39 | | | 321 | | 11.21 | % | | 4.0 | % | | 34.2 | % | | -14.7 | % | | 3.9 | % | | -0.7 | % | | | 22.81 | | | 0.65 | | | 13.34 | | | 309 | | 11.91 | % |
Cumberland Mall | | | | | | 16.87 | | | 0.85 | | | 6.91 | | | 319 | | 7.72 | % | | N/A | | | N/A | | | N/A | | | N/A | | | N/A | | | | N/A | | | N/A | | | N/A | | | N/A | | N/A | |
Palmer Park Mall | | | | | | 22.74 | | | 1.04 | | | 8.23 | | | 307 | | 10.43 | % | | 1.1 | % | | -19.2 | % | | -9.9 | % | | -9.7 | % | | 0.7 | % | | | 22.49 | | | 1.29 | | | 9.14 | | | 340 | | 9.68 | % |
Logan Valley Mall | | | | | | 22.19 | | | 1.61 | | | 10.30 | | | 304 | | 11.22 | % | | 7.0 | % | | 1.8 | % | | 34.4 | % | | -0.3 | % | | 1.4 | % | | | 20.73 | | | 1.59 | | | 7.67 | | | 305 | | 9.83 | % |
Orlando Fashion Square | | | | | | 27.32 | | | 0.12 | | | 10.36 | | | 303 | | 12.47 | % | | -0.5 | % | | -23.6 | % | | -28.1 | % | | 2.0 | % | | -1.7 | % | | | 27.45 | | | 0.16 | | | 14.40 | | | 297 | | 14.14 | % |
| | | | | | | | | | | | | | | | | | | | | | | | | | | | | | | | | | | | | | | | | | | | | | | | |
Weighted Average | | 27.1 | % | | $ | 24.33 | | $ | 0.93 | | $ | 8.45 | | $ | 322 | | 10.45 | % | | 6.9 | % | | -10.2 | % | | 7.5 | % | | -1.6 | % | | 0.8 | % | | $ | 22.76 | | $ | 1.04 | | $ | 7.86 | | $ | 328 | | 9.66 | % |
| | | | | | | | | | | | | | | | | | | | | | | | | | | | | | | | | | | | | | | | | | | | | | | | |
Sales per square foot under $300 | | | | | | | | | | | | | | | | | | | | | | | | | | | | | | | | | | | | | | | | | | | | | | | | |
Magnolia Mall | | | | | $ | 24.96 | | $ | 0.37 | | $ | 8.22 | | $ | 297 | | 11.30 | % | | 0.5 | % | | -3.9 | % | | -13.9 | % | | -3.3 | % | | 0.0 | % | | $ | 24.83 | | $ | 0.39 | | $ | 9.54 | | $ | 307 | | 11.32 | % |
Francis Scott Key Mall | | | | | | 22.66 | | | 0.60 | | | 7.09 | | | 291 | | 10.43 | % | | 8.1 | % | | 24.3 | % | | 4.2 | % | | 4.3 | % | | 0.3 | % | | | 20.96 | | | 0.49 | | | 6.80 | | | 279 | | 10.12 | % |
Wiregrass Commons | | | | | | 22.34 | | | 1.08 | | | 6.99 | | | 286 | | 10.64 | % | | 4.9 | % | | 28.0 | % | | 1.5 | % | | 6.3 | % | | -0.2 | % | | | 21.29 | | | 0.85 | | | 6.89 | | | 269 | | 10.79 | % |
Phillipsburg Mall | | | | | | 24.32 | | | 0.72 | | | 9.11 | | | 283 | | 12.07 | % | | 9.6 | % | | -6.5 | % | | -1.9 | % | | -2.1 | % | | 0.9 | % | | | 22.19 | | | 0.78 | | | 9.28 | | | 289 | | 11.16 | % |
North Hanover Mall | | | | | | 20.43 | | | 3.34 | | | 6.56 | | | 277 | | 10.95 | % | | 7.4 | % | | 214.4 | % | | 9.1 | % | | 5.7 | % | | 1.0 | % | | | 19.02 | | | 1.06 | | | 6.01 | | | 262 | | 9.96 | % |
New River Valley Mall | | | | | | 19.67 | | | 1.10 | | | 3.28 | | | 274 | | 8.78 | % | | -0.9 | % | | 66.1 | % | | -24.0 | % | | 10.0 | % | | -1.2 | % | | | 19.85 | | | 0.66 | | | 4.32 | | | 249 | | 9.97 | % |
South Mall | | | | | | 16.65 | | | 0.31 | | | 4.57 | | | 273 | | 7.89 | % | | 11.3 | % | | -10.0 | % | | 27.7 | % | | 1.1 | % | | 0.9 | % | | | 14.96 | | | 0.35 | | | 3.58 | | | 270 | | 7.00 | % |
Crossroads Mall | | | | | | 17.12 | | | 0.90 | | | 5.39 | | | 265 | | 8.83 | % | | 3.3 | % | | 6.6 | % | | -5.3 | % | | 3.1 | % | | -0.2 | % | | | 16.56 | | | 0.84 | | | 5.69 | | | 257 | | 8.99 | % |
Nittany Mall | | | | | | 21.11 | | | 1.26 | | | 7.84 | | | 258 | | 11.71 | % | | 2.6 | % | | 53.5 | % | | 15.6 | % | | 2.0 | % | | 0.6 | % | | | 20.56 | | | 0.82 | | | 6.78 | | | 253 | | 11.13 | % |
Washington Crown Center | | | | | | 17.31 | | | 0.36 | | | 4.42 | | | 257 | | 8.60 | % | | 5.2 | % | | 133.8 | % | | -6.2 | % | | 4.5 | % | | -0.1 | % | | | 16.46 | | | 0.16 | | | 4.71 | | | 246 | | 8.67 | % |
Chambersburg Mall | | | | | | 19.57 | | | 0.22 | | | 5.18 | | | 245 | | 10.19 | % | | 2.4 | % | | 46.9 | % | | 9.1 | % | | -1.6 | % | | 0.6 | % | | | 19.11 | | | 0.15 | | | 4.75 | | | 249 | | 9.64 | % |
Gadsden Mall | | | | | | 20.23 | | | 0.15 | | | 8.08 | | | 243 | | 11.72 | % | | N/A | | | N/A | | | N/A | | | N/A | | | N/A | | | | N/A | | | N/A | | | N/A | | | N/A | | N/A | |
Plymouth Meeting | | | | | | 21.72 | | | 0.00 | | | 7.64 | | | 243 | | 12.08 | % | | 13.0 | % | | -100.0 | % | | -3.4 | % | | -4.3 | % | | 1.3 | % | | | 19.21 | | | 0.28 | | | 7.91 | | | 254 | | 10.79 | % |
Uniontown Mall | | | | | | 16.13 | | | 0.84 | | | 5.74 | | | 243 | | 9.34 | % | | 8.6 | % | | -21.4 | % | | 62.2 | % | | -1.6 | % | | 1.5 | % | | | 14.85 | | | 1.07 | | | 3.54 | | | 247 | | 7.88 | % |
Lycoming Mall | | | | | | 15.83 | | | 0.91 | | | 5.21 | | | 238 | | 9.22 | % | | 5.7 | % | | -3.3 | % | | 1.9 | % | | -8.1 | % | | 1.1 | % | | | 14.98 | | | 0.95 | | | 5.11 | | | 259 | | 8.12 | % |
Beaver Valley Mall | | | | | | 16.57 | | | 0.50 | | | 6.07 | | | 234 | | 9.89 | % | | 1.4 | % | | -8.0 | % | | -5.9 | % | | -3.3 | % | | 0.2 | % | | | 16.33 | | | 0.54 | | | 6.45 | | | 242 | | 9.64 | % |
Echelon Mall | | | | | | 20.49 | | | 0.17 | | | 6.44 | | | 198 | | 13.69 | % | | -9.5 | % | | 849.3 | % | | -31.8 | % | | -8.8 | % | | -1.1 | % | | | 22.64 | | | 0.02 | | | 9.45 | | | 217 | | 14.80 | % |
Schuylkill Mall | | | | | | 11.19 | | | 0.01 | | | 2.76 | | | 189 | | 7.39 | % | | 7.3 | % | | -94.1 | % | | -13.7 | % | | -10.8 | % | | 0.9 | % | | | 10.43 | | | 0.23 | | | 3.20 | | | 212 | | 6.54 | % |
| | | | | | | | | | | | | | | | | | | | | | | | | | | | | | | | | | | | | | | | | | | | | | | | |
Weighted Average | | 31.4 | % | | $ | 19.18 | | $ | 0.65 | | $ | 6.09 | | $ | 255 | | 10.16 | % | | 0.9 | % | | 28.2 | % | | -10.8 | % | | -1.8 | % | | 0.0 | % | | $ | 19.00 | | $ | 0.51 | | $ | 6.83 | | $ | 260 | | 10.14 | % |
| | | | | | | | | | | | | | | | | | | | | | | | | | | | | | | | | | | | | | | | | | | | | | | | |
Does not include | | | | | | | | | | | | | | | | | | | | | | | | | | | | | | | | | | | | | | | | | | | | | | | | |
Springfield Mall | | | | | $ | 33.21 | | $ | 0.57 | | $ | 13.79 | | $ | 361 | | 13.18 | % | | N/A | | | N/A | | | N/A | | | N/A | | | N/A | | | | N/A | | | N/A | | | N/A | | | N/A | | N/A | |
Woodland Mall | | | | | $ | 42.42 | | $ | 0.10 | | $ | 24.22 | | $ | 360 | | 18.54 | % | | N/A | | | N/A | | | N/A | | | N/A | | | N/A | | | | N/A | | | N/A | | | N/A | | | N/A | | N/A | |
| | | | | | | | | | | | | | | | | | | | | | | | | | | | | | | | | | | | | | | | | | | | | | | | |
Enclosed Malls weighted average | | | | | $ | 25.01 | | $ | 0.82 | | $ | 9.57 | | $ | 329 | | 10.78 | % | | 6.2 | % | | -0.3 | % | | 7.3 | % | | 0.8 | % | | 0.6 | % | | $ | 23.54 | | $ | 0.82 | | $ | 8.92 | | $ | 326 | | 10.21 | % |
| | | | | | | | | | | | | | | | | | | | | | | | | | | | | | | | | | | | | | | | | | | | | | | | |
Consolidated Properties | | | | | $ | 24.62 | | $ | 0.84 | | $ | 9.46 | | $ | 322 | | 10.84 | % | | 6.2 | % | | 1.7 | % | | 6.5 | % | | 0.4 | % | | 0.6 | % | | $ | 23.17 | | $ | 0.83 | | $ | 8.88 | | $ | 321 | | 10.25 | % |
Partnership Properties | | | | | $ | 30.88 | | $ | 0.42 | | $ | 11.22 | | $ | 422 | | 10.08 | % | | -1.9 | % | | -29.7 | % | | 15.8 | % | | -5.9 | % | | 0.8 | % | | $ | 31.47 | | $ | 0.60 | | $ | 9.69 | | $ | 448 | | 9.32 | % |
| | | | | | | | | | | | | | | | | | | | | | | | | | | | | | | | | | | | | | | | | | | | | | | | |
PRI-managed | | | | | $ | 24.80 | | $ | 0.84 | | $ | 9.56 | | $ | 323 | | 10.89 | % | | 7.0 | % | | 1.0 | % | | 7.6 | % | | 0.8 | % | | 0.6 | % | | $ | 23.17 | | $ | 0.83 | | $ | 8.88 | | $ | 321 | | 10.25 | % |
Non PRI-managed | | | | | $ | 29.73 | | $ | 0.35 | | $ | 9.97 | | $ | 468 | | 8.56 | % | | -5.5 | % | | -41.7 | % | | 2.8 | % | | 4.4 | % | | -0.8 | % | | $ | 31.47 | | $ | 0.60 | | $ | 9.69 | | $ | 448 | | 9.32 | % |
| | | | | | | | | | | | | | | | | | | | | | | | | | | | | | | | | | | | | | | | | | | | | | | | |
Same Properties | | | | | $ | 24.56 | | $ | 0.86 | | $ | 9.05 | | $ | 328 | | 10.50 | % | | 4.3 | % | | 5.2 | % | | 1.4 | % | | 0.7 | % | | 0.3 | % | | $ | 23.54 | | $ | 0.82 | | $ | 8.92 | | $ | 326 | | 10.21 | % |
New | | | | | $ | 28.79 | | $ | 0.44 | | $ | 13.99 | | $ | 330 | | 13.11 | % | | N/A | | | N/A | | | N/A | | | N/A | | | N/A | | | | N/A | | | N/A | | | N/A | | | N/A | | N/A | |
| | | | | | | | | | | | | | | | | | | | | | | | | | | | | | | | | | | | | | | | | | | | | | | | |
Continuing Operations | | | | | $ | 24.87 | | $ | 0.88 | | $ | 9.20 | | $ | 331 | | 10.57 | % | | 4.2 | % | | 5.7 | % | | 1.5 | % | | 0.9 | % | | 0.3 | % | | $ | 23.86 | | $ | 0.83 | | $ | 9.06 | | $ | 328 | | 10.30 | % |
Discontinued Operations | | | | | $ | 11.19 | | $ | 0.01 | | $ | 2.76 | | $ | 189 | | 7.39 | % | | 7.3 | % | | -94.1 | % | | -13.7 | % | | -10.8 | % | | 0.9 | % | | $ | 10.43 | | $ | 0.23 | | $ | 3.20 | | $ | 212 | | 6.54 | % |
| | | | | | | | | | | | | | | | | | | | | | | | | | | | | | | | | | | | | | | | | | | | | | | | |
| (1) | Base rent is actual for the fourth quarter 2005. Additional charges and % rent are estimates for 2005. |
| (2) | Average comparable sales for December 31, 2004 are actual. |
PAGE 36
Pennsylvania REIT
QUARTERLY SUPPLEMENTAL DISCLOSURE (December 31, 2005)
Power Centers
(Includes Non-Anchor Owned Space)
| | | | | | | | | | | | | | | | | | | | | | | | | | | |
| | | December 31, 2005 | | % Change | | | December 31, 2004 |
| | Avg Base
Rent psf (1) | | Avg %
Rent psf (1) | | Additional
Charges psf | | Avg Base
Rent psf | | | Avg %
Rent psf | | | Additional
Charges
psf | | | Avg Base
Rent psf | | Avg %
Rent psf (1) | | Additional
Charges
psf |
Christiana Power Center | | $ | 21.60 | | $ | — | | $ | 2.15 | | 5.2 | % | | N/A | | | 7.7 | % | | $ | 20.52 | | $ | — | | $ | 1.99 |
Creekview Shopping Center | | | 15.67 | | | — | | | 3.24 | | 9.1 | % | | N/A | | | 23.9 | % | | | 14.37 | | | — | | | 2.62 |
Metroplex Shopping Center | | | 19.75 | | | — | | | 3.65 | | 10.4 | % | | N/A | | | 1.9 | % | | | 17.88 | | | — | | | 3.58 |
Northeast Tower Center | | | 15.16 | | | — | | | 3.10 | | 4.3 | % | | N/A | | | -6.3 | % | | | 14.53 | | | — | | | 3.31 |
Paxton Towne Center | | | 17.62 | | | — | | | 2.73 | | 9.3 | % | | N/A | | | 2.4 | % | | | 16.12 | | | — | | | 2.67 |
Red Rose Commons | | | 14.69 | | | 0.04 | | | 2.85 | | 6.0 | % | | -56.6 | % | | 14.3 | % | | | 13.86 | | | 0.09 | | | 2.50 |
The Court at Oxford Valley | | | 16.26 | | | — | | | 3.42 | | 5.8 | % | | N/A | | | 13.6 | % | | | 15.37 | | | — | | | 3.01 |
Whitehall Mall | | | 9.72 | | | 0.38 | | | 3.15 | | -9.1 | % | | 41.9 | % | | -1.2 | % | | | 10.69 | | | 0.27 | | | 3.18 |
| | | | | | | | | | | | | | | | | | | | | | | | | | | |
Power Centers weighted average | | $ | 16.28 | | $ | 0.06 | | $ | 3.14 | | 5.4 | % | | 25.7 | % | | 6.0 | % | | $ | 15.44 | | $ | 0.05 | | $ | 2.97 |
| | | | | | | | | | | | | | | | | | | | | | | | | | | |
Consolidated Properties | | $ | 17.25 | | $ | — | | $ | 2.83 | | 6.7 | % | | N/A | | | 5.8 | % | | $ | 16.17 | | $ | — | | $ | 2.68 |
Partnership Properties | | $ | 15.74 | | $ | 0.09 | | $ | 3.32 | | 4.7 | % | | 26.2 | % | | 6.1 | % | | $ | 15.04 | | $ | 0.07 | | $ | 3.13 |
| | | | | | | | | | | | | | | | | | | | | | | | | | | |
PRI-managed | | $ | 17.25 | | $ | — | | $ | 2.83 | | 6.7 | % | | N/A | | | 5.8 | % | | $ | 16.17 | | $ | — | | $ | 2.68 |
Non PRI-managed | | $ | 15.74 | | $ | 0.09 | | $ | 3.32 | | 4.7 | % | | 26.2 | % | | 6.1 | % | | $ | 15.04 | | $ | 0.07 | | $ | 3.13 |
| | | | | | | | | | | | | | | | | | | | | | | | | | | |
Same Properties | | $ | 16.28 | | $ | 0.06 | | $ | 3.14 | | 5.4 | % | | 25.7 | % | | 6.0 | % | | $ | 15.44 | | $ | 0.05 | | $ | 2.97 |
| | | | | | | | | | | | | | | | | | | | | | | | | | | |
| (1) | Base rent is actual for the fourth quarter 2005. Additional charges and % rent are estimates for 2005. |
| | | | | | | | | | | | | | | | | | |
| | Occupancy | |
| | | |
| | | December 31, 2005 | | | Change in % Occupancy | | | December 31, 2004 | |
| | | Total
w/Anchor
% Leased | | | In-Line only
(Non-
Anchor)
% Leased | | | Total
w/Anchor
% Leased | | | In-Line
only (Non-
Anchor)
% Leased | | | Total
w/Anchor
% Leased | | | In-Line
only (Non-
Anchor)
% Leased | |
| | | | | | | | | | | | | | | | | | | |
Christiana Power Center | | 100.0 | % | | 100.0 | % | | 0.0 | % | | 0.0 | % | | 100.0 | % | | 100.0 | % |
Creekview Shopping Center | | 100.0 | % | | 100.0 | % | | 0.0 | % | | 0.0 | % | | 100.0 | % | | 100.0 | % |
Metroplex Shopping Center | | 100.0 | % | | 100.0 | % | | 0.0 | % | | 0.0 | % | | 100.0 | % | | 100.0 | % |
Northeast Tower Center | | 96.6 | % | | 94.4 | % | | 6.9 | % | | 19.0 | % | | 89.7 | % | | 75.4 | % |
Paxton Towne Center | | 90.0 | % | | 84.9 | % | | -2.0 | % | | -3.1 | % | | 92.1 | % | | 87.9 | % |
Red Rose Commons | | 99.2 | % | | 99.2 | % | | 0.0 | % | | 0.0 | % | | 99.2 | % | | 99.2 | % |
The Court at Oxford Valley | | 100.0 | % | | 100.0 | % | | 0.0 | % | | 0.0 | % | | 100.0 | % | | 100.0 | % |
Whitehall Mall | | 98.6 | % | | 97.0 | % | | 1.2 | % | | 3.0 | % | | 97.4 | % | | 94.0 | % |
| | | | | | | | | | | | | | | | | | |
Power Centers weighted average | | 97.8 | % | | 96.7 | % | | 1.0 | % | | 1.7 | % | | 96.8 | % | | 95.0 | % |
| | | | | | | | | | | | | | | | | | |
Consolidated Properties | | 95.4 | % | | 92.5 | % | | 1.5 | % | | 3.6 | % | | 93.9 | % | | 88.9 | % |
Partnership Properties | | 99.4 | % | | 99.2 | % | | 0.4 | % | | 0.5 | % | | 99.1 | % | | 98.6 | % |
| | | | | | | | | | | | | | | | | | |
PRI-managed | | 95.4 | % | | 92.5 | % | | 1.5 | % | | 3.6 | % | | 93.9 | % | | 88.9 | % |
Non PRI-managed | | 99.4 | % | | 99.2 | % | | 0.4 | % | | 0.5 | % | | 99.1 | % | | 98.6 | % |
| | | | | | | | | | | | | | | | | | |
Same Properties | | 97.8 | % | | 96.7 | % | | 1.0 | % | | 1.7 | % | | 96.8 | % | | 95.0 | % |
| | | | | | | | | | | | | | | | | | |
PAGE 37
Pennsylvania REIT
QUARTERLY SUPPLEMENTAL DISCLOSURE (December 31, 2005)
Strip Centers
(Includes Non-Anchor Owned Space)
| | | | | | | | | | | | | | | | | | | | | | |
| | | December 31, 2005 | | | % Change | | | December 31, 2004 | |
| | | Avg Base Rent psf (1) | | | Additional Charges psf | | | Avg Base Rent psf | | | Additional Charges psf | | | Avg Base Rent psf | | | Additional Charges psf | |
Crest Plaza Shopping Center | | $ | 18.26 | | | $ | 2.41 | | | 14.2 | % | | 28.1 | % | | $ | 16.00 | | | $ | 1.89 | |
South Blanding Village | | | 9.92 | | | | 2.10 | | | 5.7 | % | | -9.6 | % | | | 9.38 | | | | 2.32 | |
Springfield Park I & II | | | 19.87 | | | | 3.27 | | | 12.2 | % | | -31.8 | % | | | 17.71 | | | | 4.79 | |
The Commons at Magnolia | | | 13.69 | | | | 1.76 | | | 3.9 | % | | -5.6 | % | | | 13.18 | | | | 1.87 | |
| | | | | | | | | | | | | | | | | | | | | | |
Strip Centers weighted average | | $ | 15.64 | | | $ | 2.30 | | | 9.2 | % | | -7.7 | % | | $ | 14.32 | | | $ | 2.49 | |
| | | | | | | | | | | | | | | | | | | | | | |
Consolidated Properties | | $ | 14.82 | | | $ | 2.11 | | | 9.3 | % | | 7.1 | % | | $ | 13.56 | | | $ | 1.97 | |
Partnership Properties | | $ | 19.87 | | | $ | 3.27 | | | 12.2 | % | | -31.8 | % | | $ | 17.71 | | | $ | 4.79 | |
| | | | | | | | | | | | | | | | | | | | | | |
PRI-managed | | $ | 15.64 | | | $ | 2.30 | | | 9.2 | % | | -7.7 | % | | $ | 14.32 | | | $ | 2.49 | |
Non PRI-managed | | | N/A | | | | N/A | | | N/A | | | N/A | | | | N/A | | | | N/A | |
| | | | | | | | | | | | | | | | | | | | | | |
Same Properties | | $ | 15.64 | | | $ | 2.30 | | | 9.2 | % | | -7.7 | % | | $ | 14.32 | | | $ | 2.49 | |
| | | | | | | | | | | | | | | | | | | | | | |
|
(1) Base rent is actual for the fourth quarter 2005. Additional charges and % rent are estimates for 2005. | |
| |
| | | Occupancy | |
| | | |
| | | December 31, 2005 | | | Change in % Occupancy | | | December 31, 2004 | |
| | | Total w/ Anchor % Leased | | | In-Line only (Non- Anchor) % Leased | | | Total w/ Anchor % Leased | | | In-Line only (Non- Anchor) % Leased | | | Total w/ Anchor % Leased | | | In-Line only (Non- Anchor) % Leased | |
Crest Plaza Shopping Center | | | 100.0 | % | | | 100.0 | % | | 1.9 | % | | 3.6 | % | | | 98.1 | % | | | 96.4 | % |
South Blanding Village | | | 97.9 | % | | | 93.3 | % | | 1.1 | % | | 3.7 | % | | | 96.8 | % | | | 89.6 | % |
Springfield Park I & II | | | 87.8 | % | | | 64.3 | % | | -3.1 | % | | -9.1 | % | | | 90.9 | % | | | 73.5 | % |
The Commons at Magnolia | | | 100.0 | % | | | 100.0 | % | | 0.0 | % | | 0.0 | % | | | 100.0 | % | | | 100.0 | % |
| | | | | | | | | | | | | | | | | | | | | | |
Strip Centers weighted average | | | 96.1 | % | | | 90.7 | % | | -0.1 | % | | -0.3 | % | | | 96.2 | % | | | 91.0 | % |
| | | | | | | | | | | | | | | | | | | | | | |
Consolidated Properties | | | 99.3 | % | | | 98.5 | % | | 1.0 | % | | 2.3 | % | | | 98.3 | % | | | 96.2 | % |
Partnership Properties | | | 87.8 | % | | | 64.3 | % | | -3.1 | % | | -9.1 | % | | | 90.9 | % | | | 73.5 | % |
| | | | | | | | | | | | | | | | | | | | | | |
PRI-managed | | | 96.1 | % | | | 90.7 | % | | -0.1 | % | | -0.3 | % | | | 96.2 | % | | | 91.0 | % |
| | | | | | | | | | | | | | | | | | | | | | |
Same Properties | | | 96.1 | % | | | 90.7 | % | | -0.1 | % | | -0.3 | % | | | 96.2 | % | | | 91.0 | % |
| | | | | | | | | | | | | | | | | | | | | | |
PAGE 38
Pennsylvania REIT
QUARTERLY SUPPLEMENTAL DISCLOSURE (December 31, 2005)
BALANCE SHEET-RECONCILIATION TO GAAP
(Proportionate consolidation method to GAAP)
| | | | | | | | | | | | | | | | | | | | | | | | | | | | | | | | | | | | | | | | |
| | | December 31, 2005 | | | December 31, 2004 | |
| | | Proportionate
Consolidated
Total(1) | | | Adjustments to
Equity Method | | | Subtotal | | | Assets Held
for Sale | | | GAAP Total | | | Proportionate
Consolidated
Total(1) | | | Adjustments to Equity Method | | | Subtotal | | | Assets Held for Sale | | | GAAP Total | |
ASSETS | | | | | | | | | | | | | | | | | | | | | | | | | | | | | | | | | | | | | | | | |
Investments in real estate, at cost | | | | | | | | | | | | | | | | | | | | | | | | | | | | | | | | | | | | | | | | |
Retail properties | | $ | 2,985,143,679 | | | $ | (169,300,611 | ) | | $ | 2,815,843,068 | | | $ | (8,267,586 | ) | | $ | 2,807,575,482 | | | $ | 2,649,708,369 | | | $ | (131,343,981 | ) | | $ | 2,518,364,388 | | | $ | (8,108,066 | ) | | $ | 2,510,256,322 | |
Office/industrial properties | | | 1,504,307 | | | | — | | | | 1,504,307 | | | | (1,504,307 | ) | | | — | | | | 2,504,211 | | | | — | | | | 2,504,211 | | | | — | | | | 2,504,211 | |
Land held for development | | | 5,615,744 | | | | — | | | | 5,615,744 | | | | — | | | | 5,615,744 | | | | 9,862,704 | | | | — | | | | 9,862,704 | | | | — | | | | 9,862,704 | |
Construction in progress | | | 57,588,642 | | | | (2,220,602 | ) | | | 55,368,040 | | | | — | | | | 55,368,040 | | | | 13,494,757 | | | | (2,542,307 | ) | | | 10,952,450 | | | | — | | | | 10,952,450 | |
| | | | | | | | | | | | | | | | | | | | | | | | | | | | | | | | | | | | | | | | |
TOTAL INVESTMENTS IN REAL ESTATE | | | 3,049,852,372 | | | | (171,521,213 | ) | | | 2,878,331,159 | | | | (9,771,893 | ) | | | 2,868,559,266 | | | | 2,675,570,041 | | | | (133,886,288 | ) | | | 2,541,683,753 | | | | (8,108,066 | ) | | | 2,533,575,687 | |
Accumulated depreciation | | | (253,247,257 | ) | | | 32,459,101 | | | | (220,788,156 | ) | | | — | | | | (220,788,156 | ) | | | (184,908,972 | ) | | | 34,023,363 | | | | (150,885,609 | ) | | | — | | | | (150,885,609 | ) |
| | | | | | | | | | | | | | | | | | | | | | | | | | | | | | | | | | | | | | | | |
Net real estate | | | 2,796,605,115 | | | | (139,062,112 | ) | | | 2,657,543,003 | | | | (9,771,893 | ) | | | 2,647,771,110 | | | | 2,490,661,069 | | | | (99,862,925 | ) | | | 2,390,798,144 | | | | (8,108,066 | ) | | | 2,382,690,078 | |
| | | | | | | | | | | | | | | | | | | | | | | | | | | | | | | | | | | | | | | | |
Investments in and advances to partnerships | | | — | | | | 41,536,342 | | | | 41,536,342 | | | | — | | | | 41,536,342 | | | | — | | | | 27,243,862 | | | | 27,243,862 | | | | — | | | | 27,243,862 | |
| | | | | | | | | | | | | | | | | | | | | | | | | | | | | | | | | | | | | | | | |
| | | 2,796,605,115 | | | | (97,525,770 | ) | | | 2,699,079,345 | | | | (9,771,893 | ) | | | 2,689,307,452 | | | | 2,490,661,069 | | | | (72,619,063 | ) | | | 2,418,042,006 | | | | (8,108,066 | ) | | | 2,409,933,940 | |
| | | | | | | | | | | | | | | | | | | | | | | | | | | | | | | | | | | | | | | | |
Other assets: | | | | | | | | | | | | | | | | | | | | | | | | | | | | | | | | | | | | | | | | |
Cash and cash equivalents | | | 25,828,011 | | | | (4,186,114 | ) | | | 21,641,897 | | | | — | | | | 21,641,897 | | | | 45,949,300 | | | | (5,609,103 | ) | | | 40,340,197 | | | | — | | | | 40,340,197 | |
Rents and other receivables | | | 57,898,435 | | | | (11,406,791 | ) | | | 46,491,644 | | | | — | | | | 46,491,644 | | | | 43,305,448 | | | | (11,328,239 | ) | | | 31,977,209 | | | | — | | | | 31,977,209 | |
Other assets held for sale | | | 7,948,349 | | | | — | | | | 7,948,349 | | | | 9,771,893 | | | | 17,720,242 | | | | 6,837,914 | | | | — | | | | 6,837,914 | | | | 8,108,066 | | | | 14,945,980 | |
Intangible assets | | | 173,594,395 | | | | — | | | | 173,594,395 | | | | — | | | | 173,594,395 | | | | 171,849,678 | | | | — | | | | 171,849,678 | | | | — | | | | 171,849,678 | |
Deferred costs, prepaid taxes & exp. & other assets | | | 81,942,422 | | | | (12,151,373 | ) | | | 69,791,049 | | | | — | | | | 69,791,049 | | | | 69,906,200 | | | | (7,550,567 | ) | | | 62,355,633 | | | | — | | | | 62,355,633 | |
| | | | | | | | | | | | | | | | | | | | | | | | | | | | | | | | | | | | | | | | |
TOTAL OTHER ASSETS | | | 347,211,612 | | | | (27,744,278 | ) | | | 319,467,334 | | | | 9,771,893 | | | | 329,239,227 | | | | 337,848,540 | | | | (24,487,909 | ) | | | 313,360,631 | | | | 8,108,066 | | | | 321,468,697 | |
| | | | | | | | | | | | | | | | | | | | | | | | | | | | | | | | | | | | | | | | |
TOTAL ASSETS | | | 3,143,816,727 | | | | (125,270,048 | ) | | | 3,018,546,679 | | | | — | | | | 3,018,546,679 | | | | 2,828,509,609 | | | | (97,106,972 | ) | | | 2,731,402,637 | | | | — | | | | 2,731,402,637 | |
| | | | | | | | | | | | | | | | | | | | | | | | | | | | | | | | | | | | | | | | |
LIABILITIES AND SHAREHOLDERS’ EQUITY | | | | | | | | | | | | | | | | | | | | | | | | | | | | | | | | | | | | | | | | |
Liabilities: | | | | | | | | | | | | | | | | | | | | | | | | | | | | | | | | | | | | | | | | |
Mortgage notes payable | | | 1,483,679,692 | | | | (134,500,192 | ) | | | 1,349,179,500 | | | | (17,113,872 | ) | | | 1,332,065,628 | | | | 1,269,992,376 | | | | (107,513,205 | ) | | | 1,162,479,171 | | | | (17,399,761 | ) | | | 1,145,079,410 | |
Mortgage debt premium | | | 40,065,708 | | | | — | | | | 40,065,708 | | | | — | | | | 40,065,708 | | | | 56,134,624 | | | | — | | | | 56,134,624 | | | | — | | | | 56,134,624 | |
Bank loans payable | | | 342,500,000 | | | | — | | | | 342,500,000 | | | | — | | | | 342,500,000 | | | | 271,000,000 | | | | — | | | | 271,000,000 | | | | — | | | | 271,000,000 | |
Notes payable | | | 94,400,000 | | | | — | | | | 94,400,000 | | | | — | | | | 94,400,000 | | | | — | | | | — | | | | — | | | | — | | | | — | |
Liabilities related to assets held for sale | | | 1,118,865 | | | | — | | | | 1,118,865 | | | | 17,113,872 | | | | 18,232,737 | | | | 1,156,442 | | | | — | | | | 1,156,442 | | | | 17,399,761 | | | | 18,556,203 | |
Other liabilities | | | 86,856,501 | | | | 9,230,144 | | | | 96,086,645 | | | | — | | | | 96,086,645 | | | | 93,791,248 | | | | 10,406,233 | | | | 104,197,481 | | | | — | | | | 104,197,481 | |
| | | | | | | | | | | | | | | | | | | | | | | | | | | | | | | | | | | | | | | | |
TOTAL LIABILITIES | | | 2,048,620,766 | | | | (125,270,048 | ) | | | 1,923,350,718 | | | | — | | | | 1,923,350,718 | | | | 1,692,074,690 | | | | (97,106,972 | ) | | | 1,594,967,718 | | | | — | | | | 1,594,967,718 | |
| | | | | | | | | | | | | | | | | | | | | | | | | | | | | | | | | | | | | | | | |
Minority interest | | | 118,320,249 | | | | — | | | | 118,320,249 | | | | — | | | | 118,320,249 | | | | 131,968,917 | | | | — | | | | 131,968,917 | | | | — | | | | 131,968,917 | |
| | | | | | | | | | | | | | | | | | | | | | | | | | | | | | | | | | | | | | | | |
Shareholders’ equity: | | | | | | | | | | | | | | | | | | | | | | | | | | | | | | | | | | | | | | | | |
Shares of beneficial interest at $1 par | | | 36,520,715 | | | | — | | | | 36,520,715 | | | | — | | | | 36,520,715 | | | | 36,272,160 | | | | — | | | | 36,272,160 | | | | — | | | | 36,272,160 | |
Preferred shares at $0.01 par | | | 24,750 | | | | — | | | | 24,750 | | | | — | | | | 24,750 | | | | 24,750 | | | | — | | | | 24,750 | | | | — | | | | 24,750 | |
Capital contributed in excess of par | | | 912,798,152 | | | | — | | | | 912,798,152 | | | | — | | | | 912,798,152 | | | | 899,506,128 | | | | — | | | | 899,506,128 | | | | — | | | | 899,506,128 | |
Restricted stock | | | (13,359,486 | ) | | | — | | | | (13,359,486 | ) | | | — | | | | (13,359,486 | ) | | | (7,736,812 | ) | | | — | | | | (7,736,812 | ) | | | — | | | | (7,736,812 | ) |
Accumulated other comprehensive income (loss) | | | 4,376,594 | | | | — | | | | 4,376,594 | | | | — | | | | 4,376,594 | | | | (1,821,457 | ) | | | — | | | | (1,821,457 | ) | | | — | | | | (1,821,457 | ) |
Retained earnings | | | 36,514,987 | | | | — | | | | 36,514,987 | | | | — | | | | 36,514,987 | | | | 78,221,233 | | | | — | | | | 78,221,233 | | | | — | | | | 78,221,233 | |
| | | | | | | | | | | | | | | | | | | | | | | | | | | | | | | | | | | | | | | | |
TOTAL SHAREHOLDERS’ EQUITY | | | 976,875,712 | | | | — | | | | 976,875,712 | | | | — | | | | 976,875,712 | | | | 1,004,466,002 | | | | — | | | | 1,004,466,002 | | | | — | | | | 1,004,466,002 | |
| | | | | | | | | | | | | | | | | | | | | | | | | | | | | | | | | | | | | | | | |
TOTAL LIABILITIES AND SHAREHOLDERS’ EQUITY | | $ | 3,143,816,727 | | | $ | (125,270,048 | ) | | $ | 3,018,546,679 | | | $ | — | | | $ | 3,018,546,679 | | | $ | 2,828,509,609 | | | $ | (97,106,972 | ) | | $ | 2,731,402,637 | | | $ | — | | | $ | 2,731,402,637 | |
| | | | | | | | | | | | | | | | | | | | | | | | | | | | | | | | | | | | | | | | |
| (1) | Includes PREIT’s proportionate share of partnership investments “grossed up” to reflect the Company’s share of the Total Assets and Liabilities of the underlying properties. The Company calculates the “gross up” by applying its percentage ownership interest to the historical financial statements of its equity method investments. |
PAGE 39
Pennsylvania REIT
QUARTERLY SUPPLEMENTAL DISCLOSURE (December 31, 2005)
INCOME STATEMENT-RECONCILIATION TO GAAP(1)
QUARTERLY COMPARISON
(Proportionate consolidation method to GAAP)
| | | | | | | | | | | | | | | | | | | | | | | | | | | | | | | | | | | | | | | | | | | |
| | | Three months ended December 31, 2005 | | | | | | Three months ended December 31, 2004 | |
| | | Proportionate
Consolidated
Total | | | Adjustments
to Equity
Method | | | Subtotal | | | Assets
Held
for Sale | | | GAAP Total | | | TOTAL
%
CHANGE | | | Proportionate
Consolidated
Total | | | Adjustments
to Equity
Method | | | Subtotal | | | Assets
Held
for Sale | | | GAAP Total | |
Real estate revenues: | | | | | | | | | | | | | | | | | | | | | | | | | | | | | | | | | | | | | | | | | | | |
Base rents | | $ | 78,841,861 | | | $ | (5,554,193 | ) | | $ | 73,287,668 | | | $ | (1,214,117 | ) | | $ | 72,073,551 | | | 5.7 | % | | $ | 75,105,768 | | | $ | (5,380,110 | ) | | $ | 69,725,658 | | | $ | (1,530,582 | ) | | $ | 68,195,076 | |
Straight line rent | | | 1,167,582 | | | | (84,464 | ) | | | 1,083,118 | | | | (13,125 | ) | | | 1,069,993 | | | -18.6 | % | | | 1,374,760 | | | | (62,109 | ) | | | 1,312,651 | | | | 2,519 | | | | 1,315,170 | |
Percentage rents | | | 4,608,715 | | | | (150,590 | ) | | | 4,458,125 | | | | 26,605 | | | | 4,484,730 | | | -4.5 | % | | | 4,745,172 | | | | (126,665 | ) | | | 4,618,507 | | | | 78,122 | | | | 4,696,629 | |
Expense reimbursements | | | 34,085,626 | | | | (1,975,439 | ) | | | 32,110,187 | | | | (726,389 | ) | | | 31,383,798 | | | 13.7 | % | | | 29,657,330 | | | | (1,723,062 | ) | | | 27,934,268 | | | | (342,782 | ) | | | 27,591,486 | |
Lease termination revenue | | | 551,452 | | | | 35,846 | | | | 587,298 | | | | — | | | | 587,298 | | | -53.1 | % | | | 1,252,868 | | | | — | | | | 1,252,868 | | | | — | | | | 1,252,868 | |
Other real estate revenues | | | 7,849,449 | | | | (304,459 | ) | | | 7,544,990 | | | | (116,422 | ) | | | 7,428,568 | | | 9.1 | % | | | 7,257,712 | | | | (258,452 | ) | | | 6,999,260 | | | | (192,499 | ) | | | 6,806,761 | |
| | | | | | | | | | | | | | | | | | | | | | | | | | | | | | | | | | | | | | | | | | | |
TOTAL REAL ESTATE REVENUES | | | 127,104,685 | | | | (8,033,299 | ) | | | 119,071,386 | | | | (2,043,448 | ) | | | 117,027,938 | | | 6.5 | % | | | 119,393,610 | | | | (7,550,398 | ) | | | 111,843,212 | | | | (1,985,222 | ) | | | 109,857,990 | |
| | | | | | | | | | | | | | | | | | | | | | | | | | | | | | | | | | | | | | | | | | | |
Property Operating Expenses: | | | | | | | | | | | | | | | | | | | | | | | | | | | | | | | | | | | | | | | | | | | |
CAM and real estate taxes | | | (31,780,093 | ) | | | 1,316,789 | | | | (30,463,304 | ) | | | 619,922 | | | | (29,843,382 | ) | | 17.1 | % | | | (27,873,049 | ) | | | 1,657,812 | | | | (26,215,237 | ) | | | 739,353 | | | | (25,475,884 | ) |
Utilities | | | (5,827,525 | ) | | | (48,974 | ) | | | (5,876,499 | ) | | | 252,961 | | | | (5,623,538 | ) | | 27.0 | % | | | (4,490,966 | ) | | | (139,784 | ) | | | (4,630,750 | ) | | | 203,645 | | | | (4,427,105 | ) |
Other property operating expenses | | | (10,919,681 | ) | | | 1,290,936 | | | | (9,628,745 | ) | | | 127,136 | | | | (9,501,609 | ) | | 10.3 | % | | | (9,400,536 | ) | | | 692,592 | | | | (8,707,944 | ) | | | 93,242 | | | | (8,614,702 | ) |
| | | | | | | | | | | | | | | | | | | | | | | | | | | | | | | | | | | | | | | | | | | |
TOTAL PROPERTY OPERATING EXPENSES | | | (48,527,299 | ) | | | 2,558,751 | | | | (45,968,548 | ) | | | 1,000,019 | | | | (44,968,529 | ) | | 16.7 | % | | | (41,764,551 | ) | | | 2,210,620 | | | | (39,553,931 | ) | | | 1,036,240 | | | | (38,517,691 | ) |
| | | | | | | | | | | | | | | | | | | | | | | | | | | | | | | | | | | | | | | | | | | |
NET OPERATING INCOME | | | 78,577,386 | | | | (5,474,548 | ) | | | 73,102,838 | | | | (1,043,429 | ) | | | 72,059,409 | | | 1.0 | % | | | 77,629,059 | | | | (5,339,778 | ) | | | 72,289,281 | | | | (948,982 | ) | | | 71,340,299 | |
Management company revenue | | | 1,912,627 | | | | — | | | | 1,912,627 | | | | — | | | | 1,912,627 | | | -18.0 | % | | | 2,331,728 | | | | — | | | | 2,331,728 | | | | — | | | | 2,331,728 | |
Interest and other income | | | 310,511 | | | | — | | | | 310,511 | | | | — | | | | 310,511 | | | 92.5 | % | | | 161,323 | | | | — | | | | 161,323 | | | | — | | | | 161,323 | |
Other: | | | | | | | | | | | | | | | | | | | | | | | | | | | | | | | | | | | | | | | | | | | |
General and administrative | | | (8,890,316 | ) | | | — | | | | (8,890,316 | ) | | | — | | | | (8,890,316 | ) | | -13.2 | % | | | (10,241,548 | ) | | | — | | | | (10,241,548 | ) | | | — | | | | (10,241,548 | ) |
Income taxes | | | (78,162 | ) | | | — | | | | (78,162 | ) | | | — | | | | (78,162 | ) | | N/A | | | | — | | | | — | | | | — | | | | — | | | | — | |
| | | | | | | | | | | | | | | | | | | | | | | | | | | | | | | | | | | | | | | | | | | |
Earnings before interest, taxes, depreciation and amortization (EBITDA) | | | 71,832,046 | | | | (5,474,548 | ) | | | 66,357,498 | | | | (1,043,429 | ) | | | 65,314,069 | | | 2.7 | % | | | 69,880,562 | | | | (5,339,778 | ) | | | 64,540,784 | | | | (948,982 | ) | | | 63,591,802 | |
| | | | | | | | | | | | | | | | | | | | | | | | | | | | | | | | | | | | | | | | | | | |
Interest expense (2) | | | (23,357,552 | ) | | | 2,130,646 | | | | (21,226,906 | ) | | | 310,177 | | | | (20,916,729 | ) | | 13.3 | % | | | (20,854,458 | ) | | | 2,083,405 | | | | (18,771,053 | ) | | | 315,357 | | | | (18,455,696 | ) |
Depreciation and amortization | | | (30,407,151 | ) | | | 1,295,366 | | | | (29,111,785 | ) | | | 63,859 | | | | (29,047,926 | ) | | 17.6 | % | | | (27,394,242 | ) | | | 2,558,956 | | | | (24,835,286 | ) | | | 126,026 | | | | (24,709,260 | ) |
| | | | | | | | | | | | | | | | | | | | | | | | | | | | | | | | | | | | | | | | | | | |
OTHER EXPENSES | | | (53,764,703 | ) | | | 3,426,012 | | | | (50,338,691 | ) | | | 374,036 | | | | (49,964,655 | ) | | 15.8 | % | | | (48,248,700 | ) | | | 4,642,361 | | | | (43,606,339 | ) | | | 441,383 | | | | (43,164,956 | ) |
| | | | | | | | | | | | | | | | | | | | | | | | | | | | | | | | | | | | | | | | | | | |
Equity in the income of partnerships | | | — | | | | 2,048,536 | | | | 2,048,536 | | | | — | | | | 2,048,536 | | | 193.7 | % | | | — | | | | 697,417 | | | | 697,417 | | | | — | | | | 697,417 | |
| | | | | | | | | | | | | | | | | | | | | | | | | | | | | | | | | | | | | | | | | | | |
Gains on sales of interests in real estate | | | 1,389,919 | | | | — | | | | 1,389,919 | | | | — | | | | 1,389,919 | | | -3188.6 | % | | | (45,001 | ) | | | — | | | | (45,001 | ) | | | — | | | | (45,001 | ) |
| | | | | | | | | | | | | | | | | | | | | | | | | | | | | | | | | | | | | | | | | | | |
Income before minority interest | | | 19,457,262 | | | | — | | | | 19,457,262 | | | | (669,393 | ) | | | 18,787,869 | | | -10.9 | % | | | 21,586,861 | | | | — | | | | 21,586,861 | | | | (507,599 | ) | | | 21,079,262 | |
Minority interest | | | (2,102,269 | ) | | | — | | | | (2,102,269 | ) | | | — | | | | (2,102,269 | ) | | -17.0 | % | | | (2,533,010 | ) | | | — | | | | (2,533,010 | ) | | | — | | | | (2,533,010 | ) |
| | | | | | | | | | | | | | | | | | | | | | | | | | | | | | | | | | | | | | | | | | | |
Income from operations | | | 17,354,993 | | | | — | | | | 17,354,993 | | | | (669,393 | ) | | | 16,685,600 | | | -10.0 | % | | | 19,053,851 | | | | — | | | | 19,053,851 | | | | (507,599 | ) | | | 18,546,252 | |
| | | | | | | | | | | | | | | | | | | | | | | | | | | | | | | | | | | | | | | | | | | |
Discontinued operations: | | | | | | | | | | | | | | | | | | | | | | | | | | | | | | | | | | | | | | | | | | | |
Income from discontinued operations | | | — | | | | — | | | | — | | | | 669,393 | | | | 669,393 | | | 31.5 | % | | | — | | | | — | | | | — | | | | 508,882 | | | | 508,882 | |
Minority interest | | | (338,406 | ) | | | — | | | | (338,406 | ) | | | — | | | | (338,406 | ) | | -409.4 | % | | | 110,648 | | | | — | | | | 110,648 | | | | (1,283 | ) | | | 109,365 | |
Gains on sales of real estate | | | 2,422,136 | | | | — | | | | 2,422,136 | | | | — | | | | 2,422,136 | | | N/A | | | | — | | | | — | | | | — | | | | — | | | | — | |
| | | | | | | | | | | | | | | | | | | | | | | | | | | | | | | | | | | | | | | | | | | |
TOTAL DISCONTINUED OPERATIONS | | | 2,083,730 | | | | — | | | | 2,083,730 | | | | 669,393 | | | | 2,753,123 | | | 345.3 | % | | | 110,648 | | | | — | | | | 110,648 | | | | 507,599 | | | | 618,247 | |
| | | | | | | | | | | | | | | | | | | | | | | | | | | | | | | | | | | | | | | | | | | |
NET INCOME | | $ | 19,438,723 | | | $ | — | | | $ | 19,438,723 | | | $ | — | | | $ | 19,438,723 | | | 1.4 | % | | $ | 19,164,499 | | | $ | — | | | $ | 19,164,499 | | | $ | — | | | $ | 19,164,499 | |
| | | | | | | | | | | | | | | | | | | | | | | | | | | | | | | | | | | | | | | | | | | |
| (1) | Includes PREIT’s proportionate share of partnership investments “grossed up” to reflect the Trust’s share of the total revenues and expenses of the underlying properties. The Company calculates the “gross up” by applying its percentage ownership interest to the historical financial statements of its equity method investments. |
| (2) | Capitalized interest expense of $1,108,000 is not included in the quarter ended 12/31/05 and $379,000 is not included in the quarter ended 12/31/04. |
PAGE 40
Pennsylvania REIT
QUARTERLY SUPPLEMENTAL DISCLOSURE (December 31, 2005)
INCOME STATEMENT-RECONCILIATION TO GAAP(1)
ANNUAL COMPARISON
(Proportionate consolidation method to GAAP)
| | | | | | | | | | | | | | | | | | | | | | | | | | | | | | | | | | | | | | | | | | | |
| | | Twelve months ended December 31, 2005 | | | | | | Twelve months ended December 31, 2004 | |
| | | Proportionate
Consolidated
Total | | | Adjustments
to Equity
Method | | | Subtotal | | | Assets
Held
for Sale | | | GAAP Total | | | TOTAL
%
CHANGE | | | Proportionate
Consolidated
Total | | | Adjustments
to Equity
Method | | | Subtotal | | | Assets Held
for Sale | | | GAAP Total | |
Real estate revenues: | | | | | | | | | | | | | | | | | | | | | | | | | | | | | | | | | | | | | | | | | | | |
Base rents | | $ | 293,525,801 | | | $ | (20,780,246 | ) | | $ | 272,745,555 | | | $ | (5,007,022 | ) | | $ | 267,738,533 | | | 7.8 | % | | $ | 286,789,390 | | | $ | (21,001,930 | ) | | $ | 265,787,460 | | | $ | (17,309,529 | ) | | $ | 248,477,931 | |
Straight line rent | | | 4,374,178 | | | | (108,101 | ) | | | 4,266,077 | | | | (22,306 | ) | | | 4,243,771 | | | -13.9 | % | | | 5,211,964 | | | | (113,878 | ) | | | 5,098,086 | | | | (167,192 | ) | | | 4,930,894 | |
Percentage rents | | | 10,678,811 | | | | (246,607 | ) | | | 10,432,204 | | | | (20,892 | ) | | | 10,411,312 | | | 5.9 | % | | | 10,466,743 | | | | (314,402 | ) | | | 10,152,341 | | | | (324,845 | ) | | | 9,827,496 | |
Expense reimbursements | | | 132,869,783 | | | | (6,700,686 | ) | | | 126,169,097 | | | | (2,330,856 | ) | | | 123,838,241 | | | 9.0 | % | | | 127,250,871 | | | | (6,365,863 | ) | | | 120,885,008 | | | | (7,315,293 | ) | | | 113,569,715 | |
Lease termination revenue | | | 3,297,558 | | | | (512,483 | ) | | | 2,785,075 | | | | (932,986 | ) | | | 1,852,089 | | | -52.9 | % | | | 3,953,471 | | | | — | | | | 3,953,471 | | | | (22,410 | ) | | | 3,931,061 | |
Other real estate revenues | | | 17,645,038 | | | | (705,146 | ) | | | 16,939,892 | | | | (368,487 | ) | | | 16,571,405 | | | 10.3 | % | | | 16,844,326 | | | | (697,021 | ) | | | 16,147,305 | | | | (1,121,938 | ) | | | 15,025,367 | |
| | | | | | | | | | | | | | | | | | | | | | | | | | | | | | | | | | | | | | | | | | | |
TOTAL REAL ESTATE REVENUES | | | 462,391,169 | | | | (29,053,269 | ) | | | 433,337,900 | | | | (8,682,549 | ) | | | 424,655,351 | | | 7.3 | % | | | 450,516,765 | | | | (28,493,094 | ) | | | 422,023,671 | | | | (26,261,207 | ) | | | 395,762,464 | |
| | | | | | | | | | | | | | | | | | | | | | | | | | | | | | | | | | | | | | | | | | | |
Property Operating Expenses: | | | | | | | | | | | | | | | | | | | | | | | | | | | | | | | | | | | | | | | | | | | |
CAM and real estate taxes | | | (121,974,204 | ) | | | 5,830,058 | | | | (116,144,146 | ) | | | 2,463,100 | | | | (113,681,046 | ) | | 14.2 | % | | | (115,302,233 | ) | | | 5,991,981 | | | | (109,310,252 | ) | | | 9,803,065 | | | | (99,507,187 | ) |
Utilities | | | (23,747,772 | ) | | | 268,631 | | | | (23,479,141 | ) | | | 1,060,015 | | | | (22,419,126 | ) | | 12.8 | % | | | (22,771,227 | ) | | | 460,944 | | | | (22,310,283 | ) | | | 2,436,732 | | | | (19,873,551 | ) |
Other property operating expenses | | | (29,257,106 | ) | | | 2,732,307 | | | | (26,524,799 | ) | | | 488,293 | | | | (26,036,506 | ) | | 4.8 | % | | | (29,268,616 | ) | | | 2,336,235 | | | | (26,932,381 | ) | | | 2,090,923 | | | | (24,841,458 | ) |
| | | | | | | | | | | | | | | | | | | | | | | | | | | | | | | | | | | | | | | | | | | |
TOTAL PROPERTY OPERATING EXPENSES | | | (174,979,082 | ) | | | 8,830,996 | | | | (166,148,086 | ) | | | 4,011,408 | | | | (162,136,678 | ) | | 12.4 | % | | | (167,342,076 | ) | | | 8,789,160 | | | | (158,552,916 | ) | | | 14,330,720 | | | | (144,222,196 | ) |
NET OPERATING INCOME | | | 287,412,087 | | | | (20,222,273 | ) | | | 267,189,814 | | | | (4,671,141 | ) | | | 262,518,673 | | | 4.4 | % | | | 283,174,689 | | | | (19,703,934 | ) | | | 263,470,755 | | | | (11,930,487 | ) | | | 251,540,268 | |
Management company revenue | | | 3,956,046 | | | | — | | | | 3,956,046 | | | | — | | | | 3,956,046 | | | -25.0 | % | | | 5,276,556 | | | | — | | | | 5,276,556 | | | | — | | | | 5,276,556 | |
Interest and other income | | | 1,047,632 | | | | — | | | | 1,047,632 | | | | — | | | | 1,047,632 | | | 2.0 | % | | | 1,027,016 | | | | — | | | | 1,027,016 | | | | — | | | | 1,027,016 | |
Other: | | | | | | | | | | | | | | | | | | | | | | | | | | | | | | | | | | | | | | | | | | | |
General and administrative | | | (36,723,338 | ) | | | — | | | | (36,723,338 | ) | | | — | | | | (36,723,338 | ) | | -14.7 | % | | | (43,032,865 | ) | | | — | | | | (43,032,865 | ) | | | — | | | | (43,032,865 | ) |
Income taxes | | | (597,141 | ) | | | — | | | | (597,141 | ) | | | — | | | | (597,141 | ) | | N/A | | | | — | | | | — | | | | — | | | | — | | | | — | |
| | | | | | | | | | | | | | | | | | | | | | | | | | | | | | | | | | | | | | | | | | | |
Earnings before interest, taxes, depreciation and amortization (EBITDA) | | | 255,095,286 | | | | (20,222,273 | ) | | | 234,873,013 | | | | (4,671,141 | ) | | | 230,201,872 | | | 7.2 | % | | | 246,445,396 | | | | (19,703,934 | ) | | | 226,741,462 | | | | (11,930,487 | ) | | | 214,810,975 | |
Interest expense (2) | | | (91,313,447 | ) | | | 8,165,858 | | | | (83,147,589 | ) | | | 1,240,708 | | | | (81,906,881 | ) | | 13.3 | % | | | (83,551,894 | ) | | | 8,316,640 | | | | (75,235,254 | ) | | | 2,921,455 | | | | (72,313,799 | ) |
Depreciation and amortization | | | (115,017,787 | ) | | | 4,581,995 | | | | (110,435,792 | ) | | | 433,301 | | | | (110,002,491 | ) | | 13.6 | % | | | (103,092,002 | ) | | | 5,780,885 | | | | (97,311,117 | ) | | | 502,361 | | | | (96,808,756 | ) |
| | | | | | | | | | | | | | | | | | | | | | | | | | | | | | | | | | | | | | | | | | | |
OTHER EXPENSES | | | (206,331,234 | ) | | | 12,747,853 | | | | (193,583,381 | ) | | | 1,674,009 | | | | (191,909,372 | ) | | 13.5 | % | | | (186,643,896 | ) | | | 14,097,525 | | | | (172,546,371 | ) | | | 3,423,816 | | | | (169,122,555 | ) |
| | | | | | | | | | | | | | | | | | | | | | | | | | | | | | | | | | | | | | | | | | | |
Equity in the income of partnerships | | | — | | | | 7,474,420 | | | | 7,474,420 | | | | — | | | | 7,474,420 | | | 33.3 | % | | | — | | | | 5,606,409 | | | | 5,606,409 | | | | — | | | | 5,606,409 | |
| | | | | | | | | | | | | | | | | | | | | | | | | | | | | | | | | | | | | | | | | | | |
Gains on sales of interests in real estate | | | 10,110,501 | | | | — | | | | 10,110,501 | | | | — | | | | 10,110,501 | | | 581.2 | % | | | 1,484,182 | | | | — | | | | 1,484,182 | | | | — | | | | 1,484,182 | |
| | | | | | | | | | | | | | | | | | | | | | | | | | | | | | | | | | | | | | | | | | | |
Income before minority interest | | | 58,874,553 | | | | — | | | | 58,874,553 | | | | (2,997,132 | ) | | | 55,877,421 | | | 5.9 | % | | | 61,285,682 | | | | — | | | | 61,285,682 | | | | (8,506,671 | ) | | | 52,779,011 | |
Minority interest | | | (6,383,882 | ) | | | — | | | | (6,383,882 | ) | | | — | | | | (6,383,882 | ) | | 1.7 | % | | | (6,276,320 | ) | | | — | | | | (6,276,320 | ) | | | — | | | | (6,276,320 | ) |
| | | | | | | | | | | | | | | | | | | | | | | | | | | | | | | | | | | | | | | | | | | |
Income from operations | | | 52,490,671 | | | | — | | | | 52,490,671 | | | | (2,997,132 | ) | | | 49,493,539 | | | 6.4 | % | | | 55,009,362 | | | | — | | | | 55,009,362 | | | | (8,506,671 | ) | | | 46,502,691 | |
| | | | | | | | | | | | | | | | | | | | | | | | | | | | | | | | | | | | | | | | | | | |
Discontinued Operations: | | | | | | | | | | | | | | | | | | | | | | | | | | | | | | | | | | | | | | | | | | | |
Income from Discontinued Operations | | | — | | | | — | | | | — | | | | 2,997,099 | | | | 2,997,099 | | | -64.8 | % | | | — | | | | — | | | | — | | | | 8,506,671 | | | | 8,506,671 | |
Minority interest | | | (1,020,046 | ) | | | — | | | | (1,020,046 | ) | | | 33 | | | | (1,020,013 | ) | | 51.8 | % | | | (671,753 | ) | | | — | | | | (671,753 | ) | | | — | | | | (671,753 | ) |
Gains on Disposition of Discontinued Operations | | | 6,158,550 | | | | — | | | | 6,158,550 | | | | — | | | | 6,158,550 | | | N/A | | | | (550,000 | ) | | | — | | | | (550,000 | ) | | | — | | | | (550,000 | ) |
| | | | | | | | | | | | | | | | | | | | | | | | | | | | | | | | | | | | | | | | | | | |
TOTAL DISCONTINUED OPERATIONS | | | 5,138,504 | | | | — | | | | 5,138,504 | | | | 2,997,132 | | | | 8,135,636 | | | 11.7 | % | | | (1,221,753 | ) | | | — | | | | (1,221,753 | ) | | | 8,506,671 | | | | 7,284,918 | |
| | | | | | | | | | | | | | | | | | | | | | | | | | | | | | | | | | | | | | | | | | | |
NET INCOME | | $ | 57,629,175 | | | $ | — | | | $ | 57,629,175 | | | $ | — | | | $ | 57,629,175 | | | 7.1 | % | | $ | 53,787,609 | | | $ | — | | | $ | 53,787,609 | | | $ | — | | | $ | 53,787,609 | |
| | | | | | | | | | | | | | | | | | | | | | | | | | | | | | | | | | | | | | | | | | | |
| (1) | Includes PREIT’s proportionate share of investments “grossed up” to reflect the Trust’s share of the total revenues and expenses of the underlying properties. The Company calculates the “gross up” by applying its percentage ownership interest to the historical financial statements of its equity method investments. |
| (2) | Capitalized interest expense of $2,798,000 is not included in the year ended 12/31/05 and $1,418,000 is not included in the year ended 12/31/04. |
PAGE 41
Pennsylvania REIT
QUARTERLY SUPPLEMENTAL DISCLOSURE (December 31, 2005)
Definitions
Funds From Operations (FFO)
The National Association of Real Estate Investment Trusts (“NAREIT”) defines Funds From Operations (“FFO”) which is a non-GAAP measure, as income before gains (losses) on sales of operating property and extraordinary items (computed in accordance with GAAP); plus real estate depreciation; plus or minus adjustments for unconsolidated partnership to reflect funds from operations on the same basis. FFO is a commonly used measure of operating performance and profitability in the REIT industry, and we use FFO as a supplemental non-GAAP measure to compare our company’s performance to that of our industry peers. In addition, we use FFO as a performance measure for determining bonus amounts earned under certain of our performance-based executive compensation programs. The Company computes FFO in accordance with standards established by NAREIT, which may not be comparable to FFO reported by other REITs that do not define the term in accordance with the current NAREIT definition, or that interpret the current NAREIT definition differently than the Company.
FFO does not include gains (losses) on operating real estate assets, which are included in the determination of net income in accordance with GAAP. Accordingly, FFO is not a comprehensive measure of our operating cash flows. In addition, since FFO does not include depreciation on real estate assets, FFO may not be a useful performance measure when comparing our operating performance to that of other non-real estate commercial enterprises. We compensate for these limitations by using FFO in conjunction with other GAAP financial performance measures, such as net income and net cash provided by operating activities, and other non-GAAP financial performance measures such as net operating income. FFO does not represent cash generated from operating activities in accordance with GAAP and should not be considered to be an alternative to net income (determined in accordance with GAAP) as an indication of the Company’s financial performance or to be an alternative to cash flow from operating activities (determined in accordance with GAAP) as a measure of the Company’s liquidity, nor is it indicative of funds available for the Company’s cash needs, including its ability to make cash distributions.
The Company believes that net income is the most directly comparable GAAP measurement to FFO. The Company believes that FFO is helpful to management and investors as a measure of operating performance because it excludes various items included in net income that do not relate to or are not indicative of operating performance, such as various non-recurring items that are considered extraordinary under GAAP, gains on sales of real estate and depreciation and amortization of real estate.
Net Operating Income (NOI)
Net operating income (“NOI”), which is a non-GAAP measure, is derived from revenues (determined in accordance with GAAP) minus property operating expenses (determined in accordance with GAAP). Net operating income is a non-GAAP measure. It does not represent cash generated from operating activities in accordance with GAAP and should not be considered to be an alternative to net income (determined in accordance with GAAP) as an indication of the Company’s financial performance or to be an alternative to cash flow from operating activities (determined in accordance with GAAP) as a measure of the Company’s liquidity; nor is it indicative of funds available for the Company’s cash needs, including its ability to make cash distributions. The Company believes that net income is the most directly comparable GAAP measurement to net operating income.
The Company believes that net operating income is helpful to management and investors as a measure of operating performance because it is an indicator of the return on property investment, and provides a method of comparing property performance over time. Net operating income excludes general and administrative expenses, management company revenues, interest income, interest expense, depreciation and amortization, income from discontinued operations and gains on sales of interests in real estate.
Funds Available for Distribution (FAD)
FAD is also referred to as Cash Available for Distributions (CAD) or adjusted FFO (AFFO). FAD refers to a computation made by analysts and investors to measure a real estate company’s cash flows generated by operations. FAD is calculated by subtracting from FFO (1) normalized recurring capital expenditures that are capitalized but necessary to maintain a REIT’s properties and (2) straight-line rents.
The Company believes that net income is the most directly comparable GAAP measurement to FAD. The Company believes FAD provides a meaningful indicator of its ability to fund cash needs and to make cash distributions to equity owners. In addition, the Company believes that to further understand its liquidity, FAD should be compared with its cash flow from operating activities determined in accordance with GAAP, as presented in its consolidated financial statements. The computation of FAD may not be comparable to FAD reported by other REITs or real estate companies and FAD does not represent cash generated from operating activities determined in accordance with GAAP, and should not be considered as an alternative to net income (determined in accordance with GAAP) as an indication of our performance, or as an alternative to net cash flow from operating activities (determined in accordance with GAAP), as a measure of our liquidity.
Earnings before Interest, Taxes, Depreciation and Amortization (EBITDA)
Earnings before interest, taxes, depreciation and amortization. On a property level, EBITDA and NOI are equivalent; however, certain corporate revenues and expenses are added and deducted to/from NOI to derive EBITDA on a company wide basis. Specifically, management company revenues and interest income are added to NOI while corporate payroll and other General and Administrative expenses are deducted from NOI to calculate EBITDA.
The Company believes that net income is the most directly comparable GAAP measurement to EBITDA. The Company believes that EBITDA helps the Company and its investors evaluate the ongoing operating performance of its properties and facilitate comparisons with other REITs and real estate companies. These measures assist management by providing a baseline to assess property-level results, particularly as the Company acquires or sells assets. The EBITDA measures presented by the Company may not be comparable to other similarly titled measures of other companies.
PAGE 42