
1-800-345-6611.
| Class | Costs of a $10,000 investment | Costs paid as a percentage of a $10,000 investment |
| Class A | $ 85 | 0.82 % |
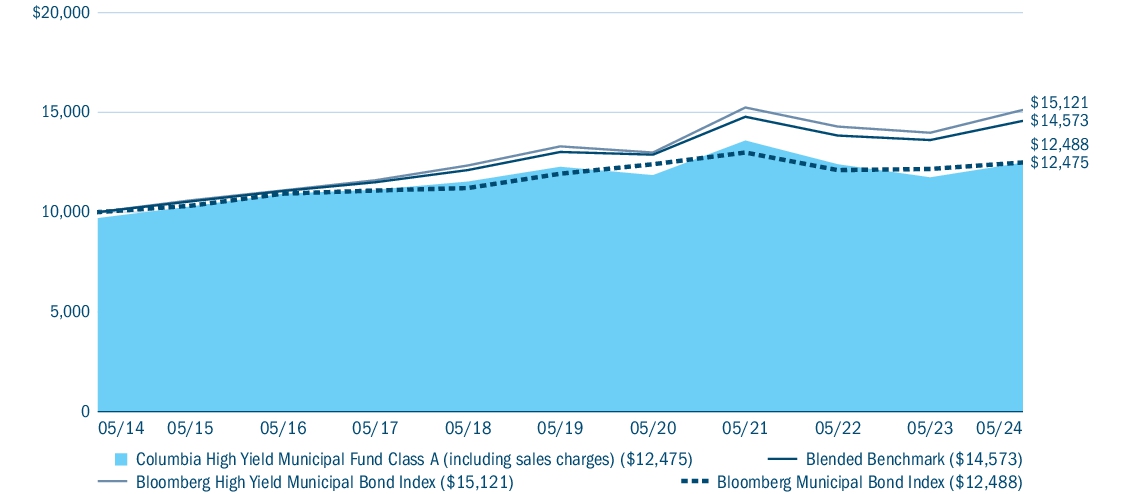
| Average Annual Total Returns (%) | 1 year | 5 years | 10 years |
| Class A (excluding sales charges) (a) | 6.27 | 0.34 | 2.55 |
| Class A (including sales charges) (a) | 3.11 | (0.27 ) | 2.24 |
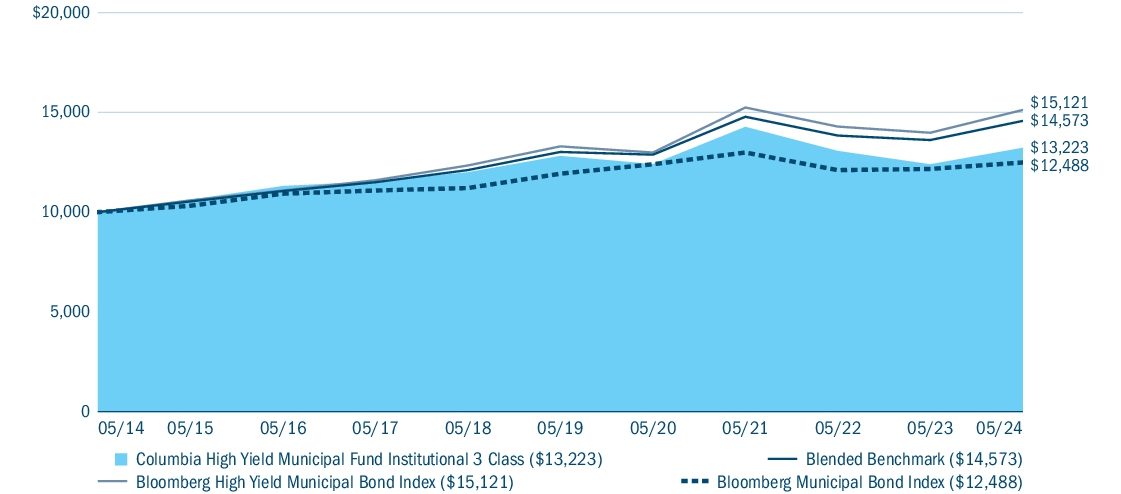
| Blended Benchmark - 80% Bloomberg High Yield Municipal Bond Index, 20% Bloomberg Municipal Bond Index | 7.07 | 2.29 | 3.84 |
| Bloomberg High Yield Municipal Bond Index | 8.19 | 2.61 | 4.22 |
| Bloomberg Municipal Bond Index | 2.67 | 0.93 | 2.25 |
| (a) | The Fund’s performance prior to November 2021 reflects returns achieved by the Investment Manager according to different principal investment strategies. If the Fund’s current management and strategies had been in place for the prior periods, results shown may have been different. |
| Fund net assets | $ 475,919,699 |
| Total number of portfolio holdings | 260 |
| Management services fees (represents 0.54% of Fund average net assets) | $ 2,681,622 |
| Portfolio turnover for the reporting period | 16% |
| Florida | 10.2 |
| Colorado | 9.1 |
| Illinois | 7.8 |
| Wisconsin | 7.1 |
| Puerto Rico | 6.2 |
| Texas | 6.1 |
| California | 5.1 |
| New York | 4.9 |
| Iowa | 3.4 |
| Ohio | 3.1 |


1-800-345-6611.
| Class | Costs of a $10,000 investment | Costs paid as a percentage of a $10,000 investment |
| Advisor Class | $ 64 | 0.62 % |

| Average Annual Total Returns (%) | 1 year | 5 years | 10 years |
Advisor Class (a) | 6.48 | 0.52 | 2.76 |
| Blended Benchmark - 80% Bloomberg High Yield Municipal Bond Index, 20% Bloomberg Municipal Bond Index | 7.07 | 2.29 | 3.84 |
| Bloomberg High Yield Municipal Bond Index | 8.19 | 2.61 | 4.22 |
| Bloomberg Municipal Bond Index | 2.67 | 0.93 | 2.25 |
| (a) | The Fund’s performance prior to November 2021 reflects returns achieved by the Investment Manager according to different principal investment strategies. If the Fund’s current management and strategies had been in place for the prior periods, results shown may have been different . |
| Fund net assets | $ 475,919,699 |
| Total number of portfolio holdings | 260 |
| Management services fees (represents 0.54% of Fund average net assets) | $ 2,681,622 |
| Portfolio turnover for the reporting period | 16% |
| Florida | 10.2 |
| Colorado | 9.1 |
| Illinois | 7.8 |
| Wisconsin | 7.1 |
| Puerto Rico | 6.2 |
| Texas | 6.1 |
| California | 5.1 |
| New York | 4.9 |
| Iowa | 3.4 |
| Ohio | 3.1 |


1-800-345-6611.
| Class | Costs of a $10,000 investment | Costs paid as a percentage of a $10,000 investment |
| Class C | $ 146 | 1.42 % |
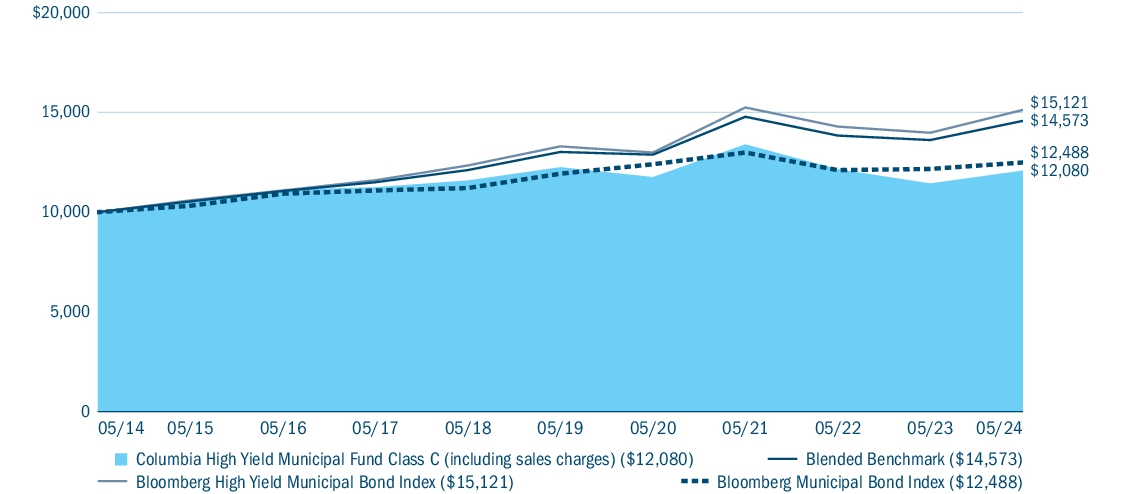
| Average Annual Total Returns (%) | 1 year | 5 years | 10 years |
Class C (excluding sales charges) (a) | 5.64 | (0.28 ) | 1.91 |
Class C (including sales charges) (a) | 4.64 | (0.28 ) | 1.91 |
| Blended Benchmark - 80% Bloomberg High Yield Municipal Bond Index, 20% Bloomberg Municipal Bond Index | 7.07 | 2.29 | 3.84 |
| Bloomberg High Yield Municipal Bond Index | 8.19 | 2.61 | 4.22 |
| Bloomberg Municipal Bond Index | 2.67 | 0.93 | 2.25 |
| (a) | The Fund’s performance prior to November 2021 reflects returns achieved by the Investment Manager according to different principal investment strategies. If the Fund’s current management and strategies had been in place for the prior periods, results shown may have been different. |
| Fund net assets | $ 475,919,699 |
| Total number of portfolio holdings | 260 |
| Management services fees (represents 0.54% of Fund average net assets) | $ 2,681,622 |
| Portfolio turnover for the reporting period | 16% |
| Florida | 10.2 |
| Colorado | 9.1 |
| Illinois | 7.8 |
| Wisconsin | 7.1 |
| Puerto Rico | 6.2 |
| Texas | 6.1 |
| California | 5.1 |
| New York | 4.9 |
| Iowa | 3.4 |
| Ohio | 3.1 |


1-800-345-6611.
| Class | Costs of a $1 0,0 00 investment | Costs paid as a percentage of a $10,000 investment |
| Institutional Class | $ 64 | 0.62 % |
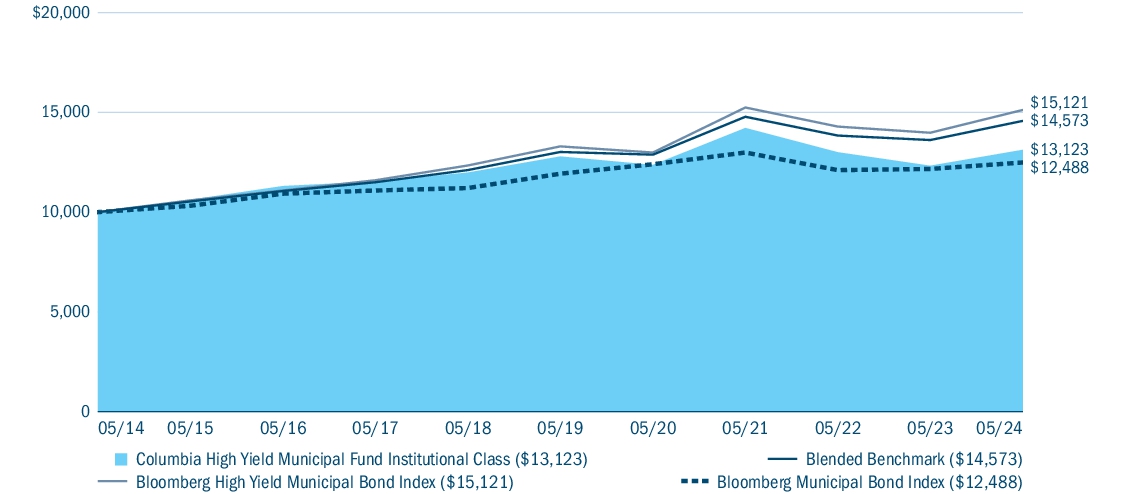
| Average Annual Total Returns (%) | 1 year | 5 years | 10 years |
| Institutional Class (a) | 6.49 | 0.52 | 2.76 |
| Blended Benchmark - 80% Bloomberg High Yield Municipal Bond Index, 20% Bloomberg Municipal Bond Index | 7.07 | 2.29 | 3.84 |
| Bloomberg High Yield Municipal Bond Index | 8.19 | 2.61 | 4.22 |
| Bloomberg Municipal Bond Index | 2.67 | 0.93 | 2.25 |
| (a) | The Fund’s performance prior to November 2021 reflects returns achieved by the Investment Manager according to different principal investment strategies. If the Fund’s current management and strategies had been in place for the prior periods, results shown may have been different. |
| Fund net assets | $ 475,919,699 |
| Total number of portfolio holdings | 260 |
| Management services fees (represents 0.54% of Fund average net assets) | $ 2,681,622 |
| Portfolio turnover for the reporting period | 16% |
| Florida | 10.2 |
| Colorado | 9.1 |
| Illinois | 7.8 |
| Wisconsin | 7.1 |
| Puerto Rico | 6.2 |
| Texas | 6.1 |
| California | 5.1 |
| New York | 4.9 |
| Iowa | 3.4 |
| Ohio | 3.1 |

1-800-345-6611.
| Class | Costs of a $10,000 investment | Costs paid as a percentage of a $10,000 investment |
| Institutional 2 Class | $ 62 | 0.60 % |

| Average Annual Total Returns (%) | 1 year | 5 years | 10 years |
| Institutional 2 Class (a) | 6.63 | 0.57 | 2.82 |
| Blended Benchmark - 80% Bloomberg High Yield Municipal Bond Index, 20% Bloomberg Municipal Bond Index | 7.07 | 2.29 | 3.84 |
| Bloomberg High Yield Municipal Bond Index | 8.19 | 2.61 | 4.22 |
| Bloomberg Municipal Bond Index | 2.67 | 0.93 | 2.25 |
| (a) | The Fund’s performance prior to November 2021 reflects returns achieved by the Investment Manager according to different principal investment strategies. If the Fund’s current management and strategies had been in place for the prior periods, results shown may have been different. |
| Fund net assets | $ 475,919,699 |
| Total number of portfolio holdings | 260 |
| Management services fees (represents 0.54% of Fund average net assets) | $ 2,681,622 |
| Portfolio turnover for the reporting period | 16% |
| Florida | 10.2 |
| Colorado | 9.1 |
| Illinois | 7.8 |
| Wisconsin | 7.1 |
| Puerto Rico | 6.2 |
| Texas | 6.1 |
| California | 5.1 |
| New York | 4.9 |
| Iowa | 3.4 |
| Ohio | 3.1 |

1-800-345-6611.
| Class | Costs of a $10,000 investment | Costs paid as a percentage of a $10,000 investment |
| Institutional 3 Class | $ 57 | 0.55 % |
| Average Annual Total Returns (%) | 1 year | 5 years | 10 years |
| Institutional 3 Class (a),(b) | 6.67 | 0.63 | 2.83 |
| Blended Benchmark - 80% Bloomberg High Yield Municipal Bond Index, 20% Bloomberg Municipal Bond Index | 7.07 | 2.29 | 3.84 |
| Bloomberg High Yield Municipal Bond Index | 8.19 | 2.61 | 4.22 |
| Bloomberg Municipal Bond Index | 2.67 | 0.93 | 2.25 |
| (a) | The returns shown for periods prior to March 1, 2017 (including returns for the Life of the Fund, if shown, which are since Fund inception) include the returns of Institutional Class. These returns are adjusted to reflect any higher class-related operating expenses of the newer share classes, as applicable. Please visit columbiathreadneedleus.com/investor/investment-products/mutual-funds/appended-performance for more information. |
| (b) | The Fund’s performance prior to November 2021 reflects returns achieved by the Investment Manager according to different principal investment strategies. If the Fund’s current management and strategies had been in place for the prior periods, results shown may have been different. |
| Fund net assets | $ 475,919,699 |
| Total number of portfolio holdings | 260 |
| Management services fees (represents 0.54% of Fund average net assets) | $ 2,681,622 |
| Portfolio turnover for the reporting period | 16% |
| Florida | 10.2 |
| Colorado | 9.1 |
| Illinois | 7.8 |
| Wisconsin | 7.1 |
| Puerto Rico | 6.2 |
| Texas | 6.1 |
| California | 5.1 |
| New York | 4.9 |
| Iowa | 3.4 |
| Ohio | 3.1 |


Item 2. Code of Ethics.
The registrant has adopted a code of ethics (the “Code”) that applies to the registrant’s principal executive officer, principal financial officer, principal accounting officer or controller, or persons performing similar functions, regardless of whether these individuals are employed by the registrant or a third party. During the period covered by this report, there were not any amendments to a provision of the Code that relates to any element of the code of ethics definition enumerated in paragraph (b) of Item 2 of Form N-CSR. During the period covered by this report, there were no waivers, including any implicit waivers, from a provision of the Code that relates to one or more of the items set forth in paragraph (b) of Item 2 of Form N-CSR. A copy of the Code is attached hereto.
Item 3. Audit Committee Financial Expert.
The registrant’s Board of Trustees has determined that J. Kevin Connaughton, Brian J. Gallagher, Douglas A. Hacker, David M. Moffett and Sandra L. Yeager qualify as “audit committee financial experts,” as such term is defined in Form N-CSR. Mr. Connaughton, Mr. Gallagher, Mr. Hacker, Mr. Moffett and Ms. Yeager, are also each “independent” members of the Audit Committee pursuant to paragraph (a)(2) of Item 3 of Form N-CSR.
Item 4. Principal Accountant Fees and Services.
The Registrant has engaged its principal accountant to perform audit services, audit-related services, tax services and other services during the past two fiscal years. The following table details the aggregate fees billed or expected to be billed for each of the last two fiscal years for the series of the relevant registrant whose reports to shareholders are included in this annual filing.
| Amount billed to the registrant | Amount billed to the registrant's investment advisor | |||
| May 31, 2024 | May 31, 2023 | May 31, 2024 | May 31, 2023 | |
| Audit fees (a) | $41,999 | $40,290 | $0 | $0 |
| Audit-related fees (b) | $0 | $0 | $0 | $0 |
| Tax fees (c) | $12,850 | $12,850 | $0 | $0 |
| All other fees (d) | $0 | $0 | $0 | $0 |
| Non-audit fees (g) | $0 | $0 | $581,000 | $577,000 |
(a) Audit Fees include amounts related to the audit of the registrant’s annual financial statements or services that are normally provided by the accountant in connection with statutory and regulatory filings or engagements for those fiscal years.
(b) Audit-Related Fees include amounts for assurance and related services by the principal accountant that are reasonably related to the performance of the audit of the registrant’s financial statements and are not reported in Audit Fees above.
(c) Tax Fees include amounts for the review of annual tax returns, the review of required shareholder distribution calculations and typically include amounts for professional services by the principal accountant for tax compliance, tax advice, tax planning and foreign tax filings, if applicable.
(d) All Other Fees include amounts for products and services provided by the principal accountant, other than the services reported in paragraphs (a) through (c) above and typically include SOC-1 reviews.
(e)(1) Audit Committee Pre-Approval Policies and Procedures
The registrant’s Audit Committee is required to pre-approve the engagement of the registrant’s independent auditors to provide audit and non-audit services to the registrant and non-audit services to its investment adviser (excluding any sub-adviser whose role is primarily portfolio management and is sub-contracted or overseen by another investment adviser (the “Adviser”) or any entity controlling, controlled by or under common control with the Adviser that provides ongoing services to the Fund (a “Control Affiliate”) if the engagement relates directly to the operations and financial reporting of the registrant.
The Audit Committee has adopted a Policy for Engagement of Independent Auditors for Audit and Non-Audit Services (the “Policy”). The Policy sets forth the understanding of the Audit Committee regarding the engagement of the registrant’s independent accountants to provide (i) audit and permissible audit-related, tax and other services to the registrant (“Fund Services”); (ii) non-audit services to the registrant’s Adviser and any Control Affiliates, that relates directly to the operations and financial reporting of a Fund (“Fund-related Adviser Services”); and (iii) certain other audit and non-audit services to the registrant’s Adviser and its Control Affiliates. A service will require specific pre-approval by the Audit Committee if it is to be provided by the Fund’s independent auditor; provided, however, that pre-approval of non-audit services to the Fund, the Adviser or Control Affiliates may be waived if certain de minimis requirements set forth in the SEC’s rules are met.
Under the Policy, the Audit Committee may delegate pre-approval authority to any pre-designated member or members who are independent board members. The member(s) to whom such authority is delegated must report, for informational purposes only, any pre-approval decisions to the Audit Committee at its next regular meeting. The Audit Committee's responsibilities with respect to the pre-approval of services performed by the independent auditor may not be delegated to management.
On an annual basis, at a regularly scheduled Audit Committee meeting, the Fund’s Treasurer or other Fund officer shall submit to the Audit Committee a schedule of the types of Fund Services and Fund-related Adviser Services that are subject to specific pre-approval. This schedule will provide a description of each type of service that is subject to specific pre-approval, along with total projected fees for each service. The pre-approval will generally cover a one-year period. The Audit Committee will review and approve the types of services and the projected fees for the next one-year period and may add to, or subtract from, the list of pre-approved services from time to time, based on subsequent determinations. This specific approval acknowledges that the Audit Committee is in agreement with the specific types of services that the independent auditor will be permitted to perform and the projected fees for each service.
The Fund’s Treasurer or other Fund officer shall report to the Audit Committee at each of its regular meetings regarding all Fund Services or Fund-related Adviser Services provided since the last such report was rendered, including a description of the services, by category, with forecasted fees for the annual reporting period, proposed changes requiring specific pre-approval and a description of services provided by the independent auditor, by category, with actual fees during the current reporting period.
(e)(2) None, or 0%, of the Audit-Related Fees, Tax Fees and All Other Fees paid by the Fund or affiliated entities relating directly to the operations and financial reporting of the Registrant disclosed above were approved by the audit committee pursuant to paragraphs (c)(7)(i)(C) of Rule 2-01 of Regulation S-X (which permits audit committee approval after the start of the engagement with respect to services other than audit, review or attest services, if certain conditions are satisfied).
(f) Not applicable.
(g) The aggregate non-audit fees billed by the registrant’s accountant for services rendered to the registrant and rendered to the registrant’s investment adviser (not including any sub-adviser whose role is primarily portfolio management and is subcontracted with or overseen by another investment adviser), and any entity controlling, controlled by, or under common control with the adviser that provides ongoing services to the registrant.
(h) The registrant’s Audit Committee of the Board of Directors has considered whether the provision of non-audit services that were rendered to the registrant’s adviser (not including any sub-adviser whose role is primarily portfolio management and is subcontracted with or overseen by another investment adviser), and any entity controlling, controlled by, or under common control with the investment adviser that provides ongoing services to the registrant that were not pre-approved pursuant to paragraph (c)(7)(ii) of Rule 2-01 of Regulation S-X, is compatible with maintaining the principal accountant’s independence.
(i) Not applicable.
(j) Not applicable.
Item 5. Audit Committee of Listed Registrants.
Not applicable.
Item 6. Investments.
(a) The registrant’s “Schedule I – Investments in securities of unaffiliated issuers” (as set forth in 17 CFR 210.12-12) is included in Item 7 of this Form N-CSR.
(b) Not applicable.
Item 7. Financial Statements and Financial Highlights for Open-End Management Investment Companies.

Not FDIC or NCUA Insured | No Financial Institution Guarantee | May Lose Value |
Floating Rate Notes 0.1% | ||||
Issue Description | Yield | Principal Amount ($) | Value ($) | |
Utah 0.1% | ||||
City of Murray(a),(b) | ||||
Revenue Bonds | ||||
IHC Health Services, Inc. | ||||
Series 2005A (JPMorgan Chase Bank) | ||||
05/15/2037 | 3.550% | 400,000 | 400,000 | |
Total Floating Rate Notes (Cost $400,000) | 400,000 | |||
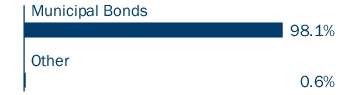
Municipal Bonds 98.1% | ||||
Issue Description | Coupon Rate | Principal Amount ($) | Value ($) | |
Alaska 0.5% | ||||
Northern Tobacco Securitization Corp.(c) | ||||
Refunding Revenue Bonds | ||||
Series 2021B-2 | ||||
06/01/2066 | 0.000% | 20,725,000 | 2,510,722 | |
Arizona 2.5% | ||||
Arizona Industrial Development Authority(d),(e) | ||||
Revenue Bonds | ||||
Legacy Cares, Inc. Project | ||||
Series 2020 | ||||
07/01/2050 | 0.000% | 3,000,000 | 180,000 | |
Series 2021A | ||||
07/01/2051 | 0.000% | 500,000 | 30,000 | |
Arizona Industrial Development Authority(d) | ||||
Revenue Bonds | ||||
Pinecrest Academy of Northern Nevada Project | ||||
Series 2022 | ||||
07/15/2029 | 4.500% | 2,500,000 | 2,358,652 | |
Industrial Development Authority of the County of Pima (The)(d) | ||||
Refunding Revenue Bonds | ||||
American Leadership Academy | ||||
Series 2022 | ||||
06/15/2057 | 4.000% | 4,000,000 | 2,995,503 | |
Revenue Bonds | ||||
La Posada at Pusch Ridge Project | ||||
Series 2022 | ||||
11/15/2057 | 7.000% | 1,000,000 | 1,063,443 | |
La Paz County Industrial Development Authority | ||||
Revenue Bonds | ||||
Charter School Solutions - Harmony Public Schools Project | ||||
Series 2016 | ||||
02/15/2046 | 5.000% | 1,500,000 | 1,450,770 | |
Series 2018 | ||||
02/15/2048 | 5.000% | 230,000 | 219,887 | |
Municipal Bonds (continued) | ||||
Issue Description | Coupon Rate | Principal Amount ($) | Value ($) | |
Maricopa County Industrial Development Authority(d) | ||||
Refunding Revenue Bonds | ||||
Sun Valley Academy Project | ||||
Series 2024A | ||||
07/01/2063 | 6.750% | 1,000,000 | 1,034,226 | |
Maricopa County Industrial Development Authority(d),(f) | ||||
Revenue Bonds | ||||
Commercial Metals Co. | ||||
Series 2022 | ||||
10/15/2047 | 4.000% | 3,000,000 | 2,626,628 | |
Total | 11,959,109 | |||
Arkansas 0.9% | ||||
Arkansas Development Finance Authority(f) | ||||
Revenue Bonds | ||||
Green Bonds - United States Steel Corp. Project | ||||
Series 2023 | ||||
05/01/2053 | 5.700% | 2,000,000 | 2,063,184 | |
Arkansas Development Finance Authority(d),(f) | ||||
Revenue Bonds | ||||
Green Bonds-Hybar Steel Project | ||||
Series 2023 | ||||
07/01/2048 | 6.875% | 2,000,000 | 2,164,602 | |
Total | 4,227,786 | |||
California 4.7% | ||||
California County Tobacco Securitization Agency(c) | ||||
Refunding Revenue Bonds | ||||
Capital Allocation | ||||
Subordinated Series 2020B-2 | ||||
06/01/2055 | 0.000% | 5,000,000 | 867,987 | |
California County Tobacco Securitization Agency | ||||
Refunding Revenue Bonds | ||||
Subordinated Series 2020B-1 | ||||
06/01/2049 | 5.000% | 260,000 | 263,085 | |
California Municipal Finance Authority(d) | ||||
Revenue Bonds | ||||
Catalyst Impact Fund Housing | ||||
Series 2024 | ||||
01/01/2039 | 6.000% | 2,000,000 | 2,067,562 | |
California Municipal Finance Authority(d),(e),(f) | ||||
Revenue Bonds | ||||
UTS Renewable Energy-Waste Water Facilities | ||||
Series 2011 | ||||
12/01/2032 | 0.000% | 1,835,000 | 36,700 | |
CMFA Special Finance Agency(d) | ||||
Revenue Bonds | ||||
Junior Bonds - Latitude33 | ||||
Series 2021A | ||||
12/01/2045 | 4.000% | 2,000,000 | 1,622,296 | |
Municipal Bonds (continued) | ||||
Issue Description | Coupon Rate | Principal Amount ($) | Value ($) | |
Junior Bonds - Solana at Grand | ||||
Series 2021A-2 | ||||
08/01/2045 | 4.000% | 5,000,000 | 4,117,690 | |
CSCDA Community Improvement Authority(d) | ||||
Revenue Bonds | ||||
Social Bonds - Mezzanine Lien - Westgate Phase 1-Pasadena | ||||
Series 2021 | ||||
06/01/2057 | 4.000% | 2,000,000 | 1,212,425 | |
Social Bonds - Millennium South Bay-Hawthorne | ||||
Series 2021 | ||||
07/01/2058 | 4.000% | 3,000,000 | 2,040,022 | |
Golden State Tobacco Securitization Corp.(c) | ||||
Refunding Revenue Bonds | ||||
Subordinated Series 2021B-2 | ||||
06/01/2066 | 0.000% | 14,275,000 | 1,554,776 | |
Hastings Campus Housing Finance Authority | ||||
Revenue Bonds | ||||
Green Bonds | ||||
Series 2020A | ||||
07/01/2061 | 5.000% | 1,000,000 | 909,519 | |
Hastings Campus Housing Finance Authority(c),(d) | ||||
Revenue Bonds | ||||
Green Bonds | ||||
Subordinated Series 2020A | ||||
07/01/2061 | 0.000% | 3,000,000 | 1,333,910 | |
M-S-R Energy Authority | ||||
Revenue Bonds | ||||
Series 2009B | ||||
11/01/2039 | 6.500% | 5,000,000 | 6,181,249 | |
Total | 22,207,221 | |||
Colorado 9.1% | ||||
Aerotropolis Regional Transportation Authority | ||||
Revenue Bonds | ||||
Series 2021 | ||||
12/01/2052 | 4.375% | 2,500,000 | 2,066,661 | |
Arista Metropolitan District | ||||
Limited General Obligation Refunding Bonds | ||||
Subordinated Series 2023B | ||||
12/15/2039 | 8.250% | 1,000,000 | 1,016,523 | |
Aurora Crossroads Metropolitan District No. 2 | ||||
Limited General Obligation Bonds | ||||
Senior Series 2020A | ||||
12/01/2050 | 5.000% | 1,000,000 | 893,844 | |
Senior Limited General Obligation Bonds | ||||
Series 2020A | ||||
12/01/2040 | 5.000% | 880,000 | 832,460 | |
Colorado Bridge Enterprise(f) | ||||
Revenue Bonds | ||||
Central 70 Project | ||||
Series 2017 | ||||
06/30/2051 | 4.000% | 6,000,000 | 5,082,295 | |
Municipal Bonds (continued) | ||||
Issue Description | Coupon Rate | Principal Amount ($) | Value ($) | |
Colorado Educational & Cultural Facilities Authority(d) | ||||
Refunding Revenue Bonds | ||||
New Summit Charter Academy Project | ||||
Series 2021 | ||||
07/01/2051 | 4.000% | 715,000 | 545,438 | |
07/01/2061 | 4.000% | 1,225,000 | 885,350 | |
Colorado Health Facilities Authority | ||||
Improvement Refunding Revenue Bonds | ||||
Christian Living Neighborhoods | ||||
Series 2021 | ||||
01/01/2042 | 4.000% | 1,000,000 | 855,561 | |
Refunding Revenue Bonds | ||||
CommonSpirit Health | ||||
Series 2019A | ||||
08/01/2049 | 4.000% | 3,250,000 | 2,979,995 | |
Revenue Bonds | ||||
NJH-SJH Center for Outpatient Health Project | ||||
Series 2019 | ||||
01/01/2045 | 3.000% | 5,000,000 | 3,718,313 | |
Eagle Brook Meadows Metropolitan District No. 3(g) | ||||
Limited General Obligation Bonds | ||||
Series 2021 | ||||
12/01/2051 | 5.000% | 1,500,000 | 1,292,453 | |
Fiddlers Business Improvement District(d) | ||||
Unlimited General Obligation Refunding Bonds | ||||
Series 2022 | ||||
12/01/2047 | 5.550% | 3,000,000 | 3,034,777 | |
Lanterns Metropolitan District No. 2(g) | ||||
Limited General Obligation Bonds | ||||
Series 2021A | ||||
12/01/2050 | 4.500% | 2,830,000 | 2,061,413 | |
Peak Metropolitan District No. 3(c) | ||||
Limited General Obligation Bonds | ||||
Capital Appreciation | ||||
Series 2022 | ||||
12/01/2052 | 0.000% | 2,000,000 | 1,159,163 | |
Prairie Center Metropolitan District No. 3 | ||||
Limited General Obligation Bonds | ||||
Series 2024B | ||||
12/15/2046 | 5.875% | 1,000,000 | 1,050,118 | |
Limited General Obligation Refunding Bonds | ||||
Series 2024A | ||||
12/15/2046 | 5.875% | 1,000,000 | 1,050,118 | |
Rampart Range Metropolitan District No. 5 | ||||
Revenue Bonds | ||||
Series 2021 | ||||
12/01/2051 | 4.000% | 2,500,000 | 1,854,603 | |
RRC Metropolitan District No. 2(g) | ||||
Limited General Obligation Bonds | ||||
Series 2021 | ||||
12/01/2051 | 5.250% | 2,500,000 | 2,108,530 | |
Municipal Bonds (continued) | ||||
Issue Description | Coupon Rate | Principal Amount ($) | Value ($) | |
Sagebrush Farm Metropolitan District No. 1 | ||||
Limited General Obligation Bonds | ||||
Series 2022A | ||||
12/01/2052 | 6.750% | 2,000,000 | 1,977,701 | |
Senac South Metropolitan District No. 1(g) | ||||
Limited General Obligation Bonds | ||||
Series 2021A | ||||
12/01/2051 | 5.250% | 3,000,000 | 2,584,651 | |
Sky Ranch Community Authority Board | ||||
Limited General Obligation Bonds | ||||
Series 2022A | ||||
12/01/2052 | 5.750% | 1,250,000 | 1,176,884 | |
Sterling Ranch Community Authority Board | ||||
Refunding Revenue Bonds | ||||
Series 2022A | ||||
12/01/2053 | 6.750% | 2,000,000 | 2,080,049 | |
Special Assessment Bonds | ||||
Special Improvement District No. 1 | ||||
Series 2024 | ||||
12/01/2043 | 5.625% | 1,000,000 | 1,012,071 | |
Waterfront at Foster Lake Metropolitan District No. 2(g) | ||||
Revenue Bonds | ||||
Series 2022 | ||||
12/01/2028 | 4.625% | 2,000,000 | 1,890,705 | |
Total | 43,209,676 | |||
Connecticut 0.5% | ||||
Connecticut State Health & Educational Facility Authority(d) | ||||
Revenue Bonds | ||||
Church Home of Hartford, Inc. Project | ||||
Series 2016 | ||||
09/01/2053 | 5.000% | 1,750,000 | 1,433,600 | |
Stamford Housing Authority(d),(g) | ||||
Revenue Bonds | ||||
The Dogwoods Project | ||||
BAN Series 2022 | ||||
12/01/2027 | 11.000% | 1,000,000 | 1,131,278 | |
Total | 2,564,878 | |||
District of Columbia 0.9% | ||||
District of Columbia | ||||
Revenue Bonds | ||||
KIPP DC Project | ||||
Series 2019 | ||||
07/01/2049 | 4.000% | 680,000 | 597,923 | |
Metropolitan Washington Airports Authority Dulles Toll Road | ||||
Refunding Revenue Bonds | ||||
Dulles Metrorail | ||||
Subordinated Series 2019 | ||||
10/01/2049 | 4.000% | 4,275,000 | 3,895,998 | |
Total | 4,493,921 | |||
Municipal Bonds (continued) | ||||
Issue Description | Coupon Rate | Principal Amount ($) | Value ($) | |
Florida 10.2% | ||||
Capital Trust Agency, Inc.(d) | ||||
04/27/2021 | ||||
07/01/2056 | 5.000% | 4,000,000 | 3,691,407 | |
Revenue Bonds | ||||
WFCS Portfolio Projects | ||||
Series 2021A | ||||
01/01/2031 | 3.300% | 250,000 | 228,782 | |
01/01/2056 | 5.000% | 1,000,000 | 877,503 | |
Capital Trust Agency, Inc.(d),(e) | ||||
Revenue Bonds | ||||
1st Mortgage - Tapestry Walden Senior Housing Project | ||||
Series 2017 | ||||
07/01/2052 | 0.000% | 3,400,000 | 629,000 | |
1st Mortgage Tallahassee Tapestry Senior Housing Project | ||||
Series 2015 | ||||
12/01/2050 | 0.000% | 3,550,000 | 1,162,625 | |
Capital Trust Agency, Inc.(c),(d) | ||||
Subordinated | ||||
07/01/2061 | 0.000% | 30,000,000 | 1,928,226 | |
Capital Trust Authority(d) | ||||
Revenue Bonds | ||||
IPS Enterprises, Inc. | ||||
Series 2023A | ||||
06/15/2058 | 6.375% | 700,000 | 727,608 | |
City of Atlantic Beach | ||||
Revenue Bonds | ||||
Fleet Landing Project | ||||
Series 2018A | ||||
11/15/2053 | 5.000% | 1,500,000 | 1,418,308 | |
City of Pompano Beach | ||||
Revenue Bonds | ||||
John Knox Village Project | ||||
Series 2021A | ||||
09/01/2056 | 4.000% | 1,835,000 | 1,376,956 | |
City of Tampa(c) | ||||
Revenue Bonds | ||||
Series 2020A | ||||
09/01/2053 | 0.000% | 1,800,000 | 394,985 | |
County of Miami-Dade(c) | ||||
Revenue Bonds | ||||
Capital Appreciation | ||||
Subordinated Series 2009B | ||||
10/01/2041 | 0.000% | 10,000,000 | 4,517,453 | |
County of Osceola Transportation(c) | ||||
Refunding Revenue Bonds | ||||
Osceola Parkway Toll Facility | ||||
Series 2019A-2 | ||||
10/01/2049 | 0.000% | 1,700,000 | 424,895 | |
Series 2020A-2 | ||||
10/01/2046 | 0.000% | 3,175,000 | 955,738 | |
Municipal Bonds (continued) | ||||
Issue Description | Coupon Rate | Principal Amount ($) | Value ($) | |
Series 2020A-2 (AGM) | ||||
10/01/2051 | 0.000% | 2,000,000 | 443,297 | |
Florida Development Finance Corp.(d),(f),(h) | ||||
Refunding Revenue Bonds | ||||
Brightline Florida Passenger Rail Project | ||||
Series 2024 (Mandatory Put 07/15/28) | ||||
07/15/2032 | 12.000% | 1,500,000 | 1,560,000 | |
Florida Development Finance Corp.(d) | ||||
Refunding Revenue Bonds | ||||
Glenridge on Palmer Ranch Project (The) | ||||
Series 2021 | ||||
06/01/2051 | 5.000% | 2,000,000 | 1,649,003 | |
Mayflower Retirement Community Project (The) | ||||
Series 2021 | ||||
06/01/2055 | 4.000% | 1,500,000 | 947,902 | |
Renaissance Charter School | ||||
Series 2020 | ||||
09/15/2050 | 5.000% | 2,200,000 | 1,925,032 | |
Revenue Bonds | ||||
Cornerstone Charter Academy Project | ||||
Series 2022 | ||||
10/01/2052 | 5.125% | 1,000,000 | 965,145 | |
10/01/2056 | 5.250% | 1,900,000 | 1,855,023 | |
Discovery High School Project | ||||
Series 2020 | ||||
06/01/2055 | 5.000% | 2,000,000 | 1,448,484 | |
Renaissance Charter School | ||||
Series 2015 | ||||
06/15/2046 | 6.125% | 4,900,000 | 4,928,270 | |
Florida Development Finance Corp.(d),(i) | ||||
Revenue Bonds | ||||
The Henry Project | ||||
Series 2024A1 | ||||
06/01/2059 | 5.250% | 1,000,000 | 995,230 | |
Lee County Industrial Development Authority | ||||
Revenue Bonds | ||||
Cypress Cove at HealthPark Florida, Inc. Project | ||||
Series 2022 | ||||
10/01/2057 | 5.250% | 3,000,000 | 2,515,972 | |
Palm Beach County Health Facilities Authority | ||||
Refunding Revenue Bonds | ||||
Toby & Leon Cooperman Sinai Residences of Boca Raton | ||||
Series 2022 | ||||
06/01/2056 | 4.250% | 4,000,000 | 3,170,602 | |
Polk County Industrial Development Authority | ||||
Refunding Revenue Bonds | ||||
Carpenter’s Home Estates, Inc. | ||||
Series 2019 | ||||
01/01/2055 | 5.000% | 2,615,000 | 2,337,493 | |
Municipal Bonds (continued) | ||||
Issue Description | Coupon Rate | Principal Amount ($) | Value ($) | |
Seminole County Industrial Development Authority | ||||
Refunding Revenue Bonds | ||||
Legacy Pointe at UCF Project | ||||
Series 2019 | ||||
11/15/2049 | 5.500% | 1,225,000 | 1,041,287 | |
Seminole County Industrial Development Authority(d) | ||||
Revenue Bonds | ||||
Galileo Schools for Gifted Learning Project | ||||
Series 2021 | ||||
06/15/2051 | 4.000% | 830,000 | 659,268 | |
06/15/2056 | 4.000% | 1,410,000 | 1,088,668 | |
Village Community Development District No. 15(d) | ||||
Special Assessment Bonds | ||||
Series 2023 | ||||
05/01/2054 | 5.250% | 2,500,000 | 2,550,007 | |
Westridge Community Development District | ||||
Special Assessment Bonds | ||||
Series 2005 | ||||
05/01/2037 | 5.800% | 285,000 | 285,134 | |
Total | 48,699,303 | |||
Georgia 1.9% | ||||
Floyd County Development Authority | ||||
Revenue Bonds | ||||
Spires Berry College Project | ||||
Series 2018 | ||||
12/01/2048 | 6.250% | 1,500,000 | 1,465,106 | |
Georgia State Road & Tollway Authority(d),(h) | ||||
Prerefunded 06/01/24 Revenue Bonds | ||||
I-75 S Expressway | ||||
Series 2014S | ||||
06/01/2049 | 7.000% | 4,600,000 | 4,830,000 | |
Oconee County Industrial Development Authority | ||||
Revenue Bonds | ||||
Presbyterian Village Athens Project | ||||
Series 2018 | ||||
12/01/2053 | 6.375% | 3,000,000 | 2,729,357 | |
Total | 9,024,463 | |||
Idaho 1.4% | ||||
Avimor Community Infrastructure District No. 1(d) | ||||
Special Assessment Bonds | ||||
Assessment Area Five | ||||
Series 2024 | ||||
09/01/2053 | 5.875% | 1,500,000 | 1,529,905 | |
Idaho Health Facilities Authority | ||||
Revenue Bonds | ||||
Terraces of Boise Project | ||||
Series 2021 | ||||
10/01/2050 | 4.500% | 4,000,000 | 2,725,477 | |
Municipal Bonds (continued) | ||||
Issue Description | Coupon Rate | Principal Amount ($) | Value ($) | |
Spring Valley Community Infrastructure District No. 1(d) | ||||
Special Assessment Bonds | ||||
Series 2021 | ||||
09/01/2051 | 3.750% | 3,000,000 | 2,489,274 | |
Total | 6,744,656 | |||
Illinois 7.8% | ||||
Chicago Board of Education(d) | ||||
Unlimited General Obligation Bonds | ||||
Dedicated | ||||
Series 2017A | ||||
12/01/2046 | 7.000% | 3,000,000 | 3,227,887 | |
Chicago Board of Education | ||||
Unlimited General Obligation Bonds | ||||
Project | ||||
Series 2015C | ||||
12/01/2039 | 5.250% | 2,000,000 | 1,995,717 | |
Series 2012A | ||||
12/01/2042 | 5.000% | 1,000,000 | 978,736 | |
Series 2016B | ||||
12/01/2046 | 6.500% | 1,500,000 | 1,554,330 | |
Series 2018D | ||||
12/01/2046 | 5.000% | 5,000,000 | 4,868,277 | |
Series 2022A | ||||
12/01/2047 | 4.000% | 6,000,000 | 5,198,961 | |
City of Chicago | ||||
Unlimited General Obligation Bonds | ||||
Series 2017A | ||||
01/01/2038 | 6.000% | 3,235,000 | 3,361,305 | |
Unlimited General Obligation Refunding Bonds | ||||
Series 2007F | ||||
01/01/2042 | 5.500% | 1,000,000 | 1,001,985 | |
Du Page County Special Service Area No. 31 | ||||
Special Tax Bonds | ||||
Monarch Landing Project | ||||
Series 2006 | ||||
03/01/2036 | 5.625% | 547,000 | 537,261 | |
Illinois Finance Authority(d) | ||||
Refunding Revenue Bonds | ||||
DePaul College Prep Foundation | ||||
Series 2023 | ||||
08/01/2053 | 5.625% | 1,000,000 | 1,044,337 | |
Metropolitan Pier & Exposition Authority | ||||
Refunding Revenue Bonds | ||||
McCormick Place Expansion Project | ||||
Series 2020 | ||||
06/15/2050 | 4.000% | 1,200,000 | 1,085,819 | |
Municipal Bonds (continued) | ||||
Issue Description | Coupon Rate | Principal Amount ($) | Value ($) | |
Metropolitan Pier & Exposition Authority(c) | ||||
Refunding Revenue Bonds | ||||
McCormick Place Expansion Project | ||||
Series 2022 | ||||
12/15/2037 | 0.000% | 2,700,000 | 1,461,266 | |
06/15/2038 | 0.000% | 3,000,000 | 1,571,626 | |
State of Illinois | ||||
Unlimited General Obligation Bonds | ||||
Series 2018A | ||||
05/01/2041 | 5.000% | 3,910,000 | 4,017,103 | |
Series 2020 | ||||
05/01/2039 | 5.500% | 570,000 | 616,910 | |
05/01/2045 | 5.750% | 750,000 | 810,274 | |
Series 2022A | ||||
03/01/2047 | 5.500% | 2,700,000 | 2,902,810 | |
Series 2023B | ||||
05/01/2047 | 5.500% | 500,000 | 538,009 | |
Village of Lincolnshire | ||||
Special Tax Bonds | ||||
Sedgebrook Project | ||||
Series 2004 | ||||
03/01/2034 | 6.250% | 458,000 | 458,227 | |
Total | 37,230,840 | |||
Indiana 0.1% | ||||
Indianapolis Local Public Improvement Bond Bank | ||||
Revenue Bonds | ||||
Convention Center Hotel | ||||
Series 2023 | ||||
03/01/2053 | 6.000% | 500,000 | 541,129 | |
Iowa 3.4% | ||||
Iowa Finance Authority(h) | ||||
Prerefunded 11/15/24 Revenue Bonds | ||||
Deerfield Retirement Community | ||||
Series 2014 | ||||
11/15/2046 | 5.400% | 1,890,493 | 1,903,038 | |
Iowa Finance Authority | ||||
Refunding Revenue Bonds | ||||
Iowa Fertilizer Co. Project | ||||
Series 2022 | ||||
12/01/2050 | 5.000% | 1,500,000 | 1,564,898 | |
Lifespace Communities, Inc. | ||||
Series 2021 | ||||
05/15/2053 | 4.000% | 4,000,000 | 2,818,742 | |
Series 2023 | ||||
05/15/2053 | 7.500% | 2,000,000 | 2,182,996 | |
Revenue Bonds | ||||
Lifespace Communities, Inc. | ||||
Series 2018A | ||||
05/15/2043 | 5.000% | 1,740,000 | 1,594,263 | |
Municipal Bonds (continued) | ||||
Issue Description | Coupon Rate | Principal Amount ($) | Value ($) | |
Iowa Tobacco Settlement Authority(c) | ||||
Refunding Revenue Bonds | ||||
Series 2021B-2 | ||||
06/01/2065 | 0.000% | 50,000,000 | 6,071,205 | |
Total | 16,135,142 | |||
Kansas 1.0% | ||||
City of Overland Park(e) | ||||
Revenue Bonds | ||||
Prairiefire-Lionsgate Project | ||||
Series 2012 | ||||
12/15/2032 | 6.000% | 6,000,000 | 2,400,000 | |
Wyandotte County-Kansas City Unified Government | ||||
Revenue Bonds | ||||
Legends Village West Project | ||||
Series 2006 | ||||
10/01/2028 | 4.875% | 2,215,000 | 2,139,052 | |
Total | 4,539,052 | |||
Kentucky 0.6% | ||||
City of Henderson(d),(f) | ||||
Revenue Bonds | ||||
Pratt Paper LLC Project | ||||
Series 2022 | ||||
01/01/2052 | 4.700% | 3,000,000 | 2,990,691 | |
Louisiana 1.4% | ||||
Louisiana Public Facilities Authority | ||||
Prerefunded 05/15/26 Revenue Bonds | ||||
Ochsner Clinic Foundation Project | ||||
Series 2016 | ||||
05/15/2034 | 5.000% | 25,000 | 25,624 | |
Louisiana Public Facilities Authority(f) | ||||
Revenue Bonds | ||||
Impala Warehousing LLC Project | ||||
Series 2013 | ||||
07/01/2036 | 6.500% | 2,420,000 | 2,420,493 | |
Parish of St. James(d) | ||||
Revenue Bonds | ||||
NuStar Logistics LP Project | ||||
Series 2020-2 | ||||
07/01/2040 | 6.350% | 3,750,000 | 4,073,147 | |
Total | 6,519,264 | |||
Maryland 0.9% | ||||
Maryland Economic Development Corp.(f) | ||||
Revenue Bonds | ||||
Green Bonds - Purple Line Light Rail Project | ||||
Series 2022 | ||||
06/30/2055 | 5.250% | 2,000,000 | 2,047,394 | |
Municipal Bonds (continued) | ||||
Issue Description | Coupon Rate | Principal Amount ($) | Value ($) | |
Maryland Economic Development Corp. | ||||
Tax Allocation Bonds | ||||
Port Covington Project | ||||
Series 2020 | ||||
09/01/2050 | 4.000% | 2,700,000 | 2,141,911 | |
Total | 4,189,305 | |||
Massachusetts 1.1% | ||||
Massachusetts Development Finance Agency(d) | ||||
Refunding Revenue Bonds | ||||
NewBridge on the Charles, Inc. | ||||
Series 2017 | ||||
10/01/2057 | 5.000% | 2,000,000 | 1,936,833 | |
Revenue Bonds | ||||
Linden Ponds, Inc. Facility | ||||
Series 2018 | ||||
11/15/2046 | 5.125% | 2,000,000 | 2,039,742 | |
Massachusetts Educational Financing Authority(f) | ||||
Refunding Revenue Bonds | ||||
Issue K | ||||
Subordinated Series 2017B | ||||
07/01/2046 | 4.250% | 1,500,000 | 1,343,408 | |
Total | 5,319,983 | |||
Michigan 0.8% | ||||
Michigan Finance Authority(c) | ||||
Refunding Revenue Bonds | ||||
Senior Series 2020B-2 Class 2 | ||||
06/01/2065 | 0.000% | 37,500,000 | 3,789,728 | |
Minnesota 1.2% | ||||
City of Crookston | ||||
Revenue Bonds | ||||
Riverview Health Project | ||||
Series 2019 | ||||
05/01/2044 | 5.000% | 500,000 | 364,397 | |
05/01/2051 | 5.000% | 1,500,000 | 1,032,632 | |
City of Deephaven(d) | ||||
Refunding Revenue Bonds | ||||
Seven Hills Preparatory Academy Project | ||||
Series 2024 | ||||
06/15/2061 | 6.125% | 1,500,000 | 1,471,924 | |
City of Minneapolis | ||||
Revenue Bonds | ||||
Hennepin Schools Project | ||||
Series 2021 | ||||
07/01/2051 | 4.000% | 1,550,000 | 1,082,608 | |
Municipal Bonds (continued) | ||||
Issue Description | Coupon Rate | Principal Amount ($) | Value ($) | |
St. Cloud Housing & Redevelopment Authority(h) | ||||
Revenue Bonds | ||||
Sanctuary St. Cloud Project | ||||
Series 2016A | ||||
08/01/2036 | 3.806% | 2,235,000 | 1,747,395 | |
Total | 5,698,956 | |||
Missouri 1.1% | ||||
Kansas City Industrial Development Authority(d) | ||||
Revenue Bonds | ||||
Platte Purchase Project | ||||
Series 2019A | ||||
07/01/2040 | 5.000% | 1,700,000 | 1,480,716 | |
Kirkwood Industrial Development Authority | ||||
Refunding Revenue Bonds | ||||
Aberdeen Heights Project | ||||
Series 2017 | ||||
05/15/2050 | 5.250% | 1,500,000 | 1,196,860 | |
St. Louis County Industrial Development Authority | ||||
Refunding Revenue Bonds | ||||
St. Andrews Residence for Seniors | ||||
Series 2015 | ||||
12/01/2045 | 5.125% | 3,000,000 | 2,658,821 | |
Total | 5,336,397 | |||
Nevada 1.2% | ||||
City of Reno(c),(d) | ||||
Refunding Revenue Bonds | ||||
Retrac-Reno Transportation Rail Access Corridor Project | ||||
Series 2018 | ||||
07/01/2058 | 0.000% | 14,000,000 | 1,789,876 | |
State of Nevada Department of Business & Industry(d) | ||||
Revenue Bonds | ||||
Somerset Academy | ||||
Series 2015A | ||||
12/15/2045 | 5.125% | 2,515,000 | 2,441,482 | |
Series 2018A | ||||
12/15/2048 | 5.000% | 1,500,000 | 1,400,528 | |
Total | 5,631,886 | |||
New Hampshire 0.7% | ||||
New Hampshire Business Finance Authority(d) | ||||
Revenue Bonds | ||||
The Vista Project | ||||
Series 2019A | ||||
07/01/2054 | 5.750% | 3,750,000 | 3,357,672 | |
New Hampshire Health and Education Facilities Authority Act(e) | ||||
Revenue Bonds | ||||
Hillside Village | ||||
Series 2017A | ||||
07/01/2052 | 0.000% | 1,563,091 | 156 | |
Total | 3,357,828 | |||
Municipal Bonds (continued) | ||||
Issue Description | Coupon Rate | Principal Amount ($) | Value ($) | |
New Jersey 1.3% | ||||
Camden County Improvement Authority (The) | ||||
Revenue Bonds | ||||
Social Bonds - Cooper Norcross Academy | ||||
Series 2022 | ||||
06/15/2062 | 6.000% | 1,000,000 | 1,055,664 | |
City of Newark Mass Transit Access Tax | ||||
Revenue Bonds | ||||
Mulberry Pedestrian Bridge Redevelopment Project | ||||
Series 2022 (AGM) | ||||
11/15/2062 | 6.000% | 1,000,000 | 1,117,806 | |
Middlesex County Improvement Authority(e) | ||||
Revenue Bonds | ||||
Heldrich Center Hotel | ||||
Series 2005C | ||||
01/01/2037 | 0.000% | 1,250,000 | 12 | |
New Jersey Economic Development Authority(f) | ||||
Revenue Bonds | ||||
UMM Energy Partners LLC | ||||
Series 2012A | ||||
06/15/2043 | 5.125% | 2,000,000 | 1,974,624 | |
Passaic County Improvement Authority (The) | ||||
Revenue Bonds | ||||
Paterson Arts and Science Charter School Project | ||||
Series 2023 | ||||
07/01/2053 | 5.375% | 1,000,000 | 1,013,510 | |
07/01/2058 | 5.500% | 1,000,000 | 1,018,084 | |
Total | 6,179,700 | |||
New York 4.9% | ||||
Build NYC Resource Corp. | ||||
Revenue Bonds | ||||
International Leadership Charter School | ||||
Series 2013 | ||||
07/01/2043 | 6.000% | 4,330,000 | 4,330,500 | |
Build NYC Resource Corp.(d) | ||||
Revenue Bonds | ||||
International Leadership Charter School | ||||
Series 2016 | ||||
07/01/2046 | 6.250% | 660,000 | 664,094 | |
Social Bonds - East Harlem Scholars Academy Charter School Project | ||||
Series 2022 | ||||
06/01/2062 | 5.750% | 500,000 | 507,704 | |
Huntington Local Development Corp. | ||||
Revenue Bonds | ||||
Fountaingate Garden Project | ||||
Series 2021A | ||||
07/01/2056 | 5.250% | 1,500,000 | 1,198,027 | |
Municipal Bonds (continued) | ||||
Issue Description | Coupon Rate | Principal Amount ($) | Value ($) | |
Jefferson County Industrial Development Agency(d),(e),(f) | ||||
Revenue Bonds | ||||
ReEnergy Black River LLC P | ||||
Series 2019 | ||||
01/01/2024 | 0.000% | 1,085,643 | 11 | |
Nassau County Tobacco Settlement Corp.(c) | ||||
Asset-Backed Revenue Bonds | ||||
Capital Appreciation | ||||
Third Series 2006D | ||||
06/01/2060 | 0.000% | 25,000,000 | 1,486,957 | |
New York State Thruway Authority | ||||
Refunding Revenue Bonds | ||||
Personal Income Tax - Bidding Group | ||||
Series 2022A | ||||
03/15/2050 | 4.000% | 3,000,000 | 2,847,410 | |
New York Transportation Development Corp.(f) | ||||
Refunding Revenue Bonds | ||||
John F. Kennedy International Airport Project | ||||
Series 2020 | ||||
08/01/2036 | 5.375% | 1,250,000 | 1,318,967 | |
Revenue Bonds | ||||
Delta Air Lines, Inc. LaGuardia | ||||
Series 2020 | ||||
10/01/2045 | 4.375% | 2,500,000 | 2,426,349 | |
John F. Kennedy International Airport New Terminal One Project | ||||
Series 2023 | ||||
06/30/2060 | 5.375% | 1,300,000 | 1,347,353 | |
LaGuardia Airport Terminal C&D | ||||
Series 2023 | ||||
04/01/2040 | 5.625% | 1,000,000 | 1,089,974 | |
Oneida Indian Nation of New York(d) | ||||
Revenue Bonds | ||||
Series 2024B | ||||
09/01/2043 | 6.000% | 700,000 | 739,046 | |
Suffolk Regional Off-Track Betting Co. | ||||
Revenue Bonds | ||||
Series 2024 | ||||
12/01/2053 | 6.000% | 1,500,000 | 1,550,582 | |
Westchester County Local Development Corp.(d) | ||||
Revenue Bonds | ||||
Purchase Senior Learning Community | ||||
Series 2021 | ||||
07/01/2056 | 5.000% | 4,000,000 | 3,683,088 | |
Total | 23,190,062 | |||
North Carolina 0.8% | ||||
North Carolina Medical Care Commission | ||||
Refunding Revenue Bonds | ||||
Sharon Towers | ||||
Series 2019 | ||||
07/01/2049 | 5.000% | 1,000,000 | 867,641 | |
Municipal Bonds (continued) | ||||
Issue Description | Coupon Rate | Principal Amount ($) | Value ($) | |
Revenue Bonds | ||||
Lutheran Services for the Aging | ||||
Series 2021 | ||||
03/01/2051 | 4.000% | 1,500,000 | 1,109,158 | |
North Carolina Turnpike Authority(c) | ||||
Revenue Bonds | ||||
Triangle Expressway System Appropriation | ||||
Series 2019 | ||||
01/01/2049 | 0.000% | 2,500,000 | 770,694 | |
North Carolina Turnpike Authority | ||||
Revenue Bonds | ||||
Triangle Expressway System Senior Lien Turnpike | ||||
Series 2019 | ||||
01/01/2055 | 4.000% | 1,400,000 | 1,187,489 | |
Total | 3,934,982 | |||
Ohio 3.1% | ||||
Buckeye Tobacco Settlement Financing Authority | ||||
Refunding Senior Revenue Bonds | ||||
Series 2020B-2 | ||||
06/01/2055 | 5.000% | 9,270,000 | 8,293,987 | |
County of Marion | ||||
Refunding Revenue Bonds | ||||
United Church Homes, Inc. | ||||
Series 2019 | ||||
12/01/2039 | 5.000% | 500,000 | 420,532 | |
12/01/2049 | 5.125% | 1,875,000 | 1,457,844 | |
Hickory Chase Community Authority(d) | ||||
Refunding Revenue Bonds | ||||
Hickory Chase Project | ||||
Series 2019 | ||||
12/01/2040 | 5.000% | 1,320,000 | 1,182,650 | |
Lake County Port & Economic Development Authority(d),(e) | ||||
Revenue Bonds | ||||
1st Mortgage - Tapestry Wickliffe LLC | ||||
Series 2017 | ||||
12/01/2052 | 0.000% | 5,600,000 | 224,000 | |
Ohio Air Quality Development Authority(d),(f) | ||||
Revenue Bonds | ||||
AMG Vanadium Project | ||||
Series 2019 | ||||
07/01/2049 | 5.000% | 1,500,000 | 1,333,309 | |
Pratt Paper LLC Project | ||||
Series 2017 | ||||
01/15/2048 | 4.500% | 500,000 | 485,108 | |
Ohio Air Quality Development Authority(f) | ||||
Revenue Bonds | ||||
Ohio Valley Electric Crop. | ||||
Series 2019 (Mandatory Put 10/01/29) | ||||
06/01/2041 | 2.600% | 500,000 | 432,485 | |
Municipal Bonds (continued) | ||||
Issue Description | Coupon Rate | Principal Amount ($) | Value ($) | |
Summit County Development Finance Authority | ||||
Revenue Bonds | ||||
University of Akron Parking Project | ||||
Series 2023 | ||||
12/01/2058 | 6.000% | 1,000,000 | 1,068,277 | |
Total | 14,898,192 | |||
Oregon 1.0% | ||||
Clackamas County Hospital Facility Authority | ||||
Revenue Bonds | ||||
Mary’s Woods at Marylhurst, Inc. | ||||
Series 2018 | ||||
05/15/2052 | 5.000% | 1,000,000 | 858,023 | |
Hospital Facilities Authority of Multnomah County | ||||
Prerefunded 10/01/24 Revenue Bonds | ||||
Mirabella at South Waterfront | ||||
Series 2014A | ||||
10/01/2049 | 5.500% | 3,115,000 | 3,128,475 | |
State of Oregon Housing & Community Services Department | ||||
Revenue Bonds | ||||
Single Family Mortgage Program | ||||
Series 2018C | ||||
07/01/2043 | 3.950% | 745,000 | 671,025 | |
Total | 4,657,523 | |||
Pennsylvania 3.0% | ||||
Allentown Neighborhood Improvement Zone Development Authority(d) | ||||
Revenue Bonds | ||||
City Center Project | ||||
Subordinated Series 2022 | ||||
05/01/2042 | 5.250% | 2,900,000 | 2,799,798 | |
Dauphin County Industrial Development Authority(f) | ||||
Revenue Bonds | ||||
Dauphin Consolidated Water Supply | ||||
Series 1992A | ||||
06/01/2024 | 6.900% | 3,200,000 | 3,200,212 | |
Franklin County Industrial Development Authority | ||||
Refunding Revenue Bonds | ||||
Menno-Haven, Inc. Project | ||||
Series 2018 | ||||
12/01/2053 | 5.000% | 1,900,000 | 1,590,749 | |
Montgomery County Industrial Development Authority | ||||
Refunding Revenue Bonds | ||||
Meadowood Senior Living Project | ||||
Series 2018 | ||||
12/01/2048 | 5.000% | 1,000,000 | 946,006 | |
Northampton County Industrial Development Authority | ||||
Refunding Revenue Bonds | ||||
Morningstar Senior Living, Inc. Project | ||||
Series 2019 | ||||
11/01/2049 | 5.000% | 1,600,000 | 1,361,282 | |
Municipal Bonds (continued) | ||||
Issue Description | Coupon Rate | Principal Amount ($) | Value ($) | |
Pennsylvania Economic Development Financing Authority(d),(e) | ||||
Refunding Revenue Bonds | ||||
Tapestry Moon Senior Housing Project | ||||
Series 2018 | ||||
12/01/2053 | 0.000% | 2,750,000 | 1,048,438 | |
Pennsylvania Economic Development Financing Authority(f) | ||||
Revenue Bonds | ||||
The PennDOT Major Bridges Package One Project | ||||
Series 2022 | ||||
06/30/2061 | 6.000% | 1,500,000 | 1,643,250 | |
Philadelphia Authority for Industrial Development | ||||
Revenue Bonds | ||||
1st Philadelphia Preparatory Charter School | ||||
Series 2014 | ||||
06/15/2033 | 7.000% | 1,720,000 | 1,724,187 | |
Total | 14,313,922 | |||
Puerto Rico 6.2% | ||||
Commonwealth of Puerto Rico(c),(j) | ||||
Revenue Notes | ||||
Series 2022 | ||||
11/01/2051 | 0.000% | 2,902,414 | 1,828,521 | |
Subordinated Series 2022 | ||||
11/01/2043 | 0.000% | 2,232,420 | 1,384,101 | |
Unlimited General Obligation Bonds | ||||
Series 2021A | ||||
07/01/2024 | 0.000% | 81,928 | 81,622 | |
Commonwealth of Puerto Rico(j) | ||||
Unlimited General Obligation Bonds | ||||
Series 2021-A1 | ||||
07/01/2033 | 4.000% | 503,640 | 502,487 | |
07/01/2035 | 4.000% | 452,705 | 443,559 | |
07/01/2037 | 4.000% | 388,540 | 375,828 | |
07/01/2041 | 4.000% | 528,266 | 489,264 | |
07/01/2046 | 4.000% | 1,719,389 | 1,548,510 | |
Puerto Rico Commonwealth Aqueduct & Sewer Authority(d),(j) | ||||
Refunding Revenue Bonds | ||||
Senior Lien | ||||
Series 2020A | ||||
07/01/2047 | 5.000% | 6,000,000 | 6,052,874 | |
Puerto Rico Electric Power Authority(e),(j) | ||||
Revenue Bonds | ||||
Series 2007TT | ||||
07/01/2037 | 0.000% | 2,000,000 | 525,000 | |
Series 2010XX | ||||
07/01/2040 | 0.000% | 8,500,000 | 2,231,250 | |
Puerto Rico Sales Tax Financing Corp.(c),(j) | ||||
Revenue Bonds | ||||
Series 2018A-1 | ||||
07/01/2046 | 0.000% | 44,000,000 | 14,014,933 | |
Total | 29,477,949 | |||
Municipal Bonds (continued) | ||||
Issue Description | Coupon Rate | Principal Amount ($) | Value ($) | |
South Carolina 2.6% | ||||
Patriots Energy Group Financing Agency | ||||
Refunding Revenue Bonds | ||||
Series 2023B-1 (Mandatory Put 03/01/31) | ||||
02/01/2054 | 5.250% | 1,000,000 | 1,069,634 | |
South Carolina Jobs-Economic Development Authority | ||||
Prerefunded 11/01/24 Revenue Bonds | ||||
York Preparatory Academy Project | ||||
Series 2014A | ||||
11/01/2045 | 7.250% | 4,000,000 | 4,049,046 | |
Revenue Bonds | ||||
Lutheran Homes of South Carolina, Inc. Obligation Group | ||||
Series 2013 | ||||
05/01/2043 | 5.000% | 750,000 | 621,389 | |
05/01/2048 | 5.125% | 1,500,000 | 1,220,231 | |
South Carolina Public Service Authority | ||||
Revenue Bonds | ||||
Santee Cooper | ||||
Series 2022A | ||||
12/01/2047 | 4.000% | 6,000,000 | 5,508,953 | |
Total | 12,469,253 | |||
Tennessee 0.6% | ||||
Shelby County Health Educational & Housing Facilities Board | ||||
Revenue Bonds | ||||
The Farms at Bailey Station Project | ||||
Series 2019 | ||||
10/01/2059 | 5.750% | 3,750,000 | 2,594,270 | |
Texas 6.1% | ||||
Angelina & Neches River Authority(d),(f) | ||||
Revenue Bonds | ||||
Jefferson Enterprise Energy LLC Project | ||||
Series 2021 | ||||
12/01/2045 | 7.500% | 2,250,000 | 1,493,500 | |
Arlington Higher Education Finance Corp. | ||||
Refunding Revenue Bonds | ||||
Legacy Traditional Schools | ||||
Series 2021 | ||||
02/15/2056 | 4.500% | 2,330,000 | 1,653,559 | |
Revenue Bonds | ||||
Brooks Academies of Texas | ||||
Series 2021 | ||||
01/15/2051 | 5.000% | 2,625,000 | 2,252,502 | |
Arlington Higher Education Finance Corp.(d) | ||||
Revenue Bonds | ||||
Magellan International School | ||||
Series 2022 | ||||
06/01/2062 | 6.375% | 1,750,000 | 1,807,499 | |
Municipal Bonds (continued) | ||||
Issue Description | Coupon Rate | Principal Amount ($) | Value ($) | |
City of Houston Airport System(f) | ||||
Refunding Revenue Bonds | ||||
United Airlines, Inc. Airport Improvement Projects | ||||
Series 2020 | ||||
07/15/2027 | 5.000% | 1,000,000 | 1,013,507 | |
Revenue Bonds | ||||
United Airlines, Inc. Terminal E Project | ||||
Series 2021A | ||||
07/01/2041 | 4.000% | 1,000,000 | 937,980 | |
United Airlines, Inc. Terminal Improvement Projects | ||||
Series 2021 | ||||
07/15/2041 | 4.000% | 1,850,000 | 1,734,959 | |
Clifton Higher Education Finance Corp. | ||||
Revenue Bonds | ||||
International Leadership of Texas | ||||
Series 2015 | ||||
08/15/2045 | 5.750% | 3,500,000 | 3,559,531 | |
New Hope Cultural Education Facilities Finance Corp. | ||||
Revenue Bonds | ||||
Bridgemoor Plano Project | ||||
Senior Series 2023A-1 | ||||
12/31/2030 | 7.250% | 3,500,000 | 3,476,320 | |
NCCD-College Station Properties LLC | ||||
Series 2015 | ||||
07/01/2035 | 5.000% | 1,000,000 | 951,250 | |
Series 2015A | ||||
07/01/2047 | 5.000% | 1,000,000 | 951,250 | |
New Hope Cultural Education Facilities Finance Corp.(c) | ||||
Revenue Bonds | ||||
Bridgemoor Plano Project | ||||
Senior Series 2023A-2 | ||||
12/31/2030 | 0.000% | 621,177 | 376,707 | |
New Hope Cultural Education Facilities Finance Corp.(e) | ||||
Revenue Bonds | ||||
Cardinal Bay, Inc. - Village on the Park/Carriage Inn Project | ||||
Series 2016 | ||||
07/01/2046 | 0.000% | 1,630,000 | 709,050 | |
Series 2016A-1 | ||||
07/01/2046 | 0.000% | 950,000 | 650,750 | |
New Hope Cultural Education Facilities Finance Corp.(d) | ||||
Revenue Bonds | ||||
Cumberland Academy Project | ||||
Series 2020A | ||||
08/15/2050 | 5.000% | 1,000,000 | 944,827 | |
Port Beaumont Navigation District(d),(f) | ||||
Revenue Bonds | ||||
Jefferson Gulf Coast Energy Project | ||||
Series 2021 | ||||
01/01/2050 | 3.000% | 1,000,000 | 676,201 | |
Municipal Bonds (continued) | ||||
Issue Description | Coupon Rate | Principal Amount ($) | Value ($) | |
Pottsboro Higher Education Finance Corp. | ||||
Revenue Bonds | ||||
Series 2016A | ||||
08/15/2046 | 5.000% | 1,000,000 | 917,652 | |
Red River Health Facilities Development Corp. | ||||
Prerefunded 11/15/24 Revenue Bonds | ||||
MRC Crossings Project | ||||
Series 2014A | ||||
11/15/2049 | 8.000% | 2,000,000 | 2,033,966 | |
Tarrant County Cultural Education Facilities Finance Corp.(e) | ||||
Revenue Bonds | ||||
CC Young Memorial Home | ||||
Series 2009A | ||||
02/15/2038 | 0.000% | 3,000,000 | 1,650,000 | |
Texas Private Activity Bond Surface Transportation Corp.(f) | ||||
Revenue Bonds | ||||
Senior Lien - Blueridge Transportation Group LLC | ||||
Series 2016 | ||||
12/31/2040 | 5.000% | 1,250,000 | 1,253,424 | |
Total | 29,044,434 | |||
Utah 2.1% | ||||
Black Desert Public Infrastructure District(d) | ||||
Limited General Obligation Bonds | ||||
Senior Bonds | ||||
Series 2021A | ||||
03/01/2051 | 4.000% | 3,000,000 | 2,449,208 | |
Downtown East Streetcar Sewer Public Infrastructure District(d) | ||||
Limited General Obligation Bonds | ||||
Series 2022A | ||||
03/01/2053 | 6.000% | 2,000,000 | 1,891,798 | |
Mida Golf and Equestrian Center Public Infrastructure District(d) | ||||
Limited General Obligation Bonds | ||||
Series 2021 | ||||
06/01/2051 | 4.500% | 1,500,000 | 1,058,726 | |
Red Bridge Public Infrastructure District No. 1(d),(g) | ||||
Limited General Obligation Bonds | ||||
Subordinated Series 2021B | ||||
08/15/2051 | 7.375% | 600,000 | 472,292 | |
UIPA Crossroads Public Infrastructure District(d) | ||||
Tax Allocation Bonds | ||||
Series 2021 | ||||
06/01/2052 | 4.375% | 3,000,000 | 2,637,021 | |
Utah Charter School Finance Authority(d) | ||||
Revenue Bonds | ||||
Ascent Academies Charter Schools | ||||
Series 2022 | ||||
06/15/2057 | 5.000% | 2,000,000 | 1,561,995 | |
Total | 10,071,040 | |||
Municipal Bonds (continued) | ||||
Issue Description | Coupon Rate | Principal Amount ($) | Value ($) | |
Virginia 2.9% | ||||
City of Chesapeake Expressway Toll Road(h) | ||||
Refunding Revenue Bonds | ||||
Transportation System | ||||
Series 2012 | ||||
07/15/2040 | 4.875% | 7,530,000 | 7,605,078 | |
Hanover County Economic Development Authority | ||||
Refunding Revenue Bonds | ||||
Covenant Woods | ||||
Series 2018 | ||||
07/01/2048 | 5.000% | 735,000 | 611,025 | |
07/01/2051 | 5.000% | 1,200,000 | 978,527 | |
James City County Economic Development Authority | ||||
Revenue Bonds | ||||
Williamsburg Landing | ||||
Series 2024A | ||||
12/01/2058 | 6.875% | 1,500,000 | 1,628,356 | |
Tobacco Settlement Financing Corp. | ||||
Revenue Bonds | ||||
Senior Series 2007B-1 | ||||
06/01/2047 | 5.000% | 3,000,000 | 2,765,190 | |
Total | 13,588,176 | |||
Washington 2.5% | ||||
King County Housing Authority | ||||
Refunding Revenue Bonds | ||||
Series 2018 | ||||
05/01/2038 | 3.750% | 3,295,000 | 3,056,109 | |
King County Public Hospital District No. 4 | ||||
Revenue Bonds | ||||
Series 2015A | ||||
12/01/2035 | 6.000% | 1,250,000 | 1,264,214 | |
12/01/2045 | 6.250% | 2,500,000 | 2,466,975 | |
Tacoma Consolidated Local Improvement Districts | ||||
Special Assessment Bonds | ||||
No. 65 | ||||
Series 2013 | ||||
04/01/2043 | 5.750% | 985,000 | 935,558 | |
Washington State Housing Finance Commission(d) | ||||
Prerefunded 07/01/25 Revenue Bonds | ||||
Heron’s Key | ||||
Series 2015A | ||||
07/01/2050 | 7.000% | 2,000,000 | 2,057,634 | |
Refunding Revenue Bonds | ||||
Seattle Academy of Arts and Sciences Project | ||||
Series 2023 | ||||
07/01/2053 | 6.125% | 375,000 | 406,968 | |
07/01/2059 | 6.250% | 320,000 | 348,180 | |
07/01/2063 | 6.375% | 375,000 | 408,590 | |
Municipal Bonds (continued) | ||||
Issue Description | Coupon Rate | Principal Amount ($) | Value ($) | |
Revenue Bonds | ||||
Transforming Age Projects | ||||
Series 2019A | ||||
01/01/2055 | 5.000% | 1,000,000 | 758,160 | |
Total | 11,702,388 | |||
Wisconsin 7.1% | ||||
Public Finance Authority | ||||
Refunding Revenue Bonds | ||||
Friends Homes | ||||
Series 2019 | ||||
09/01/2054 | 5.000% | 2,665,000 | 2,345,237 | |
WakeMed Hospital | ||||
Series 2019A | ||||
10/01/2049 | 4.000% | 4,310,000 | 3,937,100 | |
Revenue Bonds | ||||
Series 2023A | ||||
07/01/2062 | 5.750% | 2,500,000 | 2,696,345 | |
Tax-Exempt Pooled Securities | ||||
Series 2024 (Mandatory Put 02/01/27) | ||||
08/01/2059 | 4.000% | 2,000,000 | 1,961,412 | |
Public Finance Authority(d) | ||||
Refunding Revenue Bonds | ||||
Mary’s Woods at Marylhurst, Inc. | ||||
Series 2017 | ||||
05/15/2052 | 5.250% | 2,300,000 | 2,064,647 | |
Revenue Bonds | ||||
Astro Texas Land Projects | ||||
Series 2024 | ||||
12/15/2028 | 5.500% | 2,000,000 | 2,000,328 | |
Candela Project | ||||
Series 2023 | ||||
12/15/2029 | 6.125% | 1,500,000 | 1,452,144 | |
Promenade Apartments | ||||
Series 2024 | ||||
02/01/2039 | 6.250% | 1,000,000 | 1,019,973 | |
Wonderful Foundations Charter School Portfolio Projects | ||||
Series 2020 | ||||
01/01/2055 | 5.000% | 2,500,000 | 2,229,702 | |
Public Finance Authority(c),(d) | ||||
Revenue Bonds | ||||
Lariat Project | ||||
Series 2023 | ||||
09/01/2029 | 0.000% | 2,000,000 | 1,369,343 | |
Public Finance Authority(f) | ||||
Revenue Bonds | ||||
Sky Harbour Capital LLC Aviation Facilities Project | ||||
Series 2021 | ||||
07/01/2054 | 4.250% | 3,000,000 | 2,275,467 | |
Municipal Bonds (continued) | ||||
Issue Description | Coupon Rate | Principal Amount ($) | Value ($) | |
Wisconsin Center District(c) | ||||
Revenue Bonds | ||||
Junior Dedicated | ||||
Series 2020D (AGM) | ||||
12/15/2060 | 0.000% | 18,000,000 | 2,798,071 | |
Wisconsin Health & Educational Facilities Authority | ||||
Refunding Revenue Bonds | ||||
Cedar Crest, Inc. Project | ||||
Series 2022 | ||||
04/01/2057 | 5.125% | 3,000,000 | 2,375,543 | |
St. Camillus Health System, Inc. | ||||
Series 2019 | ||||
11/01/2054 | 5.000% | 3,000,000 | 2,403,150 | |
Revenue Bonds | ||||
PHW Muskego, Inc. Project | ||||
Series 2021 | ||||
10/01/2061 | 4.000% | 4,000,000 | 2,747,118 | |
Total | 33,675,580 | |||
Total Municipal Bonds (Cost $539,380,536) | 466,719,407 | |||
Municipal Short Term 0.4% | ||||
Issue Description | Yield | Principal Amount ($) | Value ($) | |
California 0.4% | ||||
California Infrastructure & Economic Development Bank(d),(f) | ||||
Revenue Bonds | ||||
Series 2023 (Mandatory Put 08/15/24) | ||||
01/01/2050 | 7.700% | 2,000,000 | 2,065,943 | |
Total Municipal Short Term (Cost $2,000,000) | 2,065,943 | |||
Money Market Funds 0.0% | ||
Shares | Value ($) | |
BlackRock Liquidity Funds MuniCash, Institutional Shares, 3.258%(k) | 88,104 | 88,113 |
Total Money Market Funds (Cost $88,104) | 88,113 | |
Total Investments in Securities (Cost $541,868,640) | 469,273,463 | |
Other Assets & Liabilities, Net | 6,646,236 | |
Net Assets | $475,919,699 | |
(a) | The Fund is entitled to receive principal and interest from the guarantor after a day or a week’s notice or upon maturity. The maturity date disclosed represents the final maturity. |
(b) | Represents a variable rate security where the coupon rate adjusts on specified dates (generally daily or weekly) using the prevailing money market rate. The interest rate shown was the current rate as of May 31, 2024. |
(c) | Zero coupon bond. |
(d) | Represents privately placed and other securities and instruments exempt from Securities and Exchange Commission registration (collectively, private placements), such as Section 4(a)(2) and Rule 144A eligible securities, which are often sold only to qualified institutional buyers. At May 31, 2024, the total value of these securities amounted to $147,730,098, which represents 31.04% of total net assets. |
(e) | Represents a security in default. |
(f) | Income from this security may be subject to alternative minimum tax. |
(g) | Cash flow bond. Interest rate represents the stated coupon rate at May 31, 2024. Income on this security, if any, is derived from the cash flow of the issuer. |
(h) | Represents a variable rate security with a step coupon where the rate adjusts according to a schedule for a series of periods, typically lower for an initial period and then increasing to a higher coupon rate thereafter. The interest rate shown was the current rate as of May 31, 2024. |
(i) | Represents a security purchased on a when-issued basis. |
(j) | Municipal obligations include debt obligations issued by or on behalf of territories, possessions, or sovereign nations within the territorial boundaries of the United States. At May 31, 2024, the total value of these securities amounted to $29,477,949, which represents 6.19% of total net assets. |
(k) | The rate shown is the seven-day current annualized yield at May 31, 2024. |
AGM | Assured Guaranty Municipal Corporation |
BAN | Bond Anticipation Note |
Level 1 ($) | Level 2 ($) | Level 3 ($) | Total ($) | |
Investments in Securities | ||||
Floating Rate Notes | — | 400,000 | — | 400,000 |
Municipal Bonds | — | 466,719,407 | — | 466,719,407 |
Municipal Short Term | — | 2,065,943 | — | 2,065,943 |
Money Market Funds | 88,113 | — | — | 88,113 |
Total Investments in Securities | 88,113 | 469,185,350 | — | 469,273,463 |
Assets | |
Investments in securities, at value | |
Unaffiliated issuers (cost $541,868,640) | $469,273,463 |
Cash | 16,437 |
Receivable for: | |
Capital shares sold | 1,768,267 |
Dividends | 5,491 |
Interest | 8,897,272 |
Expense reimbursement due from Investment Manager | 1,070 |
Prepaid expenses | 3,397 |
Deferred compensation of board members | 167,735 |
Total assets | 480,133,132 |
Liabilities | |
Payable for: | |
Investments purchased on a delayed delivery basis | 956,860 |
Capital shares redeemed | 994,944 |
Distributions to shareholders | 2,002,546 |
Management services fees | 7,004 |
Distribution and/or service fees | 1,193 |
Transfer agent fees | 22,956 |
Compensation of board members | 1,564 |
Other expenses | 32,606 |
Deferred compensation of board members | 193,760 |
Total liabilities | 4,213,433 |
Net assets applicable to outstanding capital stock | $475,919,699 |
Represented by | |
Paid in capital | 585,224,043 |
Total distributable earnings (loss) | (109,304,344 ) |
Total - representing net assets applicable to outstanding capital stock | $475,919,699 |
Class A | |
Net assets | $136,936,346 |
Shares outstanding | 15,310,286 |
Net asset value per share | $8.94 |
Maximum sales charge | 3.00% |
Maximum offering price per share (calculated by dividing the net asset value per share by 1.0 minus the maximum sales charge for Class A shares) | $9.22 |
Advisor Class | |
Net assets | $13,310,951 |
Shares outstanding | 1,486,840 |
Net asset value per share | $8.95 |
Class C | |
Net assets | $20,514,730 |
Shares outstanding | 2,293,733 |
Net asset value per share | $8.94 |
Institutional Class | |
Net assets | $212,492,691 |
Shares outstanding | 23,759,125 |
Net asset value per share | $8.94 |
Institutional 2 Class | |
Net assets | $12,641,311 |
Shares outstanding | 1,414,433 |
Net asset value per share | $8.94 |
Institutional 3 Class | |
Net assets | $80,023,670 |
Shares outstanding | 8,924,039 |
Net asset value per share | $8.97 |
Net investment income | |
Income: | |
Dividends — unaffiliated issuers | $54,118 |
Interest | 27,364,092 |
Total income | 27,418,210 |
Expenses: | |
Management services fees | 2,681,622 |
Distribution and/or service fees | |
Class A | 285,483 |
Class C | 166,486 |
Transfer agent fees | |
Class A | 106,641 |
Advisor Class | 8,594 |
Class C | 15,536 |
Institutional Class | 158,375 |
Institutional 2 Class | 7,037 |
Institutional 3 Class | 5,474 |
Custodian fees | 11,876 |
Printing and postage fees | 22,043 |
Registration fees | 128,577 |
Accounting services fees | 41,499 |
Legal fees | 63,643 |
Interest on interfund lending | 4,473 |
Compensation of chief compliance officer | 92 |
Compensation of board members | 16,046 |
Deferred compensation of board members | 7,612 |
Other | 18,494 |
Total expenses | 3,749,603 |
Fees waived or expenses reimbursed by Investment Manager and its affiliates | (313,918 ) |
Expense reduction | (400 ) |
Total net expenses | 3,435,285 |
Net investment income | 23,982,925 |
Realized and unrealized gain (loss) — net | |
Net realized gain (loss) on: | |
Investments — unaffiliated issuers | (16,316,257 ) |
Futures contracts | 619,242 |
Net realized loss | (15,697,015 ) |
Net change in unrealized appreciation (depreciation) on: | |
Investments — unaffiliated issuers | 21,543,846 |
Net change in unrealized appreciation (depreciation) | 21,543,846 |
Net realized and unrealized gain | 5,846,831 |
Net increase in net assets resulting from operations | $29,829,756 |
Year Ended May 31, 2024 | Year Ended May 31, 2023 | |
Operations | ||
Net investment income | $23,982,925 | $24,548,475 |
Net realized loss | (15,697,015 ) | (15,148,882 ) |
Net change in unrealized appreciation (depreciation) | 21,543,846 | (46,980,990 ) |
Net increase (decrease) in net assets resulting from operations | 29,829,756 | (37,581,397 ) |
Distributions to shareholders | ||
Net investment income and net realized gains | ||
Class A | (6,264,847 ) | (7,014,650 ) |
Advisor Class | (529,284 ) | (381,292 ) |
Class C | (787,241 ) | (1,042,844 ) |
Institutional Class | (9,728,974 ) | (12,239,802 ) |
Institutional 2 Class | (587,634 ) | (687,255 ) |
Institutional 3 Class | (4,497,686 ) | (4,940,646 ) |
Total distributions to shareholders | (22,395,666 ) | (26,306,489 ) |
Decrease in net assets from capital stock activity | (51,520,104 ) | (78,948,564 ) |
Total decrease in net assets | (44,086,014 ) | (142,836,450 ) |
Net assets at beginning of year | 520,005,713 | 662,842,163 |
Net assets at end of year | $475,919,699 | $520,005,713 |
Year Ended | Year Ended | |||
May 31, 2024 | May 31, 2023 | |||
Shares | Dollars ($) | Shares | Dollars ($) | |
Capital stock activity | ||||
Class A | ||||
Shares sold | 2,825,064 | 24,887,061 | 6,901,356 | 62,359,193 |
Distributions reinvested | 670,666 | 5,867,054 | 706,433 | 6,313,691 |
Shares redeemed | (5,607,036 ) | (49,150,725 ) | (7,734,760 ) | (69,392,489 ) |
Net decrease | (2,111,306 ) | (18,396,610 ) | (126,971 ) | (719,605 ) |
Advisor Class | ||||
Shares sold | 1,356,562 | 11,748,779 | 821,373 | 7,389,976 |
Distributions reinvested | 60,324 | 529,284 | 42,679 | 381,259 |
Shares redeemed | (1,060,070 ) | (9,209,614 ) | (382,996 ) | (3,398,709 ) |
Net increase | 356,816 | 3,068,449 | 481,056 | 4,372,526 |
Class C | ||||
Shares sold | 577,342 | 5,104,613 | 569,581 | 5,147,785 |
Distributions reinvested | 87,953 | 769,671 | 110,632 | 989,485 |
Shares redeemed | (1,005,298 ) | (8,778,829 ) | (1,267,986 ) | (11,390,788 ) |
Net decrease | (340,003 ) | (2,904,545 ) | (587,773 ) | (5,253,518 ) |
Institutional Class | ||||
Shares sold | 7,492,578 | 65,118,251 | 12,240,748 | 111,073,979 |
Distributions reinvested | 995,255 | 8,712,235 | 1,045,705 | 9,353,688 |
Shares redeemed | (9,062,035 ) | (78,325,498 ) | (33,723,133 ) | (312,031,967 ) |
Net decrease | (574,202 ) | (4,495,012 ) | (20,436,680 ) | (191,604,300 ) |
Institutional 2 Class | ||||
Shares sold | 686,761 | 6,052,647 | 919,365 | 8,379,478 |
Distributions reinvested | 67,107 | 587,548 | 76,900 | 686,953 |
Shares redeemed | (840,639 ) | (7,237,653 ) | (1,100,176 ) | (9,846,622 ) |
Net decrease | (86,771 ) | (597,458 ) | (103,911 ) | (780,191 ) |
Institutional 3 Class | ||||
Shares sold | 1,624,085 | 14,221,958 | 20,403,975 | 191,717,950 |
Distributions reinvested | 23,747 | 209,041 | 18,566 | 166,319 |
Shares redeemed | (4,853,732 ) | (42,625,927 ) | (8,659,030 ) | (76,847,745 ) |
Net increase (decrease) | (3,205,900 ) | (28,194,928 ) | 11,763,511 | 115,036,524 |
Total net decrease | (5,961,366 ) | (51,520,104 ) | (9,010,768 ) | (78,948,564 ) |
Net asset value, beginning of period | Net investment income | Net realized and unrealized gain (loss) | Total from investment operations | Distributions from net investment income | Total distributions to shareholders | |
Class A | ||||||
Year Ended 5/31/2024 | $8.79 | 0.41 | 0.13 | 0.54 | (0.39 ) | (0.39 ) |
Year Ended 5/31/2023 | $9.72 | 0.38 | (0.90 ) | (0.52 ) | (0.41 ) | (0.41 ) |
Year Ended 5/31/2022 | $11.04 | 0.37 | (1.31 ) | (0.94 ) | (0.38 ) | (0.38 ) |
Year Ended 5/31/2021 | $9.96 | 0.36 | 1.08 | 1.44 | (0.36 ) | (0.36 ) |
Year Ended 5/31/2020 | $10.74 | 0.42 | (0.77 ) | (0.35 ) | (0.43 ) | (0.43 ) |
Advisor Class | ||||||
Year Ended 5/31/2024 | $8.80 | 0.44 | 0.11 | 0.55 | (0.40 ) | (0.40 ) |
Year Ended 5/31/2023 | $9.74 | 0.40 | (0.91 ) | (0.51 ) | (0.43 ) | (0.43 ) |
Year Ended 5/31/2022 | $11.05 | 0.38 | (1.29 ) | (0.91 ) | (0.40 ) | (0.40 ) |
Year Ended 5/31/2021 | $9.97 | 0.38 | 1.08 | 1.46 | (0.38 ) | (0.38 ) |
Year Ended 5/31/2020 | $10.76 | 0.44 | (0.78 ) | (0.34 ) | (0.45 ) | (0.45 ) |
Class C | ||||||
Year Ended 5/31/2024 | $8.79 | 0.36 | 0.12 | 0.48 | (0.33 ) | (0.33 ) |
Year Ended 5/31/2023 | $9.72 | 0.33 | (0.90 ) | (0.57 ) | (0.36 ) | (0.36 ) |
Year Ended 5/31/2022 | $11.04 | 0.30 | (1.30 ) | (1.00 ) | (0.32 ) | (0.32 ) |
Year Ended 5/31/2021 | $9.96 | 0.30 | 1.07 | 1.37 | (0.29 ) | (0.29 ) |
Year Ended 5/31/2020 | $10.74 | 0.35 | (0.77 ) | (0.42 ) | (0.36 ) | (0.36 ) |
Institutional Class | ||||||
Year Ended 5/31/2024 | $8.79 | 0.43 | 0.12 | 0.55 | (0.40 ) | (0.40 ) |
Year Ended 5/31/2023 | $9.73 | 0.40 | (0.91 ) | (0.51 ) | (0.43 ) | (0.43 ) |
Year Ended 5/31/2022 | $11.05 | 0.39 | (1.31 ) | (0.92 ) | (0.40 ) | (0.40 ) |
Year Ended 5/31/2021 | $9.96 | 0.38 | 1.09 | 1.47 | (0.38 ) | (0.38 ) |
Year Ended 5/31/2020 | $10.75 | 0.44 | (0.78 ) | (0.34 ) | (0.45 ) | (0.45 ) |
Institutional 2 Class | ||||||
Year Ended 5/31/2024 | $8.78 | 0.43 | 0.13 | 0.56 | (0.40 ) | (0.40 ) |
Year Ended 5/31/2023 | $9.72 | 0.40 | (0.91 ) | (0.51 ) | (0.43 ) | (0.43 ) |
Year Ended 5/31/2022 | $11.04 | 0.39 | (1.30 ) | (0.91 ) | (0.41 ) | (0.41 ) |
Year Ended 5/31/2021 | $9.95 | 0.39 | 1.08 | 1.47 | (0.38 ) | (0.38 ) |
Year Ended 5/31/2020 | $10.74 | 0.44 | (0.77 ) | (0.33 ) | (0.46 ) | (0.46 ) |
Net asset value, end of period | Total return | Total gross expense ratio to average net assets(a) | Total net expense ratio to average net assets(a),(b) | Net investment income ratio to average net assets | Portfolio turnover | Net assets, end of period (000’s) | |
Class A | |||||||
Year Ended 5/31/2024 | $8.94 | 6.27% | 0.88% (c) | 0.82% (c),(d) | 4.71% | 16% | $136,936 |
Year Ended 5/31/2023 | $8.79 | (5.29% ) | 0.87% (c) | 0.83% (c),(d) | 4.25% | 14% | $153,077 |
Year Ended 5/31/2022 | $9.72 | (8.75% ) | 0.86% (c) | 0.85% (c),(d) | 3.39% | 30% | $170,634 |
Year Ended 5/31/2021 | $11.04 | 14.64% | 0.87% (e) | 0.85% (d),(e) | 3.41% | 22% | $182,125 |
Year Ended 5/31/2020 | $9.96 | (3.41% ) | 0.88% (c),(e) | 0.87% (c),(d),(e) | 3.98% | 46% | $164,388 |
Advisor Class | |||||||
Year Ended 5/31/2024 | $8.95 | 6.48% | 0.68% (c) | 0.62% (c),(d) | 4.98% | 16% | $13,311 |
Year Ended 5/31/2023 | $8.80 | (5.19% ) | 0.67% (c) | 0.63% (c),(d) | 4.47% | 14% | $9,940 |
Year Ended 5/31/2022 | $9.74 | (8.47% ) | 0.66% (c) | 0.65% (c),(d) | 3.46% | 30% | $6,318 |
Year Ended 5/31/2021 | $11.05 | 14.86% | 0.68% (e) | 0.65% (d),(e) | 3.61% | 22% | $12,442 |
Year Ended 5/31/2020 | $9.97 | (3.30% ) | 0.68% (c),(e) | 0.67% (c),(d),(e) | 4.17% | 46% | $5,549 |
Class C | |||||||
Year Ended 5/31/2024 | $8.94 | 5.64% | 1.48% (c) | 1.42% (c),(d) | 4.12% | 16% | $20,515 |
Year Ended 5/31/2023 | $8.79 | (5.86% ) | 1.47% (c) | 1.43% (c),(d) | 3.65% | 14% | $23,141 |
Year Ended 5/31/2022 | $9.72 | (9.30% ) | 1.52% (c) | 1.45% (c),(d) | 2.77% | 30% | $31,324 |
Year Ended 5/31/2021 | $11.04 | 13.94% | 1.62% (e) | 1.47% (d),(e),(f) | 2.80% | 22% | $38,720 |
Year Ended 5/31/2020 | $9.96 | (4.04% ) | 1.63% (c),(e) | 1.52% (c),(d),(e),(f) | 3.34% | 46% | $42,578 |
Institutional Class | |||||||
Year Ended 5/31/2024 | $8.94 | 6.49% | 0.68% (c) | 0.62% (c),(d) | 4.93% | 16% | $212,493 |
Year Ended 5/31/2023 | $8.79 | (5.20% ) | 0.67% (c) | 0.63% (c),(d) | 4.41% | 14% | $213,810 |
Year Ended 5/31/2022 | $9.73 | (8.56% ) | 0.66% (c) | 0.65% (c),(d) | 3.58% | 30% | $435,400 |
Year Ended 5/31/2021 | $11.05 | 14.97% | 0.67% (e) | 0.66% (d),(e) | 3.61% | 22% | $497,969 |
Year Ended 5/31/2020 | $9.96 | (3.31% ) | 0.68% (c),(e) | 0.67% (c),(d),(e) | 4.19% | 46% | $481,793 |
Institutional 2 Class | |||||||
Year Ended 5/31/2024 | $8.94 | 6.63% | 0.66% (c) | 0.60% (c) | 4.95% | 16% | $12,641 |
Year Ended 5/31/2023 | $8.78 | (5.19% ) | 0.65% (c) | 0.61% (c) | 4.47% | 14% | $13,181 |
Year Ended 5/31/2022 | $9.72 | (8.54% ) | 0.63% (c) | 0.61% (c) | 3.54% | 30% | $15,596 |
Year Ended 5/31/2021 | $11.04 | 15.03% | 0.64% (e) | 0.62% (e) | 3.64% | 22% | $27,815 |
Year Ended 5/31/2020 | $9.95 | (3.28% ) | 0.64% (c),(e) | 0.63% (c),(e) | 4.13% | 46% | $15,702 |
Net asset value, beginning of period | Net investment income | Net realized and unrealized gain (loss) | Total from investment operations | Distributions from net investment income | Total distributions to shareholders | |
Institutional 3 Class | ||||||
Year Ended 5/31/2024 | $8.81 | 0.43 | 0.14 | 0.57 | (0.41 ) | (0.41 ) |
Year Ended 5/31/2023 | $9.75 | 0.41 | (0.91 ) | (0.50 ) | (0.44 ) | (0.44 ) |
Year Ended 5/31/2022 | $11.07 | 0.40 | (1.31 ) | (0.91 ) | (0.41 ) | (0.41 ) |
Year Ended 5/31/2021 | $9.98 | 0.39 | 1.09 | 1.48 | (0.39 ) | (0.39 ) |
Year Ended 5/31/2020 | $10.77 | 0.45 | (0.78 ) | (0.33 ) | (0.46 ) | (0.46 ) |
Notes to Financial Highlights | |
(a) | In addition to the fees and expenses that the Fund bears directly, the Fund indirectly bears a pro rata share of the fees and expenses of any other funds in which it invests. Such indirect expenses are not included in the Fund’s reported expense ratios. |
(b) | Total net expenses include the impact of certain fee waivers/expense reimbursements made by the Investment Manager and certain of its affiliates, if applicable. |
(c) | Ratios include interfund lending expense which is less than 0.01%. |
(d) | The benefits derived from expense reductions had an impact of less than 0.01%. |
(e) | Ratios include interest and fee expense related to the participation in certain inverse floater programs. If interest and fee expense related to the participation in certain inverse floater programs had been excluded, expenses would have been lower by 0.01%. Due to an equal increase in interest income from fixed rate municipal bonds held in trust, there is no impact on the Fund’s net assets, net asset value per share, total return or net investment income. |
(f) | Ratios include the impact of voluntary waivers paid by the Investment Manager. For the periods indicated below, if the Investment Manager had not paid these voluntary waivers, the Fund’s net expense ratio would increase by: |
5/31/2021 | 5/31/2020 | |
Class C | 0.03% | 0.10% |
Net asset value, end of period | Total return | Total gross expense ratio to average net assets(a) | Total net expense ratio to average net assets(a),(b) | Net investment income ratio to average net assets | Portfolio turnover | Net assets, end of period (000’s) | |
Institutional 3 Class | |||||||
Year Ended 5/31/2024 | $8.97 | 6.67% | 0.61% (c) | 0.55% (c) | 4.94% | 16% | $80,024 |
Year Ended 5/31/2023 | $8.81 | (5.11% ) | 0.60% (c) | 0.55% (c) | 4.61% | 14% | $106,856 |
Year Ended 5/31/2022 | $9.75 | (8.46% ) | 0.58% (c) | 0.57% (c) | 3.69% | 30% | $3,572 |
Year Ended 5/31/2021 | $11.07 | 15.05% | 0.59% (e) | 0.57% (e) | 3.69% | 22% | $2,838 |
Year Ended 5/31/2020 | $9.98 | (3.21% ) | 0.59% (c),(e) | 0.58% (c),(e) | 4.26% | 46% | $2,170 |
Amount of realized gain (loss) on derivatives recognized in income | |
Risk exposure category | Futures contracts ($) |
Interest rate risk | 619,242 |
Derivative instrument | Average notional amounts ($) |
Futures contracts — short | 3,471,769 |
Effective rate (%) | |
Class A | 0.07 |
Advisor Class | 0.07 |
Class C | 0.07 |
Institutional Class | 0.07 |
Institutional 2 Class | 0.06 |
Institutional 3 Class | 0.01 |
Front End (%) | CDSC (%) | Amount ($) | |
Class A | 3.00 | 0.75 (a) | 65,564 |
Class C | — | 1.00 (b) | 686 |
(a) | This charge is imposed on certain investments of $500,000 or more if redeemed within 12 months after purchase. |
(b) | This charge applies to redemptions within 12 months after purchase, with certain limited exceptions. |
October 1, 2023 through September 30, 2024 (%) | Prior to October 1, 2023 (%) | |
Class A | 0.82 | 0.83 |
Advisor Class | 0.62 | 0.63 |
Class C | 1.42 | 1.43 |
Institutional Class | 0.62 | 0.63 |
Institutional 2 Class | 0.60 | 0.60 |
Institutional 3 Class | 0.55 | 0.55 |
Undistributed net investment income ($) | Accumulated net realized (loss) ($) | Paid in capital ($) |
1,214,064 | (1,214,063 ) | (1 ) |
Year Ended May 31, 2024 | Year Ended May 31, 2023 | ||||||
Ordinary income ($) | Tax-exempt income ($) | Long-term capital gains ($) | Total ($) | Ordinary income ($) | Tax-exempt income ($) | Long-term capital gains ($) | Total ($) |
188,360 | 22,207,306 | — | 22,395,666 | 65,268 | 26,241,221 | — | 26,306,489 |
Undistributed ordinary income ($) | Undistributed tax- exempt income ($) | Undistributed long-term capital gains ($) | Capital loss carryforwards ($) | Net unrealized (depreciation) ($) |
— | 13,633,199 | — | (39,302,416 ) | (81,438,821 ) |
Federal tax cost ($) | Gross unrealized appreciation ($) | Gross unrealized (depreciation) ($) | Net unrealized (depreciation) ($) |
550,712,284 | 1,336,672 | (82,775,493 ) | (81,438,821 ) |
No expiration short-term ($) | No expiration long-term ($) | Total ($) | Utilized ($) |
(11,241,428 ) | (28,060,988 ) | (39,302,416 ) | — |
Borrower or lender | Average loan balance ($) | Weighted average interest rate (%) | Number of days with outstanding loans |
Borrower | 2,107,692 | 5.88 | 13 |
Exempt- interest dividends | |
99.16% |

columbiathreadneedleus.com/investor/. The Fund is distributed by Columbia Management Investment Distributors, Inc., member FINRA, and managed by Columbia Management Investment Advisers, LLC.
Item 8. Changes in and Disagreements with Accountants for Open-End Management Investment Companies.
Not applicable.
Item 9. Proxy Disclosures for Open-End Management Investment Companies.
Not applicable.
Item 10. Remuneration Paid to Directors, Officers, and Others of Open-End Management Investment Companies.
Remuneration Paid to Directors, Officers, and Others of Open-End Management Investment Companies is included in Item 7 of this Form N-CSR.
Item 11. Statement Regarding Basis for Approval of Investment Advisory Contract.
Not applicable.
Item 12. Disclosure of Proxy Voting Policies and Procedures for Closed-End Management Investment Companies.
Not applicable.
Item 13. Portfolio Managers of Closed-End Management Investment Companies.
Not applicable.
Item 14. Purchases of Equity Securities by Closed-End Management Investment Company and Affiliated Purchasers.
Not applicable.
Item 15. Submission of Matters to a Vote of Security Holders.
There were no material changes to the procedures by which shareholders may recommend nominees to the registrant’s board of directors implemented since the registrant last provided disclosure as to such procedures in response to the requirements of Item 407(c)(2)(iv) of Regulation S-K or Item 15 of Form N-CSR.
Item 16. Controls and Procedures.
(a) The registrant’s principal executive officer and principal financial officer, based on their evaluation of the registrant’s disclosure controls and procedures as of a date within 90 days of the filing of this report, have concluded that such controls and procedures are adequately designed to ensure that information required to be disclosed by the registrant in Form N-CSR is accumulated and communicated to the registrant’s management, including the principal executive officer and principal financial officer, or persons performing similar functions, as appropriate to allow timely decisions regarding required disclosure.
(b) There was no change in the registrant’s internal control over financial reporting that occurred during the period covered by this report that has materially affected, or is reasonably likely to materially affect, the registrant’s internal control over financial reporting.
Item 17. Disclosure of Securities Lending Activities for Closed-End Management Investment Companies.
Not applicable.
Item 18. Recovery of Erroneously Awarded Compensation.
Not applicable.
Item 19. Exhibits.
SIGNATURES
Pursuant to the requirements of the Securities Exchange Act of 1934 and the Investment Company Act of 1940, the registrant has duly caused this report to be signed on its behalf by the undersigned, thereunto duly authorized.
| (registrant) | Columbia Funds Series Trust I |
| By (Signature and Title) | /s/ Daniel J. Beckman |
| Daniel J. Beckman, President and Principal Executive Officer | |
| Date | July 23, 2024 |
Pursuant to the requirements of the Securities Exchange Act of 1934 and the Investment Company Act of 1940, this report has been signed below by the following persons on behalf of the registrant and in the capacities and on the dates indicated.
| By (Signature and Title) | /s/ Daniel J. Beckman |
| Daniel J. Beckman, President and Principal Executive Officer | |
| Date | July 23, 2024 |
| By (Signature and Title) | /s/ Michael G. Clarke |
| Michael G. Clarke, Chief Financial Officer, | |
| Principal Financial Officer and Senior Vice President | |
| Date | July 23, 2024 |
| By (Signature and Title) | /s/ Charles H. Chiesa |
| Charles H. Chiesa, Treasurer, Chief Accounting | |
| Officer and Principal Financial Officer | |
| Date | July 23, 2024 |